THE STR - LACP
186
SUCCESS IS IN THE DETAILS. ANNUAL REPORT 2012
-
Upload
khangminh22 -
Category
Documents
-
view
0 -
download
0
Transcript of THE STR - LACP

FOR FURTHER QUESTIONS, PLEASE CONTACT OURINVESTOR RELATIONS DEPARTMENT:
STRABAG SE, Donau-City-Str. 9, 1220 Vienna/Austria +43 800 880890@ [email protected] www.strabag.com
This Annual Report is also available in German.In case of discrepancy the German version prevails.
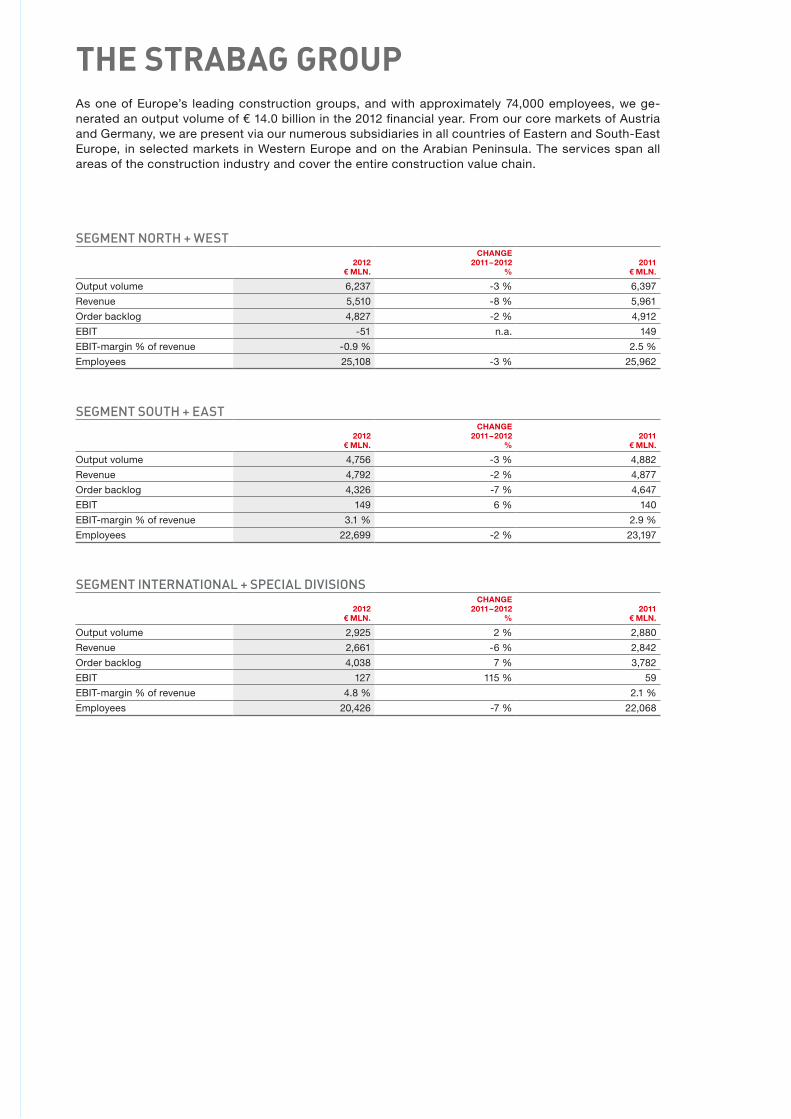
the strabag groupAs one of Europe’s leading construction groups, and with approximately 74,000 employees, we ge-nerated an output volume of € 14.0 billion in the 2012 financial year. From our core markets of Austria and Germany, we are present via our numerous subsidiaries in all countries of Eastern and South-East Europe, in selected markets in Western Europe and on the Arabian Peninsula. The services span all areas of the construction industry and cover the entire construction value chain.
SEGMENT NORTH + WEST
2012€ Mln.
change 2011 – 2012
%2011
€ Mln.
Output volume 6,237 -3 % 6,397
Revenue 5,510 -8 % 5,961
Order backlog 4,827 -2 % 4,912
EBIT -51 n.a. 149
EBIT-margin % of revenue -0.9 % 2.5 %
Employees 25,108 -3 % 25,962
SEGMENT SOUTH + EAST
2012€ Mln.
change 2011 – 2012
%2011
€ Mln.
Output volume 4,756 -3 % 4,882
Revenue 4,792 -2 % 4,877
Order backlog 4,326 -7 % 4,647
EBIT 149 6 % 140
EBIT-margin % of revenue 3.1 % 2.9 %
Employees 22,699 -2 % 23,197
SEGMENT INTERNATIONAL + SPECIAL DIVISIONS
2012€ Mln.
change 2011 – 2012
%2011
€ Mln.
Output volume 2,925 2 % 2,880
Revenue 2,661 -6 % 2,842
Order backlog 4,038 7 % 3,782
EBIT 127 115 % 59
EBIT-margin % of revenue 4.8 % 2.1 %
Employees 20,426 -7 % 22,068
suCCess Is IN the DetaILs.aNNuaL report 2012
AN
NU
AL
REP
OR
T 20
12
FOR FURTHER QUESTIONS, PLEASE CONTACT OURINVESTOR RELATIONS DEPARTMENT:
STRABAG SE, Donau-City-Str. 9, 1220 Vienna/Austria +43 800 880890@ [email protected] www.strabag.com
This Annual Report is also available in German.In case of discrepancy the German version prevails.
the strabag groupAs one of Europe’s leading construction groups, and with approximately 74,000 employees, we ge-nerated an output volume of € 14.0 billion in the 2012 financial year. From our core markets of Austria and Germany, we are present via our numerous subsidiaries in all countries of Eastern and South-East Europe, in selected markets in Western Europe and on the Arabian Peninsula. The services span all areas of the construction industry and cover the entire construction value chain.
SEGMENT NORTH + WEST
2012€ Mln.
change 2011 – 2012
%2011
€ Mln.
Output volume 6,237 -3 % 6,397
Revenue 5,510 -8 % 5,961
Order backlog 4,827 -2 % 4,912
EBIT -51 n.a. 149
EBIT-margin % of revenue -0.9 % 2.5 %
Employees 25,108 -3 % 25,962
SEGMENT SOUTH + EAST
2012€ Mln.
change 2011 – 2012
%2011
€ Mln.
Output volume 4,756 -3 % 4,882
Revenue 4,792 -2 % 4,877
Order backlog 4,326 -7 % 4,647
EBIT 149 6 % 140
EBIT-margin % of revenue 3.1 % 2.9 %
Employees 22,699 -2 % 23,197
SEGMENT INTERNATIONAL + SPECIAL DIVISIONS
2012€ Mln.
change 2011 – 2012
%2011
€ Mln.
Output volume 2,925 2 % 2,880
Revenue 2,661 -6 % 2,842
Order backlog 4,038 7 % 3,782
EBIT 127 115 % 59
EBIT-margin % of revenue 4.8 % 2.1 %
Employees 20,426 -7 % 22,068
suCCess LIes IN the DetaILs.aNNuaL report 2012
AN
NU
AL
REP
OR
T 20
12
STRABAG SEInvestor RelationsDonau-City-Str. 91220 ViennaAustria
m Please add my e-mail adress to the Investor Relations Newsletter mailing list:
......................................................................
mPlease send me the Annual Reports in printed form.
mI no longer wish to receive the Annual Report in printed form.
My address: Name .............................................................. Address ............................................................ ...................................................................... www.strabag.com
✁
✁
OWNER, EDITOR AND PUbLISHERSTRaBag SeTriglavstr. 9, 9500 Villach/AustriaAustrian Commercial Register Number FN 88983 hDistrict Court Klagenfurt
CONTACTSTRaBag SeDiana Neumüller-Klein, CFACorporate Communications Donau-City-Str. 9, 1220 Vienna/Austria +43 1 22422@ [email protected] www.strabag.com
The Annual Report was prepared with the highest possible attention to detail. All information was verified.The possibility of rounding errors, printing errors or misprints, however, can not be completely excluded.The Annual Report contains information and forecasts related to the future development of STRABAG SE.These forecasts represent estimates made on the basis of all available information at the time of publication.Should the assumptions underlying the forecasts fail to appear, the actual results could deviate from the expectations.
Many of the projects contained in this financial report were carried out in consortia.We hereby extend a warm “thank you” to all our partners.
To facilitate reading and understanding, the masculine gender may be used at times in this report to apply equally to men and women without discrimination.
Creative support during the preparation of the Annual Report 2012: pkp BBDOCopy-editing: be.public Werbung Finanzkommunikation GmbHProducer: 08/16 printproduktion gmbh
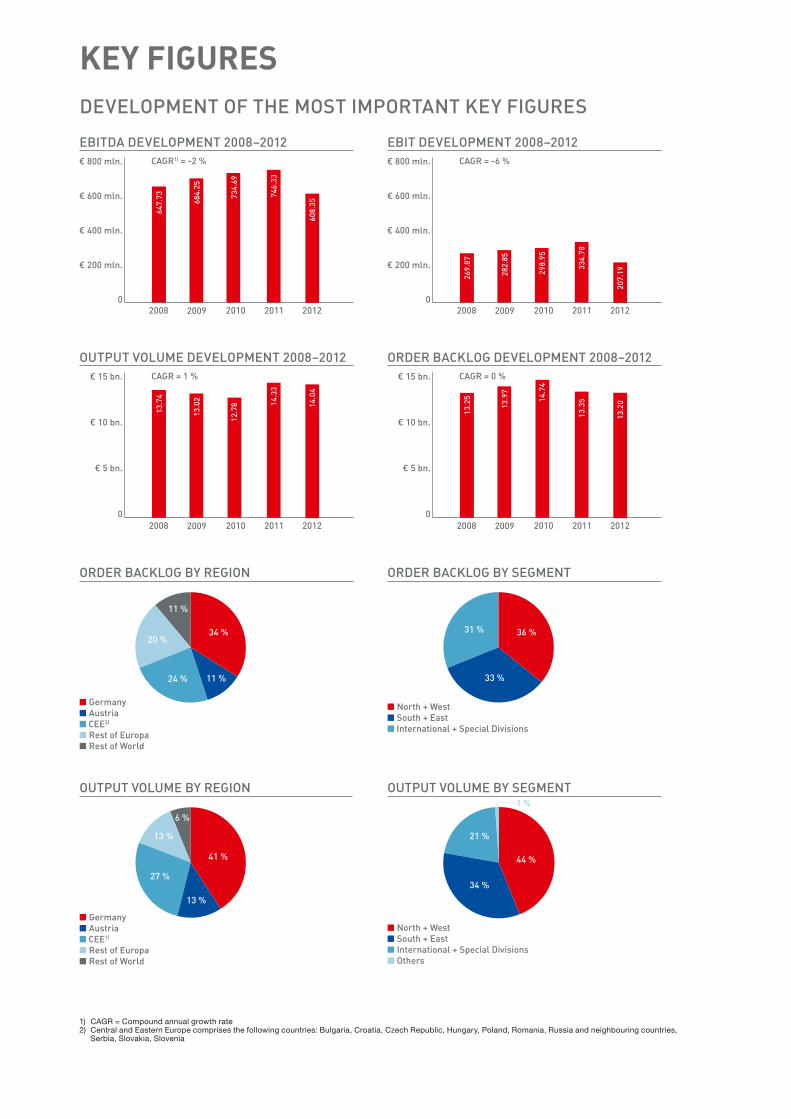
Key fIgures 2008–2012 Key fIguresDEVELOPMENT OF THE MOST IMPORTANT kEy FIGURES
1) CAGR = Compound annual growth rate2) Central and Eastern Europe comprises the following countries: Bulgaria, Croatia, Czech Republic, Hungary, Poland, Romania, Russia and neighbouring countries, Serbia, Slovakia, Slovenia
■ Germany■ Austria■ CEE2)
■ Rest of Europa■ Rest of World
ORDER BACKLOG BY REGION
34 %
11 %24 %
20 %
11 %
■ Germany■ Austria■ CEE1)
■ Rest of Europa■ Rest of World
OUTPUT VOLUME BY REGION
41 %
13 %
27 %
13 %
6 %
2008 2010 2011
OUTPUT VOLUME DEVELOPMENT 2008–2012
2012
13.7
4
13.0
2
12.7
8 14.3
3
€ 15 bn.
€ 10 bn.
€ 5 bn.
02009
14.0
4
CAGR = 1 %
2008 2010 2011
EBIT DEVELOPMENT 2008–2012
2012
269.
87
282.
85
298.
95
334.
78
€ 800 mln.
€ 600 mln.
€ 400 mln.
€ 200 mln.
02009
207.
19
CAGR = -6 %
2008 2010 2011
ORDER BACKLOG DEVELOPMENT 2008–2012
2012
13.2
5
13.9
7
14.7
4
13.3
5
€ 15 bn.
€ 10 bn.
€ 5 bn.
02009
13.2
0
CAGR = 0 %
2008 2010 2011
EBITDA DEVELOPMENT 2008–2012
2012
647.
73 684.
25
734.
69
746.
33
€ 800 mln.
€ 600 mln.
€ 400 mln.
€ 200 mln.
02009
608.
35
CAGR1) = -2 %
■ North + West■ South + East■ International + Special Divisions
ORDER BACKLOG BY SEGMENT
36 %
33 %
31 %
■ North + West■ South + East■ International + Special Divisions ■ Others
OUTPUT VOLUME BY SEGMENT
44 %
34 %
21 %
1 %
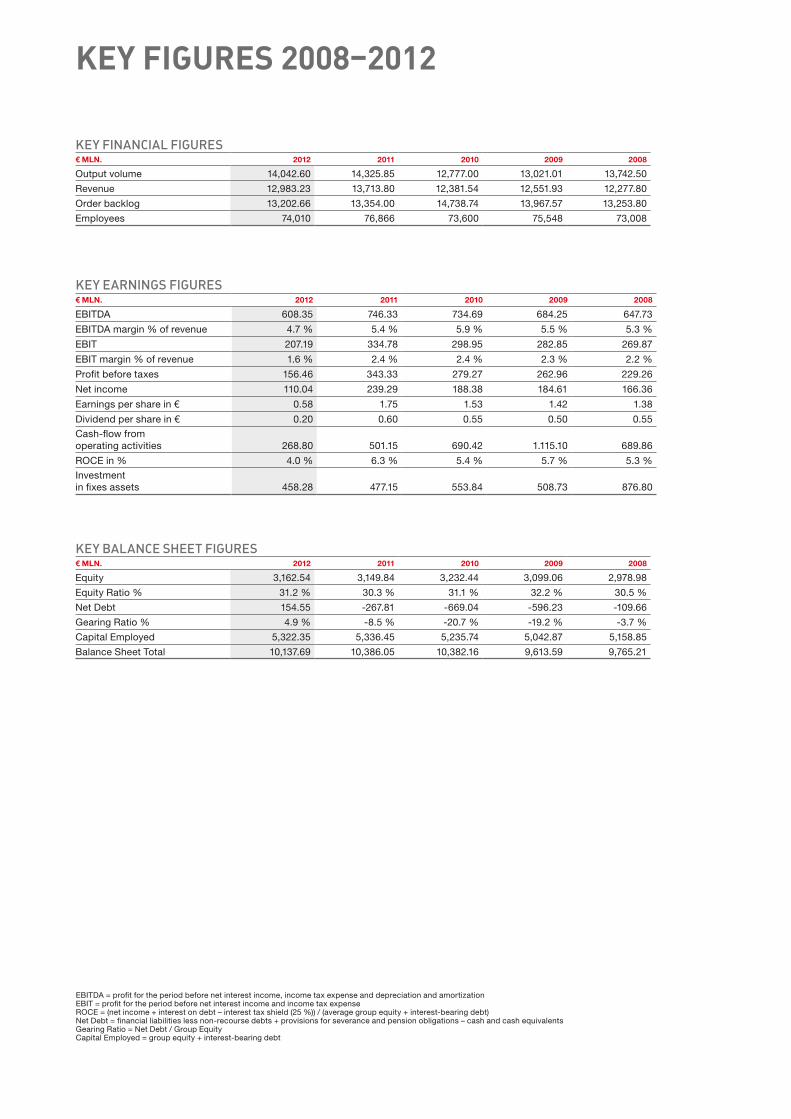
kEy FINANCIAL FIGURES€ Mln. 2012 2011 2010 2009 2008
Output volume 14,042.60 14,325.85 12,777.00 13,021.01 13,742.50
Revenue 12,983.23 13,713.80 12,381.54 12,551.93 12,277.80
Order backlog 13,202.66 13,354.00 14,738.74 13,967.57 13,253.80
Employees 74,010 76,866 73,600 75,548 73,008
kEy EARNINGS FIGURES€ Mln. 2012 2011 2010 2009 2008
EBITDA 608.35 746.33 734.69 684.25 647.73
EBITDA margin % of revenue 4.7 % 5.4 % 5.9 % 5.5 % 5.3 %
EBIT 207.19 334.78 298.95 282.85 269.87
EBIT margin % of revenue 1.6 % 2.4 % 2.4 % 2.3 % 2.2 %
Profit before taxes 156.46 343.33 279.27 262.96 229.26
Net income 110.04 239.29 188.38 184.61 166.36
Earnings per share in € 0.58 1.75 1.53 1.42 1.38
Dividend per share in € 0.20 0.60 0.55 0.50 0.55Cash-flow fromoperating activities 268.80 501.15 690.42 1.115.10 689.86
ROCE in % 4.0 % 6.3 % 5.4 % 5.7 % 5.3 %Investmentin fixes assets 458.28 477.15 553.84 508.73 876.80
kEy bALANCE SHEET FIGURES€ Mln. 2012 2011 2010 2009 2008
Equity 3,162.54 3,149.84 3,232.44 3,099.06 2,978.98
Equity Ratio % 31.2 % 30.3 % 31.1 % 32.2 % 30.5 %
Net Debt 154.55 -267.81 -669.04 -596.23 -109.66
Gearing Ratio % 4.9 % -8.5 % -20.7 % -19.2 % -3.7 %
Capital Employed 5,322.35 5,336.45 5,235.74 5,042.87 5,158.85
Balance Sheet Total 10,137.69 10,386.05 10,382.16 9,613.59 9,765.21
EBITDA = profit for the period before net interest income, income tax expense and depreciation and amortization EBIT = profit for the period before net interest income and income tax expense ROCE = (net income + interest on debt – interest tax shield (25 %)) / (average group equity + interest-bearing debt) Net Debt = financial liabilities less non-recourse debts + provisions for severance and pension obligations – cash and cash equivalents Gearing Ratio = Net Debt / Group Equity Capital Employed = group equity + interest-bearing debt
STRABAG SEInvestor RelationsDonau-City-Str. 91220 ViennaAustria
m Please add my e-mail adress to the Investor Relations Newsletter mailing list:
......................................................................
mPlease send me the Annual Reports in printed form.
mI no longer wish to receive the Annual Report in printed form.
My address: Name .............................................................. Address ............................................................ ...................................................................... www.strabag.com
✁
✁
OWNER, EDITOR AND PUbLISHERSTRaBag SeTriglavstr. 9, 9500 Villach/AustriaAustrian Commercial Register Number FN 88983 hDistrict Court Klagenfurt
CONTACTSTRaBag SeDiana Neumüller-Klein, CFACorporate Communications Donau-City-Str. 9, 1220 Vienna/Austria +43 1 22422@ [email protected] www.strabag.com
The Annual Report was prepared with the highest possible attention to detail. All information was verified.The possibility of rounding errors, printing errors or misprints, however, can not be completely excluded.The Annual Report contains information and forecasts related to the future development of STRABAG SE.These forecasts represent estimates made on the basis of all available information at the time of publication.Should the assumptions underlying the forecasts fail to appear, the actual results could deviate from the expectations.
Many of the projects contained in this financial report were carried out in consortia.We hereby extend a warm “thank you” to all our partners.
To facilitate reading and understanding, the masculine gender may be used at times in this report to apply equally to men and women without discrimination.
Creative support during the preparation of the Annual Report 2012: pkp BBDOCopy-editing: be.public Werbung Finanzkommunikation GmbHProducer: 08/16 printproduktion gmbh
Key fIgures 2008–2012 Key fIguresDEVELOPMENT OF THE MOST IMPORTANT kEy FIGURES
1) CAGR = Compound annual growth rate2) Central and Eastern Europe comprises the following countries: Bulgaria, Croatia, Czech Republic, Hungary, Poland, Romania, Russia and neighbouring countries, Serbia, Slovakia, Slovenia
■ Germany■ Austria■ CEE2)
■ Rest of Europa■ Rest of World
ORDER BACKLOG BY REGION
34 %
11 %24 %
20 %
11 %
■ Germany■ Austria■ CEE1)
■ Rest of Europa■ Rest of World
OUTPUT VOLUME BY REGION
41 %
13 %
27 %
13 %
6 %
2008 2010 2011
OUTPUT VOLUME DEVELOPMENT 2008–2012
2012
13.7
4
13.0
2
12.7
8 14.3
3
€ 15 bn.
€ 10 bn.
€ 5 bn.
02009
14.0
4
CAGR = 1 %
2008 2010 2011
EBIT DEVELOPMENT 2008–2012
2012
269.
87
282.
85
298.
95
334.
78
€ 800 mln.
€ 600 mln.
€ 400 mln.
€ 200 mln.
02009
207.
19
CAGR = -6 %
2008 2010 2011
ORDER BACKLOG DEVELOPMENT 2008–2012
2012
13.2
5
13.9
7
14.7
4
13.3
5
€ 15 bn.
€ 10 bn.
€ 5 bn.
02009
13.2
0
CAGR = 0 %
2008 2010 2011
EBITDA DEVELOPMENT 2008–2012
2012
647.
73 684.
25
734.
69
746.
33
€ 800 mln.
€ 600 mln.
€ 400 mln.
€ 200 mln.
02009
608.
35
CAGR1) = -2 %
■ North + West■ South + East■ International + Special Divisions
ORDER BACKLOG BY SEGMENT
36 %
33 %
31 %
■ North + West■ South + East■ International + Special Divisions ■ Others
OUTPUT VOLUME BY SEGMENT
44 %
34 %
21 %
1 %
kEy FINANCIAL FIGURES€ Mln. 2012 2011 2010 2009 2008
Output volume 14,042.60 14,325.85 12,777.00 13,021.01 13,742.50
Revenue 12,983.23 13,713.80 12,381.54 12,551.93 12,277.80
Order backlog 13,202.66 13,354.00 14,738.74 13,967.57 13,253.80
Employees 74,010 76,866 73,600 75,548 73,008
kEy EARNINGS FIGURES€ Mln. 2012 2011 2010 2009 2008
EBITDA 608.35 746.33 734.69 684.25 647.73
EBITDA margin % of revenue 4.7 % 5.4 % 5.9 % 5.5 % 5.3 %
EBIT 207.19 334.78 298.95 282.85 269.87
EBIT margin % of revenue 1.6 % 2.4 % 2.4 % 2.3 % 2.2 %
Profit before taxes 156.46 343.33 279.27 262.96 229.26
Net income 110.04 239.29 188.38 184.61 166.36
Earnings per share in € 0.58 1.75 1.53 1.42 1.38
Dividend per share in € 0.20 0.60 0.55 0.50 0.55Cash-flow fromoperating activities 268.80 501.15 690.42 1.115.10 689.86
ROCE in % 4.0 % 6.3 % 5.4 % 5.7 % 5.3 %Investmentin fixes assets 458.28 477.15 553.84 508.73 876.80
kEy bALANCE SHEET FIGURES€ Mln. 2012 2011 2010 2009 2008
Equity 3,162.54 3,149.84 3,232.44 3,099.06 2,978.98
Equity Ratio % 31.2 % 30.3 % 31.1 % 32.2 % 30.5 %
Net Debt 154.55 -267.81 -669.04 -596.23 -109.66
Gearing Ratio % 4.9 % -8.5 % -20.7 % -19.2 % -3.7 %
Capital Employed 5,322.35 5,336.45 5,235.74 5,042.87 5,158.85
Balance Sheet Total 10,137.69 10,386.05 10,382.16 9,613.59 9,765.21
EBITDA = profit for the period before net interest income, income tax expense and depreciation and amortization EBIT = profit for the period before net interest income and income tax expense ROCE = (net income + interest on debt – interest tax shield (25 %)) / (average group equity + interest-bearing debt) Net Debt = financial liabilities less non-recourse debts + provisions for severance and pension obligations – cash and cash equivalents Gearing Ratio = Net Debt / Group Equity Capital Employed = group equity + interest-bearing debt
This is an integrated annual report. Details on the sustainability aspects of our strategy and our business activity are available at csr.strabag.com. Here you can put together the report according to your own needs.
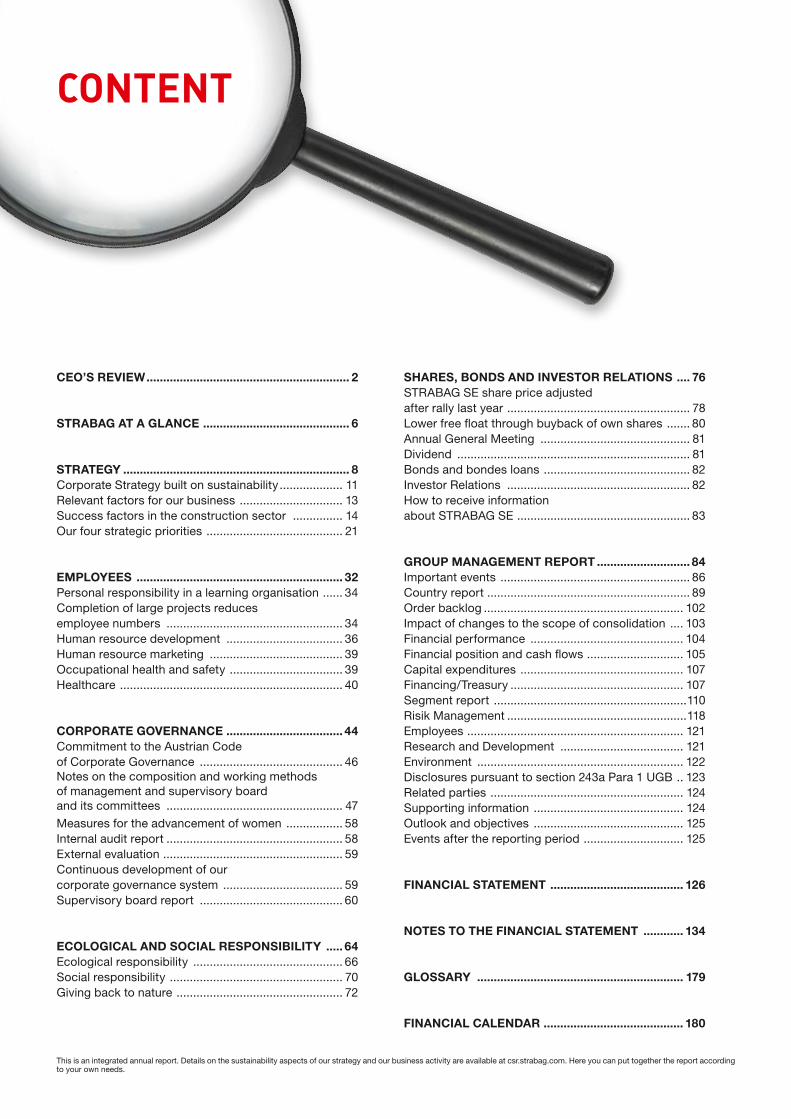
content
CEO’s REviEw ............................................................. 2
sTRABAG AT A GlAnCE ............................................ 6
sTRATEGy .................................................................... 8Corporate Strategy built on sustainability ................... 11Relevant factors for our business ............................... 13Success factors in the construction sector ............... 14Our four strategic priorities ......................................... 21
EmplOyEEs .............................................................. 32Personal responsibility in a learning organisation ...... 34Completion of large projects reduces employee numbers ..................................................... 34Human resource development ................................... 36Human resource marketing ........................................ 39Occupational health and safety .................................. 39Healthcare ................................................................... 40
CORpORATE GOvERnAnCE ................................... 44Commitment to the Austrian Code of Corporate Governance ........................................... 46Notes on the composition and working methods of management and supervisory board and its committees ..................................................... 47Measures for the advancement of women ................. 58Internal audit report ..................................................... 58External evaluation ...................................................... 59Continuous development of our corporate governance system .................................... 59Supervisory board report ........................................... 60
ECOlOGiCAl And sOCiAl REspOnsiBiliTy ..... 64Ecological responsibility ............................................. 66Social responsibility .................................................... 70Giving back to nature .................................................. 72
shAREs, BOnds And invEsTOR RElATiOns .... 76STRAbAG SE share price adjusted after rally last year ....................................................... 78Lower free float through buyback of own shares ....... 80Annual General Meeting ............................................. 81Dividend ...................................................................... 81bonds and bondes loans ............................................ 82Investor Relations ....................................................... 82How to receive information about STRAbAG SE .................................................... 83
GROup mAnAGEmEnT REpORT ............................ 84Important events ......................................................... 86Country report ............................................................. 89Order backlog ............................................................ 102Impact of changes to the scope of consolidation .... 103Financial performance .............................................. 104Financial position and cash flows ............................. 105Capital expenditures ................................................. 107Financing/Treasury .................................................... 107Segment report ..........................................................110Risik Management ......................................................118Employees ................................................................. 121Research and Development ..................................... 121Environment .............................................................. 122Disclosures pursuant to section 243a Para 1 UGb .. 123Related parties .......................................................... 124Supporting information ............................................. 124Outlook and objectives ............................................. 125Events after the reporting period .............................. 125
FinAnCiAl sTATEmEnT ........................................ 126
nOTEs TO ThE FinAnCiAl sTATEmEnT ............ 134
GlOssARy .............................................................. 179
FinAnCiAl CAlEndAR .......................................... 180

An output of € 14.0 billion in 2012 – that’s nothing to complain about! While the current crisis has shifted its focus several times – from the world of banking and finance to the real economy to a sovereign debt crisis and finally even a currency crisis – STRABAG has managed to defy the adverse environment, at least as far as the business volume is concerned. With € 13.2 billion, the end-of-the-year order backlog is also nearly exactly at the pre-crisis level of 2008, suggesting steady and stable business develop-ment in 2013.
The reason for this can be found in our strategy at STRABAG: Our group is diversified in terms of regions and segments and possesses a solid financial structure, and our flexible structure allows us to adapt our capacities quickly. If, for example, demand weakens in the public sector in Europe, we can boost our activities in the field of project development or in our internatio-nal business. This made it possible in 2012 to compensate for the collapse in transportation infrastructure investments in Poland by expanding the volume in building construction and civil engineering in Germany. Our “milli-pede principle” will prove its worth in many other areas as well. Growth rates, however, are only for the medium-term and will only be realistic if we tap new markets.
The group revenue for the 2012 financial year amounted to approx. € 13 billion, with contributions of 44 % from the segment North + West, 34 % from South + East and 21 % from International + Special Divisions; 1 % was accounted for by “Other”. As this is a new presentation of the business segments, we have adapted the previous year’s figures accordingly for better comparability.
CEO’s REviEw
Hans Peter Haselsteiner©
RE
UT
ER
S/L
isi N
iesn
er

3CEO’S Review
Year after year for more than 20 years, but especially after going public in 2007, the STRAbAG Group was able to achieve higher returns. The year 2012 marks a break in this trend. because of missing payments for services already rendered in Central and Eastern Europe, damage compensation payments for a failed acquisition as well as considerable construction site losses and loss-making acquisitions of joint ventures, the earnings before interest, taxes, depreciation and amortisation (EbITDA) fell by 18 % to about € 608 million. The earnings before interest and taxes (EbIT) declined by 38 % to € 207 million. The net income after minorities was even 69 % below the previous year’s level, resulting in earnings per share of € 0.58.
Most of the factors contributing to these disappointing results are non- recurrent factors as well as construction site losses arising from the end of construction projects in 2012 which have no significant carryover into the current year. Neither this circumstance, nor the fact that an EbIT of € 207 million would be celebrated elsewhere, can make up for the fact that most of these factors were avoidable and can be blamed on a failure on the part of management. I alone accept responsibility for this, and I can only offer you my sincerest apologies, which I hereby do in the hope that you accept this apology and that, when judging the management quality of the board, you consider not only this – as I am convinced – unique year, but that you at least look at the average across the term in office.
My colleagues and I are confident that – given the still outstanding situation resulting from our equity strength, cash flows and liquidity situation and offered by the broad positioning of the group, above all, however, given the willingness on the part of management and employees to not only learn from our mistakes, but also to use them as grounds for change – we will have the opportunity to make amendments for 2012.
At the Annual General Meeting on 14 June 2013, the management board will propose a dividend of € 0.20 per share. While maintaining our dividend policy – the dividend payout ratio amounts to 34 % of the net income after minorities – and with a dividend yield of 1 % based on the end-of-the-year share price, we want to at least give you the same level as a good bank interest rate, which these days is low enough.
Whether it was investor disappointment in the face of our results or our pre-sence in the markets of Central and Eastern Europe, which analysts assess as critical – with a minus of 8 % to € 20.43, the STRAbAG SE share was one of the few losers in the ATX in 2012. At the same time the construc-tion sector index STOXX Europe 600 Construction & Materials gained 15 % and the ATX grew by 27 %. The reason for the drop in our share price can probably be found in the previous year’s outperformance of our share and the subsequent profit taking: in 2011, STRAbAG was one of just two ATX companies whose shares were in the plus while all others had ended the year in negative territory.

The buyback programme of own shares was unable to offer any support. The low trade activity of STRAbAG SE shares also translated into sluggish progress with the buyback programme for own shares: in 2012, STRAbAG SE acquired only 2,137,076 shares, or 1.87 % of the total, ending the year with a 9.57 % stake in its own share capital. As we are allowed to acquire up to 10 % of our own shares, the buyback is nearly complete. We remain con-vinced of the meaningfulness of the buyback itself: it allows us to buy own shares – which we intend to use as transaction currency during enterprise acquisitions in the future – at a relatively affordable price.
Regarding the ongoing year, we are – as already mentioned – optimistic. Even if the results for the first quarter are not yet finalised, the most im-portant indicators paint a picture that, while quite different by region, is in general positive. The home markets of Austria and Germany, plus benelux, will contribute significantly to revenue and earnings in 2013. The develop-ment in Romania must also be emphasised as positive, while the situation in Poland and Hungary remains difficult and, as in the entire Adriatic region, no improvement in demand is in sight. An exception is Italy, where the high order backlog allows us a revenue spurt provided that political uncert-ainties do not hamper the execution of projects. With the disappearance of losses, Switzerland, Scandinavia and the specialty field of hydraulic engineering – the latter was a painful loss-maker in Germany in 2012 – will see improved results, albeit at a significantly lower level. In the Czech Republic and Slovakia, we expect weakened results at a tolerable level.
Russia remains difficult to judge as far as the pace of our market penetration is concerned. Despite several promising business prospects, we expect no large growth spurts in 2013 – but also no risks for a satisfactory result.
The segment International + Special Divisions, with the business fields of project development, property and facility services, and direct export, includes stable revenue and profit sources. In this segment, growth opportunities are also most likely if it wasn’t for the sharpened price competition.
Share price of STRAbAG SE at end of 2012 .................................... € 20.43Dividend per share ............................................................................. € 0.20Earnings per share ............................................................................. € 0.58Dividend yield .......................................................................................1.0 %Ex-dividend day ......................................................................21 June 2013Dividend payment date ...........................................................24 June 2013Annual General Meeting .......................................................... 14 June 2013
thE mOSt impORtant factS fOR OuR ShaREhOldERS
5CEO’S Review
At this point, I would like to add just a few remarks on my own behalf:
In my life, I have always tried to be a responsible businessperson. A responsible businessperson does not surprise his organisation, but shares his plans with his employees so that the organisation can prepare and adapt. For this reason, I already announced halfway through 2012 that I would leave the management board in 2014 and go into retirement after 40 years at STRAbAG.
In the person of Thomas birtel, a successor was designated who is perfectly suited and just as prepared for this task. I have therefore agreed with the supervisory board that I will resign from my position as CEO of STRAbAG SE already with the end of the Annual General Meeting on 14 June 2013, but will remain in the group in the function of authorised representative of the management board until the end of my existing contract on 31 December 2015. With this move, I will have transferred all operational responsibility to my colleagues within a few weeks. The evaluation of reports and in-sights from the STRAbAG 2013ff task force, as well as the strategy for the further internationalisation of the group, will remain my main task. Until my final departure, every division, sub-division and business unit – i.e. all three management levels – will have been reviewed in terms of efficiency, market conformity, organisational density and other improvement potential and all optimisation measures will have been made.
I want to express my especially deep sense of gratitude to my 74,010 em-ployees worldwide, who have made STRAbAG what it is today: a leading European construction group! This gratitude also extends to you, my dear fellow shareholders, for lending me your trust, and to all of our business friends, who have accompanied my professional life in many roles and who have also contributed to STRAbAG’s success.
And so I take my leave: full of optimism for the future mixed with nostalgic feelings.
P.S. We have titled this integrated annual report “The success lies in the detail” and we invite you to take a closer look – with or without magnifying glass.
Your
H.P.H.

6
stRABAG At A GLAnce
STRAbAG SE is one of Europe’s leading construction groups. From the core markets of Austria and Germany, our 74,010 employ-ees are at work at numerous subsidiaries in the countries of Eastern and South-East Europe, in selected markets in Western Europe, and on individual projects on other continents. We generated an output volume of € 14.0 billion in the 2012 financial year, 76 % thereof in markets in which we hold one of the top three market positions: Germany, Austria, Hungary, the Czech Republic, Slovakia, Poland and Romania. We offer our services under several brands, including STRAbAG, Heilit+Woerner and Züblin. The services span all areas of the construction industry and cover the entire construction value chain.
Our vision: To become Europe’s leading construction service provider. To reach this goal, we strive to be the best bidder – i.e. to deliver quality at the best price.
Over the years, STRAbAG SE has grown very strongly through acquisitions and organic growth, ascending to the top league of Euro-pean construction companies. The financial and economic crisis of the past few years may have dampened this development some- what, but the economic stimulus plans by the public sector, as well as the company’s broad and strongly diversified positioning (“millipede principle”), have helped to avoid any major setbacks in output volume.
STRAbAG generated an output volume of € 14.0 billion in the 2012 financial year. Against the backdrop of low public-sector infrastructure expenditures, the output vol-ume, with a decrease of just 2 %, remained practically at the high level of the previous year. The largest reduction was registered in Poland due to the end of the construction boom in that country. Declines in several countries in Eastern Europe were countered by increases in Germany and in Romania.
€ 0
€2 billion
€ 4 billion
€ 6 billion
€ 8 billion
€ 10 billion
€ 12 billion
€ 14 billion
2008* 2009* 2010* 2011 2012
*Data before 2011 are not adjusted to the new segment structure.
Other € 124.83 million
International + Special Divisions € 2,924.86 billion
South + East € 4,755.74 billion
North + West
Output volume 2012
€ 6,237.17 billion
€ 14,042.60 billion
OUTPUT VOLUME 2008–2012
■ Germany■ Austria■ CEE1)
■ Rest of Europe■ Rest of world
OUTPUT VOLUME BY REGION
41 %
13 %
27 %
13 %
6 %
■ North + West■ South + East■ International + Special Divisions ■ Other
OUTPUT VOLUME BY SEGMENT
44 %
34 %
21 %
-60 -30 30 60 90 120 1500€ -50 mln. 0 € 50 mln. € 100 mln. € 150 mln.
■ North + West■ South + East■ International + Special Divisions ■ Other
EBIT BY SEGMENT
-51
149
127
-18
Total:€ 207 mln.
1) Central and Eastern Europe comprises the following countries: bulgaria, Croatia, Czech Republic, Hungary, Poland, Romania, Russia and neighbouring countries, Serbia, Slovakia, Slovenia.
ECOLOGICAL RESPONSIBILITY
ECONOMIC RESPONSIBILITY
VALUES AND COMPLIANCE
CORPORATE CITIZENSHIP
MISSION AND VISION
EMPLOYEES AND WORKPLACE

north + westThe segment North + West executes con- struction services of varying types and sizes with a focus on Germany – our largest national market – as well as in Poland, the benelux countries and Scandinavia. Ground and hydraulic engineering as well as off- shore wind can also be found in this segment.
Revenue 2012: € 5,509.53 millionEBiT 2012: € -51.32 millionEBiT margin 2012: -0.9 %
we deliver our services in three segments:
south + EastThe geographic focus of the segment South + East is on Austria, Switzerland, Hungary, the Czech Republic, Slovakia, Russia and neighbouring countries as well as the region South-East Europe. Our rail- way construction and environmental tech-nology activities are also handled within this segment.
Revenue 2012: € 4,792.43 millionEBiT 2012: € 148.89 millionEBiT margin 2012: 3.1 %
international + special divisionsThe segment International + Special Divisions includes, on the one hand, the field of tunnelling, where we possess leading know-how that allows us to operate on some of the world’s largest construction sites. The concessions business, on the other hand, represents a further important area of business, with global project development activities in transportation infrastructures in particular. Regardless of where the services are rendered, our construction materials business, including our dense network of raw materials oper- ations but with the exception of asphalt,
also belongs to this segment. The real es-tate business, which stretches from project development and planning to construction and operation and also includes the property and facility services business, completes the wide range of services of the segment and of the group. Additionally, most of our services in non-European markets as well as our railway construction business are also bundled in the Inter- national + Special Divisions segment.
Revenue 2012: € 2,661.29 millionEBiT 2012: € 126.93 millionEBiT margin 2012: 4.8 %
■ Public clients■ Private clients
OUR CLIENTS
55 %45 %
Public-sector clients such as state agencies or local governments make up our largest client segment. Following close behind are the private clients – e.g. project developers and industrial companies. The exact proportion varies depending on the economic situation: In the coming years, the distribution is likely to change in favour of private clients, as the public sector is saving in our European core markets.
2012: € 5,510 million
2011: € 5,961 million
NORTH + WEST
2.5 %
-0.9 %
■ Revenue EBIT margin
2012: € 4,792 million
2011: € 4,877 million
SOUTH + EAST
2.9 %
3.1 %
■ Revenue EBIT margin
2012: € 2,661 million
2011: € 2,842 million
INTERNATIONAL + SPECIAL DIVISIONS
4.3 %
4.8 %
■ Revenue EBIT margin

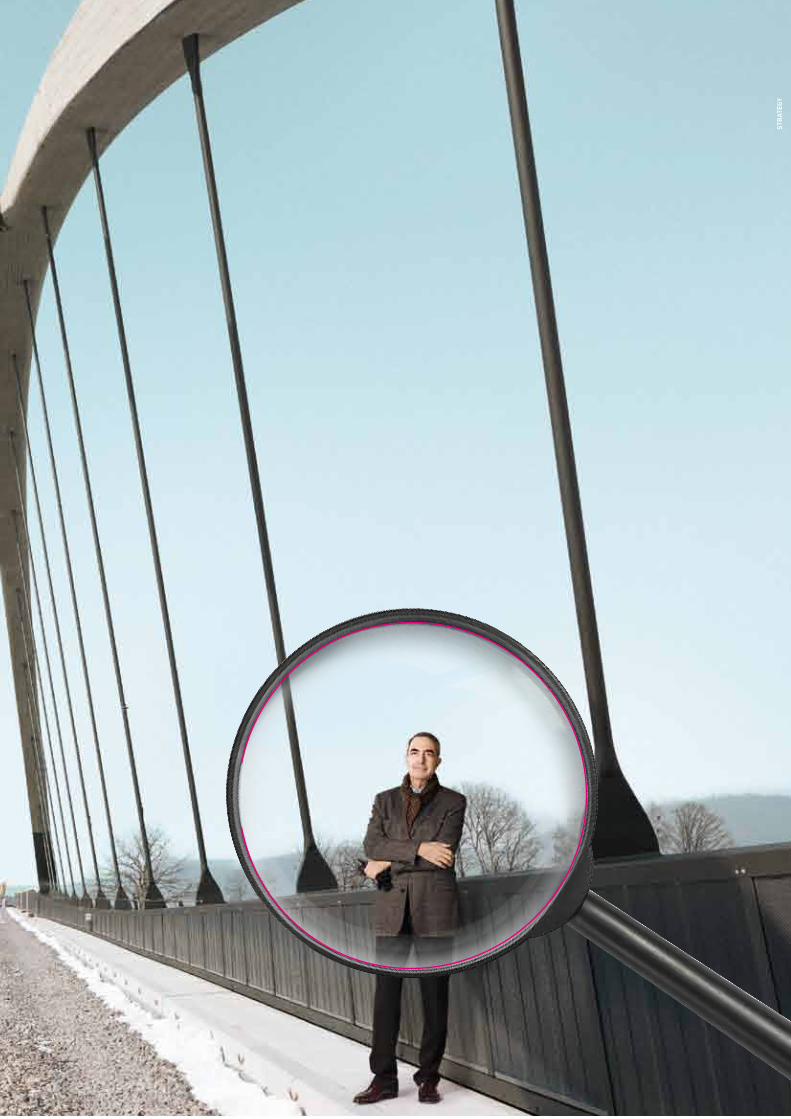
WHAT UNITES USOver 100 organisational units and more than 250 locations in Germany, Hungary and Switzerland have so far been visited by the STRABAG 2013ff task force led by Fritz Oberlerchner. In talks with 170 managers, the task force has been searching for what unites the group – like this bridge between Switzerland and Austria.
STRATEGY
Kapiteltrenner_rechts_E.indd 1 22.04.13 15:42
STR
ATEG
Y
North + WestThe segment North + West executes con- struction services of varying types and sizes with a focus on Germany – our largest national market – as well as in Poland, the Benelux countries and Scandinavia. Ground and hydraulic engineering as well as off- shore wind can also be found in this segment.
Revenue 2012: € 5,509.53 millionEBIT 2012: € -51.32 millionEBIT margin 2012: -0.9 %
We deliver our services in three segments:
South + EastThe geographic focus of the segment South + East is on Austria, Switzerland, Hungary, the Czech Republic, Slovakia, Russia and neighbouring countries as well as the region South-East Europe. Our rail- way construction and environmental tech-nology activities are also handled within this segment.
Revenue 2012: € 4,792.43 millionEBIT 2012: € 148.89 millionEBIT margin 2012: 3.1 %
International + Special DivisionsThe segment International + Special Divisions includes, on the one hand, the field of tunnelling, where we possess leading know-how that allows us to operate on some of the world’s largest construction sites. The concessions business, on the other hand, represents a further important area of business, with global project development activities in transportation infrastructures in particular. Regardless of where the services are rendered, our construction materials business, including our dense network of raw materials oper- ations but with the exception of asphalt,
also belongs to this segment. The real es-tate business, which stretches from project development and planning to construction and operation and also includes the property and facility services business, completes the wide range of services of the segment and of the group. Additionally, most of our services in non-European markets as well as our railway construction business are also bundled in the Inter- national + Special Divisions segment.
Revenue 2012: € 2,661.29 millionEBIT 2012: € 126.93 millionEBIT margin 2012: 4.8 %
■ Publ�c cl�ents■ Pr�vate cl�ents
OUR �LIENTS
55 %45 %
Public-sector clients such as state agencies or local governments make up our largest client segment. Following close behind are the private clients – e.g. project developers and industrial companies. The exact proportion varies depending on the economic situation: In the coming years, the distribution is likely to change in favour of private clients, as the public sector is saving in our European core markets.
2012� � 5,510 m�ll�on
2011� � 5,961 m�ll�on
NORTH + WEST
2�5 %
-0�9 %
■ Revenue EBIT margin
2012� � 4,792 m�ll�on
2011� � 4,877 m�ll�on
SOUTH + EAST
2�9 %
3�1 %
■ Revenue EBIT marg�n
2012� � 2,661 m�ll�on
2011� � 2,842 m�ll�on
INTERNATIONAL + SPE�IAL DIVISIONS
4�3 %
4�8 %
■ Revenue EBIT marg�n
10
OUR STRATEGIC OBJECTIVE To achieve and maintain market leadership in all defined markets and areas of business through cost leadership, employee quality, employee motivation and innovative strength.
STRATEGY
n OUR VISION: EUROPE’S LEADING CONSTRUCTION SERVICE PROVIDER
n ECONOMIC GROWTH AND PUBLIC SPENDING INFLUENCE OUR BUSINESS
n FOUR STRATEGIC PRIORITIES: EXPANDING GEOGRAPHICALLY, INVESTING IN PUBLIC-PRIVATE PARTNERSHIPS, INTENSIFYING THE ACTIVITIES IN NICHE MARKETS AND EXTENDING THE VALUE CHAIN
Successful companies do not constantly reinvent themselves. But they are struc-tured in such a way that they can react flexibly to and remain in balance in a new business context. Flexibility therefore does not mean setting new strategic pri-orities every year and turning everything on its head. Instead, the path to success leads over small adaptations along a long journey building on the company’s strengths.
As in previous years, we see our core task in helping to shape Europe’s built environ-ment and so improve the quality of life of its inhabitants. This is aptly summarised in our guiding principle: “Building Europe”. We mo- tivate ourselves with the vision of becoming “Europe’s leading construction service pro-vider”. To reach this objective, we continue to pursue the following four strategic priori-ties in accordance with our group principles:
• Expanding geographically• Investing in public-private partnerships• Intensifying the activities in niche markets• Extending the value chain
READ ABOUT OUR GROUP PRINCIPLES AT:
WWW.STRABAG.COM > STRABAG SE > STRATEGY
BUILDIN�EUROPE
�DP growth
Publ�c spend�ngF�nanc�ng env�ronment
Internal company factors
EXTENDIN� THE VALUE �HAIN
INVESTIN� IN PUBLI�-PRIVATE PARTNERSHIPS
INTENSIFYIN� THE A�TIVITIES IN
NI�HE MARKETS
OUR VISION� EUROPE’S LEADIN� �ONSTRU�TION SERVI�E PROVIDER
OUR �ROUP PRIN�IPLES
EXPANDIN� �EO�RAPHI�ALLY
All this makes STRABAG one of the few companies to offer services along the entire value chain in construction – from design to planning, from construction to property and facility services, from oper- ation all the way to demolition. That puts us
in a position to build cost- and resource- effectively. We keep this in mind when planning our future and distributing our resources – such as financial means or employee capacities – within the company.
ECOLOGICAL RESPONSIBILITY
ECONOMIC RESPONSIBILITY
VALUES AND COMPLIANCE
CORPORATE CITIZENSHIP
MISSION AND VISION
EMPLOYEES AND WORKPLACE
Kapiteltrenner_rechts_E.indd 2 22.04.13 15:43

10
OuR StRatEGic OBJEctiVE To achieve and maintain market leadership in all defined markets and areas of business through cost leadership, employee quality, employee motivation and innovative strength.
stRAteGY
n OuR ViSiOn: EuROpE’S lEadinG cOnStRuctiOn SERVicE pROVidER
n EcOnOmic GROWth and puBlic SpEndinG influEncE OuR BuSinESS
n fOuR StRatEGic pRiORitiES: EXpandinG GEOGRaphicallY, inVEStinG in puBlic-pRiVatE paRtnERShipS, intEnSifYinG thE actiVitiES in nichE maRKEtS and EXtEndinG thE ValuE chain
successful companies do not constantly reinvent themselves. But they are struc-tured in such a way that they can react flexibly to and remain in balance in a new business context. Flexibility therefore does not mean setting new strategic pri-orities every year and turning everything on its head. instead, the path to success leads over small adaptations along a long journey building on the company’s strengths.
As in previous years, we see our core task in helping to shape Europe’s built environ-ment and so improve the quality of life of its inhabitants. This is aptly summarised in our guiding principle: “building Europe”. We mo-tivate ourselves with the vision of becoming “Europe’s leading construction service pro-vider”. To reach this objective, we continue to pursue the following four strategic priori-ties in accordance with our group principles:
• Expanding geographically• Investing in public-private partnerships• Intensifying the activities in niche markets• Extending the value chain
REad aBOut OuR GROup pRinciplES at:
WWW.StRaBaG.cOm > StRaBaG SE > StRatEGY
BUILDINGEUROPE
GDP growth
Public spendingFinancing environment
Internal company factors
EXTENDING THE VALUE CHAIN
INVESTING IN PUBLIC-PRIVATE PARTNERSHIPS
INTENSIFYING THE ACTIVITIES IN
NICHE MARKETS
OUR VISION: EUROPE’S LEADING CONSTRUCTION SERVICE PROVIDER
OUR GROUP PRINCIPLES
EXPANDING GEOGRAPHICALLY
All this makes STRAbAG one of the few companies to offer services along the entire value chain in construction – from design to planning, from construction to property and facility services, from oper- ation all the way to demolition. That puts us
in a position to build cost- and resource- effectively. We keep this in mind when planning our future and distributing our resources – such as financial means or employee capacities – within the company.
ECOLOGICAL RESPONSIBILITY
ECONOMIC RESPONSIBILITY
VALUES AND COMPLIANCE
CORPORATE CITIZENSHIP
MISSION AND VISION
EMPLOYEES AND WORKPLACE

11
business ventures at STRAbAG must be not only consistent with our strategy and our group principles; they must also be in line with our values and our agenda for corporate social responsibility (CSR). This agenda, which was presented last year, is based on our understanding of sustainability: Ensuring the long-term existence of sTRABAG by maintaining a balance between reaching business objectives and respecting social and
ecological aspects. This concept of sustainability is also an integral part of our long-term strategy: We prefer a solid balance sheet and capital structure to short-term results. business growth and a satisfactory profit therefore are not the primary goal in itself, but are rather just a means to ensure the continued existence of our company sustainably, i.e. for the long- term.
Strategy
cORpORatE StRatEGY Built On SuStainaBilitY
ECOLOGICAL RESPONSIBILITY
ECONOMIC RESPONSIBILITY VALUES AND
COMPLIANCE
CORPORATE CITIZENSHIP
MISSION AND VISION
EMPLOYEES AND WORKPLACE
OCCUPATIONAL SAFETYEMPLOYEES HR DEVELOPMENT
OBJECTIVES TRANSPARENCY COMMITMENT
CLIENTS SOCIETY
LIFE CYCLE ASSESSMENT
ENERGY MANAGEMENT CARBON CERTIFICATION
RISK STRATEGYRETURN
HUMAN RIGHTS
CORE VALUES CODE OF CONDUCT
OUR SUSTAINABILITY AGENDAdEtailS REGaRdinG thE cSR aGEnda and RElEVant cSR mEaSuRES aRE aVailaBlE at cSR.StRaBaG.cOm
Sustainable action therefore consists of a number of different fields of action which only together yield an ecologically, econom-ically and socially logical whole for our future. Just as the entire corporate strategy is focused on sustainable action, this focus should also be reflected in our reporting: for this reason, this annual report should also be understood as an integrated report in which we describe the contents of all six fields of action. In order to highlight the relevance of the reported information to these fields of action, we have included the relevant puzzle pieces next to the text.
oUR GoAL FoR 2013: to MoRecoMpReHensiveLY pResent tHe MeAsURes AnD oBJectives oF tHe csR stRAteGY
Last year, the management board approved the establishment of a CSR steering commit-tee composed of representatives from the operating units and from the central service companies.The steering committee will set and prioritise measurable objectives, define the timeframe for implementation of the CSR
agenda, and monitor its fulfilment. besides the steering committee, which, in keeping with the CSR agenda, has a superordinate character, task forces and other steering committees will be set up as needed for the individual fields of action “Employees and Workplace”, “Mission and Vision”, “Corpo-rate Citizenship”, “Ecological Responsi- bility”, “Economic Responsibility” and “Values and Compliance”. The first, perma-nent, theme-oriented committee is the ener-gy steering committee, which will meet twice a year.
cSR StEERinG cOmmittEE tO EStaBliSh mEaSuRaBlE cSR OBJEctiVES in 2013

12
The CSR steering committee is supported by the CSR management team. The CSR management team oversees the implemen-tation of the individual measures, establishes a decision-making basis for the steering committee, assists in the monitoring of target compliance, and contributes to the further development of the CSR strategy
and of the CSR activities reporting within the group. It also ensures that the objec-tives formulated by the task forces are measurable and that there is relevance for the group’s financial success. The CSR management team was set up in 2011 and reports directly to the management board.
IMPLEMENTATIONCENTRALUNITS
OPERATINGUNITS
STRABAG SE MANAGEMENT BOARD
STAKEHOLDER
CSR Management
CSR SteeringCommittee
Clients n Employees n Investors n Suppliers/Subcontractors n NGOs/Associations n Universities
Strategy Recommendations Strategy
Our CsR objectives in 2013 for the field of action “mission and vision” are:
n Establish the CSR steering committee within the group
n Develop and systemise our key sustainability performance indicators
n Link the CSR objectives, measures and performance indicators to the general corporate strategy
n Provide our stakeholders with personalised information
The objective in the field of “values and Compliance” is:
n Include standards of ethics and values in the contracts with suppliers
The measures and objectives of the other fields of action are presented in the individual chapters of this report and are highlighted by the relevant puzzle piece.

12 13
When establishing the measures, we try to keep a justifiable cost/benefit ratio. The benefits of measuring key sustainability performance indicators are clear to see: for example, certain CO2 certifications can provide real competitive advantages in tenders in the form of a better appreciation of the bids. ISO 50001 certification for energy management, for example, can yield tax savings. We are also interested in better addressing institutional investors, who typically take sustainability parameters into consideration. These benefits must be compared with the staff and financial expense, which reached a euro figure in the mid-six-digit range in 2012 and is on the rise.
When it comes to the objectives and measures, we begin with those topics we can influence directly ourselves. The at-times complicated constellation of players in the construction sector means that many decisions are not up to the construction company charged with carrying out a project. The design of a building or structure, including its energy properties, is often the responsibility of the client. Our teamconcept partnership model offers our clients the possibility of early inclusion in the projects so as to address ecological and social aspects to the greatest possible extent. In places where we are able to influence our own actions, however, we work to steadily develop measures and objectives.
Strategy
“Our commitment is focused on the benefit of our stakeholders such as clients and employ-ees. Sustainability must be the result of our entrepreneurial activity. We are less concerned with merely satisfying bureaucratic interests. We ask ourselves: What added value does a project, measure or guideline have for me and my environment? Simply ticking off check-lists is not our goal.”hans peter haselsteiner, CEO of sTRABAG sE
cOntact uS:StRaBaG SE,dR. nORBERt pRallEcSR manaGER Of thE StRaBaG GROup,[email protected]
Every building is unique. Unlike in indus-tries with standardised products, it is not possible in the construction sector to perform sensitivity analyses showing the influence of changes to a dominant pro-duction factor on a company’s key perfor-mance indicators. In our business, there is not just one driving factor; rather, several factors exert their influence here. These include certain business realities, such as the risk management system, the quality of our employees, and the organisational
structure, as well as external influences such as economic growth (GDP), demogra-phic trends, the level of public infrastructure spending and the financing environment of our clients. These factors determine the framework within which we want to at least maintain our market positions and pursue our strategic priorities. Additionally, the respective factors which influence a business also yield a sector’s factors for success. In the construction sector, we have identified the following.
REad mORE aBOut thE BuSinESS cOntEXt in thE VaRiOuS maRKEtS in OuR cOuntRY REpORt StaRtinG On paGE 89
RElEVant factORS fOR OuR BuSinESS

14
Firmly established in our home markets of Austria and Germany – which account for 54 % of our output – we see ourselves as a European company which generates an additional 27 % of its business in Eastern Europe and another 13 % in other European countries. This affords us a unique position compared to the competition and assures us market leadership in the con-struction sector in Central and Eastern Europe.
We consider a leading market position in the majority of our markets to be a critical fac-tor for success. Last year, we set ourselves the goal of maintaining or expanding these strong market positions. We are still number one in Austria, Germany, Poland, Hungary and Slovakia. In Romania, a small yet – in the medium-term – promising market, we worked our way up from third to second place. On the other hand, we had to cede market leadership in the Czech Republic. In Switzerland, the acquisition of two construction SMEs had moved us up into third place in 2011, but we have since
fallen back to fourth place in the medium- term. In total, we generated about 76 % of our output volume in 2012 in those countries in which we held a market position among the top three construction firms – compared to slightly more than 80 % the year before.
Why is it important for us to achieve a strong market position in many countries? Firstly, the broad geographical positioning allows us to spread the country risk. Secondly, construction companies need a critical mass and sufficient capital resources in the individual markets in order to successfully bid for and pre-finance large-scale projects. And finally, the existing country network helps us in our expansion: We can move lar-ge equipment and machinery to those mar-kets where it is needed at any given time. We pass on know-how and technologies to the local management so that they are of use in different regions.
SuccESS factORS in thE cOnStRuctiOn SEctOR
market positionsn#1 in Austria, Germany, Poland, Slovakia and Hungaryn#2 in Czech Republic and Romania
REad mORE aBOut OuR EXpanSiOn StRatEGY
On paGE 22
faR-REachinG cOuntRY nEtWORK
#1
#1#2
#1
#1
#1
#2
ECOLOGICAL RESPONSIBILITY
ECONOMIC RESPONSIBILITY
VALUES AND COMPLIANCE
CORPORATE CITIZENSHIP
MISSION AND VISION
EMPLOYEES AND WORKPLACE

© la
ssed
esig
nen
– Fo
tolia
.co
m
noBJective 2012Increase market shares in growth markets and maintain market posi- tion among the top three
nAcHieveMents 2012 We defended our market position in the majority of cases. We fell back one position in both the Czech Republic and in Switzerland, but we moved up a slot in Romania.
oUR oBJective FoR 2013In the new financial year, we will continue to work on further increas-ing the market shares in our growth markets and maintaining the market leadership in those countries in which we already hold it. To measure our success, we conduct an annual review of our market shares and our market position.
stABLe sHAReHoLDeR stRUctURe STRAbAG is a publicly listed, but owner-man-aged company. Hans Peter Haselsteiner, the CEO of STRAbAG SE, and his family hold a 28.9 % interest. Raiffeisen Group and UNIQA Group have been core sharehold-ers since 1998, basic Element’s Rasperia Trading, which is controlled by Russian industrialist Oleg Deripaska, since 2007. This stable shareholder structure combines the best of both worlds: the years-long cooperation of the management and the investors in the boards allows STRAbAG to implement strategic decisions quickly. At the same time, the stock market listing assures the highest-possible level of trans-parency in the field of finance and corporate governance.
■ Haselsteiner Family■ Rasperia Trading■ Raiffeisen Group■ UNIQA Group■ Free float■ Own shares
SHAREHOLDER STRUCTURE ON 31 JANUARY 2013
9.6 %
28.9 %
18.2 %15.1 %
14.8 %
13.4 %
REad mORE aBOut OuR ShaREhOldER StRuctuRE StaRtinG On paGE 78 and aBOut cORpORatE GOVER-nancE StaRtinG On paGE 44

16
opeRAtionAL stRUctURe witHcentRAL Units
Under the roof of the parent company STRAbAG SE, a number of legally indepen-dent subsidiaries are active in their respective national markets. The top level of organisation are the segments North + West, South + East and International + Special Divisions each of which is headed by one management board member. The Deputy CEO, responsible for the RANC region (Russia and neighbouring countries), is also responsible for the central and central staff divisions with the exception of bRVZ. Responsibility for bRVZ, which handles accounting and IT among other things, lies with the CFO.
The STRAbAG SE management board is the group’s top management body, is responsible for maintaining its financial balance, and determines its strategic goals. In the execution of these tasks, the management board is supported by the divisions as well as the central divisions and central staff divisions (service companies).
The division managers coordinate and steer their sub-divisions and report directly to the management board member responsible for their division. They manage their business in-dependently and on their own responsibility within the framework of the group’s business policy. It is their responsibility to reach the ob-jectives laid out in the strategic and operative
planning and to realise the specified individual measures.
The operating business is managed by the sub-divisions, which in turn are organised into individual business units. They are responsible for the greatest possible success in their re- gional markets or business fields and are man-aged by the superordinate division managers.
The central divisions are one of the main in-gredients for the group’s success. They handle group-internal services in the areas of account-ing, taxes, finances, IT, Human Resources, real estate, insurances, technical development, equipment management, quality manage-ment, process management and logistics. As competence centres, they support the operating units so these can concentrate on the core business and deliver their services to the clients in an efficient manner. The uniformity of the organisation creates economies of scale and results in standardised controlling and reporting. The central staff divisions are responsible for legal matters, contract management and internal audit and report directly to the Deputy CEO.
While important decisions at the manage- ment board level are made during regular board meetings, the “four-eyes principle” applies at the levels below. For us, this dual
GROup StRuctuRE
cEO
cfO deputy cEO
central divisions and central Staff divisions
internal audit contract management
north + West South + East international + Special divisions
1) bRVZ bau- Rechen- und Verwaltungszentrum2) bMTI baumaschinentechnik International3) Gesellschaft zur Optimierung von technischen Prozessen, Arbeitssicherheit und Qualität4) Construction Legal ServicesLast updated: 1 January 2013
n accountingn taxesn financesn itn human Resourcesn Real Estaten insurances
1 board member
7 divisionsdivision managers
40 sub-divisionsSub-division managers
1 board member8 divisionsdivision managers
40 sub-divisionsSub-division managers
1 board member
6 divisionsdivision managers
16 sub-divisionsSub-division managers
deputy cEO2 divisionsdivision managers
9 sub-divisionsSub-division managers
1)
2) 3)
4)

© S
erg
ey N
iven
s –
Foto
lia.c
om
16 17Strategy
management structure ensures efficient risk management and foresees that
responsibility is largely assumed jointly by one technical and one commercial manager.
“In order to maintain an overview of the entire group, we have developed a management information system that helps us to ensure that the same standards apply in all regions where STRABAG is active. This means: Clear criteria for the assessment of new projects, a standardised process for the submission of bids and control systems serve as filters to avoid loss-bringing projects.”Thomas Birtel, deputy CEO and management board member responsible for the central divisions
Task Force sTRABAG 2013ff
Led by former Deputy CEO Fritz Oberlerchner, the STRAbAG 2013ff task force has been evaluating the STRAbAG Group’s options regarding its organisational and strategic future since mid-2012. The members of the task force travelled to Hungary, Switzerland and parts of Germany to speak with the local management and to visit construction sites and local offices before presenting the STRAbAG SE management board with final analysis documents. The measures which were decided are being implemented in an ongoing process, which means that expected consequences can be taken into consideration in the financial outlook starting with 2013, but that these will not be stated separately.

1818
Healthy capital resources are an obligation. This is the only way in which construction companies can participate in concession projects, as they must in part co-finance these with their own equity. A ready-to-use budget also makes it possible to conduct meaningful acquisitions easier and more quickly. We see the equity ratio as a suitable
figure with which to measure STRAbAG’s financial stability and strength. In the medium-term, we will be satisfied with an equity ratio (shareholder equity/total assets) between 20 % and 25 %. At the end of December 2012, the group’s equity ratio stood at 31.2 %.
A stRonG FinAnciAL BAsis
“An indispensable prerequisite for successful growth is sufficient capital and a solid balance sheet. Only then is it possible to be flexible and to react quickly to market opportunities. A healthy, sustainable structure is reflected not only in revenue, but also in results: growth is one thing – but returns must always be the other side of the coin.”hans peter haselsteiner, CEO of sTRABAG sE
2008 2009
30.5 %32.2 %
31.1 %
30.3 %
2010 2011 2012
KEY PERFORMANCE INDICATOR: EBIT MARGIN AND EQUITY RATIO
■ EBIT margin■ Equity ratio
3 %
2 %
1 %
0
31.2 %
2.2
%
2.3
%
2.4
%
2.4
%
1.6
%
The financial strength of our company is also evaluated independently: The ratings agency Standard & Poor’s (S&P) gave STRAbAG SE an investment-grade rating of bbb- with stable outlook. The latest analysis was published in December 2012.
In addition to the equity ratio, we place special importance on the attainable margins. Given the macroeconomic development, the significant overcapacities in the highly competitive European construction industry and the accompanying drop-off in prices, we consider EbIT margins of 2 % to be ex-tremely ambitious. In the past financial year, we had to experience a significant collapse of the EbIT margin from 2.4 % to 1.6 % – in part as a result of our own mistakes. We assume this to be the result of non-recurring factors, however, and that the margin will again recover in the coming financial year. We are therefore continuing to focus on cost efficiency, disciplined employment of capital, and strict risk management. This is crucial above all for our investors: given our policy of paying out 30 % to 50 % of the net income after minorities to the shareholders
in the form of a dividend, they will be espe-cially interested in seeing results grow.
S&p RatinG: BBB-
EQuitY RatiO: 31.2 %

© m
iket
– F
oto
lia.c
om
19
taKE a clOSER lOOK nOt OnlY at macROEcOnOmic dEVElOpmEnt, But aBOVE all at thE RiSK manaGEmEnt SYStEm Of a cOnStRuctiOn cOmpanY!
Strategy
stRict RisK MAnAGeMent
Analysts, investors, clients and suppliers who look into a company in the construc-tion industry are usually very interested in the forecasts on the macroeconomic development of the individual markets. Of course, our business is influenced by eco-nomic growth and public spending; at least as important, however, is a construction company’s risk management! After all, the large number of unique projects translates into an increased risk potential.
In the field of finance, our risk management addresses several points:
liquidity management
STRAbAG’s liquidity management is orient-ed towards short-, medium- and long-term objectives:
nIn the short-term, all daily payment obligations must be covered on time and in their entirety.
nIn the medium-term, liquidity levels must be sufficient to ensure that no transac- tions or projects become impossible due to a lack of sufficient financial means or payment guarantees or that they cannot be executed at the desired pace.
nIn the long-term, there should be suffi- cient financial means available to be able to pursue the strategic development targets.
Receivables management
We maintain constant contact with our key accounts to avoid payment default or the violation of settlement terms on the part of our clients. In certain markets, we insist on advances or only enter into so-called “cost-plus-fee” contracts in which the client pays a previously agreed margin on the costs of the project and settlement is made in short intervals.
Contract management
Projects must be declared as making eco-nomic sense by internal price committees that are composed of different committee members depending on the project size. Contract design is handled by a separate department: Our contract management employees advise those with operating responsibilities on matters including cost escalation clauses or formulations of the contract text. This department includes statistics experts who after 30 % completion of a construction project can forecast with an 80 % probability whether a project will be a flop or if it will yield a profit.
how we manage our risks:
nFour-eyes principle
nStandardised process for the submission of bids using internal price committees
nAssistance and support in contract design from the contract management team
nManagement information system with monthly standardised reporting and individual, up-to-date queries possible at any time
Dense RAw MAteRiALs netwoRK
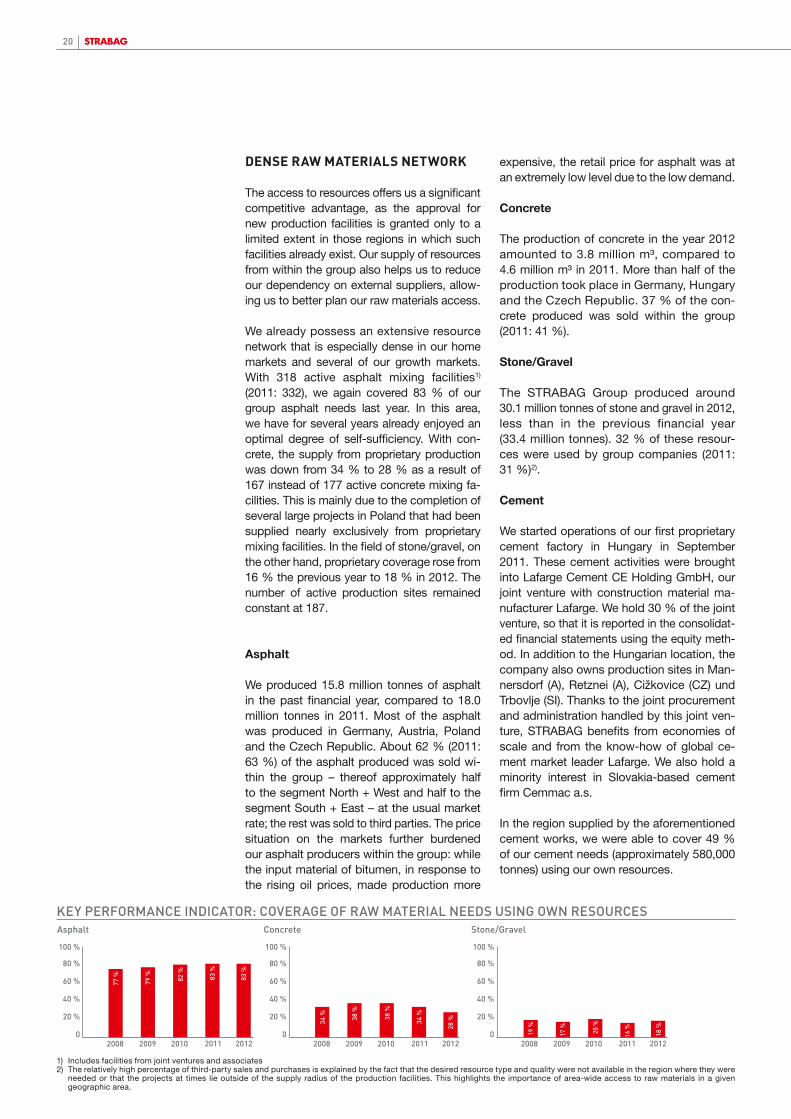
The access to resources offers us a significant competitive advantage, as the approval for new production facilities is granted only to a limited extent in those regions in which such facilities already exist. Our supply of resources from within the group also helps us to reduce our dependency on external suppliers, allow-ing us to better plan our raw materials access.
We already possess an extensive resource network that is especially dense in our home markets and several of our growth markets. With 318 active asphalt mixing facilities1) (2011: 332), we again covered 83 % of our group asphalt needs last year. In this area, we have for several years already enjoyed an optimal degree of self-sufficiency. With con-crete, the supply from proprietary production was down from 34 % to 28 % as a result of 167 instead of 177 active concrete mixing fa-cilities. This is mainly due to the completion of several large projects in Poland that had been supplied nearly exclusively from proprietary mixing facilities. In the field of stone/gravel, on the other hand, proprietary coverage rose from 16 % the previous year to 18 % in 2012. The number of active production sites remained constant at 187.
Asphalt
We produced 15.8 million tonnes of asphalt in the past financial year, compared to 18.0 million tonnes in 2011. Most of the asphalt was produced in Germany, Austria, Poland and the Czech Republic. About 62 % (2011: 63 %) of the asphalt produced was sold wi-thin the group – thereof approximately half to the segment North + West and half to the segment South + East – at the usual market rate; the rest was sold to third parties. The price situation on the markets further burdened our asphalt producers within the group: while the input material of bitumen, in response to the rising oil prices, made production more
expensive, the retail price for asphalt was at an extremely low level due to the low demand.
Concrete
The production of concrete in the year 2012 amounted to 3.8 million m³, compared to 4.6 million m³ in 2011. More than half of the production took place in Germany, Hungary and the Czech Republic. 37 % of the con-crete produced was sold within the group (2011: 41 %).
stone/Gravel
The STRAbAG Group produced around 30.1 million tonnes of stone and gravel in 2012, less than in the previous financial year (33.4 million tonnes). 32 % of these resour- ces were used by group companies (2011: 31 %)2).
Cement
We started operations of our first proprietary cement factory in Hungary in September 2011. These cement activities were brought into Lafarge Cement CE Holding GmbH, our joint venture with construction material ma-nufacturer Lafarge. We hold 30 % of the joint venture, so that it is reported in the consolidat- ed financial statements using the equity meth- od. In addition to the Hungarian location, the company also owns production sites in Man-nersdorf (A), Retznei (A), Cižkovice (CZ) und Trbovlje (SI). Thanks to the joint procurement and administration handled by this joint ven-ture, STRAbAG benefits from economies of scale and from the know-how of global ce-ment market leader Lafarge. We also hold a minority interest in Slovakia-based cement firm Cemmac a.s.
In the region supplied by the aforementioned cement works, we were able to cover 49 % of our cement needs (approximately 580,000 tonnes) using our own resources.
1) Includes facilities from joint ventures and associates2) The relatively high percentage of third-party sales and purchases is explained by the fact that the desired resource type and quality were not available in the region where they were needed or that the projects at times lie outside of the supply radius of the production facilities. This highlights the importance of area-wide access to raw materials in a given geographic area.
KEY PERFORMANCE INDICATOR: COVERAGE OF RAW MATERIAL NEEDS USING OWN RESOURCES
2008 2009 2010 2011
Asphalt
0
20 %
40 %
60 %
80 %
100 %
2012
77 %
79 % 82 %
83 %
83 %
2008 2009 2010 2011
Concrete
0
20 %
40 %
60 %
80 %
100 %
2012
34 % 38
%
38 %
34 %
2008 2009 2010 2011
Stone/Gravel
0
20 %
40 %
60 %
80 %
100 %
2012
28 %
19 %
17 %
20 %
16 %
18 %
20

noBJective 2012 With the exception of asphalt, where our coverage is already quite high, our aim for 2012 was to cover more of our raw material needs with own resources. For us, increasing our in- dependence from raw materials suppliers is a priority. In comparison, raising the revenues from raw materials sales to third parties is not an objective per se. Nevertheless, revenues in this area reached about € 530 million in the past financial year (previous year: € 560 million).
nAcHieveMents 2012 In the field of concrete, we have still not reached our target. On the other hand, we were successful with stone/gravel.
oUR oBJective FoR 2013 We are maintaining our objective of profiting from our own resources and of optimising our raw materials portfolio. The key performance indicator used to measure this success is the “Coverage of Raw Material Needs Using Own Re- sources”. Our objective therefore is to increase the degree of proprietary coverage with concrete, stone/ gravel and – for the first time in 2013 – cement.
Our far-reaching country network, our central operational structure and our strong financial basis – the group’s essential success factors – suggest a strategy that is based on size, diversity and local presence. This is good not only for STRAbAG. Our clients also benefit from a broad geographic presence in several
specific construction markets: They can expect the same quality from STRAbAG- executed works at all of their sites. Thanks to partnership models like our teamconcept and the single-source execution of all con-struction works, projects are completed quickly and smoothly. And our clients can rest easy.
OuR fOuR StRatEGic pRiORitiES
sTRABAG teamconcept:For our clients
Whether a promising construction job actu- ally becomes an economically successful property is largely decided before construction begins. About 80 % of all later construction and operating costs can be influenced during
the planning stages. This idea led us to come up with our teamconcept, in which the client and contractor work together as partners. The introduction of joint controlling and the early inclusion of the contractor in the plan-ning phase help to minimise the risk for both parties and to raise security in terms of quali-ty, costs and deadline.
StRatEGY BaSEd On SiZE, diVERSitY and lOcal pRESEncE
ECOLOGICAL RESPONSIBILITY
ECONOMIC RESPONSIBILITY
VALUES AND COMPLIANCE
CORPORATE CITIZENSHIP
MISSION AND VISION
EMPLOYEES AND WORKPLACE

22
KEY PERFORMANCE INDICATOR: NUMBER OF PPP-PROJECTS
0
5
10
15
20
25
30
35
2004 2005 2006 2007 2008 2009 2010 2011 2012
58
1215
24
29
3335 36
investinG in pUBLic-pRivAte pARtneRsHips
We have worked successfully with operator models for more than two decades. In the areas of building construction and infrastructure, the portfolio comprises 36 public-private partnership (PPP) projects with an adjusted total investment volume of € 9.81 billion (2011: € 9.51 billion). In the 2012 financial year, we were awarded one new project with an investment volume of € 301.0 million. In total, we invested a proportionate share of equity in the amount of € 386.4 million in concession projects at the end of 2012 and had committed a further € 60.5 million for a total of € 446.9 million.
Driving the business with PPP projects are the public finance situation and the financing environment. This involves at times conflict-ing effects: On the one hand, PPP financing widens the public sector’s scope of action;
REad mORE aBOut thE cOuntRiES in Which WE
haVE a pRESEncE StaRtinG On paGE 84
eXpAnDinG GeoGRApHicALLY
StRaBaG – a GlOBallY actiVE, YEt EuROpEan cOnStRuctiOn cOmpanY
■ Countries in which the STRABAG Group has a presence
broad geographic positioning is very impor-tant to us. This allows us to seize opportu-nities in a variety of markets quickly and use large equipment in different regions. We also diversify our risk by not focusing our growth on just a few countries.
We began to focus on geographic diversifi-cation at an early stage – and this strategy has paid off in the past few years. Germa-ny, a market which had not been given a lot of hope ten years ago, is now proving to be a stable earnings provider. Investors are apparently seeking refuge in “concrete gold”, as other investment options involve high risk without being very lucrative.
Especially in economically difficult times, it is important not to depend on just a few specific markets.
We are also active in projects outside of Europe in which a high degree of techno- logical know-how is required – in India, Canada and the Middle East, for exam-ple. Despite the international scope of our activities, however, we see ourselves as a European construction company. Europe is where we have our roots and where our core countries lie. We are mainly active on international, i.e. non-European, markets as part of the direct export business.

22 23Strategy
cOmpEtitiVE adVantaGE fROm ppp financinG
on the other hand, the consequences of the financial crisis – significantly higher interest premiums and liquidity costs with a trend to shorter financing terms – have an inhibitory effect. Nevertheless, there is an increasing interest, especially among institutional investors such as insurance companies and pension funds, to provide long-term capital for PPP projects. STRAbAG enjoys a competitive advantage that gives us good chances in the PPP business: Our strong financial position allows us to act as equity provider for concession companies more easily than other companies. Thanks to the inclusion of specialist providers from within the group, such as STRAbAG Property and Facility Services, we are in a position to efficiently and completely cover all speci-fications from structuring to financing and planning all the way to construction and operation. This gives both the client as well as the capital providers a high degree of security regarding contract fulfilment.
infrastructure sector
We are especially proud of the fact that we completed the first motorway concession in Denmark, the 26 km section between Kliplev and Sønderborg, on time and according to contract, and that the section was officially opened to traffic on 31 March 2012.
The two large-scale projects currently under construction in Germany, the 60 km section of the A5 motorway between Malsch and Offenburg and the 58 km A8 motorway section between Ulm and Augsburg, are proceeding according to contract speci-fications, and we are confident that these projects will be completed and opened for use on time.
Following the necessary planning and the grant of all approvals, construction on the A15 motorway project in Holland is proceed-ing according to plan. The main focus of the works was on the new botlek vertical lift bridge.
In time for the European Football Champion- ship in May 2012, we began with contractual tolling along the A2 Segment II motorway section between Nowy Tomyśl (west of Poznań) and Świecko (near the German border) in Poland. The 105 km section had already been opened to traffic in November 2011. The concession has been very successful from the beginning.
In the field of renewable energy, where we hold a 51 % stake of a total of 15 wind farms (= approx. 800 turbines) in the German North Sea, work is continuing towards making these offshore fields market-feasible in order to achieve successful commercial exploitation for our group. Meanwhile, the continuous growth of renewable energy within the total energy mix makes the question of electricity storage an increasing-ly relevant one. The development and con- struction of pumped-storage plants is there-fore an excellent addition to the business portfolio of our group.
In total, we submitted bids for four tenders for infrastructure PPP projects in 2012 with a total investment volume of nearly € 2.2 bil-lion. These tenders have not yet been decid-ed, but we are confident of being awarded one or the other contract or of being select-ed for the next stage in the award process.
Our subsidiary A-Way GmbH, a specialist in the operation and maintenance of trans-portation infrastructures, will continue to bid for operation-only tenders in Central and Eastern Europe as well as for concession projects. With its existing operating com-panies in Poland and Hungary, A-Way has a positive future ahead of it.
Building Construction sector
The market for PPP in building construction in Germany – one of our core markets – stabilised in 2012 at a slightly lower level compared to the previous year. The statistic analysis was performed on so-called “three-phase models” that comprise planning, construction and operation. Accordingly, 14 building construction projects (2011: 16) with an investment volume of about € 593 million (2011: € 757 million) were awarded last year. STRAbAG’s share of this volume stands at more than 50 % due to the acquisition of the largest pro-ject of this kind awarded in Germany in 2012 (Hamburg schools). In the period from 2003 to the end of 2012, the number of building construction projects awarded in Germany totalled 190 (2011: 176) with a cumulative volume of € 5.6 billion (2011: € 5.1 billion).
The global financial market crisis, among other things, has resulted in a fundamental de-terioration of the PPP financing environment,
eXpAnDinG GeoGRApHicALLY
StRaBaG – a GlOBallY actiVE, YEt EuROpEan cOnStRuctiOn cOmpanY

24
in particular as regards financing periods, collateral demands and financing conditions. Against this background, nearly all financing models in Germany were tendered with non-recourse forfeiting of the annuity instal-ments. Budgetary and resource restraints often lead to projects being delayed or abandoned entirely in the face of the public financing situation.
In Germany, the PPP project Three Schools Mülheim, with an investment volume of € 52.0 million, began operations following its on-time completion. The project included planning, construction and operation and was financed using the forfeiting model.
Construction on the Proton Therapy Centre Essen has been completed. The facility is currently undergoing clinical commission-ing, which involves various tests of the proton facility and the establishment of specific treatment protocols for different indications. Parallel to the clinical com-missioning, which is likely to last until the middle of 2014, the centre will begin treating patients in the second quarter of 2013.
In February 2011, following a Europe-wide tender process, we were awarded the contract for the planning, construction and operation of three football fields, spectator stands and a parking garage at the Parc des Sports in the town of Differdange, Luxem-bourg. Construction was completed in the summer of 2012 and operation began for the next 25 years.
In August 2012, the Free and Hanseatic City of Hamburg commissioned HEOS Berufs- schulen Hamburg GmbH, a special purpose company of STRABAG Real Estate GmbH and Otto Wulff GmbH, with the renovation, construction and management of 15 selected vocational schools over a period of 30 years. The tasks of HEOS GmbH comprise funda-mental renovation works including energy upgrade measures as well as the execution of necessary replacement and expansion measures for the participating schools. Further contractual obligations are building management including janitorial and cleaning services as well as constant maintenance and upkeep. The total contract value including operation amounts to € 700 million. The schools with the greatest renovation need will be renovated, new buildings built and refurbishments realised within five years
of contract conclusion. In this time, a total of € 301.0 million will have been invested. Following completion of all construction measures in late summer of 2017, the buildings will have a modernised and newly built net floor area of about 130,000 m².
In Austria, five of our rest stop projects are currently in operation – the oldest is the Wörthersee motorway rest stop on the A2 in Carinthia (since 2004), the most re-cent is the Hornstein rest stop on the A3 in Burgenland (since November 2011).
With December 2012, we placed bids for three projects in the Building Construction segment with a total investment volume of € 517 million. We are prequalified for further tenders in Central and Eastern Europe with an investment volume of about € 68 million. These projects are at different stages in the structuring and negotiation process.
Measurement principles
How the individual projects are recognised in the balance sheet depends on the legal definition. An intangible asset is recognised if the concession grants the company the right to charge users a usage fee. The accounts receivable approach is used if the company has an unconditional contractual right to receive a payment (see Receivables from Concession Arrangements, item 17 in the Notes).
A large part of the existing PPP projects within the STRABAG Group are carried out by associated group companies. These are incorporated into the consolidated financial statements using the equity method. The investment in the concession company is therefore recognised with the proportional equity.
We are pleased to say that our portfolio is developing in line with the financing mod-els underlying the projects, which form the basis for measurement according to the DCF method. This underlines the careful and conservative method of our measurement.

24
noBJective 2012 The focus in 2012 was on increasing our PPP portfolio and on working the markets of Germany, Poland and benelux as well as selected new markets such as Africa, Canada, Chile, Turkey and the Middle East.
nAcHieveMents 2012 by increasing our PPP portfolio from 35 to 36 projects, we have achieved our objective – though capacities remain for several more projects. A number of tender awards were de- layed, but our efforts were not in vain: we entered into consortia for several PPPs and are mostly already pre- qualified or in contract negotiations for:
n Canal locks in Holland
n Motorway widening projects A6, A7 I and II, A44, A1/A30, as well as various school and administrative projects in Germany
n N17/N18 motorway in Ireland
n Urban motorway and port bridge on Mauritius
n Concession motorway projects in Italy
n Doboj–Vukosavlje motorway in bosnia and Herzegovina
n Pumped-storage power plants in Germany, Austria and Switzerland
n Correctional facility in Haren, belgium
n Office complex for the brandenburg state government, Germany
oUR oBJective FoR 2013 We want to continue to work the markets in Germany, Poland and benelux and are confident of being able to maintain our market position in these countries. We continue to hope that many states, in view of the announced austerity measures, will take advantage of PPP models in public-sector infra- structure and building construction as a procurement alternative. At the same time, however, competition is expected to be on the rise.
On a selective and opportunistic basis, we also intend to become more involved in markets such as Africa, Canada, Latin America and India, where many interesting projects are expected to be tendered soon and where our group has already been successfully active as an operating construction partner for many years.
PPP measures for complex and large building construction projects are expected to account for a considerable share in the procurement of public goods. Especially in medium- sized and large-scale projects, the achievable efficiency advantages of having an integrated solutions approach (lifecycle) in planning, construction and operation will dominateover structuring-related cost overruns.

ppp-poRtFoLio
pROjECT COunTRy
TOTAlvOlumE in
€ mln.
pROpORTiOnATE shARE
OF EquiTy in€ mln.
pROpORTiOnATE shARE OF COmmiTTEd
EquiTy€ mln.
dEBT (nOn-RECOuRsE) sTRABAG's shARE
€ mln.
dEBT (RECOuRsE) sTRABAG's shARE
€ mln.sTRABAG's shARE
in % sTATus COnCEssiOn hARdTOll1)
AvAil-ABiliTy
FEE2) OThER3)COnsOlidATiOn
mEThOd4)
infrastructure
A2 motorway section II Poland 1,543.0 15.0 15.0 136.9 0.0 10.0 in operation 2009–2037 Pnot
consolidated
M5 motorway Hungary 1,292.0 252.0 252.0 630.3 0.0 100.0 in operation until 2031 Pfully
consolidatedbirecikpower plant Turkey 981.0 11.9 11.9 0.0 0.0 8.4 in operation until 2016
electricitysale
notconsolidated
M6 motorway Hungary 966.0 21.1 21.1 253.5 0.0 30.0 in operation 2007–2037 P at equity
A15 motorwayThe
Netherlands 883.8 0.0 13.0 146.0 0.0 24.0 in progress 2010–2035 P at equity
A2 motorway section I Poland 880.0 26.7 26.7 100.3 0.0 10.0 in operation 1997–2037 P5)
notconsolidated
bAb A5motorway Germany 660.0 10.6 19.7 50.0 0.0 12.5 in progress 2009–2039 P
notconsolidated
Limerickmotorway Ireland 437.0 8.3 8.3 41.5 0.0 20.0 in operation 2006–2041 P
notconsolidated
Zagrebmotorway Croatia 371.0 15.7 15.7 174.0 0.0 51.0 in operation 2007–2032 P at equityFermoymotorway Ireland 215.0 1.9 1.9 11.0 0.0 12.5 in operation 2004–2034 P
notconsolidated
M51 Kliplev-Sønderborg motorway Denmark 149.0 0.4 0.4 0.0 0.0 100.0 in operation 2012–2038 Pfully
consolidated
Nordkettenbahn aerial tramway Austria 51.0 2.1 2.1 3.4 1.8 51.0 in operation 2008–2038 P ticketingfully
consolidated
biomass recycling, Großwilfersdorf Austria 9.8 1.7 1.7 6.8 0.0 50.1 in progress unlimited Pnot
consolidated
Marienfeld Harsewinkel bypass road Germany 5.7 0.0 0.0 0.0 0.0 100.0 in operation 2007–2037 Pnot
consolidatedbAb A8motorway Germany 566.0 0.5 38.3 148.5 0.0 50.0 in progress 2010–2041 P6) at equity
1) The fee is collected directly from the user.2) A periodic lump-sum payment consisting of a fixed portion and a variable.3) Service fee for operation.4) Not consolidated means that results and/or operator‘s fees are accounted for in the net income from investments.5) Car=hard toll, truck=shadow toll (shadow toll: the fee is charged by the concessionaire)6) Partially subsidies, truck=hard toll7) No concession, but fixed payments by state or city.
26

ppp-poRtFoLio
pROjECT COunTRy
TOTAlvOlumE in
€ mln.
pROpORTiOnATE shARE
OF EquiTy in€ mln.
pROpORTiOnATE shARE OF COmmiTTEd
EquiTy€ mln.
dEBT (nOn-RECOuRsE) sTRABAG's shARE
€ mln.
dEBT (RECOuRsE) sTRABAG's shARE
€ mln.sTRABAG's shARE
in % sTATus COnCEssiOn hARdTOll1)
AvAil-ABiliTy
FEE2) OThER3)COnsOlidATiOn
mEThOd4)
infrastructure
A2 motorway section II Poland 1,543.0 15.0 15.0 136.9 0.0 10.0 in operation 2009–2037 Pnot
consolidated
M5 motorway Hungary 1,292.0 252.0 252.0 630.3 0.0 100.0 in operation until 2031 Pfully
consolidatedbirecikpower plant Turkey 981.0 11.9 11.9 0.0 0.0 8.4 in operation until 2016
electricitysale
notconsolidated
M6 motorway Hungary 966.0 21.1 21.1 253.5 0.0 30.0 in operation 2007–2037 P at equity
A15 motorwayThe
Netherlands 883.8 0.0 13.0 146.0 0.0 24.0 in progress 2010–2035 P at equity
A2 motorway section I Poland 880.0 26.7 26.7 100.3 0.0 10.0 in operation 1997–2037 P5)
notconsolidated
bAb A5motorway Germany 660.0 10.6 19.7 50.0 0.0 12.5 in progress 2009–2039 P
notconsolidated
Limerickmotorway Ireland 437.0 8.3 8.3 41.5 0.0 20.0 in operation 2006–2041 P
notconsolidated
Zagrebmotorway Croatia 371.0 15.7 15.7 174.0 0.0 51.0 in operation 2007–2032 P at equityFermoymotorway Ireland 215.0 1.9 1.9 11.0 0.0 12.5 in operation 2004–2034 P
notconsolidated
M51 Kliplev-Sønderborg motorway Denmark 149.0 0.4 0.4 0.0 0.0 100.0 in operation 2012–2038 Pfully
consolidated
Nordkettenbahn aerial tramway Austria 51.0 2.1 2.1 3.4 1.8 51.0 in operation 2008–2038 P ticketingfully
consolidated
biomass recycling, Großwilfersdorf Austria 9.8 1.7 1.7 6.8 0.0 50.1 in progress unlimited Pnot
consolidated
Marienfeld Harsewinkel bypass road Germany 5.7 0.0 0.0 0.0 0.0 100.0 in operation 2007–2037 Pnot
consolidatedbAb A8motorway Germany 566.0 0.5 38.3 148.5 0.0 50.0 in progress 2010–2041 P6) at equity
27Strategy
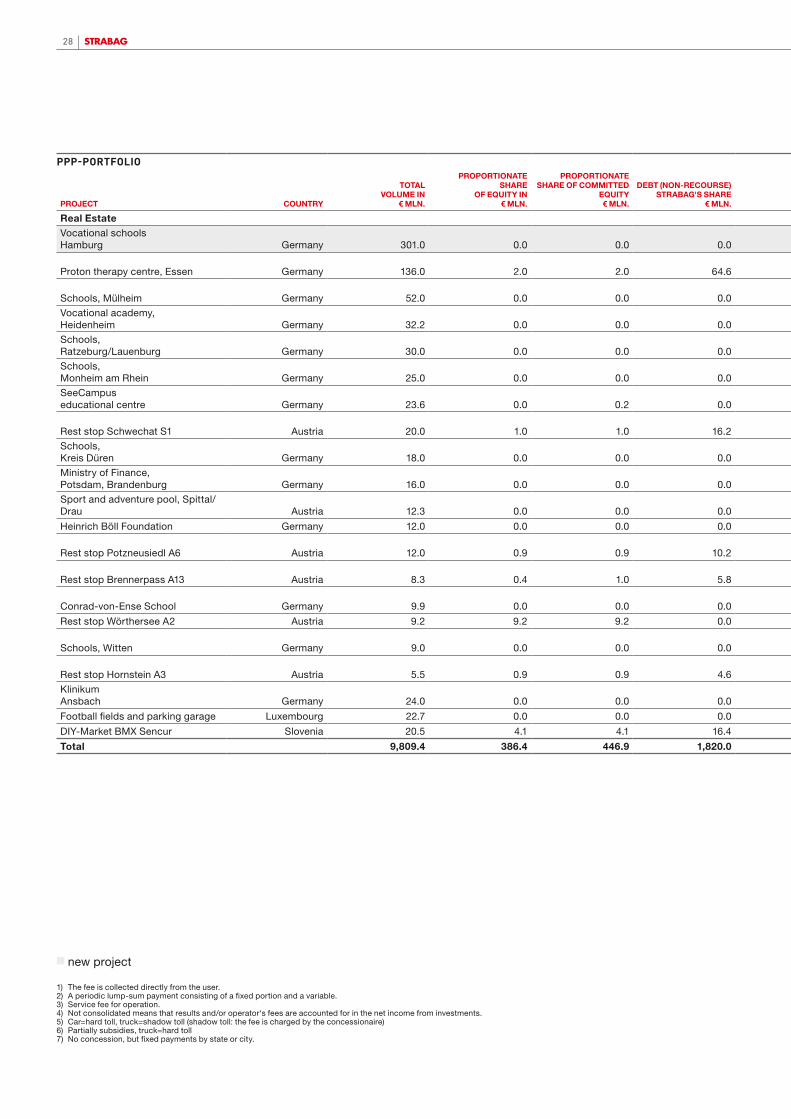
28
■ new project
ppp-poRtFoLio
pROjECT COunTRy
TOTAlvOlumE in
€ mln.
pROpORTiOnATE shARE
OF EquiTy in€ mln.
pROpORTiOnATE shARE OF COmmiTTEd
EquiTy€ mln.
dEBT (nOn-RECOuRsE) sTRABAG's shARE
€ mln.
dEBT (RECOuRsE) sTRABAG's shARE
€ mln.sTRABAG's shARE
in % sTATus COnCEssiOn hARdTOll1)
AvAil-ABiliTy
FEE2) OThER3)COnsOlidATiOn
mEThOd4)
Real EstateVocational schoolsHamburg Germany 301.0 0.0 0.0 0.0 3.8 50.0 in progress
noconcession7) not consolidated
Proton therapy centre, Essen Germany 136.0 2.0 2.0 64.6 0.0 50.0 in progress 2009–2025 service fee not consolidated
Schools, Mülheim Germany 52.0 0.0 0.0 0.0 14.8 100.0 in progressno
concession7) P fully consolidatedVocational academy, Heidenheim Germany 32.2 0.0 0.0 0.0 0.0 100.0 in operation
noconcession7) P fully consolidated
Schools, Ratzeburg/Lauenburg Germany 30.0 0.0 0.0 0.0 0.0 100.0 in operation
noconcession7) P fully consolidated
Schools, Monheim am Rhein Germany 25.0 0.0 0.0 0.0 0.0 100.0 in operation 2004–2028 P not consolidatedSeeCampus educational centre Germany 23.6 0.0 0.2 0.0 0.0 100.0 in operation 2011–2041 P not consolidated
Rest stop Schwechat S1 Austria 20.0 1.0 1.0 16.2 0.0 100.0 in operation 2008–2038 Ppartially through
rental fully consolidatedSchools,Kreis Düren Germany 18.0 0.0 0.0 0.0 0.0 100.0 in operation 2007–2032 P not consolidatedMinistry of Finance, Potsdam, brandenburg Germany 16.0 0.0 0.0 0.0 0.0 100.0 in operation
noconcession7) P fully consolidated
Sport and adventure pool, Spittal/Drau Austria 12.3 0.0 0.0 0.0 0.0 100.0 in operation 2008–2033 n.a. n.a.
Heinrich böll Foundation Germany 12.0 0.0 0.0 0.0 0.0 100.0 in operation 2008–2023 P fully consolidated
Rest stop Potzneusiedl A6 Austria 12.0 0.9 0.9 10.2 0.0 100.0 in operation 2009–2037 Ppartially through
rental fully consolidated
Rest stop brennerpass A13 Austria 8.3 0.4 1.0 5.8 0.0 100.0 in operation 2010–2042 Ppartially through
rental fully consolidated
Conrad-von-Ense School Germany 9.9 0.0 0.0 0.0 0.0 100.0 in operationno
concession7) P not consolidated
Rest stop Wörthersee A2 Austria 9.2 9.2 9.2 0.0 0.0 100.0 in operation 2004–2032 service fee fully consolidated
Schools, Witten Germany 9.0 0.0 0.0 0.0 0.0 100.0 in operationno
concession7) P fully consolidated
Rest stop Hornstein A3 Austria 5.5 0.9 0.9 4.6 0.0 100.0 in operation 2010–2040 Ppartially through
rental fully consolidatedKlinikumAnsbach Germany 24.0 0.0 0.0 0.0 7.5 100.0 in progress
noconcession7) P not consolidated
Football fields and parking garage Luxembourg 22.7 0.0 0.0 0.0 0.0 100.0 in operation 2012–2037 P fully consolidated
DIY-Market bMX Sencur Slovenia 20.5 4.1 4.1 16.4 0.0 100.0 in operation 2012–2032 leasing model fully consolidated
Total 9,809.4 386.4 446.9 1,820.0 27.9
1) The fee is collected directly from the user.2) A periodic lump-sum payment consisting of a fixed portion and a variable.3) Service fee for operation.4) Not consolidated means that results and/or operator‘s fees are accounted for in the net income from investments.5) Car=hard toll, truck=shadow toll (shadow toll: the fee is charged by the concessionaire)6) Partially subsidies, truck=hard toll7) No concession, but fixed payments by state or city.

29Strategy
ppp-poRtFoLio
pROjECT COunTRy
TOTAlvOlumE in
€ mln.
pROpORTiOnATE shARE
OF EquiTy in€ mln.
pROpORTiOnATE shARE OF COmmiTTEd
EquiTy€ mln.
dEBT (nOn-RECOuRsE) sTRABAG's shARE
€ mln.
dEBT (RECOuRsE) sTRABAG's shARE
€ mln.sTRABAG's shARE
in % sTATus COnCEssiOn hARdTOll1)
AvAil-ABiliTy
FEE2) OThER3)COnsOlidATiOn
mEThOd4)
Real EstateVocational schoolsHamburg Germany 301.0 0.0 0.0 0.0 3.8 50.0 in progress
noconcession7) not consolidated
Proton therapy centre, Essen Germany 136.0 2.0 2.0 64.6 0.0 50.0 in progress 2009–2025 service fee not consolidated
Schools, Mülheim Germany 52.0 0.0 0.0 0.0 14.8 100.0 in progressno
concession7) P fully consolidatedVocational academy, Heidenheim Germany 32.2 0.0 0.0 0.0 0.0 100.0 in operation
noconcession7) P fully consolidated
Schools, Ratzeburg/Lauenburg Germany 30.0 0.0 0.0 0.0 0.0 100.0 in operation
noconcession7) P fully consolidated
Schools, Monheim am Rhein Germany 25.0 0.0 0.0 0.0 0.0 100.0 in operation 2004–2028 P not consolidatedSeeCampus educational centre Germany 23.6 0.0 0.2 0.0 0.0 100.0 in operation 2011–2041 P not consolidated
Rest stop Schwechat S1 Austria 20.0 1.0 1.0 16.2 0.0 100.0 in operation 2008–2038 Ppartially through
rental fully consolidatedSchools,Kreis Düren Germany 18.0 0.0 0.0 0.0 0.0 100.0 in operation 2007–2032 P not consolidatedMinistry of Finance, Potsdam, brandenburg Germany 16.0 0.0 0.0 0.0 0.0 100.0 in operation
noconcession7) P fully consolidated
Sport and adventure pool, Spittal/Drau Austria 12.3 0.0 0.0 0.0 0.0 100.0 in operation 2008–2033 n.a. n.a.
Heinrich böll Foundation Germany 12.0 0.0 0.0 0.0 0.0 100.0 in operation 2008–2023 P fully consolidated
Rest stop Potzneusiedl A6 Austria 12.0 0.9 0.9 10.2 0.0 100.0 in operation 2009–2037 Ppartially through
rental fully consolidated
Rest stop brennerpass A13 Austria 8.3 0.4 1.0 5.8 0.0 100.0 in operation 2010–2042 Ppartially through
rental fully consolidated
Conrad-von-Ense School Germany 9.9 0.0 0.0 0.0 0.0 100.0 in operationno
concession7) P not consolidated
Rest stop Wörthersee A2 Austria 9.2 9.2 9.2 0.0 0.0 100.0 in operation 2004–2032 service fee fully consolidated
Schools, Witten Germany 9.0 0.0 0.0 0.0 0.0 100.0 in operationno
concession7) P fully consolidated
Rest stop Hornstein A3 Austria 5.5 0.9 0.9 4.6 0.0 100.0 in operation 2010–2040 Ppartially through
rental fully consolidatedKlinikumAnsbach Germany 24.0 0.0 0.0 0.0 7.5 100.0 in progress
noconcession7) P not consolidated
Football fields and parking garage Luxembourg 22.7 0.0 0.0 0.0 0.0 100.0 in operation 2012–2037 P fully consolidated
DIY-Market bMX Sencur Slovenia 20.5 4.1 4.1 16.4 0.0 100.0 in operation 2012–2032 leasing model fully consolidated
Total 9,809.4 386.4 446.9 1,820.0 27.9

30
intensiFYinG tHe Activities innicHe MARKets
Recent years have highlighted the im-portance not just of geographic, but also of product-oriented diversification in the building and construction trade. In Europe, the various economic stimulus programmes and the resulting state investments in in-frastructure several years ago allowed construction companies to optimally utilise their capacities. The effect was regionally quite different, however, affecting mostly companies which had specialised in civil engineering. A reversal of the trend came in 2011: the economic stimulus programmes gave way to austerity packages; public-sector demand was waning, while private demand for building construction and civil engineering grew again. Especially in Germany, this demand on the part of private clients has had a very positive effect ever since.
At best, these fluctuations balance each other out. Nevertheless, the construc-tion industry faces some very strong price pressure in some sectors. Construction companies are therefore well-advised to broadly position their range of services. For this reason, STRAbAG is not only active in the fields of building construction, civil engineering, transportation infrastructures and tunnelling, but is also intensifying its activities in niche sectors such as railway construction, environmental technology and waterway construction. We offer our clients not just planning, construction and the necessary technology; they also profit from the years of experience and know-how of our employees, from the use of state-of-the-art equipment and machinery, and from STRAbAG’s own technologies and patents. These special technologies make us more independent of the price pressure in the construction sector.
noBJective 2012 Licensing of the special equipment fleet in several EU countries
nAcHieveMents 2012 Railway construction We achieved licensing for more than 60 pieces of railway construction equipment in ten countries, including the Netherlands, Poland and Sweden.
hydraulic engineering In the field of hydraulic engineering, the licensing of large equipment is not so much an issue as is its use in new large-scale projects. Here we were successful too: using our own equipment, we expanded the con- tainerterminal at the Port of Odessa, Ukraine, and widened the Mittelland Canal in Sachsen-Anhalt, Germany.
oUR oBJective FoR 2013 The licensing of special equipment in several countries is an important prerequisite for generating a profit in niche fields, as investments made over several decades in such equip- ment initially involve high write-offs that must be earned back. Although some of the equipment is already in use in several countries, the capacity utilisation of the large equipment is, in our view, not yet at a satisfactory level. We would like to increase the potential for improving results in the niche markets. For this reason, we are rigorously continuing our strategy of internationalisation. The objective is to achieve licensing for the special equipment fleet in more countries and to obtain large orders in our niche areas.
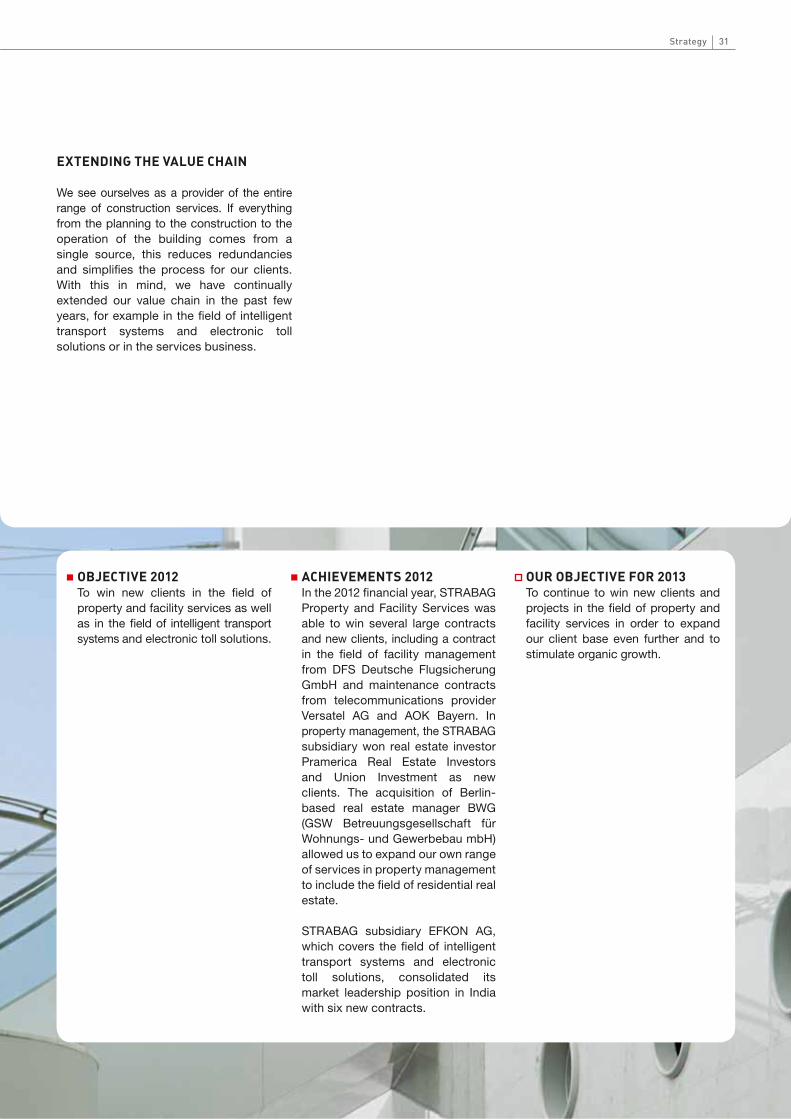
30 31Strategy
eXtenDinG tHe vALUe cHAin
We see ourselves as a provider of the entire range of construction services. If everything from the planning to the construction to the operation of the building comes from a single source, this reduces redundancies and simplifies the process for our clients. With this in mind, we have continually extended our value chain in the past few years, for example in the field of intelligent transport systems and electronic toll solutions or in the services business.
noBJective 2012 To win new clients in the field of property and facility services as well as in the field of intelligent transport systems and electronic toll solutions.
nAcHieveMents 2012 In the 2012 financial year, STRAbAG Property and Facility Services was able to win several large contracts and new clients, including a contract in the field of facility management from DFS Deutsche Flugsicherung GmbH and maintenance contracts from telecommunications provider Versatel AG and AOK bayern. In property management, the STRAbAG subsidiary won real estate investor Pramerica Real Estate Investors and Union Investment as new clients. The acquisition of berlin- based real estate manager bWG (GSW betreuungsgesellschaft für Wohnungs- und Gewerbebau mbH) allowed us to expand our own range of services in property management to include the field of residential real estate.
STRAbAG subsidiary EFKON AG, which covers the field of intelligent transport systems and electronic toll solutions, consolidated its market leadership position in India with six new contracts.
oUR oBJective FoR 2013 To continue to win new clients and projects in the field of property and facility services in order to expand our client base even further and to stimulate organic growth.

EMPL
OYEE
S
34
EMPLOYEES
n MORE THAN 74,000 EMPLOYEES WORLDWIDE
n NEW CAREER MODEL DEVELOPED
For an international group – STRABAG is present in more than 80 countries – cross-border working and an open dialogue within the company are essential components of the corporate culture. To promote these two success factors, we expect our employees to take personal responsibility for the most part. Additionally, having a transparent organi- sational structure helps to promote the em-ployees’ innovative strength and motivation.
The quality of the working relationship be-tween management and employees is also
of central importance for the business success. For this reason, we actively encour- age mutual respect in our dealings with one another.
STRABAG sees itself as a “learning organi-sation” that not only facilitates the transfer of existing knowledge, but also constantly generates and disseminates new knowl-edge. Personal development opportunities are identified within the open and trans- parent communication.
ECOLOGICAL RESPONSIBILITY
ECONOMIC RESPONSIBILITY
VALUES AND COMPLIANCE
CORPORATE CITIZENSHIP
MISSION AND VISION
EMPLOYEES AND WORKPLACE
PERSONAL RESPONSIBILITY IN A LEARNING ORGANISATION
COMPLETION OF LARGE PROJECTS REDUCES EMPLOYEE NUMBERS
EMPLOYEES FROM 126 NATIONS
As a result of the typical winter break in construction, the STRABAG Group is subject to seasonal fluctuations in em- ployee numbers. For this reason, the number of employees – as is usual in the industry – can only be stated as an annual average. 74,010 employees (45,715 blue- collar and 28,295 white-collar) worked for STRABAG in 2012. This corresponds to a decline by 2,856 employees or 4 %. The employee levels therefore fell more strongly than the output in the group. The largest por-tion of the decline can be attributed to the conclusion of large projects – for example, in Poland or the Middle East. With difficult economic conditions affecting construction activity, however, employee levels were on the decline in other markets as well.
The company’s strong international nature is reflected in the number of nationalities. In the 2012 financial year, STRABAG employed 74,010 people from a total of 126 nations, compared to 120 nationalities in 2011.
During the past financial year, we had 1,129 people as blue-collar apprentices (2011: 1,093) and 259 as white-collar trainees (2011: 246) in training.
Traditionally, the construction industry over-whelmingly employs men. Nevertheless, the percentage of women employed within the group in 2012 was 13 % (2011: 13 %). With-in group management, the percentage of women was about 8 % (2011: 9 %).
2012 2011
Employees
Number of employees 74,010 76,866 Total number of employees within the group
Percentage of women 13 % 13 % Share of women of total employees within the group
Occupational safety and health
Occupational accidents 34 34Accident rate per thousand employees: number of accidents with three or more lost days x 1,000/number of employees
Accident rate 0.5 % 0.6 % Ratio of accident days to working days
Absenteeism due to illness 4.5 % 4.5 % Ratio of sick leave days to working days
SOCIAL INDICATORS
EXTENDING THE VALUE CHAIN
We see ourselves as a provider of the entire range of construction services. If everything from the planning to the construction to the operation of the building comes from a single source, this reduces redundancies and simplifies the process for our clients. With this in mind, we have continually extended our value chain in the past few years, for example in the field of intelligent transport systems and electronic toll solutions or in the services business.
nOBJECTIVE 2012 To win new clients in the field of property and facility services as well as in the field of intelligent transport systems and electronic toll solutions.
nACHIEVEMENTS 2012 In the 2012 financial year, STRABAG Property and Facility Services was able to win several large contracts and new clients, including a contract in the field of facility management from DFS Deutsche Flugsicherung GmbH and maintenance contracts from telecommunications provider Versatel AG and AOK Bayern. In property management, the STRABAG subsidiary won real estate investor Pramerica Real Estate Investors and Union Investment as new clients. The acquisition of Berlin- based real estate manager BWG (GSW Betreuungsgesellschaft für Wohnungs- und Gewerbebau mbH) allowed us to expand our own range of services in property management to include the field of residential real estate.
STRABAG subsidiary EFKON AG, which covers the field of intelligent transport systems and electronic toll solutions, consolidated its market leadership position in India with six new contracts.
OUR OBJECTIVE FOR 2013 To continue to win new clients and projects in the field of property and facility services in order to expand our client base even further and to stimulate organic growth.
31Strategy
Kapiteltrenner_rechts_E.indd 4 22.04.13 15:44
EMPLOYEES
VARIETY AND OPPORTUNITY EVERYWHEREWe offer our employees everywhere – in the coun-try and in the city, in Europe and abroad – a variety of different tasks as an opportunity to develop their talents accordingly. Our apprentices can choose from more than ten different career paths. And when, as in 2012, one quarter of our apprentices complete their placement with excellence, we share their joy and we are proud.
Kapiteltrenner_rechts_E.indd 3 22.04.13 15:44
3434
eMpLoYees
n mORE than 74,000 EmplOYEES WORldWidE
n nEW caREER mOdEl dEVElOpEd
For an international group – STRAbAG is present in more than 80 countries – cross-border working and an open dialogue within the company are essential components of the corporate culture. To promote these two success factors, we expect our employees to take personal responsibility for the most part. Additionally, having a transparent organi- sational structure helps to promote the em-ployees’ innovative strength and motivation.
The quality of the working relationship be-tween management and employees is also
of central importance for the business success. For this reason, we actively encour- age mutual respect in our dealings with one another.
STRAbAG sees itself as a “learning organi-sation” that not only facilitates the transfer of existing knowledge, but also constantly generates and disseminates new knowl-edge. Personal development opportunities are identified within the open and trans- parent communication.
ECOLOGICAL RESPONSIBILITY
ECONOMIC RESPONSIBILITY
VALUES AND COMPLIANCE
CORPORATE CITIZENSHIP
MISSION AND VISION
EMPLOYEES AND WORKPLACE
pERSOnal RESpOnSiBilitY in a lEaRninG ORGaniSatiOn
cOmplEtiOn Of laRGE pROJEctS REducES EmplOYEE numBERS
EmplOYEES fROm 126 natiOnS
As a result of the typical winter break in construction, the STRAbAG Group is subject to seasonal fluctuations in em- ployee numbers. For this reason, the number of employees – as is usual in the industry – can only be stated as an annual average. 74,010 employees (45,715 blue- collar and 28,295 white-collar) worked for STRAbAG in 2012. This corresponds to a decline by 2,856 employees or 4 %. The employee levels therefore fell more strongly than the output in the group. The largest por-tion of the decline can be attributed to the conclusion of large projects – for example, in Poland or the Middle East. With difficult economic conditions affecting construction activity, however, employee levels were on the decline in other markets as well.
The company’s strong international nature is reflected in the number of nationalities. In the 2012 financial year, STRAbAG employed 74,010 people from a total of 126 nations, compared to 120 nationalities in 2011.
During the past financial year, we had 1,129 people as blue-collar apprentices (2011: 1,093) and 259 as white-collar trainees (2011: 246) in training.
Traditionally, the construction industry over-whelmingly employs men. Nevertheless, the percentage of women employed within the group in 2012 was 13 % (2011: 13 %). With-in group management, the percentage of women was about 8 % (2011: 9 %).
2012 2011
Employees
Number of employees 74,010 76,866 Total number of employees within the group
Percentage of women 13 % 13 % Share of women of total employees within the group
Occupational safety and health
Occupational accidents 34 34Accident rate per thousand employees: number of accidents with three or more lost days x 1,000/number of employees
Accident rate 0.5 % 0.6 % Ratio of accident days to working days
Absenteeism due to illness 4.5 % 4.5 % Ratio of sick leave days to working days
SOcial indicatORS

35Employees
■ Germany■ Austria■ CEE2)
■ Rest of Europe■ Rest of World
EMPLOYEES BY REGION
36 %
14 %28 %
7 %
15 %
74,010employees
EMPLOYEES BY SEGMENT
34 %
31 %
27 %
8 %
4 %decline
■ North + West■ South + East■ International + Special Divisions■ Other
2006 2007 2008 2009 2010 2011
■ Blue-collar■ White-collar
NUMBER OF EMPLOYEES 2006–2012¹)
0
10,000
20,000
30,000
40,000
50,000
60,000
70,000
80,000
2012
45,7
1528
,295
33,8
3819
,133
39,6
1221
,513
45,9
8427
,028
44,2
8731
,261
41,5
4732
,053
44,8
3332
,033
nORTh + wEsT sOuTh + EAsT
inTERnATiOnAl + spECiAl divisiOns OThER GROup
Germany 15,720 1,799 7,032 2,181 26,732
Austria 97 7,555 1,184 1,092 9,928
Poland 4,206 972 438 683 6,299
Middle East 112 40 5,832 7 5,991
Czech Republic 0 2,913 710 352 3,975
The Americas 2,233 6 601 2 2,842
Hungary 12 1,625 652 275 2,564
Russia and neighbouring countries 340 1,846 156 192 2,534
Slovakia 1 1,385 342 210 1,938
Africa 4 1 1,914 0 1,919
Switzerland 90 1,480 156 168 1,894
Romania 83 1,041 227 219 1,570
Scandinavia 1,188 14 5 32 1,239
benelux 899 8 112 40 1,059
Croatia 2 641 95 103 841
Serbia 14 579 27 107 727
Rest of Europe 98 438 120 12 668
Asia 5 14 580 2 601
bulgaria 0 159 35 59 253
Italy 4 45 170 28 247
Slovenia 0 138 38 13 189
Total 25,108 22,699 20,426 5,777 74,010
numBER Of EmplOYEES 2012
■ ≤20 years■ 21–30 years■ 31–40 years■ 41–50 years■ 51–60 years■ >60 years
EMPLOYEE AGE STRUCTURE 2012
3 %
18 %
24 %28 %
22 %
5 %
1) In 2012, approx. 4,100 employees were rearranged from “White-collar” to “blue-collar”.2) Central and Eastern Europe comprises the following countries: bulgaria, Croatia, Czech Republic, Hungary, Poland, Romania, Russia and neighbouring countries, Serbia, Slovakia, Slovenia.

36
human RESOuRcE dEVElOpmEntWe constantly strive to develop and optimise the professional and personal qualification of our employees. The construction sector is a human-resource-intensive industry in which our workers have a significant in-fluence on business success. The lack of skilled personnel and seasonal bottlenecks make human resources a critical factor. STRAbAG’s response is consistent strategic human resource planning and the con- tinuous training and development of its em- ployees. Modern information technologies, software and processes are used to make sure that everything is done professionally.
Our applicant and training management system, an international IT platform for the publication of job offers at all group brands, combined with the use of online applica-tion forms is already successfully in use in Austria, Germany, Hungary, Croatia, Poland, the Czech Republic, Slovakia, Romania and Russia. The system allows efficient data management of applicants and employees, offers country-specific platforms for seminar management, and is the basis for the target-oriented orientation, qualification and development of employees in the group.
uniVERSum StudEnt SuRVEY – tOp 100 idEal
EmplOYER in auStRia
measures to increase the percentage of women
STRAbAG SE is currently working on an action plan to increase the number of women employees at STRAbAG as well as the number of women in management. Measurable targets are to be set in the following three areas:
n Targeted search and selection of women employees
n Systematic promotion of high potentials regardless of gender as part of the company’s human resource development
n Reduction of the conflict of interest between job and family
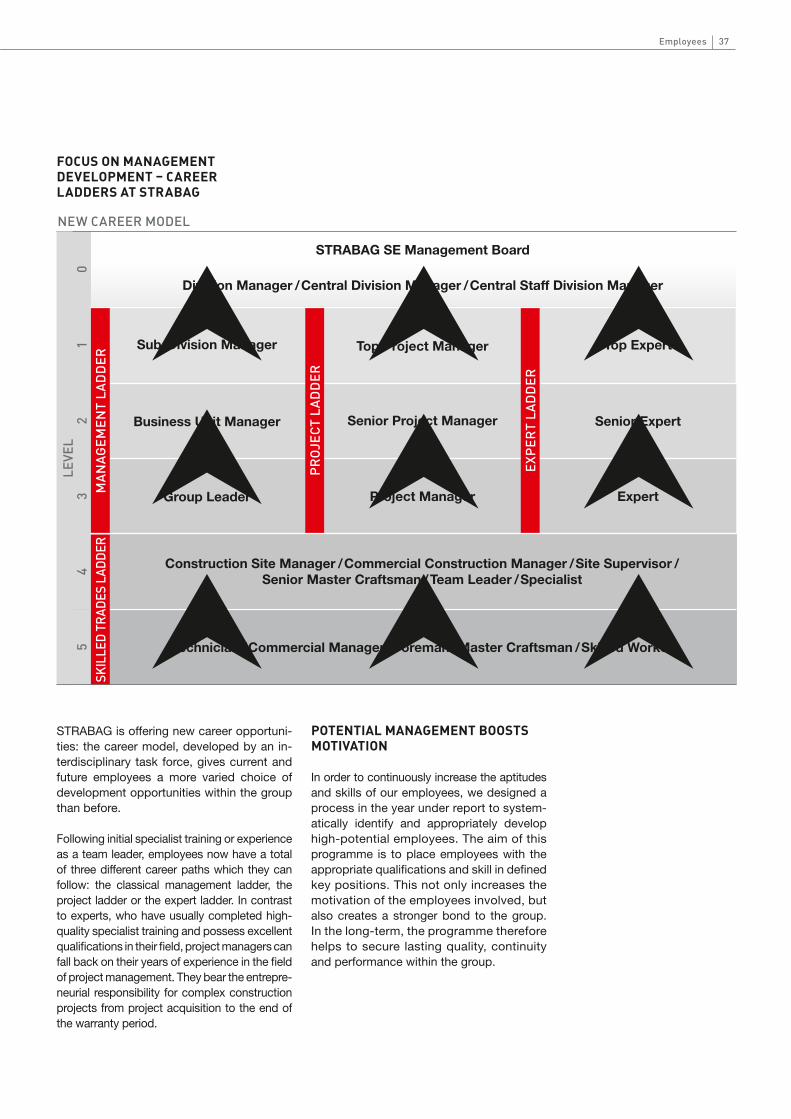
36
FocUs on MAnAGeMent DeveLopMent – cAReeR LADDeRs At stRABAG
01
23
45
SKil
lEd
tRad
ES l
addE
Rm
anag
EmEn
t la
dd
ER
pROJ
ECt
lad
dER
EXpE
Rt
lad
dER
lEVE
l
Technician / Commercial manager / Foreman / master Craftsman / skilled worker
Construction site manager / Commercial Construction manager / site supervisor / senior master Craftsman / Team leader / specialist
Group leader project manager Expert
Business unit manager senior project manager senior Expert
sub-division manager Top project manager Top Expert
sTRABAG sE management Board
division manager / Central division manager / Central staff division manager
nEW caREER mOdEl
37Employees
STRAbAG is offering new career opportuni-ties: the career model, developed by an in-terdisciplinary task force, gives current and future employees a more varied choice of development opportunities within the group than before.
Following initial specialist training or experience as a team leader, employees now have a total of three different career paths which they can follow: the classical management ladder, the project ladder or the expert ladder. In contrast to experts, who have usually completed high-quality specialist training and possess excellent qualifications in their field, project managers can fall back on their years of experience in the field of project management. They bear the entrepre- neurial responsibility for complex construction projects from project acquisition to the end of the warranty period.
potentiAL MAnAGeMent BoostsMotivAtion
In order to continuously increase the aptitudes and skills of our employees, we designed a process in the year under report to system-atically identify and appropriately develop high-potential employees. The aim of this programme is to place employees with the appropriate qualifications and skill in defined key positions. This not only increases the motivation of the employees involved, but also creates a stronger bond to the group. In the long-term, the programme therefore helps to secure lasting quality, continuity and performance within the group.

38
70 tRainEESat WORK
nUMBeR oF AppRentice positions in AUstRiA on tHe Rise
With regard to the lack of skilled workers, we are making great investments in the training of our apprentices and trainees1). In 2012, 90 apprentice positions were filled in Austria, and 110 new positions are available for 2013. In the past three years, we have increased the number of apprentice posi-tions in Austria from 300 to 375. On offer are professions such as bricklayer, ground- worker, concrete formwork carpenter, electrical engineer, metals construction engineer, agricultural and construction machinery technician or facilities engineer, which can be learned all over Austria. In Germany, Switzerland and Austria, a total of 476 (2011: 440) blue-collar apprentices were taken on in 2012. More information about the apprentice professions and positions offered at STRAbAG in Austria is available at lehrling.strabag.at.
In Germany, in-company training for the most important professions is supported by STRAbAG at the group training centre in bebra. In all, the centre can train up to 100 blue-collar apprentices in the most impor-tant professions. Together with the Commer-cial Training Centre (KAbZ) that was foun-ded two years ago, we have facilities with a prime location in Germany that can also be used for commercial employee training, test preparation seminars, as well as specialist and qualification training. The aim is to secure an efficient knowledge transfer under aspects of quality and time away from the daily working routine.
GRoUp AcADeMY FoR coMpAnY-speciFic tRAininG AnD eDUcAtion
The group academy offers training events that were developed especially for the company by internal and external experts to meet the specific needs of STRAbAG employ-ees. The target-group-oriented structured training provides up-to-date information in technology, law, business, IT, methodologi-cal and social competence, and intercultural issues.
Employees in Austria, Germany, Hunga-ry, Croatia, the Czech Republic, Slovakia, Poland and Russia have access via the STRAbAG Intranet to the “workshop list” of the group academy as part of the training
database and can register online for the further training events. The planning, funding and support of our employees’ personal development through training and further education is based on the results of the annual employee appraisal interview.
tRAinee pRoGRAMMe to DeveLop YoUnG tALents
The “war of talent” is one of the greatest challenges in human resource develop-ment. In view of the growing competition for potential leaders and the existing lack of skilled workers, STRAbAG is investing great amounts in recruiting and training young talents. We have introduced a trainee programme for young skilled employees and executive staff in all countries in which we or one of our subsidiaries operate, and we promote international trainee exchange.
On 31 December 2012, the STRAbAG Group had 49 technical trainees and 21 commercial trainees. The aim of their training is to identify and support young talents early on and to bind them to the company. After completing the programme, they should be in a position to more quickly assume responsibility within the group.
The trainee programme is a practical famil- iarisation programme for selected bachelor/ Master graduates from various universities. The individual duration depends on the applicant’s professional experience, pre- requisites and development. The commercial trainee programme usually lasts between eight and ten months plus three months abroad. The technical programme varies between nine and twelve months plus three months abroad. Trainees have access to an experienced mentor throughout the entire training period. The trainee schedule is designed together with the mentor or superior according to the specific profes-sional and personal requirements of the target position. With instruction from spe-cialists and management employees, the trainees pass through different organisati-onal divisions and are introduced to various areas of business and responsibility. Ap-propriate measures are used to develop the applicant’s personal and professional skills.
1) Due to the different training systems from country to country, only the situation in the core markets of Austria and Germany can be presented here.

38 39Employees
human RESOuRcE maRKEtinGOnly with a positive image and as an at-tractive employer will the group be able to cover the strongly growing demand for qualified skilled workers and management employees. In the year under report, we therefore began to standardise our human resource marketing in the different countries where we do business and have defined a person responsible for this process. We also launched a project to strengthen the employer brand and will begin to implement the identified measures in 2013.
As apprentices/trainees and graduates from vocational schools and universities form the basis for the next generation of skilled workers and management employees, the focus of our human resource marketing is on selected educational facilities. besides advertising in the relevant print and online media, STRAbAG takes part in numerous university and recruitment fairs, organises company tours, offers internships and work placement, and sponsors bachelor and master theses.
OccupatiOnal hEalth and SafEtYWe have launched a number of initiatives in recent years to help maintain and promote the long-term health of our employees. One third of our entities in Germany, for exam-ple, have a certified occupational health and safety management system such as SCC or bS OHSAS in place. Additionally, all group divisions work in compliance with the relevant requirements so that success- ful certification requires only minimal adjust-ment. This helps to guarantee a uniform high standard of safety within the group.
The accident rate – calculated as the ratio of accident days to working days – was 0.5 % in the group, with 0.9 % among blue- collar and 0.1 % among white-collar work- ers (2011: 0.6 % in the group, 1.0 % among blue-collar and 0.2 % among white-collar).
The subject of safety is also an important factor with acquisitions. We set first mea- sures already during the integration of new companies into the group – after all, rapid imple- mentation of the appropriate health and safe- ty measures is the first step in accident pre- vention. This helps our companies find their way around in the STRAbAG world and makes possible the exchange of health and safety information across business segments.
Individual measures at the workplace include special training conducted ahead of the construction activity as well as ongoing safety and medical inspections in which employees receive instructions and are sensitised to issues of occupational health and safety. Managers and site supervisors are called upon to pass on the acquired knowledge to their employees and to instil in them the motivation for safe and responsible action.
The detailed analysis of past incidents formed the basis for the development of a package of measures to reduce the number of occupational accidents. The focus was on the following topics: hearing exams; proper lifting and carrying; proper use and handling of scaffolding, ladders and formwork; and general cleanliness on the construction site, which contributes its share to occupational health and safety.
stRABAG HeALtH AnD sAFetY eXpeRts MonitoR AnD ADvise
The group’s occupational health and safety activities are designed by internal health and safety experts who advise the management in this regard and monitor implementation on the construction site and at the workplace. The tasks of the central and regional health and safety committees include the mutual exchange of information and experience; the improvement of health, safety and working conditions; the counselling in all matters of occupational health and safety; the promotion of internal cooper-ation; and the drafting of principles for the further development of occupation-al health and safety activities within the company. Around 150 health and safety experts across the group are currently engaged in the implementation of these activities.

40
occUpAtionAL pHYsiciAns HeLp toReDUce iLLness ABsenteeisM
Absenteeism due to illness – calculated as the ratio of sick leave days to working days – stood at 4.5 % in the group in 2012, with 5.9 % among blue-collar and 3.1 % among white-collar workers (2011: 4.5 % in the group, 5.6 % among blue-collar, 3.2 % among white-collar). To reduce this rate as much as possible, we are working together with a team of occupational physicians who conduct vaccination campaigns (TbE, teta-nus, hepatitis, influenza, travel vaccinations, etc.), check-ups and follow-ups (hearing and vision tests, pulmonary function, etc.) as well as spinal screenings. Employees are also given the possibility of eye, stress and preventive examinations.
BURnoUt pRevention: sensitisA-tion AnD step-BY-step pLAn
In recent years, STRAbAG has developed numerous initiatives on the topic of burnout in order to adequately assist employees in this difficult situation. Examples include a step-by-step plan for dealing with burnout as well as informational events on burnout to sensitise employees to the subject. Together with an occupational psychologist, we are planning to implement a burnout prevention campaign over the next few years to help employees recognise excess stress and take the proper corrective measures early on.
stRABAG eMpLoYMent AnD sociAL FUnD HeLps eMpLoYees in neeD
In order to help employees who are expe-riencing financial difficulties through no fault of their own, e.g. as a result of accidents, illness, natural disasters, etc., the STRAbAG Group set up a private foundation called the “Arbeits- und Sozialfonds” (Employment and Social Fund). When it was established, the foundation was endowed with € 3 milli-on, an amount that was raised to € 10 milli-on by 2012 in response to the rising number of employees. The application for financial assistance can be submitted by the affected employees, by their supervisors or by an employee representative.
Applications are reviewed by the foun-dation’s board before a socially appropriate decision is made. The board is chaired by an employee representative and consists of four employer and four employee repre-sentatives. Financial assistance is granted primarily in the form of monthly payments for an employee’s dependent children, but may also take the form of one-off payments for a specific purpose.
hEalthcaRE
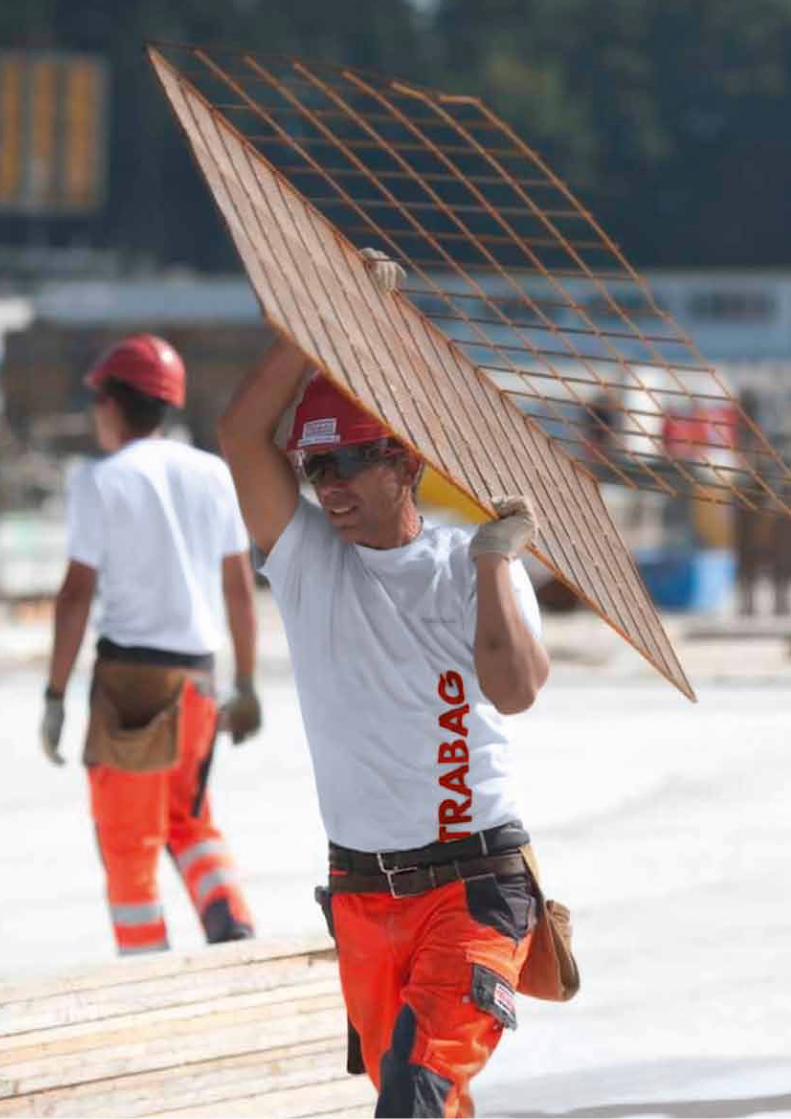
40


WHAT UNITES USOver 100 organisational units and more than 250 locations in Germany, Hungary and Switzerland have so far been visited by the STRABAG 2013ff task force led by Fritz Oberlerchner. In talks with 170 managers, the task force has been searching for what unites the group – like this bridge between Switzerland and Austria.
STRATEGY
Kapiteltrenner_rechts_E.indd 1 22.04.13 15:42
CORPORATE GOVERNANCE
COME HAVE A CLOSER LOOKEleven supervisory board members came to-gether for five supervisory board meetings and six committee meetings in 2012. Find out what they discussed, who earns what and why the members of the management and supervisory boards are qualified to assume this responsibility in our ex-tensive corporate governance report and of course online at www.strabag.com > Investor Relations > Corporate Governance.
Kapiteltrenner_rechts_E.indd 5 22.04.13 15:45
COR
POR
ATE
GOV
ERN
ANCE
MORE ABOUT REGISTERED SHARES: “DISCLOSURES PURSUANT TO SECTION
243A PARA 1 UGB” IN THE MANAGEMENT REPORT
The Austrian Code of Corporate Gover-nance, in line with international standards, represents a body of rules for good and responsible corporate governance and supervision on the Austrian capital market. The Code, introduced in 2002, aims to establish a responsible system of manage-ment and supervision of companies that is geared toward creating sustainable, long-term value. The Code is designed to provide a high degree of transparency for all company stakeholders. For this reason, investors and issuers recognise the Code as an indispensable part of the Austrian system of corporate governance and of Austrian business life.
The versions of the Code that were valid for the 2012 financial year are the January 2012 and July 2012 versions – these are available at the website of the Austrian Working Group for Corporate Governance (www.corporate-governance.at) and at the website of STRABAG SE (www.strabag.com > Investor Relations > Corporate Gover-nance > Code of Corporate Governance).
STRABAG SE is fully and without exception committed to the Austrian Code of Cor-porate Governance and its aims and sees compliance with all the rules contained within the Code as a top priority. This commitment by STRABAG SE is voluntary and aims to boost shareholder confidence and to constantly optimise the group’s high internal legal, behavioural and ethical standards. STRABAG SE is further obliga-ted to fulfil the standards of the Code due to the listing of its shares in the Prime Market segment of the Vienna Stock Exchange.
This commitment requires STRABAG SE to do more than merely comply with the pre-vailing laws and legislation. Voluntary self-imposed obligation means that STRABAG SE must explain non-compliance with the so-called C-rules (“comply or explain”) which go beyond the legal requirements.
In line with this part of the Austrian Code of Corporate Governance, STRABAG SE ex-plains its non-compliance with C-Rules 2, 27 and 27a of the Code:
C-Rule 2 of the Code: Among the shares of STRABAG SE are two special registered shares with an associated right to nominate one member of the supervisory board each; this is advantageous for STRABAG SE because it guarantees the know-how of important stakeholders on the supervisory board.
C-Rule 27 of the Code: It is a matter of concern for STRABAG SE that remu- neration of the management board members be made according to measurable criteria in a way that is transparent and easily comprehensible. The remuneration of the management board is therefore based on the scope of the work, the responsibilities and the personal performance of the individual management board member as well as on the achievement of the corporate goal, the size and the economic situation of the company. Non-financial criteria are not applied for the remuneration as these do not guarantee a transparent and easily compre-hensible remuneration within the business activities of STRABAG SE.
C-Rule 27a of the Code: The previous clause in the management contracts re-garding severance payments in the case of premature termination has proved its worth, so that STRABAG SE sees no reason for changes or amendments in this regard. In the case of premature termination of a ma- nagement contract without material breach, the management board member’s claim to the annual fixed portion remains – but not for the performance-based variable portion – for the remaining term of the contract. No severance payment is made in the case of premature termination of a management contract for a material reason for which a management board member is responsible.
CORPORATE GOVERNANCE
n COMMITTED TO THE AUSTRIAN CODE OF CORPORATE GOVERNANCE
n NOTES ON COMPOSITION AND WORKING METHODS OF THE MANAGEMENT BOARD AND OF THE SUPERVISORY BOARD AND ITS COMMITTEES
n REMUNERATION REPORT
COMMITMENT TO THE AUSTRIAN CODE OF CORPORATE GOVERNANCE
ECOLOGICAL RESPONSIBILITY
ECONOMIC RESPONSIBILITY
VALUES AND COMPLIANCE
CORPORATE CITIZENSHIP
MISSION AND VISION
EMPLOYEES AND WORKPLACE
46
Kapiteltrenner_rechts_E.indd 6 22.04.13 15:46

4646
mORE aBOut REGiStEREd ShaRES: “diSclOSuRES puRSuant tO SEctiOn
243a paRa 1 uGB” in thE manaGEmEnt REpORt
The Austrian Code of Corporate Gover-nance, in line with international standards, represents a body of rules for good and responsible corporate governance and supervision on the Austrian capital market. The Code, introduced in 2002, aims to establish a responsible system of manage-ment and supervision of companies that is geared toward creating sustainable, long-term value. The Code is designed to provide a high degree of transparency for all company stakeholders. For this reason, investors and issuers recognise the Code as an indispensable part of the Austrian system of corporate governance and of Austrian business life.
The versions of the Code that were valid for the 2012 financial year are the January 2012 and July 2012 versions – these are available at the website of the Austrian Working Group for Corporate Governance (www.corporate-governance.at) and at the website of STRAbAG SE (www.strabag.com > Investor Relations > Corporate Gover-nance > Code of Corporate Governance).
STRAbAG SE is fully and without exception committed to the Austrian Code of Cor-porate Governance and its aims and sees compliance with all the rules contained within the Code as a top priority. This commitment by STRAbAG SE is voluntary and aims to boost shareholder confidence and to constantly optimise the group’s high internal legal, behavioural and ethical standards. STRAbAG SE is further obliga-ted to fulfil the standards of the Code due to the listing of its shares in the Prime Market segment of the Vienna Stock Exchange.
This commitment requires STRAbAG SE to do more than merely comply with the pre-vailing laws and legislation. Voluntary self-imposed obligation means that STRAbAG SE must explain non-compliance with the so-called C-rules (“comply or explain”) which go beyond the legal requirements.
In line with this part of the Austrian Code of Corporate Governance, STRAbAG SE ex-plains its non-compliance with C-Rules 2, 27 and 27a of the Code:
C-Rule 2 of the Code: Among the shares of STRAbAG SE are two special registered shares with an associated right to nominate one member of the supervisory board each; this is advantageous for STRAbAG SE because it guarantees the know-how of important stakeholders on the supervisory board.
C-Rule 27 of the Code: It is a matter of concern for STRAbAG SE that remu- neration of the management board members be made according to measurable criteria in a way that is transparent and easily comprehensible. The remuneration of the management board is therefore based on the scope of the work, the responsibilities and the personal performance of the individual management board member as well as on the achievement of the corporate goal, the size and the economic situation of the company. Non-financial criteria are not applied for the remuneration as these do not guarantee a transparent and easily compre-hensible remuneration within the business activities of STRAbAG SE.
C-Rule 27a of the Code: The previous clause in the management contracts re-garding severance payments in the case of premature termination has proved its worth, so that STRAbAG SE sees no reason for changes or amendments in this regard. In the case of premature termination of a ma- nagement contract without material breach, the management board member’s claim to the annual fixed portion remains – but not for the performance-based variable portion – for the remaining term of the contract. No severance payment is made in the case of premature termination of a management contract for a material reason for which a management board member is responsible.
coRpoRAte GoveRnAnce
n cOmmittEd tO thE auStRian cOdE Of cORpORatE GOVERnancE
n nOtES On cOmpOSitiOn and WORKinG mEthOdS Of thE manaGEmEnt BOaRd and Of thE SupERViSORY BOaRd and itS cOmmittEES
n REmunERatiOn REpORt
cOmmitmEnt tO thE auStRian cOdE Of cORpORatE GOVERnancE
ECOLOGICAL RESPONSIBILITY
ECONOMIC RESPONSIBILITY
VALUES AND COMPLIANCE
CORPORATE CITIZENSHIP
MISSION AND VISION
EMPLOYEES AND WORKPLACE
47Corporate governance
STRAbAG SE further endeavours to abide not only by the minimum requirements
but also by all of the Code’s R-rules (Re- commendations).
nOtES On thE cOmpOSitiOn and WORKinG mEthOdS Of thE manaGEmEnt BOaRd and Of thE SupERViSORY BOaRd and itS cOmmittEESwoRKinG MetHoDs oF tHe MAnAGeMent BoARD AnD oF tHe sUpeRvisoRY BoARD
The management and supervisory boards of STRAbAG SE are fully committed to the objectives of the Austrian Code of Corporate Governance as amended in July 2012 (as they were to the January 2012 version) and see compliance with all the rules contained within the Code as a main obligation and duty. This means that STRAbAG SE is constantly working to maintain and op-timise its high internal legal, behavioural and ethical standards. In line with the rules of the Code, the management and super- visory boards of STRAbAG SE work together on the basis of
n regular and extensive informing of the supervisory board by the management board as to all relevant matters concerning the development of the company’s business, including the risk situation and risk management in the company and the important group entities;
n the regular exchange of information and opinions between the CEO and the chair- man of the supervisory board concerning strategy, the development of the business, risk management and important business transactions, particularly acquisitions and disposals, and the immediate informing of the chairman of the supervisory board of any important information; as well as
n an open exchange of opinion and open dialogue among the members of the supervisory board as well as between the members of the supervisory board and the management board.
The management board of STRAbAG SE and the individual members of the ma-nagement board conduct their business in accordance with the prevailing law and legislation, the articles of association, and the management board’s rules of procedure as approved by the supervisory board. The
rules of procedure govern the work of the individual members of the management board as well as the allocation of duties within the board. Coordination within the management board occurs during regular meetings, which are held approximately every two weeks, but also in the form of an informal exchange of information. Matters discussed at the management meetings include the current operations and the company strategy. Also discussed are any current or outstanding measures to be im-plemented by the relevant management board members. The rules of procedure require the management board or the in-dividual management board members to provide extensive information and report-ing to the supervisory board and define an extensive catalogue of measures and legal transactions which require approval by the supervisory board.
Information regarding the supervisory board and its committees, their decision-making rights as well as a report on their activity can be found starting on page 6 of this report.

tHe coMposition oF tHe MAnAGeMent BoARDMembers of the management board
dR. hanS pEtER haSElStEinERCEOResponsibilities for Central staff units,Central divisions Zentrale Technik,BRvZ, BmTi, TpA and Bpm (from1 july 2012 jointly with Thomas Birtel) Technical Responsibilities for divisions 3l RAnC1) and 3m RAnC(until 30 june 2012)
Hans Peter Haselsteiner was born on 1 February 1944. He received his doctorate degree from the Vienna University of Economics and busi-ness in 1970 and began working for an auditing and tax consultancy firm in Vienna. Hans Peter Haselsteiner joined the group as supervisory board member of ILbAU AG in 1972 and has held the position of CEO of the respective group parent company since 1974. From 1994 to 1998, he served as a member of the Austrian parliament and vice chair- person of the Liberal Forum. Due to his parliamentary mandate, he was on leave from the group during this time. His term expires on 31 December 2015.
maG. chRiStian haRdERCFO (from 1 january 2013)
Christian Harder was born on 19 August 1968. He passed his school-leaving ex-ams at bundesgymnasium Spittal/Drau and completed his studies in Applied business Administration at the University Klagenfurt with a focus on Controlling and Tax Management before joining the STRAbAG Group, or rather the bau-holding Group, in 1994. He held the positions of Director of Accounting, Head of Financial Accounting and, finally, Central Division Director of bRVZ before being appointed Managing Direc- tor of bRVZ in 2008. Christian Harder has been a member of the management board of STRAbAG SE since 2013 in the function as CFO. His term ends on 31 December 2014.
1) RANC = Russia and neighbouring countries 2) North + West: Germany, Poland, benelux, Scandinavia, Ground Engineering, Hydraulic Engineering, Offshore Wind3) International + Special Divisions: Tunnelling, Construction Materials, Services, Real Estate Development, Infrastructure Development4) South + East: Austria, Switzerland, Hungary, Czech Republic, Slovakia, Adriatic, Rest of Europe, Railway Structures
dR. thOmaS BiRtEldeputy CEO (from 14 december 2012) Commercial Responsibilities for Building Construction & Civil Engineering (until 30 june 2012) Responsibilities for Central staff units,Central divisions Zentrale Technik,BRvZ, BmTi, TpA and Bpm (fromjuly 2012 jointly with hans peter haselsteiner) Responsibilities for divisions3l RAnC1) and 3m RAnC (from 1 july 2012)
Thomas birtel was born on 3 June 1954. He graduated with a degree in econom-ics from the Ruhr-University bochum in 1978 and completed his doctorate there four years later. Thomas birtel began his career in 1983 at Klöckner & Co. The last position he held there before leaving in 1989 was division manager of the accounting department of Klöckner Industrie-Anlagen GmbH. From 1989 to 1996, he worked for Sweden’s Frigoscandia Group as head of the Central European region. Thomas birtel joined the STRAbAG Group in 1996 as a member of the manage-ment board of STRAbAG Hoch- + In-genieurbau AG. In 2002, he was ap-pointed member of the management board of STRAbAG AG, Cologne, re-sponsible for building construction, finance, accounting, controlling, risk management and procurement. Thomas birtel has also been a member of the group management board since 2006. His term ends on 31 December 2014.

di dR. pEtER KRammERTechnical Responsibilities forBuilding Construction & Civil Engineering except divisions 3l RAnC and 3m RAnC (until 30 june 2012) Responsibilities for Region north + west2) (from 1 july 2012)
Peter Krammer was born on 18 January 1966. He studied civ-il engineering at the Technical University in Vienna, completing his studies in 1995 with a doctorate degree in engineering sciences. His professional experience has includ-ed positions at Porr Technobau AG, Swietelsky bau GesmbH and STRAbAG AG Austria. In 2005, Mr. Krammer joined the manage-ment board of STRAbAG AG in charge of building construction and civil engineering in Eastern Europe and of environmental tech-nology for the entire company. Peter Krammer has been a member of the group management board since 2010. His term ends on 31 December 2014.
maG. hannES tRuntSchniGCommercial Responsibilities forspecial divisions & Concessions(until 30 june 2012) Commercial Responsibilities forTransportation infrastructures (until 30 june 2012) Responsibilities for Region international + special divisions3) (from 1 july 2012)
Hannes Truntschnig was born on 22 July 1956. He graduated from the Higher Technical Institute HTL Mödling specialised in electrical engineering and in 1978 completed his qualifications in electromechanical engineering before going on to study at the Karl Franzens University Graz, eventually graduating with a degree in business administra- tion in 1981. Hannes Truntschnig joined the STRAbAG Group (ILbAU AG) in 1981. Since 1985, he has held several management positions at various group companies. In 1992, he was appointed authorised signatory for bau Holding Aktiengesellschaft. Hannes Truntschnig has been a member of the group management board since 1995. His term ends on 31 December 2014.
di SiEGfRiEd WanKERTechnical Responsibilities for special divisions & Concessions (until 30 june 2012) Responsibilities for Region south + East4) except divisions3l RAnC1) and 3m RAnC (from 1 july2012)
Siegfried Wanker, born on 5 May 1968, studied civil engineering at Graz University of Technology before join-ing the STRAbAG Group as a site manager in 1994. between 2001 and 2004, he held various management-level positions at engineering ser-vice providers before rejoining the STRAbAG Group in 2005. He served as technical division manager for building Construction International, Corporate Development and Services, and finally for Infrastructure Project Development. Siegfried Wanker has been a member of the management board of STRAbAG SE since 2011. His term ends on 31 December 2014.
50
nAmE nOn-GROup COmpAny mAndATE
dr. hans peter haselsteiner CONCORDIA Sozialprojekte Gemeinnützige Privatstiftung Chairman of the Management boardRail Holding AG Vice Chairman of the Supervisory boardSEMPER CONSTANTIAPRIVATbANK AG Member of the Supervisory board Tiroler Festspiele Erl betriebsges.m.b.H Chairman of the Supervisory boardVinziRast Gemeinnützige Privatstiftung Vice Chairman of the Management board
ing. Fritz Oberlerchner Andritz AG Member of the Supervisory boarddr. Thomas Birtel Deutsche bank AG, Germany Member of the Advisory board
HDI-Gerling Industrie Versicherung AG, Germany Member of the Advisory boardVHV Allgemeine Versicherung AG, Germany Member of the Supervisory board
mag. hannes Truntschnig Raiffeisen evolution project development GmbH Vice Chairman of the Advisory boardSyrena Immobilien Holding AG Vice Chairman of the Supervisory board
di siegfried wanker Syrena Immobilien Holding AG Member of the Supervisory board
mandates
In the 2012 financial year, the following management board members held supervisory
board mandates or similar functions at companies not included in the consolidated financial statements in Austria and abroad:
directors’ dealings
Proprietary transactions with STRAbAG SE shares by members of the company’s boards and related persons or companies as well as by other management-level employees with group-wide responsibilities, the so-called Directors’ Dealings, are reported as required by law and continually posted on the web-site of STRAbAG SE (www.strabag.com > In-vestor Relations > Corporate Governance > Directors’ Dealings) as well as on the web-site of the Austrian Financial Market Authority (www.fma.gv.at > Companies > Issuers > Directors‘ Dealings (German only)).
In 2012, the following proprietary transactions with STRAbAG SE shares were made by mem-bers of the aforementioned group of people:
n Haselsteiner Familien-Privatstiftung (management: Dr. Hans Peter Haselsteiner): sale of 342,857 shares at a subscription price of € 19.25 per share on 16 July 2012
n Dr. Alfred Gusenbauer: sale of 70 shares on 3 August 2012 at a price of € 18.00 per share
The following persons from the afore- mentioned group of people held shares of STRAbAG SE on 31 December 2012:
pERsOn suBjECT TO disClOsuRE OBliGATiOn BOARd mEmBER numBER OF shAREs
Dr. Hans Peter Haselsteiner 70,002
Haselsteiner Familien-Privatstiftung Dr. Hans Peter Haselsteiner 32,891,737
Ing. Fritz Oberlerchner 4,070
Maria Oberlerchner Ing. Fritz Oberlerchner 70
Mag. Erwin Hameseder 210
inG. fRitZ OBERlERchnERdeputy CEO (until 30 june 2012) Technical Responsibilities for Transpor- tation infrastructures (until 30 june 2012)
Fritz Oberlerchner was born on 16 June 1948 and graduated from the HTL Villach poly- technic institute in 1968 as a certified engi- neer in building construction. He began his professional career as a construction engineer at a small building firm, joining the STRAbAG
Group (ASPHALTbAU Ges.m.b.H.) in 1971. In 1978, he was made authorised signatory (Prokurist) for Asphalt & beton bauges.m.b.H. and eleven years later became managing director of Magyar Aszfalt Kft, budapest. Fritz Oberlerchner was a member of the management board from 1994 and depu-ty CEO from 2003. From 1998 to 2002, he served as management board member of STRAbAG AG, Cologne. He left the manage-ment board on 30 June 2012.
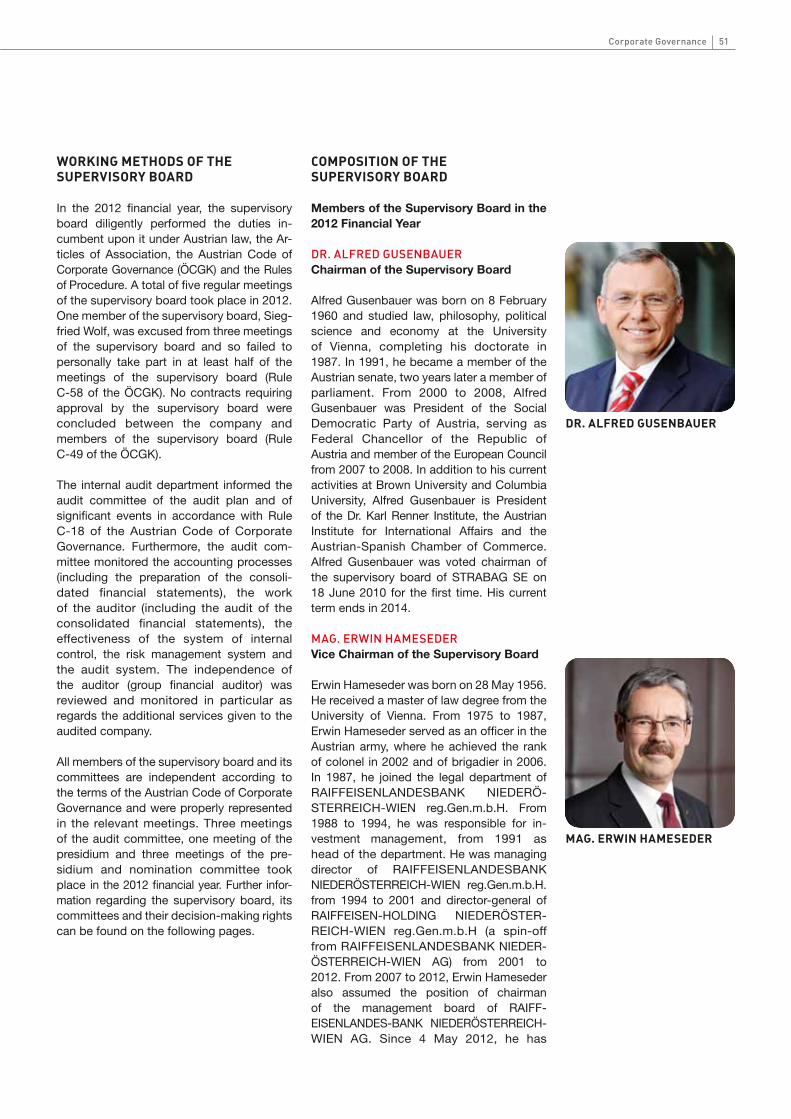
50 51Corporate governance
woRKinG MetHoDs oF tHe sUpeRvisoRY BoARD
In the 2012 financial year, the supervisory board diligently performed the duties in-cumbent upon it under Austrian law, the Ar-ticles of Association, the Austrian Code of Corporate Governance (ÖCGK) and the Rules of Procedure. A total of five regular meetings of the supervisory board took place in 2012. One member of the supervisory board, Sieg-fried Wolf, was excused from three meetings of the supervisory board and so failed to personally take part in at least half of the meetings of the supervisory board (Rule C-58 of the ÖCGK). No contracts requiring approval by the supervisory board were concluded between the company and members of the supervisory board (Rule C-49 of the ÖCGK).
The internal audit department informed the audit committee of the audit plan and of significant events in accordance with Rule C-18 of the Austrian Code of Corporate Governance. Furthermore, the audit com-mittee monitored the accounting processes (including the preparation of the consoli- dated financial statements), the work of the auditor (including the audit of the consolidated financial statements), the effectiveness of the system of internal control, the risk management system and the audit system. The independence of the auditor (group financial auditor) was reviewed and monitored in particular as regards the additional services given to the audited company.
All members of the supervisory board and its committees are independent according to the terms of the Austrian Code of Corporate Governance and were properly represented in the relevant meetings. Three meetings of the audit committee, one meeting of the presidium and three meetings of the pre-sidium and nomination committee took place in the 2012 financial year. Further infor- mation regarding the supervisory board, its committees and their decision-making rights can be found on the following pages.
coMposition oF tHe sUpeRvisoRY BoARD
members of the supervisory Board in the 2012 Financial year
dR. alfREd GuSEnBauERChairman of the supervisory Board
Alfred Gusenbauer was born on 8 February 1960 and studied law, philosophy, political science and economy at the University of Vienna, completing his doctorate in 1987. In 1991, he became a member of the Austrian senate, two years later a member of parliament. From 2000 to 2008, Alfred Gusenbauer was President of the Social Democratic Party of Austria, serving as Federal Chancellor of the Republic of Austria and member of the European Council from 2007 to 2008. In addition to his current activities at brown University and Columbia University, Alfred Gusenbauer is President of the Dr. Karl Renner Institute, the Austrian Institute for International Affairs and the Austrian-Spanish Chamber of Commerce. Alfred Gusenbauer was voted chairman of the supervisory board of STRAbAG SE on 18 June 2010 for the first time. His current term ends in 2014.
maG. ERWin hamESEdERvice Chairman of the supervisory Board
Erwin Hameseder was born on 28 May 1956. He received a master of law degree from the University of Vienna. From 1975 to 1987, Erwin Hameseder served as an officer in the Austrian army, where he achieved the rank of colonel in 2002 and of brigadier in 2006. In 1987, he joined the legal department of RAIFFEISENLANDESbANK NIEDERÖ-STERREICH-WIEN reg.Gen.m.b.H. From 1988 to 1994, he was responsible for in-vestment management, from 1991 as head of the department. He was managing director of RAIFFEISENLANDESbANK NIEDERÖSTERREICH-WIEN reg.Gen.m.b.H. from 1994 to 2001 and director-general of RAIFFEISEN-HOLDING NIEDERÖSTER- REICH-WIEN reg.Gen.m.b.H (a spin-off from RAIFFEISENLANDESbANK NIEDER- ÖSTERREICH-WIEN AG) from 2001 to 2012. From 2007 to 2012, Erwin Hameseder also assumed the position of chairman of the management board of RAIFF- EISENLANDES-bANK NIEDERÖSTERREICH- WIEN AG. Since 4 May 2012, he has
DR. ALFReD GUsenBAUeR
MAG. eRwin HAMeseDeR

52
been chairman of RAIFFEISEN-HOLDING NIEDERÖSTERREICH-WIEN reg.Gen.m.b.H. He was nominated to the current super- visory board for an indefinite period of time on 17 August 2007 and has been a member of the supervisory board of STRAbAG SE and its predecessor companies since 1998.
maG. KERStin GElBmannFree Float Representative
Kerstin Gelbmann was born on 30 May 1974. After completing her studies in trade and commerce in Vienna, she began her career at Auditor Wirtschaftsprüfungs- und Steuerberatungsgesellschaft mbH. Kerstin Gelbmann has been co-managing director of E.F. Grossnigg Finanzberatung und Treu-handelsgesellschaft m.b.H. since 2002 and of Grosso Holding Gesellschaft mbH since 2007. In January 2010, she assumed the additional position of co-managing director at Austro Holding GmbH. Kerstin Gelbmann was voted into the supervisory board of STRAbAG SE on 18 June 2010. Her current term ends in 2014.
andREi ElinSOn
Andrei Elinson was born on 19 January 1979. He has been Deputy CEO of Russian conglomerate basic Element since December 2009. Previously, he was basic Element’s director of corporate governance and internal control, responsible for the development and implementation of cor- porate governance standards. before joining basic Element, he was a partner at Deloitte & Touche CIS, where, starting in 1997, he was in charge of consulting and assurance projects for Russian and inter- national companies. Later he was appointed partner-in-charge for Forensic and Dispute services in the CIS. From 2004, Andrei Elinson managed the internal control and risk management consulting streams at Deloitte. He graduated from the Finance Academy of the Government of the Russian Federation with a degree in accountancy and audit. He is a certified public accountant and fraud examiner in the US, a licensed Russian auditor and holds a Certificate in Company Direction from the Institute of Directors (IoD) in the UK. Andrei Elinson was appointed to the supervisory board of STRAbAG SE for an indefinite period of time on 21 April 2009.
dR. GOttfRiEd WanitSchEK
Gottfried Wanitschek was born on 14 May 1955. He studied law at the University of Vienna and at the University of Salzburg. After receiving his doctorate degree in 1979, he performed his mandatory year of court training. From 1980 to 1984, he worked at the Austrian Association of Insurance Companies. From 1984 to 1990, Gottfried Wanitschek was secretary-general of Raiffeisen Versicherung AG and managing director of various group companies. From 1991 to 1993, he was a member of the management board of Leipnik-Lundenburger Invest beteiligungs AG. From 1993 to 1997, Gottfried Wanitschek was managing director of the KURIER group and several sub- sidiaries of the group. In 1997, he joined bARC Versicherungs-Holding AG, where he was a member of the management board until 1999. From 1999 to 2012, Gottfried Wanitschek was a member of the manage-ment board of UNIQA Versicherungen AG. Gottfried Wanitschek was appointed to the current supervisory board of STRAbAG SE on 18 June 2010. His term ends in 2014. He has been a member of the supervisory board of STRAbAG SE and its predecessor companies since 1998.
inG. SiEGfRiEd WOlf
Siegfried Wolf was born on 31 October 1957. He started his career with Philips in Vienna, where he trained as a tool and die-maker and continued his professional training through the stages of master crafts-man up to obtaining an engineering degree. From 1981 to 1983, he worked as quality manager and assistant director of quality control at VMW (Vereinigte Metallwerke Wien). Siegfried Wolf then joined Hirtenberger AG, where he advanced from director for quality control to plant director and authorised signatory. In 1994, he joined Magna Europa AG, becoming president of the company in 1995. In 1999, he became vice chairman of the supervisory board of Magna International Inc. He held this position until 2001, when he was appointed president and CEO of Magna Steyr. In February 2002, he was appointed executive vice chairman of Magna International Inc. and remained in this position until his nomination to co-CEO in April 2005; he exercised this function until 2010.
MAG. KeRstin GeLBMAnn
AnDRei eLinson
DR. GottFRieD wAnitscHeK
inG. sieGFRieD woLF

52 53Corporate governance
Siegfried Wolf has also been chairman of the supervisory board of GAZ Group since April 2010 and chairman of the super- visory board of Russian Machines JSC, Glavstroy Corporation LLC and Transstroy Engineering & Construction Company Ltd. since September 2010. Siegfried Wolf was first voted into the supervisory board of STRAbAG SE on 17 August 2007. His term was extended on 18 June 2010 and ends in 2014.
di andREaS BatKE
Andreas batke was born on 4 May 1962 and joined STRAbAG AG as a land surveyor on 1 April 1991. He has been a member of the works council since May 1998. Andreas batke currently serves as chairman of the segment works council for Transportation Infrastructures, chairman of the group works council and vice-chairman of the super- visory board of STRAbAG AG, Cologne. He was appointed to the supervisory board of STRAbAG SE by the STRAbAG SE works council and has been a member of the STRAbAG SE supervisory board since November 2009.
miROSlaV cERVEnY
Miroslav Cerveny was born on 16 Janu-ary 1959 and has worked for a Czech sub- sidiary of the STRAbAG Group since 1988, holding positions in IT administration, accounting, and occupational health and safety. He was appointed to the supervisory board of STRAbAG SE by the STRAbAG SE works council and has been a member of the supervisory board since November 2009.
maGdOlna p. GYulainé
Magdolna P. Gyulainé was born on 26 July 1962. She is chairwoman of the works council of STRAbAG Hungary, having joined a predecessor company of STRAbAG Hungary as bookkeeper in 1983. She was appointed to the supervisory board of STRAbAG SE by the STRAbAG SE works council in November 2009.
WOlfGanG KREiS
Wolfgang Kreis, an industrial clerk by training, was born on 18 March 1957. He joined Ed. Züblin AG as a commercial clerk
in 1979. In 1987, he was elected to the works council and today is works council chairman for the sub-division Karlsruhe and chairman of the works council at Ed. Züblin AG. He has been vice-chairman of the supervisory board of Ed. Züblin AG since 2002. He was appointed to the supervisory board of STRAbAG SE by the STRAbAG SE works council in November 2009. He also deals with the issue of occupational health and safety at the company.
GERhaRd SpRinGER
Gerhard Springer was born on 26 March 1952. He trained as construction foreman and attended the “social academy” of the Austrian Chamber of Labour before joining the STRAbAG Group in 1977. From 1977 to 1983, he worked as construction foreman, deputy foreman and employee represen-tative. He has been a full-time employee representative since April 1983. Gerhard Springer was appointed to the supervisory board of STRAbAG SE as an employee representative and has been a member of the supervisory board of STRAbAG SE and its predecessor companies since 1995.
Di AnDReAs BAtKe
MiRosLAv ceRvenY
MAGDoLnA p. GYULAiné
woLFGAnG KReisGeRHARD spRinGeR

54
mandates
In the 2012 financial year, the following super- visory board members held supervisory
board mandates or similar functions at publicly listed companies in Austria and abroad in addition to their supervisory board mandate at STRAbAG SE:
nAmE nOn-GROup COmpAny mAndATE
dr. Alfred Gusenbauer Gabriel Resources Ltd., Canada Member of the Supervisory board
mag. Erwin hameseder AGRANA beteiligungs-AG, Austria Vice Chairman of the Supervisory board
Flughafen Wien AG, Austria Chairman of the Supervisory board
Raiffeisen bank International AG, Austria Vice Chairman of the Supervisory board
Südzucker AG, Germany Member of the Supervisory board
UNIQA Versicherungen AG, Austria Member of the Supervisory board
mag. Kerstin Gelbmann conwert Immobilien Invest SE, Austria Member of the Administrative board
ECO business-Immobilien AG, AustriaMember of the Supervisory board (since 14 July 2012)
Andrei Elinson GAZ Group, Russia Member of the Supervisory board
Ingosstrakh, Russia Member of the Supervisory board
ing. siegfried wolf GAZ Group, Russia Chairman of the Supervisory board
VERbUND AG, Austria Member of the Supervisory board
Continental AG, Germany Member of the Supervisory board
di Andreas Batke STRAbAG AG, Cologne, Germany Vice Chairman of the Supervisory board
COmmiTTEE mEmBERs
presidium n Dr. Alfred Gusenbauer (Chairman)n Mag. Erwin Hameseder (Vice Chairman)n Andrei Elinson
The presidium deals with all matters affecting the relations between the company and the members of the management board, especially matters relating to the remuneration of management board members, but excluding decisions regarding the appointment or removal of a management board member or regarding the granting of stock options.
presidium and nomination Committee
n Dr. Alfred Gusenbauer (Chairman)n Mag. Erwin Hameseder (Vice Chairman)n Andrei Elinsonn Wolfgang Kreisn Gerhard Springer
The presidium and nomination committee presents the supervisory board with proposals regarding the filling of new management board mandates or positions which are opening up, deals with questions of succession planning and remuneration policy and makes decisions on urgent matters.
Audit Committee n Dr. Alfred Gusenbauer (Chairman)n Mag. Erwin Hamesedern Andrei Elinsonn Dr. Gottfried Wanitschekn DI Andreas batken Wolfgang Kreisn Gerhard Springer
The audit committee is responsible for the auditing and preparation for the approval of the annual financial report, the proposed distribution of profits and the management report, as well as the auditing of the consolidated financial statements and the corporate governance report. The committee also deals with the management letter written by the financial auditor as well as with the auditor’s report as to the efficiency of the risk management. The audit committee makes a proposal for the selection of the auditor and presents the proposal of the supervisory board to the Annual General Meeting for voting. In line with Rule 81a of the ÖCGK, the audit committee must also establish a mutual line of communication with the financial auditor in a meeting.
Committees

54 55Corporate governance
independence of the members of the supervisory Board
All members of the supervisory board and its committees are independent in accordance with the conditions contained within the Austrian Code of Corporate Governance, (see also www.strabag.com > Investor Relations > Corporate Governance > Supervisory board > Independence of the Supervisory board) and have declared in writing explicitly to adhere to all conditions of the Austrian Code of Corporate Governance. The independence of the supervisory board members is defined by the following guidelines (excerpt from the Rules of Procedure for the Supervisory board as amended on 23 April 2012):
Guidelines for the Independence of Super- visory board Members of STRAbAG SE (“the company”) in Accordance with Rule 53 of the Code
A member of the supervisory board of the company shall be deemed independent if he or she has no business or personal relations with the company or its management board which would constitute a material conflict of interest and thus could influence the member’s behaviour.
Moreover, the members of the supervisory board shall comply with the following guidelines adapted from the Code:
n The supervisory board member shall not have served as a member of the manage- ment board or as a manager of the company or one of its subsidiaries in the past five years.
n The supervisory board member shall not maintain or have maintained in the past year any business relations with the com- pany or one of its subsidiaries to an extent of significance for the supervisory board member. This shall also apply to relationships with companies in which the supervisory board member has a consider- able economic interest. The approval of individual transactions by the supervisory board according to Rule 48 does not auto- matically mean the person is qualified as not independent.
n The supervisory board member shall not have been auditor of the company or have owned a share in the auditing company or have worked there as an employee in the past three years.
n The supervisory board member shall not be a member of the management board of another company, in which a management board member of the company is a super- visory board member.
n The supervisory board member shall not be a close relative (direct offspring, spouse, partner, parent, uncle, aunt, sibling, niece, nephew) of a management board member or of persons in one of the aforementioned positions.
It shall be the responsibility of each member of the supervisory board of the company elected by the Annual General Meeting or delegated by the shareholders to declare his or her independence according to the criteria defined.
According to Rule 54 of the Austrian Code of Corporate Governance, the supervisory board of the company shall include at least one independent member delegated by the shareholders who is not a shareholder with a share of more than 10 % or who repre-sents such a shareholder’s interests. The independence of supervisory board members shall be published in the Annual Report. The supervisory board shall judge whether it and its committees contain a sufficient number of independent members in accordance with Rules 39 and 53 of the Austrian Code of Corporate Governance.

56
Total remuneration for the management board members in the 2012 financial year amoun- ted to € 2.59 million (2011: € 8.48 million).
Since 2007, board member pay has been based on a system which, in addition to a fixed base salary, foresees a variable portion dependent on the achievement of specific earnings and profitability targets for the STRAbAG Group calculated according to principles of cost accounting. The variable portion of the salary is basically calculated as a fixed percentage of the net income after minorities less minimum earnings of € 200 million. If this value surpasses the simple fixed amount, a sliding scale is applied with a maximum variable portion of 200 % of the fixed salary possible. If a mini-mum yield is surpassed (earnings according to cost accounting principles compared to output volume), a minimum variable portion is granted; the chairman of the management board may also receive additional non-mon-etary remuneration, rounded to full T€ 100, when pre-determined targets are met. From the 2011 financial year, 20 % of the bonuses of the members of the management board will be retained and deposited on a personal clearing account based on sustainable, long-term, multi-annual performance criteria. The payment from the personal clearing account will take place at the end of the term of the management agreement.
Furthermore, the members of the manage-ment board have the right to a company car.
Accident insurance provides coverage in the event of death or disability, a private liability insurance policy covers the legal liability of the members of the management board which may arise from third-party personal injury, property damage or financial losses. The board members are also covered by legal expense insurance in the event of claims resulting from administrative or criminal violations. Insurance coverage exists for damage claims resulting from third-party or group financial losses as the result of neglect of duty during service for the company.
The members of the management board are subject to a competition clause for the period of their service. If a member of the management board is dismissed without cause, the fixed base salary is paid for the full term of the contract. Haselsteiner’s man-agement contract expires on 31 December 2015, those of the remaining members of the management board on 31 December 2014.
One member of the management board is entitled to non-growing pension payments from subsidiaries of the company. No other pension agreements exist between the company and the members of the man- agement board. One member of the man- agement board has a right to legal and con-tractual severance pay in the event of the termination of service to the company, with the maximum amount set by the Austrian Employee Act (oAngG).
REmunERatiOn Of thE manaGEmEnt BOaRd 2011/20121)
T€ (incl. non-monetary2))FiXEd vARiABlE TOTAl
nAmE 2012 2011 2012 2011 2012 2011
Haselsteiner 633 633 – 1,033 633 1,666Haselsteiner – payment in kind – – – 1,100 – 1,100
Oberlerchner3) 253 506 – 823 253 1,329
birtel 426 426 – 614 426 1,040
Truntschnig 426 426 – 689 426 1,115
Krammer 426 426 – 689 426 1,115
Wanker 426 426 – 689 426 1,115
Total 2,590 2,843 – 5,637 2,590 8,480
DiscLosURe oF inFoRMAtion ReGARDinG tHe ReMUneRAtion oF tHe MeMBeRs oF tHe MAnAGeMentAnD tHe sUpeRvisoRY BoARDs
Remuneration Report – management Board
1) In the past, the individual components of remuneration paid in the respective financial year were disclosed separately for each member of the management board. Starting with the 2012 financial year, the remuneration paid to the individual management board members for their performance during the financial year will be stated as a total under Section 243b (2) 3 in conjunction with Section 239 (1) 4 a of the Austrian Commercial Code (UGb). For better comparability, the figures for 2011 are presented here in the changed form.2) Non-monetary after deductibles3) Member of the management board until 30 June 2012
lOnG-tERm, multi-annual pERfORmancE cRitERia

56 57Corporate governance
nO StOcK OptiOn pROGRammE
All management board members perform their services on the basis of employment contracts and are subject to income tax regulations.
STRAbAG SE has decided against a stock option programme for management board members. No additional recompense is granted for internal group mandates or functions. No prior agreements or exception rules exist for the event of a public takeover offer.
In the 2012 financial year, there were no changes to the remuneration system for the management board (Rule C-30 of the ÖCGK).
Remuneration Report – supervisory Board
The Annual General Meeting decides on the annual remuneration of the members of the supervisory board nominated or elected by the shareholders as well as on any additional remuneration for special tasks performed, if applicable. At the Annual General Meeting
of 10 June 2011, the shareholders approved annual remuneration of € 15,000 for the regular members of the supervisory board, € 25,000 for the vice chairman and € 50,000 for the chairman. Members of the super- visory board who are elected to or leave the board during a financial year are remune-rated in accordance with the actual period of their membership on the supervisory board pro rata temporis.
Additionally to their annual remuneration, the supervisory board members also receive cash compensation for expenses. Fur-thermore, the members of the supervisory board are, in accordance with the Articles of Association, covered by D&O (directors and officers) liability insurance up to a certain maximum amount. The insurance covers the personal liability of the supervisory board members in the event of careless neglect of duty during their service for the company. In 2012, no other remuneration was paid to the members of the supervisory board. There were no other transactions with members of the supervisory board.
REmunERatiOn Of thE SupERViSORY BOaRd 2011/2012€
2012 2011
Dr. Alfred Gusenbauer 50,000 50,000
Mag. Erwin Hameseder 25,000 25,000
Mag. Kerstin Gelbmann 15,000 15,000
Andrei Elinson 15,000 15,000
Dr. Gottfried Wanitschek 15,000 15,000
Ing. Siegfried Wolf 15,000 15,000
Total 135,000 135,000

58
mEaSuRES fOR thE adVancEmEnt Of WOmEnIn accordance with Section 243b of the Austrian Commercial Code (UGb) and L-Rule 60 of the Austrian Code of Cor- porate Governance, the corporate gov- ernance report must indicate the measures taken to promote women to the management board, the supervisory board and to leading positions in the company.
STRAbAG SE declares that it basically pro-motes women and men equally. There are no salary differences between men and women who perform equal work and have the same level of education.
Traditionally, mainly men are employed in the construction sector. It is noteworthy, there-fore, that two women sit on the supervisory board of the company: Kerstin Gelbmann and Magdolna Gyulainé. The supervisory board thus has a female percentage of around 18 % and a percentage of female members appointed by the works council of 20 %.
Additionally, 95 women (= 8 % of the corpo-rate management) hold a leading position as defined by Section 80 of the Austrian Stock Corporation Act (AktG).
The company has also set up kindergartens at its offices in Vienna, Donau-City-Strasse 9, and in bratislava, offering employees afford- able, all-day childcare. The childcare centres are designed to help employees reintegrate into professional life after their parental leave.
The STRAbAG SE management board is currently working on an action plan to in-crease the number of women employees at STRAbAG as well as the number of women in management. Measurable targets are to be set in the following three areas:
n Targeted search and selection of women employees
n Systematic promotion of high potentials regardless of gender as part of the company’s human resource development
n Reduction of the conflict of interest between job and family
intERnal audit REpORtThe STRAbAG Group’s internal audit department is a neutral and independent authority which again conducted more than 200 internal audits in all group divisions worldwide in the 2012 financial year. It is a central part of the group’s risk management.
In accordance with the rules of the Austrian Code of Corporate Governance, the internal audit department is set up as a staff unit of the management board of STRAbAG SE, giving it the greatest possible amount of independence. The internal audit depart-ment plans and conducts process-indepen-dent and neutral audits of all of the group’s divisions and regions in Austria and abroad. The audit planning is constantly updated to meet the current needs.
In 2012, the internal audit department again audited individual objects as well as entire organisational units. The audits covered all of the group’s divisions and sub-divisions as well as the most important contracts and
orders of the year. The routine and special audits served to recognise and avoid risks, to reveal opportunities and to monitor proper conduct and compliance with the group’s code of ethics.
Given its technical and commercial com-petence, the internal audit department forms an important part of the group’s risk management and internal control. With its comprehensive approach, the use of uniform auditing standards and the neutral reporting, the internal audit department also contrib-utes to the standardisation of processes and structures in the entire group.
The internal audit department reports reg-ularly to the CEO and to the supervisory board’s audit committee regarding the audit plan and significant events of its work. The audit reports are sent to the audited units and divisions, to the unit and division man-agers, and to the management board, and are made available to the financial auditors.
58 59Corporate governance
EXtERnal EValuatiOnAn external evaluation in accordance with Rule 62 of the Austrian Code of Corporate
Governance takes place every three years, the next time for the year 2013.
cOntinuOuS dEVElOpmEnt Of OuR cORpORatE GOVERnancE SYStEmIn the interests of the company and all stake- holders, STRAbAG continued its efforts to improve the corporate governance system in the 2012 financial year. The manage-ment board will now instruct the supervisory board in even more detail about the aggregate risk from ongoing construction projects. Similarly, at the suggestion of the supervisory board, more detailed
documents on transactions requiring approv- al will be sent out ahead of the super- visory board meetings to ensure that the supervisory board members are even better prepared when they meet.
STRAbAG also developed an interactive ethics e-learning course.
Villach, 9 April 2013
The management Board
dr. hans peter haselsteiner
dr. Thomas Birtel mag. Christian harder
di siegfried wanker
di dr. peter Krammer mag. hannes Truntschnig

dr. Alfred GusenbauerChairman of the Supervisory board of STRAbAG SE
RE
UT
ER
S/H
erb
ert N
eub
auer
dear shareholders,associates and friends of sTRABAG sE
The consequences of the euro debt crisis reached the European construction sector in 2012. The public sector, due to the rescue und stimulus packages of recent years, is currently following a strict policy of spending cuts. In Poland, one of STRAbAG’s core countries, the construction sector weakened considerably after the large investments related to the European Football Championships. These developments, listed here merely as examples, did not spare STRAbAG in 2012. However, a look at the general situation of Europe’s construction sector shows that, especially in difficult times, the strategy of having a broad regional and sectoral diversification helps to better deal with challenges in individ-ual areas.
In 2012, the supervisory board therefore focused especially on the group’s strategic orientation and on the evaluation of STRAbAG’s activities in countries and segments show-ing negative development. Together with the management board, it will be our task to adapt STRAbAG to the changed situation and to rigorously enact optimisation measures where necessary. The supervisory board will supervise and observe these steps and, continuing its constructive and trust-based working relationship with the management board, will help to jointly steer STRAbAG safely through difficult times into the future.
In the past financial year, the supervisory board diligently performed the duties incumbent upon it under Austrian law, the Articles of Association, the Austrian Code of Corporate Governance (ÖCGK) as amended in January and July 2012, and the Rules of Procedure. A total of five regular meetings of the supervisory board as well as three meetings of the audit committee, three meetings of the presidium and nomination committee, and one meeting of the presidium took place in 2012. All members of the supervisory board and its committees are independent and were represented in the relevant meetings in accordance with the conditions contained within the Austrian Code of Corporate Governance.
The management board engaged in an exchange of information and opinion as well as in open discussions with the supervisory board in order to regularly report on the market situation, the course of the business and the situation of the company. At all meetings, the management board informed the supervisory board of STRAbAG SE’s strategic direction, of its cash flows and financial performance, the personnel situation and of
SupERViSORY BOaRd REpORt

61Corporate governance
any plans regarding investments, disposals or large projects, and obtained its approval regarding important business transactions (e.g. enterprise acquisitions or large projects). The supervisory board studied the corporate planning and the appropriate analyses of divergence constantly and in great depth. Specifically, the following agenda items of the supervisory board meetings should be emphasised:
by circular resolution on 26 January 2012, the supervisory board approved the issue of a corporate bond and the raising of a bonded loan. The first meeting of the supervisory board then included a report on how the favourable interest rates had helped to reduce the group’s refinancing costs in this regard. The agenda of the first supervisory board meeting of the 2012 financial year on 24 February 2012 included the management board’s report on the market situation and the current situation of the company, as well as the budgeting and expenditure planning (equipment fleet) for the 2012 financial year. The meeting also discussed the results of the supervisory board’s self-evaluation, which revealed little need for improvement. The results of the cost accounting for 2011 and the deviations from the planning were explained in detail by the management board and analysed together with the members of the supervisory board. In particular, discussion centred on the unsatisfactory development in transportation infrastructures and the conclusions that can be drawn. The supervisory board also examined the situation in Hungary, Scandinavia and Russia and discussed this with the management board. The management board further reported on the new project to evaluate the organisational structure. Finally, the annual report by the STRAbAG SE compliance officer for capital market law was also on the agenda of this supervisory board meeting.
The agenda of the second supervisory board meeting of the 2012 financial year on 26 April 2012 dealt with the financial statements, the management report, the corporate governance report, the consolidated financial statements and the group management report for the year 2011. The audit committee reported on the audit of the financial state-ments, the consolidated financial statements, the management reports and the corporate governance report. There were no objections to the audit by the financial auditor and all questions of the audit committee could be answered satisfactorily. The supervisory board thereupon acknowledged completion of the 2011 financial report. The management board’s proposal for the appropriation of net income was also reviewed, with a recommendation for its acceptance by the Annual General Meeting. In preparation of the eighth Annual General Meeting, the meeting discussed and approved the supervisory board report as well as the proposal to appoint KPMG Austria AG Wirtschaftsprüfungs- und Steuer- beratungsgesellschaft, Linz, as auditor, financial auditor and group financial auditor. The management board reported on the results of the first quarter 2012 and provided an outlook of planned projects. In particular, analysis centred on the difficult situation in many core markets, whereby especially the building construction business in Germany and Russia represent a positive exception. Competition tightened in general, so that lower margins are to be expected. Draft resolutions were discussed and approved in preparation of the Annual General Meeting. Discussion focused particularly on the changes to the Articles of Association, the authorisation to issue financial instruments as defined by Section 174 of the Austrian Stock Corporation Act (AktG), and the associated conditional capital increase. Also discussed was the issue of the 2012 corporate bond in accordance with the existing bond programme and the approval thereof.
During the third supervisory board meeting of the 2012 financial year on 20 July 2012, the chairman of the supervisory board reported on the eighth Annual General Meeting of 15 June 2012 and on the resolutions which were passed. The board welcomed the con- structive nature of the meeting. From the audit committee, the chairman also reported on the evaluation of the internal audit. The committee gave the internal audit a very good review and explained possibilities for improvement and ways to further increase the high quality. The internal audit department’s work with the supervisory board, in particular with the audit committee, was also discussed. The new financial auditor, Dr. Helge Löffler, who assumed this role from Mag. Ernst Pichler due to the mandatory internal rotation, introduced himself and joined the board in discussing their future working relationship. The presidium and
SElf-EValuatiOn: littlE nEEd fOR impROVEmEnt

62
nomination committee reported that a new way of allocating responsibilities had been decided for the management board. In the future, responsibilities will be assigned not by segment but by region, each managed under the disciplinary, entrepreneurial, organisational and administrative responsibility of one management board member. The “STRAbAG 2013ff” task force is currently conducting an intense analysis of the group’s organisational structure. Also discussed was the supervisory board’s circular resolution on the board’s authorisation to acquire own shares. The current situation on the market and the difficult situation in many core countries were also discussed. Due to the successful business in the field of real estate project development, the property cost ceiling – the financial framework within which the project development business can acquire properties without further authorisation by the supervisory board – was raised. Finally, the supervisory board discussed STRAbAG’s involvement as sponsor of Tiroler Festspiele Erl and approved a direct sponsoring relationship.
The fourth supervisory board meeting of the 2012 financial year was held on 10 September 2012. The chairman reported on the preceding meeting of the audit committee, which had discussed in detail the opportunities and risks from the ongoing construction projects. The management board reported on the adjusted financial forecasts in accordance with the half-year figures. The agreement over a syndicated cash credit line was proposed by the management board as a longer-term way of securing liquidity peaks. As a result of the difficult financial performance in many core countries, the investment budget will not be fully exhausted and the investment planning for the following years will be evaluated. Cost savings in human resources are expected from the “STRAbAG 2013ff” task force. Also discussed was the current status of the share buyback programme as well as several infrastructure and real estate development projects.
The fifth supervisory board meeting of the 2012 financial year on 14 December 2012 began with the nomination of Mag. Christian Harder to the management board effective 1 January 2013 and the appointment of Dr. Thomas birtel as Deputy CEO. The market situation and the figures of the third quarter 2012 were analysed and measures were discussed. In particular, the supervisory board discussed the current developments in Switzerland. The supervisory board also dealt with the internal risk management, especially the subject of flop avoidance. The management board reported on the group’s measures to fight corruption (Rule C-18a of the ÖCGK). The strategy in the field of offshore wind is currently being subjected to an evaluation. The results of the supervisory board’s self-evaluation for 2012 were also discussed and the chairman stressed that suggestions for improvement should be expressed openly at any time. Regarding the syndicated cash credit line, the board discussed the current status of the negotiations and approved a line up to € 400 million.
The internal audit department informed the audit committee of the audit plan and of significant outcomes in accordance with Rule C-18 of the Austrian Code of Corporate Governance as amended in January and July 2012. Furthermore, the audit committee monitored the accounting processes (including the preparation of the consolidated financial statements) and the work of the auditor (including the audit of the consolidated financial statements) as well as the effectiveness of the system of internal control, the risk management system and the audit system. The independence of the auditor (group financial auditor) was reviewed and monitored in particular as regards the additional services given to the audited company.
The financial statements and management report of STRAbAG SE for the 2012 financial year were audited by KPMG Austria AG Wirtschaftsprüfungs- und Steuerberatungs- gesellschaft, Linz. Pursuant to the final result of the audit, the auditor had no cause for complaint and awarded his unqualified opinion.
The consolidated financial statements and the group management report drawn up by the management board for the 2012 financial year under application of Section 245a of the Austrian Commercial Code (UGb) in accordance with the International Financial Reporting
62 63Corporate governance
Standards (IFRS) issued by the International Accounting Standards board (IASb) applicable on the balance sheet date were reviewed by KPMG Austria AG Wirtschaftsprüfungs- und Steuerberatungsgesellschaft, Linz, and awarded their unqualified opinion.
The auditor’s reports and the group financial auditor’s reports were submitted to the supervisory board. The audit committee reviewed the 2012 financial report and the management report including the proposed appropriation of profits and the corporate governance report, and the 2012 consolidated financial statements and group management report, and prepared the approval of the annual financial report by the super-visory board.
The supervisory board reviewed all documents as well as the report by the audit committee. In the meeting of 29 April 2013, the supervisory board stated its agreement with the financial report and the 2012 consolidated financial statements and officially approved the 2012 financial report, thus acknowledging its completion. The supervisory board supports the management board in its proposal for the appropriation of net income. The supervisory board proposes appointing KPMG Austria AG Wirtschaftsprüfungs- und Steuerberatungsgesellschaft, Linz, as auditors and financial auditors for the 2013 financial year, in accordance with the proposal of the audit committee.
Furthermore, the legal firm Fellner Wratzfeld und Partner Rechtsanwälte GmbH conducted an evaluation of compliance of the 2012 corporate governance report in accordance with Section 243b of the Austrian Commercial Code (UGb). The final result of the evaluation did not give rise to any cause for complaint.
by way of closing, the supervisory board would like to express its gratitude and appreciation to the management board and to all employees for their valuable contribution in the past financial year.
The Chairman of the Supervisory board of STRAbAG SE
Dr. Alfred GusenbauerVienna, 29 April 2013

ECOLOGICAL AND SOCIAL RESPONSIBILITY63Corporate Governance
Standards (IFRS) issued by the International Accounting Standards Board (IASB) applicable on the balance sheet date were reviewed by KPMG Austria AG Wirtschaftsprüfungs- und Steuerberatungsgesellschaft, Linz, and awarded their unqualified opinion.
The auditor’s reports and the group financial auditor’s reports were submitted to the supervisory board. The audit committee reviewed the 2012 financial report and the management report including the proposed appropriation of profits and the corporate governance report, and the 2012 consolidated financial statements and group management report, and prepared the approval of the annual financial report by the super-visory board.
The supervisory board reviewed all documents as well as the report by the audit committee. In the meeting of 29 April 2013, the supervisory board stated its agreement with the financial report and the 2012 consolidated financial statements and officially approved the 2012 financial report, thus acknowledging its completion. The supervisory board supports the management board in its proposal for the appropriation of net income. The supervisory board proposes appointing KPMG Austria AG Wirtschaftsprüfungs- und Steuerberatungsgesellschaft, Linz, as auditors and financial auditors for the 2013 financial year, in accordance with the proposal of the audit committee.
Furthermore, the legal firm Fellner Wratzfeld und Partner Rechtsanwälte GmbH conducted an evaluation of compliance of the 2012 corporate governance report in accordance with Section 243b of the Austrian Commercial Code (UGB). The final result of the evaluation did not give rise to any cause for complaint.
By way of closing, the supervisory board would like to express its gratitude and appreciation to the management board and to all employees for their valuable contribution in the past financial year.
The Chairman of the Supervisory Board of STRABAG SE
Dr. Alfred GusenbauerVienna, 29 April 2013
66
At first glance, there may not appear to be any connection between ecological respon-sibility and the construction of buildings and structures. All construction impacts the natural environment and is usually very ener-gy- and resource-intensive. As a provider of construction services, we are aware of this fact. Because we know that a construction site without pollutants, noise and dust will not be a reality in the foreseeable future, it is our aim to limit the negative impact our activity has on the environment to a minimum. To this end, we are continuously investing in processes and technologies in order to increase our energy efficiency and to reduce our environmental impact.
For us, ecological responsibility begins with the planning of buildings and structures and continues through to their construction and operation. We are involved in the develop-ment of certification systems in Germany and Austria early on and are continually working to increase the number of high-quality buildings on the market. This allows us to consider environmental criteria in the planning, construction and use of buildings and structures early in the planning process if the client so desires.
We are making efforts to minimise CO2 emissions and energy use already at an early stage of the value creation process of our products. For this reason, we are shift-ing our focus toward new and innovative products, in particular within the field of renewable energy. Through the constant development of new technologies, it is our aim to steadily increase the STRABAG product portfolio. At the same time, we are working to develop and enhance the right methods and tools to control our impact on the environment.
Representative of our activities and mea- sures within the group, our environmental and energy management is presented below, as these two issues are increasingly moving into the focus of interest. As well
as our employees, who want to work for a responsible company, our clients and investors are also taking an increased in-terest in the company’s approach with regard to ecological responsibility. This approach can even be a decisive factor for the award of a construction project. We can see this most clearly with public-sector contracts in the Netherlands, where external certification for carbon avoidance strategies by SKAO affords us a competitive advantage or – like in most cases, as certification extends to our competitors as well – helps us to preserve competitiveness.
ENVIRONMENTAL MANAGEMENT: FIRST CERTIFICATIONS PLANNEDFOR 2013
Our ISO 14001-certified environmental management system, which has been established within the group for several years, helps us to ensure that defined busi-ness objectives or environmental measures are systematically implemented and that they can be managed at every stage. In addition to key environmental figures, we also developed an environmental policy during introduction of the management system, with appropriate targets regarding the reduction of environmental impact. In some countries, such as Germany, Belgium and Hungary, the system has already been introduced everywhere in form of an integrat- ed management system. The certification of individual group organisations is planned for the year 2013. In other countries, such as Austria and Croatia, the system has been partially introduced.
ECOLOGICAL AND SOCIAL RESPONSIBILITY1)
n STRABAG CARBONTRACKER SOFTWARE CALCULATES FIRST CARBON FOOTPRINT FOR 2012
n OBJECTIVE FOR 2013: DEVELOP KEY ENERGY AND CO2 INDICATORS FOR THE GROUP
n LONG-TERM SUPPORT OF SELECTED SOCIAL AND CULTURAL INITIATIVES
ECOLOGICAL RESPONSIBILITY
MORE INFORMATION ON OUR SUSTAINABLE PRODUCT
PORTFOLIO IS AVAILABLE AT WWW.STRABAG.COM
1) The information presented in this chapter covers only the most important topics and results of the past financial year. Comprehensive information on the fulfilment of our ecological and social responsibility under the group’s CSR strategy can be found online at csr.strabag.com.
ECOLOGICAL RESPONSIBILITY
ECONOMIC RESPONSIBILITY
VALUES AND COMPLIANCE
CORPORATE CITIZENSHIP
MISSION AND VISION
EMPLOYEES AND WORKPLACE
Kapiteltrenner_links_E.indd 1 22.04.13 15:50
NICE AND WARM, COMFORTABLY COOLEight weeks a year, we pay almost nothing to keep our Vienna headquarters nice and warm in the winter and comfortably cool in the summer. All thanks to a heat pump that makes efficient use of geothermal energy: In the summer, the heat removed from the air-conditioned rooms is stored at the base of the building. In the winter, this energy is reused and fed back into the heating system.
ECOL
OGIC
AL &
SO
CIAL
RES
PON
SIBI
LITY
Kapiteltrenner_links_E.indd 2 22.04.13 15:50
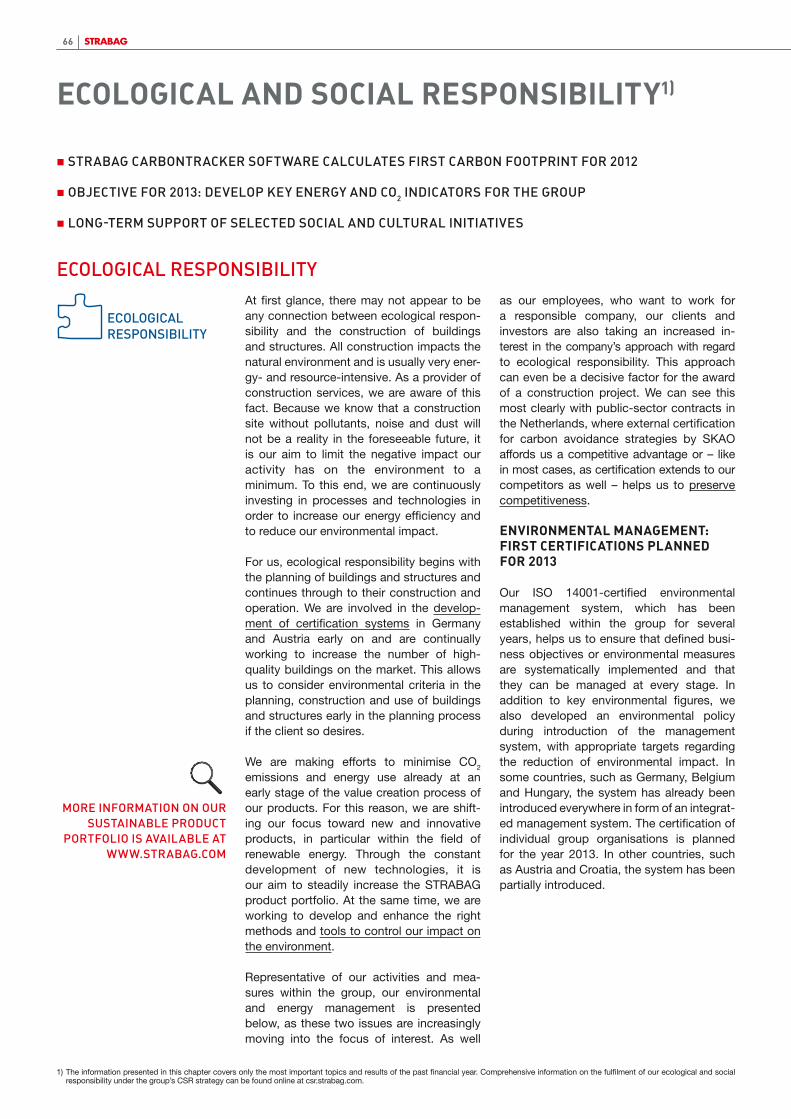
6666
At first glance, there may not appear to be any connection between ecological respon-sibility and the construction of buildings and structures. All construction impacts the natural environment and is usually very ener-gy- and resource-intensive. As a provider of construction services, we are aware of this fact. because we know that a construction site without pollutants, noise and dust will not be a reality in the foreseeable future, it is our aim to limit the negative impact our activity has on the environment to a minimum. To this end, we are continuously investing in processes and technologies in order to increase our energy efficiency and to reduce our environmental impact.
For us, ecological responsibility begins with the planning of buildings and structures and continues through to their construction and operation. We are involved in the develop-ment of certification systems in Germany and Austria early on and are continually working to increase the number of high-quality buildings on the market. This allows us to consider environmental criteria in the planning, construction and use of buildings and structures early in the planning process if the client so desires.
We are making efforts to minimise CO2 emissions and energy use already at an early stage of the value creation process of our products. For this reason, we are shift-ing our focus toward new and innovative products, in particular within the field of renewable energy. Through the constant development of new technologies, it is our aim to steadily increase the STRAbAG product portfolio. At the same time, we are working to develop and enhance the right methods and tools to control our impact on the environment.
Representative of our activities and mea- sures within the group, our environmental and energy management is presented below, as these two issues are increasingly moving into the focus of interest. As well
as our employees, who want to work for a responsible company, our clients and investors are also taking an increased in-terest in the company’s approach with regard to ecological responsibility. This approach can even be a decisive factor for the award of a construction project. We can see this most clearly with public-sector contracts in the Netherlands, where external certification for carbon avoidance strategies by SKAO affords us a competitive advantage or – like in most cases, as certification extends to our competitors as well – helps us to preserve competitiveness.
enviRonMentAL MAnAGeMent: FiRst ceRtiFicAtions pLAnneDFoR 2013
Our ISO 14001-certified environmental management system, which has been established within the group for several years, helps us to ensure that defined busi-ness objectives or environmental measures are systematically implemented and that they can be managed at every stage. In addition to key environmental figures, we also developed an environmental policy during introduction of the management system, with appropriate targets regarding the reduction of environmental impact. In some countries, such as Germany, belgium and Hungary, the system has already been introduced everywhere in form of an integrat-ed management system. The certification of individual group organisations is planned for the year 2013. In other countries, such as Austria and Croatia, the system has been partially introduced.
ecoLoGicAL AnD sociAL ResponsiBiLitY1)
n StRaBaG caRBOntRacKER SOftWaRE calculatES fiRSt caRBOn fOOtpRint fOR 2012
n OBJEctiVE fOR 2013: dEVElOp KEY EnERGY and cO2 indicatORS fOR thE GROup
n lOnG-tERm SuppORt Of SElEctEd SOcial and cultuRal initiatiVES
EcOlOGical RESpOnSiBilitY
mORE infORmatiOn On OuR SuStainaBlE pROduct
pORtfOliO iS aVailaBlE at WWW.StRaBaG.cOm
1) The information presented in this chapter covers only the most important topics and results of the past financial year. Comprehensive information on the fulfilment of our ecological and social responsibility under the group’s CSR strategy can be found online at csr.strabag.com.
ECOLOGICAL RESPONSIBILITY
ECONOMIC RESPONSIBILITY
VALUES AND COMPLIANCE
CORPORATE CITIZENSHIP
MISSION AND VISION
EMPLOYEES AND WORKPLACE

67Ecological and Social Responsibility
eneRGY MAnAGeMent cAn HeLp toLoweR costs
The topic of energy is an increasingly rele-vant one not only for ecological but also for economic reasons. In 2012, the energy costs for the companies within STRAbAG SE’s scope of consolidation amounted to nearly € 347 million and represented a considerable portion of the total costs within the group. Without measures to raise energy efficiency, energy costs in the next few years can be expected to go up in response to price hikes and legislative changes. For this reason, we began with the realisation of a comprehen-sive energy management programme in the year under report.
Under energy management, we understand the sum of all measures that are planned or are being implemented in order to guar-antee a minimum use of energy for the re-quired performance. Attempts are made to influence organisational and technical pro-cesses, and the group employees are sen-sitised to the goal of improving energy effi- ciency. The positive results of such an energy management are: we reduce energy costs, we increase the potential for tax savings, we improve environmental protection as a result of reduced emissions, we do business more sustainably with regard to resource use and we may even expect some legal relief.
Measure
Implement
Energy Balance
EnergyFlows
Analyse & Develop
Carbon Footprint
EnergyCosts
Ener
gy M
anag
emen
t
Regardless whether we consider the entire group or individual group entities, our energy management always consists of the three stages of “measure”, “analyse & develop” and “implement”:
First time measuring with the CarbonTracker
For the first time, we calculated the group’s energy balance and carbon footprint for the year under report using our own Carbon- Tracker software. Important for its develop-ment were the experiences made in calculat-ing the carbon footprint for 2010 and 2011, which we had verified by external auditors for participation in the Carbon Disclosure Project (CDP).
CarbonTracker involves the automatic and systematic calculation of energy and carbon
data contained within the available group databases. After reaching our objective of using the CarbonTracker to calculate the group’s carbon footprint for 2012, our objective for the coming years is to refine the calculation system so we can determine an exact, up-to-date carbon footprint for each organisational unit. The software is there-fore web-based to give employees access to the CarbonTracker via the group’s intranet system.
besides the development of the Carbon Tracker, we also intend to continuously develop our reporting procedure. For this reason, we have for the first time included the heating value and carbon conversion factors of selected energy suppliers.
SchEmatic dEpictiOn Of StRaBaG’S EnERGY manaGEmEnt
EnERGY cOStS 2012: € 347 milliOn

68
2012 carbon footprint
As in previous years, the carbon footprint for the 2012 financial year refers to the group’s full scope of consolidation and includes emissions caused by our activities in 60 countries. Within the group, a total of 1,293,352 tonnes of CO2 were emitted during the year under report. This represents a decline of 1 % or approx. 19,500 tonnes of
CO2 in a year-on-year comparison. The illus-tration shows the breakdown of this volume, reported for Scopes 1 and 2 as defined by the Greenhouse Gas Protocol. The highest proportion of CO2 emissions resulted from the use of fuels, which in the group is due al-most exclusively to diesel. This position also made a significant contribution to last year’s energy costs.
STRABAG GROUP EMISSIONS 2012
Scope 1
Gas use Waste
FuelCompanyvehiclefleet
Electricityfrom thenationalgrid
Commercial vehicles Suppliers and subcontractors
Rawmaterials
Businesstravel
Scope 2 Scope 3
976,651 t CO2 316,702 t CO2
51 %of emissions
from fuels
CO2 EMISSIONS BY ENERGY SOURCE
51 %
8 %
13 %
24 %
■ fuels■ electricity■ pulverised lignite■ gas■ heating oil■ district heating
1 %3 %
33 %of emissions
from Germany
CO2 EMISSIONS BY COUNTRY
33 %
8 %8 %
17 %
■ Germany■ Poland■ Austria■ Czech Republic■ other
34 %

68 69Ecological and Social Responsibility
EcOlOGical indicatORS2012 2011 2010
Energy1) Group’s total energy use
Electricity 486,033 499,146 499,945 Group’s total electricity use in MWh
Fuel 245,660 241,433 212,614 Group’s total fuel use in thousands of litresGas 565,048 658,356 705,973 Heating value in MWh
Heating oil 17,790 21,644 25,836 Group’s total heating oil use in thousands of litres
Pulverised lignite 79,107 84,318 51,452 Emissions in tonnes
Raw material Group’s raw material use
Stone/gravel 68.02) 74.82) 61.53) Group’s stone and gravel use in millions of tonnes
Asphalt 13.92) 15.32) 13.23) Group’s asphalt use in millions of tonnesConcrete 5.22) 5.82) 5.13) Group’s concrete use in millions of m³
1) Changes in the energy values in comparison to past publications are the result of changes to the calculation system.2) Includes the following countries or regions: Austria, benelux, bulgaria, Croatia, Czech Republic, Germany, Hungary, Italy, Poland, Romania, Russia and neighbouring countries, Scandinavia, Slovakia, Slovenia, Switzerland 3) The following countries were not yet included in 2010 due to organisational reasons: Italy, neighbouring countries of Russia and Scandinavia.
Analyse and develop with the energy atlas
We are planning the development of an “en-ergy atlas” to better analyse the energy flows within the group. besides assigning energy use and CO2 emissions to individual areas, we are also planning to develop key indica-tors to compare these areas. This can help in identifying energy savings measures. The crucial tool for creating this energy atlas is the CarbonTracker that was introduced above.
Especially in construction, where there are no standardised, repetitive production processes, it is important to collect and analyse data immediately on the construc-tion site. We are doing this as part of the “Energy Efficiency on the Construction Site” project, which was first implemented during the Dancing Towers construction in Hamburg. In 2013, the project will be repeat-ed at the Milaneo and CityGate construction sites in Stuttgart.
include all units in the implementation
As all processes require energy, a com- prehensive handling of the topic of energy involves complex tasks. The efficient and effective use of energy therefore necessi-tates the inclusion of all group entities: the realisation of energy efficiency measures begins with the planning and construction of our buildings, the purchase of construc-tion machinery and equipment, and the procurement of the energy itself. The use of green electricity for the Dancing Towers in Hamburg, for example, helps to avoid approx. 800 tonnes of CO2 emission a year.
In order to concentrate all the different measures, to provide a single energy policy for the group and to monitor its implementa-tion, it was decided in the year under report to set up an energy steering committee. The committee is composed exclusively of deci-sion makers from the group’s operating units and service companies.
In the year under report, we began with the introduction of an ISO 50001 energy management system at our Deutsche As-phalt GmbH and Mineral baustoff GmbH subsidiaries. The choice fell on these two companies, as both asphalt production and materials extraction are among our most energy-intense business fields and this is where the greatest savings potential can be achieved. The energy management system is to be used to systematically identify and raise the savings potential and to lower the energy costs. An energy management sys-tem certified to ISO 50001 can also lead to tax relief. For this reason, the certification of the energy management system of the two subsidiaries by an independent auditor is planned for the third quarter of 2013.
fOcuS On cultuRal and SOcial pROJEctS
noBJective 2012 Extension of SKAO certification to several group divisions
nAcHieveMents 2012 The group entities which had al- ready been certified to Level 3 in 2011 were awarded highest SKAO certification to Level 5 in 2012. Another group entity, STRAbAG Rail, was certified to Level 3 for the first time.
oUR oBJective UntiL 2015nIntroduction of an energy manage- ment system at selected group entities and certification to the inter- national standard ISO 50001
nDetailed determination of the energy flows within the group
nDevelopment of a graphic interface for the CarbonTracker
nIncreased proportion of recycling paper in the group
nEstablishment of energy efficiency and CO2 reduction targets
Our business activities directly shape the environment, which has an immediate influence on our daily routine. The result is a complex interaction between con- struction and society. Only when society is successful can we also be successful. Given our business success, we feel obliged to contribute to the healthy development of society as a whole. This includes our contribution to maintaining the social standards in Central Europe and improving them in other countries, as well as supporting cultural projects.
We do not extend our social commitment indiscriminately, but instead support se-lected initiatives over the long-term. If and in which form we lend our support is decided by the STRAbAG SE management board according to eligibility criteria such as:
nCan STRAbAG, given the nature of its business, make a contribution to the project that companies in other industries could not?
nIs the project or the applicant worth our long-term commitment?
nDoes the project fit our strategy and our public image?
SOcial RESpOnSiBilitY
ECOLOGICAL RESPONSIBILITY
ECONOMIC RESPONSIBILITY
VALUES AND COMPLIANCE
CORPORATE CITIZENSHIP
MISSION AND VISION
EMPLOYEES AND WORKPLACE

ConcordiaThe Concordia aid organisation has been caring for aban-doned children in Romania, Moldova and bulgaria since the 1990s by offering them housing and social centres, among other things. The group also cares for older people in need.
More information is available at www.concordia.or.at.
vinziRast-CortihausThe VinziRast-CortiHaus homeless shelter in Vienna offers emergency accommodation or a place in a halfway house, helping people in need find a home, make a new start or grow old in dignity.
More information is available at www.vinzirast.at.
Festspiele ErlFounded by Gustav Kuhn, the festival has been thrilling audiences with a varied programme since 1998. The new festival theatre was opened in 2012. In winter, it will serve as a second stage next to the existing Passion Play Theatre for the Tyrolean Festival Erl.
More information is available at www.tiroler-festspiele.at.
Komödienspiele porciaborn under difficult conditions, this important annual cultural event offers its guests an extensive programme of comedies from world literature as well as its own children’s theatre.
More information is available at www.komoedienspiele-porcia.at.
sTRABAG KunstforumThe STRAbAG Kunstforum opens up the world of contemporary art to employees and visitors at a number of office locations in Austria and abroad, making STRAbAG a forward-looking patron of the arts today.
More information is available at www.strabag-kunstforum.at.
71Ecological and Social Responsibility

© E
ric
Isse
lée
– Fo
tolia
.co
m
An eventful summer around the Gaaden quarry in Austria is coming to an end. bees, bats and more are moving back to their winter quarters and all the other residents of the Vienna Woods are also preparing for the cold season.
but every now and then, one of the animals takes a break from its winter preparations to observe the busy goings-on in the quarry, where work is continuing undiminished. The forest denizens have even become accustomed to the blasting that is being carried out twice a week. To offer more animals a new home on the abandoned site, planning began over a year ago on the restoration of the former Mitterotter 1 mining area of STRAbAG subsidiary Mineral Abbau GmbH in Gaaden near Mödling, where dolomite had been mined since the 1970s.
Today the site has been shut down and the equipment has been moved to Mitterotter 3 in order to mine sand, stone and gravel there. This led to the idea of “giving something back to nature”, as Erik Zechmann, the managing director of Mineral Austria, explains. The goal is to restore an area with a total size of 180,000 m² over the coming years.
The Vienna Woods Declaration calls for the “immediate recultivation of mined or non-expandable raw materials extraction sites”. As the quarry site is located in the middle of the Vienna Woods protected landscape and Föhrenberg nature park, this imposes on the company an obligation for land restoration and revegetation. For the site operators, however, the obligation for mere revegetation, as had been the norm several years ago, did not go far enough – the ecology of the region is often still intruded upon and little consideration is given to the true natural conditions.
GiVinG BacK tO natuRE

© s
ashp
ictu
res
- Fo
tolia
.co
m
© Z
byn
ek b
uriv
al –
shu
tter
sto
ck.c
om
73
From roe deer to eagle owls to mason bees, many animal species are at home even near active quarries. A prerequi-site is a diverse flora that thrives on the chalky soils. The company filled in and revegetated several areas at the for-mer quarry and set up bee hotels and bat boxes that had been made by students from the department of interior design and furniture making at the HTL Mödling second-ary school. At a later stage in the project, after the site is refilled, the area will be adapted to the true natural condi-tions of the Limestone Vienna Woods. The future site will feature steep rock cliffs, loamy areas on the south-facing
slopes and a damp bi-otope. Various details are planned to impro-ve wind protection, microclimate anderosion prevention. All of these measures were devised in cooperation with relevant experts and approved by the competent authorities.
tHe LivinG QUARRY
REducEd EmiSSiOnSAt the Mitterotter 2 and 3 sites, conveyor belts were set up to transport material from the quarry to the proces-sing plant that will begin operations soon. This will save 230,000 litres of diesel a year and will avoid annual CO2
emissions by 500 tonnes – the amount of fuel that had previously been required for transport by heavy trucks. The measure also helps to reduce the amount of dust and noise.


ECOLOGICAL AND SOCIAL RESPONSIBILITY63Corporate Governance
Standards (IFRS) issued by the International Accounting Standards Board (IASB) applicable on the balance sheet date were reviewed by KPMG Austria AG Wirtschaftsprüfungs- und Steuerberatungsgesellschaft, Linz, and awarded their unqualified opinion.
The auditor’s reports and the group financial auditor’s reports were submitted to the supervisory board. The audit committee reviewed the 2012 financial report and the management report including the proposed appropriation of profits and the corporate governance report, and the 2012 consolidated financial statements and group management report, and prepared the approval of the annual financial report by the super-visory board.
The supervisory board reviewed all documents as well as the report by the audit committee. In the meeting of 29 April 2013, the supervisory board stated its agreement with the financial report and the 2012 consolidated financial statements and officially approved the 2012 financial report, thus acknowledging its completion. The supervisory board supports the management board in its proposal for the appropriation of net income. The supervisory board proposes appointing KPMG Austria AG Wirtschaftsprüfungs- und Steuerberatungsgesellschaft, Linz, as auditors and financial auditors for the 2013 financial year, in accordance with the proposal of the audit committee.
Furthermore, the legal firm Fellner Wratzfeld und Partner Rechtsanwälte GmbH conducted an evaluation of compliance of the 2012 corporate governance report in accordance with Section 243b of the Austrian Commercial Code (UGB). The final result of the evaluation did not give rise to any cause for complaint.
By way of closing, the supervisory board would like to express its gratitude and appreciation to the management board and to all employees for their valuable contribution in the past financial year.
The Chairman of the Supervisory Board of STRABAG SE
Dr. Alfred GusenbauerVienna, 29 April 2013
66
At first glance, there may not appear to be any connection between ecological respon-sibility and the construction of buildings and structures. All construction impacts the natural environment and is usually very ener-gy- and resource-intensive. As a provider of construction services, we are aware of this fact. Because we know that a construction site without pollutants, noise and dust will not be a reality in the foreseeable future, it is our aim to limit the negative impact our activity has on the environment to a minimum. To this end, we are continuously investing in processes and technologies in order to increase our energy efficiency and to reduce our environmental impact.
For us, ecological responsibility begins with the planning of buildings and structures and continues through to their construction and operation. We are involved in the develop-ment of certification systems in Germany and Austria early on and are continually working to increase the number of high-quality buildings on the market. This allows us to consider environmental criteria in the planning, construction and use of buildings and structures early in the planning process if the client so desires.
We are making efforts to minimise CO2 emissions and energy use already at an early stage of the value creation process of our products. For this reason, we are shift-ing our focus toward new and innovative products, in particular within the field of renewable energy. Through the constant development of new technologies, it is our aim to steadily increase the STRABAG product portfolio. At the same time, we are working to develop and enhance the right methods and tools to control our impact on the environment.
Representative of our activities and mea- sures within the group, our environmental and energy management is presented below, as these two issues are increasingly moving into the focus of interest. As well
as our employees, who want to work for a responsible company, our clients and investors are also taking an increased in-terest in the company’s approach with regard to ecological responsibility. This approach can even be a decisive factor for the award of a construction project. We can see this most clearly with public-sector contracts in the Netherlands, where external certification for carbon avoidance strategies by SKAO affords us a competitive advantage or – like in most cases, as certification extends to our competitors as well – helps us to preserve competitiveness.
ENVIRONMENTAL MANAGEMENT: FIRST CERTIFICATIONS PLANNEDFOR 2013
Our ISO 14001-certified environmental management system, which has been established within the group for several years, helps us to ensure that defined busi-ness objectives or environmental measures are systematically implemented and that they can be managed at every stage. In addition to key environmental figures, we also developed an environmental policy during introduction of the management system, with appropriate targets regarding the reduction of environmental impact. In some countries, such as Germany, Belgium and Hungary, the system has already been introduced everywhere in form of an integrat- ed management system. The certification of individual group organisations is planned for the year 2013. In other countries, such as Austria and Croatia, the system has been partially introduced.
ECOLOGICAL AND SOCIAL RESPONSIBILITY1)
n STRABAG CARBONTRACKER SOFTWARE CALCULATES FIRST CARBON FOOTPRINT FOR 2012
n OBJECTIVE FOR 2013: DEVELOP KEY ENERGY AND CO2 INDICATORS FOR THE GROUP
n LONG-TERM SUPPORT OF SELECTED SOCIAL AND CULTURAL INITIATIVES
ECOLOGICAL RESPONSIBILITY
MORE INFORMATION ON OUR SUSTAINABLE PRODUCT
PORTFOLIO IS AVAILABLE AT WWW.STRABAG.COM
1) The information presented in this chapter covers only the most important topics and results of the past financial year. Comprehensive information on the fulfilment of our ecological and social responsibility under the group’s CSR strategy can be found online at csr.strabag.com.
ECOLOGICAL RESPONSIBILITY
ECONOMIC RESPONSIBILITY
VALUES AND COMPLIANCE
CORPORATE CITIZENSHIP
MISSION AND VISION
EMPLOYEES AND WORKPLACE
Kapiteltrenner_links_E.indd 1 22.04.13 15:50
SHARES, BONDS AND INVESTOR RELATIONS78
After a year of losses, the international stock markets made an impressive rebound in 2012 and the year was characterised by a surprisingly strong upward trend of share prices. Globally low interest rates were a significant contributor to this development, as they made investments in shares more attractive in comparison to other products. On many stock markets, however, especially in Europe, the share price gains came against the backdrop of a relatively thin trade volume; despite the significantly rising share prices, therefore, there can be no talk of a real recovery phase.
The year began with share price gains. At the start of the second quarter, however, the debt crisis in several European countries again took centre stage – significant share price adjustments followed. A positive counter-reaction, did not take hold until June, after repeat elections in Greece had brought a political majority for far-reaching austerity measures and the European Union had proven that it would maintain its capacity to act despite the new govern-ment in France. Mixed developments were seen from this point on: the European stock markets exhibited a volatile upward trend that lasted until year’s end; in the wake of growing fears of a recession, however, the welcome upward movement in the US was abruptly interrupted in early November. As a result of this sharp adjustment, the US stock index Dow Jones Industrial (DJI), with a plus of 7 %, was one of the relatively weaker indexes of 2012.
Despite a plus of 14 %, the pan-European stock index Eurostoxx 50 remains far from its historic high. Europe is by no means developing homogenously, however, and a more differentiated examination is called for: weak market performance in southern Europe’s “problem” states was accom-panied by a significant approximation to historic highs in other countries – Germany’s DAX, for example, grew by 29 % in 2012. In Japan, the end-of-the-year elections
transformed the rather lacklustre stock mar-ket development into a veritable share price fireworks. With a plus of 23 %, the Nikkei 225 provided for excellent full-year results, but still remained far from reaching past highs.
Relatively strong fluctuations characterised the development on the Vienna Stock Ex- change in 2012: the Austrian blue-chip index ATX rapidly climbed past 2,000 points at the beginning of the year, but emergent anxieties on the markets soon resulted in a significant decline. Upward movement resumed in June, albeit with some high fluctuations, and continued until the end of the year. The ATX finally closed the year at just over 2,400 points – far from its record high of nearly 5,000 points in July 2007 – which corre-sponds to a year’s plus of 27 % in 2012. The market development on the Vienna Stock Exchange received considerable support from the recovery of bank and real estate shares.
STRABAG SE share fell by 8 % to € 20.43, making the group one of the few losers in the ATX – despite the 15 % plus for the construction sector index STOXX Europe 600 Construction & Materials. This deve-lopment can clearly be explained by the share’s outperformance the previous year: in 2011, STRABAG was one of just two ATX companies in the plus while all others end-ed the year in negative territory. The low trade activity of STRABAG SE shares also translated into sluggish progress with the buyback programme for own shares: in 2012, STRABAG SE acquired only 2,137,076 shares, or 1.87 % of all shares, ending the year with a 9.57 % stake in its own share capital.
SHARES, BONDS AND INVESTOR RELATIONS
n PRICE ADJUSTMENT OF STRABAG SE SHARES BY 8 %
n PROPOSED DIVIDEND OF € 0.20 PER SHARE
n TEN BANKS COVER STRABAG SE ON A REGULAR BASIS
STRABAG SE SHARE PRICE ADJUSTED AFTER RALLY LAST YEAR
STRABAG SE SHARE AT YEAR’S END: € 20.43
ECOLOGICAL RESPONSIBILITY
ECONOMIC RESPONSIBILITY
VALUES AND COMPLIANCE
CORPORATE CITIZENSHIP
MISSION AND VISION
EMPLOYEES AND WORKPLACE
Kapiteltrenner_links_E.indd 3 22.04.13 15:51

ECOLOGICAL AND SOCIAL RESPONSIBILITY63Corporate Governance
Standards (IFRS) issued by the International Accounting Standards Board (IASB) applicable on the balance sheet date were reviewed by KPMG Austria AG Wirtschaftsprüfungs- und Steuerberatungsgesellschaft, Linz, and awarded their unqualified opinion.
The auditor’s reports and the group financial auditor’s reports were submitted to the supervisory board. The audit committee reviewed the 2012 financial report and the management report including the proposed appropriation of profits and the corporate governance report, and the 2012 consolidated financial statements and group management report, and prepared the approval of the annual financial report by the super-visory board.
The supervisory board reviewed all documents as well as the report by the audit committee. In the meeting of 29 April 2013, the supervisory board stated its agreement with the financial report and the 2012 consolidated financial statements and officially approved the 2012 financial report, thus acknowledging its completion. The supervisory board supports the management board in its proposal for the appropriation of net income. The supervisory board proposes appointing KPMG Austria AG Wirtschaftsprüfungs- und Steuerberatungsgesellschaft, Linz, as auditors and financial auditors for the 2013 financial year, in accordance with the proposal of the audit committee.
Furthermore, the legal firm Fellner Wratzfeld und Partner Rechtsanwälte GmbH conducted an evaluation of compliance of the 2012 corporate governance report in accordance with Section 243b of the Austrian Commercial Code (UGB). The final result of the evaluation did not give rise to any cause for complaint.
By way of closing, the supervisory board would like to express its gratitude and appreciation to the management board and to all employees for their valuable contribution in the past financial year.
The Chairman of the Supervisory Board of STRABAG SE
Dr. Alfred GusenbauerVienna, 29 April 2013
66
At first glance, there may not appear to be any connection between ecological respon-sibility and the construction of buildings and structures. All construction impacts the natural environment and is usually very ener-gy- and resource-intensive. As a provider of construction services, we are aware of this fact. Because we know that a construction site without pollutants, noise and dust will not be a reality in the foreseeable future, it is our aim to limit the negative impact our activity has on the environment to a minimum. To this end, we are continuously investing in processes and technologies in order to increase our energy efficiency and to reduce our environmental impact.
For us, ecological responsibility begins with the planning of buildings and structures and continues through to their construction and operation. We are involved in the develop-ment of certification systems in Germany and Austria early on and are continually working to increase the number of high-quality buildings on the market. This allows us to consider environmental criteria in the planning, construction and use of buildings and structures early in the planning process if the client so desires.
We are making efforts to minimise CO2 emissions and energy use already at an early stage of the value creation process of our products. For this reason, we are shift-ing our focus toward new and innovative products, in particular within the field of renewable energy. Through the constant development of new technologies, it is our aim to steadily increase the STRABAG product portfolio. At the same time, we are working to develop and enhance the right methods and tools to control our impact on the environment.
Representative of our activities and mea- sures within the group, our environmental and energy management is presented below, as these two issues are increasingly moving into the focus of interest. As well
as our employees, who want to work for a responsible company, our clients and investors are also taking an increased in-terest in the company’s approach with regard to ecological responsibility. This approach can even be a decisive factor for the award of a construction project. We can see this most clearly with public-sector contracts in the Netherlands, where external certification for carbon avoidance strategies by SKAO affords us a competitive advantage or – like in most cases, as certification extends to our competitors as well – helps us to preserve competitiveness.
ENVIRONMENTAL MANAGEMENT: FIRST CERTIFICATIONS PLANNEDFOR 2013
Our ISO 14001-certified environmental management system, which has been established within the group for several years, helps us to ensure that defined busi-ness objectives or environmental measures are systematically implemented and that they can be managed at every stage. In addition to key environmental figures, we also developed an environmental policy during introduction of the management system, with appropriate targets regarding the reduction of environmental impact. In some countries, such as Germany, Belgium and Hungary, the system has already been introduced everywhere in form of an integrat- ed management system. The certification of individual group organisations is planned for the year 2013. In other countries, such as Austria and Croatia, the system has been partially introduced.
ECOLOGICAL AND SOCIAL RESPONSIBILITY1)
n STRABAG CARBONTRACKER SOFTWARE CALCULATES FIRST CARBON FOOTPRINT FOR 2012
n OBJECTIVE FOR 2013: DEVELOP KEY ENERGY AND CO2 INDICATORS FOR THE GROUP
n LONG-TERM SUPPORT OF SELECTED SOCIAL AND CULTURAL INITIATIVES
ECOLOGICAL RESPONSIBILITY
MORE INFORMATION ON OUR SUSTAINABLE PRODUCT
PORTFOLIO IS AVAILABLE AT WWW.STRABAG.COM
1) The information presented in this chapter covers only the most important topics and results of the past financial year. Comprehensive information on the fulfilment of our ecological and social responsibility under the group’s CSR strategy can be found online at csr.strabag.com.
ECOLOGICAL RESPONSIBILITY
ECONOMIC RESPONSIBILITY
VALUES AND COMPLIANCE
CORPORATE CITIZENSHIP
MISSION AND VISION
EMPLOYEES AND WORKPLACE
Kapiteltrenner_links_E.indd 1 22.04.13 15:50
OUR THANKS TO OUR SHAREHOLDERS AND BOND INVESTORSSometimes it’s the shares and sometimes it’s the bonds that make investors happy. Good thing that STRABAG has both. That our investor relations team treats shareholders and bond investors the same goes without saying. That is why we are equally pleased with the awards we have won – such as the Vienna Stock Exchange’s Retail Investor Award 2012 and the Corporate Bond Award 2011.
SHAR
ES, B
OND
S &
INVE
STOR
REL
ATIO
NS
Kapiteltrenner_links_E.indd 4 22.04.13 15:52
SHARES, BONDS AND INVESTOR RELATIONS78
After a year of losses, the international stock markets made an impressive rebound in 2012 and the year was characterised by a surprisingly strong upward trend of share prices. Globally low interest rates were a significant contributor to this development, as they made investments in shares more attractive in comparison to other products. On many stock markets, however, especially in Europe, the share price gains came against the backdrop of a relatively thin trade volume; despite the significantly rising share prices, therefore, there can be no talk of a real recovery phase.
The year began with share price gains. At the start of the second quarter, however, the debt crisis in several European countries again took centre stage – significant share price adjustments followed. A positive counter-reaction, did not take hold until June, after repeat elections in Greece had brought a political majority for far-reaching austerity measures and the European Union had proven that it would maintain its capacity to act despite the new govern-ment in France. Mixed developments were seen from this point on: the European stock markets exhibited a volatile upward trend that lasted until year’s end; in the wake of growing fears of a recession, however, the welcome upward movement in the US was abruptly interrupted in early November. As a result of this sharp adjustment, the US stock index Dow Jones Industrial (DJI), with a plus of 7 %, was one of the relatively weaker indexes of 2012.
Despite a plus of 14 %, the pan-European stock index Eurostoxx 50 remains far from its historic high. Europe is by no means developing homogenously, however, and a more differentiated examination is called for: weak market performance in southern Europe’s “problem” states was accom-panied by a significant approximation to historic highs in other countries – Germany’s DAX, for example, grew by 29 % in 2012. In Japan, the end-of-the-year elections
transformed the rather lacklustre stock mar-ket development into a veritable share price fireworks. With a plus of 23 %, the Nikkei 225 provided for excellent full-year results, but still remained far from reaching past highs.
Relatively strong fluctuations characterised the development on the Vienna Stock Ex- change in 2012: the Austrian blue-chip index ATX rapidly climbed past 2,000 points at the beginning of the year, but emergent anxieties on the markets soon resulted in a significant decline. Upward movement resumed in June, albeit with some high fluctuations, and continued until the end of the year. The ATX finally closed the year at just over 2,400 points – far from its record high of nearly 5,000 points in July 2007 – which corre-sponds to a year’s plus of 27 % in 2012. The market development on the Vienna Stock Exchange received considerable support from the recovery of bank and real estate shares.
STRABAG SE share fell by 8 % to € 20.43, making the group one of the few losers in the ATX – despite the 15 % plus for the construction sector index STOXX Europe 600 Construction & Materials. This deve-lopment can clearly be explained by the share’s outperformance the previous year: in 2011, STRABAG was one of just two ATX companies in the plus while all others end-ed the year in negative territory. The low trade activity of STRABAG SE shares also translated into sluggish progress with the buyback programme for own shares: in 2012, STRABAG SE acquired only 2,137,076 shares, or 1.87 % of all shares, ending the year with a 9.57 % stake in its own share capital.
SHARES, BONDS AND INVESTOR RELATIONS
n PRICE ADJUSTMENT OF STRABAG SE SHARES BY 8 %
n PROPOSED DIVIDEND OF € 0.20 PER SHARE
n TEN BANKS COVER STRABAG SE ON A REGULAR BASIS
STRABAG SE SHARE PRICE ADJUSTED AFTER RALLY LAST YEAR
STRABAG SE SHARE AT YEAR’S END: € 20.43
ECOLOGICAL RESPONSIBILITY
ECONOMIC RESPONSIBILITY
VALUES AND COMPLIANCE
CORPORATE CITIZENSHIP
MISSION AND VISION
EMPLOYEES AND WORKPLACE
Kapiteltrenner_links_E.indd 3 22.04.13 15:51

7878
After a year of losses, the international stock markets made an impressive rebound in 2012 and the year was characterised by a surprisingly strong upward trend of share prices. Globally low interest rates were a significant contributor to this development, as they made investments in shares more attractive in comparison to other products. On many stock markets, however, especially in Europe, the share price gains came against the backdrop of a relatively thin trade volume; despite the significantly rising share prices, therefore, there can be no talk of a real recovery phase.
The year began with share price gains. At the start of the second quarter, however, the debt crisis in several European countries again took centre stage – significant share price adjustments followed. A positive counter-reaction, did not take hold until June, after repeat elections in Greece had brought a political majority for far-reaching austerity measures and the European Union had proven that it would maintain its capacity to act despite the new govern-ment in France. Mixed developments were seen from this point on: the European stock markets exhibited a volatile upward trend that lasted until year’s end; in the wake of growing fears of a recession, however, the welcome upward movement in the US was abruptly interrupted in early November. As a result of this sharp adjustment, the US stock index Dow Jones Industrial (DJI), with a plus of 7 %, was one of the relatively weaker indexes of 2012.
Despite a plus of 14 %, the pan-European stock index Eurostoxx 50 remains far from its historic high. Europe is by no means developing homogenously, however, and a more differentiated examination is called for: weak market performance in southern Europe’s “problem” states was accom-panied by a significant approximation to historic highs in other countries – Germany’s DAX, for example, grew by 29 % in 2012. In Japan, the end-of-the-year elections
transformed the rather lacklustre stock mar-ket development into a veritable share price fireworks. With a plus of 23 %, the Nikkei 225 provided for excellent full-year results, but still remained far from reaching past highs.
Relatively strong fluctuations characterised the development on the Vienna Stock Ex- change in 2012: the Austrian blue-chip index ATX rapidly climbed past 2,000 points at the beginning of the year, but emergent anxieties on the markets soon resulted in a significant decline. Upward movement resumed in June, albeit with some high fluctuations, and continued until the end of the year. The ATX finally closed the year at just over 2,400 points – far from its record high of nearly 5,000 points in July 2007 – which corre-sponds to a year’s plus of 27 % in 2012. The market development on the Vienna Stock Exchange received considerable support from the recovery of bank and real estate shares.
STRAbAG SE share fell by 8 % to € 20.43, making the group one of the few losers in the ATX – despite the 15 % plus for the construction sector index STOXX Europe 600 Construction & Materials. This deve-lopment can clearly be explained by the share’s outperformance the previous year: in 2011, STRAbAG was one of just two ATX companies in the plus while all others end-ed the year in negative territory. The low trade activity of STRAbAG SE shares also translated into sluggish progress with the buyback programme for own shares: in 2012, STRAbAG SE acquired only 2,137,076 shares, or 1.87 % of all shares, ending the year with a 9.57 % stake in its own share capital.
sHARes, BonDs AnD investoR ReLAtions
n pRicE adJuStmEnt Of StRaBaG SE ShaRES BY 8 %
n pROpOSEd diVidEnd Of € 0.20 pER ShaRE
n tEn BanKS cOVER StRaBaG SE On a REGulaR BaSiS
StRaBaG SE ShaRE pRicE adJuStEd aftER RallY laSt YEaR
StRaBaG SE ShaRE at YEaR’S End: € 20.43
ECOLOGICAL RESPONSIBILITY
ECONOMIC RESPONSIBILITY
VALUES AND COMPLIANCE
CORPORATE CITIZENSHIP
MISSION AND VISION
EMPLOYEES AND WORKPLACE
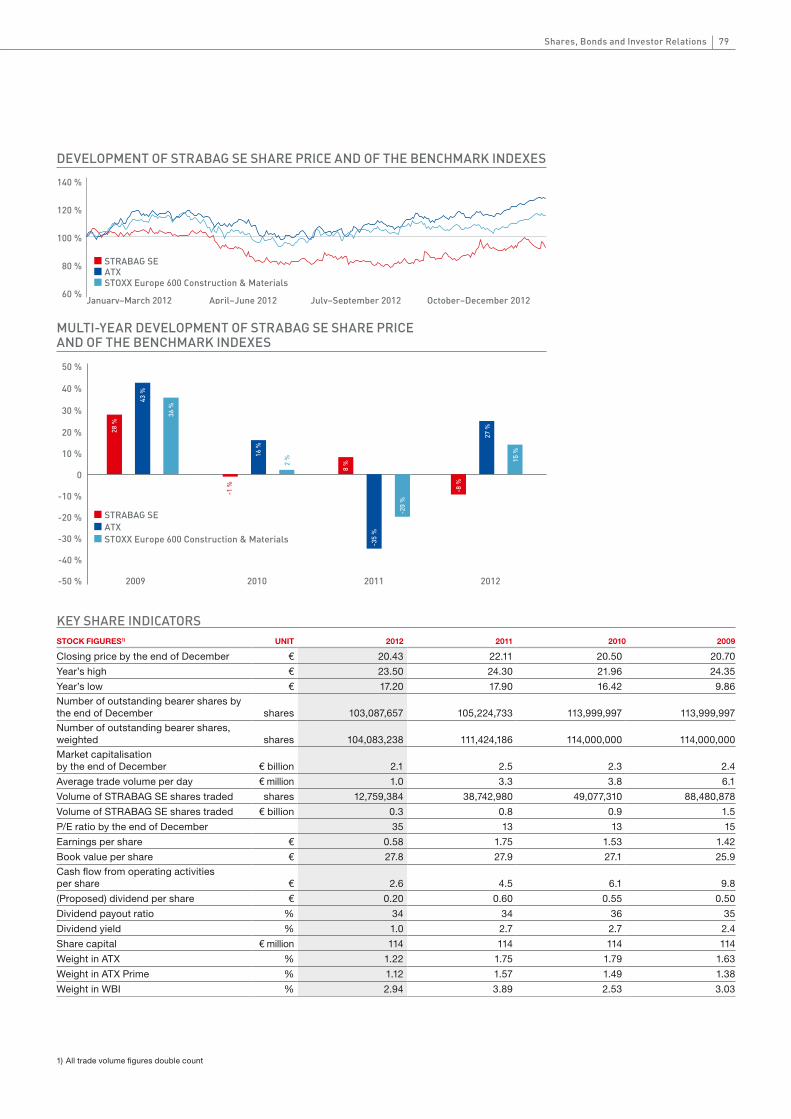
79Shares, Bonds and investor Relations
sTOCK FiGuREs1) uniT 2012 2011 2010 2009
Closing price by the end of December € 20.43 22.11 20.50 20.70
Year’s high € 23.50 24.30 21.96 24.35
Year’s low € 17.20 17.90 16.42 9.86Number of outstanding bearer shares by the end of December shares 103,087,657 105,224,733 113,999,997 113,999,997Number of outstanding bearer shares, weighted shares 104,083,238 111,424,186 114,000,000 114,000,000Market capitalisationby the end of December € billion 2.1 2.5 2.3 2.4
Average trade volume per day € million 1.0 3.3 3.8 6.1
Volume of STRAbAG SE shares traded shares 12,759,384 38,742,980 49,077,310 88,480,878
Volume of STRAbAG SE shares traded € billion 0.3 0.8 0.9 1.5
P/E ratio by the end of December 35 13 13 15
Earnings per share € 0.58 1.75 1.53 1.42
book value per share € 27.8 27.9 27.1 25.9Cash flow from operating activities per share € 2.6 4.5 6.1 9.8
(Proposed) dividend per share € 0.20 0.60 0.55 0.50
Dividend payout ratio % 34 34 36 35
Dividend yield % 1.0 2.7 2.7 2.4
Share capital € million 114 114 114 114
Weight in ATX % 1.22 1.75 1.79 1.63
Weight in ATX Prime % 1.12 1.57 1.49 1.38
Weight in WbI % 2.94 3.89 2.53 3.03
MULTI-YEAR DEVELOPMENT OF STRABAG SE SHARE PRICE AND OF THE BENCHMARK INDEXES
2009 2010 2011
-30 %
-20 %
-10 %
0
10 %
20 %
30 %
40 %
STRABAG SE ATXSTOXX Europe 600 Construction & Materials
28 %
43 %
36 %
-1 %
16 %
2 %
8 %
-35
%
-20
%
-8 %
27 %
15 %
2012
50 %
-50 %
-40 %
140 %
120 %
100 %
80 %
60 %
DEVELOPMENT OF STRABAG SE SHARE PRICE AND OF THE BENCHMARK INDEXES
January–March 2012 April–June 2012 July–September 2012 October–December 2012
STRABAG SE ATXSTOXX Europe 600 Construction & Materials
1) All trade volume figures double count
KEY ShaRE indicatORS
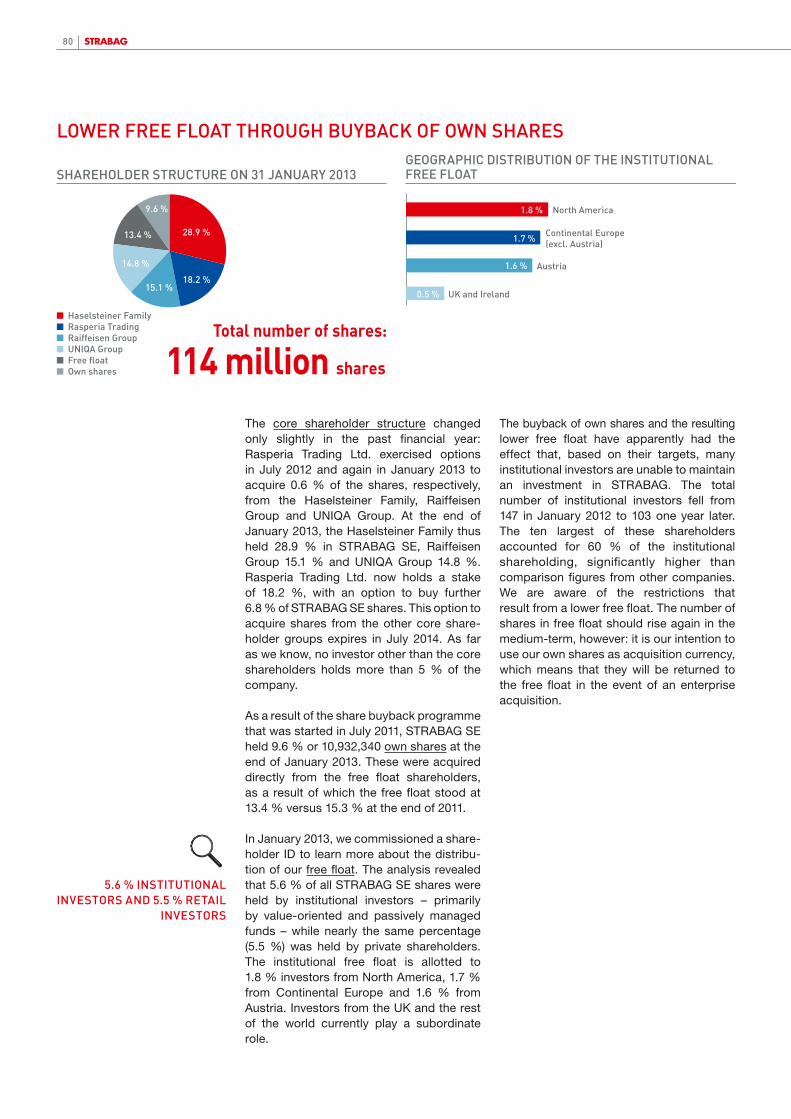
80
The core shareholder structure changed only slightly in the past financial year: Rasperia Trading Ltd. exercised options in July 2012 and again in January 2013 to acquire 0.6 % of the shares, respectively, from the Haselsteiner Family, Raiffeisen Group and UNIQA Group. At the end of January 2013, the Haselsteiner Family thus held 28.9 % in STRAbAG SE, Raiffeisen Group 15.1 % and UNIQA Group 14.8 %. Rasperia Trading Ltd. now holds a stake of 18.2 %, with an option to buy further 6.8 % of STRAbAG SE shares. This option to acquire shares from the other core share-holder groups expires in July 2014. As far as we know, no investor other than the core shareholders holds more than 5 % of the company.
As a result of the share buyback programme that was started in July 2011, STRAbAG SE held 9.6 % or 10,932,340 own shares at the end of January 2013. These were acquired directly from the free float shareholders, as a result of which the free float stood at 13.4 % versus 15.3 % at the end of 2011.
In January 2013, we commissioned a share-holder ID to learn more about the distribu-tion of our free float. The analysis revealed that 5.6 % of all STRAbAG SE shares were held by institutional investors – primarily by value-oriented and passively managed funds – while nearly the same percentage (5.5 %) was held by private shareholders. The institutional free float is allotted to 1.8 % investors from North America, 1.7 % from Continental Europe and 1.6 % from Austria. Investors from the UK and the rest of the world currently play a subordinate role.
The buyback of own shares and the resulting lower free float have apparently had the effect that, based on their targets, many institutional investors are unable to maintain an investment in STRAbAG. The total number of institutional investors fell from 147 in January 2012 to 103 one year later. The ten largest of these shareholders accounted for 60 % of the institutional shareholding, significantly higher than comparison figures from other companies. We are aware of the restrictions that result from a lower free float. The number of shares in free float should rise again in the medium-term, however: it is our intention to use our own shares as acquisition currency, which means that they will be returned to the free float in the event of an enterprise acquisition.
lOWER fREE flOat thROuGh BuYBacK Of OWn ShaRES
114 million shares
■ Haselsteiner Family■ Rasperia Trading■ Raiffeisen Group■ UNIQA Group■ Free float■ Own shares
SHAREHOLDER STRUCTURE ON 31 JANUARY 2013
9.6 %
28.9 %
18.2 %15.1 %
14.8 %
13.4 %
Total number of shares:
North America
Continental Europe (excl. Austria)
UK and Ireland
Austria
GEOGRAPHIC DISTRIBUTION OF THE INSTITUTIONAL FREE FLOAT
1.8 %
1.7 %
1.6 %
0.5 %
5.6 % inStitutiOnal inVEStORS and 5.5 % REtail
inVEStORS
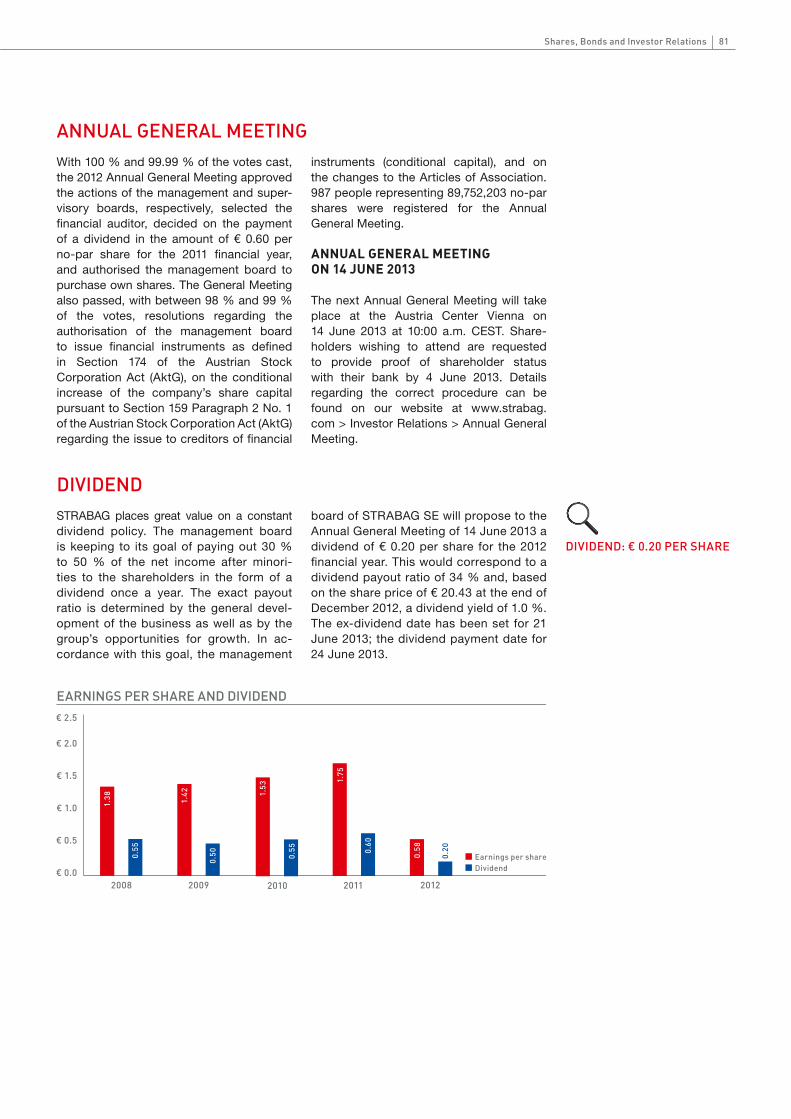
80 81
diVidEnd: € 0.20 pER ShaRE
Shares, Bonds and investor Relations
annual GEnERal mEEtinG
diVidEndSTRAbAG places great value on a constant dividend policy. The management board is keeping to its goal of paying out 30 % to 50 % of the net income after minori-ties to the shareholders in the form of a dividend once a year. The exact payout ratio is determined by the general devel-opment of the business as well as by the group’s opportunities for growth. In ac-cordance with this goal, the management
board of STRAbAG SE will propose to the Annual General Meeting of 14 June 2013 a dividend of € 0.20 per share for the 2012 financial year. This would correspond to a dividend payout ratio of 34 % and, based on the share price of € 20.43 at the end of December 2012, a dividend yield of 1.0 %. The ex-dividend date has been set for 21 June 2013; the dividend payment date for 24 June 2013.
2008 2009 2010 2011
■ Earnings per share■ Dividend€ 0.0
€ 0.5
€ 1.0
€ 1.5
€ 2.0
€ 2.5
EARNINGS PER SHARE AND DIVIDEND
1.38
0.55
1.42
0.50
1.53
0.55
1.75
0.60
2012
€ X
XX
0.58
0.20
With 100 % and 99.99 % of the votes cast, the 2012 Annual General Meeting approved the actions of the management and super-visory boards, respectively, selected the financial auditor, decided on the payment of a dividend in the amount of € 0.60 per no-par share for the 2011 financial year, and authorised the management board to purchase own shares. The General Meeting also passed, with between 98 % and 99 % of the votes, resolutions regarding the authorisation of the management board to issue financial instruments as defined in Section 174 of the Austrian Stock Corporation Act (AktG), on the conditional increase of the company’s share capital pursuant to Section 159 Paragraph 2 No. 1 of the Austrian Stock Corporation Act (AktG) regarding the issue to creditors of financial
instruments (conditional capital), and on the changes to the Articles of Association. 987 people representing 89,752,203 no-par shares were registered for the Annual General Meeting.
AnnUAL GeneRAL MeetinG on 14 JUne 2013
The next Annual General Meeting will take place at the Austria Center Vienna on 14 June 2013 at 10:00 a.m. CEST. Share-holders wishing to attend are requested to provide proof of shareholder status with their bank by 4 June 2013. Details regarding the correct procedure can be found on our website at www.strabag.com > Investor Relations > Annual General Meeting.
82
STRAbAG SE (and its predecessor, FIMAG) has to date issued ten corporate bonds, of which four are still listed. With the newest issue of a 2012–2019 bond with a coupon of 4.25 %, STRAbAG continued its years-long strategy of bond issues. The proceeds from the issue were used to pay back a matured € 75 million bond issued in 2007 as well as for general business purposes. The issue also helped the group to further improve its financing structure.
For the first time in company history, STRAbAG SE in March 2012 placed a bonded loan in the amount of € 140 million. This long-term debt financing instrument is in many ways similar to a bond, with an im-portant difference being that bonded loans are issued directly to institutional investors without using an organised capital market, i.e. an exchange. This reduces the admin-istrative effort compared with a bond issue.
s&p AGAin conFiRMs coRpoRAtecReDit RAtinG oF BBB-
STRAbAG SE and its bonds are rated by the ratings agency Standard & Poor’s (S&P). In November 2007, S&P raised the corporate credit rating for STRAbAG SE from bb+ to bbb-, thus elevating STRAbAG SE to “investment grade”. In December 2012, S&P again confirmed its bbb- rating and stable outlook for STRAbAG SE. Explaining its decision, S&P cited the group’s well-diversified and vertically integrated business, its access to raw materials and its adequately high liquidity.
S&p-RatinG: BBB-
Although we pursued our investor relations activities as persistently in 2012 as the year before, investor interest remained only moderate. In addition to the prescribed quarterly reports, we informed some 61 investors and analysts (2011: 135) in 43 (102) one-on-ones, telephone conferences and group talks. We took part in 6 (15) road shows and investor conferences organised by baader bank, Deutsche bank, Erste Group and Raiffeisen Centrobank. In all, we spent some 5 (13) working days on investor talks in places such as Vienna, London, Frankfurt, Zurich and Milan.
If you want to learn more about our future road show activities, please visit our website at www.strabag.com > Investor Relations. The corporate calendar is updated continuously and includes all the planned road show events as well as the dates for the publica-tion of our financial results.
we ARe in constAnt contAct witHoUR investoRs
Not only are we in constant e-mail and telephone contact with our institutional investors and analysts, we also provide extensive information to our private investors. We do so among other things by offering web and audio broadcasts of portions of our Annual General Meetings, investor conferences and press confer- ences on our website. We also regularly take part in private investor events – in 2012, for example, we took part in a round table debate during the ”GEWINN“ trade fair in Vienna. We try to reach our private share- holders and interested parties through a variety of different channels. Every individual investor benefits from our taking the time to communicate with the market and to strive for constant improvement in our investor relations work – because excellent investor relations have a positive effect on the share price.
inVEStOR RElatiOnS
OuR thanKS tO OuR ShaREhOldERS
TERm inTEREsT vOlumE isin EXChAnGE
2008–2013 5.75 % € 75 million AT0000A09H96 Vienna
2010–2015 4.25 % € 100 million AT0000A0DRJ9 Vienna
2011–2018 4.75 % € 175 million AT0000A0PHV9 Vienna
2012–2019 4.25 % € 100 million AT0000A0V7D8 Vienna
BOndS and BOndEd lOanS

© A
ndre
as b
uchb
erg
er82 83Shares, Bonds and investor Relations
It is our goal to further increase our inves-tor relations efforts, to maintain a steady flow of information and, in so doing, help bank analysts make correct assessments of STRAbAG SE shares. Analyst observa-tions provide current as well as potential shareholders with a first indication of the assessment of STRAbAG SE. We are there- fore proud that, in the past few months, one further bank has decided to cover our shares, so that now ten banks regularly analyse STRAbAG in order to issue target prices and recommendations for our shares:
n bank of America Merrill Lynch, London (Marcin Wojtal)n Deutsche bank, Vienna (Matthias Pfeifenberger)n DZ bank, Frankfurt (Marc Nettelbeck)n Erste Group, Vienna (Franz Hörl)n Goldman Sachs, London (Will Morgan)n HSbC Trinkaus & burkhardt, Düsseldorf (Tobias Loskamp)n Kepler Capital Markets, Vienna (Stephan Trubrich)n LbbW, Stuttgart (Hans-Peter Kuhlmann)n MainFirst bank, Frankfurt (Christian Korth)n Raiffeisen Centrobank, Vienna (Markus Remis)
STRAbAG SE’s Investor Relations de-partment reports directly to the CEO and sees itself as the service department for existing and potential private share- holders, institutional investors and ana-lysts, as well as the point of contact for capital market issues for the group’s operating units. For us, quick response times, comprehensive information and a constant dialogue with capital market participants and the public are a matter of course. We place great importance on informing all shareholder groups quickly and simultaneously. To achieve this, we publish all company-relevant news on our website at the same time that we send our shareholder newsletter per e-mail. If you would like to receive this information, please send us the reply card – which you will find at the end of this Annual Report –
or register on the Investor Relations page on our website www.strabag.com.
Your questions and suggestions are im-portant to us for the continued improve-ment of our services. We look forward to hearing from you:
STRAbAG SEInvestor RelationsMag. Diana Neumüller-Klein, CFA, Head of Investor RelationsMag. Paula Rys, Investor Relations
Donau-City-Str. 9, 1220 Vienna/Austria +43 800 880 890 +43 1 22422-1177@ [email protected]
hOW tO REcEiVE infORmatiOn aBOut StRaBaG SE
at WWW.StRaBaG.cOm > inVEStOR RElatiOnS YOu Will alSO find:n Up-to-date road show documentsn Company presentationsn Analyst consensus recommendationsn Live broadcasts and recordings of telephone and investor conferencesn Stock calculatorn Subscription to receive daily share price informationn Individual share price chartsn Download versions of the Annual Reports and Interim Reportsn Order form for the print versions of our publicationsn Financial Calendar

WHAT UNITES USOver 100 organisational units and more than 250 locations in Germany, Hungary and Switzerland have so far been visited by the STRABAG 2013ff task force led by Fritz Oberlerchner. In talks with 170 managers, the task force has been searching for what unites the group – like this bridge between Switzerland and Austria.
STRATEGY
Kapiteltrenner_rechts_E.indd 1 22.04.13 15:42
WORKING TOGETHER FLEXIBLYWhen you operate in more than 80 countries in the world, you can be flexible: Our regional diversifi-cation allows us to utilise our capacities wherever they are needed. But you’ve got to be flexible too – by meeting for a spontaneous video conference, for example.
GROUP MANAGEMENT REPORT
Kapiteltrenner_rechts_E.indd 7 22.04.13 15:47
GROU
P M
ANAG
EMEN
T R
EPOR
T
83Shares, Bonds and Investor Relations
© A
ndre
as B
uchb
erg
er
86
€ 254 million transportation infrastructures contract in Poland At the beginning of January, the company signed an approx. € 254 million contract to build a 40 km section of the S8 expressway in Poland. The order also includes the construction of 18 bridges, the conversion of adjacent local and municipal roads, as well as the construction of a rest area including the technical infrastructure.
Offshore wind project companies acquiredIn January, the contracts were finalised and signed for the acquisition of a 51 % interest in nine offshore wind project companies for the development, construction and subsequent operation of offshore wind turbines in the German North Sea. The contracts for six further project companies had already been concluded in 2011.
Bus rapid transit system in TanzaniaSTRABAG is building a bus rapid transit (BRT) infrastructure – an above-ground bus transport system with separate bus lanes and priority right of way – in Tanzania’s main city of Dar es Salaam. The € 134 million contract includes the rehabilitation and expansion of a total of three main traffic arteries.
Billion-euro Pedemontana Lombarda motorway in ItalyThe order for the STRABAG consortium includes the construction of a 50 km dual carriageway motorway with two or three lanes in each direction as well as 50 km of spurs and connecting routes to the existing road network. The contract also comprises 50 cut-and-cover tunnels as well as two bored tunnels including technical facilities, bridges and an approximately 80 km bicycle trail. Work on the € 1.7 billion order (STRABAG’s expected share amounts to approx. € 1.0 billion) is to be completed in time for the Milan Universal Exposition in 2015.
STRABAG SE places € 140 million bonded loanTo help diversify its financing structure, STRABAG SE placed a € 140 million bonded loan with European and Asian financial institutions as well as institutional investors from Germany. The volume of the issue is divided among two fixed-interest and two variable tranches with terms to maturity of five and seven years.
Extension of underground line U1 in ViennaSTRABAG was awarded the two construction contract sections U1/9 – “Altes Landgut” and U1/10 – “Troststrasse” forming part of the extension of underground line U1 into the south of Vienna, Austria. The order value amounts to a total of around € 90 million.
STRABAG Switzerland enters into strategic partnership with BH-HoldingSTRABAG reached an agreement over a strategic partnership with BH-Holding AG in the Swiss cantons of Zurich and Zug. The agreement gives STRABAG the option of assuming the construction works for projects acquired or developed by BH-Holding’s construction subsidiary, Baunova Group. STRABAG will also assume operating management and a stake of 51 % in Baunova AG.
Campus for Hamm-Lippstadt University of Applied Sciences for € 100 millionThe Hamm-Lippstadt University of Applied Sciences in Germany opened in temporary premises in 2009. By 2014, STRABAG subsidiary Ed. Züblin AG will have completed the turnkey construction of new lecture halls, laboratories, administration buildings and dining halls, as well as all exterior facilities and the execution planning. Within the planned con- struction time of 20 months, a total of around 38,000 m² of gross floor area will be built at the Hamm Campus and about 21,000 m² at Lippstadt.
GROUP MANAGEMENT REPORT1)
1) This part has been audited by the financial auditor KPMG.
IMPORTANT EVENTSJANUARY
FEBRUARY
MARCH
It is our goal to further increase our inves-tor relations efforts, to maintain a steady flow of information and, in so doing, help bank analysts make correct assessments of STRABAG SE shares. Analyst observa-tions provide current as well as potential shareholders with a first indication of the assessment of STRABAG SE. We are there- fore proud that, in the past few months, one further bank has decided to cover our shares, so that now ten banks regularly analyse STRABAG in order to issue target prices and recommendations for our shares:
n Bank of America Merrill Lynch, London (Marcin Wojtal)n Deutsche Bank, Vienna (Matthias Pfeifenberger)n DZ Bank, Frankfurt (Marc Nettelbeck)n Erste Group, Vienna (Franz Hörl)n Goldman Sachs, London (Will Morgan)n HSBC Trinkaus & Burkhardt, Düsseldorf (Tobias Loskamp)n Kepler Capital Markets, Vienna (Stephan Trubrich)n LBBW, Stuttgart (Hans-Peter Kuhlmann)n MainFirst Bank, Frankfurt (Christian Korth)n Raiffeisen Centrobank, Vienna (Markus Remis)
STRABAG SE’s Investor Relations de-partment reports directly to the CEO and sees itself as the service department for existing and potential private share- holders, institutional investors and ana-lysts, as well as the point of contact for capital market issues for the group’s operating units. For us, quick response times, comprehensive information and a constant dialogue with capital market participants and the public are a matter of course. We place great importance on informing all shareholder groups quickly and simultaneously. To achieve this, we publish all company-relevant news on our website at the same time that we send our shareholder newsletter per e-mail. If you would like to receive this information, please send us the reply card – which you will find at the end of this Annual Report –
or register on the Investor Relations page on our website www.strabag.com.
Your questions and suggestions are im-portant to us for the continued improve-ment of our services. We look forward to hearing from you:
STRABAG SEInvestor RelationsMag. Diana Neumüller-Klein, CFA, Head of Investor RelationsMag. Paula Rys, Investor Relations
Donau-City-Str. 9, 1220 Vienna/Austria +43 800 880 890 +43 1 22422-1177@ [email protected]
HOW TO RECEIVE INFORMATION ABOUT STRABAG SE
AT WWW.STRABAG.COM > INVESTOR RELATIONS YOU WILL ALSO FIND:n Up-to-date road show documentsn Company presentationsn Analyst consensus recommendationsn Live broadcasts and recordings of telephone and investor conferencesn Stock calculatorn Subscription to receive daily share price informationn Individual share price chartsn Download versions of the Annual Reports and Interim Reportsn Order form for the print versions of our publicationsn Financial Calendar
Kapiteltrenner_rechts_E.indd 8 22.04.13 15:48
8686
€ 254 million transportation infrastructures contract in poland At the beginning of January, the company signed an approx. € 254 million contract to build a 40 km section of the S8 expressway in Poland. The order also includes the construction of 18 bridges, the conversion of adjacent local and municipal roads, as well as the construction of a rest area including the technical infrastructure.
Offshore wind project companies acquiredIn January, the contracts were finalised and signed for the acquisition of a 51 % interest in nine offshore wind project companies for the development, construction and subsequent operation of offshore wind turbines in the German North Sea. The contracts for six further project companies had already been concluded in 2011.
Bus rapid transit system in TanzaniaSTRAbAG is building a bus rapid transit (bRT) infrastructure – an above-ground bus transport system with separate bus lanes and priority right of way – in Tanzania’s main city of Dar es Salaam. The € 134 million contract includes the rehabilitation and expansion of a total of three main traffic arteries.
Billion-euro pedemontana lombarda motorway in italyThe order for the STRAbAG consortium includes the construction of a 50 km dual carriageway motorway with two or three lanes in each direction as well as 50 km of spurs and connecting routes to the existing road network. The contract also comprises 50 cut-and-cover tunnels as well as two bored tunnels including technical facilities, bridges and an approximately 80 km bicycle trail. Work on the € 1.7 billion order (STRAbAG’s expected share amounts to approx. € 1.0 billion) is to be completed in time for the Milan Universal Exposition in 2015.
sTRABAG sE places € 140 million bonded loanTo help diversify its financing structure, STRAbAG SE placed a € 140 million bonded loan with European and Asian financial institutions as well as institutional investors from Germany. The volume of the issue is divided among two fixed-interest and two variable tranches with terms to maturity of five and seven years.
Extension of underground line u1 in viennaSTRAbAG was awarded the two construction contract sections U1/9 – “Altes Landgut” and U1/10 – “Troststrasse” forming part of the extension of underground line U1 into the south of Vienna, Austria. The order value amounts to a total of around € 90 million.
sTRABAG switzerland enters into strategic partnership with Bh-holdingSTRAbAG reached an agreement over a strategic partnership with bH-Holding AG in the Swiss cantons of Zurich and Zug. The agreement gives STRAbAG the option of assuming the construction works for projects acquired or developed by bH-Holding’s construction subsidiary, baunova Group. STRAbAG will also assume operating management and a stake of 51 % in baunova AG.
Campus for hamm-lippstadt university of Applied sciences for € 100 millionThe Hamm-Lippstadt University of Applied Sciences in Germany opened in temporary premises in 2009. by 2014, STRAbAG subsidiary Ed. Züblin AG will have completed the turnkey construction of new lecture halls, laboratories, administration buildings and dining halls, as well as all exterior facilities and the execution planning. Within the planned con- struction time of 20 months, a total of around 38,000 m² of gross floor area will be built at the Hamm Campus and about 21,000 m² at Lippstadt.
GRoUp MAnAGeMent RepoRt1)
1) This part has been audited by the financial auditor KPMG.
impORtant EVEntSJanuaRY
fEBRuaRY
maRch
87group management Report
Ed. Züblin AG awarded large contract for “stuttgart 21” transportation projectThe order encompasses the construction of the station concourse, of the access tunnels at the south and north ends of the station using the cut-and-cover method, and of the Hauptsammler West, Cannstatter Strasse and Nesenbach culverts in Stuttgart, Germany. The order has a net value of about € 320 million.
Acquisition of wallsee-based Brandner wasserbau Effective retroactively to 1 January 2012, STRAbAG SE acquired 100 % of brandner Wasserbau GmbH, based in Wallsee, Austria. The family SME has been active in the fields of hydraulic engineering, sand and gravel mining, and hydrography for more than 200 years. The acquisition bolsters the STRAbAG Group in the business field of hydraulic engineering and will allow the company to work the market with its own equipment and personnel.
sTRABAG sE issues € 100 million corporate bondSTRAbAG SE issued a seven-year, € 100 million fixed-interest corporate bond with a face value of EUR 1,000.00 and a coupon of 4.25 %. The issue price was set at 101.45. The international ratings agency Standard & Poor’s rates the 2012 STRAbAG bond as investment grade with a rating of bbb-.
new contracts for EFKOn in indiaEFKON AG, a subsidiary of STRAbAG SE, was awarded six contracts in the field of intelli-gent transportation systems (ITS) worth a total of around € 10 million in India.
Renovation of national Road m2 in moldovaSTRAbAG was awarded the contract to renew a 48 km section of National Road M2 be-tween Ghindeşti and Drochia by the Republic of Moldova and the Millennium Challenge Account (MCA Moldova). The project, worth approx. € 35 million, comprises the rehabilitation of roadway and bridges as well as the improvement of junctions within a construction period of 24 months.
Changes to the organisational structure at sTRABAG sEHans Peter Haselsteiner will resign as CEO of STRAbAG SE after the Annual General Meeting that will vote on the approval of the management board actions for the 2013 financial year – most likely in June 2014. As his designated successor, he will propose that the supervisory board select current management board member Thomas birtel. At the same time, Deputy CEO Fritz Oberlerchner resigned from the management board effective 30 June 2012 to objectively lead the “STRAbAG 2013ff” task force charged with evaluating the STRAbAG Group’s options regarding its organisational and strategic future. STRAbAG also departed from the principle of assigning board member responsibility according to business segment as well as from the principle of having a technical and commercial director for each segment at the management board level and is instead assigning business responsibility by region. Effective 1 July 2012, the group is organised into the segments North + West, South + East and International + Special Divisions, as well as Other.
Tunnelling contract at world’s largest copper mine in ChileSTRAbAG won a new tunnelling project at the world’s largest copper mine in Chuquicamata in the Chilean desert. The tunnellers from STRAbAG, together with those from STRAbAG subsidiary Züblin Chile and a local partner, will build several tunnels to improve the infrastructure of the mine. The contract is worth about € 100 million and will be executed over a period of three years.
apRil
maY
JunE
JulY

88
school project in hamburg The city of Hamburg, Germany, commissioned HEOS berufsschulen Hamburg GmbH, a special purpose company set up in part by STRAbAG Real Estate GmbH, with the planning, construction, renovation and management of 15 selected vocational schools. The € 700 million project is being carried out under a public-private partnership (PPP) model over 30 years including the approximately five-year construction and renovation period.
sTRABAG building waste treatment facility in ljubljanaThe city of Ljubljana, Slovenia, awarded STRAbAG the € 112 million contract to build the RCERO waste treatment facility for the generation of biogas from organic waste, the production of refuse-derived fuel and the recycling of reusable materials. The biogas facility with the patented STRAbAG LARAN® plug flow fermenter will be one of the most state- of-the-art of its kind in Europe.
large contract for Alto maipo hydropower complex in ChileThe Chilean tunnelling division of STRAbAG SE signed a design and building contract for the majority of the tunnelling and civil engineering works of the Alto Maipo hydropower complex. The contract is one of the biggest private construction contracts in South America. The client is a subsidiary of the Chilean-based AES Gener and the US-based AES Corporation. The complete contract consists of tunnels and shafts with a total length of 46.5 km. The design and construction phase will last approximately four-and-a-half years.
Contract on vienna–salzburg high-performance rail lineAfter the opening of the high-performance rail line through the Tullnerfeld, Öbb Infrastruktur AG is further upgrading the Westbahn line and awarded STRAbAG the contract to build the section West between St. Pölten and Loosdorf. The contract has a value of about € 33 million.
sTRABAG sE appointed Chief Financial Officer (CFO) At its meeting of 14 December 2012, the supervisory board appointed Christian Harder (44), managing director of bRVZ bau- Rechen- u. Verwaltungszentrum Gesellschaft m.b.H., the STRAbAG SE subsidiary responsible for the service functions of accounting, taxes, finances, IT, human resources, real estate, insurance and organisational development, to the manage-ment of STRAbAG SE. He has assumed this position as of 1 January 2013. At the same time, Thomas birtel was appointed Deputy CEO of the STRAbAG SE management board.
stronger financial position through € 400 million syndicated cash credit lineSTRAbAG SE arranged a revolving syndicated cash credit line with a consortium of banks in the amount of € 400 million. With a term of five years, the credit line represents a long-term loan commitment with which STRAbAG further safeguards its comfortable liquidity position.
SEptEmBER
nOVEmBER
dEcEmBER

88 89group management Report
cOuntRY REpORtOutput VOlumE Of StRaBaG SE BY cOuntRY 2011–2012
€ mln. 2012
% OF TOTAlOuTpuT
vOlumE 2012 2011ChAnGE
%ChAnGE
ABsOluTE
% OF TOTAlOuTpuT
vOlumE 2011
Germany 5,779 41 % 5,609 3 % 170 39 %
Austria 1,888 13 % 1,985 -5 % -97 14 %
Poland 1,139 8 % 1,719 -34 % -580 12 %
Czech Republic 646 5 % 769 -16 % -123 5 %
Scandinavia 579 4 % 512 13 % 67 4 %Russia and neighbouring countries 527 4 % 487 8 % 40 3 %
benelux 456 3 % 360 27 % 96 3 %
Switzerland 425 3 % 574 -26 % -149 4 %
Slovakia 400 3 % 441 -9 % -41 3 %
Hungary 393 3 % 436 -10 % -43 3 %
Romania 372 3 % 206 81 % 166 1 %
The Americas 348 2 % 257 35 % 91 2 %
Middle East 305 2 % 309 -1 % -4 2 %
Italy 157 1 % 186 -16 % -29 1 %
Croatia 130 1 % 106 23 % 24 1 %
Africa 125 1 % 63 98 % 62 1 %
Asia 111 1 % 109 2 % 2 1 %
Rest of Europe 83 1 % 44 89 % 39 0 %
Slovenia 81 1 % 49 65 % 32 0 %
Serbia 72 0 % 87 -17 % -15 1 %
bulgaria 27 0 % 18 50 % 9 0 %
Total 14,043 100 % 14,326 -2 % -283 100 %
thereof CEE1) 3,787 27 % 4,318 -12 % -531 30 %
Despite the strong presence in its home markets of Austria and Germany, STRAbAG sees itself as a European company. The group has been active in Central and Eastern Europe for several decades in order to diversify the country risk and to profit from the market opportunities in the region. In the 2012 financial year, business in these countries accounted for 27 % (2011: 30 %) of the total group output vol-ume. This gives STRAbAG a unique position in comparison to the competition and
makes it the market leader in the construc-tion sector in Central and Eastern Europe. Even if the growth rates have fallen over the past few years, the group is sticking to its geographic orientation: the strategy of diversification calls for a long-term focus. Furthermore, STRAbAG has for years pursued the strategy of expanding its market shares on the home and growth markets in order to achieve the necessary economies of scale to become a cost leader.
1) Central and Eastern Europe comprises the following countries: bulgaria, Croatia, Czech Republic, Hungary, Poland, Romania, Russia and neighbouring countries, Serbia, Slovakia, Slovenia.

90
stiLL no UpswinG oF tHe eURopeAnconstRUction sectoR1)
The consequences of the financial crisis continued to burden growth and employ-ment in the euro area. The gross domestic product (GDP) of the 19 Euroconstruct states fell by 0.1 % in 2012. A gradual re- turn to economic growth is not expected until 2013. Flanked by structural reforms, the growth is expected to be stronger and more even in 2014, according to the experts at Euroconstruct, which will be reflected in GDP growth of 0.6 %.
Following slight growth the year before, the European construction industry registered a strong decline by 4.7 % during the period under report. The continuing high unemployment, the dampened macro- economic outlook and the extensive consol-idation measures on the part of the public budgets hindered demand in all three
sectors of the construction industry. Further losses of 1.6 % are expected for 2013, and the situation is only expected to improve slightly toward the end of the forecast period – which reaches to 2015.
Due to the restrained public-sector demand in several countries, the field of civil engi-neering in particular – an important growth driver in the past – has had to register los-ses. The worsening economy continued to dampen business demand for building construction. Throughout it all, the develop-ment of construction production was char-acterised by country-specific differences: as a general trend, the situation of the construction business was better in northern and central Europe than in the continent’s south and east.
stRonGest MeDiUM-teRM GRowtHin ResiDentiAL constRUction
2009 2010 2011 2012e 2013e 2014e 2015e
■ Residential construction■ Building construction■ Civil engineering■ Total construction output
-12 %
-9 %
-6 %
-3 %
0
3 %
DEVELOPMENT CONSTRUCTION SECTOR EUROPE
1) All growth forecasts as well as the particular national construction volumes are taken from the Euroconstruct’s winter 2012 reports.
-10 %
-8 %
-6 %
-4 %
-2 %
0
2 %
4 %
2009 2010 2011 2012e 2013e 2014e 2015e
■ Growth of construction output Europe■ GDP growth Europe
GROWTH COMPARISON CONSTRUCTION VS. GDP EUROPE
2015e
-8.8
-4.1 -3
.3
2.3
0.2
1.7
-4.7
-0.1
0.6
-1.6
1.0 1.
4
1.9
1.6

90 91group management Report
Residential construction in Europe remains strongly influenced by the difficult macro-economic framework. As a result of the high unemployment, the indebtedness of private households, and the restrictive financing conditions, the field of residential construction slipped another 3.5 % during the period under report, although it still developed better than the fields of building construction or civil engineering. by 2015, stable growth is expected in the Nordic countries in partic-ular, but also in several countries in Central Europe. In all, Euroconstruct forecasts slight growth of 1.5 % for the 19 member coun-tries during the period from 2012 to 2015. but this positive outlook – particularly in new residential construction – depends on stabi-lisation taking hold in the euro area and in the banking system.
With a minus of 4.2 %, the field of building construction shrank even more strongly than residential construction – and not even in the medium-term is a significant recovery in sight. A country-by-country comparison revealed great differences. While the Central and Eastern European countries – carried by the continued good performance of Poland – were able to avoid negative
growth, the countries of Western Europe lost 4.6 % on average. The biggest los-ses were seen in the countries of Southern Europe, while the Nordic countries, above all Norway and Denmark, already recover-ed slightly. These regionally distinct trends will continue in the medium-term. Growth of 3.8 % is expected to return to Central and Eastern Europe by the end of the forecast period in 2015, while Southern and Western Europe will continue with only very moderate growth.
The current development in the field of civil engineering reflects the difficult situation of the European economy. The restrictive fiscal policy and the drastic spending cuts led to a 7.5 % decline in this field. The years of growth in the sector also came to an end in the countries of Central and Eastern Europe – a development that will only accelerate even further in the years to come. First positive trends are ex-pected in 2015 at the earliest. This forecast also involves uncertainties and depends on good global economic development.
2009 2010 2011 2012e 2013e 2014e 2015e
■ Residential construction■ Building construction■ Civil engineering■ Total construction output-12 %
-9 %
-6 %
-3 %
0
3 %
DEVELOPMENT CONSTRUCTION SECTOR WESTERN EUROPE
2009 2010 2011 2012e 2013e 2014e 2015e
DEVELOPMENT CONSTRUCTION SECTOR CENTRAL AND EASTERN EUROPE
-10 %
-5 %
0
5 %
10 %
15 %
20 %
■ Residential construction■ Building construction■ Civil engineering■ Total construction output

92
GeRMAnY
The strong economic growth of the past few years also slowed in Germany, where the con-tinuing negative economic climate resulted in low GDP growth of just 0.8 % in 2012. However, the experts at Euroconstruct expect a renewed upswing already in the second half of 2013. In view of the recovery of the global economy and an improvement of the economic situation in the countries of the euro area, the German GDP should again exhibit moderate growth in the years to come.
Against the backdrop of high demand for new buildings and intense renovations activity, German residential construction grew by 3 % in 2012. The situation was encouraged espe-cially by the relatively good economic position of the private households and by the sustained low interest rates. However, this development was unable to balance out the decline in civil engineering so that the overall output volume in the period under report shrank by 0.2 %. Euroconstruct expects renewed growth of 2.5 % already in 2013, however.
building construction in Germany continued to suffer greatly from the consequences of the financial and economic crisis. because of existing overcapacities in office, commercial and industrial buildings, the economic recovery did not lead to an increase of building construc-tion activities. On the whole, this field increased by just 0.9 % during the period under report.
The extensive state stimulus programmes had led to a significant rise in the civil engineering business in the past few years. The discontin-uation of these measures resulted in a 5.3 % drop in volume in 2012. In the medium-term, meanwhile, the German government will be suspending its investments especially in the field of transportation. The consequences of this restrictive policy will be felt for years to come.
With a market share of 2.0 %, STRAbAG is market leader in Germany. The group’s share of the German road construction segment, by comparison, amounts to 10.5 %. With € 5,779.34 million, about 41 % of STRAbAG’s total group output volume was generated in Germany. Most of this is accounted for by the segment North + West, while the property and facility services provided in Germany are ascribed to the segment International + Special Divisions. AUstRiA
Austria’s economic growth of 0.6 % in 2012 was considerably below the level of the previous years. Significant factors behind this development include the rising un- employment and lower income growth. Due to the ongoing debt crisis and the weak global economy, no significant recov- ery is in sight for 2013. The economic up- swing forecast for 2014, however, means that higher economic growth rates should again be possible.
The construction output in Austria slowed considerably after a strong 2011, growing by just 1.1 % in 2012. However, the experts at Euroconstruct expect higher growth rates to return in 2014 and 2015. Meanwhile, residential construction managed growth of 2.4 % in 2012 despite the difficult macro-economic development.
building construction was characterised greatly by the slower economic develop-ment in 2012. While this business field had still been the most dynamic segment the year before, with growth topping 8 % in 2011, it stagnated in the period under re-port with a growth rate of just 0.1 %. Espe-cially weak was the development of office and industrial buildings as well as shopping centres, while investments in schools and healthcare facilities continued to grow.
2012e 2013eGDP GROWTH2) 0.8 % 1.0 %CONSTRUCTION GROWTH -0.2 % 2.5 %
OVERALL CONSTRUCTION VOLUME: € 273.70 billion
41 %1)
2012e 2013eGDP GROWTH 0.6 % 1.0 %CONSTRUCTION GROWTH 1.1 % 0.6 %
OVERALL CONSTRUCTION VOLUME: € 31.93 billion
13 %
1) Country output as percentage of group output volume2) All growth forecasts as well as the particular national construction volumes are taken from the Euroconstruct’s winter 2012 reports.

92 93group management Report
2012e 2013eGDP GROWTH 2.3 % 2.0 %CONSTRUCTION GROWTH 1.6 % -3.4 %
OVERALL CONSTRUCTION VOLUME: € 47.11 billion
8 %
Renovations activities were less affected, as these will continue to be promoted by state measures until 2014. In line with the general economic development, building construction will probably exhibit first signs of a slight recovery in 2014.
Despite the currently very favourable financing conditions, the construction volume in civil engineering sank by 0.2 % in the wake of state austerity programmes and postponed infrastructure projects. The objectives of the Austrian stability pact – the federal government’s consolidation project – will put pressure on this business field over the entire forecast period. Espe-cially affected are investments in railway infrastructure. In the years 2014 and 2015, however, the economic growth rates should again reach 1.2 % and 2.3 %, respectively.
In 2012, STRAbAG generated a total of 13 % of the group output volume (2011: 14 %) in its home market of Austria. Alongside Germany and Poland, Austria thus con-tinues to be one of the group’s top three markets. With a share of 6.2 %, STRAbAG also remains market leader here. In road construction, the market share amounts to 15.2 %. The output volume in 2012 reached a volume of € 1,888.14 million.
poLAnD
Economic growth in Poland slowed in 2012 and reached only 2.3 % – compared to 4.2 % the year before. The causes can be found in the difficult economic situ-ation of the most important Polish trade partners, on the one hand, and in the declining domestic demand on the other. The rising unemployment led to a signif-icant reduction of budget income. Meanwhile, public spending was also down as part of the government’s austerity measures. The experts at Euroconstruct
expect a significant recovery in 2014 at the earliest.
With growth of just 1.6 %, the Polish construction industry reacted earlier and more strongly than expected to the macro-economic decline – with no improvement in sight in the years to come. Euroconstruct does not expect to see an upswing of the construction industry until 2015.
Residential construction remained quite dynamic in the first half of the year, but construction activity slowed due to higher interest rates and more restrictive loan approval processes for private households as the year went on. At the end of the year, growth reached a total of 3.2 %.
With a growth rate of 3.6 %, building construction proved more stable than residential construction. The main factors driving this development, however, were not the EU-financed projects, but the activities of private investors. The strongest growth rates were seen in hotel construction, followed by office and industrial buildings as well as warehouses. Due to the weaker economic performance, however, this development is expected to slow once more in the years to come.
The weak growth of the overall construc-tion output is explained mainly by the ne-gative growth of civil engineering. With the holding of Euro 2012 and the thus con-nected completion of sports and tourism structures, the field of civil engineering had to accept a decline of 1.7 % after the high growth rates of the previous years. Road construction activity also shrank significantly, although growth was recorded with airports and runways, rail-way lines, bridge building and tunnelling. A recovery in the civil engineering business is not expected until 2015.
STRAbAG is number one in the construction industry in Poland. The country contributed € 1,138.81 million, or 8 %, to the overall group output in 2012, making it STRAbAG’s third-largest market – despite expectations that the output volume will decline continuously against the backdrop of a difficult market environment. STRAbAG’s share of the en- tire Polish construction market amounted to 3.6 %, that of road construction to 12.9 %.

94
SWEDEN
OVERALL CONSTRUCTION VOLUME: € 31.38 billion 2012e 2013eGDP GROWTH 0.9 % 1.8 %CONSTRUCTION GROWTH -2.4 % 0.2 %
FINLAND
OVERALL CONSTRUCTION VOLUME: € 28.56 billion 2012e 2013eGDP GROWTH -0.5 % 0.5 %CONSTRUCTION GROWTH -3.4 % -2.3 %
DENMARK
OVERALL CONSTRUCTION VOLUME: € 25.09 billion 2012e 2013eGDP GROWTH 0.5 % 1.0 %CONSTRUCTION GROWTH 0.5 % 2.2 %
4 %
cZecH RepUBLic
The year 2012 again failed to bring a recovery to the Czech economy. Following low growth rates in the past two years, the Czech Republic slid back into recession in 2012 – the economy shrank by 0.9 %. Unfavourable factors included especially the unstable political situation, the higher value added tax, the rising unemployment and the constant decline of public-sector investments. Growth is expected to return into positive territory in the coming years, however, albeit at a low level.
In line with the economic development, the Czech construction output also shrank by 5.4 %. A slight recovery of the construction market is currently expected in 2014 or 2015 at the earliest. Residential construction was affected the most by the renewed reces- sion, with high prices a burden on the al-ready weak demand. Even low interest rates could not compensate this development, so that the volume of residential construction declined by 9.7 % in the period under report.
In building construction, state-financed projects were especially affected by the austerity measures. In this area, EU aid remains the main financing source. Due to the difficult economic situation, however, uncertainty was also on the rise among private clients, so that private investments came to a standstill as well. On the whole, the field of building construction fell by 2.8 % in the period under report. The in-creasing caution among banks in the field of real estate development also had a negative impact on the sector. Euro-construct expects slight growth in this field starting in 2014.
Civil engineering suffered the most from the decline in public-sector investments. The austerity measures that were introduced in
2010 prevented a positive development of the sector in the period under report, with an overall decline of 11.2 % the result.
STRAbAG is number two on the market in the Czech Republic. With an output volume of € 646.33 million, the group generated around 5 % of its overall output volume on the Czech market in 2012. The share of the construction market as a whole amounts to 4.2 %, even reaching 20.0 % in road construction.
scAnDinAviA
The economic performance in Scandinavia again developed quite poorly in 2012. Swe-den and Denmark recorded only moderate growth of 0.9 % and 0.5 %, respectively, while Finland exhibited an adverse trend. In 2013, however, the economic performance is expected to grow once more.
Even more significant were the differences in the construction output in Scandinavia. Against the backdrop of declining volumes in residential construction, Denmark’s con- struction business stagnated and Sweden’s construction output even shrank by 2.4 %.
2012e 2013eGDP GROWTH -0.9 % 0.8 %CONSTRUCTION GROWTH -5.4 % -1.9 %
OVERALL CONSTRUCTION VOLUME: € 18.38 billion
5 %
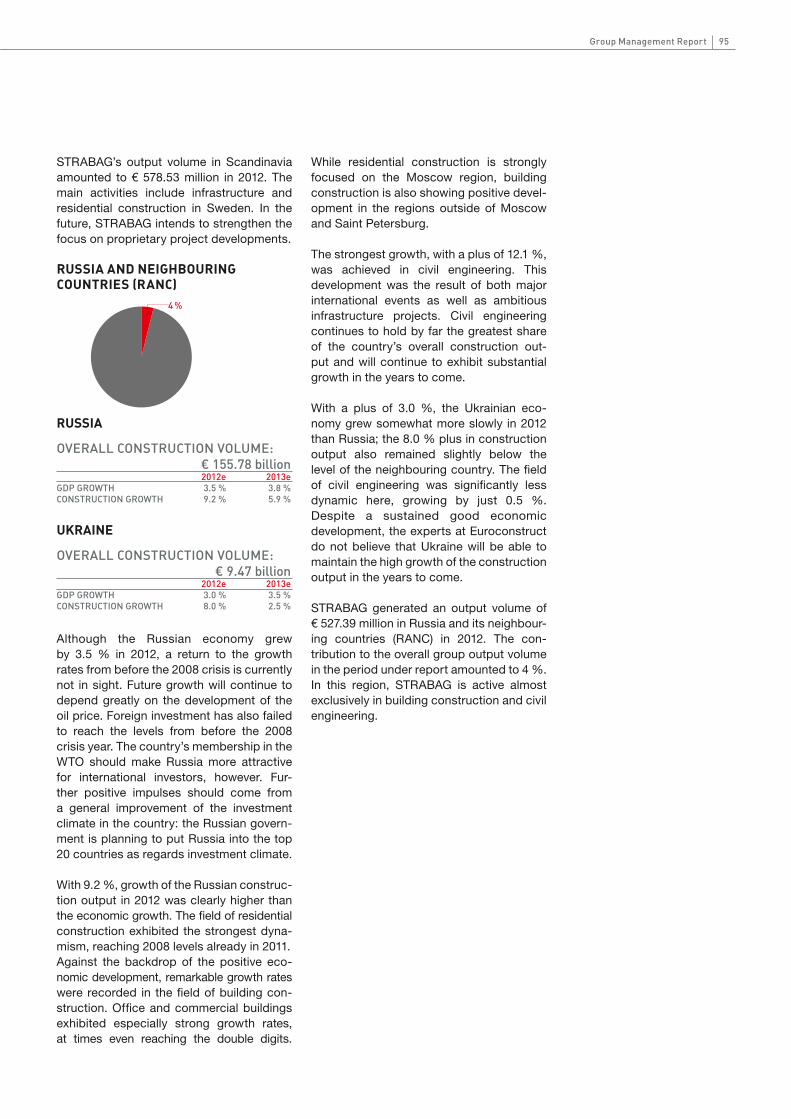
94 95group management Report
STRAbAG’s output volume in Scandinavia amounted to € 578.53 million in 2012. The main activities include infrastructure and residential construction in Sweden. In the future, STRAbAG intends to strengthen the focus on proprietary project developments.
RUssiA AnD neiGHBoURinG coUntRies (RAnc)
Although the Russian economy grew by 3.5 % in 2012, a return to the growth rates from before the 2008 crisis is currently not in sight. Future growth will continue to depend greatly on the development of the oil price. Foreign investment has also failed to reach the levels from before the 2008 crisis year. The country’s membership in the WTO should make Russia more attractive for international investors, however. Fur-ther positive impulses should come from a general improvement of the investment climate in the country: the Russian govern-ment is planning to put Russia into the top 20 countries as regards investment climate.
With 9.2 %, growth of the Russian construc-tion output in 2012 was clearly higher than the economic growth. The field of residential construction exhibited the strongest dyna-mism, reaching 2008 levels already in 2011.Against the backdrop of the positive eco- nomic development, remarkable growth rates were recorded in the field of building con- struction. Office and commercial buildings exhibited especially strong growth rates, at times even reaching the double digits.
While residential construction is strongly focused on the Moscow region, building construction is also showing positive devel-opment in the regions outside of Moscow and Saint Petersburg.
The strongest growth, with a plus of 12.1 %, was achieved in civil engineering. This development was the result of both major international events as well as ambitious infrastructure projects. Civil engineering continues to hold by far the greatest share of the country’s overall construction out-put and will continue to exhibit substantial growth in the years to come.
With a plus of 3.0 %, the Ukrainian eco-nomy grew somewhat more slowly in 2012 than Russia; the 8.0 % plus in construction output also remained slightly below the level of the neighbouring country. The field of civil engineering was significantly less dynamic here, growing by just 0.5 %. Despite a sustained good economic development, the experts at Euroconstruct do not believe that Ukraine will be able to maintain the high growth of the construction output in the years to come.
STRAbAG generated an output volume of € 527.39 million in Russia and its neighbour-ing countries (RANC) in 2012. The con- tribution to the overall group output volume in the period under report amounted to 4 %. In this region, STRAbAG is active almost exclusively in building construction and civil engineering.
RUSSIA
OVERALL CONSTRUCTION VOLUME: € 155.78 billion 2012e 2013eGDP GROWTH 3.5 % 3.8 %CONSTRUCTION GROWTH 9.2 % 5.9 %
UKRAINE
OVERALL CONSTRUCTION VOLUME: € 9.47 billion 2012e 2013eGDP GROWTH 3.0 % 3.5 %CONSTRUCTION GROWTH 8.0 % 2.5 %
4 %

96
Rest oF westeRn AnD noRtHeRn eURope
Against the backdrop of the ongoing turbulence in the euro area, and with a slight decline of the economic performance, the benelux countries rank at or just above the European average. Euroconstruct ex-pects moderate GDP growth here as early as next year.
With a decline of 6.9 %, the overall construc-tion output in the Netherlands developed significantly below the country’s economic performance. The negative trend was dis-tributed fairly evenly across all segments of the construction industry. In belgium, on the other hand, the growth of 7.2 % in civil engineering was able to compensate nega-tive developments in the other areas. While the construction output in the Netherlands is expected to grow significantly in 2014 and 2015, Euroconstruct expects only continued moderate growth in belgium.
STRAbAG achieved an output volume of € 456.24 million in the benelux countries in 2012. A stronger involvement is of interest to the company especially in motorway construction.
switZeRLAnD
The slower global economic growth led to a stagnation of the Swiss export market and a dampening of the economic growth to 0.9 %. Private consumption, on the other hand, exhibited sustained stable development. The growth rates should pick up again in the coming years.
In line with the economic performance, the construction industry registered only mod-erate growth of 1.1 % in 2012. Declines because of inclement weather at the beginning of the year also contributed to the reduced dynamism.
With growth of 2 % in 2012, the field of residential construction continued the good development of the previous years. Mean- while, a consolidation in residential con- struction is expected as of 2014 due to stricter legislation regarding secondary residences. A regulation for more restrictive credit approval will also negatively impact the sector as of 2014.
After the strong growth of the previous year, the building construction business suffered from the difficult industry situation in sev-eral individual branches in 2012, growing by just 0.8 % in the period under report. While the negative environment led to stagnating investments in mechanical engineering and automation technology, investments are in-creasingly being made in educational facili-ties as well as in the culture and healthcare sectors. This field should also provide for renewed stronger growth rates in the future.
Investments in road and rail have – after a decline the previous year – led to renewed growth of 2.0 % in civil engineering. As part of the state infrastructure programmes, ex-tensive investments in this sector are also planned for the years to come.
In 2012, Switzerland contributed € 424.68 million, or 3 %, to the group’s overall output volume.
7 %
NETHERLANDS
OVERALL CONSTRUCTION VOLUME: € 66.79 billion 2012e 2013eGDP GROWTH -0.5 % 0.8 %CONSTRUCTION GROWTH -6.9 % -2.8 %
BELGIUM
OVERALL CONSTRUCTION VOLUME: € 9.47 billion 2012e 2013eGDP GROWTH -0.1 % 0.7 %CONSTRUCTION GROWTH 0.2 % 0.1 %
SCHWEIZ
OVERALL CONSTRUCTION VOLUME: € 49.46 billion 2012e 2013eGDP GROWTH 0.9 % 1.3 %CONSTRUCTION GROWTH 1.1 % 2.5 %

96 97group management Report
itALY
The Italian economy has been in a recession since the second half of 2011. In 2012, the GDP shrank by 2.4 %, and positive growth rates are not expected until 2014.
The Italian construction output continued its negative trend for the sixth time in a row, shrinking by 5.8 % during the year under report. Euroconstruct expects a moderate recovery of the construction industry in 2014 at the earliest. In all, the market has lost nearly one third since 2006, with new construction collapsing by a total of 40 %. Investments in civil engineering have fallen by 32 % since the high of 2004.
STRAbAG’s output volume in Italy amounted to € 156.87 million in 2012. The company is mainly active in tunnelling and road construction in the north of the country, which is why most of the output volume is to be found in the segment International + Special Divisions.
Rest oF cee
sLovAKiA
The Slovak economy grew by 2.5 % in 2012, somewhat more slowly than in the previous years. Growth will likely be even less dynam- ic in 2013, but it should again cross the 3 % mark in 2014. The growth of Slovakia’s economic performance remains to a high degree dependent on foreign demand from large economies such as Germany, France and China.
Despite the solid economic development, the negative trend continued in the country’s construction industry. The overall construc-tion output suffered greatly under the European financial crisis and, with a minus of 13.3 %, shrank even more strongly than in 2009. The continuous decline of the order backlog, the restrictive budget measures from the government and the renewed postponement of planned infrastructure projects allow only a slight recovery to be expected in 2013.
After moderate growth the previous year, the field of building construction shrank by 11.1 % in the period under report. Cause for this negative development was the comple-tion of several large projects as well as the postponement or resizing of new projects. The realisation of planned structures is not expected until 2014 to 2015.
because of postponed infrastructure pro-jects, the field of civil engineering shrank by a total of 25.7 %. besides the restrictive budget policy, this development can be blamed on difficulties with contract part-ners, the necessary repetition of tender procedures, and the suspension of projects due to negative feasibility studies. The situation should improve significantly in the long-term, as the demand for modern infrastructure is continuously on the rise. The financing of such projects, however, is greatly dependent on EU aid.
With a market share of 8.3 % and an output volume of € 399.60 million in 2012, STRAbAG is market leader in the Slovak market. STRAbAG’s share of the road construction market even amounts to 17.7 %. In 2012, Slovakia contributed 3 % to the group’s overall output volume.
ITALY
OVERALL CONSTRUCTION VOLUME: € 178.12 billion 2012e 2013eGDP GROWTH -2.4 % -0.4 %CONSTRUCTION GROWTH -5.8 % -1.4 %
SLOWAKIA
OVERALL CONSTRUCTION VOLUME: € 5.30 billion 2012e 2013eGDP GROWTH 2.5 % 2.1 %CONSTRUCTION GROWTH -13.3 % -1.0 %
10 %
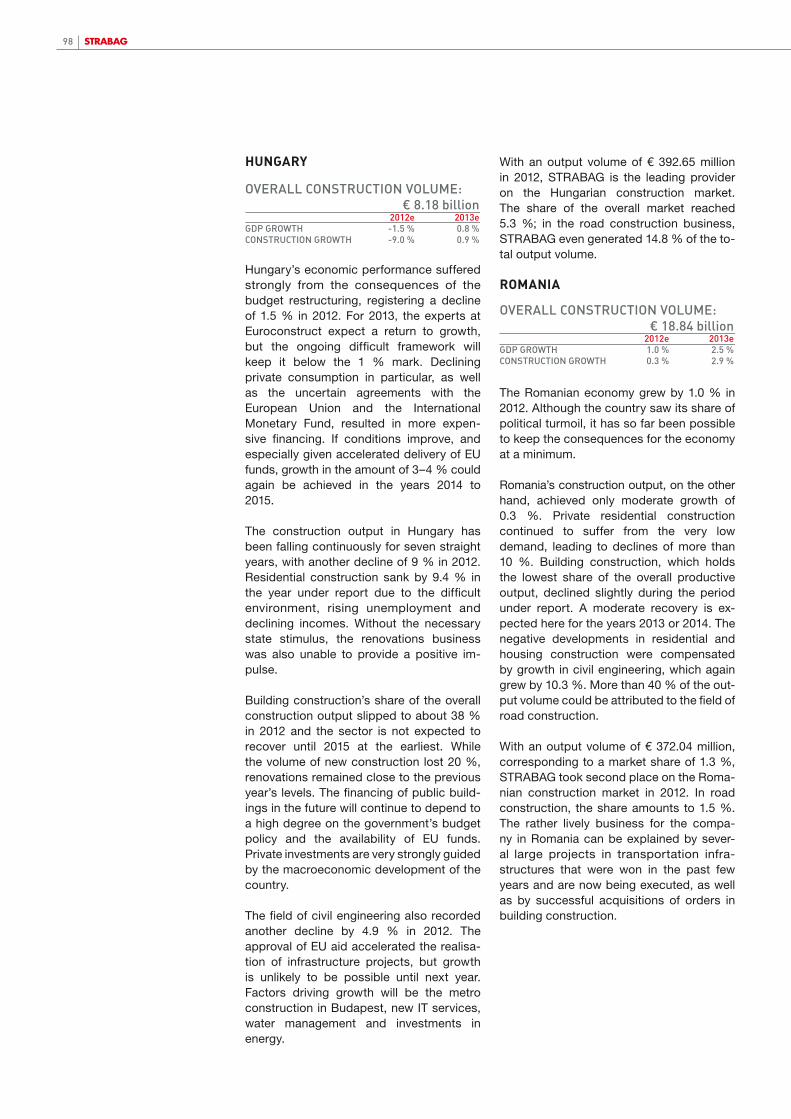
98
HUnGARY
Hungary’s economic performance suffered strongly from the consequences of the budget restructuring, registering a decline of 1.5 % in 2012. For 2013, the experts at Euroconstruct expect a return to growth, but the ongoing difficult framework will keep it below the 1 % mark. Declining private consumption in particular, as well as the uncertain agreements with the European Union and the International Monetary Fund, resulted in more expen-sive financing. If conditions improve, and especially given accelerated delivery of EU funds, growth in the amount of 3–4 % could again be achieved in the years 2014 to 2015.
The construction output in Hungary has been falling continuously for seven straight years, with another decline of 9 % in 2012. Residential construction sank by 9.4 % in the year under report due to the difficult environment, rising unemployment and declining incomes. Without the necessary state stimulus, the renovations business was also unable to provide a positive im-pulse.
building construction’s share of the overall construction output slipped to about 38 % in 2012 and the sector is not expected to recover until 2015 at the earliest. While the volume of new construction lost 20 %, renovations remained close to the previous year’s levels. The financing of public build-ings in the future will continue to depend to a high degree on the government’s budget policy and the availability of EU funds. Private investments are very strongly guided by the macroeconomic development of the country.
The field of civil engineering also recorded another decline by 4.9 % in 2012. The approval of EU aid accelerated the realisa-tion of infrastructure projects, but growth is unlikely to be possible until next year. Factors driving growth will be the metro construction in budapest, new IT services, water management and investments in energy.
With an output volume of € 392.65 million in 2012, STRAbAG is the leading provider on the Hungarian construction market. The share of the overall market reached 5.3 %; in the road construction business, STRAbAG even generated 14.8 % of the to-tal output volume.
RoMAniA
The Romanian economy grew by 1.0 % in 2012. Although the country saw its share of political turmoil, it has so far been possible to keep the consequences for the economy at a minimum.
Romania’s construction output, on the other hand, achieved only moderate growth of 0.3 %. Private residential construction continued to suffer from the very low demand, leading to declines of more than 10 %. building construction, which holds the lowest share of the overall productive output, declined slightly during the period under report. A moderate recovery is ex-pected here for the years 2013 or 2014. The negative developments in residential and housing construction were compensated by growth in civil engineering, which again grew by 10.3 %. More than 40 % of the out-put volume could be attributed to the field of road construction.
With an output volume of € 372.04 million, corresponding to a market share of 1.3 %, STRAbAG took second place on the Roma-nian construction market in 2012. In road construction, the share amounts to 1.5 %. The rather lively business for the compa-ny in Romania can be explained by sever- al large projects in transportation infra- structures that were won in the past few years and are now being executed, as well as by successful acquisitions of orders in building construction.
RUMÄNIEN
OVERALL CONSTRUCTION VOLUME: € 18.84 billion 2012e 2013eGDP GROWTH 1.0 % 2.5 %CONSTRUCTION GROWTH 0.3 % 2.9 %
HUNGARY
OVERALL CONSTRUCTION VOLUME: € 8.18 billion 2012e 2013eGDP GROWTH -1.5 % 0.8 %CONSTRUCTION GROWTH -9.0 % 0.9 %

98 99group management Report
cRoAtiA
The Croatian economy continued to suffer from the consequences of the financial and economic crisis in 2012, achieving growth of just 0.8 % against this backdrop. Due to the low level of exports, the development of the Croatian market is more strongly dependent on domestic demand than other CEE countries. Domestic demand, however, is increasingly affected by the government’s strict austerity programme.
Against the backdrop of the weak econo-mic development, only a moderate recovery could be seen in the construction industry; still, the construction output was able to grow by 2.7 % during the period under re-port. Growth potential exists especially in private residential construction, although the construction boom of the past few years has left a high number of unsold flats. As public-sector investment in building construction also fell victim to the austerity measures, growth in this field is greatly dependent on private investments. Croatia’s accession to the EU in July of this year could bring some momentum into individual market segments.
Civil engineering remains the most difficult sector to judge; its development is strongly dependent on state spending and is thus the most affected by the government’s sav-ings measures. The Croatian government has announced an ambitious infrastructure programme, but its realisation is in doubt.
In 2012, STRAbAG generated an output volume of € 129.63 million in Croatia, where it ranks among the top five construction companies.
sLoveniA
Due to its high export ratio, the Slovenian economy suffered greatly from the con-sequences of the economic and financial
crisis of 2008 and 2009. After a brief re- covery phase, the GDP shrank again by 0.9 % in 2012 due primarily to the weak domestic demand and Slovenia’s low competitive-ness.
Slovenia’s weak economic performance again prevented an upswing of the construction industry, so that the crisis in the sector continued with a 6.2 % decline of the construction output in the period un-der report. Residential construction shrank due to the high number of unsold buildings, the ongoing difficulties on the credit mar-ket and a sustained high price level. The generally restrained investment climate in the country had a dampening effect on both building construction and civil engineering. As extensive infrastructure measures are currently in the planning phase, the civil engineering business should again achieve significant gains in 2013.
In 2012, STRAbAG generated an output volume of € 81.44 million in Slovenia, placing itself among the top five construc-tion companies in the country.
seRBiA
Serbia also continues to suffer from the consequences of the global economic and financial crisis, registering another decline by 1.9 % of its economic performance in 2012. based on an agreement with the IMF as well as a number of bilateral trade agree-ments, the export volume should grow once more in the years to come and will move the economic performance back into the positive already next year.
Counter to the general economic trends, public-sector financing measures helped the Serbian construction output grow by 3.7 % in the year under report. A return to the double-digit growth rates of the previous year are expected in 2013. While the volume in residential construc-tion fell further, the building construction business delivered renewed solid growth. With growth of just 1.5 %, the development of the civil engineering business slowed
KROATIEN
OVERALL CONSTRUCTION VOLUME: € 2.82 billion 2012e 2013eGDP GROWTH 0.8 % 1.2 %CONSTRUCTION GROWTH 2.7 % 1.1 %
SLOWENIEN
OVERALL CONSTRUCTION VOLUME: € 1.83 billion 2012e 2013eGDP GROWTH -0.9 % 1.2 %CONSTRUCTION GROWTH -6.2 % 23.4 %
SERBIEN
OVERALL CONSTRUCTION VOLUME: € 2.25 billion 2012e 2013eGDP GROWTH -1.9 % 2.0 %CONSTRUCTION GROWTH 3.7 % 15.0 %

100
significantly in the year under report. As a result of large planned infrastructure projects in road and rail construction, as well as projects in the field of energy, Euro-construct expects growth of 13 % in 2013, however.
STRAbAG generated an output volume of € 71.55 million on the Serbian market in 2012.
BULGARiA
Due to declining exports, bulgaria was unable to fulfil the high expectations of its economic performance in 2012. With growth of just 1.1 %, the GDP development remained clearly below the value of the previous year. The impulses from the slow recovery of the domestic demand contrib-uted little to the growth of the economy.
With a 4.4 % decline of the construction output, the enormous collapse of the past years could at least be slowed. Due to the low domestic demand and the economic uncertainties, private residential construc-tion remains unattractive for investors. The field of building construction also develop- ed only moderately, with large shopping centres serving as the main factors driving growth. Despite the negative development in the past few years, civil engineering continues to hold the largest share of the construction output. Stable growth is ex-pected in this sector, but an intense price battle has set in for the upcoming public-sector tenders.
STRAbAG generated € 27.43 million in the bulgarian market in 2012.
MiDDLe eAst, AFRicA, tHe AMeRicAs, AsiA – Rest oF woRLD
In addition to its main markets in Europe, the STRAbAG Group is also active in individual non-European regions – these include Asia, Canada, Chile, Africa and the Middle East – in order to become more in-dependent from the economic framework in the past growth markets. In all, the group generated € 888.97 million in these regions in 2012, which corresponds to 6 % of the group’s overall output volume.
In the non-European markets, STRAbAG is usually active as a general contractor through direct export. The focus in these regions is on civil engineering, industrial and infrastructure projects and tunnelling – areas in which high technological expertise is required.
Among the most important new orders re-ceived in the past year are two projects in Chile, including the tunnelling contract at the world’s largest copper mine in Chuqui-camata.
STRAbAG’s activities in non-European countries are included – with a few minor exceptions – in the segment International + Special Divisions.
6 %
BULGARIEN
OVERALL CONSTRUCTION VOLUME: € 5.21 billion 2012e 2013e■ GDP GROWTH 1.1 % 2.1 %■ CONSTRUCTION GROWTH -4.4 % -0,1 %

100
© S
.Alia
s -
Foto
lia.c
om
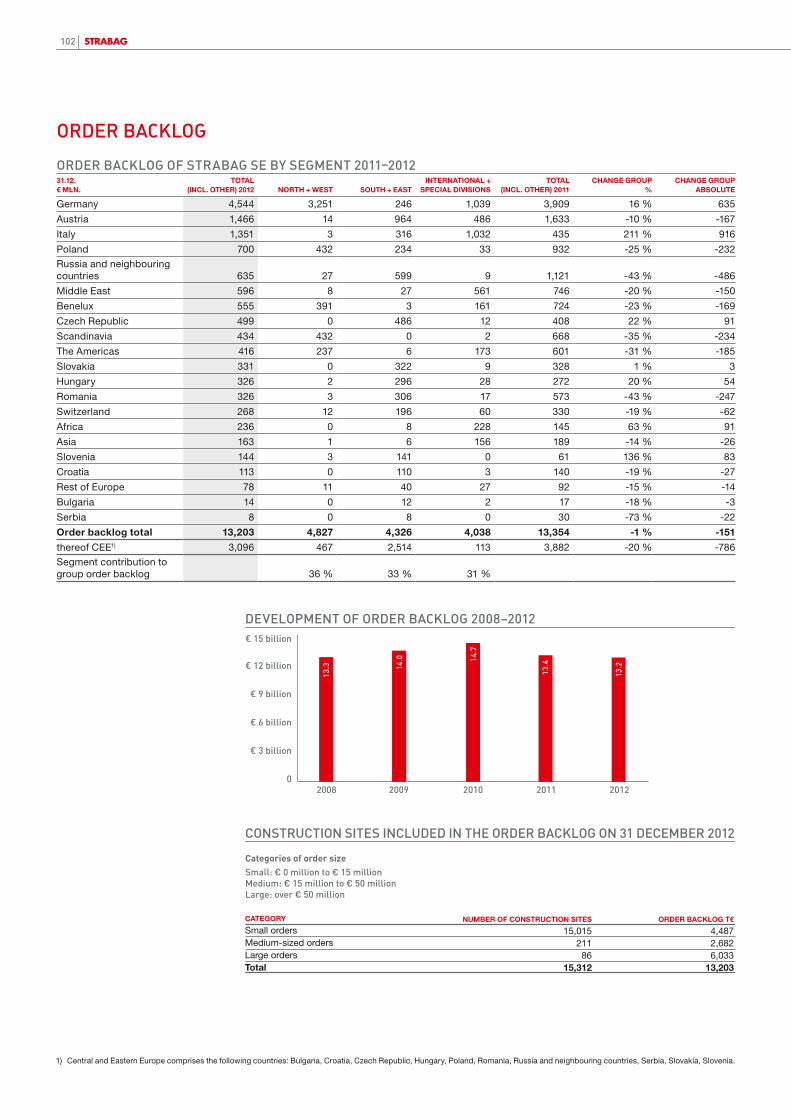
102
ORdER BacKlOG
ORdER BacKlOG Of StRaBaG SE BY SEGmEnt 2011–201231.12. € mln.
TOTAl (inCl. OThER) 2012 nORTh + wEsT sOuTh + EAsT
inTERnATiOnAl + spECiAl divisiOns
TOTAl (inCl. OThER) 2011
ChAnGE GROup%
ChAnGE GROup ABsOluTE
Germany 4,544 3,251 246 1,039 3,909 16 % 635
Austria 1,466 14 964 486 1,633 -10 % -167
Italy 1,351 3 316 1,032 435 211 % 916
Poland 700 432 234 33 932 -25 % -232Russia and neighbouring countries 635 27 599 9 1,121 -43 % -486
Middle East 596 8 27 561 746 -20 % -150
benelux 555 391 3 161 724 -23 % -169
Czech Republic 499 0 486 12 408 22 % 91
Scandinavia 434 432 0 2 668 -35 % -234
The Americas 416 237 6 173 601 -31 % -185
Slovakia 331 0 322 9 328 1 % 3
Hungary 326 2 296 28 272 20 % 54
Romania 326 3 306 17 573 -43 % -247
Switzerland 268 12 196 60 330 -19 % -62
Africa 236 0 8 228 145 63 % 91
Asia 163 1 6 156 189 -14 % -26
Slovenia 144 3 141 0 61 136 % 83
Croatia 113 0 110 3 140 -19 % -27
Rest of Europe 78 11 40 27 92 -15 % -14
bulgaria 14 0 12 2 17 -18 % -3
Serbia 8 0 8 0 30 -73 % -22
Order backlog total 13,203 4,827 4,326 4,038 13,354 -1 % -151
thereof CEE1) 3,096 467 2,514 113 3,882 -20 % -786Segment contribution to group order backlog 36 % 33 % 31 %
2008 2009 2010 2011
DEVELOPMENT OF ORDER BACKLOG 2008–2012
0
€ 3 billion
€ 6 billion
€ 9 billion
€ 12 billion
€ 15 billion
2012
13.
3 14.
0 14.7
13.4
13.
2
CONSTRUCTION SITES INCLUDED IN THE ORDER BACKLOG ON 31 DECEMBER 2012
Categories of order sizeSmall: € 0 million to € 15 millionMedium: € 15 million to € 50 millionLarge: over € 50 million
CATEGORY
Small ordersMedium-sized ordersLarge ordersTotal
NUMBER OF CONSTRUCTION SITES
15,01521186
15,312
ORDER BACKLOG T€
4,4872,6826,033
13,203
1) Central and Eastern Europe comprises the following countries: bulgaria, Croatia, Czech Republic, Hungary, Poland, Romania, Russia and neighbouring countries, Serbia, Slovakia, Slovenia.
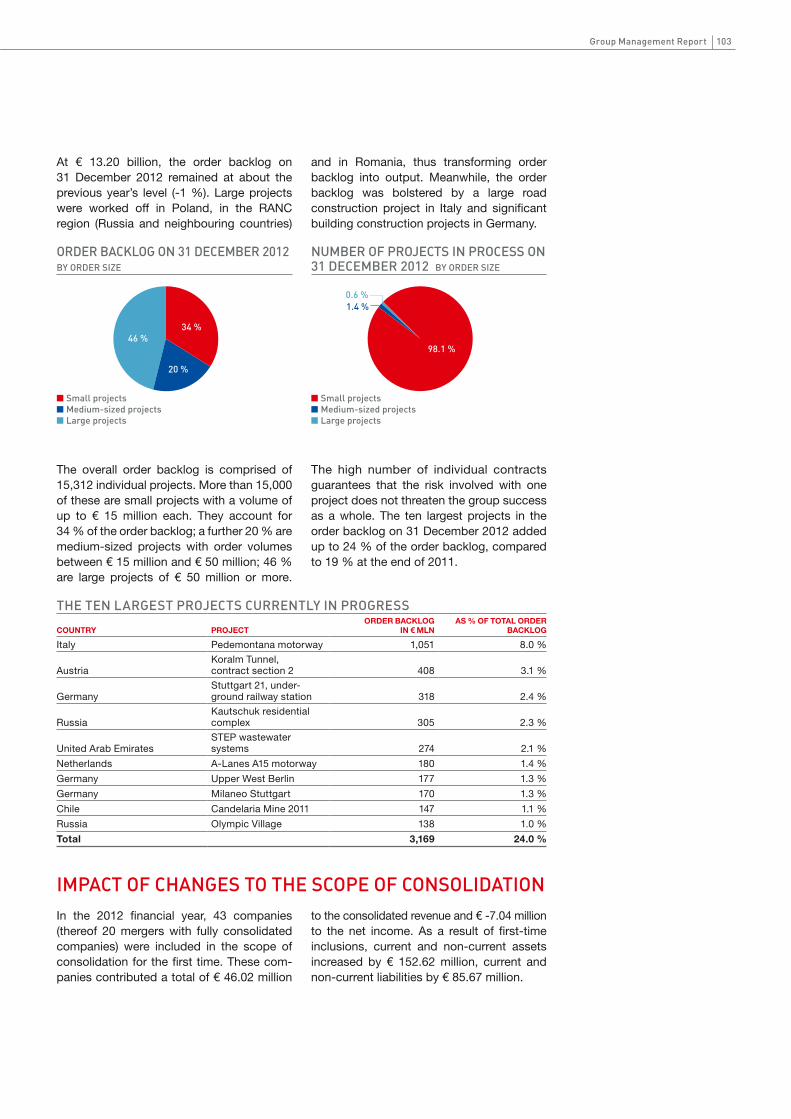
102 103group management Report
At € 13.20 billion, the order backlog on 31 December 2012 remained at about the previous year’s level (-1 %). Large projects were worked off in Poland, in the RANC region (Russia and neighbouring countries)
and in Romania, thus transforming order backlog into output. Meanwhile, the order backlog was bolstered by a large road construction project in Italy and significant building construction projects in Germany.
impact Of chanGES tO thE ScOpE Of cOnSOlidatiOn
■ Small projects■ Medium-sized projects■ Large projects
ORDER BACKLOG ON 31 DECEMBER 2012 BY ORDER SIZE
34 %
20 %
46 %
The overall order backlog is comprised of 15,312 individual projects. More than 15,000 of these are small projects with a volume of up to € 15 million each. They account for 34 % of the order backlog; a further 20 % are medium-sized projects with order volumes between € 15 million and € 50 million; 46 % are large projects of € 50 million or more.
The high number of individual contracts guarantees that the risk involved with one project does not threaten the group success as a whole. The ten largest projects in the order backlog on 31 December 2012 added up to 24 % of the order backlog, compared to 19 % at the end of 2011.
In the 2012 financial year, 43 companies (thereof 20 mergers with fully consolidated companies) were included in the scope of consolidation for the first time. These com-panies contributed a total of € 46.02 million
to the consolidated revenue and € -7.04 million to the net income. As a result of first-time inclusions, current and non-current assets increased by € 152.62 million, current and non-current liabilities by € 85.67 million.
thE tEn laRGESt pROJEctS cuRREntlY in pROGRESS
COunTRy pROjECTORdER BACKlOG
in € mlnAs % OF TOTAl ORdER
BACKlOG
Italy Pedemontana motorway 1,051 8.0 %
AustriaKoralm Tunnel, contract section 2 408 3.1 %
GermanyStuttgart 21, under-ground railway station 318 2.4 %
RussiaKautschuk residential complex 305 2.3 %
United Arab Emirates STEP wastewater systems 274 2.1 %
Netherlands A-Lanes A15 motorway 180 1.4 %
Germany Upper West berlin 177 1.3 %
Germany Milaneo Stuttgart 170 1.3 %
Chile Candelaria Mine 2011 147 1.1 %
Russia Olympic Village 138 1.0 %
Total 3,169 24.0 %
36 %
■ Small projects■ Medium-sized projects■ Large projects
NUMBER OF PROJECTS IN PROCESS ON31 DECEMBER 2012 BY ORDER SIZE
98.1 %
1.4 %0.6 %

104
STRAbAG SE generated an output volume of € 14,042.60 million in the 2012 financial year. Even against the backdrop of low public-sector infrastructure expenditures, the output volume, with a decrease of just 2 %, remained practically at the same high level of the previous year. The largest reduction was registered in Poland due to the end of the construction boom in that country. Declines in several countries in Eastern Europe were countered by increases in Germany and in Romania.
The consolidated group revenue for the 2012 financial year stood at € 12,983.23 million, which corresponds to a decrease of 5 %. The ratio of revenue to construction output sank from the high levels in the previous years to 92 % (2011: 96 %). The segment North + West contributed 42 %, South + East 37 % and International + Special Divisions 20 % to the revenue.
The changes in inventories fell by nearly one half despite the fact that the real estate pro-ject development business was pursued as
actively as in the past. The own work capitalised remained at a very low level – the year before, this item had still included final works related to the construction of the proprietary cement work in Hungary.
With the slightly lower revenue, the raw materials, consumables and services used were down as well, falling by 7 % to € 8,655.10 million, while the employee benefits expense grew slightly (2 %) to € 3,051.78 million. In total, however, the ratio of these two items versus revenue remained unchanged at 90 %.
In line with revenue, the other operating expenses fell significantly by 7 % despite charges to this item in the form of damage compensation payments amounting to € 43 million related to an arbitration ruling on a failed acquisition in the concrete busi-ness as well as noteworthy losses from consortia. At the same time, the other operating income was down by 17 %. This item also includes income from the fully consolidated concession companies.
financial pERfORmancE
2012 € mln.
2011€ mln.
ChAnGE%
Raw materials, consumables and services used 8,655 9,320 -7 %
Employee benefits expense 3,052 3,004 2 %
Other operating expenses 938 1,014 -7 %
Depreciation and amortisation 401 412 -3 %
The share of profit or loss of associates was less strongly in negative territory in the 2012 financial year than in the previous year, when it still included an extraordinary write-down in the mid-double-digit millions related to an interest in cement activities. With € 4.35 million, the net income from investments, composed of the dividends and expenses of many smaller companies or financial investments, remained at about
the previous year’s level. The missing revenue for services already rendered in Central and Eastern Europe, as well as damage compensation payments and loss- making acquisitions of joint ventures, led to a decline of the earnings before in-terest, taxes, depreciation and amortisation (EbITDA) by 18 % to € 608.35 million and an associated decline of the EbITDA margin from 5.4 % to 4.7 %.
2008 2009 2010 2011 2012
DEVELOPMENT OF EBITDA AND EDITDA MARGIN 2008–2012
0
€ 200 mln.
€ 400 mln.
€ 600 mln.
€ 800 mln.
5.3 %5.5 %
5.9 %
5.4 %
■ EBITDA■ EBITDA margin
4.7 %
648 68
4
735
746
608

105group management Report
The depreciation and amortisation fell by 3 % to € 401.17 million. The goodwill im-pairment contained in this item was down from € 16.15 million in 2011 to € 10.08 million in 2012. This resulted in a decrease in the earnings before interest and taxes (EbIT) by 38 % to € 207.19 million and an EbIT margin of 1.6 % versus 2.4 % in the previous year.
While positive exchange rate differences amounting to € 37.27 million had still been registered in 2011, the net interest income in the past financial year now contained negative foreign currency effects of € 11.75 million. This resulted in a negative net in-terest income of € -50.73 million compared to a positive figure of € 8.54 million in the previous year. As a result, the profit before tax fell by more than half to € 156.46 million.
STRAbAG considers an average tax rate of 30 % to be realistic. The actual rate of 29.7 % in 2012 confirms this expectation. This led to a net income of € 110.04 million.
The earnings owed to the other share- holders (minority interest) again climbed from € 44.30 million to € 49.41 million in the past financial year. The net income after minorities for 2012 therefore stood at € 60.63 million, 69 % below the level of the previous year. The number of weighted outstanding shares decreased due to the buyback of own shares from 111,424,186 to 104,083,238, so that the earnings per share fell by about two thirds to € 0.58.
The return on capital employed (ROCE)1)
sank to 4.0 % (2011: 6.3 %), its lowest value since the IPO in 2007.
EffEctiVE taX RatE: 29.7 %
EaRninGS pER ShaRE: € 0.58
2008 2009 2010 2011 2012
DEVELOPMENT OF ROCE 2008–2012
5.3 %5.7 %
5.4 %
6.3 %
■ ROCE
4.0 %
7 %
6 %
5 %
4 %
3 %
2 %
1 %
0
financial pOSitiOn and caSh flOWS
2012€ mln.
% OF BAlAnCE
shEET TOTAl
2011€ mln.
% OF BAlAnCE
shEET TOTAl
Non-current assets 4,546 45 % 4,534 44 %
Current assets 5,591 55 % 5,852 56 %
Equity 3,163 31 % 3,150 30 %
Non-current liabilities 2,432 24 % 2,359 23 %
Current liabilities 4,543 45 % 4,877 47 %
Balance sheet total 10,138 100 % 10,386 100 %
1) ROCE = (net income + interest on debt – interest tax shield (25 %)) / (average group equity + interest-bearing debt)
The balance sheet total of STRAbAG SE remained very stable at € 10.14 billion. This was in large part due to the renewed increase of inventories in response to sever-al new real estate project developments as well as the finalisation of the transaction to acquire a 51 % interest in a portfolio of se-veral companies to develop, build and oper-ate offshore wind turbines in the German North Sea. This also led to an increase in
the minority interest in shareholders’ equity, resulting in an improvement of the equity ratio from 30.3 % to 31.2 % despite the lower retained earnings – a result of the buyback programme of own shares and the lower net income. The management board considers an equity ratio between 20 % and 25 % to be a realistic target in the medium-term.

106
2012 2011 2010
Equity ratio % 31.2 % 30.3 % 31.1 %
Net debt. € mln. 155 -268 -669
Gearing Ratio % 4.9 % -8.5 % -20.7 %Capital employed € mln. 5,322 5,336 5,236
As expected, but unlike in previous years, STRAbAG did not register a net cash position on 31 December 2012, but instead a net debt in the amount of € 154.55 mil-lion. This is due on the one hand to the lower cash and cash equivalents – notewor-thy here are investments of € 42.88 million
for the purchase of own shares as well as the build-up of working capital in the year under report – and, on the other hand, to the significantly higher pension and severance provisions resulting from a change to the mathematical interest rate.
calculatiOn Of nEt dEBt (€ mln.)2012 2011 2010
Financial liabilities 1,650 1,732 1,559
Severance provisions 80 70 69
Pension provisions 430 384 375
Non-recourse debt -630 -754 -720
Cash and cash equivalents -1,375 -1,700 -1,952
net debt 155 -268 -669
2008 2009 2010 2011 2012
EQUITY, NET DEBT AND EQUITY RATIO 2008–2012
30.5 %32.2 %
31.1 % 30.3 %
■ Equity ■ Net debt ■ Equity ratio
€ -1.0 bn.
€ -0.5 bn.
0
€ 0.5 bn.
€ 1.0 bn.
€ 1.5 bn.
€ 2.0 bn.
€ 2.5 bn.
€ 3.0 bn.
€ 3.5 bn.
31.2 %
2,97
9
3,09
9
3,23
2
3,15
0
3,16
3
-110
-596
-669
-268
155
Due to the 28 % decline of the cash flow from profits and the somewhat stronger build-up of working capital, the cash flow from operating activities in the past finan-cial year fell by 46 % to € 268.80 million. In the previous year, the investment for an interest in a cement plant had still affected the cash flow from investing activities. The absence of this investment in the past financial year, and the cautious attitude regarding enterprise acquisitions, let the
cash flow from investing activities fall by 27 % to € -447.19 million. The cash flow from financing activities, which amounted to € -176.26 million, was defined by a significant repayment of bank borrowings related to a motorway concession project in Denmark that was completed and transferred to the client. This could not be compensated for by increasing the financial resources from the bonded loan and from the bond.

107group management Report
The number one objective for the treasury management of STRAbAG SE is assuring the continued existence of the company through the maintenance of constant solvency. This objective is to be reached through the provision of sufficient short-term, medium-term and long-term liquidity.
Liquidity for STRAbAG SE means not only solvency in the strict sense but also the availability of guarantees. The building activity requires the constant availability of bid, contract fulfilment, pre-payment and warranty guarantees and/or sureties. The financial scope of action is thus defined on the one hand by sufficient cash and cash credit lines, on the other hand by sufficient surety credit lines.
The management of liquidity risks has be-come a central element of the corporate management at STRAbAG. In practice, liquidity risks come in various forms:
nIn the short-term, all daily payment obligations must be covered in time and/or in their entirety.
nIn the medium-term, liquidity levels must be sufficient so that no transaction or projects become impossible due to a lack of suffi- cient financial means or guarantees or that they cannot be executed at the desired pace.
nIn the long-term, there should be sufficient financial means available to be able to pursue the strategic development targets.
capital EXpEndituRES
■ Enterprise acquisitions (changes to the scope of consolidation)■ Acquisition of intangible assets and PEE■ Acquisition of financial investments
COMPOSITION OF CAPEX
2010 20110
€ 100 mln.
€ 200 mln.
€ 300 mln.
€ 400 mln.
€ 500 mln.
€ 600 mln.
2012
554
114
477
161
458
9 21 4148
STRAbAG had forecast capital expenditures (CAPEX) in the amount of approximately € 475 million for the 2012 financial year. In the end, the net capital expenditures total-led € 447.19 million and so remained slightly under budget. CAPEX before subtraction of proceeds from asset disposals stood at € 520.65 million. This figure includes expen-ditures on intangible assets and on proper-ty, plant and equipment of € 458.28 million, the purchase of financial assets amounting to € 41.17 million and enterprise acquisitions (changes to the scope of consolidation) of € 21.19 million.
About € 250 million is spent annually as maintenance expenditures related to the equipment fleet in order to prevent inventory obsolescence. The high proportion of ex-pansion expenditures is due to STRAbAG’s
focus of its capital expenditures: a large portion went to expansions in the equip-ment fleet for large construction sites in tunnelling in Austria and in the international business, e.g. in Abu Dhabi and Tanzania. The company also made significant invest-ments in 2012 in equipment for hydraulic engineering, including a ship. Another focus still remains on increasing the level of self-sufficiency with construction materials and on the German market.
Expenditures on intangible assets and on property, plant and equipment during the year under report must be seen against amortisation on intangible assets and de-preciation on property, plant and equipment in the amount of € 401.17 million. This figure also includes goodwill impairment in the amount of € 10.08 million.
financinG/tREaSuRY
108
In the past, STRAbAG has always oriented its financing decisions according to the risk aspects outlined above and has organised the maturity structure of the financial liabili-ties in such a way as to avoid a refinancing risk. In this way, the company has been able to maintain a great scope for action, which is of particular importance in a difficult mar-ket environment.
The necessary liquidity is determined by liquidity planning. based on this, liquidity assurance measures are made and a liquidity reserve is defined for the entire group.
The medium- and long-term liquidity needs have so far also been covered by the issue of corporate bonds. STRAbAG SE has regularly issued bonds on the Austrian capital market since 2002. However, due to the market conditions, STRAbAG opted against issuing a new bond in the 2009 financial year. In the 2012 financial year, STRAbAG successfully issued a € 100 million tranche with a coupon of 4.25 % and a term to maturity of seven years. The proceeds from the issue were used for general business purposes and to pay back a bond which matured in 2012. At present, this leaves four bonds of STRAbAG SE with a total volume of € 450 million on the market.
In order to diversify the financing structure, STRAbAG SE placed its first bonded loan in the amount of € 140 million in the past financial year. This long-term debt financing instrument is in many ways similar to a bond, with an important difference being that bond- ed loans are issued directly to institutional investors without using an organised capital market, i.e. an exchange.
In December 2012, STRAbAG SE arranged a revolving syndicated cash credit line with a consortium of banks in the amount of € 400 million. With a term of five years, the credit line represents a long-term loan commitment with which STRAbAG will be able to maintain its comfortable liquidity position. The syndicated cash credit line partially replaces already existing short-term bilateral credit lines, provides an over-all improvement of the liquidity reserves and in particular can be used to balance out the cash infusions as required over the course of the year.
The existing liquidity of € 1.4 billion and cash credit lines of € 0.6 billion assure the group’s liquidity needs. Nevertheless, further bond issues are planned, depending on the mar-ket situation, in order to maintain a high level of liquidity reserves in the future as well.
STRAbAG SE has a total credit line for cash and surety loans in the amount of € 6.6 billion at its disposal. These credit lines in-clude a syndicated surety credit line in the amount of € 2.0 billion and the syndicated cash credit of € 0.4 billion. Furthermore, there exist bilateral credit lines with banks. A high degree of diversification creates an adequate risk spread in the provision of the credit lines.
In December 2012, S&P again confirmed its bbb- rating and stable outlook as STRAbAG SE benefits from the well-diver-sified and vertically integrated business, its good access to raw materials and the group’s adequately high liquidity.
tOtal cREdit linE fOR caSh and SuREtY lOanS:
€ 6.6 BilliOn
2012 2011 2010
Interest and other income (€ million) 73 112 79
Interest and other expense (€ million) -124 -104 -98
EbIT/net interest income -4.1x 39.2x -15.2x
Net Debt/EbITDA 0.3x -0.4x -0.9x

109group management Report
paYmEnt OBliGatiOnSBOOK vAluE 31 dECEmBER 2012
€ mln.
bonds 478
bank borrowings 1,129
Liabilities from finance leases 43
Total 1,650
■ Bonds■ Bank liabilities■ Financial leasing
2013
2014–2017
after 2017
Total: € 440 million
Total: € 651 million
Total: € 833 million
PAYMENTS INCL. INTERESTS
118 312 11
166 455 30
292 531 11
■ Bonds■ Bonded loans
REPAYMENT PROFILE
€ 180 mln.
€ 160 mln.
€ 140 mln.
€ 120 mln.
€ 100 mln.
€ 80 mln.
€ 60 mln.
€ 40 mln.
€ 20 mln.
02013 2014 2015 2016 2017
-3,3
95
1,7
-4,7
-1,6
1,9
1,6
100
117
175
24
2018 2019
0
100
8

110
oveRview oF tHe seGMents oFstRABAG se
The operating business of STRAbAG SE is divided into three segments: North + West, South + East and International + Special Divisions. A further segment defined as “Other” encompasses expenditures, income and employees at the group’s service compa-nies and central staff units. Since 1 July 2012, STRAbAG presents its business mainly by region and not – as it had done in the past – by construction segment.
The segments are comprised as follows:
north + westmanagement board responsibility: peter KrammerGermany, Poland, benelux, Scandinavia, Ground and Hydraulic Engineering, Offshore Wind
south + Eastmanagement board responsibility: siegfried wankerAustria, Switzerland, Hungary, Czech Republic, Slovakia, Adriatic, Rest of Europe, Railway Structures, Environmental Technologymanagement board responsibility: Thomas BirtelRussia and neighbouring countries
international + special divisionsmanagement board responsibility:hannes TruntschnigInternational, Tunnelling, Services, Real Estate Development, Infrastructure Devel-opment, Construction Materials
service Companiesmanagement board responsibility: Thomas Birtel and Christian harder
Construction projects are assigned to one of the segments (see chart below). Of course, projects may also be assigned to more than one segment. This is the case, for example, with PPP projects in which the construction part is assigned to its respective geographic segment, but the concession part is assigned to the concessions unit of Inter- national + Special Divisions. In projects which span more than one segment, the commercial and technical responsibility is generally assigned to that segment which has the higher share of the overall project value.
With only a few exceptions, we offer our ser-vices in all areas of the construction industry in the individual European markets in which we operate and cover the entire construc-tion value chain. Our services include:
SEGmEnt REpORt
nORTh + wEsT sOuTh + EAsTinTERnATiOnAl +
spECiAl divisiOns
Residential Construction P P P
Commercial and Industrial Facilities P P P
Public buildings P P P
Production of Prefabricated Elements P P P
Civil Engineering P P P
bridges P P P
Power Plants P P P
Environmental Technology P
Railway Structures P
Roads, Earthworks P P P
Hydraulic Engineering, Waterways, Dyking P P
Landscape Architecture and Development P P
Paving P P
Large-Area Works P P P
Sports and Recreational Facilities P P
Protective Structures P P P
Sewer Systems P P P
Production of Construction Materials P P P
Ground Engineering P
Offshore Wind P P
Tunnelling P
Real Estate Development P
Infrastructure Development P
Operation/Maintenance/Marketing of PPP Projects P
Property and Facility Services P

110 111group management Report
seGMent noRtH + west
The segment North + West executes con-struction services of nearly any kind and size with a focus on Germany, Poland,
the benelux countries and Scandinavia. Ground and hydraulic engineering as well as offshore wind can also be found in this segment.
Output VOlumE nORth + WESt 2011–2012€ mln. OuTpuT vOlumE TOTAl 2012 OuTpuT vOlumE TOTAl 2011 ChAnGE % ChAnGE ABsOluTE
Germany 4,185 4,103 2 % 82
Poland 777 1,290 -40 % -513
Scandinavia 575 487 18 % 88
benelux 329 271 21 % 58
The Americas 131 92 42 % 39
Russia and neighbouring countries 88 52 69 % 36
Switzerland 35 38 -8 % -3
Rest of Europe 33 14 136 % 19
Slovenia 19 0 n.a. 19
Austria 18 18 0 % 0
Hungary 16 9 78 % 7
Italy 9 2 350 % 7
Asia 7 8 -13 % -1
Romania 6 6 0 % 0
Middle East 5 4 25 % 1
Serbia 3 0 n.a. 3
Africa 1 3 -67 % -2
Output volume total 6,237 6,397 -3 % -160
Output volume, revenue and result
With € 6,237.17 million, the segment North + West exhibited a 3 % lower output volume in 2012 as compared to the year before. Good demand in the German building construc-tion and civil engineering business, as well as the expansion in Northern Europe, were unable to fully compensate the significant decline in Poland that followed the end of the construction boom in that country.
The revenue for the segment even fell by 8 %, and the earnings before interest and taxes (EbIT) moved from positive territory deep into the negative. While satisfactory earnings contributions could still be reported from Poland and Germany during the same period of the previous year, los-ses on large projects in hydraulic enginee-ring, the tense price situation affecting the
asphalt mixing plants in Germany, and losses in Poland have been a burden on the segment result in the past few months.
Order backlog
The order backlog decreased only slightly by 2 % to € 4,826.52 million. Here, too, Germany – with several new large con- tracts in building construction and civil engineer-ing – helped to narrow the decline in countries such as Poland, for example. In the first half of the year, STRAbAG subsidiary Ed. Züblin was able to win the tender for the station building and fur-ther infrastructure measures related to the Stuttgart 21 rail project. The company was also selected to construct new buil-dings for the Hamm-Lippstadt University of Applied Sciences. It also won the nearly € 95 million contract to build the new Germany
2012€ mln.
ChAnGE 2011 – 2012
%2011
€ mln.
Output volume 6,237 -3 % 6,397
Revenue 5,510 -8 % 5,961
Order backlog 4,827 -2 % 4,912
EbIT -51 n.a. 149
EbIT margin % of revenue -0.9 % 2.5 %
Employees 25,108 -3 % 25,962

112
headquarters for the Thales Group in Ditzingen near Stuttgart.
Employees
The employee figures, like the output volume, offer a reflection of the economic situation. An increase in Germany was accompanied by a significant reduction in Poland. A decline was also registered in the Americas region: although all non-European activities are concentrated in the segment International +Special Divisions, the activities of Züblin Chile and Züblin Ground Engineering globally are represented in the segment North + West.
Outlook
The absence of negative special items, for example in hydraulic engineering or in Poland, should lead to an improved result in the segment North + West in the 2013 financial year. Regarding the output volume, on the other hand, the STRAbAG SE management board expects to see a decline to € 5.8 billion.
STRAbAG expects the employment situation in the German building construction and civil engineering business to remain at a high level. Here STRAbAG was able to start the year 2013 with an order backlog accounting for around three quarters of the expected output volume. Positive impulses are expected from the expansion of the tim-ber engineering business field.
The German entities in transportation infra-structures are cautiously optimistic as well: the financial policy framework for the most important client, the public sector, may be solid, but while the federal and state gov-ernments are expected to make transporta-tion infrastructure investments at last year’s levels, it is uncertain to which extent local gov-ernments will use their financing flexibility for investments. Despite the fact that some communities will devote their budget surpluses toward debt reduction, STRAbAG expects to maintain a constant output volume in the German transportation infra-structures segment in 2013 as in 2012.
A burden in Germany is the business with asphalt mixing facilities. It remains difficult to sell asphalt at a sufficiently high price everywhere where it is needed. because of this tense market situation, dependence on
bitumen price developments is expected to remain high.
In Poland, the number of public-sector tenders for infrastructure projects in 2013 will be below the previous year’s levels. In connection with the new EU budget for the years 2014–2020, however, there is a possibility of higher tender activity toward the end of the year. Until then, business will be hindered by price battles. The low volume of public-sector tenders is also having an impact on building construction and civil engineering. In the face of restrictive credit approvals, the field of residential construction is also subject to reductions. STRAbAG therefore sees shopping and logistics centres as well as industrial construction as the segments of the future in the Polish building construction sector.
In Sweden, the market is expected to shrink slightly in 2013. However, the housing mar-ket for project developments is booming in Stockholm, which, according to forecasts by STRAbAG, will last for several more years. In the Stockholm, Gothenburg and Helsingborg/Malmö regions, there is high demand for new commercial real estate, hotels and shopping centres. The situation is expected to remain unchanged in the field of infrastructure and tunnelling, with stable public-sector finances contributing signifi-cantly to the positive outlook. The long-term activities in the Greater Stockholm Area and in the north of Sweden therefore offer good potential.
In the field of hydraulic engineering, STRAbAG in 2012 managed to enter the market for port construction in Russia and in Ukraine. The company sees the entire Northern and baltic area and black Sea region as a strategic area and is therefore working on several bids for large projects here.

112 113group management Report
SElEctEd pROJEctS nORth + WESt
COunTRy pROjECTORdER BACKlOG
€ mln.
pERCEnTAGE OF TOTAl GROup ORdER BACKlOG
%
Chile Candelaria Mine 2011 147 1.12 %
Germany Motorway A8 Ulm–Augsburg 113 0.86 %
Germany Taunus Tower Frankfurt on the Main 99 0.75 %
Germany Naval port Wilhelmshaven 98 0.75 %
Poland S8 Złoczew–Sieradz section 4 93 0.71 %
Poland S8 Złoczew–Sieradz section 2 91 0.69 %
seGMent soUtH + eAst
The geographic focus of the segment South + East is on Austria, Switzerland, Hungary, the Czech Republic, Slovakia,
Russia and neighbouring countries as well as the region South-East Europe. The railway construction and environmental technology activities are also handled within this segment.
Output VOlumE SOuth + EaSt 2011–2012€ mln. OuTpuT vOlumE TOTAl 2012 OuTpuT vOlumE TOTAl 2011 ChAnGE % ChAnGE ABsOluTE
Austria 1,573 1,621 -3 % -48
Czech Republic 532 640 -17 % -108
Russia and neighbouring countries 432 420 3 % 12
Slovakia 360 396 -9 % -36
Switzerland 351 438 -20 % -87
Germany 339 312 9 % 27
Romania 315 159 98 % 156
Hungary 293 330 -11 % -37
Poland 232 276 -16 % -44
Croatia 111 87 28 % 24
Serbia 66 86 -23 % -20
Slovenia 49 35 40 % 14
Rest of Europe 42 31 35 % 11
bulgaria 24 15 60 % 9
Italy 13 7 86 % 6
Asia 7 11 -36 % -4Middle East 7 1 600 % 6
The Americas 6 4 50 % 2
benelux 2 13 -85 % -11
Scandinavia 2 0 n.a. 2
Output volume total 4,756 4,882 -3 % -126
Output volume, revenue and result
The segment South + East generated an output volume of € 4,755.74 million in the 2012 financial year. This is just slightly lower, specifically by 3 %, than the pre- vious year. The result of working off several large contracts in the transportation
infrastructures business in Romania more or less balanced out the declines in the Czech Republic and in Switzerland.
With a minus of 2 % the revenue developed similary to the output volume. The segment is characterised by a strong competition and price pressure. Additional burdens
2012€ mln.
ChAnGE 2011 – 2012%
2011€ mln.
Output volume 4,756 -3 % 4,882
Revenue 4,792 -2 % 4,877
Order backlog 4,326 -7 % 4,647
EbIT 149 6 % 140
EbIT margin % of revenue 3.1 % 2.9 %
Employees 22,699 -2 % 23,197

114
include charges in the field of environmental technology and reorganisation costs in Switzerland. Nonetheless, the earnings before interest and taxes (EbIT) could be grown by 6 % to € 148.89 million, the EbIT margin from 2.9 % to 3.1 %.
Order backlog
The order backlog of this segment was down by 7 % to € 4,326.12 million. A coun-try-by-country comparison reveals quite a differentiated situation, however: Despite the large contracts for the extension of the U1 underground line in Vienna and the construction of the high-performance rail line between Vienna–Salzburg, the order backlog in Austria fell slightly due to a signi-ficant reluctance on the part of public-sector clients, in particular in the federal states of the country’s south. The order backlog was also burdened in part by contract can-cellations in the RANC region (Russia and neighbouring countries). Here, strategic changes are on the agenda, with activities gradually shifting from building construction in the major cities to industrial projects in the regions. STRAbAG is also preparing for mar-ket entry in Turkmenistan and Kazakhstan.
In Slovenia, Hungary, the Czech Republic and Italy, on the other hand, new projects helped to enlarge the order backlog. In Ljubljana, Slovenia, STRAbAG is building a waste treatment facility for € 112 million to produce biogas from organic waste, among other things. In Hungary, STRAbAG is working in a consortium to renew the Gyoma–békéscsaba rail line; and in Italy, the order backlog was bolstered by the contract award of a portion of the construction works for a bypass around the city of Milan.
Employees
The employee figures exhibited a similar situation as the output volume: growth in Romania, with a reduction of the employee levels in nearly all other markets. In total, the workforce fell by 2 % to 22,699 employees.
Outlook
The management board expects a slight im-provement of the EbIT and a higher output volume of € 5.0 billion in the segment South + East for 2013. Price pressure will remain high in the Central and Eastern European transportation infrastructures business, but there is hope for a series of tenders – albeit at lower prices – in markets such as Romania, Moldova and the Czech Republic. Mean-while, interesting projects are expected to be awarded soon in the field of railway construction in Poland and in building construction in Slovakia. The reorganisation in Switzerland should be concluded and individual loss-making projects in environ-mental technology – a business on which STRAbAG will focus more in the core mar-kets in the future – will no longer burden the results.
The management board expects continuous positive business in the building construc-tion sector in Vienna, while the price pres-sure in the rest of Austria is unlikely to let up. The stagnating to declining market for transportation infrastructures is a hotly con-tested one here. The Hungarian market lost significant volume – and attractiveness – in the past few years. Currently only a few public-sector tenders, mostly in the fields of environmental protection and railway construction, are still ongoing; long-await-ed highway investments, however, could improve the climate in the construction sector in 2013.
SElEctEd pROJEctS SOuth + EaSt
COunTRy pROjECTORdER BACKlOG
€ mln.
pERCEnTAGE OF TOTAl GROup ORdER BACKlOG
%
RussiaKautschuk residential complex, Moscow 305 2.31 %
Russia Olympic village, Sochi 138 1.04 %
Slovenia Ljubljana waste treatment facility 112 0.85 %
Czech Republic Road I/11 Rudna 75 0.57 %
Romania Modernisation of national road DN67b 58 0.44 %
Romania Promenada Mall, bucharest 48 0.37 %
Slovakia D1 motorway 43 0.32 %

114 115group management Report
seGMent inteRnAtionAL + speciAL Divisions
The segment International + Special Divisions includes, on the one hand, the field of tun-nelling. The concessions business, on the other hand, represents a further important area of business, with global project devel-opment activities in transportation infra-structures in particular. Regardless of where the services are rendered, our construction materials business, including our dense
network of raw materials operations but with the exception of asphalt, also belongs to this segment. The real estate business, which stretches from project development and planning to construction and operation and also includes the property and facility ser-vices business, completes the wide range of services. Additionally, most of the services in non-European markets are also bundled in the International + Special Divisions segment.
Output VOlumE intERnatiOnal + SpEcial diViSiOnS 2011–2012€ mln. OuTpuT vOlumE TOTAl 2012 OuTpuT vOlumE TOTAl 2011 ChAnGE % ChAnGE ABsOluTE
Germany 1,196 1,132 6 % 64
Middle East 293 304 -4 % -11
Austria 268 297 -10 % -29
The Americas 211 161 31 % 50
Italy 135 177 -24 % -42
benelux 124 76 63 % 48
Africa 124 57 118 % 67
Poland 118 132 -11 % -14
Czech Republic 109 119 -8 % -10
Asia 96 90 7 % 6
Hungary 80 92 -13 % -12
Romania 50 40 25 % 10
Slovakia 39 44 -11 % -5
Switzerland 35 92 -62 % -57
Croatia 18 18 0 % 0
Slovenia 13 14 -7 % -1
Rest of Europe 8 0 n.a. 8
Russia and neighbouring countries 5 9 -44 % -4
bulgaria 2 2 0 % 0
Serbia 1 0 n.a. 1
Scandinavia 0 24 -100 % -24
Output volume total 2,925 2,880 2 % 45
Output volume, revenue and result
The output volume in the segment Inter- national + Special Divisions improved slightly by 2 % to € 2,924.86 million. Germany – specifically the field of Property & Facility Services – continues to generate the most significant portion of the output volume, followed by the non-European markets.
The revenue, on the other hand, fell by 6 % to € 2,661.29 million. This can be explained by the completion of a public-private partnership project which had defined the revenue in 2011. Nonetheless, the earnings before interest and taxes (EbIT) could be more than doubled to € 126.93 million despite the volatile business in tunnelling and internationally – and despite the fact that this figure includes damage compen-sation payments in the amount of € 43 million.
2012€ mln.
ChAnGE2011 – 2012
%2011
€ mln.
Output volume 2,925 2 % 2,880
Revenue 2,661 -6 % 2,842
Order backlog 4,038 7 % 3,782
EbIT 127 115 % 59
EbIT margin % of revenue 4.8 % 2.1 %
Employees 20,426 -7 % 22,068

116
Order backlog
The order backlog registered a significant increase of 7 % to € 4,038.33 million. While the completion of infrastructure contracts in the Netherlands helped to reduce the order backlog, the segment International + Special Divisions added several new large orders to the books in the 2012 financial year. One of these was in Italy: The project volume of € 1.7 billion (STRAbAG’s share amounts to about € 1.0 billion, that of the segment to about € 720 million) for the Milan bypass includes the construction of a 50 km section of dual-carriage motorway with two to three lanes in each direction plus 50 km of spurs and connecting routes to the existing road network. The works also include 50 cut-and-cover tunnels as well as two bored tunnels including technical facilities, several bridges and an approx. 80 km bicycle trail.
In Germany, the city of Hamburg commis-sioned a special purpose company set up in part by STRAbAG Real Estate GmbH to plan, build, modernise and operate 15 voca-tional schools. The project has a total value of € 700 million (STRAbAG’s share is 50 %) and is being carried out under a public- private partnership model. STRAbAG also won several contracts internationally, inclu-ding one to set up a bus rapid transit system in Tanzania as well as a tunnelling project at the world’s largest copper mine in Chuqui-camata in the desert of Chile.
The services sector also contributed several new large projects to the order backlog: STRAbAG Property and Facility Services was awarded contracts in the field of facility management from DFS Deutsche Flug- sicherung GmbH and maintenance contracts from telecommunications provider Versatel AG and AOK bayern. In property manage-ment, the company won Union Investment and real estate investor Pramerica Real Estate Investors as new clients. The ac-quisition of berlin-based real estate manag-er bWG (GSW betreuungsgesellschaft für Wohnungs- und Gewerbebau mbH) allowed us to expand our own range of services in property management to include the field of residential real estate.
Employees
Development of the employee figures ran counter to the order backlog. This number
fell by 7 % to 20,426 employees in part due to the completion of construction projects in the Middle East.
Outlook
The output volume in the segment Interna-tional + Special Divisions is expected to reach about € 3.0 billion in 2013. The EbIT should remain at a high level due to the absence of the one-time compensation expense in 2012 in the amount of € 43 million as a re-sult of partially lost arbitration proceedings. At the same time, the construction materi-als business will continue to put pressure on the margins of the segment. In the field of concrete, the situation is burdened by de-lays in the tendering of large-scale projects as well as by overcapacities on the market. Growth of production in Central Europe is not expected until the spring of 2013 at the earliest. In the field of stone and gravel, ruinous price competition has become apparent in several regions, with no improvement in sight for the next one to two years.
Target markets which are currently being worked more intensely outside of Europe re-gardless of the type of service are the United Arab Emirates, Algeria, Qatar – STRAbAG expects the construction boom in pre- paration for the 2022 FIFA World Cup to begin here soon –, Oman and Saudi Arabia. because of the low price level in these regions as a result of the high degree of competition, STRAbAG is successfully offering specialty construction services such as pipe jacking (a special form of tun-nelling), test track construction or services in the field of liquefied natural gas (LNG). In India, STRAbAG subsidiary EFKON AG was awarded six new contracts in the field of intelligent transportation systems in the last financial year.
Competition is also on the rise in the PPP infrastructure business. For this reason, STRAbAG is exploring other markets be- sides the core markets in Europe, such as Canada, India, selected countries in South America, and the Middle East. Despite the high costs involved in bid processing, some of these countries are also of interest for tunnelling projects. Although several projects will be tendered in Austria, Germany and Norway in the short to medium term, the prices in the home markets are in part

116 117group management Report
at a ruinously low level. Meanwhile, STRAbAG already has an established tun-nelling presence in Canada and the company entered the mining market with contracts in Chile and Australia in the past financial year.
by contrast, the activities of the PPP building construction business are concen-trated on the home market of Germany. PPP financing widens the public sector’s scope of action on the one hand; on the other hand, the consequences of the financial crisis – significantly higher interest pre-miums and liquidity costs with a trend to shorter financing terms – are still having an inhibitory effect. The efficiency advantages of having an integrated solutions approach, i.e. through the observation of the lifecy-cle costs, are offsetting the disadvantages in the current market environment. Thanks to the inclusion of specialist providers from within the group, such as STRAbAG Property and Facility Services, STRAbAG is in a position to completely cover all specifi-cations from structuring to financing and planning all the way to construction and operation.
A positive mood can be observed in the field of real estate development. In Germany, growth forces have shifted toward residen-tial construction, which, given the clear lack of rental flats in urban agglomerations, should provide some positive impulses. STRAbAG therefore remains active in the development of apartment buildings, i.e. re-sidential properties for global investors. In September 2012, the Donnersberger Höfe, a residential building project in Munich, was handed over to the investor with full tenant occupancy. Several successes were also re-gistered in the field of commercial real es-tate last year: STRAbAG began construction on the Milaneo shopping centre in Stuttgart and on the multiuse building Upper West in berlin. Additionally, several properties were acquired for future project developments, for example in Aachen and in bremen.
SElEctEd pROJEctS intERnatiOnal + SpEcial diViSiOnS
COunTRy pROjECTORdER BACKlOG
€ mln.
pERCEnTAGE OF TOTAl GROup ORdER BACKlOG
%
ItalyPedemontana motorway, Milan bypass 1,051 7.96 %
Austria Koralm Tunnel, contract section 2 379 2.87 %
Germany Upper West, project development 168 1.27 %
Netherlands A-Lanes A15, bridge construction 138 1.05 %Oman Duqm port facility 118 0.89 %
Tanzaniabus rapid transit system Dar Es Salaam 90 0.68 %

118
The STRAbAG Group is subject to a number of risks in the course of its business activi-ties. These risks are identified and assessed using an active risk management system and dealt with using an appropriate risk policy.
The group’s goals are defined at all company levels. This was a prerequisite to setting up processes for the timely identification of potential risks standing in the way of the achievement of company objectives. The organisation of STRAbAG’s risk management builds on project-related jobsite and acquisi-tions controlling, supplemented by the higher- level assessment and steering management. The risk controlling process includes a certified quality management system, internal group guidelines for the workflow in the operating units, a central administration, controlling, auditing and contract manage-ment. Through the establishment of com-pany-wide quality standards in quotation processing and supplemental services man-agement, the centrally organised contract management department can better assert claims for outstanding debt.
The group’s internal risk report defines the following central risk groups:
eXteRnAL RisKs
The entire construction industry is subject to cyclical fluctuations and reacts to varying de-grees depending on region and sector. Over-all economic growth, development of the con- struction market, the competitive situation, the conditions on the capital markets and technological changes in construction can all result in risks. These risks are continually ob-served and monitored by the central depart-ments and operating units. Changes in exter-nal risks lead to adjustments in STRAbAG’s organisation, market presence and range of services as well as the adaptation of strate-gic and operating planning. STRAbAG fur-ther responds to market risk with geographic and product-related diversification in order to keep the influence on the company’s success exerted by an individual market or by the de-mand for certain services as low as possible. To avoid bearing the entire risk of rising prices by itself, STRAbAG makes efforts at signing cost escalation clauses and “cost-plus-fee” contracts in which the client pays a previous-ly agreed margin on the costs of the project.
opeRAtinG RisKs
The operating risks primarily include the com-plex risks of project selection and execution. STRAbAG keeps acquisition lists in order to review the project choice. business trans-actions requiring consent are reviewed and approved by business unit and subdivision managers or by division managers according to internal rules of procedure. Depending on the risk profile, bids must be analysed by commissions and reviewed for their techni-cal and economic feasibility. Cost accounting and expense allocation guidelines have been set up to assure a uniform process of costing and to establish a performance profile at the construction sites. Project execution is man-aged by the construction team on site and controlled by monthly target/performance comparisons; at the same time, the central controlling provides constant commercial backing, ensuring that risks of individual proj-ects do not endanger the continuance of the company.
FinAnciAL RisKs
Under financial risks, STRAbAG understands risks in financial matters and in accounting, including instances of manipulation. Special attention is paid to the liquidity and account-ing receivables management, which is se-cured through continuous financial planning and daily status reports. Compliance with in-ternal commercial guidelines is guaranteed by the central accounting and controlling departments, which are also responsible for internal reporting and the periodic planning process.
Risks from possible instances of manipulation (acceptance of advantages, fraud, deception or other infringements of the law) are moni-tored by all business areas in general and by the internal audit department in particular. STRAbAG last commissioned PwC Wirt-schaftsprüfung GmbH in 2007 to review and assess the group’s compliance systems and the activities designed to combat cor-ruption and unethical behaviour. The results were presented to the management board of STRAbAG SE and the auditors’ recom-mendations were passed on to the relevant departments for implementation.
In order to convey STRAbAG’s values and principles, the group drew up its Code of Ethics and internal Compliance Guidelines
RiSK manaGEmEnt

118 119
in 2007. The values and principles contained within these documents are reflected in the guidelines and instructions of the STRAbAG companies and divisions. Compliance with these values and principles is expected not only from the members of the management and supervisory boards as well as from other management-level employees but from all group employees. The Compliance Guidelines and the Code of Ethics are design- ed to guarantee honest and ethical business practices. The Code of Ethics is available for download at www.strabag.com > Investor Relations > Corporate Governance > Code of Ethics.
Detailed information regarding interest risk, currency risk, credit risk and liquidity risk can be found in the Notes under item 25 Financial Instruments.
oRGAnisAtionAL RisKs
Risks concerning the design of personnel contracts are covered by the central per-sonnel department with the support of a specialised data base. The company’s IT configuration and infrastructure (hardware and software) is handled by the central IT department, controlled by the internation-al IT steering committee.
peRsonneL RisiKs
Past experience has shown that having a highly qualified and motivated workforce is an important factor in competition. In order to properly assess the potential of employ-ees, STRAbAG uses an IT-supported ap-titude diagnostics process, the so-called behaviour profile analysis. In subsequent feedback talks and employee appraisal in-terviews, employees and their supervisors analyse the results and agree on specific training and further education measures.
investMent RisKs
STRAbAG can exert influence on the man-agement of associated companies through its shareholder position and, if applicable, any existing advisory functions. The shares in asphalt and concrete mixing companies usually involve minority holdings, which is typical for the sector. With these companies, economies of scope are at the fore.
poLiticAL RisK
The group also operates in countries which experience political instability. Interruptions of construction activity, restrictions on owner- ship interests of foreign investors, and even dispossession or expropriations could be the consequence of political changes which could have an impact on the group’s finan-cial structure.
A review of the current risk situation reveals that the reporting period shows no risks which jeopardised the company’s existence, nor were there any visible future risks.
RepoRt on KeY FeAtURes oF tHe inteRnAL contRoL AnD RisKMAnAGeMent sYsteMs in ReLAtion to tHe FinAnciAL RepoRtinG pRocess
introduction
The control structure as defined by the Committee of Sponsoring Organisations of the Treadway Commission (COSO) provides the basis for the description of the key features of the internal control and risk management systems. The COSO framework consists of five related components: control environment, risk assessment, control activ- ities, information and communication, and monitoring. On this basis, the STRAbAG Group set up a company-wide risk man-agement system according to generally ac-cepting principles.
The aim of the internal control system is to support management in such a way that it is capable of assuring internal controls in relation to financial reporting which are ef-fective and which are improved on an on-going basis. The system is geared to the compliance with rules and regulations and to creating conditions which are condu-cive to performing specific controls in key accounting processes.
Control environment
The corporate culture determines the con-trol environment in which management and employees operate. STRAbAG is constantly working to improve its communication and to convey its corporate values as defined in the STRAbAG Code of Ethics in order to gu-
group management Report
nO RiSKS JEOpaRdiSinG thE cOmpanY’S EXiStEncE

120
arantee moral standards, ethics and integ-rity within the company and in its dealings with others.
The implementation of the internal control system in relation to the financial reporting process is done on the basis of internal rules and guidelines. Responsibilities for in-ternal control were adapted to fit the corpo-rate organisation.
The internal audit department carries out periodic, unannounced inspections of all relevant business units as part of its re-sponsibility for monitoring compliance with the law and corporate guidelines in the technical and commercial areas. The in-ternal audit department also monitors the effectiveness of the compliance organisa-tion. During these inspections, the internal audit department analyses the legality and correctness of individual actions. The inter-nal audit department also conducts regular, independent reviews of compliance with in-ternal guidelines in the area of accounting. The head of the internal audit department reports directly to the CEO.
Risk assessment
The management identifies and monitors risks relating to the financial reporting pro-cess, with a focus on those risks that are typically considered to be material.
The preparation of the financial statements requires regular forecasts, with the inherent risk that the actual future development will deviate from the forecast. This especially affects the following matters/items of the consolidated financial statements: assess-ment of unfinished construction projects, recognition and measurement of provisions (including social capital), the outcome of legal disputes, the collectability of receivables as well as the recoverability of investments and goodwill. In individual cases, external experts are called in or publicly available sources are considered in order to minimise the risk of a false assessment.
Control activities
All control activities are applied in the current business process to ensure that errors or deviations in financial reporting are prevented or detected and subsequently corrected. The control activities range from
a management review of the period results to specific monitoring of accounts to the analysis of ongoing accounting processes.
It is the responsibility of the management to design the levels of hierarchy in such a way that an activity and the control of that activ-ity are not performed by the same person (“four-eyes” principle).
IT security control activities represent a cornerstone of the internal control system. The separation of sensitive activities is sup-ported by a restrictive approach to IT access authorisation. For its accounting and finan-cial reporting, the company mainly uses self-developed software which reflects the unique features of the construction sector. The effectiveness of the financial reporting system is further assured through automated IT controls included in the system.
information and Communication
The management regularly updates the rules and regulations for financial reporting and communicates them to all employees concerned. Regular discussions regarding the financial reporting and the rules and regulations in this context take place in var-ious committees. These committees are composed of the corporate management as well as the department head and senior staff from the accounting department. The committee’s work aims, amongst others, at guaranteeing compliance with accounting rules and regulations and to identifying and communicating weak points and potenti-al areas for improvement in the financial reporting process. Accounting employees receive regular training regarding new meth- ods of national and international financial reporting in order to identify risks of unin-tended misreporting at an early stage.
monitoring
The management and supervisory boards bear responsibility for the ongoing com-pany-wide monitoring. Additionally, the re-maining management levels – all the way to the department heads – are responsible for the monitoring of their respective areas of responsibility. Controls and plausibility checks are carried out at regular intervals. The internal audit department is also in- volved in the monitoring process.
120 121
The top management receives monthly sum-mary financial reports on the development of the output volume, the results of the respec-tive segments and countries, and the liquid-ity. Financial statements to be published
are submitted for final appraisal to the senior accounting staff and the commercial management board members before they are passed on to the audit committee of the supervisory board.
group management Report
EmplOYEESIn 2012, STRAbAG employed an aver-age of 74,010 employees in all countries in which the group operates (2011: 76,866 employees), of which 28,295 were white-collar and 45,715 were blue-collar work-ers. Consequently, the number of em- ployees sank by 4 % in comparison to the previous year – more strongly than the group’s output volume. The largest porti-on of the decline can be attributed to the conclusion of large projects – for example, in Poland or the Middle East. With difficult economic conditions affecting construction activity, however, employee levels were on the decline in other markets as well.
The segment North + West accounted for 25,108 (-3 %), South + East for 22,699 (-2 %) and International + Special Divisions for 20,426 employees (-7 %). The percentage of women in the group in 2012 remained un-changed at 13 % overall and 8 % (2011: 9 %)
at the group management level. There were 1,129 blue-collar apprentices (2011: 1,093) and 259 white-collar trainees (2011: 246) in the group.
Several human resource development projects were launched in 2012. STRAbAG implemented a new process to systema-tically identify and appropriately develop high-potential employees. The company is also offering new career opportunities: the model, developed by an interdisciplinary task force, gives current and future emplo-yees a more varied choice of development opportunities within the group than before. Following initial specialist training or expe-rience as a team leader, employees now have a total of three different career paths which they can follow: the classical man-agement ladder, the project ladder or the expert ladder.
RESEaRch and dEVElOpmEntWith public-sector as well as private clients cutting costs, competitive pressure in the construction industry has been on the rise in recent years. This has led to a situation in which clients are looking not only at the quality of the services being offered, but are also increasingly seeing the price as a de-cisive argument. Despite this price pressure, it is important for STRAbAG to continue to offer convincing services. An essential part of this is the investment in research and de-velopment (R&D).
Within the STRAbAG Group, Zentrale Tech-nik (ZT) is in overall charge of the planning and execution of research and development projects. Organised as a central division with 700 highly qualified employees at 19 loca-tions, ZT reports directly to the Deputy CEO. The division supports the group’s operating units in the areas of tunnelling and civil engi-neering, structural engineering and turnkey construction. The range of services covers
the entire construction process, from the early acquisition stage and bid processing to execution planning and site management. Research and development activities include the areas of building and construction physics, software, information & commu-nications technology, energy, construction materials technology, civil engineering and tunnelling, transportation infrastructures and safety. ZT also fosters international innovation networks.
Central topics for our innovation activities are sustainable construction and renewable energy. The employees at the R&D locations develop methods and tools to control the impact that construction activities have on the environment. In this context, the Carbon-Tracker software developed by STRAbAG was presented in 2012. CarbonTracker in-volves the systematic, automatic calculation of energy and carbon data contained within the available group databases.

122
Ecological responsibility has been a topic within the group for years. It begins with the planning of buildings and structures and continues through to their construction and related services such as property and facility management. A topic of increasing relevan-ce is energy. In the year under report, the energy costs for the companies within STRAbAG SE’s scope of consolidation amounted to nearly € 347 million and re- presented a considerable portion of the total costs within the group. Without measures to raise energy efficiency, ener-gy costs in the next few years can be ex-pected to go up in response to price hikes and legislative changes. For this reason, the company has begun with the realisation of a comprehensive energy management pro-gramme. This is targeted on the following positive results: reduced energy costs, increased potential for tax savings, better environmental protection as a result of reduced emissions, and more sustainability regarding resource use.
Energy management at STRAbAG con-sists of the three stages of “measure”, “analyse & develop” and “implement”. The group’s carbon footprint for 2012, which comprises all consolidated companies in 60 countries, yielded the following results: within the group, a total of 1,293,352 tonnes of CO2 were emitted in the period under re-port, which represents a decline of 1 %, or approx. 19,500 tonnes of CO2, compared to the previous year.
Following data calculation, the focus was on data analysis. The company is working on an “energy atlas” to make the data for en-ergy and resource use within the STRAbAG Group easier to compare. This involves de-fining key performance indicators, assigning energy and resource use to individual areas and comparing these with each other using the data from the CarbonTracker as a basis.
2012 saw structural changes at the group’s internal Gesellschaft zur Optimierung von Technischen Prozessen, Arbeitssicherheit und Qualität (TPA). TPA will remain the STRAbAG Group’s competence centre for quality management and construction ma-terials-related research and devel-opment. Lean management adds new competences for the efficient planning of supply and pro-duction chains. The restructured TPA has 868 employees at 129 locations.
STRAbAG’s EFKON AG subsidiary provides the group with expertise in the research and development of intelligent transportation systems in general and electronic toll collection solutions in particular. The com-pany has developed innovative products and solutions in the electronic toll collection seg-ment for multi-lane traffic flow and has alrea-dy introduced these onto the international market. The technology company based in
Raaba near Graz, Austria, is seeing a lot of international demand and was able to achieve an export ratio of 87 % in 2012.
In addition to specific research projects at the group’s units and subsidiaries, a large part of the research and development activities takes place at ongoing construc-tion projects – especially involving façade technology, tunnelling, construction engi-neering and ground engineering. During construction in these areas, new challenges or concrete questions often arise which require new technological processes or innovative solutions on site and which thus also contribute to the group’s research, development and innovation activity.
The STRAbAG Group spent about € 17 million (2011: € 15 million) on research, development and innovation activities during the 2012 financial year.
EnViROnmEnt

122 123group management Report
diSclOSuRES puRSuant tO SEctiOn 243a paRa 1 uGB1. The share capital of STRAbAG SE amounts to € 114,000,000 and consists of 114,000,000 fully paid-in, no-par value shares with a pro-rata value of € 1 per share of the share capital. 113,999,997 shares are bearer shares and are traded on the Prime Market Segment of the Vienna Stock Ex-change. Three shares are registered shares. Each bearer share and each registered share accounts for one vote (one share – one vote). The nomination rights associated with registered shares No. 1 and No. 2 are described in more detail under Item 4.
2. The Haselsteiner Group (Haselsteiner Familien-Privatstiftung, Dr. Hans Peter Haselsteiner), the Raiffeisen Group (Raiff-eisen-Holding Niederösterreich-Wien reg. Gen.m.b.H, bLR-baubeteiligungs GmbH, “Octavia” Holding GmbH), the UNIQA Group (UNIQA Versicherungen AG, UNIQA beteiligungs-Holding GmbH, UNIQA Österreich Versicherungen AG, UNIQA Erwerb von beteiligungen Gesellschaft m.b.H., Raiffeisen Versicherung AG) and Rasperia Trading Limited (controlled by Oleg Deripaska), as shareholders of STRAbAG SE, have signed a syndicate agreement governing (1) nom-ination rights regarding the supervisory board, (2) the coordination of voting during the Annu-al General Meeting, (3) restriction on the transfer of shares and (4) joint develop-ment of the Russian market as a core market. The Haselsteiner Group, the Raiff- eisen Group together with the UNIQA Group, and Rasperia Trading Limited each have the right to nominate two members of the supervisory board. The syndicate agree-ment also requires the syndicate partners to exercise their voting rights from syndicated shares unanimously at the Annual General Meeting of STRAbAG SE. The syndicate ag-reement further foresees restrictions on the transfer of shares in the form of mutual pre- emptive rights as well as a minimum share-holding on the part of the syndicate partners.
In accordance with Sec 65 Para 5 of the Austrian Stock Corporation Act (AktG), all rights were suspended for 10,912,340 no-par shares (about 9.57 % of the share capital) effective 31 December 2012 as these shares are held by STRAbAG SE as own shares as defined in Sec 65 Para 1 No 8 of the Austrian Stock Corporation Act (AktG) (see also Item 7).
3. To the knowledge of STRAbAG SE, the following shareholders held a direct or in- direct interest of at least 10 % of the share capital of STRAbAG SE on 31 December 2012:
n Haselsteiner Familien-Privatstiftung 29.21 %
n Raiffeisen-Holding Niederösterreich-Wien reg.Gen.m.b.H. (Raiffeisen Group) 15.31 %
n UNIQA Versicherungen AG (UNIQA Group) 14.88 %
n Rasperia Trading Limited 17.60 %
In addition to its 17.60 % interest, core shareholder Rasperia Trading Limited also holds an option, valid until 15 July 2014, to buy a further 7.40 % of STRAbAG SE from the other core shareholders mentioned above.
In exercising the authorisation by the 7th Annual General Meeting from 10 June 2011 and the renewed authorisation by the 8th Annual General Meeting from 15 June 2012 to acquire own shares in accordance with Sec 65 Para 1 No 8 of the Austrian Stock Corporation Act (AktG), the company by 31 December 2012 acquired 10,912,340 no-par shares, corresponding to about 9.57 % of the share capital (see also Item 7).
The remaining shares of the share capital of STRAbAG SE, amounting to about 13.42 % of the share capital, are in free float.
4. Three shares are – as mentioned under Item 1 – registered shares entered in the shareholder register. Registered shares No. 1 and No. 3 are held by the Haselsteiner Group and registered share No. 2 is held by Rasperia Trading Limited. Registered shares No. 1 and No. 2 allow their bearers to nominate a member each to the supervisory board of STRAbAG SE.
5. No employee stock option programmes exist.
6. No further regulations exist beyond Items 2 and 4 regarding the nomination and recall of members of the management and super-visory boards or regarding changes to the Articles of Association which do not result directly from relevant law and legislation.
124
7. The management board of STRAbAG SE was again authorised by resolution of the 8th Annual General Meeting of 15 June 2012, in accordance with Sec 65 Para 1 No 8 and Para 1a and 1b of the Austrian Stock Corporation Act (AktG), to acquire bearer or registered no-par shares of the company on the stock market or over the counter to the extent of up to 10 % of the share capi-tal during a period of twelve months from 10 July 2012 at a minimum price per share of € 1.00 and a maximum price per share of € 34.00. The purpose of the acquisition may not be to trade with own shares. The autho-risation can be exercised in full or in part or in several partial amounts for one or several purposes by the company, a subsidiary (Sec 228 Para 3 UGb) or third parties acting on behalf of the company. The management board can decide to acquire shares on the stock exchange but must inform the super-visory board following decision to do so. Over-the-counter purchases require prior approval by the supervisory board. The man- agement board was further authorised, in accordance with Sec 65 Para 1b AktG, for a
period of five years from this resolution, to sell or assign its own shares, with approval by the supervisory board, in a manner other than on the stock market or through a public tender, to the exclusion of the shareholders’ buyback rights (subscription rights), and to determine the conditions of sale. The autho-risation can be exercised in full or in part or in several partial amounts for one or sever-al purposes by the company, a subsidiary (Sec 228 Para 3 UGb) or third parties acting on behalf of the company.
8. With the exception of the agreements over a syndicated surety loan and a syndi-cated cash credit line, there exist no signifi-cant agreements to which STRAbAG SE is party and which would become effective, change or end due to a change of owner-ship in STRAbAG SE following a takeover offer.
9. No compensation agreements exist be-tween STRAbAG SE and its management and supervisory board members or employ-ees in the event of a public takeover offer.
SuppORtinG infORmatiOnAt the beginning of March 2009, an accident occurred during underground construction at the South Lot for the North-South urban metro line in Cologne, resulting in the col-lapse of the Historical Archive of the City of Cologne and significant portions of two neighbouring buildings. Debris collapsed into a hole which opened next to the North-South construction site at the Waidmarkt crossover junction. Two people were trap-ped under the rubble, and rescuers were only able to recover their bodies. Construc-tion on the underground is being carried out by a joint venture (JV) of bilfinger SE (for-merly bilfinger berger SE), Wayss & Freytag Ingenieurbau AG and STRAbAG. The JV is led by bilfinger SE on the technical side and by Wayss & Freytag Ingenieurbau AG on the
commercial side. STRAbAG holds a 33.3 % interest in the JV.
The cause of the collapse remains unknown. The public prosecutor’s office began an in-vestigation with three separate experts into possible negligent homicide and endan-germent in construction. Two independent proceedings are being conducted by the District Court in Cologne: one to collect evi-dence as to the cause of the accident and another to establish the damage to the build- ings and archives. A model of the building is currently being built to help determine the cause and the damages, with completion expected no sooner than 2014. We continue to believe that the incident will not result in any significant damages for the company.
RElatEd paRtiESbusiness transactions with related parties are described in item 27 of the Notes.

124 125group management Report
OutlOOK and OBJEctiVESThanks to STRAbAG’s successful strategy of diversification and the related diversification of risk, the lack of public-sector infrastructure investments in Europe have so far not re-sulted in any major declines in the company’s output. based on the balanced business in terms of regions and segments, STRAbAG SE expects the output for the 2013 financial year to remain unchanged over 2012 at € 14.0 billion. This will likely be composed of € 5.8 billion from the segment North + West, € 5.0 billion from the segment South + East and € 3.0 billion from the segment Interna-tional + Special Divisions. The rest can be allotted to “Other”. A further, expected re-duction in Poland should be countered by increases in tunnelling, in the international business and in building construction in Austria.
While the management board of STRAbAG SE expects another slight worsening of the business environment in the European construction sector in 2013, it also believes that there will be no larger negative non- recurrence items as in 2012. The management board therefore expects to see the group’s EbIT grow to at least € 260 million in the 2013 financial year. Against this backdrop, the net investments (CAPEX incl. minor acquisitions) should remain at the same level as 2012 and will likely come to rest at about € 475 million.
STRAbAG makes these forecasts on the assumption that the economic framework in Europe will remain unchanged in the coming year. This means that the financing environ-ment for the private and industrial clients should not worsen further, conversely, how-ever, that a rapid recovery of the conditions or a significant increase in government spend- ing cannot be expected in the STRAbAG core markets.
dEtailEd OutlOOK in thE SEGmEnt REpORtS
EVEntS aftER thE REpORtinG pERiOdNo significant events occurred after the close of the financial year.
EBIT-OUTLOOK
€ 300 mln.
€ 200 mln.
€ 200 mln.
02013e2012
207
≥25 %
≥26
0
OUTPUT OUTLOOK
2013e2012
14
14
0 %€ 15 billion
€ 10 billion
€ 5 billion
0


consoLiDAteDFinAnciAL stAteMent1)
Fin
Anci
AL
stAt
eMen
t
1) This part has been audited by KPMG.

128
consoLiDAteD FinAnciAL stAteMent 31.12.2012cOnSOlidatEd incOmE StatEmEnt fOR thE financial YEaR 2012
nOTEs2012
T€2011
T€
Revenue (1) 12,983,233 13,713,804Changes in inventories 50,388 97,365Own work capitalised 3,573 37,261Other operating income (2) 221,065 267,344Raw materials, consumables and services used (3) -8,655,101 -9,320,120 Employee benefits expenses (4) -3,051,777 -3,004,460 Other operating expenses (5) -938,158 -1,013,911 Share of profit or loss of associates (6) -9,217 -34,537 Net income from investments (7) 4,348 3,585EBiTdA 608,354 746,331Depreciation and amortisation expense (8) -401,168 -411,546 EBiT 207,186 334,785Interest and similar income 73,145 112,311Interest expense and similar charges -123,871 -103,767 net interest income (9) -50,726 8,544profit before tax 156,460 343,329Income tax expense (10) -46,422 -104,039 net income 110,038 239,290Attributable to: non-controlling interests 49,407 44,295Attributable to: equity holders of the parent company 60,631 194,995Earnings per share (€) (11) 0.58 1.75
StatEmEnt Of cOmpREhEnSiVE incOmE fOR thE financial YEaR 2012
nOTEs2012
T€2011
T€
Net income 110,038 239,290Differences arising from currency translation 45,051 -56,280 Change in hedging reserves including interest rate swaps -19,820 -24,994 Recycling in hedging reserves including interest rate swaps -7,122 -5,240 Change in actuarial gains or losses -63,871 -4,270 Change in fair value of financial instruments under IAS 39 -1,724 150 Other income from associates 2,530 -10,489 Deferred taxes on neutral change in equity (10) 23,428 6,523Other income -21,528 -94,600 Total comprehensive income 88,510 144,690Attributable to: non-controlling interests 43,325 38,057Attributable to: equity holders of the parent company 45,185 106,633
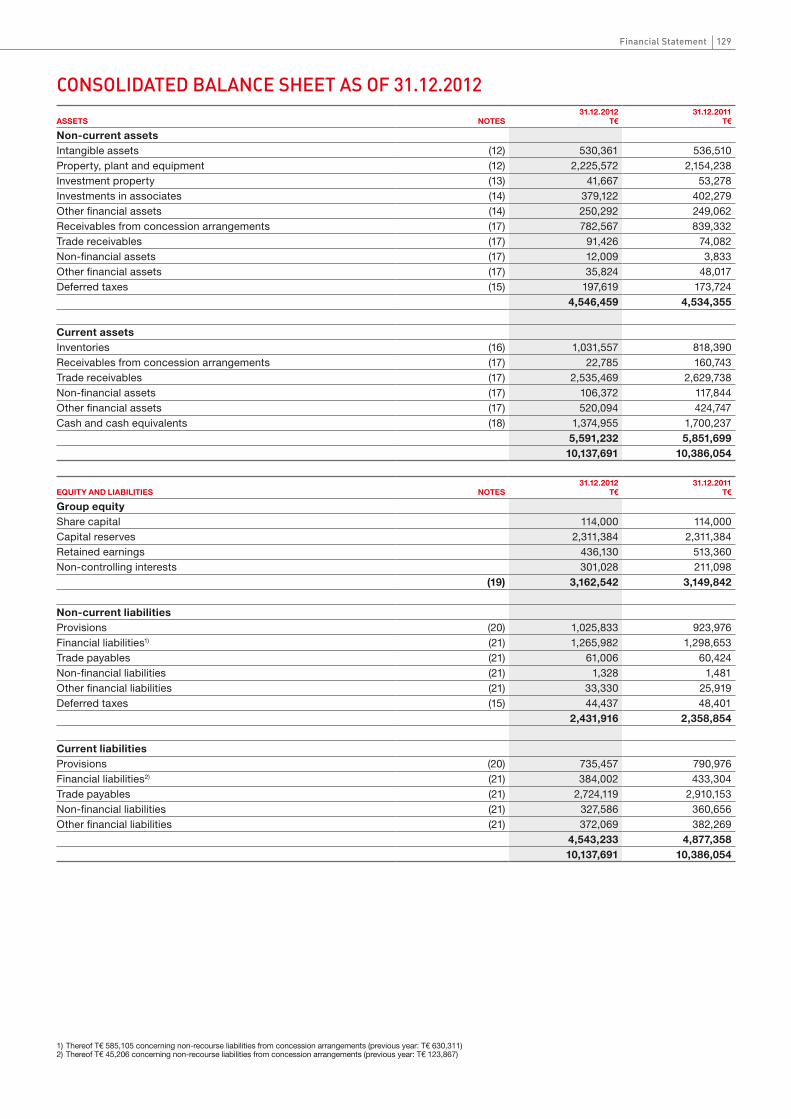
128 129financial Statement
cOnSOlidatEd BalancE ShEEt aS Of 31.12.2012
AssETs nOTEs31.12.2012
T€31.12.2011
T€
non-current assets Intangible assets (12) 530,361 536,510Property, plant and equipment (12) 2,225,572 2,154,238Investment property (13) 41,667 53,278Investments in associates (14) 379,122 402,279Other financial assets (14) 250,292 249,062Receivables from concession arrangements (17) 782,567 839,332Trade receivables (17) 91,426 74,082Non-financial assets (17) 12,009 3,833Other financial assets (17) 35,824 48,017Deferred taxes (15) 197,619 173,724 4,546,459 4,534,355
Current assetsInventories (16) 1,031,557 818,390Receivables from concession arrangements (17) 22,785 160,743Trade receivables (17) 2,535,469 2,629,738Non-financial assets (17) 106,372 117,844Other financial assets (17) 520,094 424,747Cash and cash equivalents (18) 1,374,955 1,700,237 5,591,232 5,851,699
10,137,691 10,386,054
EquiTy And liABiliTiEs nOTEs31.12.2012
T€31.12.2011
T€
Group equityShare capital 114,000 114,000Capital reserves 2,311,384 2,311,384Retained earnings 436,130 513,360Non-controlling interests 301,028 211,098
(19) 3,162,542 3,149,842
non-current liabilitiesProvisions (20) 1,025,833 923,976Financial liabilities1) (21) 1,265,982 1,298,653Trade payables (21) 61,006 60,424Non-financial liabilities (21) 1,328 1,481Other financial liabilities (21) 33,330 25,919Deferred taxes (15) 44,437 48,401
2,431,916 2,358,854
Current liabilitiesProvisions (20) 735,457 790,976Financial liabilities2) (21) 384,002 433,304Trade payables (21) 2,724,119 2,910,153Non-financial liabilities (21) 327,586 360,656Other financial liabilities (21) 372,069 382,269
4,543,233 4,877,35810,137,691 10,386,054
1) Thereof T€ 585,105 concerning non-recourse liabilities from concession arrangements (previous year: T€ 630,311)2) Thereof T€ 45,206 concerning non-recourse liabilities from concession arrangements (previous year: T€ 123,867)
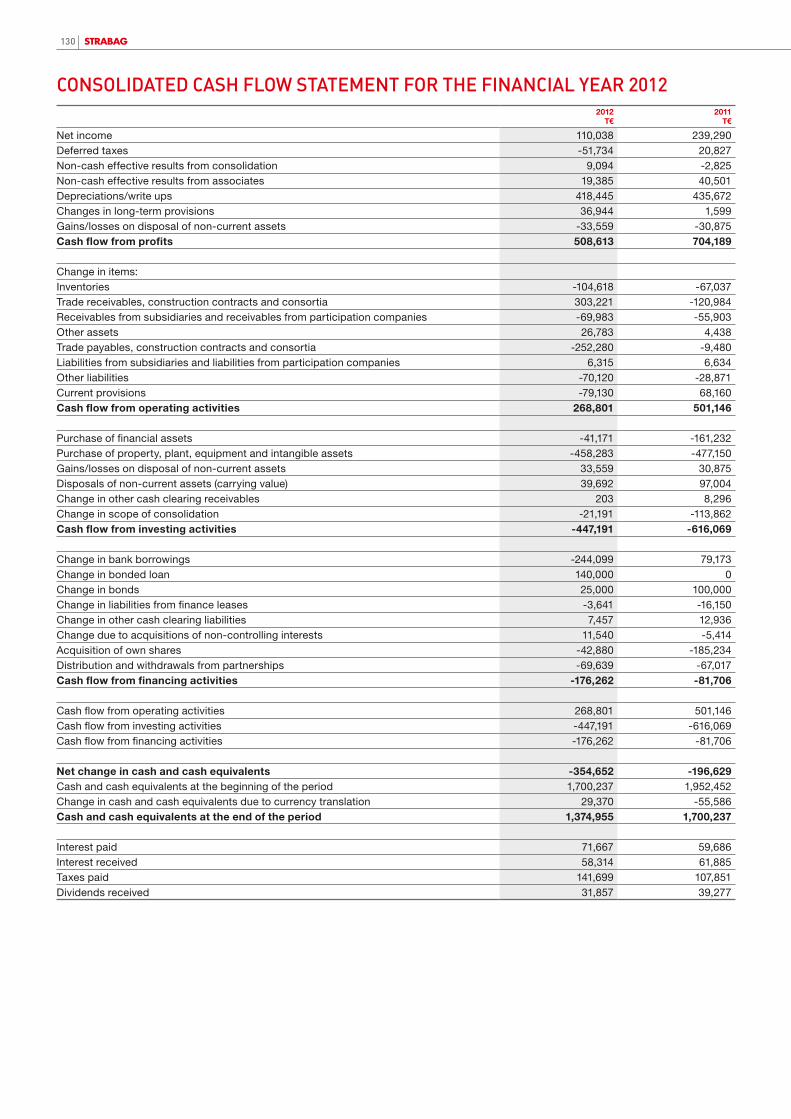
130
cOnSOlidatEd caSh flOW StatEmEnt fOR thE financial YEaR 20122012
T€2011
T€
Net income 110,038 239,290Deferred taxes -51,734 20,827Non-cash effective results from consolidation 9,094 -2,825Non-cash effective results from associates 19,385 40,501Depreciations/write ups 418,445 435,672Changes in long-term provisions 36,944 1,599Gains/losses on disposal of non-current assets -33,559 -30,875Cash flow from profits 508,613 704,189 Change in items: Inventories -104,618 -67,037Trade receivables, construction contracts and consortia 303,221 -120,984Receivables from subsidiaries and receivables from participation companies -69,983 -55,903Other assets 26,783 4,438Trade payables, construction contracts and consortia -252,280 -9,480Liabilities from subsidiaries and liabilities from participation companies 6,315 6,634Other liabilities -70,120 -28,871Current provisions -79,130 68,160Cash flow from operating activities 268,801 501,146 Purchase of financial assets -41,171 -161,232Purchase of property, plant, equipment and intangible assets -458,283 -477,150Gains/losses on disposal of non-current assets 33,559 30,875Disposals of non-current assets (carrying value) 39,692 97,004Change in other cash clearing receivables 203 8,296Change in scope of consolidation -21,191 -113,862Cash flow from investing activities -447,191 -616,069 Change in bank borrowings -244,099 79,173Change in bonded loan 140,000 0Change in bonds 25,000 100,000Change in liabilities from finance leases -3,641 -16,150Change in other cash clearing liabilities 7,457 12,936Change due to acquisitions of non-controlling interests 11,540 -5,414Acquisition of own shares -42,880 -185,234Distribution and withdrawals from partnerships -69,639 -67,017Cash flow from financing activities -176,262 -81,706 Cash flow from operating activities 268,801 501,146Cash flow from investing activities -447,191 -616,069Cash flow from financing activities -176,262 -81,706 net change in cash and cash equivalents -354,652 -196,629Cash and cash equivalents at the beginning of the period 1,700,237 1,952,452Change in cash and cash equivalents due to currency translation 29,370 -55,586Cash and cash equivalents at the end of the period 1,374,955 1,700,237 Interest paid 71,667 59,686Interest received 58,314 61,885Taxes paid 141,699 107,851Dividends received 31,857 39,277

130 131financial Statement
shARE CApiTAl
T€
CApiTAl REsERvEs
T€
RETAinEd EARninGs
T€
hEdGinG REsERvEs
T€
FOREiGn CuRREnCy REsERvEs
T€
GROup EquiTy
T€
nOn-COnTROllinG
inTEREsTsT€
TOTAl EquiTyT€
Balance as of 1.1.2011 114,000 2,311,384 724,317 -73,296 14,705 3,091,110 141,328 3,232,438Net income 0 0 194,995 0 0 194,995 44,295 239,290Differences arising from currency translation 0 0 0 0 -50,529 -50,529 -5,751 -56,280 Change in hedging reserves 0 0 0 705 0 705 35 740 Changes in financial instruments IAS 39 0 0 140 0 0 140 10 150 Changes in investments in associates 0 0 41 -609 -9,913 -10,481 -8 -10,489 Change of actuarial gains and losses 0 0 -4,361 0 0 -4,361 91 -4,270 Change of interest rate swap 0 0 0 -30,259 0 -30,259 -715 -30,974 Deferred taxes on neutral change in equity 0 0 780 5,643 0 6,423 100 6,523Total comprehensive income 0 0 191,595 -24,520 -60,442 106,633 38,057 144,690Transactions concerning non-controlling interests 0 0 -11,065 0 0 -11,065 36,030 24,965Acquisition of own shares 0 0 -185,234 0 0 -185,234 0 -185,234 Distribution of dividends1) 0 0 -62,700 0 0 -62,700 -4,317 -67,017 Balance as of 31.12.2011 114,000 2,311,384 656,913 -97,816 -45,737 2,938,744 211,098 3,149,842
StatEmEnt Of chanGES in EQuitY fOR thE financial YEaR 2012
1) The total dividend payment of T€ 62,700.00 corresponds to a dividend per share of € 0.55 based on 114,000,000 shares.2) The total dividend payment of T€ 62,492.00 corresponds to a dividend per share of € 0.60 based on 104,153,000 shares
shARE CApiTAl
T€
CApiTAl REsERvEs
T€
RETAinEd EARninGs
T€
hEdGinG REsERvEs
T€
FOREiGn CuRREnCy REsERvEs
T€
GROup EquiTy
T€
nOn-COnTROllinG
inTEREsTsT€
TOTAl EquiTyT€
Balance as of 1.1.2012 114,000 2,311,384 656,913 -97,816 -45,737 2,938,744 211,098 3,149,842Net income 0 0 60,631 0 0 60,631 49,407 110,038Differences arising from currency translation 0 0 0 0 44,304 44,304 747 45,051Change in hedging reserves 0 0 0 3,173 0 3,173 76 3,249Changes in financial instruments IAS 39 0 0 -1,533 0 0 -1,533 -191 -1,724 Changes in investments in associates 0 0 211 -2,418 4,679 2,472 58 2,530Change of actuarial gains and losses 0 0 -54,931 0 0 -54,931 -8,940 -63,871 Change of interest rate swap 0 0 0 -29,622 0 -29,622 -569 -30,191 Deferred taxes on neutral change in equity 0 0 15,833 4,858 0 20,691 2,737 23,428Total comprehensive income 0 0 20,211 -24,009 48,983 45,185 43,325 88,510Transactions concerning non-controlling interests 0 0 -17,043 0 0 -17,043 53,752 36,709Acquisition of own shares 0 0 -42,880 0 0 -42,880 0 -42,880 Distribution of dividends2) 0 0 -62,492 0 0 -62,492 -7,147 -69,639 Balance as of 31.12.2012 114,000 2,311,384 554,709 -121,825 3,246 2,861,514 301,028 3,162,542
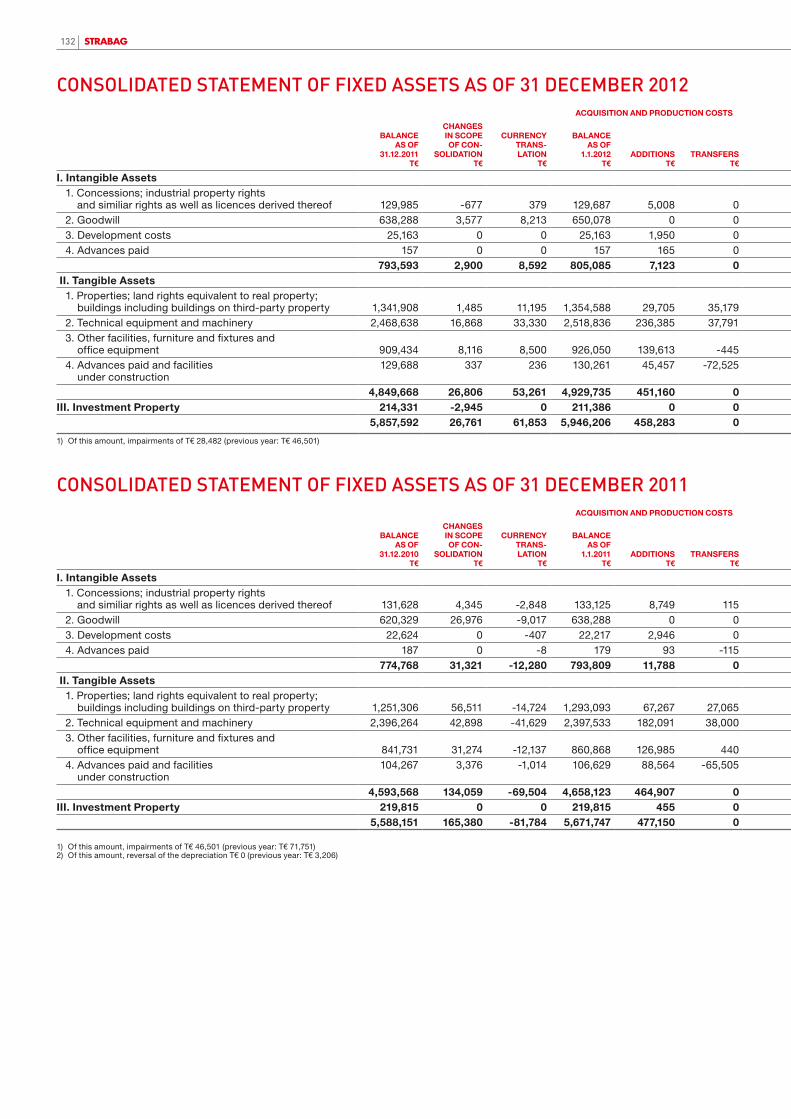
132
ACquisiTiOn And pROduCTiOn COsTs ACCumulATEd dEpRECiATiOn CARRyinG vAluEs
BAlAnCEAs OF
31.12.2011T€
ChAnGEsin sCOpEOF COn-
sOlidATiOnT€
CuRREnCy TRAns-lATiOn
T€
BAlAnCEAs OF
1.1.2012T€
AddiTiOnsT€
TRAnsFERsT€
dispOsAlsT€
BAlAnCEAs OF
31.12.2012T€
BAlAnCEAs OF
31.12.2011T€
ChAnGEsin sCOpEOF COn-
sOlidATiOnT€
CuRREnCy TRAns-lATiOn
T€AddiTiOns1)
T€TRAnsFERs
T€dispOsAls
T€
BAlAnCEAs OF
31.12.2012T€
vAluEs 31.12.2012
T€
vAluEs 31.12.2011
T€
i. intangible Assets 1. Concessions; industrial property rights and similiar rights as well as licences derived thereof 129,985 -677 379 129,687 5,008 0 12,915 121,780 83,047 105 -5 10,787 0 12,262 81,672 40,108 46,938 2. Goodwill 638,288 3,577 8,213 650,078 0 0 2,018 648,060 166,461 0 13 10,077 0 0 176,551 471,509 471,827 3. Development costs 25,163 0 0 25,163 1,950 0 0 27,113 7,575 0 0 1,116 0 0 8,691 18,422 17,588 4. Advances paid 157 0 0 157 165 0 0 322 0 0 0 0 0 0 0 322 157
793,593 2,900 8,592 805,085 7,123 0 14,933 797,275 257,083 105 8 21,980 0 12,262 266,914 530,361 536,510 ii. Tangible Assets 1. Properties; land rights equivalent to real property; buildings including buildings on third-party property 1,341,908 1,485 11,195 1,354,588 29,705 35,179 19,402 1,400,070 441,857 -1,342 2,433 42,555 6 9,544 475,965 924,105 900,051 2. Technical equipment and machinery 2,468,638 16,868 33,330 2,518,836 236,385 37,791 136,342 2,656,670 1,609,756 12,623 23,639 213,136 1,320 119,090 1,741,384 915,286 858,882 3. Other facilities, furniture and fixtures and office equipment 909,434 8,116 8,500 926,050 139,613 -445 93,261 971,957 638,012 6,836 5,430 105,662 -1,326 85,151 669,463 302,494 271,422 4. Advances paid and facilities under construction
129,688 337 236 130,261 45,457 -72,525 0 103,193 5,805 0 0 13,701 0 0 19,506 83,687 123,883
4,849,668 26,806 53,261 4,929,735 451,160 0 249,005 5,131,890 2,695,430 18,117 31,502 375,054 0 213,785 2,906,318 2,225,572 2,154,238iii. investment property 214,331 -2,945 0 211,386 0 0 4,532 206,854 161,053 0 0 4,134 0 0 165,187 41,667 53,278
5,857,592 26,761 61,853 5,946,206 458,283 0 268,470 6,136,019 3,113,566 18,222 31,510 401,168 0 226,047 3,338,419 2,797,600 2,744,026
ACquisiTiOn And pROduCTiOn COsTs ACCumulATEd dEpRECiATiOn CARRyinG vAluEs
BAlAnCEAs OF
31.12.2010T€
ChAnGEsin sCOpEOF COn-
sOlidATiOnT€
CuRREnCy TRAns-lATiOn
T€
BAlAnCEAs OF
1.1.2011T€
AddiTiOnsT€
TRAnsFERsT€
dispOsAlsT€
BAlAnCEAs OF
31.12.2011T€
BAlAnCEAs OF
31.12.2010T€
ChAnGEsin sCOpEOF COn-
sOlidATiOnT€
CuRREnCy TRAns-lATiOn
T€AddiTiOns1)
T€TRAnsFERs
T€dispOsAls2)
T€
BAlAnCEAs OF
31.12.2011T€
vAluEs 31.12.2011
T€
vAluEs 31.12.2010
T€
i. intangible Assets 1. Concessions; industrial property rights and similiar rights as well as licences derived thereof 131,628 4,345 -2,848 133,125 8,749 115 12,004 129,985 81,178 2,233 -2,078 12,188 0 10,474 83,047 46,938 50,450 2. Goodwill 620,329 26,976 -9,017 638,288 0 0 0 638,288 151,846 -1,539 2 16,152 0 0 166,461 471,827 468,483 3. Development costs 22,624 0 -407 22,217 2,946 0 0 25,163 6,057 0 0 1,518 0 0 7,575 17,588 16,567 4. Advances paid 187 0 -8 179 93 -115 0 157 0 0 0 0 0 0 0 157 187
774,768 31,321 -12,280 793,809 11,788 0 12,004 793,593 239,081 694 -2,076 29,858 0 10,474 257,083 536,510 535,687 ii. Tangible Assets 1. Properties; land rights equivalent to real property; buildings including buildings on third-party property 1,251,306 56,511 -14,724 1,293,093 67,267 27,065 45,517 1,341,908 419,720 7,765 -3,527 40,989 632 23,722 441,857 900,051 831,586 2. Technical equipment and machinery 2,396,264 42,898 -41,629 2,397,533 182,091 38,000 148,986 2,468,638 1,481,565 61,879 -30,615 217,284 95 120,452 1,609,756 858,882 914,699 3. Other facilities, furniture and fixtures and office equipment 841,731 31,274 -12,137 860,868 126,985 440 78,859 909,434 589,919 30,356 -8,733 98,300 -727 71,103 638,012 271,422 251,812 4. Advances paid and facilities under construction
104,267 3,376 -1,014 106,629 88,564 -65,505 0 129,688 0 0 0 5,805 0 0 5,805 123,883 104,267
4,593,568 134,059 -69,504 4,658,123 464,907 0 273,362 4,849,668 2,491,204 100,000 -42,875 362,378 0 215,277 2,695,430 2,154,238 2,102,364iii. investment property 219,815 0 0 219,815 455 0 5,939 214,331 146,291 0 0 19,310 0 4,548 161,053 53,278 73,524
5,588,151 165,380 -81,784 5,671,747 477,150 0 291,305 5,857,592 2,876,576 100,694 -44,951 411,546 0 230,299 3,113,566 2,744,026 2,711,575
cOnSOlidatEd StatEmEnt Of fiXEd aSSEtS aS Of 31 dEcEmBER 2012
1) Of this amount, impairments of T€ 28,482 (previous year: T€ 46,501)
1) Of this amount, impairments of T€ 46,501 (previous year: T€ 71,751)2) Of this amount, reversal of the depreciation T€ 0 (previous year: T€ 3,206)
cOnSOlidatEd StatEmEnt Of fiXEd aSSEtS aS Of 31 dEcEmBER 2011

133financial Statement
ACquisiTiOn And pROduCTiOn COsTs ACCumulATEd dEpRECiATiOn CARRyinG vAluEs
BAlAnCEAs OF
31.12.2011T€
ChAnGEsin sCOpEOF COn-
sOlidATiOnT€
CuRREnCy TRAns-lATiOn
T€
BAlAnCEAs OF
1.1.2012T€
AddiTiOnsT€
TRAnsFERsT€
dispOsAlsT€
BAlAnCEAs OF
31.12.2012T€
BAlAnCEAs OF
31.12.2011T€
ChAnGEsin sCOpEOF COn-
sOlidATiOnT€
CuRREnCy TRAns-lATiOn
T€AddiTiOns1)
T€TRAnsFERs
T€dispOsAls
T€
BAlAnCEAs OF
31.12.2012T€
vAluEs 31.12.2012
T€
vAluEs 31.12.2011
T€
i. intangible Assets 1. Concessions; industrial property rights and similiar rights as well as licences derived thereof 129,985 -677 379 129,687 5,008 0 12,915 121,780 83,047 105 -5 10,787 0 12,262 81,672 40,108 46,938 2. Goodwill 638,288 3,577 8,213 650,078 0 0 2,018 648,060 166,461 0 13 10,077 0 0 176,551 471,509 471,827 3. Development costs 25,163 0 0 25,163 1,950 0 0 27,113 7,575 0 0 1,116 0 0 8,691 18,422 17,588 4. Advances paid 157 0 0 157 165 0 0 322 0 0 0 0 0 0 0 322 157
793,593 2,900 8,592 805,085 7,123 0 14,933 797,275 257,083 105 8 21,980 0 12,262 266,914 530,361 536,510 ii. Tangible Assets 1. Properties; land rights equivalent to real property; buildings including buildings on third-party property 1,341,908 1,485 11,195 1,354,588 29,705 35,179 19,402 1,400,070 441,857 -1,342 2,433 42,555 6 9,544 475,965 924,105 900,051 2. Technical equipment and machinery 2,468,638 16,868 33,330 2,518,836 236,385 37,791 136,342 2,656,670 1,609,756 12,623 23,639 213,136 1,320 119,090 1,741,384 915,286 858,882 3. Other facilities, furniture and fixtures and office equipment 909,434 8,116 8,500 926,050 139,613 -445 93,261 971,957 638,012 6,836 5,430 105,662 -1,326 85,151 669,463 302,494 271,422 4. Advances paid and facilities under construction
129,688 337 236 130,261 45,457 -72,525 0 103,193 5,805 0 0 13,701 0 0 19,506 83,687 123,883
4,849,668 26,806 53,261 4,929,735 451,160 0 249,005 5,131,890 2,695,430 18,117 31,502 375,054 0 213,785 2,906,318 2,225,572 2,154,238iii. investment property 214,331 -2,945 0 211,386 0 0 4,532 206,854 161,053 0 0 4,134 0 0 165,187 41,667 53,278
5,857,592 26,761 61,853 5,946,206 458,283 0 268,470 6,136,019 3,113,566 18,222 31,510 401,168 0 226,047 3,338,419 2,797,600 2,744,026
ACquisiTiOn And pROduCTiOn COsTs ACCumulATEd dEpRECiATiOn CARRyinG vAluEs
BAlAnCEAs OF
31.12.2010T€
ChAnGEsin sCOpEOF COn-
sOlidATiOnT€
CuRREnCy TRAns-lATiOn
T€
BAlAnCEAs OF
1.1.2011T€
AddiTiOnsT€
TRAnsFERsT€
dispOsAlsT€
BAlAnCEAs OF
31.12.2011T€
BAlAnCEAs OF
31.12.2010T€
ChAnGEsin sCOpEOF COn-
sOlidATiOnT€
CuRREnCy TRAns-lATiOn
T€AddiTiOns1)
T€TRAnsFERs
T€dispOsAls2)
T€
BAlAnCEAs OF
31.12.2011T€
vAluEs 31.12.2011
T€
vAluEs 31.12.2010
T€
i. intangible Assets 1. Concessions; industrial property rights and similiar rights as well as licences derived thereof 131,628 4,345 -2,848 133,125 8,749 115 12,004 129,985 81,178 2,233 -2,078 12,188 0 10,474 83,047 46,938 50,450 2. Goodwill 620,329 26,976 -9,017 638,288 0 0 0 638,288 151,846 -1,539 2 16,152 0 0 166,461 471,827 468,483 3. Development costs 22,624 0 -407 22,217 2,946 0 0 25,163 6,057 0 0 1,518 0 0 7,575 17,588 16,567 4. Advances paid 187 0 -8 179 93 -115 0 157 0 0 0 0 0 0 0 157 187
774,768 31,321 -12,280 793,809 11,788 0 12,004 793,593 239,081 694 -2,076 29,858 0 10,474 257,083 536,510 535,687 ii. Tangible Assets 1. Properties; land rights equivalent to real property; buildings including buildings on third-party property 1,251,306 56,511 -14,724 1,293,093 67,267 27,065 45,517 1,341,908 419,720 7,765 -3,527 40,989 632 23,722 441,857 900,051 831,586 2. Technical equipment and machinery 2,396,264 42,898 -41,629 2,397,533 182,091 38,000 148,986 2,468,638 1,481,565 61,879 -30,615 217,284 95 120,452 1,609,756 858,882 914,699 3. Other facilities, furniture and fixtures and office equipment 841,731 31,274 -12,137 860,868 126,985 440 78,859 909,434 589,919 30,356 -8,733 98,300 -727 71,103 638,012 271,422 251,812 4. Advances paid and facilities under construction
104,267 3,376 -1,014 106,629 88,564 -65,505 0 129,688 0 0 0 5,805 0 0 5,805 123,883 104,267
4,593,568 134,059 -69,504 4,658,123 464,907 0 273,362 4,849,668 2,491,204 100,000 -42,875 362,378 0 215,277 2,695,430 2,154,238 2,102,364iii. investment property 219,815 0 0 219,815 455 0 5,939 214,331 146,291 0 0 19,310 0 4,548 161,053 53,278 73,524
5,588,151 165,380 -81,784 5,671,747 477,150 0 291,305 5,857,592 2,876,576 100,694 -44,951 411,546 0 230,299 3,113,566 2,744,026 2,711,575

134
STRAbAG SE is one of Europe’s leading construction groups. The company has its headquarters in Villach, Austria. From its core markets of Austria and Germany, STRAbAG is present via its numerous subsidiaries in all countries of Eastern and South-East Europe including Russia, in selected markets in North and Western Europe and the Arabian Peninsula, as well as in the project business in Africa, Asia and the Americas. STRAbAG’s activities span the entire construction industry (building Construction & Civil Engineering, Transportation Infrastructures, Tunnelling, construction-related services) and cover the entire value-added chain in the field of construction.
The consolidated financial statements of STRAbAG SE at the reporting date 31 December 2012, were drawn up under application of Section 245a Paragraph 2 of the Austrian Commercial Code (UGb) in accordance with the International Financial Reporting Standards (IFRS) issued by the International Accounting Standards board (IASb), including the interpretations of the International Financial Reporting Interpretations Committee (IFRIC).
Applied were exclusively those standards and interpretations adopted by the European Commission before the reporting dead-line and published in the Official Journal of the European Union. Further reporting requirements of Section 245a Paragraph 1 of the Austrian Commercial Code (UGb) were fulfilled as well.
In addition to a statement of comprehensive income, the financial statements include a cash flow statement in accordance with IAS 7, and a statement of changes in equity and a statement of recognised income and expense (IAS 1). The disclosures in the notes also contain a segment reporting section in accordance with IFRS 8.
In order to improve the clarity of the representation, various items in the balance sheet and the income statement have been combined. These items have been shown separately and are explained in the notes. The income statement has been drawn up in accordance with the nature of expense method.
The consolidated financial statements were drawn up in T€. The presentation in T€ may result in rounding differences.
notes to tHe consoLiDAteD FinAnciAL stAteMents 31.12.2012 oF stRABAG se, viLLAcH 1)
1) This part has been audited by KPMG.
BaSic pRinciplES
chanGES in accOuntinG pOliciESThe IASb has made the following amendment to the existing IFRS and passed several new IFRS and IFRIC, which have also been adopted by the European Commission. Application became mandatory on 1 January 2012.
AppliCATiOn FORFinAnCiAl yEARs whiCh
BEGin On OR AFTER (ACCORdinG TO iAsB)
AppliCATiOn FORFinAnCiAl yEARs whiCh
BEGin On OR AFTER (ACCORdinG TO Eu En-
dORsEmEnT)
IFRS 7 Notes – Transfer of financial assets 1.7.2011 1.7.2011
The first-time application of the IFRS and IFRIC standard mentioned had minor consequences on STRAbAG SE’s consolidated financial statements as of 31 December 2012.

134 135notes to the financial Statement
Future Changes of Financial Reporting standards
The IASb and the IFRIC approved further standards and interpretations. However, these were neither required to be applied in the 2012 financial year nor adopted by the European Commission. The amendments affect the following standards and interpretations:
AppliCATiOn FORFinAnCiAl yEARs whiCh
BEGin On OR AFTER (ACCORdinG TO iAsB)
AppliCATiOn FORFinAnCiAl yEARs whiCh
BEGin On OR AFTER (ACCORdinG TO Eu En-
dORsEmEnT)
IFRS 9 Financial Instruments 1.1.2015 n.a.1)
IFRS 10 Consolidated Financial Statements 1.1.2013 1.1.2014IFRS 11 Joint Arrangements 1.1.2013 1.1.2014IFRS 12 Disclosure of Interests in Other Entities 1.1.2013 1.1.2014IFRS 13 Fair Value Measurement 1.1.2013 1.1.2013IAS 1 Presentation of Financial Statements 1.7.2012 1.7.2012IAS 12 Deferred Tax – Recovery of Underlying Assets 1.1.2012 1.1.2013IAS 19 Employee benefits 1.1.2013 1.1.2013IAS 27 Separate Financial Statements 1.1.2013 1.1.2014IAS 28 Investment in Associates and Joint Ventures 1.1.2013 1.1.2014IAS 32 Financial Instruments Presentation 1.1.2014 1.1.2014IFRIC 20 Stripping Costs in the Production Phase of a Surface Mine 1.1.2013 1.1.2013Annual Improvements to IFRS 2009–2011 1.1.2013 1.1.2013Transition guidance – Changes to IFRS 10, IFRS 11 and IFRS 12 1.1.2013 1.1.2014Investment entities – Changes to IFRS 10, IFRS 12 and IAS 27 1.1.2014 n.a.1)
1) n.a.: endorsment process is still in progress
Consequences for the consolidated financial statements are expected especially from the application of the following standards and interpretations:
iFRs 9: follows a new standard for the classification and measurement of financial assets, distinguishing only between two measurement categories (measurement at fair value and measurement at amortised cost) based on the entity’s business model or on the characteristics of the contractual cash flows of the financial asset in question. Measurement with regard to impairment is to be performed using a unique method.
iFRs 10 and iAs 27: IFRS 10 replaces the criteria for the consolidated financial statements contained in IAS 27 and addres-ses issues that had previously been governed by SIC-12 Consolidation – Special Purpose Entities. IFRS 10 changes the definition of control so that the same criteria are applied to all entities to determine control. The new definition provides for more comprehensive rules to define the scope of consolidation than under IAS 27. Like IAS 27, IFRS 10 addresses the basic consolidation requirements for the interest of non-controlling entities and requires the use of uniform accounting policies.
iFRs 11 and iAs 28 regulate the accounting of arrangements in which an entity exercises joint control over a joint venture or a joint operation. It supersedes the previous rules under IAS 31 and SIC-13. The new standard does away with the option of proportionate consolidation for jointly controlled entities.
iFRs 12: This new standard encompasses all disclosure requirements for subsidiaries, associates and joint arrangements as well as for unconsolidated structured entities. It replaces the relevant requirements in IAS 27, IAS 28 and IAS 31.
iFRs 13 defines fair value, sets out a framework for measuring fair value and requires specific disclosures about fair value measurements. The regulations not only refer to financial instruments but also to the measurement of fair value according to other IAS.
iAs 1 now requires the components of other comprehensive income to be presented in such a way that it is clear whether the income and expenses will be recognised in the income statement at a later point or whether these are never recognised in the income statement.
iAs 12 “Recovery of underlying assets”: The changes offer a solution for the recognition of deferred taxes on investment property measured using the fair value model in IAS 40 as well as on revalued non-depreciable assets.
iAs 19: The amended version contains clarifications and changes. The new IAS 19 does away with the “corridor” method, i.e. the possibility of recognising actuarial gains or losses from defined benefit obligations divided over several periods. Measurement of the expected plan asset yields is performed by applying the same rate as is used to discount defined benefit obligations. As a result, the total revenue from plan assets is no longer recognised in the income statement. The new IAS 19 also contains extended disclosure requirements for defined benefit plans as well as changes to the accounting of termination benefits.

136
iAs 32 contains changes to clarify under which requirements a netting of financial instruments is permitted on the balance sheet.
iFRiC 20: This interpretation addresses the removal of mine waste materials that are produced in the production phase of a surface mine. It defines when and how to account for benefits which may arise from such an activity, as well as how to measure these benefits.
Annual improvements to iFRs 2009-2011: Amendments to individual standards in the course of annual improvement processes by the IASb.
Amendments to iFRs 10, iFRs 11 and iFRs 12: Transition guidance primarily refers to the first-time application of IFRS 10 and additional information according to IFRS 12.
Amendments to iFRs 10, iFRs 12 and iAs 27 investment entities, introduces the exception from the requirement of con-solidation for subsidiaries according to IFRS 10 for investment entities.
Early application of the new standards and interpretations is not planned. The exact impact of the new standards and in-terpretations on the consolidated financial statements is currently being analysed.
ScOpE Of cOnSOlidatiOnThe consolidated financial statements as of 31 December 2012 include STRAbAG SE as well as all major domestic and foreign subsidiaries where STRAbAG SE either directly or indirectly holds a majority of the voting rights. Major associated companies and joint ventures are reported in the balance sheet using the equity method (investments in associates).
Group companies which are of minor importance for the purpose of giving a true and fair view of the financial position, financial performance and cash flows of the group are not consolidated.
Subsidiaries included in the 2012 consolidated financial statements are given in the list of subsidiaries.
The financial year for all consolidated and associated companies, except A2 Strada Sp.z o.o., Warsaw, is identical with the calendar year.
The number of consolidated companies changed in the 2012 financial year as follows:
COnsOlidATiOn EquiTy mEThOd
situation as of 31.12.2010 295 14 First-time inclusions in year under report 33 8 First-time inclusions in year under report due to merger/accretion 14 0 Merger/accretion in year under report -26 0 Exclusions in year under report -8 -1 situation as of 31.12.2011 308 21 First-time inclusions in year under report 23 1 First-time inclusions in year under report due to merger/accretion 20 0 Merger/accretion in year under report -26 0 Exclusions in year under report -4 -1 situation as of 31.12.2012 321 21

136 137notes to the financial Statement
additiOnS tO ScOpE Of cOnSOlidatiOnThe following companies formed part of the scope of consolidation for the first time on the reporting date:
COmpAnydiRECT sTAKE
%dATE OF ACquisiTiOn
OR FOundATiOn
Consolidation Atlas Tower GmbH & Co. KG, Cologne 100.00 1.1.20121)
baunova AG, Dällikon 100.00 21.3.2012Heimfeld Terrassen GmbH, Cologne 100.00 1.1.20121)
Kaiserebersdorfer Straße LiegenschaftsverwertungsGmbH., Vienna 100.00 1.1.20121)
MiTTAG s.r.o., brno 100.00 1.1.20121)
Möbius Construction Ukraine Ltd, Odessa 100.00 1.1.20121)
Northern Energy GAIA I. GmbH, Aurich 100.00 10.1.2012Northern Energy GAIA II. GmbH, Aurich 100.00 10.1.2012Northern Energy GAIA III. GmbH, Aurich 100.00 10.1.2012Northern Energy GAIA IV. GmbH, Aurich 100.00 10.1.2012Northern Energy GAIA V. GmbH, Aurich 100.00 10.1.2012Northern Energy SeaStorm I. GmbH, Aurich 100.00 10.1.2012Northern Energy SeaStorm II. GmbH, Aurich 100.00 10.1.2012Northern Energy SeaWind III. GmbH, Aurich 100.00 10.1.2012Northern Energy SeaWind IV. GmbH, Aurich 100.00 10.1.2012R I M E X GmbH Servicebetriebe, Aalen 100.00 1.1.20121)
riw Industriewartung GmbH, Ulm 100.00 1.1.20121)
STRAbAG Holding GmbH, Vienna 100.00 27.7.2012STRAbAG Oy, Helsinki 100.00 1.1.20121)
Strabag SpA, Santiago 100.00 26.9.2012Torkret GmbH, Stuttgart 100.00 1.1.20121)
Züblin Inc., New brunswick 100.00 1.1.20121)
Zweite Nordsee-Offshore Holding GmbH, Pressbaum 51.00 10.1.2012 merger/Accretion2) becker Verwaltungsgesellschaft mbH, bornhöved 100.00 1.1.2012belagswerk Sternenfeld GmbH, basel 100.00 1.1.2012Frey & Götschi AG, Affoltern am Albis 100.00 1.1.2012GEOTEST GmbH, Leinfelden-Echterdingen 100.00 1.1.2012Ing. Siegl Installationsgesellschaft m.b.H., Vienna 100.00 1.1.2012K.H. Gaul Verwaltungs- und beteiligungs GmbH, Sprendlingen 100.00 1.1.2012Kirchhoff Projektgesellschaft mbH, Leinfelden-Echterdingen 100.00 1.1.2012Kirchhoff Stuttgart beteiligungs-GmbH, Leinfelden-Echterdingen 100.00 1.1.2012Kirchner Service GmbH, bad Hersfeld 100.00 1.1.2012Lehmann-Verwaltungs-GmbH, Müllrose 100.00 1.1.2012Mineral baustoff Verwaltungs GmbH, Cologne 100.00 1.1.2012MUSIKVIERTEL Grundstücksentwicklung GmbH, Cologne 100.00 1.1.2012SF-bAU Projektentwicklung GmbH, Cologne 100.00 1.1.2012SMG Verwaltungsgesellschaft mbH, Sprendlingen 100.00 1.1.2012SSM Stahlbau Sondergleisbau Maschinenbau GmbH, Seelze 100.00 1.1.2012Steffes-Mies Verwaltungsgesellschaft mbH, Sprendlingen 100.00 1.1.2012STUAGbAU Development GmbH, Cottbus 100.00 1.1.2012TRADON Transportbeton Verwaltungs-GmbH, Merseburg 100.00 1.1.2012Ucka Asfald d.o.o., Zagreb 100.00 1.1.2012ZIPP GECA, s.r.o., Geca 100.00 1.1.2012 at-equity A-Lanes A 15 Holding b.V., Nieuwegein 24.00 1.1.2012
1) Due to its increased business volume, the company was included in the scope of consolidation of the group for the first time effective 1 January 2012. The foundation/acquisition of the company occurred before 1 January 2012.2) The companies listed under “Merger/Accretion” were merged with/accrued on already fully consolidated companies and as such are at once represented as additions to and removals from the scope of consolidation.
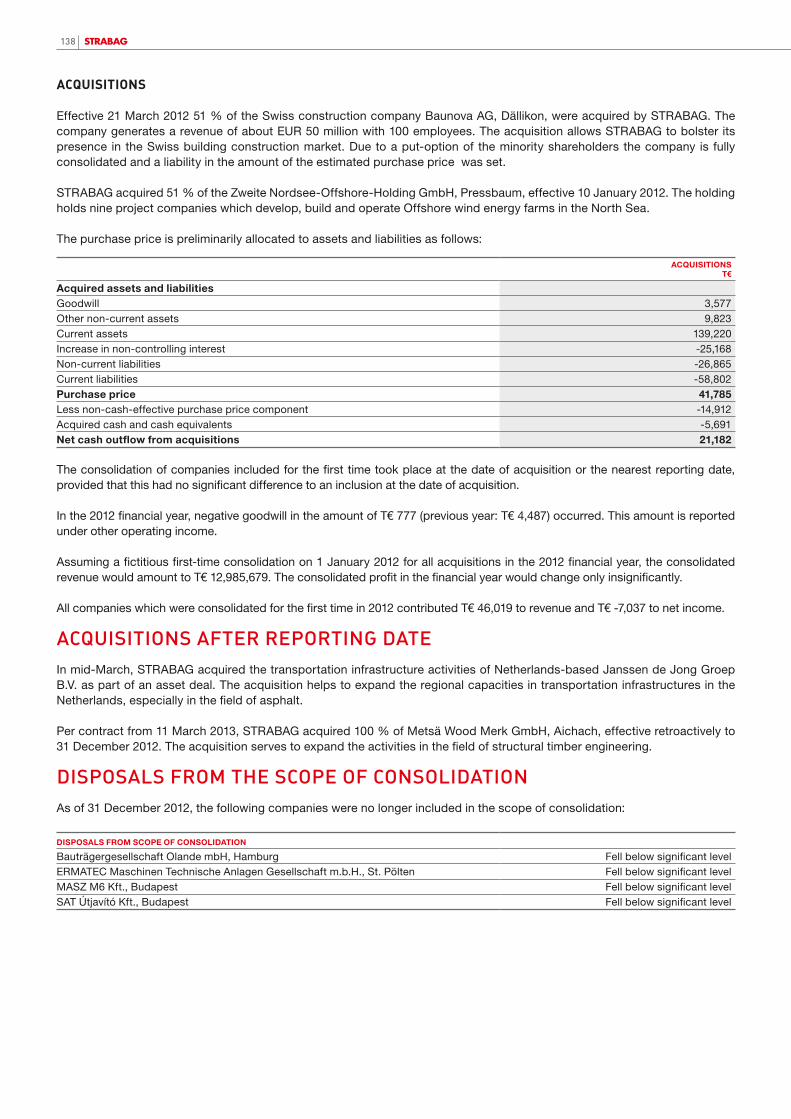
138
AcQUisitions
Effective 21 March 2012 51 % of the Swiss construction company baunova AG, Dällikon, were acquired by STRAbAG. The company generates a revenue of about EUR 50 million with 100 employees. The acquisition allows STRAbAG to bolster its presence in the Swiss building construction market. Due to a put-option of the minority shareholders the company is fully consolidated and a liability in the amount of the estimated purchase price was set.
STRAbAG acquired 51 % of the Zweite Nordsee-Offshore-Holding GmbH, Pressbaum, effective 10 January 2012. The holding holds nine project companies which develop, build and operate Offshore wind energy farms in the North Sea.
The purchase price is preliminarily allocated to assets and liabilities as follows:
ACquisiTiOnsT€
Acquired assets and liabilities Goodwill 3,577Other non-current assets 9,823Current assets 139,220Increase in non-controlling interest -25,168 Non-current liabilities -26,865 Current liabilities -58,802 purchase price 41,785Less non-cash-effective purchase price component -14,912 Acquired cash and cash equivalents -5,691 net cash outflow from acquisitions 21,182
The consolidation of companies included for the first time took place at the date of acquisition or the nearest reporting date, provided that this had no significant difference to an inclusion at the date of acquisition.
In the 2012 financial year, negative goodwill in the amount of T€ 777 (previous year: T€ 4,487) occurred. This amount is reported under other operating income.
Assuming a fictitious first-time consolidation on 1 January 2012 for all acquisitions in the 2012 financial year, the consolidated revenue would amount to T€ 12,985,679. The consolidated profit in the financial year would change only insignificantly.
All companies which were consolidated for the first time in 2012 contributed T€ 46,019 to revenue and T€ -7,037 to net income.
acQuiSitiOnS aftER REpORtinG datEIn mid-March, STRAbAG acquired the transportation infrastructure activities of Netherlands-based Janssen de Jong Groep b.V. as part of an asset deal. The acquisition helps to expand the regional capacities in transportation infrastructures in the Netherlands, especially in the field of asphalt.
Per contract from 11 March 2013, STRAbAG acquired 100 % of Metsä Wood Merk GmbH, Aichach, effective retroactively to 31 December 2012. The acquisition serves to expand the activities in the field of structural timber engineering.
diSpOSalS fROm thE ScOpE Of cOnSOlidatiOnAs of 31 December 2012, the following companies were no longer included in the scope of consolidation:
dispOsAls FROm sCOpE OF COnsOlidATiOn
bauträgergesellschaft Olande mbH, Hamburg Fell below significant levelERMATEC Maschinen Technische Anlagen Gesellschaft m.b.H., St. Pölten Fell below significant levelMASZ M6 Kft., budapest Fell below significant levelSAT Útjavító Kft., budapest Fell below significant level

138 139notes to the financial Statement
mERGER/ACCRETiOn1)
becker Verwaltungsgesellschaft mbH, bornhöved belagswerk Sternenfeld GmbH, basel bFb behmann Feuerfestbau GmbH, bremen Donnersberger Höfe Ost GmbH, Düsseldorf Donnersberger Höfe West GmbH, Düsseldorf Frey & Götschi AG, Affoltern am Albis GEOTEST GmbH, Leinfelden-Echterdingen Hermann Kirchner Polska Spolka z.o.o., Lodz Ing. Siegl Installationsgesellschaft m.b.H., Vienna K.H. Gaul Verwaltungs- und beteiligungs GmbH, Sprendlingen Kirchhoff Projektgesellschaft mbH, Leinfelden-Echterdingen Kirchhoff Stuttgart beteiligungs-GmbH, Leinfelden-Echterdingen Kirchner Service GmbH, bad Hersfeld Lehmann-Verwaltungs-GmbH, Müllrose Mineral baustoff Verwaltungs GmbH, Cologne MUSIKVIERTEL Grundstücksentwicklung GmbH, Cologne SFb behmann Feuerfestbau GmbH, Schwedt/Oder SF-bAU Projektentwicklung GmbH, Cologne SMG Verwaltungsgesellschaft mbH, Sprendlingen SSM Stahlbau Sondergleisbau Maschinenbau GmbH, Seelze Steffes-Mies Verwaltungsgesellschaft mbH, Sprendlingen STUAGbAU Development GmbH, Cottbus TRADON Transportbeton Verwaltungs-GmbH, Merseburg Ucka Asfald d.o.o., Zagreb ZIPP GECA, s.r.o., Geca ZIPP Praha, s.r.o., Prague AT-EquiTy Asphaltmischwerk Düsseldorf GmbH & Co.KG, Neuss Disposal
1) The companies listed under “Merger/Accretion” were merged with already fully consolidated companies or, as a result of accretion, formed part of fully consolidated companies.
The deconsolidation resulted in disposals of assets in the amount of T€ 9,775 and of liabilities – including non-controlling interests – in the amount of T€ 5,918.
mEthOdS Of cOnSOlidatiOnThe financial statements of the domestic and foreign companies included in the scope of consolidation are drawn up in accordance with uniform methods of accounting and valuation. The annual financial statements of the domestic and foreign group companies are adapted accordingly.
Capital consolidation is made in accordance with the stipulations contained in IFRS 3. All assets and liabilities of the subsi-diary companies are recorded at the fair values. The proportional equity thereby determined is offset by the carrying value of the investment. A difference on the assets side, which is allotted to special, identifiable intangible assets acquired in the course of capital consolidation, is recognised separately from goodwill.
Goodwill is subjected at least once a year to an impairment test in accordance with IAS 36. The option of recognising non-controlling interest at fair value (full goodwill method) is not applied.
In determining the cost of an acquisition, certain components of the purchase price are recognised at fair value at the time of initial consolidation. Later deviations from this value are recognised in profit or loss. Transaction costs are recognised immediately in profit or loss.
In the 2012 financial year, T€ 3,577 in goodwill arising from capital consolidation were recognised as assets. Impairments in the amount of T€ 10,077 were made.
Negative goodwill stemming from capital consolidation is recorded directly through profit or loss.
In a step acquisition, assets and liabilities are recognised at fair value at the acquisition date. Already existing interests have to be revalued at fair value through profit and loss. The goodwill is determined at the time of acquisition.
Value differences resulting from the acquisition or sale of investments in subsidiaries without the acquisition or loss of control are recognised in full directly in equity.

140
The same principles of capital consolidation are applied to investments included under the equity method as in the case of consolidated companies, whereby the respective last available financial statements serve as the basis for the equity method. A goodwill of T€ 0 (previous year: T€ 150,426) results from the first-time application of the equity method of the newly acquired companies, which is recognised as a component of investments in associates.
Within the framework of debt consolidation, outstanding trade receivables, loans and other receivables are offset with the corresponding liabilities and provisions of the subsidiaries included in the consolidated financial statements.
Expenses and revenues from intra-group transactions have been eliminated. Results incurred from intra-group transactions that are recognised in the non-current and current assets have been eliminated if they are material.
Non-controlling interests in equity and profits of companies controlled by the parent company are shown separately in the consolidated financial statements.
The necessary tax deferrals are made for consolidation procedures.
cuRREncY tRanSlatiOnThe group currency is the euro. The financial statements for foreign companies or permanent establishments are converted into euro according to the functional currency concept (IAS 21). In all companies this is the respective local currency.
The most important currencies are listed under item 25: financial instruments along with their average exchange rates and their exchange rates on the balance sheet date.
All balance sheet items are converted at the closing rate at the balance sheet date. Expense and income items are converted at the average annual rate.
In the course of capital consolidation, currency translation differences of T€ 45,051 (previous year: T€ -56,280) are recognised directly in equity in the financial year with no effect on the operating result. The currency translation differences between the closing rate for the balance sheet and the average rate for the income statement are allocated to equity. Forward exchange operations (hedging) excluding deferred taxes in the amount of T€ 3,249 (previous year: T€ 740) were recognised directly in equity.
Restatements in accordance with IAS 29 (Financial Reporting in Hyperinflationary Economies) were not necessary.
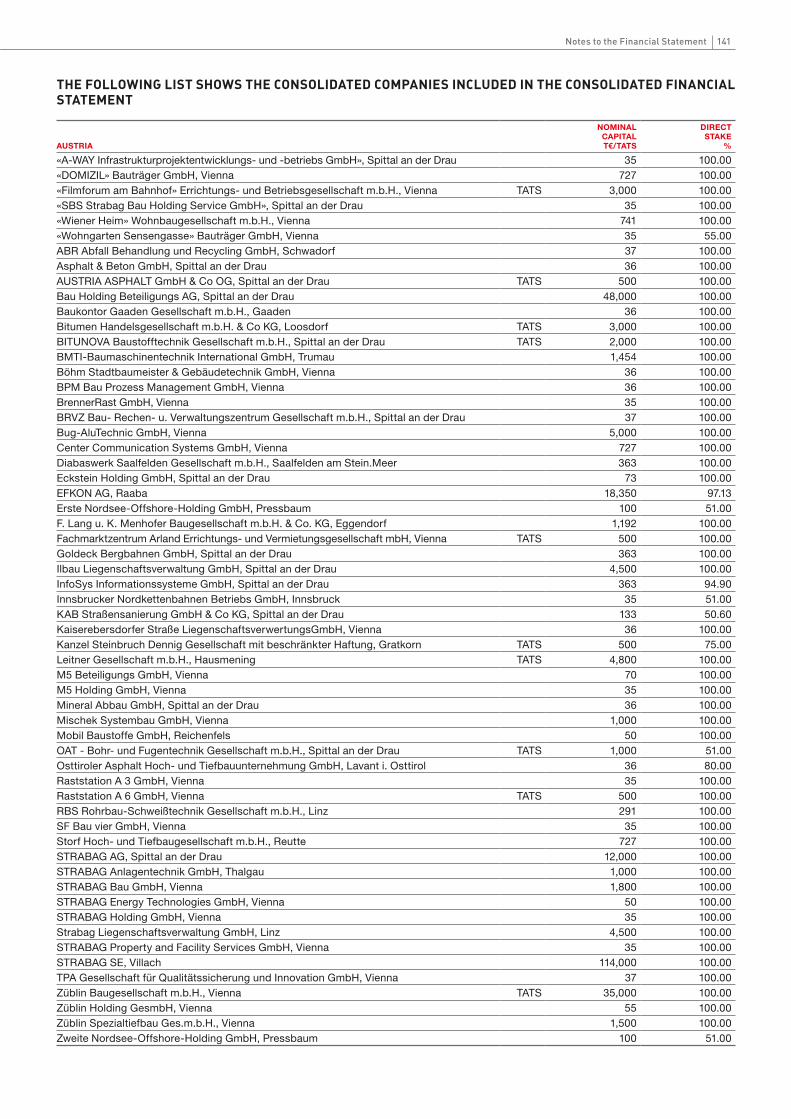
140 141notes to the financial Statement
tHe FoLLowinG List sHows tHe consoLiDAteD coMpAnies incLUDeD in tHe consoLiDAteD FinAnciAL stAteMent
AusTRiA
nOminAlCApiTAlT€/TATs
diRECTsTAKE
%
«A-WAY Infrastrukturprojektentwicklungs- und -betriebs GmbH», Spittal an der Drau 35 100.00«DOMIZIL» bauträger GmbH, Vienna 727 100.00«Filmforum am bahnhof» Errichtungs- und betriebsgesellschaft m.b.H., Vienna TATS 3,000 100.00«SbS Strabag bau Holding Service GmbH», Spittal an der Drau 35 100.00«Wiener Heim» Wohnbaugesellschaft m.b.H., Vienna 741 100.00«Wohngarten Sensengasse» bauträger GmbH, Vienna 35 55.00AbR Abfall behandlung und Recycling GmbH, Schwadorf 37 100.00Asphalt & beton GmbH, Spittal an der Drau 36 100.00AUSTRIA ASPHALT GmbH & Co OG, Spittal an der Drau TATS 500 100.00bau Holding beteiligungs AG, Spittal an der Drau 48,000 100.00baukontor Gaaden Gesellschaft m.b.H., Gaaden 36 100.00bitumen Handelsgesellschaft m.b.H. & Co KG, Loosdorf TATS 3,000 100.00bITUNOVA baustofftechnik Gesellschaft m.b.H., Spittal an der Drau TATS 2,000 100.00bMTI-baumaschinentechnik International GmbH, Trumau 1,454 100.00böhm Stadtbaumeister & Gebäudetechnik GmbH, Vienna 36 100.00bPM bau Prozess Management GmbH, Vienna 36 100.00brennerRast GmbH, Vienna 35 100.00bRVZ bau- Rechen- u. Verwaltungszentrum Gesellschaft m.b.H., Spittal an der Drau 37 100.00bug-AluTechnic GmbH, Vienna 5,000 100.00Center Communication Systems GmbH, Vienna 727 100.00Diabaswerk Saalfelden Gesellschaft m.b.H., Saalfelden am Stein.Meer 363 100.00Eckstein Holding GmbH, Spittal an der Drau 73 100.00EFKON AG, Raaba 18,350 97.13Erste Nordsee-Offshore-Holding GmbH, Pressbaum 100 51.00F. Lang u. K. Menhofer baugesellschaft m.b.H. & Co. KG, Eggendorf 1,192 100.00Fachmarktzentrum Arland Errichtungs- und Vermietungsgesellschaft mbH, Vienna TATS 500 100.00Goldeck bergbahnen GmbH, Spittal an der Drau 363 100.00Ilbau Liegenschaftsverwaltung GmbH, Spittal an der Drau 4,500 100.00InfoSys Informationssysteme GmbH, Spittal an der Drau 363 94.90Innsbrucker Nordkettenbahnen betriebs GmbH, Innsbruck 35 51.00KAb Straßensanierung GmbH & Co KG, Spittal an der Drau 133 50.60Kaiserebersdorfer Straße LiegenschaftsverwertungsGmbH, Vienna 36 100.00Kanzel Steinbruch Dennig Gesellschaft mit beschränkter Haftung, Gratkorn TATS 500 75.00Leitner Gesellschaft m.b.H., Hausmening TATS 4,800 100.00M5 beteiligungs GmbH, Vienna 70 100.00M5 Holding GmbH, Vienna 35 100.00Mineral Abbau GmbH, Spittal an der Drau 36 100.00Mischek Systembau GmbH, Vienna 1,000 100.00Mobil baustoffe GmbH, Reichenfels 50 100.00OAT - bohr- und Fugentechnik Gesellschaft m.b.H., Spittal an der Drau TATS 1,000 51.00Osttiroler Asphalt Hoch- und Tiefbauunternehmung GmbH, Lavant i. Osttirol 36 80.00Raststation A 3 GmbH, Vienna 35 100.00Raststation A 6 GmbH, Vienna TATS 500 100.00RbS Rohrbau-Schweißtechnik Gesellschaft m.b.H., Linz 291 100.00SF bau vier GmbH, Vienna 35 100.00Storf Hoch- und Tiefbaugesellschaft m.b.H., Reutte 727 100.00STRAbAG AG, Spittal an der Drau 12,000 100.00STRAbAG Anlagentechnik GmbH, Thalgau 1,000 100.00STRAbAG bau GmbH, Vienna 1,800 100.00STRAbAG Energy Technologies GmbH, Vienna 50 100.00STRAbAG Holding GmbH, Vienna 35 100.00Strabag Liegenschaftsverwaltung GmbH, Linz 4,500 100.00STRAbAG Property and Facility Services GmbH, Vienna 35 100.00STRAbAG SE, Villach 114,000 100.00TPA Gesellschaft für Qualitätssicherung und Innovation GmbH, Vienna 37 100.00Züblin baugesellschaft m.b.H., Vienna TATS 35,000 100.00Züblin Holding GesmbH, Vienna 55 100.00Züblin Spezialtiefbau Ges.m.b.H., Vienna 1,500 100.00Zweite Nordsee-Offshore-Holding GmbH, Pressbaum 100 51.00
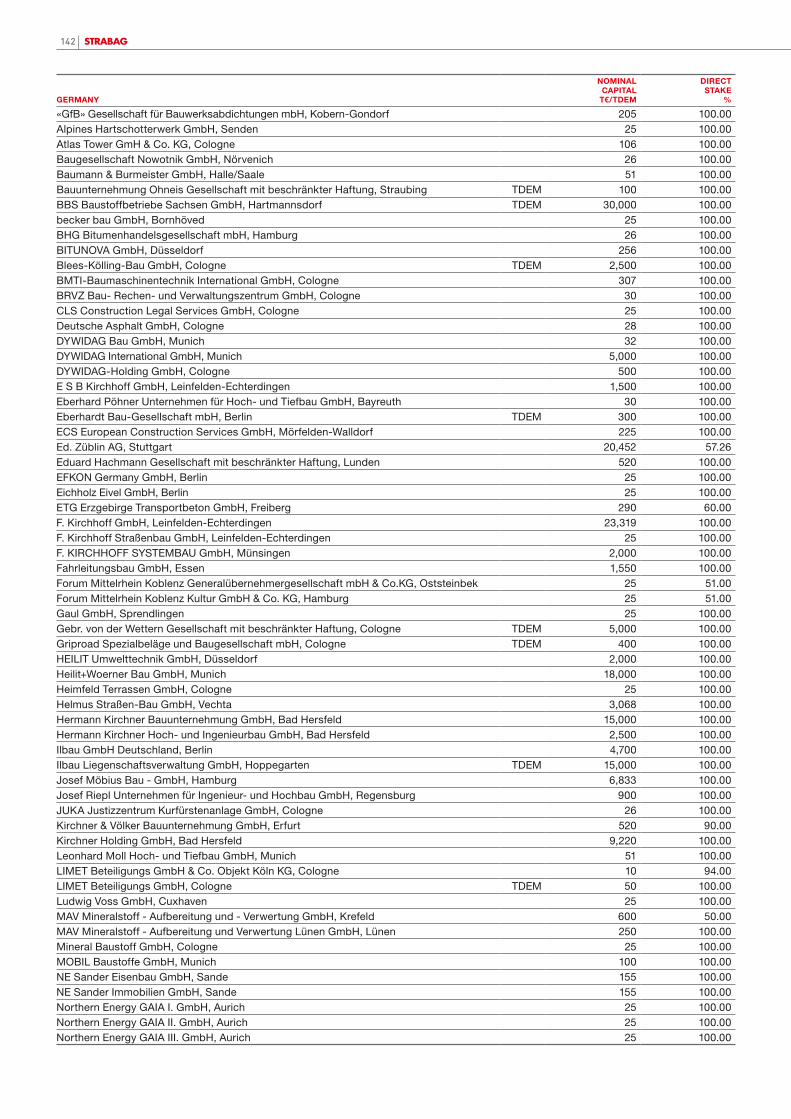
142
GERmAny
nOminAlCApiTAl
T€/TdEm
diRECTsTAKE
%
«Gfb» Gesellschaft für bauwerksabdichtungen mbH, Kobern-Gondorf 205 100.00Alpines Hartschotterwerk GmbH, Senden 25 100.00Atlas Tower GmH & Co. KG, Cologne 106 100.00baugesellschaft Nowotnik GmbH, Nörvenich 26 100.00baumann & burmeister GmbH, Halle/Saale 51 100.00bauunternehmung Ohneis Gesellschaft mit beschränkter Haftung, Straubing TDEM 100 100.00bbS baustoffbetriebe Sachsen GmbH, Hartmannsdorf TDEM 30,000 100.00becker bau GmbH, bornhöved 25 100.00bHG bitumenhandelsgesellschaft mbH, Hamburg 26 100.00bITUNOVA GmbH, Düsseldorf 256 100.00blees-Kölling-bau GmbH, Cologne TDEM 2,500 100.00bMTI-baumaschinentechnik International GmbH, Cologne 307 100.00bRVZ bau- Rechen- und Verwaltungszentrum GmbH, Cologne 30 100.00CLS Construction Legal Services GmbH, Cologne 25 100.00Deutsche Asphalt GmbH, Cologne 28 100.00DYWIDAG bau GmbH, Munich 32 100.00DYWIDAG International GmbH, Munich 5,000 100.00DYWIDAG-Holding GmbH, Cologne 500 100.00E S b Kirchhoff GmbH, Leinfelden-Echterdingen 1,500 100.00Eberhard Pöhner Unternehmen für Hoch- und Tiefbau GmbH, bayreuth 30 100.00Eberhardt bau-Gesellschaft mbH, berlin TDEM 300 100.00ECS European Construction Services GmbH, Mörfelden-Walldorf 225 100.00Ed. Züblin AG, Stuttgart 20,452 57.26Eduard Hachmann Gesellschaft mit beschränkter Haftung, Lunden 520 100.00EFKON Germany GmbH, berlin 25 100.00Eichholz Eivel GmbH, berlin 25 100.00ETG Erzgebirge Transportbeton GmbH, Freiberg 290 60.00F. Kirchhoff GmbH, Leinfelden-Echterdingen 23,319 100.00F. Kirchhoff Straßenbau GmbH, Leinfelden-Echterdingen 25 100.00F. KIRCHHOFF SYSTEMbAU GmbH, Münsingen 2,000 100.00Fahrleitungsbau GmbH, Essen 1,550 100.00Forum Mittelrhein Koblenz Generalübernehmergesellschaft mbH & Co.KG, Oststeinbek 25 51.00Forum Mittelrhein Koblenz Kultur GmbH & Co. KG, Hamburg 25 51.00Gaul GmbH, Sprendlingen 25 100.00Gebr. von der Wettern Gesellschaft mit beschränkter Haftung, Cologne TDEM 5,000 100.00Griproad Spezialbeläge und baugesellschaft mbH, Cologne TDEM 400 100.00HEILIT Umwelttechnik GmbH, Düsseldorf 2,000 100.00Heilit+Woerner bau GmbH, Munich 18,000 100.00Heimfeld Terrassen GmbH, Cologne 25 100.00Helmus Straßen-bau GmbH, Vechta 3,068 100.00Hermann Kirchner bauunternehmung GmbH, bad Hersfeld 15,000 100.00Hermann Kirchner Hoch- und Ingenieurbau GmbH, bad Hersfeld 2,500 100.00Ilbau GmbH Deutschland, berlin 4,700 100.00Ilbau Liegenschaftsverwaltung GmbH, Hoppegarten TDEM 15,000 100.00Josef Möbius bau - GmbH, Hamburg 6,833 100.00Josef Riepl Unternehmen für Ingenieur- und Hochbau GmbH, Regensburg 900 100.00JUKA Justizzentrum Kurfürstenanlage GmbH, Cologne 26 100.00Kirchner & Völker bauunternehmung GmbH, Erfurt 520 90.00Kirchner Holding GmbH, bad Hersfeld 9,220 100.00Leonhard Moll Hoch- und Tiefbau GmbH, Munich 51 100.00LIMET beteiligungs GmbH & Co. Objekt Köln KG, Cologne 10 94.00LIMET beteiligungs GmbH, Cologne TDEM 50 100.00Ludwig Voss GmbH, Cuxhaven 25 100.00MAV Mineralstoff - Aufbereitung und - Verwertung GmbH, Krefeld 600 50.00MAV Mineralstoff - Aufbereitung und Verwertung Lünen GmbH, Lünen 250 100.00Mineral baustoff GmbH, Cologne 25 100.00MObIL baustoffe GmbH, Munich 100 100.00NE Sander Eisenbau GmbH, Sande 155 100.00NE Sander Immobilien GmbH, Sande 155 100.00Northern Energy GAIA I. GmbH, Aurich 25 100.00Northern Energy GAIA II. GmbH, Aurich 25 100.00Northern Energy GAIA III. GmbH, Aurich 25 100.00
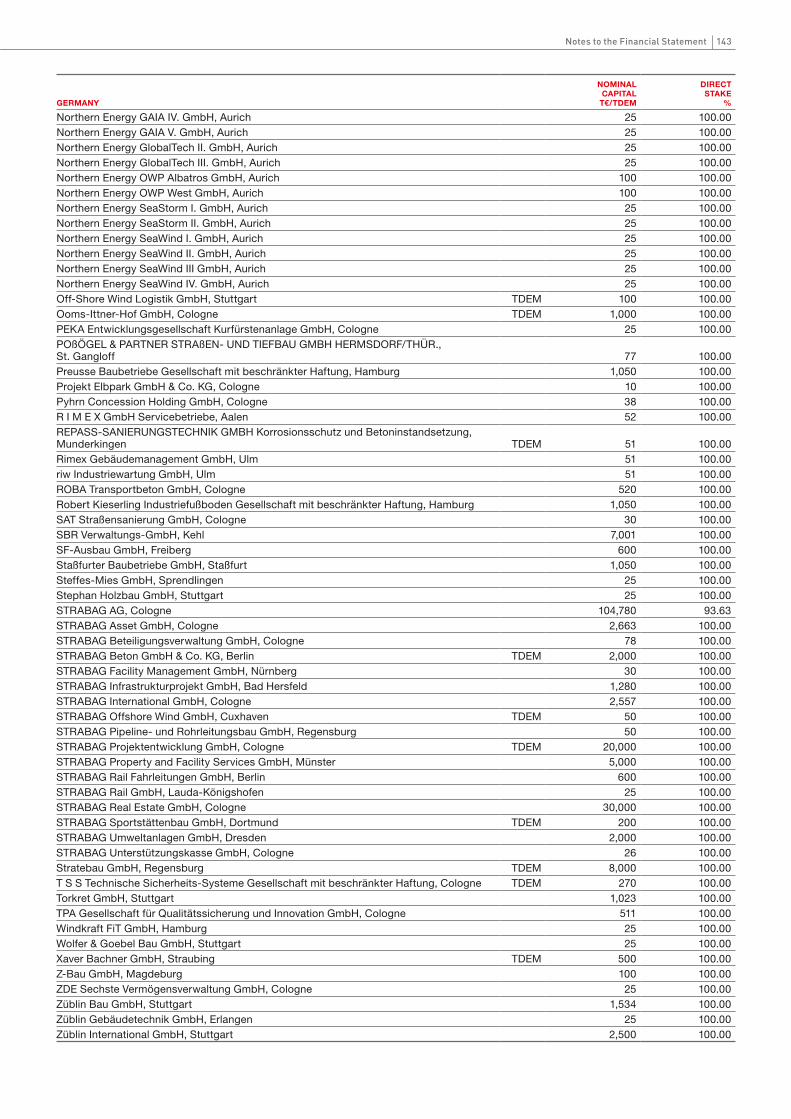
142 143notes to the financial Statement
GERmAny
nOminAlCApiTAl
T€/TdEm
diRECTsTAKE
%
Northern Energy GAIA IV. GmbH, Aurich 25 100.00Northern Energy GAIA V. GmbH, Aurich 25 100.00Northern Energy GlobalTech II. GmbH, Aurich 25 100.00Northern Energy GlobalTech III. GmbH, Aurich 25 100.00Northern Energy OWP Albatros GmbH, Aurich 100 100.00Northern Energy OWP West GmbH, Aurich 100 100.00Northern Energy SeaStorm I. GmbH, Aurich 25 100.00Northern Energy SeaStorm II. GmbH, Aurich 25 100.00Northern Energy SeaWind I. GmbH, Aurich 25 100.00Northern Energy SeaWind II. GmbH, Aurich 25 100.00Northern Energy SeaWind III GmbH, Aurich 25 100.00Northern Energy SeaWind IV. GmbH, Aurich 25 100.00Off-Shore Wind Logistik GmbH, Stuttgart TDEM 100 100.00Ooms-Ittner-Hof GmbH, Cologne TDEM 1,000 100.00PEKA Entwicklungsgesellschaft Kurfürstenanlage GmbH, Cologne 25 100.00POßÖGEL & PARTNER STRAßEN- UND TIEFbAU GMbH HERMSDORF/THÜR., St. Gangloff 77 100.00Preusse baubetriebe Gesellschaft mit beschränkter Haftung, Hamburg 1,050 100.00Projekt Elbpark GmbH & Co. KG, Cologne 10 100.00Pyhrn Concession Holding GmbH, Cologne 38 100.00R I M E X GmbH Servicebetriebe, Aalen 52 100.00REPASS-SANIERUNGSTECHNIK GMbH Korrosionsschutz und betoninstandsetzung, Munderkingen TDEM 51 100.00Rimex Gebäudemanagement GmbH, Ulm 51 100.00riw Industriewartung GmbH, Ulm 51 100.00RObA Transportbeton GmbH, Cologne 520 100.00Robert Kieserling Industriefußboden Gesellschaft mit beschränkter Haftung, Hamburg 1,050 100.00SAT Straßensanierung GmbH, Cologne 30 100.00SbR Verwaltungs-GmbH, Kehl 7,001 100.00SF-Ausbau GmbH, Freiberg 600 100.00Staßfurter baubetriebe GmbH, Staßfurt 1,050 100.00Steffes-Mies GmbH, Sprendlingen 25 100.00Stephan Holzbau GmbH, Stuttgart 25 100.00STRAbAG AG, Cologne 104,780 93.63STRAbAG Asset GmbH, Cologne 2,663 100.00STRAbAG beteiligungsverwaltung GmbH, Cologne 78 100.00STRAbAG beton GmbH & Co. KG, berlin TDEM 2,000 100.00STRAbAG Facility Management GmbH, Nürnberg 30 100.00STRAbAG Infrastrukturprojekt GmbH, bad Hersfeld 1,280 100.00STRAbAG International GmbH, Cologne 2,557 100.00STRAbAG Offshore Wind GmbH, Cuxhaven TDEM 50 100.00STRAbAG Pipeline- und Rohrleitungsbau GmbH, Regensburg 50 100.00STRAbAG Projektentwicklung GmbH, Cologne TDEM 20,000 100.00STRAbAG Property and Facility Services GmbH, Münster 5,000 100.00STRAbAG Rail Fahrleitungen GmbH, berlin 600 100.00STRAbAG Rail GmbH, Lauda-Königshofen 25 100.00STRAbAG Real Estate GmbH, Cologne 30,000 100.00STRAbAG Sportstättenbau GmbH, Dortmund TDEM 200 100.00STRAbAG Umweltanlagen GmbH, Dresden 2,000 100.00STRAbAG Unterstützungskasse GmbH, Cologne 26 100.00Stratebau GmbH, Regensburg TDEM 8,000 100.00T S S Technische Sicherheits-Systeme Gesellschaft mit beschränkter Haftung, Cologne TDEM 270 100.00Torkret GmbH, Stuttgart 1,023 100.00TPA Gesellschaft für Qualitätssicherung und Innovation GmbH, Cologne 511 100.00Windkraft FiT GmbH, Hamburg 25 100.00Wolfer & Goebel bau GmbH, Stuttgart 25 100.00Xaver bachner GmbH, Straubing TDEM 500 100.00Z-bau GmbH, Magdeburg 100 100.00ZDE Sechste Vermögensverwaltung GmbH, Cologne 25 100.00Züblin bau GmbH, Stuttgart 1,534 100.00Züblin Gebäudetechnik GmbH, Erlangen 25 100.00Züblin International GmbH, Stuttgart 2,500 100.00
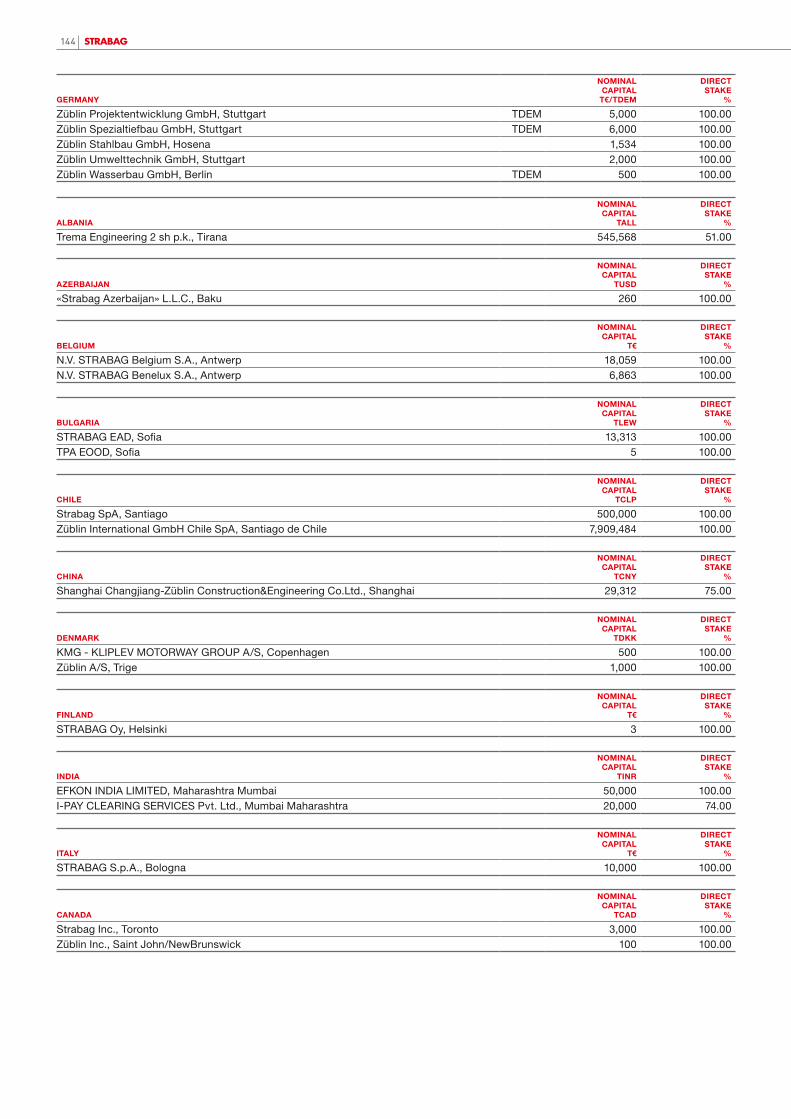
144
GERmAny
nOminAlCApiTAl
T€/TdEm
diRECTsTAKE
%
Züblin Projektentwicklung GmbH, Stuttgart TDEM 5,000 100.00Züblin Spezialtiefbau GmbH, Stuttgart TDEM 6,000 100.00Züblin Stahlbau GmbH, Hosena 1,534 100.00Züblin Umwelttechnik GmbH, Stuttgart 2,000 100.00Züblin Wasserbau GmbH, berlin TDEM 500 100.00
AlBAniA
nOminAlCApiTAl
TAll
diRECTsTAKE
%
Trema Engineering 2 sh p.k., Tirana 545,568 51.00
AZERBAijAn
nOminAlCApiTAl
Tusd
diRECTsTAKE
%
«Strabag Azerbaijan» L.L.C., baku 260 100.00
BElGium
nOminAlCApiTAl
T€
diRECT sTAKE
%
N.V. STRAbAG belgium S.A., Antwerp 18,059 100.00N.V. STRAbAG benelux S.A., Antwerp 6,863 100.00
BulGARiA
nOminAlCApiTAl
TlEw
diRECT sTAKE
%
STRAbAG EAD, Sofia 13,313 100.00TPA EOOD, Sofia 5 100.00
ChilE
nOminAlCApiTAl
TClp
diRECT sTAKE
%
Strabag SpA, Santiago 500,000 100.00Züblin International GmbH Chile SpA, Santiago de Chile 7,909,484 100.00
ChinA
nOminAlCApiTAl
TCny
diRECT sTAKE
%
Shanghai Changjiang-Züblin Construction&Engineering Co.Ltd., Shanghai 29,312 75.00
dEnmARK
nOminAlCApiTAl
TdKK
diRECT sTAKE
%
KMG - KLIPLEV MOTORWAY GROUP A/S, Copenhagen 500 100.00Züblin A/S, Trige 1,000 100.00
indiA
nOminAlCApiTAl
TinR
diRECT sTAKE
%
EFKON INDIA LIMITED, Maharashtra Mumbai 50,000 100.00I-PAY CLEARING SERVICES Pvt. Ltd., Mumbai Maharashtra 20,000 74.00
iTAly
nOminAlCApiTAl
T€
diRECT sTAKE
%
STRAbAG S.p.A., bologna 10,000 100.00
CAnAdA
nOminAlCApiTAl
TCAd
diRECT sTAKE
%
Strabag Inc., Toronto 3,000 100.00Züblin Inc., Saint John/Newbrunswick 100 100.00
FinlAnd
nOminAlCApiTAl
T€
diRECT sTAKE
%
STRAbAG Oy, Helsinki 3 100.00

144 145notes to the financial Statement
CROATiA
nOminAlCApiTAl
ThRK
diRECT sTAKE
%
bRVZ d.o.o., Zagreb 20 100.00CESTAR d.o.o., Slavonski brod 1,100 74.90MINERAL IGM d.o.o., Zapuzane 10,701 100.00Pomgrad Inzenjering d.o.o., Split 25,534 100.00PZC SPLIT d.d., Split 18,810 95.12Strabag d.o.o., Zagreb 48,230 100.00STRAbAG-HIDROINZENJERING d.o.o, Split 144 100.00TPA odrzavanje kvaliteta i inovacija d.o.o., Zagreb 20 100.00
mAlAysiA
nOminAlCApiTAl
TmyR
diRECT sTAKE
%
Züblin International Malaysia Sdn. bhd., Kuala Lumpur 4,100 100.0
mOnTEnEGRO
nOminAlCApiTAl
T€
diRECT sTAKE
%
«Crnagoraput» AD, Podgorica, Podgorica 9,779 94.99
ThE nEThERlAnds
nOminAlCApiTAl
T€
diRECT sTAKE
%
STRAbAG b.V., Vlaardingen 450 100.00Züblin Nederland bV, Vlaardingen 500 100.00
OmAn
nOminAlCApiTAl
TOmR
diRECT sTAKE
%
STRAbAG OMAN L.L.C., Muscat 1,000 100.00
pAKisTAn
nOminAlCApiTAl
TpKR
diRECT sTAKE
%
TolLink Pakistan (Private) Limited, Islamabad 2,520 60.00
pOlAnd
nOminAlCApiTAl
Tpln
diRECT sTAKE
%
«HEILIT+WOERNER» budowlana Sp.z o.o., breslau 16,140 100.00A2 Strada Sp.z o.o., Pruszkow1) 428 100.00bHG Sp.z o.o., Pruszkow 500 100.00bITUNOVA Sp.z o.o., Warsaw 2,700 100.00bMTI Sp.z o.o., Pruszkow 2,000 100.00bRVZ Sp.z o.o., Pruszkow 500 100.00Kopalnie Melafiru w Czarnym borze Sp.z o.o., Czarny bor 9,700 100.00Mineral Polska Sp. z.o.o., Czarny bor 9,361 100.00Polski Asfalt Sp.z o.o., Pruszkow 60,000 100.00Przedsiebiorstwo budownictwa Ogólnego i Uslug Technicznych Slask Sp.z o.o., Katowice 295 60.98SAT Sp.z o.o., Olawa 4,171 100.00STRAbAG Sp.z o.o., Pruszkow 12,900 100.00TPA INSTYTUT bADAN TECHNICZNYCH Sp.z o.o., Pruszków 600 100.00Züblin Sp. z o.o., Poznan 7,765 100.00
pORTuGAl
nOminAlCApiTAl
T€
diRECT sTAKE
%
Zucotec - Sociedade de Construcoes Lda., Lisbon 200 100.00
qATAR
nOminAlCApiTAl
TRiy
diRECT sTAKE
%
Strabag Qatar W.L.L., Qatar 200 100.00
1) The presentation of interests is done using the economic approach; the interests as defined by civil law may deviate from this presentation.

146
RussiA
nOminAlCApiTAl
TRuB
diRECT sTAKE
%
SAO bRVZ Ltd, Moscow 313 100.00Strabag z.a.o., Moscow 14,926 100.00
sAudi ARABiA
nOminAlCApiTAl
TsAR
diRECT sTAKE
%
Dywidag Saudi Arabia Co. Ltd., Jubail 10,000 100.00
swEdEn
nOminAlCApiTAl
TsEK
diRECTsTAKE
%
bRVZ Sweden Ab, Kumla 100 100.00Nimab Entreprenad Ab, Sjöbo 501 100.00STRAbAG Ab, Stockholm 50 100.00STRAbAG Projektutveckling Ab, Stockholm1) 1,000 100.00STRAbAG Sverige Ab, Stockholm 15,975 100.00Züblin Scandinavia Ab, Stockholm 100 100.00
swiTZERlAnd
nOminAlCApiTAl
TChF
diRECT sTAKE
%
Astrada AG, Subingen 3,000 100.00baunova AG, Dällikon1) 800 51.00bMTI GmbH, Erstfeld 20 100.00brunner Erben AG, Zurich 1,500 100.00brunner Erben Holding AG, Zurich 2,000 100.00bRVZ bau-, Rechen- und Verwaltungszentrum AG, Erstfeld 100 100.00Egolf AG Strassen- und Tiefbau, Weinfelden 3,500 100.00Meyerhans AG Amriswil, Amriswil 2,500 100.00Meyerhans AG, Strassen- und Tiefbau Uzwil, Uzwil 100 100.00STRAbAG AG, Zurich 8,000 100.00
sERBiA
nOminAlCApiTAl
TRsd
diRECT sTAKE
%
«PUTEVI» A.D. CACAK, Cacak 122,638 85.02Preduzece za puteve «Zajecar» a.D.Zajecar, Zajecar 265,015 99.53STRAbAG beograd d.o.o., belgrade T€ 8,696 100.00TPA za obezbedenje kvaliteta i inovacije d.o.o. beograd, Novi beograd T€ 401 100.00Vojvodinaput-Pancevo a.d. Pancevo, Pancevo T€ 4,196 82.07
slOvAKiA
nOminAlCApiTAl
T€
diRECT sTAKE
%
bITUNOVA spol. s r.o., Zvolen 1,195 100.00bRVZ s.r.o., bratislava 33 100.00Errichtungsgesellschaft Strabag Slovensko s.r.o., bratislava-Ruzinov 7 100.00KSR - Kamenolomy SR, s.r.o., Zvolen 25 100.00OAT spol. s.r.o., bratislava 199 100.00SLOVAKIA ASFALT s.r.o., bratislava 9,222 100.00STRAbAG - ZIPP Development s.r.o., bratislava 664 100.00STRAbAG s.r.o., bratislava 66 100.00TPA Spolocnost pre zabezpecenie kvality a inovacie s.r.o., bratislava 7 100.00Viedenska brana s.r.o., bratislava 25 100.00ZIPP bRATISLAVA spol. sr.o., bratislava 133 100.00
ROmAniA
nOminAlCApiTAl
TROn
diRECT sTAKE
%
ANTREPRIZA DE REPARATII SI LUCRARI A R L CLUJ S.A., Cluj-Napoca 64,061 100.00bitunova Romania SRL, bucharest 16 100.00bRVZ SERVICII & ADMINISTRARE SRL, bucharest 278 100.00Carb SA, brasov 10,909 99.47DRUMCO SA, Timisoara 12,957 70.00Strabag srl, bucharest 43,519 100.00TPA Societate pentru asigurarea calitatii si inovatii SRL, bucharest 0 100.00Züblin Romania S.R.L., bucharest 4,580 100.00
1) The presentation of interests is done using the economic approach; the interests as defined by civil law may deviate from this presentation.

146 147notes to the financial Statement
slOvEniA
nOminAlCApiTAl
T€
diRECT sTAKE
%
bRVZ center za racunovodstvo in upravljanje d.o.o., Ljubljana 9 100.00DRP, d.o.o., Ljubljana 9 100.00GRASTO d.o.o., Ljubljana 500 99.85STRAbAG gradbene storitve d.o.o., Ljubljana 500 100.00
sOuTh AFRiCA
nOminAlCApiTAl
T€
diRECT sTAKE
%
EFKON SOUTH AFRICA (PTY) LTD, Pretoria 166 100.00
CZECh REpuBliC
nOminAlCApiTAl
TCZK
diRECT sTAKE
%
bHG CZ s.r.o., Ceské budejovice 200 100.00bitunova spol. s r.o., Jihlava 2,000 100.00bMTI CR s.r.o., brno 100 100.00bOHEMIA ASFALT, s.r.o., Sobeslav 10,000 100.00bRVZ s.r.o., Prague 1,000 100.00Dalnicni stavby Praha, a.s., Prague 136,000 100.00FRISCHbETON s.r.o., Prague 20,600 100.00JHP spol. s.r.o., Prague 20,000 100.00KAMENOLOMY CR s.r.o., Ostrava - Svinov 106,200 100.00MiTTaG spol. s.r.o., brno 100,100 100.00Na belidle s.r.o., Prague 100 100.00OAT s.r.o., Prague 4,000 100.00SAT s.r.o., Prague 1,000 100.00Strabag a.s., Prague 1,119,600 100.00STRAbAG Property and Facility Services a.s., Prague 46,800 100.00TPA CR, s.r.o., Ceske budejovice 1,000 100.00Viamont DSP a.s., Usti nad Labem 180,000 100.00Züblin stavebni spol s.r.o., Prague 100,000 100.00
uKRAinE
nOminAlCApiTAl
TuAh
diRECTsTAKE
%
Chustskij Karier, Zakarpatska 3,279 95.96Möbius Construction Ukraine Ltd, Odessa 28 100.00Zezelivskij karier TOW, Zezelev 13,130 99.36
hunGARy
nOminAlCApiTAl
ThuF
diRECT sTAKE
%
AKA Zrt., budapest 24,000,000 100.00ASIA Center Kft., budapest 1,830,080 100.00bHG bitumen Kft., budapest 3,000 100.00bitunova Kft., budapest 50,000 100.00bMTI Kft., budapest 5,000 100.00bRVZ Kft., budapest 1,545,000 100.00Frissbeton Kft., budapest 100,000 100.00H-TPA Kft., budapest 113,000 100.00KÖKA Kft., budapest 761,680 100.00Magyar Aszfalt Kft., budapest 3,600,000 100.00OAT Kft., budapest 25,000 100.00STRAbAG Property and Facility Services Zrt., budapest 20,000 51.00Strabag Zrt., budapest 2,100,000 100.00STRAbAG-MML Kft., budapest 500,000 100.00Szentesi Vasutepitö Kft, budapest 189,120 100.00Treuhandbeteiligung H1) 10,000 100.00Züblin K.f.t, budapest 3,000 100.00
uniTEd ARAB EmiRATEs
nOminAlCApiTAl
TAEd
diRECT sTAKE
%
STRAbAG AbU DHAbI LLC, Abu Dhabi 150 100.00Züblin Ground and Civil Engineering LLC, Dubai 1,000 100.00
1) The presentation of interests is done using the economic approach; the interests as defined by civil law may deviate from this presentation.

148
AccoUntinG poLicies
Acquired intangible assets and property, plant and equipment are recognised at their initial costs or costs of production less depreciation and impairment. both the direct and the appropriate parts of overhead costs for the self-constructed plants are included in the production costs. borrowing costs are recognised for qualifying assets.
Development costs are capitalised if the group can demonstrate the technical feasibility of completing the intangible asset so that it will be available for internal use or sale and if it can demonstrate the intent to complete the intangible asset and use or sell it. The group must also demonstrate that the intangible asset will generate probable future economic benefits, that it has adequate resources to complete the asset and that it is able to reliably measure the expenditure attributable to the asset during its development. The construction costs for these assets comprise all construction costs directly attributable to the construc-tion process as well as production-related overheads. borrowing costs are capitalised for qualified assets. The capitalised development costs are amortised and depreciated according to the straight-line method over the period for which revenues from the respective project are expected.
Goodwill is subject to an annual impairment test in accordance with IAS 36 based on which the impairment is undertaken.
Within the scope of the impairment test cash-generating units are identified and assigned a goodwill value. If the book value of a cash-generating unit including its goodwill exceeds the highest attainable value, an impairment loss must be recognised.
Other intangible and tangible assets are amortised and depreciated according to the straight-line method over their estimated useful lives. If there is an indication that an asset may be impaired and if the present value of the future cash surpluses is lower than the carrying value, then the assets are impaired and recognised with the recoverable amount in accordance with IAS 36.
The following useful lives were assumed in the determination of the rate of depreciation/amortisation:
pROpERtY, plant and EQuipmEnt and intanGiBlE aSSEtS
usEFul liFE in yEARs
intangible assetsProperty rights/Utilisation rights 3–50Software 2–5 Patents, licences 3–10property, plant and equipmentbuildings 10–50Investment property 10–35Investments in third-party buildings 5–40Machinery 3–21Office equipment/furniture and fixtures 3–23Vehicles 4–12
Subsidies and investment allowances of public bodies are deducted from the respective asset value and depreciated according to the useful life.
Land and real estate which are held in order to gain rental income and/or to rise in value have been stated as investment property in accordance with IAS 40. The amount reported and the evaluation are made in accordance with the cost model. Investment property is recognised at cost and depreciated within the straight-line method. If the present value of the future cash flows is lower than the carrying value, then an impairment to the lower fair value in accordance with IAS 36 is made. The fair value of this investment property is stated separately. This is determined according to recognised methods such as the derivation of the current market price of comparable real estate or the discounted cash flow method. Leasing contracts on assets on which all opportunities and risks essentially lie with the company are treated as finance leases. The fixed assets underlying these leasing agreements are capitalised at the present value of the minimum payments at the beginning of leasing relations and depreciated over their useful life or over shorter contract terms. These are offset by the liabilities arising from future leasing payments, whereby the former are recognised at the present value of the outstanding obligations at the balance sheet.
In addition there are leasing agreements for property, plant and equipment which are regarded as operating leases. Leasing payments resulting from these contracts are recognised as expenditure.
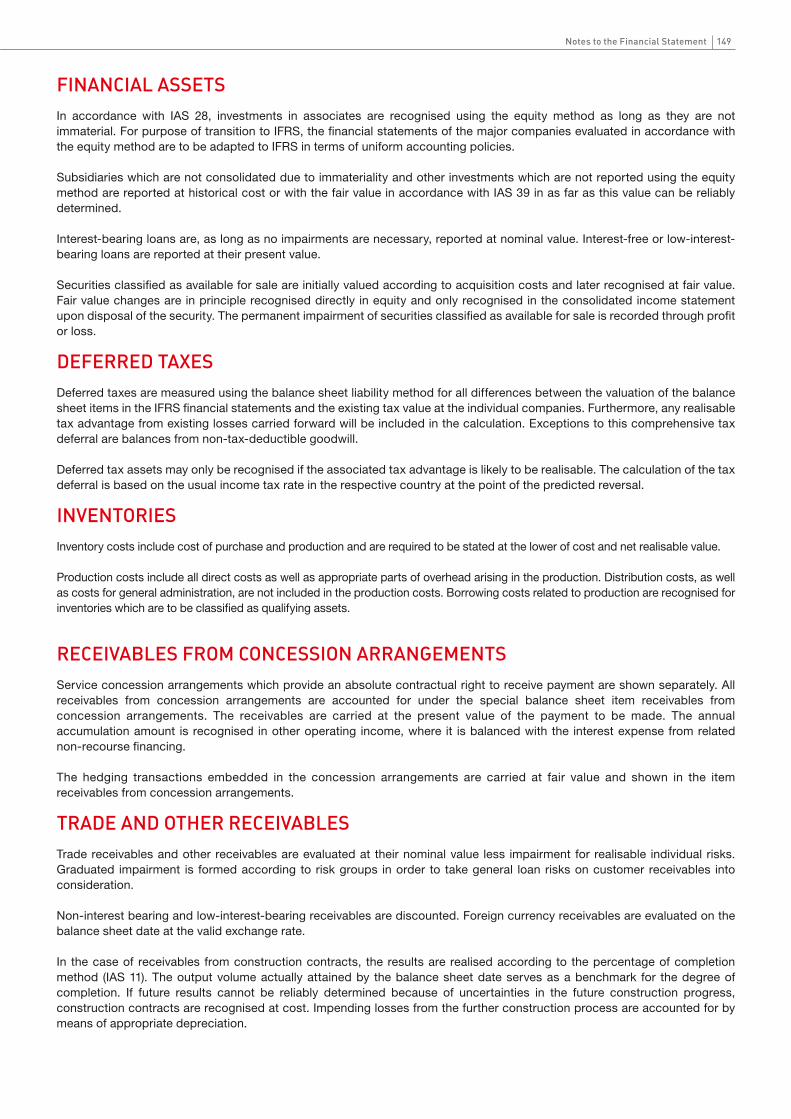
148 149notes to the financial Statement
In accordance with IAS 28, investments in associates are recognised using the equity method as long as they are not immaterial. For purpose of transition to IFRS, the financial statements of the major companies evaluated in accordance with the equity method are to be adapted to IFRS in terms of uniform accounting policies.
Subsidiaries which are not consolidated due to immateriality and other investments which are not reported using the equity method are reported at historical cost or with the fair value in accordance with IAS 39 in as far as this value can be reliably determined.
Interest-bearing loans are, as long as no impairments are necessary, reported at nominal value. Interest-free or low-interest-bearing loans are reported at their present value.
Securities classified as available for sale are initially valued according to acquisition costs and later recognised at fair value. Fair value changes are in principle recognised directly in equity and only recognised in the consolidated income statement upon disposal of the security. The permanent impairment of securities classified as available for sale is recorded through profit or loss.
financial aSSEtS
Deferred taxes are measured using the balance sheet liability method for all differences between the valuation of the balance sheet items in the IFRS financial statements and the existing tax value at the individual companies. Furthermore, any realisable tax advantage from existing losses carried forward will be included in the calculation. Exceptions to this comprehensive tax deferral are balances from non-tax-deductible goodwill.
Deferred tax assets may only be recognised if the associated tax advantage is likely to be realisable. The calculation of the tax deferral is based on the usual income tax rate in the respective country at the point of the predicted reversal.
dEfERREd taXES
Inventory costs include cost of purchase and production and are required to be stated at the lower of cost and net realisable value.
Production costs include all direct costs as well as appropriate parts of overhead arising in the production. Distribution costs, as well as costs for general administration, are not included in the production costs. borrowing costs related to production are recognised for inventories which are to be classified as qualifying assets.
inVEntORiES
Service concession arrangements which provide an absolute contractual right to receive payment are shown separately. All receivables from concession arrangements are accounted for under the special balance sheet item receivables from concession arrangements. The receivables are carried at the present value of the payment to be made. The annual accumulation amount is recognised in other operating income, where it is balanced with the interest expense from related non-recourse financing.
The hedging transactions embedded in the concession arrangements are carried at fair value and shown in the item receivables from concession arrangements.
REcEiVaBlES fROm cOncESSiOn aRRanGEmEntS
Trade receivables and other receivables are evaluated at their nominal value less impairment for realisable individual risks. Graduated impairment is formed according to risk groups in order to take general loan risks on customer receivables into consideration.
Non-interest bearing and low-interest-bearing receivables are discounted. Foreign currency receivables are evaluated on the balance sheet date at the valid exchange rate.
In the case of receivables from construction contracts, the results are realised according to the percentage of completion method (IAS 11). The output volume actually attained by the balance sheet date serves as a benchmark for the degree of completion. If future results cannot be reliably determined because of uncertainties in the future construction progress, construction contracts are recognised at cost. Impending losses from the further construction process are accounted for by means of appropriate depreciation.
tRadE and OthER REcEiVaBlES
150
If the costs incurred plus recognised profits exceed the payments received for it, then this is shown on the assets side under receivables from construction contracts. Vice versa, this is reported on the liabilities side under liabilities from construction contracts.
The results, in the case of construction contracts which are carried out in consortia, are realised according to the percentage of completion method in accordance with the degree of completion on the balance sheet date. Impending losses arising from further construction work are accounted for by means of appropriate depreciation. Receivables from or liabilities to consortia include the proportional contract result as well as capital contributions, in- and out-flows of cash and charges resulting from services.
Non-financial assets are measured at cost less impairment losses.
nOn-financial REcEiVaBlES
Financial assets classified as loans and receivables are carried at amortised cost less impairment losses.
OthER financial REcEiVaBlES
Cash and cash equivalents include all liquid assets which at the date of acquisition or investment have a remaining term of less than three months. Cash and cash equivalents are measured at amortised cost.
caSh and caSh EQuiValEntS
Provisions for severance payments are created as a result of statutory regulations. The group is obliged to pay a one-off severance payment to employees of domestic subsidiaries in the case of termination or retirement if their employment began before 1 January 2003. The level of this payment depends on the number of years at the company and amount due at the time of severance and comes to between two and twelve monthly salaries. A provision is made for this obligation.
The provisions for severance payments are calculated according to the projected unit credit method by using actuarial expertise. Here the future claim over the length of employment of the employees is collected while taking any future pay rises into consid-eration. The present value of the already earned partial-claims on the reporting date is recognised as the provision.
Pension provisions are calculated according to the projected unit credit method (IAS 19). This method determines the discounted post-employment benefit obligation acquired up to the balance sheet date. Due to the commitment of fixed pensions, it is not necessary to consider expected future salary rises as part of the actuarial parameters.
The actuarial gains and losses are fully and directly recognised in equity. Service costs are recognised in the employee benefits expense, interest costs in the allocation of provisions in the financial result.
Old-age-part-time indemnity payments are determined according to the same actuarial principles as the pension provisions.
The conditions applied to calculate the severance and pension provisions for discounting, pay rises and fluctuation vary from country to country depending on the economic situation. Life expectancy is calculated according to the respective country’s mortality tables.
The discount rate is deduced by the interest of at least AA-bonds with a comparable maturity.
All employees of the Swiss companies are covered by pension funds at pension fund providers, with benefit contributions made by employers and employees. because employers and employees are charged a “restructuring contribution” in the event that the fund does not have sufficient assets to cover the employees’ entitlements, IAS 19 identifies this system as a defined benefit plan.
The other provisions take into consideration all realisable risks and uncertain obligations. They are recognised at the respective amount, which is necessary at the balance sheet date according to commercial judgement in order to cover future payment obligations, realisable risks and uncertain obligations within the group. Hereby the respective amount is recognised, which arises as the most probable on careful examination of the facts. Long-term provisions are, in as far as they are not immaterial, entered into the accounts at their discounted discharge amount on the balance sheet date. The discharge amount also includes the cost increases to be considered on the reporting date. Provisions which arise from the obligation to recultivate gravel sites are allocated according to the rate of utilisation.
pROViSiOnS
150 151notes to the financial Statement
Non-financial liabilities reported under other liabilities are carried at the repayment amount. The overpaid amounts from construc-tion contracts are qualified as non-financial liabilities.
nOn-financial liaBilitiES
Liabilities are basically recognised at the repayment amount. Foreign currency liabilities are evaluated at the closing rate at the balance sheet date. Interest-free liabilities, especially those from finance lease liabilities, are accounted at the present value of the repayment obligation.
Costs related to the issue of corporate bonds are deducted over the term.
financial liaBilitiES
Contingent liabilities are present or possible future obligations which are not reflected in the balance sheet as liabilities because an outflow of resources is not probable. They are – as long as IFRS 3 does not require recognition on acquisition – not reflected in the balance sheet. The amount of the contingent liabilities reported corresponds to the amount of existing guarantees outstanding on balance sheet date.
cOntinGEnt liaBilitiES
Derivative financial instruments are employed exclusively to mitigate risks arising from movements in currency exchange rates and interest rates. The utilisation of financial derivatives is subject to internal guidelines and controls.
All derivative financial instruments are accounted for at fair value in accordance with IAS 39 and reported under other financial receivables or other financial liabilities.
Derivative financial instruments are measured on the basis of inter-bank conditions and, if necessary, the loan margin applicable for STRAbAG or stock exchange price, under application of the buying and selling rate on the balance sheet date. Where stock exchange prices are not used, the fair value is calculated by means of actuarial valuation methods.
Gains and losses from derivative financial instruments designated as qualified hedging instruments within the framework of a fair value hedge, or for which no qualified hedge relationship in accordance with IAS 39 could be established and which therefore do not qualify for hedge accounting, are recognised with an effect on income in the consolidated income statement.
Results from derivative financial instruments for which a cash flow hedge has been formed and whose effectiveness has been established are carried in equity with no effect on income up to the date of realisation of the hedge transaction. Any potential changes in results due to the ineffectiveness of these financial instruments are recognised in the income statement with an im-mediate effect on income. The critical-term-match method is used to determine the prospective effectiveness. The retrospective effectiveness is determined by applying the dollar-offset method.
dERiVatiVE financial inStRumEntS and hEdGinG actiVitiES
Revenues from the construction contracts are realised according to the percentage of completion method. The output volume actually attained at the balance sheet date serves as a benchmark for the degree of completion.
Revenues from the sale of proprietary projects, from trade to and services for consortia, from other services and from the sale of construction materials and bitumen are realised with the transfer of power to dispose and the related opportunities and risks and/or with the rendering of the services.
Supplementary claims in relation with construction contracts involve services which, based on the existing contractual agree-ments, cannot be invoiced until their invoicing potential or recognition is agreed with the client. While the costs are recognised in profit or loss immediately when they arise, revenue from supplementary claims is recognised generally after receipt of written recognition from the client or, in the event that payment is received before the written recognition, with the payment itself.
Revenue which is to be seen as purely transitory due to consortial structures, is offset against the corresponding expenses.
REVEnuE REcOGnitiOn

152
Estimations and assumptions which refer to the amount and recognition of the assets and liabilities accounted, the income and expenditure as well as the statement of contingent liabilities are necessary for the preparation of the consolidated financial state-ment according to IFRS and essentially concern the assessment of building projects until completion, in particular the amount of the realisation of profits, the stage of completion, the accounting and evaluation of provisions, accounting of concession ar-rangements and the impairment test of goodwill and other assets. In the case of future-oriented assumptions and estimations on the balance sheet date, the realistically expected developments of the global and branch-related environment are taken into account with regard to the expected future business development at the time of the preparation of the consolidated financial statements. In the case of developments in the underlying conditions which deviate from the assumptions and which are beyond the control of the management board, the amount which actually results can deviate from the estimated values. In the event such a development occurs, the assumptions and, if necessary, the carrying values of the affected assets and liabilities are adjusted to the latest information. During the preparation of the consolidated financial statements, there were no signs which indicate the necessity to significantly change the underlying assumptions and estimations.
EStimatES
notes on tHe iteMs oF tHe consoLiDAteD incoMe stAteMent
The revenue of T€ 12,983,233 (previous year: T€ 13,713,804) is attributed in particular to revenue from construction contracts, revenue from own projects, trade to and services for consortia, as well as other services and proportionally acquired profits resulting from consortia. Revenue from construction contracts including the realised part of profits according to the level of completion of the respective contract (percentage of completion method) amount to T€ 10,858,357 (previous year: T€ 11,443,085).
Revenue according to business fields and regions are represented individually in the segment reporting.
Revenue provides only an incomplete picture of the output volume achieved in the financial year. Additionally, therefore, the total output volume of the group is represented, which includes the proportional output of consortia and participation companies:
(1) REVEnuE
2012€ mln.
2011€ mln.
Germany 5,779 5,609Austria 1,888 1,985poland 1,139 1,719Czech Republic 646 769 hungary 393 436 Russia and neighbouring countries 527 487 Slovakia 400 441 Romania 372 206 other CEE countries 310 260 Rest of CEE 1,609 1,394Scandinavia 579 512 benelux 456 360 Switzerland 425 574 other European countries 240 230 Rest of Europe 1,700 1,676The Americas 348 257 Middle East 305 309 Africa 125 63 Asia 111 109 Rest of world 889 738 Total output volume 14,043 14,326

152 153notes to the financial Statement
The other operating income includes revenue from letting and leasing in the amount of € 22.2 million (previous year: € 23.5 million), insurance compensation and indemnification in the amount of € 37.5 million (previous year: € 27.0 million), and exchange rate differences in the amount of € 8.9 million (previous year: € 18.5 million) as well as gains from the disposal of fixed assets without financial assets in the amount of € 38.2 million (previous year: € 38.8 million). interest income from concession arrangements which is included in other operating income is represented as follows (see also notes on item 17):
(2) OthER OpERatinG incOmE
2012T€
2011T€
Interest income 70,925 70,975Interest expense -36,389 -37,539 Total 34,536 33,436
Services used are mainly attributed to services of subcontractors and professional craftsmen as well as planning services, machine rentals and third-party repairs.
(3) RaW matERialS, cOnSumaBlES and SERVicES uSEd
2012T€
2011T€
Raw materials, consumables 3,551,929 3,872,141Services used 5,103,172 5,447,979
8,655,101 9,320,120
(4) EmplOYEE BEnEfitS EXpEnSE2012
T€2011
T€
Wages 1,036,143 1,020,732Salaries 1,495,331 1,470,035Social security and related costs 462,521 457,475Expenses for severance payments and contributions to employee provident fund 22,623 22,742Expenses for pensions and similar obligations 10,054 7,994Other social expenditure 25,105 25,482 3,051,777 3,004,460
The expenses for severance payments and contributions to the employee provident fund and expenses for pensions and similar obligations include the expenses for service costs and indemnity claims resulting from old-age-part-time claims in the business year. The proportion of interest included in the expenses for severance payments as well as for pensions and similar obligations are recognised in the item interest result.
Expenses from defined contribution plans amounted to T€ 9,179 (previous year: T€ 8,296).
The average number of employees with the proportional inclusion of all participation companies is as follows:
2012 2011
Salaried employees 28,295 32,033Labourers 45,715 44,833
74,010 76,866

154
The other operating expenses of T€ 938,158 (previous year: T€ 1,013,911) mainly include general administrative costs, travel and advertising costs, insurance premiums, proportional transfer of losses from consortia, impairment of receivables, the balance of allocations to and utilisation of provisions, legal and advisory costs, rental and lease costs and losses on the disposal of assets (excluding financial assets). Other taxes amounting to T€ 40,976 (previous year: T€ 40,468) are included.
The other operating expenses include losses from exchange rate differences in the amount of € 26.3 million (previous year: € 35.5 million).
Indemnity payments in the amount of € 43 million are included in other operating expenses, due to the arbitration proceedings with Cemex. The arbitration court ruled that the cancellation of the contract on the purchase of Cemex activities in Hungary and Austria was against the law. STRAbAG has appealed against this judgement.
Spending on research and development arose in various special technical proposals, in connection with concrete competitive projects and in the introduction of building processes and products into the market, and was therefore recognised in full in the income statement.
(5) OthER OpERatinG EXpEnSES
(6) ShaRE Of pROfit OR lOSS Of aSSOciatES2012
T€2011
T€
Income from investments in associates 12,863 12,588Expenses arising from investments in associates -22,080 -47,125
-9,217 -34,537
(7) nEt incOmE fROm inVEStmEntS2012
T€2011
T€
Investment income 30,387 33,509Expenses arising from investments -7,224 -8,803 Gains on the disposal and write-up of investments 532 789 Impairment of investments -17,845 -21,727 Losses on the disposal of investments -1,502 -183
4,348 3,585
Depreciations and impairments are represented in the consolidated statement of fixed assets. In the year under report impair-ments on intangible assets and on property, plant and equipment to the amount of T€ 18,405 (previous year: T€ 30,349) were made. Impairment on goodwill amounts to T€ 10,077 (previous year: T€ 16,152). Impairment on goodwill mainly concerns the activities in Albania and water construction activities in Germany.
(8) dEpREciatiOn and amORtiSatiOn EXpEnSE
(9) nEt intERESt incOmE2012
T€2011
T€
Interests and similar income 73,145 112,311Interests and similar charges -123,871 -103,767 net interest income -50,726 8,544
Included in interest and similar charges are interest components from the allocation of severance payment and pension provisions amounting to T€ 25,695 (previous year: T€ 21,252), security impairment losses of T€ 1,009 (previous year: T€ 5,126) as well as currency losses of T€ 24,876 (previous year: T€ 12,420).
Included in interests and similar income are gains from exchange rates amounting to T€ 13,124 (previous year: T€ 49,694) and interest components from the plan assets for pension provisions in the amount of T€ 4,454 (previous year: T€ 0).
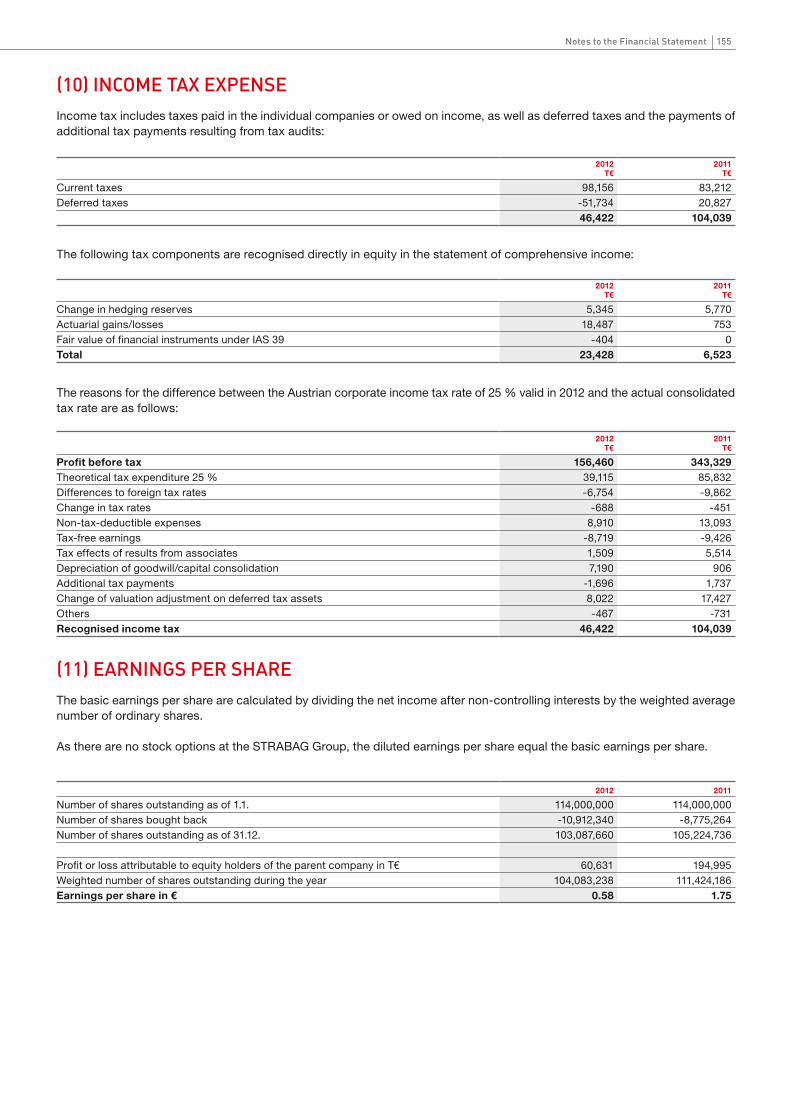
154 155notes to the financial Statement
(10) incOmE taX EXpEnSEIncome tax includes taxes paid in the individual companies or owed on income, as well as deferred taxes and the payments of additional tax payments resulting from tax audits:
2012T€
2011T€
Current taxes 98,156 83,212Deferred taxes -51,734 20,827
46,422 104,039
The following tax components are recognised directly in equity in the statement of comprehensive income:
2012T€
2011T€
Change in hedging reserves 5,345 5,770Actuarial gains/losses 18,487 753 Fair value of financial instruments under IAS 39 -404 0 Total 23,428 6,523
The reasons for the difference between the Austrian corporate income tax rate of 25 % valid in 2012 and the actual consolidated tax rate are as follows:
2012T€
2011T€
profit before tax 156,460 343,329Theoretical tax expenditure 25 % 39,115 85,832Differences to foreign tax rates -6,754 -9,862 Change in tax rates -688 -451 Non-tax-deductible expenses 8,910 13,093Tax-free earnings -8,719 -9,426 Tax effects of results from associates 1,509 5,514Depreciation of goodwill/capital consolidation 7,190 906 Additional tax payments -1,696 1,737Change of valuation adjustment on deferred tax assets 8,022 17,427Others -467 -731 Recognised income tax 46,422 104,039
(11) EaRninGS pER ShaREThe basic earnings per share are calculated by dividing the net income after non-controlling interests by the weighted average number of ordinary shares.
As there are no stock options at the STRAbAG Group, the diluted earnings per share equal the basic earnings per share.
2012 2011
Number of shares outstanding as of 1.1. 114,000,000 114,000,000Number of shares bought back -10,912,340 -8,775,264 Number of shares outstanding as of 31.12. 103,087,660 105,224,736
Profit or loss attributable to equity holders of the parent company in T€ 60,631 194,995Weighted number of shares outstanding during the year 104,083,238 111,424,186Earnings per share in € 0.58 1.75

156
notes on iteMs in tHe consoLiDAteD BALAnce sHeet
The composition of and changes in intangible assets, goodwill, and property, plant and equipment is shown separately in the consolidated statement of fixed assets.
No borrowing costs were capitalised for property, plant and equipment, or for intangible assets in the year under report, as significant qualifying assets were not produced or acquired after 1 January 2009.
GooDwiLL
The goodwill at the balance sheet date is composed as follows:
(12) pROpERtY, plant and EQuipmEnt and intanGiBlE aSSEtS
31.12.2012T€
31.12.2011T€
STRAbAG AG, Cologne 178,803 178,803Acquisitions Germany 64,360 69,408Polski Asfalt Group 60,454 55,247Viamont DSP a.s., Usti nad Labem 54,676 53,328Acquistions other Western Europe 21,139 19,477Acquisitions Eastern Europe 17,657 21,262STRAbAG Sverige Ab, Stockholm 17,590 16,939EFKON Group (incl. Center Communications Systems GmbH) 15,466 15,466Ed. Züblin AG, Stuttgart 14,938 14,938Gebr. von der Wettern Group 10,090 10,800Acquisitions Austria 9,248 9,248FRISCHbETON s.r.o., Prague 7,088 6,911 471,509 471,827
The goodwill is submitted to an impairment test once a year. For impairment testing, the recoverable value of a cash-generating unit is compared with its corresponding book value.
The cash-generating unit basically corresponds to the acquired legal unit or units which profit from the synergy potential of the business combination.
The recoverable value is the fair value or value in use determined from the discounted future cash flows.
This value is identified on the basis of the current budgeting of the internal reporting, as approved by the management board, which is based on past experiences and expectations concerning the future development of the market. The detailed planning period comprises at least four years and can be extended if this would allow a better depiction of the future cash flows. The last detailed planning year forms the basis for the calculation of the perpetuities as long as applicable legislation and legal requirements do not limit the usability of the cash-generating unit to a shorter period of time.
The discount rate for the future cash flows is identified while taking into account segment- and country-specific risks and growth rates. The discount interest rates range from 6.8 % to 10.7 % after taxes (previous year: 6.2 % to 10.7 %) respectively from 7.9 % to 11.6 % before taxes (previous year: 7.1 % to 11.2 %). The comparison of the book values with the highest attainable values of the cash-generating entities determined by the annual impairment test showed a need for goodwill impairment of T€ 10,077 (previous year: T€ 16,152).
cApitALiseD DeveLopMent costs
At the balance sheet date, development costs in the amount of T€ 18,422 (previous year: T€ 17,588) were capitalised as intan-gible assets. In the 2012 financial year, development costs in the amount of T€ 6,000 (previous year: T€ 11,544) were incurred, of which T€ 1,950 (previous year: T€ 2,946) were capitalised.

156 157notes to the financial Statement
31.12.2012T€
31.12.2011T€
Property leasing 27,451 29,916Machinery leasing 18,604 22,710
46,055 52,626
Offset against these are liabilities arising from the present value of leasing obligations amounting to T€ 43,101 (previous year: T€ 46,742).
The terms of the finance leases for property are between four and 20 years, while those for machines are between two and eight years.
The following payment obligations will arise from financial leases in subsequent financial years:
pREsEnT vAluEs minimum pAymEnTs
31.12.2012T€
31.12.2011T€
31.12.2012T€
31.12.2011T€
Term up to one year 8,577 7,154 11,091 11,147Term between one and five years 25,690 29,981 29,631 34,633Term over five years 8,834 9,607 10,679 11,296 43,101 46,742 51,401 57,076
In addition to the finance leases, there are also operating leases for the utilisation of technical equipment and machinery. The expenses from these contracts are recognised in the income statement. The payments made for the financial year 2012 amount to T€ 96,832 (previous year: T€ 107,960).
Payment obligations arising from operating lease agreements in subsequent business years are represented as follows:
31.12.2012T€
31.12.2011T€
Term up to one year 75,379 71,533Term between one and five years 148,368 133,949Term over five years 51,572 53,449 275,319 258,931
RestRictions on pRopeRtY, pLAnt AnD eQUipMent/pURcHAse oBLiGAtions
On the balance sheet date there were € 109.9 million (previous year: € 131.8 million) in contractual commitments for acquisition of property, plant and equipment which were not considered in the financial statement.
Restrictions exist for non-current assets in the amount of T€ 21,470 (previous year: T€ 22,805).
The development of investment property is shown separately in the consolidated statement of fixed assets. As of 31 December 2012, the fair value of the investment property basically corresponds to the carrying value.
The rental income from investment property in the 2012 financial year amounted to T€ 7,440 (previous year: T€ 8,484) and direct operating expenses totalled T€ 7,532 (previous year: T€ 10,210). Additionally, gains from asset disposals in the amount of T€ 2,195 (previous year: T€ 0) were achieved. No impairment was made in the financial year 2012 (previous year: T€ 15,000).
(13) inVEStmEnt pROpERtY
Detailed information on the group’s investments (shares of more than 20 %) can be found in the list of subsidiaries, associated companies and investments, which is included in the annual financial report.
LeAsinG
Due to existing finance leasing contracts, the following book values are included in property, plant and equipment assets on the balance sheet date:
(14) financial aSSEtS

158
The development of the financial assets in the financial year was as follows:
BAlAnCE As OF 1.1.2012
T€
CuRREnCy TRAnslATiOn
T€
ChAnGE in sCOpE OF COnsOli-
dATiOnT€
AddiTiOnsT€
TRAnsFERsT€
dispOsAlT€
impAiRmEnT/wRiTE-up
T€
BAlAnCE As OF 31.12.2012
T€
Investments in associates 402,279 -90 0 12,103 4 -35,174 0 379,122Investments in subsidiaries 92,971 -14 -9,697 37,743 -1,086 -3,209 -15,215 101,493Loans to subsidiaries 208 3 0 1,166 9 -347 -866 173 Other investment 104,216 70 -433 3,938 1,073 -5,622 -2,630 100,612Loans to participation com-panies 17,490 0 0 0 0 -6,583 0 10,907Securities 32,151 10 66 1,828 0 -172 1,434 35,317Other loans 2,026 0 0 61 0 -297 0 1,790 651,341 -21 -10,064 56,839 0 -51,404 -17,277 629,414
The following table provides an overview of the financial information (100 %) for associates and for companies which were reported applying the equity method of accounting in accordance with IAS 31.38 (Joint Ventures):
2012T€
2011T€
Total assets as of 31.12. 3,485,399 3,236,735Total liabilities as of 31.12. 2,877,334 2,450,333Revenue 983,736 596,221Profit for the period -62,230 -3,883
Tax accruals and deferrals recognised in the balance sheet on temporary differences between the amounts stated in the IFRS financial statements and the respective tax amounts as well as losses carried forward developed as follows:
(15) dEfERREd taXES
BAlAnCE As OF 1.1.2012
T€
CuRREnCy TRAnslATiOn
T€
ChAnGE in sCOpE OF COnsOlidATiOn
T€
OThER ChAnGEs
T€
BAlAnCE As OF 31.12.2012
T€
Property, plant and equipment and intangible assets 8,506 0 0 1,694 10,200Financial assets 1,750 0 0 -772 978 Inventories 4,056 -236 0 2,881 6,701Trade and other receivables 7,617 -237 0 3,428 10,808Provisions 143,117 -5,519 0 52,313 189,911Liabilities 2,732 -13 0 1,401 4,120Tax loss carryforward 195,599 0 0 18,284 213,883deferred tax assets 363,377 -6,005 0 79,229 436,601Netting out of deferred tax assets and liabilities of the same tax authorities -189,653 0 0 -49,329 -238,982 deferred tax assets netted out 173,724 -6,005 0 29,900 197,619
BAlAnCE As OF 1.1.2012
T€
CuRREnCy TRAnslATiOn
T€
ChAnGE in sCOpE OF COnsOlidATiOn
T€
OThER ChAnGEs
T€
BAlAnCE As OF 31.12.2012
T€
Property, plant and equipment and intangible assets -64,760 45 -79 4,740 -60,054 Financial assets -5,566 0 0 -4,199 -9,765 Inventories -31,711 0 -24,024 -6,288 -62,023 Trade and other receivables -136,017 584 -41 -16,103 -151,577 deferred tax liabilities -238,054 629 -24,144 -21,850 -283,419 Netting out of deferred tax assets and liabilities of the same tax authorities 189,653 0 0 49,329 238,982deferred tax liabilities netted out -48,401 629 -24,144 27,479 -44,437

158 159notes to the financial Statement
Deferred taxes on losses carried forward were capitalised as these can probably be offset with future taxable profits.
The Austrian Corporate Income Tax Act (Körperschaftsteuergesetz) requires a tax-effective impairment of investments to be claimed over a period of seven years. The deferred tax assets on loss carryforwards contain open one-seventh impairments in the amount of € 53.4 million (previous year: € 46.9 million).
No deferred tax assets were made for differences in book value on the assets side and tax losses carried forward of € 817.7 million (previous year: € 674.4 million), as their effectiveness as final tax relief is not sufficiently assured.
Of the non-capitalised loss carryforwards, € 745.8 million (previous year: € 614.1 million) have unrestricted use.
No deferred tax assets in accordance with Section 12 of the Austrian Corporate Income Tax Act (Körperschaftsteuergesetz) were made for open one-seventh impairments in the amount of € 129.3 million (previous year: € 124.7 million).
(16) inVEntORiES
In the financial year, impairment in the amount of T€ 10,732 (previous year: T€ 2,219) was recognised on inventories excluding materials, auxiliary supplies and fuel. T€ 53,234 (previous year: T€ 70,006) of the inventories excluding raw materials, auxiliary supplies and fuel were reported with the net realisable value.
For qualifying assets, interest on borrowings was recognised in the amount of T€ 4,886.
ReceivABLes FRoM concession ARRAnGeMents
STRAbAG has a 100 % interest in the Hungarian M5 Motorway Concession Company, AKA Alföld Koncesszios Autopalya Zrt., budapest (AKA).
In the concession agreement with the Hungarian state, AKA committed to develop, plan, finance and to build and operate the M5 motorway. The motorway itself is the property of the state; all vehicles and equipment necessary for motorway operation are to be transferred to the state free of charge following the end of the concession period.
In exchange, AKA will regularly receive an availability fee, independent of transit volume, from the Hungarian state for making the motorway available to the public. AKA bears the operator’s risk of motorway closure and non-compliance of contractually agreed roadway criteria.
The route totals 156.5 km and was built in three phases. The concession period runs until 2031. A one-time extension for up to 17.5 years is possible.
All services provided under this concession arrangement are accounted for under the separate balance sheet item receivables from concession arrangements. The receivables are carried at the present value of the payment to be made by the state. The annual accumulation amount is recognised in other operating income.
A part of the availability fee consists of interest adjustment payments of the Hungarian state. As a result, the state bears the in-terest risk from the financing of AKA. These interest adjustment payments represent an embedded hedging transaction which is measured separately in accordance with IAS 39.11. Presentation is made as a cash flow hedge; as a result, changes in the fair value of the interest rate swap are recognised directly in equity.
The negative market value of the interest rate swap in the amount of T€ -61,198 (previous year: T€ -27,217) is also recognised as long-term receivables from concession arrangements.
31.12.2012T€
31.12.2011T€
Raw materials, auxiliary supplies and fuel 332,597 312,529Offshore wind projects 174,912 56,658Finished buildings and goods 232,236 74,288Unfinished buildings and goods 176,838 251,270Development land 59,288 89,054Payments made 55,686 34,591
1,031,557 818,390
(17) REcEiVaBlES and OthER aSSEtS

160
Recognisable receivables from concession arrangements are offset by non-recourse financing in the amount of T€ 630,311 (previous year: T€ 673,927), classified either as a current or non-current liability depending on the term. The resulting interest expense is recognised in other operating income.
The STRAbAG consortium KMG - Kliplev Motorway Group was awarded the tender for Denmark’s first PPP project. The consortium will plan and build 26 km of the M51 motorway from Kliplev to Sønderborg as well as 18 km of side roads and seven interchanges and will operate the road over a period of 26 years from completion. The motorway was completed in March 2012 and was transferred to the state. The operation will then be paid for by regular payments from the state. The interim financing of the construction works included non-recourse financing in the amount of T€ 80,251 as of 31 December 2011.
Receivables and Other Assets are comprised as follows:
31.12.2012 31.12.2011
TOTAlT€
ThEREOFCuRREnT
T€
ThEREOFnOn-CuRREnT
T€TOTAl
T€
ThEREOFCuRREnT
T€
ThEREOFnOn-CuRREnT
T€
Receivables from concession arrangements 805,352 22,785 782,567 1,000,075 160,743 839,332Trade receivables Receivables from construction contracts 4,758,302 4,758,302 0 6,721,117 6,721,117 0 Advances received -3,823,135 -3,823,135 0 -5,733,044 -5,733,044 0 935,167 935,167 0 988,073 988,073 0
Other trade receivables 1,383,932 1,292,506 91,426 1,339,630 1,265,548 74,082Advances paid to subcontractors 53,652 53,652 0 124,807 124,807 0 Receivables from consortia 254,144 254,144 0 251,310 251,310 0 2,626,895 2,535,469 91,426 2,703,820 2,629,738 74,082non-financial assets 118,381 106,372 12,009 121,677 117,844 3,833Other financial assets Receivables from subsidiaries 145,042 145,036 6 128,584 128,555 29 Receivables from participation companies 162,197 158,789 3,408 87,510 83,886 3,624Other financial assets 248,679 216,269 32,410 256,670 212,306 44,364 555,918 520,094 35,824 472,764 424,747 48,017
The non-financial assets contain income tax receivables in the amount of T€ 42,831 (previous year: T€ 54,764). The receivables from construction contracts at the balance sheet date are represented as follows:
31.12.2012T€
31.12.2011T€
All contracts in progress at balance sheet date Costs incurred to balance sheet date 9,294,609 10,928,444Profits arising to balance sheet date 389,511 466,578Accumulated losses -378,307 -356,050 Less receivables recognised under liabilities -4,547,511 -4,317,855
4,758,302 6,721,117
Receivables from construction contracts amounting to T€ 4,547,511 (previous year: T€ 4,317,855) are recognised in liabilities, as advances received exceed the receivables.
As usual in the industry, the customer has the contractual right to retain part of the total amount of the invoice. These retentions are, however, redeemed as a rule by security (bank or group guarantees).

160 161notes to the financial Statement
31.12.2012T€
31.12.2011T€
Other trade receivables before impairment 1,512,040 1,475,768impairment as of 1.1. 136,138 122,775Currency translation 2,115 -3,224 Changes in scope of consolidation 330 1,271Allocation/utilisation1) -10,475 15,316As of 31.12. 128,108 136,138Book value of other trade receivables 1,383,932 1,339,630
1) Contains reclassifications amounting to T€ -12,018.
(18) caSh and caSh EQuiValEntS31.12.2012
T€31.12.2011
T€
Securities 12,472 20,553Cash on hand 5,917 2,291bank deposits 1,356,566 1,677,393
1,374,955 1,700,237
(19) EQuitYThe fully paid in share capital amounts to € 114,000,000 and is divided into 113,999,997 no-par bearer shares and three registered shares.
The management board was authorised, with the approval of the supervisory board, to increase the share capital of the company by up to € 57,000,000 by 19 June 2014, in several tranches if necessary, by issuing up to 57,000,000 registered no-par shares for cash or contributions in kind (approved capital). In the case of capital increase through contributions in kind, the partial or full exclusion of the shareholders’ subscription rights is possible. The exercise, issue price and conditions of issue shall be determined with the approval of the supervisory board. The super-visory board was authorised to determine the necessary changes to the Articles of Association required upon the issuance of shares from the approved capital.
The following resolutions were passed at the Annual General Meeting of 15 June 2012:
The management board was authorised to acquire no-par bearer or registered shares of the company on the stock market or over the counter to the extent of up to 10 % of the share capital during a period of twelve months from 10 July 2012 at a mini-mum price per share of € 1.00 and a maximum price per share of € 34.00. The purpose of the acquisition may not be to trade with own shares. The authorisation can be exercised in full, in part or in several partial amounts for one or several purposes by the company, a subsidiary (Section 228 Paragraph 3 of the Austrian Commercial Code) or third parties acting on behalf of the company.
The management board of STRAbAG SE can decide to acquire shares on the stock exchange but must inform the supervisory board following decision to do so. Over-the-counter purchases require prior approval by the supervisory board.
The management board was also authorised, for a period of five years from this resolution (Section 65 Paragraph 1b of the Austrian Stock Corporation Act), to sell or assign its own shares, with approval by the supervisory board, in a manner other than on the stock market or through a public tender, to the exclusion of the shareholders’ buyback rights (subscription rights), and to determine the conditions of sale. The authorisation can be exercised in full, or in part or in several partial amounts for one or several purposes by the company, a subsidiary (Section 228 Paragraph 3 of the Austrian Commercial Code) or third parties acting on behalf of the company.
The renewed authorisation of the management board to acquire own shares thus seamlessly follows the authorisation as per resolution by the Annual General Meeting of 10 June 2011.
The authorisation is to be exercised by the management board in such a way that, under consideration of the already acquired number of shares, a maximum of 11,400,000 shares is not exceeded and at no time the acquisition of own shares exceeds the 10 % limit.
The management board was authorised, with approval from the supervisory board, to issue financial instruments within the meaning of Section 174 of the Austrian Stock Corporation Act (AktG), in particular convertible bonds, income bonds, profit
In the reporting period, impairment on other trade receivables developed as follows:

162
participation rights with a total nominal value of up to € 1,000,000,000.00 which may also confer subscription and/or exchange rights for the acquisition of up to 50,000,000 shares of the company and/or may be designed in such a way that they can be issued as equity, also in several tranches and in different combinations, up to five years inclusive from the day of this resolution, also indirectly by way of a guarantee for the issue of financial instruments through an associate or related entity of the company with conversion rights on shares of the company. For the servicing, the management board may use the conditional capital or own shares. The issue amount and issue conditions, as well as the possible exclusion of the shareholders’ subscription rights for the issued financial instruments, are to be determined by the management board with the approval of the supervisory board. Also approved was a conditional increase of the share capital of the company pursuant to Section 159 Paragraph 2 No. 1 of the Austrian Stock Corporation Act (AktG) by up to € 50,000,000.00 through the issue of up to 50,000,000 new bearer shares with no face value (no-par shares) for issue to creditors of financial instruments within the meaning of the Annual General Meeting resolu-tion of 15 June 2012, provided the creditors of financial instruments exercise their subscription and/or exchange rights for shares of the company. The issue amount and the exchange ratio are to be determined based on recognised financial mathematical methods and the price of the shares of the company in a recognised pricing procedure. The newly issued shares of the conditional capital increase carry a dividend entitlement corresponding to that of the shares traded on the stock market at the time of the issue. The management board is authorised, with the approval of the supervisory board, to establish the further details of the implementation of the conditional capital increase. The supervisory board is authorised to pass resolution on any amendments to the Articles of Association resulting from the issue of shares within the scope of the conditional capital.
Details as to the development of the equity of STRAbAG SE are represented in the statement of changes in equity.
Long-term economic success, within the context of responsibility to our shareholders, customers, employees, suppliers, sub-contractors and the company itself, is the primary entrepreneurial objective of the STRAbAG Group. Working to pursue these goals, recognising opportunities and risks before and as they arise, and responsibly taking these into consideration safeguards the continuity of the group and protects the interests of the shareholders.
To guarantee the continuity of the company, the management and responsible employees assure that there is a balanced relationship between opportunities and risks during the selection of projects and assess the individual risks against the back-ground of the overall company risk.
The group equity ratio target was defined at between 20 % and 25 % during the IPO of STRAbAG SE in October 2007. The equity capital ratio is calculated from the book value of the equity as of 31 December divided by the balance sheet total as of 31 December. The equity contains all parts of the equity according to the balance sheet: share capital, capital reserves, retained earnings and non-controlling interests.
The group equity ratio as of 31 December 2012 amounted to 31 % (previous year: 30 %). With this equity base, the STRAbAG Group will be able to participate increasingly in tenders for Public-Private Partnership (PPP) projects. It means that the necessary funds for a participation in equity capital are available and that the related change in the balance sheet total will be manageable.
If the group is awarded the tender for large-scale projects, or if a strategically suitable acquisition is made, the equity ratio could briefly fall below the set minimum. In this case, the company reserves the right to adjust the dividend payments to the shareholders or to issue new shares.
162
(20) pROViSiOnS
BAlAnCE As OF 1.1.2012
T€
CuRREnCy TRAnslATiOn
T€
ChAnGEs in sCOpE OF COn-
sOlidATiOnT€
AddiTiOnsT€
dispOsAlsT€
impAiRmEnTT€
BAlAnCE As OF 31.12.2012
T€
provisions for severance pay-ments 70,438 0 539 8,931 0 0 79,908provisions for pensions 384,209 5 229 45,480 0 0 429,923provisions for taxes 106,801 4,766 25 55,981 2,743 94,582 70,248Other provisions Construction-related provisions 662,328 13,328 12,557 318,896 11,009 323,094 673,006Personnel-related provisions 250,307 1,838 1,016 158,206 5,174 181,243 224,9501)
Other provisions 240,869 4,985 1,363 270,094 13,296 220,760 283,2551,153,504 20,151 14,936 747,196 29,479 725,097 1,181,2111,714,952 24,922 15,729 857,588 32,222 819,679 1,761,290
1) In the other personnel-related provisions plan assets in the amount of T€ 13,763 (previous year: T€ 15,609) are deducted.
The short-term provisions include provisions for taxes in the amount of T€ 70,248 (previous year: T€ 106,801) as well as other provisions in the amount of T€ 665,209 (previous year: T€ 684,175). The long-term provisions amounting to T€ 1,025,833 (previous year: T€ 923,976) mainly include severance provisions, pension provisions and provisions for guarantees.
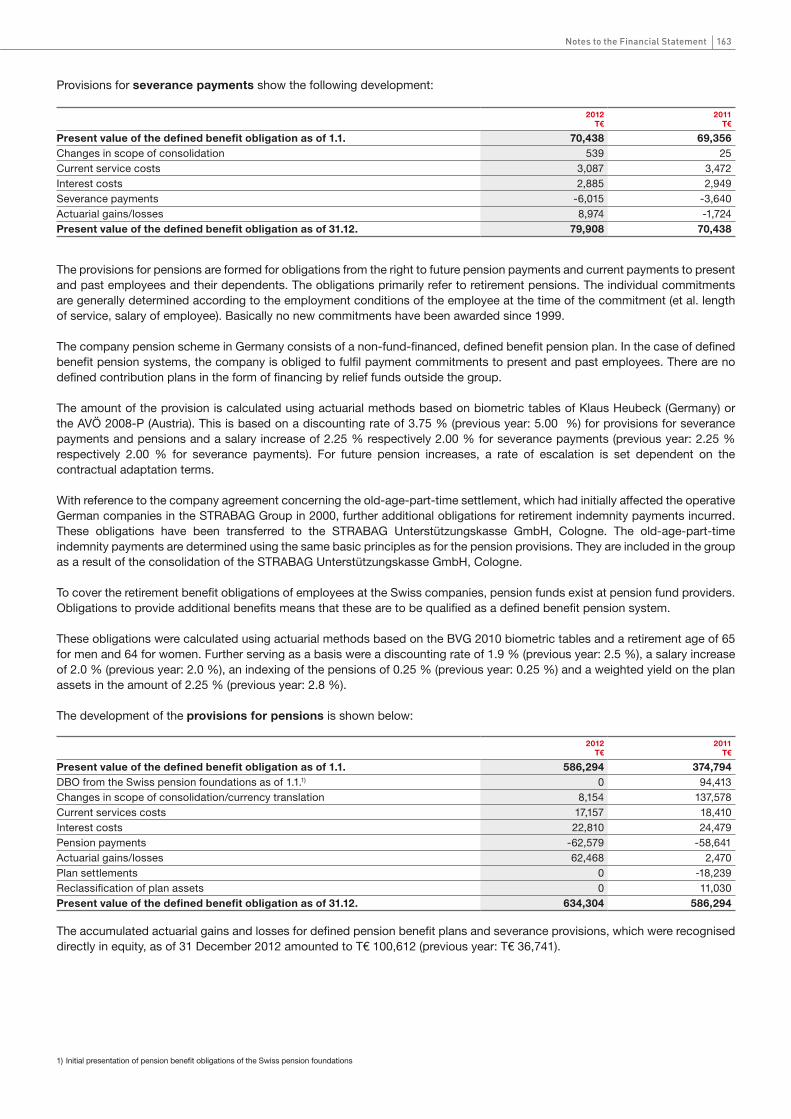
162 163notes to the financial Statement
1) Initial presentation of pension benefit obligations of the Swiss pension foundations
Provisions for severance payments show the following development:
The provisions for pensions are formed for obligations from the right to future pension payments and current payments to present and past employees and their dependents. The obligations primarily refer to retirement pensions. The individual commitments are generally determined according to the employment conditions of the employee at the time of the commitment (et al. length of service, salary of employee). basically no new commitments have been awarded since 1999.
The company pension scheme in Germany consists of a non-fund-financed, defined benefit pension plan. In the case of defined benefit pension systems, the company is obliged to fulfil payment commitments to present and past employees. There are no defined contribution plans in the form of financing by relief funds outside the group.
The amount of the provision is calculated using actuarial methods based on biometric tables of Klaus Heubeck (Germany) or the AVÖ 2008-P (Austria). This is based on a discounting rate of 3.75 % (previous year: 5.00 %) for provisions for severance payments and pensions and a salary increase of 2.25 % respectively 2.00 % for severance payments (previous year: 2.25 % respectively 2.00 % for severance payments). For future pension increases, a rate of escalation is set dependent on the contractual adaptation terms.
With reference to the company agreement concerning the old-age-part-time settlement, which had initially affected the operative German companies in the STRAbAG Group in 2000, further additional obligations for retirement indemnity payments incurred. These obligations have been transferred to the STRAbAG Unterstützungskasse GmbH, Cologne. The old-age-part-time indemnity payments are determined using the same basic principles as for the pension provisions. They are included in the group as a result of the consolidation of the STRAbAG Unterstützungskasse GmbH, Cologne.
To cover the retirement benefit obligations of employees at the Swiss companies, pension funds exist at pension fund providers. Obligations to provide additional benefits means that these are to be qualified as a defined benefit pension system.
These obligations were calculated using actuarial methods based on the bVG 2010 biometric tables and a retirement age of 65 for men and 64 for women. Further serving as a basis were a discounting rate of 1.9 % (previous year: 2.5 %), a salary increase of 2.0 % (previous year: 2.0 %), an indexing of the pensions of 0.25 % (previous year: 0.25 %) and a weighted yield on the plan assets in the amount of 2.25 % (previous year: 2.8 %). The development of the provisions for pensions is shown below:
2012T€
2011T€
present value of the defined benefit obligation as of 1.1. 70,438 69,356Changes in scope of consolidation 539 25 Current service costs 3,087 3,472Interest costs 2,885 2,949Severance payments -6,015 -3,640 Actuarial gains/losses 8,974 -1,724 present value of the defined benefit obligation as of 31.12. 79,908 70,438
2012T€
2011T€
present value of the defined benefit obligation as of 1.1. 586,294 374,794DbO from the Swiss pension foundations as of 1.1.1) 0 94,413Changes in scope of consolidation/currency translation 8,154 137,578Current services costs 17,157 18,410Interest costs 22,810 24,479Pension payments -62,579 -58,641 Actuarial gains/losses 62,468 2,470Plan settlements 0 -18,239 Reclassification of plan assets 0 11,030present value of the defined benefit obligation as of 31.12. 634,304 586,294
The accumulated actuarial gains and losses for defined pension benefit plans and severance provisions, which were recognised directly in equity, as of 31 December 2012 amounted to T€ 100,612 (previous year: T€ 36,741).
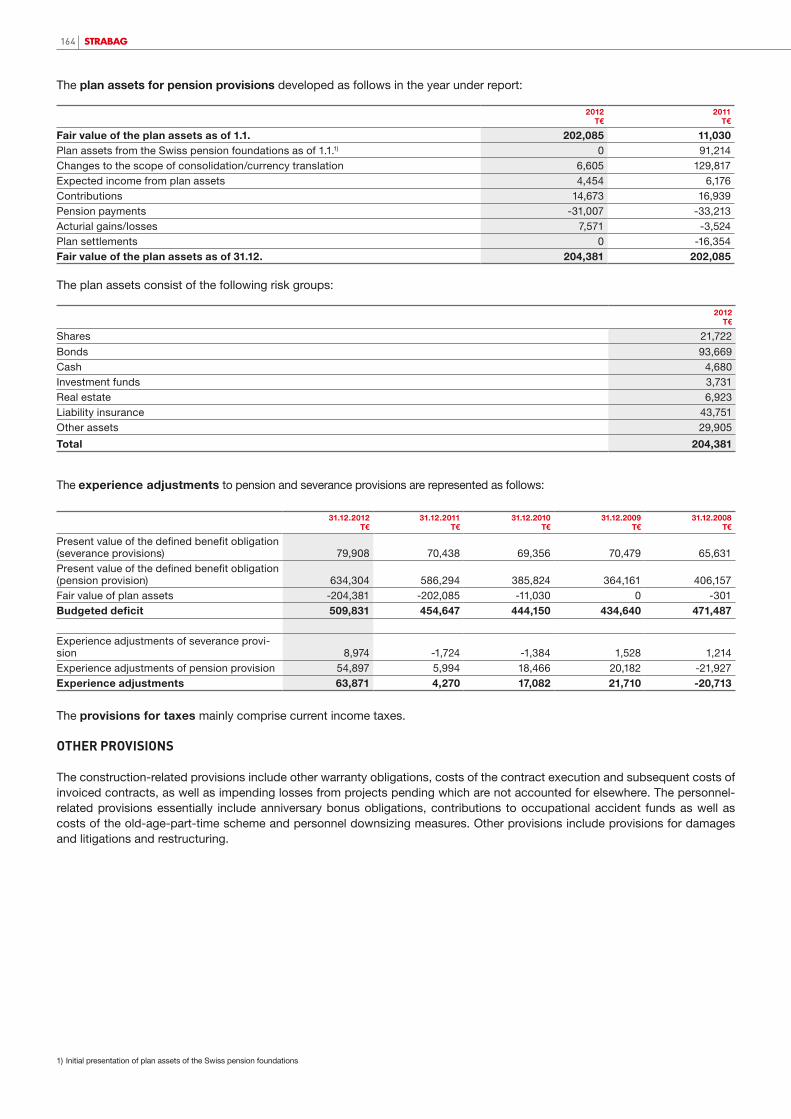
164
The plan assets for pension provisions developed as follows in the year under report:
The plan assets consist of the following risk groups:
The experience adjustments to pension and severance provisions are represented as follows:
1) Initial presentation of plan assets of the Swiss pension foundations
2012T€
2011T€
Fair value of the plan assets as of 1.1. 202,085 11,030Plan assets from the Swiss pension foundations as of 1.1.1) 0 91,214Changes to the scope of consolidation/currency translation 6,605 129,817Expected income from plan assets 4,454 6,176Contributions 14,673 16,939Pension payments -31,007 -33,213Acturial gains/losses 7,571 -3,524Plan settlements 0 -16,354Fair value of the plan assets as of 31.12. 204,381 202,085
2012T€
Shares 21,722bonds 93,669Cash 4,680Investment funds 3,731Real estate 6,923Liability insurance 43,751Other assets 29,905
Total 204,381
31.12.2012T€
31.12.2011T€
31.12.2010T€
31.12.2009T€
31.12.2008T€
Present value of the defined benefit obligation(severance provisions) 79,908 70,438 69,356 70,479 65,631Present value of the defined benefit obligation (pension provision) 634,304 586,294 385,824 364,161 406,157Fair value of plan assets -204,381 -202,085 -11,030 0 -301 Budgeted deficit 509,831 454,647 444,150 434,640 471,487
Experience adjustments of severance provi-sion 8,974 -1,724 -1,384 1,528 1,214Experience adjustments of pension provision 54,897 5,994 18,466 20,182 -21,927 Experience adjustments 63,871 4,270 17,082 21,710 -20,713
The provisions for taxes mainly comprise current income taxes.
otHeR pRovisions
The construction-related provisions include other warranty obligations, costs of the contract execution and subsequent costs of invoiced contracts, as well as impending losses from projects pending which are not accounted for elsewhere. The personnel-related provisions essentially include anniversary bonus obligations, contributions to occupational accident funds as well as costs of the old-age-part-time scheme and personnel downsizing measures. Other provisions include provisions for damages and litigations and restructuring.

164 165notes to the financial Statement
1) The prepayment exceeding the receivables from construction contracts shown here is qualified as non-financial.
(21) liaBilitiES31.12.2012 31.12.2011
TOTAlT€
ThEREOFCuRREnT
T€
ThEREOFnOn-CuRREnT
T€TOTAl
T€
ThEREOFCuRREnT
T€
ThEREOFnOn-CuRREnT
T€
Financial liabilities bonds 477,500 95,000 382,500 445,000 75,000 370,000bank borrowings 1,129,383 280,425 848,958 1,235,510 351,150 884,360Liabilities from finance leases 43,101 8,577 34,524 46,742 7,154 39,588Other liabilities 0 0 0 4,705 0 4,705
1,649,984 384,002 1,265,982 1,731,957 433,304 1,298,653Trade payablesReceivables from construction contracts1) -4,547,511 -4,547,511 0 -4,317,855 -4,317,855 0 Advances received 5,077,581 5,077,581 0 4,893,392 4,893,392 0 530,070 530,070 0 575,537 575,537 0 Other trade payables 1,981,392 1,920,386 61,006 2,119,943 2,059,519 60,424Payables to consortia 273,663 273,663 0 275,097 275,097 0 2,785,125 2,724,119 61,006 2,970,577 2,910,153 60,424non-financial liabilities 328,914 327,586 1,328 362,137 360,656 1,481Other financial liabilitiesPayables to subsidiaries 68,639 68,639 0 56,000 56,000 0 Payables to participation companies 20,072 15,409 4,663 16,888 11,105 5,783Other financial liabilities 316,688 288,021 28,667 335,300 315,164 20,136 405,399 372,069 33,330 408,188 382,269 25,919
In order to secure liabilities to banks, real securities amounting to T€ 205,526 (previous year: T€ 171,795) have been booked.
(22) cOntinGEnt liaBilitiESThe company has accepted the following guarantees:
31.12.2012T€
31.12.2011T€
Guarantees without financial guarantees 903 1,988
(23) Off-BalancE ShEEt tRanSactiOnSIn the construction industry, it is customary and necessary to provide various types of guarantees to secure the contractual obligations. These guarantees are usually issued by banks or credit insurers and most commonly comprise bid, contract performance, prepayment and warranty guarantees. In the event these guarantees are called upon, the relevant banks have a contractual right of recourse against the group. The risk that such guarantees are utilised and that a right of recourse arises materialises only if the primary contractual obligations are not properly performed.
Obligations and possible risks from such guarantees are recognised in the balance sheet as provisions or liabilities.
Not included in the balance sheet or the contingent liability as of 31 December 2012 are fulfilment guarantees in the amount of € 2.1 billion (previous year: € 2.0 billion) of which an outflow of resources is unlikely.
As is customary in the industry, STRAbAG SE shares liability with the other partners of consortia and joint ventures in which companies of the STRAbAG Group hold a share interest.

166
(24) nOtES tO thE cOnSOlidatEd caSh flOW StatEmEntThe representation of the cash flow statement was made according to the indirect method and separated into the cash flows classified by operating, investing and financing activities. The cash and cash equivalents include exclusively cash on hand, bank deposits and short-term securities. Any effects of changes in consolidation were eliminated and represented in the cash flow from investing activities.
The cash and cash equivalents are composed as follows:
31.12.2012T€
31.12.2011T€
Securities 12,472 20,553Cash on hand 5,917 2,291bank deposits 1,356,566 1,677,393
1,374,955 1,700,237
The cash and cash equivalents include deposits abroad in the amount of T€ 8,757 (previous year: T€ 6,437), subject to the restriction that they may only be transferred to another country following official completion of the construction order, or that they may only be accessed together with another partner of the construction project. Of the cash and cash equivalents, T€ 15,529 (previous year: T€ 5,188) are pledged as collateral (see also item 25).
(25) financial inStRumEntSA financial instrument is a contract that results in a financial asset at one enterprise and a financial liability or equity instrument at another. Financial assets include especially cash and cash equivalents, trade receivables and other receivables and derivatives. Financial liabilities are obligations to pay cash or other financial assets. These include especially financial liabilities such as bank borrowings, bonds, liabilities arising from financial leasing and trade payables. Initial recognition is carried out in principle using settlement date accounting.
The financial instruments are derecognised when the claims to payment from the investment extinguish or have been transferred and the group has largely transferred all risks and opportunities which are related with the property.
The financial instruments as of the balance sheet date were as follows:
mEAsuREmEnTCATEGORy
ACCORdinG TO iAs 39
31.12.2012CARRyinG
vAluE T€
31.12.2012FAiR
vAluET€
31.12.2011CARRyinG
vAluET€
31.12.2011FAiR
vAluET€
AssETsvaluation at historical costs Loans to subsidiaries L&R 173 173 208 208 Loans to participation companies L&R 10,907 10,907 17,490 17,490Other loans L&R 1,790 1,790 2,026 2,026Trade receivables L&R 2,626,895 2,626,895 2,703,820 2,703,820Receivables from concession arrange-ments L&R 866,550 866,550 1,027,292 1,027,292Other financial assets L&R 554,351 554,351 472,699 472,699Non-financial assets no FI 118,381 121,677 Cash and cash equivalents L&R 1,362,483 1,362,483 1,679,684 1,679,684 5,541,530 5,423,149 6,024,896 5,903,219valuation at fair value Investments in subsidiaries AfS 101,493 101,4931) 92,971 92,9711)
Other investments AfS 100,612 100,6121) 104,215 104,2151)
Securities AfS 35,317 35,317 32,151 32,151Cash and cash equivalents AfS 12,472 12,472 20,553 20,553Derivatives -59,632 -59,632 -27,152 -27,152 190,262 190,262 222,738 222,738
1) Investments in subsidiaries and other investments amounting to T€ 196,866 (previous year: T€ 188,144) are recognised at cost less impairment according to IAS 39 because their fair value cannot be reliably determined.

166 167notes to the financial Statement
1) Investments in subsidiaries and other investments amounting to T€ 196,866 are recognised at cost less impairment according to IAS 39 because their fair value cannot be reliably determined.2) Investments in subsidiaries and other investments amounting to T€ 188,144 are recognised at cost less impairment according to IAS 39 because their fair value cannot be reliably determined.
The fair value measurement at 31 december 2012 for financial instruments measured at fair value was done as follows:
vAluATiOn AT mARKET vAluE
T€
vAluATiOn usinG inpuT TAKEn FROm OBsERvABlE
mARKET dATAT€
OThER vAluATiOn mEThOds
T€TOTAl
T€
AssETs Investments in subsidiaries 0 0 101,493 101,493Other investments 0 0 100,612 100,612Securities 35,317 0 0 35,317Cash and cash equivalents 12,472 0 0 12,472Derivatives 0 -59,632 0 -59,632 Total 47,789 -59,632 202,1051) 190,262 liABiliTiEs Derivatives 0 -7,641 0 -7,641 Total 0 -7,641 0 -7,641
The fair value measurement at 31 december 2011 for financial instruments measured at fair value was done as follows:
vAluATiOn AT mARKET vAluE
T€
vAluATiOn usinG inpuT TAKEn FROm OBsERvABlE
mARKET dATAT€
OThER vAluATiOn mEThOds
T€TOTAl
T€
AssETs Investments in subsidiaries 0 0 92,971 92,971Other investments 0 0 104,215 104,215Securities 32,151 0 0 32,151Cash and cash equivalents 20,553 0 0 20,553Derivatives 0 -27,152 0 -27,152 Total 52,704 -27,152 197,1862) 222,738 liABiliTiEs Derivatives 0 -11,634 0 -11,634 Total 0 -11,634 0 -11,634
Cash and cash equivalents, trade receivables and other receivables have for the most part short remaining terms. Accordingly, their book values on the balance sheet date approximate their fair value. The fair value of non-current financial assets corresponds to the present value of the related payments under consideration of the prevailing market parameters as far as market values were not available.
Trade payables and other financial liabilities typically have short terms; their book values approximate the fair value. The fair value of bonds, bank borrowing and liabilities arising from financial leasing are measured at the present value of the payments
mEAsuREmEnTCATEGORy
ACCORdinG TO iAs 39
31.12.2012CARRyinG
vAluE T€
31.12.2012FAiR
vAluET€
31.12.2011CARRyinG
vAluET€
31.12.2011FAiR
vAluET€
liABiliTiEs valuation at historical costs Financial liabilities FLaC -1,649,984 -1,671,524 -1,731,957 -1,727,899 Trade payables FLaC -2,255,055 -2,255,055 -2,395,040 -2,395,040 Liabilities from construction contracts no FI -530,070 -575,537 Other financial liabilities FLaC -397,758 -397,758 -396,553 -396,553 Non-financial liabilities no FI -328,914 -362,137 Derivatives -7,641 -7,641 -11,634 -11,634 -5,169,422 -4,331,978 -5,472,858 -4,531,126 Total 562,370 1,281,433 774,776 1,594,832
measurement categories Loans and receivables (L&R) 5,423,149 5,423,149 5,903,219 5,903,219Available for sale (AfS) 249,894 249,894 249,890 249,890Financial liabilities measured at amortised costs (FLaC) -4,302,797 -4,324,337 -4,523,550 -4,519,492 Derivatives -67,273 -67,273 -38,786 -38,786 No financial instruments -740,603 -815,997 Total 562,370 1,281,433 774,776 1,594,831

168
associated with them under consideration of the relevant applicable market parameters as far as market values were not available.
T€ 15,529 (previous year: T€ 5,188) of the cash and cash equivalents, T€ 2,684 (previous year: T€ 2,924) of the securities and T€ 11,708 (previous year: T€ 11,553) of the other financial instruments were pledged as collateral for liabilities.
The non-recourse liabilities related to the concession receivable are hedged using the income from the concession receivable.
The net income effects of the financial instruments according to valuation category are as follows:
l&R2012
T€
AFs2012
T€
FlAC2012
T€
dERivATivEs2012
T€
l&R2011
T€
AFs2011
T€
FlAC2011
T€
dERivATivEs2011
T€
Interest 51,581 0 -72,293 0 59,438 0 -64,858 0 Interest from receivables from concession arrangements 70,925 0 -27,359 -9,030 70,975 0 -28,845 -8,694 Result from securities 0 786 0 0 0 745 0 0 Impairment losses -42,099 -17,600 0 -692 -18,116 -25,421 0 1,833Disposal losses/profits 0 1,857 0 0 0 1,414 0 0 Gains from de-recognition of liabilities and payments of written off receivables 18 0 7,239 0 8 0 3,342 0 net income recognised in profit or loss 80,425 -14,957 -92,413 -9,722 112,305 -23,262 -90,361 -6,861 Value changes recognised directly in equity 0 -1,724 0 -26,9421) 0 150 0 -30,2341) net income 80,425 -16,681 -92,413 -36,664 112,305 -23,112 -90,361 -37,095
1) Excluding derivatives from associated companies in the amount of T€ -2,474 (previous year: T€ -626)
Dividends and expenses from investments shown in the net income from investments are part of the operating income and therefore not part of the net income of financial instruments. Impairment losses, reversal of impairment losses, disposal gains and disposal losses of loans & receivables (L&R) and of financial liabilities amortised at cost (FLaC) are carried in other income or other expenses.
Impairment losses, reversal of impairment losses, disposal gains and disposal losses of the financial instruments available for sale are carried in the net income from investments if they are investments in subsidiaries or other investments, otherwise in net interest income.
Derivative instruments are used exclusively to hedge existing risks resulting from changes in currency and interest rates. The use of derivative financial instruments in the group is subject to the appropriate approval and control procedures. The connec-tion to a mainstay business is a must, trading is not permissible.
pRincipLes oF RisK MAnAGeMent
The STRAbAG Group is subject to credit, market and liquidity risks related to its assets, liabilities and planned transactions. The goal of financial risk management is to minimise these risks through ongoing financially oriented activities.
The basics of the financial policy are set by the management board and monitored by the supervisory board. The implementation of the financial policy and responsibility for the risk management are the domain of the group treasury. Certain transactions require prior approval by the management board, which is regularly informed as to the scope and amount of the current risk exposure.
inteRest RAte RisK
The financial instruments bear variable interest rates on the assets side, on the liabilities side there are both variable and fixed interest obligations. The risk of financial instruments bearing variable interest rates consists of increasing interest charges and sinking interest revenue resulting from an unfavourable change in market interest rates. Fixed interest obligations mainly result from the tranches of the bonds issued by STRAbAG SE amounting to a total of € 450 million.

168 169notes to the financial Statement
1) Not entirely represented as Hedge Accounting
As of 31 December 2012, following hedging transactions existed:
The amount of bank deposits and bank borrowings according to currency – giving the average interest rate at balance sheet date – is represented as follows:
BAnK Deposits
31.12.2012 31.12.2011
nOminAl vAluET€
mARKET vAluET€
nOminAl vAluET€
mARKET vAluET€
Interest rate swaps 778,680 -68,327 828,960 -29,249 -68,327 -29,249
CARRyinG vAluE31.12.2012
T€
wEiGhTEd AvERAGE inTEREsT RATE 2012
%
EUR 943,144 0.44PLN 119,503 4.18CZK 77,306 0.64Others 216,613 1.74Total 1,356,566 1.05
BAnK BoRRowinGs
CARRyinG vAluE31.12.2012
T€
wEiGhTEd AvERAGE inTEREsT RATE 2012
%
EUR 1,125,572 2.32Others 3,810 3.03Total 1,129,382 2.33
Had the interest rate level at 31 December 2012 been higher by 100 basispoints, then the result would have been higher by T€ 5,787 (previous year: T€ 6,880) and the equity at 31 December 2012 would have been higher by T€ 47,341 (previous year: T€ 51,783). Had the interest rate level been lower by 100 basispoints, this would have meant a correspondingly lower equity and profit before tax. The calculation is made based on the level of interest-bearing financial assets and liabilities at 31 December. Tax effects from interest rate changes were not considered. cURRencY RisK
Due to the decentralised structure of the group, characterised by local companies in the respective countries, mainly closed currency positions appear in the balance sheet. Loan financing and investments were predominantly made by the group companies in the respective country’s local currency. Receivables and liabilities from business activities mainly offset each other in the same currency.
The remaining currency risk mainly results when the currency of the order deviates from the functional currency of the subsidiary. This involves in particular orders in Eastern Europe and Scandinavia which are concluded in EUR. The planned proceeds are received in the currency of the order while a substantial part of the associated costs is made in the local currency.
The internal financing of companies within the group using different functional currencies resulted in an earnings-relevant currency risk.
In order to limit the remaining currency risk and secure the calculation, derivative financial instruments, above all forward exchange operations, were transacted. As of 31 december 2012, the following hedging transactions existed for the underlying transactions mentioned1) below:
CuRREnCy
EXpECTEd CAsh FlOws 2013
T€
EXpECTEd CAsh FlOws 2014
T€
EXpECTEd CAsh FlOws TOTAl
T€
pOsiTivE mARKET vAluE OF ThE
hEdGinG TRAnsACTiOn
T€
nEGATivE mARKET vAluE OF ThE
hEdGinG TRAnsACTiOn
T€
PLN 119,562 2,300 121,862 1,566 -422 CZK 52,234 0 52,234 116 -60 Others 89,998 0 89,998 488 -634 Total 261,794 2,300 264,094 2,170 -1,116

170
As of 31 december 2011, the following hedging transactions existed for the underlying transactions mentioned below:
CuRREnCy
EXpECTEd CAsh FlOws 2012
T€
EXpECTEd CAsh FlOws 2013
T€
EXpECTEd CAsh FlOws TOTAl
T€
pOsiTivE mARKET vAluE OF ThE
hEdGinG TRAnsACTiOn
T€
nEGATivE mARKET vAluE OF ThE
hEdGinG TRAnsACTiOn
T€
PLN 72,225 0 72,225 0 -1,906 Others 39,876 0 39,876 65 -573 Total 112,101 0 112,101 65 -2,479
Of the derivative financial instruments classified as cash flow hedges as of 31 December 2011, T€ 1,907 were shifted from equity and recognised in the consolidated income statement in the 2012 financial year (previous year: T€ 3,454). The resulting deferred tax expense amounted to T€ -362 (previous year: tax expense of T€ -656).
The other liabilities contain a foreign currency derivative in the amount of T€ 0 (previous year: T€ 7,122).
Development of the important currencies in the group:
CuRREnCyEXChAnGE RATE
31.12.2012: 1 € =AvERAGE RATE
2012: 1 € =EXChAnGE RATE
31.12.2011: 1 € =AvERAGE RATE
2011: 1 € =
HUF 292.3000 288.2142 314.5800 280.6692CZK 25.1510 25.1395 25.7870 24.5996PLN 4.0740 4.1677 4.4580 4.1380HRK 7.5575 7.5261 7.5370 7.4492CHF 1.2072 1.2044 1.2318 1.2156
Essentially, the Polish zloty, the Czech crown, the Hungarian forint and the Swedish crown are affected by revaluation (devaluation). A 10 % revaluation of the euro over all other currencies at 31 December 2012 would mean an increase in equity by T€ 8,564 (previous year: increase by T€ 12,266) and an increase in profit before tax by T€ 8,794 (previous year: increase by T€ 12,266). A devaluation compared to all other currencies would result in a corresponding decrease in equity (previous year: decrease) and a decrease of profit before tax.
The calculation is based on original and derivative foreign currency holdings in non-functional currency as of 31 December as well as underlying transactions for the next twelve months. The effect on tax resulting from changes in currency exchanges rates was not taken into consideration.
cReDit RisK
The maximum risk of default of the financial assets, without cash and cash equivalents, on the balance sheet date is T€ 4,238,457 (previous year: T€ 4,425,721) and corresponds to the book values presented in the balance sheet. Thereof T€ 2,626,895 (previous year: T€ 2,703,820) involve trade receivables. Receivables from construction contracts related to consortia involve on-going construction projects and are therefore not yet payable for the most part. Of the remaining trade receivables in the amount of T€ 1,383,933 (previous year: T€ 1,339,630), less than 1 % are overdue and not impaired.
The risk for receivables from clients can be rated as low due to the wide dispersion, a constant creditworthiness check and the presence of the public sector as an important employer.
The risk of default for other primary financial instruments shown on the assets side can also be regarded as low, as the contract partners are mainly financial institutions with the highest level of creditworthiness and/or the risk of default has been significantly reduced as a result of assumed liabilities of third parties.
Furthermore, there is a derived credit risk arising from the financial guarantee contracts (guarantees issued) of T€ 56,019 (previous year: T€ 45,541).
Financial assets are impaired item by item if the book value of the financial assets is higher than the present value of the future cash flows. This can be triggered by financial difficulties, insolvency of the client, breach of contract or significant default of payment. The impairment is composed of many individual items of which none, seen alone, is significant. In addition to the estimation of the creditworthiness risk, the relevant country risk is also taken into consideration. Graduated valuation adjustments are formed according to risk groups to take into consideration general credit risks.
LiQUiDitY RisK
Liquidity for the STRAbAG SE Group means not only solvency in the strict sense but also the availability of the necessary financial margin for mainstay business through sufficient aval lines.
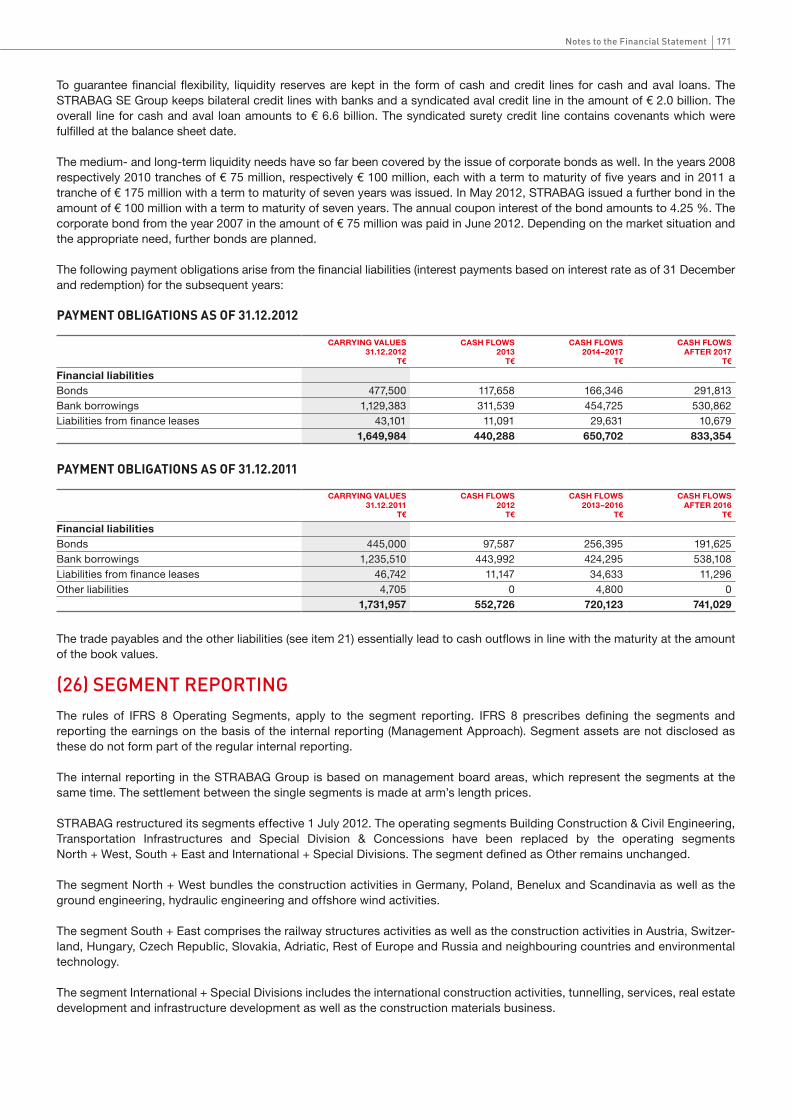
170 171notes to the financial Statement
To guarantee financial flexibility, liquidity reserves are kept in the form of cash and credit lines for cash and aval loans. The STRAbAG SE Group keeps bilateral credit lines with banks and a syndicated aval credit line in the amount of € 2.0 billion. The overall line for cash and aval loan amounts to € 6.6 billion. The syndicated surety credit line contains covenants which were fulfilled at the balance sheet date.
The medium- and long-term liquidity needs have so far been covered by the issue of corporate bonds as well. In the years 2008 respectively 2010 tranches of € 75 million, respectively € 100 million, each with a term to maturity of five years and in 2011 a tranche of € 175 million with a term to maturity of seven years was issued. In May 2012, STRAbAG issued a further bond in the amount of € 100 million with a term to maturity of seven years. The annual coupon interest of the bond amounts to 4.25 %. The corporate bond from the year 2007 in the amount of € 75 million was paid in June 2012. Depending on the market situation and the appropriate need, further bonds are planned. The following payment obligations arise from the financial liabilities (interest payments based on interest rate as of 31 December and redemption) for the subsequent years:
pAYMent oBLiGAtions As oF 31.12.2012
CARRyinG vAluEs31.12.2012
T€
CAsh FlOws2013
T€
CAsh FlOws2014–2017
T€
CAsh FlOwsAFTER 2017
T€
Financial liabilities bonds 477,500 117,658 166,346 291,813bank borrowings 1,129,383 311,539 454,725 530,862Liabilities from finance leases 43,101 11,091 29,631 10,679 1,649,984 440,288 650,702 833,354
CARRyinG vAluEs31.12.2011
T€
CAsh FlOws2012
T€
CAsh FlOws2013–2016
T€
CAsh FlOwsAFTER 2016
T€
Financial liabilities bonds 445,000 97,587 256,395 191,625bank borrowings 1,235,510 443,992 424,295 538,108Liabilities from finance leases 46,742 11,147 34,633 11,296Other liabilities 4,705 0 4,800 0 1,731,957 552,726 720,123 741,029
pAYMent oBLiGAtions As oF 31.12.2011
The trade payables and the other liabilities (see item 21) essentially lead to cash outflows in line with the maturity at the amount of the book values.
(26) SEGmEnt REpORtinGThe rules of IFRS 8 Operating Segments, apply to the segment reporting. IFRS 8 prescribes defining the segments and reporting the earnings on the basis of the internal reporting (Management Approach). Segment assets are not disclosed as these do not form part of the regular internal reporting.
The internal reporting in the STRAbAG Group is based on management board areas, which represent the segments at the same time. The settlement between the single segments is made at arm’s length prices.
STRAbAG restructured its segments effective 1 July 2012. The operating segments building Construction & Civil Engineering, Transportation Infrastructures and Special Division & Concessions have been replaced by the operating segments North + West, South + East and International + Special Divisions. The segment defined as Other remains unchanged.
The segment North + West bundles the construction activities in Germany, Poland, benelux and Scandinavia as well as the ground engineering, hydraulic engineering and offshore wind activities.
The segment South + East comprises the railway structures activities as well as the construction activities in Austria, Switzer-land, Hungary, Czech Republic, Slovakia, Adriatic, Rest of Europe and Russia and neighbouring countries and environmental technology. The segment International + Special Divisions includes the international construction activities, tunnelling, services, real estate development and infrastructure development as well as the construction materials business.
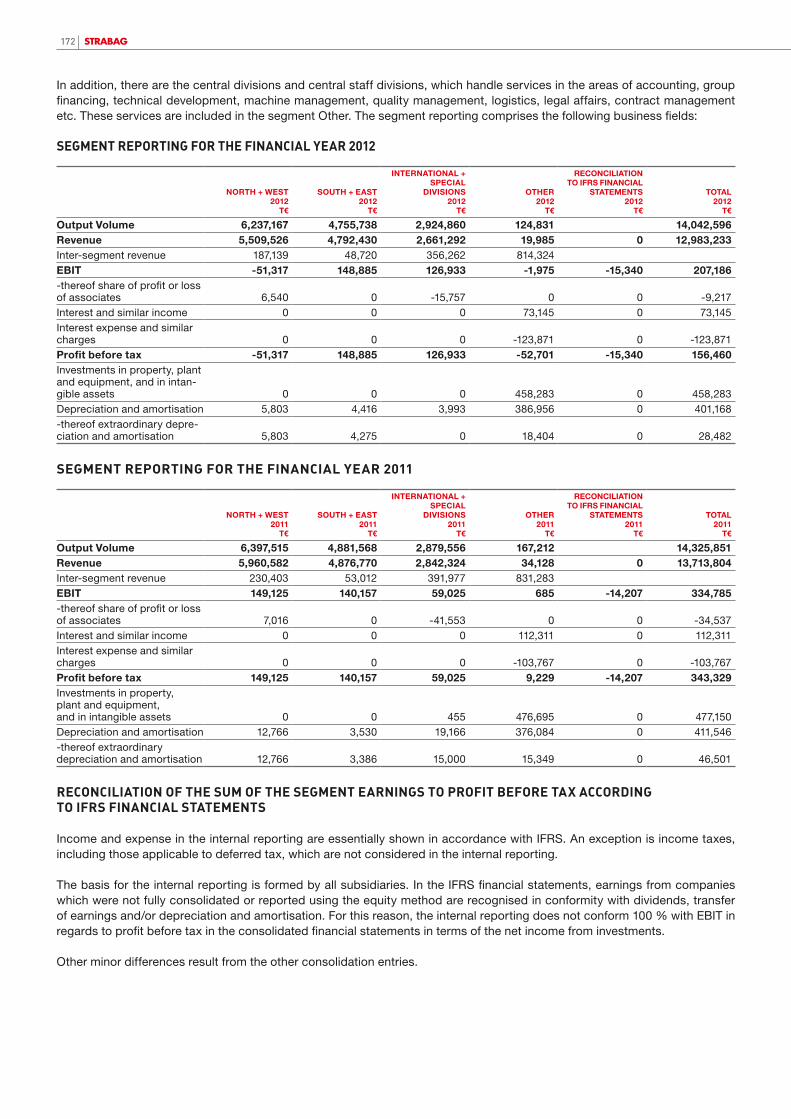
172
In addition, there are the central divisions and central staff divisions, which handle services in the areas of accounting, group financing, technical development, machine management, quality management, logistics, legal affairs, contract management etc. These services are included in the segment Other. The segment reporting comprises the following business fields:
seGMent RepoRtinG FoR tHe FinAnciAL YeAR 2012
nORTh + wEsT2012
T€
sOuTh + EAsT2012
T€
inTERnATiOnAl + spECiAl
divisiOns2012
T€
OThER2012
T€
RECOnCiliATiOn TO iFRs FinAnCiAl
sTATEmEnTs2012
T€
TOTAl2012
T€
Output volume 6,237,167 4,755,738 2,924,860 124,831 14,042,596Revenue 5,509,526 4,792,430 2,661,292 19,985 0 12,983,233Inter-segment revenue 187,139 48,720 356,262 814,324 EBiT -51,317 148,885 126,933 -1,975 -15,340 207,186-thereof share of profit or loss of associates 6,540 0 -15,757 0 0 -9,217 Interest and similar income 0 0 0 73,145 0 73,145Interest expense and similar charges 0 0 0 -123,871 0 -123,871 profit before tax -51,317 148,885 126,933 -52,701 -15,340 156,460Investments in property, plant and equipment, and in intan-gible assets 0 0 0 458,283 0 458,283Depreciation and amortisation 5,803 4,416 3,993 386,956 0 401,168-thereof extraordinary depre-ciation and amortisation 5,803 4,275 0 18,404 0 28,482
seGMent RepoRtinG FoR tHe FinAnciAL YeAR 2011
nORTh + wEsT2011
T€
sOuTh + EAsT2011
T€
inTERnATiOnAl + spECiAl
divisiOns2011
T€
OThER2011
T€
RECOnCiliATiOn TO iFRs FinAnCiAl
sTATEmEnTs2011
T€
TOTAl2011
T€
Output volume 6,397,515 4,881,568 2,879,556 167,212 14,325,851Revenue 5,960,582 4,876,770 2,842,324 34,128 0 13,713,804Inter-segment revenue 230,403 53,012 391,977 831,283 EBiT 149,125 140,157 59,025 685 -14,207 334,785-thereof share of profit or loss of associates 7,016 0 -41,553 0 0 -34,537 Interest and similar income 0 0 0 112,311 0 112,311Interest expense and similar charges 0 0 0 -103,767 0 -103,767 profit before tax 149,125 140,157 59,025 9,229 -14,207 343,329Investments in property, plant and equipment, and in intangible assets 0 0 455 476,695 0 477,150Depreciation and amortisation 12,766 3,530 19,166 376,084 0 411,546-thereof extraordinary depreciation and amortisation 12,766 3,386 15,000 15,349 0 46,501
ReconciLiAtion oF tHe sUM oF tHe seGMent eARninGs to pRoFit BeFoRe tAX AccoRDinG to iFRs FinAnciAL stAteMents
Income and expense in the internal reporting are essentially shown in accordance with IFRS. An exception is income taxes, including those applicable to deferred tax, which are not considered in the internal reporting.
The basis for the internal reporting is formed by all subsidiaries. In the IFRS financial statements, earnings from companies which were not fully consolidated or reported using the equity method are recognised in conformity with dividends, transfer of earnings and/or depreciation and amortisation. For this reason, the internal reporting does not conform 100 % with EbIT in regards to profit before tax in the consolidated financial statements in terms of the net income from investments.
Other minor differences result from the other consolidation entries.

172 173notes to the financial Statement
Reconciliation of the internal reporting to iFRs Financial statements is allocated as follows:
2012T€
2011T€
Net income from investments -8,700 -12,084 Other consolidations -6,640 -2,123 Total -15,340 -14,207
BReAKDown oF RevenUe BY GeoGRApHic ReGion
2012T€
2011T€
Germany 5,686,722 5,665,813Austria 2,278,299 2,254,189Rest of Europe 4,463,875 5,256,352Rest of World 554,337 537,450Total 12,983,233 13,713,804
Presentation of revenue by region is done according to the company’s registered place of business.
(27) nOtES On RElatEd paRtiESThe core shareholders of STRAbAG SE are the Haselsteiner Group, as well as the Raiffeisen-Holding NÖ-Wien Group, the UNIQA Group and Rasperia Trading Limited, owned by Russian businessman Oleg Deripaska.
The core shareholder Rasperia Trading Limited holds one registered share. The company sold its previous interest of 25 % to the other core shareholders. Until 31 December 2012, Rasperia bought back 17.6 % of the shares and the option to purchase the remaining 7.4 % runs until July 2014. The syndicate agreement remains unchanged, with Rasperia remaining part of the syndicate.
Arm’s-length finance and insurance transactions exist with the Raiffeisen Holding NÖ-Wien Group and the UNIQA Group.
Basic Element
The basic Element Group, a group with numerous industrial holdings, among other things in the area of construction, raw ma-terials and infrastructure, is owned by Russian businessman Oleg Deripaska. A cooperating agreement lays out the principles for joint operating cooperation in Russia and the CIS states between the STRAbAG SE Group and the basic Element Group.
Russian construction company Glavstroy Corporation, a member of the basic Element Group, commissioned STRAbAG to build the Olympic village in Sochi, Russia. The order includes the construction of residences and hotels ahead of the 2014 Winter Olympics and has a value of about € 278 million. The contract was signed in 2010. The construction works began in 2011 and are scheduled for completion in 2013. by 31 December 2012, services amounting to € 141 million had been provided and payments of € 185 million received.
To consolidate and expand the business in Russia, STRAbAG made in 2010 an advance payment secured by a bank guarantee, of € 70 million for a 26 % stake in the leading Russian road construction company Transstroy, part of the diversified industrial holding basic Element. STRAbAG will take the time for a thorough due diligence of Transstroy, which posted revenues of RUb 39 billion in 2009, before the parties agree on a transaction and on the final purchase price. The advance payment is reported under other financial assets. idAG
IDAG Immobilienbeteiligung u. -Development GmbH is entirely held by private foundations whose beneficiaries are the Haselsteiner Group and the Raiffeisen-Holding NÖ-Wien Group. It is the business purpose of IDAG Immobilienbeteiligung u. -Development GmbH to develop property and to participate in property projects.
STRAbAG’s office buildings in Vienna and Graz are held in the real estate portfolio of subsidiaries of IDAG Immobilien- beteiligung u. -Development GmbH. The buildings are let to and in part sublet by STRAbAG SE at the usual market conditions. Rental costs arising from both buildings in the 2012 financial year amounted to T€ 7,586 (previous year: T€ 7,512). Other services in the amount of T€ 762 (previous year: T€ 1,064) were obtained from the IDAG Group.

174174
Furthermore, revenues of about € 1.4 million (previous year: about € 1.2 million) were made with IDAG Immobilienbeteiligung u. -Development GmbH in the 2012 financial year. At the balance sheet date of 31 December 2012, the STRAbAG SE Group had receivables from rental deposits amounting to around € 20.9 million (previous year: € 20.0 million) from IDAG Immobilien-beteiligung u. -Development GmbH.
AssociAtes
In September 2003, Raiffeisen evolution project development GmbH, a joint project development company, was founded together with R.b.T. beteiligungsgesellschaft m.b.H, “URUbU” Holding GmbH (both Raiffeisen group) and UNIQA beteiligungs-Holding GmbH.
Raiffeisen evolution project development GmbH bundles project developments in building construction activities of the share-holders (excluding Germany and benelux). STRAbAG SE is employed in the construction work on the basis of arm’s-length contracts. In 2012 revenues of about € 122.2 million (previous year: € 42.3 million) were made.
The shareholders of the Raiffeisen evolution project development GmbH have basically agreed to proportionally accept any obligations arising from the project developments.
Lafarge Cement CE Holding bundles the cement activities of Lafarge, a market leader in construction materials manufacturing, and STRAbAG in the countries of Central and Eastern Europe. The joint activities aim at maintaining a commensurate cement supply in the group’s core countries. In 2012, STRAbAG procured cement services worth about € 16.9 million (previous year: € 6 million) from Lafarge. Per balance sheet date, there were liabilities to Lafarge Cement CE Holding GmbH in the amount of € 0.3 milllion (previous year: € 0.5 million).
The business transactions with the other associates can be presented as follows:
2012T€
20111)
T€
Work and services performed 81,494 14,380Work and services received 33,683 33,789Receivables as of 31.12. 12,707 11,020Liabilities as of 31.12. 41 2
The business transactions with the management board members and the first management level (management in key positions) and with their family members and companies which are controlled by the management in key positions or decisively influenced by them are represented as follows:
2012T€
2011T€
Work and services performed 28,973 23,472Work and services received 10,540 5,050Receivables as of 31.12. 22,167 16,118Liabilities as of 31.12. 963 42
The total remuneration including any severance and pension payments for the first management level amounted to T€ 17,939 (previous year: T€ 19,629) in the year under report. Of this amount, T€ 17,630 (previous year: T€ 19,273) is attributable to the current remuneration and T€ 309 (previous year: T€ 355) to severance and pension payments.
1) The previous year’s figures were adjusted accordingly for better comparability.
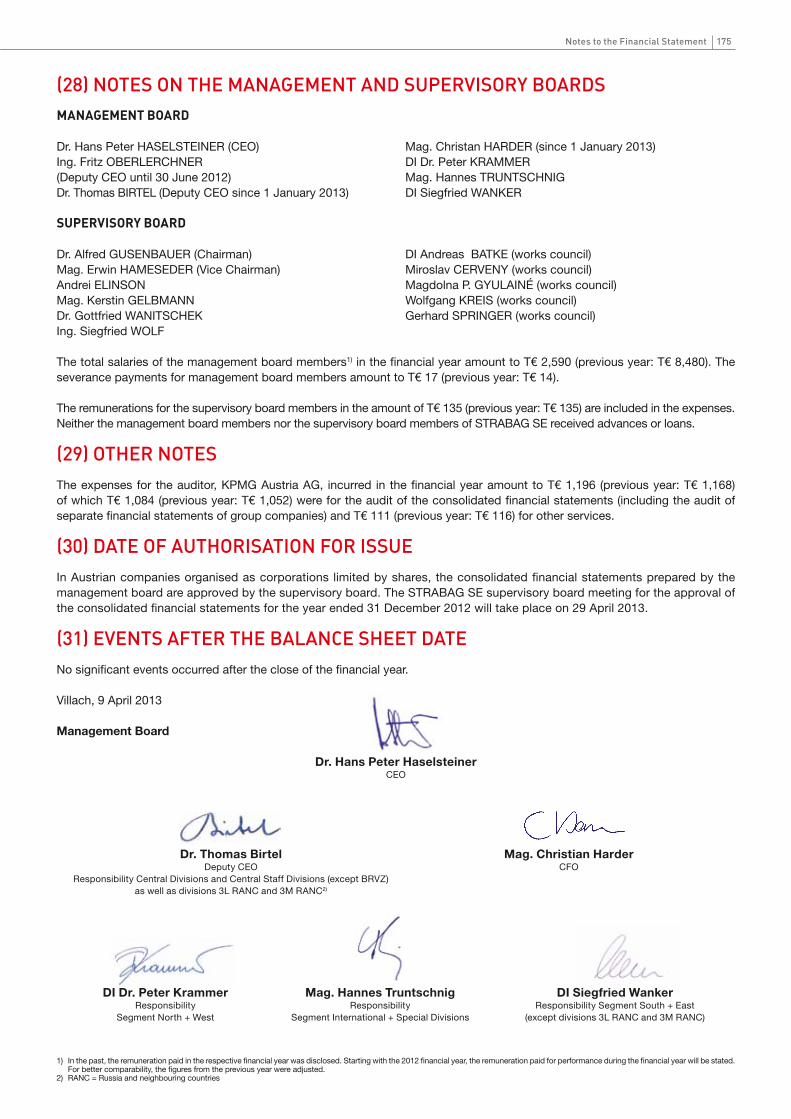
175notes to the financial Statement
(28) nOtES On thE manaGEmEnt and SupERViSORY BOaRdSMAnAGeMent BoARD
sUpeRvisoRY BoARD
The total salaries of the management board members1) in the financial year amount to T€ 2,590 (previous year: T€ 8,480). The severance payments for management board members amount to T€ 17 (previous year: T€ 14).
The remunerations for the supervisory board members in the amount of T€ 135 (previous year: T€ 135) are included in the expenses. Neither the management board members nor the supervisory board members of STRAbAG SE received advances or loans.
The expenses for the auditor, KPMG Austria AG, incurred in the financial year amount to T€ 1,196 (previous year: T€ 1,168) of which T€ 1,084 (previous year: T€ 1,052) were for the audit of the consolidated financial statements (including the audit of separate financial statements of group companies) and T€ 111 (previous year: T€ 116) for other services.
(29) OthER nOtES
In Austrian companies organised as corporations limited by shares, the consolidated financial statements prepared by the management board are approved by the supervisory board. The STRAbAG SE supervisory board meeting for the approval of the consolidated financial statements for the year ended 31 December 2012 will take place on 29 April 2013.
(30) datE Of authORiSatiOn fOR iSSuE
No significant events occurred after the close of the financial year.
(31) EVEntS aftER thE BalancE ShEEt datE
Villach, 9 April 2013
management Board
di siegfried wankerResponsibility Segment South + East
(except divisions 3L RANC and 3M RANC)
dr. hans peter haselsteinerCEO
di dr. peter KrammerResponsibility
Segment North + West
mag. Christian harderCFO
dr. Thomas BirtelDeputy CEO
Responsibility Central Divisions and Central Staff Divisions (except bRVZ) as well as divisions 3L RANC and 3M RANC2)
Dr. Alfred GUSENbAUER (Chairman)Mag. Erwin HAMESEDER (Vice Chairman) Andrei ELINSONMag. Kerstin GELbMANNDr. Gottfried WANITSCHEKIng. Siegfried WOLF
DI Andreas bATKE (works council)Miroslav CERVENY (works council)Magdolna P. GYULAINÉ (works council)Wolfgang KREIS (works council)Gerhard SPRINGER (works council)
mag. hannes TruntschnigResponsibility
Segment International + Special Divisions
1) In the past, the remuneration paid in the respective financial year was disclosed. Starting with the 2012 financial year, the remuneration paid for performance during the financial year will be stated. For better comparability, the figures from the previous year were adjusted.2) RANC = Russia and neighbouring countries
Dr. Hans Peter HASELSTEINER (CEO)Ing. Fritz ObERLERCHNER (Deputy CEO until 30 June 2012)Dr. Thomas bIRTEL (Deputy CEO since 1 January 2013)
Mag. Christan HARDER (since 1 January 2013)DI Dr. Peter KRAMMER Mag. Hannes TRUNTSCHNIG DI Siegfried WANKER

stAteMent oF ALL LeGAL RepResentAtives
We confirm to the best of our knowledge that the consolidated financial statements give a true and fair view of the assets, liabilities, financial position and profit or loss of the group as required by the applicable accounting standards and that the group management report gives a true and fair view of the development and performance of the business and the position of the group, together with a description of the principal risks and uncertain-ties the group faces.
We confirm to the best of our knowledge that the separate financial statements1) give a true and fair view of the assets, liabilities, financial position and profit or loss of the parent company as required by the applicable accounting standards and that the management report gives a true and fair view of the development and performance of the business and the position of the company, together with a description of the principal risks and uncer-tainties the company faces.
Villach, 9 April 2013
management Board
dr. hans peter haselsteinerCEO
dr. Thomas BirtelDeputy CEO
Responsibility Internal Service Units and region RANC2)
mag. Christian harderCFO
di siegfried wankerResponsibility Segment South + East
(except divisions 3L RANC and 3M RANC)
di dr. peter KrammerResponsibility Segment North + West
mag. hannes TruntschnigResponsibility Segment
International + Special Divisions
1) The annual financial statements are included in the annual financial report.2) RANC = Russia and neighbouring countries
176

177notes to the financial Statement
We have audited the accompanying consolidated financial statements of
sTRABAG sE,villach,
for the year from 1 January to 31 December 2012. These consolidated financial statements comprise the consolidated balance sheet as of 31 December 2012, the consolidated in-come statement/consolidated statement of comprehensive income, the consolidated cash flow statement and the consolidated statement of changes in equity for the year ended 31 December 2012 and a summary of significant accounting policies and other explanatory notes.
MAnAGeMent‘s ResponsiBiLitY FoR tHe consoLiDAteD FinAnciAL stAteMents AnD FoR tHe AccoUntinG sYsteM
The Company’s management is responsible for the group accounting system and for the preparation and fair presentation of these consolidated financial statements in accordance with International Financial Reporting Standards (IFRSs) as adopted by the EU. This responsibility includes: designing, implementing and maintaining internal control relevant to the preparation and fair presentation of the consolidated financial statements that are free from material misstate-ment, whether due to fraud or error; selecting and applying appropriate accounting policies; and making accounting estimates that are reasonable in the circumstances.
AUDitoR‘s ResponsiBiLitY AnD DescRiption oF tYpe AnD scope oF tHe stAtUtoRY AUDit
Our responsibility is to express an opinion on these consolidated financial statements based on our audit. We conducted our audit in accordance with laws and regulations applicable in Austria and Austrian Standards on Auditing, as well as in accordance with International Standards on Auditing, issued by the International Auditing and Assurance Standards board (IAASb) of the International Federation of Accountants (IFAC). Those standards require that we comply with professional guidelines and that we plan and perform the audit to obtain reasonable assurance about whether the consolidated financial statements are free from material misstatement. An audit involves performing procedures to obtain audit evidence about the amounts and disclosures in the consolidated financial statements. The procedures selected depend on the auditor‘s judgment, including the assessment of the risks of material misstatement of the consolidated financial statements, whether due to fraud or error. In making those risk assessments, the auditor considers internal control relevant to the Group’s preparation and fair presentation of the consolidated financial statements in order to design audit procedures that are appropriate in the circumstances, but not for the purpose of expressing an opinion on the effectiveness of the Group’s internal control. An audit also includes evaluating the appropriateness of accounting policies used and the reasonableness of accounting estimates made by management, as well as evaluating the overall presentation of the consolidated financial statements.
We believe that the audit evidence we have obtained is sufficient and appropriate to provide a basis for our audit opinion.
AUDitoR’s RepoRtREpORt On thE cOnSOlidatEd financial StatEmEntS

178178
opinion
Our audit did not give rise to any objections. In our opinion, which is based on the results of our audit, the consolidated financial statements comply with legal requirements and give a true and fair view of the financial position of the Group as of 31 December 2012 and of its financial performance and its cash flows for the year from 1 January to 31 December 2012 in accordance with International Financial Reporting Standards (IFRSs) as adopted by the EU.
RepoRt on tHe MAnAGeMent RepoRt FoR tHe GRoUp
Pursuant to statutory provisions, the management report for the Group is to be audited as to whether it is consistent with the consolidated financial statements and as to whether the other disclosures are not misleading with respect to the Company’s position. The auditor’s report also has to contain a statement as to whether the management report for the Group is consistent with the consolidated financial statements and whether the disclosures pursuant to Section 243a UGb (Austrian Commercial Code) are appropriate.
In our opinion, the management report for the Group is consistent with the consolidated financial statements. The disclosures pursuant to Section 243a UGb (Austrian Commercial Code) are appropriate.
Linz, 9 April 2013
KPMG Austria AGWirtschaftsprüfungs- und Steuerberatungsgesellschaft
This report is a translation of the original report in German, which is solely valid.
Publication of the financial statements together with our auditor‘s opinion may only be made if the financial statements and the management report are identical with the audited version attached to this report. Section 281 paragraph 2 UGb (Austrian Commercial Code) applies.
Dr. Helge LöfflerAustrian Chartered Accountants
Mag. Peter HumerAustrian Chartered Accountants
178 179178 glossary
GlOSSaRYat-equity consolidation Method of consolidation of companies in which STRAbAG has a stake between 20 % and 50 %
ATX (Austrian Traded Index) The index of leading shares of the Vienna Stock Exchange (Wiener börse)
book value per share book value of equity/number of outstanding shares
bS OHSAS Standard for occupational health and safety management systems
CAGR(Compound Annual Growth Rate) Mean growth rate on an annualised basis
CAPEX(Capital Expenditure)
Investments; Acquisition of financial assets + acquisition of intangible assets as well as property, plant and equipment + changes to the scope of consolidation
Capital Employed Total of group equity + interest-bearing debts
Carbon footprint Measure of carbon emissions caused by an activity
Cash flowA measure of cash being received and spent in a business. The cash flow amount is largely calculated as the sum of net income, taxes on profits and income, depreciation, amortisation and changes to non-current provisions.
CEE Central and Eastern Europe
CO2 Carbon dioxide (greenhouse gas)
Code of Ethics Values and principles which reflect the company’s policy and which are met by employees and management
Compliance Guidelines Recognition of the importance of and compliance with all relevant laws as well as with internal and external rules, guidelines and standards
Corporate Governance A code of conduct for publicly listed companies. Corporate governance comprises all guidelines which maxi-mise transparency and control in order to avoid conflicts of interest.
Corporate Social Responsibility (CSR) Voluntary compliance with a set of rules for sustainable corporate management
Cost-plus-fee Contract model under which the client pays the contractor a previously agreed percentage of the costs of the project as a fee
Directors‘ Dealings Transactions with company securities by company directors or officers
Earnings per share Net income after non-controlling interests/weighted average number of shares
EbIT Net income before interests and income tax expense
EbIT Margin The ratio of EbIT to revenue in percent
EbITDA Net income before interests and income tax expense, depreciation and amortisation
EbITDA-Margin The ratio of EbITDA to revenue in percent
Equity ratio book value of equity/balance sheet total
Four-eyes principle Principle according to which an activity is carried out and monitored by different persons
Gearing Ratio Net debt/group equity capital
Hard toll A form of toll collection in which the fee is collected directly from the user
IFRS Financial reporting standards and interpretations adopted by the International Accounting Standards board (IASb)
IMF International Monetary Fund
ISO 14001 International standard for environmental management systems
ISO 50001 International standard designed to help organisations establish energy management systems
Joint Venture A contractual agreement joining together two or more parties for the purpose of executing a particular busi-ness enterprise
Millipede principle Principle forming an integral part of STRAbAG’s strategy: broad diversification over many geographic regions and construction segments
Net Debt Financial liabilities – non-recourse debt + severance and pension provisions – cash and cash equivalents
öCGK Austrian Corporate Governance Codex
Order backlog Future revenues from contracts signed to a specific date, less works already accomplished
Payout ratio Dividends/net income per share
PPP(Public-Private Partnerships)
Project which is funded and operated through a partnership of private-sector companies and public-sector institutions
RANC Russia and neighbouring countries
Risk management An approach to recognise potential risks to the company and develop strategies to manage these risks
ROCE (Return on Capital Employed) Net income + interest on debt – interest tax shield (25 %)/(average group equity + interest-bearing debt)
SCC (Safety Certificate Contractors) Combined occupational safety and environmental protection management system for contractors
Shadow toll Payment of a fee by the public partner in a public-private partnership directly to the operator for the use of a road based on the number of users
SKAO (Stichting Klimaatvriendelijk Aanbe-steden en Onderneme) Dutch foundation for climate-friendly procurement and business
Sustainability The balance between reaching business objectives while respecting social and environmental aspects
Value chain The individual steps and actions required to create a product or deliver a service
WbI Vienna Stock Exchange Share Index, made up of all companies listed on the Vienna Stock Exchange
WTO World Trade Organisation

180
FinAnciAL cALenDAR
Full-year results 2012 30 April 2013Publication 7:30 amFinancial press conference 10:00 amInvestor and analyst telephone conference 2:00 pm
interim Report january–march 2013 29 may 2013Publication 7:30 amInvestor and analyst telephone conference 2:00 pm
Notice of Annual General Meeting 15 May 2013Shareholding confirmation record date 4 June 2013Annual General meeting 2013 14 june 2013beginning 10:00 amLocation: Austria Center Vienna, 1220 ViennaEx-dividend date 21 june 2013payment date for dividend 24 june 2013
semi-annual Report 2013 30 August 2013Publication 7:30 amInvestor and analyst telephone conference 2:00 pm
interim Report january–september 2013 29 november 2013Publication 7:30 amInvestor and analyst telephone conference 2:00 pm
All times are CET/CESTPlease find the current road show schedule on the website www.strabag.com > Investor Relations > Company Calendar
FOR FURTHER QUESTIONS, PLEASE CONTACT OURINVESTOR RELATIONS DEPARTMENT:
STRABAG SE, Donau-City-Str. 9, 1220 Vienna/Austria +43 800 880890@ [email protected] www.strabag.com
This Annual Report is also available in German.In case of discrepancy the German version prevails.
the strabag groupAs one of Europe’s leading construction groups, and with approximately 74,000 employees, we ge-nerated an output volume of € 14.0 billion in the 2012 financial year. From our core markets of Austria and Germany, we are present via our numerous subsidiaries in all countries of Eastern and South-East Europe, in selected markets in Western Europe and on the Arabian Peninsula. The services span all areas of the construction industry and cover the entire construction value chain.
SEGMENT NORTH + WEST
2012€ Mln.
change 2011 – 2012
%2011
€ Mln.
Output volume 6,237 -3 % 6,397
Revenue 5,510 -8 % 5,961
Order backlog 4,827 -2 % 4,912
EBIT -51 n.a. 149
EBIT-margin % of revenue -0.9 % 2.5 %
Employees 25,108 -3 % 25,962
SEGMENT SOUTH + EAST
2012€ Mln.
change 2011 – 2012
%2011
€ Mln.
Output volume 4,756 -3 % 4,882
Revenue 4,792 -2 % 4,877
Order backlog 4,326 -7 % 4,647
EBIT 149 6 % 140
EBIT-margin % of revenue 3.1 % 2.9 %
Employees 22,699 -2 % 23,197
SEGMENT INTERNATIONAL + SPECIAL DIVISIONS
2012€ Mln.
change 2011 – 2012
%2011
€ Mln.
Output volume 2,925 2 % 2,880
Revenue 2,661 -6 % 2,842
Order backlog 4,038 7 % 3,782
EBIT 127 115 % 59
EBIT-margin % of revenue 4.8 % 2.1 %
Employees 20,426 -7 % 22,068
suCCess LIes IN the DetaILs.aNNuaL report 2012
AN
NU
AL
REP
OR
T 20
12

STRABAG SEInvestor RelationsDonau-City-Str. 91220 ViennaAustria
m Please add my e-mail adress to the Investor Relations Newsletter mailing list:
......................................................................
mPlease send me the Annual Reports in printed form.
mI no longer wish to receive the Annual Report in printed form.
My address: Name .............................................................. Address ............................................................ ...................................................................... www.strabag.com
✁
✁
OWNER, EDITOR AND PUbLISHERSTRaBag SeTriglavstr. 9, 9500 Villach/AustriaAustrian Commercial Register Number FN 88983 hDistrict Court Klagenfurt
CONTACTSTRaBag SeDiana Neumüller-Klein, CFACorporate Communications Donau-City-Str. 9, 1220 Vienna/Austria +43 1 22422@ [email protected] www.strabag.com
The Annual Report was prepared with the highest possible attention to detail. All information was verified.The possibility of rounding errors, printing errors or misprints, however, can not be completely excluded.The Annual Report contains information and forecasts related to the future development of STRABAG SE.These forecasts represent estimates made on the basis of all available information at the time of publication.Should the assumptions underlying the forecasts fail to appear, the actual results could deviate from the expectations.
Many of the projects contained in this financial report were carried out in consortia.We hereby extend a warm “thank you” to all our partners.
To facilitate reading and understanding, the masculine gender may be used at times in this report to apply equally to men and women without discrimination.
Creative support during the preparation of the Annual Report 2012: pkp BBDOCopy-editing: be.public Werbung Finanzkommunikation GmbHProducer: 08/16 printproduktion gmbh
Key fIgures 2008–2012 Key fIguresDEVELOPMENT OF THE MOST IMPORTANT kEy FIGURES
1) CAGR = Compound annual growth rate2) Central and Eastern Europe comprises the following countries: Bulgaria, Croatia, Czech Republic, Hungary, Poland, Romania, Russia and neighbouring countries, Serbia, Slovakia, Slovenia
■ Germany■ Austria■ CEE2)
■ Rest of Europa■ Rest of World
ORDER BACKLOG BY REGION
34 %
11 %24 %
20 %
11 %
■ Germany■ Austria■ CEE1)
■ Rest of Europa■ Rest of World
OUTPUT VOLUME BY REGION
41 %
13 %
27 %
13 %
6 %
2008 2010 2011
OUTPUT VOLUME DEVELOPMENT 2008–2012
2012
13.7
4
13.0
2
12.7
8 14.3
3
€ 15 bn.
€ 10 bn.
€ 5 bn.
02009
14.0
4
CAGR = 1 %
2008 2010 2011
EBIT DEVELOPMENT 2008–2012
2012
269.
87
282.
85
298.
95
334.
78
€ 800 mln.
€ 600 mln.
€ 400 mln.
€ 200 mln.
02009
207.
19
CAGR = -6 %
2008 2010 2011
ORDER BACKLOG DEVELOPMENT 2008–2012
2012
13.2
5
13.9
7
14.7
4
13.3
5
€ 15 bn.
€ 10 bn.
€ 5 bn.
02009
13.2
0
CAGR = 0 %
2008 2010 2011
EBITDA DEVELOPMENT 2008–2012
2012
647.
73 684.
25
734.
69
746.
33
€ 800 mln.
€ 600 mln.
€ 400 mln.
€ 200 mln.
02009
608.
35
CAGR1) = -2 %
■ North + West■ South + East■ International + Special Divisions
ORDER BACKLOG BY SEGMENT
36 %
33 %
31 %
■ North + West■ South + East■ International + Special Divisions ■ Others
OUTPUT VOLUME BY SEGMENT
44 %
34 %
21 %
1 %
kEy FINANCIAL FIGURES€ Mln. 2012 2011 2010 2009 2008
Output volume 14,042.60 14,325.85 12,777.00 13,021.01 13,742.50
Revenue 12,983.23 13,713.80 12,381.54 12,551.93 12,277.80
Order backlog 13,202.66 13,354.00 14,738.74 13,967.57 13,253.80
Employees 74,010 76,866 73,600 75,548 73,008
kEy EARNINGS FIGURES€ Mln. 2012 2011 2010 2009 2008
EBITDA 608.35 746.33 734.69 684.25 647.73
EBITDA margin % of revenue 4.7 % 5.4 % 5.9 % 5.5 % 5.3 %
EBIT 207.19 334.78 298.95 282.85 269.87
EBIT margin % of revenue 1.6 % 2.4 % 2.4 % 2.3 % 2.2 %
Profit before taxes 156.46 343.33 279.27 262.96 229.26
Net income 110.04 239.29 188.38 184.61 166.36
Earnings per share in € 0.58 1.75 1.53 1.42 1.38
Dividend per share in € 0.20 0.60 0.55 0.50 0.55Cash-flow fromoperating activities 268.80 501.15 690.42 1.115.10 689.86
ROCE in % 4.0 % 6.3 % 5.4 % 5.7 % 5.3 %Investmentin fixes assets 458.28 477.15 553.84 508.73 876.80
kEy bALANCE SHEET FIGURES€ Mln. 2012 2011 2010 2009 2008
Equity 3,162.54 3,149.84 3,232.44 3,099.06 2,978.98
Equity Ratio % 31.2 % 30.3 % 31.1 % 32.2 % 30.5 %
Net Debt 154.55 -267.81 -669.04 -596.23 -109.66
Gearing Ratio % 4.9 % -8.5 % -20.7 % -19.2 % -3.7 %
Capital Employed 5,322.35 5,336.45 5,235.74 5,042.87 5,158.85
Balance Sheet Total 10,137.69 10,386.05 10,382.16 9,613.59 9,765.21
EBITDA = profit for the period before net interest income, income tax expense and depreciation and amortization EBIT = profit for the period before net interest income and income tax expense ROCE = (net income + interest on debt – interest tax shield (25 %)) / (average group equity + interest-bearing debt) Net Debt = financial liabilities less non-recourse debts + provisions for severance and pension obligations – cash and cash equivalents Gearing Ratio = Net Debt / Group Equity Capital Employed = group equity + interest-bearing debt