The Motivation Mega Autosomal STR Kits Yfiler Plus Profile
34
1 Massively Parallel Sequencing Enhances Forensic Genomics Applications Bruce Budowle Center for Human Identifications Department of Microbiology, Immunology, and Genetics, University of North Texas Health Science Center Fort Worth, Texas USA The Motivation Mega Autosomal STR Kits Yfiler Plus Profile
-
Upload
khangminh22 -
Category
Documents
-
view
0 -
download
0
Transcript of The Motivation Mega Autosomal STR Kits Yfiler Plus Profile

1
Massively Parallel Sequencing Enhances
Forensic Genomics Applications
Bruce BudowleCenter for Human Identifications
Department of Microbiology, Immunology, and Genetics,
University of North Texas Health Science Center
Fort Worth, Texas USA
The Motivation
Mega Autosomal STR Kits Yfiler Plus Profile
2
PowerPlex® Y23 System Mitochondrial DNA
D-loop
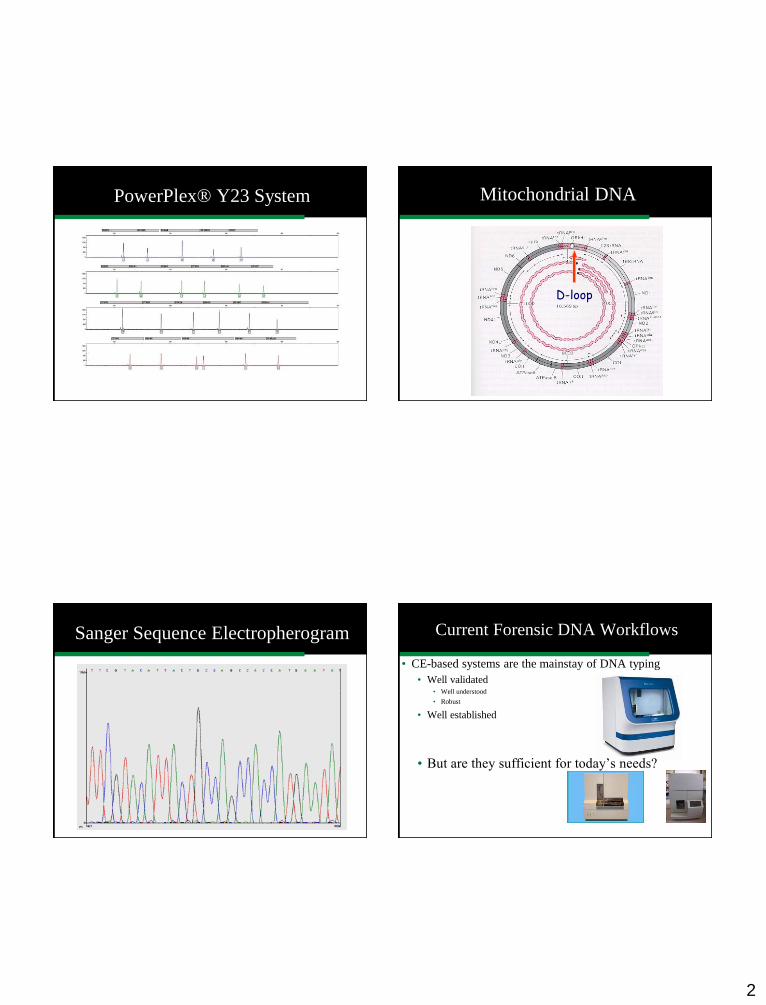
Sanger Sequence Electropherogram Current Forensic DNA Workflows
• CE-based systems are the mainstay of DNA typing
• Well validated• Well understood
• Robust
• Well established
• But are they sufficient for today’s needs?

3
Massively Parallel Sequencing Areas of Interest
• STRs
• Mitochondrial DNA
• HID SNPs
• Ancestry SNPs
• Phenotype SNPs
• Mixtures
• Pharmacogenetics
• Microbial Forensics
• …going to need a bigger boat
Image courtesy: geek.com
Generic MPS Workflow
Quantify DNA
Extract
DNA
Long
PCR
Fragment
PCR
Library Preparation
Template
Preparation
Sequence
Library Preparation
• Getting the DNA ready for sequencing
1. Genomic DNA (Nuclear/Mitochondrial)
2. Get the DNA to the right size
3. Add adapters, priming sites, and barcodes
4. Normalize and pool libraries
5. Cloning

4
Library Preparation
Adapters:
short pieces of DNA for DNA
fragment to attach to a solid
support for clonal amplification
Barcodes:
short pieces of DNA necessary for
identifying multiplexed samples
bioinformatically
Priming sites:
Short sequences for primers to
bind to initiate sequencing by
synthesis
Barcodes & Sequencing
Prime sites
Adapter
Adapter
Barcodes & Sequencing
Primer sites
Amplification of Library Fragments
• Bridge Amplification
• Emulsion PCR
Multiplexing/Demultiplexing
Barcoding/Index Sequences
Sample 1 Sample 2 Sample 3 Sample 4 Sample 5
Illumina MiSeqModified and by courtesy of Illumina and W Parson
PCR Nextera XT
Cluster Generation & Sequencing by SynthesisFlowcell
Illumina MiSeq Workflow
5
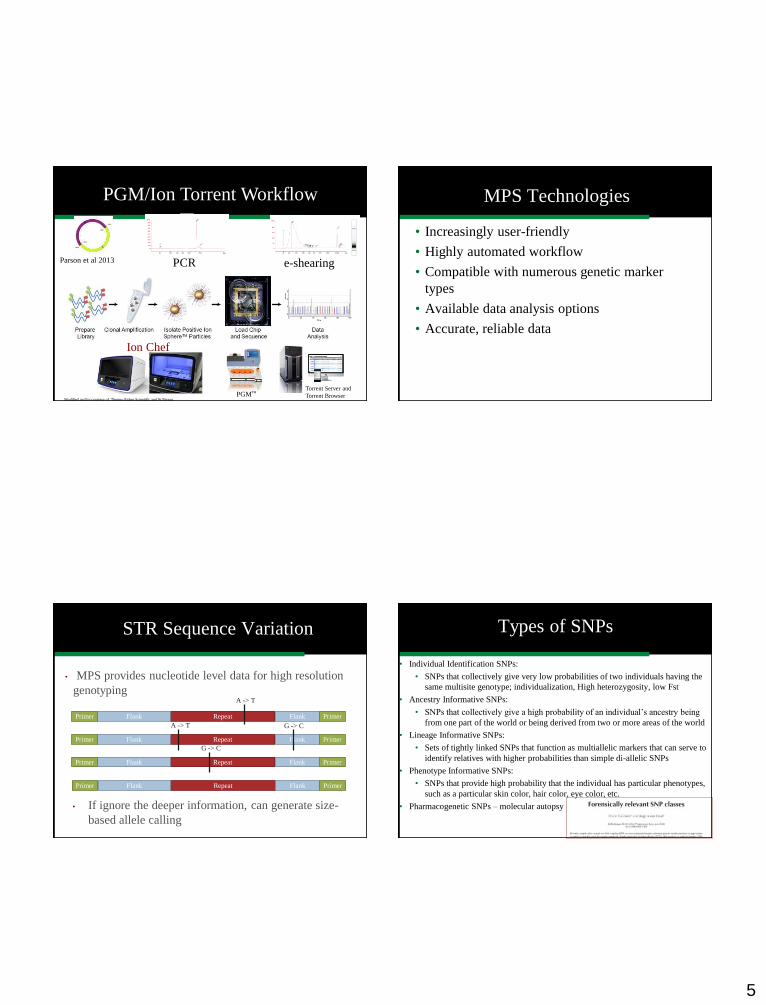
OneTouch 2™ OneTouch™ES PGM™Torrent Server and
Torrent Browser
PCR e-shearing
PGM/Ion Torrent Workflow
Parson et al 2013
Modified and by courtesy of Thermo Fisher Scientific and W Parson
Ion Chef
MPS Technologies
• Increasingly user-friendly
• Highly automated workflow
• Compatible with numerous genetic marker
types
• Available data analysis options
• Accurate, reliable data
STR Sequence Variation
• MPS provides nucleotide level data for high resolution
genotyping
RepeatFlank FlankPrimer Primer
RepeatFlank FlankPrimer Primer
RepeatFlank FlankPrimer Primer
RepeatFlank FlankPrimer Primer
A -> T
A -> T
G -> C
• If ignore the deeper information, can generate size-
based allele calling
G -> C
Types of SNPs
• Individual Identification SNPs:
• SNPs that collectively give very low probabilities of two individuals having the
same multisite genotype; individualization, High heterozygosity, low Fst
• Ancestry Informative SNPs:
• SNPs that collectively give a high probability of an individual’s ancestry being
from one part of the world or being derived from two or more areas of the world
• Lineage Informative SNPs:
• Sets of tightly linked SNPs that function as multiallelic markers that can serve to
identify relatives with higher probabilities than simple di-allelic SNPs
• Phenotype Informative SNPs:
• SNPs that provide high probability that the individual has particular phenotypes,
such as a particular skin color, hair color, eye color, etc.
• Pharmacogenetic SNPs – molecular autopsy
6
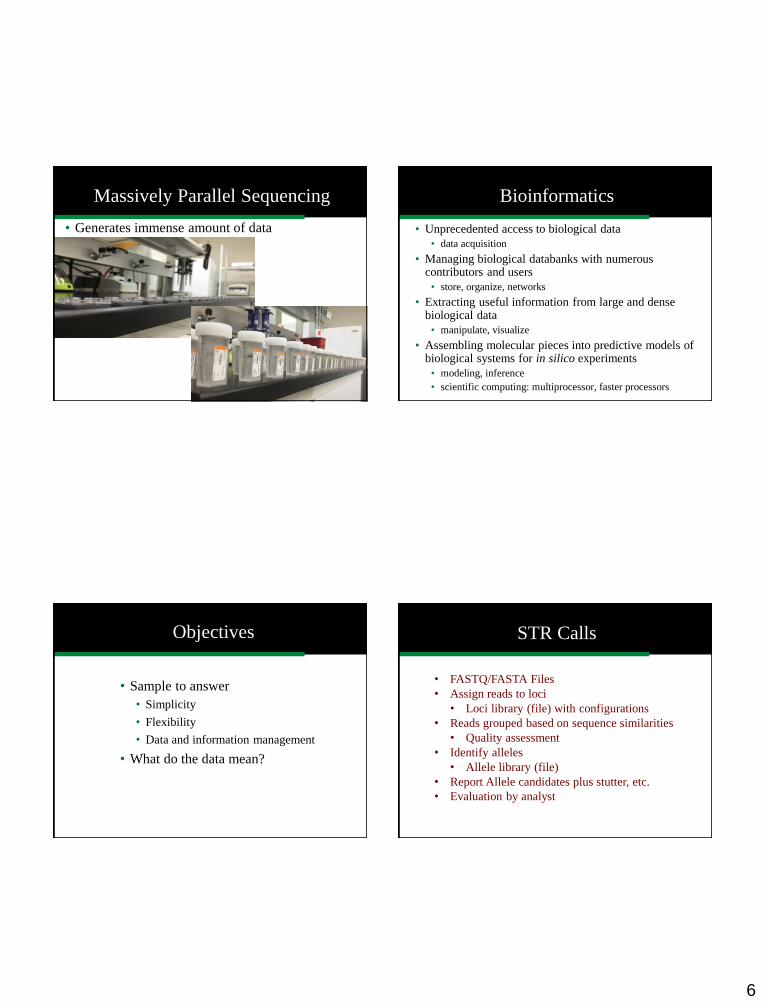
Massively Parallel Sequencing
• Generates immense amount of data
Bioinformatics
• Unprecedented access to biological data
• data acquisition
• Managing biological databanks with numerous contributors and users
• store, organize, networks
• Extracting useful information from large and dense biological data
• manipulate, visualize
• Assembling molecular pieces into predictive models of biological systems for in silico experiments
• modeling, inference
• scientific computing: multiprocessor, faster processors
• Sample to answer
• Simplicity
• Flexibility
• Data and information management
• What do the data mean?
Objectives STR Calls
• FASTQ/FASTA Files
• Assign reads to loci
• Loci library (file) with configurations
• Reads grouped based on sequence similarities
• Quality assessment
• Identify alleles
• Allele library (file)
• Report Allele candidates plus stutter, etc.
• Evaluation by analyst

7
Main Analysis Page of STR Genotyper(Ion Torrent)
Universal Analysis Software InterfaceSample Results Display: STRs and Identity SNPs
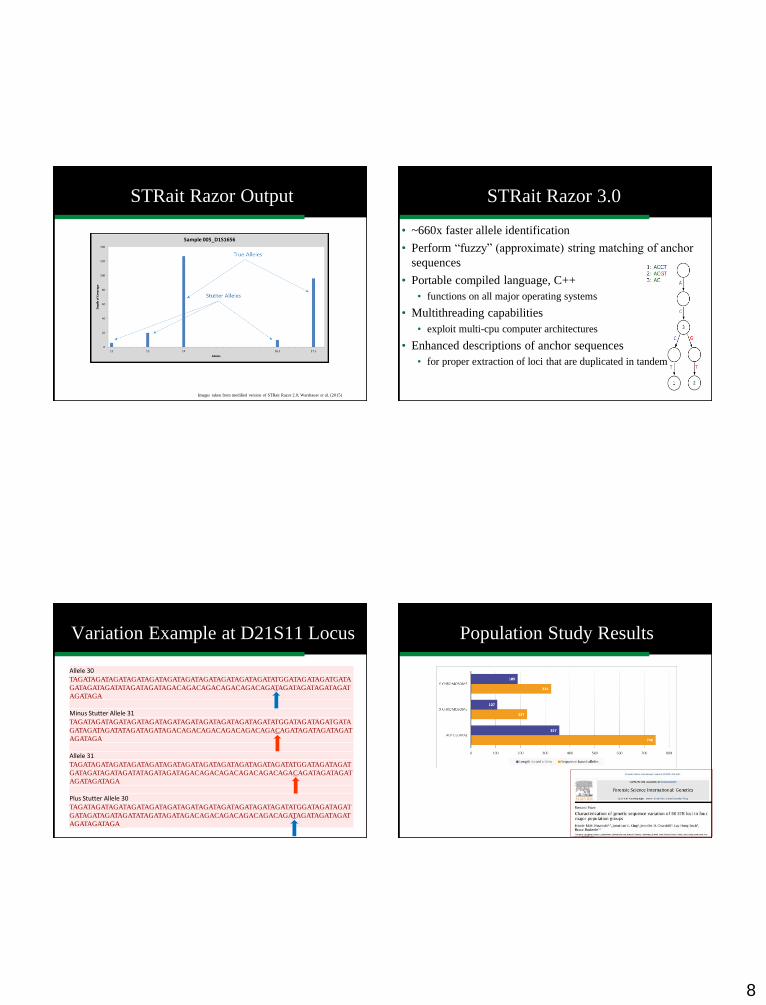
Our Efforts to Address Data Analyses STRait Razor Output
Sample 005, D1S1656 locus
Depth of
coverage: the
number of
times the
allele was
sequenced Raw Sequence Nominal allele: length-
based allele (based on
previous literature of
repeat region)
ISFG Allele Designation: the
recommended nomenclature
for sequence-based alleles for
all STR loci
Images taken from modified version of STRait Razor 2.0; Warshauer et al. (2015)
8
STRait Razor Output
Images taken from modified version of STRait Razor 2.0; Warshauer et al. (2015)
• ~660x faster allele identification
• Perform “fuzzy” (approximate) string matching of anchor
sequences
• Portable compiled language, C++
• functions on all major operating systems
• Multithreading capabilities
• exploit multi-cpu computer architectures
• Enhanced descriptions of anchor sequences
• for proper extraction of loci that are duplicated in tandem
STRait Razor 3.0
Allele 30TAGATAGATAGATAGATAGATAGATAGATAGATAGATAGATAGATATGGATAGATAGATGATA
GATAGATAGATATAGATAGATAGACAGACAGACAGACAGACAGATAGATAGATAGATAGAT
AGATAGA
Minus Stutter Allele 31TAGATAGATAGATAGATAGATAGATAGATAGATAGATAGATAGATATGGATAGATAGATGATA
GATAGATAGATATAGATAGATAGACAGACAGACAGACAGACAGACAGATAGATAGATAGAT
AGATAGA
Allele 31TAGATAGATAGATAGATAGATAGATAGATAGATAGATAGATAGATAGATATGGATAGATAGAT
GATAGATAGATAGATATAGATAGATAGACAGACAGACAGACAGACAGACAGATAGATAGAT
AGATAGATAGA
Plus Stutter Allele 30TAGATAGATAGATAGATAGATAGATAGATAGATAGATAGATAGATAGATATGGATAGATAGAT
GATAGATAGATAGATATAGATAGATAGACAGACAGACAGACAGACAGATAGATAGATAGAT
AGATAGATAGA
Variation Example at D21S11 Locus Population Study Results

9
D21S11 Example
[TCTA], [TCTG] Repeat Motif
D21S11 Example
[TCTA], [TCTG] Repeat Motif
Identifying Relationships
12,13 13,13
13,13
10,13
Sequence variants present within the D8S1179 alleles
[TCTA]2 [TCTG]1 [TCTA]9
[TCTA]2 [TCTG]1 [TCTA]10
[TCTA]13
[TCTA]1 [TCTG]1 [TCTA]11
[TCTA]2 [TCTG]1 [TCTA]10
[TCTA]1 [TCTG]1 [TCTA]11
[TCTA]10
[TCTA]1 [TCTG]1 [TCTA]11
12,13
13,13
13,13
10,13 0
1000
2000
3000
4000
5000
6000
9 10 11 12 13
De
pth
of
Co
vera
ge
Nominal Alleles by Repeat
D5S818
Major Shared Minor
Minor and Major Contributor Alleles
Mixture of 2 people
Both 11,12
0
1000
2000
3000
4000
5000
6000
9 10 11 12 13
De
pth
of
Co
vera
ge
Nominal Alleles by Repeat
D5S818
Major Shared Minor
11 indistinguishable
Stutter from allele 11
12 distinguishable
AGAT...AGAT
AGAT...AGAT
AGAT...AGAG
Stutter from allele 12
of the minor
contributor

10
Novel Autosomal STR Variants
RR – Repeat Region
FR – Flanking Region
Novel Y STR Variants
Search for More Resolving STRs
• 1000 Genomes Project (raw sequences, unsorted)
• STR Catalog Viewer
• Summary of human STR variation compiled using lobSTR software
Tetranucleotides and larger (increase PCR
efficiency, reduce artifacts)
Small length-based allele spread (minimized preferential
amplification, diversity of alleles maintained when coupled with
>80% heterozygosity)
80% Heterozygosity(↑ variability of
markers for easier differentiation
between individuals)
Phase 3: DECoDE Panel Assessment and in silico mixtures
Using top ranked candidates for heterozygosity and chemistry compatibility 73 Candidates Selected for Refined (DECoDE) Panel
53 STR Candidates that met criteria of high heterozygosity (>80%), reduced length-based allele spread (≤10), and a repeat size of four or more nucleotides
Considering (some) Poor, (all) Fair, (all) Good Performing Candidates Heterozygosity and Allele Spread Assessed and Ranked
From the 248 Candidates 55 Failures; 58 Poor Performers; 72 Fair Performers; 63 Good Performers
Sequencing Performance STR Classified on Read Depth (Depth of Coverage) and Chemistry Compatibility
Illumina TruSeq Custom Amplicon Preliminary Panel (248 Candidates)
Phase 1 with >3000 Candidates 793 Candidates Design and Redesign 248 Candidates
More Informative STRs
Mixtures

11
• 73 highly heterozygous loci using MPS chemistry
• 15 loci previously described by Phillips (2016) and others
• 451 unrelated individuals from three U.S. populations
• Caucasian (CAU; n=155);
• Hispanic (HIS; n=148);
• African American (AFA; n=148)
• Each STR locus was characterized and reviewed manually for diversity using in-house Excel workbooks
• Alleles characterized by length and sequence
• Population genetics analyses (heterozygosity; Hardy-Weinberg equilibrium (HWE); linkage disequilibrium (LD); random match probabilities (RMP))
Exploratory Multiplex
• A subset of 20 loci selected for comparison to the CODIS core
loci
• The current requirement is 20 CODIS core loci for upload into the national
DNA database
• high heterozygosity (>90%)
• Operationally problematic loci (even if heterozygosity >90%) were excluded
• 443 U.S. population samples
• African American, (AFA; n=140, 8 incomplete
profile samples removed)
• Caucasian, (CAU; n=155)
• Hispanic, (HIS; n=148)
In silico Mixtures
CODIS Panel Loci Exploratory Panel Loci BEST Panel Loci
D2S1338 D3S2406 D3S2406
D12S391 D2S1360 D2S1360
D1S1656 D7S3048 D7S3048
D21S11 D8S1132 D8S1132
D8S1179 D11S2368 D11S2368
vWA D15S822 D15S822
D3S1358 D2N2 D2N2
D18S51 D1N10 D1N10
FGA D12N15 D12N15
D19S433 D1N16 D1N19
D13S317 D1N19 D1N21
D5S818 D1N21 D8N23
D16S539 D8N23 D15N26
D22S1045 D15N26 D14N56
D7S820 D14N56 D3N61
D2S441 D3N61 D12S1338
CSF1PO D4N70 D4N70
D10S1248 D11N52 D2S1338
TPOX D17N32 D1S1656
TH01 D2N43 D11N52
Shaded cells reflect the CODIS core loci.
Comparison of the proportion per category of resolved alleles in in silico two-person mixtures, presented as a summary of all loci for
each of the three panels (C=CODIS; M=20Plex Multiplex; B=BEST; 443 (n) individuals comprising three U.S. populations (n=140
African American; n=155 Caucasian; and n=148 Hispanic); two-person (k) mixtures; 97,903 (x) comparisons per locus (n=20) in
each panel; total comparisons (N) = 1,958,060 for each DNA profile type (LB=length-based; and SB=sequenced-based)).
In silico Mixtures
Locus Resolution

12
Full ResolutionCODIS
(LB)Multiplex
(LB)BEST (LB)
CODIS (SB)
Multiplex (SB)
BEST (SB)
0 Loci 155 0 0 3 0 0
1 Locus 1330 6 7 104 0 0
2 Loci 5001 27 76 663 0 0
3 Loci 11715 211 359 2541 0 1
4 Loci 18200 839 1181 6333 8 4
5 Loci 20574 2320 2885 12056 14 41
6 Loci 17881 5242 5971 17179 128 139
7 Loci 12141 9592 10134 18791 440 496
8 Loci 6514 14203 14249 16609 1204 1275
9 Loci 2889 17073 16079 11656 2801 2682
10 Loci 1063 16806 15882 6966 5379 5230
11 Loci 317 13764 13121 3169 9287 8794
12 Loci 98 9305 8937 1253 13194 12117
13 Loci 18 5005 5235 431 16137 15125
14 Loci 5 2398 2475 119 16747 16270
15 Loci 2 823 919 22 14580 14779
16 Loci 0 226 322 6 10125 10755
17 Loci 0 53 62 1 5266 6560
18 Loci 0 10 8 1 2005 2765
19 Loci 0 0 1 0 539 777
20 Loci (Full Profile) 0 0 0 0 49 93
Total 97,903 97,903 97,903 97,903 97,903 97,903
LB = length-based; SB = sequence-based
N = 443 individuals representing three U.S. populations (n=140 African American; n=155 Caucasian; and n=148 Hispanic samples)
Highlighted in BOLD is the mode - the number of loci with the greatest number of counts for which four alleles at each
locus were resolved.
In silico Mixtures
Top 20 Performance
LB = length-based; SB = sequence-based
N = 443 individuals representing three U.S. populations (n=140 African American; n=155 Caucasian; and n=148 Hispanic samples)
↑9
In silico Mixtures
Top 20 Performance
History of Deadwood, SD
• 1874 Expedition led by
General George Custer
discovered gold in the Black Hills
of S.D.
• Growth out of “Black Hills Gold
Rush”
• 1876 City of Deadwood
established as a primitive gold
mining camp
• Wild, lawless frontier town in its
early days; transitioned to a
prosperous commercial center as
a railroad was built to connect it
to the outside world
Bone Sections
• Right femur
• Diaphysis surface-sanded w/Dremel
4000 Rotary Tool and sterile grinding
stone
• Sectioned with Stryker autopsy saw

13
Phenotype Probabilities
http://hirisplex.erasmusmc.nl/
Accessed on 10-07-2014HIrisPlex: Walsh et al. (2013)
European AncestryForenSeq Aims
Sample Biogeographic Ancestry
1 European
3 European
4 Asian
5 European
6 European
7 Asian
10 European
13 African Americans
14 African admix
15 African admix
16 African
17 European
HID-Ion AmpliSeq™ Ancestry Panel Mitochondrial DNA
• mtDNA data used to characterize the maternal lineage
of the Deadwood skeletal remains
• Halogroup: H1+16189
• Most common haplogroup in Western Europe

14
Haplogroup Predictor
http://www.hprg.com/hapest5/
Yfiler ForenSeq Combined
Analysis of
Difficult Samples
mtDNA is the most successful marker
Mitochondrial DNA
• Higher copy number per cell
compared with the nuclear genome
• Maternal inheritance
Sanger Sequencing
• Current Standard for forensic mtDNA analyses
• Reliable
• Casework
• Bones
• Teeth
• Hair
• Not used for mixtures
• However exclusions could be made
• Databases
• CE is current standard for most forensic marker
systems

15
Limitations of Sequencing Technology
• Sequencing is labor intensive
• Analysis of results is time consuming
• Costly (prices range from $1000 to $3000 per mtDNA
sample and only HV1 and HV2)
• Variation in intensity of peaks
• Not quantitative– impacts mixture interpretation
• Heteroplasmy difficulties
Length Heteroplasmy
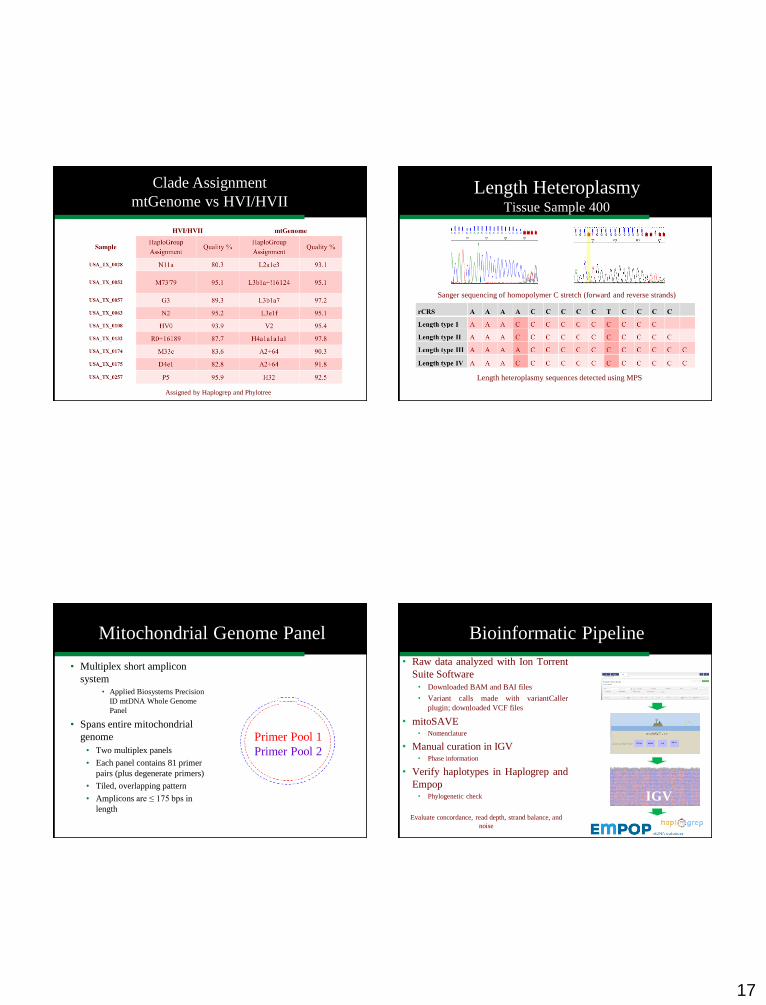
...CCACCAAACCCCCCCCTCCCCCCGCTT… 8 C’s
...CCACCAAACCCCCCCCCTCCCCCCGCTT… 9 C’s
...CCACCAAACCCCCCCCCCTCCCCCCGCTT… 10 C’s
AFDIL is first to use MPS ---
Hybridization capture…allows the non-human DNA in a
sample to be removed from the targeted human mtDNA
MPS on the MiSeq
MPS - Population Studies Become Easy
• Sequenced 283 whole genomes on MiSeq
following protocol
• Three populations – African American,
Caucasian, SW Hispanics
• Multiple software
• mitoSAVE
• Haplogrep
• First upload of MPS mtDNA data to EMPOP

16
• Mean coverage (outer circle; n=24)
• Variants distribution(middle circle;
n=283)
• Mean strand coverage - reverse (dark)
and forward (light) strand (inner circle;
n=24)
• Disproportionally low coverage
observed in HVII is likely an artifact of
alignment to a linear reference
Summary Representation of mtGenome DataVariation Across the mtGenome
(n=283)
• 11,607 variants
• defined in relation to the rCRS
• Polymorphism density clustered in HVI/HVII
• 2,938 of the variants (25.3%)
• ~75% of variation in coding region
• Increase the value of mtDNA
Comparison of Haplogroups and Haplotypes
Generated by HVI/HVII and Genome Sequence Data
Assigned by Haplogrep and Phylotree
Phylogenetics
17
Clade Assignment
mtGenome vs HVI/HVII
Assigned by Haplogrep and Phylotree
Length heteroplasmy sequences detected using MPS
Sanger sequencing of homopolymer C stretch (forward and reverse strands)
Length HeteroplasmyTissue Sample 400
Mitochondrial Genome Panel
• Multiplex short amplicon
system
• Applied Biosystems Precision
ID mtDNA Whole Genome
Panel
• Spans entire mitochondrial
genome
• Two multiplex panels
• Each panel contains 81 primer
pairs (plus degenerate primers)
• Tiled, overlapping pattern
• Amplicons are ≤ 175 bps in
length
Primer Pool 1
Primer Pool 2
Bioinformatic Pipeline
• Raw data analyzed with Ion Torrent
Suite Software
• Downloaded BAM and BAI files
• Variant calls made with variantCaller
plugin; downloaded VCF files
• mitoSAVE• Nomenclature
• Manual curation in IGV• Phase information
• Verify haplotypes in Haplogrep and
Empop• Phylogenetic check IGV
Evaluate concordance, read depth, strand balance, and
noise

18
Concordance
• 108 reference samples sequenced
• Haplotype calls concordant with previous data
• Long PCR on PGM1 and MiSeq2
Short Amplicons
Long PCR1 Churchill et al 20162 King et al. 2014
Sensitivity Study
N=3 Ranged from 286X to 8,574X
Sensitivity Study
Ranged from 32X to 683X
Hair Shaft
Coverage ranged from
23X to 2,634X across the
mitochondrial genome

19
Mixtures Microhaplotypes
Identical Twins

20
Real Case MPS and Sanger Sequencing
https://phys.org/news/2018-04-dna-elusive-golden-state-killer.html
Genetic Genealogy

21
Joseph James DeAngelo
One of the most notorious serial killers in California
• Years active 1974 – 1986
Genetic Genealogy East Area Rapist (N Cal) 1976-79
The Original Night Stalker
(S Cal) 1979 - 1986
DNA testing in 2001
connects EAR to ONS
“Golden State Killer”
120+ Burglaries
50+ Sexual Assaults
12+ Homicides
https://nypost.com/2018/06/01/cops-got-dna-of-suspected-golden-state-killer-from-tissue/

22
SNPs vs. STRs
• SNPs are mostly bi-allelic (e.g., A or T)
• Require more SNPs for identification
• ~3 SNPs = 1 STR
• SNPs have very low mutation rates compared to STRs
• Great for kinship and genealogy
• SNPs have fewer artifacts than STR data
• SNPs can provide ancestry and phenotypic (outward
appearance) information
• Technology allows for typing hundreds of thousands of
SNPs
SNPs for Identification
~60 ‘random’ SNPs = Full STR Profile
ACTTACCGTTCCTGAAGG
SNPs in close proximity = Genealogy
ATTTACCGCTCCTGAGGG
ATTTACCGTTCCTGAAGG
ACTTACCGTTCCTGAGGG
SNP Typing
• MPS can generate hundreds of thousands to millions of SNPs
for a single sample
• Arrays can type 600,000 – 1,000,000 SNPs for a single sample
Relationships (with %DNA Shared)

23
Genetic Recombination Genetic Genealogy
ISOGG wiki statistics:
Parent/child: 3539-3748 cMs
1st cousins: 548-1034 cMs
1st cousins 1R: 248-638 cMs
2nd cousins: 101-378 cMs
2nd cousins 2R: 43-191 cMs
3rd cousins: 43-ca 150 cMs
3rd cousins 1R: 11.5-99 cMs
More distant cousins: 5-ca 50 cMs
What is Pharmacogenomics?
• Also referred to as “Personalized Medicine”
• Melding of classical pharmacology + human genetics
• Using a patient’s genotype to optimize drug therapy and minimizing toxicity
Pharmacogenentics
• Ancient Greece, Egypt, Rome
• Favism – common to Central Africa and Southwest Asia
• 1930s – Phenylthiocarbamide accident and taste blindness
• 1950s – Technology and assay development
• 1975 – Debrisoquine accident and description of cytochrome
p450 mono-oxygenase

24
Back to the Beginning of the Journey Four Different Phenotypes
• Poor metabolizer (PM)
• No active copies
• Intermediate metabolizer (IM)
• 1 active copy
• Extensive metabolizer (EM)
• 2 active copies (normal)
• Ultrarapid metabolizer (UM)
• More than 2 active copies
• After complete forensic autopsy
• Cause of death unknown 0.3 - 0.6 % (~1/200)
• Manner of death unknown 3 - 6 % (~1/20)
Negative Autopsies Genetics of Death
Predisposition to Sudden Unexpected Death
Genetic variants
Developmental stage
Neonates
Infants
Juveniles
Adults
Elderly
Triggering event
Medication
Physical stress
Mental stress
Climate change
Nutritional change
25
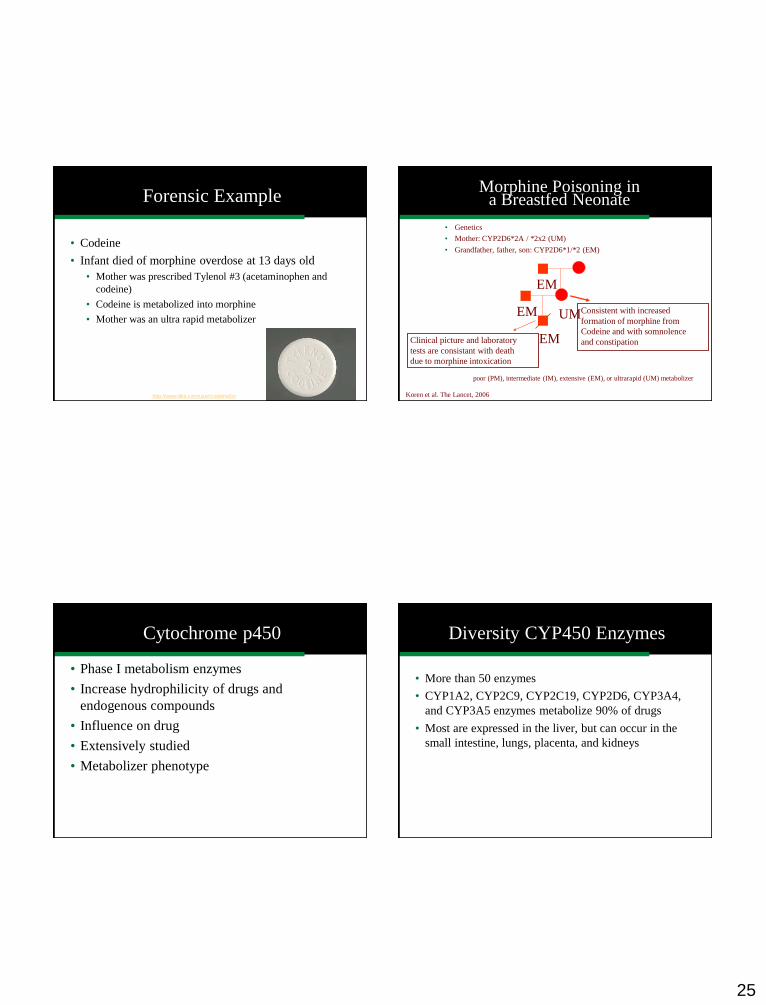
Forensic Example
• Codeine
• Infant died of morphine overdose at 13 days old
• Mother was prescribed Tylenol #3 (acetaminophen and
codeine)
• Codeine is metabolized into morphine
• Mother was an ultra rapid metabolizer
http://www.ilike.com/user/codeine0vr
• Genetics
• Mother: CYP2D6*2A / *2x2 (UM)
• Grandfather, father, son: CYP2D6*1/*2 (EM)
Koren et al. The Lancet, 2006
UM
EM
EM
EM
Consistent with increased
formation of morphine from
Codeine and with somnolence
and constipationClinical picture and laboratory
tests are consistant with death
due to morphine intoxication
Morphine Poisoning in a Breastfed Neonate
poor (PM), intermediate (IM), extensive (EM), or ultrarapid (UM) metabolizer
Cytochrome p450
• Phase I metabolism enzymes
• Increase hydrophilicity of drugs and
endogenous compounds
• Influence on drug
• Extensively studied
• Metabolizer phenotype
Diversity CYP450 Enzymes
• More than 50 enzymes
• CYP1A2, CYP2C9, CYP2C19, CYP2D6, CYP3A4,
and CYP3A5 enzymes metabolize 90% of drugs
• Most are expressed in the liver, but can occur in the
small intestine, lungs, placenta, and kidneys

26
CYP2D6
• The only constitutively expressed CYP
• Accounts for ~30% of marketed drug
metabolism
• Implicated in accidental overdose and
idiosyncratic drug response
• PM, IM, EM, UM
• 2015:
• >120 alleles
• >18 full gene duplications
CYP2D6* alleles
CYP2D6 Genotyping
• Drug Reaction
• Targeted massively parallel sequencing (MPS)
• Genome wide association studies (GWAS)
• Single nucleotide polymorphism (SNP) arrays
• No potential for discovery of new/novel
variants
• MPS of whole gene provides best prediction
CYP2D6
• Recent studies reveal
intra-metabolizer status
variability

27
CYP2D6 Genotyping Other Enzymes in Opiate Pathway
• CYP2D6 – ~30% marketed drugs
• UGT2B7 – phase II metabolism
• ABCB1 – ATP dependent transporter p-
glycoprotein
• OPRM1 – morphine and M6G receptor
• COMT – enzyme in the synaptic space
UGT2B7, ABCB1, OPRM1, COMT Multigenic Affects
Gene SNP Enzyme Activity
CYP2D6
- *1A, Wild type, considered fully functional
rs16947, rs1135840 *2D, Normal function except when duplicated
rs35742686, rs1135824 *3A, Nonfunctional, frameshift mutation
rs3892097, rs28371733 *4, Nonfunctional, splicing defect
- *5, Nonfunctional, complete gene deletion
rs5030655 *6, Nonfunctional, frameshift mutation
rs5030656 *9, Partially functional
rs1065852 *10, Partially functional
rs28371706, rs16947 *17, Partially functional
OPRM1 rs1799971 Decreased
UGT2B7rs7439366 Increased
rs62298861 Increased
ABCB1
rs2229109 Unsure
rs1128503 Decreased
rs2032582 Decreased
rs1045642 Decreased
COMT
rs4633 Not independently associated with activity
rs4818 Not independently associated with activity
rs4680 Decreased
rs2239393 Not independently associated with activity
rs165728 Not independently associated with activity
rs165599 Not independently associated with activity

28
Multigenic Affects
Gene SNP Enzyme Activity
CYP2D6
- *1A, Wild type, considered fully functional
rs16947, rs1135840 *2D, Normal function except when duplicated
rs35742686, rs1135824 *3A, Nonfunctional, frameshift mutation
rs3892097, rs28371733 *4, Nonfunctional, splicing defect
- *5, Nonfunctional, complete gene deletion
rs5030655 *6, Nonfunctional, frameshift mutation
rs5030656 *9, Partially functional
rs1065852 *10, Partially functional
rs28371706, rs16947 *17, Partially functional
OPRM1 rs1799971 Decreased
UGT2B7rs7439366 Increased
rs62298861 Increased
ABCB1
rs2229109 Unsure
rs1128503 Decreased
rs2032582 Decreased
rs1045642 Decreased
COMT
rs4633 Not independently associated with activity
rs4818 Not independently associated with activity
rs4680 Decreased
rs2239393 Not independently associated with activity
rs165728 Not independently associated with activity
rs165599 Not independently associated with activity
Microbial Forensics
• The use of scientific means to characterize microorganisms
and their products for attribution purposes of a biological
terrorist attack, biocrime, hoax, or accidental release of a
biological agent.
• Now expanded due to advancements in massively parallel
sequencing (MPS), metagenomics, and bioinformatics
New York Post Letter
AnthraxRandom Shotgun Sequencing
• Applied Biosystem 3730xl sequencer - 96 capillary array -
2 hours run time (1200 sequences/day)
• 50% higher capacity than ABI 3700
• POP-7™ separation matrix
• Sequence reads up to 1,100 bases
• Integrated auto-sampler and plate stacker
• Internal bar code reader
• Automated basecalling
• Reduced reagent & DNA consumption
• Actively temperature controlled oven (18ºC–70ºC)
• ABI Prism 3700 sequencer - 7 run per day 96-well blocks\
• (672 sequences)
• Average trimmed sequence read length: 650 bp
• Applied Biosystem PRISM Big DyeTM terminator
• Cycle Sequencing Ready Reaction Kits

29
Instruments Expansion of Microbial Forensics
• Broader Definition
• Today’s capabilities enable greater versatility
More Nonhuman Than Human
• ~10 microbial cells for
every human cell
• ~5 million genes
• Single swab
• ~10,000 bacteria/cm2
• The microbiome is a high
copy number genetic
marker!
Morgan et al. TIG. 2013
Personal Microbiomes
• Evidence of “personal microbiomes” has been demonstrated
• Potential forensic applications
• 16S rRNA or WGS metagenomic sequencing
• No species resolution, susceptible to stochastic effects
• Mainly use of unsupervised methods to demonstrate that skin
microbiome signatures from touched items associate with their donors
• Few studies have utilized supervised methods for the purposes of
classification
• Prediction of individual identification
• High accuracy (> 96%)
• One time point
• A method had yet to be described using supervised learning approaches with
strain-level features stable over time intervalshttps://www.sciencedaily.com/releases/2010/03/100315161718.htm (Photo credit: Steve Miller)

30
• 3 individuals
• Pairs of samples
• finger tips
• touched keyboard
• Sequence 16s rRNA
Hand Microflora Methods of Analysis
• Many metagenomic studies use
unsupervised methods
• These methods know nothing about
class labels
• i.e., whose metagenomic sample is whose
• e.g., PCA, cluster analysis
• This study uses supervised
methods.
• Used for prediction
• Allows models to find salient features
that differ between individuals
Original
dataset
Nearest neighbor
decision
boundaries
Logistic regression
decision
probabilities
Collect Skin Samples with
4N6FLOQSwabs® Genetics
Also see Frederike et al: Human-associated microbial populations as
evidence in forensic casework. FSI Genetics (in press)
Skin Microbiome Profiling
hidSkinPlex
The average read depth at each hidSkinPlex marker present in eight individuals from the toe web/ball of the foot (Fb), palm
of the non-dominant hand (Hp) and manubrium (Mb). Markers are ordered by clade then amplicon size on a log scale.
• Universal markers: 183 (2x read depth)
• Non-universal markers: 282
Average read depth: 2,117x ± 6,305 (SD)

31
Classification AccuracyUniversal and Nonuniversal Markers
Fb Hp
Mb
hidSkinPlex Profile and
Human-Specific STR and SNP Profile
Percentage of ForenSeq STR/SNP alleles detected from skin swabs
collected from subject S001 from the toe web/ball of the foot (Fb =
green), palm of the non-dominant hand (Hp = red), and manubrium (Mb
= blue).
• 1 skin swab:
• Low biomass samples
• < 0.5 pg/μL (Hp, Mb)
• ~70 pg/μL (Fb)
• Hp
• 32-52% alleles detected
• hidSkinPlex classification
• Up to 100%
% o
f S
TR
s/S
NP
s ca
lled
Rea
d d
epth
per
mar
ker
Benefits of STR/SNP/mtDNA
Typing by MPS• Many Applications
• Multiplexing
• Whole mtGenome
• Mixtures
• Better resolution/distinguish allele v stutter
• Can vary thresholds based on noise
• -A not an issue
• STR data are backward compatible
• Efficient Workflow
• Data analysis tools
Hypothesis Driven Methodologies
• Gold standard limitation is most evident in mixture
interpretation
• Substantial subjectivity
• But good sign is substantial discussion
• The real strength of the field
• Present and future issues will be in
hypothesis formulation, interpretation of
results, documentation and communication
• Education and training

32
Models
From J Bright Presentation 2013
Allows us do address uncertainty
Allele Drop-out and Drop-in Rates
• D: the probability of drop-out of one allele of a heterozygote ( )
• Depends on locus and DNA quantity; from 0.0 to 0.66 have been reported
• Can be as high as 100% in a specific case
• D2: the homozygote drop-out probability
• D2 ≈ ½ D2;
•
• C: drop in probability
• Some include both stutter and contamination together
1D D
2 21D D
Balding and Buckleton. Interpreting low template DNA profiles. Forensic Sci Int Genet. 2009 Dec;4(1):1-10.
H1: V + S = E
• A, B, C are not dropped out
• D is dropped out D
• No drop-in allele
Pr( | , , )pABC AB CD H DDDDC
D
C
1
STRMIX
http://strmix.esr.cri.nz/

33
MCMC – maths
best
answer
A possible answer
MCMC ‘chain’
Hot guess
Cold guess
MCMC Process
• 10 MCMC moves
• Only small fraction of all
possible answers need to
get to best explanation
• If ran again
• Probably different starting
points
• Would still reach best
explanation
• Can run for greater number
of steps
MCMC Process Comparison to RMP
0
5
10
15
20
25
30
35
0 50 100 150 200 250 300
Lo
g o
f m
atc
h s
tati
stic
Input amount (pg)
Comparison of statistical analysis in single source
profiles
RMP
STRmix

34
• Abu Dhabi Police
• GCC Conference Organizers
• Thermo Fisher
• Verogen
• COPAN
#1ACKNOWLEDGMENTS
• Research Team