Groundwater quality in and around Tuticorin town, Southeast ...
10
34 Groundwater quality in and around Tuticorin town, Southeast coast of India Somvir Singh* 1 , N.C. Mondal 2 and V.S. Singh 2 1 Central Ground Water Board (MoWR, River Development & Ganga Rejuvenation), Dehradun, India 2 CSIR-National Geophysical Research Institute, Uppal Road, Hyderabad-500 007, India *Corresponding Author: [email protected] ABSTRACT Rapid urbanization coupled with growth in agriculture and industries has led to deterioration of groundwater quality. The problem is severe in the coastal tracts due to salinity ingression since the last few decades. The present paper deals with a systematic hydrogeochemical study carried out in and around Tuticorin town covering an area of about 120 km 2 to assess groundwater quality. A total of 29 groundwater samples were collected and analyzed. Analysis of major ions has shown the anomalous values for total dissolved solids (TDS), sodium (Na + ), magnesium (Mg 2+ ), chloride (Cl − ), and sulphate (SO4 2− ) resulting in degradation of groundwater quality. Only 21% of samples are potable based on the TDS values. The order of major cations and anions obtained are Na + >Mg 2+ >Ca 2+ >K + and Cl - >SO4 2- >HCO3 - >NO3 - >F - , respectively. The results of these parameters were interpreted with the help of Piper, Wilcox and Gibbs diagrams apart from correlation matrix analysis. Cross plot of HCO3 - /Cl - (molar ratios) versus TDS indicated that about 72% of the analyzed samples are brackish and saline in nature. Out of them, about 42% samples are NaCl-type. On the basis of interpretation of US Salinity diagram, it is found that majority of the samples have very high salinity hazard and sodium hazard, and represent evaporation dominance. Key words: Hydrochemistry, Drinking and Irrigation, Groundwater salinity, Coastal aquifer, Tuticorin town, Tamil Nadu and India. INTRODUCTION Groundwater in a coastal tract is relatively vulnerable to contamination by sea water (Todd, 1980). It is of paramount importance to assess the suitability of groundwater for drinking, domestic and irrigation purposes. Saline water intrusion in coastal aquifers is a common global problem (Saxena et al., 2003; Batayneh, 2006; Singh et al., 2009; Mondal et al., 2010a; Antony Ravindran et al., 2015). This phenomenon can be attributed to a variety of factors like gentle coastal hydraulic gradients, tidal and estuarine environments, sea level rise, excessive groundwater withdrawal and local hydrogeological conditions (Rajmohan et al., 2000, Saxena et al., 2004, Sherif and Kacimov, 2007; Mondal et al., 2008; Kim et al., 2009). However, natural hazards like tidal waves and tsunami engulfing the coastal regions also result in the percolation of seawater into shallow and unconfined aquifers (Villholth et al., 2006). One of the most common methods for assessing the extent of saline water ingress in coastal aquifers is through periodic analysis of groundwater chemistry (Sukhija et al., 1996; Saxena et al., 2003; Sarwade et al., 2007; Kim et al., 2009). In case of seawater intrusion, groundwater generally exhibits high concentrations not only in total dissolved solids and major ions (Richter and Kreitler, 1993) but also enrichment of selective trace elements (Saxena et al., 2004; Mondal et al., 2010b). Tuticorin town, a part of the southeastern coast of Tamil Nadu, is chosen as the study area which is affected by seawater ingress as well as in-situ salinity in the geological past. The objective of this paper is to characterize groundwater quality of shallow coastal aquifers by identifying hydrogeochemical facies. This will help in providing a better understanding of possible changes in groundwater quality with the rapidly developing coastal belt in and around Tuticorin town. In order to understand the pollution, it is essential to have knowledge of the natural baseline quality so that the imposed environmental change can be measured with an acceptable degree of confidence (Edmunds et al., 2003). The Study Area The study area, Sterlite Industries India Ltd. (SIIL) watershed, covering an area of about 112 km 2 lies between 78.04 to 78.17°E longitudes and 8.77 to 8.85°N latitudes. It is situated in the eastern part of Tuticorin district along the eastern coastal belt of Tamil Nadu, India. (Figure 1). The topographic elevation varies from 26.22 m above mean sea level (amsl) in the east near Tuticorin town to the sea level near sea. The study area receives a good amount of rainfall (average 568 mm) during the northeast monsoon season between October and December of each year. The long-term average annual rainfall at Tuticorin J. Ind. Geophys. Union ( January 2017 ) v.21, no.1, pp: 34-43
-
Upload
khangminh22 -
Category
Documents
-
view
5 -
download
0
Transcript of Groundwater quality in and around Tuticorin town, Southeast ...

Somvir Singh, N.C. Mondal and V.S. Singh
34
Groundwater quality in and around Tuticorin town, Southeast coast of India
Somvir Singh*1, N.C. Mondal2 and V.S. Singh2
1Central Ground Water Board (MoWR, River Development & Ganga Rejuvenation), Dehradun, India2CSIR-National Geophysical Research Institute, Uppal Road, Hyderabad-500 007, India
*Corresponding Author: [email protected]
ABSTRACTRapid urbanization coupled with growth in agriculture and industries has led to deterioration of groundwater quality. The problem is severe in the coastal tracts due to salinity ingression since the last few decades. The present paper deals with a systematic hydrogeochemical study carried out in and around Tuticorin town covering an area of about 120 km2 to assess groundwater quality. A total of 29 groundwater samples were collected and analyzed. Analysis of major ions has shown the anomalous values for total dissolved solids (TDS), sodium (Na+), magnesium (Mg2+), chloride (Cl−), and sulphate (SO4
2−) resulting in degradation of groundwater quality. Only 21% of samples are potable based on the TDS values. The order of major cations and anions obtained are Na+>Mg2+>Ca2+>K+ and Cl->SO4
2->HCO3->NO3
->F-, respectively. The results of these parameters were interpreted with the help of Piper, Wilcox and Gibbs diagrams apart from correlation matrix analysis. Cross plot of HCO3
-/Cl- (molar ratios) versus TDS indicated that about 72% of the analyzed samples are brackish and saline in nature. Out of them, about 42% samples are NaCl-type. On the basis of interpretation of US Salinity diagram, it is found that majority of the samples have very high salinity hazard and sodium hazard, and represent evaporation dominance.
Key words: Hydrochemistry, Drinking and Irrigation, Groundwater salinity, Coastal aquifer, Tuticorin town, Tamil Nadu and India.
INTRODUCTION
Groundwater in a coastal tract is relatively vulnerable to contamination by sea water (Todd, 1980). It is of paramount importance to assess the suitability of groundwater for drinking, domestic and irrigation purposes. Saline water intrusion in coastal aquifers is a common global problem (Saxena et al., 2003; Batayneh, 2006; Singh et al., 2009; Mondal et al., 2010a; Antony Ravindran et al., 2015). This phenomenon can be attributed to a variety of factors like gentle coastal hydraulic gradients, tidal and estuarine environments, sea level rise, excessive groundwater withdrawal and local hydrogeological conditions (Rajmohan et al., 2000, Saxena et al., 2004, Sherif and Kacimov, 2007; Mondal et al., 2008; Kim et al., 2009). However, natural hazards like tidal waves and tsunami engulfing the coastal regions also result in the percolation of seawater into shallow and unconfined aquifers (Villholth et al., 2006). One of the most common methods for assessing the extent of saline water ingress in coastal aquifers is through periodic analysis of groundwater chemistry (Sukhija et al., 1996; Saxena et al., 2003; Sarwade et al., 2007; Kim et al., 2009). In case of seawater intrusion, groundwater generally exhibits high concentrations not only in total dissolved solids and major ions (Richter and Kreitler, 1993) but also enrichment of selective trace elements (Saxena et al., 2004; Mondal et al., 2010b).
Tuticorin town, a part of the southeastern coast of Tamil Nadu, is chosen as the study area which is affected by seawater ingress as well as in-situ salinity in the geological past. The objective of this paper is to characterize groundwater quality of shallow coastal aquifers by identifying hydrogeochemical facies. This will help in providing a better understanding of possible changes in groundwater quality with the rapidly developing coastal belt in and around Tuticorin town. In order to understand the pollution, it is essential to have knowledge of the natural baseline quality so that the imposed environmental change can be measured with an acceptable degree of confidence (Edmunds et al., 2003).
The Study Area
The study area, Sterlite Industries India Ltd. (SIIL) watershed, covering an area of about 112 km2 lies between 78.04 to 78.17°E longitudes and 8.77 to 8.85°N latitudes. It is situated in the eastern part of Tuticorin district along the eastern coastal belt of Tamil Nadu, India. (Figure 1). The topographic elevation varies from 26.22 m above mean sea level (amsl) in the east near Tuticorin town to the sea level near sea. The study area receives a good amount of rainfall (average 568 mm) during the northeast monsoon season between October and December of each year. The long-term average annual rainfall at Tuticorin
J. Ind. Geophys. Union ( January 2017 )v.21, no.1, pp: 34-43

Groundwater quality in and around Tuticorin town, Southeast coast of India
35
town is about 568 mm (IMD data) (Singh et al., 2006; Rangarajan et al., 2009).
Geomorphologically, the study area consists of flood plains, deltaic plain and natural levees. The slope of the topography is gentle in the western and central parts, but nearly flat in the eastern part of the watershed. Geologically, the area is underlain by rocks of Archaean age and recent alluvium. The Archaean rocks are mainly foliated crystalline igneous and metamorphic rocks trending in NW–SE direction (Balasubramanaian et al., 1993). The quartzite ridges in the western part are weathered, jointed and fractured. Sub-recent alluvium sands characterize the coastal areas along with coarse and calcareous grits, sandstones, shales and limestones. The watershed area is covered with black soil in the western part (in and around the SIIL Plant), red soil (sandy loam to sandy soil) in the central part and alluvial sandy soil in the eastern part. The maximum soil thickness is about 3.0 m. The sandy soil derived from sandstones has low soil moisture content. The alluvial soil is windblown, derived mainly from sands and shales including the beach sand and coastal dunes, which has low soil moisture content.
Systematic hydrogeological survey was also carried out during the year 2007 covering a number of hand pumps, dug wells and boreholes tapping shallow unconfined alluvial and fractured aquifer systems. The depth of dug wells ranges from 7 to 12 m, while the borehole depth varies from a few metres to a maximum of 70 m (bgl) (Singh et al., 2006). The sandy zone constitutes the main aquifer system in the alluvium areas while the fractured rocks too are water yielders (Mondal et al., 2009). The depth to
groundwater level during the pre-monsoon season varies from 1.8 to 14.4 m bgl whereas in the post-monsoon season, it varies from 0.9 to 12.9 m bgl (Rangarajan et al., 2009).
MATeRIAlS AND MeThODS
The analysis of water samples was carried out following Brown et al. (1983) and APHA (1985) methodologies. pH, TDS and EC were measured in in-situ condition by using portable EC and pH meters. Sodium (Na+) and potassium (K+) were determined by atomic absorption spectrophotometer (AAS). Total hardness (TH) as CaCO3, calcium (Ca2+), hydrogen carbonate (HCO3
−), and chloride (Cl−) were analyzed by volumetric methods. Magnesium (Mg2+) was calculated from TH and Ca2+ contents. Sulfate (SO4
2-) was estimated adopting the spectrophotometric technique, whereas nitrate (NO3
−) was determined by ion chromatography and fluoride (F−) by fluoride meter. All concentrations were expressed in milligrams per litre (mg/l), except pH and EC.
ReSUlTS AND DISCUSSION
General groundwater chemistry
The results of chemical analysis (carried out at CSIR-NGRI) are summarized in Table 1. The pH in the groundwater samples varies from 7.10–8.67. Comparison of hydrogeochemical data with drinking water standards of WHO (1993) shows that about 82.8% (N = 24), 75.9%
Figure 1. Location of the study area along with monitoring wells.
Somvir Singh, N.C. Mondal and V.S. Singh
36
(N = 22), 75.9% (N = 22), and 65.5% (N = 19) of the samples exceeded the upper limit for total dissolved solids (TDS=500 mg/l), magnesium (Mg2+=30 mg/l), chloride (Cl− =200 mg/l) and sodium (Na+= 200 mg/l), respectively. This indicates significant water quality deterioration in the study area.
To ascertain the suitability of groundwater for various purposes, it is essential to classify the groundwater based on their TDS values (Freeze and Cherry, 1979), The classification of groundwater based on the TDS shown that about 21% are fresh, 3% are saline and rest of the samples are moderately fresh (76%). It also indicates that only 17% of the samples falling below 500 mg/l of TDS which can be used for drinking purpose without any risk (Table 2).
The contour map of TDS (Figure 2) clearly shows that a higher value of TDS > 3000 mg/l was observed in the middle part covering more than 50% of the area, in particular, at the wells T-10, 19, 18, 14, 16, 56, 57, 54, 64, 47, and SIIL premises. Similarly, wells T-35 and 44 in the southern part and well T-5 in the north western part were also affected with higher TDS values (>3000 mg/l). This may indicate the possibility of a high rate of sea water intrusion in the middle, southern and north-western parts of the study area, where a high rate of withdrawal of groundwater was also observed (Mondal et al., 2009). It is noticed that the central and eastern parts are comparatively more populated, have larger industries and also have a large concentration of number of dug, tube, and bore wells (Singh
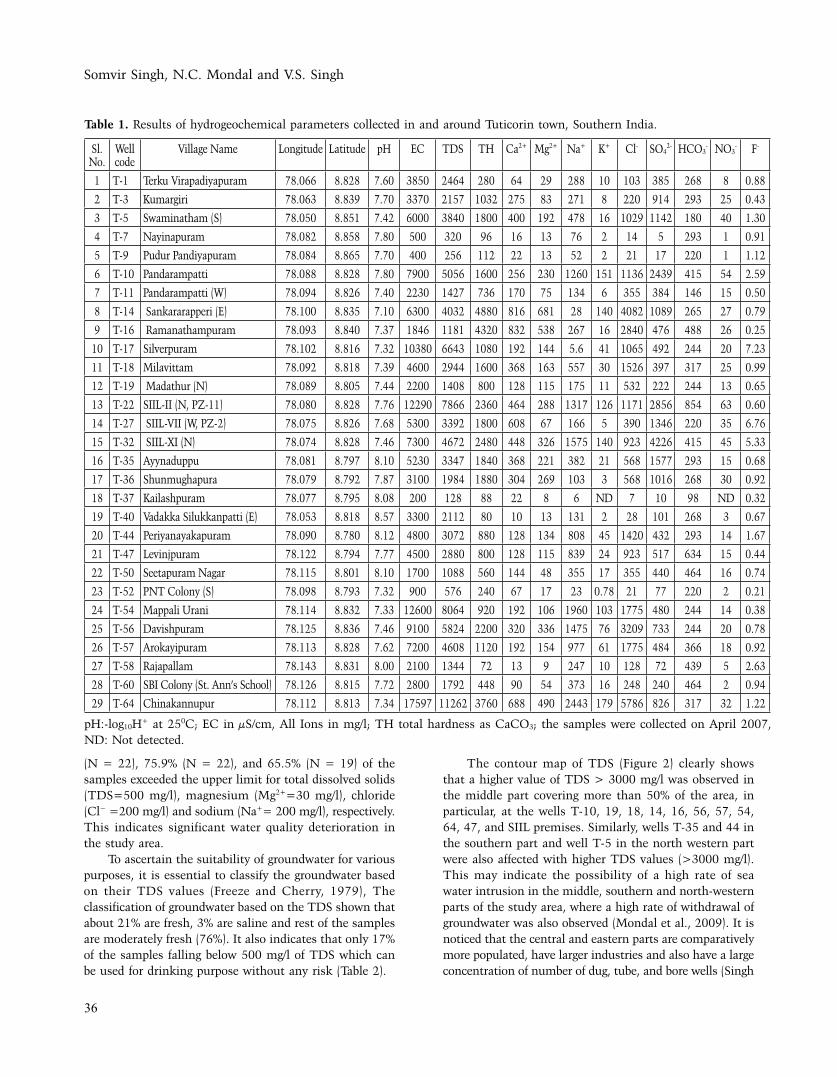
Table 1. Results of hydrogeochemical parameters collected in and around Tuticorin town, Southern India.
Sl. No.
Well code
Village Name Longitude Latitude pH EC TDS TH Ca2+ Mg2+ Na+ K+ Cl- SO42- HCO3
- NO3- F-
1 T-1 Terku Virapadiyapuram 78.066 8.828 7.60 3850 2464 280 64 29 288 10 103 385 268 8 0.88
2 T-3 Kumargiri 78.063 8.839 7.70 3370 2157 1032 275 83 271 8 220 914 293 25 0.43
3 T-5 Swaminatham (S) 78.050 8.851 7.42 6000 3840 1800 400 192 478 16 1029 1142 180 40 1.30
4 T-7 Nayinapuram 78.082 8.858 7.80 500 320 96 16 13 76 2 14 5 293 1 0.91
5 T-9 Pudur Pandiyapuram 78.084 8.865 7.70 400 256 112 22 13 52 2 21 17 220 1 1.12
6 T-10 Pandarampatti 78.088 8.828 7.80 7900 5056 1600 256 230 1260 151 1136 2439 415 54 2.59
7 T-11 Pandarampatti (W) 78.094 8.826 7.40 2230 1427 736 170 75 134 6 355 384 146 15 0.50
8 T-14 Sankararapperi (E) 78.100 8.835 7.10 6300 4032 4880 816 681 28 140 4082 1089 265 27 0.79
9 T-16 Ramanathampuram 78.093 8.840 7.37 1846 1181 4320 832 538 267 16 2840 476 488 26 0.25
10 T-17 Silverpuram 78.102 8.816 7.32 10380 6643 1080 192 144 5.6 41 1065 492 244 20 7.23
11 T-18 Milavittam 78.092 8.818 7.39 4600 2944 1600 368 163 557 30 1526 397 317 25 0.99
12 T-19 Madathur (N) 78.089 8.805 7.44 2200 1408 800 128 115 175 11 532 222 244 13 0.65
13 T-22 SIIL-II (N, PZ-11) 78.080 8.828 7.76 12290 7866 2360 464 288 1317 126 1171 2856 854 63 0.60
14 T-27 SIIL-VII (W, PZ-2) 78.075 8.826 7.68 5300 3392 1800 608 67 166 5 390 1346 220 35 6.76
15 T-32 SIIL-XI (N) 78.074 8.828 7.46 7300 4672 2480 448 326 1575 140 923 4226 415 45 5.33
16 T-35 Ayynaduppu 78.081 8.797 8.10 5230 3347 1840 368 221 382 21 568 1577 293 15 0.68
17 T-36 Shunmughapura 78.079 8.792 7.87 3100 1984 1880 304 269 103 3 568 1016 268 30 0.92
18 T-37 Kailashpuram 78.077 8.795 8.08 200 128 88 22 8 6 ND 7 10 98 ND 0.32
19 T-40 Vadakka Silukkanpatti (E) 78.053 8.818 8.57 3300 2112 80 10 13 131 2 28 101 268 3 0.67
20 T-44 Periyanayakapuram 78.090 8.780 8.12 4800 3072 880 128 134 808 45 1420 432 293 14 1.67
21 T-47 Levinjpuram 78.122 8.794 7.77 4500 2880 800 128 115 839 24 923 517 634 15 0.44
22 T-50 Seetapuram Nagar 78.115 8.801 8.10 1700 1088 560 144 48 355 17 355 440 464 16 0.74
23 T-52 PNT Colony (S) 78.098 8.793 7.32 900 576 240 67 17 23 0.78 21 77 220 2 0.21
24 T-54 Mappali Urani 78.114 8.832 7.33 12600 8064 920 192 106 1960 103 1775 480 244 14 0.38
25 T-56 Davishpuram 78.125 8.836 7.46 9100 5824 2200 320 336 1475 76 3209 733 244 20 0.78
26 T-57 Arokayipuram 78.113 8.828 7.62 7200 4608 1120 192 154 977 61 1775 484 366 18 0.92
27 T-58 Rajapallam 78.143 8.831 8.00 2100 1344 72 13 9 247 10 128 72 439 5 2.63
28 T-60 SBI Colony (St. Ann’s School) 78.126 8.815 7.72 2800 1792 448 90 54 373 16 248 240 464 2 0.94
29 T-64 Chinakannupur 78.112 8.813 7.34 17597 11262 3760 688 490 2443 179 5786 826 317 32 1.22
pH:-log10H+ at 250C; EC in μS/cm, All Ions in mg/l; TH total hardness as CaCO3; the samples were collected on April 2007, ND: Not detected.

Groundwater quality in and around Tuticorin town, Southeast coast of India
37
et al., 2006). The TDS in groundwater was observed as low as 126 mg/l in the village of Kailashpuram well (no. T-37), which indicates the availability of fresh groundwater because of its proximity to tanks and recharge area.
Cation chemistry
The concentration of Ca2+ in groundwater was found to be in the range of 10 to 832 mg/l, in the study area. Similarly, the concentrations of Mg2+ in 75% samples were found to be above the permissible limit of 50 mg/l (WHO, 1993). Sodium (Na+) is one of the important naturally occurring cation and its concentration in fresh waters is generally lower than that of Ca2+ and Mg2+. The average concentration of Na+ comparatively is higher than that of Ca2+ and Mg2+ corroborating with earlier results
(Balasubramanaian et al., 1993). The values of Na+ range between 6 and 2443 mg/l with average of 578 mg/l. It is observed that 65% of samples were above the permissible limit. The geological influence on the concentration of the cations is quite apparent as the study area is underlain by mainly granite gneisses. The concentration of potassium shows very low in the study area. Only 24% of samples are above permissible limit with an average of 45 mg/l in the groundwater samples. The total hardness (TH) varies from 72 to 4880 mg/l. The maximum allowable limit of TH for drinking purpose is 500 mg/l and the most desirable limit is 100 mg/l as per the WHO International standard. But the most desirable limit is 80–100 mg/l (Freeze and Cherry, 1979). Groundwater exceeding the limit of 300 mg/l (Table 3) is considered to be very hard (Sawyer and McMcartly, 1967).
Figure 2. TDS contour map of the study area.
Table 2. Classification of the groundwater samples in the study area (Freeze and Cherry, 1979).
Total dissolved solids (TDS)
Water type Samples No. of samples % of samples
<1,000 Fresh T-7. 9,37,40, 52 and 58 6 21
1,000-10,000 Brackish T-1, 3, 5, 10, 11, 14, 16, 17, 18, 19, 22, 27, 32, 35, 36, 44, 47, 50, 54, 56, 57 and 60
22 76
10,000-1, 00, 000 Saline T-64 1 3
>1, 00, 000 Brine Nil Nil Nil
Total 29 100
Somvir Singh, N.C. Mondal and V.S. Singh
38
Anion chemistry
The chloride (Cl-) content of samples varies between 7 to 5786 mg/l (an average: 1111 mg/l). Of the total samples, 22% of samples are exceeding the permissible limit. Similarly, 80% of the dug well samples show bicarbonate (HCO3
-) above the permissible limit with a wide variation in concentration between 98 and 854 mg/l with an average concentration of 327 mg/l. Sulphate concentration ranges from 5 to 4224 mg/l with about 79% of samples above the permissible limits. Only 10% of samples reveal nitrate concentration above permissible limit. Though the nitrate in the samples was ranging from 1 to 63 mg/l; the average shows slightly higher value (21 mg/l) as observed at the well no. T-22 (63 mg/l) and well T-10 (54 mg/l). Being loosely bound to soils, nitrate is expected to be more in runoff.
Fluoride values in the study area varies from 0.21 to 7.23 mg/l against the permissible limit of 1.50 mg/l (WHO, 1993) which can be attributed not only to mere presence of fluoride bearing minerals in rocks but also to the degree of weathering and leachable fluoride in the study area. The distribution of fluoride is quite sporadic and marked differences in concentrations are observed within very short distances with values less than 1.5mg/l in 24 samples and higher in only 5 samples. In the present case, the study area is underlain by crystalline formations such as charnockite and granitic gneiss which comprise quartz, feldspars (potash feldspars and albite), hornblende, biotite, etc. The acid charnockite of this area has quartz,
k-feldspars, hypersthene, and biotite minerals of coarse-grained nature, which are potential sources of fluoride.
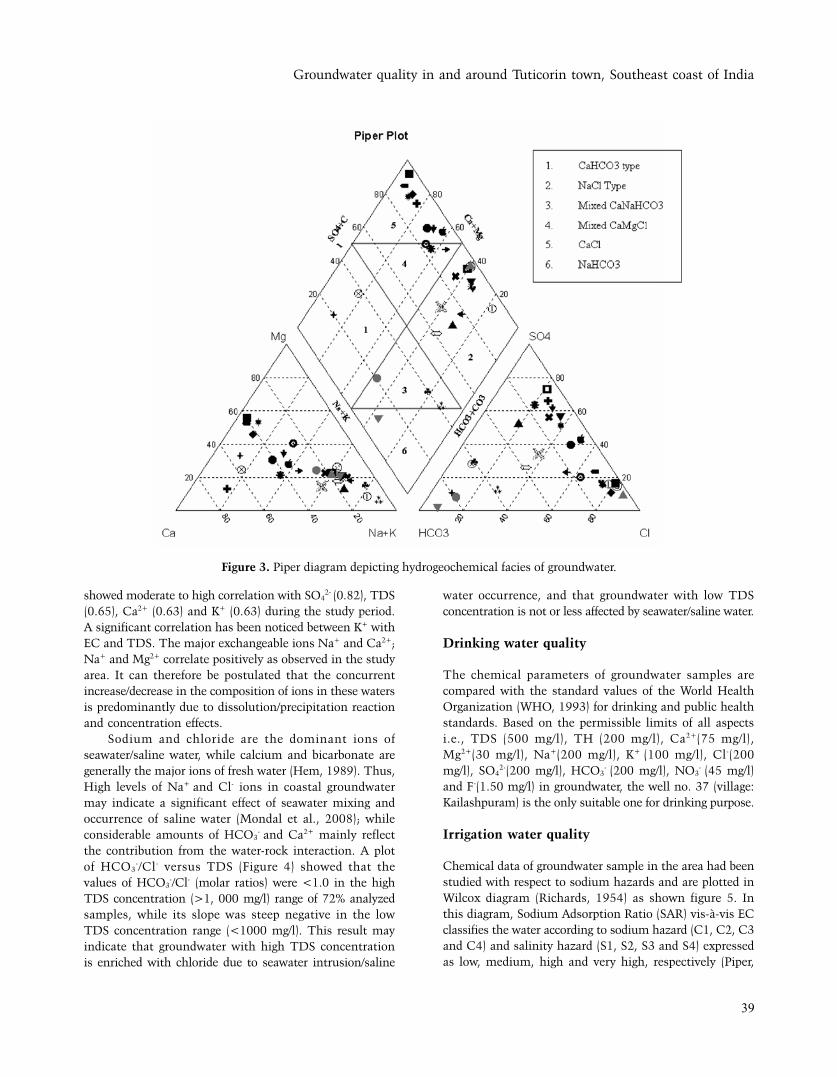
hydro-geochemical facies
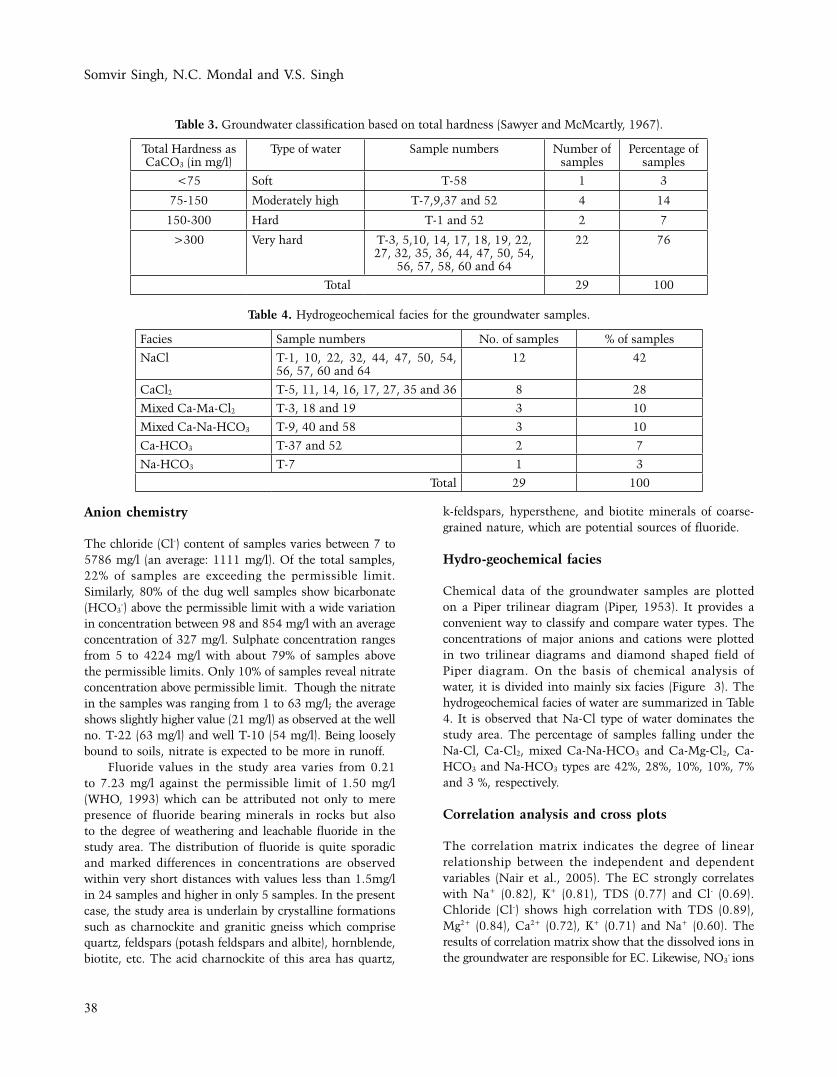
Chemical data of the groundwater samples are plotted on a Piper trilinear diagram (Piper, 1953). It provides a convenient way to classify and compare water types. The concentrations of major anions and cations were plotted in two trilinear diagrams and diamond shaped field of Piper diagram. On the basis of chemical analysis of water, it is divided into mainly six facies (Figure 3). The hydrogeochemical facies of water are summarized in Table 4. It is observed that Na-Cl type of water dominates the study area. The percentage of samples falling under the Na-Cl, Ca-Cl2, mixed Ca-Na-HCO3 and Ca-Mg-Cl2, Ca-HCO3 and Na-HCO3 types are 42%, 28%, 10%, 10%, 7% and 3 %, respectively.
Correlation analysis and cross plots
The correlation matrix indicates the degree of linear relationship between the independent and dependent variables (Nair et al., 2005). The EC strongly correlates with Na+ (0.82), K+ (0.81), TDS (0.77) and Cl- (0.69). Chloride (Cl-) shows high correlation with TDS (0.89), Mg2+ (0.84), Ca2+ (0.72), K+ (0.71) and Na+ (0.60). The results of correlation matrix show that the dissolved ions in the groundwater are responsible for EC. Likewise, NO3
- ions
Table 3. Groundwater classification based on total hardness (Sawyer and McMcartly, 1967).
Total Hardness as CaCO3 (in mg/l)
Type of water Sample numbers Number of samples
Percentage of samples
<75 Soft T-58 1 3
75-150 Moderately high T-7,9,37 and 52 4 14
150-300 Hard T-1 and 52 2 7
>300 Very hard T-3, 5,10, 14, 17, 18, 19, 22, 27, 32, 35, 36, 44, 47, 50, 54,
56, 57, 58, 60 and 64
22 76
Total 29 100
Table 4. Hydrogeochemical facies for the groundwater samples.
Facies Sample numbers No. of samples % of samples
NaCl T-1, 10, 22, 32, 44, 47, 50, 54, 56, 57, 60 and 64
12 42
CaCl2 T-5, 11, 14, 16, 17, 27, 35 and 36 8 28
Mixed Ca-Ma-Cl2 T-3, 18 and 19 3 10
Mixed Ca-Na-HCO3 T-9, 40 and 58 3 10
Ca-HCO3 T-37 and 52 2 7
Na-HCO3 T-7 1 3
Total 29 100
Groundwater quality in and around Tuticorin town, Southeast coast of India
39
showed moderate to high correlation with SO42- (0.82), TDS
(0.65), Ca2+ (0.63) and K+ (0.63) during the study period. A significant correlation has been noticed between K+ with EC and TDS. The major exchangeable ions Na+ and Ca2+; Na+ and Mg2+ correlate positively as observed in the study area. It can therefore be postulated that the concurrent increase/decrease in the composition of ions in these waters is predominantly due to dissolution/precipitation reaction and concentration effects.
Sodium and chloride are the dominant ions of seawater/saline water, while calcium and bicarbonate are generally the major ions of fresh water (Hem, 1989). Thus, High levels of Na+ and Cl- ions in coastal groundwater may indicate a significant effect of seawater mixing and occurrence of saline water (Mondal et al., 2008); while considerable amounts of HCO3
- and Ca2+ mainly reflect
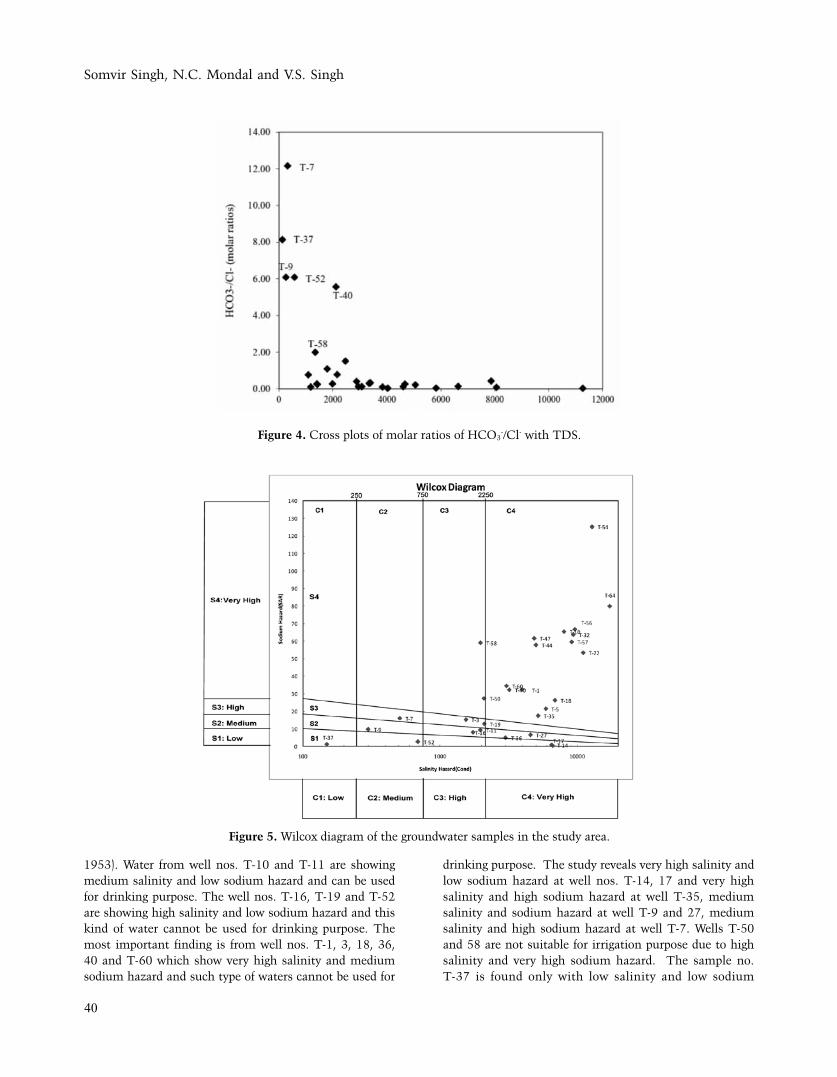
the contribution from the water-rock interaction. A plot of HCO3
-/Cl- versus TDS (Figure 4) showed that the values of HCO3
-/Cl- (molar ratios) were <1.0 in the high TDS concentration (>1, 000 mg/l) range of 72% analyzed samples, while its slope was steep negative in the low TDS concentration range (<1000 mg/l). This result may indicate that groundwater with high TDS concentration is enriched with chloride due to seawater intrusion/saline
water occurrence, and that groundwater with low TDS concentration is not or less affected by seawater/saline water.
Drinking water quality
The chemical parameters of groundwater samples are compared with the standard values of the World Health Organization (WHO, 1993) for drinking and public health standards. Based on the permissible limits of all aspects i.e., TDS (500 mg/l), TH (200 mg/l), Ca2+(75 mg/l), Mg2+(30 mg/l), Na+(200 mg/l), K+ (100 mg/l), Cl-(200 mg/l), SO4
2-(200 mg/l), HCO3- (200 mg/l), NO3
- (45 mg/l) and F-(1.50 mg/l) in groundwater, the well no. 37 (village: Kailashpuram) is the only suitable one for drinking purpose.
Irrigation water quality
Chemical data of groundwater sample in the area had been studied with respect to sodium hazards and are plotted in Wilcox diagram (Richards, 1954) as shown figure 5. In this diagram, Sodium Adsorption Ratio (SAR) vis-à-vis EC classifies the water according to sodium hazard (C1, C2, C3 and C4) and salinity hazard (S1, S2, S3 and S4) expressed as low, medium, high and very high, respectively (Piper,
Figure 3. Piper diagram depicting hydrogeochemical facies of groundwater.
Somvir Singh, N.C. Mondal and V.S. Singh
40
1953). Water from well nos. T-10 and T-11 are showing medium salinity and low sodium hazard and can be used for drinking purpose. The well nos. T-16, T-19 and T-52 are showing high salinity and low sodium hazard and this kind of water cannot be used for drinking purpose. The most important finding is from well nos. T-1, 3, 18, 36, 40 and T-60 which show very high salinity and medium sodium hazard and such type of waters cannot be used for
drinking purpose. The study reveals very high salinity and low sodium hazard at well nos. T-14, 17 and very high salinity and high sodium hazard at well T-35, medium salinity and sodium hazard at well T-9 and 27, medium salinity and high sodium hazard at well T-7. Wells T-50 and 58 are not suitable for irrigation purpose due to high salinity and very high sodium hazard. The sample no. T-37 is found only with low salinity and low sodium
Figure 4. Cross plots of molar ratios of HCO3-/Cl- with TDS.
Figure 5. Wilcox diagram of the groundwater samples in the study area.
Groundwater quality in and around Tuticorin town, Southeast coast of India
41
hazard, and this water can be used for both drinking and irrigation purposes. Water from well nos. T-5, 22, 32, 44, 47, 54, 56, 57 and T-64 are very high in both the classes and hence unsuitable for domestic as well as irrigation purpose. The study area nearby the coastal region covered by the well numbers T-44, 47, 54, 56, 57, 60, 64 (recent to sub-recent sediments) shows very high salinity due to sea water intrusion.
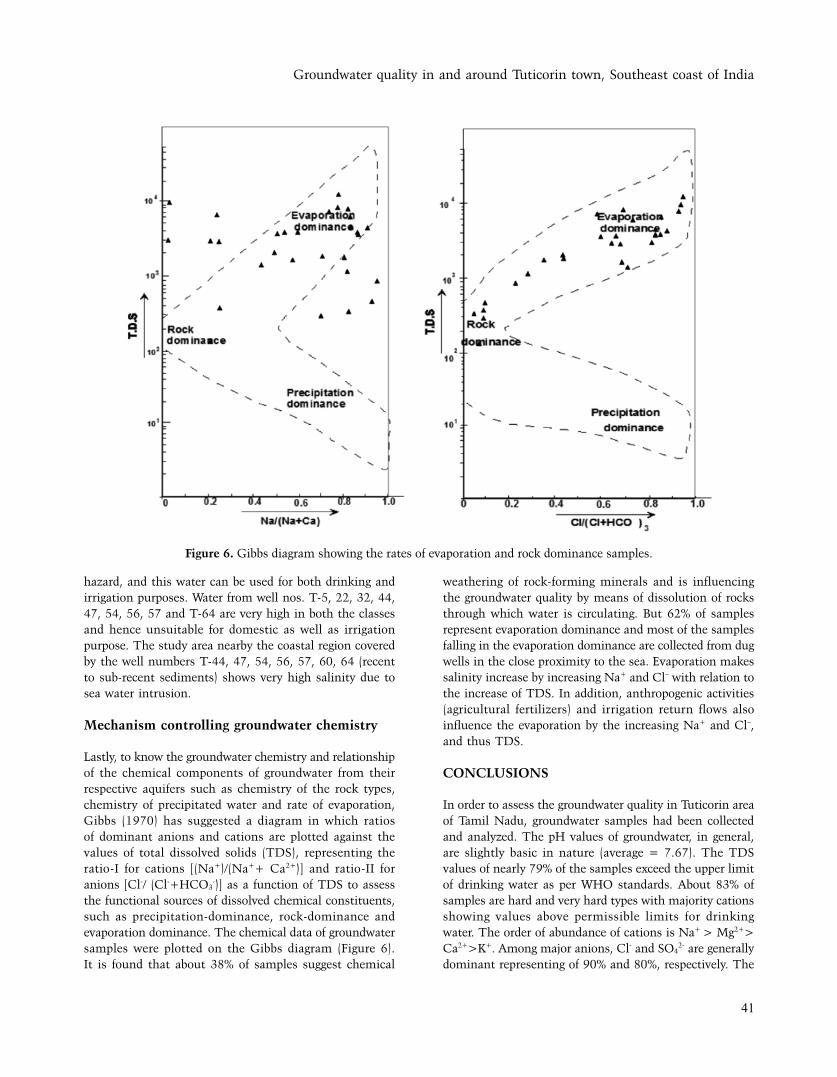
Mechanism controlling groundwater chemistry
Lastly, to know the groundwater chemistry and relationship of the chemical components of groundwater from their respective aquifers such as chemistry of the rock types, chemistry of precipitated water and rate of evaporation, Gibbs (1970) has suggested a diagram in which ratios of dominant anions and cations are plotted against the values of total dissolved solids (TDS), representing the ratio-I for cations [(Na+)/(Na++ Ca2+)] and ratio-II for anions [Cl-/ (Cl-+HCO3
-)] as a function of TDS to assess the functional sources of dissolved chemical constituents, such as precipitation-dominance, rock-dominance and evaporation dominance. The chemical data of groundwater samples were plotted on the Gibbs diagram (Figure 6). It is found that about 38% of samples suggest chemical
weathering of rock-forming minerals and is influencing the groundwater quality by means of dissolution of rocks through which water is circulating. But 62% of samples represent evaporation dominance and most of the samples falling in the evaporation dominance are collected from dug wells in the close proximity to the sea. Evaporation makes salinity increase by increasing Na+ and Cl– with relation to the increase of TDS. In addition, anthropogenic activities (agricultural fertilizers) and irrigation return flows also influence the evaporation by the increasing Na+ and Cl–, and thus TDS.
CONClUSIONS
In order to assess the groundwater quality in Tuticorin area of Tamil Nadu, groundwater samples had been collected and analyzed. The pH values of groundwater, in general, are slightly basic in nature (average = 7.67). The TDS values of nearly 79% of the samples exceed the upper limit of drinking water as per WHO standards. About 83% of samples are hard and very hard types with majority cations showing values above permissible limits for drinking water. The order of abundance of cations is Na+ > Mg2+> Ca2+>K+. Among major anions, Cl- and SO4
2- are generally dominant representing of 90% and 80%, respectively. The
Figure 6. Gibbs diagram showing the rates of evaporation and rock dominance samples.

Somvir Singh, N.C. Mondal and V.S. Singh
42
order of anionic abundance is in the order of Cl->SO42-
>HCO3-> NO3
->F-. The irrigation water quality studies show that about 90% samples fall beyond permissible limits, hence are not suitable for agricultural purpose. Based on the relative dominance of major cations and anions, different hydrogeochemical facies have been identified and majority of the samples are represented by Na-Cl and Ca-Cl2-types of water. Quality of groundwater in the open well samples are mainly by evaporation while remaining samples are dominated by chemical weathering of rock forming minerals. The spatial variation of groundwater parameters shows increasing values of chemical parameters towards the sea in the study area.
ACKNOWleDGMeNTS
The entire study is financed by SIIL, Tuticorin. The officials of SIIL have been always helpful during the field investigation. The authors have received valuable information from SIIL, CGWB, Chennai and Department of Geology, VOC Collage, Tuticorin, which have been useful for this investigation. Director, CSIR-NGRI, Hyderabad, Chairman, CGWB and Head of Office, UR, Dehradun have encouraged and provided all necessary facilities. We thank Dr. R. Rangarajan and Prof. B. Venkateswara Rao, for their constructive suggestions/comments to enhance the quality of the manuscript. We extend our thanks to Dr. M.R.K. Prabhakar Rao for detailed editing. We thank the Chief Editor for his support.
Compliance with ethical Standards
The authors declare that they have no conflict of interest and adhere to copyright norms.
ReFeReNCeS
American Public Health Association (APHA) 1985. Standard
methods for the examination of water and wastewater,
16th ed., Washington DC, USA., Am. Public Health Assoc,
pp: 100.
Antony Ravindran, A., and Mondal, N.C., 2015. Geotechnical
investigation for resort construction using resistivity and
granulomertic studies in Pattinamaruthur coast, Southern
India, Geotechnical & Geological Engineering, v.33, no.3,
pp: 1-16.
Balasubramanaian, A.R., Thirugnana, S., Chellaswamy, R., and
Radhakrishnan, V., 1993. Numerical modeling for prediction
and control of saltwater enchroment in the coastal aquifers
of Tuticorin, Tamil Nadu. Tech. Report, pp: 21.
Batayneh, A.T., 2006. Use of electrical resistivity methods for
detecting subsurface fresh and saline water and delineating
their interfacial configuration: A case study of the eastern
Dead Sea coastal aquifers, Jordan. Hydrogeological Journal,
v.14, pp: 1277–1283.
Brown, E., Skougstad, M.W., and Fishmen, M.J., 1983. Method
for collection and analyzing of water samples for dissolved
minerals and gases, Washington DC, USA: U.S. Govt.
Printing Office, pp: 75.
Edmunds, W.M., Shand, P., Hart, P., and Ward, R.S., 2003. The
natural (baseline) quality of groundwater: a UK pilot study,
Sci Total Environ, pp: 310:25–35
Freeze, R.A., and Cherry, J.A., 1979. Groundwater, Printice-Hall,
New Jersey.
Gibbs, R.J., 1970. Mechanisms controlling world’s water chemistry,
Science, pp: 1089-1090.
Hem, J. D., 1989. Study and interpretation of the chemical
characteristics of natural water, U.S.G.S. Water-Supply Paper,
US Government Printing Office, Washington DC., v.2254.
Kim, K.Y., Park, Y.S., Kim, G.P., and Park, K.H., 2009. Dynamic
freshwater–saline water interaction in the coastal zone of
Jeju Island, South Korea, Hydrogeol. J., v.17, pp: 617–629.
Mondal, N.C., Singh, V. S., Puranik, S.C., and Singh, V.P.,
2010b. Trace element concentration in groundwater of
Pesarlanka Island, Krishna Delta, India, Environ.Monit.
Assess., v.163, pp: 215–227.
Mondal, N. C., Singh, V. S., Saxena, V. K., and Prasad, R. K.,
2008. Improvement of groundwater quality due to fresh
water ingress in Potharlanka Island, Krishna delta, India,
Environ. Geol., v.55, no.3, pp: 595-603.
Mondal, N.C., Singh, V. P., Singh, V. S., and Saxena, V. K., 2010a.
Determining the interaction between groundwater and saline
water through groundwater major ions chemistry. J. Hydrol.,
v.388, no.1–2, pp: 100–111.
Mondal, N.C., Singh, V. S., and Rangarajan, R., 2009. Aquifer
characteristics and its modeling around an industrial
complex, Tuticorin, Tamil Nadu, India: A case study, J Earth
Sys. Sci., v.188, no.3, pp: 231-244.
Nair, R., Kalariya, T., and Chanda, S., 2005. Antibacterial activity
of some selected Indian medicinal flora, Turk. J. Biol, v.29,
pp: 41-47.
Piper, A.M., 1953. A Graphic Procedure in the Geochemical
Interpretation of Water Analysis. Washington D.C.: United
States Geological Survey. ISBN ASIN: B0007HRZ36, pp:
1475–1483.
Rajmohan, N., Elango, L., Ramachandran, S., and Natarajan.
M., 2000. Major ion correlation in groundwater of
Kancheepuram Region, South India, Indian J. Environ.
Protection, v.20, no.3, pp:188–193.
Rangarajan, R., Mondal, N.C., Singh, V.S., and Singh, S. V., 2009.
Estimation of natural recharge and its relation with aquifer
parameters in and around Tuticorin town, Tamil Nadu,
India, Curr. Sci., v.97, no.2, pp: 217-226.
Richard, L.A., 1954. Diagnosis and improvement of saline and
alkali soils. Agriculture handbook 60. US Department of
Agriculture, Washington DC.
Groundwater quality in and around Tuticorin town, Southeast coast of India
43
Richter, B.C., and Kreitler, C.W., 1993. Geochemical techniques
for identifying sources of groundwater salinization (258),
CRC Press.
Sarwade, D.V., Nandakumar, M.V., Kesari, M.P., Mondal, N.C.,
Singh, V.S., and Singh, B., 2007. Evaluation of sea water
ingress into an Indian Attoll, Environ. Geol., v.52, no.2,
pp: 1475–1483.
Sawyer, G.N., and McMcartly, D.L., 1967. Chemistry of sanitary
engineers, 2nd edn. McGraw Hill, New York, pp: 518.
Saxena, V. K., Mondal, N.C., and Singh, V.S., 2004. Identification
of seawater ingress using Sr and B in Krishna delta, Curr.
Sci., v.86, no.4, pp: 586–590.
Saxena, V. K., Singh, V. S., Mondal, N.C., and Jain, S.C., 2003.
Use of chemical parameters to delineation fresh groundwater
resources in Potharlanka Island, India. Environ. Geol., v.44,
no.5, pp: 516–521.
Sherif, M., and Kacimov, A., 2007. Seawater intrusion in
the coastal aquifer of Wadi Ham, UAE: A newfocus on
groundwater/seawater interactions. In Proceedings of
symposium HS 1001 at IUGG 2007, Perugia. IAHS Publ.
312, IAHS, Wallingford, UK, pp: 315–325.
Singh, V.S., Mondal, N.C., Singh, S., and Negi, B.C., 2006.
Hydrogeological and geophysical investigations to delineate
aquifer zone around SIIL, Tuticorin, Tamilnadu,Tech. Rept.
No. NGRI-2006-GW- 564, pp: 24.
Singh, V.S., Sarwade, D.V., Mondal, N.C., Nanadakumar, M.V.
and Singh, B., 2009. Evaluation of groundwater resources
in a tiny Andrott Island, Union Territory of Lakshadweep,
India, Environ. Monit. Assess.t, v.158, no.1-4, pp: 145-154.
Sukhija, B.S., Varma, V. N., Nagabhushanam, P., and Reddy, D.V.,
1996. Differentiation of paleomarine and modern seawater
intruded salinities in coastal groundwaters (of Karaikal
and Tanjavur, India) based on inorganic chemistry, organic
biomarker fingerprints and radiocarbon dating, J. Hydrol.,
v.174, pp: 173–201.
Todd, D.K., 1980. Groundwater hydrology, 2nd ed., New York:
Wiley.
Villholth, K.G., Manamperi, A.S.P., and Buergi, N., 2006.
Chemical characteristics of Tsunami-affected groundwater
and lagoon on the east coast of Sri Lanka. In: 32nd
WEDC international conference, Colombo, Sri Lanka on
“Sustainable development of water resources, water supply
and environmental sanitation”, pp: 334–340.
World Health Organization (WHO), 1993. Guidelines for drinking
water quality, recommendations, 2nd edn. WHO, Geneva,
v.1, pp: 130.