niolson_1.pdf - Deep Blue Repositories
171
Microscopic and Spectroscopic Analysis of Atmospheric Aerosols from Organic and Freshwater Sources by Nicole Olson A dissertation submitted in partial fulfillment of the requirements for the degree of Doctor of Philosophy (Chemistry) in the University of Michigan 2021 Doctoral Committee: Assistant Professor Andrew P. Ault, Chair Professor Zhan Chen Professor Stephen Maldonado Professor Allison L. Steiner
-
Upload
khangminh22 -
Category
Documents
-
view
1 -
download
0
Transcript of niolson_1.pdf - Deep Blue Repositories

Microscopic and Spectroscopic Analysis of Atmospheric Aerosols from Organic and Freshwater
Sources
by
Nicole Olson
A dissertation submitted in partial fulfillment
of the requirements for the degree of
Doctor of Philosophy
(Chemistry)
in the University of Michigan
2021
Doctoral Committee:
Assistant Professor Andrew P. Ault, Chair
Professor Zhan Chen
Professor Stephen Maldonado
Professor Allison L. Steiner

ii
Dedication
For my parents, and their unwavering support and unconditional love.
“Like branches on a tree, we all grow in different directions, yet our roots remain forever
connected.”

iii
Acknowledgements
First, I would like to thank my advisor, Dr. Andrew Ault. I never thought I would have the
opportunity to work with you after first crossing paths when I was 10 years old. Your passion for
science and dedication to discovery have made me a better scientist, and for that I’ll forever be
grateful. Thank you to my committee members, Drs. Chen, Maldonado, and Steiner, for advice
and feedback throughout the years. I’ve been fortunate to work with a number of brilliant
collaborators that include: Dr. Jason Surratt and the Surratt group, Dr. Kerri Pratt and the Pratt
group, Dr. Cassie Gaston and the Gaston group, Dr. Judy Westrick, Dr. Johnna Birbeck, Dr.
Stephen Jacquemin, Aaron Parker, Dr. Paul Shepson, and Dr. “Nate” Slade. Thank you to my
undergraduate advisor, Dr. Louise Stracener, for encouraging me to apply to graduate schools
when I wasn’t so sure.
To members of the Ault and Pratt groups, who are talented scientists and even better
friends. Your companionship and comradery helped me navigate through graduate school, and I
feel privileged to have met life-long friends at Michigan. To Nancy/Jessica, thank you for
introducing me to hot pot, boxing, and speaking Chinese, and for being the best aunt to my cat. To
Jia, for always checking my math, enabling my bubble tea addiction, and letting me beat you in
Uno. To Madeline, for leading lunch-time meditation circles and teaching me that I can enjoy
Indian food. To Jamy, for hosting Bachelor/Bachelorette fantasy leagues and being a great friend.
To Yao, for bringing positivity and excitement into the lab, which was especially appreciated in
my later years of graduate school. To Drs. Becky Craig, Amy Bondy, Nate May, Rachel Kirpes,
Kim Daley, and Alison Fankhauser, thank you for being the best mentors I could have imagined.

iv
Lastly, but most important, my family. Thank you to my grandparents for only being a
phone call away and for being some of the few people to read this dissertation cover to cover. To
my cat, Halle, who will never read this but should be thanked nonetheless. She helped transform
our apartment into a home and taught me that sometimes, the best way to deal with stress is to take
a long nap in the sun. To the Forbes family for accepting me as one of their own and trusting me
to take care of their Jake. To my brother, Jacob “Cobb”, who is currently pursuing a Ph.D. because
he can’t let Big Sis have all the fun! You’re not only my brother, you’re my best friend. I cherish
our time spent together and having an ally to gripe about graduate school with. You make me a
better person and being your Big Sis has been the greatest honor of my life. To my Dad, thank you
for instilling in me a love for science and the environment at a young age. I am writing this today
because you have always believed in me and encouraged me to chase my dreams, no matter how
hard the journey is. You are the most generous person I know, especially as I remember the time
that you took 2 weeks off work to live with me in Michigan because I was so scared to do it all
alone. I should also thank you for driving 14 hours (or less if you’re behind the wheel) to help me
move almost every single year. To my Mom, whose infamous “girls weekends” always gave me
something to look forward to. Your ability to telepathically sense when I’m struggling is
incredible, and was usually well-timed with a care package containing my favorite foods. Your
support and desire to celebrate all my accomplishments, no matter how small, truly helped me get
through the hard times. Finally, to my Jake. Your “all in” attitude started the moment I accepted
the offer to attend graduate school. Thank you for being the first person I want to tell good news
to, for all the times you picked me up and dropped me off at school, for reminding me what’s
important in life, and for moving to Michigan to make pursuing my dreams easier for me. I feel

v
like the luckiest woman in the world to have met you and I cannot wait to see where we go from
here. To all my loved ones, thank you – I owe everything to you.

vi
Table of Contents
Dedication ...................................................................................................................................... ii
Acknowledgments ........................................................................................................................ iii
List of Figures ............................................................................................................................... ix
List of Tables .............................................................................................................................. xiii
List of Equations ........................................................................................................................ xiv
List of Appendices ....................................................................................................................... xv
Abstract ....................................................................................................................................... xvi
Chapter 1. Introduction ............................................................................................................... 1
1.1 Characteristics and Formation of Atmospheric Aerosol Particles ........................................ 1
1.1.1 Impacts on Climate and Human Health .......................................................................... 1
1.1.2 Aerosol Mixing State ...................................................................................................... 2
1.2 Physicochemical Characterization of Individual Aerosol Particles ...................................... 3
1.2.1 Electron Microscopy ....................................................................................................... 4
1.2.2 Raman Microspectroscopy ............................................................................................. 5
1.2.3 Atomic Force Microscopy – Infrared Spectroscopy ....................................................... 7
1.2.4 Optical Photothermal Infrared (O-PTIR) + Raman Spectroscopy ................................. 8
1.3 Research Objectives and Scope of Dissertation .................................................................... 9
Chapter 2. Reactive Uptake of Isoprene Epoxydiols Increases the Viscosity of the Core of
Phase-Separated Aerosol Particles ............................................................................................ 10
2.1 Introduction ......................................................................................................................... 10
2.2 Methods ............................................................................................................................... 10
2.2.1 Aerosol Generation ....................................................................................................... 13
2.2.2 Microscopy and Spectroscopy Analysis ....................................................................... 13
2.3 Results and Discussion ........................................................................................................ 16
2.4 Conclusions ......................................................................................................................... 26
Chapter 3. Lake Spray Aerosol Incorporated into Great Lakes Clouds ............................... 28

vii
3.1 Introduction ......................................................................................................................... 28
3.2 Methods ............................................................................................................................... 30
3.2.1 Aircraft Sampling ......................................................................................................... 30
3.2.2 Laboratory Aerosol Generation ................................................................................... 30
3.2.3 Microscopy of Ambient and Laboratory-Generated Particles ..................................... 30
3.3 Results and Discussion ........................................................................................................ 31
3.4 Conclusions ......................................................................................................................... 42
Chapter 4. Harmful Algal Bloom Toxins in Aerosol Generated from Inland Lake Water..44
4.1 Introduction ......................................................................................................................... 44
4.2 Methods ............................................................................................................................... 47
4.2.1 Freshwater Sample Collection and Aerosol Generation ............................................... 47
4.2.2 Bulk Measurement Techniques and Toxin Characterization ....................................... 48
4.2.3 Single Particle Analysis ................................................................................................ 48
4.2.4 Analysis of Insoluble Residues ..................................................................................... 49
4.3 Results and Discussion ........................................................................................................ 50
4.4 Conclusions ......................................................................................................................... 62
Chapter 5. Harmful Algal Bloom Toxins in Ambient Freshwater Aerosol ........................... 65
5.1 Introduction ......................................................................................................................... 64
5.2 Materials and Methods ........................................................................................................ 66
5.2.1 Freshwater and Aerosol Collection .............................................................................. 66
5.2.2 LC/MS/MS Toxin Characterization ............................................................................. 67
5.2.3 Single Particle Analysis ................................................................................................ 67
5.2.4 Analysis of Insoluble Residues ..................................................................................... 67
5.3 Results and Discussion ........................................................................................................ 68
5.4 Atmospheric and Health Implications ................................................................................. 75
Chapter 6. Simultaneous Optical Photothermal Infrared (O-PTIR) and Raman
Spectroscopy of Submicrometer Atmospheric Particles ......................................................... 78
6.1 Introduction ......................................................................................................................... 77
6.2 Methods ............................................................................................................................... 80
6.2.1 Laboratory-Generated Aerosol Particle Samples ......................................................... 81
viii
6.2.2 Ambient Particle Sampling ........................................................................................... 82
6.2.3 Optical Photothermal Infrared (O-PTIR) Spectroscopy ............................................... 82
6.2.4 Raman Microspectroscopy ........................................................................................... 83
6.2.5 O-PTIR Imaging ........................................................................................................... 83
6.3 Results and Discussion ........................................................................................................ 82
6.4 Conclusions ......................................................................................................................... 90
Chapter 7. Conclusions and Future Directions ........................................................................ 91
7.1 Conclusions ......................................................................................................................... 91
7.2 Future Directions ................................................................................................................. 93
Appendices ................................................................................................................................... 96
References .................................................................................................................................. 123

ix
List of Figures
Figure 1.1. Radiative forcing estimates and uncertainties for greenhouse gases and aerosols. ..... 2
Figure 1.2. Representations of particle composition with increasing complexity and detail. ....... 3
Figure 1.3. Example SEM images and EDX maps of lake spray and sea spray aerosol. .............. 5
Figure 1.4. Raman map of an aerosol particle with highlighted regions showing the locations of
specific vibrational modes. ............................................................................................................. 6
Figure 1.5. Schematic of AFM-IR operation. ................................................................................ 7
Figure 1.6. Schematic of optical photothermal infrared (O-PTIR) + Raman spectroscopy. ......... 8
Figure 2.1. Schematic of experimental design to generate SOA particles. .................................. 17
Figure 2.2. AFM and SEM images of SOA particles. ................................................................. 19
Figure 2.3. 3D AFM height images and height traces of SOA particles. .................................... 20
Figure 2.4. Spreading ratios of SOA particles.. ........................................................................... 22
Figure 2.5. Plots depicting SOA morphology as a function of particle size. ............................... 23
Figure 2.6. SEM images and EDX spectra of SOA particles. ..................................................... 25
Figure 2.7. Raman spectra of SOA particles. ............................................................................... 26
Figure 3.1. Map depicting area of aircraft sampling with wind speed and wave height data.. .... 34
Figure 3.2. Map depicting cloud coverage and vertical profile measurements during aircraft
sampling. ....................................................................................................................................... 35
Figure 3.3. SEM images and EDX spectra of ambient and laboratory-generated LSA.. ............ 37
Figure 3.4. Elemental mole ratios of LSA, freshwater, and seawater.. ........................................ 39

x
Figure 3.5. Comparison of ambient particle types observed during aircraft sampling.. .............. 42
Figure 4.1. Map of sampling locations and microcystin concentrations at each location.. ......... 51
Figure 4.2. Chemical structure, chromatogram, and mass spectrum of microcystin-LR. ........... 53
Figure 4.3.Quantification of microcystin congeners present in Mona Lake freshwater and LSA.
....................................................................................................................................................... 56
Figure 4.4. Average size distributions for water samples and aerosol experiments. ................... 58
Figure 4.5. Mass spectra of biological and organic LSA particles from Mona and Muskegon
Lakes. ............................................................................................................................................ 60
Figure 4.6. Microcystin congeners present at all sampling locations with fraction of particle
types observed from each location. ............................................................................................... 62
Figure 5.1. Total microcystin and phycocyanin (blue-green algae, BGA) concentrations for each
freshwater sample. ........................................................................................................................ 69
Figure 5.2. Aerosolized toxins at Grand Lake St Marys. ............................................................. 70
Figure 5.3. O-PTIR (solid trace) and FTIR (dashed trace) spectra of microcystin-LR. .............. 71
Figure 5.4. O-PTIR (left, red trace) and corresponding Raman spectra (middle, green trace) of
representative individual particles defined as LSA, SOA, Biomass burning/soot/dust, and
biological....................................................................................................................................... 72
Figure 5.5. Scanning electron microscopy images with corresponding energy dispersive x-ray
spectra of representative individual particles defined as LSA, SOA, biomass burning, soot, dust,
and biological. ............................................................................................................................... 73
Figure 5.6. Average aerosol and POC number size distributions for each sampling location.. .. 75
Figure 6.1. Schematic of optical photothermal infrared spectroscopy.. ...................................... 83
Figure 6.2. IR and Raman spectra of ammonium sulfate particles on different substrates. ........ 85

xi
Figure 6.3. IR (left, red trace) and Raman (right, green trace) spectra of laboratory-generated
standards. ...................................................................................................................................... 86
Figure 6.4. IR (left, red trace) and Raman (right, green trace) spectra obtained from ambient
particles.. ....................................................................................................................................... 87
Figure 6.5. IR spectra and maps of a phase-separated particle.. .................................................. 89
Figure A.1. Experimental setup to generate SOA particles. ........................................................ 97
Figure A.2. AFM images of SOA particle re-humidified to the RH at which they were generated.
....................................................................................................................................................... 97
Figure A.3. SEM images of ambient particles collected during the Southern Oxidant and
Aerosol Study (SOAS) campaign in Centerville, AL, a rural forested location. .......................... 98
Figure A.4. AFM and SEM images of SOA generated at 30% RH. ............................................ 99
Figure A.5. SEM images of toluene SOA/sulfate particles generated at 30% RH before and after
IEPOX uptake.. ........................................................................................................................... 100
Figure A.6. Spreading ratios of SOA particles generated at 30% RH. ...................................... 100
Figure A.7. SEM-EDX and Raman spectra of seed particles before SOA coating. .................. 101
Figure A.8. SEM images of SOA particles.. .............................................................................. 102
Figure B.1. Aircraft flight path map of July 12, 2016 cloud water sampling. ........................... 104
Figure B.2. Inorganic ion concentrations for freshwater collected in Brevort, Michigan during
aircraft sampling on July 12, 2016. ............................................................................................. 105
Figure B.3. The average number size distributions of laboratory-generated LSA. ................... 106
Figure B.4. SEM images and EDX spectra of particle types identified as dust and SOA/biomass
burning during SEM-EDX analysis. ........................................................................................... 107
xii
Figure C.1. SEM-EDX and Raman analysis of insoluble residues present in Mona Lake
freshwater. ................................................................................................................................... 108
Figure C.2. Chromatograms showing separation of microcystin congeners present in Mona Lake
freshwater. Inset shows congeners present at lower concentrations. .......................................... 109
Figure C.3. Structures of all microcystin congeners analyzed. ................................................. 110
Figure C.4. pH of freshwater samples measured using pH paper. ............................................. 111
Figure C.5. Representative ATOFMS spectra of Mona Lake LSA classified as A) LSA salt, B)
LSA organic, and C) LSA biological particles. .......................................................................... 112
Figure C.6. ATOFMS spectra obtained by taking the difference of Mona Lake LSA salt and
Muskegon Lake LSA salt clusters. ............................................................................................. 113
Figure C.7. SEM images and EDX spectra of LSA particle types. ........................................... 114
Figure D.1. Sampling locations around Grand Lake St. Marys. ................................................ 116
Figure E.1. IR (left, red trace) and Raman (right, green trace) spectra of ammonium sulfate
crystals, illustrating the crystalline modes observed by Raman ................................................. 119
Figure E.2. IR (left, red trace) and Raman (right, green trace) spectra obtained from an
ammonium sulfate particle on a gold substrate........................................................................... 121
Figure E.3. Optical images of each particle analyzed in Figure 6.3. ......................................... 122
xiii
List of Tables
Table 4.1. Concentrations of microcystin congeners detected in freshwater and aerosol samples.
....................................................................................................................................................... 55
Table A.1. Experimentally determined Raman modes and tentative assignments for -pinene
and toluene SOA/sulfate. ............................................................................................................ 103
Table C.1. Liquid chromatography retention times of the microcystin congeners observed in
Mona Lake freshwater. ............................................................................................................... 109
Table E.1. Number of particles analyzed for each substrate or compound. .............................. 118
Table E.2. Table of heat capacity, heat conductivity, and refractive index values obtained from
literature for all standard compounds tested. .............................................................................. 119
Table E.3. Table listing peaks identified by IR and Raman for each substrate tested. .............. 120
Table E.4. Table listing all vibrational modes experimentally determined in IR and Raman
spectra. ........................................................................................................................................ 121
xiv
List of Equations
Equation 2.1. Volume Equivalent Diameter .......................................................................... 16
Equation 2.2. Spreading Ratio ................................................................................................ 16
Equation 6.1 Photothermal Expansion ................................................................................. 79
Equation 6.2 Photothermal Response .................................................................................... 79
Equation C.1 Total Aerosol Volume.................................................................................... 115
Equation C.2 Aerodynamic Diameter .................................................................................. 115
Equation C.3 Mass Concentration ........................................................................................ 115
Equation C.4 Mass Fraction ................................................................................................. 115
Equation C.5 Enrichment Factor .......................................................................................... 115
xv
List of Appendices
Appendix A. Reactive Uptake of Isoprene Epoxydiols Increases the Viscosity of the Core of
Phase-Separated Aerosol Particles Supplemental Information..................................................... 97
Appendix B. Lake Spray Aerosol Incorporated into Great Lakes Clouds Supplemental
Information ................................................................................................................................. 105
Appendix C. Harmful Algal Bloom Toxins in Aerosol Generated from Inland Lake Water
Supplemental Information .......................................................................................................... 109
Appendix D. Harmful Algal Bloom Toxins in Ambient Freshwater Aerosol Supplemental
Information ................................................................................................................................. 117
Appendix E. Optical Photothermal Infrared (O-PTIR) and Raman Spectroscopy of
Submicrometer Atmospheric Particles Supplemental Information ............................................ 118
xvi
Abstract
Atmospheric aerosols impact climate by scattering or absorbing solar radiation and by
participating in the formation of clouds and ice crystals. Additionally, the inhalation of aerosol
particles contributes significantly to cardiovascular and cardiopulmonary diseases, and is a leading
cause of mortality on a global scale. Despite the climate and health implications of aerosol
particles, the magnitude of their impacts is still highly uncertain. The physical and chemical
(physicochemical) properties of aerosol particles determine their impacts, though these properties
are analytically challenging to measure due to their small size, chemical complexity, and
continuous evolution in the atmosphere. Single-particle methods are necessary to build upon our
understanding of the multiphase aerosol processes occurring in the atmosphere, and to elucidate
the impact of these particles on climate and health. In this dissertation, single-particle microscopic
and spectroscopic methods were applied to study both ambient and laboratory-generated particles
to enable better predictions of the climate and health impacts of aerosol particles.
Secondary organic aerosol (SOA), formed from multiphase reactions between aerosol
particles and atmospheric gases, was systematically studied in an indoor atmospheric chamber.
Particles were collected at multiple points during the multiphase reaction for physicochemical
analysis using electron microscopy, atomic force microscopy, and Raman microspectroscopy.
Particles underwent physicochemical transformation after heterogeneous reactions, leading to the
formation of isoprene-derived organosulfate compounds in the particle phase that increased
particle viscosity and altered the internal structure of particles. This study highlighted the dynamic
physicochemical properties of SOA, a major fraction of organic aerosol in the atmosphere.
Particles emitted from freshwater lakes, known as lake spray aerosol (LSA), were studied
through laboratory and ambient observations to determine the impacts of this newly identified
particle type on climate and health. An aircraft campaign used microscopy to show that cloudwater
and ambient LSA over Lake Michigan have very similar physicochemical properties, suggesting
the incorporation of LSA into clouds with likely contributions to lake-effect precipitation. In a
separate study, freshwater was collected during a severe harmful algal bloom (HAB) and analyzed

xvii
for algal toxins using mass spectrometry. Aerosol particles were generated in the laboratory from
the freshwater samples, with an observed enrichment of hydrophobic toxins in the aerosol phase.
Following this laboratory-based study, a field campaign was performed at a lake experiencing a
severe HAB. Freshwater and aerosol samples were analyzed for the presence of algal toxins using
mass spectrometry and infrared spectroscopy, and the amount of aerosolized toxins in ambient
environments was determined. These projects highlight a new route of exposure to HAB toxins
that has implications for people living near or downwind of HABs globally.
Lastly, a new analytical spectroscopy method was developed and applied to characterize
vibrational modes present in submicron aerosol particles. This method combined optical
photothermal infrared (O-PTIR) and Raman spectroscopy for simultaneous spectroscopic
acquisition. This project identified the ideal substrate for analysis, characterized single- and multi-
component standards, and showed the first classification of ambient aerosol particles with O-PTIR
+ Raman. The spectroscopic analysis of submicron particles enabled exploration of samples
previously unstudied by vibrational spectroscopy, significantly advancing the fields of
atmospheric and analytical chemistry.
The methods and results obtained in this dissertation have resulted in detailed
measurements of particle physicochemical properties, providing new insights into the mechanisms
of multiphase atmospheric processing and improving understanding of the impacts of aerosols on
climate and human health.
1
Chapter 1. Introduction
1.1 Characteristics and Formation of Atmospheric Aerosol Particles
Atmospheric aerosols are a collection of solid or liquid particles suspended in the air.1
Aerosol particles can range in size from 1 nm to 100 µm in diameter, with modes referring to
nucleation (< 10 nm), Aitken (10 – 100 nm), accumulation (100 – 1000 nm), and course (>1 µm)
size ranges.2 Particles are formed from a plethora of natural and anthropogenic sources, each with
complex physical and chemical (physicochemical) properties that vary for each individual
particle.1,3 Aerosols can be directly emitted into the atmosphere as solid or liquid particles,
otherwise known as primary aerosol.1 One example of primary aerosol is the production of lake
spray aerosol (LSA) from wave-breaking and bubble bursting in freshwater environments.4,5
Conversely, secondary particles are formed through the oxidation and condensation of atmospheric
gases onto pre-existing particulate matter.1,6 In addition to secondary aerosol formation, particles
can undergo modifications resulting from multiphase physicochemical processing during their
atmospheric lifetime.1 Particulate matter has a range of possible morphologies, from nearly
spherical (like secondary aerosol) to amorphous (like LSA) to chain agglomerates (like soot).5,7,8
Aerosol particles impact climate and human health, with the extent of these impacts dependent on
particle physicochemical properties.1,3
1.1.1 Impacts on Climate and Human Health
Atmospheric aerosol particles affect climate directly by scattering or absorbing solar
radiation and indirectly by acting as cloud condensation nuclei (CCN) or ice nucleating particles
(INP).1,6,9 Atmospheric particles represent the largest source of uncertainty in global radiative
forcing (Figure 1.1) due to their complex and dynamic physiochemical properties, combined with
high temporal and spatial variability.10 In addition to impacting climate, increased concentrations
of atmospheric particles are linked to negative health effects,11 with over 4 million premature
deaths attributed annually to atmospheric pollution.12 Despite the importance of aerosols,

2
mechanistic understanding of many key atmospheric processes remains low, in part due to
challenges associated with measuring dynamic aerosol physicochemical properties. With aerosol
impacts closely tied to the properties of individual particles, understanding the chemical
composition and distribution of species within populations is essential to uncovering the extent of
their influence.
Figure 1.1. Radiative forcing estimates and uncertainties for greenhouse gases and aerosols.
Reproduced from Stocker et al.10
1.1.2 Aerosol Mixing State
Aerosol physicochemical mixing state is an all-encompassing term that refers to the
distribution of both chemical and physical features within an aerosol population, and is challenging
to measure and quantify.3,13,14 The distribution of chemical species within an aerosol population
can be described in terms of external and internal mixtures. An external mixture consists of
particles that contain only one pure species per particle (e.g. ammonium sulfate or soot), while an
internal mixture describes a population where each particle has the same chemical species present
in the same abundance (e.g. all particles contain the same amounts of sulfate and soot).13 However,
internal and external mixtures are idealized cases, and neither are representative of most ambient
aerosol populations. As changes in chemical composition affect particle properties such as

3
reactivity,15,16 hygroscopicity,17 and optical scattering,18,19 it is imperative to understand the
chemical mixing state of individual particles in a population. Figure 1.2 illustrates the different
chemical and physical aspects that can be incorporated into aerosol mixing state.3 Despite the
important implications of mixing state for aerosol impacts on climate, few direct measurements of
aerosol mixing state exist because this requires the measurement of individual particles which is
time intensive and analytically challenging.
Figure 1.2. Representations of particle composition with increasing complexity and detail. Chemical mixing state provides information on primary versus secondary components, but does
not provide spatial information or other physical properties. Physicochemical mixing state
provides both chemical detail and spatial information or physical properties. Note that the locations
of the colors in the chemical mixing state particles are not meant to convey spatial distribution,
only the presence of both primary and secondary components. Reproduced from Ault and Axson.3
1.2 Physicochemical Characterization of Individual Aerosol Particles
Single–particle microscopic and spectroscopic methods can be used to study aerosol
physicochemical mixing state.3 Microscopy provides information on particle size and morphology,

4
while spectroscopic methods yield detailed chemical information regarding elemental composition
or functional groups present, depending on the type of spectroscopy utilized. The offline and non-
destructive nature of these techniques allows for analysis of the same sample by multiple
techniques, providing a multimodal approach to characterizing aerosol mixing state. Typically, an
aerosol impactor with size-resolved stages collects particles onto substrates for various offline
microscopic and spectroscopic analyses. The single–particle microscopy and spectroscopy
methods used in this dissertation are described below.
1.2.1 Electron Microscopy
Scanning electron microscopy with energy dispersive X-ray spectroscopy (SEM-EDX) has
been used to characterize the structure and elemental composition of aerosol particles down to 50
nm in diameter.3,5,20-24 With SEM, an electron beam is focused on the sample to produce images
of particles impacted onto substrates. The ability to detect different electronic transitions provides
information on surface structure (if utilizing back-scattered electrons and a thicker substrate) or
internal features (if utilizing transmitted electrons and a thin sample),3 depending on the substrate
and sample composition. Recently, tilted-SEM has been used to obtain information on three-
dimensional particle morphology by imaging particles at separate angles.25,26 Electron imaging
releases element-specific X-rays that can be collected simultaneously to obtain semi-quantitative
elemental spectra with high spatial resolution (<10 nm).3 Rastering the electron beam across the
sample, otherwise known as elemental mapping, provides physicochemical mixing state
information for individual particles with different elemental composition and structure (Figure
1.3).27 The automation of computer-controlled SEM-EDX (CCSEM-EDX) allows for analysis of
thousands of particles per sample to increase throughput and enables analysis of a statistically
representative number of particles.3,23,28 Clustering algorithms have been developed for analysis
of large CCSEM-EDX datasets to mathematically group individual particles based on
physicochemical similarity and limit human bias during sorting.29-32 The grouping of similar
particles enables size-resolved characterization of aerosol sources.

5
Figure 1.3. Example SEM images and EDX maps of lake spray and sea spray aerosol. SEM images
and EDX elemental maps of representative: (A) SSA and (B) LSA particles collected at UMBS on
July 16, 68 2014 9:00 – 21:00 EST, as well as LSA generated in the laboratory from (C) Lake
Superior and (D) Lake Michigan freshwater sample. Reproduced from May et al.27
1.2.2 Raman Microspectroscopy
Raman microspectroscopy has been used to characterize aerosol physicochemical
properties by combining an optical microscope with vibrational spectra that probe functional
groups present in individual particles > 1 µm.3,22,33-37 Raman spectroscopy probes molecular
vibrations, rather than the electronic transitions utilized in SEM-EDX, to provide information on
covalently bonded organic and inorganic functional groups. Raman spectroscopy has the
sensitivity to differentiate species in slightly different bonding environments (i.e. NaNO3 vs. NO3-
),38 which can be extremely useful in determining aerosol evolution and aging. Raman has also
been used to study the relative abundances of acids and their conjugate bases to calculate the pH
of individual aerosol particles.33,35 This high sensitivity has allowed for the detection of complex
organosulfate species, an indicator of multiphase isoprene epoxydiol uptake,39-41 in individual
particles generated in the laboratory34 and observed in the ambient environment.42 Similar to SEM-
EDX, mapping can be performed to identify the location of specific molecular species within an
individual aerosol particle (Figure 1.4),43 enabling analysis of aerosol physicochemical properties.
In addition to the detailed chemical information obtained by Raman, another advantage over SEM-
EDX is that Raman analysis is performed under ambient pressure and temperature to limit particle
distortion and the loss of volatile species. Furthermore, the coupling of relative humidity (RH)
cells to Raman analysis has enabled study of the hygroscopic growth of particles,44 which is

6
challenging to do under the vacuum conditions of traditional SEM. Recently, a computer-
controlled method (CC-Raman) was developed to enable analysis of hundreds of particles per
sample.45 Though recent advances of Raman, such as surface enhanced Raman spectroscopy
(SERS)43,46 and tip enhanced Raman spectroscopy (TERS),47 have allowed for analysis of slightly
submicron particles, the uneven enhancements observed make it difficult to perform quantitative
measurements. Similarly, the ability of biological and mineral dust particles to naturally
fluoresce48,49 can often overwhelm Raman signal and often requires coupling to other vibrational
spectroscopies, such as infrared (IR).
Figure 1.4. Raman map of an aerosol particle with highlighted regions showing the locations of
specific vibrational modes. (a) Optical image of aerosol particle, (highlighted in red) against SERS
substrates, and mapped area (blue box). (b) Map of the aerosol particle (outlined in yellow dashes)
showing the location of three different enhanced chemical species at 1022 cm−1 (green), 1370 cm−1
(red), and 1480 cm−1 (blue). (c) Raman spectra accompanying the mapped intensities. Reproduced
from Craig et al.43

7
1.2.3 Atomic Force Microscopy – Infrared Spectroscopy
Atomic force microscopy coupled to infrared spectroscopy (AFM-IR) has recently been
applied to study IR-active vibrational modes in aerosol particles down to 50 nm under ambient
conditions.50-52 By detecting the photothermal expansion of an individual particle illuminated by a
tunable IR laser with a cantilever, IR absorption-like spectra can be obtained with < 50 nm spatial
resolution (Figure 1.5).53-55 This technique enables analysis of samples under the diffraction-
limited resolution of other vibrational spectroscopies, such as Raman and IR. The combination of
IR spectra with the high-resolution imaging obtained from traditional AFM has enabled study of
particle hygroscopicity,44,56 polymer degradation,51 and particle phase state.34,50 The ability to
detect vibrational modes in submicron particles that have relevance to the climate and health
impacts of particles is a significant breakthrough for both analytical and atmospheric chemistry.
However, as with any method, there are limitations. The need for the AFM tip to be in contact with
the samples makes analysis of soft or liquid samples difficult. Additionally, obtaining spectra is
time intensive, often taking 20+ minutes for a single spectrum and even longer to collect a map.
Therefore, a contact-less and rapid method is needed for analysis of vibrational modes present in
submicron aerosol particles under ambient conditions.
Figure 1.5. Schematic of AFM-IR operation. Local thermal expansion from the IR laser is detected
by the cantilever, allowing IR spectra with ∼50 nm resolution to be collected. IR spectra were
collected from individual ammonium sulfate particles using AFM-IR (this study) and micro-FT-
IR. Reproduced from Bondy et al.50

8
1.2.4 Optical Photothermal Infrared (O-PTIR) + Raman Spectroscopy
Optical photothermal infrared (O-PTIR) spectroscopy is a new, contact-less analytical
method that circumvents the diffraction limitations of traditional IR microscopy by using changes
in the scattering intensity of a continuous wave visible laser to detect the photothermal expansion
that occurs when a vibrational mode is excited by a tunable IR laser (Figure 1.6).57-61 The change
in intensity of the elastically (Rayleigh) scattered photons is processed to obtain an IR absorption-
like spectrum. As inelastically (Stokes) scattered photons are also generated, they can be
simultaneously collected to obtain Raman spectra at the same point and with the same spatial
resolution as the O-PTIR spectra. Because the spatial resolution is determined by the visible laser
and not the longer-wavelength IR laser, spectra are obtained with a spatial resolution of ~500 nm,
orders of magnitude better than previous aerosol analysis using IR microscopy.3 Like all
previously mentioned techniques, O-PTIR is able to map the location of specific vibrational modes
located within individual particles,62-64 giving insight into particle physicochemical properties and
mixing state. O-PTIR + Raman was applied to study the physicochemical properties of laboratory-
generated and ambient particles for the first time as part of this work (Chapter 6). The ability to
collect multiple types of vibrational spectra simultaneously with < 1 min acquisition times
significantly furthers throughput of complex particle analysis. The contact-less nature of this
technique makes it a highly useful method for studying other liquid or heterogeneous samples.
Figure 1.6. Schematic of optical photothermal infrared (O-PTIR) + Raman spectroscopy. Infrared
and visible light are focused on the sample through a Cassegrain objective, inducing a
photothermal expansion of the particle. Light scattered from the sample (Δpscat) is proportional to
the photothermal expansion of the particle (Δh) and absorbance of IR light (AbsIR). Simultaneous
IR and Raman spectra are obtained from a single point. Reproduced from Olson et al.57

9
1.3 Research Objectives and Scope of Dissertation
The research presented in this dissertation uses established and novel single–particle
microscopy and spectroscopy methods to provide detailed information on the physicochemical
mixing state of aerosol particles from freshwater and secondary organic sources. Chapter 2
describes a laboratory chamber study that examines the change in particle composition and
viscosity after reaction with atmospheric gases, providing insight into the dynamic
physicochemical properties of atmospheric aerosol over the course of their lifetime. This Chapter
also discusses implications for further heterogeneous uptake and climate-relevant properties such
as water uptake and cloud formation. Chapter 3 investigates the influence of freshwater-derived
particles on cloud formation over the Great Lakes, providing evidence that freshwater aerosol can
contribute to cloud formation in regions with large bodies of freshwater. This Chapter gives insight
into the climate-relevant properties of this specific particle type, which had not been previously
studied at the single-particle level. Chapters 4 and 5 explore the aerosolization of harmful algal
bloom toxins in freshwater environments, with separate focuses on laboratory-based experiments
(Chapter 4) and ambient measurements (Chapter 5). The identification and quantification of algal
toxins in aerosol particles highlights potential exposure risks for populations living near algal
blooms globally, and suggests the importance of simultaneously measuring bulk phase (water
column) and aerosolized toxins. Chapter 6 describes the application of O-PTIR + Raman
spectroscopy to characterize vibrational modes present in submicron atmospheric particles for the
first time. This Chapter also applied O-PTIR + Raman to study heterogeneous aerosol particles,
showing that this new analytical method can be applied to other fields beyond aerosol science.
Finally, Chapter 7 summarizes the conclusions of this work and future directions for on-going
projects. The results presented herein improve our understanding of the physicochemical
properties of organic and freshwater-derived particles and describe a new method to characterize
submicron atmospheric particulate matter, ultimately furthering understanding of the climate and
health impacts of particulate matter.

10
Chapter 2. Reactive Uptake of Isoprene Epoxydiols Increases the Viscosity of the Core of
Phase-Separated Aerosol Particles
Adapted with permission from Olson, N. E., Lei, Z., Craig, R. L., Zhang, Y., Chen, Y., Lambe, A.
T., Zhang, Z., Gold, A., Surratt, J. D., and Ault, A. P.: Reactive Uptake of Isoprene Epoxydiols
Increases the Viscosity of the Core of Phase-Separated Aerosol Particles, ACS Earth Space Chem.,
3, 8, 1402-1414, 2019.
https://doi.org/10.1021/acsearthspacechem.9b00138 Copyright 2019 American Chemical Society
2.1 Introduction
Climate-relevant aerosol properties, such as the ability to scatter or absorb solar radiation
and alter cloud or precipitation patterns by acting as cloud condensation nuclei (CCN) and ice
nuclei (IN),6,65,66 are dependent on individual particle physiochemical properties, including
chemical composition, aerosol phase, and morphology.6,65,67,68 These properties are dynamic as the
diurnal cycle of relative humidity (RH) modifies the water content of aerosols and, thus, alters the
physical state of particles, including particle phase state and viscosity.69-72 Changes in RH and
particle composition can both lead to transitions of particle phase states,70-75 which range from
liquid and semi-solid to glassy and crystalline state, and can include the separation of phases within
individual aerosol particles.76,77 Phase-separated particles typically form when inorganic and
organic phases are no longer miscible at higher molar concentrations at lower RH.74 Inorganic
particles, particularly sulfate-containing particles, can react with gas-phase organic species
generated by gas-phase oxidation of biogenic and anthropogenic volatile organic compounds
(VOCs).65,74,78,79 For instance, isoprene and -pinene are major VOCs emitted from vegetation,80,81
while toluene is a ubiquitous anthropogenic VOC.82 Oxidation products of VOCs condensing onto
existing inorganic aerosols leads to the formation of secondary organic aerosol (SOA), accounting
for more than 50% of the total organic aerosol mass globally.83,84
Isoprene, the most abundant non-methane hydrocarbon emitted into the atmosphere (~600
Tg y-1),80,85 undergoes oxidation by hydroxyl radicals to form large quantities of gaseous isoprene

11
epoxydiols (IEPOX) under low-NOx conditions.86,87 The increased molecular functionality and
associated decrease in vapor pressure that occurs from the oxidation of isoprene (0.62 atm at 293
K) to IEPOX (3.4 x 10⁻⁶ atm at 293 K) facilitates uptake into the particle phase via multi-phase
chemical reactions,79,83,88-90 particularly under acidic conditions.91,92 IEPOX-derived SOA has
been shown to contribute up to 40% of submicron organic aerosol mass in isoprene-rich
environments,93,94 contributing to changes in aerosol physiochemical properties.15,76 However, to
date, few studies have analyzed changes in SOA physiochemical properties (particle morphology,
viscosity, and phase) after IEPOX uptake. Individual particle measurements are necessary to
provide better understanding of the effect of IEPOX uptake on particle morphology and phase,
which impact how particles participate in light scattering and climate-altering processes.95,96
Phase separation within atmospheric aerosol particles has a wide range of atmospheric
implications, including altering SOA formation by modifying the partitioning of organic species
from the gas to particle phase.97-99 This includes either inhibition15,70-75,98,100 or enhancement of
reactive uptake to particles containing more than one phase101 typically an organic outer layer and
an aqueous-inorganic core.102 Given that these results have primarily been based on
thermodynamic models, further experimental data is needed on the uptake of key oxidation
products for phase separated particles. Phase separations have also been shown to increase solar
radiation scattering and absorption.103 Therefore, determining aerosol phase, phase separations,
and morphology (e.g. core-shell) is necessary to accurately predict atmospheric SOA formation
and aerosol impacts on air quality and radiative forcing.
SOA species can exist in glassy, highly viscous states that alter aerosol reactivity.81,104-106
Multiphase chemistry of IEPOX in the ambient environment leads to the formation of
organosulfates,40,42,107,108 polyols,83,108-110 and oligomers90,109,111,112 in the condensed phase,
thereby increasing particle viscosity. Viscosity alters mixing timescales and diffusion throughout
the particle, with potential to change the particle phase from homogeneously mixed to phase-
separated.113 Highly viscous organic phases can kinetically inhibit the transfer of mass and, thus,
inhibit phase transitions and gas-particle partitioning.81,104-106,114-116 More viscous particles have
lower gaseous uptake,15,81 reactivity,81,106 and limited particle growth,81 impacting particle
evolution in the atmosphere.70 However, the relationship between reactive uptake, particle
viscosity, and phase separation is not well characterized for mixed SOA-inorganic particles, the
dominant particle type, by number, in the Southeastern United States.78
12
To date, laboratory studies investigating phase separation have primarily been conducted
using inorganic particles coated with organic acids (pimelic,73,117 succinic,73,75,117 glutaric72,75),
sucrose,75 and decane.8 Additional laboratory studies have investigated phase separation of more
chemically complex, atmospherically-relevant biogenically-derived SOA, such as -pinene
SOA.77,100,118 However, investigations of -pinene SOA using imaging methods as direct evidence
of phase separation77,118 focused on 8.5 – 30 µm particles, a size range that is significantly larger
than the number and mass modes of atmospheric particulate matter (PM),6 and therefore might not
be an accurate representation of particle phase at smaller sizes due to the size-dependent kinetic
effects observed in Veghte et al.117 Virtanen et al.105 found laboratory-generated 100 nm -pinene
SOA particles exhibited semi-solid behavior based on particle bounce measurements. However,
this study was performed at 30% RH, which is much lower than the 50-90% ambient RH reported
by field studies in the Southeast United States where IEPOX-derived SOA is prevalent,119 and
therefore might influence the particle phase state observed.77 Studies examining -pinene SOA at
higher RH found particles to have semi-solid behavior up to 90% RH,120 but particle morphology
(homogeneous versus phase-separated) was not investigated across the different RH conditions.
Bertram et al.121 and Ciobanu et al.122 systematically studied phase separation as a function of RH
for laboratory-generated SOA and inorganic sulfate mixtures using optical microscopy, though
they used 20–30 µm particles that are much larger than atmospheric SOA particles. Additional
studies have analyzed the phase separation of laboratory-generated SOA from 0–100% RH.100,123
However, most used SOA in the absence of seed particles so the results are not directly comparable
to the phase states presented herein. Particle coatings in boreal forest regions, where -pinene SOA
is dominant,124 can behave differently than particle coatings in regions where isoprene and -
pinene emissions are both abundant, as shown recently by Slade et al.76 Additional insights into
atmospherically relevant sizes of -pinene and isoprene SOA infer phase separation based on
indirect methods such as an aerosol mass spectrometer (AMS),125 scanning mobility particle sizer
(SMPS),125,126tandem differential mobility analyzer,127,128 and single particle ablation time-of-
flight mass spectrometer (SPLAT),98,126 providing information on particle size and phase state at
different RH. Smith et al. found lower efflorescence and deliquescence RHs of isoprene-derived
SOA127 and -pinene SOA128 coated onto sulfate particles compared to pure ammonium sulfate
particles, indicating changes in aerosol hygroscopic phase transitions with addition of SOA
material. You et al.77 showed aerosols can undergo phase separation after extraction of bulk
13
particle organic material from filters. While informative, bulk measurements are unable to
determine the number and composition of individual phase-separated atmospheric particles, but
rather show that in 30 µm particles that the bulk SOA phase separates from an aqueous, inorganic
phase. Song et al.129 measured the phase state of toluene-derived anthropogenic SOA, obtaining
results demonstrating that pure toluene-derived SOA particles become more viscous at lower RH.
While these studies made important contributions to understanding biogenic and anthropogenic
organic aerosol phases, we lack characterization of the changes in particle phase state after the
reactive uptake of additional gaseous species, particularly for mixed organic-inorganic systems.
Microscopic studies that directly investigate aerosol phase using single particles of
atmospherically relevant size, composition, and RH are necessary to determine the factors
influencing phase separation in particles, and particle phase changes following reaction with
gaseous species.
In this study, we analyzed changes in particle phase state and viscosity after uptake of gas-
phase IEPOX onto phase-separated -pinene and toluene SOA-coated inorganic particles.
Particles were characterized using atomic force microscopy (AFM), scanning electron microscopy
coupled with energy dispersive x-ray spectroscopy (SEM-EDX), and Raman microspectroscopy
to study the particle phase, morphology, and composition before and after IEPOX reactive uptake.
Phase separation was influenced by particle size, with most small SOA particles (< 100 nm)
remaining homogeneous and particles > 100 nm showing distinct phase-separated core-shell
morphology, as confirmed by microscopic images and compositional differences between particle
core and shell. Significant changes to particle core phase and morphology were observed after
IEPOX reactive uptake, suggesting IEPOX diffusion through the outer organic shell to react with
the inorganic core and modification of its physiochemical properties. Overall particle viscosity
increased after IEPOX uptake, as shown by measurements of particle heights and spreading ratios,
likely driven by a more viscous core. These changes to phase and morphology have important
implications for further multi-phase chemical reactions and SOA formation.
2.2 Methods
2.2.1 Aerosol Generation
The system for generating SOA-coated sulfate particles was previously described in detail
in Zhang et al.15 and shown in Figure A.1. Briefly, acidic ammonium sulfate particles (pH = 1.4 ±
14
0.2) were generated by atomizing a solution of 0.06 M ammonium sulfate ((NH4)2SO4, Sigma
Aldrich, 99% purity) and 0.06 M sulfuric acid (H2SO4, Sigma Aldrich, 98% purity) using a
constant output atomizer (TSI Inc., Model 3076) to simulate the pH of ambient aerosol particles
in the southeastern United States.119 Initial particle pH was confirmed using the pH indicator
method described in Craig et al.130 Aerosols passed through a diffusion drier to remove excess
water resulting in particle RH of 26 ±3%, remaining near the efflorescence point of 34% RH.131 A
differential mobility analyzer (DMA, TSI Inc., Model 3080) was used to size select seed particles
with 100 nm electrical mobility diameter. The DMA operated at a 12:3 sheath:sample flow ratio
over the mobility size range of 10 – 600 nm, resulting in a number size distribution with a mode
at 100 nm and a geometric standard deviation of 1.5 for acidic seed particles.15
A Potential Aerosol Mass (PAM) oxidation flow reactor (OFR; Aerodyne Research Inc.)132
was used to generate SOA coatings on sulfate seed particles via ozonolysis of 200 ppb -pinene
or photooxidation of 800 ppb toluene. The OFR was operated in continuous flow mode with a
mean residence time of 2 min. To establish ozonolysis conditions, 40 ppm O3 was added at the
inlet of the OFR using an external O3 chamber. To establish photooxidation conditions, the O3 was
photolyzed at of 254 nm inside the OFR to generate O(1D) radicals, which reacted with H2O to
continuously produce hydroxyl (OH) radicals ([OH] ~1010 cm-3). Recent studies suggest that SOA
particles generated in OFRs have compositions similar to SOA generated in environmental
chambers116,133-136 and in the atmosphere.137-142
The aerosol-laden flow exiting the OFR was passed through two Nafion tubes (Perma Pure,
Model PD-200T-12) to control and vary the RH prior to performing IEPOX uptake in a glass flow
tube (1 m length, 8 cm ID, 40 s residence time) coated with halocarbon wax (Halocarbon Products
Corporation) to minimize wall loss. IEPOX uptake was conducted using authentic trans--IEPOX,
which is the predominant IEPOX isomer in the atmosphere,86 and was synthesized following
published procedures.143 At the inlet and outlet of the glass flow tube, aerosols were collected for
microscopy and spectroscopy analysis (details below). Aerosol size distributions were measured
by a SMPS consisting of a DMA and a condensation particle counter (CPC, TSI Inc., Model
3022A) at the end of the flow tube.

15
2.2.2 Microscopy and Spectroscopy Analysis
Aerosol particles were collected for microscopy and spectroscopy analysis before and after
IEPOX reactive uptake using a 3-stage microanalysis particle sampler (MPS-3, California
Measurements Inc.). Particles were impacted onto carbon-type-b Formvar coated copper
transmission electron microscopy (TEM) grids (Ted Pella Inc.), silicon wafers (Ted Pella Inc.),
and quartz slides (Ted Pella Inc.) for SEM, AFM, and Raman analysis, respectively. Samples from
stage 3 (aerodynamic diameter (da) < 400 nm) were selected for analysis. Particle morphology was
classified as homogeneous or phase-separated based on the criteria defined in Veghte et al,117
where non-phase-separated particles were visually homogeneous and phase-separated particles
contained two or more immiscible substances. AFM and Raman measurements were performed at
ambient pressure and RH (30-40%), while SEM was performed under vacuum conditions (10-5-
10-6 Torr). Because the ambient RH at which particles were imaged using AFM (30-40% RH) was
lower than RH when samples were generated (50% RH), samples were re-humidified to 50% RH
and imaged with AFM to investigate possible morphology changes resulting from humidity
changes to the sample. As shown in Figure A.2, re-humidified samples did not show significant
differences in morphology compared to samples imaged at ambient RH. Therefore, AFM images
and data in this text were collected at the ambient RH values of 30-40%.
SEM analysis was performed on an FEI Helios 650 Nanolab Dualbeam electron
microscope that operated at an accelerating voltage of 10.0 kV and a current of 0.40 nA. The Helios
microscope was equipped with a high angle annular dark field (HAADF) detector that provided
contrast between areas of different elemental composition.144 EDX spectra were acquired for 20
seconds using an EDAX detector and GENESIS EDX software version 5.10 (EDAX Inc.,
Mahwah, NJ). To investigate trends between particle size and phase separation, SEM images were
analyzed with image processing software (ImageJ, version 1.50i, National Institutes of Health,
USA) to determine individual particle projected area diameters (diameter of particles after
impaction onto substrate). Projected area diameters were then converted to volume equivalent
diameters (dve) to simulate particle diameter before impaction and spreading onto substrate.145
Volume equivalent diameters were calculated using particle volume (v) data obtained from AFM
analysis (described below) and the following equation, assuming particles were initially spheres
before impaction:145

16
Equation 2.1. Volume Equivalent Diameter (dve) = √6𝑣
𝜋
3
AFM was performed with a PicoPlus 5500 AFM (Agilent, Santa Clara, CA) that operated
using 300 kHz resonant frequency and 40 N/m spring constant. Tapping mode was performed
utilizing Aspire CT300R probes (NanoScience, AZ) to obtain phase and height images. Samples
were scanned in 5 µm x 5µm areas with 0.75 Hz scan rates to obtain 512 pixels per line. Raw data
was processed using SPIP 6.2.6 software (Image Metrology, Hørsholm, Denmark) to measure
particle height, radius, and dve. Spreading ratios of individual particles were then calculated using
the following equation which divides the particle radius (r) by particle height (h):50
Equation 2.2. Spreading Ratio = (𝑟)
(ℎ)
T-tests were performed by comparing the mean spreading ratio of each sample to the mean
spreading ratio of the sulfate seed aerosol. SOA-coated particles exposed to IEPOX were also
statistically analyzed with respect to SOA-coated particles. Spreading ratios were considered to be
statistically different for p values < 0.05.
Raman microspectroscopy was conducted using a Horiba LabRAM HR Evolution Raman
Spectrometer (Horiba Scientific) equipped with a 50mW 532 nm Nd:YAG laser source, CCD
detector and coupled to a confocal optical microscope (Olympus, 100x objective). Raman spectra
were collected in the range 500-4000 cm-1 for 3 accumulations at 10 second acquisition times for
each particle. A diffraction grating of 600 grove/mm with spectral resolution of 1.7 cm-1 was used.
2.3 Results and Discussion
Single particles were analyzed for phase and composition at three experimental points: 1)
initial acidic ammonium sulfate seed particles with no SOA coating, 2) seed particles coated with
-pinene or toluene SOA, and 3) seed particles coated with SOA and exposed to IEPOX. Figure
2.1 is a schematic representing the changes in particle phase and morphology of single particles
obtained at each step in the experiment. Acidic seed particles were expected to be homogeneous,
characterized by a single aqueous phase with spherical morphology. Following the coating stage
of each experiment by either -pinene or toluene SOA, the particles are expected to experience
phase separation resulting in a core-shell morphology consisting of a viscous organic coating and
aqueous inorganic core. Modeling the properties of the -pinene or toluene SOA organic layers
predicts viscosities of 103-109 Pa s for -pinene SOA70,146 and 102-107 Pa s for toluene SOA at

17
50% RH based on O:C measurements from an aerosol chemical speciation monitor (ACSM).129,146
This range of viscosities corresponds to semi-solid material147,148 with mixing times of 2.8 h for
-pinene coated SOA and < 1 h for toluene coated SOA at 50% RH for particles < 1 µm
diameter.129 Uptake of IEPOX vapor is expected to induce particle phase processing that changes
the phase state of the inorganic core from aqueous to semi-solid following the diffusion of IEPOX
through the SOA coating.15 The SOA coating inhibited some uptake into the particle, in
comparison to an uncoated acidic aqueous particle.15 Predicted IEPOX diffusion times through the
organic coating ranged from 101-104 seconds with a reduction in the reactive uptake coefficient
(γ) of ~50% for -pinene SOA compared to an uncoated acidic particle.15 Though IEPOX uptake
was reduced, uptake was sufficient for significant acid-catalyzed particle-phase chemistry to occur.
The continuing chemistry changed the core of the particles from aqueous to a viscous or semi-
solid core. The phase transitions of the particle core are shown below using a combination of AFM,
SEM-EDX, and Raman microspectroscopy.
Figure 2.1. Schematic of experimental design to generate SOA particles. First, homogeneous seed
particles were generated with an atomizer using solutions of ammonium sulfate and sulfuric acid
to achieve an initial pH of 1.4. Next, seed particles were coated with -pinene or toluene SOA in
a Potential Aerosol Mass (PAM) reactor to achieve a coating thickness of ~10 nm before impaction
onto substrates and spreading. SOA-coated seed particles were then exposed to gaseous isoprene
epoxydiol (IEPOX) in a flow tube.
To demonstrate the changes in particle phase after coating and IEPOX uptake, AFM and
SEM images of the three particle types are shown in Figure 2.2. Acidic ammonium sulfate seed
particles were homogeneous in phase and composition with a circular morphology, indicative of a

18
spherical shape when suspended, before addition of SOA coatings (Figure 2.2a). The circular
morphology indicates the particles were still liquid and above the efflorescence point,131 per the
experimental design.15 After coating with SOA, the mixed sulfate-SOA particles exhibited core-
shell morphology117 with a circular sulfate core and SOA shell (Figure 2.2b and 2.2d). These
coated SOA particles were similar to ambient particles observed during the Southern Oxidant and
Aerosol Study (SOAS) in the Southeastern United States during a period of high SOA production
(Figure A.3).78 Following IEPOX uptake, particles still exhibited phase separation, but changes to
the core morphology were observed for both -pinene SOA/sulfate particles and toluene
SOA/sulfate particles (Figure 2.2c and 2.2e). Particle cores became non-circular with a variety of
irregular shapes. The less viscous organic coating filled in along the irregular surface created by
the viscous core to leave the overall particle morphology spherical, consistent with the outer
spherical morphology observed before IEPOX uptake These core morphology changes suggest
IEPOX diffused through the organic shell and reacted with the inorganic core to form viscous
IEPOX-derived organosulfates.40,42,107,108 AFM showed phase separation after SOA coating and
core morphology changes after IEPOX uptake at ambient temperature and RH. SEM corroborated
the phase and morphology observed by AFM. The images in Figure 2.2 show -pinene and toluene
SOA-coated inorganic sulfate particles generated at 50% RH. Additional samples generated at
30% RH show similar trends with respect to phase and morphology (Figures A.4 and A.5).

19
Figure 2.2. AFM and SEM images of SOA particles. Representative AFM height images (top
row), AFM phase images (middle row), and SEM images (bottom row) of seed particles (a), -
pinene SOA/sulfate particles (b), -pinene SOA/sulfate after IEPOX uptake (c), toluene
SOA/sulfate (d), and toluene SOA/sulfate after IEPOX uptake (e). All particles were generated at
50% RH.
To quantify the observed changes in particle morphology and phase state shown in Figure
2.2, AFM height traces from 10 seed particles, SOA-coated particles, and SOA particles exposed
to IEPOX were averaged (Figure 2.3c and 2.3d). Acidic ammonium sulfate seed particles had
average heights of 70 10 nm, which is in the range of spreading values observed for liquid
particles impacted on silicon previously.50 After coating with -pinene- or toluene-derived SOA,
particle heights increased, indicating particles spread less upon impaction, as depicted in the
cartoon in Figure 2.4a. -Pinene coated core-shell particles were taller (150 10 nm), on average,
than toluene coated core-shell particles (110 10 nm). The increase in particle height after
impaction onto substrates is related to particle viscosity because more viscous particles will spread
less and will therefore remain taller.50,149 The particle heights observed here are in agreement with
predicted viscosities of the -pinene (9.3 x 10⁷ Pa s)70,146 and toluene (7.8 x 10⁴ Pa s)129,146,147 SOA

20
at 50% RH in previous work.15,113,129,146,150 The results presented here are only applicable at 50%
RH, as toluene SOA has higher viscosity than -pinene SOA at lower RH.146 After IEPOX uptake,
both types of mixed sulfate-SOA particles were taller and larger in diameter than SOA coated
particles. Average particle height of -pinene SOA + acidic seed particles exposed to IEPOX were
170 10 nm (20 nm taller than -pinene SOA + acidic seed) and toluene SOA + acidic seed
particles exposed to IEPOX were 130 10 nm (20 nm taller than toluene SOA + acidic seed).
Representative 3-dimensional AFM images show particle morphology at the three steps in the
experiment (Figure 2.3a and 2.3b). With the high volume fraction of organic present, the core
would not be expected to effloresce at the 30-40% RH values at which the particles were
imaged.121,127 3D images show particles coated with SOA become taller on the substrate than seed
particles. Particle cores become taller after IEPOX uptake while the particle shell appeared flat on
the substrate, suggesting the cores are becoming more viscous through IEPOX uptake and core
chemistry modification.
Figure 2.3. 3D AFM height images and height traces of SOA particles. Representative 3D AFM
images of a) -pinene SOA/sulfate and b) toluene SOA/sulfate particles before and after IEPOX
uptake. 3D images show flat shells for phase-separated SOA and viscous, tall cores. Average
height traces of 10 particles composed of c) -pinene SOA/sulfate and d) toluene SOA/sulfate
before and after IEPOX uptake.
To further investigate changes in particle viscosity and account for differences in particle
diameter, spreading ratios were calculated for individual SOA + acidic seed particles using Eq. 2,

21
which compares particle radius to particle height. Particle spreading is used as an indirect
measurement of particle viscosity, as more viscous particles will remain taller on the substrate by
spreading less and will thus have a lower spreading ratio compared to more liquid-like particles of
lower viscosity.50 Average spreading ratios for ~30 particles per sample measured at 50% RH are
shown in Figure 2.4. Seed particles had an average spreading ratio of 6.6 0.7. After coating with
-pinene or toluene SOA, the average spreading ratio decreased to 3.4 0.2 for -pinene SOA +
acidic seed and 3.9 0.4 for toluene SOA + acidic seed particles, and were thus more viscous, in
agreement with predictions by Zhang et al.15 This shift to less spreading upon impaction for phase-
separated particles agrees with qualitative observations in Bondy et al.50 for liquid-liquid phase-
separated polyethylene glycol and ammonium sulfate particles. After reactive uptake of IEPOX
leading to altered core morphology, average spreading ratio further decreased to 2.6 0.2 for -
pinene SOA and 3.4 0.7 for toluene SOA particles. Spreading ratios of -pinene SOA and seed
particles generated at 30% RH are shown in Figure A.6 and follow similar trends of decreased
spreading after coating with -pinene oxidation products and further decrease in spreading
following IEPOX uptake.

22
Figure 2.4. Spreading ratios of SOA particles. a) Diagrams depicting particle spreading onto
substrates. Particle spreading is inversely related to particle viscosity. Bar charts show average
spreading ratio of ~30 particles/sample for b) -pinene SOA/sulfate particles before and after
IEPOX uptake and c) toluene SOA/sulfate particles before and after IEPOX uptake. Error bars
represent standard error. Single asterisks denote spreading ratios that are statistically different than
seed aerosol (p < 0.05). The double asterisk denotes spreading ratio that are statistically different
than spreading ratio before IEPOX uptake.
To examine the relationship between particle size, composition, and phase separation,
particle phase state and dve of ~500 particles per sample were measured and plotted as histograms
(Figure 2.5). We observed particles under 80 nm (dve) to have homogeneous composition for all
SOA samples, similar to previously published work.73,117 Before IEPOX uptake, the smallest
phase-separated particles were 160 10 nm (dve) for -pinene SOA + acidic seed (mode 570 ± 20
nm) and 127 5 nm (dve) for toluene SOA + acidic seed (mode 342 ± 5 nm), and most often
resulted in a core-shell morphology. This agrees with Fard et al.151 who stated the most likely
morphology for phase-separated atmospheric particles greater than 100 nm was core-shell due to
kinetically fast inorganic diffusion, preventing further nucleation after the first inclusion. After
IEPOX uptake, the size of the smallest phase-separated particles decreased to 83 3 nm (dve) for
-pinene SOA (mode 239 ± 3 nm) and 80 3 nm (dve) for toluene SOA (mode 259 ± 3 nm). When
the particle core contains less water and is a more viscous semi-solid, the organic layer becomes
less miscible and can initiate a separate phase at smaller particle sizes.71 The transition regime, the
size range where phase-separated and homogeneous particles both exist,73 became wider for both

23
SOA types after IEPOX uptake, expanding from 150 – 230 nm to 80 – 180 nm after uptake of
IEPOX onto -pinene SOA + acidic seed and from 130 – 280 nm to 80 – 270 nm for toluene SOA
+ acidic seed after IEPOX uptake. The widening of the transition region, due to greater variability
in core composition based on differences in reactive uptake of IEPOX,15 introduces increased
difficulty for predicting phase for particles within these size ranges. Pie chart insets in Figure 2.5
show the percent of particles that were phase-separated versus homogeneous. After IEPOX uptake,
the percent of phase-separated particles decreased from 67.9 0.6% to 58.8 0.2% for -pinene
SOA and from 68.2 0.2% to 61.6 0.1% for toluene SOA.
Figure 2.5. Plots depicting SOA morphology as a function of particle size. Histograms depicting
size-dependent morphology behavior of a) -pinene SOA/sulfate, b) -pinene + IEPOX
SOA/sulfate, c) toluene SOA/sulfate, and d) toluene + IEPOX SOA/sulfate particles. Lognormal
fits show modes at 570 ± 20 nm for phase-separated -pinene SOA/sulfate, 239 ± 3 nm for phase-
separated -pinene + IEPOX SOA/sulfate, 342 ± 5 nm for phase-separated toluene SOA/sulfate,
and 259 ± 3 nm for phase-separated toluene SOA/sulfate. After determining modes, sticks
representing phase-separated particles were offset by 25 nm to visualize differences between
homogeneous and phase-separated traces. Pie charts represent the percent of particles that were
phase-separated versus homogeneous.
Chemical composition plays a key role in determining viscosity, so both -pinene and
toluene SOA-containing particles were analyzed using SEM-EDX for elemental composition and
Raman microspectroscopy for functional group composition. Raman spectra of acidic ammonium

24
sulfate seed particles do not show evidence for the presence of organic species (Figure A.7), as
shown previously.33,35 Once seed particles were coated with -pinene or toluene SOA, separate
EDX and Raman spectra were taken for the particle core and shell. EDX showed particle cores
contained sulfur and oxygen, indicative of sulfate, while particle shells contained primarily carbon
and oxygen, indicative of -pinene or toluene SOA (Figure 2.6). Sulfur is clearly discernable and
located primarily in the core of particles. Raman spectra show the broad ν(N-H) region around
3200 cm-1 indicating ammonium and a mode for νs(SO42-) was observed at 976 cm-1 in the particle
core before IEPOX uptake (Figure 2.7).36,45,152-155 Peaks in the ν(C-H) region between 2800-3000
cm-1 indicate organic materials in the shell of -pinene and toluene SOA-coated acidic seed
particles. Specifically, methyl ν(CH3) and methylene ν(CH2) symmetric and anti-symmetric
stretches were detected, along with modes in the organic fingerprint region which are listed in the
Supporting Information (Table S1). Differences in composition between particle core and shell for
both SOA types shows that the coating of -pinene or toluene SOA creates chemically distinct
phases with a primarily inorganic core and organic shell, instead of homogeneously mixed
particles. After IEPOX uptake, EDX spectra show particle cores contained carbon for both types
of SOA, suggesting IEPOX reaction forming organic species, possibly organosulfur compounds
(i.e., organosulfates and oligomers thereof), within the particle core. After IEPOX uptake, SOA
cores contained methyl ν(CH3) and methylene ν(CH2) symmetric and anti-symmetric stretches in
the Raman spectra. Particle cores also showed signs of organosulfate formation with peaks around
1060 cm-1 in the Raman spectra, indicative of νs(RO-SO3).42 Peaks indicative of organosulfates
were not observed in the shell for either -pinene and toluene SOA after IEPOX uptake indicating
that the shells did not mix with the core as it solidified. Future work will investigate conditions for
organosulfate formation in various types of SOA across a range of RH
conditions.39,40,98,107,110,156,157

25
Figure 2.6. SEM images and EDX spectra of SOA particles. Representative SEM images and
EDX spectra of a) -pinene SOA/sulfate particles, b) -pinene SOA/sulfate + IEPOX particles, c)
toluene SOA/sulfate particles, and d) toluene SOA/sulfate + IEPOX particles showing differences
between core and shell composition. Elements with asterisk denote contribution from substrate.
Images were colored to easily identify phase-separated morphology. Unedited images are shown
in Figure A.8.

26
Figure 2.7. Raman spectra of SOA particles. Representative Raman spectra of -pinene
SOA/sulfate particles before and after IEPOX reactive uptake (top) and toluene SOA/sulfate
particles before and after IEPOX reactive uptake (bottom) showing differences between core and
shell composition.
2.4 Conclusions
The existence of liquid-liquid phase-separated particles in the ambient atmosphere and
their role in modifying reactive uptake has important consequences for SOA formation and PM
concentrations. Recent flow tube studies have shown that IEPOX uptake can be reduced by liquid-
liquid phase separations involving coatings of -pinene SOA around an acidic aqueous core rich
in sulfate.15 This is true even with a pH of 1.5 for the core, typical of pH values for the southeast
United States (0-2).119,158 Chamber studies have shown that inorganic sulfate can rapidly be
converted into organosulfates after reaction with IEPOX,159 which are quite viscous. The
atmospheric implications of the results from this study are that the core of phase-separated
submicron particles can be converted from aqueous-inorganic to viscous organics, such as IEPOX-
Inte
nsity
1600140012001000800600
Wavenumber (cm-1
)
36003400320030002800
Toluene SOA Core Shell Background
61
8
97
6
14
18
10
64
11
30
12
97
14
41
14
60
Pinene + IEPOX SOA Core Shell
28
46
28
82
29
34
3119
10
64
10
97
11
30
12
95
14
41
14
63
27
24
28
46
28
81
28
96
29
32
28
96
31
33
v(SO42-) v(CH2/CH3) v(N-H)v(RO-SO3)
61
46
25
62
6
11
05
Toluene + IEPOX SOA Core Shell
Pinene SOA Core Shell Background
27
derived organosulfates, which can further inhibit SOA formation. This viscous core formation
occurs within acidic inorganic particles coated with both -pinene (biogenic) and toluene
(anthropogenic) SOA. That the increased core viscosity occurs on the timescale of flowtube
experiments (< 1 min) indicates that the -pinene and toluene coatings were not sufficiently
viscous at 50% RH to fully inhibit IEPOX uptake and the subsequent rapid formation of viscous
organosulfates in the core. The increase in core viscosity and thus diffusion and mixing timescales
likely limits additional reactive uptake of IEPOX, since acidic particles (pH = 1.5) have been
shown to form organosulfates that almost completely shut off IEPOX uptake within 40 hours of
simulated atmospheric aging.159 The prevalence of phase separated and viscous particles may
impact atmospheric model predictions of IEPOX-derived SOA, as many of these models do not
consider the kinetic limitations of phase-separated particles on multiphase chemical processes
yielding SOA.160 Recent modeling has shown that -pinene SOA coatings around acidic cores can
decrease SOA formation by 33%, even at 55-80% RH,161 but the impact of transforming an
aqueous acidic core to a diffusion limited viscous core could have an even larger effect, but has
not yet been evaluated. The increased viscosity and morphologies observed could also impact the
CCN and INP properties of these aerosols.66,68,162 Therefore, further studies are needed to improve
understanding of phase separation and viscosity in flowtube, chamber, and ambient particles of
different and more complex compositions and at different atmospheric conditions.

28
Chapter 3. Lake Spray Aerosol Incorporated into Great Lakes Clouds
Adapted with permission from Olson, N. E., May, N. W., Kirpes, R. M., Watson, A. E., Hajny, K.
D., Slade, J. H., Shepson, P. B., Stirm, B. H., Pratt, K. A., and Ault, A. P.: Lake Spray Aerosol
Incorporated into Great Lakes Clouds, ACS Earth Space Chem., 3, 12, 2765-2774, 2019.
https://doi.org/10.1021/acsearthspacechem.9b00258 Copyright 2019 American Chemical Society.
3.1 Introduction
In aquatic environments, breaking waves entrain air beneath the water’s surface and form
bubbles that then burst at the surface to eject droplets into the atmosphere. Sea spray aerosol (SSA)
produced by bubble bursting in marine environments has been more extensively studied than lake
spray aerosol (LSA) production in freshwater environments.5,163,164 SSA production is generally
modeled as a function of wind speed, with speeds greater than 4 m s−1 inducing wave-breaking
particle production.163 Similarly, airborne lake-derived particles have been observed during
aircraft measurements over the Laurentian Great Lakes during the presence of whitecaps at wind
speeds above 3.5 m s−1.4 The Laurentian Great Lakes, have annual mean wind speeds > 6.6 m s-1
(other than Lake Ontario)165, indicating the frequent presence of wind speeds necessary to produce
breaking waves and white caps.166,167 LSA observed from Lake Michigan has been chemically
characterized for samples collected at the shore in a ground based study5 and after transport inland
(> 25 km).27 LSA is composed primarily of calcium carbonate, other inorganic ions, organic
species, and biological material.5,27,168 A regional modeling study suggested that particles produced
from wave breaking over the Great Lakes could increase surface level aerosol number
concentrations by ~20% over the remote northern Great Lakes and by ~5% over other parts of the
Great Lakes region.167 However, the model utilized a parameterization for SSA production and
only considered ultrafine (< 100 nm) particle production due to limited knowledge, at the time, of
LSA production.167 More recent laboratory164 and field work4 has identified both ultrafine (80 nm)
and accumulation (200 nm) modes for nascent LSA, indicating contributions to aerosol
concentrations at diameters important for cloud formation.9 However, models have not yet
evaluated the impact of LSA on regional cloud formation and climate due to a lack of observations.

29
Moisture and heat released from the Great Lakes impact clouds and precipitation regionally
via the lake effect.169 The lake effect is a meteorological phenomenon resulting from the upward
flux of water vapor and subsequent precipitation when air masses transition from water to land,
forming clouds and leading to precipitation regionally.169 It is important to determine sources of
aerosols that may act as cloud condensation nuclei (CCN) and ice nucleating particles (INPs) over
the Great Lakes where the upward flux is adding extra moisture, particularly as many areas in the
Great Lakes region are relatively pristine with low concentrations of particles (~100 cm-3).167
Further, decreased winter ice extent170 and increased annual wind speeds171 associated with
warming of the Great Lakes are predicted to increase emissions of LSA in the future. Thus, given
the importance of lake-effect meteorology regionally,169 it is essential to quantify the extent that
LSA are lofted to and entrained in clouds.
Both CCN and INP activation are dependent on individual particle size and
composition.9,172-184 Previous studies in marine environments have shown that SSA can act as both
CCN or INPs,9,175,185-192 with efficiencies varying with seawater composition.186,193,194 Laboratory
studies suggest increased INP efficiency from freshwater samples containing biological
material.195-197 Borduas-Dedekind et al.198 discovered increased CCN activity for freshwater
containing organic matter, suggesting the incorporation of organics into LSA168 likely increases
the CCN ability of these particles. Notably, recent laboratory studies have shown freshwater INP
concentrations that are orders of magnitude greater than INPs produced from seawater.197,199
However, to our knowledge, the CCN and INP efficiency of LSA have not been characterized.
The identification of droplets in Great Lakes regional clouds200,201 containing primarily calcium,
the highest concentration cation in Great Lakes freshwater,202 suggests that LSA likely participates
in cloud formation though the source wasn’t identified at the time. Laboratory studies have shown
that particles composed of CaCO3, the primary inorganic component of LSA,5 undergo multiphase
reactions with HNO3 and N2O5, thereby increasing the hygroscopicity and CCN efficiencies of
these particles.203,204 LSA particles transported inland have been shown to undergo heterogeneous
processing leading to the formation of Ca(NO3)2,27 analogous to aging of SSA.205-207 It has also
been shown that clouds over the Great Lakes contain freshwater bacteria.208 Therefore, the
incorporation of biological material into LSA168,209 may increase the CCN and INP efficiencies of
LSA. Taken together, the composition of individual particles emitted from the Great Lakes and
30
their modification after emission is critical to understanding the overall aerosol mixing state in the
region, a key attribute connected to CCN and INP concentrations and impacts.13,67,210
In this study, ambient particles and cloud water samples were collected by aircraft over
northern Lake Michigan during high wind and wave activity on July 12, 2016. In addition, surface
freshwater samples collected from Lake Michigan at the time of aircraft sampling were used to
generate LSA in the laboratory. Individual ambient and laboratory-generated LSA particles were
analyzed by scanning electron microscopy with energy dispersive X-ray spectroscopy (SEM-
EDX) to determine size-resolved chemical composition and morphology. Residual particles from
aerosolized cloud water were also analyzed by SEM-EDX to compare with ambient and
laboratory-generated LSA particle composition. Particle size, morphology, and inorganic
elemental mole ratios provide evidence that LSA emitted from the Great Lakes are incorporated
into clouds, indicating that LSA is a potential source of CCN and INPs in regions with large bodies
of freshwater.
3.2 Methods
3.2.1 Aircraft Sampling
Atmospheric aerosol and cloudwater samples were collected during a flight occurring on
July 12, 2016 using a Beechcraft Duchess twin-engine aircraft (Purdue University Airborne
Laboratory for Atmospheric Research).4,201,211 Wind speed and atmospheric pressure were
measured during aircraft sampling using a Best Air Turbulence (BAT) probe to characterize the
atmospheric boundary layer.212 Potential temperature was calculated following previously
established methods.213,214 A flight-modified Picarro cavity ring-down spectrometer (model
number G2301-f) measured real-time concentrations of water vapor and CH4.215-217 Size-resolved
aerosol particle number concentrations were measured using an optical particle counter (model
1.109, Grimm Aerosol Technik GmbH) that quantified particles from 0.20 − 32 µm.218 Grimm
particle size data was corrected for inlet transmission efficiency following the method described
in Peterson et al.218
Atmospheric particles were collected using a three stage modified Davis Rotating Uniform
Size-Cut Monitor (DRUM) impactor (model DA400, DRUMAir, LLC). Particle samples in three
size ranges (stage A: da = 1.2−2.5 μm, stage B: da = 0.34−1.2 μm, and stage C: da = 0.07−0.34 μm)
were collected onto aluminum foil. Aerosol particle samples were stored in the dark at room

31
temperature.219 A modified Mohnen slotted rod cloud water collector extended out of the top of
the aircraft for cloud water collection.220 Cloud droplets were impacted onto slotted Teflon rods,
which are characterized by a 50% cutoff da of ∼5.5 μm,201 and collected into glass vials (sample
volume ranging from 5 − 15 mL each). Cloudwater samples were frozen upon collection and stored
at −20 °C until analysis. Prior work has shown that freezing aquatic samples creates minimal
changes to the size and composition of aerosol particles generated from or insoluble residues
within a thawed sample.21,168
Atmospheric particle sampling was conducted from 14:51 – 15:51 EDT on July 12, 2016
at 600 m above ground level (AGL) over northern Lake Michigan in the area of Manistique Bay
between Thompson, MI (45.866, -86.406) and Seul Choix Point, MI (45.921, -85.912, Figure 3.1).
The cloud layer present on July 12 was near the surface (cloud height at 300 m AGL with thickness
of approximately 70 m) such that the aircraft could not safely fly below, and as a result the particles
sampled that day were collected above the cloud layer. After particle sampling, two cloud water
samples (16:20 – 16:50 EDT and 17:00 – 17:30 EDT) were collected over the northern portion of
Lake Michigan at 300 m AGL (Figure 3.1, Figure B.1). Convective available potential energy
(CAPE) was obtained from the National Weather Service station 72634 in Gaylord, Michigan, a
location 100 km southeast from sampling and under cloud coverage at the time of measurement
(Figure 3.2). CAPE was measured from a sounding
(http://weather.uwyo.edu/upperair/sounding.html) recorded at 12:00 UTC (08:00 EDT). The
CAPE value was 556.8 J/kg, indicating a slightly unstable atmosphere (CAPE range 500 − 1000
J/kg), where the sampled particles and clouds were likely influenced by the atmospheric boundary
layer.221,222 Wind speed and wave height data were obtained from National Oceanic and
Atmospheric Administration Great Lakes Environmental Research Laboratory (NOAA GLERL)
buoy 45022 (45.405, -85.086) located approximately 40 km southeast from sampling.
3.2.2 Laboratory Aerosol Generation
Surface freshwater was collected from Lake Michigan at Brevort, Michigan (46.018, -
85.041) on July 12, 2016. The freshwater sampling location corresponds to the area of Lake
Michigan over which aircraft sampling was conducted. After collection, the freshwater samples
were frozen (−20 ˚C) and thawed prior to aerosol generation and analysis by ion chromatography.
Freshwater samples were filtered with a 0.22 µm filter (Celltreat Scientific Products) prior to

32
triplicate measurements of sodium, potassium, magnesium, calcium, chloride, and sulfate
concentrations using Thermo Dionex ICS-1100 (cation) and ICS-2100 (anion) ion
chromatography columns (Thermo Fisher Scientific, Figure B.2). Freshwater samples were then
used to generate aerosols in a laboratory LSA generator, described in detail by May et al.164 Briefly,
the LSA generator circulates 4 L of freshwater sample at 2 L min−1 via a diaphragm pump into
four plunging jets, which create bubbles that burst at the freshwater sample surface to generate
aerosol particles. During all experiments the LSA generator was kept at room temperature (23 ± 1
°C) with a relative humidity (RH) of 85%. Prior to particle generation, particle-free air (HEPA
capsule filter, Pall) was cycled through the LSA generator to ensure background particle
concentrations were minimal (< 20 particles cm−3), in comparison to the average total particle
concentration generated from the freshwater samples (∼ 500 particles cm−3), as measured by a
condensation particle counter (CPC; TSI Inc., model 3775). Generated LSA passed through two
silica gel diffusion dryers to achieve an RH of ∼ 15% before measurement, a standard established
for SSA.163 The aerosol number size distributions (20 – 800 nm, Figure B.3) were measured by a
scanning mobility particle sizer (SMPS), consisting of a differential mobility analyzer (DMA; TSI
Inc., model 3082) and a CPC (TSI Inc., model 3775). Particle diameters were converted to
aerodynamic diameter (da)145,223 after analysis using a spherical shape factor based on SEM image
analysis and a particle density of 2.71 g cm-3 representing CaCO3.27 Laboratory-generated LSA
were collected for microscopy analysis using a three stage microanalysis particle sampler (MPS-
3, California Measurements Inc.). Cloud water was nebulized using a glass nebulizer (Meinhard,
Type A, operated at 1 mL/min) before impaction of insoluble residue particles using the MPS-3.224
Particles were impacted onto carbon-type-b Formvar coated copper transmission electron
microscopy (TEM) grids (Ted Pella Inc.) for electron microscopy analysis. Samples impacted onto
MPS-3 stages 2 and 3 (da of 400 – 2800 nm and 70 – 400 nm, respectively) were analyzed.
3.2.3 Microscopy of Ambient and Laboratory-Generated Particles
Particles collected on stages A, B, and C (0.07 − 2.5 μm) of the DRUM impactor during
ambient sampling and on stages 2 and 3 (0.07 − 2.8 μm) of the MPS-3 during laboratory
experiments were analyzed by manual SEM-EDX and computer controlled SEM-EDX (CCSEM-
EDX). SEM analysis was conducted using a FEI Helios 650 Nanolab Dualbeam electron
microscope operating at an accelerating voltage of 20.0 kV and a current of 0.40 nA. EDX spectra

33
were acquired for 20 seconds using GENESIS EDAX software version 5.10 (EDAX Inc., Mahwah,
NJ). The elements detected by EDX were C, N, O, Na, Mg, Si, P, S, Cl, K, Ca, and Fe. Due to the
overwhelming signal from the Al foil substrate used for ambient sampling, Al was excluded from
the CCSEM-EDX measurements. A total of 3264 ambient particles and 1993 nebulized cloud
water residual particles were chemically analyzed by CCSEM-EDX. K-means clustering was
applied in MATLAB (Mathworks, Inc., version R2015a) to sort particles into 10 clusters based on
the relative atomic percentages of elements from the CCSEM-EDX spectra.29,225 Particle clusters
present in each sample were determined by mathematical similarity of spectra to limit human bias
during sorting. In K-means clustering, the fraction of total error, defined as total distance of particle
spectra to their cluster centroid divided by the distance of all particles to the centroid of one cluster,
is used to determine the optimal number of clusters to characterize the data set.30-32,226,227 Particle
types were identified based on the similarity of elemental composition to EDX spectra reported in
single particle measurements from previous studies,5,21,27,78,154,168,228,229 and clusters representing
the same particle types were combined.
3.3 Results and Discussion
On July 12, 2016, elevated wave heights resulting from high wind speeds were observed
on Lake Michigan. During the aircraft particle sampling period, wave heights peaked at 1.4 m, and
wind speeds peaked at 9.4 m s-1 over northern Lake Michigan (Figure 3.1a). Wave height mapping
indicated wave heights over 1 m were present over a large area of northern Lake Michigan (Figure
3.1b), and white capped waves were observed visually on the surface of Lake Michigan during
aircraft sampling. NOAA HYSPLIT 48 h backward air mass trajectories (Figure 3.1c) and heights
(Figure 3.1d) show that the air mass measured on July 12 traveled across Lake Michigan from the
southeast prior to reaching the aircraft sampling area, passing over areas with significant sources
of anthropogenic pollutants near Chicago, Illinois and Gary, Indiana.230,231

34
Figure 3.1. Map depicting area of aircraft sampling with wind speed and wave height data. (A)
Wave height and wind speed during ambient sampling. Data were obtained from NOAA GLERL
buoy 45022, represented by a star in part B. Grey shaded areas show periods of aircraft sampling.
(B) Wave height maps for July 12, 2016 12:00 EDT during aircraft sampling over Lake Michigan.
(C) 48 Hour HYSPLIT back trajectory July 12, 2016 13:00 EDT at starting heights of 300 and 600
m AGL that correspond to heights of cloud water and aerosol sampling, respectively. Circles on
traces mark the location of air masses every 12 hours. The area of aircraft sampling is displayed
in a green box on the map. Map data adapted from Google. Copyright 2016. (D) 48 hour height
profiles of air masses sampled during aircraft sampling.
A NASA MODIS image shows stratocumulus clouds present over much of northern Lake
Michigan on July 12 (Figure 3.2a). Boundary layer height and depth were determined from vertical
profile measurements of potential temperature, water vapor, and CH4 during aircraft ascent (Figure
3.2b). The top of the boundary layer, occurring at 1050 m, is indicated by the largest rate of change
in water vapor.213,214 This confirms aircraft particle (600 m) and cloud water (300 m) sampling
occurred within the boundary layer.
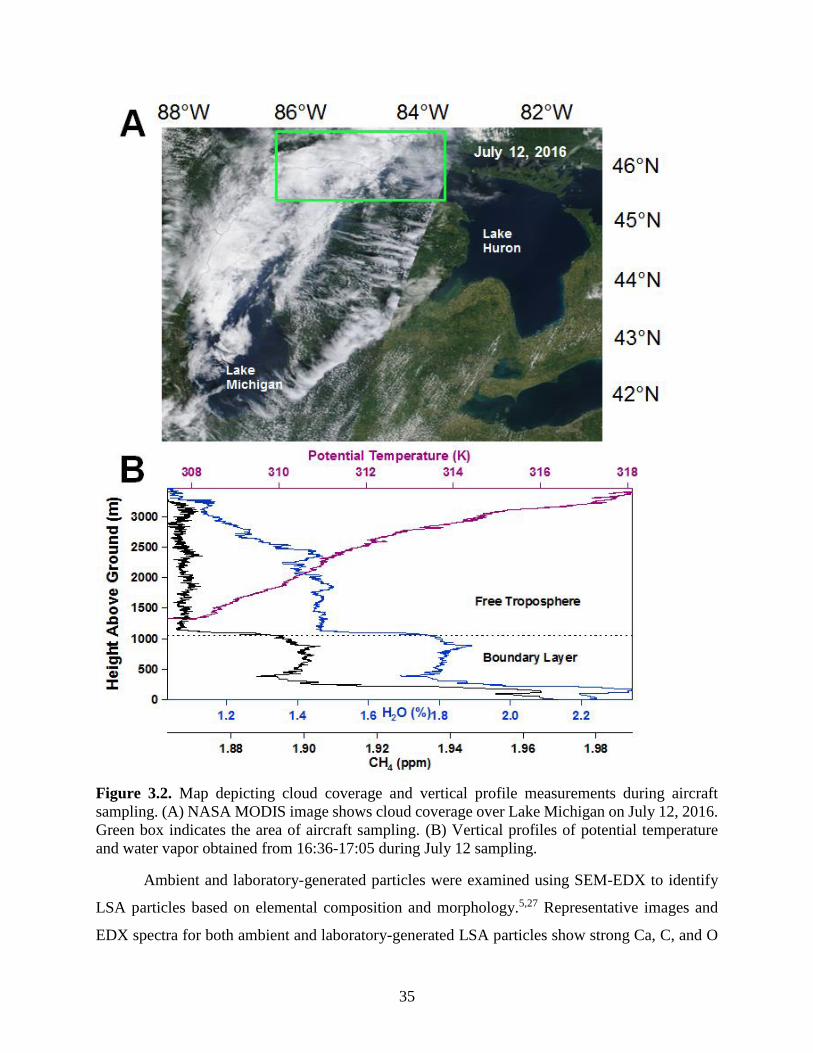
35
Figure 3.2. Map depicting cloud coverage and vertical profile measurements during aircraft
sampling. (A) NASA MODIS image shows cloud coverage over Lake Michigan on July 12, 2016.
Green box indicates the area of aircraft sampling. (B) Vertical profiles of potential temperature
and water vapor obtained from 16:36-17:05 during July 12 sampling.
Ambient and laboratory-generated particles were examined using SEM-EDX to identify
LSA particles based on elemental composition and morphology.5,27 Representative images and
EDX spectra for both ambient and laboratory-generated LSA particles show strong Ca, C, and O

36
peaks (indicative of CaCO3 and organics), minor Na and Mg peaks, and an amorphous solid
morphology after drying on the substrate (Figure 3.3).5 This Ca-dominant elemental composition
is consistent with Great Lakes freshwater composition202 (Figure B.2) and previous measurements
of Lake Michigan LSA chemical composition and morphology, both in the ambient atmosphere5,27
and laboratory.164,168 The ambient LSA is not believed to be CaCO3 mineral dust, as soil from this
region is rich in Fe and Al and regional sand is composed primarily of quartz or amorphous silica
(Si, O).5,232 SEM images and EDX spectra of residual particles generated from ambient cloud water
also show similar morphology and composition to ambient and laboratory-generated LSA (Figure
3.3c), suggesting that LSA particles emitted from Lake Michigan become incorporated into clouds
above Lake Michigan.

37
Figure 3.3. SEM images and EDX spectra of ambient and laboratory-generated LSA.
Representative SEM images (left) and EDX spectra (right) of individual particles, with asterisks
denoting elemental contribution from substrate. (A) Ambient LSA particle collected on aluminum
foil during aircraft sampling on July 12, 2016. Aluminum background was removed from the
spectrum and is noted by an asterisk. (B) LSA particle generated in the laboratory from the Lake
Michigan freshwater sample and collected on a TEM grid. (C) Cloud water residual particle
collected on a TEM grid.
Elemental mole ratios were calculated for ambient LSA, laboratory-generated LSA, and
cloud water residual particles using atomic weight percentages of each element measured by
CCSEM-EDX (Figure 3.4). Elemental mole ratios for Lake Michigan freshwater were obtained
from ion concentrations reported by Chapra et al.202 The Ca/Na mole ratios of the cloud water

38
residual particles classified as LSA (3.5 ± 0.8) and ambient LSA (3.1 ± 0.1) resembled those of
the laboratory-generated LSA (3.8 ± 0.3), Lake Michigan freshwater (3.3), and ambient LSA
previously reported by May et al (3 ± 3).27 Similarly, the Mg/Na mole ratios of the cloud water
residual particles (2.2 ± 0.2) and ambient LSA (1.9 ± 0.3) were also consistent with those of
laboratory-generated LSA (1.4 ± 0.2), Lake Michigan freshwater (1.7), and ambient LSA
previously reported by May et al (1.8 ± 0.5).27 Both Ca/Na and Mg/Na ratios are significantly
different from seawater (0.02 and 0.1 for Ca/Na and Mg/Na, respectively),206,233,234 emphasizing
the freshwater origin of these particles. The variability measured for the cloud water residual
particles is larger than for other particle classes due to potential influence from multiple particle
types present in the cloud water prior to and during the nebulization process.224,235 Ambient LSA
collected above the cloud layer and residual particles generated from the collected cloud water
featured higher S/Ca mole ratios (1.0 ± 0.2 and 0.7 ± 0.2, respectively) compared to laboratory-
generated LSA (0.4 ± 0.1) and Lake Michigan freshwater (0.28). These observations suggest the
collected LSA had likely undergone either cloud processing, with sulfate formation following
partitioning of gaseous SO2 into cloud drops and oxidation, or heterogeneous reactions prior to
droplet formation.236

39
Figure 3.4. Elemental mole ratios of LSA, freshwater, and seawater. Comparison of ambient LSA,
laboratory-generated LSA, cloud water residual LSA particles, Lake Michigan freshwater, and
seawater elemental mole ratios. Ambient LSA, cloudwater residual particles, and laboratory-
generated LSA mole ratios were calculated from the atomic weight percentages of each element
measured by CCSEM-EDX. Error bars represent 95% confidence intervals. Only cloud water
residual particles that contained the elements Ca, Na, and Mg were classified as LSA and included
here. Seawater and Lake Michigan freshwater mole ratios were calculated from ion concentrations
reported by Pilson et al.233 and Chapra et al.,202 respectively. Comparison to ambient LSA mole
ratios provided by May et al.27 are included.
In addition to LSA, CCSEM-EDX identified two additional ambient particle types:
secondary organic aerosol (SOA)/biomass burning and dust. Example SEM images and EDX
spectra of these particles are shown in Figure B.4. LSA was differentiated from SOA and biomass
burning particles (defined by combinations of C, O, N, and S)78 by the presence of Ca. Both SOA
and biomass burning are abundant in this region43,76,237 and differentiating them using only SEM-
EDX is challenging because both particle types contain the elements C, O, N, and S and have
similar morphology.78 Biomass burning is commonly differentiated from SOA by the presence of
K, which is often not clearly detected by EDX for biomass burning particles with significant SOA
coatings.78,230 Organics from SOA or biomass burning can be particularly challenging to
distinguish in resuspended rain, snow, and cloud water samples.224,235,238-240 Therefore, since their
distinction was not central to the findings of this study, the SOA and biomass burning particle
types are combined here.
The CCSEM-EDX data enabled determination of the size-resolved contributions of the
observed particle types. Ambient LSA particles were primarily observed in the submicron size
range (Figure 3.5a). LSA particles were the most abundant particle type at the smallest sizes
40
measured (0.17 − 0.23 μm), where they composed 65% of the observed particles, by number, in
this size range. This is supported by the number mode of laboratory-generated LSA occurring at
0.20 μm (measured by SMPS operating in the 0.020 – 0.80 μm range), similar to the mode observed
in ambient particles over Lake Michigan (0.20 μm), as measured by the optical particle counter
(0.20 – 4 μm, Figure 3.5 and B.3). This analysis shows LSA to exist in a size range241 and with
composition (CaCO3 + organics) that suggests LSA can act as CCN198,242,243 or INPs.198,244,245
These size distributions are similar to the previously observed accumulation mode peaks for
laboratory-generated (0.2 μm)5,164,168 and ambient LSA (0.2 – 0.3 μm).4,5,27 LSA particles likely
also contributed at smaller diameters, as previous studies have observed a second, ultrafine mode
(0.02 – 0.08 μm) for LSA particles4,164 (Figure B.3); however, particles at that size were unable to
be chemically analyzed in this study. In comparison, dust particles primarily contributed to the
0.75 – 1.4 μm size range, where they accounted for 10–15% of all particles analyzed, by number,
in this size range. SOA/biomass burning particles accounted for 30–40% of all particles < 0.30
μm, ~70% of all particles from 0.30 – 1.0 μm, and 70–90% of particles > 1.0 μm. The contribution
of SOA/biomass burning particles is consistent with the observations by Gunsch et al.,237 who
identified highly aged biomass burning particles comprising ~80% of 1 – 2.5 micron summertime
aerosol, by number, at a field site located 75 km from the flight sampling area. Similarly, Sheesley
et al.246 observed organic aerosol contributing up to 90% of the aerosol population, by mass, in
this geographic region.
Similar to the ambient particle analysis, CCSEM-EDX also identified cloud water residual
particles corresponding to SOA/biomass burning (63%) and dust (11%), in addition to LSA (26%)
(Figure 3.5b). As cloud water residual particles were resuspended from solution during the
nebulization process, particle size could not reliably be related to the ambient diameter and, thus,
was not used as a parameter during classification.224,235,247 Therefore, percentages listed are
number fractions of the total particles analyzed. The abundance of each particle type identified
from ambient aerosol particles for SOA/biomass burning (68%), dust (6%) and LSA (26%) were
similar to the amounts observed in cloud water residual particles (63%, 11%, and 26%,
respectively). Similar to the ambient particles, the LSA particle type contained Ca, C, and O, with
additional Na and Mg. SOA/biomass burning particles were characterized by a circular
morphology and contained elements C, O, and S (Figure B.4), as in the ambient particles. Dust
particles were characterized by irregular shapes and the elements C, O, Si, and Fe.21,239 Similar to

41
this work, Twohy and Anderson200 previously conducted a flight study that characterized ambient
particles and cloud water residual particles collected downwind of the Great Lakes. They classified
8% of the aerosol particles and 6% of the cloud water residual particles as salts containing
calcium.200 Though the source was not identified at the time, the common Ca elemental
signature5,27,168 indicates it is likely to have been LSA. Similarly, they identified 3% and 58%, by
number, as dust and sulfate-containing (SOA or biomass burning) particles, respectively.200 That
study suggested that the majority of particles > 0.2 μm were activated as CCN because they did
not find significant changes in the number fractions of each particle type when comparing ambient
particles to cloud water residues.200 The study by Twohy and Anderson200 occurred over the Great
Lakes region in wintertime while the current study took place in July. While the two studies were
performed in different seasons, both found similar atmospheric particle and cloud water
composition.

42
Figure 3.5. Comparison of ambient particle types observed during aircraft sampling. (A) CCSEM-
EDX size-resolved number fractions of ambient particles collected during aircraft sampling on
July 12, 2016. Black trace shows the size distribution of ambient particles measured by an optical
particle counter (0.20 – 4 μm) during aircraft sampling. Grey trace shows the average size
distribution of laboratory-generated LSA measured by SMPS (0.020 – 0.80 μm) for comparison.
(B) Number fractions of particle types identified by CCSEM-EDX for cloud water residual
particles (n = 1993 particles) and ambient particles (n = 3264 particles). Example SEM images and
EDX spectra of each particle type are shown in Figures 3.3 and B.4.
3.4 Conclusions
In this study, a recently identified source of particles, lake spray aerosol (LSA),4,5,27 was
shown to be lofted to cloud heights and incorporated into clouds over Lake Michigan. This was
shown through single particle microscopy and chemical analysis comparing laboratory-generated
LSA to ambient LSA and cloud water. The size, morphology, and elemental composition of

43
laboratory-generated LSA resembled that of ambient particles collected via aircraft over Lake
Michigan during a wave breaking event. Additionally, 26% of 1993 residual particles generated
from cloud water collected above Lake Michigan in July 2016 were identified as LSA, identifying
a new potential source of CCN in regions with large bodies of freshwater.
The potential for LSA to act as CCN and/or INPs are particularly important in the Great
Lakes region as air masses transition from water to land with excess water vapor, which condenses,
forming lake effect clouds, fog, and precipitation, regionally. With the chemical characterization
in the present study, we suggest that the previously measured calcium-rich droplets in Great Lakes
clouds200 were LSA from the freshwater lakes. This provides further evidence that freshwater-
generated aerosols can form cloud droplets, likely impacting cloud properties both over and
downwind of the Great Lakes. Previous studies have identified LSA over 25 km inland from the
nearest Great Lake,27 suggesting LSA acting as CCN can impact a spatially broad region
surrounding the Great Lakes. Measurements of the CCN and INP efficiencies of LSA with organic
and biological components are needed to fully assess their meteorological and climate importance.
In addition, detailed characterization of LSA production as a function of wind speed, wave height,
and water composition is necessary for further parametrization in models to assess LSA impacts.
Further ambient measurements of LSA physicochemical properties are needed to improve
modeling of the potential wide-ranging climate197,199 and health168,209 impacts of LSA. In addition
to the Great Lakes region, LSA could potentially impact many other regions containing large
bodies of freshwater, such as the African Great Lakes, Lake Winnipeg and Great Bear Lake in
Canada, and Lakes Baikal, Ladoga, and Onega in Russia.

44
Chapter 4. Harmful Algal Bloom Toxins in Aerosol Generated from Inland Lake Water
Adapted with permission from Olson, N. E., Cooke, M. E., Shi, J. H., Birbeck, J. A., Westrick, J.
A., and Ault, A. P.: Harmful Algal Bloom Toxins in Aerosol Generated from Inland Lake Water,
Environ. Sci. Technol., 2020, 54, 8, 4769-4780. https://doi.org/10.1021/acs.est.9b07727 Copyright
2020 American Chemical Society.
4.1 Introduction
The frequency and intensity of harmful algal blooms (HABs) from cyanobacteria in
freshwater are increasing globally due to increased anthropogenic nutrient loading.248-251 Warmer
global temperatures are also expected to increase HAB frequency and intensity due to longer
growing seasons and amplified algal growth rates.252-261 Intracellular and extracellular algal toxins
from cyanobacteria pose a threat to human and animal health.209,262 In 2014, a HAB with high
concentrations of microcystin in Lake Erie infiltrated the public drinking water treatment facility
for the city of Toledo, Ohio, causing a do not drink posting for > 400,000 people due to toxin levels
unsafe for ingestion.263,264 The immediate impact of HAB toxins on human health necessitates a
deeper scientific understanding of their chemical structure and mechanisms of transport.
Variations in HAB toxin concentrations and the relative amounts of different toxin congeners (i.e.
chemical structures) have been observed that are independent of overall HAB biomass
concentrations.265-268 The physical size of a HAB does not correlate with the concentration of
toxins produced, which creates difficulty in predicting and mitigating HAB-related health impacts.
Many genera of cyanobacteria, commonly known as blue-green algae (BGA, e.g.
Microcystis), and associated cyanotoxins (e.g. microcystin) have been identified within freshwater
HABs, but there is limited understanding of their impacts on human health.269,270 Microcystin is a
class of cyclic heptapeptides named by the combination of amino acids in their structure,271 with
over 200 microcystin congeners identified to date.272-276 However, despite differences in the acute
toxicities of different congeners, there is minimal overall understanding of HAB toxicity.277,278
Laboratory studies examining the toxicity of microcystin-containing aerosols administered to mice
have shown ten times higher sensitivity to inhaled microcystin compared to orally ingested

45
microcystin.279,280 Therefore, toxic effects from exposure to aerosolized microcystin likely occur
at lower doses than for microcystin ingestion,281 on which the Environmental Protection Agency
(EPA) recommendations are based. This raises concerns regarding unexpected exposure that could
occur for populations living near or downwind of HABs, for occupations that interact with HABs,
or for recreational users on HAB-impacted water. Studies have observed microscopic lesions in
both the nasal cavity281 and liver280 after microcystin inhalation. It is believed that microscopic
lesions observed in the nasal cavity from microcystin inhalation enhanced absorption into the
bloodstream leading to systemic impacts.281 The diversity of cyanobacteria and associated toxins,
as well as our limited knowledge of exposure routes and acute toxicities, necessitate further study
as this has the potential to negatively impact populations living and working near HABs
globally.282
Lake spray aerosol (LSA) is produced by freshwater wave breaking and bubble bursting,164
similar to the production of sea spray aerosol (SSA) from wave breaking in marine
environments.163,234,283,284 LSA from freshwater lakes have been observed along lakeshores on the
ground,5 after transport inland,27 lofted to cloud heights,4,285 and incorporated into cloud water.285
Modeling of LSA concentrations shows that freshwater aerosol production contributes
significantly to particle number concentrations over the Great Lakes region.167 LSA are generated
in a size range important for inhalation exposure with modes in the ultrafine (30-80 nm) and
accumulation (200-300 nm) size ranges.4,164 LSA have a distinct chemical composition in
comparison to SSA,234,286 and are composed primarily of calcium carbonate and organic
carbon.5,164 Recently May et al.168 showed that LSA generated from HABs contained greater
organic and biological material than LSA generated during non-HAB conditions, demonstrating
the incorporation of biological material from HABs into LSA. However, little is known regarding
the incorporation of toxins from freshwater HABs into LSA in the Great Lakes region.
The few studies of aerosolized HAB toxins in freshwater environments include Backer et
al., which observed microcystin in ambient LSA emitted from small, inland lakes in
Michigan287,288 and California.289 Wood et al.290 detected microcystin-containing aerosols at a
freshwater site 20 m from the shore and 30 m high, demonstrating freshwater aerosol can be
transported aloft and inland. Cheng et al.291 identified microcystin-containing droplets produced
from freshwater bubble bursting in the laboratory. These studies confirmed that freshwater toxins
can become aerosolized, however they all used enzyme-linked immunosorbent assays (ELISA)

46
that are unable to distinguish between the congeners of aerosolized microcystin.292,293 Additional
questions remain about the relationship between freshwater and aerosolized toxin concentrations.
Further studies are needed to assess aerosolized toxin congeners with respect to toxin
concentrations found in bulk water. Toxin incorporation into aerosol is not expected to be uniform
at the particle-to-particle level, which makes understanding its presence as a function of size and
at the single particle level (i.e. toxins as a function of aerosol mixing state)3,13,294 important for
distinguishing the health implications in the Great Lakes region or other regions with HABs (e.g.
Florida).27,43,230,237,285,295 Characterizing the aerosolization of HAB toxins in freshwater
environments is crucial for understanding the impacts of toxin inhalation on public health.
Given the limited information on freshwater HAB toxin aerosolization, it is useful to
consider what is known about aerosolization of toxins in oceanic environments from red tides and
other marine blooms. Studies examining toxin aerosolization in oceanic blooms by wave
breaking296-301 and recreational activities302,303 show adverse respiratory effects after as little as 1
hour exposure.300,303 Exposure to toxin-containing aerosols particularly impacts people with pre-
existing breathing diseases, such as asthma.301,304,305 Gambaro et al.306 detected microcystin in SSA
particles generated from seawater artificially spiked with microcystin, showing algal toxin transfer
from seawater to aerosol particles. Similarly, organic material increases in SSA during
blooms,36,234,286 impacting water uptake,194 incorporating metals,307 and even emitting whole,
intact bacterial cells.24 Blanchard et al.308 discovered elevated bacterial cells in aerosol particles
compared to bulk water concentrations due to aerosolization of the surface-active organics present
in the sea surface microlayer.309 Brevetoxins produced from red tides contain hydrophobic
functional groups310 that impact toxin type and potency,311 but further information is needed
regarding the impact of hydrophobic structures on the aerosolization efficiency of HAB toxins.
Pierce et al.299 observed marine toxin aerosolization up to one mile inland, suggesting inland
transport of aerosolized toxins in addition to previously reported inland transport of SSA.27,206
Toxins in atmospheric particles were transported many kilometers inland without degradation,290
consistent with the stability of microcystin under a range of chemical and physical conditions.312,313
The well-established aerosolization, transport, and health consequences of toxins from marine
blooms highlight the need to study these properties in freshwater environments.
In this study, freshwater was collected in Michigan from Mona Lake during a HAB and
high microcystin concentrations and Muskegon Lake in which the microcystin concentrations were

47
below EPA recommended levels. Freshwater samples were analyzed for the presence of BGA and
microcystin toxins, after which LSA was generated using established methods in the laboratory164
to gain understanding of fundamental emission processes of nascent LSA in a controlled setting.284
Microcystin present in the freshwater samples was also detected in aerosol samples. However,
microcystin congeners were not transferred from freshwater to the aerosol phase uniformly,
leading to greater enrichment of hydrophobic microcystin congeners in aerosol particle samples.
Freshwater samples were also analyzed for insoluble organic particles using nanoparticle tracking
analysis (NTA).238 A relationship between increasing freshwater organic particle concentrations
and higher aerosol number concentrations was observed. Overall, this study demonstrates the
emissions of microcystin within particles and suggests that the relative amounts of toxins present
in the aerosol phase are distinctly different than those present in the water column. These key
findings improve the currently limited understanding of freshwater HABs toxins in size-resolved
aerosols, which will ultimately lead to a better understanding of this potential route of exposure
for HABs toxins and their health impacts.
4.2 Methods
4.2.1 Freshwater Sample Collection and Aerosol Generation
Freshwater samples were collected from the surface of Mona Lake (43.1856, -86.2360) on
July 11, 2018 and September 4, 2018 and from Muskegon Lake (43.2325, -86.2677) on June 11,
2015 and October 25, 2015 (Figure 4.1A). Freshwater samples were stored in 8 L carboy LDPE
containers (United States Plastic Corp) and frozen (–20°C) prior to analysis. After thawing,
freshwater samples were then used to generate aerosol particles using the method described by
May et al.164 Briefly, 4 L aliquots of freshwater were cycled through four plunging jets at 2 L/min,
creating bubbles that burst at the air-water interface to generate aerosol particles. Particles were
sampled from the headspace of the tank after passing through two silica gel diffusion driers to
achieve a relative humidity (RH) of ~15%, a standard established for SSA.163 The tank was kept
at room temperature (23 ± 1 °C) for all experiments. Particle-free air (Pall, HEPA Capsule Filter)
was cycled through the LSA generator to test for leaks before LSA generation. Background particle
concentrations were minimal (< 20 particles/cm3) compared to the particle concentrations
generated from freshwater samples (~500 – 1500 particles/cm3). The aerosol number size
distributions for each LSA sample were measured by a scanning mobility particle sizer (SMPS)

48
consisting of a differential mobility analyzer (DMA, TSI Inc., model 3082) and a condensation
particle counter (CPC, TSI Inc., model 3755) for particles ranging from 14.1 – 736.5 nm diameter.
Particles with diameters from 0.52 – 19.8 µm were measured by an aerodynamic particle sizer
(APS, TSI Inc., model 3321).
4.2.2 Bulk Measurement Techniques and Toxin Characterization
A spectrophotometer (AquaFluor 8000, Turner Designs) measured phycocyanin
fluorescence of freshwater samples, serving as an indicator of BGA.314 ELISA kits (Thermo
Fischer Scientific) measured total microcystin concentrations in freshwater samples. For
comparison, 12 microcystin congeners were also measured using the liquid chromatography triple
quadrupole mass spectrometry (LC-MS/MS) method developed by Birbeck et al.315 Laboratory-
generated LSA were impacted onto glass fiber filters (Whatman, grade GF/c, 47 mm) using a
cyclone (URG Crop., model 2000-30ED) and single stage impactor (URG Corp., model 2000-
30FV) that operated at 3 L/min and impacted particles < 2.5 µm aerodynamic diameter (da).
Impacted particles were extracted following the method described by Wood et al.290 Filters and 5
mL of 100% methanol were placed into 50 mL beakers covered by ParafilmTM. Samples were
sonicated for 30 minutes, after which the supernatant of each sample was placed into a glass vial.
The extraction procedure was repeated for a total of three times. The supernatants from each filter
were combined, dried under nitrogen, and solubilized in LC/MS grade water before LC-MS/MS
analysis using a Thermo TSQ Quantiva triple quadrupole MS (Thermo Scientific) equipped with
an online concentrating column (Thermo Scientific Hypersil GOLD aQ 2.1 x 20 mm, 12 µm).315
Extract from three filters, each representing sixty minute LSA experiments, were analyzed by LC-
MS/MS, as well as aliquots from each corresponding freshwater sample. The mobile phases
consisting of 0.1% formic acid in water and 0.1% formic acid in acetonitrile separated the
microcystin congeners present using gradient analysis with a C18 column (Thermo Accucore aQ,
50 x 2.1 mm, 2.6 µm) then detected using selective reaction monitoring (SRM) in positive
electrospray ionization (ESI) mode. Retention times and concentrations of each measured
microcystin congener were determined by calibration using commercially available standards.
4.2.3 Single Particle Analysis
An aerosol time–of–flight mass spectrometer (ATOFMS) measured the size and chemical
composition of individual LSA particles ranging from 0.1 – 1.5 µm.316 Briefly, particles entered

49
the instrument and were focused into a narrow particle beam by passing through an aerodynamic
focusing lens. Particle sizes were determined by measuring the time it takes an individual particle
to pass through two continuous wave lasers (wavelengths of 405 and 488 nm, respectively)
separated by 6 cm. Particle da was determined after calibration using polystyrene latex spheres of
known diameters ranging from 0.1 – 1.5 µm. Individual particles were desorbed and ionized by a
266 nm Nd:YAG laser upon entering the mass spectrometer source region, generating positive and
negative ions for individual particles. Ions were detected using a dual polarity time–of–flight mass
spectrometer. A total of 5277 particles were chemically analyzed by ATOFMS from the Mona
Lake – July sample, 2332 particles from the Mona Lake – September sample, 1616 particles from
the Muskegon Lake – June sample, and 1007 particles from the Muskegon Lake – October sample.
Single-particle mass spectra were analyzed using the MATLAB toolkit FATES (Flexible Analysis
Toolkit for the Exploration of Single-particle mass spectrometry data).317 Mass spectral peak
assignments correspond to ions identified from previous studies.5,27,168,224,235,239,247,284,294,307,318-320
A three-stage microanalysis particle sampler (MPS-3, California Measurements, Inc.)
impacted LSA particles onto Formvar coated copper microscopy grids (Ted Pella Inc.) for
scanning electron microscopy coupled to energy dispersive x-ray spectroscopy (SEM-EDX)
analysis. The MPS-3 operated at 2 L min-1 and impacted particles with diameters 2.5 – 5.0 µm, 0.7
– 2.5 µm, and < 0.7 µm onto stages 1, 2, and 3, respectively. SEM analysis was performed using
a FEI Helios 650 Nanolab Dualbeam electron microscope that operated at an accelerating voltage
of 20.0 kV and a current of 0.40 Na The Helios microscope utilized a high angle annular dark field
(HAADF) detector to provide contrast between areas of differing chemical composition.144 EDX
spectra were acquired for 20 seconds using an EDAX detector and GENESIS EDX software
version 5.10 (EDAX Inc.). Raman microspectroscopy was performed on a Horiba LabRAM HR
Evolution Raman Spectrometer (Horiba Scientific) to analyze droplets of freshwater placed onto
quartz substrates (Ted Pella Inc.). The Raman spectrometer contained a 50 mW 532 nm Nd:YAG
laser, CCD detector, 600 gr/mm grating, and a 100x objective confocal microscope (Olympus Life
Science). Raman spectra were collected using 3 accumulations at 15 second acquisition times for
the range 500 – 4000 cm-1.
4.2.4 Analysis of Insoluble Residues
Concentrations and number size distributions of the insoluble residues present in each
freshwater sample were analyzed by NTA using a NanoSight LM10 (NanoSight Ltd.) traditionally

50
applied to nanoparticle analysis,3,321,322 following the method for environmental insoluble residues
described in Axson et al.238 NTA determines the size-resolved number concentration (i.e. size
distribution) of individual particles in a liquid medium by illuminating them with a laser and
monitoring the Brownian motion of particles to determine their 2-D displacement. The Stokes-
Einstein equation is then used to determine the individual particle hydrodynamic diameter.323,324
Aliquots of each freshwater sample were filtered prior to analysis using a 2 µm glass syringe filter
before 500 µL was loaded into the LM10 cell housing a 405 nm laser. Freshwater sample flowed
through the instrument using a syringe pump that operated at 60 rpm. Light scattering was
measured using a sCMOS camera (Hamamatsu, Orca) coupled to a 20x objective microscope. Ten
60 second videos of each freshwater sample were analyzed using the NTA 3.2 (Build 60) software.
The average of the ten videos generated an average size distribution in the range 10 nm – 1 µm for
each freshwater sample. Droplets of Mona Lake – September freshwater were placed on Raman
and SEM substrates following previously established methods,325 and the insoluble residues were
analyzed by SEM-EDX and Raman microspectroscopy after the droplet dried.36,234 The insoluble
residues were composed of particulate organic carbon (POC, Figure C.1)326,327 and will be referred
to as POC.
4.3 Results and Discussion
BGA and microcystin concentrations present in freshwater samples were analyzed prior to
aerosol generation. Mona Lake – September had the highest phycocyanin/BGA (1166 µg/L) and
microcystin concentrations (280 and 230 µg/L for ELISA and LC-MS/MS methods, respectively)
of all samples (Figure 4.1B). For this reason, we focused on this sample for aerosol generation in
subsequent laboratory experiments. Mona Lake – July had the second highest concentrations of
phycocyanin/BGA (192 µg/L) and microcystin (21 and 8 µg/L for ELISA and LC-MS/MS
methods, respectively). Both Muskegon Lake samples had lower phycocyanin/BGA
concentrations (93 and 86 µg/L for the June and October samples, respectively). Muskegon Lake
also had lower microcystin concentrations of 0.3 and 0.8 µg/L (using ELISA) and 0.03 and 0.08
µg/L (using LC-MS/MS) for the June and October samples, respectively. The microcystin
concentrations present in Muskegon Lake were below the EPA swimming advisory (8 µg/L total
microcystin)328 and drinking advisory (1.6 µg/L total microcystin) recommendations,329 while
Mona Lake samples were above for both guidelines. For all samples, ELISA kits predicted slightly
higher amounts of algal toxins more than likely due to the simultaneous detection of toxins and

51
their degradation products and differing responses of each congener to ELISA.293,315,330 ELISA is
not able to differentiate between microcystin congeners like the LC-MS/MS method used.315
Figure 4.1. Map of sampling locations and microcystin concentrations at each location. A) Map
of Mona and Muskegon Lakes located in Western Michigan, with inset showing location of inland
lakes relative to the surrounding Great Lakes. B) Total microcystin and phycocyanin (blue green
algae, BGA) concentrations for each freshwater sample. Inset shows microcystin for Muskegon
Lake samples. Dashed line shows EPA drinking water advisory of 1.6 µg/L total microcystin.
Aerosolized microcystin congeners from Mona Lake LSA were quantified with LC-
MS/MS, described in Birbeck et al.315 Figure 4.2A shows the molecular structure of microcystin–
LR (MC–LR), the congener with the highest concentration in the aerosol generated from Mona
Lake (Figure 4.2B). Chromatograms of the retention times of each microcystin congener measured

52
in Mona Lake LSA are shown in Figure 4.2B, with the chromatogram of microcystin congeners
detected in Mona Lake freshwater shown in Figure C.2. Retention times and structures for each
congener are listed in Table C.1315 and illustrated in Figure C.3. The commercially available
microcystin congeners were previously optimized for select quantitative and qualitative ion
transitions using known fragmentation patterns from the literature.331-334 The microcystin
congeners were separated by gradient analysis HPLC and detected using SRM analysis on the
triple quadrupole MS system. Figure 4.2C shows the mass spectral fragments detected for MC–
LR, with fragmentation patterns illustrated in Figure 4.2A. Quantitative and qualitative fragment
ions were observed at m/z +135.07 [Ph–CH2–CH(OCH3)]+, +155.08 [H+Mdha–Ala]+, +163.08
[C11H14O+H]+, and +212.97 [H+Glu–Mdha]+, and are known fragments of that microcystin
molecule.331-334

53
Figure 4.2. Chemical structure, chromatogram, and mass spectrum of microcystin-LR. A)
Structure and fragmentation of microcystin–LR, the microcystin congener with the highest
concentration in Mona Lake LSA. B) Chromatogram showing microcystin congeners present in
Mona Lake LSA. Inset shows congeners present at lower concentrations. C) Mass spectrum of
microcystin–LR identified from Mona Lake LSA. All congener structures, retention times, and
their abundance in the Mona Lake freshwater sample are provided in the supporting information.

54
The LC-MS/MS method allows for the quantification of each microcystin congener based
on calibration with microcystin standards. The congeners detected and quantified in Mona Lake –
September freshwater are shown in Figure 4.3A and listed in Table 4.1. Microcystin concentrations
in LSA were determined by extracting LSA impacted onto filters and analyzing the extract with
LC-MS/MS. Average aerosolized microcystin concentrations from three experiments are shown
in Figure 4.3B and listed in Table 4.1. Of the eight toxins detected in freshwater, seven were also
detected in aerosol particles. However, the relative concentrations of specific toxins in the water
and aerosol phase differed substantially. In our experiments, MC–LR and MC–LA, were more
concentrated than other congeners in aerosol particles (Figure 4.3B). Enrichment calculations
(details in the supporting information) show enrichment factors of 830 and 2000 for MC–LR and
MC–LA, respectively, in the aerosol phase relative to the bulk freshwater (Table 4.1). MC–LR
and MC–LA contain the amino acid leucine (Figures 4.2A and C.3), a hydrophobic amino acid.335-
338 Conversely, the amino acid arginine is significantly more hydrophilic,336-338 and the congener
with this structure, MC–RR, was significantly less enriched in the aerosol relative to freshwater
(enrichment factor of 10). Hydrophobic molecules have been shown to be enhanced in SSA
particles relative to bulk seawater,17,284,309,339-343 which is believed to be due to hydrophobic and
low solubility species partitioning to the air-water interface of bubbles as they rise through the
water column. Octanol-water partitioning coefficients log(Kow) for MC–LR (1.67) and MC–RR (-
0.71)344 support preferential transfer of MC–LR to the aerosol phase, while MC–RR remains
primarily in the bulk freshwater. De Maagd et al.345 suggested the hydrophobicity of MC-LR
changes as a function of pH, with higher pH values leading to lower log(Kow) values. Freshwater
sample pH ranged from 6.9-7.1 (Figure C.4) though it is unclear what the role of pH is with respect
to toxin emissions into the particle phase and future work is needed in this area. Though
extracellular microcystin excreted from algal cells generally accounts for 20% of total toxins,270
this percentage can increase drastically during bloom senescence, algaecide treatment, and lysis.263
The aerosolized microcystin detected was likely extracellular because the bubble-bursting process
lyses cells, as noted by the observation of aerosolized bacterial cell components from marine algal
blooms.24 Additionally, the freshwater samples used within this manuscript were collected near
bloom senescence and intact cells are unlikely to be aerosolized as the cell size of Microcystis (>
4 µm)346 is larger than the mass and number modes of the generated aerosol. Therefore,
extracellular microcystin likely dominated the measurements.

55
Table 4.1. Concentrations of microcystin congeners detected in freshwater and aerosol samples.
Error bars refer to the standard deviation of triplicate aerosol experiments. MC–HtyR, MC–LY,
and MC–LW were below the limit of detection (5 x 10⁻³ µg/L). MC–LF and nodularin were not
detected in the freshwater samples. Enrichment factors were calculated by dividing the toxin
concentration in aerosol by the toxin concentration in freshwater (details are provided in the
supporting information). Octanol-water partitioning coefficients log(Kow) are provided by McCord
et al.344

56
Figure 4.3.Quantification of microcystin congeners present in Mona Lake freshwater and LSA
(parts A and B, respectively). Concentrations reported in µg/L refer to the mass of toxin per mass
of water. Concentrations reported in ng/m3 refer to the mass of toxin per meter cubed of air
measured. C) Schematic showing the aerosolization of hydrophobic microcystin congeners.
Toxin concentrations present in the aerosol samples were converted to ng/m3 for
comparison to previously reported measurements, as mass per volume of air is the standard unit
for particulate matter and specific particle-phase toxins. We detected 50 ± 20 ng/m3 of total
aerosolized microcystin (Table 4.1). Backer et al.288 detected aerosolized microcystin
concentrations up to 23 ng/m3 during ambient sampling on the shore of a small lake in Michigan.
However, the freshwater microcystin concentrations in that study were significantly lower than
those observed herein (5 µg/L288 and 230 µg/L, respectively), which likely accounts for the
difference in aerosolized toxin concentrations observed.
The size and concentration of LSA and insoluble residues in freshwater were analyzed to
investigate trends between the properties of organic material of the water and aerosol phases. Mona
and Muskegon Lake LSA had a mode at 46 nm in the number size distribution (Figures 4.4A and
4.4B), similar to the Aitken mode observed for LSA generated from Lake Michigan freshwater
(30 – 80 nm).4,5,164 A larger LSA mode at 270 nm was also observed, corresponding to the
accumulation mode previously identified in laboratory164,168 and field studies (200 – 300
nm).4,5,27,285 POC present in Mona Lake – September freshwater as insoluble residues had a number

57
size distribution mode at 155 nm and an average concentration of 1.15 (± 0.04) x 109 POC/mL
(Figures 4.4A and 4.4C, respectively). Similar concentrations of 1.22 (± 0.03) x 109 POC/mL were
observed for Mona Lake – July freshwater, with a slightly larger mode at 240 nm. POC
concentrations for the Muskegon samples were much lower (3.62 ± 0.08 x 10⁸ and 3.32 ± 0.07 x
108 POC/mL for June and October samples, respectively). These POC distributions correspond to
mass concentrations of 68, 38, 6, and 7 µg/cm3 for Mona Lake – July, Mona Lake – September,
Muskegon Lake – June, and Muskegon Lake – October samples, respectively. Average LSA
number concentrations for Mona Lake – September were 1400 ± 200 particles/cm3 (Figure 4.4C).
LSA number concentrations were lower for Mona Lake – July and both Muskegon Lake samples
(260 ± 20 particles/cm3, 270 ± 15 particles/cm3, and 110 ± 6 particles/cm3, respectively). The
increase in POC and microcystin for Mona Lake – September corresponded to an increase in
overall aerosol production, particularly with enhanced aerosol production in the ultrafine size
range (< 100 nm) resembling the size of observed POC. Incorporation of insoluble residues into
SSA has been observed347 with aerosol size shifting to that of the insoluble residues,348 similar to
the results presented herein. A positive relationship between organic content in water and increased
algal growth has been observed,349-351 demonstrating the importance of simultaneously measuring
POC and microcystin in freshwater environments. This analysis is the first use of NTA to
investigate the insoluble residues of freshwater in relationship to aerosol generation, and shows
that insoluble residues present in freshwater play a role in higher atmospheric aerosol
concentrations, as well as impacting the size of particles that form.

58
Figure 4.4. Average size distributions for water samples and aerosol experiments. Average aerosol
and POC number size distributions for A) Mona and B) Muskegon Lake samples. Microcystin
concentrations for each sample are listed in parentheses. C) Quantification of aerosol and POC
number concentrations for each freshwater sample.

59
LSA analyzed by single particle mass spectrometry (ATOFMS) were classified into three
particle types following the criteria used in May et al:168 LSA composed primarily of salt (LSA
salt), LSA with organic content (LSA organic), and LSA with enhanced biological material (LSA
biological). Average dual polarity mass spectra of all three particle types are shown in Figure C.5
with the major ions labeled. Salt particles contained primarily inorganic ions, with the major ions
present being m/z +40 [Ca+], +23 [Na+], and +24 [Mg+] (Figure C.5).5,27,168 LSA organic particles
were classified by the presence of m/z +66 [CaCN+] and +82 [CaCNO+]168 (Figure C.5), peaks
consistent with the presence of organic nitrogen.307 Additional organic ions observed were m/z +74
[N(CH3)4+], –45 [CHOO–], –59 [CH3COO/HCNO2
–], and –71 [C3H3O2–].318 LSA biological
particles were classified by the presence of m/z –79 [PO3–]168,307,319,320 and +89, the amino acid
aspartic acid [Asp–CO2+].352
Difference mass spectra, calculated by subtracting the average mass spectra of particles in
Muskegon Lake from the average spectra of particles in Mona Lake, highlight the compositional
differences between particles generated from each lake (Figures 4.5A, 4.5B, and C.6). Both
biological markers were observed in higher concentration in Mona Lake biological LSA (Figure
4.5B), while organic markers were observed in both Mona and Muskegon Lake LSA organic
particle types (Figure 4.5A). The identification of salt, organic, and biological particles was
verified by SEM-EDX analysis (Figure C.7). Salt particles were identified with SEM-EDX by
containing the elements Na, Mg, Ca, and Cl,168 along with an amorphous morphology similar to
previous analysis of ambient LSA collected on the shore5 and via aircraft285 over Lake Michigan.
Organic particles were identified by SEM-EDX by containing only the elements C and O, and a
circular morphology.168 Biological particles were classified by the presence of elemental P and an
amorphous morphology similar to previously observed ambient biological particles.20,168

60
Figure 4.5. Mass spectra of biological and organic LSA particles from Mona and Muskegon
Lakes. Difference spectra calculated by subtracting Muskegon Lake mass spectra from Mona Lake
spectra of A) LSA organic particles and B) LSA biological particles.
Freshwater toxin concentrations and aerosol particle types were investigated for each
freshwater sample. Percentages of microcystin congeners for each freshwater sample were
calculated using the concentrations obtained by LC-MS/MS to compare relative toxin abundance
for each lake. MC–RR was the toxin of highest concentration in all samples, accounting for 48%
(Mona Lake – July), 50% (Mona Lake – September and Muskegon Lake – October), and 67%

61
(Muskegon Lake – June) of microcystin congeners observed (Figure 4.6A). MC–LR was the
second highest for each sample at 34% (Mona Lake – July and Mona Lake – September), 33%
(Muskegon Lake – June) and 25% (Muskegon Lake – October). The remaining toxins detected
were: D–Asp3–RR (1% for both Mona Lake samples, 0% for both Muskegon Lake samples), MC–
YR (8 and 9 % of Mona Lake – July and – September samples, 0 and 12% of Muskegon Lake –
June and –October), D–Asp3–LR (1% for both Mona Lake samples, 0% for both Muskegon Lake
samples), MC–HilR (1% for both Mona Lake samples, 0% for both Muskegon Lake samples),
MC–WR (2% for both Mona Lake samples, 0% for both Muskegon Lake samples), and MC–LA
(5% for both Mona Lake – July, 2% for Mona Lake –September, 0% for Muskegon Lake – July,
and 13% for Muskegon Lake – October.). Particle types observed by ATOFMS were combined
for each freshwater sample. The percentage of particles identified as LSA biological from Mona
Lake were 10% and 14% for the July and September samples, respectively (Figure 4.6B).
Biological particles generated from Muskegon Lake freshwater comprised 10% and 6% of all
particles analyzed from the June and October samples, respectively. Organic particle types were
also at higher percentages for Mona Lake LSA (80% and 75% for July and September,
respectively) than Muskegon Lake (67% and 60% for June and October, respectively). Salt
particles comprised the smallest percentage of LSA generated from Mona Lake freshwater at 10%
and 11% for July and September samples, respectively. Conversely, salt particles were 23% and
34% of all particles observed from Muskegon June and October samples, respectively. Mona Lake
– September had the highest microcystin (230 µg/L) and phycocyanin/BGA (1166 µg/L)
concentrations, corresponding to an increase in the amount of biological and organic particles
detected, similar to previous observations.168 The significantly lower contribution of salt particles
to Mona Lake LSA demonstrate the incorporation of biological and organic material from HABs
into aerosols.

62
Figure 4.6. Microcystin congeners present at all sampling locations with fraction of particle types
observed from each location. A) Fraction of microcystin congeners present in all freshwater
samples. B) Number fractions of ATOFMS particle types generated from Mona and Muskegon
Lake freshwater. Average phycocyanin/blue green algae (BGA) and microcystin freshwater
concentrations are shown for each sample.
4.4 Conclusions
This study identified HAB toxins, specifically microcystin, in laboratory-generated
freshwater particles < 2.5 µm, a key size range impacting human health.1 Microcystin congeners
were quantified in freshwater from a HAB in Mona Lake in Michigan using two microcystin
measurement methods (ELISA and LC-MS/MS). Aerosol particles were then generated in the
laboratory and analyzed for the presence of toxins relative to the toxins identified in the freshwater
samples. Of the eight microcystin congeners detected in the freshwater, seven were also detected
in LSA particles, demonstrating that toxins are emitted through the aerosolization process in
freshwater environments.
63
For the first time, we show that hydrophobic microcystin congeners were preferentially
aerosolized versus hydrophilic microcystin congeners, which suggests that the relative amounts of
toxins present in the aerosol phase are distinctly different than those present in the water column.
This is analogous to previous observations of preferentially aerosolized hydrophobic material in
SSA from marine environments.50,63,84-88 The alignment between aerosol-phase enhancement and
octanol-water partitioning coefficients log(Kow’s) for different microcystin congeners344 supports
the finding that hydrophobic congeners partition to the air-water interface of bubbles passing
through the HAB and are then transferred to the aerosol phase after bubble bursting. The fact that
aerosol phase concentrations of microcystin cannot be predicted solely based on water
concentrations, combined with the differing toxicities of microcystin congeners, demonstrates the
need for further aerosolization studies aimed at predicting concentrations of toxins emitted to the
atmosphere.
To improve understanding of the linkages between organic material in freshwater and
emitted in the aerosol phase, the size and amount of insoluble organic material in freshwater was
tracked and related to aerosol size. Increased POC number concentrations corresponded to
increased aerosol number concentrations and a shift in the aerosol size distribution to resemble
that of the POC size distribution, leading to aerosol production at smaller sizes that are more
readily inhaled.349-351 Our results demonstrate an enhancement in ultrafine aerosol particles with
an increase in HAB concentration.
Overall this work highlights the potential exposure risks for populations near or downwind
of HABS. Understanding these exposures is challenging since we show that the hydrophobicity of
microcystin congeners improves their aerosolization efficiency, leading to different relative
amounts of congeners in the aerosol phase compared to the freshwater bloom itself. Ambient
measurements are needed to quantify HAB toxin aerosolization, while accounting for different
atmospheric (wind speed, turbulence, temperature, RH) and biological (freshwater nutrient levels,
type and amount of cyanobacteria, cyanobacteria buoyancy and distribution throughout the water
column) conditions. Additional questions remain regarding the diel patterns of freshwater toxin
production and associated aerosol emission. Future work is needed to determine relative toxicities
of each congener and relate these to the atmospheric concentrations and bloom dynamics to fully
assess the health impacts of toxin-containing LSA.

64
Chapter 5. Harmful Algal Bloom Toxins in Ambient Freshwater Aerosol
Nicole E. Olson,1 Jia H. Shi,1 Madeline E. Cooke,1 Johnna A. Birbeck,2 Judy A. Westrick,2Andrew
P. Ault1*
1Department of Chemistry, University of Michigan, Ann Arbor, MI, USA 48109
2Department of Chemistry, Wayne State University, Detroit, MI, USA 48202
5.1 Introduction
Increased anthropogenic nutrient loadings in freshwater environments combined with
rising temperatures have led to a global increase in harmful algal blooms (HABs).248,250-
252,255,256,258,261 HABs, typically caused by cyanobacteria (blue-green algae, BGA),250,270 release
toxins (e.g. microcystin) that are a threat to both human health and wildlife.209,262-264 With over
200 microcystin congeners identified thus far,272-274,276 many questions remain regarding their
impact on human health. Drinking water regulations require the monitoring of HAB toxins to
ensure the amounts present are safe for ingestion.263,264,328,329 However, recent laboratory studies
have suggested that inhalation of microcystins results in 10 times higher sensitivity compared to
oral ingestion of these toxins.279-281,353 Therefore, it is crucial to determine the amounts of
aerosolized HABs toxins in order to predict exposure for populations living near or downwind of
HABs globally.302,354
The physicochemical properties of lake spray aerosol (LSA), produced from wave breaking
and subsequent bubble bursting in freshwater environments,164 have been extensively studied
through laboratory studies164,168,355 and in the ambient environment.4,5,27,285 LSA is composed
primarily of CaCO3,5,168,285 and can be chemically differentiated from the sodium-rich sea spray
aerosol (SSA) that is produced in marine environments.27,163,234,283,286 The submicron size of LSA
suggests it can be important for inhalation exposure.4,5,285,355 In a laboratory-based study, May et
al.168 observed the incorporation of biological material from HABs into aerosol particles, showing
that both the organic and inorganic content of freshwater impacts aerosol composition. However,
questions remain regarding the transfer of algal toxins into aerosol particles and their abundance
in ambient freshwater environments.

65
Recent laboratory studies have observed microcystin in aerosol particles generated from
both freshwater291 and seawater,306 highlighting that aerosol particles can contain HAB toxins.
However, these studies used enzyme-linked immunosorbent assays (ELISA) for microcystin
measurements, a technique that is unable to distinguish between microcystin congeners.292,293
Recently, a liquid chromatography tandem mass spectrometry (LC/MS/MS) method was
developed to separate and quantify microcystin congeners.315 Olson et al.355 used this method and
observed an enrichment of hydrophobic microcystins in laboratory-generated aerosol particles
relative to toxins present in the water column. These results highlight the need for simultaneous
water and aerosolized toxin measurements in ambient environments.
Aerosolized algal toxins has been reported in ambient studies taking place in
Michigan,287,288 California,289 and Florida,301,303,356-358 with long-term effects reported after as little
as one exposure to aerosolized HAB toxins.356 Toxin-containing particles have been observed up
to 1 mile from shore,290,299 similar to previous observations of LSA lofted to cloud heights4,285 and
after inland transport.27,206 The stability of microcystin312,313,359 and other cyanobacteria330,360
suggests minimal degradation after inland transport, thus necessitating measurements of
aerosolized toxins at several sites around a HAB-infested lake. With toxin incorporation into
particles not expected to be uniform for every particle, single-particle techniques are needed to
assess the physicochemical properties of individual toxin-containing particles, and how prevalent
these particles are in relation to other particle types in the region.
In this study, freshwater and aerosol samples were collected from five locations around
Grand Lake St. Marys (GLSM) in Celina, Ohio, United States. This site was chosen due to severe
annual algal blooms resulting from excessive phosphorus loading from crops and livestock
operations in a shallow, hypereutrophic environment.361,362 GLSM routinely has Microcystis, the
bacteria that produces microcystin,363 with microcystin concentrations often exceeding 2000
μg/L.363 These concentrations are orders of magnitude larger than what the Environmental
Protection Agency (EPA)329 and World Health Organization (WHO) regulates for drinking
water.363 Ambient freshwater and aerosol samples were analyzed with LC/MS/MS for microcystin
speciation and quantification. A transfer of microcystins from the bulk water into aerosol particles
was observed. In addition, microcystin was characterized with spectroscopic methods which were
also used to study the aerosol population as a whole in this region. Finally, the size and
concentration of insoluble residues in the freshwater samples was correlated to the size and

66
concentration of aerosol particles, with increased insoluble residues leading to an increase in
aerosol particles observed. Overall, this study identified microcystin in aerosol particles in a size
range critical for inhalation exposure. These findings improve our understanding of microcystin-
containing aerosols in the ambient environment, and have important implications for populations
living near or downwind of HABs globally.
5.2 Methods
5.2.1 Freshwater and Aerosol Collection
Five freshwater samples were collected from the surface of GLSM (40.5439, -84.5033) on
August 6, 2019 (Figure D.1) and stored in 8 L carboy LDPE containers (United States Plastic
Corp) at room temperature (~23°C) until analysis. A spectrophotometer (AquaFluor 8000, Turner
Designs) measured phycocyanin fluorescence, serving as an indicator of blue-green algae (BGA)
and microcystin.314 Microcystin congeners were quantified using a previously established
LC/MS/MS method.315
A three-stage microanalysis particle sampler (MPS-3, California Measurements, Inc.)
impacted aerosol particles onto Formvar coated copper microscopy grids and silicon wafers (Ted
Pella Inc.) for scanning electron microscopy coupled to energy dispersive x-ray spectroscopy
(SEM-EDX) and optical photothermal infrared (O-PTIR) + Raman analysis, respectively. The
MPS-3 operated at 2 L min-1 to impact particles with diameters 2.5 – 5.0 µm, 0.7 – 2.5 µm, and <
0.7 µm onto stages 1, 2, and 3, respectively. Aerosols were impacted onto glass fiber filters
(Whatman, grade GF/c, 47 mm) for LC/MS/MS analysis using a cyclone (URG Crop., model
2000-30ED) and single stage impactor (URG Corp., model 2000-30FV) that operated at 3 L min-
1 to collect particles < 2.5 µm in diameter. For comparison, aerosols were also impacted onto baked
quartz fiber filters (Sigma Aldrich, 47 mm) using a five-stage impactor (TSI Inc., model 130A)
that impacted particles with diameters 1.4 – 2.5 µm, 0.7 – 1.4 µm, 0.4 – 0.7 µm, 0.25 – 0.4 µm,
and < 0.25 µm onto stages 1, 2, 3, 4, and 5, respectively. Ambient aerosol number size distributions
in the range 0.52 – 19.8 µm were measured by an aerodynamic particle sizer (APS, TSI Inc., model
3321) and averaged every 30 min.

67
5.2.2 LC/MS/MS Toxin Characterization
Particles impacted onto glass and quartz fiber filters were extracted following the method
described by Wood et al.290 Filters were mixed with 5 mL of 70% methanol and sonicated for 15
minutes, after which the supernatant was poured into a glass vial. The extraction procedure was
repeated for a total of three times. The supernatant of each filter were combined, filtered through
a nylon syringe filter to remove particulates, dried under nitrogen, and solubilized in LC/MS grade
water before LC/MS/MS analysis using a Thermo TSQ Quantiva triple quadrupole MS (Thermo
Scientific).315 Microcystin congeners were separated using gradient analysis (mobile phases of
0.1% formic acid in water and 0.1% formic acid in acetonitrile) and a C18 column (Thermo
Accucore aQ, 50 x 2.1 mm, 2.6 µm) before detection using positive electrospray ionization mode.
Concentrations of each microcystin congener were determined by calibration using commercially
available standards (Enzo Life Sciences). Extract from the filters and aliquots from each
corresponding freshwater sample were analyzed by LC/MS/MS to compare toxin concentrations
present in the water column and aerosol phase.
5.2.3 Single Particle Analysis
SEM-EDX was performed using a FEI Helios 650 Nanolab Dualbeam electron microscope
that operated at an accelerating voltage of 20.0 kV and a current of 0.40 nA. The Helios microscope
utilized a high angle annular dark field (HAADF) detector to provide contrast between areas of
differing chemical composition.144 EDX spectra were acquired for 20 seconds using an EDAX
detector and GENESIS EDX software version 5.10 (EDAX Inc.). O-PTIR + Raman spectroscopy
was performed on a mIRage infrared + Raman microscope (Photothermal Spectroscopy Corp.).
The mIRage contained a 40x Cassegrain reflective objective (0.78 numerical aperture, 8.3 mm
working distance), continuous wave visible laser (532 nm, 200 mW), and two, pulsed tunable IR
lasers (a quantum cascade laser, QCL, covers 880-1950 cm-1 at 100 kHz, 40-500 ns pulses, and 2
cm-1 spectral resolution; an optical parametric oscillator, OPO, covers 2700-3600 cm-1 at 150 kHz,
<10 ns pulses, and 4 cm-1 spectral resolution). Raman spectra were obtained using a Horiba
iHR320 module (Horiba Scientific) that contained a CCD detector and used a 600 gr/mm grating
for 4 cm-1 spectral resolution. Raman spectra were collected using 3 accumulations at 5 second
acquisition times for the range 500 – 4000 cm-1.

68
5.2.4 Analysis of Insoluble Residues
Concentrations and size distributions of the insoluble residues present in each freshwater
sample were analyzed by nanoparticle tracking analysis (NTA) using a NanoSight LM10
(NanoSight Ltd.) and the method for environmental samples described by Axson et al.238 NTA
determines the size of individual particles in water by illuminating the sample with a 405 nm laser
and monitoring the Brownian motion of particles, which is then used to determine the individual
particle hydrodynamic diameter with the Stokes-Einstein equation.323,324 Light scattering was
measured using a sCMOS camera (Hamamatsu, Orca) coupled to a 20x objective microscope as
freshwater sample was flowed through the instrument using a syringe pump at 60 rpm. Ten 60
second videos of each freshwater sample were analyzed using the NTA 3.2 (Build 60) software to
generate an average size distribution in the range 10 nm – 1 µm for each freshwater sample.
5.3 Results and Discussion
Microcystin and phycocyanin concentrations in each freshwater sample were measured
immediately following sample collection. The Beach sample had the highest toxin concentrations:
194,000 ppt D-Asp3-MC-RR, 32,000 ppt MC-YR, 5400 ppt D-Asp3-MC-LR, and 370 ppt MC-LR
(Figure 5.1). The Dock, Spillway, Central, and Prairie Creek samples all had similar toxin
concentrations of: 14,000, 15,000, 23,000, and 19,000 ppt of D-Asp3-MC-RR, respectively; 0,
3500, 3500, and 3100 ppt of MC-YR, respectively; 430, 530, 630, and 580 ppt of D-Asp3-MC-LR,
respectively; and 320, 0, 0, and 350 ppt of MC-LR, respectively. Phycocyanin concentrations
averaged after triplicate measurements were as follows: 9500 ± 160 µg/L for the Dock sample,
6400 ± 190 µg/L for the Spillway sample, 9400 ± 670 µg/L for the Beach sample, 9700 ± 220
µg/L for the Central sample, and 2400 ± 60 µg/L for the Prairie Creek sample. The diversity in
toxin and phycocyanin concentrations at each freshwater sampling location highlight the need for
aerosolized toxin measurements at several points around the lake for thorough exposure
assessments.

69
Figure 5.1. Total microcystin and phycocyanin (blue-green algae, BGA) concentrations for each
freshwater sample.
Aerosol particles extracted from filters were analyzed with LC-MS/MS to compare the
amounts of toxins present in the aerosol phase to those identified in the water column. Of the
aerosol samples analyzed thus far, the only toxin detected was D-Asp3-MC-RR at 22 pg/m3 at the
Central sampling location (Figure 5.2). These results are consistent with Backer et al. who
observed ambient aerosolized microcystin concentrations up to 52 pg/m3 at a site in California.289
The aerosol sample collected at the Beach was below the limit of detection for this method (5 ppt).
Analysis of additional aerosol samples collected at the Dock, Spillway, and Prairie Creek are
planned and will give insight into the spatial distribution of toxin-containing particles in this
region.

70
Figure 5.2. Aerosolized toxins at Grand Lake St Marys.
To identify individual toxin-containing aerosols with single-particle spectroscopy, a
spectral signature of each toxin is necessary. Halvorson et al. characterized the Raman-active
vibrational modes for microcystin-LR325 and other microcystin congeners.364 However, to our
knowledge, no characterization of microcystin with infrared spectroscopy has been performed.
Microcystin-LR was characterized both at the bulk (droplet) level with conventional Fourier-
transform infrared spectroscopy (FTIR) and as a single particle with O-PTIR (Figure 5.3). Both
spectra had similar modes, with peaks at 1100 cm-1 representing νas(C-O), ~1415 cm-1 representing
νas(O-H), 1530 cm-1 representing νas(N-H), ~1655 cm-1 representing νas(C=C), ~1720 cm-1
representing νas(C=O). The spectral agreement suggests IR techniques can identify algal toxins in
individual particles. Future work will aim to identify these markers in ambient particles and
characterize the vibrational modes for other microcystin congeners.

71
Figure 5.3. O-PTIR (solid trace) and FTIR (dashed trace) spectra of microcystin-LR.
Following toxin characterization, O-PTIR + Raman was used to identify ambient particle
types. LSA particles were classified by ν(O-H) at 1350 cm-1, νas(C-O) at 1414 cm-1, and ν(C=O)
at 1610 cm-1 in the O-PTIR spectra365-368 and ν(C-O) at 1087 cm-1, δ(C-H) at 1490 cm-1, and ν(C-
H) at 2960 cm-1 in the Raman spectra (Figure 5.4).207,234,369-373 Secondary organic aerosol (SOA)
particles were identified by νas(SO42-) at 1100 cm-1 and ν(C-C) at 1625 cm-1 in the O-PTIR
spectra50,52,57,374,375 and by νs(SO42-) at 1000 cm-1 and ν(C-H) at 2470 and 2924 cm-1 in the Raman
spectra.22,34,35,45,152,153 Organic particles containing ν(C-H) at 1460 cm-1 and ν(C-C) at 1610 cm-1
in the O-PTIR spectra57,365-367 also contained Raman modes representing ν(C-O-C) at 1064 cm-1,
ν(C=C) at 1340 cm-1, ν(C=C) at 1580 cm-1, and ν(C-H) at 2960 cm-1.57,207,371-373 These modes
commonly appear in biomass burning,285,376 dust,22,374,377-379 and soot aerosol,374,380,381 which are
all present in this region.225,382-384 Additional analysis using elemental spectroscopy was necessary
to separate SOA, biomass burning, and soot particles, and is discussed below. Lastly, biological
particles were identified by containing ν(C-N) at 1330 cm-1, νa(NO3-) at 1351 cm-1, ν(C-H) at 1450
cm-1, and ν(C=N) at 1630 cm-1 in the O-PTIR spectra.50,52,57,385 The same particle contained ν(NO3-
) at 1068 cm-1, ν(C=N) at 1569 cm-1, and ν(C-H) at 2960 cm-1 in the Raman spectra.33,43,153,386 The
identification of biological particles generated from HAB-containing water aligns with the findings

72
of prior mass spectrometry analysis,168,355 and provides further evidence that material from HABs
can become incorporated into aerosol particles.
Figure 5.4. O-PTIR (left, red trace) and corresponding Raman spectra (middle, green trace) of
representative individual particles defined as LSA, SOA, Biomass burning/soot/dust, and
biological. Optical images of each particle analyzed are shown on the right. Peaks labeled with *
in the Raman spectra indicate contribution from the substrate on which the particles were
collected.
In addition to O-PTIR + Raman, ambient particles were also analyzed with SEM-EDX for
complimentary, elemental spectra. SEM-EDX identified LSA particles by the presence of Ca, C,
and O in the elemental spectra (indicative of CaCO3) and an amorphous particle structure (Figure
5.5).5,27,168,285,355 SOA particles had a circular morphology and the elements C, O, and S.20,22,34,76,387
Biomass burning particles were differentiated from SOA by the presence of K.20,22,387 Soot
particles were classified by an agglomerate structure and an elemental spectrum dominated by

73
C.20,22,387 Dust particles were identified by the presence of Fe and their supermicron
size.5,20,238,285,387 Lastly, biological particles were identified by their unique structure and the
presence of P.20,168,355 The particle types observed with SEM-EDX corroborate the O-PTIR +
Raman analysis, and give us insight into the particle sources in this region.
Figure 5.5. Scanning electron microscopy images with corresponding energy dispersive x-ray
spectra of representative individual particles defined as LSA, SOA, biomass burning, soot, dust,
and biological. Spectral peaks labeled with * indicate contribution from the substrate on which
the particles were collected.
The size and number concentrations of ambient particles were compared to the size and
concentration of insoluble residues present in the freshwater samples to investigate trends between
water properties and aerosol formation. Aerosols collected near the Spillway had a size mode of
790 nm and insoluble residues of 150 nm (Figure 5.6), similar to previous analysis of insoluble
residues in freshwater environments.355 Aerosol particles collected from the Central and Dock
locations had slightly larger modes (840 nm and 1000 nm, respectively), but similar modes for

74
insoluble residues (150 nm each). The insoluble residues present in the Prairie Creek freshwater
sample were the largest (220 nm) and corresponded to an increase in average aerosol size (940
nm). The Beach location had the largest size of aerosols (1100 nm), and 190 nm sized insoluble
residues. Quantification of each aerosol and insoluble residue size distribution revealed that the
concentration of insoluble residues impacted aerosol concentration. The Dock had the highest
insoluble residue concentration (1.82 ± 0.06 x 10⁹ insoluble residues/mL3) and average aerosol
concentrations of 22.4 ± 0.5 particles/cm3. The Spillway and Central locations had similar
insoluble residue (1.64 ± 0.03 x 10⁹ and 1.51 ± 0.06 x 10⁹ insoluble residues/mL3, respectively)
and aerosol (30.9 ± 0.6 and 32.5 ± 0.7 particles/cm3, respectively) concentrations. The Prairie
Creek and Beach locations had the lowest amount of insoluble residues (7.66 ± 0.02 x 10⁸ and 1.24
± 0.01 x 10⁹ insoluble residues/mL3, respectively) and correspondingly lower aerosol
concentrations were observed in these regions (18.1 ± 0.3 and 23.2 ± 0.4 particles/cm3,
respectively). Generally, with the exception of the Dock sample, increased insoluble residue
concentrations in the water column corresponded to increased aerosol production, similar to
previous observations during late-bloom conditions.355
75
Figure 5.6. A) Average aerosol and POC number size distributions for each sampling location.
B) Quantification of aerosol and POC number concentrations for each sample.
5.4 Atmospheric and Health Implications
The identification of the HAB toxin microcystin in ambient aerosols < 2.5 µm in diameter
poses a potentially significant human health risk via inhalation. The authors characterized
microcystin-LR with O-PTIR + Raman for the first time, providing a detailed spectral signature of
the toxin. This information will be valuable as future measurements will focus on identifying
microcystin-LR spectroscopically in individual particles. In addition to microcystin
characterization, ambient particles were characterized with O-PTIR + Raman and electron
microscopy with elemental spectroscopy. LSA particles represented a significant fraction of the
ambient particles observed in this region, suggesting that aerosols containing HAB toxins are
abundant in regions experiencing severe HABs. The size and concentration of aerosol particles

76
was measured at several sites around the lake, with an increase in aerosol concentration generally
correlated with an increase in insoluble residues in the water column. These observations align
with previous laboratory measurements355 that reported enhanced ultrafine aerosol production with
the presence of insoluble organics in the freshwater. Overall, the results obtained from this study
highlight the potential health impacts of HAB toxin aerosolization in ambient environments.

77
Chapter 6. Simultaneous Optical Photothermal Infrared (O-PTIR) and Raman
Spectroscopy of Submicrometer Atmospheric Particles
Adapted with permission from Olson, N. E., Xiao, Y., Lei, Z., and Ault, A. P.: Simultaneous
Optical Photothermal Infrared (O-PTIR) and Raman Spectroscopy of Submicrometer Atmospheric
Particles, Anal. Chem., 92, 14, 9932-9939, 2020.
https://doi.org/10.1021/acs.analchem.0c01495 Copyright 2020 American Chemical Society.
6.1 Introduction
Atmospheric aerosols impact climate by scattering or absorbing solar radiation, nucleating
cloud droplets and ice crystals, and undergoing heterogeneous reactions with atmospheric gases.2
Atmospheric particles represent the largest uncertainty in the evolving radiative balance of our
changing climate2 due to their complex and evolving physicochemical properties26,295,388 and the
analytical challenge of measuring them.3,13 Particles with diameters <1 µm almost always account
for >99% of particles by number in the atmosphere.2,294 Submicrometer particles are the most
important contributors to the uncertain impacts of aerosols on radiative balance, and thus climate,
due to their optical and cloud droplet forming properties.2 Submicrometer particles also contribute
a large fraction of fine particulate matter mass (PM2.5, PM with aerodynamic diameters <2.5 µm),
the most important size range for impacts on human health.11,389 Inhaled submicrometer
atmospheric particles deposit deep in the alveoli of the lungs, contributing significantly to
pulmonary and cardiovascular diseases, and ~8% of global deaths annually from air pollution.390
Determining the size, chemical composition, phase state (liquid, semi-solid, or solid), and structure
(e.g., core-shell) of individual particles is crucial for estimating their impacts on climate and
health.14,74,105,391
Spectroscopic methods providing both chemical and physical characterization of
individual particles <1 µm under ambient conditions are limited.3 The most common
microspectroscopic methods applied to atmospheric particles have traditionally been under
vacuum, such as electron microscopy with energy dispersive X-ray spectroscopy (EDX) which
provides elemental information,20,29,206,234,392 but limited information about organic species.

78
Scanning transmission x-ray microscopy coupled with near edge x-ray absorption fine structure
spectroscopy (STXM/NEXAFS) provides greater spectroscopic detail on carbon-containing
species,37,234,393 but focuses on electronic transitions and is often under vacuum, which can modify
particle morphology. In contrast, vibrational spectroscopy methods (i.e., infrared (IR) and Raman)
provide information on key inorganic species (e.g., sulfate, nitrate, and ammonium) and organic
functional groups present in atmospheric particles under ambient conditions.3,45 Fourier Transform
IR (FTIR) performed on bulk samples has shown the ability of vibrational spectroscopy to
complement the widespread use of mass spectrometry in aerosol analysis.394
Raman spectroscopy has been used to study vibrational modes in individual atmospheric
and laboratory-generated particles ~1 µm or larger.22,33,36,37,45,48,49,286 To illustrate the benefits of
vibrational spectroscopy for analysis of chemical species in atmospheric particles, inorganic
sulfate ions (SO42-) and organosulfates (ROSO3
-) can be difficult to distinguish via aerosol mass
spectrometry and other mass spectrometers using hard ionization methods,395 but Raman clearly
differentiates modes for sulfate (973 cm-1), bisulfate (1040 cm-1), and organosulfates (1065 cm-1)
in model systems,42 particles generated in atmospheric chambers,34 and the ambient atmosphere.42
Recent advances to push Raman <1 µm include surface enhanced Raman spectroscopy
(SERS)43,46,396,397 and tip enhanced Raman spectroscopy (TERS),47 but both are challenging due
to inconsistent enhancements between substrates and for different vibrational modes.46
Fluorescence emission after excitation by visible lasers provides additional challenges for the
broad use of Raman spectroscopy for atmospheric particles, and is particularly challenging for
primary biological, mineral dust, and soot particles, which can all fluoresce.37,48,239
Atomic force microscopy coupled to photothermal infrared spectroscopy (AFM-PTIR)53
has recently been applied to study particles and their chemical properties50-52,374,398 by providing
information on vibrational modes in particles down to 100 nm diameter.50,52 The basic principle of
AFM-PTIR is that a tunable IR laser, such as an optical parametric oscillator (OPO), scans across
the mid-IR (i.e., 800-3600 cm-1), while an AFM tip is in contact with a particle or surface.53,55,399,400
When the laser wavenumber excites a vibrational mode of a molecular species in the sample, the
sample heats and slightly expands.50,55,401 This photothermal expansion is detected by the AFM tip
at each frequency as the laser source is scanned across the spectral range to produce an IR
spectrum. The relationship between IR absorption and photothermal expansion detected by the
AFM-PTIR tip is shown in Equation 6.1:

79
Equation 6.1 𝑢(𝑡) = 𝑎𝐺𝛼𝑇∆𝑇(𝑡)
where u(t) is the photothermal expansion of the sample in m2, a is the area of the heated region in
m2 (e.g., sphere = circle = radius, cube = square = edge length), G is a geometric constant based
on the shape of the sample (e.g., sphere or cube), αT is the thermal expansion coefficient of the
sample in K-1, and ∆𝑇(𝑡) is the time-dependent temperature increase of the sample in K.55 The
thermal expansion of the sample (u) is proportional to the temperature change of the sample after
absorption of incident IR radiation (∆𝑇), the power absorbed by the sample (Pabs), and the optical
absorption from the Beer-Lambert Law.55 Thus, IR absorption-like spectra are obtained by
measuring the photothermal expansion of the sample as a function of wavenumber. See Dazzi and
Prater for further details.55 AFM-PTIR analysis has been time intensive; often taking 20-30
minutes to collect a high quality spectrum. Additionally, tip interactions, particularly during the
analysis of soft or liquid samples, have been challenging.402
Optical photothermal infrared (O-PTIR) spectroscopy has recently been developed and
overcomes both the issues of the AFM tip and slow collection time of earlier AFM-PTIR
instruments.403 With O-PTIR, localized IR absorption is obtained after co-aligning a continuous
wave (CW) visible laser (532 nm) and a pulsed, tunable IR laser on the sample and measuring the
photothermal expansion that occurs when the incident frequency of the IR laser matches an IR
absorption mode of the sample.401,404,405 The resulting modulated photothermal expansion causes
a change in the intensity of the elastically (Rayleigh) scattered light from the visible laser,406 which
can be processed to generate an IR spectrum. The photothermal response is shown in equation 6.2:
Equation 6.2 ∆𝑃𝑃𝑅 ∝𝜎𝑁
𝐾 𝐶𝑝
𝜕𝑛
𝜕𝑇𝑃𝑝𝑟𝑃𝐼𝑅
where PPR refers to the probe (visible laser) power, 𝜎 is the absorption cross section of the sample,
N is the number density of absorbing molecules in the sample, K is the heat conductivity of the
sample, Cp is the heat capacity of the sample, n is the refractive index of the illuminated volume
of the sample, T is the temperature, and PIR refers to the power of the IR laser.62 The generated O-
PTIR spectra resemble FTIR absorbance spectra.62 Unlike traditional FTIR microscopy, O-PTIR
can achieve submicron spatial resolution67,68 because the spatial resolution is determined by the
visible laser, not the longer wavelength IR laser. The potential of this new analytical technique has

80
been shown during recent applications where O-PTIR imaged live cells,60,62 tissues,406
polymers,407,408 and plasmonic nanostructures.409
Herein, we report simultaneous collection of O-PTIR and Raman spectra to characterize
submicron atmospheric particles. As the 532 nm probe laser used for O-PTIR also generates Stokes
and anti-Stokes shifted photons from inelastic scattering, these can be detected simultaneously to
generate both O-PTIR and Raman spectra. The capability of O-PTIR+Raman to analyze submicron
particles with <1 minute acquisition times are shown below. Microscopy substrates were tested
for optimal sample signal and to minimize interferences within OPTIR+Raman spectra. Organic
and inorganic functional groups were characterized for both laboratory-generated standards and
ambient aerosol particles. Mapping was performed on two-component, liquid-liquid phase-
separated particles to determine the spatial distribution of chemical species. These results highlight
the capability of O-PTIR to analyze particles well below the diffraction limited spatial resolution
of traditional IR microscopy and show the power of the combined O-PTIR+Raman analytical
method to study physicochemical properties of atmospheric aerosol particles.
6.2 Methods
6.2.1 Laboratory-Generated Aerosol Particle Samples
Standard solutions were prepared using 18.2 MΩ Milli-Q water and the following
chemicals: ammonium sulfate ((NH4)2SO4, Honeywell Fluka), ammonium nitrate (NH4NO3,
Acros Organics), ammonium oxalate ((NH4)2C2O4, Sigma-Aldrich), sodium acetate (CH3COONa,
Sigma-Aldrich), sucrose (C12H22O11, Fisher Scientific), polyethylene glycol (PEG 400,
C2nH4n+2On+1, Honeywell Fluka), and sodium dodecyl sulfate (SDS, NaC12H25SO4, Research
Products International). All chemicals were >98% purity and used without further purification.
Particles were generated by atomizing 50 mM solutions with a Collison nebulizer using HEPA-
filtered air. Samples were inertially impacted onto silicon (Ted Pella Inc., product number 16013),
quartz (Ted Pella Inc.), germanium (Wafer World Inc.), aluminum foil (Ted Pella Inc.), silver foil
(ESPI Metals), and gold deposited onto silicon (Platypus Technologies) substrates using a
microanalysis particle sampler (MPS, California Measurements Inc.). Samples impacted onto
stage 3 of the MPS (<400 nm aerodynamic diameter before spreading after inertial impaction onto
the substrates50,410) were analyzed. To provide context with respect to mass of material detected, a
400 nm particle with a 50 mM concentration of ammonium sulfate contains 160 attograms of

81
sulfate per particle and 60 attograms of ammonium. Liquid liquid phase separated particles were
generated by atomizing a mixed solution of PEG and ammonium nitrate at a 1:1 mass ratio using
1% by weight of each compound. All samples were stored in the dark at room temperature
following established protocols219 and analyzed within 24 hours at room temperature (23 °C) and
RH (30%). At minimum, ten particles per sample were analyzed to ensure representative and
reproducible spectra, with details on the number of particles analyzed for each sample available in
the Supporting Information (Table E.1). All spectra were obtained at a single point (laser spot size
~450 nm) in the center of particles unless otherwise stated.
6.2.2 Ambient Particle Sampling
Atmospheric particles were collected onto silicon substrates in Ann Arbor, MI on February
4, 2020 from 13:04 – 14:15 EST using an MPS. Stages 1, 2, and 3 (aerodynamic diameters of 2.8
– 5.0 µm, 0.4 – 2.8 µm, and <0.4 µm, respectively) were analyzed.
6.2.3 Optical Photothermal Infrared (O-PTIR) Spectroscopy
This study used a mIRage infrared + Raman microscope (Photothermal Spectroscopy
Corp.) based on the O-PTIR concept of Zhang et al.,62 which was recently utilized for polymers
and fibers.58,59,411 The mIRage contains a custom microscope frame with two motorized objectives:
a visible objective (4×, 0.13 numerical aperture, 17.3 mm working distance, Nikon Plan Fluor)
and a Cassegrain reflective objective for simultaneous use of IR and visible lasers (40×, 0.78
numerical aperture, 8.3 mm working distance, 55 µm x 42 µm field of view). The mIRage uses a
CW laser source (532 nm, 200 mW, ~20% reaches sample) as the probe (detected by a
photodetector, range 0-1 mV) and two pulsed, tunable infrared lasers to generate photothermal
enhancement. A quantum cascade laser (QCL) covers 880-1950 cm-1 with tunable repetition rate
of 100 kHz, 40-500 ns pulses, up to 1 W power per pulse (much lower in practical use, see below),
and 4 chips with spectral resolution of 2 cm-1. An OPO covers the range 2700-3600 cm-1 with
tunable repetition rate up to 150 kHz, <10 ns pulses, >250 mW power per pulse, and spectral
resolution of 4 cm-1.
Focusing was optimized for each QCL chip at 1726, 1575, 1270, and 1026 cm-1 using the
IR signal from a polyethylene terephthalate standard within the instrument. IR spectra were
collected at a scan rate of 100 cm-1/s for 15 s acquisitions and averaged after 3 accumulations. The

82
IR laser repetition rate was set at 100 kHz and 300 ns per pulse. The powers of the IR and visible
lasers were set to approximately 4-10 mW each (details in Appendix E and Table E.2). Prior to
collecting sample spectra, a background profile of the laser was collected from an AFM cantilever
that absorbs uniformly at all wavenumbers. The sample spectra were then divided by the
background profile to produce photometrically accurate background compensated spectra across
the full spectral range.
6.2.4 Raman Microspectroscopy
Raman scattering was detected after photons passed back through the Cassegrain objective
into a Horiba iHR320 module (focal length = 320 mm) with three gratings (600, 1200, and 1800
groove/mm), spectral dispersion at 500 nm of 2.31 nm/mm, scan speed of 160 nm/sec, and step
size of 0.002 nm. Spectra were collected across the spectral range of 200–4000 cm-1 using the 600
groove/mm grating to yield spectral resolution of 4 cm-1. Raman spectra were collected using 5 s
acquisitions with 3 accumulations and calibrated against the known Raman peaks of silicon and
acetaminophen.
6.2.5 O-PTIR Imaging
PTIR Studio software (version 4.0, Photothermal Spectroscopy Corp.) was used to process
spectra and IR images. Spectra were not smoothed and raw data is shown. IR images were
generated by inputting the wavenumber of interest and scanning the field of view with 100 nm
steps.50 IR absorbance images were generated to show the intensity of IR signal on a color scale
from 0 – 1 mV.
6.3 Results and Discussion
A diagram illustrating the operating principle of O-PTIR+Raman is shown in Figure 6.1a.
A pulsed IR laser and CW laser of 532 nm are co-aligned and focused through a Cassegrain
objective onto the sample. If the vibrational energy levels of the sample match the incident
frequency of IR light, IR light is absorbed by the sample (𝐴𝑏𝑠𝐼𝑅) leading to photothermal
expansion (∆ℎ) and change in refractive index based on the heat capacity (Cp), heat conductivity
(K), and absorption cross section of the sample(𝜎).49,52,62 Table E.2 includes available values for
the compounds used. The change in scattering (∆𝑝𝑠𝑐𝑎𝑡) due to changes in refractive index with
temperature and photothermal expansion is detected and extracted to give an IR spectrum of the

83
sample.62,406,412 The inelastically scattered photons from the sample pass back through the
Cassegrain objective to a Raman spectrometer. With O-PTIR+Raman, we are able to observe
molecular vibrations associated with changes in the dipole moment (IR) and polarizability
(Raman) of the species analyzed. The ability to detect both IR active and Raman active vibrational
modes simultaneously from the same spot and with the same submicron spatial resolution allows
for far more comprehensive sample characterization. As an example, we show the symmetric and
anti-symmetric stretching modes of sulfate molecules (Figure 6.1b) with the corresponding spectra
generated from an ammonium sulfate particle (Figure 6.1c). For example, νs(SO42-) is not IR active
as the dipole moment of this symmetric molecule does not change during this molecular vibration,
however, the polarizability does, making it Raman active. There is a substantial dipole moment
change for νas(SO42-) that corresponds to intense signal in the IR spectrum, but the Raman activity
of νas(SO42-) is weaker. Thus, by obtaining both IR and Raman spectra at the same point
simultaneously, greater molecular detail can be obtained for a wide range of samples
Optimal substrates for both spectroscopies need to be determined as IR and Raman spectra
have seldom been collected simultaneously, particularly not from the same spot and with the same
spatial resolution. Interferences for different substrates were explored by impacting ammonium
sulfate particles onto common microscopy substrates including silicon, quartz, germanium,
Figure 6.1. Schematic of optical photothermal infrared spectroscopy. A) Infrared and visible light
are focused on the sample through a Cassegrain objective, inducing a photothermal expansion of
the particle. Light scattered from the sample (∆𝑝𝑠𝑐𝑎𝑡) is proportional to the photothermal expansion
of the particle (∆ℎ) and absorbance of IR light (𝐴𝑏𝑠𝐼𝑅). Simultaneous IR and Raman spectra are
obtained from a single point. B) Molecular vibrations are shown corresponding to anti-symmetric
(red) and symmetric (green) stretching modes of sulfate. C) IR and Raman spectra obtained from
a sulfate-containing particle. The peak width of νas(SO42-) is broader than νs(SO4
2-) as 3-fold
degeneracy of Td symmetry breaks down in non-ideal aerosol environment.
84
aluminum foil, silver foil, and Platypus flat gold. IR vibrational modes observed include νas(SO42-
) at 1100 cm-1, δ(NH4+) at 1422 cm-1, ν(N-H) at ~3040 cm-1, with δ(O-H) at 1766 cm-1 and ν(O-H)
at ~3220 cm-1 from water (Figure 6.2A). Ammonium sulfate modes are comparable to FTIR
spectra of ammonium sulfate (Figure E.1).50,52,375 Raman spectra contained peaks at 977 cm-1
representing νs(SO42-), 634 cm-1 for an umbrella bend δ(SO4
2-), 471 cm-1 representing a scissoring
motion for SO42-, and ~3168 cm-1 representing ν(N-H) (Figure 6.2B).22,34,35,45 Optical images of
each particle are shown in Figure 6.2C, with images of blank substrates and peaks from substrates
listed in Table E.3. Fluorescence was generated with flat gold substrates, which overwhelmed the
Raman signal of the sample (Figure E.2). Al foil provided weak IR signal, possibly due to the
rough surface. Quartz showed interference peaks in the IR spectra at 1056 and 1223 cm-1 and an
uneven baseline in the Raman spectra. While germanium and Ag foil had minimal spectral
interferences, the IR signal generated from particles on these substrates was lower than with
silicon. Silicon was determined to be the best substrate and was used hereafter due to minimal
interference in the Raman spectra (520 and 963 cm-1), no interference in the IR spectra, and intense
sample signal compared to other substrates tested.

85
Figure 6.2. IR and Raman spectra of ammonium sulfate particles on different substrates.
Background spectra were taken adjacent to the particle on a clear location of the substrate. Peaks
labeled with asterisks denote contribution from the substrate and are listed in Table E.2. Optical
images of the particles analyzed are shown in panel C. All particles had aerodynamic diameters
<400 nm before spreading after inertial impaction onto the substrates, with spreading ratios
typically between 4:1 to 10:1.39,57 Intensities on IR and Raman spectra are in arbitrary units, but
are not related, which is also true for subsequent figures.
Aerosols from single-component solutions were used to evaluate the ability of O-PTIR to
study a range of species commonly observed in atmospheric particles. Representative IR and
Raman spectra of laboratory-generated particles (ammonium nitrate, sodium acetate, sucrose,
SDS, and ammonium oxalate) on silicon substrates are shown in Figure 6.3, with spectral

86
assignments and corresponding references reported in Table E.4. Optical images of all particles
analyzed are shown in Figure E.3. The combined O-PTIR+Raman spectra clearly distinguish
organic and inorganic vibrational modes commonly found in atmospheric particles.
Figure 6.3. IR (left, red trace) and Raman (right, green trace) spectra of laboratory-generated
standards. A) ammonium nitrate, B) sodium acetate, C) sucrose, D) SDS, and E) ammonium
oxalate particles. Peaks labeled with * in the Raman spectra indicate contribution from the silicon
substrate. All particles had an aerodynamic diameter <400 nm before spreading after inertial
impaction onto the silicon substrates.
Ambient particles were analyzed with O-PTIR+Raman for the first time. Particles
containing ammonium nitrate were identified by IR modes at 1351 and 1411 cm-1, indicative of
νa(NO3-) and δ(NH4
+), respectively (Figure 6.4A).50,385 The same particle contained Raman modes

87
at 1068 and 3026 cm-1, representing ν(NO3-) and ν(N-H), respectively.33,43,45 The agreement
between IR and Raman provide robust evidence for the presence of ammonium nitrate, much
stronger than either IR or Raman would provide independently due to common peaks in similar
regions (e.g., organosulfates ~1065 cm-1 in Raman).34,42 Similarly, ambient sulfate-containing
particles were identified by νas(SO42-) at 1107 cm-1 in the IR spectrum50,375 and νs(SO4
2-) at 990
cm-1 in the Raman spectrum (Figure 6.4C).34,35,45 This particle also contained organic modes
identified as δ(C-H) in the IR spectrum413 and ν(C-H), ν(CH2), and δ(CH2) in the Raman
spectrum,370,372 similar to mixtures of sulfate and organic material identified in ambient particles
with AFM-PTIR50,76,374 and Raman.22,37,43 Additional organic vibrational modes were identified in
both IR and Raman spectra of ambient particles (Figure 6.4B), resembling modes detected in
oxalate,368 sucrose,370 and SDS36,413 (Figure 6.3). OPTIR+Raman spectra show that significant
chemical detail can be obtained from atmospheric particles containing complex mixtures of
chemical species.13
Figure 6.4. IR (left, red trace) and Raman (right, green trace) spectra obtained
from ambient particles. Spectra represent A) ammonium nitrate-containing, B)
organic, and C) organic- and sulfate-containing particles. Peaks corresponding
to vibrational modes identified from laboratory-generated standards are labeled.
Peaks labeled with * in the Raman spectra indicate contribution from the silicon
substrate. Optical images of each particle analyzed are shown on the right and
are labeled with the size range of the impactor stage on which the particle was
collected. Uneven baselines in the Raman spectra are likely from fluorescence.

88
Atmospheric particles are frequently not homogeneous, but rather adopt core-shell and
other complicated morphologies.74,76,117 To demonstrate the spatial distribution of chemical
species within an individual particle, IR spectra and maps were collected from liquid-liquid phase-
separated particles containing PEG and ammonium nitrate with aerodynamic diameters <400 nm,
which spread upon impaction. A line scan (Figure 6.5A) collected spectra every 2.0 µm across a
two-component, phase-separated particle. IR spectra collected from the core and shell of the
particle confirm the presence of nitrate primarily in the particle core and PEG primarily in the
particle shell (Figure 6.5A). The IR peak intensity ratio of 1105 and 1371 cm-1, corresponding to
ν(C-O)50 and νa(NO3-),50 respectively, was calculated at each point in the line scan to show the
enhancement of PEG on the edge of the particle with minimal PEG in the particle core (Figure
6.5B). Two IR modes representing ν(C-O)50 and νa(NO3-)50 (1105 and 1371 cm-1, respectively)
were observed with differing spatial distributions in spectral maps with 100 nm step sizes (Figure
6.5C). Inorganic components (nitrate) were located primarily in the core of the particle, while the
outer layer of the particle was primarily organic (PEG), similar to previously observed phase-
separated particles studied in the laboratory34,52,117 and in ambient environments.76 These results
show that O-PTIR can determine the distribution of chemical species within individual particles
related to particle morphology, which can be used to study aerosol physicochemical mixing state.13

89
Figure 6.5. IR spectra and maps of a phase-separated particle. A) IR spectra collected from
the core (point 3 on the line scan) and shell (point 1) of phase-separated PEG + ammonium
nitrate particle. Shell spectra was multiplied x10 for clarity. The optical image of the particle
analyzed includes numbers denoting the location of the five spectra acquired during the line
scan. B) Ratio of the intensity of PEG and nitrate IR peaks obtained during the line scan,
confirming the presence of PEG primarily in the outer shell of the particle with nitrate in the
core. C) Optical image of phase-separated PEG + ammonium nitrate particle, with maps
showing the location of nitrate (1371 cm-1) in the core of the particle and PEG (1105 cm-1)
in the outer shell using 100 nm step size. It should be noted that repeating scans (2 or more)
across the sample resulted in minor beam damage to organic compounds and is visible
through the slightly irregularly-shaped shell.
90
6.4 Conclusions
The simultaneous spectroscopic and physicochemical analysis of submicron aerosol
particles is analytically challenging because traditional vibrational spectroscopy techniques, such
as FTIR, struggle to investigate particles in the size range reported herein (<400 nm aerodynamic
diameter before spreading after impaction onto the substrates) as the diffraction limit of IR light
traditionally limits spatial resolution. O-PTIR+Raman was applied to simultaneously collect
vibrational IR and Raman spectra from individual particles <400 nm aerodynamic diameter under
ambient conditions, allowing for faster analysis times and complementary chemical information.
We show the potential of O-PTIR+Raman for single-component model systems, two-component
phase-separated particles, and ambient aerosol particles. The contactless nature of O-PTIR enables
analysis of different phase states (liquid, semi-solid or solid).16,34,76 High spatial resolution maps
of vibrational modes presented within particles demonstrate the ability of this analytical technique
to determine intra-particle chemical differences, which impact aerosol reactivity in the
atmosphere.16 Future work will push the analytical capabilities of O-PTIR to even smaller
particles, with a focus on viscous particles that spread less upon impaction and ambient particles
whose viscosity changes as a function of relative humidity and temperature. Spectral information
obtained will enable key insights regarding physicochemical properties of atmospheric particles in
a critical size range for climate and human health. The power of O-PTIR+Raman, shown above
for laboratory-generated and atmospheric particles, has applications for a wide range of scientific
disciplines from materials science to the biosciences.

91
Chapter 7. Conclusions and Future Directions
7.1 Conclusions
The impacts of atmospheric aerosol particles on climate and human health are dependent
on the physical structure and chemical composition of individual particles. However, aerosol
physicochemical properties are seldom measured in detail due to the analytical challenges
associated with determining species present in minute concentrations and the time-intensive
manner of characterizing the structure of individual particles. This dissertation focuses on the
development and use of microspectroscopic techniques to characterize the physicochemical
properties of model and ambient particles in the mid-latitude regions. The multimodal approach
applied within each chapter gives insight into the complex chemical compositions observed while
also monitoring the evolving physical structure of particles during their atmospheric lifetime. The
information discovered helps discern the climate and health impacts of particles and provides
motivation for future studies.
Chapter 2 discussed the physicochemical changes to secondary organic aerosol (SOA)
particles after reactions with gas-phase IEPOX, an isoprene oxidation product. Particles initially
had two distinct phases: an inorganic core followed by a coating with organic SOA material. After
exposure to gas-phase organics, the morphology and composition of the particle core changed.
Organics were present in the particle core (as determined by SEM-EDX) due to the formation of
organosulfate species (as determined by Raman spectroscopy). The formation of viscous
organosulfates changed the internal structure of the core and increased the viscosity of the particles
(as determined by spreading ratios calculated from AFM data). The increase in particle viscosity
likely inhibits further heterogeneous reactions and climate-relevant properties, such as water
uptake. This chapter suggests the importance of not only monitoring chemical composition but
also physical morphology over the atmospheric lifetime of SOA particles.
Chapter 3 investigated the climate impacts of freshwater-derived lake spray aerosol (LSA)
particles. An aircraft-based campaign was performed over Lake Michigan to collect ambient

92
particles and cloudwater. SEM-EDX discerned similar structures and compositions for ambient
and laboratory-generated LSA and the insoluble residues present in ambient cloudwater,
suggesting the incorporation of LSA into clouds above Lake Michigan. Computer controlled SEM-
EDX was applied to thousands of particles for quantitative measurements of the elements present
in individual particles as well as the amount of LSA related to other particle types observed. The
elemental ratios calculated from the insoluble cloudwater residues were similar to those present in
LSA and Lake Michigan freshwater, providing further evidence of the source of these cloudwater
residues. Additionally, the amounts of LSA, dust, and SOA observed were similar to previously
reported measurements in the Great Lakes region. This study suggested the incorporation of LSA
into clouds above the Great Lakes, a phenomenon that likely occurs in other regions around the
globe with large bodies of freshwater. The results obtained give insight into the composition and
formation of lake-effect precipitation in this region.
Chapters 4 and 5 explored the health impacts of LSA by studying the incorporation of algal
toxins into aerosol particles. Harmful algal blooms (HABs) are known to release toxins into
freshwater lakes, but little is known about the transfer of these toxins into the aerosol phase.
Chapter 4 was a laboratory-based study in which ambient freshwater was collected from a HAB-
infested lake and brought to the lab for analysis. Eight toxins were identified in the freshwater
sample before aerosols were generated in a controlled laboratory setting, with seven toxins
detected in the aerosol phase. These results suggest the transfer of toxins from water into the
atmosphere, with likely impacts on human health through inhalation of HAB toxins. An
enrichment of the most hydrophobic toxins was discovered in the aerosol particles relative to the
freshwater samples, suggesting the importance of simultaneous measurement of freshwater and
aerosolized toxins to fully discern the impacts of HABs on human health. Chapter 5 explored this
phenomenon through an ambient study performed on Grand Lake St. Mary in Ohio. Similarly to
Chapter 4, HAB toxins were identified in freshwater and aerosol samples, with an enrichment of
hydrophobic toxins in the aerosol phase. Together, these chapters explore the health impacts of
freshwater-derived particles formed during HAB conditions on lakes.
Chapter 6 applied a new multimodal microspectroscopic method, optical photothermal
infrared (O-PTIR) + Raman spectroscopy, to study atmospheric particles for the first time. First,
the ideal substrate was determined based on minimal interferences within both types of spectra
and intense sample signal. Next, this method was validated by analyzing a variety of standard

93
compounds commonly identified in aerosol particles and comparing the spectra obtained to those
reported in the literature. Ambient particles were collected in Ann Arbor and analyzed according
to the vibrational modes identified in the standard particles, providing the first analysis of O-PTIR
+ Raman to ambient atmospheric particles. Lastly, phase-separated particles were chemically
analyzed and mapped to show the distribution of chemical species within a single aerosol particle.
This method significantly enhanced the resolution of IR spectroscopy to allow for analysis of
submicron particles. Additionally, the ability of this technique to study heterogeneous samples
advances the fields of both atmospheric and analytical chemistry.
7.2 Future Directions
The research described within this dissertation addresses the challenge of physicochemical
measurements of aerosol particles relevant to the mid-latitude regions, with specific chapters
focusing on the climate and health impacts of these particles. These five research chapters have
contributed new insights into aerosol physicochemical characterization using both novel and
established single-particle microspectroscopic methods. However, further work can be performed
to understand more about the properties of model systems and ambient aerosol particles.
In Chapter 2, the effects of heterogeneous reactions on aerosol physicochemical properties
were studied using model aerosols generated in a laboratory chamber. Though multiple types of
organic coatings were investigated, these experiments used one type of gas-phase organic species
(IEPOX), one seed particle (ammonium sulfate), and one relative humidity condition (50%).
Further studies are warranted that study reactions between different gaseous species (limonene,
for example), different starting materials (ammonium nitrate, for example), a wider range of
relative humidity conditions, temperature, size of seed particles, and pH of seed particles.
Furthermore, the analysis of ambient phase-separated particles from different regions around the
globe would be useful to fully classify the changing physicochemical properties of aerosol particles
after reaction with organic gases. Lastly, quantitative particle viscosity measurements are needed
to assess the effect of viscosity on climate-relevant properties such as water uptake, for example.
Chapter 3 involved an ambient aircraft campaign that investigated the incorporation of
freshwater aerosol into clouds above Lake Michigan. This campaign was a case study performed
in July 2016, warranting additional measurements of particle and cloudwater composition during
different seasons and in different global regions. Additional measurements of the cloud-forming

94
efficiencies of particles with organic and biological components are needed to fully understand the
climate-relevance of freshwater particles. Analysis of LSA using a cloud condensation nuclei
counter would provide quantitative measurements on the cloud forming efficiencies of individual
particles. Lastly, characterization of freshwater aerosol formation during different atmospheric
conditions (as a function of wind speed or temperature, for example) are needed to better constrain
model predictions in the Great Lakes region, as well as other regions around the globe with large
bodies of freshwater.
In Chapter 4, the aerosolization of toxins emitted from harmful algal blooms in freshwater
lakes was investigated through laboratory experiments and bulk analysis of freshwater and aerosol
samples. Ambient measurements around the globe are needed to fully quantify the amount of
toxins incorporated into aerosol particles to better estimate the potential health effects associated
with inhalation of toxins. Single-particle measurements of particles containing algal toxins would
be useful, though thorough characterization of algal toxins is needed first (using single-particle
mass spectrometry, for example). Additionally, these experiments focused on one class of algal
toxins (microcystins), though others are known (such as nodularins, cylindrospermopsins, and
anatoxins). Further investigation is also needed to assess the relative toxicities of each microcystin
congener, particularly for inhalation as a route of exposure as most work to date has been done
with ingestion as the primary mode of exposure.
In Chapter 5, ambient particles were analyzed to identify the concentration of aerosolized
harmful algal bloom toxins, as well as the prevalence of freshwater aerosol compared to other
particle types in the region (soot and dust, for example). Future work should investigate the lifetime
of toxin-containing particles, particularly how long they can stay aloft and how far they can travel
inland. To connect these results with those of Chapter 3, identifying if/how much toxins are
incorporated into clouds and the subsequent precipitation are critical to monitor how far toxins are
transported. Additional questions remain regarding the stability of aerosolized toxins, particularly
if they undergo photochemical degradation, for example. All of these future steps will aid in
estimating exposure to harmful algal bloom toxins.
In Chapter 6, optical photothermal infrared (O-PTIR) + Raman spectroscopy was applied
to classify the vibrational modes present in 400 nm laboratory-generated and ambient particles.
Further work is needed to push the analytical capabilities of O-PTIR to even smaller particles and
to analyze particles with complex compositions and morphologies (aged soot with an organic

95
coating, for example). Additional ambient particle characterization is needed to study particles
from different regions and sources. Furthermore, the fabrication of an environmental chamber
compatible with the O-PTIR + Raman system that can control and monitor temperature and
relative humidity would enable detailed study of how the physicochemical properties of particles
change during different environmental conditions. This chamber could also be used to measure the
dynamic physicochemical properties of particles as they react with different atmospheric gases in
situ, providing detailed analysis of the reaction products as they are formed.
This body of work improves current understanding of the physicochemical properties of
aerosol particles created from organic and freshwater sources. These results highlight the need for
additional laboratory studies and ambient particle measurement at diverse locations to fully
understand the dynamic properties of aerosol particles. The future directions outlined above will
help improve model measurements of aerosol impacts on a global scale.
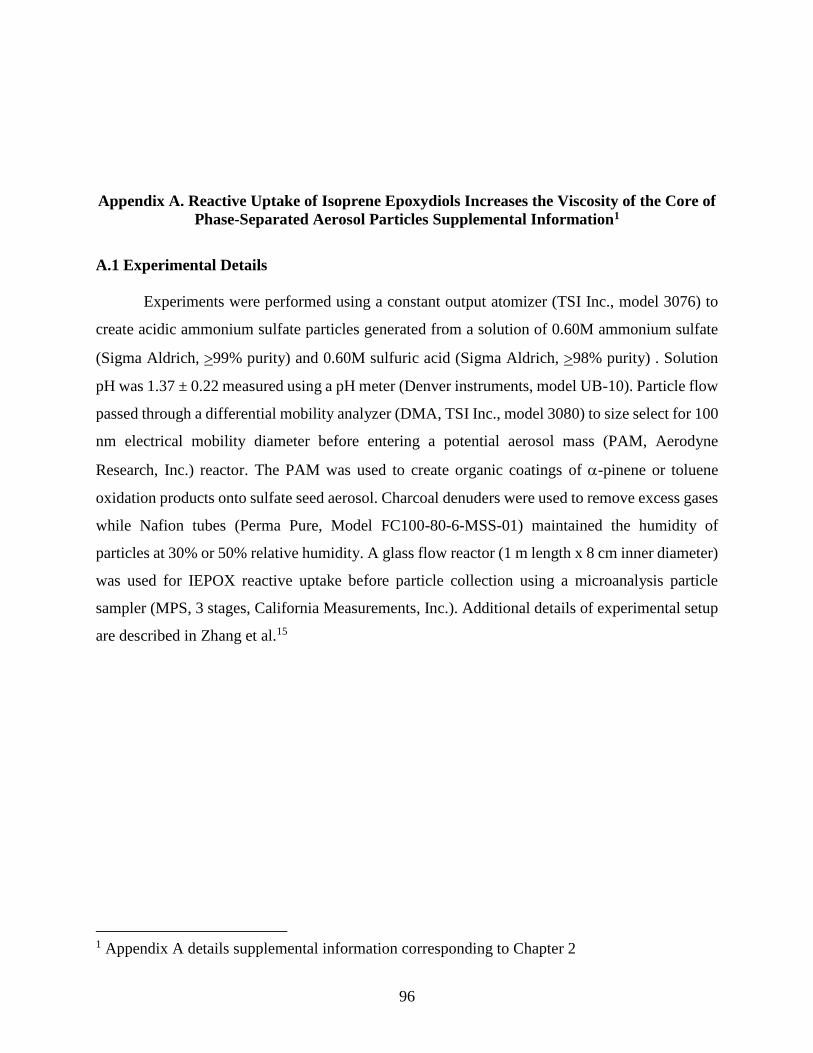
96
Appendix A. Reactive Uptake of Isoprene Epoxydiols Increases the Viscosity of the Core of
Phase-Separated Aerosol Particles Supplemental Information1
A.1 Experimental Details
Experiments were performed using a constant output atomizer (TSI Inc., model 3076) to
create acidic ammonium sulfate particles generated from a solution of 0.60M ammonium sulfate
(Sigma Aldrich, 99% purity) and 0.60M sulfuric acid (Sigma Aldrich, 98% purity) . Solution
pH was 1.37 ± 0.22 measured using a pH meter (Denver instruments, model UB-10). Particle flow
passed through a differential mobility analyzer (DMA, TSI Inc., model 3080) to size select for 100
nm electrical mobility diameter before entering a potential aerosol mass (PAM, Aerodyne
Research, Inc.) reactor. The PAM was used to create organic coatings of -pinene or toluene
oxidation products onto sulfate seed aerosol. Charcoal denuders were used to remove excess gases
while Nafion tubes (Perma Pure, Model FC100-80-6-MSS-01) maintained the humidity of
particles at 30% or 50% relative humidity. A glass flow reactor (1 m length x 8 cm inner diameter)
was used for IEPOX reactive uptake before particle collection using a microanalysis particle
sampler (MPS, 3 stages, California Measurements, Inc.). Additional details of experimental setup
are described in Zhang et al.15
1 Appendix A details supplemental information corresponding to Chapter 2
97
Figure A.1. Experimental setup to generate SOA particles. Cartoons of particles describe
particle phase after each addition of chemical species.
Figure A.2. AFM images of SOA particle re-humidified to the RH at which they were generated.
AFM a) phase and b) height images of re-humidified 200 ppb -pinene SOA/sulfate particles
created at 50% RH before and after IEPOX uptake. Samples undergo drying between impaction
onto substrates and analysis; therefore these samples were re-humidified to 50% RH during
imaging to simulate initial RH. Minimal morphological changes were observed between particles
analyzed at ambient RH and re-humidified particles analyzed at 50% RH.
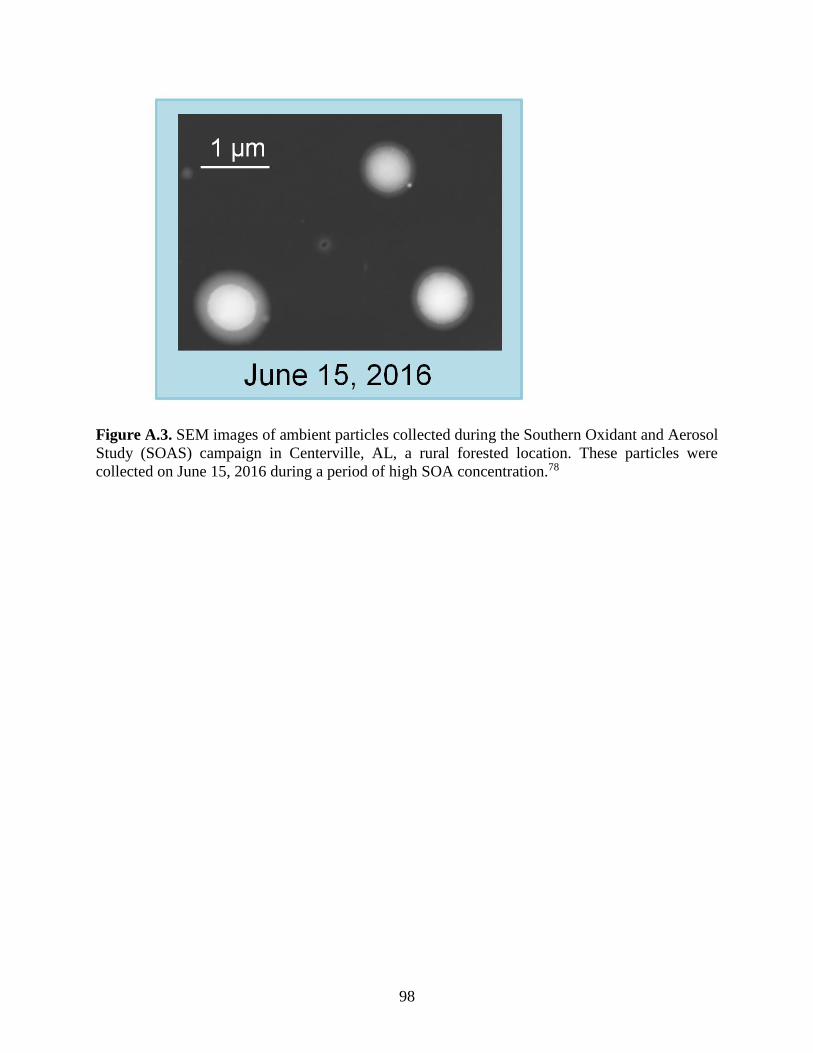
98
Figure A.3. SEM images of ambient particles collected during the Southern Oxidant and Aerosol
Study (SOAS) campaign in Centerville, AL, a rural forested location. These particles were
collected on June 15, 2016 during a period of high SOA concentration.78

99
Figure A.4. AFM and SEM images of SOA generated at 30% RH. a) SEM images, b) AFM phase
images, and c) AFM height images of -pinene SOA/sulfate particles generated at 30% RH before
and after IEPOX uptake. Particles show similar morphology trends to -pinene SOA/sulfate
particles created at 50% RH. Before IEPOX uptake, particles show core shell morphology. After
IEPOX uptake, particle shell remains circular while particle core undergoes morphology changes.

100
Figure A.5. SEM images of toluene SOA/sulfate particles generated at 30% RH before and after
IEPOX uptake. Samples were not available on AFM substrates. Particles show similar morphology
trends to toluene SOA/sulfate particles generated at 50% RH. Before IEPOX uptake, particles
show core shell morphology. After IEPOX uptake, particle shell remains circular while particle
core undergoes morphology changes.
Figure A.6. Spreading ratios of SOA particles generated at 30% RH. Average spreading ratio (30
particles/sample) of -pinene SOA/sulfate particles generated at 30% RH before and after IEPOX
uptake. Error bars show standard error. Asterisks denote spreading ratios that are statistically
different than seed aerosol spreading ratio, as determined by t-tests at 95% confidence interval.
Toluene samples at 30% RH were not available on AFM substrates.

101
Figure A.7. SEM-EDX and Raman spectra of seed particles before SOA coating. a) SEM image
and EDX spectrum and b) Raman spectrum of ammonium sulfate seed aerosol. Elements with
asterisks in EDX spectrum denote partial contribution from substrate, sample holder, or detector.
Seed aerosols were homogeneous and did not become phase separated until coated with organic
species.

102
Figure A.8. SEM images of SOA particles. Unedited SEM images of a) -pinene SOA, b) -
pinene + IEPOX SOA, c) toluene SOA, and d) toluene + IEPOX SOA coated onto ammonium
sulfate seed particles. SEM images are shown in color in Figure 2.6 to emphasize phase separation.

103
Table A.1. Experimentally determined Raman modes and tentative assignments for -pinene and
toluene SOA/sulfate, based on assignments described in Bondy et al.42 Modes were classified as
vs (very strong), s (strong), m (medium), and w (weak).

104
Appendix B. Lake Spray Aerosol Incorporated into Great Lakes Clouds Supplemental
Information2
Figure B.1. Aircraft flight path map of July 12, 2016 cloud water sampling. Flight path data are
not available for July 12, 2016 aerosol sampling.
2 Appendix B details supplemental information corresponding to Chapter 3

105
Figure B.2. Inorganic ion concentrations for freshwater collected in Brevort, Michigan during
aircraft sampling on July 12, 2016. Bars represent average concentration of triplicate
measurements; error bars show corresponding standard deviations. Values are compared to
previous Lake Michigan measurements by Chapra et al.202 Calcium values obtained are slightly
lower than Chapra et al. due to insoluble CaCO3 residues that are not measured by the IC method
utilized here.
40
30
20
10
0
Co
nce
ntr
atio
n (
mg
/L)
Sodium Potassium Magnesium Calcium Chloride Sulfate
Lake Michigan Lake Michigan - Chapra et al. 2012

106
Figure B.3. The average number size distributions of laboratory-generated LSA. Traces represent
freshwater collected in Brevort, Michigan at the time of aircraft sample collection (July 12, 2016)
and freshwater collected at Michigan City, Michigan courtesy of May et al.164
400
300
200
100
0
dN
/dlo
gD
p (
# c
m-3
)
2 3 4 5 6 7 8 9
1002 3 4 5 6 7 8
Mobility Diameter (nm)
Lake Michigan - Brevort May et al. 2016

107
Figure B.4. SEM images and EDX spectra of particle types identified as dust and SOA/biomass
burning during SEM-EDX analysis. Aluminum peaks were removed from the spectra and are
denoted by asterisks to show contribution from aluminum foil substrate.

108
Appendix C. Harmful Algal Bloom Toxins in Aerosol Generated from Inland Lake Water
Supplemental Information3
Figure C.1. SEM-EDX and Raman analysis of insoluble residues present in Mona Lake
freshwater. Mona Lake freshwater samples were drop coated and dried onto substrates for
chemical analysis of insoluble residues using A) SEM-EDX and B) Raman spectroscopy. Silicon
was labeled with an asterisk in part A to denote contribution from the silicon wafer substrate.
Insoluble residues contained peaks representative of organic material43,45,46,168 in both analysis
methods and resembled particulate organic carbon (POC).326,327
3 Appendix C details supplemental information corresponding to Chapter 4
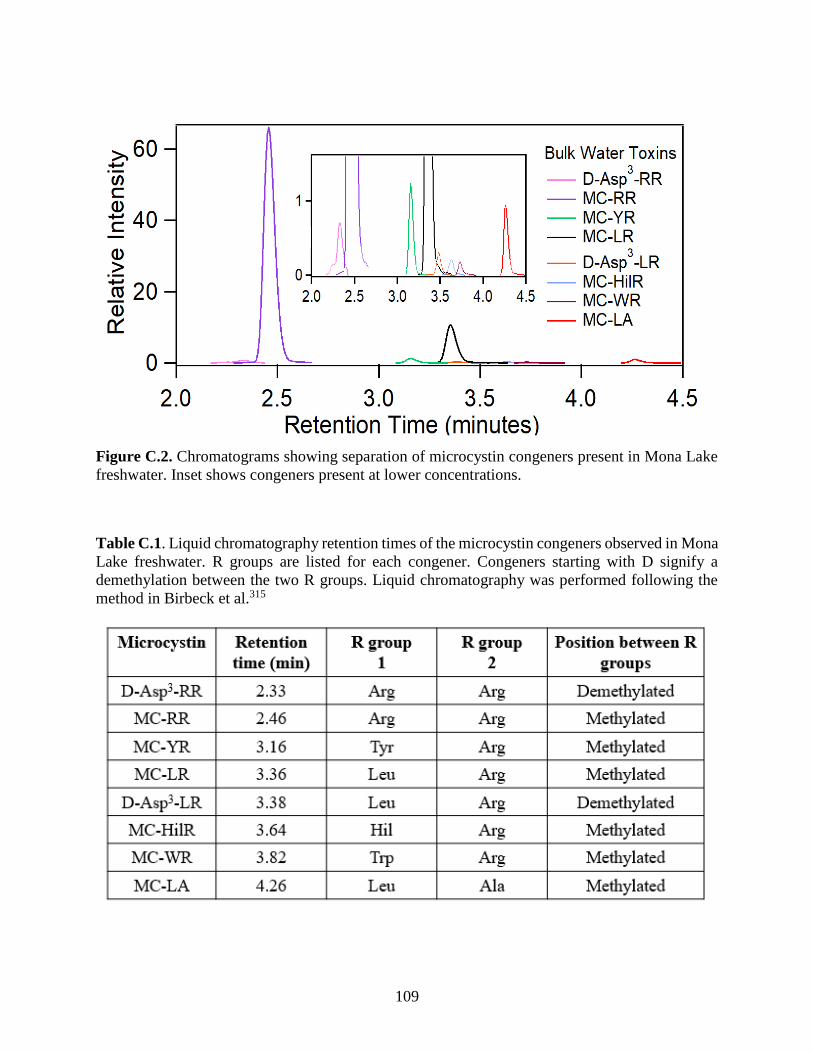
109
Figure C.2. Chromatograms showing separation of microcystin congeners present in Mona Lake
freshwater. Inset shows congeners present at lower concentrations.
Table C.1. Liquid chromatography retention times of the microcystin congeners observed in Mona
Lake freshwater. R groups are listed for each congener. Congeners starting with D signify a
demethylation between the two R groups. Liquid chromatography was performed following the
method in Birbeck et al.315

110
Figure C.3. Structures of all microcystin congeners analyzed.

111
Figure C.4. pH of freshwater samples measured using pH paper. Mona Lake freshwater had pH
values of 7.0 ± 0.1 and 7.1 ± 0.1 for the July and September samples, respectively. Muskegon Lake
freshwater had pH values of 6.9 ± 0.1 and 7.0 ± 0.1 for the June and October samples, respectively.

112
Figure C.5. Representative ATOFMS spectra of Mona Lake LSA classified as A) LSA salt, B)
LSA organic, and C) LSA biological particles. Spectra were clustered using the markers identified
by May et al.168

113
Figure C.6. ATOFMS spectra obtained by taking the difference of Mona Lake LSA salt and
Muskegon Lake LSA salt clusters.

114
Figure C.7. SEM images and EDX spectra of LSA particle types. Representative SEM images
(left) and EDX spectra (right) of A) LSA salt, B) LSA organic, and C) LSA biological particles
generated from Mona Lake freshwater sample. Scale bars all represent 1 µm. Particles are similar
to those previously observed by May et al.168

115
C.1 Enrichment calculations of microcystin in laboratory-generated aerosol
The enrichments of different microcystins in aerosol samples were calculated as a ratio
between the concentration of microcystins in all particulate matter (PM) with an aerodynamic
diameter (da) < 2.55 µm and the concentration of microcystin in the freshwater. The aerosol
number concentrations during the laboratory experiments were calculated from size distributions
collected with an aerodynamic particle sizer (APS) and a scanning mobility particle sizer (SMPS)
distributions, which are shown in the main text. Using the aerodynamic diameter midpoint of each
bin, the volume of the average particle in each bin was determined. The concentration of aerosol
in the air was determined by multiplying the volume of each individual particle and the number
concentration of aerosol determined by the APS (da 698.0 nm - 2.55 µm) and SMPS (da 23.6 -
694.4 nm) shown below in equation C.1:
Equation C.1 𝑉𝑜𝑙𝑢𝑚𝑒
𝑃𝑎𝑟𝑡𝑖𝑐𝑙𝑒∗
𝑃𝑎𝑟𝑡𝑖𝑐𝑙𝑒𝑠 (#)
𝑉𝑜𝑙𝑢𝑚𝑒𝑎𝑖𝑟= 𝑇𝑜𝑡𝑎𝑙 𝑎𝑒𝑟𝑜𝑠𝑜𝑙 𝑣𝑜𝑙𝑢𝑚𝑒
The electrical mobility diameter (dem) reported by the SMPS was converted to aerodynamic
diameter (da) using equation C.2, where χ is a spherical shape factor of 1 based on SEM image
analysis and ρ is the density of freshwater aerosol (1.5 g/cm3):27,145,223,414
Equation C.2 𝑑𝑎 = 𝑑𝑒𝑚 ∗𝜒
𝜌
The mass concentration of aerosol was then determined using equation C.3, in which aerosol mass
was calculated by multiplying the aerosol volume by ρ:
Equation C.3 𝑉𝑜𝑙𝑢𝑚𝑒𝑎𝑒𝑟𝑜𝑠𝑜𝑙
𝑉𝑜𝑙𝑢𝑚𝑒𝑎𝑖𝑟∗ 𝜌 =
𝑀𝑎𝑠𝑠𝑎𝑒𝑟𝑜𝑠𝑜𝑙
𝑉𝑜𝑙𝑢𝑚𝑒𝑎𝑖𝑟
Utilizing the amount of microcystin detected in the air sampled, the fraction of microcystin in the
total aerosol mass was determined using equation C.4:
Equation C.4
𝑀𝑎𝑠𝑠𝑚𝑖𝑐𝑟𝑜𝑐𝑦𝑠𝑡𝑖𝑛𝑉𝑜𝑙𝑢𝑚𝑒𝑎𝑖𝑟
⁄
𝑀𝑎𝑠𝑠𝑎𝑒𝑟𝑜𝑠𝑜𝑙𝑉𝑜𝑙𝑢𝑚𝑒𝑎𝑖𝑟
⁄=
𝑀𝑎𝑠𝑠𝑚𝑖𝑐𝑟𝑜𝑐𝑦𝑠𝑡𝑖𝑛
𝑀𝑎𝑠𝑠𝑎𝑒𝑟𝑜𝑠𝑜𝑙
Enrichment was calculated using the ratio of each microcystin detected in the aerosol from
equation 4 and their respective concentrations in the water, shown below in equation C.5:
Equation C.5

116
Appendix D. Harmful Algal Bloom Toxins in Ambient Freshwater Aerosol Supplemental
Information4
Figure D.1. Sampling locations around Grand Lake St. Marys.
4 Appendix D details supplemental information corresponding to Chapter 5
117
Appendix E. Optical Photothermal Infrared (O-PTIR) and Raman Spectroscopy of
Submicrometer Atmospheric Particles Supplemental Information5
Because O-PTIR signal is dependent on the heat capacity, heat conductivity, and refractive
index of the sample,62 the authors gathered these values reported in literature for all standards
tested. Probe and IR power differed during data collection depending on the sample characteristics
and sensitivity to the laser beams. Probe and IR power was varied to maximize signal intensity
without oversaturating the detector. The authors list the probe and IR power used for each sample
on silicon substrates. The 4 chips for the QCL laser are as follows: 880–1160 cm-1, 1160.1–1420
cm-1, 1420.1–1700 cm-1, and 1700.1–1950 cm-1.
The LOD in terms of raw signal is 0.12 mA from the photodiode. Particles used in the
manuscript were generated from 50 mM solutions. To estimate the LOD based on the initial
solution concentration, if the volume of a 400 nm volume equivalent diameter (dve) particle is 3.35
x 107 nm3 (3.35 x 10⁻²⁰ m3), then there are ~1.01 x 10⁶ molecules of analyte in that particle before
impaction. After impaction the particle spreads to 1 µm projected area diameter (dpa) on the
substrate. The spot size of the green laser (λ = 532 nm) should be similar to the 450 nm spot size
at λ = 550 nm based on manufacturer specs for the Cassegrain objective (40×, 0.78 N.A.
Schwarzschild Objective, IR Reflective, Pike Technologies Inc.). This means would mean we can
detect ~4.5 x 10⁵ molecules within the illuminated volume that is determined by the spot size of
the green laser.
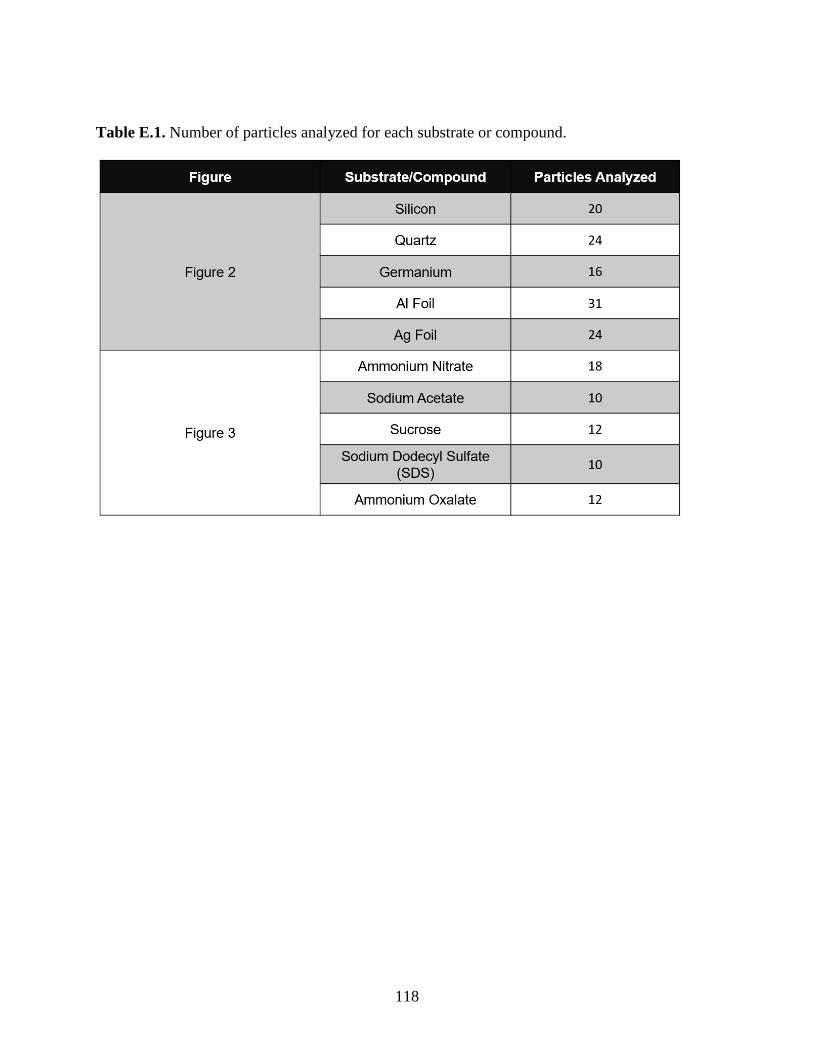
118
Table E.1. Number of particles analyzed for each substrate or compound.

119
Table E.2. Table of heat capacity,415-422 heat conductivity,423,424 and refractive index values425-431
obtained from literature for all standard compounds tested. On the right, the probe and IR power
used to obtain O-PTIR spectra from each standard on silicon substrates is listed.
Figure E.1. IR (left, red trace) and Raman (right, green trace) spectra of ammonium sulfate
crystals, illustrating the crystalline modes observed by Raman.152 O-PTIR and FTIR spectra of
ammonium sulfate aligns well, similar to previous comparison of photothermal IR and FTIR.50

120
Table E.3. Table listing peaks identified by IR and Raman for each substrate tested. Optical
images of blank substrates (with no particles) are included on the right.

121
Figure E.2. IR (left, red trace) and Raman (right, green trace) spectra obtained from an ammonium
sulfate particle on a gold substrate. Raman spectra were dominated from fluorescence due to the
substrate. An optical image of the particle is included on the right.
Table E.4. Table listing all vibrational modes experimentally determined in IR and Raman
spectra. Literature is referenced to corroborate the spectral assignments.22,33,35,36,43,45,50,52,152,153,365-
373,375,385,386,413,432

122
Figure E.3. Optical images of each particle analyzed in Figure 6.3. All particles had an
aerodynamic diameter <400 nm before spreading onto the silicon substrate.

123
References
1. Pöschl, U., Atmospheric aerosols: composition, transformation, climate and health effects.
Angew. Chem. Int. Ed. 2005, 44, 7520 – 7540.
2. Seinfeld, J. H.; Pandis, S. N., Atmospheric chemistry and physics: from air pollution to
climate change. John Wiley & Sons: 2016.
3. Ault, A.; Axson, J., Atmospheric aerosol chemistry: spectroscopic and microscopic
advances. Anal. Chem. 2017, 89, 430-452.
4. Slade, J. H.; Vanreken, T. M.; Mwaniki, G. R.; Bertman, S.; Stirm, B.; Shepson, P. B.,
Aerosol production from the surface of the Great Lakes. Geophys. Res. Lett. 2010, 37, L18807.
5. Axson, J. L.; May, N. W.; Colon-Bernal, I. D.; Pratt, K. A.; Ault, A. P., Lake spray aerosol:
a chemical signature from individual ambient particles. Envion. Sci. Tech. 2016, 50, 9835–9845.
6. Prather, K. A.; Hatch, C. D.; Grassian, V. H., Analysis of atmospheric aerosols. Annu. Rev.
Anal. Chem. 2008, 1, 485-514.
7. Hinds, W. C., Aerosol technology: Properties, behavior, and measurement of airborne
particles. 2 ed.; John Wiley & Sons: New York, 1999.
8. Kwamena, N. O. A., Buajarern, J., Reid, J. P., Equilibrium morphology of mixed
organic/inorganic/aqueous aerosol droplets: investigating the effect of relative humidity and
surfactants. J. Phys. Chem. A 2010, 114, 5787–5795.
9. Andreae, M. O.; Rosenfeld, D., Aerosol–cloud–precipitation interactions. Part 1. The
nature and sources of cloud-active aerosols. Earth Sci. Rev. 2008, 89, 13-41.
10. Stocker, T. F.; Qin, D., Climate change 2013: The physical science basis. Working group
I contribution to the fifth assessment report of the intergovernmental panel on climate change.
Cambridge University Press: Cambridge, UK and New York, NY, USA, 2013.
11. Pope, C. A.; Dockery, D. W., Health effects of fine particulate air pollution: Lines that
connect. J. Air Waste Manage. 2006, 56, (6), 709-742.
12. Shiraiwa, M.; Ueda, K.; Pozzer, A.; Lammel, G.; Kampf, C. J.; Fushimi, A.; Enami, S.;
Arangio, A. M.; Frohlich-Nowoisky, J.; Fujitani, Y.; Furuyama, A.; Lakey, P. S. J.; Lelieveld, J.;
Lucas, K.; Morino, Y.; Poschl, U.; Takahama, S.; Takami, A.; Tong, H.; Weber, B.; Yoshino, A.;
Sato, K., Aerosol Health Effects from Molecular to Global Scales. Environ. Sci. Technol. 2017.
13. Riemer, N., Ault, A. P., West, M., Craig, R. L., Curtis, J. H., Aerosol mixing state:
measurements,modeling, and impacts. Rev. Geophys. 2019, 57, 187-249.
14. Fierce, L.; Bond, T. C.; Bauer, S. E.; Mena, F.; Riemer, N., Black carbon absorption at the
global scale is affected by particle-scale diversity in composition. Nat. Commun. 2016, 7, 8.
15. Zhang, Y.; Chen, Y.; Lambe, A. T.; Olson, N. E.; Lei, Z.; Craig, R. L.; Zhang, Z.; Gold,
A.; Onasch, T. B.; Jayne, J. T.; Worsnop, D. R.; Gaston, C. J.; Thornton, J. A.; Vizuete, W.; Ault,
A. P.; Surratt, J. D., Effect of the aerosol-phase state on secondary organic aerosol formation from

124
the reactive uptake of isoprene-derived epoxydiols (IEPOX). Environ. Sci. Technol. Lett. 2018, 5,
167-174.
16. Zhang, Y.; Chen, Y.; Lei, Z.; Olson, N. E.; Riva, M.; Koss, A. R.; Zhang, Z.; Gold, A.;
Jayne, J. T.; Worsnop, D. R.; Onasch, T. B.; Kroll, J. H.; Turpin, B. J.; Ault, A. P.; Surratt, J. D.,
Joint impacts of acidity and viscosity on the formation of secondary organic aerosol from isoprene
epoxydiols (IEPOX) in phase separated particles. ACS Earth Space Chem. 2019, 3, (12), 2646-
2658.
17. Moore, M. J. K.; Furutani, H.; Roberts, G. C.; Moffet, R. C.; Gilles, M. K.; Palenik, B.;
Prather, K. A., Effect of organic compounds on cloud condensation nuclei (CCN) activity of sea
spray aerosol produced by bubble bursting. Atmos. Environ. 2011, 45, (39), 7462-7469.
18. Moffet, R. C.; Prather, K. A., In-situ measurements of the mixing state and optical
properties of soot with implications for radiative forcing estimates. Proc. Natl. Acad. Sci. U. S. A.
2009, 106, (29), 11872-11877.
19. Zhang, Q.; Thompson, J. E., Effect of particle mixing morphology on aerosol scattering
and absorption: A discrete dipole modeling study. Geo. Res. J. 2014, 3, 9-18.
20. Bondy, A. L.; Bonanno, D.; Moffet, R. C.; Wang, B.; Laskin, A.; Ault, A. P., The diverse
chemical mixing state of aerosol particles in the southeastern United States. Atmos. Chem. Phys.
2018, 18, (16), 12595-12612.
21. Axson, J. L. S., Hongru; Bondy, Amy L.; Landry, Christopher C.; Welz, Jason; Creamean,
Jessie M.; Ault, Andrew P., Transported mineral dust deposition case study at a hydrologically
sensitive mountain site: size and composition shifts in ambient aerosol and snowpack. Aerosol Air
Qual. Res. 2016, 16, (3), 555-567.
22. Kirpes, R. M.; Bondy, A. L.; Bonanno, D.; Moffet, R. C.; Wang, B.; Laskin, A.; Ault, A.
P.; Pratt, K. A., Secondary sulfate is internally mixed with sea spray aerosol and organic aerosol
in the winter Arctic. Atmos. Chem. Phys. 2018, 18, (6), 3937-3949.
23. Laskin, A.; Cowin, J. P.; Iedema, M. J., Analysis of individual environmental particles
using modern methods of electron microscopy and X-ray microanalysis. J. Electron Spectros.
2006, 150, 260-274.
24. Patterson, J. P.; Collins, D. B.; Michaud, J. M.; Axson, J. L.; Sultana, C. M.; Moser, T.;
Dommer, A. C.; Conner, J.; Grassian, V. H.; Stokes, M. D.; Deane, G. B.; Evans, J. E.; Burkart,
M. D.; Prather, K. A.; Gianneschi, N. C., Sea spray aerosol structure and composition using
cryogenic transmission electron microscopy. ACS Cent. Sci. 2016, 2, 40-47.
25. Laskin, A.; Gilles, M. K.; Knopf, D. A.; Wang, B.; China, S., Progress in the analysis of
complex atmospheric particles. Annu Rev Anal Chem 2016, 9, 117-143.
26. Riva, M.; Chen, Y.; Zhang, Y.; Lei, Z.; Olson, N.; Boyer, H. C.; Narayan, S.; Yee, L. D.;
Green, H.; Cui, T.; Zhang, Z.; Baumann, K. D.; Fort, M.; Edgerton, E. S.; Budisulistiorini, S.;
Rose, C. A.; Ribeiro, I.; e Oliveira, R. L.; Santos, E.; Szopa, S.; Machado, C.; Zhao, Y.; Alves, E.;
de Sa, S.; Hu, W.; Knipping, E.; Shaw, S.; Duvoisin Junior, S.; Souza, R. A. F. d.; Palm, B. B.;
Jimenez, J. L.; Glasius, M.; Goldstein, A. H.; Pye, H. O. T.; Gold, A.; Turpin, B. J.; Vizuete, W.;
Martin, S. T.; Thornton, J.; Dutcher, C. S.; Ault, A. P.; Surratt, J. D., Increasing isoprene
epoxydiol-to-inorganic sulfate aerosol (IEPOX:Sulfinorg) ratio results in extensive conversion of
inorganic sulfate to organosulfur forms: implications for aerosol physicochemical properties.
Environ. Sci. Technol. 2019, 53, (15), 8682-8694.

125
27. May, N. W.; Gunsch, M. J.; Olson, N. E.; Bondy, A. L.; Kirpes, R. M.; Bertman, S. B.;
China, S.; Laskin, A.; Hopke, P. K.; Ault, A. P.; Pratt, K. A., Unexpected contributions of sea
spray and lake spray aerosol to inland particulate matter. Environ. Sci. Technol. Lett. 2018, 5, 405-
412.
28. Willis, R. D., Blanchard, F. T., Conner, T. L. , Guidelines for the application of SEM/EDX
analytical techniques to particulate matter samples. National Exposure Research Laboratory
Report, Office of Research and Development 2002.
29. Shen, H.; Peters, T. M.; Casuccio, G. S.; Lersch, T. L.; West, R. R.; Kumar, A.; Kumar,
N.; Ault, A. P., Elevated concentrations of lead in particulate matter on the neighborhood-scale in
Delhi, India as determined by single particle analysis. Environ. Sci. Technol. 2016, 50, (10), 4961-
4970.
30. Anderson, B. J.; Musicant, D. R.; Ritz, A. M.; Ault, A.; Gross, D.; Yuen, M.; Gälli, M.,
User-friendly clustering for atmospheric data analysis. Carleton College, Northfield, MN, USA
2005.
31. Jain, A. K., Data clustering: 50 years beyond K-means. Pattern Recognit. Lett. 2010, 31,
(8), 651-666.
32. Likas, A., Vlassis, N., Verbeek, J. J. , The global k-means clustering algorithm. Pattern
Recognit. 2003, 36, 451-461.
33. Craig, R. L.; Nandy, L.; Axson, J. L.; Dutcher, C. S.; Ault, A. P., Spectroscopic
determination of aerosol pH from acid-base equilibria in inorganic, organic, and mixed systems.
J. Phys. Chem. A 2017, 121, (30), 5690-5699.
34. Olson, N. E.; Lei, Z.; Craig, R. L.; Zhang, Y.; Chen, Y.; Lambe, A. T.; Zhang, Z.; Gold,
A.; Surratt, J. D.; Ault, A. P., Reactive uptake of isoprene epoxydiols increases the viscosity of the
core of phase-separated aerosol particles. ACS Earth Space Chem. 2019, 3, 1402-1414.
35. Rindelaub, J. D.; Craig, R. L.; Nandy, L.; Bondy, A. L.; Dutcher, C. S.; Shepson, P. B.;
Ault, A. P., Direct measurement of pH in individual particles via Raman microspectroscopy and
variation in acidity with relative humidity. J. Phys. Chem. A 2016, 120, (6), 911-917.
36. Ault, A. P.; Zhao, D.; Ebben, C. J.; Tauber, M. J.; Geiger, F. M.; Prather, K. A.; Grassian,
V. H., Raman microspectroscopy and vibrational sum frequency generation spectroscopy as
probes of the bulk and surface compositions of size-resolved sea spray aerosol particles. Phys.
Chem. Chem. Phys. 2013, 15, (17), 6206-6214.
37. Kirpes, R. M.; Bonanno, D.; May, N. W.; Fraund, M.; Barget, A. J.; Moffet, R. C.; Ault,
A. P.; Pratt, K. A., Wintertime Arctic sea spray aerosol composition controlled by sea ice lead
microbiology. ACS Cen Sci 2019, 5, 1760−1767.
38. Ault, A. P.; Guasco, T. L.; Baltrusaitis, J.; Ryder, O. S.; Trueblood, J. V.; Collins, D. B.;
Ruppel, M. J.; Cuadra-Rodriguez, L. A.; Prather, K. A.; Grassian, V. H., Heterogeneous reactivity
of nitric acid with nascent sea spray aerosol: large differences observed between and within
individual particles. J. Phys. Chem. Lett. 2014, 5, (15), 2493-2500.
39. Riva, M.; Budisulistiorini, S. H.; Chen, Y.; Zhang, Z.; D'Ambro, E. L.; Zhang, X.; Gold,
A.; Turpin, B. J.; Thornton, J. A.; Canagaratna, M. R.; Surratt, J. D., Chemical characterization of
secondary organic aerosol from oxidation of isoprene hydroxyhydroperoxides. Envion. Sci. Tech.
2016, 50, (18), 9889-9899.
40. Surratt, J. D., Gomez-Gonzalez, Y., Chan, Arthur W. H.,Vermeylen, Reinhilde. Shahgholi,
Mona. Kleindienst,Tadeusz E., Edney, Edward O., Offenberg, John H., Lewandowski, Michael.

126
Jaoui, Mohammed. Maenhaut, Willy. Claeys, Magda.Flagan, Richard C., Seinfeld, John H. ,
Organosulfate formation in biogenic secondary organic aerosol J. Phys. Chem. A 2008, 112, 8345–
8378.
41. Hettiyadura, A. P. S.; Al-Naiema, I. M.; Hughes, D. D.; Fang, T.; Stone, E. A.,
Organosulfates in Atlanta, Georgia: Anthropogenic influences on biogenic secondary organic
aerosol formation. Atmospheric Chemistry and Physics Discussions 2018, 1-27.
42. Bondy, A. L.; Craig, R. L.; Zhang, Z.; Gold, A.; Surratt, J. D.; Ault, A. P., Isoprene-derived
organosulfates: vibrational mode analysis by Raman spectroscopy, acidity-dependent spectral
modes, and observation in individual atmospheric particles. J. Phys. Chem. A 2018, 122, (1), 303-
315.
43. Craig, R. L.; Bondy, A. L.; Ault, A. P., Surface enhanced Raman spectroscopy enables
observations of previously undetectable secondary organic aerosol components at the individual
particle level. Anal. Chem. 2015, 87, (15), 7510-7514.
44. Laskina, O.; Morris, H. S.; Grandquist, J. R.; Qin, Z.; Stone, E. A.; Tivanski, A. V.;
Grassian, V. H., Size matters in the water uptake and hygroscopic growth of atmospherically
relevant multicomponent aerosol particles. J. Phys. Chem. A 2015, 119, (19), 4489-4497.
45. Craig, R. L.; Bondy, A. L.; Ault, A. P., Computer-controlled Raman microspectroscopy
(CC-Raman): A method for the rapid characterization of individual atmospheric aerosol particles.
Aerosol. Sci. Technol. 2017, 51, 1099–1112.
46. Tirella, P. S.; Craig, R. L.; Tubbs, D. B.; Olson, N. E.; Lei, Z.; Ault, A. P., Extending
surface enhanced Raman spectrscopy (SERS) of atmospheric aerosol particles to the accumulation
mode (150-800 nm). Environ. Sci.: Processes Impacts 2018, 20, 1570-1580.
47. Ofner, J.; Deckert-Gaudig, T.; Kamilli, K. A.; Held, A.; Lohninger, H.; Deckert, V.; Lendl,
B., Tip-enhanced Raman spectroscopy of atmospherically relevant aerosol nanoparticles. Anal
Chem 2016, 88, (19), 9766-9772.
48. Doughty, D. C.; Hill, S. C., Raman spectra of atmospheric particles measured in Maryland,
USA over 22.5 h using an automated aerosol Raman spectrometer. J Quant Spectrosc Radiat
Transf 2020, 244.
49. Doughty, D. C.; Hill, S. C., Automated aerosol Raman spectrometer for semi-continuous
sampling of atmospheric aerosol. J Quant Spectrosc Radiat Transf 2017, 188, 103-117.
50. Bondy, A. L.; Kirpes, R. M.; Merzel, R. L.; Pratt, K. A.; Banaszak Holl, M. M.; Ault, A.
P., Atomic force microscopy-infrared spectroscopy of individual atmospheric aerosol particles:
subdiffraction limit vibrational spectroscopy and morphological analysis. Anal. Chem. 2017, 89,
8594-8598.
51. Lei, Z.; Bliesner, S. E.; Mattson, C. N.; Cooke, M. E.; Olson, N. E.; Chibwe, K.; Albert, J.
N. L.; Ault, A. P., Aerosol acidity sensing via polymer degradation. Anal Chem 2020, 92, (9),
6502-6511.
52. Or, V. W., Estillore, A. D., Tivanski, A. V., Grassian, V. H., Lab on a tip: atomic force
microscopy - photothermal infrared spectroscopy of atmospherically relevant organic/inorganic
aerosol particles in the nanometer to micrometer size range. Analyst 2018, 143, 2765-2774.
53. Dazzi, A., Prater, C. B., Hu, Q., Chase, D. B., Rabolt, J. F., Marcott, C., AFM-IR:
Combining atomic force microscopy and infrared spectroscopy for nanoscale chemical
characterization Appl. Spectrosc. 2012, 66, (12), 1365-1384.

127
54. Dazzi, A., Prazeres, R., Glotin, F., Ortega, J. M., Local infrared microspectroscopy with
subwavelength spatial resolution with an atomic force microscope tip used as a photothermal
sensor. Opt. Lett. 2005, 30, (18), 2388-2390.
55. Dazzi, A.; Prater, C. B., AFM-IR: Technology and applications in nanoscale infrared
spectroscopy and chemical imaging. Chem. Rev. 2016, 117, 5146−5173.
56. Morris, H. S.; Estillore, A. D.; Laskina, O.; Grassian, V. H.; Tivanski, A. V., Quantifying
the hygroscopic growth of individual submicrometer particles with atomic force microscopy. Anal.
Chem. 2016, 88, (7), 3647-54.
57. Olson, N. E.; Xiao, Y.; Lei, Z.; Ault, A. P., Simultaneous optical photothermal infrared (O-
PTIR) and Raman spectroscopy of submicrometer atmospheric particles. Anal Chem 2020, 92,
(14), 9932-9939.
58. Hale, R. C.; Seeley, M. E.; La Guardia, M. J.; Mai, L.; Zeng, E. Y., A global perspective
on microplastics. J. Geophys. Res. Oceans 2020, 125, (1).
59. Klementieva, O.; Sandt, C.; Martinsson, I.; Kansiz, M.; Gouras, G. K.; Borondics, F.,
Super‐resolution infrared imaging of polymorphic amyloid aggregates directly in neurons. Adv.
Sci. 2020.
60. Li, X.; Zhang, D.; Bai, Y.; Wang, W.; Liang, J.; Cheng, J. X., Fingerprinting a living cell
by Raman integrated mid-infrared photothermal microscopy. Anal Chem 2019, 91, (16), 10750-
10756.
61. Li, Z., Kuno, M., Hartland, G., Super-resolution mid-infrared imaging using photothermal
microscopy. In Conference on Lasers and Electro-Optics, Optical Society of America: San Jose,
California, United States, 2016; Vol. ATu3J.7.
62. Zhang, D., Li, C., Zhang, C., Slipchenko, M. N., Eakins, G., Cheng, J. X., Depth-resolved
mid-infrared photothermal imaging of living cells and organisms with submicrometer spatial
resolution. Sci. Adv. 2016, 2, (9), e1600521.
63. Li, C.; Zhang, D.; Slipchenko, M. N.; Cheng, J. X., Mid-infrared photothermal imaging of
active pharmaceutical ingredients at submicrometer spatial resolution. Anal Chem 2017, 89, (9),
4863-4867.
64. Druy, M. A.; Furstenberg, R.; Crocombe, R. A.; Kendziora, C. A.; Papantonakis, M. R.;
Nguyen, V.; McGill, R. A., Chemical imaging using infrared photothermal microspectroscopy.
2012.
65. Pöschl, U., Atmospheric aerosols: Composition, transformation, climate and health effects.
Atmos. Chem. 2005, 44, 7520 – 7540.
66. Knopf, D. A.; Alpert, P. A.; Wang, B., The role of organic aerosol in atmospheric ice
nucleation: a review. ACS Earth Space Chem. 2018, 2, (3), 168-202.
67. Ault, A.; Axson, J., Atmospheric aerosol chemistry: spectroscopic and microscopic
advances. Anal. Chem. 2016, 89, 430-452.
68. Riemer, N., Ault, A. P., West, M., Craig, R. L., Curtis, J. H., Aerosol mixing state:
measurements,modeling, and impacts. Review of Geophysics 2019, 57, 1-63.
69. Saukko, E.; Lambe, A. T.; Massoli, P.; Koop, T.; Wright, J. P.; Croasdale, D. R.; Pedernera,
D. A.; Onasch, T. B.; Laaksonen, A.; Davidovits, P.; Worsnop, D. R.; Virtanen, A., Humidity-
dependent phase state of SOA particles from biogenic and anthropogenic precursors. Atmospheric
Chemistry and Physics 2012, 12, (16), 7517-7529.

128
70. Zhang, Y.; Sanchez, M. S.; Douet, C.; Wang, Y.; Bateman, A. P.; Gong, Z.; Kuwata, M.;
Renbaum-Wolff, L.; Sato, B. B.; Liu, P. F.; Bertram, A. K.; Geiger, F. M.; Martin, S. T., Changing
shapes and implied viscosities of suspended submicron particles. Atmospheric Chemistry and
Physics 2015, 15, (14), 7819-7829.
71. You, Y.; Smith, M. L.; Song, M.; Martin, S. T.; Bertram, A. K., Liquid–liquid phase
separation in atmospherically relevant particles consisting of organic species and inorganic salts.
Int. Rev. Phys. Chem. 2014, 33, (1), 43-77.
72. You, Y.; Renbaum-Wolff, L.; Bertram, A. K., Liquid–liquid phase separation in particles
containing organics mixed with ammonium sulfate, ammonium bisulfate, ammonium nitrate or
sodium chloride. Atmos. Chem. Phys. 2013, 13, (23), 11723-11734.
73. Altaf, M. B.; Freedman, M. A., Effect of drying rate on aerosol particle morphology. J.
Phys. Chem. Lett. 2017, 8, 3613-3618.
74. Freedman, M. A., Phase separation in organic aerosol. Chem. Soc. Rev. 2017, 46, 7694-
7705.
75. Freedman, M. B., Baustian, K. J.,Wise, M. E., Tolbert, M. A., Characterizing the
morphology of organic aerosols at ambient temperature and pressure. Anal. Chem. 2010, 82, 7965–
7972.
76. Slade, J. H.; Ault, A. P.; Bui, A. T.; Ditto, J. C.; Lei, Z.; Bondy, A. L.; Olson, N. E.; Cook,
R. D.; Desrochers, S. J.; Harvey, R. M.; Erickson, M. H.; Wallace, H. W.; Alvarez, S. L.; Flynn,
J. H.; Boor, B. E.; Petrucci, G. A.; Gentner, D. R.; Griffin, R. J.; Shepson, P. B., Bouncier particles
at night: biogenic secondary organic aerosol chemistry and sulfate drive diel variations in the
aerosol phase in a mixed forest. Environ. Sci. Technol. 2019, 53, 4977-4987.
77. You, Y.; Renbaum-Wolff, L.; Carreras-Sospedra, M.; Hanna, S. J.; Hiranuma, N.; Kamal,
S.; Smith, M. L.; Zhang, X.; Weber, R. J.; Shilling, J. E.; Dabdub, D.; Martin, S. T.; Bertram, A.
K., Images reveal that atmospheric particles can undergo liquid-liquid phase separations. Proc.
Natl. Acad. Sci. U. S. A. 2012, 109, (33), 13188–13193.
78. Bondy, A. L.; Bonanno, D.; Moffet, R. C.; Wang, B.; Laskin, A.; Ault, A. P., The diverse
chemical mixing state of aerosol particles in the southeastern United States. Atmos. Chem. Phys
2018, 18, (16), 12595-12612.
79. Carlton, A. G., Wiedinmyer, C.,Kroll, J. H. , A review of Secondary Organic Aerosol
(SOA) formation from isoprene. Atmospheric Chemistry and Physics 2009, 9, 4987–5005.
80. Guenther, A., Karl, T.,Harley, P., Wiedinmyer, C., Palmer, P. I., Geron, C., Estimates of
global terrestrial isoprene emissions using MEGAN (Model of Emissions of Gases and Aerosols
from Nature). Atmospheric Chemistry and Physics 2006, 6, 3181–3210.
81. Renbaum-Wolff, L.; Grayson, J. W.; Bateman, A. P.; Kuwata, M.; Sellier, M.; Murray, B.
J.; Shilling, J. E.; Martin, S. T.; Bertram, A. K., Viscosity of alpha-pinene secondary organic
material and implications for particle growth and reactivity. Proc. Natl. Acad. Sci. U. S. A. 2013,
110, (20), 8014-8019.
82. Beauregard, D., Locating and estimating air emissions from sources of toluene. Office of
Air Quality Planning and Standards, United States Environmental Protection Agency, EPA:
Research Triangle Park, NC, 1994.
83. Hallquist, M., Wenger,J. C., Baltensperger, U., Rudich, Y., Simpson, D., Claeys, M.,
Dommen, J. , ; Donahue, N. M., George, C., Goldstein, A. H., Hamilton, J. F., Herrmann, H.,
Hoffmann, T., Iinuma, Y.,; Jang, M., Jenkin, M. E., Jimenez, J. L., Kiendler-Scharr, A.,

129
Maenhaut, W., McFiggans, G., Mentel, Th. F.,; Monod, A., Prevot, A. S. H., Seinfeld,J. H.,
Surratt, J. D., Szmigielski, R., Wildt, J., The formation, properties, and impacts of secondary
organic aerosol: current and emerging issues. Atmospheric Chemistry and Physics 2009, 9, 5155–
5236.
84. Zhang, H., Lindsay D. Yee, Ben H. Lee, Michael P. Curtis, David R.; Worton, G. I.-V.,
John H. Offenberg, Michael Lewandowski, Tadeusz; E. Kleindienst, M. R. B., Amara L. Holder,
William A. Lonneman, Kenneth S.; Docherty, M. J., Havala O. T. Pye, Weiwei Hu, Douglas A.
Day, Pedro; Campuzano-Jost, J. L. J., Hongyu Guo, Rodney J. Weber, Joost de Gouw, Abigail R.
Koss, Eric S. Edgerton, William Brune, Claudia Mohr, Felipe D. Lopez-; Hilfiker, A. L., Nathan
M. Kreisberg, Steve R. Spielman, Susanne V. Hering, Kevin; R. Wilson, J. A. T., Allen H.
Goldstein, Monoterpenes are the largest source of summertime organic aerosol in the Southeastern
United States. Proc. Natl. Acad. Sci. U. S. A. 2018, 115, 2038-2043.
85. Guenther, A. B.; Jiang, X.; Heald, C. L.; Sakulyanontvittaya, T.; Duhl, T.; Emmons, L. K.;
Wang, X., The Model of Emissions of Gases and Aerosols from Nature version 2.1 (MEGAN2.1):
an extended and updated framework for modeling biogenic emissions. Geosci. Mod. Devel. 2012,
5, (6), 1471-1492.
86. Bates, K. H.; Crounse, J. D.; St Clair, J. M.; Bennett, N. B.; Nguyen, T. B.; Seinfeld, J. H.;
Stoltz, B. M.; Wennberg, P. O., Gas phase production and loss of isoprene epoxydiols. J Phys
Chem A. 2014, 118, (7), 1237-1246.
87. Paulot, F.; Crounse, J. D.; Kjaergaard, H. G.; Kurten, A.; St Clair, J. M.; Seinfeld, J. H.;
Wennberg, P. O., Unexpected epoxide formation in the gas-phase photooxidation of isoprene.
Science 2009, 325, (5941), 730-733.
88. Riva, M.; Budisulistiorini, S. H.; Zhang, Z.; Gold, A.; Thornton, J. A.; Turpin, B. J.; Surratt,
J. D., Multiphase reactivity of gaseous hydroperoxide oligomers produced from isoprene
ozonolysis in the presence of acidified aerosols. Atmos. Env. 2017, 152, 314-322.
89. Gaston, C. J.; Riedel, T. P.; Zhang, Z.; Gold, A.; Surratt, J. D.; Thornton, J. A., Reactive
uptake of an isoprene-derived epoxydiol to submicron aerosol particles. Environ. Sci. Technol.
2014, 48, (19), 11178-11186.
90. Riedel, T. P.; Lin, Y.-H.; Budisulistiorini, S. H.; Gaston, C. J.; Thornton, J. A.; Zhang, Z.;
Vizuete, W.; Gold, A.; Surratt, J. D., Heterogeneous reactions of isoprene-derived epoxides:
reaction probabilities and molar secondary organic aerosol yield estimates. Environ. Sci. Technol.
Lett. 2015, 2, (2), 38-42.
91. Jang, M., Czoschke, N. M., Lee, S., Kamens, R. M., Heterogeneous atmospheric aerosol
production by acid- catalyzed particle-phase reactions. Science 2002, 298, 814-817.
92. Czoschke, N. M., Jang, M., Kamens, R. M., Effect of acidic seed on biogenic secondary
organic aerosol growth. Atmos. Env. 2003, 37, (30), 4287-4299.
93. Budisulistiorini, S. H.; Baumann, K.; Edgerton, E. S.; Bairai, S. T.; Mueller, S.; Shaw, S.
L.; Knipping, E. M.; Gold, A.; Surratt, J. D., Seasonal characterization of submicron aerosol
chemical composition and organic aerosol sources in the southeastern United States: Atlanta,
Georgia,and Look Rock, Tennessee. Atmospheric Chemistry and Physics 2016, 16, (8), 5171-
5189.
94. Hu, W. W.; Campuzano-Jost, P.; Palm, B. B.; Day, D. A.; Ortega, A. M.; Hayes, P. L.;
Krechmer, J. E.; Chen, Q.; Kuwata, M.; Liu, Y. J.; de Sá, S. S.; McKinney, K.; Martin, S. T.; Hu,
M.; Budisulistiorini, S. H.; Riva, M.; Surratt, J. D.; St. Clair, J. M.; Isaacman-Van Wertz, G.; Yee,

130
L. D.; Goldstein, A. H.; Carbone, S.; Brito, J.; Artaxo, P.; de Gouw, J. A.; Koss, A.; Wisthaler, A.;
Mikoviny, T.; Karl, T.; Kaser, L.; Jud, W.; Hansel, A.; Docherty, K. S.; Alexander, M. L.;
Robinson, N. H.; Coe, H.; Allan, J. D.; Canagaratna, M. R.; Paulot, F.; Jimenez, J. L.,
Characterization of a real-time tracer for isoprene epoxydiols-derived secondary organic aerosol
(IEPOX-SOA) from aerosol mass spectrometer measurements. Atmospheric Chemistry and
Physics 2015, 15, (20), 11807-11833.
95. Fuzzi, S., Andreae, M. O., Huebert, B. J., Kulmala, M., Bond,T. C., Boy, M.,Doherty,
S. J., Guenther, A., Kanakidou ,M., Kawamura, K., Kerminen, V. M., Lohmann, U., Russell,
L.M., Poschl, U. , Critical assessment of the current state of scientific knowledge, terminology,
and research needs concerning the role of organic aerosols in the atmosphere, climate, and global
change. Atmospheric Chemistry and Physics 2006, 6, 2017–2038.
96. Reid, J. P.; Dennis-Smither, B. J.; Kwamena, N. O.; Miles, R. E.; Hanford, K. L.; Homer,
C. J., The morphology of aerosol particles consisting of hydrophobic and hydrophilic phases:
hydrocarbons, alcohols and fatty acids as the hydrophobic component. Phys. Chem. Chem. Phys.
2011, 13, (34), 15559-15572.
97. Erdakos, G. B.; Chang, E. I.; Pankow, J. F.; Seinfeld, J. H., Prediction of activity
coefficients in liquid aerosol particles containing organic compounds, dissolved inorganic salts,
and water—Part 3: Organic compounds, water, and ionic constituents by consideration of short-,
mid-, and long-range effects using X-UNIFAC.3. Atmos. Env. 2006, 40, (33), 6437-6452.
98. Riva, M.; Bell, D. M.; Hansen, A. M.; Drozd, G. T.; Zhang, Z.; Gold, A.; Imre, D.; Surratt,
J. D.; Glasius, M.; Zelenyuk, A., Effect of organic coatings, humidity and aerosol acidity on
multiphase chemistry of isoprene epoxydiols. Environ. Sci. Technol. 2016, 50, (11), 5580-5588.
99. Shiraiwa, M.; Zuend, A.; Bertram, A. K.; Seinfeld, J. H., Gas-particle partitioning of
atmospheric aerosols: interplay of physical state, non-ideal mixing and morphology. Phys. Chem.
Chem. Phys. 2013, 15, (27), 11441-11453.
100. Renbaum-Wolff, L.; Song, M.; Marcolli, C.; Zhang, Y.; Liu, P. F.; Grayson, J. W.; Geiger,
F. M.; Martin, S. T.; Bertram, A. K., Observations and implications of liquid–liquid phase
separation at high relative humidities in secondary organic material produced by a-pinene
ozonolysis without inorganic salts. Atmospheric Chemistry and Physics 2016, 16, (12), 7969-7979.
101. Chang, E. I.; Pankow, J. F., Prediction of activity coefficients in liquid aerosol particles
containing organic compounds, dissolved inorganic salts, and water—Part 2: Consideration of
phase separation effects by an X-UNIFAC model. Atmos. Environ. 2006, 40, (33), 6422-6436.
102. Zuend, A.; Seinfeld, J. H., Modeling the gas-particle partitioning of secondary organic
aerosol: the importance of liquid-liquid phase separation. Atmospheric Chemistry and Physics
2012, 12, (9), 3857-3882.
103. Brunamonti, S., Krieger, U. K., Marcolli, C., Peter, T., Redistribution of black carbon in
aerosol particles undergoing liquid-liquid phase separation. Geophys. Res. Lett. 2015, 42, 2532–
2539.
104. Lienhard, D. M.; Huisman, A. J.; Krieger, U. K.; Rudich, Y.; Marcolli, C.; Luo, B. P.;
Bones, D. L.; Reid, J. P.; Lambe, A. T.; Canagaratna, M. R.; Davidovits, P.; Onasch, T. B.;
Worsnop, D. R.; Steimer, S. S.; Koop, T.; Peter, T., Viscous organic aerosol particles in the upper
troposphere: diffusivity-controlled water uptake and ice nucleation? Atmospheric Chemistry and
Physics 2015, 15, (23), 13599-13613.

131
105. Virtanen, A.; Joutsensaari, J.; Koop, T.; Kannosto, J.; Yli-Pirila, P.; Leskinen, J.; Makela,
J. M.; Holopainen, J. K.; Poschl, U.; Kulmala, M.; Worsnop, D. R.; Laaksonen, A., An amorphous
solid state of biogenic secondary organic aerosol particles. Nature 2010, 467, (7317), 824-827.
106. Pajunoja, A.; Malila, J.; Hao, L.; Joutsensaari, J.; Lehtinen, K. E. J.; Virtanen, A.,
Estimating the viscosity range of SOA particles based on their coalescence time. Aerosol. Sci.
Technol. 2013, 48, (2), i-iv.
107. Surratt, J. D.; Chan, A. W.; Eddingsaas, N. C.; Chan, M.; Loza, C. L.; Kwan, A. J.; Hersey,
S. P.; Flagan, R. C.; Wennberg, P. O.; Seinfeld, J. H., Reactive intermediates revealed in secondary
organic aerosol formation from isoprene. Proc. Natl. Acad. Sci. U. S. A. 2010, 107, (15), 6640-
6645.
108. Budisulistiorini, S. H.; Nenes, A.; Carlton, A. M. G.; Surratt, J. D.; McNeill, V. F.; Pye, H.
O. T., Simulating aqueous-phase isoprene-epoxydiol (IEPOX) secondary organic aerosol
production during the 2013 Southern Oxidant and Aerosol Study (SOAS). Environ. Sci. Technol.
2016, 51, 5026-5034.
109. Surratt, J. D.; Murphy, S. M.; Kroll, J. H.; Ng, N. L.; Hildebrandt, L.; Sorooshian, A.;
Szmigielski, R.; Vermeylen, R.; Maenhaut, W.; Claeys, M.; Flagan, R. C.; Seinfeld, J. H.,
Chemical composition of secondary organic aerosol formed from the photooxidation of isoprene.
J. Phys. Chem. A 2006, 110, (31), 9665-9690.
110. Lin, Y. H.; Zhang, Z.; Docherty, K. S.; Zhang, H.; Budisulistiorini, S. H.; Rubitschun, C.
L.; Shaw, S. L.; Knipping, E. M.; Edgerton, E. S.; Kleindienst, T. E.; Gold, A.; Surratt, J. D.,
Isoprene epoxydiols as precursors to secondary organic aerosol formation: acid-catalyzed reactive
uptake studies with authentic compounds. Environ. Sci. Technol. 2012, 46, (1), 250-258.
111. Lin, Y. H.; Budisulistiorini, S. H.; Chu, K.; Siejack, R. A.; Zhang, H.; Riva, M.; Zhang, Z.;
Gold, A.; Kautzman, K. E.; Surratt, J. D., Light-absorbing oligomer formation in secondary
organic aerosol from reactive uptake of isoprene epoxydiols. Environ. Sci. Technol. 2014, 48, (20),
12012−12021.
112. Hosny, N. A.; Fitzgerald, C.; Tong, C.; Kalberer, M.; Kuimova, M. K.; Pope, F. D.,
Fluorescent lifetime imaging of atmospheric aerosols: a direct probe of aerosol viscosity. Faraday
Discuss. 2013, 165, 343.
113. Shiraiwa, M.; Li, Y.; Tsimpidi, A. P.; Karydis, V. A.; Berkemeier, T.; Pandis, S. N.;
Lelieveld, J.; Koop, T.; Poschl, U., Global distribution of particle phase state in atmospheric
secondary organic aerosols. Nature Comm. 2017, 8, 15002.
114. Booth, A. M.; Murphy, B.; Riipinen, I.; Percival, C. J.; Topping, D. O., Connecting bulk
viscosity measurements to kinetic limitations on attaining equilibrium for a model aerosol
composition. Environ. Sci. Technol. 2014, 48, (16), 9298−9305.
115. Berkemeier, T.; Shiraiwa, M.; Pöschl, U.; Koop, T., Competition between water uptake
and ice nucleation by glassy organic aerosol particles. Atmospheric Chemistry and Physics 2014,
14, (22), 12513-12531.
116. Shrestha, M.; Zhang, Y.; Upshur, M. A.; Liu, P.; Blair, S. L.; Wang, H. F.; Nizkorodov, S.
A.; Thomson, R. J.; Martin, S. T.; Geiger, F. M., On surface order and disorder of alpha-pinene-
derived secondary organic material. J. Phys. Chem. A 2014, 119, (19), 4609−4617.
117. Veghte, D. P.; Altaf, M. B.; Freedman, M. A., Size dependence of the structure of organic
aerosol. J. Am. Chem. Soc. 2013, 135, (43), 16046−16049.

132
118. Gorkowski, K.; Donahue, N. M.; Sullivan, R. C., Emulsified and liquid-liquid phase
separated states of alpha-pinene secondary organic aerosol determined using aerosol optical
tweezers. Environ. Sci. Technol. 2017, 51, 12154-12163.
119. Guo, H.; Xu, L.; Bougiatioti, A.; Cerully, K. M.; Capps, S. L.; Hite, J. R.; Carlton, A. G.;
Lee, S. H.; Bergin, M. H.; Ng, N. L.; Nenes, A.; Weber, R. J., Fine-particle water and pH in the
southeastern United States. Atmospheric Chemistry and Physics 2015, 15, (9), 5211-5228.
120. Pajunoja, A.; Lambe, A. T.; Hakala, J.; Rastak, N.; Cummings, M. J.; Brogan, J. F.; Hao,
L.; Paramonov, M.; Hong, J.; Prisle, N. L.; Malila, J.; Romakkaniemi, S.; Lehtinen, K. E. J.;
Laaksonen, A.; Kulmala, M.; Massoli, P.; Onasch, T. B.; Donahue, N. M.; Riipinen, I.; Davidovits,
P.; Worsnop, D. R.; Petäjä, T.; Virtanen, A., Adsorptive uptake of water by semisolid secondary
organic aerosols. Geophys. Res. Lett. 2015, 42, (8), 3063-3068.
121. Bertram, A. K.; Martin, S. T.; Hanna, S. J.; Smith, M. L.; Bodsworth, A.; Chen, Q.;
Kuwata, M.; Liu, A.; You, Y.; Zorn, S. R., Predicting the relative humidities of liquid-liquid phase
separation, efflorescence, and deliquescence of mixed particles of ammonium sulfate, organic
material, and water using the organic-to-sulfate mass ratio of the particle and the oxygen-to-carbon
elemental ratio of the organic component. Atmospheric Chemistry and Physics 2011, 11, (21),
10995-11006.
122. Ciobanu, V. G.; Marcolli, C.; Krieger, U. K.; Weers, U.; Peter, T., Liquid-liquid phase
separation in mixed organic/inorganic aerosol particles. The journal of physical chemistry. A 2009,
113, (41), 10966-10978.
123. Song, M.; Liu, P.; Martin, S. T.; Bertram, A. K., Liquid–liquid phase separation in particles
containing secondary organic material free of inorganic salts. Atmos. Chem. Phys. 2017, 17, (18),
11261-11271.
124. Lehtipalo, K.; Sipilä, M.; Junninen, H.; Ehn, M.; Berndt, T.; Kajos, M. K.; Worsnop, D.
R.; Petäjä, T.; Kulmala, M., Observations of nano-CN in the nocturnal boreal forest. Aerosol. Sci.
Technol. 2011, 45, (4), 499-509.
125. Prisle, N. L.; Engelhart, G. J.; Bilde, M.; Donahue, N. M., Humidity influence on gas-
particle phase partitioning of α-pinene + O3 secondary organic aerosol. Geophys. Res. Lett. 2010,
37, (1), L01802.
126. Vaden, T. D.; Song, C.; Zaveri, R. A.; Imre, D.; Zelenyuk, A., Morphology of mixed
primary and secondary organic particles and the adsorption of spectator organic gases during
aerosol formation. Proc. Natl. Acad. Sci. U. S. A. 2010, 107, (15), 6658–6663.
127. Smith, M. L.; Bertram, A. K.; Martin, S. T., Deliquescence, efflorescence, and phase
miscibility of mixed particles of ammonium sulfate and isoprene-derived secondary organic
material. Atmos. Chem. Phys. 2012, 12, (20), 9613-9628.
128. Smith, M. L.; Kuwata, M.; Martin, S. T., Secondary organic material produced by the dark
ozonolysis of α-pinene minimally affects the deliquescence and efflorescence of ammonium
sulfate. Aerosol Sci. Technol. 2011, 45, (2), 244-261.
129. Song, M.; Liu, P. F.; Hanna, S. J.; Zaveri, R. A.; Potter, K.; You, Y.; Martin, S. T.; Bertram,
A. K., Relative humidity-dependent viscosity of secondary organic material from toluene photo-
oxidation and possible implications for organic particulate matter over megacities. Atmospheric
Chemistry and Physics 2016, 16, (14), 8817-8830.
130. Craig, R. L.; Peterson, P. K.; Nandy, L.; Lei, Z.; Hossain, M. A.; Camarena, S.; Dodson,
R. A.; Cook, R. D.; Dutcher, C. S.; Ault, A. P., Direct determination of aerosol pH: size-resolved

133
measurements of submicrometer and supermicrometer aqueous particles. Anal. Chem. 2018, 90,
(19), 11232-11239.
131. Imre, D. G., Xu ,J., Tang, I. N., McGraw, R., Ammonium bisulfate/water equilibrium and
metastability phase diagrams. J. Phys. Chem. A 1997, 101, 4191-4195.
132. Lambe, A. T.; Ahern, A. T.; Williams, L. R.; Slowik, J. G.; Wong, J. P. S.; Abbatt, J. P.
D.; Brune, W. H.; Ng, N. L.; Wright, J. P.; Croasdale, D. R.; Worsnop, D. R.; Davidovits, P.;
Onasch, T. B., Characterization of aerosol photooxidation flow reactors: heterogeneous oxidation,
secondary organic aerosol formation and cloud condensation nuclei activity measurements. Atmos.
Meas. Tech. 2011, 4, (3), 445-461.
133. Bruns, E. A.; El Haddad, I.; Keller, A.; Klein, F.; Kumar, N. K.; Pieber, S. M.; Corbin, J.
C.; Slowik, J. G.; Brune, W. H.; Baltensperger, U.; Prévôt, A. S. H., Inter-comparison of laboratory
smog chamber and flow reactor systems on organic aerosol yield and composition. Atmos. Meas.
Tech. 2015, 8, (6), 2315-2332.
134. Lambe, A. T.; Chhabra, P. S.; Onasch, T. B.; Brune, W. H.; Hunter, J. F.; Kroll, J. H.;
Cummings, M. J.; Brogan, J. F.; Parmar, Y.; Worsnop, D. R.; Kolb, C. E.; Davidovits, P., Effect
of oxidant concentration, exposure time, and seed particles on secondary organic aerosol chemical
composition and yield. Atmos. Chem. Phys. 2015, 15, (6), 3063-3075.
135. Pieber, S. M.; Kumar, N. K.; Klein, F.; Comte, P.; Bhattu, D.; Dommen, J.; Bruns, E. A.;
Kılıç, D.; El Haddad, I.; Keller, A.; Czerwinski, J.; Heeb, N.; Baltensperger, U.; Slowik, J. G.;
Prévôt, A. S. H., Gas-phase composition and secondary organic aerosol formation from standard
and particle filter-retrofitted gasoline direct injection vehicles investigated in a batch and flow
reactor. Atmos. Chem. Phys. 2018, 18, (13), 9929-9954.
136. Shrestha, M.; Zhang, Y.; Ebben, C. J.; Martin, S. T.; Geiger, F. M., Vibrational sum
frequency generation spectroscopy of secondary organic material produced by condensational
growth from alpha-pinene ozonolysis. J. Phys. Chem. A 2013, 117, (35), 8427-8436.
137. Zanca, N.; Lambe, A. T.; Massoli, P.; Paglione, M.; Croasdale, D. R.; Parmar, Y.;
Tagliavini, E.; Gilardoni, S.; Decesari, S., Characterizing source fingerprints and ageing processes
in laboratory-generated secondary organic aerosols using proton-nuclear magnetic resonance (1H-
NMR) analysis and HPLC HULIS determination. Atmos. Chem. Phys. 2017, 17, (17), 10405-
10421.
138. Lambe, A.; Massoli, P.; Zhang, X.; Canagaratna, M.; Nowak, J.; Daube, C.; Yan, C.; Nie,
W.; Onasch, T.; Jayne, J.; Kolb, C.; Davidovits, P.; Worsnop, D.; Brune, W., Controlled nitric
oxide production via O(1D) + N2O reactions for use in oxidation flow reactor studies. Atmos.
Meas. Tech. 2017, 10, (6), 2283-2298.
139. Palm, B. B.; Campuzano-Jost, P.; Ortega, A. M.; Day, D. A.; Kaser, L.; Jud, W.; Karl, T.;
Hansel, A.; Hunter, J. F.; Cross, E. S.; Kroll, J. H.; Peng, Z.; Brune, W. H.; Jimenez, J. L., In situ
secondary organic aerosol formation from ambient pine forest air using an oxidation flow reactor.
Atmos. Chem. Phys. 2016, 16, (5), 2943-2970.
140. Tkacik, D. S.; Lambe, A. T.; Jathar, S.; Li, X.; Presto, A. A.; Zhao, Y.; Blake, D.; Meinardi,
S.; Jayne, J. T.; Croteau, P. L.; Robinson, A. L., Secondary organic aerosol formation from in-use
motor vehicle emissions using a potential aerosol mass reactor. Environ Sci Technol 2014, 48,
(19), 11235-11242.
141. Bahreini, R., Middlebrook, A. M., Brock, C. A., de Gouw, J. A., McKeen, S.
A.,Williams, L. R., Daumit, K. E., Lambe, A. T., Massoli, P., Canagaratna, M. R., Ahmadov,

134
R.,Carrasquillo, A. J., Cross, E. S., Ervens, B., Holloway, J. S.,Hunter, J. F., Onasch, T. B.,
Pollack, I. B., Roberts, J. M., Ryerson, T. B., Warneke, C., Davidovits, P., Worsnop, D. R.,
Kroll, J. H., Mass spectral analysis of organic aerosol formed downwind of the Deepwater Horizon
oil spill: field studies and laboratory confirmation. Environ. Sci. Technol. 2012, 46, 8025−8034.
142. Ortega, A. M.; Hayes, P. L.; Peng, Z.; Palm, B. B.; Hu, W.; Day, D. A.; Li, R.; Cubison,
M. J.; Brune, W. H.; Graus, M.; Warneke, C.; Gilman, J. B.; Kuster, W. C.; de Gouw, J.; Gutiérrez-
Montes, C.; Jimenez, J. L., Real-time measurements of secondary organic aerosol formation and
aging from ambient air in an oxidation flow reactor in the Los Angeles area. Atmos. Chem. Phys.
2016, 16, (11), 7411-7433.
143. Zhang, Z.; Lin, Y. H.; Zhang, H.; Surratt, J. D.; Ball, L. M.; Gold, A., Technical Note:
Synthesis of isoprene atmospheric oxidation products: isomeric epoxydiols and the rearrangement
products <i>cis</i>- and <i>trans</i>-3-methyl-3,4-
dihydroxytetrahydrofuran. Atmospheric Chemistry and Physics 2012, 12, (18), 8529-8535.
144. Midgley, P. A.; Weyland, M.; Thomas, J. M.; Johnson, B. F. G., Z-Contrast tomography:
a technique in three-dimensional nanostructural analysis based on Rutherford scattering. Chem.
Comm. 2001, (10), 907-908.
145. DeCarlo, P. F.; Slowik, J. G.; Worsnop, D. R.; Davidovits, P.; Jimenez, J. L., Particle
morphology and density characterization by combined mobility and aerodynamic diameter
measurements. part 1: theory. Aerosol. Sci. Technol. 2004, 38, (12), 1185-1205.
146. DeRieux, W.-S. W.; Li, Y.; Lin, P.; Laskin, J.; Laskin, A.; Bertram, A. K.; Nizkorodov, S.
A.; Shiraiwa, M., Predicting the glass transition temperature and viscosity of secondary organic
material using molecular composition. Atmospheric Chemistry and Physics 2018, 18, (9), 6331-
6351.
147. Koop, T.; Bookhold, J.; Shiraiwa, M.; Poschl, U., Glass transition and phase state of
organic compounds: dependency on molecular properties and implications for secondary organic
aerosols in the atmosphere. Phys. Chem. Chem. Phys. 2011, 13, (43), 19238–19255.
148. Shiraiwa, M., Ammann, M., Koop, T., Pöschl, U., Gas uptake and chemical aging of
semisolid organic aerosol particles. Proc. Natl. Acad. Sci. U. S. A. 2011, 103, (27), 11003–11008.
149. Lee, H. D.; Kaluarachchi, C. P.; Hasenecz, E. S.; Zhu, J. Z.; Popa, E.; Stone, E. A.;
Tivanski, A. V., Effect of dry or wet substrate deposition on the organic volume fraction of core–
shell aerosol particles. Atmos. Meas. Tech. 2019, 12, (3), 2033-2042.
150. Liu, P.; Li, Y. J.; Wang, Y.; Bateman, A. P.; Zhang, Y.; Gong, Z.; Bertram, A. K.; Martin,
S. T., Highly viscous states affect the browning of atmospheric organic particulate matter. ACS
Cent. Sci. 2018, 4, (2), 207-215.
151. Fard, M. M.; Krieger, U. K.; Peter, T., Kinetic limitation to inorganic ion diffusivity and
to coalescence of inorganic inclusions in viscous liquid-liquid phase-separated particles. J. Phys.
Chem. A 2017, 121, 9284-9296.
152. Venkateswarlu, P., Bist, H. D., Jain, Y. S., Laser excited Raman spectrum of ammonium
sulfate single crystal. J. Raman Spectrosc. 1975, 3, 143-151.
153. Jentzsch, P. V.; Kampe, B.; Ciobota, V.; Rosch, P.; Popp, J., Inorganic salts in atmospheric
particulate matter: Raman spectroscopy as an analytical tool. Spectrochim. Acta A Molec.
Biomolec. Spectrosc. 2013, 115, 697-708.
154. Sobanska, S.; Hwang, H.; Choel, M.; Jung, H. J.; Eom, H. J.; Kim, H.; Barbillat, J.; Ro, C.
U., Investigation of the chemical mixing state of individual Asian dust particles by the combined
135
use of electron probe X-ray microanalysis and Raman microspectrometry. Anal. Chem. 2012, 84,
(7), 3145−3154.
155. Zhou, Q.; Pang, S. F.; Wang, Y.; Ma, J. B.; Zhang, Y. H., Confocal Raman studies of the
evolution of the physical state of mixed phthalic acid/ammonium sulfate aerosol droplets and the
effect of substrates. J. Phys. Chem. B 2014, 118, (23), 6198−6205.
156. Hatch, L. E.; Creamean, J. M.; Ault, A. P.; Surratt, J. D.; Chan, M. N.; Seinfeld, J. H.;
Edgerton, E. S.; Su, Y.; Prather, K. A., Measurements of isoprene-derived organosulfates in
ambient aerosols by aerosol time-of-flight mass spectrometry - part 1: single particle atmospheric
observations in Atlanta. Environ. Sci. Technol. 2011, 45, (12), 5105–5111.
157. Hatch, L. E.; Creamean, J. M.; Ault, A. P.; Surratt, J. D.; Chan, M. N.; Seinfeld, J. H.;
Edgerton, E. S.; Su, Y.; Prather, K. A., Measurements of isoprene-derived organosulfates in
ambient aerosols by aerosol time-of-flight mass spectrometry-part 2: temporal variability and
formation mechanisms. Environ. Sci. Technol. 2011, 45, (20), 8648-8655.
158. Weber, R. J., Guo, H., Russell, A. G., Nenes, A., High aerosol acidity despite declining
sulfate concentrations over the past 15 years. Nat. Geosci. Lett. 2016, 9, 282-286.
159. Riva, M.; Chen, Y.; Zhang, Y.; Lei, Z.; Olson, N.; Boyer, H. C.; Narayan, S.; Yee, L. D.;
Green, H.; Cui, T.; Zhang, Z.; Baumann, K. D.; Fort, M.; Edgerton, E. S.; Budisulistiorini, S.;
Rose, C. A.; Ribeiro, I.; e Oliveira, R. L.; Santos, E.; Szopa, S.; Machado, C.; Zhao, Y.; Alves, E.;
de Sa, S.; Hu, W.; Knipping, E.; Shaw, S.; Duvoisin Junior, S.; Souza, R. A. F. d.; Palm, B. B.;
Jimenez, J. L.; Glasius, M.; Goldstein, A. H.; Pye, H. O. T.; Gold, A.; Turpin, B. J.; Vizuete, W.;
Martin, S. T.; Thornton, J.; Dutcher, C. S.; Ault, A. P.; Surratt, J. D., Increasing isoprene
epoxydiol-to-inorganic sulfate aerosol (IEPOX:Sulfinorg) ratio results in extensive conversion of
inorganic sulfate to organosulfur forms: implications for aerosol physicochemical properties.
Environ. Sci. Technol. 2019, Just accepted.
160. Pye, H. O.; Pinder, R. W.; Piletic, I. R.; Xie, Y.; Capps, S. L.; Lin, Y. H.; Surratt, J. D.;
Zhang, Z.; Gold, A.; Luecken, D. J.; Hutzell, W. T.; Jaoui, M.; Offenberg, J. H.; Kleindienst, T.
E.; Lewandowski, M.; Edney, E. O., Epoxide pathways improve model predictions of isoprene
markers and reveal key role of acidity in aerosol formation. Environ. Sci. Technol. 2013, 47, (19),
11056−11064.
161. Schmedding, R.; Ma, M.; Zhang, Y.; Farrell, S.; Pye, H. O. T.; Chen, Y.; Wang, C.-t.;
Rasool, Q. Z.; Budisulistiorini, S. H.; Ault, A. P.; Surratt, J. D.; Vizuete, W., α-Pinene-derived
organic coatings on acidic sulfate aerosol impacts secondary organic aerosol formation from
isoprene in a box model. Atmos. Environ. 2019, Just accepted.
162. Silvern, R. F.; Jacob, D. J.; Kim, P. S.; Marais, E. A.; Turner, J. R.; Campuzano-Jost, P.;
Jimenez, J. L., Inconsistency of ammonium–sulfate aerosol ratios with thermodynamic models in
the eastern US: a possible role of organic aerosol. Atmos. Chem. Phys. 2017, 17, (8), 5107-5118.
163. Lewis, E. R., Schwartz, S. E., Sea salt aerosol production: Mechanisms, methods,
measurements, and models - A critical review. American Geophysical Union: Washington D. C.,
2004; Vol. 152.
164. May, N. W.; Axson, J. L.; Watson, A.; Pratt, K. A.; Ault, A. P., Lake spray aerosol
generation: a method for producing representative particles from freshwater wave breaking. Atmos.
Meas. Tech. 2016, 9, 4311–4325.
136
165. Doubrawa, P.; Barthelmie, R. J.; Pryor, S. C.; Hasager, C. B.; Badger, M.; Karagali, I.,
Satellite winds as a tool for offshore wind resource assessment: the Great Lakes wind atlas. Remote
Sens. Environ. 2015, 168, 349-359.
166. Monahan, E. C., Fresh water whitecaps. J. Atmos. Sci. 1969, 26, 1026-1029.
167. Chung, S. H.; Basarab, B. M.; Vanreken, T. M., Regional impacts of ultrafine particle
emissions from the surface of the Great Lakes. Atmospheric Chemistry and Physics 2011, 11,
12601–12615.
168. May, N. W.; Olson, N. E.; Panas, M.; Axson, J. L.; Tirella, P. S.; Kirpes, R. M.; Craig, R.
L.; Gunsch, M. J.; China, S.; Laskin, A.; Ault, A. P.; Pratt, K. A., Aerosol emissions from Great
Lakes harmful algal blooms. Environ. Sci. Technol. 2017, 52, 397–405.
169. Hjelmfelt, M. R., Numerical study of the influence of environmental conditions on lake-
effect snowstorms over Lake Michigan Mon. Weather Rev. 1989, 118, 138-150.
170. Wang, J.; Bai, X.; Hu, H.; Clites, A.; Colton, M.; Lofgren, B., Temporal and spatial
variability of Great Lakes ice cover, 1973–2010*. J. Clim. 2012, 25, (4), 1318-1329.
171. Desai, A. R., Austin, J. A., Bennington, V., McKinley, G. A. , Stronger winds over a large
lake in response to weakening air-to-lake temperature gradient. Nat. Geosci. Lett. 2009, 2, 855-
858.
172. Novakov, T., Penner, J. E. , Large contribution of organic aerosols to cloud-condensation-
nuclei concentrations. Nat. Lett. 1993, 365, 823-826.
173. Pierce, J. R., Adams, P. J., Efficiency of cloud condensation nuclei formation from ultrafine
particles. Atmos. Chem. Phys 2007, 7, 1367-1379.
174. Farmer, D. K.; Cappa, C. D.; Kreidenweis, S. M., Atmospheric processes and their
controlling influence on cloud condensation nuclei activity. Chem. Rev. 2015, 115, (10), 4199-
4217.
175. Szyrmer, W., Zawadzki, I., Biogenic and anthropogenic sources of ice-forming nuclei: A
review. Bull. Amer. Meteor. Soc. 1997, 78, (2), 209-228.
176. McFiggans, G., Artaxo, P., Baltensperger, U., Coe, H., Facchini, M. C., Feingold, G.,
Fuzzi, S., Gysel, M., Laaksonen, A., Lohmann, U., Mentel, T. F., Murphy, D. M., O;Dowd, C. D.,
Snider, J. R., Weingartner, E., The effect of physical and chemical aerosol properties on warm
cloud droplet activation. Atmos. Chem. Phys 2006, 6, 2593-2649.
177. Levin, Z., Ganor, E., Gladstein, V., The effects of desert particles coated with sulfate on
rain formation in the Eastern Mediterranean. J. Appl. Meteorol. 1996, 35, 1511-1523.
178. Pierce, J. R.; Evans, M. J.; Scott, C. E.; Andrea, S. D.; Farmer, D. K.; Swietlicki, E.;
Spracklen, D. V., Weak global sensitivity of cloud condensation nuclei and the aerosol indirect
effect to Criegee + SO2 chemistry. Atmos. Chem. Phys 2013, 13, (6), 3163-3176.
179. Bates, T. S.; Huebert, B. J.; Gras, J. L.; Griffiths, F. B.; Durkee, P. A., International global
atmospheric chemistry (IGAC) project's first aerosol characterization experiment (ACE 1):
overview. J. Geophys. Res.: Atmos. 1998, 103, 16297-16318.
180. Bigg, E. K., Ice nucleus concentrations in remote areas. J. Atmos. Sci. 1973, 30, 1153-1157.
181. Bigg, E. K., Ice forming nuclei in the high Arctic. Tellus 2017, 48B, (2), 223-233.
182. Rogers, J. S., Stall, R. E., Burke, M. J., Low-temperature conditioning of the ice nucleation
active bacterium, Erwinia herbicola. Cryobiology 1987, 24, 270-279.
183. Fletcher, N. H., Nucleation by crystalline particles. J. Chem. Phys. 1963, 38, 237-240.

137
184. Quinn, P. K., Bates, T. S., Coffman, D. J., Covert, D. S., Influence of particle size and
chemistry on the cloud nucleating properties of aerosols Atmos. Chem. Phys 2008, 8, 1029-1042.
185. Huang, W. T. K.; Ickes, L.; Tegen, I.; Rinaldi, M.; Ceburnis, D.; Lohmann, U., Global
relevance of marine organic aerosol as ice nucleating particles. Atmospheric Chemistry and
Physics 2018, 18, (15), 11423-11445.
186. Brooks, S. D., Thornton, D. C. O., Marine aerosols and clouds. Annu. Rev. Mar. Sci. 2018,
10, 289–313.
187. Gaston, C.; Cahill, J.; Collins, D.; Suski, K.; Ge, J.; Barkley, A.; Prather, K., The cloud
nucleating properties and mixing state of marine aerosols sampled along the Southern California
coast. Atmosphere 2018, 9, (2), 52.
188. Vergara-Temprado, J.; Murray, B. J.; Wilson, T. W.; Sullivan, D.; Browse, J.; Pringle, K.
J.; Ardon-Dryer, K.; Bertram, A. K.; Burrows, S. M.; Ceburnis, D.; DeMott, P. J.; Mason, R. H.;
Dowd, C. D.; Rinaldi, M.; Carslaw, K. S., Contribution of feldspar and marine organic aerosols to
global ice nucleating particle concentrations. Atmospheric Chemistry and Physics 2017, 17, (5),
3637-3658.
189. Wilson, T. W.; Ladino, L. A.; Alpert, P. A.; Breckels, M. N.; Brooks, I. M.; Browse, J.;
Burrows, S. M.; Carslaw, K. S.; Huffman, J. A.; Judd, C.; Kilthau, W. P.; Mason, R. H.;
McFiggans, G.; Miller, L. A.; Najera, J. J.; Polishchuk, E.; Rae, S.; Schiller, C. L.; Si, M.;
Temprado, J. V.; Whale, T. F.; Wong, J. P.; Wurl, O.; Yakobi-Hancock, J. D.; Abbatt, J. P.; Aller,
J. Y.; Bertram, A. K.; Knopf, D. A.; Murray, B. J., A marine biogenic source of atmospheric ice-
nucleating particles. Nature 2015, 525, 234-238.
190. Ayers, G. P., Gras, J. L., Seasonal relationship between cloud condensation nuclei and
aerosol methanesulfonate in marine air. Nature 1991, 353, 834-835.
191. Orellana, M. V., Matrai, P. A., Leck, C., Rauschenberg, C. D., Lee, A. M., Coz, E., Marine
microgels as a source of cloud condensation nuclei in the high Arctic. Proc Natl Acad Sci USA.
2011, 108, (33), 13612-13617.
192. Coggon, M. M.; Sorooshian, A.; Wang, Z.; Metcalf, A. R.; Frossard, A. A.; Lin, J. J.;
Craven, J. S.; Nenes, A.; Jonsson, H. H.; Russell, L. M.; Flagan, R. C.; Seinfeld, J. H., Ship impacts
on the marine atmosphere: insights into the contribution of shipping emissions to the properties of
marine aerosol and clouds. Atmos. Chem. Phys 2012, 12, (18), 8439-8458.
193. DeMott, P. J.; Hill, T. C.; McCluskey, C. S.; Prather, K. A.; Collins, D. B.; Sullivan, R. C.;
Ruppel, M. J.; Mason, R. H.; Irish, V. E.; Lee, T.; Hwang, C. Y.; Rhee, T. S.; Snider, J. R.;
McMeeking, G. R.; Dhaniyala, S.; Lewis, E. R.; Wentzell, J. J.; Abbatt, J.; Lee, C.; Sultana, C. M.;
Ault, A. P.; Axson, J. L.; Diaz Martinez, M.; Venero, I.; Santos-Figueroa, G.; Stokes, M. D.;
Deane, G. B.; Mayol-Bracero, O. L.; Grassian, V. H.; Bertram, T. H.; Bertram, A. K.; Moffett, B.
F.; Franc, G. D., Sea spray aerosol as a unique source of ice nucleating particles. Proc. Natl. Acad.
Sci. U. S. A. 2016, 113, (21), 5797-5803.
194. Collins, D. B.; Ault, A. P.; Moffet, R. C.; Ruppel, M. J.; Cuadra-Rodriguez, L. A.; Guasco,
T. L.; Corrigan, C. E.; Pedler, B. E.; Azam, F.; Aluwihare, L. I.; Bertram, T. H.; Roberts, G. C.;
Grassian, V. H.; Prather, K. A., Impact of marine biogeochemistry on the chemical mixing state
and cloud forming ability of nascent sea spray aerosol. J. Geophys. Res. Atmos. 2013, 118, (15),
8553-8565.

138
195. Pietsch, R. B.; Vinatzer, B. A.; Schmale, D. G., 3rd, Diversity and abundance of ice
nucleating strains of Pseudomonas syringae in a freshwater lake in Virginia, USA. Front.
Microbiol. 2017, 8, 318-329.
196. Knackstedt, K.; Moffett, B. F.; Hartmann, S.; Wex, H.; Hill, T. C. J.; Glasgo, E.; Reitz, L.;
Augustin-Bauditz, S.; Beall, B.; Bullerjahn, G. S.; Frohlich-Nowoisky, J.; Grawe, S.; Lubitz, J.;
Stratmann, F.; McKay, R. M., A terrestrial origin for abundant riverine nanoscale ice-nucleating
particles. Environ. Sci. Technol. 2018, 52, 12358-12367.
197. Moffett, B.; Hill, T.; DeMott, P., Abundance of biological ice nucleating particles in the
Mississippi and its major tributaries. Atmosphere 2018, 9, (8), 307.
198. Borduas-Dedekind, N.; Ossola, R.; David, R. O.; Boynton, L. S.; Weichlinger, V.; Kanji,
Z. A.; McNeill, K., Photomineralization mechanism changes the ability of dissolved organic matter
to activate cloud droplets and to nucleate ice crystals. Atmos. Chem. Phys 2019, 19, 12397-12412.
199. Moffett, B. F., Fresh water ice nuclei. Fund. Appl. Limnol. 2016, 188, (1), 19-23.
200. Twohy, C. H.; Anderson, J. R., Droplet nuclei in non-precipitating clouds: composition
and size matter. Environ. Res. Lett. 2008, 3, (4), 045002.
201. Hill, K. A.; Shepson, P. B.; Galbavy, E. S.; Anastasio, C.; Kourtev, P. S.; Konopka, A.;
Stirm, B. H., Processing of atmospheric nitrogen by clouds above a forest environment. J.
Geophys. Res. 2007, 112, D11301.
202. Chapra, S. C.; Dove, A.; Warren, G. J., Long-term trends of Great Lakes major ion
chemistry. J. Great Lakes Res. 2012, 38, 550–560.
203. Gibson, E. R.; Hudson, P. K.; Grassian, V. H., Aerosol chemistry and climate: Laboratory
studies of the carbonate component of mineral dust and its reaction products. Geophys. Res. Lett.
2006, 33, (13), L13811.
204. Sullivan, R. C., Moore, M. J. K., Petters, M. D., Kreidenweis, S. M., Roberts, G. C.,
Prather, K. A., Timescale for hygroscopic conversion of calcite mineral particles through
heterogeneous reaction with nitric acid. Phys. Chem. Chem. Phys. 2009, 11, 7826-7837
205. Gard, E. E., Kleeman, M. J., Gross, D. S., Hughes, L. S., Allen, J. O., Morrical, B. D.,
Fergenson, D. P., Dienes, T., Galli, M. E., Johnson, R. J., Cass, G. R., Prather, K. A., Direct
observation of heterogeneous chemistry in the atmosphere. Science 1998, 279, 1184-1187.
206. Bondy, A. L.; Wang, B.; Laskin, A.; Craig, R. L.; Nhliziyo, M. V.; Bertman, S. B.; Pratt,
K. A.; Shepson, P. B.; Ault, A. P., Inland sea spray aerosol transport and incomplete chloride
depletion: varying degrees of reactive processing observed during SOAS. Environ. Sci. Technol.
2017, 51, 9533-9542.
207. Ault, A. P.; Guasco, T. L.; Ryder, O. S.; Baltrusaitis, J.; Cuadra-Rodriguez, L. A.; Collins,
D. B.; Ruppel, M. J.; Bertram, T. H.; Prather, K. A.; Grassian, V. H., Inside versus outside: Ion
redistribution in nitric acid reacted sea spray aerosol particles as determined by single particle
analysis. J. Am. Chem. Soc. 2013, 135, 14528−14531.
208. Kourtev, P. S.; Hill, K. A.; Shepson, P. B.; Konopka, A., Atmospheric cloud water contains
a diverse bacterial community. Atmos. Env. 2011, 45, (30), 5399-5405.
209. Schmale, D. G., 3rd; Ault, A. P.; Saad, W.; Scott, D. T.; Westrick, J. A., Perspectives on
harmful algal blooms (HABs) and the cyberbiosecurity of freshwater systems. Front. Bioeng.
Biotechnol. 2019, 7, 128.
210. Prather, K. A.; Hatch, C. D.; Grassian, V. H., Analysis of atmospheric aerosols. Annu. Rev.
Anal. Chem. 2008, 1, 485-514.

139
211. Boone, E. J.; Laskin, A.; Laskin, J.; Wirth, C.; Shepson, P. B.; Stirm, B. H.; Pratt, K. A.,
Aqueous processing of atmospheric organic particles in cloud water collected via aircraft
sampling. Environ. Sci. Technol. 2015, 49, (14), 8523-8530.
212. Garman, K. E., Hill, K. A., Wyss, P., Carlsen, M., Zimmerman, J. R., Stirm, B. H., Carney,
T. Q., Santini, R., Shepson, P. B. , An airborne and wind tunnel evaluation of a wind turbulence
measurement system for aircraft-based flux measurements. J. Atmos. Ocean. Tech. 2006, 23, 1696-
1708.
213. Dai, C.; Wang, Q.; Kalogiros, J. A.; Lenschow, D. H.; Gao, Z.; Zhou, M., Determining
boundary-layer height from aircraft measurements. Boundary Layer Meteorol. 2014, 152, (3), 277-
302.
214. Salmon, O. E.; Welp, L. R.; Baldwin, M.; Hajny, K.; Stirm, B. H.; Shepson, P. B., Vertical
profile observations of water vapor deuterium excess in the lower troposphere. Atmos. Chem. Phys
2019, 19, 11525–11543.
215. Crosson, E. R., A cavity ring-down analyzer for measuring atmospheric levels of methane,
carbon dioxide, and water vapor. Appl. Phys. B 2008, 92, (3), 403-408.
216. Karion, A.; Sweeney, C.; Wolter, S.; Newberger, T.; Chen, H.; Andrews, A.; Kofler, J.;
Neff, D.; Tans, P., Long-term greenhouse gas measurements from aircraft. Atmos. Meas. Tech.
2013, 6, (3), 511-526.
217. Chen, H., Winderlich, J., Gerbig, C., Hoefer, A., Rella, C. W., Crosson, E. R., Van Pelt, A.
D., Steinbach, J., Kolle, O., Beck, V., Daube, B. C., Gottlieb, E. W., Chow, V. Y., Santoni, G. W.,
Wofsy, S. C., High-accuracy continuous airborne measurements of greenhouse gases (CO2 and
CH4) using the cavity ring-down spectroscopy (CRDS) technique. Atmos. Meas. Tech. 2010, 3,
375–386.
218. Peterson, P. K.; Pöhler, D.; Sihler, H.; Zielcke, J.; General, S.; Frieß, U.; Platt, U.; Simpson,
W. R.; Nghiem, S. V.; Shepson, P. B.; Stirm, B. H.; Dhaniyala, S.; Wagner, T.; Caulton, D. R.;
Fuentes, J. D.; Pratt, K. A., Observations of bromine monoxide transport in the Arctic sustained
on aerosol particles. Atmospheric Chemistry and Physics 2017, 17, (12), 7567-7579.
219. Laskina, O.; Morris, H. S.; Grandquist, J. R.; Estillore, A. D.; Stone, E. A.; Grassian, V.
H.; Tivanski, A. V., Substrate-deposited sea spray aerosol particles: influence of analytical
method, substrate, and storage conditions on particle size, phase, and morphology. Environ. Sci.
Technol. 2015, 49, (22), 13447−13453.
220. Huebert, B. J., Vanbramer, S., Tschudy, K. L., Liquid cloudwater collection using modified
Mohnen slotted rods. J. Atmos. Chem. 1988, 6, 251-263.
221. Donner, L. J., Boundary layer control on convective available potential energy:
Implications for cumulus parameterization. J. Geophys. Res. 2003, 108, 4701.
222. Blanchard, D. O., Assessing the vertical distribution of convective available potential
energy. Weather Forecast. 1998, 13, 870-877.
223. Ott, D. K.; Cyrs, W.; Peters, T. M., Passive measurement of coarse particulate matter. J.
Aerosol Sci. 2008, 39, (2), 156-167.
224. Ault, A. P.; Williams, C. R.; White, A. B.; Neiman, P. J.; Creamean, J. M.; Gaston, C. J.;
Ralph, F. M.; Prather, K. A., Detection of Asian dust in California orographic precipitation. J.
Geophys. Res. 2011, 116, D16205.
225. Ault, A. P.; Peters, T. M.; Sawvel, E. J.; Casuccio, G. S.; Willis, R. D.; Norris, G. A.;
Grassian, V. H., Single-particle SEM-EDX analysis of iron-containing coarse particulate matter in

140
an urban environment: sources and distribution of iron within Cleveland, Ohio. Environ. Sci.
Technol. 2012, 46, (8), 4331−4339.
226. Gross, D. S.; Atlas, R.; Rzeszotarski, J.; Turetsky, E.; Christensen, J.; Benzaid, S.; Olson,
J.; Smith, T.; Steinberg, L.; Sulman, J., Environmental chemistry through intelligent atmospheric
data analysis. Environ. Modell. Softw. 2010, 25, (6), 760-769.
227. Rebotier, T. P.; Prather, K. A., Aerosol time-of-flight mass spectrometry data analysis: a
benchmark of clustering algorithms. Anal Chim Acta 2007, 585, 38-54.
228. Kirpes, R. M.; Bondy, A. L.; Bonanno, D.; Moffet, R. C.; Wang, B.; Laskin, A.; Ault, A.
P.; Pratt, K. A., Secondary sulfate is internally mixed with sea spray aerosol and organic aerosol
in the winter Arctic. Atmos. Chem. Phys 2018, 18, (6), 3937-3949.
229. Hopkins, R. J.; Lewis, K.; Desyaterik, Y.; Wang, Z.; Tivanski, A. V.; Arnott, W. P.; Laskin,
A.; Gilles, M. K., Correlations between optical, chemical and physical properties of biomass burn
aerosols. Geophys. Res. Lett. 2007, 34, (18), L18806.
230. Gunsch, M. J.; Schmidt, S. A.; Gardner, D. J.; Bondy, A. L.; May, N. W.; Bertman, S. B.;
Pratt, K. A.; Ault, A. P., Particle growth in an isoprene-rich forest: Influences of urban, wildfire,
and biogenic air masses. Atmos. Env. 2018, 178, 255-264.
231. VanReken, T. M.; Mwaniki, G. R.; Wallace, H. W.; Pressley, S. N.; Erickson, M. H.;
Jobson, B. T.; Lamb, B. K., Influence of air mass origin on aerosol properties at a remote Michigan
forest site. Atmos. Environ. 2015, 107, 35-43.
232. Cahill, R. A., Geochemistry of recent Lake Michigan sediments. Illinois State Geological
Survey: Champaign, IL 1981.
233. Pilson, M. E. Q., An Introduction to the Chemistry of the Sea, 2nd ed. Cambridge
University Press: Cambridge, U.K. 2013.
234. Ault, A. P.; Moffet, R. C.; Baltrusaitis, J.; Collins, D. B.; Ruppel, M. J.; Cuadra-Rodriguez,
L. A.; Zhao, D.; Guasco, T. L.; Ebben, C. J.; Geiger, F. M.; Bertram, T. H.; Prather, K. A.;
Grassian, V. H., Size-dependent changes in sea spray aerosol composition and properties with
different seawater conditions. Envion. Sci. Tech. 2013, 47, (11), 5603-5612.
235. Creamean, J. M.; Lee, C.; Hill, T. C.; Ault, A. P.; DeMott, P. J.; White, A. B.; Ralph, F.
M.; Prather, K. A., Chemical properties of insoluble precipitation residue particles. J. Aerosol Sci.
2014, 76, 13-27.
236. Wurzler, S.; Reisin, T. G.; Levin, Z., Modification of mineral dust particles by cloud
processing and subsequent effects on drop size distributions. J. Geophys. Res. Atmos. 2000, 105,
(D4), 4501-4512.
237. Gunsch, M. J.; May, N. W.; Wen, M.; Bottenus, C. L. H.; Gardner, D. J.; VanReken, T.
M.; Bertman, S. B.; Hopke, P. K.; Ault, A. P.; Pratt, K. A., Ubiquitous influence of wildfire
emissions and secondary organic aerosol on summertime atmospheric aerosol in the forested Great
Lakes region. Atmospheric Chemistry and Physics 2018, 18, (5), 3701-3715.
238. Axson, J. L.; Creamean, J. M.; Bondy, A. L.; Capracotta, S. S.; Warner, K. Y.; Ault, A. P.,
An in situ method for sizing insoluble sesidues in precipitation and other aqueous samples.
Aerosol. Sci. Technol. 2014, 49, 24-34.
239. Creamean, J. M., Axson, J. L., Bondy, A. L., Craig, R. L., May, N. W., Shen, H., Weber,
M. H., Pratt, K. A., Ault, A. P., Changes in precipitating snow chemistry with location and
elevation in the California Sierra Nevada. J. Geophys. Res. Atmos. 2016, 121, 7296-7309.

141
240. Creamean, J. M.; Ault, A. P.; White, A. B.; Neiman, P. J.; Ralph, F. M.; Minnis, P.; Prather,
K. A., Impact of interannual variations in sources of insoluble aerosol species on orographic
precipitation over California's central Sierra Nevada. Atmos. Chem. Phys. 2015, 15, (11), 6535-
6548.
241. Hindman II, E. E., Hobbs, P. V., Radke, L. F., Cloud condensation nucleus size
distributions and their effects on cloud droplet size distributions. J. Atmos. Sci. 1977, 34, 951-956.
242. Hatch, C. D.; Gierlus, K. M.; Schuttlefield, J. D.; Grassian, V. H., Water adsorption and
cloud condensation nuclei activity of calcite and calcite coated with model humic and fulvic acids.
Atmos. Environ. 2008, 42, (22), 5672-5684.
243. Gierlus, K. M.; Laskina, O.; Abernathy, T. L.; Grassian, V. H., Laboratory study of the
effect of oxalic acid on the cloud condensation nuclei activity of mineral dust aerosol. Atmos.
Environ. 2012, 46, 125-130.
244. Roberts, P., Hallett, J., A laboratory study of the ice nucleating properties of some mineral
particulates. Q. J. Royal Meteorol. Soc. 1968, 94, (399), 25-34.
245. Mason, B. J., Maybank, J., The fragmentation and electrification of freezing water drops.
Q. J. Royal Meteorol. Soc. 1960, 86, (368), 176-185.
246. Sheesley, R. J., Schauer, J. J., Bean, E., Kenski, D., Trends in secondary organic aerosol at
a remote site in Michigan's Upper Peninsula. Environ. Sci. Technol. 2004, 38, 6491-6500.
247. Creamean, J. M.; Ault, A. P.; White, A. B.; Neiman, P. J.; Ralph, F. M.; Minnis, P.; Prather,
K. A., Impact of interannual variations in sources of insoluble aerosol species on orographic
precipitation over California's central Sierra Nevada. Atmos. Chem. Phys 2015, 15, (11), 6535-
6548.
248. Carpenter, S. R., Caraco, N. F., Correll, D. L., Howarth, R. W., Sharpley, A. N., Smith, V.
H., Nonpoint pollution of surface waters with phosphorus and nitrogen. Ecol. Appl. 1998, 8, (3),
559-568.
249. Backer, L. C.; Manassaram-Baptiste, D.; LePrell, R.; Bolton, B., Cyanobacteria and algae
blooms: Review of health and environmental data from the Harmful Algal Bloom-Related Illness
Surveillance System (HABISS) 2007-2011. Toxins 2015, 7, (4), 1048-1064.
250. Smith, V. H., Eutrophication of freshwater and coastal marine ecosystems. Environ. Sci. &
Pollut. Res. 2003, 10, (2), 126-139.
251. Anderson, D. M., Gilbert, P. M., Burkholder, J. M., Harmful algal blooms and
eutrophication: nutrient sources, composition, and consequences. Estuaries 2002, 25, (4), 704-726.
252. Paerl, H. W., Huisman, J., Blooms like it hot. Science 2008, 320, (5872), 57-58.
253. Paul, V. J., Global warming and cyanobacterial harmful algal blooms. In Cyanobacterial
Harmful Algal Blooms: State of the Science and Research Needs, Hudnell, H. K., Ed. Springer
New York: New York, NY, 2008; pp 239-257.
254. Walls, J. T.; Wyatt, K. H.; Doll, J. C.; Rubenstein, E. M.; Rober, A. R., Hot and toxic:
Temperature regulates microcystin release from cyanobacteria. Sci. Total Environ. 2018, 610-611,
786-795.
255. O’Neil, J. M.; Davis, T. W.; Burford, M. A.; Gobler, C. J., The rise of harmful
cyanobacteria blooms: The potential roles of eutrophication and climate change. Harmful Algae
2012, 14, 313-334.

142
256. Lurling, M.; Eshetu, F.; Faassen, E. J.; Kosten, S.; Huszar, V. L. M., Comparison of
cyanobacterial and green algal growth rates at different temperatures. Freshw. Biol. 2013, 58, (3),
552-559.
257. Liu, X.; Lu, X.; Chen, Y., The effects of temperature and nutrient ratios on Microcystis
blooms in Lake Taihu, China: An 11-year investigation. Harmful Algae 2011, 10, (3), 337-343.
258. Kosten, S.; Huszar, V. L. M.; Bécares, E.; Costa, L. S.; Donk, E.; Hansson, L. A.; Jeppesen,
E.; Kruk, C.; Lacerot, G.; Mazzeo, N.; Meester, L.; Moss, B.; Lürling, M.; Nõges, T.; Romo, S.;
Scheffer, M., Warmer climates boost cyanobacterial dominance in shallow lakes. Global Change
Biol. 2012, 18, (1), 118-126.
259. Duan, H.; Ma, R.; Xu, X.; Kong, F.; Zhang, S.; Kong, W.; Hao, J.; Shang, L., Two-decade
reconstruction of algal blooms in China's Lake Taihu. Environ Sci Technol 2009, 43, (10), 3522-
3528.
260. Del Giudice, D.; Zhou, Y.; Sinha, E.; Michalak, A. M., Long-term phosphorus loading and
springtime temperatures explain interannual variability of hypoxia in a large temperate lake.
Environ Sci Technol 2018, 52, (4), 2046-2054.
261. Johnk, K. D.; Huisman, J. E. F.; Sharples, J.; Sommeijer, B. E. N.; Visser, P. M.; Stroom,
J. M., Summer heatwaves promote blooms of harmful cyanobacteria. Global Change Biol. 2008,
14, (3), 495-512.
262. Carmichael, W. W.; Boyer, G. L., Health impacts from cyanobacteria harmful algae
blooms: Implications for the North American Great Lakes. Harmful Algae 2016, 54, 194-212.
263. Steffen, M. M.; Davis, T. W.; McKay, R. M. L.; Bullerjahn, G. S.; Krausfeldt, L. E.;
Stough, J. M. A.; Neitzey, M. L.; Gilbert, N. E.; Boyer, G. L.; Johengen, T. H.; Gossiaux, D. C.;
Burtner, A. M.; Palladino, D.; Rowe, M. D.; Dick, G. J.; Meyer, K. A.; Levy, S.; Boone, B. E.;
Stumpf, R. P.; Wynne, T. T.; Zimba, P. V.; Gutierrez, D.; Wilhelm, S. W., Ecophysiological
examination of the Lake Erie microcystis bloom in 2014: Linkages between biology and the water
supply shutdown of Toledo, OH. Environ Sci Technol 2017, 51, (12), 6745-6755.
264. Denef, V. J., Cyanobacterial harmful algal blooms are a biological disturbance to western
Lake Erie bacterial communities. Environ. Microbiol. 2016, 19, (3), 1149–1162.
265. Allen, J. I.; Smyth, T. J.; Siddorn, J. R.; Holt, M., How well can we forecast high biomass
algal bloom events in a eutrophic coastal sea? Harmful Algae 2008, 8, (1), 70-76.
266. Downing, J. A.; Watson, S. B.; McCauley, E., Predicting cyanobacteria dominance in
lakes. Can. J. Fish. Aquat. Sci. 2001, 58, (10), 1905-1908.
267. Wicks, R. J., Thiel, Pleter G. , Environmental factors affecting the production of peptide
toxins in floating scums of the cyanobacterium Microcystis aeruginosa in a hypertrophic African
reservoir. Environ. Sci. Technol. 1990, 24, 1413-1418.
268. Pitcher, G. C., Weeks, S. J., The variability and potential for prediction of harmful algal
blooms in the Southern Benguela ecosystem. Large Mar. Eco. 2006, 14, 125-145.
269. Graham, J. L., Loftin, K. A., Meyer, M. T., Ziegler, A. C., Cyanotoxin mictures and taste-
and-odor compounds in cyanobacterial blooms from the Midwestern United States. Environ. Sci.
Technol. 2010, 44, 7361-7368.
270. Chorus, I., Bartram, J., Toxic cyanobacteria in water: A guide to their public health
consequences, monitoring and management. E & FN Spon: CRC Press, 1999.
271. Rineheart, K. L., Namikoshi, M., Choi, B. W., Structure and biosynthesis of toxins from
blue-green algae (cyanobacteria). J. Appl. Phycol. 1994, 6, 159-176.

143
272. He, H.; Wu, S.; Wahome, P. G.; Bertin, M. J.; Pedone, A. C.; Beauchesne, K. R.; Moeller,
P. D. R.; Carter, G. T., Microcystins containing doubly homologated tyrosine residues from a
Microcystis aeruginosa bloom: Structures and cytotoxicity. J Nat Prod 2018, 81, (6), 1368-1375.
273. Yilmaz, M.; Foss, A. J.; Miles, C. O.; Ozen, M.; Demir, N.; Balci, M.; Beach, D. G.,
Comprehensive multi-technique approach reveals the high diversity of microcystins in field
collections and an associated isolate of Microcystis aeruginosa from a Turkish lake. Toxicon. 2019,
167, 87-100.
274. Puddick, J.; Prinsep, M. R.; Wood, S. A.; Kaufononga, S. A.; Cary, S. C.; Hamilton, D. P.,
High levels of structural diversity observed in microcystins from Microcystis CAWBG11 and
characterization of six new microcystin congeners. Mar Drugs 2014, 12, (11), 5372-5395.
275. Carmichael, W., A world overview — One-hundred-twenty-seven years of research on
toxic cyanobacteria — Where do we go from here? In Cyanobacterial Harmful Algal Blooms:
State of the Science and Research Needs, Hudnell, H. K., Ed. Springer New York: New York, NY,
2008; pp 105-125.
276. Du, X.; Liu, H.; Yuan, L.; Wang, Y.; Ma, Y.; Wang, R.; Chen, X.; Losiewicz, M. D.; Guo,
H.; Zhang, H., The diversity of cyanobacterial toxins on structural characterization, distribution
and identification: a systematic review. Toxins 2019, 11, (9), 530.
277. Ward, C. J., Codd, G. A., Comparative toxicity of four microcystins of different
hydrophobicities to the protozoan, Tetrahymena pyriformis. J. Appl. Microbiol. 1999, 86, 874-
882.
278. Fischer, A.; Hoeger, S. J.; Stemmer, K.; Feurstein, D. J.; Knobeloch, D.; Nussler, A.;
Dietrich, D. R., The role of organic anion transporting polypeptides (OATPs/SLCOs) in the
toxicity of different microcystin congeners in vitro: a comparison of primary human hepatocytes
and OATP-transfected HEK293 cells. Toxicol Appl Pharmacol 2010, 245, (1), 9-20.
279. Codd, G.; Bell, S.; Kaya, K.; Ward, C.; Beattie, K.; Metcalf, J., Cyanobacterial toxins,
exposure routes and human health. Eur. J. Phycol. 1999, 34, (4), 405-415.
280. Fitzgeorge, R. B., Clark, S. A., Keevil, C. W., Routes of intoxication. Detection Methods
for Cyanobacterial Toxins, 1994; p 69-74.
281. Benson, J. M.; Hutt, J. A.; Rein, K.; Boggs, S. E.; Barr, E. B.; Fleming, L. E., The toxicity
of microcystin LR in mice following 7 days of inhalation exposure. Toxicon. 2005, 45, (6), 691-
698.
282. Holden, J. P., Harmful algal blooms and hypoxia comprehensive research plan and action
strategy: An interagency report In National Science and Technology Council Subcommittee on
Ocean Science and Technology: 2016.
283. Quinn, P. K.; Collins, D. B.; Grassian, V. H.; Prather, K. A.; Bates, T. S., Chemistry and
related properties of freshly emitted sea spray aerosol. Chem. Rev. 2015, 115, (10), 4383-4399.
284. Prather, K. A.; Bertram, T. H.; Grassian, V. H.; Deane, G. B.; Dale Stokes, M.; DeMott, P.
J.; Aluwihare, L. I.; Palenik, B. P.; Azam, F.; Seinfeld, J. H.; Moffet, R. C.; Molina, M. J.; Cappa,
C. D.; Geiger, F. M.; Roberts, G. C.; Russell, L. M.; Ault, A. P.; Baltrusaitis, J.; Collins, D. B.;
Corrigan, C. E.; Cuadra-Rodriguez, L. A.; Ebben, C. J.; Forestieri, S. D.; Guasco, T. L.; Hersey,
S. P.; Kim, M. J.; Lambert, W. F.; Modini, R. L.; Mui, W.; Pedler, B. E.; Ruppel, M. J.; Ryder, O.
S.; Schoepp, N. G.; Sullivan, R. C.; Zhao, D.; Thiemens, M. H., Bringing the ocean into the
laboratory to probe the chemical complexity of sea spray aerosol. Proc. Natl. Acad. Sci. U. S. A.
2013, 110, 7550–7555.

144
285. Olson, N. E.; May, N. W.; Kirpes, R. M.; Watson, A. E.; Hajny, K. D.; Slade, J. H.;
Shepson, P. B.; Stirm, B. H.; Pratt, K. A.; Ault, A. P., Lake spray aerosol incorporated into Great
Lakes Clouds. ACS Earth Space Chem. 2019, 3, (12), 2765-2774.
286. Ebben, C. J.; Ault, A. P.; Ruppel, M. J.; Ryder, O. S.; Bertram, T. H.; Grassian, V. H.;
Prather, K. A.; Geiger, F. M., Size-resolved sea spray aerosol particles studied by vibrational sum
frequency generation. J. Phys. Chem. A 2013, 117, (30), 6589-6601.
287. Backer, L. C., Carmichael, W., Kirkpatrick, B., Williams, C., Irvin, M., Zhou, Y., Johnson,
T. B., Nierenberg, K., Hill, V. R., Kieszak, S. M., Cheng, Y. S. Recreational exposure to
microcystins during a Microcystis aeruginosa bloom in Bear Lake, Michigan; 2006.
288. Backer, L. C.; Carmichael, W.; Kirkpatrick, B.; Williams, C.; Irvin, M.; Zhou, Y.; Johnson,
T. B.; Nierenberg, K.; Hill, V. R.; Kieszak, S. M.; Cheng, Y. S., Recreational exposure to low
concentrations of microcystins during an algal bloom in a small lake. Mar. Drugs 2008, 6, (2),
389-406.
289. Backer, L. C.; McNeel, S. V.; Barber, T.; Kirkpatrick, B.; Williams, C.; Irvin, M.; Zhou,
Y.; Johnson, T. B.; Nierenberg, K.; Aubel, M.; LePrell, R.; Chapman, A.; Foss, A.; Corum, S.;
Hill, V. R.; Kieszak, S. M.; Cheng, Y. S., Recreational exposure to microcystins during algal
blooms in two California lakes. Toxicon. 2010, 55, (5), 909-921.
290. Wood, S. A.; Dietrich, D. R., Quantitative assessment of aerosolized cyanobacterial toxins
at two New Zealand lakes. J. Environ. Monit. 2011, 13, (6), 1617-1624.
291. Cheng, Y. S., Zhou, Y., Irvin, C. M., Barbara Kirkpatrick, B., Backer, L. C.,
Characterization of aerosols containing microcystin. Mar. Drugs 2007, 5, 136-150.
292. Rivasseau, C., Racaud, P., Deguin, A., Hennion, M. C., Evaluation of an ELISA kit for the
monitoring of microcystins (cyanobacterial toxins) in water and algae environmental samples.
Environ. Sci. Technol. 1999, 33, 1520-1527.
293. Metcalf, J. S., Beattie, K. A., Pfugmacher, S., Codd, G. A., Immuno-crossreactivity and
toxicity assesment of conjugation products of the cyanobacterial toxin, microcystin-LR. FEMS
Microbiol. Lett. 2000, 189, 155-158.
294. Bauer, S. E.; Ault, A.; Prather, K. A., Evaluation of aerosol mixing state classes in the
GISS modelE-MATRIX climate model using single-particle mass spectrometry measurements. J
Geophys Res Atmos 2013, 118, (17), 9834-9844.
295. Fitzgerald, E.; Ault, A. P.; Zauscher, M. D.; Mayol-Bracero, O. L.; Prather, K. A.,
Comparison of the mixing state of long-range transported Asian and African mineral dust. Atmos.
Env. 2015, 115, 19-25.
296. Cheng, Y. S.; McDonald, J. D.; Kracko, D.; Irvin, C. M.; Zhou, Y.; Pierce, R. H.; Henry,
M. S.; Bourdelaisa, A.; Naar, J.; Baden, D. G., Concentration and particle size of airborne toxic
algae (brevetoxin) derived from ocean red tide events. Environ. Sci. Technol. 2005, 39, (10), 3443-
3449.
297. Pierce, R. H., Red tide (Ptychodiscus brevis) toxin aerosols: a review. Toxicon. 1986, 24,
955-965.
298. Cheng, Y. S.; Villareal, T. A.; Zhou, Y.; Gao, J.; Pierce, R.; Naar, J.; Baden, D. G.,
Characterization of red tide aerosol on the Texas coast. Harmful Algae 2005, 4, 87-94.
299. Pierce, R. H.; Henry, M. S.; Blum, P. C.; Lyons, J.; Cheng, Y. S.; Yazzie, D.; Zhou, Y.,
Brevetoxin concentrations in marine aerosol: human exposure levels during a Karenia brevis
harmful algal bloom. Bull. Environ. Contam. Toxicol. 2003, 70, (1), 161-165.
145
300. Kirkpatrick, B.; Fleming, L. E.; Bean, J. A.; Nierenberg, K.; Backer, L. C.; Cheng, Y. S.;
Pierce, R.; Reich, A.; Naar, J.; Wanner, A.; Abraham, W. M.; Zhou, Y.; Hollenbeck, J.; Baden, D.
G., Aerosolized red tide toxins (brevetoxins) and asthma: Continued health effects after 1 hour
beach exposure. Harmful Algae 2011, 10, (2), 138-143.
301. Fleming, L. E.; Kirkpatrick, B.; Backer, L. C.; Bean, J. A.; Wanner, A.; Dalpra, D.; Tamer,
R.; Zaias, J.; Cheng, Y. S.; Pierce, R.; Naar, J.; Abraham, W.; Clark, R.; Zhou, Y.; Henry, M. S.;
Johnson, D.; Van De Bogart, G.; Bossart, G. D.; Harrington, M.; Baden, D. G., Initial evaluation
of the effects of aerosolized Florida red tide toxins (brevetoxins) in persons with asthma. Environ.
Health Perspect. 2005, 113, (5), 650-657.
302. Pilotto, L. S., Douglas, R. M., Burch M. D., Cameron S., Beers M., Rouch G. J., Robinson
P., Kirk M., Cowie C. T., Hardiman S., Moore C., Attewell R. G., Health effects of exposure to
cyanobacteria (blue-green algae) during recreational water-related activities. Aust. NZ J. Public
Health 1997, 21, (6), 562-566.
303. Backer, L. C.; Fleming, L. E.; Rowan, A.; Cheng, Y. S.; Benson, J.; Pierce, R. H.; Zaias,
J.; Bean, J. A.; Bossart, G. D.; Johnson, D.; Quimbo, R.; Baden, D. G., Recreational exposure to
aerosolized brevetoxins during Florida red tide events. Harmful Algae 2003, 2, (1), 19-28.
304. Abraham, W. M.; Bourdelais, A. J.; Ahmed, A.; Serebriakov, I.; Baden, D. G., Effects of
inhaled brevetoxins in allergic airways: toxin-allergen interactions and pharmacologic
intervention. Environ. Health Perspect. 2005, 113, (5), 632-637.
305. Abraham, W. M.; Bourdelais, A. J.; Sabater, J. R.; Ahmed, A.; Lee, T. A.; Serebriakov, I.;
Baden, D. G., Airway responses to aerosolized brevetoxins in an animal model of asthma. Am. J.
Respir. Crit. Care. Med. 2005, 171, (1), 26-34.
306. Gambaro, A.; Barbaro, E.; Zangrando, R.; Barbante, C., Simultaneous quantification of
microcystins and nodularin in aerosol samples using high-performance liquid
chromatography/negative electrospray ionization tandem mass spectrometry. Rapid Commun.
Mass Spectrom. 2012, 26, (12), 1497-1506.
307. Guasco, T. L.; Cuadra-Rodriguez, L. A.; Pedler, B. E.; Ault, A. P.; Collins, D. B.; Zhao,
D.; Kim, M. J.; Ruppel, M. J.; Wilson, S. C.; Pomeroy, R. S.; Grassian, V. H.; Azam, F.; Bertram,
T. H.; Prather, K. A., Transition metal associations with primary biological particles in sea spray
aerosol generated in a wave channel. Environ. Sci. Technol. 2014, 48, (2), 1324-1333.
308. Blanchard, D. C.; Syzdek, L. D., Concentration of bacteria in jet drops from bursting
bubbles. J. Geophys. Res. 1972, 77, (27), 5087-5099.
309. Wang, X.; Deane, G. B.; Moore, K. A.; Ryder, O. S.; Stokes, M. D.; Beall, C. M.; Collins,
D. B.; Santander, M. V.; Burrows, S. M.; Sultana, C. M.; Prather, K. A., The role of jet and film
drops in controlling the mixing state of submicron sea spray aerosol particles. Proc. Natl. Acad.
Sci. U. S. A. 2017, 114, 6978-6983.
310. Baden, D. G., Brevetoxins: unique polyether dinoflagellate toxins. FASEB J. 1989, 3, (7),
1807-1817.
311. Baden, D. G., Mende, T. J., Szmant, A. M., Trainer, V. L., Edwards, R. A., Roszell, L. E.,
Brevetoxin binding: Molecular pharmacology versus immunoassay. Toxicon. 1988, 26, (1), 97-
103.
312. Tsuji, K., Watanuki, T., Kondo, F., Watanabe, M. F., Suzuki, S., Nakazawa, H., Suzuki,
M., Uchida, H., Harada, K. I., Stability of microcystins from cyanobacteria II- effect of UV light
on decomposition and isomerization. Toxicon. 1995, 33, (12), 1619-1631.

146
313. Tsuji, K.; Naito, S.; Kondo, F.; Ishikawa, N.; Watanabe, M. F.; Suzuki, M.; Harada, K.,
Stability of microcystins from cyanobacteria: effect of light on decomposition and isomerization.
Environ. Sci. Technol. 1994, 28, 173-177.
314. Marion, J. W.; Lee, J.; Wilkins, J. R., 3rd; Lemeshow, S.; Lee, C.; Waletzko, E. J.; Buckley,
T. J., In vivo phycocyanin flourometry as a potential rapid screening tool for predicting elevated
microcystin concentrations at eutrophic lakes. Environ Sci Technol 2012, 46, (8), 4523-4531.
315. Birbeck, J. A.; Westrick, J. A.; O'Neill, G. M.; Spies, B.; Szlag, D. C., Comparative
analysis of microcystin prevalence in Michigan lakes by online concentration LC/MS/MS and
ELISA. Toxins 2019, 11, 13.
316. Pratt, K. A.; Mayer, J. E.; Holecek, J. C.; Moffet, R. C.; Sanchez, R. O.; Rebotier, T. P.;
Furutani, H.; Gonin, M.; Fuhrer, K.; Su, Y.; Guazzotti, S.; Prather, K. A., Development and
characterization of an aircraft aerosol time-of-flight mass spectrometer. Anal. Chem. 2009, 81,
(40), 1792-1800.
317. Sultana, C. M.; Cornwell, G. C.; Rodriguez, P.; Prather, K. A., FATES: a flexible analysis
toolkit for the exploration of single-particle mass spectrometer data. Atmos. Meas. Tech. 2017, 10,
(4), 1323-1334.
318. Cahill, J. F.; Darlington, T. K.; Fitzgerald, C.; Schoepp, N. G.; Beld, J.; Burkart, M. D.;
Prather, K. A., Online analysis of single cyanobacteria and algae cells under nitrogen-limited
conditions using aerosol time-of-flight mass spectrometry. Anal Chem 2015, 87, (16), 8039-8046.
319. Pratt, K. A., DeMott, P. J., French, J. R., Wang, Z., Westphal, D. L., Heymsfield, A. J.,
Twohy, C. H., Prenni, A. J., Prather, K. A., In situ detection of biological particles in cloud ice-
crystals. Nat. Geosci. 2009, 2, 398-401.
320. Sultana, C. M.; Al-Mashat, H.; Prather, K. A., Expanding single particle mass spectrometer
analyses for the identification of microbe signatures in sea spray aerosol. Anal. Chem. 2017, 89,
(19), 10162-10170.
321. Bergin, I. L.; Wilding, L. A.; Morishita, M.; Walacavage, K.; Ault, A. P.; Axson, J. L.;
Stark, D. I.; Hashway, S. A.; Capracotta, S. S.; Leroueil, P. R.; Maynard, A. D.; Philbert, M. A.,
Effects of particle size and coating on toxicologic parameters, fecal elimination kinetics and tissue
distribution of acutely ingested silver nanoparticles in a mouse model. Nanotoxicology 2016, 10,
(3), 352-360.
322. Axson, J. L.; Stark, D. I.; Bondy, A. L.; Capracotta, S. S.; Maynard, A. D.; Philbert, M. A.;
Bergin, I. L.; Ault, A. P., Rapid kinetics of size and pH-dependent dissolution and aggregation of
silver nanoparticles in simulated gastric fluid. J. Phys. Chem. A 2015, 119, (35), 20632-20641.
323. Kramberger, P., Ciringer, M., Strancar, A., Peterka, M., Evaluation of nanoparticle tracking
analysis for total virus particle determination. Virol. J. 2012, 9, 265.
324. Malloy, A., Count, size and visualize nanoparticles. Mater. Today 2011, 14, (4), 170-173.
325. Halvorson, R. A.; Vikesland, P. J., Drop coating deposition Raman (DCDR) for
microcystin-LR identification and quantitation. Environ. Sci. Technol. 2011, 45, (13), 5644-5651.
326. Daisey, J. M., McCaffrey, R. J., Gallagher, R. A., Polycyclic aromatic hydrocarbons and
total entractable particulate organic matter in the Arctic Aerosol. Atmos. Environ. 1981, 15, (8),
1353-1363.
327. Li, W.; Shao, L., Mixing and water-soluble characteristics of particulate organic
compounds in individual urban aerosol particles. J. Geophys. Res. 2010, 115, D02301.

147
328. Human health recreational ambient water quality criteria or swimming advisories for
microcystins and cylindrospermopsin. In United States Environmental Protection Agency:
Washington, D. C., 2016; Vol. 822-P-16-002.
329. 2015 Drinking water health advisories for two cyanobacterial toxins. In United States
Environmental Protection Agency Office of Water: Washington, D. C., 2015; Vol. 820F15003.
330. Mazur-Marzec, H.; Meriluoto, J.; Plinski, M., The degradation of the cyanobacterial
hepatotoxin nodularin (NOD) by UV radiation. Chemosphere 2006, 65, (8), 1388-1395.
331. Oehrle, S. A.; Southwell, B.; Westrick, J., Detection of various freshwater cyanobacterial
toxins using ultra-performance liquid chromatography tandem mass spectrometry. Toxicon. 2010,
55, (5), 965-972.
332. Dai, M.; Xie, P.; Chen, J.; Liang, G.; Liu, Y.; Qiu, T., Quantitative determination of
microcystins in rat plasma by LC–ESI tandem MS. Chromatographia 2008, 68, 811-815.
333. Allis, O., Dauphard, J., Hamilton, B., Shuilleabhain, A. N., Lehane, M., James, K. J., Furey,
A., Liquid chromatography-tandem mass spectrometry application for the determination of
extracellular hepatotoxins in Irish Lake and drinking waters. Anal. Chem. 2007, 79, 3436-3447.
334. Kubwabo, C.; Vais, N.; Benoit, F. M., Characterization of microcystins using in-source
collision-induced dissociation. Rapid Commun. Mass Spectrom. 2005, 19, (5), 597-604.
335. Zhu, C., Gao, Y., Li, H., Meng, S., Li, L., Francisco, J. S., Zeng, X. C., Characterizing
hydrophobicity of amino acid side chains in a protein environment via measuring contact angle of
a water nanodroplet on planar peptide network. Proc Natl Acad Sci USA 2016, 113, (46), 12946-
12951.
336. Rose, G. D., Wolfenden, R. , Hydrogen bonding, hydrophobicity, packing, and protein
folding. Annu. Rev. Biophys. Biomol. Struct. 1993, 22, 381-415.
337. Kyte, J., Doolittle, R. F., A simple method for displaying the hydropathic character of a
protein. J. Mol. Biol. 1982, 157, 105-132.
338. Biswas, K. M.; DeVido, D. R.; Dorsey, J. G., Evaluation of methods for measuring amino
acid hydrophobicities and interactions. J. Chromatogr. A. 2003, 1000, 637-655.
339. Fuentes, E.; Coe, H.; Green, D.; McFiggans, G., On the impacts of phytoplankton-derived
organic matter on the properties of the primary marine aerosol – Part 2: Composition,
hygroscopicity and cloud condensation activity. Atmos. Chem. Phys. 2011, 11, (6), 2585-2602.
340. Cochran, R. E.; Laskina, O.; Jayarathne, T.; Laskin, A.; Laskin, J.; Lin, P.; Sultana, C.;
Lee, C.; Moore, K. A.; Cappa, C. D.; Bertram, T. H.; Prather, K. A.; Grassian, V. H.; Stone, E. A.,
Analysis of organic anionic surfactants in fine and coarse fractions of freshly emitted sea spray
aerosol. Environ Sci Technol 2016, 50, (5), 2477-2486.
341. Blanchard, D. C., The ejection of drops from the sea and their enrichment with bacteria
and other materials: A review. Estuaries 1989, 12, (3), 127-137.
342. Aller, J. Y.; Kuznetsova, M. R.; Jahns, C. J.; Kemp, P. F., The sea surface microlayer as a
source of viral and bacterial enrichment in marine aerosols. J. Aerosol Sci. 2005, 36, 801-812.
343. Jayarathne, T.; Sultana, C. M.; Lee, C.; Malfatti, F.; Cox, J. L.; Pendergraft, M. A.; Moore,
K. A.; Azam, F.; Tivanski, A. V.; Cappa, C. D.; Bertram, T. H.; Grassian, V. H.; Prather, K. A.;
Stone, E. A., Enrichment of saccharides and divalent cations in sea spray aerosol during two
phytoplankton blooms. Environ. Sci. Technol. 2016, 50, 11511−11520.
344. McCord, J.; Lang, J. R.; Hill, D.; Strynar, M.; Chernoff, N., pH dependent octanol-water
partitioning coefficients of microcystin congeners. J Water Health 2018, 16, (3), 340-345.

148
345. De Maagd, P. G., Hendriks, A. J., Seinen, W., Sijm, D. T., pH dependent hydrophobicity
of the cyanobacteria in toxin microcystin-LR. Wat. Res. 1999, 33, (3), 667-680.
346. Chen, M.; Li, J.; Dai, X.; Sun, Y.; Chen, F., Effect of phosphorus and temperature on
chlorophyll a contents and cell sizes of Scenedesmus obliquus and Microcystis aeruginosa.
Limnology 2010, 12, (2), 187-192.
347. Bigg, E. K., Comparison of aerosol at four baseline atmospheric monitoring stations. J.
Appl. Meteorol. 1980, 19, 521-533.
348. Andreae, M. O., Charlson, R. J., Bruynseels, F., Storms, H., Grieken, R. V., Maenhaut, W.,
Internal mixture of sea salt, silicates, and excess sulfate in marine aerosols. Science 1986, 232,
1620-1623.
349. Gobler, C. J., Sanudo-Wilhelmy, S. A., Effects of organic carbon, organic nitrogen,
inorganic nutrients, and iron additions on the growth of phytoplankton and bacteria during a brown
tide bloom. Mar. Ecol. Prog. Ser. 2001, 209, 19-34.
350. Goldman, J. C., Porcella, D. B., Middlebrooks, J. E., Toerien, D. F. The effect of carbon
on algal growth - Its relationship to eutrophication; Utah Water Research Laboratory, 1971.
351. Ballah, M.; Bhoyroo, V.; Neetoo, H., Assessment of the physico-chemical quality and
extent of algal proliferation in water from an impounding reservoir prone to eutrophication. J.
Ecol. Environ. 2019, 43, 5.
352. Russell, S. C.; Czerwieniec, G.; Lebrilla, C.; Tobias, H.; Fergenson, D. P.; Steele, P.;
Pitesky, M.; Horn, J.; Srivastava, A.; Frank, M.; Gard, E. E., Toward understanding the ionization
of biomarkers from micrometer particles by bio-aerosol mass spectrometry. J. Am. Soc. Mass.
Spectrom. 2004, 15, (6), 900-909.
353. Facciponte, D. N.; Bough, M. W.; Seidler, D.; Carroll, J. L.; Ashare, A.; Andrew, A. S.;
Tsongalis, G. J.; Vaickus, L. J.; Henegan, P. L.; Butt, T. H.; Stommel, E. W., Identifying
aerosolized cyanobacteria in the human respiratory tract: A proposed mechanism for cyanotoxin-
associated diseases. Sci. Total Environ. 2018, 645, 1003-1013.
354. Wisniewska, K.; Lewandowska, A. U.; Sliwinska-Wilczewska, S., The importance of
cyanobacteria and microalgae present in aerosols to human health and the environment - Review
study. Environ. Int. 2019, 131, 104964.
355. Olson, N. E.; Cooke, M. E.; Shi, J.; Birbeck, J. A.; Westrick, J. A.; Ault, A. P., Harmful
algal bloom toxins in aerosol generated from inland lake water. Environ Sci Technol 2020, 54, (8),
4769−4780.
356. Hu, J.; Liu, J.; Zhu, Y.; Diaz-Perez, Z.; Sheridan, M.; Royer, H.; Leibensperger, R.; Maizel,
D.; Brand, L.; Popendorf, K. J.; Gaston, C. J.; Zhai, R. G., Exposure to aerosolized algal toxins in
South Florida increases short- and long-term health risk in Drosophila model of aging. Toxins
2020, 12, (12).
357. Schaefer, A. M.; Yrastorza, L.; Stockley, N.; Harvey, K.; Harris, N.; Grady, R.; Sullivan,
J.; McFarland, M.; Reif, J. S., Exposure to microcystin among coastal residents during a
cyanobacteria bloom in Florida. Harmful Algae 2020, 92, 101769.
358. Stewart, I.; Webb, P. M.; Schluter, P. J.; Fleming, L. E.; Burns, J. W., Jr.; Gantar, M.;
Backer, L. C.; Shaw, G. R., Epidemiology of recreational exposure to freshwater cyanobacteria--
an international prospective cohort study. BMC public health 2006, 6, 93.

149
359. Jang, M.; Berthold, D. E.; Yu, Z.; Silva-Sanchez, C.; Laughinghouse Iv, H. D.; Denslow,
N. D.; Han, S., Atmospheric progression of microcystin-LR from cyanobacterial aerosols.
Environ. Sci. Technol. Lett. 2020, 7, (10), 740-745.
360. Wisniewska, K.; Sliwinska-Wilczewska, S.; Lewandowska, A.; Konik, M., The effect of
abiotic factors on abundance and photosynthetic performance of airborne cyanobacteria and
microalgae isolated from the Southern Baltic Sea region. Cells 2021, 10, (1).
361. Hoorman, J.; Hone, T.; Sudman, T.; Dirksen, T.; Iles, J.; Islam, K. R., Agricultural impacts
on lake and stream water quality in Grand Lake St. Marys, Western Ohio. Water Air Soil Pollut
2008, 193, 309-322.
362. Filbrun, J. E.; Conroy, J. D.; Culver, D. A., Understanding seasonal phosphorus dynamics
to guide effective management of shallow, hypereutrophic Grand Lake St. Marys, Ohio. Lake
Reservoir Manag 2013, 29, (3), 165-178.
363. Steffen, M. M.; Zhu, Z.; McKay, R. M. L.; Wilhelm, S. W.; Bullerjahn, G. S., Taxonomic
assessment of a toxic cyanobacteria shift in hypereutrophic Grand Lake St. Marys (Ohio, USA).
Harmful Algae 2014, 33, 12-18.
364. Halvorson, R. A.; Leng, W.; Vikesland, P. J., Differentiation of microcystin, nodularin,
and their component amino acids by drop-coating deposition Raman spectroscopy. Anal Chem
2011, 83, (24), 9273-9280.
365. Jones, L. H., Infrared spectra and structure of the crystalline sodium acetate complexes of
U(VI), Np(VI), Pu(VI), and Am(VI). A comparison of metal‐oxygen bond distance and bond force
constant in this series. J. Chem. Phys. 1955, 23, (11), 2105-2107.
366. Jones, L. H.; McLaren, E., Infrared spectra of CH3COONa and CD3COONa and
assignments of vibrational frequencies. J. Chem. Phys. 1954, 22, (11), 1796-1800.
367. Kakihana, M., Kotaka, M., Okamoto, M., Infrared spectra of 13C-substituted species of
solid sodium acetate at 80 K. J. Phys. Chem. 1982, 86, (22), 4385-4387.
368. Frost, R. L., Jing, Y., Ding, Z., Raman and FTIR spectroscopy of natural oxalates:
Implications for life on Mars. Chinese Sci. Bull. 2003, 48, (17), 1844-1852.
369. Mathlouthi, M., Luu, D. V., Laser-Raman spectra of D-glucose and sucrose in aqueous
solution. Carbohydr Res 1980, 81, (2), 203-212.
370. Brizuela, A. B.; Bichara, L. C.; Romano, E.; Yurquina, A.; Locatelli, S.; Brandan, S. A., A
complete characterization of the vibrational spectra of sucrose. Carbohydr Res 2012, 361, 212-
218.
371. Frost, R. L., Kloprogge, J. T., Raman spectroscopy of the acetates of sodium, potassium,
and magnesium at liquid nitrogen temperature J. Mol. Struct. 2000, 526, 131-141.
372. Wang, L. Y., Zhang, Y. H., Zhao, L. J., Raman spectroscopic studies on single
supersaturated droplets of sodium and magnesium acetate. J. Phys. Chem. A 2005, 109, 609-614.
373. Picquart, M.; Laborde, M., Raman Scattering in Aqueous Solutions of Sodium Dodecyl
Sulfate. In Surfactants in Solution: Volume 4, Mittal, K. L.; Bothorel, P., Eds. Springer US: Boston,
MA, 1986; pp 189-201.
374. Kirpes, R. M.; Rodriguez, B.; Kim, S.; China, S.; Laskin, A.; Park, K.; Jung, J.; Ault, A.
P.; Pratt, K. A., Emerging investigator series: influence of marine emissions and atmospheric
processing on individual particle composition of summertime Arctic aerosol over the Bering Strait
and Chukchi Sea. Environ Sci Process Impacts 2020, 22, 1201-1213.

150
375. Onasch, T. B.; Siefert, R. L.; Brooks, S. D.; Prenni, A. J.; Murray, B.; Wilson, M. A.;
Tolbert, M. A., Infrared spectroscopic study of the deliquescence and efflorescence of ammonium
sulfate aerosol as a function of temperature. J Geophys Res Atmos 1999, 104, 21317-21326.
376. Hudson, P. K.; Murphy, D. M.; Cziczo, D. J.; Thomson, D. S.; de Gouw, J. A.; Warneke,
C.; Holloway, J.; Jost, H.-J.; Hübler, G., Biomass-burning particle measurements: Characteristic
composition and chemical processing. J. Geophys. Res. Atmos. 2004, 109, (D23), D23S27.
377. Wang, H.; Zhang, L.; Wang, D.; He, X., Experimental investigation on the wettability of
respirable coal dust based on infrared spectroscopy and contact angle analysis. Adv Powder
Technol 2017, 28, (12), 3130-3139.
378. Laskina, O.; Young, M. A.; Kleiber, P. D.; Grassian, V. H., Infrared extinction
spectroscopy and micro-Raman spectroscopy of select components of mineral dust mixed with
organic compounds. J. Geophys. Res. Atmos. 2013, 118, (12), 6593-6606.
379. Alali, H.; Gong, Z.; Videen, G.; Pan, Y.-L.; Muñoz, O.; Wang, C., Laser spectroscopic
characterization of single extraterrestrial dust particles using optical trapping-cavity ringdown and
Raman spectroscopy. J Quant Spectrosc Radiat Transf. 2020, 255.
380. Cain, J. P.; Gassman, P. L.; Wang, H.; Laskin, A., Micro-FTIR study of soot chemical
composition-evidence of aliphatic hydrocarbons on nascent soot surfaces. Phys. Chem. Chem.
Phys. 2010, 12, (20), 5206-5218.
381. Patel, M.; Azanza Ricardo, C. L.; Scardi, P.; Aswath, P. B., Morphology, structure and
chemistry of extracted diesel soot—Part I: Transmission electron microscopy, Raman
spectroscopy, X-ray photoelectron spectroscopy and synchrotron X-ray diffraction study. Tribol.
Int. 2012, 52, 29-39.
382. Shaw, R. W., Paur, R. J., Composition of aerosol particles collected at rural sites in the
Ohio River Valley. Atmos. Environ. 1983, 17, (10), 2031-2044.
383. Huntzicker, J. J.; Heyerdahl, E. K.; McDow, S. R.; Rau, J. A.; Griest, W. H.; MacDougall,
C. S., Combustion as the principal source of carbonaceous aerosol in the Ohio River Valley. J. Air
Pollut. Control Assoc. 1986, 36, (6), 705-709.
384. John, K.; Karnae, S.; Crist, K.; Kim, M.; Kulkarni, A., Analysis of trace elements and ions
in ambient fine particulate matter at three elementary schools in Ohio. J Air Waste Manag Assoc
2007, 57, (4), 394-406.
385. Theoret, A., Sandorfy, C., Infrared spectra and crystalline phase transitions of ammonium
nitrate. Can. J. Chem. 1964, 42, 57-62.
386. Rousseau, D. L., Miller, R. E., Leroi, G. E. , Raman spectra of crystalline sodium nitrate.
J. Chem. Phys. 1968, 48, (8), 3409.
387. Hand, V. L.; Capes, G.; Vaughan, D. J.; Formenti, P.; Haywood, J. M.; Coe, H., Evidence
of internal mixing of African dust and biomass burning particles by individual particle analysis
using electron beam techniques. J Geophys Res 2010, 115, (D13).
388. Bauer, S. E.; Ault, A.; Prather, K. A., Evaluation of aerosol mixing state classes in the
GISS modelE-MATRIX climate model using single-particle mass spectrometry measurements. J.
Geophys. Res.: Atmos. 2013, 118, (17), 9834-9844.
389. Dedoussi, I. C.; Eastham, S. D.; Monier, E.; Barrett, S. R. H., Premature mortality related
to United States cross-state air pollution. Nature 2020, 578, (7794), 261-265.
390. Institute for Health Metrics and Evaluation - IHME, Global Burden of Disease Compare
Data Visualization. In IHME, U. o. W., Ed. Seattle, WA:, 2016.

151
391. Eaves, L. A.; Smeester, L.; Hartwell, H. J.; Lin, Y.-H.; Arashiro, M.; Zhang, Z.; Gold, A.;
Surratt, J. D.; Fry, R. C., Isoprene-derived Secondary Organic Aerosol Induces the Expression of
micro RNAs (miRNAs) Associated with Inflammatory/Oxidative Stress Response in Lung Cells.
Chem. Res. Toxicol. 2019.
392. Laskin, A.; Iedema, M. J.; Cowin, J. P., Quantitative time-resolved monitoring of nitrate
formation in sea salt particles using a CCSEM/EDX single particle analysis. Environ. Sci. Technol.
2002, 36, (23), 4948-4955.
393. O'Brien, R. E.; Wang, B.; Kelly, S. T.; Lundt, N.; You, Y.; Bertram, A. K.; Leone, S. R.;
Laskin, A.; Gilles, M. K., Liquid-liquid phase separation in aerosol particles: imaging at the
nanometer scale. Environ Sci Technol 2015, 49, (8), 4995-5002.
394. Takahama, S.; Johnson, A.; Russell, L. M., Quantification of carboxylic and carbonyl
functional groups in organic aerosol infrared absorbance spectra. Aerosol Sci. Technol. 2013, 47,
(3), 310-325.
395. Farmer, D.; Matsunaga, A.; Docherty, K.; Surratt, J.; Seinfeld, J.; Ziemann, P.; Jimenez,
J., Response of an aerosol mass spectrometer to organonitrates and organosulfates and implications
for atmospheric chemistry. Proc. Natl. Acad. Sci. U. S. A. 2010, 107, (15), 6670-6675.
396. Gen, M.; Chan, C. K., Electrospray surface-enhanced Raman spectroscopy (ES-SERS) for
probing surface chemical compositions of atmospherically relevant particles. Atmos. Chem. Phys.
2017, 17, (22), 14025-14037.
397. Fu, Y.; Kuppe, C.; Valev, V. K.; Fu, H.; Zhang, L.; Chen, J., Surface-enhanced Raman
spectroscopy: A facile and rapid method for the chemical component study of individual
atmospheric aerosol. Environ. Sci. Technol. 2017, 51, (11), 6260-6267.
398. Wang, L.; Huang, D.; Chan, C. K.; Li, Y. J.; Xu, X. G., Nanoscale spectroscopic and
mechanical characterization of individual aerosol particles using peak force infrared microscopy.
Chem. Commun. 2017, 53, (53), 7397-7400.
399. Kurouski, D.; Dazzi, A.; Zenobi, R.; Centrone, A., Infrared and Raman chemical imaging
and spectroscopy at the nanoscale. Chem Soc Rev 2020, 10.1039/c8cs00916c.
400. Morsch, S.; Lyon, S. B.; Edmondson, S.; Gibbon, S. R., Reflectance in AFM-IR:
Implications for interpretation and remote analysis of the buried interface. Anal Chem 2020,
10.1021/acs.analchem.9b05793.
401. Dazzi, A., Glotin, F., Carminati, R., Theory of infrared nanospectroscopy by photothermal
induced resonance. J. Appl. Phys. 2010, 107, 124519.
402. Mathurin, J.; Pancani, E.; Deniset-Besseau, A.; Kjoller, K.; Prater, C. B.; Gref, R.; Dazzi,
A., How to unravel the chemical structure and component localization of individual drug-loaded
polymeric nanoparticles by using tapping AFM-IR. Analyst 2018, 143, (24), 5940-5949.
403. Zhang, D.; Li, C.; Zhang, C.; Slipchenko, M. N.; Eakins, G.; Cheng, J.-X., Depth-resolved
mid-infrared photothermal imaging of living cells and organisms with submicrometer spatial
resolution. Sci. Adv. 2016, 2, (9), e1600521.
404. Busse, G., Photothermal transmission imaging and microscopy. Optics Comm. 1981, 36,
(6), 441-443.
405. Wang, C. T.; Jiang, B.; Zhou, Y. W.; Jiang, T. W.; Liu, J. H.; Zhu, G. D.; Cai, W. B.,
Exploiting the surface-enhanced IR absorption effect in the photothermally induced resonance
AFM-IR technique toward nanoscale chemical analysis. Anal Chem 2019, 91, (16), 10541-10548.
152
406. Wrobel, T. P.; Bhargava, R., Infrared spectroscopic imaging advances as an analytical
technology for biomedical sciences. Anal Chem 2018, 90, (3), 1444-1463.
407. Nowak, D., Morrison, W., Wickramasinghe, H. K., Jahng, J., Potma, E., Wan, L., Ruiz, R.,
Albrechy, T. R., Schmidt, K., Frommer, J., Sanders, D. P., Park, S., Nanoscale chemical imaging
by photoinduced force microscopy. Sci. Adv. 2016, 2, e1501571.
408. Jahng, J.; Fishman, D. A.; Park, S.; Nowak, D. B.; Morrison, W. A.; Wickramasinghe, H.
K.; Potma, E. O., Linear and nonlinear optical spectroscopy at the nanoscale with photoinduced
force microscopy. Acc. Chem. Res. 2015, 48, (10), 2671-2679.
409. Tumkur, T. U.; Yang, X.; Cerjan, B.; Halas, N. J.; Nordlander, P.; Thomann, I.,
Photoinduced force mapping of plasmonic nanostructures. Nano. Lett. 2016, 16, (12), 7942-7949.
410. Sobanska, S.; Falgayrac, G.; Rimetz-Planchon, J.; Perdrix, E.; Brémard, C.; Barbillat, J.,
Resolving the internal structure of individual atmospheric aerosol particle by the combination of
Atomic Force Microscopy, ESEM–EDX, Raman and ToF–SIMS imaging. Microchem. J. 2014,
114, 89-98.
411. Marcott, C.; Kansiz, M.; Dillon, E.; Cook, D.; Mang, M. N.; Noda, I., Two-dimensional
correlation analysis of highly spatially resolved simultaneous IR and Raman spectral imaging of
bioplastics composite using optical photothermal Infrared and Raman spectroscopy. J. Mol. Struct.
2020, 1210.
412. Furstenberg, R.; Kendziora, C.; Papantonakis, M.; Nguyen, V.; McGill, R. A., Chemical
imaging using infrared photothermal microspectroscopy. SPIE: 2012; Vol. 8374.
413. Gao, X.; Chorover, J., Adsorption of sodium dodecyl sulfate (SDS) at ZnSe and alpha-
Fe2O3 surfaces: combining infrared spectroscopy and batch uptake studies. J Colloid Interface Sci
2010, 348, (1), 167-176.
414. Nakao, S.; Tang, P.; Tang, X.; Clark, C. H.; Qi, L.; Seo, E.; Asa-Awuku, A.; Cocker, D.,
Density and elemental ratios of secondary organic aerosol: Application of a density prediction
method. Atmos. Environ. 2013, 68, 273-277.
415. Latimer, W. M., Schutz, P. W., Hicks, J. F. G., The heat capacity and entropy of calcium
oxalate from 19 to 300* absolute. The entropy and free energy of oxalate ion. J. Am. Chem. Soc.
1993, 55, (3), 971-975.
416. Angell, C. A., Sichina, J. W., Oguni, M., Heat capacity of water at extremes of supercooling
and superheating. J. Phys. Chem. 1982, 86, (6), 998-1002.
417. Zhou, S.-Q.; Ni, R., Measurement of the specific heat capacity of water-based Al2O3
nanofluid. Appl. Phys. Lett. 2008, 92, (9), 093123.
418. Clegg, S. L., Ho, S. S., Chan, C. K., Brimblecombe, P., Thermodynamic properties of
aqueous (NH4)2SO4 to high supersaturation as a function of temperature. J. Chem. Eng. Data
1995, 40, 1079-1090.
419. Stephenson, C. C., Bentz, D. R., Stevenson, D. A., The heat capacity of ammonium nitrate
from 15 to 315 K. J. Am. Chem. Soc. 1955, 77, (8), 2161-2164.
420. Magoń, A.; Wurm, A.; Schick, C.; Pangloli, P.; Zivanovic, S.; Skotnicki, M.; Pyda, M.,
Heat capacity and transition behavior of sucrose by standard, fast scanning and temperature-
modulated calorimetry. Thermochim. Acta. 2014, 589, 183-196.
421. Araki, N., Futamura, M., Makino, A., Shibata, H., Measurements of thermophysical
properties of sodium acetate hydrate. Int. J. Thermophys. 1995, 16, (6), 1455-1466.

153
422. Bakshi, M. S., Crisantino, R., De Lisi, R., Milioto, S., Volume and heat capacity of sodium
dodecyl sulfate-dodecyldimethylamine oxide mixed micelles. J. Phys. Chem. 1993, 97, 6914-
6919.
423. Sengers, J. V.; Watson, J. T. R.; Basu, R. S.; Kamgar‐Parsi, B.; Hendricks, R. C.,
Representative equations for the thermal conductivity of water substance. J. Phys. Chem. Ref. Data
1984, 13, (3), 893-933.
424. Zhang, M.; Che, Z.; Chen, J.; Zhao, H.; Yang, L.; Zhong, Z.; Lu, J., Experimental
determination of thermal conductivity of water−agar gel at different concentrations and
temperatures. J. Chem. Eng. Data 2011, 56, (4), 859-864.
425. Hale, G. M., Querry, M. R., Optical constants of water in the 200-nm to 200-um
wavelength region. Appl. Opt. 1973, 12, (3), 555-563.
426. Earle, M. E., Pancescu, R. G., Cosic, B., Zasetsky, A. Y., Sloan, J. J., Temperature-
dependent complex indices of refraction for crystalline (NH4)2SO4. J. Phys. Chem. A 2006, 110,
13022-13028.
427. Jarzembski, M. A., Norman, M. L., Fuller, K. A., Srivastava, V., Cutten, D. R., Complex
refractive index of ammonium nitrate in the 2–20nm spectral range. Appl. Opt. 2003, 42, (6), 922-
930.
428. Deosarkar, S. D.; Mendkudle, M. S., Physicochemical properties and ion-solvent
interactions in aqueous sodium, ammonium, and lead acetate solution. Russ. J. Phys. Chem. A
2014, 88, (9), 1527-1532.
429. Charles, D. F., Refractive indices of sucrose-water solutions in the range from 24 ro 53%
sucrose. Anal. Chem. 1965, 37, (3), 405-406.
430. Singh, R.; Chauhan, S.; Sharma, K., Surface tension, viscosity, and refractive index of
sodium dodecyl sulfate (SDS) in aqueous solution containing polyethylene glycol (PEG),
polyvinyl pyrrolidone (PVP), and their blends. J. Chem. Eng. Data 2017, 62, (7), 1955-1964.
431. Frej, H., Jakubczyk, M., Density, surface tension, and refractive index of aqueous
ammonium oxalate solutions from 293 to 333 K. J. Chem. Eng. Data 1998, 43, 158-161.
432. Hibben, J. H., The Raman spectra of oxalic acid. J. Chem. Phys. 1935, 3, 675-679.