Behavioral profiles and within‐ - Deep Blue Repositories
37
This is the author manuscript accepted for publication and has undergone full peer review but has not been through the copyediting, typesetting, pagination and proofreading process, which may lead to differences between this version and the Version of Record. Please cite this article as doi: 10.1111/JOPY.12536 This article is protected by copyright. All rights reserved DR. JINKYUNG NA (Orcid ID : 0000-0002-7100-9606) Article type : Original Manuscript Culture and personality revisited: Behavioral profiles and within-person stability in interdependent (vs. independent) social orientation and holistic (vs. analytic) cognitive style Jinkyung Na 1 Igor Grossmann 2 Michael E. W. Varnum 3 Mayumi Karasawa 4 Youngwon Cho 1 Shinobu Kitayama 5 Richard E. Nisbett 5 1 Sogang University 2 University of Waterloo 3 Arizona State University 4 Tokyo Women’s Christian University 5 University of Michigan Correspondence should be addressed to either Jinkyung Na ([email protected]), Department of Psychology, Sogang University, 35 Baekbeom-ro, Mapo-gu, Seoul 04107, Korea, Author Manuscript
-
Upload
khangminh22 -
Category
Documents
-
view
5 -
download
0
Transcript of Behavioral profiles and within‐ - Deep Blue Repositories
This is the author manuscript accepted for publication and has undergone full peer review but has
not been through the copyediting, typesetting, pagination and proofreading process, which may
lead to differences between this version and the Version of Record. Please cite this article as doi:
10.1111/JOPY.12536
This article is protected by copyright. All rights reserved
DR. JINKYUNG NA (Orcid ID : 0000-0002-7100-9606)
Article type : Original Manuscript
Culture and personality revisited:
Behavioral profiles and within-person stability in interdependent (vs. independent)
social orientation and holistic (vs. analytic) cognitive style
Jinkyung Na 1
Igor Grossmann 2
Michael E. W. Varnum 3
Mayumi Karasawa 4
Youngwon Cho1
Shinobu Kitayama 5
Richard E. Nisbett 5
1 Sogang University
2 University of Waterloo
3 Arizona State University
4 Tokyo Women’s Christian University
5 University of Michigan
Correspondence should be addressed to either Jinkyung Na ([email protected]),
Department of Psychology, Sogang University, 35 Baekbeom-ro, Mapo-gu, Seoul 04107, Korea, Auth
or
Manuscript

2
This article is protected by copyright. All rights reserved
or Igor Grossmann ([email protected]), Department of Psychology, University of
Waterloo, 200 University Avenue West, Waterloo, ON, N2L 3G1, Canada.
Abstract
Objective: We test the proposition that both social orientation and cognitive style are constructs
consisting of loosely related attributes. Thus, measures of each construct should weakly correlate
among themselves, forming intra-individually stable profiles across measures over time.
Method: Study 1 tested diverse samples of Americans (N = 233) and Japanese (N = 433) with a
wide range of measures of social orientation and cognitive style to explore correlations among
these measures in a cross-cultural context, using demographically heterogeneous samples. Study
2 recruited a new sample of 485 Americans and Canadians and examined their profiles on
measures of social orientation and cognitive style twice, one month apart, to assess the stability
of individual profiles using these variables.
Results: Despite finding typical cross-cultural differences, Study 1 demonstrated negligible
correlations both among measures of social orientation and among measures of cognitive style.
Study 2 demonstrated stable intra-individual behavioral profiles across measures capturing
idiosyncratic patters of social orientation and cognitive style, despite negligible correlations
among the same measures.
Conclusion: The results provide support for the behavioral profile approach to conceptualizing
social orientation and cognitive style, highlighting the need to assess intra-individual stability of
psychological constructs in cross-cultural research.
Keywords
Social Orientation, Cognitive Style, Cultural differences, Individual differences
Psychological scientists tend to conceptualize culture from two distinct perspectives. On
the one hand, cross-cultural researchers have assumed that culture is personality writ large, and
have aimed to identify unitary constructs to assess individual differences across different
cultures (Harris, 1979; Skinner, 1938; Smith & Bond, 1998). On the other hand, cultural
psychologists have focused on specifics of psychological processes within a given culture,
opposing the idea that cultural differences are reducible to a handful of individual differences
(Malinowski, 1992; Shweder, 1991; Wundt, 1888). Despite fundamental differences between
cross-cultural and cultural psychologists, researchers from both traditions have shown an
Auth
or
Manuscript
3
This article is protected by copyright. All rights reserved
increasing interest in the same two cultural constructs: social orientation, namely independence
vs. interdependence1 (ie.g. the relative importance of self in relation to others; Markus &
Kitayama, 1991; Triandis, 1989) and cognitive style (e.g, the degree to which contexts are
considered in reasoning; Nisbett, Peng, Choi, & Norenzayan, 2001; Witkin & Goodenough,
1981).
Recently, the validity of these constructs was called into a question, with a handful of
studies demonstrating that measures of social orientation do not correlate among themselves nor
do measures of cognitive style correlate among themselves (Dong, Talhelm, & Ren, 2018;
Kitayama, Park, Servincer, Karasawa, & Uskul, 2009; Na et al., 2010; San Martin, Schug, &
Maddux, 2019). Following on this initial work, we attempted to systematically evaluate the
correlations among measures of social orientation and among measures of cognitive style. We
also aimed to explore new ways to conceptualize social orientation and cognitive style through
the lens of behavioral profiles.
Social orientation and cognitive style
Ideas concerning social orientation and cognitive style can be traced to the late 19th
century. For instance, Tӧnnies (1887/1988) described human relationship patterns in terms of
one’s social orientation toward a community vs. one's self-interest. Contemporary definitions of
social orientation similarly focus on the relative importance of one’s group vs. the self (Markus
& Kitayama, 1991; Triandis, 1989; Varnum, Grossmann, Kitayama, & Nisbett, 2010). This
definition has been applied to characterize cultural differences in emotion, motivation and the
self, with some cultures favoring interdependence –viewing the self as connected to others and
emphasizing harmonious relations with others – and other cultures favoring independence –
viewing the self as separate from others and emphasizing uniqueness (Markus & Kitayama,
1991).
Another major difference between cultures is holistic vs. analytic cognitive style
characterized as preference for contextualized vs. decontextualized cognition (Nisbett et al., 2001;
Varnum et al., 2010; Witkin & Goodenough, 1981). This distinction can be traced back to
William James, who distinguished between associative and rule-governed reasoning (1890/1950).
1 Also referred to as individualism-collectivism (Hofstede, 1980; Triandis, 1989) or Gesellschaft vs. Gemeinschaft (Greenfield, 2009). We use social orientation as a broad term that encompasses values, motivations, emotions, and behavioral tendencies.
Auth
or
Manuscript
4
This article is protected by copyright. All rights reserved
The notion of cognitive style has been applied to characterize cultural differences in social
cognition, with some cultures preferring a holistic cognitive style – focusing on the larger
context and attending to similarities and relationships – and other cultures preferring an analytic
cognitive style – separating a focal object from its context and reasoning about it using
categories and rules (Nisbett et al., 2001).
Using these characterizations of social orientation and cognitive style, researchers have
documented a wide range of group-level differences. East Asians are relatively interdependent
and holistic as compared to Americans (Markus & Kitayama, 1991; Nisbett et al., 2001). Eastern
Europeans are relatively interdependent and holistic as compared to Western Europeans (Kühnen
et al., 2001; Varnum, Grossmann, Katunar, Kitayama, & Nisbett, 2008), who are in turn more
interdependent and holistic than North Americans (Kitayama et al., 2009). Similar variations
occur within countries. Southern Italians are relatively more interdependent and holistic than
Northern Italians (2007) and Japanese from Hokkaido (a northern island) are relatively more
independent and analytic than mainland Japanese (Kitayama et al., 2006). Likewise, people from
middle-class backgrounds are more independent and analytic than people from working-class
backgrounds (Grossmann & Varnum, 2011; Kraus, Piff, Mendoza-Denton, Rheinschmidt, &
Keltner, 2012; Stephens, Fryberg, & Markus, 2011; Varnum, Na, Murata, & Kitayama, 2012).
Social orientation and cognitive style: Unitary construct vs. behavioral profile perspectives
A noteworthy development in cross-cultural research concerns treating both social
orientation and cognitive style as unitary constructs that are defined by a mutually correlated
network of features (Choi, Koo, & Choi, 2007; Singelis, 1994; Triandis, 1996). That is, some
scholars assume that a single task with decent reliability would be sufficient for assessing
individual differences in these constructs. For example, an individual whose score was higher on
one type of task measuring interdependence would be expected to have a higher score on every
other task measuring interdependence. This view is rooted in differential psychology (e.g.,
theorizing about the g-factor in research on cognitive abilities; Allport & Odbert, 1936; Eysenck,
1990; McCrae & Costa, 1999). From this perspective, one’s scores on a single task of a construct
would predict one’s scores in other measures of the same construct.
Unitary construct perspective is not the only way to conceptualize individual differences.
An alternative, behavioral profile perspective suggests that individual differences in either social
orientation or cognitive style might consist of loosely connected, cross-temporally stable sub-
Auth
or
Manuscript
5
This article is protected by copyright. All rights reserved
domains of broader constructs that successfully differentiate cultures. We elaborate on this
perspective below.
Several contemporary models of individual differences suggest that personality is best
viewed through the lens of situationally-contingent profiles (Fleeson, 2007; Furr & Funder, 2004;
Mischel & Shoda, 1995). In this view, personality characteristics may be expressed differently
from one situation to the next, resulting in low consistency across situations but high consistency
within the same situation across time. Thus, reliable cross-situational profiles can emerge. In
these theoretical models, variability is not regarded as a random error. Instead, these models
suggest that the variability can be systematic, reflecting stable profiles of one’s behaviors across
various situations (Furr, 2009; Shoda, Mischel, & Wright, 1994). For example, Person A may be
aggressive at a party and would also be aggressive at another similar party (measured with a
“party aggression” instrument) although the person may not be aggressive in a different situation,
such as at work (a tendency which might be measured with a “work aggression” instrument). In
contrast, Person B may be consistently aggressive at work, but not at all aggressive during social
gatherings. As a consequence, distinct and stable behavioral profiles of Person A and Person B
would yield negligible correlations between these “aggression” measures when aggregating
responses across multiple individuals.
Just as within-person variability across different situations is an integral aspect of one’s
personality system, so too could within-person variability across measures be an important
aspect of one’s cultural orientation. Specifically, different situations require different
psychological skills or propensities, which allows for within-person variability in the personality
system. Likewise, different measures of social orientation or cognitive style recruit different
types of psychological skills or propensities, which leads to within-person variability across
measures. Notably, measures of social orientation/cognitive style capture a wide range of ways
people use to navigate their culture. For social orientation, measures include the representation of
emotions, self-views, emotional reactivity, or adherence to social norms. For cognitive style,
measures include attention, memory, and higher-order reasoning. Therefore, unique profiles of
satisfying the culture-specific ways of being can exist depending on personality traits, different
types of skills, exposure to idiosyncratic cultural niches, and preferences for some aspects of a
culture rather than others. For one person, this may include emphasizing the self, but ignoring
emotional reactivity, whereas for another person, it may be about adhering to social norms, with
Auth
or
Manuscript
6
This article is protected by copyright. All rights reserved
a weaker focus on one's self. Importantly, such profiles may remain stable over time. As a
consequence, performance on measures of social orientation (or cognitive style) may show weak
consistency across tasks at a given time point, while simultaneously forming cross-temporally
stable behavioral profiles. An empirical test of this proposition requires examining whether one’s
profiles of responses to various measures of social orientation / cognitive style would be stable
across time points.
Past research reveals an isomorphic puzzle of social orientation and cognitive style
A handful of studies have begun to explore the construct-related nature of social
orientation and cognitive style. Results from these studies reveal that measures within each
ostensible construct of social orientation or cognitive style are negligibly correlated. Kitayama
and colleagues (2009) administered four social-orientation and two cognitive-style measures in
four different cultures (the US, UK, Germany, & Japan) and found that measures did not
correlate among themselves within each culture. Building on this initial demonstration, Na and
colleagues (2010) used a wide range of measures of social orientation and cognitive style in the
US and found that correlations among measures of each construct were negligible, even though
these measures systematically differentiated working class participants from middle-class
participants. The negligible cross-measures correlations suggested that individual differences in
social orientation and cognitive style do not represent distinct unitary constructs.
Na et al. (2010) also demonstrated the lack of isomorphism (i.e., the differences between
individual level and cultural level): Examination of cognitive style scores on two tasks collected
in five countries (Croatia, Germany, Japan, UK, and the US) revealed substantial correlations on
the group level (r = .82), despite negligible individual-level correlations within each country.
This lack of isomorphism across individual and cultural levels is consistent with earlier theories
in cross-cultural research (Hofstede, 1980; Schwartz, 1994). Moreover, it suggests that social
orientation and cognitive style do not follow the same pattern as cultural values (Fischer &
Poortinga, 2012) or Big Five personality (McCrae, Terracciano, & Personality Profiles of
Cultures Project, 2005), in that both of them show a convergence between individual and group
levels.
Limitations of prior research
Though the initial evidence appears to suggest that neither social orientation nor
cognitive style are unitary constructs, the evidence so far has been limited due to the breadth of
Auth
or
Manuscript

7
This article is protected by copyright. All rights reserved
the tasks used (Kitayama et al., 2009) or diversity of samples (Na et al., 2010). Kitayama and
colleagues employed only a small number of social cognitive tasks, whereas Na and colleagues
have only tested sub-groups within the US and looked at correlations between only two measures
in a handful of countries. Moreover, little is known about the cross-temporal stability of tasks
themselves. It is possible that the measures do not even show intra-individual stability and
therefore violate the ergodicity principle (Molenaar & Campbell, 2009), which states that intra-
individual consistency is a necessary condition for making inter-individual inferences, including
examination of relationships between measures.
Present research
We address prior limitations by systematically replicating previous observations of
negligible correlations among a broad range of tasks assessing social orientation and cognitive
style, respectively, on random-stratified samples of Japanese and Americans (Study 1). We
selected these target cultures because of the frequency with which these groups have been used
in prior research on social orientation as well as cognitive style (e.g., Markus and Kitayama,
1991; Nisbett et al., 2001). Second, we examined whether within-person variability would be
stable and predictable (Study 2). Toward this end, we asked a community sample of Americans
and Canadians to complete several measures of social orientation and cognitive style at different
time points and examined both the stability of individual tasks, as well as the cross-temporal
stability of possible behavioral profiles assessed via latent class analyses.
Study 1
Study 1 attempted to systematically probe the inter-individual associations of a range of
widely-used measures of social orientation / cognitive style with diverse samples of Japanese and
Americans. We expected that the correlations among measures of social orientation / cognitive
style would be negligible within each culture and perhaps also when collapsing across both
cultural groups.
Methods
Participants. We recruited a socio-economically diverse sample of Japanese from the
Tokyo Metropolitan area (N = 433) and Americans from the Washtenaw Country in Michigan (N
Auth
or
Manuscript

8
This article is protected by copyright. All rights reserved
= 233)2 with an approximately equal number of participants of both genders and of each of three
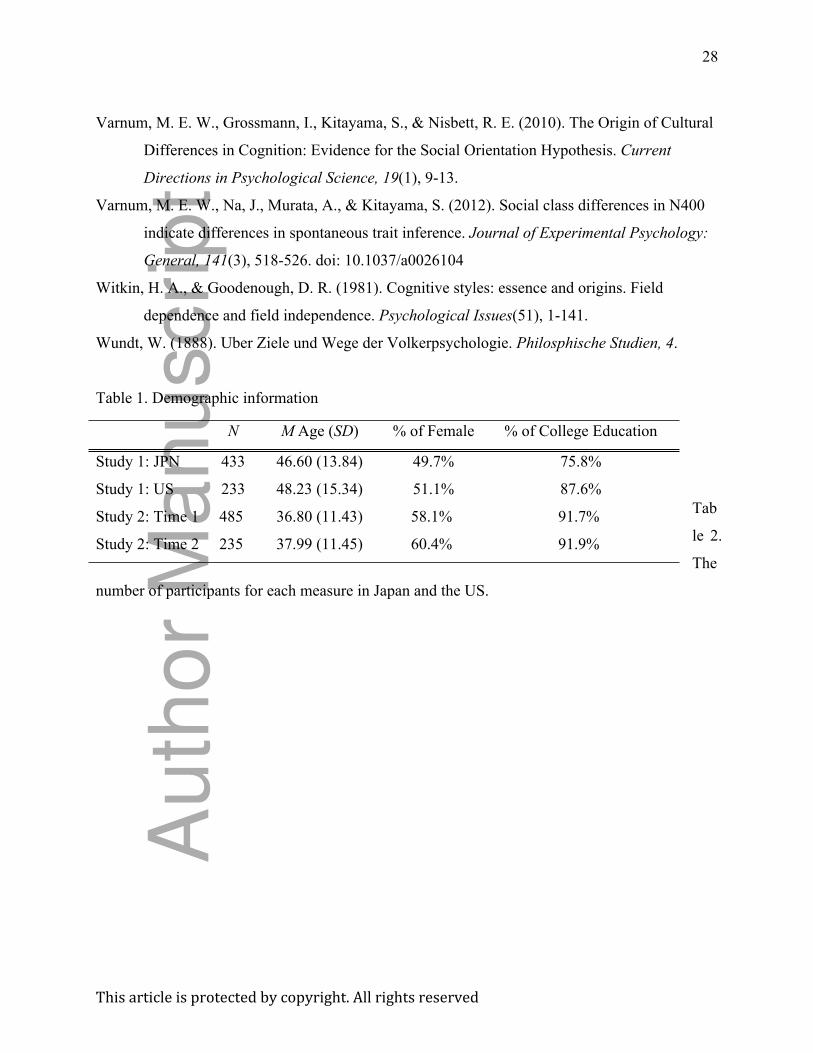
age groups (25-40, 41-59, 60-79). Detailed demographic information is summarized in Table 1.
Procedure. Participants in the US were invited to three different sessions of a two-
hour study and paid $70 for each session. Participants in Japan first filled out a questionnaire
packet and came in for two different laboratory sessions in return for equivalent monetary
compensation. In these sessions, participants completed a range of social and cognitive tasks,
selected for their success in differentiating cultural groups in prior research (see Varnum,
Grossmann, Kitayama, & Nisbett, 2010, for review). Since the data were collected across three
sessions and participants were allowed to skip any question they were uncomfortable with, the
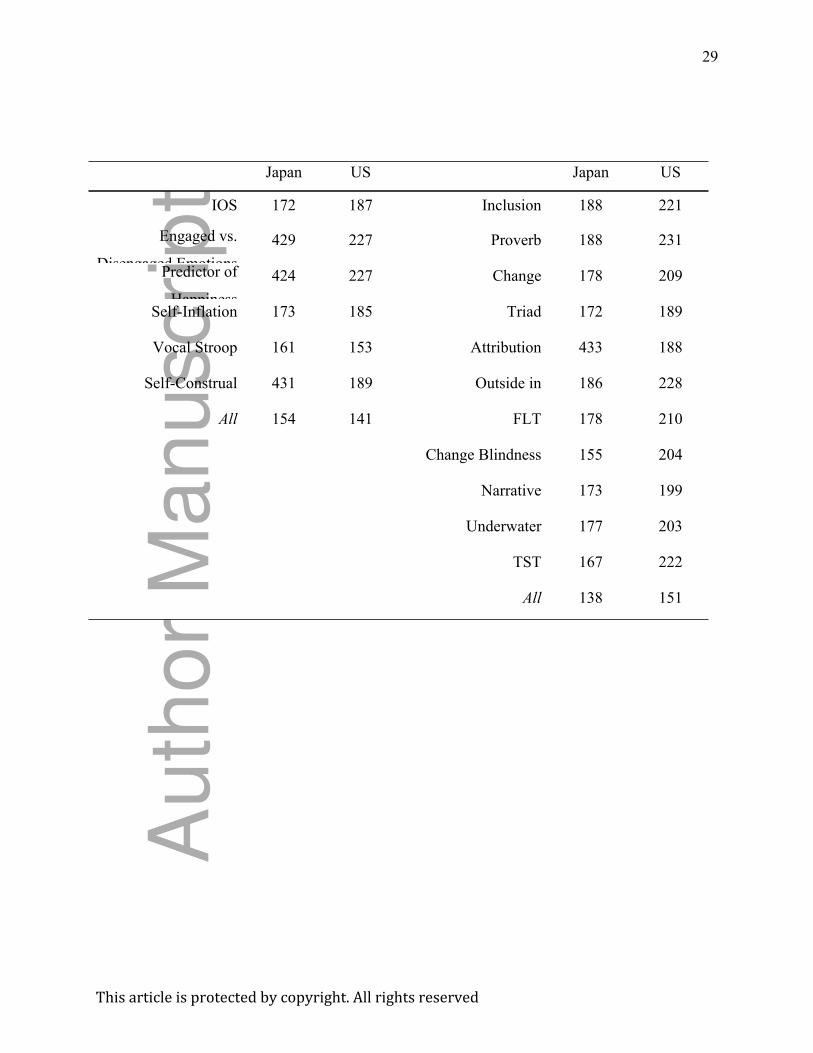
number of participants varies across tasks (See Table 2). We report results from six social and
eleven cognitive measures previously used as markers of social orientation and cognitive style,
respectively. For each measure of the social construct, larger values reflect more interdependent
and less independent social orientation. For each of the cognitive construct, larger values reflect
more holistic and less analytic cognitive style. For measures consisting of sub-scores, we
calculated a relative score reflecting more interdependence/holistic reasoning and less
independence/analytic reasoning based on prior theorizing and empirical findings (e.g.,
Kitayama, 2002; Na et al., 2010). Although the main analyses were based on the relative indexes,
we performed relevant analyses on sub-scores in the supplementary materials which yield very
similar results (See STables 1 & 2). The following section describes exactly how we calculated
scores for each task. Table 3 summarizes the means, standard deviations, and reliabilities of the
measures. Also, we reported reliabilities of sub-scores in the case of measures with sub-scores.
Data repository. Supplemental analyses and data for both studies are posted online at
https:// osf.io/hb2zg.
Measures of Independent vs. Interdependent Social Orientation
Inclusion of Other in the Self (IOS) scale. The IOS scale (Aron, Aron, & Smollan, 1992)
is a pictorial measure of closeness. In the IOS scale, a series of two circles is provided where the
degree of overlap between them progresses linearly, creating a seven-point scale of relational
2 Originally, we recruited participants over 79 years of age in the US (n = 12). For the sake of comparability with the Japanese sample, we excluded them from the analyses. Results remain virtually identical if including this sub-sample). Analyses on the American samples were previously reported in Na et al. (2010).
Auth
or
Manuscript
9
This article is protected by copyright. All rights reserved
closeness. Participants selected one pair of circles that best represents their relationships with
family members.
Intensity of Engaged Emotion. This measure was computed from the Implicit Social
Orientation Questionnaire (Kitayama, Mesquita, & Karasawa, 2006). In this questionnaire,
participants were asked to remember 10 social episodes (e.g. “when I had a positive interaction
with friends) and indicate the intensity of experiencing each of 12 emotions. Among those
emotions, three different types were embedded: general positive emotions (e.g., happiness),
socially engaged positive emotions (e.g., friendly feeling), & socially disengaged positive
emotions (e.g., personal pride). We calculated the relative intensity of experiencing engaged vs.
disengaged emotions as an index of the relative importance of social relations. The score was the
average of engaged minus disengaged emotions across ten episodes.
Predictors of Happiness. This measure was also computed from the Implicit Social
Orientation Questionnaire (Kitayama, Mesquita, & Karasawa, 2006). In this measure, we
examined the relative effects of socially engaged emotions vs. socially disengaged emotions on
happiness. The score was the regression coefficients predicting general positive emotions as a
function of socially engaged vs. socially disengaged emotions. To the extent that they view
themselves as connected to others, socially engaged emotions would be more associated with
happiness more than socially disengaged emotions.
Self-inflation. We calculated this measure following the guidelines of the Sociogram task
(Duffy, Uchida, & Kitayama, 2013). In the task, participants were asked to draw their social
network by using circles to represent the self and others. We calculated the size (i.e., diameter) of
the self-circle relative to the other-circles as an index of self-inflation. The score was calculated
by dividing the size of self-circle by the average size of other circles while controlling for the
overall area of the drawing (defined by the outer horizontal and vertical margins).
Vocal Stroop task. In the Vocal Stroop task, words that are either positive (e.g.,
"wedding") or negative (e.g., "funeral") are pronounced in either an emotionally positive or
negative tone (Kitayama & Ishii, 2002). Participants were asked to judge whether each word is
positive or negative and we measured the reaction time for congruent trials (positive words in
positive tone or negative words in negative tone) and incongruent trials (positive words in
negative tones or negative words in positive tones) as an index of their sensitivity to social cues.
Auth
or
Manuscript

10
This article is protected by copyright. All rights reserved
The score was the interference effect of vocal tone: reaction times for incongruent trials (e.g.,
"wedding" in a negative tone) minus the congruent trials (e.g., "wedding" in a positive tone).
Self-Construal scale. In the Self-Construal scale (Singelis, 1994), participants indicated
how much they agreed with ten independent (e.g. "I always try to have my own opinions") and
ten interdependent statements (e.g., "I am concerned about what people think of me"). The score
was ratings of interdependent statements minus those of independent statements.
Measures of Analytic vs. Holistic Cognitive Style
Inclusion task. The task investigated the amount of information participants considered
before making the final attribution (Choi, Dalal, Kim-Prieto, & Park, 2003). In the task,
participants imagined that they were a detective investigating a murder case. Participants
received 97 clues that may or may not be relevant to the case (e.g., the number of pets the victim
owned and the victim's history of sexual abuse by his/her parents) with a task to exclude clues
which they thought were causally irrelevant. The score was the number of items that participant
thought was causally relevant to the event.
Proverb task. The task measured whether people preferred dialectical (holistic) vs. linear
(analytic) reasoning (Peng & Nisbett, 1999). Participants read eight dialectical ("Too humble is
half proud") and eight non-dialectical ("One against all is certain to fall") proverbs, reporting
their preferences for each proverb on a 7-point scale (1 = Not at all to 7 = Very much). The score
was the relative preference for dialectical proverbs vs. the non-dialectical proverbs.
Change task. This task measured how much participants thought that contradictory events
depicted in a written scenario (e.g., people who fought as children might become lovers as adults
or a person who grew up in a low-income family might become rich) was likely to happen in the
future (Ji, Nisbett, & Su, 2001). To the extent that participant based their reasoning on focal
information (i.e., the current status), they believe that a future event that is contradictory to the
current status would be less likely to happen. There were eight scenarios, and participants were
asked to estimate a probability for each scenario (0-100 %).
Triad task. The task examined whether participants categorized 14 objects based on a
thematic relation vs. focal attributes (Chiu, 1972). For each object (e.g., “a cow”), participants
chose one of two alternatives (e.g., “chicken” vs. “grass”). One alternative was thematically
related to the target (e.g., grass) and the other belonged to the same taxonomic category as the
target (e.g., chicken). The final score concerned the number of thematic categorizations.
Auth
or
Manuscript
11
This article is protected by copyright. All rights reserved
Causal Attribution Task. The task examined the extent to which participants attributed
the causality to an actor vs. the context (Kitayama, Ishii, Imada, Takemura, & Ramaswamy,
2006). Specifically, participants read four vignettes describing either positive or negative
behavior of a target (two positive vignettes and two negative vignettes). For each vignette, they
indicated their level of agreement with two items reflecting dispositional attribution and two
items reflecting situational attribution on a 7-point scale (1: Strongly Disagree to 7: Strongly
Agree). Following prior research, the final score concerned participants’ ratings for situational
attributions minus those for dispositional attributions (Kitayama et al., 2006).
Outside-in task. The task measured whether participants took a third person (holistic) or
a first person (analytic) perspective when they thought about their past experience (Cohen &
Gunz, 2002). First, participants recalled a specific instance of two social situations (when you
had a conversation with a friend or when you were embarrassed). Next, they indicated whether
the memory was a first-person memory or a third-person memory on an 11-point scale (1 =
Entirely first-person memory to 11 = Entirely third-person memory).
Framed Line Test (FLT). The FLT measured how easily participants ignored vs. took into
account contextual information (Kitayama, Duffy, Kawamura, & Larsen, 2003). In this task,
participants saw a square with a line drawn inside it and were asked to reproduce the line inside a
new square of a different size either by duplicating its absolute length (ignoring the context of
the square) or its length relative to the square (by drawing a line with the same proportion as in
the original square). The score was the error in millimeters for the absolute judgments minus the
error in millimeters for the relative judgments.
Change Blindness task. The task examined how easily participants detected changes in
focal vs. backgrounds objects in order to measure whether they paid attention to focal vs.
background objects (Masuda & Nisbett, 2006). Specifically, participants watched four pairs of
animated scenes, such as a construction site and an airport. Each scene pair consisted of two
similar, but slightly different vignettes, and participants were asked to detect the difference
between them. The number of changes noticed in focal objects and contexts was counted.
Following prior research, the final score was the frequency of contextual changes noticed minus
the frequency of focal object changes noticed (Masuda & Nisbett, 2006). Note that both Japanese
and American participants detected more changes in the context than in focal objects. One may
assume that, if Americans are analytic, then they should always detect more changes in focal
Auth
or
Manuscript
12
This article is protected by copyright. All rights reserved
objects than in the context. However, if focal objects are not salient enough, even Americans
may not be attracted by them. In other words, one's tendency to attend to focal vs. background
objects is reflected in the relative difference between focal and background changes. A similar
logic applies to two other measures described below.
Underwater Animations task. Participants watched eight animated vignettes of fish and
were asked to recall what they saw after seeing each vignette. As in the narrative task, we
counted the number of statements about focal objects (i.e., focal fish) and background objects or
the context. The final score concerned the frequency that participants mentioned the context
minus the frequency they mentioned focal fish.
Narrative task. The task examined whether participants paid attention to the main
character vs. other supporting characters (Chua, Leu, & Nisbett, 2005). In this task, participants
watched two video clips (events at Swimming Pool and Library) and read two one-page stories
(about a working mother, Kathy, and a college graduate, Lea). After watching/reading each
episode, participants were asked to recall what they saw or read and we counted the number of
statements about focal characters and other supporting characters. The final score was the
frequency that other characters were mentioned minus the frequency that focal characters were
mentioned.
Twenty Statements Task. In the TST (Kuhn & McPartland, 1954), participants were asked
to describe themselves in twenty different ways. The statements were coded as reflecting
abstract/dispositional representation vs. concrete/contextual representation of self, following the
guidelines outlined by Rhee, Uleman, Lee, and Roman (1995). For instance, decontextualized
statements like “kind,” “friendly,” as well as universal and existential statements like “human
being,” or “myself” were quantified as abstract, whereas statements like “kind to my parents,”
“friendly to my neighbors,” as well as statements representing social identity “salesperson,” and
preferences “like to help people” were quantified as contextualized. The score was the proportion
of concrete/contextual statements.
Results
We replicated previously reported cultural differences on measures of social orientation
and cognitive style. As Table 3 indicates, Japanese showed more interdependent (vs. independent)
social orientation on most measures, with the cultural differences being of moderate/high
magnitude (d > .4; except for self-inflation). Similarly, Japanese showed more holistic (vs.
Auth
or
Manuscript
13
This article is protected by copyright. All rights reserved
analytic) cognitive style than Americans on most measures (except for FLT), with the cultural
differences being of low to moderate magnitude.3
If coherent group differences are due to different cultural distributions of unitary
constructs of social orientation and cognitive style, respectively, correlations among measures
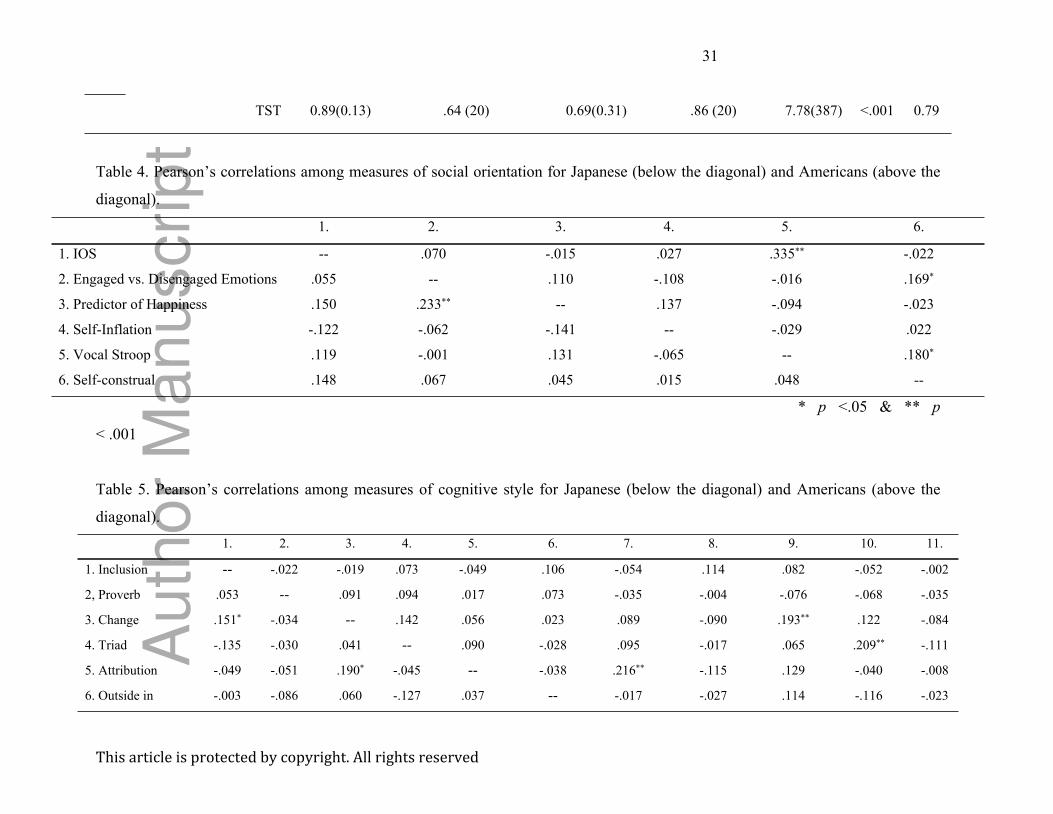
should be positive and significant. However, we observed negligible correlations for social
orientation not only in the US (mean r = .05 & median r = .02) but also in Japan (mean r = .04 &
median r = .05, see Table 4). These correlations did not increase when collapsing across cultural
groups, mean r = .10 & median r = .07 (STable 3). Similarly, cognitive style measures did not
correlate among themselves either in Japan (mean r = .03 & median r = -.004) or the US (mean r
= .02 & median r = -.01, see Table 5.) Correlations were weak even when collapsed across
cultures, mean r = .08 & mean r = .06 (STable 4).
Next, we conducted exploratory factor analyses (extraction: maximum likelihood) within
each culture and when collapsed across cultures to further examine the coherence at the
individual level. For social orientation, the first factor did not explain more variance (Japan:
17.44%, US: 17.85%; All: 19.01%) than each measure would on its own (i.e., when assuming
measures are orthogonal; 17%). Results were similar for cognitive style: The variance explained
by the first factor (Japan: 14.11%, US: 12.14%, All: 11.87%) was only trivially different from
the standard criterion of variance explained for one measure out of eleven (9%). The first factor
was driven by a single measure for both social orientation and cognitive style (see Table 6).
In sum, measures of social orientation or cognitive style showed little coherence at the
individual level. The findings replicated previously reported patterns of negligible correlations
for such measures among random-stratified samples of Japanese and Americans, despite
significant and frequently sizable cultural differences on most of the same measures. Zero-order
correlations remain negligible when measures of social orientation and cognitive style are
combined (see online supplement). However, the evidence so far concerns single-shot
observation of inter-individual variability across measures of ostensible constructs of social
orientation and cognitive style. Thus, it is possible that lack of coherence between tasks is due to
low stability of tasks – stability being a prerequisite for coherence between tasks (Molenaar &
3 Additional information regarding cultural differences in these samples is available in Kitayama, Karasawa, Grossmann, Na, Varnum, & Nisbett (2019).
Auth
or
Manuscript
14
This article is protected by copyright. All rights reserved
Campbell, 2009). We addressed the question of intra-individual stability in key measures of
social orientation / cognitive style in Study 2.
Study 2
To investigate whether within-person variability would be predictable, Study 2 examined
whether individual measures of social orientation / cognitive style are cross-temporally stable.
Further, we examined the stability of the relationships between individual tasks of social
orientation and cognitive style over time by probing existence and stability of behavioral profiles.
Such cross-temporally stable profiles can emerge despite trivial correlations among tasks
measured at a single sampling point.
Methods
Participants and procedures. We recruited 485 adults (201 males, 281 females, 1 other,
& 1 no response) from the Amazon Mechanical Turk at Time 1. Any worker on the MTurk could
participate in Study 2 as long as they lived in the US or Canada. They completed eight tasks (4
social orientation and 4 cognitive style tasks). All these tasks were selected based on the
frequency of use in prior research as well as high internal reliability in Study 1. About one month
after the initial data collection, we contacted participants and asked them to complete the same
eight tasks again. Two hundred and thirty-five participants out of 485 (retention rate: 48%)
participated in the second portion of Study 2 at Time 2. Both samples consisted predominantly of
people of European descent (Time 1: 380 European Americans/European Canadians, 37 African
Americans/Canadians, 26 Hispanic American/Canadians, 36 Asian Americans/Canadians, 5
Others, & 1 no response and Time 2: 191 European Americans/Canadians, 15 African
Americans/Canadians, 12 Hispanic American/Canadians, & 17 Asians Americans/Canadians).
The demographic composition of the sample did not differ significantly at Time 1 vs. Time 2
(see Table 1).
Measures of social orientation and cognitive style. We included four measures of
social orientation and cognitive style, respectively. We selected these measures based on their
high degree of internal stability in Study 1: Inclusion of Other in the Self scale (IOSS), Intensity
of engaged vs. disengaged emotion, Predictor of happiness, the Self-construal scale for social
orientation and Outside-in task, Inclusion task, Change task, and the modified Twenty Statement
task (TST). These measures were administered in the same way as Study 1 except that
participants were asked to describe themselves in ten different ways as opposed to twenty
Auth
or
Manuscript
15
This article is protected by copyright. All rights reserved
different ways in the modified TST. We calculated the scores for these tasks in the same way as
Study 1. Table 7 includes inter-item reliability for each multi-item task. Note that reliability was
calculated for sub-scale if applicable.
Results
Internal consistency across measures. First, we examined the inter-task consistency
among the distinct tasks measuring social orientation and cognitive style. As shown in Table 8,
correlations among the measures of social orientation were negligible at Time 1, with the
exception of a negative correlation between Engaged vs. Disengaged Emotions and Self-
Construal, r = -.182, p < .001. Both mean and median correlations were close to zero, mean r =
-.036 and median r = -.036. The same pattern was observed at Time 2. Specifically, most
correlations were negligible, with an exception of a negative correlation between the task
assessing the intensity of engaged vs. disengaged emotions and the self-construal task, r = -.233,
p < .001, mean & median rs = -.024 & -.013 (Table 8).
Turning to the cognitive style tasks (Table 9), we observed a single positive correlation
between the tasks measuring prediction of change and a tendency for third-person memory, r
= .127, p = .006 Overall, there was a trivial degree of inter-task convergence, mean r = .040 and
median r =.021. Similarly, correlations were negligible at Time 2, -.113 < rs. < .019, mean r =
-.037 and median r = -.010. To sum up, Study 2 replicated low degree of inter-individual
stability among measures of social orientation and cognitive style, even among the tasks showing
a conventionally moderate-high level of internal reliability.
Cross-temporal consistency. Next, we examined whether stability might be observed
within each person over time despite the negligible correlations among measures representing
social orientation and cognitive style. As shown on the diagonal in Table 8, for social orientation
each measure was significantly correlated with itself across time points. Moreover, except for
one task, the size of test-retest correlations was moderate-high, mean r = .564 and median r
= .592. The task that showed a low test-retest correlation concerned a single-item prediction of
happiness task, r = .161, p = .015. The single-item nature of this estimate may have resulted in
the small-moderate cross-temporal consistency of this measure.
Similarly, for cognitive style each measure showed a significant degree of consistency
over time, with moderate-high degree of test-retest stability, .47 < rs < .70 (see the diagonal in
Table 9). Overall, it is clear that the lack of inter-task correlations for measures of social
Auth
or
Manuscript
16
This article is protected by copyright. All rights reserved
orientation and measures of cognitive style is not due to low inter-temporal stability of the
measures themselves.
Behavioral profiles. Lack of inter-task consistency in social orientation and cognitive
style raises questions about the operationalization of these concepts as unitary constructs.
However, research on individual differences suggests that such a unitary construct approach is
just one of many ways to conceptualize individual differences. In particular, constructs could
also be represented through a network of situationally-contingent relationships (Epskamp,
Borsboom, & Fried, 2018; Fleeson & Furr, 2016; Mischel & Shoda, 1995), in turn forming latent
profiles for individuals (Gabriel, Daniels, Diefendorff, & Greguras, 2015; Van den Akker,
Deković, Asscher, Shiner, & Prinzie, 2013). In a similar vein, social orientation and cognitive
style could be represented through a network of task-contingent relationships. Person A may
score higher on the first task, but low on the second task, and moderate on the third task, whereas
person B may score low on the first task, but moderate on the second task and high on the third
task. Moreover, these relations might be stable across time.
To address this possibility, we estimated and tested the stability of latent profiles with
help of latent class analyses (LCA) on the Time 1 and Time 2 data, separately. For the LCA, we
standardized scores of each measure within each time point and selected participants who
completed all the measures at both time points. Also, following the suggestion from Stevens
(2012), five participants were excluded because their scores were extreme (more than 3 SDs
above/below the mean) at one or more measures. Including these participants resulted in several
classes with only one extreme participant in it. As a result, two hundred and thirty participants
were analyzed in the LCA.
Individual profiles would be considered as stable if the number and shape of classes
identified at Time 1 and Time 2 were similar to each other and if individuals were categorized
into the same class across two time points. We performed all latent profile analyses in Mplus 7.1
(Muthén & Muthén, 2012) using robust maximum likelihood estimator. To determine the
adequate number of classes, models with increasing number of classes were compared using the
following indexes: 1) the Akaike information criterion (AIC), 2) the Bayesian information
criterion (BIC), 3) the sample-size-adjusted Bayesian information criterion (SSA-BIC), 4)
Entropy, 5) the Lo-Mendell-Rubin Adjusted Likelihood Ratio Test (LMRT), and 6) the
Bootstrapped Likelihood Ration Test (BLRT). The lower values in AIC, BIC, and SSA-BIC
Auth
or
Manuscript
17
This article is protected by copyright. All rights reserved
indicate a better fit of the model to the data (Nylund, Asparouhov, & Muthén, 2007). Entropy is
a measure of classification quality, reflecting better quality as values approach 1 (Celeux &
Soromenho, 1996). Finally, LMRT and BLRT indicated whether the model provided a
significantly better model fit than a model with k-1 classes (Nylund et al., 2007).
First, results from four measures of social orientation generally pointed to a two-class
model over the other models at both Time 1 and Time 2 (see Table 10). LMRT and BLRT
indicates that the two-class model was better than the one class model, whereas the three-class
model was not significantly better than the two-class model. Also, given that entropy values
of .60 indicate around 80% correct classification, and entropy values of above .80 indicate 90%
correct classification (Lubke & Muthén, 2007), the classification in the two-class model is
considered as reasonably good. As shown in Figures 1(a) & 1(b), classes identified at Time 1 and
Time were minimally different from each other. Moreover, 85% of participants (196 out of 230;
40 in Class A & 156 in Class B) were classified into the same class across two time points. That
is, not only were classes identified at Time 1 and Time 2 were similar to each other; participants
belonged to the same class at both time points.
We found similar results for four measures of cognitive style. Indicators in Table 10
suggest that a two-class model showed the best fit. Both LMRT and BLRT shows that the two-
class model was significantly better than the one-class model. Although BLRT indicates that the
three-class model was significantly better than the two-class model, we selected the two-class
model over the three-class model because entropy was larger in the two-class model than the
three-class model. As shown in Figure 1(c) & 1(d), classes identified at Time 1 and Time 2 are
virtually the same. Also, 88% of participants (203 out of 230; 15 in Class A & 188 in Class B)
belonged to the same class across two time points. Thus, we can conclude that one’s behavior
profile across four measure of cognitive style remained stable. We also note that a similar
conclusion can be drawn from the three-class model.
To sum up, the results of Study 2 suggest that even internally reliable tasks assessing
social orientation and cognitive style cannot be reduced to unitary constructs at the individual
level: the inter-individual associations between the tasks were negligible. At the same time, most
tasks showed at least a moderate level of intra-individual, cross-temporal stability. Moreover,
both social orientation and cognitive style tasks have stable behavioral profiles: Latent Class
Auth
or
Manuscript
18
This article is protected by copyright. All rights reserved
Analysis indicated that profiles of performance across four social orientation tasks and four
cognitive style tasks, respectively, was quite stable from Time 1 to Time 2.
Discussion
In the present research, two of the most widely studied concepts in cultural psychology,
namely social orientation and cognitive style, show substantial inter-individual variability across
tasks ostensibly measuring the same constructs. Notably, this variability is not due to intra-
individual noise. Instead, the relations between measures presented in behavioral profiles of
these measures are stable over time. These insights call for a fundamental re-evaluation of
assumptions among researchers interested in cultural and individual differences in these
constructs in terms of both their operationalization and measurement. Below we summarize and
discuss some of the implications of the present work.
First, we demonstrated that the dissociation between group- and individual-level
processes holds when examining the most comprehensive set of measures of social orientation
and cognitive style available to date. Specifically, Study 1 extends the observation of negligible
inter-individual correlations between social orientation measures as well as between cognitive
style measures (Dong et al., 2018; Kitayama et al., 2009; Marquez & Ellwanger, 2014; Na et al.,
2010; San Martin et al., 2019) to more representative samples of Japanese and Americans. And
yet, on most measures we replicated prior research concerning cultural differences in social
orientation and cognitive style (Markus & Kitayama, 1991; Nisbett et al., 2001), observing
medium-size effects with our age- and social-class-diverse samples (Henrich, Heine, &
Norenzayan, 2010). Thus, despite significant group-level differences on social orientation and on
cognitive style measures, there is no reason to expect inter-individual convergence between tasks
for either construct. Indeed, making inferences about cross-task associations just because groups
systematically vary on these tasks is a bona fide example of the ecological fallacy (the fallacy
that occurs when inferences about individuals are deduced from inferences about groups to
which those individuals belong; Robinson, 1950).
The second insight from the present research is that some of the key tasks claiming to
measure either social orientation or cognitive style are intra-individually stable, and yet do not
correlate with each other. This observation suggests that the lack convergence of social
orientation and cognitive style tasks into unitary constructs is not due to lack of test-retest
reliability of the tasks. Rather, neither social orientation nor cognitive style appear to be unitary
Auth
or
Manuscript
19
This article is protected by copyright. All rights reserved
constructs (e.g., Campbell & Fiske, 1959), raising questions about the concepts’
operationalization and measurement. Study 2 starts to shed light on one possible way to re-think
these concepts. Latent profile analyses in Study 2 suggest that both social orientation and
cognitive style could be described using a set of loosely inter-related behavioral profiles. A
profile of loosely connected sub-components allows for substantial inter-individual variability,
simultaneously remaining intra-individually stable over time.
When examining the pattern of profiles identified in Study 2, differences in two classes
for social orientation appear to be largely driven by the Inclusion-of-Others-in-the-Self task (IOS;
see Figure 1), whereas differences in two classes for cognitive style are mostly driven by the
Outside-in and Change tasks (see Figure 2). To test whether these patterns would be applicable
to other samples, we sought to cross-validate the results from a set of Latent Class Analyses on
Japanese and American data in Study 1, including only measures equivalent to those used in
Study 2. Supplementary results reported online revealed that profiles identified from Studies 1 &
2 were similar to each other in terms of overall shape and yet, there were also variations across
them (see Figure S1). Though observed similarities suggest that the identified profiles in the
present research may be generalized to other samples, observed differences between studies
indicate that more work is necessary to systematically unpack and evaluate the stability of
profiles across diverse samples.
A practical implication of this perspective for culture-relevant concepts is that a single
measurement is not sufficient to characterize either cultural or individual differences in social
orientation or cognitive style, as it cannot capture such latent profiles. Rather, measuring people
across multiple situations appears necessary to fully capture how different people embody or do
not embody broad cultural constraints and affordances (Fleeson, 2007; Furr & Funder, 2004;
Mischel & Shoda, 1995).
The present work dovetails with emerging literature in social and personality psychology.
In particular, research on emotion suggests that cultural differences are best understood from a
perspective allowing for inter-individual variability in the ways emotions may manifest
themselves (Boiger et al., 2018). For instance, there can be various types of anger, and thus, the
vital question is what types of anger one experiences, not whether one experiences anger or not.
Accordingly, the central question for research on culture and emotion shifts from mere presence
of broad emotional categories such as anger across cultures, to the question of how different
Auth
or
Manuscript
20
This article is protected by copyright. All rights reserved
aspects of anger may be distributed across cultures (Boiger et al., 2018). Similar to this
proposition, it may be more informative to investigate how different profiles of social orientation
or cognitive style are distributed across cultures than to focus solely on cultural differences in
any given aspect of social orientation and cognitive style.
Before closing, we wish to highlight some important limitations in the present research.
Though most measures in the present research showed acceptable degree of inter-item reliability,
further measurement work is needed to further improve the reliability of the tasks, and to
subsequently test the inter-individual correlations between conceptually-related tasks of social
orientation or cognitive style. Also, previously developed tasks of social orientation and
cognitive style vary in the measurement format: Some measures consisted of Likert-type
response scales to vignettes (the attribution task), whereas others involved open-ended recall of
visual scenes (the change blindness task) or measured physical features of participant-generated
drawings (the FLT). Future work may control for the response format of tasks to test whether
inter-individual correlations among measures would improve. More relevant to the present work,
it appears prudent to consider emerging techniques enabling cultural psychologists to analyze
one’s behavior profile across different measures (e.g., Ram, Coccia, Conroy, Lorek, Orland,
Pincus,… & Gerstorf, 2013). Addressing this possibility would require the generation of new
instruments designed to assess various components of social orientation or cognitive style.
Finally, Study 2 focused on North American participants, opening the door for exploring intra-
individual stability in social orientation and cognitive style in other cultures.
Concluding remarks
For decades, social orientation and cognitive style have been at the center of the
demonstration about the role of culture in thought and behavior (Grossmann & Na, 2014;
Hamamura, 2012; Heine, 2010; Kitayama, Duffy, & Uchida, 2007; Markus & Kitayama, 2010;
Nisbett, 2007; Norenzayan, Choi, & Peng, 2007; Tsai, 2007). The breadth of social orientation
and cognitive style has allowed for detecting differences between many different groups such as
gender (Kashima et al., 1995), social class (Kraus et al., 2012; Stephens, Markus, & Phillips,
2014), and ethnicity (Markus & Conner, 2013). Possibly because of such breadth, many aspects
of social orientation and cognitive style appear to be only loosely related to each other. We argue
that a behavioral profile approach proposed in the present research is one way to conceptualize
these loosely related attributes. Moreover, we believe that such a new look at the cultural
Auth
or
Manuscript
21
This article is protected by copyright. All rights reserved
constructs could motivate a novel program of research situating intra-individual variability in
one’s various psychological tendencies such as emotions, motivations and behaviors.
Declaration of Conflicts of Interest
The author(s) declared no potential conflicts of interest concerning the research,
authorship, and publication of this article.
Funding
The authors disclosed receipt of the following financial support for the research,
authorship, and publication of this article: Preparation of this manuscript was supported by
the Social Sciences and Humanities Research Council of Canada grants (grant # 435-2014-0685),
as well as the Templeton Pathway to Character Project, and the Ontario Ministry of Research,
Innovation and Science (Early Researcher Award) to Igor Grossmann & National Institute on
Aging Grant 5RO129509-02, and National Science Foundation (NSF) Grant 2007: BCS 0717982
to Richard E. Nisbett and Shinobu Kitayama.
Acknowledgments
We thank Sonia Vintan for help with coding statements in Study 2 and William Chopik
and Jochen Gebauer for comments on an earlier version of this manuscript.
References
Allport, G. W., & Odbert, H. S. (1936). Trait-names: A psycho-lexical study. Psychological
Monographs, 47(1), i-171. doi: 10.1037/h0093360
Aron, A., Aron, E. N., & Smollan, D. (1992). Inclusion of Other in the Self Scale and the
structure of interpersonal closeness. Journal of Personality and Social Psychology, 63(4),
596-612.
Boiger, M., Ceulemans, E., De Leersnyder, J., Uchida, Y., Norasakkunkit, V., & Mesquita, B.
(2018). Beyond essentialism: Cultural differences in emotions revisited. Emotion, 18(8),
1142-1162. doi: http://dx.doi.org/10.1037/emo0000390
Auth
or
Manuscript
22
This article is protected by copyright. All rights reserved
Campbell, D. T., & Fiske, D. W. (1959). Convergent and discriminant validation by the
multitrait-multimethod matrix. Psychological Bulletin, 56(2), 81-105. doi:
10.1037/h0046016
Celeux, G., & Soromenho, G. (1996). An entropy criterion for assessing the number of clusters
in a mixture model. Journal of Classification, 13(2), 195-212. doi: 10.1007/bf01246098
Chiu, L.-H. (1972). A cross-cultural comparison of cognitive styles in Chinese and American
children. International Journal of Psychology, 7(4), 235-242.
Choi, I., Dalal, R., Kim-Prieto, C., & Park, H. (2003). Culture and judgment of causal relevance.
Journal of Personality and Social Psychology, 84(1), 46-59.
Choi, I., Koo, M., & Choi, J. A. (2007). Individual differences in analytic versus holistic thinking.
Personality and Social Psychology Bulletin, 33(5), 691-705.
Chua, H., Leu, J., & Nisbett, R. E. (2005). Diverging Views of Social Events. Personality and
Social Psychology Bulletin, 31, 925-934.
Cohen, D., & Gunz, A. (2002). As seen by the other... Perspectives on the self in the memories
and emotional perceptions of Easterners and Westerners. Psychological Science, 13(1),
55-59.
Dong, X., Talhelm, T., & Ren, X. (2018). Teens in Rice County Are More Interdependent and
Think More Holistically Than Nearby Wheat County. Social Psychological and
Personality Science, 1948550618808868. doi: 10.1177/1948550618808868
Duffy, S., Uchida, Y., & Kitayama, S. (2013). Symbolic self-inflation: A cross-cultural
comparison. Rutgers University - Camden.
Epskamp, S., Borsboom, D., & Fried, E. I. (2018). Estimating psychological networks and their
accuracy: A tutorial paper. Behavior Research Methods, 50(1), 195-212. doi:
10.3758/s13428-017-0862-1
Eysenck, H. J. (1990). Biological dimensions of personality. In L. A. Pervin (Ed.), Handbook of
Personality: Theory and research (pp. 244 - 276). New York: Guilford.
Fleeson, W. (2007). Situation-Based Contingencies Underlying Trait-Content Manifestation in
Behavior. Journal of Personality, 75(4), 825-862. doi: doi:10.1111/j.1467-
6494.2007.00458.x
Auth
or
Manuscript
23
This article is protected by copyright. All rights reserved
Fleeson, W., & Furr, R. M. (2016). Do broad character traits exist? Repeated assessments of
individuals, not group summaries from classic experiments, provide the relevant evidence.
In I. Fileva (Ed.), Questions of Character (pp. 231-248). Oxford University Press.
Furr, R. M. (2009). Profile analysis in person–situation integration. Journal of Research in
Personality, 43(2), 196-207. doi: https://doi.org/10.1016/j.jrp.2008.08.002
Furr, R. M., & Funder, D. C. (2004). Situational similarity and behavioral consistency:
Subjective, objective, variable-centered, and person-centered approaches. Journal of
Research in Personality, 38(5), 421-447. doi: https://doi.org/10.1016/j.jrp.2003.10.001
Gabriel, A. S., Daniels, M. A., Diefendorff, J. M., & Greguras, G. J. (2015). Emotional labor
actors: A latent profile analysis of emotional labor strategies. Journal of Applied
Psychology, 100(3), 863-879. doi: http://dx.doi.org/10.1037/a0037408
Greenfield, P. M. (2009). Linking social change and developmental change: Shifting pathways of
human development. Developmental Psychology, 45(2), 401-418. doi:
http://dx.doi.org/10.1037/a0014726
Grossmann, I., & Na, J. (2014). Research in culture and psychology: past lessons and future
challenges. WIREs Cognitive Science, 5, 1-14. doi: 10.1002/wcs.1267
Grossmann, I., & Varnum, M. E. W. (2011). Social class, culture, and cognition. Social
Psychological and Personality Science, 2(1), 81-89. doi: 10.1177/1948550610377119
Hamamura, T. (2012). Are Cultures Becoming Individualistic? A Cross-Temporal Comparison
of Individualism–Collectivism in the United States and Japan. Personality and Social
Psychology Review, 16(1), 3-24. doi: 10.1177/1088868311411587
Harris, M. (1979). Cultural materialism: The struggle for a science of culture. New York:
Vintage.
Heine, S. J. (2010). Cultural Psychology. In S. T. Fiske, D. T. Gilbert & G. Lindzey (Eds.),
Handbook of Social Psychology: Wiley.
Henrich, J., Heine, S. J., & Norenzayan, A. (2010). The weirdest people in the world?
Behavioral and Brain Sciences, 33(2-3), 61-83.
Hofstede, G. (1980). Culture's consequences: International differences in work-related values.
Beverly Hills: Sage.
James, W. (1890/1950). Principles of psychology. New York: Holt.
Auth
or
Manuscript

24
This article is protected by copyright. All rights reserved
Ji, L.-J., Nisbett, R. E., & Su, Y. (2001). Culture, change, and prediction. Psychological Science,
12(6), 450-456.
Kühnen, U., Hannover, B., Roeder, U., Shah, A. A., Schubert, B., Upmeyer, A., & Zakaria, S.
(2001). Cross-Cultural Variations in Identifying Embedded Figures: Comparisons from
the United States, Germany, Russia, and Malaysia. Journal of Cross-Cultural Psychology,
32(3), 366-372. doi: 10.1177/0022022101032003007
Kashima, Y., Yamaguchi, S., Kim, U., Choi, S.-C., Gelfand, M. J., & Yuki, M. (1995). Culture,
gender, and self: A perspective from individualism-collectivism research. Journal of
Personality and Social Psychology, 69, 925-937.
Kitayama, S. (2002). Culture and basic psychological processes--Toward a system view of
culture: Comment on Oyserman et al. (2002). Psychological Bulletin, 128(1), 89-96.
Kitayama, S., Duffy, S., Kawamura, T., & Larsen, J. T. (2003). Perceiving an object and its
context in different cultures: A cultural look at New Look. Psychological Science, 14(3),
201-206.
Kitayama, S., Duffy, S., & Uchida, Y. (2007). Self as cultural mode of being. In S. Kitayama &
D. Cohen (Eds.), Handbook of cultural psychology (pp. 136-174). New York: Guilford
Press.
Kitayama, S., & Ishii, K. (2002). Word and voice: Spontaneous attention to emotional utterances
in two languages. Cognition & Emotion, 16(1), 29-59.
Kitayama, S., Ishii, K., Imada, T., Takemura, K., & Ramaswamy, J. (2006). Voluntary
Settlement and the Spirit of Independence: Evidence from Japan's 'Northern Frontier.'.
Journal of Personality and Social Psychology, 91(3), 369-384.
Kitayama, S., Mesquita, B., & Karasawa, M. (2006). Cultural Affordances and Emotional
Experience: Socially Engaging and Disengaging Emotions in Japan and the United States.
Journal of Personality and Social Psychology, 91(5), 890-903.
Kitayama, S., Karasawa, M., Grossmann, I., Na, J., Varnum, M. E. W., & Nisbett, R.E. (2019).
East-West Differences in Cognitive Style and Social Orientation: Are They Real?
Retrieved from psyarxiv.com/c57ep
Kitayama, S., Park, H., Servincer, A. T., Karasawa, M., & Uskul, A. K. (2009). A Cultural Task
Analysis of Implicit Independence: Comparing North America, West Europe, and East
Asia. Journal of Personality and Social Psychology, 97(2), 236-255.
Auth
or
Manuscript
25
This article is protected by copyright. All rights reserved
Knight, N., & Nisbett, R. E. (2007). Culture, class and cognition: Evidence from Italy. Journal of
Cognition and Culture, 7(3), 283-291.
Kraus, M. W., Piff, P. K., Mendoza-Denton, R., Rheinschmidt, M. L., & Keltner, D. (2012).
Social class, solipsism, and contextualism: How the rich are different from the poor.
Psychological Review, 119(3), 546-572. doi: 10.1037/a0028756
Kuhn, M. H., & McPartland, T. S. (1954). An empirical investigation of self-attitudes. American
Sociological Review, 19, 68-76.
Lubke, G. H., & Muthén, B. O. (2007). Performance of Factor Mixture Models as a Function of
Model Size , Covariate Effects , and Class-Specific Parameters. Structural Equation
Modeling: A Multidisciplinary Journal, 14(1), 26-47. doi: OI:
10.1207/s15328007sem1401_2
Malinowski, B. (1992). Argonauts of the western Pacific. London: Routledge.
Markus, H. R., & Conner, A. L. (2013). Clash! 8 Cultural conflicts that makes us who we are.
New York: Hudson Street Press.
Markus, H. R., & Kitayama, S. (1991). Culture and the self: Implications for cognition, emotion,
and motivation. Psychological Review, 98, 224-253.
Markus, H. R., & Kitayama, S. (2010). Cultures and selves: A cycle of mutual constitution.
Perspectives on Psychological Science, 5(4), 420-430.
Marquez, R. C., & Ellwanger, J. (2014). Independent and Interdependent Self-Construals do Not
Predict Analytic or Holistic Reasoning. Psychological Reports, 115(1), 326-338. doi:
10.2466/17.07.PR0.115c16z8
Masuda, T., & Nisbett, R. E. (2006). Culture and Change Blindness. Cognitive Science, 30(2),
381-399.
McCrae, R. R., & Costa, P. T. (1999). A Five-Factor theory of personality Handbook of
personality: Theory and research, 2nd ed. (pp. 139-153). New York, NY, US: Guilford
Press.
Mischel, W., & Shoda, Y. (1995). A cognitive-affective system theory of personality:
Reconceptualizing situations, dispositions, dynamics, and invariance in personality
structure. Psychological Review, 102(2), 246-268.
Muthén, L. K., & Muthén, B. O. (2012). Mplus statistical modeling software: Release 7.1. Los
Angeles, CA: Muthén & Muthén.
Auth
or
Manuscript
26
This article is protected by copyright. All rights reserved
Na, J., Grossmann, I., Varnum, M. E. W., Kitayama, S., Gonzalez, R., & Nisbett, R. E. (2010).
Cultural differences are not always reducible to individual differences. Proceedings of the
National Academy of Sciences of the United States of America, 107(14), 6192-6197.
Nisbett, R. E. (2007). A psychological perspective: Cultural psychology--Past, present, and
future. In S. Kitayama & D. Cohen (Eds.), Handbook of cultural psychology. (pp. 837-
844). New York, NY US: Guilford Press.
Nisbett, R. E., Peng, K., Choi, I., & Norenzayan, A. (2001). Culture and systems of thought:
Holistic versus analytic cognition. Psychological Review, 108(2), 291-310.
Norenzayan, A., Choi, I., & Peng, K. (2007). Perception and cognition. In S. Kitayama & D.
Cohen (Eds.), Handbook of cultural psychology. (pp. 569-594). New York, NY US:
Guilford Press.
Nylund, K. L., Asparouhov, T., & Muthén, B. O. (2007). Deciding on the Number of Classes in
Latent Class Analysis and Growth Mixture Modeling: A Monte Carlo Simulation Study.
Structural Equation Modeling: A Multidisciplinary Journal, 14(4), 535-569. doi:
10.1080/10705510701575396
Peng, K., & Nisbett, R. E. (1999). Culture, dialectics, and reasoning about contradiction.
American Psychologist, 54(9), 741-754.
Ram, N., Coccia, M., Conroy, D., Lorek, A., Orland, B., Pincus, A., ... & Gerstorf, D. (2013).
Behavioral landscapes and change in behavioral landscapes: A multiple time-scale
density distribution approach. Research in Human Development, 10(1), 88-110.
Rhee, E., Uleman, J. S., Lee, H. K., & Roman, R. J. (1995). Spontaneous self-descriptions and
ethnic identities in individualistic and collectivistic cultures. Journal of Personality and
Social Psychology, 69(1), 142-152.
Robinson, W. (1950). Ecological Correlations and the Behavior of Individuals. American
Sociological Review, 15(3), 351-357.
San Martin, A., Schug, J., & Maddux, W. W. (2019). Relational mobility and cultural differences
in analytic and holistic thinking. Journal of Personality and Social Psychology, 116(4),
495-518. doi: http://dx.doi.org/10.1037/pspa0000142
Shoda, Y., Mischel, W., & Wright, J. C. (1994). Intraindividual stability in the organization and
patterning of behavior: Incorporating psychological situations into the idiographic
Auth
or
Manuscript
27
This article is protected by copyright. All rights reserved
analysis of personality. Journal of Personality and Social Psychology, 67(4), 674-687.
doi: http://dx.doi.org/10.1037/0022-3514.67.4.674
Shweder, R. A. (1991). Thinking through cultures: Expeditions in cultural psychology.
Cambridge, MA: Harvard University Press.
Singelis, T. M. (1994). The measurement of independent and interdependent self-construals.
Personality and Social Psychology Bulletin, 20(5), 580-591.
Skinner, B. F. (1938). The behavior of organisms: An experimental analysis. Englewood Cliffs,
NJ: Prentice-Hall.
Smith, P. B., & Bond, M. H. (1998). Social Psychology Across Cultures (2nd ed.). Boston: Allyn
and Bacon.
Stephens, N. M., Fryberg, S. A., & Markus, H. R. (2011). When choice does not equal freedom:
A sociocultural analysis of agency in working-class American contexts. Social
Psychological and Personality Science, 2(1), 33-41. doi: 10.1177/1948550610378757
Stephens, N. M., Markus, H. R., & Phillips, L. T. (2014). Social class culture cycles: How three
gateway contexts shape selves and fuel inequality. Annual Review of Psychology, 65,
611-634. doi: 10.1146/annurev-psych-010213-115143
Stevens, J. P. (2012). Applied Multivariate Statistics for the Social Sciences (5th ed.): Routledge.
Tönnies, F. (1887/1988). Community and Society. New Brunswick: Oxford Transaction Books.
Triandis, H. C. (1989). The self and social behavior in differing cultural contexts. Psychological
Review, 96, 269-289.
Triandis, H. C. (1996). The psychological measurement of cultural syndromes. American
Psychologist, 51(4), 407-415.
Tsai, J. L. (2007). Ideal affect: Cultural causes and behavioral consequences. Perspectives on
Psychological Science, 2(3), 242-259.
Van den Akker, A. L., Deković, M., Asscher, J. J., Shiner, R. L., & Prinzie, P. (2013).
Personality types in childhood: Relations to latent trajectory classes of problem behavior
and overreactive parenting across the transition into adolescence. Journal of Personality
and Social Psychology, 104(4), 750-764. doi: http://dx.doi.org/10.1037/a0031184
Varnum, M. E. W., Grossmann, I., Katunar, D., Kitayama, S., & Nisbett, R. E. (2008). Holism in
a European cultural context: Differences in cognitive style between Central and East
Europeans and Westerners. Journal of Cognition and Culture, 8(3), 321-333.
Auth
or
Manuscript
28
This article is protected by copyright. All rights reserved
Varnum, M. E. W., Grossmann, I., Kitayama, S., & Nisbett, R. E. (2010). The Origin of Cultural
Differences in Cognition: Evidence for the Social Orientation Hypothesis. Current
Directions in Psychological Science, 19(1), 9-13.
Varnum, M. E. W., Na, J., Murata, A., & Kitayama, S. (2012). Social class differences in N400
indicate differences in spontaneous trait inference. Journal of Experimental Psychology:
General, 141(3), 518-526. doi: 10.1037/a0026104
Witkin, H. A., & Goodenough, D. R. (1981). Cognitive styles: essence and origins. Field
dependence and field independence. Psychological Issues(51), 1-141.
Wundt, W. (1888). Uber Ziele und Wege der Volkerpsychologie. Philosphische Studien, 4.
Table 1. Demographic information
Tab
le 2.
The
number of participants for each measure in Japan and the US.
N M Age (SD) % of Female % of College Education
Study 1: JPN 433 46.60 (13.84) 49.7% 75.8%
Study 1: US 233 48.23 (15.34) 51.1% 87.6%
Study 2: Time 1 485 36.80 (11.43) 58.1% 91.7%
Study 2: Time 2 235 37.99 (11.45) 60.4% 91.9%
Auth
or
Manuscript
29
This article is protected by copyright. All rights reserved
Japan US Japan US
IOS 172 187 Inclusion 188 221
Engaged vs.
Disengaged Emotions
429 227 Proverb 188 231
Predictor of
Happiness
424 227 Change 178 209
Self-Inflation 173 185 Triad 172 189
Vocal Stroop 161 153 Attribution 433 188
Self-Construal 431 189 Outside in 186 228
All 154 141 FLT 178 210
Change Blindness 155 204
Narrative 173 199
Underwater 177 203
TST 167 222
All 138 151
Auth
or
Manuscript

30
This article is protected by copyright. All rights reserved
Table 3. Means, SDs, and reliabilities of measures of social orientation and cognitive style.
Japan US JPN vs. US
α (n) α (n)M(SD)
Ind/Ana Int/HolM(SD)
Ind/Ana Int/Holt(df) p d
IOS 5.65(1.31) 5.07(1.52) 3.81(357) <.001 0.40
Intensity of Engaged
Emotions0.32(0.72) .78(10) .74(10) -0.43(0.62) .78(10) .73(10) 13.26(654) <.001 1.09
Predictor of Happiness 0.50(0.48) 0.23(0.60) 6.15(649) <.001 0.51
Self-inflation -0.14(0.30) -0.25(0.40) 3.07(356) .002 0.33
Vocal Stroop (log) 6.28(0.23) .84(14) 6.04(0.67) .94(14) 4.22(312) <.001 0.47Soci
al
Ori
enta
tion
Self-Construal -0.11(0.54) .65(12) .69(12) -0.43(0.88) .52(12) .62(12) 5.39(618) <.001 0.43
Inclusive reasoning 66.52(18.42) .96 (97) 47.78(18.27) .96(97) 10.30(407) <.001 1.02
Proverb 0.50(0.70) .87 (8) .88 (8) 0.32(0.80) .86 (8) .85 (8) 2.41(417) .016 0.24
Change 46.37(12.39) .70 (8) 32.1(10.61) .73(8) 12.20(385) .001 1.24
Triad (log) -0.99(0.80) .88 (14) -1.11(0.72) .78(14) 1.58(359) .115 0.18
Attribution 0.11(1.10) .67 (8) .65 (8) -0.17(1.26) .58 (8) .56 (8) 2.78(619) .006 0.24
Outside in (log) 1.17(0.74) .52 (2) 0.67(0.73) .62(2) 6.91(412) <.001 0.70
FLT 6.65(7.66) .64 (6) .48 (4) 6.83(6.74) .62 (6) .52 (6) -0.24(386) .807 -0.02
Change Blindness 0.35(0.84) .57 (4) .51(4) 0.05(0.72) .63 (4) .63 (4) 3.54(357) <.001 0.38
Underwater Animation
(log)3.92(0.49) .93 (8) .87 (8) 4.3(0.40) .88 (8) .87 (8) 8.30(378) <.001 0.86
Cogn
itiv
e S
tyle
Narrative -58.66(33.83) .78 (4) .60 (4) -68.25(37.76) .64 (2) .24 (2) 2.56(370) .011 0.27
Au
tho
r M
an
uscrip
t
31
This article is protected by copyright. All rights reserved
TST 0.89(0.13) .64 (20) 0.69(0.31) .86 (20) 7.78(387) <.001 0.79
Table 4. Pearson’s correlations among measures of social orientation for Japanese (below the diagonal) and Americans (above the
diagonal).
1. 2. 3. 4. 5. 6.
1. IOS -- .070 -.015 .027 .335** -.022
2. Engaged vs. Disengaged Emotions .055 -- .110 -.108 -.016 .169*
3. Predictor of Happiness .150 .233** -- .137 -.094 -.023
4. Self-Inflation -.122 -.062 -.141 -- -.029 .022
5. Vocal Stroop .119 -.001 .131 -.065 -- .180*
6. Self-construal .148 .067 .045 .015 .048 --
* p <.05 & ** p
< .001
Table 5. Pearson’s correlations among measures of cognitive style for Japanese (below the diagonal) and Americans (above the
diagonal).
1. 2. 3. 4. 5. 6. 7. 8. 9. 10. 11.
1. Inclusion -- -.022 -.019 .073 -.049 .106 -.054 .114 .082 -.052 -.002
2, Proverb .053 -- .091 .094 .017 .073 -.035 -.004 -.076 -.068 -.035
3. Change .151* -.034 -- .142 .056 .023 .089 -.090 .193** .122 -.084
4. Triad -.135 -.030 .041 -- .090 -.028 .095 -.017 .065 .209** -.111
5. Attribution -.049 -.051 .190* -.045 -- -.038 .216** -.115 .129 -.040 -.008
6. Outside in -.003 -.086 .060 -.127 .037 -- -.017 -.027 .114 -.116 -.023
Au
tho
r M
an
uscrip
t
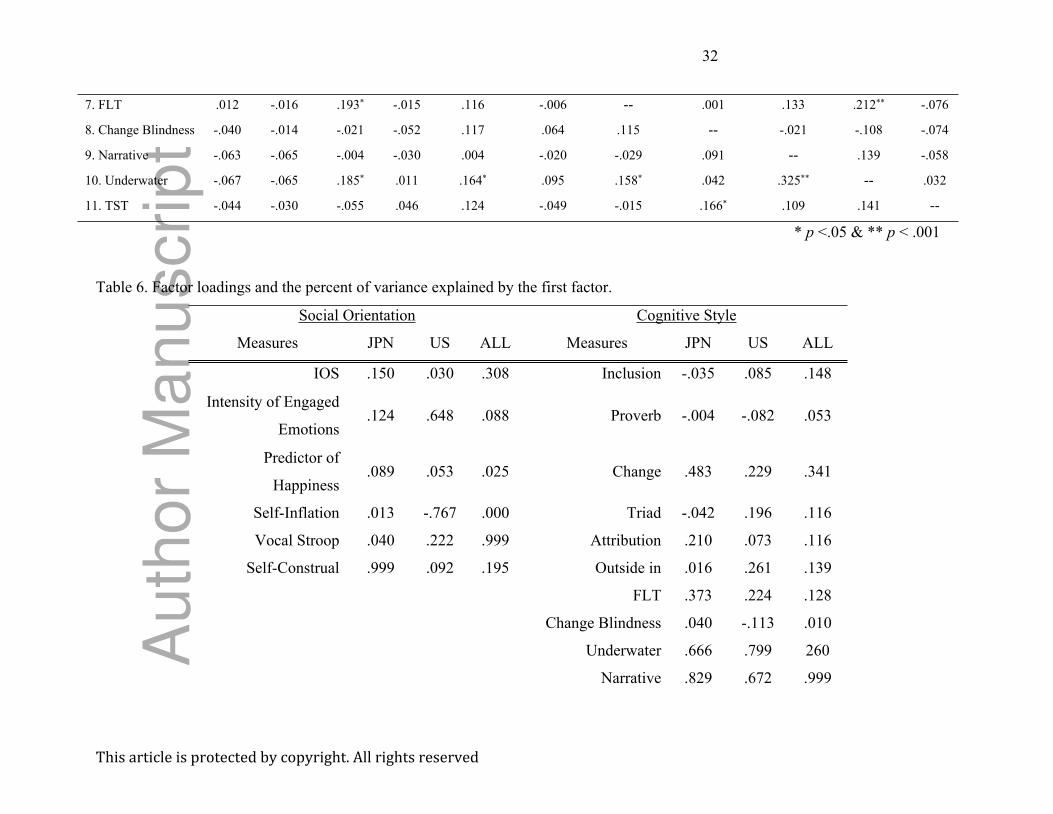
32
This article is protected by copyright. All rights reserved
7. FLT .012 -.016 .193* -.015 .116 -.006 -- .001 .133 .212** -.076
8. Change Blindness -.040 -.014 -.021 -.052 .117 .064 .115 -- -.021 -.108 -.074
9. Narrative -.063 -.065 -.004 -.030 .004 -.020 -.029 .091 -- .139 -.058
10. Underwater -.067 -.065 .185* .011 .164* .095 .158* .042 .325** -- .032
11. TST -.044 -.030 -.055 .046 .124 -.049 -.015 .166* .109 .141 --
* p <.05 & ** p < .001
Table 6. Factor loadings and the percent of variance explained by the first factor.
Social Orientation Cognitive Style
Measures JPN US ALL Measures JPN US ALL
IOS .150 .030 .308 Inclusion -.035 .085 .148
Intensity of Engaged
Emotions.124 .648 .088 Proverb -.004 -.082 .053
Predictor of
Happiness.089 .053 .025 Change .483 .229 .341
Self-Inflation .013 -.767 .000 Triad -.042 .196 .116
Vocal Stroop .040 .222 .999 Attribution .210 .073 .116
Self-Construal .999 .092 .195 Outside in .016 .261 .139
FLT .373 .224 .128
Change Blindness .040 -.113 .010
Underwater .666 .799 260
Narrative .829 .672 .999
Au
tho
r M
an
uscrip
t
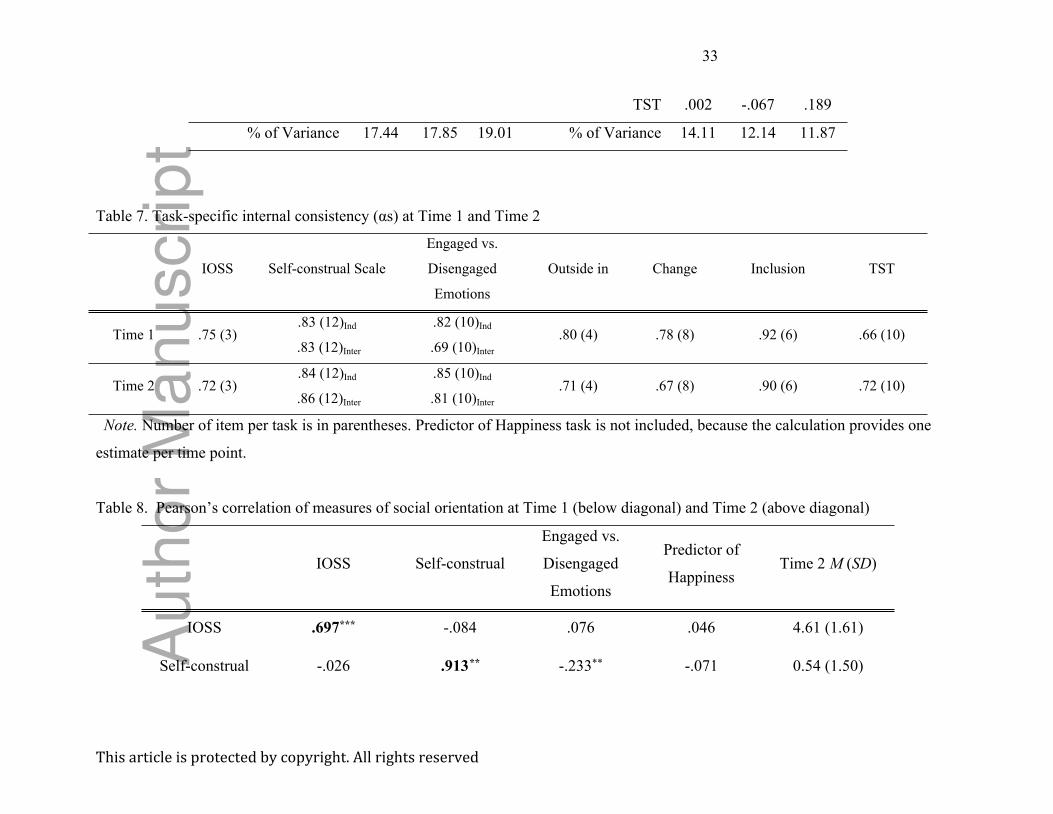
33
This article is protected by copyright. All rights reserved
TST .002 -.067 .189
% of Variance 17.44 17.85 19.01 % of Variance 14.11 12.14 11.87
Table 7. Task-specific internal consistency (αs) at Time 1 and Time 2
IOSS Self-construal Scale
Engaged vs.
Disengaged
Emotions
Outside in Change Inclusion TST
Time 1 .75 (3).83 (12)Ind
.83 (12)Inter
.82 (10)Ind
.69 (10)Inter
.80 (4) .78 (8) .92 (6) .66 (10)
Time 2 .72 (3).84 (12)Ind
.86 (12)Inter
.85 (10)Ind
.81 (10)Inter
.71 (4) .67 (8) .90 (6) .72 (10)
Note. Number of item per task is in parentheses. Predictor of Happiness task is not included, because the calculation provides one
estimate per time point.
Table 8. Pearson’s correlation of measures of social orientation at Time 1 (below diagonal) and Time 2 (above diagonal)
IOSS Self-construal
Engaged vs.
Disengaged
Emotions
Predictor of
HappinessTime 2 M (SD)
IOSS .697*** -.084 .076 .046 4.61 (1.61)
Self-construal -.026 .913** -.233** -.071 0.54 (1.50)Au
tho
r M
an
uscrip
t
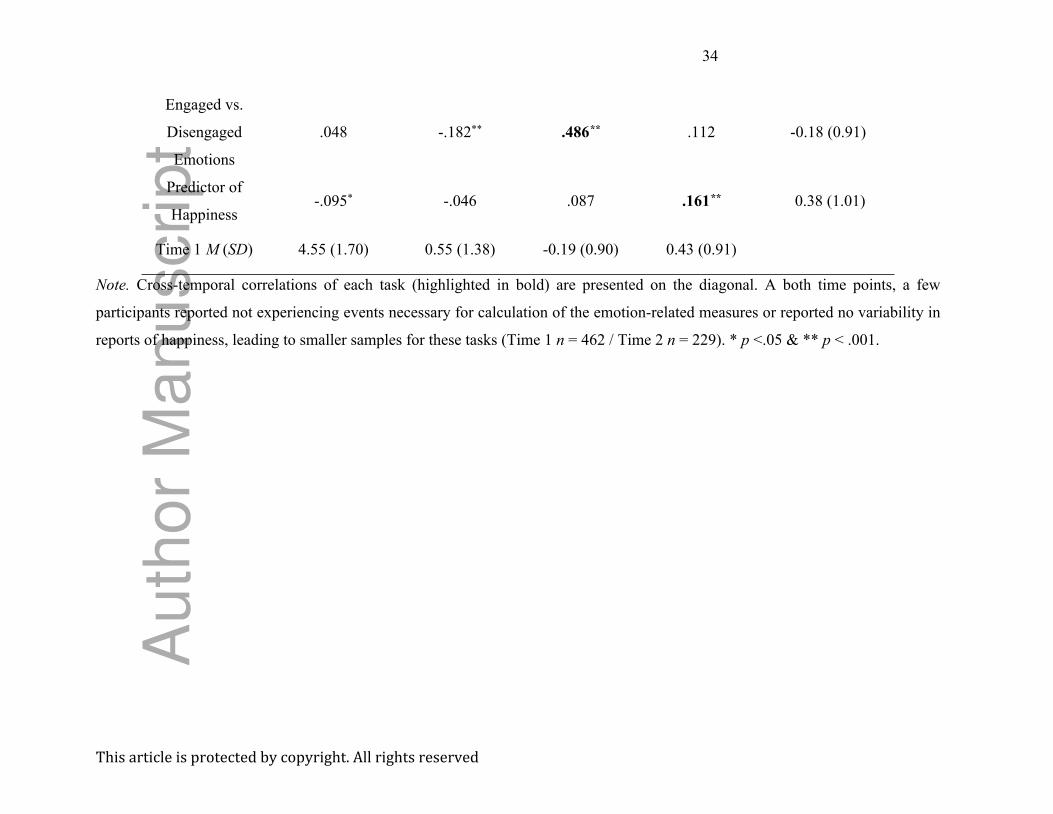
34
This article is protected by copyright. All rights reserved
Engaged vs.
Disengaged
Emotions
.048 -.182** .486** .112 -0.18 (0.91)
Predictor of
Happiness-.095* -.046 .087 .161** 0.38 (1.01)
Time 1 M (SD) 4.55 (1.70) 0.55 (1.38) -0.19 (0.90) 0.43 (0.91)
Note. Cross-temporal correlations of each task (highlighted in bold) are presented on the diagonal. A both time points, a few
participants reported not experiencing events necessary for calculation of the emotion-related measures or reported no variability in
reports of happiness, leading to smaller samples for these tasks (Time 1 n = 462 / Time 2 n = 229). * p <.05 & ** p < .001.
Au
tho
r M
an
uscrip
t
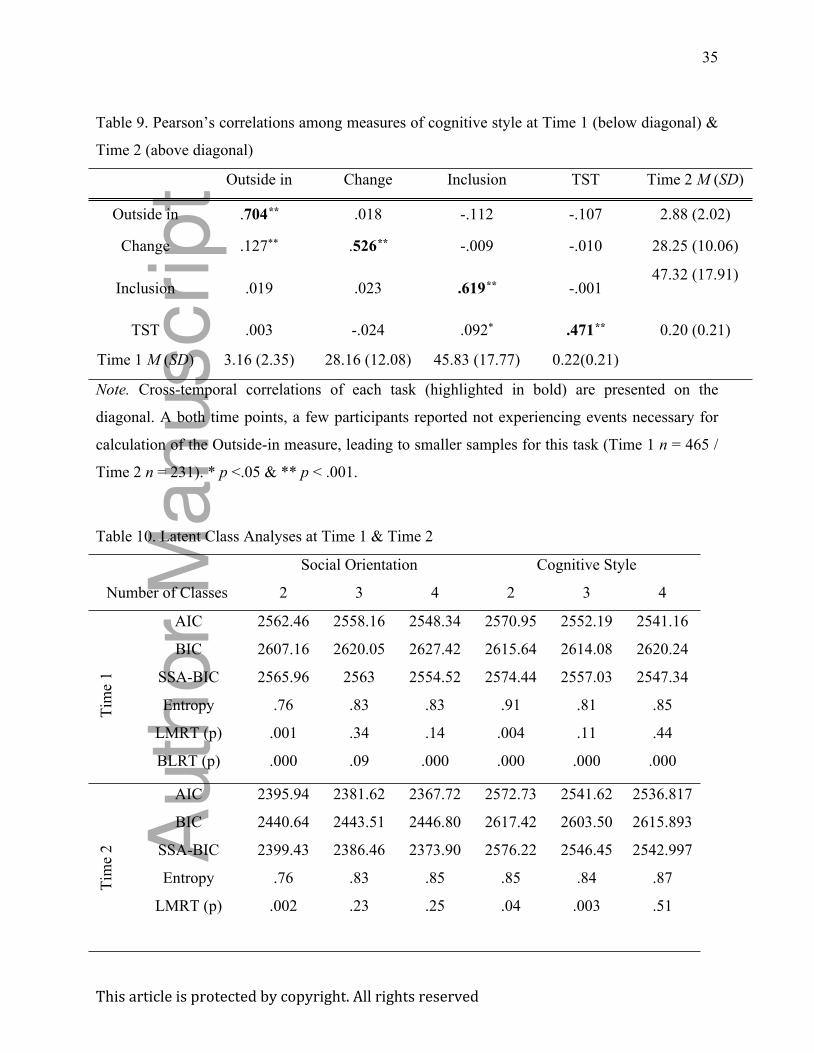
35
This article is protected by copyright. All rights reserved
Table 9. Pearson’s correlations among measures of cognitive style at Time 1 (below diagonal) &
Time 2 (above diagonal)
Outside in Change Inclusion TST Time 2 M (SD)
Outside in .704** .018 -.112 -.107 2.88 (2.02)
Change .127** .526** -.009 -.010 28.25 (10.06)
Inclusion .019 .023 .619** -.00147.32 (17.91)
TST .003 -.024 .092* .471** 0.20 (0.21)
Time 1 M (SD) 3.16 (2.35) 28.16 (12.08) 45.83 (17.77) 0.22(0.21)
Note. Cross-temporal correlations of each task (highlighted in bold) are presented on the
diagonal. A both time points, a few participants reported not experiencing events necessary for
calculation of the Outside-in measure, leading to smaller samples for this task (Time 1 n = 465 /
Time 2 n = 231). * p <.05 & ** p < .001.
Table 10. Latent Class Analyses at Time 1 & Time 2
Social Orientation Cognitive Style
Number of Classes 2 3 4 2 3 4
AIC 2562.46 2558.16 2548.34 2570.95 2552.19 2541.16
BIC 2607.16 2620.05 2627.42 2615.64 2614.08 2620.24
SSA-BIC 2565.96 2563 2554.52 2574.44 2557.03 2547.34
Entropy .76 .83 .83 .91 .81 .85
LMRT (p) .001 .34 .14 .004 .11 .44
Tim
e 1
BLRT (p) .000 .09 .000 .000 .000 .000
AIC 2395.94 2381.62 2367.72 2572.73 2541.62 2536.817
BIC 2440.64 2443.51 2446.80 2617.42 2603.50 2615.893
SSA-BIC 2399.43 2386.46 2373.90 2576.22 2546.45 2542.997
Entropy .76 .83 .85 .85 .84 .87
LMRT (p) .002 .23 .25 .04 .003 .51
Tim
e 2 Au
tho
r M
an
uscrip
t

36
This article is protected by copyright. All rights reserved
Au
tho
r M
an
uscrip
t
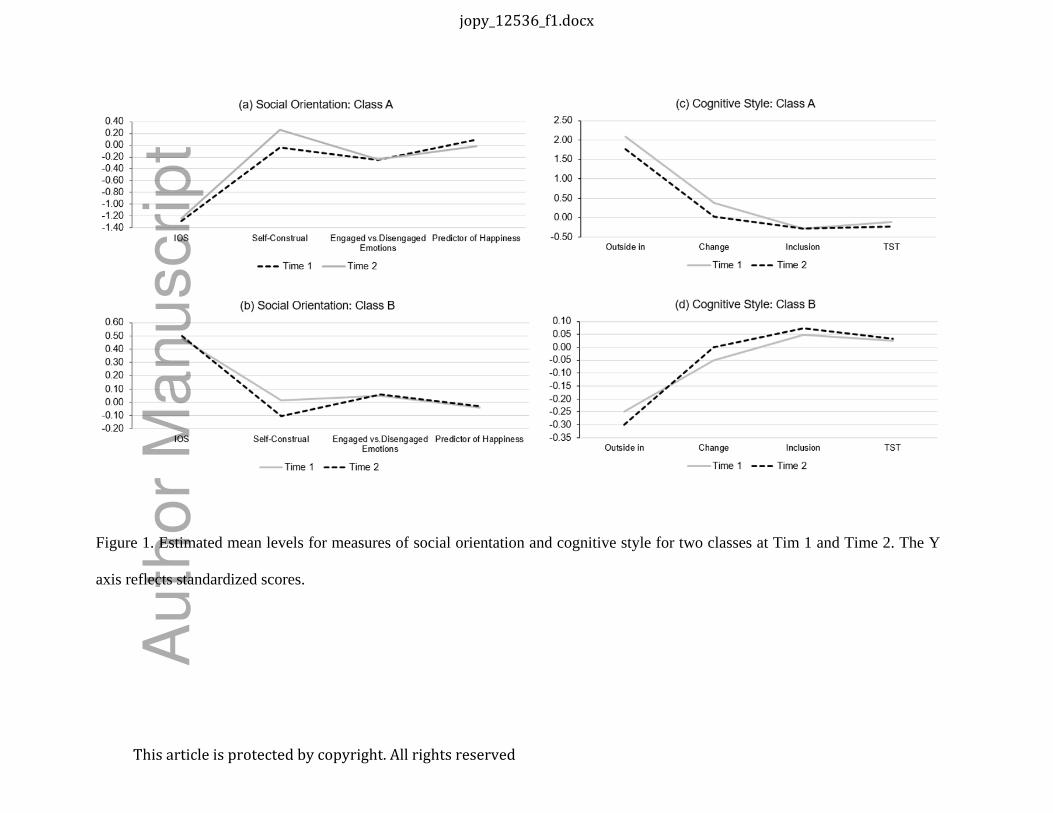
Figure 1. Estimated mean levels for measures of social orientation and cognitive style for two classes at Tim 1 and Time 2. The Y
axis reflects standardized scores.
jopy_12536_f1.docx
Thisarticleisprotectedbycopyright.Allrightsreserved
Auth
or
Manuscript