als9527.0018.004.pdf - Deep Blue Repositories
100
-
Upload
khangminh22 -
Category
Documents
-
view
2 -
download
0
Transcript of als9527.0018.004.pdf - Deep Blue Repositories


The Endangered Species UPDATE published this issue in partnership with the Defenders of Wildlife. Defenders of Wildlife is a leading nonprofit con- servation organization recognized as one of the nation's most progressive advocates for wildlife and its habitat. Defenders uses education, litigation, research and promotion of sound conservation policies to protect wild ani- mals and plants in their natural communities. Defenders has been a national leader in wolf restoration and protection for two decades. Founded in 1947, defenders is a 501(c)(3) membership organization with more than 430,000 members and supporters. It is headquartered in Washington, DC with field offices around the country.
Last November, Defenders of Wildlife hosted Carnivores 2000, a con- ference on carnivore conservation in the twenty-first century. The confer- ence, held in Denver, Colorado, spanned the full taxonomic range of carni- vores and addressed both biological and sociological issues impacting car- nivore conservation in North America and abroad. Due to its overwhelming success, Defenders of Wildlife will hold a second conference, Carnivores 2002, in Monterey, California November 18 to 20,2002. This conference will likewise encompass the full range of marine and terrestrial carnivores. For more information, visit www.defenders.org/carnivores2002. We hope to see you there.
The editors and staff would like to sincerely thank B. Moose PetersonIWRP for contributing photographs to this issue, and Rochelle Mason for contribut- ing her series, Focus on Nature.
Endangered Species UPDATE
A forum for information exchange on endangered species issues JulyIAugust 2001 Vol. 18 No. 4
M. Elsbeth McPhee ................. Managing Editor Jennifer Jacobus Mackay.. ........ Associate Editor Nina Fascione ................................. Guest Editor Stephen Kendrot .............................. Guest Editor Martin E. Smith. .............................. Guest Editor
......................... Paula Zemrowski Content Editor Deborah Kleinman ....................... Content Editor Chris Wood .................................. Content Editor SaulAlarcon.. .................. Web Page Coordinator Terry L. Root ............................. Faculty Advisor
Advisorv Board Richard Block
Santa Barbara Zoological Gardens Susan Haig
Forest and Rangeland Ecosystem Science Center, USGS Oregon State University
Chris Howes Chicago Zoological Society
Patrick O'Brien Chevron Ecological Services
Hal Salwasser U.S. Forest Service, Boone and Crockett Club
Imtructiom for Authors: The Endangered Species UPDATE welcomes articles, editorial comments, and announcements related to species protection. For W e r i n f o d o n contact the editor.
Subscription Information: The Endangered Species UPDATE is published six times per year by the School of Natural Resources and Environment at The University of Michigan. Annual rates are $28 for regular subscriptions, and $23 for students and senior c i h n s (add $5 for postage outside the US). Send check or money order (payable to The University of Michigan) to:
Endangered Species UPDATE School of Natural Resources and Environment
The University of Michigan Ann Arbor, MI 48109-1 115
(734) 763-3243; fax (734) 936-2195 E-mail: [email protected]
http:llwww.umich.eduI-esupdate
Cover: Black bear (Ursus americanus). Photograph by B. Moose Peterson~WRP.
The views expressed in the Endangered Species UPDATE may not necessarily reflect those of the U.S. Fish and Wildlife Service or The University of Michigan.
The Endangered Species UPDATE was made possible in part by the David and Lucile Packard Foundation, Turner Foundation. Boone and Cruckett Club, Chevron Corporation, and the U.S. FWS Division of Endangered Species Region 3.
@ & y @ " Q 0'
@printed on recycled paper
94 Endangered Species UPDATE Vol. 18 No. 4 2001

Table of Contents ...................................................................... Carnivore Conservation in the Twenty-first Century 97
Nina Fascione and M. Elsbeth McPhee
I. Theory and Methods in Carnivore Conservation Who Limits Whom: Predators or Prey? ................. .... .......................................................... 98 Roger A. Powell
A New Approach to Understanding Canid Populations Using an Individual-Based Computer Model: Preliminary Results ................. ... ................................ 103 William C. Pitt, Frederick F. Knowlton, and Paul W. Box
11. Carnivores and Habitat Mapping Occupied Habitat for Forest Carnivores in the American West and Estimating their Conservation Status ................................................................................. 107 David L. Gaillard
Road Density as a Factor in Habitat Selection by Wolves and ............................................. .................... Other Carnivores in the Great Lakes Region .... 110
Adrian P. Wydeven, David J. Mladenoff, Theodore A. Sickley, Bruce E. Kohn, R. P. Thiel, and Jennifer L. Hansen
A Predator-Habitat Assessment for Felids in the Inland Atlantic Forest ............................................................................. of Eastern Paraguay: A Preliminary Analysis 115
Gerald L. Zuercher, Philip S. Gipson, and Kim Hill
111. Raptor Conservation Status of the California Condor and Mortality Factors Affecting Recovery ................................ 120 Kelly J. Sorenson, L. Joseph Burnett, and James R. Davis
Raptors as Vermin: A History of Human Attitudes towards I . Pennsylvan~a s B~rds of Prey ..................................................................................................... 124
Keith L. Bildstein
IV. Felid Conservation Status and Conservation of Endangered Cats along the US.-Mexico Border .......................... 129 Melissa Grigione, Arturo Caso, Rurik List, and Carlos Lopez-Gonzalez
Molecular Scatology as a Conservation Tool ............................................................................. 133 Laura Farrell
Linking Snow Leopard Conservation and People-Wildlife Conflict Resolution: Grassroots Measures to Protect the Endangered Snow Leopard from
..................................................................................................................... Herder Retribution 138 Rodney Jackson and Rinchen Wangehuk
Vol, 18 No. 4 2001 Endangered Species UPDATE 95

K Canid Conservation The Status of the Wolf Population in Post-Soviet Kyrgyzstan ................................................... 142 CJ Hazell
Gray wolf restoration in the Northwestern United States ........................................................... 147 Ed Bangs, Joe Fontain, Mike Jimenez, Tom Meier, Carter Niemeyer, Doug Smith, Kerry Murphy, Deb Guernsey, Larry Handegard, Mark Collinge, Rod Krischke, John Shivik, Curt Mack, lssac Babcock, Val Asher, and Dominic Domenici
The Feasibility of Gray Wolf Reintroduction to the Grand Canyon Ecoregion ........................... 153 Paul G. Sneed
Canis Soupus: Eastern Wolf Genetics and its Implications for Wolf Recovery in the Northeast United States ................................................................................... 159 Nina Fascione, Lisa G. L. Osborn, Stephen R. Kendrot, and Paul C. Paquet
Captivity, Inbreeding, Cross-Lineage Matings, and Body Size in ........................................................................................................................ Mexican Wolves 164
Richard Fredrickson and Philip Hedrick
First Swift fox, Vulpes velox, Reintroduction in the USA: Results of the First Two Years ............................................................................................. ,167 Clio Smeeton and Ken Weagle
lnterspecific Interactions Among Wild Canids: Implications for the Conservation of Endangered San Joaquin Kit Foxes ............................................................... 171 Brian L. Cypher, Howard 0 . Clark, Jr., Patrick A. Kelly, Christine Van Horn Job, Gregory D. Warrick, and Daniel F. Williams
VI. Predation Management Chemical Repellents and Other Aversive Strategies in Predation Management ...................... 175 J.R. Mason, J.A. Shivik, and M.W. Fall
Effectiveness of Livestock Guarding Animals for Reducing Predation on Livestock. ............... .I82 William F. Andelt
VII. Opinions ................................ Historic Attitudes and Images and the Implications on Carnivore Survival 186
Karlyn Atkinson Berg
............................................................................................................ Bringing Down the Walls 190 Gale H. Ford
News from Zoos. ............................................................................................................................. 1 9 1
96 Endangered Species UPDATE Vol. 18 No. 4 2001

Carnivore Conservation in the Twenty-first Century Nina Fascione Defenders of Wildlife, 1101 14th St. NW, Suite 1400, Washington DC 20005; [email protected] M. Elsbeth McPhee Endangered Species UPDATE, University of Michigan, 430 E. University, Ann Arbor, MI 481 09; (734) 763-3243; (fax) (734) 936-21 95; [email protected]
The dawn of this new millennium is proving to be an interesting time for carnivores. In some areas predators
- seem to be rebounding after years of declining populations resulting from habitat loss and human persecution. For example, in this volume, Bangs et al. (p. 147) discuss the remarkable recovery gray wolves (Canis lupus) are making in the lower 48 states, and Sneed (p. 153) describes plans to re- store wolves into the Grand Canyon ecoregion. Grigione et al. (p. 129) report signs of jaguars (Panthera onca), ocelots (Leopardus pardalis), and jaguarundis (Herpailurus yaguarondi) on both sides of the
Mexico-U.S. border. Smeeton and Weagle (p. 167) describe successful reintroductions of the swift fox (Vulpes velox) into the great plains of North America.
In addition, new technologies have fostered improved research in both field studies and laboratory set- tings. Improvements in radio-telem- etry, remote-sensing work, geo- graphic information systems (see Gaillard p. 107 and Wydeven et al. p. 1 lo), genetics (see Farrell p. 133 and Fascione et al. p. 159), and computer modeling (see Pitt et al. p. 103) have led to increased knowledge of the myriad factors affecting carnivore
Subscribe to the UPDATE today! In its 18 years of publication, the Endangered Species UPDATE, published by the School of Natural Resources and Environment at the University of Michi- gan, has established itself as the primary forum for government agencies, conservation organizations, private consulting and law firms, zoos, museums, educational institutions, and others to exchange ideas and information on endangered species issues.
-Subscription rates are: regular subscriptions $28 studentlsenior (65+) $23 address outside the US add $5 electronic subscription $20
To subscribe, make check payable to the Universityof Michigan and mail to: Endangered Species UPDATE School of Natural Resources and Environment University of Michigan 430 E. University Ann Arbor, MI 481 09-11 15
or visit our website: http://www.umich.edu/-esupdatel
conservation. Finally, the rigorous application of ecological theory to conservation questions has lead to greater understanding of population dynamics and behavior within imper- iled carnivore populations (see Powell p. 98; Zuercher p. 115; Fredrickson and Hedrick p. 164; and Cypher et al. p. 171). Understanding issues such as genetics, natural his- tory, habitat needs, and predator-prey relationships will enable scientists to manage and conserve carnivore popu- lations well into the future.
Unfortunately, not all carnivores are showing such positive signs of recovery (see Sorenson p. 120 and Hazel1 p. 142), and all predators still face innumerable threats. Habitat loss, competition with humans for resources and human persecution are some of the major issues with which wildlife managers must contend. Anti-predator sentiment remains strong in some arenas as well (see Bildstein p. 124; Jackson p. 138; Berg p. 186; Ford p. 190; Mason et al. 175; and Andelt p. 182).
Continuing to expand our knowl- edge of carnivores will be essential to combating these issues and find- ing new and innovative ways to en- able humans to co-exist with healthy carnivore populations. Forums such as the Defenders of Willdife's confer- ences (Carnivores 2000 Denver, CO November 2000; and Carnivores 2002 Monterey, CA November 2002), and the Endangered Species UPDATE are vital to the continued success of carnivore conservation ef- forts. We thank the authors for their contributions to this edition and their work on carnivore conservation.
Vol. 18 No. 4 2001 Endangered Species UPDATE 97

Theory and Methods in Carnivore Conservation Who Limits Whom: Predators or Prey? Roger A. Powell Department of Zoology, North Carolina State University, Raleigh, North Carolina 27695-7617
Abstract Animal populations can be limited by the availability of food (limited from the bottom of the food chain up), by predators (limited from the top of the food chain down), or by the interaction of these two processes. Whether carnivores, in particulal; limit the populations of their prey, or are limited by those prey, has long been controversial and is critical to conservation of prey and predatory species. I return to the question because it is a good question that we wish to have answered and, in part, because it has no simple answer. Our knowledge of ecological communi- ties has matured to the point that we can tease the question apart, look at its pieces, andfind conditional answers. Predator-prey models suggest that predators may limit prey populations on one scale while food limits prey, and prey limit predators on another scale. Predator populations are always limited by the availability of their prey. Data from the literature supports action on two time scales.
Introduction "Who limits whom: predators or prey?" is an old question that resurfaces regu- larly because, in part, it is a good ques- tion that we wish to have answered and, in part, because it has no simple an- swer. I address the question once again because ow knowledge of ecological communities has matured to the point that we can tease the question apart, look at its pieces, and find conditional answers. These answers provide a ba- sis for managing populations of preda- tors and prey, for conserving endan- gered species, for understanding what kinds of population fluctuations we can affect and what kinds we can not, and for knowing where in an ecological sys- tem our management energies should be targeted.
The debate regarding who limits whom has been viewed from two pre- dominant perspectives. The Bottom- Up perspective emphasizes that plant defenses against herbivores and herbi- vore defenses against predators are so strong that communities are limited at each level predominantly by food (Mwdoch 1966; Polis 1999; Polis &
Strong 1996; Strong 1992; White 1978). From this perspective, preda- tors in species-rich, terrestrial commu- nities rarely have large effects on the populations of their prey but, instead, are limited by them. Herbivore popu- lations limit the populations of their predators because predator populations are small and herbivores are well adapted to avoid their predators.
In contrast, a Top-Down perspec- tive was outlined by Elton (1927), then made more rigorous by Hairston et al. (1960) in their "The World is Green" paper, and has been explored extensively by Fretwell, Oksanen and coworkers (Fretwell 1977 ,1987; Oksanen et al. 1981; Oksanen and Oksanen 2000) as the Exploitation Ecosystem Hypothesis. From this perspective, plants are vulnerable to folivores but are seldom severely de- foliated because of predation pressure on herbivores. The Exploitation Ecosystem Hypothesis is not lim- ited to productive, species-rich sys- tems and is most often tested using communities with vertebrate preda- tors and prey.
Here, I ignore the abilities of plants to defend themselves and explore the effects on herbivores and predators of varying the productivity of plants that is available to herbivores. For conve- nience, I call this available productiv- ity of plants "primary productivity."
Model predators and prey Using a difference equation model similar to that used by Boyce and Anderson (1999), incorporating Type 3 functional responses (Holling 1959) and density-dependent population growth for both predators and prey, I developed a system with three trophic levels. The responses of this system to changes in primary productivity re- semble the classic Top-Down trophic pattern (Figure 1 a) except that the her- bivore graph has a "hump" (Figure lb). The model predicts that at high levels of primary productivity, predators limit their prey to lower population sizes than they do at intermediate levels of pri- mary productivity. Similarly, when her- bivores are not limited by predators, they limit the standing crop of vegeta- tion. The model also predicts a most
98 Endangered Species UPDATE Vol. 18 No. 4 2001

basic characteristic of herbivore and predators to exist. If primary produc- predator populations: primary produc- tivity is not great enough, herbivore tivity establishes the conditions that populations are not large enough to
TOPeDOWN TROPHIC PATTERNS
W
i Vegetation
5 5 3 0
8
PRIMARY PRODUCTIVITY
allow herbivores, or herbivores and support predators and predator popu- lations can not be- come established. Hence, predators are ultimately lim- ited by their prey (Figure 2).
Admit tedly , most predator-prey systems involve more than one prey and one predator spe- cies, yet some well- studied systems are quite simple. On Isle Royale in Lake Supe-
Figure l(a). Classic Top-Down Trophic Patterns. At very low primary productivity, vegetation can not support her- bivores. When primary productivity is capable of support- ing herbivores, increased primary productivity leads to a population of herbivores that maintains a stable standing crop of vegetation. When primary productivity is high enough to support enough herbivores to support preda- tors, the predators maintain a stable population of herbi- vores, and, therefore, the standing crop of vegetation in- creases. When primary productivity is capable of sup- porting a secondary carnivore, the population of primary carnivores remains constant, herbivore populations in- crease, and the standing crop of vegetation is constant once again. Population sizes are not drawn to scale so that carnivore populations can appear on the figure.
SIMULATED TROPHIC PATTERNS
W
$ 6 5 3 a L?
Carnivores
PRIMARY PRODUCTIVITY
rior, for example, moose (Alces alces) have been basically the only prey for wolves (Canis lu- pus) for nearly five decades (McLaren and Peterson 1994). Similarly, muskoxen (Ovibus moschutus) generally are prey only for wolves, or
wolves and Man (Gray 1987; Mech 1992). In the Upper Midwest states, wolves and white-tailed deer (Odocoileus virginianus) form the dominant predator-prey system (Mech 2000).
To introduce a bit more realism into my model, I varied the annual pri- mary productivity and the annual pre- dation rate on herbivores stochastically (Figure 3a, 3b). Such stochastic varia- tion in primary productivity mimics annual variation due to weather. I mod- elled the stochastic variation in avail- ability of prey as a variation in wolf carrying capacity, which could result from changes in snow conditions. For parameter values that lead to realistic relative densities of predator and prey, stochastic variation of primary produc- tivity or predation rate, or both, affects all three trophic levels (Figure 3b). If stochasticity in primary productivity is superimposed on a long-term cycle, which might be caused by cyclical variation in climate, for example, the cycle may be seen in the predator and prey populations (Figure 3c). A re- searcher studying such a predator-prey system might conclude that interactions between predator and prey populations
WHO CONTROLS WHOM? Model Predictions:
*Predators
*Across years, primary productivity sets reduce
equilibrium population sizes of both herbivores equilibrium
and predators. population size LU of herbivores, N
Z G 1, % Q $ 5
c c - - - - -
E32 t
PRIMARY PRODUCTIVITY
Figure l(b). Simulated Top-Down Trophic Patterns mimic Figure 2. Who Limits Whom? Over long time spans, the classic pattern except that the graph of the herbi- primary productivity dictates when herbivores and car- vore population has a "hump" at levels of primary pro- nivores can maintain populations. Predators reduce ductivity that are capable only of supporting low carni- long-term populations of herbivores below the level sup- vore population sizes. portable by primary productivity and allow consequent
increases in the standing crop of vegetation.
Vol. 18 No. 4 2001 Endangered Species UPDATE 99

Figure 3(a). Sample population standing crop of vegetation and of herbivores and predators.
EQUILIBRIUM CONDITIONS
trajectories for the for population sizes
z 0
!3# 3 0
8 a
lead to population cycles when the cycles are actually driven from below by variation in primary productivity.
Consistent with the results of Boyce and Anderson (1999), I found that variation in primary productivity had a profoundly greater effect on year- to-year changes in herbivore popula- tions than did variation in predation efficiency. The vast majority of the year-to-year variation in the model her- bivore population could be explained by the productivity of vegetation dur- ing the preceding two years, while only about a quarter could be explained by the variation in predation rates. On a year-to-year basis, the model predicts that variation in food affects popula- tion dynamics of herbivores more than does variation in predation (Figure 4).
Stochastic variation of predation rate leads to an approximate 10% de- crease in the long-term, average preda- tor populations. This result is expected for predators with a Type 3 functional response. Because predation rate in- creases in a concave-downward fash- ion with high and increasing prey popu- lations, variations in prey population size below the average population size lead to larger changes in predation than do variation in prey populations above the average. For the same reason, sto-
YEAR
FOR PREDATOR-PREY
1 SIMULATIONS
chastic variation in primary productiv- ity leads to a sirni- lar, though smaller, decrease in long- term, average prey populations. Sto- chastic variation in both primary pro- ductivity and preda- tion, however, leads to a modest (ca. 2%)
1
increase in prey populations, be-
C
Vegetation
Herbivores +.
cause of the de-
Predators
J i-
creased predator
STOCHASTIC VEGETATION and , PREDATORS I
U Predalors
YEAR
Figure 3(b). Trajectories for vegetation, herbivores and predators using the same model parameters used in Fig- ure 3a except that primary productivity and predation vary stochastically. Year-to-year variation in herbivore popu- lation size depends more on variations in primary pro- ductivity during the preceding two years than on varia- tions in predation pressure.
STOCHASTIC VEGETATION and
W N, V)
6 5 3 n B
YEAR
populations. Figure 3(c). Same as Flgure 3b except that a long-term Who controls cycle is imposed on primary productivity, such as might
whom, predators or be caused by climate cycles. The cyclic variation in pri- mary productivity caused cyclic variation in predator and
prey? The prey populations might be mistaken as cycles caused by predicts that each interactions between the population of predators and prey. controls the other but the control acts at different levels, or on different scales. (Figure 2). In contrast, on a year-to- Ultimately, predator populations are year basis, variation in productivity of controlled by the populations of their food causes more variation in herbivore prey, wYch &e, in &, dependent on population sizes than does variation in the primary productivity of their foods. predation rates (Figure 4). When primary productivity can support an herbivore population large enough Real predators and prey to support carnivores, however, preda- Do real populations of predators tion then decreases the long-term, av- and prey act as the model predicts, erage size of the population of its prey with control acting on two scales?
100 Endangered Species UPDATE Vol. 18 No. 4 2001

WHO CONTROLS WHOM? Model Predictions:
TIME
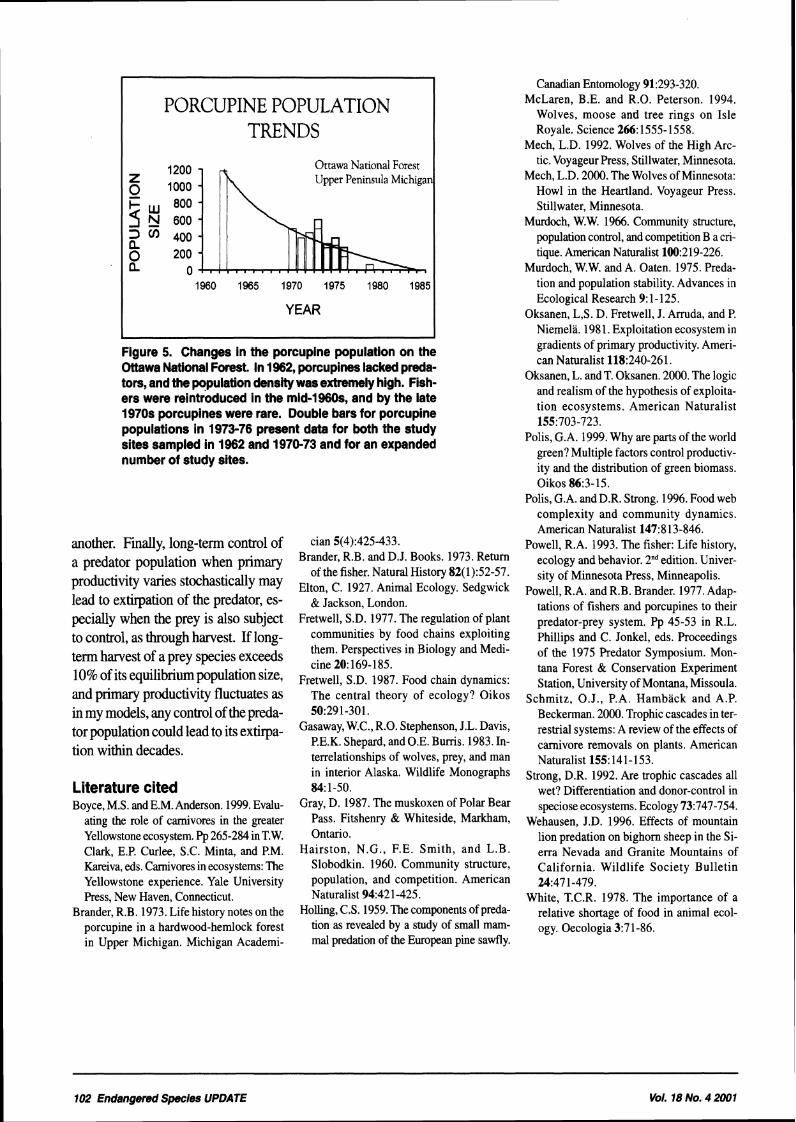
by the 1930s, and by the 1960s, porcu- pine populations had grown to previ- ously unknown sizes. Fishers were reintroduced in the 1960s, and thus I studied a growing population. Porcu- pines had two lim- iting resources: win- ter food and safe winter dens. During
Figure 4. Who Limits Whom? Annual variation in plants winter, porcupines explains most of the variation in the herbivore popula- denned near their tion, while variation in predation rate explains consider- food trees. D d g ably less. the years of high
population density, Results from field studies support porcupines browsed hemlocks and this hypothesis. white pines heavily during winters, of-
The data for communities with ten stunting tree growth, Where small vertebrates in arctic and north tem- of hemlocks dwindled and died, Perate ecosystems reviewed by porcupines abandoned the associated Oksanen and Oksanen (2000) are dens. In my study area, most dens were consistent with control on two scales. hollow trees or hollow logs. ofl low Similarly, data for communities with logs with holes at both ends were ac- herbivorous or predatory insects and ceptable t~ porcupines before fishers small, vertebrate predators reviewed were reintroduced (Brander 1973; by Schmitz et al. (2000) are consis- Brander and Books 1973; Powell and tent with control on two scales. Brander 1977). As the fisher popula-
IvIcLaren and Peterson (1994) ar- tion grew, however, fishers killed por- gued from data on wolves, moose and cupines in log dens with two entrance balsam f~ (Abies balsamia) on Isle holes. A safe den near good winter food Ro~ale, that predation by wolves con- became in short supply. Fishers caused trolled the moose population. In addi- a significant decrease in the porcupine tion, moose browsed their major win- population (Figure 5). ter food, balsam fir, so heavily that pro- Wehausen (19%) also documented duction of fr was limited when the a resurgent predator population taus- moose po~ulations was high. Reanaly- ing the distinct decease of a formerly sis of their data yields results consis- healthy prey population, in this case tent with model results: production of mountain lions (puma concolor) taus- fir explains a significant amount of the ing the decrease of a mountain sheep year-to-year variation in the moose (Ovis canadensis) population. ~~ulation,while~ear-to-~earvdation Thus, field data support the hy- in the wolf population does not. pothesis that populations of real preda-
Istudiedfishers (Martes~ennanti) tors and prey exhibit controls on two and their Prey, ~ d c u l a r l ~ porcupines scales. Most annual variation in popu- (Erethizon dorsatum), in Michigan's lations of prey appears controlled by Upper Peninsula in the 1970s (re- variation in food supplies, Yet, viewed by Powell 1993). Fishers had when primary productivity is high been extir~atedintheu~perpeninsula enough to support communities of prey
and their predators, predators are ca- pable of limiting prey populations to levels below the levels they would reach without predation. In addition, when prey populations do not sup- port predators, they limit the abun- dance of their food.
Management implications Reduction of a predator's population size to increase the size of a prey popu- lation is often considered by manage- ment agencies (Gasaway et al. 1983). The models presented here indicate that reducing the population of a predator will have little effect on the year-to-year fluctuations in the populations of its prey but may affect the long-term mean population size of prey. Figures 1, 2 and 3a illustrate how, when primary productivity is high enough, predators might limit prey from reaching the population size the food supply can support. Consequently, reducing the population of a predator can be one op- tion to consider, with caution, when faced with a threatened or endangered population of a prey species.
Reduction of a predator population must be considered with caution for several reasons. First, Figure 3c illus- trates that cyclic and stochastic fluctua- tions in primary productivity can lead to large fluctuations in an herbivore population that might be confused with a predator-prey cycle. The models pre- sented here suggest that the year-to- year variation in abundance of herbi- vores are caused more by fluctuations in food supply than by changes in pre- dation. The same may be true of long- term cycles of prey populations. Sec- ond, most predators prey on several prey species, which, in turn, have more than one predator, yet the models pre- sented here deal with single predator and prey populations. The switching of prey by predators may prevent any one predator h m limiting any one prey population (Murdoch and Oaten 1975), and the removal of one predator spe- cies may simply offer opportunity to
Vol. 18 No. 4 2001 Endangered Species UPDATE 101
PORCUPINE POPULATION TRENDS
1200 Ottawa National Forest
= 2000 Upper Peninsula Michiga
Q 3 ::; 3 V, 400 8 200 a 0 I
1960 1965 1970 1975 1980 1985
YEAR
Figure 5. Changes in the porcupine population on the Ottawa National Forest. In 1962, porcupines lacked preda- tors, and the population density was extremely high. Fish- ers were reintroduced In the mid-19608, and by the late 1970s porcupines were rare. Double bars for porcupine populations in 1973-76 present data for both the study sites sampled in 1962 and 1970-73 and for an expanded number of study sites.
another. Finally, long-term control of a predator population when primary productivity varies stochastically may lead to extirpation of the predator, es- pecially when the prey is also subject to control, as through harvest. If long- term harvest of a prey species exceeds 10% of its equilibrium population size, and primary productivity fluctuates as in my models, any control of the preda- tor population could lead to its extirpa- tion within decades.
Literature cited Boyce, M.S. andE.M.Anderson. 1999. Evalu-
ating the role of carnivores in the greater Yellowstone ecosystem. 4 265-284 in TOW. Clark, E.P. Curlee, S.C. Minta, and P.M. Kareiva, eds. Carnivores in ecosystems: The Yellowstone experience. Yale University Press, New Haven, Connecticut.
Brander, R.B. 1973. Life history notes on the porcupine in a hardwood-hemlock forest in Upper Michigan. Michigan Academi-
cian 5(4):425-433. Brander, R.B. and D.J. Books. 1973. Return
of the fisher. Natural History 82(1):52-57. Elton, C. 1927. Animal Ecology. Sedgwick
& Jackson, London. Fretwell, S.D. 1977. The regulation of plant
communities by food chains exploiting them. Perspectives in Biology and Medi- cine 20: 169-1 85.
Fretwell, S.D. 1987. Food chain dynamics: The central theory of ecology? Oikos 50:291-301.
Gasaway, W.C., R.O. Stephenson, J.L. Davis, P.E.K. Shepard, and O.E. Burris. 1983. In- terrelationships of wolves, prey, and man in interior Alaska. Wildlife Monographs 84: 1-50.
Gray, D. 1987. The muskoxen of Polar Bear Pass. Fitshenry & Whiteside, Markham, Ontario.
Hairston, N.G., F.E. Smith, and L.B. Slobodkin. 1960. Community structure, population, and competition. American Naturalist 94:42 1-425.
Holling, C.S. 1959. The components of preda- tion as revealed by a study of small mam- mal predation of the European pine sawfly.
Canadian Entomology 91:293-320. McLaren, B.E. and R.O. Peterson. 1994.
Wolves, moose and tree rings on Isle Royale. Science 266:1555-1558.
Mech, L.D. 1992. Wolves of the High Arc- tic. Voyageur Press, Stillwater, Minnesota.
Mech, L.D. 2000. The Wolves of Minnesota: Howl in the Heartland. Voyageur Press. Stillwater, Minnesota.
Murdoch, W.W. 1966. Community structure, population control, and competition B a cri- tique. American Naturalist 100:219-226.
Murdoch, W.W. and A. Oaten. 1975. Preda- tion and population stability. Advances in Ecological Research 9: 1 - 125.
Oksanen, L,S. D. Fretwell, J. Armda, and P. Niemela. 1981. Exploitation ecosystem in gradients of primary productivity. Ameri- can Naturalist 118:240-261.
Oksanen, L. and T. Oksanen. 2000. The logic and realism of the hypothesis of exploita- tion ecosystems. American Naturalist 155:703-723.
Polis, G.A. 1999. Why are parts of the world green? Multiple factors control productiv- ity and the distribution of green biomass. Oikos 86:3-15.
Polis, G.A. and D.R. Strong. 1996. Food web complexity and community dynamics. American Naturalist 147:813-846.
Powell, R.A. 1993. The fisher: Life history, ecology and behavior. 2nd edition. Univer- sity of Minnesota Press, Minneapolis.
Powell, R.A. and R.B. Brander. 1977. Adap- tations of fishers and porcupines to their predator-prey system. Pp 45-53 in R.L. Phillips and C. Jonkel, eds. Proceedings of the 1975 Predator Symposium. Mon- tana Forest & Conservation Experiment Station, University of Montana, Missoula.
Schmitz, O.J., P.A. Hamback and A.P. Beckerman. 2000. Trophic cascades in ter- restrial systems: A review of the effects of carnivore removals on plants. American Naturalist 155: 141- 153.
Strong, D.R. 1992. Are trophic cascades all wet? Differentiation and donor-control in speciose ecosystems. Ecology 73:747-754.
Wehausen, J.D. 1996. Effects of mountain lion predation on bighorn sheep in the Si- erra Nevada and Granite Mountains of California. Wildlife Society Bulletin 24:471-479.
White, T.C.R. 1978. The importance of a relative shortage of food in animal ecol- ogy. Oecologia 3:71-86.
102 Endangered Species UPDATE Vol. 18 No. 4 2001

A New Approach to Understanding Canid Populations Using an lndividual-based Computer Model: Preliminary Results
William C. Pitt USDNAPHISMIS, National Wildlife Research Center, Utah State University, Logan, UT, Utah State University, Logan, Utah, 84322-5295; (435) 245-6091 ; wwQcc.usu.edu
Frederick F, Knowlton USDNAPHISMIS, National Wildlife Research Center, Utah State University, Logan, Utah, 84322-5295
Paul W. Box Department of Geography and Earth Resources Department, Utah State University, Logan, Utah, 84322
Abstract Ensuring the welfare of wild canid populations depends upon the ability to integrate species biology, the environmental aspects upon which those populations depend, and the factors control- ling species abundance. Toward this end, we developed an individual-based computer model using Swarm to mimic natural coyote populations. Swarm is a sofhvare platform that allows the user to describe individual behaviors for all individuals, link those behaviors in each concurrent time step, and assemble behaviors and objects in a hierarchicalfvamework. Our model stands apartfvom previous modeling eforts because it relies on field data and explicitly incorporates behavioral features, such as dominance and territoriality, as major determinates of species demography. Individual variation, such as status within territorial social groups and age-based reproduction are assumed, but assumptions typically associated with most demographic models are not needed. The eventual goal is to incorporate other environmental components such as prey abundance andor competing carnivores. This type of model could also provide insights into potential management alternatives for when the gray wolf is removed from endangered status in Minnesota.
Introduction Ensuring the welfare of wild canid populations depends upon the abil- ity to integrate our best understand- ings of species biology, the environ- mental aspects upon which those populations depend, and the factors controlling species abundance (Gese et a1 1989; Murray et a1 1999). Previously, biologists and managers have relied upon insights provided by many analytical and computer models of animal popu- lations. Canid populations, how- ever, differ from other species be- cause they are highly territorial and have a specific social structure, relatively low density (Knowlton 1972; Sillero-Zubiri and Gotelli 1995; Knowlton et. a1 1999). Ana- lytical models are not suited to in-
clude the individual characteristics that are critical to canid populations and past computer models have not incorporated territoriality and so- cial structure (Connolly and Longhurst 1975). Toward this end, we developed an individual-based computer model using the Swarm modeling system to provide a bet- ter understanding of canid popula- tion dynamics. We use coyotes (Canis latrans) to parameterize the model for this exercise, but the model could easily be adapted to many other canid species with simi- lar population structure. This paper is a preliminary summary of a model that will be presented in greater detail elsewhere (Pitt et al. in preparation)
The model Swarm is a software platform that allows the user to describe indi- vidual behaviors for all individuals, link those behaviors in each con- current time step, and assemble be- haviors and objects in a hierarchi- cal framework (Savage and Askenazi 1998; Railsback et al. 1999; SDG 2001). Our model stands apart from previous model- ing efforts because it relies on field data with all population parameters derived from data sets and pub- lished papers, and explicitly incor- porates behavioral features, such as dominance and territoriality, as major determinates of species de- mography (Connolly and Longhurst 1975; Knowlton et al. 1999; Pitt et al. 2001). Individual variation,
Vol. 18 No. 4 2001 Endangered Species UPDATE 103

such as status within territorial social groups and age-based reproduction are specified and assumptions typi- cally associated with most demo- graphic models are not needed.
The coyote population model was divided into 100 packs and a collection of non-territorial ani- mals. Each individual is character- ized by sex, age, status, and pack membership. Pack size was not lim- ited but the likelihood of subordi- nates increased with the number of animals in the pack. Individuals could change status or pack mem- bership by dispersing from natal packs, replacing a dominant animal, or by moving to a pack from non- territorial status.
As with most animals, the prob- ability of mortality increases with age. Mortality rates are higher for non-territorial animals than pack members (Gese et al. 1989). In ad- dition, mortality rates increase with the density of non-territorial animals because they would potentially share a common area and the probability of encountering other animals would increase with density. Thus, density increases would either result in less food or an increase in the number of negative encounters.
Although subordinate coyotes occasionally produce offspring in natural populations, in our model only alpha females breed (Knowlton et al. 1999). The birth rate is based on a normal distribu- tion with the mean based upon pack size. Few would disagree that the number of offspring produced is a function of the health of the animal. There has been, however, continued disagreement over what is a good indicator of health. Some evidence from captive coyote studies sug- gests that old (>8 years) animals will produce fewer offspring (Green et al. 2001). The most con- tentious argument is that litter size is a function of food supply or den-
sity (Crabtree and Sheldon 1999; Knowlton et al. 1999). Field evi- dence for and against this argument has been mixed (Gier 1968; Todd et al. 198 1 ; Knowlton and Stoddart 1983; Windberg 1995; Gese et al. 1996). The most likely reason for these mixed results is that the num- ber of offspring produced is a func- tion of the food supply for that par- ticular female. The food supply is a function of the food in the terri- tory and the number of animals in the pack. Studies that have at- tempted to determine the relation- ship between offspring produced and density of food supply have looked at entire populations and large land areas (Gier 1968; Todd et al. 198 1; Knowlton and Stoddart 1983; Windberg 1995; Gese et al. 1996). Thus, the relationship would only be observed if most packs were similar in size, food supply was homogenous across the landscape, and territories were identical in size. The likelihood of all of these factors being similar in one population would be low and extremely rare between popula- tions, so this relationship would not be observed under most conditions on a population basis. For these reasons, we set the mean number of pups produced as a function of the number of pack members. In this model, territories are identical so we could ignore differences be- tween territories.
The second part of this model- ing exercise is the management model, which allows us to examine the effects of managing the popu- lation (Pitt et al. 2000). The man- agement model combines the popu- lation model and a manipulation model so we can investigate the ef- fect of removing individuals on population size and the resistance and resilience of the population. Herein, only random removal indi- viduals will be considered.
Model output We ran the population model under three management scenarios: no re- moval, pulse removal (a proportion of animals were removed in year five and the population then al- lowed to recover), or press removal (a constant proportion of animals were removed every year after year five). The populations were evalu- ated according to structure, the re- sistance to removal (proportion of animals removed required to have an effect for more than one year), and the resilience of the population (how quickly the population recov- ered under various removal levels).
With no removal, the popula- tion was stable and population size ranged from 350 to 700 adult ani- mals with 15 to 35% of the popula- tion being non-territorial. The rea- son for this stability was animals were forced out of packs as they matured and non-territorial animals had a higher mortality rate then animals in packs. The population exhibited source-sink dynamics. Average pack size in this simula- tion was about four but varied from one to eight.
To determine the effect of pulse removal on the population, we let the population run for five years and then randomly removed 10 to 90% of the adult population in one year and then examined the re- sponse of the population. All popu- lations recovered within one year when less than 60% of the popula- tion was removed (Figure 1). Ba- sically, the population was reduced until new offspring were produced. The number of transients decreased as animals moved into packs and fewer animals moved out of packs. Populations subject to removal had younger age structures. When more than 60% of the population was re- moved, the population required more than one year to return to the population size prior to removal.
104 Endangered Species UPDATE Vol. 18 No. 4 2001

I 0 20 30 40 50 60 70 80 90 Proportion Removed
Figure 1. Number of years required for a population to return to pre-removal size after a certain proportion of animals are randomly removed from the popu- lation in one year. The horizontal line indicates the threshold where annual reproduction compensates for animals removed.
This removal proportion is lower than reported in previous computer models (Connolly and Longhurst 1975). The population recovered within five years, however, even with 90% removal in one year. When a large (>70%) proportion of the population was removed, the number of non-territorial animals decreased. In natural populations less time would be required to re- cover than what was depicted in the model because in the model, terri- tories remained even at low densities, animals were not allowed to move out of their territories to mate, and animals were not allowed to move in from surrounding areas. Further- more, we did not reduce natural mor- tality rates at low densities.
To determine the effect of sus- tained or press removal on the
population, we let the population run for five years and then ran- domly removed 10 to 90% of the adult population each year and ex- amined the response of the popula- tion. When removal was less than 60% of the population, population size was the same as an unexploited population, and it did not decline, even after 50 years of simulation. The population structure, however, differed from an unexploited popu- lation. The population with press removal at 50% had fewer transient animals (10 to 25%), a younger age structure, and higher reproduction than an unexploited population. High removal rates (>70% per year) resulted in an initial loss of non-ter- ritorial animals and after seven years the entire population was re- moved. In natural populations, a
population decline could take sev- eral more years because territories remained in the model and animals did not move to mate, natural mor- tality rates were not reduced at low densities, and animals did not move in from surrounding areas. Remov- ing more than 70% of the popula- tion annually would become logis- tically difficult at low densities. Territoriality would likely dissolve at low densities, animals would move to mate, natural mortality may be re- duced, animals would immigrate into the population, and the high removal rates could not be achieved.
Implications for management These simulations suggest that coy- otes and other canid populations are very resistant and resilient to change. A population decrease was not observed until more than 60% of the population was removed an- nually. The populations are buff- ered against change by the high re- productive capacity and the non- breeding animals in the population, subordinates and non-territorial animals. Non-breeders would re- place breeding individuals lost from the population so the reproductive capacity of the population is not re- duced. Coyote and other canid populations are resilient because they have a high reproductive ca- pacity. These conclusions may pro- vide insight into the potential ef- fects of disease on Ethiopian wolves (Canis simensis) or the po- tential management of timber wolves (Canis lupus). These spe- cies would also have similar popu- lation characteristics as was dis- played in this model.
In the future, the model analy- sis will be expanded to investigate various types of removal, e.g. se- lective versus random removal. The management model allows the user to remove animals of a specific status, litters of offspring, during a
Vol. 18 No. 4 2001 Endangered Species UPDATE 105

particular month, and/or animals in a specific area. In addition, we can also investigate the effects of repro- ductive control or the effects of dis- ease on populations. To determine the effects of unequal resource dis- tribution, we can also vary re- sources among packs and over time as part of the foraging and preda- tion models. Other components we contemplate adding are competing carnivores, predator-prey interac- tion, as well as, management cost- benefit programs to the model.
Literature cited Connolly, G.E. and W.M. Longhurst. 1975.
The effects of control on coyote popu- lations: a simulation model. Division of Agriculture Science Bulletin 1872, Davis, CA.
Crabtree, R.L. and J.W. Sheldon. 1999. Coyotes and canid coexistence in Yellowstone. Pp 127-163 in T. W. Clark, A. P. Curlee, S. C. Minta, and P. M. Karieva, eds. Carnivores in Ecosystems, The Yellowstone Experience. Yale Uni- versity Press, New Haven. Connecticut.
Gese, E. M., 0 . J. Rongstad, and W. R. Mytton. 1989. Population dynamics of coyotes in southeastern Colorado. Jour- nal of Wildlife Management 53: 174- 181.
Gese, E.M., R.L. Ruff, and R.L. Crabtree. 1996. Social and nutritional factors in- fluencing the dispersal of resident coy- otes. Animal Behaviour 52:1025-1043.
Gier, J.T. 1968. Coyotes of Kansas, Kan- sas Agricultural Experiment Station Bul- letin 393, l l8pp.
Green, J.S., F.F. Knowlton, and W.C. Pitt. 2001. Reproductive patterns among cap- tive wild-caught coyotes (Canis latrans). Journal of Mammalogy in press.
Knowlton, F.F. 1972. Preliminary interpreta- tions of coyote population mechanics with some management implications. Journal of Wildlife Management 36369-382.
Knowlton, F.F. and L.C. Stoddart. 1983. Coyote population mechanics: another look. Pp 93-1 11 in F.L. Bunnell, D.S. Eastman, and J.M. Peek, eds. Sympo- sium on Natural Regulation of Wildlife Populations. Forest, Wildlife and Range Experiment Station, University of Idaho, Moscow, Idaho.
Knowlton, F.F., E.M. Gese, and M.M. Jae- ger. 1999. Coyote depredation control: an interface between biology and man- agement. Journal of Range Management 52:398-412.
Murray, D.L., C.A. Kapke, J.J. Everman, and T.K. Fuller. 1999. Infectious dis- eases and the conservation of free-rang- ing large carnivores. Animal Conserva- tion 2:241-254.
Pitt, W.C., F.F. Knowlton, A. Ogawa, and P.W. Box. 2000. Evaluation of depreda- tion management techniques for territo- rial animals using a computer model: coyotes as a case study. Pp 315-318 in T.P. Salmon and A.C. Crabb, eds. Pro- ceedings of the 191h Vertebrate Pest Con- trol Conference. Published by Univer- sity of California, Davis.
Pitt, W.C., A. Ogawa, F.F. Knowlton, and P.W. Box. 2001. Evaluating the effects
of management on territorial animals using Swarm. Pp 36-40 in W. C. Pitt, ed. Swarm User Group Conference Pro- ceedings. Published by S. J. and Jessie E. Quinney Natural Resources Research Library, Logan, UT.
Pitt, W.C., F.F. Knowlton, and P.W. Box. In preparation. A new approach to un- derstanding canid populations using an individual-based computer model.
Railsback, S.F., R.H. Lamberson, B.C. Harvey, and W.E. Duffy. 1999. Move- ment rules for individual-based models of stream fish. Ecological Modelling 123:73-89.
Savage, M. and M. Askenazi. 1998. Arborscapes: a Swarm-based multi- agent ecological disturbance model. Proceedings of Geographical and Envi- ronmental Modelling, Available as Santa Fe Institute Working Paper 98-06-056.
Sillero-Zubiri, C. and D. Gotelli. 1995. Spatial organization in the Ethiopian wolves Canis simensis: large packs and small stable home ranges. Journal of Zoology (London) 237:65-8 1.
SDG (Swarm Development Group). 2001. The Swarm Simulation System. Pp 1- 10 in W.C. Pitt, ed. Swarm 2000 Con- ference Proceedings. Published by S. J. and Jessie E. Quinney Natural Resources Research Library, Logan, UT.
Todd, A.W., L.B. Keith, and C.A. Fisher. 1981. Population ecology of coyotes dur- ing a fluctuation of snowshoe hares. Jour- nal of Wildlife Management 45629-640.
Windberg, L.A. 1995. Demography of a high-density coyote population. Cana- dian Journal of Zoology 73:942-954.
106 Endangered Species UPDATE Vol. 18 No. 4 2001

Habitat issues
Mapping Occupied Habitat for Forest Carnivores in the American West and Estimating their Conservation Status David L, Gaillard Predator Conservation Alliance, P.O. Box 6733, Bozeman, MT 59771; (406) 587-3389; [email protected]; www.predatorconservation.org
Abstract Conservation concerns are escalating due to the small numbers, reduced range, and increasingly fragmented distribution of wide-ranging forest carnivores in the American West-speci$cally the lynx (Lynx canadensis), wolverine (Gulo gulo), andfisher (Martes pennanti). Observation data from the U.S. Forest Service and state natural heritage programs were compiled and mapped. Occupied habitats and population centers for the three species were identijied and population sizes estimated based upon recorded densities and distribution. The results indicate small, isolated populations well below what may be necessary for long-tern viability.
Introduction Some of the smaller forest carni- vores of the American West-the lynx (Lynx canadensis), wolverine (Gulo gulo), and fisher (Martes pennunti)-have not yet grabbed headlines like bears (Ursus spp.) and wolves (Canis lupus). Yet mounting concerns about their vi- ability indicate that large carnivores are not the only species in jeopardy because of past and ongoing habi- tat loss and fragmentation, and ex- cessive human-caused mortality. While these lesser known species were never persecuted like the wolf, grizzly bear (Ursus arctos), and other species that pose a risk to live- stock, their conservation status is now suffering due to neglect.
Critical information about the habitat requirements and popula- tion sizes of these animals is lack- ing, leaving conservationists ill-in- formed at where and how to initiate conservation strategies. Existing range maps are too coarse to pri- oritize specific areas for protection, such as individual mountain ranges or watersheds. There are few pub- lished population estimates, and
they are limited to specific study areas and fail to address the con- servation status of each species throughout its range.
We can no longer take for granted the survival of wide-rang- ing, low-density forest carnivores. As we have done for the grizzly bear and the wolf, we should make conscious decisions about where in the western U.S. we will maintain and restore forest carnivores, and protect them and their habitat in these areas accordingly. The capac- ity of these areas to support forest carnivores should be assessed to ensure that sufficient habitat is pro- tected to provide for their long-term survival and recovery. Given the forest carnivores' large ranges and low densities and the fragmented nature of suitable habitat that re- mains, a conservation strategy will likely require restoration and main- tenance of a connected network of population centers across the west- ern U.S. and Canada (e.g. , McKelvey et al. 2000a). The ob- jective of this paper is to identify occupied habitats and population centers for the lynx, wolverine, and
fisher based on available presence1 absence data, and to estimate popu- lation sizes within these areas based upon recorded densities, as a first step toward devising a long-term conser- vation strategy for these species.
Mapping occupied habitat To identify occupied habitats and population centers for the lynx, wolverine, and fisher, observation data from the U.S. Forest Service and the natural heritage programs of eight western states were gath- ered (Maj and Garton 1994; McKelvey et al. 2000b). These data were not collected through stan- dardized survey techniques but in- clude observations made by work- ers in the field, trapping records, and museum specimen records. State natural heritage programs maintain this data and attempt to filter out unreliable observations.
GIs software was used to high- light parcels of public lands where the observations were located. Pri- vate land was excluded from this analysis, because of the difficulty delineating borders around point locations on private lands. Admin-
Vol. 18 No. 42001 Endangered Species UPDATE 107

istrative boundaries were conve- nient for this purpose on public lands, and though they have no bio- logical basis they serve the purpose of delineating the large landscape features relevant to this scale of analysis. This methodology unfor- tunately excludes important areas of carnivore habitat on private lands, but the vast majority (>80%) of the carnivore observations oc- curred on public lands.
These areas were sorted by date to provide an approximation of cur- rent versus historic range. Observa- tions made after 1990 were used to delineate current range while obser- vations prior to 1990 denote historic range for the purpose of this analy- sis. Overlapping data for all three species revealed occupied habitat for all three species, and for various com- binations of the three (Figure 1).
Estimating current population status Population centers for each species were identified using observation data plus additional information found in scientific literature. Popu- lation numbers were estimated by multiplying the area occupied by a species (as determined by current observation data) by density esti- mates obtained from field studies in those or similar areas. For ex- ample, an analysis of wolverine observations in Idaho indicates three areas where sightings are con- centrated: the Selkirk Mountains of northern Idaho, the Lochsa and Kelly Creek drainages in north-cen- tral Idaho, and the Sawtooth and Smoky Mountains in south-central Idaho (Groves 1988). Delineation of the specific clusters was subjec- tive, but they account for 21%, 18%, and 22% of the 89 "probable" wolverine reports respectively. Each of these areas encompasses approximately 20.000 square kilo- meters of public lands, which com-
prises 90 to 100% of these areas. Copeland (1 996) es- timated one wolverine per 90 to 248 km2 within his study area in the Sawtooth Mountains, based upon his analysis of 1,050 reloca- tions of 19 wolverines by ground and aerial telem- etry. A conservative esti- mate of one wolverine per 200 km2 across each of these areas indicates three
Figure 1. Occupied habitat for lynx, wolverine, subpopulations of 100 wol- and verines each in Idaho (Fig- ure 2). Delineation of po- tential subpopulations for each of the forest carni- vores and estimating their numbers provides a starting point to assess the conser- vation status of these spe- cies relative to other imper- iled species like grizzly
Dark Cny = h b S c and tnbl kndr wiIh cumnl Obdt,VP11W111WPl
LighlGmy = Fuhlte and WlwiS*iibpari <hrirvruno iprc 19W'~)
bears and wolves.
Results Occupied habitat for all three forest carnivores oc- Figure 2. Wolverine sub-population estimates
curs throughout northern and central Idaho, north- western Montana, portions of the Greater Yellowstone Ecosys- extent of their range are rare. In tern, Washington (northeastern tor- Washington and Oregon, there have ner, North Cascades), and Oregon been only seven verifiable sightings (South Cascades). Lynx presence since 1986, and despite an exten- diminishes to the south, notwith- sive helicopter survey in the Gas- standing recent progress restoring cades, current wolverine presence lynx to the southern Rockies. Fish- is confirmed only in the North Gas- ers are rarely observed south or east cades of Washington (K. Aubry per- of the Bitterroot Range along the sonal communication). There has IdahoIMontana border, although not been a verified wolverine ob- populations persist in Cascades of servation in the Sierra Range since southwestern Oregon, and in both before 1990 (Zielinski, personal the northern and southern Sierra communication). Nevada Range. Wolverine range Population estimates indicate appears to have decreased over re- current numbers of all three species cent decades as follows. Known to may be well below what is needed historically OCCUPY the Cascades of to ensure their long-term viability, the Northwest and south into the if you consider that a minimum ef- southern Sierra Nevada, current fective population size of 500 indi- sightings throughout this western viduals may be necessary (Soul6
108 Endangered Species UPDATE Vol. 18 No. 4 2001

1)rrk Gray = Public and tnbal lands wrlh cumnloh\ew;llionr (IRLl's)
Ltgh~ Gray = Publte and tribal Ian&% with paslohcwauons (prs I9Ws)
estimated numbers of lynx (Figure 4) and grizzly bear across the western U.S., both of which are listed as threat- ened species under the fed- eral Endangered Species Act.
Discussion This analysis provides a coarse but useful first step toward identifying occupied habitat for the lynx, wolver- ine, and fisher, toward as-
Figure 3. Fisher sub-population estimates sessing their conservation status across the American West and prioritizing areas for their protection. Obser- vation data are inherently biased by observer effort and reliability, and by im- perfect reporting and orga- nization of observations. These data should be re- fined with more careful screening and supple- mented with new informa- tion regarding the conser- vation status and distribu- tion of these species. Addi-
Figure 4. Lynx sub-population estimates tional data from Canada are needed to develop a com- prehensive, range-wide
1987), and that just a fraction of the conservation assessment and strat- individuals within these carnivore egy for the forest carnivores. De- populations are actively breeding spite these limitations, this analy- and thus count toward the effective sis provides an initial step toward population size (Ruggiero et al. the design and implementation of a 1994). The fisher appears to be the forest carnivore conservation strat- most imperiled of the three in the egy that encompasses occupied West, with an estimated total popu- habitat within the western U.S. for lation of perhaps 600 animals, includ- one or more of these species. ing populations that may be function- ally isolated in the southern Sierra, Acknowledgements northern Sierra, southwestern Or- I am grateful to the U.S. Forest Ser- egon, and portions of Greater vice Rocky Mountain Research Sta- Yellowstone (Figure 3). The wolver- tion for compiling and providing ine is more widespread than the me with its lynx distribution data, fisher, but its low densities coupled and to the natural heritage programs with recent declines in the Sierra and of California, Colorado, Idaho, Northwest are cause for concern. Montana, Oregon, Utah, Washing- Population estimates for both the ton, and Wyoming for providing for- fisher and the wolverine are less than
est carnivore observation data free of charge. Thanks also to the Ecology Center in Missoula, Montana for some GIs assistance, to Defenders of Wildlife for providing a venue to share this analysis, and to Stephen Kendrot (USDA Wildlife Services) for a helpful review.
Literature cited Copeland, J. 1996. Biology of the wolverine in
central Idaho. MS Thesis, University of Idaho, Moscow, Idaho, May 1996.
Groves, C.R. 1988. Distribution of the wolver- ine in Idaho as determined by mail question- naire. Northwest Science 62(4): 181-5.
Maj, Mary and E.O. Garton. 1994. Fisher, lynx, wolverine; summary of distributiorl informa- tion. Pp 169-175 in L.F. Ruggiero, K.B. Aubry, S.W. Buskirk, L.J. Lyon, and W.J. Zielinski, eds. The scientific basis for con- serving forest carnivores: American marten, fisher, lynx, and wolverine in the western United States. U.S. Dept, ofAgriculture, For- est Service, Gen. Tech. Rep. RM-254.
McKelvey, K.S ., K.B. Aubry, J.K. Agee, S. W. Buskirk, L.F. Ruggiero, and G.M. Koehler. 2000a. Lynx conservation in an ecosystem management context. Chapter 15 in Ruggiero, L.F., K.B. Aubry, S.W. Buskirk, G.M. Koehler, C.J. Krebs, K.S. McKelvey, and J.R. Squires, eds. Ecology and conser- vation of lynx in the United States. U.S. Dept. of Agriculture, Forest Senrice Rocky Mountain Research Station, Missoula, Mon- tana; published by University Press of Colo- rado, Boulder, Colorado.
McKelvey, K.S ., K. B. Aubry, andY.K. Ortega. 2000b. History and distribution of lynx in the contiguous United States. Chapter 8 in Ruggiero, L.F., K.B. Aubry, S.W. Buskirk, G.M. Koehler, C.J. Krebs, K.S. McKelvey, and J.R. Squires, eds. Ecology and conser- vation of lynx in the United States. U.S. Dept, of Agriculture, Forest Service Rocky Mountain Research Station, Missoula, Mon- tana; published by University Press of Colo- rado, Boulder, Colorado.
Ruggiero, L.F., K.B. Aubry, S.W. Buskirk, L.J. Lyon, and W.J. Zielinski, eds. 1994. The scientific basis for conserving forest cami- vores: American marten, fisher, lynx, and wolverine in the western United States. Gen Tech Rep RM-254, Fort Collins, Colorado, U.S. Dept. of Agriculture, Forest Service, Rocky Mountain Forest and Range Exp. Stat, 184 pp.
Soul6 M.E. 1987. Viable populations for con- servation. Cambridge University Press, Cambridge, England.
Vol. 18 No. 4 2001 Endangered Species UPDATE 109

Road Density as a Factor in Habitat Selection by Wolves and Other Carnivores in the Great Lakes Region Adrian P, Wydeven Mammalian Ecologist/Conservation Biologist, Wisconsin Department of Natural Resources, 875 South 4th Ave., Box 220, Park Falls, WI 54552; (715) 762.4684 x10⁷; (fax) (715) 762-4348; [email protected]
David J. Mladenoff Department of Forest Ecology and Management; University of Wisconsin Madison; 1630 Linden Drive; Madison, WI 53706
Theodore A, Sickley Department of Forest Ecology and Management; University of Wisconsin Madison; 1630 Linden Drive; Madison, WI 53706
Bruce E. Kohn Wisconsin Department of Natural Resources; Highway 17 S., Box 576; Rhinelander, WI 54501
R. P. Thiel Wisconsin Department of Natural Resources; Sandhill Wildlife Area; Box 156; Babcock, WI 54413
Jennifer L. Hansen Land Information and Computer Graphics Facility; University of Wisconsin Madison; 550 Babcock Drive, 8102 Steenbach Library; Madison , WI 53706; (608) 263-5534; (fax) (608) 262-2500; [email protected]
Abstract Although wolves (Canis lupus) and many other carnivores are habitat generalists, certain land- scape features can be used to predict suitable habitat. Thiel examined the concept of road density as an important factor in the persistence of wolfpopulations in Wisconsin prior to the 1960s and found a relationship with the disappearance of breeding wolfpopulations when average road density exceeded 0.58 km/km2. Mladenofand co2leagues examined road density in the early 1990s as a factor in predicting favorable habitat of wolves colonizing Wisconsin between 1980 and 1992, and found that areas with road densities less than 0.45 km/km2 had greater than a 50% probability of being colonized by wolf packs. Mladenoff and colleagues updated this work in the late 1990s by examining 23packs colonizing Wisconsin between 1993 and 1997; 78% continued to occupy areas with road densities below 0.45 km/km2. In a recent examination of radio-collared wolves in Wisconsin, a total of 60% of human-induced mortality occurred at road densities above-0.63 km/km2. Although road density may become less of a factor as human tolerance changes, and wolfpopulations increase, it continues to be an important factor in habitat selection by wolves and probably other carnivores.
Introduction Gray wolves (Canis lupus) are gen- eralists in their use of habitat, and historically have been found in most regions across temperate, bo- real, and arctic regions of North America (Mech 1995). Despite this generalist nature of habitat use, landscape features, especially those relating to human impacts, can be used to predict suitable wolf habi- tat (Corsi et al. 1999; Massolo and Meriggi 1998; Mladenoff et al. 1995). Road density has frequently been used as a landscape feature to predict suitable wolf habitat (Corsi et al. 1999; Frair 1999; Fuller et al.
1992; Jensen et al. 1986; Mech et al. 1988; Mladenoff et al. 1995; Thiel 1985).
Early development of concept of road density As a graduate student under Aldo Leopold, Thompson (1 952) studied wolf food habits in northern Wis- consin in the late 1940s, about 10 years before wolves disappeared from the state. Thompson (1952) warned that development and open- ing of roads across the logged for- ests of northern Wisconsin could cause wolves to become extirpated from the state. As predicted,
wolves were extirpated from Wis- consin by 1960 (Thiel 1985; Wydeven et al. 1995).
Thiel(1985) examined the dis- appearance of breeding populations of wolves in Wisconsin from 1926 to 1960. Using State Highway Commission Reports, he deter- mined that breeding wolves disap- peared from 10 Wisconsin counties after road densities in these coun- ties exceeded 0.48 to 0.68 krn/km2 (X=0.58 km/km2). The value of 0.6 krn/km2 has since been used fre- quently as the threshold level at which wolf populations can be maintained. This level was found
-
11 0 Endangered Species UPDATE
- -
Val. 18 No. 4 2001

to correspond well with areas of oc- cupied wolf range in Minnesota (Fuller et al. 1992; Mech et al. 1988), Michigan, and Ontario (Buss and Almeida 1998; Jensen et al. 1986).
GIs analysis of road density Through elimination of bounties and protection by the 1973 Endan- gered Species Act, wolves were provided protection that allowed re- 'colonization of Wisconsin in the 1970s (Wydeven et al. 1995). Mladenoff et al. (1995) used a geo- graphic information system (GIs) to assess landscape features that contributed to re-colonization of 14 Wisconsin wolf packs from 1980 to 1992. Known pack territories of radio-collared wolves were com-
pared to 14 random non-pack areas scattered across northern Wiscon- sin. Areas occupied by wolf packs (80% isopleth of harmonic mean) had average road densities of 0.23 kmlkm2 (Table 1). Road density was based on paved roads, and im- proved dirt and gravel roads that appeared as solid lines on U.S. Geo- logical Survey (USGS) 1 : 100,000 quadrangle maps (Mladenoff et al. 1995). Other important features of wolf pack areas included lack of urban and agricultural areas, exten- sive forest (X=93%), high percent- age wetland (X=29%), mostly pub- lic lands and industrial forest land ( X=80%), and low human popula- tion density. Human density com- pared closely to road density.
Table 1. Average landscape variables for 14 wolf packs, random non- pack areas (1-144) and overall Wisconsin study area (modified from Mladenoff et al. 1995).
Vol. 18 No. 4 2001
Mladenoff et al. (1995) used road density as the main factor used in a logistical regression model that predicted areas of suitable wolf habitat (Table 2). Areas with < 0.45 km/km2 were considered highly suitable wolf habitat and were esti- mated to have > 0.50 probability of being colonized by wolf packs. Minnesota had the most extensive area of highly suitable habitat, and packs expanded outside perceived suitable habitat in some areas (Berg and Benson 1998). Fuller et al. (1992) indicated that in 1989, 88% of wolf pack areas had road densi- ties < 0.70 krn/km2. As predicted, most areas of highly suitable habi- tat were occupied by wolves in Michigan (James Hammill, per- sonal communication).
Based on the logistical regres- sion model, areas with > 0.60 km road/km2 have less than a 10% chance of being occupied by wolf packs. Thus, the G I s analysis agrees with the threshold found by Thiel(1985).
Roads as a factor in wolf habitat in other studies A habitat model developed in the Great Lakes region was used as a basis for assessing potential wolf habitat in the northeast U.S. (Harrison and Chapin 1998; Mladenoff and Sickley 1998). Mladenoff and Sickley (1998) esti- mated 53,500 km2 of potential habi- tat in Maine and New Hampshire and 16,020 km2 in New York. Harrison and Chapin (1998) esti- mated 48,787 km2 of potential habi- tat in Maine and New Hampshire, and 14,618 km2 in New York. Mladenoff and Sickley (1998) re- lied mainly on road density values, while Harrison and Chapin used a combination of road density and human population density.
Road density has also been found to be important in predicting
Endangered Species UPDATE 1 11

Table 2. Area of wolf habitat probability classes from a logistical regression model and corresponding road density for portions of three Great Lakes states (from Mladenoff et el. 1995).
wolf habitat in Italy (Corsi et al. 1999; Massolo and Meriggi 1998). The estimated area of highly suitable habitat in Italy (14,200 krn2) (Corsi et al. 1999) was similar to the area estimated in Wisconsin (14,864 km2) (Mladenoff et al. 1995).
Kohn et al. (2000) conducted a variety of studies examining the re- lationship of wolves to roads in northwest Wisconsin. Shelley and Anderson (1995) found road den- sities in northwest Wisconsin wolf territories to average 0.33 km/km2 for eight pack areas. Although wolves selected areas of low road density, travel areas selected by packs were generally close to trails and forest roads (Gehring 1995). Unger (1999) found that wolves se- lected den sites in roadless or low road density areas; dens were gen- erally located more than 1 km from improved roads. Frair (1999) found that wolves most frequently used areas away from roads, and aver- age road density in wolf territories was 0.25 km/km2; road density was found to be the best predictor of suitable wolf habitat.
Recent examinations of road densities in Wisconsin Mladenoff et al. (1999) examined 23 additional wolf territories that colonized Wisconsin from 1993 to
1997. Five packs (22%) exceeded the 0.45 km/km2 threshold of road density and one (4%) exceeded the 0.60 km/km2 threshold. Thirteen packs were radio collared and pro- vided more precise data on area of pack use; two (15%) exceeded the 0.45 km/km2 threshold and one (7%) exceeded the 0.60 km/km2 threshold. In general, the road den- sity model continued to be a good predictor of suitable wolf habitat. The one territory that exceeded the 0.60 krn/km2 threshold was in a state wildlife area that had a higher road density (0.71 km/km2), but greater access control may have nullified the effects of higher road density.
The wolf population in Wiscon- sin increased from 15 wolves in 1985 to 248 wolves in 2000, total- ing 66 packs (Wydeven and Wiedenhoeft 2000). We examined whether packs occurred within ar- eas of suitable habitat as illustrated by Mladenoff et al. (1995, 1999). Of 66 packs in Wisconsin, 53 (80%) were contained in areas mapped as highly suitable wolf habitat (P > 0.50), seven (1 1%) were contained within marginal wolf habitat (0.50 > P > 0.10), and six (9%) occurred in areas mapped as poor wolf habi- tat (P < 0.10). Thus, packs contin- ued to occur mainly in areas of low road density. Even those packs oc-
curring in areas that seemed unsuit- able (road density > 0.60 km/km2), were within 10 km of areas of highly suitable habitat.
We recently examined the rela- tionship between wolf mortality and road density. Fifty radio-col- lared wolves died in Wisconsin be- tween 1979 and 1999. The road densities for 47 wolf mortalities were collected (Figure 1). The av- erage road density for natural mor- talities was 0.65 km/km2 and for human-induced mortalities was 0.78 km/km2.
Highest natural mortality was at the road density range of 0.63 to 0.84 km/km2, areas considered poor habitat. We initially had expected natural mortality to be highest in areas of most suitable habitat where wolves most frequently occurred, but higher rates at higher road den- sity make sense. Wolves dying from natural mortality, died mainly from disease or intraspecific strife. Diseased animals lose their fear of humans, and often wander off by themselves into poor habitat. An adult female with severe mange crawled into a garage in 1993. Mortality from intraspecific strife usually occurs near the edge of a territory and often pack boundaries are near roadways. Thus even wolves dying from natural mortal- ity are more likely to be killed closer to roads.
Human-induced mortality peaked at relatively high road den- sities (Figure 2). Most shootings and vehicle collisions occurred at road densities of 0.84 to 1.14 km/ km2. A total of 60% of human-in- duced mortality occurred at a road density greater than 0.63 krn/km2.
In general, wolves appear more likely to be killed at higher road densities. Although most wolves spend little time at these higher densities, they are at a much greater risk of being killed in these areas.
1 12 Endangered Species UPDATE Vol. 18 No. 4 2001

9
8
7
i 8
F 5 Z i 4
5 t
2
1
0 4 . 4 3 0.434.63 0.850.84 0.84-1.14 1.141.55
Road Densky (KmlKmY)
Figure 1. Cause of mortality of radio-collared wolves in Wisconsin 1979 to 1999 relation to road density.
Discussion As human attitudes toward wolves improve and wolf populations con- tinue to increase, road densities may become less of a factor in wolf habitat selection (Mech 1995). In the Great Lakes region, road den- sity provides a useful proxy for human disturbance and risk of mor- tality. In mountainous terrain where ungulate distribution is very patchy, road density may be a less useful index (Diane Boyd, personal communication), but in the gener- ally homogeneous landscape of the northern Great Lakes region it con- tinues to be useful. Whether road density serves as a good predictor of wolf habitat in northeastern U.S. remains to be seen.
Exceptions to the usefulness of road density will continue to occur. Mech (1989) cites an example of ar- eas with road densities of 0.73 km/ km2 supporting wolf packs in Min- nesota but having large wilderness reservoirs nearby. Merrill (2000) indicates that a military base in Minnesota with a road density of 1.42 km/km2 has supported a wolf
pack for over six years. Strict con- trol on access, and human activity limited to day light hours, can nul- lify the effect of road density. In Wisconsin, packs occur in the Crex Meadow Wildlife Area and Necedah National Wildlife Refuge that are classified as low probabil- ity of pack occupation, but stricter access control by the management agency reduces the effects of high road densities. Wolves do not have an aversion to roads, and readily travel on roadways if traffic levels are low (Gehring 1995). Wolves learn to avoid roads with high traf- fic volumes, but readily use gated roads (Thurber et al. 1994). Al- though wolves seem to cross sec- ondary roads, they vary in willing- ness to cross busy highways (Frair 1999). Some dispersers do exten- sive crossings of highways (Kohn et al. 2000; Mech et a1 1995; Merrill and Mech 2000).
Road density as a habitat factor has applicability to other carnivores. Roads affect movements and harvest of black bear populations (Ursus americanus) (Brody and Pelton 1989). Bobcat (Lynx rufus) avoid
certain types of roads and seem more attracted to areas with low traffic volume (Lovallo and Anderson 1996). American mar- ten (Martes americana) may be impacted by trapping when ac- cess is high and avoid crossing large open areas, which could be impacted by road density (Chapin et al. 1998). Other car- nivores that require large home ranges may also be affected by road density.
Management and research recommendation
, in Road density appears to be an important habitat factor for wolves and other carnivores; therefore public lands managed for these species should main-
tain suitable habitats with low den- sities of roads. Forested areas man- aged for wolves should maintain overall road densities of 0.6 km/ km2. Core wolf habitat should be managed at road densities of 0.45 km/km2. If productive packs exist in areas at much higher road den- sity, a reduction to lower densities would not be necessary, but at- tempts should be made to avoid in- creasing road density or changing traffic levels.
On public forest lands, new log- ging roads should be closed or obliterated after logging operations are completed. Where possible, temporary, winter-only roads should be used, because these roads cause least damage and revert back to vegetated areas. Areas within 100 meters of den sites should be kept undeveloped, and logging roads and trails should stay more than 100 meters from those sites.
The impact of road density is not well known for other carni- vores; therefore research on habi- tat use should include assessments of road density as a habitat value. The impacts of various types of
Voi. 18 No. 4 2001
-
Endangered Species UPDATE 113

roads on carnivores should be studied and impacts from all-ter- rain vehicles (ATVs), snowmo- biles, and other off-road vehicles should also be investigated. Roads are important habitat vari- ables for carnivores that need to be more carefully researched.
Literature cited Berg, B. and S. Benson. 1998. Summary
report 1997- 1998 Wolf Survey Coop- erators. Minnesota Department of Natu- ral Resources. 4 p. (unpublished report).
Brody, A.J. and M.R. Pelton. 1989. Ef- fects of roads on black bear movements in western North Carolina. Wildlife Society Bulletin 175-10.
B ~ ~ ~ , M. and M. de Almeida, 1998. A re- Figure 2. Human causes of mortality of radio-collared wolves in Wisconsin 1979 view of wolfand coyote status and policy to 1999 in relation to road density. in Ontario. Ontario Ministry of Natural Resources. Pewborough Ontario.
Chapin, T.G., D.J. Harrison and D.O. Katnik. 1998. Influences of landscape pattern on habitat use by American marten Lovallo, M.J. mdE.M. Anderson. 1996. Bob-
in an industrial forest, Conservation Biol- Cat movements and home range relative to lation levels. Journal of Wildlife Manage- ogy 12:1327-1337. roads in Wisconsin. Wildlife Society Bulle- ment 62: 1- 10.
Corsi, F., E. Dupre, and L. Boitani. 1999. A tin 24:71-76. Mladenoff, D.J, T.A. Sickley and A.P. large scale model of wolf distribution in Italy Massolo, A. and A. Meriggi. 1998. Factors Wydeven. 1999. Predicting gray wolf for conservation planning. Consewation Bi- affecting habitat occupancy by wolves in landscape recolonization: logistic regression
ology 13: 150-159. northern Apennines (northern Italy): a model models vs. new field data. Ecological Ap- Frair, J,L. 1999. Crossing paths: g a y wolves of habitat suitability. Ecography 21:97-107. plication 9:37-44.
highways in the M~nesota-Wisconsin Mech, L.D. 1989. Wolf population survival in Shelley, D.P. and E.M. Anderson. 1995. Impact border region. University of Wisconsin, area of high road density. American Mid- of U. S. Highway 53 expansion on timber Stevens Point, WI MS. Thesis. 57 pp. land Naturalist 125387-389. wolves - Baseline Data. University of Wiscon-
Fuller, T.K., W.E. Berg, G.L. Raddle, M.S. Mech, L.D. 1995. The challenge and oppor- sin, Stevens Point, WI, Final Report. 32 pp. Lenarz, G.B. Joselyn. 1992. A history and tunity of recovering wolf populations. Con- %el, RR. 1985. Relationshipbetween roadden- current estimate of wolf distribution and senation Biology 9:270-278. sities and wolf habitat suitability in Wisconsin. numbers in Minnesota. Wildlife Society Mech, L.D., S.H. Fritts, G.L. Radde, and W.J. A m e r i c a n M i ~ N ~ t 113:40447.
Bulletin 20:42-55. Paul. 1988. Wolf distribution and road den- Thompson, D.Q. 1952. Travel, range, and food Gehring, T.M, 1995, Winter wolf movements siQ in Minnesota. Wildlife Society Bulletin habits of timber wolves in Wisconsin. Jour-
in northwestern Wisconsin and east-central I(i:@-87. nal of Mammalogy 33:429-442. Minnesota: a quantitative approach. uni- Mech, L.D., S.H. Fritts, and D. Wagner. 1995. Thurber, J.M., R.O. Peterson, T.D. Drummer,
versity of Wisconsin, Stevens Point, WI Minnesota wolf dispersal to Wisconsin and and S.A. Thomasma. 1994. Gray wolf re-
M.S. Thesis 132 pp. Michigan. American Midland Naturalist sponse to refuge boundaries and roads in Harrison, D. J. and T. G. Chapin. 1998. Ex- 133368-370. Alaska. Wildlife Society Bulletin 22:61-68.
tent and comectivi~ of habitat for wolves Menill, S.B. 2000. Roaddensities andgray wolf Unger, D.E. 1999. Timber wolf den and ren-
in eastem ~~~h America, Wildlife Society (Canis l u p u ~ ) , habitat suitability: exception, dezvous site selection in northwestern Wis- Bulletin 26:767-775. CandianFieldNaturalist 114:312-313. consin and east-central Minnesota. Univer-
Jensen, W,E, T,K, Fuller, W,L, Robinson, Menill, S.B. and L.D. Mech. 2000. Details of sity of W ~ S C O ~ S ~ , Stevens Point, WI. M.S. 1986. wolf (Canis lupus) distribution on the extensive movements by Minnesota wolves Thesis. 76 pp.
OntarieMiChiganbordernearSaultSte.Marie. (Canis lupus). American Midland Natural- Wydeven, A.P., R.N. Schult~, and R.P. Thiel. Canadian Field-Naturalist 100:363-366. ist 144428-433. 1995. Gray wolf (Canis lupus) population
Kohn, B,w,, J,L, Frair, D,E, Unger, T.M, Mladenoff. D.J., T.A. Sickley, R.G. Haight, and monitoring in Wisconsin 1979-1991. Pp. Gehng, D.P. Shelley, E.M. Anderson, and A.P. Wydeven. 1995. Aregiond landscape 147-156 in L. N. Carbyn, S. H. Fritts, and P.W. Keenlance. 2000. h p a c t of (he U.S. analysis and prediction of favorable gray D. R. Seip, eds. Ecology and conservation Highway 53 expansion project on wolves in wolf habitat in the Northern Great Lakes re- of wolves in a changing world. Canadian northwestem Wisconsin, Final Report for gion. Conservation Biology 9:279-294. Circumpolar Institute, University of Alberta, Wisconsin Department of Transportation, Mladenoff, D.J. and T.A. Sickley. 1998. AS- Edmonton, Canada. Wisconsin Department of Natural Re- sessing potential gray wolf restoration in the Wydeven, A.P. and J.E. Wiedenhoeft. 2000. sources. 49 pp + appendices. northeastern United States: a spatial predic- Gray wolf population 1999-2000. Wiscon-
tion of favorable habitat and potential popu- sin Wildlife Surveys 10: 130-137.
114 Endangered Species UPDATE Val. 18 No. 4 2001
A Predator-Habitat Assessment for Felids in the Inland Atlantic Forest of Eastern Paraguay: A Preliminary Analysis Gerald L. Zuercher Ph.D. Candidate, Kansas Cooperative Fish and Wildlife Research Unit, Kansas State University, 205 Leasure Hall, Manhattan, KS 66506; (785) 532-6336; (fax) (785) 532-7159; Research Associate, Sunset Zoological park; geraldza ksu.edu
Philip S. Gipson Unit Leader, Kansas Cooperative Fish and Wildlife Research Unit, Kansas State University, 205 Leasure Hall, Manhattan, KS 66506; (785) 532-6070; (fax) (785) 532-71 59; gipson Q ksti.edu
Kim Hill Associate Professor, Department of Anthropology, University of New Mexico, Albuquerque, NM 87131 ; (505) 277-1536; (fax) (505) 277-0874; kimhillQunm.edu
Abstract Jaguar (Panthera onca), puma (Puma concolor), and possibly six species of small cats (ocelot, Leopardus pardalis; margay, Leopardus wiedii; oncilla, Leopardus tigrinus; Geoffmy's cat, Oncifelis geoffroyi, pampas cat, Oncifelis colocolo, jaguarundi, Herpailurus yagouaroundi) co- exist within Mbaracayli Forest Nature Reserve in eastern Paraguay. At the landscape level, this 64,000-hectare island of Inland Atlantic Forest, surrounded by agricultural land, is a mosaic of forest habitats and interspersed grasslands. Habitats on the reserve include low, medium, and high forest, as well as dry and wet grasslands. The adaptive nature of most predators led us to predict that felids would occur uniformly across habitats. Tests of independence between species and habitats, howevel; suggest distinct associations between felids and habitats. Explanations for habitat afinities include integerence competition or simply following prey to their preferred habitats. Thus, while felids in the inland Atlantic forest may be habitat generalists across their entire range, they exhibit some habitat preferences within Mbaracayli reserve, possibly as an adaptation to interspecific competition and/or prey availability, Further research is needed to determine whether these patterns continue long-term or are an artifact of the timing of our current data collection efforts.
Reserva Natural del Bosque Mbaracayu The Mbaracayd reserve is the larg- est tract of undisturbed forest in eastern Paraguay covering approxi- mately 64,000 hectares of the quar- ter million hectare upper Jejui wa- tershed. Only the combined reserve areas in Brazil and Argentina around Yguazu Falls contains more of the Alto Parana formation of the Atlantic Rainforest. Located at ap- proximately 55O west and 24" south, the reserve is mostly between 150 to 300m in elevation and is drained to the west by the Paraguay River. The area averages about 1800 mm of rainfall per year but is charac-
terized by extreme unpredictability in monthly patterns from year to year. The typical dry season lasts from May to September (Sanchez 1973; FMB unpublished data). Seasons are associated with marked temperature fluctuations, with av- erage daily high-low temperatures of 14 to 25 C in July and 22 to 34O C in January. The reserve contains about 90% of all species classified as rare or endangered within Para- guay (FMB 1992) and was chosen as the top priority conservation site in eastern Paraguay (Keel et al. 1993). The Mbaracayd reserve is located in the traditional homeland of Ache hunter-gatherers. The Ache
have exceptional knowledge of the Paraguayan forest because they lived off wild resources until re- cently and most adults have spent most of their lives in the forest (Hill and Hurtado 1989). Further, the Ache are allowed exclusive rights to hunt and forage within the reserve.
Felid species within Mbaracayu Reserve The diversity of mammalian carni- vores (Mammalia, Carnivora) exist- ing within the bounds of the reserve is high with published lists of spe- cies ranging between 13 to 17 (Hill et al. 1997; FMB 1997; MNHNP 1996). There is disagreement about
Vol. 18 No. 4 2001 Endangered Species UPDATE 115

the occurrence of some species, with the following listed: three or four canids [bush dog (Speothos venaticus), maned wolf (Chrysocyon brachyurus), crab-eat- ing fox (Cerdocyon thous), pampas fox (Pseudalopex gymnocercus)], two procyonids [South American coati (Nasua nasua), crab-eating raccoon (Procyon cancrivorus)], four or five mustelids [tayra (Eira barbara), lesser grison (Galictis cuja) long-tailed otter (Lontra longicaudus), giant otter (Pteronura brasiliensis), hog-nosed skunk (Conepatus chinga)], and, f ive to eight fel ids [jaguar (Panthera onca) , puma (Puma concolor) , ocelot (Leopardus pardal is ) , margay (L. wiedii), oncilla (L. tigrina), jaguarundi (Herpai lurus yagouaroundi) , Geoffroy's cat (Oncifelis geoffroyi), pampas cat (0 . colocolo)]. Many of these carnivore species, includ- ing all canids and felids, are listed by the Convention on International Trade in Endangered Species of Wild Fauna and Flora (CITES), ei- ther on Appendix I or Appendix I1 (Table 1). We chose to focus on felids as a first analysis of habitat associations by predators in Mbaracay6 reserve.
The jaguar is found in many habitats throughout i ts range (southwestern United States through northern Argentina). This is the largest native cat in the west- ern hemisphere with males weigh- ing as much as 136 kg. Jaguars are a top predator, and, in Mbaracayd Reserve, evidence of predation by a jaguar on a puma has been documented (K. Hill, personal observation). Jaguars are thought to be dietary generalist and take ad- vantage of any prey available. Pu- mas currently exist over a larger area (northern Canada through southern Chile and Argentina) than jaguars and function as top preda-
tors in much of their range. Pumas are also large cats (males weighing as much as 103 kg); they are consid- ered deer specialists, although they feed on a diverse prey spectrum.
Several species of small cats potentially co-exist within Mbaracay6 Reserve. The presence of the ocelot, oncilla, jaguarundi, and Geoffroy's cat at this site is confirmed by voucher specimens at the Natural History Museum of Paraguay (MNHNP 1996). Mar- gays are considered residents (Hill et al. 1997) and pampas cat is ru- mored to exist in the cenado por- tion on the western edge of the re- serve (E. Esquivel, personal com- munication). This discrepancy of confirmed felid species, coupled
with the limited number of local names for small cats in the area (Table 2), led us to consider all small cats as a group.
Major habitat types within Mbaracayu Reserve Until recently, categorizing the for- est mosaic of Mbaracay6 was dif- ficult. Sources for identifying in- dividual plants and some plant communities have been available for reference for several years (Lopez et al. 1987) but no consis- tent description of key habitat types was available. The publication of "Plantas Comunes de Mbaracay6" provides a scientifically based habi- tat classification system for studies within Mbaracayti (Marin et al.
Table 1. CITES listings for mammalian carnivores in Paraguay (MAG- CITES 1999).
1 Carnivore Species I Sciitific Name I CITES Listing I Canidae
bush dog
Mustelidae
Appendix I
maned wolf
pampas fox
Felidae
Speothos venaticus
jaguar Panthera onca Appendix I
Puma concolor Appendix I1
ocelot Leopardus pardalis Appendix I
- - - - - - -
Appendix I
Chrysocyon brachyurus
Pseudalopex gymnocercus
I margay 1 Leopardus wiedii 1 Appendix l I
Appendix II
Appendix II
Appendix I
I pampas cat 1 Oncifelis colocolo I Appendix ll I
11 6 Endangered Species UPDATE Vol. 18 No. 4 2001
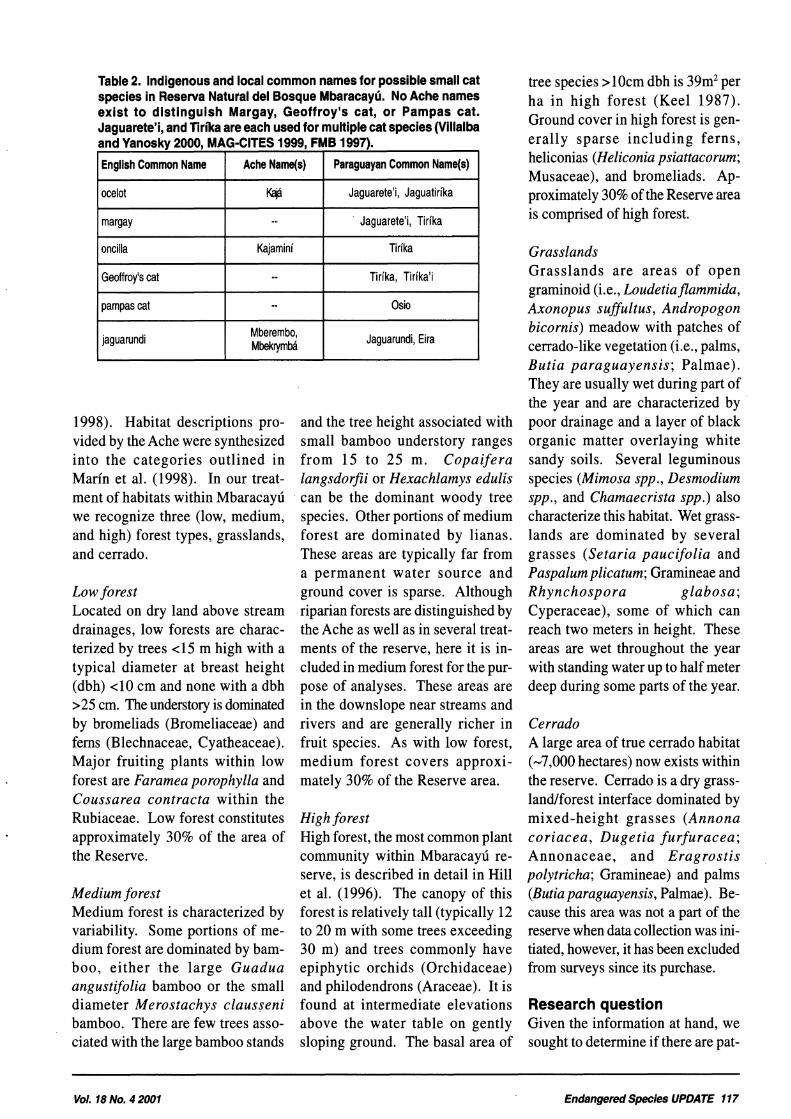
Table 2. Indigenous and local common names for possible small cat species in ~eserva Natural del Bosque Mbaracayu. No Ache names exist to distinguish Margay, Geoffroy's cat, or Pampas cat. Jaguarete'i, and Tirika are each used for multiple cat species (Villalba and Yanosky 2000, MAG-CITES 1999, FMB 1997).
English Common Name
ocelot Jaguarete'i, Jaguatirika
margay Jaguarete'i, Tirika
tree species > 10cm dbh is 39m2 per ha in high forest (Keel 1987). Ground cover in high forest is gen- erally sparse including ferns, heliconias (Heliconia psiattacorum; Musaceae), and bromeliads. Ap- proximately 30% of the Reserve area is comprised of high forest.
oncilla Kajamini Tirika
Geoffrey's cat Tirika, Tirika'i
pampas cat Osio
jaguarundi I Jaguarundi, Eira
1998). Habitat descriptions pro- vided by the Ache were synthesized into the categories outlined in Marin et al. (1998). In our treat- ment of habitats within Mbaracayd we recognize three (low, medium, and high) forest types, grasslands, and cerrado.
Low forest Located on dry land above stream drainages, low forests are charac- terized by trees <15 m high with a typical diameter at breast height (dbh) <10 cm and none with a dbh >25 cm. The understory is dominated by bromeliads (Bromeliaceae) and ferns (Blechnaceae, Cyatheaceae). Major fruiting plants within low forest are Faramea porophylla and Coussarea contracta within the Rubiaceae. Low forest constitutes approximately 30% of the area of the Reserve.
Medium forest Medium forest is characterized by variability. Some portions of me- dium forest are dominated by bam- boo, either the large Guadua angustifolia bamboo or the small diameter Merostachys clausseni bamboo. There are few trees asso- ciated with the large bamboo stands
and the tree height associated with small bamboo understory ranges from 15 to 25 m. Copaifera langsdorfii or Hexachlamys edulis can be the dominant woody tree species. Other portions of medium forest are dominated by lianas. These areas are typically far from a permanent water source and ground cover is sparse. Although riparian forests are distinguished by the Ache as well as in several treat- ments of the reserve, here it is in- cluded in medium forest for the pur- pose of analyses. These areas are in the downslope near streams and rivers and are generally richer in fruit species. As with low forest, medium forest covers approxi- mately 30% of the Reserve area.
High forest High forest, the most common plant community within Mbaracayd re- serve, is described in detail in Hill et al. (1996). The canopy of this forest is relatively tall (typically 12 to 20 m with some trees exceeding 30 m) and trees commonly have epiphytic orchids (Orchidaceae) and philodendrons (Araceae). It is found at intermediate elevations above the water table on gently sloping ground. The basal area of
Grasslands Grasslands are areas of open graminoid (i.e., Loudetiaflammida, Axonopus suflultus, Andropogon bicornis) meadow with patches of cerrado-like vegetation (i.e., palms, Butia paraguayensis; Palmae). They are usually wet during part of the year and are characterized by poor drainage and a layer of black organic matter overlaying white sandy soils. Several leguminous species (Mimosa spp., Desmodium spp., and Chamaecrista spp.) also characterize this habitat. Wet grass- lands are dominated by several grasses (Setaria paucifolia and Paspalum plicatum; Gramineae and Rhynchospora glabosa; Cyperaceae), some of which can reach two meters in height. These areas are wet throughout the year with standing water up to half meter deep during some parts of the year.
Cerrado A large area of true cerrado habitat (-7,000 hectares) now exists within the reserve. Cenado is a dry grass- landtforest interface dominated by mixed-height grasses (Annona coriacea, Dugetia furfuracea; Annonaceae, and Eragrostis polytricha; Gramineae) and palms (Butia paraguayensis, Palmae). Be- cause this area was not a part of the reserve when data collection was ini- tiated, however, it has been excluded from surveys since its purchase.
Research question Given the information at hand, we sought to determine if there are pat-
Vol. 18 No. 4 2001 Endangered Species UPDATE 11 7

terns of association between spe- cific felids and major habitat types. We hypothesize that: felids in Reserva Natural del Bosque Mbaracayd exhibit no detectable habitat associations. Our rationale for this are (1) predators are gener- ally highly adaptive, and (2) the habitats in Mbaracayd exist as a mosaic with no distinct patches available for exclusive residence.
Data collection and analysis A stratified random sample of walk- ing transects through the Mbaracayd reserve was employed as the f ield method of game censusing. Data for this analysis come from four census periods: June 1994 to April 1995, July 1995 to June 1996, July 1996 to May 1997, and July 1997 to May 1998. Five Ache assistants, walking in parallel, and a data recorder, walk- ing 5 m directly behind the middle researcher, censused the same 91 transects each year of the study. One individual walked directly on the transect line while two assis- tants were located on each side, separated by 25 and 50 m. Each transect began at a specified GPS location and proceeded along a specified compass bearing through- out the day for approximately 5 km. Transects passed through all habi- tat types and were only suspended when water exceeded half meter in depth. Transects were continued on the far side of water bodies (swamp, streams, river, etc.) that had to be crossed. A GPS location and habi- tat description were noted for all types of animal encounters (for all animals at least 0.5 kg in size). The type of sighting was noted: (1) ani- mal was seen, heard, or found in a burrow, or (2) identified through fresh sign or feces. All locations during the study were determined using a Trimble Pathfinder Pro Glo- bal Positioning System (GPS) re-
ceiver. Data were then categorized according to species (jaguar, puma, small cat) and habitat type prior to statistical analysis. In order to de- tect deviations from random habi- tat associations, a Chi-square test for independence between species occurrence and habitat was per- formed using SAS (SAS Institute Inc., Cary, NC 27513). Data were pooled across survey years to en- sure a robust analysis.
Results and discussion The Chi-square test resulted in a significant deviation from random (x" 22.29, P = 0.0012) indicating that some species were non-ran- domly associated with habitats. The relationship between species occurrence within each habitat is displayed in Figure 1. Jaguars oc- cur within high forest habitat greater than expected and in low forest and grassland habitats less than expected. This apparent pref- erence for high forest by jaguars may be related to greater availabil- ity of prey species; an issue that re-
quires further investigation. Jag- uars appear to be the exclusive top predator in Mbaracayd reserve; their diet overlaps and includes all other cat species.
Pumas occur within all habitat types as expected. The lack of a pattern by pumas may reflect an overall high abundance of brocket deer, Mazama spp., within Mbaracayd reserve (Hill unpub- lished data).
Small spotted cats occur within low forest and grassland habitats greater than expected and in high forest habitat less than expected. The apparent preference for low forest and grasslands by small spot- ted cats may reflect an avoidance of jaguars, and other large preda- tors, or a response to more abun- dant prey. Data for small mammal and small bird population densities are not available.
Thus, while felids in the inland Atlantic forest may be habitat gen- eralists across their entire range, they exhibit some habitat prefer- ences within Mbaracayd reserve,
- -- --
I
Erpoctrd Acturl w A c h . l Expected A- EIpseted Aehlrl mgb Fomt M* Pomt Lon Fomt G m d r a d r
8J-r UPama ESmrUCats
Figure 1. Expected and actual counts of jaguars, pumas, and small cats within four habitat types in Mbaracayu reserve.
11 8 Endangered Species UPDATE Vol. 18 No. 4 2001

possibly as an adaptation to prey availability and interspecific com- petition. Research is needed to test our hypothesis that small cats ap- pear to be associated with distinct habitats, in response to potential predation by jaguars and pumas.
Literature cited FMB (Fundacidn MoisCs Bertoni). 1992.
Reserva Natural Mbaracayd. Plan opera- t ive. Fundacidn Mois6s Bertoni, Asuncidn, Paraguay.
FMB (Fundaci6n MoisCs Bertoni) 1997. Reserva Natural del Bosque Mbaracayd. Plan de manejo 1997-2001. Fundacidn MoisCs Bertoni, Asuncidn, Paraguay.
Hill, K. and A. Hurtado. 1989. Hunter- gatherers of the New World. American Scientist 77:436-443.
Hill , K., J . Padwe, C . Bejyvagi, A . Bepurangi, F. Jakugi, R. Tykuarangi, and T. Tykuarangi. 2000. Sustainability of Ache hunting in the Mbaracayd Reserve,
Paraguay. Pp 79-105 in J. Robinson and E. Bennett, eds. Hunting for sustainability in tropical forests. Colum- bia University Press, New York.
Hill , K., J. Padwe, C . Bejyvagi, A. Bepurangi, F. Jakugi, R. Tykuarangi, and T. Tykuarangi. 1997. Impact of hunt- ing on large vertebrates in the Mbaracayd Reserve, Paraguay. Conser- vation Biology 11: 1339-1353.
Keel, S. 1987. Informe de viaje a1 terrano del Banco Mundial. Centro de Datos para la Conservacion, Asunci6n, Para- guay.
Keel, S., A. Gentry, and L. Spinzi. 1993. Using vegetation analysis to facilitate the selection of conservation sites in eastern Paraguay. Conservation Biology 7:66-75.
Lopez, J.A., E.L. Little, Jr., G.F. Ritz., J.S. Rombold, W.J. Hahn, W.R. Sterrett, and M.J. McDonald. 1987. Arboles Comunes del Paraguay. Cuerpo de Paz, Coleccidn e Intercambio de Informaci61-1, Asuncidn, Paraguay.
MAG-CITES (Ministerio de Agricultura y Ganaderia - Oficina CITES-Paraguay), 1999. Especies Nativas de Paraguay. MAG-CITES, Asunci6n, Paraguay
Marin, G., B. Jiminez, M. Pena-Chocarro, and S. Knapp. 1998. Plantas Comunes de Mbaracay6. The Natural History Mu- seum, London.
MNHNP (Museo Nacional de Historia Natural del Paraguay). 1996. Colecciones de Flora y Fauna del Museo de Histor ia Natural del Paraguay. Direccion de parques Nacionales y Vida Silvestre, Ministerio de Agricultura y Ganaderfa, Asunci6n, Paraguay.
Sanchez, T.F. 1973. The climate of Para- guay. Pp 33-38 in J.R. Gorham, ed. Paraguay: ecological essays. Academy of the Arts and Sciences of the Ameri- cas, Miami.
Villalba, R. and A. Yanosky. 2000. Guia de Huellas y Seiiales: Fauna Paraguaya. Fundacidn MoisCs Bertoni and U.S. Agency for International Development, Asuncidn, Paraguay.
The FLORIDA PANTHER (Felis concolor coryi) is a subspecies of mountain lion. However, this endangered cat resides in isolated areas of the Florida Everglades and Big Cypress Swamp. The males measure seven feet in length (including the tail) and weigh 100 to 160 pounds. Females are smaller at six feet and 55 to 100 pounds. The Florida panther is mostly crepuscular (active at dusk and dawn) and feeds primarily on white-tailed deer but also con- sumes wild hogs and raccoons. As habitat shrinks, the remaining population is experiencing a loss of genetic viability making it vulnerable to disease. By donating time or money to a nature conservation organization you can help save its habitat and help with relocation efforts and captive-breeding programs. 01999 by endangered species art ist Rochelle Mason www. rmasonfinearts. corn (808) 985- 731 I
Vol. 18 No. 4 2001 Endangered Species UPDATE 119

Raptor Conservation Status of the California Condor and Mortality Factors Affecting Recovery Kelly J. Sorenson Wildlife Restoration Coordinator and Assistant Director, Ventana Wilderness Society, P.O. 894, Carmel Valley, CA 93924; (831) 455-951 4, (fax) (831) 455-2846; [email protected]
L. Joseph Burnett Condor Field Coordinator, Ventana Wilderness Society, P.O. 894, Carmel Valley, CA 93924; http://w.ventanaws.org
James R. Davis Executive Director, Ventana Wilderness Society, P.O. 894, Carmel Valley, CA 93924; http://www.ventanaws.org
Abstract The California Condor Recovery Program (Program) is moving forward after the release of 116 California condors (Gyrnnogyps californianus) to southern and central California and northern Arizona. As of February 1, 2001 a total of 161 condors were alive of which 46 were in the wild: 24 in California and 22 in Arizona. Due to a high number of fatalities thus far (431, the Program remains challenging. Discovering the relative importance of present-day mortality factors and controlling especially problematic ones is critical to recovery efforts. The effects of lead toxicity as a result of contamination from spent rifle and shot ammunition, and possibly other sources, is the most signijtcant threatpresently. As a result, jield release programs must focus a great deal of effort on ways to counter mortality until long-term solutions to this problem can be realized. This paper discussesfrom the perspective of Ventana Wldemess Society, the current status of the Calijor- nia condor; mortality factors that affect recovery, and management strategies to reduce fatalities.
Current status of recovery program In 1987, all remaining wild condors were brought into captivity to pre- vent their extinction and rebuild the population. By 1992, captive breeding at the Zoological Society of San Diego and Los Angeles Zoo increased the population to 52 birds and U.S. Fish and Wildlife Service (FWS) began releases of young condors to southern California. The Peregrine Fund began captive breed- ing in 1993 and releases to Arizona in 1996. Ventana Wilderness Soci- ety began releases in central Califor- nia in 1997 to aid the recovery of the species. Captive breeding has brought the total population size to 161 birds as of February 1, 2001 (Jurek personal communication).
The California Condor Recov- ery Program Plan (1996) calls for
two geographically separate wild, self-sustaining populations each having 150 individuals, 15 breed- ing pairs and a positive rate of growth as well as a third popula- tion with 150 individuals in captiv- ity in order to qualify for reclassi- fication from endangered to threat- ened. As of February 1,2001, 116 different condors have been re- leased at three different geographic locations and despite heavy losses the wild population maintains a fairly evenly distributed age struc- ture (Table 1). A total of 27 con- dors have been removed to captiv- ity for possible re-release and an- other 43 birds have died or were presumed dead. A total of 46 con- dors remain in the wild-24 in Cali- fornia and 22 in Arizona. The old- est members of the reintroduced population are now entering matu-
rity and therefore successful breed- ing may occur in the near future. In order to attain a self-sustaining popu- lation, controllable mortality factors must be identified and reduced.
Mortality factors affecting recovery California condors are a long-lived k-selected species with low repro- ductive rates (Temple and Wallace 1989). Wild condor populations cannot sustain themselves with an- nual mortality rates exceeding five to 7.5% for adults and 13 to 15% for juveniles (Verner 1978; Meretsky et al. 2000). Up to the early twentieth century, the condor population plummeted due to losses primarily caused by shooting. poi- soning, and museum collecting (FWS 1996). Throughout the re- maining 1900s the condor contin-
120 Endangered Species UPDATE Vol. 18 No. 4 2000

Table 1. California Condor releases, losses, and age structure in wild (as of February 1, 2001). (a) "Total" includes one bird (b) relocated to Arizona and therefore was released twice. . .
I I I I
Southern California
No, removed to captivity or possible re-release
No. relocated
I No. I-year-olds in wild I 0 1 0 I 5 1 5 1
Arizona Central
California
1 17(a) No, released
I I I I
I NO. 2-yeawids in wild 1 1 1 5 1 1 1 7 1
Total
12
0
I No. 3-year-olds in wild 1 ° 1 3 1 4 1 7 1
48
43 No. died or presumed dead
I No. 4-year-dds in wild 1 2 1 6 1 2 1 10 1
7
1 (b)
I NO. 5-year-olds in wild I 0 I 0 I 4 1 4 1
22
26
1 No. 6-year-olds in wild 1 7 1 0 1 6 1 13 1
47 1
I Total in wild 1 10 ( 14 1 2 2 1 4 6 I
8
0
0
ued to decline though the reasons were not entirely clear.
Known causes of death in the reintroduced population include: power line collisions/electrocu- tions, coyote (Canis latrans) and golden eagle (Aquila chrysaetos) predation, lead poisoning, acciden- tal drowning, shooting, ethylene glycol poisoning, aspiration, can- cer, and malnutrition (Jurek per- sonal communication). Meretsky et al. 2000 determined that recent an- nual mortality rates of the reintro- duced population are in excess of what is critical to maintain a self- sustaining population. In the fol- lowing section, we will discuss cur- rent mortality factors to shed light on their impact on recovery efforts.
27
1
17
Electrocution/collision Power line collisions and electro- cutions represented a significant threat to the reintroduced popula- tion of condors during the first two years of release efforts. A total of 4 birds were lost to this hazard and
the remaining individuals regularly perched on power poles, which led to their return to captivity (Snyder and Snyder 2000). Beginning with the 1995 release cohort, a negative conditioning program was initiated to train condors from perching on power poles (Wallace personal communication). The results of this training appear to be promising. Prior to aversion training, 31 % (four of 13) of the condors released died to collision and or electrocu- tion with power lines, while only 2% (two of 103) died of the same cause after the training was re- quired for all releases. As a result, this threat was greatly reduced. The long-term effectiveness of this training, however, is unknown.
Predation Coyotes and golden eagles combined killed eight young or inex~rienced re- introduced condors. Although ravens and golden eagles are known threats to condor eggs and nestlings respectively (Snyder 1986), adult mortality from
natural causes is virtually unknown (FWS 1996). The high rate of deaths to predation is likely a result of the re- introduced birds not having parental guidance or protection in the wild.
Shooting Shooting greatly affected the origi- nal wild population since scores of condor deaths were attributed to this factor both done indiscrimi- nately and for the purposes of mu- seum collecting (Wilbur 1978). In the reintroduced population only two condors were shot and killed. While this threat may always loom over the recovery of this species, it does not, by itself, appear to be a significant problem at present.
Lead poisoning Lead exposure and acute poisoning was first detected in the original wild population of California con- dors during the 1980s. Between 1984 and 1986 three condor deaths were attributed to lead poisoning and one bird showed a positive ra- diograph for a bullet fragment in its digestive tract (Janssen et al. 1986). Other evidence of the lead threat within the range of the species in- cludes studies on condors (Wiemeyer et al. 1988), turkey vultures (Cathartes aura) and ravens (Coruus corm) (Wiemeyer et al. 1986b), and golden eagles (Pattee et al. 1990).
Condors encounter lead bullet/ pellet fragments in their food sup- ply, although the exact pathways are not well understood. Currently, lead rifle ammunition, in unrecov- ered carcasses and/or gut piles fed upon by the condor, may be the pri- mary source of contamination. A single ingested lead fragment can be lethal (Risebrough personal communication). Four confirmed lead poisoning fatalities were docu- mented among all reintroduced birds. To date, many of the rein- troduced condors over the age of
Vol. 18 No. 4 2001 Endangered Specles UPDATE 121

one year experienced elevated lev- els of lead in their blood at one time or another. Since 1997, 14 condors were successfully treated for acute lead toxicity using a technique called chelation therapy.
Without this intensive interven- tion effort, lead poisoning would easily account for the greatest num- ber of deaths. So important is the lead threat resulting from spent ammunition in the condors' food sup- ply that the California Condor Recov- ery Team is now recommending that FWS reduce lead contamination within condor range (Recovery Team Meeting February 14, 2001).
Other causes The original wild population expe- rienced some fatalities from drown- ing, leg-hold traps, and in one case a collision with a vertical pipe used as a surveyor marker (Koford 1953). No evidence exists to sup- port any of these "other causes" playing a consistent role in the de- cline of the original wild popula- tion (Wilbur 1978). Accidental drowning (2), ethylene glycol poi- soning (I) , cancer (I) , aspiration (I) , and malnutrition (1) are each recorded causes of death in the re- introduced population. Although these causes combined may affect current recovery to some extent, in- dividually they do not appear to be significant problems.
Unknown causes and disappearances Out of 116 different condors re- leased since the onset of the rein- troduction program, a total of seven deaths of unknown causes and an- other 10 disappearances (presumed dead) occurred. These results un- dermine the ability of the Program to combat limiting factors.
Management strategies The authors support strategies to (1) reduce the threat of lead to condors
through public education, promo- tion of viable non-lead ammunition alternatives and enhanced food sub- sidy efforts, (2) to improve moni- toring efforts utilizing aerial and satellite tracking, and (3) to oper- ate facilities in the field for post- release management. In the long run, measures taken to reduce the availability of lead in the condors' food supply represents the best chance for eventual full recovery.
Ventana Wilderness Society supports public awareness efforts to openly discuss the problems of lead poisoning in wildlife, especially within the range of the California condor. Overall, the general pub- lic knows little of this problem. The use of viable, non-toxic ammuni- tion should also be encouraged when possible. Non-toxic shotgun ammunition is already commer- cially available and non-toxic rifle ammunition, called Ultimet, may
soon be available (Oltrogge per- sonal communication). Until then, education is an important step that should be expanded. Currently, clean food subsidy is provided at all release sites. In addition, we support placing clean food at spe- cific locations near known nest sites as they are discovered.
In response to increasing losses to the reintroduced population and a growing number of unknown deaths and disappearances, Ventana Wilder- ness Society initiated an intensive (weekly) aerial tracking program for all condors in California beginning in fall of 2000 to augment the ongo- ing ground tracking effort. The au- thors also support the use of satellite telemetry on key individuals, espe- cially those actively feeding on their own to discover sources of lead con- tamination and other threats.
Currently, condors are released both with and without post-release
California Condor, stud book M80, free-flying over Ventana Wilderness, Cali- fornia. Photograph by Kelly Sorenson
122 Endangered Species UPDATE
- -
Val. 18 No. 4 2001

management facilities in the field Literature cited depending on the release site. The California Condor Recovery Team Meet- - authors support the use of post-re- ing. February 13-14, 2001. Sari Diego
Wild Animal Park, Escondido, California. lease management at 'On- Janssen, D.L., J.E. Oosterhuis, J.L. Allen, dor release sites. Ventana Wilder- M.P. Anderson. D.G. Kelts. and S.N. ness Society uses a "double-door," Wiemeyer. 1986. Lead poisoning in walk-in t r a ~ attached to ~0st-l-e- free-ranging California Condors. J.
I
Amer. Veter. Med. Assoc. lease management facilities, that 189: 17.
managers to Koford, C.B. 1953. The California Con- capture previously released con- dor. National Audubon Society Re- dors. Routine evaluations of blood- source Report No. 41-154.
lead levels can be achieved with M e r e t s k ~ , Vicky J . 3 Noel F.R. Snyder, Steven R. Beissinger, David A. minimal stress to individual con- Clendenen, and James W, Wiley. 2000.
dors and reduced staff effort. BY Demography of the California Condor: - . - increasing the level of monitoring Implications for Reestablishment. Con-
both in terms of tracking and cap- servation Biology. 11(1):957-967.
tures, field crews may be able to Pattee, O.H., Bloom, P.H., Scott, J.M., and M.R. Smith. 1990. Lead hazards within
further reduce fatalities. the range of the California Condor. Con- dor 92,931-937.
Acknowledgements Snyder, N.F.R. 1986. California Condor
This manuscript was improved af- recovery program. PP 56-71 in S.E. Senner, C.M. White and J.R. Parrish,
ter review from Bruce eds. Raptor Reserch Report No. 5: Rap- Robert Risebrough, Dr. Michael tor conservation in the next 50 years. Wallace, Salvatore Lucido, Piper Raptor Research Foundation, Provo,
Magallanes, and Carla Bundrick. Utah.
Snyder, N.F.R. and Helen Snyder. 2000. The California Condor: A saga of Natural His- tory and Conservation. Academic Press.
Temple, S.A., and M.P. Wallace. 1989. Raptors in the Modern World. Pp 247- 251 in Meyburg, B.U. and R.D. Chan- cellor, eds. World Working Group Birds of Prey, Pica Press.
U.S. Fish and Wildlife Service. 1996. California Condor Recovery Plan. 1996. Third Revision. Portland, Oregon.
Verner, J. 1978. California condors: sta- tus of the recovery effort. Gen. Tech. Rep. PSW-28, U.S. Forest Service, Washington, D.C.
Wiemeyer, S. N. Jurek, R. M, and J. R. Moore. 1986b. Environmental contami- nants in surrogates, foods, and feces of California condors (Gymnogyps californianus). Environ. Monit. Assess. 6:91-111.
Wiemeyer, S.N., Scott, J.M., Anderson, M.P. Bloom, P.H. and C.J. Stafford. 1988. Environmental contaminants in California Condors. J. Wildl. Manag. 52:238-247.
Wilbur, S.R. 1978. The California Con- dor, 1966-1976: a look at its past, present and future. US gish and Wildlife Serivce North American Fauna 72: 1-1 36.
Moose Peterson is a wildlife photographer dedicated to photographing the life history of California's threat- ened and endangered wildlife and wildplaces. His work covers all of the western US. He is currently looking to hook up with biologists working with interior grizzly bears and wolverines anywhere in the USICanada to document the critter's biology and the research work being conducted. If you want incredible images for your project at no cost, contact him!
Wildlife Research Photography PO Box 3628
Mammoth Lakes, CA 93546-3628 760-924-8632
www.moose395.net
1 ' 1 ]
Vol. 18 No. 4 2001 Endangered Species UPDATE 123

Raptors as Vermin: A History of Human Attitudes towards Pennsylvania's Birds of Prey Keith L. Bildstein Hawk Mountain Sanctuary, 1700 Hawk Mountain Road, Kempton, Pennsylvania 19529; (610) 756-6000 x235
~bstract Many species of raptors (hawks, eagles, and falcons) were considered vermin in Pennsylvania well into mid-twentieth century. Indeed, as recently as the 1930s and 1940s, even eminent conservationists were calling for the elimination of so-called harmful birds of prey. Raptors were unprotected in Pennsylvania throughout the eighteenth and nineteenth centuries, and in I885 a 50-cent bounty was placed on all species of raptors. Although this particular bounty was re- pealed several years l a t e ~ other bounties on diurnal raptors occurred sporadically until 1951. Bounties on several species of owls remained in force until 1969. Raptorprotection, focusing on so-called beneficial species, first occurred in 1937. Bird-eating hawks, howevel; received only partial protection until 1969, and not all owls were protected until 1972, when the Migratory Bird Treaty Act of 1918 was amended to include birds of prey. At least part of the change in attitudes towards raptors can be attributed to activities at Hawk Mountain Sanctuary, the world'sfirst refuge for birds of prey, which was founded in Kempton, Pennsylvania, in 1934. Over the past two decades, populations of Pennsylvania's raptors have rebounded from shooting and pesticide- era lows of the early and mid-twentieth century. Recently, many hunters and bird watchers in the state have suggested that populations of raptors may once again be too high. As a result, Pennsylvania's raptor conservationists again face some of the same human attitudes theirprede- cessors faced more than a century ago.
Introduction Raptors and other vermin (i.e, harm- ful or objectionable animals) were unprotected in Pennsylvania through- out the eighteenth and nineteenth centuries. Persecution of raptors in the commonwealth increased sub- stantially in the latter half of the 1800s, when an overwhelming ma- jority of rural residents considered raptors highly injurious. By 1885, animosity toward predatory birds had intensified to the point that the state legislature placed a 50-cent bounty on the heads of all diurnal birds of prey, as well as on all owls. During the next two years, 180,000 scalps were sent to the state capital in Har- risburg, by which time increased populations of destructive rodents and insects, together with fraudulent claims and a drain on the state trea- sury, induced the Pennsylvania leg- islature to repeal what by then many
were calling the "fool hawk law" (Hornaday 19 14). Raptors remained unprotected in the state until 1937, when all species of diurnal birds of prey, except for three accipiters (sharp-shinned hawk, Accipiter striatus; Cooper's hawk, A. cooperii; northern goshawk, A. gentilis) first received protection (Kosak 1995). Unfortunately, the new law was not particularly popular among Pennsylvania's hunters and farmers, and scant enforcement within the state continued to plague so-called "protected" species well into the 1960s. A bounty established on northern goshawks in 1929 was lifted in 195 1, but it was not until 1969 that Pennsylvania granted this species, along with sharp-shinned and Cooper's hawks, full protection. Great horned owls (Bubo virginianus) remained unprotected statewide until March 1972, when the
United States and several foreign sig- natories ratified an amended Migra- tory Bird Treaty Act of 191 8. Since then, all species of diurnal birds of prey and owls have been protected in Pennsylvania. Here I detail how shifts in attitudes, both within and outside of the conservation commu- nity, contributed to this history.
Raptors as vermin Raptors have had close associations with humans throughout history. Many longstanding human-raptor as- sociations are positive, including the use of raptors in falconry, as national emblems and symbols of strength and courage, and as flagship species for broader conservation concerns. Un- fortunately, raptors also have been scorned and feared, usually out of ignorance. Because of this they have been and continue to be heavily per- secuted (e.g., Burnham 1990; Zalles
124 Endangered Species UPDATE Vol. 18 No. 4 2001

and Bildstein 2000). Indeed, to paraphrase Paul Errington (1946), "whatever else may be said of raptors and their predatory habits, they cer- tainly do draw attention."
Systematic efforts to ex- terminate birds of prey can be traced to seventeenth century England (Gensbol1984). At- tempts at eradication, how- ever, escalated substantially in the 1800s, when the advent of breech-loading guns in- creased the popularity of small-game hunting and placed hunters in direct com-
I I
Figure 1. A series of three Works Progress Administration posters from the late 1930s commissioned by the Pennsylvania Game Commission in an attempt to help educate hunters regarding the identification of 'good', and therefore protected species of rap- tors (e.g., Red-shouldered Hawks and Peregrine Falcons), versus 'bad' hawks (e.g., Northern Goshawks). Note that the 'bad' goshawk is labeled "unprotected."
petition with raptors (New- ton 1990). Polls taken at the Pearson 1897). The last half of the Renowned conservationist Will- time of passage of the Pennsylvania nineteenth and first half of the twen- iam T. Hornaday's world of animal Scalp Act of June 1885, a law that tieth centuries, was an era of 'good' protection also included both "good" established a 50-cent bounty on birds (i.e. rodent-eating) and 'bad' (i.e. bird- and "bad" hawks: " . . . 'chicken hawk of prey, suggested that the Act was eating) hawks (Fisher 1893) (Figure or hen hawk' are usually applied to supported by more than 90% of the 1). The idea that individual hawks the red-shouldered [Buteo lineatus] public in most areas of the state. Not and, in some instances entire species or red-tailed species. Neither of these surprisingly, contemporary conserva- of hawks, were "chicken hawks," and is really very destructive to poultry, tionists, including the president of the as such merited destruction, extended but both are very destructive to mice, New York Zoological Society, Will- well into the conservation community. rats and other pestiferous creatures.. . iamT. Hornaday, who referred to the The writings of conservationists Neither of them should be de- Act as the "fool hawk law" of the era reveal the animosity held stroyed-not even though they do (Hornaday 1914), and even Pennsyl- for some raptors. Consider, for ex- once in a great while, take a chicken vania state veterinarian and author of ample, this passage from John Muir's or wild bird," however " [tlhere are Diseases and enemies of poultry, The story of my boyhood and youth several species of birds that may at Leonard Pearson, considered the (1913): "When I went to the stable once be put under the sentence of Scalp Act unjust, uneconomic, and simply wrong-headed (Pearson 1897). Although the law was re- scinded in 1887, the commonwealth reinstated bounties on raptors in 1913, and maintained them on some species until well into the 1960s (Kosak 1995).
'Good' versus 'bad' hawks Most conservationists who opposed the Scalp Act took exception to the Act's all-encompassing nature- American kestrels (Falco span~erius) were targeted along with northern goshawks-rather than to the notion that some hawks merited destruction (Hornaday 1913, 1914, 1931;
to feed the horses, I noticed a big white-breasted hawk [most likely a red-tailed hawk, Buteo jamaicensis], on a tall oak in front of our chicken house, evidently waiting for a chicken breakfast.. . I ran to the house for a gun, and when I fired, he fell.. . then managed to stand erect. I fired again to put him out of pain. He flew off.. . but then died suddenly in the air, and dropped like a stone."
Although the event that Muir re- lated took place when he was a young boy in 1850s Wisconsin, the founder of the Sierra Club expresses no re- morse when recalling it in his auto- biography more than half a century later (Muir 19 13).
death for their destructiveness of use- ful birds, without any extenuating cir- cumstances worth mentioning. Four of these are Cooper's hawk, the sharp- shinned hawk, pigeon hawk [or mer- lin, Falco columbarius] and duck hawk [or peregrine falcon, F. peregrinus] " (Hornaday 19 13).
Hornaday's distinction appears to have been both moralistic and utilitar- ian: "The ethics of men and animals are thoroughly comparative.. . Guilty ani- mals, therefore, must be brought to jus- tice" (Hornaday 1922). By 1931, Hornaday had dropped the Merlin from the list of "pest" birds, apparently be- cause of its rarity, but retained the oth- ers, along with the great horned owl
-
Vol. 18 No. 4 2001
- -
Endangered Species UPDATE 125

(Bubo virginianus), barred owl (Strix varia), and eastern screech-owl (Otus asio) (Hornaday 193 1).
The broader ornithological and birdwatching communities, too, took aim at certain raptors during the first three decades of the twentieth cen- tury. The prolific and highly regarded bird artist, Louis Agassiz Fuertes, writing in National Geographic, for example, commented that "The whole genus Accipiter, consisting of the [northern] goshawk, Cooper's hawk, and sharp-shinned hawk, are savage, bloodthirsty, and cold- hearted slaughterers, and are respon- sible in large measure for the anath- ema that is then portion of all hawks" (Fuertes 1920). And famed birdwatcher and president of the Con- necticut Audubon Society, Mabel Osgood Wright, suggested helping songbirds by "shooting some of their enemies" including several species of hawks (Wright 1936). Similarly, Pennsylvania's official "state orni- thologist," and later president of the Wilson Ornithological Society, George Miksch Sutton, wrote in the Introduction to the birds of Pennsyl- vania that: " [tlhe sharp-shin is the en- emy of all small birds.. . [and that it] and [the] Cooper's hawk, both bird killers, are fairly common and are rated as our most objectionable birds of prey. They are not protected in Pennsylvania." (Sutton 1928a).
Even Boy Scouts were instructed in the whys and wherefores of "good" and "bad" hawks. George E. Hix, a Brooklyn, New York, scoutmaster and Associate of the American Ornitholo- gists' Union wrote in his Birds of prey for Boy Scouts " . . . [that] the benefi- cial hawks are the larger, slower spe- cies, [and that] the smaller swifter hawks are the ones which are destruc- tive to wildlife. . . [and that these include] the goshawk, Cooper's, sharpshinned, duck and pigeon hawks.. ." (Hix 1933).
Small wonder then that bird-eat- ing birds were heavily persecuted in the
first half of the twentieth century. Un- fortunately, because many of the shoot- ers either were unwilling or unable to separate the 'bad' hawks from "good," all species of raptors remained at risk (Broun 1949; Kosak 1995) (Figure 2). The impact of such shooting was little studied, probably because much of the conservation community condoned or even favored it. Even so, banding re- coveries for Cooper's Hawks suggest that first year mortality due to shoot- ing ranged from 28 to 47% in 1929 to 1940, and from 12 t021% asrecentlyas 1946 to 1957 (Henny and Wight 1972).
The goshawk invasion of the late twenties As hated as resident accipiters were, migrants from the north were de- spised even more (Gerstell 1937). Northern Goshawks, in particular, were singled out in this regard. As ornithologists Edward H. Forbush re- marked in his Birds of Massachusetts "A great flight of goshawks into the United States in fall or winter is fol- lowed invariably by a scarcity of Ruffed Grouse [Bonasa urnbellus]" (Forbush 1929). Thus, when rural in- habitants of Drehersville, at the base of the Kittatinny Ridge in the central Appalachian Mountains of eastern Pennsylvania, reported an "invasion" of northern goshawks during the win- ters of 1926-1927 and 1927- 1928 to the Pennsylvania Game Commission, the commission quickly dispatched state ornithologist George Miksch Sutton to investigate.
Sutton published his initial find- ings in the Wilson Bulletin in 1928 (Sutton 1928b). His report, together with a second paper published three years later (Sutton 1931), initiated a series of events that eventually re- sulted in the creation of the world's first Sanctuary for birds of prey.
First, by 1929, the Pennsylvania Game Commission was offering a new five-dollar bounty on northern goshawks shot between 1 November
Figure 2. The results of raptor shoot- ing in Pennsylvania in the late 19509, when Sharp-shinned Hawks (top) re- mained unprotected, while Ospreys (Pandion haliaetus) (bottom), were protected (photographs courtesy Hawk Mountain Sanctuary archives).
and 1 May. Not surprisingly, the bounty substantially increased raptor shooting at the site, as well as throughout Pennsylvania. Second, Sutton's articles alerted the ornitho- logical and conservation cornrnuni- ties of both raptor migration and shooting at the site, which the locals called Hawk Mountain.
Earl Poole, then assistant cura- tor at the Reading Public Museum in nearby Reading, Pennsylvania, began visiting Hawk Mountain in 1929. His description of a broad-winged hawk (B. platypterus) flight of 2,000 birds on 22 September 1932, represents the first detailed account of raptor migra- tion at the site (Poole 1934). Shortly thereafter, conservationists Henry H. Collins, Jr., and Richard Pough vis- ited the ridge, confirming Sutton and Poole's earlier accounts, and photo- graphing the slaughter that was then underway (Pough 1932; Collins 1933). Pough showed slides of his photographs to a joint meeting of the Hawk and Owl, Linnean, and Na- tional Association of Audubon soci-
126 Endangered Species UPDATE Vol. 18 No. 4 2001

Figure 3. The view from Hawk Moun- tain Sanctuary, the world's first refuge for birds of prey, in the 1940s. (Photo: Hawk Mountain Sanctuary archives.)
eties meeting in New York City in autumn 1933. Rosalie Edge, the head of the Emergency Conservation Committee, was in the audience the evening Pough spoke.
The following June, Mrs. Edge, ac- companied by Richard Pough and her son Peter, visited Hawk Mountain. Shortly thereafter, Rosalie Edge leased the 565 acres that was to become Hawk Mountain Sanctuary (Bildstein and Compton 2000). Today, the Hawk Mountain Sanctuary Association, the largest and oldest member-based rap- tor conservation organization in the world, manages the Sanctuary, which has now grown to more than 2,300 acres. Once a shooting gallery where thousands of raptors were killed each autumn, Hawk Mountain's Appala- chian lookouts now serve as both learn- ing center and biological field station for more than 80,000 visitors annually (Zalles and Bildstein 2000) (Figure 3).
Unfortunately, the Pennsylvania bounty on goshawks (reduced to two dollars in 1937) remained in place until 195 1, when the state legislature approved, and Governor G. H. Earle signed a law protecting all raptors, excepting the three species of "bird- killing" accipiters and two species of owls, the great horned owl and the snowy owl (Nyctea scandiaca) (Kosak 1995).
The founding of Hawk Mountain Sanctuary highlighted raptor conser- vation both within and outside of Pennsylvania as never before.
Thirty-five years of conservation and education efforts at the Sanctuary, in part, resulted in statewide, year- round protection for all diurnal birds of prey, including the three "bird-kill- ing" accipiters, in 1969 (Senner 1984). It was not, however, until the Migratory Bird Treaty Act of 191 8 was amended in March of 1972, that all raptors, including great horned and snowy owls, were protected in Pennsylvania (Kosak 1995).
A modern era? Although all raptor species remain officially protected in Pennsylvania, and have for almost thirty years, their status remains controversial. As re- cently as 1999, the Pennsylvania Game Commission held hearings on a proposal from the President of the Commission (game commissioners are appointed by the Governor) re- garding "experimentally" controlling populations of Red-tailed Hawks and Great Horned Owls on several wild- life management areas in an attempt to increase the survivorship of Ring- necked Pheasants (Phasianus colchicus) (Riegner 1999). Although a public hearing revealed widespread opposition to the proposal-that was later withdrawn-letters to the edi- tors of local newspapers also sug- gested a degree of public support for the idea (e.g., Riegel 1999).
Indeed, many birdwatchers, es- pecially those maintaining backyard birdfeeders, continue to call Hawk Mountain Sanctuary to express out- rage at the seemingly persistent predatory activities of sharp-shinned and Cooper's hawks at their bird feed- ers. Both species of accipiters ap- pear to be increasingly willing to en- ter human-dominated landscapes; most likely in response to reduced hu- man-caused mortality there. Al- though most callers seem resigned to this situation, particularly once they have been informed that removing a single accipiter from a backyard is
likely to be as ineffective as remov- ing a single Gray Squirrel (Sciurus carolinensis), others appear deter- mined to "do something themselves" about the situation, including, a few have suggested, shooting the hawk (Bildstein, personal observation).
Research conducted at Hawk Mountain Sanctuary and elsewhere suggests that recent shifts in the rni- gration behavior of eastern popula- tions of sharp-shinned hawks may be related to an increasing tendency to pause at bird feeders along migration routes in the northeastern United States (Viverette et al. 1996; Duncan 1996). Furthermore, data collected by participants in the Cornell Univer- sity Laboratory of Ornithology's Project Feederwatch indicate that sharp-shinned hawks take more birds at birdfeeders than do feral cats (Dunn and Tassaglia 1994). Whether or not increased numbers of accipi- ters at bird feeders are impacting re- gional populations of songbirds and other species feeding at these sites re- mains unclear, although evidence from England suggests that this may not be occurring (Newton et al. 1997). On the other hand, studies of American kestrels that overwinter in farmlands surrounding Hawk Moun- tain suggest that recently increased populations of Cooper's and, possi- bly, sharp-shinned hawks, both of which prey on kestrels, are affecting regional populations of this small fal- con (Ardia and Bildstein 1997; Ardia et al. unpublished data).
Conclusion Raptor populations have increased substantially in the last two decades of the twentieth century (Bednarz et al. 1990; Bildstein 1998), quite pos- sibly to levels similar to those of the latter nineteenth and early twentieth centuries. In Pennsylvania and, in- deed throughout most of North America, birds of prey are no longer the endangered boutique predators
Vol. 18 No. 4 2001 Endangered Spedes UPDATE 127

(i.e. predators whose populations are so low that they do not substantially influence the behavior and ecology of their prey species) that they were as recently as the late 1970s (Bildstein 1998). Now that raptors once again are fairly common and fully functional components of natu- ral and human-dominated land- scapes, raptor conservationists are facing many of the same manage- ment concerns and human attitudes their predecessors faced more than one hundred years ago.
As a result, keeping common raptors common at the beginning of the twenty-first century may prove to be as much of a challenge for today's raptor conservationists (Garrott et a1.1993) as it was for their predeces- sors at the beginning of the 20" Cen- tury. Experience at Hawk Mountain Sanctuary suggests that focused con- servation education that extends from primary schools through the general public, longterm population monitor- ing, and, above all, opportunities for viewing large numbers of these nor- mally secretive birds at migration hawkwatches, are practical and effec- tive ways to build local and regional support for our charismatic birds of prey. With this in mind, the Sanctu- ary continues to work with local, re- gional, and national conservationists to foster migration watchsites else- where in the world so as to protect long-distance migratory raptors throughout their journeys.
Acknowledgments I thank Kyle McCarty and Martin Smith for reviewing earlier versions of this manuscript, and Kev Biffna for scanning the figures. This is Hawk Mountain Sanc- tuary contribution number 68.
Literature cited Ardia, D.R. and KL. Bildstein. 1997. Sex-re-
lated differences in habitat selection in winter- ing American Kestrels, Falco sparverius. Ani-
mal Behaviour 53: 1305-131 1. Bednarz, J.C., D. Klem Jr., L.J. Goodrich, and
S.E. Senner. 1990. Migration counts of rap- tors at Hawk Mountain, Pennsylvania, as indicators of population trends, 1934-1986. Auk 107:96-109.
Bildstein, K.L. 1998. Long-term counts of migrating raptors: a role for volunteers in wildlife research. Journal of Wildlife Man- agement 62:435-445.
Bildstein, K.L. and R.A. Compton. 2000. Mountaintop science: the history of conser- vation omithology at Hawk Mountain Sanc- tuary. Pp. 153-181 in W.E. Davis and J.A. Jackson, eds. Contributions to the History of North American Ornithology, Volume II Memoirs of the Nuttall Ornithological Club, No. 13. Nuttall Ornithological Club, Cam- bridge, MA.
Broun, M. 1949. Hawks aloft. Cornwall Press, Cornwall, NY.
Burnham, W.A. 1990. Raptors and people. Pages 170-189 in I. Newton, ed. Birds of Prey, Facts on File, New York, NY.
Collins, H.H., Jr. 1933. Hawk slaughter at Drehersville. Hawk and Owl Society Bul- letin 3:lO-18.
Duncan, C.D. 1996. Changes in the winter abundance of sharp-shinned hawks in New England. Journal of Field Ornithology 67:254-262.
Dunn, E.H, and D.L. Tassaglia. 1994. Preda- tion of birds at feeders in winter. Journal of Field Ornithology 658-16.
Errington, P.L. 1946. Predation and vertebrate populations. Quarterly Review of Biology 21: 144-177.
Fisher, A.K. 1893. Hawks and owls of the United States in relation to agriculture. U.S.D.A. Division of Ornithology and Mam- malogy, Bulletin Number 3. U.S.D.A., Washington, D. C.
Forbush, E.H., ed. 1929. Birds of Massachu- setts and other New England states, Vol. 11. Massachusetts Department of Agriculture, Boston, MA.
Fuertes, L.A. 1920. American birds of prey - a review of their value. National Geographic 38:460-467.
Ganott, R.A., P.J.White, C.A.V.White. 1993. Overabundance: an issue for conservation biologists? Conservation Biology 7:946- 949.
Gensbol, B. 1984. Birds of prey of Britain, Europe, North Africa and the Middle East. Collins, London, England.
Gerstell, R. 1937. The Pennsylvania bounty system. Research Bulletin 1. The Pennsyl- vania Game Commission, Harrisburg, PA.
Henny, C.J. and H.M. Wight. 1972. Popula- tion ecology and environmental pollution:
red-tailed and Cooper's hawks. 4 . 2 2 9 - 249 in Population ecology of migratory birds. Wildlife Research Report 2. U. S. Fish and Wildlife Service, Washington, D. C.
Hix, G.E. 1933. The birds of prey for Boy Scouts. Privately published, Brooklyn, NY.
Homaday, W.T. 1913. Our vanishing wild life. New York Zoological Society, New York, NY.
Hornaday, W.T. 1914. Wild life conservation in theory and practice. Yale University Press, New Haven, CT.
Homaday, W.T. 1922. The minds and m r s of wild animals. Scribner, New Yo& NY
Hornaday, W.T. 1931. Thxty years war for wild life. C. Scribner's Sons, NewYork, NY.
Kosak, J. 1995. The PennsylvaniaGame Com- mission 1895-1995. Pennsylvania Game Commission, Harrisburg, PA.
Muir, J. 1913. The story of my boyhood and youth. Houghton Mifflin, Boston, MA.
Newton, I. 1990. Human impacts on raptors. Pages 190-207 in I. Newton, ed. Birds of Prey Facts on File, New York, NY.
Newton, I., L. Dale, P. Rothery. 1997. Appar- ent lack of impact of Sparrowhawks on the breeding densities of some woodland song- birds. Bird Study 44129-135.
Pearson, L. 1897. Diseases and enemies of poultry. Clarence M. Busch, Hanisburg, PA.
Poole, E.L. 1934. The hawk migration along the Kittatinny Ridge in Pennsylvania. Auk 51:17-20.
Pough, R.H. 1932. Wholesale killing of hawks in Pennsylvania. Bird-Lore 34429-430,
Riegel, E. 1999. No sympathy for killer hawks. Reading Eagle (newspaper). 1 1 March 1999.
Riegner, C. 1999. Pheasant problems. Penn- sylvania Game 70(11): 16-18.
Senner, S.E. 1984. The model hawk law - 1934 to 1972. Hawk Mountain News 6229-36.
Sutton, G.M. 1928a. An introduction to the birds of Pennsylvania. McFarland, Harris- burg, PA.
Sutton, G.M. 1928b. Notes on a collection of hawks from Schuylkill County, Pennsylva- nia. Wilson Bulletin 40: 84-95.
Sutton, G.M. 1931. The status of the Gos- hawk in Pennsylvania. Wilson Bulletin 43:108-113.
Viverette, C.B., S. Struve, L.J. Goodrich, and K.L. Bildstein. 19%. Decreases in migrat- ing sharpshinned hawks (Accipiter striatus) at traditional raptor-migration watch sites in eastern North America. Auk 113:32-40.
Wright, M.O. 1936. Birdcraft, ninth edition. Macmillan, London, England.
Zalles, J. and K.L. Bildstein. 2000. Raptor watch: a global directory of raptor migra- tion sites. Hawk Mountain Sanctuary Asso- ciation, Kempton, PA; and BirdLife Inter- national, Cambridge, England.
128 Endangered Species UPDATE Vol. 18 No. 4 2001

Felid Conservation Status and Conservation of Endangered Cats Along the U.S.-Mexico Border Melissa Grigione Deptartment of Environmental Science and Policy, College of Arts & Sciences, University of South Florida, 4202 East Fowler Ave., Tampa, Florida 33620; mmgrigione0 iname.com
Arturo Caso Proyectos Sobre 10s Felinos Neotropicales de Mexico, Bosques 144-B, Lomas del Chairel, C.P. 89360 Tampico, Tam. Mexico; acaso20terra.com.mx
Rurik List Institute de Ecologia, UNAM. 38r Circuito Exterior Ciudad Universitaria, Anexo al Jardin Botanico, Coyoacan, 04510 Mexico; rurik0toluca.podernet.com.mx
Carlos Lopez-Gonzalez Department of Conservation Biology, Denver Zoological Foundation, 2300 Steel Street, City Park, Denver, Colorado 80205-4899: cats4rnexQaol.com
Abstract This paper reviews the research and conservation projects associated with the Bordercats Work- ing Group, a group of scientists and advocates concerned with the status of neotropical cats in northern Mexico and the American Southwest. For ocelots (Leopardus pardalis), jaguarundis (Herpailurus yaguarondi) and jaguars (Panthera onca), this region is the northernmost limit of their geographical distribution. We review the results of ourfield surveys for bordercats in Arizona, Chihuahua, Coahuila, New Mexico, Nuevo Leon, Sonora, Tamaulipas, and Texas; describe a GIs-based habitat mapping project for bordercats; and discuss what consewation- related activities are critical for the long-term survival of the cats in the border regions.
Introduction There are three cat species whose northernmost range coincides with the border region of the United States and Mexico. These are North America's neotropical cat species: the ocelot (Leopardus pardal is) , jaguar (Panthera onca ) , and jaguarundi (Herpailurus yaguarondi). Un- like the mountain l ion (Felis concolor ) and bobcat (Fe l i s rufus), these species are endan- gered and protected by both the U.S. Endangered Species Act (ESA) and by Mexican law (NOM-059- 1994), which prohib- its hunting of the three species.
The border region presents an array of threats to neotropical cats, such as highway and international bridge construction, land develop-
ment, and ranching practices that are intolerant of predators. In ad- dition, the border region is a major thoroughfare for illegal aliens. The United States Border Patrol at- tempts to prevent such crossings by burning or mowing border vegeta- tion, constructing fences, and put- ting up large floodlights across the border, which for nocturnal cat spe- cies are less than ideal. Recovery for neotropical cat populations in the border region requires not only an understanding of the spatial re- quirements and habitat needs of the cats but an understanding of how the cats can best fit into a complex human matrix consisting of farm- ing and ranching communities, refugees, federal agencies, all con- verging at the international border. There are a suite of national and in-
ternational laws, such as the President's National Drug Control Strategy, the National Defense Au- thorization Act, and U.S.-Mexican immigration policies, which often conflict with Federal environmen- tal laws like the ESA and the Na- tional Environmental Policy Act (NEPA). In addition, Texas and states in northern Mexico consist primarily of private land, making a large refuge for the cats particu- larly difficult. Despite this, out- standing commitment to cat conser- vation by the U.S. National Wild- life Refuge system, particularly the Lower Rio Grande National Wild- life Refuge (LRGNWR) and La- guna Atascosa National Wildlife Refuge, both in Texas, has elevated public awareness about the cats and the challenges they face.
Vol. 18 No. 4 2001 Endangered Species UPDATE 129

Addressing conservation needs: The Bordercats Working Group The Bordercats Working Group was founded in 1998 to promote recov- ery and conservation for neotropical cats in the border region of the U.S. and Mexico. The group was created because of the great amount of biodiversity in the border region, evi- dence of few to no neotropical cats in this region in recent times, a gap in knowledge about the detailed dis- tribution of the species in this region, and an existing legal framework in place to protect all three species.
The Bordercats Working Group (BWG), now a member of the World Conservation Union's (IUCN) Cat Specialist Group, has several objec- tives: to conduct research on all three species in the border region; to de- marcate important habitats for the cats in the border region; to educate local communities and organizations about the cats; and to bring individu- als, groups, and government agencies together to share in a common mis- sion. This paper will focus on the first two objectives: the distribution of borderland cat populations, and the identification of important cat habi- tats in this region.
Distribution of bordercat populations The historic distribution (Figure I) for all three cat species in the border region is located in the U.S. South- west (Arizona, New Mexico, and Texas) and adjacent Mexican States (Chihuahua, Coahuila, Nuevo Leon, Sonora, and Tamaulipas). At present, there are approximately 100 ocelots in the United States and no known populations of jaguars or jaguarun- dis. From 1982 to 1996,12 out of 17 radio-collared ocelots in south Texas were killed by automobiles (Tewes et al. 1997). BWG is involved with neotropical cat surveys in four re- gions: Arizona/New Mexico, Sonora,
Figure 1. Historical distribution of jaguarundls, laguars, and d o t s
Chihuahua, TexaslCoahuila, and Tamaulipas/Nuevo Leon.
Arizona/New Mexico The Chiracahua and Peloncillo Mountains were surveyed for cats for four months during the Spring and Fall of 1999. Field biologists used a combination of techniques to detect cat presence: scat surveys, track sur- veys, remotely-triggered camera sur- veys, and formal interviews with bi- ologists and local naturalists. Dur- ing this survey, no physical evidence of neotropical cats was obtained. There were, however, approximately 12 interviews held with knowledge- able locals, including biologists, who attested to the presence of jaguarun- dis. More surveys would have to be conducted to verify these reports.
SonoraKhihuahua Approximately 215 km south of the Arizona/New Mexico border, in the Mexican State of Sonora, lie impor- tant areas for both jaguars and oce- lots; jaguarundis may occur just south of this area. Surveys for all three spe- cies, which incorporate formal inter- views and remotely-triggered cam- eras, have been ongoing since June 1998. Formal interviews have oc- curred in 50 municipalities in Sonora and 12 in Chihuahua. Interviewees
consisted of cattle association offi- cials, ranchers, and predator hunters. Whenever possible, physical evi- dence (such as skins, skulls, and pho- tographs) of recently killed cats was collected (Lopez-Gonzalez and Brown in preparation).
There are approximately three ex- tant metapopulations of jaguars in the State of Sonora: Sierra Bacatete, Sahuaripa-Huasabas, and Quiriego- Sinaloa (Lopez-Gonzalez and Brown in preparation). Preliminary evidence suggests that this area supports approxi- mately 1.3 to 1.5 jaguars per 100 km2. Using a home range estimator (Adap- tive Kernel model), a minimum of 6,000 krn2 would be needed to conserve viable metapopulations in this region (Brown and Lopez-Gonzalez 2000). This initial research has found that at least 140 jaguars have been killed in Sonora since 1900; 45 have been killed since 1990 (Lopez-Gonzalez and Brown unpublished report). A mini- mum of 14 females, three lactating fe- males, and five kittens have been killed since 1989. In 1999 to 2000, sixteen jaguars were killed in the northern range of this distribution (Lopez- Gonzalez and Brown 2000). All of these animals were killed in response to livestock losses and none of the skins were sold internationally (Lopez- Gonzalez and Brown in preparation).
130 Endangered Species UPDATE Vol. 18 No. 4 2001

The closest known population of ocelots to ArizonaJNew Mexico is also in this area. From July 1998 to October 1999, 33 records of hunted ocelots were collected in this region; approximately 79% of these ocelots were killed after 1990 (Lopez-Gonzalez 2000). Although three ocelots have been taken in Sonora within 40 km from the Ari- zona border, all were male. Due to an average dispersal distance of ap- proximately 20 km, it is unlikely that female ocelots would be found this close to the Arizona border.
Texas/Coahuila In March 1999, BWG surveyed the Rio Grande River near Big Bend National Park, in Texas and the Mexi- can State of Coahuila for neotropical cats. Approximately 100 km of river and associated tributaries were sur- veyed during this trip. Transects walked along each sandy substrate adjacent to the river were scanned for cat tracks and scat. When tracks were found, they were measured and pho- tographed, and plaster castes of each track set were made. A Global Posi- tioning System (GPS) unit was used to measure the location of each track set. In addition, data on substrate, time of day, and general habitat char- acteristics were recorded for each track set. Scent-stations were set up prior to sunset by sifting sand over one m2 areas, placed 10 meters from one another. Hawbawkers Cat Lure was spread over a stone and placed in the center of each one m2 sampling unit. Each station was checked for cat tracks the following morning.
During this survey, we observed several cat tracks, including nine mountain lion track sets (seven adults and two cubs), six bobcat track sets, and what appeared to be one jagua- rundi track set, all found at the mouth of the western end of the Boquillas Canyon (Figure 2). Big Bend Na- tional Park employees have collected
numerous jaguarundi sightings from park visitors but currently have no physical evidence in support of this species inhabiting the park.
TamaulipasNuevo Leon BWG has ongoing research in both Tamaulipas and Nuevo Leon, just south of the Texas border. Survey efforts have focused in areas, within close proximity to the border, which have intact cat habitat and reports of ocelots or jaguarundis (Figure 3). Once suitable areas are identified, a combination of track and scat sur- veys, remotely-triggered cameras, predator calls, and box traps baited with chickens are used to detect cat presence. We are currently investi- gating two recent reports of jaguarun- dis in close proximity to Monterrey, Nuevo Leon, approximately 200 km from the international border (Area #1, Figure 3). We have no evidence of ocelots in this area; however, our surveys are not yet complete. We have surveyed in areas north of Monterrey and have not detected
Identification of key bordercat habitats In order to identify what borderland habitats are most important to neotropical cats, BWG initiated a Geographical Information System (GIs) habitat mapping project in 1999. BWG collected sighting data for each species, spanning the last 100 years. These sightings were plot- ted on a map containing the follow- ing information: vegetation, city and county boundaries, roads, rivers and streams, and elevation. Mapping par- ticipants, each familiar with a particu- lar region or conservation unit (CU), were asked important questions about each species sighting map. The ques- tions pertained to both the species and their habitats, major threats to each, the development of conservation cor- ridors between CU's, and the effec- tiveness of the land-tenure system in place within each CU. The results of this large mapping project will be synthesized and a final map will be produced. The final map will be
habitat use. Figure 2. Details of bordercat sightings
Vol. 18 No. 4 2001 Endangered Species UPDATE 131
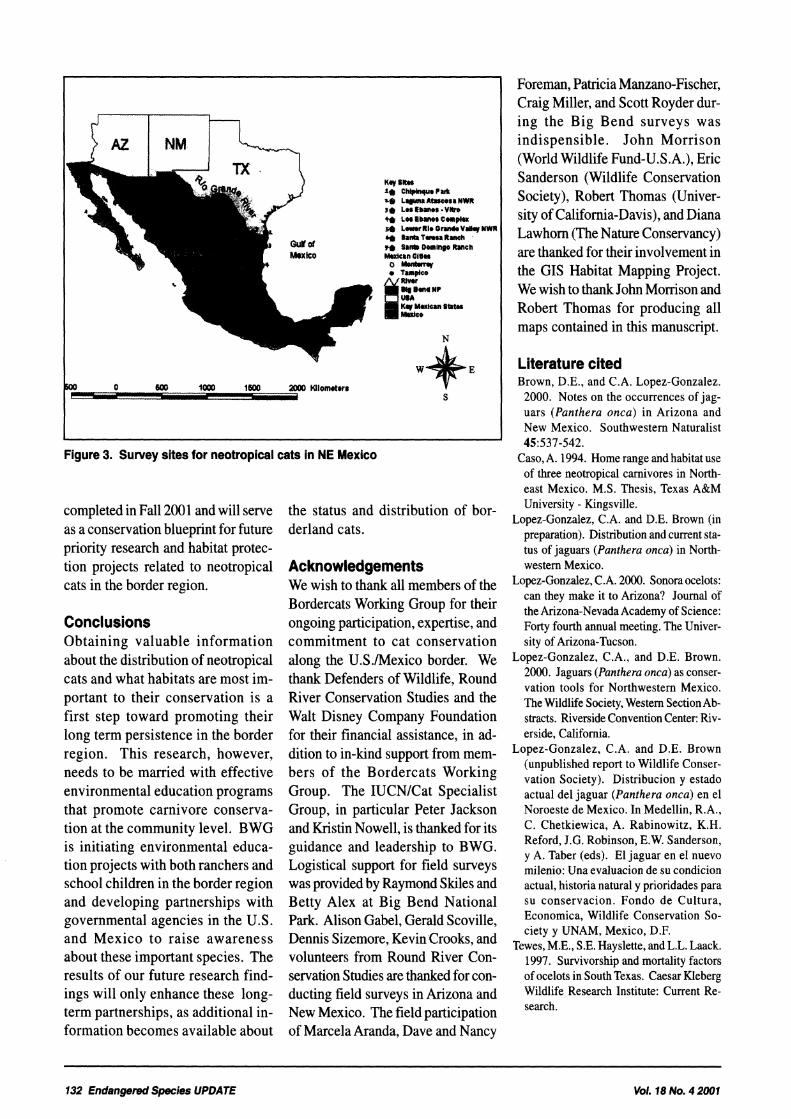
Kay sites ** chlrryue rur re L y u n o A t w o r a ~ W 9. Lbr E l w r . V h y LoStbmeS O W * d L . m R l o O r n c V # y N W 9 I r n ( r t U 0 ~ R n c h , ,* aa* D o m ~ Ranch
0 s
Figure 3. Survey sites for neotropical cats in NE Mexico
completed in Fall 2001 and will serve as a conservation blueprint for future priority research and habitat protec- tion projects related to neotropical cats in the border region.
Conclusions Obtaining valuable information about the distribution of neotropical cats and what habitats are most im- portant to their conservation is a first step toward promoting their long term persistence in the border region. This research, however, needs to be married with effective environmental education programs that promote carnivore conserva- tion at the community level. BWG is initiating environmental educa- tion projects with both ranchers and school children in the border region and developing partnerships with governmental agencies in the U.S. and Mexico to raise awareness about these important species. The results of our future research find- ings will only enhance these long- term partnerships, as additional in- formation becomes available about
the status and distribution of bor- derland cats.
Acknowledgements We wish to thank all members of the Bordercats Working Group for their ongoing participation, expertise, and commitment to cat conservation along the U.S./Mexico border. We thank Defenders of Wildlife, Round River Conservation Studies and the Walt Disney Company Foundation for their financial assistance, in ad- dition to in-kind support from mem- bers of the Bordercats Working Group. The IUCNICat Specialist Group, in particular Peter Jackson and Kristin Nowell, is thanked for its guidance and leadership to BWG. Logistical support for field surveys was provided by Raymond Skiles and Betty Alex at Big Bend National Park. Alison Gabel, Gerald Scoville, Dennis Sizemore, Kevin Crooks, and volunteers from Round River Con- servation Studies are thanked for con- ducting field surveys in Arizona and New Mexico. The field participation of Marcela Aranda, Dave and Nancy
Foreman, Patricia Manzano-Fischer, Craig Miller, and Scott Royder dur- ing the Big Bend surveys was indispensible. John Morrison (World Wildlife Fund-U.S.A.), Eric Sanderson (Wildlife Conservation Society), Robert Thomas (Univer- sity of California-Davis), and Diana Lawhorn (The Nature Conservancy) are thanked for their involvement in the GIs Habitat Mapping Project. We wish to thank John Morrison and Robert Thomas for producing all maps contained in this manuscript.
Literature cited Brown, D.E., and C.A. Lopez-Gonzalez. 2000. Notes on the occurrences of jag- uars (Panthera onca) in Arizona and New Mexico. Southwestern Naturalist 45:537-542.
Caso, A. 1994. Home range and habitat use of three neotropical carnivores in North- east Mexico. M.S. Thesis, Texas A&M University - Kingsville.
Lopez-Gonzalez, C.A. and D.E. Brown (in preparation). Distribution and current sta- tus of jaguars (Panthera onca) in North- western Mexico.
Lopez-Gonzalez, C.A. 2000. Sonora ocelots: can they make it to Arizona? Journal of the Arizona-Nevada Academy of Science: Forty fourth annual meeting. The Univer- sity of Arizona-Tucson.
Lopez-Gonzalez, C.A., and D.E. Brown. 2000. Jaguars (Panthera onca) as conser- vation tools for Northwestern Mexico. The Wildlife Society, Western SectionAb- stracts. Riverside Convention Center: Riv- erside, California.
Lopez-Gonzalez, C.A. and D.E. Brown (unpublished report to Wildlife Conser- vation Society). Distribution y estado actual del jaguar (Panthera onca) en el Noroeste de Mexico. In Medellin, R.A., C. Chetkiewica, A. Rabinowitz, K.H. Reford, J.G. Robinson, E.W. Sanderson, y A. Taber (eds). El jaguar en el nuevo milenio: Una evaluacion de su condicion actual, historia natural y prioridades para su conservacion. Fondo de Cultura, Economica, Wildlife Conservation So- ciety y UNAM, Mexico, D.F.
Tewes, M.E., S.E. Hayslette, and L.L. Laack. 1997. Survivorship and mortality factors of ocelots in South Texas. Caesar Kleberg Wildlife Research Institute: Current Re- search.
132 Endangered Species UPDATE Vol. 18 No. 4 2001

Molecular Scatology as a Conservation tool Laura E. Farrell Museum of Comparative Zoology, Hatvard University. 26 Oxford Street, Cambridge, MA02138; IfarrellQoeb.hatvard.edu
Abstract The threat of predation on livestock by large carnivores represents a major impediment to the conservation of intact ecosystems throughout the world. Although it has taken nearly a century to learn the truth about predation on livestock in North America, advanced tech- nologies now exist to greatly expedite similar findings elsewhere. By examining the dietary ecology of puma and jaguar on a cattle ranch in the Venezuelan llanos, it is possible to help identify simple, effective methods to reduce livestock predation. In my study, dietary habits of the puma and jaguar were defined from feces (scats), kills, and ranch records. Scats were assigned to predator species through analysis of mitochondrial DNA from feces of wild carnivores. Based on dietary and ecological data of these two large carnivores, recommen- dations on livestock husbandry are made.
The puma (Puma concolor) and the jaguar (Panthera onca) are large sympatric carnivores trying to sur- vive in increasingly fragmented habitats of the Neotropics. Much of the range of these endangered animals has been converted to ranchlands, which now hold some of the last remaining natural habi- tats in Latin America. In much of the Neotropics, the major cause of mortality for large felids is perse- cution by cattle ranchers for alleged predation on livestock. To conserve viable populations of large cats it is necessary to find some resolution to this problem. This study at- tempts to accurately identify the predator species involved in live- stock depredation, and to provide a clearer understanding of carnivore interactions with livestock.
Dietary habits can be accurately determined noninvasively only by a thorough analysis of scats-the end product of predation. Unfor- tunately, accurate analysis has eluded scientists until recently. Scats have traditionally been sorted to donor species by diameter. In 1980 thin layer chromatography analysis of bile acids was intro- duced (Major et al.), and for more
than a decade it was the most accu- rate method for determining donor species. But bile acid assays can give misleading results for closely related carnivores. The identity of puma and jaguar scats is based on the presence of one bile acid that appears in only 7 1 % of jaguar scats, leaving a 29% possibility of mis- taking jaguars for pumas (Taber et al. 1997). Nevertheless, diameter of puma and jaguar feces in Taber's study overlapped in almost all size ranges. The need for a more de- finitive analysis is apparent.
The advent of polymerase chain reaction (PCR) has enabled scien- tists to acquire information through molecular analysis. Hoss et al: (1992) used genetic techniques to analyze mitochondrial DNA (mtDNA) from sloughed off colon cells found in wild scat in order to identify Italian bears. By isolating DNA from scats and checking it against reference samples, it is now possible to accurately determine which species, and sometimes even which individual left the sample (Kohn et al. 1995; Kohn et al. 1999; Ernst et al. 2000).
Molecular scatology can pro- vide new insights into the carnivore
diet, and help lead to solutions for a range of conservation problems (Kohn and Wayne 1997). With the use of scat-sniffing dogs, non-bi- ased recovery of samples from mul- tiple target species is now feasible (Wasser et al. 1999), making popu- lation estimates for similar-sized sympatric species possible. By ana- lyzing the prey content of scats from undisturbed habitats, we can determine the preferred prey of car- nivores. If we manage this prey ap- propriately, attacks on livestock by hungry carnivores can be reduced.
The molecular method is com- pletely noninvasive, though remov- ing all scats may confuse animals by removing territorial markers, which also signal reproductive sta- tus (Brown et al. 1994). The field collection methods for this study were simple and effective; samples were collected, air-dried, and then stored at room temperature. Using these collection and storage meth- ods, a recent lab run produced posi- tive identifications from scats that were seven to ten years old (in preparation). Samples were trans- ported without freezing or excess bulk, hazardous chemicals, or cum- bersome permit restrictions. Scats
Vol. 18 No. 4 2001 Endangered Species UPDATE 133

are the only item from Appendix I species exempt from CITES con- trols (Gerloff et al. 1995), although other restrictions, such as those imposed by the USDA, may apply.
Carnivore scats were collected opportunistically from roads and trails on Hato Piiiero, a cattle ranch in the llanos, the seasonally flood- ing savanna of western Venezuela. Samples were dried and a small portion of each scat was stored for genetic analysis (Farrell et al . 2000). Samples were then analyzed for prey contents; remains were vi- sually identified to the lowest taxon possible by examining teeth, claws, bones, fur, feathers, and scales. For this study, all mammals less than one kilogram were considered small-mostly rodents, but includ- ing small marsupial mouse opos- sums (Marmosa sp.) . Medium mammal prey ranged from 1 to 15 kilograms, including armadillo (Dasypus novemcinctus), rabbit, sloth (Bradypus variegatus), opossum (Di- delphis marsupialis), juvenile pec- cary, and newborn calves (Bus bus). Large mammals were anything over 15 kilograms, such as adult capybara (Hydrochaeris hydrochaeris) and peccary, deer, giant anteater (Myrmecophaga tridactyla), and ju- venile and adult cows.
In the l lanos, the ocelot (Leopardus pardalis) and crab-eat- ing fox (Cerdocyon thous) each average about six to 10 kg in body weight, the puma about 40 to 50 kg, and the jaguar up to 100 kg (Figure I) . But, body size is not necessar- ily indicative of scat size. Puma scats have been identified down to 19mm in diameter, and ocelot scats up to 27 mm. Because of this over- lap, it was necessary to define prey contents of almost all size predator scats to accurately define the di- etary habits of puma and jaguar. Frequency of occurrence of prey types were separated into small and
Jaguar >
Puma
Fox - Ocelot -
0 10 20 30 40 50 60 70 80 90 100 110 120
Body weight (kg)
Linares 1998
Figure 1. Overlap in body size of the four main carnivores on Hato Piiiero, Venezuela (Linares 1998).
large predator categories-first based on size of scat (traditional method) and then based on DNA identification.
For the preliminary analysis by scat size, scats were split into large, assumed to be puma and jaguar, and small, assumed to be ocelot and fox. Based on previous studies (L. Emmons, personal communication; Fernandez et al. 1997), 25 mm dry diameter was chosen as an arbitrary breaking point large enough so that it was beyond the range of most fox and ocelots.
For the molecular analysis, a portion of the mitochondria1 cyto- chrome b gene was chosen as the DNA marker to assign unknown 'scats to predator species. Samples were washed, and DNA extracted from the isolate and amplified us- ing PCR (Farrell et al. 2000). The resulting strands of DNA were se- quenced and compared to samples extracted from blood of the carni- vore species at the study site. Even this test wasn't perfect at first-one sample that could not be matched to a known carnivore was compared to sequences posted in GenBank us- ing the BLAST program (National Center for Biotechnology Informa- tion (NCBI), www.ncbi.nlm.nih.gov)
to find a cytochrome b sequence with the closest match. When that came back as a fruitfly (Drosophila melanogaster; likely apprehended while the scat was collected), prim- ers that targeted carnivores were designed. The sample was reamplified with these new prim- ers and found to be a perfect match with our ocelot reference. Target- ing a shortened fragment of 147 base pairs also increased the per- centage of successful samples, be- cause fecal DNA is often degraded. Twenty of 34 samples (59%) were successfully sequenced.
Three jaguar and two fox scats were identical to control samples, as were five puma scats (one puma scat differed by one base pair). The sequences from 10 ocelots showed more varia- tion, which makes sense in light of a study by Eizerick et al. (1998) showing a relatively high degree of intraspecific variation among the smaller Neotropical felids.
Puma, ocelot, and fox scat sizes overlap in a narrow range around 25mm diameter, and puma and jag- uar overlap at larger diameters be- tween 32 and 37 mm (Figure 2). One individual can leave scats of various sizes, and the range of body
134 Endangered Species UPDATE Vol. 18 No. 4 2001

4
Scats to species using mtDNA
Jaguar n 3
Puma n = 5
Fox n = 2 - Ocelot n = 10 -
19 20 25 30 35 40 41
Scat diameter (mm)
be highly significant (X- = 7.36, p<0.0 1, ldf). With differentiation by size, 83% of ocelot and fox scats were misclassified as large preda- tor scats, and 12% of puma and jag- uar scats were misclassified as small predator scats. These find- ings are preliminary and the sample size is small, dietary results may change when scats from the last two years of the three year project are analyzed.
With DNA analysis, predators are discernable to the species level
Figure 2. Overlap in scat sizes of the four main carnivores when the scat (Table 2)- Thebbmass of each Prey identity is confirmed by molecular analysis. type is then calculated to learn its
relative importance in each carnivore's diet (Farrell et al. 2000). Dietary resources are divided more between large and small carnivores
sizes can vary greatly within spe- cies. For example, male jaguars in the llanos average about 100 kilo- grams, whereas males in the Cen- Table 1. A comparison of prey frequencies with scats separated by
size and molecular analysis. One jaguar scat was disqualified from tral American rain forest average 55 the dietary analysis for containing bait (from Farrell et al. 2000). Small kg. predators = Fox and ocelot. Large predators = Puma and jaguar.
Using size to define dietary analyses, smaller carnivores appear to ingest solely mammalian prey (Table 1, left side). They even ap- pear to take large prey, though the thought of an ocelot or fox subdu- ing and killing an 18 kg collared peccary (Tayassu tajacu) may seem unusual. Large predators appear to take prey from all categories, pre- dominantly small mammals.
DNA analysis of samples shows that almost the inverse is true. Large carnivores prey exclu- sively on medium and large mam- mals, and small carnivores take a wide range of prey, including ev- erything except large mammals (Table 1, right side). Analysis of one scat with a size indicative of a small ocelot (19.25mm), clarified that it was a puma who ate the peccary.
McNemar's test (Harrison 1996) showed the difference be- tween identification of scat donor by size and by genetic analysis to
Vol. 18 No. 4 2001 Endangered Species UPDATE 135
Frequency (%) of Prey Types
Small mammals
Medium mammals
Large mammals
Reptiles
Birds
Fish
Crabs
Scat size
Small Large predators Predators 525mm 125mm
75 46
12.5 12
12.5 9
9
12
3
9
n=3 n=16
mtDNA
Small Large Predators Predators
64
3 50
50
9
12
3
9
n=12 n=7

Table 2. Frequency of prey biomass with predator scats identified using molecular analysis (from Farrell 1999).
Birds
Fish
Crabs 12 I Large mammals
Reptiles
Table 3. Predation on cattle (calves and adults) by puma and jaguar on Hato Piiiero from January 1987 through Oc- tober 1996, as reported by ranch workers (Hato PiAero, un- published data; from Farrell1999). *There was found to be a discrepancy of 27% between causes of livestock mortal- ity reported by ranch workers and evidence at the site when reported incidences of predation were investigated in 1999.
Fox n = 2
Jaguar n = 2
72
than between same size sympatric carnivores; puma and jaguar versus fox and ocelot. Jaguar scats con- tained a peccary and a cottontail rabbit (Sylvilagus floridanus). A third was disqualified from the di- etary analysis because it contained a wild pig set as bait while trapping cats for radio-telemetry. Five puma scats contained a couple of juvenile peccaries, an armadillo, one deer (Odocoileus virginianus), and a do- mestic guard dog (Canis familiarus), confirming the suspi- cion of ranch workers that their
Puma n = 5
Number of mortalities attributed to predation*
% Predation
O/O of total cattle mortalities from all causes (n=3672)
missing tag-along dog had been consumed by a puma. The samples containing dog and pig bait illus- trate that this method can be used to pinpoint problem predators.
Dietary data derived from the genetic analysis, along with infor- mation from kills recovered during this study and ranch records, can of- fer suggestions to help decrease livestock predation. Livestock and wild kills were examined when lo- cated (n=15) and habitat conditions were recorded to discern where cats kill, and what conditions are con-
Ocelot n = 1 0
54
Total Puma Jaguar
310 275 35
89 11
8,4 7.5 <,
ducive to predation. Seven verifi- able incidences of livestock preda- tion were examined, and six of these confirmed as pumas (Farrell 1999). Frequency and location of predation by cats on cattle was de- termined from 10 years of ranch records that reported causes of live- stock mortality (Table 3: Hato Pifiero, unpublished data). When observations of livestock killed during my study are combined with evidence from ranch records and molecular data, the preference for different sizes of prey between the two cats becomes clearer. Jaguars select for very large adult prey. They took only a very small per- centage of the total cattle lost (el % according to ranch records), yet these cows were typically full grown and a greater financial loss per head. As the more endangered of the two felids, perhaps jaguars should be allowed to keep practic- ing business as usual, and a com- pensation program for ranchers be initiated. Pumas are pinpointed as a greater problem; they are more general in prey selection and con- centrate on medium and large size prey-often in the form of newborn and juvenile calves. Their prefer- ence for calves and juveniles when preying on livestock corroborates data from genetic identification of puma scats that revealed no prey item larger than a juvenile calf.
While jaguars prefer moister habitats of lower elevations; the pu- mas preference for dry habitat types is significant. Pumas move to dryer, nonflooding ranges for the wet season. Unfortunately cattle are also moved to these areas at the same time. The birthing of insemi- nated cows (each representing an investment of over $100 US) is timed as well for the beginning of the wet season in pastures along the edges of the ranch. In these areas humans harvest much of the
43
136 Endangered Species UPDATE Vol. 18 No. 4 2001
natural prey, so it is no surprise that these pastures exhibit the greatest incidences of livestock 'predation. Pumas arriving thin and hungry from desolate ranges at the end of the dry season are greeted by a landscape flush with naive, newborn prey that are just learning to walk.
It is important to incorporate different types of data and the views of different parties to create solu- tions that will be effective in help- ing both predators and local ranch- ers. This study verified that pumas are a greater problem than jaguars on Hato Piiiero. By determining which prey carnivores favor through scat analysis, management of the preferred prey can help re- duce predation problems. To test deterrence, electric fencing was used in one of the hardest hit ma- ternity pastures during a later phase of this study, and found to curtail predation by 100% (Scognamillo et al. 1999). One noteworthy finding of my study is that when water buf- falo (Bubalis bubalis) were placed with cattle, predation mortalities in one long-suffering maternity pas- ture decreased close to zero (Andres Rodriguez, personal com- munication). Water buffalo are al- ready being raised on this and other ranches throughout the llanos for meat and cheese and mix well with cattle, while apparently affording them some protection from preda- tion (Farrell 1998).
Vast portions of puma and jag- uar ranges are dedicated to livestock production-often on ranches of 80,000 to 120,000 hectares that con- tain large areas of natural habitat. Owners who are confident that their stock is safe are less likely to go hunt- ing for these elusive cats. Reducing the threat of felid predation on live- stock will have broad implications for future conservation of jaguar and
puma in the Neotropics.
Acknowledgements I would like to thank Sam Wasser and Chris Clarke, who generously allowed me to learn in the Center for Wildlife Conservation's molecu- lar lab, Joe Roman who helped with many facets of this study, Brian Bowen who encouraged this along, and Me1 Sunquist, without whom this would not have been possible. Martin Smith reviewed earlier ver- sions of the manuscript and his sug- gestions improved the paper. Many others helped as well, special thanks to the llaneros on Hato Pinero. This study was part of work done for a Masters thesis at the Uni-
and jaguar feces through bile acid chro- matography. Journal of Wildlife Manage- ment 61506-5 10.
Gerloff U, C. Schlotterer, K. Rassmann, I. Rambold, G. Hohmann, B. Fruth and D. Tautz. 1995. AmpWcation of hypervariable simple sequence repeats (rnicrosatellites) from excremental DNA of wild living bonobos (Pan paniscus). Molecular Ecol- ogy 4515-5 18.
Harrison, J.M. 1996. Categorical Data Analy- sis. Jay M. Harrison, IFAS Dept. of Statis- tics. University of Florida, Gainesville, FL.
Hoss M., M. Kohn, S. PiCibo, F. Knauer and W. Schriider. 1992. Excrement analysis by PCR. Nature 359: 199.
Kohn M., F. Knauer, A. Stoffella, W. Schroder and S. Paabo. 1995. Conserva- tion genetics of the European brown bear-a study using excremental PCR of nuclear and mitochondrial sequences. Molecular Ecology 4:95-103.
K0hnM.H. andR.K. Wayne. 1997. Facts from
versity of Florida, Gainesville, with Dr. Me1 Sunquist, who put together the field project.
Literature cited Brown, J.L., S.K Wasser, D.E. Wddt and L.H
Graham. 1994. Comparative aspects of ste- roid hormone metabolism and ovarian ac- tivity in felids, measured non-invasively in feces. Biology of Reproduction 51:776-786.
Eizirick E., S.L. Bonato, W.E. Johnson, P.G. Crawshaw Jr., J.C. Vi6, D.M. Brousset, S.J. O'Brien, F.M Salzano. 1998. Phylogeographic patterns and evolution of the mitochondrial DNA control region in two Neotropical cats (Mammalia, Felidae). Jow- nal of Molecular Evolution 47613-624.
Ernest HB, M.C.T. Penedo, B.P. May, M. Syvanen and W.M. Boyce. 2000. Molecu- lar tracking of mountain lions in theyosemite Valley region in California: genetic analysis using microsatellites and faecal DNA. Mo- lecular Ecology 9:433-441.
Farrell L.E. 1998. Water buffalo as a conser- vation tool. Water Buffalo Newsletter 10(4):2 The American Water BuffaloAsso- ciation, Gainesville, FL.
Farrell L.E. 1999. The ecology of the puma and the jaguar in the Venezuelan llanos. MS thesis. University of Florida, Gainesville.
Farrell, L.E., J. Roman and M.E. Sunquist. 2000. Dietary separation of sympatric car- nivores identified by molecular analysis of scats. Molecular Ecology 9: 1583-1590.
Fernandez G.J., J.C. Corley and A.F. Capurro. 1997. Identification of cougar
feces revisited. Trends in Ecology and Evo- lution 12:223-227.
Kohn M.H., E.C. York, D.A. Kamradt, G. Haught, R.M. Sauvajot and R.K. Wayne. 1999. Estimating population size by genotyping faeces. Proceedings of the Royal Society of London B 266:657-663.
Linares, O.J. 1998. Mamfferos de Venezuela. Sociedad Conservationista Audubon de Ven- ezuela, Caracas.
Major M., M.K. Johnson, W.S. Davis and T.F. Kellog. 1980. Identifying scats by recov- ery of bile acids. Journal of Wildlife Man- agement 44290-293,
Scognamillo, D., I.E. Maxit, M. Sunquist, and L. Farrell. In press. Ecologia del jag- uar y el problema de la depredacion sobre ganado en Hato Piiiero, Venezuela. Manu- script submitted for publication in El Jag- uar en el nuevo milenio. Una evaluacion de su estado, deteccion de prioridades y recomendaciones para la conservacion de 10s jaguares en America. Medellin, R. A., C. Chetkiewicz, A. Rabinowitz, K. H. Redford, J. G. Robinson, E.W. Sanderson, y A. Taber, eds. Universidad Nacional Autonoma de Mexico~Wildlife Consema- tion Society. Mexico D. F.
Taber A.B., A.J. Novaro, N. Neris and F.H. Colman. 1997. The food habits of sympat- ric jaguar and puma in the Paraguayan Chaco. Biotropica 29:204-213.
Wasser S., M. Parker and B. Davenport. 1999. Noninvasive DNA sampling using scat sniff- ing dogs. Society for Conservation Biology Abstracts. Thirteenth Annual Meeting, Col- lege Park, Maryland.
Vol. 18 No. 4 2001 Endangered Species UPDATE 137

Linking Snow Leopard Conservation and People-Wildlife Conflict Resolution: Grassroots Measures to Protect the Endangered Snow Leopard from Herder Retribution Rodney Jackson Snow Leopard Conservancy, 236 North Santa Cruz Ave., Suite 201, Lost Gatos, CA95030, USA; (408) 354-6459; (fax) (408) 654-5869; [email protected]
Rinchen Wangchuk Field Program Director, Snow Leopard Conservancy, Leh, Ladakh, India
Abstract Livestock depredation has become a signijicant problem across the snow leopard's (Panthera uncia) range in Central Asia, being most severe in and near protected areas. Such predation, especially incidents of "surplus killing," in whichfive to 100 or more sheep and goats are lost in a single night, almost inevitably leads herders to retaliate by killing rare or endangered carnivores like snow leopard, WOK and lynx. Ironically, such loss can be avoided by making the night-time enclosures predator-prooj improving animal husbandry techniques, educating herders on wildlife consewmion and the importance of protecting the natural prey base, and by providing economic incentives like handicrafts skills training and marketing, along with carefully planned ecotourism trekking and guiding. The author explores innovative conservation initiatives in the Himalaya (Ladakh and Tibet) and Mongolia, which also build local capacity, self-reliance, and stewardship for nature using Appreciative Participatory Planning and Action, or APPA, techniques. The most sound conservation investments are those contingent upon establishing direct linkages with biodiversity protection, ensuring co-financing and reciprocal responsibility for project activities, encouraging the full participation of all stakeholders, and assuring regular monitoring and evaluation of the village-based agreements (embodied in Action Plans).
Introduction Wildlife damage is a major source for conflict between local com- muni t ies and protected areas managers in the Himalaya (Kharel 1997; Jackson e t a l . 1996; Oli et al. 1994). In India's Kibber Wildlife Sanctuary, Mishra (1997) noted that 18% of livestock holdings were killed by snow leop- ard (Uncia uncia) and wolf (Canis lupus) for an estimated total value of US $128 per household per an- num-a very significant economic impact given per annual cash in- comes of $200 to $400. Villagers claimed predation rates increased after sanctuary establishment, while surveys indicated dramatic increases in livestock numbers ac- companying changes in animal hus- bandry systems (Mishra 2000).
A similar situation in Hemis National Park, Ladakh, Jammu and Kashmir State, led to the establish- ment of a compensation scheme, but within two years the sponsor- ing Ladakh Wildlife Department found itself committing 60% of its annual $26,000 budget to the pro- gram. Payment takes up to two years, with claimants being paid only 10 to 30% of their animal's market value. Understandably re- lations between local people and the park have deteriorated, with re- taliatory killing constituting a ma- jor threat to both snow leopard and wolf. Because local livelihoods are intimately bound with long-stand- ing patterns of agro-pastoralism, re- location of people or the exclusion of livestock is not a feasible solu- tion. Rather, local people's willing-
ness to co-exist with predators hinges upon reducing depredation to an acceptable level while im- proving incomes to help offset un- avoidable losses of livestock.
This field note describes grass- roots initiatives being undertaken in Hemis National Park to alleviate livestock loss to predation and to encourage herders to become effec- tive stewards of the snow leopard, its prey and its habitat.
Community-based conflict alleviation initiatives in Hemis National Park Established in 198 1, this park cov- ers 3,350 square kilometers in the TransHimalayan Range (Fox and Nurbu 1990). Besides offering ex- cellent snow leopard habitat, the park's four species of wild sheep
138 Endangered Species UPDATE Vol. 18 No. 4 2001

and goats give it international biodiversity importance. About 1,600 people live in 16 small settle- ments scattered in three valleys. They grow barley and a few veg- etables, and own more than 4,000 head of livestock, of which 8 1 % are sheep and goats, and 1 1 % are yaks, cattle and crossbreeds. Tourism provides an important source of supplementary income. Ladakh was opened to tourism in 1974, and the Markha Valley circuit through Hemis National Park remains the most popular trekking route, with about 5,000 visitors per year.
We surveyed 79 households liv- ing within or immediately adjacent to the park to determine livestock ownership patterns, document dep- redation losses and map the depre- dation-prone areas or "hotspots" (Bhatnagar et al. 1999). Over half the households interviewed lost one to 15% or more of their domestic stock to predators, or 492 animals valued at USD $23,500 over a 14- month period. Snow leopard and wolf were associated with 55% and 3 1 % of the presumed depredation incidents respectively, with sheep and goats constituting 75% of the stock lost, followed by yak-cattle (13%) and horses (8%). Three settlements incurred 54% of the depredation. Losses incurred from snow leopards entering poorly con- structed corrals accounted for 14% of all incidents (N=210), but nearly 50% of all livestock lost-under- standably arousing considerable anger among the livestock owners.
Along with poorly constructed livestock pens, investigations into the root causes of depredation im- plicated lax daytime livestock guarding practices. Stock was al- lowed to forage in areas with well- broken terrain and cliffs, prime habitat for snow leopard (Jackson et al. 1996). The fact that domes- tic livestock now substantially out-
numbers natural prey and biomass in predator densities, habitat suit- only invites loss to wild predators. Historically there has been better emphasis on daytime guarding, and problem predators were controlled through trapping and other tradi- tional control methods. With more children going to school and youths reticent to assume this hard liveli- hood, even highly vulnerable small- bodied livestock are left to graze unattended. While baseline docu- mentation is lacking, predator num- bers appear to have increased due to park regulations prohibiting hunting and patrolling by park guards. As Figure 1 suggests, dep- redation rates vary with locality, presumably reflecting differences
ability and herding patterns. The household survey was fol-
lowed by a workshop held in Markha village in association with the Ladakh Wildlife Department, national and international non-gov- ernmental agencies (NGOs). The primary objectives were to (1) iden- tify cost-effective and ecologically compatible measures for reducing livestock losses; (2) Train park staff, NGOs and villagers in wild- life damage alleviation techniques; and (3) Promote community-based wildlife stewardship and enhance awareness of the opportunities to conserve even "problem" species.
Using a highly participatory
Snow leopard (Uncia uncia). Photograph by M. Elsbeth McP hee
Vol. 18 No. 4 2001 Endangered Species UPDATE 139

process known as Appreciative Par- ticipatory Planning and Action (APPA), workshop participants and villagers examined root causes of depredation and identified a series of measures aimed at reducing dep- redation loss, improving household incomes and promoting wildlife conservation. APPA combines con- cepts from Appreciative Inquiry (used in business leadership train- ing) and Participatory Learning and Action (PLA, Pretty et al. 1995), in a collective inquiry and planning process aimed at fostering effective group action. It operates under two complimentary premises: (1) What Figure 1. Depredation hotspots you seek is what you find-"if you look for problems, then you will find more problems" or conversely, "if you look for successes, you will fined conservation objectives. remedial actions that were environ-
find more successes;" and (2) What 2) Participation-the active mentally responsible (i.e., compli-
you believe is what matters most- and equitable involvement of each ant with park regulations and spe-
"if you have faith in your vision or stakeholder group is promoted cieslhabitat management require-
ideas for the future, and if these are throughout the project to ensure all ments); economically sustainable
believable, you can achieve success affected households will be benefit- within the local context; socially
without waiting for government or ted and to encourage participation responsible (e.g. building upon
outside agents to take you there." irrespective of gender, age or eco- proven traditions and cultural val-
APPA is practiced through an nomic status. ues which protect nature); and
iterative process that seeks to (1) 3) Reciprocity-All stake- which are implemented under a
discover the community's strengths holders, whether outside donor, mutually agreed-to (and signed)
and its valued resources; (2) envi- local NGO, government, or vil- work-plan that sets forth the re-
sion short-term and long-term fu- lagers are expected to make a re- sponsibilities, contributions and
tures if resources were mobilized ciprocal contribution within their obligations of each partner.
and the community acted in con- means (e.g., cash, materials, la- Markha villagers concluded
cert; (3) design a basic action plan bor, or in-kind service). that their best option lay in replac-
for guiding development and nature 4) Responsibility-The ben- ing the existing four winter corrals
protection in ways that substan- eficiary community must be will- with three larger predator-proof
tially limit long-term dependency ing to assume responsibility for structures placed side-by-side and
upon outside financial sources or meeting the conservation objectives sharing inner walls. They donated
technical "know-how;" and (4) mo- and for maintaining any their labor and provided on-site ma-
tivate participants to initiate com- infrastructural development. There terials (stones and mud), while ex-
munity-improvement actions imme- should be clear penalties for infringe- ternal donors provided off-site ma-
diately, and largely on their own. ment by any of the participants. terials (wire mesh, roofing poles,
Outside donor support was 5) Monitoring-Stakeholders and secure doors). Construction
only offered if the following pro- should employ simple but realistic was scheduled for spring, but was
visions were met: indicators for monitoring project delayed due to frozen ground. Also,
1) Conservation-Biodiversity impact and performance, described corrals had to be 15 feet longer than
conservation is the primary motiva- in the Action Plan prepared jointly the plans indicated because the vil-
tion behind external investment, and and signed by the key parties. lagers deliberately underestimated
therefore all project activities must External expertise is blended their livestock holdings, fearing
be implicitly linked with clearly de- with local knowledge in designing they would be taxed more by the
140 Endangered Species UPDATE Vol. 18 No. 4 2001
government for reporting actual herd sizes. Unfortunately, they used the corral before it was fully preda- tor-proofed, and lost 29 animals to a snow leopard. The outside donors felt some responsibility for the loss and called a community meeting. The villagers, however, assumed full responsibility for what had hap- pened. Their reasoning was as fol- lows: there had been a death in one of the families, just before the depre- dation. As the other six affected households had only lost one or two animals, they all agreed that a tradi- tional Mountain Spirit had been re- sponsible for the snow leopard's visit. We believe that by predator-proofing a village's corrals we are removing as many as five to 10 snow leopards from risk of retaliatory killing.
Conclusions At the broader level, the future of these protected areas hinges on the degree to which the basic concerns, needs and aspirations of the local people are addressed. Over the long-term, the most cost-effective approach for cash-strapped devel- oping countries may lie in promot- ing a set of carefully designed and monitored community-based stew- ardship initiatives in which local people benefit from the presence of wildlife, including predators. While our initial effort focused on reducing loss of livestock to preda- tors, we are now concentrating on measures aimed at helping local people capture more benefits from tourism. For example, women are
being offered skills training to en- hance their summer tea-house op- erations by improving menus, en- suring hygienic conditions, and building campground facilities. A key next-step will be to use the "parachute cafes" or tea-houses as focal points for providing tourists and local communities with wild- life conservation education.
We believe this approach is highly effective in mobilizing ru- ral communities toward greater self-reliance and thus a more har- monious long-term relationship with the National Park in which they live, and on whose resources they depend so heavily. APPA builds pride by highlighting posi- tive community attributes and building upon traditional values and successes. NGOs are the most ob- vious vehicle for facilitating com- munity-based integration of conser- vation and development; however, the sponsoring agency must be will- ing to make a long-term commit- ment to their rural stakeholders (Sanjayan et al. 1997).
Acknowledgments This work was initiated in the senior author's capacity as Conservation Director of the International Snow Leopard Trust, now being continued under the Snow Leopard Conser- vancy. Special thanks to the J&K Wildlife Department and LEDeG for co-sponsoring the workshop in Markha. The senior author is in- debted to Rinchen Wangchuk and the residents of Hernis National Park for
their commitment to finding long- term solutions to this vexing problem. Literature cited Bhatnagar, Y.V., R. Wangchuk, and R.
Jackson. 1999. A survey of depredation and related wildlife-human conflicts in Hemis National Park, Ladakh, Jammu and Kashmir, India. Unpublished Re- port, International Snow Leopard Trust. 20 pages.
Fox, J.L. and C. Nurbu. 1990. Hemis, a Na- tional park for Snow Leopard in India's Trans-Himalaya. International Pedigree Book of Snow Leopards 6:71-84.
Jackson, R.M., G. Ahlborn, M. Gurung, and S. Ale. 1996. Reducing livestock depredation losses in the Nepalese Himalaya. Proceedings Vertebrate Pest Conference 17:241-247.
Kharel, F.R. 1997. Agricultural crop and livestock depredation by wildlife in Langtang National Park, Nepal. Moun- tain Research and Development 17(2):127-134.
Mishra, C. 1997. Livestock depredation by large carnivores in the Indian trans- Himalaya: conflict perceptions and con- servation prospects. Environmental Con- servation 24(4):338-343.
Mishra, C. 2000. Socioeconomic transition and wildlife conservation in the Indian Trans-Himalaya. Journal Bombay Natu- ral History Society 97(1):25-32.
Oli, M.K., I.R. Taylor, and M.E. Rogers. 1994. Snow leopard (Panthera uncia) predation of livestock - an assessment of local perceptions in the Annapurna Conservation Area, Nepal. Biological Conservation 68(1):63-68.
Pretty, J.N., I. Guijt, I. Scoones, and J. Th- ompson. 1995. A Trainer's Guide for Par- ticipatory Learning and Action. IIED Participatory Methodology Series, Inter- national Institute for Environment and Development, London. 267 pages.
Sanjayan, M.A., S. Shen, and M. Jansen. 1997. Experiences with integrated-con- servation development projects in Asia. World Bank Technical Paper 388:l-41.
Vol. 18 No, 4 2001 Endangered Specles UPDATE 14 1

Canid Conservation The Status of the Wolf Population in Post-Soviet Kyrgyzstan CJ Hazel1 State University of New York, Environment Science and Forestry, 133 lllick Hall, 1 Forestry Drive, Syracuse, NY 13210; [email protected]
Abstract The countries that made up the former Soviet Union are home to the largest existing wild gray wolf(Canis lupus) population. This makes the status of wolves in these areas of particular importance. Kyrgyzstan is a former Soviet republic located in Central Asia that became indepen- dent in 1991. Russia and other former Soviet republics with wolves reported in 1999 that their wolfpopulations were either stable or increasing. Kyrgyz oficials also consider their wolf populations to be increasing since independence. At the same time, oficials report that popula- tions of deer, wild boar, and other wildlife are decreasing drastically. Between January and May 1999, I made sevenfield trips in southern Kyrgyzstan to look for evidence to support oficial reports. I visited two zapovedniks (strictly protected areas), one national park and two national forests (less protected), and two rural areas with no wildlife protection to look forfield signs and to collect anecdotal informationfvom local villagers. I found abundant wolf sign at only two sites and abundant deer sign at only one site. Villagers tended to say that there were many wolves, but they were 20 km away. They also said that deel; boar, and other wildlife were dificult t o j n d now. This evidence supported oflcial reports that wildlife populations were decreasing but contradicted reports that wolfpopulations were increasing. Government records show that most species of game animals and sheep, the primary livestock animal, have decreased by close to 50% in the south since independence. Data also showed that wolfpopulations in the south have dropped by 43%. This evidence suggests that oficial reports that wolfpopulations in Kyrgyzstan are stable or increasing are inaccurate and wolfpopulations may actually be declining.
Introduction Gray wolves (Canis lupus) used to roam over most of the Northern Herni- sphere. Human persecution over the last few centuries has resulted in very small, isolated populations or extirpa- tion in much of North America and Western Europe. The area encom- passed by the former Soviet Union is the home of the largest remaining popu- lations of gray wolves (Theberge 1991). The Soviets have always con- sidered wolves to be a pest species and have traditionally supported strong, government-sponsored wolf control programs. Historically, during eco- nomic downturns, wolf populations have increased due to less money being available for wolf control (Bibikov 1993).
In 1999, Wolf International, the magazine of the International Wolf Center, reported on the status of wolf populations worldwide, in- cluding some areas of the former Soviet Union. Of the Common- wealth of Independent States (CIS) countries reporting, most list their populations as increasing or stable with wolves being unprotected or considered game species (Route and Aylsworth 1999). Since the break up of the Soviet Union from 1989 to 1991, most of that region has been experiencing severe eco- nomic decline (Anderson and Pomfret 2000). Given the changes currently taking place, both po- l i t ica l and economic, an as-
sessment of the impact these changes are having on wolf popu- lations is important.
The Kyrgyz Republic is a former Soviet republic in Central Asia that became independent in 199 1. It is a small country of just under 200,000 krn2 with a population of about 4.6 million people. Over 90% of the terrain is mountainous with eleva- tions ranging up to 7,439 meters. Almost 40% of the land area is con- sidered to be uninhabitable due to elevation, glaciers, or the presence of bare rock. Less than 4% of the land area is currently forested. It has an arid, alpine climate and much of its economy is agriculturally based with livestock grazing, particularly
142 Endangered Species UPDATE Vol. 18 No, 4 2001

ests, and alpine meadows at eleva- tions ranging from 2,000 to 3,000 meters. The major commonality for these areas was that all of them were historically rich in wildlife. I also collected anecdotal information from local people on wolves and the abun- dance of deer and other wildlife. In particular, I asked about changes they had noticed since Kyrgyzstan became independent. In addition, I looked at government records from the Hunt- ing Institution and the Agricultural Ministry of Osh Oblast (province) in southern Kyrgyzstan to determine the official estimates of both wildlife and livestock populations and the changes from pre- to post-independence.
Commonwealth of Independent States (CIS): Central Asian States
sheep, a primary activity (Ministry of Environmental Protection 1998).
Evaluating the current status of wolf populations Information on the condition of wild- life in Kyrgyzstan that was collected as part of a biodiversity assessment completed in 1999 indicated that, in general, wildlife populations were declining (Ministry of Environmen- tal Protection 1998). In contrast, the general perception on the part of the public and government officials was that wolf populations were actually increasing. People in villages were concerned about livestock losses to wolf depredation. The perception that wolves were an increasing threat to the economic well being of villag- ers contributed to the government policy of paying a substantial bounty for killing wolves. The bounty in 1998 was 1000 som ($20) for an adult male and 1500 som ($30) for an adult female (Kurmanaliev, personal com- munication). This is a substantial amount of money in a country where over half the population makes less than 4,500 som a year (World Bank 1999).
From January to May 1999, I conducted a study to determine if the perception that wolves were increas- ing in abundance in spite of decreas- ing wildlife populations could be sub- stantiated. I conducted seven field surveys in the southern part of the country by going out with local guides to look for wolf signs as well as signs of potential wild prey spe- cies. These surveys were not meant to be exhaustive or systematic. I asked the guides to show me the most likely places that wolf sign would be found. I hoped to survey the areas that were more likely to have higher wolf populations than elsewhere near the village. This way, the results were more likely to indicate an abundance of wolves and result in a conserva- tive measure of possible declines. The surveys included two zapovedniks (protected areas with no recreational use or hunting allowed), two national forests and one national park (protected, but some uses al- lowed), and two rural areas with no protected status. These areas also rep- resented a variety of ecosystem types including juniper forests, walnut for-
Results Out of the seven locations surveyed, there was only one that had abundant signs of both wolves and potential wild prey species. This was in one of the rural, unprotected areas. Wolf tracks were abundant both on the mountain ridges and down into the river valley near the villages. Roe deer (Capreolus capreolus) were also abundant in the area, though there were no signs of wild boar (Sus scrofa), which used to be common in the area. We did locate one deer kill site about one km from a village and also a marking post with scat on a mountain ridge 12 km from the vil- lage. The scat consisted entirely of wool, indicating that these wolves had been eating sheep.
The other unprotected rural lo- cation also had abundant signs of wolves coming down from the moun- tain ridges into the river valley near the villages. The only wildlife spe- cies that appeared abundant in the river valley, however, was red mar- mot (Mamota caudata). There were no signs of deer or other larger mam- mal species. The wildlife signs in the other sites surveyed ranged from a few to no wolf signs with few signs of other large mammal species.
- - -
Vol. 18 No. 4 2001 Endangered Specles UPDATE 143

One of the zapovedniks, Sara Chilik, had some signs of wolves, deer, and wild boar, but the official wildlife counts indicated that the numbers of all were lower than they had been a decade earlier, prior to in- dependence. In Besh Aral Zapovednik, there were few signs of wolves in spite of high official esti- mates. There were no deer or boar signs and marmots were the only spe- cies that appeared abundant. There were no long-term population sur- veys available for Besh Aral so a comparison of abundance from be- fore to after independence was not possible. Anecdotal evidence indi- cated that in most areas, most wild- life species were declining in num- bers. Villagers were having to range further away when hunting to find game. Even wild boar, which had not been hunted much in the past due to the Muslim culture of the Kyrgyz, seemed to be in decline. In most of the villages near the field survey sites, the locals felt that wolves were still abundant, but that most of the wolves were further away from the villages than they had been before. Most cases of wolf depredation on live- stock that were related to me were from "the next village" rather than from the village I was in.
Official estimates The Government Hunting Institu- tions of Kyrgyzstan are responsible for keeping yearly estimates of all games species and other species of interest throughout the country. While the numbers from the official surveys may not be accurate as to the actual population size for the animals surveyed, they are collected using the same technique from year to year. Therefore, while not relying on the numbers to represent true population sizes, I felt that they were still useful to indicate trends. I compared the re- sults of government estimates of the populations of wolves, roe deer, and
Figure 1. Survey of roe deer populations in Osh Oblast (data from Osh Oblast Hunting Institution 1988-1999).
Figure 2. Survey of wild boar populations in Osh Oblast (data from Osh Oblast Hunting Institution 1988-1999).
wild boar in Osh Oblast from 1988 to 1999 (Osh Oblast Hunting Institu- tion 1988- 1999). These estimates showed a substantial decrease in the number of deer and boar over this time period. Deer populations de- clined by 39.4% while boar popula- tions declined by 55.7% from a few years before the breakup of the So- viet Union to the present with the de- clines starting around 1992, just af- ter independence (Figures 1 and 2). These numbers coincided with the results of the field surveys and with the anecdotal information from both official and local sources.
Since livestock plays such an irn- portant role in the Kyrgyz economy and can serve as an alternative prey base
for wolves, I also examined the agri- cultural census data for Osh Oblast from 1987 to 1997 (Osh Oblast Sub- sistence Farm Administration 1987- 1997). This was to determine if there had been changes in the total number of livestock that might be available to wolves. According to the official count, the numbers of horses and cattle have experienced only small declines over the 10-year period. However, sheep, which is the domi- nant domestic species in the country, have steadily declined since indepen- dence. There were almost two mil- lion sheep in Osh Oblast before the breakup of the Soviet Union and by 1997 the number had declined to less than 900,000-a drop of 55.6%.
144 Endangered Specles UPDATE
--
Vol. 18 No. 4 2001

Figure 3. Survey of gray wolf populations in Osh Oblast (data from Osh Oblast Hunting Institution 1988-1999).
In addition to showing declining populations for wild prey species, the Government Hunting Institution sur- vey data also showed a marked de- cline in wolf abundance from ap- proximately 1100 wolves in Osh Oblast to just over 600 -a decline of 44.3% over the same time period (Figure 3) (Osh Oblast Hunting In- stitution 1988-1999). This would seem to indicate that even the survey information collected by the govern- ment does not support the official stance that wolf populations have in- creased substantially since indepen- dence. The field survey results, as well as much of the anecdotal infor- mation, also provide evidence that wolf populations have actually de- clined over the last decade.
Discussion There are two questions that need to be addressed. One is why, dur- ing the current economic hard times, are wolf populations declin- ing rather than increasing, as they have in the past during Soviet times? The other is why the current perception is that wolf populations are increasing when populations may actually be declining? In order to answer these questions, we must understand how the economy and lifestyle of the people have changed
with the breakup of the Soviet Union and the coming of independence.
Since the breakup of the Soviet Union, Kyrgyzstan, like most of the former republics, has been experienc- ing a severe economic decline. Over- all the country has experienced declines in productivity and GDP, resulting in a sharp increase in the unemployment rate (World Bank 1999). During the early years of independence, there was a serious decline in income for most people (Anderson and Pomfret 2000). Pensions are no longer sufficient for the elderly to live on, and even people who did have jobs frequently were not paid for months at a time (personal obser- vation). This decline in income and employment coincided with the dis- mantling of much of the social safety net that was in place during the Soviet times. Medical care and education are no longer free and subsidies for food and utilities have either been eliminated or sharply reduced (Anderson and Pomfret 2000). This has resulted in close to 80% of the population of Kyrgyzstan living in poverty (Minis- try of Environmental Protection 1998).
The increase in poverty and un- employment and the changes in gov- ernment subsidies for social pro- grams are only part of the story. In addition, there have been substantial changes in the structure of the agri-
cultural sector of the economy. This is significant because the economy is largely agriculturally-based (World Bank, 1999). The large state-owned collective farms of the Soviet Union have almost all been broken up and the assets distributed as part of the privatization process (Karimbiekov, personal communication). As a re- sult, most livestock is now privately held in small family farms with pri- vate herds being relatively sniall.
The increase in poverty has also played a role in the overall decrease of wildlife populations. More people are exploiting natural resources for their daily subsistence. Poaching has increased significantly. Habitat de- struction is also an increasing prob- lem with the need to use natural re- sources for both food and fuel due to a lack of alternatives that were pre- viously available. In addition, the changes in the structure of livestock herds has brought about a change in grazing patterns, resulting in in- creased competition for resources be- tween wild and domestic species (Ministry of Environmental Protec- tion 1998). The reason that this eco- nomic decline hasn't resulted in an in- crease in wolf populations is that the nature of the economy itself has changed. During Soviet times, the major threat to wolves was the large- scale government sponsored wolf control programs. When the economy experienced a recession, there was less money to spend on these programs and wolf populations were able to rebound (Bibikov 1993). Currently, the major threat is a lack of natural resources. The prey base for wolves has declined significantly in less than 10 years due to habitat de- struction, increased human exploitation of game species, and a decline in do- mestic livestock. In addition, while there are currently no government em- ployees being paid to hunt wolves, there are still bounties in place that en- courage private hunting of wolves.
Vol. 18 No. 4 2001 Endangered Specles UPDATE 145

Over 90% of the countryside of Kyrgystan is mountainous (photograph by CJ Hazell).
The reason that people perceive wolf populations as increasing rather than decreasing may be due to the changes in both the economy and in the lifestyle of people. Economically, before independence, individuals didn't experience significant changes in living conditions during a reces- sion because of the regulated, cen- tralized economy that existed during the Soviet times. The social safety net that existed guaranteed access to employment and basic amenities. In addition, most livestock was gathered into large state-owned herds. Wolf depredation resulted in the taking of a few head of sheep from very large flocks so proportionately the losses were not as significant.
Since independence, the state- owned herds have been broken up and distributed to individuals, result- ing in many small, privately owned herds. In addition, the economic downturn has resulted in a significant increase in poverty and a drop in the standard of living for most people. When sheep were taken from a state- owned herd, it didn't result in indi- vidual farm workers experiencing economic hardship. This is no longer
true. The increased economic hard- ship for farmers resulting from wolf depredation is coupled with a decline in wild prey species. The wolves have fewer alternatives to livestock. This may be resulting in wolves com- ing closer to villages as well as a pos- sible increase in depredation. The lat- ter is difficult to substantiate due to the lack of documentation of depre- dation rates. These conditions could easily result in the perception that wolves are increasing in number sim- ply because their visibility and eco- nomic impact may be increasing.
Conclusion The former Soviet Union comprised a very large geographic area. Since its breakup, the former republics are all experiencing profound economic and social upheaval. These changes are not only affecting people, but are also having a significant impact on wildlife. Most of the resulting de- clines in wildlife populations are be- ing acknowledged. Wolves, how- ever, have not been recognized as a species that may also be experienc- ing negative impacts from the current situation. The perception that wolf
populations are stable or increasing appears to be common in these re- gions. This perception in Kyrgyzstan, coupled with the in- creased economic impact of wolf depredation due to the increase in poverty and private ownership of livestock, appears to be exerting in- creasing pressure on the government to re-institute wolf control programs (Kurmanaliev, personal cornrnunica- tion). This could be devastating if wolf populations are already in decline.
The Kyrgyz Republic is only one small part of the former Soviet Union, but most former republics are experiencing similar social and eco- nomic problems. We need to more fully investigate how these changes are affecting wildlife communities. Most of this region has reported that wolf populations are stable. We should be skeptical of this.
Literature cited Anderson, K. and R. Pornfret. 2000. Living
standards during transition to a market economy: the Kyrgyz Republic in 1993 and 1996. Journal of Comparative Economics 28502-523.
Bibikov, D.I. 1993. The wolf in the cornrnu- nity of independent states (former Soviet Union). Pp 22-24 In Promberger, C. and W. Schroeder, eds. Wolves in Europe: Status and Perspectives. Proceedings of a Work- shop in Oberarnmergau, Germany April 2- 5, 1992. Munich Wildlife Society.
Ministry of Environmental Protection. 1998. Kyrgyz Republic biodiversity strategy and ac- tion plan. MEP. Bishkek, Kyrgyz Republic.
Osh Oblast Hunting Institution. 1988-1999. Re- ports on wildlife populations. Osh, Kyrgyzstan.
Osh Oblast Subsistence Farm Administration. 1987-1997. Total Counts of Livestock and Domestic Birds in AU Categories. Osh Oblast Committee on Subsistence. National State Committee on Statistics. Kyrgyz Republic.
Route, B. and L. Aylsworth. 1999.1999 World Wolf Status Report. International Wolf 9(3) <http:l/www.wolf.org/>
Theberge, J. B. 199 1. Ecological classification, status, and management of the gray wolf, Ca- nis lupus, in Canada. The Canadian Field- Naturalist 105(4):459-463
World Bank. 1999. Kyrgyz Republic: update on poverty in the Kyrgyz Republic. Report 19425-KG. World Bank. Washington. D.C.
146 Endangered Species UPDATE Vol. 18 No. 4 2001

Gray Wolf Restoration in the Northwestern United States Ed Bangs Wolf Recovery Coordinator, U.S. Fish and Wildlife Service, 100 N. Park, #320, Helena, MT 59601; (406) 449-5225 x204; (fax) (406) 449-5339; [email protected]; http://midwest.fws.gov/wolf; http://mountain-prairie.fws.gov/wolf/annualrptOO/
Joe Fontaine Assistant Wolf Recovery Coordinator, U.S. Fish and Wildlife Service, 100 N. Park, #320, Helena, MT 59601; (406) 449- 5225 x206; joe-fontaineQfws.gov
Mike Jimenez Project Leader Wyoming Wolf Recovery, U.S. Fish and Wildlife Service, 190 N. 1st St., Lander, WY 82520; (307) 332- 7789; mike [email protected]
Tom Meier Wolf Biologist, U.S. Fish and Wildlife Service, c/o MT Fish, Wildlife and Parks, 490 N. Meridian Rd., Kalispell, MT 59901; (406) 751-4581 ; [email protected]
Carter Niemeyer Project leader for ldaho Wolf Recovery, U.S. Fish and Wildlife Service, 1387 S. Vinnel Way, Rm 368, Boise, ID 83709; (208) 378-5639; [email protected]
Doug Smith Project Leader, Yellowstone Wolf Recovery, Yellowstone Center for Resources, P.O. Box 168, Yellowstone National Park, WY 82190; (307) 344-2242; [email protected]
Kerry Murphy Biologist, Yellowstone Wolf Recovery, Yellowstone Center for Resources, P.O. Box 168, Yellowstone National Park, WY 821 90; (307) 344-2242; kerry-murphy @nps.gov
Deb Guernsey Program Assistant, Yellowstone Wolf Recovery, Yellowstone Center for Resources, P.O. Box 168, Yellowstone National Park, WY 821 90; (307) 344-2242; deb-guernsey @nps.gov
Larry Handegard Montana State Director, Wildlife Services, USDAIAPHIS, P.O. Box 1938, Billings, MT 59103; (406) 657-6464; larry.l.handegardQaphis.usda.gov
Mark Collinge ldaho State Director, Wildlife Services, 9134 W. Blackeagle Dr., Boise, ID 83709; (208) 378-5077, mark.d.collingeQaphis.usda.gov
Rod Krischke Wyoming State Director, Wildlife Services, P.O. Box 59, Casper, WY 82602; (307) 261-5336; rod.f.krischkeOaphis.usda.gov
John Shivik Leader Predation Management Project, WS National Wildlife Research Center, 4101 LaPorte Ave, Fort Collins, CO 80521 ; (970) 266-6088; john.shivikQaphis.usda.gov
Curt Mack Project Leader Nez Perce Tribe Wolf Recovery, 1000 Mission, McCall, ID 83638; (208) 634-1061; cmackOnezperce.org
Issac Babcock Nez Perce Wolf Biologist, 1000 Mission, McCall, ID 83638; (208) 634-1061; ibabcock.hotbot.com
Val Asher Wolf Biologist, Turner Endangered Species Fund, 1123 Research Dr., Bozeman, MT 59718; (406) 556-8514; valasherd montana.net
Dominic Domenici Wyoming Senior Resident Agent, U.S. Fish and Wildlife Service, 100 East B St., Federal Bldg Rm 41 30, Casper, WY 82602; (307) 261-6365; [email protected]
Abstract Gray wolf (Canis lupus) populations were eliminated from Montana, Idaho, and Wyoming, as well as adjacent southwestern Canada by the 1930s. After human-caused mortality of wolves in southwestern Canada began to be regulated in the 1960s) populations began expanding south- ward. Dispersing individuals occasionally reached the northern Rocky Mountains of the United States, but lacked legal protection there until 1974, after passage of the Endangered Species Act of 1973. In 1986, wolves from Canada successfully raised a litter of pups in Glacier National Park, Montana, and a small population was soon established. In 1995 and 1996, wolves from
Vol. 18 No. 4 2001 Endangered Species UPDATE 147

western Canada were reintroduced to remote public lands in central Idaho and Yellowstone National Park. These wolves were designated as nonessential experimental populations to increase managementflexibility and address local and state concerns. Wolfrestoration is rapidly occurring in Montana, Idaho, and Woming, and there were at least 28 breeding pairs in Decem- ber 2000. There are now about 63 adult wolves in northwestern Montana, 192 in central Idaho, and 177 in the Greater Yellowstone area. Dispersal of wolves between Canada, Montana, Idaho, and Wyoming has been documented. Occasional lone wolves may disperse into adjacent states, but population establishment outside of Montana, Idaho, and Wyoming is probably not imminent. The gray wolfpopulation in the northwestern U.S. should be recovered and, depending on the completion of state and tribal wolf conservation plans, could be proposed to be removed from Act protection within three years. Wolf restoration has proceeded more quickly and with more benefits, such as public viewing than predicted. Problems, including confirmed livestock depre- dations, have been lower than estimated. The Service led interagency recovery program focuses its efforts on achieving wolf recovery while addressing the concerns of people who live near wolves. Wolves have restored an important ecological process to several large wild areas in the northern Rocky Mountains of the U.S. The program has been widely publicized and is generally viewed as highly successful.
Wolves in northwestern Montana Sixty years after being nearly exter- minated from the lower 48 states, the gray wolf (Canis lupus) was listed under the Endangered Species Act (ESA) in 1974 and was eventually re- stored to Montana, Idaho, and Wyo- ming. Wolves were once common throughout North America but were deliberately exterminated in the lower 48 states (except northeastern Minnesota). Wolves remained abun- dant in much of Canada and Alaska. Recovery began in northwestern (NW) Montana in the late 1970s by natural dispersal from nearby ex- panding Canadian wolf populations (Pletscher et al. 1997). Wolves first denned in NW Montana in Glacier National Park in 1986 (Ream et al. 1989). Wolf numbers steadily in- creased until 1996, when there were a minimum of 70 wolves in seven different packs that lived solely in NW Montana. An unusually severe winter in 1996-97 caused a 30 to 50% decline in the white-tailed deer (Odocoileus virginanus) populations, the primary prey of those wolves. The number of wolves dropped to just over 50 in five packs in 1997, largely as a result of agency wolf
control actions in response to high livestock depredations and subse- quent poor pup production (Bangs et al. 1998). Wolf numbers have only slightly increased since 1997. In 2000, there were an estimated 63 wolves in about a dozen groups, but only six of those successfully repro- duced. Most wolves in NW Montana live in a mix of private and public land west of the Continental Divide.
Wolf reintroduction in Yellowstone National Park and central Idaho In 1988 and 1990, Congress directed the National Park Service to prepare a series of reports on the potential effects of reintroducing wolves to Yellowstone National Park (YNP 1990). Wolf depredation on live- stock, wolf predation on wildlife, land-use restrictions, tourism, other predators including grizzly bears (Ursus arctos), diseases, and a wide variety of other issues were evalu- ated. In 1990, Congress established a Wolf Management Committee, con- sisting of federal, state, and private special interest groups to try to forge a political compromise on the issue of wolf reintroduction in both Yellowstone and central Idaho. Their
report was completed in May 199 1, but Congress chose not to act on the Committee's recommendation, which included wolf reintroduction and more flexible wolf management than was normally allowed under the ESA. All these reports, and all sub- sequent investigations, made it clear that reintroducing wolves in Yellowstone National Park and cen- tral Idaho was feasible and would ultimately result in wolves attempt- ing to recolonize areas throughout Montana, Idaho, and Wyoming and far outside the reintroduction areas.
In late 1991, Congress directed the Fish and Wildlife Service (FWS) to lead preparation of an environmen- tal impact statement (EIS) to exam- ine the effect of reintroducing wolves to Yellowstone National Park and central Idaho (FWS 1994). The plan- ning and public involvement effort took two years to complete. By the time it was finished the Service had distributed over 750,000 documents, conducted over 130 public meetings and hearings, and reviewed 170,000 public comments. The decision was to reintroduce wolves to both Yellowstone and central Idaho as nonessential experimental popula- tions, the most flexible classification
148 Endangered Species UPDATE Vol. 18 No. 4 2001

for species listed under the ESA. The decision was approved in spring 1994 by both the Secretary of the Interior (FWS, National Park Service and Bureau of Land Management) and the Secretary of Agriculture (Wild- life Services and Forest Service).
The EIS predicted that a recov- ered wolf population (a minimum of 10 breeding pairs, estimated to be about 100 adult-sized wolves) in the Yellowstone area would kill an aver- age of 19 cattle (Bos sp.), 68 sheep (Ovis aries), and up to 1,200 ungu- lates (primarily elk) annually. This would not affect hunter harvest of male ungulates, but could reduce hunter harvest of female elk (Cewus elaphus), deer (Odocoileus sp.), and moose (Alces alces) in some herds. Hunter harvests or populations of bighorn sheep (Ovis Canadensis), mountain goats (Oreamnos americanus), or antelope (Antilopra americana) would not be affected. Bison (Bison bison) would not be preferred prey. Wolf predation may reduce populations of elk five to 30%, deer three to 19%, moose seven percent, and bison up to 15%. The presence of wolves would not change uses of public or private land except for potential use of M-44 cyanide devices, used to control coyote (Ca- nis latrans) damage, in areas occu- pied by wolves. Visitor use was pre- dicted to increase five to 10%. At wolf recovery, annual economic losses were estimated to be $1 87,000 to $465,000 in hunter benefits (what hunters said hunting female elk was worth to them), $207,000 to $4 14,000 in potential reduced hunter expenditures (what hunters of female elk said they would have spent hunt- ing), and $1,888 to $30,470 in poten- tial livestock losses. Annual in- creased visitor expenditures were es- timated at $23 million and the exist- ence value of wolves was estimated at $8.3 million (what people believed having wolves in the Yellowstone
area was worth to them). Similar pre- dictions were made for the central Idaho area. Depending upon their distribution, more than 100 adult- sized wolves would proportionally increase impacts above those pre- dicted in the EIS. To date, at least the trends in these predictions appear to have been fairly accurate. It will take time before wolf numbers and distribution stabilize and the true ef- fect of having wolves back in these areas can be ascertained.
The restoration of wolves to pub- lic lands in the western United States, particularly Yellowstone National Park, was proposed as early as the 1940s. After years of direct involve- ment by Congress and exhaustive public involvement and planning, 35 wolves were reintroduced via hard (immediate) release to wilderness ar- eas in central Idaho, and 3 1 were soft released in Yellowstone National Park, Wyoming in January 1995 and January 1996 (Fritts et al. 1997; Bangs et al. 1998). Those wolves, originally from Canada, were desig- nated as nonessential experimental populations to increase management flexibility over what is normally al- lowable for species listed under the ESA. Examples of this flexibility are: landowners could harass wolves at any time; livestock producers could shoot wolves seen attacking livestock; wolves could be relocated if they significantly impacted wild ungulate herds (as defined in ap- proved state wolf management plans); there would be virtually no land-use restrictions; the Service. could use special permits to take wolves for various management rea- sons; and funding was offered for state and tribal leadership in wolf re- covery actions (Bangs and Fritts 1996). Currently wolves in Wyo- ming and Montana are primarily managed by the FWS, National Park Service (in Parks), and USDA Wild- life Services. In Idaho, wolves are
primarily managed by the Nez Perce Tribe and Wildlife Services, under a cooperative agreement with the FWS.
Reintroduced wolves adapted better than predicted and only two years of reintroduction were required rather than the three to five years that were predicted (Fritts et al. 1997). In December 2000, the population esti- mate was 177 wolves in 13 breeding groups in the Yellowstone area and 192 wolves in 9 breeding groups in Idaho. To date, wolves have settled primarily on remote public lands, but that will change as the population expands and more wolves disperse beyond where wolf packs currently exist. Dispersing wolves will in- creasingly try to occupy private lands used for livestock production; this will increase the rate of livestock dep- redations and agency control. Except for a few temporary closures to pro- tect wolf viewing opportunities around active dens in Yellowstone National Park, and restricting some M-44 use, the wolf restoration pro- gram has caused no land-use restric- tions that might disrupt traditional human activities such as logging, mining, livestock grazing, hunting, trapping, or wildland recreation. Over 70,000 visitors toYellowstone National Park have seen wolves and public in- terest in them is extremely high.
Wolf research Between 1979 and the late 1990s, extensive research on wolves in NW Montana was supported by a host of state and federal resource manage- ment agencies. Field work and data analysis were carried out largely by graduate students and the University of Montana. Those studies investi- gated the relationships between wolves and other wildlife, including white-tailed deer, elk, and moose, other predators such as mountain li- ons (Felis concolor) and coyotes, and livestock (Kunkel and Pletscher 1999; Kunkel et al. 1999; Kunkel
Vol. 18 No. 4 2001 Endangered Species UPDATE 149

1997). This research indicated wolves were just another predator on wild ungulates, neither much less nor much more effective than other na- tive predators, such as mountain li- ons, black (Ursus americanus) and grizzly bears, or coyotes. Wild preda- tors, including wolves, typically killed more of the most vulnerable of ungulates (injured, sick, or very young and very old individuals) than did human hunters. Wolf predation in combination with other factors such as winter weather, human hunt- ing, other predators, and habitat con- ditions, contributed to a decline in white-tailed deer and elk in the North Fork of the Flathead River. Moose populations apparently were not as affected by these same circum- stances. As a result of that prey de- cline, wolf numbers in that area dra- matically declined, from nearly 30 wolves in three packs during the most intensive research in the early 1990s to a few individuals that did not pro- duce pups in 1999 or 2000. Wolves often trailed mountain lions to take over their kills and killed a few li- ons. Direct competition for the types of ungulates that are most vulnerable to predation was likely the main im- pact that wolves would have on li- ons. Wolves also killed a few coy- otes. While wolves displaced lions and coyotes from ungulate carcasses, wolf kills were often usurped by griz- zly bears. Studies of wolf genetics and dispersal indicated that genetic diversity was high and likely not a management concern, as long as op- portunity for occasional dispersal from wolf populations in Canada and other U.S. recovery areas in Idaho and Wyoming was maintained (Boyd and Pletscher 1999).
Research indicated that although wolves often lived near livestock (primarily cattle) and other domestic animals, conflicts were uncommon. Dogs, almost exclusively hunting hounds and livestock guard and herd-
ing dogs, were apparently killed as competitors rather than prey. Wolves commonly fed on carrion of both livestock (carcass dumps) and wild ungulates (road and train kills, unretrieved hunter-killed game, and gut piles). In some instances, abun- dance of natural prey and relative vulnerability of livestock affected how often wolves attempted to attack livestock. Sick or wounded livestock or small livestock, such as calves or sheep, appeared particularly vulner- able to wolf predation. But often, wolves appeared to attack livestock without any predisposing factors and nearly all wolf packs with regular exposure to livestock sporadically caused depredations.
A large number of studies and research are currently being con- ducted on wolves in the Yellowstone and central Idaho experimental areas so that accurate information can be used to better manage wolf popula- tions and expand the level of knowl- edge about wolves. Wolf predation studies indicated elk were more than 90% of the prey killed by wolves in Yellowstone. Kill rates were about 15 elk per wolf per year. In Idaho, wolves also preyed mainly on elk, but wolves there killed a higher propor- tion of mule deer (Odocoileus hemionus). Wolf kills were more likely to be in open habitats and the remains scattered, compared to mountain lion kills that were often covered and hidden in thick cover. This gave a visual impression that wolves killed more deer and elk than mountain lions, but a lion actually kills more ungulates per year than does a wolf. Annual wolf kill rates typically average about 20 adult deer or 12 adult female elk per year, while adult lion kill rates can be twice as high. Both wolves and lions tended to prey on the most vulnerable wild ungulates such as calves and very old females. Calf elk killed by lions in Idaho were in better condition than
calf elk killed by wolves. Bison are difficult to kill and few wolves have learned to do so effectively (Smith et al. 2000). Somewhat surpris- ingly, to date no Bighorn Sheep have been confirmed killed by wolves in either area.
Carcasses of elk killed by wolves were utilized by a wide variety of other wildlife species and provided a year-long food source that would likely increase overall wildlife diver- sity. Coyote numbers in some areas may have been reduced by half be- cause of wolves killing coyotes. Mountain lions and wolves tend to kill the same types of prey, but lions are usually confined to more rugged steep and vegetated terrain, while wolves preferred flatter terrain and made more use of open habitat. Griz- zly bears often usurped wolf killed ungulates. Studies are investigating the effect of wolves on elk distribu- tion on winter feeding grounds in Wyoming, but tentative results sug- gest little effect other than elk appear to be more wary and may prefer larger groups and more open habitat when wolves are present. Earlier studies in Montana indicated that wolves did not change ungulate dis- tribution on natural winter ranges, but apparently caused ungulates to be more wary and to temporarily retreat to thicker cover when wolves were present.
A recent study funded and initi- ated by the Nez Perce Tribe and a host of federal agencies and local live- stock producers found that confirmed livestock losses may be a fraction of actual losses under some circum- stances. That study determined the cause of death and detection rate of 220 radio-tagged livestock calves of about 700 on large, very remote, and heavily forested USDA Forest Ser- vice grazing allotments. After two years, pneumonia killed the most marked calves, but wolf predation was the second leading cause of
150 Endangered Species UPDATE Vol. 18 No. 4 2001

death. Sample sizes were very small, but as many as 5.7 calves may have died from wolf predation for every one discovered by normal livestock herding practices. Wolves killed calves that were the lowest weight, least guarded by people, nearest to an active wolf den, and in the heavi- est forest cover, suggesting that wolves tested and hunted cattle like wild prey and attacked the most vul- nerable animals.
Livestock depredations Since 1987, annual confirmed mini- mum livestock losses in NW Mon- tana totaled 82 cattle, 68 sheep and seven dogs. As a result, 41 wolves were killed and 32 were moved. Dep- redations averaged 5.8 cattle, 4.8 sheep, and less than one dog annu- ally. Agency control killed an aver- age of three wolves per year. On av- erage, less than six percent of the wolf population is annually affected by agency wolf control actions (Bangs et al. 1995). Minimum con- firmed livestock losses have annually averaged about 3.6 cattle, 27.8 sheep, and 3.8 dogs in the Yellow stone area, and 9.2 cattle, 29.4 sheep, and 1.8 dogs in central Idaho. In addition, one newborn horse (Equus sp.) was killed in the Yellowstone area. In total there have been 146 cattle, 356 sheep and 35 dogs confirmed killed by wolves from 1987 until January 2001. Since 1987, the Service and USDA Wildlife Services have killed 41 wolves in NW Montana, 18 in central Idaho, and 26 in the Yellowstone area because of conflicts with livestock. The rate of confirmed wolf-caused livestock losses and the number of wolves that have been re- moved in agency control actions is one-third to one-half of the levels predicted in the EIS. Despite lower than expected losses and less wolf control than predicted, wolf depreda- tions and control remain inordinately controversial. Even the most routine
wolf depredation and control actions still result in major local news cov- erage. To the general public, this probably greatly exaggerates both the role of wolves as livestock predators and the level of agency control. Since 1987, livestock producers who expe- rienced confirmed or highly probable wolf-caused losses in Montana, Idaho, and Wyoming have been compensated about $155,000 by a private compensation fund admin- istered by the Defenders of Wild- life, who support wolf recovery and management efforts.
Minimizing livestock conflicts The Service is evaluating a wide va- riety of alternative methods to pre- vent or reduce conflicts with live- stock in addition to relocating or kill- ing problem wolves. The experimen- tal population rules and the recently proposed. special rule for wolves listed as threatened would allow for harassment and killing of problem wolves. In cooperation with USDA Wildlife Services and private conser- vation organizations we have: used light and siren devices, including models triggered by the signals from individual radio-collared wolves; es- tablished barriers to wolves using guard animals, flagging and fencing; provided extra surveillance of live- stock with herders or agency person- nel; harassed and moved andlor pro- vided supplemental food to wolves that established dens and rendezvous sites in livestock grazing pastures; initiated research using electronic dog training collars to teach wolves not to attack livestock; provided live- stock producers radio telemetry re- ceivers so they could closely moni- tor wolves near their livestock; and helped provide alternative pasture to reduce livestock and wolf encounters. We have permitted livestock produc- ers to shoot wolves actually seen at- tacking livestock, and in a few chronic cases of depredation on pri-
vate property, to shoot wolves on- sight. We have allowed landowners to non-injuriously harass wolves at any time. We have trained and then issued cracker shells and less-than- lethal munitions (12-gauge bean- bag or rubber bullet shells) to pri- vate landowners so they could in- juriously harass any wolves near their livestock or property.
Litigation Several lawsuits were filed over the reintroduction program, by a wide variety of groups, including the Si- erra Club Legal Defense Fund who supported and the American Farm Bureau Federation who opposed wolf restoration. The lawsuits were pooled into a single case that ques- tioned whether the Service's use of an experimental population designa- tion for reintroduced wolves illegally reduced protection of wolves that might naturally wander into the ex- perimental areas. To date, no natu- rally dispersing wolves have been found in the Yellowstone area, but at least three wolves from NW Montana have dispersed into the central Idaho area. The Wyoming District Court eventually ruled against the Service's position in December 1998 and or- dered all the reintroduced wolves re- moved, but stayed its own decision pending appeal. That case was then reviewed by the Tenth Circuit Court of Appeals in Denver, Colorado. Their ruling in January 2000 over- turned the Wyoming lower court rul- ing. The Tenth Circuit endorsed and validated the legality of the Service's authority and the wolf reintroduction program. None of the losing parties appealed to the Supreme Court per- haps because several months earlier, in a closely related case that involved the illegal killing of an reintroduced wolf, the Ninth Circuit Court of Ap- peals in California had also ruled strongly in favor of the Service's au- thority and the Supreme Court had
Vol. 18 No. 4 2001 Endangered Species UPDATE 151

refused to hear an appeal. The only delisting proposal, including assur- vation of wolves in a changing world. Ca-
unresolved litigation involves a Wyo- ance that state wolf management nadian Institute$ Alberta.
ming rancher who suffered several plans would conserve wolves above Boyd, D.K, and D.H. Pletscher 1999, confirmed wolf-caused livestock and recovery levels, the affected states Charcteristics of dispersal in a colonizing pet depredations, and suspects he had and tribes could manage wolves with- wolf population in the central ~ o c k y
many other unconfirmed losses. He out federal oversight, except for the Mountains. Journal of Wildlife Manage-
claims that the government reintro- five-year post recovery monitoring ment 63:1094-1108. Fritts, S.H., E.E. Bangs, J.A. Fontaine, M.R.
duction program resulted in an un- period that is required by the ESA. Johnson, M,K, Phillips, E.D. Koch, and compensated "taking" of his private State and tribal management pro- J.R. Gunson. 1997. Planning and imple- property and lifestyle. Other litiga- grams will likely allow wolves to be menting a reintroduction of wolves to
tion on a wide variety of wolf man- killed in defense of life and property Park and Idaho. Restoration Ecology 57-27,
agement issues is almost certain be- and in regulated public harvest pro- Fritts, S.H. and L,N, Carbyn. 1995 Popu- cause of the strong symbolism of grams, just as other large predators lation viability, nature reserves, and the wolves to various special interest in these states are managed. Ulti- outlook for gray wolf conservation in
groups and the public, both at the lo- mately, wolf numbers (above mini- N~*hAmerica. Restoration Ecology 3:26-
cal and national level. 38. mum levels) and pack Kunkel, K.E. 1997. Predation by wolves and The Service-led interagency wolf distribution will be determined by other large carnivores in northwestern
recovery program focuses its efforts state and tribal wildlife management Montana and southeastern British Colum- on achieving the wolf recovery goal agencies. Once recovery goals have bia. Ph.D. dissertation, University of
while addressing the concerns of been achieved, delisting and a return Montana, MissOula$ MT. Kunkel, K.E., T.K. Ruth, D.H. Pletscher, and people who live near wolves. Over to sole state and tribal management M.G, Hornocker 1999. Winter prey se-
85% of all known wolf mortalities are will signal the final success of the lection by wolves and cougars in and near caused by people, and the majority ESA at recovering the once imper- Glacier National Park, Montana. Journal
of those are a result of agency wolf iled gray wolf in the northern Rocky Management63:901-910.
control actions (Bangs et al. 1998). Mountains of the U.S. Kunkel, K.E. and D.H. Pletscher. 1999. Spe- cies-specific population dynamics of
The key to successfully completing cervids in a multipredator ecosystem. Jour- wolf restoration efforts will depend Acknowledgments nal of Wildlife Management 63:1082- on maintaining some connectivity Literally hundreds of people have 1093.
between the few remaining areas of contributed in a multitude of ways to 'letscher* D*H., R*R. Ream$ D.K. M.W. Fairchild, and K.E. Kunkel. 1997.
large wild habitat remaining in the wolf restoration. It is impossible for Population dynamics of a recolonizing western U.S. and tolerance of wolves us to individually recognize and population in the ~~~k~ Mountains, by the local rural residents (Fritts and thank all of them in this paper, but . Journal of Wildlife Management 61:459-
Carbyn 1995). without strong interagency coopera- 465 Ream, R.R., W. Fairchild, D. K. Boyd and tion and public involvement and tol-
A. Blalresley. 1989. Firs wolf den in Wolf recovery erance, the successes so evident to- western United States in recent history. Wolf populations should be fully re- day would not have been possible. Northwestern Naturalist 70:39-40. covered (30 breeding pairs with eq- Smith, D.S., L.D. Mech, M. Meagher, W.E.
uitable distribution throughout the Literature cited Clark, R. Jaffe, M.K. Phillips, and J.A.
three recovery areas for three succes- Bangs, E.E. and S.H. Fritts. 1996. Reintro- Mack. 2000. Wolf-Bison interactions in Yellowstone National Park. Journal of
sive years) and will no longer need ducing the gray to Idaho and Yellowstone National Park. Wildlife So- Mammalogy 81:1128-1135.
protection under the ESA by 2003. ciety Bulletin 24:402-4i3. U.S. Fish and Wildlife Service. 1994. The
As a result of dispersal by wolves Bangs E.E., S.H. Fritts, J.A. Fontaine, D.W. reintroduction of gray wolves to
from Canada and the combination of Smith, K.M. Murphy, C.M. Mack, and Yellowstone National Park and Central Idaho. Final Environmental Impact State-
reintroduction from two areas in C.C. Niemeyer. 1998. Status of gray wolf restoration in Montana, Idaho, and Wyo-
ment. USFWS, Helena, MT. Canada, genetics not be a _ng, wildlife society ~ ~ l l ~ ~ i ~ 26:785- Yellowstone National Park, U.S. Fish and tor in wolf population viability as 798.
Wildlife Service, University of Wyoming,
long as some connectivity is main- Bangs, E.E., S.H. Fritts, D.A. H ~ S , J.A. University of Idaho, Interagency Grizzly Bear Study Team, and University of Min- tained (Boyd and Pletscher 1999). Fontaine, M.D. Jimenez, W.G. Brewster,
once the recovery goal is achieved, and C.C. Niemeyer. 1995. Control of en- nesota Cooperative Parks Studies Unit,
dangered gray wolves in Montana. Pp editors. 1990. Wolves for Yellowstone?
be proposed to be 127-134 in L.N. Carbyn, S.H. Fritts, and A report to the United States Congress. Vol
delisted. After extensive public and D.R. seip, editors. ~~~l~~~ and censer- I. Research and analysis. Mammoth, Wyo.
professional review of the Service's 586 pp.
152 Endangered Species UPDATE Vol. 18 No. 4 2001

The Feasibility of Gray Wolf Reintroduction to the Grand Canyon Ecoregion Paul G. Sneed Environmental Studies , Master of Arts Program, Prescott College, 4906 Box Canyon Road, Billings, MT 59101; (406) 245-91 17; (fax) (406) 245-0787; [email protected]
Abstract As part of a regional conservation planning initiative, this study is being undertaken to determine the biophysical and socioeconomic feasibility of reestablishing a top carnivore, the gray wolf (Canis lupus), in the Grand Canyon Ecoregion (GCE). The GCE is a roughly 1.5 million km2 area located on the southern Colorado Plateau. The last remaining gray wolves were probably eradicated in the 1920s and 1930s. Because of an interest in restoring extirpated native species to this ecoregion, and the desire to increase the size of the gray wolfmetapopulation in the Southwest, there is need for an objective and spatially explicit landscape-scale model of potential gray wolfhabitat. Thefirst phase of this conservation GIS analysis involves utilizing six habitat characteristics or factors-vegetation cover, suface water availability, prey density, human population density, road density, and land ownership-to identify and describe potential reintro- duction sites in the Arizona section of the Grand Canyon Ecoregion. Initial results show that there are at least two localities in northern Arizona suitable for reintroduction of around 100 wolves. This paper is a preliminary report on observations, results, and some recommendations deriving from the feasibility study.
- -
Introduction Conservation biologists have shown that large or top carnivores are often keystone species whose removal jeopardizes the maintenance of eco- logical integrity in large-scale ecosys- tems (Soule and Noss 1998; Terborgh et al. 1999). Therefore, conservation planners interested in restoring and protecting large ecosystems or ecoregions emphasize recovery of top predators. The primary goal of this study-which is supported by the Grand Canyon Wildlands Council, Defenders of Wildlife, and Prescott College-is to determine the capabil- ity and suitability (together, the fea- sibility) of reintroducing one top car- nivore, the gray wolf (Canis lupus), to the Grand Canyon Ecoregion (GCE) (Figure 1).
Ultimately, this study will ad- dress 26 factors or aspects, grouped into two dimensions-biophysical and human-that are expected to af- fect the feasibility of wolf recovery in the entire GCE (Sneed and
Crumbo 1998). This paper, how- ever, will focus on current, prelimi- nary results from research done on a limited number of factors in the northern Arizona section of the ecoregion (see Figure 1).
Historic occurrence and taxonomic position To accurately reconstruct the his- toric distribution of gray wolves in the GCE is challenging for a vari- ety of reasons. Nineteenth century writers often accidentally or pur- posefully misidentified coyotes (Canis latrans), wolves, and wolf- dog hybrids (Gipson et al. 1998). Wolf hunters and trappers some- times exaggerated the number of wolves in an area to enhance their job security and occasionally mis- represented where a wolf was killed in order to claim a local bounty. Furthermore, the widespread use of poisons meant that many animals, including wolves, were dispatched without any record of their death.
Regardless of inaccuracies in the historical record, a partial picture of where wolves occurred prior to their extermination in the Southwest can still be pieced together. These records show that at least small populations of wolves were found throughout the woodlands and forests of northern Arizona (Brown 1984). For example, from these records we know that there were at least 30 wolves on or near the North Kaibab because of the number reported killed between 1907 and 1926 (Russo 1964). Brown (1984) claimed that "the last wolf in this part of northern Arizona was taken on the Paria Plateau about 1928", but a former Civilian Conservation Corps worker recently reported that he saw wolves on three different occasions in 1935 on the North Rim of Grand Canyon National Park (GCNP) (Leslie, personal communication). Moreover, "as recently as March 3, 1948, assistant chief ranger A.L. Brown reported wolf tracks in fresh snow in the area of Bright Angel
Vol. 18 No. 4 2001 Endangered Species UPDATE 153

Figure 1. Grand Canyon ecoregion
Point" on the North Rim of GCNP (Hoffmeister 1971). Finally, the last wolf inhabiting the Mogollon Rim area in the southern part of the GCE was reportedly taken in 1942 (Hoffmeister 1986). Clearly, gray wolves occurred within the Grand Canyon Ecoregion well into the twen- tieth century, although their exact numbers and range will probably never be known with certainty.
Due to the taxonomic splitting approach of the time, Young and Goldman (1944) identified 23 sub- species of North American gray wolves (based on skull measure- ments, pelage color, and size) and mapped their geographic distribution. Two of these 23 nominal subspe- cies-C. I . mogollonensis (the Ari- zona wolf), C.l. youngii (the Great Basin or Intermountain wolf), and, possibly, C.I. baileyii (the Mexican wolf)-inhabited the Grand Can- yon Ecoregion (Brown 1984; FWS 1996). Development of similar classification schemes continued into the 1970s (e.g., Hall and Kelson 1959) until some taxono- mists began questioning the split- ting tradition of wolf taxonomy.
Modern lumping systems of wolf taxonomy are based on multivariate statistical analysis of large sample sizes and confirmed by the results of
dispersed into the southeast- em part of the GCE.
Habitat capability and suitability mapping Restoration of viable large carnivore populations is probably among society's greatest challenges, requir- ing extraordinary innovation and co- operative management on an ecoregional scale (Paquet and Hack- man 1995). Furthermore, solutions to large predator conservation are economic, sociological and political (human dimension issues), as well as biological and ecological (biophysi- cal factors) (Clark et al. 1996). The feasibility of wolf recovery depends on the capability and suitability of habitat for sustaining wolf popula- tions. Although many factors can and should be considered, the ultimate de- terminants are ungulate prey and hu- man impact (Fuller et al. 1992) or, put another way, sustenance and security.
Course screen landscape-scale habitat mapping for the Arizona por- tion of the GCE (see Figure 1) has been done following other .similar studies (Mladenoff et al. 1995; Quinby et al. 1999; Ratti et al. 1999; Wydeven et al. 1998). Various bio- physical factors can be considered in evaluating the capability of habitat to support wolves, but this study focuses on vegetation cover, surface water availability, and, most importantly, ungulate prey abundance. In addition
to adequate food supplies, security from human disturbance and perse- cution are important factors affect- ing the suitability of a landscape for wolf recovery. At this stage in the research, three critical human di- mension aspects are considered: human population density, road density, and land status.
Biophysical factors Several reintroduction studies (e.g., Mladenoff et al. 1995) suggest that gray wolves, at least those living south of the Arctic, tend to prefer for- ested landscapes. Historically, in the Southwest, wolves were most com- monly found associated with wood- lands and montane forests (Groebner et al. 1995; FWS 1996). When ob- served elsewhere, such as in grass- lands, they were probably simply passing through as they moved be- tween their preferred habitat of for- ested highlands. Figure 2 maps the distribution of these two vegetation types, as well as others such as shrublands and grasslands. This fig- ure plainly illustrates a broad band of forestlands-woodlands extending north-south from the Kaibab Pla- teau, through the Flagstaff area to the Mogollon Rim, interrupted only by the Grand Canyon and urbanized areas such as Flagstaff. Other ar- eas of woodland/forest vegetation types are found in isolated moun- tain areas of the Arizona Strip as well as the Hualapai and Navajo Indian Reservations.
Because wolves require large amounts of water to aid digestion (Lopez 1978; Mech 1970), several studies of wolves in the Southwest (Groebner et al. 1995; FWS 1996) and elsewhere (Quinby et al. 1999) have suggested that the availability of free water is an important deter- minant of gray wolf abundance and distribution. Figure 3 illustrates the distribution of currently mapped lakes, springs, and streams in the Ari-
154 Endangered Species UPDATE Vol. 18 No. 4 2001

I ' I Figure 2. Vegetation cover
zona portion of the Grand Canyon Ecoregion. Although the digital data available is very incomplete, this fig- ure shows that there are more than enough sources of surface water on the Kaibab Plateau, in the Flagstaff area, and along the Mogollon Rim. This conclusion is supported by the observed presence of relatively high numbers of other large predators (e.g., mountain lions (Felis concolor) and prey species in these locales.
Clearly, one of the most impor- tant determinants of suitable wolf habitat is the abundance of ungulate prey species. The primary prey spe- cies for wolves in the Grand Canyon Ecoregion are mule deer (Odocoileus hemionus), followed in order of im- portance by elk (Cervus elaphus), pronghorn (Antilocarpa americana), and bighorn sheep (Ovis canadensis). Information about abundance (den- sity) and distribution of these wild- life species in the Arizona part of the ecoregion was obtained from the Ari- zona Game and Fish Department. Figures 4 and 5 display the approxi- mate density of mule deer and elk populations in Arizona GCE.
Other reintroduction studies (e.g., FWS 1996) indicate that a density of approximately two to six deer per km2 would be required to support a Mexi- can wolf population and, presumably, similar numbers would be adequate for wolves in the GCE. Figure 4 dem- onstrates that much of the Kaibab Pla-
man population den- sity. Studies (e.g., Mladenoff et al. 1995; Ratti et al. 1999) have shown that lands with a hu- man population den- sity greater than 12 to 13 persons per square kilometer will not be suitable wolf habitat. The
I
Figure 3. Surface water I map displayed in Figure 6 indicates
teau enjoys a very high density of mule deer (eight to 13 animals per km2), while the remainder of the area has an adequate density of three to eight deer per km2. The Coconino Plateau around Flagstaff also supports quite dense populations (three to eight per km2). Furthermore, similar den- sities probably exist on parts of the Hualapai and Navajo reservations in the GCE, but no data is readily avail- able to confirm this supposition. Even if the current mule deer popu- lation density is one-half of what these figures indicate, as some Ari- zona Game and Fish Department per- sonnel suggest (e.g., Goodwin, per- sonal communication), there are still more than sufficient deer densities to support gray wolves. Figure 5 shows that elk densities, while somewhat lower on average than mule deer, are quite high (i.e. two to three animals per krn2) around Flagstaff and south- east along the Mogollon Rim. Of course, elk also average three times the biomass of deer. Figures 4 and 5 combined map an adequate ungulate prey base extending north-south from the Kaibab Plateau, through the Flag- staff area, and southeast along the Mogollon Rim.
Human dimensions An important determinant of habitat suitability for gray wolves and other large carnivores such as grizzly bears (Merrill et al. 1999) seems to be hu-
that most of the Arizona section of the Grand Canyon Ecoregion has population densities less than 13 per- sons per km2. Except for the Flag- staff-Sedona urban zone, the entire north-south corridor from the Kaibab Plateau to the eastern, slightly urban- ized, part of the Mogollon Rim has a human population density of less than four people per km2. Not surprisingly, this same corridor has high prey spe- cies densities and seems capable of supporting wolves.
Wolves are usually not threatened by roads, except when they are struck by motor vehicles (Mech 1977). Nonetheless, roads can provide ac- cess to generally undisturbed areas where humans may harass or kill wolves. Studies of road density and wolf distribution relationships by Thiel (1985) and Mech et al. (1988) suggest a road density threshold value of between 0.6 and 0.8 kilometers of road per square kilometer of area. Higher road density values generally result in unsuccessful breeding at- tempts. Mladenoff et al. (1995), us- ing radio collar data on recolonizing wolves in northern Wisconsin, dis- covered that road density and fractal dimension-reflecting the degree of habitat fragmentation (often the re- sult of road buildingewere the most important predictors of favorable wolf habitat. Figure 7 shows that most of the north-south corridor, ex- tending from the Kaibab Plateau
Vol. 18 No. 4 2001 Endangered Species UPDATE 155

through to the Mogollon Rim south- east of Flagstaff, has road densities higher than 0.68 krn per km2, but gen- erally lower than 1.4 km per km2. Road density in many parts of the GCE is somewhat higher than recom- mended in other studies, but most of the numerous roads in the ecoregion are tertiary or unimproved roads that could be eliminated on public lands with a vigorous road-closing program. Furthermore, the low hu- man density numbers (Figure 6) might indicate that these areas are favorable wolf recovery habitat de- spite the existence of relatively high unimproved road densities.
Favorable land status, defined here as lands in public ownership and, especially, designated protected ar- eas, can help make a landscape suit- able for gray wolf reintroduction (Southern Rockies Ecosystem Project, 1998). Identifying, describ- ing, and mapping proposed and des- ignated wilderness areas and other ar- eas designed to protect ecological processes or wildlife, such as the Grand Staircase/Escalante National Monument and the Grand Canyon Game Preserve in the Kaibab Forest (Miller 1996) is especially important. Figure 8 maps distribution of public lands, both state and federal, exclu- sive of Indian reservations. This re- veals that a wide band of federal pub- lic lands (including large tracts of pro- tected areas) runs north-south from the Kaibab Plateau through the Flag- staff area and southeast along the Mogollon Plateau (again, corre- sponding with the distribution of important biophysical factors). State lands, even though currently interspersed in a "checkerboard" fashion (see Figure 8) with private and federal lands, could be consoli- dated through land trades and pur- chases to create wildlife corridors between federal public lands such as the Coconino and Kaibab Na- tional Forests.
The landscape-scale habitat mapping, included in this progress report, is adrnit- tedly somewhat incomplete at this stage in the research. Nonetheless, the mapped variables of both biophysical and human dimensions point strongly towards the prob- ability that at least two ar- eas-the Kaibab Plateau and much of the Mogollon Rim south and east of Flag- Figure 4. Mule deer density
staff-are capable of sup- porting viable wolf popula- tions and suitable for rein- troduction of gray wolves
Projected wolf densities Assuming that wolf reintro- duction is feasible, it is rea- sonable to ask how many wolves might the Arizona portion of the Grand Canyon Ecoregion support. Utilizing the existing deer and elk den- sity distribution maps (Fig- Figure 5. Elk density ures 4 and 5), and following Fuller (1989), very prelimi- nary calculations of predicted wolf density were done us- ing these equations:
and
where W is predicted wolf density (per 10OCl km2), D is Figure 6. Human density estimated mule deer density (per km2), and 3E is estimated elk density (per km2) times a relative suggest that to reintroduce at least 100 biomass value (elk biomass is 3 x 1 gray wolves into the Arizona portion deer). Both low andhighungulate den- of the Grand Canyon Ecoregion sity estimates were utilized in calculat- would be feasible. ing a range of predicted wolf numbers shown in Table 1. Potential stock for wolf
Although this facet of the study reintroduction is far from finished, historical records When the time comes to make a de- and initial carrying capacity research cision about reintroducing gray
156 Endangered Speclet? UPDATE Vol. 18 No. 4 2001

Figure 7. Road denisty
Figure 8. Land status
wolves to the Grand Canyon Ecoregion, we should " . ..consider behavioral or demographic factors to be more important than maintenance of the genetic purity of putative wolf subspecies.. . " (Wayne et al. 1992). If Nowak's (1995) recent revision of wolf taxonomy is accepted, it seems biologically appropriate that stock for reintroduction could be taken from anywhere in the historic range of C. I. nubilus. While finding areas of surplus wolf populations with habi- tat exactly comparable to the GCE will be difficult, regions such as the Great Lakes, currently supporting C.1. nubilus populations, do exhibit analo- gous forested ecosystems (albeit dif- ferent forest types) and have similar ungulate prey species (i.e., deer and elk). Wild wolves translocated from the Great Lakes region, for ex- ample, would at least be habituated to forest habitats (as opposed to
tundra) and experienced in hunting the types of ungu- late species that are most abundant in the GCE.
Alternatively, captive or wild-bred Mexican wolves (C. 1. baileyii) could be uti- lized for reintroduction. Given the difficulties expe- rienced with-captive bred stock in the current Mexican wolf recovery effort, how- ever, it seems best to wait for the availability of surplus wild-raised stock GCE (par- sons, personal communica- tion). Also, when the Mexi- can wolf population reaches a viable size in the wild, dis- persers from eastern Arizona and western New Mexico will likely attempt to colo- nize the southeastern part of the GCE. Thus, this recov- ery opportunity in the GCE could help extend the geo- graphic range and metapopulation of the cur-
rently recovering, but still endan- gered, Mexican wolf.
Conclusions The first phase of this landscape-scale analysis involved utilizing six factors of the biophysical and human dimen- sions to identify and describe poten-
tial reintroduction sites in the Arizona section of the Grand Canyon Ecoregion. Initial results show that there are at least two localities in northern Arizona available for rein- troduction of around 100 wolves. Source stock for wolf recovery in the GCE could come from existing large C. I. nubilus populations in the Great Lakes andlor a recovered C. I. baileyii population in the Southwest. Clearly, the future extension of wolf recovery into northern Arizona and other parts of the GCE will have to be done un- der the legal mandate of the ESA and will most likely be sponsored by a federal agency such as the Fish and Wildlife Service and/or Na- tional Park Service.
Further investigation and study will continue to refine the habitat ca- pability and suitability analyses, as well as to help determine the most ap- propriate subspecies for wolf reintro- duction in the ecoregion. In the end, however, the most important consid- eration is how to best assist nature in restoring gray wolves to the Grand Canyon Ecoregion and thereby help in the national effort to conserve this magnificent and ecologically essential carnivore.
Acknowledgements This project was primarily funded by the Grand Canyon Wildlands Coun-
Table 1. Minimum and maximum number of wolves predicted to oc- cupy Arizona part of Grand Canyon Ecoregion based on combined mule deer and elk densities and areas.
Vol. 18 No. 4 2001
Location
North Kaibab
South Colorado Plateau
Total Arizona GCE
Endangered Species UPDATE 157
Area (square kms)
1472
3849
5321
Wolves (pop. range)
35 to 62
80 to 125
115 to 187

cil, Defenders of Wildlife, and Prescott College. Although I am solely responsible for any errors or shortcomings, I could not have made the progress I have without the help of these people: Kelly Burke, Larry Stevens, and Kim Crumbo of the Grand Canyon Wildlands Council; Melissa Grigione and Dan Smith, Defenders of Wildlife; Mike Siedman, Phoenix Zoo; Mike Senn, Rick Miller, John Goodwin, Ray Lee, Matt Alderson, and Amber Munoz, Arizona Game and Fish Department; Elaine Leslie, Grand Canyon Na- tional Park; Rick Moore and Aimee Porcaro, Grand Canyon Trust; Dave Hanna and Craig Martinsen, Prescott College; and, Jim Riedman, Arizona Land Resources Information System.
Literature eited Brown, D.E., ed. 1984. The wolf in the south-
west: the making of an endangered species. The University of Arizona Press, Tucson, Arizona.
Clark, T.W., A.P. Curlee, and R.P. Reading. 1996. Crafting effective solutions to the large carnivore conservation problem. Conservation Biology 10:940-948.
Fuller, T.K. 1989. Population dynamics of wolves in north-central Minnesota. Wild- life Monographs 105: 1-41.
Fuller, T.K., G.L. Raddle, M.S. Lenarz, and G.B. Joselyn. 1992. A history and current estimate of wolf distribution and numbers in Minnesota. Wildlife Society Bulletin 20:42-55.
Gipson, P.S., W.B. Ballard, and R.M. Nowak. 1998. Famous North American wolves and the credibility of early wildlife literature. Wildlife Society Bulletin 26:808-8 16.
Groebner, D. J., A.L. Girmendonk, and T.B . Johnson. 1995. A proposed cooperative reintroduction plan for the Mexican wolf in Arizona. Technical Report 56,
Arizona Game and Fish Department, Phoe- nix, Arizona.
Hall, E.R. and K.R. Kelson. 1959. Themam- mals of North America. Vol. 2. The Ronald Press, New York, N.Y.
Hoffmeister, D.F. 1971. Mammals of Grand Canyon. University of Illinois Press, Ur-
bana, Illinois. Hoffmeister, D.F. 1986. Mammals of Ari-
zona. The University of Arizona Press: Tucson, AZ.
Lopez, B.H. 1978. Of wolves and men. Charles Scribner's Sons, New York, New York.
Mech, L.D. 1970. The wolf: the ecology and behavior of an endangered species. Uni- versity of Minnesota Press, Minneapolis, Minnesota.
Mech, L.D. 1977. Productivity, mortality, and population trends of wolves in north- eastern Minnesota. Journal of Marnmology 58559-574.
Mech, L.D., S.H. Fritts, G.L. Raddel, and W.J. Paul. 1988. Wolf distribution and road density in Minnesota. Wildlife Society Bulletin 16%-87.
Merrill, T., D.J. Mattson, R.G. Wright, and H.B. Quigley. 1999. Defining landscapes suitable for restoration of grizzly bears Ursus arctos in Idaho. Biological Conser- vation 87:23 1-248.
Miller, R. 1996. History of the intent and management of the Grand Canyon Game Preserve. Unpublished report prepared for Arizona Game and Fish Department, Flag- staff, Arizona.
Mladenoff, D.J., T.A. Sickley, R.G. Haight, and A.P. Wydeven. 1995. A regional land- scape analysis and prediction of favorable gray wolf habitat in the northern Great Lakes region. Conservation Biology 9:279- 294.
Nowak, R.M. 1995. Another look at wolf taxonomy. Pp 375-398 in L.N. Carbyn, S.H. Fritts, and D.R. Seip, eds. Ecology and conservation of wolves in a changing world. Occasional Publication No. 35, Canadian Circumpolar Institute, University of Alberta, Edmonton, Alberta.
Paquet, P.C. and A. Hackman. 1995. Large carnivore conservation in the Rocky Moun- tains. World Wildlife Fund Canada, Toronto, Ontario.
Quinby, P., S. Trombulak, T. Lee, J. Lane, M. Henry, R. Long, and P. MacKay. 1999. Opportunities for wildlife habitat connec- tivity between Algonquin Park, Ontario and the Adirondack Park, New York. Unpub- lished report prepared for The Greater Laurentian Wildlands Project, South Burlington, Vermont.
Ratti, J.T., M. Weinstein, J.M. Scott, P. Avsharian, A. Gillesberg, C.A. Miller, M.M. Szepanski, and L.K. Bomar. 1999.
Final draft: feasibility study on the reintro- duction of gray wolves to the Olympic Pen- insula. Unpublished report prepared for the United States Fish and Wildlife Service, Lacey, Washington.
Russo, J.P. 1964. The Kaibab North deer herd - Its history, problems and manage- ment: A research and management study, Wildlife Bulletin No. 7. Arizona Game and Fish Department: Phoenix, Arizona.
Sneed, P. and K. Crumbo. 1998. The rein- troduction of gray wolves to the Grand Canyon Ecoregion: A proposed feasibility study. Unpublished research proposal. Grand Canyon Wildlands, Flagstaff, Ari- zona.
Soule, M. and R. Noss. 1998. Rewilding and biodiversity: Complementary goals for con- tinental conservation. Wild Earth 8(3): 18- 28.
Southern Rockies Ecosystem Project. 1998. Wolf recovery in the Greater Southern Rockies: an initial suitability analysis. Unpublished in-house report, Nederland, Colorado.
Terbourgh, J., J.A. Estes, P. Paquet, K. Ralls, D. Boyd, B. Miller and R. Noss. 1999. The role of top carnivores in regulating terres- trial ecosystems. Pp 39-64 in Soule, M. and J. Terbourgh, ed. Continental conser- vation: design and management principles for long-term, regional conservation net- works. Island Press: Washington, D.C.
Thiel, R.P. 1985. Relationship between road densities and wolf habitat suitability in Wisconsin. American Midland Naturalist 113:404-407.
United States Fish and Wildlife Service. 1996. Final environmental impact statement- Reintroduction of the Mexican wolf within its historic range in the southwestern United States. U.S. Fish and Wildlife Service, Albuquerque, New Mexico.
Wayne, R.K., N. Lehman, M.W. Allard, and R.L. Honeycutt. 1992. Mitochondria1 DNA variability of the gray wolf: genetic consequences of population decline and habitat fragmentation. Conservation Biol- ogy 6 3 9 - 5 6 9
Wydeven, A.P., T.K. Fuller, W. Weber, and K. MacDonald. 1998. The potential for wolf recovery in the northeastern United States via dispersal from southeastern Canada. Wildlife Society Bulletin 26776-784.
Young, S.P. and E.A. Goldman. 1944. The wolves of North America. American Wild- life Institute, Washington, D.C.
158 Endangered Species UPDATE Vol. 18 No. 4 2001

Canis Soupus: Eastern Wolf Genetics and Its Implications for Wolf Recovery in the Northeast United States
Nina Fascione Defenders of Wildlife, 1101 14th St. NW, Suite 1400, Washington DC 20005; [email protected]
Lisa G. L, Osborn Defenders of Wildlife, P.O. Box 756, Shelburne, VT 05482; [email protected]
Stephen R. Kendrot USDNAPHIS/Wildlife Services, P.O. Box 130, Hull Street Rd., Mosely, VA 23120; [email protected]
Paul C, Paquet Faculty of Environmental Design, University of Calgary, Calgary, AB, Canada; ppaquet0sk.syrnpatico.ca
Abstract Efforts to restore wolves to the northeastern United States have been confounded by a new taxonomic proposal: that the wolf historically inhabiting this region was not, as previously thought, a subspecies of gray wolfcommonly called the eastern timber wolf(Canis lupus lycaon), but rather a separate species closely related to the red wolf(Canis rufus) of the southeast United States. This hypothesis raises numerous biological, legal, policy, and management questions about potential wolf restoration. While restoring wolves could complete a broken food chain by providing a natural predator for moose in the northern forest ecosystem, the process of wolf restoration in the Northeast is in its infancy. Further studies must address biological, sociologi- cal, and economic impact questions, as well as answer the basic question of what wolf originally inhabited the northeastern forests?
Introduction Efforts to restore wolves to the north- eastern United States have been con- founded by a new taxonomic pro- posal: that the wolf historically in- habiting this region was not, as pre- viously thought, a subspecies of gray wolf commonly called the eastern timber wolf (Canis lupus lycaon), but rather a separate species closely re- lated to the red wolf (Canis rubs) of the southeast United States (Wilson et al. 2000). This hypothesis raises numerous legal, policy, and manage- ment questions about potential wolf restoration. In addition, wildlife managers now have a basic biologi- cal question to consider when debat- ing the merits of wolf reintroduction to New England and upstate New York: what wolf should be restored?
Wolves were extirpated from the Northeast by the end of the nineteenth century (Fowler 1974). In 1974, a year after passage of the Endangered
Species Act (ESA), the U.S. Fish and Wildlife Service (FWS) listed east- ern timber wolves as endangered, except in Minnesota where a remnant population was listed as threatened. In 1978, the Service developed a re- covery plan for the eastern timber wolf. At that time, scientists believed that the eastem timber wolf had his- torically ranged throughout the Northeast and west to the Great Lakes region. The recovery plan identified several areas in the Northeast as po- tential wolf habitat, including north- west Maine and the Adirondack Mountains of New York. These ar- eas remained in the recovery plan when it was revised in 1992 but the Service did not actively pursue north- east wolf restoration.
A recent proposal by the Service to declare a Distinct Population Seg- ment for wolves in the Northeast (Federal Register 2000) has triggered renewed interest in wolf recovery in
this region. If enacted, this designa- tion would separate the Northeast administratively under the ESA from wolf populations in the Great Lakes states and require the Service to de- velop a new recovery plan for New England and upstate New York. Re- cent studies indicate there are ad- equate habitat and prey to sustain a healthy wolf population in this region (Harrison and Chapin 1997; Mladenoff and Sickley 1998), and several surveys indicate strong pub- lic support for wolf restoration (Re- sponsive Management 1996; Downs and Smith 1998). However, the un- resolved issue of taxonomy, while certainly not the only impediment to northeast wolf restoration, is compli- cating the prospect.
Previous taxonomic classification In this article, we use the term east- em wolf to refer to the wolf that, by
Vol. 18 No. 4 2001 Endangered Species UPDATE 159

Nowak's description (1995), cur- rently resides in southeastern Canada and formerly inhabited the northeast- ern United States. We also use the term western gray wolf to refer to what Nowak (1995) describes as Ca- nis lupus nubilus, the larger wolf that formerly inhabited much of the west- ern United States and much of Canada. Goldman (1937) classified the eastern wolf as Canis lupus lycaon, a subspecies of gray wolf, and for years its historic range was thought to be the northeastern United States as far west as the Great Lake states and north into southern Ontario and Quebec (Goldman 1944; FWS 1992; Nowak 1995). The red wolf is classified as Canis rufus, a distinct species (Goldman 1937), and its historic range has long been con- sidered to be the southeastern United States as far west as Texas and as far north as Pennsylvania (Nowak 1995). By these boundary definitions, the ranges of the red wolf and eastern wolf would have originally overlapped in the mid- Atlantic states (Nowak 1995), in- cluding Pennsylvania, West Vir- ginia, and Virginia (see Figure 1).
Over the years, scientists noted similarities between the two canids based on morphology and skull measurements (Lawrence and Bossert 1975; Alexander 1983 ). The two animals are apparently so similar that one report in the litera- ture 25 years ago refers to a red wolf in Algonquin Park, Ontario (P. Wilson, personal communication), even though scientists did not think they ranged that far north.
Recipe for canid soup Scientists noted another trait com- mon to both red wolves and eastern wolves-the tendency to hybridize with coyotes, Canis latrans (Wilson et al. 2000). Coyotes, historically ab- sent from the east, reached Ontario in the early 1900s as habitat alteration
and fragmentation favored their east- ward expansion (Clarke 1970; Wayne and Lehman 1992; Roy et al. 1994). In the 1920s, coyotes moved east across southern Ontario and east- ern Quebec and by the 1930s had reached New York and New En- gland (Parker 1995). The south- eastern United States similarly un- derwent landscape changes that enabled coyotes to expand to this region as gray and red wolves were extirpated in the last century (Jenks and Wayne 1992; Parker 1995).
As coyotes expanded eastward, they encountered dwindling popula- tions of both eastern and red wolves. There has been much discussion in the literature about the propensity for and degree of interbreeding between red wolves and coyotes, both earlier this century and since their reintro- duction in North Carolina (Wayne and Jenks 199 1 ; Nowak 1992; Kelly et al. 1999 ). At present, the FWS is struggling to keep reintroduced red wolves from hybridizing with coy- otes. If the current rate of interbreed- ing is not halted, red wolf genes will be completely diluted within a few generations in a process known as genetic swamping (Kelly et al. 1999).
Genetic testing of the relatively large coyotes from the Adirondack Park and central New York similarly indicates a history of interbreeding with wolves. The degree of wolf ge- netic material varies across these samples, with some being more " wolf-like" than others (Chambers 2000). Genetic testing on northern New England canids shows inter- breeding as well, though more sam- pling is needed. In the Frontenac Axis region of Ontario, southeast of Algonquin Park, a similar, though slightly larger canid is commonly called the Tweed wolf, and is prob- ably a hybrid containing more wolf genes than coyote genes (Edwins et al. 2000; P. Wilson personal commu- nication). A coyote-wolf mix is com-
monly found west of Algonquin Park, whereas the park itself maintains the most wolf-like form of eastern wolf (Wilson et al. 2000).
The result of these genetic analy- ses is the discovery of a canid gradi- ent in the northeastern United States and southeastern Canada, containing a mix of eastern wolf, western gray wolf and coyote genes. This phe- nomenon is often lightheartedly re- ferred to as "canid soup." According to Wilson et al. (2000), in the north- eastern United States, coyote genes dominate this mix. 1n southeastern Ontario, eastern wolf genes are more common, and in northeastern and northwestern Ontario an eastern wolflwestern gray wolf animal may be predominant. The extent to which eastern wolves interbreed with west- ern gray wolves is currently un- known. The regions in far northern Ontario are predicted to be predomi- nantly western gray wolf, but at present the boundary between the eastern wolf and western gray wolf is not well established (P. Wilson, personal communication).
Genetic hypothesis The tendency for eastern and red wolves to hybridize with coyotes is not observed in western gray wolves (Edwins et al. 2000; Wilson et al. 2000). Additionally, there are mor- phological characteristics shared by red and eastern wolves but not west- ern gray wolves, such as the smaller size of wolves in the East (Goldman 1944). These commonalities led re- searchers to examine more closely the relationship between red wolves and eastern wolves. They hypoth- esized that red and eastern wolves were more closely related to each other than either was to western gray wolves (Wilson et al. 2000). In the past decade, researchers from the genetics labs at Trent and McMasterts universities in Ontario have con- ducted genetic analyses of canids
- -
I60 Endangered Species UPDATE Voi. 18 No. 4 2001

Figure 1. Historic and current ranges of the red and eastern wolf
from throughout the red and eastern wolf range, using various criteria to compare relatedness. Their data sup- port the hypothesis that the red wolf and eastern wolf have. a common North American origin separate from that of the western gray wolf. In fact, these researchers suggest that the red wolf and eastern wolf are actually the same species, and they propose changing the scientific name of both to Canis lycaon, with a common name of red wolf (Wilson et al. 2000). The recommended name is based on historical precedence in early wolf taxonomy (Brewster and Fritts 1995).
According to Wilson et al. (2000), North America was inhab- ited by a common canid ancestor one to two million years ago. At some point, some of these animals traveled to Eurasia over the Bering
land bridge and evolved into the gray wolf. The remaining canids evolved wholly in North America. Between 150,000 and 300,000 years ago they diverged into the coyote, which adapted to preying on smaller mammals in the arid southwest, and the eastedred wolf, which adapted to preying on white- tailed deer (Odocoileus virginianus) in eastern forests. Gray wolves returned to the North American continent approximately 300,000 years ago, adapting to preying on large ungulates through- out the western United States and Canada. According to this hypoth- esis, coyotes are more closely re- lated to the easternlred wolf than to the western gray wolf, hence the propensity for interbreeding (Wil- son et al. 2000).
Discussion If the issue of eastern canid taxonomy is the subject of debate for academi- cians, it is nothing less than con- founding to the public, legislators and even wildlife managers, who want to make informed decisions about wolf restoration in the Northeast. The con- cept that the eastern wolf and red wolf are the same species complicates an already complex topic, presenting nu- merous questions to all those inter- ested in examining the potential for wolf recovery in New England and New York. What canid originally oc- cupied the Northeast and what canid is there now? What role is the present canid filling and what role would a restored, larger canid fill? What wolf population would scientists use as source animals, and would they dis- place or interbreed with the Northeast's resident coyotes?
Because of the tendency of the eastern wolf to hybridize with coy- otes, it is a fair assumption that if it were reintroduced in the Northeast it would be vulnerable to interbreeding with eastern coyotes. Therefore, de- spite efforts to reintroduce a separate species in the Northeast, biologists might just be regenerating an animal that is already present in the form of a large, hybrid coyote. It is impor- tant to note, however, that the core population of eastern wolves within Algonquin Park is not readily hybrid- izing with coyotes, although the rea- son for this is unclear (Edwins et al. 2000). Habitat saturation by estab- lished wolf packs might be one ex- planation. Protected wolves that are able to maintain long-term territories are able to prevent the encroachment of coyotes into core wolf areas (J. Theberge, personal communication). Canadian wolf researcher John Theberge has documented short-term invasion by coyotes following the breakup of a resident wolf pack within Algonquin's core wolf zone (J. Theberge, personal communication).
Vol. 18 No. 4 2001
- -
Endangered Species UPDATE 161

Understanding this relationship could prove useful in the Northeast to de- termine what conditions are neces- sary to discourage interbreeding.
From an ecological perspective, wildlife managers will have to deter- mine what the most appropriate spe- cies of wolf is for the modem day moose-dominated North Woods. Should a species' historical presence be the determining factor, or should the most suitable candidate be se- lected to match the ecological condi- tions existing today or likely to exist in the future? If so, the wolves in the Laurentides area of Quebec might provide a better source population for the northeastern United States. The close proximity of the two regions might allow some genetic exchange. Preliminary testing indicates that ge- netically, the Laurentides animals may be a mix of gray and eastern wolf (P. Wilson, personal communication), a finding which is further supported by their large size of up to 100 pounds. The Laurentides wolves prey primarily on moose (Alces alces), a plentiful prey item in Maine. Most importantly perhaps, these ani- mals may be less likely to hybridize with eastern coyotes than the Algonquin-type wolf, though this crucial relationship remains to be tested (P. Wilson, personal commu- nication). In the world of survival of the fittest, it is unlikely that natural selection would favor a moose-eat- ing canid that compromises its size by breeding with the much smaller eastern coyote.
This theorizing, however, begs the question: did this larger gray wolf ever exist in the Northeast? For now, scientists can only speculate, but it is generally accepted that the northeast- ern United States was primarily a moose-caribou ecosystem before Eu- ropean settlement (D. Harrison, per- sonal communication). It is question- able whether the deer-adapted east- ern wolf would have thrived in this
environment, indicating that perhaps both canids-the larger gray wolf and the smaller eastern wolf-might have inhabited the northeast at various points (P. Wilson, personal commu- nication). Given the radical changes that have occurred in the Northeast ecosystem since colonial times, and the lack of remaining physical evi- dence of the presence of wolves, it is difficult to determine which species may have been present.
Similarly, some scientists specu- late that the eastern wolf did not his- torically occur north of the Canadian border (P. Wilson, personal commu- nication). Southeastern Canada was home to moose, woodland caribou (Rangifer tarandus caribou) and elk (Cewus elaphus) and would have more likely contained the larger gray wolf. Overhunting and habitat alter- ation likely contributed to the decline of some of these species, including the wolf (Nelson 1997). As intensive logging encroached into southeastern Canada, white-tailed deer popula- tions expanded northward from the United States, thriving in the second growth forests that resulted. Eastern wolf populations may have likewise moved north in an expansion similar to their primary prey species. Today, the range of the eastern wolf may extend as far west as Saskatchewan and include northwestern Ontario and Minnesota. These northern areas may contain both eastern wolves and western gray wolves, but more re- search is needed before this can be determined (Wilson et al. 2000).
The sociological implications of the new taxonomic proposal are as challenging as the biological. Wolf restoration is always politically divi- sive. Groups and individuals oppos- ing wolf restoration have already latched onto the current debate, de- claring that the role of the eastern wolf is filled by the large, resident eastern coyote, which many call the "brush wolf." If scientists determine
that the Laurentides animal is the most suitable for Northeast reintro- duction, but cannot definitively prove its earlier existence there, would the public accept a species whose original range may have stopped short of the proposed rein- troduction area? These types of debates will most certainly slow the process of wolf restoration.
Conclusion While the current genetics research is intriguing, and increasingly gain- ing the support of the scientific com- munity (Kelly, personal communica- tion), further research and discussion is essential before conclusions can be drawn. In the meantime, other bio- logical factors are ripe for wolf res- toration. The northern forests have made a remarkable recovery in the last fifty years and now comprise more than 26 million acres-ample habitat to support a population of wolves (Harrison and Chapin 1998; Mladenoff and Sickley 1998). With the expansion of moose and beaver (Castor canadensis) and the occur- rence of white-tailed deer throughout the north woods, there is ample prey. Most scientists agree that there is an ecological role for a larger canid in the northeast's North Woods (Harrison quoted in Fascione and Kendrot, 2000). Even though coy- otes occasionally form packs, they do not normally prey on moose. Restor- ing wolves could complete a broken food chain by providing a natural predator for moose in the northern forest ecosystem. Since the 1995 wolf reintroduction in the northern Rockies, the Greater Yellowstone ecosystem has undergone significant ecological changes as a result of the restoration of this top predator. Recent research in Yellowstone National Park suggests that the effect wolves have on their prey can benefit vegetative struc- ture and overall species biodiversity (Ripple and Larsen, in press).
162 Endangered Species UPDATE Vol. 18 No. 4 2001
The process of wolf restoration in the Northeast is in its infancy, how- ever, and further studies must address biological, sociological and eco- nomic impact questions (Fascione et al. 2000). While the proposed taxo- nomic revision highlights the need to identify the connections and poten- tial interactions between eastern wolves, red wolves, gray wolves and eastern coyotes in the Northeast, a clearer picture of these complex re- lationships is not likely to simplify the management, policy, legal, and moral issues that follow. Although the questions raised by this taxo- nomic discussion are unique to the Northeast, controversy itself is noth- ing new to wolf restoration. Ulti- mately, genetics are just one more piece of information that wildlife managers, advocates, and the public will have to distill and blend with the ecological and sociological realities of not only today's environment, but tomorrow's as well.
Acknowledgments The authors are very grateful to Paul Wilson, not only for reviewing this manuscript, but for always being willing to come out of the lab to ex- plain this research. We would also like to thank Paul Nickerson, Michael Amaral, Bob Ferris and Martin Smith for their review and feedback.
Literature cited Alexander, H.E. 1983. The red wolf saga.
Arkansas Game & Fish 14(2): 2-6. Brewster, W.G. and S.H. Fritts. 1995. Tax-
onomy and genetics of the gray wolf in North America: a review. Pp 353-373 in L.N. Carbyn, S.H. Fritts and D.R. Seip, eds. Ecology and conservation of wolves in a changing world: proceedings of the second North American symposium of wolves. Canadian Circumpolar Institute, University of Alberta, Edmonton, Canada.
Chambers, R.C. 2000. Taxonomic and di- etary characteristics of eastern coyotes (Canis latrans var.) in New York state. Un-
published manuscript. Clarke, C.H.D. 1970. Temporary Study Com-
mission on the Future of the Adirondacks. Technical Report a.
Downs, G. and L. Smith. 1998. Summary Report of the Maine Wolf Attitudes Sur- vey. Center for Research and Evaluation. University of Maine, Orono.
Edwins, P., M. de Almeida, P. Miller and 0 . Byers, eds. 2000. Population and Habitat Viability Assessment Workshop for the Wolves of Algonquin Park: Final Report. IUCNISSC Conservation Breeding Spe- cialist Group: Apple Valley, MN.
Fascione, N., 0. Byers, U.S. Seal, eds. 2000. Wolves in the Northeast? A Workshop to Exchange Views. Final Report. IUCNISSC Conservation Breeding Specialist Group: Apple Valley, MN.
Fascione, N. and S. Kendrot. 2000. The Northeastern wolf question. Defenders Winter 2000/2001:27-33.
Federal Register. July 13, 2000. 65(135). Fowler, B. 1974. Adirondack Album. Out-
door Association, Schenectady, New York. Goldman, E.A.1937. The wolves of North
America. J. Mammalogy 18:37-45. Goldman, E.A. 1944. Classification of
wolves. Pp 389-636 in S.P. Young and E.A. Goldman. The wolves of North America. American Wildlife Institute, Washington, D.C.
Harrison, D.J., and T.G. Chapin. 1997. An assessment of potential habitat for eastern timber wolves in the northeastern United States and connectivity with occupied habitat in southeastern Canada. A sum- mary report and position paper prepared for the Wildlife Conservation Society. Working Paper No. 7, March 4, 1997.
Jenks, S.M. and R.K. Wayne. 1992. Prob- lems and policy for species threatened by hybridization: the red wolf as a case study. Pp 237-25 1 in McCullough, D.R., and R.H.Barrett, eds. Wildlife 2001: Populations. New York: Elsevier Ap- plied Science.
Kelly, B.T., P.S. Miller and U.S. Seal, eds. 1999. Population and Habitat Viability Assessment Workshop for the Red Wolf (Canis rufus). Apple Valley, MN: Con- servation Breeding Specialist Group (IUCNISSC).
Lawrence, B. and W.H. Bossert. 1975. Rela- tionships of North American Canis shown by a multiple character analysis of selected populations. Pp 73-86 in M.W. Fox, ed. The wild canids. Van Nostrand Reinhold, New York.
Mladenoff, D.J. and T.A. Sickley. 1998. As- sessing potential gray wolf restoration in
the northeastern United States: a spatial prediction of favorable habitat and poten- tial population levels. Journal of Wildlife Management 62: 1-10.
Nelson, R. 1997. Heart and blood: living with deer in America. Random House, Inc. New York, NY.
Nowak, R.M. 1992. The red wolf is not a hy- brid. Conservation Biology 6(4):593-595.
Nowak, R.M. 1995. Another look at wolf tax- onomy. Pp 375-397 in L.N. Carbyn, S.H. Fritts and D.R. Seip, eds. Ecology and con- servation of wolves in a changing world: proceedings of the second North Ameri- can symposium of wolves. Canadian Cir- cumpolar Institute, University of Alberta, Edmonton, Canada.
Parker, G. 1995. Eastern Coyote: the story of its success. Nimbus Publishing. Halifax, Nova Scotia.
Responsive Management. 1996. Public Opin- ion on and Attitudes toward the Reintro- duction of the Eastern Timber Wolf to Adirondack Park. Presented to Defenders of Wildlife, Washington, DC.
Ripple, W.J., and E. J. Larsen. In Press. His- toric aspen recruitment, elk, and wolves in N. Yellowstone National Park, USA. Biological Conservation.
Roy, M.S., E. Geffen, D. Smith, E.A. Ostrander, and R. K. Wayne. 1994. Pat- terns of differentiation and hybridization in North American wolflike canids, re- vealed by analysis of microsatelitte loci. Molecular Biology and Evolution 11553-570.
U.S. Fish and Wildlife Service. 1992. Recov- ery Plan for the eastern timber wolf. Twin Cities, Minnesota.
Wayne, R.K. and S. Jenks. 1991. Mitochon- drial DNA analysis implying extensive hybridization of the endangerd red wolf Canis rufus. Nature 351565568,
Wayne, R.K. and Lehman.1992. Mitochon- drial DNA analysis of the eastern coyote: origins and hybridization. Pp 9-22 in A.H. Boer, ed. Ecology and management of the eastern coyote. Wildlife Research Unit, 'University of New Brunswick, Fredericton.
Wilson, P.J., Grewal, S., Lawford, I.D., Heal, J.N.M., Granacki, A.G., Pennock, D. Theberge, J.B., Theberge, M.T., Voigt, D.R., Waddell, W., Chambers, R.E., Paquet, P.C., and Goulet, G., Cluff, D. and B.N.White. 2000. DNA profiles of the eastern Canadian wolf and the red wolf provide evidence for a common evolutionary history independent of the gray wolf. Canadian Journal of Zoology 78:2156-2166.
Vol. 18 No. 4 2001 Endangered Species UPDATE 163

Captivity, Inbreeding, Cross-Lineage Matings, and Body Size in Mexican Wolves Richard Fredrickson Department of Biology, Arizona State University, Tempe, AZ 85287-1 501; [email protected]
Philip Hedrick Department of Biology, Arizona State University, Tempe, AZ 85287-1 501; [email protected]
Abstract The Mexican gray wolf (Canis lupus baileyi) appears to be extinct in the wild and exists now only in captivity and in a single, small, reintroduced population. A recent study of captive animals found no evidence for inbreeding depression in juvenile viability or litter size. We examined the relationship between inbreeding and body weight in captive wolves. We found that captive wolves with little or no known inbreeding had lower body size than wild caught wolves. In addition, captive wolves with higher inbreeding had lower body size than captive wolves with little or no inbreeding. The captive population was descended from three founders until two other lineages, each descended from two founders, were recently added to the population. Consequently we examined the potential sfatistical power associated withfiture comparisons of body weights between inbred wolves and the offspring of cross-lineage matings. In this case it appears likely that in the next few years there will be an adequate sample size to statistically evaluate differ- ences in body size between these groups.
Introduction Minimizing inbreeding and the loss of genetic variation are major con- cerns of captive breeding programs for endangered species. Increases in inbreeding have been correlated with decreases in juvenile survival in captivity in a number of differ- ent species (Ralls et al. 1988). In addition, a number of recent stud- ies in wild po,pulations have dem- onstrated that a reduction in genetic variation resulting from inbreeding andlor genetic drift has been asso- ciated with the decay of phenotypic attributes related to fitness in wild populations (see references in Hedrick and Kalinowski 2000).
Mexican wolves (Canis lupus baileyi), the southern-most subspe- cies of gray wolf, currently exist pri- marily as a captive population num- bering about 200 individuals. Other than a small, recently reintroduced population in Arizona and New Mexico, there have been no con- firmed sightings of wild Mexican wolves in more than 20 years. The
current population of wolves origi- nated from three independent captive lineages with each having only two or three founders captured during the 1960s and 1970s from northern Mexico and southern Arizona. Be- cause of the few founders, each of the lineages has become inbred in cap- tivity. Following a genetic evalua- tion of the three lineages (Hedrick et al., 1997) in which no evidence of coyote, (Canis latrans), or dog, (Ca- nis familiaris), ancestry was found, the McBride, Ghost Ranch, and Aragon lineages were recently com- bined to form a single population with seven founders.
The most common phenotypic trait used to evaluate the effects of fitness in captive populations of en- dangered species has been juvenile survival; secondarily, reproductive traits, such as litter size, have been used. Kalinowski et al. (1999), however, recently found no effect of inbreeding on juvenile survival and litter size in captive Mexican wolves. The only other trait for
which a substantial amount of data currently exists for captive Mexi- can wolves is adult body size mea- sured by mass. Some body size data is also available from histori- cal wild-caught wolves (see below). For these reasons and others, body size has been proposed as a pheno- typic indicator with which to moni- tor the effects of merging the three lineages. Because until recently there had been no breeding between the three lineages, offspring from crosses between lineages will be free of inbreeding. If inbreeding has negatively affected body size or other fitness related traits then in- dividuals free of inbreeding may show changes in these traits. Ex- cept for a few offspring that have re- sulted from recent crosses between the lineages, all Mexican wolves alive today are inbred to some extent.
For wolves, changes in body size resulting from inbreeding in captivity may result in reduced fitnesses of individuals reintro- duced into the wild. This may con-
164 Endangered Specles UPDATE Vol. 18 No. 4 2001

sequently result in a lower viabil- sons involving captive wolves, we and female wolves were considered ity of wild, reestablished popula- used 71 masses from 26 male and separately in all analyses. Com- tions because body size is impor- tant in successful prey capture. Further, if body size has been af- fected by inbreeding, other fitness- related traits may also be adversely affected. Besides inbreeding, the captive environment and its related husbandry may also potentially re- sult in changes in fitness-related traits by exerting selective forces dif- ferent from the natural environment.
Here we look for evidence of an effect of inbreeding on adult body size in captive Mexican wolves and evaluate the utility of this trait for detecting potential fu- ture changes in size in offspring from cross-lineage matings. Spe- cifically we ask (1) whether historic wild-caught adult wolves were larger than captive adult wolves with little or no inbreeding and (2) whether wolves in the McBride captive lineage with little or no in- breeding were larger than adults later in the lineage with greater amounts of inbreeding. In addition, we examine the statistical power as- sociated with future comparisons when larger samples of inbred and cross-lineage wolves become available to assess the likelihood of detecting differences associ- ated with inbreeding and out- breeding, should they occur.
Materials and methods For comparisons involving historic, wild wolves we used the masses of 28 wild Mexican wolves killed in Chihuahua and Durango, Mexico during the 1970s as part of control efforts (McBride, 1980, as reported in Brown, 1983). Full masses were reported for only eight of the 20 wolves; the remaining wolves had their viscera removed before weighing. Sizes of gutted wolves were adjusted to approximate their full weight (Table 1). For compari-
24 female adult wolves from the McBride captive lineage. Two of these wolves were wild-caught, and one was a lineage founder. Only masses from wolves 1.5 to 9.5 years old that were taken from August through January were used. Of the three lineages, only the McBride lineage was managed from its in- ception as part of a captive breed- ing program; the weight data used here was taken during the course of these activities. Because the other lineages were not similarly man- aged until more recently, similar data for the Ghost Ranch and Aragon lineages do not exist.
Because the level of inbreeding in the captive wolves varied we split the wolves into two groups based on the level of inbreeding in individuals. Wolves with no in- breeding in captivity (inbreeding coefficient f = 0) and wolves com- prising the first generation of inbred individuals (f = 0.125) were com- ' bined to form a group with little or no inbreeding, and wolves with greater levels of inbreeding (f > 0.125) were combined to form the second group (Table 1). The maxi- mum inbreeding coefficient in our sample was 0.25. Because body size varies between the sexes, male
parisons between groups were made using t and nonparametric Mann-Whitney U tests.
Results and discussion Comparisons using existing data For wild and captive wolves com- bined, female body sizes ranged from 20.2 to 37.4 kg, while male sizes ranged from 21.8 to 41.3 kg. Historic wild male and female wolves were significantly larger than wolves in the McBride lineage with little or no inbreeding (fe- males: t = 4.01, df =24 , P< 0.001; males: t = 4.24, df = 23, P< 0.001). Even with the limited data currently available, the mean size of inbred female wolves (f > 0.125) was sig- nificantly smaller than lhose of fe- males with little or no inbreeding (Mann-Whitney U=112.00, P< 0.01), however, there was not a sig- nificant difference between males (t =1.18, df=24, P=0.129) (Table 1). The mean difference in body size for females in the two groups is only 3.0 kg (about an 11% size re- duction), a value that becomes sig- nificant primarily because of the low variance in body mass in inbred females (2.4). The comparison be- tween males had only a 30% chance of detecting a difference at the a=
Table 1. Sample sizes and mean body sizes (kg) for historic, wild Mexican wolves and captlve wolves by level of inbreeding.
Vol. 18 No. 4 2001 Endangered Species UPDATE 165

0.05 level if a difference truly ex- ists, given the means, variances and sample sizes of the two groups.
Although inbreeding did not appear to have an effect on viabil- ity and litter size in Mexican wolves (Kalinowski et al., 1999), our re- sults provide some evidence of changes in body size that may be manifestations of inbreeding de- pression. Conclusions from these small samples, however, may or may not be supported when larger samples from inbred wolves in the McBride lineage become available. Such samp1e.s would he helpful in determining more definitively whether there is any evidence of a decline in size among inbred wolves. Masses from additional wolves with little or no inbreeding in the McBride lineage will not be available because most of these in- dividuals are dead and no such matings are now possible.
Comparisons using future data Analyses of statistical power sug-
gest that differences between males with little inbreeding and those with greater inbreeding will probably not be detectable with the sample sizes attainable in the next few years without a lower mean mass or vari- ance in the larger sample of inbred wolves. Differences, however, be- tween inbred wolves and the off- spring from cross-lineage matings will likely be detectable, should they occur, with the samples sizes likely available in the next few years. In other words, within the next few years, assuming several litters of cross-lineage wolves are produced per year, enough data should soon be available to evalu- ate the effect of merging the lin- eages on body size. It will be in- teresting to determine if crossing to other lineages will genetically re- store fitness-related traits in Mexi- can wolves, as found in recent stud- ies of other species.
Acknowledgements Financial support for this work was
provided by the US Fish and Wild- life (RJF) and the Ullman Distin- guished Professorship (PWH). S. Kalinowski provided helpful com- ments and C. Buchanan, P. Miller, and P. Siminski provided the data used in this work.
Literature cited Brown, D.E. 1983. The wolf in the south-
west, the making of an endangered spe- cies. Univ. of Arizona Press, Tucson.
Hedrick, P.W. and S.T. Kalinowksi. 2000. Inbreeding depression in conservation biology. Ann. Rev. Ecol. Syst. 31:139- 162.
Hedrick, P.W., P.S. Miller, E. Geffen, and R. Wayne. 1997. Genetic evaluation of the three captive Mexican wolf lineages. Zoo Biology 16: 47-69.
Kalinowski, S .T., P. W. Hedrick, and P.S. Miller. 1999. No evidence of inbreeding depression in Mexican and red wolves. Conservation Biology 13: 137 1- 1377.
McBride, R.T. 1980. The Mexican wolf (Canis lupus baileyi). US Fish and Wildlife Service. Endangered Species Report 8: 1-38.
Ralls, K., J.D. Ballou, andA.R. Templeton. 1988. Estimates of lethal equivalents and the cost of inbreeding in mammals. Con- servation Biology 2: 185-193.
166 Endangered Species UPDATE Vol. 18 No. 4 2001

First Swift fox, Vulpes velox, Reintroduction in the USA: Results of the First Two Years Clio Smeeton Cochrane Ecological institute, PO Box 484, Cochrane, AB, Canada TOL OWO; (403) 932-5632; (fax) (403) 932-6303; cei Qcadvision.com
Ken Weagle CEI Consulting Ltd., 7109 Bulyes Ave., Fort McMurray, AB, Canada T9H 5J6; kweagleQhome.com
Abstract The swift fox, Vulpes velox, is native only to the great plains of North America. The species was completely eradicated from its Canadian range by 1938, andfrom over 90% of its range in the USA by 1993. There have been two attempts at reintroducing the swift fox in to its historic range, one in Canada (1983 to 1997) and one on Blackfeet Tribal Land in the USA (1998 topresent). The reintroduction of the swift fox to the Blackfeet Tribal Lands in Montana began in August 1998. This is thefirst swift fox reintroduction to be undertaken in the USA. The project is afive- year partnership between the Blackfeet Fish and Wildlife Department, Cochrane Ecological Institute and Defenders of Wildlife. The reintroduction methodology used was based on that developed by the Cochrane Ecological Institute. A total of 76 swift fox have been released to date, and two years remain in the program. Survival of released animals is still being investi- gated; survival of radio collared swift fox released in 1999 was 75% over a one-yearperiod. Cubs have been produced in all years of the program. More than 24 cubs were observed in the field in 1999 and 2000.
Introduction Two species of fox, the kit fox (Vulpes macrotis) and the swift fox (Vulpes velox), are native to the great plains of North America. Histori- cally, the swift fox range coincided with that of the North American bi- son, Bison bison. The species was once commonly found over a vast area, ranging from the eastern slopes of the Rocky Mountains in the west to the Souris hills of Manitoba in the east, north to the banks of Canada's North Saskatchewan River and south to the Texas panhandle and the New Mexico border in the U.S.A (Mackenzie 191 1; Carlington 1980; MacGregor 1998).
The swift fox is North America's smallest canid, weighing between 2.3 and 3.2 kg. They are opportunistic feeders, eating seeds, berries, grass, insects, amphibians, reptiles, and small animals and birds (Uresk and Sharps 1986; Bremner 1997). If water is available they require 210 g
of food per day, in the absence of water they absorb their needed liq- uid from their food and require 330 g of food per day (Flaherty and Plaake 1986). Swift foxes are preyed upon by both terrestrial and avian predators and are extremely den de- pendent. Swift foxes are sedentary, extremely social and largely monoga- mous. They rely on the burrows of other species for survival, making use of them as escape terrain and den sites. Swift fox are, in general, more active at night than during the day but this activity pattern varies with the season (Pruss 1994; Teeling 1996).
A subspecies of the swift fox, the northern swift fox, V v. hebes, de- scribed by Merriam (1902) was briefly listed as endangered in the U.S. The species was delisted on the basis that a valid subspecific varia- tion did not exist, supported by Hall's statement that Vulpes velox was con- specific with Vulpes macrotis (Hall 1981). By 1980, the northern swift
fox had vanished throughout its Ca- nadian range and from much of its northern range in the U.S. reducing the possibility of subspecies verifi- cation. Definitive research, combin- ing morphological and molecular systematic data (Stromberg and Boyce 1986; Wayne1998) has re- sulted in the acceptance of distinct taxonomic descriptions for kit fox and swift fox.
In 1978, the Committee On the Status of Endangered Wildlife In Canada (COSEWIC) classified the swift fox as extirpated in Canada. By 1995, the species was considered ex- tirpated from 90% of its historic range in the USA (United States Fed- eral Register Vol. 60, No. 116,1995). The causes of the extirpation of this species were attributed to the rapid and radical change of the great plains ecosystem from native grasslands to cultivated farmland, and the inevi- table hunting, trapping and poison- ing programs which accompany such
Vol. 18 No. 4 2001 Endangered Species UPDATE 167

habitat transformation (Carlington 1980; Weagle and Smeeton 1995).
Captive breeding of the swift fox for reintroduction into their original Canadian range was initiated in 1972, at the Wildlife Reserve of Western Canada (now the Cochrane Ecologi- cal Institute, CEI), using four founder foxes from the United States. Over the period of the program CEI has continued to acquire swift foxes to add to the captive colony from the USA. No Canadian animals were available for addition to the swift fox captive breeding group as the species had been extirpated from that coun- try. The captive breeding program was initiated solely to provide swift foxes for reintroduction and not for exhibit, sale or trade. M.R. Smeeton, of the CEI, started the swift fox stud- book in 1972 and in 1986 the stud- book information was transferred to ISIS software. That studbook has now been consistently maintained for over 29 years. The ISIS software (ISIS 1989) is used to ensure maxi- mum genetic heterozygosity in new breeding pairs (inbreeding coefficient <0.05) and, also, that animals of the same bloodlines are not repeatedly reintroduced into the same geo- graphic area. In mid-1980, on the advice of the newly formed Swift fox Propagation Committee, swift foxes from the CEI captive breeding colony were sent to three zoos (Calgary, Edmonton, and Moose Jaw) as breed- ing and educational exhibit animals. By 1997, none of the zoos participat- ing in the breeding program had swift foxes, having either returned their swift fox stock to the CEI, released, or euthanized them.
After founding the CEI's captive breeding colony in 1972, Miles & Beryl Smeeton went on to sign a co- operative agreement with Dr. Steven Herrero, then Dean of the Faculty of Environmental Design at the Univer- sity of Calgary, in 1977. This agree- ment outlined a series of research
projects to be conducted as M.Sc. the- ses (Carlington 1980; Reynolds 1983; Schroeder 1987) on potential release sites and methodology. The Canadian Wildlife Service (CWS) a branch of the Federal Government of Canada, became involved for the first time in the program in 1978, when the Committee on the Status of En- dangered Wildlife in Canada (COSEWIC) designated the swift fox as "extirpated" in Canada. The Ca- nadian federal government's jurisdic- tional involvement in the swift fox reintroduction program was joined by provincial government involvement when the provinces of Alberta (1983) and Saskatchewan (1985) permitted swift fox releases within their juris- diction. The last swift fox reintro- duction took place in Canada in 1997, and in 1998 the species was downlisted from extirpated in Canada to endangered in Canada by COSEWIC (COSEWIC1998)
In the summer of 1996 a rancher from Montana visited the CEI. Upon his return to the U.S., he contacted the Blackfeet Fish &Wildlife Depart- ment (BFWD), to discuss the possi- bilities of reintroducing swift fox into their original, historic range on the Blackfeet Tribal Lands. Swift fox were consid- ered extir- pated from the Blackfeet tribal lands by the 1950s, and extir- pated from the State of Montana by the 1960s ( K n o w l e s 1991). The B l a c k f e e t Tribe showed interest in the project, pro-
introduction sites appeared suitable, and offered to provide release sites, protection and monitoring for the projected swift fox program.
At the Swift Fox Symposium in Saskatoon, Saskatchewan, February 1998 the project was further devel- oped and, as result of these discus- sions, Defenders of Wildlife were contacted to explore project funding.
In June 1998, The BFWD invited the Directors of CEI to the Blackfeet tribal lands to examine possible swift fox reintroduction sites (Figure 1). After this meeting and the examination of the potential release sites BFWD initiated the project by requesting CEI to provide swift fox to the Blackfeet Nation for a reintroduction program.
In July of 1998 an 11 day baseline survey of potential swift fox habitat, escape terrain, and prey abundance and predator abundance was conducted to find suitable swift fox release sites on the AMS Ranch on the Blackfeet tribal lands. This survey identified seven release sites to be used for the initial release, that occurred in late August of 1998.
Project design The project was designed as a part- nership of three groups: Blackfeet
vided that the Figure 1. Land use in the release areas on the Blackfeet Tribal proposed re- lands, Montana
168 Endangered Species UPDATE Vol. 18 No. 4 2001

Fish and Wildlife Department who provided the lands for the release, protection of the reintroduced ani- mals and some post release monitor- ing; Cochrane Ecological Institute who maintain the captive colony, and provided swift foxes for release, as well as the logistical planning for the releases, including liaison with gov- ernment agencies in USA and Canada, development of nonintrusive survey methodology and research from graduate students; and Defend- ers of Wildlife who provided a sig- nificant proportion of the funding and help obtaining the requisite additional funding needed for the project.
The protocol used to release the swift foxes on Blackfeet land fol- lowed that described in Smeeton and Weagle (2000). After identifying potential release sites through a pre- release survey, Portable Protective Shelters (PPS) were set out in the re- lease sites. One set of observers and one PPS was used per sibling group. Each sibling group was released in the vicinity of the PPS and, for a pe- riod of two days to one month, the released animals were kept under close observation. At the end of 10 days the PPS was removed from the site. The use of PPS encouraged the animals to remain in the area where they were released. Longterrn moni- toring of the population after the first month of intensive observation was conducted and coordinated by Blackfeet Fish and Wildlife and the CEI. Subsequent swift fox releases took place in areas where pre-release surveys indicated swift fox presence.
Results to date Table 1 summarizes the swift fox re- leased to date on the Blackfeet Tribal lands. In 1998,30 juvenile swift fox were released on the AMS Ranch on the Blackfeet tribal lands. This was the first attempt at reintroducing swift fox to be undertaken in the USA. Throughout the first winter follow-
Table 1. Summary of data on the swift fox released on Blackfeet Tribal Land, Montana from 1998 to 2000.
ing the release (1998199) the reintro- duced animals were monitored, us- ing tracks and scat, by officers of the Blackfeet Fish & Wildlife Depart- ment. A spring survey by CEI found abundant swift fox sign, three active dens, one pair with a litter of four cubs and one other den with a pos- sible litter of three. A later survey, in early August, discovered a den con- taining 2 cubs. Tho known mortali- ties occurred during the first winter, the cause of which was vehicle im- pact, as the swift foxes were hunting on or near roads.
In 1999, 15 mixed adult and ju- venile swift foxes were released on the AMS Ranch, eight of these, all adult animals, were radio collared. A radio telemetry program, undertaken by the Blackfeet Tribal Fish &Wild- life Department in the spring of 2000, found 5 of the collared swift fox and additional searches in August found a sixth radio collared swift fox. Al- though the analysis of the data is not complete first indications are that 75% of the captive bred, radio-collared swift foxes survived the winter.
In 2000, a spring survey under- taken by the CEI and the Blackfeet Fish and Wildlife Branch discovered five swift fox natal den sites contain- ing more than 21 cubs. These cubs were all born to swift foxes without radio collars.
In general, (although they were not trapped and handled to confirm)
the cubs sighted on the Blackfeet land in 2000 appeared to be older than the cubs born to new pairs at the CEI in 2000. This indicated either:
(1) that the difference in latitude between the more northerly CEI and Blackfeet lands to the south resulted in an earlier mating season, or
(2) that these cubs had been born to established pairs, rather than new pairs, either to the adult pairs released in 1999 or juvenile pairs, which had bred in 1999 and again in 2000. Es- tablished pairs do not go through the extended mating ritual that newly paired animals do, as a result their cubs are bigger because they are born ear- lier in the year (Smeeton et al. in press).
In August, 2000 3 1 swift fox were released on the AMS Ranch. Sixteen of these animals were radio collared. To date there have been three mortalities, two of the mortali- ties occurred in the first two weeks after the release.
Monitoring of the radio collared animals released on Blackfeet tribal lands continues over the winter of 2000 to 200 1.
Recorded Deaths
2
2
3 (to mid October)
Year
1998
1999
2000
Conclusion The Blackfeet swift fox reintroduc- tion project seems to have benefited from the lessons learned in the Ca- nadian Swift Fox Reintroduction Pro- gram (1983 to 1997). The use of the PPS release methodology, developed by the CEI over the latter part of the
Vol. 18 No. 42001
SwiR Fox Released (Fall)
30
15
31
Endangered Species UPDATE 169
Radio Collared
0
8
16
Cubs Found (Spring)
NI A
4 (possibly 9)
2Ot

Canadian reintroduction program, encouraged the animals to remain in the release sites and reduced mortal- ity. The full support for the program by the Blackfeet people and the pro- tection provided to the released ani- mals by the Blackfeet Fish & Wild- life Department has ensured that none of the animals released on Blackfeet lands, unlike those released in the Canadian program, were killed by being accidentally poisoned, trapped, or shot. Pre-release surveys to iden- tify suitable release sites, undertaken by the CEI on the Blackfeet Tribal Lands, indicated that the area was suitable and that there was sufficient escape- terrain and a large enough prey base to support reintroduction. The survival and successful repro- duction of the swift foxes released in Montana on the Blackfeet tribal lands appears to confirm that assessment. Unlike the Canadian reintroduction program, only captive bred swift foxes have been reintroduced in the Blackfeet program and these animals have survived, bred, and successfully raised their young on the release sites. Radio telemetry data has shown 75% survivorship over one year from those radio collared captive bred swift foxes that have been reintro- duced onto the Blackfeet tribal lands.
Acknowledgements The project could not have been un- dertaken without the support of Minette Johnson and Defenders of Wildlife, the Shared Earth Founda- tion, the International Wildlife Coa- lition, Elsa Wild Animal Appeal of Canada and all their funders and as- sociates. Moving large numbers of an endangered species across an inter- national border requires the help and support of many jurisdictions, we thank Ira Newbreast and the Blackfeet Fish & Wildlife Depart- ment, the province of Alberta, the government of Canada, the Canadian Food Inspection Agency (Dr. Tom
Green), the U.S. Fish &Wildlife Ser- vice, and the State of Montana and its agencies. The CEI captive breed- ing colony would not have the wide genetic heterozygosity which it has were it not for the founder foxes con- tributed to the captive breeding colony by Ms. Vona Bate, Jon Sharps, CWB, and the States of Wyoming and Colorado. Above all, the CEI would be lost without the work of my husband Ken Weagle and my friend and collaborator, Sian Waters.
Literature cited Bremner, S. 1997. Diet and hunting
behaviour of captive bred swift fox (Vulpes velox veloxlVulpes velox hebes) intended for release. Unpubublished M.S. thesis, University of Edinburgh, Scotland.
Carlington, B.G. 1980. Reintroduction of the Swift fox (Vulpes velox) to the Canadian Prairie. Unpublished M.S. thesis, Univer- sity of Calgary, Calgary, Alberta, Canada.
Committee on the Status of Endangered Wildlife in Canada. 1978. Official Classi- fication of the Swift Fox as Extirpated in Canada. Vol. 1. COSEWIC Status Reports and Evaluations. Ottawa, Canada.
Committee on the Status of Endangered Wildlife in Canada. 1998. Official Classi- fication of the Swift Fox as Extirpated in Canada. Vol. 1. COSEWIC Status Reports and Evaluations. Ottawa, Canada.
Flaherty, M. and R. Plaake. 1986. Response of swift fox (Vulpes velox) to water stress. The Journal of Colorado-Wyoming Acad- emy of Science 18:51.
Hall, E.R. 1981. The Mammals of North AmericaVol. 2. John Wiley and Sons. New York.
ISIS. 1989. Single Population Analysis and Record Keeping System. International Species Information System, 12101 Johnny Cake Ridge Road, Apple Valley, MN. 55124.
Knowles, C. 1991. An Ecological and Taxo- nomic Review of the Swift Fox (Vulpes velox) with Special Reference to Montana. FaunaWest Wildlife Consultants, Boulder, MT.
Macgregor, J.G. 1998. Peter Fidler, Canada's forgotten explorer 1769 to 1822. House Ltd., Calgary, AB, Canada.
Mackenzie, A. 19 11. Voyages from Montreal through the Continent of North America to the frozen and Pacific Oceans in 1789 and 1793. Vol. 1 andVol. 2. Courier Press Ltd. Toronto
Merriam, C.H. 1902. Three new foxes of the kit and desert fox group. Proceedings of the Biological Society of Washington 15:73-74.
Pruss, S.D. 1994. An Observational Natal Den Study of Wild Swift fox (Vulpes velox) on the Canadian Prairie. Unpub- lished M.S. thesis, University of Calgary, Calgary, Alberta, Canada.
Reynolds, J. 1983. A Plan for the Reintro- duction of the Swift Fox to the Canadian Prairies. Unpublished M.S. thesis, Univer- sity of Calgary, Calgary, Alberta, Canada.
Schroeder, C. 1987. Swift Fox Reproductive Biology in Captivity. Unpublished report, University of Calgary, Calgary, AB, Canada.
Smeeton, C. and K. Weagle. 2000. The re- introduction of the swift fox Vulpes velox to South Central Saskatchewan, Canada. Oryx 34:171-179
Smeeton, C., K.Weagle, and S.S.Waters. In Press. Captive breeding of the swift fox at the Cochrane Ecological Institute in Alberta, Canada. In L.C. Carbyn and M.A. Sovada, eds. Ecology and Management of Swift fox in a Changing World. Cana- dian Plains Research Centre.
Stromberg, M. R andM.S. Boyse. 1986. Sys- tematics and conservation of the swift fox, Vulpes velox, in North America. Biologi- cal Conservation 3597-1 10.
Teeling. E. C. 1996. Born to be Free: Cap- tive Breeding as a Conservation Tech- nique. Unpublished M.S. thesis, Univer- sity of Edinburgh, Scotland.
Uresk, D. W. and J. C. Sharps. 1986. Den- ning habitat and diet of the swift fox in western South Dakota. The Great Basin Naturalist 46:249-253.
US Fish and Wildlife. 1994. Endangered and Threatened Wildlife and Plants. 5OCFR 17.11 & 17.12, United States Fish and Wildlife Service, Washington D.C., USA.
US Fish and Wildlife. 1995. Twelve Month Administrative Finding on Petition to List the Swift Fox (Action Needed), From Re- gional Director, Region 6 to Director (AESITE). United States Fish and Wild- life Service, Washington D.C., USA.
Wayne, R. 1998. A look at swift foxlkit fox taxonomy within the canid complex. First North American Swift Fox Symposium, Ecology and Conservation of the Swift Fox in a Changing World, Saskatoon, Saskatchewan, Canada.
Weagle, K . and C. Smeeton. 1995. Behavioural aspects of the swift fox (Vulpes velox) reintroduction program. Pp 268-286 in B. Holst, ed. Proceedings of the 2nd International Conference on En- vironmental Enrichment. Copenhagen Zoo, Copenhagen, Denmark.
170 Endangered Species UPDATE Voi. 18 No. 4 2001

lnterspecific Interactions Among Wild Canids: Implications for the Conservation of Endangered San Joaquin Kit Foxes Brian L. Cypher Research Ec'ologist, Endangered Species Recovery Program, P.O. Box 9622, Bakersfield, CA 93389; (661) 837-5061; (fax) (661) 398-0549; [email protected]
Howard 0. Clark, Jr. Ecologist, Endangered Species Recovery Program, 1900 N. Gateway Blvd., #101, Fresno, CA 93727; (559) 453-1103; (fax) (559) 453-1227; hclarkQesrp.org
Patrick A. Kelly Director, Endangered Species Recovery Program, 1900 N. Gateway Blvd., #I 01, Fresno, CA 93727; (559) 453-1 103; (fax) (559) 453-1227; [email protected]
Christine Van Horn Job Ecologist, Endangered Species Recovery Program, 3517 Sedona Way, Bakersfield, CA 93309; (661) 834-6781 ; cvanjobQaol.com
Gregory D. Warrick Manager, Center for Natural Lands Management, 10018 Rain Check Drive, Bakersfield, CA 93312; (661) 399-2257; cnlmgret9aol.com
Daniel F, Williams Executive Director, Endangered Species Recovery Program, Department of Biological Sciences, California State University - Stanislaus, Turlock, CA 95382; (209) 667-3446; (fax) (209) 667-3694; [email protected].
Abstract Interspecific interactions among wild canids have significant implications for the conservation and recovery of endangered Sun Joaquin kit foxes (Vulpes macrotis mutica). Coyotes (Canis latrans) and non-native red foxes (V. vulpes) both engage in interference and exploitative compe- tition with kit foxes. Several behavioral and ecological adaptations of kit foxes ameliorate such competition with coyotes and facilitate their coexistence. These adaptations include habitat partitioning, food partitioning, opportunistic foraging patterns, and year-round use of multiple dens. These adaptations are less effective against red foxes due to greater food and habitat overlap, the ability to pursue kit foxes into dens, and high potential for disease transmission. Thus, non-native red foxes pose a serious threat to kit foxes. Interactions between coyotes and red foxes may benefit kit foxes. In particulal; integerence competition by coyotes may limit the abundance and distribution of red foxes in the Sun Joaquin Valley. These interactions should be considered when evaluating management options (e.g., predator control).
Introduction Kit foxes are relatively small canids (1.7 to 3.0 kg) that occur in arid and semi-arid habitats of the southwestern United States and northern Mexico. The San Joaquin kit fox (Vulpes macrotis mutica) is a genetically dis- tinct subspecies that historically oc- curred in the San Joaquin, Salinas, and Cuyama Valleys of central California. The abundance and range of this taxon have been sigrdicantly reduced, prirna- rily due to habitat loss and degradation associated with agricultural, industrial, and urban development (FWS 1998).
Fur harvests, predator control pro- grams, and rodent control programs also may have contributed to observed declines. San Joaquin kit foxes persist as a metapopulation comprising three larger "core" populations and a num- ber of smaller "satellite" populations. Current threats include continuing habi- tat conversion, rodenticide use, and in- terspecific competition. Much of the remaining habitat is fragmented, dis- turbed, and subject to competing land uses such as hydrocarbon production and water banking (FWS 1998). The San Joaquin kit fox was listed as Fed-
erally Endangered in 1967 and Califor- nia Threatened in 197 1.
Interspecific competition from other mammalian predators is an im- portant factor affecting the remaining San Joaquin kit fox populations (Cypher et al. in press). Coyotes (Ca- nis latrans), bobcats (Lynx w s ) , gray foxes (Urocyon cineareoargenteus), badgers (Taxidea taxus), feral cats (Felis domesticus), and non-native red foxes (V vu2pes) all engage in interfer- ence andfor exploitative competition with kit foxes. Interference competi- tion consists of direct mortality, harass-
Vol. 18 No. 4 2001 Endangered Specles UPDATE 171

San Joaquin kit fox (Vulpes macrotis mutica). Photograph by B. Moose PetersonMIRP.
ment, and spatial exclusion. Exploit- ative competition consists of overlap in use of potentially limited resources such as food items and dens. Competi- tive interactions with coyotes and red foxes have the greatest implications for San Joaquin kit foxes. Our objectives for this paper are to summarize the competitive interactions that occur be- tween kit foxes, coyotes, and red foxes, and to assess the potential implications of these interactions for kit fox conser- vation and recovery.
Competitive interactions Coyotes engage in both interference and exploitative competition with kit foxes. Coyotes have long been recog- nized as a significant cause of mortal- ity for kit foxes (Seton 1925). At vari- ous study sites throughout the range of the San Joaquin kit fox, coyotes are the primary source of kit fox mortality for which the cause of death is identifiable (Hall 1983; Briden et al. 1992; Standley et al. 1992; Ralls and White 1995; Spiegel and Disney 1996; Cypher et al. 2000). This mortality indeed appears to be the result of competition rather
than predation. Coyotes commonly do not consume the kit foxes they kill (Spiegel and Disney 1996; Cypher and Spencer 1998), although over half of kit foxes killed at one location were consumed during a period of low food availability (Ralls and White 1995).
Another effect of interference competition is spatial exclusion in which the presence of one species in an area results in decreased use of that area by another species. On a re- gional scale, kit foxes usually are ab- sent or less abundant in more rugged terrain (areas with average slopes >5%). Kit foxes may have more dif- ficulty eluding predators in rugged terrain. At one study site, kit foxes were abundant in rugged terrain when regional coyote abundance was low, but kit fox numbers quickly declined in this terrain as coyote abundance increased (Warrick and Cypher 1998). On a local scale, White et al. (1994) did not detect any temporal segregation among telemetered kit foxes and coyotes, indicating that ar- eas were being used concurrently by the two species.
With regards to exploitative com- petition, coyotes consume some of the same food items consumed by kit foxes. Items commonly used by both species include black-tailed hares (Lcpus californicus), desert cottontails (Sylvilagus audubonii), kangaroo rats (Dipodomys spp.), pocket mice (Chaetodipus californicus, Perognathus inornatus), California ground squirrels (Spermophilus beechyi), pocket gophers (Thommys bottae), grasshoppers (Acrididae), Jerusalem crickets (Gryllacrididae), and beetles (Eleodes spp.). Overlap in resource use varies with the relative availability of different food items (Whlte et al. 1995; Cypher and Spen- cer 1998), and therefore may not be a siguficant factor in all areas or all years.
The overall effect of competitive interactions between coyotes and kit foxes is not clear. Declines in kit fox
abundance in some areas have been associated with increases in coyote abundance (Cypher et al. 2000; White et al. 2000). Coyote predation, how- ever, does not appear to be the primary factor driving kit fox population trends. Instead, food availability as mediated by annual environmental conditions (particularly precipitation) appears to be the primary factor influencing kit fox population dynamics (White et al. 1996; Cypher et al. 2000). Predation by coyotes potentially could have a more significant impact on kit fox populations when food availability is low or when kit fox populations are small (particularly introduced populations).
Coyotes have historically occurred throughout the range of the kit fox, and kit foxes have evolved adaptive strate- gies for coexisting with coyotes. One such strategy is year-round use of dens. Kit foxes may have over 100 dens scat- tered throughout their home range, al- though on average about 12 dens are used by a given fox annually (Koopman et al. 1998). These dens facilitate escape from predators (Whtte et al. 1994; Cypher and Spencer 1998). In addition, some amount of resource partitioning occurs between coyotes and kit foxes. Although food habits overlap, coyotes take higher propor- tions of leporids while kit foxes usu- ally consume higher proportions of nocturnal rodents, particularly kanga- roo rats and pocket mice (White et al. 1995; Cypher and Spencer 1998). Fur- thermore, there is some evidence that some degree of habitat partitioning may occur with kit foxes prefening more open axas with reduced shtub cover (White et al. 1995; Warrick and Cy-pher 1998).
Red foxes also engage in both in- terference and exploitative competition with kit foxes. Historically, native red foxes only occurred at high elevations in the Sierra Nevada and Cascade ranges in California, and were not found in any portion of the range of San Joaquin kit foxes (Grinnell et al. 1937). In more recent times, red foxes
172 Endangered Species UPDATE Vol. 18 No. 4 2001

from the eastern United States have been introduced into lower elevation areas of California by humans for hunt- ing and trapping, and have escaped from fur farms (Jurek 1992; Lewis et al. 1993). These highly adaptable, non- native red foxes have spread rapidly and have colonized many regions of California, including the San Joaquin Valley. The abundance of anthropo- genic water sources in the San Joaquin Valley (e.g., canals, irrigated agriculture, stock ponds, and urban areas) likely has fkilitated colonization by red foxes.
Red foxes are larger (3 to 8 kg) than kit foxes, and therefore dominate in interference competition. Red foxes are known to have killed radiocollared kit foxes on at least three occasions (Ralls and White 1995; Clark 2001). In addi- tion, red foxes may be competitively displacing kit foxes in some locations (Whlte et al. 2000). At one location, kit foxes primarily used areas not oc- cupied by red foxes (Clark 2001). Fi- nally, red foxes and kit foxes are closely related taxonomically which may increase the potential for disease transmission.
Being relatively close in size to kit foxes, exploitative competition may be more intense between the two species. Considerable overlap in use of foods was documented at one location in the San Joaquin Valley (Warrick and Clark unpublished data). Red foxes will use kit fox dens, excluding use by kit foxes. Red foxes have been observed in dens formerly used by kit foxes on a number of occasions at three different locations (white et al. 2000; Cypher et al. in press; Wanick and Clark unpublished data).
Red foxes constitute a serious threat to San Joaquin kit foxes. Adap- tations of kit foxes that reduce compe- tition with coyotes are less effective against red foxes. Red foxes can enter most dens used by kit foxes, making escape and avoidance more difficult. Resource partitioning may be minimal although some degree of habitat parti- tioning may occur between the two species. Red foxes may have difficulty
colonizing kit fox habitat lacking in nearby water sources. Most red fox observations in the San Joaquin Valley are in relatively close proximity to sources of water.
Interactions between coyotes and red foxes can affect kit foxes. The pres- ence of both coyotes and red foxes in a given area may act in an additive man- ner with regards to reducing food avail- ability for kit foxes. Thus, exploitation competition between coyotes and red foxes may detrimentally sect kit foxes.
killed by coyotes (Clark 2001). Coy- otes have been suggested as a biologi- cal control strategy for red foxes in coastal areas of California where the foxes are preying on endangered Cali- fornia least terns (Sterna antillarum browni) and California light-footed clapper rails (Rallus longirostris levipes) (Jurek 1992). Coyotes also have been proposed as a means of re- ducing red foxes in the prairie pothole region of North America, thereby re- ducing red fox predation on duck nests (Sargeant and Arnold 1984).
Interference competition between coyotes and red foxes may also benefit kit foxes. Reduced abundance of red foxes attributable to coyotes has been documented in a number of locations (Dekker 1983; Voigt and Earle 1983; Major and Sherburne 1987; Sargeant et al. 1987). This reduction is a conse- quence of both direct mortality and exclusion. In a study in the San Joaquin Valley of California, 1 1 radiocollared red foxes were recovered dead. Of the nine mortalities for which the cause of death could be identified, all nine were
conservation implications Due to anthropogenic ecosystem modification, non-native red foxes are expanding their range and in- creasing in abundance in California (Jurek 1992; Lewis et al. 1993). As described above, this species poses a potentially serious threat to kit foxes. Implementing effective con- trol programs for red foxes would be extremely difficult for a number of reasons. In general, predator control programs can be costly as they usu- ally must be implemented over large areas for multiple years (sometimes indefinitely) to achieve effective con- trol, and are not popular with the gen- eral public even when conducted for the conservation of a rare, native spe- cies (Goodrich and Buskirk 1'995). Poisons can not be used due to the threat to kit foxes as well as other non-target species. Trapping red foxes without also capturing kit foxes would be difficult due to the rela- tively close weights of the two spe- cies. The use of many types of trap- ping devices was banned in California in 1998. Shooting, possibly in conjunc- tion with predator calling, may be pos- sible, but could be difficult and costly to implement over large areas or near human-inhabited areas where red foxes commonly occur.
Coyote control is often suggested as an action that would benefit San Joaquin kit foxes. Similar to control
Vol. 18 No. 4 2001 Endangemd Species UPDATE 173

efforts for red foxes, coyote control can be both difficult and controversial (Cypher and Scrivner 1992; Connolly and Longhurst 1975). There may be certain situations where limited coyote control might benefit kit foxes (e.g., re- introduction sites, smaller preserves and habitat blocks during periods of low food availability). Given the po- tential beneficial role of coyotes in lim- iting non-native red foxes, however, the implementation of coyote control should be carefully considered. Any reduction or limitation of red fox abun- dance achieved naturally through com- petitive pressure from native predators could simcantly benefit kit foxes and would require no effort on the part of humans. Red foxes are rarely observed in areas where coyotes are abundant, even though kit foxes persist in these areas (Ralls and White 1995; Spiegel and Disney 1996; Cypher et al. 2000).
Ultimately, the strategy with the greatest potential for effectively con- serving and recovering San Joaquin kit foxes will be to conserve and properly manage large blocks of habitat that are connected by movement corridors. This will facilitate larger kit fox popu- lations that are more robust to losses from interspecific competition, and that are able to naturally recolonize areas where local extirpations of kit foxes may have occurred. Also, the fragmen- tation of kit fox habitat by anthropo- genic disturbances promotes increased abundance of red foxes, which nega- tively impacts kit foxes. The conser- vation of large blocks of habitat is a paramount goal of the recovery plan for San Joaquin kit foxes and a number of other rare species that occur sympatri- cally with kit foxes (FWS 1998).
Literature cited Briden, L.E., M. Archon, and D.L. Chesemore.
1992. Ecology of the San Joaquin kit fox in Western Merced County, California. Pp 8 1-87 in D. E W a r n , S. Byme, and T. A. Rado, eds. Endangered and sensitive species of the San Joaquin Valley, California: their biology, management, and conservation. Califomia En-
ergy Commission, Sacramento. Clark, H.O., Jr. 2001. Endangered San Joaquin
kit fox and non-native red fox interspecific competitive interactions. M.S. thesis, Cali- fornia State University, Fresno.
Connolly, G. E., and W. M. Longhurst. 1975. The effects of control of coyote populations: a simulation model. University of Califor- nia - Davis, Cooperative Extension Bulle- tin 1872.
Cypher, B. L., P. A. Kelly, and D. F. Williams. In press. Factors influencing populations of endangered San Joaquin kit foxes: implica- tions for conservation and recovery. Pro- ceedings of the North American swift fox symposium.
Cypher, B. L., and J. H. Scrivner. 1992. Coy- ote control to protect endangered San Joaquin kit foxes at the Naval Petroleum Reserves, California. Pp 42-47 in J. E. Borrecco and R. E. Marsh, eds. Proceed- ings of the fifteenth vertebrate pest confer- ence. University of California, Davis.
Cypher, B. L., and K. A. Spencer. 1998. Com- petitive interactions between coyotes and San Joaquin kit foxes. Journal of Mammal- ogy 79:204-214.
Cypher, B. L., G. D. Warrick, M. R. M. Otten, T. P. O'Farrell, W. H. Beny, C. E. Harris, T. T. Kato, P. M. McCue, J. H. Scrivner, and B. W. Zoellick. 2000. Population dynamics of San Joaquin kit foxes at the Naval Petroleum Reserves in California. Wildlife Mono- graphs 145.
Dekker, D. 1983. Denning and foraging hab- its of red foxes, Vulpes vulpes, and their in- teractions with coyotes, Canis latrans, in central Alberta, 1972- 198 1. Canadian Field- Naturalist 97:303-306.
Goodrich, J. M., and S. W. Buskirk. 1995. Control of abundant native vertebrates for conservation of endangered species. Con- servation Biology 9: 1357-1364.
Grinnell, J., J. S. Dixon, and J. M. Linsdale. 1937. Fur-bearing mammals of California, Vol. 2. University of California Press, Berkeley.
Hall, F, A., Jr. 1983. Status of the San Joaquin kit fox, Vulpes macrotis mutica, at the Bethany wind turbine generating (WTG) project site, Alameda County, California. California Department of Fish and Game, Sacramento.
Jurek, R. M. 1992. Nonnative red foxes in California. California Department of Fish and Game, Nongame Bird and Mammal Section Report 92-04.
Koopman, M. E., J. H. Scrivner, and T. T. Kato. 1998. Patterns of den use by San Joaquin kit foxes. Journal of Wildlife Management 62:373-379.
Lewis, J. C., K. L. Sallee, and R. T. Golightly, Jr. 1993. Introduced red fox in California Cali- fornia Department of Fish and Game, Nongame
Bird and Mammal Section Report 93-10. Major, J. T., and J. A. Sherbwne. 1987. Inter-
specific relationships of coyotes, bobcats, and red foxes in western Maine. Journal of Wildlife Management 51:606-616.
Ralls, K., and P, J. White. 1995. Predation on San Joaquin kit foxes by larger canids. Jour- nal of Mammalogy 76:723-729.
Sargeant, A. B., S. H. Allen, and J. 0 . Hastings. 1987. Spatial relations between sympatric coyotes and red foxes in North Dakota. Jour- nal of Wildlife Management 51:285-293.
Sargeant, A. B., and P, M. Arnold. 1984. Preda- tor management for ducks on waterfowl pro- duction areas in the northern plains. Pp 16 1 - 167 in Proceedings of the 1 lth vertebrate pest control conference. University of Califor- nia, Davis.
Seton, E. T. 1925. Lives of game animals. Volume I: cats, wolves and foxes. Doubleday, Doran and Company, New York.
Spiegel, L. K., and M. Disney. 1996. Mortal- ity sources and survival rates of San Joaquin kit fox in oil-developed and undeveloped lands of southwestern Kern County, Califor- nia. 4 71-92 in L. K. Spiegel, ed. Studies of the San Joaquin kit fox in undeveloped and oil-developed areas. California Energy Commission, Sacramento.
Standley, W. G., W. H. Beny, T. P. O'Farrell, and T. T. Kato. 1992. Mortality of San Joaquin kit fox at Camp Roberts Army Na- tional Guard Training Site, California. U.S. Department of Energy Topical Report No. EGG 10627-2157.
U.S. Fish and Wildlife Service. 1998. Recov- ery plan for upland species of the San Joaquin Valley, California. U.S. Fish and Wildlife Service, Portland, Oregon.
Voigt, D. R., and B. D. Earle. 1983. Avoid- ance of coyotes by red fox families. Journal of Wildlife Management 471852-857.
Warrick;G. D., and B. L. Cypher. 1998. Fac- tors affecting the spatial distribution of a kit fox population. Journal of Wildlife Man- agement 62:707-717.
White, P, J., W. H. Berry, J. J. Eliason, and M. T. Hanson. 2000. Catastrophic decrease in an isolated population of kit foxes. South- western Naturalist 45204-21 1.
White, P, J., K. Ralls, and R. A. Garrott. 1994. Coyote-kit fox interactions as revealed by telemetry. Canadian Journal of zoology 72:1831-1836.
White, P. J., K. Ralls, and C. A. Vanderbilt White. 1995. Overlap in habitat and food use between coyotes and San Joaquin kit foxes. Southwestern Naturalist 40:342-349.
White, P. J., C. A. Vanderbilt White, and K. Ralls. 1996. Functional and numerical re- sponses of kit foxes to a short-term decline in mammalian prey. Journal of Mamrnal- ogy 77:370-376.
174 Endangered Species UPDATE Vol. 78 No. 4 2001

Predation Management Chemical Repellents and Other Aversive Strategies in Predation Management J.R. Mason National Wildlife Research Center, USDA-APHIS-WS, BNR-163, Utah State University, Logan, UT 84322-5295; (435) 245-6091; James.R.Mason Q usda.gov
J.A. Shivik National Wildlife Research Center, USDA-APHIS-WS, 4101 LaPorte Avenue, Fort Collins, CO 80521-21 54; (970) 266- 6088; John.ShivikQusda.gov
M.W. Fall National Wildlife Research Center, USDA-APHIS-WS, 4101 LaPorte Avenue, Fort Collins, CO 80521 -21 54; (970) 266- 6086; Michael.W.Fall Q usda.gov
Abstract Chemical repellents and other aversive strategies are the core of non-lethal wildlife management. These strategies typically depend on irritation (pain), conditioning, or fear for their effectiveness, and none is universally successful. Thus, conditioned food aversions deter browsing and forag- ing by deer (Odocoileus virginianus, 0 . hemionus), but are less useful with predators, because killing, not consumption, is the behavior of interest. Broadly speaking, the utility of non-lethal strategies is afSected by number and density of wildlife species, availability of alternative foods, palatability and novelty of treated items, and intensity of pain, sickness, or fear used to establish avoidance. Some of the most promising areas for successfil predation management are those involving a combination of strategies tailored to a spec@ problem. For example, behavioral- contingent auditory and visual stimuli coupled with presentations of electric shock or momentary vibration (via telemetry collars) could provide an effective and unambiguous cue for withdrawal. Non-lethal methods, however; are rarely stand-alone technologies. More ofen, integrated strategies, involving both lethal and non-lethal methods, are required for effective predation management.
Introduction The survival or restoration of threatened and endangered species can depend on protection from predators (Witmer and Fall 1995; Witmer e t al. 1996; Hecht and Nickerson 1999). Most of the rel- evant data for managing predation stem from research on the protec- tion of livestock, crops, and com- modities (Campbell et. a1 1998; Fall and Jackson 1998). Deterring predators from prey is even more complex than protecting crops or other commodities because more is involved than food consumption (Fall 1990; Knowlton et al. 1999). Especially challenging is the devel- opment of non-lethal approaches. Demand for these strategies is in-
creasing despite the fact that effec- tive options remain virtually non- existent. Repellents and other aver- sive techniques provide cases in point. If wildlife numbers are suf- ficiently high, or alternative foods are sufficiently scarce, repellents usually fail as a deterrent. Few de- monstrably effective alternatives exist, and practical obstacles to the development of new materials are considerable. The present discus- sion will cover these topics by con- sidering: mechanisms underlying the effectiveness of repellents and aversive agents, regulatory con- straints that govern implementation of new methods, and the impor- tance of employing multiple sen- sory modalities (i.e. visual and au-
ditory cues, chemical and color cues) whenever non-lethal strate- gits are implemented.
Chemical repellents Vertebrate chemical repellents are effective because they are irritating, cause sickness, or stimulate fear (Ma- son and Clark 1997). As a rule, these substances are most useful when they are applied directly to inert materials (e.g., prepared foods, fruits, grains, electrical wiring, irrigation hose; Werner et al. 1998). There is no good evidence that predators or other wild- life will avoid areas protected solely with border treatments. To illustrate the point, Renardine is commercially available for use with red fox (Vulpes vulpes) in the United Kingdom and
Vol. 18 No. 4 2001 Endangered Species UPDATE 1 75
is being evaluated for use with coy- otes (Canis latrans) in Canada (Mar- tin and O'Brien 2000). (Mention of trade names and manufacturers is for identification only and does not im- ply endorsement by the authors or the U.S. Department of Agriculture.) The substance is bone tar oil dis- solved in kerosene. The label ad- vises that it should be applied lib- erally to pasture borders (on fence posts, etc.) to prevent predators from entering and attacking live- stock. In testing with captive coy- otes in the U.S., not only did Renardine fail to prevent entries into areas, but food adulterated with the material was eaten as rapidly as unadulterated food (Zemlicka and Mason 2000). This probably re- flects the fact that sulfurous com- pounds in bone tar oil are attractive to coyotes (see Fear below).
Tastes, per se, are rarely effec- tive feeding deterrents. While bit- ter and acidic substances can ini- tially reduce the consumption of treated materials slightly (cf. Nolte et al.l994b), intake typically re- turns to baseline within a short pe- riod of time. Products that claim effectiveness solely because of a "bad" taste are doing so largely be- cause humans find the taste repul- sive. Some species of interest, in- cluding obligate carnivores such as the Felidae, have taste sensitivities that are greatly different than hu- mans, including insensitivity to salt and sweet (Beauchamp and Mason 1991). In particular, products that contain denatonium derivatives (compounds very bitter to humans) are ineffective repellents, almost re- gardless of species (although bears, Ursus horr ib i l i s and Ursus americanus, may avoid denatonium in foods; G. Witmer, National Wild- life Research Center, personal com- munication) or method of applica- tion (e.g., topical spray, incorpo- rated into products). Canids, in
particular coyotes, are markedly in- sensitive to denatonium benzoate (Mason and McConnell 1997). De- spite this lack of demonstrated util- ity, new veterinary and wildlife con- trol products containing denatonium derivatives as the active ingredient are regularly offered for sale.
Irritation Among the three types of chemical repellents, substances that cause sen- sory irritation or pain (the same neu- ral receptors are involved) usually are most effective. This is because sensory pain leads to immediate withdrawal, independent of learn- ing. Such avoidance does not ha- bituate (diminish) for as long as the irritating stimulus is present. More- over, taxonomic differences in irri- tant sensitivity between birds and mammals (Clark 1998a) permit the development of repellents with some degree of selectivity (e.g., Norman et al. 1992).
For mammals, strong irritants include capsaicin and capsicum oleo resins (i.e. the active ingredients in 'hot sauce' preparations; Norman et al. 1992), volatile chemicals like mustard oil (ally1 isothiocyanate) and ammonia (Budavari et al. 1996), and non-volatile substances including as- tringent tannins such as quebracho (Swihart 1990). None of these sub- stances repel birds (Mason and Clark 1997). Unfortunately, when irritant chemicals dissipate (e.g, by evapo- ration or photolysis), there is usually an immediate resumption of the un- wanted behavior (Mason et al. 1985). A more important drawback is that intrataxonornic differences in irritant sensitivity are small. There are no known irritants that affect only some mammalian species but not others (e.g., coyotes but not sheep, Ovis aries, or humans).
This is not to say that irritants are completely ineffective deterrents to predation. Irritants can be effective
when prey are completely infused. This strategy is relatively common among insects (e.g., Wickler 1968), amphibians, reptiles (e.g., Schmidt et al. 1989), and occasionally birds. ,
One example is the Pitohui bird (Pitohui dichrous) that stores and uses toxicants from insects it ingests (Dumbacher et al. 1992). However, in the absence of complete infusion, repellency is easily circumvented. This explains the ineffectiveness of topically applied irritants as deter- rents to predation. For example, sheep fitted with collars containing capsicum oleo resin were killed as readily as sheep without collars, de- spite the fact that attacking coyotes punctured collars and were exposed to high concentrations of the irritant (Burns and Mason 1996).
Fear Sulfur compounds and volatile am- monium soaps of higher fatty acids induce what humans describe as fear in herbivores (Milunas et al. 1994). These substances underlie the effectiveness of predator urines and many commercial preparations used to repel browsing deer, rabbits (Sylvilagusfloridanus), and rodents (Nolte et al. 1994a; Lewison et al. 1995; Mason et al. 1999). Typi- cally, substances that frighten her- bivores attract obligate carnivores and many omnivores (Kimball et al. 2000). There are no published data consistent with the belief that urine samples from one predator are ac- tively avoided by other predators.
A disadvantage of fear-inducing chemicals is that animals readily ha- bituate to their presence. The rate of habituation is largely dependent on the degree to which the chemical cue is associated with a risk of predation. When risk is low, habituation is rapid. Cues may even become attractive. For example, wolf (Canis lupis) urine applied as a repellent along roadways in winter can attract moose (Alces
176 Endangered Species UPDATE Vol. 18 No. 4 2001

alces) and other ungulates that learn to associate the odor with the pres- ence of road salt (T. Sullivan, per- sonal communication).
Sickness (conditioned or learned avoidance) When the inge'stion of novel flavors or tastes by mammals or distinctively colored foods by birds is followed by sickness, a learned avoidance usually results (Beauchamp and Mason 1991). This effect is variously called conditioned (or learned) taste, food, or flavor avoidance (CA). CA can occur after a single aversive experi- ence, particularly when the intensity of sickness is great and the taste, food, or flavor is new (Pelchat et al. 1983). As with other chemical repel- lents, substances that elicit CA are classified as pesticides by regulatory agencies, which typically require ex- tensive data sets for registration prior to commercial use.
An extensive literature on theory, use and applications of CA is avail- able (e.g., Riley and Tuck 1985). CA is the mechanism underlying the util- ity of commercial bird repellents con- taining methiocarb or anthraquinone (Conover 1982; Reidinger and Ma- son 1983), and commercial deer, rab- bit, and rodent repellents containing thiram or ziram (Thomson 1995). CA using lithium chloride or estrogens to induce sickness has been investi- gated as a way to: reduce depreda- tion by coyotes, resolve nuisance feeding by black bears (Ursus americanus; Ternent and Garshelis 1999), and curtail egg predation by raccoons (Procyon lotor), skunks (Mephitis mephitis), mongooses (Herpestes nyula), and ravens and crows (Corvus spp.; e.g., Nicolaus and Nellis 1987; Nicolaus et al. 1982, 1983; Semel and Nicolaus 1992). While evidence suggests that CA can be used to successfully manage nuisance complaints and egg depredation under some condi-
tions, no lithium chloride- or estro- gen-based method has been regis- tered by the U.S. Environmental Protection Agency.
Gustavson (1974) conducted the first studies of CA as a manage- ment strategy with coyotes. His ini- tial data were promising, generat- ing considerable interest in the ap- proach. Some investigators have reported success in preventing pre- dation (Gustavson et a1.1974; Ellins and Martin 1981; Gustavson et a1.1982; Forthman-Quick et al. 1985a, 1985b), while others have reported failure (Conover et al. 1977; Burns 1980; Burns and Connolly 1980; Bourne and Dorrance 1982; Burns 1983). Two large field trials conducted in Canada generated opposite results (Bourne and Dorrance 1982; Gustavson et al. 1982). Ten years after the most extensive field trial (Gustavson et al. 1982; Jelinski et al. 1983), survey responses of 52 participating ranchers indicated that while 54% initially considered lithium-chloride baiting "success- ful" or "somewhat successful," only one participant continued to use it (Conover and Kessler 1994). While no explanation for differences among studies is completely ac- cepted, most arguments have fo- cused on methods and experimen- tal design (Bekoff 1975; Gustavson et al. 1975; Sterner and Shumake 1978; Horn 1983; Forthman-Quick et a1.1985b; Conover 1997). Al- though CA may be a useful tool in some situations, its utility in pre- dation management appears quite limited. Gustavson acknowledged that coyotes often resumed killing sheep shortly after conditioning, and ". . .once a coyote becomes a confirmed sheep-killer, perhaps it will be necessary to remove it from the population" (Gustavson et al. 1978). This could reflect the pos- sibility that while CA may affect
consumption of prey, the generali- zation of learning from consump- tion to killing is weak. There are no data on the use of CA to protect big game from predators, but con- siderable data relating to attempts at livestock protection provide little promise of potential utility.
Mechanical and electronic devices There are many parallels between chemical repellents and mechanical or electronic devices that provoke fear or deliver painful or irritating stimulation. Scarecrows and their modern analogues have been widely examined with both birds and mammals. Studies typically report rapid habituation and vari- ability among species and settings (Koehler et al. 1990; Bomford and O1Brien 1990). Nevertheless, at least for depredation management, there are promising results in cer- tain situations. For example, Linhart et al. (1984) found that combinations of battery-operated strobe lights, sirens, and high fre- quency horns, placed on the edges of sheep pastures or bedgrounds and activated for short irregular in- tervals during night and early morn- ing, stopped predation for 27 to 136 nights. Coyotes apparently re- mained active around the peripher- ies of the test pastures, but habitu- ation to the devices was delayed by the irregular patterns of activation. More recently, using animal-acti- vated or demand-performance frightening devices (Stevens et al. 2000), Shivik and Martin (in press) showed that motion-activated si- rens were more effective than ran- dom sirens in delaying habituation by captive coyotes. Limited field trials of behavior-contingent, multi- stimulus (light and sound), systems to deter wolf predation are ongo- ing and appear promising (Shivik and Martin in press). Devices are
Vol. I8 No. 4 2001 Endangered Specles UPDATE 177

activated when radio-collared wolves approach livestock production areas.
Application of a brief, non-le- thal electric current has been widely studied as a means of deterring predators (Linhart et al. 1982; Sargeant and Arnold 1984). Linhart et al. (1976) found that coyotes fit- ted with collars that provided a con- tingent electric shock stopped at- tacks on rabbits for several months. More recently, commercial elec- tronic dog training collars that de- liver a mild static electrical dis- charge have been successfully tested as a deterrent to captive coy- otes attacking sheep (Andelt et al. 1999). Manual activation of col- lars stopped attacks in progress and greatly reduced the probability of subsequent attacks. After one to three training bouts, coyotes avoided or retreated from sheep in tests four months after initial ses- sions. Shivik and Martin (in press) are testing similar collars, triggered by radio signals, with wolves. Ani- mals wearing modified radio telem- etry collars self-activate the static discharge when they approach within biting distance of a calf, pro- viding an unambiguous cue for withdrawal. Collars utilizing mo- mentary vibration (a sensation hu- mans perceive as similar to static discharge) are also commercially available for dog training and could have similar application. Shivik and Martin (in press) describe ef- forts to develop auto-attaching col- laring systems that utilize break- away snare technology, which, if successful, would substantially re- duce the cost of the method.
Ecological and behavioral consequences At issue is effective adaptation of agricultural methods to endangered species protection, while avoiding negative ecological consequences (e.g., affecting wildlife other than
target species) often associated with pest control efforts. Much attention has focused in the past on unin- tended consequences on non-target species of broad-spectrum pesticide use. However, all proposed meth- ods of pest control, including those presumed to be non-lethal, must be carefully examined for effective- ness in specific situations, selectiv- ity, and potential environmental and behavioral effects. For example, fences placed to exclude a preda- tory species may interrupt move- ment patterns or block migration routes of another. Selectivity for particular problem species, or indi- vidual animals causing predation, and avoidance of problems with primary or secondary effects on non-target animals are desirable features for all animal control tac- tics, especially those involving chemical applications. Classic ex- amples of past successes in agricul- ture in finding such alternative ap- proaches include: (1) replacing dy- namiting of vampire bat (Diphylla ecaudata) caves to control paralytic cattle rabies with vampire bat-se- lective toxicant treatments (Mitchell 1986; Lewin 1986); and (2) replacing poisoned carcass bait stations as a method of coyote pre- dation control with selective meth- ods, such as Livestock Protection Collars (Connolly et al. 1978; Connolly 1993), den hunting (Till and Knowlton 1983), and aerial hunting (Connolly and O'Gara 1988; Wagner and Conover 1999; and Mason et al. in press).
Similarly, control programs aimed at protecting endangered species from predation must be planned strategically for specific areas to assure they achieve desired objectives. For example, Conner et al. (1998) found no relationship between annual coyote removal and levels of coyote predation on sheep on a California agricultural experi-
ment station where non-lethal methods and non-selective coyote removal had not achieved desired reductions in predation after several years of effort. Sacks et al. (1999) found that adult territorial coyotes responsible for sheep killing in the area were less vulnerable to these control tactics than coyotes not in- volved in livestock predation. U1- timately, removal of specific dep- redating individuals by shooting and Livestock Protection Collars greatly reduced predation (Blejwas et al, in press). Livestock Protec- tion Collars, however, have re- cently been banned in California by a ballot initiative, creating a need for development of effective alter- native methods. In another situa- tion, probably common in both ag- riculture and conservation preda- tion management applications, fe- ral cat (Felis catus) control efforts had to be implemented following a highly successful rodent control ef- fort to protect nesting Dark-rumped petrels (Pterodroma phaeopygia) from predation in the Galapagos Is- lands (Cruz and Cruz 1987). When black rats (Rattus rattus) were re- moved as the primary predator, cats, which had been subsisting on rats, switched prey, diminishing ini- tial increases in nesting success achieved by the rat control pro- gram. Although non-lethal tactics, if they become available, would be expected to be more benign and specific in such situations, both le- gal and ethical considerations re- quire their careful assessment be- fore implementation takes place.
Regulatory constraints Obstacles to development of new materials and methods .are consider- able. These include a variety of con- straints imposed by regulatory agen- cies. Even when new repellent tech- nologies are uncovered, the path to commercial availability is long and
178 Endangered Species UPDATE Vol. 18 No. 4 2001
can be very expensive (Fagerstone and Schafer 1998). For example, methyl anthranilate is one of two new bird repellents to become commer- cially available in the United States during the past 25 years. This natu- ral substance is GRAS-listed (gener- ally recognized as safe) with the U.S. Food and Drug Administration and it has been widely used as a grape flavoring in human and animal feeds since the turn of the century. Despite these facts, registration efforts to per- mit spraying of methyl anthranilate on turf to deter grazing Canada geese (Branta canadensis) took five years and cost $5 million (P.J. Voigt, R. J. Advantage, Inc., personal communi- cation). While research on non-le- thal methods for agricultural appli- cations has been relatively well-sup- ported, support needed to develop and evaluate methods for endangered species applications has been more elusive, usually coming in the form of small grants that cannot cover long term costs of developmental research to meet regulatory requirements.
Combinations of stimuli Beauchamp (1 997), among others, has suggested that the most effective strategy in development of repellents may be use of combinations of stimuli. The evidence is consistent with this suggestion (Clark 1998b). Thus, a mixture of capsaicin (irrita- tion), thiram (sickness-based condi- tioned avoidance), and Big Game Repellent (sulfur-based fear) is a more effective deterrent to browsing white-tailed deer (Odocoileus virginianus) than any of these sub- stances alone (M. Richmond, U.S. Geological Survey, Cornell Univer- sity, personnel communication). Likewise, mixtures of methiocarb (sickness-based conditioned avoid- ance) and methyl anthranilate (irri- tation) are more effective than either substance alone. Cinnamaldehyde (Crocker and Perry 1990) and d-
pulegone (Mason 1990) are both broadly effective vertebrate (bird and mammal) repellents that have both irritant and sickness-inducing effects.
Conclusion Development and application of eco- logically sound and effective repel- lents is dependent upon a knowledge of the sensory Umwelt of the species in question (von Uexkull 1934). Even when aversive strategies can be successfully applied, their continued utility will likely depend on applica- tion of other techniques in a mosaic of management strategies designed to meet requirements of a specific lo- cation, time, and context. Indeed, se- lective removal of wildlife (either in terms of local population suppression or removal of specific individuals) may often be prerequisite for effec- tive implementation of non-lethal al- ternatives. For this reason, integrated strategies that incorporate both lethal and non-lethal methods will often be the most logical course for effective predation management. The high cost of development and application of alternative technologies for endan- gered species applications and the highly specific minor-use markets for such products, which limit private in- dustry interest in the problem, present challenges to the emergence of new technologies needed to help assure effective recovery of species threat- ened by predation.
Literature cited Andelt, W.E, R.L. Phillips, K.S. Gruver, and
J.W. Guthrie. 1999. Coyote predation on domestic sheep deterred with electronic dog-training collar. Wildlife Society Bul- letin 27:12-18.
Beauchamp, G.K. 1997. Chemical signals and repellency: problems and prognosis. Pp. 1- 10,Pp. 371-392, in J.R. Mason, ed. Repel- lents in Wildlife Management. Colorado State University Press, Ft. Collins, CO.
Beauchamp, G.K. and J.R. Mason. 1991. Comparative hedonics of taste. Pp. 159- 184 in R.C. Bolles, ed. The Hedonics of Taste. Lawrence Erlbaum and Associates.
Hillsdale, New Jersey. Bekoff, M. 1975. Predation and aversive
conditioning in coyotes. Science 187: 1096.
Blejwas, K.M., Sacks, B.N., Jaeger, M.M., and D.R. McCullough. In press. The ef- fectiveness of selective removal of breed- ing coyotes in reducing sheep depredation. Journal of Wildlife Management.
Bomford, M. and P.H. O'Brien. 1990. Sonic deterrents in animal damage control: a re- view of device tests and effectiveness. Wildlife Society Bulletin 18:411-422.
Bourne, J., and M.J. Dorrance. 1982. A field test of lithium chloride aversion to reduce coyote predation on domestic sheep. Jour- nal of Wildlife Management 46:235-239.
Budavari, S., M.J. O'Neil, A. Smith, P.E. Heckelman, and J.F. Kinneary, eds. 1996. The Merck Index, 12" Edition. Merck and Company, Whitehouse Station, NJ.
Burns, R.J. 1983. Microencapsulated lithium chloride bait aversion did not stop coyote predation on sheep. Journal of Wildlife Management 47: 1010- 1017.
Burns, R.J., and G.E. Connolly. 1980. Lithium chloride bait aversion did not in- fluence prey killing by coyotes. Proceed- ings of the Vertebrate Pest Conference 9:200-204.
Burns, R.J. and J.R. Mason. 1996. Effec- tiveness of Vichos non-lethal collars in de- temng coyote attacks on sheep. Proceed- ings of the Vertebrate Pest Conference 17~204-206.
Campbell, E.W., M.W. Fall, R.T. Sugihara, andA.E. Koehler. 1998. A review of wild- life damage management techniques de- veloped for use in agriculture that could be used for endangered species conserva- tion (abstract). Hawaii Conservation Con- ference, Honolulu, HI.
Clark, L. 1998a. Physiological, ecological, and evolutionary bases for the avoidance of chemical initants by birds. Current Or- nithology 14: 1-33.
Clark, L. 1998b. Bird repellents: interaction of chemical agents in mixture. Physiol- ogy and Behavior 64:689-695.
Conner, M.M., M.M. Jaeger, T.J. Weller, and D.R. McCullough. 1998. Effect of coy- ote removal on sheep predation in north- em California. Journal of Wildlife Man- agement 62(2):690-699.
Connolly, G. 1993. Livestock protection collars in the United States, 1988-1993. Proceedings Great Plains Wildlife Dam- age Control Workshop 11:25-33.
Connolly, G.E., R.E. Griffiths, Jr., and P.J. Savarie. 1978. Toxic collar for control of sheep-killing coyotes: a progress report. Proceedings of the Vertebrate Pest Con- ference 8: 197-205.
Vol. 18 No. 4 2001 Endangered Species UPDATE 179

Connolly, G. andB.W. OIGara. 1988. Aerial hunting takes sheep-killing coyotes in western Montana. Proceedings Great Plains Wildlife Damage Control Workshop 8:184-188.
Conover, M.R. 1982. Behavioral techniques to reduce bird damage to blueberries: methiocarb and hawk-kite predator mod- els. Wildlife Society Bulletin 10:211-216.
Conover, M.R. 1997. Behavioral principles governing conditioned food aversions based on deceptions. Pp. 29-41 in J. R. Mason, ed. Repellents in Wildlife Man- agement, Colorado State University Press, Ft, Collins, CO.
Conover, M.R., J.G. Francik, and D.E. Miller. 1977. An experimental evaluation of us- ing taste aversion to control sheep loss due to coyote predation. Journal of Wildlife Management 41:775-779.
Conover, M.R. and K.K. Kessler. 1994. Di- minished producer participation in an aver- sive conditioning program to reduce coy- ote depredation on sheep. Wildlife Soci- ety Bulletin 22:229-233.
Crocker, D.R. and S.M. Perry. 1990. Plant chemistry and bird repellents. Ibis 132:300-308.
Cruz, F. and J.B. Cruz. 1987. Control of black rats (Rattus rattus) and its effect on nesting dark-rumped petrels in the Galapagos Islands. Vida Silvestre Neo- tropical l(2): 3-13.
Dumbacher, J.P., B.M. Beehler, T.F. Spande, H.M. Garraffo, and J.W. Daly. 1992. Homobatrachotoxin in the genus Pitohui: Chemical defense in birds? Science 258:799-80 1.
Ellins, S.R. and G.C. Martin. 1981. Olfac- tory discrimination of lithium chloride by the coyote (Canis latrans). Behavioral and Neural Biology 31:214-224.
Fagerstone, K.A. and E.W. Schafer, Jr. 1998. Status of APHIS vertebrate pesticides and drugs. Proceedings of the Vertebrate Pest Conference 18:3 19-324.
Fall, M.W. 1990. Control of coyote preda- tion on livestock- progress in research and development. Proceedings of the Verte- brate Pest Conference 14:245-25 1.
Fall, M.W. and W.B. Jackson. 1998. A new era of vertebrate pest control? Interna- tional Biodeterioration & Biodegradation 42:85-91.
Forthman-Quick, D.L., C.R. Gustavson, and K.W. Rusiniak. 1985a. Coyote control and taste aversion. Appetite 6:253-264.
Forthman-Quick, D.L., C.R. Gustavson, and K.W. Rusiniak. 1985b. Coyotes and taste aversion: the authors' reply. Appetite 6:284-290.
Gustavson, C.R. 1974. Taste aversion con- ditioning as a predator control method in
the coyote and ferret. Ph.D. dissertation. University of Utah.
Gustavson, C.R., L.P. Brett, J. Garcia, and D.J. Kelly. 1978. A working model and experimental solutions to the control of predatory behavior. Pp.21-66 in H. Markowitz and V.J. Stevens, eds. Behav- ior of Captive Wild Animals. Nelson and Hall, Chicago. 314 pp.
Gustavson, C.R., J.R. Jowsey, and D.N. Milligan. 1982. A 3-year evaluation of taste aversion coyote control in Saskatchewan. Journal of Range Manage- ment 3557-59.
Gustavson, C.R., J. Garcia, W.G. Hankins, and K.W. Rusiniak. 1974. Coyote preda- tion control by aversive conditioning. Science 18458 1-583.
Gustavson, C.R., D.J. Kelly, and J. Garcia. 1975. Predation and aversive condition- ing in coyotes. Science 187: 1096.
Hecht, A. and P.R. Nickerson. 1999. The need for predator management in conser- vation of some vulnerable species. En- dangered Species Update 16: 114-1 18.
Horn, S.W. 1983. An evaluation of preda- tory suppression in coyotes using lithium chloride-induced illness. Journal of Wild- life Management 47:999-1009.
Jelinski, D.E., R.C. Rounds, and J.R. Jowsey. 1983. Coyote predation on sheep, and control by aversive conditioning in Saskatchewan. Journal of Range Manage- ment 3616-19.
Koehler, A.E., R.E. Marsh, and T.P. Salmon. 1990. Frightening methods and devices/ stimuli to prevent mammal damage - a re- view. Proceedings of the Vertebrate Pest Conference 14: 168- 173.
Kimball, B.A., J.R. Mason, F.S. Blom, J.J. Johnston, and D.E. Zemlicka. 2000. De- velopment and testing of seven new syn- thetic coyote attractants. Journal of Agri- cultural and Food Chemistry 48:1892- 1897.
Knowlton, F., E.M. Gese, and M.M. Jaeger. 1999. Coyote depredation control: an in- terface between biology and management. Journal of Range Management (5): 398-412.
Lewin, R. 1986. Why dynamiting vampire bats is wrong. Science 232:24-26.
Lewison, R., N.J. Bean, E.V. Aronov, and J.R. Mason. 1995. Similarities between big game repellent and predator urine repel- lency to white-tailed deer: the importance of sulfur and fatty acids. Proceedings of the Eastern Wildlife Damage Control Con- ference : 145-148.
Linhart, S.B., J.D. Roberts, and G.J. Dasch. 1982. Electric fencing reduces coyote pre- dation on pastured sheep. Journal of Range Management 35276-281.
Linhart, S.B., J.D. Roberts, S.A. Shumake, and ReJohnson. 1976. Avoidance of prey by captive coyotes punished by electric shock. Proceedngs of the Vertebrate Pest Conference :302-306.
Linhart, S.B., R.T. Sterner, G.J. Dasch, and J.W. Theade. 1984. Efficacy of light and sound stimuli for reducing coyote preda- tion upon pastured sheep. Protection Ecol- ogy 6:75-84.
Martin, J. and A.OIBrien. 2000. The use of bone oil (Renardine) as a coyote re- pellent on sheep farms in Ontario. Pro- ceedings of the Vertebrate Pest Confer- ence 19:310-314.
Mason, J.R. 1990. Evaluation of pulegone as an avian repellent. Journal of Wildlife Management 54: 130- 135.
Mason, J.R., W.C. Pitt, andM.J. Bodenchuk. In press. Factors influencing the efficiency of fixed-wing aerial hunting for coyotes in the western United States. International Biodeterioration & Biodegradation.
Mason, J.R. and L. Clark. 1997. Avian re- pellents: options, modes of action, and economic considerations. Pp. 371-392 in J. R. Mason, ed. Repellents in Wildlife Management. Colorado State University Press, Ft. Collins, CO.
Mason, J.R., J.F. Glahn, R.F. Reidinger, and R.A. Dolbeer. 1985. Field trial of dim- ethyl anthranilate as a nontoxic bird re- pellent in cattle and swine feedlots. Jour- nal of Wildlife Management 49:636-642.
Mason, J.R., J. Hollick, B.A. Kimball, and J.J. Johnston. 1999. Repellency of Deer Away big game repellent to eastern cot- tontail rabbits. Journal of Wildlife Man- agement 63:309-314.
Mason, J.R. and J.A. McConnell. 1997. He- donic responsiveness of coyotes to 15 aqueous taste solutions. Journal of Wild- life Research 2:21-24.
Milunas, M.C., A.F. Rhoads and J.R. Mason. 1994. Effectiveness of odor repellents for protecting ornamental shrubs from brows- ing by white-tailed deer. Crop Protection 13:393-397.
Mitchell, G.C. 1986. Vampire bat control in Latin America. Pp. 152- 164 in National Research Council. Ecological Knowledge and Environmental Problem-Solving. Na- tional Academy Press, Washington, D.C.
Nicolaus, L.K., J.F. Cassel, B.B. Carlson, and C.R. Gustavson. 1983. Taste-aversion conditioning of crows to control predation on eggs. Science 220:212-214.Nicolaus,
L.K., T.E. Hoffman, and C.R. Gustavson. 1982. Taste aversion conditioning in free- ranging raccoons, Procyon lotor. North- west Science 56:165-169.
Nicolaus, L.K. and D. Nellis. 1987. The first evaluation of the use of conditioned
180 Endangered Species UPDATE Vol. I8 No. 4 2001

taste aversion to control predation by mon- gooses upon eggs. Applied Animal Behaviour Science 17:329-334.
Nolte D.L., J.R. Mason, G. Epple, E. Aronov, and D.L. Campbell. 1994a. Why are predator urines aversive to prey? Journal of Chemical Ecology 20: 1505-1516.
Nolte, D.L., J.R. Mason and L. Lewis. 1994b. Tolerance of bitter compounds by an herbivore, Cavia porcellus. Journal of Chemical Ecology 20:303-308.
Norman, D.M., J.R. Mason, and L. Clark. 1992. Capsaicin effects on consumption of feed .by cedar waxwings, and house finches. Wilson Bulletin 104549-551.
Pelchat, M.L., H.J. Grill, P. Rozin, and J. Jacobs. 1983. Quality of acquired re- sponses to tastes by Rattus norvegicus de- pends on the type of associated discom- fort. Journal of Comparative Psychology 97: 140-153.
Reidinger, R.F. and J.R. Mason. 1983. Evaluation and exploitation of weaknesses in behavioral defenses against dietary poi- soning. Pp. 20-39 in D.E. Kaukienen, ed. Test Methods for Vertebrate Pest Control and Management Materials. ASTM STP 817, American Society for Testing and Materials, Philadelphia.
Riley, A.L., and D.L. Tuck. 1985. Conditioned food aversions: a bibliography. Pp. 381-437 in N.S. Braveman and P. Bronstein, eds. Experimental Assessments and Clinical Ap- plications of Conditioned Food Aversions. Annals of the New York Academy of Sci- ences Series, Volume 443. NewYorkAcad- emy of Sciences, New York.
Sacks, B.N., K.M. Blejwas, and M.M. Jae- ger. 1999. Relative vulnerability of coy- otes to removal methods on a northern
California ranch. Journal of Wildlife Management 63(3):939-949.
Sargeant, A.B., and P.M. Arnold. 1984. Predator management for ducks on water- fowl production areas in the northern plains. Proceedings of the Vertebrate Pest Conference 11:161-167.
Schmidt, P.J., W.C. Sherbrooke, and J.O. Schmidt. 1989. The detoxification of ant (Pogonomyrmex) venom by a blood fac- tor in horned lizards (Phrynosoma). Copeia 3:603-607.
Semel, B. and L.K. Nicolaus. 1992. Estro- gen-based aversion to eggs among free- ranging raccoons. Ecological Applications 2:439-449.
Shivik, J.A., and D.J. Martin. In press. Aver- sive and disruptive stimulus applications for managing predation. Proc. Eastern Wildlife Damage Management Confer- ence.
Sterner, R.T. and S.A. Shumake. 1978. Bait- induced prey aversions in predators: some methodological issues. Behavioral Biol- ogy 22565-566.
Stevens, G.R., J. Rogue, R. Weber, and L. Clark. 2000. Evaluation of a radar-acti- vated demand-performance bird hazing system. International Biodeterioration and Biodegradation 45: 129-1 37.
Swihart, R.K. 1990. Quebracho, thiram and methiocarb reduce consumption of apple twigs by meadow voles. Wildlife Society Bulletin 18: 162-166.
Ternent, M.A. and D.L. Garshelis. 1999. Taste-aversion conditioning to reduce nui- sance activity by black bears in a Minne- sota military reservation. Wildlife Society Bulletin 27:720-728Ti11, J.A. and F.F. Knowlton. 1983. Efficacy of denning in
alleviating coyote depredations upon do- mestic sheep. Journal of Wildlife Man- agement 47(4): 1018- 1025.
Thomson, W.T. 1995. Agricultural Chemi- cals, Book III: Fumigants, Growth Regu- lators, Repellents, and Rodenticides. Thomson Publications, Fresno, CA.
Von Uexkull, J. 1934. A stroll through the worlds of animals and men: a picture book of Iinvisible worlds. Pp. 5-76 (translation) in C.H. Schiller, ed. 1957. Instinctive Be- havior: The Development of a Modem Concept. International Universities Press, New York.
K.K. Wagner and M.R. Conover. 1999. Ef- fect of preventive coyote hunting on sheep losses to coyote predation. Journal of Wildlife Management 63(2):606-6 12.
Werner, S., A. El Hani, and J.R. Mason. 1998. Repellent coatings for irrigation hose: effectiveness against coyotes. Jour- nal of Wildlife Research 2: 146- 148.
Wickler, W. 1968. Mimicry in Plants and Animals. New York, McGraw-Hill Pub- lishing Company, New York.
Witmer, G.W., J.L. Bucknall, T.H. Fritts, and D.G. Moreno. 1996. Predator manage- ment to protect endangered avian species. Transactions of the North American Wild- life and Natural Resources Conference 61: 102-108.
Witmer, G.W. and M.W. Fall. 1995. Man- aging mammalian carnivores to protect en- dangered species (abstract). The Wildlife Society 2nd Annual Conference, Portland, OR.
Zemlicka, D. and J.R. Mason. 2000. Re- sponse of captive coyotes to Renardine coyote repellent. Proceedings of the Ver- tebrate Pest Conference 19:336-338.
Vol. 18 No. 4 2001 Endangered Species UPDATE 181


Disadvantages of guarding dogs include: some dogs not stay- ing with or harassing sheep; some dogs, especially Komondors, being overly aggressive toward people (Green and Woodruff 1988; Andelt 1992); and the dogs can be subject to injury and premature death. Many of the disadvantages are rela- tively uncommon. Most producers surveyed feel strongly that the ad- vantages of their dogs far outweigh the disadvantages.
Green and Woodruff (1988) re- ported that the rate of success in protecting livestock from predators did not vary among Great Pyrenees, Komondor, Akbash, Anatolians, Maremma, and hybrids, nor was the rate of success different among males and females or intact and neutered dogs. Dogs that were reared with livestock from at most two months old, however, had a sig- nificantly higher rate of success than dogs that were older than two months when placed with livestock. Andelt (1999) reported that ratings of the effectiveness of guarding dogs by producers using one breed of dog in Colorado did not differ among breeds, but producers that used multiple breeds rated Akbash more effective than Great Pyrenees and Komondors.
Llamas Llamas have been used to deter pre- dation primarily by coyotes, red foxes (Vulpes vulpes), and dogs since the early 1980s. The National Agricultural Statistics Service (2000) reported that 13% of the sheep producers in the United States used llamas to protect sheep from predators during 1999. Lla- mas are naturally aggressive toward coyotes and dogs. Typical re- sponses of llamas to coyotes and dogs are being alert, alarm calling, walking to or running toward the predator, chasing, kicking, or paw-
ing the predator, herding the sheep, or positioning themselves between the sheep and predator.
Franklin and Powell (1993) sur- veyed 145 producers that used lla- mas, primarily in Montana, Wyo- ming, Colorado, California, and Or- egon. Most producers used one gelded male with 250 to 300 sheep in 250 to 300 acre pastures. Nearly all llamas were not raised with sheep and were not trained to guard sheep. One llama was more effec- tive than multiple llamas for deter- ring predation; the effectiveness of gelded males, intact males, and fe- males was similar. Producers re- ported, however, more problems with intact (25% of 61 intact males) than gelded males (5% of 135 gelded males) attempting to breed with ewes. Sheep that were intro- duced to llamas in corrals initially sustained lower mortality than those introduced in pastures. The success of llamas was not related to age when the llama was introduced, age of llama (after one or two years old) when guarding, if lambs were present or absent when the llama was intro- duced, or between open and covered (forested, shrub lands, gullies, ra- vines, etc.) habitat.
Franklin and Powell (1993) re- ported that gelded male llamas cost $700 to $800, whereas intact males were about $100 less. Most produc- ers reported that daily care for llamas was the same as for sheep and that no special feeds were provided. Av- erage annual expense was $90 for feed (not including pasture) and vet- erinary costs were about $15.
Franklin and Powell (1993) re- ported that 21% of ewes and lambs were killed annually before acquir- ing a llama and 7% afterwards. Meadows and Knowlton (2000) re- ported that producers with llamas lost significantly fewer sheep (n = 42) to predators than producers without lla- mas (n = 128) during the first year of
use, but sheep mortalities did not dif- fer between producers with (n = 35) and without (n = 32) llamas during the second year in Utah.
Donkeys The National Agricultural Statistics Service (2000) reported that 9% of sheep producers in the United States used donkeys (Equus asinus) to pro- tect sheep from predators during 1999. Donkeys apparently have an inherent dislike for dogs and other canids. They will bray, bear their teeth, run and chase, and attempt to bite and kick an intruder (Green 1989).
Donkeys apparently are most effective in small open pastures or where sheep graze together. Green (1989) and Walton and Feild (1989) recommended using only one jenny or gelded jack per pasture because two or more donkeys often stay to- gether instead of being with the sheep. Intact jacks generally are too aggressive around sheep. Don- keys generally should be allowed four to six weeks for bonding with sheep before they are used to deter predators. Donkeys should be re- moved during lambing because they might trample lambs or disrupt the ewe-lamb bond. Green (1990) recommended challenging a don- key with a dog to test its response to canids; donkeys that are not ag- gressive should not be used.
Walton and Feild (1989) re- ported that the average purchase price per donkey was $144. They also reported that average annual upkeep per donkey was $66.
Bonding sheep and goats to cattle Bonding young sheep to cattle (Anderson et al. 1987; Hulet et al. 1987) and goats to sheep that have been bonded to cattle (Hulet et al. 1989) has reduced coyote preda- tion. This technique has not been readily adopted by sheep producers,
Vol. 18 No. 4 2001 Endangered Species UPDATE 183

possibly because of the additional labor and expense involved with bonding sheep and goats to cattle.
Relative effectiveness of guarding animals Benefits of using guarding animals include a decrease or elimination of predation, reduced labor to confine sheep at night, more efficient use of pastures for grazing, reduced re- liance on other predator control techniques, and a greater peace of mind. A comparison of surveys where producers reported the aver- age annual value of sheep saved per guarding animal suggests guarding dogs, compared to llamas, saved more sheep from predators (Table 1). Guarding dogs and llamas have been rated as more effective than donkeys for deterring predation. The above comparisons should be interpreted conservatively because guarding dogs, llamas, and donkeys were not surveyed in the same stud- ies nor under the same sheep man- agement conditions.
Advantages of donkeys and lla- mas over guarding dogs include: less prone to accidental death; longer-lived; do not require special feeds; stay in the same pasture as sheep; apparently do not need to be raised with sheep; more compatible with other depredation control tech- niques such as traps, snares, M-44s, and livestock protection collars; and donkeys are cheaper than guarding dogs. Guarding dogs ap- parently have some advantages over donkeys and llamas. Guard- ing dogs deter predators in fenced pastures and on open range, whereas llamas and donkeys appear most effective in fenced pastures smaller than 300 acres. Guarding dogs are effective in deterring bear and mountain lion predation (Green and Woodruff 1989; Andelt and Hopper 2000), whereas some don- keys (Green 1989) and possibly lla-
mas are afraid of bears and moun- tain lions. Guarding dogs also ap- peared successful in protecting catt le from wolf predation (Coppinger et al. 1988), and were fairly effective in keeping wolves and black bears from carrion feed- ing sites in Minnesota (Coppinger et al. 1987).
Several methods, including livestock confinement, disposal of livestock carcasses, herders, fenc- ing, frightening devices, trapping, snaring, sodium cyanide ejectors, "denning" (locating the dens of depredating coyotes and killing the pups andlor adults), aerial hunting, ground shooting, hunting with de- coy dogs, livestock protection col- lars, and poison baits have been used to reduce predation on live- stock (Andelt 1996). Poison baits were withdrawn from use in 1972 (Andelt 1996), and use of some methods such as trapping, snaring, sodium cyanide ejectors, gas car-
tridges for denning coyotes, and livestock protection collars have been restricted or eliminated by bal- lot initiatives in some states such as Arizona, California, Colorado, and Massachusetts (Manfred0 et al. 1999). The public also has rated guarding animals as more accept- able than most other techniques for reducing predation (Arthur 198 1; Reiter et al. 1999). Thus, guarding animals are one of the few remain- ing successful techniques, in some states, that livestock producers can use to mitigate predation.
Green and Woodruff (1989) and Green et al. (1993) reported that guarding dogs repelled black bears and grizzly bears (Ursus arctos) during most encounters, and Andelt and Hopper (2000) reported that producers with guarding dogs, compared to producers without guarding dogs, sustained fewer ewe and lamb mortalities to black bears. Thus, guarding dogs may offer
Table 1. Average annual value of sheep saved from predation by each livestock guarding animal and ratings of effectiveness of guard- ing animals as reported in various studies.
"reen et al. (1 984) bFranklin and Powell (1 993) "ndelt and Hopper (2000) dGreen and Woodruff (1 988) eAndelt (1 992) 'Meadows and Knowlton (2000) gWalton and Feild (1 989)
184 Endangered Specks UPDATE Vol. 18 No. 4 2001

some potential for reducing grizzly bear predation on livestock, which may result in conserving more bears.
Many of our carnivores are found on private lands and in areas where livestock are grazed on pri- vate and public lands. Producers need to have successful techniques for resolving predation on live- stock. Without successful methods, predation on livestock will increase and animosity by livestock produc- ers toward predators likely will also increase, which will result in fewer attempts to conserve carnivores. Without successful techniques, pro- ducers also may sell their land for other uses, such as subdivisions, which are less conducive to carni- vore conservation. Thus, guarding dogs, llamas, and donkeys should be thought of as valuable additions to the toolbox of management prac- tices that reduce predation on live- stock. In addition, use of guarding animals may result in enhanced conservation of carnivores.
Literature cited Andelt, W.F. 1985. Livestock guarding
dogs protect domestic sheep from coy- ote predation in Kansas. Proceedings Great Plains Wildlife Damage Control Workshop7:lll-113.
Andelt, W.F. 1992. Effectiveness of live- stock guarding dogs for reducing preda- tion on domestic sheep. Wildlife Soci- ety Bulletin 20:55-62.
Andelt, W.F. 1995. Livestock guard dogs, llamas, and donkeys for reducing live- stock losses to predators. Cooperative Extension Bulletin Number 1.218, Colo- rado State University, Fort Collins.
Andelt, W.F. 1996. Carnivores. Pp133- 155 in P. R. Krausman, ed. Rangeland wildlife. The Society for Range Man- agement, Denver, Colorado.
Andelt, W.F. 1999. Relative effectiveness of guarding-dog breeds to deter preda- tion on domestic sheep in Colorado. Wildlife Society Bulletin 27:706-714.
Andelt, W.F., and S.N. Hopper. 2000. Livestock guard dogs reduce predation on domestic sheep in Colorado. Journal of Range Management 53:259-267.
Anderson, D.M., C.V. Hulet, J.N. Smith, W.L. Shupe, and L.W. Murray. 1987. Bonding young sheep to heifers. Ap- plied Animal Behaviour Science 19:3 1- 40.
Arthur, L.M. 1981. Coyote control: the public response. Journal of Range Man- agement 34: 14-15.
Coppinger, R., L. Coppinger, G. Langeloh, and L. Gettler. 1988. A decade of use of livestock guarding dogs. Proceedings Vertebrate Pest Conference 13:209-214.
Coppinger, R., J . Lorenz, and L. Coppinger. 1983. Introducing livestock guarding dogs to sheep and goat produc- ers. Proceedings Eastern Wildlife Dam- age Control Conference 1: 129- 132.
Coppinger, R. , J . Lorenz, and L. Coppinger. 1987. New uses of livestock guarding dogs to reduce agriculture1 wildlife conflicts. Proceedings Eastern Wildlife Damage Control Conference 3:253-259.
Franklin, W.L., and K.J. Powell. 1993. Guard llamas. Iowa State University Ex- tension Bulletin, Ames, Iowa.
Green, J.S. 1989. Donkeys for predation control. Proceedings Eastern Wildlife Damage Control Conference 4:83-86.
Green, J.S. 1990. Reducing predation with guarding animals. University of Cali- fornia Hopland Field Station Publication 101:62-68.
Green, J.S., and R.A. Woodruff. 1988. Breed comparisons and characteristics of use of livestock guarding dogs. Journal of Range Management 41:249-251.
Green, J.S. and R.A. Woodruff. 1989. Live- stock-guarding dogs reduce depredation by bears. Pp 49-54 in M. Bromley, ed. Bear-people conflicts: proceedings of a symposium on management strategies. Northwest Territories Department of Re- newable Resources, Yellowknife, North- west Territories, Canada.
Green, J.S., R.A. Woodruff, and T.T. Tueller. 1984. Livestock-guarding dogs for predator control: costs, benefits, and practicality. Wildlife Society Bulletin 12:44-50.
Green, J.S., R.A. Woodruff, and P.J. Wick. 1993. Bears, ostriches, and specialized grazing: putting guarding dogs to work. Proceedings of the Great Plains Wildlife Damage Control Workshop 11: 105-108.
Hulet, C.V., D.M. Anderson, J.N. Smith, and W.L. Shupe. 1987. Bonding of sheep to cattle as an effective technique for predation control. Applied Animal Behaviour Science 19: 19-25.
Hulet, C.V., D.M. Anderson, J.N. Smith, W.L. Shupe, C.A. Taylor, Jr., and L.W. Murray. 1989. Bonding of goats to sheep and cattle for protection from predators. Applied Animal Behaviour Science 22:261-267.
Manfredo, M.J., C.L. Pierce, D. Fulton, J. Pate, and B.R. Gill. 1999. Public ac- ceptance of wildlife trapping in Colo- rado. Wildlife Society Bulletin 27:499-508.
Meadows L.E., and F.L. Knowlton. 2000. Efficacy of guard llamas to reduce ca- nine predation on domestic sheep. Wild- life Society Bulletin 28:614-622.
National Agricultural Statistics Service. 2000. Sheep and goats predator loss. USDA, National Agricultural Statistics Service, Report Mt An 2 (5-OO), Wash- ington, D.C.
Pearson, E.W. 1986. A literature review of livestock losses to predators in west- ern U.S. Final Report, U.S. Department of Interior, Fish and Wildlife Service, Denver, Colorado.
Pfeifer, W.K., and M.W. Goos. 1982. Guard dogs and gas exploders as coyote depredation control tools in North Da- kota. Proceedings Vertebrate Pest Con- ference 10:55-61.
Reiter, D.K., M.W. Brunson, and R.H. Schmidt. 1999. Public attitudes toward wildlife damage management and policy. Wildlife Society Bulletin 27:746-758.
Walton, M.T. and C.A. Feild. 1989. Use of donkeys to guard sheep and goats in Texas. Proceedings Eastern Wildlife Damage Control Conference 4:87-94.
Vol. 18 No. 4 2001 Endangered Species UPDATE 185

Opinions Historical Attitudes and Images and the Implications on Carnivore Survival Karlyn Atkinson Berg Wolf Consultant, Humane Society of the United States, 44781 Bittner Point Road, Bovey, MN 55709; (218) 245-3049; [email protected]
Abstract This paper examines how mythological images and historical attitudes emerge and influence our interactions with different predator species, such as the grizzly bear (Ursus arctos), cougar (Puma concolor), lynx (Lynx canadensis), wolf(Canis lupus), coyote (Canis latrans), and raven (Corvus corax). The author will compare the relationship between humans and carnivores, and how attitudes and beliefs have impacted different predator species. Do people regard certain carnivores as more fierce, dangerous, or problematic? Is there more animosity and disparate levels of hostility or tolerance toward the different carnivores? Have these attitudes influenced concepts and ethics applied to wildlife management? How is the value of predators measured, considered or applied? Can understanding the different perceptions help resolve complicated issues, such as reintroduction, critical habitat, depre- dation conflicts, animal damage control, and management? The author believes scientific knowledge is not enough to achieve acceptance of carnivores. The purpose of this inquiry will be to discover i f knowledge and education can develop understanding and tolerance of all predators, and thus enhance the commitment to co-exist with carnivore species
Mythlcal images and historical attitudes may still influence human interactions with carnivores such as the grizzly bear (Ursus arctos), cougar (Puma concolor), lynx (Lynx canadensis), wolf (Canis lupus), coyote (Canis latrans), and raven (Cowus corax). The earliest historic records, creation stories, and fables were examined. No- tably, at the advent of agriculture, Akkadian literature delineates the split between humans and nature, and the god Ea predicts that from this time for- ward, nature will be hostile to man. He asserts that lion, wolf, famine and plague will not be removed from humankind's dilemmas, but provided "to rise up and cut the people low" (Gardnerl984). This division between wilderness and the tamed domestic lands that humans seek does seem to have taken place, and remains a cur- rent conflict among predators, wilder- ness advocates, and ranchers.
Historical attitudes and cultural beliefs have impacted many differ- ent predator species. From Viking bearskin wearers to the arrival of humans in the New World, most carnivores continued to meet the same fate. Most of the legends re- volve around the fear of wilderness, the idea of good and bad animals, and the need to remove all that stands in the way of progress. Species with fang and claw that hunted the good prey (which humans wanted for themselves) are traditionally de- scribed as the bad animals. The predator is reduced to the status of marauder and thief, and hence sub- jected to extermination.
Do people regard certain carni- vores as more fierce, dangerous, or problematic? Some species have been described with more vivid hostile imagery that did not reflect actual biological evidence of their
threat to humans, but had more to do with deeply rooted bias and mythological symbolism.
The cougar is commonly de- scribed as the coward. Theodore Roosevelt described a cougar he had treed as "the big horse-killing cat, the destroyer of the deer, the lord of stealthy murder, facing his doom with a heart both craven and cruel" (Danz 1999; Worster 1977; Roosevelt 1913). The cougar is re- peatedly described as a cunning, merciless, and sneaky cat. The por- trayal is made with little concern that a trait like stealth is a neces- sary ability to survive as a cougar, and has little to do with intentions of mere cruelty for cruelty's sake. Predation is often perceived as murder, not as a pursuit of food.
The bear, however, is character- ized more in terms of admiration, combining descriptions of its sav-
186 Endangered Species UPDATE Vol. 18 No. 4 2001

Grizzly bear (Ursus arctos). Photograph by B. Moose Peterson1 WRP.
ageness with the animal's almost human dignity. Descriptions such as "unbelievable size of the brute" and "lordly intelligence" (Young 1980) serve as examples of the bear's more dignified status among the carnivores. The name Old Ephraim, taken from the Biblical patriarch of noble lineage, is hon- orably bestowed upon the bear.
Other cultures, such as the Na- tive Americans, viewed bears as half human, for the bear walked the
same trails, fished for the same salmon, dug for roots, harvested berries, seeds, and nuts, caught meat, and could stand upright like humans. While the grizzly bear was feared as dangerous, it was consid- ered a powerful shaman of the ani- mal world. The depiction of the bear is not infamous, though it was considered dangerous for humans to encounter. Keith Johnson, a mas- ter guide, actually admires the al- leged viciousness of the bear, say-
ing, "A grizz or a brown is a bear, but a black is a dog. They don't even belong in the same category. I don't have much respect for a black bear as a vicious animal" (Kaniut 1983).
Native Americans admired the per- severance and hunting prowess of the wolf. These traits were despised by wolf hunters who consistently describe the wolf as ruthless, treacherous, and a cruel demon that exists in spite of man's will. Myths also accuses the wolf of not only devouring human bodies, but also devouring the soul for the devil. The "yellow eyes as the lamps of the devil" is apparently still an image that persists (Berg un- published manuscript). A Minnesota state legislator recently exclaimed, "wolves are serial killers" (McAuliffe 1999), and a sign held at hearings at declared, "Pedophiles and wolves kill children" (Sandstrom 1998)
The coyote is described as a te- nacious varmint (the last of the out- laws), detested for its intelligence, and defined as crafty or the mytho- logical Trickster. As prophesied for the wolf, fears are exaggerated about predators, and people pro- claim that it is only a matter of time before a coyote is going to jump onto someone's deck, grab their child, and run off. (Interestingly, a proposed black bear hunt in New Jersey was canceled after wildlife organizations protested. But there was minimal outcry over the coy- ote hunt that was also proposed.) People see the bear as a cuddly ani- mal worth protecting because of their teddy bear experience. Con- versely people fear the wolf and coyote because of the negative childhood stories about these ca- nines. Unfortunately the Teddy Bear image causes problems be- cause people feel they can treat real black bears as the cute stuffed bear they have at home. This ultimately puts the people and bears in danger.
Vol, 18 No. 4 2001 Endangered Specles UPDATE 187
Mythical depiction has not spared any of these species. Even the lordly bears or monarchy of the big cats were considered killers in the way of progress. The value of a varmint has traditionally been cal- culated as being worthless. The historic, negative attitudes prevail; throughout history, humans have not progressed, learned from mis- takes, improved methods, nor be- come enlightened on the value of predators. Unfortunately, predator programs and proposals of the year 2000 are not much improved from those of the past. Society seems to be in an era of rational compromise that may be headed in reverse.
Perhaps it has been forgotten that conservation evolved from the progressive political movement which valued nature, lands, trees, and wildlife as a commodity to be used for human economic success. The movement set forth the goals of more efficient management and maximum utilization of natural re- sources, not conservation or the preservation of biodiversity. Be- tween 1901 and 1909, as the pro- gressive ideology developed, it soon included an extensive program designed to exterminate predators and make America safe from their thieving presence. The rescue of nature from these killers would no longer be carried out just by pio- neers, ranchers, and lone wolf hunt- ers. The new Bureau of the Bio- logical Survey (BBS), as part of the Department of Agriculture, would now reinforce the ferocity against predators. Thus, a major focus of conservation in the early years was the well-funded, staunch effort to deliberately eradicate predators. Today, this practical technique of killing any creature that does not suit humans has been renamed flex- ible management.
It is important to remember that the tremendous loss of our nation's
predators was not an accidental byproduct of progress, but a well- organized extermination. The BBS was also a center for state bounty information, which published pam- phlets on the habits of predators, and bulletins about the best trap- ping scents and poisons with which to kill the animals. In 1915, Con- gress appropriated $125,000 di- rectly to fund this war on predators. This amount kept increasing; thus in 1950, $1,098,00 was allocated, and by 1970, $3,267,000 (Advisory Committee on Predator Control 1972). The program was defined by Jenks Cameron of the BBS as "suppressive warfare against unde- sirable, injurious wildlife," and "the protection and encouragement of wildlife in its desirable and benefi- cial forms" (Worster 1977).
In these modern times, most of us have thought that the idea of poi- son, especially 1080, would not loom again over wildlife, or that bounties-repeatedly proven to be ineffective, fraudulent, and wasteful -would not be promoted. However, Wyoming recently proposed a $1000 bounty, fortunately vetoed by the governor. But in Minnesota, Gov- ernor Jesse Ventura just signed a law that includes a $150 bounty, now called a predator payment. The new management law also allows dis- cretionary killing by ranchers.
People are familiar with legis- lators' negative views on predators, but what about the modern scien- tists? Have their data redefined the value of the varmint by its ecologi- cal place in the ecosystem? It is quite disappointing to see recent scientific papers calculating mon- etary formulae to promote the view that it is cost efficient to only main- tain a population of 1400 wolves in the wilderness and semi-wilderness of Minnesota (e.g., Mech 1998). The average annual cost, according to these calculations, would be $86
per wolf of 1438 wolves living pri- marily in the wilderness, and an ad- ditional $197 per wolf outside the designated area (surplus animals, dismissed as unnecessary extras).
Unfortunately, this study wrongly assumed the cost of the compensation program were pay- ments made to verified wolf depre- dation cases only. In fact, the com- pensation granted by state conser- vation officers is not based on sci- entific verification, and often con- flicts with the Federal examination findings. Considerable payments were made to cases that were not wolf-related or verified, and some were documented by the Federal program as outright fraud.
The thesis also wrangly as- sumes that most or all wolves out- side of the designated area contrib- ute to depredation. Current wolf plans appear to be determined by how many wolves humans can kill and get away with, rather then how few wolves create problems and need to be removed. The study wrongly excludes the savings that could occur with good, preventative husbandry methods, set in place with non-lethal advancements.
However, is the only measure of their existence based on a bargain price value system? E.O. Wilson says it is prudent "to judge every scrap of biodiversity as priceless" (Wilson 1992). What is the real cost if wolves are not allowed to exist?
It is most distressing that a bi- ologist should calculate the eco- nomic value of wolves, rather than focusing on their ecological value, by saying that "wolves inhabiting wilderness cost little to societyt' (Wilson 1992). Wilson's words seem to fit this sad situation: "If a price can be put on something, that something can be devalued, sold and discarded" (Wilson 1992).
The study ponders an even more disturbing premise by noting
188 Endangered Species UPDATE Vol. 18 No. 4 2001

that trapping and hunting would not be efficient methods of wolf con- trol. The following question is raised: Without using poison or substantial financial incentives, would the Minnesota wolf population be controllable in 2005? It is pro- posed that the sooner controls begin, the easier and less costly it will be.
Sadly, society seems to have entered a monumental era derived from the philosophy of Descartes. Apparently, all nonhuman animals are machines, and nature (as a gi- ant mathematical mechanism) is to be measured, counted, computer- ized, and placed on a GIs map, with a statistical and monetary formula to determine how many specimens are profitable and thus allowed to survive. It seems that humans have yet to find what Aldo Leopold called ecological conscience (Leopold 1949). As long as preda- tor control is based on the bullet as the cheapest method, there will be no earnest attempt to initiate pre- ventative, non-lethal, and humane management programs.
Fear is a force still working against predators. Although some carnivores are capable of attacking people, these are rare encounters. Education has to include not only how to avoid predator encounters, but also teaching a willingness to give them space. It has been clearly demonstrated that modern tech- nologies that decimate nature are adequate. Society needs to strive and find ways for living success- fully in association with our native fauna and flora. Do people want
wilderness, or Disney areas with just enough species to entertain from a safe distance? Is a wilder- ness experience a mob howling ad- venture? Do carnivores need to fit into approved behaviors? Are people willing to not intrude some habitats, or at least enter with knowledge and respect? Do carni- vores have an intrinsic right to exist without directly helping humanity?
The majority of Americans sup- port protection of large predators and restoration of a diverse, natu- ral ecosystem. They do not support the abuse and over-utilization of public lands, nor the destruction of wild animals, wild lands, and natu- ral resources for private interest groups. Humans have a responsi- bility to protect other species, even if it is inconvenient. Species should not be removed from protection for short term political favors to spe- cial interest groups. The stakehold- ers of our lands have been narrowly defined as consumptive users for too long. More importantly, future generations and wild creatures are the most vulnerable to today's ac- tions. What legacy will society leave for future generations?
Carnivore recovery should be based on ecological principles, not political pandering. Recovery must ensure the long-term survival of the species, and also restore functional ecosystems that will benefit the full range of wildlife and human com- munities that depend on them.
Coexistence with large predators requires tolerance and education.
The future of carnivores is still threat- ened by hostile attitudes. Wild car- nivores are a part of American cul- ture and heritage; their preservation cannot be neglected. Responsible stewards need to be on a path of co- existence, not returning to the sanc- tioned destruction of America's predators.
Literature cited Advisory Committee on Predator Control.
1972. 1971 Predator control report to the Council on Environmental Quality and the Department of the Interior. Institute for Environmental Quality and United States Department of the Interior University of Michigan, Ann Arbor, Michigan.
Berg, K. 1983. Wolves and Humans His- tory. Unpublished manuscript.
Berg, C. 1999 Minnesota Senate wolf Hearings, St Paul. Minnesota
Danz, H.P. 1999. Cougar. Swallow Press/ Ohio University Press, Athens, Ohio.
Gardner, J. and J. Maier. 1984. Gilgamesh. Alfred Knopf, New York.
Kaniut, L. 1983. Alaska BEAR Tales. Alaska Northwest Books, Anchorage, Alaska.
Leopold, A. 1949. A Sand County Almanac. Oxford University Press, New York.
McAuliffe, B. 1999. Wolf bill may be dead. Minneapolis Star Tribune, April 15. Minneapolis, MN.
Mech, L.D. 1998. Estimatedcosts of main- taining a recovered wolf population in agricultural regions of Minnesota. Wild- life Society Bulletin 26(4):817-822.
Roosevelt, T. 1913. A cougar hunt on the rim of the Grand Canyon. Outlook 105: 259-266.
Wilson, E.O. 1992. Diversity of Life. BelknaptHarvard University Press, Cambridge, Massachusetts.
Worster, D. 1977. Nature's Economy. Si- erra Club Books, San Francisco.
Young, EM. 1980. Encounters of Lewis and Clark to Modern Times: Man Meets Griz- zly. Houghton Mifflin Publishers, Boston.
Vol. 18 No. 4 2001 Endangered Species UPDATE 189

Bringing Down the Walls Gale H. Ford Executive Director, Grizzly Discovery Center; MTBEARDOCQaol.com
West Yellowstone, MT; (406) 646-7001 ; (fax) (406)
Educational venues to view, interact, and learn about wildlife occur in many settings, including zoos, pre- serves, refuges, rehabilitation centers, national parks, and other wild lands. Each human believes his or her venue or political camp to be the best model for teaching ecology. The world is rapidly changing, both in the effects created by increasing human popu- lations, and the often-heroic attempts to halt and even reverse such trends. In the 1960s, "ecology" was a new, mysterious word to most people. Thirty years later, the term "conser- vation" has been expanded beyond a resource management definition and now includes concern with retaining the planet's biodiversity and the ac- tions that affect such change.
These concerns for sustainability, cessation of extinction, and enhance- ment of the welfare of endangered species ultimately will succeed only if they do not fall on deaf ears, but on the ears of those who know the language and arena of concern. As the family structure has taken on a different face from that of the past, the connection between young people and wildlife must be nurtured and not left to chance. Parents and grandpar- ents often were the inspiration for wildlife wonderment through shared outings into the wild. Each person can probably recall those mentors who were the frst to introduce nature.
Today's living and working con- ditions do not foster such opportuni- ties. Urban living situations, in- creased job demands, widening eth- nic perspectives, an aging population, and changes in nuclear family struc- ture are but a few of the major shifts drastically affecting the nature edu-
cation of young people. Alternative avenues for inspiring an interest in wildlife and wild lands must be rec- ognized and enhanced for their abil- ity to establish a closer relationship between people and wildlife.
The need for effective conserva- tion education is absolutely urgent to- day. The desire to understand or merely view animals has been joined by the need to conserve their popu- lations and ecosystems. Over the last few decades, the explosive growth of human populations has been linked with changes in the abundance of other species. The understanding of animals' needs and of human impacts on animal populations became criti- cal; the future of these animals de- pends on people's actions. This un- derstanding is no longer optional. Everyone in this discipline knows the message, but in spite of its size, this group is still in the minority.
Today, conservation education needs to be recognized as a specialty that benefits from diverse technolo- gies, varied educational efforts, and multi-disciplinary expertise. The conservation message needs to shift from merely endangerment, captive breeding, or even reintroduction to include and emphasize the impor- tance of saving habitat. The exper- tise to facilitate the delivery of this message exists. It is present within conservation groups and in areas that were previously ignored.
Zoos and aquariums draw 121 million visitors each year. Captive wildlife facilities have historically been considered substandard or poor substitutes for wildlife experiences. While hearing wolves howl at the Grizzly Discovery Center is not the
same experience as hearing a pack of wolves in Lamar Valley, the zoo still allows the visitor to have a close and personal moment with this species. The next headline about a wolf is more likely to be read by someone who knows the sound of a howl than one who does not. Even more im- portantly, the impact on wild habi- tats should be considered if human- animal connections in a wild setting were the only experiences allowed.
Openness to learning about new exhibition techniques, husbandry programs and educational outreach programs offered in today's zoologi- cal institutions needs to be embraced as a viable non-consumptive aug- mentation to wildlife education. For the general visitor, zoos and aquari- ums serve the conservation commu- nity by providing information in a relaxed, family-oriented setting. Zoos and aquariums are positioned to play an ever-changing role in con- servation through education.
Conservation requires an ex- panding perspective, but educators are divided and confounded by dis- agreements about the message and the appropriate media of delivery. Conservationists must share united intentions in order to be effective. Advocacy groups, wildlife protection groups, and zoological educators share a common goal: to instill in oth- ers the passion to protect, conserve, restore, and ultimately live harmoni- ously with the unique wildlife and wild lands in the environment. Therefore, the crucial partnerships that make the conservation message reach the most ears, in the most ef- fective manner humanly and hu- manely possible, should be fostered.
190 Endangered Species UPDATE Vol. 18 No. 4 2001

News from Zoos
Minnesota Zoo, China Work to Save World's Most Endangered Tiger
Minnesota Zoo Conservation Director Dr. Ron Tilson led a team of Chinese conservation officials on an expedition through Longyan, Fujian Province, in an effort to save the critically endangered South China Tiger. Dr. Tilson also held a tiger conservation workshop, which marks the beginning of a partnership between China and foreign officials, including AZA's Tiger Species Survival Plan, on the South China Tiger Project.
More than 20 conservation officers from seven provinces attended the workshop, which highlighted tiger track- ing and search techniques. Following the expedition, the team visited the South China Tiger Captive Breeding Program in Meihuashan Mountain, where "first phase facilities" have been constructed to breed and prepare the tigers for release. The South China Tiger, know to locals as a "Mountain God," is the most endangered subspecies of tigers know to exist. Fewer than 30 live in the wild and only 60 are held in Chinese Zoos. [Source: Communique]
Namibian Cheetah Ambassadors Come to the States
Ten young Namibian cheetahs arrived in the United States in April for distribution to AZA accredited zoos who participate in the Cheetah Species Survival Plan (SSP). These cheetahs, comprising a group of cats from eight different litters, all originated from commercial farmland areas and eventually found sanctuary at the Cheetah Con- servation Fund (CCF).
The cheetahs represent a presidential gift from Namibia to the United States in recognition of the support it has given to cheetah conservation efforts in Namibia. Four of the cheetahs are housed at the Cincinnati Zoological Gardens and the other six were given to the White Oak Conservation Center. They will be integrated into the Cheetah SSP, which was established in 1982 and manages of all captive cheetahs at different facilities in North America as a unit. Working within this program, all the facilities holding cheetahs cooperate on issues concerning reproduction, genetics, diets and general husbandry of the species.
CCF selected these ten cheetah based strictly on the criteria that they are non-releasable animals. The circum- stances under which these cheetahs were orphaned are mostly tragic, with their mothers being shot. However, all of the cubs found their way to CCF through the concern for their welfare of the people that caught them and in two cases, through the speedy intervention of a concerned neighbor. CCF has been the recipient of three grants from the AZA's Conservation Endowment Fund. [Source: Jack Grisham, AZA Cheetah SSP Coordinator]
Mexican Gray Wolves Make Zoo New Home
The National Zoo announced that it has made a home for three Mexican gray wolves as part of an international recovery effort to reintroduce the highly endangered wolf subspecies into the wild in Arizona, New Mexico and Mexico. At a news conference this morning at the new wolf exhibit, located uphill from the seal pool, zoo and animal conservation officials said the wolves will stay at the zoo until they can be released into a wilderness area in either Arizona, New Mexico or Mexico.
The National Zoo participates in the Mexican Wolf Species Survival Plan (SSP), which manages the Mexican wolves held in captivity. The SSP and the US Fish and Wildlife Service work cooperatively to support the Mexican Wolf Recovery Program, the international effort to reintroduce Mexican Wolves.
The Mexican gray wolf is the most rare and genetically distinct subspecies of gray wolf in North America but have not been seen in the United States and Mexico since 1970 and 1980, respectively. There are about 200 Mexican gray wolves living today, and nearly all of them were born and raised in captivity.
Conservation officials said they work with the ranchers to try to keep the wolves away from humans and live- stock, and they attach radio collars to the animals to track their whereabouts. [Adapted from an article by Karlyn Barker, The Washington Post]
Information for News from Zoos is provided by the American Zoo and Aquarium Association
Vol. 18 No. 4 2001 Endangered Species UPDATE 191