Michael Todd Greene Dissertation Final - Deep Blue ...
212
Social and Biological Predictors of Blood Pressure in Hypertensives by Michael Todd Greene A dissertation submitted in partial fulfillment of the requirements for the degree of Doctor of Philosophy (Epidemiological Science) in The University of Michigan 2009 Doctoral Committee: Professor Sharon R. Kardia, Chair Professor Ana V. Diez Roux Professor Jeffrey D. Morenoff Assistant Professor Allison E. Aiello
-
Upload
khangminh22 -
Category
Documents
-
view
6 -
download
0
Transcript of Michael Todd Greene Dissertation Final - Deep Blue ...

Social and Biological Predictors of Blood Pressure in Hypertensives
by
Michael Todd Greene
A dissertation submitted in partial fulfillment of the requirements for the degree of
Doctor of Philosophy (Epidemiological Science)
in The University of Michigan 2009
Doctoral Committee: Professor Sharon R. Kardia, Chair Professor Ana V. Diez Roux Professor Jeffrey D. Morenoff Assistant Professor Allison E. Aiello

© Michael Todd Greene
2009

ii
To my wife and best friend Colleen, and our wonderful children.

iii
Acknowledgements
First and foremost, I would like to thank my wife and best friend Colleen for her
undying support and patience along the way. The process of completing this dissertation
often felt like a Sisyphean task and I am certain that without Colleen’s constant support
and encouragement the huge rock would have bowled me over completely on its way
back down. I would also like to thank my parents Michael and Mary Greene, my two
brothers Matthew and Christopher, my grandparents Richard and Elaine Greene and Bill
and Jean Hale, my in-laws John and Kathleen O’Neil, and my great lifelong friend
Charlie Stanley for believing in me.
I would like to graciously thank my committee members Sharon Kardia, Ana
Diez Roux, Allison Aiello, and Jeffrey Morenoff for their guidance and support in this
journey. I would particularly like to acknowledge and thank Sharon Kardia for her
mentorship and support over the past few years. It has been a wonderful learning
experience to work in the Kardia Research Group and I feel very fortunate to have had
the opportunity to develop as scientist alongside all of the great people in this lab.
I am grateful for the pioneers of skateboarding for creating something that I have
been able to use for creative expression and cathartic release for nearly all of my life.

iv
Table of Contents Dedication ii Acknowledgements iii List of Tables vii List of Figures ix Abstract xi Chapter 1 Introduction 1 BACKGROUND 1 Race and Ethnicity Differences 2 Age and Sex Effects 3 Hypertension as a Co-Morbidity 3 Anthropometric Factors 5 Lifestyle Factors 5 Genetic Factors 7 Socioeconomic Status and Education 9 Familial Factors 10 Neighborhood Factors 10 Multilevel Analysis 12 DISSERTATION RESEARCH OBJECTIVES 13 STUDY POPULATION 14 PUBLIC HEALTH SIGNIFICANCE 15 REFERENCES 17 Chapter 2 Control of Hypertension in the Genetic Epidemiology Network of Arteriopathy (GENOA) Study 22 INTRODUCTION 22 METHODS 23 Study Population 23 Covariates 25 Measurement of Blood Pressure Outcomes 26 Blood Pressure Readings 26 Antihypertensive Medications 27 Blood Pressure Awareness, Treatment and Control 27 Statistical Analysis 28 Cross-Validation 29 RESULTS 30 Systolic and Diastolic Blood Pressure 33 Blood Pressure Treatment 35 Blood Pressure Control 37

v
DISCUSSION 40 REFERENCES 66 Chapter 3 Investigating the Influence of Neighborhood Socioeconomic Status on the Treatment and Control of Hypertension in African Americans in the Genetic Epidemiology Network of Arteriopathy (GENOA) Study 72 INTRODUCTION 72 METHODS 73 Study Population 73 Covariates 75 Blood Pressure Readings 75 Antihypertensive Medications 76 Blood Pressure Awareness, Treatment and Control 76 Addresses and Geocoding 77 US Census Data 77 Neighborhood Socioeconomic Indicators and Neighborhood Summary Score 77 Statistical Analysis 79 RESULTS 81 Neighborhood Socioeconomic Summary Score 82 Median Household Income, Poor Neighborhood of Residence, and Neighborhood Racial Composition 83 DISCUSSION 86 REFERENCES 111 Chapter 4 Investigating Familial Correlations of Quantitative Blood Pressure Measures and the Control of Hypertension 116 INTRODUCTION 116 METHODS 117 Study Population 117 Covariates 118 Blood Pressure Readings 119 Blood Pressure Treatment and Antihypertensive Medications 119 Blood Pressure Control 120 Statistical Analysis 120 Familial Clustering of Blood Pressure and Variance Partitioning 120 Sib-Sib Blood Pressure Correlations by Neighborhood Poverty 123 RESULTS 124 Systolic Blood Pressure 124 Diastolic Blood Pressure 126 Blood Pressure Control 128 Blood Pressure Correlations and Aggregation of Blood Pressure Control by Neighborhood Poverty 128 DISCUSSION 129 REFERENCES 140
vi
Chapter 5 Interactions Between Cell Adhesion Molecule Genes and Antihypertensive Drug Therapies in Determining Systolic Blood Pressure in Hypertensive Subjects 141 INTRODUCTION 141 METHODS 144 Study Population 144 Blood Pressure Readings 145 Antihypertensive Medications 145 Genotyping 146 Statistical Analysis 146 RESULTS 150 SNP effects within treatment class and gene-drug interactions 152 SELE 152 African Americans 152 Non-Hispanic Whites 154 VCAM1 156 African Americans 156 Non-Hispanic Whites 157 DISCUSSION 159 REFERENCES 185 Chapter 6 Conclusion 190 SUMMARY OF FINDINGS 190 LIMITATIONS 193 SIGNIFICANCE AND FUTURE DIRECTIONS 196 REFERENCES 198

vii
List of Tables
Table 2.1. Characteristics of the hypertensive GENOA study subjects by race/ethnicity 49 Table 2.2. Hypertension awareness, treatment, and control by baseline characteristics among African Americans 50 Table 2.3. Hypertension awareness, treatment, and control by baseline characteristics among non-Hispanic whites 52 Table 2.4. Use of antihypertensive drug class by race/ethnicity* 54 Table 2.5. Multivariablea predictors of combination antihypertensive treatment by race/ethnicity 55 Table 2.6. Multivariablea predictors of blood pressure control by race/ethnicity 57 Table 2.7. Blood pressure controla by race/ethnicity among GENOA subjects with treated hypertension (n=2093) 59 Table 3.1. Selected sample characteristics of the treated hypertensive African American GENOA study subjects included in the analyses (n=948) 94 Table 3.2. Descriptive statistics of US Census 2000 socioeconomic indicator variables and neighborhood socioeconomic summary scores across 48 census tracts within the tri-county Jackson, MS geographic region 95 Table 3.3. Association of neighborhood socioeconomic score with systolic blood pressure in the African American GENOA subjects included in multilevel linear model analyses (n=948) 96 Table 3.4. Association of neighborhood socioeconomic score with diastolic blood pressure in the African American GENOA subjects included in multilevel linear model analyses (n=948) 97 Table 3.5. Association of neighborhood socioeconomic score with combination antihypertensive pharmacologic treatment in the African American GENOA subjects included in multilevel logistic regression model analyses (n=948) 98

viii
Table 3.6. Association of neighborhood socioeconomic score with blood pressure controla in the African American GENOA subjects included in multilevel logistic regression model analyses (n=948) 99 Table 3.7. Use of antihypertensive drug class by poor neighborhood of residencea 100 Table 4.1. Familial correlation of systolic blood pressure in GENOA African Americans (n=1123) 133 Table 4.2. Familial correlation of systolic blood pressure in GENOA non-Hispanic whites (n=970) 134 Table 4.3. Familial correlation of diastolic blood pressure in GENOA African Americans (n=1123) 135 Table 4.4. Familial correlation of diastolic blood pressure in GENOA non-Hispanic whites (n=970) 136 Table 4.5. Selected sample characteristics of the treated hypertensive African American GENOA study subjects included in the sibpair by neighborhood poverty analyses (n=960 from 871 sibpairs) 137 Table 4.6. Blood pressure correlations between GENOA African American sibpairs (n=871) by neighborhood poverty concordance 138 Table 5.1. Distribution of antihypertensive therapies among hypertensive African Americans in GENOA 166 Table 5.2. Distribution of antihypertensive therapies among hypertensive non-Hispanic whites in GENOA 167 Table 5.3. Description of Cell Adhesion Molecule Candidate Genes 168 Table 5.4. SELE SNP sample size information and genotype distribution among hypertensive African Americans in GENOA 169 Table 5.5. SELE SNP sample size information and genotype distribution among hypertensive non-Hispanic whites in GENOA 170 Table 5.6. VCAM1 SNP sample size information and genotype distribution among hypertensive African Americans in GENOA 171 Table 5.7. VCAM1 SNP sample size information and genotype distribution among hypertensive non-Hispanic whites in GENOA 172
ix
List of Figures
Figure 2.1. Hypertension status in the GENOA study 60 Figure 2.2. Mean systolic and diastolic blood pressures by age and race/ethnicity for men and women, US population 18 years of age and older* 61 Figure 5.1. Linkage disequilibrium between 11 SELE SNPs in GENOA African Americans 173 Figure 5.2. Linkage disequilibrium between 11 SELE SNPs in GENOA non-Hispanic whites 174 Figure 5.3. Linkage disequilibrium between 16 VCAM1 SNPs in GENOA African Americans 175 Figure 5.4. Linkage disequilibrium between 16 VCAM1 SNPs in GENOA non-Hispanic whites 176 Figure 5.5. Single SNP and SNP-drug effects of SELE SNPs on systolic blood pressure in GENOA African American hypertensives (n=1329) 177 Figure 5.6. SELE rs932307 genotype specific mean systolic blood pressure by treatment class in GENOA African American hypertensive subjects 178 Figure 5.7. Single SNP and SNP-drug effects of SELE SNPs on systolic blood pressure in GENOA non-Hispanic white hypertensives (n=1129) 179 Figure 5.8. SELE rs5368 genotype specific mean systolic blood pressure by treatment class in GENOA non-Hispanic white hypertensive subjects 180 Figure 5.9. Single SNP and SNP-drug effects of VCAM1 SNPs on systolic blood pressure in GENOA African American hypertensives (n=1329) 181 Figure 5.10. VCAM1 rs3176876 genotype specific mean systolic blood pressure by treatment class in GENOA African American hypertensive subjects 182 Figure 5.11. Single SNP and SNP-drug effects of VCAM1 SNPs on systolic blood pressure in GENOA non-Hispanic white hypertensives (n=1129) 183

x
Figure 5.12. VCAM1 rs3176860 genotype specific mean systolic blood pressure by treatment class in GENOA non-Hispanic white hypertensive subjects 184

xi
Abstract
Hypertension affects 1 in 4 adults in the United States and is a major contributor
to cardiovascular morbidity and mortality. Blood pressure control is observed in slightly
less than two-thirds of those on antihypertensive pharmacologic treatment, and
racial/ethnic disparities persist with significantly lower blood pressure control rates
observed among minority populations. Hypertension is a multifactorial disease,
involving both genetic and environmental pathogenic mechanisms. This dissertation
used the Genetic Epidemiology Network of Arteriopathy (GENOA) study to examine (1)
cross-sectional associations of individual characteristics (demographic, medical history,
physiological, and lifestyle) with blood pressure outcomes, (2) cross-sectional
associations of neighborhood socioeconomic environment with blood pressure outcomes,
(3) familial aggregation of blood pressure outcomes, and (4) cross-sectional associations
of gene-drug interactions with systolic blood pressure (SBP). The first study found that
blood pressure control rates were suboptimal among treated hypertensives, and blood
pressure control rates were lower among African Americans, compared to non-Hispanic
whites. Increasing age and the presence of co-morbidities were associated with
decreased odds of blood pressure control. Individual education was significantly
associated with blood pressure control in African Americans, but not non-Hispanic
whites, even after control for other individual level factors. The second study found that
neighborhood socioeconomic environment was associated with increased odds of

xii
combination antihypertensive pharmacological therapy, but not blood pressure control,
among African Americans. The third study found evidence of moderate familial
aggregation of quantitative blood pressure measures and blood pressure control in both
African Americans and non-Hispanic whites. Among African subjects, sib-sib
correlations of quantitative blood pressure values and familial aggregation of blood
pressure control were detected among sibpairs in which both siblings resided in poor
neighborhoods. The fourth study found that single nucleotide polymorphisms in the
SELE and VCAM1 genes had significant main effects, as well as gene-drug interaction
effects, on SBP in both African Americans and non-Hispanic whites. Findings from
these studies illustrate the multifactorial nature of hypertension and the importance of
understanding how multiple factors across multiple levels influence variation in blood
pressure levels. This dissertation research took important, novel steps in building
connections between the physiological, lifestyle, socio-demographic, familial, genetic
and antihypertensive therapy factors that influence blood pressure control in
hypertensives from the general clinical population.

1
Chapter 1
Introduction
BACKGROUND
Hypertension, defined by a systolic blood pressure (SBP) ≥ 140 mmHg or
diastolic blood pressure (DBP) ≥ 90 mmHg (1), affects more than 65 million adults in the
United States (US) and is the most common disease for which adults seek medical
attention (2, 3). Uncontrolled hypertension is an established risk factor for
cardiovascular, cerebrovascular, and renal disease morbidity and mortality (4). Despite
the recognized health and economic burdens of hypertension, the prevalence of
hypertension is increasing (5) and success in achieving and maintaining target blood
pressure levels necessary to reduce cardiovascular risk has been limited. Data from the
National Health and Nutrition Examination Survey (NHANES) from 1999-2002 indicate
that the age- and sex- adjusted prevalence of hypertension across racial groups (non-
Hispanic white, non-Hispanic black, and Mexican American) is approximately 28.6%.
Of those with hypertension, 63.4% were aware of their condition, 45.3% were receiving
antihypertensive medication, and 29.3% had their blood pressure under control (<140/90
mm Hg) (6). Although national awareness, treatment, and control of hypertension have
all increased in recent years (7), rates remain suboptimal and improvements in these
measures are necessary to meet national health objectives (8) and to minimize the public
health impact of hypertension and related morbidity and mortality.

2
Race and Ethnicity Differences
Hypertension prevalence, awareness, treatment, and control are distributed
unevenly across racial/ethnic groups in the US (5, 6, 9). According to recent NHANES
data, hypertension prevalence is statistically significantly higher in non-Hispanic blacks
(40.5%), compared to comparable rates in non-Hispanic whites (27.4%) and Mexican
Americans (25.1%) (6). Other studies (10, 11) have detected similar trends and have
noted even higher hypertension prevalence rates for blacks in the range of 48-60%. The
racial/ethnic disparity in hypertension prevalence is a highly publicized public health
issue that may contribute to higher levels of hypertension awareness and treatment among
blacks compared to whites. Findings from a recent NHANES analysis indicate that
blacks have higher percentages of hypertension awareness and treatment (70.3% and
55.4%, respectively), compared to lower awareness and treatment rates among whites
(62.9% and 48.6%, respectively), although these differences were not statistically
significant (6). The percentages of treated individuals that had their condition under
control were comparable between blacks and whites based on this national sample (6). In
contrast, other studies (10-12) have found that among those on antihypertensive
treatment, blacks were less likely than whites to have their condition under control.
Based on recent national data, the prevalence of hypertension among Mexican
Americans was lower, yet comparable, to rates among non-Hispanic whites and
substantially lower than rates among non-Hispanic blacks. Despite having the lowest
prevalence rates, Mexican Americans were the least likely to be aware of their condition
(49.8%), to be undergoing treatment (34.9%), and to have their condition under control
(17.3%), when compared nationally to whites and blacks, and these differences were

3
statistically significant (6). In a separate analysis, Hispanics (including Hispanic
subgroups other than Mexican Americans) were less likely to be taking antihypertensive
medications, compared to whites and blacks (13), which may stem from low awareness
among the Hispanic population (14) and may subsequently contribute to lower control
rates among this group.
Age and Sex Effects
In addition to the racial/ethnic trends described above, other demographic factors
influence the distribution of hypertension prevalence, awareness, treatment, and control.
Results from NHANES (6) indicate that across racial/ethnic groups, hypertension
prevalence statistically significantly increased with increasing age and was higher in
women compared to men, although the sex difference was not statistically significant.
The respective proportions of hypertensive individuals that were aware of their
hypertension, were currently being treated, and had their blood pressure controlled all
generally increased with age. One notable exception to this general trend is a decrease in
the percentage of individuals who had their blood pressure controlled among the oldest
age category relative to previous younger age group. Hypertension awareness, treatment,
and control rates were all higher in women compared to men. Recent research has also
suggested that the age trajectories of adult hypertension prevalence follow steeper
gradients for blacks (compared to whites) and women (compared to men), with black
women having the highest rates of hypertension and the steepest age-gradient by the age
of 40 (15).
Hypertension as a Co-Morbidity

4
Elevated blood pressure levels are associated with an increased risk for
cardiovascular disease (CVD), independent of other risk factors. Despite this consistent
relationship, previous research (16) has demonstrated that the presence of additional CVD
risk factors compounds the risk from hypertension alone. In addition to contributing to
an increased overall risk of developing CVD, the presence of other risk factors may also
concurrently contribute to elevations in blood pressure levels, thereby hindering the
ability to achieve target blood pressure control. The presence of other CVD risk factors
and/or resulting co-morbidities may also influence the probabilities of hypertension
awareness, and control. For instance, individuals that have been diagnosed with high
cholesterol levels or diabetes may be more likely than their comparatively healthy
counterparts to seek more frequent medical care and may be more likely to be aware of
their hypertension status, by virtue of increased exposure to blood pressure measurements
that are part of routine care. The presence of co-morbidities may also impact the
probabilities of hypertension treatment and subsequent control. As discussed briefly
below, African-American individuals typically respond favorably to diuretic therapy
compared to other forms of treatment. If, for example, a hypertensive African-American
individual also has an established dyslipidemia profile of some type, treatment with
certain diuretic regimens may be contraindicated (17), which could reduce both the
probabilities of treatment (assuming prescription practices were influenced by knowledge
of indications and contraindications) and control (if a drug that might normally prove
efficacious were not administered as a result of directed prescribing). Although these
examples are hypothetical, they help to illustrate the importance of considering the
influences of other CVD risk factors on blood pressure levels and hypertension

5
awareness, treatment, and control. It is also intuitive, yet important to note that
concurrent management of blood pressure and other CVD risk factors is essential in
reducing overall CVD risk (1).
Anthropometric Factors
Obesity has become an epidemic problem in the US. The strong positive
association between body weight and hypertension is well documented, with both
overweight and obesity related to increases in blood pressure levels. Findings from
recent NHANES data suggest that body mass index (BMI) is associated with
hypertension prevalence after controlling for age, sex, and race/ethnicity and has
contributed to more than half of the hypertension prevalence increase from 1998 – 2000
(5). Recent research has suggested that a higher intensity of treatment may be required to
control blood pressure in obese individuals (18) and a lack of blood pressure control with
both increasing BMI (4) and waist circumference (19) has been documented. Decreases
in BMI have been shown to reduce hypertension risk (20) and blood pressure levels (21),
suggesting that lifestyle modifications leading to weight reductions are important in
preventing hypertension and controlling blood pressure levels in hypertensive adults.
Lifestyle Factors
The adoption of healthy behaviors is essential in reducing and maintaining
appropriate blood pressure levels, preventing hypertension incidence, improving
antihypertensive drug efficacy, and reducing cardiovascular disease (CVD) risk (1).
Lifestyle modifications should be used as initial therapy to control blood pressure and
should be standard in all hypertensive patients (17). The current recommended lifestyles
with proven efficacy for preventing hypertension include: maintaining normal body

6
weight; adopting a diet that is low in sodium and saturated fats, and rich in fruits,
vegetables, and potassium; engaging in regular aerobic physical activity; and limiting
alcohol consumption (22). Although cigarette smoking has not been established as an
independent risk factor for hypertension, it does increase risk for both coronary heart
disease and stroke. As such, smoking cessation is suggested for overall CVD risk
reduction (1).
Results from a recent clinical trial on lifestyle interventions has suggested that
combining two or more of the recommended behaviors may be even more effective at
reducing and maintaining blood pressure levels (23). Accordingly, combining a diet rich
in fruits and vegetables (and hence potassium) with low dietary sodium intake has been
shown to decrease SBP by at least 5 mmHg (24), a reduction that is comparable to the
reductions obtained with an effective antihypertensive agent (17).
Antihypertensive medications are among the most frequently used medications in
the United States. One of the challenges in achieving broad blood pressure control is the
difficulty in predicting how effective a particular antihypertensive regimen will be for a
particular patient. Without a priori knowledge of how individuals will respond to a
medication, a “trial-and-error” approach is typically employed to find the ideal drug for a
given patient (25). Furthermore, it is recognized that hypertension is a multifactorial
disease and that combinations of antihypertensive agents, acting through different
mechanisms at different sites, are often prescribed (17), with most patients requiring two
or more drugs to achieve target blood pressure (26). This illustrates the importance of
incorporating lifestyle modifications into treatment plans and public health efforts, versus

7
a predominant reliance on the prescription of antihypertensive medications, as a means of
controlling blood pressure levels among hypertensive individuals.
Genetic Factors
A positive family history of hypertension is another known risk factor for
developing hypertension. In addition to the demographic and environmental factors
discussed above, genetic factors play a role in inter-individual blood pressure variation
(CITE GWAS STUDIES HERE), and the notion that hypertension results from complex
interactions between genetic and environmental factors has become widely accepted.
Single-gene disorders, including glucocorticoid-remediable aldosteronism, apparent
mineralocorticoid excess and Liddle’s syndrome, are known to cause hypertension.
However, these disorders are rare and are only likely to explain a small proportion of the
total genetic variation in blood pressure (27). Several linkage studies of hypertension
have concluded that there is no single gene for hypertension (28-33). It is more likely
that hypertension is a polygenic disorder in which the additive and interactive effects of
polymorphisms at numerous gene loci contribute to inter-individual blood pressure
variation and differential risk of developing hypertension. Variations in candidate genes,
such as those encoding components of the renin-angiotensin-aldosterone-system (RAAS)
(e.g. – angiotensinogen and angiotensin converting enzyme), may predispose individuals
to hypertension by altering various blood pressure regulation pathways (34).
Furthermore, genetic variation in the RAAS genes may contribute to differences in
hypertension control between blacks and whites. It has been suggested that hypertension
among blacks is characterized by sodium dependence and low plasma renin and responds
better to treatment with diuretics and calcium channel blockers. Conversely,

8
hypertension among whites is characterized by high plasma renin and exaggerated
sodium elimination, and responds better to ACE inhibitors, angiotensin blockers, and
beta-blockade (35). Investigating genetic variations in the RAAS and other pathways
may offer insights into the etiology of hypertension and the reasons for disparities in
blood pressure levels and hypertension control across various groups.
Genome wide association studies (GWAS) analyze whole-genome information to
identify genetic associations with observable traits and/or the presence of disease
conditions. Many GWAS on blood pressure are ongoing (36-39) and have identified a
number of genomic regions that influence blood pressure levels. Replication of findings
across these and other GWAS may identify genomic regions involved in the pathogenesis
of hypertension and/or blood pressure regulation.
Although difficult to dissect and interpret, the potential for numerous
gene*environment interactions should not be ignored. In a discussion regarding genes,
environment and cardiovascular risk, Sing et al. (40) have described the incidence of
common chronic diseases such as CVD and hypertension as a consequence of a
population’s distribution of susceptibility genetic factors interacting with the numerous,
population–specific, environmental factors over time. Under this paradigm, these
researchers pose the following fundamental question:
“…which variations, in which genes, and in which populations are useful for understanding disease and predicting which individuals will develop disease in which strata of environmental histories? (40)”
Investigation of variations within genes and appropriately measured interactions with
other genes and various environmental factors may offer insights into the etiology
hypertension and possible explanations for blood pressure control for certain individuals
within particular environmental contexts.

9
Socioeconomic Status and Education
A comprehensive review of the literature indicates that there is a general inverse
relationship between various SES measures (income, education, and occupation) and
hypertension (41). A recent trend analysis of NHANES data has found that, despite the
overall decrease in the prevalence of hypertension, reductions in income- and education-
related disparities in hypertension have not followed suit. Across all race/ethnicity
groups, the age- and sex-adjusted prevalence of high blood pressure was consistently
higher for individuals in lower income and education categories for each of the four-year
periods investigated (1971-1974; 1976-1980; 1988-1994; and 1999-2002) (42). A
separate analysis of the NHANES data has confirmed that CVD risk factors, including
hypertension, cluster according to SES status (43).
Individual measures of SES, such as income and education level attained, are also
likely to influence hypertension awareness, treatment, and control. For example,
individuals in higher SES categories may be more likely to have access to quality health
care and more likely to seek routine medical care. If this were the case, such individuals
may also be more likely to be aware of their conditions, as
“…awareness of hypertension presumes sufficient contact with a health care professional to permit an accurate diagnosis and communication of the finding to the effected party (44)”.
SES status may also impact the probability that a hypertensive individual is currently
being treated and has his or her condition under control. For example, the cost of
expensive antihypertensive medications, such as calcium channel blockers, may reduce
the probability that a hypertensive individual in a low SES category is currently being
10
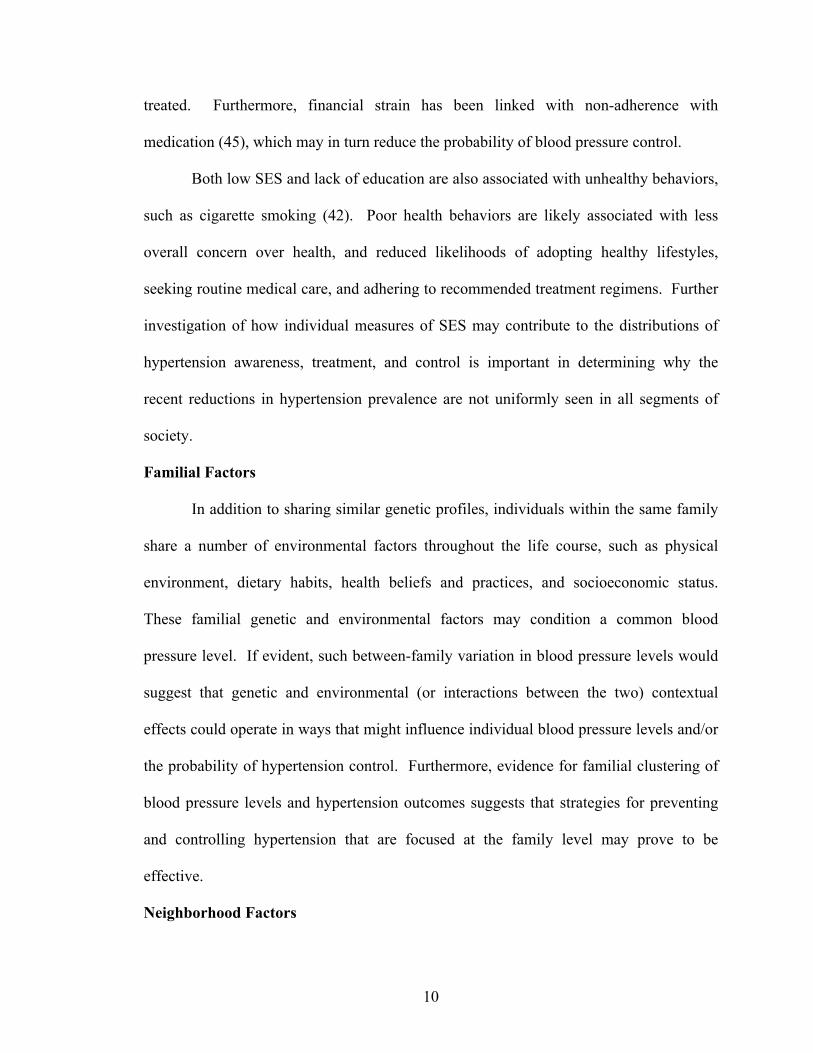
treated. Furthermore, financial strain has been linked with non-adherence with
medication (45), which may in turn reduce the probability of blood pressure control.
Both low SES and lack of education are also associated with unhealthy behaviors,
such as cigarette smoking (42). Poor health behaviors are likely associated with less
overall concern over health, and reduced likelihoods of adopting healthy lifestyles,
seeking routine medical care, and adhering to recommended treatment regimens. Further
investigation of how individual measures of SES may contribute to the distributions of
hypertension awareness, treatment, and control is important in determining why the
recent reductions in hypertension prevalence are not uniformly seen in all segments of
society.
Familial Factors
In addition to sharing similar genetic profiles, individuals within the same family
share a number of environmental factors throughout the life course, such as physical
environment, dietary habits, health beliefs and practices, and socioeconomic status.
These familial genetic and environmental factors may condition a common blood
pressure level. If evident, such between-family variation in blood pressure levels would
suggest that genetic and environmental (or interactions between the two) contextual
effects could operate in ways that might influence individual blood pressure levels and/or
the probability of hypertension control. Furthermore, evidence for familial clustering of
blood pressure levels and hypertension outcomes suggests that strategies for preventing
and controlling hypertension that are focused at the family level may prove to be
effective.
Neighborhood Factors

11
Much of the CVD epidemiology research has focused on the contribution of
individual-level risk factors (46). Recently, there has been a resurgence of interest in
examining the health consequences of living in particular areas or neighborhoods (47).
The broad hypothesis surrounding neighborhood effects on health is that the contextual
features of neighborhoods may be related to health outcomes, independently of
individual-level characteristics (47, 48). Many studies examining the potential role of
neighborhood effects have used readily available, census-defined areas as proxies for
neighborhoods and aggregate socioeconomic measures as proxies for specific features of
neighborhoods (49). A recent summary of the empirical research focusing on
neighborhood effects has indicated that living in low SES neighborhoods is associated
with increased coronary heart disease, cardiovascular mortality, and related CVD risk
factors (including blood pressure), even after accounting for individual-level
socioeconomic characteristics (46). A recent study (50), investigating the extent to which
neighborhood effects influence disparities in blood pressure levels and hypertension
outcomes, has suggested that contextual features of neighborhoods may play a role in
explaining social disparities in elevated blood pressure, and in hypertension prevalence
and awareness, but not in hypertension treatment, or control. To the authors’ knowledge,
this was the only study to examine the potential neighborhood effects on continuous
measures of blood pressure and dichotomous measures of hypertension prevalence,
awareness, treatment, and control. As such, additional investigation of the potential role
of neighborhood contextual effects on these blood pressure/hypertension outcomes in
other study samples is warranted. Further investigations will contribute to this evolving

12
area of research and may offer additional insights into the etiology of hypertension and
the contexts that shape the distribution of hypertension/CVD risk factors.
Multilevel Analysis
There is an inherent organizational structure that extends from biological systems
within individuals to higher order groupings of individuals, such as families and
neighborhoods, to even higher order classifications of such groupings, such as counties
and states. Within this natural organizational structure, a multitude of nesting structures
are possible. For example, one possible 2-level nesting structure is individuals nested
within families, and this nesting structure could be extended to a 3-level structure of
individuals nested within families that are in turn nested within neighborhoods. In order
to capture the relevant impact of these different data structures on a given outcome,
multilevel analysis is a useful approach. Multilevel analysis permits simultaneous
examination of the effects of individual- and group-level characteristics on individual-
level outcomes, controls for correlations within groups, and allows for examination of
both inter-individual (within-group) and inter-group (between-group) variation (51).
The degree to which group-level contexts exert “independent” effects on
individual-level health outcomes may have important implications for public health
efforts. If group-level characteristics influence hypertension risk, apart from individual-
level characteristics, interventions that are directed towards the relevant group (e.g.
families or neighborhoods) may prove beneficial in reducing blood pressure levels and
increasing the levels of hypertension awareness, treatment, and control. Accounting for
group-level features may also be important in providing the context that determines the
distribution of hypertension risk factors.

13
DISSERTATION RESEARCH OBJECTIVES
The goal of this dissertation was to investigate social and biological factors that
influence interindividual variation in quantitative blood pressure measures and the
relative odds of hypertension treatment and control. The first paper (Chapter 2)
examined the associations of individual characteristics (demographic, medical history,
physiological, and lifestyle) with quantitative SBP and DBP measures, blood pressure
treatment with a combination antihypertensive medication regimen, and blood pressure
control among aware and treated hypertensives. Analyses for this paper were conducted
in an exclusively African American cohort and separately in an exclusively non-
Hispanic white cohort. This stratification permitted racial/ethnic comparisons of the
associations detected within each cohort. The second paper (Chapter 3) examined how
neighborhood-level socioeconomic variables, after controlling for individual-level risk
factors, influenced quantitative blood pressure measures, blood pressure combination
therapy, and blood pressure control among African Americans. The third paper
(Chapter 4), investigated sibling correlation structures of quantitative blood pressure
measures and the degree to which blood pressure control aggregated within families.
Additionally, the African American sib-sib correlation structures indexed by sib-sib
concordance of neighborhood-level socioeconomic indicators were also investigated to
determine if sibs living in similar (or dissimilar) types of neighborhoods demonstrated
similar blood pressure outcomes. Finally, the fourth paper (Chapter 5) examined effects
of polymorphisms in inflammation genes (SELE and VCAM1) stratified by
antihypertensive medication classes, in order to assess the potential influence of gene-
drug interactions on SBP. As in the first paper, stratification by racial/ethnic group

14
permitted the investigation of the influence of gene-drug interactions on SBP in
racially/ethnically homogeneous samples.
STUDY POPULATION
The Genetic Epidemiology Network of Arteriopathy (GENOA)
In 1995, the National Heart, Lung and Blood Institute (NHLBI) established The
Family Blood Pressure Program (FBPP) to assess the genetic influence on inter-
individual blood pressure variation and the occurrence of hypertension. One of the four
networks established by the NHLBI to meet this objective is the Genetic Epidemiology
Network of Arteriopathy (GENOA). Subject recruitment for GENOA was population
based and took place in three geographic locations: Jackson, Mississippi; Starr County,
Texas; and Rochester, Minnesota. The Rochester field center recruited non-Hispanic
whites (N=1578), the Jackson field center recruited African-Americans (N=1854), and
the Starr County field center recruited Mexican-Americans (N=1804) (52).
In Rochester and Jackson, recruitment was restricted to sibships containing a
minimum of two individuals diagnosed with essential hypertension before the age of 60.
Hypertensive probands in Rochester, MN and Jackson, MS were identified through the
Rochester Epidemiology Project/Mayo Clinic diagnostic index (53) and the
Atherosclerosis Risk in Communities (ARIC) study (54), respectively. Due to the high
prevalence of diabetes among Mexican-Americans, the Starr County recruitment was
restricted to Mexican-American sibships containing at least two individuals diagnosed
with type-2 diabetes mellitus. Mexican American participants less than 60 years of age
were identified from participants in the Starr County Health Studies (55). In each cohort,
all available siblings, including normotensive individuals, of the index sibling pairs were

15
invited to participate in interviews, physical examinations, and phlebotomy. Exclusion
criteria for participation included secondary hypertension, alcoholism or drug abuse,
pregnancy, insulin-dependent diabetes mellitus, or active malignancy. Approximately
67% of the GENOA sample was hypertensive. The initial phase of the GENOA study
took place from September 1996 through June 2000 (52). The analyses in this
dissertation will focus on the African American and non-Hispanic white GENOA
subjects, and will primarily focus on two general classes of reduced analytic samples: (1)
all hypertensive subjects, regardless of hypertension awareness, treatment, or control
status (African American, N=1329; non-Hispanic white, N=1129); and (2) hypertensive
subjects that are aware of their hypertension diagnosis and are currently taking prescribed
antihypertensive medication(s) to control their blood pressure (African American,
N=1123; non-Hispanic white, N=970).
PUBLIC HEALTH SIGNIFICANCE
Uncontrolled blood pressure affects 1 in 4 adults in the US (2), accounts for
nearly $1 billion annually in direct medical expenditures (56) and is a major contributor
to cardiovascular morbidity and mortality (5). Blood pressure control is observed in only
64% of hypertensives on antihypertensive pharmacologic treatment. Racial/ethnic
disparities persist with minority populations (particularly non-Hispanic blacks)
demonstrating poorer treated blood pressure control compared to non-Hispanic whites
(7). Identifying potential predictors of inadequate blood pressure control is crucial for
determining key areas that public health and clinical efforts should concentrate on in
order to reduce disparities, as well as the health and economic burdens related to
hypertension. Few studies focused on blood pressure have investigated the influence of

16
characteristics defined across a broad framework of health determinants. This
dissertation research took an important, novel step of attempting to build connections
between the social, behavioral, physiological, genetic and antihypertensive therapy
factors that influence variations in blood pressure levels and hypertension outcomes
within and across racial/ethnic groups.

17
REFERENCES 1. Chobanian AV, Bakris GL, Black HR, et al. Seventh report of the joint national committee on prevention, detection, evaluation, and treatment of high blood pressure. Hypertension. 2003;42(6):1206-52. 2. Fields LE, Burt VL, Cutler JA, et al. The burden of adult hypertension in the United States 1999 to 2000: A rising tide. Hypertension. 2004;44(4):398-404. 3. Hing E, Cherry DK, Woodwell DA. National ambulatory medical care survey: 2004 summary. Adv Data. 2006;(374):1-33. 4. Lloyd-Jones DM, Evans JC, Larson MG, et al. Differential control of systolic and diastolic blood pressure : Factors associated with lack of blood pressure control in the community. Hypertension. 2000;36(4):594-9. 5. Hajjar I, Kotchen TA. Trends in prevalence, awareness, treatment, and control of hypertension in the United States, 1988-2000. JAMA. 2003;290(2):199-206. 6. Centers for Disease Control and Prevention (CDC). Racial/ethnic disparities in prevalence, treatment, and control of hypertension--United States, 1999-2002. MMWR Morb Mortal Wkly Rep. 2005;54(1):7-9. 7. Ong KL, Cheung BM, Man YB, et al. Prevalence, awareness, treatment, and control of hypertension among United States adults 1999-2004. Hypertension. 2007;49(1):69-75. 8. Healthy people 2010 . (http://www.health.gov/healthypeople). 9. Hertz RP, Unger AN, Cornell JA, et al. Racial disparities in hypertension prevalence, awareness, and management. Arch Intern Med. 2005;165(18):2098-104. 10. Kramer H, Han C, Post W, et al. Racial/ethnic differences in hypertension and hypertension treatment and control in the multi-ethnic study of atherosclerosis (MESA). Am J Hypertens. 2004;17(10):963-70. 11. Sheats N, Lin Y, Zhao W, et al. Prevalence, treatment, and control of hypertension among African Americans and caucasians at primary care sites for medically under-served patients. Ethn Dis. 2005;15(1):25-32. 12. Howard G, Prineas R, Moy C, et al. Racial and geographic differences in awareness, treatment, and control of hypertension: The REasons for geographic and racial differences in stroke study. Stroke. 2006;37(5):1171-8. 13. Sudano JJ,Jr, Baker DW. Antihypertensive medication use in Hispanic adults: A comparison with black adults and white adults. Med Care. 2001;39(6):575-87.

18
14. Pappas G, Gergen PJ, Carroll M. Hypertension prevalence and the status of awareness, treatment, and control in the hispanic health and nutrition examination survey (HHANES), 1982-84. Am J Public Health. 1990;80(12):1431-6. 15. Geronimus AT, Bound J, Keene D, et al. Black-white differences in age trajectories of hypertension prevalence among adult women and men, 1999-2002. Ethn Dis. 2007;17(1):40-8. 16. Anderson KM, Wilson PW, Odell PM, et al. An updated coronary risk profile. A statement for health professionals. Circulation. 1991;83(1):356-62. 17. Kaplan NM, Opie LH. Antihypertensive drugs. In: Opie LH, Gersch BJ, eds. Drugs for the Heart. Philadelphia: Elsevier Saunders, 2005:184,185,186. 18. Saito I, Murata K, Hirose H, et al. Relation between blood pressure control, body mass index, and intensity of medical treatment. Hypertens Res. 2003;26(9):711-5. 19. de Resende SM, Velasquez-Melendez G. Abdominal adiposity, age, education level and therapy associated with uncontrolled hypertension. J Hum Hypertens. 2003;17(5):365-6. 20. Huang Z, Willett WC, Manson JE, et al. Body weight, weight change, and risk for hypertension in women. Ann Intern Med. 1998;128(2):81-8. 21. Droyvold WB, Midthjell K, Nilsen TI, et al. Change in body mass index and its impact on blood pressure: A prospective population study. Int J Obes (Lond). 2005;29(6):650-5. 22. Whelton PK, He J, Appel LJ, et al. Primary prevention of hypertension: Clinical and public health advisory from the national high blood pressure education program. JAMA. 2002;288(15):1882-8. 23. Appel LJ, Champagne CM, Harsha DW, et al. Effects of comprehensive lifestyle modification on blood pressure control: Main results of the PREMIER clinical trial. JAMA. 2003;289(16):2083-93. 24. Sacks FM, Svetkey LP, Vollmer WM, et al. Effects on blood pressure of reduced dietary sodium and the dietary approaches to stop hypertension (DASH) diet. DASH-sodium collaborative research group. N Engl J Med. 2001;344(1):3-10. 25. Arnett DK, Claas SA, Glasser SP. Pharmacogenetics of antihypertensive treatment. Vascul Pharmacol. 2006;44(2):107-18. 26. ALLHAT Officers and Coordinators for the ALLHAT Collaborative Research Group. The Antihypertensive and Lipid-Lowering Treatment to Prevent Heart Attack Trial. Major outcomes in high-risk hypertensive patients randomized to angiotensin-converting

19
enzyme inhibitor or calcium channel blocker vs diuretic: The antihypertensive and lipid-lowering treatment to prevent heart attack trial (ALLHAT). JAMA. 2002;288(23):2981-97. 27. Lifton RP. Molecular genetics of human blood pressure variation. Science. 1996;272(5262):676-80. 28. Kardia SL, Rozek LS, Krushkal J, et al. Genome-wide linkage analyses for hypertension genes in two ethnically and geographically diverse populations. Am J Hypertens. 2003;16(2):154-7. 29. Thiel BA, Chakravarti A, Cooper RS, et al. A genome-wide linkage analysis investigating the determinants of blood pressure in whites and African Americans. Am J Hypertens. 2003;16(2):151-3. 30. Rao DC, Province MA, Leppert MF, et al. A genome-wide affected sibpair linkage analysis of hypertension: The HyperGEN network. Am J Hypertens. 2003;16(2):148-50. 31. Ranade K, Hinds D, Hsiung CA, et al. A genome scan for hypertension susceptibility loci in populations of Chinese and Japanese origins. Am J Hypertens. 2003;16(2):158-62. 32. Province MA, Kardia SL, Ranade K, et al. A meta-analysis of genome-wide linkage scans for hypertension: The National Heart, Lung and Blood Institute Family Blood Pressure Program. Am J Hypertens. 2003;16(2):144-7. 33. Hunt SC, Ellison RC, Atwood LD, et al. Genome scans for blood pressure and hypertension: The Heart, Lung and Blood Institute Family Heart Study. Hypertension. 2002;40(1):1-6. 34. Schoen FJ, Cotran RS. Blood vessels. In: Cotran RS, Kumar V, Collins T, eds. Pathologic Basis of Disease. Philadelphia: W.B. Saunders Company, 1999:513. 35. Brown MJ. Hypertension and ethnic group. BMJ. 2006;332(7545):833-6. 36. Adeyemo A, Gerry N, Chen G, et al. A genome-wide association study of hypertension and blood pressure in African Americans. PLoS Genet. 2009;5(7):e1000564. 37. Org E, Eyheramendy S, Juhanson P, et al. Genome-wide scan identifies CDH13 as a novel susceptibility locus contributing to blood pressure determination in two European populations. Hum Mol Genet. 2009;18(12):2288-96. 38. Levy D, Larson MG, Benjamin EJ, et al. Framingham Heart Study 100K project: Genome-wide associations for blood pressure and arterial stiffness. BMC Med Genet. 2007;8 Suppl 1:S3.

20
39. Ranade K, Hinds D, Hsiung CA, et al. A genome scan for hypertension susceptibility loci in populations of Chinese and Japanese origins. Am J Hypertens. 2003;16(2):158-62. 40. Sing CF, Stengard JH, Kardia SL. Genes, environment, and cardiovascular disease. Arterioscler Thromb Vasc Biol. 2003;23(7):1190-6. 41. Kaplan GA, Keil JE. Socioeconomic factors and cardiovascular disease: A review of the literature. Circulation. 1993;88(4 Pt 1):1973-98. 42. Kanjilal S, Gregg EW, Cheng YJ, et al. Socioeconomic status and trends in disparities in 4 major risk factors for cardiovascular disease among US adults, 1971-2002. Arch Intern Med. 2006;166(21):2348-55. 43. Sharma S, Malarcher AM, Giles WH, et al. Racial, ethnic and socioeconomic disparities in the clustering of cardiovascular disease risk factors. Ethn Dis. 2004;14(1):43-8. 44. Whelton PK, Beevers DG, Sonkodi S. Strategies for improvement of awareness, treatment and control of hypertension: Results of a panel discussion. J Hum Hypertens. 2004;18(8):563-5. 45. Johnell K, Lindstrom M, Sundquist J, et al. Individual characteristics, area social participation, and primary non-concordance with medication: A multilevel analysis. BMC Public Health. 2006;6:52. 46. Diez Roux AV. Residential environments and cardiovascular risk. J Urban Health. 2003;80(4):569-89. 47. Diez Roux AV. Investigating neighborhood and area effects on health. Am J Public Health. 2001;91(11):1783-9. 48. Henderson C, Diez Roux AV, Jacobs DR, et al. Neighbourhood characteristics, individual level socioeconomic factors, and depressive symptoms in young adults: The CARDIA study. J Epidemiol Community Health. 2005;59(4):322-8. 49. Mujahid MS, Diez Roux AV, Morenoff JD, et al. Assessing the measurement properties of neighborhood scales: From psychometrics to ecometrics. Am J Epidemiol. 2007;165(8):858-67. 50. Morenoff JD, House JS, Hansen BB, et al. Understanding social disparities in hypertension prevalence, awareness, treatment, and control: The role of neighborhood context. Soc Sci Med. 2007;65(9):1853-66. 51. Diez-Roux AV. Multilevel analysis in public health research. Annu Rev Public Health. 2000;21:171-92.

21
52. FBPP Investigators. Multi-center genetic study of hypertension: The family blood pressure program (FBPP). Hypertension. 2002;39(1):3-9. 53. Melton LJ,3rd. History of the Rochester Epidemiology Project. Mayo Clin Proc. 1996;71(3):266-74. 54. The atherosclerosis risk in communities (ARIC) study: Design and objectives. the ARIC investigators. Am J Epidemiol. 1989;129(4):687-702. 55. Hanis CL. Hypertension among Mexican Americans in Starr County, Texas. Public Health Rep. 1996;111 Suppl 2:15-7. 56. Flack JM, Casciano R, Casciano J, et al. Cardiovascular disease costs associated with uncontrolled hypertension. Manag Care Interface. 2002;15(11):28-36.

22
Chapter 2
Control of Hypertension in the Genetic Epidemiology Network of Arteriopathy (GENOA) Study
INTRODUCTION
Hypertension affects more than 65 million adults in the United States (US) and is
the most common disease for which adults seek medical attention (1, 2). Uncontrolled
hypertension is an established risk factor for cardiovascular, cerebrovascular, and renal
disease morbidity and mortality (3). Despite the recognized health and economic burdens
of hypertension, the prevalence of hypertension has increased in recent years (4) and
success in achieving and maintaining target blood pressure levels necessary to reduce
cardiovascular risk has been limited. Recent age-adjusted data from the National Health
and Nutrition Examination Survey (NHANES) indicate that among all individuals with
hypertension, 54% were receiving antihypertensive medication and only 33% have their
blood pressure under control. The importance of adequate antihypertensive therapy is
clear, as blood pressure control rates among treated individuals are markedly better at
nearly 64% (4). Although national rates of treatment and control of hypertension have
increased in recent years (4), rates remain suboptimal and improvements in these
measures are necessary to meet national health objectives (5) and to minimize the public
health impact of hypertension and related morbidity and mortality.
One of the key goals of the Healthy People 2010 objective is to eliminate health
disparities (5). African Americans in the US have consistently higher prevalence of

23
hypertension in nationally representative samples (4) and about 30% of mortality among
African Americans is attributable to hypertension (6). The racial/ethnic disparity in
hypertension prevalence is a highly publicized public health issue that may contribute to
higher levels of hypertension awareness and treatment among blacks compared to whites.
Despite this, national data (4) and results from other studies (7-9) indicate that among
those on antihypertensive treatment, blacks are less likely than whites to have their
condition under control.
Many studies have illustrated the trends of hypertension prevalence, awareness,
treatment, and control among the general US population (1, 4, 10, 11). Fewer studies
have examined the influence of specific determinants on blood pressure control among
clinical populations of treated hypertensive individuals. The objective of this study was to
examine the associations between various demographic, lifestyle, biological, and personal
medical history factors and blood pressure control in a bi-ethnically diverse sample of
hypertensive subjects, with the intentions of offering insights into the potential
determinants of blood pressure control within racial/ethnic groups and identifying factors
that may contribute to the observed disparities in blood pressure control.
METHODS
Study Population
In 1995, the National Heart, Lung and Blood Institute (NHLBI) established The
Family Blood Pressure Program (FBPP) to assess the genetic influence on inter-
individual blood pressure variation, hypertension, and hypertensive target organ damage.
One of the four networks established by the NHLBI to meet this objective is the Genetic
Epidemiology Network of Arteriopathy (GENOA). GENOA field centers in Jackson,

24
MS, Starr County, TX, and Rochester, MN recruited hypertensive African American,
Hispanic, and non-Hispanic white sibships, respectively, for linkage and family-based
association studies. Subject were diagnosed with hypertension if they had a previous
clinical diagnosis of hypertension by a physician with current antihypertensive treatment
or an average systolic blood pressure (SBP) >=140 mmHg and/or an average diastolic
blood pressure (DBP) >=90 mmHg.
In Rochester, MN and Jackson, MS, recruitment was restricted to sibships that
contained a minimum of two individuals diagnosed with essential hypertension before the
age of 60. Once this criterion was met, the entire sibship was invited to participate in the
study. As the prevalence of diabetes among Mexican-Americans is high, the Starr County
recruitment was restricted to Mexican-American sibships containing at least two
individuals diagnosed with type-2 diabetes (12). Data was collected through personal
interviews, and physical and laboratory examinations. The initial phase of the GENOA
study took place from September 1995 through June 2001 (13).
The study presented here focuses on 2458 hypertensive subjects from the
Rochester, MN and Jackson, MS cohorts. Although a majority of the subjects in both
cohorts have been diagnosed as hypertensive, approximately 25% of the sibship members
invited to participate were identified as normotensive during the baseline examination
and have been excluded from this analysis. Other exclusion criteria included secondary
hypertension, alcoholism or drug abuse, pregnancy, insulin-dependent diabetes, or active
malignancy. Of the 1579 non-Hispanic white subjects enrolled in the study, 1129 (72%)
subjects from 548 sibships were identified as having essential hypertension. Of the 1854

25
African American subjects enrolled in the study, 1329 (72%) subjects from 637 sibships
were identified as having essential hypertension.
Covariates
Height was measured by stadiometer, weight by electronic balance, and body
mass index (BMI) was calculated as weight in kilograms divided by the square of height
in meters. Diabetes was defined as having a fasting glucose level ≥ 126 mg/dL or
currently being treated with insulin or oral agents. Blood was drawn by venipuncture
after an overnight fast. Serum cholesterol, triglycerides, and high-density lipoprotein
(HDL) cholesterol were measured by standard enzymatic methods. Subjects were
categorized as having a positive high-risk lipid profile if one or more of the following
criteria were met: high-density lipoprotein (HDL) cholesterol <35 mg/dL; triglycerides
>200 mg/dL; total cholesterol >240 mg/dL; or total cholesterol to HDL ratio >6.
Although calculation of low-density lipoprotein (LDL) cholesterol by the Friedewald
formula (14) has been commonly used in epidemiologic studies and validated (15),
calculated LDL values are invalid for subjects with very high (>400 mg/dL) triglyceride
levels, as the ratio of LDL to triglycerides is not constant as triglyceride levels increase.
A number of subjects from each racial/ethnic group (30 (2%) African Americans, 53
(5%) non-Hispanic whites) with triglyceride values that exceeded the validated cutpoint
of 400 mg/dL were excluded from the respective samples when calculating LDL values.
Given these modest reductions in sample size for both racial/ethnic groups, LDL was
investigated as an independent risk factor for the outcomes of interest, but was not
included as criteria for the dichotomization of high-risk lipid profiles. Trained
interviewers asked subjects standard questions on numerous factors, including

26
sociodemographic, lifestyle, behavioral and cardiovascular health history. Age in years
was assessed on the baseline examination date. Education was defined as the total
number of years of education completed and was also categorized as < 12 years; ≥ 12
years, < 16 years; and ≥ 16 years (reference group). Marital status was based on self-
reports and was defined as “married” for subjects currently married and “single”
otherwise. Physical activity was based on the number of miles each subject jogged
and/or walked per week. Current smoking status and alcohol consumption (sometimes
versus never) were based on self-reports. Presence of coronary heart disease (CHD) was
based on self reported positive history of heart attack, myocardial infarction, coronary
bypass surgery, coronary angioplasty, coronary balloon dilation, and/or coronary stent.
History of cerebrovascular disease was based on self-reported positive history of stroke
and/or carotid artery surgery. Where applicable, the duration of hypertension for each
subject was based on the difference between the baseline examination date and the date
of hypertension diagnosis.
Measurement of Blood Pressure Outcomes
Blood Pressure Readings
Blood pressure measurements were made with random zero sphygmomanometers
and cuffs appropriate for arm size. Three readings were taken in the right arm after the
subject rested in the sitting position for at least five minutes according to the Seventh
report of the Joint National Committee on Prevention, Detection, Evaluation, and
Treatment of High Blood Pressure (JNC-7, 2003) guidelines (16). The SBP and DBP
values were determined by the first and fifth phase Korotkoff sounds, respectively, and
the last two blood pressure readings were averaged for the analyses. The diagnosis of

27
hypertension was established based on blood pressure levels measured at the study visit
(≥140/90 mmHg), or a prior diagnosis of hypertension and current treatment with
antihypertensive medications.
Antihypertensive Medications
Based on lists of all antihypertensive medications available in the US each
prescription antihypertensive drug recorded at the study visit was assigned a code number
corresponding to the first 6 digits of the Medi-Span Generic Product Identifier. This
number, which identifies pharmacologically equivalent drug products, was used to
categorize agents with similar mechanisms of antihypertensive action. The number of
subjects classified for each antihypertensive medication group is summarized in Table
2.4.
Blood Pressure Awareness, Treatment and Control
Subjects were considered to be “aware” of their hypertension status if they were
(a) defined as hypertensive, and (b) answered yes to the question, “Have you ever been
told by a physician that you have high blood pressure or hypertension?” Conditional
upon being hypertensive and aware of their hypertension status, subjects were considered
to be “treated” if they answered yes to the questions, “Has medication ever been
prescribed by a physician to lower your blood pressure?” and “During the last month,
have you used any medication that was prescribed or recommended by a physician?”
Official guidelines propose that patients with a SBP ≥ 140 mmHg or DBP ≥ 90 mmHg be
considered as hypertensive (16, 17). Accordingly, in this study controlled blood pressure
was defined as SBP < 140 mmHg and DBP < 90 mmHg for a treated subject with
hypertension. If either one, or both, of the two requirements were not met, a hypertensive

28
subject’s blood pressure was defined as uncontrolled. In 1997, the sixth report of the
Joint National Committee on the Prevention, Detection, Evaluation, and Treatment of
High Blood pressure (JNC-VI) put forth the recommendation that the threshold for
control should be lowered to 130/85 mmHg for diabetic patients (18). This more
stringent definition of blood pressure control among diabetics was used to derive general
blood pressure control rates for diabetics within each racial/ethnic group, in order to
reflect the clinical recommendations that were in place during the study time period.
Statistical Analysis
Means and standard deviations (SD) for continuous variables, and frequencies and
percentages for categorical variables, were used to summarize the study sample
characteristics. Continuously distributed variables were examined graphically by
histogram plots and analytically by subjective observations of associated skewness values
to ensure approximation to the normal distribution. Variable comparisons between male
and female genders were assessed within racial/ethnic groups, and pooled sex variable
comparisons were assessed between racial/ethnic groups. Continuous variables were
compared using standard t-tests, and categorical variables were compared using the χ2
statistic. To account for familial correlations in the data, linear mixed effects models,
using maximum likelihood estimation methods, were used to assess linear associations
between quantitative SBP and DBP values and baseline participant variables.
Generalized linear mixed models, using penalized quasi-likelihood estimation
methods, were used to assess associations where the probabilities of blood pressure
treatment and blood pressure control were the designated outcomes of interest, and odds
ratios (OR) and 95 % confidence intervals (CIs) were calculated for each variable.

29
Adjusted regression models including age and sex plus the baseline variable of interest
were assessed to account for potential confounding by age and/or sex. An alpha-level of
0.05 was used to determine statistical significance for all models. Regression analyses
were stratified by race/ethnicity, as they were carried out separately in the Rochester, MN
(distinctly non-Hispanic White) and Jackson, MS (distinctly African American) cohorts.
Since hypertension awareness and treatment were high in both racial/ethnic groups, the
focus of all regression analyses was on reduced hypertensive samples containing subjects
that were both aware of their hypertension diagnoses and taking antihypertensive
medications to reduce blood pressure (African American n = 1123, non-Hispanic white n
= 970). The objective of investigating these reduced analytic samples was to provide
insights into the potential reasons for (a) the observed lack of blood pressure control,
even among treated hypertensives, and (b) blood pressure control disparities along
racial/ethnic lines. Analyses were performed using the R statistical language (19).
Cross-Validation
The predictive ability of the variables of interest on quantitative blood pressure
outcomes was assessed using cross-validation methods (20) and results are displayed in
Appendices 2.1 and 2.2. Cross-validation significantly reduces false positive results by
eliminating associations that lack predictive ability in independent test samples. Four-fold
cross-validation was performed by dividing the full sample into four equally sized
groups. Three of the four groups were combined into a training dataset, and the modeling
strategy outlined above was carried out to estimate model coefficients. These coefficients
were then applied to the fourth group, the testing dataset, to predict the value of the
outcome variable of each subject in the independent test sample. This process was

30
repeated for each of the 4 testing sets. Predicted values for all subjects in the test set were
then subtracted from their observed values, yielding the total residual variability (SSE),
( )∑=
−n
iii yy
1
2ˆ . The total variability in the outcome (SST) – the difference between each
subject’s observed value and the mean value for the outcome – was then calculated,
( )∑=
−n
iiyy
1
2 . In order to estimate the proportion of variation in the outcome predicted in
the independent test samples, the cross-validated R2 (CV R2) was calculated as follows:
SSTSSESSTRCV −=2 . This cross-validation method provides a more accurate measure of
the predictive ability of the regression models and will be negative when the model’s
predictive ability is poor. Because random variations in the sampling of the four mutually
exclusive test groups can potentially impact the estimates of CV R2, this procedure was
repeated 10 times and the CV R2 values were averaged (21). Covariate associations
were considered cross-validated if the average percent variation predicted in independent
test samples was greater than 0.5%.
RESULTS
A total of 2458 subjects from the Rochester, MN and Jackson, MS phase I cohorts
of the GENOA study were identified as being hypertensive. The sample characteristics
by racial/ethnic group are shown in Table 2.1. Among all hypertensive subjects, SBP
values were significantly higher among African Americans compared to non-Hispanic
whites. While DBP values did not differ by racial/ethnic group, overall blood pressure
control (<140/90) was significantly lower among African Americans (44%) compared to
non-Hispanic whites (52%). The majority of both racial/ethnic groups were female.

31
African Americans were significantly older, had higher BMI, were diagnosed earlier with
hypertension, were more likely to have diabetes, smoked more frequently, reported less
physical activity, and completed fewer years of education compared to non-Hispanic
whites. Non-Hispanic whites had significantly poorer lipid profiles (higher total
cholesterol and triglycerides, and lower high-density lipoprotein (HDL) cholesterol),
reported higher positive history of CHD, and consumed alcoholic beverages more
frequently compared to African Americans.
The distributions of hypertension awareness, treatment and control by sample
characteristics are presented in Table 2.2 for African Americans and Table 2.3 for non-
Hispanic whites. As awareness of previously diagnosed hypertension in two or more
siblings was a criterion for participation in the GENOA study, the overall proportion of
hypertension awareness was high and largely consistent by baseline characteristics in
both racial/ethnic groups. Similarly, a high proportion of subjects that were aware of
their hypertension diagnosis were currently taking antihypertensive medications in both
racial/ethnic groups. While hypertension awareness was greater among African
Americans, treatment (conditional on awareness) and blood pressure control (conditional
on awareness and treatment) were lower compared to non-Hispanic Whites. Blood
pressure control is poorer among all (including untreated) hypertensive subjects in both
racial/ethnic groups, which clearly illustrates the benefits of antihypertensive medication
therapy. Despite this parallel, a disparity still exists, with all African American
hypertensive subjects having poorer blood pressure control, compared to their non-
Hispanic white counterparts (Figure 2.1).

32
Among the 1329 African American, hypertensive subjects, 1294 (97.4%) were
aware of their hypertension diagnoses, 1123 (86.8%) of those that were aware were
currently taking antihypertensive medications, and 590 (52.5%) of those that were both
aware and taking antihypertensive medications had their blood pressure controlled.
blood pressure control was achieved in less than half (44%) of African Americans,
regardless of awareness or treatment status. While awareness was high and did not differ
greatly by baseline characteristics, subjects that were older, overweight or obese,
diabetic, and had high-risk lipid profiles were significantly more likely to be aware of
their hypertension diagnoses. Treatment varied quite a bit by baseline characteristics.
Subjects that were female, had greater BMI values, and had co-morbidities present,
including diabetes, history of CHD, and history of CBVD, were significantly more likely
to be taking antihypertensive medications compared to counterparts without co-
morbidities. Subjects that did not smoke cigarettes or consume alcohol were also
significantly more likely to be receiving treatment. Blood pressure control among
subjects that were both aware and treated was largely consistent by baseline
characteristics, but older subjects were significantly less likely to have their blood
pressure controlled to 140/90 mmHg. Subjects with diabetes were much less likely to
have their blood pressure controlled compared to their non-diabetic counterparts and had
the lowest blood pressure control across all age, sex, co-morbidity, lifestyle, and
education groups.
Among all 1129 non-Hispanic white, hypertensive subjects, 1025 (90.8%) were
aware of their hypertension diagnoses, 970 (94.6%) of those that were aware were
currently taking antihypertensive medications, and 587 (60.5%) of those that were both

33
aware and taking antihypertensive medications had their blood pressure controlled.
Blood pressure control was achieved in just over half (52%) of non-Hispanic whites,
regardless of awareness or treatment status. Awareness and treatment were generally
high across age, sex, co-morbidity, lifestyle, and education groups, but older subjects
were significantly more likely to be aware of their hypertension diagnoses, and women
were significantly more likely to be aware and taking antihypertensive medications
compared to men. A marginally significant trend for awareness was detected among the
education groups, with more educated subjects more likely to be aware of their
hypertension diagnoses. A marginally significant trend for treatment was detected
among the BMI groups, with overweight and obese subjects less likely to be taking
antihypertensive medications. Among subjects that were both aware and treated, subjects
that were older (particularly those ≥ 60 years of age), reported positive histories of CHD,
and were less educated were significantly less likely to achieve blood pressure control
rates. Women and subjects without diabetes had marginally better blood pressure control
compared to men and those with diabetes, respectively.
Systolic and Diastolic Blood Pressure
The least squares linear regression results for the covariates of interest regressed
on SBP are shown in Appendix 2.1. As expected, age, independent of sex, was a highly
statistically significant and cross-validated predictor of SBP in both racial/ethnic groups,
with estimated averages of 4.5% and 8.1% variation in SBP predicted in African
Americans and non-Hispanic whites respectively. Among African Americans, diabetes
and years of education completed were also statistically significant and cross-validated
predictors of SBP, after adjusting for age and sex. Diabetics had SBP values that were on
34
average 5.5 mmHg higher than their non-diabetic counterparts and diabetes predicted an
average of 1.1% variation in SBP. For every year increase in education, SBP decreased
by 0.5 mmHg and education predicted an average of 0.6% variation in SBP. Increases
in total cholesterol and having hypertension for longer than 5 years both led to increases
in SBP, however these associations only reached marginal significance. Among non-
Hispanic whites, BMI was the only other covariate that demonstrated a statistically
significant and cross-validated association with SBP, after controlling for age and sex.
Per unit increase in BMI, SBP increased 0.19 mmHg and just over 0.5% variation in SBP
was predicted by BMI. Increased triglyceride levels were statistically significantly
associated with increased SBP, however the association did not cross-validate. Diabetic
non-Hispanic white subjects also had higher SBP values compared to their non-diabetic
counterparts, however this association only reached marginal significance.
The least squares linear regression results for the covariates of interest regressed
on DBP are shown in Appendix 2.2. Age, female sex, total cholesterol and LDL
cholesterol all demonstrated statistically significant and cross-validated associations with
DBP, in both racial/ethnic groups. As with SBP, age, independent of sex, was the
strongest predictor of DBP, with estimated averages of 6.9% and 8.4% variation in SBP
predicted in African Americans and non-Hispanic whites respectively. Contrary to
increases in SBP with increasing age however, increases in age led to modest reductions
in DBP levels in both racial/ethnic groups. Since each of the analytic samples was
comprised largely of older individuals, this relationship accurately reflects the slight
decrease of DBP values commonly observed after 50 years of age (Figure 2.2., from Burt
et al. (10)). While no age-adjusted sex differences in SBP were noted in either

35
racial/ethnic group, females had statistically significantly lower DBP values compared to
males in both groups. The predictive ability of female sex on DBP was greater among
non-Hispanic whites, compared to African Americans, as the estimated averages of
variation predicted were 4.5% and 1.2% respectively. Increases in total cholesterol and
LDL cholesterol led to statistically significant increases in DBP and approximately 1% of
the variation in DBP was predicted by each of these cholesterol types in both racial/ethnic
groups. Although a strong statistically significant association between diabetes and SBP
was detected among African Americans, no such relationship was found for DBP.
Conversely, diabetic non-Hispanic whites had statistically significantly lower DBP values
on average, compared to their non-diabetic counterparts, although this association failed
to cross-validate. A marginal association between the number of years of education
completed and DBP was detected among African Americans, with a one-year increase in
education associated with a 0.20 reduction in DBP.
Blood Pressure Treatment
Table 2.4 lists the use of antihypertensive drug classes verified at baseline among
the aware and treated hypertensive GENOA subjects by race/ethnicity. Diuretics were
the most commonly used antihypertensive drug, regardless of race/ethnicity. This is an
expected result as diuretics are the most commonly prescribed drug as a first line defense
against hypertension. Among the main antihypertensive drug classes, the use of diuretics
and calcium channel blockers was statistically significantly higher among African
Americans, whereas the use of β-blockers and renin-angiotensin-aldosterone-system
(RAAS) inhibitors was statistically significantly higher among non-Hispanic whites.
This trend may reflect prescription patterns motivated by conventional wisdom that

36
African Americans tend to have lower renin activity compared to non-Hispanic whites
and likely respond better to calcium channel blockers and diuretics, and less effectively to
RAAS inhibitors and β-blockers (22). The use of ‘other’ drugs, including α-blockers,
vasodilators, and sympatholytics, was statistically significantly higher among African
Americans. While the majority of treated hypertensive GENOA subjects in both
racial/ethnic groups were taking some type of antihypertensive drug as monotherapy
regimens, the percentage was significantly higher in non-Hispanic whites compared to
African Americans. The use of antihypertensive drugs in combination was higher in
African Americans compared to non-Hispanic whites, particularly among those taking
three or more antihypertensive drugs. This potentially reflects a general clinical attempt
to treat African Americans more aggressively, given the consistently lower blood
pressure control rates among African Americans on a national level (4).
Overall, the percentage of antihypertensive treatment, conditional on being aware
of hypertension status, was high in both racial/ethnic groups (87%, African Americans
and 95%, non-Hispanic whites), and this low variability limited the ability to identify
significant predictors of the antihypertensive treatment outcome.. There was, however,
substantial variability among aware and treated subjects with respect to those that were
taking antihypertensive drugs in monotherapy or combination form. Table 2.5 lists the
results of age- and sex-adjusted generalized linear mixed models examining potential
significant predictors of taking antihypertensive drugs in combination versus
monotherapy form.
Many of the predictors investigated were statistically significantly associated with
the odds of taking antihypertensive drugs in combination form, relative to monotherapy

37
form, and the results were largely consistent across the racial/ethnic groups. Increasing
age and BMI were associated with slight increased odds of combination therapy in both
African Americans and non-Hispanic whites. Each of the co-morbidities investigated,
including Type 2 diabetes, history of CHD and history of CBVD, was associated with
greatly increased odds of combination therapy (African American, OR=1.71, p<0.001,
OR=3.62, p<0.001, OR=2.05, p=0.008; non-Hispanic white, OR=2.16, p<0.001,
OR=1.58, p=0.041, OR=2.37, p=0.020), respectively). These associations reflect not
only the difficulty in managing blood pressure and the common need for multiple drugs
in the presence of co-morbidities, but also that hypertensive patients with other
conditions may have greater likelihoods of being both treated by health professionals and
subsequently prescribed combination regimens. In line with this, the duration of
hypertension was also statistically significantly associated with increased odds of
combination therapy, as expected, in both African Americans (OR=2.19, p<0.001) and
non-Hispanic whites (OR=2.31, p<0.001). Among non-Hispanic whites only, the odds of
taking antihypertensive medications in combination form were higher among subjects
with high-risk lipid profiles (OR=1.33, p=0.033) compared to those with moderate to low
risk lipid profiles, and the odds of taking antihypertensive medications in combination
form were lower among subjects that consumed alcohol (OR=0.72, p=0.025) compared
to those that did not consume alcohol.
Blood Pressure Control
Table 2.6 lists the results of age- and sex-adjusted generalized linear mixed
models examining the influence of various predictors on blood pressure control (< 140/90
mmHg) among treated hypertensive subjects, conditional upon being aware of their

38
hypertension diagnosis. As expected, control was lower with increasing age, independent
of sex, among African Americans (OR=0.97, p<0.001) and non-Hispanic whites
(OR=0.95, p<0.001). The duration of hypertension was also statistically significantly
associated with decreased odds of blood pressure control, even after adjustment for age
and sex, in both racial/ethnic groups. African Americans that were diagnosed with
hypertension for more than 5 years (prior to baseline) were less likely (OR=0.62, p
=0.012) to have their blood pressure controlled compared to those with shorter durations
of hypertension. Similarly, non-Hispanic whites that had hypertension for more than 5
years were less likely (OR=0.70, p=0.031) compared to non-Hispanic whites that were
diagnosed with hypertension ≤ 5 years prior to baseline.
Among non-Hispanic white subjects, the odds of blood pressure control were
higher among current smokers (OR=1.58, p=0.039) compared to never and former
smokers. Although this relationship seems counterintuitive given the common risks
associated with smoking, evidence does not support the role of smoking as a risk factor
for hypertension as numerous studies (23-27) have demonstrated that, despite acute
increases in blood pressure stemming from smoking, current smokers had lower blood
pressure compared to former and never smokers. The increased likelihood for controlled
blood pressure detected among non-Hispanic white, current smokers may reflect the
possibility that smokers are more likely to seek healthcare due to other complications
related to smoking and an increase in healthcare visits may lead to appropriately guided
blood pressure management. This notion is supported by a recent study (28) that found
current smoking was associated with higher healthcare utilization compared to former or
never smokers.

39
Among treated African American subjects, the odds of blood pressure control
were lower among those with type 2 diabetes (OR=0.62, p<0.001) compared to non-
diabetics. Among diabetic GENOA subjects, blood pressure control at the conventional
<140/90 mmHg level was observed in 44% and 53% among African American and non-
Hispanic whites subjects, respectively. blood pressure control rates to the more stringent
<130/85 mmHg, as recommended for subjects with type 2 diabetes in JNC-VI (18), were
poorer still, with control observed in 31% of the African American subjects and 28% of
the non-Hispanic white subjects, reflecting the need for improvements in managing blood
pressure in patients with type 2 diabetes.
The odds of blood pressure control increased with increasing years of education
completed among African Americans (OR=1.04, p=0.048), after controlling for age and
sex differences. This relationship was maintained (OR=1.04, p=0.044) after additional
control for BMI, diabetes, history of CHD, history of CBVD, current smoking, and
alcohol consumption. Consistent with trends from recent national data (4), investigation
of the pooled GENOA sample of African American and non-Hispanic white aware and
treated hypertensive subjects (n=2093) indicated that African American race/ethnicity
was statistically significantly associated with poorer blood pressure control compared to
non-Hispanic white race/ethnicity, after adjustment for multiple covariates. Table 2.7
lists the odds of blood pressure control associated with African American race/ethnicity.
An unadjusted model indicated that the odds of blood pressure control were lower among
African Americans (OR=0.69, p<0.001) compared to non-Hispanic whites. This
association between African American race/ethnicity and blood pressure control was
attenuated, but remained statistically significant, after adjustment for age, sex, BMI, and

40
co-morbidities including type 2 diabetes, history of CHD, and history of CBVD
(OR=0.81, p=0.046). The association of African American race/ethnicity was attenuated
further and lost statistical significance with the additional adjustment for years of
education completed (OR=0.84, p=0.100), providing additional supporting evidence that
factors indexed by SES may influence blood pressure control and contribute to observed
disparities in blood pressure control rates between racial/ethnic groups.
DISCUSSION
In recent years, national data suggest modest improvements in hypertension
awareness, treatment, and control among the general hypertensive population, although
hypertension prevalence has not declined and control remains suboptimal, particularly for
minority populations (4). Awareness and treatment rates among the hypertensive
GENOA subjects were high, regardless of race/ethnicity, and substantially exceeded rates
reported from national studies during the similar time period (4), although this reflects a
selection bias since essential hypertension was a study inclusion criteria. The GENOA
control rates observed among treated hypertensives compared favorably with national
rates for both African Americans and non-Hispanic whites (4). Higher than nationally
observed rates for both treatment and treated control among the GENOA African
American subjects residing in the Jackson, MS area also compared favorably with rates
recently observed among African Americans in the Jackson Heart Study (JHS) (29). As
Wyatt et al. (29) point out, African Americans residing in the Jackson, MS area have
benefited from participation in the Atherosclerosis Risk in Communities (ARIC) study
(30) and increased exposure to health education through community outreach efforts of
the JHS, and it is likely that such benefits have contributed to higher control rates. As the

41
ARIC study population was utilized to identify African American hypertensive probands
for the GENOA study, similar community resources have also benefited the African
American subjects in the GENOA study and may have influenced comparably higher
blood pressure control rates. Despite the relative improvement in blood pressure control
among African Americans within this particular community, rates remain suboptimal and
are significantly lower compared to rates observed in this study among GENOA non-
Hispanic white subjects, as well as those reported for non-Hispanic whites in other
population and community based samples (4, 7-9, 11, 29, 31, 32).
Epidemiologic studies have provided evidence that age is a key determinant of
blood pressure (33). Among the GENOA subjects, strong positive associations between
increasing age and both SBP and DBP were observed. The cross-validation of these
associations in this study provides further evidence of the predictive ability of age on
quantitative blood pressure values. While awareness and treatment among the elderly
GENOA subjects in both racial/ethnic groups were comparable to middle aged and
younger subjects, the percentages of elderly subjects with controlled treated hypertension
were lower in both groups. A number of hemodynamic, metabolic, and nutritional
factors certainly contribute to progressive increases in blood pressure values (34) and,
subsequently, the difficulty in blood pressure control and simultaneous increased
cardiovascular risk among the elderly. Among these factors, hemodynamic alterations
over the life-course, manifesting as increased vascular resistance earlier in life and
shifting towards a predominance of large artery stiffness later in life (35), contribute to
the commonly observed increasing SBP and decreasing DBP later in life. This shift
towards isolated systolic hypertension commonly occurs in the sixth decade of life (10),

42
is associated with increased cardiovascular risk among the elderly (36, 37) and often
requires treatment intensification which is often accompanied by tolerability,
affordability (29), compliance and other associated issues that in turn influence blood
pressure control. Among the treated hypertensives with uncontrolled blood pressure in
this study sample, the majority of subjects in each racial/ethnic group (African American,
58%; non-Hispanic white, 67%) had isolated systolic hypertension (SBP≥140/DBP<90
mmHg), reflecting the influence of age on blood pressure, particularly systolic, control.
National blood pressure control rates among treated elderly individuals have
steadily improved to approximately 50% over recent years (4), providing further support
to trials (38-40) that have demonstrated the ability to achieve blood pressure control
among elderly populations. Control rates among the elderly GENOA subjects compared
favorably, possibly reflecting a general recognition of the importance of managing blood
pressure, particularly SBP, among the elderly in order to reduce overall cardiovascular
risk, as well as a shift away from clinical inertia among older individuals. Although this
recent trend is encouraging, treatment efforts that couple drug therapy with lifestyle
interventions should be increased among the elderly, as treated control rates among
individuals ≥ 60 years of age remain sub-optimal and lower than younger age groups.
Particular attention to the African American elderly population is warranted, as
racial/ethnic disparities in uncontrolled treated hypertension among the elderly still
remain and data indicates that African American women ≥ 60 years of age have the
poorest blood pressure control rates among those treated for their condition (4). Although
sex differences among GENOA subjects within racial/ethnic group did not significantly
influence blood pressure control, the vast majority of the African American subjects were

43
female and this may well have contributed to lower blood pressure control among
African Americans compared to non-Hispanic whites, given the difficulty of blood
pressure control among African American women. Furthermore, studies have shown
that, compared to non-Hispanic whites, African Americans (particularly females) have
steeper age-gradients for hypertension prevalence (41, 42), suggesting that the influences
of the aging process and life-course exposures may differentially impact blood pressure
control among the African American population.
Type 2 diabetes and hypertension are intimately connected and poor blood
pressure control among diabetic individuals with co-morbid hypertension has been
consistently noted (4, 43-45). The coexistence of diabetes and hypertension is associated
with dramatically increased risk of CHD, stroke, renal disease, and mortality (16).
Mechanisms contributing to both additive and multiplicative effects of hypertension and
diabetes on cardiovascular risk have been proposed (46). Within this GENOA sample,
the prevalence of diabetes was statistically significantly higher in African Americans
compared to non-Hispanic whites, in line with trends from national data (47-50). This
higher percentage of diabetes may be a contributing factor to the more aggressive drug
treatment (i.e.- the higher use of combination antihypertensive therapies) observed among
African Americans, compared to non-Hispanic whites, in this study.
Recent studies have indicated that African Americans with diabetes may be 3
times less likely to have controlled blood pressure compared to hypertensive African
Americans without type 2 diabetes, even after accounting for age and treatment intensity
differences, and that the use of 3 or more antihypertensive drugs may be required to
adequately achieve and maintain blood pressure control among diabetics (51),
44
particularly to the more stringent control level of <130/85 mmHg recommended for
diabetics in JNC-VI (52). Despite this information, only 24% of the treated African
American GENOA subjects with co-existent hypertension and diabetes were treated with
3 or more antihypertensive drugs, while 37% were solely prescribed monotherapy
antihypertensive regimens. Although this discrepancy with treatment recommendations
among diabetic subjects may point to an area for improvement in blood pressure
management among this subgroup, the types of drugs prescribed were found to be
relatively consistent with national guidelines (16), with 60% taking a diuretic and 35%
taking a calcium channel blocker, alone or in combination, and 20 % were taking both in
combination.
Low-dose thiazide diuretics and calcium channel blockers are both effective first-
line agents in African Americans (53). Thiazide-type diuretics are also beneficial in
hypertensive patients with diabetes, even though these agents pose a small risk for
worsening hyperglycemia, and calcium channel blockers, particularly in combination,
may also be effective at lowering blood pressure and reducing diabetic related
cardiovascular events (16). Studies have shown the benefits of angiotensin-converting
enzyme (ACE) inhibitors among diabetic patients (54). These drugs are common first-
line agents in this group of patients (53), but ACE inhibitors are potentially less effective
in African Americans due to low-renin and salt sensitive profiles (22, 55).
Among the treated African American GENOA subjects with diabetes, 48% were
taking RAAS inhibitors, a general class that includes ACE inhibitors and angiotensin
receptor blockers, in some form. This potentially reflects a tendency to treat diabetic
patients with agents acting on the RAAS system, despite the perceived lack of efficacy of

45
these agents among African Americans compared to non-Hispanic whites. JNC-VI
guidelines highlighted the ability to overcome lack of antihypertensive efficacy by RAAS
blockade in African Americans and low-renin populations by increasing RAAS agent
dosage and/or adding agents that activate the RAAS system, such as diuretics and
calcium channel blockers, in combination (18, 56). Accordingly, 66% of the African
American GENOA subjects with diabetes that were taking a RAAS inhibitor were also
taking a diuretic and/or a calcium channel blocker. While this may be an encouraging
sign that many clinicians are adhering to treatment guidelines, particularly in high-risk
hypertensive patients, 22% of the African American GENOA subjects with diabetes that
were taking a RAAS inhibitor were taking then in monotherapy form. Paying greater
attention to treatment guidelines and key factors that contribute to drug effectiveness in
individuals within specific subgroups of the population may be an important step towards
achieving blood pressure reduction goals. However, data from a recent study suggests
that prescribing patterns are not a major contributor to ethnic differences in blood
pressure control (57) and other factors are certain to play contributing roles in both the
lack of blood pressure control in the general population, as well as the disparities in blood
pressure control that have been consistently noted between African Americans and other
(particularly non-Hispanic white) racial/ethnic groups. Nonetheless, the need for
adequate drug therapy, coupled with lifestyle interventions, including diet modifications
and increased physical activity, is crucial among all hypertensive subjects generally, and
among African Americans in particular.
The inverse relationship between SES, for which education has been a common
proxy, and cardiovascular disease has been described (58) and many health disparities
46
between racial/ethnic groups appear to be partially explained by SES differences (59).
Inverse, albeit weak, associations between SES and blood pressure have also generally
been detected (60). African Americans in the GENOA study had significantly lower
levels of education compared to the non-Hispanic whites. Increasing levels of education
among the African American subjects were related to increased probabilities of blood
pressure control, even after controlling for other cardiovascular risk factors. This effect
did not appear to be present among the non-Hispanic white subjects, indicating that
targeting areas of intervention indexed by SES may be effective at improving the
probability of blood pressure control among African Americans, and reducing disparities
in blood pressure control and cardiovascular sequelae. The effects of SES on blood
pressure are likely mediated via a range of influences including dietary practices,
physical activity levels, and psychosocial stressors. Access to quality health care and
proper drug compliance are also likely influenced by SES differences, and numerous
studies have related each of these factors to uncontrolled blood pressure (29, 61-63).
Promoting the adoption of healthy lifestyles (64) and ensuring access to quality
comprehensive health care are essential for blood pressure management and should
constitute constructive components of a national initiative to reduce ethnic disparities in
blood pressure control and cardiovascular risk (65).
Several limitations and strengths of this study warrant brief discussion. This
study utilized cross-sectional data from the first phase of the GENOA study and, as such,
the ability to make inferences about causality is limited. The GENOA subjects in this
study were aware and treated hypertensives and the results may not be generalizable to
the general hypertensive population, or moreover, the general population. Further, as the

47
African American and non-Hispanic white cohorts of this study were recruited from
distinct metropolitan areas (Jackson, MS and Rochester, MN, respectively) the findings
may not be generalizable to African Americans or non-Hispanic whites from other
regions in the US. Still, many of the findings in this study reflect those derived from US
representative samples (1, 4, 11). Although it is standard for many studies investigating
hypertension, cross-sectional blood pressure measurements may have lead to
misclassification of hypertension and/or blood pressure control status for some subjects.
The standard blood pressure control definition (<140/90 mmHg) that was used in this
study may have overestimated the clinical blood pressure control rate, as those with co-
morbid conditions should clinically be identified as having their blood pressure
controlled under a more stringent definition (<130/85 mmHg) (18). Results on the odds
of age and sex adjusted blood pressure control using this more stringent definition where
applicable did not significantly alter from results using the standard control definition
(<140/90 mmHg) in either racial/ethnic group. Given the cross-sectional nature of this
study, pre-treatment blood pressure values were not available, precluding the prospective
assessment of treatment effects and efficacy of particular regimens. The study did,
however, examine the influence of taking combination therapies, relative to monotherapy
treatment, on the odds of blood pressure control and found no statistically significant
associations in either racial/ethnic group. The definition of ‘treatment’ in this study only
included pharmacological treatment(s) and did not incorporate other interventions such as
diet and exercise. Despite this, this study’s assessment of treatment based on Medi-Span
coding of pharmacological agents used at baseline is more robust than other studies using
treatment based on self-reports.

48
This bi-racially diverse study sample uniquely provided information on both
African American and non-Hispanic racial/ethnic groups and allowed for crude
comparisons that offered potential insights into the myriad reasons for observed health
disparities in hypertension and blood pressure outcomes. It should be noted that the
racial/ethnic differences in hypertension and blood pressure control outcomes noted from
the comparisons that were made in this study are only valid for demonstrating variability
in subgroups of the population and that etiologic inferences based on ‘race’ as a risk
factor in observational studies are hazardous and inherently flawed (66). Despite these
caveats, the results from this study lend additional support to other studies (3, 4, 8, 9, 29,
67) indicating that, while general improvements have been made, public health efforts
need to remain focused on reducing the observed racial/ethnic disparities in blood
pressure control among treated hypertensives. Efforts aiming to achieving goal SBP
levels should be a general focus in all hypertensive patients, particularly those that are
older, have co-morbid conditions, and/or are in lower SES groups, regardless of
race/ethnicity. Although still disparate compared to non-Hispanic whites, blood pressure
control rates among the treated African Americans in this study and similar rates recently
reported for African Americans in the JHS (29) were better than the comparable rates
reported for African Americans nationally (4). This suggests that focused interventions
may have been effective at increasing blood pressure control among African Americans
in this southern region of the US, and that, as Wyatt et al. (29) conclude, continued
efforts using ethnic specific approaches could prove equally effective for African
Americans from other regions and help narrow the current gap in blood pressure control
and related cardiovascular events.

49
Table 2.1. Characteristics of the hypertensive GENOA study subjects by race/ethnicity
African American non-Hispanic white n = 1329 n = 1129
Age (years) 60.0 (9.4)‡ 57.6 (10.0) Height (cm) 168.3 (8.7) 168.6 (9.3) Weight (kg) 89.7 (18.8) 88.7 (20.0) BMI (kg/m2) 31.8 (6.8)* 31.2 (6.5) Total cholesterol (mg/dL) 206.2 (47.4)† 211.3 (38.8) HDL cholesterol (mg/dL) 55.4 (17.9)‡ 51.0 (16.2) LDLa cholesterol (mg/dL) 121.8 (42.7) 120.7 (33.9) Triglycerides (mg/dL) 150.8 (83.1)‡ 202.5 (106.4) Age hypertension diagnosis (years) 43.6 (10.2)‡ 45.2 (11.5) Education (years completed) 11.7 (3.6)‡ 13.1 (2.4) Jog/walk (miles/month) 2.8 (6.2)‡ 6.5 (9.0) Female (%) 71‡ 55 Type 2 diabetes (%) 26‡ 12 History of CHD (%) 7* 10 History of CBVD (%) 5* 4 Current smoker (%) 18‡ 12 Alcohol consumption (%) 31‡ 70 Married (%) 50‡ 80 SBP (mmHg) 142.5 (22.6)‡ 137.9 (16.6) DBP (mmHg) 79.8 (12.9) 80.0 (9.7) Blood pressure controlledb (%) 44‡ 52 Quantitative variables are presented as mean (SD); categorical variables as percentages. a LDL values calculated by the Friedewald formula. Friedewald calculation is only valid for subjects with triglyceride levels ≤ 400 mg/dL. 30 African American and 53 non-Hispanic white subjects had triglyceride values that exceeded this validated cutpoint and, as such, LDL values were calculated for 1299 African American subjects and 1076 non-Hispanic white subjects. Blood pressure control defined as systolic blood pressure <140 mmHg and diastolic blood pressure <90 mmHg. p-values for contrasts between racial/ethnic groups: *<0.05; †<0.01; ‡<0.001. BMI = body mass index; HDL = high-density lipoprotein; LDL = low-density lipoprotein; CHD = coronary heart disease; CVBD = cerebrovascular disease; SBP = systolic blood pressure; DBP = diastolic blood pressure.

50
Table 2.2. Hypertension awareness, treatment, and control by baseline characteristics among African Americans Category % Sample N Awarenessa, n (%) Treatmentb, n (%) Controlc, n (%)
Overall 1329 1294 (97.4) 1123 (86.8) 590 (52.5) Age, years ‡ † 20 - 39 2 34 32 (94.1) 30 (93.8) 18 (60.0) 40 - 59 48 636 605 (95.1) 525 (86.8) 304 (57.9) >=60 50 659 657 (99.7) 568 (86.4) 268 (47.2) Sex ‡ Female 71 942 917 (97.3) 816 (89.0) 421 (51.6) Male 29 387 377 (97.4) 307 (81.4) 169 (55.0) BMI, kg/m2 † ‡ < 25 13 174 163 (93.7) 129 (79.1) 60 (46.5) 25 to 29 32 425 416 (97.9) 354 (85.1) 190 (53.7) >= 30 55 730 715 (97.9) 640 (89.5) 340 (53.1) High-risk lipid profiled ** No 64 855 826 (96.6) 714 (86.4) 378 (52.9) Yes 36 473 467 (98.7) 408 (87.4) 212 (52.0) Type 2 diabetes ** ‡ Absent 74 983 951 (96.7) 811 (85.3) 454 (56.0) Present 26 346 343 (99.1) 312 (91.0) 136 (43.6) History of CHD † Absent 93 1233 1198 (97.2) 1031 (86.1) 541 (52.5) Present 7 96 96 (100) 92 (95.8) 49 (53.3) History of CBVD † Absent 95 1257 1222 (97.2) 1053 (86.2) 556 (52.8) Present 5 72 72 (100) 70 (97.2) 34 (48.6) Current smoker **

51
No 82 1086 1061 (97.7) 933 (87.9) 489 (52.4) Yes 18 243 233 (95.9) 190 (81.5) 101 (53.2) Alcohol consumption † No 69 913 888 (97.3) 789 (88.9) 413 (52.3) Yes 31 416 406 (97.6) 334 (82.3) 177 (53.0) Education ** >= 16 years 17 226 220 (97.3) 190 (86.4) 114 (60.0) >= 12 years, <16 years 42 560 538 (96.1) 477 (88.7) 257 (53.9) < 12 years 41 543 536 (98.7) 456 (85.1) 219 (48.0) Marital status Married 50 666 648 (97.3) 564 (87.0) 295 (52.3) Single 50 663 646 (97.4) 559 (86.5) 295 (52.8) a Awareness of hypertension diagnosis among all subjects identified as hypertensive. b Hypertension treatment with antihypertensive medications among those aware of their hypertension diagnosis. c Control of blood pressure to 140/90 mmHg among those that are both aware and treated. d High-risk lipid profile defined as positive for one or more of the following: high-density lipoprotein (HDL) cholesterol <35 mg/dL; triglycerides >200 mg/dL; total cholesterol >240 mg/dL; total cholesterol to HDL ratio >6. p-value contrasts between baseline characteristic groups: *<0.10; **<0.05; †<0.01; ‡<0.001. BMI = body mass index; CHD = coronary heart disease; CVBD = cerebrovascular disease.
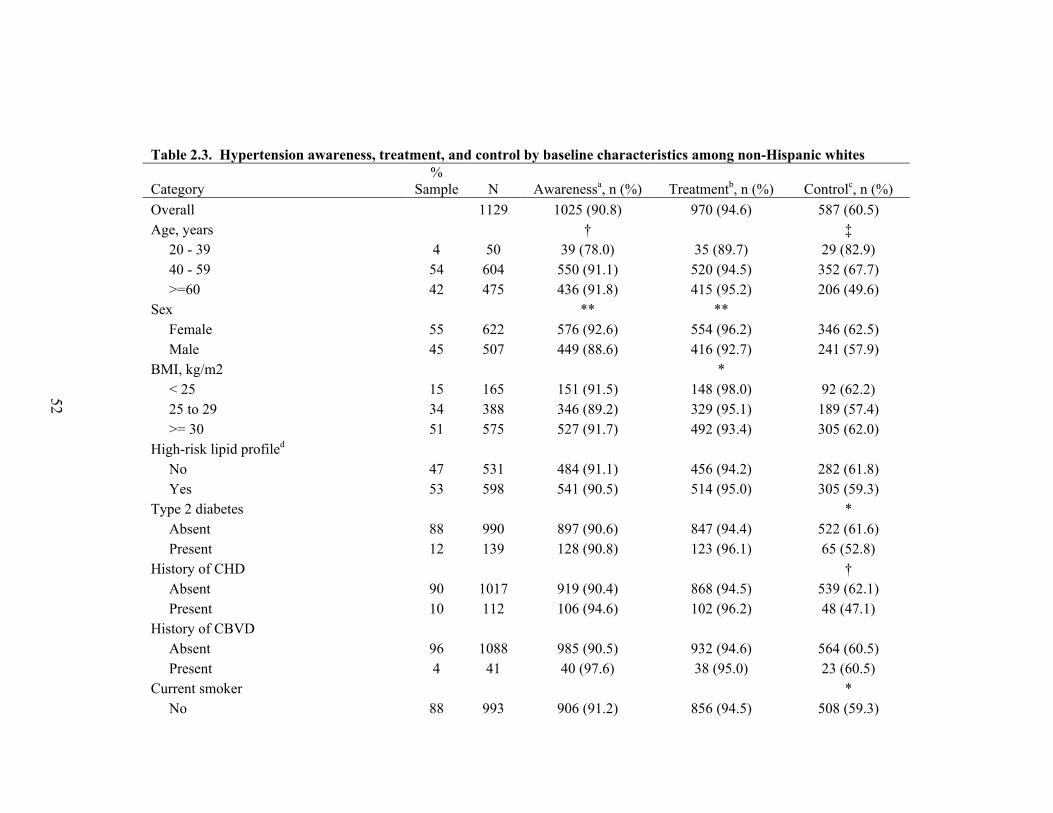
52
Table 2.3. Hypertension awareness, treatment, and control by baseline characteristics among non-Hispanic whites
Category %
Sample N Awarenessa, n (%) Treatmentb, n (%) Controlc, n (%) Overall 1129 1025 (90.8) 970 (94.6) 587 (60.5) Age, years † ‡ 20 - 39 4 50 39 (78.0) 35 (89.7) 29 (82.9) 40 - 59 54 604 550 (91.1) 520 (94.5) 352 (67.7) >=60 42 475 436 (91.8) 415 (95.2) 206 (49.6) Sex ** ** Female 55 622 576 (92.6) 554 (96.2) 346 (62.5) Male 45 507 449 (88.6) 416 (92.7) 241 (57.9) BMI, kg/m2 * < 25 15 165 151 (91.5) 148 (98.0) 92 (62.2) 25 to 29 34 388 346 (89.2) 329 (95.1) 189 (57.4) >= 30 51 575 527 (91.7) 492 (93.4) 305 (62.0) High-risk lipid profiled No 47 531 484 (91.1) 456 (94.2) 282 (61.8) Yes 53 598 541 (90.5) 514 (95.0) 305 (59.3) Type 2 diabetes * Absent 88 990 897 (90.6) 847 (94.4) 522 (61.6) Present 12 139 128 (90.8) 123 (96.1) 65 (52.8) History of CHD † Absent 90 1017 919 (90.4) 868 (94.5) 539 (62.1) Present 10 112 106 (94.6) 102 (96.2) 48 (47.1) History of CBVD Absent 96 1088 985 (90.5) 932 (94.6) 564 (60.5) Present 4 41 40 (97.6) 38 (95.0) 23 (60.5) Current smoker * No 88 993 906 (91.2) 856 (94.5) 508 (59.3)
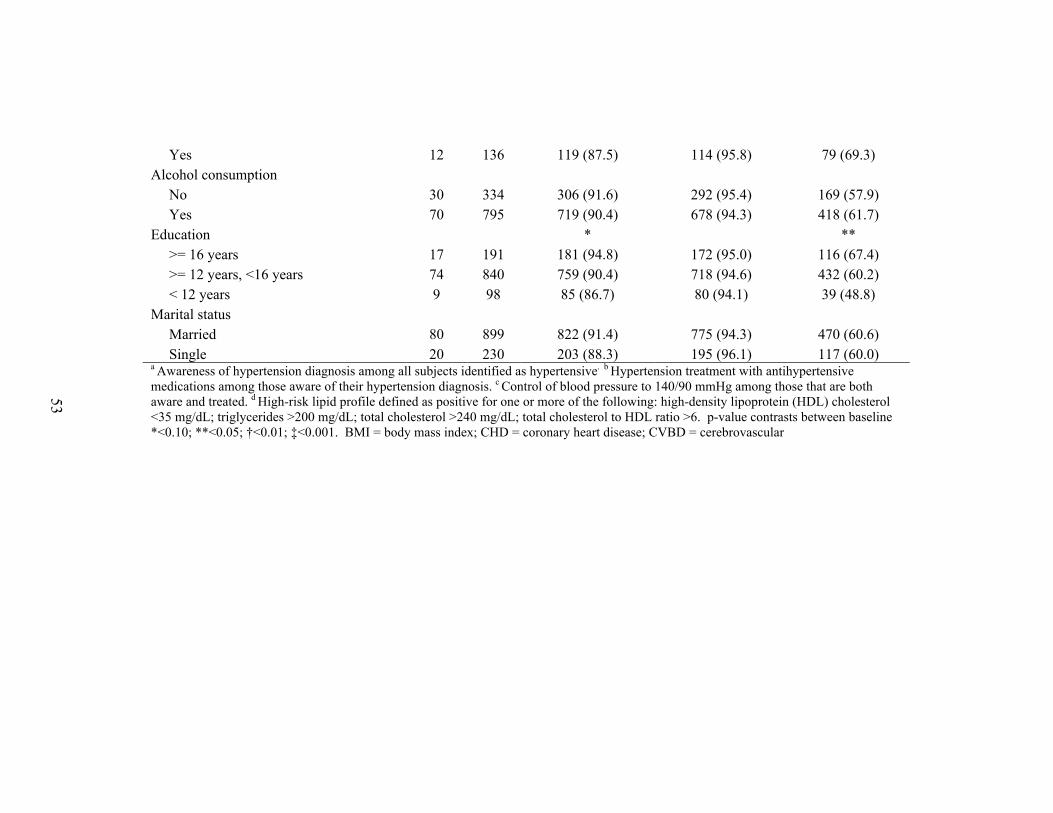
53
Yes 12 136 119 (87.5) 114 (95.8) 79 (69.3) Alcohol consumption No 30 334 306 (91.6) 292 (95.4) 169 (57.9) Yes 70 795 719 (90.4) 678 (94.3) 418 (61.7) Education * ** >= 16 years 17 191 181 (94.8) 172 (95.0) 116 (67.4) >= 12 years, <16 years 74 840 759 (90.4) 718 (94.6) 432 (60.2) < 12 years 9 98 85 (86.7) 80 (94.1) 39 (48.8) Marital status Married 80 899 822 (91.4) 775 (94.3) 470 (60.6) Single 20 230 203 (88.3) 195 (96.1) 117 (60.0) a Awareness of hypertension diagnosis among all subjects identified as hypertensive. b Hypertension treatment with antihypertensive medications among those aware of their hypertension diagnosis. c Control of blood pressure to 140/90 mmHg among those that are both aware and treated. d High-risk lipid profile defined as positive for one or more of the following: high-density lipoprotein (HDL) cholesterol <35 mg/dL; triglycerides >200 mg/dL; total cholesterol >240 mg/dL; total cholesterol to HDL ratio >6. p-value contrasts between baseline *<0.10; **<0.05; †<0.01; ‡<0.001. BMI = body mass index; CHD = coronary heart disease; CVBD = cerebrovascular

54
Table 2.4. Use of antihypertensive drug class by race/ethnicity*
African American n=1123
non-Hispanic white n=970
Diuretic 57%‡ (14%) 48% (13%)
Β-blocker 17% (4%) 40%‡ (16%‡)
Calcium channel blocker 36%‡ (13%‡) 21% (6%)
RAAS Inhibitor 35% (9%) 41%‡ (16%‡)
Other** 23%‡ (7%‡) 6% (2%)
Mono-therapy 47% 53%*
2 of the above drugs in combination 39% 38%
3 or more of the above drugs in combination 14%‡ 9%
*Top portion of table data represent percentages of aware and treated hypertensive subjects taking each respective antihypertensive drug class as part of any regimen. Percentages using each class in mono-therapy form shown in parentheses; **Other antihypertensive class includes alpha-blockers, vasodilators, sympatholytics, and study drugs. RAAS = renin angiotensin aldosterone system. p-value contrasts between racial/ethnic groups; p<0.05*; p<0.01†; p<0.001‡.
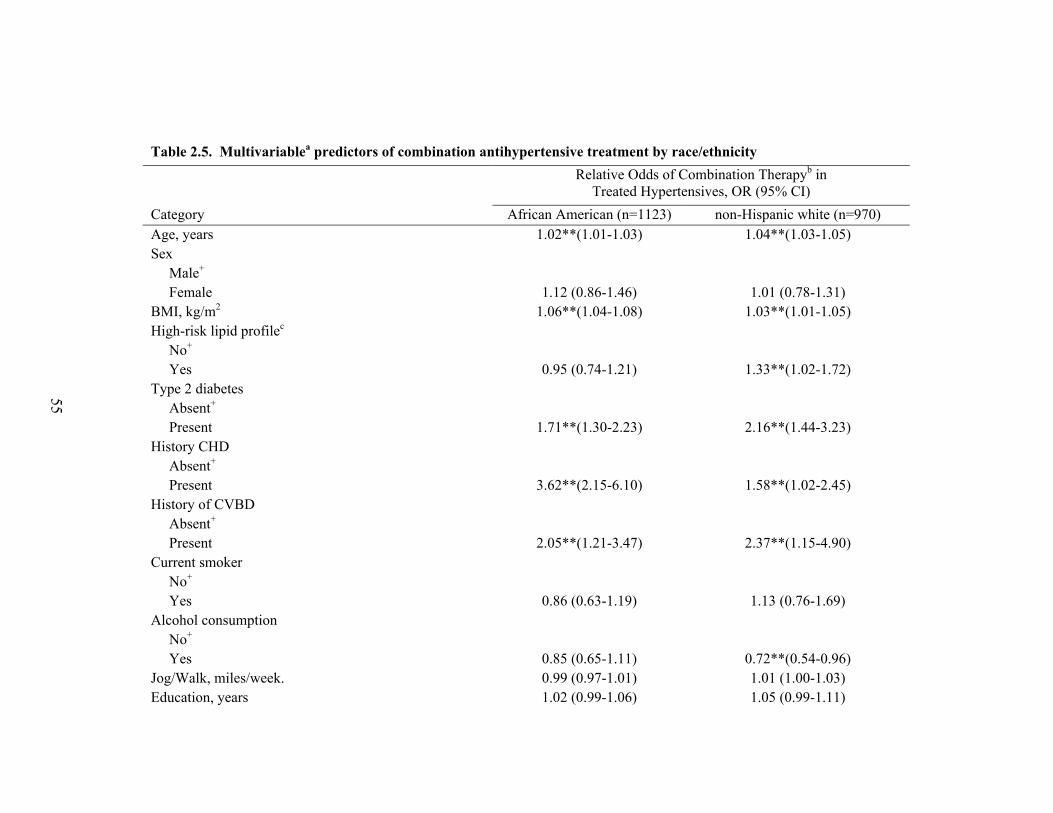
55
Table 2.5. Multivariablea predictors of combination antihypertensive treatment by race/ethnicity
Relative Odds of Combination Therapyb in Treated Hypertensives, OR (95% CI)
Category African American (n=1123) non-Hispanic white (n=970) Age, years 1.02**(1.01-1.03) 1.04**(1.03-1.05) Sex Male+ Female 1.12 (0.86-1.46) 1.01 (0.78-1.31) BMI, kg/m2 1.06**(1.04-1.08) 1.03**(1.01-1.05) High-risk lipid profilec No+ Yes 0.95 (0.74-1.21) 1.33**(1.02-1.72) Type 2 diabetes Absent+ Present 1.71**(1.30-2.23) 2.16**(1.44-3.23) History CHD Absent+ Present 3.62**(2.15-6.10) 1.58**(1.02-2.45) History of CVBD Absent+ Present 2.05**(1.21-3.47) 2.37**(1.15-4.90) Current smoker No+ Yes 0.86 (0.63-1.19) 1.13 (0.76-1.69) Alcohol consumption No+ Yes 0.85 (0.65-1.11) 0.72**(0.54-0.96) Jog/Walk, miles/week. 0.99 (0.97-1.01) 1.01 (1.00-1.03) Education, years 1.02 (0.99-1.06) 1.05 (0.99-1.11)

56
Education 16+ years+ 12 - 15 years 0.94 (0.67-1.32) 0.90 (0.64-1.28) <12 years 0.88 (0.62-1.25) 0.82 (0.46-1.45) Hypertension duration ≤ 5 years+ > 5 years 2.19**(1.52-3.17) 2.31**(1.69-3.15) Married No+ Yes 1.01 (0.79-1.30) 0.62**(0.45-0.87) aAll associations age and sex adjusted. Age associations adjusted for sex. Sex associations adjusted for age. All models account for sibling correlations through fitting of generalized linear mixed models. bRelative odds of taking 2 or more antihypertensive drugs vs. taking an antihypertensive drug as a monotherapy. cHigh-risk lipid profile defined as positive for one or more of the following: high-density lipoprotein (HDL) cholesterol <35 mg/dL; triglycerides >200 mg/dL; total cholesterol >240 mg/dL; total cholesterol to HDL ratio >6. +Referent; OR = odds ratio; CI = confidence interval; BMI = body mass index; CHD = coronary heart disease; CVBD = cerebrovascular disease. **P<0.05; *P<0.10.

57
Table 2.6. Multivariablea predictors of blood pressure control by race/ethnicity
Relative Odds of Blood Pressure Controlb in Treated Hypertensives, OR (95% CI)
Category African American (n=1123) non-Hispanic white (n=970) Age, years 0.97**(0.95-0.98) 0.95**(0.94-0.97) Sex Male+ Female 0.82(0.63-1.08) 1.23 (0.94-1.61) BMI, kg/m2 1.00 (0.98-1.02) 0.99 (0.97-1.02) High-risk lipid profilec No+ Yes 0.99 (0.77-1.27) 0.90(0.69-1.18) Type 2 diabetes Absent+ Present 0.62**(0.47-0.82) 0.76 (0.51-1.13) History CHD Absent+ Present 1.03 (0.66-1.61) 0.71 (0.46-1.11) History of CVBD Absent+ Present 0.83 (0.50-1.36) 1.26 (0.63-2.51) Current smoker No+ Yes 0.93 (0.67-1.29) 1.58**(1.03-2.43) Alcohol consumption No+ Yes 0.90 (0.68-1.18) 1.13 (0.84-1.52)

58
Jog/Walk, miles/week. 1.00 (0.98-1.02) 1.00 (0.98-1.01) Education, years 1.04**(1.00-1.08) 1.01 (0.95-1.07) Education 16+ years+ 12 - 15 years 0.73*(0.51-1.04) 0.83 (0.57-1.21) <12 years 0.72*(0.49-1.04) 0.77 (0.42-1.40) Hypertension duration ≤ 5 years+ > 5 years 0.62**(0.42-0.90) 0.70**(0.51-0.97) Number of antihypertensive medications Monotherapy+ 2 medications 0.98 (0.75-1.27) 1.22 (0.92-1.63) 3 or more medications 1.03 (0.73-1.46) 0.81 (0.50-1.31) Married No+ Yes 0.89 (0.69-1.15) 1.08 (0.77-1.52) aAll associations age and sex adjusted. Age associations adjusted for sex. Sex associations adjusted for age. All models account for sibling correlations through fitting of generalized linear mixed models. bRelative odds of having blood pressure controlled to <140/90 mmHg. cHigh-risk lipid profile defined as positive for one or more of the following: high-density lipoprotein (HDL) cholesterol <35 mg/dL; triglycerides >200 mg/dL; total cholesterol >240 mg/dL; total cholesterol to HDL ratio >6. +Referent; OR= odds ratio; CI = confidence interval; BMI = body mass index; CHD = coronary heart disease; CVBD = cerebrovascular disease. p-value **P<0.05; *P<0.10

59
Table 2.7. Blood pressure controla by race/ethnicity among GENOA subjects with treated hypertension (n=2093)
Unadjusted Model 1 Model 2 Model 3 OR (95% CI) OR (95% CI) OR (95% CI) OR (95% CI)
non-Hispanic white 1.00 (ref) 1.00 (ref) 1.00 (ref) 1.00 (ref) African American 0.69 (0.57-0.84) 0.77 (0.63-0.93) 0.81 (0.66-0.99) 0.84 (0.68-1.03)
a Blood pressure controlled to <140/90 mmHg. OR = odds ratio; CI = confidence interval; ref = referent group. Model 1 includes age and sex. Model 2 includes Model 1 and BMI, type 2 diabetes, history of coronary heart disease, and history of cerebrovascular disease. Model 3 includes Model 2 and number of years of education completed. All models account for sibling correlations through fitting of generalized linear mixed models.

60
Figure 2.1. Hypertension status in the GENOA study
0
10
20
30
40
50
60
70
80
90
100
non - Hispanic white African - American
Awareness Treatment Blood pressure Control*
Blood pressure Control**
*Blood pressure control among subjects that were aware of their hypertension diagnosis and currently taking antihypertensive medication(s); ** Blood pressure control among all hypertensive subjects, regardless of awareness and/or treatment status.

61
Figure 2.2. Mean systolic and diastolic blood pressures by age and race/ethnicity for men and women, US population
18 years of age and older*
*From Burt, V. L. et al. Hypertension 1995; 25:305-313.
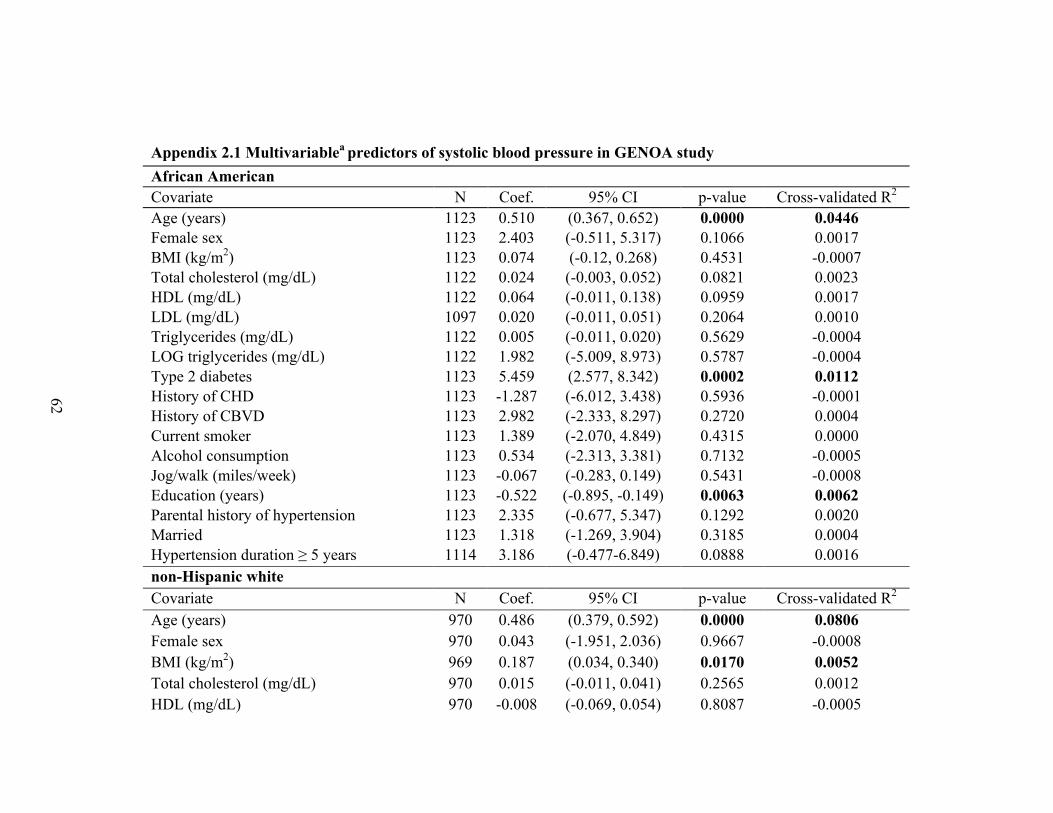
62
Appendix 2.1 Multivariablea predictors of systolic blood pressure in GENOA study African American Covariate N Coef. 95% CI p-value Cross-validated R2
Age (years) 1123 0.510 (0.367, 0.652) 0.0000 0.0446 Female sex 1123 2.403 (-0.511, 5.317) 0.1066 0.0017 BMI (kg/m2) 1123 0.074 (-0.12, 0.268) 0.4531 -0.0007 Total cholesterol (mg/dL) 1122 0.024 (-0.003, 0.052) 0.0821 0.0023 HDL (mg/dL) 1122 0.064 (-0.011, 0.138) 0.0959 0.0017 LDL (mg/dL) 1097 0.020 (-0.011, 0.051) 0.2064 0.0010 Triglycerides (mg/dL) 1122 0.005 (-0.011, 0.020) 0.5629 -0.0004 LOG triglycerides (mg/dL) 1122 1.982 (-5.009, 8.973) 0.5787 -0.0004 Type 2 diabetes 1123 5.459 (2.577, 8.342) 0.0002 0.0112 History of CHD 1123 -1.287 (-6.012, 3.438) 0.5936 -0.0001 History of CBVD 1123 2.982 (-2.333, 8.297) 0.2720 0.0004 Current smoker 1123 1.389 (-2.070, 4.849) 0.4315 0.0000 Alcohol consumption 1123 0.534 (-2.313, 3.381) 0.7132 -0.0005 Jog/walk (miles/week) 1123 -0.067 (-0.283, 0.149) 0.5431 -0.0008 Education (years) 1123 -0.522 (-0.895, -0.149) 0.0063 0.0062 Parental history of hypertension 1123 2.335 (-0.677, 5.347) 0.1292 0.0020 Married 1123 1.318 (-1.269, 3.904) 0.3185 0.0004 Hypertension duration ≥ 5 years 1114 3.186 (-0.477-6.849) 0.0888 0.0016 non-Hispanic white Covariate N Coef. 95% CI p-value Cross-validated R2
Age (years) 970 0.486 (0.379, 0.592) 0.0000 0.0806 Female sex 970 0.043 (-1.951, 2.036) 0.9667 -0.0008 BMI (kg/m2) 969 0.187 (0.034, 0.340) 0.0170 0.0052 Total cholesterol (mg/dL) 970 0.015 (-0.011, 0.041) 0.2565 0.0012 HDL (mg/dL) 970 -0.008 (-0.069, 0.054) 0.8087 -0.0005

63
LDL (mg/dL) 924 0.007 (-0.024, 0.038) 0.6418 -0.0002 Triglycerides (mg/dL) 970 0.011 (0.001, 0.021) 0.0274 0.0049 LOG triglycerides (mg/dL) 970 5.698 (0.524, 10.872) 0.0314 0.0048 Type 2 diabetes 970 2.793 (-0.173, 5.758) 0.0656 0.0031 History of CHD 970 2.192 (-1.021, 5.405) 0.1818 0.0007 History of CBVD 970 -0.650 (-5.733, 4.433) 0.8021 -0.0010 Current smoker 970 -1.607 (-4.666, 1.452) 0.3038 -0.0006 Alcohol consumption 970 -1.428 (-3.594, 0.738) 0.1970 0.0013 Jog/walk (miles/week) 970 0.031 (-0.079, 0.140) 0.5828 -0.0004 Education (years) 970 -0.057 (-0.487, 0.374) 0.7966 -0.0005 Parental history of hypertension 904 2.333 (-0.968, 5.635) 0.1668 0.0020 Married 970 -0.389 (-2.849, 2.071) 0.7568 -0.0005 Hypertension duration ≥ 5 years 970 2.325 (0.165, 4.485) 0.0354 0.0032 aAll associations are age and sex adjusted. Age associations adjusted for sex. Sex associations adjusted for age. Boldface indicates p-value <0.05 and Cross-validated R2 >0.005 respectively. BMI = body mass index; HDL = high-density lipoprotein cholesterol; LDL = low-density lipoprotein cholesterol; CHD = coronary heart disease; CBVD = cerebrovascular disease.

64
Appendix 2.2 Multivariablea predictors of diastolic blood pressure in GENOA study African American Covariate N Coef. 95% CI p-value Cross-validated R2
Age (years) 1123 -0.346 (-0.424, -0.268) 0.0000 0.0688 Female sex 1123 -2.970 (-4.542, -1.397) 0.0002 0.0119 BMI (kg/m2) 1123 -0.095 (-0.200, 0.010) 0.0773 0.0034 Total cholesterol (mg/dL) 1122 0.026 (0.012, 0.041) 0.0005 0.0094 HDL (mg/dL) 1122 0.028 (-0.012, 0.069) 0.1685 0.0010 LDL (mg/dL) 1097 0.029 (0.012, 0.046) 0.0008 0.0093 Triglycerides (mg/dL) 1122 -0.001 (-0.009, 0.008) 0.8577 -0.0003 LOG triglycerides (mg/dL) 1122 -0.195 (-3.972, 3.581) 0.9193 -0.0006 Type 2 diabetes 1123 -0.897 (-2.461, 0.668) 0.2618 0.0004 History of CHD 1123 -2.268 (-4.812, 0.276) 0.0812 0.0031 History of CBVD 1123 0.186 (-2.672, 3.043) 0.8986 -0.0006 Current smoker 1123 0.025 (-1.841, 1.891) 0.9790 -0.0005 Alcohol consumption 1123 1.164 (-0.373, 2.701) 0.1383 0.0012 Jog/walk (miles/week) 1123 0.050 (-0.066, 0.167) 0.3959 0.0004 Education (years) 1123 -0.198 (-0.402, 0.006) 0.0576 0.0017 Parental history of hypertension 1123 1.346 (-0.293, 2.948) 0.1081 0.0021 Married 1123 0.691 (-0.702, 2.085) 0.3313 0.0010 Hypertension duration ≥ 5 years 1114 1.770 (-0.203, 3.744) 0.0793 0.0023 non-Hispanic white Covariate N Coef. 95% CI p-value Cross-validated R2
Age (years) 970 -0.284 (-0.344, -0.224) 0.0000 0.0844 Female sex 970 -3.831 (-4.942, -2.721) 0.0000 0.0446 BMI (kg/m2) 969 -0.017 (-0.103, 0.069) 0.6928 -0.0001 Total cholesterol (mg/dL) 970 0.030 (0.015, 0.044) 0.0001 0.0182 HDL (mg/dL) 970 -0.002 (-0.037, 0.032) 0.8890 -0.0010

65
LDL (mg/dL) 924 0.033 (0.016, 0.050) 0.0002 0.0150 Triglycerides (mg/dL) 970 0.005 (0.000, 0.011) 0.0562 0.0034 LOG triglycerides (mg/dL) 970 3.201 (0.306, 6.095) 0.0307 0.0037 Type 2 diabetes 970 -1.993 (-3.643, -0.343) 0.0184 0.0058 History of CHD 970 -1.145 (-2.934, 0.643) 0.2100 0.0010 History of CBVD 970 -1.950 (-4.778, 0.878) 0.1771 0.0009 Current smoker 970 -0.561 (-2.265, 1.143) 0.5191 -0.0006 Alcohol consumption 970 -0.055 (-1.265, 1.155) 0.9288 -0.0009 Jog/walk (miles/week) 970 0.044 (-0.017, 0.105) 0.1556 0.0006 Education (years) 970 0.013 (-0.229, 0.255) 0.9171 -0.0006 Parental history of hypertension 904 1.641 (-0.226, 3.508) 0.0856 0.0019 Married 970 -0.049 (-1.419, 1.321) 0.9439 -0.0009 Hypertension duration ≥ 5 years 970 1.169 (-0.037, 2.374) 0.0581 0.0024 aAll associations are age and sex adjusted. Age associations adjusted for sex. Sex associations adjusted for age. Boldface indicates p-value <0.05 and Cross-validated R2 >0.005 respectively. BMI = body mass index; HDL = high-density lipoprotein cholesterol; LDL = low-density lipoprotein cholesterol; CHD = coronary heart disease; CBVD = cerebrovascular disease.

66
REFERENCES
1. Fields LE, Burt VL, Cutler JA, et al. The burden of adult hypertension in the United States 1999 to 2000: A rising tide. Hypertension. 2004;44(4):398-404. 2. Hing E, Cherry DK, Woodwell DA. National ambulatory medical care survey: 2004 summary. Adv Data. 2006;(374):1-33. 3. Lloyd-Jones DM, Evans JC, Larson MG, et al. Differential control of systolic and diastolic blood pressure : Factors associated with lack of blood pressure control in the community. Hypertension. 2000;36(4):594-9. 4. Ong KL, Cheung BM, Man YB, et al. Prevalence, awareness, treatment, and control of hypertension among United States adults 1999-2004. Hypertension. 2007;49(1):69-75. 5. Healthy people 2010 . (http://www.health.gov/healthypeople).
6. Flack JM, Ferdinand KC, Nasser SA. Epidemiology of hypertension and cardiovascular disease in African Americans. J Clin Hypertens (Greenwich). 2003;5(1 Suppl 1):5-11. 7. Kramer H, Han C, Post W, et al. Racial/ethnic differences in hypertension and hypertension treatment and control in the multi-ethnic study of atherosclerosis (MESA). Am J Hypertens. 2004;17(10):963-70. 8. Sheats N, Lin Y, Zhao W, et al. Prevalence, treatment, and control of hypertension among African Americans and caucasians at primary care sites for medically under-served patients. Ethn Dis. 2005;15(1):25-32. 9. Howard G, Prineas R, Moy C, et al. Racial and geographic differences in awareness, treatment, and control of hypertension: The REasons for geographic and racial differences in stroke study. Stroke. 2006;37(5):1171-8. 10. Burt VL, Whelton P, Roccella EJ, et al. Prevalence of hypertension in the US adult population. Results from the third national health and nutrition examination survey, 1988-1991. Hypertension. 1995;25(3):305-13. 11. Hajjar I, Kotchen TA. Trends in prevalence, awareness, treatment, and control of hypertension in the United States, 1988-2000. JAMA. 2003;290(2):199-206. 12. Daniels PR, Kardia SL, Hanis CL, et al. Familial aggregation of hypertension treatment and control in the genetic epidemiology network of arteriopathy (GENOA) study. Am J Med. 2004;116(10):676-81.

67
13. Kullo IJ, Bailey KR, Kardia SL, et al. Ethnic differences in peripheral arterial disease in the NHLBI genetic epidemiology network of arteriopathy (GENOA) study. Vasc Med. 2003;8(4):237-42. 14. Friedewald WT, Levy RI, Fredrickson DS. Estimation of the concentration of low-density lipoprotein cholesterol in plasma, without use of the preparative ultracentrifuge. Clin Chem. 1972;18(6):499-502. 15. Warnick GR, Knopp RH, Fitzpatrick V, et al. Estimating low-density lipoprotein cholesterol by the Friedewald equation is adequate for classifying patients on the basis of nationally recommended cutpoints. Clin Chem. 1990;36(1):15-9. 16. Chobanian AV, Bakris GL, Black HR, et al. Seventh report of the joint national committee on prevention, detection, evaluation, and treatment of high blood pressure. Hypertension. 2003;42(6):1206-52. 17. European Society of Hypertension-European Society of Cardiology Guidelines Committee. 2003 European Society of Hypertension-European Society of Cardiology guidelines for the management of arterial hypertension. J Hypertens. 2003;21(6):1011-53. 18. The sixth report of the joint national committee on prevention, detection, evaluation, and treatment of high blood pressure. Arch Intern Med. 1997;157(21):2413-46. 19. R Core Development Team. R: A language and environment for statistical computing. 2005. 20. Stone M. Cross-validatory choice and assessment of statistical predictions. Journal of the Royal Statistical Society. 1974;Series B, 36:111-47. 21. Molinaro AM, Simon R, Pfeiffer RM. Prediction error estimation: A comparison of resampling methods. Bioinformatics. 2005;21(15):3301-7. 22. Brown MJ. Hypertension and ethnic group. BMJ. 2006;332(7545):833-6. 23. Green MS, Jucha E, Luz Y. Blood pressure in smokers and nonsmokers: Epidemiologic findings. Am Heart J. 1986;111(5):932-40. 24. Fogari R, Zoppi A, Lusardi P, et al. Cigarette smoking and blood pressure in a worker population: A cross-sectional study. J Cardiovasc Risk. 1996;3(1):55-9. 25. Omvik P. How smoking affects blood pressure. Blood Press. 1996;5(2):71-7.
26. Primatesta P, Falaschetti E, Gupta S, et al. Association between smoking and blood pressure: Evidence from the health survey for England. Hypertension. 2001;37(2):187-93.

68
27. John U, Meyer C, Hanke M, et al. Smoking status, obesity and hypertension in a general population sample: A cross-sectional study. QJM. 2006;99(6):407-15. 28. Kahende JW, Adhikari B, Maurice E, et al. Disparities in health care utilization by smoking status--NHANES 1999-2004. Int J Environ Res Public Health. 2009;6(3):1095-106. 29. Wyatt SB, Akylbekova EL, Wofford MR, et al. Prevalence, awareness, treatment, and control of hypertension in the Jackson Heart Study. Hypertension. 2008;51(3):650-6. 30. The atherosclerosis risk in communities (ARIC) study: Design and objectives. The ARIC investigators. Am J Epidemiol. 1989;129(4):687-702. 31. Centers for Disease Control and Prevention (CDC). Racial/ethnic disparities in prevalence, treatment, and control of hypertension--United States, 1999-2002. MMWR Morb Mortal Wkly Rep. 2005;54(1):7-9. 32. Hertz RP, Unger AN, Cornell JA, et al. Racial disparities in hypertension prevalence, awareness, and management. Arch Intern Med. 2005;165(18):2098-104 33. Whelton PK. Epidemiology of hypertension. Lancet. 1994;344(8915):101-6.
34. Paciaroni E, Fraticelli A, Antonicelli R. Arterial hypertension in the elderly: A review. Arch Gerontol Geriatr. 1996;23(3):257-64. 35. Franklin SS, Gustin W,4th, Wong ND, et al. Hemodynamic patterns of age-related changes in blood pressure. The Framingham Heart Study. Circulation. 1997;96(1):308-15. 36. Basile J. Hypertension in the elderly: A review of the importance of systolic blood pressure elevation. J Clin Hypertens (Greenwich). 2002;4(2):108,12, 119. 37. Staessen JA, Gasowski J, Wang JG, et al. Risks of untreated and treated isolated systolic hypertension in the elderly: Meta-analysis of outcome trials. Lancet. 2000;355(9207):865-72. 38. Prevention of stroke by antihypertensive drug treatment in older persons with isolated systolic hypertension. Final results of the systolic hypertension in the elderly program (SHEP). SHEP cooperative research group. JAMA. 1991;265(24):3255-64. 39. Medical research council trial of treatment of hypertension in older adults: Principal results. MRC working party. BMJ. 1992;304(6824):405-12. 40. Dahlof B, Lindholm LH, Hansson L, et al. Morbidity and mortality in the Swedish trial in old patients with hypertension (STOP-hypertension). Lancet. 1991;338(8778):1281-5.
69
41. Geronimus AT, Andersen HF, Bound J. Differences in hypertension prevalence among U.S. black and white women of childbearing age. Public Health Rep. 1991;106(4):393-9. 42. Geronimus AT, Bound J. Use of census-based aggregate variables to proxy for socioeconomic group: Evidence from national samples. Am J Epidemiol. 1998;148(5):475-86. 43. Suh DC, Kim CM, Choi IS, et al. Trends in blood pressure control and treatment among type 2 diabetes with comorbid hypertension in the United States: 1988-2004. J Hypertens. 2009. 44. Wong ND, Lopez VA, L'Italien G, et al. Inadequate control of hypertension in US adults with cardiovascular disease comorbidities in 2003-2004. Arch Intern Med. 2007;167(22):2431-6. 45. Andros V, Egger A, Dua U. Blood pressure goal attainment according to JNC 7 guidelines and utilization of antihypertensive drug therapy in MCO patients with type 1 or type 2 diabetes. J Manag Care Pharm. 2006;12(4):303-9. 46. Franjic B, Marwick TH. The diabetic, hypertensive heart: Epidemiology and mechanisms of a very high-risk situation. J Hum Hypertens. 2009. 47. Harris MI. Noninsulin-dependent diabetes mellitus in black and white Americans. Diabetes Metab Rev. 1990;6(2):71-90. 48. Carter JS, Pugh JA, Monterrosa A. Non-insulin-dependent diabetes mellitus in minorities in the United States. Ann Intern Med. 1996;125(3):221-32. 49. Kamel HK, Rodriguez-Saldana J, Flaherty JH, et al. Diabetes mellitus among ethnic seniors: Contrasts with diabetes in whites. Clin Geriatr Med. 1999;15(2):265-78. 50. Mokdad AH, Ford ES, Bowman BA, et al. Diabetes trends in the U.S.: 1990-1998. Diabetes Care. 2000;23(9):1278-83. 51. Jackson JH,4th, Bramley TJ, Chiang TH, et al. Determinants of uncontrolled hypertension in an African-American population. Ethn Dis. 2002;12(4):S3,53-7. 52. Tight blood pressure control and risk of macrovascular and microvascular complications in type 2 diabetes: UKPDS 38. UK prospective diabetes study group. BMJ. 1998;317(7160):703-13. 53. Gibbs CR, Beevers DG, Lip GY. The management of hypertensive disease in black patients. QJM. 1999;92(4):187-92.

70
54. Lewis EJ, Hunsicker LG, Bain RP, et al. The effect of angiotensin-converting-enzyme inhibition on diabetic nephropathy. the collaborative study group. N Engl J Med. 1993;329(20):1456-62. 55. ALLHAT Officers and Coordinators for the ALLHAT Collaborative Research Group. The Antihypertensive and Lipid-Lowering Treatment to Prevent Heart Attack Trial. Major outcomes in high-risk hypertensive patients randomized to angiotensin-converting enzyme inhibitor or calcium channel blocker vs diuretic: The antihypertensive and lipid-lowering treatment to prevent heart attack trial (ALLHAT). JAMA. 2002;288(23):2981-97. 56. Jamerson KA. Rationale for angiotensin II receptor blockers in patients with low-renin hypertension. Am J Kidney Dis. 2000;36(3 Suppl 1):S24-30. 57. Riehle JF, Lackland DT, Okonofua EC, et al. Ethnic differences in the treatment and control of hypertension in patients with diabetes. J Clin Hypertens (Greenwich). 2005;7(8):445-54. 58. Kaplan GA, Keil JE. Socioeconomic factors and cardiovascular disease: A review of the literature. Circulation. 1993;88(4 Pt 1):1973-98. 59. Williams DR, Collins C. US socioeconomic and racial differences in health: Patterns and explanations. Annu Rev Sociol. 1995;21:349-86. 60. Colhoun HM, Hemingway H, Poulter NR. Socio-economic status and blood pressure: An overview analysis. J Hum Hypertens. 1998;12(2):91-110. 61. He J, Muntner P, Chen J, et al. Factors associated with hypertension control in the general population of the United States. Arch Intern Med. 2002;162(9):1051-8. 62. Moy E, Bartman BA, Weir MR. Access to hypertensive care. Effects of income, insurance, and source of care. Arch Intern Med. 1995;155(14):1497-502. 63. Busnello RG, Melchior R, Faccin C, et al. Characteristics associated with the dropout of hypertensive patients followed up in an outpatient referral clinic. Arq Bras Cardiol. 2001;76(5):349-54. 64. Whelton PK, He J, Appel LJ, et al. Primary prevention of hypertension: Clinical and public health advisory from the national high blood pressure education program. JAMA. 2002;288(15):1882-8. 65. Rehman SU, Hutchison FN, Hendrix K, et al. Ethnic differences in blood pressure control among men at Veterans Affairs clinics and other health care sites. Arch Intern Med. 2005;165(9):1041-7.

71
66. Cooper RS, Kaufman JS. Race and hypertension: Science and nescience. Hypertension. 1998;32(5):813-6. 67. Ostchega Y, Hughes JP, Wright JD, et al. Are demographic characteristics, health care access and utilization, and comorbid conditions associated with hypertension among US adults? Am J Hypertens. 2008;21(2):159-65.

72
Chapter 3
Investigating the Influence of Neighborhood Socioeconomic Status on the Treatment and Control of Hypertension in African Americans in the Genetic Epidemiology
Network of Arteriopathy (GENOA) Study
INTRODUCTION
Individual socioeconomic status (SES), commonly quantified by education, income
and occupation, is a key determinant of health status and has shown consistent, generally
inverse, relationships with cardiovascular disease (CVD), CVD mortality, and CVD risk
factors, including hypertension (1). Consistent with this, findings discussed in Chapter 2
of this dissertation suggested that increasing individual education was significantly
associated with decreases in quantitative systolic blood pressure (SBP) levels and
increases in the relative odds of blood pressure control (<140/90 mmHg) among African
Americans. In addition to individual SES, interest in the effects of contextual attributes
of neighborhoods and other area-based measures, independent of individual-level
attributes, on health outcomes has grown in recent years (2). Numerous studies have
identified significant associations between neighborhood socioeconomic environment
and coronary heart disease incidence (3-7), stroke risk (8), and blood pressure outcomes
(9-13). Many of these and other studies have documented that area characteristics may
provide additional information about social inequalities in health that are not fully
captured by individual level data.
A majority of the neighborhood effects studies of hypertension outcomes have

73
focused on quantitative blood pressure measures, hypertension prevalence, and/or
hypertension incidence. One previous study examined the influence of neighborhood
socioeconomic environment in Chicago neighborhoods on quantitative blood pressure
values, hypertension prevalence, as well as awareness, treatment, and control of
hypertension, and concluded that residential contexts may play a role in accounting for
racial/ethnic and socioeconomic disparities in hypertension prevalence and awareness,
but not in the treatment or control of hypertension (12). The central aim of this chapter
was to further examine the potential influence of neighborhood socioeconomic
environment on quantitative blood pressure measures, as well as the treatment and
control of hypertension. I hypothesized that, even after adjustment for other individual-
level factors, subjects residing in socioeconomically disadvantaged neighborhoods would
have higher quantitative blood pressure measures, would be less likely to be treated with
multiple antihypertensive medications, and would be less likely to have their blood
pressure controlled to clinical recommendations (<140/90 mmHg) (14), compared to
subjects residing in more socioeconomically advantaged neighborhoods.
METHODS
Study Population
In 1995, the National Heart, Lung and Blood Institute (NHLBI) established The
Family Blood Pressure Program (FBPP) to assess the genetic influence on inter-
individual blood pressure variation, hypertension, and hypertensive target organ damage.
One of the four networks established by the NHLBI to meet this objective is the Genetic
Epidemiology Network of Arteriopathy (GENOA). GENOA field centers in Jackson,
MS, Starr County, TX, and Rochester, MN recruited hypertensive African American,

74
Hispanic, and non-Hispanic white sibships, respectively, for linkage and family-based
association studies. Subject were diagnosed with hypertension if they had a previous
clinical diagnosis of hypertension by a physician with current antihypertensive treatment
or an average SBP >=140 mmHg and/or an average diastolic blood pressure (DBP) >=90
mmHg.
In Rochester, MN and Jackson, MS, recruitment was restricted to sibships that
contained a minimum of two individuals diagnosed with essential hypertension before the
age of 60. Once this criterion was met, the entire sibship was invited to participate in the
study. As the prevalence of diabetes among Mexican-Americans is high, the Starr County
recruitment was restricted to Mexican-American sibships containing at least two
individuals diagnosed with type-2 diabetes (15). Data was collected through personal
interviews, and physical and laboratory examinations. The initial phase of the GENOA
study took place from September 1995 through June 2001 (16).
The study presented here focuses on the hypertensive subjects from the Jackson,
MS cohort that were both aware of their hypertension status and taking antihypertensive
medication(s) to lower blood pressure. Although a majority of the subjects in this cohort
were diagnosed as hypertensive, a number of the sibship members invited to participate
were identified as normotensive during the baseline examination and have been excluded
from this analysis. Other exclusion criteria included secondary hypertension, alcoholism
or drug abuse, pregnancy, insulin-dependent diabetes, or active malignancy. Of the 1854
African American subjects enrolled in the study, 1123 (61%) subjects were identified as
having essential hypertension and were taking antihypertensive medication(s),
conditional upon being aware of their hypertension status. Of these subjects, 1049 (93%)

75
had valid addresses that were successfully geocoded to the census tract level. An
additional 101 of these subjects were excluded from the analyses for residing outside of
the tri-county Jackson, MS area (i.e. - Hinds, Madison, or Rankin counties) (n=37), or
residing in a census tract within the tri-county Jackson, MS area that was represented by
fewer than 5 study subjects (n=64). The final analytic sample for this study contained
948 aware and treated, hypertensive, African American subjects from 48 census tracts
within the tri-county Jackson, MS geographic area.
Covariates
Trained interviewers asked subjects standard questions on numerous factors,
including sociodemographic, lifestyle, behavioral, and cardiovascular health history. Age
in years was assessed on the baseline examination date. Education was defined as the
total number of years of education completed. Height was measured by stadiometer,
weight by electronic balance, and body mass index (BMI) was calculated as weight in
kilograms divided by the square of height in meters. Diabetes was defined as having a
fasting glucose level ≥ 126 mg/dL or currently being treated with insulin or oral agents.
Blood Pressure Readings
Blood pressure measurements were made with random zero sphygmomanometers
and cuffs appropriate for arm size. Three readings were taken in the right arm after the
subject rested in the sitting position for at least five minutes according to the Seventh
report of the Joint National Committee on Prevention, Detection, Evaluation, and
Treatment of High Blood Pressure (JNC-7, 2003) guidelines (14). The SBP and DBP
values were determined by the first and fifth phase Korotkoff sounds, respectively, and
the last two blood pressure readings were averaged for the analyses. The diagnosis of
76
hypertension was established based on blood pressure levels measured at the study visit
(≥140/90 mmHg), or a prior diagnosis of hypertension and current treatment with
antihypertensive medications.
Antihypertensive Medications
Based on lists of all antihypertensive medications available in the US each
prescription antihypertensive drug recorded at the study visit was assigned a code number
corresponding to the first 6 digits of the Medi-Span Generic Product Identifier. This
number, which identifies pharmacologically equivalent drug products, was used to
categorize agents with similar mechanisms of antihypertensive action.
Blood Pressure Awareness, Treatment and Control
Subjects were considered to be “aware” of their hypertension status if they were
(a) defined as hypertensive, and (b) answered yes to the question, “Have you ever been
told by a physician that you have high blood pressure or hypertension?” Conditional
upon being hypertensive and aware of their hypertension status, subjects were considered
to be “treated” if they answered yes to the questions, “Has medication ever been
prescribed by a physician to lower your blood pressure?” and “During the last month,
have you used any medication that was prescribed or recommended by a physician?”
The number of prescribed antihypertensive medications was tallied for each subject.
Subjects taking only one prescribed antihypertensive medication were defined as being
treated with a monotherapy regimen, while those taking two or more prescribed
antihypertensive medications were defined as being treated with a combination therapy
regimen. Official guidelines propose that patients with a SBP ≥ 140 mmHg or DBP ≥ 90
mmHg be considered as hypertensive (14, 17). Accordingly, in this study controlled
77
blood pressure was defined as SBP < 140 mmHg and DBP < 90 mmHg for a treated
subject with hypertension. If either one, or both, of the two requirements were not met, a
hypertensive subject’s blood pressure was defined as uncontrolled.
Addresses and Geocoding
Home addresses were assessed and recorded at baseline examination of the
GENOA study. Available, valid addresses were geocoded to the census tract level based
on US Census 2000 tract definitions, using the Federal Financial Institutions Examination
Council (FFIEC) Geocoding System (18).
US Census Data
Census tracts are subdivisions of a county. They generally have between 2,500
and 8,000 residents, and, when first delineated, are designed to be homogeneous with
respect to population characteristics, economic status, and living conditions. Summary
File 3 was used to gather neighborhood socioeconomic indicator variables. Summary
File 1 was used to assess total race tallies by tract and subsequently generate a tract-level
percent African American variable that served as a racial composition proxy.
Neighborhood Socioeconomic Indicators and Neighborhood Summary Score
US census tracts were used as neighborhood proxies and data from the US Census
2000 was used to obtain measures of the socioeconomic characteristics of each subject’s
neighborhood (i.e.- census tract) of residence. Previous factor analyses of census
derived socioeconomic indicators have highlighted the following six variables that reflect
dimensions of income/wealth, education, and occupation: annual median household
income; median value of occupied housing units; percentage of households receiving
interest, dividends, or net rental income; percentage of adults who completed high school;

78
percentage of adults who completed college; and percentage of employed adults in
executive, managerial, or professional occupations (3). Based on previous methods (3),
these six indicator variables were combined to construct neighborhood summary scores
(NSS). Briefly, for each census-derived indicator variable, a mean and standard
deviation (SD) was calculated across the 48 census tracts represented in the study. Z
scores for each census tract were estimated for each of the census-derived variables by
subtracting the overall mean (across all 48 census tracts) from each respective census
tract and dividing by the SD. The z scores for each of the six census-derived variables
were then summed to construct the NSS. The NSS for the 48 census tracts represented in
the analytical sample ranged from -8.6 to 14.6 (see Table 3.2), with increasing NSS
representing increasing neighborhood-level socioeconomic advantage. Investigation of
the distribution of these census-derived indicator variables in this study revealed skewed
distributions for annual median household income and median value of occupied housing
units. As such, these variables were log transformed to approximate normal distributions,
prior to constructing the NSS. The constructed NSS was used as the primary indicator of
neighborhood-level socioeconomic status in this study. Additionally, log transformed
median annual household income, percentage of poverty, and percentage of African
American residential composition were also separately investigated to determine the
potential influence of neighborhood context on quantitative blood pressure levels, blood
pressure treatment, and blood pressure control. Percentage of poverty was analyzed
based on a constructed “poor neighborhood” variable, where a neighborhood was defined
as poor if the percentage of poverty was greater than 25%, and more socioeconomically

79
advantaged otherwise. Individual-level education was used as a measure of individual
socioeconomic position.
Statistical Analysis
There is an inherent organizational structure that extends from biological
components that comprise individuals to higher order groupings of individuals, such as
families and neighborhoods, to even higher order classifications of such groupings, such
as counties and states. Within this natural organizational structure, a multitude of nesting
structures arises. In order to retain such data structures, multilevel analysis is a useful
approach, as all available data is not collapsed to the individual-level or aggregated to the
group-level. In addition to retaining the multilevel structure of data, multilevel analysis
permits simultaneous examination of the effects of individual- and group-level
characteristics on individual-level outcomes, controls for correlations within groups by
modeling intercepts (as well as coefficients) as random, and allows for examination of
both inter-individual (within-group) and inter-group (between-group) variation [46].
The analytic study sample had a natural hierarchical structure, with 948 subjects
nested within 48 neighborhoods (defined as US Census 2000 tracts). Given this data
structure, multilevel models with a random intercept for each neighborhood were fit to
examine the associations of neighborhood socioeconomic characteristics with continuous
blood pressure measures, before and after adjustment for individual-level variables. A
series of model types were fit: models with a neighborhood-level variable only (i.e.-
unadjusted for individual-level variables); and models with both individual-level
variables (including age, gender, BMI, type 2 diabetes, and education) and neighborhood-
level variables.

80
The first (individual) level of the model type including individual and
neighborhood variables took the following form:
Yij = β0j + β1jageij + β2jgenderij + β3jBMIij + β4jdiabetesij + β5jeducationij + εij, (1)
where Yij represents the predicted quantitative blood pressure outcome for the ith
individual in the jth neighborhood; β0j is the intercept specific to the jth neighborhood; β1j,
β2j, β3j, β4j , and β5j are the individual level, fixed effects of age, gender, BMI, diabetes,
and education, respectively, that are specific to the jth neighborhood; and εij represents the
individual level error for the ith individual in the jth neighborhood. Individual-level errors
are assumed to be independent and normally distributed (εij ~ N(0,σ2)).
In the second (neighborhood) level, the coefficients listed in model equation (1)
were modeled as a function of neighborhoods as follows:
β0j = γ00 + γ01NSSj + Uoj
β1j = γ10
β2j = γ20
β3j = γ30
β4j = γ40
β5j = γ50, (2)
where γ00 represents the common intercept across neighborhoods; γ01 is the fixed effect of
the jth neighborhood socioeconomic summary score; γ10, γ20, γ30, γ40, γ50 are the common

81
slopes of age, gender, BMI, diabetes, and education, respectively, across neighborhoods;
and Uoj is a macro error, assumed to be independent and normally distributed (Uoj ~
N(0,τ00)), that measures the unique deviation of each neighborhood intercept from the
common intercept (γ00). Applying substitution to combine model equations (1) and (2)
yields the full multilevel model form:
Yij = γ00 +γ01NSSj +γ10agej +γ20genderij +γ30BMIij + γ40diabetesij + γ50educationij + U0j+εij.
A similar modeling strategy was employed to investigate the dichotomous
hypertension outcomes (blood pressure combination treatment and blood pressure
control). Given the non-normal distribution of errors when considering dichotomous
outcomes, logistic multilevel models were used to assess the odds of these hypertension
outcomes. Models were fitted in R (19) using the “lme” function for quantitative
outcomes (SBP and DBP) and the “glmm” function for dichotomous outcomes (blood
pressure combination treatment and blood pressure control).
RESULTS
Select characteristics of the study sample are presented in Table 3.1. The mean
age of the subjects was 61 years of age. Females comprised 73% of the subjects, while
diabetics comprised 28%. The subjects were generally obese (mean BMI = 32), and on
average completed less than 11.5 years of education.
The median number of subjects per census tract was 11 (range, 5 – 92). The
distributions of the selected, US Census derived, neighborhood socioeconomic indicators,
as well as the constructed NSS, are presented in Table 3.2. The range of the NSS across

82
the 48 census tracts included in the present study was -8.6 to 14.6. Compared to men,
women had slightly lower mean NSS (p=0.035). Individual education level demonstrated
a highly significant, graded positive association with NSS, with subjects who had
completed 16 or more years of education having NSS that were on average 4.05 points
higher compared to those who had completed less than 12 years of education. Compared
to subjects that were between 20 and 39 years of age, subjects that were between 40 and
59 had higher NSS, while subjects that were 60 or older had lower NSS, although neither
of these differences reached statistical significance. NSS did not differ by obesity or
diabetes status. The median percentage of individuals per census tract living in poverty
was 30% (interquartile range, 21-37). The median percentage of African American
residents per census tract was 97% (interquartile range, 92-98), indicating that the racial
composition across the 48 census tracts investigated was notably homogeneous.
Neighborhood Socioeconomic Summary Score
Table 3.3 presents the associations between NSS and SBP, before and after
adjustment for individual-level variables. Modeled continuously and unadjusted for
individual level variables (Model 1), a one unit increase NSS was statistically
significantly associated with a –0.40 mmHg decrease in SBP (p=0.012). Upon additional
adjustment for age, sex, BMI, and diabetes (Model 2), the association between NSS and
SBP was attenuated and lost statistical significance. Further adjustment for individual
education (Model 3) attenuated the association even further and the association remained
non-significant. In a separate model, unadjusted for individual variables, that divided the
NSS into quintiles, a graded increase in SBP was noted from the highest to lowest
quintile. Only the difference between the highest and lowest NSS quintiles reached

83
statistical significance, with subjects with NSS in the lowest quintile having SBP values
6.85 mmHg higher than those with NSS in the highest quintile (p=0.007). Upon
additional adjustment for individual age, sex, BMI, and diabetes, the difference in SBP
values between subjects in the highest and lowest NSS quintiles was attenuated (3.95
mmHg higher in subjects in the lowest quintile), yet remained marginally significant
(p=0.10). This difference was attenuated even further with additional adjustment for
individual education attainment, and resulted in no significant differences in SBP values
for any of the NSS quintiles, relative to the highest quintile. No statistically significant
associations between NSS and DBP were detected before (Model 1, Table 3.4) or after
(Models 2 and 3, Table 3.4) adjustment for individual-level variables.
Table 3.5 presents the association of NSS with taking antihypertensive
medications in combination therapy form (versus taking an antihypertensive medication
as part of a monotherapy regimen). After adjustment for age, sex, BMI, and diabetes
(Model 2), NSS was statistically significantly associated with increased odds of taking 2
or more antihypertensive medications that were prescribed to lower blood pressure
(OR=1.03, p=0.044). The magnitude and direction of this association remained upon
additional adjustment for individual education (Model 3), however the association was
only marginally statistically significant (OR=1.03, p=0.084). No statistically significant
associations were detected between NSS and blood pressure control, before (Model 1,
Table 3.6) or after (Models 2 and 3, Table 3.6) adjustment for individual-level variables.
Median Household Income, Poor Neighborhood of Residence, and Neighborhood
Racial Composition

84
Appendices 3.1-3.4 list the associations between (log) median household income
and SBP, DBP, combination antihypertensive therapy, and blood pressure control,
respectively. Of note, increasing (log) median household income at the neighborhood
level was statistically significantly associated with decreasing SBP, unadjusted (Model 1,
Appendix 3.1) for individual-level variables (p=0.006). Additional adjustment for
individual-level variables (Models 2 and 3, Appendix 3.1) resulted in no statistically
significant association of census tract level (log) median household income with SBP.
Log-transformed median household income at the neighborhood level was also
statistically significantly associated with increased odds of taking 2 or more prescribed
antihypertensive medications to lower blood pressure, even after adjustment for age, sex,
BMI, and diabetes (Model 2, Appendix 3.3), and additional adjustment for individual
education (Model 3, Appendix 3.3).
62% of the study subjects were residing in a neighborhood that was defined as
“poor” (i.e.- a neighborhood with greater than 25 % poverty). Table 3.7 presents the
distributions of the types of antihypertensive medications prescribed by neighborhood of
residence poverty status. Appendices 3.5-3.8 list the associations between poor
neighborhood of residence and SBP, DBP, combination antihypertensive therapy, and
blood pressure control, respectively. Poor neighborhood of residence was statistically
significantly associated with increased SBP values (4.5 mmHg higher than those residing
in more socioeconomically advantaged neighborhoods), before adjustment for individual-
level variables (Model 1, Appendix 3.5) (p=0.005). This association was attenuated, yet
remained marginally statistically significant (p=0.071) upon adjustment for age, sex,
BMI, and diabetes (Model 2, Appendix 3.5), and attenuated further and fell out of

85
statistical significance (p=0.113) with the additional adjustment for individual education
(Model 3, Appendix 3.5). Although the distributions of the types of antihypertensive
medications prescribed did not differ significantly by neighborhood poverty (Table 3.7),
residing in a poor neighborhood was statistically significantly associated with a decreased
odds of being treated with 2 or more prescribed antihypertensive medications to lower
blood pressure, after adjustment for age, sex, BMI, and diabetes (Model 2, Appendix 3.7)
(OR=0.71, p=0.019). This association remained, even after additional adjustment for
individual education (Model 3, Appendix 3.7) (OR=0.72, p = 0.03). No statistically
significant associations with quantitative DBP values or blood pressure control were
detected in any models using either (log) median household income (Appendices 3.2 and
3.4, respectively) or poor neighborhood of residence (Appendices 3.6 and 3.8,
respectively) as the neighborhood-level independent variable.
Models, unadjusted and adjusted for individual-level variables, were fit for all
outcomes (SBP, DBP, combination therapy, and blood pressure control) using % African
American residents per neighborhood as the neighborhood-level independent variable.
This racial composition variable was investigated to explore the potential mechanisms,
for example racial segregation, that may influence hypertension outcomes. No
statistically significant associations were detected between % African American residents
per neighborhood and any of the hypertension outcomes, before or after adjustment for
individual-level variables (results not shown). Although racial composition may exert
important contextual effects on hypertension outcomes through a variety of mechanisms,
the high degree of racial homogeneity (97% African American) across the neighborhoods

86
investigated in this study limited the ability to thoroughly investigate such potential
effects.
DISCUSSION
The main aim of this study was to determine the extent to which neighborhood
socioeconomic environment influenced blood pressure levels, as well as the probabilities
of more aggressive antihypertensive pharmacological treatment and blood pressure
control, after controlling for other influential individual-level factors. Neighborhood
socioeconomic context did not appear to be an important determinant of quantitative DBP
levels or blood pressure control, before or after adjustment for potential confounding
factors at the individual-level. In analyses unadjusted for individual-level factors, lower
NSS were associated with higher SBP levels. However, this association was attenuated
and lost statistical significance after adjustment for age, sex, co-morbid conditions, and
education, suggesting that the potential influence of neighborhood socioeconomic context
(as quantified by NSS) was confounded by individual-level factors. Residing in
neighborhoods marked by a high degree of poverty was associated with higher SBP
levels, even after adjustment for individual age, sex and co-morbid conditions. However,
this association was also attenuated and lost statistical significance after adjusting for
individual education. While the contextual factors of neighborhood socioeconomic
environments may indeed influence SBP levels, findings from this study seem to indicate
that neighborhood compositional factors, including individual-level SES, may play more
important roles in shaping the distribution of SBP among African American hypertensive
individuals.

87
The key significant finding in this study suggests that residing in a
socioeconomically disadvantaged neighborhood may reduce the likelihood of being
treated for hypertension more aggressively with multiple medications. This finding was
consistent regardless of the neighborhood-level variable used to capture neighborhood
socioeconomic environments, and associations detected withstood individual-level
adjustments, including individual SES. Although this study did not investigate specific
mechanisms that may help to explain this finding, several mechanisms (including health
and social resource quality/availability, and logistics) are plausible and may warrant
further investigation.
Availability of and access to quality health resources is often more limited for
minority populations and individuals of lower SES (20-24). Racial/ethnic and
socioeconomic differences in prescription practices have been noted (25, 26), and
treatment for hypertension has been shown to be less aggressive among African
Americans (27). The presence of quality clinics and pharmacies plays an obvious critical
role in the delivery of adequate healthcare services and certain clinical services are less
accessible in socioeconomically disadvantaged areas (28). The importance of
pharmacists and pharmacy services in effectively helping patients with essential
hypertension manage their blood pressure has been recognized for decades (29).
Socioeconomically disadvantaged areas may be less likely to have quality clinical and
pharmacy services available, which could directly and negatively impact both the
treatment and control of hypertension. The lack of availability for certain medications in
pharmacies located in poorer areas has been noted (30-32), which may restrict acquiring
certain medications, even if they were prescribed. Quality of care may be poorer in

88
socioeconomically disadvantaged, poor-resource areas (33, 34). Proximity to wealthier
areas with adequate health resources has been linked with insulin resistance (35),
providing further evidence that the general lack of adequate health resources in poorer,
underserved areas is a barrier to the delivery of health services and directly impacts
health outcomes.
Strong social networks and support can positively influence a variety of health
outcomes. A recent study has shown that low SES is related to poor social networks and
support (36), and the quality and quantity of such social resources are likely more limited
in areas marked by socioeconomic disadvantage. Numerous studies have shown that
these social resources are important for hypertension treatment, treatment adherence, and
control, particularly among African American populations (37-42). Neighborhood social
participation has also been linked to adherence with antihypertensive medications (43),
and use of hormone replacement therapy among women (44). In addition to many
positive influences, including the promotion of positive health-related group norms,
social networking and support provides an excellent platform for education and the
exchange of information through group interaction. As a result of missed opportunities to
access and/or utilize social resources, hypertensive individuals living in
socioeconomically disadvantaged areas may be less likely to receive the pertinent
information (e.g. – the fact that multiple antihypertensive medications are often required
to achieve and maintain target blood pressure), which could influence the likelihood of
being treated with combination therapy regimens.
In addition to a variety of patient, medication, and disease specific factors, basic
logistic issues have been reported as barriers to antihypertensive treatment (40). A key
89
reported logistic issue is difficulty in reaching appointments at clinics and/or pharmacies.
Effective blood pressure management commonly calls for antihypertensive medication
adjustment and/or intensification, which require repeated provider contact through
frequent clinical visits. Low neighborhood SES may be associated with factors (such as
inadequate public transportation) that restrict access to health (and social) care resources,
which may negatively impact health outcomes.
This study had several limitations that warrant discussion. This study was based
on cross-sectional data and residential histories of the subjects were unavailable. As
such, temporality, and hence causality, is difficult to establish, as a subject’s exposure to
certain risk factors (e.g. - neighborhood of residence) at the time of enrollment may not
equal exposure status when the disease process began and cumulative exposures may be
more relevant. The study findings pertain to hypertensive African American subjects
from the tri-county Jackson, MS area and may not be generalizable to other racial/ethnic
groups or African Americans in other geographic locations. Baseline address information
was not available for the non-Hispanic white GENOA subjects from Rochester, MN or
the Mexican American subjects from Starr County, TX, which precluded the examination
of neighborhood socioeconomic environment in other racial/ethnic groups from other US
geographic locations.
Census tracts were used as proxies for neighborhoods in this study. Census tracts
have been commonly employed as an area measure in health research and previous
studies indicate that differences between census tracts and smaller area measures (block-
groups) are likely small (45). Still, defining neighborhoods in this way has limitations, as
the boundaries used to define them may not correspond with what people define/perceive

90
as their neighborhoods, and a proxy used to define the relevant area may, “grossly
underspecify neighborhood contexts” (46). Furthermore, census tracts may not be the
most appropriate spatial scale relevant to hypertension (13). Neighborhood SES was
relatively homogeneous across the census tracts investigated, which may have limited the
ability to detect neighborhood contextual associations.
Data sparseness within certain census tracts may have biased the estimates of
neighborhood socioeconomic indicators. Unbalanced data and/or small group size (<2
individuals per group) can lead to over-estimation of group-level random effects and
standard errors of these effects, and this decrease in precision can result in decreased
power to detect between-group variance. Monte-Carlo simulation work has suggested
that 5 observations per group are sufficient for robust estimation of group-level effects
(47). Accordingly, this study focused exclusively on subjects residing in neighborhoods
with 5 or more subjects and a number of subjects were excluded for residing in
neighborhoods with fewer than 5 subjects. Subjects residing in neighborhoods outside of
the tri-county Jackson, MS area were also excluded in order to create an analytic sample
that was more homogeneous geographically. If the neighborhood socioeconomic
indicators related to the excluded subjects systematically differed from those of the
subjects included in the study, neighborhood socioeconomic estimates may have been
biased.
The need to “identify the specific characteristics of residential environments that
are deleterious to health” (48) has been recognized for decades. This study used
individual census-derived socioeconomic indicators, as well as constructed NSS, to
capture the socioeconomic contexts of the neighborhoods investigated. While such
91
measures have been used in “area-effects” research (3, 4, 49, 50), they may be poor
proxies for the specific neighborhood mechanisms that are potentially relevant to health
outcomes (51). This study was limited in this regard, due to the absence of data on
specific neighborhood features (e.g. - healthy food availability, built environment, access
to quality health care, social cohesion, and stress) that may have more direct influences
on the hypertension outcomes examined.
It should also be noted that the detected associations between the neighborhood
socioeconomic context and SBP and combination treatment could simply reflect
unmeasured individual-level socioeconomic characteristics rather than a contextual effect
of the neighborhood (46, 52). The potential for this possibility existed in this study,
particularly since individual education was the only measure of individual-level SES
investigated, as data on other individual-level measures of SES, such as income and
health insurance, was not available. Despite this, education is less prone to reverse
causation and has commonly been used as an indicator of individual SES. Given the
potential for misspecification of models at one or more of the levels in the proposed
analyses, effect estimates at each level should be interpreted with caution, as
misspecification at one level can also impact estimates at another level. The degree of
familial correlation in the study sample overall, and within given neighborhoods, had the
potential to influence the associations (or lack thereof) detected in this study. Despite
this, it was unlikely that neighborhood contextual effect estimates were seriously
impacted by familial correlations, as the degree of within-neighborhood relatedness was
small across the neighborhoods investigated (Appendix 3.9). Furthermore, the inclusion
of macro errors in the multilevel regression models theoretically allowed for correlations

92
within neighborhoods. Still, the individual- and neighborhood-level estimates may have
been impacted by unspecified familial factors. Independent of neighborhood context, the
familial aggregation of quantitative blood pressure levels and blood pressure control is
examined and discussed further in Chapter 4.
The extent to which individuals from different neighborhoods are “exchangeable”
and the inability to draw correct causal inferences about neighborhood effects in the
absence of the exchangeability assumption has been discussed (46, 53). It has been noted
that individuals ‘select’ into certain neighborhoods for a variety of reasons and such
selection may lead to systematic differences in the compositional factors of individuals
across neighborhoods. If all relevant compositional factors are not controlled for,
obtaining accurate estimates of "independent" neighborhood effects may be difficult (53).
Furthermore, if there is little overlap between individual-level characteristics across
neighborhoods, adjustment for these variables may bias the estimate of the neighborhood
effect, as a result of extrapolation (46). Without more complete data on individual-level
SES characteristics, the extent to which this characteristic truly overlaps across
neighborhoods was difficult to estimate in this study.
The degree to which neighborhood-level contexts exert “independent” effects on
individual-level health outcomes may have important implications for public health
efforts. If neighborhood-level characteristics influence hypertension outcomes, apart
from individual-level characteristics, interventions that are community focused and
directed towards neighborhoods may prove beneficial in reducing blood pressure levels
and increasing the levels of hypertension awareness, treatment, and control. Accounting
for group-level features may also be important in providing the context that determines
the distribution of hypertension risk factors. This study contributed to the “area effects”
93
research and detected the novel finding that neighborhood socioeconomic environment
may influence hypertension treatment and treatment intensity. Future research
investigating specific characteristics of neighborhood socioeconomic environments, such
as accessibility and proximity to clinics and pharmacies, may highlight areas that need to
be addressed in order to improve adequate treatment and control among minority and
underserved hypertensive populations.

94
Table 3.1. Selected sample characteristics of the treated hypertensive African American GENOA study subjects included in the analyses (n=948) Mean (SD) Age (years) 60.7 (9.0) Height (cm) 168.0 (8.6) Weight (kg) 89.9 (18.5) BMI (kg/m2) 31.9 (6.7) Education (years completed) 11.5 (3.6) SBP (mmHg) 139.8 (22.9) DBP (mmHg) 78.0 (12.5) Female (%) 73 Type 2 diabetes (%) 28 Blood pressure controlleda (%) 53 Taking 2 or more antihypertensive medications (%) 53 Residence within poor neighborhoodb 62 Quantitative variables are presented as mean (SD); categorical variables as percentages. aBlood pressure control defined as systolic blood pressure <140 mmHg and diastolic blood pressure <90 mmHg. bPoor neighborhood based on percentage of census tract poverty, where a neighborhood was defined as “poor” if the percentage of poverty was greater than 25%, and “more advantaged” otherwise. BMI = body mass index; SBP = systolic blood pressure; DBP = diastolic blood pressure.

95
Table 3.2. Descriptive statistics of US Census 2000 socioeconomic indicator variables and neighborhood socioeconomic summary scores across 48 census tracts within the tri-county Jackson, MS geographic region Variable Min Median Max Interquartile range Annual household income in 1999 (US dollars) 10510 25480 66350 18960, 30730 Value of occupied housing units (US dollars) 29400 47200 133200 38500, 57300 % of households receiving interest, dividend or net rental income 1 11 49 9, 18 % of adults who completed high school 45 67 95 62, 77 % of adults who completed college 5 17 49 11, 19 % of adults in managerial or professional occupations 8 22 63 18, 26 % poverty in 1999** 3 30 54 21, 37 % African American 7 97 99 92, 98 Neighborhood socioeconomic summary score* -8.6 -1.3 14.6 -4.3, 0.7 * Neighborhood socioeconomic summary score derived from summation of calculated z-scores from the following indicators: Annual household income in 1999 (US dollars); Value of occupied housing units (US dollars); % of households receiving interest, dividend or net rental income; % of adults who completed high school; % of adults who completed college; % of adults in managerial or professional occupations. ** % poverty to income ratio (PIR) < 1.0.

96
Table 3.3. Association of neighborhood socioeconomic score with systolic blood pressure in the African American GENOA subjects included in multilevel linear model analyses (n=948)
Model 1 Model 2 Model 3 Coef (CI) Coef (CI) Coef (CI)
Intercept 139.41** (137.93, 140.88)
109.11** (96.20, 122.03)
117.59** (102.22, 132.95)
Individual-level variables Age (years) 0.46** (0.31, 0.63) 0.42** (0.25, 0.59) Gender Male (ref) Female 1.75 (-1.57, 5.07) 2.21 (-1.14, 5.56) BMI (kg/m2) -0.03 (-0.26, 0.20) -0.05 (-0.27, 0.18) Type 2 diabetes Absent (ref) Present 5.79** (2.57, 9.03) 5.73** (2.51, 8.96) Education (years completed) -0.44** (-0.88, -0.01) Neighborhood level variable NSSa -0.40** (-0.70, -0.10) -0.23 (-0.52, 0.07) -0.16 (-0.46, 0.15) All models fit using hierarchical linear models with random intercept components. Model 1 is unadjusted for individual factors. Model 2 adjusted for individual age, sex, BMI and diabetes. Model 3 adjusted for individual age, sex, BMI, diabetes, and education. aNSS = Neighborhood socioeconomic summary score. Neighborhood socioeconomic summary score derived from summation of calculated z-scores from the following indicators: Annual household income in 1999 (US dollars); Value of occupied housing units (US dollars); % of households receiving interest, dividend or net rental income; % of adults who completed high school; % of adults who completed college; % of adults in managerial or professional occupations. CI = estimated 95% confidence interval. BMI = body mass index. p-value **P<0.05; *P<0.10.

97
Table 3.4. Association of neighborhood socioeconomic score with diastolic blood pressure in the African American GENOA subjects included in multilevel linear model analyses (n=948)
Model 1 Model 2 Model 3 Coef (CI) Coef (CI) Coef (CI)
Intercept 78.07** (77.21, 78.93)
106.75** (99.80, 113.70)
111.23** (102.96, 119.50)
Individual-level variables Age (years) -0.37** (-0.46, -0.29) -0.40** (-0.49, -0.31) Gender Male (ref) Female -2.99** (-4.78, -1.21) -2.75** (-4.55, -0.95) BMI (kg/m2) -0.11* (-0.23, 0.01) -0.12* (-0.24, 0.00) Type 2 diabetes Absent (ref) Present -1.10 (-2.84, 0.64) -1.13 (-2.87, 0.60) Education (years completed) -0.23* (-0.47, 0.00) Neighborhood level variable NSSa 0.06 (-0.11, 0.23) -0.08 (-0.24, 0.08) -0.04 (-0.20, 0.12) All models fit using hierarchical linear models with random intercept components. Model 1 is unadjusted for individual factors. Model 2 adjusted for individual age, sex, BMI and diabetes. Model 3 adjusted for individual age, sex, BMI, diabetes, and education. aNSS = Neighborhood socioeconomic summary score. Neighborhood socioeconomic summary score derived from summation of calculated z-scores from the following indicators: Annual household income in 1999 (US dollars); Value of occupied housing units (US dollars); % of households receiving interest, dividend or net rental income; % of adults who completed high school; % of adults who completed college; % of adults in managerial or professional occupations. CI = estimated 95% confidence interval. BMI = body mass index. p-value **P<0.05; *P<0.10.

98
Table 3.5. Association of neighborhood socioeconomic score with combination antihypertensive pharmacologic treatment in the African American GENOA subjects included in multilevel logistic regression model analyses (n=948)
Model 1 Model 2 Model 3 OR (CI) OR (CI) OR (CI)
Individual-level variables Age (years) 1.02** (1.01, 1.04) 1.02** (1.01, 1.04) Gender Male (ref) Female 0.81 (0.59, 1.09) 0.79 (0.58, 1.07) BMI (kg/m2) 1.05** (1.03, 1.08) 1.06** (1.03, 1.08) Type 2 diabetes Absent (ref) Present 1.49** (1.10, 2.01) 1.50** (1.11, 2.02) Education (years completed) 1.02 (0.98, 1.07) Neighborhood level variable NSSa 1.02 (0.99, 1.05) 1.03** (1.00, 1.06) 1.03* (1.00, 1.06) All models fit using hierarchical linear models with random intercept components. Model 1 is unadjusted for individual factors. Model 2 adjusted for individual age, sex, BMI and diabetes. Model 3 adjusted for individual age, sex, BMI, diabetes, and education. aNSS = Neighborhood socioeconomic summary score. Neighborhood socioeconomic summary score derived from summation of calculated z-scores from the following indicators: Annual household income in 1999 (US dollars); Value of occupied housing units (US dollars); % of households receiving interest, dividend or net rental income; % of adults who completed high school; % of adults who completed college; % of adults in managerial or professional occupations. CI = estimated 95% confidence interval. BMI = body mass index. p-value **P<0.05; *P<0.10.

99
Table 3.6. Association of neighborhood socioeconomic score with blood pressure controla in the African American GENOA subjects included in multilevel logistic regression model analyses (n=948)
Model 1 Model 2 Model 3 OR (CI) OR (CI) OR (CI)
Individual-level variables Age (years) 0.97** (0.96, 0.99) 0.97** (0.96, 0.99) Gender Male (ref) Female 0.82 (0.61, 1.12) 0.80 (0.59, 1.09) BMI (kg/m2) 1.01 (0.99, 1.03) 1.01 (0.99, 1.03) Type 2 diabetes Absent (ref) Present 0.66** (0.49, 0.89) 0.67** (0.50, 0.90) Education (years completed) 1.03 (0.99, 1.07) Neighborhood level variable NSSb 1.02 (0.99, 1.04) 1.00 (0.98, 1.03) 1.00 (0.97, 1.03) All models fit using hierarchical linear models with random intercept components. Model 1 is unadjusted for individual factors. Model 2 adjusted for individual age, sex, BMI and diabetes. Model 3 adjusted for individual age, sex, BMI, diabetes, and education. aBlood pressure controlled to <140/90 mmHg. bNSS = Neighborhood socioeconomic summary score. Neighborhood socioeconomic summary score derived from summation of calculated z-scores from the following indicators: Annual household income in 1999 (US dollars); Value of occupied housing units (US dollars); % of households receiving interest, dividend or net rental income; % of adults who completed high school; % of adults who completed college; % of adults in managerial or professional occupations. CI = estimated 95% confidence interval. BMI = body mass index. p-value **P<0.05; *P<0.10.

100
Table 3.7. Use of antihypertensive drug class by poor neighborhood of residencea
Poor neighborhood n= 584
More advantaged neighborhood
n= 364 Diuretic 57% (14%) 57% (13%)
β-blocker 15% (3%) 17% (4%)
Calcium channel blocker 33% (13%) 39% (13%)
RAAS inhibitor 34% (10%) 37% (10%)
Otherb 24% (9%) 21% (5%)
Mono-therapy 49% 45%
2 of the above drugs in combination 37% 41%
3 or more of the above drugs in combination 14% 14%
Top portion of table data represent percentages of aware and treated hypertensive subjects taking each respective antihypertensive drug class as part of any regimen. Percentages using each class in mono-therapy form shown in parentheses; aPoor neighborhood based on percentage of census tract poverty, where a neighborhood was defined as “poor” if the percentage of poverty was greater than 25%, and “more advantaged” otherwise. bOther antihypertensive class includes alpha-blockers, vasodilators, sympatholytics, and study drugs. RAAS = renin angiotensin aldosterone system. p-value contrasts between neighborhood type groups; p<0.05*; p<0.01†; p<0.001‡.

101
Appendix 3.1. Association of log median household income with systolic blood pressure in the African American GENOA subjects included in multilevel linear model analyses (n=948)
Model 1 Model 2 Model 3 Coef (CI) Coef (CI) Coef (CI)
Intercept 196.35** (157.43, 235.28)
141.41** (98.23, 184.60)
141.02** (97.90, 184.14)
Individual-level variables Age (years) 0.47** (0.30, 0.63) 0.41** (0.24, 0.59) Gender Male (ref) Female 1.67 (-1.66, 5.00) 2.14 (-1.21, 5.50) BMI (kg/m2) -0.03 (-0.26, 0.20) -0.05 (-0.28, 0.18) Type 2 diabetes Absent (ref) Present 5.79** (2.56, 9.02) 5.73** (2.50, 8.95) Education (years completed) -0.44** (-0.87, 0.00) Neighborhood level variable Log median household incomea -12.82** (-21.62, -4.01) -7.19 (-16.00, 1.61) -5.23 (-14.23, 3.78) All models fit using hierarchical linear models with random intercept components. Model 1 is unadjusted for individual factors. Model 2 adjusted for individual age, sex, BMI and diabetes. Model 3 adjusted for individual age, sex, BMI, diabetes, and education. aThe distribution of median household income by census tract in the study sample was right-skewed and was log-transformed to approximate a normal distribution. CI = estimated 95% confidence interval. BMI = body mass index. p-value **P<0.05; *P<0.10.

102
Appendix 3.2. Association of log median household income with diastolic blood pressure in the African American GENOA subjects included in multilevel linear model analyses (n=948)
Model 1 Model 2 Model 3 Coef (CI) Coef (CI) Coef (CI)
Intercept 64.82** (42.62, 87.03) 114.18** (90.93, 137.42)
113.96** (90.75, 137.17)
Individual-level variables Age (years) -0.37** (-0.46, -0.29) -0.40** (-0.49, -0.31) Gender Male (ref) Female -2.99** (-4.79, -1.20) -2.73** (-4.54, -0.93) BMI (kg/m2) -0.11* (-0.23, 0.01) -0.12* (-0.24, 0.00) Type 2 diabetes Absent (ref) Present -1.10 (-2.84, 0.64) -1.13 (-2.87, 0.60) Education (years completed) -0.24** (-0.47, -0.01) Neighborhood level variable Log median household incomea 2.99 (-2.04, 8.02) -1.69 (-6.43, 3.05) -0.61 (-5.45, 4.24) All models fit using hierarchical linear models with random intercept components. Model 1 is unadjusted for individual factors. Model 2 adjusted for individual age, sex, BMI and diabetes. Model 3 adjusted for individual age, sex, BMI, diabetes, and education. aThe distribution of median household income by census tract in the study sample was right-skewed and was log-transformed to approximate a normal distribution. CI = estimated 95% confidence interval. BMI = body mass index. p-value **P<0.05; *P<0.10.

103
Appendix 3.3. Association of log median household income with combination antihypertensive pharmacologic treatment in the African American GENOA subjects included in multilevel logistic regression model analyses (n=948)
Model 1 Model 2 Model 3 OR (CI) OR (CI) OR (CI)
Individual-level variables Age (years) 1.02** (1.01, 1.04) 1.02** (1.01, 1.04) Gender Male (ref) Female 0.82 (0.60, 1.11) 0.80 (0.58, 1.09) BMI (kg/m2) 1.06** (1.03, 1.08) 1.06** (1.03, 1.08) Type 2 diabetes Absent (ref) Present 1.49** (1.10, 2.02) 1.50** (1.11, 2.02) Education (years completed) 1.02 (0.98, 1.06) Neighborhood level variable Log median household incomea 1.99* (0.91, 4.32) 2.75** (1.21, 6.24) 2.49** (1.08, 5.77) All models fit using hierarchical linear models with random intercept components. Model 1 is unadjusted for individual factors. Model 2 adjusted for individual age, sex, BMI and diabetes. Model 3 adjusted for individual age, sex, BMI, diabetes, and education. aThe distribution of median household income by census tract in the study sample was right-skewed and was log-transformed to approximate a normal distribution. CI = estimated 95% confidence interval. BMI = body mass index. p-value **P<0.05; *P<0.10.

104
Appendix 3.4. Association of log median household income with blood pressure controla in the African American GENOA subjects included in multilevel logistic regression model analyses (n=948)
Model 1 Model 2 Model 3 OR (CI) OR (CI) OR (CI)
Individual-level variables Age (years) 0.97** (0.96, 0.99) 0.98** (0.96, 0.99) Gender Male (ref) Female 0.83 (0.61, 1.13) 0.81 (0.59, 1.10) BMI (kg/m2) 1.01 (0.99, 1.03) 1.01 (0.99, 1.03) Type 2 diabetes Absent (ref) Present 0.66** (0.50, 0.89) 0.67** (0.50, 0.90) Education (years completed) 1.03 (0.99, 1.07) Neighborhood level variable Log median household incomeb 1.86 (0.86, 4.05) 1.32 (0.59, 2.96) 1.17 (0.51, 2.68) All models fit using hierarchical linear models with random intercept components. Model 1 is unadjusted for individual factors. Model 2 adjusted for individual age, sex, BMI and diabetes. Model 3 adjusted for individual age, sex, BMI, diabetes, and education. a Blood pressure controlled to <140/90 mmHg. bThe distribution of median household income by census tract in the study sample was right-skewed and was log-transformed to approximate a normal distribution. CI = estimated 95% confidence interval. BMI = body mass index. p-value **P<0.05; *P<0.10.

105
Appendix 3.5. Association of poor neighborhood of residence with systolic blood pressure in the African American GENOA subjects included in multilevel linear model analyses (n=948)
Model 1 Model 2 Model 3 Coef (CI) Coef (CI) Coef (CI)
Intercept 136.98** (134.63, 139.32)
108.33** (95.53, 121.13)
117.40** (102.04, 132.76)
Individual-level variables Age (years) 0.46** (0.30, 0.62) 0.41** (0.24, 0.58) Gender Male (ref) Female 1.71 (-1.61, 5.03) 2.15 (-1.19, 5.49) BMI (kg/m2) -0.04 (-0.27, 0.19) -0.06 (-0.28, 0.17) Type 2 diabetes Absent (ref) Present 5.84** (2.61, 9.07) 5.76** (2.54, 8.99) Education (years completed) -0.45** (-0.88, -0.03) Neighborhood level variable Poor neighborhooda 4.51** (1.53, 7.50) 2.81* (-0.17, 5.79) 2.46 (-0.53, 5.45) All models fit using hierarchical linear models with random intercept components. Model 1 is unadjusted for individual factors. Model 2 adjusted for individual age, sex, BMI and diabetes. Model 3 adjusted for individual age, sex, BMI, diabetes, and education. aPoor neighborhood based on percentage of census tract poverty, where a neighborhood was defined as “poor” if the percentage of poverty was greater than 25%, and “more advantaged” otherwise. BMI = body mass index. p-value **P<0.05; *P<0.10.

106
Appendix 3.6. Association of poor neighborhood of residence with diastolic blood pressure in the African American GENOA subjects included in multilevel linear model analyses (n=948)
Model 1 Model 2 Model 3 Coef (CI) Coef (CI) Coef (CI)
Intercept 78.80** (77.52, 80.08) 106.31** (99.42, 113.20)
111.25** (102.98, 119.52)
Individual-level variables Age (years) -0.37** (-0.46, -0.28) -0.40** (-0.49, -0.31) Gender Male (ref) Female -2.95** (-4.74, -1.16) -2.70** (-4.50, -0.91) BMI (kg/m2) -0.11* (-0.23, 0.01) -0.12* (-0.24, 0.00) Type 2 diabetes Absent (ref) Present -1.09 (-2.83, 0.65) -1.13 (-2.87, 0.61) Education (years completed) -0.25** (-0.48, -0.02) Neighborhood level variable Poor neighborhooda -1.31 (-2.95, 0.32) 0.19 (-1.41, 1.80) 0.00 (-1.61, 1.61) All models fit using hierarchical linear models with random intercept components. Model 1 is unadjusted for individual factors. Model 2 adjusted for individual age, sex, BMI and diabetes. Model 3 adjusted for individual age, sex, BMI, diabetes, and education. aPoor neighborhood based on percentage of census tract poverty, where a neighborhood was defined as “poor” if the percentage of poverty was greater than 25%, and “more advantaged” otherwise. BMI = body mass index. p-value **P<0.05; *P<0.10.

107
Appendix 3.7. Association of poor neighborhood of residence with combination antihypertensive pharmacologic treatment in the African American GENOA subjects included in multilevel logistic regression model analyses (n=948)
Model 1 Model 2 Model 3 OR (CI) OR (CI) OR (CI)
Individual-level variables Age (years) 1.02** (1.01, 1.04) 1.03** (1.01, 1.04) Gender Male (ref) Female 0.81 (0.59, 1.10) 0.79 (0.58, 1.07) BMI (kg/m2) 1.06** (1.03, 1.08) 1.06** (1.03, 1.08) Type 2 diabetes Absent (ref) Present 1.48** (1.10, 2.00) 1.49** (1.10, 2.01) Education (years completed) 1.03 (0.99, 1.07) Neighborhood level variable Poor neighborhooda 0.80 (0.62, 1.04) 0.71** (0.54, 0.94) 0.72** (0.55, 0.96) All models fit using hierarchical linear models with random intercept components. Model 1 is unadjusted for individual factors. Model 2 adjusted for individual age, sex, BMI and diabetes. Model 3 adjusted for individual age, sex, BMI, diabetes, and education. aPoor neighborhood based on percentage of census tract poverty, where a neighborhood was defined as “poor” if the percentage of poverty was greater than 25%, and “more advantaged” otherwise. BMI = body mass index. p-value **P<0.05; *P<0.10.

108
Appendix 3.8. Association of poor neighborhood of residence with blood pressure controla in the African American GENOA subjects included in multilevel logistic regression model analyses (n=948)
Model 1 Model 2 Model 3 OR (CI) OR (CI) OR (CI)
Individual-level variables Age (years) 0.97** (0.96, 0.99) 0.98** (0.96, 0.99) Gender Male (ref) Female 0.83 (0.61, 1.12) 0.81 (0.59, 1.10) BMI (kg/m2) 1.01 (0.99, 1.03) 1.01 (0.99, 1.03) Type 2 diabetes Absent (ref) Present 0.66* (0.49, 0.89) 0.67** (0.50, 0.90) Education (years completed) 1.03 (0.99, 1.07) Neighborhood level variable Poor neighborhoodb 0.81 (0.62, 1.05) 0.89 (0.68, 1.17) 0.91 (0.69, 1.20) All models fit using hierarchical linear models with random intercept components. Model 1 is unadjusted for individual factors. Model 2 adjusted for individual age, sex, BMI and diabetes. Model 3 adjusted for individual age, sex, BMI, diabetes, and education. aBlood pressure controlled to <140/90 mmHg. bPoor neighborhood based on percentage of census tract poverty, where a neighborhood was defined as “poor” if the percentage of poverty was greater than 25%, and “more advantaged” otherwise. BMI = body mass index. p-value **P<0.05; *P<0.10.
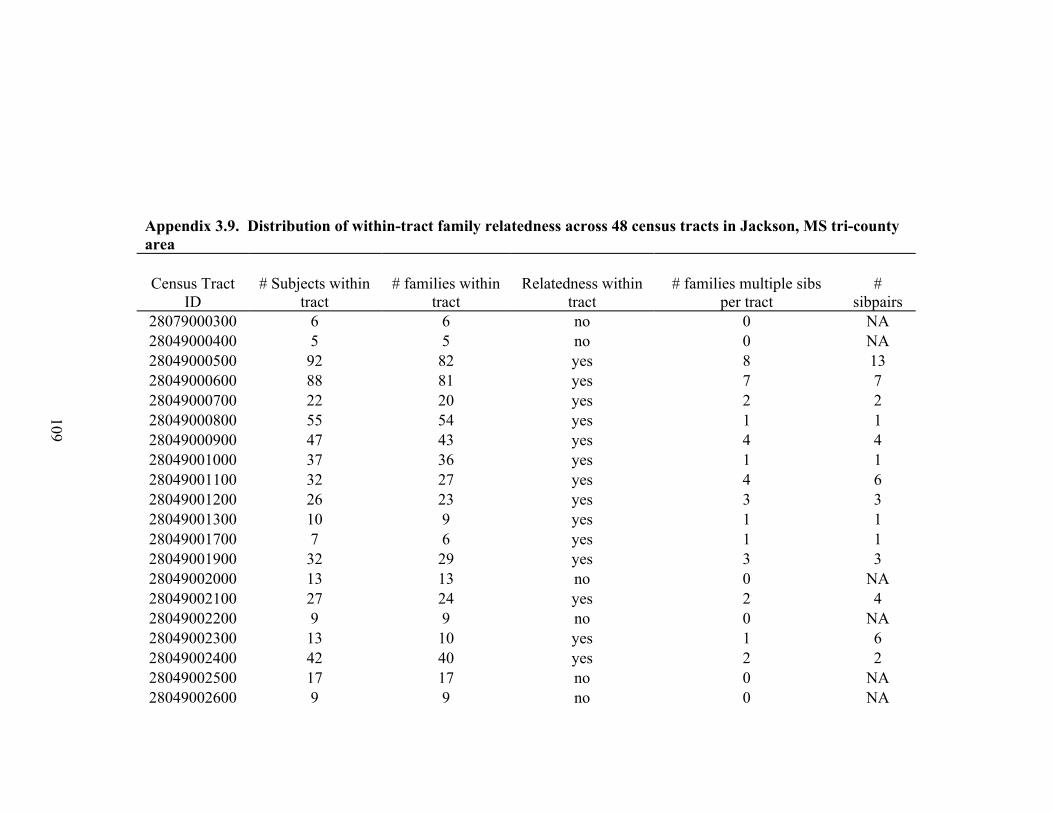
109
Appendix 3.9. Distribution of within-tract family relatedness across 48 census tracts in Jackson, MS tri-county area Census Tract
ID # Subjects within
tract # families within
tract Relatedness within
tract # families multiple sibs
per tract #
sibpairs 28079000300 6 6 no 0 NA 28049000400 5 5 no 0 NA 28049000500 92 82 yes 8 13 28049000600 88 81 yes 7 7 28049000700 22 20 yes 2 2 28049000800 55 54 yes 1 1 28049000900 47 43 yes 4 4 28049001000 37 36 yes 1 1 28049001100 32 27 yes 4 6 28049001200 26 23 yes 3 3 28049001300 10 9 yes 1 1 28049001700 7 6 yes 1 1 28049001900 32 29 yes 3 3 28049002000 13 13 no 0 NA 28049002100 27 24 yes 2 4 28049002200 9 9 no 0 NA 28049002300 13 10 yes 1 6 28049002400 42 40 yes 2 2 28049002500 17 17 no 0 NA 28049002600 9 9 no 0 NA

110
28049002700 8 8 no 0 NA 28049003000 11 11 no 0 NA 28049003100 12 10 yes 1 3 28049003200 15 13 yes 2 2 28049003300 9 8 yes 1 1 28049003400 5 5 no 0 NA 28049003700 5 4 yes 1 1 28049010201 13 12 yes 1 1 28049010202 69 66 yes 3 3 28049010203 13 13 no 0 NA 28049010301 44 36 yes 7 9 28049010400 5 5 no 0 NA 28049010500 27 18 yes 5 13 28049010801 11 10 yes 1 1 28049010802 12 11 yes 1 1 28049010807 6 3 yes 1 6 28049010901 10 9 yes 1 1 28049010902 20 19 yes 1 1 28049011001 7 7 no 0 NA 28049011200 11 9 yes 2 2 28089030101 5 4 yes 1 1 28089030105 6 4 yes 1 3 28089030302 5 5 no 0 NA 28121020102 5 3 yes 2 2 28120120204 8 8 no 0 NA 28121020302 6 5 yes 1 1 28121020600 5 5 no 0 NA 28121021002 6 5 yes 1 1

111
REFERENCES 1. Kaplan GA, Keil JE. Socioeconomic factors and cardiovascular disease: A review of the literature. Circulation. 1993;88(4 Pt 1):1973-98. 2. Diez Roux AV. Investigating neighborhood and area effects on health. Am J Public Health. 2001;91(11):1783-9. 3. Diez Roux AV, Merkin SS, Arnett D, et al. Neighborhood of residence and incidence of coronary heart disease. N Engl J Med. 2001;345(2):99-106. 4. Diez-Roux AV, Nieto FJ, Muntaner C, et al. Neighborhood environments and coronary heart disease: A multilevel analysis. Am J Epidemiol. 1997;146(1):48-63. 5. Sundquist K, Theobald H, Yang M, et al. Neighborhood violent crime and unemployment increase the risk of coronary heart disease: A multilevel study in an urban setting. Soc Sci Med. 2006;62(8):2061-71. 6. Sundquist K, Winkleby M, Ahlen H, et al. Neighborhood socioeconomic environment and incidence of coronary heart disease: A follow-up study of 25,319 women and men in Sweden. Am J Epidemiol. 2004;159(7):655-62. 7. Winkleby M, Sundquist K, Cubbin C. Inequities in CHD incidence and case fatality by neighborhood deprivation. Am J Prev Med. 2007;32(2):97-106. 8. Lisabeth LD, Diez Roux AV, Escobar JD, et al. Neighborhood environment and risk of ischemic stroke: The Brain Attack Surveillance in Corpus Christi (BASIC) project. Am J Epidemiol. 2007;165(3):279-87. 9. Cozier YC, Palmer JR, Horton NJ, et al. Relation between neighborhood median housing value and hypertension risk among black women in the United States. Am J Public Health. 2007;97(4):718-24. 10. Cubbin C, Hadden WC, Winkleby MA. Neighborhood context and cardiovascular disease risk factors: The contribution of material deprivation. Ethn Dis. 2001;11(4):687-700. 11. Gary TL, Safford MM, Gerzoff RB, et al. Perception of neighborhood problems, health behaviors, and diabetes outcomes among adults with diabetes in managed care: The translating research into action for diabetes (TRIAD) study. Diabetes Care. 2008;31(2):273-8. 12. Morenoff JD, House JS, Hansen BB, et al. Understanding social disparities in hypertension prevalence, awareness, treatment, and control: The role of neighborhood context. Soc Sci Med. 2007;65(9):1853-66.
112
13. Mujahid MS, Diez Roux AV, Morenoff JD, et al. Neighborhood characteristics and hypertension. Epidemiology. 2008;19(4):590-8. 14. Chobanian AV, Bakris GL, Black HR, et al. Seventh report of the joint national committee on prevention, detection, evaluation, and treatment of high blood pressure. Hypertension. 2003;42(6):1206-52. 15. Daniels PR, Kardia SL, Hanis CL, et al. Familial aggregation of hypertension treatment and control in the Genetic Epidemiology Network of Arteriopathy (GENOA) study. Am J Med. 2004;116(10):676-81. 16. Kullo IJ, Bailey KR, Kardia SL, et al. Ethnic differences in peripheral arterial disease in the NHLBI Genetic Epidemiology Network of Arteriopathy (GENOA) study. Vasc Med. 2003;8(4):237-42. 17. European Society of Hypertension-European Society of Cardiology Guidelines Committee. 2003 European Society of Hypertension-European Society of Cardiology guidelines for the management of arterial hypertension. J Hypertens. 2003;21(6):1011-53. 18. Federal Financial Institutions Examination Council. (http://www.ffiec.gov). 19. R Core Development Team. R: A language and environment for statistical computing. 2005. 20. Bach PB, Pham HH, Schrag D, et al. Primary care physicians who treat blacks and whites. N Engl J Med. 2004;351(6):575-84. 21. Chun H, Kim IH. Socioeconomic inequalities in preventive services among the elderly: Results from medical checkup, cancer check, and blood pressure check. J Prev Med Public Health. 2007;40(5):404-10. 22. Mayberry RM, Mili F, Ofili E. Racial and ethnic differences in access to medical care. Med Care Res Rev. 2000;57 Suppl 1:108-45. 23. Ostchega Y, Hughes JP, Wright JD, et al. Are demographic characteristics, health care access and utilization, and comorbid conditions associated with hypertension among US adults? Am J Hypertens. 2008;21(2):159-65. 24. Rooks RN, Simonsick EM, Klesges LM, et al. Racial disparities in health care access and cardiovascular disease indicators in black and white older adults in the health ABC study. J Aging Health. 2008;20(6):599-614. 25. Brown AF, Perez-Stable EJ, Whitaker EE, et al. Ethnic differences in hormone replacement prescribing patterns. J Gen Intern Med. 1999;14(11):663-9.

113
26. Guo JD, Liu GG, Christensen DB, et al. How well have practices followed guidelines in prescribing antihypertensive drugs: The role of health insurance. Value Health. 2003;6(1):18-28. 27. Howard G, Prineas R, Moy C, et al. Racial and geographic differences in awareness, treatment, and control of hypertension: The REasons for geographic and racial differences in stroke study. Stroke. 2006;37(5):1171-8. 28. Pollack CE, Armstrong K. The geographic accessibility of retail clinics for underserved populations. Arch Intern Med. 2009;169(10):945,9; discussion 950-3. 29. McKenney JM, Slining JM, Henderson HR, et al. The effect of clinical pharmacy services on patients with essential hypertension. Circulation. 1973;48(5):1104-11. 30. Morrison RS, Wallenstein S, Natale DK, et al. "We don't carry that"--failure of pharmacies in predominantly nonwhite neighborhoods to stock opioid analgesics. N Engl J Med. 2000;342(14):1023-6. 31. Green CR, Ndao-Brumblay SK, West B, et al. Differences in prescription opioid analgesic availability: Comparing minority and white pharmacies across Michigan. J Pain. 2005;6(10):689-99. 32. Lin SJ, Crawford SY, Warren Salmon J. Potential access and revealed access to pain management medications. Soc Sci Med. 2005;60(8):1881-91. 33. Flores G, Snowden-Bridon C, Torres S, et al. Urban minority children with asthma: Substantial morbidity, compromised quality and access to specialists, and the importance of poverty and specialty care. J Asthma. 2009;46(4):392-8. 34. van Balen F, Gerrits T. Quality of infertility care in poor-resource areas and the introduction of new reproductive technologies. Hum Reprod. 2001;16(2):215-9. 35. Auchincloss AH, Diez Roux AV, Brown DG, et al. Association of insulin resistance with distance to wealthy areas: The multi-ethnic study of atherosclerosis. Am J Epidemiol. 2007;165(4):389-97. 36. Weyers S, Dragano N, Mobus S, et al. Low socio-economic position is associated with poor social networks and social support: Results from the Heinz Nixdorf recall study. Int J Equity Health. 2008;7:13. 37. Dressler WW. Hypertension in the African American community: Social, cultural, and psychological factors. Semin Nephrol. 1996;16(2):71-82. 38. Williams CA, Beresford SA, James SA, et al. The Edgecombe County High Blood Pressure Control Program: III. social support, social stressors, and treatment dropout. Am J Public Health. 1985;75(5):483-6.

114
39. Fongwa MN, Evangelista LS, Hays RD, et al. Adherence treatment factors in hypertensive African American women. Vasc Health Risk Manag. 2008;4(1):157-66. 40. Ogedegbe G, Harrison M, Robbins L, et al. Barriers and facilitators of medication adherence in hypertensive African Americans: A qualitative study. Ethn Dis. 2004;14(1):3-12. 41. Ogedegbe G. Barriers to optimal hypertension control. J Clin Hypertens (Greenwich). 2008;10(8):644-6. 42. Strogatz DS, James SA. Social support and hypertension among blacks and whites in a rural, southern community. Am J Epidemiol. 1986;124(6):949-56. 43. Johnell K, Rastam L, Lithman T, et al. Low adherence with antihypertensives in actual practice: The association with social participation--a multilevel analysis. BMC Public Health. 2005;5:17. 44. Merlo J, Lynch JW, Yang M, et al. Effect of neighborhood social participation on individual use of hormone replacement therapy and antihypertensive medication: A multilevel analysis. Am J Epidemiol. 2003;157(9):774-83. 45. Diez-Roux AV, Kiefe CI, Jacobs DR,Jr, et al. Area characteristics and individual-level socioeconomic position indicators in three population-based epidemiologic studies. Ann Epidemiol. 2001;11(6):395-405. 46. Diez Roux AV. Estimating neighborhood health effects: The challenges of causal inference in a complex world. Soc Sci Med. 2004;58(10):1953-60. 47. Clarke P. When can group level clustering be ignored? multilevel models versus single-level models with sparse data. J Epidemiol Community Health. 2008;62(8):752-8. 48. Williams DR, Collins C. US socioeconomic and racial differences in health: Patterns and explanations. Annu Rev Sociol. 1995;21:349-86. 49. Bosma H, van de Mheen HD, Borsboom GJ, et al. Neighborhood socioeconomic status and all-cause mortality. Am J Epidemiol. 2001;153(4):363-71. 50. Henderson C, Diez Roux AV, Jacobs DR,Jr, et al. Neighbourhood characteristics, individual level socioeconomic factors, and depressive symptoms in young adults: The CARDIA study. J Epidemiol Community Health. 2005;59(4):322-8. 51. Mujahid MS, Diez Roux AV, Morenoff JD, et al. Assessing the measurement properties of neighborhood scales: From psychometrics to ecometrics. Am J Epidemiol. 2007;165(8):858-67.

115
52. Diez Roux AV. Residential environments and cardiovascular risk. J Urban Health. 2003;80(4):569-89. 53. Oakes JM. The (mis)estimation of neighborhood effects: Causal inference for a practicable social epidemiology. Soc Sci Med. 2004;58(10):1929-52.

116
Chapter 4
Investigating Familial Correlations of Quantitative Blood Pressure Measures and the Control of Hypertension
INTRODUCTION
In addition to a variety of individual-level sociodemographic, anthropometric, and
lifestyle related factors, a positive family history of hypertension is a known risk for
developing hypertension. An estimated 30% of the general population variability in
blood pressure is due to genetic heritability and 60% -70% of familial aggregation of
blood pressure is due to common genetic backgrounds (1). Genetic factors play key roles
in inter-individual blood pressure variation and it is now widely accepted that essential
hypertension results from complex interactions between genetic and environmental
factors. In addition to sharing similar genetic profiles, individuals within the same family
share a number of environmental factors throughout the life course, such as physical
environment, dietary habits, and health beliefs and practices. These shared genetic and
environmental factors may condition a common blood pressure level and, if evident, such
between-family variation in blood pressure levels would suggest that genetic and
environmental (or interactions between the two) effects could operate in ways that might
influence individual blood pressure levels and/or the probability of hypertension control.
Furthermore, evidence for familial clustering of blood pressure levels and hypertension
outcomes may suggest that strategies directed for preventing hypertension should also be
focused at the family level rather than on the individual level exclusively. The goal of

117
this study was to estimate the degree of familial clustering of quantitative blood pressure
values in hypertensive sibships, and to investigate the influence of blood pressure
determinants at multiple levels on such clustering.
METHODS
Study Population
In 1995, the National Heart, Lung and Blood Institute (NHLBI) established The
Family Blood Pressure Program (FBPP) to assess the genetic influence on inter-
individual blood pressure variation, hypertension, and hypertensive target organ damage.
One of the four networks established by the NHLBI to meet this objective is the Genetic
Epidemiology Network of Arteriopathy (GENOA). GENOA field centers in Jackson,
MS, Starr County, TX, and Rochester, MN recruited hypertensive African American,
Hispanic, and non-Hispanic white sibships, respectively, for linkage and family-based
association studies. Subject were diagnosed with hypertension if they had a previous
clinical diagnosis of hypertension by a physician with current antihypertensive treatment
or an average systolic blood pressure (SBP) >=140 mmHg and/or an average diastolic
blood pressure (DBP) >=90 mmHg.
In Rochester, MN and Jackson, MS, recruitment was restricted to sibships that
contained a minimum of two individuals diagnosed with essential hypertension before the
age of 60. Once this criterion was met, the entire sibship was invited to participate in the
study. As the prevalence of diabetes among Mexican-Americans is high, the Starr County
recruitment was restricted to Mexican-American sibships containing at least two
individuals diagnosed with type-2 diabetes (2). Data was collected through personal

118
interviews, and physical and laboratory examinations. The initial phase of the GENOA
study took place from September 1995 through June 2001 (3).
The primary analytic samples for the study presented here contained African
American subject (n = 1123 from 598 sibships) and non-Hispanic white (n = 970 from
528 sibships) hypertensive subjects that were both aware of their hypertension status and
taking antihypertensive medication(s) to lower blood pressure. Although a majority of
the subjects in this cohort were diagnosed as hypertensive, a number of the sibship
members invited to participate were identified as normotensive during the baseline
examination and have been excluded from this analysis. Other exclusion criteria included
secondary hypertension, alcoholism or drug abuse, pregnancy, insulin-dependent
diabetes, or active malignancy. A second analytic sample (described below) was created
to investigate the influence of neighborhood poverty concordance among African
American sibpairs on the sib-sib correlations of quantitative blood pressure values and
the aggregation of blood pressure control. Subjects sharing the same mother and father
(assessed by concordance for both de-identified, parental personal identifier numbers)
were assigned into respective sibpairs.
Covariates
Trained interviewers asked subjects standard questions on numerous factors,
including sociodemographic, lifestyle and behavior, and cardiovascular health history.
Age in years was assessed on the baseline examination date. Education was defined as
the total number of years of education completed. Height was measured by stadiometer,
weight by electronic balance, and body mass index (BMI) was calculated as weight in

119
kilograms divided by the square of height in meters. Diabetes was defined as having a
fasting glucose level ≥ 126 mg/dL or currently being treated with insulin or oral agents.
Blood Pressure Readings
Blood pressure measurements were made with random zero sphygmomanometers
and cuffs appropriate for arm size. Three readings were taken in the right arm after the
subject rested in the sitting position for at least five minutes according to the Seventh
report of the Joint National Committee on Prevention, Detection, Evaluation, and
Treatment of High Blood Pressure (JNC-7, 2003) guidelines (4). The SBP and DBP
values were determined by the first and fifth phase Korotkoff sounds, respectively, and
the last two blood pressure readings were averaged for the analyses. The diagnosis of
hypertension was established based on blood pressure levels measured at the study visit
(≥140/90 mmHg), or a prior diagnosis of hypertension and current treatment with
antihypertensive medications.
Blood Pressure Treatment and Antihypertensive Medications
Based on lists of all antihypertensive medications available in the US each
prescription antihypertensive drug recorded at the study visit was assigned a code number
corresponding to the first 6 digits of the Medi-Span Generic Product Identifier. This
number, which identifies pharmacologically equivalent drug products, was used to
categorize agents with similar mechanisms of antihypertensive action.
Conditional upon being hypertensive and aware of their hypertension status,
subjects were considered to be “treated” if they answered yes to the questions, “Has
medication ever been prescribed by a physician to lower your blood pressure?” and
“During the last month, have you used any medication that was prescribed or
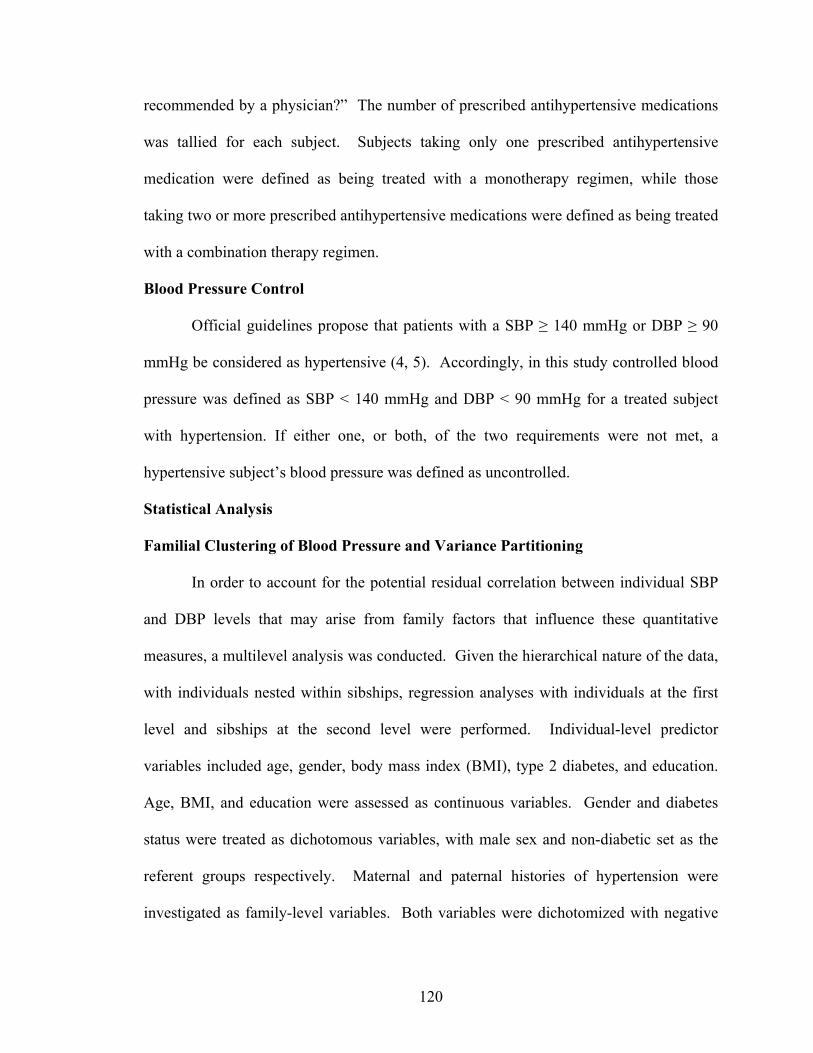
120
recommended by a physician?” The number of prescribed antihypertensive medications
was tallied for each subject. Subjects taking only one prescribed antihypertensive
medication were defined as being treated with a monotherapy regimen, while those
taking two or more prescribed antihypertensive medications were defined as being treated
with a combination therapy regimen.
Blood Pressure Control
Official guidelines propose that patients with a SBP ≥ 140 mmHg or DBP ≥ 90
mmHg be considered as hypertensive (4, 5). Accordingly, in this study controlled blood
pressure was defined as SBP < 140 mmHg and DBP < 90 mmHg for a treated subject
with hypertension. If either one, or both, of the two requirements were not met, a
hypertensive subject’s blood pressure was defined as uncontrolled.
Statistical Analysis
Familial Clustering of Blood Pressure and Variance Partitioning
In order to account for the potential residual correlation between individual SBP
and DBP levels that may arise from family factors that influence these quantitative
measures, a multilevel analysis was conducted. Given the hierarchical nature of the data,
with individuals nested within sibships, regression analyses with individuals at the first
level and sibships at the second level were performed. Individual-level predictor
variables included age, gender, body mass index (BMI), type 2 diabetes, and education.
Age, BMI, and education were assessed as continuous variables. Gender and diabetes
status were treated as dichotomous variables, with male sex and non-diabetic set as the
referent groups respectively. Maternal and paternal histories of hypertension were
investigated as family-level variables. Both variables were dichotomized with negative

121
history for hypertension set as the referent group. To examine the extent to which
individual SBP and DBP variation could be attributed to a higher contextual level, four
models were fit, intra-class coefficients (ICC) were calculated, and variance proportional
changes were estimated.
The first model did not include any explanatory variables and aimed to partition
the total SBP (and separately DBP) variance (Vt) into individual (Vi) and sibship (Vs)
components. Doing so allows for the potential detection of a contextual effect that can be
quantified as clustering of blood pressure values within sibships. The first level of this
model took the following form: Yij = β0j+εij, where Yij represents the predicted blood
pressure level for the ith individual in the jth sibship, the intercept (β0j) is constant within
sibship and allowed to vary from one sibship to another, and the individual level errors
are assumed to be independent and normally distributed (εij ~ N(0,σ2)). In the second
level, the intercept defined in the first level (β0j) is modeled as a function of sibships, such
that β0j = γ00+Uoj, where γ00 represents the common intercept across sibships and Uoj is a
macro error, assumed to be independent and normally distributed (Uoj ~ N(0,τ00)), that
measures the unique deviation of each sibship intercept from the common intercept.
Applying substitution yields the full form of the null model: Yij = γ00+Uoj +εij.
The second model expanded the null model by including only individual-level
fixed effects for age, gender, BMI, diabetes, and education. This model took the
following full form: Yij = γ00 + γ10Ageij + γ20Genderij + γ30BMIij + γ40Diabetesij +
γ50Education + U0j +εij . The third model expanded the null model by including family-
level fixed effects for maternal and paternal history of hypertension and took the

122
following full form: Yij = γ00 + γ01Maternal history of hypertensionj + γ02Paternal history
of hypertensionj + U0j +εij. The fourth model combined the second and third models to
include fixed effects at both the individual and family levels. This model took the
following full form: Yij = γ00 + γ01Maternal history of hypertensionj + γ02Paternal history
of hypertensionj + γ10Ageij + γ20Genderij + γ30BMIij + γ40Diabetesij + γ50Education + U0j
+εij .
In the null model (i.e. – random intercepts model), the variance partition
coefficient (VPC) is equivalent to the (ICC): VPC = (Vs/(Vs+Vi)) * 100 = ICC = (τ00/(σ2
+ τ00)) *100, where τ00 equals the variance of the macro error Uoj,, and σ2 equals the
variance of the individual level error εij. This coefficient measures the percent of the total
inter-individual variability in blood pressure that is between sibships and is a general
measure of clustering of individual blood pressure in sibships. ICCs were calculated for
the null models to establish a general measure of the extent of familial clustering of blood
pressure. ICCs were also calculated for models 2-4 and each estimate was compared to
those derived from the null models. Estimates of proportional variance explained were
calculated and the degree to which the proportions of total variance in individual blood
pressure levels that were within and between sibships (i.e.- families) changed as variables
were added at both the individual- and family-levels was assessed. To assess the
reduction in within-family variance, the following formula was applied: (σ21- σ2
2) / σ21,
with σ21 derived from model 1 and σ2
2 derived from models 2-4 separately. Similarly, the
reduction in between-family variance was assessed using the following formula: (τ00 1- τ00
2) / τ00 1, with τ00
1 derived from model 1 and τ00
2 derived from models 2-4 separately.
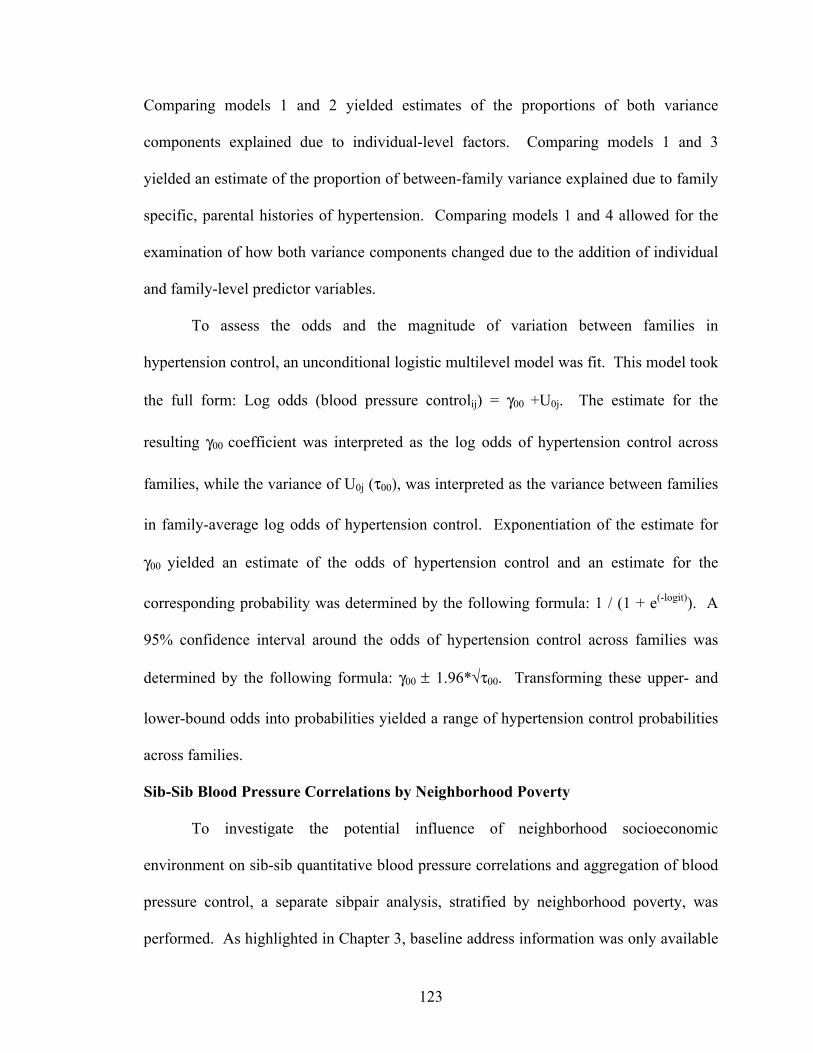
123
Comparing models 1 and 2 yielded estimates of the proportions of both variance
components explained due to individual-level factors. Comparing models 1 and 3
yielded an estimate of the proportion of between-family variance explained due to family
specific, parental histories of hypertension. Comparing models 1 and 4 allowed for the
examination of how both variance components changed due to the addition of individual
and family-level predictor variables.
To assess the odds and the magnitude of variation between families in
hypertension control, an unconditional logistic multilevel model was fit. This model took
the full form: Log odds (blood pressure controlij) = γ00 +U0j. The estimate for the
resulting γ00 coefficient was interpreted as the log odds of hypertension control across
families, while the variance of U0j (τ00), was interpreted as the variance between families
in family-average log odds of hypertension control. Exponentiation of the estimate for
γ00 yielded an estimate of the odds of hypertension control and an estimate for the
corresponding probability was determined by the following formula: 1 / (1 + e(-logit)). A
95% confidence interval around the odds of hypertension control across families was
determined by the following formula: γ00 ± 1.96*√τ00. Transforming these upper- and
lower-bound odds into probabilities yielded a range of hypertension control probabilities
across families.
Sib-Sib Blood Pressure Correlations by Neighborhood Poverty
To investigate the potential influence of neighborhood socioeconomic
environment on sib-sib quantitative blood pressure correlations and aggregation of blood
pressure control, a separate sibpair analysis, stratified by neighborhood poverty, was
performed. As highlighted in Chapter 3, baseline address information was only available

124
for the African American GENOA subjects. As such, the sibpair analyses were restricted
to African American sibpairs. The analytic sample consisted of full sibpairs only. All
subjects in the analytic sample were hypertensive, aware of their hypertension status,
currently taking prescribed antihypertensive medication(s) to lower blood pressure, had
baseline address information that was successfully geo-coded to the census tract level and
linked to tract level socioeconomic indicator data, and had at least one full sibling that
met the same criteria. The final analytic sibpair sample contained 969 subjects from 387
sibships. A total of 871 possible sibpairs were analyzed. As in Chapter 3,
neighborhoods were defined as poor if the percentage of poverty within a given census
tract exceeded 25%, and more socioeconomically advantaged otherwise. For all possible
sibpairs, concordance of neighborhood poverty was determined (i.e. - both residing in
poor neighborhood(s), one residing in poor neighborhood, neither residing in poor
neighborhood). Pearson’s correlation coefficients (unadjusted, and age-sex adjusted)
were estimated to assess sib-sib correlations of SBP and DBP levels by neighborhood
concordance. Odds ratios (OR) (odds that siblings were concordant for blood pressure
control divided by the odds that they were discordant) were calculated as a measure of
familial aggregation blood pressure control by neighborhood concordance. All statistical
analyses were performed in the R statistical package (6). An alpha-level of 0.05 was
used to determine statistical significance.
RESULTS
Systolic Blood Pressure
Variance components and calculated ICCs for models 1 – 4, and the fixed effects
from the full model (Model 4) for the African American cohort are illustrated in Table

125
4.1. The ICC from the null model (Table 4.1, Null model) suggests moderate clustering
of SBP within families, as approximately 13.5% of the inter-individual variability in SBP
was at the family-level. The addition of only individual-level variables to the null model
led to a 3.6% reduction in within-family variability and a 22.3% reduction in the
between-family variability. In general, the addition of group-level variables does not
impact within-group variability, but can have an impact on between-group variability.
The addition of only family-level variables to the null model did not lead to reductions in
between-family variability (nor within-family variability as expected). The reductions in
both types of variability due to the addition of both individual- and family-level variables
to the null model were essentially the same as the reductions due to the addition of
individual-level variables only, although the addition of family-level variables after
accounting for individual-level variables (model 4) led to a slightly higher overall
reduction (23.4%) in the between-family variability. The average SBP across families
(i.e. - common intercept as assessed from null model) was 139.83 mmHg. In the
comprehensive model including individual- and family-level variables (Table 4.1, Model
4), increasing age, female sex, diabetes, and both parental histories of hypertension were
all associated with increases in SBP. Conversely, increasing levels of education was
associated with decreases in SBP. Age, diabetes, and education use all reached statistical
significance.
Variance components and calculated ICCs for models 1 – 4, and the fixed effects
from the full model (Model 4) for the non-Hispanic white cohort are illustrated in Table
4.2. The ICC from the null model (Table 4.2, Null model) indicates that approximately
16.8% of the inter-individual variability in SBP was at the family-level. Although still

126
moderate, this degree of familial clustering was slightly higher compared to the African
American cohort. The addition of only individual-level variables to the null model led to
a 4.8% reduction in within-family variability and a 26.1% reduction in the between-
family variability. The addition of only family-level variables to the null model led to a
small 1% reduction in the between-family variability (and no reduction in the within-
family variability as group-level variables will only reduce between-group variability).
The addition of both individual- and family-level variables to the null model led to a
5.1% reduction in within-family variability and a 26.8% reduction in the between-family
variability. The average SBP across families was 135.90 mmHg, slightly lower than that
of the African American cohort. In the comprehensive model including individual- and
family-level variables (Table 4.2, Model 4), increasing age, BMI, diabetes, and maternal
history of hypertension were all associated with increases in SBP, while female sex and
paternal history of hypertension were associated with decreases in SBP. Age, BMI, and
maternal history of hypertension all reached statistical significance.
Diastolic Blood Pressure
Variance components and calculated ICCs for models 1 – 4, and the fixed effects
from the full model (Model 4) for the African American cohort are illustrated in Table
4.3. Approximately 20% of the inter-individual variability in DBP was at the family-
level (ICC from null model (Table 4.3, Null model) = 19.7). The addition of only
individual-level variables to the null model led to a 3.6% reduction in within-family
variability and a 27.0% reduction in the between-family variability in individual DBP.
The addition of only family-level variables to the null model led to a 6.0% reduction in
between-family variability and the fixed effect for maternal history of hypertension was

127
statistically significant. The addition of both individual- and family-level variables to the
null model led to a 3.3% reduction in within-family variability and a 27.9% reduction in
the between-family variability. The average DBP across families was 78.21 mmHg. In
the comprehensive model including individual- and family-level variables (Table 4.3
Model 4), only parental histories of hypertension were associated with increases in DBP.
Conversely, all individual-level fixed effects (age, female sex, BMI, diabetes, and
education) were associated with decreases in DBP. The age, female sex, and education
associations were statistically significant, and the BMI association was marginally
significant.
Variance components and calculated ICCs for models 1 – 4, and the fixed effects
from the full model (Model 4) for the non-Hispanic white cohort are illustrated in Table
4.4. As in the African American cohort, approximately 20% of the inter-individual
variability in DBP was at the family-level (ICC from null model (Table 4.4, Null model)
= 20.4). The addition of only individual-level variables to the null model led to a 9.5%
reduction in within-family variability and a 22.7% reduction in the between-family
variability in individual DBP. The addition of only family-level variables to the null
model did not lead to reductions in variable components, although the fixed effect for
maternal history of hypertension was statistically significant. The addition of both
individual- and family-level variables (Table 4.4, Model 4) to the null model led to a
10.6% reduction in within-family variability and a 21.3% reduction in the between-
family variability. The average DBP across families was 79.06 mmHg. Maternal history
of hypertension was associated increased DBP. Conversely, increasing age, female sex,
diabetes, and paternal history of hypertension were all associated with decreases in DBP.

128
The age, female sex, diabetes and maternal history of hypertension associations were
statistically significant.
Blood Pressure Control
Among African Americans, the log odds of hypertension control across families
was 0.10, corresponding to an odds of 1.11 and a probability of 0.52 (95% confidence
interval (CI), 0.24, 0.80). Among non-Hispanic whites, the log odds of hypertension
control across families was 0.47, corresponding to an odds of 1.60 and a probability of
0.62 (95% CI, 0.23, 0.90).
Blood Pressure Correlations and Aggregation of Blood Pressure Control by
Neighborhood Poverty
Descriptive statistics for the hypertensive African American subjects (n=960)
included in the sibpair by neighborhood poverty analyses are presented in Table 4.5.
Table 4.6 presents the sib-sib correlations of SBP and DBP. Of the total 871 possible
sibpairs, 313 were concordant for residing in poor neighborhoods, 365 were discordant
for poor neighborhood of residence, and 193 were concordant for residing in more
socioeconomically advantaged neighborhoods. In the pooled sample of all 871 possible
African American sibpairs, significant sib-sib correlations were detected for both SBP (r
= 0.12, p < 0.001) and DBP (r = 0.14, p < 0.001). Examination of the sib-sib correlations
of quantitative blood pressure values by poor neighborhood of residence concordance
revealed that SBP values among sibpairs in which both siblings resided in poor
neighborhoods were statistically significant and more strongly correlated (r = 0.20, p <
0.001). Similarly, statistically significant sib-sib correlations of DBP values were
detected among sibpairs in which one or both siblings resided in poor neighborhoods.

129
Conversely, sib-sib correlations of quantitative blood pressure values were not
significantly correlated among sibpairs in which both siblings resided in more
socioeconomically advantaged neighborhoods. There was statistically significant
familial aggregation (sib-sib concordance) of blood pressure control among sibpairs in
which both siblings resided in poor neighborhoods (OR = 1.84; 95% CI: 1.17, 2.90), but
not among sibpairs in which only one (OR = 1.23; 95% CI: 0.81,1.86) or neither (OR =
0.99; 95% CI: 0.56, 1.75) sibling resided in poor neighborhoods.
DISCUSSION
Family aggregation of blood pressure is well recognized (1) and has been
documented in numerous populations (2, 7, 8). Results from this study provided further
evidence of moderate familial aggregation of quantitative blood pressure levels in both
African Americans non-Hispanic Whites. For both racial/ethnic groups, the addition of
individual-level variables led to significant reductions in within- and between-family
variability in individual SBP and DBP, and expected relationships were detected for the
individual-level fixed effects of age, BMI, and diabetes. There was also evidence of an
inverse relationship between education and SBP (as reported in Chapter 2) and DBP
among African Americans, after control for other individual and familial factors.
Furthermore, individual-level education explained approximately 1% of the between-
family variability in SBP. Maternal histories of hypertension did explain a moderate
proportion of the between-family variability in SBP and DBP among non-Hispanic
whites. Other studies have demonstrated similar associations between maternal history of
hypertension and offspring blood pressure levels, and familial aggregation of other
factors known to influence blood pressure (e.g. – dietary intake and physical activity)

130
may be stronger between mothers and their offspring (7). Despite this, parental history of
hypertension does not seem to confer strong contextual effects that condition common
blood pressure levels in non-Hispanic whites or African American families. The addition
of individual- and family-level fixed effects reduced, but did not explain all of,
quantitative blood pressure clustering among sibships in each racial/ethnic group. This
likely reflects residual confounding that stems from the omission of potentially important
predictor variables at one or multiple levels.
Previous research on the overall GENOA hypertensive sibships sample detected
evidence of familial aggregation of hypertension treatment and control (2). Consistent
with these earlier findings, unconditional (null) multilevel models fit in this study
indicated that hypertension control among treated hypertensives aggregates in non-
Hispanic white and African American families. While the range of probabilities of
hypertension control were comparably wide for both ethnic groups, the odds and
probability of hypertension control were greater in non-Hispanic White families,
compared to African American families (as expected and previously reported in Chapter
2). Daniels et al. suggest that the familial aggregation of hypertension treatment and
control are likely explained by a combination of shared environmental and genetic
influences, and further point out that, “numerous environmental factors are indexed by
socioeconomic status, which aggregates in families and correlates inversely with blood
pressure levels (2).” Acknowledging this, the study presented here extended the previous
research on familial aggregation of blood pressure control in the GENOA cohort by
examining the degree to which neighborhood socioeconomic environment concordance
among sibs shaped familial aggregation of blood pressure control. In general, sib-sib

131
correlations of quantitative blood pressure values and familial aggregation of blood
pressure control were detected among sibpairs in which both siblings resided in poor
neighborhoods. These findings represent a possible cross level interaction in which the
degree of familial similarities in blood pressure outcomes is dependent (at least in part)
on shared socioeconomic environmental context.
The present study had several limitations. First, the cross-sectional nature of the
study limited the ability to make causal inferences. Second, selection bias may have been
present in this study, as only families with at least two sibs with essential hypertension
diagnosed before age 60 were included. Third, if the individual-level and/or group-level
models were misspecified, estimates at both levels may have been biased. This brief
examination of familial blood pressure correlations was particularly susceptible to
misspecification of the family-level models, since parental histories of hypertension were
the only variables modeled at this level and other unavailable family-level variables may
have demonstrated contextual familial effects that could potentially condition common
blood pressure levels among families. Furthermore, the detected moderate contextual
effect of maternal history for hypertension among non-Hispanic whites may simply
reflect unmeasured individual-level characteristics rather than a common familial effect.
The examination of the influence of neighborhood socioeconomic environment was
specifically carried out among the African American GENOA study subjects from 48
neighborhoods in the Jackson, MS tri-county area. As such, these particular findings may
not be generalizable to other racial/ethnic groups, or to other individuals (regardless of
race/ethnicity) residing in geographic areas marked by different socioeconomic
environments.

132
In conclusion, this analysis provided new insights into familial aggregation of
blood pressure outcomes, by specifically examining the influence of numerous factors
defined at multiple levels (individual, family, and neighborhood). Significant findings
across these levels suggest that combinations of family- and community-based
interventions may be successful in the prevention and control of hypertension.

133
Table 4.1. Familial correlation of systolic blood pressure in GENOA African Americans (n=1123) Covariance parameter estimates Estimate Null model Model 2 Model 3 Model 4 τ00 69.65 54.14 70.31 53.39 σ2 444.81 429.00 445.03 430.08 ICC *100% 13.54% 11.21% 13.64% 11.04% Fixed effect estimates from Model 4 Effect Estimate SE p-value Intercept 116.68 7.41 <0.0001
Individual-level Age (years) 0.43 0.08 <0.0001 Gender Male (ref) Female 2.46 1.55 0.1131 BMI (kg/m2) -0.01 0.11 0.9320 Diabetes No (ref) Yes 5.56 1.50 0.0002 Education (years) -0.58 0.20 0.0041
Family-level Paternal history of hypertension No (ref) Yes 1.08 1.44 0.4540 Maternal history of hypertension No (ref) Yes 0.84 1.44 0.5635 Null model – random intercept only model; Model 2 – includes all individual-level variables only; Model 3 includes all family-level variables only; Model 4 includes all individual- and family-level variables. τ00 = macro error variance. σ2 = individual error variance. ICC = intraclass correlation coefficient. BMI = body mass index. Bold type indicates p<0.05.

134
Table 4.2. Familial correlation of systolic blood pressure in GENOA non-Hispanic whites (n=970) Covariance parameter estimates Estimate Null model Model 2 Model 3 Model 4 τ00 45.19 33.40 44.87 33.07 σ2 224.26 213.42 223.81 212.91 ICC *100% 16.77% 13.53% 16.70% 13.44% Fixed effect estimates from Model 4 Effect Estimate SE p-value Intercept 99.49 6.16 <0.0001
Individual-level Age (years) 0.51 0.06 <0.0001 Gender Male (ref) Female -0.35 1.02 0.7353 BMI (kg/m2) 0.17 0.08 0.0329 Diabetes No (ref) Yes 2.04 1.56 0.1898 Education (years) 0.02 0.23 0.9413
Family-level Paternal history of hypertension No (ref) Yes -0.13 1.08 0.9061 Maternal history of hypertension No (ref) Yes 2.55 1.13 0.0243 Null model – random intercept only model; Model 2 – includes all individual-level variables only; Model 3 includes all family-level variables only; Model 4 includes all individual- and family-level variables. τ00 = macro error variance. σ2 = individual error variance. ICC = intraclass correlation coefficient. BMI = body mass index. Bold type indicates p<0.05.

135
Table 4.3. Familial correlation of diastolic blood pressure in GENOA African Americans (n=1123) Covariance parameter estimates Estimate Null model Model 2 Model 3 Model 4 τ00 30.68 22.41 28.86 22.14 σ2 125.46 120.97 126.48 121.29 ICC *100% 19.65% 15.63% 18.58% 15.44% Fixed effect estimates from Model 4 Effect Estimate SE p-value Intercept 108.49 4.06 <0.0001
Individual-level Age (years) -0.38 0.04 <0.0001 Gender Male (ref) Female -2.41 0.84 0.0044 BMI (kg/m2) -0.11 0.06 0.0624 Diabetes No (ref) Yes -0.62 0.82 0.4473 Education (years) -0.23 0.11 0.0367
Family-level Paternal history of hypertension No (ref) Yes 0.26 0.79 0.7465 Maternal history of hypertension No (ref) Yes 0.77 0.79 0.3304 Null model – random intercept only model; Model 2 – includes all individual-level variables only; Model 3 includes all family-level variables only; Model 4 includes all individual- and family-level variables. τ00 = macro error variance. σ2 = individual error variance. ICC = intraclass correlation coefficient. BMI = body mass index. Bold type indicates p<0.05.

136
Table 4.4. Familial correlation of diastolic blood pressure in GENOA non-Hispanic whites (n=970) Covariance parameter estimates Estimate Null model Model 2 Model 3 Model 4 τ00 18.05 13.96 18.20 14.20 σ2 70.36 63.66 69.89 62.93 ICC *100% 20.42% 17.99% 20.66% 18.41% Fixed effect estimates from Model 4 Effect Estimate SE p-value Intercept 96.13 3.46 <0.0001
Individual-level Age (years) -0.28 0.03 <0.0001 Gender Male (ref) Female -3.96 0.57 <0.0001 BMI (kg/m2) 0.00 0.05 0.9356 Diabetes No (ref) Yes -2.03 0.87 0.0195 Education (years) 0.02 0.13 0.8512
Family-level Paternal history of hypertension No (ref) Yes -0.64 0.61 0.2903 Maternal history of hypertension No (ref) Yes 1.74 0.64 0.0066 Null model – random intercept only model; Model 2 – includes all individual-level variables only; Model 3 includes all family-level variables only; Model 4 includes all individual- and family-level variables. τ00 = macro error variance. σ2 = individual error variance. ICC = intraclass correlation coefficient. BMI = body mass index. Bold type indicates p<0.05.
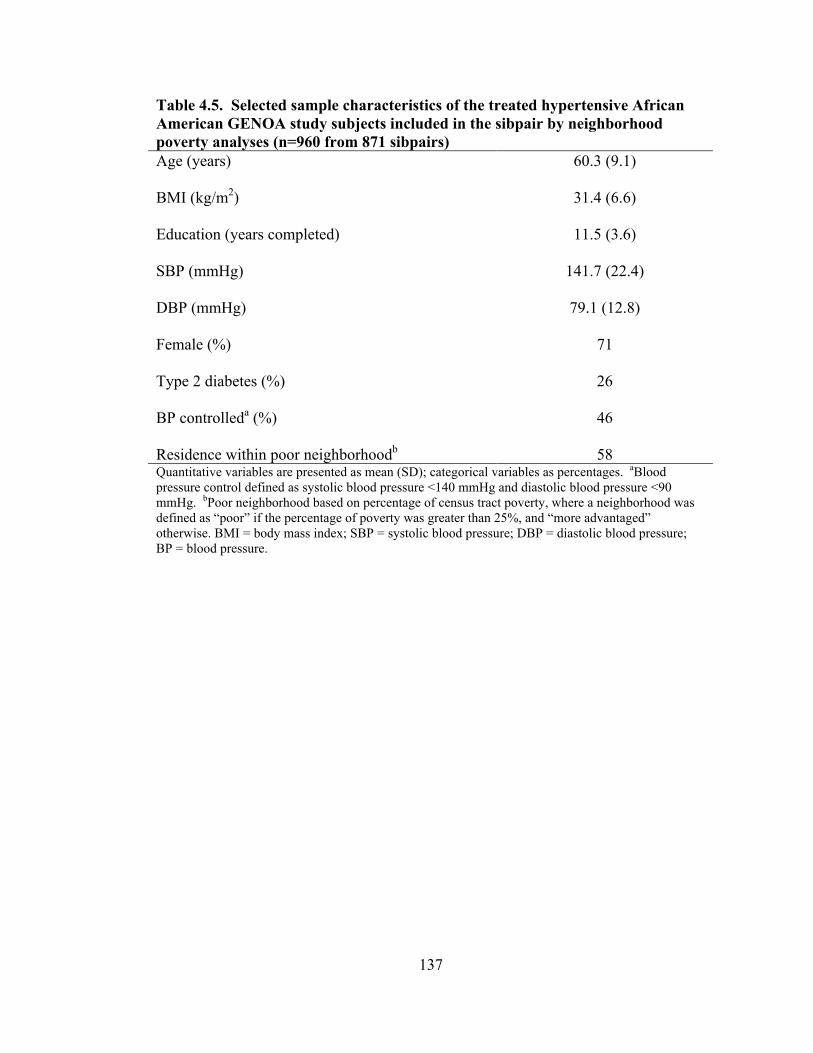
137
Table 4.5. Selected sample characteristics of the treated hypertensive African American GENOA study subjects included in the sibpair by neighborhood poverty analyses (n=960 from 871 sibpairs) Age (years) 60.3 (9.1) BMI (kg/m2) 31.4 (6.6) Education (years completed) 11.5 (3.6) SBP (mmHg) 141.7 (22.4) DBP (mmHg) 79.1 (12.8) Female (%) 71 Type 2 diabetes (%) 26 BP controlleda (%) 46 Residence within poor neighborhoodb 58 Quantitative variables are presented as mean (SD); categorical variables as percentages. aBlood pressure control defined as systolic blood pressure <140 mmHg and diastolic blood pressure <90 mmHg. bPoor neighborhood based on percentage of census tract poverty, where a neighborhood was defined as “poor” if the percentage of poverty was greater than 25%, and “more advantaged” otherwise. BMI = body mass index; SBP = systolic blood pressure; DBP = diastolic blood pressure; BP = blood pressure.

138
Table 4.6. Blood pressure correlations between GENOA African American sibpairs (n=871) by neighborhood poverty concordance
Systolic blood pressure Unadjusted Age and sex adjusted
# of Sib Pairs (# of Families) r p-value r p-value Both Sibs in Poor* Neighborhoods 313 (181) 0.206 0.0002 0.183 0.0012 One Sib in Poor* Neighborhood 365 (197) 0.045 0.3884 0.022 0.6723 Neither Sib in Poor* Neighborhood 193 (116) 0.101 0.1621 0.051 0.4757 Total 871 (387) 0.121 0.0003 0.088 0.0090
Diastolic blood pressure Unadjusted Age and sex adjusted
# of Sib Pairs (# of Families) r p-value r p-value Both Sibs in Poor* Neighborhoods 313 (181) 0.140 0.0133 0.107 0.0594 One Sib in Poor* Neighborhood 365 (197) 0.187 0.0003 0.133 0.0112 Neither Sib in Poor* Neighborhood 193 (116) 0.036 0.6233 -0.028 0.7031 Total 871 (387) 0.137 0.0001 0.088 0.0094 *Poor Neighborhoods defined as census tracts with >25% poverty, where percent poverty is defined as the % of individuals living below the poverty level in 1999 within a given census tract. r = Pearson’s correlation coefficient. Bold type indicates p < 0.05.

139
Appendix 4.1. Calculations for familial aggregation of blood pressure control by neighborhood poverty concordance.
Both Sibs Residing in Poor Neighborhoods
BP Controlled BP Not ControlledSib2 BP Controlled 70 61
BP Not Controlled 70 112
OR = (70*112)/(61*70) = 1.84SE (log OR) = sqrt ((1/70)+(1/61)+(1/70)+(1/112)) = 0.2321496Lower 95 % CI = 1.84 * exp - [1.96*0.2321496] = 1.17Upper 95% CI = 1.84 * exp[1.96*0.2321496] = 2.90
One Sib Residing in Poor Neighborhood
BP Controlled BP Not ControlledSib2 BP Controlled 86 79
BP Not Controlled 94 106
OR = (86*106)/(79*94) = 1.23SE (log OR) = sqrt ((1/86)+(1/79)+(1/94)+(1/106)) = 0.2106143Lower 95 % CI = 1.23 * exp - [1.96*0.2106143] = 0.81Upper 95% CI = 1.23 * exp[1.96*0.2106143] = 1.86
Neither Sib Residing in Poor Neighborhood
BP Controlled BP Not ControlledSib2 BP Controlled 40 50
BP Not Controlled 46 57
Sib1
Sib1
OR = (40*57)/(50*46) = 0.99SE (log OR) = sqrt ((1/40)+(1/50)+(1/46)+(1/57)) = 0.2903153Lower 95 % CI = 0.99 * exp - [1.96*0.2903153] = 0.56Upper 95% CI = 0.99 * exp[1.96*0.2903153] = 1.75
Sib1

140
REFERENCES 1. Ward R. Familial aggregation and genetic epidemiology of blood pressure. In: Laragh JH, Brenner BM, eds. Hypertension: Pathophysiology, Diagnosis, and Management. 2nd ed. New York, New York: Raven Press, 1995:67-88. 2. Daniels PR, Kardia SL, Hanis CL, et al. Familial aggregation of hypertension treatment and control in the genetic epidemiology network of arteriopathy (GENOA) study. Am J Med. 2004;116(10):676-81. 3. Kullo IJ, Bailey KR, Kardia SL, et al. Ethnic differences in peripheral arterial disease in the NHLBI genetic epidemiology network of arteriopathy (GENOA) study. Vasc Med. 2003;8(4):237-42. 4. Chobanian AV, Bakris GL, Black HR, et al. Seventh report of the joint national committee on prevention, detection, evaluation, and treatment of high blood pressure. Hypertension. 2003;42(6):1206-52. 5. European Society of Hypertension-European Society of Cardiology Guidelines Committee. 2003 European Society of Hypertension-European Society of Cardiology guidelines for the management of arterial hypertension. J Hypertens. 2003;21(6):1011-53. 6. R Core Development Team. R: A language and environment for statistical computing. 2005. 7. Fuentes RM, Notkola IL, Shemeikka S, et al. Familial aggregation of blood pressure: A population-based family study in eastern Finland. J Hum Hypertens. 2000;14(7):441-5. 8. Perusse L, Leblanc C, Tremblay A, et al. Familial aggregation in physical fitness, coronary heart disease risk factors, and pulmonary function measurements. Prev Med. 1987;16(5):607-15.

141
Chapter 5
Interactions Between Cell Adhesion Molecule Genes and Antihypertensive Drug Therapies in Determining Systolic Blood Pressure in Hypertensive Subjects
INTRODUCTION
Hypertension affects more than 65 million adults in the United States (US) and is
the most common disease for which adults seek medical attention (1, 2). Uncontrolled
hypertension is an established risk factor for cardiovascular, cerebrovascular, and renal
disease morbidity and mortality. In addition to lifestyle changes and behavior
modifications, a variety of antihypertensive medications are commonly used as
monotherapies or in combination to attempt to control hypertension. Accordingly,
antihypertensive medications are among the most frequently used medications in the US.
Despite this, only slightly more than half of subjects with hypertension in the US are
treated pharmacologically for their condition and roughly two-thirds of those treated have
their blood pressure adequately controlled (3). A contributing factor to this lack of blood
pressure control is that hypertensives respond heterogeneously to antihypertensive
therapies. In addition to various environmental influences, genetic variation that alters
the structure, configuration, or quantity of any of the proteins involved in
pharmacokinetic or pharmacodynamic mechanisms may contribute to interindividual
variation in drug response (4). The goal of identifying genetic variations that influence
these mechanisms regulating blood pressure response to antihypertensive therapies is to
use the identified genetic predictors of response as a benchmark for ascertaining a given
142
drug’s efficacy and toxicity prior to administering the drug to patients. If successful, the
findings from antihypertensive phamacogenetic (and emerging pharmacogenomic)
research could be used to tailor specific drug interventions based on an individual’s
biological profile. This could have major public health and economic impacts by
improving the effectiveness of therapy, while concurrently reducing the occurrence of
adverse events and clinical management periods.
Genetic and epidemiological research efforts, sponsored by the National Heart
Lung and Blood Institute (NHLBI), have been established to identify genes influencing
inter-individual blood pressure variation. Genomic regions that potentially influence
blood pressure variation have been identified on several chromosomes through a variety
of linkage analyses. Genome-wide linkage analyses have identified evidence of linkage
on chromosome 1 with hypertension and blood pressure used as phenotypes (5, 6).
Chang et al. recently conducted genome-wide linkage and candidate gene studies and
identified multiple genes located on chromosome 1q that were associated with systolic
blood pressure (SBP) and one positional candidate gene identified in these analyses was
the E Selectin (SELE) gene (7). The vascular cell adhesion molecule-1 (VCAM1) gene is
also located on chromosome 1 in a different region (1p) and has been linked to
cardiovascular risk factors including blood pressure (8).
Although it is not clear whether inflammation may contribute to the development
of hypertension or if the two are independent phenomena interacting bi-directionally to
promote vascular alterations, a growing interest in the potential pathophysiologic link
between inflammation and hypertension has emerged (9-17) Recent epidemiological

143
studies have demonstrated that the presence of a chronic low grade inflammatory status
can anticipate the future development of hypertension (9, 18-20).
Cell adhesion molecules play an integral role in the inflammatory process in
general, and are involved in vascular inflammatory responses stemming from mechanical
stress on the vascular walls and/or the effects of pro-inflammatory humoral factors (9).
The SELE gene is a 13 kb gene localized to 1q22-q25 and the VCAM1 gene is a 25 kb
gene localized to 1p32-p31. Both genes encode for glycoproteins expressed by activated
endothelium that mediate the adhesion of leukocytes to the vascular lining during the
inflammatory process and are thought to play a role in the pathogenesis of atherosclerosis
(21, 22). Hypertension is a major risk factor for atherosclerosis and is associated with
endothelial cell alterations. Several studies have shown that hypertensive subjects have
elevated serum levels of soluble e-selectin and vascular adhesion molecule-1 compared to
normotensive controls (23-25), and positive correlations between elevated levels of
soluble vascular adhesion molecule-1 and SBP have also been reported (26), suggesting
that SELE and VCAM1 could be involved in the pathogenesis of hypertension. The
relationships between hypertension and several polymorphisms in the SELE gene have
been studied. In particular, studies have demonstrated statistically significant
associations between the L/F554 polymorphism and both SBP and diastolic blood
pressure (DBP) levels (27). Associations have also been detected between arterial
stiffness and polymorphisms in candidate genes, including VCAM1 and other
inflammatory molecule genes (28). Age-related arterial stiffening is thought to be a
major contributor to isolated systolic hypertension (29) and the importance of SBP in the
clinical management of hypertension has been recognized (30, 31).

144
Genes that potentially influence the risk of developing hypertension are prime
candidates for influencing an individual’s pharmacodynamic response to treatment.
Therefore we examined whether single nucleotide polymorphisms (SNPs) in the SELE
and VCAM1genes influence SBP in hypertensive subjects stratified by antihypertensive
drug therapy category and tested for gene-by-drug interactions in a population-based
sample of hypertensive African Americans and non-Hispanic whites from the Genetic
Epidemiology Network of Arteriopathy (GENOA) study.
METHODS
Study Population
In 1995, the National Heart, Lung and Blood Institute (NHLBI) established The
Family Blood Pressure Program (FBPP) to assess the genetic influence on inter-
individual blood pressure variation, hypertension, and hypertensive target organ damage.
One of the four networks established by the NHLBI to meet this objective is the Genetic
Epidemiology Network of Arteriopathy (GENOA). GENOA field centers in Jackson,
MS, Starr County, TX, and Rochester, MN recruited hypertensive African American,
Hispanic, and non-Hispanic white sibships, respectively, for linkage and family-based
association studies. Subject were diagnosed with hypertension if they had a previous
clinical diagnosis of hypertension by a physician with current antihypertensive treatment
or an average SBP >=140 mmHg and/or an average diastolic blood pressure (DBP) >=90
mmHg.
In Rochester, MN and Jackson, MS, recruitment was restricted to sibships that
contained a minimum of two subjects diagnosed with essential hypertension before the
age of 60. Once this criterion was met, the entire sibship was invited to participate in the

145
study. As the prevalence of diabetes among Mexican-Americans is high, the Starr County
recruitment was restricted to Mexican-American sibships containing at least two subjects
diagnosed with type-2 diabetes (32). Data was collected through personal interviews, and
physical and laboratory examinations. The initial phase of the GENOA study took place
from September 1995 through June 2001 (33). The study presented here focused on all
of the hypertensive African American (n = 1329) and non-Hispanic white (n = 1129)
hypertensive subjects.
Blood Pressure Readings
Blood pressure measurements were made with random zero sphygmomanometers
and cuffs appropriate for arm size. Three readings were taken in the right arm after the
subject rested in the sitting position for at least five minutes according to the Seventh
report of the Joint National Committee on Prevention, Detection, Evaluation, and
Treatment of High Blood Pressure (JNC-7, 2003) guidelines (34). The SBP and DBP
values were determined by the first and fifth phase Korotkoff sounds, respectively, and
the last two blood pressure readings were averaged for the analyses. The diagnosis of
hypertension was established based on blood pressure levels measured at the study visit
(≥140/90 mmHg), or a prior diagnosis of hypertension and current treatment with
prescription antihypertensive medications.
Antihypertensive Medications
Based on lists of all antihypertensive medications available in the US, each
prescription antihypertensive drug recorded at the study visit was assigned a code number
corresponding to the first 6 digits of the Medi-Span Generic Product Identifier. This
number, which identifies pharmacologically equivalent drug products, was used to

146
categorize agents with similar mechanisms of antihypertensive action. In this study,
subjects on monotherapy were classified as taking a “beta-blocker”, “calcium-channel
blocker”, “renin-angiotensin-aldosterone system (RAAS) inhibitor”, “diuretic only”, or
“other antihypertensive” drug (e.g. research drugs). Subjects on combination therapies
were classified as taking “beta-blocker + diuretic”, “beta-blocker + other”, “diuretic +
other”, or “neither beta-blocker nor diuretic”. Due to both the wide variation in the types
of drugs falling into the monotherapy class of “other antihypertensive” and the
combination therapy class “neither beta-blocker nor diuretic”, and the relatively low
group sizes, subjects in these classes were excluded from the regression analyses.
Genotyping
SNP genotyping was conducted at the GENOA central genotyping center at the
University of Texas-Houston. SNPs were selected in positional candidate genes in the
region using the public National Center for Biotechnology Information (NCBI) database
(35) and the private Celera database (36). SNP genotyping on a total of 11 loci in the
SELE gene and 16 loci in the VCAM1 gene (Table 5.3) were obtained using a
combination of two genotyping platforms: mass spectrometer-based detection system
implemented on a Sequenom MassARRAY system, and the fluorogenic TaqMan assay
implemented on an ABI Prism 7900 Sequence Detection System.
Statistical Analysis
The primary goal of this analysis was to determine if there was evidence of SNP
effects and gene-drug interactions on SBP levels in African American and non-Hispanic
white hypertensives. Given the correlation structure inherent in sibship data of the
GENOA study cohort, the distribution of subjects within each of the ten treatment groups

147
(no treatment, five monotherapy groups and four combination therapy groups) was
assessed. Although some degree of relatedness within treatment groups was evident in
both racial/ethnic groups (African Americans, Table 5.1; non-Hispanic whites Table 5.2),
there were few related subjects within particular treatment groups. As such, regression
analyses did not formally account for familial correlations. The parameter estimates in
regression modeling are not affected by correlated data, however the standard errors of
parameters are often underestimated (37). Differences in the age, BMI, SBP and DBP
distributions across treatment groups were examined using an F-test. To determine if two
SNPs were likely to be representing the same variation in the gene we used
22
1 2 1 2
Drp p q q
= (38) as a measure of linkage disequilibrium (LD). SNPs with high 2r
values are likely to have the same genotype-phenotype relationship.
Age- and sex-adjusted SNP effects on mean levels of SBP within each treatment
class were estimated using linear regression modeling, where SNP genotypes were
dummy coded. The dummy variables for each SNP of interest were modeled against the
SBP residuals from separate multivariable regression models that included age and sex as
predictor variables. Modeling the SNP genotype relationship to the resulting residuals
yielded age- and sex-adjusted associations between each of the selected SNP genotypes
and SBP. The regression models within each treatment class took the following basic
form:
Yi = β0 + β1SNP12i + β2SNP22i + ε, (1)

148
where Yi = the age- and sex-adjusted SBP residual for the ith subject, SNP12i = the
heterozygous genotype of the SNP of interest for the ith subject, and SNP22i = the second
alphabetically ordered, homozygous genotype of the SNP of interest for the ith subject.
Because of the limited sample size of some of the drug categories, a leave-one-out
cross validation strategy was used to provide more accurate estimates of the percent
variation in SBP explained by the SNPs and to reduce reporting of false positives. The
leave-one-out cross validation procedure leaves one person out of the sample (designated
as the test case) and estimates the genetic model on the N-1 remaining subjects
(designated as the training cases). The estimated model was then applied to the test case,
a predicted SBP was calculated, and the residual variability between observed and
predicted values was estimated. A cross-validated R2 value was then calculated by taking
the total SBP variability in the sample minus the total residual variability divided by the
total variability. The results were averaged across all test cases. The cross-validated R2
will have a negative value when the model’s prediction is poor (i.e. the predicted values
deviate substantially from the observed values).
In order to formally evaluate whether there was evidence of gene-by-drug
interactions, the effect of each SNP on SBP was compared between each treatment class.
Using analysis of covariance methods, overall gene-by-drug interactions were
systematically tested for using the partial F-test and potential SNP effect differences
among each treatment class were assessed using pair-wise comparisons. The regression
models used to assess each pairwise comparison between each of the treatment classes
extended equation (1) above by adding SNP-treatment class interaction terms and took
the following form:

149
Yi = β0 + β1SNP12i + β2SNP22i + β3SNP12*Ci + β4SNP12*Ci + ε, (2)
where Yi = the age- and sex-adjusted SBP residual for the ith subject; SNP12i = the
heterozygous genotype of the SNP of interest for the ith subject; SNP22i = the second
alphabetically ordered, homozygous genotype of the SNP of interest for the ith subject;
and C = a dichotomous treatment class variable that is assigned a value of “0” for the first
treatment class of each possible treatment class pair, and a value of “1” for the second
treatment class of each possible treatment class pair.
The lack of replication of genetic effects or gene-environment interactions on
complex traits such as blood pressure is a major issue in the field of human genetic
association studies. In order to minimize false inferences a leave one out cross validation
strategy was used to estimate the extent to which gene-drug interactions improved
prediction of SBP levels beyond the SNP main effects.
Because the cross-validation method provides an alternative to the adjustment of
p-values (which is often conservative and can lead to type II errors), p-values were not
formally adjusted for multiple testing. This issue is particularly important in
susceptibility gene research since the small effects of relatively common alleles are likely
to have the greatest public health impact but are unlikely to achieve p-values that
withstand conservative adjustments. At the heart of the multiple testing issue is the
question of how to separate out false positives from true positives. Adjusting p-values
for multiple comparisons does not directly address this question, but rather aims to reduce
the probability of a false positive. Cross-validation better addresses this question by

150
testing the predictive capability of the model on independent test cases and provides a
more direct assessment of whether the result is a false positive.
All regression analyses conducted to assess (a) SNP main effects within the
various treatment classes, and (b) gene-drug interactions were adjusted for age and sex.
An alpha level of 0.05 was used to determine statistical significance and a cross-validated
R2 x 100>0.50 cut point was used to identify SNPs with potential predictive capabilities
based on their performance in the test cases. All analyses were performed in R (39).
RESULTS
The average age, BMI, SBP and DBP values for African American subjects in
each treatment class are presented in Table 5.1. This table also presents analysis of
variance results used to determine if the sample mean of these traits differed significantly
between treatment classes. Age differed significantly (p=0.008) between the treatment
classes, with the oldest average age among subjects in the “beta-blocker + other” class
and the youngest average age among those in the “calcium-channel blocker” class.
Although the mean BMI values in all treatment classes were at or above the clinical
cutpoint for clinical obesity, they differed significantly (p<0.001) between the various
treatment classes, with the highest mean BMI values among subjects in the “diuretic +
other” class. Overall, there was evidence of significant variation (p<0.001) of SBP across
treatment classes, with the highest mean level among subjects in the “beta-blocker +
other” and the lowest mean level among those in the “RAAS inhibitor” class. Similar
distribution information for non-Hispanic white subjects within each treatment class is
presented in Table 5.2. Age differed significantly (p<0.001) between the treatment
classes, with the oldest average age among subjects in the “beta-blocker + other” class
151
and the youngest average age among those in the “RAAS inhibitor” class. Statistically
significant differences in BMI were not noted between the various treatment classes (p =
0.146), although the mean BMI values within each class nearly met or exceed the clinical
cutpoint for obesity. There was also evidence of significant variation (p<0.001) of SBP
across treatment classes, with the highest mean level among subjects in the “beta-blocker
+ other” and the lowest mean level among those in the “beta-blocker” class.
Table 5.3 presents a brief description of the SELE and VCAM1 SNPs that were
genotyped in this study. Among the SELE SNPs, three SNPs are located in the 5’
untranslated (UTR) region, one synonymous SNP is located in exon 14, three SNPs are
located in introns, three non-synonymous SNPs are located in exons 10, 9, and 5, and one
SNP is located in the 3’ UTR region. Among the VCAM1 SNPs, three SNPs are located
in the 5’ upstream gene region, nine SNPs are located in intronic regions, two
synonymous and one non-synonymous SNPs are located in exon 9, and one SNP is
located in the 3’ downstream region. Tables 5.4 and 5.5 present the total number of
subjects that were genotyped for each SELE SNP, as well as the frequency and
percentage of each of the corresponding three genotypes, in African Americans and non-
Hispanic whites respectively. Among the non-Hispanic white sample, the rs5366 variant
was monomorphic (with the exception of one subject having the heterozygous genotype
at this locus) and the rs5357 SNP had a low call rate (n= 511). Similar results for each of
the VCAM1 SNPs genotyped are presented in Tables 5.6 and 5.7. The rs3786315 variant
was monomorphic in the non-Hispanic white sample.
The LD pattern among variations in the SELE SNPs in African American and
non-Hispanic white subjects are displayed in Figure 5.1 and Figure 5.2 respectively. It is
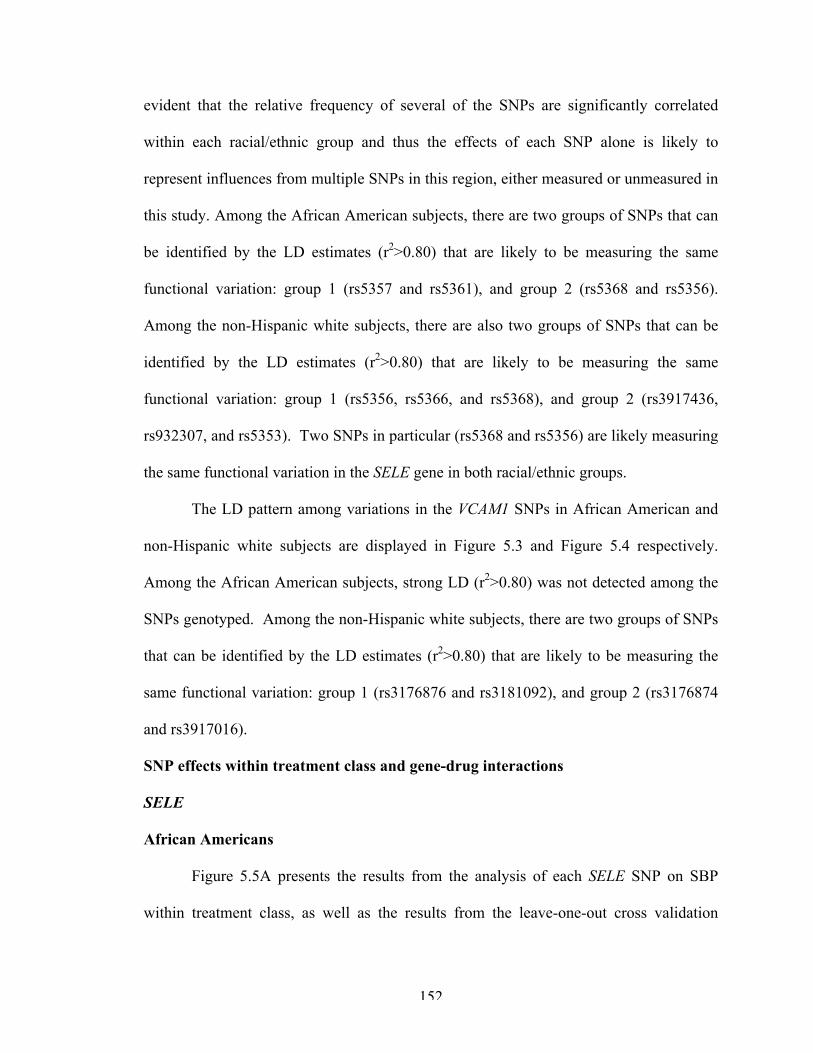
152
evident that the relative frequency of several of the SNPs are significantly correlated
within each racial/ethnic group and thus the effects of each SNP alone is likely to
represent influences from multiple SNPs in this region, either measured or unmeasured in
this study. Among the African American subjects, there are two groups of SNPs that can
be identified by the LD estimates (r2>0.80) that are likely to be measuring the same
functional variation: group 1 (rs5357 and rs5361), and group 2 (rs5368 and rs5356).
Among the non-Hispanic white subjects, there are also two groups of SNPs that can be
identified by the LD estimates (r2>0.80) that are likely to be measuring the same
functional variation: group 1 (rs5356, rs5366, and rs5368), and group 2 (rs3917436,
rs932307, and rs5353). Two SNPs in particular (rs5368 and rs5356) are likely measuring
the same functional variation in the SELE gene in both racial/ethnic groups.
The LD pattern among variations in the VCAM1 SNPs in African American and
non-Hispanic white subjects are displayed in Figure 5.3 and Figure 5.4 respectively.
Among the African American subjects, strong LD (r2>0.80) was not detected among the
SNPs genotyped. Among the non-Hispanic white subjects, there are two groups of SNPs
that can be identified by the LD estimates (r2>0.80) that are likely to be measuring the
same functional variation: group 1 (rs3176876 and rs3181092), and group 2 (rs3176874
and rs3917016).
SNP effects within treatment class and gene-drug interactions
SELE
African Americans
Figure 5.5A presents the results from the analysis of each SELE SNP on SBP
within treatment class, as well as the results from the leave-one-out cross validation

153
procedure, among the African American subjects. Evidence of statistically significant
and cross-validated SNP effects on SBP was demonstrated in two of the eight treatment
categories. Among hypertensives taking a beta-blocker only, the rs932307 SNP was
statistically significantly associated with SBP levels and predicted a substantial amount
of variation in SBP (cross-validated R2 x 100 = 3.2%). Among hypertensives taking a
diuretic only, one SNP (rs3917436) was statistically significantly associated with SBP
and cross validated, predicting approximately 0.5% of the variation in SBP.
Evidence of SELE SNP-drug interactions among the African American subjects is
visualized in Figure 5.5B, which summarizes the results of the tests for interaction for
each pair of treatment classes examined. Statistically significant and cross-validated
SNP-drug interactions that predict SBP variation have been highlighted. Some of the
strongest evidence for gene-by-drug interaction comes from the comparison of the SNP
genotype means among subjects in the “no treatment” vs. “beta-blocker” classes, and
among subjects in the “beta-blocker” class relative to the respective SNP genotype means
among subjects in the other monotherapy and combination therapy treatment classes.
Three separate SNPs (rs5366, rs5361, and rs932307) each demonstrated statistically
significant, cross-validated differences in mean SBP between the “no treatment” and
“beta-blocker” classes. The rs932307 SNP demonstrated statistically significant
differences in mean SBP between the “beta-blocker” class and all 7 other classes, with
cross-validated differences detected between 4 other (“calcium-channel blocker”, “RAAS
inhibitor”, “diuretic only”, and “diuretic + other”) classes. The rs5366 and rs5361 SNPs
also demonstrated numerous statistically significant mean SBP differences between the
“beta-blocker” and the 7 other classes, although most failed to cross-validate. These

154
results suggest that the genotype-specific effects of particular SELE SNPs on SBP
variation may depend upon the drug that is administered, and highlight the possibility of
gene-by-beta-blocker interaction in particular. Genotype-specific mean SBP values by
treatment class for the rs932307 SNP are displayed in Figure 5.6.
Non-Hispanic Whites
Figure 5.7A presents the results from the analysis of each SELE SNP on SBP
within treatment class, as well as the results from the leave-one-out cross validation
procedure, among the non-Hispanic white subjects. Evidence of statistically significant
and cross-validated SNP effects on SBP was demonstrated in two of the eight drug
categories. Among hypertensives taking a beta-blocker, four of the ten (rs5366
essentially monomorphic in sample) SNPs were statistically significantly associated with
SBP levels and three of these SNPs (rs5356, rs5368, and rs1076638) each predicted a
substantial amount of variation in SBP (cross-validated R2 x 100 = 3.3%, 3.2%, and
2.8% respectively). Among hypertensives taking a combination therapy of a diuretic plus
another antihypertensive drug, one SNP (rs932307) demonstrated a statistically
significant, cross-validated association with SBP and predicted approximately 0.7% of
the variation in SBP. These findings suggest possible gene-by-drug interactions between
SELE and antihypertensive medications (particularly beta blockers) in determining SBP
levels in hypertensives.
Evidence of SELE SNP-drug interactions among the non-Hispanic white subjects
is visualized in Figure 5.7B, which summarizes the results of the tests for interaction for
each pair of treatment classes examined. Statistically significant and cross-validated
SNP-drug interactions that predict SBP variation have been highlighted. Similar to

155
results detected in the African American racial/ethnic group, some of the strongest
evidence for gene-by-drug interaction comes from the comparison of SNP genotype
means among subjects in the “beta-blocker” class relative to the respective SNP genotype
means among subjects in the other monotherapy and combination therapy treatment
classes. Since the SNPs that demonstrated significant and cross-validated effects among
hypertensives taking a beta-blocker did not seem to have an influence in the other
treatment classes, significant SNP-drug interactions in drug comparisons involving beta-
blocker usage were expected. Accordingly, 20 of the 25 statistically significant, cross-
validated comparisons of SNP effects on SBP between treatment classes involved
treatment classes with beta-blocker use (in monotherapy and/or combination forms).
Three separate SNPs (rs5356, rs5368, and rs1076638) each demonstrated cross-validated
differences in mean SBP between the “beta-blocker” class vs. both the “diuretic only”
and beta-blocker + diuretic” classes. Two of these SNPs (rs5368 and rs1076638) also
demonstrated cross-validated differences in mean SBP between comparisons among the:
“beta-blocker” vs. “beta-blocker + other” classes; “diuretic only” vs. “beta-blocker +
other” classes; and “beta-blocker + other” vs. “diuretic + other” classes. Many of the
results for the rs5356, rs5368, and rs1076638 SNPs were similar and may stem from LD
relationships. In particular, rs5356 and rs5368 are in high LD (r2 = 0.98) and likely
represent similar functional variation within the SELE gene in this non-Hispanic white
cohort. Still, these results suggest that the genotype-specific effect of a particular SNP on
SBP variation may depend upon the drug that is administered. Furthermore, as observed
in the African American cohort, SELE SNP genotype effects on SBP may be highly

156
dependent on beta-blocker use. Genotype-specific mean SBP values by treatment class
for the rs5368 SNP are displayed in Figure 5.8.
VCAM1
African Americans
Figure 5.9A presents the results from the analysis of each VCAM1 SNP on SBP
within treatment class, as well as the results from the leave-one-out cross validation
procedure, among the African American subjects. Evidence of statistically significant
and cross-validated SNP effects on SBP was demonstrated in three of the eight treatment
categories. Among hypertensives taking a beta-blocker only, the rs3176862 SNP was
statistically significantly associated with SBP levels and predicted a substantial amount
of variation in SBP (cross-validated R2 x 100 = 4.2%). Among hypertensives taking a
calcium-channel blocker only, the rs3176878 SNP was statistically significantly
associated with SBP and cross-validated, predicting approximately 6.0% of the variation
in SBP. Among hypertensives taking a beta-blocker + other drug, rs3176876 was
statistically significantly associated with SBP and cross-validated, predicting
approximately 10.5% of the variation in SBP.
Evidence of VCAM SNP-drug interactions among the African American subjects
is visualized in Figure 5.9B, which summarizes the results of the tests for interaction for
each pair of treatment classes examined. Statistically significant and cross-validated
SNP-drug interactions that predict SBP variation have been highlighted. Statistically
significant and cross-validated genotype effects on mean SBP differences between
various treatment classes were observed for many of the SNPs investigated. Some of the
strongest evidence for gene-by-drug interaction involved three SNPs in particular
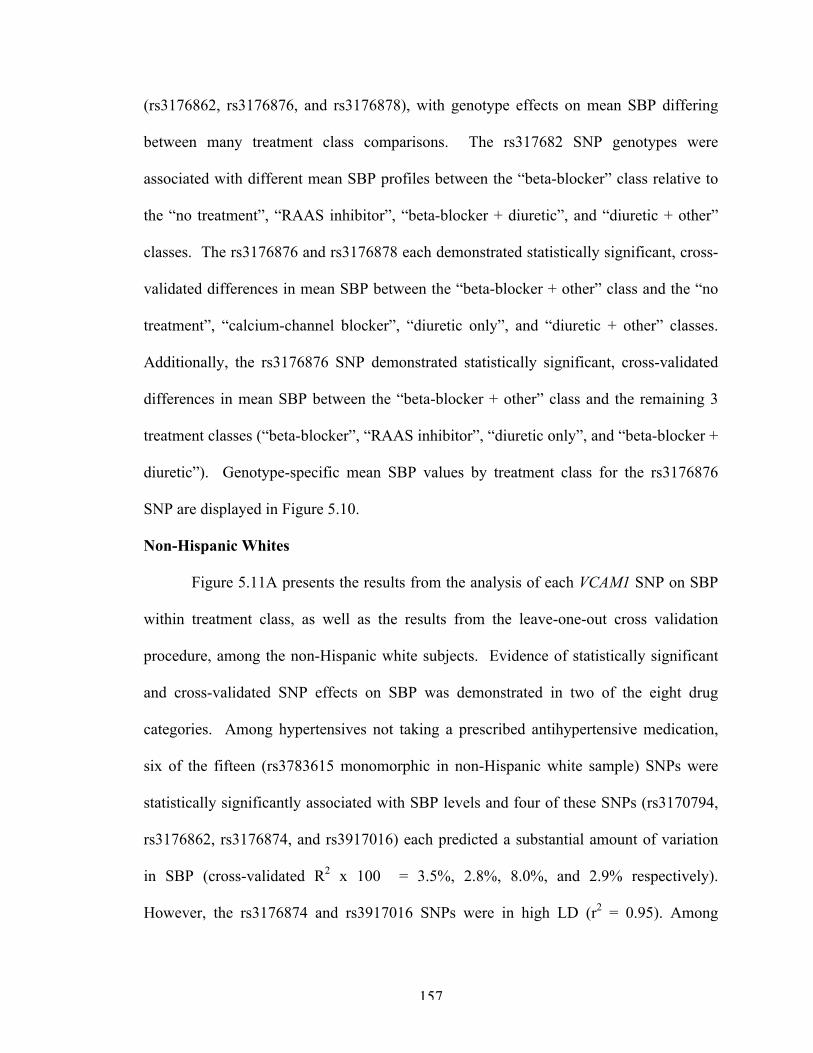
157
(rs3176862, rs3176876, and rs3176878), with genotype effects on mean SBP differing
between many treatment class comparisons. The rs317682 SNP genotypes were
associated with different mean SBP profiles between the “beta-blocker” class relative to
the “no treatment”, “RAAS inhibitor”, “beta-blocker + diuretic”, and “diuretic + other”
classes. The rs3176876 and rs3176878 each demonstrated statistically significant, cross-
validated differences in mean SBP between the “beta-blocker + other” class and the “no
treatment”, “calcium-channel blocker”, “diuretic only”, and “diuretic + other” classes.
Additionally, the rs3176876 SNP demonstrated statistically significant, cross-validated
differences in mean SBP between the “beta-blocker + other” class and the remaining 3
treatment classes (“beta-blocker”, “RAAS inhibitor”, “diuretic only”, and “beta-blocker +
diuretic”). Genotype-specific mean SBP values by treatment class for the rs3176876
SNP are displayed in Figure 5.10.
Non-Hispanic Whites
Figure 5.11A presents the results from the analysis of each VCAM1 SNP on SBP
within treatment class, as well as the results from the leave-one-out cross validation
procedure, among the non-Hispanic white subjects. Evidence of statistically significant
and cross-validated SNP effects on SBP was demonstrated in two of the eight drug
categories. Among hypertensives not taking a prescribed antihypertensive medication,
six of the fifteen (rs3783615 monomorphic in non-Hispanic white sample) SNPs were
statistically significantly associated with SBP levels and four of these SNPs (rs3170794,
rs3176862, rs3176874, and rs3917016) each predicted a substantial amount of variation
in SBP (cross-validated R2 x 100 = 3.5%, 2.8%, 8.0%, and 2.9% respectively).
However, the rs3176874 and rs3917016 SNPs were in high LD (r2 = 0.95). Among

158
hypertensives taking a combination therapy of a diuretic + other antihypertensive drug,
five of the fifteen SNPs were statistically significantly associated with SBP levels and
three of these SNPs (rs3176860, rs3176862, and rs3176876) each predicted a substantial
amount of variation in SBP (cross-validated R2 x 100 = 6.1%, 0.9%, and 1.0%
respectively).
Evidence of VCAM1 SNP-drug interactions among the non-Hispanic white
subjects is visualized in Figure 5.11B, which summarizes the results of the tests for
interaction for each pair of treatment classes examined. Statistically significant and
cross-validated SNP-drug interactions that predict SBP variation have been highlighted.
A majority of the strongest evidence for gene-by-drug interaction comes from the
comparison of SNP genotype means among subjects in the “no treatment” class relative
to the respective SNP genotype means among subjects in the 4 monotherapy and 3
combination therapy treatment classes. Three separate SNPs (rs3170794, rs3176862, and
rs3176874) each demonstrated cross-validated differences in mean SBP between the “no
treatment” and the “beta-blocker” classes. Two of these SNPs (rs3170794 and
rs3176862) and the rs1041163 SNP also demonstrated cross-validated differences in
mean SBP between the “no treatment” and the “calcium-channel blocker” classes. Three
SNPs (rs3176874, rs3176876, and rs3181092) each demonstrated cross-validated
differences in mean SBP between the “no treatment” and the “RAAS inhibitor” classes.
The rs3176876 and rs3181092 SNPs were in relatively high LD (r2 = 0.81). Three SNPs
(rs1409419, rs3176860, and rs3176874) each demonstrated cross-validated differences in
mean SBP between the “no treatment” and the “diuretic + other” classes. 10 of the
remaining 15 cross-validated results were among comparisons involving the “diuretic +

159
other” class. Notably, 11 of the 15 SNPs examined demonstrated statistically significant
and cross-validated evidence that SNP genotype effects on mean SBP were different
between one or more of the treatment classes analyzed. Genotype-specific mean SBP
values by treatment class for the rs3176860 SNP are displayed in Figure 5.12.
The results illustrated in Figures 5.5-5.12 provide evidence that for certain SNPs
located in the SELE and VCAM1 genes, genotype-SBP phenotype associations may vary
by treatment class. These findings indicate that genetic susceptibility loci for
hypertension may also interact with antihypertensive therapies to influence an
individual’s blood pressure levels. As such, a particular genetic subgroup in the
hypertensive population may benefit more from a particular drug regimen.
DISCUSSION Hypertension is a major risk factor for cardiovascular, cerebrovascular, and renal
disease morbidity and mortality. Despite the recognized health and economic burdens of
hypertension, success in achieving and maintaining target blood pressure levels necessary
to reduce cardiovascular risk has been limited. This stems largely from low hypertension
awareness and treatment, as an estimated 67% of hypertensives in the US are aware of
their condition and only 54% are being treated. Furthermore, in the midst of increasing
prevalence, more than two-thirds of treated hypertensives in the US do not have their
blood pressure adequately controlled (3).
One of the challenges in achieving broad blood pressure control is the difficulty in
predicting how effective a particular antihypertensive regimen will be for a particular
patient. Without a priori knowledge of how subjects will respond to a medication, a
“trial-and-error” approach is typically employed to find the ideal drug for a given patient

160
(40). Furthermore, it is recognized that hypertension is a multifactorial disease and that
combinations of antihypertensive agents, acting through different mechanisms at different
sites, are often prescribed, with most patients requiring two or more drugs to achieve
target blood pressure (41).
During the earlier years of phamacogenetic investigations, the focus was directed
towards variants in genes (e.g.- CVP2D6 and N-acetyltransferase 2 genes) that coded for
enzymes affecting drug metabolism (42). However, the variations in these genes, known
to impact the pharmacokinetics (i.e.- mechanisms affecting drug concentration such as
absorption, distribution, metabolism, and excretion) of particular antihypertensive agents,
have decreased in importance as the agents they impacted are no longer widely
prescribed and newer agents have gained widespread use. More recently,
pharmacogenetic research has focused on identifying variants in candidate genes that
impact the pharmacodynamic (i.e.- mechanisms governing the drug-target cell interaction
and subsequent regulation of drug activity and efficacy) properties influencing individual
variation in antihypertensive response (4, 40, 42). Accordingly, numerous variants in
biological and positional candidate genes (mainly in the RAAS) have been predictive of
blood pressure response to a variety of antihypertensive therapies, however studies have
yielded conflicting results, reflecting the heterogeneous nature of hypertension and
response to antihypertensive treatment (40, 43).
In the current study, we hypothesized that polymorphisms in the SELE and
VCAM1 genes could influence interindividual variation in blood pressure response, on the
premise that hypertension is associated with endothelial cell alteration/dysfunction and
that cell adhesion molecules, including SELE and VCAM1, are products of activated

161
endothelium. Numerous studies have demonstrated statistically significant associations
between hypertension and elevated plasma levels of e-selectin (23-25, 44) and vascular
adhesion molecule-1 (25, 26), suggesting that these circulating molecules are either by-
products of the endothelial damage caused by hypertension or that the respective proteins
encoded by the SELE and VCAM1 genes are somehow involved in the determination of
blood pressure. Results from recent research show that e-selectin expression correlates
with vascular structural alterations, and the authors point out the possibility that e-selectin
might independently contribute to such vascular changes by fostering leukocyte
adhesion/accumulation (23). Previous genetic analyses using the GENOA cohort
detected statistically significant associations between quantitative blood pressure values
and the non-synonymous rs5368 SNP in the SELE gene among African American
subjects (7). The common Ser128Arg (rs5361) and L/F554 (rs5355) polymorphisms in
SELE have been investigated for their potential role in cardiovascular diseases.
Associations have been detected between both variants and atherosclerosis (45), between
the Ser128Arg (rs5361) variant and coronary artery disease (46-48) and recurrent venous
thromboembolism (49), and between the L/F554 (rs5355) variant and blood pressure (27,
50). Furthermore, reductions in soluble selectin molecules (both e- and p-selectin)
through the administration of the calcium-channel blocker benidipine (51) and variance
in the degree of vascular effects derived through different antihypertensive therapies (45)
have been demonstrated, suggesting that variants in genes influencing vascular tone and
function may also affect blood pressure response. Administration of the angiotensin
converting enzyme (ACE) inhibitor fosinopril has been shown to lower circulating
vascular cell adhesion molecule-1 levels (52).

162
This study detected and cross-validated sets of SNPs within the SELE and
VCAM1 genes that may influence interindividual variation in blood pressure and blood
pressure response in African American and non-Hispanic white hypertensive patients.
Investigation of SELE SNP effects on blood pressure within treatment classes revealed
that the effects that were significant and cross-validated in independent samples were
primarily seen within the “beta-blocker” monotherapy class in each racial/ethnic group.
Subsequent comparisons across treatment classes to investigate the potential evidence for
gene-by-drug interaction revealed that most of the significant and cross-validated
differences were between monotherapy and combination therapy classes relative to the
beta-blocker usage, and these findings were also common to both racial/ethnic groups.
A potential explanation for the differences detected may be that certain
antihypertensive therapies confer vasculoprotective properties, in addition to blood
pressure lowering properties, which may improve outcomes. Studies comparing such
properties between antihypertensive agents have noted improved endothelial structure
and function with RAAS inhibitors (53, 54) and calcium-channel blockers (45), relative
to no improvements under beta-blocker usage. Interestingly, this study provided similar
evidence of gene-by-drug interaction involving the common Ser128Arg (rs5361) variant
was detected between the “calcium-channel blocker” and “beta-blocker + other”
treatment classes in non-Hispanic whites, and the genotypes of this SNP were associated
with statistically significant different SBP profiles in several treatment classes (“calcium-
channel blocker”, “diuretic only”, “beta-blocker + other”, and “diuretic + other”) relative
to the “beta-blocker” class in African Americans. Although the rs5361 associations
failed to cross-validate in either racial/ethnic group, these differences may have clinical
163
relevance as subjects with a particular allele at this locus may respond better to calcium-
channel blocker administration, and simultaneously benefit from both blood pressure
lowering and inhibition of e-selectin molecule expression which could reduce the rate of
atherosclerotic progression (51).
The etiology of hypertension is believed to be multifactorial and polygenic, with
numerous environmental and genetic factors influencing interindividual blood pressure
variation. Studies investigating the role of SELE and VCAM1 polymorphisms have
detected that SNP effects on blood pressure may depend on environmental factors such as
age and BMI (26, 27, 50). While statistically significant age differences were noted
between subjects within different treatment classes in our study, the actual mean ages
across classes were within a relatively tight range. While BMI differed significantly by
treatment class among the African American subjects, no statistically significant BMI
differences between treatment classes were observed among the non-Hispanic white
subjects. Overall, mean BMI values in both racial/ethnic groups were near or above the
clinical cutpoint for obesity, regardless of treatment class. This may indicate that our
findings are only generalizable to over-weight and obese populations, and may reinforce
the previously identified (50) BMI-specific effect of polymorphisms in inflammatory
genes on blood pressure and blood pressure response.
This study had several limitations that warrant discussion. Without prospective
data, genetic influence on blood pressure response to various treatment regimens could
not be accurately assessed. Despite this, as illustrated in a identical analysis conducted in
the GENOA non-Hispanic white cohort that investigated interactions between the
adducin2 (ADD2) gene and antihypertensive drug therapies on SBP, the various gene

164
effects observed within treatment classes were taken as a reflection of how the certain
SNP genotypes responded to different antihypertensive drug environments (55).
Although the within-treatment class samples were somewhat balanced and moderately
sized in both racial/ethnic groups, results may have been biased by relatively small
sample sizes within some classes. In particular, the “beta-blocker” monotherapy and the
“beta-blocker + other” class sizes were quite small among African American subjects,
and findings involving these classes (in the form of SNP main effects within these classes
or SNP-drug interactions) should be interpreted with caution.
The genetic analyses carried out in these analyses were limited to a select number
of SNPs within two genes in the inflammatory/endothelial dysfunction pathway(s).
Genetic variants in other physiologic systems and pathways, including the RAAS, the
sodium system, signal transduction pathways, the noradrenergic system, and endothelin
system, influence blood pressure regulation and may be related to relationships between
various antihypertensive treatments and blood pressure lowering effects. Given that
hypertension is believed to be multifactorial and polygenic, further investigation of SNP
main effects in other genes, as well as appropriately defined gene-environment and gene-
gene interactions may provide additional insights into genetic influences on treatment
response. Many ongoing genome-wide association studies have great potential to
identify variants that could serve as benchmarks for individual treatment response and
influence the design of novel therapies (56). Numerous statistical genetic tests were
carried out in the analyses of this study, increasing the chance of false-positive findings.
As used in previous research investigating the influence of ADD2-drug interactions on
SBP (55), the cross-validation techniques used in this study reduced the number of

165
statistically significant findings by likely ruling out false-positive associations. Direct
comparison of the various SNP effects between the African American and non-Hispanic
white subject is limited due to genetic heterogeneity (i.e.- population differences in allelic
distributions), although results specific to racially/ethnically homogeneous cohorts were
presented. Despite these limitations, this study contributed to the developing
pharmacogenetic knowledge base by demonstrating that blood pressure response to
antihypertensive therapy may be modified by variations in the SELE and VCAM1 genes,
and presented another avenue of investigation into the potential link between
inflammation and hypertension.
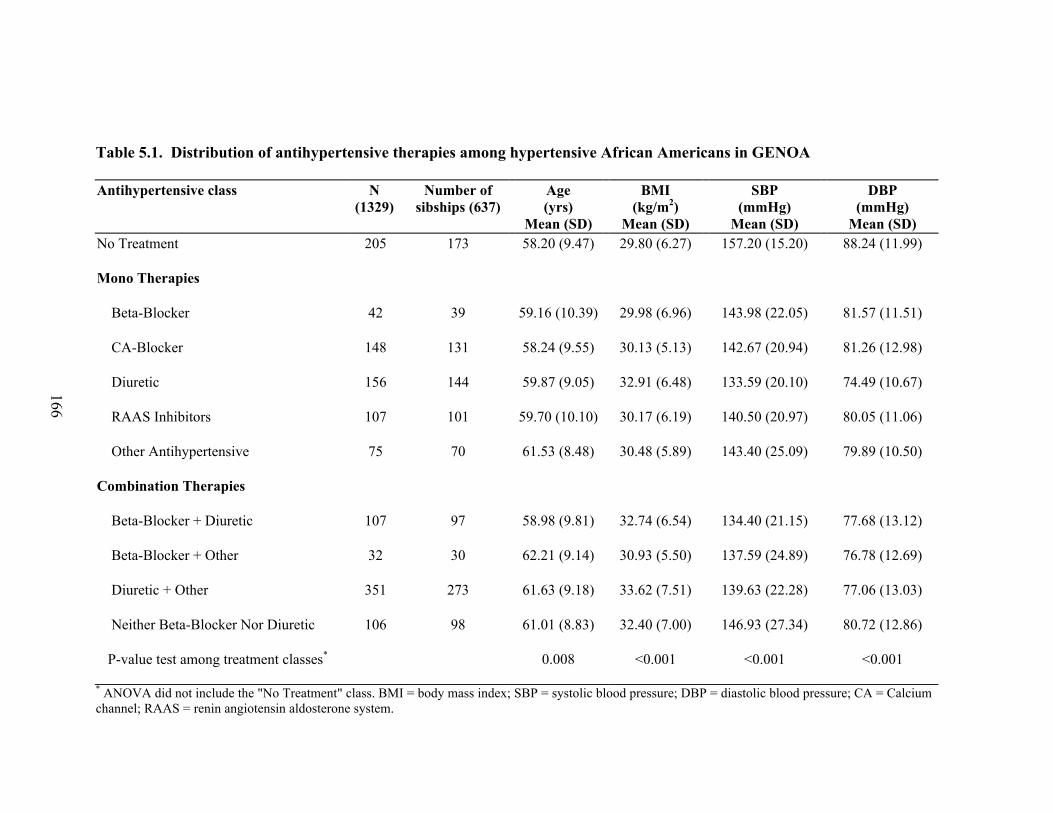
166
Table 5.1. Distribution of antihypertensive therapies among hypertensive African Americans in GENOA
Antihypertensive class N (1329)
Number of sibships (637)
Age (yrs)
Mean (SD)
BMI (kg/m2)
Mean (SD)
SBP (mmHg)
Mean (SD)
DBP (mmHg)
Mean (SD) No Treatment 205 173 58.20 (9.47) 29.80 (6.27) 157.20 (15.20) 88.24 (11.99)
Mono Therapies
Beta-Blocker 42 39 59.16 (10.39) 29.98 (6.96) 143.98 (22.05) 81.57 (11.51)
CA-Blocker 148 131 58.24 (9.55) 30.13 (5.13) 142.67 (20.94) 81.26 (12.98)
Diuretic 156 144 59.87 (9.05) 32.91 (6.48) 133.59 (20.10) 74.49 (10.67)
RAAS Inhibitors 107 101 59.70 (10.10) 30.17 (6.19) 140.50 (20.97) 80.05 (11.06)
Other Antihypertensive 75 70 61.53 (8.48) 30.48 (5.89) 143.40 (25.09) 79.89 (10.50)
Combination Therapies
Beta-Blocker + Diuretic 107 97 58.98 (9.81) 32.74 (6.54) 134.40 (21.15) 77.68 (13.12)
Beta-Blocker + Other 32 30 62.21 (9.14) 30.93 (5.50) 137.59 (24.89) 76.78 (12.69)
Diuretic + Other 351 273 61.63 (9.18) 33.62 (7.51) 139.63 (22.28) 77.06 (13.03)
Neither Beta-Blocker Nor Diuretic 106 98 61.01 (8.83) 32.40 (7.00) 146.93 (27.34) 80.72 (12.86)
P-value test among treatment classes* 0.008 <0.001 <0.001 <0.001
* ANOVA did not include the "No Treatment" class. BMI = body mass index; SBP = systolic blood pressure; DBP = diastolic blood pressure; CA = Calcium channel; RAAS = renin angiotensin aldosterone system.

167
Table 5.2. Distribution of antihypertensive therapies among hypertensive non-Hispanic whites in GENOA
Antihypertensive class N (1129)
Number of sibships (548)
Age (yrs)
Mean (SD)
BMI (kg/m2)
Mean (SD)
SBP (mmHg)
Mean (SD)
DBP (mmHg)
Mean (SD) No Treatment 148 133 54.99 (11.2) 30.9 (5.6) 149.24 (13.2) 86.53 (9.4)
Mono Therapies
Beta-Blocker 162 147 55.79 (10.4) 30.69 (6.7) 134.43 (16.1) 79.09 (8.1)
CA-Blocker 62 59 57.06 (9.3) 29.49 (5.3) 142.37 (15.6) 82.56 (9.0)
Diuretic 127 121 58.04 (9.6) 32.01 (6.6) 134.98 (12.5) 79.17 (9.7)
RAAS Inhibitors 151 136 54.87 (9.5) 31.11 (7.3) 133.73 (15.9) 80.52 (8.8)
Other Antihypertensive 18 17 59.97 (10.7) 29.38 (4.8) 141.67 (22.6) 78.56 (8.1)
Combination Therapies
Beta-Blocker + Diuretic 167 141 59.66 (9.4) 32.01 (6.8) 136.23 (16.0) 77.34 (9.4)
Beta-Blocker + Other 72 67 62.57 (8.7) 30.66 (5.9) 143.63 (20.8) 78.36 (9.5)
Diuretic + Other 178 159 59.13 (9.4) 31.55 (6.3) 134.64 (15.6) 77.83 (10.2)
Neither Beta-Blocker Nor Diuretic 44 42 58.21 (9.3) 30.89 (6.1) 138.64 (19.1) 80.50 (10.5)
P-value test among treatment classes* <0.001 0.146 <0.001 0.004
* ANOVA did not include the "No Treatment" class. BMI = body mass index; SBP = systolic blood pressure; DBP = diastolic blood pressure; CA = Calcium channel; RAAS = renin angiotensin aldosterone system.

168
Table 5.3. Description of Cell Adhesion Molecule Candidate Genes Gene Name Gene GENOA SNP ID SNP rs# SNP Type Chromosomal Band selectin E SELE SELE_012037 rs5357 UTR 1q22-q25 (endothelial adhesion molecule 1) SELE_010130 rs3917436 UTR 1q22-q25
SELE_010054 rs3917434 UTR 1q22-q25 SELE_009831 rs5356 synonymous 1q22-q25 SELE_007803 rs5368 nonsynonymous 1q22-q25 SELE_007532 rs5366 nonsynonymous 1q22-q25 SELE_007158 rs1076638 intron 1q22-q25 SELE_005924 rs1534904 intron 1q22-q25 SELE_003689 rs5361 nonsynonymous 1q22-q25 SELE_002043 rs932307 intron 1q22-q25 SELE_001774 rs5353 UTR 1q22-q25
vascular cell adhesion molecule 1 VCAM1 VCAM1_000376 rs1409419 1p32-p31
VCAM1_000805 rs1041163 1p32-p31 VCAM1_001564 rs3170794 1p32-p31 VCAM1_004199 rs3176860 intron 1p32-p31 VCAM1_004301 rs3176861 intron 1p32-p31 VCAM1_004952 rs3176862 intron 1p32-p31 VCAM1_011199 rs3176867 intron 1p32-p31 VCAM1_013438 rs3176869 intron 1p32-p31 VCAM1_015713 rs3181088 intron 1p32-p31 VCAM1_016891 rs3176874 intron 1p32-p31 VCAM1_017613 rs3176876 intron 1p32-p31 VCAM1_018152 rs3917016 intron 1p32-p31 VCAM1_020703 rs3176878 synonymous 1p32-p31 VCAM1_020770 rs3783615 nonsynonymous 1p32-p31 VCAM1_020832 rs3176879 synonymous 1p32-p31
VCAM1_021649 rs3181092 1p32-p31

169
Table 5.4. SELE SNP sample size information and genotype distribution among hypertensive African Americans in GENOA SNP Ntotal N11 P11 N12 P12 N22 P22
rs5357 616 572 (0.93) 41 (0.06) 3 (0.01)
rs3917436 1197 321 (0.27) 630 (0.53) 246 (0.20)
rs3917434 1211 979 (0.81) 220 (0.18) 12 (0.01)
rs5356 1229 1082 (0.88) 144 (0.11) 3 (0.01)
rs5368 1214 1059 (0.87) 151 (0.12) 4 (0.01)
rs5366 1211 1118 (0.92) 85 (0.07) 8 (0.01)
rs1076638 1204 564 (0.47) 535 (0.44) 105 (0.09)
rs1534904 1212 1088 (0.90) 111 (0.09) 13 (0.01)
rs5361 1239 1132 (0.91) 104 (0.09) 3 (0.01)
rs932307 1211 504 (0.42) 562 (0.46) 145 (0.12)
rs5353 1198 345 (0.29) 617 (0.51) 236 (0.20) N: number of subjects; P: genotype frequency; 11: homozygous major allele genotype; 12: heterozygous genotype; 22: homozygous minor allele genotype. SNP = single nucleotide polymorphism.

170
Table 5.5. SELE SNP sample size information and genotype distribution among hypertensive non-Hispanic whites in GENOA SNP Ntotal N11 P11 N12 P12 N22 P22
rs5357 511 4 (0.01) 91 (0.18) 416 (0.81)
rs3917436 965 52 (0.05) 383 (0.40) 530 (0.55)
rs3917434 994 425 (0.43) 472 (0.47) 97 (0.10)
rs5356 998 10 (0.01) 159 (0.16) 829 (0.83)
rs5368 986 814 (0.83) 160 (0.16) 12 (0.01)
rs5366 996 995 (0.99) 1 (0.00) 0 (0.00)
rs1076638 979 748 (0.76) 213 (0.22) 18 (0.02)
rs1534904 983 93 (0.09) 466 (0.47) 424 (0.43)
rs5361 994 787 (0.79) 196 (0.20) 11 (0.01)
rs932307 992 572 (0.58) 372 (0.38) 48 (0.05)
rs5353 962 526 (0.55) 384 (0.40) 52 (0.05) N: number of subjects; P: genotype frequency; 11: homozygous major allele genotype; 12: heterozygous genotype; 22: homozygous minor allele genotype. SNP = single nucleotide polymorphism.

171
Table 5.6. VCAM1 SNP sample size information and genotype distribution among hypertensive African Americans in GENOA SNP Ntotal N11 P11 N12 P12 N22 P22
rs1409419 1218 471 (0.39) 568 (0.46) 179 (0.15)
rs1041163 1188 811 (0.68) 330 (0.28) 47 (0.04)
rs3170794 1221 876 (0.72) 310 (0.25) 35 (0.03)
rs316860 1208 333 (0.28) 618 (0.51) 257 (0.21)
rs3176861 1240 1126 (0.91) 110 (0.08) 4 (0.01)
rs3176862 1229 771 (0.63) 409 (0.33) 49 (0.04)
rs3176867 1233 1103 (0.89) 123 (0.10) 7 (0.01)
rs3176869 1169 1103 (0.94) 66 (0.06) 0 (0.00)
rs3181088 1227 1156 (0.94) 68 (0.05) 3 (0.01)
rs3176874 1202 1029 (0.85) 168 (0.14) 5 (0.01)
rs3176876 1218 338 (0.28) 589 (0.48) 291 (0.24)
rs3917016 1205 1060 (0.88) 136 (0.11) 9 (0.01)
rs3176878 1222 902 (0.74) 302 (0.25) 18 (0.01)
rs3783615 1217 1080 (0.89) 128 (0.10) 9 (0.01)
rs3176879 1230 591 (0.48) 529 (0.43) 110 (0.09)
rs3181092 1228 647 (0.53) 494 (0.40) 87 (0.07) N: number of subjects; P: genotype frequency; 11: homozygous major allele genotype; 12: heterozygous genotype; 22: homozygous minor allele genotype. SNP = single nucleotide polymorphism.
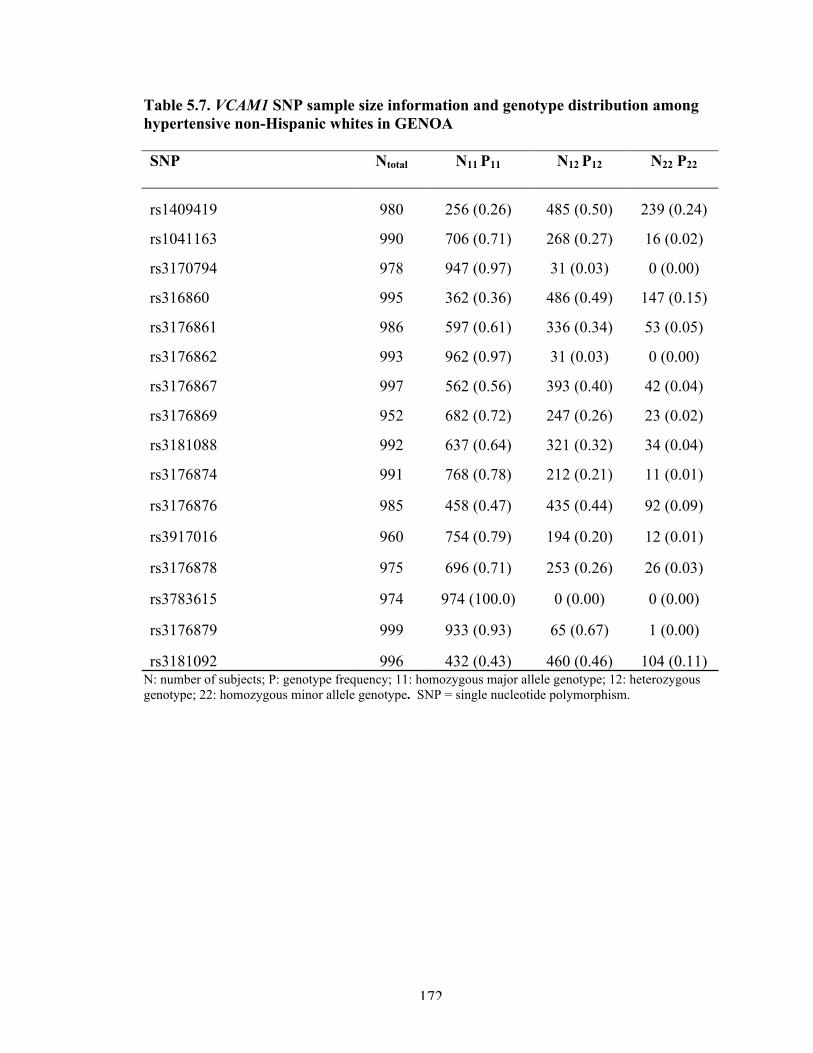
172
Table 5.7. VCAM1 SNP sample size information and genotype distribution among hypertensive non-Hispanic whites in GENOA SNP Ntotal N11 P11 N12 P12 N22 P22
rs1409419 980 256 (0.26) 485 (0.50) 239 (0.24)
rs1041163 990 706 (0.71) 268 (0.27) 16 (0.02)
rs3170794 978 947 (0.97) 31 (0.03) 0 (0.00)
rs316860 995 362 (0.36) 486 (0.49) 147 (0.15)
rs3176861 986 597 (0.61) 336 (0.34) 53 (0.05)
rs3176862 993 962 (0.97) 31 (0.03) 0 (0.00)
rs3176867 997 562 (0.56) 393 (0.40) 42 (0.04)
rs3176869 952 682 (0.72) 247 (0.26) 23 (0.02)
rs3181088 992 637 (0.64) 321 (0.32) 34 (0.04)
rs3176874 991 768 (0.78) 212 (0.21) 11 (0.01)
rs3176876 985 458 (0.47) 435 (0.44) 92 (0.09)
rs3917016 960 754 (0.79) 194 (0.20) 12 (0.01)
rs3176878 975 696 (0.71) 253 (0.26) 26 (0.03)
rs3783615 974 974 (100.0) 0 (0.00) 0 (0.00)
rs3176879 999 933 (0.93) 65 (0.67) 1 (0.00)
rs3181092 996 432 (0.43) 460 (0.46) 104 (0.11) N: number of subjects; P: genotype frequency; 11: homozygous major allele genotype; 12: heterozygous genotype; 22: homozygous minor allele genotype. SNP = single nucleotide polymorphism.

173
Figure 5.1. Linkage disequilibrium between SELE SNPs in GENOA African Americans

174
Figure 5.2. Linkage disequilibrium between SELE SNPs in GENOA non-Hispanic whites

175
Figure 5.3. Linkage disequilibrium between VCAM1 SNPs in GENOA African Americans

176
Figure 5.4. Linkage disequilibrium between VCAM1 SNPs in GENOA non-Hispanic whites
*rs3783615 monomorphic in this sample.

177
SNP rs #’s listed from left to right according to relative positions on SELE gene in the 5’ to 3’ direction. SNP = single nucleotide polymorphism; CA = Calcium channel; RAAS = renin angiotensin aldosterone system.
Statistically significant p<0.05 and CV R2 * 100 >0.50Statistically significant p<0.05 and CV R2 * 100 <0.50Not statistically significant

178
Figure 5.6. SELE rs932307 genotype specific mean systolic blood pressure by treatment class in GENOA African American hypertensive subjects
*Other antihypertensive class includes alpha-blockers, vasodilators, sympatholytics, and study drugs. SBP = systolic blood pressure; CA = calcium channel; RAAS = renin angiotensin aldosterone system.

179
SNP rs #’s listed from left to right according to relative positions on SELE gene in the 5’ to 3’ direction. SNP = single nucleotide polymorphism; CA = Calcium channel; RAAS = renin angiotensin aldosterone system.
Statistically significant p<0.05 and CV R2 * 100 >0.50Statistically significant p<0.05 and CV R2 * 100 <0.50Not statistically significant

180
Figure 5.8. SELE rs5368 genotype specific mean systolic blood pressure by treatment class in GENOA non-Hispanic white hypertensive subjects
*Other antihypertensive class includes alpha-blockers, vasodilators, sympatholytics, and study drugs. SBP = systolic blood pressure; CA = calcium channel; RAAS = renin angiotensin aldosterone system.

181
SNP rs #’s listed from left to right according to relative positions on SELE gene in the 5’ to 3’ direction. SNP = single nucleotide polymorphism; CA = Calcium channel; RAAS = renin angiotensin aldosterone system.
Statistically significant p<0.05 and CV R2 * 100 >0.50Statistically significant p<0.05 and CV R2 * 100 <0.50Not statistically significant

182
Figure 5.10. VCAM1 rs3176876 genotype specific mean systolic blood pressure by treatment class in GENOA African American hypertensive subjects
*Other antihypertensive class includes alpha-blockers, vasodilators, sympatholytics, and study drugs. SBP = systolic blood pressure; CA = calcium channel; RAAS = renin angiotensin aldosterone system.

183
SNP rs #’s listed from left to right according to relative positions on SELE gene in the 5’ to 3’ direction. SNP = single nucleotide polymorphism; CA = Calcium channel; RAAS = renin angiotensin aldosterone system.
Statistically significant p<0.05 and CV R2 * 100 >0.50Statistically significant p<0.05 and CV R2 * 100 <0.50Not statistically significant
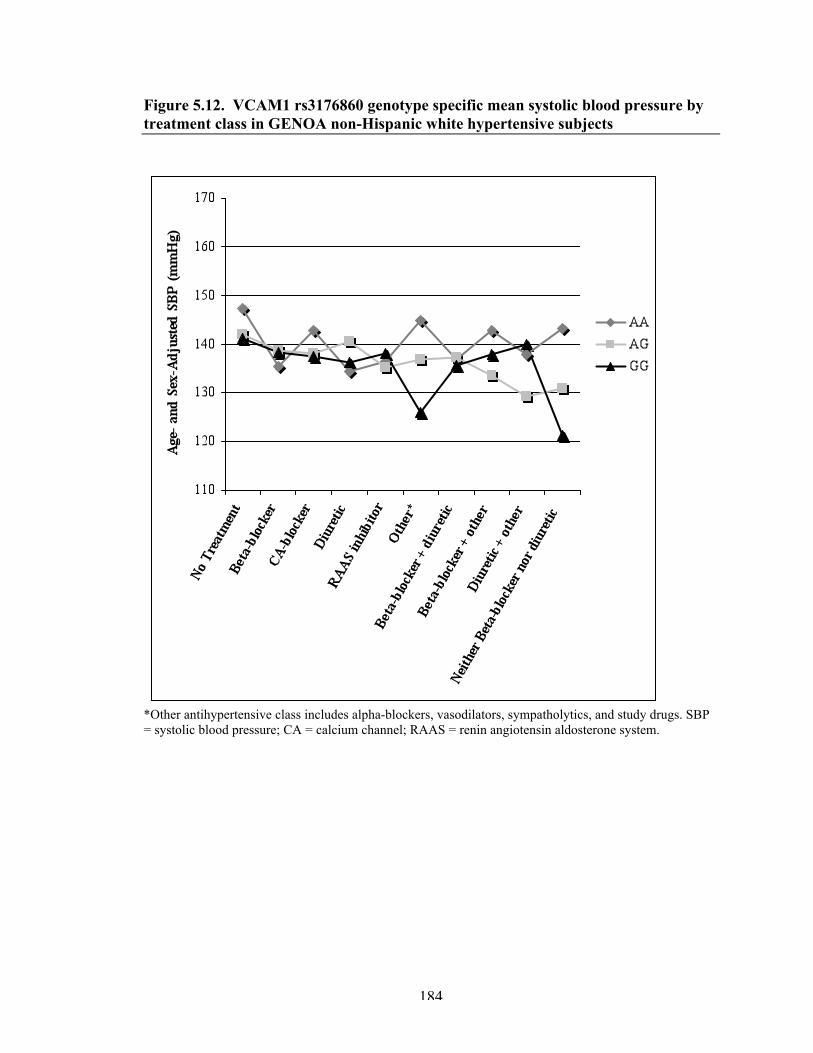
184
Figure 5.12. VCAM1 rs3176860 genotype specific mean systolic blood pressure by treatment class in GENOA non-Hispanic white hypertensive subjects
*Other antihypertensive class includes alpha-blockers, vasodilators, sympatholytics, and study drugs. SBP = systolic blood pressure; CA = calcium channel; RAAS = renin angiotensin aldosterone system.
185
REFERENCES 1. Fields LE, Burt VL, Cutler JA, et al. The burden of adult hypertension in the United States 1999 to 2000: A rising tide. Hypertension. 2004;44(4):398-404. 2. Hing E, Cherry DK, Woodwell DA. National ambulatory medical care survey: 2004 summary. Adv Data. 2006;(374)(374):1-33. 3. Ong KL, Cheung BM, Man YB, et al. Prevalence, awareness, treatment, and control of hypertension among United States adults 1999-2004. Hypertension. 2007;49(1):69-75. 4. Turner ST, Schwartz GL, Chapman AB, et al. Antihypertensive pharmacogenetics: Getting the right drug into the right patient. J Hypertens. 2001;19(1):1-11. 5. Hunt SC, Ellison RC, Atwood LD, et al. Genome scans for blood pressure and hypertension: The National Heart, Lung, and Blood Institute Family Heart Study. Hypertension. 2002;40(1):1-6. 6. Thiel BA, Chakravarti A, Cooper RS, et al. A genome-wide linkage analysis investigating the determinants of blood pressure in whites and African Americans. Am J Hypertens. 2003;16(2):151-3. 7. Chang YP, Liu X, Kim JD, et al. Multiple genes for essential-hypertension susceptibility on chromosome 1q. Am J Hum Genet. 2007;80(2):253-64. 8. Demerath E, Towne B, Blangero J, et al. The relationship of soluble ICAM-1, VCAM-1, P-selectin and E-selectin to cardiovascular disease risk factors in healthy men and women. Ann Hum Biol. 2001;28(6):664-78. 9. Pauletto P, Rattazzi M. Inflammation and hypertension: The search for a link. Nephrol Dial Transplant. 2006;21(4):850-3. 10. Rattazzi M, Puato M, Faggin E, et al. C-reactive protein and interleukin-6 in vascular disease: Culprits or passive bystanders? J Hypertens. 2003;21(10):1787-803. 11. Savoia C, Schiffrin EL. Vascular inflammation in hypertension and diabetes: Molecular mechanisms and therapeutic interventions. Clin Sci (Lond). 2007;112(7):375-84. 12. Savoia C, Schiffrin EL. Inflammation in hypertension. Curr Opin Nephrol Hypertens. 2006;15(2):152-8. 13. Stefanadi E, Tousoulis D, Androulakis ES, et al. Inflammatory markers in essential hypertension: Potential clinical implications. Curr Vasc Pharmacol. 2010.
186
14. Androulakis ES, Tousoulis D, Papageorgiou N, et al. Essential hypertension: Is there a role for inflammatory mechanisms? Cardiol Rev. 2009;17(5):216-21. 15. Calo LA, Davis PA, Pagnin E, et al. Linking inflammation and hypertension in humans: Studies in Bartter's/Gitelman's syndrome patients. J Hum Hypertens. 2008;22(3):223-5. 16. Granger JP. An emerging role for inflammatory cytokines in hypertension. Am J Physiol Heart Circ Physiol. 2006;290(3):H923-4. 17. Li J, Doerffel Y, Hocher B, et al. Inflammation in the genesis of hypertension and its complications--the role of angiotensin II. Nephrol Dial Transplant. 2007;22(11):3107-9. 18. Engstrom G, Lind P, Hedblad B, et al. Long-term effects of inflammation-sensitive plasma proteins and systolic blood pressure on incidence of stroke. Stroke. 2002;33(12):2744-9. 19. Sesso HD, Buring JE, Rifai N, et al. C-reactive protein and the risk of developing hypertension. JAMA. 2003;290(22):2945-51. 20. Niskanen L, Laaksonen DE, Nyyssonen K, et al. Inflammation, abdominal obesity, and smoking as predictors of hypertension. Hypertension. 2004;44(6):859-65. 21. Collins T, Williams A, Johnston GI, et al. Structure and chromosomal location of the gene for endothelial-leukocyte adhesion molecule 1. J Biol Chem. 1991;266(4):2466-73. 22. Cybulsky MI, Fries JW, Williams AJ, et al. Gene structure, chromosomal location, and basis for alternative mRNA splicing of the human VCAM1 gene. Proc Natl Acad Sci U S A. 1991;88(17):7859-63. 23. De Caterina R, Ghiadoni L, Taddei S, et al. Soluble E-selectin in essential hypertension: A correlate of vascular structural changes. Am J Hypertens. 2001;14(3):259-66. 24. Blann AD, Tse W, Maxwell SJ, et al. Increased levels of the soluble adhesion molecule E-selectin in essential hypertension. J Hypertens. 1994;12(8):925-8. 25. Palomo I, Marin P, Alarcon M, et al. Patients with essential hypertension present higher levels of sE-selectin and sVCAM-1 than normotensive volunteers. Clin Exp Hypertens. 2003;25(8):517-23. 26. DeSouza CA, Dengel DR, Macko RF, et al. Elevated levels of circulating cell adhesion molecules in uncomplicated essential hypertension. Am J Hypertens. 1997;10(12 Pt 1):1335-41.

187
27. Sass C, Pallaud C, Zannad F, et al. Association between E-selectin Leu554Phe polymorphism and blood pressure in the Stanislas cohort. Arch Mal Coeur Vaiss. 2001;94(8):855-8. 28. Lacolley P, Challande P, Osborne-Pellegrin M, et al. Genetics and pathophysiology of arterial stiffness. Cardiovasc Res. 2009;81(4):637-48. 29. Franklin SS, Gustin W,4th, Wong ND, et al. Hemodynamic patterns of age-related changes in blood pressure. The Framingham Heart Study. Circulation. 1997;96(1):308-15. 30. Basile J. Hypertension in the elderly: A review of the importance of systolic blood pressure elevation. J Clin Hypertens (Greenwich). 2002;4(2):108,12, 119. 31. Staessen JA, Gasowski J, Wang JG, et al. Risks of untreated and treated isolated systolic hypertension in the elderly: Meta-analysis of outcome trials. Lancet. 2000;355(9207):865-72. 32. Daniels PR, Kardia SL, Hanis CL, et al. Familial aggregation of hypertension treatment and control in the Genetic Epidemiology Network of Arteriopathy (GENOA) study. Am J Med. 2004;116(10):676-81. 33. Kullo IJ, Bailey KR, Kardia SL, et al. Ethnic differences in peripheral arterial disease in the NHLBI Genetic Epidemiology Network of Arteriopathy (GENOA) study. Vasc Med. 2003;8(4):237-42. 34. Chobanian AV, Bakris GL, Black HR, et al. Seventh report of the Joint National Committee on Prevention, Detection, Evaluation, and Treatment of High Blood Pressure. Hypertension. 2003;42(6):1206-52. 35. National center of biotechnology information (NCBI) public database. (http://www.ncbi.nlm.nih.gov) 36. Celera database. (http://www.celeradiscoverysystem.com) 37. Zeger SL, Liang KY, Albert PS. Models for longitudinal data: A generalized estimating equation approach. Biometrics. 1988;44(4):1049-60. 38. Barkley RA, Chakravarti A, Cooper RS, et al. Positional identification of hypertension susceptibility genes on chromosome 2. Hypertension. 2004;43(2):477-82. 39. R Core Development Team. R: A language and environment for statistical computing. . 2005. 40. Arnett DK, Claas SA, Glasser SP. Pharmacogenetics of antihypertensive treatment. Vascul Pharmacol. 2006;44(2):107-18.

188
41. ALLHAT Officers and Coordinators for the ALLHAT Collaborative Research Group. The Antihypertensive and Lipid-Lowering Treatment to Prevent Heart Attack Trial. Major outcomes in high-risk hypertensive patients randomized to angiotensin-converting enzyme inhibitor or calcium channel blocker vs diuretic: The antihypertensive and lipid-lowering treatment to prevent heart attack trial (ALLHAT). JAMA. 2002;288(23):2981-97. 42. Trotta R, Donati MB, Iacoviello L. Trends in pharmacogenomics of drugs acting on hypertension. Pharmacol Res. 2004;49(4):351-6. 43. Mellen PB, Herrington DM. Pharmacogenomics of blood pressure response to antihypertensive treatment. J Hypertens. 2005;23(7):1311-25. 44. Srivastava K, Narang R, Das S, et al. Nitric oxide and cell adhesion molecules in essential hypertension: A case control study. J Hum Hypertens. 2006;20(7):537-9. 45. Wenzel K, Ernst M, Rohde K, et al. DNA polymorphisms in adhesion molecule genes--a new risk factor for early atherosclerosis. Hum Genet. 1996;97(1):15-20. 46. Ellsworth DL, Bielak LF, Turner ST, et al. Gender- and age-dependent relationships between the E-selectin S128R polymorphism and coronary artery calcification. J Mol Med. 2001;79(7):390-8. 47. Abu-Amero KK, Al-Boudari OM, Mohamed GH, et al. E-selectin S128R polymorphism and severe coronary artery disease in Arabs. BMC Med Genet. 2006;7:52. 48. Li Y, Wei YS, Wang M, et al. Association between the Ser128Arg variant of the E-selectin and risk of coronary artery disease in the central China. Int J Cardiol. 2005;103(1):33-6. 49. Jilma B, Kovar FM, Hron G, et al. Homozygosity in the single nucleotide polymorphism Ser128Arg in the E-selectin gene associated with recurrent venous thromboembolism. Arch Intern Med. 2006;166(15):1655-9. 50. Marteau JB, Sass C, Pfister M, et al. The Leu554Phe polymorphism in the E-selectin gene is associated with blood pressure in overweight people. J Hypertens. 2004;22(2):305-11. 51. Sanada H, Midorikawa S, Yatabe J, et al. Elevation of serum soluble E- and P-selectin in patients with hypertension is reversed by benidipine, a long-acting calcium channel blocker. Hypertens Res. 2005;28(11):871-8. 52. Gasic S, Wagner OF, Fasching P, et al. Fosinopril decreases levels of soluble vascular cell adhesion molecule-1 in borderline hypertensive type II diabetic patients with microalbuminuria. Am J Hypertens. 1999;12(2 Pt 1):217-22.

189
53. Schiffrin EL, Deng LY. Comparison of effects of angiotensin I-converting enzyme inhibition and beta-blockade for 2 years on function of small arteries from hypertensive patients. Hypertension. 1995;25(4 Pt 2):699-703. 54. Schiffrin EL, Deng LY, Larochelle P. Effects of a beta-blocker or a converting enzyme inhibitor on resistance arteries in essential hypertension. Hypertension. 1994;23(1):83-91. 55. Kardia SL, Sun YV, Hamon SC, et al. Interactions between the Adducin 2 gene and antihypertensive drug therapies in determining blood pressure in people with hypertension. BMC Med Genet. 2007;8:61. 56. Marteau JB, Zaiou M, Siest G, et al. Genetic determinants of blood pressure regulation. J Hypertens. 2005;23(12):2127-43.

190
Chapter 6
Conclusion
SUMMARY OF FINDINGS
The need for a shift in epidemiology to a paradigm that considers many levels of
organization (molecular, individual, and societal) in the design, analysis, and
interpretation of epidemiological studies has been described (1). The purpose of this
dissertation was to investigate factors across multiple levels that likely shape the
distribution of quantitative blood pressure (BP) measures and the relative odds of BP
treatment and control in a bi-ethnic sample of hypertensive subjects from the Genetic
Epidemiology Network of Arteriopathy (GENOA) study.
Findings from Chapter 2 indicated that BP control rates were suboptimal, even
among treated hypertensives, and BP control rates were lower among African American
(particularly female) subjects, compared to non-Hispanic white subjects. These findings
were in accordance with national data on BP control (2-4). The distributions of the types
of antihypertensive drug therapies utilized within each racial/ethnic group suggested that
prescribing patterns may generally comply with recommended treatment guidelines (5).
As expected, age was the strongest predictor of both continuous BP measures and the
probability of BP control in both racial/ethnic groups. The presence of co-morbidities
was strongly associated with the relative odds of receiving more aggressive BP treatment
in both racial/ethnic groups, as expected. Positive histories of coronary heart disease

191
(CHD) and/or cerebrovascular disease (CBVD) were relatively low and comparable in
each racial/ethnic group. In non-Hispanic whites, a positive history of CHD was
associated with a decreased odds of BP control (unadjusted OR: 0.55, 95% CI: 0.36,
0.84). The African American sample had a significantly higher percentage of diabetic
individuals compared to their non-Hispanic white counter parts (28% vs. 13%). The
presence of diabetes was a strong univariate predictor of BP control among African
Americans (OR: 0.59, 95% CI: 0.45, 0.77) and this effect remained upon adjustment for
age and sex (OR: 0.61, 95% CI: 0.46, 0.81). Low levels of education were significantly
associated with decreased odds of BP control in both racial/ethnic groups in unadjusted
analyses. Upon controlling for potential confounders, the education effect was attenuated
towards non-significance in non-Hispanic whites. In contrast, the education effect
remained statistically significant in African Americans, even after adjustment for age,
sex, BMI, and diabetes (OR: 1.04, 95% confidence interval (CI): 1.00-1.08), providing
additional supporting evidence that factors indexed by SES may influence BP control and
contribute to observed disparities in BP control rates between racial/ethnic groups.
The main finding in Chapter 3 suggested that residing in a socioeconomically
disadvantaged neighborhood might reduce the likelihood of being treated for
hypertension more aggressively with multiple medications among treated African
Americans. This finding was consistent regardless of the neighborhood-level variable
used to capture neighborhood socioeconomic environments (neighborhood
socioeconomic summary score (increasing score represented greater affluence), OR: 1.03,
95% CI: 1.00, 1.06; poor neighborhood of residence (defined as a neighborhood with
>25% poverty), OR: 0.72, 95% CI: 0.55, 0.96) and the associations detected withstood

192
adjustment for individual age, sex, BMI, diabetes, and education. Neighborhood
socioeconomic environment, as measured using census-derived proxy variables, was not
associated with BP control, and this finding corroborates findings from similar previous
investigations in other studies (6).
Findings from Chapter 4 provided further evidence of moderate familial
aggregation of quantitative BP levels in both African Americans non-Hispanic Whites.
Adjustment for individual level variables led to significant reductions in both the within-
and between-family variance in BP levels in both racial/ethnic groups. Parental histories
of hypertension were the only family-level variables available and, in general, did not
seem to confer strong contextual effects on individual BP levels. Among African
subjects, sib-sib correlations of quantitative BP values and familial aggregation of BP
control were detected among sibpairs in which both siblings resided in poor
neighborhoods. These findings suggest that sibs living in similar types of
neighborhoods may be more likely to demonstrate similar BP outcomes, as opposed to
sibs living in dissimilar types of neighborhoods.
The main finding from Chapter 5 was that SELE and VCAM1 single nucleotide
polymorphism (SNP) main effects, as well as gene-drug interaction effects, were
associated with SBP in both African Americans and non-Hispanic whites. These
findings suggest that SBP response to antihypertensive drug therapies may be partially
dependent on the effects of SNPs within genes, namely SELE and VCAM1, in the
inflammation/endothelial dysfunction pathway. These findings add to the growing body
of pharmacogenetic knowledge and the promise of developing “personalized medicine”
approaches that tailor clinical management decisions based on genetic profiles.

193
LIMITATIONS
The high percentages of hypertension awareness and treatment in the GENOA
subjects may pose a couple of issues. First, greater awareness and more frequent
treatment in our sample may reflect selection bias since hypertension (in at least two
sibs), with or without prior use of antihypertensive medication, was a criterion for study
participation. Second, as a result of such high percentages there was not much variation
in these hypertension outcomes, which limited the ability to assess/detect significant
predictors. Given that the GENOA study was based on hypertensive sibships, data
correlations may have potentially affected the standard errors of effect estimates in this
dissertation work. Multi-level modeling strategies were used to account for familial (and
neighborhood) correlation in this dissertation. As the GENOA subjects were generally
older hypertensives, inferences may not be generalizable to individuals who are younger,
normotensive.
All analyses in this dissertation were based on cross-sectional data. Establishing
causality from such data can be difficult, since exposure(s) and disease are measured at
the same time. This may not be an issue for some exposures (e.g. - individual genotypes)
that are relatively constant within individuals. However, it is important to note that an
individual’s exposure to certain risk factors (e.g. - neighborhood of residence) at the time
of enrollment in a cross-sectional study may not equal exposure status when the disease
process began. This latter point was a particular limitation in the proposed study, as
residential histories of the GENOA participants are unavailable. The influence of genetic
variation (and other factors) on BP response was limited in the absence of longitudinal
data on BP measures, treatment adherence, and treatment dosage.

194
The quantitative BP measure and BP control outcomes of this study were all
based on BP measurements taken during one short time period. As BP continually
fluctuates in individuals, the measurements taken at the time of examination may have
been artificially higher (white coat hypertension phenomenon) or lower than a normal
average for a given individual. As a result, cross-sectional classifications of BP control,
for example, may not reflect a given individual’s typical BP control status. Furthermore,
although efforts were made to obtain accurate office BP measurements, calibration errors,
inappropriately sized arm cuffs, or operator digit preference may have led to
measurement errors. Despite this, it is likely that such errors are distributed evenly across
the study samples and may not have biased findings. There is also the potential for
similar measurement errors of the various exposures that were based on physical
examinations at one time point. In addition, some exposure variables are based on
information ascertained from questionnaires and are prone to response bias.
Census tracts were used as proxies for neighborhoods in this research. Census
tracts have been commonly employed as an area measure in health research and previous
studies indicate that differences between census tracts and smaller area measures (block-
groups) are likely small (7). Still, defining neighborhoods in this way had limitations, as
the boundaries used to define them may not have corresponded with what people
define/perceive as their neighborhoods. The census-derived socioeconomic proxies used
may not have accurately represented the neighborhood construct(s) most relevant to the
BP outcomes tested, and failed to investigate specific mechanisms/characteristics that
may be causally related to BP levels, treatment, and/or control. Socioeconomic
environments (based on the various indicator variables used) were relatively

195
homogeneous across the census tracts investigated in this research, which may have
limited the ability to parse out important neighborhood socioeconomic contextual effects.
Several of the analyses conducted in this dissertation (chiefly those in Chapter 5)
involved many association tests and the results were vulnerable to false positive findings.
Acknowledging this, cross-validation methods were employed to reduce the possibility of
Type I errors, increase the internal validity of findings within samples, and assess the
predictive ability of factors considered.
The genetic analytic approach used in Chapter 5 was based on the premise that
susceptibility alleles for common diseases, such as cardiovascular disease (and related
subclinical disease measures such as BP), are not under strong negative selection, and
common variants contribute to common disease traits (i.e., the ‘common disease/common
variant’ hypothesis) (8). However, the allelic spectrum for complex quantitative traits
such as BP is not fully delineated, and it is possible that multiple rare variants (not
assessed) influence BP. While many genome-wide association studies (GWAS) on BP
are ongoing (9-12) and have the great potential to identify genomic regions that influence
BP (and BP response to therapeutic interventions), genome-wide data was not available
on the GENOA subjects at the time analyses in Chapter 5 were conducted. Particular
investigation of SNPs in the SELE and VCAM1 candidate genes was based on previously
detected associations between SNPs in these genes and cardiovascular outcomes
(including hypertension), and the hypothesis that inflammation may independently
promote the development of hypertension. Although this possible pathogenic direction
has sparked recent interest, reverse causation (i.e. - inflammation is a response to
hypertension induced endothelial dysfunction) is equally likely. Insufficient sample sizes
in each treatment class or random measurement error may have limited the power to
detect genotype–phenotype associations.

196
SIGNIFICANCE AND FUTURE DIRECTIONS
Strengthening our understanding of common chronic diseases is a difficult
challenge given their complex and multi-factorial nature. It is well accepted that many
genes influence the risk of developing chronic disease through their additive and
interactive effects, and that such risk also depends on lifetime environmental exposures,
as well as interactions between genetic and environmental influences. Although many
studies have made (and continue to make) valuable contributions towards the
identification of important health determinants of chronic diseases, they remain largely
rooted within scientific disciplines and a need for transdisciplinary approaches exists.
The work presented in this dissertation was part of a key project with the Center
for Integrative Approaches to Health Disparities (a collaboration between the University
of Michigan and the Jackson Heart Study through its partners the University of
Mississippi Medical Center and Jackson State University) (13). The future development
and continuation of such transdisciplinary research is perfectly aligned with the
aforementioned call for a paradigm shift in epidemiological research (1). A
transdisciplinary focus on the determinants of chronic diseases holds the promise of
yielding new etiological insights, identifying reasons for observed health disparities in
chronic disease outcomes that persist along racial/ethnic and socioeconomic lines, and
would help to identify key intervention points to reduce the overall health and economic
burdens stemming from common chronic diseases.
A natural future direction of such integrative research will be to thoroughly
investigate the ways in which health determinants at different levels interact to influence
the risk of chronic disease development. In 2006, the Institute of Medicine (IOM) drafted

197
a consensus report containing recommendations that were “designed to explicate and
facilitate research on the impact on health of interactions among social, behavioral, and
genetic factors (14).” The primary recommendations the IOM set forth in this report
include: the promotion and development of transdisciplinary and collaborative research
and research training; the development of rich databases containing life course social,
behavioral, and genetic information in diverse populations; the development and
implementation of new and innovative modeling strategies (including pattern recognition
models, multivariate statistics, and pathway analysis) that will yield more comprehensive
predictions of disease; the investigation of biological signatures as a means of
discovering biological systems that interact with social and behavioral factors; testing
gene-environment interactions and pathways of human diseases using controllable animal
models; and attending to the ethical, legal, and social implications of conducting
transdisciplinary research (14).
The IOM report reminds that, “health outcomes are multidetermined and result
from complex interactions of many factors over time (14).” It is intuitive then that
approaches aimed to further our etiological understanding of disease should be integrated
and reasonably consider the multitude of factors acting in concert to give rise to the
development of common chronic disease. This dissertation research took important novel
first steps in constructing interconnections between factors across a broad framework of
health determinants that jointly influence BP outcomes. Significant findings from this
research highlight the importance of mutually considering factors defined at multiple
levels in developing a richer etiological understanding of common chronic diseases.
198
REFERENCES 1. Susser M, Susser E. Choosing a future for epidemiology: II. From black box to Chinese boxes and eco-epidemiology. Am J Public Health. 1996;86(5):674-7. 2. Fields LE, Burt VL, Cutler JA, et al. The burden of adult hypertension in the United States 1999 to 2000: A rising tide. Hypertension. 2004;44(4):398-404. 3. Hajjar I, Kotchen TA. Trends in prevalence, awareness, treatment, and control of hypertension in the United States, 1988-2000. JAMA. 2003;290(2):199-206. 4. Ong KL, Cheung BM, Man YB, et al. Prevalence, awareness, treatment, and control of hypertension among United States adults 1999-2004. Hypertension. 2007;49(1):69-75. 5. Chobanian AV, Bakris GL, Black HR, et al. Seventh report of the Joint National Committee on Prevention, Detection, Evaluation, and Treatment of High Blood Pressure. Hypertension. 2003;42(6):1206-52. 6. Morenoff JD, House JS, Hansen BB, et al. Understanding social disparities in hypertension prevalence, awareness, treatment, and control: The role of neighborhood context. Soc Sci Med. 2007;65(9):1853-66. 7. Diez-Roux AV, Kiefe CI, Jacobs DR,Jr, et al. Area characteristics and individual-level socioeconomic position indicators in three population-based epidemiologic studies. Ann Epidemiol. 2001;11(6):395-405. 8. Reich DE, Lander ES. On the allelic spectrum of human disease. Trends Genet. 2001;17(9):502-10. 9. Adeyemo A, Gerry N, Chen G, et al. A genome-wide association study of hypertension and blood pressure in African Americans. PLoS Genet. 2009;5(7):e1000564. 10. Org E, Eyheramendy S, Juhanson P, et al. Genome-wide scan identifies CDH13 as a novel susceptibility locus contributing to blood pressure determination in two European populations. Hum Mol Genet. 2009;18(12):2288-96. 11. Levy D, Larson MG, Benjamin EJ, et al. Framingham Heart Study 100K project: Genome-wide associations for blood pressure and arterial stiffness. BMC Med Genet. 2007;8 Suppl 1:S3. 12. Ranade K, Hinds D, Hsiung CA, et al. A genome scan for hypertension susceptibility loci in populations of Chinese and Japanese origins. Am J Hypertens. 2003;16(2):158-62.

199
13. Center for Integrative Approaches to Health Disparities. (http://www.sph.umich.edu/ciahd/) 14. Institute of Medicine of the National Academies Committee on Assessing Interactions Among Social, Behavioral, and Genetic Factors in Health. Genes, Behavior, and the Social Environment: Moving Beyond the Nature/Nuture Debate. Hernandez, LM and Blazer, DG, eds. Washington, D.C: The National Academies Press, 2006: 1-13.