Small-scale gold mining erodes fish assemblage structure in small neotropical streams

This article appeared in a journal published by Elsevier. The attachedcopy is furnished to the author for internal non-commercial researchand education use, including for instruction at the authors institution
and sharing with colleagues.
Other uses, including reproduction and distribution, or selling orlicensing copies, or posting to personal, institutional or third party
websites are prohibited.
In most cases authors are permitted to post their version of thearticle (e.g. in Word or Tex form) to their personal website orinstitutional repository. Authors requiring further information
regarding Elsevier’s archiving and manuscript policies areencouraged to visit:
http://www.elsevier.com/copyright

Author's personal copy
Original article
Niche partitioning and species coexistence in a Neotropical felid assemblage
Mario S. Di Bitetti*, Carlos D. De Angelo, Yamil E. Di Blanco, Agustín PavioloNational Research Council of Argentina (CONICET), Instituto de Biología Subtropical, Facultad de Ciencias Forestales, Universidad Nacional de Misiones,and Asociación Civil Centro de Investigaciones del Bosque Atlántico (CeIBA), Yapeyú 23, 3370 Puerto Iguazú, Misiones, Argentina
a r t i c l e i n f o
Article history:Received 23 December 2008Accepted 4 April 2010Published online 27 April 2010
Keywords:AbundanceCamera trapsCharacter displacementCompetitionWild cats
a b s t r a c t
Carnivores have been used as a model to understand the effects of competition in community structure.Behavioral mechanisms that facilitate species coexistence have been poorly explored and may explainthe lack of community-wide morphological character displacement in some carnivore assemblages. Weuse the results of large-scale and intensive camera-trap surveys conducted in the Atlantic Forest of NEArgentina between 2003 and 2008 to describe the spatial patterns of detection and the daily pattern ofrecords of the six wild cat species present in the region (jaguar Panthera onca, puma Puma concolor,ocelot Leopardus pardalis, jaguarundi Puma yagouaroundi, margay Leopardus wiedii, and oncilla Leopardustigrinus). We use these patterns to generate hypotheses about behavioral differences that may facilitatespecies coexistence. The larger species were more frequently recorded in the better-protected areas,probably as a result of anthropogenic effects (poaching of cats and their prey). Competitive release fromocelots and jaguarundis may explain why the oncilla and the margay showed the opposite pattern.Morphologically similar species had the most contrasting activity patterns: the margay was exclusivelynocturnal and the jaguarundi diurnal. The other species were cathemeral, but alternated their peaks ofactivity in relation to the relative order of their body weights. The contrasting temporal patternsobserved and the ability of pumas and oncillas to adjust their activity patterns to local conditions mayfacilitate the coexistence of these cat species and explain the lack of character displacement in thisassemblage.
� 2010 Elsevier Masson SAS. All rights reserved.
1. Introduction
The mechanisms that determine the species diversity incommunities have been one of the central topics in ecology (Morin,1999). Inter-specific competition has been suggested as one of themost important organizing mechanism, limiting the number ofspecies that could be packed in an assemblage as a result of theirsimilarity in ecological niches (Jaksic and Marone, 2007). SinceHutchinson’s (1959) seminal paper, the questions of how closelyrelated species with similar morphologies and diets can coexist, orhowmany species belonging to an ecological guild could be packedin a community are debated and open questions (Tokeshi, 1999).Guilds of top carnivore species are expected to reveal the evolu-tionary or ecological consequences of the strong competitiveinteractions exerted among them and for this reason have beenfrequently used to test these hypotheses (Schoener, 1974).
Among carnivores, several authors have looked for morpho-logical evidence of ecological character displacement (Brown andWilson, 1956) as a result of food competition among species
(Dayan and Simberloff, 2005). The logic behind this is that, asa result of competition, two species with similar diets and trophicmorphologies cannot coexist, and consequently one of the speciesis excluded from the community or they coevolve and segregatetheir morphology. The avoidance of interference food competitionand the coexistence of morphologically similar species could alsobe achieved through behavioral mechanisms, particularly by spatialor temporal segregation of their activity (Schoener, 1974). Severalstudies have focused on morphological characters as evidence ofcharacter displacement; behavioral differences have been relativelyless explored, particularly the temporal segregation of species (butsee Kronfeld-Schor and Dayan, 2003).
There is compelling evidence that interference intra-guildcompetition and killing in carnivore assemblages are importantselective factors (Palomares and Caro, 1999; Donadio and Buskirk,2006). It is also frequently the case that, as a result of interfer-ence competition, subordinate species are restricted to suboptimalhabitats (Creel and Creel, 2002; Tannerfeldt et al., 2002; Macdonaldet al., 2004; Mitchell and Banks, 2005). When inter-specific inter-ference competition (including intra-guild killing) is important,temporal separation could be a prominent mechanism of speciessegregation (Carothers and Jaksic, 1984).
* Corresponding author. Tel.: þ54 3757 422139; fax: þ54 3757 422370.E-mail address: [email protected] (M.S. Di Bitetti).
Contents lists available at ScienceDirect
Acta Oecologica
journal homepage: www.elsevier .com/locate/actoec
1146-609X/$ e see front matter � 2010 Elsevier Masson SAS. All rights reserved.doi:10.1016/j.actao.2010.04.001
Acta Oecologica 36 (2010) 403e412
Author's personal copy
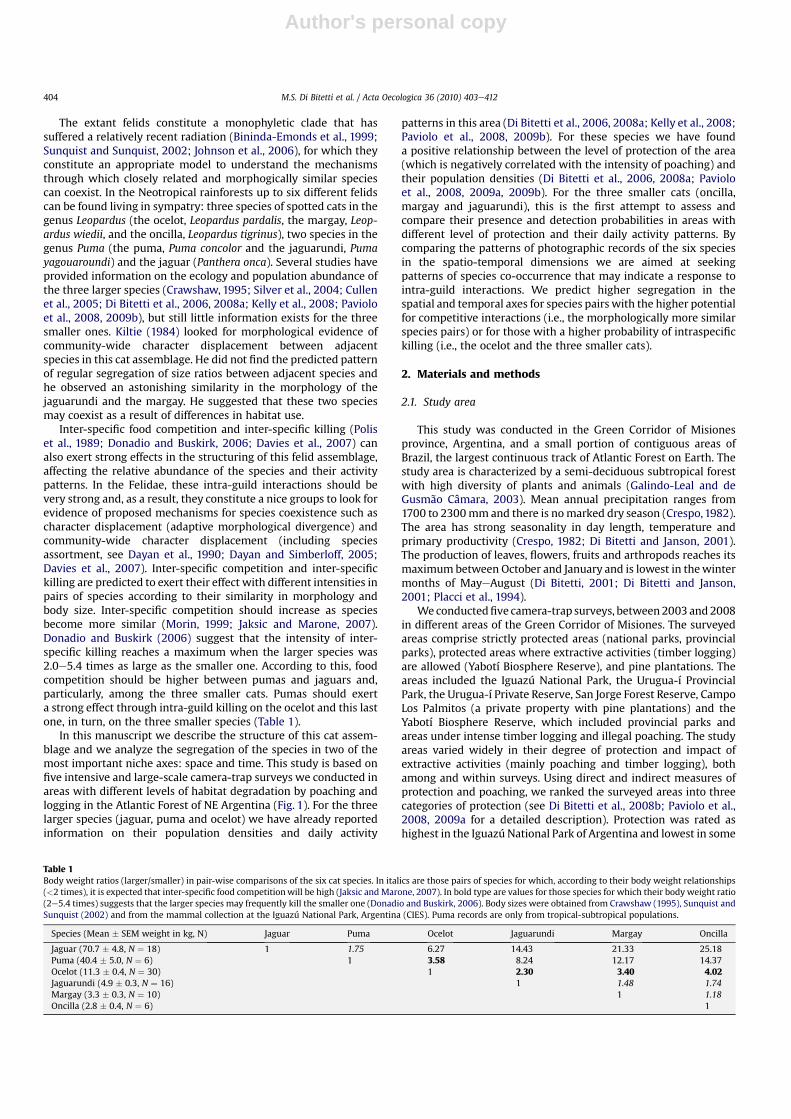
The extant felids constitute a monophyletic clade that hassuffered a relatively recent radiation (Bininda-Emonds et al., 1999;Sunquist and Sunquist, 2002; Johnson et al., 2006), for which theyconstitute an appropriate model to understand the mechanismsthrough which closely related and morphogically similar speciescan coexist. In the Neotropical rainforests up to six different felidscan be found living in sympatry: three species of spotted cats in thegenus Leopardus (the ocelot, Leopardus pardalis, the margay, Leop-ardus wiedii, and the oncilla, Leopardus tigrinus), two species in thegenus Puma (the puma, Puma concolor and the jaguarundi, Pumayagouaroundi) and the jaguar (Panthera onca). Several studies haveprovided information on the ecology and population abundance ofthe three larger species (Crawshaw, 1995; Silver et al., 2004; Cullenet al., 2005; Di Bitetti et al., 2006, 2008a; Kelly et al., 2008; Pavioloet al., 2008, 2009b), but still little information exists for the threesmaller ones. Kiltie (1984) looked for morphological evidence ofcommunity-wide character displacement between adjacentspecies in this cat assemblage. He did not find the predicted patternof regular segregation of size ratios between adjacent species andhe observed an astonishing similarity in the morphology of thejaguarundi and the margay. He suggested that these two speciesmay coexist as a result of differences in habitat use.
Inter-specific food competition and inter-specific killing (Poliset al., 1989; Donadio and Buskirk, 2006; Davies et al., 2007) canalso exert strong effects in the structuring of this felid assemblage,affecting the relative abundance of the species and their activitypatterns. In the Felidae, these intra-guild interactions should bevery strong and, as a result, they constitute a nice groups to look forevidence of proposed mechanisms for species coexistence such ascharacter displacement (adaptive morphological divergence) andcommunity-wide character displacement (including speciesassortment, see Dayan et al., 1990; Dayan and Simberloff, 2005;Davies et al., 2007). Inter-specific competition and inter-specifickilling are predicted to exert their effect with different intensities inpairs of species according to their similarity in morphology andbody size. Inter-specific competition should increase as speciesbecome more similar (Morin, 1999; Jaksic and Marone, 2007).Donadio and Buskirk (2006) suggest that the intensity of inter-specific killing reaches a maximum when the larger species was2.0e5.4 times as large as the smaller one. According to this, foodcompetition should be higher between pumas and jaguars and,particularly, among the three smaller cats. Pumas should exerta strong effect through intra-guild killing on the ocelot and this lastone, in turn, on the three smaller species (Table 1).
In this manuscript we describe the structure of this cat assem-blage and we analyze the segregation of the species in two of themost important niche axes: space and time. This study is based onfive intensive and large-scale camera-trap surveys we conducted inareas with different levels of habitat degradation by poaching andlogging in the Atlantic Forest of NE Argentina (Fig. 1). For the threelarger species (jaguar, puma and ocelot) we have already reportedinformation on their population densities and daily activity
patterns in this area (Di Bitetti et al., 2006, 2008a; Kelly et al., 2008;Paviolo et al., 2008, 2009b). For these species we have founda positive relationship between the level of protection of the area(which is negatively correlated with the intensity of poaching) andtheir population densities (Di Bitetti et al., 2006, 2008a; Pavioloet al., 2008, 2009a, 2009b). For the three smaller cats (oncilla,margay and jaguarundi), this is the first attempt to assess andcompare their presence and detection probabilities in areas withdifferent level of protection and their daily activity patterns. Bycomparing the patterns of photographic records of the six speciesin the spatio-temporal dimensions we are aimed at seekingpatterns of species co-occurrence that may indicate a response tointra-guild interactions. We predict higher segregation in thespatial and temporal axes for species pairs with the higher potentialfor competitive interactions (i.e., the morphologically more similarspecies pairs) or for those with a higher probability of intraspecifickilling (i.e., the ocelot and the three smaller cats).
2. Materials and methods
2.1. Study area
This study was conducted in the Green Corridor of Misionesprovince, Argentina, and a small portion of contiguous areas ofBrazil, the largest continuous track of Atlantic Forest on Earth. Thestudy area is characterized by a semi-deciduous subtropical forestwith high diversity of plants and animals (Galindo-Leal and deGusmão Câmara, 2003). Mean annual precipitation ranges from1700 to 2300mm and there is nomarked dry season (Crespo,1982).The area has strong seasonality in day length, temperature andprimary productivity (Crespo, 1982; Di Bitetti and Janson, 2001).The production of leaves, flowers, fruits and arthropods reaches itsmaximum between October and January and is lowest in thewintermonths of MayeAugust (Di Bitetti, 2001; Di Bitetti and Janson,2001; Placci et al., 1994).
We conductedfive camera-trap surveys, between2003 and 2008in different areas of the Green Corridor of Misiones. The surveyedareas comprise strictly protected areas (national parks, provincialparks), protected areas where extractive activities (timber logging)are allowed (Yabotí Biosphere Reserve), and pine plantations. Theareas included the Iguazú National Park, the Urugua-í ProvincialPark, the Urugua-í Private Reserve, San Jorge Forest Reserve, CampoLos Palmitos (a private property with pine plantations) and theYabotí Biosphere Reserve, which included provincial parks andareas under intense timber logging and illegal poaching. The studyareas varied widely in their degree of protection and impact ofextractive activities (mainly poaching and timber logging), bothamong and within surveys. Using direct and indirect measures ofprotection and poaching, we ranked the surveyed areas into threecategories of protection (see Di Bitetti et al., 2008b; Paviolo et al.,2008, 2009a for a detailed description). Protection was rated ashighest in the Iguazú National Park of Argentina and lowest in some
Table 1Body weight ratios (larger/smaller) in pair-wise comparisons of the six cat species. In italics are those pairs of species for which, according to their body weight relationships(<2 times), it is expected that inter-specific food competitionwill be high (Jaksic and Marone, 2007). In bold type are values for those species for which their body weight ratio(2e5.4 times) suggests that the larger species may frequently kill the smaller one (Donadio and Buskirk, 2006). Body sizes were obtained from Crawshaw (1995), Sunquist andSunquist (2002) and from the mammal collection at the Iguazú National Park, Argentina (CIES). Puma records are only from tropical-subtropical populations.
Species (Mean � SEM weight in kg, N) Jaguar Puma Ocelot Jaguarundi Margay Oncilla
Jaguar (70.7 � 4.8, N ¼ 18) 1 1.75 6.27 14.43 21.33 25.18Puma (40.4 � 5.0, N ¼ 6) 1 3.58 8.24 12.17 14.37Ocelot (11.3 � 0.4, N ¼ 30) 1 2.30 3.40 4.02Jaguarundi (4.9 � 0.3, N ¼ 16) 1 1.48 1.74Margay (3.3 � 0.3, N ¼ 10) 1 1.18Oncilla (2.8 � 0.4, N ¼ 6) 1
M.S. Di Bitetti et al. / Acta Oecologica 36 (2010) 403e412404

Author's personal copy
portions of Yabotí; the relative abundance of ungulates (peccaries,brocket deers, tapirs) varies accordingly (Di Bitetti et al., 2008b;Paviolo et al., 2008, 2009a).
Some areas were surveyed more than once. The Iguazú NationalPark (high protection) was surveyed in 2004, 2006 and 2008.Portions of Urugua-í Provincial Park, Urugua-í Private Reserve andCampo Los Palmitos (intermediate protection) were surveyed in2003 and 2008. The San Jorge Private Reserve (intermediateprotection) was surveyed in 2006 and 2008. The Yabotí BiosphereReserve (with areas of intermediate protection and low protection)was surveyed only in 2005. Several sampling stations were activeduring 2 or 3 surveys. These stations were considered one samplingunit in the analyses and, to estimate their sampling effort, we sumup the total number of days they were active in each survey. For theoccupancy modeling (see below) we used only data from the firstthree surveys that were conducted in areas with no spatial overlap.The first four surveys were preceded by a relatively long prelimi-nary survey that usually started in the fall (MarcheMay) and endedin the spring-early summer (AugusteNovember), when the90e100 days long intensive survey begun (see details in Di Bitetti
et al., 2008a; Paviolo et al., 2009b). The last survey (2008) waspreceded by a short preliminary survey (FebruaryeMarch) and theintensive survey was completed between April and June.
2.2. Study species
The study species range is size from the heavily built jaguar(45e100 kg), to the smaller oncilla (2e3.5 kg). The continentaldistribution of the six species overlaps extensively (Sunquist andSunquist, 2002), which suggests that they have had ample oppor-tunities for coevolutionary process to take place. Jaguars preymainly on ungulates and medium size prey, usually of >2 kg(Scognamillo et al., 2003; Azevedo, 2008). The puma is lighter andslender than the jaguar (Iriarte et al., 1990) and has a broader foodniche breadth (Haines, 2006), but their diets and body size rangesoverlap extensively (Taber et al., 1997; Scognamillo et al., 2003;Haines, 2006; Azevedo, 2008). The ocelot is a medium sized cat(8e15 kg) with a diet composed of small to medium size verte-brates (Murray and Gardner, 1997; Sunquist and Sunquist, 2002).The body size of the ocelot is intermediate between the two large
Fig. 1. Map of the study area showing the location of the camera-trap grids where we conducted the five surveys.
M.S. Di Bitetti et al. / Acta Oecologica 36 (2010) 403e412 405
Author's personal copy
species and the smaller ones (Table 1), but there is the potential forinter-specific negative interactions, particularly with the puma andthe smaller cats. The three smaller cats, the jaguarundi, the margayand the oncilla, have broadly similar diets, composed mainly ofsmall rodents, birds and reptiles (Oliveira, 1998a, 1998b; Sunquistand Sunquist, 2002; Oliveira et al., 2010), and their body sizesoverlap extensively (Table 1), which suggests potential foodcompetition among these three species (Kiltie, 1984).
2.3. Methods
The five camera-trap surveys were designed to get densityestimates of jaguars, pumas and ocelots (Di Bitetti et al., 2006,2008a; Paviolo et al., 2008, 2009b). The number of samplingstations, area surveyed and total sampling effort varied slightlyamong surveys but was very large when compared to similarstudies (Table 2). Two hundred and sixteen stations were active fora total of 13,929 camera-trap days in an area of approximately2400 km2. With a few exceptions, sampling stations were atdistances >1 km from the nearest one. Each sampling stationconsisted of two camera-traps operating independently and facingeach other at both sides of unpaved roads and trails. Records fromten stations that were active only at night were used to estimate theabsolute densities of jaguars, pumas and ocelots, but not in otheranalyses, due to potential biases. Records from ten other stationsthat were active for less than 21 days each were used to analyze thedaily activity patterns but were not used in other analysis, also dueto potential biases. The equipment consisted of a set of 45e60passive infrared-triggered scouting cameras (Di Bitetti et al., 2006,2008; Paviolo et al., 2008). For other details on the protocols used inthese surveys we refer the readers to Di Bitetti et al. (2006, 2008a,2008b) and Paviolo et al. (2008, 2009b).
The event of photographing a cat, whether it was photographedby only one or by the two camera traps, was considered a record ofthat animal. In rare occasions, an individual was photographedmore than once in a sampling station during a short period of time(<1 h), and to avoid pseudoreplication, we only considered the firstdetection of that animal as a record.
For the three smaller cats we cannot use these camera-trapsurveys to estimate absolute densities because their rangingpatterns do not conform to the spacing of the camera-trap stationsused in these surveys (see Karanth and Nichols, 1998, 2002). Tocompare the patterns of spatial relative abundance of the sixspecies we used the recording rate per station (number of records/camera-trap days) and the number of stations where the animalswere recorded as indexes of relative abundance. These indexes ofrelative abundance should be taken with caution, since manyvariables can affect the probability of detecting a species, for whichthese variables may not be directly correlated with the abundance(MacKenzie et al., 2005; Tobler et al., 2008). When habitat differ-ences among study sites and stations are not large, factors that are
known to affect detectability are statistically controlled for (e.g.,sampling effort) and comparisons are confined to within a species,these indexes could be indicative of their relative abundances (e.g.,Carbone et al., 2001; Di Bitetti et al., 2008b; Rovero and Marshall,2009). However, differences in detection probability due tounknown factors may still affect these indexes and new methodshave been developed to estimate the probability of a species beingpresent in an area (or the proportion of the area occupied bya species) when detection probabilities are less than one(MacKenzie et al., 2002, 2005; Royle and Nichols, 2003). We usedthe data from the stations active during the intensive portions ofthe three first surveys only and with this smaller data set we runprogram PRESENCE (http://www.mbr-pwrc.usgs.gov/software/doc/presence/presence.html) to estimate the proportion of thearea occupied by the species.
Since the recording rate did not conform to a normal distribu-tion and could not be normalized using standard procedures weused the KruskaleWallis rank sums test in univariate analyses withrecording rate as the response variable. In multivariate tests weused whether a species was detected or not in a sampling station asthe dependent variable in an ANCOVA-type logistic regression, withthe level of protection of the area where the station was located(3 levels), sampling effort (number of days the station was active)and whether the station was located on a road or a trail as theindependent variables. These logistic regression models usedetection and non-detection of the species as the response variableandmake the assumption that the probability of detecting a specieswill be positively correlated with the abundance of the species afterstatistically controlling the variables that may affect detectability(sampling effort, location of a station on a road vs a trail). We useda backward elimination procedure to reduce the models to thosepredictive variables that had an alpha P-value <0.05.
To run the single species single season occupancy models withprogram PRESENCE we develop one matrix for each species con-sisting of four sampling occasions (columns) of ten consecutivedays each. We developed these matrices with the 118 stations(rows) that were active during the first three intensive surveys only,thus avoiding sampling the same area more than once and to keepsampling effort equal across surveys. Each sampling occasion con-sisted of ten consecutive camera-trap days and we overlay the datafrom the three surveys as if belonging from simultaneous surveys.Thus, the first sampling occasion (first ten days) at Urugua-í (2003)was overlapped with the first sampling occasion at Iguazú (2004)and at Yabotí (2005). We had to make an important assumption torun these models: that populations were closed and detectabilitydid not change across this 3-year long study period.We decided notto include the data from the preliminary surveys and from the twolast surveys in this analysis to keep sampling effort constant in eachsampling occasion, to reduce the length of the study period and toavoid pseudoreplication (using the same camera-trap stations intwo different surveys). With this occupancy models we assessed
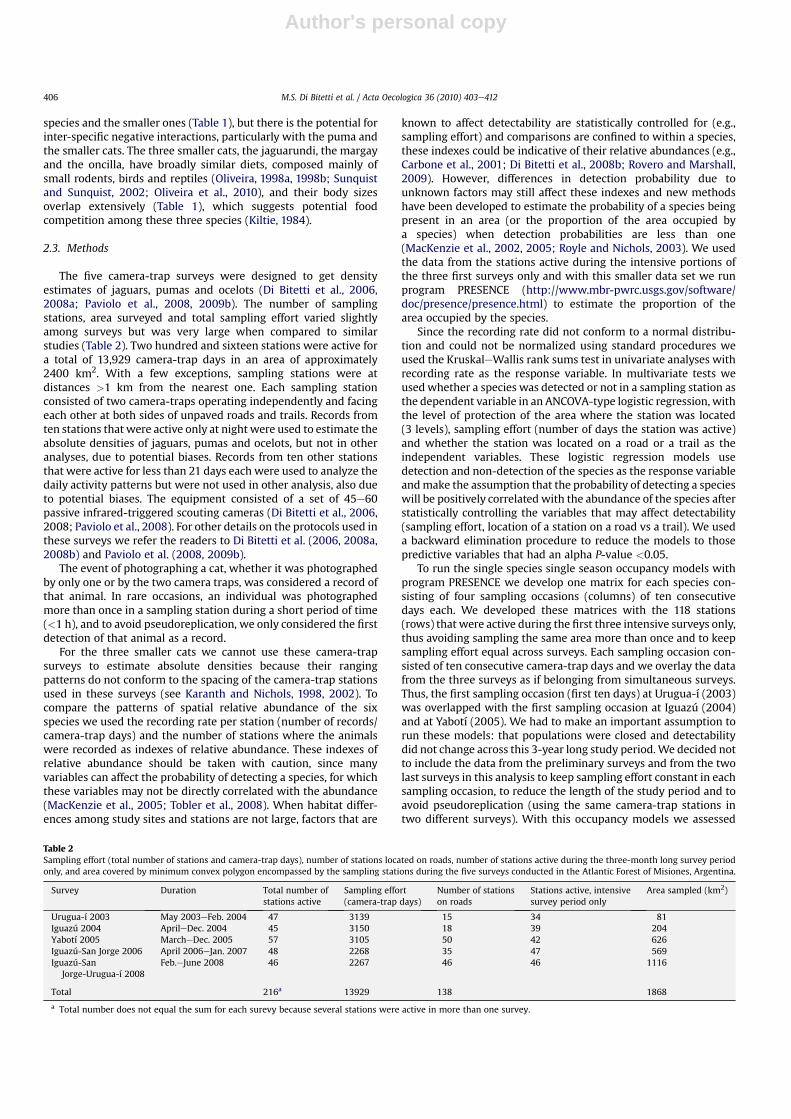
Table 2Sampling effort (total number of stations and camera-trap days), number of stations located on roads, number of stations active during the three-month long survey periodonly, and area covered by minimum convex polygon encompassed by the sampling stations during the five surveys conducted in the Atlantic Forest of Misiones, Argentina.
Survey Duration Total number ofstations active
Sampling effort(camera-trap days)
Number of stationson roads
Stations active, intensivesurvey period only
Area sampled (km2)
Urugua-í 2003 May 2003eFeb. 2004 47 3139 15 34 81Iguazú 2004 AprileDec. 2004 45 3150 18 39 204Yabotí 2005 MarcheDec. 2005 57 3105 50 42 626Iguazú-San Jorge 2006 April 2006eJan. 2007 48 2268 35 47 569Iguazú-San
Jorge-Urugua-í 2008Feb.eJune 2008 46 2267 46 46 1116
Total 216a 13929 138 1868
a Total number does not equal the sum for each surevy because several stations were active in more than one survey.
M.S. Di Bitetti et al. / Acta Oecologica 36 (2010) 403e412406

Author's personal copy
the effect of the protection of the area on the proportion of thesurveyed area occupied by a species and the effect of the location ofa station on a trail or a road on the probability of detection ofa species. Models were ranked based on the Akaike (AIC) criteriaand using AIC model weights (MacKenzie et al., 2005). The occu-pancy models were based on a much smaller data set (1/3 of thetotal camera-trap days and records) than the one used in the otheranalyses. Thus, we report and compare the results of the threedifferent analyses: 1) logistic regression models using detection/non-detection as the response variable, 2) univariate analyses usingthe recording rate as the response variable, and 3) estimates of theprobability of occupancy obtained with program PRESENCE.
We used the likelihood ratio test of independence of thedetection/non-detection of a species in a camera-trap station toassess the degree of association of the species with each other.MacKenzie et al. (2004, 2005) developed occupancy models toassess patterns of species co-occurrence and species interactions.These models specifically deal with the fact that detection proba-bilities are less than one and can change depending on the presenceor detection of another species (e.g., species avoidance). Despite ourlarge sampling effort, the relatively few records and small samplesizes available for this analyses did not allow us to conduct co-occurrence analyses for most species pairs, with the exception ofthe ocelot e puma pair. We investigated the pattern of co-occurrence for these two species, using as covariates the protectionstatus of the area and whether stations were located on trails orroads. We compare the results of this co-occupancy modelingexercisewith the independence test to discuss the drawbacks of thelast approach.
We used the hour printed in the photo records to describe thedaily activity patterns of the species. To analyze the daily activitypatterns we grouped the records of the species into 24 � 1-hintervals. The concentration parameter for a von Mises distributionwas estimated for each species (Batschelet, 1981; Fisher, 1993). Thisvector provides a characterization of how concentrated is the dailyactivity pattern (measured by the length of the vector, with valuesclose to 0 indicating a random or homogeneous pattern ora bimodal pattern and values close to 1 indicating that most activitywas concentrated in a 1-h interval) and at what time is the peak ofactivity located (indicated by the mean direction of the vector). Weused program JMP (3.2.2) to conduct the statistical analyses forwhich we set a probability level to commit an alpha error to 0.05.
3. Results
3.1. Patterns of abundance
In the 196 stations that were active 24 hs and for more than 21days each we obtained 77 records of jaguars, 409 records of pumas,938 ocelot records, 43 records of the jaguarundi, 35 records of themargay and 122 records of the oncilla. The six species were recor-ded in all the study areas, although margays were not recordedduring the 2004 survey conducted in the core area of IguazúNational Park. The overall mean recording rate varied amongspecies, with the ocelot being the most frequently recorded cat,followed by the puma; the smaller cats and the jaguar have lowerrecording rates, with the margay and the jaguarundi having thelowest ones. A similar pattern was observed for the number andproportion of sampling stations where the species were detected(Table 3).
The recording rate of jaguars, pumas and ocelots increased withthe protection level of the area (KruskaleWallis test, jaguar,X2 ¼ 7.205, df ¼ 2, P ¼ 0.0273; puma, X2 ¼ 7.890, df ¼ 2, P¼ 0.0193;ocelot, X2 ¼ 11.209, df ¼ 2, P ¼ 0.0037; Fig. 2a). The jaguarundishowed a similar but not statistically significant pattern
(X2 ¼ 2.829, df ¼ 2, P ¼ 0.2431; Fig. 2a). The oncilla and the margayshowed a pattern opposite to that of the other cats, being recordedat higher rates in stations located in the less protected areas(margay, X2 ¼ 14.116, df¼ 2, P¼ 0.0009; oncilla, X2 ¼ 12.911, df¼ 2,P ¼ 0.0016; Fig. 2a).
Since sampling effort and the location of a station on a trail ora road were known to affect the probability of recording a catspecies, we statistically controlled for their effect in multivariateANCOVA-like logistic regressionmodels, using the protection of thearea as another independent variable and the detection/non-detection of the species as the binary categorical response variable.A statistical model with the three independent factors testedsimultaneously was unstable for the jaguar because all stationslocated in the less protected areas were located on roads and norecords of jaguars were obtained. In univariate independent teststhe probability of recording a jaguar increased with sampling effort(X2 ¼ 16.69, df ¼ 1, P < 0.0001), was higher on roads than on trails(G ¼ 17.340, df ¼ 1, P < 0.0001) and was higher in the better-pro-tected areas (G¼ 12.383, df¼ 2, P< 0.0020, Fig. 2b). The probabilityof recording a puma increased with sampling effort (X2 ¼ 15.354,df ¼ 1, P < 0.0001), the quality of the area (X2 ¼ 6.439, df ¼ 2,P ¼ 0.0400, Fig. 2b) and was higher on roads than on trails(X2 ¼ 15.691, df ¼ 1, P < 0.0001). Ocelots showed a similar pattern,with higher probabilities of being recorded on roads than on trails(X2 ¼ 7.906, df ¼ 1, P ¼ 0.0049) and at stations located in moreprotected sites (X2 ¼ 6.922, df ¼ 2, P ¼ 0.0314, Fig. 2b). They alsoshowed a tendency, although not statistically significant, to bemore frequently recorded as sampling effort increased (X2 ¼ 3.470,df ¼ 1, P ¼ 0.0625). For these three species, the occupancy modelswith the highest empirical support were those that included thevariable trail vs road affecting the probability of detection andprotection level as a variable affecting the proportion of the areaoccupied by the species (AIC weights for these models:jaguar ¼ 0.996; puma ¼ 0.698; ocelot ¼ 0.954). Other models (e.g.,the null model) showed much lower support. The probability ofdetecting these felids when present was highest at stations locatedon roads than at those located on trails (jaguar: proad ¼ 0.14 � 0.04,ptrail ¼ 0.01 � 0.01; puma: proad ¼ 0.39 � 0.05; ptrail ¼ 0.12 � 0.03;ocelot: proad ¼ 0.60 � 0.04, ptrail ¼ 0.26 � 0.04). The proportion ofthe area occupied by these species was higher in the better-pro-tected sites (Fig. 2c). Jaguarundies showed a higher probability ofbeing recorded at stations located on roads than on trails(X2 ¼ 6.633, df ¼ 1, P ¼ 0.0100), but no effect of sampling effort(X2 ¼ 1.268, df ¼ 1, P ¼ 0.2601) or protection (X2 ¼ 3.423, df ¼ 2,P ¼ 0.1806, Fig. 2b). For the jaguarundi the occupancy model withthe highest AIC weight (0.476) was the null model: no effect ofprotection on the proportion of the area occupied by the species(Fig. 2c) and no effect of the location of the station on trail vs roadon its probability of detection. Margays and oncillas increased theirdetection probability with sampling effort (margay, X2 ¼ 10.234,
Table 3Total frequency of records, recording rate, number of stations where the species wasdetected and proportion of stations with detection of the species for the six speciesof felids present in the Atlantic Forest of Misiones, Argentina. Values are calculatedfor the 196 sampling stations that were active 24 hs a day and >21 days.
Species Frequencyof records
Recording rate(per 100 camera-trapnights) � SEM
Number of stationswith detections
Proportion ofstations withdetections
Jaguar 77 0.52 � 0.09 43 0.22Puma 409 2.62 � 0.29 103 0.53Ocelot 938 6.68 � 0.55 155 0.79Jaguarundi 43 0.33 � 0.06 31 0.16Margay 35 0.27 � 0.05 30 0.15Oncilla 122 0.97 � 0.15 56 0.29
M.S. Di Bitetti et al. / Acta Oecologica 36 (2010) 403e412 407

Author's personal copy
df ¼ 1, P ¼ 0.0014; oncilla, X2 ¼ 8.726, df ¼ 1, P ¼ 0.0031), but notwith the location of a station on a road vs a trail (margay, X2¼1.734,df¼ 1, P¼ 0.1918; oncilla, X2 ¼ 1.500, df¼ 2, P¼ 0.2207). They bothshowed an opposite pattern to the other species in relation tohabitat quality, having a higher probability of being recorded instations located in the less protected sites (margay, X2 ¼ 16.242,df ¼ 2, P ¼ 0.0003; oncilla, X2 ¼ 12.924, df ¼ 1, P ¼ 0.0016, Fig. 2b).The occupancy models for these two species showed similarresults. For the margay, the model with the highest AIC weight
(0.48) included protection as a variable affecting the proportion ofsites occupied and the location of the station on roads vs trail asa variable affecting the probability of detection. However, a modelwithout this last variable ranked second and got a similar level ofsupport as the previous one (DAIC ¼ 0.18). In contrast to the largerspecies, the probability of detecting amargay showed a tendency tobe higher at stations located on trails (ptrail ¼ 0.22 � 0.14) than onthose located on roads (proad ¼ 0.07 � 0.03). For the oncilla, themodel with the highest support (AIC weight ¼ 0.73) includedprotection as a variable affecting the probability of sites occupiedbut no effect of the location of a station on a road vs a trail on theprobability of detection. For both species the probability of occu-pancy decreased with the protection of the area (Fig. 2c).
In pair-wise independent tests we found a positive associationbetween the jaguar and the other cat species with the exception ofthe margay (Table 4). Pumas were positively associated withjaguars and ocelots but not with the smaller cats. The only negativeassociation was found between margays and jaguarundis. In the196 camera-trap stations that operated 24 hs and for >21 days,jaguarundis were recorded in 31 and margays in 30 of them butonly in one of them both species were recorded (G ¼ 5.17, df ¼ 1,P ¼ 0.0188).
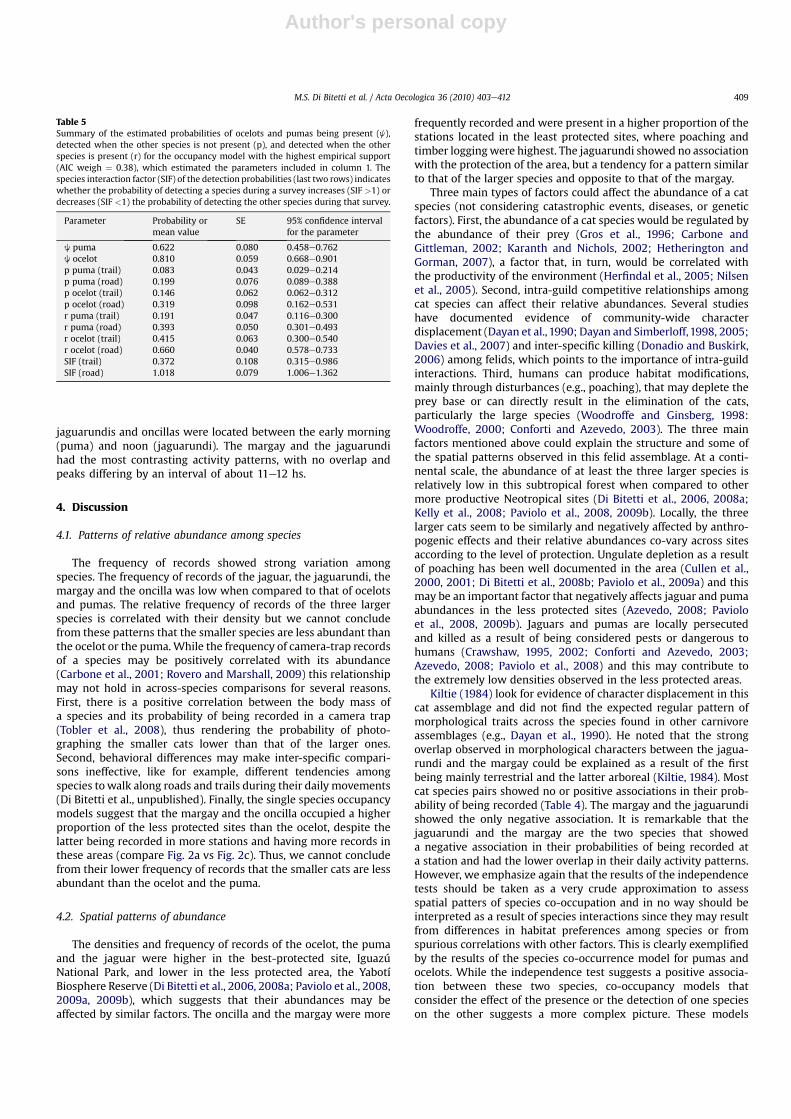
Three puma-ocelot co-occurrence models showed similarsupport and their combined AIC weights summed >0.99. In allthree models the probabilities of detecting pumas and ocelots werehigher on roads than on trails whether the other species waspresent or not (Table 5). For both species detection probabilitieswere higher when the other species was present in a station. In allthree models the species interaction factor for the detectionprobability (Lambda) was close to one in stations located on roadsbut lower than one in stations located on trails: when one specieswas detected during a survey the probability of detecting the otherspecies diminished but only in trails (Table 5). The second rankingmodel (AIC weight ¼ 0.33) suggested that the presence of onespecies increases the probability of the other being present. Thethird ranking one (AIC weight ¼ 0.29) suggested that the proba-bility of ocelots and pumas being present increases with protection,but no interaction of the presence of one species on the other.
3.2. Activity patterns
Only one of the cat species is completely diurnal, the jagua-rundi (Fig. 3). Another species, the margay, is strictly nocturnal(Fig. 3). The puma and the oncilla are cathemeral species, beingactive at any time of the day and with a peak of activity in theearly morning. The jaguar and the ocelot are mostly nocturnal butshow a small amount of diurnal activity (Fig. 3). There seems to bea pattern of nocturnal species alternating with cathemeral ordiurnal species when the cats are order by decreasing bodyweight (Fig. 3). Peaks of activity for jaguars, ocelots and margays(their concentration parameters) were located near midnight,between 23:00 and 1:00 h, while the peak of activity of pumas,
Jaguar Puma Ocelot Jaguarundi Margay Oncilla
Ln ((
reco
rds/
day)
+ 1
)
0,00
0,02
0,04
0,06
0,08
0,10
High protection (N=68)Interm. protect. (N=105)Low protection (N=23)
Jaguar Puma Ocelot Jaguarundi Margay Oncilla
Prop
ortio
n of
sta
tions
with
pre
senc
e
0,0
0,2
0,4
0,6
0,8
1,0
1,2
1,4
1,6
1,8High protection (N=3)Interm. protect. (N=4)Low protection (N=1)
a
b
Jaguar Puma Ocelot Jaguarundi Margay Oncilla
Prob
abilit
y of
"occ
upan
cy" (
Psi)
+ SE
0,0
0,2
0,4
0,6
0,8
1,0
1,2
1,4 High protection (N=40) Medium protection (N=57)Low protection (N=21)
c
Fig. 2. The recording rate (a), the probability of detecting a species at a camera-trapstation (b) and the probability of occupancy (Psi ¼ j) estimated using program Pres-ence (c) for the six species of cats in stations located in areas with three different levelof protection during five camera-trap surveys conducted in the Atlantic Forest of NEArgentina. Sample sizes between brackets correspond to the number of stations ineach category of protection (a and c) or the number of times a portion of area in eachcategory was sampled (b). The whiskers above the bars represent the standard error ofthe mean. Table 4
Association of pairs of species at sampling stations. Plus signs indicate a positiveassociation, negative signs indicate a negative association and ceros indicate noassociation. The association was ascertained with independent likelihood ratio tests(species were considered associated when the alpha probability value was <0.05).
Jaguar Puma Ocelot Jaguarundi Margay Oncilla
Jaguar þ þ þ 0 þPuma þ þ 0 0 0Ocelot þ þ 0 0 0Jaguarundi þ 0 0 e 0Margay 0 0 0 e 0Oncilla þ 0 0 0 0
M.S. Di Bitetti et al. / Acta Oecologica 36 (2010) 403e412408
Author's personal copy
jaguarundis and oncillas were located between the early morning(puma) and noon (jaguarundi). The margay and the jaguarundihad the most contrasting activity patterns, with no overlap andpeaks differing by an interval of about 11e12 hs.
4. Discussion
4.1. Patterns of relative abundance among species
The frequency of records showed strong variation amongspecies. The frequency of records of the jaguar, the jaguarundi, themargay and the oncilla was low when compared to that of ocelotsand pumas. The relative frequency of records of the three largerspecies is correlated with their density but we cannot concludefrom these patterns that the smaller species are less abundant thanthe ocelot or the puma.While the frequency of camera-trap recordsof a species may be positively correlated with its abundance(Carbone et al., 2001; Rovero and Marshall, 2009) this relationshipmay not hold in across-species comparisons for several reasons.First, there is a positive correlation between the body mass ofa species and its probability of being recorded in a camera trap(Tobler et al., 2008), thus rendering the probability of photo-graphing the smaller cats lower than that of the larger ones.Second, behavioral differences may make inter-specific compari-sons ineffective, like for example, different tendencies amongspecies towalk along roads and trails during their daily movements(Di Bitetti et al., unpublished). Finally, the single species occupancymodels suggest that the margay and the oncilla occupied a higherproportion of the less protected sites than the ocelot, despite thelatter being recorded in more stations and having more records inthese areas (compare Fig. 2a vs Fig. 2c). Thus, we cannot concludefrom their lower frequency of records that the smaller cats are lessabundant than the ocelot and the puma.
4.2. Spatial patterns of abundance
The densities and frequency of records of the ocelot, the pumaand the jaguar were higher in the best-protected site, IguazúNational Park, and lower in the less protected area, the YabotíBiosphere Reserve (Di Bitetti et al., 2006, 2008a; Paviolo et al., 2008,2009a, 2009b), which suggests that their abundances may beaffected by similar factors. The oncilla and the margay were more
frequently recorded and were present in a higher proportion of thestations located in the least protected sites, where poaching andtimber loggingwere highest. The jaguarundi showed no associationwith the protection of the area, but a tendency for a pattern similarto that of the larger species and opposite to that of the margay.
Three main types of factors could affect the abundance of a catspecies (not considering catastrophic events, diseases, or geneticfactors). First, the abundance of a cat species would be regulated bythe abundance of their prey (Gros et al., 1996; Carbone andGittleman, 2002; Karanth and Nichols, 2002; Hetherington andGorman, 2007), a factor that, in turn, would be correlated withthe productivity of the environment (Herfindal et al., 2005; Nilsenet al., 2005). Second, intra-guild competitive relationships amongcat species can affect their relative abundances. Several studieshave documented evidence of community-wide characterdisplacement (Dayan et al., 1990; Dayan and Simberloff,1998, 2005;Davies et al., 2007) and inter-specific killing (Donadio and Buskirk,2006) among felids, which points to the importance of intra-guildinteractions. Third, humans can produce habitat modifications,mainly through disturbances (e.g., poaching), that may deplete theprey base or can directly result in the elimination of the cats,particularly the large species (Woodroffe and Ginsberg, 1998:Woodroffe, 2000; Conforti and Azevedo, 2003). The three mainfactors mentioned above could explain the structure and some ofthe spatial patterns observed in this felid assemblage. At a conti-nental scale, the abundance of at least the three larger species isrelatively low in this subtropical forest when compared to othermore productive Neotropical sites (Di Bitetti et al., 2006, 2008a;Kelly et al., 2008; Paviolo et al., 2008, 2009b). Locally, the threelarger cats seem to be similarly and negatively affected by anthro-pogenic effects and their relative abundances co-vary across sitesaccording to the level of protection. Ungulate depletion as a resultof poaching has been well documented in the area (Cullen et al.,2000, 2001; Di Bitetti et al., 2008b; Paviolo et al., 2009a) and thismay be an important factor that negatively affects jaguar and pumaabundances in the less protected sites (Azevedo, 2008; Pavioloet al., 2008, 2009b). Jaguars and pumas are locally persecutedand killed as a result of being considered pests or dangerous tohumans (Crawshaw, 1995, 2002; Conforti and Azevedo, 2003;Azevedo, 2008; Paviolo et al., 2008) and this may contribute tothe extremely low densities observed in the less protected areas.
Kiltie (1984) look for evidence of character displacement in thiscat assemblage and did not find the expected regular pattern ofmorphological traits across the species found in other carnivoreassemblages (e.g., Dayan et al., 1990). He noted that the strongoverlap observed in morphological characters between the jagua-rundi and the margay could be explained as a result of the firstbeing mainly terrestrial and the latter arboreal (Kiltie, 1984). Mostcat species pairs showed no or positive associations in their prob-ability of being recorded (Table 4). The margay and the jaguarundishowed the only negative association. It is remarkable that thejaguarundi and the margay are the two species that showeda negative association in their probabilities of being recorded ata station and had the lower overlap in their daily activity patterns.However, we emphasize again that the results of the independencetests should be taken as a very crude approximation to assessspatial patters of species co-occupation and in no way should beinterpreted as a result of species interactions since they may resultfrom differences in habitat preferences among species or fromspurious correlations with other factors. This is clearly exemplifiedby the results of the species co-occurrence model for pumas andocelots. While the independence test suggests a positive associa-tion between these two species, co-occupancy models thatconsider the effect of the presence or the detection of one specieson the other suggests a more complex picture. These models
Table 5Summary of the estimated probabilities of ocelots and pumas being present (j),detected when the other species is not present (p), and detected when the otherspecies is present (r) for the occupancy model with the highest empirical support(AIC weigh ¼ 0.38), which estimated the parameters included in column 1. Thespecies interaction factor (SIF) of the detection probabilities (last two rows) indicateswhether the probability of detecting a species during a survey increases (SIF >1) ordecreases (SIF <1) the probability of detecting the other species during that survey.
Parameter Probability ormean value
SE 95% confidence intervalfor the parameter
j puma 0.622 0.080 0.458e0.762j ocelot 0.810 0.059 0.668e0.901p puma (trail) 0.083 0.043 0.029e0.214p puma (road) 0.199 0.076 0.089e0.388p ocelot (trail) 0.146 0.062 0.062e0.312p ocelot (road) 0.319 0.098 0.162e0.531r puma (trail) 0.191 0.047 0.116e0.300r puma (road) 0.393 0.050 0.301e0.493r ocelot (trail) 0.415 0.063 0.300e0.540r ocelot (road) 0.660 0.040 0.578e0.733SIF (trail) 0.372 0.108 0.315e0.986SIF (road) 1.018 0.079 1.006e1.362
M.S. Di Bitetti et al. / Acta Oecologica 36 (2010) 403e412 409

Author's personal copy
suggest that both species, when present, were more easily detectedat stations located on roads than on trails, both had a higherprobability of being detected when the other species was presentand that they had a lower chance of being detected when the otherspecies was detected during a sampling occasion, but only on trails.Several authors have cautioned about the temptation of inferringbiological processes (e.g., competition) from observed patterns(Burnham and Anderson, 2002; MacKenzie et al., 2004, 2005) and itis not easy to interpret the results of our modeling exercise in termsof ecological interactions. The increased probability of a speciesbeing detected when the other is present at a site (Table 5) could
explain the non-independent association of records of thesespecies (Table 4). However, it is important to note that the proba-bility of detection of a species is usually positively correlated withits abundance (Royle and Nichols, 2003) and the patterns of pres-ence and abundance of these species are positively correlated(Fig. 2c, Paviolo et al., 2009a). The contrasting values of the speciesinteraction factor observed in trails and roads suggest that ocelotsmay be avoiding trails that have been recently used by pumas asa result of potentially higher risks of being killed. Only behavioraland experimental studies will help understand the potentiallycomplex spatial interactions among the species in this guild.
Jaguarundi (N=45), r = 0.71
0 1 2 3 4 5 6 7 8 9 10 11 12 13 14 15 16 17 18 19 20 21 22 23 240,00
0,05
0,10
0,15
0,20
0,25
0,30
Jaguar (N=105), r = 0.31
0 1 2 3 4 5 6 7 8 9 10 11 12 13 14 15 16 17 18 19 20 21 22 23 24
Rel
ativ
e fre
quen
cy o
f rec
ords
0,00
0,02
0,04
0,06
0,08
0,10
Ocelot (N=977), r = 0.48
0 1 2 3 4 5 6 7 8 9 10 11 12 13 14 15 16 17 18 19 20 21 22 23 24
Rel
ativ
e fre
quen
cy o
f rec
ords
0,00
0,02
0,04
0,06
0,08
0,10
Margay (N=32), r = 0.72
Hour interval (starting at 00:00 hs)
0 1 2 3 4 5 6 7 8 9 10 11 12 13 14 15 16 17 18 19 20 21 22 23 24
Rel
ativ
e fre
quen
cy o
f rec
ords
0,00
0,02
0,04
0,06
0,08
0,10
0,12
0,14
0,16
0,18Oncilla (N=117), r = 0.19
Hour interval (starting at 00:00 hs)
0 1 2 3 4 5 6 7 8 9 10 11 12 13 14 15 16 17 18 19 20 21 22 23 240,00
0,02
0,04
0,06
0,08
0,10
Puma (N=417), r = 0.12
0 1 2 3 4 5 6 7 8 9 10 11 12 13 14 15 16 17 18 19 20 21 22 23 240,00
0,02
0,04
0,06
0,08
0,10
0,12
Fig. 3. Daily pattern of records for the six cat species photographed in the Atlantic Forest of NE Argentina during five camera-trap surveys conducted between 2003 and 2008. Thearrow is themean vector. Its position indicateswhere the peak of activity is located and its length indicates howconcentrated is the daily pattern of activity. The length of the vector (r)in this graph is depicted, for comparative purposes, not with its absolute value but as a proportion of the total length of the Y axis. Absolute values of r are indicated inside the graph.
M.S. Di Bitetti et al. / Acta Oecologica 36 (2010) 403e412410

Author's personal copy
4.3. Daily activity patterns
If interference competition and intra-guild killing (see Donadioand Buskirk, 2006) are strong selective factors, the temporalsegregation of the daily activity patterns could potentially be themost effective mechanism to reduce competition (Carothers andJaksic, 1984). We have observed all types of daily activity patternsamong this Neotropical cat community: one strictly diurnal species,the jaguarundi, one strictly nocturnal species, the margay, and fourcathemeral species, two of which (jaguar and ocelot) are mostlynocturnal, and two (puma and oncilla) are active at any time of theday but with a peak of activity in the morning. Their activitypatterns seem not to be distributed randomly but in an orderlyfashion according to their body weights. This pattern may be theresult of adaptations to reduce competition or the result of speciesassortment. The temporal segregation of the daily activity patternsbetween species more similar in body weight may contribute tospecies coexistence and may explain the lack of a morphologicalcommunity-wide character displacement in this felid assemblage.
Most discussions on community-wide character displacementhave been focused on morphological characters (Dayan andSimberloff, 2005), but there is no reason not to consider the dailyactivity pattern of a species or its ability to adjust it to local condi-tions as a character that may evolve in response to interferencecompetition with other species. It is remarkable, again, that two ofthe species with the highest morphological overlap, the jaguarundiand the margay (Kiltie, 1984) are the twowith the lowest overlap intheir daily activity patterns. Cathemeral species in general may beable to adjust their activity pattern to local conditions (predationrisk, competitors or prey) and increase their fitness. For example,two similar Neotropical foxes seem to coexist as a result of thesubordinate one being able to adjust its daily activity pattern to thepresence of the other (Di Bitetti et al., 2009). In Misiones, pumastend to become more nocturnal in areas where jaguars are lessabundant (Paviolo et al., 2009b). As an example from anotherregion, there is evidence that leopards (Panthera pardus) tend tochange their daily activity patterns in areas where tigers (Pantheratigris) are abundant (Azlan and Sharma, 2006).
Many camera-trap studies are producing information on thecommunity structure and spatio-temporal activity patterns ofmammals that could be used to test the hypothesis that a regularpartitioning of the daily activity pattern among species is animportant, and probably widespread, mechanism that allows thecoexistence of otherwisemorphologically similar species. This is notto say thatmorphological community-wide character displacementis not an important mechanism that may explain the coexistence ofcarnivore species. Rather, we suggest that a larger portion of theunexplained variance found in studies looking for morphologicalcharacter displacement (see Davies et al., 2007) could be explainedif behavioralmechanisms, and particularly, the daily activity patternare taken into account. We predict that in sympatric cat species, thedegree of overlap in their activity patterns will be negativelycorrelated to their degree of morphological similarity.
5. Conclusion
The three larger species seem to be mostly affected by anthro-pogenic effects. The ocelot being a relatively abundant speciesmaybeexerting a differential negative effect on the three smaller cat speciesthrough intra-guild competition or killing (Oliveira et al., 2010). Thejaguarundi, being strictly diurnal may not only reduce the effect ofinterference competition or attacks from the larger and mostlynocturnal ocelots, but also competition with the similarly sizedmargays through a temporal partitioning of their activities. Itsabundance does not seem to be affected by the presence of the ocelot
and may have a negative association with the margay. The threesmaller species have similar sizes and very similar diets and may becoexisting along their distributional range more as a result of theirbehavioral differences than as a result of their morphological differ-ences. The margay has strong adaptations for an arboreal andnocturnal lifestyle (Oliveira, 1998b), and these characteristics mayreduce competition with the similarly sized jaguarundi and theoncilla, this last one with a more terrestrial habit and a cathemeralactivity pattern,which allows for aflexible use of the temporal axis inresponse to local competitive conditions. However, bothmargays andoncillas are more abundant in the most degraded areas, probably asa result of competitive release from ocelots and jaguarundis in thoseareas. We cannot however, exclude the possibility that prey abun-dance for these small cats is higher in the most degraded areas, butthis will imply that their diets differ markedly from that of thejaguarundi, something that needs to be tested. In conclusion, ourresults suggest that the interaction of anthropogenic factors andintra-guild competition and killing seem to affect the relative abun-dance and the activity patterns of the species in this felid community.
Acknowledgements
We are grateful to all the students and park rangers that helpedus with the field activities. We acknowledge the support andpermits provided by the Ministry of Ecology, Natural Resources andTourism of Misiones province (MERNRyT) and the National ParksAdministration of Argentina. We are thankful to the propertyowners for permission to conduct this work in their properties. Thismanuscript was highly improved thanks to comments andsuggestions from Andrew Smith and two anonymous reviewers.Financial support was provided by CONICET, Fundación VidaSilvestre Argentina, WWF-USA, WWF-International, WWF-Switzerland, Lincoln Park Zoo, Fundación Antorchas, WildlifeConservation Society, Idea Wild, Rufford Foundation, MERNRyTand the Eden Project - Darwin Initiative. We are thankful to Tuto,Horacio and Martín for help with film processing.
References
Azevedo, F.C.C., 2008. Food habits and livestock depredation of sympatric jaguarsand pumas in the Iguaçu National Park area, South Brazil. Biotropica 40,494e500.
Azlan, J.M., Sharma, D.S.K., 2006. The diversity and activity patterns of wild felids ina secondary forest in Peninsular Malaysia. Oryx 40, 36e41.
Batschelet, E., 1981. Circular Statistics in Biology. Academic Press, New York.Bininda-Emonds, O.R.P., Gittleman, J.L., Purvis, A., 1999. Building large trees by
combining phylogenetic information: a complete phylogeny of the extantCarnivora (Mammalia). Biol. Rev. 74, 143e175.
Brown, W.L., Wilson, E.O., 1956. Character displacement. Syst. Zool. 5, 49e64.Burnham, K.P., Anderson, D.R., 2002. Model Selection and Multimodel Inference e
a practical information-theoretic approach, second ed.. Springer-Verlag, NewYork, USA.
Carbone, C., Gittleman, J.L., 2002. A common rule for the scaling of carnivoredensity. Science 295, 2273e2276.
Carbone, C., Christie, S., Conforti, K., Coulson, T., Franklin, N., Ginsberg, J.R.,Griffiths, M., Holden, J., Kawanishi, K., Kinnaird, M., Laidlaw, R., Lynam, A.,MacDonald, D.W., Martyr, D., McDougal, C., Nath, L., O’Brien, T., Seidensticker, J.,Smith, D.J.L., Sunquist, M., Tilson, R., Wan Shahruddin, W.N., 2001. The use ofphotographic rates to estimate densities of tigers and other cryptic mammals.Anim. Conserv. 4, 75e79.
Carothers, J.H., Jaksic, F.M., 1984. Time as a niche difference: the role of interferencecompetition. Oikos 42, 403e406.
Conforti, V.A., Azevedo, F.C.C., 2003. Local perceptions of jaguars Panthera onca andpumas Puma concolor in the Iguacu National Park area, south Brazil. Biol.Conserv. 111, 215e221.
Crawshaw Jr., P.G., 1995. Comparative ecology of ocelot Felis pardalis and JaguarPanthera onca in a protected subtropical forest in Brazil and Argentina. DPhilthesis, University of Florida, United States.
Crawshaw Jr., P.G., 2002. Mortalidad inducida por humanos y conservación dejaguares: el Pantanal y el Parque Nacional Iguaçu en Brasil. In: Medellín, R.A.,Equihua, C., Chetkiewicz, Ch.L., Crawshaw, P.G., Rabinowitz, A., Redford, K.H.,Robinson, J.G., Sanderson, E.W., Taber, A.B. (Eds.), El jaguar en el nuevo milenio.Editorial Ediciones Cientificas Universitarias, México, pp. 451e464.
M.S. Di Bitetti et al. / Acta Oecologica 36 (2010) 403e412 411

Author's personal copy
Creel, S., Creel, N.M., 2002. The African Wild Dog: Behavior, Ecology and Conser-vation. In: Monographs in Behavior and Ecology. Princeton University Press,Princeton, New Jersey.
Crespo, J.A., 1982. Ecología de la comunidad de mamíferos del Parque NacionalIguazú, Misiones. Revista MACN, Ecología 3, 45e162.
Cullen Jr., L., Bodmer, R.E., Valladares-Pádua, C., 2000. Effects of hunting in habitatfragments of the Atlantic Forests, Brazil. Biol. Conserv. 95, 49e56.
Cullen Jr., L., Bodmer, R.E., Valladares-Pádua, C., 2001. Ecological consequences ofhunting in Atlantic forest patches, São Paulo, Brazil. Oryx 35, 137e144.
Cullen, L., Cachuba Abreu, K., Sana, D., Ferreira Dales Nava, A., 2005. As onças-pintadas como detetives da paisagem no corredor do Alto Paraná, Brasil.Natureza & Conservação 3, 43e58.
Davies, T.J., Meri, S., Barraclough, T.G., Gittleman, J.L., 2007. Species co-existence andcharacter divergence across carnivores. Ecol. Lett. 10, 146e152.
Dayan, T., Simberloff, D., 1998. Size patterns among competitors: ecological char-acter displacement and character release in mammals, with special reference toisland populations. Mammal Rev. 28, 99e124.
Dayan, T., Simberloff, D., 2005. Ecological and community-wide characterdisplacement: the next generation. Ecol. Lett. 8, 875e894.
Dayan, T., Simberloff, D., Tchernov, E., Yom-Tov, Y., 1990. Feline canines: community-wide character displacement among the small cats of Israel. Am. Nat.136, 39e60.
Di Bitetti, M.S., Janson, C.H., 2001. Reproductive socioecology of tufted capuchins(Cebus apella nigritus), in Northeastern Argentina. Int. J. Primatol. 22, 127e142.
Di Bitetti, M.S., Paviolo, A., De Angelo, C., 2006. Density, habitat use and activitypatterns of ocelots (Leopardus pardalis) in the Atlantic Forest of Misiones,Argentina. J. Zool., Lond. 270, 153e163.
Di Bitetti, M.S., De Angelo, C., Paviolo, A., Di Blanco, Y., 2008a. Local and continentalcorrelates of the abundance of a neotropical cat, the ocelot (Leopardus pardalis).J. Trop. Ecol. 24, 189e200.
Di Bitetti, M.S., Paviolo, A., Ferrari, C.A., De Angelo, C., Di Blanco, Y., 2008b. Differ-ential responses to hunting in two sympatric species of brocket deer (Mazamaamericana and M. nana). Biotropica 40, 636e645.
Di Bitetti, M.S., Di Blanco, Y.E., Pereira, J.A., Paviolo, A., Jiménez Pérez, I., 2009. Timepartitioning favors the coexistence of sympatric crab-eating foxes (Cerdocyonthous) and pampas foxes (Lycalopex gymnocercus). J. Mammal., 90(2), 479e490.
Di Bitetti, M.S., 2001. Home range use by the tufted capuchin monkey, Cebus apellanigritus, in a subtropical rainforest of Argentina. J. Zool., Lond. 253, 33e45.
Donadio, E., Buskirk, S.W., 2006. Diet, morphology, and interspecific killing inCarnivora. Am. Nat. 167, 524e536.
Fisher, N.I., 1993. Statistical Analysis of Circular Data. Cambridge University Press,Cambridge and New York.
Galindo-Leal, C., de Gusmão Câmara, I., 2003. The Atlantic Forest of South America.Center for Applied Biodiversity Science, Island Press, Washington, D.C.
Gros, P.M., Kelly, M.J., Caro, T.M., 1996. Estimating carnivore densities for conser-vation purposes. Oikos 77, 197e206.
Haines, A.M., 2006. Is there competition between sympatric jaguar Panthera oncaand puma Puma concolor? Acta Zoologica Sinica 52, 1142e1147.
Herfindal, I., Linnell, J.D.C., Odden, J., Nilsen, E.B., Andersen, R., 2005. Prey density,environmental productivity and home-range size in the Eurasian lynx(Lynx lynx). J. Zool., Lond. 265, 63e71.
Hetherington, D.A., Gorman, M.L., 2007. Using prey densities to estimate thepotential size of reintroduced populations of Eurasian lynx. Biol. Conserv. 137,37e44.
Hutchinson, G.E., 1959. Homage to Santa Rosalia, or why are there so many kinds ofanimals? Am. Nat. 93, 145e159.
Iriarte, J.A., Franklin, W.L., Johnson, W.E., Redford, K.H., 1990. Biogeographicvariation of food habits and body size of the American puma. Oecologia 85,185e190.
Jaksic, F., Marone, L., 2007. Ecología de Comunidades, segunda edición ampliada.Ediciones Universidad Católica de Chile, Santiago, Chile.
Johnson, W.E., Eizirik, E., Pecon-Slattery, J., Murphy, W.J., Antunes, A., Teeling, E.,O’Brien, S.J., 2006. The late Miocene radiation of modern Felidae: a geneticassessment. Science 311, 73e77.
Karanth, K.U., Nichols, J.D., 1998. Estimation of tiger densities in India usingphotographic captures and recaptures. Ecology 79, 2852e2862.
Karanth, K.U., Nichols, J.D., 2002. Monitoring Tigers and Their Prey: a Manual forResearchers, Managers and Conservationists in Tropical Asia. Centre for WildlifeStudies, Bangalore, Karnataka, India.
Kelly, M.J., Noss, A.J., Di Bitetti, M.S., Maffei, L., Arispe, R., Paviolo, A., De Angelo, C.D.,Di Blanco, Y.E., 2008. Estimating puma densities from camera trapping acrossthree study sites: Bolivia, Argentina, Belize. J. Mammal 89, 408e418.
Kiltie, R.A., 1984. Size ratios among sympatric neotropical cats. Oecologia 61,411e416.
Kronfeld-Schor, N., Dayan, T., 2003. Partitioning of time as an ecological resource.Ann. Rev. Ecol. Evol. Syst. 34, 153e181.
Macdonald, D.W., Loveridge, A.J., Atkinson, R.P.D., 2004. A Comparative Study ofSide-striped Jackals in Zimbawe: the Influence of Habitat and Congeners. In:Macdonald, D.W., Sillero-Zubiri, C. (Eds.), Biology and Conservation of WildCanids. Oxford University Press, Oxford, U.K, pp. 255e270.
MacKenzie, D.I., Nichols, J.D., Lachman, G.B., Droege, S., Royle, J.A., Langtimm, C.A.,2002. Estimating site occupancy rates when detection probabilities are lessthan one. Ecology 83, 2248e2255.
MacKenzie, D.I., Bailey, L.L., Nichols, J.D., 2004. Investigating species co-occur-rence patterns when species are detected imperfectly. J. Anim. Ecol. 73,546e555.
MacKenzie, D.I., Nichols, J.D., Royle, J.A., Pollock, K.H., Hines, J.E., Bailey, L.L., 2005.Occupancy Estimation and Modeling: Inferring Patterns and Dynamics ofSpecies Occurrence. Elsevier, San Diego, USA.
Mitchell, B.D., Banks, P.B., 2005. Do wild dogs exclude foxes? Evidence forcompetition from dietary and spatial overlaps. Austral. Ecol. 30, 581e591.
Morin, P.J., 1999. Community Ecology. Blackwell Science, Malden, Massachusetts.Murray, R.L., Gardner, G.L., 1997. Leopardus pardalis. Mamm. Species 548, 1e10.Nilsen, E.B., Herfindal, I., Linnel, J.D.C., 2005. Can intra-specific variation in carnivore
home-range size be explained using remote-sensing estimates of environ-mental productivity? Ecoscience 12, 68e75.
Oliveira, T.G., Tortato, M.A., Silveira, L., Kasper, C.B., Mazim, F.D., Lucherini, M.,Jácomo, A.T., Soares, J.B.G., Marques, R.V., Sunquist, M.E., 2010. Ocelot ecologyand its effect on the small-felid guild in the lowland Neotropics In: Macdonald,D., Loveridge, A. (Eds.), Biology and Conservation of Wild Felids. OxfordUniversity Press, Oxford, U.K., pp. 563e574.
Oliveira, T.G., 1998a. Herpailurus yagouaroundi. Mamm. Species 578, 1e6.Oliveira, T.G., 1998b. Leopardus wiedii. Mamm. Species 579, 1e6.Palomares, F., Caro, T.M., 1999. Interspecific killing among mammalian carnivores.
Am. Nat. 153, 492e508.Paviolo, A., De Angelo, C.D., Di Blanco, Y.E., Di Bitetti, M.S., 2008. Jaguar population
decline in the Upper Paraná Atlantic forest of Argentina and Brazil. Oryx 42,554e561.
Paviolo, A., De Angelo, C., Di Blanco, Y., Agostini, I., Pizzio, E., Melzew, R., Ferrari, C.,Palacio, L., Di Bitetti, M.S., 2009a. Efecto de la caza y el nivel de protección en laabundancia de los grandes mamíferos del Bosque Atlántico de Misiones. In:Carpinetti, B., Garciarena, M. (Eds.), Contribuciones para la Conservación yManejo en el Parque Nacional Iguazú. Administración de Parques Nacionales,Buenos Aires, Argentina, pp. 237e254.
Paviolo, A., Di Blanco, Y.E., De Angelo, C.D., Di Bitetti, M.S., 2009b. Protection affectspuma abundance and activity patterns in the Atlantic Forest. J. Mammal. 90,926e934.
Placci, L.G., Arditi, S.I., Cioteck, L.E., 1994. Productividad de hojas, flores y frutos en elParque Nacional Iguazú, Misiones. Yvyraretá 5, 49e56.
Polis, G.A., Myers, C.A., Holt, R.D., 1989. The ecology and evolution of intraguildpredation: potential competitors that eat each other. Ann. Rev. Ecol. Syst. 20,297e330.
Rovero, F., Marshall, A.R., 2009. Camera trapping photographic rate as an index ofdensity on forest ungulates. J. Appl. Ecol. 46, 1011e1017.
Royle, J.A., Nichols, J.D., 2003. Estimating abundance from repeated presence-absence data or point counts. Ecology 84, 777e790.
Schoener, T.W., 1974. Resource partitioning in ecological communities. Science 185,27e39.
Scognamillo, D., Maxit, I.E., Sunquist, M., Polistar, J., 2003. Coexistence of jaguar(Panthera onca) and puma (Puma concolor) in a mosaic landscape in the Ven-ezuelan llanos. J. Zool., Lond. 259, 269e279.
Silver, S.C., Ostro, L.E.T., Marsh, L.K., Maffei, L., Noss, A.J., Kelly, M.J., Wallace, R.B.,Gómez, H., Ayala, G., 2004. The use of camera traps for estimating jaguarPanthera onca abundance and density using capture/recapture analysis. Oryx38, 148e154.
Sunquist, M., Sunquist, F., 2002. Wild Cats of the World. The University of ChicagoPress, Chicago.
Taber, A.B., Novaro, A.J., Neris, N., Colman, F.H., 1997. The food habits of sympatricYaguareté and puma in the Paraguayan Chaco. Biotropica 29, 204e213.
Tannerfeldt, M., Elmhagen, B., Angerbjörn, A., 2002. Exclusion by interferencecompetition? The relationship between red and arctic foxes. Oecologia 132,213e220.
Tobler, M.W., Carrillo-Percastegui, S.E., Leite Pitman, R., Mares, R., Powel, G., 2008.An evaluation of camera traps for inventorying large and medium sizedterrestrial rainforest mammals. Anim. Conserv. 11, 169e178.
Tokeshi, M., 1999. Species Coexistence. Ecological and Evolutionary Perspectives.Blackwell Science Ltd., London, UK.
Woodroffe, R., Ginsberg, J.R., 1998. Edge effects and the extinction of populationsinside protected areas. Science 280, 2126e2128.
Woodroffe, R., 2000. Predators and people: using human densities to interpretdeclines of large carnivores. Anim. Conserv. 3, 165e173.
M.S. Di Bitetti et al. / Acta Oecologica 36 (2010) 403e412412
Copyright © 2022 FDOKUMEN