A composite sphere assemblage model for porous oolitic rocks
Upload
khangminh22Category
view
1download
0
THE LIANA ASSEMBLAGE OF
A CONGOLIAN RAINFOREST
Diversity, Structure and Dynamics
Corneille E.N. Ewango

THE LIANA ASSEMBLAGE OF A CONGOLIAN RAINFOREST
Diversity, Structure and Dynamics
Corneille E.N. Ewango
Ewango_PROEF (all).ps Front - 1 T1 - Black
ii
THESIS COMMITTEE
THESIS SUPERVISORSProf. Dr. F.J.J.M. Bongers Personal chair at the Forest Ecology and Forest Management Group Wageningen University
Prof. Dr. M.S.M. Sosef Professor of Biosystematics Wageningen University
THESIS CO-SUPERVISORDr. Ir. L. Poorter Associate professor, Forest Ecology and Forest Management Group Wageningen University
OTHER MEMBERSProf. Dr. F. Berendse, Wageningen University Dr. S.A. Schnitzer , University of Wisconsin-Milwaukee, USA Dr. H. ter Steege, Utrecht University Dr. R. Zagt, Tropenbos International, Wageningen
This research was conducted under the auspices of the Research School Biodiversity and of the C.T. de Wit Graduate School of Production Ecology and Resource Conservation (PE&RC).
Ewango_PROEF (all).ps Back - 1 T1 - Black
iii
THE LIANA ASSEMBLAGE OF A CONGOLIAN RAINFOREST
Diversity, Structure and Dynamics
Corneille E.N. Ewango
THESISsubmitted in fulfillment of the requirements for the degree of doctor
at Wageningen University by the authority of the Rector Magnificus
Prof. Dr. M.J. Kropff, in the presence of the
Thesis Committee appointed by the Academic Board to be defended in public
on Monday 29 November 2010 at 11 a.m. in the Aula.
Ewango_PROEF (all).ps Front - 2 T1 - Black

iv
Corneille E.N. Ewango
The liana assemblage of a Congolian rainforest: Diversity, structure and dynamics,
161 pages.
Thesis, Wageningen University, Wageningen, NL (2010)
With references, with summaries in English, Dutch and French
ISBN 978-90-8585-813-3
Ewango_PROEF (all).ps Back - 2 T1 - Black

v
The research described in this thesis was financially supported by the Wildlife Conservation Society (WCS) in collaboration with the Center for Tropical Forest Science (CTFS), a PhD Sandwich grant from Wageningen University, by the Research School Biodiversity and by the C.T. de Wit Graduate School of Production Ecology and Resource conservation (PE&RC).
Ewango_PROEF (all).ps Front - 3 T1 - Black

vi
Ewango_PROEF (all).ps Back - 3 T1 - Black

vii
To my parents for the best gift of life and ensuring my education
To Esse, Diane, Yannick, Simplice, Rhoda and Achilles for adding sense to life
To Nadine and Gaylord who have left us early
To my brothers and sisters for showing me love and affection
This is it!!!
Ewango_PROEF (all).ps Front - 4 T1 - Black

viii
Ewango_PROEF (all).ps Back - 4 T1 - Black
ix
Abstract
This study analyzes the diversity, composition, and dynamics of the liana assemblage of the
Ituri rain forest in northeastern DR Congo. I used data from two 10-ha plots of the Ituri
Forest Dynamics Plots, in which all liana stems 2 cm diameter at breast height (dbh) were
marked, mapped, measured and identified in 1994, 2001 and 2007. In addition, the plot
topography and canopy structure were measured.
Chapter 2 analyzes the liana assemblage (in terms of species richness, abundance
and diversity), characterizes liana functional traits and determines effects of forest structure,
topography and edaphic variation on liana species composition. In 20 ha, 15008 liana
individuals were found, representing 195 species, 83 genera and 34 plant families. Per
hectare species number averaged 64, basal area was 0.71 m2 and Fisher alpha, Shannon and
Simpson diversity indices were 17.9, 3.1 and 11.4, respectively. There was oligarchic
dominance of 10 plant families that represented 69% of total species richness, 92% of liana
abundance and 92% of basal area, while ten dominant species accounted for 63% of
abundance and 59% of basal area. Forty-one species (21%) were represented by one
individual only. Most lianas were light-demanding, climbed their hosts by twining, and had
conspicuous flowers, medium-sized leaves and animal-dispersed propagules. Liana
abundance increased with abundance of medium-sized and large trees but was, surprisingly,
independent of small-tree abundance. Canopy openness, soil moisture, and tree size were
the most important environmental factors influencing abundance and distribution of lianas.
In Chapter 3 I investigate changes in structural characteristics, diversity,
recruitment, mortality and growth of the liana community over the thirteen years (1994 -
2007). Liana density decreased from 750 (1994) through 547 (2001) to 499 (2007) stems ha-1,
with concomitant declines in basal area and above-ground biomass. Despite lower stem
densities the species richness remained constant over time. Total liana recruitment rates
decreased slightly from 8.6% per year in the first period to 6.6% in the second, but this
decrease was not significant. Liana mortality rates decreased significantly from 7.2% to 4.4%
per year over the two census intervals. Diameter growth rates and survival increased with
liana stem diameter. Surprisingly, liana abundance in Ituri showed recent declines, rather
than recent increases, as has been reported for tropical and temperate forests in the
Americas. Interestingly, changes in overall liana community structure and composition
were mostly driven by one species only: the dramatic collapse of superabundant
Manniophyton fulvum between the first and the second census.
Ewango_PROEF (all).ps Front - 5 T1 - Black
x
In chapter 4 I investigated species-specific dynamics of the 79 most abundant liana
species, representing 13,156 of the stems (97% of total) in two 10-ha plots. I evaluated their
demographic performance and the relation of the vital rates (growth, mortality, recruitment)
to the species abundance and four functional traits (climbing strategy, dispersal syndrome,
leaf size and light requirements) to determine across species variations and major strategies
characterizing species. Vital rates shared a wide interspecific variation; species-specific
recruitment rates varied from 0.0-10.9%, mortality rates from 0.43-7.89% over 13-year, and
growth rates from -0.03-3.51 mm y-1. Most species had low to moderate rates. Species that
grew fast tended also to recruit and die fast, but recruitment and mortality rates were not
directly related, suggesting that species shift in absolute abundance over the 13 year period.
However, with the exception of the collapsing Manniophyton fulvum population, species
maintained their rank-dominance over time. Species growth declined with abundance, but
recruitment and mortality rates were not related to abundance. The demographic
performance of liana species varied weakly with their climbing strategy and dispersal mode
but was, surprisingly, not related to their lifetime light requirements. A principle
components analysis of liana strategies in terms of functional traits and vital rates showed
that light demand, and dispersal syndrome were the most determining traits. Based on the
PCA three functional guilds were distinguished. I conclude that old-growth forest liana
species show a large variation in abundance and vital rates, and that density-dependent
mechanisms are insufficient to explain the species abundance patterns over time.
Lianas are thought to globally increase in density, but we have limited knowledge
about the taxonomic patterns of change in liana abundance, and the underlying vital rates
that explain changes in liana density. In chapter 5 the changes in abundance of 79 relatively
abundant liana species are evaluated. The Ituri forest showed a pervasive change in liana
population density in the last decade. 37 species changed significantly in their abundance
over time: 12 (15% of total) species increased, and 25 (32%) species decreased. 42 (53%)
species did not change. Of the 48 genera, 40% decreased and 52% stayed the same. Five of
the 12 increasing species belonged to the Celastraceae, which also was the only
significantly increasing family. Surprisingly, none of the four functional traits (lifetime
light requirements, climbing mechanism, dispersal mechanism, and leaf size) was
significantly associated with species change in population density. Many decreasing
species, however, are associated with disturbed habitats and are short-lived. Many
increasing species are late successional and longer-lived. Increasing species have a slightly
higher recruitment, decreasing species a higher mortality. This study suggests that changes
in the liana community result from forest recovery from past disturbances. Rising
atmospheric CO2 level was not a likely explanation for liana change: more species declined
Ewango_PROEF (all).ps Back - 5 T1 - Black

xi
than increased, and increasing species did not have higher growth rates. In the Ituri Forest
local stand dynamics override more global drivers of liana change.
Key words: Liana assemblage, species composition, community, dynamics, canopy openness, Manniophyton fulvum, functional traits, population density, pervasive change.
Ewango_PROEF (all).ps Front - 6 T1 - Black

xii
Ewango_PROEF (all).ps Back - 6 T1 - Black

xiii
Contents Abstract
Contents
Chapter 1 1 General introduction
Chapter 2 13 Structure and composition of the liana assemblage of a mixed rain forest in the Congo Basin (Corneille E.N. Ewango, Frans Bongers, Lourens Poorter, Jean-Remy Makana & Marc S.M. Sosef) Submitted to Journal of Tropical Ecology
Chapter 3 45 Thirteen years of dynamics of the liana assemblage in a Congo Basin rain forest (Corneille E.N. Ewango, Lourens Poorter, Marc S.M. Sosef, Jean-Remy Makana & Frans Bongers) Submitted to Biotropica
Chapter 4 65 Thirteen years of species-specific dynamics of lianas in a Central African Rain Forest (Corneille E.N. Ewango, Lourens Poorter, Marc S.M. Sosef & Frans Bongers)
Chapter 5 91 Pervasive changes in liana species population density in a Paleotropical Forest in Central Africa, DR Congo (Corneille E.N. Ewango, Frans Bongers & Lourens Poorter)
Chapter 6 109 General discussion
References 121
Samenvatting 143
Résumé 147
Acknowledgements 151
Short biography 155
List of Publications 157
Education Certificate 160
Ewango_PROEF (all).ps Front - 7 T1 - Black

xiv
Ewango_PROEF (all).ps Back - 7 T1 - Black
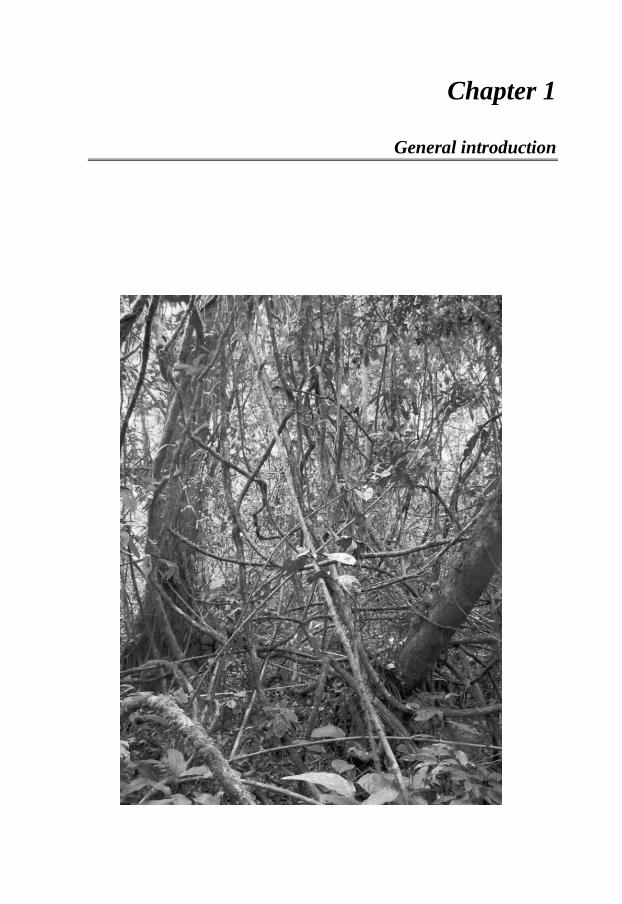
Chapter 1
General introduction
Ewango_PROEF (all).ps Front - 8 T1 - Black

Chapter 1 – General introduction
2
DIVERSITY AND SPECIES RICHNESS OF LIANAS IN TROPICAL FOREST
Lianas are woody plants that begin life on the ground as small self-supporting shrubs and
rely on other plants to reach the light-rich environment of the upper canopy (Darwin 1867,
Putz 1984, Letcher & Chazdon 2009). Because lianas use other plants for support, they
devote relatively little to structural support and instead allocate more resources to leaf
production and stem/root elongation for rapid growth (Putz 1983, 1990). Lianas are
important components of many forest communities across the world, and are especially
conspicuous, diverse, and characteristic in tropical forest (Putz 1984, Phillips and Gentry
1994, Schnitzer et al. 2000). Lianas provide an important contribution to the physiognomy
and species richness of tropical forests and are expected to play a vital role in ecosystem
functioning as well (Putz & Mooney 1991, Schnitzer & Bongers 2002, Bongers et al. 2005,
Phillips et al. 2005).
Lianas constitute around 25% of the woody species in lowland tropical forest, and
on average 18% to the overall taxonomic diversity of tropical forests (Gentry 1991). Their
importance decreases with increasing latitude, the average percentage of lianas in woody
floras falling to c. 10% in temperate forests (Gentry 1991). Estimates of their contribution
to the vascular plants species diversity of the community range from 12% in Puerto Rico,
25% in Upper Guinea, 31% in Ghana (Hall and Swaine 1981) and to over 40% in the
Monogaga forest, Ivory Coast (Bongers et al. 2002). In Barro Colorado Island, Panama,
45% of all plant species >10 m tall are lianas (Croat 1978). In Neotropical and South-East
Asian forests, 40–60% of all large ( 10 cm diameter) trees typically bear at least one liana
of any diameter (Putz 1983, Putz and Chai 1987, Campbell and Newbery 1993, Pérez-
Salicrup 1998). Liana diversity in Neotropical and South-East Asian forests is relatively
well documented, but diversity in African forests lags behind, especially the central African
rainforest of the Congo Basin. Lianas species account for one third of woody plant diversity
in the Ituri Forest (Makana et al. 1998, 2004a, b), north-eastern part of the Congo Basin and
our own study area. In the only other study I have found, Caballé and Martin (2001) have
recorded 60 species of liana 5 cm diameter in a Gabonese rain forest. Lianas are
characterized by a vegetative multiplication aptitude. Next to genets they can produce
ramets and show extraordinary resprouting capacities (vegetative proliferation), a potential
to increase their dominance (Nabe-Nielsen 2000, Parren & Bongers 2001, Parren 2003).
Lianas share a common growth strategy centered on ascending to the canopy using
the architecture of other plants (Schnitzer & Bongers 2002). They display a variety of
adaptations for attaching themselves to their host and climb towards the forest canopy
Ewango_PROEF (all).ps Back - 8 T1 - Black

Chapter 1 – General introduction
3
(Darwin 1867, Hegarty 1991). They come in a huge variety of climbing mechanisms (from
hook/tendrils to twiners/adhesive), as well as seed sizes and leaf size (from small to large).
In tropical rain forest they are predominantly animal-dispersed, while wind-dispersal has
often been mentioned as important for the spatial distribution of lianas in tropical dry and
temperate forests (Gentry 1991, Bullock 1995, Killeen et al. 1998). As structural parasites,
lianas colonize trees and thus provide food and access between trees to arboreal animals
(Emmons & Gentry 1983).
LIANAS AND ECOSYSTEM FUNCTIONING
A number of studies documented the role of lianas for the ecosystem regulation and
productivity. First, lianas contribute to canopy closure after tree fall, stabilizing the
microclimate underneath (Schnitzer & Bongers 2002) and contributing to local evapo-
transpiration (Meinzer et al. 1999). Second, lianas also play a role at the ecosystem level by
contributing to the carbon budget of tropical forests, representing as much as 10% of fresh
aboveground biomass (Putz 1984). Despite their size, lianas comprise an important
structural component producing 5–7% of tropical forest biomass and up to 40% of leaf area
and leaf productivity (Hegarty & Caballé 1991, Gerwing & Farias 2000), as well as large
amounts of litter (up to 30%) that is incorporated in the nutrient cycle. More importantly,
when lianas become abundant they can reduce the amount of carbon sequestered by a forest
stand when the leaf area of highly productive trees is reduced due to liana shading
(Schnitzer & Bongers 2002), suppress tree growth and regeneration (Grauel & Putz 2004,
Peña-Claros et al. 2008, van der Heijden & Phillips 2009), increase tree mortality, and
affect the competitive ability of trees for ecosystem function (Laurance et al. 2001, Phillips
et al. 2002).
LIANAS AND FOREST DYNAMICS
Lianas are considered to be drivers of a number of forest dynamics aspects. It is known that
lianas may influence forest dynamics by increasing the size of tree fall gaps and thereby
increasing tree turnover rate (e.g. Phillips & Gentry 1994, Putz 1984, Putz & Chai 1987,
but see Parren & Bongers (2001) who did not find an effect of liana cutting on gap size)
and by arresting forest development in tree fall gaps (Schnitzer et al. 2000). Liana removal
in tree fall gaps, for instance, resulted in increased tree growth and recruitment (Schnitzer
& Carson 2010). Large lianas compete with trees for light, water, soil nutrients, and space
and may thus depress the growth and fecundity of trees and increase their mortality
(Richard 1952, Putz 1984, Stevens 1987, Clark & Clark 1990, Schnitzer & Bongers 2002,
Ewango_PROEF (all).ps Front - 9 T1 - Black

Chapter 1 – General introduction
4
van der Heijden et al. 2008, Nabe-Nielsen et al. 2009, Ingwell et al. 2010). The above- and
below-ground competition is reason for reduced growth and regeneration of tree species
(Dillenburg et al. 1993, Pérez-Salicrup & Bakker 2000, Schnitzer & Bongers 2002,
Schnitzer et al. 2005, Peña-Claros et al. 2008, Villegas et al. 2009) co-occurring with
lianas. In contrast to general belief, preliminary results show that below-ground competition
is most important (Schnitzer et al. 2005, Toledo-Aceves & Swaine 2008).
DRIVERS OF LIANA ABUNDANCE AND DISTRIBUTION IN TROPICAL RAIN FORESTS
Several factors have been suggested to influence the abundance, species richness and
distribution of lianas in tropical forests, but these are not globally conclusive (see Londré &
Schnitzer 2006, Toledo 2010, Schnitzer & Bongers 2002). Lianas, being disturbance-
adapted life forms (Hegarty & Caballé 1991), are profiting to some degree from increasing
forest disturbance by humans (Laurence et al. 2001). Lianas may be found almost
everywhere, but their abundance increases in canopy gaps or forest edges (Putz 1984,
Hegarty & Caballé 1991, Schnitzer & Carson 2001, Babweteera et al. 2000) because of
elevated light intensities (Schnitzer et al. 2000). At local scale, both liana density and
species richness have been found to be related to forest architecture and structure (Putz
1984, Nabe-Nielsen 2000), and to the successional stage of the forests (DeWalt et al. 2000).
The abundance of liana in a forest is greater in recent tree fall gaps and their density is
higher in regenerating secondary forest than in old-growth forest (DeWalt et al. 2000).
Furthermore, tree fall dynamics together with host tree identity and host availability may be
important factors determining the abundance and species composition of liana communities
(Hegarty 1989, Ibarra-Manríquez & Martínez-Ramos 2002).
Lianas are light demanding species (Putz 1984) although some studies showed that
lianas can proliferate along the whole light gradient of a forest (Hegarty 1991, Campbell &
Newberry 1993), and are also tolerant to low light intensities on the forest understory
(Nabe-Nielsen 2000). Consequently, lianas are more abundant in seasonal dry forest, where
light intensity and penetration is high under the seasonally deciduous canopy (Gentry 1991,
Toledo 2010). However, light availability seemingly does not affect liana abundance and
distribution in temperate rain forests (Baars et al. 1998, Carrasco-Urra & Gianoli 2009,
Gianoli et al. 2010). Moreover, contrasts in light availability among patches at different
successional stages may permit the coexistence of groups of species defined by differential
shade tolerance at the seedling stage (Denslow 1987, Clark & Clark 1992).
Ewango_PROEF (all).ps Back - 9 T1 - Black
Chapter 1 – General introduction
5
The patterns of species differentiation with respect to soil-borne resource
availability, topography and forest canopy structure are less well known (but see Baars et
al. 1998, Bond et al. 2001). In a study by Homeier et al. (2010) in Ecuador, elevation had
less importance to liana abundance variation, and diameter size decreased with increasing
altitude, but density and basal area were strongly correlated with host tree diameter and at
little to soil fertility. For Amazonian and Malaysian forests, Putz & Chai (1987) and Gentry
(1981) both found a positive relationship between soil fertility and density of lianas, but this
was not the case in Mexico (Ibarra-Manríquez & Martínez-Ramos 2002). Lianas have been
suggested to be less abundant and to have lower biomass on nutrient poor than on more
fertile soils (DeWalt et al. 2006, Gentry 1991, Laurance et al. 2001, Putz & Chai 1987).
However, recent studies have shown that the success of lianas may depend more on the
availability of suitable host trees than on soil conditions (Phillips et al. 2005). In
Neotropical forests, liana density may even be unrelated to soil fertility or to other soil
gradients (van der Heijden & Phillips 2008), and Toledo (2010) showed that average liana
infestation of trees is higher on more fertile soils, and the number of trees per hectare that
have lianas (an indirect measure of liana density) was higher on more sandy soils.
Increased seasonality in rainfall is positively related to lianas abundance and
species richness (Gentry 1991, Pérez-Salicrup et al. 2001, DeWalt et al. 2010, Toledo
2010), but Clinebell et al. (1995) also pointed out a negative association to species richness
in Neotropical forests. Similarly, from their dry forest plot study in Ghana, Swaine & Grace
(2007) reported an increase for the number of liana species as a proportion of total species
related to forest rainfall gradient. Seen in conjunction, these results suggest that many
abiotic and biotic environmental factors play a role in liana abundance, distribution, and
maintenance of species richness; and most likely many of the variables are interrelated as
well (Balfour & Bond 1993) to have a co- deterministic effect.
LIANA DYNAMICS AND CLIMATE CHANGE
Recent investigations have shown that the abundance of lianas in tropical forests may
increase (Phillips et al. 2002, Wright et al. 2004, Ingwell et al. 2010), possibly as a result of
global climate change, probably promoted by a higher atmospheric CO2 concentration and
anthropogenic land use (Laurance et al. 2001). Raising atmospheric concentration of CO2
might enhance density and dominance of lianas in western Amazonian rain forests, but
failed to have a clear effect on their floristic composition, distribution, and compositional
turnover rates (Phillips et al. 2002). Based on the Neotropical forests data from several
unique, long-term, multi-regional studies of liana and tree populations, Phillips et al. (2002)
Ewango_PROEF (all).ps Front - 10 T1 - Black
Chapter 1 – General introduction
6
reported that lianas experienced enhanced growth, significant increases in the density, basal
area and mean size of climbing woody plants, and that the dominance of large lianas
relative to trees had increased by 1.7–4.6% a year over the last two decades of the 20th
century. Similarly, Wright et al. (2004) observed an increase by 100% in the relative
importance of large lianas for stems enumerated during the 1980s and 1990s surveys. They
also noted that between 1986 and 2002 in the Barro Colorado Island, Panama the total liana
leaf litter production and the proportion of liana matter in forest-wide leaf litter increased.
More evidence continues to accumulate and recently, Ingwell et al. (2010) documented
aggressive increase of tree infestation by lianas in Barro Colorado Island, while Allen et al.
(2007) reported an increase in importance of lianas in the temperate floodplain forests of
the southeastern United States. As lianas are increasing in density, proportion of woody
stems and basal area, they are likely influencing tree species composition, growth, and
mortality. Consequently, Gerwing & Farias (2000) argued that the role of lianas in forest
stand development should be further explored and incorporated into stand development
models of tropical forests.
STUDYING LIANA DYNAMICS
Liana are taxonomically diverse (i.e. are found in many different plant families) and
individual species differ widely in climbing mechanisms, light requirement, seed dispersal,
etc., which influences life history across species (Darwin 1867). Approximately one-half of
the families of vascular plants contain climbing species (Schenck 1892). In some families
nearly all of the species are climbers, Hippocrateaceae and Vitaceae being examples. Little
is known about the demography of liana species (but see Nabe-Nielsen 2002, 2004).
Globally seen lianas appear to be increasing in importance, but looking only at liana
demography, as seen in most studies of woody plants, is not providing a full understanding
of the causes of liana community dynamics. The evolution of lianoid growth forms has
occurred many times in the course of plant evolution, so that phylogenetic constraints on
some characters, for example, is also expected to play a role in the demographic
performance (Felsenstein 1985). Laurance et al. (2004) showed a pervasive alteration in
tree communities in undisturbed Amazonian forests. However, no studies have so far
taxonomically assessed the observed large-scale changes in liana communities. The high
species richness and functional traits variation across species in relation to vital rates make
it both necessary and advantageous to explore the demography and species composition
changes on the basis of their taxonomic and phylogenetic considerations. Gerwing (2004)
showed that different lianas employ different growth strategies in response to light and
successional stage. Perhaps looking at the species phylogeny constrained to liana
Ewango_PROEF (all).ps Back - 10 T1 - Black
Chapter 1 – General introduction
7
demographic performance and functional traits is an essential step toward understanding the
observed general liana increases. It will enable us to detect commonalities in degree of
change in population density and determinants for change among species that are members
of particular functional or evolutionary groups based on both demographic apparent
affinities and life history characteristics.
Although lianas are common in most of the world’s rainforests, there is a paucity
of information on their biology and ecology (Hegarty & Clifford 1991, Schnitzer & Carson
2000), although the last two decades the number of liana studies has increased drastically
(S.A. Schnitzer, pers. com.). Up to now, most of the research was focused on lianas and
liana assemblages of Neotropical rainforests. In contrast, this thesis analyses the liana
assemblage of an African lowland tropical rain forest in the Congo basin, one of the largest
tropical rain forest areas in the world. Richards (1973) referred to Africa as the odd man out
because its tropical and other floras were considered taxonomically and structurally
different from Neotropical and Indo-Malaysian ones. For lianas, the dominant
Bignoniaceae family in the Neotropics is completely lacking and replaced by Apocynaceae
in the Paleotropics (Gentry 1991). One of the major differences is also the relative poverty
of the African rain forest flora. Specifically, it is time to ask whether the relationships found
in the Neotropics and Australasian forests also hold in African forest ecosystems.
OBJECTIVE AND RESEARCH QUESTIONS
In this thesis, I report on my studies on the liana assemblage of the Ituri rain forest in
northeastern DR Congo. I describe, analyze and evaluate patterns of floristic composition
and diversity, and changes therein, over a 13 year period. Specifically, I address the
following questions:
(1) What is the overall diversity and structure of the liana assemblage in the mixed rain
forest of Ituri?
(2) What are the dynamics in the liana assemblage of this forest?
(3) How do liana species vary in their demographic vital rates and how are these rates
related to the liana species’ abundance and their functional traits?
(4) Do lianas increase in abundance over the last 13 years?
Ewango_PROEF (all).ps Front - 11 T1 - Black
Chapter 1 – General introduction
8
THESIS OUTLINE
This study deals with the long-term changes in species composition and vegetation
structure of lianas in two paired 10-ha plots of mixed old-growth rain forest in Ituri, DR
Congo. Three censuses (in 1994, 2000 and 2007) were realized. The main goal of this study
is to provide insight in the dynamics of the Ituri Forest liana communities. It is composed of
four core research chapters (chapter 2 to 5) apart from the general introduction (chapter 1) and
the general synthesis (chapter 6). To examine the richness and diversity of lianas at a local
scale, I used classic diversity indices (species richness, Fisher’s alpha, Shannon-Wiener and
Simpson’s diversity) as they more relate either to abundance or species richness in the
sampling size. I used a Principal Component Analysis (PCA) to detect the trends of changes
in species composition and abundance in the liana community. Community-wide and species-
specific demographic changes were assessed across the plots. Using the huge amount of
available inventory data for these large plots in Ituri forest, DR Congo, collected over a
comparatively long time-span, I disentangle the question: Do liana increase the last 13 years?
It tests the hypothesis of Phillips et al. (2002) that the “composition of old-growth tropical
forests is changing over large scales, and the prediction that lianas are benefiting and increase
in abundance over the last two decades”
In CHAPTER 2 I evaluate the community structure of the liana assemblage of the
mixed lowland Ituri forest. I first describe the floristics, diversity and structure of the liana
assemblage in this old-growth forest. I then characterize liana functional traits (climbing
mechanisms, regeneration guilds, leaf sizes, flower types and dispersal syndromes). I also
determine the effects of forest structure, small-scale local topography and edaphic variation
on liana species composition. I hypothesize that the forest tree canopy structure and
composition (i.e. upper-canopy openness) affects the composition and structure of liana
assemblages, and expect that liana abundance and diversity is lower in closed canopy forest
parts, and that liana dominance is higher in forest parts with an open upper-canopy, parallel to
light-demanding as most liana species are light loving and respond positively to forest
disturbance (Webb 1958, Putz 1984, Laurance et al. 2001).
In CHAPTER 3 I describe the long-term dynamics in the liana community of this
forest, based on liana inventories that took place in 1994, 2000 and 2007. I examine the
changes in structural characteristics of lianas (size, density, growth, mortality, recruitment
and above-ground biomass). I expect vital and dynamic rates (growth and survival) to be
size dependent, and small-size stems to have faster growth and higher mortality compared
to large-size stems that would have lower growth and higher survival in an old-growth
Ewango_PROEF (all).ps Back - 11 T1 - Black
Chapter 1 – General introduction
9
forest liana community. I also analyze the liana assemblage in terms of species composition
and test whether the change over time is directional (two periods of data available 1994-2000
and 2000-2007).
In CHAPTER 4 I analyze the species-specific patterns of liana recruitment, growth
and mortality over the 13-year period. I predict that mortality, recruitment and growth rates
will be highly variable across species. I expect common species to be more dynamic than
rare species, twiners to be more dynamic than non-twiners, light demanding species to be
more dynamic than shade tolerant ones, and large leaf size species to be more dynamic than
the ones with small leaves. Additionally, I explore the relation between liana vital rates and
species functional traits, how liana vital rates are associated one another and which general
strategies do lianas have, based on their vital rates and functional traits.
In CHAPTER 5 I investigate the changes in population density and address whether
the general prediction that “lianas increase in abundance over the last two decades” (Phillips
et al. 2002), holds true for the Ituri Forest. For this I test whether liana abundance at different
taxonomic levels (species, genera, families) increases or decreases more than expected by
chance. Using demographic and functional traits-based comparisons, I test the hypothesis that
species sharing particular ecological characteristics have undergone similar types of density
shifts over time due to similar ecological constraints that determine their performance in local
scale.
Finally, in CHAPTER 6 I summarize and synthesize the main findings of the
different chapters and discuss the general research questions as well as ideas for future work
on liana dynamics. Additionally, the implications of my results for forest management and
conservation of liana diversity are discussed.
STUDY SITES
Plot vegetation characteristics
The two 10-ha mixed forest plots analyzed in this thesis form part of the Ituri Forest
Dynamics Plot, that consist of four plots of 10-ha (200 x 500 m) each established by the
Centre de Formation et de Recherche en Conservation Forestière (CEFRECOF) in 1994 in the
central Ituri Forest at the Réserve de Faune à Okapis (RFO, 1 25 N, 28 35 E). The layout of
the four plots is a replicated pair in two study areas with largely different forest communities,
Edoro (mixed forest) and Lenda (monodominant forest). The distance between two 10-ha
plots of a pair is 500 meters. The plots have a gentle undulating topography with occasional
Ewango_PROEF (all).ps Front - 12 T1 - Black

Chapter 1 – General introduction
10
low hills of exposed patches of shallow rocky soils. Differences between the highest and
lowest points between each pair are 24 m on Lenda and 14 m on Edoro plots. The most
dominant species in the mixed forest are Cynometra alexandri, Julbernardia seretii (both
legumes) and Cleisthanthus michelsonii (Euphorbiaceae), together representing about 30%
of the canopy trees. The monodominant forest is strongly dominated by Gilbertiodendron
dewevrei (legume): more than 90% of the canopy trees belong to this species. The forest
canopy height varies between 35 to 40 m (based on the dominant species), with scattered
emergents exceeding 45 m (Makana et al. 1998, 2004a, b). For my present study, I only used
data of the Edoro mixed forest, and hence of a total of 20 ha.
Experimental design and data collection
In 1994, the two 10-ha plots were surveyed and mapped to generate their topography. To
facilitate the botanical inventory, each 1-ha subplot was divided again into 20 x 20 m
subplots, and each free standing stem of shrubs and trees 1 cm diameter at breast height
(dbh; at 1.30 cm above the ground) was measured, mapped, and tagged with a unique pre-
numbered aluminum tag. Similarly, all lianas 2 cm dbh were included in the inventory. For
both trees and lianas with several stems (clone individual) every stem received a single tag.
The point of measurement was marked with a bright colored oil-based paint. Effort was made
to identify each individual of tree and liana found in the plot to the species, genus or family
level whenever possible. All unidentified individuals were assigned to morphospecies. A
variety of herbarium collections has been made for both common species and unidentified
ones to facilitate further botanical comparison and identification. Plant identification
continued at the National Herbarium of the Netherlands - Wageningen branch (now
Netherlands Centre for Biodiversity Naturalis – section NHN)) and the National Botanical
Garden of Belgium (Meise). At least one good voucher for each species was selected and
housed in the herbarium of CEFRECOF in Epulu; most of them have a duplicate deposited in
the herbaria of Wageningen (The Netherlands) and Meise (Belgium). In 2000 and
2007/2008, all living stems were re-measured and new recruits mapped, tagged and
identified. In this PhD study, we will use the liana data from all three 1994-2000-2007
censuses.
The Ituri Forest Dynamics Plots (IFDP) database includes the standard
information of forest inventories and long-term dynamics studies data (largely following
the worldwide CTFS protocol), but the IFDP differed to all other inventories in the network
by adding lianas. Additional data include complementary topographical aspect (elevation)
and mapping data of individuals within the plots. The database consists of three data sets
Ewango_PROEF (all).ps Back - 12 T1 - Black
Chapter 1 – General introduction
11
containing sampling conducted from 1994 for initial inventories, and the first and second
censuses that were undertaken in 2000 and 2007 respectively. The IFDP database includes
observations on about 450 tree species from 300,000 stems of 1 cm dbh, and about 280
lianas species (30,000 stems) 2 cm dbh. Climatic data (rainfall and temperature) for each
plot are collected from a station associated to each plot.
THE ITURI FOREST IN THE CONGO BASIN AND TROPICAL FOREST
NETWORK
This study is conducted within the framework of the Wildlife Conservation Society –
Democratic Republic of Congo (WCS-DRC) & the Centre de Formation et de Recherche en
Conservation Forestière (CEFRECOF) effort in partnership with the Center for Tropical
Forest Science (CTFS). CEFRECOF aims to develop guidelines for conservation and
sustainable management of forest resources and exploitation of botanical diversity within
DRC, as an effort that complies to its national contribution to the Global Strategy of Plant
Conservation (GSPC). Specifically, the current Ituri Forest Dynamics Plots is within the
group of projects to provide knowledge on forest dynamics parameters and biodiversity in
the context of climate change in the Congo Basin (Fig. 1.1). The biodiversity and
demography of species are evaluated in this long-term ecological research. The overall
objective of this IFDP is to contribute basic information to understand the processes leading
to forest and biodiversity dynamics of this part of the Congo Basin forest. Such
understanding is crucial for an effective management of tropical forest in general and the
Ituri Forest in particular. Among the IFDP project output are: Lianas (this study), Forest
structure, diversity of liana and understory treelets (Makana et al. 1998, 2004a, b; Makana
2004, Condit et al. 2006, Chave et al. 2008, Lewis et al. 2009, DeWalt et al. 2010).
Ewango_PROEF (all).ps Front - 13 T1 - Black
Chapter 1 – General introduction
12
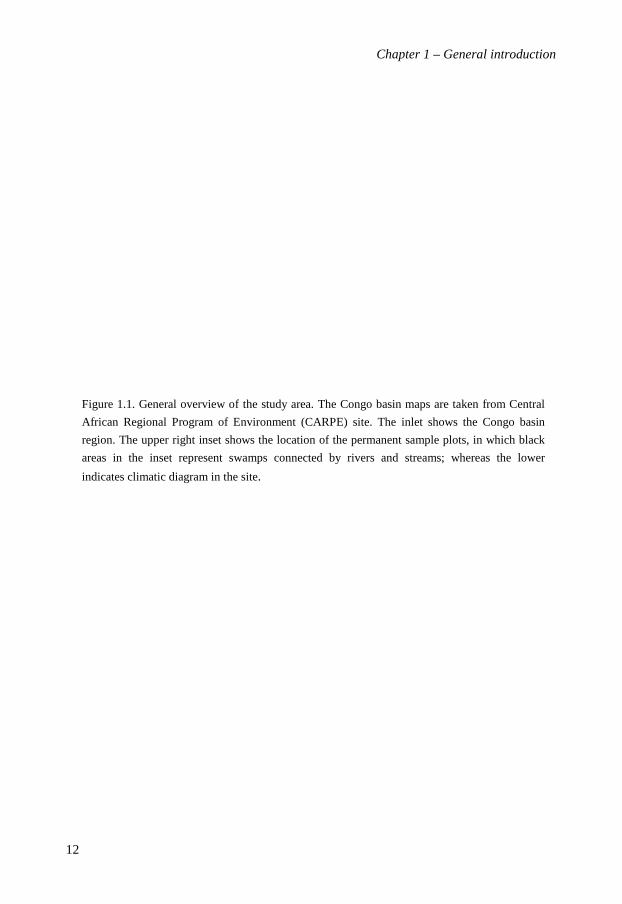
Figure 1.1. General overview of the study area. The Congo basin maps are taken from Central
African Regional Program of Environment (CARPE) site. The inlet shows the Congo basin
region. The upper right inset shows the location of the permanent sample plots, in which black
areas in the inset represent swamps connected by rivers and streams; whereas the lower
indicates climatic diagram in the site.
Ewango_PROEF (all).ps Back - 13 T1 - Black
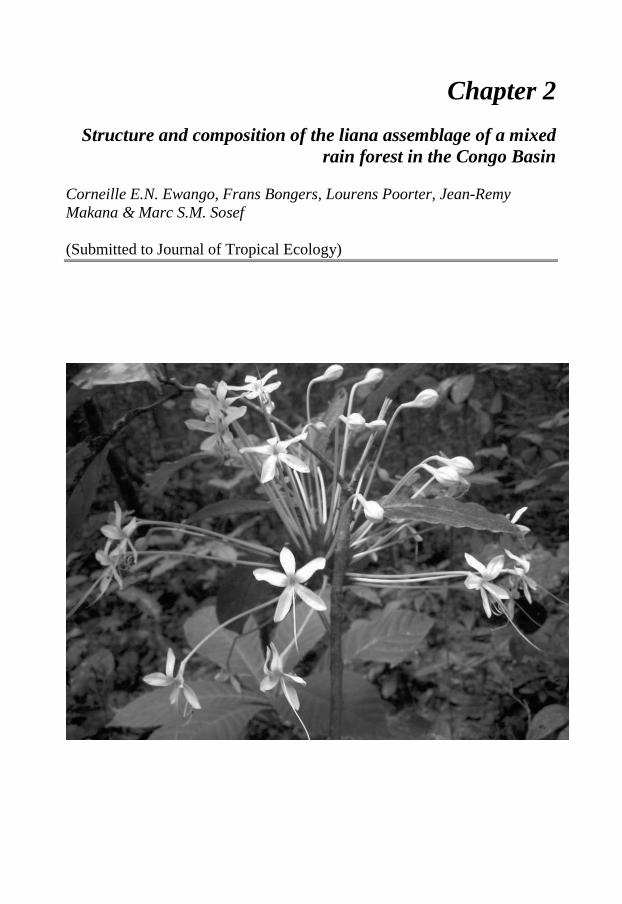
Chapter 2
Structure and composition of the liana assemblage of a mixed rain forest in the Congo Basin
Corneille E.N. Ewango, Frans Bongers, Lourens Poorter, Jean-Remy Makana & Marc S.M. Sosef
(Submitted to Journal of Tropical Ecology)
Ewango_PROEF (all).ps Front - 14 T1 - Black

Chapter 2 – Structure and composition of liana
14
ABSTRACT
The Congo lowland forest represents one of the largest remaining tropical forest blocks in
the world, but its liana assemblage has never been characterized. We evaluate liana
floristics, diversity and structure in two 10-ha plots in Ituri Forest, characterize liana
functional traits and determine effects of forest structure, topography and edaphic variation
on liana species composition. In 20 ha, 15008 lianas (diameter 2 cm) were found,
representing 195 species, 83 genera and 34 plant families. Per hectare species number
averaged 64, basal area was 0.71 m2 and Fisher’s alpha, Shannon and Simpson diversity
index values were 17.9, 3.1 and 11.4, respectively. Ten dominant plant families represented
69% of total species richness, 92% of liana abundance and 92% of basal area, while ten
dominant species accounted for 63% of abundance and 59% of basal area. Forty-one
species (21%) had one individual only. Most lianas were light-demanding, climbed their
hosts by twining, had conspicuous flowers, medium-sized leaves and animal dispersed
propagules. Liana abundance increased with abundance of medium-sized and large trees
but was, surprisingly, independent of small-tree abundance. Canopy openness, soil
moisture, and tree size were the most important environmental factors influencing
abundance and distribution of lianas. We conclude that the liana assemblage of this Congo
basin forest generally concurs with those of lowland tropical forests elsewhere.
Key words: Climbing mechanisms, Dispersal Types, Forest structure, Floristic
composition, Ituri Forest Dynamics Plots, Lianas, Species diversity.
Ewango_PROEF (all).ps Back - 14 T1 - Black
Chapter 2 – Structure and composition of liana
15
INTRODUCTION
Lianas (woody climbers) are notoriously abundant in the tropics, forming up to 25% of the
woody stem density (Gentry 1991a, Schnitzer & Bongers 2002) and contributing 12%-40%
to the overall species diversity of tropical forests (Bongers et al. 2005, Gentry 1991a, Hall
& Swaine 1981, Schnitzer & Bongers 2002, Smith 1970). Apart from their direct
contribution to diversity, lianas help maintain diversity through their effects on forest
structure and dynamics (Putz 1984, Schnitzer & Bongers 2002) and thus on species
composition of both plants and animals. For some animals, such as phytophagous beetles,
lianas even may be the preferential habitat (Ødegaard 2000). A number of studies have
documented the functional aspects of lianas in tropical forests. First, lianas substantially
contribute to canopy closure after tree fall, stabilizing the microclimate underneath, and
contributing to whole-forest transpiration (Andrade et al. 2005, Schnitzer & Bongers 2002).
Second, lianas contribute to the carbon budget of tropical forests (Lewis et al. 2009),
representing as much as 10% of fresh above-ground biomass (Gehring et al. 2004, Phillips
et al. 2002, Putz 1984) and accounting for up to 40% of leaf productivity (Gerwing &
Farias 2000, Hegarty & Caballé 1991, Wright et al. 2004). When lianas become abundant
they may reduce the amount of carbon sequestered by tropical forests (Laurance et al. 2001,
Phillips et al. 2002, Schnitzer & Bongers 2002). Finally, by colonizing trees, lianas create
structural stresses on their hosts, compete for light, water and soil nutrients, and reduce tree
growth (Peña-Claros et al. 2008, Schnitzer et al. 2005, Villegas et al. 2009, Whigham
1984) and reproduction (Kainer et al. 2006, Nabe-Nielsen et al. 2009, Stevens 1987), and
increase rates of tree fall and limb breakage (Lowe & Walker 1977, Putz 1984).
The varying species composition of lianas in different forest types demonstrates
that there are large ecological and functional differences across species. Although lianas
have a similar growth form and are generally thought to be light demanding (Putz 1984),
species do differ in for example climbing mechanisms (Putz 1984, Putz & Holbrook 1991)
and light requirements (Baars et al. 1998, Gianoli et al. 2010, Putz 1984). This enables
occupation of a wide range of habitat types (Balfour & Bond 1993, Darwin 1867, Nabe-
Nielsen 2001). Furthermore, flower size and diaspore type vary markedly across liana
species (Bullock 1995, Cai et al. 2009, Gentry 1991b) and are connected to a wide range of
pollinators and propagule distributers. Dispersal mechanisms are critical for plants to reach
and colonize new locations while they influences patterns of seed predation, seedling
establishment and survival, and determine the density and distribution of the next
generation of adult individuals (Cain et al. 2000). Light requirements may determine the
competitive ability of lianas and their power to infest tree crowns.
Ewango_PROEF (all).ps Front - 15 T1 - Black
Chapter 2 – Structure and composition of liana
16
The abundance, species diversity and distribution of lianas depend upon several
abiotic factors, including total rainfall, seasonality of rainfall, soil fertility, landscape
topography, forest canopy structure, disturbance regimes and successional stage (DeWalt et
al. 2000, 2006, 2010; Ibarra-Manriquez & Martinez-Ramos 2002, Poulsen et al. 2005,
Schnitzer & Bongers 2002, Schnitzer et al. 2005, Toledo 2010). Putz (1984) and Balfour &
Bond (1993) showed that trellis availability and canopy structure (i.e. canopy openness and
tree architecture) together influence the distribution and abundance of lianas in different
forest types. In addition, light availability and topographic positions differently affect liana
growth, mortality and survival (Baars & Kelly 1996, Nabe-Nielsen 2002). Close
associations between tree, Pteridophytes species and habitat (e.g. soil, topography) are
shown at regional level (Clark et al. 1999, Harms et al. 2001, Pyke et al. 2001, Toledo
2010) as well as at local level (Duque et al. 2002, Itoh et al. 2003, Palmiotto et al. 2004,
Svenning 1999, Tuomisto et al. 2002). Spatial variation in water availability may play an
important role in these patterns and is often driven by topography, with higher soil moisture
in valleys compared to slopes, ridges or plateaux (Brubaker et al. 1993, Enoki et al. 1997,
Markesteijn et al. 2010, Roy & Singh 1994). Various growth forms have been analysed in
these studies but none of them concern lianas (but see Kusumoto et al. 2008).
In Africa, liana community studies are available for South Africa (Balfour & Bond
1993), Upper Guinea (Addo-Fordjour et al. 2008, 2009; Bongers et al. 2002, 2005;
Muoghalu & Okeesan 2005), western Lower Guinea (Caballé & Martin 2001, Parren 2003,
Parren & Bongers 2001, Tchouto 2004), and East Africa (Babweteera et al. 2000, Eilu
2001, Senbeta et al. 2005). However, few studies have been performed in the vast Congo
Basin (Lebrun 1937, Makana et al. 1998). In this study we evaluate the community
structure of the liana assemblage of the mixed lowland Ituri forest, north-eastern
Democratic Republic of Congo. Using data from two 10-ha forest plots we (1) describe the
floristics, diversity and structure of the liana assemblage in this old-growth forest; (2)
characterize liana functional traits (climbing mechanisms, regeneration guilds, leaf sizes,
flower types and dispersal syndromes); and (3) determine the effects of forest structure,
small-scale local topography and edaphic variation on liana species composition. We
expect that the liana assemblage of this mixed old-growth forest concurs with those of
lowland rain forests elsewhere.
Ewango_PROEF (all).ps Back - 15 T1 - Black
Chapter 2 – Structure and composition of liana
17
METHODS
Study site
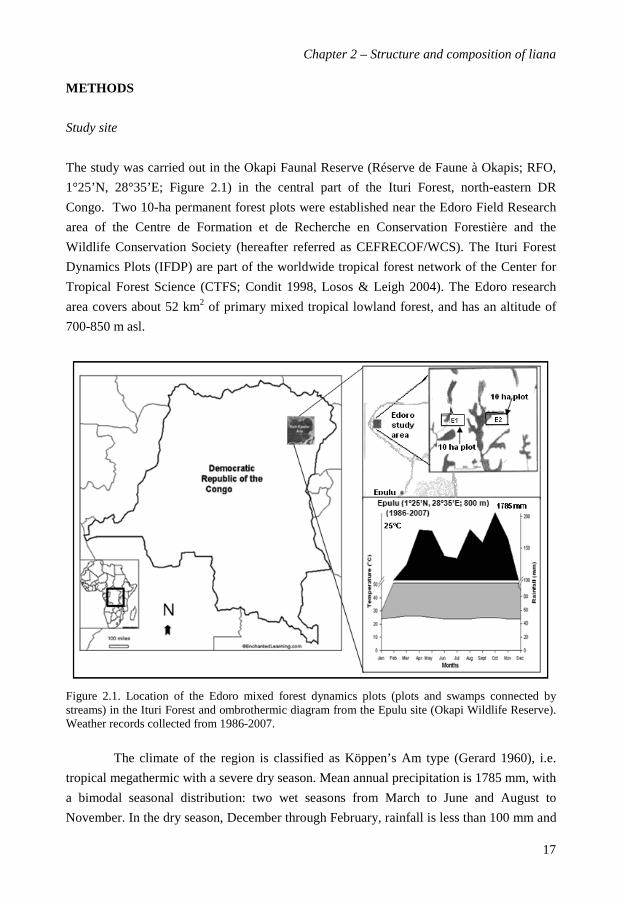
The study was carried out in the Okapi Faunal Reserve (Réserve de Faune à Okapis; RFO,
1°25’N, 28°35’E; Figure 2.1) in the central part of the Ituri Forest, north-eastern DR
Congo. Two 10-ha permanent forest plots were established near the Edoro Field Research
area of the Centre de Formation et de Recherche en Conservation Forestière and the
Wildlife Conservation Society (hereafter referred as CEFRECOF/WCS). The Ituri Forest
Dynamics Plots (IFDP) are part of the worldwide tropical forest network of the Center for
Tropical Forest Science (CTFS; Condit 1998, Losos & Leigh 2004). The Edoro research
area covers about 52 km2 of primary mixed tropical lowland forest, and has an altitude of
700-850 m asl.
Figure 2.1. Location of the Edoro mixed forest dynamics plots (plots and swamps connected by streams) in the Ituri Forest and ombrothermic diagram from the Epulu site (Okapi Wildlife Reserve). Weather records collected from 1986-2007.
The climate of the region is classified as Köppen’s Am type (Gerard 1960), i.e.
tropical megathermic with a severe dry season. Mean annual precipitation is 1785 mm, with
a bimodal seasonal distribution: two wet seasons from March to June and August to
November. In the dry season, December through February, rainfall is less than 100 mm and
Ewango_PROEF (all).ps Front - 16 T1 - Black

Chapter 2 – Structure and composition of liana
18
the two driest months, January and February, have less than 50 mm. Mean annual
temperature ranges between 17.9°C to 25.5°C (Hart & Carrick 1996, Figure 1). The soils in
the region consist mainly of highly weathered tropical oxisols, with texture ranging from
sandy clay loam to sandy clay (Hart et al. 1989). Topography is gentle with only small
differences in elevation: both plots have less than 20 m of internal elevation difference
(Makana et al. 2004). For a more detailed description of the study area, soils and climate,
see Hart (1985), Conway (1992) and Hart & Carrick (1996).
The vegetation in the area is classified as mixed tropical lowland forest (sensu
White 1983). Cynometra alexandri C.H.Wright, Julbernardia seretii (De Wild.) Troupin
(both Fabaceae), and Cleistanthus michelsonii J.Léonard (Phyllanthaceae) account for up to
30% of basal area and density of stems 10 cm dbh in the two plots (Hart 1985). The
canopy is heterogeneous, 30-40 m in height, with frequent emergent trees.
Data collection
Two permanent plots of 10-ha (200 × 500 m), 500 m apart and called Edoro-1 and Edoro-2,
were established in mixed forest in December 1994. Botanical and topographic data were
collected following the plot standards of the CTFS network (Condit 1998). In each 10-ha
plot, a grid of 250 contiguous 20 × 20-m quadrats was demarcated with 286 cement stakes
and each quadrat was subdivided into 16 sub-quadrats of 5 × 5 m. All individuals of lianas
2 cm dbh were identified, measured, mapped and marked with a pre-numbered
aluminium tag. Most of the individuals of this size have their leaves in the forest canopy.
Lianas were measured at 1.3 m height along the stem from their rooting point. To facilitate
comparison with other liana studies, we only included true lianas species: climbing plants
that produce true wood and that germinate on the ground but lose their ability to support
themselves as they grow, so they have to rely on external physical support to ascend to the
canopy (Gerwing et al. 2006). We distinguished genets from ramets for each individual
liana, based on rooting location and underground stem connections. This was checked by
removing litter. All multiple and non-rooted interconnected stems were assumed to belong
to the rooted individual and were counted as an individual clone group. However, in some
cases we could not reject with total certainty the possibility of below-ground connections.
We adopted as a general rule, that stems were treated as genets unless it was evident that
they had connections with other stems.
Major habitat types were defined using visual evaluation of superficial soil water
permanence criteria. Tierra firme forest (TF) is non-inundated terrain with sandy to loamy
Ewango_PROEF (all).ps Back - 16 T1 - Black

Chapter 2 – Structure and composition of liana
19
soils and a thin layer of organic matter, and swamp forest (SF) is terrain with hydromorphic
and alluvial soils along streambeds, regularly flooded during rainy periods. The canopy of
SF is much lower, more open, and less homogeneous than that of TF. Elevation, convexity
and slope were measured and calculated for each 20 × 20-m quadrat in the plot. Elevation
was obtained from the mean elevations at the four corners of a quadrat (Harms et al. 2001).
For each 5 × 5-m subquadrat we estimated canopy openness using a three-class semi-
quantitative scale (0: cover = <25%, 1: cover =25%-50%, 2: cover = 50%-100%). This
allows for a relative comparison of canopy structure across plots. Data were converted to
their midpoint values for further analysis.
If possible, we identified lianas to species in the field. All botanical identifications
were based on both reproductive (flowers or fruits) and vegetative (leaves, bark and trunks
form) characteristics of specimens collected or observed in the field. In most cases, either
fertile or sterile materials were collected for identifications at the reference Herbarium of
CEFRECOF at Epulu. Collected materials were later compared with identified collections
at international herbaria, notably the National Herbarium of the Netherlands-Wageningen
branch (WAG), National Botanical Garden of Belgium (BR, Meise) and Missouri Botanical
Garden (MO, St. Louis), where a set of voucher specimens was also deposited. Family
nomenclature in the present study follows the Angiosperms Phylogeny Group (APG,
Stevens 2001). Species nomenclature followed that of Lebrun & Stork (1991-1997).
Data analysis
We characterized liana floristic and structural components at a fine scale (20 × 20-m
quadrat), plot level (10 ha) and community level (20 ha). We used a conservative approach
in calculating species numbers by lumping morphospecies into one group of higher taxa
(i.e. genus or family) instead of considering them as several distinct species. All analyses in
the present paper are based on identifications at different taxonomic ranks: species (with all
subspecific taxa lumped under the parent species), genus and family. Morphogroups not
identified to a named taxon (9.8% of all recorded stems) were excluded from further
analyses.
To describe the liana community structure we calculated for each taxon the
Importance Value Index (IVI), i.e. the average percentage of relative density, frequency and
basal area (Ellenberg & Muller-Dombois 1974). The total number of species, genera and
families were tallied for each plot (10 ha) and for the whole community (20 ha). We plotted
each of the parameters following the method of Preston (1948), counting the frequency of
Ewango_PROEF (all).ps Front - 17 T1 - Black
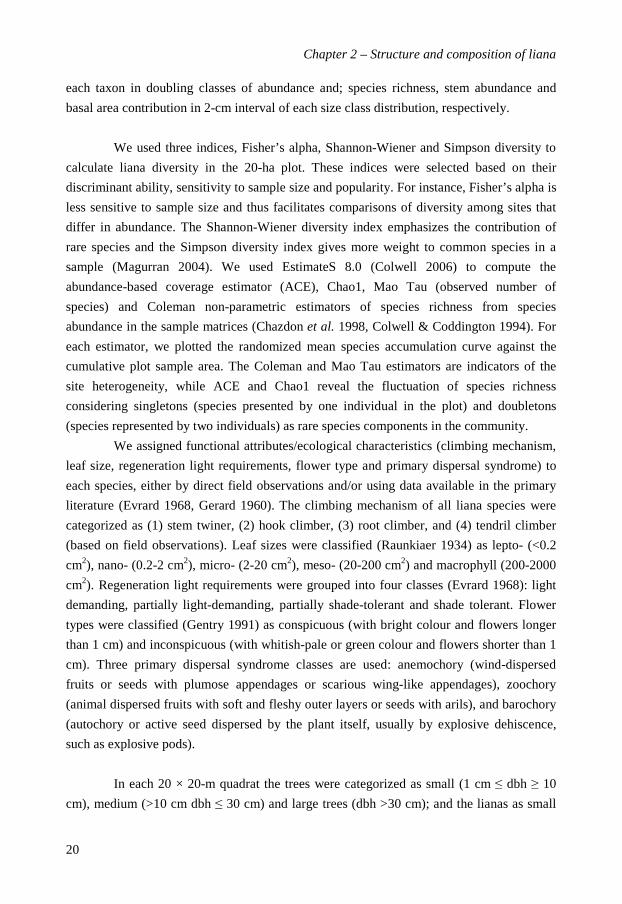
Chapter 2 – Structure and composition of liana
20
each taxon in doubling classes of abundance and; species richness, stem abundance and
basal area contribution in 2-cm interval of each size class distribution, respectively.
We used three indices, Fisher’s alpha, Shannon-Wiener and Simpson diversity to
calculate liana diversity in the 20-ha plot. These indices were selected based on their
discriminant ability, sensitivity to sample size and popularity. For instance, Fisher’s alpha is
less sensitive to sample size and thus facilitates comparisons of diversity among sites that
differ in abundance. The Shannon-Wiener diversity index emphasizes the contribution of
rare species and the Simpson diversity index gives more weight to common species in a
sample (Magurran 2004). We used EstimateS 8.0 (Colwell 2006) to compute the
abundance-based coverage estimator (ACE), Chao1, Mao Tau (observed number of
species) and Coleman non-parametric estimators of species richness from species
abundance in the sample matrices (Chazdon et al. 1998, Colwell & Coddington 1994). For
each estimator, we plotted the randomized mean species accumulation curve against the
cumulative plot sample area. The Coleman and Mao Tau estimators are indicators of the
site heterogeneity, while ACE and Chao1 reveal the fluctuation of species richness
considering singletons (species presented by one individual in the plot) and doubletons
(species represented by two individuals) as rare species components in the community.
We assigned functional attributes/ecological characteristics (climbing mechanism,
leaf size, regeneration light requirements, flower type and primary dispersal syndrome) to
each species, either by direct field observations and/or using data available in the primary
literature (Evrard 1968, Gerard 1960). The climbing mechanism of all liana species were
categorized as (1) stem twiner, (2) hook climber, (3) root climber, and (4) tendril climber
(based on field observations). Leaf sizes were classified (Raunkiaer 1934) as lepto- (<0.2
cm2), nano- (0.2-2 cm2), micro- (2-20 cm2), meso- (20-200 cm2) and macrophyll (200-2000
cm2). Regeneration light requirements were grouped into four classes (Evrard 1968): light
demanding, partially light-demanding, partially shade-tolerant and shade tolerant. Flower
types were classified (Gentry 1991) as conspicuous (with bright colour and flowers longer
than 1 cm) and inconspicuous (with whitish-pale or green colour and flowers shorter than 1
cm). Three primary dispersal syndrome classes are used: anemochory (wind-dispersed
fruits or seeds with plumose appendages or scarious wing-like appendages), zoochory
(animal dispersed fruits with soft and fleshy outer layers or seeds with arils), and barochory
(autochory or active seed dispersed by the plant itself, usually by explosive dehiscence,
such as explosive pods).
In each 20 × 20-m quadrat the trees were categorized as small (1 cm dbh 10
cm), medium (>10 cm dbh 30 cm) and large trees (dbh >30 cm); and the lianas as small
Ewango_PROEF (all).ps Back - 17 T1 - Black
Chapter 2 – Structure and composition of liana
21
(dbh 5 cm) or large (dbh > 5 cm). We tested the hypothesis that tree abundance (in
separate size classes) would affect the liana abundance (in separate size classes) using
backward multiple regression analysis (SPSS 15.0 for Windows; SPSS Inc. Chicago, IL,
USA).
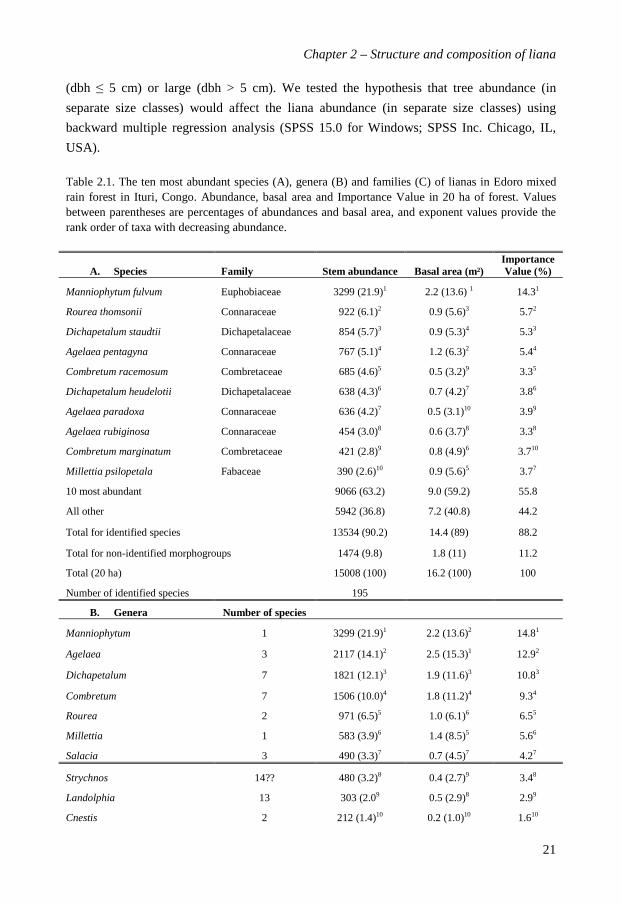
Table 2.1. The ten most abundant species (A), genera (B) and families (C) of lianas in Edoro mixed rain forest in Ituri, Congo. Abundance, basal area and Importance Value in 20 ha of forest. Values between parentheses are percentages of abundances and basal area, and exponent values provide the rank order of taxa with decreasing abundance.
A. Species Family Stem abundance Basal area (m²) Importance Value (%)
Manniophytum fulvum Euphobiaceae 3299 (21.9)1 2.2 (13.6) 1 14.31
Rourea thomsonii Connaraceae 922 (6.1)2 0.9 (5.6)3 5.72
Dichapetalum staudtii Dichapetalaceae 854 (5.7)3 0.9 (5.3)4 5.33
Agelaea pentagyna Connaraceae 767 (5.1)4 1.2 (6.3)2 5.44
Combretum racemosum Combretaceae 685 (4.6)5 0.5 (3.2)9 3.35
Dichapetalum heudelotii Dichapetalaceae 638 (4.3)6 0.7 (4.2)7 3.86
Agelaea paradoxa Connaraceae 636 (4.2)7 0.5 (3.1)10 3.99
Agelaea rubiginosa Connaraceae 454 (3.0)8 0.6 (3.7)8 3.38
Combretum marginatum Combretaceae 421 (2.8)9 0.8 (4.9)6 3.710
Millettia psilopetala Fabaceae 390 (2.6)10 0.9 (5.6)5 3.77
10 most abundant 9066 (63.2) 9.0 (59.2) 55.8
All other 5942 (36.8) 7.2 (40.8) 44.2
Total for identified species 13534 (90.2) 14.4 (89) 88.2
Total for non-identified morphogroups 1474 (9.8) 1.8 (11) 11.2
Total (20 ha) 15008 (100) 16.2 (100) 100
Number of identified species 195
B. Genera Number of species
Manniophytum 1 3299 (21.9)1 2.2 (13.6)2 14.81
Agelaea 3 2117 (14.1)2 2.5 (15.3)1 12.92
Dichapetalum 7 1821 (12.1)3 1.9 (11.6)3 10.83
Combretum 7 1506 (10.0)4 1.8 (11.2)4 9.34
Rourea 2 971 (6.5)5 1.0 (6.1)6 6.55
Millettia 1 583 (3.9)6 1.4 (8.5)5 5.66
Salacia 3 490 (3.3)7 0.7 (4.5)7 4.27
Strychnos 14?? 480 (3.2)8 0.4 (2.7)9 3.48
Landolphia 13 303 (2.09 0.5 (2.9)8 2.99
Cnestis 2 212 (1.4)10 0.2 (1.0)10 1.610
Ewango_PROEF (all).ps Front - 18 T1 - Black
Chapter 2 – Structure and composition of liana
22
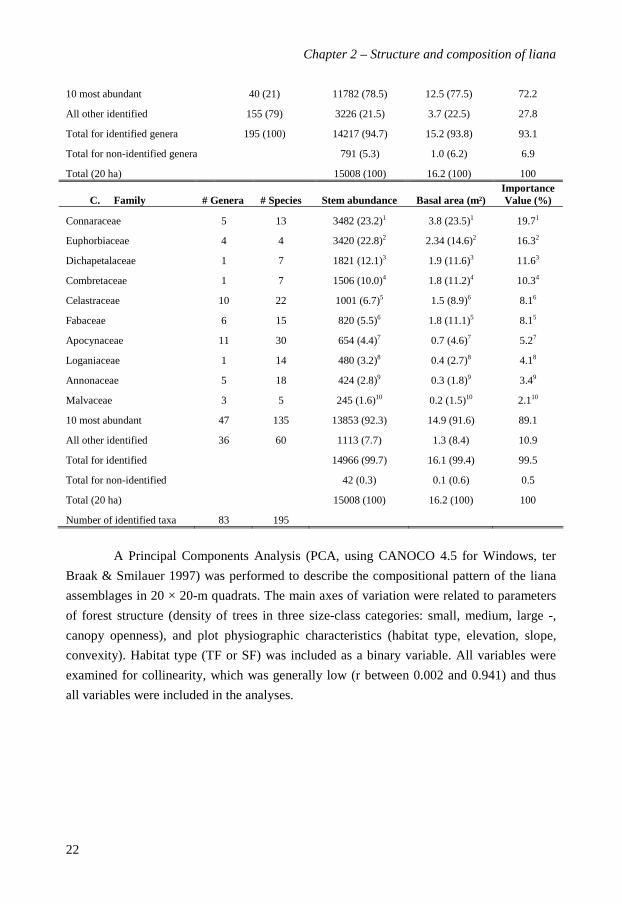
10 most abundant 40 (21) 11782 (78.5) 12.5 (77.5) 72.2
All other identified 155 (79) 3226 (21.5) 3.7 (22.5) 27.8
Total for identified genera 195 (100) 14217 (94.7) 15.2 (93.8) 93.1
Total for non-identified genera 791 (5.3) 1.0 (6.2) 6.9
Total (20 ha) 15008 (100) 16.2 (100) 100
C. Family # Genera # Species Stem abundance Basal area (m²) Importance Value (%)
Connaraceae 5 13 3482 (23.2)1 3.8 (23.5)1 19.71
Euphorbiaceae 4 4 3420 (22.8)2 2.34 (14.6)2 16.32
Dichapetalaceae 1 7 1821 (12.1)3 1.9 (11.6)3 11.63
Combretaceae 1 7 1506 (10.0)4 1.8 (11.2)4 10.34
Celastraceae 10 22 1001 (6.7)5 1.5 (8.9)6 8.16
Fabaceae 6 15 820 (5.5)6 1.8 (11.1)5 8.15
Apocynaceae 11 30 654 (4.4)7 0.7 (4.6)7 5.27
Loganiaceae 1 14 480 (3.2)8 0.4 (2.7)8 4.18
Annonaceae 5 18 424 (2.8)9 0.3 (1.8)9 3.49
Malvaceae 3 5 245 (1.6)10 0.2 (1.5)10 2.110
10 most abundant 47 135 13853 (92.3) 14.9 (91.6) 89.1
All other identified 36 60 1113 (7.7) 1.3 (8.4) 10.9
Total for identified 14966 (99.7) 16.1 (99.4) 99.5
Total for non-identified 42 (0.3) 0.1 (0.6) 0.5
Total (20 ha) 15008 (100) 16.2 (100) 100
Number of identified taxa 83 195
A Principal Components Analysis (PCA, using CANOCO 4.5 for Windows, ter
Braak & Smilauer 1997) was performed to describe the compositional pattern of the liana
assemblages in 20 × 20-m quadrats. The main axes of variation were related to parameters
of forest structure (density of trees in three size-class categories: small, medium, large -,
canopy openness), and plot physiographic characteristics (habitat type, elevation, slope,
convexity). Habitat type (TF or SF) was included as a binary variable. All variables were
examined for collinearity, which was generally low (r between 0.002 and 0.941) and thus
all variables were included in the analyses.
Ewango_PROEF (all).ps Back - 18 T1 - Black

Chapter 2 – Structure and composition of liana
23
Table 2.2. Liana community floristic and structural attributes of Edoro mixed rainforest, Ituri,
DR Congo (mean ± SD)
Site Edoro 1 Edoro 2 Edoro
20 x 20 m 1 ha 20 x 20 m 1 ha 20 x 20 m 1 ha Attribute
N=250 N=10 N=250 N=10 N=500 N=20
Structural and taxonomic recorded characteristics
Abundance 24.1 ± 13.7 603.6 ± 122.5 29.9 ± 15.1
749.8 ± 123.6 27.1 ± 0.7
676.7 ± 141.3
Basal area (x10-2 m²) 2 ± 1 61 ± 10 3 ± 1 82 ± 10 3 ± 0. 1 71 ± 10
Number of species 9.1 ± 3.5 54.8 ± 7.8 11.6 ± 3.5 73.1 ± 2.1 10.2 ± 0.2 63.9 ± 10.9
Number of genera 8.4 ± 3.1 39.0 ± 3.9 9.4 ± 2.8 42.3 ±2.6 9.1 ± 0.1 40.6 ± 3.7
Number of families 7.6 ± 2.4 21.7 ± 1.7 7.9 ± 2.2 22.2 ± 1.7 8.4 ± 0.1 21.9 ± 1.7
Species richness non-parametric estimators
ACE 19.8 ± 11.7 78.6 ± 10.3 25.2 ± 14.9 100.3 ± 9.3 19.9 ± 12.7 90.4 ± 17.0
Chao 1 18.8 ± 9.7 88.1 ± 24.4 25.4 ± 14.9 100.1 ± 14.8 20.5 ± 11.8 96.4 ± 21.9
Coleman 13.4 ± 2.6 62.8 ± 4.2 16.5 ± 2.9 85.9 ± 4.7 15.3 ± 2.9 80.1 ± 4.8
Mao Tau (Spp Obs) 9.1 ± 1.7 54.6 ± 4.3 11.6 ± 1.9 73.2 ± 4.8 10.4 ± 1.8 63.9 ± 5.0
Species diversity
Fisher's Alpha 6.2 ± 2.1 15.1 ± 1.2 8.4 ± 3.1 20.3 ± 1.4 7.4 ± 3.3 17.9 ± 1.3
Shannon-Wiener 1.9 ± 0.4 2.9 ± 0.1 2.1 ± 0. 3 3.2 ± 0.1 1.9 ± 0.4 3.1 ± 0.2
Species dominance
Simpson 6.9 ± 3.5 10.0 ± 1.6 8.7 ± 3.8 12.1 ± 1.7 8.4 ± 4.8 11.4 ± 1.9
RESULTS
Floristic and taxonomic diversity
A total of 15,008 stems was recorded in the two 10-ha plots. Of these stems, 90.2% (13,534
stems) were identified to species level and represented 195 species (see Appendix 2.1?? for
a complete list), 83 genera and 34 families (Table 2.1). Edoro-2 (169 species, 76 genera
and 33 families) was slightly richer than Edoro-1 (137 species, 72 genera and 31 families).
The ten most abundant species together accounted for 63.2% (9066 stems) of the total
number of stems and 59.2% (9.0 m²) of the total basal area. Manniophytum fulvum
(Euphorbiaceae) had the highest Importance Value Index (14.3%): it accounted for 21.9%
of all liana stems and 13.6% of the total basal area, and was distributed in 88.4% of the
Ewango_PROEF (all).ps Front - 19 T1 - Black
Chapter 2 – Structure and composition of liana
24
quadrats. The 10 most important genera harboured 40 species (21%) and contributed 78.5%
to the number of stems and 77.5% to the basal area. Manniophytum (Euphorbiaceae) was
the most abundant genus (21.9% of total number of stems), but Agelaea (Connaraceae) had
the highest basal area (15.3%). Landolphia (13 species) was the most species-rich genus but
contributed only 2% to the abundance and 2.9% to the basal area. Ten out of 34 families
contained 47 genera, and contributed 92.3% to the number of stems, 91.6% to the basal area
and 89.1% to the total Importance Value Index. The most species-rich families were
Apocynaceae (30 species), Celastraceae (22) and Annonaceae (18). Laccosperma
secundiflorum (Arecaceae) was the only palm liana in the IFDP liana assemblage.
Species richness and diversity
An average of 63.9 species, 40.6 genera and 21.9 families were recorded per hectare (Table
2.2). Fisher was 17.9, Shannon-Wiener index was 3.1 and Simpson dominance index was
11.4. Considering the whole community (20 ha), we found that the species estimates ranged
between Mao Tau (63.9) and Chao1 (96.4), where Chao1 is 1.5 times the observed species
number.
Ewango_PROEF (all).ps Back - 19 T1 - Black

25
Figure 2.2. (A) Species area curves for observed species richness (S Obs) and species richness estimators Chao 1, ACE and Coleman for lianas in the Edoro mixed forest of Ituri, and (B) Rank-importance curves for species, genera and families for lianas in 20 ha of mixed rain forest in Ituri. Taxon importance is calculated as the percentage of the total community Importance Value Index and in the graph log-transformed.
At the smaller scale of 20 × 20-m quadrats all of these values were considerably
lower (Table 2). The estimated species number was up to twice as high as the observed
number, but species dominance (Simpson) was rather similar. The species accumulation
curves (Figure 2.2a) did not attain an asymptote, despite the 20 ha of sampling area. Rare
species, defined as those found as singletons and doubletons remained numerous even in
large samples.
Ewango_PROEF (all).ps Front - 20 T1 - Black
Chapter 2 – Structure and composition of liana
26
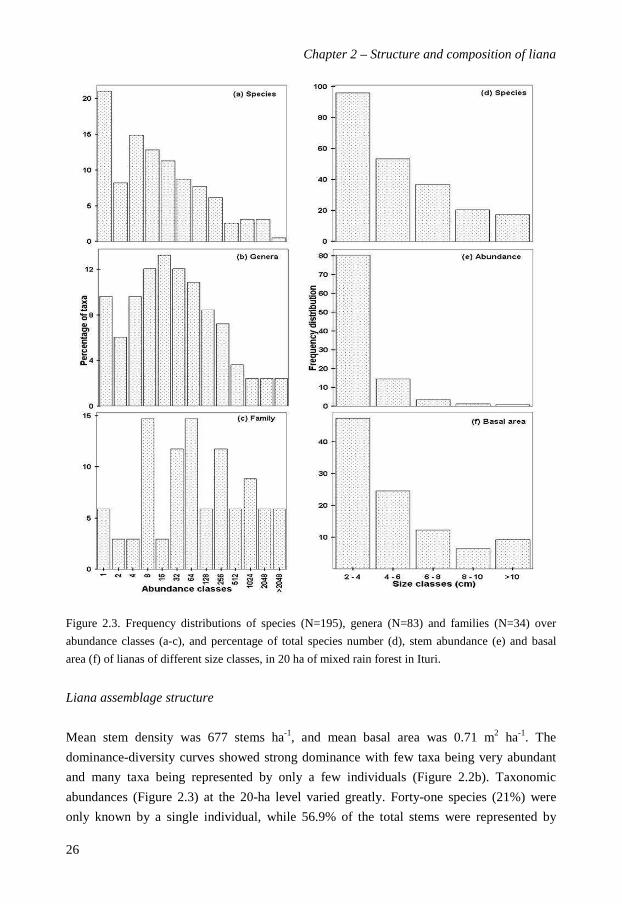
Figure 2.3. Frequency distributions of species (N=195), genera (N=83) and families (N=34) over
abundance classes (a-c), and percentage of total species number (d), stem abundance (e) and basal
area (f) of lianas of different size classes, in 20 ha of mixed rain forest in Ituri.
Liana assemblage structure
Mean stem density was 677 stems ha-1, and mean basal area was 0.71 m2 ha-1. The
dominance-diversity curves showed strong dominance with few taxa being very abundant
and many taxa being represented by only a few individuals (Figure 2.2b). Taxonomic
abundances (Figure 2.3) at the 20-ha level varied greatly. Forty-one species (21%) were
only known by a single individual, while 56.9% of the total stems were represented by
Ewango_PROEF (all).ps Back - 20 T1 - Black
Chapter 2 – Structure and composition of liana
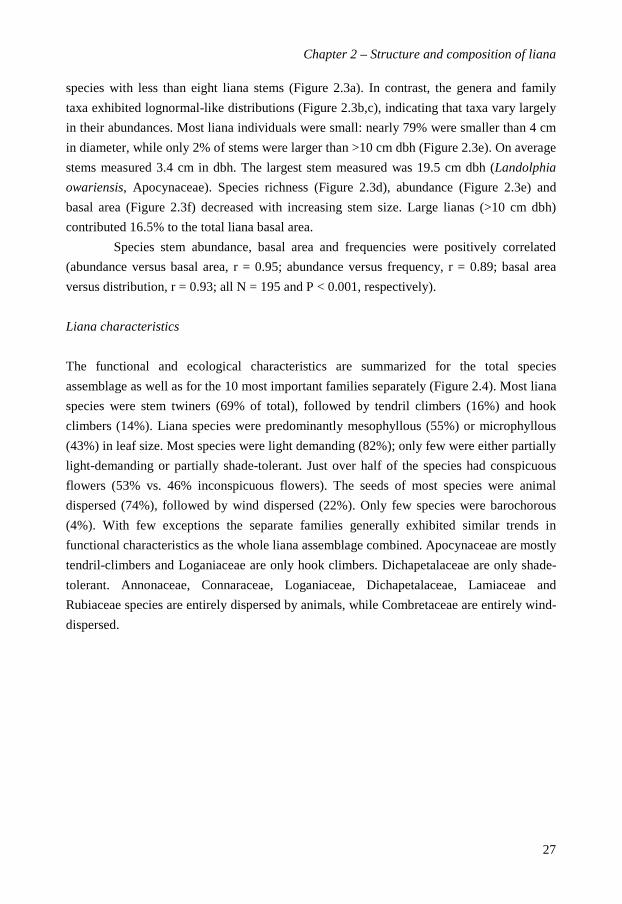
27
species with less than eight liana stems (Figure 2.3a). In contrast, the genera and family
taxa exhibited lognormal-like distributions (Figure 2.3b,c), indicating that taxa vary largely
in their abundances. Most liana individuals were small: nearly 79% were smaller than 4 cm
in diameter, while only 2% of stems were larger than >10 cm dbh (Figure 2.3e). On average
stems measured 3.4 cm in dbh. The largest stem measured was 19.5 cm dbh (Landolphia
owariensis, Apocynaceae). Species richness (Figure 2.3d), abundance (Figure 2.3e) and
basal area (Figure 2.3f) decreased with increasing stem size. Large lianas (>10 cm dbh)
contributed 16.5% to the total liana basal area.
Species stem abundance, basal area and frequencies were positively correlated
(abundance versus basal area, r = 0.95; abundance versus frequency, r = 0.89; basal area
versus distribution, r = 0.93; all N = 195 and P < 0.001, respectively).
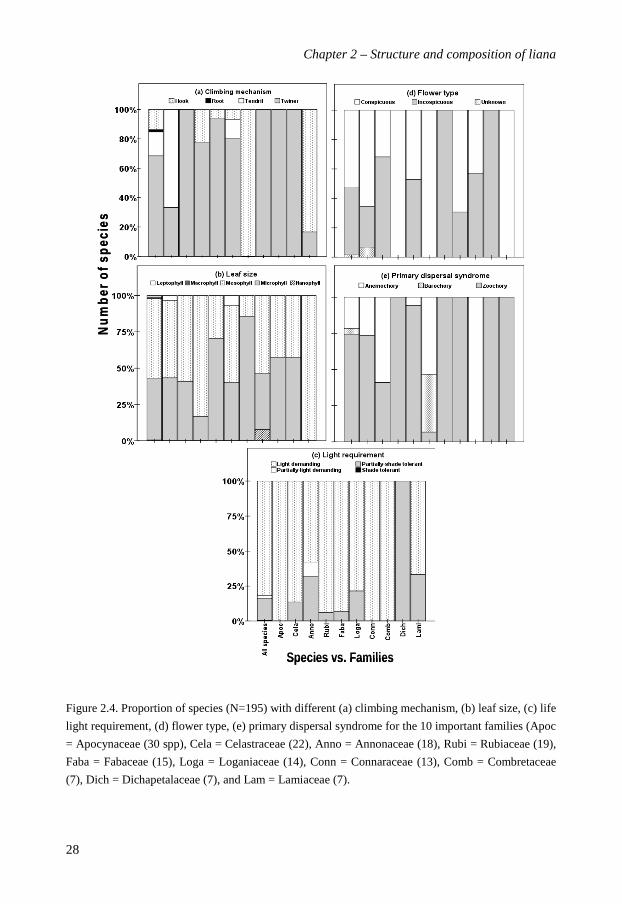
Liana characteristics
The functional and ecological characteristics are summarized for the total species
assemblage as well as for the 10 most important families separately (Figure 2.4). Most liana
species were stem twiners (69% of total), followed by tendril climbers (16%) and hook
climbers (14%). Liana species were predominantly mesophyllous (55%) or microphyllous
(43%) in leaf size. Most species were light demanding (82%); only few were either partially
light-demanding or partially shade-tolerant. Just over half of the species had conspicuous
flowers (53% vs. 46% inconspicuous flowers). The seeds of most species were animal
dispersed (74%), followed by wind dispersed (22%). Only few species were barochorous
(4%). With few exceptions the separate families generally exhibited similar trends in
functional characteristics as the whole liana assemblage combined. Apocynaceae are mostly
tendril-climbers and Loganiaceae are only hook climbers. Dichapetalaceae are only shade-
tolerant. Annonaceae, Connaraceae, Loganiaceae, Dichapetalaceae, Lamiaceae and
Rubiaceae species are entirely dispersed by animals, while Combretaceae are entirely wind-
dispersed.
Ewango_PROEF (all).ps Front - 21 T1 - Black
Chapter 2 – Structure and composition of liana
28
Species vs. Families
Nu
mb
er o
f sp
ecie
s
Species vs. Families
Nu
mb
er o
f sp
ecie
s
Figure 2.4. Proportion of species (N=195) with different (a) climbing mechanism, (b) leaf size, (c) life
light requirement, (d) flower type, (e) primary dispersal syndrome for the 10 important families (Apoc
= Apocynaceae (30 spp), Cela = Celastraceae (22), Anno = Annonaceae (18), Rubi = Rubiaceae (19),
Faba = Fabaceae (15), Loga = Loganiaceae (14), Conn = Connaraceae (13), Comb = Combretaceae
(7), Dich = Dichapetalaceae (7), and Lam = Lamiaceae (7).
Ewango_PROEF (all).ps Back - 21 T1 - Black

Chapter 2 – Structure and composition of liana
29
Factors driving the abundance and distribution of lianas
Species richness and abundance of lianas were positively related to richness and abundance
of trees, although the explained variation was very low (r2 = 0.02 and 0.01, P < 0.01 in both
cases). Especially large-sized trees were important for liana abundance (Table 2.3);
medium-sized trees had a large positive effect and, surprisingly, small trees had no effect at
all.
Table 2.3. Pearson’s correlations of liana abundance with abundance of trees in different stem diameter at breast height size classes in the Ituri mixed forest (N=500 quadrats). r is the Pearson coefficient of correlation, P is significance level (** P < 0.01, *** P < 0.001, ns = not significant).
Small trees (1-10 cm)
Medium trees (> 10-30 cm)
Large trees (> 30 cm) Stature category
r P r p r P
Small lianas (2-50 cm) 0.08 ns 0.15 ** 0.25 *** Large lianas (> 5 cm) 0.04 ns 0.11 ** 0.09 ns All size-class lianas 0.08 ns 0.16 *** 0.23 ***
The multivariate PCA showed that the two principal components together
explained 50.3% of the multivariate variation in liana species abundances across the 500
quadrats. Axis 1 (32.1%) was strongly related to canopy openness and tree stature of the
quadrats (forest structure) (Table 2.4) while axis 2 (18.2%) was also related to forest
structure (canopy openness and medium-sized trees) but most importantly to the moisture
(swamp versus tierra firme) and microtopography (elevation, convexity) of the quadrats
(Figure 2.5a, b). Liana abundance and distribution reflect the mixed forest canopy structure
in the ordination projection, in which many quadrats have an open canopy. The majority of
species were aggregated in tierra firme habitat with open and comparatively low canopy
stature. A limited number of species were associated either to swamp or to tierra firme
areas and few were associated to medium-sized trees (Figure 2.5c, Table 2.4).
DISCUSSION
The liana assemblage in the Ituri mixed lowland forest showed remarkable trends in
floristic composition, structure and functional traits. Lianas were more abundant and
diverse then reported for other forests, and the assemblage consisted of many small and
only few large individuals. Twiners, zoochorous, light-demanding and meso- or
microphyllous species dominated. Flower types were equally distributed among the two
classes. Individual species differences in abundance and distribution were partly driven by
Ewango_PROEF (all).ps Front - 22 T1 - Black
Chapter 2 – Structure and composition of liana
30
micro-environmental variation in canopy openness, and to a lesser extent by habitat
moisture.
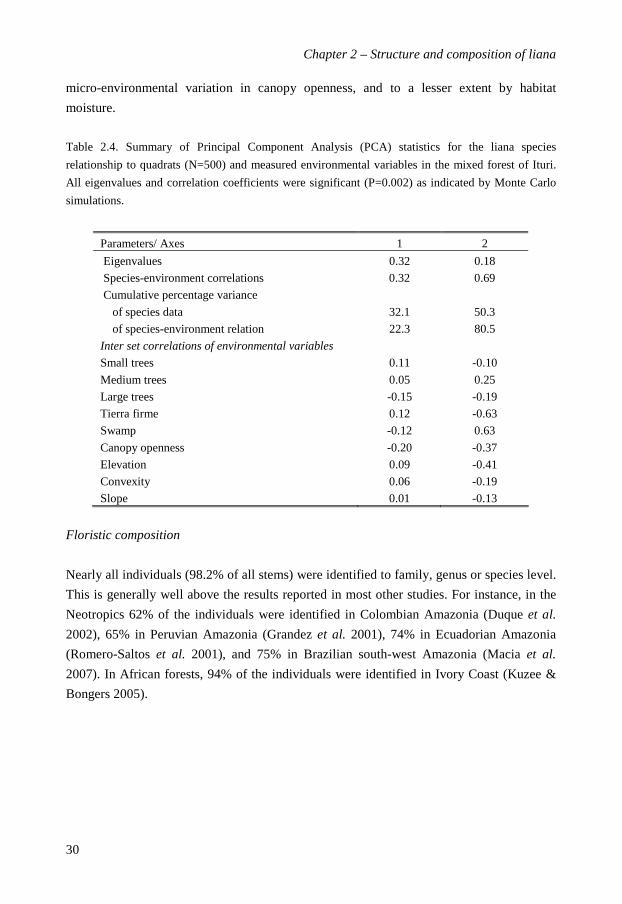
Table 2.4. Summary of Principal Component Analysis (PCA) statistics for the liana species
relationship to quadrats (N=500) and measured environmental variables in the mixed forest of Ituri.
All eigenvalues and correlation coefficients were significant (P=0.002) as indicated by Monte Carlo
simulations.
Parameters/ Axes 1 2
Eigenvalues 0.32 0.18
Species-environment correlations 0.32 0.69
Cumulative percentage variance
of species data 32.1 50.3
of species-environment relation 22.3 80.5
Inter set correlations of environmental variables
Small trees 0.11 -0.10
Medium trees 0.05 0.25
Large trees -0.15 -0.19
Tierra firme 0.12 -0.63
Swamp -0.12 0.63
Canopy openness -0.20 -0.37
Elevation 0.09 -0.41
Convexity 0.06 -0.19
Slope 0.01 -0.13
Floristic composition
Nearly all individuals (98.2% of all stems) were identified to family, genus or species level.
This is generally well above the results reported in most other studies. For instance, in the
Neotropics 62% of the individuals were identified in Colombian Amazonia (Duque et al.
2002), 65% in Peruvian Amazonia (Grandez et al. 2001), 74% in Ecuadorian Amazonia
(Romero-Saltos et al. 2001), and 75% in Brazilian south-west Amazonia (Macia et al.
2007). In African forests, 94% of the individuals were identified in Ivory Coast (Kuzee &
Bongers 2005).
Ewango_PROEF (all).ps Back - 22 T1 - Black

31
Figure 2.5
Ordination diagrams (Principal Component Analysis) showing the relationship between 195 liana species and environmental parameters in 500 quadrats. (a) environmental factors (note that tierra firme and swamp factors for quadrats are computed as presence/absence dummy variables), (b) scores of tierra firme (open circle) and swamp (triangle) plots and, (c) species scores in the Ituri mixed forest. Abbreviations of species names are based on the first four letters of the genus and the first two letters of the species names (for full species names see Appendix 2.1).
The liana flora in our study plots was dominated by only a few widespread and more
generalist species, among them, Manniophytum fulvum. Such dominance may be the result
of effective dispersal capacity, prolific vegetative sprouting, lack of specific habitat
requirements and low abundance of seed predators, or combinations of these. Although this
species is generally thought to be light-demanding, it is also found in shady environments.
No apparent predator is known to attack its seeds.
Species composition and family dominance are largely the same as those found in
most African tropical forests studied (West Africa: Jongkind & Hawthorne 2005, Ghana:
Swaine et al. 2005; Cameroon: Parren 2003, Tchouto 2004; Ivory Coast: Kuzee & Bongers
Ewango_PROEF (all).ps Front - 23 T1 - Black

Chapter 2 – Structure and composition of liana
32
2005, and Uganda: Eilu 2001). The IFDP liana community exhibits taxonomic
characteristics (i.e. species, genera and families) also found elsewhere in the Guineo-
Congolian liana flora. The most abundant species and families (Connaraceae,
Euphorbiaceae, Dichapetalaceae, Combretaceae, Celastraceae, Fabaceae and Apocynaceae)
are widely distributed in the Upper Guinea region (see Addo-Fordjour et al. 2008, Jongkind
& Hawthorne 2005, Muoghalu & Okeesan 2005, Natta & Sinsin 2005, Swaine et al. 2005),
suggesting that all West and Central African lowland forests are similar in the taxonomic
composition of their lianas communities.
Diversity and community structure
Lianas in the Ituri forest are abundant and diverse, and species diversity in our plot was
high when compared to many other tropical forests (DeWalt et al. 2010, Parren 2003). The
total number of liana species (195 species) in our dataset falls in the range of species
numbers reported for other primary lowland forests in Africa and the Neotropics. Kuzee &
Bongers (2005) recorded 156 liana species for 20-y-old and mature forest in Côte d’Ivoire,
with on average 54 species per plot of varied forest structure and age. Liana community
species richness in the Ituri Forest (on average 64 species ha-1) is comparable to other
tropical forests: 65 species ha-1 in Panama ( 2 cm dbh, Putz 1984), 68 species ha-1 in
Cameroon (Parren 2003), and 70 species ha-1 in Brazilian Amazonia (Laurance et al. 2001).
Schnitzer & Bongers (2002) reported an average of 39 species ha-1 for some African
forests, and hence the Ituri Forest liana community can be placed among the richest in
Africa.
Species richness (observed number of species, ACE and Chao 1; Figure 2) and
species diversity (Shannon-Wiener and Fisher ) indices increased with sample sizes, as
predicted. The continuous increase of richness and diversity, even after 20 ha, suggests that
the total number of species would continue to increase with plot size, despite the plots
being located in a rather homogeneous forest. The majority of species are rare, and
therefore the probability of their occurrence still increases with plot size.
The IFDP contains a few highly abundant lianas. Manniophytum fulvum accounts
for 22% of all liana stems, with 3299 individuals in 20 ha, and it is nearly threefold more
important than the next species in line (Rourea thomsonii). This single species dominance
(22%) is exceptional, compared to other studies of liana assemblages, even if these forests
also had dominant liana species: Moutabea aculeata (Polygalaceae) accounted for 17% of
the stems at La Selva (Burnham 2002, DeWalt et al. 2000, Nabe-Nielsen 2001), while
Strophanthus barteri (Apocynaceae) accounted for 12% of the stems in Ghana (Addo-
Ewango_PROEF (all).ps Back - 23 T1 - Black
Chapter 2 – Structure and composition of liana
33
Fordjour et al. 2008). Machaerium cuspidatum (Fabaceae) represented 11% of all stems
censused in Yasuni National Park, Ecuador (Burnham 2002, Nabe-Nielsen 2001) while
11% of all stems in both secondary and primary forests in Panama belonged to Maripa
panamensis (Convolvulaceae; DeWalt et al. 2000). Possibly, M. fulvum, a light-demanding
species, is likely to have taken advantage of recent disturbances but the population is now
declining due to gap closure. Family dominance, however, was in line with other studies in
Africa, with Connaraceae, Euphorbiaceae, Dichapetalaceae, Combretaceae, Celastraceae,
and Fabaceae being the most important families. The general dominance in the Ituri forest
(10 out of 195 liana species represent 63.2% of the stems) may be characteristic of the Ituri
forest, as also the tree assemblage shows a strong dominance (Hart 1985).
Small lianas account for the highest species richness, abundance and basal area
(Figure 2.3d,e,f), and, compared to other tropical forests, Ituri forest is particularly poor in
large lianas stems. The Ituri forest lianas had a relatively low basal area (0.7 m2 ha-1),
comparable to southern Cameroonian forests (0.3 to 1.6 m2 ha-1, Parren 2003), and 1.1 m2
ha-1 in a Nigerian secondary forest (Muoghalu & Okeesan 2005). Richards (1952) advanced
that Africa is typical for its high liana density, but we hypothetically argue that having
many lianas individuals and few big ones may be because Ituri Forest is a dynamic forest
with recent disturbances. It might even be that its high liana density is caused by the fact
that the forest is relatively seasonal, and that only few big lianas are present because it is
too wet.
Liana density in Ituri (mean 677 liana stems ha-1, Table 1) is also high when
compared to other African forests (DeWalt et al. 2010). Lowland tropical rain forest in
Cameroon, for example, had 408 lianas ha-1 (Parren 2003). Wet lowland Neotropical forests
had, on average, higher number of lianas than Paleotropical forests (DeWalt et al. 2010). In
four Neotropical forests liana stems 2.5 cm dbh averaged 605 ha-1 (DeWalt & Chave
2004). However, Bolivian Amazon forests are known to be exceptionally liana-dense
(mean of 2471 lianas ha-1 2 cm dbh) and in these forests lianas can constitute as much as
44% of the total woody species (Pérez-Salicrup et al. 2001). As most studies of floristic and
structural characteristics of lianas are difficult to compare due to the lack of standardized
methodology we welcome recent standardizations (Gerwing et al. 2006, Parren et al. 2005,
Schnitzer et al. 2008). It is important to emphasize that lianas, despite their high abundance,
have only low biomass in our study area compared to other tropical rain forests (e.g. in
Brazil, Klinge & Rodriguez 1974; Venezuela, Putz 1983; Bolivia, Pérez-Salicrup et al.
2001, 2004; West Africa, Parren 2003). This is consistent with the observation that lianas in
our studied plots are mainly of small size.
Ewango_PROEF (all).ps Front - 24 T1 - Black
Chapter 2 – Structure and composition of liana
34
Functional characteristics of the liana community
In Ituri, twining is the dominant climbing mode (70% of the species, figure 4a). Our
findings corroborate with many others in the tropical forests. DeWalt et al. (2000) showed
that both stem and branch twiners were more common in later successional forests in
Panama. Twiners counted for more than half (63%) of the liana community of the semi-
deciduous rain forest in Ghana (Addo-Fordjour et al. 2008). Twining featured prominently
as climbing mechanism in the Xishuangbanna forests, southern China (Cai et al. 2009) and
in Central Amazonian forest in Brazil (Laurence et al. 2001). Because of their ability to
ascent trees directly via twining, twining species colonize indistinctively a wide range of
trees and species. Herbivory in the understorey has been reported as an ecological factor
inducing twining in climbing plant (Gianoli & Molina-Montenegro 2005). Families with
tough and heavy stems tend to rely on safe. There seems to be an association between stems
mechanical architecture and climbing mechanism; some families with heavy stem are
entirely twiners (e.g. Celastraceae, Connaraceae, Combretaceae and Rubiaceae) or hook-
climbing (e.g. Loganiaceae), while other families that tend to have flexible stems also rely
on tendrils (e.g. Apocynaceae).
Herbaceous climbers are generally light-demanding, since they establish and grow
well in large clearings (Putz 1984) while in contrast, woody lianas often occur in very
heterogeneous light habitats such as in old gaps, forest margins and under irregular and
broken forest canopies (Hegarty & Caballé 1991, Putz 1984). Our findings indicate that
lianas are common in both deep shade and full-sun environments, and thus may possess a
broad intraspecific physiological plasticity which strongly affects survival, growth and
competitive ability (Cai et al. 2008). Most liana species can start their life as a seedling in
the understorey, and wait for a long time until they find support and get access to the
canopy. Liana abundance in old-growth forest is therefore not so much determined by light
availability, but more by the availability of trellis trees (Table 2.3, cf. Carter & Teramura
1988). Most lianas in this study have been classified as light-demanders, because they need
bright light in the adult stage (Figure 2.4c). Eighteen per cent of the liana species were
classified as being (partially) shade tolerant. These species have the ability to remain self-
supporting for a longer time, and they can grow several meters tall before they have to rely
on trees for support. If they do not find support, they can flower and reproduce as a self-
supporting plant in the shaded understorey, such as for instance the case for Millettia
psilopetala, Strychnos camptoneura, S. icaja, Trichoscypha reygaertii and Dichapetalum
spp.
Ewango_PROEF (all).ps Back - 24 T1 - Black
Chapter 2 – Structure and composition of liana
35
About half of the species featured conspicuous flowers, while the other half
featured inconspicuous flowers (Figure 2.4d). Species with conspicuous flowers are likely
to be pollinated by birds, while species with inconspicuous flowers are likely to be
pollinated by small insects such as bees and flies. The prevalence of zoochory and animal-
mediated pollination confirms the faunal dependence of the majority of liana species, as is
the case for most other rain-forest plants (Bawa 1980, Bullock 1995). This is important for
conservation: lianas rely on animals for their seed dispersal and pollination, whilst animals
rely on them for food and habitat (Ødegaard 2000, Schnitzer & Bongers 2002). Gentry
(1991a) argued that animal dispersal is a characteristic feature of tropical rain-forest plants,
as in such wind-still, closed-canopy forests seed dispersal is most effectively done by
animals. In our study site we indeed found zoochory (74% of the species) to be the
predominant dispersal mechanism of lianas, in line with other liana studies (Addo-Fordjour
et al. 2008, Gentry 1991, Senbeta et al. 2005). In contrast, in semi-evergreen and dry
evergreen forests, wind dispersal can be dominant, dispersal mechanism, and up to 60% of
the species may be anemochorous (Cai et al. 2009, Muthuramkumar & Parthasarathy 2000,
Parthasarathy et al. 2004). This can be explained by the fact that in dry forest with a
seasonally open canopy, wind can disperse seeds more effectively.
Environmental effects on liana species composition
Our results showed that abundance and distribution of most lianas were influenced by
forest structure and micro-environmental variation in the plots (Figure 2.5). Openness of
the canopy creates higher irradiance at the forest floor which is favourable for liana
proliferation (Schnitzer & Carson 2001, Schnitzer et al. 2004). Lianas occurred in all
quadrats, but their abundance was related to canopy openness, habitat moisture and
elevation. These results are in accordance with Maestre & Cortina (2004), who showed that
associations between plants and their habitat can give rise to a complex combination of
positive and negative interactions, with a net outcome that depends on the abiotic and
community contexts. The species richness and abundance of lianas was positively
correlated with that of trees in the same quadrats (Table 2.3), which suggests that both trees
and liana diversity and abundance are driven by the same local environmental conditions.
Most liana species were found in open terra firme habitats (Figure 2.5). This small-scale
pattern parallels observations done at larger spatial scales; that lianas tend to be most
abundant in drier forests with a seasonally open canopy (DeWalt et al. 2010, Gentry 1991a,
Schnitzer 2005).
Ewango_PROEF (all).ps Front - 25 T1 - Black

Chapter 2 – Structure and composition of liana
36
In conclusion, this study shows that, in terms of structure and family composition,
the liana community in IFDP is typical for a Guineo-Congolian old-growth forest, with
prominent liana taxa being Dichapetalaceae, Connaraceae, Fabaceae, Apocynaceae and
Loganiaceae. However, the Ituri Forest also differs from other Guineo-Congolian forests
because it has a high liana abundance, basal area, and species richness, in the small size
classes. In addition, the extreme dominance of one single liana species (Manniophyton
fulvum) renders it unique compared to other forests worldwide.
Ewango_PROEF (all).ps Back - 25 T1 - Black
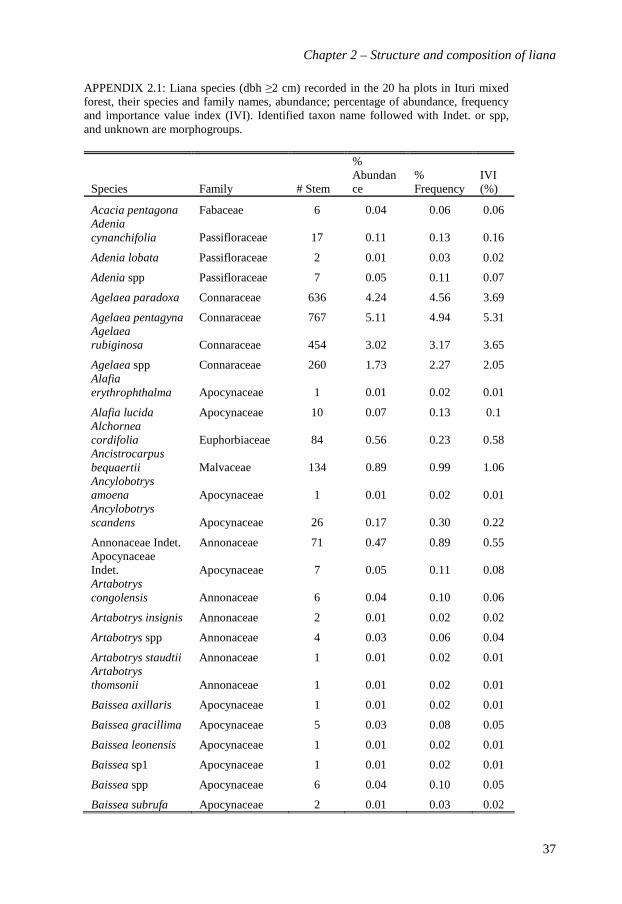
Chapter 2 – Structure and composition of liana
37
APPENDIX 2.1: Liana species (dbh 2 cm) recorded in the 20 ha plots in Ituri mixed forest, their species and family names, abundance; percentage of abundance, frequency and importance value index (IVI). Identified taxon name followed with Indet. or spp, and unknown are morphogroups.
Species Family # Stem
% Abundance
% Frequency
IVI (%)
Acacia pentagona Fabaceae 6 0.04 0.06 0.06 Adenia cynanchifolia Passifloraceae 17 0.11 0.13 0.16
Adenia lobata Passifloraceae 2 0.01 0.03 0.02
Adenia spp Passifloraceae 7 0.05 0.11 0.07
Agelaea paradoxa Connaraceae 636 4.24 4.56 3.69
Agelaea pentagyna Connaraceae 767 5.11 4.94 5.31 Agelaea rubiginosa Connaraceae 454 3.02 3.17 3.65
Agelaea spp Connaraceae 260 1.73 2.27 2.05 Alafia erythrophthalma Apocynaceae 1 0.01 0.02 0.01
Alafia lucida Apocynaceae 10 0.07 0.13 0.1 Alchornea cordifolia Euphorbiaceae 84 0.56 0.23 0.58 Ancistrocarpus bequaertii Malvaceae 134 0.89 0.99 1.06 Ancylobotrys amoena Apocynaceae 1 0.01 0.02 0.01 Ancylobotrys scandens Apocynaceae 26 0.17 0.30 0.22
Annonaceae Indet. Annonaceae 71 0.47 0.89 0.55 Apocynaceae Indet. Apocynaceae 7 0.05 0.11 0.08 Artabotrys congolensis Annonaceae 6 0.04 0.10 0.06
Artabotrys insignis Annonaceae 2 0.01 0.02 0.02
Artabotrys spp Annonaceae 4 0.03 0.06 0.04
Artabotrys staudtii Annonaceae 1 0.01 0.02 0.01 Artabotrys thomsonii Annonaceae 1 0.01 0.02 0.01
Baissea axillaris Apocynaceae 1 0.01 0.02 0.01
Baissea gracillima Apocynaceae 5 0.03 0.08 0.05
Baissea leonensis Apocynaceae 1 0.01 0.02 0.01
Baissea sp1 Apocynaceae 1 0.01 0.02 0.01
Baissea spp Apocynaceae 6 0.04 0.10 0.05
Baissea subrufa Apocynaceae 2 0.01 0.03 0.02
Ewango_PROEF (all).ps Front - 26 T1 - Black
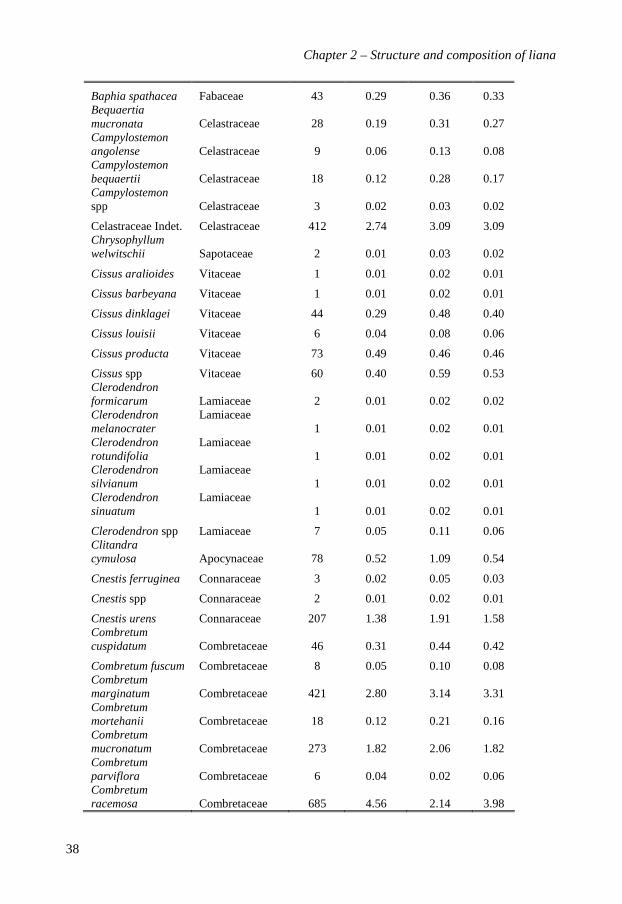
Chapter 2 – Structure and composition of liana
38
Baphia spathacea Fabaceae 43 0.29 0.36 0.33 Bequaertia mucronata Celastraceae 28 0.19 0.31 0.27 Campylostemon angolense Celastraceae 9 0.06 0.13 0.08 Campylostemon bequaertii Celastraceae 18 0.12 0.28 0.17 Campylostemonspp Celastraceae 3 0.02 0.03 0.02
Celastraceae Indet. Celastraceae 412 2.74 3.09 3.09 Chrysophyllum welwitschii Sapotaceae 2 0.01 0.03 0.02
Cissus aralioides Vitaceae 1 0.01 0.02 0.01
Cissus barbeyana Vitaceae 1 0.01 0.02 0.01
Cissus dinklagei Vitaceae 44 0.29 0.48 0.40
Cissus louisii Vitaceae 6 0.04 0.08 0.06
Cissus producta Vitaceae 73 0.49 0.46 0.46
Cissus spp Vitaceae 60 0.40 0.59 0.53 Clerodendron formicarum Lamiaceae 2 0.01 0.02 0.02 Clerodendron melanocrater
Lamiaceae 1 0.01 0.02 0.01
Clerodendron rotundifolia
Lamiaceae 1 0.01 0.02 0.01
Clerodendron silvianum
Lamiaceae 1 0.01 0.02 0.01
Clerodendron sinuatum
Lamiaceae 1 0.01 0.02 0.01
Clerodendron spp Lamiaceae 7 0.05 0.11 0.06 Clitandra cymulosa Apocynaceae 78 0.52 1.09 0.54
Cnestis ferruginea Connaraceae 3 0.02 0.05 0.03
Cnestis spp Connaraceae 2 0.01 0.02 0.01
Cnestis urens Connaraceae 207 1.38 1.91 1.58 Combretum cuspidatum Combretaceae 46 0.31 0.44 0.42
Combretum fuscum Combretaceae 8 0.05 0.10 0.08 Combretum marginatum Combretaceae 421 2.80 3.14 3.31 Combretum mortehanii Combretaceae 18 0.12 0.21 0.16 Combretum mucronatum Combretaceae 273 1.82 2.06 1.82 Combretum parviflora Combretaceae 6 0.04 0.02 0.06 Combretum racemosa Combretaceae 685 4.56 2.14 3.98
Ewango_PROEF (all).ps Back - 26 T1 - Black
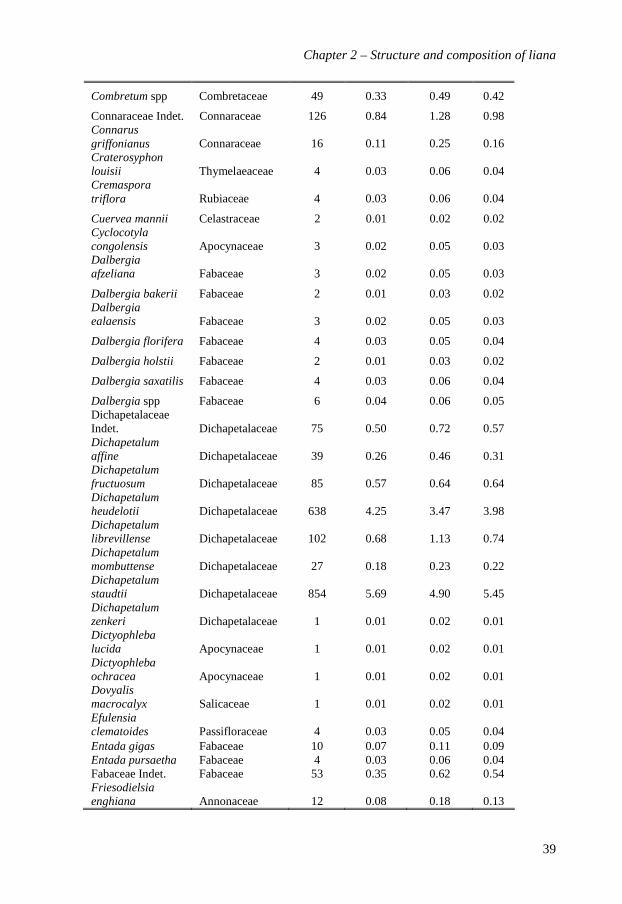
Chapter 2 – Structure and composition of liana
39
Combretum spp Combretaceae 49 0.33 0.49 0.42
Connaraceae Indet. Connaraceae 126 0.84 1.28 0.98 Connarus griffonianus Connaraceae 16 0.11 0.25 0.16 Craterosyphon louisii Thymelaeaceae 4 0.03 0.06 0.04 Cremaspora triflora Rubiaceae 4 0.03 0.06 0.04
Cuervea mannii Celastraceae 2 0.01 0.02 0.02 Cyclocotyla congolensis Apocynaceae 3 0.02 0.05 0.03 Dalbergia afzeliana Fabaceae 3 0.02 0.05 0.03
Dalbergia bakerii Fabaceae 2 0.01 0.03 0.02 Dalbergia ealaensis Fabaceae 3 0.02 0.05 0.03
Dalbergia florifera Fabaceae 4 0.03 0.05 0.04
Dalbergia holstii Fabaceae 2 0.01 0.03 0.02
Dalbergia saxatilis Fabaceae 4 0.03 0.06 0.04
Dalbergia spp Fabaceae 6 0.04 0.06 0.05 Dichapetalaceae Indet. Dichapetalaceae 75 0.50 0.72 0.57 Dichapetalum affine Dichapetalaceae 39 0.26 0.46 0.31 Dichapetalum fructuosum Dichapetalaceae 85 0.57 0.64 0.64 Dichapetalum heudelotii Dichapetalaceae 638 4.25 3.47 3.98 Dichapetalum librevillense Dichapetalaceae 102 0.68 1.13 0.74 Dichapetalum mombuttense Dichapetalaceae 27 0.18 0.23 0.22 Dichapetalum staudtii Dichapetalaceae 854 5.69 4.90 5.45 Dichapetalum zenkeri Dichapetalaceae 1 0.01 0.02 0.01 Dictyophleba lucida Apocynaceae 1 0.01 0.02 0.01 Dictyophleba ochracea Apocynaceae 1 0.01 0.02 0.01 Dovyalis macrocalyx Salicaceae 1 0.01 0.02 0.01 Efulensia clematoides Passifloraceae 4 0.03 0.05 0.04 Entada gigas Fabaceae 10 0.07 0.11 0.09 Entada pursaetha Fabaceae 4 0.03 0.06 0.04 Fabaceae Indet. Fabaceae 53 0.35 0.62 0.54 Friesodielsia enghiana Annonaceae 12 0.08 0.18 0.13
Ewango_PROEF (all).ps Front - 27 T1 - Black

Chapter 2 – Structure and composition of liana
40
Grewia malacocarpoides Malvaceae 9 0.06 0.13 0.08
Grewia seretii Malvaceae 59 0.39 0.51 0.45
Grewia spp Malvaceae 32 0.21 0.21 0.21
Grewia ugandensis Malvaceae 2 0.01 0.03 0.02 Helictonema velutina Celastraceae 3 0.02 0.03 0.03 Hippocratea myriantha Celastraceae 7 0.05 0.08 0.07 Hugonia platysepala Linaceae 44 0.29 0.62 0.38 Illigera pentaphylla Hernandiaceae 20 0.13 0.26 0.18
Iodes africana Icacinaceae 1 0.01 0.02 0.01
Jasminum bakeri Oleaceae 5 0.03 0.08 0.05
Keetia gueinzii Rubiaceae 3 0.02 0.05 0.03
Keetia mannii Rubiaceae 5 0.03 0.08 0.05 Keetia molundensis Rubiaceae 15 0.10 0.11 0.15
Keetia multiflora Rubiaceae 2 0.01 0.03 0.02
Keetia ornata Rubiaceae 1 0.01 0.02 0.01
Keetia spp Rubiaceae 3 0.02 0.05 0.03
Keetia venosa Rubiaceae 7 0.05 0.11 0.07 Laccosperma secundiflorum Arecaceae 117 0.78 0.31 0.78 Landolphia angustisepala Apocynaceae 1 0.01 0.02 0.01 Landolphia eminiana Apocynaceae 3 0.02 0.05 0.03 Landolphia forestiana Apocynaceae 16 0.11 0.18 0.16
Landolphia glabra Apocynaceae 7 0.05 0.10 0.07
Landolphia incerta Apocynaceae 82 0.55 1.05 0.58 Landolphia landolphioides Apocynaceae 6 0.04 0.05 0.06 Landolphia ligustrifolia Apocynaceae 10 0.07 0.11 0.09
Landolphia mannii Apocynaceae 12 0.08 0.13 0.13 Landolphia owariensis Apocynaceae 121 0.81 1.64 0.87
Landolphia sp1 Apocynaceae 25 0.17 0.33 0.21
Landolphia sp2 Apocynaceae 14 0.10 0.20 0.14
Landolphia sp3 Apocynaceae 1 0.01 0.02 0.01
Landolphia villosa Apocynaceae 5 0.03 0.08 0.05
Ewango_PROEF (all).ps Back - 27 T1 - Black
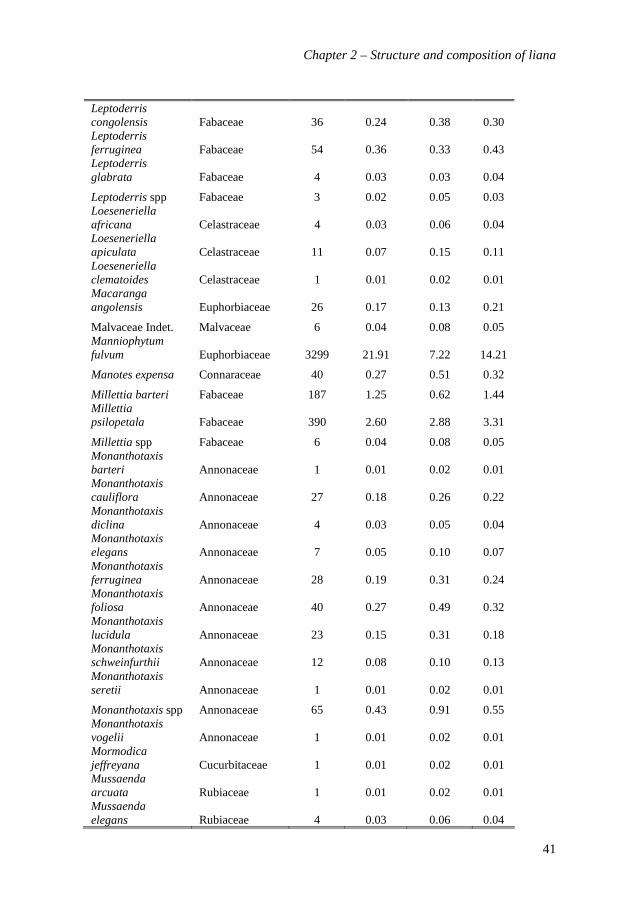
Chapter 2 – Structure and composition of liana
41
Leptoderris congolensis Fabaceae 36 0.24 0.38 0.30 Leptoderris ferruginea Fabaceae 54 0.36 0.33 0.43 Leptoderris glabrata Fabaceae 4 0.03 0.03 0.04
Leptoderris spp Fabaceae 3 0.02 0.05 0.03 Loeseneriella africana Celastraceae 4 0.03 0.06 0.04 Loeseneriella apiculata Celastraceae 11 0.07 0.15 0.11 Loeseneriella clematoides Celastraceae 1 0.01 0.02 0.01 Macaranga angolensis Euphorbiaceae 26 0.17 0.13 0.21
Malvaceae Indet. Malvaceae 6 0.04 0.08 0.05 Manniophytum fulvum Euphorbiaceae 3299 21.91 7.22 14.21
Manotes expensa Connaraceae 40 0.27 0.51 0.32
Millettia barteri Fabaceae 187 1.25 0.62 1.44 Millettia psilopetala Fabaceae 390 2.60 2.88 3.31
Millettia spp Fabaceae 6 0.04 0.08 0.05 Monanthotaxis barteri Annonaceae 1 0.01 0.02 0.01 Monanthotaxis cauliflora Annonaceae 27 0.18 0.26 0.22 Monanthotaxis diclina Annonaceae 4 0.03 0.05 0.04 Monanthotaxis elegans Annonaceae 7 0.05 0.10 0.07 Monanthotaxis ferruginea Annonaceae 28 0.19 0.31 0.24 Monanthotaxis foliosa Annonaceae 40 0.27 0.49 0.32 Monanthotaxis lucidula Annonaceae 23 0.15 0.31 0.18 Monanthotaxis schweinfurthii Annonaceae 12 0.08 0.10 0.13 Monanthotaxis seretii Annonaceae 1 0.01 0.02 0.01
Monanthotaxis spp Annonaceae 65 0.43 0.91 0.55 Monanthotaxis vogelii Annonaceae 1 0.01 0.02 0.01 Mormodica jeffreyana Cucurbitaceae 1 0.01 0.02 0.01 Mussaenda arcuata Rubiaceae 1 0.01 0.02 0.01 Mussaenda elegans Rubiaceae 4 0.03 0.06 0.04
Ewango_PROEF (all).ps Front - 28 T1 - Black

Chapter 2 – Structure and composition of liana
42
Neostenanthera myristicifolia Annonaceae 2 0.01 0.02 0.02 Neuropeltis acuminata Convolvulaceae 6 0.04 0.08 0.05 Neuropeltis alnifolia Convolvulaceae 2 0.01 0.03 0.02
Neuropeltis spp Convolvulaceae 10 0.07 0.15 0.11 Orthopichonia seretii Apocynaceae 44 0.29 0.61 0.38 Pararistolochia triactina Aristolochiaceae 7 0.05 0.10 0.07 Passifloraceae Indet. Passifloraceae 8 0.05 0.11 0.07 Phyllanthus muellerianus Phyllanthaceae 7 0.05 0.06 0.06
Piper guineensis Piperaceae 44 0.29 0.38 0.33 Plukenettia conophora Euphorbiaceae 11 0.07 0.16 0.10 Pristimera andongensis Celastraceae 4 0.03 0.06 0.04 Pristimera plumbea Celastraceae 1 0.01 0.02 0.01 Pyrenacantha klaineana Icacinaceae 38 0.25 0.56 0.30
Reissantia indica Celastraceae 7 0.05 0.11 0.06 Rhaphiostylis beninensis Icacinaceae 3 0.02 0.05 0.03 Rhaphiostylis ferruginea Celastraceae 4 0.03 0.05 0.04 Ritchiea capparoides Capparaceae 9 0.06 0.15 0.08
Rourea coccinea Connaraceae 8 0.05 0.11 0.08 Rourea erythrocalyx Connaraceae 5 0.03 0.06 0.04
Rourea minor Connaraceae 4 0.03 0.06 0.03 Rourea obliquifoliolata Connaraceae 8 0.05 0.13 0.07
Rourea parviflora Connaraceae 21 0.14 0.33 0.18
Rourea spp Connaraceae 3 0.02 0.05 0.03
Rourea thomsonii Connaraceae 922 6.13 5. 41 5.72
Rubiaceae Indet. Rubiaceae 72 0.48 0.89 0.59
Rutidea dupuisii Rubiaceae 1 0.01 0.02 0.01
Rutidea smithii Rubiaceae 1 0.01 0.02 0.01
Rytigynia nigerica Rubiaceae 3 0.02 0.05 0.03
Saba comorensis Apocynaceae 3 0.02 0.05 0.03
Sabicea dewevrei Rubiaceae 1 0.01 0.02 0.01
Ewango_PROEF (all).ps Back - 28 T1 - Black
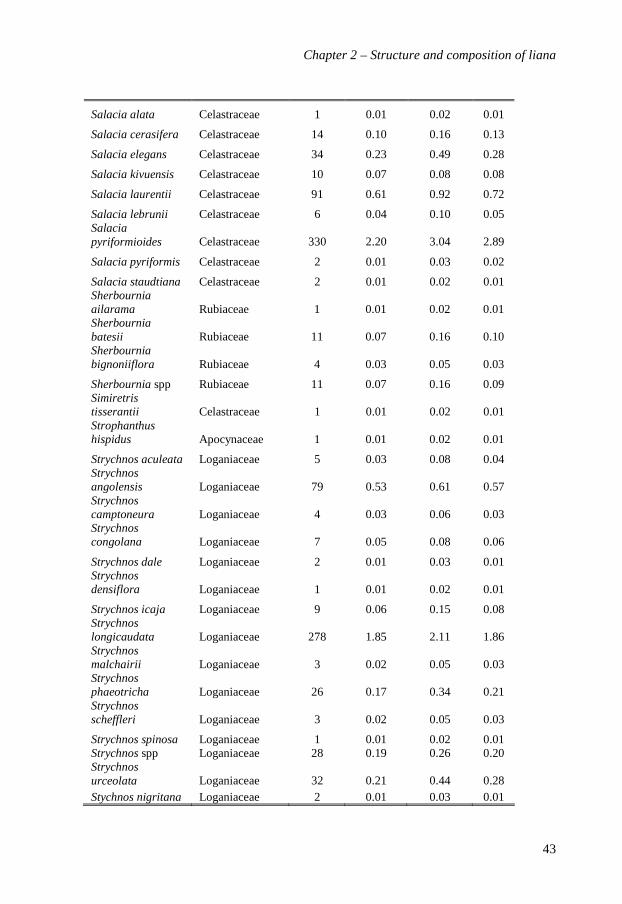
Chapter 2 – Structure and composition of liana
43
Salacia alata Celastraceae 1 0.01 0.02 0.01
Salacia cerasifera Celastraceae 14 0.10 0.16 0.13
Salacia elegans Celastraceae 34 0.23 0.49 0.28
Salacia kivuensis Celastraceae 10 0.07 0.08 0.08
Salacia laurentii Celastraceae 91 0.61 0.92 0.72
Salacia lebrunii Celastraceae 6 0.04 0.10 0.05 Salacia pyriformioides Celastraceae 330 2.20 3.04 2.89
Salacia pyriformis Celastraceae 2 0.01 0.03 0.02
Salacia staudtiana Celastraceae 2 0.01 0.02 0.01 Sherbournia ailarama Rubiaceae 1 0.01 0.02 0.01 Sherbournia batesii Rubiaceae 11 0.07 0.16 0.10 Sherbournia bignoniiflora Rubiaceae 4 0.03 0.05 0.03
Sherbournia spp Rubiaceae 11 0.07 0.16 0.09 Simiretris tisserantii Celastraceae 1 0.01 0.02 0.01 Strophanthus hispidus Apocynaceae 1 0.01 0.02 0.01
Strychnos aculeata Loganiaceae 5 0.03 0.08 0.04 Strychnos angolensis Loganiaceae 79 0.53 0.61 0.57 Strychnos camptoneura Loganiaceae 4 0.03 0.06 0.03 Strychnos congolana Loganiaceae 7 0.05 0.08 0.06
Strychnos dale Loganiaceae 2 0.01 0.03 0.01 Strychnos densiflora Loganiaceae 1 0.01 0.02 0.01
Strychnos icaja Loganiaceae 9 0.06 0.15 0.08 Strychnos longicaudata Loganiaceae 278 1.85 2.11 1.86 Strychnos malchairii Loganiaceae 3 0.02 0.05 0.03 Strychnos phaeotricha Loganiaceae 26 0.17 0.34 0.21 Strychnos scheffleri Loganiaceae 3 0.02 0.05 0.03
Strychnos spinosa Loganiaceae 1 0.01 0.02 0.01 Strychnos spp Loganiaceae 28 0.19 0.26 0.20 Strychnos urceolata Loganiaceae 32 0.21 0.44 0.28 Stychnos nigritana Loganiaceae 2 0.01 0.03 0.01
Ewango_PROEF (all).ps Front - 29 T1 - Black

Chapter 2 – Structure and composition of liana
44
Syrrheonema fasciculata Menispermaceae 1 0.01 0.02 0.01 Tabernaemontana eglandulosa Apocynaceae 159 1.06 1.64 1.25
Tetracera alnifolia Dilleniaceae 24 0.16 0.38 0.20
Tetracera poggei Dilleniaceae 1 0.01 0.02 0.01 Tetracera potatoria Dilleniaceae 9 0.06 0.15 0.08
Tetracera spp Dilleniaceae 8 0.05 0.11 0.07 Tiliacora mayumbensis Menispermaceae 1 0.01 0.02 0.01 Trichoscypha reygaertii Anacardiaceae 71 0.47 0.54 0.46 Triclisia dictyophylla Menispermaceae 4 0.03 0.05 0.03 Triumphetta cordifolia Malvaceae 3 0.02 0.03 0.02
Uncaria africana Rubiaceae 60 0.40 0.46 0.45
Unknown (spp) xxx 42 0.28 0.48 0.37 Urera camerooniana Urticaceae 174 1.16 1.51 1.41
Urera trinervis Urticaceae 12 0.08 0.11 0.12
Uvaria platyphylla Annonaceae 1 0.01 0.02 0.01
Uvaria pulchra Annonaceae 86 0.57 1.12 0.68
Uvaria spp Annonaceae 29 0.19 0.38 0.23
Ventilago diffusa Rhamnaceae 20 0.13 0.30 0.18
Vernonia andohii Asteraceae 5 0.03 0.05 0.04
Vitex thyrsiflora Lamiaceae 12 0.08 0.10 0.11
Ewango_PROEF (all).ps Back - 29 T1 - Black

Chapter 3
Thirteen years of dynamics of the liana assemblage in a Congo
Basin rain forest
Corneille E.N. Ewango, Lourens Poorter, Marc S.M. Sosef, Jean-Remy Makana & Frans Bongers
(Submitted to Biotropica)
Ewango_PROEF (all).ps Front - 30 T1 - Black

Chapter 3 – Thirteen years of liana dynamics
46
ABSTRACT
Lianas are important components of tropical rain forests having a large impact on forest
functioning, and their importance may even increase with global climate change. We
evaluated changes in structural characteristics, diversity, recruitment, mortality and growth
of the liana community over thirteen years period in the Ituri rain forest, Democratic
Republic of Congo. We used data from three censuses conducted in two 10-ha plots,
comprising 17,653 liana stems. Liana density decreased from 750 (1994) through 547 (2001)
to 499 (2007) stems ha-1, with concomitant declines in basal area and above-ground biomass.
Despite lower stem densities the species richness remained constant over time. Total
community recruitment rates decreased slightly from 8.6% per year in the first period to 6.6%
in the second, but this decrease was not significant. Liana community mortality rates
decreased significantly from 7.2% to 4.4% per year over the two census intervals. Diameter
growth rates and survival increased with liana stem diameter. Changes in liana community
structure and composition were driven by one species only, the dramatic collapse of
superabundant Manniophyton fulvum between first and second period of censuses. In
contrast to what has been reported for tropical forests elsewhere, liana abundance in Ituri
showed recent declines, rather than the increases reported earlier. This questions the
generality of liana responses to global climate change. In conclusion, lianas are extremely
dynamic in this forest, but this community level dynamism is fully driven by one strongly
dominant species. This is, as far as we know, the first documented liana collapse.
Key words: Iutri rain forest, liana, species populations, community-wide dynamics,
Manniophyton fulvum, Congo basin.
Ewango_PROEF (all).ps Back - 30 T1 - Black
Chapter 3 – Thirteen years of liana dynamics
47
INTRODUCTION
Old-growth tropical forests have long been considered as steady-state communities that
have passed all successional phases and are now stable in their community and population
characteristics (Richards, 1952; Whitmore, 1984). This view however, has been challenged
(Connell, 1978; Sheil, 2001) and the forest community may be seen as the result of
continuously changing species populations (Connell and Slatyer, 1997). Lianas are
characteristic components of tropical forests comprising up to 25% of woody plant stems
and species (Gentry, 1991; Schnitzer & Bongers, 2002) and contributing up to 40% of
forest leaf biomass (Wright et al., 2004). Lianas are considered as drivers (Putz, 2001;
Parren and Bongers, 2001) or inhibitors (Schnitzer et al., 2000; Schnitzer and Carson, 2010)
of forest dynamics, and their importance may even be increasing under global climate
change scenarios (Phillips et al., 2002).
Recent studies have shown that in the Americas lianas are in general increasing in
abundance and productivity (Phillips et al., 2002; Wright, 2004; Allen et al., 2007, but see
Londré and Schnitzer, 2006), but evidence for similar patterns in African forests is scarce
(Caballé and Martin, 2001). If lianas are increasing in abundance and basal area, then they
are likely to influence tree species composition, growth, and mortality. Long-term and
persistent increase in the density and distribution of lianas may also imply shifts in the
composition of plant functional traits (Allen et al., 2005). Consequently, we argue that the
structure, dynamics and functioning of lianas in forest stand development should be
explored and incorporated into stand dynamics models of tropical forests.
Increases in liana abundance have been associated with increased small-scale
disturbance (Laurance et al., 2001; Zagt et al., 2003; Bongers et al., 2005) with succession
after shifting cultivation (DeWalt et al., 2000, Guariguata and Ostertag, 2001) and with
large-scale disturbances such as hurricanes (Vandermeer et al., 2000; Allen et al., 2005).
The changes in the liana communities have been related to changes in environmental
conditions, notably increasing light availability (Avalos and Mulkey, 1999; Guariguata and
Ostertag, 2001) but changes in response to increasing drought have been suggested as well
(Schnitzer, 2005; Dewalt et al., 2010). Nonetheless, successional patterns of lianas in
undisturbed old-growth forest have hardly been studied (Phillips et al., 2005). Long-term
dynamics in natural old-growth forests may be driven by small-scale tree death, resulting in
individual-tree replacement patterns through natural-gap dynamics. Small-scale species loss
and gain due to mortality and recruitment of individual trees can serve as an inherent factor
that drives successional change within old-growth forests: community change being then
Ewango_PROEF (all).ps Front - 31 T1 - Black
Chapter 3 – Thirteen years of liana dynamics
48
the result of individual species population dynamics (Harper, 1977). Although lianas are
said to be extremely dynamic, only few quantitative data are available to evaluate these
claims and growth and turnover rates are rarely reported (Phillips et al., 2005; Nabe-
Nielsen, 2002), let alone size-dependent patterns therein. For tree community and tree
populations many studies are available (e.g., Dallmeier and Comiskey, 1998; Losos and
Leigh, 2004 for more details) but for lianas such information is scarce (Phillips et al., 2002,
2005; Wright et al., 2004). Additionally, as liana populations strongly interact with trees
(Van der Heijden and Phillips, 2009; Peña-Claros et al., 2008; Ingwell et al., 2010,
Schnitzer & Carson, in press) and crucially depend on forest structure (Toledo, 2010); the
magnitude and impact of liana long-term changes need examination.
Although lianas have been the focus of a growing number of studies in tropical forests
in the last two decades, questions on their constituent floristic, structural and dynamics
patterns at a detailed level have hardly been explicitly addressed (but see Caballé and
Martin, 2001; Mascaro et al., 2004; Nabe-Nielsen, 2002, 2004). Their richness and
abundance differ greatly from one forest to another and between forest locations, climate
seasonality being one of the major driving factors at least for abundance (Swaine and
Grace, 2007; DeWalt et al., 2010). These differences have been demonstrated at a
continental scale (Rollet, 1974; Gentry, 1993) and at a regional scale (Van der Heijden et
al., 2008, 2009), but less so at smaller, more local scales (but see Burnham, 2002, 2004;
Mascaro et al., 2004).
In African forests, most studies have concentrated in the western Upper and Lower
Guinea phytochoria (White, 1979, reviewed in Bongers et al., 2005) reflecting typologies and
dynamics of these forests. In contrast, few long-term studies have been conducted on liana
diversity and corresponding population dynamics elsewhere in Africa (but see Caballé and
Martin, 2001; Parren, 2003) despite their undisputed importance in the forest. In this paper we
analyze community-wide dynamics of lianas in tropical old-growth forest in the Congo
Basin. We use long-term data from three censuses (1994, 2001 and 2007) conducted in the
Ituri Forest Dynamics plots, Democratic Republic of Congo for two 10-ha plots, in which we
monitor 17,653 liana stems. We evaluate the structural characteristics, and recruitment,
mortality and growth of the liana community over time. We specifically address the
following questions: (1) How does the liana community change over time in abundance,
basal area, stem size, aboveground biomass, recruitment and mortality? (2) Are the patterns
in vital rates (mortality and growth) size-dependent? and (3) How does the species
composition of the liana assemblage change over time? We have the following
corresponding predictions: (H1) Given the recently reported increase in liana abundance in
Ewango_PROEF (all).ps Back - 31 T1 - Black
Chapter 3 – Thirteen years of liana dynamics
49
the Neotropical forests (Phillips et al., 2002), we expect that lianas also become more
dominant in this old-growth African forest and population changes to be mainly driven by
increased recruitment rates and stem densities; (H2) Considering small-size stems as fragile
individuals, we expect vital and dynamic rates (growth and survival) to be size dependent,
and small-size stems to have faster growth and higher mortality compared to large-size
stems that would have lower growth and higher survival rates in the old-growth forest liana
community; and (H3) Assuming that lianas are highly dynamic, and that they have recently
increased in abundance (Phillips et al., 2002, 2005), we expect large directional changes in
liana species community composition.
MATERIAL AND METHODS
Study sites
The long-term plot is located in the Réserve de Faune à Okapi (RFO) in the Ituri Forest,
Democratic Republic of the Congo, at the northeastern edge of the Congo Basin forest. Two
10-ha plot are studied, Edoro 1 (NE corner: 01°33’44”N 028°31’02”E; SW corner:
01°33’37”N 028°30’45”) and Edoro 2 (NE corner: 01°33’46”N 028°31’34”E; SW corner:
01°33’38”N 028°31’18”), both 500 x 200 m, with a comparatively flat topography and a
natural mixed old-growth forest between the Edoro and Afarama rivers. The climate is
seasonal, with a 4 to 5 months dry season (with rainfall <50 mm/month in the two driest
months, January and February) from December through March/April. Mean annual rainfall is
1785 mm. Detailed descriptions of the climate, vegetation, and fauna of the Edoro Field
Research can be found elsewhere (Hart, 1985, 1986; Makana et al., 1998). The plots contain
some swampy areas but the large majority is dry-land forest. Mean altitude is 750 m. Upon
establishment of the plots there were no large gaps. The floristic composition of the mixed
forest in both plots is similar; the canopies are characterized by Cynometra alexandri,
Julbernardia seretii, and Cleistanthus michelsonii. The 10 most abundant liana families in
this forest (Connaraceae, Euphorbiaceae, Dichapetalaceae, Combretaceae, Celastraceae,
Fabaceae, Apocynaceae, Loganiaceae, Annonaceae and Malvaceae) account for 69% of the
liana species and 92% of the basal area (Ewango et al., submitted). Manniophyton fulvum is
by far the most abundant liana species in the mixed forest comprising 24% of the stems.
Field sampling
The two plots were established in 1994-1996, and were re-censused during 2000/2001 and
again in 2007, thus providing three censuses over a 13-year period. In each plot, all liana
stems 2 cm dbh (diameter at breast height) were identified, labelled and mapped, and their
Ewango_PROEF (all).ps Front - 32 T1 - Black
Chapter 3 – Thirteen years of liana dynamics
50
dbh was measured. All stems were marked with paint at 1.3 m height. During re-censuses all
stems were checked, re-measured and re-painted. New recruits reaching 2 cm dbh were added
in the same way (see Makana et al., 1998 for details of the measuring protocol). Throughout
re-censuses, individuals were classified as being alive, recruit or dead if a tag was found or if
no vital sign (e.g. resprouting, survival basal part of a damaged stem) could be established.
We differentiated and individually marked resprouts; if the main stem died or was broken
below the point of measurement and a new stem was emerging, this stem was marked as a
new individual in the subsequent censuses.
Forest dynamic analysis
Liana community dynamics was calculated from a total of 17,653 stems over the 13-years
period, recorded in two 10-ha plots. Stem abundance (density), species numbers, mortality,
recruitment, and biomass were calculated by summing the total of each species and all
individuals recorded in a given census.
We analyzed liana changes in recruitment, mortality and basal area growth for the whole
community and for three size classes separately (2-5 cm, > 5-10 cm and > 10 cm dbh), using
the derived exponential model (the natural logarithm equations of dynamics) of population
changes over time.
Annual liana recruitment (R) and mortality (M) rates (in % year-1) are calculated as: R =
[ln(N0 – Nm + Nr) – ln(N0 – Nm)/t] x 100 (Phillips et al., 1994), and M = [ln(N0) – ln(N0 –
Nm)/t] x 100 (Lewis et al., 2004); where N0 is the number of stem at the initial census, Nm and
Nr are the individuals that died or were recruited during the time interval of first and second
census (t), respectively. Individual liana basal area (BA in m2 = (dbh)2/4*10,000) was
calculated for all individuals that survived one or both of the monitoring periods, and was
translated into above ground biomass using the standardized liana stem biomass allometric
equation of Schnitzer et al. (2006): AGB = exp[-1.484 + 2.657 ln(D)], where D is diameter
at breast height in centimeter. Total above ground biomass for all lianas was then calculated
for each of the 20 one-ha plots, for each of the census years.
Diameter growth (in mm year-1) was calculated as the slope of the linear regression
between individual’s dbh and the two measurement dates of census intervals 1 (1994-2001)
and 2 (2001-2007). Survivorship of liana individuals across these stem size diameters was
calculated as P(S) = 1 P(M), where P(M) is the probability of mortality in a diameter size
class for a given census interval.
We quantified the relative importance of each species (i.e. species rank-abundance) on
the basis of the number of individual of a given species to the total number of individuals
Ewango_PROEF (all).ps Back - 32 T1 - Black
Chapter 3 – Thirteen years of liana dynamics
51
recorded in the community for each census. To describe the nature of changes of species
dominance over time we regressed all relative abundances of the species at the first census
against relative abundances at the second census. Based on the abundance in the 1994
census, we classified species as being dominant (total abundance 300 individuals),
abundant (60-299 individuals), frequent (15-59 individuals), and rare (<15 individuals); and
also differentiated doubletons (species exactly known by two records) and singletons
(recorded only by a single individual).
A principal component analysis (PCA) was used to analyze community changes in
liana composition over time. For every single one-ha plot data on species abundance for
each of the three censuses (1994, 2001 and 2007) was used in a composite PCA. Changes
in species composition of each one-ha plot over time are reflected in the trajectories of each
plot in PCA space (cfr. Austin and Greig-Smith, 1968; Verburg and Van Eijk-Bos, 2003).
Statistical analysis
Temporal changes in numbers of individuals, recruitment, mortality, basal area and biomass
per ha (n = 20) and in diameter size classes between 1994 and 2001 and between 2001 and
2007 were tested using a paired t-test. To detect how structural characteristics and vital
rates vary with census interval and liana size classes we did a repeated-measures ANOVA
with censuses year as a within-factor and size class as a between-factor. We used a Sidak
post hoc test in the ANOVA analyses to evaluate differences between classes (Zar, 1999).
In this repeated-measures ANOVA, the Mauchley’s W statistic tested for sphericity (i.e.
equality of variances of the differences between census years). If sphericity was not met,
Greenhouse-Geisser values were considered and where needed data were log10-transformed
prior to analysis. All statistical analyses were conducted using SPSS 15 for windows (SPSS
Inc., 2006).
In addition, we calculated diversity (Fisher alpha, Shannon-Wiener and Simpson
diversity index) per ha (n = 20) for each of the three censuses and evaluated temporal
changes using repeated-measures ANOVA.
RESULTS
Dynamics in the liana assemblage: density, biomass, mortality and recruitment
Mean liana density decreased from 750 (1994) through 547 (2001) to 499 (2007) stems per
hectare and similar changes were found in basal area and above-ground biomass (Figure 3.1).
Ewango_PROEF (all).ps Front - 33 T1 - Black
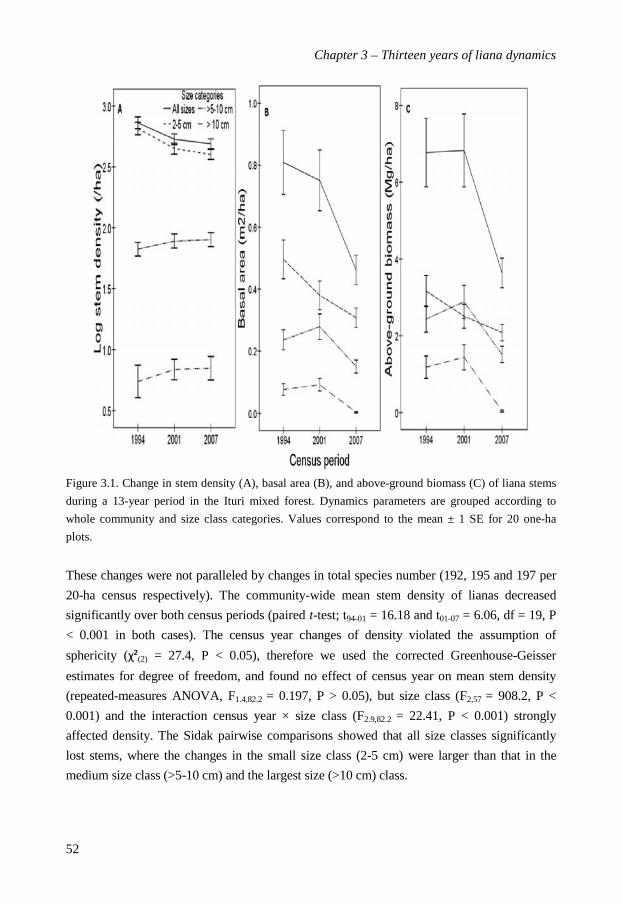
Chapter 3 – Thirteen years of liana dynamics
52
Figure 3.1. Change in stem density (A), basal area (B), and above-ground biomass (C) of liana stems
during a 13-year period in the Ituri mixed forest. Dynamics parameters are grouped according to
whole community and size class categories. Values correspond to the mean ± 1 SE for 20 one-ha
plots.
These changes were not paralleled by changes in total species number (192, 195 and 197 per
20-ha census respectively). The community-wide mean stem density of lianas decreased
significantly over both census periods (paired t-test; t94-01 = 16.18 and t01-07 = 6.06, df = 19, P
< 0.001 in both cases). The census year changes of density violated the assumption of
sphericity ( (2) = 27.4, P < 0.05), therefore we used the corrected Greenhouse-Geisser
estimates for degree of freedom, and found no effect of census year on mean stem density
(repeated-measures ANOVA, F1.4,82.2 = 0.197, P > 0.05), but size class (F2,57 = 908.2, P <
0.001) and the interaction census year × size class (F2.9,82.2 = 22.41, P < 0.001) strongly
affected density. The Sidak pairwise comparisons showed that all size classes significantly
lost stems, where the changes in the small size class (2-5 cm) were larger than that in the
medium size class (>5-10 cm) and the largest size (>10 cm) class.
Ewango_PROEF (all).ps Back - 33 T1 - Black

Chapter 3 – Thirteen years of liana dynamics
53
Mean basal area (BA) of the liana assemblage declined significantly over time (paired t-
test; t94-01 = 4.9 for the first interval, t01-07 = 11.1 at the second interval; df =19 and P < 0.001 in
both cases), being 0.81, 0.75 and 0.46 m2 ha-1 in 1994, 2001 and 2007 respectively. This
reduction led to concomitant reductions in overall liana biomass (6.8, 6.8 and 3.6 Mg ha-1) in
which the biomass in 2007 was nearly half of the biomass in 2001. Surprisingly, biomass did
not change significantly in the first interval (t94-01 =-0.5, d f=19, P > 0.05) but it decreased
sharply during the second interval (t01-07 =11.0; df =19, P < 0.001). This difference is caused
by the significantly higher relative growth and recruitment rates in the first interval compared
to the second interval (Figure 3.2, 3.3). Surprisingly, there was only little change in basal
area and biomass during the first census interval while lots of change occurred during the
second; this contrasts with the changes in density.
Figure 3.2.
Mean annualized
mortality (A) and
recruitment (B) rates of
lianas community of the
Ituri mixed forest plots.
Different census periods
(1994-2001, 2001-
2007), the whole
community and separate
size class intervals (2-5
cm, 5-10 cm, and > 10
cm dbh) are shown.
Each bar represents the
mean ± 1 SE for 20 one-
ha plots.
Total community recruitment rates decreased slightly from 8.6% per year in the first
period to 6.6% in the second, but this decrease was not significant (Figure 3.2b; paired t-test: t
= -0.64, df = 19, P > 0.05). Recruitment rates in size classes varied significantly over census
year (repeated-measures ANOVA, F2,76 = 32.6, P < 0.001) and with size class (F2,38 = 507.1, P
< 0.001), but not their interaction (F2,76 = 2.89, P > 0.05). Small sized lianas increased slightly
Ewango_PROEF (all).ps Front - 34 T1 - Black
Chapter 3 – Thirteen years of liana dynamics
54
(1.56 to 2.55%) while medium sized (4.98 to 3.58 %) and large lianas (6.08 to 4.39%)
decreased markedly over time.
Total liana mortality rates decreased significantly from 7.2% per year over the first
interval to 4.4% over the second (Figure 3.2a; paired t-test: t = 10.6, df = 19, P < 0.001).
Annual mortality rates of lianas differed between census intervals (F2,114 = 13.3, P < 0.001),
among size classes (repeated-measures ANOVA, F2,57 = 737.5, P < 0.001) and there was also
a strong interaction between size class and census interval (F2,114 = 37.9, P < 0.001). The Sidak
post hoc pairwise comparisons estimated average mortality of 2.3% and 1.0% per year for
each interval and there were significant differences between small (2-5 cm; 7.8 to 4.7% of
mortality), medium (5-10 cm, 2.5 to 0.3%) and large (>10 cm, 2.3 to 4.1%) lianas stems.
Size-dependent growth and survivorship
Annual size-growth differed significantly among diameter size classes (repeated-
measures ANOVA, F1,18.5 = 39.21, P < 0.001), but did not between census intervals (paired t-
test, t = 1.95, df=8, P > 0.05). Liana growth was size-dependent and increased from 0.5
mm/y for the smallest size class to 1.50 mm/y for the largest size class (Figure 3a). Growth
of lianas in the middle size classes (50-70 mm) was twice as fast in the first census period
compared to the second period, although this was not the case for smallest and largest size
classes. Survival differed significantly amongst size classes (repeated-measures ANOVA,
F1.1,8.5 = 21.04, P < 0.001), but did not differ between the census intervals (paired t-test, t = -
0.94, df = 8, P > 0.05). Size-dependent survival differences were large during the first
interval, but less so during the second interval. Larger lianas survived better that smaller ones
(Figure 3.3b). Liana survival probability over census period ranged from 0.57 to 0.94 over the
liana size range, with a continuous increase up to 50 mm, a maximal survivorship probability
at 70 mm, and a somewhat declining probability with bigger sizes for the first interval.
Survival of lianas in the lower size classes (20-40 mm) was substantially higher in the
second period compared to the first period (Figure 3.3b), and fast growth in large-sized
stems was, surprisingly, coupled with their decline in survivorship.
Community diversity and rank-abundance changes
During our 13-year study period there were significant temporal changes in Fisher’s
(repeated-measures ANOVA, F1.2,23.5 = 78.4, P < 0.001), Shannon-Wiener (F1.3,25.5 = 116.3, P
< 0.001), and Simpson (F1.2,22.3 = 45.6, P < 0.001) diversity indices. All three measures
increased during the first period (especially Simpson’s diversity) after which they remained
Ewango_PROEF (all).ps Back - 34 T1 - Black
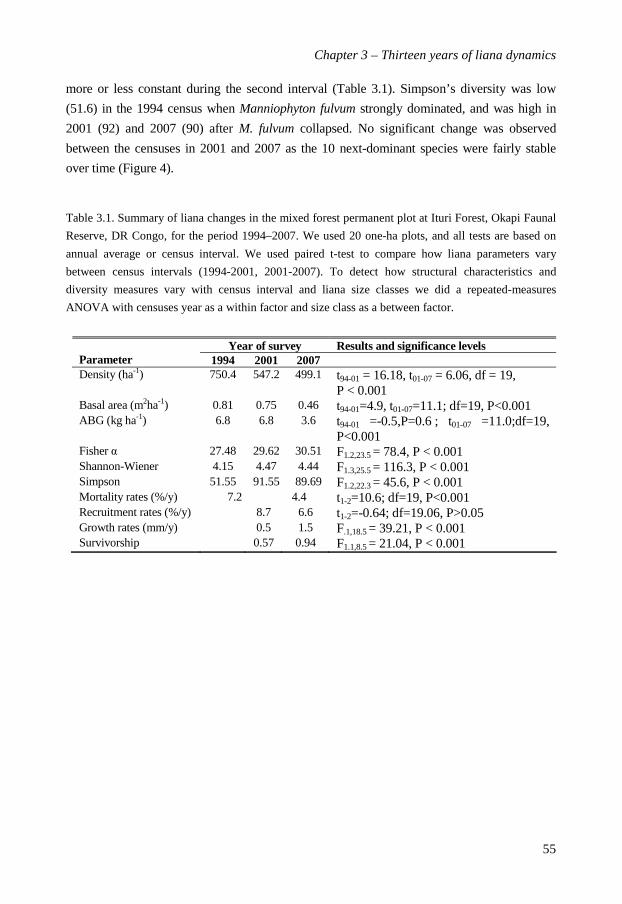
Chapter 3 – Thirteen years of liana dynamics
55
more or less constant during the second interval (Table 3.1). Simpson’s diversity was low
(51.6) in the 1994 census when Manniophyton fulvum strongly dominated, and was high in
2001 (92) and 2007 (90) after M. fulvum collapsed. No significant change was observed
between the censuses in 2001 and 2007 as the 10 next-dominant species were fairly stable
over time (Figure 4).
Table 3.1. Summary of liana changes in the mixed forest permanent plot at Ituri Forest, Okapi Faunal
Reserve, DR Congo, for the period 1994–2007. We used 20 one-ha plots, and all tests are based on
annual average or census interval. We used paired t-test to compare how liana parameters vary
between census intervals (1994-2001, 2001-2007). To detect how structural characteristics and
diversity measures vary with census interval and liana size classes we did a repeated-measures
ANOVA with censuses year as a within factor and size class as a between factor.
Year of survey Results and significance levels Parameter 1994 2001 2007 Density (ha-1) 750.4 547.2 499.1 t94-01 = 16.18, t01-07 = 6.06, df = 19,
P < 0.001 Basal area (m2ha-1) 0.81 0.75 0.46 t94-01=4.9, t01-07=11.1; df=19, P<0.001 ABG (kg ha-1) 6.8 6.8 3.6 t94-01 =-0.5,P=0.6 ; t01-07 =11.0;df=19,
P<0.001 Fisher 27.48 29.62 30.51 F1.2,23.5 = 78.4, P < 0.001 Shannon-Wiener 4.15 4.47 4.44 F1.3,25.5 = 116.3, P < 0.001 Simpson 51.55 91.55 89.69 F1.2,22.3 = 45.6, P < 0.001 Mortality rates (%/y) 7.2 4.4 t1-2=10.6; df=19, P<0.001 Recruitment rates (%/y) 8.7 6.6 t1-2=-0.64; df=19.06, P>0.05 Growth rates (mm/y) 0.5 1.5 F.1,18.5 = 39.21, P < 0.001 Survivorship 0.57 0.94 F1.1,8.5 = 21.04, P < 0.001
Ewango_PROEF (all).ps Front - 35 T1 - Black
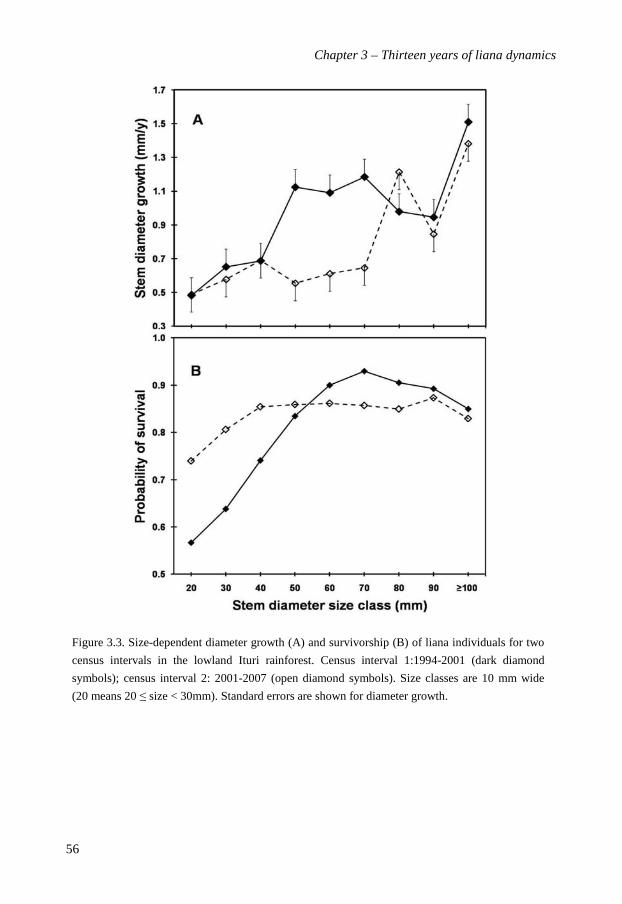
Chapter 3 – Thirteen years of liana dynamics
56
Figure 3.3. Size-dependent diameter growth (A) and survivorship (B) of liana individuals for two
census intervals in the lowland Ituri rainforest. Census interval 1:1994-2001 (dark diamond
symbols); census interval 2: 2001-2007 (open diamond symbols). Size classes are 10 mm wide
(20 means 20 size < 30mm). Standard errors are shown for diameter growth.
Ewango_PROEF (all).ps Back - 35 T1 - Black

Chapter 3 – Thirteen years of liana dynamics
57
Species rank-abundance patterns differed significantly amongst census years (repeated-
measures ANOVA, F1.4,292.7 = 20.18, P < 0.001). This difference is probably driven by M.
fulvum, which was very dominant in 1994 (24% of all individuals) and collapsed thereafter
(comprising 0.6% of all individuals). The relative abundance of species in 2001 is moderately
correlated with their relative abundance in 1994 when M. fulvum is included (Pearsons r =
0.57), but strongly correlated (Pearsons r = 0.99) when M. fulvum is excluded (Figure 3.4a).
The relative species abundance in 2007 is, in turn, also highly correlated with the relative
abundance in 2001 (Figure 3.4b). Models that exclude the M. fulvum collapse describe
therefore nicely the relatively constant ranks of the other species over time (Figure 3.4a, b).
Figure 3.4. Ranking of dominance of liana species between different census periods. (A): Relative
abundance of species in 2001 versus 1994 (B): Relative abundance of species in 2007 versus 2001.
Regression line (dotted line) and coefficients of determination (R2) are given. The continuous line
indicates the relationship where y=x. Only the label for the most common species are shown (Agelpa:
Agelaea paradoxa, Agelpe: A. pentagyna, Agelru: A. rubiginosa, Dichhe: D. heudelotii, Dichst;
Dichapetalum staudtii, Cnesur: Cnestis urens, Combma: Combretum marginatum, Combmu: C.
mucronatum, Combra: C. racemosa, Mannfu: Manniophyton fulvum, Millba: Millettia barteri, Millps:
M. psilopetala, Rourth: Rourea thomsonii, Salapy: Salacia pyriformioides, Strylo: Strychnos
longicaudata, Uvarpu: Uvaria pulchra).
Ewango_PROEF (all).ps Front - 36 T1 - Black
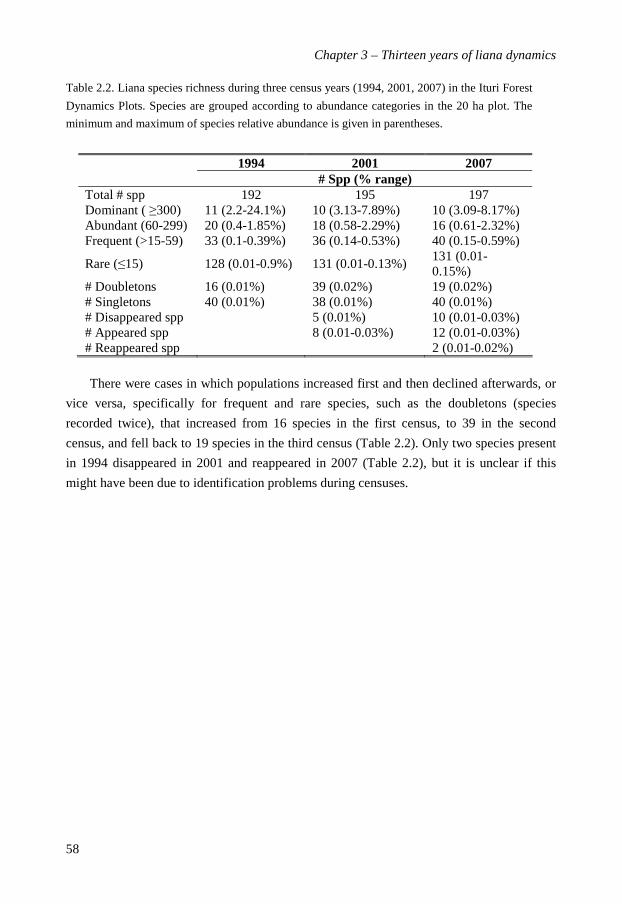
Chapter 3 – Thirteen years of liana dynamics
58
Table 2.2. Liana species richness during three census years (1994, 2001, 2007) in the Ituri Forest
Dynamics Plots. Species are grouped according to abundance categories in the 20 ha plot. The
minimum and maximum of species relative abundance is given in parentheses.
1994 2001 2007 # Spp (% range)
Total # spp 192 195 197 Dominant ( 300) 11 (2.2-24.1%) 10 (3.13-7.89%) 10 (3.09-8.17%)Abundant (60-299) 20 (0.4-1.85%) 18 (0.58-2.29%) 16 (0.61-2.32%) Frequent (>15-59) 33 (0.1-0.39%) 36 (0.14-0.53%) 40 (0.15-0.59%)
Rare ( 15) 128 (0.01-0.9%) 131 (0.01-0.13%) 131 (0.01-0.15%)
# Doubletons 16 (0.01%) 39 (0.02%) 19 (0.02%) # Singletons 40 (0.01%) 38 (0.01%) 40 (0.01%) # Disappeared spp 5 (0.01%) 10 (0.01-0.03%) # Appeared spp 8 (0.01-0.03%) 12 (0.01-0.03%) # Reappeared spp 2 (0.01-0.02%)
There were cases in which populations increased first and then declined afterwards, or
vice versa, specifically for frequent and rare species, such as the doubletons (species
recorded twice), that increased from 16 species in the first census, to 39 in the second
census, and fell back to 19 species in the third census (Table 2.2). Only two species present
in 1994 disappeared in 2001 and reappeared in 2007 (Table 2.2), but it is unclear if this
might have been due to identification problems during censuses.
Ewango_PROEF (all).ps Back - 36 T1 - Black

Chapter 3 – Thirteen years of liana dynamics
59
Figure 3.5. Changes in the abundance weighted community composition of lianas over time, for
20 1-ha plots of a mixed forest in the Ituri dynamics plot. A: Ordination with all recorded species,
and B: ordination excluding the strongly dominating Manniophyton fulvum. Census dates are:
1994, 2001 and 2007. Circle represents each 1-ha plot. The number near each circle indicates the
plot number.
The results of the PCA analyses show that the community composition of all 20 one-ha
plots changed strongly in the first period and weakly in the second (Figure 3.5a). Two plots
separated from the rest, both with M. fulvum and Combretum racemosum as co-dominant
species. In all other plots M. fulvum was strongly dominant. Because of this overall strong
dominance of M. fulvum we recalculated the PCA after excluding this species (Figure 3.5b).
Then most plots were stable in their composition over time, and only five plots showed small
Ewango_PROEF (all).ps Front - 37 T1 - Black

Chapter 3 – Thirteen years of liana dynamics
60
temporal changes. This indicates that M. fulvum alone is accounting for virtually all changes
in the liana assemblage of this old-growth mixed forest.
DISCUSSION
In this study we analyse community-wide dynamics of lianas and showed how a super-
dominant species, M. fulvum, drives changes of the community over time in this tropical old-
growth forest in the Congo Basin. Most changes occurred during the first census interval, and
over the 13 years evaluated, the liana abundance decreased, rather than increased over time.
Dynamics in the liana assemblage: individuals and biomass
Given the recently reported increase in liana abundance in Neotropical forests (Phillips et
al., 2002), we expected that lianas would also become more dominant in this old-growth
African forest and that population changes would mainly be driven by increased
recruitment rates and stem densities. Our results clearly show that this was not the case.
Lianas were extremely dynamic in our Ituri Forest Dynamics Plots (Table 3.1, 3.2). Liana
density, basal area and biomass generally decreased during the course of our study, especially
for density during the first period (Figure 3.1). The number of small-sized lianas decreased
considerably due to low recruitment, high mortality and growth into the next size class.
Concomitantly, liana basal area and aboveground biomass decreased over the thirteen-year
monitoring period. The decrease in density does agree with the results of Caballé and Martin
(2001) who, in a 13-year study in Gabonese rainforests, found that both species richness and
density of lianas decreased. Liana basal area, however, did not decrease in their study.
Our results are in contrast to findings of several studies in the Americas on recent
increase in liana abundance. For example, over the last two decades, the relative abundance
of large lianas has increased by 1.7 - 4.6 % year-1 in Neotropical forests (Phillips et al.,
2002). Similarly, Wright et al. (2004) reported a 100% increase in liana density between
1980s and 1990s surveys on Barro Colorado Island, Panama. They also found that between
1986 and 2002 the total liana leaf litter production and the contribution of lianas to forest-
wide leaf litter production increased. Ingwell et al. (2010) showed that liana infestation in
trees of 30 species in Panama increased drastically over the last decades, and also noted the
extreme variation on a per tree basis during the last 10 years. Recently, Allen et al. (2007)
showed an increasing importance of lianas in term of abundance in temperate floodplain
forests of the southeastern USA. They suggested that the observed increase is primarily
caused by atmospheric CO2 increase and regional severe drought effect of El Niño, as a
Ewango_PROEF (all).ps Back - 37 T1 - Black

Chapter 3 – Thirteen years of liana dynamics
61
global signal of climate change. However, the African rain forest including the Ituri region,
is recovering from past disturbance (Richards, 1952; Maley 1996; Van Gemerden et al.,
2003) and past drought (a phase ending 2,500 yr BP; Maley, 2001). These forests are
characterized by high abundance of liana in the re-colonization and building phase, but
some species are now decreasing with the age of the forest. Specifically in the Ituri Forest,
Hart et al. (1996) found evidence of small widespread fires associated with increased
human activities during the last two millennia; and storm tracks in the form of corridors of
fallen trees are also relatively common in the central Ituri Forest, which is the reason for the
occurrence of old secondary forest scattered in the forest. These storm tracks in addition to
the intermittent canopy structure provide suitable habitats to the development and high
abundance of lianas, because of their high light intensities. Therefore, disturbance-related
changes in canopy structure may regulate the abundance and species composition of the
liana community.
Are growth and mortality size-dependent?
We expected vital and dynamic rates (growth and survival) to be size-dependent and small-
sized stems to show faster growth and higher mortality compared to large-sized stems. Our
results show that vital rates indeed were stem size dependent. Mortality rates were high,
both at community level and for each of the size classes, especially during the first interval
(Figure 3.2a). Recruitment to larger size classes was generally high but little recruitment
occurred in the smallest size class (Figure 3.2b). As a result, recruitment was not sufficient
to counterbalance the high mortality rates of lianas in the smallest size class. This pattern
may be explained by a wave of high recruitment, possibly as a result of high disturbance in
the past (e.g. fire, storm treefall gaps, and drought) and followed by reduced recruitment in
later post-disturbance stages due to canopy closure.
This past wave of recruitment in smaller size classes continued in the larger sizes classes
during the course of our study (Figure 3.1, 3.2b). Nabe-Nielsen (2002, 2004) and Nabe-
Nielsen and Hall (2002) pointed out that large canopy openness facilitates the penetration
of high light intensity to the understory and together with micro-topographic conditions led
to drastic increase in abundance and growth of Machaerium cuspidatum, a dominant liana
species in most Amazonian forests. This may be congruent to what we observed for M.
fulvum in the Ituri Forest. The population structure of M. fulvum thus may be controlled by
the age and structure (e.g. canopy openness, light availability) of the forest. M. fulvum is a
generalist species, widely distributed in West and Central Africa. There should have been
large disturbance in the past (but not that too long ago) that the forest is now “recovering
Ewango_PROEF (all).ps Front - 38 T1 - Black
Chapter 3 – Thirteen years of liana dynamics
62
from”; alternatively the collapse of only this one species seems more likely associated with
a specific pathogen. It is relatively shade tolerant, and as a result it can be found in a wide
range of environments (also in the plot), although it requires high light conditions for a fast
growth. The ability of M. fulvum to combine shade tolerance (i.e. survival in seedling stage)
with faster growth in areas of high-light intensities is probably crucial to its establishment
and abundance in old-growth mixed forest with potential disturbances in the future.
In general, liana growth was size dependent, and varied from 0.5 to 1.5 mm for the two
census periods (Figure 3.3a). Growth increased with stem diameter, with the largest
increases in stems from 40 mm (first period) or 70 mm onward (second period). Similarly,
Gilbert et al. (2006) showed for a Neotropical rainforest community that all liana and tree
species showed an increased growth and survival with size. Large lianas may realize fast
radial growth because of their larger leaf area and better access to light compared to small
lianas. Larger lianas also survive better because they are more robust against environmental
hazards. Surprisingly, individuals in the largest size class (>100 mm diameter) combine fast
growth with a decline in survivorship (Figure 3.3), possibly because these largest
individuals die from hazards (drought, windthrow by storms), or because they have attained
their maximal age.
Do liana diversity and community composition change over time?
Assuming that lianas are highly dynamic, and that they have recently increased in
abundance (Phillips et al., 2002, 2005), we expected that recruitment would increase overall
liana population size and that there would be large directional changes in liana community
composition. The liana community species abundance in all plots changed drastically from
1994 to 2001 and only slightly thereafter (Figure 3.5). This change was mainly due to the
collapse of the dominant M. fulvum, while other abundant species changed only
insignificantly in their population size. As far as we know this is the first time such a drastic
one-species-only collapse is reported in the literature. This phenomenon needs further
investigation, for instance of the particularities (e.g. seedlings autoecology) of this dominant
species. Possibly, the significant collapse of M. fulvum was due to either the combined
effect of forest regrowth and canopy closure, or to drought effects, specifically between
1994 and 2001.
There was a non-directional change in the community composition as a whole, and the
ten most abundant species remained rather constant over the 13 year period that we analyzed
(Figure 3.4). However, species richness slightly increased despite a decrease in abundance,
and all these new species entered the community through new recruits. Our local large-scale
Ewango_PROEF (all).ps Back - 38 T1 - Black
Chapter 3 – Thirteen years of liana dynamics
63
and long-term study illustrates three main patterns: (1) long-term trends in which liana
density, basal area and biomass consistently decreased; with poor recruitment being unable to
balance the strong increase in liana mortality over time in our study plots; (2) the size class
structure suggests a population with very little recruitment over time; small lianas that die or
that recruit into larger size classes are not being replaced (Figure 3.2b), so there is a
continuous trend of declining stem density, basal area and correlated biomass likely to
continue for a long time if recruitment and growth are not enough to balance losses; (3) the
species richness and diversity remained constant over time, despite the continuous decrease of
liana abundance.
In conclusion, our study is the first to show a strong decrease of the liana population
in old-growth forest. This general decrease is in contrast with the widely documented
increase of lianas over the last decades. Our study is also the first to document that this
community level dynamics is completely driven by the dynamics of one species only.
Future studies on liana communities in old-growth forests are needed to test whether or not
such single dominant species driven community dynamics is a general phenomenon in
tropical old-growth forests. We also showed that changes in liana dynamics and
composition differed dramatically between the first and the second census interval, despite
the fact that these census intervals spanned a relatively long time (6-7 years), in which year-
to-year fluctuations are expected to average out. Conclusions on liana increase or decrease
thus depend heavily on the time-window used. Therefore, we argue that long-term and large
scale studies are needed to evaluate the direction of community changes and to predict the
eventual consequences of climate change.
Ewango_PROEF (all).ps Front - 39 T1 - Black

Chapter 3 – Thirteen years of liana dynamics
64
Ewango_PROEF (all).ps Back - 39 T1 - Black
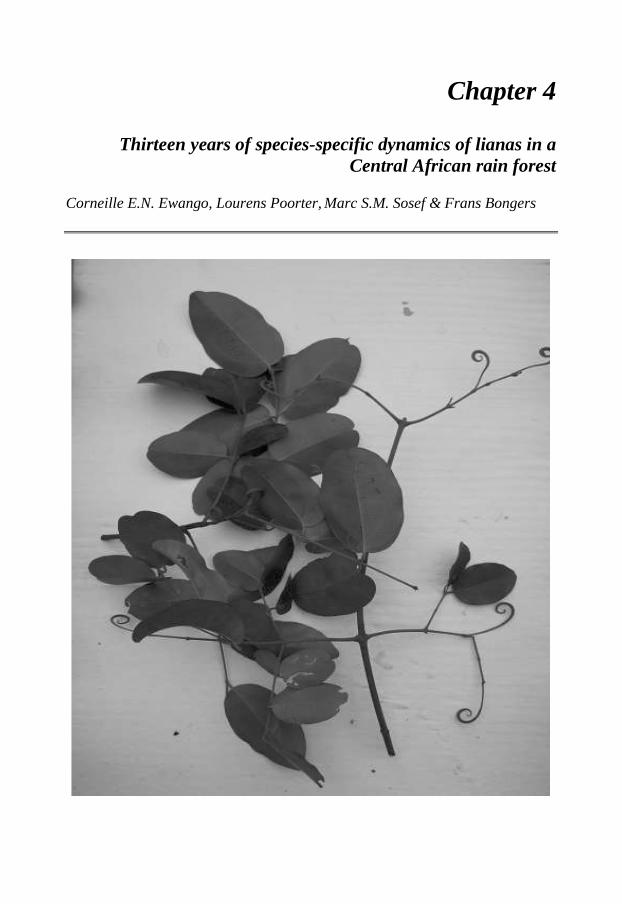
Chapter 4
Thirteen years of species-specific dynamics of lianas in a Central African rain forest
Corneille E.N. Ewango, Lourens Poorter, Marc S.M. Sosef & Frans Bongers
Ewango_PROEF (all).ps Front - 40 T1 - Black
Chapter 4 – Thirteen years of species-specific dynamics
66
ABSTRACT
Demographic rates of liana species are expected to be related to their functional traits. We
investigated over a 13 years period species-specific dynamics of the 79 most abundant
lianas species in the evergreen Ituri rain forest of Congo. We evaluated their demographic
performance and the relation of vital rates to abundance and to four functional traits
(climbing strategy, dispersal syndrome, leaf size and light requirements) to determine
across species variation and to characterize their major strategies. Vital rates varied widely:
species-specific recruitment rates varied from 0.0-10.9%, mortality rates from 0.43-7.89%,
and growth rates from -0.03-3.51 mm y-1. Most species had low to moderate rates. Fast
growing species tended to recruit and die fast, but recruitment and mortality rates were not
related, suggesting that species shift in absolute abundance. However, with the exception of
the collapsing Manniophyton fulvum population, species maintained their rank in
abundance over time. Species growth declined with abundance, but recruitment and
mortality rates were not significantly related to abundance. Liana demographic performance
varied weakly with climbing strategy and dispersal mode but was, surprisingly, not related
to lifetime light requirements of the species. Liana strategies in terms of functional traits
and vital rates were summarized using a principle components analysis. Light demand, and
dispersal syndrome were the most determining traits. Three functional guilds were
distinguished. We conclude that old-growth forest liana species show a large variation in
abundance and vital rates, and that density-dependent mechanisms are insufficient to
explain the species abundance patterns over time.
Key words: species-specific dynamics, lianas, growth, mortality, recruitment, functional
traits
Ewango_PROEF (all).ps Back - 40 T1 - Black

Chapter 4 – Thirteen years of species-specific dynamics
67
INTRODUCTION
A community assemblage is the product of the dynamics of the individual species that
compose the assemblage. Therefore, knowledge of the dynamics of individual species
(recruitment, growth and mortality rates) helps to understand the dynamics of the whole
assemblage (Haper 1977, Begon et al. 1996). The first step to understand liana dynamics is
to characterize their species’ vital rates and relate this to their functional traits. Until recently,
hardly any studies exist dealing with the vital rates of individual liana species (but see Caballé
& Martin 2001; Nabe-Nielsen 2002, 2004, Mascaro et al. 2004), and none has tried to relate
those to their functional traits. Community-level long-term demographic studies on lianas are
nearly non-existing (but see Caballé & Martin 2001; Phillips et al. 2002; Wright et al. 2004;
Allen et al. 2005). Here we report on the demography and vital rates of a highly diverse
assemblage of liana species in an old-growth lowland rainforest in the Congo Basin, where
the liana community appears to be extremely dynamic and decreasing in overall abundance
(Ewango et al. submitted). This decrease contrasts with the generally found increase in earlier
liana studies, notably in the Neotropics (Phillips et al. 2002; Wright et al. 2004; Allen et al.
2007).
Changes in abundance of a species are the result of the recruitment, growth, and
mortality rates. These vital rates are not only affected by the environment, but also by the
species-specific functional traits. Empirical studies have shown that species traits such as
seed size, leaf size, adult height and wood density influence species vital rates (Ackerly et
al. 2002; Cornwell, Schwilk & Ackerly 2006, Poorter et al. 2008, Kooyman et al. 2010). In
addition, for liana species also their climbing mechanism affects their vital rates (Darwin
1867; Putz and Mooney 1991, Currasco-Urra & Gianoli 2009).
Determining the causes of commonness and rarity of individual species in ecological
communities is essential for our understanding of how communities are structured and has
important implications for biodiversity conservation (Kunin & Gaston 1997; Hubbell &
Foster 1986). Identifying the determinants of species abundance has been particularly
challenging in tropical forests, which are characterized by both high species richness and
high rarity. Although Rabinowitz (1981) outlined the seven causes of species rarity, a
number of more recent studies neglected the importance of vital rates trade-offs to explain
and understand species relative abundance. Density-dependent decline in growth and
survival is thought to keep the most abundant species under control (Janzen 1970, Connell
1978,), and hence, maintain species diversity. It has also been shown that vital rates of tree
Ewango_PROEF (all).ps Front - 41 T1 - Black
Chapter 4 – Thirteen years of species-specific dynamics
68
species are related to their abundance (Comita & Hubbell 2009), but it is not known yet
whether the same applies for lianas as well.
Most previous studies on liana dynamics strongly relied on community dynamics and
hardly determined how species-specific performances contribute to species population
maintenance within a community. For the present paper we use the existing long-term,
standardized datasets from the Ituri Forest Dynamics Plots, Democratic Republic of Congo,
which is part of the global network of large forest dynamics plots coordinated by the Center
for Tropical Forest Science (CTFS). We examine the demography of lianas over 13 years
(1994–2007) for 15,008 stems belonging to 195 species showing a wide range of functional
traits. We address five specific questions: (1) How variable are liana species in
demographic performance (i.e. their vital rates)? (2) How are liana vital rates associated
with each another? (3) What is the relation between liana vital rates and species abundance?
(4) What is the relation between liana vital rates and species functional traits? and (5)
Which general strategies do lianas have, based on vital rates and functional traits? We
formulate the following corresponding hypotheses: First, species mortality, recruitment and
growth rates are highly variable across species, considering that lianas are a taxonomically
diverse group. Second, liana vital rates are closely associated in a fast-slow continuum, in
which species with a high recruitment rate will also have high growth and mortality rates.
Third, species growth, survival and recruitment will be lower in common species than in
rare species because of negative density-dependent effects (Connell et al. 1984, Comita et
al. 2010). Fourth, vital rates will be higher for species that are light demanding, twine, and
have large leaves (Bonsall et al. 2004, Gerwing 2004, Gilbert et al. 2006). Fifth, we expect
that competition for light will be the major process characterizing species.
MATERIAL AND METHODS
Study site and plot sampling
We conducted this research in the Réserve de Faune à Okapis (RFO; 1°25’N, 28°35’E), a
protected area in the Ituri Forest, north-eastern Democratic Republic of Congo. For this
paper, we use two 10-ha plots established in mixed tropical rain forest. Each plot was
divided into 250 20 × 20 m contiguous subplots. In 1994, all lianas 2 cm dbh (diameter at
breast height, measured at 130 cm from the rooting point) were tagged, mapped, identified
and their diameter measured to the nearest mm in 1994 (Makana et al. 1998). In 2001 and
2007, these plots were recensused, and all individuals alive from the previous censuses
Ewango_PROEF (all).ps Back - 41 T1 - Black
Chapter 4 – Thirteen years of species-specific dynamics
69
were re-measured and newly recruited individuals were recorded and measured following
the same methods used in 1994.
The two 10-ha plots are floristically and topographically homogenous. Cynometra
alexandri C.H.Wright, Julbernardia seretii (De Wild.) Troupin and Cleistanthus
michelsonii J.Léonard are the most common and dominant canopy trees. The canopy is 30-
40m in height and irregular. The altitude reaches 700-850 m asl and topography in the
study plots is fairly insignificant: the surface is only slightly undulating and the difference
between the highest and lowest point is only 14 to 21 m for each plot, respectively (Makana
et al. 2004). Temperatures are quite uniform year-round (with daily minimum reaches
17.9°C and 25.5°C at maximum), but rainfall (mean annual precipitation of c. 1785 mm) is
seasonal, with the driest months January and February receiving less than 50 mm of rain.
More details for climate, vegetation, and fauna in the area of the two plots can be found in
Hart (1985, 1986) and Makana et al. (1998).
In the field, the most common and readily identifiable species were directly named
and plant material was collected of all other species and for fertile herbarium material. A
total of nearly 10000 vouchers were collected during the survey. The vouchers were
processed at the Centre de Formation et de Recherche en Conservation Forestière:
CEFRECOF Herbarium (Epulu) and part of duplicates deposited to the Nationaal
Herbarium Nederland (Wageningen University Branch), Meise (Brussels), and Missouri
Botanical Garden (St. Louis, USA) for identification by specialists. Vouchers collected
were identified using major regional floras/ taxonomic literature, mainly Flore d’Afrique
centrale [Congo-Rwanda-Burundi], Flore du Cameroun, Flore du Gabon, Flora of East
(FTEA) & West Tropical Africa (FTWA), and either by comparisons with identified
herbarium materiel or assisting by plant taxonomists in Wageningen, Meise and Missouri.
Nomenclature follows the Angiosperm Phylogeny Group (APG) and for taxonomic group
with unreliable classification, we referred to Lebrun et al. (1991–1997).
Species functional traits
We selected four species functional traits from literature (Evrad 1968, Bongers et al. 2005)
that are thought to be important for liana dynamics. Dispersal syndrome is an indicator of
the dispersal and colonization potential of species, and was derived from diaspore types and
included anemochory (wind-dispersed), barochory (e.g. explosive) and zoochory (animal-
dispersed). The climbing strategy indicates how fast and efficient species grow to the
canopy, and it was categorized based on their anchorage structures as hook, tendril, twiner,
Ewango_PROEF (all).ps Front - 42 T1 - Black

Chapter 4 – Thirteen years of species-specific dynamics
70
and root climbers. Light requirements for species recruitment and growth were classified
into light-demanding or shade-tolerance, based on information on species life history
(Evrard 1968). Leave size is important for the light capture and heat balance of the plant,
and leaf size was classified as being small (< 20 cm2) or large ( 20 cm2), based on
information from Raunkiaer (1934) on leaf size categories and adopted in Evrard (1968).
Species-specific vital rates
For each species we calculated the relative abundance as the percentage of number of
individuals of that species over the total individuals of all the species, and changes therein
over time. We calculated recruitment, mortality and annual growth rates during the
intercensus period (1994 to 2007) for all species with 10 individuals in 1994.
Demographic rates were defined for the recruitment rate over 13-year for a species
calculated as r = 100×[ln Nt1 - ln Nt2/t], and mortality rate as m = 100×[ln (Nt2) - ln
(Nt1)]/(t2 - t1), in which Nt1 is the total number of lianas present at the initial census, Nt2 is
the number of lianas of this cohort still alive at the second census, and t1 and t2, are the
initial and final census dates (i.e., species-specific time varied from 11-13 years),
respectively (Condit et al. 1999). The annual diameter growth was calculated as D = (dbh2 -
dbh1)/(t2 - t1), where dbh1 and dbh2 refer to the diameter of the individuals at the initial and
final census. The time interval spanned by a species was defined as the arithmetic mean time
between censuses for individuals of that species, based on the census data of each 20 x 20 m
quadrat in the plots.
Statistical analysis
First, we performed the Shapiro-Wilk test to assess whether liana species show a normal
distribution of their vital rates. Relationships between demographic vital rates on the one
hand, and functional traits, and species abundances in 1994 and 2007 on the other hand,
were analyzed using linear regressions. From this analysis we excluded 3 species (Entada
gigas for growth, Laccosperma secundiflorum as palm, and Urera trinervis for recruitment)
that were clear outliers with very extreme rates. To test whether species with different
functional traits differed in demographic vital rates and in their abundance (i.e.
commonness/rarity) we used one-way ANOVA, with Tukey’s HSD significant difference
post hoc test. We used a t-test for light requirement and leaf size (Zar 1999). In all these
analyses, only species with at least 10 individuals in total were used, and where necessary
population data were transformed using a logarithmic transformation (log10(x)), to conform
to assumptions of normality and homogeneity of variance.
Ewango_PROEF (all).ps Back - 42 T1 - Black
Chapter 4 – Thirteen years of species-specific dynamics
71
To summarize lianas species strategies, we performed a Principal Component
Analysis (PCA) ordination to detect potential species guilds based on the combination of
their demographic vital rates and functional traits. Finally, to estimate species concordance
in species rank-abundance across time, we used the non-parametric Kendall’s tau
correlation (Field 2009). All statistical analyses were done using SPSS for Windows 17.0.
RESULTS
Floristics
The two 10-ha plots contained 15,008 stems 2 cm dbh in 1994 and 9,982 stems in 2007
representing a total of 195 and 198 species, respectively. Of these, 79 species (41% of the
total) were selected that had sufficient individuals ( 10 stems in the 20 ha) in 1994 to
calculate their vital rates. These 79 species represent together 13,156 of the stems (97% of
total) in 1994 and 8,749 stems (95%) in 2007, and belong to 23 families and 44 genera
(Table 4.1). The Apocynaceae (12 species), Celastraceae and Connaraceae (8), Annonaceae
(7), Dichapetalaceae and Fabaceae (6) were the most speciose families. Manniophyton
fulvum (Euphorbiaceae) alone accounted for 24% of the stems.
Species-specific performance
Most species are rare; the species frequency distributions over abundance classes was not
normal and strongly skewed to the right (1994 census, Shapiro-Wilk test = 0.24, P < 0.001,
n = 195, Figure 4.1A; 2007 census, Shapiro-Wilk test = 0.39, P < 0.001, n = 198, Figure
4.1B). Recruitment rates of the 79 analyzed species varied from 0.0-10.9% per year with an
average (mean ± SE) of 1.29 ± 0.16. Most species had a low recruitment rate (Figure 4.1C;
Shapiro-Wilk test = 0.61, P < 0.001, n = 79). Mortality rates varied from 0.43-7.89% per
year with an average of 2.78 ± 0.18. Its distribution was not normal (Shapiro-Wilk test =
0.92, P < 0.001, n = 79, Figure 4.1D) but most species had intermediate mortality. Growth
rates varied from -0.03-3.51 mm y-1 with an average of 0.67 ± 0.54, its distribution being
not normal (Shapiro-Wilk test = 0.77, P < 0.001, n = 79, Figure 4.1E). Most species had
intermediate growth rates. Few species, however, grow extremely fast. For example, Urera
trinervis had the highest recruitment (10.9% y-1) of all species, and Entada gigas had the
highest (3.51 mm y-1) growth rate.
Ewango_PROEF (all).ps Front - 43 T1 - Black
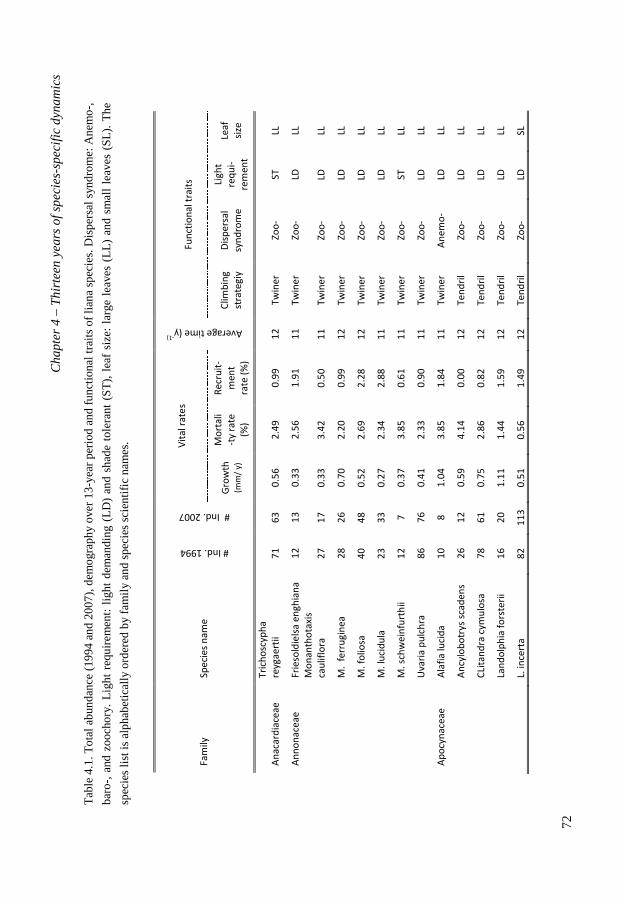
C
hapt
er 4
– T
hirt
een
year
s of
spe
cies
-spe
cifi
c dy
nam
ics
72
Tab
le 4
.1. T
otal
abu
ndan
ce (
1994
and
200
7), d
emog
raph
y ov
er 1
3-ye
ar p
erio
d an
d fu
ncti
onal
trai
ts o
f li
ana
spec
ies.
Dis
pers
al s
yndr
ome:
Ane
mo-
,
baro
-, a
nd z
ooch
ory.
Lig
ht r
equi
rem
ent:
lig
ht d
eman
ding
(L
D)
and
shad
e to
lera
nt (
ST
), l
eaf
size
: la
rge
leav
es (
LL
) an
d sm
all
leav
es (
SL
). T
he
spec
ies
list
is a
lpha
betic
ally
ord
ered
by
fam
ily
and
spec
ies
scie
ntif
ic n
ames
.
Ewango_PROEF (all).ps Back - 43 T1 - Black

C
hapt
er 4
– T
hirt
een
year
s of
spe
cies
-spe
cifi
c dy
nam
ics
73
Ewango_PROEF (all).ps Front - 44 T1 - Black

C
hapt
er 4
– T
hirt
een
year
s of
spe
cies
-spe
cifi
c dy
nam
ics
74
Ewango_PROEF (all).ps Back - 44 T1 - Black

C
hapt
er 4
– T
hirt
een
year
s of
spe
cies
-spe
cifi
c dy
nam
ics
75
Ewango_PROEF (all).ps Front - 45 T1 - Black

C
hapt
er 4
– T
hirt
een
year
s of
spe
cies
-spe
cifi
c dy
nam
ics
76
Ewango_PROEF (all).ps Back - 45 T1 - Black
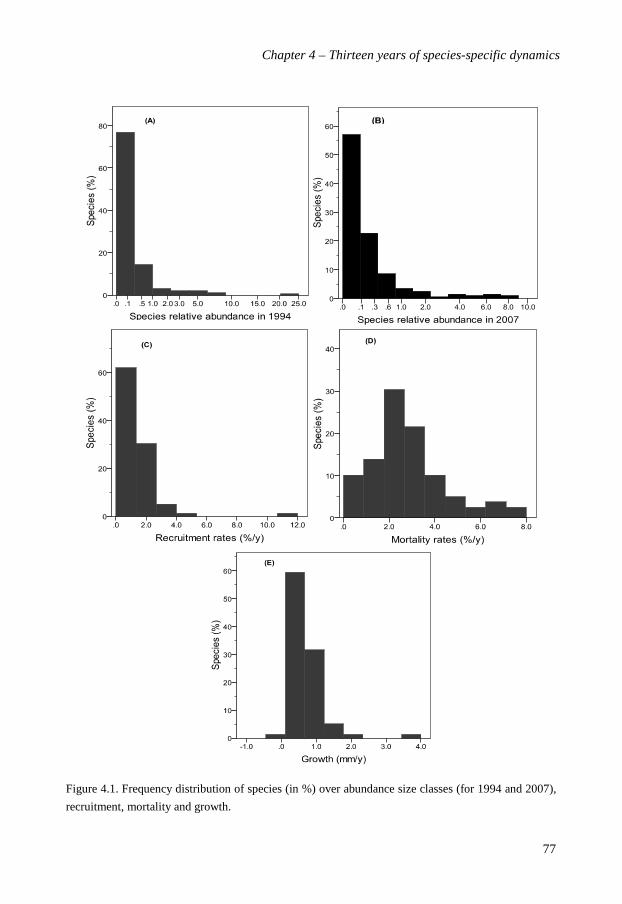
Chapter 4 – Thirteen years of species-specific dynamics
77
Figure 4.1. Frequency distribution of species (in %) over abundance size classes (for 1994 and 2007),
recruitment, mortality and growth.
Ewango_PROEF (all).ps Front - 46 T1 - Black
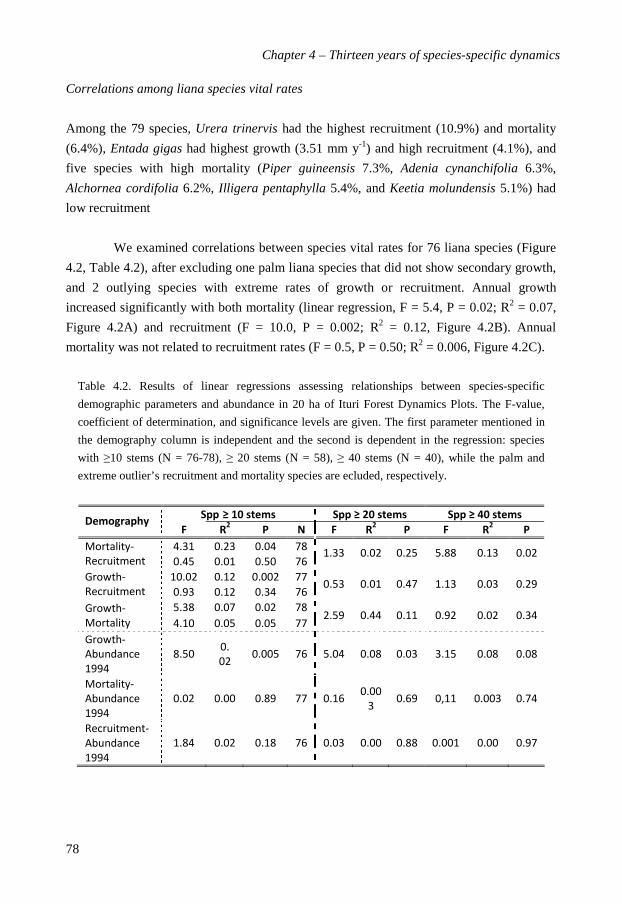
Chapter 4 – Thirteen years of species-specific dynamics
78
Correlations among liana species vital rates
Among the 79 species, Urera trinervis had the highest recruitment (10.9%) and mortality
(6.4%), Entada gigas had highest growth (3.51 mm y-1) and high recruitment (4.1%), and
five species with high mortality (Piper guineensis 7.3%, Adenia cynanchifolia 6.3%,
Alchornea cordifolia 6.2%, Illigera pentaphylla 5.4%, and Keetia molundensis 5.1%) had
low recruitment
We examined correlations between species vital rates for 76 liana species (Figure
4.2, Table 4.2), after excluding one palm liana species that did not show secondary growth,
and 2 outlying species with extreme rates of growth or recruitment. Annual growth
increased significantly with both mortality (linear regression, F = 5.4, P = 0.02; R2 = 0.07,
Figure 4.2A) and recruitment (F = 10.0, P = 0.002; R2 = 0.12, Figure 4.2B). Annual
mortality was not related to recruitment rates (F = 0.5, P = 0.50; R2 = 0.006, Figure 4.2C).
Table 4.2. Results of linear regressions assessing relationships between species-specific
demographic parameters and abundance in 20 ha of Ituri Forest Dynamics Plots. The F-value,
coefficient of determination, and significance levels are given. The first parameter mentioned in
the demography column is independent and the second is dependent in the regression: species
with 10 stems (N = 76-78), 20 stems (N = 58), 40 stems (N = 40), while the palm and
extreme outlier’s recruitment and mortality species are ecluded, respectively.
Ewango_PROEF (all).ps Back - 46 T1 - Black

Chapter 4 – Thirteen years of species-specific dynamics
79
RRR
Figure 4.2. Relationships between mortality, diameter growth, and recruitment of 79 liana species
in the Ituri Forest. Each point represents a species; the regression lines corresponding coefficient of
determination (R2), and significance levels are shown as ** P < 0.001, ns = no significant. Species-
specific mortality and recruitment are investigated over a 13 years period.
Abundance and vital rates
Of the species vital rates only growth was negatively related to abundance (linear
regression, F = 8.5, P = 0.005; R2 = 0.02; Table 4.2, Figure 4.3B). This relation
disappeared, however, when only species with 20 (n = 58 species) or 40 (n = 40 species)
stems were considered (data not shown). Species mortality (linear regression, F = 0.002, P
= 0.09; R2 = 0.00; Figure 4.3A) and recruitment (F = 1.84, P = 0.18; R2 = 0.02; Figure
4.3C) were independent of species abundance. This lack of density-dependence remained
when only species with 20 or 40 stems were considered (data not shown).
Ewango_PROEF (all).ps Front - 47 T1 - Black

Chapter 4 – Thirteen years of species-specific dynamics
80
RRR
Figure 4.3. Relationship between mortality, diameter growth and recruitment and abundance in
1994 of 79 liana species in the Ituri Forest. Each point represents a species; the regression line,
corresponding coefficient of determination (R2), and significance levels are shown as ** P < 0.001,
ns = no significant. Species-specific mortality and recruitment are investigated over a 13 years
period.
Over the 13-year study period, 48% of the liana stems died. However, species
maintained their abundance over time (n=211, R2 = 0.98, Figure 4.6B) when the dominant
species Manniophyton fulvum was excluded. Although the species-dominance rank order
was significantly concordant between the 1994 and 2007 censuses (Kendal tau, = 0.77; n
= 212, P = 0.01; Figure 4.6A), rare species tended to have more rank crossovers during that
period than common species.
Ewango_PROEF (all).ps Back - 47 T1 - Black
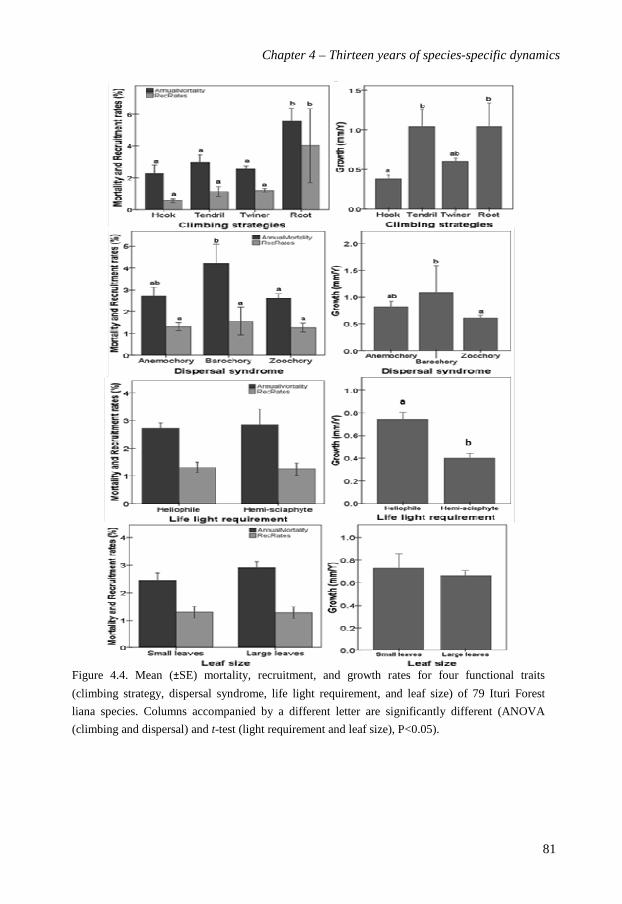
Chapter 4 – Thirteen years of species-specific dynamics
81
Figure 4.4. Mean ( SE) mortality, recruitment, and growth rates for four functional traits
(climbing strategy, dispersal syndrome, life light requirement, and leaf size) of 79 Ituri Forest
liana species. Columns accompanied by a different letter are significantly different (ANOVA
(climbing and dispersal) and t-test (light requirement and leaf size), P<0.05).
Ewango_PROEF (all).ps Front - 48 T1 - Black
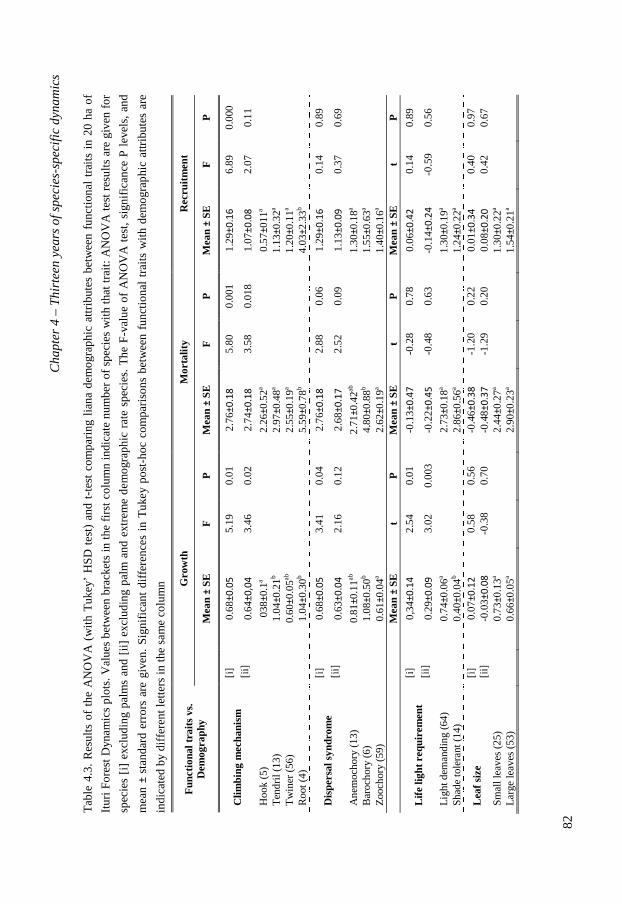
C
hapt
er 4
– T
hirt
een
year
s of
spe
cies
-spe
cifi
c dy
nam
ics
82
Tab
le 4
.3.
Res
ults
of
the
AN
OV
A (
wit
h T
ukey
’ H
SD
tes
t) a
nd t
-tes
t co
mpa
ring
lia
na d
emog
raph
ic a
ttri
bute
s be
twee
n fu
ncti
onal
tra
its
in 2
0 ha
of
Itur
i For
est D
ynam
ics
plot
s. V
alue
s be
twee
n br
acke
ts in
the
firs
t co
lum
n in
dica
te n
umbe
r of
spe
cies
wit
h th
at tr
ait:
AN
OV
A te
st r
esul
ts a
re g
iven
for
spec
ies
[i]
excl
udin
g pa
lms
and
[ii]
exc
ludi
ng p
alm
and
ext
rem
e de
mog
raph
ic r
ate
spec
ies.
The
F-v
alue
of
AN
OV
A t
est,
sign
ific
ance
P l
evel
s, a
nd
mea
n st
anda
rd e
rror
s ar
e gi
ven.
Sig
nifi
cant
dif
fere
nces
in
Tuk
ey p
ost-
hoc
com
pari
sons
bet
wee
n fu
ncti
onal
tra
its
wit
h de
mog
raph
ic a
ttrib
utes
are
indi
cate
d by
dif
fere
nt le
tter
s in
the
sam
e co
lum
n Gro
wth
M
orta
lity
Rec
ruit
men
t F
unct
iona
l tra
its
vs.
Dem
ogra
phy
M
ean
SE
F
P
M
ean
SE
F
P
M
ean
SE
F
P
[i]
0.68
5.19
0.
01
2.76
5.80
0.
001
1.29
6.89
0.
000
Clim
bing
mec
hani
sm
[ii]
0.
643.
46
0.02
2.
743.
58
0.01
8 1.
072.
07
0.11
Hoo
k (5
)
038
0.1a
2.26
0.52
a
0.
5701
1a
T
endr
il (1
3)
1.
040.
21b
2.97
0.48
a
1.
130.
32a
Tw
iner
(56
)
0.60
0.05
ab
2.
550.
19a
1.20
0.11
a
R
oot (
4)
1.
040.
30b
5.59
0.78
b
4.
032.
33b
[i]
0.68
3.41
0.
04
2.76
2.88
0.
06
1.29
0.14
0.
89
Dis
pers
al s
yndr
ome
[i
i]
0.63
2.16
0.
12
2.68
2.52
0.
09
1.13
0.37
0.
69
Ane
moc
hory
(13
)
0.81
0.11
ab
2.
710.
42ab
1.30
0.18
a
B
aroc
hory
(6)
1.08
0.50
b
4.
800.
88b
1.55
0.63
a
Z
ooch
ory
(59)
0.61
0.04
a
2.
620.
19a
1.40
0.16
a
M
ean
SE
t
P
Mea
n S
E
t P
M
ean
SE
t
P
[i]
0,34
2.54
0.
01
-0.1
3-0
.28
0.78
0.
060.
14
0.89
L
ife
light
req
uire
men
t
[ii]
0.
293.
02
0.00
3 -0
.22
-0.4
8 0.
63
-0.1
4-0
.59
0.56
Lig
ht d
eman
ding
(64
)
0.74
0.06
a
2.
730.
18a
1.30
0.19
a
Sh
ade
tole
rant
(14
)
0.40
0.04
b
2.
860.
56a
1.24
0.22
a
[i
] 0.
070.
58
0.56
-0
.46
-1.2
0 0.
22
0.01
0.40
0.
97
Lea
f si
ze
[ii]
-0
.03
-0.3
8 0.
70
-0.4
8-1
.29
0.20
0.
080.
42
0.67
Sm
all l
eave
s (2
5)
0.
730.
13a
2.44
0.27
a
1.
300.
22a
Lar
ge le
aves
(53
)
0.66
0.05
a
2.
900.
23a
1.54
0.21
a
Ewango_PROEF (all).ps Back - 48 T1 - Black

Chapter 4 – Thirteen years of species-specific dynamics
83
Liana functional traits and demography
Liana demographic performance varied with functional traits (Table 4.3, Figure 4.4). Lianas
with different climbing strategy varied in growth (One-way ANOVA, F = 5.19, P = 0.01),
mortality (F = 5.80, P = 0.001) and recruitment (F = 6.89, P = 0.0001) rates (the palm
species were excluded). When considering climbing strategies, hook species had a lower
mean growth compared to the tendril and root climbing species, and root climbing species
show a higher mean mortality and recruitment rate compared to the other three strategies
(Tukey’s HSD test, P<0.05). Dispersal syndrome had a significant effect on growth and
mortality rate (One-way ANOVA, F = 3.41, P = 0.04; excluding palm), in which
barochorous species had a significantly faster growth rate than zoochorous species (Tukey’s
HSD test, Figure 4.4D). Light demanding species had significantly higher growth rate than
shade tolerant species (t = 3.02, P = 0.003; removing palm and two species with extreme
demographic values), but the two groups did not differ in mortality and recruitment rates.
Leaf size did not have a significant effect on any of the demographic vital rates (Table 4.3).
Characterizing species variation
Species were characterized using a PCA including all functional traits and all vital rates.
Categorical variables (light demanding, shade tolerant, large leaves, small leaves, hook,
tendril, twiner, root-climber, animal-dispersed, explosive dispersal, and wind-dispersed)
were entered as dummy variables. The PCA of the eleven functional traits explained 36%
of the total trait variation with the first two axes. Axis 1 (20%) can be characterized as an
axis of variation in light demand with light-demanding species at the left and shade-tolerant
species at the right. Axis 2 (16%) can be characterized as an axis of variation in dispersal
(Figure 4.5A) with wind-dispersed species at the top and animal-dispersed species at the
bottom. The species showed a nice spread on the first two axes of the PCA. A few species
had unique trait and rate combinations (Manniophyton fulvum, Millettia psilopetala, and
Uncaria africana; Figure 4.5B), but generally three clusters show up in the figure,
indicating species with similar characteristics of vital rates and functional traits. Species in
cluster (a) are characterized by wind-dispersal species in cluster (b) are root climbers and
intermediate mortality and recruitment species in cluster (c) are characterized by hooks or
tendrils and animal dispersal. Interestingly, most families and genera with >2 species had
their species in a single cluster; only Combretaceae, Connaraceae and Celastraceae had
species in two clusters.
Ewango_PROEF (all).ps Front - 49 T1 - Black

Chapter 4 – Thirteen years of species-specific dynamics
84
(B)
(A)
(a)
(b)
(c)
Figure 4.5. PCA ordination of 76 liana species based on three vital rates (growth, mortality,
and recruitment) and four functional traits. (A) trait loadings. The functional traits relate to
climbing strategy (hook, tendril, twiner, root climber), dispersal syndrome (animal,
explosive, wind), life light requirement (light-demanding, shade-tolerant), and leaf size
(small, large). (B) species regressions cores, with (a) wind-dispersal species, (b) root
climbers and intermediate mortality and recruitment, (c) hooks or tendrils climbers and
animal-dispersed cluster.
Ewango_PROEF (all).ps Back - 49 T1 - Black
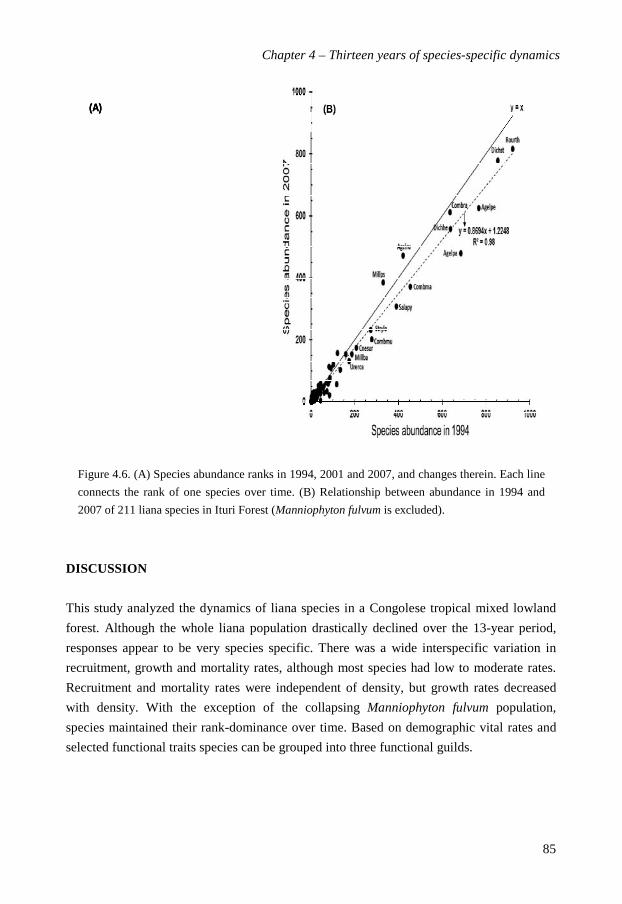
Chapter 4 – Thirteen years of species-specific dynamics
85
(B)(A) (B)(B)(A)(A)
Figure 4.6. (A) Species abundance ranks in 1994, 2001 and 2007, and changes therein. Each line
connects the rank of one species over time. (B) Relationship between abundance in 1994 and
2007 of 211 liana species in Ituri Forest (Manniophyton fulvum is excluded).
DISCUSSION
This study analyzed the dynamics of liana species in a Congolese tropical mixed lowland
forest. Although the whole liana population drastically declined over the 13-year period,
responses appear to be very species specific. There was a wide interspecific variation in
recruitment, growth and mortality rates, although most species had low to moderate rates.
Recruitment and mortality rates were independent of density, but growth rates decreased
with density. With the exception of the collapsing Manniophyton fulvum population,
species maintained their rank-dominance over time. Based on demographic vital rates and
selected functional traits species can be grouped into three functional guilds.
Ewango_PROEF (all).ps Front - 50 T1 - Black

Chapter 4 – Thirteen years of species-specific dynamics
86
Patterns in species performance
We expected that species would be normally distributed with respect to their abundance,
and vital rates. However, none of these rates were normally distributed, and recruitment and
mortality were clearly skewed to the right (Figure 4.1). In 2007, there is an increase of
species in some of the intermediate abundances classes due to growth to higher size classes,
and as a consequence, the number of rare species (i.e. with low abundance) decreased. Most
common species tended to remain their relative rank in the community, with the exception
of the initially strongly dominant Manniophyton fulvum. That declined tremendously in its
absolute and relative abundance (Figure 4.6B).
We hypothesized that species mortality, recruitment and growth rates would be
highly variable across species. Most of the species had low recruitment (<2%) and growth
(<1 mm/ y), while mortality showed a peak between 2 and 3% (Figure 4.1D). Changes in
species richness are affected by a number of demographic factors. Among such factors,
recruitment and growth have a decisive influence to counterbalance populations and species
richness in many cases (Harper 1977). This study has some similarities with other tropical
forests, suggesting that our findings that liana diameter growth rates are typically low but
variable among species corroborates with results reported in the Neotropical forests. In a 8-
year monitoring of 15 species, Putz (1990) recorded an average annual species diameter
growth rate of 1.4 mm in a Panamanian forest. Considering large lianas (dbh >10 cm),
Ewers et al. (1991) registered on average 1.8 mm y-1, but with many species represented
only by single stem, over 13 year period in a Costa Rican forest. Putz (1990) also found that
for a 3-year study period, species diameter growth ranged between 0.2 and 5.8 mm per
year. Gerwing (2004) reported a mean annual diameter growth rate of 1.3 mm for the six
species he studied, varying from 0.3 mm for the late successional Memora to 2.2 mm for
the pioneer Croton. In a temperate forest, Allen et al. (1997) found a mean annual diameter
increment of 1.3 mm for five liana species. Data on mortality rates are scarce. Putz (1990)
reported mean annual mortality rates of 1.5% for climbing ramets and 0.3% for climbing
genets of 15 species studied over 8 years. Gerwing (2004) found 6.7% mortality for ramets
and 3.1% for genets. Mortality rates in the Ituri forest were substantially higher (average
across species mean annual stem mortality rate of 2.76%; range 0.43–11%, with a
maximum of 11% for Urera), may be because we did not differentiate between genets and
ramets. Gerwing (2004) and Gilbert et al. (2006) concluded that lianas and trees exhibit
broadly overlapping ranges in survival and relative growth rates. They also found large
interspecific variation in liana mortality rates, and high diversity in life history strategies.
Ewango_PROEF (all).ps Back - 50 T1 - Black

Chapter 4 – Thirteen years of species-specific dynamics
87
Are vital rates correlated?
We hypothesized that the species vital rates would be highly correlated and that fast-
growing species would die and recruit fast as well. Species growth was indeed positively,
albeit weakly correlated to mortality and recruitment rate. Similarly, Gilbert et al. (2006)
found for 22 Panamanian liana species a positive relation between growth and mortality
rate, both at the seedling and the sapling stage. This relationship, also known as the growth-
survival trade-off, has been widely found across tropical and temperate tree communities
(e.g., Hubbell & Foster 1992, Kitajima 1992, Kobe 1996, Poorter & Bongers 2006), and is
thought to represent an important demographic axis of variation, shaping the life history
strategies of liana and tree species. It should be said that this trade-off is strongest in the
smallest size classes, and disappears when plants grow taller, perhaps because they acquire
all similar beneficial high light conditions, or because taller individuals are more robust
against environmental hazards and show less mortality. The relatively weak growth-
survival trade-off that we found in our study can be explained by the fact that vital rates
have been calculated for relatively large individuals (between 2-10 cm dbh), of which most
are already exposed to full light in the canopy.
Species co-occurring within a community often show a wide variation in
demographic vital rates, as demonstrated by long-term community dynamics studies in
permanent tropical forests plots (e.g. Condit et al.1995, Gerwing 2004, Nascimento et al.
2005, Swaine et al. 1987). In our study, species mortality rate was not related to recruitment
rate (Figure 4.2C), indicating that individual species populations are not in equilibrium, and
that some species should be increasing in abundance, while others decrease. Yet, given that
the majority of the species have low to intermediate recruitment and mortality rates, these
changes should go relatively slow. In our forest the species populations were quite stable:
species abundances were constant over time and species ranks were concordant for the two
periods of this study (Figure 4.6A). The only species showing dramatic changes is the
single, most dominant species, Manniophyton fulvum, comprising as much as 24% of the
stems in the liana community, and without that one, species populations are in equilibrium
(Figure 4.6B).
Are vital rates dependent on species abundance?
We predicted that density-dependence processes would keep the most abundant species
under control in this forest, and that survival, growth, and recruitment should be lower in
Ewango_PROEF (all).ps Front - 51 T1 - Black
Chapter 4 – Thirteen years of species-specific dynamics
88
common (here relatively abundant) species compared to rare ones. Species growth indeed
declines with species abundance, while recruitment and mortality rates were not
significantly related to abundance, although abundance may set an upper limit to the
recruitment and mortality rates that are possible (i.e., the upper right corners in the graphs
are empty, Figure 4.3). This is a slightly counterintuitive result, because one might expect
that if density-dependence is important, that it first should affect survival (Comita &
Hubbell 2009) and recruitment (Harms et al. 2000), rather than growth. The trade-off
between vital rates and abundance can therefore not explain dynamics in species abundance
over time. Although we analyzed a relatively long time window (13 years), vital rates may
still change over time, and the initial abundance values may be the result of different vital
rates in the past. For example, current low recruitment values may results from dispersal
limitation in the recent past (Tilman 1994, Hurtt and Pacala 1995, Hubbell 1997). Such
discordance over time may lead to the absence of correlations between current recruitment
and current abundance of older stages (Connell et al. 1977, Connell 1978, Warner and
Hughes 1988).
Do functional traits matter?
We further predicted that groups of liana species that differed in functional traits would also
differ in their demographic vital rates. Some functional traits were indeed found as being
characteristic for species with certain vital rates and thus to drive species dynamics. Dispersal
groups differed in mortality and growth, but not in recruitment. Climbing strategies showed
such relationships, but leaf size and, surprisingly, light requirements, did not. Our results
suggest that for larger individuals of old-growth forest lianas their climbing strategies are
more important in terms of reaching the canopy than their light requirements: from 2 cm
dbh onwards most species were adult and exposed in the canopy already and thus do not
compete for light anymore (C.E.N. Ewango, unpublished data). Light seems to be more
important for seedling establishment, growth and mortality (Welden et al. 1991; Nabe-
Nielsen 2002).
Based on the fifteen demographic and functional variables we evaluated, liana
species are separated along two main axes of variation: one axis characterized by light
requirement and one axis by seed dispersal (Figure 4.5A). In fact, having tendrils appeared
to be correlated to high growth rates, while being a root climbing is correlated to mortality.
Our PCA analyses discriminated species into three relatively discrete clusters, based on the
first two axes. Thus, our results reflects the importance of the joined influences of the
dispersal mechanisms and light requirement in which individuals are found, and not so
Ewango_PROEF (all).ps Back - 51 T1 - Black
Chapter 4 – Thirteen years of species-specific dynamics
89
much with vital rates in different environments. Furthermore, there is a variation among
species in growth and mortality rates of climbing stems that may correlate with habitat
affinity. For instance, later successional species of lianas appear to have lower growth and
mortality rates than those associated with early successional forest in the eastern Brazilian
Amazon old-growth forest (Gerwing 2004). Such trade-offs in life history strategies can
contribute to species coexistence and the maintenance of local diversity (Bonsall et al.
2004).
Concluding remarks
In conclusion, old-growth tropical forest lianas show a wide variation in species-specific
abundance: most species are rare and only few are very common. Except for one extremely
abundant species, the Ituri forest liana species are relatively stable in their dominance
ranking. Only three species entered the community over a 13-year period. The liana stand
as a whole is indeed highly dynamic, which is in line with earlier studies in the Neotropics
(Phillips et al. 2005, Wright et al. 2004, Ingwell et al. 2010). However, in contrast to the
strong increase in lianas in other forests, overall liana abundance in the Ituri forest
collapsed. Individual species may respond differently to such environmental changes, and
further research should examine species’ vital rates across environments.
Density-dependent mechanisms regulating the dynamic equilibrium in dominance
across common and rare lianas are insufficient to explain species abundance. Other factors,
such as disturbance, habitat association, canopy structure and topography, and soil
pathogens (Nabe-Nielsen 2002, Mangan et al. 2010) also determine species performance
and need to be considered to explain the high diversity and dynamics of old-growth tropical
forest lianas.
Ewango_PROEF (all).ps Front - 52 T1 - Black

Chapter 4 – Thirteen years of species-specific dynamics
90
Ewango_PROEF (all).ps Back - 52 T1 - Black
Chapter 5
Pervasive decline in density of liana species in a Congolese rainforest
Corneille E.N. Ewango, Frans Bongers & Lourens Poorter
Ewango_PROEF (all).ps Front - 53 T1 - Black

Chapter 5 – Pervasive changes in liana species
92
ABSTRACT
Lianas are thought to increase globally in density, but we have limited knowledge about the
taxonomic patterns of change in liana abundance, and the underlying vital rates that explain
changes in liana density. In this study the abundance of 79 relatively abundant liana species
has been monitored for 13 years in 20 ha of undisturbed old-growth forest in the Ituri
Forest, in the northeastern Congo basin in DR Congo. Here we show that the Ituri forest
experienced a pervasive change in liana population density in the last decade. We found
that 37 species changed significantly in their abundance over time; 12 (15% of total)
species increased and 25 (32%) species decreased. 42 (53%) species did not change
significantly. Of the 48 genera, 40% decreased, 8% increased and 52% stayed the same.
Five of the 12 increasing species belonged to the Celastraceae, which also was the only
significantly increasing family, and 39% of the families decreased. Surprisingly, none of
the four functional traits analyzed (lifetime light requirements, climbing mechanism,
dispersal mechanism, and leaf size) was significantly associated with species change in
population density. A close examination at species level, however, revealed that many of
the decreasing species are associated with disturbed habitats and that many of the
increasing species are late successional and short-lived. Our results suggest that the liana
community is recovering from past disturbances. Rising atmospheric CO2 level is not a
likely explanation for liana change, because more species were declining than increasing,
and increasing species did not have higher growth rates. In this forest local stand dynamics
override more global drivers of liana change.
Key words: Lianas, Population change, Growth, Mortality, Recruitment, Functional traits,
Ituri Forest, Random drift
Ewango_PROEF (all).ps Back - 53 T1 - Black
Chapter 5 – Pervasive changes in liana species
93
INTRODUCTION
Recent studies suggest that tropical forests have become more dynamic over the past
decades, with an increase in tree growth, mortality, and turnover (Phillips and Gentry 1994,
Wright 2005, Lewis et al. 2009) and directional changes in genus composition (Laurence et
al. 2004). Such changes have been attributed to global increases in atmospheric CO2
concentrations (Lewis et al. 2009, Rozendaal et al. 2010), fire-derived nutrient deposition
(Artaxo et al. 2003), reduced cloud cover (Graham et al. 2003) and increased forest
disturbance (Laurance et al. 2001). If true, such changes in tree communities may have
large consequences for ecosystem productivity and carbon storage, and cascading effects on
pollinators, herbivores, and symbiotic fungi that are often highly specialized on these tree
species.
In documenting these changes, lianas or woody climbers have often been
overlooked, despite the fact that they are a conspicuous component of tropical forest
ecosystems, typically comprising between 15% and 45% of the woody individuals and
species (Gentry 1991, Pérez-Salicrup et al. 2001, Schnitzer 2005) and contributing up to
40% of forest leaf area and leaf productivity (Hegarty & Caballé 1991, Wright et al. 2004).
Lianas have often been overlooked, perhaps because they are more difficult to measure
(Gerwing et al. 2004, Parren et al. 2005)), and good long-term data are lacking. This is
surprising, as especially lianas are thought to respond to increased atmospheric CO2
concentrations because of their fast inherent growth rates, and to respond to increased
disturbance because of their high light requirements (Hegarty & Caballé 1991, Laurance et
al. 2001), although the putative increase of lianas in forest ecosystems and the potential
influence of CO2 in explaining it are both controversial (Mohan et al. 2006).
Recent increases in stand-wide liana density and basal area (Phillips et al. 2002)
and liana litter production (Wright et al. 2004) have been reported for tropical forests in
Latin America and for temperate forests in North America (Allen et al. 2007, but see
Londré & Schnitzer 2006). However, comparable studies for African forests are near to
absent (there is only one study); despite the fact that African forests represent one-third of
the remaining tropical forest blocks in the world. The Congo Basin rainforests is the
world’s second largest expanse of forest (with an estimated total area of 200 million
hectares) accounting for 26% of the world’s tropical rainforest. Caballé and Martin (2001)
found that liana density in a Gabonese rainforest declined over a 13 year period, which
suggests that the Neotropical findings can not easily be extended to other continents, or that
this African forest is a special case. Many authors have suggested that African old-growth
Ewango_PROEF (all).ps Front - 54 T1 - Black

Chapter 5 – Pervasive changes in liana species
94
forests are undergoing recovery of past natural and large-scale anthropogenic disturbances
(Richards 1952, Fairhead & Leach 1998, van Gemerden et al. 2003, Lewis et al. 2009).
Most studies that documented changes in liana abundance did so at the stand level, and
evaluated the largest individuals (>10 cm in stem diameter) only (e.g., Phillips et al. 2002),
or inferred liana abundance from leaf litter production (Wright et al. 2004). However, no
studies have examined so far whether changes in liana abundance are pervasive and occur
among many distant taxa, what liana species are changing in abundance and why. Such
changes in liana abundance are not readily attributable to a single cause, and life-history
features, vital rates, and functional traits may shape species responses to environmental
change and give insight into the ecological determinants of species change.
Despite increasing attention from researchers, the ecology of lianas is in many
aspects still poorly understood. Particularly limited is our knowledge about taxonomic
patterns of liana change in abundance and dynamics. In this study the abundance of 79 most
numerous liana species has been monitored for 13-year in 20 ha of mixed old-growth forest
in the northeastern Congo basin forest. We examined population trends of species and
changes in liana abundance were related to their underlying vital rates (growth, recruitment,
mortality) and functional traits (i.e., light requirements, climbing mechanism, dispersal
mechanism, and leaf size). We hypothesized that there are pervasive changes in population
density of lianas, and that these changes occur across many different taxa (i.e., species,
genera, and families). We also expect increases in liana density to be driven by recruitment
and mortality rather than growth, as these vital rates have a direct impact on population
size. We predicted that increasing species will have larger leaf size as large leaves are more
efficient in terms of light capture, and will have a twining climbing mechanism, as twining
species reach the canopy faster and thus have faster access to favourable high light
conditions. Decreasing species are expected to be light demanding as with time forests
generally get darker.
MATERIALS AND METHODS
Study area and data collection
The study was carried out in lowland tropical forest on the Ituri Forest Dynamics Plots of
Edoro Field Research Station, northeastern Democratic Republic of Congo. Detailed
descriptions of the vegetation, fauna, and climate of Edoro terrain can be found in Hart
(1985), Makana et al. (2004), and Ewango et al. (subm.: chap II of this thesis). Two 10-ha
plot in old-growth mixed forest where established in 1994 (Makana et al. 1998, 2004). All
Ewango_PROEF (all).ps Back - 54 T1 - Black
Chapter 5 – Pervasive changes in liana species
95
liana 2 cm diameter at breast height (dbh) were tagged, mapped, identified. The diameter
of each stem was measured at diameter at breast height, i.e. at 130 cm or from a rooting
point unless there were trunk irregularities at the measurement point, in which case the
measurement was taken at a nearest lower/upper point where the stem was cylindrical
(Makana et al.1998, see also Gerwing et al. 2006). In 2001 and 2007 these plots were
recensused, and all individuals alive from the previous censuses were re-measured and
newly recruited individuals were recorded and measured following the same criteria as used
in 1994. For the present paper, we use data from the first (1994) and last (2007) census, to
provide a long-term (13 years) perspective on population change.
Species selection and functional traits
Only those taxa were included that had at least 10 stems in 1994, to ensure robust statistical
power, and to have a sufficient sample size to estimate mortality and growth rates. We thus
calculated annualized recruitment, mortality and growth rates for the period 1994 to 2007
for 79 species (38% of all species) with 10 individuals.
To get insight what species are changing in abundance and why, we described the species
based on four functional traits that are important for liana performance and were compiled
from a variety of published primary literature (Evrard 1968, Bongers et al. 2005). The
climbing mechanism (hook, tendril, twiner and root), indicates how quickly and with what
investment species access the canopy. The life light requirement (light demanding and
shade tolerant) indicate whether species need disturbances or not for the completion of their
life cycle. The dispersal syndrome (animal-dispersed: zoochory, explosive: barochory, and
wind-dispersed: anemochory) is an indicator of the potential dispersal distance. Leaf size
(small: 20 cm2 or large: > 20 cm2) is important for light capture and the regulation of the
heat balance of the plant.
Calculation of vital rates
To estimate the dynamics underlying population change, we calculated species vital rates in
terms of growth, mortality, and recruitment. The annual diameter growth D was calculated
as: D = (dbh2 – dbh1) / (t2 – t1), where dbh and t refers to the diameter of the individuals and
time at the initial and the final census, respectively.
The annualized mortality rate was calculated as m = (lnN1 – lnS2) / (t2 – t1), while
recruitment rate r = (lnN1 – lnS2) / (t2 – t1) is the number of individuals recruiting in the
interval between 1994 and 2007; in which N and S refers to number of individuals and
survivors at each census period t, and ln stands for the natural logarithm (Harper 1977,
Ewango_PROEF (all).ps Front - 55 T1 - Black
Chapter 5 – Pervasive changes in liana species
96
Swaine & Lieberman 1987, Condit 1999). The time interval spanned by a species was
defined as the arithmetic mean time between censuses for individuals of that species, based on
the census data of each 20 x 20 m quadrat in the plots. To examine the change in population
density and trend for each taxon (species, genus, or family) we calculated the ratio ( ) of
species abundance in 2007 (N2) over abundance in 1994 (N1). Thus, a ratio > 1 indicates an
increase, < 1 a decrease, whereas a ratio equal to one indicates a constant population.
Statistical analyses
We estimated confidence limits for of each species using bootstrapping. The census plots
were divided in 20 1-ha plots. Randomly (with replacement) 20 1-ha plots were drawn from
these 20 plots and the cumulative abundance of these plots in 2007 were divided by the
cumulative abundance in 1994. This value represents the bootstrapped of the species. We
repeated this procedure a thousand times, which gives the confidence interval for that species
(the 25th and 975th ranking values of give the 95% confidence interval. If the confidence
interval does not include = 1 then the species significantly changed in abundance.
Additional to 95% confidence limits also 99% confidence limits were determined (the 5th and
995th ranking value of ) to have a more conservative evaluation of species level changes in
abundance. We used a one-way ANOVA to test whether decreasing, constant, and increasing
species differed in their vital rates, and used ² tests to test whether increasing and decreasing
taxa differed in their functional traits. All analyses were performed with PASW Statistics 17
(SPSS 17) for windows (SPSS Inc.).
RESULTS
Taxonomic changes in abundance
We recorded 13391 stems (in 1994) for the 79 relatively abundant identified liana species,
taxonomically distributed among 48 genera and 23 families (Appendix 5.1). The average
across species was 0.70, and ranged from 0.03 for Manniophyton fulvum to 2.77 for
Monanthotaxis lucidula. Of the 79 species considered, 37 species changed significantly in
their abundance over time, which is nine times higher than expected by chance (using a P
level of 0.05 we expected that 4 of the 79 species would show a significant change). 12
(15% of total) species increased, 25 (32%) species decreased and 42 (53%) species did not
change significantly. Five of the 12 increasing species belonged to the Celastraceae.
Typical decreasing species were Manniophyton fulvum (0.03) and Piper guineensis (0.09).
The more conservative P level of 0.01, still resulted in 23 species (29% of the total) with a
Ewango_PROEF (all).ps Back - 55 T1 - Black
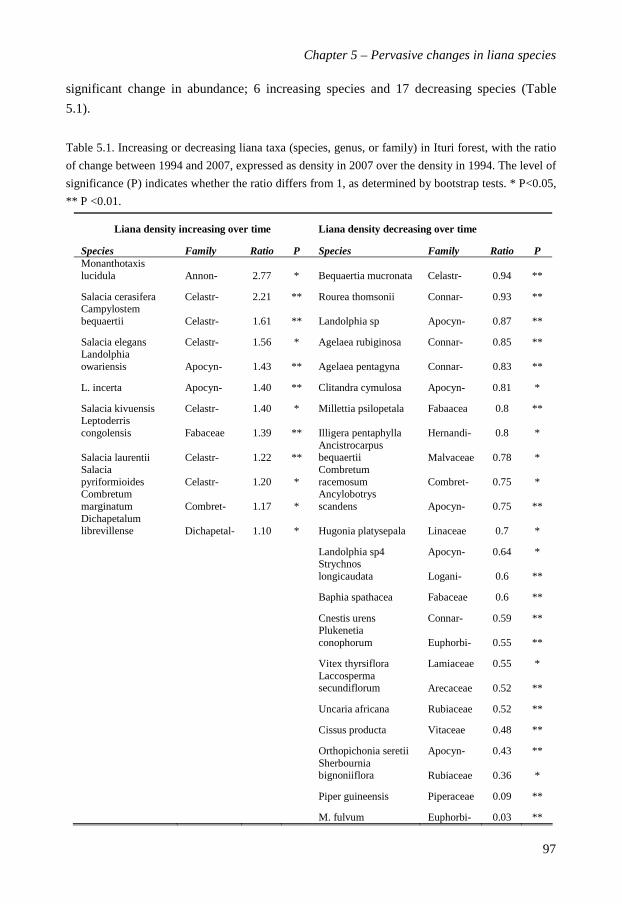
Chapter 5 – Pervasive changes in liana species
97
significant change in abundance; 6 increasing species and 17 decreasing species (Table
5.1).
Table 5.1. Increasing or decreasing liana taxa (species, genus, or family) in Ituri forest, with the ratio
of change between 1994 and 2007, expressed as density in 2007 over the density in 1994. The level of
significance (P) indicates whether the ratio differs from 1, as determined by bootstrap tests. * P<0.05,
** P <0.01.
Liana density increasing over time Liana density decreasing over time
Species Family Ratio P Species Family Ratio P Monanthotaxis lucidula Annon- 2.77 * Bequaertia mucronata Celastr- 0.94 **
Salacia cerasifera Celastr- 2.21 ** Rourea thomsonii Connar- 0.93 ** Campylostem bequaertii Celastr- 1.61 ** Landolphia sp Apocyn- 0.87 **
Salacia elegans Celastr- 1.56 * Agelaea rubiginosa Connar- 0.85 ** Landolphia owariensis Apocyn- 1.43 ** Agelaea pentagyna Connar- 0.83 **
L. incerta Apocyn- 1.40 ** Clitandra cymulosa Apocyn- 0.81 *
Salacia kivuensis Celastr- 1.40 * Millettia psilopetala Fabaacea 0.8 ** Leptoderris congolensis Fabaceae 1.39 ** Illigera pentaphylla Hernandi- 0.8 *
Salacia laurentii Celastr- 1.22 ** Ancistrocarpus bequaertii Malvaceae 0.78 *
Salacia pyriformioides Celastr- 1.20 *
Combretum racemosum Combret- 0.75 *
Combretum marginatum Combret- 1.17 *
Ancylobotrys scandens Apocyn- 0.75 **
Dichapetalum librevillense Dichapetal- 1.10 * Hugonia platysepala Linaceae 0.7 *
Landolphia sp4 Apocyn- 0.64 *
Strychnos longicaudata Logani- 0.6 **
Baphia spathacea Fabaceae 0.6 **
Cnestis urens Connar- 0.59 **
Plukenetia conophorum Euphorbi- 0.55 **
Vitex thyrsiflora Lamiaceae 0.55 *
Laccosperma secundiflorum Arecaceae 0.52 **
Uncaria africana Rubiaceae 0.52 **
Cissus producta Vitaceae 0.48 **
Orthopichonia seretii Apocyn- 0.43 **
Sherbournia bignoniiflora Rubiaceae 0.36 *
Piper guineensis Piperaceae 0.09 **
M. fulvum Euphorbi- 0.03 **
Ewango_PROEF (all).ps Front - 56 T1 - Black

Chapter 5 – Pervasive changes in liana species
98
Genus Ratio P Genus Ratio P
Baissea 2.90 ** Rourea 0.94 *
Salacia 1.29 ** Cnestis 0.91 **
Landolphia 1.18 ** Agelaea 0.89 **
Leptoderris 1.12 ** Strychnos 0.82 **
Clitandra 0.81 *
Millettia 0.81 **
Ancistrocarpus 0.78 *
Hugonia 0.73 *
Orthopichonia 0.66 **
Bequaertia 0.61 **
Baphia 0.6 **
Plukenetia 0.55 **
Ancylobotrys 0.52 **
Laccosperma 0.52 *
Uncaria 0.52 *
Vitex 0.5 *
Illigera 0.4 *
Piper 0.09 **
Manniophyton 0.03 **
Family Ratio P Family Ratio P
Celastraceae 1.25 ** Connaraceae 0.91 **
Fabaceae 0.85 **
Loganiaceae 0.82 **
Malvaceae 0.79 **
Linaceae 0.73 *
Arecaceae 0.52 **
Hernandiaceae 0.4 *
Piperaceae 0.09 **
Euphorbiaceae 0.04 **
Of the 48 genera evaluated, 8% increased significantly in abundance, 40% decreased and
52% stayed the same (Figure 5.1A, Table 5.1). Baissea (2.90) was the strongest increasing
and Manniophyton (0.03) was the strongest decreasing genus. Of the 23 families evaluated,
4% increased significantly in abundance, 37% decreased and 59% stayed the same.
Ewango_PROEF (all).ps Back - 56 T1 - Black
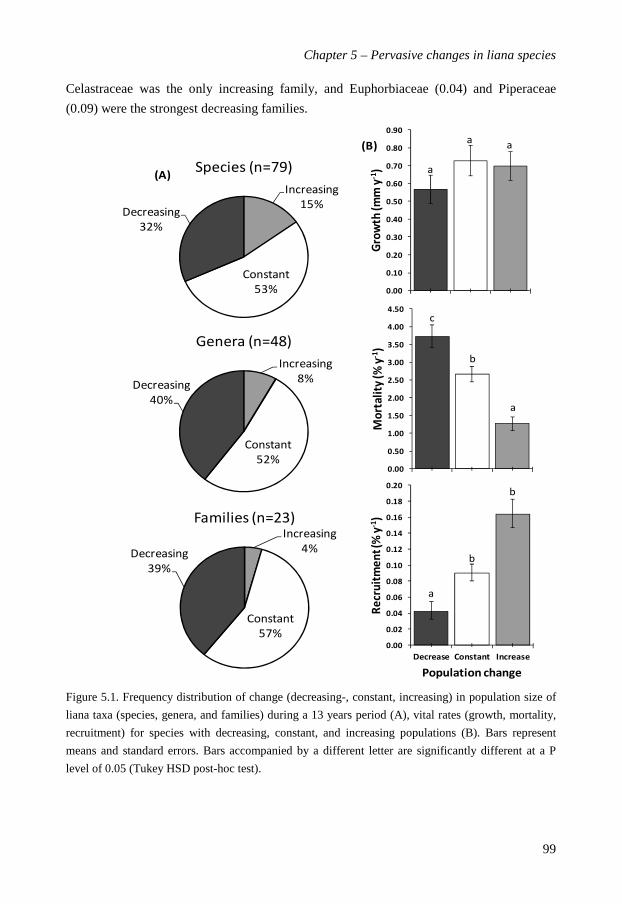
Chapter 5 – Pervasive changes in liana species
99
Celastraceae was the only increasing family, and Euphorbiaceae (0.04) and Piperaceae
(0.09) were the strongest decreasing families.
Figure 5.1. Frequency distribution of change (decreasing-, constant, increasing) in population size of
liana taxa (species, genera, and families) during a 13 years period (A), vital rates (growth, mortality,
recruitment) for species with decreasing, constant, and increasing populations (B). Bars represent
means and standard errors. Bars accompanied by a different letter are significantly different at a P
level of 0.05 (Tukey HSD post-hoc test).
Ewango_PROEF (all).ps Front - 57 T1 - Black

Chapter 5 – Pervasive changes in liana species
100
Population change as function of species characteristics
Increasing, decreasing, and constant species differed in their recruitment rates (F2,76 =
10.32, P = 0.001) and mortality rates (F2,76 = 13.05, P = 0.001), but not in their growth rates
(F2,76 = 0.89, P = 0.41). Increasing- (on average 0.16%/y) and constant species (0.09) had
much higher recruitment rates than decreasing species (0.04, Figure 5.1). In contrast,
decreasing species had much higher mortality rate (on average 3.73%/y) than constant
(2.66) and increasing (1.27) species (Figure 5.1B).
None of the four functional traits (Table 5.2) was associated with species change (at P =
0.05) in population density ( ²<4.68, and P>0.19 in all cases). However, at a more
conservative significance level of 0.01, the dispersal syndrome differed significantly
between increasing and decreasing species ( ² = 9.09, df = 4, P = 0.05): anemochorous
species increased more than expected (2 increasing species observed versus 1 expected) and
barochorous species decreased more than expected (4 observed versus 1.3 expected). Leaf
size ( ² = 5.26, df = 2, P = 0.07) was only weakly associated with species change.
Table 5.2. Results of contingency ² tests of number of species that have increased, decreased or stay
equal against functional traits of these species. Species changes are based on conservative estimates of
change (P < 0.05) and on very conservative estimates of change (P < 0.01). Climbing mechanisms are
divided in four classes (Hook, tendril, twiner, root), dispersal syndrome in 3 classes (anemochory,
barochory, zoochory), leaf size in 2 classes (large leaves, small leaves), and light requirement in 2
classes (light demanding and shade tolerant). ², degree of freedom (df) and significance level (P) are
shown.
Variables ² df P
Species changes (based on P<0.05) against
Climbing mechanisms 4.24 6 0.64
Dispersal syndrome 4.68 4 0.32
Leaf size 3.28 2 0.19
Light requirement 1.05 2 5.59
Species change (based on P<0.01) against
Climbing mechanisms 4.34 6 0.63
Dispersal syndrome 9.09 4 0.06
Leaf size 5.26 2 0.07
Light requirement 1.43 2 0.49
Ewango_PROEF (all).ps Back - 57 T1 - Black
Chapter 5 – Pervasive changes in liana species
101
DISCUSSION
This study set out to examine the abundance of 79 most representative liana species
monitored for 13-year in 20 ha census plot in an old-growth forest. We found pervasive
changes in population density for almost half of the species examined. Changes in liana
abundance were related to their mortality and recruitment rates, and weakly to dispersal
syndrome and leaf size.
Pervasive decreases in liana density in Ituri forest
Our working hypothesis was that there would be pervasive changes in population density of
lianas, and that these changes would occur across many different taxa. Our results support
this hypothesis. The Ituri old-growth forest showed drastic changes in abundances of many
species. Nearly half of the species (47%) showed a significant change in density, which is
nine times higher than expected by chance. In contrast to one expectation, only 15% of all
species increased in density, whereas 32% of the species decreased. A closer examination
of the individual species reveals that nearly two-third of the changing species were
associated with disturbed habitat types (e.g. old gaps and open canopy patches in the plots).
Ecologically, decreasing species tend to be pioneers or early successional species (e.g.,
Rourea thomsonii, Ancistrocarpus bequaertii, Cnestis urens, Hugonia platysepala,
Manniophyton fulvum), characterized by high mortality and low recruitment rates. These
species do not regenerate anymore, suggesting that the forest is in a transition from an
early- towards a later successional stage. These pioneer and late-successional species were
distributed in different genera and or families recorded in the plots. Five of the 10
significantly changed families are among the most important liana families in African
tropical forest (Jongkind & Hawthorne 2005), and may be changing in abundance all over
Africa.
The evidence for pervasive changes is not only found at the species level, but also at the
genus and family level (Figure 5.1). We expected changing taxa to be driven by recruitment
and mortality rather than growth, as these vital rates have a direct impact on population
size. Indeed, high mortality and low recruitment are the main causes of population changes
for the increasing species, and vice versa for the decreasing species. Increasing and
decreasing liana taxa did not have clear biological differences: their functional traits did not
differ much. Decreasing barochorous species might have faced limitation in seed dispersal
towards their suitable recruitment habitats. Surprisingly, lifetime light requirement was not
Ewango_PROEF (all).ps Front - 58 T1 - Black

Chapter 5 – Pervasive changes in liana species
102
of importance for population changes trends. Carrasco-Urra & Gianoli (2009) argued that
climbing host characteristic, rather than light availability are important for liana success in
old-growth forest. As species mortality and recruitment depend on many other
environmental factors (e.g. topography, moisture, soil, and drought) it is perhaps difficult
(if not elusive) to show strong links between rather soft species traits and population
change.
Collectively observed trends suggest that the changing species and genera reflect two
ecological patterns that are biologically distinct: 1) increasing species belong to a late
successional group, with low growth and high persistence, and 2) decreasing species
include many pioneers that are adapted to disturbances and are generally fast-growing and
mass-dying. The growth rates of the two groups were not significantly different, maybe
because most individuals of the species reached their maximum size, with overall slowed
growth. In line with our findings, it is likely that species’ dynamics and successional
position would at least partially drive the observed changes in population density.
What are the external drivers of liana change?
Lianas in the Neotropics and North America have been reported to increase (Phillips et al.
2002, Wright et al. 2004, Allen et al. 2007), while this study in Congo and the study by
Caballé and Martin (2001) in Gabon show that lianas are decreasing in Africa. We believe
that this observation is crucial for hypotheses regarding the generality of the drivers of
pervasive changes in liana density.
Changes in liana density could be due to global increases in atmospheric CO2
concentrations (Phillips et al. 2002) fire-derived nutrient deposition (Asner et al. 1997,
Chen et al. 2010), droughts (Condit et al. 1995, Engelbrecht et al. 2005), forest disturbance
(Laurance et al. 2001), global dimming (Stanhill & Cohen 2001, Feeley et al. 2007) or
changes in liana density may also simply be a result of random drift (Hubbell 2001). The
combined effects of increasing CO2 and increasing N-depositions is likely to lead to high
fertilization of lianas, and thus rapid growth and reproduction, resulting in increased liana
abundance. This growth fertilization hypothesis is not likely to explain the observed
changes, as growth did not differ among species groups (Fig. 1), and because liana
populations are decreasing, not increasing. Global changes in liana density could also be
due to global changes in rainfall patterns and increasing El Niño droughts (Holmgren et
al.2001, Condit et al. 2004). Yet, neither this hypothesis is likely to explain our results, as
the Ituri Forest did not experience strong droughts in the last two decades, and as lianas in
Ewango_PROEF (all).ps Back - 58 T1 - Black

Chapter 5 – Pervasive changes in liana species
103
our forest decreased rather than increased, as expected based upon their high abundance in
drier regions (DeWalt et al. 2010, Toledo 2010) and their dry season growth advantage
(Schnitzer 2005). Neutral theory and random drift are neither a likely explanation, as
random changes would imply a similar amount of increasing and decreasing species,
whereas in our community changes are clearly directional at all taxonomic levels: there are
far more decreasing than increasing taxa at the species-, genus-, and family level (Figure
5.1).
Based on our results we believe that at least two phenomena more likely may
account for the liana changes and the massive decline of the strongly dominant species.
First, the observed changes might reflect more cloudy weather. Graham et al. (2003) argued
that cloud cover, and thus reduced irradiance, limits net CO2 uptake and growth of
rainforest trees during tropical rainy seasons. Such a reduction in irradiance might have
especially strong inhibiting effects on light-demanding lianas. Second, the observed
changes might reflect forest recovery from past disturbances. This supports the alternative
hypothesis that African tropical forest are recovering from past disturbances (Richards
1952, Whitmore & Burslem 1998), Recent studies showed such recovery for trees in
tropical forest worldwide (Chave et al. 2008, Laurance et al. 2004). Forest recovery over
time after disturbance is generally accompanied by shifts in species composition. Our forest
stand clearly shows such changes in taxonomic composition, with more persistent liana taxa
characteristic of undisturbed forest. For the Ituri Forest we believe the most likely cause of
liana decrease is the recovery from past disturbances. This is also indicated by a general
lack of large sized lianas (chapter 2) in the plots, generally considered being a good
indicator of past disturbances in Ituri Forest. Either the global drivers are less important
than previously thought for explaining changes in liana abundance, or local stand dynamics
override the more global drivers of liana change. Whether or not our findings represent a
general phenomenon needs to be studied in detail by extending the species level changes in
liana abundance for a large number of sites across a wide array of local conditions.
Ewango_PROEF (all).ps Front - 59 T1 - Black

Cha
pter
5 –
Per
vasi
ve c
hang
es in
lian
a sp
ecie
s
104App
endi
x 5.
1. S
peci
es d
ensi
ty r
atio
, bo
otst
rap
perc
enti
le,
sign
ific
ance
lev
els,
vit
al r
ates
, an
d fu
ncti
onal
att
ribu
tes
show
ing
incr
easi
ng o
r de
crea
sing
popu
latio
n ch
ange
in
Itur
i ol
d-gr
owth
mix
ed f
ores
t pl
ots.
Dis
pers
al s
yndr
ome
(Ane
mo-
, B
aro-
, Z
ooch
ory)
. L
ife
ligh
t re
quir
emen
t (L
D =
lig
ht
dem
andi
ng, S
T =
Sha
de to
lera
nt).
Cli
mbi
ng =
cli
mbi
ng s
trat
egy
(Ho
= h
ook,
Te
= te
ndri
l, T
w =
twin
er, R
o =
roo
t).
Lea
f si
ze (
L =
larg
e, S
= s
mal
l). T
he
list
is
alph
abet
ical
y or
dere
d by
fam
ily
and
spec
ies
scie
ntif
ic n
ame.
+ i
ndic
ates
a s
igni
fica
ntly
inc
reas
ing
spec
ies,
a
sig
nifi
cant
ly d
ecre
asin
g on
e. 0
indi
cate
s no
sig
nifi
cant
cha
nge.
Ewango_PROEF (all).ps Back - 59 T1 - Black

Cha
pter
5 –
Per
vasi
ve c
hang
es in
lian
a sp
ecie
s
105
Ewango_PROEF (all).ps Front - 60 T1 - Black

Cha
pter
5 –
Per
vasi
ve c
hang
es in
lian
a sp
ecie
s
106
Ewango_PROEF (all).ps Back - 60 T1 - Black

Cha
pter
5 –
Per
vasi
ve c
hang
es in
lian
a sp
ecie
s
107
Ewango_PROEF (all).ps Front - 61 T1 - Black

Chapter 6 – General discussion
108
Ewango_PROEF (all).ps Back - 61 T1 - Black

Chapter 6 – General discussion
109
Chapter 6
General Discussion
Lianas, woody vines, are a characteristic component of tropical forests (Richards 1952).
However, they are most diverse in tropical forests near the equator (Gentry 1991, Schnitzer
and Bongers 2002). Schnitzer & Bongers (2002) reviewed their role in tropical forest
functioning, while Schnitzer & Carson (2001, 2008, 2010) addressed mechanisms by which
lianas influence tropical forest diversity and regeneration. Lianas are favoured by forest
disturbances, thus also human-induced disturbances, and increases in atmospheric CO2
concentrations are likely to promote liana abundance (Laurence et al. 2001). These
environmental modifications are reported to be responsible for the observed increase in the
abundance, growth rates, leaf productivity and tree crown infestations of lianas in tropical
forests (Phillips et al. 2002, Wright et al. 2004, Ingwell et al. 2010, Schnitzer & Carson
2010). However, although this reported increase is reasonably well investigated in
Neotropical forests, the question remains whether or not this is a worldwide trend. Long-
term data from Paleotropical forests are extremely scarce. Apart from the general trend in
liana abundance, species specific demographic changes of lianas remain largely
unexplored, worldwide. This thesis describes the liana community and analyses its
dynamics in the Ituri Forest Dynamics Plots, a Congo Basin forest in northeastern DR
Congo. All lianas in this plot are being meticulously recorded over a period of 13 years
now, the longest record available on liana dynamics in the tropics.
ANSWERING THE RESEARCH QUESTIONS
(1) What is the overall diversity and structure of the liana assemblage in the mixed
rain forest of Ituri?
Hart et al. (1998) demonstrated that the contemporary forest has been a Pleistocene forest
refuge (Maley 1996, Sosef 1996), but that its composition and structure changed considerably
over the past 4000 years. Tracks of past forest disturbance can still be observed today. The
Ituri Forest survived the last maximum glaciations, but important windstorm disturbances that
took place in the recent past strongly influenced the present forest structure and composition.
Richards (1952) stated that Africa is typical for its high liana density, but this is not
supported by quantitative reviews (Parren 2003, DeWalt et al. 2010). For the Ituri Forest,
liana abundance, species richness and diversity was high compared to other African forests,
and more or less similar to that observed in the Neotropics. In contrast to the general
Ewango_PROEF (all).ps Front - 62 T1 - Black
Chapter 6 – General discussion
110
assumption that lianas are only rich and abundant in degraded habitats, our study revealed
that old-growth forests also show high diversity and abundance of lianas.
Its high liana density may be related to the fact that the forest is quite seasonal, with 4-5 dry
months per year. Recently, DeWalt et al. (2010) analyzed pan-tropical patterns of lianas
abundance and basal area, and found that liana density and basal area increase with
increasing rainfall seasonality and decreasing rainfall (cf. Toledo 2010). Thus, this
extensive review supported the hypothesis of Gentry (1991) and Schnitzer (2005) stating
that lianas are most abundant and have higher basal area in drier tropical forests (i.e., <
2000 mm y-1) with greater seasonality of rainfall.
In the Ituri forest, twiners, zoochorous, light-demanding and meso- or microphyllous
species dominate. Flower types were equally distributed among conspicuous and
inconspicuous classes. In general, our results are consistent with other studies which
reported also comparable dominance of these functional traits for tropical forest lianas
worldwide (Addo-Fordjour et al. 2008, Cai et al. 2009, Gentry 1991, Hegarty & Caballé
1991, Putz 1984, Senbeta et al. 2005). In this forest, lianas are widely distributed, although
their abundance varied with canopy openness, habitat moisture, and elevation.
The Ituri Forest liana community composition is a reflection of both the regional species pool
(the flora of African tropical forests) and past local dynamics. In Chapter 2, I acknowledged
that, in terms of structure and taxonomic composition, the liana community in the Ituri
forest is typical for Guineo-Congolian old-growth forest, with prominent liana taxa
belonging to the Dichapetalaceae, Connaraceae, Fabaceae, Apocynaceae and Loganiaceae.
This suggests that West and Central African lowland forests are similar in the taxonomic
composition of their liana communities. However, the Ituri Forest also differs from other
Guineo-Congolian forests because it has a high liana abundance, basal area, and species
richness in the small diameter size classes; which might indicate a population emerging
from recent disturbances. Furthermore, this chapter showed that the liana community was
oligarchic (i.e. dominated by a few species only). The extreme dominance of one single
liana species (Manniophyton fulvum) renders it unique compared to other forests
worldwide.
(2) What are the dynamics in the liana assemblage of this forest?
Our general knowledge of the ecology of lianas, their dynamics and their role in forest
dynamics lags far behind that of trees (Schnitzer and Bongers 2002). Such knowledge is a
necessary prerequisite for developing a better understanding of the distribution and ecology
Ewango_PROEF (all).ps Back - 62 T1 - Black

Chapter 6 – General discussion
111
of lianas in all types of terrestrial ecosystems. Chapter 3 shows that the overall liana
population in our old-growth Ituri forest has decreased dramatically over the past 13 years.
Despite this decrease in liana abundance the species richness increased slightly during the
same period. The general decrease in liana abundance that I found is one of the first studies
documenting a decrease- rather than the widely documented increase of lianas over the last
decades. The only other study showing a decrease in liana abundance was in Gabon
(Caballé & Martin 2001), observed over the period of 13 years. Likely, this is due to the
undergoing recovery from past disturbances in many African forests (Richards 1952, Chave
et al. 2008) rather than the atmospheric CO2 increase as has been suggested for the
Neotropics.
This study is also the first one to document that stand-level liana dynamics are completely
driven by one species only (Manniophyton fulvum). Manniophyton represents 24% of the
liana stems in the Ituri forests, and declined from 3299 stems in the first census period, to
94 stems in the last census. Such a massive die-off is not likely due to global change
phenomena, such as rising CO2 levels or enhanced nitrogen deposition. Instead, it is more
likely to be caused by large scale pathogen infection, although it could also be the result of
species-specific responses to drought or past disturbance events. Clearly, much more in-
depth studies of the autoecology of Manniophytion are needed to unravel the cause of its
dramatic decline. In the Neotropics, Machaerium cuspidatum (Fabaceae) is the most
abundant liana species in floodplain and terra firme habitats in Yasuni, (Burnham 2002),
whereas Adelobotrys adscendens (Melastomataceae) and Cydista aequinoctialis
(Bignoniaceae) are also the most abundant in other sites (Romero-Saltos 1999) in Ecuador.
DeWalt et al. (2000) found Maripa panamensis (Convolvulaceae) as the most abundant
species in Panama. Pérez-Salicrup et al. (2001) recorded Tynanthus schumannianus
(Bignoniaceae) as the most abundant liana in eastern Bolivia. Surprisingly, none of these
species come close to the Ituri Manniophyton fulvum (Euphorbiaceae) abundance.
I also found that changes in liana dynamics and composition differed dramatically between
the first and the second census interval, despite the fact that these census intervals spanned
a relatively long time period (6-7 years), in which year-to-year fluctuations are expected to
average out. Thus, it strongly depends on the time window considered what results will be
found. This strongly suggests that long-term studies are really needed in order to
distinguish between short-term fluctuations and long-term trends. As for trees, underlying
dynamics of lianas would need such long-term approach if one is interested in documenting
and obtaining reliable patterns in forest dynamics (Phillips et al. 2002).
Ewango_PROEF (all).ps Front - 63 T1 - Black
Chapter 6 – General discussion
112
This study illustrates four main patterns: (1) the long-term trends show that overall liana
density, basal area and biomass decreased, (2) the liana population shows very little
recruitment over time; small lianas die or recruit into larger size classes and are not being
replaced; (3) growth of individual lianas is not large enough to compensate the basal area and
with that also biomass for losses in abundance, and (4) species richness and diversity
remained rather constant over time, despite the continuous decrease of liana abundance. The
community composition as a whole changed in a non-directional manner, in which the ten
most abundant species remained rather constant over the 13 year period, and did not change
markedly in abundances (rank and absolute abundance) in response to the Manniophyton
collapse.
(3) How do liana species vary in their demographic vital rates and how are these rates
related to the liana species’ abundance and their functional traits?
Our study is one of the first addressing demographic vital rates for a large number of liana
species. The majority of species showed low to medium growth and recruitment. Most of
the species had low recruitment (<2%/y) and growth (<1%/y), while mortality showed a
peak between 2 and 3%/y. Species had a variation in recruitment rate up to 10.9% y-1,
mortality rates of 8% y-1, with growth rates of 3.5 mm y-1 at the upper end. Comparing to
lianas, Ituri forest trees had similar mortality rates of up to 10% y-1 (Condit et al. 2006). At
a deterministic equilibrium, an indefinite number of species can coexist if species differ
from all others along a continuum from short lifespan with high growth to long lifespan
with low growth (Pacala & Rees 1998, Bonsall et al. 2004). As many species show a
similar demography, this suggests that these species converged in their strategy, as Hubbell
(2005) pointed out. Alternatively, it might also imply that these vital rates are not so
important for coexistence.
In chapter 4, I investigated the general question: how do liana communities maintain
themselves in old-growth forest? One general hypothesis is that rare species are favoured
over common species in their recruitment (i.e. reproduction), growth, and/or survival
(Connell 1978, Janzen 1970). This is a compensatory mechanism to keep the most abundant
species in check, and is also referred to as negative density dependence (reviewed in
Connell 1978, 1979, Carson & Schnitzer 2008). I found that species growth indeed declined
with species abundance, while recruitment and mortality rates were not significantly related
to abundance. I conclude that negative density-dependent mechanisms alone are insufficient
to explain species relative abundance and coexistence in this forest.
Ewango_PROEF (all).ps Back - 63 T1 - Black

Chapter 6 – General discussion
113
I found that species growth was positively, albeit weakly, correlated to mortality and
recruitment rate, which suggests a trade-off between fast growth and recruitment on the one
hand versus high survival and long lifespan on the other hand. It seems suggestive that
during their life trajectories lianas involve into r-k strategies as proposed by MacArthur &
Wilson (1967) and expanded later by Pianka (1970), in which organisms or species with k-
strategies have a long life expectancy and devote a small proportion of energy and other
captured resources to reproduction. The r-strategie is a type made up of species with a short
life expectancy and large reproductive effort. Species mortality rate was not related to
recruitment rate, which implies that some species should be increasing in abundance, and
others decreasing. The Ituri Forest liana community as a whole is highly dynamic, which is
consistent with earlier studies in the Neotropics (Phillips et al. 2005, Wright et al. 2004,
Ingwell et al. 2010). Unfortunately, species-specific demographic liana studies are hardly
available for comparison. An example from an individual species might serve as a useful
illustration, though. In his study of the Neotropical liana Machaerium demography, Nabe-
Nielsen (2002, 2004) recorded a population growth rate of 1.03. The dynamics of the
species was most influenced by survival of large plants, which is typical for slow-growing
woody species, and canopy openness in which the population growth rate was lower in tall
forest (height> 10 m) than in the population in general. These results indicate that the
species is shade-tolerant but that it is sensitive to variation in gap dynamics. The dominance
of the species and the increasing population size suggest that the forest has had a low
disturbance rate for a long time. Machaerium is ecologically comparable to our dominant
Manniophyton, but Manniophyton had a considerably lower growth rate of 0.32 mm y-1 and
a high population decrease. In contrast to mechanism, a shade-tolerant species,
Manniophyton is a light demanding one.
(4) Do lianas change in abundance over the last 13 years?
To answer this question, I evaluated liana dynamics at the community level (Chapter 3),
species-level (Chapter 4) and changes in population density of individual species (Chapter
5). Overall, I detected pervasive changes in density of lianas at the community and species
level. The liana community as a whole shows a dramatic decline in stem density and very
limited recruitment. Despite of this, there are little changes in the rank abundance of the
most abundant species. Taxonomically, a pervasive alteration is observed at the species
level, where 50% of the examined species changed significantly, over a 13 years
monitoring period.
Tropical forests reflect biogeographical patterns. First, the Neotropical forests obviously
harbor more lianas than Paleotropical forests (Gentry 1991). Second, studies in the
Ewango_PROEF (all).ps Front - 64 T1 - Black
Chapter 6 – General discussion
114
Neotropics showed an increase in lianas abundance, productivity and infestation (Laurance et
al. 2001, Phillips et al. 2002, Wright et al. 2004, Allen et al. 2007, Ingwell et al. 2010,
Schnitzer & Carson 2010) and a persistent change of trees communities (Laurance et al.
2004) and increasing turnover (Phillips & Gentry 1984), which has been attributed to
atmospheric CO2 increase and anthropogenic land-uses. However, in a rainforest in Gabon
(Caballé & Martin, 2001) and in our Ituri forest we observed a decrease of lianas and an
increase of tree growth (Chave et al. 2008), probably as result of recovery from past
disturbances. Yet we do believe that the African data, with evidence from two sites, are not
sufficient enough to definitively claim that lianas are systematically decreasing in African
forests. African samples are only from wet forest, and data are lacking from a drier subset
of the rainfall spectrum. To compare differences in liana change between the Paleo- and
Neotropics properly, more long term liana surveys need to be conducted in Africa covering
the full range in climatic conditions.
SUCCESSIONAL DEVELOPMENT OF THE ITURI LIANA COMMUNITY
The analyzed data suggest that Ituri Forest is in a old-growth stage, but most of the liana
species composition and size distribution reflect forest successional change. However,
some species occurring in old gap patches across the plots are typical of early successional
forest. As trellises are of large size in late-successional forest, only the large lianas that
have already reached the canopy have a high probability of surviving in a tall forest. Lianas
can serve as indicators of forest disturbance history (Laurance et al. 2001, Zagt et al. 2003).
Manniophyton fulvum is a short-lived, light demanding species that after establishment in
high light can persist for a long time as a shade-tolerant liana. The dominance of the species
in the first census, followed by its dramatic decline later on suggests that the forest is
changing towards a later successional stage. Similarly, the lack of large lianas may be
evidence for past disturbance and that the forest is slowing down. Many of the decreasing
species tend to be pioneer lianas. Pioneer lianas are unable to regenerate in a dark late-
successional forest.
LIANA COMMUNITY AND GLOBAL CHANGE
Recent concerns over forest fragmentation, abandoned agricultural lands, repeated timber
harvesting, and increasing levels of carbon dioxide in the atmosphere have stimulated
research on the relative response of lianas to these changes. It is suggested that, lianas are
able to respond more quickly and more intensely to forest openings (Schnitzer et al. 2000),
disturbance (Schnitzer & Bongers 2005), and increased CO2 (Schnitzer & Carson 2001,
Ewango_PROEF (all).ps Back - 64 T1 - Black
Chapter 6 – General discussion
115
2010; Londre & Schnitzer 2006). Recent studies documented a substantial increase in the
density and relative dominance of lianas in western Amazonia, which has been attributed to
climate change induced by the increase in atmospheric CO2 concentrations, and land uses. I
failed to find convincing evidence for this in the Ituri forest. The documented increase in
CO2 concentrations is not a possibility, as lianas should respond strongly to CO2
fertilization over the historical range of concentrations with increased photosynthesis and
growth. Instead, I observed a decrease of many liana species, of which many are gap
specialists. The effect of lianas tree infestation appears to be negligible as in the studied
plots; trees are gaining biomass (Lewis et al. 2009). However, a number of predictions
(Malhi et al. 2008) and climate models suggest that conditions which may favor lianas,
such as synergisms between climate change and logging, forest openings for roads
construction, and effects of continuous decreases in areas will contribute to increasing liana
densities and magnify the impact either to tree growth or to forest functioning. As to quote
Schnitzer & Carson (2010), “Better understanding of these risks will require intensive field
research to improve the liana-on-tree mortality functions and to begin including lianas
within full tropical forest vegetation models and coupled carbon cycle/climate models”.
USEFUL LIANAS FROM ITURI FOREST
Lianas are an important group of non-timber forest products. Many liana species have a
high value for people, especially for people living in rural areas. In the Ituri Forest, lianas
are the forgotten non-timber forest product, although they economically contribute to local
communities’ revenue. Liana species constitute a very important group of non-timber forest
products (Abbiw 1990, Malaisse 1997, Van Andel 2000, Tra Bi 1997, Van Valkenburg
1997). For example, during his constant search for plant products, the Belgium King
Leopold II explored and used to harvest rubber from many Landolphia liana species before
the rubber tree Hevea was cultivated. The Strophanthus kombe, known for its
cardiovascular virtue is only found in the Ituri Forest, but the size of population is unknown
and the species seems to be going extinct, and has neither been recorded in our inventory.
Unfortunately, there is no evaluation of lianas as a non-forest timber resource in the Ituri
region. A rough appraisal of our species indicates that lianas are used for edible fruits
(Landolphia spp), artisanal work and construction of traditional houses (Loesenerialla spp,
Laccosperma secundiflorum, Pyrenacantha lebrunii) as no construction is made without
lianas; medicine (Manniophyton, Strophantus kombe), hygienic teeth brush, hunting traps
and nets or poisons (Manniophyton, Pyrenacantha, Strophanthus). It is particularly clear
that lianas are an important resource for local communities. For example, in remote areas
without roads in Ituri Forest, local people have built impressive bridges made entirely of
Ewango_PROEF (all).ps Front - 65 T1 - Black
Chapter 6 – General discussion
116
lianas. Such bridges are found in a number of big rivers in the Ituri region, for example in
the Ngayo and Ebiena rivers. Some lianas are extremely important for the livelihood of
Pygmies (like Loeseneriella spp, Manniophyton, Landolphia spp.). Other liana species
serve as appreciated forage for Okapi diet, an endemic forest giraffe species of the DR
Congo forest (e.g., Alchornea cordiolia).
A number of studies have advocated the reliance on forest products by indigenous people as
a reason for rain forest conservation (Myers 1982, Wiersum 2000). Unfortunately, in some
regions, including Ituri, the knowledge of useful plants is disappearing even more rapidly
than the plants themselves. If no efforts are made to conserve and study both the biological
and cultural diversity of knowledge, that potential resource of new medicines for human
disease, food crops, and indigenous management systems will disappear together with the
forest.
TAXONOMICAL CONSIDERATIONS
Lianas are omitted from most forest studies because of difficulties with taxonomic
identification, because it is difficult to distinguish liana ramets from genets, and a self-
supporting liana individual from shrubs (Parren et al. 2005). Lianas are hard to identify
because it is difficult to collect vegetative and/or generative herbarium material, as this is
located at the top of the canopy which is difficult to access. Because taxonomic
uncertainties make lianas difficult to identify in the field, many studies group lianas into
morphospecies.
Western botanists have dedicated considerable effort in collecting in Central Africa and
major regional flora of tropical Africa (e.g., Flore du Cameroun, Flore du Gabon, Flore
d’Afrique Centrale [Congo-Rwanda-Burundi] and Flora of East and West Tropical Africa)
are well advanced, and have been useful for plant identification as the majority of liana
families are included. Throughout the course of our census in the Ituri plots, rules of data
quality control were incorporated. One of the rules has been botanical collection
consistency and efficiency. Botanical collection and identification were done by well-
trained field botanists, who verified all lianas in the field sheets after each working day, and
checked for their identification and if collections were made following the botanical
collection protocol. About ten thousand collections were made, including all vegetative and
climbing structures that could assist identification. The majority of collections are housed in
the CEFRECOF herbarium at Epulu, with sets stored at the National Herbarium of the
Netherlands (Wageningen branch), Meise (Brussels) and Missouri Botanical Garden
Ewango_PROEF (all).ps Back - 65 T1 - Black

Chapter 6 – General discussion
117
(USA). The Ituri first forest dwellers, the Mbuti (Pygmies), have extensive knowledge on
the identification of plants and their use, and thanks to them most of our lianas were
collected and identified. This collection was critical to the generation of reliable keys and
field guides; they synthesized a substantial amount of the available vegetative information
and created a more coherent taxonomy. The quality of the taxonomy of our data is good as
collections were carefully made, and matched in the herbarium (Wag, Br, MBG) with well-
identified material by expert taxonomist of most of the families. This study is one of the
rare inventories where botanical identification has been excellent, as more than 95% of the
stems were identified to species.
However, as i) lianas are more difficult to collect in flower or fruit, ii) are known
vegetatively by fewer specialists, and iii) have been less collected and monitored activity
over the last decade, I anticipate that training of field botanists is needed. Complete
reporting of species identities, facilitated by exchange of specimens and photographs
among experts will vastly improve this situation. Construction and usage of “Field Guides”
(e.g., Hawthorne & Jongkind 2006) and web-based interactive vegetative keys to various
areas of the tropics are starting points for this venture of liana biodiversity across the
tropics. Greater collection of plant material in the established large permanent plots
enhances the potential quantification of the variation in vegetative characters within and
among woody plant taxa and provides didactic material for plant identification training. If
not, species- or even genus-level identification of woody plants based on vegetative
characters will only be feasible in those areas for which the flora has been well described
and for plant groups in which the taxonomy is clear and workable.
RECOMMENDATIONS FOR FURTHER RESEARCH
Our understanding of lianas ecology is still incomplete. More supplementary studies are
essential for understanding the observed patterns in this thesis. These should include:
The factors driving seedling liana dynamics are yet unexplored in tropical forests
worldwide. It is important to know how spatial and temporal variation in regeneration
dynamics act to maintain diversity and shape species abundance and composition
within and across plant communities. Such insight in seedling ecology may be used to
understand how species can adapt to different environmental conditions and also for the
restoration of degraded habitats or for forest management.
Ewango_PROEF (all).ps Front - 66 T1 - Black
Chapter 6 – General discussion
118
Determining the causes of commonness and rarity at the local scale is essential for
understanding how liana communities are structured and has important implications for
biodiversity conservation.
Investigation of liana-tree associations is needed as liana infestation negatively affects
tree productivity, and as liana infestation of trees has been shown to increase.
Fortunately, data are being collected and in the near future we will evaluate the ongoing
trends.
Special attention should focus on the canopy dynamics and patterns of treefalls and
branchfalls creating gaps. This will gave insights into structural changes in the forest
canopy over time, and how these affect the dynamics of tree seedlings and lianas.
It is important to investigate the functional ecology of lianas. Understanding of hard
functional traits and differential species ecophysiology will enhance our knowledge on
how lianas may respond to increasing atmospheric CO2 concentrations, N deposition, and
water stress.
The phylogenetic structure of the liana community assemblage. Phylogenetically,
climbers are found in over 125 families of flowering plants (Gentry 1991). This
phylogenetic breadth strongly suggests multiple origins of the climbing habit within
angiosperms. As better phylogenetic hypotheses become available for many groups of
lianas families, studies in lianas community ecology can be informed by knowledge of
the evolutionary relationships among coexisting species. Three primary approaches to
integrating phylogenetic information into studies of community organization are
recommended: 1. examining the phylogenetic structure of community assemblages, 2.
exploring the phylogenetic basis of community niche structure, and 3. adding a
community context to studies of trait evolution and biogeography (Webb et al. 2002,
Cadotte et al. 2010). Much of these have been investigated for trees and among them,
Chazdon et al. (2002) provide an example for woody plant reproductive traits.
Finally, I suggest that an ethnobotanical study needs to be done on forest lianas and
their uses. This information should be distributed widely for conservation and
sustainable use. Guidelines should be developed for the management of the
economically important lianas, aimed at sustainable use of this valuable resource.
Ewango_PROEF (all).ps Back - 66 T1 - Black

Chapter 6 – General discussion
119
CONCLUSIONS
The liana assemblage of the Ituri Forest reflects both contemporary and past dynamics.
Historical dynamics are well known to have occurred in West and Central African forest
(Maley 1996, Sosef 1996). The Ituri forest, for example, is known as a Pleistocene refugium
and plots exhibited no evidence of recent major disturbances, although some occasional tracks
of windstorms prior to the establishment of the plots were perceptible (Hart et al. 1996).
These factors influence the contemporary vegetation in terms of species composition and
vegetation structure. The liana assemblage of this Congo Basin forest generally concurs
with those of lowland tropical forests elsewhere. In terms of structure and family
composition, the liana community in IFDP is typical for a Guineo-Congolian old-growth
forest. However, the Ituri Forest also differs from other Guineo-Congolian forests because
it has high liana abundance, basal area, and species richness, and more stems in the small
size classes. In addition, the extreme dominance of one single liana species (Manniophyton
fulvum) is unique compared to other forests worldwide. The old-growth forest of Ituri
shows a strong decrease of its liana population. This general decrease is in contrast with the
widely documented general increase of lianas over the last decades. Our study is also the
first to document that the dynamics of the overall liana stand is completely driven by the
dynamics of one species only. More studies on liana communities in old-growth forests are
needed to confirm whether or not such single dominant species driven community
dynamics is a general phenomenon in tropical old-growth forests. Whether lianas were
found to increase or decrease depended heavily on the time-window used. Therefore, I
argue that many more long-term and large scale studies are needed to evaluate the direction
of community changes and to predict the eventual consequences of global change.
Ewango_PROEF (all).ps Front - 67 T1 - Black

References
120
Ewango_PROEF (all).ps Back - 67 T1 - Black

References
121
References
Abbiw, D.K. 1990. Useful plants of Ghana. West African uses of wild and cultivated
plants. Intermediate technology Publications and The Royal Botanical Gardens,
Kew, Uk.
Ackerly, D.D., C.A. Knight, S.B. Weiss, K. Barton & K.P. Starmer. 2002. Leaf size,
specific leaf area and microhabitat distribution of chaparral woody plants:
contrasting patterns in species level and community level analyses. Oecologia 130:
449-457.
Addo-Fordjour, P., Anning, A. K., Atakora, E. A. & Agyei, P. S. 2008. Diversity and
distribution of climbing plants in a semi-deciduous rain forest, KNUST botanic
garden, Ghana. International Journal of Botany 4: 186-195.
Addo-Fordjour, P., Anning, A. K., Larbi, J. A. & Akyeampong, S. 2009. Liana species
richness, abundance and relationship with trees in the Bobiri forest reserve, Ghana:
impact of management systems. Forest Ecology and Management 257: 1822–1828.
Allen, B. P., E. F. Pauley & R. R. Sharitz. 1987. Hurricane Impacts on Liana Populations in
an Old-Growth Southeastern Bottomland Forest. Journal of the Torrey Botanical
Society 124: 34-42.
Allen, B.P., E.F. Pauley & R.R. Sharitz. 1997. Hurricane Impacts on Liana Populations in
an Old-Growth Southeastern Bottomland Forest. Journal of the Torrey Botanical
Society 124: 34-42.
Allen, B. P., R. R. Sharitz & P. C. Goebel. 2005. Twelve years post-hurricane liana
dynamics in an old-growth southeastern floodplain forest. Forest Ecology and
Management 218: 259-269.
Allen, B.P., R.R. Sharitz & P.C. Goebel. 2007. Are lianas increasing in importance in
temperate floodplain forests in the southeastern United States? Forest Ecology and
Management 242: 17-23.
Andrade, J. L., Meinzer, F. C., Goldstein, G. & Schnitzer, S. A. 2005. Water uptake and
transport in lianas and co-occurring trees of a seasonally dry tropical forest. Trees 19:
282–289.
Angiosperm Phylogeny Group (APG). 2009-on going. An ordinal classification for families
of flowering plants. http://www.mobot.org/MOBOT/research/APweb/
Artaxo, P. et al. 2003. Dry and wet deposition in Amazonia: from natural biogenic aerosols
to biomass burning impacts. Int. Glob. Atmos. Chem. Newsl. 27: 12–16.
Asner, G.P., T.R. Seastedt & A.R. Townsend. 1997. The decoupling of terrestrial carbon
and nitrogen cycles. BioScience 47: 226–234.
Ewango_PROEF (all).ps Front - 68 T1 - Black
References
122
Austin, M. P. & P. Greig-Smith. 1968. The application of quantitative methods to
vegetation survey: II. Some methodological problems of data from rain forest.
Journal of Ecology 56: 827-844.
Avalos, G. & S.S. Mulkey. 1999. Photosynthetic acclimation of the liana Stigmaphyllon
lindenianum to light changes in a tropical dry forest canopy. Oecologia 120: 475-
484.
Ayres, M.P. & J.M. Scriber. 1994. Local adaptation to regional climates in Papilio
canadensis (Lepidoptera: Papilionidae). Ecological Monographs 64: 465-482.
Baars, R. & Kelly, D. 1996. Survival and growth responses of native and introduced vines
in New Zealand to light availability. New Zealand Journal of Botany 34: 389-400.
Baars, R., Kelly, D. & Sparrow, A. 1998. Liane distribution within native forests remnants
in two regions of the south island, New Zealand. New Zealand Journal of Ecology
21: 71-85.
Babweteera, F., A. Plumptre & Obua, J. 2000. Effect of gap size and age on climber
abundance and diversity in Budongo Forest Reserve, Uganda. African Journal of
Ecology 38: 230-237.
Balfour, D. A. & Bond, W. J. 1993. Factors limiting climber distribution and abundance in
a southern African forest. Journal of Ecology 11: 93-99.
Bond, W. J., K.-A. Smythe, and D. A. Balfour. 2001. Acacia species turnover in space and
time in an African savanna. Journal of Biogeography 28: 117–128.
Baltzer, J.L., S.J. Davies, A.R. Kassim, N.S. Noor & J.V. LaFrankie. 2007. Geographic
distributions and habitat association in tropical trees: Can geographic range predict
performance and habitat association in co-occurring tree species? Journal of
Biogeography 34: 1916-1926.
Bazzaz, F. A. 1979. The physiological ecology of plant succession: a comparative review.
Annual Review of Ecology and Systematics 11: 287-310.
Begon, M., J.L. Harper & C.R. Townsend. 1996. Ecology: individuals, populations and
communities. Third edition, Blackwell Science Ltd.
Bongers, F., Schnitzer, S. A. & Traoré, D. 2002. The importance of lianas and
consequences for forest management in West Africa. Bioterre. Revue Internationale
de Science de la Vie et de la Terre No Spécial: 59-70.
Bongers, F., M.P.E. Parren & D. Traoré. 2005. Forest climbing plants of West Africa:
Diversity, Ecology and Management. CAB International, Wallingford, Oxfordshire,
UK.
Bongers, F., Parren, M. P. E., Swaine, M. D. & Traoré, D. 2005. Forest climbing plants of
West: Introduction. Pp. 5-18 in Bongers, F., Parren, M. P. E. & Traoré, D. (eds.).
Ewango_PROEF (all).ps Back - 68 T1 - Black
References
123
Forest climbing plants of West Africa: Diversity, Ecology and Management. CAB
International, Wallingford, Oxfordshire, UK.
Bonsall M.B., V.A.A. Jansen, M.P. Hassell. 2004. Life History Trade-offs Assemble
Ecological Guilds. Science 306: 111-114.
Brubaker, S.C., Jones, A. J., Lewis, D.T. & Frank, T. 1993. Soil properties associated with
landscape positions and management. Soil Science Society of America Journal 57:
235-239.
Bullock, S.H.1995. Plant reproduction in neotropical; dry forests. Pp. 277-303 in Bullock,
S. H., Mooney, H. A. & Medina, E. (eds.). Seasonally dry tropical forests. Cambridge
University Press, Cambridge.
Burnham, R.J. 2002. Dominance, diversity and distribution of lianas in Yasuni, Ecuador:
who is on top? Journal of Tropical Ecology 18: 845–864.
Burnham, R.J. 2004. Alpha and Beta Diversity of Lianas in Yasuní National Park, Ecuador.
Forest Ecology and Management 190: 43-55.
Caballé, G. & A. Martin. 2001. Thirteen years of change in trees and liana in a Gabonese
rainforest. Plant Ecology 152: 167-173.
Cadotte, M.W. et al. 2010. Phylogenetic diversity metrics for ecological communities:
integrating species richness, abundance and evolutionary history. Ecology Letters
13: 96 – 105.
Cai, Z-Q., Poorter, L., Han, Q. & Bongers, F. 2008. Effects of light and nutrients on
seedlings of tropical Bauhinia lianas and trees. Tree Physiology 28: 1277-1285.
Cai Z-Q., Schnitzer, S. A., Wen, B., Chen, Y. J. & Bongers, F. 2009. Liana communities in
three Tropical forest types in Xishuangbanna, South-West China. Journal of Tropical
Forest Science 21: 252-264.
Cain, M.L., Milligan, B. G. & Strand, A.E. 2000. Long-distance seed dispersal in plant
populations. American Journal of Botany 87: 127-1227.
Campbell, E. J. F. & Newbery, D. M.1993. Ecological relationships between lianas and
trees in lowland rain forest in Sabah, East Malaysia. Journal of Tropical Ecology 9:
469–490.
Carrasco-Urra, F. & Gianoli, E. 2009. Abundance of climbing plants in a southern temperate
rain forest: host-tree characteristics or light availability? Journal of Vegetation Science
20: 1155-1162.
Carter, G. A. & Teramura, A. H. 1988. Vine photosynthesis and relationships to climbing
mechanics in a forest understory. American Journal of Botany 75: 1011-1018.
Chave, J, R. Condit, H.C. Muller-Landau, S.C. Thomas, P.S. Ashton, S. Bunyavejchewin,
L.L. Co, H.S. Dattaraja, S.J. Davies, S. Esufali, C.E.N. Ewango, K.J. Feeley, R.B.
Foster, N. Guanatilleke, S. Guanatilleke, P. Hall, T.B. Hart, C. Hernandez, S.P.
Ewango_PROEF (all).ps Front - 69 T1 - Black
References
124
Hubbell, A. Itoh, S. Kiratiprayoon, J.V. LaFrankie, S. Loo de Lao, J-R. Makana, Md.
N. Supardi Noor, A.R. Kassim, C. Samper, R. Sukumar, H. S. Suresh, S. Tan, J.
Thompson, M. D. C. Tongco, R. Valencia, M. Vallejo, G. Villa, T. Yamakura, J.K.
Zimmerman & E.C. Losos. 2008. Assessing evidence for a pervasive alteration in
tropical tree communities. PLoS Biology 6: 455-562.
Chazdon, R. L., Colwell, R. K., Denslow, J. S. & Guariguata, M. R. 1998. Statistical
methods for estimating species richness of woody regeneration in primary and
secondary rain forests of NE Costa Rica. Pp. 285-309 in Dallmeier, F. & Comiskey, J.
A. (eds.). Forest biodiversity research, monitoring and modeling: Conceptual
background and Old World case studies. Parthenon Publishing, Paris. 671 pp.
Chazdon, R.L, Careaga, S., Webb, C.O, Vargas, O. 2002. Community and phylogenetic
structure of reproductive traits of woody species in wet tropical forests. Ecological
Monographs 73: 331-348.
Chen, Y., J.T. Randerson, R., G.R. van der Werf, D.C. Morton, M. Mu & P.S. Kasibhatla.
2010. Nitrogen deposition in tropical forests from savanna and deforestation fires.
Global Change Biology 16: 2024–2038.
Clark, D. A. & Cark, D. B. 1990. Distribution and effects on tree growth of lianas and
woody hemiepiphytes in a Costa Rican tropical wet forest. Journal of Tropical
Ecology 6: 321-331.
Clark, D. A. & Cark, D. B. 1992. Life history diversity of canopy and emergent trees in a
neotropical rain forest. Ecological Monographs 62: 315–344.
Clinebell, R. R., Phillips, O. L., Gentry, A. H., Stark, N., and Zuuring, H.1995. Predictions
of Neotropical tree and liana species richness from soil and climatic data. Biodiversity
and Conservation 4: 56–90.
Clark, D.B., Palmer, M.W. & Clark, D.A. 1999. Edaphic factors and the landscape-scale
distributions of tropical rain forest trees. Ecology 80: 2662–2675.
Colwell, R.K. 2006. EstimateS: Statistical Estimation of Species Richness and Shared
Species from Samples, Version 8.0. http://viceroy.eeb.uconn.edu/estimates.
Colwell, R.K. & Coddington, J.A. 1994. Estimating terrestrial biodiversity through
extrapolation. Philosophical Transactions of the Royal Society of London B 345: 101-
118.
Comita, L. S., And S. P. Hubbell. 2009. Local neighborhood and species' shade tolerance
influence survival in a diverse seedling bank. Ecology 90: 328-334.
Comita, L.S., H.C. Muller-Landau, S. Aguilar & S.P. Hubbell. 2010. Asymmetric Density
Dependence Shapes Species Abundances in a Tropical Tree Community. Science
329: 330 – 332.
Ewango_PROEF (all).ps Back - 69 T1 - Black
References
125
Condit, R. S.P. Hubbell & R.B. Foster. 1995. Mortality rates of 205 Neotropical tree and
shrub species and the impact of a severe drought. Ecological Monographs 65: 419-
439.
Condit, R., 1996. Changes in tree species abundance in a Neotropical forest over eight
years: impact of climate change. Journal of Tropical Ecology 12: 231–256.
Condit, R. 1998a. Tropical forest census plots. Springer Verlag. Berlin. 207p.
Condit, R. 1998b. Tropical forest census plots: methods and results from Barro Colorado
Island, Panama and a comparison with other plots. Springer, New York, New York,
USA.
Condit, R., P.S. Ashton, N. Manokaran, J.V. LaFrankie, S.P. Hubbell & R.B. Foster. 1999.
Dynamics of the forest communities at Pasoh and Barro Colorado: comparing two
50-ha plots. Phil. Trans. R. Soc. Lond. B. 354: 1739–1748.
Condit, R., S. Aguilar, A. Hernandez, R. Perez, S. Lao, G. Angehr. et al. 2004. Tropical forest
dynamics across a rainfall gradient and impact of an El Niño dry season. Journal of
Tropical Ecology 20: 51–72.
Condit, R., P. Ashton, S. Bunyavejchewin, H.S. Dattaraja, S, Davies, S. Esufali, C. Ewango,
R. Foster, I.A.U.N. Guanatileke, C.V.S. Guanatilleke, P. Hall, K.E. Harms, T. Hart, C.
Hernandez, S. Hubbell, A. Itoh, S. Kiratiprayoon, J. LaFrankie, S. Loo de Lao, J-R.
Makana, M.N. Supardi Noor, A.R. Kassim, S. Russo, R. Sukumar, C. Samper, H.S.
Suresh, S. Tan, S. Thomas, R. Valencia, M. Vallejo, G. Villa & T. Zillio. 2006. The
importance of demographic niches to tree diversity. Science 313: 98-101.
Connell, J.H. 1978. Diversity in tropical forests and coral reefs. Science 199: 1302-1310.
Connell, J.H. 1979. Tropical rain forests and coral reefs as open nonequilibrium systems. In:
Anderson R.M., Turner B.D., Turner, L.R. (eds) Population dynamics. Blackwell
Scientific, Oxford, pp. 141-163.
Connell, J.H. & R.O. Slatyer. 1977. Mechanisms of succession in natural communities and
their role in community stability and organization. The American Naturalist 111:
1119-44.
Connell, J.H., J.G. Tracey & L.J. Webb. 1984. Compensatory recruitment, growth, and
mortality as factors maintaining rain-forest tree diversity. Ecological Monographs
54: 141.
Connell, J.H. & P.T. Green. 2000. Seedling dynamics over thirty-two years in a tropical
rain forest tree. Ecology 81: 568–584.
Conway, D. J. 1992. A comparison of soil parameters in monodominant and mixed forest in
Ituri Forest Reserve, Zaire. Honors Project. University of Aberdeen, Aberdeen,
Scotland.
Ewango_PROEF (all).ps Front - 70 T1 - Black

References
126
Cornwell, W.K., D.W. Schwilk & D.D. Ackerly. 2006. A trait-based test for habitat
filtering: convex hull volume. Ecology 87: 1465-1471.
Croat, T.B. 1978. Flora of Barro Colorado Island, Standford University Press, Standford,
California, USA.
Dallmeier, F. & J. A. Comiskey. 1998. Forest biodiversity research, monitoring and
modeling: Conceptual background and Old World case studies. Parthenon
Publishing, Paris. 671 p.
Darwin C. 1867. On the movements and habits of climbing plants. Journal of the Linnean
Society of London (Botanical) 9: 1-118.
Denslow, J. S.1987. Tropical forest gaps and tree species diversity. Annual Review of
Ecology and Systematics 18: 431-451.
DeWalt, S. J., Schnitzer, S. A. & Denslow, J. S. 2000. Density and diversity of lianas along
a chronosequences in a Central Panamanian tropical forest. Journal of Tropical
Ecology 16: 1-19.
DeWalt, S. J. & Chave, J. 2004. Structure and biomass of four lowland Neotropical forests.
Biotropica 36: 7-19.
DeWalt, S. J., Ickles, K., Nilus, R., Harms, K. E. & Burslem, D. F. R. P. 2006. Liana
habitat association and community structure in a Bornean lowland tropical forest.
Plant Ecology 186: 203-216.
DeWalt, S.J, S.A. Schnitzer, J. Chave, F. Bongers, R.J. Burnham, Z. Cai, G. Chuyong, D.B.
Clark, C.E.N. Ewango, J.J. Gerwing, E. Gortaire, T. Hart, D. Kenfack, M.J. Macia, J-
R. Makana, G. Ibarra-Manriquez, M. Martinez-Ramos, M. Sainge, H.C. Muller-
Landau, M.P.E. Parren, N. Parthasarathy, D.R. Pérez-Salicrup, F.E. Putz, H. Romero-
Saltos & D. Thomas. 2010. Annual rainfall and seasonality predict pan-tropical
patterns of liana density and basal area. Biotropica 42: 309-317.
Dillenburg, L. R., D. F. Whigham, A. H. Teramura, and I. N. Forseth. 1993a. Effects of
vine competition on availability of light, water and nitrogen to a tree host
(Liquidambar styraciflua). American Journal of Botany 80: 224–252.
Duque, A., Sanchez, M., Cavelier, J. & Duivenvoorden, J. F. 2002. Different floristic
patterns of woody understorey and canopy plants in Colombian Amazonia. Journal of
Tropical Ecology 18: 499–525.
Eilu, G. 2001. The diversity and distribution of climbers and trellises in some forests of the
Albertine Rift, western Uganda. PhD, Makerere University.
Emmons, L. H., And A. H. Gentry. 1983. Tropical forest structure and the distribution of
gliding and prehensile-tailed Vertebrates. Am. Nat. 121: 513-524.
Ewango_PROEF (all).ps Back - 70 T1 - Black
References
127
Enoki, T., Kawaguhi, H. & Iwatsubo, G. 1997. Nutrient-uptake and nutrient-use efficiency
of Pinus thunbergii Parl. along a topographical gradient of soil nutrient availability.
Ecological Research 12: 191–199.
Engelbrecht, B.M.J., T.A. Kursar & M.T. Tyree. 2005. Drought effects on seedling survival
in a tropical moist forest. Trees 19: 312–321.
Évrard, C. 1968. Recherches écologiques sur le peuplement des sols hydromorphes de la
cuvette centrale congolaise. Ministère belge de l’éducation nationale et culture. Publ.
INEAC, Série scientifique 87, 159 pp.
Ewers, F.W. & J.B. Fisher. 1991. Why vines have narrow stems: histological trends in
Bahunia (Fabaceae). Oecologia 88: 233-237.
Fairhead, J. & M. Leach. 1998. Reframing deforestation-Global analyses and local realities:
studies in West Africa. The Global Environmental Change Series, London, UK. 238
pp.
Felseinstein, J. 1985. Phylogenies and the comparative method. American Naturalist 125: 1-
15.
Field, A. 2009. Discovering statistics using SPSS. Third edition. SAGE Publications Ltd.
London, UK.
Fox, L.R. & P.A. Morrow. 1981. Specialization: species property or local phenomenon?
Science 211: 887-893.
Gaston, K.J. 1996. The multiple forms of the interspecific abundance-distribution
relationship. Oikos 76: 211-220.
Gemerden, B.S., Van, H. Olff, M.P.E. Parren & F. Bongers. 2003. The pristine rain forest?
Remnants of historical impacts on current tree species composition and diversity.
Journal of Biogeography 30: 1381-1390.
Germerden, B.S., Van, G. Shun & H. Olff. 2003. Recovery of conservation values in
Central African rain forest after logging and shifting cultivation. Biodiversity &
Conservation 12: 1553–1570.
Gentry, A.H. 1981. Distributional patterns and an additional species of the Passiflora
vitiflora complex: Amazonian species diversity due to edaphically differential
communities. Plant Systematics and Evolution 173: 95-105.
Gentry, A. H. 1982. Patterns of Neotropical plant species diversity. Evolutionary Biology
15: 1-84.
Gentry, A. H. 1991a. The distribution and evolution of climbing plants. Pp. 3-49 in Putz, F.
E. & Mooney, A. H. (eds.). The Biology of Vines. Cambridge University Press,
Cambridge.
Ewango_PROEF (all).ps Front - 71 T1 - Black
References
128
Gentry, A. H. 1991b. Breeding and dispersal systems of lianas. Pp. 393-426 in Putz, F. E. &
Mooney, A. H. (eds.). The Biology of Vines. Cambridge University Press,
Cambridge.
Gentry, A. H. 1993. Diversity and floristic composition of lowland tropical forest in Africa
and South America. In Goldblatt P (Ed.). Biological relationships between Africa and
South America , pp. 500-547. Yale University Press, USA.
Gentry, A. H. & Dodson, C.1987. Contributions of non trees to species richness of a
tropical rain forest. Biotropica 19: 149-156.
Gerard, P. 1960. Etude écologique de la forêt dense à Gilbertiodendron dewevrei dans la
région de l’Uélé. Publ. INEAC, Sér. Scient. 87, Brusssels.
Gerhing, C., Park, S. & Denich, M. 2004. Liana allometric biomass equations for
Amazonian primary and secondary forest. Forest Ecology and Management 195: 69-
83.
Germain, R. & Évrard, C. 1956. Etude écologique et phytosociologique de la forêt à
Brachystegia laurentii. Publ. INEAC, Sér. Scient. 67, Brussels.
Gerwing, J. J. & Farias, D. L. 2000. Integrating liana abundance and forest stature into an
estimate of total aboveground biomass for an eastern Amazonian forest. Journal of
Tropical Ecology 16: 327–335.
Gerwing, J.J. 2004. Life history diversity among six species of canopy lianas in an old-
growth forest of the eastern Brazilian Amazon. Forest Ecology and Management 190:
57-72.
Gerwing, J.J., Schnitzer, S.A., Burnham, R.J., Bongers, F., Chave, J., DeWalt, S.J.,
Ewango, C.E.N., Foster, R. & Kenfack, D. 2006 A Standard protocol for liana
censuses. Biotropica 38: 256–261.
Gianoli, E. & Molina-Montenegro, M. A. 2005. Leaf damage induces twining in a climbing
plant. New Phytologist 167: 385-389.
Gianoli, E., Saldana, A., Jimenez-Castillo, M. & Valladares, F. 2010. Distribution and
abundance of vines along the light gradient in a southern temperate rain forest.
Journal of Vegetation Science 21: 66-73.
Gilbert, B., S.J. Wright, H.C. Muller-Landau, K. Kitajima & A. Hernandez. 2006. Life
history trade-offs in tropical trees and lianas. Ecology 87: 1281-1288.
Graham, E.A., S.S. Mulkey, K. Kitajima, et al. 2003. Cloud cover limits net CO2 uptake
and growth of a rainforest tree during tropical rainy seasons. PNAS 100: 572-576.
Grandez, C., Garcia, A., Duque, A. & Duivenvoorden, J. F. 2001. La composicion floristica
de los bosques en las cuencas de los r ios Ampiyacu y Yaguasyacu (Amazon a
peruana). Pp. 163-176 in Duivenvoorden, J. F., Balslev, H., Cavelier, J., Grandez, C.,
Tuomisto, H. & Valencia, R. (eds.). Evaluacion de recursos forestales no maderables
Ewango_PROEF (all).ps Back - 71 T1 - Black
References
129
en la Amazon a noroccidental. IBED, Universiteit van Amsterdam, Amsterdam, The
Netherlands.
Guariguata, M.R. & R. Ostertag. 2001. Neotropical secondary forest succession: changes in
structural and functional characteristics. Forest Ecology and Management 148: 185-
206.
Grauel, W. T. & Putz, F. E. 2004. Effects of lianas on growth and regeneration of Prioria
copaifera in Darien, Panama. Forest Ecology and Management 190: 99–108.
Hall, J. B. & Swaine, M. D. 1981. Distribution and Ecology of Vascular Plants in a
Tropical Rain Forest: Forest Vegetation in Ghana. W. Junk, The Hague.
Harms, K.E., S.J. Wright, O. Calderon, A. Hernandez & E.A. Herre. 2000. Pervasive
density-dependent recruitment enhances seedling diversity in a tropical forest. Nature
404: 493-495.
Harms, K.E., Condit, R., Hubbell, S. P. et al. 2001. Habitat associations of trees and shrubs
in a 50-ha neotropical forest plot. Journal of Ecology 89: 947–959.
Harper, J.L. 1977. Population biology of plants. Academic Press, London, UK.
Hart, T. 1985. The ecology of a single-species dominant forest and of a mixed forest in
Zaïre, Africa. Ph.D. dissertation, Michigan State University, East Lansing.
Hart, T.B., J.A. Hart, R. Deschamps, M. Fournier, And M. Ataholo.1996. Changes in forest
composition over the last 4000 years in the Ituri basin, Zaïre. In L.J.G. van der
Maesen, X.M. van de Burgt, and J.M. Medenbach de Rooy (Eds.). The biodiversity of
African plants, pp. 545-563. Proceedings XIVth AETFAT Congress, 22-27 August
1994, Wageningen, The Netherlands.
Hart, J.A. 1986. Comparative dietary of a community of frugivorous forest ungulates in
Zaïre. Dissertation, Michigan State University, East Lansing.
Hart, J. A. & Carrick, P. 1996. Climate of the Reserve de Faune à Okapi: Rainfall and
temperature in the Epulu sector 1986-1995. Unpublished CEFRECOF Working Paper
No. 2, Kampala. Uganda.
Hawthorne, W. & Jongkind, C. 2006. Woody Plants of Western African Forests: A Guide
to the Forest Trees, Shrubs and Lianes from Senegal to Ghana (first edition). Kew
Publishing, Royal Botanical Gardens, Kew.
Hegarty, E.E. 1989. The climbers-lianes and vines. In Tropical Rain Forest Ecosystems:
Biogeographical and Ecological Studies. Ecosystems of the World 14B, ed. H. Lieth
and M.J.A. Werger, pp.339-53. Elsevier, Amsterdam.
Hegarty, E.E. 1991. Vine–host interactions. Pp 357–375 in Putz, F. E. & Mooney, A. H.
(eds.). The Biology of Vines. Cambridge University Press, Cambridge. 526 pp.
Ewango_PROEF (all).ps Front - 72 T1 - Black
References
130
Hegarty, E.E., Caballé, G., 1991. Distribution and abundance in forest communities. Pages
313-335, In: F.E. Putz & H.A. Mooney (eds), The Biology of Vines. Cambridge
University Press, Cambridge.
Hegarty, E. E. & H.T. Clifford. 1991. Climbing angiosperms in the Australian flora. In G.
Werren and P. Kecshaw (eds). The rainforest legacy, pp. 105-120. Ausdian
Government Publishing Service, Canberra, ACT, Australia.
Holmgren, M., Scheffer, M., Ezcurra. E., J.R. Gutiérrez & G.M.J. Morhen. 2001. El Niño
effects on the dynamics of terrestrial ecosystems. Trends in Ecology and Evolution
16:89–94.
Homeier, J., F. Englert, C. Leuschner, P. Weigelt & M. Unger. Factors controlling the
abundance of lianas along an altitudinal transect of tropical forests in Ecuador. Forest
Ecology and Management 259: 1399-1405.
Hubbell, S.P. & R.B. Foster. 1986. Commonness and rarity in a neotropical forest:
implications for tropical tree conservation. Conservation Biology: Science of Scarcity
and Diversity (ed. M. Soulé), pp. 205–231. Sinauer Associates, Sunderland, MA.
Hubbell, S.P. & R.B. Foster. 1992. Short-term dynamics of a neotropical forest: why
ecological research matters to tropical conservation and management. Oikos 63: 48-
61.
Hubbell, S. P. 1995. The maintenance of diversity in a neotropical tree community:
conceptual issues, current evidence, and challenges ahead. In F. Dallmeier and J.A.
Comiskey (Eds). Forest biodiversity in North, Central and South America, and the
Caribbean. Research and Monitoring , pp. 17-44. Man and Biosphere series volume
21. UNESCO, Paris, France.
Hubbell, S.P. 1997. A unified theory of biogeography and relative species abundance and
its implication to tropical forests and coral reefs. Coral Reefs 16 (Suppl.): S1-S21.
Hubbell, S.P. 2001. The unified neutral theory of biodiversity and biogeography. Princeton
University Press.
Hubbell, S.P. 2005. Neutral theory in community ecology and the hypothesis of functional
equivalence. Functional Ecology 19: 166-172.
Hurtt, G.C. & S.W. Pacala. 1995. The consequences of recruitment limitation: reconciling
chance, history, and competitive differences between plants. Journal of Theoretical
Biology 176: 1-12.
Ibarra-Manriquez, G. & Martinez-Ramos, M. 2002. Landscape variation of liana
communities in a Neotropical rain forest. Plant Ecology 160: 91-112.
Ingwell, L.L., S.J. Wright, K.K. Becklund, S.P. Hubbell & S.A. Schnitzer. 2010. The
impact of lianas on 10 years of tree growth and mortality on Barro Colorado Island,
Panama. Journal of Ecology 98: 879-887.
Ewango_PROEF (all).ps Back - 72 T1 - Black
References
131
Itoh, A., Yamakura, T., Ohkubo, T., Kanzaki, M., Palmiotto, P. A., Lafrankie, J. V.,
Ashton, P. S. & Lee, H. S. 2003. Importance of topography and soil texture in the
spatial distribution of two sympatric dipterocarp trees in a Bornean rain forest.
Ecological Resources 18: 307-320.
Janzen D.H. 1970. Herbivores and number of tree species in tropical forests. The American
Naturalist 104: 501-528.
Jongkind, C.C.H. & W.D. Hawthorne. 2005. A botanical synopsis of lianes and other forest
climbers. Pages 19-39 in: F. Bongers, M.P.E. Parren & D. Traoré (eds.), Forest
climbing plants of West Africa: Diversity, Ecology and management. CABI
Publishing, Oxfordshire, UK.
Kainer, K. A., Wadt, L. H. O., Gomes-Silva, D. A. P. & Capanu, M. 2006. Liana loads and
their association with Bertholletial excelsa fruit and nut production, diameter growth
and crown attributes. Journal of Tropical Ecology 22: 147-154.
Killeen, T.J., A. Jardim, F. Mamani & N. Rojas. 1998. Diversity, composition and structure
of a tropical semideciduous forest in Chiquitania region of Santa Cruz, Bolivia.
Journal of Tropical Ecology 14: 803-827.
Kitajima, K. 1992. Relationship between photosynthesis and thickness of cotyledons for
tropical tree species. Functional Ecology 6: 582-589.
Kitajima, K., And L. Poorter. 2008. Functional basis for resource niche partitioning by
tropical trees. In W. Carson and S.A. Schnitzer (Eds.), Tropical forest community
ecology, pp. 160-181. Wiley-Blackwell.
Klinge, H. & Rodriguez, W. W. 1974. Phytomass estimation in a central Amazonian rain
forest. Pp. 339-350 in Young, H. E. (eds.). Forest biomass studies. International
Union of Forest Research Organizations Congress 15, Rome, Italy. University Press,
Orono, Maine. 311 pp.
Kobe, R.K. 1996. Intraspecific variation in sapling mortality and growth predicts
geographic variation in forest composition. Ecological Monographs 66: 181-201.
Kooyman R., W. Cornwell and M. Westoby. 2010. Plant functional traits in Australian
subtropical rain forest: partitioning within-community from cross-landscape
variation. Journal of Ecology 98: 517–525.
Kunin, W.E. & K.J. Gaston. 1997. Biology of Rarity Causes and Consequences of Rare-
Common Differences Series: Population and Community Biology Series, Vol. 17.
Kusumoto, B., Enoki, T. & Watanabe, Y. 2008. Community structure and topographic
distribution of lianas in a watershed on Okinawa, south-western Japan. Journal of
Tropical Ecology 24: 675-683.
Kuzee, M. E. & Bongers, F. 2005. Climber abundance, diversity and colonization in
degraded forests of different ages in Côte d’Ivoire. Pp. 73-91 in Bongers, F., Parren,
Ewango_PROEF (all).ps Front - 73 T1 - Black
References
132
M. P. E. & Traoré, D. (eds.). Forest climbing plants of West Africa: Diversity,
Ecology and Management. CAB International, Wallingford, Oxfordshire, UK.
Laurance WF, Pérez-Salicrup D, Delamônica P, Fearnside PM, D’angelo S, Jerozolinski A,
Pohl L & Lovejoy TE. 2001. Rain forest fragmentation and the structure of
Amazonian liana communities. Ecology 82: 105–116.
Laurance WF, Oliveira AA, Laurance SG, Condit R, Nascimento HEM, et al. 2004.
Pervasive alteration of tree communities in undisturbed Amazonian forests. Nature
428: 171–175.
Lebrun, J. 1937. Observations sur la morphologie et l’écologie des lianes de la forêt
équatoriale du Congo. Institut Royal Colonial Belge, Bulletin Séances 8: 78-87.
Lebrun J.P., A.L. Stork, P. Goldblatt, L. Gautier & R.M. Polhill R.M. 1991–1997.
Enumération des plantes à fleurs d’Afrique tropicale. Volume 1-4. Conservatoire et
Jardin Botaniques de la Ville de Genève, Genève, Switzerland.
Letcher, S.G. & R.L. Chazdon. 2009. Lianas and self-supporting plants during tropical
forest succession. Forest Ecology and Management 257: 2150-2156.
Lewis, S.L., O.L. Phillips, T.R. Baker, J. Lloyd, Y. Malhi, S. Almeida, N. Higuchi, W.F.
Laurance, D.A. Neill, J.N.M. Silva, J. Terborgh, A. Torres Lezama, R. Vásquez
Martínez, S. Brown, J. Chave, C. Kuebler, P. Núñez Vargas & B. Vincenti.
Concerted changes in tropical forest structure and dynamics: evidence from 50 South
American long-term plots. Phil. Trans. R. Soc. Lond. B. 359: 421–436.
Lewis, S.L., G. Lopez-Gonzalez, B. Sonké, K. Affum-Baffoe, T.R. Baker, L.O. Ojo, O.L.
Phillips, J.M. Reitsma, L. White, J.A. Comiskey, M-N. K. Djuikouo, C.E.N.
Ewango, T.R. Feldpausch, A.C. Hamilton, M. Gloor, T. Hart, A. Hladik, J. Lloyd,
J.C. Lovett, J-R. Makana, Y. Malhi, F.M. Mbago, H.J. Ndangalasi, J. Peacock, K.S.-
H. Peh, D.Sheil, T. Sunderland, M.D. Swaine, J. Taplin, D. Taylor, S.C. Thomas, R.
Votere & H. Wöll. 2009. Increasing carbon storage in intact African tropical forests.
Nature 457: 1003-1006.
Londré, R.A. & S.A. Schnitzer. 2006. The distribution of lianas and their change in
abundance in temperate forests over the past 45 years. Ecology 87: 2973–2978.
Losos, E. C. & Leigh, E. G., Jr. 2004. Tropical forest diversity and dynamism: Findings
from a large-scale plot network. University of Chicago Press, Chicago.
Lowe, R. G. & Walker, P. 1977. Classification of canopy, stem crown status and climber
infestation in natural tropical forests in Nigeria. Journal of Applied Ecology 14: 897–
903.
MacArthur, R. H., and E. 0. Wilson. 1967. The theory of island biogeography. Princeton
University Press, Princeton, New Jersey.
Ewango_PROEF (all).ps Back - 73 T1 - Black

References
133
Macia, M. J., Ruokolainen, K., Tuomisto, H., Quisbert, J. & Cal, V. 2007. Congruence
between floristic patterns of trees and lianas in a Southwest Amazonian rain forest.
Ecography 30: 561-577.
Maestre, F. T. & Cortina, J. 2004. Do positive interactions increase with abiotic stress? A
test from semi-arid steppe. Proceedings of the Royal Society of London, B,
Biological Sciences 271:S331-S333.
Magurran, A. E. 2004. Measuring biological diversity. Blackwell Publishing, Oxford, UK.
Makana, J-R., T.B. Hart & J.A. Hart. 1998. Forest structure and diversity of lianas and
understory treelets in monodominant and mixed stands in Ituri Forest, Democratic
Republic of the Congo. Pages 429-446, in Dallmeier, F. & J.A. Comiskey (eds.),
Forest biodiversity research, monitoring and modeling. Conceptual background and
Old World case studies. The Parthenon Publishing Group, London.
Makana, J-R., Hart, T. B., Hibbs, D. E. & Condit, R. 2004a. Stand structure and species
diversity in the Ituri Forest Dynamics Plots: A comparison of monodominant and
mixed forest stands. Pp. 159-174 in Losos, E. C. & Leigh, E. G., Jr. (eds.). Tropical
Forest Diversity and Dynamism: Findings from a Large-scale plot Network. The
University of Chicago Press, Chicago.
Makana, J-R, T.B. Hart, I. Liengola, C. Ewango, J.A. Hart & R.Condit. 2004b. Ituri Forest
Dynamics Plots, Democratic Republic of Congo. Pages 492-505 in Losos, EC & GL
Egbert, Jr (eds), Tropical forest diversity and dynamism: findings from a large-scale
plot network. The University of Chicago Press, Chicago.
Malaisse, F. 1997. Se nourrir en forêt Claire africaine. Approche écologique et nutritionelle.
Les Presses Agronomique de Gembloux, Gembloux, and Centre Technique de
Coopération Agricole et Rurale, CTA, Wageningen.
Malhi, Y., J.T. Roberts, R.A. Betts, T.J. Killeen, W. Li & C.A. Nobre. 2008. Climate
Change, Deforestation, and the Fate of the Amazon. Science 319: 169–172.
Maley, J. 1996. The African rain forest – main characteristics of changes in vegetation and
climate from the Upper Cretaceous to the Quaternary. In I.J. Alexander, M.D.
Swaine, and R. Watling (Eds.). Essays on the ecology of the Guinea-Congo rain
forest, pp. 31-74. Proceedings of the Royal Society of Edinburgh Series B 104.
Maley, J. 1996. Le cadre paléoenvironemental des refuges forestiers africains: quelques
données et hypothèses. In: L.J.G. van der Maesen, X.M. van der Burgt & J.M. van
Medenbach de Rooy (Eds). The biodiversity of African plants. Proceedings XIVth
AETFAT Congress, 22 27 August 1994, Wageningen, The Netherlands: 519 535.
Kluwer Academic Publishers, Dordrecht.
Maley, J. 2001. The impact of arid phases on the African rain forest through geological
history. In W. Weber, L.J.T. White, A. Vedder, and L. Naughton-Treves (Eds.).
Ewango_PROEF (all).ps Front - 74 T1 - Black
References
134
African rain forest ecology and conservation, pp. 68-87. Yale University Press, New
Haven, CT.
Mangan, S.A., S.A. Schnitzer, E.A. Herre, K.M.L. Mack, M.C. Valencia, E.I. Sanchez &
J.D. Bever. 2010. Negative plant-soil feedbacks predict relative species abundance in
a tropical forest. Nature 466: 752–755.
Markesteijn, L, Iraipi, J., Bongers, F. & Poorter, L. 2010. Seasonal variation in soil and
plant water potentials in Bolivian tropical moist and dry forests. Journal of Tropical
Ecology 26: 497-508.
Mascaro, J., S.A. Schnitzer & W.P. Carson. 2004. Liana diversity, abundance, and
mortality in a tropical wet forest in Costa Rica. Forest Ecology and Management 19:
3-14.
Meinzer, F.C., J.L. Andrade, G. Goldestein, N.M. Holbrook, J. Cavelier & S.J. Wright.
1999. Partitioning of soil water among canopy trees in a seasonally dry tropical forest.
Oecologia 121: 293–301.
Mohan, J.E., L.H. Ziska & W.H. Schlesinger. 2006. Biomass and toxicity responses of
poison ivy (Toxicodendron radicans) to elevated atmospheric CO2. Proceedings of the
National Academy of Sciences of the USA. 103: 9086–9089.
Mueller-Dombois, D. & Ellenberg, H. 1974. Aims and methods of vegetation ecology.
John Wiley & Sons, New York. 547 pp.
Muoghalu, J. I. & Okeesan, O. O. 2005. Climber species composition, abundance and
relationship with trees in a Nigerian secondary forest. African Journal of Ecology 43:
258-266.
Muthuramkumar, S. & Parthasarathy, N. 2000. Alpha diversity of lianas in a tropical
evergreen forest in the Anamalais, Western Ghats, India. Diversity and Distributions
6: 1-14.
Myers, N. 1982. Deforestation in the Tropics: who gains, who loses? Studies in Third
World Societies 13: 1-24.
Nabe-Nielsen, J. 2000. Liana community and population ecology in a Neotropical
rainforest. Ph.D. dissertation, University of Aarhus, Danemark.
Nabe-Nielsen, J. 2001. Diversity and distribution of lianas in a neotropical rain forest,
Yasuni National Park, Ecuador. Journal of Tropical Ecology 17: 1-19.
Nabe-Nielsen, J. 2002. Growth and mortality rates of the liana Machaerium cuspidatum in
relation to light and topography position. Biotropica 34: 319-322.
Nabe-Nielsen, J. 2004. Demography of Machaerium cuspidatum, a shade-tolerant
neotropical liana. Journal of Tropical Ecology 20: 505-516.
Ewango_PROEF (all).ps Back - 74 T1 - Black

References
135
Nabe-Nielsen, J. & P. Hall. 2002. Environmentally Induced Clonal Reproduction and Life
History Traits of the Liana Machaerium cuspidatum in an Amazonian Rain Forest,
Ecuador. Plant Ecology 162: 215-226.
Nabe-Nielsen, J., Kollmann, J. & Peña-Claros, M. 2009. Effects of liana load, tree diameter
and distances between conspecifics on seed production in tropical timber trees. Forest
Ecology and Management 257: 987-993.
Nagamatsu, D., Y. Hirabuki, And Y. Mochida. 2003. Influence of micro-landforms on
forest structure, tree death and recruitment in a Japanese temperate mixed forest.
Ecol. Res. 18: 533-547.
Natta, A. K. & Sinsin, B. 2005. Taxonomic diversity of climbers of riparian forests in
Benin. Pp. 123-136 in Bongers, F., Parren, M. P. E. & TRAORÉ, D. (eds.). Forest
climbing plants of West Africa: Diversity, Ecology and Management. CAB
International, Wallingford, Oxfordshire, UK. 273 pp.
Nascimento, H.E.M., W.F. Laurance, R. Condit, S.G. Laurance, S. D’Angelo, and A.C.
Andrade. 2005. Demographic and life-history correlates for Amazonian trees. Journal
of Vegetation Science 16: 625-634.
Ødegaard, F. 2000. The relative importance of trees versus lianas as host for phytophagous
beetles (coleopteran) in tropical forest. Journal of Biogeography 27: 283-296.
Pacala, S.W. & M. Rees. 1998. Models suggesting field experiments to test two hypotheses
explaining successional diversity. The American Naturalist 152: 729-737.
Palmiotto, P.A., Davies, S. J., Vogt, K. A., Ashton, M. S., Vogt, D. J. & Ashton, P. S.
2004. Soil-related habitat specialization in dipterocarp rain forest tree species in
Borneo. Journal of Ecology 92: 609–623.
Parren, M. P. E. 2003. Lianas and logging in West Africa. Tropenbos-Cameroon Series 6.
Tropenbos International, Wageningen, Netherlands.
Parren, M. P. E. & Bongers, F. 2001. Does climber cutting reduce felling damage in
southern Cameroun? Forest Ecology and Management 141: 175-188.
Parren, M. P. E. & Bongers, F. & Caballe, G, Nabe-Nielsen, J. & Schnitzer, S. A. 2005. On
censusing lianes: a review of common methodologies. Pp. 41-57 in Bongers, F., Parren,
M. P. E. & Traoré, D. (ed.). Forest climbing plants of West Africa: Diversity, Ecology
and Management. CAB International, Wallingford, Oxfordshire, UK.
Parthasarathy, N., Muthuramkumar, S. & Reddy, S. 2004. Patterns of liana diversity in
tropical evergreen forests of peninsular India. Forest Ecology and Management 190:
15-31.
Peña-Claros, M., Fredericksen, T.S., Alarcón, A., Blate, G.M., Choque, U.,Leaño, C.,
Licona, J. C., Mostacedo, B., Pariona, W., Villegas, Z., Putz, F.E. 2008. Beyond
Ewango_PROEF (all).ps Front - 75 T1 - Black

References
136
reduced-impact logging: silvicultural treatments to increase growth rates of tropical
trees. Forest Ecology and Management 256: 1458-1467.
Pérez-Salicrup, D.R. 1998. Effects of liana cutting on trees and tree seedlings in a tropical
forest in Bolivia. Dissertation. University of Missouri-St. Louis. St. Louis, Missouri,
USA.
Pérez-Salicrup, D.R., Sork, V.L. & F.E. Putz. 2001. Lianas and trees in a liana forest of
Amazonian Bolivia. Biotropica 33: 34–47.
Pérez-Salicrup, D. & M.G. Barker. 2000. Effect of liana cutting on water potential and
growth of adult Senna multijuga (Ceasalpinioideae) trees in a Bolivian tropical forest,
Oecologia 124: 469–475.
Pérez-Salicrup, D. R., Schnitzer, S. A. & Putz, F. E. 2004. The community ecology and
management of lianas. Forest Ecology and Management (Special Issue) 190:1-118.
Phillips, O.L. & A.H. Gentry. 1994. Increasing turnover through time in tropical forests.
Science 263: 954–958.
Phillips, O.L., P. Hall, A.H. Gentry. 1994. Dynamics and species richness of tropical rain
forests. PNAS 91: 2805-2809.
Phillips, O.L., R. Vasquez Martinez, L. Arroyo, T.R. Baker, T. Killeen, S.L. Lewis,
Y. Malhi, A.M. Mendoza, D. Neill, P. Nunez Vargas, M. Alexiades, C. Ceron, A. Di
Fiore, T. Erwin, A. Jardim, W. Palacios, M. Saldias & B. Vinceti. 2002. Increasing
dominance of large lianas in Amazonian forests. Nature 418: 770-774.
Phillips, O.L., R. Vasquez Martínez, A.M. Mendoza, T.R. Baker & P. Nunez Vargas.
2005. Large lianas as hyperdynamic elements of the tropical forest canopy. Ecology
86: 1250-1258.
Pianka, E.R. 1970. On r and K selection. Amer. Naturalist 104: 592-597.
Poorter, L. & F. Bongers. 2006. Architecture of 54 moist forest species: traits, trade-offs,
and functional groups. Ecology 87: 1289-1301.
Poorter, L., S.J. Wright, H. Paz, D.D. Ackerly, R. Condit, G. Ibarra-Manriquez, K.E.
Harms, J.C. Licona, M. Martinez-Ramos, S.J. Mazer, H. Muller-Landau, M. Peña-
Claros, C.O. Webb, I. Wright. 2008. Are functional traits good predictors of
demographic rates? Evidence from five Neotropical forests. Ecology 89: 1908-1920.
Poulsen, A. D., Hafashimana, D., Eilu, G., Liengola, I. B., Ewango, C. E. N. & Hart, T. B.
2005. Composition and species richness of forest plants along the Albertine Rift,
Africa. Biologiske Skrifter 55: 129-143.
Preston, F. W. 1948. The commonness and rarity of species. Ecology 29: 254-83.
Putz, F.E. 1983. Liana biomass and leaf area of a “Tierra Firme” forest in the Rio Negro
Basin, Venezuela. Biotropica 15: 185-189.
Ewango_PROEF (all).ps Back - 75 T1 - Black

References
137
Putz, F. E. 1984. The natural history of lianas on Barro Colorado Island, Panama. Ecology
65: 1713-1724.
Putz, F.E. 1990. Liana stem diameter growth and mortality rates on Barro Colorado Island,
Panama. Biotropica 22: 103-105.
Putz, F. E. & Chai, P. 1987. Ecological studies of lianas in Lambir National Park, Sarawak,
Malaysia. Journal of Ecology 75: 523-531.
Putz, F. E. & Holbrook, N. M. 1991a. Biomechanical studies of vines. Pp 73-96 in Putz, F.
E. & Mooney, H. A. (ed.). The biology of vines. Cambridge University Press,
Cambridge.
Putz, F.E. & H.A. Mooney. 1991b. The biology of vines. Cambridge, U.K., Cambridge
University Press, Cambridge.
Pyke, C.R., Condit, R., Aguilar, S. & Lao S. 2001. Floristic composition across a climatic
gradient in a neotropical lowland forest. Journal of Vegetation Science 12: 553–566.
Rabinowitz, D. 1981. Seven forms of rarity. Pages 205-217 in H. Synge, editor. The
biological aspects of rare plant conservation. John Wiley, Chichester, UK.
Raunkiaer, C. 1934. The life forms of plants and statistical plant geography. Clarendon
Press, Oxford.
Richards, P.W. 1952. The tropical rain forest: an ecological study. Cambridge University
Press, Cambridge.
Richards, P. W. 1973. Africa, the “Odd Man Out.”. Pp. 21–26. in. Tropical forest
ecosystems in Africa and South America: a comparative review eds. B.J. Meggers,
E.S. Ayensu, W.D. Duckworth. Washington: Smithsonian Institution Press.
Rollet, B. 1974. L’architecture des forêts denses humides sempervirentes de plaine. CTFT,
Nogent-sur-Marne, France.
Romero-Saltos, H. V. 1999. Diversidad, analisis estructural y aspectos flor sticos relevantes
de las lianas en una parcela de bosque muy hu´medo premontano, Amazonia
Ecuadoriana. Disertacion de Licenciado en Ciencias Biologicas, Pontificia
Universidad Catolica del Ecuador.
Romero-Saltos, H., Valencia, R., Macía, M. J. 2001. Patrones de diversidad, distribución y
rareza de plantas leñosas en el Parque Nacional Yasuní y la Reserva Étnica Huaorani,
Amazonía ecuatoriana. Pp. 131-162 in Duivenvoorden, J. F., Balslev, H., Cavelier, J.,
Grandez, C., Tuomisto, H., Valencia, R. (eds.). Evaluación de recursos vegetales no
maderables en la Amazonía noroccidental. IBED, Universiteit van Amsterdam.
Roy, S. & Singh, J. S. 1994. Consequences of habitat heterogeneity for availability of
nutrients in a dry tropical forest. Journal of Ecology 82: 503-509.
Ewango_PROEF (all).ps Front - 76 T1 - Black

References
138
Rozendaal, D.M. A., R.J.W. Brienen, C.C. Soliz-Gamboa, P.A. Zuidema. 2010. Tropical
tree rings reveal preferential survival of fast-growing juveniles and increased juvenile
growth rates over time. New Phytologist 185: 759-769.
Schenck, H. 1892-1893. Beiträge zur biologie und anatomie der lianen, im besonderen der
in Brasilien einheimischen arten. In Botanische Mitteilungen aus den Tropen.
Schimper, Jena, Deutschland, 2 Vol.
Schnitzer, S.A. 2005. A mechanistic explanation for global patterns of liana abundance and
distribution. The American Naturalist 166: 262-276.
Schnitzer, S. A., J.W. Dalling & W.P. Carson. 2000. The impact of lianas on tree
regeneration in tropical forests canopy gaps: evidence for an alternative pathway of
gap-phase regeneration. Journal of Ecology 88: 655-666.
Schnitzer, S. A. & W. P. Carson. 2001. Treefall gaps and the maintenance of species
diversity in a tropical forest. Ecology 82: 913- 919.
Schnitzer, S. A, J. Mascaro & W. P. Carson. 2008. Treefall gaps and the maintenance of
plant species diversity in tropical forest. Pages 196-209, In W.P. Carson & S.A.
Schnitzer (eds), Tropical Forest Community Ecology. Wiley-Blackwell.
Schnitzer, S. A & W. P. Carson. 2010. Lianas suppress the regeneration and diversity in
treefall gaps. Ecology Letters 13: 849-857.
Schnitzer, S. A. & Bongers, F. 2002. The ecology of lianas and their role in forests. Trends
in Ecology and Evolution 17: 223-230.
Schnitzer, S. A. & F. Bongers. 2005. Lianas and gap-phase regeneration: implications for
forest dynamics and species diversity. In F. Bongers, M.P.E. Parren and D. Traoré
(Eds.), Forest climbing plants of West Africa: Diversity, Ecology and Management,
pp. 59-72. CAB International, Wallingford, Oxfordshire, UK.
Schnitzer, S. A., Kuzee, M. A. & Bongers, F. 2005. Disentangling above- and below-
ground completion between lianas and trees in a tropical forest. Journal of Ecology
93: 1115-1125.
Schnitzer, S. A., S. J. Dewalt, And J. Chave. 2006. Censusing and measuring lianas: a
quantitative comparison of the common methods. Biotropica 38: 581-591.
Schnitzer, S. A., Rutishauer, S. & Aguilar, S. 2008. Supplemental protocol for liana
censuses. Forest Ecology and Management 255: 1044-1049.
Senbeta, F., Schmit, C., Denich, M., Demissew, S., Vlek, P. L. G., Preisinger H.,
Woldemariam T. & Teketay, D. 2005. The diversity and distribution of lianas in the
Afromontane rain forests of Ethiopia. Diversity and Distributions 11: 443-452.
Sheil, D. 2001. Long-term observations of rain forest succession, tree diversity and
responses to disturbance. Plant Ecology 155: 183-199.
Ewango_PROEF (all).ps Back - 76 T1 - Black

References
139
Smith, R. F. 1970. The vegetation structure of a Puerto Rican rain forest before and after
short-term gamma irradiation. Pp. 103-140 in Odum, T. H. (ed.). A tropical rain
forest. US Atomic Energy Commission, Oak Ridge. 694 pp.
Sosef, M.S.M., 1996. Begonias and African rain forest refuges: general aspects and recent
progress. In: L.J.G. van der Maesen, X.M. van der Burgt & J.M. van Medenbach de
Rooy (Eds). The biodiversity of African plants. Proceedings XIVth AETFAT
Congress, 22 27 August 1994, Wageningen, The Netherlands: 602 611. Kluwer
Academic Publishers, Dordrecht.
SPSS, 2006. Procedures Guide, Version 15.0. SPSS Inc., Chicago, Il, USA.
PASW, 2009. Procedures Guide, Version 17.0. SPSS Inc., Chicago, Il, USA.
Stanhill, G. & S. Cohen. 2001. Global dimming: a review of the evidence for a widespread
and significant reduction in global radiation with discussion of its probable causes and
possible agricultural consequences. Agricultural and Forest Meteorology 107: 255–
278.
Stevens, G. C. 1987. Lianas as structural parasites: the Bursera simaruba example. Ecology
68:77-81.
Stevens, P. F. 2001 (onwards). Angiosperm Phylogeny website. Version 9, June 2008 [and
more or less continuously updated since].
http:/www.mobot.org/MOBOT/research/APweb/.
Svenning, J-C. 1999. Microhabitat specialization in a species-rich palm community in
Amazonian Ecuador. Journal of Ecology 87: 55–65.
Swaine, M.D., D. Lieberman, and F.E. Putz. 1987. The dynamics of tree populations in
tropical forest: a review. Journal of Tropical Ecology 3: 359-367.
Swaine, M.D. & J. Grace. 2007. Lianas may be favoured by low rainfall: evidence from
Ghana. Plant Ecology 192: 271-276.
Swaine, M. D., Hawthorne, W. D., Bongers, F. & M. Toledo-Aceves. 2005. Climbing
plants in Ghana Forests. Pp. 93-108 in Bongers, F., Parren, M. P. E. & Traoré, D.
(ed.). Forest climbing plants of West Africa: Diversity, Ecology and Management.
CAB International, Wallingford, Oxfordshire, UK.
Tchouto, M. G. P. 2004. Plant diversity in a central African rain forest, implications for
biodiversity conservation in Cameroun. PhD thesis, Wageningen University, The
Netherlands.
Ter Braak, C. J. F. & Smilauer, P. 1997. CANOCO Reference Manual and User's Guide to
Canoco for Windows: Software for Canonical Community Ordinations Version 4 .
New York, Centre for Biometry Wageningen and Microcomputer Power.
Ewango_PROEF (all).ps Front - 77 T1 - Black
References
140
Tilman, D. 1994. Competition and biodiversity in spatially structured habitats. Ecology
75:2-16.
Tokeshi, M. 1993. Species abundance patterns and community structure. Adv. Ecol. Res. 24:
111-186.
Toledo, M. 2010. Neotropical lowland forests along environmental gradients. PhD Thesis,
Wageningen University, the Netherlands.
Toledo-Aceves, T. & Swaine, M. D. 2008. Above- and below-ground competition between
the liana Acacia kamerunensis and tree seedlings in contrasting light environments.
Plant Ecology 196: 233–244.
Tuomisto, H, Ruokolainen, K., Poulsen, A. D., Moran, R. C., Quintana, C., Cañas, G. &
Celi, J. 2002. Distribution and diversity of pteridophytes and Melastomataceae along
edaphic gradients in Yasuni National Park, Ecuadorian Amazonia. Biotropica 34:
516-533.
Tra Bi, F.H. 1997. Utilisations des plantes, par l’homme, dans les forêts Classées du Haut
Sassandra et du Scio, en Côte d’Ivoire. Thèse, 3ème Cycle, Université de Cocody,
Abidjan.
Van Andel, T. 2000. Non-timber forest products of the north-West District of Guyana.
Tropenbos-Guyana Series 8a, Tropenbos Foundation, Wageningen.
Van Der Heijden, G. M. & Phillips, O. L. 2008a. What controls liana success in
Neotropical forests? Global Ecology and Biogeography 17: 372-383.
Van Der Heijden G. M. F., Healey, J. R., And O. L. Phillips. 2008b. Infestation of trees by
lianas in a tropical forest in Amazonian Peru. Journal of Vegetation Science 19: 747-
756.
Van Der Heijden, G. M. & Phillips, O. L. 2009a. Environmental effects on Neotropical
liana species richness. Journal of Biogeography 36: 1561-1572.
Van Der Heijden G. M. F., And O. L. Phillips. 2009b. Liana infestation impacts tree growth
in a lowland tropical moist forest. Biogeosciences 6: 3133-3158.
Vandermeer, J., I. Granzow De La Cerda, D. Boucher, I. Perfecto & J. Ruiz. 2000.
Hurricane Disturbance and Tropical Tree Species Diversity. Science 290: 788-791.
Van Valkenburg, J.L.C.H. 1997. Non-timber forest products of East Kalimantan: potential
for sustainable forest use. Tropenbos Series 16. PhD thesis, Wageningen University,
the Netherlands.
Verburg, R. & C. Van Eijk-Bos. 2003. Effects of selective logging on tree diversity,
composition and plant functional type patterns in a Bornean rain forest. Journal of
Vegetation Science 14: 99-110.
Ewango_PROEF (all).ps Back - 77 T1 - Black

References
141
Villegas, Z, Peña-Claros, M., Mostacedo, B., Alarcon, A., Licona, J. C., Leano, C., Pariona,
W. & Choque, U. 2009. Silvicultural treatments enhance growth rates of future
crop trees in a tropical dry forest. Forest Ecology and Management 258: 971-977.
Warner, R. R. & T. P. Hughes. 1988. The population dynamics of reef fishes. Pages 149-
155 in Proceedings of the sixth International Coral Reef Symposium. Volume 1. The
Sixth International Coral Reef Symposium Executive Committee, Townsville,
Australia.
Webb, L.J. 1958. Cyclones as an ecological factor in tropical lowland rainforest, North
Queensland. Australian Journal of Botany 6: 220-228.
Webb, C.O., D.D. Ackerly, M.A. McPeek & M.A. Donoghue. 2002. Phylogenies and
community ecology. Annual Review of Ecology and Systematics 33: 475–505.
Welden C.W., S.W. Hewett, S.P. Hubbell & R.B. Foster. 1991. Sapling survival, growth,
and recruitment: relationship to canopy height in a Neotropical forest. Ecology 72:
35-50.
Whigham, D. 1984. The influence of vines on the growth of Liquidambar styraciflua L.
(sweetgum). Canadian Journal of Forest Research 14: 37-39.
White, F. 1983. The Vegetation of Africa. UNESCO, Paris.
White, F. 1979. The Guineo-Congolian region and its relationship to other phytochoria.
Bull. Jard. Bot. Nat. Belg. 49: 11-55.
Whitmore, T.C. 1984. Tropical rain forests of the Far East. 2nd ed., Oxford, U.K., Clarendon
Press.
Whitmore, T.C. & D.F.R.P. Burlsem. 1998. Major disturbances in tropical forests In:
Newbery DM, Prins HHT, Brown ND (eds.). Dynamics of tropical communities: the
37th Symposium of the British Ecological Society, Royal Holloway College,
University of London, 1996. Malden (Massachusetts): Blackwell Science. pp 549–
565.
Wiersum, K.F (ed). 2000. Tropical forest resource dynamics and conservation: From local
to global issues. Tropical Resource Management Papers 33, Wageningen University.
Wright, S.J., O. Calderón, A. Hernandéz & S. Paton. 2004. Are lianas increasing in
importance in tropical forests? A 17-year record from Panama. Ecology 85: 484-489.
Wright, S.J. 2005. Tropical forests in a changing environment. Trends in Ecology and
Evolution 20: 553-560.
Zagt, R. J, R. C. Ek & N. Raes. 2003. Logging effects on liana diversity and abundance in
Central Guyana. Tropenbos series 1.
Zar, J.H. 1999. Biostatistical Analysis. Fourth ed. Prentice-Hall, Engelewood Cliffs, NJ.
Ewango_PROEF (all).ps Front - 78 T1 - Black

References
142
Zhang, D-Y., K. Lin & F. He. 2009. Demographic trade-offs in a neutral model explain
death-rate–abundance-rank relationship. Ecology 90: 31-38.
Ewango_PROEF (all).ps Back - 78 T1 - Black

143
Samenvatting Deze studie analyseert de diversiteit, samenstelling en dynamiek van de lianengemeenschap
van het Ituri regenbos in noord-oost DR Congo. Ik heb data gebruikt van twee 10-ha plots,
onderdeel van de Ituri Forest Dynamic Plots, waarin alle lianen met diameter-op-borst-
hoogte (dbh) 2 cm werden gemerkt, gekarteerd en geïdentificeerd in 1994, 2001 en 2007.
Bovendien werden plot topografie en de structuur van het kronendak gemeten.
Hoofdstuk 2 analyseert de lianengemeenschap (in termen van soortenrijkdom,
abundantie en diversiteit), karakteriseert hun functionele eigenschappen en bepaalt de effecten
van bosstructuur, topografie en edafische variatie op de lianensamenstelling. In 20 ha werden
15008 individuele lianen aangetroffen, die 195 soorten, 83 geslachten en 34 plantenfamilies
vertegenwoordigen. Per hectare was het soortenaantal gemiddeld 64, de bedekking was 0,71
m2 en de Fisher alfa, Shannon en Simpson diversiteitindexen waren respectievelijk 17,9,
3,1 en 11,4. Er was oligarchische dominantie van 10 plantenfamilies die 69% van de totale
soortenrijkdom, 92% van de lianenabundantie en 92% van de bedekking
vertegenwoordigden. Eenenveertig soorten (21%) waren door slechts één individu
vertegenwoordigd. De meeste lianen waren lichtminnend, klimmen via windingen, en
hadden opvallende bloemen, bladen van gemiddelde grootte en zaadverspreiding via dieren.
Lianenabundantie nam toe met de aanwezigheid van middelgrote en grote bomen, maar
was, verrassend, onafhankelijk van de abundantie van kleine bomen. Openheid van het
kronendak, bodemvochtigheid en grootte van de boom bleken de belangrijkste
omgevingsfactoren die de abundantie en verbreiding van lianen bepalen.
In Hoofdstuk 3 onderzoek ik de veranderingen in structuurkenmerken, diversiteit,
verjonging, sterfte en groei van de lianengemeenschap over dertien jaren (1994 – 2007).
Lianendichtheid nam af van 750 (1994) via 547 (2001) tot 499 (2007) stammen ha-1,
gepaard gaand met afname in bedekking en bovengrondse biomassa. Ondanks afnemende
stamdichtheden, bleef de soortenrijkdom constant. Snelheid van verjonging van lianen nam
licht af van 8,6% per jaar in de eerste periode tot 6,6% in de tweede, maar deze afname was
niet significant. Snelheid in lianensterfte nam in deze twee periodes significant af van 7,2%
naar 4,4% per jaar. Diametertoename en overleving nam toe met stamdiameter. Verrassend
genoeg toonde lianenabundantie in Ituri recente afname in plaats van toename, zoals
gerapporteerd voor tropische en gematigde bossen in beide Amerika’s. Interessant genoeg
werden veranderingen in algemene structuur en samenstelling van de lianengemeenschap
Ewango_PROEF (all).ps Front - 79 T1 - Black
144
aangestuurd door slechts één soort: de dramatische ineenstorting van de superabundante
Manniophyton fulvum tussen de eerste en tweede telling.
In Hoofdstuk 4 onderzoek ik de soortspecifieke dynamiek van de 79 meest
algemene lianensoorten, die 13,156 van de stammen (97% van het totaal) in twee 10-ha
plots vertegenwoordigen. Ik evalueer hun demografische prestatie en de relatie tussen hun
vitale snelheden (groei, sterfte, verjonging) en de soortenabundantie en vier functionele
eigenschappen (klimstrategie, verspreidingssyndroom, bladgrootte en lichtbehoefte) om de
variatie tussen soorten te bepalen alsmede de belangrijkste karakteriserende strategieën.
Soorten laten een grote variatie zien in verjongings snelheid (0,0-10.9% over 13 jaar), in
sterfte (0,43-7,89% over 13 jaar), en in groeisnelheid (-0,03-3,51 mm y-1). De meeste
soorten hadden lage tot gemiddelde snelheden. Snelgroeiende soorten verjongen en sterven
doorgaans ook snel, maar verjongings- en sterfte-snelheden waren niet direct gecorreleerd,
suggererend dat de absolute abundantie van soorten verschuift over de periode van 13 jaar.
Echter, met uitzondering van de ineenstortende Manniophyton fulvum populatie, soorten
behielden hun dominantiepositie door de tijd. Groei per soort nam af met abundantie, maar
verjongings- en sterftesnelheid waren niet gerelateerd aan abundantie. De demografische
prestatie van lianensoorten varieert zwak met hun klimstrategie en
verspreidingsmechanisme, maar was, verrassend genoeg, niet gerelateerd aan hun
lichtbehoefte als plant. Een principale componentenanalyse (PCA) van lianenstrategieën in
termen van functionele eigenschappen en van snelheden van verjonging, groei en sterfte liet
zien dat deze vooral bepaald worden door lichtbehoefte en verspreidingssyndroom. Op
basis van de PCA werden drie functionele groepen onderscheiden. Ik concludeer dat lianen
soorten van primair bos een grote variatie in abundantie en van verjonging -, groei - en
sterfte snelheden vertonen, en dat dichtheidsafhankelijke mechanismen onvoldoende zijn
om de veranderingen in soortsabundantiepatronen gedurende de tijd te verklaren.
Men neemt aan dat lianen wereldwijd in dichtheid toenemen, maar er is beperkte
kennis over de taxonomische patronen van deze verandering in lianenabundantie en de
onderliggende snelheden van verjonging, groei en sterfte die veranderingen in
lianendichtheid verklaren. In Hoofdstuk 5 worden de veranderingen in abundantie van 79
relatief algemene lianensoorten geëvalueerd. Het Ituri regenbos laat een
alomvertegenwoordige verandering in de dichtheid van de lianenpopulatie gedurende het
laatste decennium zien. 37 soorten veranderde significant in hun dichtheid: 12 (15% van het
totaal) soorten namen toe, 25 soorten (32%) namen af, en 42 soorten (53%) bleven gelijk.
Van de 48 genera nam 40% af en bleef 52% gelijk. Vijf van de 12 toenemende soorten
behoren tot de Celastraceae, wat tevens de enige significant toenemende familie was.
Ewango_PROEF (all).ps Back - 79 T1 - Black
145
Verrassend was dat geen van de vier functionele eigenschappen (lichtbehoefte als plant,
klimmechanisme, verspreidingsmechanisme en bladgrootte) significant geassocieerd was
met een verandering van populatiedichtheid per soort. Echter, veel afnemende soorten zijn
geassocieerd met verstoorde habitats en zijn kort-levend. Veel toenemende soorten behoren
tot het late successiestadium en zijn lang-levend. Toenemende soorten hebben een iets
snellere verjonging, afnemende soorten een hogere sterfte. Deze studie suggereert dat
veranderingen in de lianengemeenschap het gevolg is van bosherstel van vroegere
verstoring. Toenemend atmosferisch CO2-niveau was geen waarschijnlijke verklaring voor
deze veranderingen: meer soorten namen af dan toe, en toenemende soorten hadden geen
hogere groeisnelheden. In het Ituri regenbos overheerst de lokale dynamiek van opstanden
de meer mondiale aansturing van veranderingen bij lianen.
Trefwoorden: Lianen, soortensamenstelling, gemeenschap, dynamiek, openheid
kronendak, Manniophyton fulvum, functionele eigenschappen, populatiedichtheid,
wereldwijde verandering.
Ewango_PROEF (all).ps Front - 80 T1 - Black

146
Ewango_PROEF (all).ps Back - 80 T1 - Black
147
Résumé
Cette étude analyse la diversité, composition, et dynamique d’une communauté des lianas
de la forêt dense humide de l’Ituri au Nord-Est de la République Démocratique du Congo.
J’ai utilisé les données de deux parcelles de 10-ha des parcelles permanentes d’Etude de la
Dynamique Forestière de la Forêt de l’Ituri, dans lesquelles toute tige de liane 2 cm de
diamètre à hauteur de la poitrine (DPH) était marquée, cartographiée, mesurée et identifée
en 1994, 2001 et 2007. En outre, la topographie des parcelles et la structure de la canopée
était mesurée.
Chapitre 2 analyse la communauté des lianes (en termes de richesse spécifique,
abundance et diversité), caractérise les traits fonctionnels des lianes et détermine les effects
de la structure de la forêt, topographie et variation édaphique sur la composition spécifique
des lianes. Dans 20 ha, on a quantifié 15008 individus de lianes, représentant 195 espèces,
83 genres et 34 familles. Le nombre moyen d’espèce par hectare était de 64, la surface
terrière était de 0.71 m2 et les indices de diversité de Fisher alpha, Shannon et Simpson
étaient de 17.9, 3.1 et 11.4, respectivement. Il y avait une dominance oligarchique de 10
familles qui représentait 69% du total de la richesse spécifique, 92% de l’abondance et 92%
de la surface terrière, pendant que les 10 dominantes espèces constituent 63% de
l’abondance et 59% de surface terrière. Quarante et une espèces (21%) étaient représentées
seulement par un individu. La plupart de lianes était des espèces de lumière, volubile, à
fleurs apparantes, feuilles de taille moyenne et à dispersion des graines assurée par les
animaux. L’abondance des lianes augmentait avec l’abondance des moyens et grands arbres
mais, surprenant, elle était indépendante de l’abundance des petits arbres. L’ouverture de la
canopée, humidité du sol, et la taille des arbres furent les plus important facteurs
environementaux ayant influencé l’abundance et la distribution des lianes.
Au Chapitre 3 j’examine les changements des caractéristiques structurales,
diversité, recrutement, mortalité et croissance de la communauté des lianes sur une période
de treize ans (1994-2007). La densité des lianes a diminué de 750 (1994), puis 547 (2001)
pour 499 (2007) tiges par hectare, avec une baisse concomittante dans la surface terrière et
la biomasse en surface. En dépit de la faible densité des tiges la richesse spècifique est
restée constante au cours du temps. Les taux de recrutement total ont légèrement diminué
de 8.6% par an au cours de la première période à 6.6% dans la seconde, mais cette
diminution n’était pas significative. Le taux de mortalité a significativement diminué de
Ewango_PROEF (all).ps Front - 81 T1 - Black
148
7.2% à 4.4% par an au cours des deux intervalles de recensement. Le taux de croissance en
diamètre et de survie a augmenté avec le diamètre des tiges. Surprenant, l’abondance des
lianes en Ituri a montré une récente dimunition, plutôt qu’une récente augmentation,
comme celà a été announcé pour les forêts tropicales et temperées en Amérique. Plus
interressant, les changements de l’ensemble de la structure et composition de la
communauté des lianes étaient principalement menée par une seule espèce : le considérable
changement du superabondant Manniophyton fulvum entre le premier et le second
recensement.
Au Chapitre 4 j’ai examiné la dynamique spécifique de 79 espèces des lianes les
plus abondantes, représentant 13156 des tiges (97% du total) dans deux parcelles de 10-ha.
J’ai évalué leur performance démographique et la relation des taux vitaux (croissance,
mortalité, recruitement) pour l’abondance des epèces et quatre traits fonctionnels (stratégie
de grimpage, syndrôme de dispersion, taille des feuilles et exigences de lumière) pour
déterminer les variations générales et les importantes stratégies caractérisant les espèces
entre elles. Les taux vitaux partagent une large variation interspécifique ; le taux de
recrutement spécifique des espèces varie de 0.0-10.9%, mortalité de 0.43-7.8% au cours de
13 ans, et la croissance de -0.03-3.51 mm par an. La plupart d’espèces ont des taux faibles à
modérés. Les espèces à croissance rapide ont aussi tendance de recruiter et mourir
rapidement, mais les taux de recruitement et de mortalité n’étaient pas directement lié,
suggérant que les espèces ont changé en abondance absolue au cours de cette période de 13
ans. Cependant, à l’exception du changement consiérable de la population de
Manniophyton fulvum, les espèces ont maintenu leur rang de dominance au cours du temps.
La croissance des espèces a diminué avec l’abondance, mais les taux de recrutement et de
mortalité n’ont pas été liés à l’abondance. La performance démographique des espèces des
lianes a faiblement varié avec leurs stratégies de grimpage et modes de dispersion mais
était, en toute surprise, pas lié à leurs exigences de lumière au cours de leur vie. L’Analyse
en Composantes Principales des stratégies des lianes en termes des traits fonctionnels et
taux vitaux a montré que la demande en lumière, et le syndrôme de dispersion étaient des
traits les plus déterminants. Trois associations fonctionnelles ont éte distinguées sur base
du PCA. Je conclus que les espèces des lianes de la vieille forêt montre une grande
variation dans l’abondance et les taux vitaux, et que les mécanismes de densité-dependance
sont insuffisant pour expliquer les tendances d’abondance des espèces au cours du temps.
Il ya des prevenances que les lianes sont en train de mondialement augmenter en
densité, mais nous avons des connaissances limitées à propos des tendances taxonomiques
de changement en abundance, et les taux vitaux sous-jacents qui expliquent les
Ewango_PROEF (all).ps Back - 81 T1 - Black
149
changements en densité des lianes. Au Chapitre 5 les changements en abundance de 79
espèces des lianes relativement abondantes sont évalués. La forêt de l’Ituri a montré un
changement qui se répand partout dans la densité de population des lianes au cours de cette
dernière décennie. 37 espèces on significativement changé dans leur abondance au cours du
temps : 12 (15% du total) espèces ont augmenté, et 25 (32%) espèces diminué. 42 (53%)
espèces n’ont pas changé. De 48 genres, 40% ont diminué et 52% restés inchangés. Cinq
des 12 espèces en augmentation appartiennent au Celastraceae, laquelle était aussi la seule
famille avec une significative augmentation. Il est surprenant qu’aucun des quatres traits
fonctionnels (exigences de lumière au cours de vie, mécanisme de grimpage, mécanisme de
dispersion, et taille des feuilles) n’être significativement associé au changement dans la
densité de population des espèces. Cependant, nombre de ces espèces en diminution sont
associées aux habitats perturbés et sont de courte-durée de vie. Beaucoups de ces espèces
en augmentation sont de succession tardive et longue-durée de vie. Les espèces en
augmentation ont un taux de recrutement légèrement élevé, les espèces en diminution une
mortalité élevée. Cette étude suggère que les changements dans les communautés des lianes
résultent du recouvrement de la forêt des perturbations antérieures. La montée du niveau de
CO2 atmosphérique n’était pas la probalbe explication pour le changement des lianes : plus
d’espèces ont diminué qu’augmenté, et les espèces en augmentation n’ont pas été de taux
de croissance élevée. Dans la forêt de l’Ituri la dynamique locale de la forêt a plus
d’importance que les déterminants globaux de changement des lianes.
Mots clés : Assemblage des lianes, composition spécifique, communauté, dynamique,
ouverture de la canopée, Manniophyton fulvum, traits fonctionnels, densité de population,
changement total.
Ewango_PROEF (all).ps Front - 82 T1 - Black

150
Ewango_PROEF (all).ps Back - 82 T1 - Black

151
Acknowledgements La route du succès n'est pas droite. Il y a une courbe appelée Chute, un rond-point appelé Confusion, des casse-vitesses appelés Amis, des feux rouges appelés Ennemis, des voyants d'alarme appelés Famille. Vous aurez des pannes appelées Job. Mais, si vous avez des pièces de rechange appelées Détermination, un moteur appelé Persévérance, une assurance appelée Foi (Heb.11:1), un conducteur appelé Jésus (Luc 7:23) ; cette route vous fera arriver à un endroit appelé Succès.
While I sit here reflecting over the past four years I wonder if I would have had the courage to begin this journey if I had known at which cost it would take me. Although I knew where it would take me, it has been a journey filled with such extremes as I have learnt both about the wonders of humanity as well as its cruelty. This made me question how many other times I had to learn about life as an experience of obstacles. There is no word to describe what I faced in the course of my studies. It literally took months of day to day mental and psychological battles to overcome all the moral pains. Without the strong and loving support of my wife and our children; and family to conquer my psychological devastation, I know I would not have been able to complete this journey. This has shown me the true value of the family for which I eternally devote my life and will be grateful. Thanks and I love you all. Mama Esse, as you are the “hero” of this journey I would like you to be with me on the defence.
To finish a PhD’s degree at an age of above forty and managing a large family is for sure something you cannot do alone. There might be motivation and good reason going beyond. Many years of work with the help of many people and institutions are condensed in the following pages. I first of all wish to extend my deepest gratitude to my supervisors, Prof. Dr. Frans Bongers, Prof. Dr. Marc Sosef, and Dr. Lourens Poorter who, despite my tons of problems during the four years, never lost faith in me to regain my passion for my studies. Neither did they ever question my ability to complete this doctorate. Their guidance and insight has both expanded my scientific inquiry and improved the quality of this work considerably. Their attention to detail and devoted availability over the past four years has been very much appreciated. I am sorry for the many troubles that were introduced in the course of my studies with you and thank you for having been very supportive, encouraging and always willing to listen to my concerns and fears. More than supervisors, you’re part of my family and life at the other side of the Atlantic Ocean.
The Ituri Forest Dynamics Plots fieldwork of this study was carried out with inspiration, dedication and scientific talent and leadership of Drs. John and Terese Hart. Your leadership and sense of organization shaped my life and career. I am proud of you, mama Terese and Baba Jean. Je vous rassure: “Je maintiendrai”. Dr. Jean-Remy Makana and
Ewango_PROEF (all).ps Front - 83 T1 - Black

152
Félicien Bola, I am in lack of words for you, all that comes is thank you. Thank you so much for your 20 years of guidance. Dr. Jefferson Hall, you’ve been artisan of this journey, thanks for your support. To all the staff of CTFS, from Liz Losos to Stuart Davies, Rick Condit, Joe Wright, Suzanne Loo de Lao, Duncan Thomas, and all others unnamed here, including Sean Thomas, your support made me what to be today. To David Kenfack and your wife, I still miss you on the loop. A mes frères et sœurs Didier & Cecile Bolamba, Jacob Madidi & Nono Kibani, Félicien Bola & son épouse merci pour votre soutien combien inestimable à ma famille. Vous vous êtes depassés et substitués en mes devoirs pour voir réaliser mon object. You provided substantive help far beyond the financial. Que Dieu vous garde et vous pouvoit en abondance.
To you people I worked with in the implementation and ongoing of this project, I think that the best way to honor your memory and make your knowledge alive, was to get this work done. To my lovely Pygmies team, you’re the botanical Bible of my life from whom I learned plants; without your contributions botanical surveys and identifications would have been impossible.
In the course of this study I have received help and encouragement from many people and families. It is therefore a pleasant duty to record here my debt and thanks to those who have provided the most essential support. En première place, I would like to express my deepest gratitude to Wildlfe Conservation Society (WCS)-DR Congo Program, for their financial support. In particular I thank our staff at WCS-NY Headquarters; families of Innocent & Beat Liengola, Robert & Caroline Mwinyihali, Richard Tshombe & Nicole Mathe, Emmanuel Kayumba, Paulin & Joyce Tshikaya, Fidèle & Bibish Amsini, Dieudonné & Françoise Batido, Benjamin & Cecile Ntumba, J.J. Mapilanga, Mushenzi Lusenge, Somba Byombo. I am also grateful for support received from various staff of Wildlife Conservation Society and colleagues during the course of this thesis, including José Mokpondo, Floribert Bujo, Peter Umunay, Kasereka Bisele, Baraka Othep, Jacques Mukinzi, Leonard Cihengunza, Eric Bahati, Deo Kujirakwinja, and Ellen Brown. The data compiled and presented here could not have been completed without a lot of input from experts in the field and for data entry, and our special thanks are due to Caroline Mandango, Marceline Makana, Nono Kibani, and Noela Ndiu for the data entry.
In the Netherlands I studied in a joint program with the NHN-Wageningen branch &
Biosystematics Group and Forest Ecology and Forest Management Group. My special thanks are directed to all the staff and, in particular to Frans Breteler, Jos van der Maesen, Carel Jongkind, Jan Wieringa, J.J.F.E. de Wilde, Lemans, Folkert Aleva, Theo Damen, W.J. van de Burg, P.J.M. Maas, H. Maas- van de Kamer, L.Y. Th. Westra, J.M. de Vries, J.J. Janssen, H.J. van Os Breijer, K.J. Manschot, R.A. Pattiasina, B. Pracht-Mahabier, N. Patist, K. van Setten, R. Siep, T. Smaling, of the National Herbarium of Netherlands-Wageningen branch, where I did most of the taxonomic part of my thesis and for kindly
Ewango_PROEF (all).ps Back - 83 T1 - Black

153
lending me their botanical expertise and insights. To the Biosystematics Group: Marc Sosef, Ronald van den Berg, Freek Bakker, Lars Chatrou, L. Visser, C.M. Bill-Flann, Th. Heijerman, M. Staats, P.W.F. de Vrijer, Robin van Velzen, R. Vrielink van Ginkel, N. Groendijk-Wilders, Wilma Twigt, I. Paardenkooper, A.S.J. van Proosdij, D. Quiroz, P. Audie, M. Banaticla, Pulchérie Bissiengou, X. Cadima, A. Maroyi, B. Mengesha, and Romaric Vihotogbe.
I would also like to acknowledge the help and advice received from our friends and colleagues at the Forest Ecology and Forest Management Group namely, all the staff: Frits Mohren, Frans Bongers, Lourens Poorter, Frank Sterck, Jan den Ouden, Marielos Peña Claros, Ute Sass-Klaassen, Ellen Wilderink, Neeltje van Hulten, Hans Jansen, Joke Jansen, Patrick Jansen, Leo Goudzwaard, Pieter Zuidema, Hans Polman, Jorge Meave, Stefan Schnitzer, Peter Hietz, and Sandra Diaz. All colleague students: Vanda Acacio, Lucy Amissah, Honoré Biaou, Michiel van Breugel, Lars Markesteijn, Marisol Toledo, Geovana Carreño, Gijn Ceca, Paul Copini, Abeje Eshete Wassie, Motuma Tolera Feyissa, Arnold van Gelder, Noelia Gonzalez-Muñoz, Pilar Castro, Emiru Hizikias, Meenakshi Kaul, Edwin Lebrija, Tefera Mengistu Woldie, Gabriel Mukuria Muturi, Canisius Mugunga, Esron Munyanziza, Edward Mufandaedza, Jean Damasene Ndayambaje, Kwame Oduro, Cesar Perez-Cruzado, Ioan Stetca, Alemayu Wassie Eshete, Gustavo Schwartz, and Lennart Suselbeek; at PE&RC: Claudius van de Vijver; each of you has been instrumental to this achievement. My special thanks are due to José Luis Quero for all the best you did and support at the hard time. To the Royal Museum for Central Africa: Hans Beeckman, Benjamin Toirambe, Camille Couralet, Aghate, and Claire Delvaux. Tropenbos International, in particular Marc Parren, Charlotte Benneker, Roderick Zagt, Prof. Réné Boot: I am very grateful for all your input and assistance.
I would also like to acknowledge the following individuals and institutions, either for providing support, or for other forms of assistance over the last few years that helped make my work possible. In particular, I thank Missouri Botanical Garden (in particular Peter Raven, Roy Gereau, Charlotte Taylor, Peter Stevens, Mick Richardson, Porter P. Lowry II, Gretchen Walters and Tariq Stévart); University of Missouri St. Louis-Dept. of Biology (in particular Patrick Osborne, Robert Ricklefs, Elisabeth Kellog, and Robert Marquis), the Herbarium of the National Botanic Garden of Belgium-Meise Herbarium (in particular Jan Rameloo, Elmar Robbrecht, Steven Dessein, Piet Stoffelen, Luc Pauwels, and late Prof. Dr. J. Léonard), and the National Geographic Society. I am proud to have been part of the “NCEAS Liana Working Group” and thanks to Stefan Schnitzer, Robin Burnham, Sara DeWalt, Francis E. Putz, Lucia Lohman, Helena Muller-Landau, Cambell Webb and many others for this initiative that shaped also my ideas for this thesis.
Last, but not the least, Axel Poulsen, Renaat van Rompaey, Katalin Halom & Horst you always made me feel immediately welcome, thank you for making all my visits so
Ewango_PROEF (all).ps Front - 84 T1 - Black

154
memorable. You remain in the center of my heart and part of my family. I only hope one day to return this hospitality.
The Ituri Forest Dynamics Plots would not have been established and completed without the financial support from the National Geographic Society (NGS), the Conservation Food and Health Fund (CFHF) and the Center for Tropical Forest Science (CTFS). I also wish to thank the Wildlife Conservation Society (WCS) and l’Institut Congolais pour la Conservation de la Nature (ICCN), in particular J.J. Mapilanga for their support over time of the present study.
For all those who have shared our concern, the work goes on, the cause endures, the hope still lives and the dream shall never die. This thesis is the end of a long journey, and yet I hope it is also another beginning.
Ewango_PROEF (all).ps Back - 84 T1 - Black

155
Short biography Corneille (Ekokinya Ndomba) Ewango was born on 08 November 1963 in Bomongo
(Equateur Province), Democratic Republic of Congo. He grew up in the forest region. Since
he was fourteen old and after obtaining the diploma of Secondary School in Biology and
Chemistry in 1985, he was involved in poaching activities that led him to discover the
forest biodiversity and nurtured his passion to tropical botany. In 1987, he went to the
University of Kisangani and started a higher education in biology in 1995 and obtained his
“Licence” degree in Biological Sciences (Faculty of Sciences, Department of Ecology and
Nature Conservation) with honours, with majors in Tropical Forest Ecology, Plant
Taxonomy and Conservation. During his study, he took practical training and performed
field research in the Réserve de Faune à Okapi, Ituri Forest. He contributed with his plant
expertise to the establishment and botanical surveys of the Ituri 40-hectare plot, the first
large African permanent forest dynamics study plot, in collaboration with Wildlife
Conservation Society (WCS)’s Centre de Formation et de Recherche en Conservation
Forestière (CEFRECOF)-Ituri Project and the Center for Tropical Forest Science (CTFS) of
the Smithsonian Instutition.
After graduation in 1995, he was appointed as teaching Assistant at the Department of
Ecology and Nature Conservation of the University of Kisangani. Shortly after he was
employed by the Wildlife Conservation Society-DR Congo and CEFRECOF-Ituri Project.
For about ten years, he has been involved in research on forest ecology, vegetation and
ecosystem dynamics, plant taxonomy, conservation and human ecology in the Ituri Forest
and central Congo Basin. His research interests focus on forest ecology, especially the
monitoring and ecology of forest change (both natural and induced, climate change and
carbon sequestration), natural resource uses in relation to forest management and the
implications for conservation and management. In addition to taxonomic expertise on the
flora of Tropical Africa, Corneille extended his research work to encompass the systematics
of vascular plants (mainly Sapotaceae, Orchidaceae, and Pteridophytes), and the ecology of
several groups of plants, mainly those growing in epiphytic environments and lianas. He
coordinated the WCS-CEFRECOF Botanical program, the permanent dynamics plots, and
developed a herbarium for the study of the regional flora that became a reference for the
study of plant diversity and conservation of the Ituri Forest and DR Congo forest national
parks and other areas of biodiversity importance. During his career, he has assembled
botanical collections totalling about 3000 numbers and contributed to the description of
some species new to science.
Ewango_PROEF (all).ps Front - 85 T1 - Black

156
In 2003, after the deadly armed conflict that devastated DR Congo, he went to the
University of Missouri, Saint Louis (USA), and in 2006 obtained an MSc in Ecology,
Evolution and Systematics with a Graduate certificate in Tropical biology, Forest resources,
and Plant conservation. In 2005, in recognition of his work and effort to protect the Reserve
de Faune à Okapi (RFO) during the armed conflict, he received the prestigious “Goldman
Environmental Prize” also known as the Nobel Prize for Environment
(www.goldmanprize.org). He was then honored by the University of Missouri and became
the first student to receive the “Chancellor of University of Missouri, St. Louis, Medal of
Merit and Excellence”. In 2006, Corneille received the National Geographic Society (NGS)
Emerging Explorers Award for Africa and joined the society’s explorers community
(www.ngs.org). After graduation in 2006, he returned to his Ituri project as Director of the
WCS-CEFRECOF/ RFO Project.
In 2007 he started his studies for a Ph.D degree at Wageningen University with
Biosystematics Group and Forest Ecology and Forest Management Group. During the
course of the PhD, he remained active in the WCS-DR Congo Program as senior staff
(Team) and leader of research activities in Forest Ecology, Biodiversity and Climate
Change. After completing his PhD in 2010, he will return to DR Congo well equipped to
continue his work on the Congo basin forests. He aims to increase scientific understanding
of forest ecosystems, to guide sustainable forest management and natural-resource policy,
to monitor the impacts of climate change, and to build capacity in forest science. All for the
long-term conservation of the tropical Congo Basin forests.
Corneille Ewango is married and a father of five children.
Ewango_PROEF (all).ps Back - 85 T1 - Black

157
List of Publications DeWalt SJ, Schnitzer, SA, Chave J, Bongers F, Burnham R.J., Cai Z-Q, Chuyong G, Clark
DB, Ewango C.E.N, Gerwing J.J, Gortaire E, Hart T, Ibarra-Manríquez G, Ickes
K, Kenfack D, Macia MJ, Makana J-R, Martinez-Ramos M, Mascaro J, Sainge M,
Muller-Landau HC, Parren MPE, Parthasarathy N, Pérez-Salicrup DR, Putz FE,
Romero-Saltos H, and Thomas D. 2010. Annual Rainfall and Seasonality Predict
Pan-tropical Patterns of Liana Density and Basal Area. Biotropica 42: 309-317.
Lewis, S.L., Lopez-Gonzalez, G., Sonké, B., Affum-Baffoe, K., Baker, T.R., Ojo, L.O.,
Phillips, O.L., Reitsma, J.M., White, L., Comiskey, J.A., Djuikouo, M-N.,
Ewango, C.E.N., Feldpausch, T.R., Hamilton, A.C., Gloor, M., Hart, T., Hladick,
A., Lloyd, J., Lovett, J.C., Makna, J-R., Malhi, Y., Mbago, F.M., Ndangalasi, H.J.,
Peacock, J., Peh, K.S-H., Sheil, D., Sunderland, T., Swaine, M.D., Taplin, J.,
Taylor, D., Thomas, S.C., Votere, R. & Wöll, H. 2009. Increasing carbon storage
in intact African tropical forests. Nature 457: 1003-1007.
Chave, J, R. Condit, H.C. Muller-Landau, S.C. Thomas, P.S. Ashton, S. Bunyavejchewin,
L.L. Co, H.S. Dattaraja, S.J. Davies, S. Esufali, C.E.N. Ewango, K.J. Feeley,
R.B. Foster, N. Guanatilleke, S. Guanatilleke, P. Hall, T.B. Hart, C. Hernandez,
S.P. Hubbell, A. Itoh, S. Kiratiprayoon, J.V. LaFrankie, S. Loo de Lao, J-R.
Makana, Md. N. Supardi Noor, A.R. Kassim, C. Samper, R. Sukumar, H. S.
Suresh, S. Tan, J. Thompson, M. D. C. Tongco, R. Valencia, M. Vallejo, G.
Villa, T. Yamakura, J.K. Zimmerman & E.C. Losos. 2008. Assessing evidence
for a pervasive alteration in tropical tree communities. PLoS Biology 6: 455-562.
Plumptre, A. J.; Davenport, T.; Behangana, M.; Kityo, Eilu, G.; Ssegawa, R. P.; Ewango,
C.E.N.; Mierte, D.; Kahindo, C. 2007. The Biodiversity of the Albertine Rift.
Biological Conservation 134: 178 –194.
Ewango, C.E.N. 2006. Sapotaceae. In: Akoegninou, A.; Burg, W.J. van der; Maesen, L.J.G
van der (Eds.) Flore Analytique du Benin: 926-931, Cotonou/Wageningen:
Backhuys Publishers, The Netherlands.
Condit R; Ashton P; Bunyavejchewin S; Dattaraja HS; Davies S; Esufali S; Ewango
C.E.N; Foster R; Gunatilleke IAUN; Gunatilleke CVS; Hall P; Harms KE; Hart T;
Hernandez C; Hubbell S; Itoh A; Kiratiprayoon S; LaFrankie J; Loo de Lao S;
Makana J-R; Supardi Noor MN; Abdul Rahman Kassim; Russo S; Sukumar R;
Samper C; Suresh HS; Tan S; Thomas S; Valencia R; Vallejo M; Villa G. 2006.
The importance of demographic niches to tree diversity. Science 313: 98-101.
Gerwing J.J, Schnitzer S.A., Burnham R.J., Bongers F., Chave J., DeWalt S.J., Ewango
C.E.N., Foster R., Kenfack D., Martinez-Ramos M., Parren M., Parthasarathy N.,
Ewango_PROEF (all).ps Front - 86 T1 - Black

158
Pérez-Salicrup D.R., Putz F.E., Thomas D.W. 2006. Censusing Lianas. Biotropica
39: 256-261.
Hart T. & Ewango C. 2005. Standing Firm for Conservation in DR Congo’s Ituri Forest:
Caught in the Fire, Part II. Wildlife Conservation 108: 44-47.
Poulsen, A.D., Hafashimana, D., Eilu, G., Liengola, I.B., Ewango, C.E.N. & Hart, T.B.
2005. Composition and species richness of forest plants along the Albertine Rift,
Africa. Biol. Skr. 55: 129-143.
Condit, R., Ashton, P., Balslev, H., Brokaw, N., Bunyavejchewin, S., Chuyong, G., CO, L.,
Dattaraja, H.S., Davies, S., Esufali, S., Ewango, C.E.N., Foster, R., Gunatilleke,
N., Gunatilleke, S., Hernandez, C., Hubbell, S., John, R., Kenfack, D.,
Kiratiprayoon, S., Hall, P., Hart, T., Itoh, A., LaFrankie, J., Liengola, I., Lagunzad,
D., Lao, S., Losos, E., Magard, E., Makana, J., Manokaran, N, Navarrete, H.,
Mohammed Nur, S., Okhubo, T., Pérez, R., Samper, C., Hua Seng, L., Sukumar,
R., Svenning, J.C., Tan, S., Thomas, D., Thompson, J., Vallejo, M., Villa Muñoz,
G., Valencia, R., Yamakura, T. & Zimmerman, J. 2005. Tropical tree a-diversity:
Results from a worldwide network of large plots. Biol. Skr. 55: 565-582.
Kenfack, D., Ewango, C. E. N., and Thomas, D. W. 2005. Manilkara lososiana Kenfack &
Ewango (Sapotaceae), a new species of Sapotaceae from Cameroon. Kew Bulletin
59: 609-612.
Makana, J-R, T.B. Hart, C.E.N. Ewango, I. Liengola and S.C. Thomas. 2004. Tree
demography and population change in the Ituri Forest Dynamics Plots, Democratic
Republic of Congo. Inside CTFS, Summer 2004, PP. 5 & 14.
Makana, J-R, T.B. Hart, I. Liengola, C. Ewango. 2004. The Ituri Forest Dynamics Plots. In
E.C. Losos and E.G. Leigh, Jr. (eds.) Forest Diversity Dynamism: Findings from a
Network of Large-scale Tropical Forest Plots, pp. 492-505. The University of
Chicago Press, Chicago.
Ashton, M. S., Brokaw, N. V. L., Bunyavejchwin, R., Chuyong, G. B., Co, L., Dattaraja, H.
S., Davies, S. J., Esufali, S., Ewango, C. E. N., Foster, R. B., Gunatilleke, N.,
Gunatilleke, S., Hart, T. H., Hernandez, C., Hubbell, S. P., Itoh, A., John, R.,
Kanzaki, M., Kenfack, D., S., K., LaFrankie, J. V., Lee, H.-S., Liengola, I.,
Makana, J.-R., Manokaran, N., Navarette Hernandez, M., Ohkugo, T., Perez, R.,
Pongpattananurak, N., Samper, C., Sri-ngernyuang, K., Sukumar, R., Fun, I.-F.,
Sureh, H. S., Tan, S., Thomas, D. W., Thompson, J. D., Vallejo, M. I., Villa
Munoz, G., Valencia, R., Yamakura, T., and Zimmerman, J. K. 2004. Floristics
and vegetation of the Forest Dynamics Plots. Pages 90-102 in E. C. Losos and J.
Leigh, Egbert Giles, eds. Tropical forest diversity and dynamism: Findings from a
large-scale plot network. University of Chicago Press, Chicago.
Ewango_PROEF (all).ps Back - 86 T1 - Black

159
Condit, R. G., Leigh, J., Egbert Giles, Loo de Lao, S., Ashton, M. S., Brokaw, N. V. L.,
Bunyavejchwin, R., Chuyong, G. B., Co, L., Dattaraja, H. S., Davies, S. J.,
Esufali, S., Ewango, C. E. N., Foster, R. B., Gunatilleke, N., Gunatilleke, S., Hart,
T. H., Hernandez, C., Hubbell, S. P., Itoh, A., John, R., Kanzaki, M., Kenfack, D.,
S., K., LaFrankie, J. V., Lee, H.-S., Liengola, I., Makana, J.-R., Manokaran, N.,
Navarette Hernandez, M., Ohkugo, T., Perez, R., Pongpattananurak, N., Samper,
C., Sri-ngernyuang, K., Sukumar, R., Fun, I.-F., Sureh, H. S., Tan, S., Thomas, D.
W., Thompson, J. D., Vallejo, M. I., Villa Munoz, G., Valencia, R., Yamakura, T.,
and Zimmerman, J. K. 2004. Species-area relationships and diversity measures in
the forest dynamics plots. Pages 79-89 in E. C. Losos and J. Leigh, Egbert Giles,
eds. Tropical forest diversity and dynamism: Findings from a large-scale plot
network. University of Chicago Press, Chicago.
Losos E.C. & CTFS Working Group. 2004. The structure of tropical forests. In Losos E.C. and
Leigh, E.G. Jr. eds. Forest Diversity and Dynamism: Findings from a Large-Scale
Plot Network. Pp. 69-78. University of Chicago Press, Chicago.
Ewango, C.E.N. 2001. Flore et Végétation de la Forêt naturelle de Nyungwe, Rwanda
[Flora and Vegetation of the Natural Forest of Nyungwe, Rwanda]. Syst. Geogr.
Pl. 71 (2) [Special Issue]: 1009-1015, in E. Robbrecht, J. Degreef and I. Friis
(Eds). Plant systematics and phytogeography for the understanding of African
biodiversity : proceedings of the XVIth AETFAT Congress, held at the National
Botanic Garden, Belgium, August 28 - September 2, 2000.
Ewango, C.E.N. & Breteler, F.J. 2001. Présence du genre Pradosia (Sapotaceae) en
Afrique description d'une nouvelle espèce, P. spinosa. Adansonia, Sér. 3. 23: 147-
150.
Mercador, J., Runge, F., Vrydaghs L., Doutrelpont, H., Ewango, C.E.N and Juan-
Tressears, J. 2000. Phytoliths from Archeological Sites in the Tropical Forest of
Ituri, Democratic Republic of Congo. Quarternary Research 54: 102-112.
Poulsen, A.D., Lock, J.M, Liengola, I.B.and Ewango, C.E.N. 1999. A new forest species
of Siphonochilus (Zingiberaceae) from Central Africa. Kew Bulletin 54: 203-207
WORKING PAPERS
Plumptre, A.J., Masozera, M., Fashing, P.J., McNeilage, A, Ewango, C., Kaplin, B.A., and
Liengola, I. .2002. Biodiversity Surveys of the Nyungwe Forest Reserve in SW
Rwanda. WCS Working Paper No.19: 1-93.
http://wcs.org/media/general/workingpaper19.pdf
Plumptre, A.J., Behangana, M., Ewango, C. E.N., Davenport, T., Kahindo, C., Kityo, R.
Ssegawa, P., Eilu, G., Nkuutu, D. and Owiunji, I. 2003. The Biodiversity of the
Albertine Rift. Albertine Rift Technical Reports No. 3.
Ewango_PROEF (all).ps Front - 87 T1 - Black

160
Education Certificate With the educational activities listed below the PhD candidate has complied with the educational requirements set by the Research School Biodiversity and the C.T. de Wit Graduate School for Production Ecology and Resource Conservation (PE&RC) which comprises of minimum total of 32 ECTS (= 22 weeks of activities).
Review of Literature (5.6 ECTS)Diversity and species richness of liana in tropical old-growth forest; presented on the PhD discussion group on Forest ecology and Conservation (2007)
Writing of Project proposal (4.5 ECTS)Lianas Diversity, Distribution Patterns and Functional Ecology in a Central African Rain Forest, Ituri, North-eastern Democratic Republic of Congo (2007)
Post-Graduate Courses (8.1 ECTS) Multivariate Analysis; PE&RC (2007) Advanced Statistics; PE&RC (2007) Survival Analysis; PE&RC (2009) Geographic Information System; PE&RC (2009) What’s up in Tropical Forest Community Ecology?; PE&RC (2009)
Deficiency, Refresh, Brush-up courses (3.0 ECTS) Ecological Methods I (2007) Forest Ecology & Forest Management (2009) Ecological Methods II (2009)
Competence Strengthening/ Skills Courses (1.8 ECTS) Information Literacy for PhD + EndNote Introduction; WUR Library (2007) Techniques for Writing and Presenting a Scientific Paper; WUR Graduate Schools / CENTA (2007)
PE&RC Annual Meetings, Seminars and the PE&RC Weekend (1.5 ECTS) Research School Biodiversity and Biosystematics Group introduction day (2007) PE&RC Introduction weekend (2009) Annual PhD day Research School Biodiversity Symposium; Presentation (2010)
Discussion Groups/ Local Seminars and Other Scientific Meetings (7.3 ECTS) Current issues in Forest Management & Conservation; home institute Wildlife Conservation Society-CEFRECOF/ DR Congo (2007-2008) Wageningen Evolution and Ecology Seminars: Current issues in Biosystematics, PE&RC discussion group (2007-2010) Monthly chair group presentations: Biosystematics group (2007-2010) Weekly chair group presentations: Forest Ecology and Forest Management group (2007-2010) Ecological Theory and Application: Forest Ecology & Conservation, PE&RC discussion group (2008-2010) IUCN Netherlands Working Group Ecology and Development: Nature for Peace: The role of Conservation and natural resources management in conflict and peacebuilding Seminar, The Hague, the Netherlands; oral presentation (2009)
Ewango_PROEF (all).ps Back - 87 T1 - Black

161
International Symposia, Workshops and Conferences (9.9 ECTS) TEDGlobal Conference: Africa – The Next Chapter, Arusha/ Tanzania; oral presentation (2007) Sustainable forest management in the tropics: Are we on the right track? (2007) NERN Annual meeting; Lunteren, the Netherlands (2008) Annual meeting of the Association of Tropical Biology and Conservation (ATBC) in Marburg, Germany; oral presentation (2009) Tropical forests and climate change: Are we on the right track ... beyond Copenhagen? (2009) Earth Day’s 2010 International Year of Biodiversity- Rotterdam School of Management, Erasmus University; oral presentation (2010)
Lecturing / Supervision of practical’s / tutorials (3.2 ECTS) Sustainability and Natural Resources Management: Companies in Ecologies-Learning from an environmental leader; Master class on sustainability; Rotterdam School of Management, Erasmus University (2009) Sustainability Management and Climate change: Conflicts, Resources management and conservation. Master’s class on sustainability. Rotterdam School of Management, Erasmus University (2010) Forest inventories: field botany for identification of tree, lianas and carbon estimation in the tropical forest. Wildlife Conservation Society-CEFRECOF, Epulu. DR Congo (2010)
Ewango_PROEF (all).ps Front - 88 T1 - Black

Copyright © 2022 FDOKUMEN