Life-Cycle Assessment of Biodiesel Production from Microalgae
Upload
khangminh22Category
view
0download
0
RESEARCH ARTICLE
DNA Barcoding Green Microalgae Isolatedfrom Neotropical Inland WatersSámed I. I. A. Hadi1,2,3, Hugo Santana1,4, Patrícia P. M. Brunale1, Taísa G. Gomes2, MárciaD. Oliveira5, Alexandre Matthiensen6, Marcos E. C. Oliveira7, Flávia C. P. Silva1, Bruno S.A. F. Brasil1*
1 Embrapa Agroenergy, Brasília, DF, Brazil, 2 Universidade Federal do Tocantins, Gurupi, TO, Brazil,3 Universidade Federal de Minas Gerais, Belo Horizonte, MG, Brazil, 4 Universidade Federal da Bahia,Vitória da Conquista, BA, Brazil, 5 Embrapa Pantanal, Corumbá, MS, Brazil, 6 Embrapa Swine and Poultry,Concórdia, SC, Brazil, 7 Embrapa Amazônia Oriental, Belém, PA, Brazil
AbstractThis study evaluated the feasibility of using the Ribulose Bisphosphate Carboxylase Large
subunit gene (rbcL) and the Internal Transcribed Spacers 1 and 2 of the nuclear rDNA
(nuITS1 and nuITS2) markers for identifying a very diverse, albeit poorly known group, of
green microalgae from neotropical inland waters. Fifty-one freshwater green microalgae
strains isolated from Brazil, the largest biodiversity reservoir in the neotropics, were submit-
ted to DNA barcoding. Currently available universal primers for ITS1-5.8S-ITS2 region
amplification were sufficient to successfully amplify and sequence 47 (92%) of the samples.
On the other hand, new sets of primers had to be designed for rbcL, which allowed 96% of
the samples to be sequenced. Thirty-five percent of the strains could be unambiguously
identified to the species level based either on nuITS1 or nuITS2 sequences’ using barcode
gap calculations. nuITS2 Compensatory Base Change (CBC) and ITS1-5.8S-ITS2 region
phylogenetic analysis, together with morphological inspection, confirmed the identification
accuracy. In contrast, only 6% of the strains could be assigned to the correct species based
solely on rbcL sequences. In conclusion, the data presented here indicates that either
nuITS1 or nuITS2 are useful markers for DNA barcoding of freshwater green microalgae,
with advantage for nuITS2 due to the larger availability of analytical tools and reference bar-
codes deposited at databases for this marker.
IntroductionDNA barcoding is a method used for species identification, which identifies specimens basedon DNA sequence similarity against a sequence database of a priori defined species[1]. Thispowerful technique has brought significant improvements to applications such as taxonomy[2–4], ecology [5, 6], biosecurity [7–9] and food product regulation [10–12]. DNA-based iden-tification is particularly useful for unveiling cryptic diversity at various taxonomic levels andidentifying species where there are few or difficult to observe structural characters [13–17].
The green algae, Chlorophyta, are an ancient and taxonomically diverse lineage with approxi-mately 8,000 described species [18, 19]. It is estimated that at least 5,000 species still remain
PLOSONE | DOI:10.1371/journal.pone.0149284 February 22, 2016 1 / 18
OPEN ACCESS
Citation: Hadi SIIA, Santana H, Brunale PPM,Gomes TG, Oliveira MD, Matthiensen A, et al. (2016)DNA Barcoding Green Microalgae Isolated fromNeotropical Inland Waters. PLoS ONE 11(2):e0149284. doi:10.1371/journal.pone.0149284
Editor: Shashi Kumar, ICGEB, INDIA
Received: October 3, 2015
Accepted: January 13, 2016
Published: February 22, 2016
Copyright: © 2016 Hadi et al. This is an openaccess article distributed under the terms of theCreative Commons Attribution License, which permitsunrestricted use, distribution, and reproduction in anymedium, provided the original author and source arecredited.
Data Availability Statement: All relevant data arewithin the paper and its Supporting Information files.
Funding: The authors are grateful to the EmpresaBrasileira de Pesquisa Agropecuária (EMBRAPA),Coordenação de Aperfeiçoamento de Pessoal deNível Superior (CAPES), Financiadora de Estudos eProjetos (FINEP) and Conselho Nacional dePesquisa (CNPq) for supporting this work. Thefunders had no role in study design, data collectionand analysis, decision to publish, or preparation ofthe manuscript.
Competing Interests: The authors have declaredthat no competing interests exist.

undescribed, notably in tropical and subtropical areas [19]. Chlorophytes are important produc-ers in aquatic and humid terrestrial ecosystems, which are often used as bioindicators in watermonitoring and ecological studies [20, 21]. In addition, there is a growing interest in using greenmicroalgae for biotechnological applications such as the production of fuels, chemicals, food andanimal feed [22, 23]. The identification of green microalgae can be a difficult task and oftenrequires careful microscopic examination of live cultured cells by a trained specialist [14, 24, 25].Even so, the presence of cryptic species and phenotypic plasticity found in some species mayhamper conclusive morphologic species diagnosis [26, 27]. DNA barcodes could provide themeans to identify green microalgae consistently and rapidly, regardless of life stage [13, 28, 29].
Targets for potential Chlorophyta DNA barcodes have included chloroplast (rbcL, tufA andCp23S), mitochondrial (COI) and nuclear genes (18S rDNA, nuITS1 and nuITS2) [13, 28–30].However, none of these markers were considered ideal for use across all lineages tested [13, 29,31, 32]. Given the complexity and heterogeneity of chlorophytes, the protist working group ofthe Consortium for the Barcode of Life (CBOL) recommended the use of a two-step barcodingpipeline in which a universal pre-barcode marker should be used first, followed by the use of agroup-specific second barcode [29]. A dual marker barcode based onmatK and rbcL genes hasbeen formally proposed for use in DNA barcoding embryophytes [4]. However, thematK geneis absent in chlorophytes precluding its use in this group [33]. Despite the unavailability of auniversal PCR toolkit for rbcL amplification, this marker is considered a promising barcode forgreen algae [13]. Indeed, there are currently 4,449 rbcL sequences from chlorophyte speciesdeposited at the Barcode of Life Data Systems (BOLD), a taxonomically curated database [3].Apart from rbcL, the most promising candidates for green microalgae barcoding are thenuITS1 and nuITS2 markers [13, 14, 26, 28, 30, 34]. The ITS1-5.8S-ITS2 region from virtuallyall Viridiplantae can be amplified with a single set of universal primers [35], despite these beingmarkers of high variability [13]. Furthermore, it is possible to analyze not only the nuITS1 andnuITS2 primary sequence, but also their secondary structures [36]. Although there are reportsindicating that nuITS1 and nuITS2 might be insufficiently conserved or confounded by intro-gression or biparental inheritance patterns, a growing body of evidence has shown that simul-taneous analysis of nucleotide data and compensatory base changes (CBCs) with secondarystructure information can overcome most of the limitations of this potential barcode [14, 28,30]. In addition, nuITS1 and nuITS2 have been the molecular markers of choice in severalrecent taxonomic revisions of freshwater chlorophytes species that were based on integratedmorphological, physiological and molecular approaches [14, 26, 27, 34, 37–42] The use ofnuITS1- and nuITS2-based phylogenies promoted considerable changes in green microalgaetaxonomy, especially in taxa with simple morphology and few ultrastructural characteristicssuch as coccoid chlorophytes [26, 27].
This study aimed to identify neotropic green microalgae specimens isolated from Brazilianinland waters through the use of rbcL, nuITS1 and nuITS2 molecular markers as DNA bar-codes. Brazilian continental waters comprise a biodiversity reservoir of enormous global signif-icance and might contain up to 25% of the world’s algae species [43]. Novel primers forneotropic specimens’ rbcL gene amplification and sequencing are presented, as well as compar-isons between rbcL, nuITS1 and nuITS2 markers variability, primers universality and databasesaccuracy and comprehensiveness.
Materials and Methods
Isolation and culturingAll the sample collections were made under the authorization SISBIO #39146 (09/26/2013)conceded by the Instituto Chico Mendes de Conservação da Biodiversidade (ICMBio) of the
DNA Barcoding Freshwater Chlorophytes
PLOS ONE | DOI:10.1371/journal.pone.0149284 February 22, 2016 2 / 18

Brazillian Ministry of the Environment (MMA). The collections made on private land werealso authorized by the owner of the land. This study did not involve endangered or protectedspecies. Water samples were collected from the sites shown in S1 Fig. The collection environ-ments included natural freshwater bodies within the Amazon rainforest, the Cerrado savannaand the Pantanal flooded grasslands, as well as anthropogenic wastewater deposits from thesugarcane industry (vinasse), pisciculture ponds and wastewater from swine farming. Samplingareas were delimited as being a 1 km radius centered in the geographic coordinates shown inS1 Fig. The collected environmental samples were submitted to an enrichment step throughsuspension in modified Bold's Basal Medium–BBM [44] and subsequent culturing at 28°C,light intensity of 50 μEm-2 s-1 and 16/8h light/dark regime. After 15 days of culture, the micro-algae strains were isolated by two subsequent rounds of subculturing on BBM agar plates sup-plemented with ampicillin (100 μg/ml), chloramphenicol (25 μg/ml) and amphotericin B(2,5 μg/ml) under the same conditions described above. Individualized macroscopic colonieson agar plates were collected and inoculated into liquid BBMmedia to derive axenic cultures.The absence of contaminants was confirmed through microscopic inspection. The isolatedstrains were deposited in the Collection of Microorganisms and Microalgae Applied to Agroe-nergy and Biorefineries at Embrapa (Brasília/DF–Brazil).
DNA extraction, amplification and sequencingTotal genomic DNA was isolated from 30 mg of fresh algal biomass using the Cetyl Trimethy-lammonium Bromide (CTAB) DNA extraction protocol adapted by [45]. The rbcL and ITS1-5.8S-ITS2 DNA regions were submitted to PCR amplification using the primers described inTable 1. The 25 μL PCR reaction mix was composed of 14.5 μL of ultrapure water, 5 μL ofGoTaq 5X PCR buffer, 1.5 μL MgCl2 25 mM, 0.75 μL BSA 10 mg/mL, 0.5 μL dNTPs 10 mM,0.25 μL of GoTaq DNA polymerase (5 U/μL) (Promega, USA), 0.25 μL of each primer (10 μM)and 2.0 μl of DNA template (50–100 ng/μL). The PCR amplification protocol used for bothmarkers was: 96°C for 5 min, 40 cycles of 96° C for 1 min, (primer annealing temperature—seeTable 1) for 1 min and 72°C for 1 min, with a final extension at 72° C for 5 min. The PCR prod-ucts (5 μL) were visualized on agarose gels and selected for direct sequencing. Sequences weredetermined bi-directionally for at least two different amplicons using the BigDye Terminatorv.3.1 Cycle Sequencing Kit on the ABI 3130 automated DNA sequencer (both from Life Tech-nologies, USA), in accordance with the manufacturer’s instructions. The forward and reversesequences were aligned and edited using Geneious 6.1 software [46], generating consensusnucleotide positions with QV� 20. Sequences were deposited in GenBank under the accessionnumbers: rbcL sequences (KT307991 to KT308039); ITS1-5.8S-ITS2 sequences (KT308040 toKT308042; KT308046 to KT308076; KT308078 to KT308086; KT445859 to KT445863).
Molecular data analysisSequences were aligned automatically using ClustalW [47] under default parameters usingMEGA5 software [48]. The nuITS1, 5.8S and nuITS2 sequences were annotated using ITSx v.1.0.11 [49]. For similarity searches, the rbcL sequences were submitted to the Barcode of LifeData Systems (BOLD systems) using the Plant identification tool, while nuITS2 sequences weresubmitted to the Basic Local Alignment Search Tool (BLASTN) for comparisons against nucle-otide sequences deposited at the Genbank. The nuITS2 secondary structures were predicted byeither direct fold (energy minimization) or homology modelling [50]. Subsequently, in order tolocate hemi-compensatory base changes (hemi-CBCs) and compensatory base changes(CBCs), each sequence-structure along with its top match on ITS2 Blast tool were aligned andanalyzed with 4SALE v. 1.7 [51, 52].
DNA Barcoding Freshwater Chlorophytes
PLOS ONE | DOI:10.1371/journal.pone.0149284 February 22, 2016 3 / 18

Tab
le1.
Listo
fprimersuse
din
this
study,
includingtheprimer
sequen
ces,
amplic
onlength,a
nnea
lingtemperature
andthese
quen
cingsu
cces
srate
foratotalo
f51
strainstested
.
Primer
pair
Molecu
lar
marke
rSeq
uen
ceAmplic
onlength
(Nucleo
tides
span
)Annea
ling
temperature
Seq
uen
cing
succ
essrate
Referen
ce
Fw_ITS1/
Rv_
ITS4
ITS1-5.8S
-ITS2
Fw_ITS1:
5’–AGGAGAAGTCGTAACAAGGT–3’
Rv_
ITS4:
5’–TCCTCCGCTTATTGATATGC–3’
�65
0pb
52°C
92,15%
[35]
Fw_rbc
L_19
2/Rv_
rbcL
_657
rbcL
Fw_rbc
L_19
2:5’–GGTACTTGGACAACWGTWTGGAC–3’
Rv_
rbcL
_657
:5’–GAAACGGTCTCKCCARCGCAT–3’
465pb
(pos
ition
192to
657)
52°C
82,35%
Thisstud
y
Fw_rbc
L_37
5/Rv_
rbcL
_108
9rbcL
Fw_rbc
L_37
5:5’–TTTGGTTTCAAAGCIYTWCGTGC–3’
Rv_
rbcL
_108
9:5’–ATACCACGRCTACGRTCTTT–3’
714pb
(pos
ition
375to
1089
)52
°C50
,98%
Thisstud
y
Fw_rbc
L_19
2/Rv_
rbcL
_108
9rbcL
Fw_rbc
L_19
2:5’–GGTACTTGGACAACWGTWTGGAC–3’
Rv_
rbcL
_108
9:5’–ATACCACGRCTACGRTCTTT–3’
897pb
(pos
ition
192to
1089
)52
°C37
,25%
Thisstud
y
Fw_rbc
La_f/
Rv_
rbcL
_ajf6
34R
rbcL
Fw_rbc
La_f
5’–ATGTCACCACAAACAGAAACTAAAGC–3’
Rv_
rbcL
_ajf6
34R:5
’–GAAACGGTCTCTCCAACGCAT–3’
654pb
(pos
ition
1to
654)
54°C
15,69%
[4]
Fw_rbc
L_10
9/Rv_
rbcL
_657
rbcL
Fw_rbc
L_10
9:5’–TTCTTGCTGCITTYCGTATG–3’
Rv_
rbcL
_657
:5’–GAAACGGTCTCKCCARCGCAT–3’
548pb
(pos
ition
109to
657)
52°C
13,75%
Thisstud
y
Fw_rbc
La_f/
rbcL
A_rev
rbcL
Fw_rbc
La_f:5
’–ATGTCACCACAAACAGAGACTAAAGC–3’
rbcL
A_rev
:5’–GTAAAATCAAGTCCACCRCG–3’
599pb
(pos
ition
1to
599)
54°C
7,84
%[4]
Fw_rbc
L_10
9/Rv_
rbcL
_108
9rbcL
Fw_rbc
L_10
9:5’–TTCTTGCTGCITTYCGTATG–3’
Rv_
rbcL
_108
9:5’–ATACCACGRCTACGRTCTTT–3’
980pb
(pos
ition
109to
1089
)52
°C1,96
%Thisstud
y
Fw_rbc
L_RH1/
rbcL
_724
RrbcL
Fw_rbc
L_RH1:
5’–ATGTCACCACAAACAGAAACTAAAGC–
3’rbcL
_724
R:5
’–TCGCATGTACCTGCAGTAGC–3’
743pb
(pos
ition
1to
743)
54°C
1,96
%[4]
Fw_rbc
L_RH1/
rbcL
_138
5RrbcL
Fw_rbc
L_RH1:
5’–ATGTCACCACAAACAGAAACTAAAGC–
3’rbcL
_138
5R:5
’–AATTCAAATTTAATTTCTTTCC–3’
1406
pb(pos
ition
1to
1406
)48
°C0%
[13]
doi:10.1371/journal.pone.0149284.t001
DNA Barcoding Freshwater Chlorophytes
PLOS ONE | DOI:10.1371/journal.pone.0149284 February 22, 2016 4 / 18

The barcode gap was inferred based on uncorrected pair–wise (p) distance matrices.MEGA5 software was used for calculation. The taxon samplings used were reference nuITS1,nuITS2 and rbcL sequences derived from recent taxonomic revisions of the Chlorella and Des-modesmus genera [14, 53, 54] (S1–S3 Tables). The maximum intraspecific distances and mini-mum interspecific distances obtained were computed.
For phylogenetic tree analysis, the ITS1-5.8S-ITS2 sequences from Embrapa|LBA#2–3,#22–23, #26–27, #30, #32–36, #39, #42–44 and #50 strains were included in the dataset togetherwith their respectively closest sequences at GenBank. Desmodesmus sp., Chlorella sp. andMicractinium sp. ITS1-5.8S-ITS2 reference sequences [14, 39, 53–55]. The dendrograms wereconstructed through the maximum likelihood (ML) method using MEGA5 software. The GTRmodel with invariable sites (I) and gamma distribution shape parameter (G) was chosen. Theneighbor-joining (NJ) algorithm was used to generate the initial tree for ML computation. Aphylogenetic test using the Bootstrap method (1,000 replicates) was used.
Morphologic IdentificationMicroscopic morphologic identification at the genus level was performed according to Bellin-ger & Sigee, 2015 [56]. Further identification to species levels was accomplished by comparisonwith the species original descriptions that are available at the AlgaeBase [57]. In the case of theas of yet undescribed species, the morphological comparisons were made with the closeststrains obtained in the molecular identification step: Desmodesmus sp. MAT2008c [58];Micractinium sp. CCAP 211/92 [39]; Desmodesmus sp. GM4a [59]. A Carl Zeiss Axio ImagerA2 microscope (Zeiss.co, Brazil) equipped with Differential Interference Contrast (DIC) wasused for morphological analysis.
Results
Barcode markers primer universalityA total of 51 unialgal strains (named Embrapa|LBA#1 to #51) were isolated from natural waterbodies within the Cerrado savanna, the Pantanal wetlands and the Amazon rainforest, as wellas anthropogenic wastewater deposits (S1 Fig). Coccoid morphotypes were the most abundantamong the isolated strains (51%), followed by monadoids/palmelloids morphotypes (41%)(data not shown).
The ITS1-5.8S-ITS2 region could be successfully sequenced from DNA samples extractedfrom 47 strains (92,15% sequencing success rate) by using the universal primers described byWhite and coworkers (1990) [35] (Table 1). Even though all the 51 samples could be amplifiedwith this set of primers, the presence of multiple PCR products impaired direct sequencing offour samples. On the other hand, the sequencing success rate obtained using the rbcL gene uni-versal primer sets described by Hall and coworkers (2010) [13] or the sets proposed forembryophytes by the CBOL Plant working group [4], ranged from 0% to 15,69% (Table 1). Inorder to circumvent this problem, new sets of primers targeting rbcL gene partial amplification(Table 1) were designed based on 175 rbcL reference sequences from distinct Chlorophyta taxamined from BOLD Systems. The newly designed primer pairs Fw_rbcL_192/Rv_rbcL_657 andFw_rbcL_357/Rv_rbcL-1089 could successfully amplify and sequence 82,35% and 50,98% ofthe dataset, respectively (Table 1). The combination of the sequencing results from both theserbcL primer pairs allowed the construction of quality consensus sequences (QV�20) for 49samples (96,08% sequencing success rate). A total of 18 distinct 5.8S genotypes, 23 distinctnuITS1 genotypes, 23 nuITS2 distinct genotypes and 26 distinct rbcL genotypes were obtained.
DNA Barcoding Freshwater Chlorophytes
PLOS ONE | DOI:10.1371/journal.pone.0149284 February 22, 2016 5 / 18

Similarity search based on nuITS1, nuITS2 and rbcL markersIn order to perform the molecular identification of Embrapa|LBA strains, the rbcL sequencesobtained were submitted to similarity searches against the DNA barcoding dedicated database,BOLD systems. The closest matches retrieved for rbcL sequences ranged from 90% to 99% ofsimilarity (Table 2). Currently, there are very few nuITS1 and nuITS2 sequences from chloro-phytes deposited at taxonomically curated databases such as BOLD, therefore similaritysearches were performed against the GenBank. The closest matches retrieved for nuITS1sequences ranged from 70% to 100% of similarity and for nuITS2 sequences ranged from 81%to 100% of similarity (Table 2). Embrapa|LBA strains retrieved matches from species thatbelong to the Chlorophyceae and Trebouxiophyceae classes, especially to the orders Chlamy-domonadales, Chlorococcales, Sphaeropleales and Chlorellales (Table 2). Ten nuITS1sequences, 14 nuITS2 sequences and 0 rbcL sequences retrieved matches with a 100% similarity(Table 2).
Barcode gap analysisSimilarity searches only configure the first step for DNA barcoding since they provide informa-tion about the closest matches present in reference databases, but not necessarily species-levelidentification. In order to establish a genetic distance threshold for species-level identificationthat is applicable to chlorophytes, barcode gap analyses were conducted based on referencesequences from two species-dense green microalgae genera, Chlorella and Desmodesmus (S2–S4 Figs; S1–S3 Tables).
Chlorella genus nuITS1 intraspecific distances ranged from 0 to 0,014, while nuITS1 inter-specific distances ranged from 0,058 to 0,199 (S2A Fig). Desmodesmus genus nuITS1 intra-specific distances ranged from 0 to 0,018, while nuITS1 interspecific distances ranged from0,029 to 0,193 (S2B Fig). The presence of a barcode gap (gap between maximum intraspecificand minimum interspecific distances) was observed for all species analyzed (S2 Fig). Chlo-rella genus nuITS2 intraspecific distances ranged from 0 to 0,071, while nuITS2 interspecificdistances ranged from 0,076 to 0,204 (S3A Fig). Desmodesmus genus nuITS2 intraspecificdistances ranged from 0 to 0,02, while nuITS2 interspecific distances ranged from 0,032 to0,167 (S3B Fig). The presence of a barcode gap was also observed for all species analyzed (S3Fig). Desmodesmus rbcL genus intraspecific distances ranged from 0 to 0,108, while rbcLinterspecific distances ranged from 0,015 to 0,086 (S4 Fig). The presence of a barcode gap isobserved for all species based on rbcL sequences, except for Desmodesmus serratus species(S4 Fig).
Distance thresholds for species-level identification were inferred for each marker based onthe minimum interspecific distances observed for each marker (S2–S4 Figs), as follows: i)nuITS1 sequences (< 0,029); ii) nuITS2 sequences (< 0,032); ii) rbcL sequences (< 0,015). Theapplication of these distance thresholds to the data presented in Table 2 suggests that species-level identification has been achieved for: i) 35% of the nuITS1 sequences, namely Embrapa|LBA#2–3, #22–23, #26–27, #30, #32–36, #39, #42–44, #46 and #50; ii) 33% of the nuITS2sequences, namely Embrapa|LBA#2–3, #22–23, #26–27, #30, #32–36, #39, #42–44 and #46. iii)18% of the rbcL sequences, namely Embrapa|LBA#27, #32–34, #39, #42–44 and #50.
Additionally, even though nuITS2 Embrapa|LBA#50 sequence presents only 96% of identityto its GenBank closest match, it can also be considered that species-level identification hasbeen achieved, since the lowest interspecific distance calculated specifically for the Chlorellagenus nuITS2 sequences is 0,076 (S3A Fig). On the other hand, rbcL based identificationassigned Embrapa|LBA #32–34 and #42–44 strains to Chlorella pyrenoidosa species, which isnot currently a taxonomically accepted name [57]. Therefore, Embrapa|LBA #32–34 and #42–
DNA Barcoding Freshwater Chlorophytes
PLOS ONE | DOI:10.1371/journal.pone.0149284 February 22, 2016 6 / 18

Table 2. Molecular identification of the strains used in this study, including the percentual of identity, accession number and the name of the iden-tified species on the Barcode of Life Database (based on rbcLmarker sequence) and GenBank (based on nuITS2marker sequence).
Strain ITS1 (GenBank) ITS2 (GenBank) rbcL (BOLD)
Closest matchspecies
Identity GenBankaccess
Closest matchspecies
Identity Number ofCBCs /hCBCs
GenBankaccess
Closest matchspecies
Identity GenBankaccess
LBA#1 Desmodesmusarmatus
95% KP281288.1 Desmodesmusbicellularis
91% 1 / 7 AB917134.1 Scenedesmusquadricauda
90% AB084332.1
LBA#2 Desmodesmus sp.MAT-2008c
100% EU502836.1 Desmodesmus sp.MAT-2008c
100% 0 / 0 EU502836.1 Acutodesmusobliquus
93% DQ396875.1
LBA#3 Desmodesmus sp.MAT-2008c
100% EU502836.1 Desmodesmus sp.MAT-2008c
100% 0 / 0 EU502836.1 Acutodesmusobliquus
90% DQ396875.1
LBA#4 Chlamydopodiumstarrii
70% AB983644.1 Chlorococcumoleofaciens
91% 1 / 2 AB983633.1 Chlorococcumellipsoideum
91% EF113431.1
LBA#5 Desmodesmus sp.Tow 10/11 T-12W
79% DQ417556.1 Desmodesmusregularis
84% 4 / 2 AM228924.1 Desmodesmussantosii
93% GU192417.1
LBA#6 Chlamydopodiumstarrii
70% AB983644.1 Chlorococcumoleofaciens
94% - AB983633.1 Chlorococcumellipsoideum
91% EF113431.1
LBA#7 Desmodesmus sp.Tow 10/11 T-12W
79% DQ417556.1 Desmodesmusregularis
84% 4 / 2 AM228924.1 Desmodesmussantosii
93% GU192417.1
LBA#8 Chlamydomonas sp.KU107
94% KM061447.1 Chlamydomonas sp.KU107
87% 0 / 1 KM061447.1 Chlamydomonasoblonga
95% EF113424.1
LBA#9 Chlamydopodiumstarrii
90% AB983644.1 Chlamydopodiumstarrii
93% 0 / 1 AB983644.1 Chlorococcumellipsoideum
92% KC810301.1
LBA#10 Chlamydopodiumstarrii
90% AB983644.1 Chlamydopodiumstarrii
93% 0 / 1 AB983644.1 Chlorococcumellipsoideum
92% KC810301.1
LBA#11 Chlamydopodiumstarrii
90% AB983644.1 Chlamydopodiumstarrii
93% 0 / 1 AB983644.1 Chlorococcumellipsoideum
92% KC810301.1
LBA#12 Chlamydopodiumstarrii
90% AB983644.1 Chlamydopodiumstarrii
93% 0 / 1 AB983644.1 - - -
LBA#13 Coelastrella sp. shy-188
96% KP702302.1 Scenedesmusrubescens
95% 0 / 2 JX513884.1 Scenedesmusquadricauda
90% AB084332.1
LBA#14 Chlamydopodiumstarrii
90% AB983644.1 Chlamydopodiumstarrii
93% 0 / 1 AB983644.1 Chlorococcumellipsoideum
92% KC810301.1
LBA#15 Chlamydopodiumstarrii
90% AB983644.1 Chlamydopodiumstarrii
93% 0 / 1 AB983644.1 Chlorococcumellipsoideum
92% KC810301.1
LBA#16 - - - - - - - Ecballocystopsisdichotomus
90% JX018187.1
LBA#17 Chlamydopodiumstarrii
90% AB983644.1 Chlamydopodiumstarrii
93% 0 / 1 AB983644.1 Chlorococcumellipsoideum
92% KC810301.1
LBA#18 Chlamydopodiumstarrii
90% AB983644.1 Chlamydopodiumstarrii
93% 0 / 1 AB983644.1 Chlorococcumellipsoideum
92% KC810301.1
LBA#19 - - - - - - - Ecballocystopsisdichotomus
90% JX018187.1
LBA#20 Coelastrumastroideum
76% GQ375093.1 Scenedesmusarcuatus
81% 0 / 6 AY170855.1 Hariotina reticulata 93% JQ394815.1
LBA#21 Coelastrella sp. shy-188
96% KP702302.1 Scenedesmusrubescens
95% 0 / 2 JX513884.1 Desmodesmuscostato-granulatus
94% GU192427.1
LBA#22 Desmodesmusultrasquamatus
100% GU192392.1 Desmodesmusultrasquamatus
99% 0 / 0 GU192392.1 Desmodesmuscostato-granulatus
93% GU192427.1
LBA#23 Desmodesmusultrasquamatus
100% GU192392.1 Desmodesmusultrasquamatus
99% 0 / 0 GU192392.1 Desmodesmuscostato-granulatus
94% GU192427.1
LBA#24 Desmodesmusultrasquamatus
94% GU192392.1 Desmodesmusultrasquamatus
94% 0 / 3 AM228926.1 Desmodesmuscostato-granulatus
94% GU192427.1
LBA#25 Desmodesmusultrasquamatus
94% GU192392.1 Desmodesmusultrasquamatus
94% 0 / 3 AM228926.1 Desmodesmuscostato-granulatus
94% GU192427.1
LBA#26 Desmodesmus sp.MAT-2008c
100% EU502836.1 Desmodesmus sp.MAT-2008c
100% 0 / 0 EU502836.1 Acutodesmusobliquus
92% DQ396875.1
LBA#27 Chlorella sorokiniana 100% KM061456.1 Chlorellasorokiniana
100% 0 / 0 KJ676113.1 Chlorellasorokiniana
99% HM101339.1
(Continued)
DNA Barcoding Freshwater Chlorophytes
PLOS ONE | DOI:10.1371/journal.pone.0149284 February 22, 2016 7 / 18
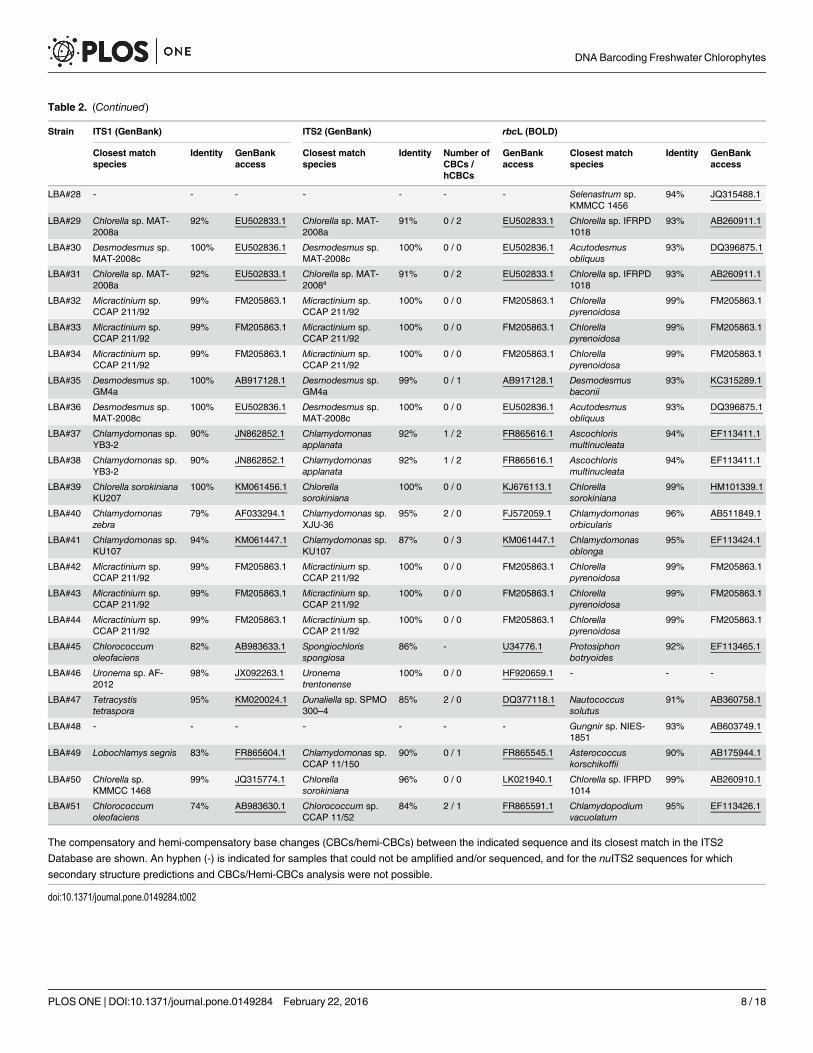
Table 2. (Continued)
Strain ITS1 (GenBank) ITS2 (GenBank) rbcL (BOLD)
Closest matchspecies
Identity GenBankaccess
Closest matchspecies
Identity Number ofCBCs /hCBCs
GenBankaccess
Closest matchspecies
Identity GenBankaccess
LBA#28 - - - - - - - Selenastrum sp.KMMCC 1456
94% JQ315488.1
LBA#29 Chlorella sp. MAT-2008a
92% EU502833.1 Chlorella sp. MAT-2008a
91% 0 / 2 EU502833.1 Chlorella sp. IFRPD1018
93% AB260911.1
LBA#30 Desmodesmus sp.MAT-2008c
100% EU502836.1 Desmodesmus sp.MAT-2008c
100% 0 / 0 EU502836.1 Acutodesmusobliquus
93% DQ396875.1
LBA#31 Chlorella sp. MAT-2008a
92% EU502833.1 Chlorella sp. MAT-2008ª
91% 0 / 2 EU502833.1 Chlorella sp. IFRPD1018
93% AB260911.1
LBA#32 Micractinium sp.CCAP 211/92
99% FM205863.1 Micractinium sp.CCAP 211/92
100% 0 / 0 FM205863.1 Chlorellapyrenoidosa
99% FM205863.1
LBA#33 Micractinium sp.CCAP 211/92
99% FM205863.1 Micractinium sp.CCAP 211/92
100% 0 / 0 FM205863.1 Chlorellapyrenoidosa
99% FM205863.1
LBA#34 Micractinium sp.CCAP 211/92
99% FM205863.1 Micractinium sp.CCAP 211/92
100% 0 / 0 FM205863.1 Chlorellapyrenoidosa
99% FM205863.1
LBA#35 Desmodesmus sp.GM4a
100% AB917128.1 Desmodesmus sp.GM4a
99% 0 / 1 AB917128.1 Desmodesmusbaconii
93% KC315289.1
LBA#36 Desmodesmus sp.MAT-2008c
100% EU502836.1 Desmodesmus sp.MAT-2008c
100% 0 / 0 EU502836.1 Acutodesmusobliquus
93% DQ396875.1
LBA#37 Chlamydomonas sp.YB3-2
90% JN862852.1 Chlamydomonasapplanata
92% 1 / 2 FR865616.1 Ascochlorismultinucleata
94% EF113411.1
LBA#38 Chlamydomonas sp.YB3-2
90% JN862852.1 Chlamydomonasapplanata
92% 1 / 2 FR865616.1 Ascochlorismultinucleata
94% EF113411.1
LBA#39 Chlorella sorokinianaKU207
100% KM061456.1 Chlorellasorokiniana
100% 0 / 0 KJ676113.1 Chlorellasorokiniana
99% HM101339.1
LBA#40 Chlamydomonaszebra
79% AF033294.1 Chlamydomonas sp.XJU-36
95% 2 / 0 FJ572059.1 Chlamydomonasorbicularis
96% AB511849.1
LBA#41 Chlamydomonas sp.KU107
94% KM061447.1 Chlamydomonas sp.KU107
87% 0 / 3 KM061447.1 Chlamydomonasoblonga
95% EF113424.1
LBA#42 Micractinium sp.CCAP 211/92
99% FM205863.1 Micractinium sp.CCAP 211/92
100% 0 / 0 FM205863.1 Chlorellapyrenoidosa
99% FM205863.1
LBA#43 Micractinium sp.CCAP 211/92
99% FM205863.1 Micractinium sp.CCAP 211/92
100% 0 / 0 FM205863.1 Chlorellapyrenoidosa
99% FM205863.1
LBA#44 Micractinium sp.CCAP 211/92
99% FM205863.1 Micractinium sp.CCAP 211/92
100% 0 / 0 FM205863.1 Chlorellapyrenoidosa
99% FM205863.1
LBA#45 Chlorococcumoleofaciens
82% AB983633.1 Spongiochlorisspongiosa
86% - U34776.1 Protosiphonbotryoides
92% EF113465.1
LBA#46 Uronema sp. AF-2012
98% JX092263.1 Uronematrentonense
100% 0 / 0 HF920659.1 - - -
LBA#47 Tetracystistetraspora
95% KM020024.1 Dunaliella sp. SPMO300–4
85% 2 / 0 DQ377118.1 Nautococcussolutus
91% AB360758.1
LBA#48 - - - - - - - Gungnir sp. NIES-1851
93% AB603749.1
LBA#49 Lobochlamys segnis 83% FR865604.1 Chlamydomonas sp.CCAP 11/150
90% 0 / 1 FR865545.1 Asterococcuskorschikoffii
90% AB175944.1
LBA#50 Chlorella sp.KMMCC 1468
99% JQ315774.1 Chlorellasorokiniana
96% 0 / 0 LK021940.1 Chlorella sp. IFRPD1014
99% AB260910.1
LBA#51 Chlorococcumoleofaciens
74% AB983630.1 Chlorococcum sp.CCAP 11/52
84% 2 / 1 FR865591.1 Chlamydopodiumvacuolatum
95% EF113426.1
The compensatory and hemi-compensatory base changes (CBCs/hemi-CBCs) between the indicated sequence and its closest match in the ITS2
Database are shown. An hyphen (-) is indicated for samples that could not be amplified and/or sequenced, and for the nuITS2 sequences for which
secondary structure predictions and CBCs/Hemi-CBCs analysis were not possible.
doi:10.1371/journal.pone.0149284.t002
DNA Barcoding Freshwater Chlorophytes
PLOS ONE | DOI:10.1371/journal.pone.0149284 February 22, 2016 8 / 18
44 strains were excluded from the subset of strains identified to the species-level based on rbcLsequences.
In conclusion, the results presented so far indicate that 18, 18 and 3 Embrapa|LBA strainswere identified to the species-level based on nuITS1, nuITS2 or rbcL sequences, respectively.
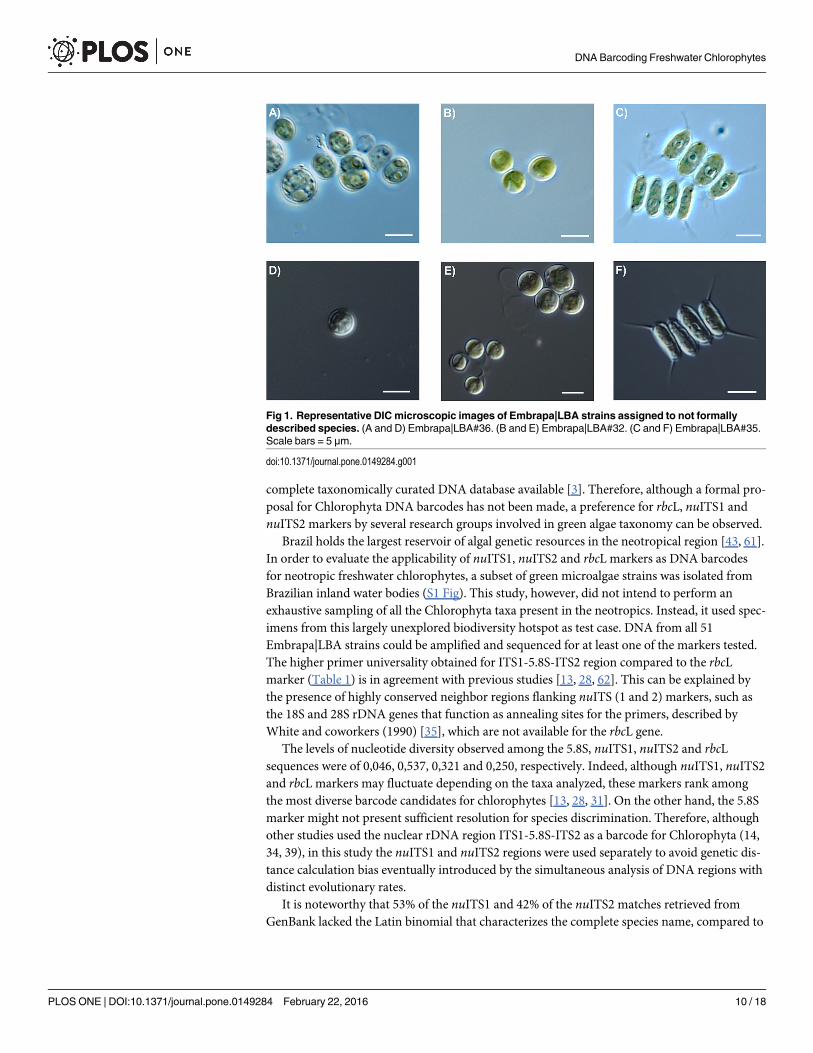
Morphologic, Phylogenetic and Compensatory Base Changes (CBCs)analysesIn order to confirm the species-level identification based on barcode gap calculations, thestrains Embrapa|LBA#2–3, #22–23, #26–27, #30, #32–36, #39, #42–44,#46 and #50 were identi-fied based on morphology. The strains Embrapa|LBA#22–23 were identified as Desmodesmusultrasquamatus, Embrapa|LBA#27, 39 and 50 were identified as Chlorella sorokiniana andEmbrapa|LBA#46 was identified as Uronema trentonense, according to these species originaldescriptions [57]. The molecular identification of strains Embrapa|LBA#2–3, #26, #30, #32–36and #42–44 (Table 2) suggest that they correspond to species still not formally described.Indeed, strains Embrapa|LBA#2–3, #26, #30 and #36 correspond to unicellular spineless coc-coid Desmodemus species with sizes ranging from 4–6 μm (Fig 1A and 1D), similar to thedescription of its closest GenBank match (Table 2) the strain Desmodesmus sp. MAT-2008cisolated in Australia [58]. Strains Embrapa|LBA#32–34 and #42–44 correspond to coccoidbristlelessMicractinium species with sizes ranging from 3–5 μm (Fig 1B and 1E), which is con-gruent with the description reported for its closest GenBank match (Table 2) the strainMicrac-tinium sp. CCAP 211/92 isolated from a soil sample collected fromMahe Island, Seychelles[39]. Strain Embrapa|LBA#35 corresponds to a two-, four- or eight-celled coenobia formingDesmodemus species that present few spines and dimensions of 3–6 x 8–13 μm (Fig 1C and1F), similar to the description of its closest GenBank match (Table 2) the strain Desmodesmussp. GM4a isolated from German inland waters [59].
Furthermore, the species-level identification obtained for strains Embrapa|LBA#2–3, #22–23, #26–27, #30, #32–36, #39, #42–44,#46 and #50 is corroborated by the absence of Compen-satory Base Changes (CBCs) between nuITS2 sequences of these strains and their closestmatches at GenBank (Table 2). Additionally, phylogenetic analyses using reference ITS1-5.8S-ITS2 sequences from currently accepted Chlorella,Micractinium and Desmodesmus spe-cies also corroborate species-level identification of strains Embrapa|LBA#2–3, #22–23, #26–27,#30, #32–36, #39, #42–44 and #50 (Figs 2 and 3). Figs 2 and 3 clearly demonstrate thatsequences from these strains group together with their closest matches from GenBank(Table 2) in monophyletic clades.
DiscussionA dual marker DNA barcode system has been proposed as a potential solution to cope with thegreat diversity of protists, however there is no current consensus about which marker shouldbe used [29, 32]. Ideally the two chosen markers should be easily amplified/sequenced using asingle set of primers and sufficiently variable to permit clear species delimitations without lossof the phylogenetic signal [29, 32]. Even though tufA has been reported to be a promising bar-code for chlorophytes [13, 31, 32], the number of green algae tufA sequences deposited at Gen-Bank is three times lower than the number of deposits for the protein-coding plastid gene rbcLor the non-coding regions of nuclear rDNA ITS1 and ITS2 (over 6,000 sequences deposited forrbcL and nuITS1 and over 7,000 sequences deposited for nuITS2 markers up to December/2015). Furthermore, recent taxonomic revisions of green algae have been based mainly onrbcL, nuITS1 or nuITS2 sequences [14, 26, 27, 32, 34, 37–42, 60]. In addition, there are thou-sands of rbcL sequences from chlorophytes deposited at BOLD systems, which is the most
DNA Barcoding Freshwater Chlorophytes
PLOS ONE | DOI:10.1371/journal.pone.0149284 February 22, 2016 9 / 18
complete taxonomically curated DNA database available [3]. Therefore, although a formal pro-posal for Chlorophyta DNA barcodes has not been made, a preference for rbcL, nuITS1 andnuITS2 markers by several research groups involved in green algae taxonomy can be observed.
Brazil holds the largest reservoir of algal genetic resources in the neotropical region [43, 61].In order to evaluate the applicability of nuITS1, nuITS2 and rbcL markers as DNA barcodesfor neotropic freshwater chlorophytes, a subset of green microalgae strains was isolated fromBrazilian inland water bodies (S1 Fig). This study, however, did not intend to perform anexhaustive sampling of all the Chlorophyta taxa present in the neotropics. Instead, it used spec-imens from this largely unexplored biodiversity hotspot as test case. DNA from all 51Embrapa|LBA strains could be amplified and sequenced for at least one of the markers tested.The higher primer universality obtained for ITS1-5.8S-ITS2 region compared to the rbcLmarker (Table 1) is in agreement with previous studies [13, 28, 62]. This can be explained bythe presence of highly conserved neighbor regions flanking nuITS (1 and 2) markers, such asthe 18S and 28S rDNA genes that function as annealing sites for the primers, described byWhite and coworkers (1990) [35], which are not available for the rbcL gene.
The levels of nucleotide diversity observed among the 5.8S, nuITS1, nuITS2 and rbcLsequences were of 0,046, 0,537, 0,321 and 0,250, respectively. Indeed, although nuITS1, nuITS2and rbcL markers may fluctuate depending on the taxa analyzed, these markers rank amongthe most diverse barcode candidates for chlorophytes [13, 28, 31]. On the other hand, the 5.8Smarker might not present sufficient resolution for species discrimination. Therefore, althoughother studies used the nuclear rDNA region ITS1-5.8S-ITS2 as a barcode for Chlorophyta (14,34, 39), in this study the nuITS1 and nuITS2 regions were used separately to avoid genetic dis-tance calculation bias eventually introduced by the simultaneous analysis of DNA regions withdistinct evolutionary rates.
It is noteworthy that 53% of the nuITS1 and 42% of the nuITS2 matches retrieved fromGenBank lacked the Latin binomial that characterizes the complete species name, compared to
Fig 1. Representative DIC microscopic images of Embrapa|LBA strains assigned to not formallydescribed species. (A and D) Embrapa|LBA#36. (B and E) Embrapa|LBA#32. (C and F) Embrapa|LBA#35.Scale bars = 5 μm.
doi:10.1371/journal.pone.0149284.g001
DNA Barcoding Freshwater Chlorophytes
PLOS ONE | DOI:10.1371/journal.pone.0149284 February 22, 2016 10 / 18

10% of the rbcL matches retrieved from BOLD (Table 2). This might be due to the combinationof two factors: i) CBOL’s effort to preserve traditional taxonomic nomenclature; ii) The overalltendency in phycology to gradually move away from species identifiers based on Latin binomi-als pushed by the faster rate of genetic information discovery compared with the traditionaltaxonomic descriptions [24]. Importantly, species names that are not currently taxonomicallyaccepted were found at both the BOLD and GenBank databases. That is the case, for example,of the strains Embrapa|LBA#32–34 and #42–44, which were assigned as Chlorella pyrenoidosa(Table 2), currently Pseudochlorella pyrenoidosa [26, 38], at BOLD systems. Although this find-ing is not unexpected within GenBank, it is especially relevant in a taxonomically curated data-base such as BOLD. A possible explanation is that these are, actually, non-validated reference
Fig 2. Phylogenetic tree forChlorella andMicractinium genera inferred based on ITS1-5.8S-ITS2sequences. Chlorella sp. andMicractinium sp. ITS1-5.8S-ITS2 reference barcode sequences reported byLuo et al. (2010) [39] and Bock et al. (2011) [14] were included in the analysis together with Embrapa|LBA#27, #32–34, #39, #42–44 and #50 strains sequences and their respectively closest sequences atGenBank. Identical sequences were omitted for simplification. The phylogenetic tree was inferred using theMaximumComposite Likelihood method based on dataset of 472 aligned positions of 31 nucleotidesequences. For the analysis, the GTR+G+I model was chosen. For the analysis, the GTRmodel withinvariable sites (I) and gamma distribution shape parameter (G) was chosen. The bootstrap values (1000replicates) are shown next to the branches.
doi:10.1371/journal.pone.0149284.g002
DNA Barcoding Freshwater Chlorophytes
PLOS ONE | DOI:10.1371/journal.pone.0149284 February 22, 2016 11 / 18

sequences mined directly from GenBank that are currently under taxonomic revision byBOLD collaborators. Indeed, it can be observed that the Acutodesmus obliquus rbcL referencesequence DQ396875.1 retrieved from BOLD (Table 2) is deposited with the old species name,Scenedesmus obliquus, at GenBank (data not shown).
Only few sequences retrieved matches with 100% of identity from GenBank and BOLD(Table2), suggesting incomplete taxa coverage within the reference databases analyzed. This iscorroborated by the fact that there are less than 500 hundred rbcL records from the neotropicalregion (only 21 from Brazil) deposited at BOLD up to July/2015. Thus, it seems that the incon-gruences observed between species names retrieved from nuITS1, nuITS2 and rbcL similaritysearches (Table 2) are mainly due to reference databases incompleteness rather than to realconflicts derived from distinct species identification by each marker. This is important
Fig 3. Phylogenetic tree forDesmodesmus genus inferred based on ITS1-5.8S-ITS2 sequences.Demodesmus sp. ITS1-5.8S-ITS2 reference barcode sequences reported by Fawley et al. (2011) [53] andGorelova et al. (2014) [54] were included in the analysis together with Embrapa|LBA#2–3, #22–23, #26, #30and #35–36 strains sequences and their respectively closest sequences at GenBank. Identical sequenceswere omitted for simplification. The phylogenetic tree was inferred using the MaximumComposite Likelihoodmethod based on a dataset of 470 aligned positions of 34 nucleotide sequences. For the analysis, the GTR+G+I model was chosen. The bootstrap values (1000 replicates) are shown next to the branches.
doi:10.1371/journal.pone.0149284.g003
DNA Barcoding Freshwater Chlorophytes
PLOS ONE | DOI:10.1371/journal.pone.0149284 February 22, 2016 12 / 18

information to be considered since the possibility of biased performance, eventually leading tosample misidentification, when using search algorithms such as BLAST is increased when ana-lyzing poorly sampled groups [63].
Barcode gap analyses can provide the means to improve the accuracy for species level identi-fication [1, 17]. A barcode gap is present when the maximum intraspecific distance is lowerthan the minimum interspecific distance for a certain taxon, thereby revealing a correspondingdistance threshold that can be applied to delimit species [17]. However, the same distancethreshold may not be applicable to every species and should be determined for each taxon ana-lyzed [32, 63, 64]. Due to the unavailability of a complete set of reference sequences for most ofthe taxa listed in Table 2, the analyses were based on sequences Chlorella and Desmodesmusgenera for nuITS1 and nuITS2, and for Desmodesmus genus for rbcL. These reliable referencebarcode sequences are originated from recent revisions of these genera based on integrativetaxonomy approaches (S2–S4 Figs; S1–S3 Tables). As expect, the barcode gap analyses basedon nuITS1, nuITS2 and rbcL makers (S2–S4 Figs) indicate that it is not possible to establish asingle universal distance threshold that would avoid incorrect identifications and, at the sametime, include all specimens into the correct species. However, assuming that incorrect speci-men identification is more problematic than simply not assigning a specimen to any species,distance thresholds were inferred for each marker based on the minimum interspecific dis-tances observed (S2–S4 Figs) allowing species-level identification.
There are several reports suggesting that the presence of compensatory base changes(CBCs) in nuITS2 secondary structures correlate with reproductive isolation [65–67]. A large-scale testing with ~300.000 nuITS2 secondary structures revealed that if a CBC is present thenthere are two different species with a probability of ~93% [65, 67]. Therefore, the detection ofCBCs between the Embrapa|LBA strains nuITS2 sequences and their closest matches at Gen-Bank seems to be a reasonable predictor that species-level identification has not been achieved.In accordance, the CBCs analyses shown in Table 2 corroborate the species-level identificationachieved based on barcode gap calculations. Additionally, the morphological (Fig 1) and phylo-genetic analyses (Figs 2 and 3) also corroborate the species-level identification based on bar-code gap calculations.
The DNA barcoding results presented here using a subset of neotropic freshwater greenmicroalgae as a test case suggest that nuITS1 and nuITS2 are the most useful markers, whilerbcL presented lower primer universality and species-level identification power. Although,both nuITS1 and nuITS2 precisely identified the same 18 strains to the species-level based onbarcode gap calculations, nuITS2 accounts with a more complete set of reference sequencesdeposited at databases and an automated and well developed pipeline for secondary structureanalysis [50]. The S5 Fig depicts the tentative DNA barcoding workflow for green microalgaespecimens based on the results presented.
ConclusionsDNA barcoding can make specimens identification to species level faster, more reliable andaccessible to non-specialists. Defining of the appropriate DNA barcodes for Chlorophyta iden-tification and the availability of taxonomically curated DNA databases are pivotal to this task.The results presented here indicate that a DNA barcoding pipeline based on nuITS2 should beuseful for green microalgae species identification. It is clear, however, that there is an urgentneed for the deposition of more taxonomically accurate reference barcodes in curated data-bases (e.g.: BOLD Systems). Therefore, extensive efforts on integrative taxonomy are crucial,ideally encompassing the use of both DNAmarkers. These studies are especially relevant forpoorly studied taxa such as tropical chlorophytes.
DNA Barcoding Freshwater Chlorophytes
PLOS ONE | DOI:10.1371/journal.pone.0149284 February 22, 2016 13 / 18
Supporting InformationS1 Fig. Collection sites.Map of Brazilian biomes, including the Amazon tropical rainforest(1), the Caatinga xeric shrublands (2), the Cerrado tropical Savanna (3), the Pantanal floodedgrassland (4), theMata Atlântica tropical rainforest (5) and the Pampa subtropical grassland(6). The geographic coordinates of the six distinct locations sampled and the respective isolatedstrains in each site are shown. The strains isolated were deposited in the Collection of Microor-ganisms and Microalgae Applied to Agroenergy and Biorefineries at Embrapa (Brasília/DF–Brazil). The Brazilian territory is highlighted in black in the map of the neotropical region(inset).(TIF)
S2 Fig. nuITS1-based barcode gap calculation. The maximum intraspecific distances (◆) andminimum interspecific distances (□) based on nuITS1 marker between Chlorella (A) and Des-modesmus (B) genera species are shown. The dataset was composed of reference barcodesequences reported for each genera (S1 and S2 Tables).(TIF)
S3 Fig. nuITS2-based barcode gap calculation. The maximum intraspecific distances (◆) andminimum interspecific distances (□) based on nuITS2 marker between Chlorella (A) and Des-modesmus (B) genera species are shown. The dataset was composed of reference barcodesequences reported for each genera (S1 and S2 Tables).(TIF)
S4 Fig. rbcL-based barcode gap calculation. The maximum intraspecific distances (◆) andminimum interspecific distances (□) based on rbcL marker between Desmodesmus genus spe-cies are shown. The dataset was composed of reference barcode sequences reported this genus(S3 Table).(TIF)
S5 Fig. Roadmap for green microalgae DNA barcoding. nuITS2 should be primarilysequenced and submitted to similarity searches against GenBank. Similarity values obtainedmust be compatible with the barcode gap thresholds calculated using reference sequences forthe taxon indicated (a). The absence of CBCs between the query nuITS2 sequence and its clos-est match retrieved from similarity search is necessary to confirm species diagnosis (b). Finally,the current status of the assigned species name must be checked using a reference database(e.g.: AlgaeBase) (c). If nuITS2 is not sufficient for a species diagnosis, other markers/methodsshould be tried (d).(TIF)
S1 Table. nuITS1 and nuITS2 reference sequences from Chlorella genus mined from Gen-Bank used for barcode gap calculation.(DOCX)
S2 Table. nuITS1 and nuITS2 reference sequences from Desmodesmus genus mined fromGenBank used for barcode gap calculation.(DOCX)
S3 Table. rbcL reference sequences from Desmodesmus genus mined from GenBank usedfor barcode gap calculation.(DOCX)
DNA Barcoding Freshwater Chlorophytes
PLOS ONE | DOI:10.1371/journal.pone.0149284 February 22, 2016 14 / 18

AcknowledgmentsThe authors are grateful to the Empresa Brasileira de Pesquisa Agropecuária (EMBRAPA),Coordenação de Aperfeiçoamento de Pessoal de Nível Superior (CAPES), Financiadora deEstudos e Projetos (FINEP) and Conselho Nacional de Pesquisa (CNPq) for supporting thiswork. The funders had no role in study design, data collection and analysis, decision to publish,or preparation of the manuscript.
Author ContributionsConceived and designed the experiments: SIIAH BSAFB. Performed the experiments: SIIAHHS PPMB TGGMDO AMMECO. Analyzed the data: SIIAH BSAFB. Contributed reagents/materials/analysis tools: SFCP BSAFB. Wrote the paper: SIIAH HS FCPS BSAFB.
References1. Hebert PD, Cywinska A, Ball SL, deWaard JR. Biological identifications through DNA barcodes. Pro-
ceedings Biological sciences / The Royal Society. 2003; 270(1512):313–21. doi: 10.1098/rspb.2002.2218 PMID: 12614582; PubMed Central PMCID: PMC1691236.
2. Hebert PD, Ratnasingham S, deWaard JR. Barcoding animal life: cytochrome c oxidase subunit 1divergences among closely related species. Proceedings Biological sciences / The Royal Society.2003; 270 Suppl 1:S96–9. doi: 10.1098/rsbl.2003.0025 PMID: 12952648; PubMed Central PMCID:PMC1698023.
3. Ratnasingham S, Hebert PD. bold: The Barcode of Life Data System (http://www.barcodinglife.org).Molecular ecology notes. 2007; 7(3):355–64. doi: 10.1111/j.1471-8286.2007.01678.x PMID:18784790; PubMed Central PMCID: PMC1890991.
4. Hollingsworth PM, Forrest LL, Spouge JL, Hajibabaei M, Ratnasingham S, van der Bank M, et al. ADNA barcode for land plants. Proceedings of the National Academy of Sciences of the United States ofAmerica. 2009; 106(31):12794–7. doi: 10.1073/pnas.0905845106 PMID: 19666622
5. Leray M, Knowlton N. DNA barcoding and metabarcoding of standardized samples reveal patterns ofmarine benthic diversity. Proceedings of the National Academy of Sciences of the United States ofAmerica. 2015; 112(7):2076–81. doi: 10.1073/pnas.1424997112 PMID: 25646458; PubMed CentralPMCID: PMC4343139.
6. Francis RA. Wall ecology: A frontier for urban biodiversity and ecological engineering. Prog PhysGeogr. 2011; 35(1):43–63.
7. Collins RA, Armstrong KF, Meier R, Yi Y, Brown SDJ, Cruickshank RH, et al. Barcoding and border bio-security: identifying cyprinid fishes in the aquarium trade. PloS one. 2012; 7(1):e28381. doi: 10.1371/journal.pone.0028381 PMID: 22276096
8. Palhares RM, Drummond MG, Brasil BDAF, Cosenza GP, Brandao MDL, Oliveira G. Medicinal plantsrecommended by the World Health Organization: DNA Barcode identification associated with chemicalanalyses guarantees their quality. PloS one. 2015; 10(5). doi: UNSP e0127866 doi: 10.1371/journal.pone.0127866 PMID: WOS:000354916100155.
9. Palhares RM, DrummondMG, Brasil BS, Krettli AU, Oliveira GC, Brandão MG. The use of an integratedmolecular-, chemical-and biological-based approach for promoting the better use and conservation ofmedicinal species: A case study of Brazilian quinas. J Ethnopharmacol. 2014; 155(1):815–22. doi: 10.1016/j.jep.2014.06.040 PMID: 24971797
10. Carvalho DC, Neto DA, Brasil BS, Oliveira DA. DNA barcoding unveils a high rate of mislabeling in acommercial freshwater catfish from Brazil. Mitochondrial DNA. 2011; 22(sup1):97–105.
11. Carvalho DC, Palhares RM, Drummond MG, Frigo TB. DNA Barcoding identification of commercializedseafood in South Brazil: A governmental regulatory forensic program. Food Control. 2015; 50:784–8.
12. Drummond MG, Brasil BSAF, Dalsecco LS, Brasil RSAF, Teixeira LV, Oliveira DAA. A versatile real-time PCRmethod to quantify bovine contamination in buffalo products. Food Control. 2013; 29(1):131–7.
13. Hall JD, Fucikova K, Lo C, Lewis LA, Karol KG. An assessment of proposed DNA barcodes in freshwa-ter green algae. Cryptogam, Algol. 2010; 31(4):529–55.
14. Bock C, Krienitz L, Proeschold T. Taxonomic reassessment of the genus Chlorella (Trebouxiophyceae)using molecular signatures (barcodes), including description of seven new species. Fottea. 2011; 11(2):293–312.
DNA Barcoding Freshwater Chlorophytes
PLOS ONE | DOI:10.1371/journal.pone.0149284 February 22, 2016 15 / 18
15. Costa ES, Plastino EM, Petti R, Oliveira EC, Oliveira MC. The Gracilariaceae Germplasm Bank of theUniversity of São Paulo, Brazil—a DNA barcoding approach. J Appl Phycol. 2012; 24(6):1643–53.
16. Pawlowski J, Holzmann M. A plea for DNA barcoding of Foraminifera. J Foraminiferal Res. 2014; 44(1):62–7.
17. Hebert PDN, Stoeckle MY, Zemlak TS, Francis CM. Identification of birds through DNA barcodes.PLoS Biol. 2004; 2:1657–63.
18. Becker B, Marin B. Streptophyte algae and the origin of embryophytes. Ann Bot. 2009; 103(7):999–1004. doi: 10.1093/aob/mcp044 PMID: 19273476
19. Guiry MD. Howmany species of algae are there? J Phycol. 2012; 48(5):1057–63.
20. Torres MA, Barros MP, Campos SCG, Pinto E, Rajamani S, Sayre RT, et al. Biochemical biomarkers inalgae and marine pollution: a review. Ecotoxicol Environ Saf. 2008; 71(1):1–15. doi: 10.1016/j.ecoenv.2008.05.009 PMID: 18599121
21. Amengual-Morro C, Niell GM, Martínez-Taberner A. Phytoplankton as bioindicator for waste stabiliza-tion ponds. J Environ Manage. 2012; 95:S71–S6. doi: 10.1016/j.jenvman.2011.07.008 PMID:21820796
22. Subhadra B, Grinson-George. Algal biorefinery‐based industry: an approach to address fuel and foodinsecurity for a carbon‐smart world. J Sci Food Agric. 2011; 91(1):2–13. doi: 10.1002/jsfa.4207 PMID:20981716
23. Nascimento IA, Marques SSI, Cabanelas ITD, Pereira SA, Druzian JI, de Souza CO, et al. Screeningmicroalgae strains for biodiesel production: lipid productivity and estimation of fuel quality based onfatty acids profiles as selective criteria. Bioenergy Res. 2013; 6(1):1–13.
24. Clerck O, Guiry MD, Leliaert F, Samyn Y, Verbruggen H. Algal taxonomy: a road to nowhere? J Phycol.2013; 49(2):215–25.
25. Škaloud P. Variation and taxonomic significance of somemorphological features in European strains ofKlebsormidium (Klebsormidiophyceae, Streptophyta). Nova Hedwigia. 2006; 83(3–4):533–50.
26. Krienitz L, Bock C. Present state of the systematics of planktonic coccoid green algae of inland waters.Phytoplankton responses to human impacts at different scales: Springer; 2012. p. 295–326.
27. Krienitz L, Huss VA, Bock C. Chlorella: 125 years of the green survivalist. Trends in plant science.2015; 20(2):67–9. doi: 10.1016/j.tplants.2014.11.005 PMID: 25500553.
28. BuchheimMA, Keller A, Koetschan C, Forster F, Merget B, Wolf M. Internal transcribed spacer 2 (nuITS2 rRNA) sequence-structure phylogenetics: towards an automated reconstruction of the green algaltree of life. PloS one. 2011; 6(2):e16931. doi: 10.1371/journal.pone.0016931 PMID: 21347329;PubMed Central PMCID: PMC3037400.
29. Pawlowski J, Audic S, Adl S, Bass D, Belbahri L, Berney C, et al. CBOL protist working group: barcod-ing eukaryotic richness beyond the animal, plant, and fungal kingdoms. PLoS biology. 2012; 10(11):e1001419. doi: 10.1371/journal.pbio.1001419 PMID: 23139639; PubMed Central PMCID:PMC3491025.
30. Caisová L, Marin B, Melkonian M. A close-up view on ITS2 evolution and speciation—a case study inthe Ulvophyceae (Chlorophyta, Viridiplantae). BMC evolutionary biology. 2011; 11:262. doi: 10.1186/1471-2148-11-262 PMID: 21933414; PubMed Central PMCID: PMC3225284.
31. Du G, Wu F, Mao Y, Guo S, Xue H, Bi G. DNA barcoding assessment of green macroalgae in coastalzone around Qingdao, China. J Ocean Univ China. 2014; 13(1):97–103.
32. Leliaert F, Verbruggen H, Vanormelingen P, Steen F, López-Bautista JM, Zuccarello GC, et al. DNA-based species delimitation in algae. Eur J Phycol. 2014; 49(2):179–96.
33. Pombert J-F, Otis C, Lemieux C, Turmel M. The chloroplast genome sequence of the green alga Pseu-dendoclonium akinetum (Ulvophyceae) reveals unusual structural features and new insights into thebranching order of chlorophyte lineages. Mol Biol Evol. 2005; 22(9):1903–18. PMID: 15930151
34. Hegewald E, Bock C, Krienitz L. A phylogenetic study on Scenedesmaceae with the description of anew species of Pectinodesmus and the new genera Verrucodesmus and Chodatodesmus (Chloro-phyta, Chlorophyceae). Fottea. 2013; 13(2):14.
35. White TJ, Bruns T, Lee SJWT, Taylor JW. Amplification and direct sequencing of fungal ribosomal RNAgenes for phylogenetics: Academic Press; 1990. 315–22 p.
36. Koetschan C, Förster F, Keller A, Schleicher T, Ruderisch B, Schwarz R, et al. The ITS2 Database III—sequences and structures for phylogeny. Nucleic acids research. 2010; 38(suppl 1):D275–D9.
37. Pröschold T, Bock C, LuoW, Krienitz L. Polyphyletic distribution of bristle formation in Chlorellaceae:Micractinium, Diacanthos, Didymogenes and Hegewaldia gen. nov.(Trebouxiophyceae, Chlorophyta).Phycological Res. 2010; 58(1):1–8.
DNA Barcoding Freshwater Chlorophytes
PLOS ONE | DOI:10.1371/journal.pone.0149284 February 22, 2016 16 / 18

38. Darienko T, Gustavs L, Mudimu O, Menendez CR, Schumann R, Karsten U, et al. Chloroidium, a com-mon terrestrial coccoid green alga previously assigned to Chlorella (Trebouxiophyceae, Chlorophyta).Eur J Phycol. 2010; 45(1):79–95.
39. LuoW, Proschold T, Bock C, Krienitz L. Generic concept in Chlorella-related coccoid green algae(Chlorophyta, Trebouxiophyceae). Plant biology. 2010; 12(3):545–53. doi: 10.1111/j.1438-8677.2009.00221.x PMID: 20522192.
40. Pröschold T, Darienko T, Silva PC, Reisser W, Krienitz L. The systematics of Zoochlorella revisitedemploying an integrative approach. Environ Microbiol. 2011; 13(2):350–64. doi: 10.1111/j.1462-2920.2010.02333.x PMID: 20874732
41. Krienitz L, Hegewald EH, Hepperle D, Huss VAR, Rohr T, Wolf M. Phylogenetic relationship of Chlo-rella and Parachlorella gen. nov.(Chlorophyta, Trebouxiophyceae). Phycologia. 2004; 43(5):529–42.
42. Pöschold T, Marin B, Schlosser UG, Melkonian M. Molecular phylogeny and taxonomic revision ofChlamydomonas (Chlorophyta). I. Emendation of Chlamydomonas Ehrenberg and Chloromonas Gobi,and description of Oogamochlamys gen. nov. and Lobochlamys gen. nov. Protist. 2001; 152(4):265–300. doi: 10.1078/1434-4610-00068 PMID: 11822658.
43. Agostinho AA, Thomaz SM, Gomes LC. Conservation of the biodiversity of Brazil's inland waters. Con-serv Biol. 2005; 19(3):646–52.
44. Schlösser U. Additions to the culture collection of algae since 1994. Bot Acta. 1997; 110(5):424–9.
45. Bonato ALV, do Valle CB, Jank L, Resende RMS, Leguizamon GOdC. Extração de DNA genômico deBrachiaria e Panicummaximum. Embrapa Gado de Corte Comunicado técnico. 2002.
46. Kearse M, Moir R, Wilson A, Stones-Havas S, Cheung M, Sturrock S, et al. Geneious Basic: an inte-grated and extendable desktop software platform for the organization and analysis of sequence data.Bioinformatics. 2012; 28(12):1647–9. doi: 10.1093/bioinformatics/bts199 PMID: 22543367; PubMedCentral PMCID: PMC3371832.
47. Thompson JD, Higgins DG, Gibson TJ. CLUSTALW: improving the sensitivity of progressive multiplesequence alignment through sequence weighting, position-specific gap penalties and weight matrixchoice. Nucleic acids research. 1994; 22(22):4673–80. PMID: 7984417
48. Tamura K, Peterson D, Peterson N, Stecher G, Nei M, Kumar S. MEGA5: molecular evolutionary genet-ics analysis using maximum likelihood, evolutionary distance, and maximum parsimony methods. MolBiol Evol. 2011; 28(10):2731–9. doi: 10.1093/molbev/msr121 PMID: 21546353
49. Bengtsson-Palme J, Ryberg M, Hartmann M, Branco S, Wang Z, Godhe A, et al. Improved softwaredetection and extraction of ITS1 and ITS2 from ribosomal ITS sequences of fungi and other eukaryotesfor analysis of environmental sequencing data. Methods Ecol Evol. 2013; 4(10):914–9. doi: 10.1111/2041-210X.12073
50. Koetschan C, Hackl T, Müller T, Wolf M, Förster F, Schultz J. ITS2 database IV: interactive taxon sam-pling for internal transcribed spacer 2 based phylogenies. Mol Phylogenet Evol. 2012; 63(3):585–8. doi:10.1016/j.ympev.2012.01.026 PMID: 22366368
51. Seibel PN, Müller T, Dandekar T, Schultz J, Wolf M. 4SALE–a tool for synchronous RNA sequence andsecondary structure alignment and editing. BMC bioinformatics. 2006; 7(1):498.
52. Seibel PN, Müller T, Dandekar T, Wolf M. Synchronous visual analysis and editing of RNA sequenceand secondary structure alignments using 4SALE. BMC research notes. 2008; 1(1):91.
53. Fawley MW, Fawley KP, Hegewald E. Taxonomy of Desmodesmus serratus (Chlorophyceae, Chloro-phyta) and related taxa on the basis of morphological and DNA sequence data. Phycologia. 2011; 50(1):23–56. doi: 10.2216/10-16.1
54. Gorelova OA, Baulina OI, Solovchenko AE, Chekanov KA, Chivkunova OB, Fedorenko TA, et al. Simi-larity and diversity of the Desmodesmus spp. microalgae isolated from associations with White Seainvertebrates. Protoplasma. 2015; 252(2):489–503. doi: 10.1007/s00709-014-0694-0 PMID:25189657.
55. Bock C, Pröschold T, Krienitz L. Two new Dictyosphaerium-morphotype lineages of the Chlorellaceae(Trebouxiophyceae): Heynigia gen. nov. and Hindakia gen. nov. European Journal of Phycology. 2010;45(3):267–77.
56. Bellinger EG, Sigee DC. Freshwater Algae: Identification and Use as Bioindicators: Wiley; 2015.
57. AlgaeBase [Internet]. Galway: National University of Ireland. 2015 [cited 16 december 2015]. Availablefrom: http://www.algaebase.org.
58. Timmins M, Thomas-Hall SR, Darling A, Zhang E, Hankamer B, Marx UC, et al. Phylogenetic andmolecular analysis of hydrogen-producing green algae. Journal of experimental botany. 2009; 60(6):1691–702. doi: 10.1093/jxb/erp052 PMID: 19342428; PubMed Central PMCID: PMC2671627.
DNA Barcoding Freshwater Chlorophytes
PLOS ONE | DOI:10.1371/journal.pone.0149284 February 22, 2016 17 / 18

59. Hoshina R. DNA analyses of a private collection of microbial green algae contribute to a better under-standing of microbial diversity. BMC research notes. 2014; 7:592. doi: 10.1186/1756-0500-7-592PMID: 25182710; PubMed Central PMCID: PMC4167140.
60. Loughnane CJ, McIvor LM, Rindi F, Stengel DB, Guiry MD. Morphology, rbc L phylogeny and distribu-tion of distromatic Ulva (Ulvophyceae, Chlorophyta) in Ireland and southern Britain. Phycologia. 2008;47(4):416–29.
61. Freitas LC, Loverde-Oliveira SM. Checklist of green algae (Chlorophyta) for the state of Mato Grosso,Central Brazil. Check List. 2013; 9:1471–83.
62. Nozaki H, Krienitz L. Morphology and phylogeny of Eudorina minodii (Chodat) Nozaki et Krienitz,comb. nov.(Volvocales, Chlorophyta) from Germany. Eur J Phycol. 2001; 36(1):23–8.
63. Hoef-Emden K. Pitfalls of establishing DNA barcoding systems in protists: the cryptophyceae as a testcase. PloS one. 2012; 7(8):e43652. doi: 10.1371/journal.pone.0043652 PMID: 22970104; PubMedCentral PMCID: PMC3436593.
64. Collins RA, Cruickshank RH. The seven deadly sins of DNA barcoding. Molecular ecology resources.2013; 13(6):969–75. doi: 10.1111/1755-0998.12046 PMID: 23280099.
65. Wolf M, Chen S, Song J, Ankenbrand M, Muller T. Compensatory base changes in ITS2 secondarystructures correlate with the biological species concept despite intragenomic variability in ITS2sequences—a proof of concept. PloS one. 2013; 8(6):e66726. doi: 10.1371/journal.pone.0066726PMID: 23826120; PubMed Central PMCID: PMC3691174.
66. Coleman AW. Is there a molecular key to the level of “biological species” in eukaryotes? A DNA guide.Mol Phylogenet Evol. 2009; 50(1):197–203. doi: 10.1016/j.ympev.2008.10.008 PMID: 18992828
67. Müller T, Philippi N, Dandekar T, Schultz J, Wolf M. Distinguishing species. RNA. 2007; 13(9):1469–72.PMID: 17652131
DNA Barcoding Freshwater Chlorophytes
PLOS ONE | DOI:10.1371/journal.pone.0149284 February 22, 2016 18 / 18
Copyright © 2022 FDOKUMEN