
NGNP Hydrogen Plant Alternatives Study - INL Advanced ...
599
NGNP-HPS SHAW-HPA March 2009 Revision 1 NGNP Hydrogen Plant Alternatives Study APPROVALS Function Printed Name and Signature Date Author Name: Charles Bolthrunis Company: Shaw Energy & Chemicals March 19, 2009 Reviewer Name: Thomas St. Louis Company: Shaw Environmental & Infrastructure March 19, 2009 Reviewer Name: Company: March 19, 2009 Reviewer Name: Daniel Mears Company: Technology Insights March 19, 2009 Approval Name: Edward Brabazon Company: Shaw Environmental & Infrastructure March 19, 2009 Westinghouse Electric Company LLC Nuclear Power Plants Post Office Box 355 Pittsburgh, PA 15230-0355 2009 Westinghouse Electric Company LLC All Rights Reserved Edward Lahoda Westinghouse Electric Company
-
Upload
khangminh22 -
Category
Documents
-
view
1 -
download
0
Transcript of NGNP Hydrogen Plant Alternatives Study - INL Advanced ...

NGNP-HPS SHAW-HPA March 2009 Revision 1
NGNP Hydrogen Plant Alternatives Study
APPROVALS
Function Printed Name and Signature Date Author
Name: Charles Bolthrunis Company: Shaw Energy & Chemicals
March 19, 2009
Reviewer
Name: Thomas St. Louis Company: Shaw Environmental & Infrastructure March 19, 2009
Reviewer
Name: Company: March 19, 2009
Reviewer
Name: Daniel Mears Company: Technology Insights
March 19, 2009
Approval
Name: Edward Brabazon Company: Shaw Environmental & Infrastructure March 19, 2009
Westinghouse Electric Company LLC Nuclear Power Plants Post Office Box 355
Pittsburgh, PA 15230-0355
�2009 Westinghouse Electric Company LLC All Rights Reserved
Edward Lahoda Westinghouse Electric Company

LIST OF CONTRIBUTORS
Name and Company Date Dan Allen (Technology Insights) December 2008 Joan Schork (Air Products and Chemicals) December 2008 Thomas St. Louis (Shaw Environmental & Infrastructure) December 2008 Karl Goff (Shaw Environmental & Infrastructure) December 2008
BACKGROUND INTELLECTUAL PROPERTY CONTENT
Section Title Description
N/A
REVISION HISTORY
RECORD OF CHANGES
Revision No. Revision Made by Description Date A Thomas St. Louis Issued for review 15 January 2009 0 Karl B. Goff Document for release 11 March 2009 1 Karl B. Goff Editorial Changes 19 March 2009
DOCUMENT TRACEABILITY
Created to Support the Following Document(s)
Document Number Revision
NGNP_HPAS_Cover.doc March 2009
Hydrogen Plant Alternatives Study NGNP-HPS SHAW-HPA List of Acronyms
NGNP_HPAS_List_of_Acronyms.doc March 2009
LIST OF ACRONYMS BUN Bunsen Reaction CDA Clean Dry Air CSTR Continually Stirred Tank Reactor CTF Component Test Facility DDN Design Data Needs DOE Department of Energy DRL Design Readiness Level EDI Electro-Deionization FUS Feed and Utility Systems HAD Hydroiodic Acid Decomposition HHV High Heating Value HPAS Hydrogen Plant Alternatives Study HPS Hydrogen Production System HTGR High Temperature Gas Reactor HTSE High Temperature Steam Electrolysis HYS Hybrid Sulfur INL Idaho National Laboratory LHV Low Heating Value LWR Light Water Reactor MT Metric Tonne NGNP Next Generation Nuclear Plant NHI National Hydrogen Initiative NHSS Nuclear Heat Supply System PCHX Process Coupling Heat Exchanger PEM Proton Exchange Membrane PFDs Process Flow Diagrams PPU Product Purification System PTFE or Teflon Polytetrafluoroethylene ROT Reactor Outlet Temperature SCFD Standard Cubic Feet per Day SDD System Design Description SDE Sulfur Dioxide Depolarized Electrolyzer SI Sulfur Iodine SIC Silicon Carbide SMR Steam Methane Reforming SNL Sandia National Laboratories SRNL Savannah River National Laboratory SSCS Structures Systems and Components TRL Technology Readiness Level

Hydrogen Plant Alternatives Study NGNP-HPS SHAW-HPA Table of Contents
March 2009
i
TABLE OF CONTENTS Executive Summary .......................................................................................................... ES-1 Introduction ............................................................................................................................. 1
Purpose and Objectives.................................................................................................... 1 Description of the Process of Preparing Information ...................................................... 2 The Evaluation Process.................................................................................................... 3
1 Technology Descriptions .............................................................................................. 1-1 1.1 Sulfuric Acid Decomposition .............................................................................. 1-3 1.2 Sulfur Dioxide Depolarized Electrolysis Technology ......................................... 1-8 1.3 The Bunsen Reaction ......................................................................................... 1-11 1.4 Hydroiodic Acid Decomposition ....................................................................... 1-12 1.5 High Temperature Steam Electrolysis ............................................................... 1-12
2 Process Development.................................................................................................... 2-1 2.1 Hybrid Sulfur ....................................................................................................... 2-2
2.1.1 Process Heat Usage.................................................................................. 2-3 2.1.2 Sulfuric Acid Decomposer....................................................................... 2-5 2.1.3 Electrolyzer .............................................................................................. 2-5 2.1.4 Materials of Construction ........................................................................ 2-7
2.2 Sulfur Iodine ........................................................................................................ 2-8 2.2.1 Process Heat Usage.................................................................................. 2-9 2.2.2 Process Integration and Quantity of Iodine ........................................... 2-10 2.2.3 Design of Reactors and Associated Equipment ..................................... 2-10 2.2.4 Materials of Construction ...................................................................... 2-12
2.3 High Temperature Steam Electrolysis ............................................................... 2-12 2.3.1 Process Heat Usage................................................................................ 2-13 2.3.2 Electrolyzer and Enclosure Design........................................................ 2-14 2.3.3 Piping and Thermal Expansion.............................................................. 2-20 2.3.4 Materials of Construction ...................................................................... 2-20
3 Summary Process Descriptions..................................................................................... 3-1 3.1 Hybrid Sulfur ....................................................................................................... 3-1
3.1.1 Feed and Utility Systems ......................................................................... 3-1 3.1.2 Sulfur Dioxide Depolarized Electrolysis ................................................. 3-2 3.1.3 HyS Sulfuric Acid Decomposition .......................................................... 3-2 3.1.4 Product Purification Systems................................................................... 3-3
3.2 Sulfur Iodine ........................................................................................................ 3-4 3.2.1 Feed and Utility Systems ......................................................................... 3-4 3.2.2 Bunsen Reaction ...................................................................................... 3-5 3.2.3 SI Sulfuric Acid Decomposition.............................................................. 3-7 3.2.4 Hydroiodic Acid Decomposition ............................................................. 3-7 3.2.5 Product Purification Systems................................................................... 3-8
3.3 High Temperature Steam Electrolysis ................................................................. 3-9 3.3.1 Feed and Utility Systems ......................................................................... 3-9 3.3.2 Heat Recovery System........................................................................... 3-11 3.3.3 Electrolysis............................................................................................. 3-11 3.3.4 Product Purification System .................................................................. 3-12

Hydrogen Plant Alternatives Study NGNP-HPS SHAW-HPA Table of Contents
March 2009
ii
4 Life-cycle Cost of Hydrogen ........................................................................................ 4-1 4.1 Development of the Economic Model ................................................................. 4-1 4.2 Economic Factors................................................................................................. 4-2
4.2.1 Price of Hydrogen.................................................................................... 4-2 4.2.2 Availability .............................................................................................. 4-6
4.3 Capital Cost Estimate Basis ................................................................................. 4-7 4.3.1 Estimate Methodology............................................................................. 4-7 4.3.2 Estimate Assumptions.............................................................................. 4-7 4.3.3 Estimate Exclusions ................................................................................. 4-7
4.4 Operating and Maintenance Cost Estimates ........................................................ 4-8 4.5 Economic Analysis and Life-Cycle Cost of Hydrogen........................................ 4-9
4.5.1 Sulfur Iodine ............................................................................................ 4-9 4.5.2 Hybrid Sulfur ......................................................................................... 4-15 4.5.3 High Temperature Steam Electrolysis ................................................... 4-20 4.5.4 Comparison to Baseline Alternates........................................................ 4-25
4.6 Financing Hurdles.............................................................................................. 4-31 5 Other Factors Affecting Commercial Potential ............................................................ 5-1
5.1 Safety, Health and Environmental Assessment ................................................... 5-1 5.1.1 Hybrid Sulfur Process .............................................................................. 5-1 5.1.2 Sulfur Iodine Process ............................................................................... 5-6 5.1.3 High Temperature Steam Electrolysis ................................................... 5-11
5.2 Operability Assessment ..................................................................................... 5-16 5.3 Sensitivity to Reactor Outlet Helium Temperature ........................................... 5-17
5.3.1 Effect on Nuclear Reactor Heat Source ................................................. 5-17 5.3.2 Effect on Hydrogen Production System ................................................ 5-22 5.3.3 Combined Results .................................................................................. 5-27
6 Technology Development............................................................................................. 6-1 6.1 Sulfuric Acid Decomposition .............................................................................. 6-6
6.1.1 Functions and Operating Requirements................................................... 6-6 6.1.2 Development Status ................................................................................. 6-7 6.1.3 Sulfuric Acid Decomposition TRLs ........................................................ 6-9 6.1.4 Technology Development Plan................................................................ 6-9
6.2 Sulfur Dioxide Electrolysis................................................................................ 6-18 6.2.1 Functions and Operating Requirements................................................. 6-19 6.2.2 Development Status ............................................................................... 6-19 6.2.3 Sulfur Dioxide TRLs.............................................................................. 6-20 6.2.4 Technology Development Plan.............................................................. 6-21
6.3 Bunsen Reaction and HI Decomposition Technology Area .............................. 6-29 6.3.1 Functions and Operating Requirements................................................. 6-29 6.3.2 Development Status ............................................................................... 6-30 6.3.3 Sulfur Iodine TRLs ................................................................................ 6-31 6.3.4 Technology Development Plan.............................................................. 6-32
6.4 High Temperature Steam Electrolysis ............................................................... 6-39 6.4.1 Functions and Operating Requirements................................................. 6-40 6.4.2 Development Status ............................................................................... 6-41

Hydrogen Plant Alternatives Study NGNP-HPS SHAW-HPA Table of Contents
March 2009
iii
6.4.3 High Temperature Steam Electrolysis TRLs ......................................... 6-44 6.4.4 Technology Development Plan.............................................................. 6-45
7 Conclusions & Recommendations................................................................................ 7-1 7.1 Summary of Findings........................................................................................... 7-1
7.1.1 Major Findings......................................................................................... 7-1 7.1.2 NGNP Application................................................................................... 7-1 7.1.3 Capital Cost.............................................................................................. 7-1 7.1.4 Cost of Hydrogen..................................................................................... 7-2 7.1.5 Operating Risk ......................................................................................... 7-2 7.1.6 Technology Development........................................................................ 7-3 7.1.7 Technology Risk ...................................................................................... 7-3 7.1.8 Schedule................................................................................................... 7-9 7.1.9 Budget ...................................................................................................... 7-9
7.2 Conclusion ........................................................................................................... 7-9 7.3 Recommendations.............................................................................................. 7-10
8 Appendices
8.1 Hybrid Sulfur Electrolysis 8.1.1 Simulation Diagrams 8.1.2 Mass and Energy Balances 8.1.3 Process Flow Diagrams 8.1.4 Summary Plot Plan Layout 8.1.5 Sized Equipment List 8.1.6 Preliminary Hazards Analysis 8.1.7 Capital Cost Estimate 8.1.8 Operating Cost Estimate
8.2 Sulfur Iodine Process 8.2.1 Simulation Diagrams 8.2.2 Mass and Energy Balances 8.2.3 Process Flow Diagrams 8.2.4 Summary Plot Plan Layout 8.2.5 Sized Equipment List 8.2.6 Preliminary Hazards Analysis 8.2.7 Capital Cost Estimate 8.2.8 Operating Cost Estimate
8.3 High Temperature Steam Electrolysis 8.3.1 Simulation Diagrams 8.3.2 Mass and Energy Balances 8.3.3 Process Flow Diagrams 8.3.4 Summary Plot Plan Layout 8.3.5 Sized Equipment List 8.3.6 Preliminary Hazards Analysis 8.3.7 Capital Cost Estimate 8.3.8 Operating Cost Estimate
8.4 Technology Development

Hydrogen Plant Alternatives Study NGNP-HPS SHAW-HPA Table of Contents
March 2009
iv
8.4.1 Technology Readiness Levels 8.4.2 Design Data Needs 8.4.3 Design Tasks
8.5 Economic Model 8.6 Component Cost Development 8.7 HPAS Study 90% Review Slides
9 References

Hydrogen Plant Alternatives Study NGNP-HPS SHAW-HPA List of Tables
March 2009
v
LIST OF TABLES Table ES-1: Technology Comparison Matrix........................................................................... ES-3 Table ES-2: Technology Capital Requirements ....................................................................... ES-6 Table ES-3: Major HTSE Technology Challenges................................................................. ES-10 Table ES-4: Major HyS Technology Challenges.................................................................... ES-13 Table ES-5: Major SI Technology Challenges ....................................................................... ES-14 Table 1: Economic Parameters ....................................................................................................... 6 Table 2: Chemical Hazard Classifications...................................................................................... 7 Table 2-1: Common Technology Design Basis Issues and Mitigation Measures ....................... 2-2 Table 2-2: Hybrid Sulfur Design Basis Flow Sheet Issues and Mitigation ................................. 2-3 Table 2-3: Comparison of Sizing Assumptions ........................................................................... 2-5 Table 2-4: Sulfur Iodine Design Basis Flow Sheet Issues and Mitigation .................................. 2-8 Table 2-5: HTSE Design Basis Flow Sheet Issues and Mitigation ........................................... 2-13 Table 2-6: Comparison of Sizing Assumptions ......................................................................... 2-15 Table 4-1: Major Assumptions for Analysis of Economics......................................................... 4-2 Table 4-2: Alternate Parameters and Inputs for Analysis of Economics..................................... 4-3 Table 4-3: Variable Inputs for Sensitivity Analysis .................................................................... 4-4 Table 4-4: Calculated Hydrogen Price......................................................................................... 4-9 Table 4-5: Sulfur Iodine – Overall Cost and Performance Factors for Analysis....................... 4-10 Table 4-6: Sulfur Iodine, Reference Case – Capital Cost Summary ......................................... 4-11 Table 4-7: Sulfur Iodine, Carbon Steel Case – Capital Cost Summary..................................... 4-11 Table 4-8: Sulfur Iodine – Replacement Capital Summary....................................................... 4-12 Table 4-9: Calculated Sulfur Iodine Hydrogen Prices............................................................... 4-12 Table 4-10: Sulfur Iodine � Hydrogen Price Components Summary........................................ 4-13 Table 4-11: Hybrid Sulfur – Overall Cost and Performance Factors for Analysis.................... 4-16 Table 4-12: Hybrid Sulfur – Capital Cost Summary ................................................................. 4-17 Table 4-13: Hybrid Sulfur – Replacement Capital Summary.................................................... 4-18 Table 4-14: Hybrid Sulfur – Hydrogen Price Components Summary....................................... 4-18 Table 4-15: HTSE – Overall Cost and Performance Factors for Analysis ................................ 4-21 Table 4-16: HTSE – Capital Cost Summary.............................................................................. 4-22 Table 4-17: HTSE – Replacement Capital Summary................................................................ 4-22 Table 4-18: HTSE – Hydrogen Price Components Summary ................................................... 4-23 Table 4-19: Hydrogen from Natural Gas by Advanced Steam Methane Reforming ................ 4-27 Table 4-20: Hydrogen from Conventional Alkaline Electrolysis .............................................. 4-29 Table 4-21: Project Capital Financing Hurdle ........................................................................... 4-32 Table 5-1: Hazardous Chemicals – Hybrid Sulfur Electrolysis................................................... 5-1 Table 5-2: HyS Process Equipment Summary............................................................................. 5-2 Table 5-3: Preliminary Hazard Assessment, Hybrid Sulfur Hydrogen Production Process........ 5-4 Table 5-4: Hazardous Chemicals – Sulfur Iodine Process........................................................... 5-6 Table 5-5: Sulfur Iodine Process Equipment Summary .............................................................. 5-7 Table 5-6: Preliminary Hazard Assessment, Sulfur Iodine Hydrogen Production Process......... 5-9 Table 5-7: Hazardous Chemicals � High Temperature Steam Electrolysis .............................. 5-11 Table 5-8: HTSE Process Equipment Summary........................................................................ 5-12

Hydrogen Plant Alternatives Study NGNP-HPS SHAW-HPA List of Tables
March 2009
vi
Table 5-9: Preliminary Hazard Assessment, High Temperature Steam Electrolysis Hydrogen Production Process .................................................................................. 5-13
Table 5-10: Effect on NHSS Costs of Lower ROT ................................................................... 5-19 Table 5-11: Effect on Reactor Core Operating Parameters of Lower ROT .............................. 5-22 Table 6-1: Design Readiness Level Generic Definitions............................................................. 6-2 Table 6-2: Technology Readiness Level Generic Definition ...................................................... 6-4 Table 6-3: Overall System DRLs and TRLs................................................................................ 6-6 Table 6-4: Sulfuric Acid Decomposition DRLs .......................................................................... 6-8 Table 6-5: Acid Decomposition Section TRLs............................................................................ 6-9 Table 6-6: Cost and Schedule for the Sulfuric Acid Decomposition Technology Area............ 6-18 Table 6-7: Sulfur Dioxide Electrolysis Systems DRLs ............................................................. 6-19 Table 6-8: Sulfur Dioxide Electrolysis TRLs ............................................................................ 6-20 Table 6-9: Nominal Goals of Electrolyzer Pilot-Scale Test ...................................................... 6-26 Table 6-10: Nominal Goals of Electrolyzer Engineering-Scale Test ........................................ 6-26 Table 6-11: Duration and Maximum Rates Degradation for Cell Tests.................................... 6-28 Table 6-12: Cost and Schedule for the Sulfur Dioxide Electrolysis Technology Area ............. 6-28 Table 6-13: Bunsen Reaction and HI Decomposition Systems DRLs ...................................... 6-31 Table 6-14: Bunsen Reaction and HI Decomposition Section TRLs ........................................ 6-32 Table 6-15: Cost and Schedule for the Bunsen Reaction and HI Decomposition
Technology Area.................................................................................................... 6-39 Table 6-16: High Temperature Steam Electrolysis DRLs ......................................................... 6-43 Table 6-17: High Temperature Steam Electrolysis TRLs.......................................................... 6-44 Table 6-18: Cost and Schedule for the High Temperature Steam Electrolysis
Technology Area.................................................................................................... 6-54 Table 7-1: Major HTSE Technology Challenges ........................................................................ 7-4 Table 7-2: Major Hybrid Sulfur Technology Challenges ............................................................ 7-6 Table 7-3: Major Sulfur Iodine Technology Challenges ............................................................. 7-8

Hydrogen Plant Alternatives Study NGNP-HPS SHAW-HPA List of Figures
March 2009
vii
LIST OF FIGURES Figure ES-1: Hydrogen Plant Alternatives Study Work Flow.................................................. ES-2 Figure ES-2: Hydrogen Selling Price as a Function of Reactor Outlet Temperature............... ES-8 Figure 1: Evaluation Criteria .......................................................................................................... 4 Figure 1-1: The Hybrid Sulfur Process........................................................................................ 1-1 Figure 1-2: The Sulfur Iodine Process ......................................................................................... 1-2 Figure 1-3: The High Temperature Steam Electrolysis Process.................................................. 1-3 Figure 1-4: Schematic Diagram of the SNL Bayonet Decomposition Reactor ........................... 1-5 Figure 1-5: Sulfuric Acid Decomposition Bayonet Reactor Helium Cooling and Process
Stream Heating Curves ............................................................................................. 1-7 Figure 1-6: Sulfuric Acid Decomposition Bayonet Reactor Process Stream Heating
and Cooling Curves .................................................................................................. 1-8 Figure 1-7: Schematic of HyS Electrolysis Reaction .................................................................. 1-9 Figure 1-8: SRNL Test Cell Schematic ..................................................................................... 1-10 Figure 1-9: Thermodynamic Potential of HTSE........................................................................ 1-14 Figure 1-10: Energy Budgets in Fuel Cell and Electrolysis Modes for Solid Oxide Cells ....... 1-16 Figure 2-1: Enthalpy�Temperature Diagram for Steam Generation in the HyS Process............ 2-4 Figure 2-2: Electrolysis Cell Assembly Concept......................................................................... 2-6 Figure 2-3: Typical Electrolyzer Rack......................................................................................... 2-7 Figure 2-4: Enthalpy�Temperature Diagram for Steam Generation in the HTSE Process ....... 2-14 Figure 2-5: Planar Solid-Oxide Electrolysis Cell ...................................................................... 2-15 Figure 2-6: Plan View of Electrolysis Module .......................................................................... 2-17 Figure 2-7: Cross Section of Electrolysis Module..................................................................... 2-18 Figure 4-1: Schematic Diagram and Energy Balance for Sulfur Iodine...................................... 4-9 Figure 4-2: Tornado Chart for Sulfur Iodine Initial and Replacement Capital Cost Factors .... 4-14 Figure 4-3: Tornado Chart for Sulfur Iodine’s Other Cost Factors ........................................... 4-15 Figure 4-4: Schematic Diagram and Energy Balance for Hybrid Sulfur................................... 4-16 Figure 4-5: Tornado Chart for HyS Initial and Replacement Capital Cost Factors................... 4-19 Figure 4-6: Tornado Chart for Hybrid Sulfur’s Other Cost Factors .......................................... 4-20 Figure 4-7: Schematic Diagram and Energy Balance for HTSE ............................................... 4-21 Figure 4-8: Tornado Chart for HTSE’s Initial and Replacement Capital Cost Factors............. 4-24 Figure 4-9: Tornado Chart for HTSE’s Other Cost Factors ...................................................... 4-25 Figure 4-10: H2 Price from SMR as a Function of Natural Gas Cost with Escalation .............. 4-27 Figure 4-11: Hydrogen Price from Electrolysis as a Function of Electricity Cost .................... 4-29 Figure 4-12: Hydrogen Price and SMR Baseline, All with Escalation...................................... 4-30 Figure 4-13: Hydrogen Price and Electrolysis Baselines, All with Escalation.......................... 4-31 Figure 5-1: Cost of Heat from the NHSS................................................................................... 5-20 Figure 5-2: Cost Savings from Sharing between Multiple Reactor Modules............................ 5-21 Figure 5-3: Effect of ROT on NHSS Flows and Circulator Power ........................................... 5-22 Figure 5-4: Influence of Reactor Outlet Temperature for SI ..................................................... 5-24 Figure 5-5: Influence of Reactor Outlet Temperature for HyS.................................................. 5-25 Figure 5-6: Influence of Reactor Outlet Temperature for HTSE............................................... 5-27 Figure 5-7: Influence of Reactor Outlet Temperature on Process Efficiency ........................... 5-28 Figure 5-8: Influence of Reactor Outlet Temperature on Plant Overall Efficiency .................. 5-28

Hydrogen Plant Alternatives Study NGNP-HPS SHAW-HPA List of Figures
March 2009
viii
Figure 5-9: Hydrogen Selling Price as a Function of Reactor Outlet Temperature................... 5-29 Figure 6-1: Technology Development Roadmap for Sulfuric Acid Decomposition................. 6-10 Figure 6-2: Technology Development Road Map for Sulfur Dioxide Electrolysis................... 6-22 Figure 6-3: Technology Development Road Map for the Bunsen Reaction and
HI Decomposition .................................................................................................. 6-33 Figure 6-4: Technology Development Road Map for High Temperature Steam Electrolysis .. 6-46

Hydrogen Plant Alternatives Study NGNP-HPS SHAW-HPA Executive Summary
NGNP_HPAS_ExecutiveSummary.doc March 2009
ES�1 of 17
EXECUTIVE SUMMARY
PURPOSE AND OBJECTIVES The purpose of this study is to compare three hydrogen production technologies and
processes on consistent technical and economic bases. The technologies and associated process systems are the leading candidates for deployment with a High Temperature Gas Cooled Reactor (HTGR). These processes are the Sulfur Iodine (SI), High Temperature Steam Electrolysis (HTSE), and Hybrid Sulfur (HyS) water splitting technologies. Additionally, the study provides the cost and technology readiness basis for further development, testing, and demonstration of each technology.
The economic viability of each technology is assessed based on capital costs, operating
costs, technical risk, safety, and operability. Standard industry practice with respect to process engineering and cost estimating were used to assess the economic viability of each technology for commercial implementation. Only limited credit was given for cost improvements from technology breakthroughs. Operating costs were based on first-of-a-kind process availability. All of these technologies are at an early stage of development, and the individual operability and safety concerns were identified and evaluated to further define risks to commercialization. To that end, an analysis was performed that evaluated the sensitivity of hydrogen cost, per kilogram of hydrogen produced, against variations in the range of the HTGR outlet temperature (i.e., from 950°C to 700°C).
Although there are many potential configurations for hydrogen production processes
coupled to HTGRs, a single scenario was developed for this study to make the comparison consistent and easy to understand. This scenario sizes each hydrogen process to approximately the same production rate as a large commercial hydrogen facility in operation today. Three flowsheets with consistent assumptions, and using commercially available equipment where possible, were developed based on that production rate. The flowsheets were used to rate the process maturity and identify technology development and design needs for major equipment and subsystems. It was assumed that design, development, and construction would be completed in a ten year period. Estimated costs are based on industry databases for materials and labor, and on the estimates of technical experts from associated research and development programs. This comparison process is consistent with industry practices used to assess the commercial potential of new technologies and chemical processes.
Besides economic viability, the commercial potential of a technology depends upon its
industrial safety and operability. Although all of these technologies are at an early stage of development, attributes of each that raise operability or safety concerns are identified and evaluated.
Hydrogen Plant Alternatives Study NGNP-HPS SHAW-HPA Executive Summary
NGNP_HPAS_ExecutiveSummary.doc March 2009
ES�2 of 17
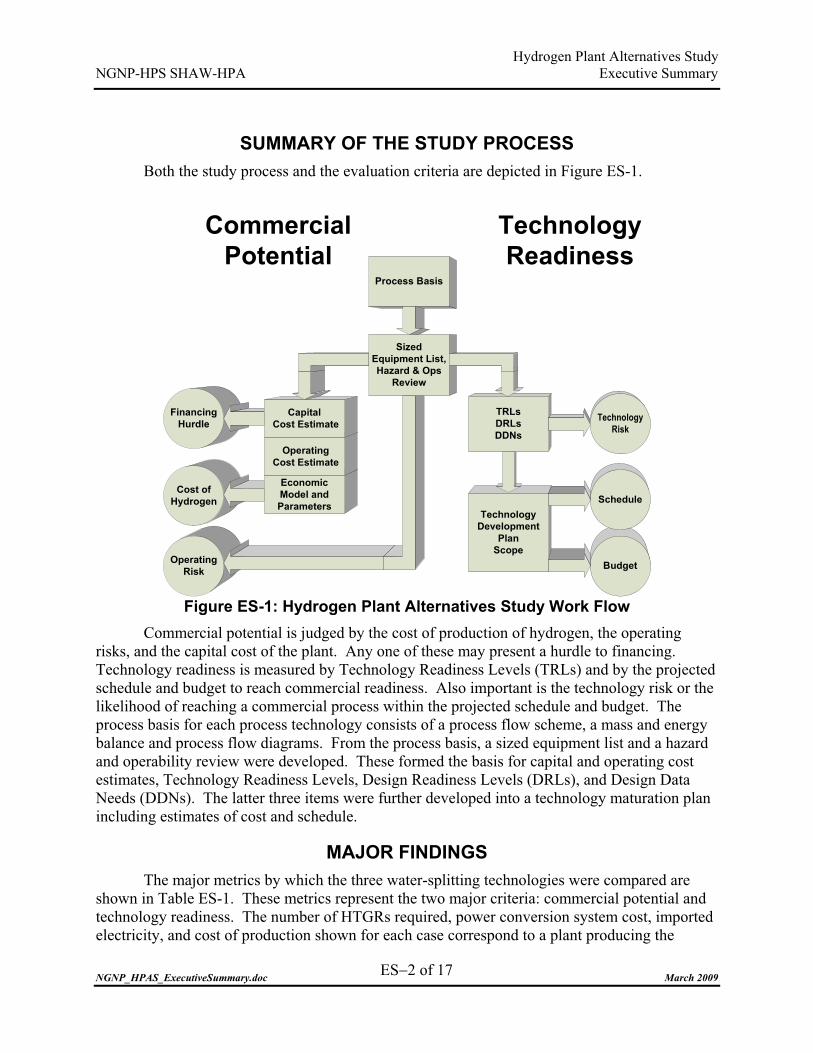
SUMMARY OF THE STUDY PROCESS Both the study process and the evaluation criteria are depicted in Figure ES-1.
Operating Risk
Cost of Hydrogen
Financing Hurdle
Economic Model and Parameters
Operating Cost Estimate
Commercial Potential
Technology Readiness
Process Basis
Budget
Technology Development
Plan Scope
Capital Cost Estimate
TRLsDRLsDDNs
Sized Equipment List, Hazard & Ops
Review
Technology Risk
Schedule
Figure ES-1: Hydrogen Plant Alternatives Study Work Flow
Commercial potential is judged by the cost of production of hydrogen, the operating risks, and the capital cost of the plant. Any one of these may present a hurdle to financing. Technology readiness is measured by Technology Readiness Levels (TRLs) and by the projected schedule and budget to reach commercial readiness. Also important is the technology risk or the likelihood of reaching a commercial process within the projected schedule and budget. The process basis for each process technology consists of a process flow scheme, a mass and energy balance and process flow diagrams. From the process basis, a sized equipment list and a hazard and operability review were developed. These formed the basis for capital and operating cost estimates, Technology Readiness Levels, Design Readiness Levels (DRLs), and Design Data Needs (DDNs). The latter three items were further developed into a technology maturation plan including estimates of cost and schedule.
MAJOR FINDINGS The major metrics by which the three water-splitting technologies were compared are
shown in Table ES-1. These metrics represent the two major criteria: commercial potential and technology readiness. The number of HTGRs required, power conversion system cost, imported electricity, and cost of production shown for each case correspond to a plant producing the

Hydrogen Plant Alternatives Study NGNP-HPS SHAW-HPA Executive Summary
NGNP_HPAS_ExecutiveSummary.doc March 2009
ES�3 of 17
capacity shown in the first row of the table. The plant capacity is intended to match the capacity of a large commercial hydrogen plant by current standards. Capacities are not equal in all cases because of adjustments made to better optimize the cost of production in each case.
Table ES-1: Technology Comparison Matrix
Commercial Potential SI HyS HTSE
Plant Capacity, Million Standard Cubic Feet per Day (MMSCFD) 157 142 142
Hydrogen Production Process Capital Cost (no contingency)(1) , $ million 2,672(2) 916 506
Number of HTGRs required 3 2 1
Power Conversion System Capital Cost, $ million N/A(3) 178 217
Nuclear Heat Supply, $/MWth 25 to 35
Imported Electricity, MWehr/hr 226 100 327
Cost of Production, $/kg 10.71 6.83 6.04
Operating Risk, Low (L)/ Medium (M)/ High (H) H M-H M-H
Technology Readiness TRL (4) 2 2 3
Number of Technology Challenges (Refer to Tables ES-3 to ES-5)
9 8 6
Risk � Low (L)/ Medium (M)/ High (H) H M-H H
R&D Schedule to Reach Commercial Status, years 10 10 10
R &D Budget to Deploy Commercial-Scale Demonstration, $ million
178 194 130
(1) Capital cost does not include the cost of the HTGR(s). Cost of nuclear heat is assessed as $/MWth assuming that the nuclear heat required by the respective process is purchased “over the fence.” This cost factor reflects the capital cost of the HTGR(s).
(2) This capital cost estimate is imprecise due to the large amount of exotic materials of construction (tantalum, tantalum alloys, and tantalum lined steel) for which reliable costs for large quantities are not available. To establish a lower limit to the capital cost, the estimate was also executed using carbon steel as the material of construction. This estimate resulted in a capital cost of $1,201 million.
(3) PCS cost is associated with the electrolyzers, which is not present in the SI technology. (4) Technology Readiness Levels (TRLs) are rated from 1 to 10, with 1 corresponding to observed
phenomena in the laboratory without any defined application and 10 corresponding to one that is ready for commercial-scale demonstration. A TRL of 2 corresponds to there being the formulation of a technology concept and application. A TRL of 3 corresponds to there being a proof of concept through laboratory scale testing and experimentation.
Major findings of this study are presented below and support for these findings is
presented in the following section.

Hydrogen Plant Alternatives Study NGNP-HPS SHAW-HPA Executive Summary
NGNP_HPAS_ExecutiveSummary.doc March 2009
ES�4 of 17
Competitiveness � The best of the HTGR-based water-splitting processes is not projected to be
competitive with Steam Methane Reforming (SMR) until the price of natural gas exceeds about $15/MMBtu plus a real escalation rate of 2%/yr and/or there is an equivalent cost or tax associated with carbon collection and sequestration.
� Operating risks of these technologies are very high in comparison with current hydrogen production plants. Of the three hydrogen production technologies, the SI process has the highest risk because of the complex chemical process and the large inventory of hazardous chemicals.
� The HyS and HTSE processes should be competitive with ambient temperature alkaline or PEM electrolysis, even when considering the future cost goals associated with those technologies.
Capital Cost � Costs of electrolytic cells dominate the capital cost of both the HTSE and HyS
technologies. Available cost estimates are indicative at best. The authors utilized the best estimates available from the technology developers for capital costs associated with key components of these developing technologies. Otherwise, costs not provided by the technology developers are consistent in source and accuracy. SI iodine inventory costs are about the same as the cost of the electrolytic cells.
Technology Limitations and Challenges � All three water-splitting technologies have irreducible costs and complexity due to
fundamental thermodynamic limitations. Alleviation by additional research or engineering is considered limited.
� For HTSE, thermodynamic limitations indicate that this process may be better suited to a combined process heat application in which HTSE uses process heat above 700°C and the other applications, such as cogeneration, uses the lower portion. Even this arrangement faces serious challenges. Alternately, HTSE could be coupled to a conventional light water reactor with heat recuperation integrated into the electrolysis module, if dedicated hydrogen production is the goal.
Technology Development � Insufficient design has been carried out on the major components of these
technologies to have assurance either that all the major component engineering and design issues have been discovered or that some of the major issues identified here can be resolved.
� Materials of construction, including auxiliary materials such as seals, gaskets, and linings, will be a major development issue. Development of these items is not included in the R&D program, yet they may be a limiting factor associated with cost and schedule.

Hydrogen Plant Alternatives Study NGNP-HPS SHAW-HPA Executive Summary
NGNP_HPAS_ExecutiveSummary.doc March 2009
ES�5 of 17
� Current plans for technology development are for demonstrations larger than is typically required by industry. In part because each technology will operate in a modular fashion or with multiple process trains, smaller demonstrations may be sufficient to demonstrate viability. Additionally, viability of the processes may be demonstrated with a non-nuclear heat source.
NGNP Application � For HTSE, there is a distinct disproportion between the amount of nuclear heat
supplied by the HTGR and the amount of process heat used by the technology. There is significantly more heat produced by the HTGR than required by the process. Scaling up a HTSE process to match the nuclear heat output would result in an unrealistically large hydrogen production rate. Coupling HTSE with a HTGR also presents formidable challenges with thermal expansion of the process piping and thermal insulation within vessels and the electrolysis modules. From a commercial perspective, there is little incentive to incur the significant development costs and risks in developing HTSE for a HTGR when there are other more attractive alternatives for HTSE (e.g., an LWR).
� A key step in the SI process, HI reactive distillation, has not yet been proven in principle and operating risks and costs are likely to be very high. It too is an unlikely candidate for NGNP application.
� Although it also faces several challenges, the HyS process is the most likely candidate, at this time, for the earliest commercial-scale demonstration with NGNP or to replace an industrial-scale SMR process.
� The risk is high that none of these technologies can reach commercial-scale demonstration readiness in time to support a demonstration immediately following NGNP’s initial start-up.
SUMMARY OF REASONS FOR THE MAJOR CONCLUSIONS AND RECOMMENDATIONS
Capital Cost The capital cost of all three of these technologies is high in comparison to steam methane
reforming plants. Current estimates for a ~150 million SCFD steam methane-based hydrogen plant range around $300 million.
The estimated cost of the hydrogen production plants developed for this study, excluding
nuclear reactors, range from about three to ten times the cost of a comparably sized steam methane reforming plant. This is not surprising given the complexity of these plants, costly materials of construction, and the high cost components such as electrolytic cells.

Hydrogen Plant Alternatives Study NGNP-HPS SHAW-HPA Executive Summary
NGNP_HPAS_ExecutiveSummary.doc March 2009
ES�6 of 17
Total capital required to develop the respective hydrogen production facilities is summarized in Table ES-2. Costs are developed for facilities with about 142 MMSCFD hydrogen output, including costs associated the nuclear heat supply and an allocation for new nuclear power plants to provide the imported electricity.
Table ES-2: Technology Capital Requirements
Capital Requirements ($M) SI HyS HTSE
Capital Cost of Hydrogen Plant 3,061 1,326 903
Capital Cost of Nuclear Heat Plant(s) 2,912 2,192 1,349
Total Capital Required for Hydrogen Production Facility 5,973 3,518 2,252
Capital Required for New Nuclear Generation Plants (Imported Electrical Power) 813 410 1,177
Total Capital Required for Hydrogen Production Plant Development 6,786 3,928 3,429
It can be seen from Table ES-2 that the direct capital required for the development of a
hydrogen production facility is the lowest for the HTSE process with the HyS process requiring about 50% more capital and the SI process requires about 2.6 times more capital than the HTSE Process. As mentioned previously, the above costs are based on the best estimates available from the technology developers for capital costs associated with key components of these developing technologies. Otherwise, costs not provided by the technology developers are consistent in source and accuracy. Additionally, it should be noted that the above costs are based on the design bases and assumptions detailed within this study. The authors caution that care should be taken when comparing these numbers against others based on different reference conditions and assumptions.
The HyS and the HTSE process have about the same financing hurdle when considering
the capital required to construct new nuclear generating capacity to supply the imported power required for hydrogen production. The SI process has the highest financial hurdle when considering both process plant capital costs and new nuclear generating capacity.
Cost of Production Cost of production of hydrogen from these plants is largely dependent upon the capital
charges and the cost of the nuclear heat. However imported electric power is a significant cost contributor for the SI and HTSE processes. Cost of hydrogen is estimated to be $10.71/kg H2 for the SI process, $6.83/kg H2 for the HyS process, and $6.04/kg H2 for the HTSE process.
The economic analysis assumes that all utilities, including the nuclear process heat, are
purchased “over-the-fence.”

Hydrogen Plant Alternatives Study NGNP-HPS SHAW-HPA Executive Summary
NGNP_HPAS_ExecutiveSummary.doc March 2009
ES�7 of 17
Generally, the SI process was the most sensitive to variations in the value of the economic assumptions used to estimate the cost of hydrogen. The HyS and HTSE processes were less sensitive to variations in the value of the economic assumptions used to estimate the cost of hydrogen.
Reductions in capital cost, and the IRR, would provide the greatest opportunity for
reducing the cost of hydrogen in the SI process. The capital cost for the SI process is dominated by the cost of the exotic materials of construction. Identification of alternate less costly materials would result in the greatest reduction in the cost of hydrogen produced by the SI process.
Reduction in capital cost would also result in lower hydrogen costs for the HyS and
HTSE processes The SI and HyS hydrogen production costs were most sensitive to IRR, nuclear heat
costs, capacity factor, and electricity costs – in that order – while HTSE hydrogen production costs were sensitive to electricity costs, nuclear heat costs, and IRR.
The above mentioned costs of production for the three production technologies were then
compared on an equivalent basis to the prices for hydrogen from alternate baseline technologies. The baselines chosen are natural gas steam methane reforming and alkaline water electrolysis. Based on the analyses performed in the study, the hydrogen costs varied between $2 to $3/kg H2 for steam methane reforming and varied between $4 to $6/kg H2 for alkaline water electrolysis.
Hydrogen Selling Price As part of the study, a sensitivity analysis of the hydrogen selling price versus various
Reactor Outlet Temperatures (ROT) was conducted for each of the technologies. Intuitively, the lowering of the ROT would have an effect of increasing the contribution of the HPS cost to the hydrogen selling price and reducing the contribution of the NHSS cost to the price. The selling price of hydrogen as a function of the ROT is shown in Figure ES-2.
It can be seen in Figure ES-2 that HTSE has not only the lowest calculated hydrogen
selling price, but also the least sensitivity to NHSS reactor outlet temperature. The magnitude of sensitivity can be explained by the HTSE process cycle using the least amount of high-temperature heat among the three processes. At a 950°C reactor outlet temperature, the reference HTSE HPS uses a small fraction of the heat from one reactor unit. As reactor outlet temperature declines, the fraction from the HTGR is less, and to provide the required heat for the electrolysis process greater amounts of ohmic heating are utilized. Thus, as the temperature of the heat from the NHSS decreases, the amount of heat per unit output of the HTSE process is even less. However, since the fraction of high-temperature heat in the reference 950°C case is so small, the influence on hydrogen selling price is slight. At or below a NHSS outlet temperature of about 850°C, the energy budget is such that no process heat is required.

Hydrogen Plant Alternatives Study NGNP-HPS SHAW-HPA Executive Summary
NGNP_HPAS_ExecutiveSummary.doc March 2009
ES�8 of 17
5.00
6.00
7.00
8.00
9.00
10.00
11.00
12.00
13.00
14.00
650 700 750 800 850 900 950 1000
Reactor Outlet Temperature, °C
Hyd
roge
n Se
lling
Pric
e, $
/kg
S-I
HyS
HTSE
Figure ES-2: Hydrogen Selling Price as a Function of Reactor Outlet Temperature
Both Hybrid Sulfur and Sulfur Iodine cycles have rapid capital cost increase and
increasing power consumption as the conversion in the Sulfuric Acid Decomposer per pass declines with lower maximum process temperature. This is because the Sulfuric Acid Decomposition section flows need to be greater, pumping power is higher, and energy for acid concentration is greater.
Hybrid Sulfur has the most sensitivity to NHSS reactor outlet temperature at the 750°C
end of the range calculated. This is a phenomenon of the limit on usable heat set by the pinch point in the Sulfuric Acid Decomposer. All heat below approximately 500°C can only be used for electric generation.
The same sensitivity is not shown by the Sulfur Iodine cycle because the NHSS heat goes
to both the Sulfuric Acid Decomposition section and to the HI section. Therefore, less heat is committed to the Acid Decomposer and consequently limited by the pinch.
A notable result is that, based on the mathematical model and assumptions of this
evaluation, the hydrogen price with all factors considered is relatively flat as a function of reactor outlet temperature down to about 800-850°C for SI and HTSE. This trend would suggest that HTSE is a better match for an HTGR at lower temperatures than the other two technologies.

Hydrogen Plant Alternatives Study NGNP-HPS SHAW-HPA Executive Summary
NGNP_HPAS_ExecutiveSummary.doc March 2009
ES�9 of 17
However, this trend is misleading. Rather, the relatively modest increase in selling price is due to the fact that HTSE is increasingly importing inexpensive electricity for process use and is relying less and less on nuclear heat from the HTGR for process heat. In other words, HTSE technology is more appealing at lower temperatures because its process heat demands are being provided through other more economical energy sources than a HTGR.
Operating Risk The operating risk for all of these technologies is high. Operating risk includes such
aspects as the potential for operating failure, loss of investment, and down-time. For HTSE, there is a serious potential for hot hydrogen and/or hot oxygen leakage. This would result in a hydrogen flame with resulting loss of investment or operator injury, depending upon the design of the cell stacks. There are roughly 1500 km of seal length in the cell modules in the current design, all of which are operating at temperatures at or above 800°C, but at a relatively low differential pressure. The operating temperature is above the auto-ignition temperature for hydrogen guaranteeing a flame rather than an explosion.
Both Hybrid Sulfur and Sulfur Iodine plants handle large amounts of sulfuric acid as well
as mixtures of hot steam, sulfur trioxide, sulfur dioxide, and oxygen. The potential for corrosion from these materials increases the risk of leakage. Economical materials currently available for this service consist of polymer lined steel. Mechanical damage to the linings can cause very rapid corrosion of the pressure boundary and catastrophic failure. Increased maintenance can alleviate this problem, but detection of lining failure is difficult and uncertain.
In addition, the Sulfur Iodine process requires circulation of very large amounts of iodine
and hydroiodic acid. The estimated inventory of the base case plant is 7500 tonnes of iodine. The stoichiometric circulation rate of iodine is 2 kmols/s in each of the three trains, which equals 508 kilograms per second or about ½ ton per second. The circulation rate is actually higher because iodine as well as HI is circulated to the HI decomposition section. The corrosive nature of these materials enhances the potential for leaks, spills, and increased maintenance costs.
Technology Readiness Level (TRL) The technology readiness level for each of these technologies is currently low. This is
the case because although some critical systems, structures, and components (SSCs) of each technology have advanced beyond the early stages of development, others have not. For sulfuric acid decomposition, used in both HyS and SI, the functionality of the bayonet tube has been tested at bench scale. A catalyst with a reasonable commercial life, however, has not. The technology as a whole therefore cannot advance beyond the level of the least developed component.
Risk Risk as used here means the likelihood of not achieving a commercial, economically
viable process design, including all critical components, in a ten year period. Risk is therefore

Hydrogen Plant Alternatives Study NGNP-HPS SHAW-HPA Executive Summary
NGNP_HPAS_ExecutiveSummary.doc March 2009
ES�10 of 17
relative to process economics and schedule. Given a higher value product or a more leisurely schedule, the risk of failure to achieve these goals is reduced. The standard by which risk is judged here is the standard set by this study. The risk we are judging is the likelihood of missing the economic and schedule parameters set forth in this study by a significant margin due to technology development challenges.
By a careful analysis of the challenges faced by each technology, the risks fall into five
major categories: � Fundamental (F) limitations: These are clear limits set by the laws of physics,
chemistry, and thermodynamics. It is evident that no amount of research or engineering will overcome these.
� Possible (P) fundamental limitations: These are limits that may be fundamental, but that could be circumvented by an alternative design.
� Obscure (O) path to success: These are issues for which little consideration has yet been given.
� Difficult (D) but relatively clear path forward: Some consideration has been given to these issues and the path forward is reasonably clear, but could still raise challenges to schedule and cost.
� Straightforward (S) path to success. These issues are treated in the body of the report, but are not dealt with here.
Some engineering judgment is involved in these rankings and some disagreement
between honest judges is to be expected. Table ES-3 through Table ES-5 list the major technical issues of each technology and categorize them according to the above scheme of five major categories (F, P, O, D or S). The initial letter of each category is used as a designator in the tables.
Table ES-3: Major HTSE Technology Challenges
A. Uses proportionately little high temperature process heat F B. High temperature heat added between cell stack and heat recuperation F C. Thermal expansion in the delivery piping and pipe insulation P D. Thermal insulation of electrolyzer modules P E. Reliably sealing the cells from hydrogen, steam, air, and oxygen leaks P�O F. Rapid deactivation of the cells O�D G. Cell scale-up P
A. Very little of the energy required to electrolyze steam into oxygen and hydrogen
can be supplied as process heat using the HTSE technology. At best only 15% of the total energy to split water would be added as process heat. The rest is added as electrical energy. Considering the process heat as a fraction of the total heat used for both process heat and electrical generation, the fraction is only about 7%. This means that if a 550 MWth HTGR were used exclusively for process heat, the plant capacity would be about 900 MMSCFD of hydrogen and the amount of

Hydrogen Plant Alternatives Study NGNP-HPS SHAW-HPA Executive Summary
NGNP_HPAS_ExecutiveSummary.doc March 2009
ES�11 of 17
imported electricity would be 3,000 MWehr/hr. The bench scale laboratory work that has been carried out thus far has been using the thermal neutral point as the benchmark case. Consequently, process heat is required only to compensate for thermal losses. The thermal requirement of the process is generated by ohmic losses in the cells.
B. Process heat must be added between the cell stack and the recuperation equipment. This results in several very challenging engineering problems including distributing very hot steam and air to many cell stacks, limiting heat losses from the pipe and stacks, designing for thermal expansion of the distribution piping, designing for thermal expansion of the stacks and of tension bars meant to maintain pressure on the inter-cell seals, penetrating a pressure boundary at very high temperatures and pressures with large electrical cables, and maintaining the integrity of electrical connections in a very hot and possibly oxidizing environment. Recognizing these issues, the technology development team has developed a recuperator integrated into the cell stack. Combined with operation at the thermal neutral point, this is an elegant approach. However, it practically precludes using any appreciable amount of nuclear process heat from a HTGR.
C. Thermal expansion of the delivery pipe is a more difficult issue than it at first
appears. The fact that the piping must operate at very high temperatures and possibly pressures will require that it be very heavy wall pipe. This will reduce its flexibility considerably thereby increasing the stress on critical fittings (e.g., elbows) during expansion of the piping. Expansion loops will be required to compensate for about two meters of expansion. The length of these loops will add appreciably to the length, pressure drop, and heat losses from the piping. From discussions with piping experts, it is not clear that a feasible solution is available. It is unclear at this time how this expanding piping will be insulated such that the insulation will accommodate or expand with the piping.
D. Per the study’s design, the operating temperature and pressure of the electrolyzer modules are 870°C and 56 bar, respectively. For the modules, the insulating properties of any internal insulation will be an order of magnitude lower than we expected due to the high operating pressure. Up to about 40 bar, the thermal conductivity of gases are affected only very slightly by pressure. As pressure rises above this level, however, the thermal conductivity increases very rapidly. The thermal conductivity of the insulation is entirely dependent upon the conductivity of the gas in the insulation. For internal insulation, this will be air and oxygen. For air and oxygen above 40 bar, the dependence of thermal conductivity on pressure changes dramatically and becomes quite strong. Although the effect on the Prandtl number is negligible, the effect on conductivity, and therefore presumably also on viscosity, is large. For gas trapped in the insulation, conductivity and not Prandtl number is important: heat

Hydrogen Plant Alternatives Study NGNP-HPS SHAW-HPA Executive Summary
NGNP_HPAS_ExecutiveSummary.doc March 2009
ES�12 of 17
transmission is mostly by conduction, not convection. The net effect is that the insulation becomes largely ineffective.
E. The sealing issues inherent in the current design are described above. A cell stack design that does not require enclosure by a pressure vessel may mitigate some of the problems, but it raises additional issues. Such a stack design would be able to operate only at low pressure. This would require much larger equipment as well as expensive compression of low pressure hydrogen to pipeline pressures.
F. Current active cell life is extremely short by commercial standards. The causes of de-activation are as yet unknown. This may be a problem related to dissolved ions in the feed water or may be inherent to the cell design itself. This is discussed in further detail in the HyS section below. If the current Ceramatec cell design is indeed inherently life limiting, alternative cell designs such as the all ceramic NASA cells may need to be considered. It should be noted, however, that the NASA cells are at a much earlier stage of development. Therefore, if the Ceramatec design is deemed not to be viable because of cell longevity, there is the implication that the technology readiness will need to be downgraded further.
G. Cell scale-up is an issue for both HTSE and HyS. In the case of SO2 electrolysis cells, there are similar commercial cells operating in chlor-alkali and in water electrolysis service. There is a reasonable chance, therefore, that this electrolysis technology can be successfully scaled to commercial size. For HTSE cells, on the other hand, operating conditions are far more demanding. Although solid oxide fuel cells have been developed and tested at a reasonable scale, there are significant differences between fuel cells and electrolysis cells that call into question the possibility of developing electrolysis cells at a scale large enough to make a nuclear heated installation practical. Differential thermal expansion at high temperatures may establish a physical limit to the cell size.
The cell deactivation and scale-up challenges may be resolved in a timely fashion for the
NGNP project. The disproportionate process heat requirement and the difficulty of applying process heat to this technology, or the need to operate at low pressures and compress the products, reduce the incentive for using this as an NGNP application. The risk of reaching commercial status in time for commercial deployment with NGNP is high due to several key technical challenges: the thermal expansion issues associated with the electrolyzer modules’ structure, distribution piping, and cell stacks; the thermal insulation of the electrolyzer modules; and the sealing of the cells.

Hydrogen Plant Alternatives Study NGNP-HPS SHAW-HPA Executive Summary
NGNP_HPAS_ExecutiveSummary.doc March 2009
ES�13 of 17
Table ES-4: Major HyS Technology Challenges A. Only 65% of the NHSS can be used for sulfuric acid decomposition. F B. Decomposer tolerance to contaminants P�O C. Metal to ceramic transition in the sulfuric acid decomposer D�S D. Decomposition catalyst D E. Thermal and hydraulic design of the decomposer D�S F. Sulfur leakage through cell membranes D G. Cell tolerance to contaminants O H. Shunt currents O
A. Thermal analysis of the sulfuric acid decomposition shows that there is a heat recovery limitation associated with the bayonet reactor and the shape of the enthalpy versus temperature curve. In essence, the minimum process temperature at which heat can be used is 500°C. This means that the minimum temperature of helium leaving the sulfuric acid decomposer must be about 520 to 550°C. The remainder of the nuclear heat must be used in processes that use lower temperature heat. If the nuclear reactor return temperature is around 350°C, a significant portion of the nuclear heat cannot therefore be used in the process. Steam can be raised and power generated with this heat, but this would be high-cost power because of the scale of the reactor and generation plant.
B. All of these technologies use liquid water as a feedstock. No matter how well the
water is purified, there will be dissolved ions in it. The products are all gaseous and therefore these ions will be left in the system. After extended operation these will have an effect on the cells and decomposer. Those effects have not been identified or quantified.
C. The sulfuric acid decomposer will most likely use silicon carbide heat transfer
surfaces because of its resistance to both corrosion and loss of strength at high temperatures. The pressure boundary will, however, be metallic. At some point, regardless of the design, there must be a transition between silicon carbide and metal. This will be in the form of a seal or some kind of brazing or welding. Potential solutions for this are available, but further investigation is required.
D. Decomposition catalyst now being used is costly and has a limited lifetime. A
commercially viable catalyst must be developed. Although catalyst development is never straightforward, several avenues of approach have been suggested and the experts are hopeful that a catalyst can be developed in a timely fashion.
E. Initial studies have been made of the thermal and hydraulic characteristics of the
decomposer under ideal conditions. These must be extended to include reaction kinetics and realistic estimates of heat transfer rates, pressure drops, and the like.
Hydrogen Plant Alternatives Study NGNP-HPS SHAW-HPA Executive Summary
NGNP_HPAS_ExecutiveSummary.doc March 2009
ES�14 of 17
F. Current SO2 electrolysis cell operation shows a significant amount of sulfur formation on the hydrogen side of the proton exchange membrane (PEM). This indicates that one or more sulfur species are migrating through the membrane. Until now the approach has been to try different membrane materials to reduce this effect. Recent progress at SRNL has demonstrated cell operation for relatively short durations (i.e., 50 hours) without sulfur build-up or noticeable cell degradation, and longer term testing is planned. This may ultimately be successful, but it may be fruitful to work at better understanding the fundamentals of the problem.
G. See paragraph “B” above.
H. Distributing electrolyte flow to many cells in parallel while they are connected in
series electrically presents the opportunity for current to flow through the electrolyte and short circuit the cells. This shunt current can become a serious problem with large cell stacks.
The use of only a portion of the nuclear energy as process heat is a handicap for this
technology, but it does not appear to render it economically uncompetitive with the other technologies. Lack of tolerance to contaminants and shunt currents may be potential roadblocks to this technology, but insufficient knowledge is available to make that judgment now. The risk of HyS reaching commercial status in time for NGNP is now high. If the contaminant and shunt current issues can be laid to rest promptly, the risk is deemed to be moderate.
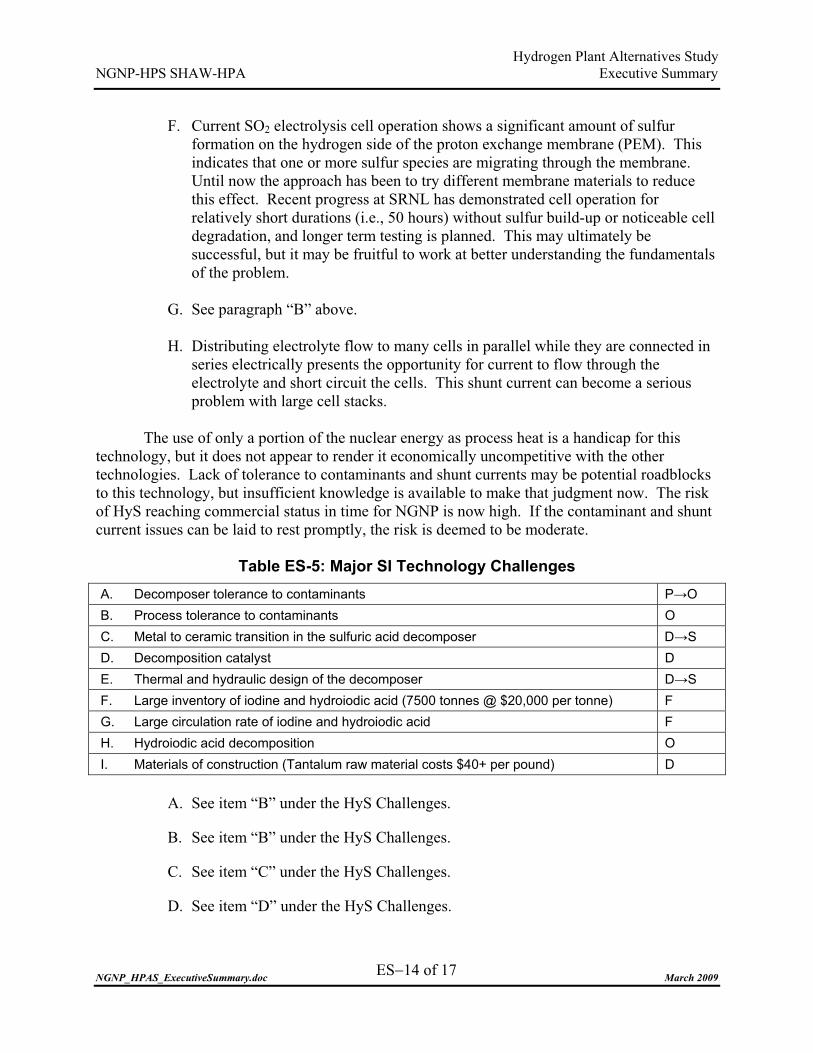
Table ES-5: Major SI Technology Challenges
A. Decomposer tolerance to contaminants P�O B. Process tolerance to contaminants O C. Metal to ceramic transition in the sulfuric acid decomposer D�S D. Decomposition catalyst D E. Thermal and hydraulic design of the decomposer D�S F. Large inventory of iodine and hydroiodic acid (7500 tonnes @ $20,000 per tonne) F G. Large circulation rate of iodine and hydroiodic acid F H. Hydroiodic acid decomposition O I. Materials of construction (Tantalum raw material costs $40+ per pound) D
A. See item “B” under the HyS Challenges.
B. See item “B” under the HyS Challenges.
C. See item “C” under the HyS Challenges.
D. See item “D” under the HyS Challenges.

Hydrogen Plant Alternatives Study NGNP-HPS SHAW-HPA Executive Summary
NGNP_HPAS_ExecutiveSummary.doc March 2009
ES�15 of 17
E. See item “E” under the HyS Challenges.
F. The iodine inventory necessary to produce commercial quantities of hydrogen is large and costly. This is also a theoretical limit. It cannot be substantially reduced by further investigation. The inventory for one plant represents about 30% of the current worldwide annual production. It would cost $150 million at today’s prices.
G. The iodine circulation rate between the Bunsen reaction section and HI decomposition is about 3 tons or 1 cubic meter per second. This makes any intermediate storage between the units impractical. Operating upsets in one unit will be immediately propagated to the others rendering operations difficult.
H. Most work to date on hydroiodic acid decomposition in the Nuclear Hydrogen Initiative has focused on an extractive distillation method. This method has been judged to be technically and economically infeasible. The alternative technology, reactive distillation has not been proven in principal. Moreover, design of the reactive distillation column will involve incorporating a catalytic section and handling two liquid phases. These are complex process engineering techniques that are difficult to reduce to practice. No effort has as yet been applied to design this on an industrial scale.
I. For the most part, materials of construction for the SI process can be carbon steel lined with polytetrafluoroethylene (PTFE or Teflon�). Surfaces used for heat transfer cannot use this material because of its insulating qualities. Surfaces subject to erosion or with penetrations such as distillation tray or packing supports may not use this material due to the possibility of lining failure and catastrophic corrosion. The only identified substitutes are tantalum or tantalum alloys. The cost of these materials will increase the capital cost of this plant unacceptably. Moreover, it is uncertain whether tantalum is available or can be fabricated in the quantities and forms required. Developing alternative materials is a time-consuming process and almost certainly cannot be accomplished in the required time frame.
The combination of the effects of large iodine inventory and circulation rates, the
contaminant tolerance issue, and the lack of economical materials of construction make the risk of reaching commercial status for NGNP high.
Schedule The development schedules presented by the technology developers all indicated that the
required work could be completed within about 10 years. These estimates are based upon the assumption that the work will proceed in an orderly fashion without major roadblocks. This

Hydrogen Plant Alternatives Study NGNP-HPS SHAW-HPA Executive Summary
NGNP_HPAS_ExecutiveSummary.doc March 2009
ES�16 of 17
analysis shows, however, that there is a significant likelihood of major delays and detours in the development path for all of these technologies.
Budget The research and development budgets presented are those proposed by the technology
developers researched for this study. Like the schedules, they are based upon an orderly progression of work following the current view of the remaining technology issues. If a development issue arises that clearly will have significant cost implications, such as the need to develop new materials, a decision will have to be made to continue with a larger budget or abandon the effort. With the current state of knowledge, the budgets are the best that can be produced. What is not included is the engineering effort recommended by this study to accompany the development effort. A first estimate for the engineering effort is that it can be covered by increasing each of the R&D budgets by 10%.
CONCLUSION There is significant risk that none of the technologies can demonstrate commercial
viability within ten years. Schedule risk can be reduced by focusing on a single technology on which to concentrate resources. Further, initiating design will identify development needs earlier, allowing more time to investigate other options and still meet project deadlines. Of the three technologies, the HyS process poses the least risk of achieving commercial status as a HTGR application.
TRLs, sensitivity analysis, and the estimation of $/kg H2 costs are important only if a
technology is fundamentally viable. All of these metrics assume a timely solution to the engineering problems. The overriding consideration in selecting a candidate technology should be the risk posed by unknowns and unresolved issues. Both HTSE and SI at this point pose risks that are significantly greater than those presented by HyS. If a single technology path is chosen for coupling with a HTGR, HyS is the most suitable candidate based on this study’s findings.
The SI process was eliminated due to cost; a need for large quantities of exotic materials
(i.e., tantalum and iodine), complexity, and technical risk due to lack of fundamental data and adequate design concepts.
HTSE was eliminated primarily due to the lack of proportion between the nuclear heat
supply source and the need for process heat. However, HTSE also has serious technical challenges with regard to thermal expansion and thermal insulation. In contrast with both the SI and HyS processes, the HTSE technology using HTGR process heat requires extraordinary amounts of both equipment and piping that operate at both extremely high temperature and very high pressure. These problems are amenable for very short piping runs and for equipment where the pressure envelope can be maintained at a low temperature, but this is not the case for HTSE. In the author’s view, HTSE technology and HTGR technology, as they have been developed to date, are not a good match. From a commercial perspective, there would be little point in facing the enormous development costs and risks identified herein by developing a large centralized

Hydrogen Plant Alternatives Study NGNP-HPS SHAW-HPA Executive Summary
NGNP_HPAS_ExecutiveSummary.doc March 2009
ES�17 of 17
HTSE system for the sake of supplying only a small portion of the energy required for splitting water as heat. This is especially so since a much less challenging, and perhaps even less costly, solution is available by using electricity alone. All these issues are extraneous to two basic issues having to do with the cell itself: the brief useful life of cells tested thus far and the scaling up of cells to a reasonable size. These challenges also pose significant technical risks.
Commercial enterprises would typically have made a selection by this stage of
development, although they typically would not assume the financial risk associated with the identified technology challenges. Further, they commonly prove viability with smaller demonstrations. Demonstrating the hydrogen process at a smaller scale and with a non-nuclear heat source is judged to be as viable as a large demonstration coupled to the NGNP. A benefit of this approach is the ability to test severe transients for the hydrogen process independent of operating limits of a prototype reactor.
RECOMMENDATIONS � Work should be carried out with electrolytic cell and fuel cell manufacturers to
overcome the most serious technical challenges associated HyS cells and stacks (i.e., sulfur deposition and shunt currents).
� Serious design efforts developing alternatives should be started as soon as possible on major components such as helium control valves, SOEC stacks and enclosures, HyS electrolytic cells and enclosures, sulfuric acid decomposers, and Bunsen reactors and hydroiodic acid decomposition reactors.
� Added attention should be given to the interface components between the NHSS and the process plant. This includes not only the IHX but also high-temperature gas circulators, helium flow control valves, insulation, and features to accommodate thermal expansion.
� Consideration should be given to demonstrating the hydrogen process with a smaller, non-nuclear heat source to allow acceleration of testing, provide cost savings, and improve test flexibility.

Hydrogen Plant Alternatives Study NGNP-HPS SHAW-HPA Introduction
NGNP_HPAS_Introduction.doc March 2009
1 of 9
INTRODUCTION
PURPOSE AND OBJECTIVES The purpose of this study is to compare three hydrogen production technologies and
processes on consistent technical and economic bases. The technologies and associated process systems are the leading candidates for deployment with a High Temperature Gas Cooled Reactor (HTGR). These processes are the Sulfur Iodine (SI), High Temperature Steam Electrolysis (HTSE), and Hybrid-Sulfur (HyS) water splitting technologies. Additionally, the study provides the cost and technology readiness basis for further development, testing, and demonstration of each.
The economic viability of each technology is assessed based on capital costs, operating
costs, technical risk, safety, and operability. Standard industry practice with respect to process engineering and cost estimating were used to assess the economic viability of each technology for commercial implementation. Only limited credit was given for cost improvements from technology breakthroughs. Operating costs were based on first-of-a-kind process availability. All of these technologies are at an early stage of development and the individual operability and safety concerns were identified and evaluated to further define risks to commercialization. To that end, an analysis was performed that evaluated the sensitivity of hydrogen cost, per kilogram of hydrogen produced, against variations in the HTGR outlet temperature (i.e., from 950°C to 700°C).
Although there are many potential configurations for hydrogen production processes that
could be coupled to any of one of multiple process applications, a single scenario was developed to make the comparison consistent and easy to understand. This scenario sizes each hydrogen process to approximately the same production rate as any large commercial hydrogen facility in operation today. Three flowsheets with consistent assumptions, using commercially available equipment where possible, were developed based on that production rate. The flowsheets were used to rate the process maturity and identify technology development and design needs for major equipment and subsystems. It was assumed that design, development, and construction would be completed in a 10 year period. Estimated costs are based on industry databases for materials and labor, and on the estimates of technical experts from associated research and development programs. This comparison process is consistent with industry practices used to assess commercial potential of new technologies and chemical processes.
Besides economic viability, the commercial potential of a technology depends upon its
safety and operability. Although all of these technologies are at an early stage of development, attributes of each that raise operability or safety concerns are identified and evaluated.
A life cycle cost assessment is developed for each hydrogen production technology. The
life cycle cost assessment includes: � Estimated capital costs with consistent component sizing, material selections, and
installation estimates; � A qualitative estimate of plant reliability and availability;

Hydrogen Plant Alternatives Study NGNP-HPS SHAW-HPA Introduction
NGNP_HPAS_Introduction.doc March 2009
2 of 9
� Raw material costs; � Routine and corrective maintenance costs including replacement costs; � Waste type and disposal costs; � Management, technical, and operating staff costs; and � Electrical and thermal power costs.
This study also assesses the technical risks based on the Technology Readiness Levels associated with each of the hydrogen production technologies. A technology development plan is generated for each candidate. Special attention is given to issues that, if remaining unresolved, will prevent scale-up and eventual commercial implementation.
One intended purpose of this study was to provide an estimate of the duration required
for each process to be ready for demonstration in the Component Test Facility (CTF) and the schedule for subsequent demonstration in the CTF. A similar estimate was planned for HTGR demonstration of these same technologies that would confirm they were ready for commercial deployment. Duration of basic technology development tasks were estimated, but too many uncertainties remain to be able to make reasonable estimates of demonstration dates for any of the technologies. Development costs have been estimated, but are similarly uncertain.
Reactor outlet temperature (ROT) may have a significant effect on the efficiency of the
water splitting processes, and the hydrogen production rate from a 550 MWth HTGR nuclear reactor, depending upon the water-splitting process. The ROT will influence the cost of hydrogen, cost of equipment, reliability, and the technology and design readiness level for each process. A preliminary assessment of the sensitivity of each of these to the ROT is to be made.
DESCRIPTION OF THE PROCESS OF PREPARING INFORMATION Despite the fact that the three leading water-splitting technologies have been under
development for several years, adequate information to make the assessments proposed in this study was not immediately available. Moreover, the information that was available had not been prepared on a consistent basis. This study attempted to place the basis for comparison of each technology on an equal footing and to bring all information to a level adequate for preliminary economic and technical assessment generally accepted in the process industries.
Available simulations were gathered from published reports and the work of the
technology developers. Without exception these required reworking. In general, the assumptions made by the technology developers were far too optimistic especially with regard to pressure drop and the capability of industrial heat transfer equipment. The work that had recently been done on the bayonet sulfuric acid decomposition reactor was judged to be superior to that available in the older SI simulations and a new sulfuric acid decomposition simulation was prepared for this technology.

Hydrogen Plant Alternatives Study NGNP-HPS SHAW-HPA Introduction
NGNP_HPAS_Introduction.doc March 2009
3 of 9
The simulations obtained from the technology developers provide mass and energy balances as well. But these balances had to be made to match with interfacing flowsheets and balances and with the NHSS. At this point, the capacity of the hydrogen production facility was fixed so as to approach the target capacity without unduly penalizing any technology.
Once the revised simulations were completed, process flow diagrams (PFDs) were
prepared. These diagrams contain significantly more information than the simulation diagrams. Simulation diagrams indicate the basic functions of a process and the unit operations and stream conditions. PFDs show this data and also show all the major equipment needed to carry out these functions. Final PFDs also show the major control functions as well, but in this study little attention has been paid to these. Materials of construction for the process equipment are also shown on the PFDs.
The PFDs are the departure point for most of the other work in this study. They are used
as the basis for the hazard and operability review and for equipment sizing. The PFDs also provide insight into required process steps that have not been included in the simulations. All technologies, for example, will require both feed water treatment and product purification steps that do not appear in the simulations. The requirements for each technology are somewhat different in this regard and therefore have an impact on the cost of production. Preparation of the PFDs also revealed technology development and design issues that were not identified in the basic technology development phases.
Equipment identified during the PFD development was next sized. Flows and heat duties
from the properly adjusted mass and energy balances were used for this purpose. This step also revealed additional development needs. The list of sized equipment and the PFDs are the basis for the preliminary equipment layouts and the cost estimates included herein.
The development requirements identified by the technology developers, as well as those
identified as part of this study, were listed according to the associated structure, system, or component, and design data needs were identified for each. These were then assigned a Technology Readiness Level (TRL) after discussion with the technology developers and a Design Readiness Level (DRL). Development paths were prepared for the CTF development road mapping task and were adjusted slightly for the needs of this report.
Development tasks, schedules, and budgets were solicited from the technology
developers and reviewed by this team.
THE EVALUATION PROCESS
Introduction This section describes the process used to evaluate hydrogen production technologies for
the Hydrogen Production Facilities (HPF) of the U.S. Department of Energy (DOE) NGNP. The purpose of this evaluation is to facilitate identification of an optimum technology among competing alternatives and to support the allocation of funding and scheduling of resources for the future hydrogen technology development efforts sponsored by DOE.
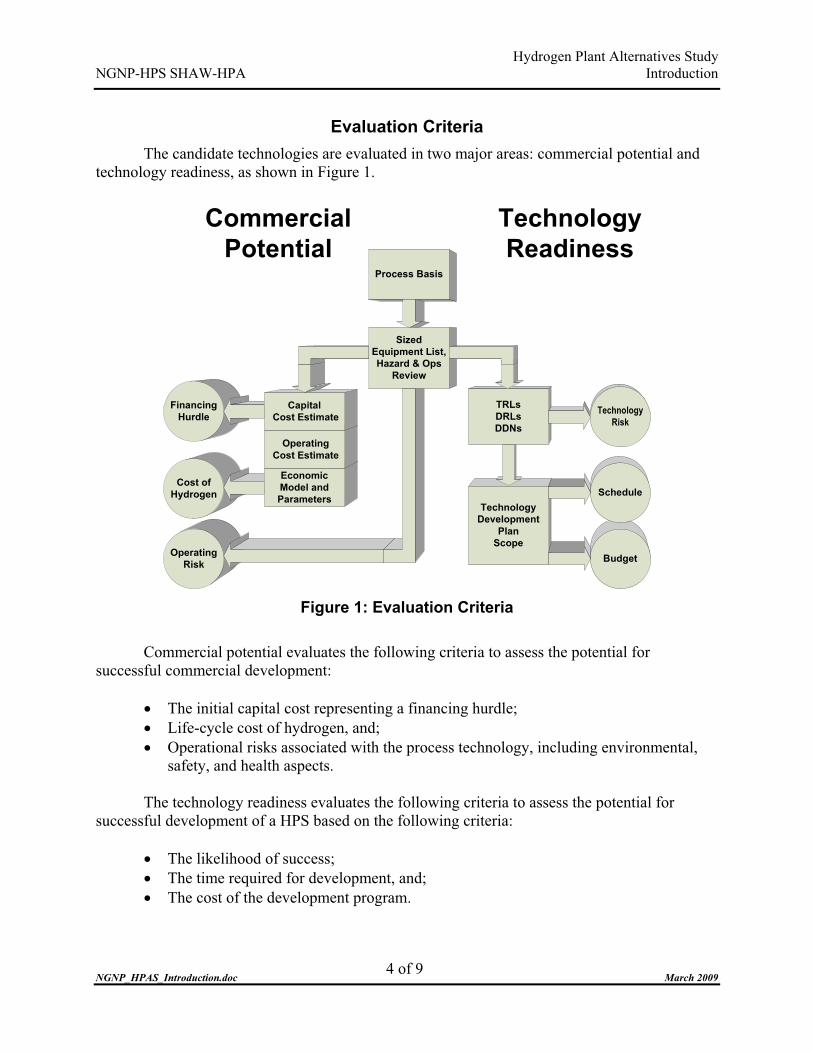
Hydrogen Plant Alternatives Study NGNP-HPS SHAW-HPA Introduction
NGNP_HPAS_Introduction.doc March 2009
4 of 9
Evaluation Criteria The candidate technologies are evaluated in two major areas: commercial potential and
technology readiness, as shown in Figure 1.
Operating Risk
Cost of Hydrogen
Financing Hurdle
Economic Model and Parameters
Operating Cost Estimate
Commercial Potential
Technology Readiness
Process Basis
Budget
Technology Development
Plan Scope
Capital Cost Estimate
TRLsDRLsDDNs
Sized Equipment List, Hazard & Ops
Review
Technology Risk
Schedule
Figure 1: Evaluation Criteria
Commercial potential evaluates the following criteria to assess the potential for
successful commercial development: � The initial capital cost representing a financing hurdle; � Life-cycle cost of hydrogen, and; � Operational risks associated with the process technology, including environmental,
safety, and health aspects. The technology readiness evaluates the following criteria to assess the potential for
successful development of a HPS based on the following criteria: � The likelihood of success; � The time required for development, and; � The cost of the development program.

Hydrogen Plant Alternatives Study NGNP-HPS SHAW-HPA Introduction
NGNP_HPAS_Introduction.doc March 2009
5 of 9
Process Evaluation Basis The following items define the base case for which the life-cycle cost of production of
hydrogen and other criteria are evaluated. They are drawn in part from a report titled Summary of Bounding Conditions for Development of the NGNP Project, June 2008, Idaho National Laboratory (INL/EXT-08-14370). Some of the parameters listed here are varied in the sensitivity analyses that are part of this study to determine the effect on both the technology economics and development plan. These sensitivity analyses are listed in Sensitivity Analyses subsection below.
� Hydrogen Technologies: Hydrogen production technologies considered in the HPAS
are HTSE, HyS, and SI. HyS and SI share the same sulfuric acid decomposition step. The major design and operating parameters of this step are common to both technology process flow schemes.
� Reactor Technologies: Reactor technologies are not studied directly, but power, temperature levels, and energy costs used in the study are representative of a Pebble Bed Modular Reactor at 500 MWth or a prismatic core reactor at 565 to 600 MWth. No allowance is made for piping and equipment heat losses or additions due to circulator inefficiency. All configurations use a secondary helium loop to reduce tritium transport and to isolate the process streams from the primary helium loop in the event of a leak in either the Intermediate Heat Exchanger (IHX) or the Process Coupling Heat Exchanger (PCHX). This is reflected in the helium delivery temperatures to the PCHX. It should be noted that the reference HTGR design basis requires that there is little or no pressure differential between the helium-to-helium and helium-to-process sides of the IHX and PCHX, respectively.
� System Energy Balance: The HPS is supplied heat from a HTGR in the form of hot helium. The cost of this energy is estimated for the base case and charged to the hydrogen plant. Heat not usable by the process is used to generate electricity and the cost of generating power from this heat is estimated separately. A Rankine cycle is used and generation efficiency is varied depending upon the maximum steam temperature available in each case. In this way, the value of the unused exported heat is estimated. Any electricity deficit or surplus is balanced by imports from or exports to the grid. Cost of imports from the grid in excess of that generated by the unused nuclear heat accounts for a carbon penalty, and the sensitivity analysis is then performed for variations in the carbon penalty/credit as it affects the relative price advantage of nuclear hydrogen.
� Plant Size: In industrial practice, a technology provider is required to meet the capacity requirements of the customer. Plant size is therefore set by attempting to match a technology with current large hydrogen plant capacities. A medium plant size is approximately 30 to 50 million Standard Cubic Feet per Day (MMSCFD) and a large-scale plant capacity is about 120 MMSCFD. The latter is used as a target capacity. Adjustments are made to the capacity so as not to unduly penalize a given technology. Consequently, the production capacity used for HTSE and HyS is 142 MMSCFD, and for SI is 157 MMSCFD.

Hydrogen Plant Alternatives Study NGNP-HPS SHAW-HPA Introduction
NGNP_HPAS_Introduction.doc March 2009
6 of 9
� Operating Temperatures: Maximum operating temperature of the PCHX is 870°C on the process side. The inlet process side temperature and therefore the temperature of the return helium is set by process requirements. The maximum return helium temperature is 490°C; the minimum is 350°C.
Commercial Potential The Financing Hurdle consists of the capital cost estimate for a commercial-scale
hydrogen plant and includes project overheads, contingency, and owner’s costs. The result is reported in $US.
The Life Cycle Cost of Hydrogen is estimated based upon the capital cost estimate,
estimated operating costs, and the set of economic parameters listed in Table 1. The result is reported as a $US/kg of hydrogen product.
Table 1: Economic Parameters
Parameter Value Reference Dollar Year 3rd Quarter 2008
Assumed Start-up Year 2030
Plant Maturity Assumption Nth-of-a-Kind plant
Financing 100% Equity
After-Tax Real IRR 10%
Project Overall Capital Cost Contingency 10%
Plant Life 30 years
Lifetime Capacity Factor 8,200 hr/yr (94%)
Construction Period 3 years
Costs in Construction Years 25% / 45% / 30%
Start-up Period 1 year
Income Tax Rate (composite) 38.9%
Property Tax Rate 1% of Overnight Capital Cost
Insurance Rate 1% of Overnight Capital Cost
Working Capital 15% of Incremental Change in Annual Operating Costs
The Operating Risk is a qualitative assessment of each process based on the following
factors: � Hazard Ranking of the chemicals used. The hazard ranking is based on the NFPA
704, “Standard System for the Identification of the Hazardous Materials for Emergency Response” and the Code of Federal Regulations Title 49, “Subpart B
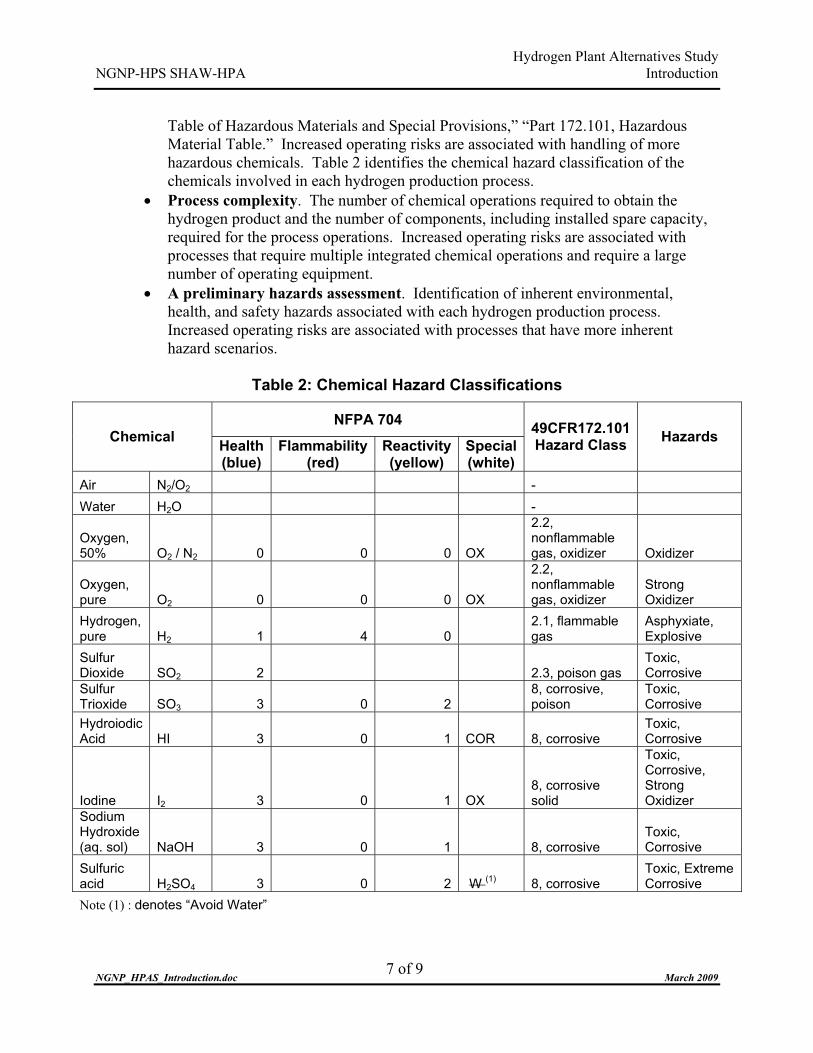
Hydrogen Plant Alternatives Study NGNP-HPS SHAW-HPA Introduction
NGNP_HPAS_Introduction.doc March 2009
7 of 9
Table of Hazardous Materials and Special Provisions,” “Part 172.101, Hazardous Material Table.” Increased operating risks are associated with handling of more hazardous chemicals. Table 2 identifies the chemical hazard classification of the chemicals involved in each hydrogen production process.
� Process complexity. The number of chemical operations required to obtain the hydrogen product and the number of components, including installed spare capacity, required for the process operations. Increased operating risks are associated with processes that require multiple integrated chemical operations and require a large number of operating equipment.
� A preliminary hazards assessment. Identification of inherent environmental, health, and safety hazards associated with each hydrogen production process. Increased operating risks are associated with processes that have more inherent hazard scenarios.
Table 2: Chemical Hazard Classifications
NFPA 704 Chemical Health
(blue) Flammability
(red) Reactivity (yellow)
Special (white)
49CFR172.101 Hazard Class Hazards
Air N2/O2 - Water H2O -
Oxygen, 50% O2 / N2 0 0 0 OX
2.2, nonflammable gas, oxidizer Oxidizer
Oxygen, pure O2 0 0 0 OX
2.2, nonflammable gas, oxidizer
Strong Oxidizer
Hydrogen, pure H2 1 4 0
2.1, flammable gas
Asphyxiate, Explosive
Sulfur Dioxide SO2 2 2.3, poison gas
Toxic, Corrosive
Sulfur Trioxide SO3 3 0 2
8, corrosive, poison
Toxic, Corrosive
Hydroiodic Acid HI 3 0 1 COR 8, corrosive
Toxic, Corrosive
Iodine I2 3 0 1 OX 8, corrosive solid
Toxic, Corrosive, Strong Oxidizer
Sodium Hydroxide (aq. sol) NaOH 3 0 1 8, corrosive
Toxic, Corrosive
Sulfuric acid H2SO4 3 0 2 W (1) 8, corrosive
Toxic, Extreme Corrosive
Note (1) : denotes “Avoid Water”

Hydrogen Plant Alternatives Study NGNP-HPS SHAW-HPA Introduction
NGNP_HPAS_Introduction.doc March 2009
8 of 9
Using this information, a qualitative assessment is developed for each of the hydrogen production processes. The qualitative assessments are ranked as follows:
� Low – Limited hazardous materials, simple chemical process, limited hazards that are
easily mitigated, and few operating components. � Medium Low. � Medium High. � High – Large number of hazardous materials required for the process, complex
chemical process, increased hazards that are not easily mitigated, and a large number of operating components.
Technology Readiness The technology readiness assessment is based on data contained in Section 8, which is
excerpted from WEC’s NGNP Technology Development Road Mapping Report. � The Likelihood of Success distinguishes between the difficulties of the development
goals, as defined by the TRLs, DRLs, and DDNs for each of the technologies and their components. The difficulty of reaching each goal is assessed and the number of goals for which a clear path is not evident or for which there does not appear to be more than one viable solution is enumerated. Comparative metrics are the number of TRLs, DRLs, and DDNs to bring each technology first to TRL�6, and then to TRL�8.
� The Development Schedule is the duration of time required for the technology development schedule based on the Technology Maturation Plan. Comparative metrics are durations to bring each technology first to TRL�6, a successful pilot scale demonstration, and then to TRL�8, a demonstrated integrated prototype.
� The Development Cost is the cost of technology development based on the scope and schedule in Section 8. Comparative metrics are cost to bring each technology first to TRL 6 and then to TRL 8.
Sensitivity Analyses
The following sensitivity analyses are included in this study: � Reactor Outlet Temperature. The effect of ROT on both the life-cycle cost of
production and the development cost and schedule are studied. ROT is set at 950°C in the base case. An alternative case with a ROT of 750°C is examined and the effects evaluated. Any temperatures between these that represent a step change in hydrogen cost, or development cost and schedule, are identified.
� Price of electricity and carbon penalty on imported power. For the cases identified above, the effects of the price of electricity and the price of a carbon penalty are evaluated separately.
� Cost of converting unused heat to electricity or conversion efficiency.

Hydrogen Plant Alternatives Study NGNP-HPS SHAW-HPA Introduction
NGNP_HPAS_Introduction.doc March 2009
9 of 9
� Plant size. For each technology, the effect of varying plant size and requiring that specific plant hydrogen capacities be met is evaluated against the cost of production of hydrogen.
� Capital Costs. Capital costs of major components and subsystems. � Reliability. Reliability and expected availability of these major components and
subsystems as well as of the overall plant. � Maintenance Costs. Routine and corrective maintenance including replacement
costs. � Staffing. Management, technical, and operating staff requirements.
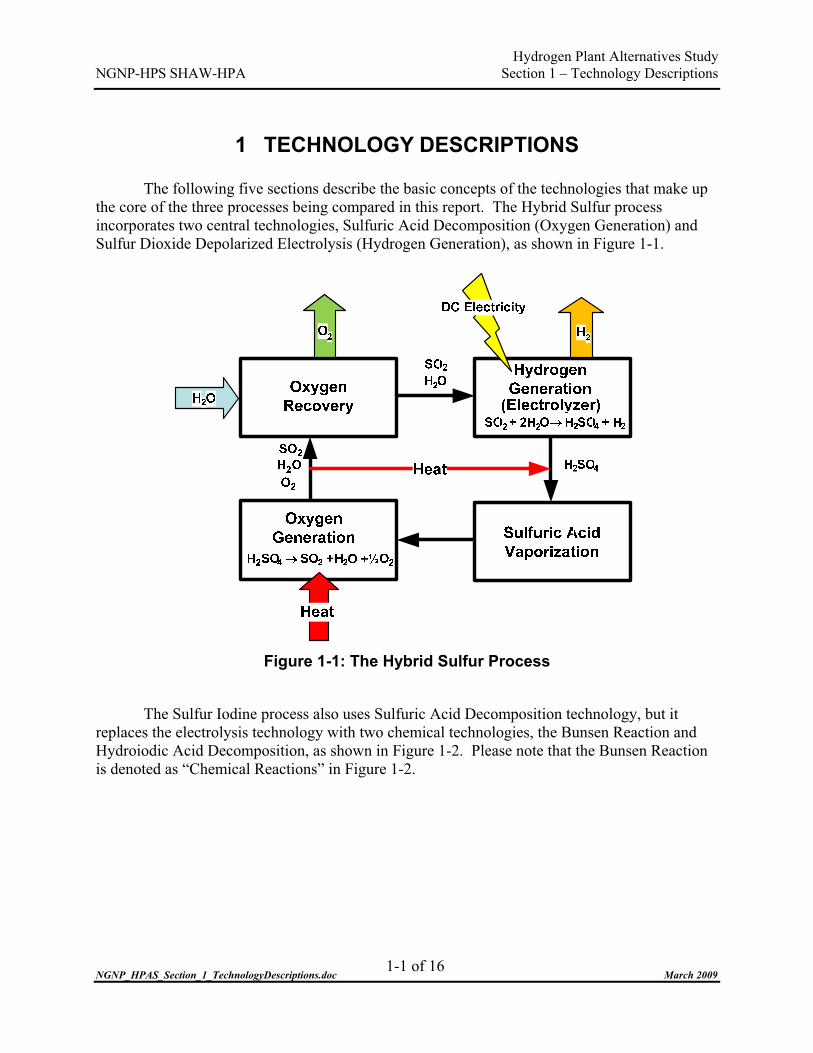
Hydrogen Plant Alternatives Study NGNP-HPS SHAW-HPA Section 1 – Technology Descriptions
NGNP_HPAS_Section_1_TechnologyDescriptions.doc March 2009
1-1 of 16
1 TECHNOLOGY DESCRIPTIONS The following five sections describe the basic concepts of the technologies that make up
the core of the three processes being compared in this report. The Hybrid Sulfur process incorporates two central technologies, Sulfuric Acid Decomposition (Oxygen Generation) and Sulfur Dioxide Depolarized Electrolysis (Hydrogen Generation), as shown in Figure 1-1.
Figure 1-1: The Hybrid Sulfur Process
The Sulfur Iodine process also uses Sulfuric Acid Decomposition technology, but it replaces the electrolysis technology with two chemical technologies, the Bunsen Reaction and Hydroiodic Acid Decomposition, as shown in Figure 1-2. Please note that the Bunsen Reaction is denoted as “Chemical Reactions” in Figure 1-2.
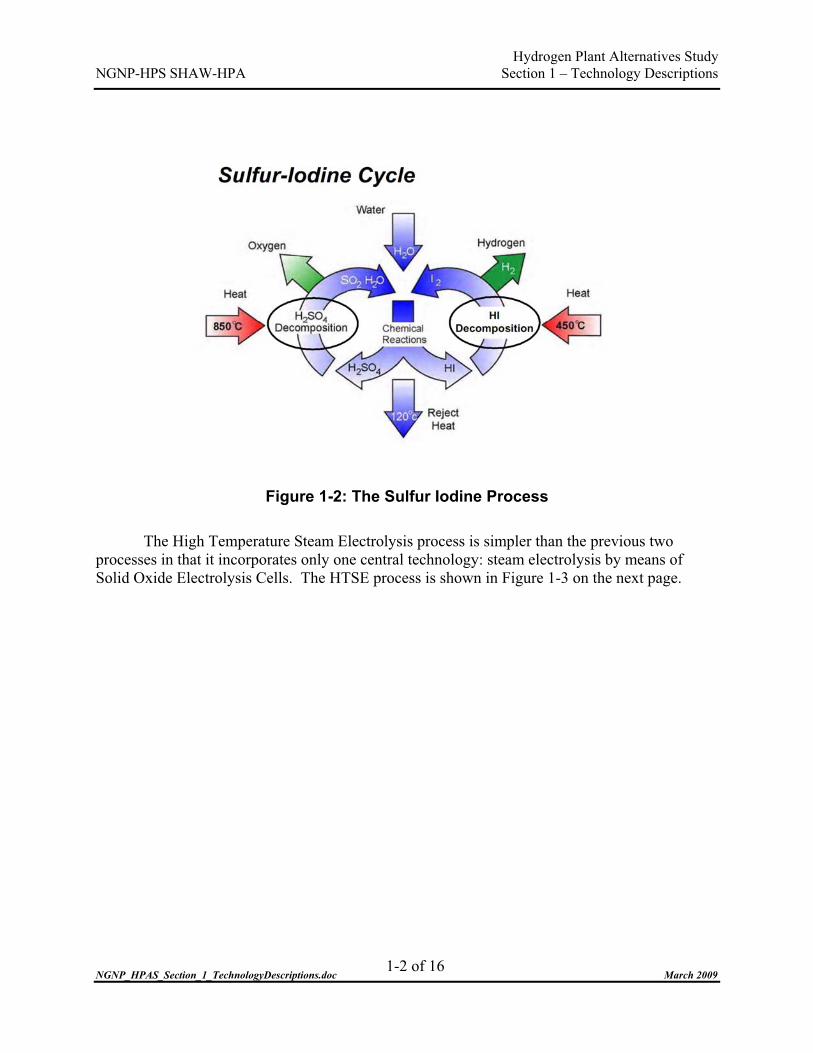
Hydrogen Plant Alternatives Study NGNP-HPS SHAW-HPA Section 1 – Technology Descriptions
NGNP_HPAS_Section_1_TechnologyDescriptions.doc March 2009
1-2 of 16
Figure 1-2: The Sulfur Iodine Process
The High Temperature Steam Electrolysis process is simpler than the previous two
processes in that it incorporates only one central technology: steam electrolysis by means of Solid Oxide Electrolysis Cells. The HTSE process is shown in Figure 1-3 on the next page.

Hydrogen Plant Alternatives Study NGNP-HPS SHAW-HPA Section 1 – Technology Descriptions
NGNP_HPAS_Section_1_TechnologyDescriptions.doc March 2009
1-3 of 16
Figure 1-3: The High Temperature Steam Electrolysis Process
In the following sections, the major thermodynamic and kinetic reasons for considering
each technology are discussed, as well as their major advantages and limitations. The intent of these sections is to orient the reader. Advantages and limitations will be treated in more detail in the subsequent sections of the report that deal with process and technology development.
1.1 SULFURIC ACID DECOMPOSITION Although it is embodied slightly differently in each, this technology is common to both
the Hybrid Sulfur and the Sulfur Iodine processes. The point of sulfuric acid decomposition is that it replaces a portion of the energy required to split water provided as work in water electrolysis with heat. It therefore virtually eliminates the thermal losses associated with the generation of electricity from thermal energy for this portion of the water splitting energy. The basic chemistry is simple. Sulfuric acid is first decomposed into water and sulfur trioxide.
H2SO4 � H2O + SO3
This occurs quantitatively and uncatalyzed at temperatures well below the maximum at
which the reactor operates. The more difficult reaction is the decomposition of sulfur trioxide:
SO3 � SO2 + ½ O2
Process Coupling Heat Exchangers
Electrolysis Cells
HeatHeat
H2O
H2 H2O Air
Heat from NHSS
Air O2
Air,O2
Air H2
H2O
H2, H2O
10% H2O 90% H2
50% O2
90% H2O 10% H2
WaterHydrogen Oxygen Air
H2
H2O

Hydrogen Plant Alternatives Study NGNP-HPS SHAW-HPA Section 1 – Technology Descriptions
NGNP_HPAS_Section_1_TechnologyDescriptions.doc March 2009
1-4 of 16
This step requires a catalyst and estimated conversions at expected operating temperatures (i.e., ~870°C) are about 50%. These reactions are favored as pressure is lowered and temperature is raised. The decomposition reactor should therefore be designed to operate at the highest temperature that can practically be achieved. Although a lower pressure favors the chemical equilibrium, mechanical considerations in the reactor design make operating significantly below the helium heat transfer medium pressure, that is ~90 bar, difficult.
One of the most difficult challenges in decomposing sulfuric acid at high temperatures
(i.e., >800°C, 1073°K) and pressures (i.e., up to 90 bar) is finding a material that can contain the process at the required conditions without significantly corroding or deteriorating, while also providing adequate heat transfer characteristics. Silicon carbide (SiC) is the one commercially available substance that meets these requirements. Since SiC is ceramic, it cannot be shaped as easily as metal. This greatly complicates the design and fabrication of process vessels and piping. A particular concern is making and maintaining sealed joints between individual SiC and SiC-metal components that operate at high temperature and pressure.
Responsibility for developing this reaction process for the NHI program belongs to
Sandia National Laboratories (SNL). SNL has devised an innovative solution that makes use of readily available SiC shapes and does not have any high-temperature connections [Ref. 1]. Their bayonet decomposition reactor features internal recuperation and allows all of the connections to be made at relatively low temperatures, where polytetrafluoroethylene (PTFE) and similar materials can be used for seals. The essential elements of SNL’s bayonet decomposition reactor are shown in Figure 1-4.
In its simplest form, the reactor consists of one closed ended SiC tube co-axially aligned
with an open ended SiC tube to form two concentric flow paths. A baffle tube may be included to enhance heat transfer. High-temperature heat is applied externally, except near the open end. Concentrated liquid H2SO4 is fed at the open end to the annulus, where it is vaporized before passing through an annular catalyst bed. The decomposition reaction takes place in the catalyst bed, using heat provided by the external heat source. SO2, O2, and H2O vapor product returns through the center and loses its heat to the feed through recuperation. Cooled and partially condensed product exits out the open end into a metal base or manifold at a temperature low enough (i.e., � ~250°C, or 523°K) to allow the use of PTFE seals. Imbedding the open ends of the SiC tubes in a metallic manifold facilitates the transition to metal pipe.

Hydrogen Plant Alternatives Study NGNP-HPS SHAW-HPA Section 1 – Technology Descriptions
NGNP_HPAS_Section_1_TechnologyDescriptions.doc March 2009
1-5 of 16
Figure 1-4: Schematic Diagram of the SNL Bayonet Decomposition Reactor
The catalyst for this reactor is being developed by Idaho National Laboratory (INL) as
part of the NHI Program. Heat transfer limitations will impose a high surface-to-volume ratio limit, thereby
keeping diameters small. Therefore, it should be obvious that a single bayonet will not have sufficient capacity for a full-scale reactor. However, it is easy to envision an arrangement in which many bayonets are attached in parallel to a manifolded base plate to achieve the necessary production rate. This would be at least somewhat analogous to the common practice with commercial fixed bed catalytic reactors, in which an endothermic reaction is carried out in parallel in multiple narrow tubes held between two tubesheets, with the heat source on the shell side. Advantages of the bayonet design include internal heat recuperation, the need for low-temperature connections only, corrosion resistance, and low fabrication cost. In fact, SiC bayonets are an off-the-shelf item, since they are used commercially for thermowells[Ref. 2].
Process economics favors using as much high temperature process heat for
decomposition of sulfuric acid as possible. The amount of heat available for decomposition is

Hydrogen Plant Alternatives Study NGNP-HPS SHAW-HPA Section 1 – Technology Descriptions
NGNP_HPAS_Section_1_TechnologyDescriptions.doc March 2009
1-6 of 16
determined by the concentration of acid in the feed to the decomposer. Higher acid concentration results in more heat available for decomposition. This is due to two major effects. As the water content of the feed is reduced, the amount of water that must be heated to the decomposition temperature is also reduced. Although most of this heat can be recovered, it must be recovered at a lower temperature, thus reducing the energy availability for decomposition. Moreover, the pinch point between the feed and effluent acid gases will change also affecting the quantity of recoverable heat.
At a given helium circulation rate and decomposer inlet temperature, the slope of the
helium cooling curve – that is stream enthalpy vs. temperature – is fixed. As more water is added to the process stream, the slope of the process heating curve is reduced. With a pinch point at the cold end of the curve, the total acid flow must be reduced to maintain the same outlet temperature or the outlet temperature must be reduced while maintaining the acid flow. Refer to Figure 1-5 and Figure 1-6. In either case, the amount of acid that is decomposed drops off rapidly with increasing water content in the feed. A concentration of 75% acid has been selected for this study to represent a reasonably high concentration that is achievable in the acid concentration steps. Because of the high affinity of sulfuric acid for water, concentrations above about 75% cannot be practically attained by flashing or vacuum distillation at temperatures below about 250°C.

Hydrogen Plant Alternatives Study NGNP-HPS SHAW-HPA Section 1 – Technology Descriptions
NGNP_HPAS_Section_1_TechnologyDescriptions.doc March 2009
1-7 of 16
Bayonet Reactor Utility Composite CurveSRNL-WEC HyS Cycle 07-25-2008
75% H2SO4 feed, 86-bar pressure, 870°C peak process temperature, 2-bar pressure drop
100
200
300
400
500
600
700
800
900
0 50 100 150 200 250 300 350
Enthalpy, MW
Tem
pera
ture
, °C
Figure 1-5: Sulfuric Acid Decomposition Bayonet Reactor Helium Cooling and Process Stream Heating Curves

Hydrogen Plant Alternatives Study NGNP-HPS SHAW-HPA Section 1 – Technology Descriptions
NGNP_HPAS_Section_1_TechnologyDescriptions.doc March 2009
1-8 of 16
Bayonet Reactor Heating and Cooling CurvesSRNL-WEC HyS Cycle 07-25-2008
75% H2SO4 feed, 86-bar pressure, 870°C peak process temperature, 2-bar pressure drop
100
200
300
400
500
600
700
800
900
020
040
060
080
01,0
00
Enthalpy, MW
Tem
pera
ture
, °C
Figure 1-6: Sulfuric Acid Decomposition Bayonet Reactor Process Stream
Heating and Cooling Curves
1.2 SULFUR DIOXIDE DEPOLARIZED ELECTROLYSIS TECHNOLOGY
The Hybrid Sulfur process uses a low-temperature, liquid phase electrolysis similar to
existing electrolytic processes to generate hydrogen from water. The HyS cycle is attractive because the standard cell potential for SO2-depolarized electrolysis is -0.158 V at 25°C (298°K) in water. The reversible potential increases to -0.243 V if SO2 is dissolved to saturation at 1 bar total pressure in a 50-wt% H2SO4-H2O solution, the most likely anolyte. This means that the Sulfur Dioxide Depolarized Electrolyzer (SDE) will consume much less electricity per mole of hydrogen product than water electrolysis, which has a reversible cell potential of -1.229 V at 25°C (298°K) [Ref. 3]. The energy difference has been supplied as heat for the process of decomposing sulfuric acid.
The catholyte is water and the anolyte is a solution of sulfuric acid, water, and dissolved
sulfur dioxide. Sulfur dioxide is oxidized at the anode to produce sulfuric acid and hydronium ions (i.e., protons). The outlet anolyte stream therefore has a higher concentration of sulfuric acid than the inlet anolyte stream. The protons produced at the anode transport as hydronium

Hydrogen Plant Alternatives Study NGNP-HPS SHAW-HPA Section 1 – Technology Descriptions
NGNP_HPAS_Section_1_TechnologyDescriptions.doc March 2009
1-9 of 16
ions across the cation-exchange membrane into the catholyte and are reduced at the cathode to produce hydrogen gas. The reactions that constitute this process are as follows:
Anode reaction: SO2 (aq) + 2H2O (aq) � H2SO4 (aq) + 2H+ (aq) + 2e- Cathode reaction: 2H+ (aq) + 2e- � H2 (g) Overall reaction: SO2 (aq) + 2H2O (aq) � H2SO4 + H2 (g) Figure 1-7 depicts a parallel plate single cell electrochemical reactor and the reaction
chemistry that occurs at each electrode.
H2SO4 Solution
H2SO4
Solution + H2
anod
e
mem
bran
e
cath
ode
H2SO4
H2O H2
SO3+
2H+
SO2 + H2O
SO2(l)+ H2SO4
SolutionH2SO4
Solution
Figure 1-7: Schematic of HyS Electrolysis Reaction
Experimental work is currently being carried out by the Savannah River National Laboratory (SRNL)[Ref. 4] where they are using a test cell similar to the one shown in Figure 1-8.

Hydrogen Plant Alternatives Study NGNP-HPS SHAW-HPA Section 1 – Technology Descriptions
NGNP_HPAS_Section_1_TechnologyDescriptions.doc March 2009
1-10 of 16
Figure 1-8: SRNL Test Cell Schematic
A major challenge for the HyS Process is the development of an efficient, cost-effective
electrochemical reactor or SDE. The SRNL is leading efforts supported by the NHI Program to develop such a reactor based on the use of PEM technology. PEM technology is also being developed for water electrolyzers and automotive fuel cells and some of this work may be of use in the development of an SDE. This technology offers high electrochemical efficiency, a small footprint, and the potential of a competitive capital cost.
The environment in which the PEM must operate is challenging. It consists of sulfuric
acid, water, sulfur dioxide, and hydrogen at temperatures and pressures relatively high for electrolytic applications. Although sulfuric acid is currently handled commercially at concentrations and temperatures similar to the ones envisioned, all wetted components of the cell must be constructed of carbon or polymeric materials. Work is still progressing to discover suitable commercial membranes and electrocatalysts. The best membranes tested thus far still exhibit permeability to sulfur species and consequent formation of elemental sulfur at the cathode. Improving electrocatalysts will reduce the cell overpotential or increase current density. In the laboratory, SRNL has been able to achieve about 0.8 to 0.9 V at a current density of 5000A/m2. The commercial target and basis for this study is 0.6V at 5000A/m2. This appears to be a reasonable goal in light of recent work on narrow gap cells. Ultimately, the target value will balance the capital cost against the operating cost of the electrolyzer as a function of the current density. Research as to the optimum current density continues to unfold.

Hydrogen Plant Alternatives Study NGNP-HPS SHAW-HPA Section 1 – Technology Descriptions
NGNP_HPAS_Section_1_TechnologyDescriptions.doc March 2009
1-11 of 16
1.3 THE BUNSEN REACTION As described in Section 1, the Sulfur Iodine cycle consists of three coupled chemical
reactions: (1) the Bunsen Reaction, (2) Sulfuric Acid Decomposition, and (3) Hydroiodic Acid (HI) Decomposition. The overall process conveniently divides into distinct process sections, as shown in Figure 1-2. The thermodynamic advantage of the Sulfur Iodine cycle is that the energy required to split water can theoretically be supplied entirely as heat rather than as work or electricity as in other water-splitting processes considered here. In reality, as we shall see, this process also requires a considerable input of work.
The Bunsen Reaction may be considered the first step of the cycle, where water, sulfur
dioxide, and iodine chemically react to form sulfuric acid and hydrogen iodide as follows:
2H2O + SO2 + I2 � H2SO4 + 2HI.
The sulfuric acid and hydrogen iodide reaction products are then chemically broken down in subsequent decomposition reactions to produce oxygen and hydrogen gas respectively. Other decomposition reaction products, such as sulfur dioxide, water, and iodine, are recycled back from the associated decomposition reactions to the Bunsen Reaction.
As can be seen in Figure 1-2, the Bunsen reaction is exothermic and the two
decomposition reactions are endothermic. Unfortunately, the endothermic reactions require heat at much higher temperatures than could be recovered from the Bunsen Reaction. Therefore, in practical terms, the heat from the Bunsen Reaction is best sent to cooling water and lost.
The Bunsen reaction takes place at the interface between two immiscible liquid phases:
(1) an iodine-rich phase, which contains the hydroiodic acid product, and (2) a sulfur dioxide-rich phase , which contains the sulfuric acid product. These phases must be well-mixed in the reactor while the exotherm is being removed and then separated quickly to prevent the formation of elemental sulfur. Separation of light and heavy phases is readily achievable through gravity separation. The ratio of the densities of two phases is on the order of 2:1. A large excess of liquid iodine must be maintained in the system in order to effect good separation between the hydroiodic acid and the sulfuric acid. This has serious implications for process design and economics.
An oxidizing atmosphere is required for the reaction to proceed and product oxygen is
usually circulated through the Bunsen reactor to assist in removing sulfur dioxide and to provide this atmosphere. Maintaining adequate concentrations of the reactants in the two liquid phases in the reactor is of prime importance. The phase equilibria, especially of the HI/I2/H2O system, as well as the chemical equilibria, must be well understood to provide an adequate basis for process design. The data currently available is limited and not adequate for a robust process design. Reactor design for equipment larger than bench scale has not progressed further than preliminary concepts.
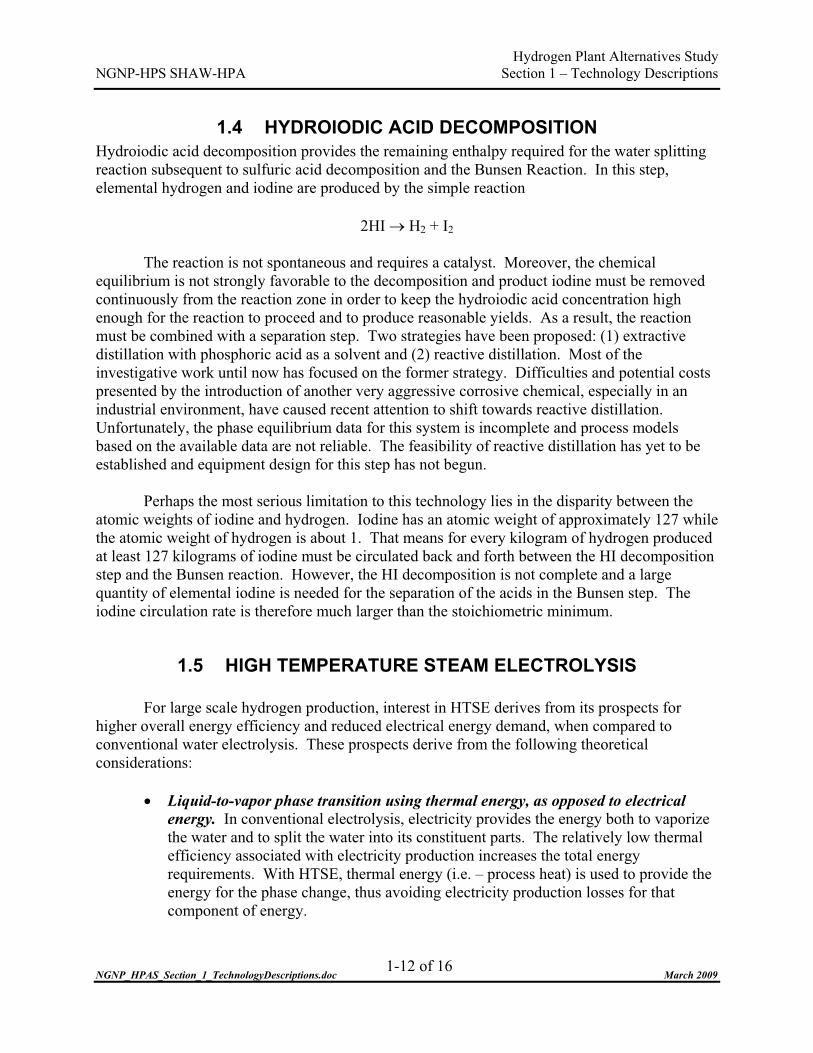
Hydrogen Plant Alternatives Study NGNP-HPS SHAW-HPA Section 1 – Technology Descriptions
NGNP_HPAS_Section_1_TechnologyDescriptions.doc March 2009
1-12 of 16
1.4 HYDROIODIC ACID DECOMPOSITION Hydroiodic acid decomposition provides the remaining enthalpy required for the water splitting reaction subsequent to sulfuric acid decomposition and the Bunsen Reaction. In this step, elemental hydrogen and iodine are produced by the simple reaction
2HI � H2 + I2
The reaction is not spontaneous and requires a catalyst. Moreover, the chemical
equilibrium is not strongly favorable to the decomposition and product iodine must be removed continuously from the reaction zone in order to keep the hydroiodic acid concentration high enough for the reaction to proceed and to produce reasonable yields. As a result, the reaction must be combined with a separation step. Two strategies have been proposed: (1) extractive distillation with phosphoric acid as a solvent and (2) reactive distillation. Most of the investigative work until now has focused on the former strategy. Difficulties and potential costs presented by the introduction of another very aggressive corrosive chemical, especially in an industrial environment, have caused recent attention to shift towards reactive distillation. Unfortunately, the phase equilibrium data for this system is incomplete and process models based on the available data are not reliable. The feasibility of reactive distillation has yet to be established and equipment design for this step has not begun.
Perhaps the most serious limitation to this technology lies in the disparity between the
atomic weights of iodine and hydrogen. Iodine has an atomic weight of approximately 127 while the atomic weight of hydrogen is about 1. That means for every kilogram of hydrogen produced at least 127 kilograms of iodine must be circulated back and forth between the HI decomposition step and the Bunsen reaction. However, the HI decomposition is not complete and a large quantity of elemental iodine is needed for the separation of the acids in the Bunsen step. The iodine circulation rate is therefore much larger than the stoichiometric minimum.
1.5 HIGH TEMPERATURE STEAM ELECTROLYSIS For large scale hydrogen production, interest in HTSE derives from its prospects for
higher overall energy efficiency and reduced electrical energy demand, when compared to conventional water electrolysis. These prospects derive from the following theoretical considerations:
� Liquid-to-vapor phase transition using thermal energy, as opposed to electrical
energy. In conventional electrolysis, electricity provides the energy both to vaporize the water and to split the water into its constituent parts. The relatively low thermal efficiency associated with electricity production increases the total energy requirements. With HTSE, thermal energy (i.e. – process heat) is used to provide the energy for the phase change, thus avoiding electricity production losses for that component of energy.

Hydrogen Plant Alternatives Study NGNP-HPS SHAW-HPA Section 1 – Technology Descriptions
NGNP_HPAS_Section_1_TechnologyDescriptions.doc March 2009
1-13 of 16
� Thermodynamic requirements for heat and work. In theory, as the temperature of the electrolysis process is increased, the amount of energy that must be input as work (i.e., electricity) decreases.
� Reduced overvoltage. In an electrolysis process, the voltage required to drive the process is a direct indicator of electrical energy demand. The principal advantage of HTSE derives from its reduced over-voltage characteristics, relative to low-temperature processes.
In conventional electrolysis, hydrogen and oxygen are generated by passing an electric current through a solution of water and an electrolyte. Hydrogen gas is generated at the cathode and oxygen gas is generated at the anode. The basic reactions that take place at the cathode and anode are shown below.
At the Cathode: H2O + 2e� � H2 + O� � At the Anode: O� � � ½ O2 + 2e�
The transformation of water into hydrogen and oxygen gas is endothermic. Energy must
be added to the reaction from the environment. At standard conditions, the amount of energy required to transform one mole of water to one mole of hydrogen gas and one-half mole oxygen gas is 285.83 kJ.
In general, thermodynamic potential of the system may be described by the system’s
internal energy that is defined using the following equation.
�U = �H – p�V = �G + T�S – p�V For a reaction at a given temperature and pressure, �H is the enthalpy of reaction, �G is
the change in free energy, and �S is the entropy of reaction. The p�V term is the work associated with the expansion of the gases. Using the above equation, the enthalpy of reaction may be expressed in terms of the change in free energy and entropy:
�H = �G + T�S
For the electrolysis of water into hydrogen and oxygen, �G is work added to the system in the form of electricity while T�S is in the form of heat added by the environment. As temperature of the system increases, �H and �S of the system do not significantly change. Therefore, as the portion of the work provided through heat increases, the portion provided in the form of electricity will decrease accordingly.
Figure 1-9 illustrates the thermodynamic potentials for the electrolysis of water for a
temperature range between 25°C to 1000°C and a system pressure of 1 bar. As can be seen in the figure, there is a significant reduction in the amount of electrical work that needs to be

Hydrogen Plant Alternatives Study NGNP-HPS SHAW-HPA Section 1 – Technology Descriptions
NGNP_HPAS_Section_1_TechnologyDescriptions.doc March 2009
1-14 of 16
provided with increasing temperature. At 850°C, this reduction is approximately 25%. Note that the total enthalpy of reaction remains relatively constant with temperature, except at the boiling point, where �H drops. This drop, the latent heat of vaporization, is the difference between the high heating value (HHV) and the low heating value (LHV). At higher pressures, there will be an increase in the total energy demand, albeit not significant. At a pressure of 80 bar, it is estimated that there will be an approximate 2% increase in the total energy demand.
0
50
100
150
200
250
300
350
400
0 100 200 300 400 500 600 700 800 900 1000 1100
�H�GT�S
850°C
�25%
Electric Energy Demand
Heat Demand
Total Energy Demand
Temperature (°C)
Energy (kJ/mole)
Figure 1-9: Thermodynamic Potential of HTSE
Please note that the Figure 1-9 is illustrative of the thermodynamic potential of HTSE and
is for discussion purposes only. The mass and energy balances, electrical consumption estimate, and costs estimates developed for this study are based on the Aspen Plus® simulation model for HTSE, which was run at a pressure of 56 bar in the electrolyzers.
An additional advantage is gained with respect to electrolysis cells’ electrochemical
properties (i.e., overvoltage). Overvoltage is the difference between the cell potential with current flowing and the open cell potential, and is the result of internal resistive losses within the cell. Cell potential (E), or the voltage being applied to a cell, can be described quantitatively by the following expression:
E = �G 2F
+ R T 2F ln NH2O
(NH2 × NO2½) p p°
+ I R RES + I R PO
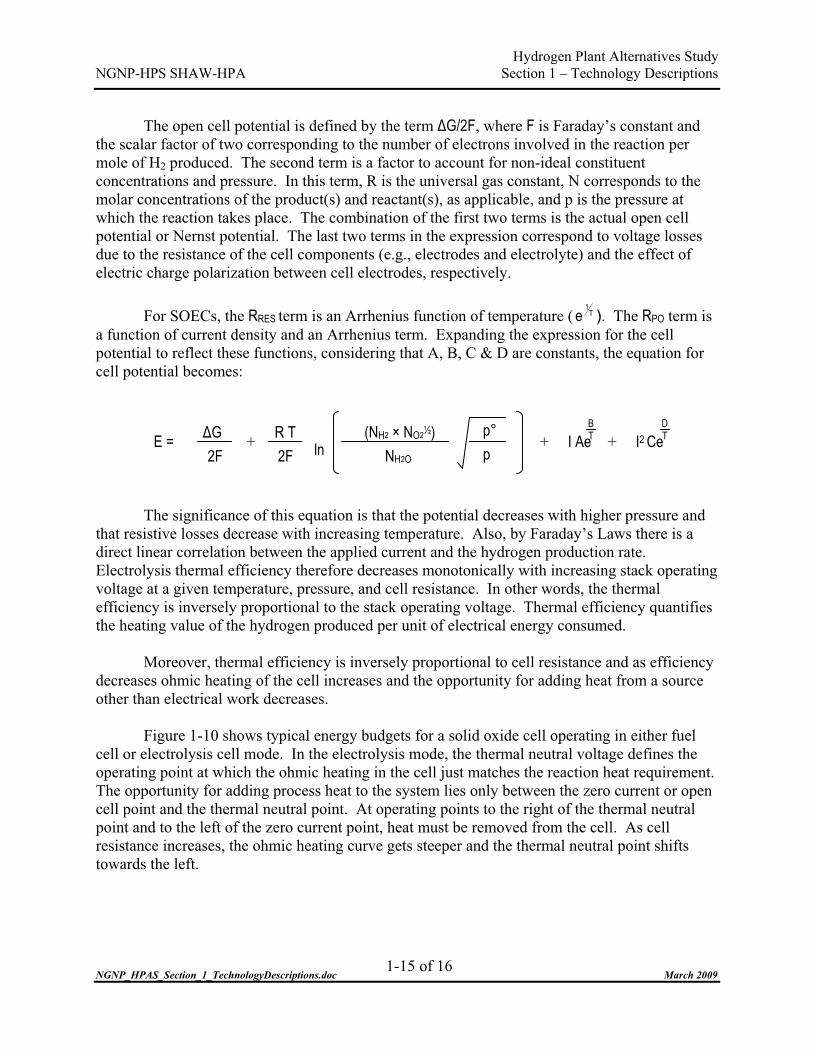
Hydrogen Plant Alternatives Study NGNP-HPS SHAW-HPA Section 1 – Technology Descriptions
NGNP_HPAS_Section_1_TechnologyDescriptions.doc March 2009
1-15 of 16
The open cell potential is defined by the term �G/2F, where F is Faraday’s constant and the scalar factor of two corresponding to the number of electrons involved in the reaction per mole of H2 produced. The second term is a factor to account for non-ideal constituent concentrations and pressure. In this term, R is the universal gas constant, N corresponds to the molar concentrations of the product(s) and reactant(s), as applicable, and p is the pressure at which the reaction takes place. The combination of the first two terms is the actual open cell potential or Nernst potential. The last two terms in the expression correspond to voltage losses due to the resistance of the cell components (e.g., electrodes and electrolyte) and the effect of electric charge polarization between cell electrodes, respectively.
For SOECs, the RRES term is an Arrhenius function of temperature ( T
1e ). The RPO term is
a function of current density and an Arrhenius term. Expanding the expression for the cell potential to reflect these functions, considering that A, B, C & D are constants, the equation for cell potential becomes:
The significance of this equation is that the potential decreases with higher pressure and
that resistive losses decrease with increasing temperature. Also, by Faraday’s Laws there is a direct linear correlation between the applied current and the hydrogen production rate. Electrolysis thermal efficiency therefore decreases monotonically with increasing stack operating voltage at a given temperature, pressure, and cell resistance. In other words, the thermal efficiency is inversely proportional to the stack operating voltage. Thermal efficiency quantifies the heating value of the hydrogen produced per unit of electrical energy consumed.
Moreover, thermal efficiency is inversely proportional to cell resistance and as efficiency
decreases ohmic heating of the cell increases and the opportunity for adding heat from a source other than electrical work decreases.
Figure 1-10 shows typical energy budgets for a solid oxide cell operating in either fuel
cell or electrolysis cell mode. In the electrolysis mode, the thermal neutral voltage defines the operating point at which the ohmic heating in the cell just matches the reaction heat requirement. The opportunity for adding process heat to the system lies only between the zero current or open cell point and the thermal neutral point. At operating points to the right of the thermal neutral point and to the left of the zero current point, heat must be removed from the cell. As cell resistance increases, the ohmic heating curve gets steeper and the thermal neutral point shifts towards the left.
E = �G 2F
+ R T 2F ln NH2O
(NH2 × NO2½) p p°
+ I Ae T + I2 Ce B D
T
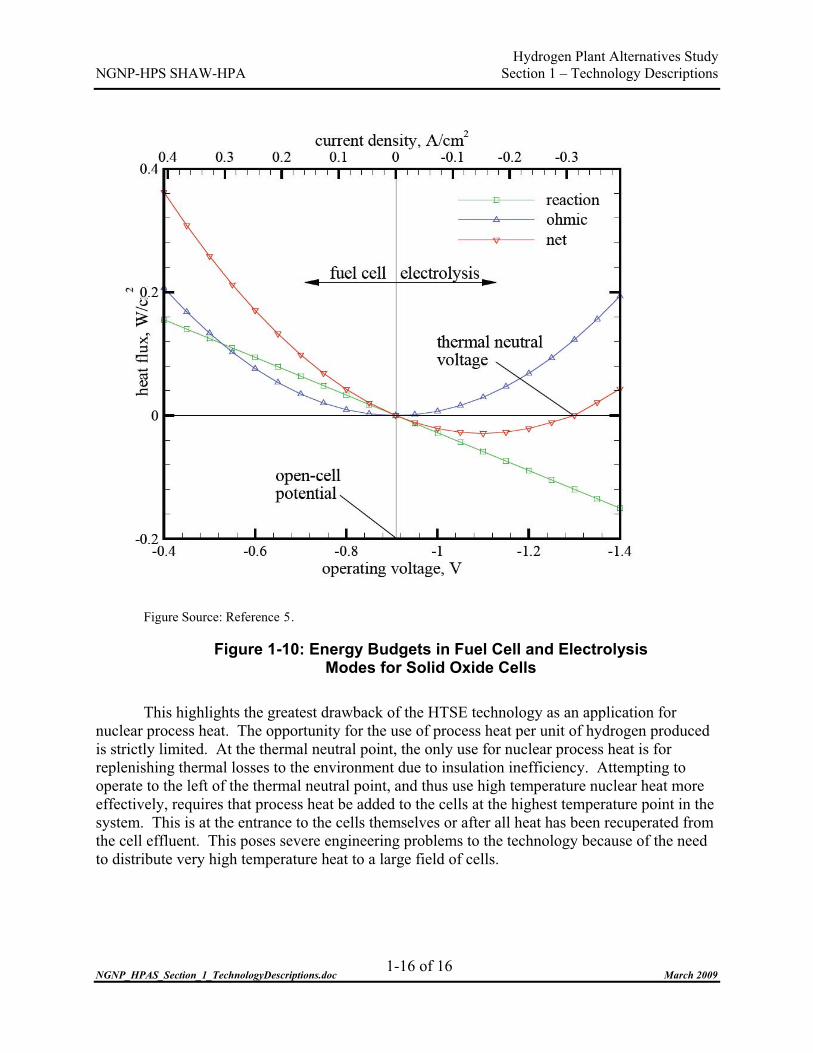
Hydrogen Plant Alternatives Study NGNP-HPS SHAW-HPA Section 1 – Technology Descriptions
NGNP_HPAS_Section_1_TechnologyDescriptions.doc March 2009
Figure Source: Reference 5.
Figure 1-10: Energy Budgets in Fuel Cell and Electrolysis Modes for Solid Oxide Cells
This highlights the greatest drawback of the HTSE technology as an application for
nuclear process heat. The opportunity for the use of process heat per unit of hydrogen produced is strictly limited. At the thermal neutral point, the only use for nuclear process heat is for replenishing thermal losses to the environment due to insulation inefficiency. Attempting to operate to the left of the thermal neutral point, and thus use high temperature nuclear heat more effectively, requires that process heat be added to the cells at the highest temperature point in the system. This is at the entrance to the cells themselves or after all heat has been recuperated from the cell effluent. This poses severe engineering problems to the technology because of the need to distribute very high temperature heat to a large field of cells.
1-16 of 16
Hydrogen Plant Alternatives Study NGNP-HPS SHAW-HPA Section 2 – Process Development
NGNP_HPAS_Section_2_ProcessDevelopment.doc March 2009
2-1 of 20
2 PROCESS DEVELOPMENT If one were to procure a license for a fully-developed process technology, one would
expect the licensor to provide � along with permission to practice the technology and guarantees regarding the yield, throughput, and utility usages � a set of basic information that would allow one to build and operate a plant based on that technology. Some of the key items that are typically provided are:
� Basic process chemistry, thermodynamics, and physical properties of process streams. � Catalyst, if required, including the quantity required, approved manufacturers,
expected life, poisons, etc. � Mass and energy balance for a plant of the required production capacity. This
includes the expected yields for the specified catalyst and separation efficiencies of unit operations upstream and downstream of the reactor, expected heat duties, etc.
� Process flow diagrams and a process description that include complete expected steady state process operating conditions, such as temperature, pressure, flow rates, and compositions; and complete list of required equipment including sizes of major equipment. This includes the recommended separation techniques and processing configuration, as well as the major control loops and a workable control strategy.
� Detailed mechanical, fabrication-ready designs of reactors and any special separation equipment if they vary from commonly used equipment such as distillation towers, packed bed or tubular reactors, and the like. Even when the equipment is ordinary process equipment, such critical parameters as the diameter, length, and number of tubes in a tubular reactor or a recommended packing or tray design for a critical distillation step are often specified by the licensor.
� Economic materials of construction for all major equipment and piping. � Startup, normal shutdown, and emergency shutdown strategies, including
recommended instrumentation. � Recommended special Health, Safety, and Environmental precautions. � Preliminary piping and instrumentation diagrams that embody much of the
information listed above. When this information can be provided, a process technology may be considered
commercial. Each of the water-splitting technologies may be judged with respect to its approach to this goal of commercial status. As can be determined from this report, all of the technologies require extensive process development to reach this goal.
This section discusses some of the issues that have been identified previously and some
that have been addressed in the course of this study to move toward this goal. For each hydrogen production alternative considered in this study, the process data and
design development are based on existing work completed under separate contracts for DOE. Specifically, published literature concerning existing research and, as applicable, prototype

Hydrogen Plant Alternatives Study NGNP-HPS SHAW-HPA Section 2 – Process Development
NGNP_HPAS_Section_2_ProcessDevelopment.doc March 2009
2-2 of 20
development including Aspen Plus� simulation models were provided to the Westinghouse Team. In addition, the Westinghouse Team fostered a continuing dialog during the course of the study with the various scientists associated with the research to ensure that the work of this study captured the most recent technology developments.
Mass and energy balances and process flow diagrams developed for this study are based
on these simulations models and other data to the greatest extent possible. However, there are instances where the models included features that either do not necessarily reflect good engineering practices or possibly jeopardize technical feasibility. Table 2-1 summarizes some of the common issues that were encountered and their resolution.
Table 2-1: Common Technology Design Basis Issues and Mitigation Measures
Design Basis Issue Resolution Unrealistic or missing pressure drops Pressure drops incorporated for heat exchangers,
estimated piping distances and corresponding friction losses.
No provision for pumping between vessels, where required
Pumps and mixing vessels added, as necessary
No provisions for purifying feed water or other chemicals included in the designs.
Ultrapure water treatment systems added. Chemical purity requirements are unknown and requirements for further purification and processing are not included in the reference designs.
No Provisions for liquid or solid waste treatment. Final treatment and disposal methods will be dictated by the environmental requirements of the federal, state, and local regulations. At a conceptual level without a selected project site, these requirements cannot be defined. Appropriate baseline wastewater treatment has been assumed for each of the technologies. Disposal of solid, universal, and hazardous wastes have not been addressed
Purity requirements for the product gases are not defined and product purification systems are not included in the design
Product gases are assumed to be required to meet typical standards for industrial gases. Facilities were added to meet this goal.
Mitigation of these items required modification of the original Aspen Plus� simulation
models and development of new converging models. The following subsections provide more specific details concerning the process development issues encountered for each of the separate technologies considered.
2.1 HYBRID SULFUR The Hybrid Sulfur design used in this study is based upon a flowsheet developed by
Savannah River National Laboratory for Pebble Bed Modular Reactor (Pty) Ltd. as part of a technology consulting agreement the results of which have not yet been published.[Ref. 6] The

Hydrogen Plant Alternatives Study NGNP-HPS SHAW-HPA Section 2 – Process Development
NGNP_HPAS_Section_2_ProcessDevelopment.doc March 2009
2-3 of 20
process flowsheet is modeled in Aspen Plus� and includes both the electrolysis and sulfuric acid decomposition sections. It does not include feedwater and product purification. The Westinghouse Team was involved in the evolution of the process model from its inception. Nevertheless, significant changes were made to that flowsheet during this study. Most of these changes involved simplifications such as consolidation of flash vessels and similar mitigation measures common to all technologies, as indicated in Table 2-1 above. Table 2-2 summarizes the design basis issues encountered with the HyS design and the Westinghouse Team’s resolution of these issues.
Table 2-2: Hybrid Sulfur Design Basis Flow Sheet Issues and Mitigation
Design Basis Issue Resolution Unrealistic temperature approaches on heat exchangers
All temperature approaches were set at a minimum of 10°K.
Too many flash stages with inadequate vapor flow from some stages
Several flashes were consolidated, but additional consolidation is possible.
No provision for trapping scale and dirt before entering the electrolyzers
A bank of PTFE disposable filters have been added upstream of the electrolyzers.
Unrealistic heat integration scheme An effort was made to minimize the number of streams used in heat integration, but additional consolidation is probably required for a realistic design.
No provision made for sulfuric acid blowdown. Recovery means for sulfur dioxide in the oxygen product not defined.
Losses were neutralized and replenished using market prices for the chemicals. However, in a real plant provisions would be made to recover sulfur, which is of value. It was judged that the cost of recovery and the cost of neutralization and replenishment would be approximately equal within the accuracy of the study economics. Extensive oxygen purification equipment was added to remove remaining traces of sulfur compounds and water to make this by-product saleable.
Utility steam injected directly into the process via the steam jet ejectors
Special equipment and provisions will have to be made to ensure pure steam if this scheme were to be used in a commercial plant. It was judged that either an alternative means of providing vacuum would be used in a commercial plant or the economic impact would be small in comparison to the precision of the estimate. Consequently, no additional provisions were added to the design.
2.1.1 Process Heat Usage The Hybrid Sulfur Process uses process heat only for decomposition of sulfuric acid.
The remainder of the energy required to split water is provided as work in the form of electrical energy to the electrolysis cells. For given helium supply temperature and reactor return

Hydrogen Plant Alternatives Study NGNP-HPS SHAW-HPA Section 2 – Process Development
NGNP_HPAS_Section_2_ProcessDevelopment.doc March 2009
2-4 of 20
temperature, the amount of usable process heat is therefore set by the helium temperature exiting the sulfuric acid decomposer or the PCHX. The lower the temperature out of the PCHX, the more process heat is used. On the other hand, effective recuperation of heat is required so as not to use high temperature process heat to perform a task that could be carried out with lower temperature heat. The bayonet reactor designed by Sandia National Laboratory and described in Section 1 uses high temperature process heat very effectively. The thermal analysis shown in that discussion indicates the thermodynamic limits of process heat use. The PCHX effectiveness is set by the process pinch point. In essence, the minimum process temperature at which heat can be used is 500°C. This means that the minimum temperature of helium leaving the sulfuric acid decomposer must be about 520 to 550°C. The remainder of the nuclear heat must be used in processes that use lower temperature heat.
The heat remaining between this temperature and the helium return temperature is best
used to raise and superheat steam for electricity generation. The design presented here is able to generate almost 70 kg/s of 125 bar steam at 480°C, as shown in the enthalpy-temperature diagram in Figure 2-1. The temperature of the helium leaving the PCHX sets the maximum temperature of the steam that can be generated.
HyS Steam Generation per Reactor
0.0
100.0
200.0
300.0
400.0
500.0
600.0
0.0 50.0 100.0 150.0 200.0 250.0
Heat Transfered, MWth
Tem
pera
ture
, deg
. C
Hot Stream Cold Stream
Figure 2-1: Enthalpy�Temperature Diagram for Steam Generation in the HyS Process

Hydrogen Plant Alternatives Study NGNP-HPS SHAW-HPA Section 2 – Process Development
NGNP_HPAS_Section_2_ProcessDevelopment.doc March 2009
2-5 of 20
2.1.2 Sulfuric Acid Decomposer Development of a mechanical design for the sulfuric acid decomposer vessel requires
attention. The information used in this study is a combination of work on two different decomposer designs. The thermal analysis used in the flowsheet is based upon the bayonet design developed by Sandia National Laboratory. However, there has been little detailed work carried out on the mechanical design and cost of a commercial scale unit based on this concept.
A similar, but distinct design has been developed by the Westinghouse Electric
Company. More effort has been expended in developing a mechanical design and cost for this unit, but less detail is available regarding its hydraulic and thermal characteristics. As described in Section 8.6, it was shown in the development of the Westinghouse decomposer cost that the cost of the decomposer will depend to a large degree on the silicon carbide heat transfer elements. Furthermore, the decomposition reaction is considered to be heat transfer limited. Therefore, regardless of differences in mechanical design, all decomposers using silicon carbide tubes should have commensurate costs proportional to the thermal capacity of the unit. For this study, the costs used are taken from the Westinghouse cost analysis, although the thermal analysis used is for the Sandia bayonet design.
2.1.3 Electrolyzer Table 2-3 is a comparison of the sizing assumptions used in this study for the PEM
electrolyzer cells and the corresponding simultaneous conditions achieved in the laboratory.
Table 2-3: Comparison of Sizing Assumptions
Sizing Assumption Achieved in the Laboratory PEM current density 5000 A/m2 5000 A/m2
PEM cell voltage 0.6 V 0.75 V
(narrow gap cell, 10/08) The electrolyzer design is based on PEM electrolyzer concepts. Each electrolyzer unit is
made up of a stack of 200 cells. Each cell has an active surface area of about one square meter. A unit therefore contains 200 cells and 200 m2 of electrode surface area. Each cell is a unit comprised of an anode in an anode compartment, a cathode in a cathode compartment, and a membrane separating the two compartments. There is a sealing system between the anode and cathode compartments that prevents communication between the two, other than through the membrane.
Each cell contains a feed pipe that distributes the feed anolyte across the anode
compartment and feed catholyte across the cathode compartment so that they flow uniformly across the face of the anode and cathode, respectively. Figure 2-2 shows a conceptual arrangement for a HyS cell. Both compartments are liquid flooded at all times. Hydrogen generated at the cathode flows with the catholyte and is collected in a cathode channel that exits the unit. The sulfuric acid generated leaves the cell with the anolyte.
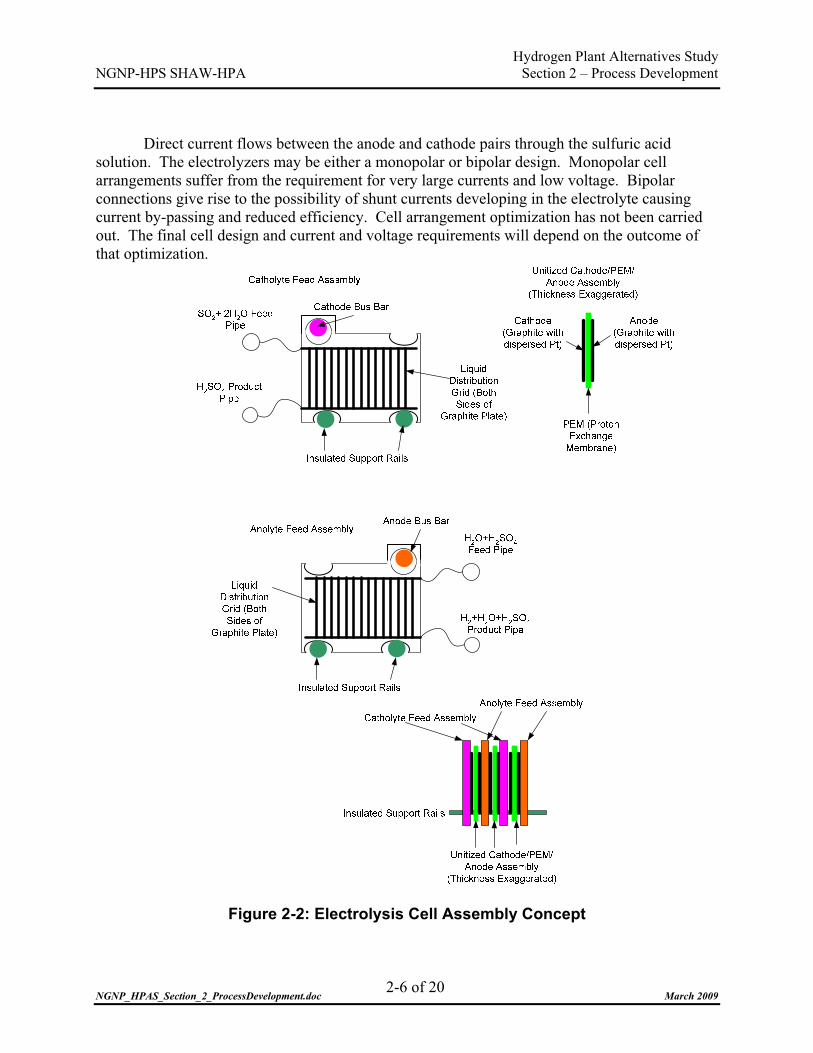
Hydrogen Plant Alternatives Study NGNP-HPS SHAW-HPA Section 2 – Process Development
NGNP_HPAS_Section_2_ProcessDevelopment.doc March 2009
2-6 of 20
Direct current flows between the anode and cathode pairs through the sulfuric acid
solution. The electrolyzers may be either a monopolar or bipolar design. Monopolar cell arrangements suffer from the requirement for very large currents and low voltage. Bipolar connections give rise to the possibility of shunt currents developing in the electrolyte causing current by-passing and reduced efficiency. Cell arrangement optimization has not been carried out. The final cell design and current and voltage requirements will depend on the outcome of that optimization.
Figure 2-2: Electrolysis Cell Assembly Concept

Hydrogen Plant Alternatives Study NGNP-HPS SHAW-HPA Section 2 – Process Development
NGNP_HPAS_Section_2_ProcessDevelopment.doc March 2009
2-7 of 20
The cells are contained in a frame or “cell rack,” as shown in Figure 2-3, which connects them electrically. The cell rack supports the individual cells and includes:
� The liquid inlet and distribution piping to the individual cells; � The effluent liquid and collection piping from the cells; � The hydrogen header piping collecting the hydrogen from each cell and carrying it to
the main collection system, and; � The bus bars connecting the anodes and cathodes to the direct current power grid.
Reference: www.spartanwatertreatment.com/eodsystems.html
Figure 2-3: Typical Electrolyzer Rack
Although it will operate at an elevated pressure, about 23 bar, it is expected that a stack
enclosure will not be required. Industry experts at Giner Electrochemical Systems, LLC believe the seals can be designed to hold the operating pressure.
2.1.4 Materials of Construction With the exception of the heated tubes in the Sulfuric Acid Decomposer, the conditions
in the HyS process are similar to those encountered in a sulfuric acid manufacturing plant. The HyS process operates under higher pressures than in these plants, but adequate materials of construction should be available, albeit costly. Materials of construction for this study were based on handbook information with a corrosion expert selecting the most demanding service.
Hydrogen Plant Alternatives Study NGNP-HPS SHAW-HPA Section 2 – Process Development
NGNP_HPAS_Section_2_ProcessDevelopment.doc March 2009
2-8 of 20
Information is not readily available for mixtures of sulfur dioxide, oxygen, and sulfuric acid and further investigation is required.
2.2 SULFUR IODINE The SI process has been in development since the 1970’s with continuing research being
conducted to improve the technology. To date, the significant portion of continuing research focuses on laboratory studies and bench scale prototype testing at the SI Integrated Laboratory-Scale (ILS) experiment sponsored by an international effort with the NHI Program. The ILS is located at General Atomic’s laboratories in San Diego. Recurring iterative development of mass and energy balances also continues using the limited laboratory data available to model the process and improve the cycle’s efficiency.
The Sulfur Iodine design presented in this study is based a DOE report [Ref. 7] containing
an integrated flowsheet for the process. This report was developed for DOE and presents a compilation of information from two other reports: one developed for General Atomics by P.M. Mathias concerning preliminary flowsheets for the SI Cycle; and the second a Master’s thesis written by J.E. Murphy on the Sulfur Iodine Cycle.
The process flowsheets included in the report are modeled in Aspen Plus� and are
separated into three distinct but integrated sections corresponding to the respective chemical reactions of the SI cycle: Section 1 for the Bunsen Reaction; Section 2 for Sulfuric Acid Decomposition; and Section 3 for Hydroiodic Acid Decomposition. The Section 1 flowsheet incorporates two major modifications from General Atomics original design. These modifications are the elimination of a boost reactor and the addition of scrubbing columns on the oxygen and hydrogen product streams. Section 2 is modeled using a multi-vessel Ozturk-style sulfuric acid decomposition. Section 3 utilizes reactive distillation for the decomposition and separation of HI to H2 and I2 and features two heat pumps that heat the distillation column reboiler and feed preheater.
The Westinghouse Team reviewed the above mentioned flow sheets with respect to good
engineering practice and technical feasibility. Table 2-4 summarizes several significant issues identified with the flowsheets provided to the Westinghouse Team as the design basis for SI, and the modifications made to the process to mitigate them.
Table 2-4: Sulfur Iodine Design Basis Flow Sheet Issues and Mitigation
Design Basis Issue Resolution A Multi-vessel arrangement for Bunsen reaction and 3 phase product separation.
A single multi-stage tower for the Bunsen Reaction and vapor phase separation, featuring an integral bottom liquid reservoir. Separate decant vessels are provided for liquid separation.

Hydrogen Plant Alternatives Study NGNP-HPS SHAW-HPA Section 2 – Process Development
NGNP_HPAS_Section_2_ProcessDevelopment.doc March 2009
2-9 of 20
Design Basis Issue Resolution A significant amount of heat is generated in the Bunsen reaction with no apparent means in the model to remove the heat.
A constant column bottoms recirculation cooling loop added to the Bunsen Reactor requiring the addition of pumps and heat exchangers.
Multi-vessel Ozturk style SAD Replaced SAD section in its entirety with a bayonet reactor similar to HyS.
Overly complicated heat integration for HAD. Distillation column product vapor and liquid fractions required to be mixed and heat of mixing recovered and used in the process via a heat pump. Practicality of recovering heat of mixing on a large scale due to the volume of liquid stream is anticipated to be problematic.
Simplified heat integration scheme by eliminating the heat pump used to recover heat of mixing. Heat is recovered from the distillation column tops and bottoms via heat exchangers to preheat the column feed streams.
For HAD, reactive distillation column features a high temperature and pressure steam heat pump loop to provide heat to boil the column bottom liquid and condense reflux from the column vapor stream. This loop does not provide entire heat input required to boil the column bottom liquid. The remaining heat duty will therefore need to be provided by the NHSS and the secondary helium loop. This heat supply was not shown on the original flow sheets.
Helium loop process coupling heat exchanger reboiler added. Helium reboiler provides the balance of heat not provided by the distillation column’s heat pump.
Engineering practicality of the reactive distillation column heat pump is questionable and may not be viable. Inlet and outlet temperature for the heat pump compressor, 256°C and 342°C respectively, as well as the 78 bar operating pressure, are higher than typical applications.
Heat pump retained in the design. This will undoubtedly consist of custom engineered equipment. Inclusion of the heat pump will be a continuing engineering challenge if retained in the design.
The above noted modifications were made to the original design basis Aspen Plus�
simulation models provided to the Westinghouse Team. Flow sheets and mass and energy balances for the converged simulations, as well as PFDs developed for the modified SI cycle by the Westinghouse Team may be found in Section 8 of this report.
2.2.1 Process Heat Usage Unlike the HyS Process, the process heat usage in the SI process is not constrained by the
thermodynamic pinch point in the Sulfuric Acid Decomposer. This is because the thermal requirement of the HI decomposition step is high enough that when proportioned to the sulfuric acid decomposition load, the pinch point with the helium heat transfer medium is increased and this does not become a restriction except in unusual circumstances. All the reactor heat can therefore be used as process heat and no steam need be generated because of process heat usage limitations.
Hydrogen Plant Alternatives Study NGNP-HPS SHAW-HPA Section 2 – Process Development
NGNP_HPAS_Section_2_ProcessDevelopment.doc March 2009
2-10 of 20
2.2.2 Process Integration and Quantity of Iodine The SI ILS is configured as a skid-mounted system with a dedicated skid representing
each of the three process sections. These skids have been run independently with simulated process integration between skids, meaning that products and effluents from skids are stored and then run through the next section or skid at a later time. Normally, one would expect some surge capacity to be built into a commercial-scale plant between units such as these to aid in dampening any process upsets. The quantity of iodine circulating between the Bunsen Reaction section and the HI Decomposition section is so large, however, that any appreciable hold up time for this stream is impractical. The ILS sections have not been operated as a fully integrated continuous system and further development is required. Therefore, a complete integrated scalable design is not considered available at this time.
At the SI ILS, the amount of iodine being used in the Bunsen reactor is 88% in excess of
the amount being reacted. This results in a large recycle flow and iodine inventory. On a laboratory or bench scale application, the excess mass of iodine required may be manageable. A commercial scale version of the SI technology will require a massive stream of iodine to be circulating through the Bunsen and HI decomposition sections. Based on the design developed for this study, the total mass of iodine required for the process to meet the target hydrogen production rate is estimated to be approximately 7.3 million kilograms, or 30% of the annual global iodine production. The circulation rate for a single train is in excess of 3 tonnes per second. This corresponds to a liquid flow rate to the Bunsen Reaction of 0.96 m2/sec (i.e., �15,300 gallons per minute). There are distinct design implications to utilizing this large mass of iodine in the process. These include:
� Significantly larger vessel capacities and pipe sizes; � Increased pump capacities and operating costs, and � Significantly higher heat recuperation requirements. In addition, identifying and securing a large source of iodine meeting required purity
requirements may be problematic. High purity iodine may be readily obtainable in small quantities required for laboratory and bench scale applications, but sufficiently pure iodine may not be available in the large quantities required for this technology. Design and construction of purification facilities may be necessary. Iodine purity requirements have not been established, but are expected to be stringent.
2.2.3 Design of Reactors and Associated Equipment Development of designs for the Bunsen reactor and HI Decomposition reactor is ongoing
and the configuration and mechanics of these vessels are currently preconceptual. Designs that have been proposed for the Bunsen reactor by the researchers are judged to be impractical to construct or to maintain. For this study, reactor configurations and vessels are based on proven technologies that are currently used in similar large scale applications. Specifically these are:
� For Section 100, the Bunsen reactor, a multi-stage tower with integral CSTR reactor;

Hydrogen Plant Alternatives Study NGNP-HPS SHAW-HPA Section 2 – Process Development
NGNP_HPAS_Section_2_ProcessDevelopment.doc March 2009
2-11 of 20
� For Section 300, the Hydrogen Iodide Decomposition reaction, a multi-stage reactive distillation column.
Residence time in the Bunsen Reactor and liquid decanters is a concern. Laboratory
experience has shown that there is significant sulfur formation with long residence times (i.e., greater than 16 hours). Sulfur appears to be fairly soluble in hydrogen iodide. The upper limit on reactor residence time is not yet known. Thirty (30) minutes to 4 hours may be acceptable. However, further research is required to document and establish a proper design requirement. For this study, residence times in vessels have been minimized to reduce the potential for sulfur formation.
One of the implications of the total mass of iodine required for the process is that there is
an unusually high number of large, high pressure vessels such as decanters, reactive distillation columns, reboilers, condensers, and heat pumps. Fabrication and shipping restrictions limit shop-fabricated heavy-wall vessel sizes to about 5.5 m (18 ft) in diameter and approximately 15 m (50 ft) in length for drums and other mixing vessels. Tower and column diameters are also limited to 5.5 m as well. Larger vessels can be shop-fabricated and erected in locations that can be reached easily by water or field fabricated. Field fabrication of heavy-wall vessels would require stress relieving at a construction site, which is very difficult and costly. The Westinghouse Team chose to limit the vessel dimensions rather than attempt to estimate costs for field fabricated vessels. Therefore for a single production train there will be six (6) Reactive Distillation Columns (TO-04 A through F). Each column will have an associated heat pump loop (HP-C A through F) with:
� A condenser integral to the column (HP-QC A through F); � An associated Steam drum (KO-301 A through F), and; � Reboiler (HP-QH A through F). In addition, each column will have a dedicated Helium Process Coupling Heat Exchanger
(EX-06 A through F). The reactive distillation column condenser selected for this design is an integral tube
bundle located within the column shell. This design was selected to avoid the cost of multiple heavy-wall vessel heads and tubesheets in separate condenser shells. Condensate from the column reboiler flows to the steam drum. Boiler water circulates through the condenser tube bundle either by thermosyphon action or by pump, if necessary. Steam generated in the condenser coils is separated from boiler water in the steam drum and then flows to the suction of the heat pump compressor. This compressor conveys the steam to the column reboiler.
There are significant additional electrical loads associated with the SI process due to
iodine circulation and heat pump operation. These loads are estimated to be: � For the Bunsen Reaction (e.g., pumping) �35.6 MW, and; � For Hydrogen Iodide Decomposition (e.g., heat pump compressor) �193.6 MW.

Hydrogen Plant Alternatives Study NGNP-HPS SHAW-HPA Section 2 – Process Development
NGNP_HPAS_Section_2_ProcessDevelopment.doc March 2009
2-12 of 20
2.2.4 Materials of Construction Previous studies for the SI cycle that considered such issues identified carbon steel or
Teflon® lined carbon steel as the material of construction for most piping and vessels. These materials may be used in certain areas of the process where temperature and pressure requirements allow. However, they will not be suitable in many services. Teflon® lining, for example, is not recommended for heat transfer applications due to its insulating nature. Moreover, for some high temperature applications a more heat-resistant fluoropolymer is required. Some of these exotic polymers are very costly.
Several portions of the SI process require materials that must have corrosion resistance in
very demanding and unusual services and perform at temperatures as high as 340�C and at pressures as high as 40 bar. The SI ILS experiment at General Atomic is currently using tantalum cladding for several of these applications. For the purposes of this study, it is assumed that tantalum cladding for vessels and tantalum tubes for heat exchangers are the sole material choice for these high temperature corrosive applications. The combination of the large size and number of vessels and heat exchangers, as well as the cost of the tantalum cladding and tubing, results in a very high capital cost. The estimate carried out in conjunction with this study indicates that the cost of these materials on a large scale is prohibitive and clearly affects the economic feasibility of this technology. For this technology, it is recommended that a materials of construction development program be implemented. Stainless steel is deemed appropriate for other non-corrosive high temperature applications in the process to prevent contamination of process fluids due to ordinary corrosion.
2.3 HIGH TEMPERATURE STEAM ELECTROLYSIS The HTSE design presented in this study is based on a report provided by INL[Ref. 8] ,
which contains an optimized flow sheet developed by INL for a reference commercial scale hydrogen production facility. The reference plant design assumed a high temperature helium cooled reactor coupled to a direct Brayton power cycle. The reference design reactor power is 600 MWth and the electrolysis unit consists of over 4 million cells. The intent of the report is to establish an optimized design for the reference nuclear-driven HTSE hydrogen production plant so that parameters can be compared with other hydrogen production methods and power cycles, as well as to evaluate relative performance characteristics and plant economics.
The Westinghouse Team used the Aspen Plus� simulation model, information contained
in the report, and information gathered during meeting and correspondences with the report authors’ to further develop the simulation models and develop a viable commercial scale process design. During the process development, the Westinghouse Team identified and modified aspects of the INL reference design. These aspects are described in Table 2-5.

Hydrogen Plant Alternatives Study NGNP-HPS SHAW-HPA Section 2 – Process Development
NGNP_HPAS_Section_2_ProcessDevelopment.doc March 2009
2-13 of 20
Table 2-5: HTSE Design Basis Flow Sheet Issues and Mitigation
Design Basis Issue Resolution Sweep gas purity requirements are not defined and sweep gas purification systems not included in the design.
State-of-the-art Clean Dry Air (CDA) system added to the design to remove contaminants and provide dry air (sweep gas). CDA system requires a low pressure inlet compressor in addition to the high pressure Sweep Gas Compressor after the CDA system.
No provisions in the design to remove dissolved gases from the influent process feed water.
Deaerator added to remove dissolved gases. Inclusion of the deaerator necessitated a source of steam, thereby requiring further modifications to the heat integration.
Single Recuperator used to both condense and boil not viable for large scale application.
Significant modification to heat integration scheme. Parallel heat exchanger trains added that utilize the electrolyzer effluent hot hydrogen and sweep gas streams to preheat the inlet feed water and sweep gas prior to the respective PCHXs. Each train consists of a preheater, common thermosiphon boiler, and superheater.
Single process coupling heat exchanger is shown for both the cathode feed stream (i.e., water and hydrogen) and the anode feed stream (i.e., sweep gas). Shaw deemed that a single heat exchanger for this application is not viable.
Separate process coupling heat exchangers for cathode feed (water and hydrogen) and anode feed streams (Air)
A separate heat exchanger system is shown to add process heat directly into the electrolyzer modules in order to provide the required heat of reaction. A concept is not proposed for a cell module configuration and required distribution system to each individual cell in order to provide the required heat. Shaw deemed this approach to be problematic and not viable.
In lieu of adding heat directly to the cells, inlet feed stream temperatures maximized using the heat available with the PCHXs. The remaining heat is assumed to be generated by increasing the electrical energy to the cells via ohmic heating.
The above noted modifications were made to the original design basis Aspen Plus�
simulation models provided to the Westinghouse Team. Flow sheets and mass and energy balances for the converged simulations, as well as PFDs developed by the Westinghouse Team may be found in Section 8 of this report.
2.3.1 Process Heat Usage The process heat requirement for this technology is proportionally very low in
comparison to the other water splitting technologies. At a fixed current density and plant capacity, the opportunity for use of process heat is reduced as the operating temperature decreases due to the increase in cell resistance and ohmic heating in the cells. Operating at the thermal neutral point by definition requires no process heat except that which is needed to account for thermal insulation losses and the inability to fully recuperate heat due to Second Law considerations. Even under the best of circumstances – operating at a voltage below the thermal

Hydrogen Plant Alternatives Study NGNP-HPS SHAW-HPA Section 2 – Process Development
NGNP_HPAS_Section_2_ProcessDevelopment.doc March 2009
2-14 of 20
neutral point and introducing steam and sweep gas at a temperature above the cell operating temperature as was assumed for this study – the process heat requirement is low. To match the hydrogen production rate of the base case HyS plant, 142 MMSCFD, only 88 MWth is required. The electrical requirement is 479 MWe. This means that for a reasonably sized hydrogen plant, most of the thermal output of the HTGR will be used to generate electrical energy. If all of the heat from a 550 MWth HTGR were used for process heat under the above operating conditions, the plant would have to be 12 ½ times the size of a HyS plant powered by a single reactor. Moreover, 3000 MWe would have to be imported. For this reason, most of the heat from the HTGR in the base case for this technology is used to raise and superheat steam for electricity generation as shown in Figure 2-4 below.
HTSE Steam Generation
0.0
100.0
200.0
300.0
400.0
500.0
600.0
700.0
800.0
900.0
0.0 50.0 100.0 150.0 200.0 250.0 300.0 350.0 400.0 450.0 500.0
Heat Transfered, MWth
Tem
pera
ture
, deg
. C
Cooling Curve Heating Curve
Figure 2-4: Enthalpy�Temperature Diagram for Steam
Generation in the HTSE Process
2.3.2 Electrolyzer and Enclosure Design The following is a comparison of the sizing assumptions used in this study for the PEM
electrolyzer cells and the corresponding simultaneous conditions achieved in the laboratory.

Hydrogen Plant Alternatives Study NGNP-HPS SHAW-HPA Section 2 – Process Development
NGNP_HPAS_Section_2_ProcessDevelopment.doc March 2009
2-15 of 20
Table 2-6: Comparison of Sizing Assumptions
The cross section of a solid-oxide electrolysis cell is shown in Figure 2-5 below.
Figure Source: 2006 DOE Hydrogen Fuel Cells & Infrastructure Technologies Program Review [Ref. 9]
Figure 2-5: Planar Solid-Oxide Electrolysis Cell
Regarding the number and configuration of the electrolysis cells, work to date on a
design for a large scale commercial application, such as the one being considered in this study,
Sizing Assumption Achieved in the Laboratory
SOEC current density 2500 A/m2 2800 A/m2
(after 1000 hours, with continuing degradation, 9/06)
SOEC cell voltage 1.26V 1.3V

Hydrogen Plant Alternatives Study NGNP-HPS SHAW-HPA Section 2 – Process Development
NGNP_HPAS_Section_2_ProcessDevelopment.doc March 2009
2-16 of 20
has been conceptual at best. Therefore, as part of this study, the Shaw Team developed a conceptual electrolyzer module and cell arrangement and modeled the sweep gas and feed steam distribution within the electrolyzer modules. The concepts shown here are presumed to be viable based on the modeling conducted. However, more intensive study of the electrolyzer and electrolysis cell configuration is required.
As envisioned, the cells are assembled into 76 modules, including eight in-place spare
modules. The inlet hydrogen/steam feed and the sweep gas streams must be distributed evenly amongst all the modules. Each module contains 4 stacks of 2500 cells each. Each cell is 50 cm by 50 cm in area for a total of 2500 m2 of cell area per module. The above mentioned cell size is considerably larger than those currently under development. However, the 50 cm by 50 cm size was chosen because it is deemed that any cell size smaller than this will not be technically feasible in a large centralized installation. Figure 2-6 depicts a plan view of the module configuration, while Figure 2-7 is an elevation cross-section of a module.
The approximate dimensions of an electrolyzer module are 2.2 m in diameter by 7.3 m
long. Based on the target production rate, the total electricity demand of the electrolysis cells is
estimated to be approximately 479 MWe for a hydrogen production rate of 142 MMSCFD. Given a 550 MWth nuclear reactor and a Rankine cycle, it is estimated that approximately 204 MWe of electricity will be purchased in order to meet the required electricity demand of the electrolyzer.

Hydrogen Plant Alternatives Study NGNP-HPS SHAW-HPA Section 2 – Process Development
NGNP_HPAS_Section_2_ProcessDevelopment.doc March 2009
2-17 of 20
Figure 2-6: Plan View of Electrolysis Module
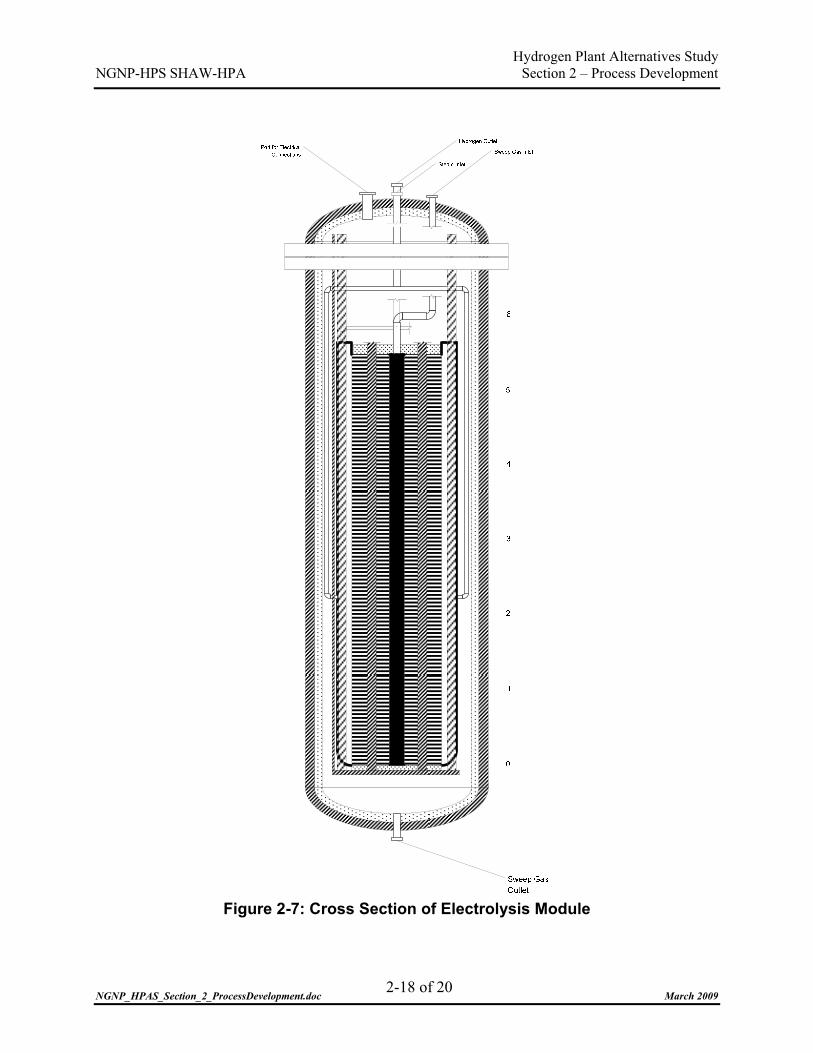
Hydrogen Plant Alternatives Study NGNP-HPS SHAW-HPA Section 2 – Process Development
NGNP_HPAS_Section_2_ProcessDevelopment.doc March 2009
2-18 of 20
Figure 2-7: Cross Section of Electrolysis Module

Hydrogen Plant Alternatives Study NGNP-HPS SHAW-HPA Section 2 – Process Development
NGNP_HPAS_Section_2_ProcessDevelopment.doc March 2009
2-19 of 20
Sweep gas enters the center manifold of each module and exits from the cells directly
into the vessel enclosure where it is collected and sent on to heat recovery. This arrangement avoids the presence of moisture in the vessel enclosure and the possibility of condensation in the internal insulation. The steam/hydrogen feed enters in the end manifolds and exits from a center manifold. All connections to the cell stack, both fluid and electrical with the exception for the sweep gas exit, are made through the removable vessel head. This allows the enclosure vessel and piping to remain in place while the electrolyzer module can be lifted out for replacement or repairs. Use of internal insulation makes it possible to use carbon steel as a material of construction for this service. This is economically important due to the large number of vessels required.
Pressurized operation of the modules was selected to avoid the large cost of compressing
product hydrogen generated at a low pressure. This enclosed pressurized design, however, raises several difficult module design problems:
� The mechanism for adjustment of pressure on the stack to ensure good sealing is
inaccessible; � Tension bars used to provide sealing pressure are located within the thermal boundary
and are subject to thermal expansion; � Hydrogen can leak into the enriched air sweep gas-filled enclosure; � High pressure gas in the enclosure renders the thermal qualities of the vessel internal
insulation largely ineffective; � Large cables with high current loads must penetrate the pressure boundary, and; � Electrical connections must be made to the stack in a very high temperature, enriched
air environment. Regarding the module thermal insulation, the insulating properties of any internal
insulation will be an order of magnitude lower than expected due to the high operating pressure. The operating temperature and pressure of the electrolyzer modules is 870°C and 56 bar, respectively. Up to about 40 bar, the thermal conductivity of gases are affected only very slightly by pressure. As pressures rise above this level, however, the thermal conductivity increases very rapidly. The thermal conductivity of the insulation is entirely dependent upon the conductivity of the gas in the insulation. For internal insulation, this will be air and oxygen. For air and oxygen above 40 bar, the dependence of thermal conductivity on pressure changes dramatically and becomes quite strong. Although the effect on the Prandtl number is negligible, the effect on conductivity, and therefore presumably also on viscosity, is large. For gas trapped in the insulation, conductivity and not Prandtl number is important: heat transmission is mostly by conduction, not convection. The net effect is that the insulation becomes largely ineffective.
These disadvantages may outweigh the advantages of this design. Considerably more
design work is required before an adequate cell enclosure design is achieved

Hydrogen Plant Alternatives Study NGNP-HPS SHAW-HPA Section 2 – Process Development
NGNP_HPAS_Section_2_ProcessDevelopment.doc March 2009
2-20 of 20
2.3.3 Piping and Thermal Expansion One troubling design issue facing this technology is the distribution of very high
temperature gas from a central location, the steam and sweep gas PCHXs, to a multitude of electrolyzer vessels. The problem can be appreciated by examining the equipment layout of this technology included in Section 8.3.4. Long runs of high pressure, high temperature thick-wall piping made of an alloy such as 800H must be used to distribute hot gases to the electrolyzer enclosures. The thermal expansion of this pipe will be on the order of 1½ per cent. The material and heavy wall thickness render this pipe less flexible than would otherwise be the case. It has not yet been determined whether a workable piping design can be achieved. Until now piping at these temperatures has been limited to short runs at low pressures and even these piping designs are difficult.
The fundamental question is whether the difficulty and cost of solving these design
problems is justified by the limited utility of process heat to this technology. Effective recuperators have been designed that can be easily integrated with the cell stacks. These can only be used when cell heating is provided electrically, by ohmic losses or otherwise. Process heat in excess of that recuperated must be introduced between the cell stacks and the recuperator. This introduces a myriad of issues that can be avoided by a small amount of electrical heating.
2.3.4 Materials of Construction Materials experience with high temperature steam and hydrogen streams is well
established, and will require alloy 800H. There is, however, only limited experience with material requirements for oxygen streams under high temperature and pressure (i.e., the outlet sweep gas). Further material testing and validation will be required for materials to be used in the high-oxygen sweep gas streams. Sweep gas piping and valves must be oxygen cleaned prior to service. Electrolysis cell design, constituent materials, and sealant materials, will need to be selected, or perhaps developed, for the process design temperature. These material requirements will need to be explored further during the course of the conceptual design.

Hydrogen Plant Alternatives Study NGNP-HPS SHAW-HPA Section 3 – Summary Process Descriptions
NGNP_HPAS_Section_3_SummaryProcessDescriptions.doc March 2009
3-1 of 12
3 SUMMARY PROCESS DESCRIPTIONS
3.1 HYBRID SULFUR As noted previously in Section 2, the design basis for the HyS cycle consists of one flow
sheet and its associated mass and energy balance. Study modifications expanded the number of major process sections to four. These sections are:
� Section 100 Feed and Utility Systems (FUS) � Section 200 Sulfuric Acid Decomposition (SAD) � Section 300 Electrolysis (ELE) � Section 400 Product Purification System (PPU) For Sections 200 and 300, stream and equipment identifiers have been kept consistent
with the corresponding identifiers in the Aspen Plus® simulation model. Sections 100 and 400 include systems that produce the assumed feed water and product purity requirements, respectively. A brief process description for each section is provided below.
The simulation diagram, mass and energy balance, as well as PFDs for the HyS design
used in this study may be found in the Section 8. Capacities described in the following discussion are for one production train, with two production trains required to meet the target hydrogen production rate. The hydrogen production capacity for one train is approximately 71 MMCFD.
3.1.1 Feed and Utility Systems Due to the high degree of internal recycle in the HyS process, impurities contained within
the feed water will remain within the process. The result of the concentration of these impurities in the process would cause negative consequences, at a minimum, in the Sulfuric Acid Decomposer (RX-01 A&B). Therefore, it is assumed that the feed water quality must be of the highest purity and that a state-of-the-art water treatment system will be required. At the time of this study, feed water purity requirements for the HyS cycle are not known. Therefore, this design assumes that the water quality requirements are ultrapure water.
The design of a water treatment system depends on the source water quality and its
analysis. This study assumes that the water source is well water with a minimum hardness of 200 ppm as CaCO3. The pretreatment system includes a multi-media filtration and softener system to remove suspended solids and hardness, respectively. The pretreatment system is followed by a demineralizer system consisting of a reverse osmosis and electro-deionization (EDI) system. All water treatment systems are considered packaged systems and are therefore shown as ‘black boxes’ on the PFDs. For the HyS cycle, the water treatment system capacity is estimated to be 130 m3/hr. Purified water storage for 48 hours of process water demand and feed water pumps to convey this water are provided.

Hydrogen Plant Alternatives Study NGNP-HPS SHAW-HPA Section 3 – Summary Process Descriptions
NGNP_HPAS_Section_3_SummaryProcessDescriptions.doc March 2009
3-2 of 12
The FUS also includes a wastewater treatment system to treat water treatment wastes and process wastes. The system is estimated to need to treat approximately 60 m3/hr of wastewater. The type of treatment required will depend on the effluent discharge limits imposed by the permitting jurisdiction. For this study, it is anticipated that the wastewater treatment system will consist of an oil/water separation system, final neutralization system, physical/chemical treatment system with mixing tank, and ancillary pumps, instrumentation, and equipment. The wastewater treatment system is also treated as a vendor supplied system or ‘black box’ on the PFDs.
The final components of the FUS consist of sulfuric acid and caustic bulk storage and
transfers systems. The sulfuric acid system provides makeup to Sulfuric Acid Decomposition. Caustic is required to remove residual sulfur dioxide from the product oxygen in the PPU caustic scrubber. Both sulfuric acid and caustic are delivered as a 50 mass per cent liquid solution. Sulfuric acid is delivered to the Bunsen Reactor as is and caustic is diluted to a 10% by weight solution before being pumped to the scrubber.
3.1.2 Sulfur Dioxide Depolarized Electrolysis Make up purified water feed is fed to the Catholyte Surge Drum (KO-15). After being
filtered to remove any solid debris or products of corrosion, it is circulated through the cathode of the Electrolyzers (EL-01A:A-BB/ B:A-BB/ C:A-BB/ D:A-BB). There are four trains of electrolyzers each containing 54 units. Each unit consists of 200 PEM cells. Water is consumed in the electrolyzers forming hydrogen gas and oxygen ions. The ions pass through the cell membrane and react with dissolved sulfur dioxide to form sulfur trioxide ions, as described in Section 2. Catholyte and hydrogen gas leave the top of the electrolyzer units and are separated in the Wet Hydrogen Knockout Drum (KO-01A/B/C/D). Catholyte is returned to the Catholyte Surge Drum after being cooled by the Vacuum Column feed.
Anolyte consisting of 15.5 mass per cent sulfur dioxide dissolved in 43.5 mass per cent
sulfuric acid is pumped to the electrolyzer units from the Anolyte Prep Tank (TK-01). After being cooled by the Vacuum Column feed, most of the anolyte is circulated back to the Anolyte Prep Tank. Approximately 20% of the anolyte is further cooled with cooling water and sent to the Sulfuric Acid Decomposition section. About 40% of the sulfur dioxide in the anolyte is converted to sulfuric acid.
3.1.3 HyS Sulfuric Acid Decomposition Sulfuric acid feed at about 50% concentration by weight is sent from the ELE section to
the SAD section to be decomposed into sulfur dioxide, water, and oxygen. Before being pumped to the decomposer, the acid is concentrated to 75% by weight to maximize the efficiency of the decomposition step. Because the per-pass conversion is only about 50%, a substantial amount of sulfuric acid is recycled. Process heat is recuperated by recovering heat from several flashed vapor and other streams to preheat Vacuum Column feed.

Hydrogen Plant Alternatives Study NGNP-HPS SHAW-HPA Section 3 – Summary Process Descriptions
NGNP_HPAS_Section_3_SummaryProcessDescriptions.doc March 2009
3-3 of 12
Acid feed to the section is flashed in two stages: the first stage is at atmospheric pressure, and the second stage under vacuum to remove as much sulfur dioxide as possible. The feed is then pumped to one of four Vacuum Columns (TO-01 A/B/CX/D) where water is removed to concentrate the decomposition feed. The vacuum towers operate at a top pressure of about 0.1 bar and a bottom temperature of about 127°C in order to reach the required 75 mass per cent concentration. To handle the column internal vapor load for each train, about 1160 m3/s, four very large vacuum towers are required along with reboilers, condensers, reflux drums, and pumps. Heat for the distillation, about 108 MWth total for each train of four columns, is provided by imported steam at a pressure of 10 Bar. Condensing cooling for the tower, about 204 MWth total for each train of four columns, and a vacuum steam ejector system is provided by imported cooling water. The two-stage steam ejector system provides the vacuum for the system. Uncondensed vapor, primarily sulfur dioxide, is collected from the column and flash drums and is compressed in the SO2 Recycle Compressor (CO-01) and sent to the bottom of the Absorber Column (TO-02). The vapor flashed from several streams, both upstream and downstream of the decomposer, is partially condensed and flows to the Absorber Column.
Concentrated acid bottoms from the Vacuum Columns are pumped to the Sulfuric Acid
Decomposers (RX-201 A&B). Here the decomposition of sulfuric acid into water, sulfur dioxide, and oxygen takes place. The heat for the endothermic reaction and feed heating is provided by helium at 910°C from the NHSS. The helium return temperature from the decomposers is 522°C for a duty of 356 MWth per train. The design and operation of the decomposer is described in Section 2. Decomposer product is flashed in four stages to separate product sulfur dioxide and oxygen from unreacted sulfuric acid. Vapor from these flashes is partially condensed using the feed streams to the Vacuum Column and cooling water. The condensate and vapor are sent to the Absorber Column, while the liquid is recycled to the bottom of the Vacuum Column.
Liquid condensate and vapor from the flashed streams and Vacuum Column overhead
product are all sent to the Absorber Column. The condensate is then used to scrub sulfur dioxide out of the product oxygen. The oxygen product flows to the Product Purification System and the liquid, primarily sulfur dioxide dissolved in water, flows to the Anolyte Prep Tank.
3.1.4 Product Purification Systems Purification of the oxygen product from the SAD and the hydrogen product from ELE is
required to meet industry standards for these product gases. For this study, the Westinghouse Team adopted purification system designs that are typical for industrial gases. The design of these systems assumes that the feedstocks of water and sulfuric acid are relatively pure and that there are no contaminants in the product gas streams that will require purification other than what is described below.
The oxygen produced by the SAD is assumed to be a saleable product and will be
delivered to a user or pipeline at an offsite location. This oxygen is conveyed to the PPU and passes through a caustic scrubber to remove any remaining sulfur dioxide. The scrubbed oxygen stream then passes through a set of zeolite drying beds, followed by polishing adsorbers that

Hydrogen Plant Alternatives Study NGNP-HPS SHAW-HPA Section 3 – Summary Process Descriptions
NGNP_HPAS_Section_3_SummaryProcessDescriptions.doc March 2009
3-4 of 12
further remove any residual traces of sulfur dioxide. Both sets of adsorbers are regenerated using a portion of the oxygen product.
The hydrogen purification system is designed to remove sulfur species and water from
the hydrogen product prior to being discharged to a pipeline. Precautions have been made to remove sulfur species because of the current experience of the migration of sulfur across the cell membrane. The hydrogen gas effluent stream is conveyed from the Wet Hydrogen Knockout Drum to the hydrogen purification system, where it is further compressed to sufficient pressure for discharge to a hydrogen pipeline. Prior to discharge to the pipeline, the hydrogen passes through a set of dryers followed by a hydrogenation reactor to ensure that any sulfur species in the gas are reduced to hydrogen sulfide. Hydrogen sulfide is captured in zinc oxide beds and water produced in hydrogenation is removed in zeolites drying beds. The system is designed to use a portion of the hydrogen product to regenerate the drying beds.
3.2 SULFUR IODINE As noted previously in Section 2, the design basis for the SI cycle consists of three
integrated flow sheets, or sections. Study modifications expanded the number of major process sections to five. These sections are:
. � Section 000 Feed and Utility Systems (FUS) � Section 100 Bunsen Reaction (BUN) � Section 200 Sulfuric Acid Decomposition (SAD) � Section 300 Hydroiodic Acid Decomposition (HAD) � Section 400 Product Purification System (PPU) For Sections 100 through 300, stream and equipment identifiers have been kept
consistent with the corresponding identifiers in the Aspen Plus® simulation models. Sections 000 and 400 include systems that produce the assumed feed water and product purity requirements, respectively. A brief process description for each section is provided below.
The simulation diagram, mass and energy balance, as well as PFDs for the SI design used
in this study may be found in the Section 8 of this report. Capacities described in the following discussion are for one production train, with three production trains required to meet the target hydrogen production rate. The hydrogen production capacity for one train is approximately 52 MMCFD.
3.2.1 Feed and Utility Systems Due to high degree of internal recycle in the SI cycle and the absence of any process
blowdown streams, it is surmised that any impurities contained within the feed water will remain within the process. The result of the build up of these impurities in the process would undoubtedly cause negative consequences for the operability of the process. Therefore, it is assumed that the feed water quality must be of the highest purity and that a state-of-the-art water treatment system will be required. At the time of this study, feed water purity requirements for

Hydrogen Plant Alternatives Study NGNP-HPS SHAW-HPA Section 3 – Summary Process Descriptions
NGNP_HPAS_Section_3_SummaryProcessDescriptions.doc March 2009
3-5 of 12
the SI cycle are unknown. Therefore, the Westinghouse Team assumes that the water quality requirements are ultrapure water.
Ultimately, the design of any water treatment system will depend on the source water
quality and should be based on a source water quality analysis. This study assumes that the water source is well water with a minimum hardness is 200 ppm as CaCO3. The pretreatment system includes a multi-media filtration and softener system to remove suspended solids and hardness, respectively. The pretreatment system is followed by a demineralizer system consisting of a reverse osmosis and electro-deionization (EDI) system. All water treatment system are considered packaged systems and are therefore shown as ‘black boxes’ on the PFDs. For the SI cycle, the water treatment system capacity is estimated to be 140 m3/hr. Purified water storage for 48 hours of process water demand and feed water pumps are provided.
The FUS also includes a wastewater treatment system to treat water treatment wastes and
process wastes. The system is estimated to need to treat approximately 67 m3/hr of wastewater. The type of treatment required will depend on the effluent discharge limits imposed by the permitting jurisdiction. For this study, it is anticipated that the wastewater treatment system will consist of an oil/water separation system, final neutralization system, physical/chemical treatment system with mixing tank and ancillary pumps, instrumentation, and equipment. The wastewater treatment system is also treated as a vendor supplied system or ‘black box’ on the PFDs.
The final components of the FUS consist of sulfuric acid and caustic bulk storage and
transfers systems. The sulfuric acid system provides makeup to the Bunsen Reaction. Caustic is required to remove residual sulfur dioxide from product oxygen in the PPU caustic scrubber. Both sulfuric acid and caustic are delivered as a 50 mass per cent liquid solution. Sulfuric acid is delivered to the Bunsen Reactor as is and caustic is diluted to a 10 mass per cent solution before being pumped to the scrubber.
3.2.2 Bunsen Reaction The Bunsen Reaction section of the process includes internal feed stream recycle, the
Bunsen Reactor, reactor product separation, and a Reverse Bunsen Reactor to remove any residual sulfur from the HIx product stream. As noted in Section 2 of this report, the Westinghouse Team’s major modification to the Bunsen portion of the process is the design of the Bunsen Reactor and product separation.
The Westinghouse Team’s revised concept for the Bunsen Reactor (TO-101) is a
multistage tower featuring bottom storage section to retain the required mass of iodine and dissolved sulfur dioxide for proper phase mixing and heat of reaction removal. The reactor features three distinct zones:
� Scrubbing Zone. Top third of the tower contains packing for final scrubbing of the vapor phase to remove any iodine. Feed streams to this zone are purified feed water and H2SO4.

Hydrogen Plant Alternatives Study NGNP-HPS SHAW-HPA Section 3 – Summary Process Descriptions
NGNP_HPAS_Section_3_SummaryProcessDescriptions.doc March 2009
3-6 of 12
� Final Reaction Zone. Bottom two thirds of the tower with 9 stages of packing for completion of the Bunsen Reaction. Purified feed water and recovered water from the HAD section are feed at the top of this zone, while recycled SO2 vapor and O2 gas are fed at the bottom of the zone.
� Bottoms Zone. Holds the required mass of iodine and acts as a reservoir for the recirculating cooling loop. Iodine and recycled acid from the SAD section are fed into the Bottoms Zone. Most of the Bunsen Reaction takes place in this zone.
The Scrubbing Zone and Reaction Zone are separated by a liquid collection tray with
capped chimneys. Liquid collected in this tray is directed to the Reverse Bunsen Reactor for further processing.
The Bottoms Zone of the reactor is essentially a CSTR with a residence time of 30
seconds. The iodine feed rate to the Bottoms Zone is approximately 3,400 m3/hr. This zone also acts as a reservoir for the Bunsen Reactor’s recirculating cooling system. This system consists of three parallel heat exchangers each with a dedicated pump. The cooling system withdraws the bottoms liquid from the reservoir, passes the liquid through the heat exchangers, and returns it back to the reservoir. The circulating pumps that pump the reaction mixture through the cooling heat exchangers keep the reservoir well-mixed. Two of the heat exchangers are considered full duty exchangers with the third heat exchanger being used as a trim cooler. Cooling requirements are estimated to be 181.5 MWth. Based on the heat capacity of the reactor bottom liquids, the total cooling system process liquid recirculation rate is estimated to be 4,500 m3/hr. The amount of cooling water required will be significant and will most likely necessitate a dedicated cooling water system. Air coolers may be considered as an alternative.
The Bunsen Reactor product liquid flow rate of approximately 3,750 m3/hr is conveyed
via a 900 mm (i.e., 36 inch) pipe to one of two Decant Tanks (TK-102A/B) for liquid separation. These vessels are designed as decanters with overflow and underflow baffles and a sump for each of the separated phases. The retention time of the product liquid in each vessel, including sump volumes, is set at 8 minutes. Due to the large difference in the phase densities of the liquids, separation is judged to be an easy one. The iodine and HIx product phase is transferred to a Reverse Bunsen Reactor for further processing. The sulfuric acid phase is pumped to the Vacuum Column in the SI SAD section for concentration before being sent to the Decomposer.
The Reverse Bunsen Reactor (TO-102) converts any residual sulfuric acid that may be in
the Iodine and HIx product liquid to SO2 vapor. This vapor is recycled back to the Bunsen Reactor. The Reverse Bunsen Reactor design is essentially the same as the Bunsen Reactor with the exception that it does not have an iodine Scrubbing Zone, and the Reaction Zone consists of five stages instead of nine.
Iodine and HIx separated from the Bunsen Reactor product stream in the Decant Tanks is
pumped to the first stage of the Reverse Bunsen Reactor at the top of the tower. A portion of the oxygen product stream exiting the Bunsen Reactor is directed to the bottom of the Reverse Bunsen Reactor. The I2/HIx and oxygen flow within the tower section is countercurrent. The liquid collected in the reactor’s bottom reservoir is pumped to the HAD section of the process.

Hydrogen Plant Alternatives Study NGNP-HPS SHAW-HPA Section 3 – Summary Process Descriptions
NGNP_HPAS_Section_3_SummaryProcessDescriptions.doc March 2009
3-7 of 12
The tower sections of the Bunsen and Reverse Bunsen Reactors are sized using estimation methods commonly used in the chemical and petrochemical industry. The unusual physical properties of the HI/ I2/H2O/ SO2 system may render some of these methods somewhat inaccurate. In further design efforts, tower sizing should be reassessed using methods that take these properties into account.
3.2.3 SI Sulfuric Acid Decomposition Sulfuric acid feed at about 60% concentration by weight is sent from the Bunsen
Reaction to the SI SAD section to be decomposed into sulfur dioxide, water, and oxygen. Before being pumped to the Decomposer, the acid is concentrated to 75% by weight to maximize the efficiency of the decomposition step. Because the per-pass conversion is only about 50%, a substantial amount of sulfuric acid is recycled. Process heat is recuperated by recovering heat from vapor flashed from the reactor product with feed to the concentration step.
Acid feed to the section is first preheated in the HP Recycle Acid Flash Condenser (EX-
201). It then flows to one of two Vacuum Columns (TO-201 A&B) where water is removed to concentrate the decomposition feed. The vacuum towers operate at a top pressure of about 0.1 bar and a bottom temperature of about 127°C in order to reach the required 75 mass per cent concentration. To handle the column internal vapor load for each train, about 680 m3/s, two very large vacuum towers are required along with reboilers, condensers, reflux drums, and pumps. Heat for the distillation for both columns, about 51 MWth total for each train, is provided by imported steam at a pressure of 10 bar. A two-stage steam ejector system provides the vacuum for the system. Uncondensed vapor, primarily sulfur dioxide, is sent to the Bunsen Reaction section. Condensing cooling for the tower, both columns, and the vacuum ejector system is provided by imported cooling water. The cooling duty is about 88 MWth total for each train.
Concentrated acid bottoms from the Vacuum Columns are pumped to the Sulfuric Acid
Decomposers (RX-201 A&B). Here the decomposition of sulfuric acid into water, sulfur dioxide, and oxygen takes place. The heat for the endothermic reaction and feed heating is provided by helium at 910°C from the NHSS. The helium return temperature from the decomposers is 640°C for a duty of 247 MWth per train. The design and operation of the decomposer is described in Section 3.1 above. Decomposer product is flashed in three stages to separate the sulfur dioxide product and oxygen from unreacted sulfuric acid. Vapor from these flashes is partially condensed using the feed streams to the Vacuum Tower and cooling water. Three streams are sent to the Bunsen Reaction section: low pressure sulfur dioxide, oxygen and sulfur dioxide vapor, and liquid water with dissolved sulfur dioxide.
3.2.4 Hydroiodic Acid Decomposition As noted in Section 2, the revised heat integration recovery scheme for HAD eliminates
the need for the heat pump for the mixing and provides approximately the same column feed temperature. The heat pump used for condensing reflux and reboiling in the Reactive Distillation Column is retained in the design. An additional benefit of the new recovery scheme

Hydrogen Plant Alternatives Study NGNP-HPS SHAW-HPA Section 3 – Summary Process Descriptions
NGNP_HPAS_Section_3_SummaryProcessDescriptions.doc March 2009
3-8 of 12
is that the phase separation in two of the columns separation drums is simplified since HIx in the feed streams to these drums is now completely dissolved.
With the new heat integration scheme, the Iodine and HIx stream from the Bunsen
section is preheated to approximately 260°C using the heat from the vapor and iodine product streams from the Reactive Distillation Column (TO-04). The iodine/HIx stream is split to flow to either the Vapor Heat Recuperator (HX-1) or the Recovered Iodine Heat Recuperator (HX-2). A proportional flow control scheme is currently shown on the PFDs as the basis for splitting this flow. However, this may be changed to a temperature based control scheme upon further development. The two preheated streams are recombined in a mix tank prior to a final preheat to 272°C in the Distillation Column Reheater (HX-3) using heat from the liquid product of the distillation column.
The design of the Reactive Distillation Column has been improved and the number of
columns increased, as discussed below. Each column consists of 15 stages and includes a condenser and reboiler, and utilizes ceramic packing. The preheated HIx feed is introduced to each column at stage 12.
The total heat demand for the decomposition reaction is approximately 980 MWth, and
the total cooling requirement for reflux is approximately 560 MWth. The total cooling requirement and a majority of the heat demand is provided by the heat pumps associated with each column. Approximately 272 MWth of heat is provided by the NHSS helium loop. The total electrical energy required for heat pump compressors is 61.8 MWe. In consideration of the high column pressure of 37 bar, the heat pump and helium reboilers are designed as kettle reboilers. Residence time of the liquid at the bottom of the column is approximately 80 seconds. Column bottoms product, the iodine-rich stream, is returned to the Bunsen Reaction section after process heat is recovered and the stream is cooled and flashed to the required conditions.
The vapor product from the reactive distillation column along with vapor flashed from
the column bottoms is cooled and condensed to remove water and iodine from the hydrogen product. Water and iodine are returned to the Bunsen Section. The hydrogen product flows to the Product Purification System.
3.2.5 Product Purification Systems Purification of the oxygen product from the Bunsen Reaction and the hydrogen product
from the HI Decomposition is required to meet industry standards for these product gases. For this study, the Westinghouse Team adopted purification system designs that are typical for the commercial specialty gas industry. The design of these systems also assumes that the feedstock of iodine, water, and sulfuric acid are relatively pure and that there are no other contaminants in the product gas streams that will require purification other than what is described below.
The oxygen produced by the Bunsen Reaction is assumed to be a saleable product and
will be delivered to a user or pipeline at an offsite location. Oxygen produced in the Bunsen Reaction is conveyed to the oxygen purification system and passes through a caustic scrubber to

Hydrogen Plant Alternatives Study NGNP-HPS SHAW-HPA Section 3 – Summary Process Descriptions
NGNP_HPAS_Section_3_SummaryProcessDescriptions.doc March 2009
3-9 of 12
remove any remaining sulfur dioxide that may be present. The scrubbed oxygen stream then passes through a set of zeolite drying beds, followed by polishing adsorbers that remove any residual traces of SO2. Both sets of adsorbers may be regenerated using a portion of the oxygen product.
Similarly, the hydrogen purification system is designed to scrub the hydrogen gas of
iodine and water prior to being discharged to a pipeline. The hydrogen gas product stream is conveyed from the HAD separators to the hydrogen purification system, where it is further compressed to sufficient pressure for discharge to a hydrogen pipeline. Prior to discharge to the pipeline, the hydrogen passes through a set of iodine adsorbers followed by a set of drying beds. The system is designed to use a portion of the hydrogen product to regenerate the drying beds.
3.3 HIGH TEMPERATURE STEAM ELECTROLYSIS Shaw’s modifications to the design basis further expanded the number of major process
sections to four. These sections are: . � Section 100 Feed and Utility Systems (FUS) � Section 200 Heat Recovery System (HRS) � Section 300 Electrolysis (ELE) � Section 400 Product Purification System (PPU) Sections 100 and 400 are the systems that produce the assumed feed water and product
purity requirements, respectively. The HRS system essentially recovers as much heat as possible from the hot hydrogen and sweep gas streams exiting the electrolyzers to preheat the inlet water and sweep gas feed streams.
There are two significant recycle streams within the process. The first is the recycle of a
portion of the hydrogen product that is mixed with the feed water in order to maintain reducing conditions at the cathode. The second is the recycle of water in the hydrogen product stream. The majority of the water in the process is converted to hydrogen but about 10% is recycled back to the process via the water purification system in the FUS.
The simulation diagram, mass and energy balance, as well as PFDs for the HTSE design
used in this study may be found in the Section 8 of this report. A brief process description for each section is provided below. Capacities described in the following discussion are for one production train, which is required to meet the target hydrogen production rate of 142 MMCFD.
3.3.1 Feed and Utility Systems Feed water and sweep gas purity requirements have not been established yet for the
HTSE process, particularly with regards to operability of the electrolyzer cells. However, it is assumed that the feed water and sweep gas quality must be of the highest purity and that state-of-the-art treatment systems used for ultra-pure water and specialty gas production systems will be required.

Hydrogen Plant Alternatives Study NGNP-HPS SHAW-HPA Section 3 – Summary Process Descriptions
NGNP_HPAS_Section_3_SummaryProcessDescriptions.doc March 2009
3-10 of 12
Ultimately, the design of any water treatment system will depend on the source water
quality and should be based on a source water quality analysis. This study assumes that the water source is well water with a minimum hardness is 200 ppm as CaCO3. The pretreatment system includes a multi-media filtration and softener system to remove suspended solids and hardness, respectively. The pretreatment system is followed by a demineralizer system consisting of reverse osmosis and electro-deionization (EDI) systems. All water treatment systems are considered packaged systems and are therefore shown as ‘black boxes’ on the PFDs. For the HTSE, the water treatment system capacity is estimated to be 150 m3/hr (i.e., �670 gpm). Purified water storage for 48 hours of process water demand and feed water pumps are provided.
Prior to the RO/EDI system, the softened water is used to cool the product hydrogen
stream sufficiently to condense the majority of water in the product gas stream. Condensed water is removed in a knockout drum and then directed to the water treatment RO/EDI system to remove any contaminants that may have been picked up in the process.
Purified water is stored and then pumped to the feed water deaerator. The hydrogen
product gas stream is used to heat the purified water feed to approximately 117°C prior to entering the deaerator. The operating pressure of the deaerator is about 3 Bar, which is typical for this type of application. Deaerator materials of construction are 304 stainless steel. High pressure steam generated in the HRS is used to deaerate the feed water. Deaerated water is then pumped to the HRS for further conditioning.
The FUS also includes a wastewater treatment system to treat water treatment wastes and
process wastes. The system is estimated to need to treat approximately 45 m3/hr (i.e., 200 gpm) of wastewater. The type of treatment required will depend on the effluent discharge limits imposed by the permitting jurisdiction. For this study, it is anticipated that the wastewater treatment system will consist of an oil/water separation system, neutralization system, physical/chemical treatment system with mixing tank and ancillary pumps, instrumentation, and equipment. The wastewater treatment system is also treated as a vendor supplied system or ‘black box’ on the PFDs.
The sweep gas is assumed to be air. Purity requirements for the sweep gas are not known
at this time, but are assumed to be high. Therefore, a state-of-the-art Clean Dry Air (CDA) system is used to remove contaminants and water. The CDA system has a dedicated inlet air compressor. The clean dry air is then compressed by the Sweep Gas Compressor (PC-01) to a pressure of 58 Bar and a temperature of 176°C and is conveyed to the ELE.
As the sweep gas passes through the electrolyzers, it removes the oxygen generated at the
anodes of the electrolysis cells. The exiting sweep gas is about 50% oxygen on a molar basis, and is at a temperature and pressure of 800°C and 55 Bar, respectively. The majority of the heat in the sweep gas is recovered in the HRS. However, the sweep gas still has significant energy after passing through HRS. The temperature and pressure of the sweep gas are 142°C and 53 Bar. The expansion turbine shown to utilize this energy in the original design basis is retained in this design study. Electricity generated by the expansion turbine is 13.3 MWe, and the exit temperature and pressure of the Sweep Gas is approximately -43°C and 2 Bar. The exit

Hydrogen Plant Alternatives Study NGNP-HPS SHAW-HPA Section 3 – Summary Process Descriptions
NGNP_HPAS_Section_3_SummaryProcessDescriptions.doc March 2009
3-11 of 12
Sweep Gas is assumed to be discharged directly to atmosphere. No consideration is given to recovery of the gas stream for refrigeration purposes.
3.3.2 Heat Recovery System Deaerated feed water is preheated using the hot hydrogen product and outlet sweep gas
from the electrolyzers. The HRS utilizes a complex series of parallel preheaters, boilers, and superheaters to raise the temperature of the inlet ultrapure feed water to 396°C. The hot hydrogen product and sweep gas streams pass consecutively from the superheaters, to the boilers, and then the preheaters.
Feed water is pumped from the deaerator at a pressure of 65 Bar to a pair of preheaters
operating in parallel. The total feed water flow to the HRS preheaters is approximately 34 kg/s or 130 m3/hr. One preheater recovers heat from the hydrogen product gas stream, while the other recovers heat from the outlet sweep gas from the electrolyzers. The deaerated feed water flow is split based on a preset flow setpoint and is trimmed based on the outlet temperatures from each of the preheaters. The feed water is heated to just below the feed water boiling point, approximately 274.5°C.
The preheated feedwater then flows to the Feed Steam Drum (KO-03), which features
two thermosyphon boilers: a sweep gas boiler (EX-03) that utilizes the hot outlet sweep gas to boil the feed water and a hydrogen boiler (EX-06) that utilizes the hot hydrogen product stream. Steam exits the feed drum at a temperature of 273.4°C and at a pressure of 58 Bar. Flow controllers split the exiting steam flow between the hydrogen and sweep gas superheaters also based on a preset flow setpoint. The superheated steam temperatures exiting the respective superheaters are used to trim this inlet flow control. Steam flows to the Hydrogen Feed Water Superheater (EX-07) and to the Sweep Gas Feed Water Superheater (EX-04) are estimated to be 18.2 kg/sec and 15.4 kg/sec, respectively. Approximately 0.25 kg/sec of the outlet steam from the steam drum is directed to the deaerator.
A portion of the hydrogen product is compressed and recycled back through the HRS to
preheat and mix it with the steam feed. The recycled hydrogen flow is approximately 0.45 kg/sec, or 10% of the total inlet molar flow to the cathode. Hot hydrogen product is used to heat the recycled hydrogen from 46°C to 275°C in the Recycled Hydrogen Preheater (EX-08). The preheated hydrogen is then mixed with the steam flow exiting the Feed Steam Drum and the mixture is conveyed to the Hydrogen Feed Water Superheater. The Hydrogen Feed Water Superheater heats the hydrogen and steam flow to approximately 396°C.
3.3.3 Electrolysis The Electrolysis section of HTSE essentially consists of the Process Coupling Heat
Exchangers (PCHX) that heat the inlet feed steam and sweep gas to 870°C and the Electrolyzer. Separate PCHXs are provided for the Hydrogen/steam inlet stream to the electrolyzer cathodes, and the inlet sweep gas stream to the anodes. The electrolyzer comprises 760,000 solid-oxide electrolysis cells.

Hydrogen Plant Alternatives Study NGNP-HPS SHAW-HPA Section 3 – Summary Process Descriptions
NGNP_HPAS_Section_3_SummaryProcessDescriptions.doc March 2009
3-12 of 12
3.3.4 Product Purification System The hydrogen purification system is designed to remove water prior to the hydrogen
being discharged to a pipeline. The hydrogen gas product stream is conveyed to the hydrogen purification system via the HRS. The hydrogen product pressure and temperature after passing through the HRS is 51 Bar and 26°C, respectively. Prior to discharge to the pipeline, the hydrogen passes through a set of drying beds. The system is designed to use a portion of the hydrogen product to regenerate the drying beds, as required.

Hydrogen Plant Alternatives Study NGNP-HPS SHAW-HPA Section 4 – Life Cycle Cost of Hydrogen
NGNP_HPAS_Section_4_Life-CycleCostHydrogen.doc March 2009
4-1 of 32
4 LIFE-CYCLE COST OF HYDROGEN The development of a Hydrogen Economy is motivated by foreseen benefits of energy
security, lower pollutant emissions, and reduced climate change. In the final analysis, the figure of merit for production of hydrogen by means of any technology is the minimum price that the product can be sold for. This is the price that will recoup the hydrogen production plant’s initial and ongoing capital investment, fuel, feedstock, and other fixed and variable operating costs, and return a profit to the owner. The price calculated is strongly influenced by financial assumptions as well as specifics of the particular technology.
The resulting hydrogen prices are compared on an equivalent basis to the prices for
hydrogen from alternate baseline technologies in Section 4.5.4.
4.1 DEVELOPMENT OF THE ECONOMIC MODEL The focus of the study and the subject of this report is the hydrogen process plant and its
alternate designs. The HPS is supplied heat from a HTGR in the form of hot helium. The nuclear reactor heat source technology is not studied directly, but power and temperature levels and energy costs used in the study are representative of a pebble bed core reactor at 500 MWth and a prismatic core reactor at 565 to 600 MWth. All configurations use a secondary helium loop to reduce tritium transport and to separate the process streams from the primary helium loop in the event of a leak in either the Intermediate Heat Exchanger (IHX) or the Process Coupling Heat Exchanger (PCHX). The reference helium delivery temperature to the PCHX is 910°C. The corresponding maximum bulk mean operating temperature on the process side of the PCHX is 870°C in all cases. The secondary helium heat source temperature, and therefore the reactor primary loop outlet temperature, varies correspondingly. The reference reactor outlet temperature is 950°C.
The cost of the thermal energy from the nuclear heat source is estimated for the reference
case and charged to the hydrogen plant as a fixed operating cost. The heat available in the helium exiting the PCHX and not usable by the process is used to generate electricity. The cost of generating power from this heat is estimated separately. A Rankine cycle is used and generation efficiency is varied depending upon the maximum steam temperature available in each case. In this way, the value of the unused exported heat is estimated. Any electricity deficit or surplus is balanced by imports from or exports to the grid. Cost of imports from the grid in excess of that generated by the unused heat would include any carbon penalty reflecting the generation mix of gas, coal, and nuclear. These economic factors are discussed further in the following sections.

Hydrogen Plant Alternatives Study NGNP-HPS SHAW-HPA Section 4 – Life Cycle Cost of Hydrogen
NGNP_HPAS_Section_4_Life-CycleCostHydrogen.doc March 2009
4-2 of 32
4.2 ECONOMIC FACTORS
4.2.1 Price of Hydrogen Cost elements of the process plant are estimated with derivations documented in Sections
4.3 and 4.4. In Sections 4.5.1, 4.5.2 and 4.5.3, a price is calculated for hydrogen produced by each water splitting based HPS identified for HTGR applications. The calculation uses the H2A tool and documentation as it pertains to this study may be found in Section 8.5.1.
4.2.1.1 Economic Parameters The major economic assumptions for the hydrogen price analyses are listed in Table 4-1. The reference dollar year is in agreement with the cost estimates corresponding to the
designs in Section 3. The reference financing arrangement of 100% equity at 10% IRR is the H2A default value. This is equivalent to a typical commercial financing structure of 50% equity/50% debt with 15% IRR and 8.25% debt interest rate. The plant life is as would be expected for a process industry plant. The construction period and startup time are reference values for future nuclear plants.
Table 4-1: Major Assumptions for Analysis of Economics
Parameter Value Reference Dollar Year 3rd Quarter 2008
Assumed Start-up Year 2030
Plant Location US Gulf Coast
Plant Maturity Assumption Nth-of-a-Kind plant
Financing 100% Equity
After-Tax Real IRR 10%
Project Overall Capital Cost Contingency 10%
Plant Life 30 years
Lifetime Capacity Factor 8,200 hr/yr (94%)
Construction Period 3 years
Costs in Construction Years 25% / 45% / 30%
Start-up Period 1 year
Income Tax Rate (composite) 38.9%
Property Tax Rate 1% of Overnight Capital Cost
Insurance Rate 1% of Overnight Capital Cost
Working Capital 15% of Incremental Change in Annual Operating Costs

Hydrogen Plant Alternatives Study NGNP-HPS SHAW-HPA Section 4 – Life Cycle Cost of Hydrogen
NGNP_HPAS_Section_4_Life-CycleCostHydrogen.doc March 2009
4-3 of 32
A more extensive list of the ground rules for the economic modeling is in Section 8.5.2.
4.2.1.2 Alternate Parameters and Inputs Two factors are recognized as notable assumed parameters and/or inputs and are
considered separately from other calculated sensitivities. These are the real escalation rate of electricity cost and the credit for sale of oxygen byproduct in the cases where oxygen is practically recovered. These values are as shown in Table 4-2. The hydrogen price will be separately calculated for comparison by varying each separately from the reference case.
Table 4-2: Alternate Parameters and Inputs for Analysis of Economics
Reference Alternates Electricity Cost Escalation 1% per year No 1% per year
Credit for Oxygen Byproduct Yes Yes No
The H2A modeling tool, as published, is based on an assumption that all costs and the
selling price have the same rate of inflation. Energy costs are expected to rise more rapidly than general inflation, and so a modification to the H2A model has been made to make the analysis more realistic. For the reference analysis, real escalation, over and above any inflation, is included at 1%/yr over the plant life for the electric power bought or sold.
In addition, the sensitivities to the value of electric power cost and the oxygen price is included in Section 4.2.1.4.
4.2.1.3 Overall Plant Capital Costs The hydrogen plant capital costs include the helium regulating valves and process
coupling heat exchanger isolation valves that will be required to regulate and protect the interface with the NHSS and the overall plant.
A Power Conversion System (PCS) generates electricity with the heat energy remaining
in the NHSS helium circuit after the process coupling heat exchanger(s) and before the circulating gas returns to the heat source. It should be noted that all cases do not have such remaining usable heat. A steam generator converts the heat to superheated steam. The steam is converted into electric power with a steam turbine-generator in a conventional non-reheat Rankine water vapor cycle with regenerative feedwater heating. A final water circuit from the steam turbine condenser to a wet cooling tower provides the ultimate heat sink for the cycle. The capital cost and operating costs of the PCS are scaled from the system described in the preconceptual design commercial NGNP application report [Ref. 10].
Balance of Plant (BOP) costs are added to account for overall plant electrical service (i.e.,
substation and distribution), water systems (i.e., sanitary, storm, potable & fire), and common

Hydrogen Plant Alternatives Study NGNP-HPS SHAW-HPA Section 4 – Life Cycle Cost of Hydrogen
NGNP_HPAS_Section_4_Life-CycleCostHydrogen.doc March 2009
4-4 of 32
buildings. Indirect capital costs are site preparation and overall project development and management. A contingency factor and cost of land are added to reach a total capital investment value that is used in the H2A analysis. The contingency factor is considered such that the resulting cost represents a mean or expected value. This serves as a baseline value to which variations with approximately 10% and 90% confidence values are used in the sensitivity analyses.
4.2.1.4 Sensitivities Sensitivity analysis can provide indications of the priorities to be assigned for further
development effort. The effect on hydrogen price is calculated for the expected range of uncertainties in the parameters that have a major impact on such prices. These analyses are divided into two groups – capital cost factors and other factors. The expected range of these uncertainties are provided in Table 4-3 and the resulting sensitivities of the parameters are presented in Sections 4.5.1.2, 4.5.2.2 and 4.5.3.2. The range of these parameters have been chosen using some engineering judgment and reasonable anticipation of future trends.
The influence of nuclear heat source outlet temperature on the processes is separately
discussed in Section 5.3. Table 4-3 presents the variable inputs for the sensitivity analysis. In the table, values on
the left most side have the lowest H2 price impact. The right most values have the highest. Shaded entries are base case values.
Table 4-3: Variable Inputs for Sensitivity Analysis
Variable Analysis Value Reactor outlet temperature, °C 950 900 850 800 750 700 NHSS energy cost, $/MWth-hr of reactor core power 25 30 35 IRR, % ( with 100% equity case) 8 10 12 Capacity factor, % 94 85
Cost of electricity (incl. carbon penalty), $/MWe-hr Buy: 60 Sell: 50
75 60
85 70
Plant size, for SI and HyS; for HTSE base and maximum heat utilization cases approx. double * base
CO2 “Credit” 30 $/tonne None Initial capital costs Overall Hydrogen Production System capital cost -15% base +30% For SI Overall cost of materials -20% base +50% Sulfuric acid decomposer -20% base +50% Sulfuric acid decom. section -15% base +30% Bunsen reactor -20% base +50% Bunsen reaction section -15% base +30% HI decomposition reactor -20% base +50% HI decomposition section -15% base +30% For HyS Overall cost of materials -20% base +50%
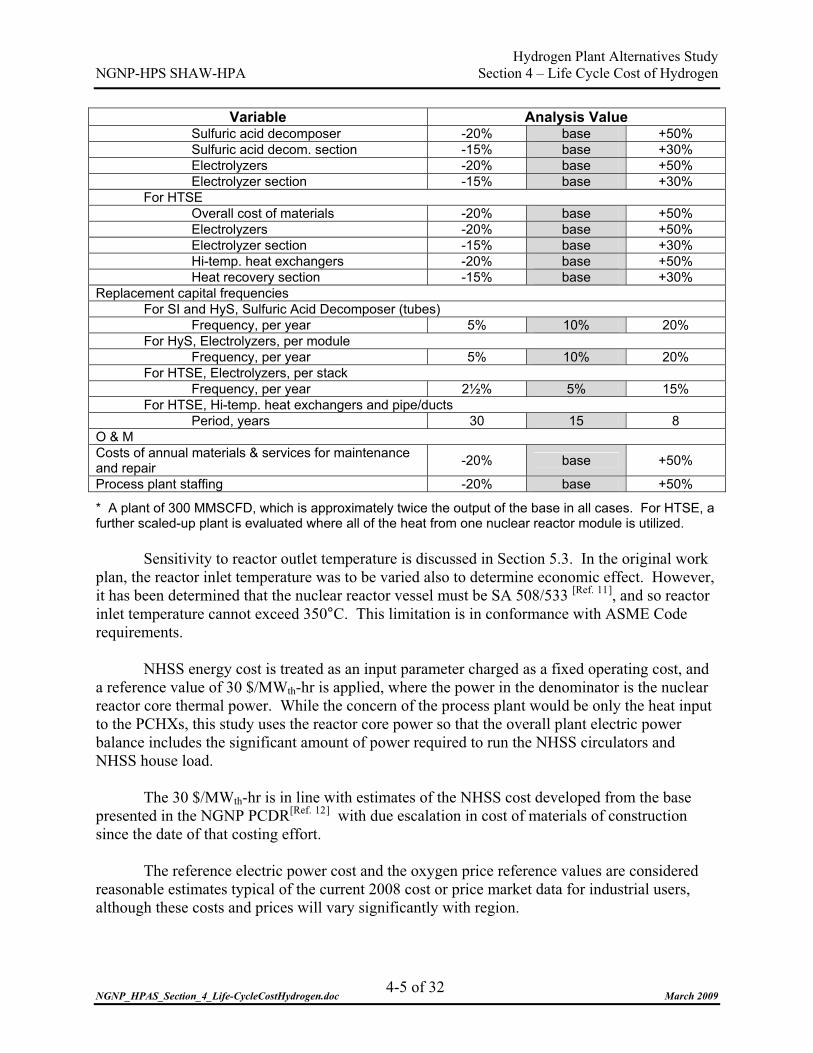
Hydrogen Plant Alternatives Study NGNP-HPS SHAW-HPA Section 4 – Life Cycle Cost of Hydrogen
NGNP_HPAS_Section_4_Life-CycleCostHydrogen.doc March 2009
4-5 of 32
Variable Analysis Value Sulfuric acid decomposer -20% base +50% Sulfuric acid decom. section -15% base +30% Electrolyzers -20% base +50% Electrolyzer section -15% base +30% For HTSE Overall cost of materials -20% base +50% Electrolyzers -20% base +50% Electrolyzer section -15% base +30% Hi-temp. heat exchangers -20% base +50% Heat recovery section -15% base +30% Replacement capital frequencies For SI and HyS, Sulfuric Acid Decomposer (tubes) Frequency, per year 5% 10% 20% For HyS, Electrolyzers, per module Frequency, per year 5% 10% 20% For HTSE, Electrolyzers, per stack Frequency, per year 2½% 5% 15% For HTSE, Hi-temp. heat exchangers and pipe/ducts Period, years 30 15 8 O & M Costs of annual materials & services for maintenance and repair -20% base +50%
Process plant staffing -20% base +50%
* A plant of 300 MMSCFD, which is approximately twice the output of the base in all cases. For HTSE, a further scaled-up plant is evaluated where all of the heat from one nuclear reactor module is utilized.
Sensitivity to reactor outlet temperature is discussed in Section 5.3. In the original work
plan, the reactor inlet temperature was to be varied also to determine economic effect. However, it has been determined that the nuclear reactor vessel must be SA 508/533 [Ref. 11], and so reactor inlet temperature cannot exceed 350°C. This limitation is in conformance with ASME Code requirements.
NHSS energy cost is treated as an input parameter charged as a fixed operating cost, and
a reference value of 30 $/MWth-hr is applied, where the power in the denominator is the nuclear reactor core thermal power. While the concern of the process plant would be only the heat input to the PCHXs, this study uses the reactor core power so that the overall plant electric power balance includes the significant amount of power required to run the NHSS circulators and NHSS house load.
The 30 $/MWth-hr is in line with estimates of the NHSS cost developed from the base
presented in the NGNP PCDR[Ref. 12] with due escalation in cost of materials of construction since the date of that costing effort.
The reference electric power cost and the oxygen price reference values are considered
reasonable estimates typical of the current 2008 cost or price market data for industrial users, although these costs and prices will vary significantly with region.

Hydrogen Plant Alternatives Study NGNP-HPS SHAW-HPA Section 4 – Life Cycle Cost of Hydrogen
NGNP_HPAS_Section_4_Life-CycleCostHydrogen.doc March 2009
4-6 of 32
Plant size for all three reference cases is approximately 150 MMSCFD, as used in the design study. Generally, this is the size of the largest hydrogen plant that users would want or that suppliers would build considering present norms of the petrochemical industry.
The sensitivities are presented for plants approximately twice the size of the study
reference designs. Sulfur Iodine would have six rather than three reactor heat sources and Hybrid Sulfur four rather than two. For the HTSE base case, the HPS is not using all of the heat available at usable temperature from one reactor unit. A plant with double output would still not use the full heat from one reactor, and so another case is evaluated. A second, larger scale HTSE plant is included in the sensitivity analysis where the maximum input heat from one reactor unit is utilized. The large amount of electricity needed is still charged at the reference case rate. Although in the event such a plant was built, there would probably be a dedicated electric power-only plant included in the overall project.
The reference case H2A assessment does not account for any credit for avoiding emission
of CO2. This is because the selling price will be compared in Section 4.5.4 to alternative technologies for hydrogen, which include the costs for CO2 management. One of these alternatives is natural gas steam methane reforming for which mitigation of CO2 production is included as a cost or tax. The cost in that case is $30/tonne CO2 captured in the process and $100/tonne CO2 in the flue gas. Sensitivity to “carbon credit” is then calculated for an increment in “credit” for the nuclear H2 over these values. In calculating the “credit,” the emission from the source of imported electricity for the hydrogen plant is also accounted for.
A second case to gauge CO2 avoidance is comparison to conventional electrolysis. The
comparison to conventional electrolysis is also made in Section 4.5.4. In calculating the credit compared to conventional electrolysis, the entire differential is from the “upstream” emissions from the source of imported electricity.
4.2.2 Availability It is not possible to assess availability for a mature plant from the extremely limited
performance data for any of the three HPS systems at this early stage of design and development. Meaningful availability analysis requires failure rate data from a statistically valid number of prototypical units. There are few high-temperature process systems of the same scale and functional similarity, and there are no known plants of any scale that have heat exchange between high temperature closed gas circuits to process fluids such as in these hydrogen production systems.
Nevertheless, a reference value of capacity factor of 94% is assumed as a goal and
subject to sensitivity analysis. The reference value corresponds to 8,200 hours per year of full rated operation. Availability is addressed in the design of all three systems by 1) including spares of critical components, 2) accounting for periodic replacement and refurbishment of select components, and 3) allocations of labor, materials, and services for a program of regular maintenance and repairs. Each of these factors is highly judgmental since there is limited reliability data with which to do a quantitative assessment.

Hydrogen Plant Alternatives Study NGNP-HPS SHAW-HPA Section 4 – Life Cycle Cost of Hydrogen
NGNP_HPAS_Section_4_Life-CycleCostHydrogen.doc March 2009
4-7 of 32
4.3 CAPITAL COST ESTIMATE BASIS Capital costs are summarized in Section 4.5 along with the analyses of the life-cycle cost
of hydrogen. The detailed capital costs are in Sections 8.1.7, 8.2.7 and 8.3.7 for conventional components and subsystems of the process plants. The costs for developmental equipment, in contrast to equipment for which data bases exist, are in Section 8.6.
4.3.1 Estimate Methodology Study estimates of the costs for conventional components and subsystems of the process
plant have been prepared using the Shaw Group’s “FACES” software. The estimates are based on 3rd Quarter 2008 US Gulf Coast (USGC) site related costs.
Construction material costs are based on Shaw’s USGC historical data. Design
development allowances are not included in the equipment material costs. Freight and spares are estimated separately. Bulk material quantities are factored and then current USGC costs are applied. USGC construction labor hours are factored from equipment and bulk material. Current USGC rates are applied. Home office costs are factored from equipment counts.
Estimate accuracy is in the range of + 50%/-20% for all 3 processes due to
indeterminants at this stage of design development. A 10% contingency is added to reflect a 50% confidence estimate, i.e. 50% chance of being either higher or lower.
4.3.2 Estimate Assumptions The process plant capital cost estimates are based on the following assumptions: � Third quarter 2008 US Dollars; � Soil condition is suitable for spread footing foundations, and; � Site is clear and level with suitable lay-down area adjacent to the site.
4.3.3 Estimate Exclusions Excluded from the process plant cost estimates are the following: � Licensor fees; � Permits & Licenses; � Owner’s costs; � Utilities during construction; � Site environmental considerations such as;
o Contaminated soil disposal o Asbestos abatement o Lead abatement

Hydrogen Plant Alternatives Study NGNP-HPS SHAW-HPA Section 4 – Life Cycle Cost of Hydrogen
NGNP_HPAS_Section_4_Life-CycleCostHydrogen.doc March 2009
4-8 of 32
o Environmental clean up of demolition items � Demolition. Commissioning and start-up costs of operation and maintenance are modeled in the H2A
tool, but training and extra staffing are not. Nuclear-related initial costs, such as licensing and staff training and continuing nuclear-related costs, such as security, are presumed included in the “over-the-fence” fixed nuclear heat cost.
4.4 OPERATING AND MAINTENANCE COST ESTIMATES Operating and maintenance (O&M) costs for the hydrogen processes can be divided into
fixed and variable costs, where variable costs are only incurred while the plant is operating to produce hydrogen.
Fixed costs, in approximate order from the largest to the smallest, are property tax and
insurance, labor, and material costs for maintenance and repairs. The cost of nuclear heat is included in the H2A model as a fixed operating cost.
Variable O&M costs are generally the process inputs: electric power, process steam,
cooling water, process water, water treatment (softening and deionization, as required), replacement catalysts, and make-up chemicals. Also, variable O&M includes any costs to handle effluents: liquid waste disposal and solid waste disposal. Note that cooling water and water treatment are modeled as costs in these analyses. Alternatively, they could have been included as process plant capital cost elements, such as a cooling tower instead of a charge per unit cooling service.
Several components or subsystems of the hydrogen systems are anticipated to have
shorter lifetimes than the overall plant, and these will be replaced or refurbished on schedules that are different for each. For example, replacement could be on a period of 10 or 15 years, or alternatively, done every year or two with a frequency of 5 or 10% changed each year. The costs of replacements are modeled in the H2A tool as separate capital items with subsequent depreciation and tax treatment separate from the other maintenance costs. Therefore, while the labor for replacement and refurbishment is included in fixed O&M costs, the equipment costs are not. These replacement capital items are detailed in the next section for each system. Additionally, there is a general unplanned replacement capital cost factor of ½% applied to the total initial direct depreciable costs per year.
The operating and maintenance costs for the hydrogen process systems are developed and
documented in Sections 8.1.8, 8.2.8 and 8.3.8.

Hydrogen Plant Alternatives Study NGNP-HPS SHAW-HPA Section 4 – Life Cycle Cost of Hydrogen
NGNP_HPAS_Section_4_Life-CycleCostHydrogen.doc March 2009
4-9 of 32
4.5 ECONOMIC ANALYSIS AND LIFE-CYCLE COST OF HYDROGEN A levelized selling price for hydrogen over the plant lifetime is calculated using the H2A
analysis with the ground rules and cost elements detailed above for each HPS technology: Sulfur-Iodine, Hybrid Sulfur, and High Temperature Steam Electrolysis. Refer to Section 8.5.1. The reference case costs are for the hydrogen product with 1%/yr electricity cost escalation and credit for the parallel production of oxygen. The hydrogen prices for the reference case for each plant are summarized in Table 4-4.
Table 4-4: Calculated Hydrogen Price
Selling Price of Hydrogen ($/kg H2)
Sensitivity Analysis Case Sulfur Iodine Hybrid Sulfur High Temperature Steam Electrolysis
Reference Cases 10.71 6.83 6.04 Excluding Electricity Cost Escalation 10.12 6.43 5.31
Excluding O2 Credit 11.09 7.21 Reference Case has no O2 Credit
4.5.1 Sulfur Iodine The Hydrogen Production System for SI is described in Section 3. Of the options
considered for the SI HAD section, this study uses reactive distillation. The HPS consists of three process trains supplied with thermal energy from three 550 MWth nominally rated nuclear heat sources and supplied with entirely imported electric power. Figure 4-1 is a schematic representation of the overall plant arrangement.
HPSInputs 1,650 MWt
226 MWe
Hydrogen157.0 Mscf/d
4.4 kg/s379.8 MT/d
Electricity330 MWe
NHSS (x3)Output 528 MWt
Input 33 MWe
Reactor Outlet 950°CReactor Inlet 350°C
910°C
344°C
BOPInput 4.5 MWe
HPSInputs 1,650 MWt
226 MWe
Hydrogen157.0 Mscf/d
4.4 kg/s379.8 MT/d
Electricity330 MWe
NHSS (x3)Output 528 MWt
Input 33 MWe
Reactor Outlet 950°CReactor Inlet 350°C
910°C
344°C
BOPInput 4.5 MWe
Figure 4-1: Schematic Diagram and Energy Balance for Sulfur Iodine

Hydrogen Plant Alternatives Study NGNP-HPS SHAW-HPA Section 4 – Life Cycle Cost of Hydrogen
NGNP_HPAS_Section_4_Life-CycleCostHydrogen.doc March 2009
4-10 of 32
4.5.1.1 Reference Case H2 Selling Price Table 4-5 presents the major performance factors for the reference case. The NHSS
energy cost, import electricity cost, and O2 byproduct price are parameters subject to sensitivity analysis in each case.
Table 4-5: Sulfur Iodine – Overall Cost and Performance Factors for Analysis
Major Plant Parameters Nuclear Reactor Power 3 x 528 MWth = 1,584 MWth PCHX Heat Input 1,650 MWth Plant H2 Output 4.4 kg/s
157 MMSCFD Electric Power Generated 0 MWe Electricity Imported 330 MWe
Major Input / Byproduct Costs 1 Cost of High-Temperature Heat $ 30 /MWth-hr Cost of Electricity, Levelized 2 $ 101 /MWe-hr Cost of Water $ 0.0021 /gal Price for O2 By-product $ 0.04 /kg O2
Notes: 1 2008 dollars
2 $75/ MWe-hr in 2008, escalated at 1%/yr
Table 4-6 summarizes the capital cost of the reference case. The process system capital
cost is extraordinarily high because of the apparent requirement that much of the interior surfaces exposed to concentrated HI at required temperatures will have to be lined with tantalum. As an indication of the sensitivity to this requirement, a case with only carbon steel throughout the entire plant was run, and numbers for this case are shown in Table 4-7.

Hydrogen Plant Alternatives Study NGNP-HPS SHAW-HPA Section 4 – Life Cycle Cost of Hydrogen
NGNP_HPAS_Section_4_Life-CycleCostHydrogen.doc March 2009
4-11 of 32
Table 4-6: Sulfur Iodine, Reference Case – Capital Cost Summary
Total Costs Specific Costs
Hydrogen Plant Capital Cost $ 2,683M $ 7,060 /kg H2/day $ 5,090 /kWth H2 (LHV)
BOP & Other Capital Cost $ 40M - -
Total Direct Capital Cost $ 2,723M - -
Indirect Capital Cost $ 63M - -
Base Construction Cost $ 2,786M - -
Contingency $ 272M - -
Total Depreciable Capital Cost $ 3,059M - -
Cost of Land $ 2.5M - -
Total Overnight Capital Cost $ 3,061M $ 8,060 /kg H2/d $ 5,800 /kWth H2 (LHV)
Interest During Construction $ 398M - -
Total Capital Investment $ 3,459M $ 9,110 /kg H2/d $ 6,560 /kWth H2 (LHV)
The capital costs summarized in Table 4-6, and in the capital summary tables for other
cases, include more than the capital costs stated elsewhere in this report for the process plant alone, as described in Section 4.2.1.3. Details of the process plant capital cost are in Appendix 8.2.7.
Table 4-7: Sulfur Iodine, Carbon Steel Case – Capital Cost Summary
Total Costs Specific Costs
Hydrogen Plant Capital Cost $ 1,211M $ 3,190 /kg H2/day $ 2,300 /kWth H2 (LHV)
BOP & Other Capital Cost $ 40M - -
Total Direct Capital Cost $ 1,251M - -
Indirect Capital Cost $ 63M - -
Base Construction Cost $ 1,315M - -
Contingency $ 125M - -
Total Depreciable Capital Cost $ 1,440M - -
Cost of Land $ 2.5M - -
Total Overnight Capital Cost $ 1,442M $ 3,800 /kg H2/d $ 2,730 /kWth H2 (LHV)
Interest During Construction $ 187M - -
Total Capital Investment $ 1,630M $ 4,290 /kg H2/d $ 3,090 /kWth H2 (LHV)
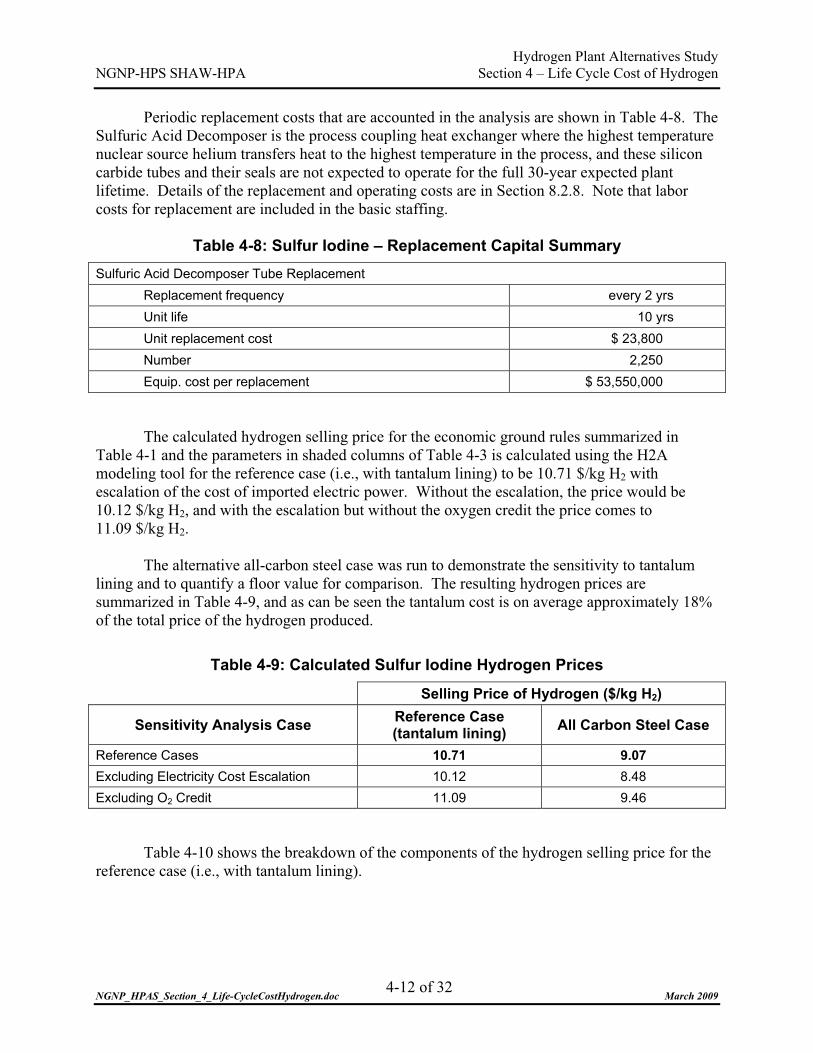
Hydrogen Plant Alternatives Study NGNP-HPS SHAW-HPA Section 4 – Life Cycle Cost of Hydrogen
NGNP_HPAS_Section_4_Life-CycleCostHydrogen.doc March 2009
4-12 of 32
Periodic replacement costs that are accounted in the analysis are shown in Table 4-8. The Sulfuric Acid Decomposer is the process coupling heat exchanger where the highest temperature nuclear source helium transfers heat to the highest temperature in the process, and these silicon carbide tubes and their seals are not expected to operate for the full 30-year expected plant lifetime. Details of the replacement and operating costs are in Section 8.2.8. Note that labor costs for replacement are included in the basic staffing.
Table 4-8: Sulfur Iodine – Replacement Capital Summary
Sulfuric Acid Decomposer Tube Replacement Replacement frequency every 2 yrs Unit life 10 yrs Unit replacement cost $ 23,800 Number 2,250 Equip. cost per replacement $ 53,550,000
The calculated hydrogen selling price for the economic ground rules summarized in Table 4-1 and the parameters in shaded columns of Table 4-3 is calculated using the H2A modeling tool for the reference case (i.e., with tantalum lining) to be 10.71 $/kg H2 with escalation of the cost of imported electric power. Without the escalation, the price would be 10.12 $/kg H2, and with the escalation but without the oxygen credit the price comes to 11.09 $/kg H2.
The alternative all-carbon steel case was run to demonstrate the sensitivity to tantalum
lining and to quantify a floor value for comparison. The resulting hydrogen prices are summarized in Table 4-9, and as can be seen the tantalum cost is on average approximately 18% of the total price of the hydrogen produced.
Table 4-9: Calculated Sulfur Iodine Hydrogen Prices
Selling Price of Hydrogen ($/kg H2)
Sensitivity Analysis Case Reference Case (tantalum lining) All Carbon Steel Case
Reference Cases 10.71 9.07 Excluding Electricity Cost Escalation 10.12 8.48 Excluding O2 Credit 11.09 9.46
Table 4-10 shows the breakdown of the components of the hydrogen selling price for the reference case (i.e., with tantalum lining).
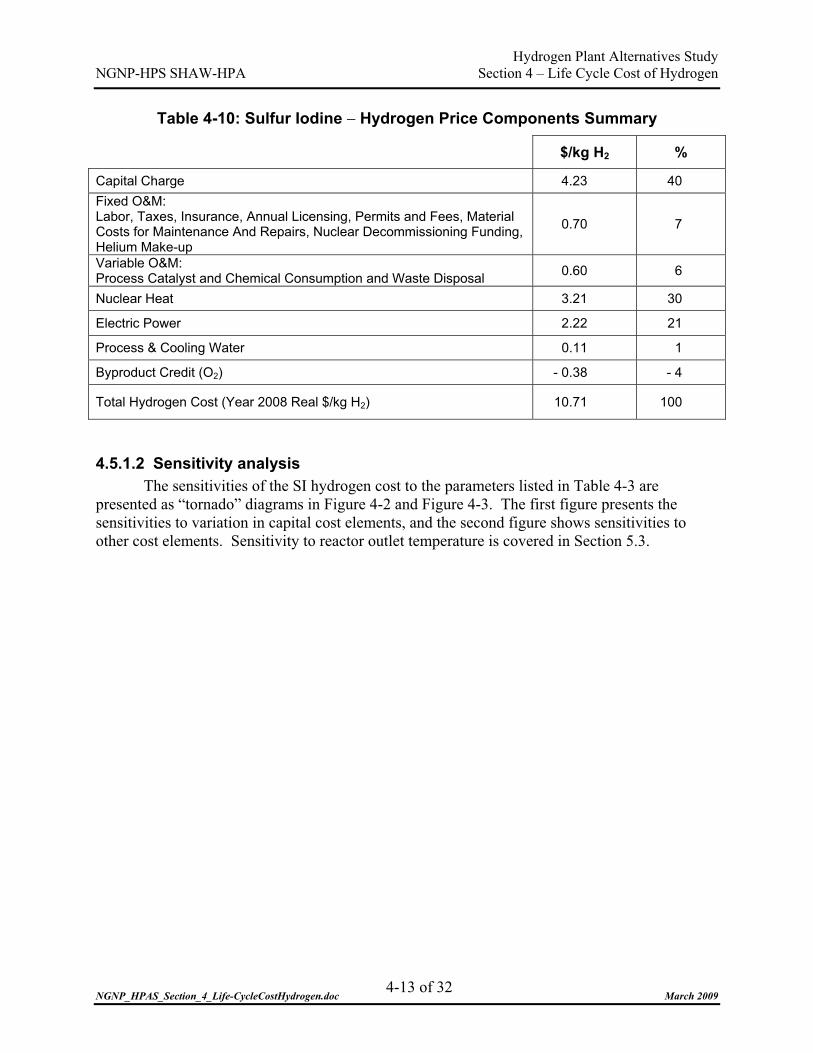
Hydrogen Plant Alternatives Study NGNP-HPS SHAW-HPA Section 4 – Life Cycle Cost of Hydrogen
NGNP_HPAS_Section_4_Life-CycleCostHydrogen.doc March 2009
4-13 of 32
Table 4-10: Sulfur Iodine � Hydrogen Price Components Summary
$/kg H2 %
Capital Charge 4.23 40 Fixed O&M: Labor, Taxes, Insurance, Annual Licensing, Permits and Fees, Material Costs for Maintenance And Repairs, Nuclear Decommissioning Funding, Helium Make-up
0.70 7
Variable O&M: Process Catalyst and Chemical Consumption and Waste Disposal 0.60 6
Nuclear Heat 3.21 30
Electric Power 2.22 21
Process & Cooling Water 0.11 1
Byproduct Credit (O2) - 0.38 - 4
Total Hydrogen Cost (Year 2008 Real $/kg H2) 10.71 100
4.5.1.2 Sensitivity analysis The sensitivities of the SI hydrogen cost to the parameters listed in Table 4-3 are
presented as “tornado” diagrams in Figure 4-2 and Figure 4-3. The first figure presents the sensitivities to variation in capital cost elements, and the second figure shows sensitivities to other cost elements. Sensitivity to reactor outlet temperature is covered in Section 5.3.

Hydrogen Plant Alternatives Study NGNP-HPS SHAW-HPA Section 4 – Life Cycle Cost of Hydrogen
NGNP_HPAS_Section_4_Life-CycleCostHydrogen.doc March 2009
4-14 of 32
$10.00 $10.50 $11.00 $11.50 $12.00 $12.50
Bunsen Reactor
H2SO4 Decomposer
H2SO4 Decomp. Tube Repl.Freq.
H2SO4 Decomp. Section
Bunsen Section
HI Distillation Column
HI Section
Overall HPS Capital, %
$/kg of Hydrogen
-15%
-20%
+30%
+50%
-15% +30%
-15% +30%
-20% +50%
-15% +30%
-20% +50%
5% per yr. 20% per yr.10% per yr.
Figure 4-2: Tornado Chart for Sulfur Iodine Initial and
Replacement Capital Cost Factors The capital cost, particularly the cost of the HI section, is the most influential of the
selected sensitivity parameters. The HI section cost is due to the tantalum linings needed to resist the concentrated high-temperature acid.
In Figure 4-2, the hydrogen cost can be seen to be most sensitive to the two factors most
closely associated with the capital investment – the rate of return and the capacity factor. This is also a manifestation of the high capital cost of the process plant. The next most sensitive cost driver is the nuclear energy cost followed by the electric energy cost. A plant double the size shows significant cost effectiveness, but as discussed elsewhere in this report, the reference plant size is at the limit of what is foreseen to fit the hydrogen market.
The credit for CO2 avoidance relative to future ambient temperature electrolysis as
calculated is significant. In that comparison, the CO2 emission comes from “upstream” generation of electricity, and SI hydrogen production consumes less imported electricity than the electrolysis. However, a similar calculation for comparison to Steam Methane Reforming (SMR) showed that the combination of direct CO2 emission plus “upstream” emission from natural gas production and delivery, and electricity generation for SMR, is less than that from the “upstream” generation of import electricity for SI. “Upstream” emissions are taken from data available in DOE’s H2A analysis model[Ref. 13].
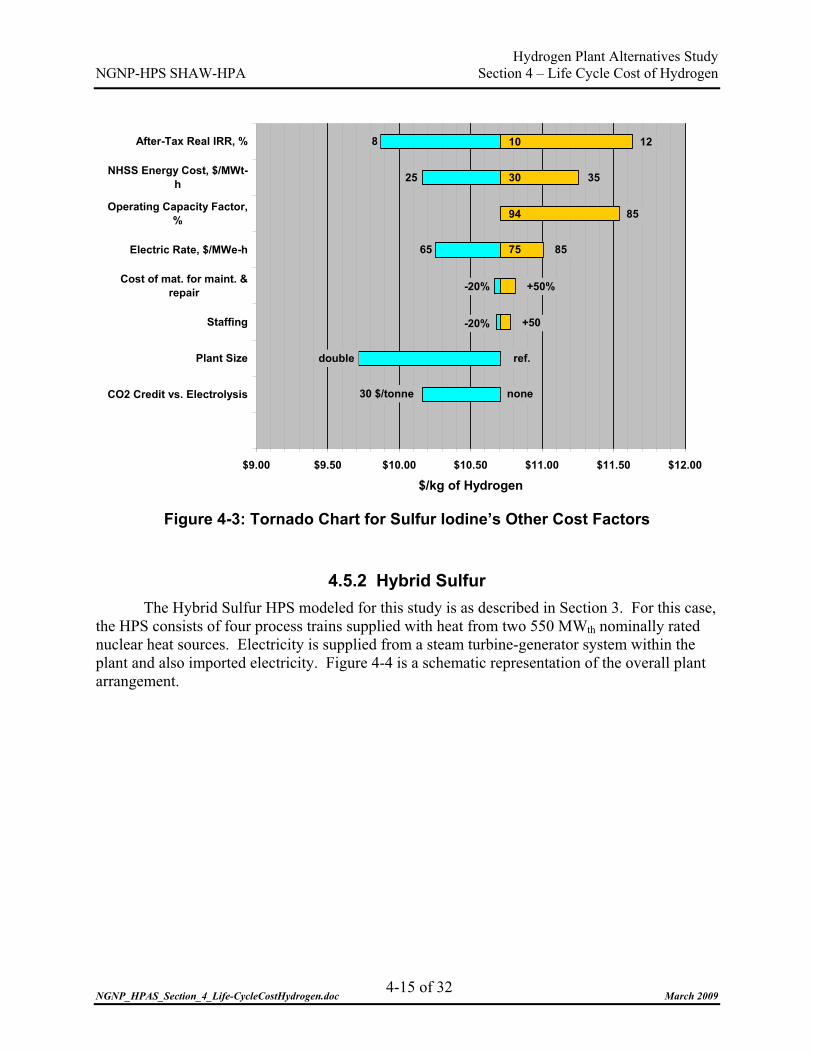
Hydrogen Plant Alternatives Study NGNP-HPS SHAW-HPA Section 4 – Life Cycle Cost of Hydrogen
NGNP_HPAS_Section_4_Life-CycleCostHydrogen.doc March 2009
4-15 of 32
$9.00 $9.50 $10.00 $10.50 $11.00 $11.50 $12.00
CO2 Credit vs. Electrolysis
Plant Size
Staffing
Cost of mat. for maint. &repair
Electric Rate, $/MWe-h
Operating Capacity Factor,%
NHSS Energy Cost, $/MWt-h
After-Tax Real IRR, %
$/kg of Hydrogen
65
8
25
-20%
-20%
8575
10
30
12
8594
35
+50%
+50
30 $/tonne none
double ref.
Figure 4-3: Tornado Chart for Sulfur Iodine’s Other Cost Factors
4.5.2 Hybrid Sulfur The Hybrid Sulfur HPS modeled for this study is as described in Section 3. For this case,
the HPS consists of four process trains supplied with heat from two 550 MWth nominally rated nuclear heat sources. Electricity is supplied from a steam turbine-generator system within the plant and also imported electricity. Figure 4-4 is a schematic representation of the overall plant arrangement.

Hydrogen Plant Alternatives Study NGNP-HPS SHAW-HPA Section 4 – Life Cycle Cost of Hydrogen
NGNP_HPAS_Section_4_Life-CycleCostHydrogen.doc March 2009
4-16 of 32
HPSInputs 712 MWt
262 MWe
PCSInput 388 MWt
Output 133 MWe
Hydrogen142.0 Mscf/d
4.0 kg/s343.5 MT/d
Electricity198 MWe
NHSS (x2)Output 528 MWt
Input 33 MWe
Reactor Outlet 950°CReactor Inlet 350°C
910°C
277°C
522°C
BOPInput 3 MWe
HPSInputs 712 MWt
262 MWe
PCSInput 388 MWt
Output 133 MWe
Hydrogen142.0 Mscf/d
4.0 kg/s343.5 MT/d
Electricity198 MWe
NHSS (x2)Output 528 MWt
Input 33 MWe
Reactor Outlet 950°CReactor Inlet 350°C
910°C
277°C
522°C
BOPInput 3 MWe
Figure 4-4: Schematic Diagram and Energy Balance for Hybrid Sulfur
4.5.2.1 Reference Case H2 Selling Price Table 4-11 presents the major performance factors for the reference case. The NHSS
energy cost, import electricity cost and O2 byproduct price are parameters subject to sensitivity analysis in each case also.
Table 4-11: Hybrid Sulfur – Overall Cost and Performance Factors for Analysis
Major Plant Parameters Nuclear Reactor Power 2 x 528 MWth = 1,056 MWth PCHX Heat Input 712 MWth Plant H2 Output 4.0 kg/s
142 MMSCFD Electric Power Generated 136 MWe Additional Electricity Imported 198 MWe
Major Input / Byproduct Costs 1 Cost of High-Temperature Heat $ 30 /MWth-hr Cost of Electricity, Levelized 2 $ 101 MWe-hr Cost of Water $ 0.0021 /gal Price for O2 By-product $ 40 /tonne
Notes: 1 2008 dollars
2 $75 /MWe-hr in 2008, escalated at 1%/yr

Hydrogen Plant Alternatives Study NGNP-HPS SHAW-HPA Section 4 – Life Cycle Cost of Hydrogen
NGNP_HPAS_Section_4_Life-CycleCostHydrogen.doc March 2009
4-17 of 32
Table 4-12 summarizes the capital cost of the reference case. Details of the capital cost are in Section 8.1.7.
Table 4-12: Hybrid Sulfur – Capital Cost Summary
Total Costs Specific Costs
Hydrogen Plant Capital Cost $ 918M $ 2,670 /kg H2/day $ 1,925 /kWth H2 (LHV)
Power Conversion System Capital Cost $ 188M $ 1,170 /kWe
BOP & Other Capital Cost $ 40M - -
Total Direct Capital Cost $ 1,146M - -
Indirect Capital Cost $ 63M - -
Base Construction Cost $ 1,209M - -
Contingency $ 115M - -
Total Depreciable Capital Cost $ 1,324M - -
Cost of Land $ 2.5M - -
Total Overnight Capital Cost $ 1,326M $ 3,860 /kg H2/d $ 2,780 /kWth H2 (LHV)
Interest During Construction $ 172M - -
Total Capital Investment $ 1,498M $ 4,360 /kg H2/d $ 3,140 /kWth H2 (LHV)
The capital costs summarized in Table 4-12 include more than the capital costs stated
elsewhere in this report for the process plant alone. This is described previously in Section 4.2.1.3.
Periodic replacement costs that are accounted for in the analysis are shown in Table 4-13.
As with the Sulfur Iodine process, the Sulfuric Acid Decomposer is the process coupling heat exchanger and is where the highest temperatures are present in the process. The Sulfuric Acid Decomposer utilizes silicon carbide tubes. The tubes and the associated seals are not expected to operate for the full 30-year expected plant lifetime. Additionally, the electrolyzer cells and the electrolyzer modular units will require replacement or refurbishment on a periodic schedule, as indicated in Table 4-13.
Details of the replacement and operating costs are in Section 8.1.8. The calculated hydrogen selling price for the economic ground rules summarized in
Table 4-1 and the parameters in shaded columns of Table 4-3 is calculated using the H2A modeling tool to be 6.83 $/kg H2 with escalation of the cost of imported electric power. Without the escalation the price would be 6.43 $/kg H2, and with the escalation but without the oxygen credit the price comes to 7.21 $/kg H2.

Hydrogen Plant Alternatives Study NGNP-HPS SHAW-HPA Section 4 – Life Cycle Cost of Hydrogen
NGNP_HPAS_Section_4_Life-CycleCostHydrogen.doc March 2009
4-18 of 32
Table 4-13: Hybrid Sulfur – Replacement Capital Summary
Parameter Value Sulfuric Acid Decomposer Tube Replacement
Unit life 10 yrs Replacement frequency every 2 yrs
Number 1,500 Equip. cost per replacement $ 35,700,000
Cell Replacement Replacement frequency 5 yrs
Unit replacement cost $ 984 Number 48,400 Equip. cost per replacement $47,625,600
Electrolyzer Replacement Replacement frequency 20 yrs
Unit replacement cost $ 300,000 Number 392 Equip. cost per replacement $ 117,600,000
Table 4-14 shows the breakdown of the components of the hydrogen selling price.
Table 4-14: Hybrid Sulfur – Hydrogen Price Components Summary
$/kg H2 %
Capital Charge 2.20 32 Fixed O&M: Labor, Taxes, Insurance, Annual Licensing, Permits and Fees, Material Costs for Maintenance And Repairs, Nuclear Decommissioning Funding, Helium Make-up
0.43 6
Variable O&M: Process Catalyst and Chemical Consumption and Waste Disposal 0.58 9
Nuclear Heat 2.36 35
Electric Power 1.48 22
Process & Cooling Water 0.15 2
Byproduct Credit (O2) - 0.38 - 6
Total Hydrogen Cost (Year 2008 Real $/kg) 6.83 100

Hydrogen Plant Alternatives Study NGNP-HPS SHAW-HPA Section 4 – Life Cycle Cost of Hydrogen
NGNP_HPAS_Section_4_Life-CycleCostHydrogen.doc March 2009
4-19 of 32
4.5.2.2 Sensitivity analysis The sensitivities of the HyS hydrogen cost to the parameters listed in Table 4-3 are
presented as “tornado” diagrams in Figure 4-5 and Figure 4-6. In the first figure are sensitivities to variation in capital cost elements, and the second figure shows sensitivities to other cost elements. Sensitivity to reactor outlet temperature is covered in Section 5.3.
$6.00 $6.50 $7.00 $7.50 $8.00
Decomp. Tube Repl. Freq.
Decomposer
Decomposition Section
Electrolyzer CellReplacement Freq.
Electrolyzers
Electrolysis Subsystem
Overall HPS Capital, %
$/kg of Hydrogen
5% per yr.
-15%
-20%
20% per yr.10% per yr.
+30%
+50%
-15% +30%
-15% +30%
-20% +50%
5% per yr. 20% per yr.10% per yr.
Figure 4-5: Tornado Chart for HyS Initial and Replacement Capital Cost Factors
The overall HPS capital cost is the most influential of the selected sensitivity parameters.
The electrolyzer cost and electrolyzer replacement frequency are next most significant. The costs of the decomposer and its replacement are less significant.
In Figure 4-6, the hydrogen cost can be seen to be most sensitive to the IRR, nuclear heat
cost and capacity factor, and, following those, to the electric power cost. While the HyS hydrogen production cost looks very good compared to conventional
electrolysis, it is to be expected because it uses less electricity. The HyS analysis also shows hydrogen price advantage over SMR, when considering increased CO2 penalties. This is not the case for SI or HTSE because of the lower relative imported electricity consumption.
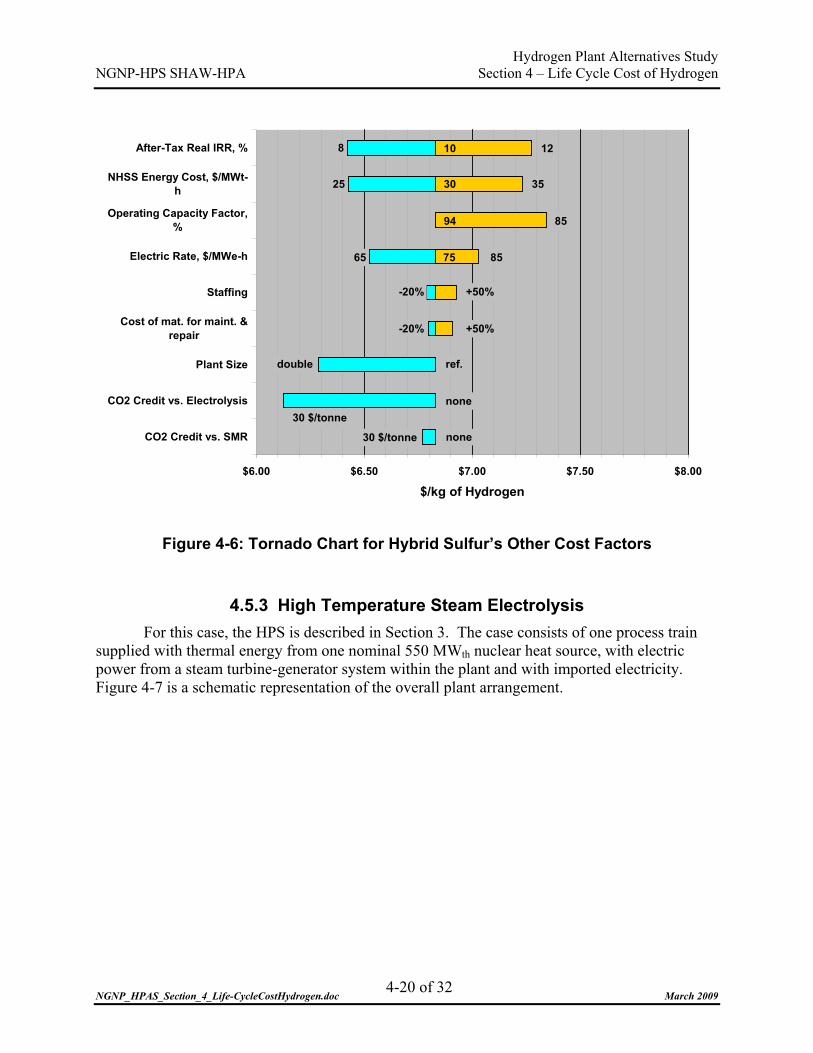
Hydrogen Plant Alternatives Study NGNP-HPS SHAW-HPA Section 4 – Life Cycle Cost of Hydrogen
NGNP_HPAS_Section_4_Life-CycleCostHydrogen.doc March 2009
4-20 of 32
$6.00 $6.50 $7.00 $7.50 $8.00
CO2 Credit vs. SMR
CO2 Credit vs. Electrolysis
Plant Size
Cost of mat. for maint. &repair
Staffing
Electric Rate, $/MWe-h
Operating Capacity Factor,%
NHSS Energy Cost, $/MWt-h
After-Tax Real IRR, %
$/kg of Hydrogen
65
8
25
-20%
-20%
8575
10
30
12
8594
35
+50%
+50%
30 $/tonnenone
30 $/tonne none
double ref.
Figure 4-6: Tornado Chart for Hybrid Sulfur’s Other Cost Factors
4.5.3 High Temperature Steam Electrolysis For this case, the HPS is described in Section 3. The case consists of one process train
supplied with thermal energy from one nominal 550 MWth nuclear heat source, with electric power from a steam turbine-generator system within the plant and with imported electricity. Figure 4-7 is a schematic representation of the overall plant arrangement.

Hydrogen Plant Alternatives Study NGNP-HPS SHAW-HPA Section 4 – Life Cycle Cost of Hydrogen
NGNP_HPAS_Section_4_Life-CycleCostHydrogen.doc March 2009
4-21 of 32
NHSSOutput 528 MWt
Temp. out 950°C
Input 33 MWe
HPSInputs 88 MWt
507 MWe
PCSInput 440 MWt
Output 176 MWe
Hydrogen142.0 Mscf/d
4.0 kg/s343.5 MT/d
Electricity365 MWe
BOPInput 1.5 MWe
910°C
277°C
829°C
NHSSOutput 528 MWt
Temp. out 950°C
Input 33 MWe
HPSInputs 88 MWt
507 MWe
PCSInput 440 MWt
Output 176 MWe
Hydrogen142.0 Mscf/d
4.0 kg/s343.5 MT/d
Electricity365 MWe
BOPInput 1.5 MWe
910°C
277°C
829°C
Figure 4-7: Schematic Diagram and Energy Balance for HTSE
4.5.3.1 Reference Case H2 Selling Price Table 4-15 presents the major performance factors for the HTSE reference case. The
NHSS energy cost, import electricity cost, and O2 byproduct price are parameters subject to sensitivity analysis in each case.
Table 4-15: HTSE – Overall Cost and Performance Factors for Analysis
Major Plant Parameters Nuclear Reactor Power 528 MWth PCHX Heat Input 88 MWth Plant H2 Output 4.0 kg/s
142 MMSCFD Electric Power Generated 180 MWe Additional Electricity Imported 365 MWe
Major Input/Byproduct Costs 1 Cost of High-Temperature Heat $ 30 / MWth-hr Cost of Electricity, Levelized 2 $ 101 / MWe-hr Cost of Water $ 0.0021 /gal
Notes: 1 2008 dollars
2 $75 /MWe-hr in 2008, escalated at 1%/yr

Hydrogen Plant Alternatives Study NGNP-HPS SHAW-HPA Section 4 – Life Cycle Cost of Hydrogen
NGNP_HPAS_Section_4_Life-CycleCostHydrogen.doc March 2009
4-22 of 32
Table 4-16 summarizes the capital cost of the reference case. Details of the capital cost are in Section 8.3.7.
Table 4-16: HTSE – Capital Cost Summary
Total Costs
Specific Costs
Hydrogen Plant Capital Cost $ 509M $ 1 y $ 1,070 /k 2 (LHV)
,480 /kg H2/daWth H
Power Conversion System Capital Cost $ 212M $ 1,175 /kWe
BOP & Other Capital Cost $ 40M - -
Total Direct Capital Cost $ 761M - -
Indire al Cost ct Capit $ 63M - -
Base Construction Cost $ 824M - -
Contingency $ 76M - -
Total Depreciable Capital Cost $ 900M - -
C Land ost of $ 2.5M - -
Total Overnight Capital Cost $ 2,630 /kg H2/d $ 1 V) $ 903M ,890 /kWth H2 (LH
Interest During Construction $ 117M - -
$ 2,970 /kg H /d Total Capital Investment $ 1,020M 2$ 2,140 /kWth H2 (LHV)
Periodic replacement costs that are accounted for in the analysis are shown in Table 4-17.
As with the Hybrid Sulfur process, the electrolyzer’s modular units will require replacement or refurbishment on a periodic basis. Table 4-17 summarizes the replacement schedule and costs. Details of replacem
Table – Replacement Capital Sum
Parameter Value
ent and operating costs are in Appendix 8.3.8.
4-17: HTSE mary
Electrolyzer Replacement
Cell Sta cks
Replacement frequency 4 per year
Unit replacement cost $ 1,880,000
Cost per replacement $ 7,520,000
Stack Assemblies
Replacement frequency er year 7 p
Unit replacement cost $ 184,000
Cost per replacement $ 1,288,000
Module Enclosures
Replacement frequency 2 per year

Hydrogen Plant Alternatives Study NGNP-HPS SHAW-HPA Section 4 – Life Cycle Cost of Hydrogen
NGNP_HPAS_Section_4_Life-CycleCostHydrogen.doc March 2009
4-23 of 32
Parameter Value Unit replacement cost $ 270,000
Cost per replacement $ 540,000
High-Te eplacement mperature Heat Exchanger R
Replace rs ment frequency 15 y
Equip. c nt ost per replaceme
Heat exchangers $ 2,321,000
Connecting pipe $ 1,160,500
Equipment cost total $ 3,481,500
Replacement labor cost $ 19,200
Piping Replacement
Replacement frequency 15 yrs
Equipment cost total $ 7,000,000
Replacement labor cost $ 23,040 The calculated hydrogen selling price for the economic ground rules summarized in
Table 4-1 and the parameters in the shaded columns of Table 4-3 is calculated using the H2A modeli ithout the esc 2
Table rice.
Table 4-18: HTSE – Hydrogen Price Components Summary
$/kg H2 %
ng tool to be 6.04 $/kg H2 with escalation of the cost of imported electric power. Wation, the price would be 5.31 $/kg H . al
4-18 shows the breakdown of the components of the hydrogen selling p
Capital Charge 1.52 25 Fixed O&M: Labor, Taxes, Insurance, Annual Licensing, Permits and Fees, Material
ding, p
Costs for Maintenance And Repairs, Nuclear Decommissioning FunHelium Make-u
0.34 6
Variable O&M: Process Catalyst and Chemical Consumption and Waste Disposal 0.27 5
Nuclear Heat 1.18 19
Electric Power 2.72 45
Process & Cooling Water 0.01 0.1
Byprodu t Credit (O2) 0.00 0 c
Total Hydrogen Cost (Year 2008 Real $/kg H2) 6.04 100

Hydrogen Plant Alternatives Study NGNP-HPS SHAW-HPA Section 4 – Life Cycle Cost of Hydrogen
NGNP_HPAS_Section_4_Life-CycleCostHydrogen.doc March 2009
4-24 of 32
4.5.3.2 Sensitivity analysis The sensitivities of the HTSE hydrogen cost to the parameters listed in Table 4-3 are
presented as “tornado” diagrams in Figure 4-8 and Figure 4-9. The first figure presents sensitivities to variations in capital cost elements, and the second figure shows sensitivities to other cost elements. Sensitivity to reactor outlet temperature is discussed in Section 5.3.
$5.50 $6.00 $6.50
$/kg of Hydrogen$7.00
HTHX & Pipe Repl. Period
High-Temp. Heat Exchrs.
Heat Recovery Subsystem
Electrolyzer ReplacementFreq.
Electrolyzers
Electrolysis Subsystem
Overall HPS Capital, %
2 per yr.
no repl.
-15%
-20%
10 per yr.
4 per yr.
8 yrs
+30%
+50%
-15% +30%
-15% +30%
-20% +50%
eat upling Heat Exchangers. These vessels and the pipe
between them will require replacement during the life of the plant because of their high operating
n Figure 4-9, the hydrogen cost is most sensitive to the cost of electricity, as one might expect ysis,
Figure 4-8: Tornado Chart for HTSE’s Initial and Replacement Capital Cost Factors
The overall HPS capital cost is the most influential of the selected sensitivity parameters.
The electrolyzer cost and electrolyzer replacement frequency are the next most significant. The high-temperature heat exchangers in the process include the Sweep Gas Feed Water
Superheaters, Hydrogen Feed Water Superheaters, Superheated Steam Process Coupling HExchangers, and the Sweep Gas Process Co
temperatures (i.e., up to 910°C on the hot sides). However, the hydrogen cost is not very sensitive to this replacement requirement.
Ifor an electrolysis system. The results compare favorably to conventional electrol
which is to be expected because of the lower electric power needed.

Hydrogen Plant Alternatives Study NGNP-HPS SHAW-HPA Section 4 – Life Cycle Cost of Hydrogen
NGNP_HPAS_Section_4_Life-CycleCostHydrogen.doc March 2009
4-25 of 32
Two values of hydrogen cost are plotted for larger plant sizes. The first is for an
approximate doubling in the plant output to 300 MMSCFD. The second shows the economy of scale for a plant producing 893 MMSCFD, which correlates to an HPS that uses the entire nuclear heat from one HTGR nuclear unit and imports all needed electricity. It should be noted that this would be an unreasonably large plant and not one likely to suit the hydrogen market.
$5.00 $5.50 $6.00 $6.50 $7.00
CO2 Credit vs. Electrolysis
Plant Size
Cost of mat.for maint. &repair
Staffing
Operating Capacity Factor,%
NHSS Energy Cost, $/MWt-h
After-Tax Real IRR, %
Electric Rate, $/MWe-h
$/kg of Hydrogen
65
8
25
-20%
-20%
8575
10
30
12
8594
35
+50%
+50%
30 $/tonne none
double ref.max.
tors
.
caution that although these alternative baseline economic analyses were performed using the H2A economic model, the bases of the capital costs utilized by the model for these alternatives
assumptions.
to convert natural gas into hydrogen. As distributed commercially, methane generally constitutes 95% of natural gas by molar fraction. Methane
Figure 4-9: Tornado Chart for HTSE’s Other Cost Fac
4.5.4 Comparison to Baseline Alternates The resulting reference case hydrogen prices for the three production technologies are
compared on an equivalent basis to the prices for hydrogen from alternate baseline technologiesThese baselines are natural gas steam reforming and alkaline water electrolysis. The authors
have been developed using unknown methodologies and
4.5.4.1 Natural Gas Steam Reforming Baseline The SMR process is used

Hydrogen Plant Alternatives Study NGNP-HPS SHAW-HPA Section 4 – Life Cycle Cost of Hydrogen
NGNP_HPAS_Section_4_Life-CycleCostHydrogen.doc March 2009
4-26 of 32
re e chemical process according to thacts with steam in a two-stag e following equations, roducing hydrogen and CO2:
CH4 + H2O + heat � CO + 3 H2,
he CO2 produced in these reactions can be captured relatively easily.
Natural gas is both the feed to the process and the heat source for the first of the two reaction
CH4 + 2 O2 � CO2 + 2 H2O + heat.
y and e
apture efficiencies for the product stream and the combustion products leaving the stack are 99% and 90%, re
5
Since
gas,
tu, which reflects the 2007 year price for industrial gas , to $10.00/MMBtu, which is a data point from mid 2008[Ref. 17]. For real escalation, a rate of 2% is estimat
uture natural gas price, and to a lesser degree CO2 costs, are the two main driving factors
.
st is further demonstrated in Figure 4-10 for cases with and without the 2% gas price escalation in the model. Escalation is also included for the small amount of electricity used by the modeled SMR plant and for the CO2
p
CO + H2O � CO2 + H2 + heat.
T
s. The heat is generated from simple atmospheric combustion, as follows:
The CO2 produced from combustion, which would ordinarily go out up a stack, is difficult and expensive to capture.
SMR is the conventional industrial process for large-scale hydrogen production today.
This is hydrogen primarily used in the oil refining and petrochemical industries. Future SMR plants will use essentially the same technology, but with some expected improved efficiencanticipated lower capital cost. An H2A analysis of advanced SMR[Ref. 14] is used for the baselincalculation. The case used corresponds to present technology for SMR with CO2 capture and sequestration with efficiencies and costs projected for 2025. The CO2 is captured from both the syngas product stream and the combustion stack by aqueous amine solution. CO2 c
spectively. The reference model was used with minimal changes. One input change to the model was to factor plant capital costs from 2005 to mid-2008 dollars by a multiplier of 1.2based upon changes to costs of chemical equipment, labor, and engineering[Ref. 15].
The SMR hydrogen selling price will be most sensitive to the cost of natural gas.
the natural gas price is expected to rise at a higher rate than general inflation in the future, the H2A calculation tool was modified to enter a fixed percentage real escalation rate for natural which is an escalation above the rate of general inflation. The range of recent historical natural gas cost is $8.00/MMB [Ref. 16]
ed based on the recent annual price increase of natural gas. Because the input cost isescalated, the hydrogen selling price is a levelized cost over the 40-year plant lifetime deflated back to 2007 dollars.
Ffor SMR economics. Table 4-19 shows the results of the analysis for the hydrogen price
from SMR with these factors varied. The SMR technology is based upon the advanced technology case. Costs are in 2008 dollars, as per the ground rules described in Section 8.5.2
The sensitivity of the hydrogen price to natural gas co

Hydrogen Plant Alternatives Study NGNP-HPS SHAW-HPA Section 4 – Life Cycle Cost of Hydrogen
NGNP_HPAS_Section_4_Life-CycleCostHydrogen.doc March 2009
4-27 of 32
costs. In such an analysis that includes real escalation, the forecast selling price of hydrogen may increase significantly, depending on the escalation rate.
ydrogen from Natural Gas by Advanced Steam Methane Reforming
Natural Gas Cost * $/MMBtu
CO2 Emission Penalt † $/MT
Hydrogen Selling Price $/kg H2
Table 4-19: H
Sensitivity Analysis Case y *
Reference Case 8 30 2.16
Increased Natural Gas Cost 12 30 2.93
Increased CO2 Cost 8 100 2.26
BC
oth Higher Natural Gas and CO2 osts 12 100 3.02
* No real escalation in natural gas cost † $30/MT CO2 is $110/MT C; $100/MT CO2 is $367/MT C
$1.00
$1.50
$2.00
$2.50
$3.00
$3.50
$4.00
$4.50
$5.00
$5.50
$6.00
$6.50
$7.00
5 6 7 8 9 10 11 12 13 14 15 16 17 18
Natural Gas price, 2008$/MMBtu
Hyd
roge
n pr
ice,
200
8$/k
g
Advanced SMR, with escalation
Advanced SMR, no escalation
Conventional SMR (w/o CO2 removal)
CO2 costs: 30 $/tonne from syngas, 100 $/tonne from flue gasEscalation: Natural Gas 2% Electricity 1% CO2 costs 1%
Figure 4-10: H2 Price from SMR as a Function of Natural Gas Cost with Escalation

Hydrogen Plant Alternatives Study NGNP-HPS SHAW-HPA Section 4 – Life Cycle Cost of Hydrogen
NGNP_HPAS_Section_4_Life-CycleCostHydrogen.doc March 2009
4-28 of 32
4.5.4.2 Alkaline Water Electrolysis Baseline Water electrolysis uses direct electric current to split water, as in the classic tabletop
school experiment. Historically, it has been occasionally used for industrial hydrogen generation where electricity is economically priced. It is referred to as alkaline electrolysis because potassium hydroxide (KOH) is added to the water as an electrolyte. There is one manufacturer of large-scale electrolysis units, Hydrogen Technologies, a division of StatoilHydro, formerly Norsk Hydro[Ref. 18]. Their production plants comprise multiple units having many electrolysis cells. In conventional electrolysis cells, the electrodes utilize non-platinum group catalysts, and a membrane separates the electrodes so that the hydrogen and oxygen products do not mix. Significant effort is underway to improve the performance of conventional alkaline electrolysis. With partial DOE funding, General Electric has been pursuing two avenues – improved electrodes and lower manufacturing cost[Ref. 19].
Two H2A cases posted on the DOE website utilize grid electricity for conventional
electrolysis[20]. One change made is an increase in capital costs from 2005 to 2008, as done for the SMR baseline case. The two cases are current conventional alkaline electrolysis technology and future electrolyzer technology. In the analysis of current electrolysis, the model uses performance data from StatoilHydro of an efficiency of 74% on a HHV basis. An electrolyzer cost of $1000/kWe in 2008 dollars was used herein based on specific pricing[Ref. 21].
For future grid electrolysis, considered to be in 2030, the H2A model includes an
electrolyzer cost of $375/kWe in 2008 dollars. The cost of $375/kWe (i.e., $300/kWe in 2005 dollars) is a DOE H2A program consensus[Ref. 22] based on a target for fuel cell costs set in the DOE fuel cell vehicle program.
For all cases, a credit is included in the hydrogen price for byproduct oxygen from the
electrolysis process at $40/MT. The dominant cost input factors for the electrolysis baseline case are the capital cost of
the electrolyzers and the cost of electric energy used. The input electricity cost for a reference point baseline calculation is $60/MWe-hr, which is representative of recent industrial electricity pricing[Ref. 23]. Although unlike natural gas pricing, for which there is a nationwide market, the price of electricity is highly variable region-to-region. Table 4-20 shows the results of the analysis for the hydrogen price from electrolysis with the capital and electric cost factors varied. These cases do not have any escalation of electricity cost. Costs are in 2008 dollars, as per the ground rules discussed in Section 8.5.2.

Hydrogen Plant Alternatives Study NGNP-HPS SHAW-HPA Section 4 – Life Cycle Cost of Hydrogen
NGNP_HPAS_Section_4_Life-CycleCostHydrogen.doc March 2009
4-29 of 32
Table 4-20: Hydrogen from Conventional Alkaline Electrolysis
Sensitivity Analysis Case Electrolyzer Capital Cost* $/kWe
Electricity Cost† $/MWth
Hydrogen Selling Price $/kg H2
Reference Case 1000 60.00 5.57
Future Electrolyzer 375 60.00 4.19
Future Electrolyzer and Higher Electricity Cost 375 90.00 5.92
* uninstalled modular equipment cost, 2008 dollars † no real escalation in electricity cost
As with the natural gas cost in the SMR baseline analysis, the H2A model was modified
to include a 1% real escalation in the electric power cost as an option. Figure 4-11 shows the effect of electricity cost on the hydrogen selling price with and without real electricity price escalation for the current electrolyzer cost and the projected most optimistic future case.
$2.00
$2.50
$3.00
$3.50
$4.00
$4.50
$5.00
$5.50
$6.00
$6.50
$7.00
$7.50
$8.00
40 45 50 55 60 65 70 75 80 85 90 95
Electricity price, 2008$/MWh
Hyd
roge
n pr
ice,
200
8$/k
g
Current Electrolysis, 1% escalation Advanced Electrolysis, 1% escalation Current Electrolysis, no escalation Advanced Electrolysis, no escalation
Figure 4-11: Hydrogen Price from Electrolysis as a Function of Electricity Cost
4.5.4.3 Comparison to Reference cases It is useful then to compare the calculated price for hydrogen with Sulfur Iodine, Hybrid
Sulfur and HTSE processes with calculations on the same bases of hydrogen production from the baseline alternative technologies (i.e., natural gas SMR and ambient temperature electrolysis).
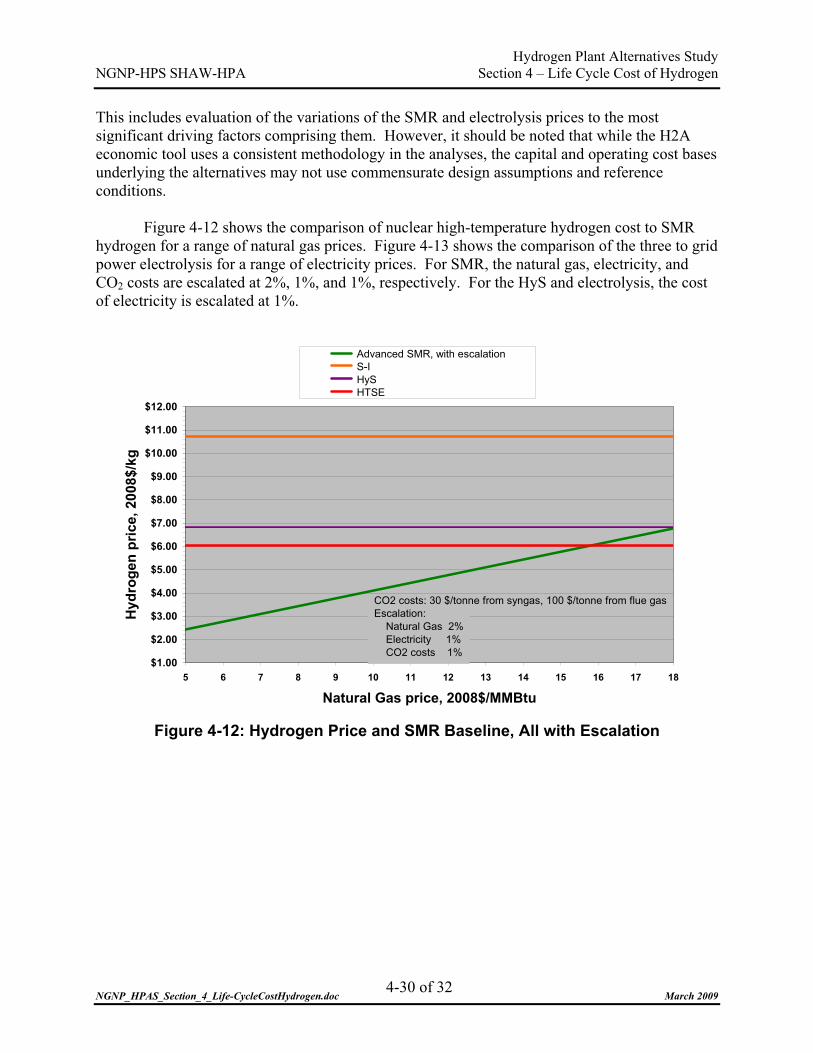
Hydrogen Plant Alternatives Study NGNP-HPS SHAW-HPA Section 4 – Life Cycle Cost of Hydrogen
NGNP_HPAS_Section_4_Life-CycleCostHydrogen.doc March 2009
4-30 of 32
This includes evaluation of the variations of the SMR and electrolysis prices to the most significant driving factors comprising them. However, it should be noted that while the H2A economic tool uses a consistent methodology in the analyses, the capital and operating cost bases underlying the alternatives may not use commensurate design assumptions and reference conditions.
Figure 4-12 shows the comparison of nuclear high-temperature hydrogen cost to SMR
hydrogen for a range of natural gas prices. Figure 4-13 shows the comparison of the three to grid power electrolysis for a range of electricity prices. For SMR, the natural gas, electricity, and CO2 costs are escalated at 2%, 1%, and 1%, respectively. For the HyS and electrolysis, the cost of electricity is escalated at 1%.
$1.00
$2.00
$3.00
$4.00
$5.00
$6.00
$7.00
$8.00
$9.00
$10.00
$11.00
$12.00
5 6 7 8 9 10 11 12 13 14 15 16 17 18
Natural Gas price, 2008$/MMBtu
Hyd
roge
n pr
ice,
200
8$/k
g
Advanced SMR, with escalation S-I HyS HTSE
CO2 costs: 30 $/tonne from syngas, 100 $/tonne from flue gasEscalation: Natural Gas 2% Electricity 1% CO2 costs 1%
Figure 4-12: Hydrogen Price and SMR Baseline, All with Escalation

Hydrogen Plant Alternatives Study NGNP-HPS SHAW-HPA Section 4 – Life Cycle Cost of Hydrogen
NGNP_HPAS_Section_4_Life-CycleCostHydrogen.doc March 2009
4-31 of 32
$2.00
$3.00
$4.00
$5.00
$6.00
$7.00
$8.00
$9.00
$10.00
$11.00
$12.00
40 45 50 55 60 65 70 75 80 85 90 95
Electricity price, 2008$/MWh
Hyd
roge
n pr
ice,
200
8$/k
g Current Electrolysis, 1% escalation Advanced Electrolysis, 1% escalation S-I HyS HTSE
Figure 4-13: Hydrogen Price and Electrolysis Baselines, All with Escalation As indicated earlier, reference values for recent historical prices of natural gas are
$8/MMBtu and for industrial electricity $60/MWe-hr. Higher values for comparison might be the spot price ranges as of this writing, which are $9.25 to $10/MMBtu and $75 to $90/MWe-hr[Ref. 24]. In June 2008, natural gas prices reached $13/MMBtu with the price of crude oil peaking then as well. Also, because of seasonal variations, the spot price of natural gas is not an indicator of the annual average.
4.6 FINANCING HURDLES A measure of the difficulty of executing a project to produce hydrogen is the imposing
level of investment that must be assured. This is the amount of capital needed for construction of a mature HPS facility. The total capital requirement would include the cost for the hydrogen production equipment, the power conversion system and the capital to build the reactor plant. Table 4-21 illustrates the relative magnitude of this financing hurdle for the three hydrogen production systems.

Hydrogen Plant Alternatives Study NGNP-HPS SHAW-HPA Section 4 – Life Cycle Cost of Hydrogen
NGNP_HPAS_Section_4_Life-CycleCostHydrogen.doc March 2009
4-32 of 32
Table 4-21: Project Capital Financing Hurdle HTSE HyS SI
Plant Capacity, MMSCFD 142 142 157
Hydrogen Plant Capital Cost (no contingency), $million 509 918 2,683
Power Conversion System Cost, NGNP-19-RPT-001 Section 19.1.2.4 (Scaled & Escalated), $million 212 188 N/A
Total Capital Cost for Hydrogen Production Facility (incl. BOP, Other Costs and Contingency; not including interest during construction), $million
903 1,326 3,061
Number of HTGRs required 1 2 3
Reactor Thermal Output, MWth 550 550 550
Capital Cost of reactor plant(s) from NGNP-19-RPT-001 Section 19.2 (Scaled & Escalated), $million 1,349 2,192 2,912
Total Capital Required for ~150 MMSCFD Hydrogen Production Facility, $million
2,252 3,518 5,973
Imported Power, MWe 365 198 330
Capital allocation for new nuclear generation at 3,599 $/kWe, $million 1,177 410 813
Total Capital required for Hydrogen Production, $million 3,429 3,928 6,786

Hydrogen Plant Alternatives Study NGNP-HPS SHAW-HPA Section 5 – Other Factors Affecting Commercial Potential
NGNP_HPAS_Section_5_OtherFactors.doc March 2009
5-1 of 30
5 OTHER FACTORS AFFECTING COMMERCIAL POTENTIAL
5.1 SAFETY, HEALTH AND ENVIRONMENTAL ASSESSMENT
5.1.1 Hybrid Sulfur Process The Hybrid Sulfur HPS is described in Sections 2 and 3. The process feed material is
water and a small amount of 50% by weight sulfuric acid. The process products are hydrogen and oxygen gas. Process intermediates include large amounts of sulfur dioxide, sulfur trioxide, and sulfuric acid. Sodium hydroxide (NaOH) is used as a scrubbing agent.
HyS is a process in which 50% by weight sulfuric acid from the electrolyzers, which
contains dissolved sulfur dioxide, is stripped of the sulfur dioxide, and further concentrates the sulfuric acid to 75% by weight. The sulfuric acid is then decomposed to steam, oxygen, and sulfur dioxide at high pressure and high temperature. The product and stripped sulfur dioxide is dissolved in water and is sent as anolyte to the electrolyzer. Water is supplied to the cathode where it is separated into hydrogen and oxygen ions and converts the sulfur dioxide water solution into sulfuric acid.
The HyS process involves hazardous chemicals that are commonly used in chemical
processing and manufacturing, and the process products are either explosive or an oxidizer, as shown in Table 5-1. In process chemicals are toxic and aggressively corrosive.
Table 5-1: Hazardous Chemicals – Hybrid Sulfur Electrolysis
Hybrid Sulfur
Chemical Hazards Sulfuric Acid Decomposition Electrolysis
Temperature, °C 870 99
Pressure, Bar 86 23
Air
Water X X
Oxygen, 50% with Diluent Gas Oxidizer X
Oxygen, pure Strong Oxidizer
Hydrogen, pure Explosive, Asphyxiate X
Sulfur Dioxide Toxic, Corrosive X X
Sulfur Trioxide Toxic, Corrosive X
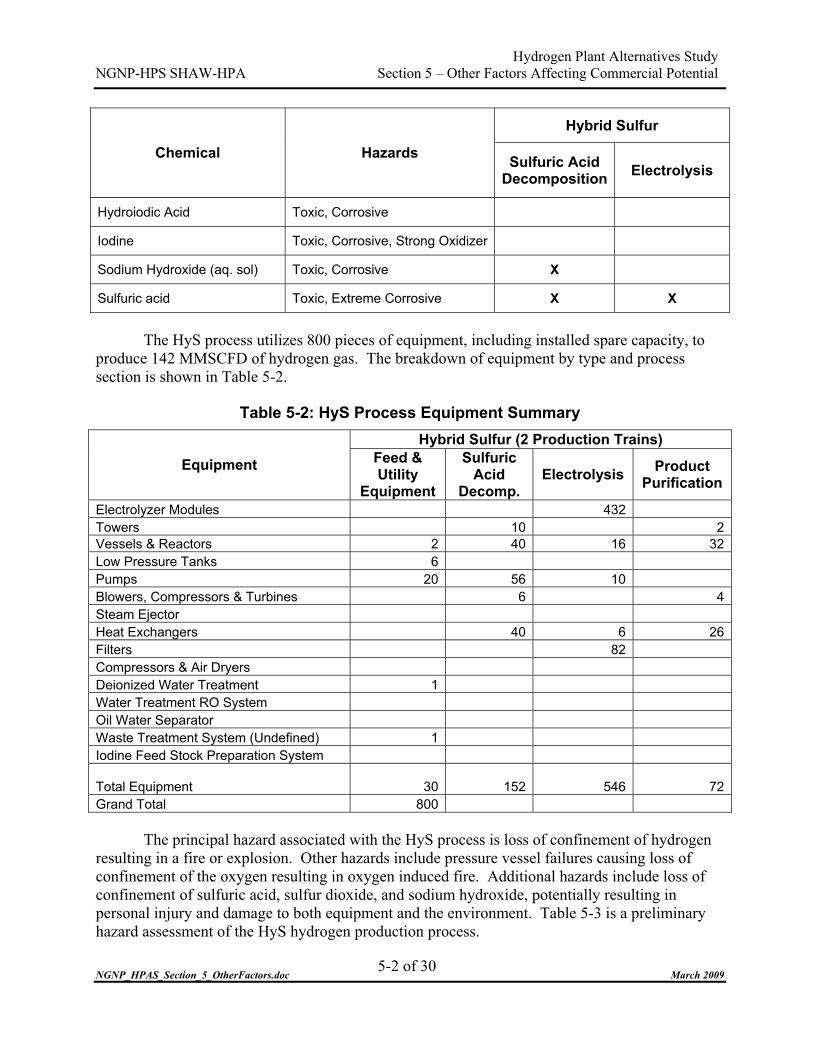
Hydrogen Plant Alternatives Study NGNP-HPS SHAW-HPA Section 5 – Other Factors Affecting Commercial Potential
NGNP_HPAS_Section_5_OtherFactors.doc March 2009
5-2 of 30
Hybrid Sulfur
Chemical Hazards Sulfuric Acid Decomposition Electrolysis
Hydroiodic Acid Toxic, Corrosive
Iodine Toxic, Corrosive, Strong Oxidizer
Sodium Hydroxide (aq. sol) Toxic, Corrosive X
Sulfuric acid Toxic, Extreme Corrosive X X
The HyS process utilizes 800 pieces of equipment, including installed spare capacity, to
produce 142 MMSCFD of hydrogen gas. The breakdown of equipment by type and process section is shown in Table 5-2.
Table 5-2: HyS Process Equipment Summary Hybrid Sulfur (2 Production Trains)
Equipment Feed & Utility
Equipment
Sulfuric Acid
Decomp. Electrolysis Product
Purification
Electrolyzer Modules 432 Towers 10 2Vessels & Reactors 2 40 16 32Low Pressure Tanks 6 Pumps 20 56 10 Blowers, Compressors & Turbines 6 4Steam Ejector Heat Exchangers 40 6 26Filters 82 Compressors & Air Dryers Deionized Water Treatment 1 Water Treatment RO System Oil Water Separator Waste Treatment System (Undefined) 1 Iodine Feed Stock Preparation System
Total Equipment 30 152 546 72Grand Total 800
The principal hazard associated with the HyS process is loss of confinement of hydrogen resulting in a fire or explosion. Other hazards include pressure vessel failures causing loss of confinement of the oxygen resulting in oxygen induced fire. Additional hazards include loss of confinement of sulfuric acid, sulfur dioxide, and sodium hydroxide, potentially resulting in personal injury and damage to both equipment and the environment. Table 5-3 is a preliminary hazard assessment of the HyS hydrogen production process.

Hydrogen Plant Alternatives Study NGNP-HPS SHAW-HPA Section 5 – Other Factors Affecting Commercial Potential
NGNP_HPAS_Section_5_OtherFactors.doc March 2009
5-3 of 30
The HyS process’ operating risk is assessed MEDIUM HIGH due to the use of hazardous
chemicals in the process, the large number of process equipment and the number of hazards associated with the process.
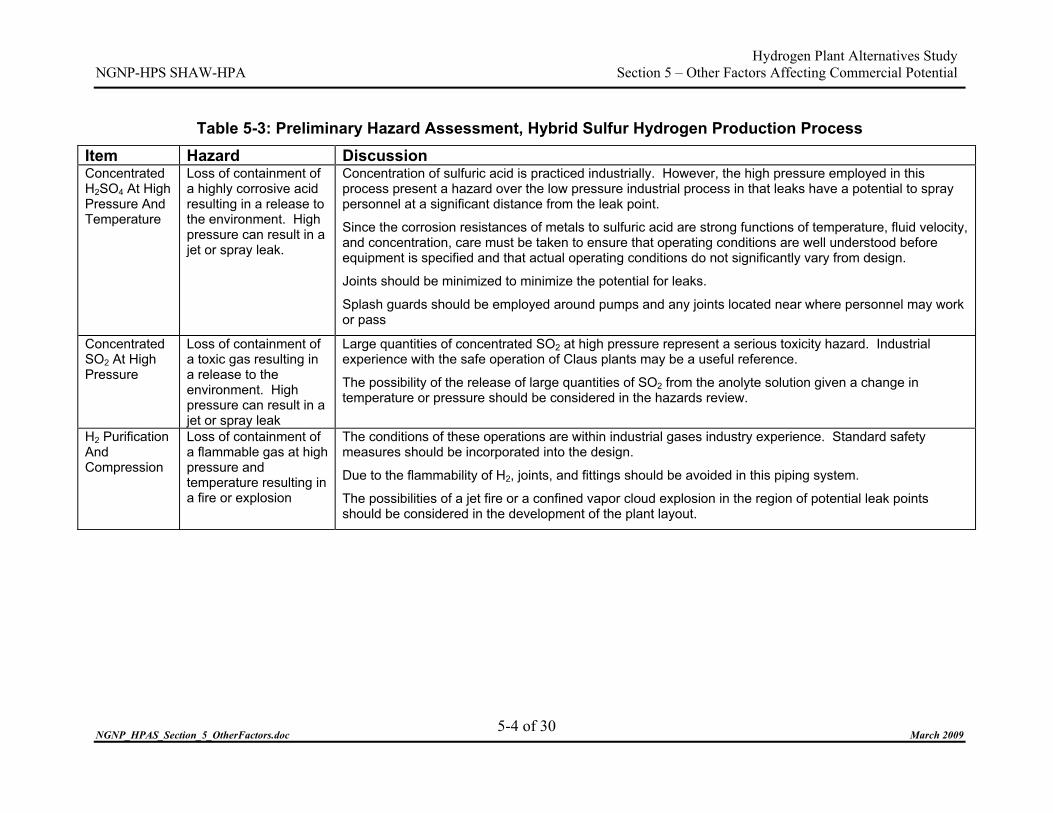
Hydrogen Plant Alternatives Study NGNP-HPS SHAW-HPA Section 5 – Other Factors Affecting Commercial Potential
Table 5-3: Preliminary Hazard Assessment, Hybrid Sulfur Hydrogen Production Process Item Hazard Discussion Concentrated H2SO4 At High Pressure And Temperature
Loss of containment of a highly corrosive acid resulting in a release to the environment. High pressure can result in a jet or spray leak.
Concentration of sulfuric acid is practiced industrially. However, the high pressure employed in this process present a hazard over the low pressure industrial process in that leaks have a potential to spray personnel at a significant distance from the leak point.
Since the corrosion resistances of metals to sulfuric acid are strong functions of temperature, fluid velocity, and concentration, care must be taken to ensure that operating conditions are well understood before equipment is specified and that actual operating conditions do not significantly vary from design.
Joints should be minimized to minimize the potential for leaks.
Splash guards should be employed around pumps and any joints located near where personnel may work or pass
Concentrated SO2 At High Pressure
Loss of containment of a toxic gas resulting in a release to the environment. High pressure can result in a jet or spray leak
Large quantities of concentrated SO2 at high pressure represent a serious toxicity hazard. Industrial experience with the safe operation of Claus plants may be a useful reference.
The possibility of the release of large quantities of SO2 from the anolyte solution given a change in temperature or pressure should be considered in the hazards review.
H2 Purification And Compression
Loss of containment of a flammable gas at high pressure and temperature resulting in a fire or explosion
The conditions of these operations are within industrial gases industry experience. Standard safety measures should be incorporated into the design.
Due to the flammability of H2, joints, and fittings should be avoided in this piping system.
The possibilities of a jet fire or a confined vapor cloud explosion in the region of potential leak points should be considered in the development of the plant layout.
NGNP_HPAS_Section_5_OtherFactors.doc March 2009
5-4 of 30

Hydrogen Plant Alternatives Study NGNP-HPS SHAW-HPA Section 5 – Other Factors Affecting Commercial Potential
NGNP_HPAS_Section_5_OtherFactors.doc March 2009
5-5 of 30
Item Hazard Discussion O2 Purification and Compression
The enhanced flammability of materials in O2 resulting in an equipment fire
All piping, fittings, and equipment exposed to > 25% oxygen must be oxygen-clean before start up. Fittings that are oxygen-cleaned at the factory must be shipped sealed.
The use of soft materials and lubricants should be minimized with oxygen-enriched streams. Fluorinated compounds such as Teflon™ and Viton™ are normally used for seals and per-fluorinated materials as lubricants.
The use of O2 as the regeneration gas for the TSAs will require that the maximum regeneration temperature and pressure be considered in the specification of the materials of construction for the adsorber vessels and piping that will be exposed to the hot gas.
It is standard industry practice to place O2 compressors inside of barriers for containment and personnel protection in case of a fire. The frequency of fires in such equipment should be considered in plant layout
Sulfuric Acid Decomposer
Loss of containment of high pressure He. Contamination of He stream due to tube leaks and acid corrosion of He heat exchange equipment
Keeping the pressure of the He stream above that of the decomposer should minimize acid leakage into the He in the event of a leak.
Water Treatment
No extra ordinary risk This system should be standard equipment routinely used in industry with standard safety measures.

Hydrogen Plant Alternatives Study NGNP-HPS SHAW-HPA Section 5 – Other Factors Affecting Commercial Potential
NGNP_HPAS_Section_5_OtherFactors.doc March 2009
5-6 of 30
5.1.2 Sulfur Iodine Process The Sulfur Iodine hydrogen production process is described in Sections 2 and 3.
The process feed material is water, small amounts of 50% by weight sulfuric acid, and iodine. The process products are hydrogen and oxygen gas. Process intermediates include large amounts of sulfur dioxide, sulfuric acid, sulfur trioxide, iodine, and hydroiodic acid. Sodium hydroxide is used as a scrubbing agent.
SI is a process in which water, sulfur dioxide, and iodine are reacted in the
presence of oxygen to form hydroiodic acid and sulfuric acid (i.e., Bunsen Reaction). These acids are separated in immiscible liquid phases. The heavy phase, containing large amounts of both hydroiodic acid and iodine, is thermally decomposed into hydrogen and additional iodine. The iodine stream is returned to the Bunsen Reaction. The light phase consisting of 60 % sulfuric acid by weight is concentrated to 75 weight % and is decomposed to oxygen, steam, and sulfur dioxide at high pressure and high temperature. The resulting sulfur dioxide is dissolved in water and is returned to the Bunsen Reaction
With the exception of iodine and hydroiodic acid, the SI process involves
hazardous chemicals that are commonly used in chemical processing and manufacturing, as shown in Table 5-4. The process products are either explosive or an oxidizer.
Table 5-4: Hazardous Chemicals – Sulfur Iodine Process
Sulfur Iodine Chemical Hazards Sulfuric Acid
DecompositionBunsen
Reaction HI
Decomposition
Temperature, °C 870 120 288
Pressure, Bar 86 12 40
Air
Water X X X
Oxygen, 50% with Air
Oxidizer
Oxygen, pure Strong Oxidizer X X
Hydrogen, pure Explosive, Asphyxiate X
Sulfur Dioxide Toxic, Corrosive X X

Hydrogen Plant Alternatives Study NGNP-HPS SHAW-HPA Section 5 – Other Factors Affecting Commercial Potential
NGNP_HPAS_Section_5_OtherFactors.doc March 2009
5-7 of 30
Sulfur Iodine Chemical Hazards Sulfuric Acid
DecompositionBunsen
Reaction HI
Decomposition
Sulfur Trioxide Toxic, Corrosive X
Hydroiodic Acid Toxic, Corrosive X X
Iodine Toxic, Corrosive, Strong Oxidizer X X
Sodium Hydroxide (aq. sol)
Toxic, Corrosive
Sulfuric acid
Toxic, Extreme Corrosive X X
The SI Process utilizes 519 pieces of equipment, including installed spare capacity,
to produce 157 MMSCFD of hydrogen gas. The breakdown of equipment by type and process section is shown in Table 5-5.
The principal hazards associated with the SI process is loss of confinement of
hydrogen resulting in a fire or explosion. Other hazards include pressure vessel failures and loss of confinement of the oxygen resulting in oxygen induced fire. Additional hazards include loss of confinement of sulfuric acid, sulfur dioxide, iodine, and hydroiodic acid resulting in personal injury and damage to both equipment and the environment. Due to the large volumes of hazardous chemicals in the SI process, a loss of confinement event has very high consequences that will require mitigation features to reduce the risk to an acceptable level. Table 5-6 is a preliminary hazard assessment of the SI hydrogen production process.
Table 5-5: Sulfur Iodine Process Equipment Summary Sulfur Iodine (3 Production Trains)
Equipment
Feed & Utility
Equipment
Sulfuric Acid
Decomp.Bunsen Reaction
HI Decomposition
Product Purification
Electrolyzer Modules Towers 1 6 6 18 3 Vessels & Reactors 1 36 6 30 33 Low Pressure Tanks 9 Pumps 39 30 45 6 Blowers, Compressors & Turbines 6 6 21 12 Steam Ejector 9
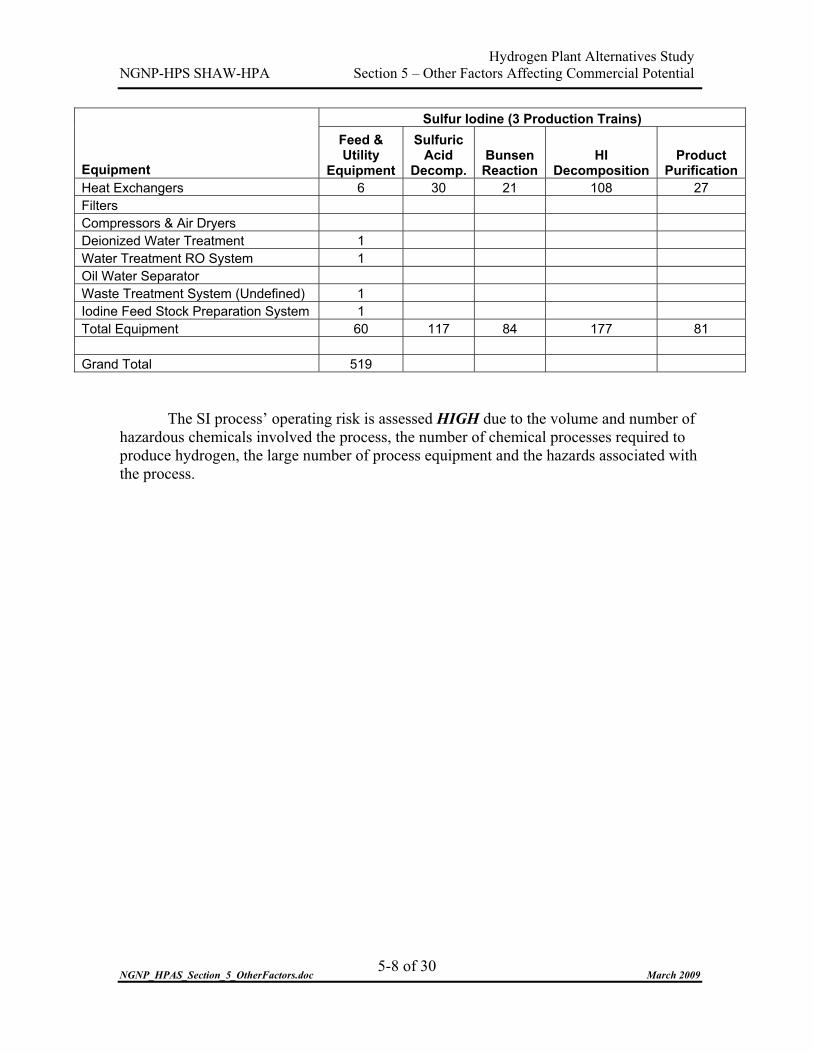
Hydrogen Plant Alternatives Study NGNP-HPS SHAW-HPA Section 5 – Other Factors Affecting Commercial Potential
NGNP_HPAS_Section_5_OtherFactors.doc March 2009
5-8 of 30
Sulfur Iodine (3 Production Trains)
Equipment
Feed & Utility
Equipment
Sulfuric Acid
Decomp.Bunsen Reaction
HI Decomposition
Product Purification
Heat Exchangers 6 30 21 108 27 Filters Compressors & Air Dryers Deionized Water Treatment 1 Water Treatment RO System 1 Oil Water Separator Waste Treatment System (Undefined) 1 Iodine Feed Stock Preparation System 1 Total Equipment 60 117 84 177 81 Grand Total 519
The SI process’ operating risk is assessed HIGH due to the volume and number of
hazardous chemicals involved the process, the number of chemical processes required to produce hydrogen, the large number of process equipment and the hazards associated with the process.
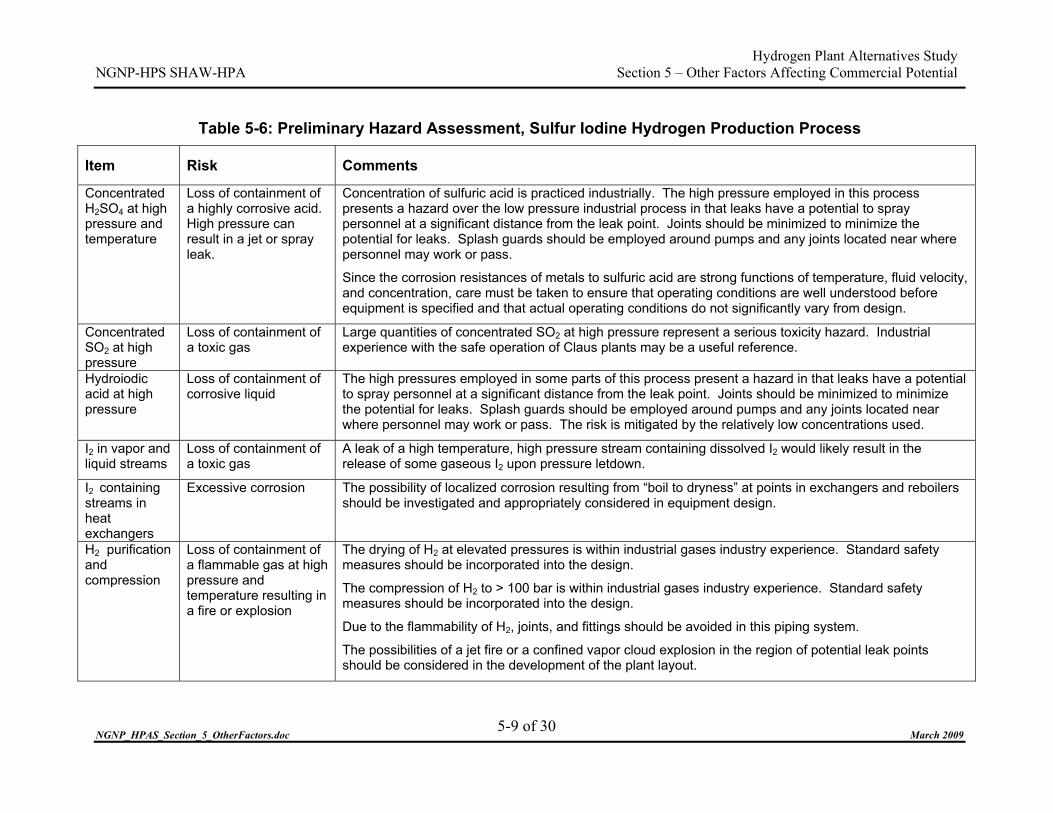
Hydrogen Plant Alternatives Study NGNP-HPS SHAW-HPA Section 5 – Other Factors Affecting Commercial Potential
Table 5-6: Preliminary Hazard Assessment, Sulfur Iodine Hydrogen Production Process
Item Risk Comments
Concentrated H2SO4 at high pressure and temperature
Loss of containment of a highly corrosive acid. High pressure can result in a jet or spray leak.
Concentration of sulfuric acid is practiced industrially. The high pressure employed in this process presents a hazard over the low pressure industrial process in that leaks have a potential to spray personnel at a significant distance from the leak point. Joints should be minimized to minimize the potential for leaks. Splash guards should be employed around pumps and any joints located near where personnel may work or pass.
Since the corrosion resistances of metals to sulfuric acid are strong functions of temperature, fluid velocity, and concentration, care must be taken to ensure that operating conditions are well understood before equipment is specified and that actual operating conditions do not significantly vary from design.
Concentrated SO2 at high pressure
Loss of containment of a toxic gas
Large quantities of concentrated SO2 at high pressure represent a serious toxicity hazard. Industrial experience with the safe operation of Claus plants may be a useful reference.
Hydroiodic acid at high pressure
Loss of containment of corrosive liquid
The high pressures employed in some parts of this process present a hazard in that leaks have a potential to spray personnel at a significant distance from the leak point. Joints should be minimized to minimize the potential for leaks. Splash guards should be employed around pumps and any joints located near where personnel may work or pass. The risk is mitigated by the relatively low concentrations used.
I2 in vapor and liquid streams
Loss of containment of a toxic gas
A leak of a high temperature, high pressure stream containing dissolved I2 would likely result in the release of some gaseous I2 upon pressure letdown.
I2 containing streams in heat exchangers
Excessive corrosion The possibility of localized corrosion resulting from “boil to dryness” at points in exchangers and reboilers should be investigated and appropriately considered in equipment design.
H2 purification and compression
Loss of containment of a flammable gas at high pressure and temperature resulting in a fire or explosion
The drying of H2 at elevated pressures is within industrial gases industry experience. Standard safety measures should be incorporated into the design.
The compression of H2 to > 100 bar is within industrial gases industry experience. Standard safety measures should be incorporated into the design.
Due to the flammability of H2, joints, and fittings should be avoided in this piping system.
The possibilities of a jet fire or a confined vapor cloud explosion in the region of potential leak points should be considered in the development of the plant layout.
NGNP_HPAS_Section_5_OtherFactors.doc March 2009
5-9 of 30

Hydrogen Plant Alternatives Study NGNP-HPS SHAW-HPA Section 5 – Other Factors Affecting Commercial Potential
NGNP_HPAS_Section_5_OtherFactors.doc March 2009
5-10 of 30
Item Risk Comments
O2 purification and compression
The enhanced flammability of materials in O2 resulting in an equipment fire
All piping, fittings, and equipment exposed to > 25% oxygen must be oxygen-clean before start up. Fittings that are O2-cleaned at the factory must be shipped sealed.
The use of soft materials and lubricants should be minimized with oxygen-enriched streams. Fluorinated compounds such as Teflon™ and Viton™ are normally used for seals and per-fluorinated materials as lubricants.
The use of O2 as the regeneration gas for the TSAs will require that the maximum regeneration temperature and pressure be considered in the specification of the materials of construction for the adsorber vessels (and piping that will be exposed to the hot gas).
It is standard industry practice to place O2 compressors inside of barriers for containment and personnel protection in case of a fire. The frequency of fires in such equipment should be considered in plant layout
He exchanger at decomposer
Loss of containment of high pressure He or cross contamination between primary and secondary He streams due to acid corrosion of He heat exchange equipment
Keeping the pressure of the He stream above that of the decomposer should minimize acid leakage into the helium in the event of a leak.
Water treatment
This system should be standard equipment routinely used in industry with standard safety measures.
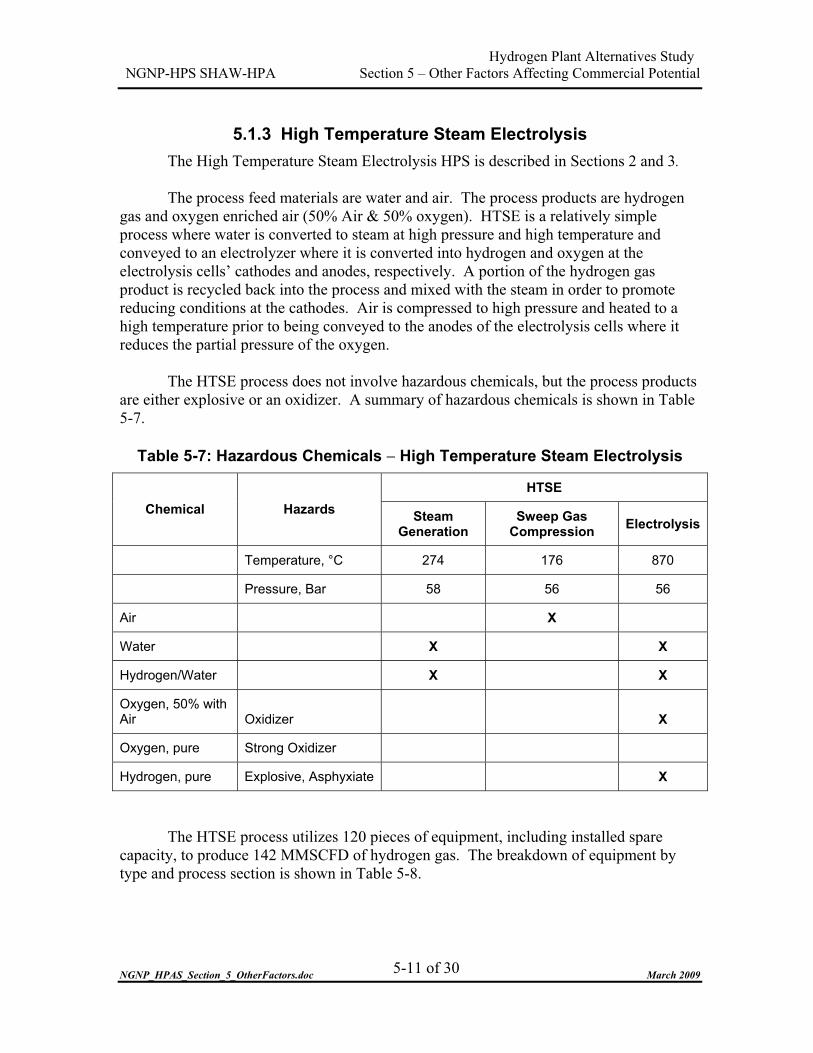
Hydrogen Plant Alternatives Study NGNP-HPS SHAW-HPA Section 5 – Other Factors Affecting Commercial Potential
NGNP_HPAS_Section_5_OtherFactors.doc March 2009
5-11 of 30
5.1.3 High Temperature Steam Electrolysis The High Temperature Steam Electrolysis HPS is described in Sections 2 and 3. The process feed materials are water and air. The process products are hydrogen
gas and oxygen enriched air (50% Air & 50% oxygen). HTSE is a relatively simple process where water is converted to steam at high pressure and high temperature and conveyed to an electrolyzer where it is converted into hydrogen and oxygen at the electrolysis cells’ cathodes and anodes, respectively. A portion of the hydrogen gas product is recycled back into the process and mixed with the steam in order to promote reducing conditions at the cathodes. Air is compressed to high pressure and heated to a high temperature prior to being conveyed to the anodes of the electrolysis cells where it reduces the partial pressure of the oxygen.
The HTSE process does not involve hazardous chemicals, but the process products
are either explosive or an oxidizer. A summary of hazardous chemicals is shown in Table 5-7.
Table 5-7: Hazardous Chemicals � High Temperature Steam Electrolysis
HTSE Chemical Hazards Steam
Generation Sweep Gas
Compression Electrolysis
Temperature, °C 274 176 870
Pressure, Bar 58 56 56
Air X
Water X X
Hydrogen/Water X X
Oxygen, 50% with Air Oxidizer
X
Oxygen, pure Strong Oxidizer
Hydrogen, pure Explosive, Asphyxiate X
The HTSE process utilizes 120 pieces of equipment, including installed spare
capacity, to produce 142 MMSCFD of hydrogen gas. The breakdown of equipment by type and process section is shown in Table 5-8.

Hydrogen Plant Alternatives Study NGNP-HPS SHAW-HPA Section 5 – Other Factors Affecting Commercial Potential
NGNP_HPAS_Section_5_OtherFactors.doc March 2009
5-12 of 30
Table 5-8: HTSE Process Equipment Summary HTSE (1 Production Train)
Equipment
Feed & Utility
Equipment Heat
Recovery Electrolysis Product
Purification Electrolyzer Modules 76 Towers Vessels & Reactors 5 1 3 Low Pressure Tanks 1 Pumps 4 Blowers, Compressors & Turbines 2 1 Steam Ejector Heat Exchangers 6 7 2 2 Filters Compressors & Air Dryers 6 Deionized Water Treatment 1 Water Treatment RO System 1 Oil Water Separator 1 Waste Treatment System (Undefined) 1 Iodine Feed Stock Preparation System Total Equipment 28 9 78 5 Grand Total 120
The principal hazard associated with the HTSE process is loss of confinement of
hydrogen resulting in a fire or explosion. Other hazards include pressure vessel failures and loss of confinement of the oxygen enriched air resulting in an oxygen induced fire. Table 5-9 is a preliminary hazard assessment of the HTSE hydrogen production process.
The HTSE process’ operating risk is assessed to be MEDIUM due to the use of
non-hazardous chemicals in the process, the limited number of process equipment and the likelihood and severity of seal failure in the electrolyzer.

Hydrogen Plant Alternatives Study NGNP-HPS SHAW-HPA Section 5 – Other Factors Affecting Commercial Potential
Table 5-9: Preliminary Hazard Assessment, High Temperature Steam Electrolysis Hydrogen Production Process
Item Hazard Discussion
Electrolytic Cell Leak between H2 and O2 enriched streams resulting in a fire
Need to consider the safety consequences of a crack in the solid electrolyte or at any of the seals within the electrolyzer. Since the H2 is above its auto-ignition temperature, one would expect a leak in either direction to result in an immediate fire. As the fire raised the temperature of the contained gas, equipment rupture could occur if the relief devices were not sized for an internal fire. Fortunately, the leak rate should be low due to the lack of significant pressure difference between the H2 and sweep streams. Since routine inspection of the electrolyzer internals will be difficult, a means of leak detection should be considered (perhaps a high temperature alarm) and a means devised for shutting down appropriate sections. The minimization of non-ceramic materials in the design of the electrolyzer will minimize the fuel present in the case of a fire.
Sweep Gas- 50% O2 at High Temperature and Pressure
The enhanced flammability of materials in O2 enriched air resulting in an equipment fire
All piping, fittings, and equipment exposed to > 25% oxygen must be oxygen-cleaned before start up. Fittings that are oxygen-cleaned at the factory must be shipped sealed. At 56 bar and < 300°C, carbon steel might be used but velocity limits would need to be imposed to minimize the impact energy of any particles carried by the gas stream. The pipe should have a minimum thickness of 4.8 mm to minimize flammability. Special attention must be given to the material of construction of thin metal items such as filters and strainers and items in high velocity regions such as valve stems. 50% O2 at 870°C and 56 bar is far outside of the range of industrial experience. Certainly a Ni alloy would be required. At 50% oxygen, stainless steel may be acceptable with velocity limits. Testing would be recommended before final specification. The Marshall Space Flight Center has appropriate equipment for such testing. The electrical connections and wiring within the electrolyzer must be designed for exposure to the O2 enriched sweep gas within the electrolyzer vessel. The use of soft materials and lubricants should be minimized with oxygen-enriched streams. Fluorinated compounds such as Teflon™ and Viton™ are normally used for seals and per-fluorinated materials as lubricants. Temperature limits must of course be considered when using these materials.
NGNP_HPAS_Section_5_OtherFactors.doc March 2009
5-13 of 30
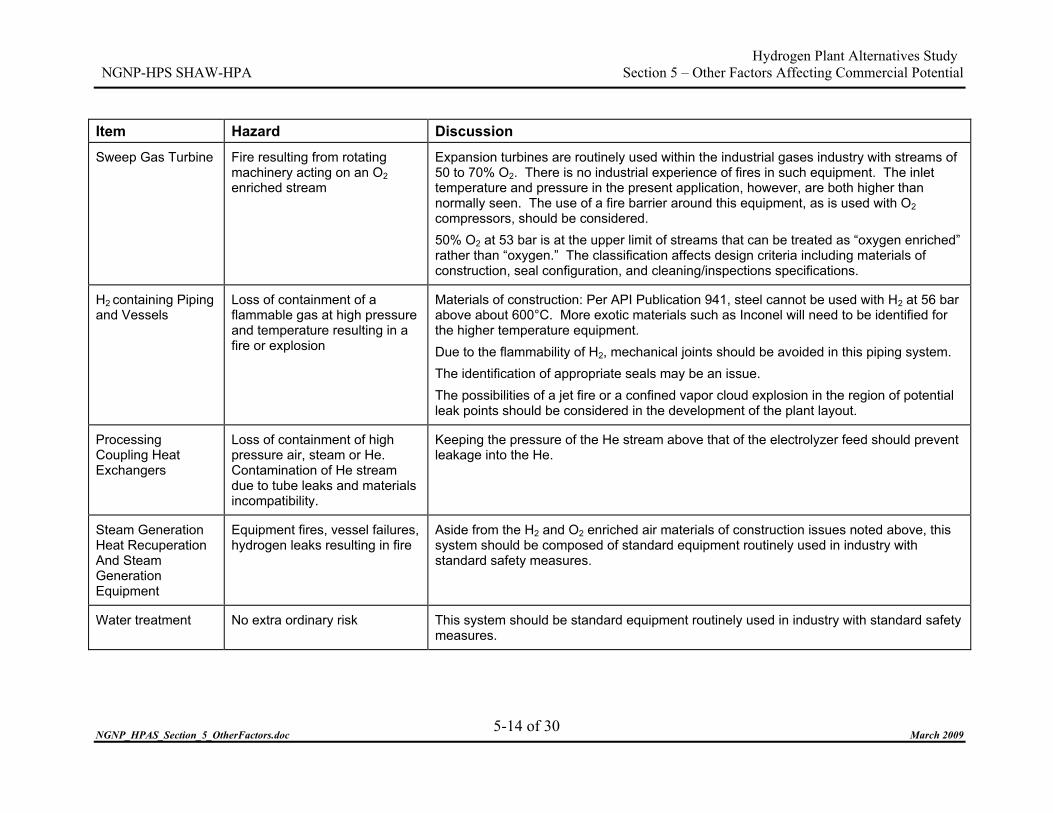
Hydrogen Plant Alternatives Study NGNP-HPS SHAW-HPA Section 5 – Other Factors Affecting Commercial Potential
NGNP_HPAS_Section_5_OtherFactors.doc March 2009
5-14 of 30
Item Hazard Discussion
Sweep Gas Turbine Fire resulting from rotating machinery acting on an O2 enriched stream
Expansion turbines are routinely used within the industrial gases industry with streams of 50 to 70% O2. There is no industrial experience of fires in such equipment. The inlet temperature and pressure in the present application, however, are both higher than normally seen. The use of a fire barrier around this equipment, as is used with O2 compressors, should be considered. 50% O2 at 53 bar is at the upper limit of streams that can be treated as “oxygen enriched” rather than “oxygen.” The classification affects design criteria including materials of construction, seal configuration, and cleaning/inspections specifications.
H2 containing Piping and Vessels
Loss of containment of a flammable gas at high pressure and temperature resulting in a fire or explosion
Materials of construction: Per API Publication 941, steel cannot be used with H2 at 56 bar above about 600°C. More exotic materials such as Inconel will need to be identified for the higher temperature equipment. Due to the flammability of H2, mechanical joints should be avoided in this piping system. The identification of appropriate seals may be an issue. The possibilities of a jet fire or a confined vapor cloud explosion in the region of potential leak points should be considered in the development of the plant layout.
Processing Coupling Heat Exchangers
Loss of containment of high pressure air, steam or He. Contamination of He stream due to tube leaks and materials incompatibility.
Keeping the pressure of the He stream above that of the electrolyzer feed should prevent leakage into the He.
Steam Generation Heat Recuperation And Steam Generation Equipment
Equipment fires, vessel failures, hydrogen leaks resulting in fire
Aside from the H2 and O2 enriched air materials of construction issues noted above, this system should be composed of standard equipment routinely used in industry with standard safety measures.
Water treatment No extra ordinary risk This system should be standard equipment routinely used in industry with standard safety measures.

Hydrogen Plant Alternatives Study NGNP-HPS SHAW-HPA Section 5 – Other Factors Affecting Commercial Potential
NGNP_HPAS_Section_5_OtherFactors.doc March 2009
5-15 of 30
Item Hazard Discussion
Air Compressor No extra ordinary risk This system should be standard equipment routinely used in industry with standard safety measures.
CDA system No extra ordinary risk This system should be standard equipment routinely used in industry with standard safety measures.
H2 compressor Hydrogen leaks resulting in fire This design is within industrial gases industry experience. Standard safety measures should be incorporated into the design.
H2 Driers Hydrogen leaks resulting in fire This system should be standard equipment routinely used in industry with standard safety measures.

Hydrogen Plant Alternatives Study NGNP-HPS SHAW-HPA Section 5 – Other Factors Affecting Commercial Potential
NGNP_HPAS_Section_5_OtherFactors.doc March 2009
5-16 of 30
5.2 OPERABILITY ASSESSMENT An operability review of each of the three hydrogen production processes was undertaken
to assess the operating complexity of the processes. This review identified operability elements that will require future investigation and development.
The review identified the following: � Integrated control systems have not been developed for any of these processes.
Sophisticated integrated process controls will be required for each of the processes. The SI process may require additional controls in order to properly integrate the three interdependent chemical processes.
� Control of heat recuperation and steam generation for the HTSE process can be based on proven control concepts from the power generation industry involving feedwater heating, steam generation, and steam superheating.
� Startup and shut down of each process has not been included in the conceptual PFDs. Startup and shut down will require modification of the PFDs to address reduced flow rates during heat-up, means to add and remove the chemical inventory during startup and shut down, and means to bypass equipment during startup and shut down. Start up and shut down is more complex when an inadvertent change of state could occur, such as solidification of iodine in the SI process.
� There is currently limited buffer storage between process operations. Lack of buffer storage will tend to propagate a small perturbation through the system causing complete shut down of the hydrogen production system.
� Features required to prevent iodine from solidifying in process lines during shutdown and in instrument sensing lines during shutdown and operation may result in the need to heat trace all iodine containing components.
� Process responses to control system and component failures have not been analyzed. � Operational integration with the NHSS, including response to loss of load due to
hydrogen production system upsets and hydrogen production system response to emergency reactor shutdown, has not been analyzed.
� Safety instrumented systems have not been integrated into the PFDs. � Pressure relief devices to prevent vessel failure as a result of pressure transients, as
required by Code, will require capture and treatment of the chemical releases for the HyS and SI hydrogen production processes.
Based on the above findings, the operating complexities of the hydrogen production
processes are assessed to be MEDIUM-LOW for HTSE, MEDIUM-HIGH for HyS and HIGH for SI.

Hydrogen Plant Alternatives Study NGNP-HPS SHAW-HPA Section 5 – Other Factors Affecting Commercial Potential
NGNP_HPAS_Section_5_OtherFactors.doc March 2009
5-17 of 30
5.3 SENSITIVITY TO REACTOR OUTLET HELIUM TEMPERATURE
As well as changing the performance of the HPS, a reduction in the temperature of helium from the NHSS to the HPS will mean alteration to the NHSS design. Intuitively, the lowering of the Reactor Outlet Temperature would have an effect of increasing the contribution of the HPS to the hydrogen selling price and reducing the contribution of the NHSS to the price.
5.3.1 Effect on Nuclear Reactor Heat Source There would be numerous cost factors changed in the NHSS due to lowering ROT. The
most significant change would be reductions in capital cost due to changes in materials of construction. Generally, countering those reductions would be increases in operating cost due to altered design conditions.
5.3.1.1 NHSS Capital Cost Based on analyses completed to date, the HTGR fuel and core appear to be capable of
steady operation at up to a maximum helium temperature of about 950°C to 1000°C for the 500 to 600 MWth configurations. However, the combination of maximum power level and outlet temperature also depends on overall cost optimization and the consideration of accident analyses addressing licensing basis events. In the case of accident analyses, the dependence is on transient conditions, rather than steady-state operation. From the broader plant perspective, limits on normal operating conditions will depend not on the reactor, but on the capabilities of components that are located downstream of the reactor.
Where the outlet helium flow is enveloped in graphite, carbon fiber reinforced composite
(CFRC) or ceramic materials, temperature limits would be well above 1000°C. However, the helium flow must be directed to and flow through a heat exchanger in one or more chained heat transfer loops to deliver its heat to the hydrogen production system. CFRC materials for ducting and, in particular, ceramic heat exchanger components are in development. But for plant designs that could be built today, metallic materials would be necessary at least for the heat transfer core materials of the IHX.
The database for high temperature materials capability has evolved from the development
of alloys for such applications as aircraft engines. The materials of the high temperature nuclear reactor are preferably among those accepted by and under conditions recognized in the ASME Boiler and Pressure Vessel Code, or in the Code qualification process. The intersection of high-temperature materials and the ASME Code presently includes only a few materials. Alloy 800H, a nickel/chromium/iron alloy, is the material of choice for the IHX core up to approximately 750°C service temperature. The present Code limit is 760°C. Alloy 800H is also the present reference material for duct liners, which are passive non-load bearing components, up to about 900°C. At 950°C, the material for the duct liner is Hastelloy X, and at this higher temperature consideration of CFRC for the duct liner is an alternative.

Hydrogen Plant Alternatives Study NGNP-HPS SHAW-HPA Section 5 – Other Factors Affecting Commercial Potential
NGNP_HPAS_Section_5_OtherFactors.doc March 2009
5-18 of 30
Above approximately 750°C, the reference material for the IHX core changes to Hastelloy X because of the ASME Code limit. This represents an increase in the component cost, but not a significant increase in the overall plant cost since the IHX core material costs comprise a relatively small part of the total cost. Hastelloy X, a nickel/ molybdenum alloy, is about twice as expensive as Alloy 800H.
Similarly, above approximately 850°C, the reference metallic material for the hot end of
the IHX core changes to Inconel 617, a nickel/chrome/cobalt alloy. An alloy change to Inconel 617 would be reflected in plant cost by a further step change due to Inconel 617 being about four times more costly than Alloy 800H. As the temperature is increased further above 850°C, Inconel 617 would be subject to life-shortening factors. These factors will depend on the service temperature and details of the IHX design and operation that are yet to be defined, up to an upper limit corresponding to a ROT of 950°C. Shortened life span would be addressed by replacement or partial replacement of the IHX over the plant lifetime, with frequency and cost impact increasing with higher temperature.
A recent NGNP conceptual design study[Ref. 25] included the evaluation of materials
selections for the reactor outlet to IHX duct liner, and enclosing pipe for the IHX and its vessel. In addition, the study evaluated the possibility of using two IHXs in series in each NHSS (i.e., IHX A for the hot end and IHX B for lower temperature flows). For ROTs greater than 850°C, this would have the effect of reducing the replacement cost of life-limited IHX components. At ROT temperatures of 800°C and below there would only be one IHX (i.e., IHX B). The relevant study results are reproduced in Table 5-10.
As shown in Table 5-10, there is a factor applied to the nuclear fuel as a function of
reactor temperature. A reference factor, 100% in the table, is applied to the fuel that would see a similar environment as fuel in actual test and demonstration reactor cores using particle fuel. Then for ROTs above 800°C, a multiplicative factor on overall fuel cost is used to account for differing manufacture and/or shortened lifetime. This factor can be up to 100% at 950°C. This was done in a previous study that evaluated cost variation as a function of ROT [Ref. 26].
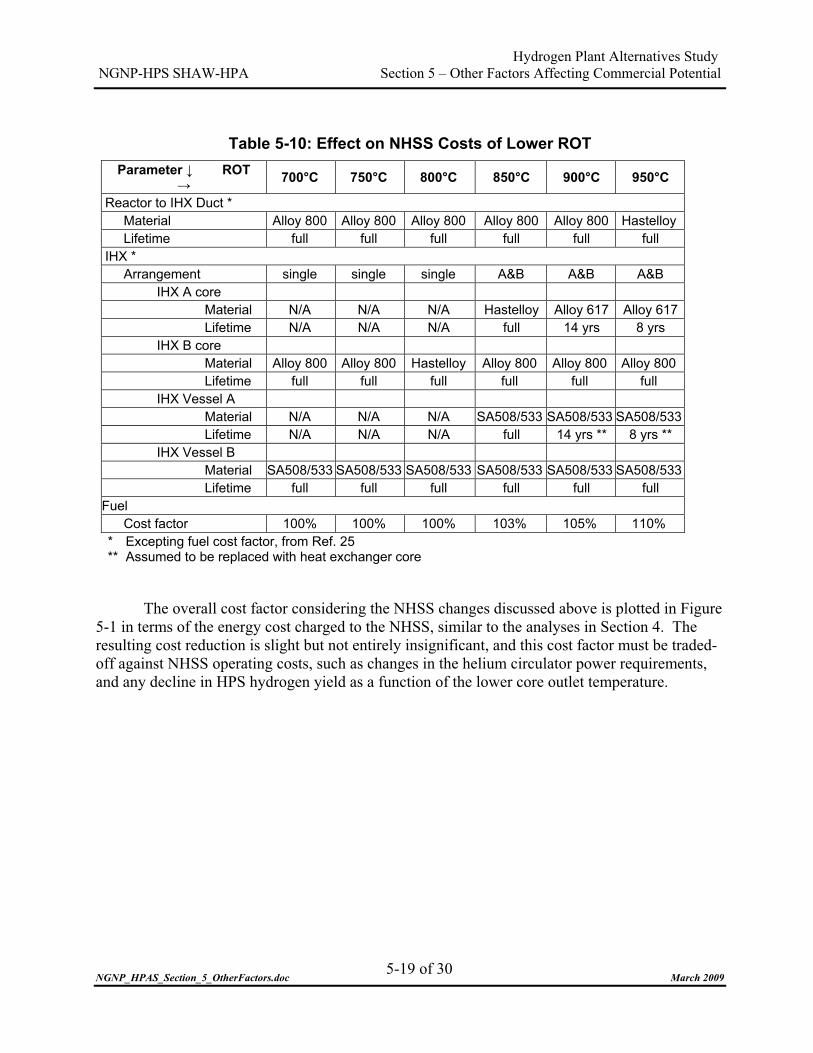
Hydrogen Plant Alternatives Study NGNP-HPS SHAW-HPA Section 5 – Other Factors Affecting Commercial Potential
NGNP_HPAS_Section_5_OtherFactors.doc March 2009
5-19 of 30
Table 5-10: Effect on NHSS Costs of Lower ROT
Parameter � ROT � 700°C 750°C 800°C 850°C 900°C 950°C
Reactor to IHX Duct * Material Alloy 800 Alloy 800 Alloy 800 Alloy 800 Alloy 800 Hastelloy Lifetime full full full full full full
IHX * Arrangement single single single A&B A&B A&B IHX A core Material N/A N/A N/A Hastelloy Alloy 617 Alloy 617 Lifetime N/A N/A N/A full 14 yrs 8 yrs IHX B core Material Alloy 800 Alloy 800 Hastelloy Alloy 800 Alloy 800 Alloy 800 Lifetime full full full full full full IHX Vessel A Material N/A N/A N/A SA508/533 SA508/533 SA508/533 Lifetime N/A N/A N/A full 14 yrs ** 8 yrs ** IHX Vessel B Material SA508/533 SA508/533 SA508/533 SA508/533 SA508/533 SA508/533 Lifetime full full full full full full
Fuel Cost factor 100% 100% 100% 103% 105% 110% * Excepting fuel cost factor, from Ref. 25 ** Assumed to be replaced with heat exchanger core
The overall cost factor considering the NHSS changes discussed above is plotted in Figure
5-1 in terms of the energy cost charged to the NHSS, similar to the analyses in Section 4. The resulting cost reduction is slight but not entirely insignificant, and this cost factor must be traded-off against NHSS operating costs, such as changes in the helium circulator power requirements, and any decline in HPS hydrogen yield as a function of the lower core outlet temperature.

Hydrogen Plant Alternatives Study NGNP-HPS SHAW-HPA Section 5 – Other Factors Affecting Commercial Potential
NGNP_HPAS_Section_5_OtherFactors.doc March 2009
5-20 of 30
28.0
28.5
29.0
29.5
30.0
30.5
650 700 750 800 850 900 950 1000
Reactor Outlet Temperature, °C
Proc
ess
Hea
t Cos
t, $/
MW
t-h
Figure 5-1: Cost of Heat from the NHSS
For the cases presented in the next section with lower ROT, additional nuclear reactor modules need to be added to maintain the same HPS output for SI and HyS. Some capital and operating costs are logically saved by constructing multiple nuclear reactor units together at the same site. These cost savings come from learning and sharing. Learning includes such factors as reduced construction labor, system modularization, product improvements, lower regulatory burden, and volume procurement of factory components. All of these savings are considered to have been “learned” for the Nth-of-a-Kind plants that are the subject of this report. However, there would still be savings from sharing in modular configuration. Sharing cost savings come from efficiencies in construction that are reflected in capital savings, such as common facilities for reactor services that result in capital and operating cost savings and staff and management efficiencies that reduce operating cost. Studies have considered the combined effects of learning and sharing[Ref. 27], but the authors find no straightforward basis for separating the two factors. For this study, an assumed sharing benefit in terms of the energy cost charged to the NHSS, similar to the analyses in Section 4, is plotted in Figure 5-2. A maximum savings of about 8the asymptote at 6 units or mo
% is re.

Hydrogen Plant Alternatives Study NGNP-HPS SHAW-HPA Section 5 – Other Factors Affecting Commercial Potential
NGNP_HPAS_Section_5_OtherFactors.doc March 2009
5-21 of 30
27.0
27.5
28.0
28.5
29.0
29.5
30.0
30.5
0 1 2 3 4 5 6 7 8 9
Number of 550MWt NHSS Reactor Modules
Proc
ess
Hea
t Cos
t, $/
MW
t-h
Figure 5-2: Cost Savings from Sharing between Multiple Reactor Modules
5.3.1.2 NHSS Operating Cost A study has been performed on the effect of lowering ROT of the NGNP from 950°C to
700°C [Ref. 28]. The minimum reactor inlet temperature (RIT) is set at 280°C to order to have margin with respect to the ductility limits of the low-alloy steel (i.e., SA508/SA533) of the reactor pressure vessel. Inlet and outlet temperatures can be reduced together down to a RIT of 280°C. At ROTs below the point where the RIT is 280°C, the lower reactor outlet temperature for the same reactor inlet temperature and heat generation necessitates higher primary and secondary helium flow rates. These rates are proportional to the ratio of temperature differences across the core. Table 5-11 shows the resulting temperatures and flows. These higher flow rates have the effect of increasing the power required by the helium circulators, and that lowers overall plant efficiency.
Figure 5-3 plots the helium flow rate, which is assumed to be essentially equal for the
reactor primary coolant and the secondary helium loop, and the calculated combined primary and secondary circulator power consumption as a function of ROT. Note that lowering the RIT has the effect of lowering circulator consumption because the pumping power is inversely proportional to density.

Hydrogen Plant Alternatives Study NGNP-HPS SHAW-HPA Section 5 – Other Factors Affecting Commercial Potential
NGNP_HPAS_Section_5_OtherFactors.doc March 2009
5-22 of 30
Table 5-11: Effect on Reactor Core Operating Parameters of Lower ROT
ROT 700°C 750°C 800°C 850°C 900°C 950°C
RIT 280°C 280°C 280°C 280°C 300°C 350°C
Flow, kg/s 252 225 204 186 177 177
Adjusted for 550MWth from Ref. 27
10.0
20.0
30.0
40.0
50.0
60.0
70.0
650 700 750 800 850 900 950 1000
Reactor Outlet Temperature, °C
Cir
cula
tor
Pow
er, M
We
0
50
100
150
200
250
300
Helium
Flow R
ate, kg/sec
Figure 5-3: Effect of ROT on NHSS Flows and Circulator Power
5.3.2 Effect on Hydrogen Production System For temperature sensitivity calculations the same H2A calculation tool was used as in
Section 4. In all cases, the output of the HPS is held constant at the values in the Section 4 analyses. HPS equipment is resized and process trains added as needed to maintain the hydrogen output. If the resizing results in reaching a limit on the heat supply from the NHSS, then the calculation is based on an increment of nuclear reactor modules.
Hydrogen Plant Alternatives Study NGNP-HPS SHAW-HPA Section 5 – Other Factors Affecting Commercial Potential
NGNP_HPAS_Section_5_OtherFactors.doc March 2009
5-23 of 30
5.3.2.1 Sulfur Iodine The principal impact of NHSS helium supply temperature on the SI process is in the
sulfuric acid decomposition section. Lower peak temperature for the process cycle gives lower conversion per pass through the decomposition section. This results in an increase in the flow through the sulfuric acid decomposition reactor and the recycle feed concentration loop. This is accounted for in the calculation model by an increased capital cost for the HPS to accommodate the greater flow and higher electric power input to provide the circulation.
The helium source heat leaving the Acid Decomposer goes to the HI section in the
reference SI plant configuration and not to a bottoming PCS as in HyS. The reference process is described in Section 3, and consists of three HPS trains delivering 157 MMSCFD of hydrogen and receiving heat from three NHSS units.
As ROT declines, the same NHSS heat is applied to both the H2SO4 and HI sections. All
of the reactor heat is used for the HPS and helium is returned directly to the NHSS. Therefore, down to a certain level of ROT there is no PCS. In the Sulfuric Acid Decomposition section, heat can be recuperated in the bayonet tubes of the decomposition reactor down to a helium temperature exiting the decomposer of 522°C. This value is set by the pinch point in the heat transfer, as shown in Figures 1-5 and 1-6. Below 522°C, the outlet from the decomposer the H2SO4 section can take no more heat because of the pinch, and so a fourth NHSS is added. This is calculated to be a ROT of approximately 785°C. Below that ROT, a Rankine PCS is included in the design to utilize the excess heat.
Figure 5-4 shows the hydrogen price result. The upper curve is the hydrogen selling price
calculated for a constant cost of heat from the NHSS, and the lower curve is the total hydrogen price taking into account lower cost of the NHSS heat. The increasing process system cost contribution is driven by the capital cost for the revised operating conditions and increased electric power consumption. For the total cost, small downward step changes are seen at 800°C and 750°C where configuration and/or materials changes yield lower cost for the IHX. A large step change upward, at around 785°C, is the impact of demand for nuclear heat from four reactor units instead of three.

Hydrogen Plant Alternatives Study NGNP-HPS SHAW-HPA Section 5 – Other Factors Affecting Commercial Potential
NGNP_HPAS_Section_5_OtherFactors.doc March 2009
5-24 of 30
9.5010.0010.5011.0011.5012.0012.5013.0013.5014.0014.5015.00
650 700 750 800 850 900 950 1000
Reactor Outlet Temperature, °C
Hyd
roge
n Se
lling
Pric
e, $
/kg
Figure 5-4: Influence of Reactor Outlet Temperature for SI
5.3.2.2 Hybrid Sulfur The Hybrid Sulfur process plant takes heat from the NHSS in one high-temperature
exchange in the sulfuric acid decomposition section. The sulfuric acid decomposition section in the HyS plant is essentially the same as in the SI plant. Lower peak temperature for the process cycle would give lower conversion per pass through the decomposition section, as in the case for the SI plant.
Sensitivity is based on the reference size plant described in Section 3.1, which consists of
two HPS trains delivering 142 MMSCFD of hydrogen, receiving heat from two NHSS units and a Rankine PCS utilizing the heat not used by the process directly.
As the helium temperature from the NHSS declines, the same hydrogen production is
maintained while the circulation through the feed and recycle circuits of the HPS increases. This is accounted for in the calculation model with increased capital cost for the HPS to accommodate the greater flow and higher electric power input to provide the circulation. In the Sulfuric Acid Decomposition section, heat is recuperated in the bayonet tubes of the decomposition reactor down to a helium exit temperature of 522°C. This value is set by the pinch point in the heat transfer, as shown in Figures 1-5 and 1-6. The temperature of helium exiting the sulfuric acid decomposer is constant to maintain the difference at the process interface pinch point. Therefore, the process heat duty per train declines with lower NHSS output temperature. Overall thermal power required from the NHSS remains essentially constant, but since only heat down to 522°C is usable, reactor modules must be added to supply that useful heat. As more total NHSS heat is
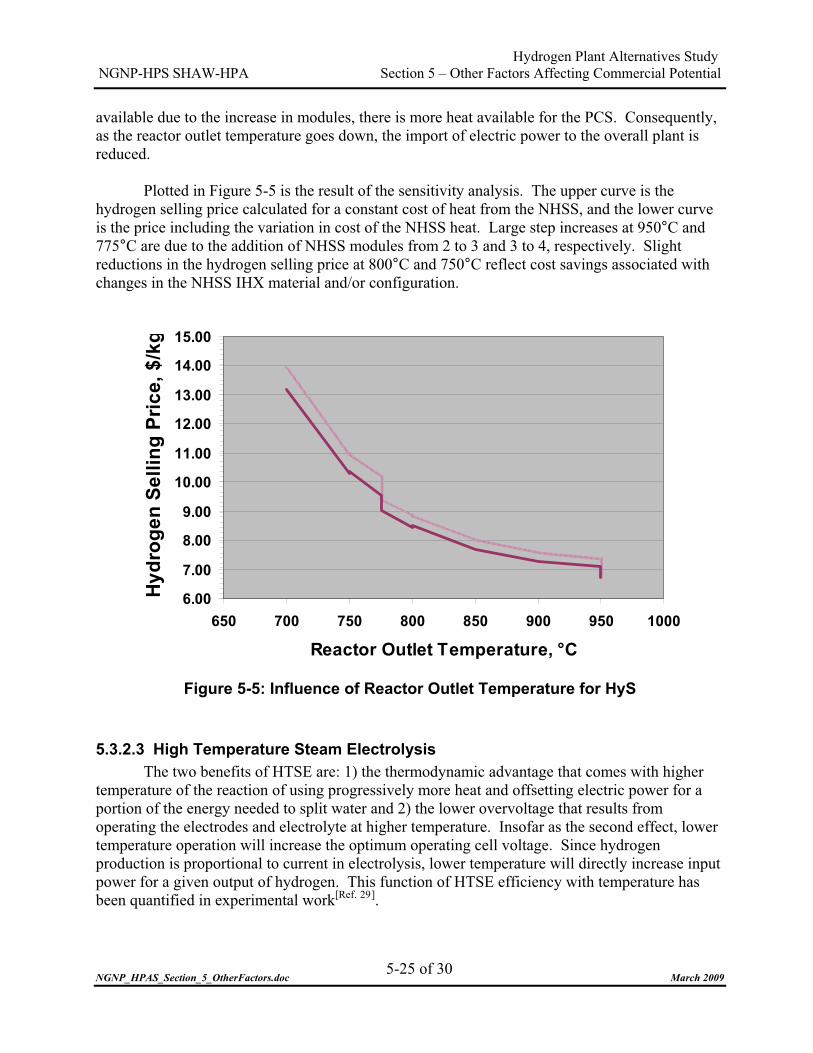
Hydrogen Plant Alternatives Study NGNP-HPS SHAW-HPA Section 5 – Other Factors Affecting Commercial Potential
NGNP_HPAS_Section_5_OtherFactors.doc March 2009
5-25 of 30
available due to the increase in modules, there is more heat available for the PCS. Consequently, as the reactor outlet temperature goes down, the import of electric power to the overall plant is reduced.
Plotted in Figure 5-5 is the result of the sensitivity analysis. The upper curve is the
hydrogen selling price calculated for a constant cost of heat from the NHSS, and the lower curve is the price including the variation in cost of the NHSS heat. Large step increases at 950°C and 775°C are due to the addition of NHSS modules from 2 to 3 and 3 to 4, respectively. Slight reductions in the hydrogen selling price at 800°C and 750°C reflect cost savings associated with changes in the NHSS IHX material and/or configuration.
6.00
7.00
8.00
9.00
10.00
11.00
12.00
13.00
14.00
15.00
650 700 750 800 850 900 950 1000
Reactor Outlet Temperature, °C
Hyd
roge
n Se
lling
Pric
e, $
/kg
Figure 5-5: Influence of Reactor Outlet Temperature for HyS
5.3.2.3 High Temperature Steam Electrolysis The two benefits of HTSE are: 1) the thermodynamic advantage that comes with higher
temperature of the reaction of using progressively more heat and offsetting electric power for a portion of the energy needed to split water and 2) the lower overvoltage that results from operating the electrodes and electrolyte at higher temperature. Insofar as the second effect, lower temperature operation will increase the optimum operating cell voltage. Since hydrogen production is proportional to current in electrolysis, lower temperature will directly increase input power for a given output of hydrogen. This function of HTSE efficiency with temperature has been quantified in experimental work[Ref. 29].

Hydrogen Plant Alternatives Study NGNP-HPS SHAW-HPA Section 5 – Other Factors Affecting Commercial Potential
NGNP_HPAS_Section_5_OtherFactors.doc March 2009
5-26 of 30
However, between the reference operating point of the design from this study and the “thermoneutral” operating point, where the heat required by thermodynamics comes from excess ohmic heating in the cell, there is an operating range for which the reaction temperature does not have to be reduced. In this range, the process efficiency suffers only from the additional electric power for the excess ohmic heating.
The reference process is described in Section 3, and consists of one HPS train delivering
142 MMSCFD of hydrogen gas, receiving heat from one NHSS unit. Electric power for the electrolyzers is generated in a bottoming cycle as well as being imported.
In the calculation of HTSE, as in the SI and HyS sensitivity calculations, the hydrogen
production rate is held constant. The electrolysis cell current density is held constant, so that the number of electrolysis cells and the HPS size are not changed. As the temperature in the electrolyzer cells declines, the internal electrical resistance, principally of the electrodes, increases and voltage required to produce the hydrogen increases. Therefore, the major cost implication in the production of hydrogen is in the use of electricity. The cost impacts are only associated with the quantity of power imported and the size of PCS. The next most influential costs are the high-temperature heat exchanger costs, which decrease with lower NHSS reactor temperature.
Figure 5-6 shows the result of the calculation of hydrogen selling price. As with the
corresponding plots for SI and HyS, the upper curve is the effect of process plant costs only and the lower curve accounts for the NHSS cost variation with reactor outlet temperature. Step reductions in the total curve at 800°C and 750°C are due to the changes in the NHSS IHX material and/or configuration.

Hydrogen Plant Alternatives Study NGNP-HPS SHAW-HPA Section 5 – Other Factors Affecting Commercial Potential
NGNP_HPAS_Section_5_OtherFactors.doc March 2009
5-27 of 30
6.00
6.05
6.10
6.15
6.20
6.25
6.30
6.35
6.40
6.45
6.50
650 700 750 800 850 900 950 1000
Reactor Outlet Temperature, °C
Hyd
roge
n Se
lling
Pric
e, $
/kg
Figure 5-6: Influence of Reactor Outlet Temperature for HTSE
5.3.3 Combined Results The process efficiencies as a function of ROT, as calculated in this evaluation for each of
the three HPSs, is plotted in Figure 5-7. This efficiency is calculated as the heating value of the hydrogen produced divided by the sum of the nuclear, electric source and steam power inputs to the process section. Electric source power is the heat that would be required to generate the electricity consumed by the HPS at 33% conversion efficiency. Low pressure saturated steam input is in the reference designs for the sulfuric acid decomposition stage vacuum pumping in the SI and HyS designs.
Figure 5-8 shows the overall plant efficiencies for the same numerator divided by the sum
of the reactor core heat, the source heat for HPS, NHSS, and BOP electric consumption and the steam heat input.

Hydrogen Plant Alternatives Study NGNP-HPS SHAW-HPA Section 5 – Other Factors Affecting Commercial Potential
NGNP_HPAS_Section_5_OtherFactors.doc March 2009
5-28 of 30
10%
15%
20%
25%
30%
35%
40%
650 700 750 800 850 900 950 1000
Reactor Outlet Temperature, °C
Proc
ess
Effic
ienc
y (H
HV)
S-I
HyS
HTSE
Figure 5-7: Influence of Reactor Outlet Temperature on Process Efficiency
10%
15%
20%
25%
30%
35%
40%
650 700 750 800 850 900 950 1000
Reactor Outlet Temperature, °C
Plan
t Effi
cien
cy (H
HV)
S-I
HyS
HTSE
Figure 5-8: Influence of Reactor Outlet Temperature on Plant Overall Efficiency

Hydrogen Plant Alternatives Study NGNP-HPS SHAW-HPA Section 5 – Other Factors Affecting Commercial Potential
NGNP_HPAS_Section_5_OtherFactors.doc March 2009
5-29 of 30
The ultimate hydrogen cost is essentially calculated from the initial plant capital cost with consideration of the efficiencies shown in the preceding figures. Figure 5-9 reproduces the upper curves from the hydrogen cost curves from the analyses of the three HPS technologies (i.e., Figure 5-4, Figure 5-5 and Figure 5-6).
5.00
6.00
7.00
8.00
9.00
10.00
11.00
12.00
13.00
14.00
650 700 750 800 850 900 950 1000
Reactor Outlet Temperature, °C
Hyd
roge
n Se
lling
Pric
e, $
/kg
S-I
HyS
HTSE
Figure 5-9: Hydrogen Selling Price as a Function of Reactor Outlet Temperature
It can be seen that HTSE has not only the lowest calculated hydrogen selling price, but
also has the least sensitivity to NHSS reactor outlet temperature. The magnitude of sensitivity can be explained by the HTSE process cycle using the least amount of high-temperature heat among the three processes. At 950°C ROT, the reference HTSE HPS uses a small fraction of the heat from one reactor unit. As ROT declines, the fraction from the HTGR is less, and to provide the required heat for the electrolysis process, greater amounts of ohmic heating are utilized. Thus, as the temperature of heat from the NHSS goes down, the amount of heat per unit output of the HTSE process is even less. However, since the fraction of high-temperature heat in the reference 950°C case is so small, the influence on hydrogen selling price is slight. At or below a NHSS outlet temperature of about 850°C, the energy budget is such that no process heat is required.
Hybrid Sulfur has the most sensitivity to NHSS reactor outlet temperature at the 750°C
end of the calculated range. This phenomenon is due to the limit on usable heat set by the pinch point in the Sulfuric Acid Decomposer. All heat below 522°C can only be used for electric generation. The same sensitivity is not shown by the Sulfur Iodine cycle because the NHSS heat

Hydrogen Plant Alternatives Study NGNP-HPS SHAW-HPA Section 5 – Other Factors Affecting Commercial Potential
NGNP_HPAS_Section_5_OtherFactors.doc March 2009
5-30 of 30
goes to both the Sulfuric Acid Decomposition section and to the HI section. Therefore, less heat is committed to the Acid Decomposer and consequently limited by the pinch.
A notable result is that, based on the mathematical model and assumptions of this
evaluation, the hydrogen price with all factors considered is relatively flat as a function of reactor outlet temperature down to about 800-850°C for SI and HTSE. It should also be noted both HyS and SI show a marked increase in hydrogen selling price as the ROT decreases past 800°C, while HTSE shows only a modest increase. This trend would suggest that HTSE is a better match for an HTGR at lower temperatures than the other two technologies. However, this trend is misleading. Rather, the relatively modest increase in selling price is due to the fact that HTSE is increasingly importing inexpensive electricity for process use and is relying less and less on nuclear heat from the HTGR for process heat. In other words, HTSE technology is more appealing at lower temperatures because its process heat demands are being provided through other more economical energy sources.

Hydrogen Plant Alternatives Study NGNP-HPS SHAW-HPA Section 6 – Technology Development
NGNP_HPAS_Section_6_Technology Development.doc March 2009
6-1 of 54
6 TECHNOLOGY DEVELOPMENT Hydrogen production development is organized into four separate process technology
areas. These are the following, and for each the Technology Development status, needs, and plans are covered in Sections 6.1 through 6.4:
� Sulfuric Acid Decomposition, which is common to both Sulfur Iodine and Hybrid
Sulfur hydrogen production systems; � Sulfur Dioxide Electrolysis, the principal step in the Hybrid Sulfur thermo- electro-
chemical water splitting; � Bunsen Reaction and HI Decomposition, which are two steps in the Sulfur Iodine
thermo-chemical water splitting, and; � High Temperature Steam Electrolysis. For each process or component area, the technology development needs and plans are
addressed in two parts. First, the design of the technology area, as progressed to this point, is presented from the perspective of the functions and requirement of the process steps and in context of present design status and Design Data Needs (DDNs). Design status includes discussion of candidate designs, decisions already made, design options yet to be resolved and how they will be decided, and a numerical ranking of Design Readiness Level (DRL) at this point in the conceptual design.
The second part of Technology Development is the path forward. This consists of the
assessment of present TRL, the Technology Development Road Map (TDRM), which is a graphic format outline showing present status and plans to advance the TRL rank and the Technology Maturation Plans. For each of the four process technology areas, the TRLs, TDRMs, and summary Maturation Plans are organized by subsystems in each of the technology areas. Within each subsystem only the Critical Systems, Structures, and Components (SSCs) are evaluated for TRL.
Critical Systems, Structures, and Components are those identified aspects or portions of
the systems that must be developed prior to commercialization, are not commercially available or do not have proven industry experience.
Design Readiness Levels DRLs are assigned to provide a semi-quantitative measure of the readiness of the design
of critical SSCs for full-scale deployment. The term “semi-quantitative” is used because the DRL ratings are partially subjective. The fact that the levels are numbered is only a method to categorize the levels. DRLs provide the ability to compare the design readiness of any SSC relative to another SSC to assist in programmatic decisions.

Hydrogen Plant Alternatives Study NGNP-HPS SHAW-HPA Section 6 – Technology Development
NGNP_HPAS_Section_6_Technology Development.doc March 2009
6-2 of 54
Table 6-1 is a presentation of the guidance used to assign DRLs, and it is taken from the Westinghouse Report “NGNP and Hydrogen Production, Report on Design Readiness Levels and Design Technology Readiness Levels”[Ref. 30].
Table 6-1: Design Readiness Level Generic Definitions Rating Level Definition
1 Design need or concept identified in white papers or feasibility study reports. Goal and scope defined. Typically part of Pre-Conceptual Design. In most instances, design need identification is indicative that a design concept is not presently known.
2 Initiate Conceptual Design. Establish functional & operational requirements and define design criteria. Identify alternative configurations and materials. Prepare scoping cost and schedule estimates. Establish top level requirements. Allocate requirements to SSCs.
3 Complete Conceptual Design. Complete trade studies, selection of alternatives, and select initial configuration and materials. Initial Overall Plant Design Specification (System Requirements Manual) and initial portions of Facility Design Descriptions (FDDs), and System Design Descriptions (SDDs) issued for facilities, major systems, structures, and components. (FDDs, SDDs, scoping calculations, drawings, and outline specifications. Block Flow Diagrams, Mass Balances, Process Flow Diagrams (PFDs) and Piping & Instrumentation Diagrams (P&IDs), one lines, Instrument & Control (I&C) diagrams, plant layout, Floor plans, General Arrangements, Systems Configurations, etc. are initiated) Perform Value Engineering and evaluate changes that can reduce cost. Preliminary Cost & Schedule Baseline Range. This rating is associated with a 15% completion of the overall design.
4 Initiate Preliminary Design. Perform preliminary safety and other analyses, complete additional trade studies, engineering analysis, preliminary calculations, preliminary performance specifications, and PFD and P&IDs. This rating is associated with a 25% completion of the overall design.
5 Complete Preliminary Design. Issue preliminary key design output documents. The major key documents are SDDs, calculations, drawings, and specifications, PFDs and P&IDs, one lines, I&C diagrams, plant layout, floor plans, typical sections, general arrangements, systems configurations, etc. When finalized, all key documents are placed under cost & schedule change control. Complete initial startup and operation planning. Final Cost & Schedule Performance Baseline established. All facilities, associated systems, structures, and components have been identified, sized, and integrated. This rating is associated with a 40% completion of overall design.
6 Initiate Final Design. Validate design selections, and safety and other engineering analyses. This rating is associated with a 50% completion of the overall design.
7 Continue Final Design. Prepare final FDDs, SDDs, calculations, drawings, and procurement and construction specifications. Develop operating manuals and operator training programs. Long Lead procurement initiated. This rating is associated with a 75% completion of the design.

Hydrogen Plant Alternatives Study NGNP-HPS SHAW-HPA Section 6 – Technology Development
NGNP_HPAS_Section_6_Technology Development.doc March 2009
6-3 of 54
Rating Level Definition
8 Complete Final Design. Issue construction and procurement specifications and drawings for use. Complete final startup and operation documentation. This rating is associated with a 100% of the final design, but not including changes during construction and start-up.
9 Facilities, structures, systems, and components manufactured and/or constructed, inspected, tested, and ready for turnover to operations.
10 Facilities, structures, systems, and components successfully operated for one full cycle. As built drawings reviewed and approved.
Design Data Needs (DDNs) DDNs are formally prepared descriptions of the needed data for design calculations and
design decisions that are identified at the level of the SSCs. The ideal sequence entails the design engineer writing a DDN telling what quantitative
data results are needed to do the design. The DDN is related to technology readiness in that more than likely there are one or more DDNs written for a system or component that is not "ready" technologically. On the other hand, existence of a DDN does not necessarily mean something is not developed, just that required design data is missing.
The listings of DDNs for the hydrogen production systems are tabulated in Section 8.4.2.
Complete DDNs include discussion of current status, assumptions, alternatives, detailed statements of the needs, schedules, and priorities. These have been prepared for the HyS hydrogen production system as part of the NGNP Preconceptual Design[Ref. 31], but the DDNs need updating. A review of the listings for the DDNs in Section 8 shows that many of the needs are design-related rather than strictly addressing the technology. This reflects the focus thus far on the technology and anticipates the Conceptual Design phase ahead.
Design Tasks The process of establishing DRLs, DDNs, and TRLs has resulted in initial lists of design
tasks that should be addressed in the next phase of design for the three hydrogen processes – Hybrid Sulfur, Sulfur Iodine, and High Temperature Steam Electrolysis. These Design Tasks are tabulated in Section 8.4.3.
Technology Readiness Level TRL ranks for the Critical SSCs of the hydrogen generation process are assigned
according to the definitions in Table 6-2, which is revised from the NGNP Technical Readiness Plan[Ref. 32]. Note the addition of a rating “U” for the situations where requirements are

Hydrogen Plant Alternatives Study NGNP-HPS SHAW-HPA Section 6 – Technology Development
NGNP_HPAS_Section_6_Technology Development.doc March 2009
6-4 of 54
HPSs.
undefined and technology readiness is unclear. This categorization is necessary for a few of theSSCs of the
Table 6-2: Technology Readiness Level Generic Definition
Rating Level Definition
U Uncertain at this phase in design and development.
1 Basic principles observed and reported in white papers, industry literature, lab reports, etc. Scientific research without well-defined application.
2 Technology concept and application formulated. Issues related to performance identified. Issues related to technology concept have been identified. Paper studies indicate potentially viable system operation
3 Proof-of concept: Analytical and experimental critical function and/or characteristic proven in laboratory. Technology or component tested at laboratory scale to identify/screen potential viability in anticipated service.
4 Technology or Component is tested at bench scale to demonstrate technical feasibility and functionality. For analytical modeling, use generally recognized benchmarked computational methods and traceable material properties.
5 SSC demonstrated at experimental scale in relevant environment. Components have been defined, acceptable technologies identified and technology issues quantified for the relevant environment. Demonstration methods include analyses, verification, tests, and inspection.
6 SSCs have been demonstrated at a pilot scale in a relevant environment.
7 SSCs integrated engineering scale demonstration in a relevant environment.
8 Integrated prototype of the SSC is demonstrated in its operational environment with the appropriate number and duration of tests and at the required levels of test rigor and quality assurance. Analyses, if used support extension of demonstration to all design conditions. Analysis methods verified and validated. Technology issues resolved pending qualification (for nuclear application, if required). Demonstrated readiness for application.
9 The project is in final configuration, tested and demonstrated in operational environment.
10 Commercial-scale demonstration is achieved. Technological risks minimized by multiple units built and running through several years of service cycles – Multiple Units
Distinctions between TRLs are generally a function of three factors. These are: 1) the
scale of the technology demonstration; 2) the closeness of the design to prototype; and 3) the extent to which test conditions match the operating conditions in application. The demonstration that can advance the SSC from one to the next TRL needs to meet a specific quantitative test duration and satisfy criteria for acceptable stable operation.

Hydrogen Plant Alternatives Study NGNP-HPS SHAW-HPA Section 6 – Technology Development
NGNP_HPAS_Section_6_Technology Development.doc March 2009
6-5 of 54
In the following listings of current TRL rankings, a large number of supporting SSCs can be seen to be TRL-6. This is in contrast to the systems that are the focus of hydrogen process development. A ranking of TRL-6 denotes that there will be no new technology required for the hydrogen process, only the extension of the present technology to more extreme operational environments and maybe with new materials of construction. These technologies are clearly beyond experimental demonstration of feasibility (i.e., TRL-4) but no prototype has been tested in the operational environment (i.e., TRL-8). TRL-5, -6 and -7 are all demonstrations in relevant environments, and the gradation is on the scale and closeness to prototype. Striking the middle value of TRL-6 seems logical.
In several places in this section, specific hydrogen outputs, heat or power inputs, scale
factors, and scale-up steps are quantified. These are all estimates based on the TDRMs developed here and on the present plans of the technology developers in the NHI Program who have been consulted. Far more progress in development and work on specific designs is required before these numbers can be confirmed. The ratings should be used only for general planning purposes and not as bases for design.
Where scale relative to the NGNP Demonstration or the NGNP commercial application is
expressed, the reference plants are single nuclear reactor-powered units of 550 MWth rating. The sizes of the HPS in the NGNP Demonstration are based on thermal input of 50 MWth for the Sulfur Iodine and Hybrid Sulfur technologies and 5 MWth for High Temperature Steam Electrolysis. The 50, 50, and 5 MWth numbers were preliminarily judged to correspond to the scale of the minimum commercially viable hydrogen production train for each of the three technologies[Ref. 33].
For each process concept, the Hydrogen Production Facility consists of the Hydrogen
Production System and the Hydrogen Production Buildings and Structures. For discussion of technology development, the buildings and structures are assumed to be entirely commercially available or having proven industry experience. Therefore, the following technology assessment relates only to the Hydrogen Production Systems.
DRLs and TRLs of the Hydrogen Generation Processes In the following sections, DRLs and TRLs are developed for the four technology areas.
Table 6-3 summarizes the DRLs and TRLs for the three HPS overall systems where the system level is the minimum level of its respective constituent SSCs.
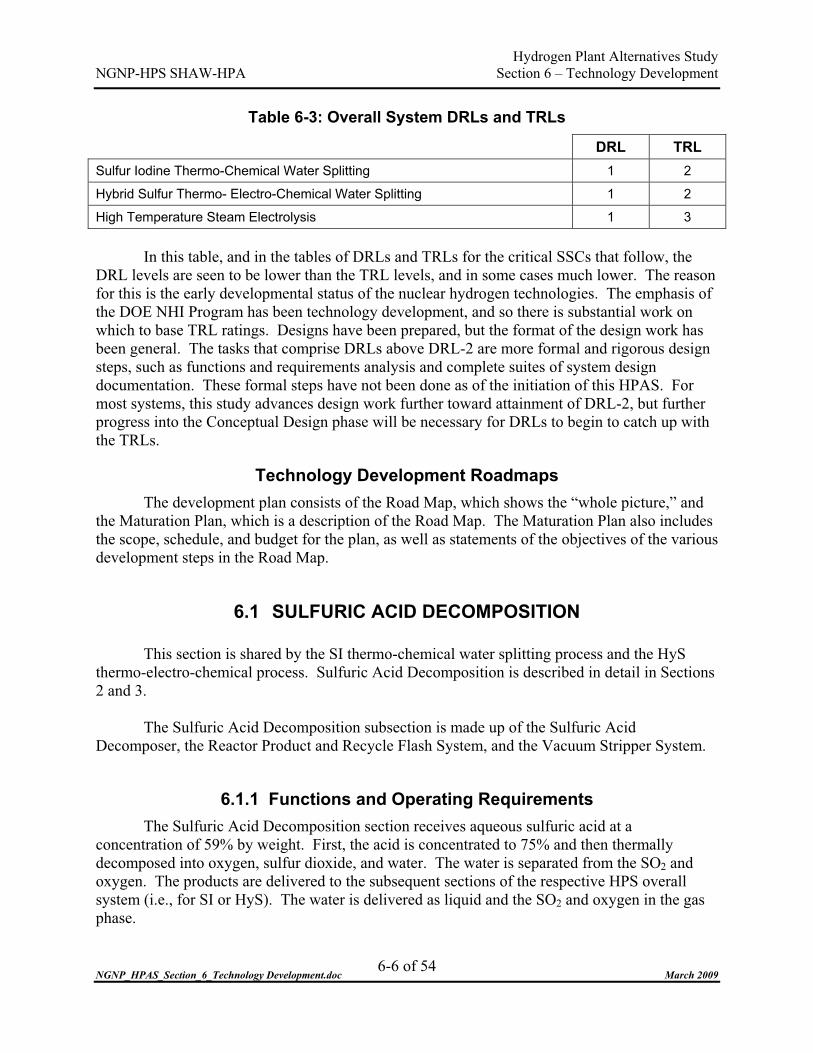
Hydrogen Plant Alternatives Study NGNP-HPS SHAW-HPA Section 6 – Technology Development
NGNP_HPAS_Section_6_Technology Development.doc March 2009
6-6 of 54
Table 6-3: Overall System DRLs and TRLs
DRL TRL Sulfur Iodine Thermo-Chemical Water Splitting 1 2
Hybrid Sulfur Thermo- Electro-Chemical Water Splitting 1 2
High Temperature Steam Electrolysis 1 3 In this table, and in the tables of DRLs and TRLs for the critical SSCs that follow, the
DRL levels are seen to be lower than the TRL levels, and in some cases much lower. The reason for this is the early developmental status of the nuclear hydrogen technologies. The emphasis of the DOE NHI Program has been technology development, and so there is substantial work on which to base TRL ratings. Designs have been prepared, but the format of the design work has been general. The tasks that comprise DRLs above DRL-2 are more formal and rigorous design steps, such as functions and requirements analysis and complete suites of system design documentation. These formal steps have not been done as of the initiation of this HPAS. For most systems, this study advances design work further toward attainment of DRL-2, but further progress into the Conceptual Design phase will be necessary for DRLs to begin to catch up with the TRLs.
Technology Development Roadmaps The development plan consists of the Road Map, which shows the “whole picture,” and
the Maturation Plan, which is a description of the Road Map. The Maturation Plan also includes the scope, schedule, and budget for the plan, as well as statements of the objectives of the various development steps in the Road Map.
6.1 SULFURIC ACID DECOMPOSITION
This section is shared by the SI thermo-chemical water splitting process and the HyS thermo-electro-chemical process. Sulfuric Acid Decomposition is described in detail in Sections 2 and 3.
The Sulfuric Acid Decomposition subsection is made up of the Sulfuric Acid
Decomposer, the Reactor Product and Recycle Flash System, and the Vacuum Stripper System.
6.1.1 Functions and Operating Requirements The Sulfuric Acid Decomposition section receives aqueous sulfuric acid at a
concentration of 59% by weight. First, the acid is concentrated to 75% and then thermally decomposed into oxygen, sulfur dioxide, and water. The water is separated from the SO2 and oxygen. The products are delivered to the subsequent sections of the respective HPS overall system (i.e., for SI or HyS). The water is delivered as liquid and the SO2 and oxygen in the gas phase.

Hydrogen Plant Alternatives Study NGNP-HPS SHAW-HPA Section 6 – Technology Development
NGNP_HPAS_Section_6_Technology Development.doc March 2009
6-7 of 54
6.1.2 Development Status
6.1.2.1 Candidate Configurations There are several concepts that have been proposed for the Acid Decomposer. In the
most straight-forward concept, the heat source is flowing helium, which would flow across or along the outside of tubes containing the process fluids in a shell-in-tube configuration.
Another concept that is under study in the DOE NHI Program has the features of a
compact heat exchanger of the plate-fin or “printed circuit” construction[Ref. 34][Ref. 35] . A novel feature of one embodiment of this concept is the inclusion of platinum catalyst in the material of a “printed circuit” heat exchanger[Ref. 36].
Two similar concepts consider a bayonet tube configuration with the process flow in the
tube and helium on the shell side. One has the tubesheet at the top and one at the bottom. These are the Westinghouse Electric Company’s decomposer design[Ref. 37] and the Sandia National Laboratory design[Ref. 38].
Also, there are optional conventional technologies for acid concentration, such as using
mechanically pumped vacuum or vapor compression. However, since they are conceptually well developed, there is no justification for further discussion of the choice of vacuum flash with the vacuum provided by steam air ejectors.
6.1.2.2 Decision Discriminators A tentative choice was made for the SNL decomposer configuration for the SI ILS
Experiment. The WEC configuration was proposed after that test was defined. In the TDRM, the final decision is in sequence after a number of experimental and analytical tasks.
The decision on configuration and materials for the Acid Decomposer will consider these
factors: � Corrosion resistance; � High temperature operation, especially thermal expansion; � Sealing and transition from ceramics to metals; � Thermal performance: longitudinal and transverse temperature profiles in each tube
and among tubes, recuperation, heat transfer rate; � Ease of catalyst replacement, and; � Hydraulic performance: need for gravity flow, even flow distribution between tubes,
pressure drop, etc…

Hydrogen Plant Alternatives Study NGNP-HPS SHAW-HPA Section 6 – Technology Development
NGNP_HPAS_Section_6_Technology Development.doc March 2009
6-8 of 54
6.1.2.3 Reference Design for Hydrogen Plant Alternative Study The Sulfuric Acid Decomposition processes and chosen design are discussed in
Section 3.
6.1.2.4 DRLs The Sulfuric Acid Decomposition section is at the preconceptual design stage. There are
concept designs for the Decomposer tubes and catalyst and for the Concentrator. The Decomposer vessel and the complete interface with the helium heat source are not yet beyond concept definition. Table 6-4 lists the DRLs of the components of the Acid Decomposition section common to the SI and the HyS process systems.
Table 6-4: Sulfuric Acid Decomposition DRLs
DRL
Acid Decomposition Section 1
Acid Decomposer (Decomposition Reactor) 1
Tube Array 2
Manifolds and Seals 2
Vessel 2
Catalyst 2
Helium Control Valves 1
Process Side Control Valves 1
Decomposer product handling equipment 1
Valves 1
Pumps 1
Coolers 1
Acid concentration vacuum column 1
Feed acid handling and concentrating equipment 1
Steam ejectors and vacuum pump 1
Instrumentation and Control 1
I&C System 1
Sensors, instruments 1
6.1.2.5 Down-Selection Tasks Decisions will be made on the alternatives at the Conceptual Design stage. Note that in
the TDRM, considerable additional testing and experimental development is charted ahead of

Hydrogen Plant Alternatives Study NGNP-HPS SHAW-HPA Section 6 – Technology Development
NGNP_HPAS_Section_6_Technology Development.doc March 2009
6-9 of 54
Conceptual Design. Considerable design work is also required before final selections can be considered. Testing in full thermal and hydraulic similitude will be needed to establish a basis for performance going into the Conceptual Design.
Additional decision discriminators will be the performance in testing and anticipated
operational features, such as fill and drain procedure, leak detectability, access for catalyst removal, etc.
6.1.3 Sulfuric Acid Decomposition TRLs In summary, the current TRLs for the critical SSCs of the Acid Decomposition section
are evaluated as shown in Table 6-5. The critical SSCs other than the Acid Decomposer and the Helium Control Valves are generally established technology lacking only the choice of and verification of materials compatibility for the operational environment.
Table 6-5: Acid Decomposition Section TRLs
TRL Sulfuric Acid Decomposition Section 3 Acid Decomposer (decomposition reactor) [H2SO4 � ½O2 + SO2 + H2O] – including tubes, seals, manifolds and vessel 3
Tube Array 4
Manifolds and Seals 4
Vessel 4
Decomposer Catalyst 3
Decomposer product handling equipment 6
Acid concentration vacuum column 6
Feed acid handling and concentrating equipment 6
Steam ejectors and vacuum pump 6
Helium Control Valves 4
Sensors and Instruments 6
In Section 8.4.1 can be found the detailed rating sheets of the TRLs for the five SSCs in
Table 6-5 that make up the Acid Decomposition Section.
6.1.4 Technology Development Plan
6.1.4.1 Overview and Road Map The Technology Development Road Map (TDRM) for the Sulfuric Acid Decomposition
section, which is common to both the SI and HyS HPSs, is shown on the next pages.

Hydrogen Plant Alternatives Study NGNP-HPS SHAW-HPA Section 6 – Technology Development
NGNP_HPAS_Section_6_Technology Development.doc March 2009
6-10 of 54
Figure 6-1: Technology Development Roadmap for Sulfuric Acid Decomposition
(Sheet 1 of 2)

Hydrogen Plant Alternatives Study NGNP-HPS SHAW-HPA Section 6 – Technology Development
NGNP_HPAS_Section_6_Technology Development.doc March 2009
6-11 of 54
Figure 6-1: Technology Development Roadmap for Sulfuric Acid Decomposition (Sheet 2 of 2)
Catalyst Bench Tests
Balance of System
Reactor Product and Recycle Flash(Steam Ejectors and Vacuum Pumps)
Vacuum Stripper
VLE Data Verification
Design
Design
Stripper Tower Design Data
Tasks
Experimentally verify vendor packing choiceDetermine Height Equivalent to the Theoretical Plate (HETP) and/or mass transfer factors
# 9
# 5
Tasks
Choose catalystCharacterize catalystLearn degradation mechanismsAccelerated testiing
TRL 8
TRL 6
TRL 8
Decomposer Product Handling
Feed Acid Handling
Materials Test
Materials Test
TasksVerify Material Compatibility
Design TRL 6
TRL 8
Design TRL 6
TDRM - Decomp 07.vsd28NOV08Page 2 0f 2
TasksVerify Material Compatibility
Tasks
Get VLE (Vapor-Liquid Equilibirum) data for design
TRL 6
TRL 8
#11
#10
Catalyst
#12
TRL 3
Helium Control ValvesValve Test
Design TRL 4
TRL 8
#13
Sensors and Instruments Sensor Tests
TasksAssure FunctionalityVerify Material Compatibility
Dynamic model of Overall System
Bechmark to data from experiments
Specify Instrumentation and Control System
System Modeling
Tasks
#17
TRL 6
#14
System Level DDNsIntegration and Operation
TasksAssure FunctionalityVerify Material Compatibility

Hydrogen Plant Alternatives Study NGNP-HPS SHAW-HPA Section 6 – Technology Development
NGNP_HPAS_Section_6_Technology Development.doc March 2009
6-12 of 54
6.1.4.2 Maturation Plans for Reference Design
6.1.4.2.1 Scope The SI ILS Experiment is in progress. Successful operation of the Acid Decomposer in
the SI ILS provides feasibility and functional demonstration and supports the computational modeling that has gone into the SI and HyS flow sheets. The SI ILS brings the Acid Decomposer to TRL-4.
Before a pilot test, further maturation of the technology will move along parallel tracks.
One track is for materials compatibility verification and the second track concerns the decomposition: verification of the equilibrium thermodynamic model and characterization of reaction kinetics. The third track is determination of a workable Decomposer Catalyst. These tests are essential to prove the technology is feasible and functional, as well as to support analytical modeling. Thus, TRL 5 can be accomplished.
The pilot test and balance of system tests are in sequence ahead of Conceptual Design.
The pilot test will be the first test in a fully relevant environment (e.g., convective tube heating). Because it is also to be a full-scale test of one tube, the step to test at experimental-scale is skipped. The two alternative decomposer designs can be tested at this stage. With the pilot test, the technology goes to TRL-6.
The balance of the Sulfuric Acid Decomposition section consists of the feed and recycle
concentration equipment and the effluent handling equipment. Tests are also needed to advance their TRLs.
TRL-8 can be reached in two steps from the Conceptual Design: Engineering and
Prototype Tests, both of which are multi-tube sections of a full-scale Acid Decomposer.
6.1.4.2.2 Specific Steps in the Road Map Following are brief descriptions of the objectives of the nineteen tests shown with
numbered ovals on the TDRM.
SI Integrated Laboratory Scale (ILS) Experiment (#1) The SI ILS, which is in progress, is a test of the SNL Acid Decomposer on a small scale
with heating provided by an electric furnace rather convective heating with helium. However, it is a significant test that will demonstrate feasibility and functionality. Test results will provide data to support further analytical modeling of the SI and HyS cycles. Particular results anticipated are effects of catalyst and process side flow distribution. For the SI process, but not HyS, this ILS will give initial data on time effects of iodine impurities on the decomposition process and on materials compatibility when operated for an extended period.

Hydrogen Plant Alternatives Study NGNP-HPS SHAW-HPA Section 6 – Technology Development
NGNP_HPAS_Section_6_Technology Development.doc March 2009
6-13 of 54
The completion of this test advances the Acid Decomposer to TRL-4, skipping TRL-3, because operation in the SI ILS accomplishes both proof of concept and demonstration of technical functionality.
Materials Testing (#2) The SI ILS Experiment will validate the compatibility of the SiC tubes with the process
fluids, which is to be expected from initial decomposer demonstration tests. Separate tests are needed for materials other than the SiC tubes. In particular, the seals between the SiC tubes and their manifolds or tubesheets need to be tested in anticipated pulse and cycle conditions. For the SI process the tests need to determine effects of iodine impurities on corrosion and seal life.
Thermal-Hydraulic Analysis (#3) The alternative decomposer designs that are the most advanced, SNL and WEC as
described in Section 6.1.2.1, have significantly different fluid follow patterns. This thermal-hydraulic analysis may be a discriminator in the choice of which design to carry forward to the pilot test. This task will require iteration with the Bench-scale Tests for Decomposer Catalyst Development to account for the effects of flow and temperature on the catalyst and the decomposition reaction.
Acid Decomposer Data Verification (#4) Experimental confirmation of the equilibrium and kinetic model implicit in the
simulations generated thus far are essential. Much of the modeling has involved extrapolations of data that need confirmation. Results will provide data to support further analytical modeling of the SI and HyS cycles.
Bench-scale Tests for Decomposer Catalyst Development (#5) The Decomposer Catalyst requires development testing to assure reasonable performance
stability and lifetime, since periodic replacement is expected. Chemical industry practice would dictate a lifetime of 20,000 hours, which often can be established by accelerated testing.
The characteristic of the Decomposer Catalyst, combined with thermodynamic analyses,
determines whether the Decomposer design is set by limits on heat transfer or by the Decomposer Catalyst performance. This is essential input to the Conceptual Design. This task will require iteration with the Thermal-Hydraulic Analysis to account for the effects of flow and temperature on the Decomposer Catalyst and the decomposition reaction.
Catalyst bench testing will reveal the mechanisms and parameters of catalyst poisoning
and degradation, and from those results one can initiate meaningful accelerated testing to support the overall HPS design.
Hydrogen Plant Alternatives Study NGNP-HPS SHAW-HPA Section 6 – Technology Development
NGNP_HPAS_Section_6_Technology Development.doc March 2009
6-14 of 54
The completion of this test will advance the Decomposer Catalyst to TRL-5, skipping TRL-4, because operation in the SI ILS demonstrates technical functionality in a relevant environment.
HyS Integrated Laboratory Scale Experiment (#6) An ILS test is in the program plan for the HyS process development. According to
present plans, the HyS ILS is to use the same or an improved Acid Decomposer based on the design of the SI ILS. The alternative WEC decomposer design needs to be considered for the Acid Decomposer in the HyS ILS, in which case the Conceptual Design would have the test results from each decomposer design to choose from.
Note that the HyS ILS will not advance the Decomposer technology to a higher level.
Technology Decision Point (#7) The two alternative designs for the Decomposer, WEC and SNL, may need to be carried
to this stage in development to discriminate sufficiently to make a final choice. The principal factors in the choice will be the feasibility and buildability. These factors will be determined by the testing of the materials of construction and the catalyst, and by the verified thermodynamic data. Other discriminators will be the relative technology readiness, economics of the cycle in application, and schedule and risk in the context of the overall program.
Pilot Test (#8) The combined tests and analyses following the ILS Experiment will bring the Acid
Decomposer to TRL-5. At this point in development, a decision can be made on the preferred concept, SNL or WEC, as described in Section 6.1.2.1, to carry forward.
In the Pilot Test, a full-scale-length, single-tube, convection-heated bayonet tube
assembly will be tested at design conditions. The test assembly will also include a reference sealing configuration and replaceable catalyst to verify the function of these features. This will be the first test with helium convective heating, rather than furnace heating, of the Decomposer. Only in this configuration are the catalyst bed and wall temperature profiles correct in detail. Helium flow in this test can be in one end and out the other, in contrast to the Engineering Test for which the flow return to the same end as entry will be required.
Possibly this test, and the later Engineering and Prototype Tests, could be conducted at a
sulfuric acid plant since sulfuric acid decomposition is nothing more than undoing what a sulfuric acid plant does. It would draw a continuous feed from the plant and put its effluent product back into their feed.

Hydrogen Plant Alternatives Study NGNP-HPS SHAW-HPA Section 6 – Technology Development
NGNP_HPAS_Section_6_Technology Development.doc March 2009
6-15 of 54
A nominal goal of 1000 hours of steady operation without degradation of performance exceeding 5% per 1000 hours would constitute success. Ideally, the testing would also include startup, shutdown, and accident transients to the degree confirmed at that design phase.
The test provides the thermal and hydraulic data needed for integration of the
decomposer into the HPS of either SI or HyS. The single full-length tube will have been tested at relevant conditions and so this will advance the TRL of the Acid Decomposer to TRL-6.
Integration of this test with the HyS ILS should be considered for program efficiency.
VLE Data Verification (#9) The design of the reactor product and recycle concentration system requires verification
and refinement of the vapor-liquid equilibrium data.
Vacuum Stripper Tower Design Data (#10) Determinations of mass transfer coefficients or Heights Equivalent to the Theoretical
Plate (HETPs) are needed along with good VLE data in order to confidently design this tower and, for the HyS system, the SO2 absorber.
A vendor would supply a suitable packing that will be tested to measure an HETP or
mass transfer coefficient. It may be useful also to do small bench scale tests to determine whether and how much the mass transfer in this system of components and conditions deviates from that of similar known systems.
Decomposer Product Materials Test (#11) The materials of construction of the decomposer product handling equipment need to be
tested for compatibility. Because of the effects of material transport, simple immersion of material coupons will not be sufficient. A circulating test loop should be considered.
Feed Handling Materials Test (#12) Testing of the materials of construction of the feed acid handling and concentrating
equipment and the verified VLE data completes development to the TRL-8 level for the prototype application.
Valve Test (#13) The valves that control the flow of high temperature helium in the NHSS Secondary Heat
Transport System (SHTS) between either series or parallel PCHXs are part of the HPS. The number of valves is dependent on the process, either SI or HyS, and on the scale of eventual

Hydrogen Plant Alternatives Study NGNP-HPS SHAW-HPA Section 6 – Technology Development
NGNP_HPAS_Section_6_Technology Development.doc March 2009
6-16 of 54
application. These valves are not anticipated to be new technology, but they are critical SSCs because there is no recent industrial experience with such valves. The valves will need verification testing. These do not need to be full-scale valve tests, but they should be prototypic in form to the ultimate application, and therefore experience with smaller valves will not apply. Once the technology is validated at the pressures and temperatures of the NGNP application, the TRL will advance from a ranking of 4 to 8.
Sensor Tests (#14) Thermocouples, pressure sensors, and other instruments need to be qualified for the
operational environment they will experience. New technology is not expected to be required, and so prior to such tests the sensors would have been operated in relevant environments. Scale does not particularly apply to sensors, and so prior to testing they could be TRL-5, TRL-6 or TRL-7. The middle value is chosen arbitrarily. After successful testing, the sensors are TRL-8.
Decomposer Model (#15) A computational model of the Conceptual Design unit in a system will be based on data
from the pilot-scale testing. This computer model will provide a basis for design of the Engineering Test unit and confidence that the results of the Engineering Test will work in the NGNP Demonstration.
Engineering Test (#16) In order to reach TRL-7, there needs to be a further scale-up and approach to prototype
configuration. The test proposed is for a hexagonal matrix of 19 full-length tubes with helium heating. In such a configuration, the central 5 tubes would be tested in full-scale thermo-hydraulic conditions on the outside, and likewise for the process flow inside the tubes.
Note that this test precedes the Final Design and so will not necessarily include the
prototypical tube seals, process side valves or instrumentation sensors. The test will provide design verification for these components.
The goal is 1500 hours of steady operation without degradation of performance
exceeding 2% per 1000 hours
System Model (#17) The input from the Acid Decomposer mathematical model will be used in the SI and HyS
HPS models.

Hydrogen Plant Alternatives Study NGNP-HPS SHAW-HPA Section 6 – Technology Development
NGNP_HPAS_Section_6_Technology Development.doc March 2009
6-17 of 54
Prototype Test (#18) This final test in the sequence of technology maturation would be the same configuration
as the Engineering Test, but with the final design features including the prototype seals, valves, and instruments. The testing would cover the full operational environment and through the design cycles as determined by final system design. In addition, stable operation of less than 1% decline per 1000 hours for a time period of 2000 hours would be expected. This is full prototypic testing of a full-scale section of the Decomposer and constitutes advancement to TRL-8.
Sulfuric Acid Decomposition Section for S-I or HyS Development (#19) The Sulfur Dioxide Electrolysis and the Bunsen Reaction and HI Decomposition TDRMs
show system tests that would require a Sulfuric Acid Decomposition Section. These are discussed in Sections 6.2.4.2.2 and 6.3.4.2.2.
A SI Systems Engineering Test is in the Bunsen Reaction and HI Decomposition TDRM
is an optional step before the NGNP. This test will have integrated a Sulfuric Acid Decomposition Section approximately 1/20th of the NGNP size. This would be a design derived from the Acid Decomposer Engineering Test.
An optional HyS Systems Engineering Test is shown in the Sulfur Dioxide Electrolysis
TDRM before the NGNP, and that would have a Sulfuric Acid Decomposition Section of as yet undetermined size. This could be also a design derived from the Acid Decomposer Engineering Test.
Neither of these tests nor test articles is essential to the Sulfuric Acid Decomposition
technology development, but their execution would support the other steps and as a minimum reduce risk in the final application. In addition, use of the Acid Decomposer developmental test article may be cost effective for the SO2 supply needed for these other tests.
6.1.4.2.3 Schedule and Cost The cost and schedule for the Sulfuric Acid Decomposition technology development that
are developed in this study are summarized in Table 6-6. The cost and completion years are keyed to stages along the Road Map as indicated by the step numbers, which correlate to the numbers in red ovals on the TDRM.

Hydrogen Plant Alternatives Study NGNP-HPS SHAW-HPA Section 6 – Technology Development
NGNP_HPAS_Section_6_Technology Development.doc March 2009
6-18 of 54
Table 6-6: Cost and Schedule for the Sulfuric Acid Decomposition Technology Area
TRL Achievement Step Numbers from TDRM Completion
Up to completion of S-I ILS – TRL-2�3 #1 - -
Complete analysis, supporting data, materials testing, and catalyst choice & tests – TRL-4�5
#2, #3, #4, #5, #6 1.5 $M 2011
Pilot test of Decomposer – TRL- 5�6 #7, #8, #14 10.3 $M 2014
Engineering test of Decomposer – TRL-6�7 #15, #16 22.0 $M 2016
Prototype test of Decomposer – TRL-7�8 #17, #18 27.0 $M 2018
Balance of system design verification – TRL-x�8 #9, #10, #11, #12, #13 4.9 $M
6.2 SULFUR DIOXIDE ELECTROLYSIS The HyS thermo- electro-chemical water splitting HPS design is discussed in Section 3.1.
There are three major systems associated with the HyS HPS, and of these, the Sulfuric Acid Decomposition System is very similar to the SI Sulfuric Acid Decomposition System addressed in Section 6.1. The three systems marked with asterisks are those that are covered in Section 6.1 and are not discussed further here.
� Sulfuric Acid Decomposition System (SAD)
o Acid Concentration System * o Acid Steam Preheater and Vacuum Stripping * o H2SO4 Decomposition and Acid Separation * o Anolyte Processing o SO2 Recovery System o SO2 Compression
� Electrolyzer System (ELE) o SO2 Electrolysis Cells o Electrolyzer Internal Components o Electrolyzer Module Pressure Boundary
� Feed and Utility System (FUS) o Acid and Caustic Storage o Water Treatment
� Product Purification System (PPU) o H2 Compression and Drying o H2 Purification System o O2 Purification System
� Instrumentation and Control System
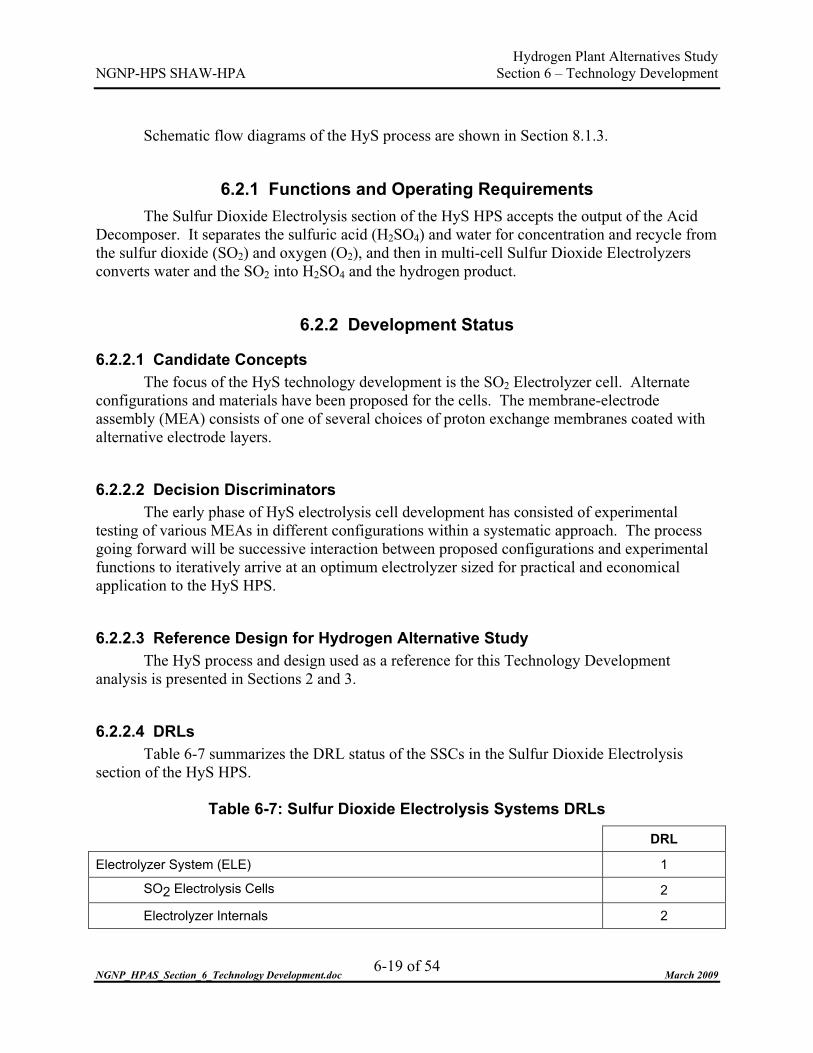
Hydrogen Plant Alternatives Study NGNP-HPS SHAW-HPA Section 6 – Technology Development
NGNP_HPAS_Section_6_Technology Development.doc March 2009
6-19 of 54
Schematic flow diagrams of the HyS process are shown in Section 8.1.3.
6.2.1 Functions and Operating Requirements The Sulfur Dioxide Electrolysis section of the HyS HPS accepts the output of the Acid
Decomposer. It separates the sulfuric acid (H2SO4) and water for concentration and recycle from the sulfur dioxide (SO2) and oxygen (O2), and then in multi-cell Sulfur Dioxide Electrolyzers converts water and the SO2 into H2SO4 and the hydrogen product.
6.2.2 Development Status
6.2.2.1 Candidate Concepts The focus of the HyS technology development is the SO2 Electrolyzer cell. Alternate
configurations and materials have been proposed for the cells. The membrane-electrode assembly (MEA) consists of one of several choices of proton exchange membranes coated with alternative electrode layers.
6.2.2.2 Decision Discriminators The early phase of HyS electrolysis cell development has consisted of experimental
testing of various MEAs in different configurations within a systematic approach. The process going forward will be successive interaction between proposed configurations and experimental functions to iteratively arrive at an optimum electrolyzer sized for practical and economical application to the HyS HPS.
6.2.2.3 Reference Design for Hydrogen Alternative Study The HyS process and design used as a reference for this Technology Development
analysis is presented in Sections 2 and 3.
6.2.2.4 DRLs Table 6-7 summarizes the DRL status of the SSCs in the Sulfur Dioxide Electrolysis
section of the HyS HPS.
Table 6-7: Sulfur Dioxide Electrolysis Systems DRLs
DRL
Electrolyzer System (ELE) 1
SO2 Electrolysis Cells 2
Electrolyzer Internals 2
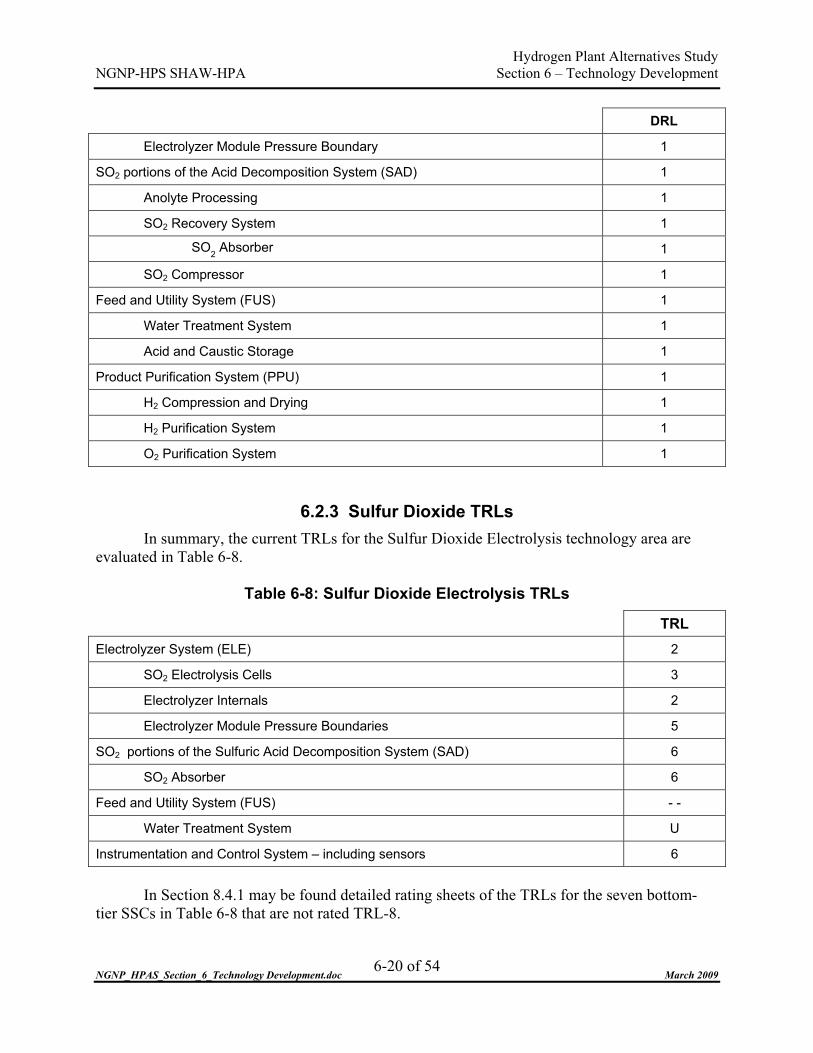
Hydrogen Plant Alternatives Study NGNP-HPS SHAW-HPA Section 6 – Technology Development
NGNP_HPAS_Section_6_Technology Development.doc March 2009
6-20 of 54
DRL
Electrolyzer Module Pressure Boundary 1
SO2 portions of the Acid Decomposition System (SAD) 1
Anolyte Processing 1
SO2 Recovery System 1
SO2 Absorber 1
SO2 Compressor 1
Feed and Utility System (FUS) 1
Water Treatment System 1
Acid and Caustic Storage 1
Product Purification System (PPU) 1
H2 Compression and Drying 1
H2 Purification System 1
O2 Purification System 1
6.2.3 Sulfur Dioxide TRLs In summary, the current TRLs for the Sulfur Dioxide Electrolysis technology area are
evaluated in Table 6-8.
Table 6-8: Sulfur Dioxide Electrolysis TRLs
TRL Electrolyzer System (ELE) 2
SO2 Electrolysis Cells 3
Electrolyzer Internals 2
Electrolyzer Module Pressure Boundaries 5
SO2 portions of the Sulfuric Acid Decomposition System (SAD) 6
SO2 Absorber 6
Feed and Utility System (FUS) - -
Water Treatment System U
Instrumentation and Control System – including sensors 6
In Section 8.4.1 may be found detailed rating sheets of the TRLs for the seven bottom-
tier SSCs in Table 6-8 that are not rated TRL-8.

Hydrogen Plant Alternatives Study NGNP-HPS SHAW-HPA Section 6 – Technology Development
NGNP_HPAS_Section_6_Technology Development.doc March 2009
6-21 of 54
6.2.4 Technology Development Plan
6.2.4.1 Overview and Road Map The Technology Development Road Map for Sulfur Dioxide Electrolysis is shown on
Figure 6-2.

Hydrogen Plant Alternatives Study NGNP-HPS SHAW-HPA Section 6 – Technology Development
NGNP_HPAS_Section_6_Technology Development.doc March 2009
6-22 of 54
Figure 6-2: Technology Development Road Map for Sulfur Dioxide Electrolysis (Sheet 1 of 2)

Hydrogen Plant Alternatives Study NGNP-HPS SHAW-HPA Section 6 – Technology Development
NGNP_HPAS_Section_6_Technology Development.doc March 2009
Figure 6-2: Technology Development Road Map for Sulfur Dioxide Electrolysis (Sheet 2 of 2)
6-23 of 54

Hydrogen Plant Alternatives Study NGNP-HPS SHAW-HPA Section 6 – Technology Development
NGNP_HPAS_Section_6_Technology Development.doc March 2009
6-24 of 54
6.2.4.2 Maturation Plans for Reference Design
6.2.4.2.1 Scope A ranking of TRL-8 for the technology requires the design and development of an SO2
Electrolyzer Module that is scaled appropriately such that a reasonable number of the units can be combined with the Sulfuric Acid Decomposition section to make up the HyS HPS for an NGNP heat source.
From the individual SO2 cells being tested today, there will be scale up in three steps: (1)
from the present 160 cm2 of cell demonstration to 400 cm2, (2) from 400 cm2 to 1000 cm2 and (3) finally to one square meter. Cells would be assembled into SO2 Electrolyzer Modules of progressively larger power input and hydrogen output. Although subject to further definition in the design process, the final SO2 Electrolyzer Module for the NGNP Demonstration would be sized so that about 20 modules would comprise the HyS HPS. Since the NGNP commercial plant is to have as many as ten such trains in the HPS, the eventual NGNP commercial application would have about 200 of the finally developed SO2 Electrolyzer Modules.
Scale-up proposed for planning purposes and shown in the TDRM is as follows:
Module Basis
System Basis
ILS to Pilot x 140 - -
Pilot to Engineering x 10 - -
Engineering to System Prototype x 1.5 - -
System Prototype to NGNP Demonstration Plant x 1 x 20
NGNP Demonstration Plant to NGNP Commercial Plant - - x 10 In addition, demonstrations will be done on the SO2 Recovery System, the Feed
Purification System and the Instrumentation and Control system. These are conventional systems that can be assembled in prototype at sub-scale to bring them to TRL-8 in one step.
6.2.4.2.2 Specific Steps in the Road Map The following are brief descriptions of the objectives of the sixteen tests shown with
numbered ovals on the TDRM.
Cell Stability Demonstration (#1) Basic issues of cell degradation, due for example to migration of constituents across cell
membranes, will be resolved through interaction of design and experiment.

Hydrogen Plant Alternatives Study NGNP-HPS SHAW-HPA Section 6 – Technology Development
NGNP_HPAS_Section_6_Technology Development.doc March 2009
6-25 of 54
Single Cell testing at 100ºC, 10 atm (#2) Tests up to this point are in a laboratory environment. This test is at elevated temperature
and at pressure, similar to the application. The stability demonstration and this test at relevant conditions accomplish TRL-4.
Integrated Lab Scale Experiment (#3) This test will combine a small-scale Decomposition section to demonstrate the HyS
cycle. As noted in Section 6.1.4.2.2, this could be combined with the Pilot Test of the Acid Decomposer.
Optimized Cell Assembly Demonstration (#4) In parallel with the ILS and Preconceptual Design, the electrolysis cell design and
materials will be reoptimized. This is an additional step in iteration of design and experiment.
Cell Scale-up to 400 cm2 (#5) The plan has electrolyzer cells scaled-up from the ILS size in two steps. Each step
corresponds to the completion of the Preconceptual and Conceptual Design. Cell scale-up to 400 cm2 plus the ILS operation constitute experimental demonstration and advance Sulfur Dioxide Electrolysis to TRL-5. Note that this scale-up follows a step of Fabrication Development, which will transition the overall R&D from laboratory orientation to manufacturing orientation. The Fabrication Development envisions significant participation by a commercial entity with some relevant experience.
Electrolyzer Module Internals Test (#6) Following Preconceptual Design of the Electrolyzer Module Pressure Boundary, the
Module Internal design will be tested. At this stage, all components of the Electrolyzer Module are TRL-5, including cells, internals, and vessel. This is because they are defined and demonstrated on experimental scale.
Structural Test (#7) The design requirements of the vessel or pressure retaining exterior boundary for the SO2
Electrolysis Cell are not finalized. However, there is a preferred concept of a pressurized module that qualifies for TRL-5 because it is defined and has been modeled analytically. It would be tested separately for pressure retention and material compatibility and then used in the Electrolyzer pilot-scale test.

Hydrogen Plant Alternatives Study NGNP-HPS SHAW-HPA Section 6 – Technology Development
NGNP_HPAS_Section_6_Technology Development.doc March 2009
6-26 of 54
Electrolyzer Pilot-scale Test (#8) This is the first test of an electrolyzer with 400 cm2 cells and the first test of the Module
Pressure Boundary and module internals. For this test the nominal goals, which are subject to change as the R&D program proceeds along the Road Map, are as follows:
Table 6-9: Nominal Goals of Electrolyzer Pilot-Scale Test
Electrolyzer Avg. cell voltage, mV 700 Current Density, mA/cm2 500 Cell Active Area, cm2 400 HyS System Hydrogen output, �/h 28,000 Hydrogen output, kWth (HHV) 70 Process heat input, kWth 200 Process electrical input, kWe 100 Time on line, hours 1000
Electrolyzer Engineering-Scale Test (#9) This is a test of one electrolyzer with full-scale cells (i.e., 1000 cm2) following
Conceptual Design. It will suffice as an engineering scale test since this is the final electrolyzer scale-up, although not yet prototypical. Testing will not necessarily be to the full range of transients, and so the test will advance the TRL from 6 to 7.
The nominal goals of this test are as follows:
Table 6-10: Nominal Goals of Electrolyzer Engineering-Scale Test Electrolyzer Avg. cell voltage, mV 650 Current Density, mA/cm2 500 Cell Active Area, cm2 1000 HyS System Hydrogen output, �/h 280,000 Hydrogen output, kWth (HHV) 1000 Process heat input, kWth 2000 Process electrical input, kWe 1000 Time on line, hours 1500
Prototype Electrolyzer Test (#10) This test will also be of one electrolyzer. It will be the full-scale prototype resulting from
Final Design with the cell scaled up in area from 1000 cm2 to 1 m2. The heat and power input

Hydrogen Plant Alternatives Study NGNP-HPS SHAW-HPA Section 6 – Technology Development
NGNP_HPAS_Section_6_Technology Development.doc March 2009
6-27 of 54
and the hydrogen output in this test will be only 1.5 times that of the Electrolyzer engineering-scale test.
It is anticipated that this test would be performed in the same facility as the Engineering
Test. Tests will be in the operational environment and cover the appropriate number and duration of tests. This will accomplish TRL-8 for the Electrolyzer Module.
The goal of this test is 2000 hours of operation with production on the order of 420 Nm3
of hydrogen per hour and stability of less than 1% decline per 1000 hours.
SO2 Absorber Demonstration Test (#11) System feasibility and functionality can be assured from general industry experience, but
design data is needed in the operating environment. Specifically, mass transfer in the SO2 absorber column, the Heights Equivalent to the Theoretical Plate (HETPs) need to be experimentally determined. In order to be applied to the NGNP, sub-scale demonstration testing of the SO2 Recovery System in the operational environment is expected. This is a jump from TRL-6 to TRL-8.
Feed Purification System Demonstration Test (#12) There are a number of proven water purification processes that can provide ultra-pure
water, but without requirements the scope of development of this SSC is uncertain.
System Modeling (#13) Demonstration of integrated operation can be done by computer simulation given input of
the performance of the discrete components in prototype or pilot testing in their operational environments. Results will be input to the final system design.
Sensor Tests (#14) Thermocouples, pressure sensors, and other instruments need to be qualified for the
operational environment they will experience. New technology is not expected to be required. It is presumed that the sensors would have been operated in relevant environments. Scale does not particularly apply to sensors, and so prior to testing they could be TRL-5, TRL-6 or TRL-7. The middle value is chosen arbitrarily. After successful testing, the sensors are TRL-8.
Prototype HPS Test (#15) This test is intended to be an assembly of one or more of the Prototype Electrolyzers from
the previous test with a scaled-down Acid Decomposer section. It is not clear that this test is needed. Separate testing of the Acid Decomposer and one Prototype Electrolyzer with transfer

Hydrogen Plant Alternatives Study NGNP-HPS SHAW-HPA Section 6 – Technology Development
NGNP_HPAS_Section_6_Technology Development.doc March 2009
6-28 of 54
of feed and products between them could be sufficient to assure TRL-8. Integrated operation would be demonstrated by analysis.
Continuing Cell Testing (#16) As cell stack and system tests proceed, there is a need to accumulate lifetime data and
quantify long-term degradation. One or more cell tests should continue after the cell scale-up to one square meter. The attainment of TRL levels elsewhere on the Road Map would be supported by the Continuing Cell Testing according to the criteria in Table 6-11.
Table 6-11: Duration and Maximum Rates Degradation for Cell Tests
TRL Max. rate of degradation Minimum test duration 4 20%/1000 hours 500 hours 5 10%/1000 hours 1000 hours 6 5%/1000 hours 2000 hours 7 2%/1000 hours 5000 hours 8 1%/1000 hours 10,000 hours
6.2.4.2.3 Schedule and Cost The cost and schedule for the Sulfur Dioxide Electrolysis technology development are
summarized in Table 6-12. The cost and completion years are keyed to stages along the Road Map as indicated by the step numbers (i.e., the numbers in red ovals on the TDRM).
Table 6-12: Cost and Schedule for the
Sulfur Dioxide Electrolysis Technology Area
TRL Achievement Step Numbers from TDRM Cost Completion
Up to completion of cell demonstration at temperature and pressure – cells: TRL-3�4 #1, #2, #3, #4
3.0 $M 2009
HyS ILS and optimized cell demonstration – cells: TRL-4�5 #5, #6 4.8 $M
2010
Scale-up cells to 400 cm2 – TRL-4�5, and Electrolyzer Pilot Test – module: TRL-2�6 #7, #8 36.5 $M
2013
Scale-up cells to 1000 cm2 and Engineering test of Electrolyzer – TRL-6�7 #9 59.0 $M
2016
Scale-up cells to 1 m2 and Prototype test of Electrolyzer – TRL-7�8 #10 22.0 $M
2018
(Prototype HPS Test) (#15) - -
Balance of system design verification – TRL-x�8 #11, #12, #13, #14 2.9 $M

Hydrogen Plant Alternatives Study NGNP-HPS SHAW-HPA Section 6 – Technology Development
NGNP_HPAS_Section_6_Technology Development.doc March 2009
6-29 of 54
6.2.4.3 Maturation Plans for Alternatives Presently there are no plans for alternative HyS HPS designs. The Preconceptual Design
phase could generate an alternate path in the development road map for the Sulfur Dioxide Electrolysis technologies.
6.3 BUNSEN REACTION AND HI DECOMPOSITION TECHNOLOGY AREA
The Bunsen Reaction and HI Decomposition technology area is part of the SI
thermochemical water splitting process. Combined with the Sulfuric Acid Decomposition section, this area makes up the SI HPS. The SI HPS has been discussed in Sections 2 and 3. The Bunsen and HI Decomposition sections are comprised of the following systems and major components:
� Bunsen Reaction Section (Section 1 - reference version: Co-Current Reactor)
o Bunsen Reactor [ I2 + SO2 + 2 H2O � H2SO4 + 2 HI ] o Reverse Bunsen Reactor
� HI Distillation Section (Section 3 - reference version: Reactive HI Distillation) o Reactive Still [ 2 HI � I2 + H2 ] o Recuperators o Process Coupling Heat Exchanger o Power Recovery System
� Balance of SI Plant o Feed Purification o Product Purification o Instrumentation and Controls
6.3.1 Functions and Operating Requirements The Bunsen Reaction section of the SI cycle ideally receives feed water, sulfur dioxide
from the Acid Decomposer section and iodine from the HI Decomposition section, and produces sulfuric acid and hydroiodic acid. This is an exothermic reaction requiring cooling and is run at about 100°C. In actuality, the cycle flowsheets balance with significant water, H2SO4 and HI recirculation.
In the HI Decomposition section, HI is decomposed into I2 and H2 and these two
separated. The reaction is endothermic, and so heat is added from the nuclear heat supply secondary helium circuit through a PCHX in order to maintain a temperature within the range of 300 to 400°C. The I2 is recycled to the Bunsen Reaction section and the H2 is delivered as product after purification.

Hydrogen Plant Alternatives Study NGNP-HPS SHAW-HPA Section 6 – Technology Development
NGNP_HPAS_Section_6_Technology Development.doc March 2009
6-30 of 54
6.3.2 Development Status The three sections of the SI cycle have been demonstrated separately in the laboratory
and in small-scale glass apparatus. Although there has been no final selection of the optimum alternatives from among various approaches, integrated systems have been assembled and tested. Testing of a complete system was reported in Japan several years ago[Ref. 39] and the SI ILS Experiment is in progress under an International Nuclear Energy Research Initiative (I-NERI) as part of the NHI Program.
These experiments are running ahead of SI system design, which is only reaching a
Preconceptual Design phase. This Hydrogen Plant Alternatives Study is an initial step in that Preconceptual Design.
6.3.2.1 Candidate Configurations Each of the three sections of the SI cycle has two or more alternative candidate concepts.
The Sulfuric Acid Decomposer alternatives are addressed in Section 6.1.2.1. The Bunsen Reaction section has the alternatives of a co-current reactor with separate phase separation or a counter current reactor with integral phase separation. The former has been conceptually considered and used in flowsheets developed in the U.S. The latter is the design of the Commissariat à l'Énergie Atomique (CEA), which was developed under I-NERI and has been selected for the SI ILS.
There are two HI Decomposition section concepts proposed. Distillation by extraction
with phosphoric acid is the method chosen for the SI ILS based upon the recommendation of the CEA. Reactive distillation is proposed for the NGNP and eventual commercial application.
6.3.2.2 Decision Discriminators In all cases of choices made thus far, the discrimination has been a trade-off of the
minimum critical path to demonstration versus the estimated cycle efficiency and anticipated cost to commercially produce hydrogen.
6.3.2.3 Reference Design for Hydrogen Plant Alternative Study The SI process and chosen design has been discussed in Sections 2 and 3.
6.3.2.4 DRLs The SI HPS is at an early design stage with numerous issues related to design yet to be
resolved. Preconceptual design is ahead for essentially all parts of the Bunsen Reaction and HI Decomposition Systems.

Hydrogen Plant Alternatives Study NGNP-HPS SHAW-HPA Section 6 – Technology Development
NGNP_HPAS_Section_6_Technology Development.doc March 2009
6-31 of 54
Table 6-13: Bunsen Reaction and HI Decomposition Systems DRLs
DRL Bunsen Reaction System 1
Bunsen Reactor 2
Contact Device 2
Seals 1
Vessel 1
Three-Phase Separator 1
HI Decomposition Systems 1
Reactive Still 1
Catalyst 1
Contact Device 1
Seals 1
Vessel 1
6.3.2.5 Down-Selection Tasks While one SI flowsheet has been chosen for ultimate development, the conceptual design
phase of the NGNP is still ahead. When that design phase is entered, it is recommended that alternatives be reviewed.
6.3.3 Sulfur Iodine TRLs The three sections of the SI cycle have been demonstrated separately in the laboratory
and in small-scale glass apparatus. However, the three sections tested do not have the same flow sheets as the reference designs for nuclear hydrogen production with the NGNP. The useful results from these tests are the basis for the SI ILS Experiment. For the Bunsen Reaction section, the concepts have been formulated and issues related to performance are identified. General proof-of-principle was demonstrated and critical functions proven. These put the Bunsen section at TRL-3.
The HI Decomposition section of the ILS, however, was a solvent extraction cycle and
not the reference concept, which is reactive distillation. Therefore, the HI Decomposition section remains TRL-2.
In summary, the current TRLs for the Bunsen Reaction and HI Decomposition sections
are evaluated as shown in Table 6-14.

Hydrogen Plant Alternatives Study NGNP-HPS SHAW-HPA Section 6 – Technology Development
NGNP_HPAS_Section_6_Technology Development.doc March 2009
6-32 of 54
Table 6-14: Bunsen Reaction and HI Decomposition Section TRLs
TRL Bunsen Reaction System 3 Bunsen Reactor -- including seals and vessel 3 Three-Phase Separator 3 HI Decomposition Systems 2 Reactive Still -- including catalyst, seals, and vessel 2 Process Coupling Heat Exchanger 5 Power Recovery System 6 Balance of SI Plant 6 Reactor Product Handling Equipment 6 Feed Purification U Product Purification U Helium Control Valves 4 Instrumentation and Controls -- including sensors 6
In Section 8.4.1 may be found detailed rating sheets of the TRLs for the ten SSCs in
Table 6-14 that make up the Bunsen Reaction and HI Decomposition sections.
6.3.4 Technology Development Plan
6.3.4.1 Overview and Road Map The Technology Development Road Map for the Bunsen Reaction and HI Decomposition
is shown in Figure 6-3.
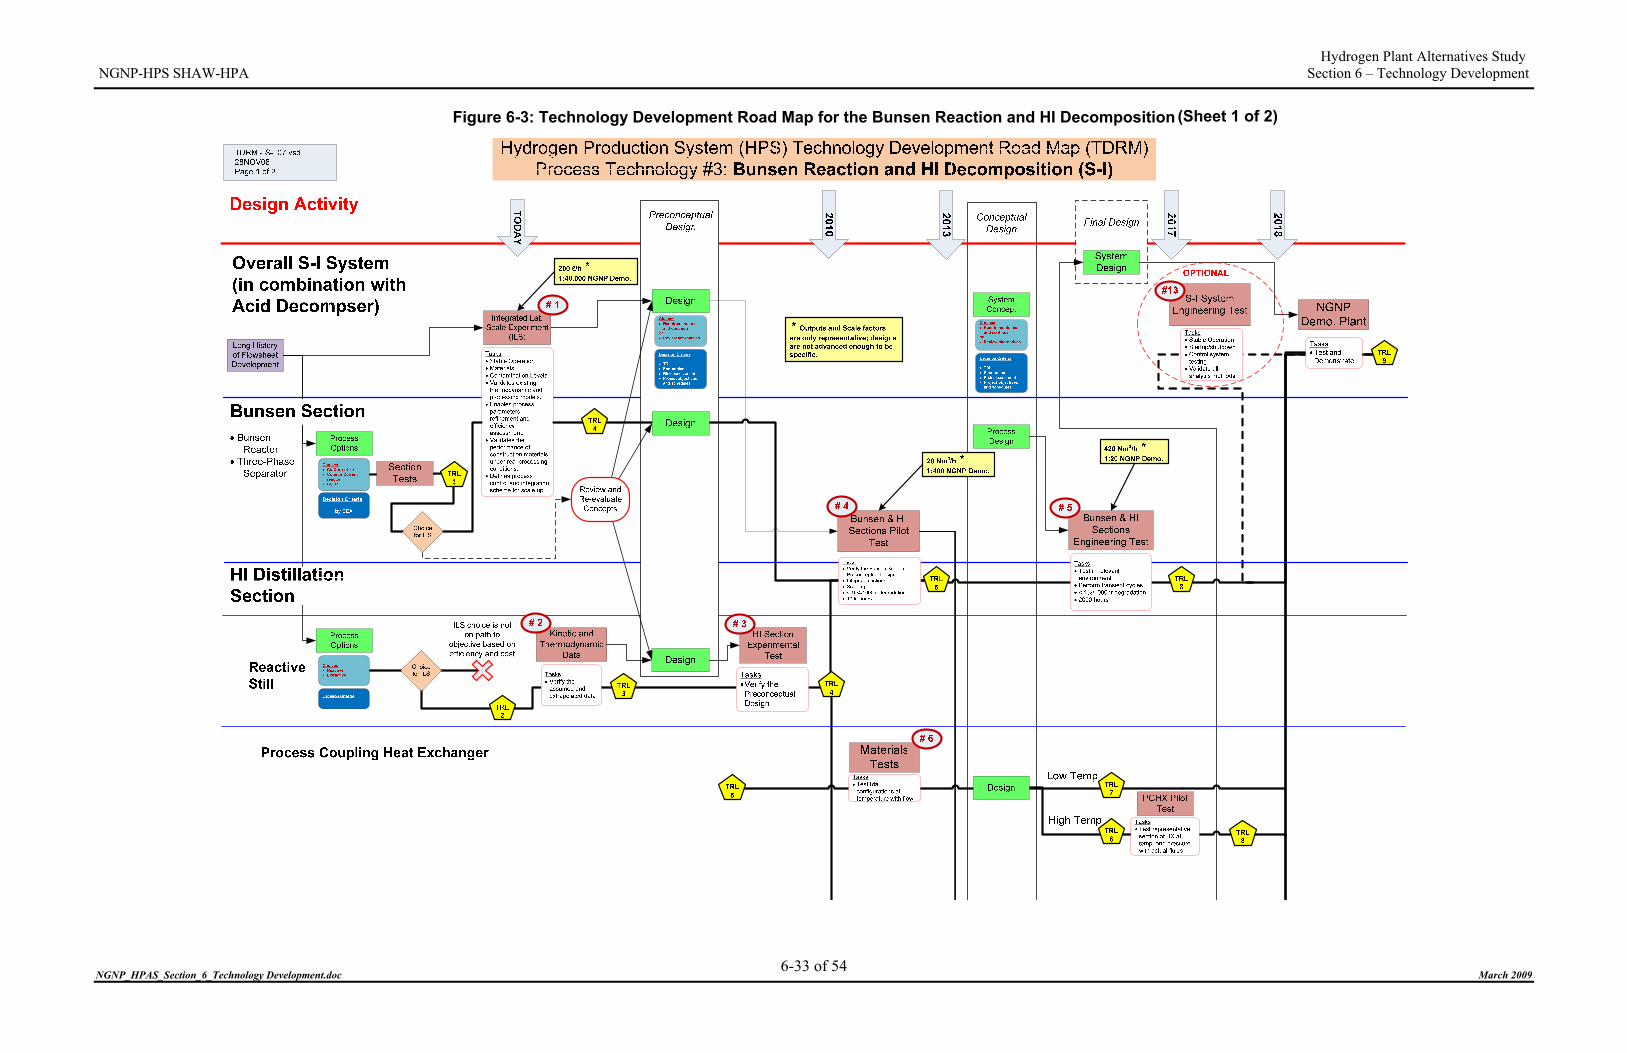
Hydrogen Plant Alternatives Study NGNP-HPS SHAW-HPA Section 6 – Technology Development
NGNP_HPAS_Section_6_Technology Development.doc March 2009
6-33 of 54
Figure 6-3: Technology Development Road Map for the Bunsen Reaction and HI Decomposition (Sheet 1 of 2)

Hydrogen Plant Alternatives Study NGNP-HPS SHAW-HPA Section 6 – Technology Development
NGNP_HPAS_Section_6_Technology Development.doc March 2009
6-34 of 54
Figure 6-3: Technology Development Road Map for Bunsen Reaction and HI Decomposition (Sheet 2 of 2)
Balance of System
Product Purificaion
Instrumentation & Control
Feed Purification SystemDesign FUS
Design PPU
Design I&C
System Modeling
TasksDynamic model of Overall SystemBechmark to data from experimentsSpecify Instrumentation and Control System
TRL 6
TRL U
TRL 8
# 8
#11
Design Data
TDRM - S-I 07.vsd28NOV08Page 2 of 2
# 7
TRL U
# 9
Reactor Products Handling Equipment
Design Materials Test
TasksVerify Material Compatibility
TRL 6
TRL 8
TasksFluid data for phase separtionMaterials data
Helium Control Valves
Design TRL 4
TRL 8
Sensors and InstrumentsTRL
6
Sensor Tests
TasksAssure FunctionalityVerify Material Compatibility
#12
Valve Test
TasksAssure FunctionalityVerify Material Compatibility
#10

Hydrogen Plant Alternatives Study NGNP-HPS SHAW-HPA Section 6 – Technology Development
NGNP_HPAS_Section_6_Technology Development.doc March 2009
6-35 of 54
6.3.4.2 Maturation Plans for Reference Design
6.3.4.2.1 Scope From today’s status, the next step is for the reactive HI distillation concept to be brought
up to the same level of proof of concept that the Bunsen Reaction section design will have reached at the end of the SI ILS Experiment. Following that will be the Preconceptual Design of a flowsheet and components that will meet the performance goals of the NGNP. The steps to TRL-8 will then be successive tests of scaled-up assemblies.
The Preconceptual Design will lead to experimental-scale tests of the Bunsen Reaction
section and the HI Decomposition section separately to demonstrate progress in basic unit operations and to confirm the design. The two sections will then be combined for integrated operation into a pilot-scale test, the results of which will support Conceptual Design.
The next juncture on the Road Map is a Bunsen & HI Sections Engineering Scale Test.
This test should bring these sections of the SI HPS to readiness for the NGNP Demonstration where they would then be combined with the Sulfuric Acid Decomposition section. However, if necessary, the next step could be a SI System Engineering Prototype Test including the Sulfuric Acid Decomposition Section.
Scale-up proposed for planning purposes and shown in the TDRM is approximately as
follows:
� ILS to Pilot x 100 � Pilot to Engineering x 20 � Engineering to NGNP Demonstration Plant x 20 � NGNP Demonstration Plant to NGNP Commercial Plant x 10
6.3.4.2.2 Specific Steps in the Road Map The following are brief descriptions of the objectives of the thirteen steps shown with
numbered ovals on the TDRM.
SI ILS Experiment (#1) This is a presently ongoing system test. The apparatus has advanced from glass
laboratory assembly to metal and SiC in contact with the process fluids. A major distinction of this experiment is that the HI Distillation section is not of a design that appears to be feasible in a commercial application because of the low overall system efficiency. Therefore, this system test advances only the Bunsen section to TRL-4. The development skips TRL-3 since operation in the SI ILS accomplishes both proof of concept and demonstration of technical functionality.

Hydrogen Plant Alternatives Study NGNP-HPS SHAW-HPA Section 6 – Technology Development
NGNP_HPAS_Section_6_Technology Development.doc March 2009
6-36 of 54
Kinetic and Thermodynamic Data (#2) In order to design the HI reactive distillation section, the reaction kinetic and
thermodynamic data is required. At this point in development of the reactive distillation option, thermodynamic and mass transfer data have been approximated and/or extrapolated. The cycle requires work input, in the form of electric power, and the calculation of this is indeterminate without more reliable data. Gathering this data fulfills the TRL-3 criterion to prove analytical and experimental critical function and/or characteristic in the laboratory.
HI Section Experimental Test (#3) Following Preconceptual Design, an experimental scale design verification test of the HI
Decomposition section will advance it to TRL-4. It falls short of TRL-5 because without the Bunsen section the test is not in a relevant environment.
Bunsen & HI Sections Pilot Test (#4) Before Preconceptual Design, the results of the SI ILS will be reviewed. Following
Preconceptual Design, further maturation requires a test of the Bunsen section combined with the reactive distillation HI section. Separate tests would not be adequate because of the high interchange of I2 and HI between the sections during operation. This test assembly would be equivalent in scale to an HPS producing about one half gram/second of hydrogen. This test will provide the data for SI HPS Conceptual Design, and the test size is the minimum that would provide confidence to proceed with the system design.
The goal of this test is 1000 hours of operation with production on the order of 20 Nm3 of hydrogen per hour and stability of less than 10% decline per 1000 hours.
Bunsen & HI Sections Engineering Test (#5) The design and experimental iterative process will continue according to the design
resulting from the Conceptual Design. This test assembly would be equivalent in scale to an HPS producing about ten grams per second of hydrogen. The assembly will be tested in the full operating conditions at the required temperatures and pressures for dynamics, startup, shutdown, emergencies, etc. The test assembly would include designed seals, valves, and instrumentation sensors, and the testing would provide design verification for the Final Design exercise.
The goal of this test is 2000 hours of operation with production on the order of 420 Nm3
of hydrogen per hour and stability of less than 1% decline per 1000 hours. This completes the maturation of the Bunsen Reaction and HI Decomposition sections to
TRL-8.

Hydrogen Plant Alternatives Study NGNP-HPS SHAW-HPA Section 6 – Technology Development
NGNP_HPAS_Section_6_Technology Development.doc March 2009
6-37 of 54
Process Coupling Heat Exchanger Tests (#6) This heat exchanger is conventional and will require materials compatibility testing at the
temperatures and pressures at which it will operate. If necessary, a pilot assembly of the PCHX would be tested at sub-scale but with appropriate similitude at its high temperature operational environment. Further definition of these tests requires the completion of design.
Bunsen Reactor Products Handling Equipment (#7) Basic fluid data and materials compatibility data are needed for the various compositions
of iodine and HI. No specific equipment handling technology development is intended. Materials’ testing after the designs are established advances this technology to TRL-8.
Feed Purification System Demonstration Test (#8) Design of the water purification system of the FUS needs to mitigate the effects of
various contaminants on the Bunsen and HI decomposition reactions. Concern is with impurities dissolved in iodine that build up in the system or precipitate out at the liquid/liquid interface. Without requirements the scope of development of this SSC is uncertain.
Product Purification System Demonstration Test (#9) The overall system design must assure that the hydrogen product purity requirements are
realized. The concern is iodine presence in the hydrogen. In theory it could be removed, but this would have to be demonstrated convincingly before the hydrogen could be put into any pipeline. Without requirements the scope of development of this SSC is uncertain.
Valve Test (#10) The valves that control the flow of high-temperature helium in the NHSS SHTS between
either series or parallel PCHXs are part of the HPS. The number of valves is dependent on the process, either SI or HyS, and on the scale of eventual application. These valves are not anticipated to be new technology, but they are critical SSCs because there is no recent industrial experience with such valves. The valves will need verification testing. These do not need to be full-scale valve tests, but they should be prototypic in form to the ultimate application, and therefore experience with smaller valves will not apply. Once the technology is validated at the pressures and temperatures of the NGNP application, the TRL will advance from a ranking of 4 to 8.
System Modeling (#11) Instrumentation and Control (I&C) requires design verification that can be accomplished
by analysis. The model will use data from the Bunsen & HI Sections Pilot Scale Test. Since the HPS is made of discrete thermal-hydraulic components connected by piping, the demonstration
Hydrogen Plant Alternatives Study NGNP-HPS SHAW-HPA Section 6 – Technology Development
NGNP_HPAS_Section_6_Technology Development.doc March 2009
6-38 of 54
of integrated operation can be done by computer simulation given input of the performance of the discrete components in prototype or pilot testing in their operational environments. Results will be input to the final System Design.
A specific I&C concern is interface measurement and control of the liquid/liquid
interface in the three phase separator and elsewhere in the system. There is a need to test available methods of interface determination and assess their effectiveness. If none were suitable, a new technology might have to be developed.
Completion of system modeling will constitute demonstration of the I&C System, and so
the I&C System advances to TRL-8.
Sensor Tests (#12) Thermocouples, pressure sensors, and other instruments need to be qualified for the
operational environment they will experience. New technology is not expected to be required as the sensors would have been operated in relevant environments. Scale does not particularly apply to sensors, and so prior to testing they could be TRL-5, TRL-6 or TRL-7. The middle value is chosen arbitrarily. After successful testing the sensors are TRL-8.
SI System Engineering Prototype Test (#13) This test is not considered useful to advance the technology because the separate testing
of the Acid Decomposer and the combined Bunsen & HI Sections in the engineering scale could assure TRL-8. It is included as an option in the case that an integrated SI system HPS assembly is required. Depending on design work yet to be done, the test will be built for input power of about 2.5 MWth, which is 1/20 of the minimum commercial scale and 1/200 of the ultimate commercial plant scale. This test assembly would be producing about 10 grams/second of hydrogen.
6.3.4.2.3 Schedule and Cost The cost and schedule for the Bunsen Reaction and HI Decomposition technology
development are summarized in Table 6-15. The cost and completion years are keyed to stages along the Road Map as indicated by the step numbers, which correlate to the numbers in red ovals on the TDRM.

Hydrogen Plant Alternatives Study NGNP-HPS SHAW-HPA Section 6 – Technology Development
NGNP_HPAS_Section_6_Technology Development.doc March 2009
6-39 of 54
Table 6-15: Cost and Schedule for the Bunsen Reaction and HI Decomposition Technology Area
TRL Achievement Step Numbers from TDRM Cost Completion
Up to completion of S-I ILS –Bunsen: TRL-2�4 #1 - -
HI Section Experimental Test – HI: TRL-1�4 #2, #3 3.0 $M
2010
Bunsen and HI Systems Pilot Test – TRL-4�5 #4 43.0 $M
2013
Bunsen and HI Systems Engineering Test – TRL-5�8 #5, #6 58.0 $M
2017
(#13) Test is not needed, but .
if done at scale of NGNP Demo
(Prototype HPS Test: Sulfuric Acid, Bunsen & HI Sections - optional)
if done using duplicate of previous Engineering Test (or actual hardware)
(140.0 $M) ( 15.0 $M)
2018
Balance of system design verification – TRL-x�8 #7, #8, #9, #10, #11, #12 8.1 $M
6.3.4.2.4 Maturation Plans for Alternatives Presently there are no plans for alternative SI HPS designs. Although, there will be a
review of all design choices at the beginning of the Preconceptual Design phase. This review could generate an alternate path in the development road map for the Bunsen Reaction and HI Decomposition technologies.
6.4 HIGH TEMPERATURE STEAM ELECTROLYSIS
The HTSE process has been discussed in Sections 2 and 3. The overall HTSE system is divided into four major systems, as shown below, with the principal systems and major components itemized for each.
� Electrolyzer System (ELE)
o Electrolyzer Modules � Solid Oxide Electrolysis (SOE) Cells � Other Electrolyzer Module Internals
o Process Coupling Heat Exchangers

Hydrogen Plant Alternatives Study NGNP-HPS SHAW-HPA Section 6 – Technology Development
NGNP_HPAS_Section_6_Technology Development.doc March 2009
6-40 of 54
o Piping, Manifolds & Insulation � Heat Recovery System (HRS)
o Heat Exchangers o Recirculator
� Feed & Utility System (FUS) o Feed Purification Systems o Sweep Gas Turbine
� Product Purification System (PPU) Process flow diagrams for the HTSE HPS are shown in Section 8.3.3.
6.4.1 Functions and Operating Requirements The HTSE HPS accepts heat from the plant NHSS. Heat is provided to the PCHXs of the
HTSE ELE system by the helium circuit of the NHSS SHTS. The HPS also takes electric power from the plant PCS and imports additional electric power from the offsite electric grid through the BOP.
The HPS gets process feed water from the BOP, the water is further purified for use in
the HPS. The heat and electric energy converts the feed water into hydrogen and oxygen gas. The hydrogen is directly provided to a pipeline for export after drying, and the oxygen is vented to the atmosphere in the form of oxygen enriched air after drying. Wastewater streams are released to the environment after treatment.
Hydrogen production occurs in the ELE. Functions of the other major systems that
comprise the HTSE HPS are implied from their names: Heat Recovery System, Feed & Utility System and Product Purification System.
Operating requirements are to meet project requirements with respect to safety,
availability, product output, and environmental impact in accordance with the overall plant design. Therefore, cell and stack performance must be safe and meet the economic target of the project. Minimum requirements to accomplish this are:
� Oxygen-rich and hydrogen-rich environments must not communicate with one
another; � Cell area-specific resistance should be minimized; � Cell current density should be maximized; � Electrical potential between contiguous stack sections must be minimized; � Flow distribution among cells, stacks of cells, and modules must be equalized; � Sweep gas requirements should be minimized; � Transfer adequate heat to the operating cells and maintain them at the required
operating temperature; � Maximize energy recuperation within practical engineering limits;
Hydrogen Plant Alternatives Study NGNP-HPS SHAW-HPA Section 6 – Technology Development
NGNP_HPAS_Section_6_Technology Development.doc March 2009
6-41 of 54
� Purify the feed water and sweep gas to the extent required by economical cell operation;
� Purify the products to the extent required by the customer; � Treat waste streams to the extent required by applicable environmental regulations,
and; � Design the plant so that it can be operated in a safe manner and operate the plant in a
safe manner in accordance with the design. Further specific statements of functions and requirements of the HTSE HPS will result
from the Conceptual Design.
6.4.2 Development Status The most advanced concept for an HTSE HPS is the process described in Section 2.
Although much work has been carried out in the design of bench-scale cells and stacks, significant work has yet to be done in the design of commercial scale cells, stacks, and modules. Future technology development must work to arrive at a practical initial concept. There are four areas for which HTSE electrolyzer issues must be addressed:
� Individual SOECs:
o Maximize current density and minimize area specific resistance. o Seal the cells such that the hydrogen-rich side does not communicate with
the oxygen-rich side in spite of differences in thermal expansion coefficient between cell components.
o Avoid cell de-lamination in spite of differences in thermal expansion coefficient between cell components.
o Optimize resistance to flow of the feed and sweep gases. o Minimize or eliminate the need for sweep gas.
� Stacks of cells: o Equalize the resistance to flow through the cells such that individual cells
are neither flooded with nor starved of feed steam. This may be an issue of control of variability in the manufacture of cells.
o Minimize the electric potential between contiguous sections of the stack. o Seal the edges of the stacks to the manifolds such that hydrogen-rich and
oxygen-rich environments do not communicate. o Maintain electrical connectivity between the power supply and the cell
stacks and between cells within the enclosure environment. o Maintain adequate mechanical force on the stack to hold the inter-cell
seals within the enclosure environment. � Enclosure of the stacks:
o Optimize the operating pressure of the stacks. The higher the operating pressure, the lower product and sweep gas compression requirements. On the other hand, high operating pressures pose difficult sealing and safety issues.
Hydrogen Plant Alternatives Study NGNP-HPS SHAW-HPA Section 6 – Technology Development
NGNP_HPAS_Section_6_Technology Development.doc March 2009
6-42 of 54
o Maintain the required operating temperature of the stacks while minimizing heat losses
� System design o Low current density in the cells requires that very large cell area is
required for a commercial installation. This, in turn, requires a large number of modules, each of which is a high pressure vessel operating at very high temperatures. There are 76 modules included in the preconceptual design.
o The plant layout must be devised so as to minimize piping run length and pipe growth due to thermal expansion. A 1½% to 2% (2m/100m) growth from ambient to operating temperature is expected. Moreover, adequate access for repair and replacement of modules must also be provided.
o Pressure drop in the feed lines must be limited to ensure adequate distribution among the modules.
6.4.2.1 Solid Oxide Electrolysis Cells The SOECs have been developed to a “laboratory” or “bench scale” level and the
electrolyzer stacks have been designed and tested to the degree necessary to demonstrate feasibility and functionality at low pressure. Commercial scale cell and stack concepts have received only very preliminary attention. Electrolyzer enclosure concepts and development of the overall process, including heat recuperation also have received little attention. All of these elements interact with one another and need to be part of the technology development effort.
Candidate Concepts The SOEC’s are in the early stages of conceptual development using stacked individual
planar cells with peripheral feed supply and product removal. An alternative is tubular cells[Ref.40]. The tubular configuration appears to have inferior current and fluid flow access and an inherently lower packing density. However, the tubular design should be considered as a back-up to be revisited in the event difficulties with planar cells occur in the manufacturing, sealing, or module assemblies. Electrode materials and electrolyte materials have been chosen, but alternative materials continue to be considered.
Sealing concepts have been developed and tested in the partial stack tests. They will be
further tested in the HTSE ILS. Sealing problems are connected with cell size and issues surrounding assembling cells into modules. Refinements are expected in the course of development.
The most significant issue is the size of the planar cell. The cells are now sized based
upon a rectangular electrolyte 100 mm on a side. If physical limits – particularly differential thermal expansion – permit, the cells need to be scaled up to 500 mm on a side to approach commercial economic viability. This size has been selected for the design in Section 3 of this report.

Hydrogen Plant Alternatives Study NGNP-HPS SHAW-HPA Section 6 – Technology Development
NGNP_HPAS_Section_6_Technology Development.doc March 2009
6-43 of 54
6.4.2.2 Decision Discriminators Decisions regarding the size and configuration of the cells include individual cell
performance: primarily current density, area specific resistance and resistance to flow.
6.4.2.3 Reference Design for Hydrogen Alternative Study HTSE process and design used as a reference for this Technology Development analysis
has been presented in Section 3.
6.4.2.4 DRLs The HTSE HPS is at an early design stage with numerous developmental issues yet to be
resolved. The HTSE system design is based on the high temperature SOEC in development at INL. The Electrolyzer Unit general configuration and principal features have been selected from alternatives and materials chosen for further development work. Cost and requirements analyses are in progress as part of the initial phase of Conceptual Design. Therefore, the ELE System is considered DRL-2.
The remainder of the overall system is only at the preconceptual stage (i.e., DRL-1). A
summary of the HTSE HPS DRLs is shown in Table 6-16.
Table 6-16: High Temperature Steam Electrolysis DRLs
DRL
Overall HTSE HPS 1
ELE System (Electrolysis System) 1
Electrolyzer Module 1
SOE Cells 2
Internal Manifolds 2
Seals 2
Vessel 1
Sweep Gas Coupling Heat Exchanger 1
Helium control valves 1
Process Side Control Valves 1
Process Coupling Heat Exchanger 1
Helium control valves 1
Process Side Control Valves 1
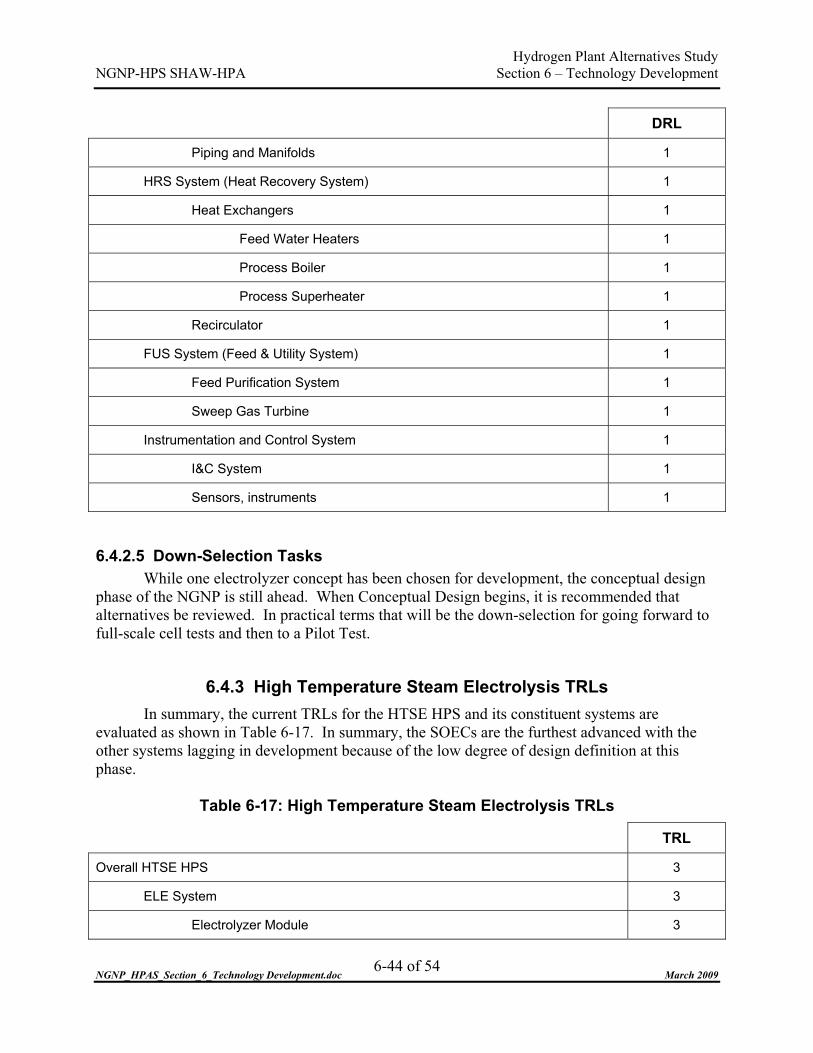
Hydrogen Plant Alternatives Study NGNP-HPS SHAW-HPA Section 6 – Technology Development
NGNP_HPAS_Section_6_Technology Development.doc March 2009
6-44 of 54
DRL
Piping and Manifolds 1
HRS System (Heat Recovery System) 1
Heat Exchangers 1
Feed Water Heaters 1
Process Boiler 1
Process Superheater 1
Recirculator 1
FUS System (Feed & Utility System) 1
Feed Purification System 1
Sweep Gas Turbine 1
Instrumentation and Control System 1
I&C System 1
Sensors, instruments 1
6.4.2.5 Down-Selection Tasks While one electrolyzer concept has been chosen for development, the conceptual design
phase of the NGNP is still ahead. When Conceptual Design begins, it is recommended that alternatives be reviewed. In practical terms that will be the down-selection for going forward to full-scale cell tests and then to a Pilot Test.
6.4.3 High Temperature Steam Electrolysis TRLs In summary, the current TRLs for the HTSE HPS and its constituent systems are
evaluated as shown in Table 6-17. In summary, the SOECs are the furthest advanced with the other systems lagging in development because of the low degree of design definition at this phase.
Table 6-17: High Temperature Steam Electrolysis TRLs
TRL
Overall HTSE HPS 3
ELE System 3
Electrolyzer Module 3
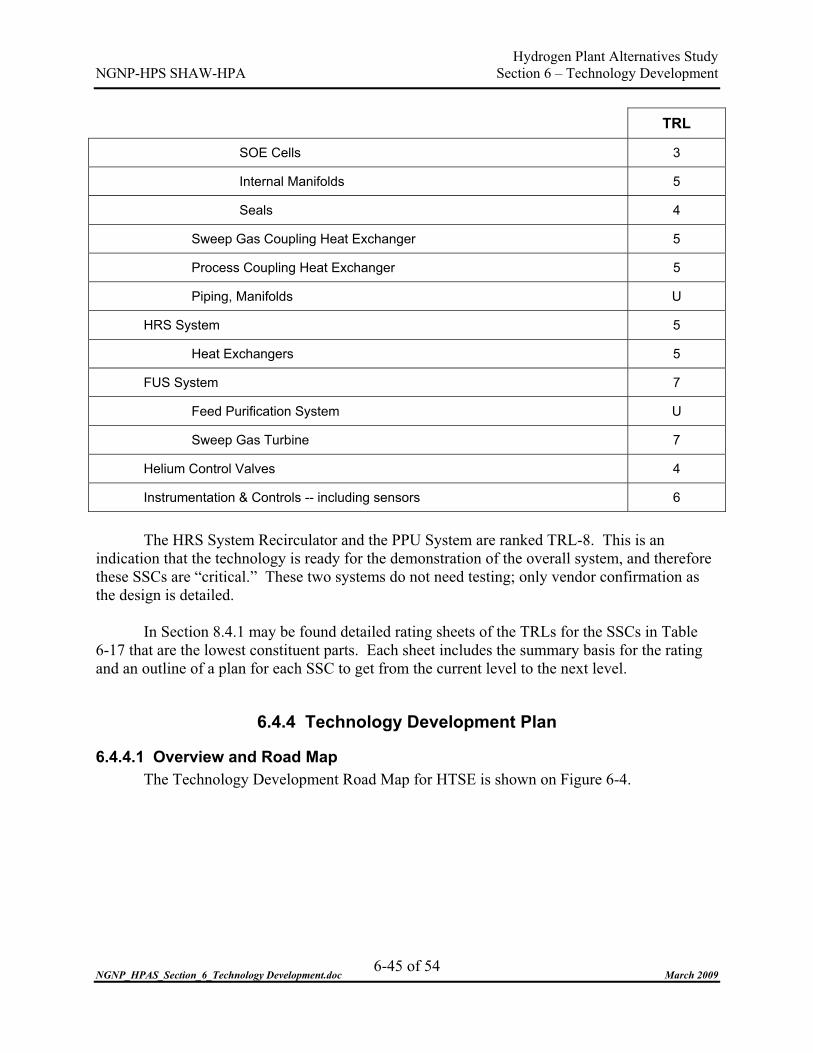
Hydrogen Plant Alternatives Study NGNP-HPS SHAW-HPA Section 6 – Technology Development
NGNP_HPAS_Section_6_Technology Development.doc March 2009
6-45 of 54
TRL
SOE Cells 3
Internal Manifolds 5
Seals 4
Sweep Gas Coupling Heat Exchanger 5
Process Coupling Heat Exchanger 5
Piping, Manifolds U
HRS System 5
Heat Exchangers 5
FUS System 7
Feed Purification System U
Sweep Gas Turbine 7
Helium Control Valves 4
Instrumentation & Controls -- including sensors 6
The HRS System Recirculator and the PPU System are ranked TRL-8. This is an
indication that the technology is ready for the demonstration of the overall system, and therefore these SSCs are “critical.” These two systems do not need testing; only vendor confirmation as the design is detailed.
In Section 8.4.1 may be found detailed rating sheets of the TRLs for the SSCs in Table
6-17 that are the lowest constituent parts. Each sheet includes the summary basis for the rating and an outline of a plan for each SSC to get from the current level to the next level.
6.4.4 Technology Development Plan
6.4.4.1 Overview and Road Map The Technology Development Road Map for HTSE is shown on Figure 6-4.

Hydrogen Plant Alternatives Study NGNP-HPS SHAW-HPA Section 6 – Technology Development
NGNP_HPAS_Section_6_Technology Development.doc March 2009
6-46 of 54
Figure 6-4: Technology Development Road Map for High Temperature Steam Electrolysis
Hydrogen Production System (HPS) Technology Development Road Map (TDRM)Process Technology #4: High Temperature Steam Electrolysis (HTSE)
NGNP Demo. Plant
TRL9
Tasks
Test and Demonstrate
ELE System Engineering
Prototype TestTasks
Run multiple Electrolyzer ModulesVerify control system
OPTIONAL
TasksTest and Demonstrate< 1%/1000hr degradation2000 hours
TRL7
Overall System
ELE
Electrolyzer Module
Test at pressure?
no
yes
Operational environment?
Modes and duration?
no
yes
Electrolysis Cells
Integrated Lab Scale Experiment
(ILS)Cell Stack
Demonstrations
TasksPerformance stabilityInterconnectionsCell sealingFlow distribution
Cell Demonstration (partial stack)
TRL3
TasksPerformance stabilityInterconnectionsCell sealingFlow distribution
Decision Criteria
Buildable?
Cell Demonstration (button)
Tasks
Electrolyte performanceElectrode performacne
TRL2
Cell Design
Choices
Planar vs. tubularElectrode materialsElectrolyteSealing Technique
Decision CriteriaBuildable?
Electrolyzer Design
ChoicesPlanar vs. tubularElectrode materialsElectrolyteSealing Technique
System Concept
Sweep gas and configurationAdded heat or “autothermal”
Preconceptual Design
Conceptual Design
Decision CriteriaAt maximum heat input is it feasibleTubular may mean a penalty in efficiency in order to get a system that can be built at a reasonable scale.
Electrolyzer Re-Design
Redesign for 15x15 or 20x20 or 50x50Input from materials testsInput from ILS
Electrolyzer “Pilot” Test
# 1
#14
# 5
TDRM - HTSE 07.vsd28NOV08Page 1 of 2
Design Activity
Internal Manifolds
Full-scale Cell Demo. (partial
stack)Tasks
Performance stabilityInterconnectionsCell sealingFlow distributionThermal expansion
Final Design
Full-scale Stack Demonstrations
System Design
# 3
# 4
TRL5
TasksPerformance stability < 10%/1000hr degradationInterconnectionsCell sealingFlow distribution500 hours
Decision CriteriaMaximize Efficiency
Fabrication Development
TRL8
TRL5
TasksPerformance stabilityInterconnectionsCell sealingFlow distribution< 10%/1000hr degradation1000 hours
4000 �/h *1:2500 NGNP Demo.
50 Nm3/h * 1:200 NGNP Demo.
* Outputs and Scale factors are only representative; designs are not advanced enough to be specific.
TasksTest pressurized
Alternate Cell Tets (partial stack)
TasksPerformance stabilityInterconnectionsCell sealingFlow distribution
TRL 4
Seals TRL4
TRL6
# 2
Tasks< 1%/1000hr degradation2000 hours
Tasks< 1%/1000hr degradation2000 hours
Continuing Cell Testing
Tasks
Lifetime and performance stability confirmation
#15
(Sheet 1 of 2)
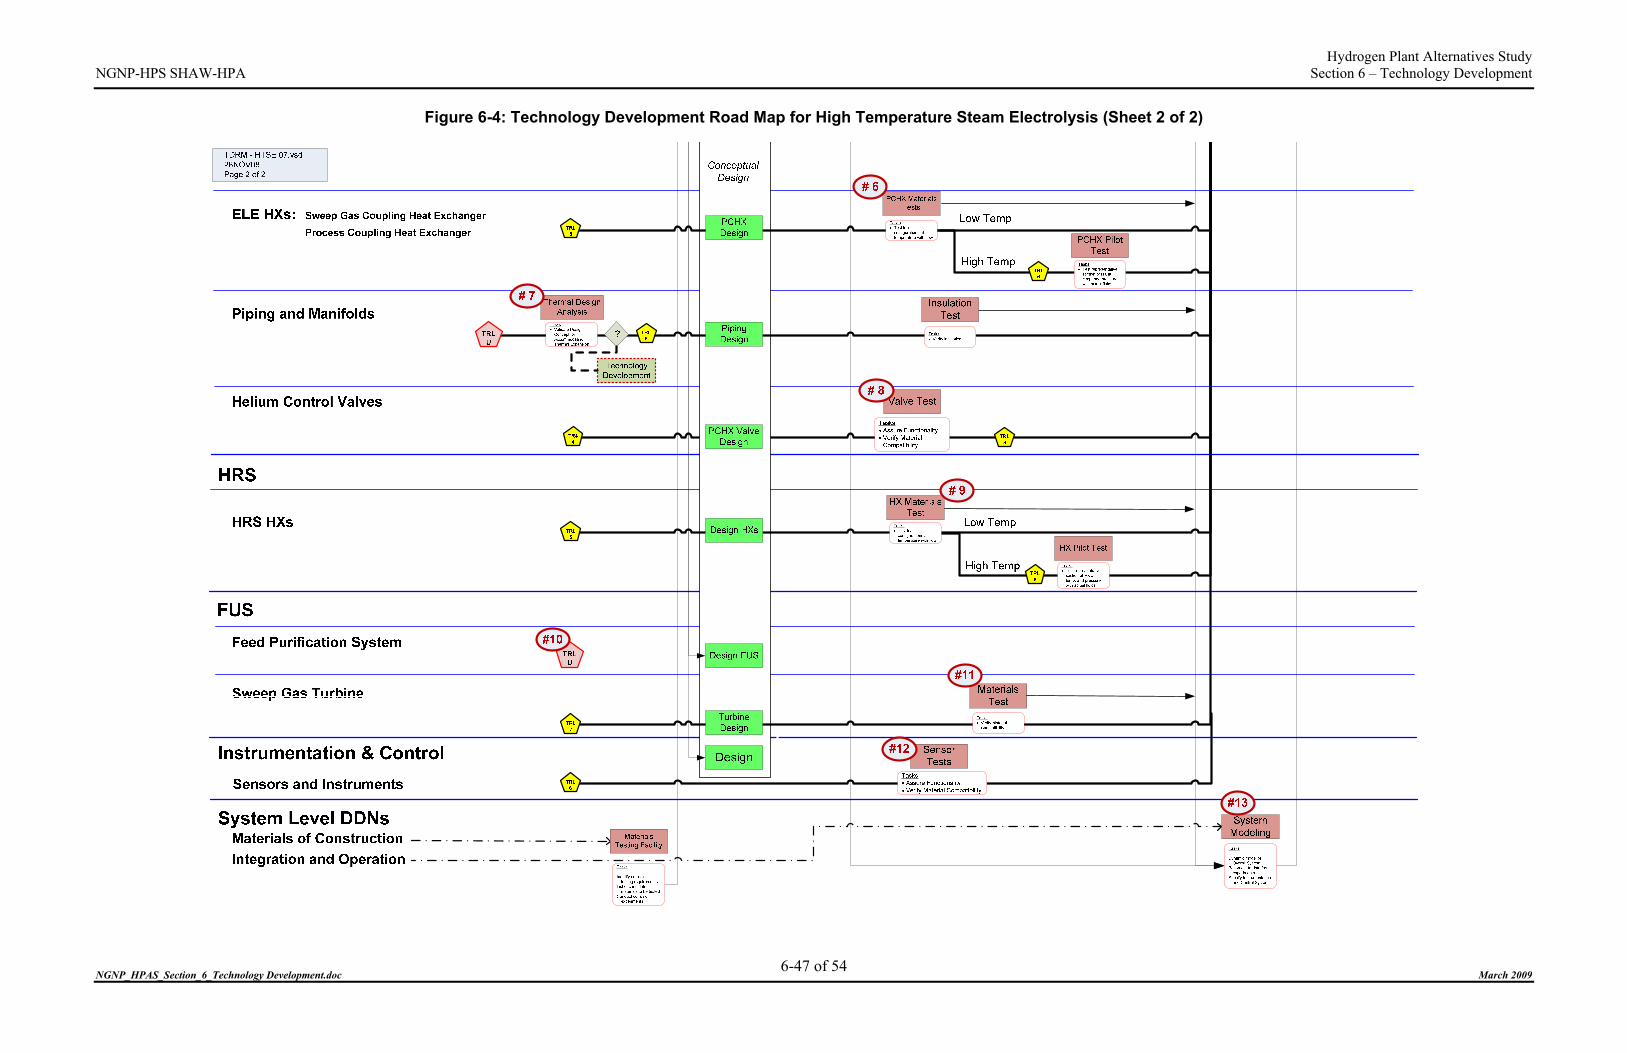
Hydrogen Plant Alternatives Study NGNP-HPS SHAW-HPA Section 6 – Technology Development
NGNP_HPAS_Section_6_Technology Development.doc March 2009
Figure 6-4: Technology Development Road Map for High Temperature Steam Electrolysis (Sheet 2 of 2)
6-47 of 54

Hydrogen Plant Alternatives Study NGNP-HPS SHAW-HPA Section 6 – Technology Development
NGNP_HPAS_Section_6_Technology Development.doc March 2009
6-48 of 54
6.4.4.2 Maturation Plans for Reference Design
6.4.4.2.1 Scope The critical path through the TDRM toward maturation of the technologies pertaining to
the HTSE HPS follows the following course. The maturation plan can not be more precise because of the early stage of design and of
the low TRLs today. The present phase is between preconceptual and conceptual design with supporting development at laboratory or bench scale. In those circumstances, design and development are in a chicken-or-the-egg relationship. Although we identify steps, mainly experiments and tests, to advance the technology, these can not be more definitely specified until the designs advance further. In some cases, whether the test is really necessary or if the technology is already nearly ready (i.e., TRL-6, -7 or -8) cannot be decided until after the design details are done.
The above describes the appropriate cycle of design and development, where initial
concepts frame technical issues and produce DDNs. The technology is then developed to answer the need and the design moves to further detail. The continued design effort raises more technical uncertainties. More DDNs are written and through development testing technology moves ahead. This circuit is repeated numerous times maturing as it goes. In the current case of HTSE technology, the process is between preconceptual and conceptual design and at a low degree of technical maturity.
Note that the TDRM and maturation plans will need to be adjusted as new DDNs evolve
as part of the conceptual and final designs.
Advance the Electrolyzer Module The Materials Test Facility is in operation, and the ILS Experiment is running. The
electrolyzers are presently at TRL-4. Their feasibility and functionality having been proved in earlier partial cell stack tests, but the specific issue of stable operation needs to be resolved in the ILS test.
The successful completion of the ILS Experiment will support the overall system
conceptual design, which will include SOE cell and Electrolyzer Module re-design. At this point, the cell production will be re-engineered to meet the requirements of cell area scale-up, and a round of fabrication development tasks can be anticipated.
Scale-up proposed for planning purposes and shown in the TDRM is approximately as
follows: � ILS to Pilot x 13 � Pilot to NGNP Demonstration Plant x 200 � NGNP Demonstration Plant to NGNP Commercial Plant x 10
Hydrogen Plant Alternatives Study NGNP-HPS SHAW-HPA Section 6 – Technology Development
NGNP_HPAS_Section_6_Technology Development.doc March 2009
6-49 of 54
This conceptual design will be followed by electrolyzer internal component tests for internal manifolds and connectors and cell stack tests of the new cell design. With completion of these tests, the Electrolyzer Module will attain TRL-5.
The next task is final design and testing of a prototypical Electrolyzer Module in
operational conditions. In the Pilot Test of the unit, the TRL will advance to TRL-6, -7 and -8 as tasks identified are accomplished. Because in the ultimate application they are highly modular, testing of one full-scale Electrolyzer Module satisfies the scale requirement to reach TRL-8.
Advance the ELE Heat Exchangers Two heat exchangers interface with the NHSS. These are the Process Coupling Heat
Exchanger and the Sweep Gas Coupling Heat Exchanger. The former transfers heat from the SHTS helium to the HPS sweep gas (i.e., the electrolyzer anode input flow) and the latter transfers heat from the SHTS helium to HPS process feed (i.e., the electrolyzer cathode input flow).
As conceived thus far, these heat exchangers are not novel technology. Although, there
is no significant similar experience at the temperatures and pressures of the superheating sections. Materials testing will advance these heat exchangers to TRL-6 or -8. The latter will be achieved if tested at operational conditions and at suitable scale. If only the former, then a separate pilot test is an alternative to assure TRL-8.
These heat exchangers have requirements for valves on the process side at the inlet and
the outlet. In addition, there is a requirement for valves or other flow balancing components on the colder helium side to assure proper division of helium flow to the heat exchangers. These valves are not considered items requiring technology development based on the definition of the design at this stage. As system functional requirements are clarified and design proceeds, there could be DDNs for these valves that lead to development tasks on the TDRM.
Advance the ELE Piping and Manifolds Piping and manifolds have a severe duty to accommodate significant differential thermal
expansion because of the very high fluid temperatures. Piping very high temperature gas to several dozen cell modules will be an extremely difficult problem. Thermal expansion of the pipe is expected to be from 1 ½ to 2 %. Pipe runs will be on the order of 100+ meters. The growth that must be accommodated is therefore about 2 m. Absorbing this amount of expansion in very high temperature piping has not been done commercially and a design for this requirement is not at hand. It is not possible to say the technology has reached “proof-of-principle.”
Piping and manifolds on the process circuit will require thermal insulation to assure the
efficiency of the overall system. The concept for this insulation needs to be determined, particularly when the insulation is integrated with the thermal expansion features. There would clearly be a trade-off between efficiency, internal insulation, external insulation, operating
Hydrogen Plant Alternatives Study NGNP-HPS SHAW-HPA Section 6 – Technology Development
NGNP_HPAS_Section_6_Technology Development.doc March 2009
6-50 of 54
temperature of the external surface and pipe material. If internal insulation is used, a concern is the fact that the lines carry steam and are subject to condensation as the vapor cools in the insulation. This is a design problem that needs to be addressed before the degree of technology development can be fully assessed.
When designed there is an insulation test for design verification of the resulting
configuration and move it to TRL-8.
Advance the Heat Recovery System The recuperative heat exchangers of the HRS System, like the ELE heat exchangers, will
be operating at higher temperature and pressure than current-state-of-the-art. A materials test can advance these to TRL-8 directly, or a pilot test may be needed.
Advance the Feed & Utility System The FUS System has two main parts. The Feed Purification System is likely to be critical
to the stable operation of the cells. Results from the ILS Experiment will clarify the design requirements for this system.
The Sweep Gas Turbine is a standard turbomachine. Vendor design verification of
compatibility of the materials of construction with air/oxygen mixture will give it TRL 8.
6.4.4.2.2 Specific Steps in the Road Map The following are brief descriptions of the objectives of the fifteen tests shown with
numbered ovals on the TDRM.
ILS Experiment (#1) The ILS is a first assembly intended to demonstrate performance of the HTSE process in
realistic conditions at or near temperatures needed for system feasibility[Ref. 41]. Test objectives are closed-loop operation with good flow distribution and heat transport performance, stable operation for extended periods of operation or, if not, identification of degradation and/or failure mechanisms and results on materials compatibility testing.
Alternate Cell Testing (#2) Following the HTSE ILS, there will be a new development activity in the main “Road.”
It will entail testing of all ceramic, electrode-supported cells, which being metal-free may resolve some “poisoning” issues such as the suspected effect of displaced chromium. Cell designs to be considered are being developed for Solid Oxide Fuel Cells by Saint-Gobain, originally by Forschungszentrum Jülich, and NASA-Glenn Research Center. Accomplishment of this step will result in TRL-4.

Hydrogen Plant Alternatives Study NGNP-HPS SHAW-HPA Section 6 – Technology Development
NGNP_HPAS_Section_6_Technology Development.doc March 2009
6-51 of 54
Full-scale Cell Demonstration (#3) Cells will be scaled-up in cross section in the Conceptual Design. Following that the re-
designed cells will be tested. Long-term, stable operation will be the test objective.
Full-scale Stack Demonstration (#4) A stack of the scaled-up cells will be tested. The goal of this test is 1000 hours of
operation stability of less than 10% degradation per 1000 hours. Combined with the demonstration of an Electrolyzer Module in the ILS, this will advance
the technology to TRL-5.
Pilot Test (#5) The purpose of the Pilot Test is to generate data needed to confirm or fine tune the design
and to provide confidence to go on to the first application. The currently planned INL pilot test[Ref. 42] may be this test, although the scope and scale of the test as presently planned appears to be less than what is proposed in the TDRM.
The HTSE Electrolyzer Pilot Test in reality would be most likely a series of tests with
more-or-less the same test article design. The Pilot Test is intended to move the technology beyond TRL-5. It begins with the completion of the cell and cell stack tests of the SOEC re-designed for full sized cells, which are assumed for the purpose of the TDRM to be 500 mm x 500 mm in nominal area. The actual active cell surface area is approximately 2,300 cm2.
To reach TRL-8, an SSC must be a prototype, being as close as possible to the form, fit,
and function for final application. It also must be close to full scale, that is no less than approximately ¼ scale, and rigorously tested in its operational environments. Since feed purity is anticipated to be an issue influencing cell performance stability, the testing includes an appropriately sized water purification and deaeration system configured in the design for the NGNP Demonstration plant. It should also test variability of gas distribution by varying the flow of sweep gas and steam/hydrogen to this module.
The test article is to be prototypical of the Electrolyzer design progression to that stage
based on the Conceptual Design of the component. It would ultimately be a complete modular unit of the form and size intended for final application. Although the initial tests in the series might use fewer than the design number of cells in the stacks or fewer stacks than the final arrangement. Therefore, the scale of the Pilot Test is 100%.
What then needs to be demonstrated in order to reach TRL-8 is sufficient performance in
operational environments. Testing in the ILS will be testing of the 100 mm cells at temperature and flows but not at pressure. The Pilot Test article, since prototypical, includes the pressure vessel. Basic operation in the Pilot Test in full normal operating temperature, flows, and

Hydrogen Plant Alternatives Study NGNP-HPS SHAW-HPA Section 6 – Technology Development
NGNP_HPAS_Section_6_Technology Development.doc March 2009
6-52 of 54
pressure will accomplish TRL-6, because that will pass the “gate” of test at scale and in the relevant environment.
The goal of this test is 2000 hours of operation with production on the order of 50 Nm3 of
hydrogen per hour and stability of less than 1% decline per 1000 hours.
ELE Heat Exchanger Tests (#6) The preheaters, boilers, and superheaters of the HRS are anticipated to be multiple
modular units of conventional configuration. However, the boilers and superheaters are being used at temperatures, pressures, and differential pressures that may challenge the present state-of-the-art. Therefore, in accord with chemical engineering industry practice, pilot tests will be done with actual fluids and at operational conditions.
If necessary, pilot assemblies would be tested at sub-scale. The issues are with the heat
transfer equipment are material selections and thermal/mechanical properties.
Piping Thermal Design and Insulation Test (#7) Accommodating differential thermal expansion is expected to be a significant design
issue. Mechanical analysis, possibly supported by experiment, will be needed ahead of Conceptual Design. It is possible that technology development could be required for the expansion design, but this requirement is not demonstrated and is left off the TDRM at this phase until a specific DDN is prepared. Demonstration by analysis will suffice for TRL-5.
A section of the ELE Piping & Manifolds will be tested with flows at temperature to
confirm the mathematical bases for pressure drop and thermal losses through the insulation in finally designed material and configuration.
Valve Test (#8) This valve test is for the valves that control the flow of high-temperature helium in the
NHSS SHTS between series and parallel PCHXs. These valves are not anticipated to be new technology, but they are critical SSCs because there is no recent industrial experience with such valves. The valves will need verification testing. These do not need to be full-scale valve tests, but they should be prototypic in form to the ultimate application, and therefore experience with smaller valves will not apply. Once the technology is validated at the pressures and temperatures of the NGNP application, the TRL will advance from level 4 to 8.
HRS Heat Exchanger Tests (#9) These heat exchangers are conventional units but will require materials compatibility
testing at the high temperatures and pressures and differential pressures at which they will

Hydrogen Plant Alternatives Study NGNP-HPS SHAW-HPA Section 6 – Technology Development
NGNP_HPAS_Section_6_Technology Development.doc March 2009
6-53 of 54
operate. If necessary, pilot assemblies would be tested at sub-scale. Further definition of these tests requires the completion of design.
FUS System Demonstration Test (#10) Without requirements for feed water purity the scope of development of this SSC is
uncertain. If necessary, air sweep gas pre-treatment requirements may be specified and subject to operational verification tests.
Sweep Gas Turbine Materials Test (#11) This will be a vendor test to verify the compatibility with the application.
Sensor Tests (#12) Thermocouples, pressure sensors, and other instruments need to be qualified for the
operational environment they will experience. New technology is not expected to be required, as the sensors would have been operated in relevant environments. Scale does not particularly apply to sensors, and so prior to testing they could be TRL-5, TRL-6 or TRL-7. The middle value is chosen arbitrarily. After successful testing the sensors are TRL-8.
System Modeling (#13) Since the HTSE HPS is made of discrete thermal-hydraulic components connected by
piping, the demonstration of integrated operation can be done by computer simulation given input of the performance of the discrete components in prototype or pilot testing in their operational environments.
ELE System Demonstration Test (#14) If separate, lower Level (subsystem) tests together with system computational modeling
are not sufficient, this hardware assembly and test series will demonstrate the integrated operation of the ELE and HRS systems.
Continuing Cell Testing (#15) As cell stack and system tests proceed, there is a need to accumulate lifetime data and
quantify long-term degradation. One or more cell tests should continue after the Full Scale Cell Demonstration (#3). The attainment of TRL levels elsewhere on the Road Map would be supported by the Continuing Cell Testing according to the criteria in Table 6-11.

Hydrogen Plant Alternatives Study NGNP-HPS SHAW-HPA Section 6 – Technology Development
NGNP_HPAS_Section_6_Technology Development.doc March 2009
6-54 of 54
6.4.4.2.3 Schedule and Cost The cost and schedule for the High Temperature Steam Electrolysis technology
development are summarized in Table 6-18. The cost and completion years are keyed to stages along the Road Map as indicated by the step numbers (i.e., the numbers in red ovals on the TDRM).
Table 6-18: Cost and Schedule for the High Temperature Steam Electrolysis
Technology Area
TRL Achievement Step Numbers from TDRM Cost Completion
Up to completion of ILS – TRL-3�4 #1, #2 - - Full-scale stack demonstration – TRL-4�5 #3, #4 35.0 $M
2012
Pilot Test – TRL-5�8 #5 30.0 $M 2016
(Prototype HPS Test) (#14) (50.0 $M) 2018
Balance of system design verification – TRL-x�8
#6, #7, #8, #9, #10, #11, #12, #13 13.8 $M
6.4.4.3 Maturation Plans for Alternatives Presently there are no plans for alternative HTSE HPS designs. However, there will be a
review of all design choices in the conceptual design phase, which could generate an alternate path in the development road map.

Hydrogen Plant Alternatives Study NGNP-HPS SHAW-HPA Section 7 – Conclusions
NGNP_HPAS_Section_7_ConclusionsRecommendations.doc March 2009
7-1 of 11
7 CONCLUSIONS & RECOMMENDATIONS
7.1 SUMMARY OF FINDINGS
7.1.1 Major Findings The best of the HTGR-based water-splitting processes is not projected to be competitive
with SMR until the price of natural gas exceeds about 15$/MMBtu plus a real escalation rate of 2%/yr, or there is an equivalent cost or tax associated with carbon collection and sequestration.
Operating risks of these technologies are very high in comparison with current hydrogen
plants. The HyS and HTSE hydrogen production processes are likely to be competitive with
ambient temperature alkaline or PEM electrolysis, even considering the future cost goals associated with those technologies.
7.1.2 NGNP Application For HTSE, there is a distinct disproportion between the amount of nuclear heat supplied
by the HTGR and process heat used by the technology. There is significantly more heat produced by the HTGR than required by the process. Scaling up a HTSE process to match the nuclear heat would result in an unrealistically large hydrogen production rate. Coupling HTSE with an HTGR also presents formidable challenges with regard to thermal expansion of the process piping and thermal insulation within vessels and the electrolysis modules. From a commercial perspective, there is little incentive to incur the significant development costs and risks in developing HTSE for an HTGR when there are other more attractive alternatives for HTSE (e.g., a LWR). A key step in the SI process, HI reactive distillation, has not yet been proven in principle and operating risks and costs are likely to be very high. It too is an unlikely candidate for NGNP application. Although it also faces several challenges, the HyS process is the most likely candidate, at this time, for the earliest commercial-scale demonstration with NGNP, or to replace an industrial-scale SMR process.
7.1.3 Capital Cost The capital costs of all three of these technologies are high in comparison to steam
methane reforming plants. Current estimates for a ~150 MMSCFD steam methane-based hydrogen plant range around $300 million.
The estimated costs of the hydrogen production plants developed for this study,
excluding nuclear reactors, range from about three to ten times the cost of a comparably sized steam methane reforming plant. This is not surprising given the complexity of these plants, and the costly materials of construction. The cost of electrolyzer cells dominates the capital cost of both the HTSE and HyS technologies. Available cost estimates are indicative at best. The

Hydrogen Plant Alternatives Study NGNP-HPS SHAW-HPA Section 7 – Conclusions
NGNP_HPAS_Section_7_ConclusionsRecommendations.doc March 2009
7-2 of 11
authors utilized the best estimates available from the technology developers for capital costs associated with key components of these developing technologies. Otherwise, costs not provided by the technology developers are consistent in source and accuracy.
Total capital required to for a ~150 MMSCFD hydrogen production facility, including
the HTGR reactors, is estimated to be $5,973 million for SI, $3,518 million for HyS, and $2,252 million for HTSE. These are the costs of Nth-of-a-Kind plants and they do not include the development costs to proceed from the current state of the technologies to commercial-scale demonstrations, nor do they include the costs of the NGNP development and demonstration. In addition, if capital associated with the construction of new nuclear generation capacity for supply of imported electric power is included, the HyS and the HTSE process have about the same financing hurdle. The SI process, on the other hand, has the highest financial hurdle when considering both process plant capital costs and new nuclear generating capacity.
7.1.4 Cost of Hydrogen Cost of production of hydrogen from these plants is largely dependent upon the capital
charges and the cost of the nuclear heat. However, imported electric power is a significant cost contributor for the SI and HTSE processes.
Base case hydrogen production costs were calculated to be $10.71/kg H2 for SI, $6.83/kg
H2 for HyS, and $6.04/kg H2 for HTSE. Hydrogen production costs were determined to be sensitive to capital cost, IRR, capacity factor, nuclear heat, and electricity costs. The HTSE hydrogen production cost was also sensitive to the electrolyzer replacement frequency.
7.1.5 Operating Risk The operating risk – such as the potential for operating failure, loss of investment, and
down-time – for all of these technologies is high. For HTSE, there is a serious potential for hot hydrogen and/or hot oxygen leakage. This type of event would result in a hydrogen flame with resulting loss of investment or operator injury, depending upon the design of the cell stacks.
Both Hybrid Sulfur and Sulfur Iodine plants handle large amounts of sulfuric acid as well
as mixtures of hot steam, sulfur trioxide, sulfur dioxide, and oxygen. The potential for corrosion from these materials increases the risk of leakage.
The Sulfur Iodine process requires circulation of very large amounts of iodine and
hydroiodic acid. The estimated inventory of the base case plant is 7,500 tonnes of iodine. The corrosive nature of these materials enhances the potential for leaks, spills, and increased maintenance costs.

Hydrogen Plant Alternatives Study NGNP-HPS SHAW-HPA Section 7 – Conclusions
NGNP_HPAS_Section_7_ConclusionsRecommendations.doc March 2009
7-3 of 11
7.1.6 Technology Development Insufficient design has been carried out on the major components of these technologies to
have assurance either that all the major component engineering and design issues have been discovered or that some of the major issues identified here can be resolved.
Materials of construction, including auxiliary materials such as seals, gaskets, and
linings, will be a major development issue. Development of these materials is not included in the R&D program yet and may present a limiting factor for progressing the technologies and affect cost and schedule.
Current plans for technology development are for demonstrations larger than is typically
required by industry. Since each technology will operate in a modular fashion or with multiple process trains, smaller demonstrations may be sufficient to demonstrate viability. Additionally, viability of the processes may be demonstrated with a non-nuclear heat source.
The technology readiness level for each of these technologies is currently low. This is
the case because although some critical systems, structures, and components of each technology have advanced beyond the early stages of development, others have not. For example, the functionality of the bayonet tube reactor in the sulfuric acid decomposition section has been tested at bench scale. However, a catalyst with a reasonable commercial life has not.
7.1.7 Technology Risk Risk as used here means the likelihood of not achieving a commercial, economically
viable process design, including all critical components, in a ten year period. The risk assessed is the likelihood of missing the economic and schedule parameters set forth in this study by a significant margin due to technology development challenges.
By a careful analysis of the challenges faced by each technology, they fall into five major
categories: � Fundamental (F) limitations: These are clear limits set by the laws of physics,
chemistry, and thermodynamics. It is evident that no amount of research or engineering will overcome these.
� Possible (P) fundamental limitations: These are limits that may be fundamental, but that could be circumvented by an alternative design.
� Obscure (O) path to success: These are issues for which little consideration has yet been given.
� Difficult (D) but relatively clear path forward: Some consideration has been given to these issues and the path forward is reasonably clear, but could still raise challenges to schedule and cost.
� Straightforward (S) path to success. These issues are treated in the body of the report, but are not dealt with here.

Hydrogen Plant Alternatives Study NGNP-HPS SHAW-HPA Section 7 – Conclusions
NGNP_HPAS_Section_7_ConclusionsRecommendations.doc March 2009
7-4 of 11
Some engineering judgment is involved in these rankings and some disagreement between honest judges is to be expected. The tables below list the major technical issues and categorize them according to the above scheme of five major categories (F, P, O, D or S). The initial letter of each category is used as a designator in the tables.
Table 7-1: Major HTSE Technology Challenges
A. Uses proportionately little high temperature process heat F B. High temperature heat added between cell stack and heat recuperation F C. Thermal expansion in the delivery piping and pipe insulation P D. Thermal insulation of electrolyzer modules P E. Reliably sealing the cells from hydrogen, steam, air, and oxygen leaks P�O F. Rapid deactivation of the cells O�D G. Cell scale-up P
A. Very little of the energy required to electrolyze steam into oxygen and hydrogen can be supplied as process heat using the HTSE technology. At best only 15% of the total energy to split water would be added as process heat. The rest is added as electrical energy. Consider the process heat as a fraction of the total heat used for both process heat and electrical generation, the fraction is only about 7%. This means that if a 550MWth HTGR were used exclusively for process heat, the plant capacity would be about 900 MMSCFD of hydrogen and the amount of imported electricity would be 3,000 MWeh/h. The bench scale laboratory work that has been carried out thus far has been using the thermal neutral point as the benchmark case. Consequently, process heat is required only to compensate for thermal losses. The thermal requirement of the process is generated by ohmic losses in the cells.
B. Process heat must be added between the cell stack and the recuperation equipment. This results in several very challenging engineering problems including distributing very hot steam and air to many cell stacks, limiting heat losses from the pipe and stacks, designing for thermal expansion of the distribution piping, designing for thermal expansion of the stacks and of tension bars meant to maintain pressure on the inter-cell seals, penetrating a pressure boundary at very high temperatures and pressures with large electrical cables, and maintaining the integrity of electrical connections in a very hot and possibly oxidizing environment. Recognizing these issues, the technology development team has developed a recuperator integrated into the cell stack. Combined with operation at the thermal neutral point, this is an elegant approach. However, this approach practically precludes using any appreciable amount of nuclear process heat from a HTGR.
C. Thermal expansion of the delivery pipe is a more difficult issue than it at first appears. The fact that the piping must operate at very high temperatures and possibly pressures will require that it be very heavy wall pipe. This will reduce its flexibility considerably thereby increasing the stress on critical fittings (e.g., elbows) during expansion of the piping. Expansion loops will be required to
Hydrogen Plant Alternatives Study NGNP-HPS SHAW-HPA Section 7 – Conclusions
NGNP_HPAS_Section_7_ConclusionsRecommendations.doc March 2009
7-5 of 11
compensate for about two meters of expansion. The length of these loops will add appreciably to the length, pressure drop, and heat losses from the piping. From discussions with piping experts, it is not clear that a feasible solution is available. It is unclear at this time how this expanding piping will be insulated such that the insulation will accommodate or expand with the piping.
D. Per the study’s design, the operating temperature and pressure of the electrolyzer modules are 870°C and 56 bar, respectively. For the modules, the insulating properties of any internal insulation will be an order of magnitude lower than we expected due to the high operating pressure. Up to about 40 bar, the thermal conductivity of gases are affected only very slightly by pressure. As pressure rises above this level, however, the thermal conductivity increases very rapidly. The thermal conductivity of the insulation is entirely dependent upon the conductivity of the gas in the insulation. For internal insulation, this will be air and oxygen. For air and oxygen above 40 bar, the dependence of thermal conductivity on pressure changes dramatically and becomes quite strong. Although the effect on the Prandtl number is negligible, the effect on conductivity, and therefore presumably also on viscosity, is large. For gas trapped in the insulation, conductivity and not Prandtl number is important: heat transmission is mostly by conduction, not convection. The net effect is that the insulation becomes largely ineffective.
E. The sealing issues inherent in the current design are described above. A cell stack design that does not require enclosure by a pressure vessel may mitigate some of the problems, but it raises additional issues. Such a stack design would be able to operate only at low pressure. This would require much larger equipment as well as expensive compression of low pressure hydrogen to pipeline pressures.
F. Current active cell life is extremely short by commercial standards. The causes of de-activation are as yet unknown. This may be a problem related to dissolved ions in the feed water or may be inherent to the cell design itself. If the current Ceramatec cell design is indeed inherently life limiting, alternative cell designs such as the all ceramic NASA cells may need to be considered. It should be noted, however, that the NASA cells are at a much earlier stage of development. Therefore, if the Ceramatec design is deemed not to be viable because of cell longevity, there is the implication that the technology readiness will need to be downgraded further.
G. Cell scale-up is an issue for both HTSE and HyS. In the case of SO2 electrolysis cells, there are similar commercial cells operating in chlor-alkali and in water electrolysis service. There is a reasonable chance, therefore, that this electrolysis technology can be successfully scaled to commercial size. For HTSE cells, on the other hand, operating conditions are far more demanding. Although solid oxide fuel cells have been developed and tested at a reasonable scale, there are significant differences between fuel cells and electrolysis cells that call into question the possibility of developing electrolysis cells at a scale large enough to make a nuclear

Hydrogen Plant Alternatives Study NGNP-HPS SHAW-HPA Section 7 – Conclusions
NGNP_HPAS_Section_7_ConclusionsRecommendations.doc March 2009
7-6 of 11
heated installation practical. Differential thermal expansion at high temperatures may establish a physical limit to the cell size.
The cell deactivation and scale-up may be resolved in a timely fashion for the NGNP
project. The disproportionate process heat requirement and the difficulty of applying process heat to this technology, or the need to operate at low pressures and compress the products, reduce the incentive for using this as an NGNP application. The risk of reaching commercial status in time for commercial deployment with NGNP is high due to several key technical challenges: the thermal expansion issues associated with the electrolyzer modules’ structure, distribution piping and cell stacks; the thermal insulation of the electrolyzer modules; and the sealing of the cells.
Table 7-2: Major Hybrid Sulfur Technology Challenges A. 65% of the NHSS can be used for sulfuric acid decomposition. F B. Decomposer tolerance to contaminants P�O C. Metal to ceramic transition in the sulfuric acid decomposer D�S D. Decomposition catalyst D E. Thermal and hydraulic design of the decomposer D�S F. Sulfur leakage through cell membranes D G. Cell tolerance to contaminants O H. Shunt currents O
A. Thermal analysis of the sulfuric acid decomposition shows that there is a heat recovery limitation associated with the bayonet reactor and the shape of the enthalpy versus temperature curve. In essence, the minimum process temperature at which heat can be used is 500°C. This means that the minimum temperature of helium leaving the sulfuric acid decomposer must be about 520 to 550°C. The remainder of the nuclear heat must be used in processes that use lower temperature heat. If the nuclear reactor return temperature is around 350°C, a significant portion of the nuclear heat cannot therefore be used in the process. Steam can be raised and power generated with this heat, but this would be high-cost power because of the scale of the reactor and generation plant.
B. All of these technologies use liquid water as a feedstock. No matter how well the water is purified, there will be dissolved ions in it. The products are all gaseous and therefore these ions will be left in the system. After extended operation these will have an effect on the cells and decomposer. Those effects have not been identified or quantified.
C. The sulfuric acid decomposer will most likely use silicon carbide heat transfer surfaces because of its resistance to both corrosion and loss of strength at high temperatures. The pressure boundary will, however, be metallic. At some point, regardless of the design, there must be a transition between silicon carbide and metal. This will be in the form of a seal or some kind of brazing or welding. Potential solutions for this are available, but further investigation is required.

Hydrogen Plant Alternatives Study NGNP-HPS SHAW-HPA Section 7 – Conclusions
NGNP_HPAS_Section_7_ConclusionsRecommendations.doc March 2009
7-7 of 11
D. Decomposition catalyst now being used is costly and has a limited lifetime. A commercially viable catalyst must be developed. Although catalyst development is never straightforward, several avenues of approach have been suggested and the experts are hopeful that a catalyst can be developed in a timely fashion.
E. Initial studies have been made of the thermal and hydraulic characteristics of the decomposer under ideal conditions. These must be extended to include reaction kinetics and realistic estimates of heat transfer rates, pressure drops, and the like.
F. Current SO2 electrolysis cell operation in some tests has shown a significant amount of sulfur formation on the hydrogen side of the proton exchange membrane (PEM). This indicates that one or more sulfur species are migrating through the membrane. Until now the approach has been to try different membrane materials to reduce this effect. Recent progress at SRNL has demonstrated cell operation for relatively short durations (i.e., 50 hours) without sulfur build-up or noticeable cell degradation, and longer term testing is planned. This may ultimately be successful, but it may be fruitful to work at better understanding the fundamentals of the problem.
G. See paragraph “B” above.
H. Distributing electrolyte flow to many cells in parallel while they are connected in series electrically presents the opportunity for current to flow through the electrolyte and short circuit the cells. This shunt current can become a serious problem with large cell stacks. The use of only a portion of the nuclear energy as process heat is a handicap for this technology, but it does not appear to render it economically uncompetitive with the other technologies. Lack of tolerance to contaminants and shunt currents may be potential roadblocks to this technology, but insufficient knowledge is available to make that judgment now. The risk of HyS reaching commercial status in time for NGNP is now high. If the contaminant and shunt current issues can be laid to rest promptly, the risk is deemed to be moderate.

Hydrogen Plant Alternatives Study NGNP-HPS SHAW-HPA Section 7 – Conclusions
NGNP_HPAS_Section_7_ConclusionsRecommendations.doc March 2009
7-8 of 11
Table 7-3: Major Sulfur Iodine Technology Challenges
A. Decomposer tolerance to contaminants P�O B. Process tolerance to contaminants O C. Metal to ceramic transition in the sulfuric acid decomposer D�S D. Decomposition catalyst D E. Thermal and hydraulic design of the decomposer D�S F. Large inventory of iodine and hydroiodic acid (7500 tonnes @ $20,000 per tonne) F G. Large circulation rate of iodine and hydroiodic acid F H. Hydroiodic acid decomposition O I. Materials of construction (Tantalum raw material costs $40+ per pound) D
A. See item “B” under the HyS Challenges.
B. See item “B” under the HyS Challenges.
C. See item “C” under the HyS Challenges.
D. See item “D” under the HyS Challenges.
E. See item “E” under the HyS Challenges.
F. The iodine inventory necessary to produce commercial quantities of hydrogen is large and costly. This is also a theoretical limit. It cannot be substantially reduced by further investigation. The inventory for one plant represents about 25% of the current worldwide annual production. It would cost $150 million at today’s prices.
G. The iodine circulation rate between the Bunsen reaction section and HI decomposition is about three tons or one cubic meter per second. This makes any intermediate storage between the units impractical. Operating upsets in one unit will be immediately propagated to the others rendering operations difficult.
H. Most work to date on hydroiodic acid decomposition in the Nuclear Hydrogen Initiative has focused on an extractive distillation method. This method has been judged to be technically and economically infeasible. The alternative technology, reactive distillation has not been proven in principal. Moreover, design of the reactive distillation column will involve incorporating a catalytic section and handling two liquid phases. These are complex process engineering techniques that are difficult to reduce to practice. No effort has as yet been applied to design this on an industrial scale.
I. For the most part, materials of construction for the SI process can be carbon steel lined with polytetrafluoroethylene (PTFE or Teflon�). Surfaces used for heat transfer cannot use this material because of its insulating qualities. Surfaces subject to erosion or with penetrations such as distillation tray or packing supports may not

Hydrogen Plant Alternatives Study NGNP-HPS SHAW-HPA Section 7 – Conclusions
NGNP_HPAS_Section_7_ConclusionsRecommendations.doc March 2009
7-9 of 11
use this material due to the possibility of lining failure and catastrophic corrosion. The only identified substitutes are tantalum or tantalum alloys. The cost of these materials will increase the capital cost of this plant unacceptably. Moreover, it is uncertain whether tantalum is available or can be fabricated in the quantities and forms required. Developing alternative materials is a time-consuming process and almost certainly cannot be accomplished in the required time frame.
The combination of the effects of large iodine inventory and circulation rates, the
contaminant tolerance issue and the lack of economic materials of construction make the risk of reaching commercial status for NGNP high.
7.1.8 Schedule The development schedules presented by the technology developers all indicated that the
required work could be completed within about ten years. These estimates are based upon the assumption that the work will proceed in an orderly fashion without major roadblocks. This analysis shows, however, that there is a significant likelihood of major delays and detours in the development path for all of these technologies.
There is significant risk that none of the technologies can demonstrate commercial
viability within ten years. Of the three technologies, the HyS process poses the least risks of achieving commercial status as a HTGR application. Schedule risk can be reduced by focusing on a single technology on which to concentrate resources. Further, initiating design will identify development needs earlier, allowing more time to investigate other options and still meet project deadlines.
7.1.9 Budget The research and development budgets presented are those proposed by the technology
developers researched for this study. Like the schedules, they are based upon an orderly progression of work following the current view of the remaining technology issues. If a development issue arises that clearly will have significant cost implications, such as the need to develop new materials, a decision will have to be made to continue with a larger budget or abandon the effort. With the current state of knowledge, the budgets are the best that can be produced. What is not included is the engineering effort recommended by this study to accompany the development effort. A first estimate for the engineering effort is that it can be covered by increasing each of the R&D budgets by 10%.
7.2 CONCLUSION There is significant risk that none of the technologies can demonstrate commercial
viability within ten years. Schedule risk can be reduced by focusing on a single technology on which to concentrate resources. Further, initiating design will identify development needs earlier, allowing more time to investigate other options and still meet project deadlines. Of the

Hydrogen Plant Alternatives Study NGNP-HPS SHAW-HPA Section 7 – Conclusions
NGNP_HPAS_Section_7_ConclusionsRecommendations.doc March 2009
7-10 of 11
three technologies, the HyS process poses the least risk of achieving commercial status as a HTGR application.
TRLs, sensitivity analysis, and the estimation of $/kg H2 costs are important only if a
technology is fundamentally viable. All of these metrics assume a timely solution to the engineering problems. The overriding consideration in selecting a candidate technology should be the risk posed by unknowns and unresolved issues. Both HTSE and SI at this point pose risks that are significantly greater than those presented by HyS. If a single technology path is chosen for coupling with a HTGR, HyS is the most suitable candidate based on this study’s findings.
The SI process was eliminated due to cost, the need for large quantities of exotic
materials (i.e., tantalum and iodine), complexity, and technical risk due to lack of fundamental data and adequate design concepts.
HTSE was eliminated primarily due to the lack of proportion between the nuclear heat
supply source and the need for process heat. However, HTSE also has serious technical challenges with regard to thermal expansion and thermal insulation. In contrast with both the SI and HyS processes, the HTSE technology using HTGR process heat requires extraordinary amounts of both equipment and piping that operate at both extremely high temperature and very high pressure. These problems are amenable for very short piping runs and for equipment where the pressure envelope can be maintained at a low temperature, but this is not the case for HTSE. In the author’s view, HTSE technology and HTGR technology, as they have been developed to date, are not a good match. From a commercial perspective, there would be little point in facing the enormous development costs and risks identified herein by developing a large centralized HTSE system for the sake of supplying only a small portion of the energy required for splitting water as heat. This is especially so since a much less challenging, and perhaps even less costly, solution is available by using electricity alone. All these issues are extraneous to two basic issues having to do with the cell itself: the brief useful life of cells tested thus far and the scaling up of cells to a reasonable size. These challenges also pose significant technical risks.
Commercial enterprises would typically have made a selection by this stage of
development, although they typically would not assume the financial risk associated with the identified technology challenges. Further, they commonly prove viability with smaller demonstrations. Demonstrating the hydrogen process at a smaller scale and with a non-nuclear heat source is judged to be as viable as a large demonstration coupled to the NGNP. A benefit of this approach is the ability to test severe transients for the hydrogen process independent of operating limits of a prototype reactor.
7.3 RECOMMENDATIONS
� Work should be carried out with electrolytic cell and fuel cell manufacturers to overcome the most serious technical challenges associated HyS cells and stacks (i.e., sulfur deposition and shunt currents).

Hydrogen Plant Alternatives Study NGNP-HPS SHAW-HPA Section 7 – Conclusions
NGNP_HPAS_Section_7_ConclusionsRecommendations.doc March 2009
7-11 of 11
� Serious design efforts developing alternatives should be started as soon as possible on major components such as helium control valves, SOEC stacks and enclosures, HyS electrolytic cells and enclosures, sulfuric acid decomposers, and Bunsen reactors and hydroiodic acid decomposition reactors.
� Added attention should be given to the interface components between the NHSS
and the process plant. This includes not only the IHX but also high-temperature gas circulators, helium flow control valves, insulation, and features to accommodate thermal expansion.
� Consideration should be given to demonstrating the hydrogen process with a
smaller, non-nuclear heat source to allow acceleration of testing, provide cost savings, and improve test flexibility.

Hydrogen Plant Alternatives Study NGNP-HPS SHAW-HPA Section 8 � Appendices
March 2009
8 APPENDICES

Hydrogen Plant Alternatives Study NGNP-HPS SHAW-HPA Section 8 � Appendices
March 2009
8.1 HYBRID SULFUR ELECTROLYSIS

Hydrogen Plant Alternatives Study NGNP-HPS SHAW-HPA Section 8 � Appendices
March 2009
8.1.1 Simulation Diagrams

������
������
�
����
�����
�
����
������
����
�������
������
�������
����
������
��
����
������
��
����
��������
����
������
�
������
����
��
������
����
��
������
�����
������
������
��
����
��������
����
������
��
���
������
��
����
������
��
����
������
���
������
��
���
������
�
����
��������
���
������
�
����
������
��
����
������
�
�����
������
�����
�
����
������
������
������
�
����
������
�
����
����������
����
������
������
������
��
������
��������
������
�����
��
��
��
����
������
��
����
��������
�����
�����
��
���
���
������
�����
�
�����
�����
�
����
�����
�
����
������
����
�����
��
���
������
����
�����
�
����
�����
�
����
�������
����
������
����
������
����
������
���
�����
��
���
�����
�
���
�������
����
�������
����
�����
��
����
�������
����
�������
������
������
�����
����������
�
�����
���������
�
������
�����
������
������
����
�������
����
������
�
�
�
������
������
�
�����
�������������
�����
���
����
������
��
�����
�����
��
�����
����
�
�����
����
��
����
�������
����
�����
�
������
������
��
������
�������
������
�����
��������
�����
��
����
������
����
�����
���
���
������
��
������
�����
���
�����
�����
��
������
�����
���
�����
�����
��
��
��
���
�����
��
�
�����
�����
���
�������
�����
��������
�����
�����
����
������
�����
���� �
����
�����
��
����
�������
���
�������
����
�����
��
����
�����
���
���
����
��
���
����
���
���
�������
���
�������
�����
�����
���
�����
��������
�����
��������
���
�������
����
�������
�
��
����
�����
��
�
�� ��
�!�����
�� �
"� �
�! �����
## ��
�� ��
�� ��
## �
�� ��
�� ��
�$ ��
�� ��
�� �� "�
�! �����
�� ��
��
��
�
��
��
��
�% ��
## ��
�� ��
"� ���! ����
�� ��
�� ��
## ��
�� ��
�� �
"� ��
�! �����
�� ��
�!����
�� ���!����
� ��
�� ��
�� ��
�� � "�
�! ����
�� ��
�!�����
� ��
�� ����! ��������!������
�� ���
�!����
�� �
## �
## ��
�� ��
�� ���!����
�� �
�!�����
�� �
�!����
� ���
�& ��
�& ��
�� ���!�����
�� �� "�
�! ������
�� �� "�
�! �����
�� �� ��
�!������
�� �� ���!�����
�' ��
�!���
"� ��
�! �����
"� ���! ����
�� ��
�!�����
� ��
�� �� � ��
�� �� ���!�����
�� � ���!����
�� ���!�����
�� ���!�����
## ��
"� ��
�! �����
�� ��!�����
�� ���!�����
"� ��
�! ����
�� ��
�!�����
�� � "�
�! �����
�� � ���!�����
�� ��
�!����
������������
�����������
������
� ������
� ������
� � ������
���������� ���
��������������
���������������������������
��������������
����� ���
�!����������
"#$#%�&�����''��(����
)*$#%�&����)
#+$"%�&����)
#+$#%�&����)
,#$+%�&����)
#+$,%�&����)
--$.%�&����)
-#$+%�&����)
#/$.%�&����)
����0�1��������%��%�'
2$$����0
2$$����0
3���������4����
����
5����06���0�
����������6�0���''��
����������������0�1�����
��'�����������0�1�����
������� ������ �� ������������� ������������!
"� �#$%#&&'*������
,-�- ����� �.����00&3�%#0���%4&5���*������%$&5���6�����
�������7����6�������8��������'9&3�6��!6���������6�������%';<���6�������%9$5������
>������� �����&�00�������?#<���?�������@�����%443�
��������
�����-@��������������� ��<����������!�<�6�����
��J�� ���,��6K��!

Hydrogen Plant Alternatives Study NGNP-HPS SHAW-HPA Section 8 � Appendices
March 2009
8.1.2 Mass and Energy Balances

1 1R 2 2R 3 4 5 6 7 8 9 10 11 12 13 14 15EL-01 EL-01 KO-01 DR-01 EX-04-HS MX-01 MX-01 MX-01 PP-01 EX-02-HS SP-01 HX-01 VV-01 KO-02
PP-01 AN-MIX PP-10 EL-01 KO-01 DR-01 KO-01 EX-04-HS DR-01 MX-01 EL-01 EX-02-HS SP-01 HX-01 VV-01LIQUID LIQUID LIQUID LIQUID MIXED VAPOR VAPOR LIQUID MIXED LIQUID LIQUID MIXED LIQUID LIQUID LIQUID LIQUID MIXED
Substream: MIXED Mole Flow kmol/sec H2O 46.678 46.678 31.363 31.363 45.678 0.072 - 45.605 45.605 0.072 1.000 46.678 31.363 31.363 6.431 6.431 6.431 H2SO4 - - - - - - - - - - - - - - - - 0.000 H2 0.014 0.014 - - 1.014 1.000 1.000 0.014 0.014 - - 0.014 - - - - - O2 - - 0.003 0.003 - - - - - - - - 0.003 0.003 0.001 0.001 0.001 SO2 - - 2.500 2.500 - - - - - - - - 1.500 1.500 0.308 0.308 0.308 SO3 - - 3.884 3.884 - - - - - - - - 4.884 4.884 1.001 1.001 1.001 Mole Frac H2O 1.000 1.000 0.831 0.831 0.978 0.068 - 1.000 1.000 1.000 1.000 1.000 0.831 0.831 0.831 0.831 0.831 H2SO4 - - - - - - - - - - - - - - - - 0.000 H2 0.000 0.000 - - 0.022 0.932 1.000 0.000 0.000 - - 0.000 - - - - - O2 - - 0.000 0.000 - - - - - - - - 0.000 0.000 0.000 0.000 0.000 SO2 - - 0.066 0.066 - - - - - - - - 0.040 0.040 0.040 0.040 0.040 SO3 - - 0.103 0.103 - - - - - - - - 0.129 0.129 0.129 0.129 0.129 Mass Frac H2O 1.000 1.000 0.545 0.545 0.998 0.393 - 1.000 1.000 1.000 1.000 1.000 0.537 0.537 0.537 0.537 0.537 H2SO4 - - - - - - - - - - - - - - - - 0.000 H2 0.000 0.000 - - 0.002 0.607 1.000 0.000 0.000 - - 0.000 - - - - - O2 - - 0.000 0.000 - - - - - - - - 0.000 0.000 0.000 0.000 0.000 SO2 - - 0.155 0.155 - - - - - - - - 0.091 0.091 0.091 0.091 0.091 SO3 - - 0.300 0.300 - - - - - - - - 0.372 0.372 0.372 0.372 0.372 Total Flow kmol/sec 46.691 46.691 37.750 37.751 46.691 1.072 1.000 45.619 45.619 0.072 1.000 46.691 37.750 37.750 7.741 7.741 7.741 Total Flow kg/sec 840.942 840.942 1,036.254 1,036.255 824.943 3.321 2.016 821.622 821.622 1.305 18.015 840.942 1,052.253 1,052.253 215.762 215.762 215.762 Total Flow cum/sec 0.876 0.876 0.779 0.779 2.451 1.588 1.353 0.863 0.858 0.001 0.018 0.878 0.774 0.771 0.158 0.158 9.800 Temperature C 98.689 98.689 94.779 94.779 110.000 110.000 48.000 110.000 100.000 48.000 40.000 98.661 110.000 100.000 100.000 90.000 75.925 Pressure bar 22.750 22.750 22.750 22.750 21.750 21.750 20.000 21.750 21.000 20.000 20.000 20.000 21.750 21.000 21.000 20.250 1.013 Vapor Frac - - - - 0.023 1.000 1.000 - 0.000 - - 0.000 - - - - 0.044 Liquid Frac 1.000 1.000 1.000 1.000 0.977 - - 1.000 1.000 1.000 1.000 1.000 1.000 1.000 1.000 1.000 0.956 Solid Frac - - - - - - - - - - - - - - - - -
Enthalpy J/kmol -2.803E+08 -2.803E+08 -3.146E+08 -3.146E+08 -2.734E+08 -1.383E+07 6.963E+05 -2.795E+08 -2.802E+08 -2.843E+08 -2.849E+08 -2.804E+08 -3.201E+08 -3.210E+08 -3.210E+08 -3.218E+08 -3.218E+08Enthalpy J/kg -1.557E+07 -1.557E+07 -1.146E+07 -1.146E+07 -1.547E+07 -4.467E+06 3.454E+05 -1.552E+07 -1.556E+07 -1.578E+07 -1.581E+07 -1.557E+07 -1.149E+07 -1.152E+07 -1.152E+07 -1.154E+07 -1.154E+07Enthalpy Watt -1.309E+10 -1.309E+10 -1.188E+10 -1.188E+10 -1.276E+10 -1.483E+07 6.963E+05 -1.275E+10 -1.278E+10 -2.059E+07 -2.849E+08 -1.309E+10 -1.209E+10 -1.212E+10 -2.485E+09 -2.491E+09 -2.491E+09Entropy J/kmol-K 8.657E+04 1.099E+03 7.598E+04 7.598E+04 8.949E+04 1.164E+05 1.080E+05 8.880E+04 8.684E+04 7.541E+04 7.358E+04 8.651E+04 7.467E+04 7.247E+04 7.247E+04 7.020E+04 7.263E+04Entropy J/kg-K 4.807E+03 6.101E+01 2.768E+03 2.768E+03 5.065E+03 3.759E+04 5.356E+04 4.931E+03 4.822E+03 4.186E+03 4.084E+03 4.803E+03 2.679E+03 2.600E+03 2.600E+03 2.518E+03 2.606E+03Density kmol/cum 53.301 53.301 48.434 48.434 19.051 0.676 0.739 52.836 53.166 54.940 55.123 53.177 48.789 48.952 48.952 49.055 0.790 Density kg/cum 959.985 959.985 1,329.517 1,329.517 336.587 2.092 1.490 951.609 957.551 989.768 993.062 957.744 1,359.930 1,364.485 1,364.485 1,367.362 22.017 Average Mol Wt 18.011 18.011 27.450 27.450 17.668 3.096 2.016 18.011 18.011 18.015 18.015 18.011 27.874 27.874 27.874 27.874 27.874 Liq Vol 60F cum/sec 0.843 0.843 0.908 0.908 0.879 0.055 0.054 0.824 0.824 0.001 0.018 0.843 0.908 0.908 0.186 0.186 0.186 *** VAPOR PHASE *** Density kg/cum 2.092 2.092 1.490 1.879 1.796 1.978 MUMX N-sec/sqm 0.000 0.000 0.000 0.000 0.000 0.000 KMX Watt/m-K 0.192 0.192 0.189 0.194 0.193 0.013 *** LIQUID PHASE *** Density kg/cum 959.985 959.985 1,329.517 1,329.517 951.609 951.609 958.982 989.768 993.062 959.909 1,359.930 1,364.485 1,364.485 1,367.362 1,363.587 MUMX N-sec/sqm 0.000 0.000 0.001 0.001 0.000 0.000 0.000 0.001 0.001 0.000 0.001 0.001 0.001 0.001 0.001 KMX Watt/m-K 0.675 0.675 0.222 0.222 0.680 0.680 0.676 0.635 0.626 0.675 0.200 0.214 0.214 0.227 0.262 SIGMAMX N/m 0.058 0.058 0.052 0.052 0.056 0.056 0.058 0.068 0.070 0.058 0.049 0.051 0.051 0.053 0.057 *** LIQUID_1 PHASE * Density kg/cum 1,364.485 1,364.485 MUMX N-sec/sqm 0.001 0.001 KMX Watt/m-K 0.214 0.214 SIGMAMX N/m 0.051 0.051 *** LIQUID_2 PHASE * Density kg/cum MUMX N-sec/sqm KMX Watt/m-K SIGMAMX N/m

Substream: MIXEDMole Flow kmol/sec H2O H2SO4 H2 O2 SO2 SO3Mole Frac H2O H2SO4 H2 O2 SO2 SO3Mass Frac H2O H2SO4 H2 O2 SO2 SO3Total Flow kmol/secTotal Flow kg/secTotal Flow cum/secTemperature CPressure barVapor FracLiquid FracSolid Frac
Enthalpy J/kmolEnthalpy J/kgEnthalpy WattEntropy J/kmol-KEntropy J/kg-KDensity kmol/cumDensity kg/cumAverage Mol WtLiq Vol 60F cum/sec*** VAPOR PHASE ***Density kg/cumMUMX N-sec/sqmKMX Watt/m-K*** LIQUID PHASE ***Density kg/cumMUMX N-sec/sqmKMX Watt/m-KSIGMAMX N/m*** LIQUID_1 PHASE *Density kg/cumMUMX N-sec/sqmKMX Watt/m-KSIGMAMX N/m*** LIQUID_2 PHASE *Density kg/cumMUMX N-sec/sqmKMX Watt/m-KSIGMAMX N/m
16 17 18 19 20A 20B 20C 20D 21A 21B 21C 21D 22 23 24 25 26VV-02 KO-03 PP-02 SP-02 EX-02-CS EX-03-CS EX-04-CS EX-05-CS MX-02 MX-02 MX-02 MX-02 TO-01 PP-02X RX-01 KO-04 VV-04KO-02 VV-02 KO-03 PP-02 SP-02 SP-02 SP-02 SP-02 EX-02-CS EX-03-CS EX-04-CS EX-05-CS MX-02 TO-01 PP-02X RX-01 KO-04LIQUID MIXED LIQUID LIQUID LIQUID LIQUID LIQUID LIQUID MIXED MIXED MIXED MIXED MIXED LIQUID LIQUID MIXED LIQUID
6.373 6.373 6.331 6.331 1.818 1.677 2.028 0.808 1.818 1.677 2.028 0.808 6.331 5.830 5.830 5.830 5.334 - 0.000 - - - - - - 0.000 0.000 0.000 0.000 0.000 0.000 - 0.000 - - - - - - - - - - - - - - - - - -
0.000 0.000 0.000 0.000 0.000 0.000 0.000 0.000 0.000 0.000 0.000 0.000 0.000 0.000 - 0.501 0.008 0.026 0.026 0.003 0.003 0.001 0.001 0.001 0.000 0.001 0.001 0.001 0.000 0.003 0.000 0.000 1.001 0.225 1.001 1.001 1.001 1.001 0.288 0.265 0.321 0.128 0.288 0.265 0.321 0.128 1.001 2.071 2.071 1.070 1.070
0.861 0.861 0.863 0.863 0.863 0.863 0.863 0.863 0.863 0.863 0.863 0.863 0.863 0.738 0.738 0.694 0.804 - 0.000 - - - - - - 0.000 0.000 0.000 0.000 0.000 0.000 - 0.000 - - - - - - - - - - - - - - - - - -
0.000 0.000 0.000 0.000 0.000 0.000 0.000 0.000 0.000 0.000 0.000 0.000 0.000 0.000 - 0.060 0.001 0.004 0.004 0.000 0.000 0.000 0.000 0.000 0.000 0.000 0.000 0.000 0.000 0.000 0.000 0.000 0.119 0.034 0.135 0.135 0.137 0.137 0.137 0.137 0.137 0.137 0.137 0.137 0.137 0.137 0.137 0.262 0.262 0.127 0.161
0.584 0.584 0.587 0.587 0.587 0.587 0.587 0.587 0.587 0.587 0.587 0.587 0.587 0.388 0.388 0.388 0.489 - 0.000 - - - - - - 0.000 0.000 0.000 0.000 0.000 0.000 - 0.000 - - - - - - - - - - - - - - - - - -
0.000 0.000 0.000 0.000 0.000 0.000 0.000 0.000 0.000 0.000 0.000 0.000 0.000 0.000 - 0.059 0.001 0.009 0.009 0.001 0.001 0.001 0.001 0.001 0.001 0.001 0.001 0.001 0.001 0.001 0.000 0.000 0.237 0.074 0.408 0.408 0.412 0.412 0.412 0.412 0.412 0.412 0.412 0.412 0.412 0.412 0.412 0.612 0.612 0.316 0.436 7.400 7.400 7.335 7.335 2.106 1.943 2.350 0.936 2.106 1.943 2.350 0.936 7.335 7.901 7.901 8.402 6.638
196.667 196.667 194.411 194.411 55.827 51.499 62.278 24.808 55.827 51.499 62.278 24.808 194.411 270.863 270.863 270.863 196.462 0.144 8.586 0.142 0.142 0.041 0.038 0.046 0.018 143.845 132.694 160.467 63.922 500.929 0.179 0.179 0.984 0.166
75.925 71.539 71.539 71.546 71.549 71.549 71.549 71.549 88.700 88.700 88.700 88.700 88.700 126.499 127.260 256.420 256.420 1.013 0.220 0.220 0.580 0.430 0.430 0.430 0.430 0.130 0.130 0.130 0.130 0.130 0.150 86.000 84.000 84.000
- 0.009 - - - - - - 0.296 0.296 0.296 0.295 0.296 - - 0.210 - 1.000 0.991 1.000 1.000 1.000 1.000 1.000 1.000 0.704 0.704 0.704 0.705 0.704 1.000 1.000 0.790 1.000
- - - - - - - - - - - - - - - - - -3.235E+08 -3.235E+08 -3.240E+08 -3.240E+08 -3.240E+08 -3.240E+08 -3.240E+08 -3.240E+08 -3.092E+08 -3.092E+08 -3.092E+08 -3.092E+08 -3.092E+08 -3.525E+08 -3.523E+08 -2.908E+08 -3.169E+08-1.217E+07 -1.217E+07 -1.223E+07 -1.223E+07 -1.223E+07 -1.223E+07 -1.223E+07 -1.223E+07 -1.167E+07 -1.167E+07 -1.167E+07 -1.167E+07 -1.167E+07 -1.028E+07 -1.028E+07 -9.020E+06 -1.071E+07-2.394E+09 -2.394E+09 -2.377E+09 -2.377E+09 -6.825E+08 -6.296E+08 -7.614E+08 -3.033E+08 -6.514E+08 -6.009E+08 -7.266E+08 -2.895E+08 -2.268E+09 -2.785E+09 -2.784E+09 -2.443E+09 -2.104E+096.478E+04 6.499E+04 6.357E+04 6.357E+04 6.360E+04 6.360E+04 6.360E+04 6.360E+04 1.064E+05 1.064E+05 1.064E+05 1.064E+05 1.064E+05 6.358E+04 6.357E+04 1.129E+05 8.954E+042.437E+03 2.446E+03 2.399E+03 2.399E+03 2.400E+03 2.400E+03 2.400E+03 2.400E+03 4.015E+03 4.015E+03 4.015E+03 4.015E+03 4.015E+03 1.855E+03 1.854E+03 3.501E+03 3.025E+03
51.310 0.862 51.521 51.521 51.521 51.521 51.521 51.521 0.015 0.015 0.015 0.015 0.015 44.084 44.086 8.539 39.893 1,363.587 22.905 1,365.486 1,365.493 1,365.487 1,365.487 1,365.487 1,365.487 0.388 0.388 0.388 0.388 0.388 1,511.290 1,511.343 275.298 1,180.731
26.576 26.576 26.503 26.503 26.503 26.503 26.503 26.503 26.503 26.503 26.503 26.503 26.503 34.282 34.282 32.239 29.597 0.170 0.170 0.168 0.168 0.048 0.045 0.054 0.021 0.048 0.045 0.054 0.021 0.168 0.216 0.216 0.243 0.166
0.267 0.078 0.078 0.078 0.078 0.078 91.011 0.000 0.000 0.000 0.000 0.000 0.000 0.000 0.018 0.023 0.023 0.023 0.023 0.023 0.031
1,363.587 1,365.486 1,365.486 1,365.493 1,365.487 1,365.487 1,365.487 1,365.487 1,474.938 1,474.938 1,474.938 1,474.937 1,474.938 1,511.290 1,511.343 1,180.731 1,180.731 0.001 0.001 0.001 0.001 0.001 0.001 0.001 0.001 0.001 0.001 0.001 0.001 0.001 0.000 0.000 0.000 0.000 0.262 0.270 0.270 0.270 0.270 0.270 0.270 0.270 0.220 0.220 0.220 0.220 0.220 0.155 0.154 0.085 0.085 0.057 0.058 0.058 0.058 0.058 0.058 0.058 0.058 0.053 0.053 0.053 0.053 0.053 0.043 0.042 0.020 0.020
1,180.731 0.000 0.085 0.020

Substream: MIXEDMole Flow kmol/sec H2O H2SO4 H2 O2 SO2 SO3Mole Frac H2O H2SO4 H2 O2 SO2 SO3Mass Frac H2O H2SO4 H2 O2 SO2 SO3Total Flow kmol/secTotal Flow kg/secTotal Flow cum/secTemperature CPressure barVapor FracLiquid FracSolid Frac
Enthalpy J/kmolEnthalpy J/kgEnthalpy WattEntropy J/kmol-KEntropy J/kg-KDensity kmol/cumDensity kg/cumAverage Mol WtLiq Vol 60F cum/sec*** VAPOR PHASE ***Density kg/cumMUMX N-sec/sqmKMX Watt/m-K*** LIQUID PHASE ***Density kg/cumMUMX N-sec/sqmKMX Watt/m-KSIGMAMX N/m*** LIQUID_1 PHASE *Density kg/cumMUMX N-sec/sqmKMX Watt/m-KSIGMAMX N/m*** LIQUID_2 PHASE *Density kg/cumMUMX N-sec/sqmKMX Watt/m-KSIGMAMX N/m
27 28 29 30 31 32 33 34 35 36 37 38 39 40 41 42 43KO-05 VV-05 KO-06 VV-06 KO-07 PP-12 EX-01-CS TO-01 EX-01-HS HX-04 VV-09 KO-10 TK-01 TO-02 EX-05-HS HX-03 KO-21VV-04 KO-05 VV-05 KO-06 VV-06 KO-07 PP-12 EX-01-CS KO-04 EX-01-HS HX-04 VV-09 KO-10 KO-10 KO-05 EX-05-HS HX-03MIXED LIQUID MIXED LIQUID MIXED LIQUID LIQUID MIXED VAPOR MIXED MIXED MIXED LIQUID VAPOR VAPOR MIXED MIXED
5.334 5.075 5.075 4.418 4.418 3.850 3.850 3.850 0.495 0.495 0.495 0.495 0.494 0.002 0.260 0.260 0.260 0.000 - 0.000 - 0.000 - - 0.000 0.000 0.000 0.000 0.000 - 0.000 0.000 0.000 0.000
- - - - - - - - - - - - - - - - - 0.008 0.000 0.000 0.000 0.000 0.000 0.000 0.000 0.493 0.493 0.493 0.493 0.000 0.492 0.008 0.008 0.008 0.225 0.049 0.049 0.001 0.001 0.000 0.000 0.000 0.776 0.776 0.776 0.776 0.617 0.159 0.176 0.176 0.176 1.070 1.070 1.070 1.070 1.070 1.070 1.070 1.070 0.000 0.000 0.000 0.000 0.000 - 0.000 0.000 0.000
0.804 0.819 0.819 0.805 0.805 0.783 0.783 0.783 0.281 0.281 0.281 0.281 0.444 0.003 0.585 0.585 0.585 0.000 - 0.000 - 0.000 - - 0.000 0.000 0.000 0.000 0.000 - 0.000 0.000 0.000 0.000
- - - - - - - - - - - - - - - - - 0.001 0.000 0.000 0.000 0.000 0.000 0.000 0.000 0.279 0.279 0.279 0.279 0.000 0.754 0.018 0.018 0.018 0.034 0.008 0.008 0.000 0.000 0.000 0.000 0.000 0.440 0.440 0.440 0.440 0.555 0.243 0.397 0.397 0.397 0.161 0.173 0.173 0.195 0.195 0.217 0.217 0.217 0.000 0.000 0.000 0.000 0.000 - 0.000 0.000 0.000
0.489 0.507 0.507 0.481 0.481 0.447 0.447 0.447 0.120 0.120 0.120 0.120 0.184 0.001 0.289 0.289 0.289 0.000 - 0.000 - 0.000 - - 0.000 0.000 0.000 0.000 0.000 - 0.000 0.000 0.000 0.000
- - - - - - - - - - - - - - - - - 0.001 0.000 0.000 0.000 0.000 0.000 0.000 0.000 0.212 0.212 0.212 0.212 0.000 0.607 0.016 0.016 0.016 0.074 0.018 0.018 0.000 0.000 0.000 0.000 0.000 0.668 0.668 0.668 0.668 0.816 0.392 0.696 0.696 0.696 0.436 0.475 0.475 0.518 0.518 0.553 0.553 0.553 0.000 0.000 0.000 0.000 0.000 - 0.000 0.000 0.000 6.638 6.194 6.194 5.489 5.489 4.920 4.920 4.920 1.764 1.764 1.764 1.764 1.111 0.653 0.444 0.444 0.444
196.462 180.240 180.240 165.310 165.310 155.014 155.014 155.016 74.402 74.402 74.402 74.402 48.443 25.959 16.222 16.222 16.222 0.935 0.150 10.435 0.124 82.681 0.104 0.104 115.550 0.818 0.372 0.207 0.782 0.032 0.749 0.785 0.152 0.027
236.256 236.256 173.269 173.269 111.829 111.829 111.837 116.051 256.420 121.832 48.000 31.046 31.046 31.046 236.256 91.549 48.000 22.200 22.200 2.500 2.500 0.220 0.220 0.450 0.150 84.000 83.400 82.800 21.000 21.000 21.000 22.200 21.600 21.000 0.067 - 0.114 - 0.104 - - 0.109 1.000 0.689 0.329 0.370 - 1.000 1.000 0.279 0.029 0.933 1.000 0.886 1.000 0.896 1.000 1.000 0.891 - 0.311 0.671 0.630 1.000 - - 0.721 0.971
- - - - - - - - - - - - - - - - - -3.169E+08 -3.216E+08 -3.216E+08 -3.319E+08 -3.319E+08 -3.427E+08 -3.427E+08 -3.370E+08 -1.924E+08 -2.081E+08 -2.184E+08 -2.184E+08 -3.037E+08 -7.319E+07 -2.526E+08 -2.838E+08 -2.920E+08-1.071E+07 -1.105E+07 -1.105E+07 -1.102E+07 -1.102E+07 -1.088E+07 -1.088E+07 -1.070E+07 -4.560E+06 -4.934E+06 -5.178E+06 -5.178E+06 -6.967E+06 -1.841E+06 -6.915E+06 -7.769E+06 -7.994E+06-2.104E+09 -1.992E+09 -1.992E+09 -1.822E+09 -1.822E+09 -1.686E+09 -1.686E+09 -1.658E+09 -3.393E+08 -3.671E+08 -3.853E+08 -3.853E+08 -3.375E+08 -4.778E+07 -1.122E+08 -1.260E+08 -1.297E+089.085E+04 8.262E+04 8.818E+04 7.392E+04 7.892E+04 6.372E+04 6.373E+04 7.915E+04 2.007E+05 -8.966E+08 -4.573E+09 -1.156E+09 -1.835E+09 1.900E+05 2.056E+05 -1.953E+09 -3.987E+093.070E+03 2.839E+03 3.030E+03 2.454E+03 2.620E+03 2.022E+03 2.023E+03 2.512E+03 4.758E+03 -2.126E+07 -1.084E+08 -2.740E+07 -4.209E+07 4.778E+03 5.629E+03 -5.347E+07 -1.091E+08
7.096 41.197 0.594 44.286 0.066 47.255 47.255 0.043 2.158 4.739 8.520 2.257 34.211 0.871 0.566 2.922 16.640 210.015 1,198.837 17.273 1,333.843 1.999 1,488.949 1,488.936 1.342 91.011 199.887 359.387 95.192 1,491.537 34.653 20.661 106.761 607.873 29.597 29.100 29.100 30.119 30.119 31.509 31.509 31.509 42.180 42.180 42.180 42.180 43.598 39.766 36.531 36.531 36.531 0.166 0.152 0.152 0.137 0.137 0.127 0.127 0.127 0.077 0.077 0.077 0.077 0.042 0.035 0.015 0.015 0.015
20.661 1.448 0.125 0.084 91.011 164.587 124.966 34.653 34.653 20.661 51.565 37.050 0.000 0.000 0.000 0.000 0.000 0.000 0.000 0.000 0.000 0.000 0.000 0.000 0.030 0.030 0.025 0.026 0.031 0.020 0.024 0.021 0.021 0.030 0.014 0.019
1,198.837 1,198.837 1,333.843 1,333.843 1,488.949 1,488.949 1,488.936 1,516.999 1,166.862 1,478.625 1,491.537 1,491.537 1,182.248 1,368.791 0.000 0.000 0.000 0.000 0.001 0.001 0.001 0.000 0.083 0.083 0.116 0.116 0.182 0.182 0.182 0.171 0.024 0.024 0.036 0.036 0.047 0.047 0.047 0.045
1,198.837 1,333.843 1,098.942 1,120.586 1,125.947 1,125.947 1,099.996 1,116.116 0.000 0.000 0.000 0.001 0.001 0.001 0.000 0.001 0.083 0.116 0.217 0.305 0.326 0.326 0.260 0.312 0.024 0.036 0.047 0.063 0.067 0.067 0.054 0.063
1,198.837 1,333.843 1,442.451 1,594.468 1,639.101 1,639.101 1,491.299 1,586.333 0.000 0.000 0.000 0.000 0.000 0.000 0.000 0.000 0.083 0.116 0.142 0.184 0.195 0.195 0.160 0.185 0.024 0.036 0.019 0.024 0.026 0.026 0.021 0.024

Substream: MIXEDMole Flow kmol/sec H2O H2SO4 H2 O2 SO2 SO3Mole Frac H2O H2SO4 H2 O2 SO2 SO3Mass Frac H2O H2SO4 H2 O2 SO2 SO3Total Flow kmol/secTotal Flow kg/secTotal Flow cum/secTemperature CPressure barVapor FracLiquid FracSolid Frac
Enthalpy J/kmolEnthalpy J/kgEnthalpy WattEntropy J/kmol-KEntropy J/kg-KDensity kmol/cumDensity kg/cumAverage Mol WtLiq Vol 60F cum/sec*** VAPOR PHASE ***Density kg/cumMUMX N-sec/sqmKMX Watt/m-K*** LIQUID PHASE ***Density kg/cumMUMX N-sec/sqmKMX Watt/m-KSIGMAMX N/m*** LIQUID_1 PHASE *Density kg/cumMUMX N-sec/sqmKMX Watt/m-KSIGMAMX N/m*** LIQUID_2 PHASE *Density kg/cumMUMX N-sec/sqmKMX Watt/m-KSIGMAMX N/m
44 45 46 47 48 49 50 51 52 53 54 55 56 57 58 59 60TK-01 TO-02 TK-01 PP-10 HX-07 EX-03-HS VV-03 HX-07 KO-12 CO-01 KO-13 MX-02X TK-01 PP-04 TK-01 PP-05 MX-02XKO-21 KO-21 SP-01 TK-01 KO-02 KO-06 EX-03-HS VV-03 HX-07 KO-12 CO-01 KO-13 MX-02X CO-01 PP-04 CO-01 PP-05LIQUID VAPOR LIQUID LIQUID VAPOR VAPOR MIXED MIXED MIXED VAPOR MIXED LIQUID LIQUID LIQUID LIQUID LIQUID LIQUID
0.260 0.000 24.932 31.363 0.058 0.657 0.657 0.657 0.715 0.049 0.003 0.003 0.016 0.032 0.032 0.013 0.013 - 0.000 - - 0.000 0.000 0.000 0.000 0.000 0.000 - - - - - - - - - - - - - - - - - - - - - - - -
0.000 0.008 0.002 0.003 0.001 0.000 0.000 0.000 0.001 0.001 0.001 0.000 0.000 0.000 0.000 0.000 0.000 0.171 0.005 1.192 2.500 0.281 0.048 0.048 0.048 0.330 0.347 0.231 0.231 0.345 0.001 0.001 0.114 0.114 0.000 0.000 3.883 3.884 0.000 0.000 0.000 0.000 0.000 0.000 - - - - - - -
0.603 0.007 0.831 0.831 0.172 0.931 0.931 0.931 0.684 0.123 0.014 0.014 0.046 0.972 0.972 0.104 0.104 - 0.000 - - 0.000 0.000 0.000 0.000 0.000 0.000 - - - - - - - - - - - - - - - - - - - - - - - -
0.000 0.614 0.000 0.000 0.002 0.000 0.000 0.000 0.001 0.002 0.003 0.000 0.000 0.000 0.000 0.000 0.000 0.397 0.379 0.040 0.066 0.827 0.068 0.068 0.068 0.315 0.875 0.983 0.986 0.954 0.028 0.028 0.896 0.896 0.000 0.000 0.129 0.103 0.000 0.000 0.000 0.000 0.000 0.000 - - - - - - -
0.299 0.003 0.537 0.545 0.055 0.793 0.793 0.793 0.379 0.038 0.004 0.004 0.013 0.907 0.907 0.032 0.032 - 0.000 - - 0.000 0.000 0.000 0.000 0.000 0.000 - - - - - - - - - - - - - - - - - - - - - - - -
0.000 0.446 0.000 0.000 0.001 0.000 0.000 0.000 0.001 0.001 0.002 0.000 0.000 0.000 0.000 0.000 0.000 0.701 0.551 0.091 0.155 0.944 0.207 0.207 0.207 0.621 0.961 0.995 0.996 0.987 0.093 0.093 0.968 0.968 0.000 0.000 0.372 0.300 0.000 0.000 0.000 0.000 0.000 0.000 - - - - - - - 0.431 0.013 30.010 37.751 0.340 0.705 0.705 0.705 1.046 0.396 0.235 0.234 0.362 0.033 0.033 0.128 0.128
15.657 0.565 836.491 1,036.255 19.095 14.930 14.930 14.930 34.026 23.112 14.898 14.845 22.420 0.639 0.639 7.575 7.575 0.011 0.015 0.613 0.779 9.656 10.311 0.717 2.095 10.694 11.457 0.011 0.009 0.014 0.001 0.001 0.005 0.005
48.000 48.000 100.000 94.757 75.925 173.269 86.549 74.751 48.000 48.000 48.000 48.000 47.530 48.000 49.134 48.000 49.253 21.000 21.000 21.000 21.000 1.013 2.500 2.400 1.013 0.913 0.913 21.000 21.000 21.000 2.501 21.000 7.308 21.000
- 1.000 - - 1.000 1.000 0.082 0.105 0.353 1.000 0.005 - - - - - - 1.000 - 1.000 1.000 - - 0.918 0.895 0.647 - 0.995 1.000 1.000 1.000 1.000 1.000 1.000
- - - - - - - - - - - - - - - - - -2.973E+08 -1.140E+08 -3.210E+08 -3.146E+08 -2.851E+08 -2.408E+08 -2.815E+08 -2.815E+08 -2.861E+08 -2.889E+08 -3.172E+08 -3.181E+08 -3.167E+08 -2.853E+08 -2.852E+08 -3.141E+08 -3.140E+08-8.189E+06 -2.588E+06 -1.152E+07 -1.146E+07 -5.082E+06 -1.137E+07 -1.330E+07 -1.330E+07 -8.793E+06 -4.952E+06 -5.007E+06 -5.015E+06 -5.110E+06 -1.478E+07 -1.478E+07 -5.300E+06 -5.298E+06-1.282E+08 -1.462E+06 -9.632E+09 -1.188E+10 -9.704E+07 -1.698E+08 -1.986E+08 -1.986E+08 -2.992E+08 -1.144E+08 -7.459E+07 -7.445E+07 -1.146E+08 -9.450E+06 -9.447E+06 -4.014E+07 -4.013E+07-4.105E+09 1.974E+05 7.247E+04 7.598E+04 2.442E+05 1.992E+05 9.674E+04 9.736E+04 1.355E+05 2.446E+05 1.412E+05 1.409E+05 1.383E+05 7.691E+04 7.691E+04 1.344E+05 1.344E+05-1.131E+08 4.480E+03 2.600E+03 2.768E+03 4.352E+03 9.407E+03 4.570E+03 4.599E+03 4.164E+03 4.193E+03 2.229E+03 2.221E+03 2.233E+03 3.985E+03 3.985E+03 2.268E+03 2.268E+03
37.700 0.841 48.952 48.431 0.035 0.068 0.984 0.337 0.098 0.035 22.340 25.522 26.010 53.340 53.356 26.873 26.862 1,368.791 37.050 1,364.485 1,329.441 1.978 1.448 20.831 7.126 3.182 2.017 1,415.080 1,618.841 1,611.614 1,029.509 1,029.816 1,592.824 1,592.200
36.307 44.060 27.874 27.450 56.107 21.171 21.171 21.171 32.542 58.347 63.343 63.430 61.962 19.301 19.301 59.272 59.272 0.014 0.001 0.722 0.908 0.016 0.014 0.014 0.014 0.031 0.019 0.012 0.012 0.019 0.001 0.001 0.006 0.006
37.050 1.978 1.448 4.270 1.650 2.017 2.017 38.733 0.000 0.000 0.000 0.000 0.000 0.000 0.000 0.000 0.019 0.013 0.030 0.015 0.015 0.012 0.012 0.018
1,368.791 1,364.485 1,329.441 979.979 981.134 1,003.725 1,618.841 1,618.841 1,611.614 1,029.509 1,029.816 1,592.824 1,592.200 0.001 0.001 0.000 0.000 0.001 0.000 0.000 0.000 0.001 0.001 0.000 0.000 0.214 0.222 0.543 0.600 0.542 0.182 0.182 0.183 0.444 0.444 0.184 0.183 0.051 0.052 0.060 0.063 0.068 0.018 0.018 0.020 0.067 0.067 0.023 0.022
1,116.116 1,364.485 979.979 981.134 1,618.841 1,029.509 1,592.824 0.001 0.001 0.000 0.000 0.000 0.001 0.000 0.312 0.214 0.543 0.600 0.182 0.444 0.184 0.063 0.051 0.060 0.063 0.018 0.067 0.023
1,586.333 1,329.441 0.000 0.001 0.185 0.222 0.024 0.052

Substream: MIXEDMole Flow kmol/sec H2O H2SO4 H2 O2 SO2 SO3Mole Frac H2O H2SO4 H2 O2 SO2 SO3Mass Frac H2O H2SO4 H2 O2 SO2 SO3Total Flow kmol/secTotal Flow kg/secTotal Flow cum/secTemperature CPressure barVapor FracLiquid FracSolid Frac
Enthalpy J/kmolEnthalpy J/kgEnthalpy WattEntropy J/kmol-KEntropy J/kg-KDensity kmol/cumDensity kg/cumAverage Mol WtLiq Vol 60F cum/sec*** VAPOR PHASE ***Density kg/cumMUMX N-sec/sqmKMX Watt/m-K*** LIQUID PHASE ***Density kg/cumMUMX N-sec/sqmKMX Watt/m-KSIGMAMX N/m*** LIQUID_1 PHASE *Density kg/cumMUMX N-sec/sqmKMX Watt/m-KSIGMAMX N/m*** LIQUID_2 PHASE *Density kg/cumMUMX N-sec/sqmKMX Watt/m-KSIGMAMX N/m
61 62 63 64 65 66 67 68 69 70 71 72 73 74 75 76 77TO-02 PP-06 TO-02 HX-09 HX-09 KO-14 PP-07 TO-02 EJ-01 EJ-01 HX-11 PP-17 MX-03 KO-12 PP-08 TO-02 EJ-02KO-13 KO-12 PP-06 KO-03 KO-07 HX-09 KO-14 PP-07 KO-14 EJ-01 HX-11 PP-17 HX-11 TO-01 PP-08 TO-01
VAPOR LIQUID LIQUID VAPOR VAPOR MIXED LIQUID LIQUID VAPOR MIXED VAPOR LIQUID LIQUID VAPOR LIQUID LIQUID VAPOR
0.000 0.670 0.670 0.041 0.568 0.609 0.547 0.547 0.064 0.089 0.154 0.151 0.151 0.003 4.348 4.348 0.004 - - - 0.000 0.000 0.000 - - 0.000 - - - - - 0.000 - 0.000 - - - - - - - - - - - - - - - - -
0.001 0.000 0.000 0.000 0.000 0.000 0.000 0.000 0.000 - 0.000 0.000 0.000 0.000 0.000 0.000 0.000 0.000 0.006 0.006 0.024 0.001 0.025 0.000 0.000 0.025 - 0.025 0.001 0.001 0.024 0.002 0.002 0.001
- 0.000 0.000 0.000 0.000 0.000 0.000 0.000 0.000 - - - - - 0.000 - 0.000
0.001 0.990 0.990 0.637 0.998 0.961 0.999 0.999 0.721 1.000 0.860 0.990 0.990 0.123 1.000 1.000 0.823 - - - 0.000 0.000 0.000 - - 0.000 - - - - - 0.000 - 0.000 - - - - - - - - - - - - - - - - -
0.573 0.000 0.000 0.000 0.000 0.000 0.000 0.000 0.000 - 0.000 0.000 0.000 0.000 0.000 0.000 0.000 0.426 0.010 0.010 0.363 0.002 0.039 0.001 0.001 0.279 - 0.140 0.010 0.010 0.877 0.000 0.000 0.177
- 0.000 0.000 0.000 0.000 0.000 0.000 0.000 0.000 - - - - - 0.000 - 0.000
0.000 0.967 0.967 0.331 0.994 0.874 0.998 0.998 0.420 1.000 0.634 0.967 0.967 0.038 0.998 0.998 0.566 - - - 0.000 0.000 0.000 - - 0.000 - - - - - 0.000 - 0.000 - - - - - - - - - - - - - - - - -
0.402 0.000 0.000 0.000 0.000 0.000 0.000 0.000 0.000 - 0.000 0.000 0.000 0.000 0.000 0.000 0.000 0.598 0.033 0.033 0.669 0.006 0.126 0.002 0.002 0.580 - 0.366 0.033 0.033 0.962 0.002 0.002 0.434
- 0.000 0.000 0.000 0.000 0.000 0.000 0.000 0.000 - - - - - 0.000 - 0.000 0.001 0.676 0.676 0.065 0.569 0.634 0.547 0.547 0.089 0.089 0.179 0.152 0.152 0.027 4.350 4.350 0.004 0.053 12.481 12.481 2.256 10.295 12.551 9.875 9.875 2.762 1.611 4.373 2.806 2.806 1.567 78.449 78.449 0.114 0.001 0.012 0.012 8.444 82.576 18.957 0.010 0.010 19.548 0.395 5.389 0.003 0.003 0.776 0.079 0.079 1.041
48.000 48.000 48.369 71.539 111.829 43.000 43.000 43.407 43.000 169.987 98.213 48.000 48.004 48.000 43.872 44.070 43.872 21.000 0.913 21.000 0.220 0.220 0.120 0.120 21.000 0.120 7.910 1.013 0.913 1.013 0.913 0.110 21.000 0.110 1.000 - - 1.000 1.000 0.137 - - 1.000 1.000 1.000 - - 1.000 - - 1.000
- 1.000 1.000 - - 0.863 1.000 1.000 - 0.000 - 1.000 1.000 - 1.000 1.000 - - - - - - - - - - - - - - - - - -
-1.266E+08 -2.847E+08 -2.846E+08 -2.603E+08 -2.392E+08 -2.809E+08 -2.847E+08 -2.846E+08 -2.568E+08 -2.377E+08 -2.472E+08 -2.847E+08 -2.847E+08 -2.894E+08 -2.846E+08 -2.846E+08 -2.511E+08-2.774E+06 -1.542E+07 -1.542E+07 -7.498E+06 -1.322E+07 -1.418E+07 -1.578E+07 -1.577E+07 -8.313E+06 -1.320E+07 -1.011E+07 -1.542E+07 -1.542E+07 -4.956E+06 -1.578E+07 -1.578E+07 -9.590E+06-1.459E+05 -1.925E+08 -1.925E+08 -1.692E+07 -1.361E+08 -1.780E+08 -1.558E+08 -1.557E+08 -2.296E+07 -2.126E+07 -4.422E+07 -4.327E+07 -4.327E+07 -7.767E+06 -1.238E+09 -1.238E+09 -1.093E+061.994E+05 7.594E+04 7.586E+04 2.284E+05 2.104E+05 9.497E+04 7.432E+04 7.424E+04 2.253E+05 1.842E+05 2.047E+05 7.586E+04 7.586E+04 2.447E+05 7.444E+04 7.444E+04 2.201E+054.368E+03 4.115E+03 4.111E+03 6.580E+03 1.162E+04 4.796E+03 4.118E+03 4.114E+03 7.297E+03 1.022E+04 8.371E+03 4.110E+03 4.110E+03 4.190E+03 4.128E+03 4.128E+03 8.404E+03
0.849 54.388 54.429 0.008 0.007 0.033 54.986 55.029 0.005 0.227 0.033 54.387 54.387 0.035 54.977 55.024 0.004 38.733 1,003.727 1,004.485 0.267 0.125 0.662 992.328 993.091 0.141 4.083 0.811 1,003.751 1,003.754 2.019 991.529 992.375 0.109 45.648 18.455 18.455 34.712 18.099 19.802 18.047 18.047 30.884 18.015 24.449 18.456 18.456 58.404 18.035 18.035 26.186 0.000 0.012 0.012 0.002 0.010 0.012 0.010 0.010 0.003 0.002 0.004 0.003 0.003 0.001 0.079 0.079 0.000
38.733 0.267 0.125 0.141 0.141 4.083 0.811 2.019 0.109 0.000 0.000 0.000 0.000 0.000 0.000 0.000 0.000 0.000 0.018 0.018 0.025 0.016 0.016 0.031 0.022 0.012 0.018
1,003.727 1,004.485 992.328 992.328 993.091 897.535 1,003.751 1,003.754 991.529 992.375 0.001 0.001 0.001 0.001 0.001 0.000 0.001 0.001 0.001 0.001 0.542 0.542 0.622 0.622 0.622 0.681 0.542 0.542 0.625 0.626 0.068 0.068 0.069 0.069 0.069 0.044 0.068 0.068 0.069 0.069
1,003.727 1,003.751 0.001 0.001 0.542 0.542 0.068 0.068

Substream: MIXEDMole Flow kmol/sec H2O H2SO4 H2 O2 SO2 SO3Mole Frac H2O H2SO4 H2 O2 SO2 SO3Mass Frac H2O H2SO4 H2 O2 SO2 SO3Total Flow kmol/secTotal Flow kg/secTotal Flow cum/secTemperature CPressure barVapor FracLiquid FracSolid Frac
Enthalpy J/kmolEnthalpy J/kgEnthalpy WattEntropy J/kmol-KEntropy J/kg-KDensity kmol/cumDensity kg/cumAverage Mol WtLiq Vol 60F cum/sec*** VAPOR PHASE ***Density kg/cumMUMX N-sec/sqmKMX Watt/m-K*** LIQUID PHASE ***Density kg/cumMUMX N-sec/sqmKMX Watt/m-KSIGMAMX N/m*** LIQUID_1 PHASE *Density kg/cumMUMX N-sec/sqmKMX Watt/m-KSIGMAMX N/m*** LIQUID_2 PHASE *Density kg/cumMUMX N-sec/sqmKMX Watt/m-KSIGMAMX N/m
78 79 80 81 82 83 84 85 86 87 88 89 ACID BFW FEED MAKEUP SO2EJ-02 HX-12 PP-09 MX-03 KO-14 DR-02 TK-01 PP-15 TK-01 TO-02 MX-00 SG-01 AN-MIX TK-01 MX-00
EJ-02 HX-12 PP-09 MX-03 HX-12 TO-02 DR-02 TO-02 DR-02 PP-15 TK-01 MX-00MIXED VAPOR LIQUID LIQUID LIQUID VAPOR VAPOR VAPOR LIQUID LIQUID LIQUID VAPOR LIQUID LIQUID LIQUID LIQUID MIXED
0.004 0.008 0.006 0.006 0.157 0.002 0.003 - 5.564 0.003 0.003 0.000 31.363 0.094 31.363 0.063 - - - - - - - 0.000 - 0.000 - - 0.000 - - - - - - - - - - - - - - - - - - - - - - - 0.000 0.000 0.000 0.000 0.000 0.501 0.501 0.002 - - 0.002 - - 0.003 - 0.003 - 0.001 0.000 0.000 0.001 0.001 0.001 - 0.179 0.001 0.001 0.007 - - 2.500 - 2.500 - - - - - - 0.000 - 0.000 - - 0.000 3.884 - 3.884 0.001 -
1.000 0.911 0.999 0.999 0.991 0.721 0.005 - 0.968 0.780 0.780 0.029 0.890 1.000 0.831 0.977 - - - - - - - 0.000 - 0.000 - - 0.000 - - - - - - - - - - - - - - - - - - - - - - - 0.000 0.000 0.000 0.000 0.000 0.993 1.000 0.000 - - 0.189 - - 0.000 - 0.001 - 0.089 0.001 0.001 0.009 0.279 0.001 - 0.031 0.220 0.220 0.783 - - 0.066 - 0.999 - - - - - - 0.000 - 0.000 - - 0.000 0.110 - 0.103 0.023 -
1.000 0.743 0.998 0.998 0.968 0.420 0.003 - 0.897 0.500 0.500 0.009 0.645 1.000 0.545 0.906 - - - - - - - 0.000 - 0.000 - - 0.000 - - - - - - - - - - - - - - - - - - - - - - - 0.000 0.000 0.000 0.000 0.000 0.994 1.000 0.000 - - 0.106 - - 0.000 - 0.001 - 0.257 0.002 0.002 0.032 0.580 0.003 - 0.103 0.500 0.500 0.884 - - 0.155 - 0.999 - - - - - - 0.000 - 0.000 - - 0.000 0.355 - 0.300 0.094 -
0.004 0.009 0.006 0.006 0.158 0.003 0.504 0.501 5.745 0.003 0.003 0.009 35.247 0.094 37.750 0.064 2.503 0.078 0.192 0.108 0.108 2.913 0.085 16.119 16.023 111.789 0.096 0.096 0.526 875.996 1.689 1,036.254 1.247 160.257 0.019 1.214 0.000 0.000 0.003 0.601 0.631 0.664 0.108 0.000 0.000 0.012 0.670 0.002 0.779 0.001 0.140
169.987 96.656 43.000 43.054 47.824 43.000 44.168 48.000 52.700 48.000 48.075 94.757 80.000 38.000 80.137 38.000 80.000 7.910 0.220 0.120 1.013 1.013 0.120 20.900 20.000 21.000 20.000 21.000 21.000 21.000 1.000 21.000 21.000 21.000 1.000 1.000 - - - 1.000 1.000 1.000 - - - 1.000 - - - - 0.013 0.000 - 1.000 1.000 1.000 - - - 1.000 1.000 1.000 - 1.000 1.000 1.000 1.000 0.987
- - - - - - - - - - - - - - - - - -2.377E+08 -2.444E+08 -2.847E+08 -2.847E+08 -2.847E+08 -2.568E+08 -1.309E+06 5.381E+05 -2.849E+08 -2.916E+08 -2.916E+08 -2.380E+08 -3.158E+08 -2.850E+08 -3.158E+08 -2.922E+08 -3.161E+08-1.320E+07 -1.106E+07 -1.578E+07 -1.578E+07 -1.544E+07 -8.313E+06 -4.094E+04 1.682E+04 -1.464E+07 -1.036E+07 -1.036E+07 -4.196E+06 -1.271E+07 -1.582E+07 -1.151E+07 -1.504E+07 -4.938E+06-1.035E+06 -2.129E+06 -1.696E+06 -1.696E+06 -4.497E+07 -7.061E+05 -6.599E+05 2.694E+05 -1.637E+09 -9.929E+05 -9.929E+05 -2.208E+06 -1.113E+10 -2.673E+07 -1.192E+10 -1.876E+07 -7.913E+081.842E+05 2.143E+05 7.432E+04 7.425E+04 7.588E+04 2.253E+05 1.814E+05 1.822E+05 7.825E+04 -1.683E+09 -1.673E+09 2.191E+05 6.828E+04 7.311E+04 7.193E+04 7.071E+04 1.581E+051.022E+04 9.696E+03 4.118E+03 4.114E+03 4.115E+03 7.297E+03 5.673E+03 5.693E+03 4.021E+03 -5.980E+07 -5.946E+07 3.864E+03 2.747E+03 4.058E+03 2.620E+03 3.640E+03 2.470E+03
0.227 0.007 54.986 54.987 54.411 0.005 0.799 0.754 53.050 43.956 43.956 0.782 52.582 55.118 48.491 55.307 17.888 4.083 0.159 992.327 992.345 1,003.353 0.141 25.533 24.116 1,032.256 1,236.797 1,236.801 44.343 1,306.794 992.969 1,331.084 1,074.310 1,145.289
18.015 22.101 18.047 18.047 18.440 30.884 31.973 31.999 19.458 28.137 28.137 56.703 24.853 18.015 27.450 19.424 64.027 0.000 0.000 0.000 0.000 0.003 0.000 0.027 0.027 0.110 0.000 0.000 0.000 0.774 0.002 0.908 0.001 0.134
4.083 0.159 0.141 25.533 24.116 44.343 52.922 0.000 0.000 0.000 0.000 0.000 0.000 0.000 0.031 0.023 0.016 0.028 0.028 0.015 0.013
897.535 992.327 992.345 1,003.353 1,032.256 1,236.797 1,240.576 1,306.794 992.969 1,331.084 1,074.310 1,568.635 0.000 0.001 0.001 0.001 0.001 0.001 0.001 0.001 0.001 0.001 0.000 0.681 0.622 0.622 0.544 0.424 0.246 0.274 0.623 0.241 0.492 0.161 0.044 0.069 0.069 0.068 0.066 0.057 0.058 0.070 0.055 0.069 0.012
992.327 992.345 1,003.353 1,115.964 0.001 0.001 0.001 0.001 0.622 0.622 0.544 0.314 0.069 0.069 0.068 0.063
1,586.376 0.000 0.185 0.024

Hydrogen Plant Alternatives Study NGNP-HPS SHAW-HPA Section 8 � Appendices
March 2009
8.1.3 Process Flow Diagrams

NO DATE ISSUE DESCRIPTION BY CHKD DISCP APPR
NTS.
Battelle Energy Alliance (BEA) LLCIdaho Falls, Idaho
38
HX-51
10% CausticTo TO-03
Sulfuric Acid Make-Up To TK-01
Sulfuric AcidFrom TK-01
Potable Water
LPS/CW
H2SO4 Make-Up Pump
H2SO4 FeedPump
NaOH SolutionSupply Pump
H2SO4 StorageTank
H2SO4 StorageTank Heater/
Cooler
Caustic StorageTank
NaOHTank Heater/
Cooler
MT-51 HX-51 MT-52 HX-52
PP-51
PP-51A/B/S PD-52A/S PD-54A/S
NaOH Supply
H2SO4 Supply
PP-53A/B/SNaOH Make-up
Pump
PPU-403
SAD-204
FUS-102
MOC: CS-TFE lined MOC: S:CS/T:20CB3
MOC: 20CB3 MOC: 20CB3
SAD-204
From Truck
From Truck
132155-T-PFD-HPS-FUS-1010 132155-T-PFD-HPS-FUS-101
MOC: CS
MOC: CS
36 MAX 0.21
MOC: CS MOC: CS
0.3
MT-51 MT-52
Sulfuric AcidDegassing
Drum
KO-51
MOC: CS-TFE lined
KO-51
VENT
0
LPS
CW
STREAM #
PRESSURE (Bar a)
TEMPERATURE (°C)
DUTY (MWth)
LOAD (kWe)
LOW PRESSURE STEAM
COOLING WATER
LEGEND
09/12/08 For Report MM COB COB
TO-04
To WasteTreatment
WTD
95
1.5 0.3 7.7
Sulfuric AcidVent Scrubber
TO-04
MOC: CS-TFE lined
PD-52
22
PP-53
HX-52
LPS/CW
PP-54
To WasteTreatment
WTD
0
NGNP HPAS: Hybrid Sulfur Sulfuric Acid and Caustic Supply

NO DATE ISSUE DESCRIPTION BY CHKD DISCP APPR
NTS.
Battelle Energy Alliance (BEA) LLCIdaho Falls, Idaho
GZ-101
40
Potable Water
To KO-01
Water TransferPumps
LPS
Water Pretreatment Filter/ Softener System
Treated WaterStorage Tank
GZ-101 MT-53
PP-55 A/S
ELE-301
MOC:CS
MOC: By VendorMOC:CS
FUS-101To MT-52
From Offsite
NGNP HPAS: Hybrid Sulfur Water Treatment
132155-T-PFD-HPS-FUS-1020 132155-T-PFD-HPS-FUS-102
LPS
CW
STREAM #
PRESSURE (Bar a)
TEMPERATURE (°C)
DUTY (MWth)
LOAD (kWe)
LOW PRESSURE STEAM
COOLING WATER
LEGEND
MT-53
0
0 9/12/08 For Report COB COB
61.4
PP-55
Water Treatment RO/EDI System
GZ-102
MOC: By Vendor
GZ-102
920
WTD
To Waste Water Treatment System
MM

NO DATE ISSUE DESCRIPTION BY CHKD DISCP APPR
NTS.
Battelle Energy Alliance (BEA) LLCIdaho Falls, Idaho
KO-03
90Sulfuric Acid
From Electrolysis
Sulfuric AcidFrom KO-05 KO-06
KO-02
To KO-12
To KO-14
CW
KO-061st Water Removal
Flash Drum
KO-02A/B/C/D50% Acid
Flash Drum #1
HX-07A/B/C/DKO-02
O/Head Vapor Cooler
KO-03 A/B/C/D50% Acid
Flash Drum #2
HX-09A/B/C/DKO-03
Condenser
KO-07A/B/C/D2nd Water
Removal Flash Drum
CW
MOC:Alloy B3 MOC:20CB3 MOC:316L SS MOC:20CB3 MOC:316L SS MOC:Alloy B3
To EX-01
PP-02 A/B/C/D/S50% AcidBoosterPump
PP-12A/B/C/D/S 65% AcidBoosterPump
MOC:20CB3 MOC:Alloy B3
ELE-301
SAD-203
SAD-203
SAD-205
SAD-205
NGNP HPAS: Hybrid SulfurAcid Concentration
132155-T-PFD-HPS-SAD-2010 132155-T-PFD-HPS-SAD-201
0
LPS
CW
STREAM #
PRESSURE (Bar a)
TEMPERATURE (°C)
DUTY (MWth)
LOAD (kWe)
LOW PRESSURE STEAM
COOLING WATER
LEGEND
KO-07
ELE-301To EX-04, EX-02
To EX-05SAD-203
SAD-202
To TO-01
EX-03
TC
FC
76 1.01LC
-3.6
20.314
17
LC
29173
2.5
HX-07
48
PP-02 PP-12
LC
19
112 0.2
-24.7
48
0.9
20D
HX-09
6643
0.12
LC
0.533
0.13
88.7
75
1.01
0.6
20B 65
0.272
22 14
EX-03A/B/C/DLP Recycle Acid Flash Condenser
MOC:316L SS
28.7
0 10/17/08 For Report MM COB COB

NO DATE ISSUE DESCRIPTION BY CHKD DISCP APPR
NTS.
Battelle Energy Alliance (BEA) LLCIdaho Falls, Idaho
TO-01
From EX-05
From EX-01
CW
To RX-01
To TO-02
To EJ-02
TO-01A/B/C/DVacuumColumn
TO-01 HX1A/B/C/DVacuum Column
Condenser
TO-01 HX2A/B/C/DVacuum ColumnRebolier
KO-25A/B/C/DVacuum
Column RefluxDrum
MOC:Alloy B3 Clad CSCeramic Packing
MOC:316L SS MOC:Alloy B3 MOC:316L SS
PP-03 A/B/C/D/SReactor
FeedPump
PP-08A/B/C/D/SVacuum ColumnReflux/Overhead
Product PumpMOC:Alloy B3 MOC:316L SS
SAD-205
SAD-204
SAD-203
SAD-203
SAD-203
NGNP HPAS: Hybrid SulfurAcid Steam Preheater and Vacuum Stripping
132155-T-PFD-HPS-SAD-2020 132155-T-PFD-HPS-SAD-202
0
CW
STREAM #
PRESSURE (Bar a)
TEMPERATURE (°C)
DUTY (MWth)
LOAD (kWe)
COOLING WATER
LEGEND
MPS MEDIUM PRESSURE STEAM
MPS
SAD-201From EX-03
From EX-02, EX-04ELE-301
107.6-204.4
89
0.13
116
0.15
PP-03
TO-01 HX2
LC
FC
PP-08
FC
LCKO-25
TO-01 HX1
22
44
2176
7744
0.11
2199 297
34127
8624
0 10/17/08 For Report MM COBCOB

NO DATE ISSUE DESCRIPTION BY CHKD DISCP APPR
NTS.
Battelle Energy Alliance (BEA) LLCIdaho Falls, Idaho
RX-01
75% AcidFrom PP-03
Recycle AcidTo KO-06
To TO-02Bottom
To AnolytePrep Tank TK-01
Sulfuric Acid Decomposer
Reactor EffluentFlash Drum
Recycle AcidFlash Drum
Reactor Product Trim
Cooler
Weak SO2Flash Drum
KO-10RX-01 A/B KO-04A/B KO-05 HX-04
To TO-01
To TO-01
From PP-12
MOC:Alloy B3MOC:Alloy B3 MOC:Alloy B3
MOC:316L SSMOC:316L SS
SAD-202
SAD-201
SAD-201
SAD-204
SAD-204
SAD-202
SAD-202
NGNP HPAS: Hybrid SulfurH2SO4 Decomposition and Acid Seperation
132155-T-PFD-HPS-SAD-2030 132155-T-PFD-HPS-SAD-203
Combined Vent AcidConcentration Vapor
Combined Condensate
Recovery
0
LPS
CW
STREAM #
PRESSURE (Bar a)
TEMPERATURE (°C)
DUTY (MWth)
LOAD (kWe)
LOW PRESSURE STEAM
COOLING WATER
LEGEND
From PP-02SAD-201
SAD-204To TK-01
-17.9
KO-0484256
KO-05236 22
LC
EX-01
LC
EX-05
20D
Helium Supply from NHSS
B/L
Helium Return to PCS
B/L
HX-03
HX-04
29
27
CW
CW
KO-1048 82.8 LC
KO-2148 21
2.5
71.6
0.43
PC
116
0.1534
112
0.45
173
43
37
2148
35
0.13
88.7
33
90
910
25
86
12724
89
TBD
40
39
EX-01 EX-05 HX-03Reactor Product
CondenserHP Recycle Acid Flash
CondenserRecycle Acid Trim Cooler
MOC: Shell 20Cb3b Clad CSTube 316L ss/ 20CB3 MOC:316L SS MOC:B3/CS
27.8 13.9 -3.6
HP Recycle AcidVapor KO Drum
KO-21
MOC:316L SS
0 10/17/08 For Report MM COBCOB

NO DATE ISSUE DESCRIPTION BY CHKD DISCP APPR
NTS.
Battelle Energy Alliance (BEA) LLCIdaho Falls, Idaho
Water from PP-08
Ejector Condensate from PP-07
SO2 Compressor Vent
Combined Vent Acid Concentration Vapor
To Electrolyzers
50.1 wt% H2SO4 From Electrolyzers
To Oxygen Purification
Makeup H2SO4
Absorber Column Anolyte Prep Tank
Ejector Condensate from PP-06
TO-02 TK-01
TK-01
MOC:316L SSCeramic Packing
MOC:TFE-lined CS
SAD-205
SAD-205
SAD-206
SAD-203
ELE-301
ELE-301
PPU-403
FUS-101
SAD-202
SAD-206
SAD-203
Combined SO2 Compressor Condensate
Combined Condensate Recovery
FUS-101
NGNP HPAS: Hybrid Sulfur Anolyte Processing
132155-T-PFD-HPS-SAD-204132155-T-PFD-HPS-SAD-2040
PP-10A/B/C/D/S Anolyte
Circulation PumpMOC:20CB3
Acid To Storage MT-51
Blowdown AcidWTD
To NeutralizationTreatment and Disposal
From KO-13
LPS
CW
STREAM #
PRESSURE (Bar a)
TEMPERATURE (°C)
DUTY (MWth)
LOAD (kWe)
LOW PRESSURE STEAM
COOLING WATER
LEGEND
0
From PP-52
TO-03
PP-10
406
44
2176
6843
21
21
4863
46
100
2121
84
86
95
21
48
LC
LC
PC
56
TO-02
2153
21
44
21
4861
89
0 10/17/08 For Report MM COBCOB

NO DATE ISSUE DESCRIPTION BY CHKD DISCP APPR
NTS.
Battelle Energy Alliance (BEA) LLCIdaho Falls, Idaho
LPSEJ-01
Vapor From TO-01
From HX-09
From HX-07
To CO-01 SO2 Recycle Compressor
To TO-02
To WasteTreatment Offsite
To TO-02
CW
HX-11
KO-12
EJ-02
LPS
KO-14
KO-17
HX-12
CW
EJ-01First Stage Vacuum
ColumnEjector
HX-12First Stage
Ejector Condenser
KO-17Ejector Condensate
Surge Pot
KO-14Second Stage
Ejector Suction Drum
EJ-02Second Stage Vacuum
ColumnEjector
HX-11Second Stage
Ejector Condenser
KO-12SO2
Recycle Compressor Suction Drum
PP-09A/SEJECTOR
Condensate Pump
PP-07A/SFirst Stage Condensate
Pump
PP-06A/SSecond StageCondensate
PumpPP-09 PP-07
PP-06
MOC: 316L SS MOC: 316L SS MOC: 316L SS MOC: 316L SSMOC:316L SS MOC: 316L SS MOC: 316L SS
SAD-202
SAD-201
SAD-201
SAD-206
SAD-204
SAD-204
MOC: 316L SS MOC: 316L SSMOC: 316L SS
NGNP HPAS: Hybrid Sulfur SO2 Recovery System
132155-T-PFD-HPS-SAD-205
WTD
0 131199-T-PFD-HPS-SAD-205
LPS
CW
STREAM #
PRESSURE (Bar a)
TEMPERATURE (°C)
DUTY (MWth)
LOAD (kWe)
LOW PRESSURE STEAM
COOLING WATER
LEGEND
0
7.978
0.1
4477
0.1
4366
0.9
4852
2 34 44
LC
LC
LC
83
79
8067
68
21
431.01
4882
62
53
63
71
73
69
70170
8170
0.27 6.71
98 1.010.9148
2148
43
0.1
97 0.2
0 10/17/08 MM COBCOBFor Report
0.91 48
74

NO DATE ISSUE DESCRIPTION BY CHKD DISCP APPR
NTS.
Battelle Energy Alliance (BEA) LLCIdaho Falls, Idaho
E
CWCW
SO2 FromKO-12
Combined SO2 CompressorCondensateTo TK-01
SO2 Compressor1st StageKO Drum
SO2 Compressor2nd Stage KO Drum
SO2 Recycle Compressor
1st Stage Aftercooler
2nd StageAftercooler
3rd StageAftercooler
SO2 Compressor3rd StageKO Drum
1st Stage Discharge
Pump
2nd StageDischarge
Pump
KO-20 KO-22
CO-01
CO-01 HX1 CO-01 HX2 CO-01 HX3 KO-13
PP-04A/S
CO-01
CO-01 HX1
KO-20
PP-05
KO-22
CO-01 HX2
CO-01 HX3
MOC:316L SS MOC:316L SS MOC:316L SS MOC:316L SS
MOC:316L SS
MOC:316L SSMOC:316L SS
PP-05A/S
SAD-205
SAD-204
SAD-204
MOC:316L SS MOC:316L SS
PP-04NGNP HPAS: Hybrid Sulfur
SO2 Compression
132155-T-PFD-HPS-SAD-2060 132155-T-PFD-HPS-SAD-206
CW
LPS
CW
STREAM #
PRESSURE (Bar a)
TEMPERATURE (°C)
DUTY (MWth)
LOAD (kWe)
LOW PRESSURE STEAM
COOLING WATER
LEGEND
0
KO-13
SO2 Compresor
Vent To TO-02
4213 2 15
LC LC
LC
53
2.548
48
0.91
58
49 21
48
7.31
60
2149
5421
48
55
6121
48
0.4 4.6 8.9
0 10/17/08 MMFor Report COBCOB
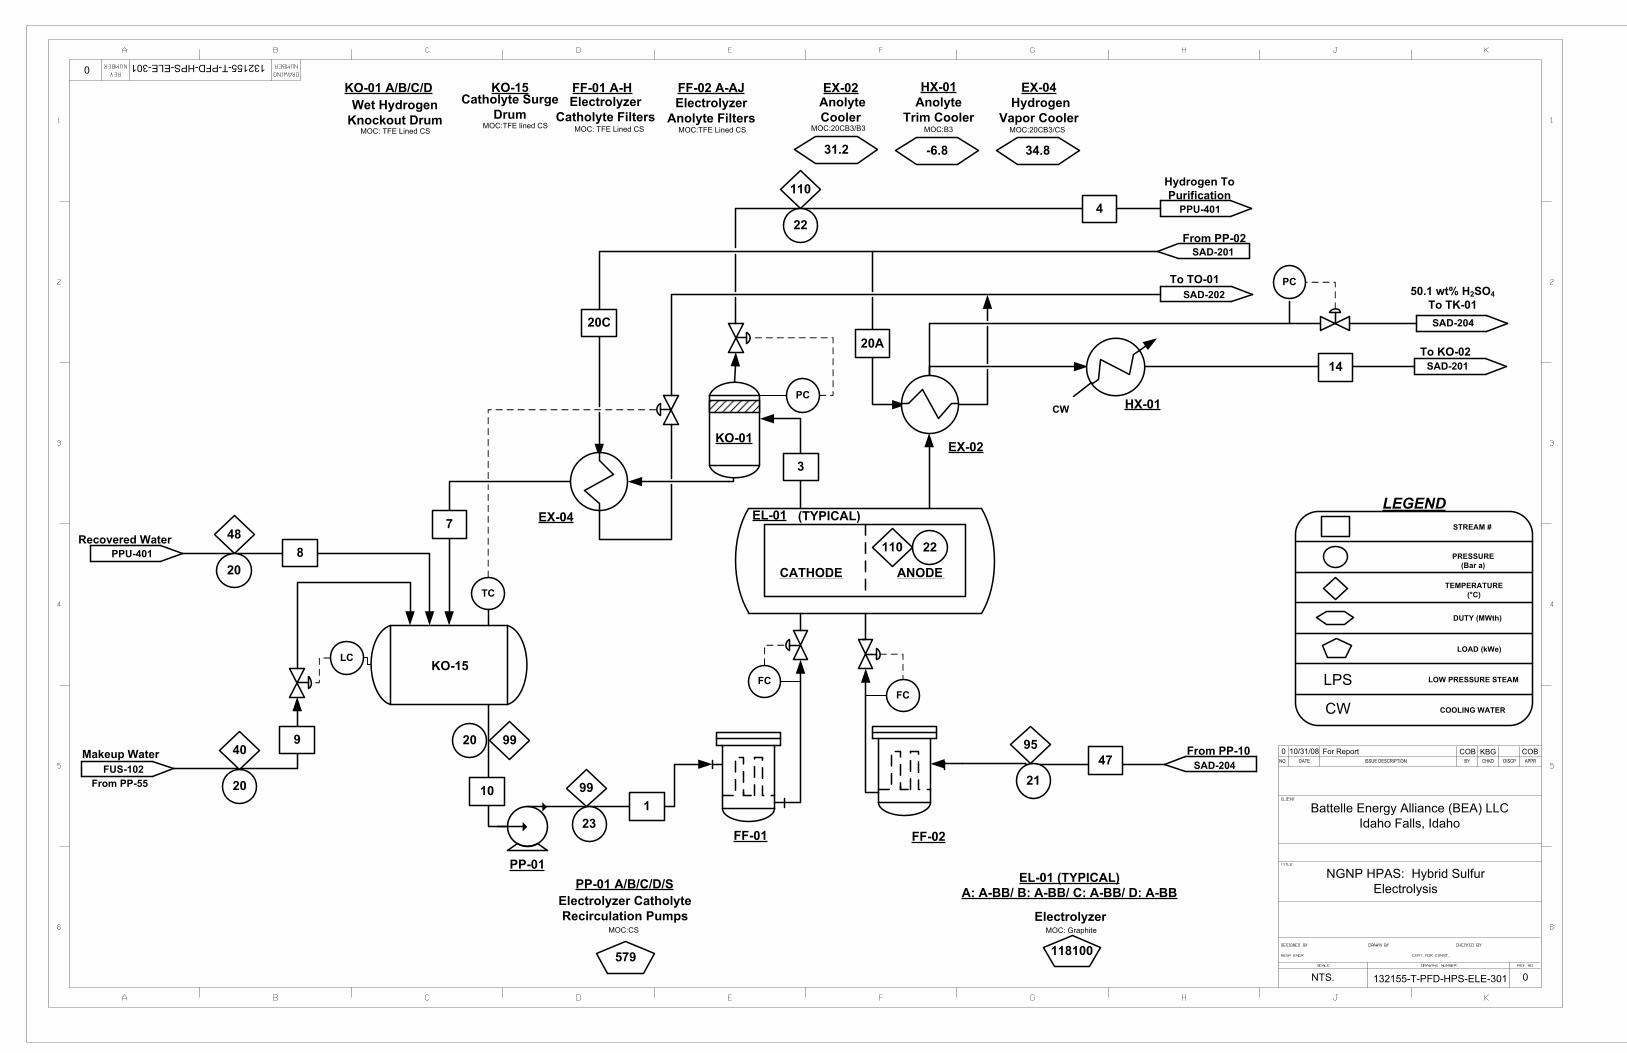
NO DATE ISSUE DESCRIPTION BY CHKD DISCP APPR
NTS.
Battelle Energy Alliance (BEA) LLCIdaho Falls, Idaho
CATHODE
PC
ANODE
Recovered Water
Makeup Water
Hydrogen ToPurification
To KO-02
50.1 wt% H2SO4To TK-01
From PP-10
Catholyte Surge Drum
ElectrolyzerCatholyte Filters
ElectrolyzerAnolyte Filters
Electrolyzer
AnolyteCooler
Electrolyzer CatholyteRecirculation Pumps
KO-01 A/B/C/D FF-01 A-H FF-02 A-AJ
EL-01 (TYPICAL)A: A-BB/ B: A-BB/ C: A-BB/ D: A-BB
EX-02
PP-01 A/B/C/D/SPP-01
FF-01 FF-02
To TO-01
From PP-02
HX-01Anolyte
Trim Cooler
EX-04 Hydrogen
Vapor CoolerMOC:TFE lined CS
EL-01
MOC:20CB3/B3 MOC:B3 MOC:20CB3/CSMOC: TFE Lined CS MOC:TFE Lined CS
MOC: Graphite
PPU-401
FUS-102
SAD-201
SAD-201
SAD-204
SAD-202
SAD-204
MOC:CS
PPU-401
NGNP HPAS: Hybrid SulfurElectrolysis
132155-T-PFD-HPS-ELE-301
(TYPICAL)
0 132155-T-PFD-HPS-ELE-301
From PP-55
LPS
CW
STREAM #
PRESSURE (Bar a)
TEMPERATURE (°C)
DUTY (MWth)
LOAD (kWe)
LOW PRESSURE STEAM
COOLING WATER
LEGEND
0
KO-15
TC
FC
LC
FC
KO-01
PC
KO-15Wet Hydrogen
Knockout DrumMOC: TFE Lined CS
CW HX-01
EX-04
EX-02
579
488
20
40
20
9
10
9920
1
9547
21
14
110
20C
22
110
4
22
20A
118100
31.2 -6.8 34.8
99
23
3
7
0 COB KBG10/31/08 For Report COB
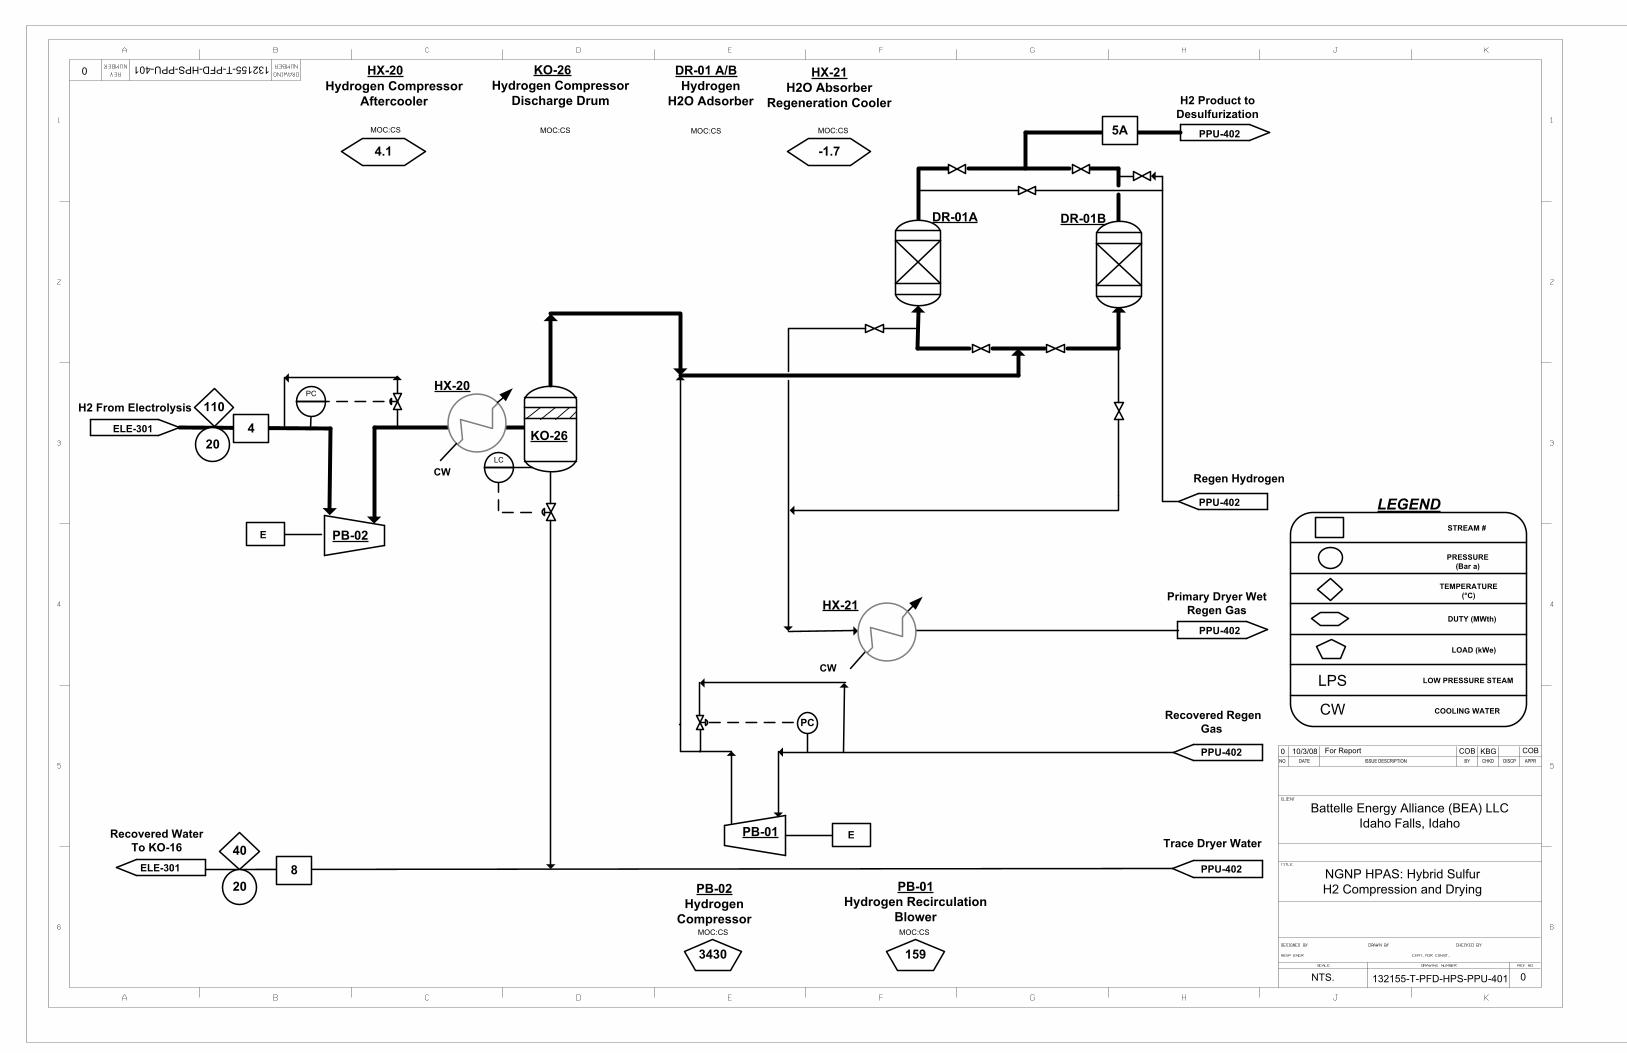
NO DATE ISSUE DESCRIPTION BY CHKD DISCP APPR
NTS.
Battelle Energy Alliance (BEA) LLCIdaho Falls, Idaho
Hydrogen CompressorDischarge Drum
HX-20 KO-26 DR-01 A/B
MOC:CS MOC:CS MOC:CS MOC:CS
NGNP HPAS: Hybrid SulfurH2 Compression and Drying
132155-T-PFD-HPS-PPU-4010 132155-T-PFD-HPS-PPU-401
Hydrogen H2O Adsorber
HX-21H2O Absorber
Regeneration CoolerHydrogen Compressor
Aftercooler
LPS
CW
STREAM #
PRESSURE (Bar a)
TEMPERATURE (°C)
DUTY (MWth)
LOAD (kWe)
LOW PRESSURE STEAM
COOLING WATER
LEGEND
0
0 For Report COB COB
CW
H2 From Electrolysis
E
Recovered Water To KO-16
CW
PC
PB-02
KO-26
HX-21
DR-01A
PB-01
HX-20
DR-01B
ELE-301
PB-02Hydrogen
Compressor
PB-01Hydrogen Recirculation
BlowerMOC:CS MOC:CS
ELE-301
PPU-402
PPU-402
PPU-402
PPU-402
PPU-402
E
3430 159
LC
110PC
408
20
4.1 -1.75A
H2 Product to Desulfurization
Regen Hydrogen
Trace Dryer Water
Recovered Regen Gas
Primary Dryer Wet Regen Gas
KBG10/3/08
204

NO DATE ISSUE DESCRIPTION BY CHKD DISCP APPR
NTS.
Battelle Energy Alliance (BEA) LLCIdaho Falls, Idaho
CW
HX-25
H2 Product
HDS SystemHeat Economizer
Hydrogen H2O AdsorberRegen Heater
Regen WaterKnockout Drum
Hydrogenator Desulfurizer BedsTrace H2O Adsorber Regen Cooler
Trace H2OAdsorber
HDS Trim CoolerHX-24 HX-22 HX-27 KO-27 RX-02 DR-03 A/B/C/DHX-26DR-04 A/B
RX-02
DR-03A/B DR-03C/D
DR-04A DR-04B
KO-27
MOC:CS MOC: 1¼ Cr, ½ Mo. MOC:CS MOC:CSMOC: 1¼ Cr, ½ Mo. MOC: 1¼ Cr, ½ Mo.MOC:CSMOC:CS
PPU-401
PPU-401
PPU-401
PPU-401
PPU-401
To Offsite Storage
NGNP HPAS: Hybrid Sulfur H2 Purification System
132155-T-PFD-HPS-PPU-402
CW
0 132155-T-PFD-HPS-PPU-402
LPS
HDS Feed Heater Trace H2OAdsorber Regen
Heater
HX-25HX-23
MOC:CS
MOC: 1¼ Cr, ½ Mo.
HX-23
0
0 10/17/08 For Report COB COB
HX-27
ELEC.
ELEC.
LEGEND
LPS
CW
ELEC.
STREAM #
PRESSURE (Bar a)
TEMPERATURE (°C)
DUTY (MWth)
LOAD (kWe)
LOW PRESSURE STEAM
COOLING WATER
ELECTRICAL HEATER
HX-26
HX-24
HX-22
5678
LC
PC
77
44
775
40
-1.7 9.5 1.8 (LPS) -0.1
H2 Product
Trace Dryer Water
Recovered Regen Gas
Primary Dryer Wet Regen Gas
Primary Regen Gas
5A
B/L
KBG

NO DATE ISSUE DESCRIPTION BY CHKD DISCP APPR
NTS.
Battelle Energy Alliance (BEA) LLCIdaho Falls, Idaho
PB-03O2 Regen
Gas Recirc. Blower
PP-20 A/SNaOH PurgePump
TO-03SO2 Scrub
Tower
HX-30SO2
AdsorberRegen Cooler
HX-31Oxygen H2O
AdsorberRegen Cooler
DR-02 A&BOxygen H2O
Adsorber
DR-05 A&BSO2
Adsorber
HX-28SO2
AdsorberRegen Heater
HX-29Oxygen H2O
AdsorberRegen Heater
PP-20
PB-03
KO-28
PH
LPS
CW
LPS
HX-30
HX-31
HX-29
HX-28
PB-04 E
CW
Fresh CausticFrom PP-54
Oxygen FromTO-02
Oxygen Product
PB-04Oxygen
Compressor
KO-28O2 Regen Gas
BlowerSuction Drum
Sodium SulfatePurge
TO-03
DR-02A DR-02B
DR-05A DR-05B
MOC:CS MOC:CS MOC:CS MOC:CS MOC:CS MOC:CS MOC:CS MOC:CS
FUS-101
SAD-204
MOC:CSMOC:CS MOC:CS
HX-32 A/BO2
Product Cooler
MOC:CS
To Offsite Storage
CW
HX-32 A/B
E
NGNP HPAS: Hybrid Sulfur O2 Purification System
132155-T-PFD-HPS-PPU-4030 132155-T-PFD-HPS-PPU-403
0
0 10/17/08 For Report COB KBG COB
LPS
CW
STREAM #
PRESSURE (Bar a)
TEMPERATURE (°C)
DUTY (MWth)
LOAD (kWe)
LOW PRESSURE STEAM
COOLING WATER
LEGEND
58 10 1300
LC
LC
PC
PC
PC
To Waste Treatment
4190
21
4091
40
-0.1 -0.1 0.2 (LPS) 0.3 (LPS)
B/L

Hydrogen Plant Alternatives Study NGNP-HPS SHAW-HPA Section 8 � Appendices
March 2009
8.1.4 Summary Plot Plan Layout


Hydrogen Plant Alternatives Study NGNP-HPS SHAW-HPA Section 8 � Appendices
March 2009
8.1.5 Sized Equipment List

1
Battelle Energy Alliance, LLC (BEA)
Next Generation Nuclear Plant
Idaho Falls, Idaho
Hybrid Sulfur Hydrogen
Feed and Utility Supply
Equipment List
Shaw E&I Project No. 132155
ISSUE DATE DESCRIPTION ORIGR CHK’R SDE PEM INTERDISCIPLINE REVIEW
DISCIPLINE REV’R DATE
Process
Mechanical
Civil/Structural
Control Systems
Power Systems
Piping
Material & Corr.
0 11/18/2008 For Report COB COB COB
FILE NAME NGNP HPAS HyS Feed & Utility Equipment List
08.doc
SHEET1 of 7
DOC.NO. 132155-T-EQL-HPS-HYS-FUS-0

Note: Above data (except for Item No. and name) shall not be used for design purposes. For this purpose the data on the relevant specification/data sheets shall be used
ISSUE DATE SHEET DOC NO
0 11/18/2008 2 of 7 132155-T-EQL-HPS-HYS-FUS-0
EQUIPMENT LIST - TOWERS
Client: Battelle Energy Alliance (BEA), LLC Signature:
Unit: NGNP HPS Hybrid Sulfur Location: Idaho Falls, Idaho
Mechanical Design Material Item No. Name Diameter
(mm)Height (mm)
Packing/Trays Press
(bar g) Temp (°C) Shell C.A. (mm)
PackingTrays
PFD Remarks
HPS-FUSTO-04
Sulfuric Acid Vent Scrubber 4300 12900
30 m3 CS Chevron
disengaging packing
3.5 130 CS CS FUS-101 Spray tower

Note: Above data (except for Item No. and name) shall not be used for design purposes. For this purpose the data on the relevant specification/data sheets shall be used
ISSUE DATE SHEET DOC NO
0 11/18/2008 3 of 7 132155-T-EQL-HPS-HYS-FUS-0
EQUIPMENT LIST – VESSELS / REACTORS
Client: Battelle Energy Alliance (BEA), LLC Signature:
Unit: NGNP Hybrid Sulfur Location: Idaho Falls, Idaho
Mechanical Design Item No. Name Diameter
(mm)Length (mm)
Horizon/Vertical Pressure
bar (g)Temp (°C)
MaterialC.A. (mm) PFD Remarks
HPS-FUSKO-51
Sulfuric Acid Degassing Drum 3000 8000 Vertical 3.5 130 CS-TFE
Lined FUS-101

Note: Above data (except for Item No. and name) shall not be used for design purposes. For this purpose the data on the relevant specification/data sheets shall be used
ISSUE DATE SHEET DOC NO
0 11/18/2008 4 of 7 132155-T-EQL-HPS-HYS-FUS-0
EQUIPMENT LIST – LOW PRESSURE TANKS
Client: Battelle Energy Alliance (BEA) LLC Signature:
Unit: NGNP Hybrid Sulfur Location: Idaho Falls, Idaho
Mechanical Design Item No. Name Diameter
(mm)Height (mm) Pressure
mm WG Temperature
(°C)
MaterialC.A. (mm) PFD Remarks
HPS-FUSMT-51
H2SO4 Storage Tank
6700 7300 150 130 CS-TFE Lined FUS-101
HPS-FUSMT-52
Caustic Storage Tank
12400 11000 150 75 CS FUS-101
HPS-FUSMT-53
Treated Water Storage Tank
22500 12800 150 75 316 SS FUS-102 Included in the cost of GZ-102

Note: Above data (except for Item No. and name) shall not be used for design purposes. For this purpose the data on the relevant specification/data sheets shall be used
ISSUE DATE SHEET DOC NO
0 11/18/2008 5 of 7 132155-T-EQL-HPS-HYS-FUS-0
EQUIPMENT LIST – PUMPS
Client: Battelle Energy Alliance (BEA) LLC Signature:
Unit: NGNP Hybrid Sulfur Location: Idaho Falls, Idaho
MaterialItem No. Name Type
RatedFlow
(m3 /h)
Differential Pressure
(bar)
MotorkW
Casing Impeller PFD Remarks
HPS-FUSPP-51 A/B/S
H2SO4
Make-Up Pump ANSI
Centrif. 18 0.3 0.55 20CB3 20CB3 FUS-101 Static Head allowed 15m
HPS-FUSPD-52A/S
H2SO4 Feed Pump
Rotary Gear 1.7 20 2.2 20CB3 20CB3 FUS-101 Static Head allowed 15m
HPS-FUSPP-53 A/B/S
NaOH Make-up Pump
ANSICentrif. 18 0.3 0.55 CS CS FUS-101 Static Head allowed 15m
HPS-FUSPD-54 A/S
NaOH Solution Supply Pump
Rotary Gear 9 21.3 11 CS CS FUS-101 Static Head allowed 15m
HPS-FUSPP-55A/B
Water Transfer Pumps
Multi-stg.Centrif. 77 20.8 90 316 SS 316 SS FUS-102 Static Head allowed 15m

Note: Above data (except for Item No. and name) shall not be used for design purposes. For this purpose the data on the relevant specification/data sheets shall be used
ISSUE DATE SHEET DOC NO
0 11/18/2008 6 of 7 132155-T-EQL-HPS-HYS-FUS-0
EQUIPMENT LIST – MISCELLANEOUS
Client: Battelle Energy Alliance (BEA) LLC Signature:
Unit: NGNP Hybrid Sulfur Location: Idaho Falls, Idaho
Item No. Name Material PFD Duty - Description - Remarks
HYS-FUSGZ-101
Water Pretreatment Filter/Softener System Various FUS 102
Water treatment multimedia and zeolite softener system. System consists of two trains, each train having a capacity of 80 m3/hr (360 gpm product). Vessels are plasite lined carbon steel. System consists of skid mounted feed pumps (2 x 100%), skid mounted backwash pumps (2 x 100%), skid mounted regeneration pumps (2 x 100%), two multi-media filter vessels (10 ft diameter each), two zeolite vessels (8 ft diameter each), and one salt dissolving tank. Total equipment cost: $1 Million for equipment described above plus PLC controls. Estimated from quote from Aquatech via email dated 10/3/08. Building/foundation costs included in GZ-02.
HYS-FUSGZ-102
Water Treatment RO/EDI System Various FUS 102
Reverse Osmosis, Electric Deionization System, 4 x 120 gpm RO/EDI trains. System capacity 360 gpm (product), with 120 gpm installed spare capacity. RO/EDI equipment pricing based on Jan 2008 estimate for Duke Buck combined cycle plant. 3,300 m3 purified water tank, 48 hrs storage, $528/m3 installed cost. Water Purification Building, 550 m2, $3122/m2 installed. Total Installed System Cost: $14 Million (including tank, building and foundations and electrical)
HYS-WTD GZ-103
Waste Water Treatment System Various
Corrugated inclined plate oil/water separator, 200 gpm capacity. Equipment includes tank, separation media, pumps and control panel. Neutralization, physical treatment system with Mixing tank, piping valves, metering pumps for pH neutralization system. Allowance also for potential physical/chemical treatment, if required. Total Installed System Cost: $2.5 Million (allowance)

Note: Above data (except for Item No. and name) shall not be used for design purposes. For this purpose the data on the relevant specification/data sheets shall be used
ISSUE DATE SHEET DOC NO
0 11/18/2008 7 of 7 132155-T-EQL-HPS-HYS-FUS-0
EQUIPMENT LIST – HEAT EXCHANGERS
Client: Battelle Energy Alliance (BEA) LLC Signature:
Unit: NGNP Hybrid Sulfur Location: Idaho Falls, Idaho
Mechanical Design
Shell Tube Item No. Name Area
(m2) MaterialPressure (bar g)
Temperature (oC)
MaterialPressure (bar g)
Temperature (oC)
Type PFD Remarks
HPS-FUSHX-51
H2SO4 Storage Tank Heater/Cooler
1050 CS3
150
20CB3 3090
BEU FUS-101
HPS-FUSHX-52
NaOH Tank Heater/Cooler 2
CS3
150
CS2390
Double Pipe FUS-101
1
Battelle Energy Alliance, LLC (BEA)
Next Generation Nuclear Plant
Idaho Falls, Idaho
Hybrid Sulfur Hydrogen
Sulfuric Acid Decomposition
Equipment List
Shaw E&I Project No. 132155
ISSUE DATE DESCRIPTION ORIGR CHK’R SDE PEM INTERDISCIPLINE REVIEW
DISCIPLINE REV’R DATE
Process
Mechanical
Civil/Structural
Control Systems
Power Systems
Piping
Material & Corr.
0 11/18/2008 For Estimate COB TS COB COB
FILE NAME BEA LLC SAD Equipment List 08.doc
SHEET 1 of 11
DOC.NO.132155-T-EQL-HPS-HYS-SAD-0
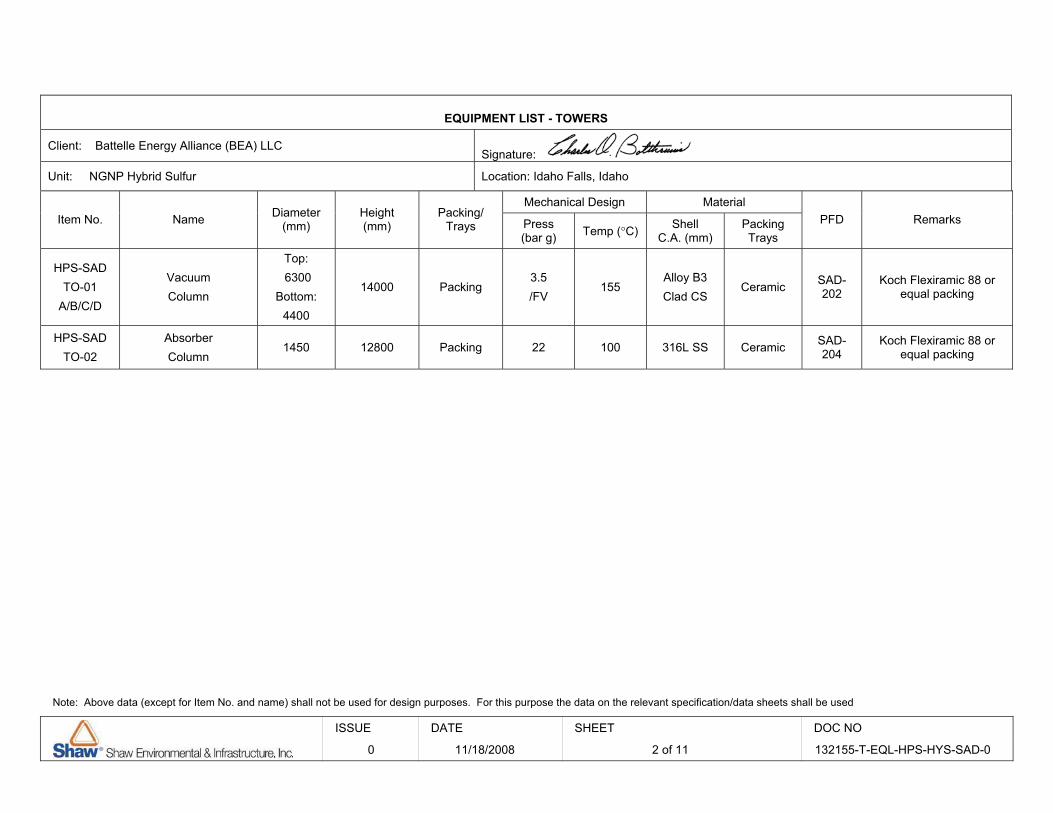
Note: Above data (except for Item No. and name) shall not be used for design purposes. For this purpose the data on the relevant specification/data sheets shall be used
ISSUE DATE SHEET DOC NO
0 11/18/2008 2 of 11 132155-T-EQL-HPS-HYS-SAD-0
EQUIPMENT LIST - TOWERS
Client: Battelle Energy Alliance (BEA) LLC Signature:
Unit: NGNP Hybrid Sulfur Location: Idaho Falls, Idaho
Mechanical Design Material Item No. Name Diameter
(mm)Height (mm)
Packing/Trays Press
(bar g) Temp (°C) Shell C.A. (mm)
PackingTrays
PFD Remarks
HPS-SADTO-01
A/B/C/D
VacuumColumn
Top: 6300
Bottom:4400
14000 Packing 3.5/FV
155Alloy B3 Clad CS
Ceramic SAD-202
Koch Flexiramic 88 or equal packing
HPS-SADTO-02
AbsorberColumn
1450 12800 Packing 22 100 316L SS Ceramic SAD-204
Koch Flexiramic 88 or equal packing

Note: Above data (except for Item No. and name) shall not be used for design purposes. For this purpose the data on the relevant specification/data sheets shall be used
ISSUE DATE SHEET DOC NO
0 11/18/2008 3 of 11 132155-T-EQL-HPS-HYS-SAD-0
EQUIPMENT LIST – VESSELS / REACTORS
Client: Battelle Energy Alliance (BEA) LLC Signature:
Unit: NGNP Hybrid Sulfur Location: Idaho Falls, Idaho
Mechanical Design Item No. Name Diameter
(mm)Length (mm)
Horizon/Vertical Pressure
(bar g ) Temp (°C)Material
C.A. (mm) PFD Remarks
HPS-SADRX-01 A/B
Sulfuric Acid Decomposer 4800 10300 Vertical 95 300
He (Shell) side:
Internally insulated
CS, Process side (Tube side) TFE lined CS, Silicon Carbide tubes
SAD-203
Similar to a large, vertical, tubular heat exchanger. Alloy B3 piping
on sulfuric acid side; Incoloy 800H piping on the Helium side.
Hemispherical heads, cold wall design
2 Units at $27 million for both units, not installed
HPS-SADKO-02
A/B/C/D
50% Acid Flash Drum #1
1900 4800 Vertical 3.5/FV
10520Cb3
Clad CS SAD-201
HPS-SADKO-03
A/B/C/D
50% Acid Flash Drum #2
2300 6900 Horizontal 3.5/FV
10520Cb3
Clad CS SAD-201
HPS-SADKO-04A/B
Reactor Effluent Flash Drum
4000 11750 Horizontal 92 285 Alloy B3 Clad CS
SAD-203
HPS-SADKO-05
Recycle Acid Flash Drum
2600 7600 Horizontal 23 265 Alloy B3 Clad CS
SAD-203
HPS-SADKO-06
A/B/C/D
1st Water RemovalFlash Drum
2100 5450 Vertical 3.5/FV
200Alloy B3 Clad CS
SAD-201
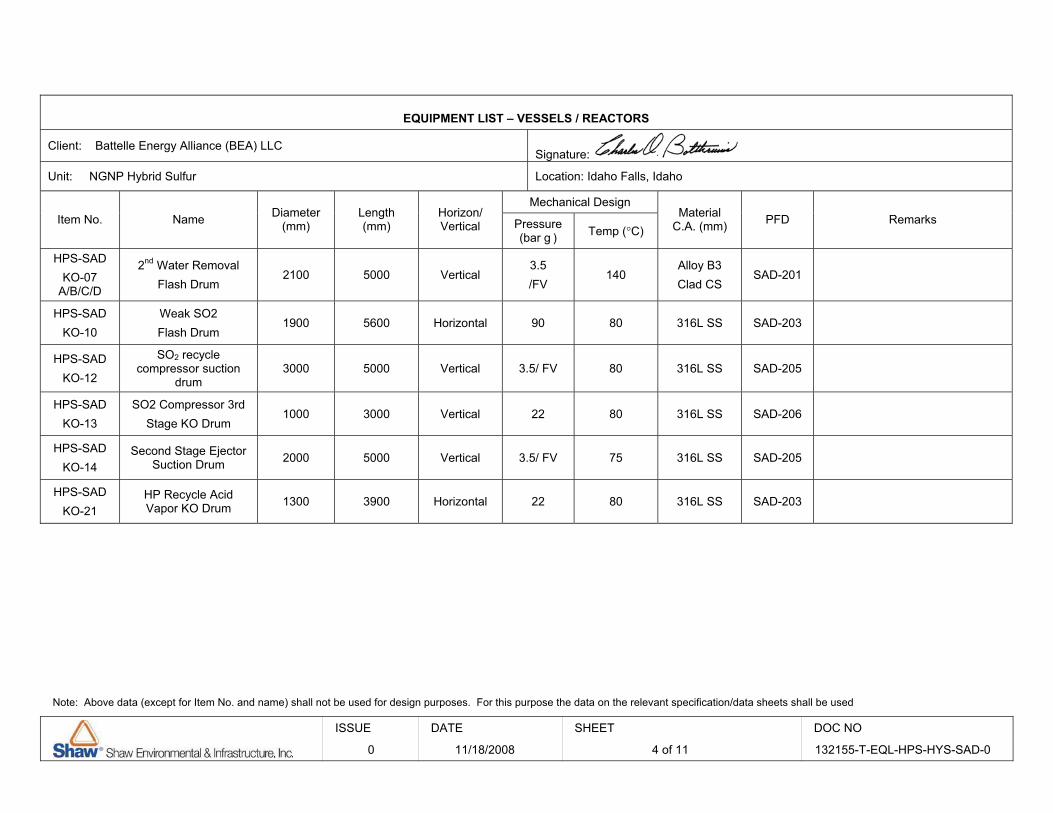
Note: Above data (except for Item No. and name) shall not be used for design purposes. For this purpose the data on the relevant specification/data sheets shall be used
ISSUE DATE SHEET DOC NO
0 11/18/2008 4 of 11 132155-T-EQL-HPS-HYS-SAD-0
EQUIPMENT LIST – VESSELS / REACTORS
Client: Battelle Energy Alliance (BEA) LLC Signature:
Unit: NGNP Hybrid Sulfur Location: Idaho Falls, Idaho
Mechanical Design Item No. Name Diameter
(mm)Length (mm)
Horizon/Vertical Pressure
(bar g ) Temp (°C)Material
C.A. (mm) PFD Remarks
HPS-SADKO-07
A/B/C/D
2nd Water Removal Flash Drum
2100 5000 Vertical 3.5/FV
140Alloy B3 Clad CS
SAD-201
HPS-SADKO-10
Weak SO2 Flash Drum
1900 5600 Horizontal 90 80 316L SS SAD-203
HPS-SADKO-12
SO2 recycle compressor suction
drum3000 5000 Vertical 3.5/ FV 80 316L SS SAD-205
HPS-SADKO-13
SO2 Compressor 3rd Stage KO Drum
1000 3000 Vertical 22 80 316L SS SAD-206
HPS-SADKO-14
Second Stage Ejector Suction Drum 2000 5000 Vertical 3.5/ FV 75 316L SS SAD-205
HPS-SADKO-21
HP Recycle Acid Vapor KO Drum 1300 3900 Horizontal 22 80 316L SS SAD-203

Note: Above data (except for Item No. and name) shall not be used for design purposes. For this purpose the data on the relevant specification/data sheets shall be used
ISSUE DATE SHEET DOC NO
0 11/18/2008 5 of 11 132155-T-EQL-HPS-HYS-SAD-0
EQUIPMENT LIST – VESSELS / REACTORS
Client: Battelle Energy Alliance (BEA) LLC Signature:
Unit: NGNP Hybrid Sulfur Location: Idaho Falls, Idaho
Mechanical Design Item No. Name Diameter
(mm)Length (mm)
Horizon/Vertical Pressure
(bar g) Temp (°C)Material
C.A. (mm) PFD Remarks
HPS-SADKO-17
Ejector Condensate Surge Pot
1200 3200 Verticall 3.5/ FV 130 316L SS SAD-205
HPS-SADKO-20
SO2 Compressor 1st
Stage KO Drum 2300 5000 Vertical 3.5 80 316L SS SAD-206
HPS-SADKO-22
SO2 Compressor 2nd
Stage KO Drum 1300 3000 Vertical 7.0 80 316L SS SAD-206
HPS-SADKO-25
A/B/C/D
Vacuum Column Reflux Drum
1400 4200 Horizontal 3.5/FV 75 316L SS SAD-202 One drum per TO-01 column train;
4 trains
HPS-SADTK-01
Anolyte Prep Tank
4600 18400 Horizontal 22 125 TFE-lined CS SAD-204
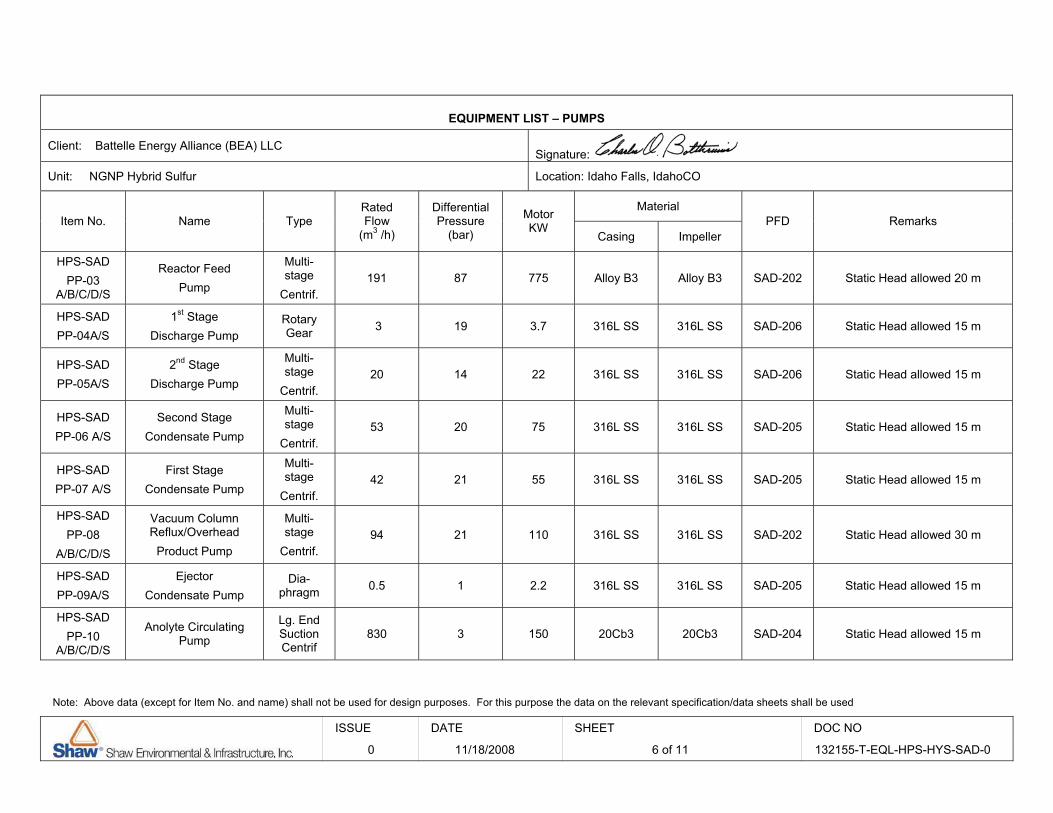
Note: Above data (except for Item No. and name) shall not be used for design purposes. For this purpose the data on the relevant specification/data sheets shall be used
ISSUE DATE SHEET DOC NO
0 11/18/2008 6 of 11 132155-T-EQL-HPS-HYS-SAD-0
EQUIPMENT LIST – PUMPS
Client: Battelle Energy Alliance (BEA) LLC Signature:
Unit: NGNP Hybrid Sulfur Location: Idaho Falls, IdahoCO
MaterialItem No. Name Type
RatedFlow
(m3 /h)
Differential Pressure
(bar)
MotorKW
Casing Impeller PFD Remarks
HPS-SADPP-03
A/B/C/D/S
Reactor Feed Pump
Multi-stage
Centrif.191 87 775 Alloy B3 Alloy B3 SAD-202 Static Head allowed 20 m
HPS-SADPP-04A/S
1st StageDischarge Pump
Rotary Gear 3 19 3.7 316L SS 316L SS SAD-206 Static Head allowed 15 m
HPS-SADPP-05A/S
2nd StageDischarge Pump
Multi-stage
Centrif.20 14 22 316L SS 316L SS SAD-206 Static Head allowed 15 m
HPS-SADPP-06 A/S
Second Stage Condensate Pump
Multi-stage
Centrif.53 20 75 316L SS 316L SS SAD-205 Static Head allowed 15 m
HPS-SADPP-07 A/S
First Stage Condensate Pump
Multi-stage
Centrif.42 21 55 316L SS 316L SS SAD-205 Static Head allowed 15 m
HPS-SADPP-08
A/B/C/D/S
Vacuum Column Reflux/Overhead
Product Pump
Multi-stage
Centrif.94 21 110 316L SS 316L SS SAD-202 Static Head allowed 30 m
HPS-SADPP-09A/S
EjectorCondensate Pump
Dia-phragm 0.5 1 2.2 316L SS 316L SS SAD-205 Static Head allowed 15 m
HPS-SADPP-10
A/B/C/D/S
Anolyte Circulating Pump
Lg. End SuctionCentrif
830 3 150 20Cb3 20Cb3 SAD-204 Static Head allowed 15 m

Note: Above data (except for Item No. and name) shall not be used for design purposes. For this purpose the data on the relevant specification/data sheets shall be used
ISSUE DATE SHEET DOC NO
0 11/18/2008 7 of 11 132155-T-EQL-HPS-HYS-SAD-0
EQUIPMENT LIST – PUMPS
Client: Battelle Energy Alliance (BEA) LLC Signature:
Unit: NGNP Hybrid Sulfur Location: Idaho Falls, IdahoCO
MaterialItem No. Name Type
RatedFlow
(m3 /h)
Differential Pressure
(bar)
MotorKW
Casing Impeller PFD Remarks
HPS-SADPP-02
A/B/C/D/S
50% Acid Booster Pump
Centrif. 150 0.4 7.5 20Cb3 20Cb3 SAD-201
HPS-SADPP-12
A/B/C/D/S
65% Acid Booster Pump
Centrif. 110 0.3 5.5 Alloy B3 Alloy B3 SAD-201

Note: Above data (except for Item No. and name) shall not be used for design purposes. For this purpose the data on the relevant specification/data sheets shall be used
ISSUE DATE SHEET DOC NO
0 11/18/2008 8 of 11 132155-T-EQL-HPS-HYS-SAD-0
EQUIPMENT LIST – COMPRESSORS / BLOWERS / VACUUM PUMPS
Client: Battelle Energy Alliance (BEA) LLC Signature:
Unit: NGNP Hybrid Sulfur Location: Idaho Falls, Idaho
Driver
Item No. Name Type Capacity (Am 3/h)
SuctionPressure(bar a)
Differential Pressure
(bar) Type RatedPower (kW)
MaterialC.A.(mm) PFD Remarks
HPS-SADEJ-02
Second Stage Vacuum Column Ejector
SteamEjector
77000 0.12 0.9 - - 316L SS SAD-205
HPS-SADEJ-01
First Stage Vacuum Column Ejector
SteamEjector
4100 0.11 0.11 - - 316L SS SAD-205
HPS-SADCO-01
SO2 Recycle Compressor
Three Stage
Centrif.45000 0.9 20.1 Electric 5300 316L SS SAD-206

Note: Above data (except for Item No. and name) shall not be used for design purposes. For this purpose the data on the relevant specification/data sheets shall be used
ISSUE DATE SHEET DOC NO
0 11/18/2008 9 of 11 132155-T-EQL-HPS-HYS-SAD-0
EQUIPMENT LIST – HEAT EXCHANGERS
Client: Battelle Energy Alliance (BEA) LLC Signature:
Unit: NGNP Hybrid Sulfur Location: Idaho Falls, Idaho
Mechanical Design
Shell Tube Item No. Name
Area(m2)
(Total) Material
Pressure (bar g) Temperature
(oC)
MaterialPressure (bar g)
Temperature (oC)
Type PFD Remarks
HPS-SADCO-01 HX1
SO2 Recycle 1st Stage Aftercooler
5316L SS
5200
CS/ 316L SS 7
80BEU SAD-206
HPS-SADCO-01 HX2
SO2 Recycle 2nd Stage Aftercooler
35316L SS
7200
CS/ 316L SS 7
80BEU SAD-206
HPS-SADCO-01HX3
SO2 Recycle 3rd Stage Aftercooler
65316L SS
22200
CS/ 316L SS 1680
BEU SAD-206
HPS-SADEX-01
Reactor Product Condenser
40020Cb3b Clad CS
63126
316L ss/ 20CB3 91132
DEU SAD-203
HPS-SADHX-03
Recycle Acid Trim Cooler 85
B3/CS 22
260
B3/CS1680
BEU SAD-203
HPS-SADHX-04
Reactor Product Trim Cooler
300316 L SS
92260
316 L SS 6380
BEU SAD-203

Note: Above data (except for Item No. and name) shall not be used for design purposes. For this purpose the data on the relevant specification/data sheets shall be used
ISSUE DATE SHEET DOC NO
0 11/18/2008 10 of 11 132155-T-EQL-HPS-HYS-SAD-0
EQUIPMENT LIST – HEAT EXCHANGERS
Client: Battelle Energy Alliance (BEA) LLC Signature:
Unit: NGNP Hybrid Sulfur Location: Idaho Falls, Idaho
Mechanical Design
Shell Tube Item No. Name
Area(m2)
(Total) Material
Pressure (bar g) Temperature
(oC)
MaterialPressure (bar g)
Temperature (oC)
Type PFD Remarks
HPS-SADHX-07
KO-02 O/Head Vapor Cooler
35316 L SS
7/FV 105
316L SS 10100
BEU SAD-201
HPS-SADEX-05
HP Recycle Acid Flash Condenser 180
316 L SS 24
265
316L SS 16120
BEU SAD-203
HPS-SADEX-03
A/B/C/D
LP Recycle Acid Flash Condenser 105
316 L SS 3.5/FV
205
316L SS 3.5/FV
120BEU SAD-201 Area shown is per shell
HPS-SADHX-09
A/B/C/D
KO-03Condenser
165316L SS
7/FV 100
CS/ 316L SS 10100
BEU SAD-201 Area shown is per shell
HPS-SADHX-11
EJ-02 Discharge Condenser
155316L SS
7/FV 130
316L SS 10100
BEU SAD-205
HPS-SADHX-12
EJ-01 Discharge Condenser
25316L SS
7/ FV 130
316L SS 10100
BEU SAD-205

Note: Above data (except for Item No. and name) shall not be used for design purposes. For this purpose the data on the relevant specification/data sheets shall be used
ISSUE DATE SHEET DOC NO
0 11/18/2008 11 of 11 132155-T-EQL-HPS-HYS-SAD-0
EQUIPMENT LIST – HEAT EXCHANGERS
Client: Battelle Energy Alliance (BEA) LLC Signature:
Unit: NGNP Hybrid Sulfur Location: Idaho Falls, Idaho
Mechanical Design
Shell Tube Item No. Name
Area(m2)
(Total) Material
Pressure (bar g) Temperature
(oC)
MaterialPressure (bar g)
Temperature (oC)
Type PFD Remarks
HPS-SADTO-01 HX1
A/B/C/D
Vacuum Column Condenser
4495 316L SS 3.5/FV
126
CS/ 316L SS 3.5/FV
100BXM SAD-202
One condenser shell per TO-01 column train; area shown is for one
shell
HPS-SADTO-01 HX2
A/B/C/D
Vacuum Column Reboiler
365CS7
170
Alloy B3 5/FV 155
BEM SAD-202 One reboiler per TO-01 column; area shown is for one shell

1
Battelle Energy Alliance, LLC (BEA)
Next Generation Nuclear Plant
Idaho Falls, Idaho
Hybrid Sulfur Hydrogen
Electrolysis System
Equipment List
Shaw E&I Project No. 132155
ISSUE DATE DESCRIPTION ORIGR CHK’R SDE PEM INTERDISCIPLINE REVIEW
DISCIPLINE REV’R DATE
Process
Mechanical
Civil/Structural
Control Systems
Power Systems
Piping
Material & Corr.
0 11/24/2008 For Estimate MM COB COB COB
FILE NAME BEA LLC EL Equipment List 08 .doc
SHEET1 of 5
DOC.NO. 132155-T-EQL-HPS-HYS-ELE-0

Note: Above data (except for Item No. and name) shall not be used for design purposes. For this purpose the data on the relevant specification/data sheets shall be used
ISSUE DATE SHEET DOC NO
0 11/24/2008 2 of 5 132155-T-EQL-HPS-HYS-ELE-0
EQUIPMENT LIST – VESSELS / REACTORS
Client: Battelle Energy Alliance (BEA) LLC Signature:
Unit: NGNP Hybrid Sulfur Location: Idaho Falls, Idaho
Mechanical Design Item No. Name Diameter
(mm)Length (mm)
Horizon/Vertical Pressure
(bar g)Temperature
(°C)
MaterialC.A. (mm) PFD Remarks
HPS-ELEKO-1
A/B/C/D
Wet Hydrogen Knockout Drum
2200 8800 Horizontal 23 140 TFE lined CS
ELE-301
HPS-ELEKO-15
A/B/C/D
Catholyte Surge Drum
5200 15600 Horizontal 23 130 TFE lined CS
ELE-301

Note: Above data (except for Item No. and name) shall not be used for design purposes. For this purpose the data on the relevant specification/data sheets shall be used
ISSUE DATE SHEET DOC NO
0 11/24/2008 3 of 5 132155-T-EQL-HPS-HYS-ELE-0
EQUIPMENT LIST – PUMPS
Client: Battelle Energy Alliance (BEA) LLC Signature:
Unit: NGNP Hybrid Sulfur Location: Idaho Falls, Idaho
MaterialItem No. Name Type
RatedFlow
(m3 /h)
Differential Pressure
bar
MotorkW (HP)
Casing Impeller PFD Remarks
HPS-ELEPP-01
A/B/C/D/S
Electrolyzer Catholyte Recirculation Pumps
Centrifugal 935 2 90 Alloy B3 Alloy B3 ELE-301 Static Head allowed 3 m
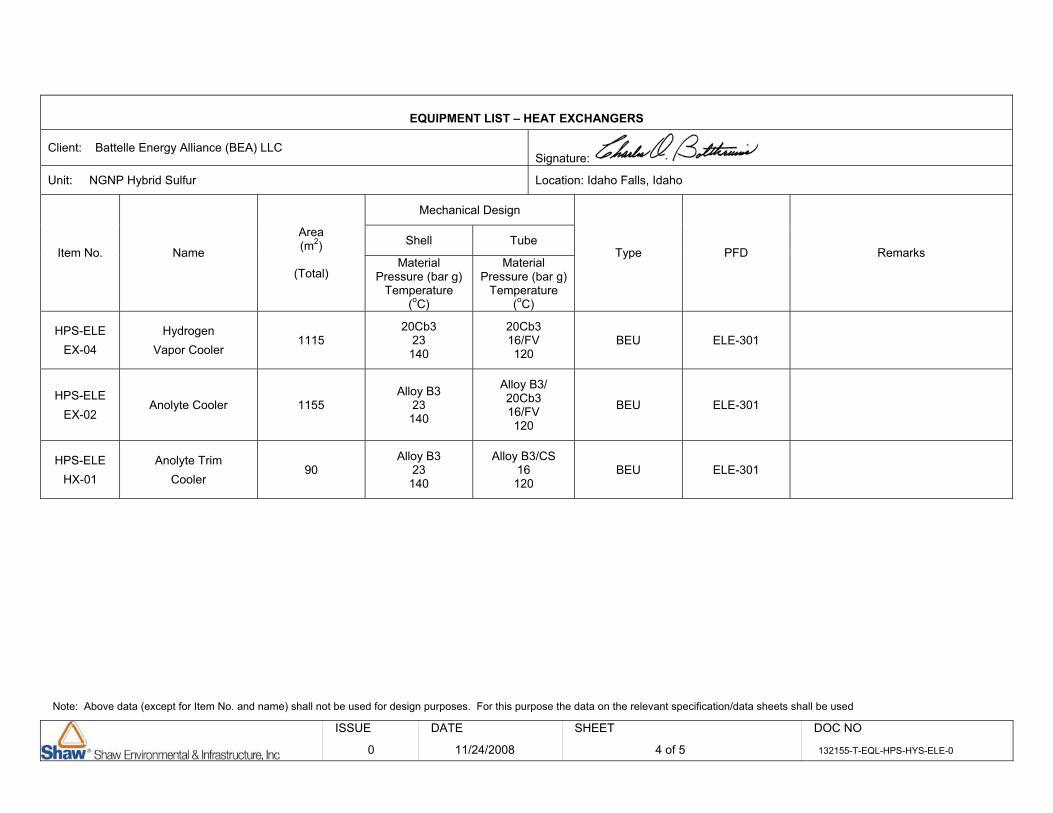
Note: Above data (except for Item No. and name) shall not be used for design purposes. For this purpose the data on the relevant specification/data sheets shall be used
ISSUE DATE SHEET DOC NO
0 11/24/2008 4 of 5 132155-T-EQL-HPS-HYS-ELE-0
EQUIPMENT LIST – HEAT EXCHANGERS
Client: Battelle Energy Alliance (BEA) LLC Signature:
Unit: NGNP Hybrid Sulfur Location: Idaho Falls, Idaho
Mechanical Design
Shell Tube Item No. Name
Area(m2)
(Total) Material
Pressure (bar g) Temperature
(oC)
MaterialPressure (bar g)
Temperature (oC)
Type PFD Remarks
HPS-ELEEX-04
Hydrogen Vapor Cooler
111520Cb3
23140
20Cb3 16/FV 120
BEU ELE-301
HPS-ELEEX-02
Anolyte Cooler 1155 Alloy B3
23140
Alloy B3/ 20Cb3 16/FV 120
BEU ELE-301
HPS-ELEHX-01
Anolyte Trim Cooler
90Alloy B3
23140
Alloy B3/CS 16120
BEU ELE-301

Note: Above data (except for Item No. and name) shall not be used for design purposes. For this purpose the data on the relevant specification/data sheets shall be used
ISSUE DATE SHEET DOC NO
0 11/24/2008 5 of 5 132155-T-EQL-HPS-HYS-ELE-0
EQUIPMENT LIST – MISCELLANEOUS
Client: Battelle Energy Alliance (BEA) LLC Signature:
Unit: NGNP Hybrid Sulfur Location: Idaho Falls, Idaho
Item No. Name Material PFD Duty - Description - Remarks
HPS-ELEEL-01
A: A-BB/ B: A -BB/ C: A-BB/ D: A-BB
Electrolyzer Graphite ELE-301
4 banks of 54 modules each; 216 modules Design pressure: 300 psig. Cylindrical module made up of 200
circular bipolar plate cells with an OD of 1.22 meters (48 inches). The total thickness of each cell is 0.5 inches; the overall length of
the 200 cell stack is 2.54 meters (100 inches). The overall length of a module, including the end plates and other structural components,
is 3.15 meters (124 inches). Weight per module is about 8 tons Cost of module F.O.B. at manufacturer’s plant: $300,000;
Electricals: $19.5 Million (Materials only; installation not included) Improved Estimate PENDING
A building is needed to house the electrolyzers, electricals and control room: Total floor area: about 45,000 sq. ft.
HPS-ELEFF-01 A-H
Electrolyzer Catholyte Filters
TFE lined CS ELE-301 PALL FluoryteTM High Flow Filter (Cartridge filter)
PTFE cartridge elements; Des. P: 23 bar g; Des. T: 100°C Diameter= 1.33 m; Length = 1.2 m,; 28 cartridges per case , 8 cases
HPS-ELEFF-02 A-AJ
Electrolyzer Anolyte Filters
TFE lined CS ELE-301
PALL FluoryteTM High Flow Filter (Cartridge filter) PTFE cartridge elements; Des. P: 23 bar g; Des. T: 100°C
Diameter= 1.33m; Length = 1.2 m,; 24 cartridges per case PTFE elements, 36 cases

1
Battelle Energy Alliance, LLC (BEA)
Next Generation Nuclear Plant
Idaho Falls, Idaho
Hybrid Sulfur Hydrogen
Product Purification
Equipment List
Shaw E&I Project No. 132155
ISSUE DATE DESCRIPTION ORIGR CHK’R SDE PEM INTERDISCIPLINE REVIEW
DISCIPLINE REV’R DATE
Process
Mechanical
Civil/Structural
Control Systems
Power Systems
Piping
Material & Corr.
0 11/24/2008 For Estimate COB KG COB COB
FILE NAME NGNP HPAS HyS Product purification
Equipment List 08.doc
SHEET1 of 7
DOC.NO. 132155-T-EQL-HPS-HYS-PPU-0

Note: Above data (except for Item No. and name) shall not be used for design purposes. For this purpose the data on the relevant specification/data sheets shall be used
ISSUE DATE SHEET DOC NO
0 11/25/2008 2 of 7 132155-T-EQL-HPS-HYS-PPU-0
EQUIPMENT LIST - TOWERS
Client: Battelle Energy Alliance (BEA), LLC Signature:
Unit: NGNP HPS Hybrid Sulfur Location: Idaho Falls, Idaho
Mechanical Design Material Item No. Name Diameter
(mm)Height (mm)
Packing/Trays Press
(bar g) Temp (°C) Shell C.A. (mm)
PackingTrays
PFD Remarks
HPS-PPUTO-03
SO2 Scrub Tower
2600 7000 33.4 m3 of 1 inch IMTP
#25 Packing 27 100 CS CS
PPU-403
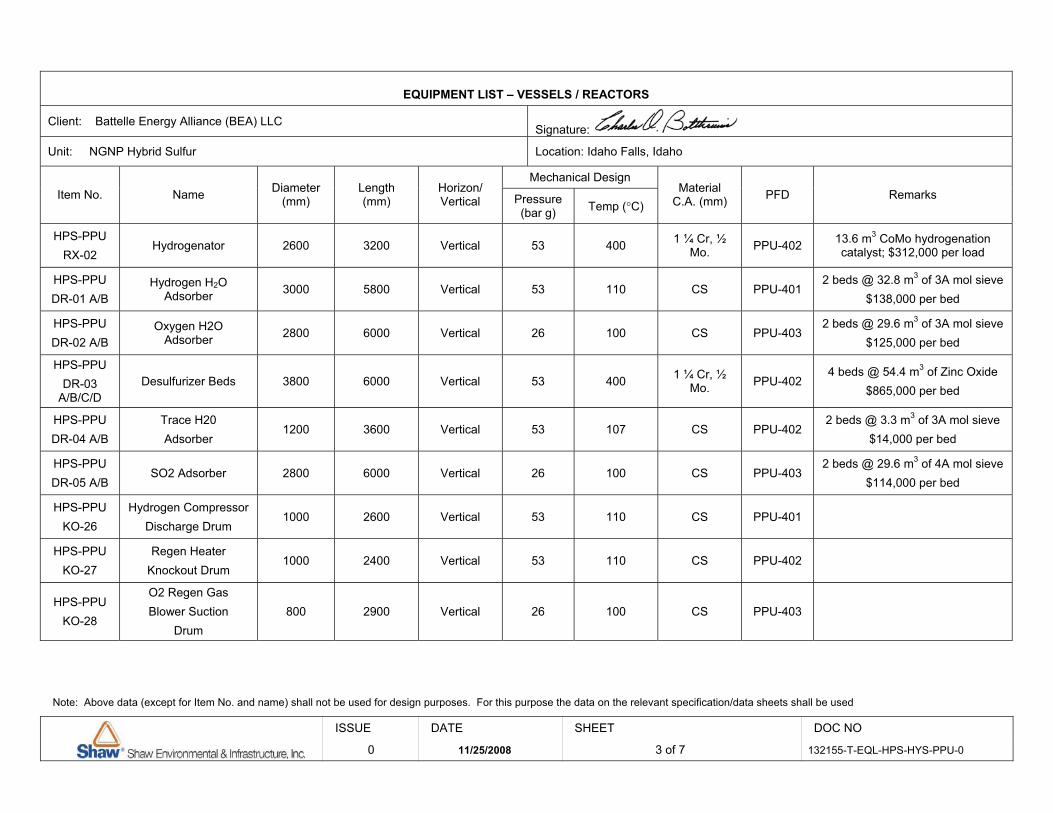
Note: Above data (except for Item No. and name) shall not be used for design purposes. For this purpose the data on the relevant specification/data sheets shall be used
ISSUE DATE SHEET DOC NO
0 11/25/2008 3 of 7 132155-T-EQL-HPS-HYS-PPU-0
EQUIPMENT LIST – VESSELS / REACTORS
Client: Battelle Energy Alliance (BEA) LLC Signature:
Unit: NGNP Hybrid Sulfur Location: Idaho Falls, Idaho
Mechanical Design Item No. Name Diameter
(mm)Length (mm)
Horizon/Vertical Pressure
(bar g) Temp (°C)Material
C.A. (mm) PFD Remarks
HPS-PPURX-02
Hydrogenator 2600 3200 Vertical 53 400 1 ¼ Cr, ½ Mo. PPU-402 13.6 m3 CoMo hydrogenation
catalyst; $312,000 per load
HPS-PPUDR-01 A/B
Hydrogen H2OAdsorber 3000 5800 Vertical 53 110 CS PPU-401
2 beds @ 32.8 m3 of 3A mol sieve $138,000 per bed
HPS-PPUDR-02 A/B
Oxygen H2O Adsorber 2800 6000 Vertical 26 100 CS PPU-403
2 beds @ 29.6 m3 of 3A mol sieve $125,000 per bed
HPS-PPUDR-03
A/B/C/DDesulfurizer Beds 3800 6000 Vertical 53 400 1 ¼ Cr, ½
Mo. PPU-4024 beds @ 54.4 m3 of Zinc Oxide
$865,000 per bed
HPS-PPUDR-04 A/B
Trace H20 Adsorber
1200 3600 Vertical 53 107 CS PPU-402 2 beds @ 3.3 m3 of 3A mol sieve
$14,000 per bed
HPS-PPUDR-05 A/B
SO2 Adsorber 2800 6000 Vertical 26 100 CS PPU-403 2 beds @ 29.6 m3 of 4A mol sieve
$114,000 per bed
HPS-PPUKO-26
Hydrogen Compressor Discharge Drum
1000 2600 Vertical 53 110 CS PPU-401
HPS-PPUKO-27
Regen Heater Knockout Drum
1000 2400 Vertical 53 110 CS PPU-402
HPS-PPUKO-28
O2 Regen Gas Blower Suction
Drum800 2900 Vertical 26 100 CS PPU-403

Note: Above data (except for Item No. and name) shall not be used for design purposes. For this purpose the data on the relevant specification/data sheets shall be used
ISSUE DATE SHEET DOC NO
0 11/25/2008 4 of 7 132155-T-EQL-HPS-HYS-PPU-0
EQUIPMENT LIST – PUMPS
Client: Battelle Energy Alliance (BEA) LLC Signature:
Unit: NGNP Hybrid Sulfur Location: Idaho Falls, Idaho
MaterialItem No. Name Type
RatedFlow
(m3 /h)
Differential Pressure
bar
MotorkW
Casing Impeller PFD Remarks
HPS-PPUPP-20A/S
NaOH Purge Pump
Centrif. 9 2 1.1 CS CS PPU-403

Note: Above data (except for Item No. and name) shall not be used for design purposes. For this purpose the data on the relevant specification/data sheets shall be used
ISSUE DATE SHEET DOC NO
0 11/25/2008 5 of 7 132155-T-EQL-HPS-HYS-PPU-0
EQUIPMENT LIST – COMPRESSORS / BLOWERS / VACUUM PUMPS
Client: Battelle Energy Alliance (BEA) LLC Signature:
Unit: NGNP Hybrid Sulfur Location: Idaho Falls, Idaho
Driver
Item No. Name Type Capacity (Am 3/h)
SuctionPressure(bar a )
Differential Pressure
(bar ) Type RatedPower (kW)
MaterialC.A.(mm) PFD Remarks
HPS-PPUPB-01
Hydrogen Recirculation Blower
Rotary Blower
500 39.6 1 Electric 160 CS PPU-401
HPS-PPUPB-02
Hydrogen Compressor Recipr. 5660 20 30 Steam 3500 CS PPU-401
HPS-PPUPB-03
O2 Regen Gas Recirc. Blower
Rotary Blower
315 20 25 Electric 75 CS PPU-403
HPS-PPUPB-04
Oxygen Compressor
2 Stage Centrif.
2126 39.5 5 SteamTurbine
1400 CS PPU-403 2 Stage Compressor w/ intercooler
and after cooler supplied as packaged unit.

Note: Above data (except for Item No. and name) shall not be used for design purposes. For this purpose the data on the relevant specification/data sheets shall be used
ISSUE DATE SHEET DOC NO
0 11/25/2008 6 of 7 132155-T-EQL-HPS-HYS-PPU-0
EQUIPMENT LIST – HEAT EXCHANGERS
Client: Battelle Energy Alliance (BEA) LLC Signature:
Unit: NGNP Hybrid Sulfur Location: Idaho Falls, Idaho
Mechanical Design
Shell Tube Item No. Name
Area(m2)
(Total) Material
Pressure (bar g) Temperature
(oC)
MaterialPressure (bar g)
Temperature (oC)
Type PFD Remarks
HPS-PPUHX-20
Hydrogen Compressor Aftercooler
280CS53
110
CS41100
BEU PPU-401
HPS-PPUHX-21
H2O Absorber Regeneration cooler
65CS54
110
CS41100
BEU PPU-401
HPS-PPUHX-22
HDS System Heat Economizer
1350 1 ¼ Cr, ½ Mo.
52405
1 ¼ Cr, ½ Mo. 52405
BEU PPU-402
HPS-PPUHX-23
HDSFeed Heater
1 ¼ Cr, ½ Mo. 52
400 Electric Heater PPU-402 60 kW
HPS-PPUHX-24
HDSTrim Cooler
650CS52
110
CS40100
BEU PPU-402
HPS-PPUHX-25
Trace H2O Absorber Regen Heater
CS52
200 Electric Heater PPU-402 80 kW
HPS-PPUHX-26
Trace H2O Adsorber Regen Cooler
5CS52
110
CS40100
BEU PPU-402 5
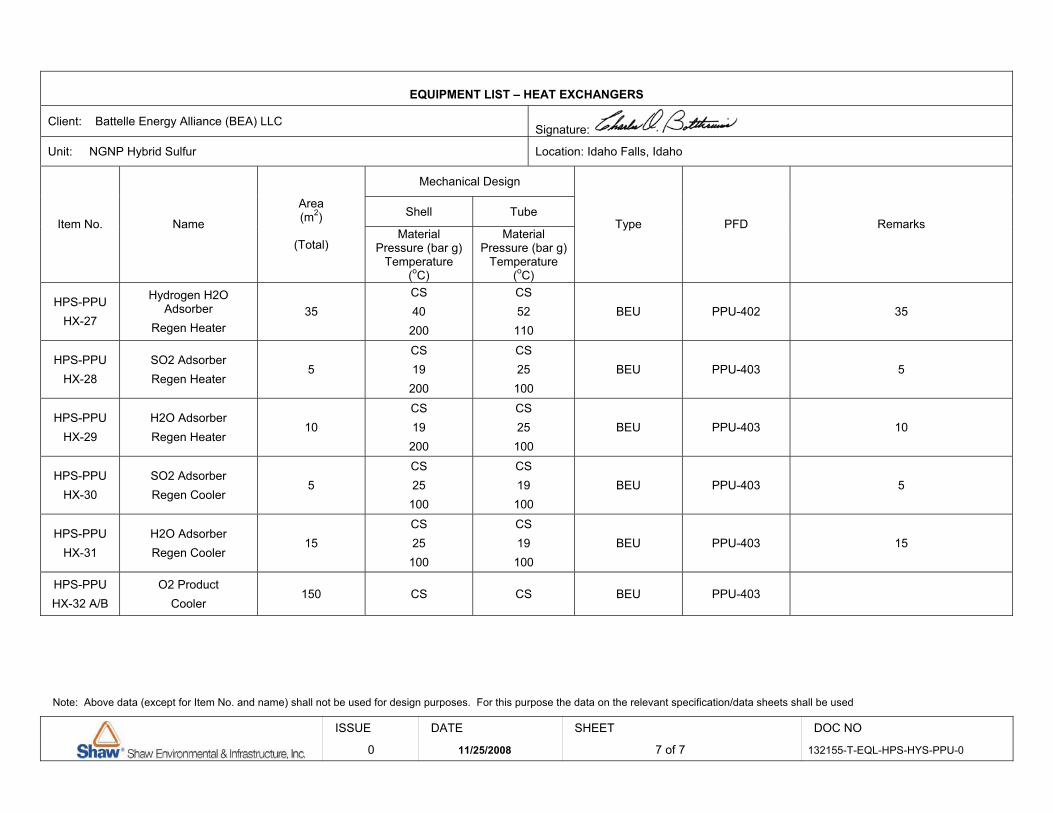
Note: Above data (except for Item No. and name) shall not be used for design purposes. For this purpose the data on the relevant specification/data sheets shall be used
ISSUE DATE SHEET DOC NO
0 11/25/2008 7 of 7 132155-T-EQL-HPS-HYS-PPU-0
EQUIPMENT LIST – HEAT EXCHANGERS
Client: Battelle Energy Alliance (BEA) LLC Signature:
Unit: NGNP Hybrid Sulfur Location: Idaho Falls, Idaho
Mechanical Design
Shell Tube Item No. Name
Area(m2)
(Total) Material
Pressure (bar g) Temperature
(oC)
MaterialPressure (bar g)
Temperature (oC)
Type PFD Remarks
HPS-PPUHX-27
Hydrogen H2O Adsorber
Regen Heater 35
CS40
200
CS52110
BEU PPU-402 35
HPS-PPUHX-28
SO2 Adsorber Regen Heater
5CS19
200
CS25100
BEU PPU-403 5
HPS-PPUHX-29
H2O Adsorber Regen Heater
10CS19
200
CS25100
BEU PPU-403 10
HPS-PPUHX-30
SO2 Adsorber Regen Cooler
5CS25
100
CS19100
BEU PPU-403 5
HPS-PPUHX-31
H2O Adsorber Regen Cooler
15CS25
100
CS19100
BEU PPU-403 15
HPS-PPUHX-32 A/B
O2 Product Cooler
150 CS CS BEU PPU-403

Hydrogen Plant Alternatives Study NGNP-HPS SHAW-HPA Section 8 � Appendices
March 2009
8.1.6 Preliminary Hazards Analysis

Hydrogen Plant Alternatives Study NGNP-HPS SHAW-HPA Section 8.1.6 – NGNP HyS Preliminary Hazards Assessment
1 of 2 March 2009
Section 8.1.6: NGNP HyS Preliminary Hazards Assessment
Item Risk Comments
Concentrated H2SO4 at high pressure and temperature
Loss of containment of a highly corrosive acid. High pressure can result in a jet or spray leak.
Concentration of sulfuric acid is practiced industrially. The high pressure employed in this process present a hazard over the low pressure industrial process in that leaks have a potential to spray personnel at a significant distance from the leak point.
Since the corrosion resistances of metals to sulfuric acid are strong functions of temperature, fluid velocity and concentration, care must be taken to ensure that operating conditions are well understood before equipment is specified and that actual operating conditions do not significantly vary from design.
Joints should be minimized to minimize the potential for leaks.
Splash guards should be employed around pumps and any joints located near where personnel may work or pass.
Concentrated SO2 at high pressure
Loss of containment of a toxic gas
Large quantities of concentrated SO2 at high pressure represent a serious toxicity hazard. Industrial experience with the safe operation of Claus plants may be a useful reference.
The possibility of the release of large quantities of SO2 from the anolyte solution given a change in temperature or pressure should be considered in the hazards review.
H2 purification and compression
Loss of containment of a flammable gas at high pressure and temperature resulting in a fire or explosion
The conditions of these operations are within industrial gases industry experience. Standard safety measures should be incorporated into the design.
Due to the flammability of H2, joints, and fittings should be avoided in this piping system.
The possibilities of a jet fire or a confined vapor cloud explosion in the region of potential leak points should be considered in the development of the plant layout.

Hydrogen Plant Alternatives Study NGNP-HPS SHAW-HPA Section 8.1.6 – NGNP HyS Preliminary Hazards Assessment
2 of 2 March 2009
Item Risk Comments
O2 purification and compression
The enhanced flammability of materials in O2 resulting in an equipment fire
All piping, fittings and equipment exposed to > 25% oxygen must be oxygen-clean before start up. Fittings that are O2-cleaned at the factory must be shipped sealed.
The use of soft materials and lubricants should be minimized with oxygen-enriched streams. Fluorinated compounds such as Teflon™ and Viton™ are normally used for seals and per-fluorinated materials as lubricants.
The use of O2 as the regeneration gas for the TSA’s will require that the maximum regeneration temperature and pressure be considered in the specification of the materials of construction for the adsorber vessels (and piping that will be exposed to the hot gas).
It is standard industry practice to place O2 compressors inside of barriers for containment and personnel protection in case of a fire. The frequency of fires in such equipment should be considered in plant layout
He exchange at decomposer
Loss of containment of high pressure He or cross contamination between primary and secondary He streams due to acid corrosion of He heat exchange equipment
Keeping the pressure of the He stream above that of the decomposer should minimize acid leakage into the He in the event of a leak.
Water treatment
This system should be standard equipment routinely used in industry with standard safety measures.

Hydrogen Plant Alternatives Study NGNP-HPS SHAW-HPA Section 8 � Appendices
March 2009
8.1.7 Capital Cost Estimate

Hydrogen Plant Alternatives Study NGNP-HPS SHAW-HPA Section 8.1.7 � HyS Capital Cost Estimate
1 of 6 March 2009
Section 8.1.7 � HyS Capital Cost Estimate
ELE System Qty Cost
Equipment
Electrolyzers each module 881,104 total 192 169,172,000 Electrolyzer Catholyte Filter Housing 16 823,000 Electrolyzer Catholyte Filters 1,120,000 Electrolyzer Anolyte Filter Housing 72 1,233,000 Electrolyzer Anolyte Filters 4,320,000 Wet Hydrogen KO Drum 8 1,870,000 Catholyte Surge Drum 8 12,917,000
Electrolyzer Catholyte Recirculation Pumps 10 1,872,000 Hydrogen Vapor Cooler 2 1,701,000 Anolyte Cooler 2 2,545,000 Anolyte Trim Cooler 2 396,000
Subtotal Equipment 197,969,000
Installation Construction Labor 46,226,000 Expenses & Supplies 2,550,000 Construction Equipment 4,560,000 Vendor Services 300,000 Sub-subtotal Construction 53,636,000 Bulk Material 92,426,000 EPC Engineering 12,480,000 Spares 4,356,000 Freight 14,501,000 Other Costs - Catalyst, Desiccant 0 Subtotal Installation 177,399,000
ELE System Total 375,368,000

Hydrogen Plant Alternatives Study NGNP-HPS SHAW-HPA Section 8.1.7 � HyS Capital Cost Estimate
2 of 6 March 2009
SAD System Qty Cost
Equipment Vacuum Column Top & Bottom 8 9,566,000 Vacuum Column Internals 8 9,324,000 Absorber Column Top 2 571,000 Absorber Column Internals 2 212,000 First Stage Vacuum Column Ejector 2 132,000 Second Stage Vacuum Column Ejector 2 1,027,000
Sulfuric Acid Decomposer 4 21,600,000 Sulfuric Acid Decomposer Internals 4 32,800,000 incl. cat. 50% Acid Flash Drum #1 8 140,000 50% Acid Flash Drum #2 8 222,000 Reactor Effluent Flash Drum 4 3,612,000 Recycle Acid Flash Drum 2 149,000 1st Water Removal Flash Drum 8 183,000 2nd Water Removal Flash Drum 8 178,000
Weak SO2 Flash Drum 2 226,000
SO2 Recycle Compressor Suction Drum 2 74,000 SO2 Compressor 3rd Stage KO Drum 2 24,000 Second Stage Ejector Suction Drum 2 42,000 Ejector Condensate Surge Pot 2 19,000 SO2 Compressor 1st Stage KO Drum 2 50,000 HP Recycle Acid Vapor KO Drum 2 39,000 SO2 Compressor 2nd Stage KO Drum 2 22,000 Vacuum Column Reflux Drum 8 96,000 Anolyte Prep Tank 2 3,986,000 Reactor Feed Pump 10 16,043,000 1st Stage Discharge Pump 4 178,000 2nd Stage Discharge Pump 4 246,000 Second Stage Condensate Pump 4 454,000 First Stage Condensate Pump 4 365,000
Vacuum Column Reflux/Ovhd Product Pump 10 1,670,000
Ejector Condensate Pump 4 68,000 Anolyte Circulating Pump 10 2,104,000 50% Acid Booster Pump 10 361,000 65% Acid Booster Pump 10 379,000
SO2 Recycle Compressor 2 14,357,000 SO2 Recycle 1st Stage Aftercooler 2 47,000 SO2 Recycle 2nd Stage Aftercooler 2 129,000 SO2 Recycle 3rd Stage Aftercooler 2 195,000 Reactor Product Condenser 2 1,192,000 Recycle Acid Trim Cooler 2 512,000 Reactor Product Trim Cooler 2 482,000 KO-02 O/Head Vapor Cooler 2 129,000

Hydrogen Plant Alternatives Study NGNP-HPS SHAW-HPA Section 8.1.7 � HyS Capital Cost Estimate
3 of 6 March 2009
SAD System Qty Cost
HP Recycle Acid Flash Condenser 2 330,000 LP Recycle Acid Flash Condenser 2 447,000 KO-03 Condenser 2 709,000 EJ-02 Discharge Condenser 2 277,000 EJ-01 Discharge Condenser 2 108,000 Vacuum Column Condenser 8 21,396,000 Vacuum Column Reboiler 8 3,001,000 Helium Control Valves 12 2,400,000
Subtotal Equipment 151,873,000
Installation Construction Labor 76,025,000 Equipment & Supplies 3,974,000 Construction Equipment 7,108,000 Vendor Services 150,000
Sub-subtotal Construction 87,257,000
Bulk Material 92,416,000 EPC Engineering 30,264,000 Spares 3,485,000 Freight 11,587,000 Other Costs - Catalyst, Desiccant 1,000,000 Subtotal Installation 226,009,000
SAD System Total 377,882,000

Hydrogen Plant Alternatives Study NGNP-HPS SHAW-HPA Section 8.1.7 � HyS Capital Cost Estimate
4 of 6 March 2009
FUS System Qty Cost
Equipment Sulfuric Acid Vent Scrubber 1 201,000 Sulfuric Acid Vent Scrubber Internals 1 159,000 Water Pretreatment Filter/Softener System 1 1,000,000 Water Treatment RO/EDI System 1 14,000,000 Waste Water Treatment System 1 1,000,000 Sulfuric Acid Degassing Drum 1 125,000 H2SO4 Make-up Pump 3 61,000 H2SO4 Feed Pump 2 95,000 NaOH Make-up Pump 3 37,000 NaOH Solution Supply Pump 2 82,000 Water Transfer Pump 2 235,000 H2SO4 Storage Tank 1 58,000 Caustic Storage Tank 1 118,000 H2SO4 Storage Tank Heater/Cooler 1 803,000 NaOH Tank Heater/Cooler 1 4,000 Subtotal Equipment 17,978,000
Installation Construction Labor 6,887,000 Equipment & Supplies 380,000 Construction Equipment 683,000 Vendor Services 0
Sub-subtotal Construction 7,950,000
Bulk Material 4,608,000 EPC Engineering 2,970,000 Spares 127,000 Freight 414,000 Other Costs - Catalyst, Desiccant 0 Subtotal Installation 16,069,000
FUS System Total $ 34,047,000

Hydrogen Plant Alternatives Study NGNP-HPS SHAW-HPA Section 8.1.7 � HyS Capital Cost Estimate
5 of 6 March 2009
PPU System Qty/Train Cost
SO2 Scrub Tower 2 453,000 SO2 Scrub Tower Internals 2 265,000 Hydrogenator 2 551,000 ints. & cat. H2O Absorber #1 4 1,139,000 ints. & cat. H2O Absorber #2 4 564,000 ints. & cat. Desulfurizer Beds 8 6,635,000 ints. & cat. Trace H2O Adsorber 4 173,000 ints. & cat. SO2 Adsorber 4 564,000 ints. & cat. Hydrogen Compressor Discharge Drum 2 45,000 Regen Heater Knockout Drum 2 43,000 O2 Regen Gas Blower Suction Drum 2 27,000 NaOH Purge Pump 4 80,000 Hydrogen Recirculation Blower 2 2,067,000 Hydrogen Compressor 2 6,075,000 O2 Regen Gas Recirc. Blower 2 1,830,000 Oxygen Compressor 2 5,242,000 Hydrogen Compressor Aftercooler 2 125,000 H2O Absorber Regeneration Cooler 2 59,000 HDS System Heat Economizer 2 971,000 HDS Feed Heater 2 150,000 HDS Trim Cooler 2 233,000 Trace H2O Absorber Regen Heater 2 120,000 Trace H2O Absorber Regen Cooler 2 16,000 H2O Absorber Regen Heater #1 2 43,000 SO2 Absorber Regen Heater 2 15,000 H2O Absorber Regen Heater #2 2 22,000 SO2 Absorber Regen Cooler 2 15,000 H2O Absorber Regen Cooler 2 26,000 O2 Product Cooler 4 181,000 Subtotal Equipment 27,729,000
Installation Construction Labor 40,969,000 Equipment & Supplies 2,245,000 Construction Equipment 4,017,000 Vendor Services 0 Sub-subtotal Construction 47,231,000

Hydrogen Plant Alternatives Study NGNP-HPS SHAW-HPA Section 8.1.7 � HyS Capital Cost Estimate
6 of 6 March 2009
Bulk Material 30,634,000 EPC Engineering 11,544,000 Spares 876,000 Freight 2,898,000 Other Costs - Catalyst, Desiccant 9,756,000 Subtotal Installation 102,939,000
PPU system total 130,668,000
Total HyS Hydrogen Production System Cost
ELE System Total 375,368,000 SAD System Total 377,882,000 FUS System Total 34,047,000 PPU System Total 130,668,000
Grand Total (for 2 operating HPS train) 917,965,000

Hydrogen Plant Alternatives Study NGNP-HPS SHAW-HPA Section 8 � Appendices
March 2009
8.1.8 Operating Cost Estimate

Hydrogen Plant Alternatives Study NGNP-HPS SHAW-HPA Section 8.1.8 � HyS Operating Cost Estimate
1 of 6 March 2009
Section 8.1.8 � Operating Cost Estimate, HyS
8.1.8.1: Overall Plant Operating Costs
Fixed Operation & Maintenance $/year Total plant staff (Direct labor) HPS 52 FTEs PCS 25 FTEs BOP 36 FTEs Total 113 FTEs Composite rate 50 $/hr Overhead rate 60 % Burdened rate 80 Annual labor $ 18,803,200 G&Arate 20 % G&A $ 3,760,640 Material costs for maintenance and repairs HPS $ 823,575 PCS $ 100,000 BOP $ 100,000 Subtotal Material Costs $ 1,023,575 Licenses Property Tax & Insurance $ 26,517,908 Other
Subtotal $ 50,105,323 Heat Use 1055.78 MWt Rate 30 $/MWt-h Cost $ 277,458,984
Total Fixed O&M $ 327,564,307

Hydrogen Plant Alternatives Study NGNP-HPS SHAW-HPA Section 8.1.8 � HyS Operating Cost Estimate
2 of 6 March 2009
Variable Operation & Maintenance $/year Electric power consumption $ 122,072,076 rate 75 $/MWe-h annual cost Cooling water consumption $ 6,828,423 q 50,622 m3/hr = 934.27 gal/kg H2
trains 4 3.515 m3/sec CS,u 0.016 $/m3 Process steam $ 26,375,066
q 413,592 kg/hr = 114.89 kg/sec trains 4 28.72 m3/sec p 7.9 bar CS,u 0.008 $/kg Process water
supply - natural water
q 182 m3/hr = 3.36 gal/kg H2
0.05 m3/sec CS,u 0.069 $/m3 $ 102,711 softening q 164 m3/hr 0.079 $/m3 $ 106,312 RO/EDI q 130 m3/hr 0.403 $/m3 $ 429,892 Total Unit Cost 0.002 $/gal
Total Water Cost $ 638,915

Hydrogen Plant Alternatives Study NGNP-HPS SHAW-HPA Section 8.1.8 � HyS Operating Cost Estimate
3 of 6 March 2009
Other Material Costs $/year Decomposer Tubes in Replacement Capital
Electrolyzer refurbishment in Replacement Capital Filter replacement 133 $/hr $ 1,091,347 Make-up catalyst 520 $/hr $ 4,266,921 ZnO 360 $/hr $ 2,954,022 Mol seives 163 $/hr $ 1,337,515 Hydrogenation Catalyst 39 $/hr $ 320,019 Make-up acid 223 $/hr $ 1,829,852 Make-up caustic 608 $/hr $ 4,989,015 Total Other Material Costs $ 16,788,691
Waste treatment costs $ 31,045,355 q 16.97 kg/s CS,u 0.186 $/kg ÷ 3 = 0.06193 $/kg Solid waste disposal costs $ 3,049 q 2 kg/hr CS,u 0.186 $/kg Total Unplanned Replacement Capital Cost Factor (% of total direct depreciable costs/year) 0.50 %
Total Variable O&M $ 135,392,113

Hydrogen Plant Alternatives Study NGNP-HPS SHAW-HPA Section 8.1.8 � HyS Operating Cost Estimate
4 of 6 March 2009
8.1.8.2: Detail, Hydrogen Production System Operating Costs
NGNP HPAS HyS Operating Usages [ All usages are on a per train basis. HTSE Plant has One (1) train] Number of trains: 2 Staffing:
Operations: 6 per shift Maintenance 4 per shift 8 additional, day shift only ( these should cover the electrolyzer replacement labor) Supervision & Engineering Plant Mgr, Assistant, Engineer and Administrative assistant.
Electricity Hourly Total Per train Electrolysis total MWeh/h 236.3 118.1 Other users (hydrogen plant only) MWeh/h 26.0 13.0
Steam kg/h 413,592 206,796 Cooling Water
Plant total m3/h 50,622 25,311

Hydrogen Plant Alternatives Study NGNP-HPS SHAW-HPA Section 8.1.8 � HyS Operating Cost Estimate
5 of 6 March 2009
Catalyst and Chemicals Water softening chemicals ( included in process water cost)
Hourly Total per plant as 100%, kg/h
per train as 50%, kg/h
Cost, $ per tonne
Sulfuric Acid make-up $ 223 1935 1935 $ 115 Caustic $ 608 1578 1578 $ 385
Hourly Total Cost of a load
or unit Loads or units
per train Life, hours Cost per train-hour
Decomposition catalyst $ 520 $ 2,600,000 2 20,000 $ 260 Zinc oxide Katalco 32-5 $ 360 $ 865,000 1 4,800 $ 180 Hydrogenation catalyst Katalco 61-1 $ 39 $ 312,000 1 16,000 $ 20
Mol sieves UOP Molsiv 3A & 4A $ 163 $ 391,000 1 4,800 $ 81
Subtotal Catalyst & Chemicals $ 1,913
Replacements
Electrolyzers Hourly Total Cost of a load
or unit Loads or units
per train Life, hours Cost per train-hour
Electrolyzers $ 717 $ 300,000 196 164,000 $ 359 Cell replacement $ 1,165 $ 984 39,200 41,000 $ 582 RO membranes ( included in process water cost) Electrolyzer filters $ 133 $ 2,500 1088 41,000 66 Decomposer tubes $ 435 $ 23,800 750 82,000 218
Subtotal Replacements $ 2,450

Hydrogen Plant Alternatives Study NGNP-HPS SHAW-HPA Section 8.1.8 � HyS Operating Cost Estimate
6 of 6 March 2009
Process Water Usage 50.16 kg/s Density 999.6 kg/m3 Blowdown 1% Supply 182 m3/h Softened 164 m3/h RO/EDI 130 m3/h
Costs Supply 0.069 $/m3
Ulrich & Vasudevan, "How to estimate Utility Costs," Chem. Eng., Apr 2006, pp. 66-69: Natural Water Pumped and screened.
Softening 0.079 $/m3 RO/EDI 0.403 $/m3
Wastes
Liquid Effluent FromSoftening 5.02 kg/s
From RO/EDI 9.56 kg/s Sodiumsulfite waste 2.39 kg/s
Total 16.97 kg/s 61,095 kg/h 0.186 $/kg 1/3 of Ulrich, " Conventional Liquid Waste"
Solid Wastes Damaged stacks Assumed damaged stacks are returned to the manufacturer for recycle SiC tubes and spent filters 2 kg/h Ulrich, " Conventional Solid Waste"
Hydrogen Plant Alternatives Study NGNP-HPS SHAW-HPA Section 8 � Appendices
March 2009
8.2 SULFUR IODINE PROCESS
8.2.1 Simulation Diagrams 8.2.2 Mass and Energy Balances 8.2.3 Process Flow Diagrams 8.2.4 Summary Plot Plan Layout 8.2.5 Sized Equipment List 8.2.6 Preliminary Hazards Analysis 8.2.7 Capital Cost Estimate 8.2.8 Operating Cost Estimate

Hydrogen Plant Alternatives Study NGNP-HPS SHAW-HPA Section 8 � Appendices
March 2009
8.2.1 Simulation Diagrams

151.240.0043130.00
110
148.212.6043130.00
110A
40.000109
0
109A
25.013.00
20.00105
120.010.00
371.00115Y
48.040.00
470.00
101
47.510.00
341.00112Z
80.510.00
520.00125
42.212.001220.01
233
35.510.00
540.97113
120.012.0043130.00
110B
120.010.0045410.03
115Z
25.014.00
180.00
104
25.013.00
160.00
106
48.010.00
240.94
111A
21.612.00
301.00
219
48.010.00
10.95
121
153.540.001260.00318
154.840.0041870.00
315
152.140.00
470.00
317
25.013.00
00.00
142
27.110.00
321.00
116
46.610.00
190.00
119
120.010.0043390.00
129
27.110.00
161.00118
111.48.0024
1.00
34
108.78.0043500.00
32
27.110.00
161.00
117
141.410.10
241.00111
120.010.001650.00
127
47.72.00
11.00226
197.810.10
11.00
120
VV-02
VV-01
TO-101
TO-101S1
Q=-249.884
SP-101
MX-101
KO-101
HX-101
Q=-20.176
TO-103
TO-102
SP-102
PC-101
W=0.591
TK-102
Q=10.441
HX-102
Q=-84.333
HX-103
Q=-3.433
PC-102
W=0.072
HX-104Q=-0.102
Temperature (C)
Pressure (bar)
Mass Flow Rate (kg/sec)
Vapor Fraction
Q Duty (MW)
W Power(MW)
Warnings
H2O/SO2 liquid from Section 2
O2/SO2 vapor from Section 2
HIx from Section 3
I2 from Section 3
H2O from Section 3
Feed Water
O2 to SO2 Scrubber
HIx to Section 3
H2SO4 to Section 2
Make-up SO2
TO-103OXYGEN SCRUBBER
TO-102REVERSE BUNSEN
REACTOR
TO-101BUNSEN REACTOR
LP wet SO2 vapor from Section 2
BUNSEN REACTION SIMULATION MODEL

127.26
86.000
205256.42
84.000
206
256.42
84.000214
256.42
84.000207
137.27
83.400215
48.00
82.800216
20.51
12.000
217
20.51
12.000232
20.51
12.000218
170.16
2.200
210
170.16
2.200
211
170.16
2.200224
220.41
13.200
209
48.00
2.100225
48.00
2.000
231
47.67
2.000235
47.67
2.000
226
120.00
1.100
201
48.00
0.380229
47.87
12.000
236
101.90
0.135
203
112.08
0.135213
126.50
0.150
204
46.08
0.110227
46.08
0.110
243
220.41
13.200
208
220.41
13.200220
169.99
7.910
237
108.16
2.100
230
169.99
7.910
242
99.26
0.480
228
46.22
12.000
244
24
Q202
127.27
0.435
212
38.00
1.000
BFW
170.09
7.910
STEAM
48.00
0.380240
48.10
2.000241
48.00
2.000
238
48.11
2.000
239
48.00
12.000222
48.00
12.000
223
48.00
12.000234
RX-201
Q=340.517
KO-201
HX-201Q=-21.658
VV-205
KO-204
KO-203
VV-203
EX-201HSQ=-16.551
KO-206
VV-201
PP-202W=0.017
TO-201QC=-121.853QR=70.781
PP-201
W=1.842
KO-202
VV-202
VV-204
EJ-201
EJ-202
PP-204W=0.074
EX-202HS
Q=-24.319
EX-202CS
Q=24.319
SG-201
Q=0.134
HX-205Q=-0.015
HX-204
Q=-0.218
PP-203
W=0.000
MX-203
HX-202
Q=-9.433
KO-205
Temperature (C)
Pressure (bar)
Duty (MW)
Q Duty (MW)
W Power(MW)
Bayonet Reactor
H2SO4 Feed from Section 1
75.0 wt% H2SO4
Steam EjectorBlow Downs
L.P. Steam
L.P. Steam
VacuumColumn
Second-Stage Steam Ejector
First-Stage Steam Ejector
Sulfur-Iodine CycleSection 2 Flowsheet
Maximilian B. GorensekSeptember 10, 2008 version
Bunsen reaction feed at 120°C, 1.1 bar
Bayonet Decomposition Reactor at870°C peak process temperature,86-bar pressure, 75% acid feed
Vacuum Column at 0.11 bar using2-stage steam ejector, 48°C
condenser
Steam Ejector condensate blow-downs
120.00
0.435
202
EX-201CSQ=16.552
130.00
12.600221
HX-203Q=-24.869
17
Q201
MX-20242.24
12.000
233
MX-20121.64
12.000
219
Water/SO2 to Section 1
Oxygen/SO2 to Section 1
Low-pressure SO2 to Section 1
EjectorSteam Simulation

102.3
1.0
1-138
106.7
41.1
3-1
271.6
40.1
3-7
288.3
40.1
3-21-TRU
261.0
40.0
3-8
288.3
40.13-21-APP
256.0
43.9
HP-1
341.6
78.6
HP-2
293.3
78.1HP-3256.7
44.4
HP-4
256.0
43.9
HP-5
154.0
39.0
3-11
154.0
39.0
3-15
39.0
3-18
154.0
39.0
3-12
113.0
38.5
3-13
113.0
38.5
3-14
113.0
38.53-16
38.53-19260.0
26.0
3-23
260.0
26.03-26
260.0
26.03-24
337.5
40.0
3-25
203.2
39.53-10
203.2
25.5
3-27
154.0
25.0
3-28
269.0
39.63-22
259.0
40.6
3-6
106.7
41.1
3-2
106.7
41.1
3-4
250.0
40.63-5
263.0
40.6
3-3
273.0
40.03-9
3-20
153.7
38.5
3-17
P3-11
W=1945
COLUMN QC=-214249QR=341125
HP-C
W=23564
HP-QH
Q=-237814
HP-VHP-QC
Q=214250
SEP3-1
Q=-0
SEP3-2
Q=0
SEP3-3
Q=0
COMPR
W=1127
HX-5
Q=-19517
HX-6Q=-26566
V3-1
HX-4
Q=-1602
HX-3
Q=34709
SPLIT-1
HX-2
Q=49128
MIX-1HX-1
Q=116332
MIX-4
MIX-3
MIX-2
RSTOIC
TRU2APP
Q=0
Temperature (C)
Pressure (bar)
Q Duty (Watt)
W Power(Watt)
Warnings
Heat Pump
SI Cycle Flowsheet - Section 3

Hydrogen Plant Alternatives Study NGNP-HPS SHAW-HPA Section 8 � Appendices
March 2009
8.2.2 Mass and Energy Balances

32 34 101 104 105 106 110 110A 110B 111 111A 112Z 113 115Y 115ZPC-101 TO-101 SP-101 TO-101 TO-103 VV-02 HX-102 TO-101S1 HX-103 MX-101 TO-103 TO-101S1 TO-101 TK-102
TO-102 TO-102 HX-101 SP-101 SP-101 KO-101 VV-02 HX-102 PC-101 HX-103 TO-101 MX-101 TK-102 TO-101S1LIQUID VAPOR MIXED LIQUID LIQUID LIQUID LIQUID LIQUID LIQUID VAPOR MIXED VAPOR MIXED VAPOR MIXED
Substream: MIXED Mole Flow kmol/sec H2O 12.22 0.03 1.82 0.73 0.07 0.65 10.75 10.75 10.75 0.03 0.03 0.01 0.03 0.04 14.06 H2SO4 0.00 0.00 - - - - - - - 0.00 0.00 0.00 0.00 0.00 0.78 SO2 0.02 0.06 - - - - - - - 0.06 0.06 0.00 0.22 0.01 0.01 HI 2.61 0.00 0.00 - - - 1.21 1.21 1.21 0.00 0.00 0.00 0.00 0.00 2.78 I2 10.26 0.01 0.01 - - - 10.97 10.97 10.97 0.01 0.01 0.01 0.01 0.01 10.20 H2 0.00 0.00 0.00 - - - 0.00 0.00 0.00 0.00 0.00 0.00 0.00 0.00 0.00 O2 0.00 0.36 - - - - - - - 0.36 0.36 0.72 0.73 0.72 0.73 Mole Frac H2O 0.4866 0.0567 0.9951 1.0000 1.0000 1.0000 0.4689 0.4689 0.4689 0.0567 0.0567 0.0116 0.0278 0.0535 0.4923 H2SO4 0.0000 0.0000 - - - - - - - 0.0000 0.0000 0.0000 0.0000 0.0000 0.0273 SO2 0.0008 0.1235 - - - - - - - 0.1235 0.1235 0.0000 0.2244 0.0065 0.0003 HI 0.1041 0.0000 0.0013 - - - 0.0530 0.0530 0.0530 0.0000 0.0000 0.0000 0.0000 0.0000 0.0972 I2 0.4084 0.0129 0.0030 - - - 0.4781 0.4781 0.4781 0.0129 0.0129 0.0083 0.0059 0.0138 0.3574 H2 0.0000 0.0027 0.0005 - - - 0.0000 0.0000 0.0000 0.0027 0.0027 0.0033 0.0012 0.0019 0.0001 O2 0.0001 0.8042 - - - - - - - 0.8042 0.8042 0.9768 0.7405 0.9244 0.0254 Total Flow kmol/sec 25.12 0.45 1.83 0.73 0.07 0.65 22.94 22.94 22.94 0.45 0.45 0.74 0.98 0.78 28.55Total Flow kg/sec 3159.30 17.09 34.50 13.08 1.31 11.78 3132.31 3132.31 3132.31 17.09 17.09 24.85 39.27 26.95 3297.93Total Flow cum/sec 0.961 1.786 0.034 0.013 0.001 0.012 0.966 0.964 0.944 1.526 1.118 1.959 2.389 2.546 3.587Temperature C 108.6822 111.3968 48 25 25.02217 25.02217 151.1576 148.1576 120 141.353 48 47.45574 35.52863 120 120Pressure bar 8 8 40 14 13 13 40 12.6 12 10.1 10 10 10 10 10Vapor Frac 0 1 1.79E-05 0 0 0 0 0 0 1 0.9414532 1 0.9705488 1 0.027403Liquid Frac 1 0 0.9999821 1 1 1 1 1 1 0 0.0585468 0 0.0294511 0 0.9725969Solid Frac 0 0 0 0 0 0 0 0 0 0 0 0 0 0 0Enthalpy J/kmol -1.42E+08 -4.69E+07 -2.83E+08 -2.86E+08 -2.86E+08 -2.86E+08 -1.25E+08 -1.25E+08 -1.28E+08 -4.60E+07 -5.15E+07 -1.70E+06 -7.42E+07 -1.12E+07 -1.66E+08Enthalpy J/kg -1.13E+06 -1.24E+06 -1.50E+07 -1.59E+07 -1.59E+07 -1.59E+07 -9.16E+05 -9.18E+05 -9.38E+05 -1.21E+06 -1.36E+06 -50660.03 -1.85E+06 -3.25E+05 -1.44E+06Enthalpy MW -3571.315 -21.128 -517.031 -207.583 -20.758 -186.825 -2868.231 -2875.374 -2936.626 -20.699 -23.193 -1.259 -72.640 -8.770 -4742.819Entropy J/kmol-K -1.70E+05 -2956.207 -1.58E+05 -1.63E+05 -1.63E+05 -1.63E+05 -94515.34 -95160.5 -1.01E+05 -2492.406 -17934.74 -15277.03 -14128.71 -8379.624 -1.76E+05Entropy J/kg-K -1351.837 -77.8856 -8378.491 -9056.322 -9055.979 -9055.979 -692.062 -696.786 -741.9523 -65.66606 -472.5168 -454.9014 -352.443 -243.2104 -1521.265Density kmol/cum 26.14686 0.2520407 54.49634 55.38351 55.38071 55.38071 23.75184 23.79856 24.29646 0.2950673 0.4026494 0.3776818 0.4100236 0.3072272 7.95839Density kg/cum 3288.982 9.566397 1028.158 997.7495 997.6991 997.6991 3243.803 3250.185 3318.183 11.19951 15.28287 12.68375 16.437 10.58527 919.3457Average MW 125.7888 37.95575 18.86655 18.01528 18.01528 18.01528 136.5706 136.5706 136.5706 37.95577 37.95577 33.58317 40.08793 34.45422 115.5191Liq Vol 60F cum/sec 1.017 0.023 0.033 0.013 0.001 0.012 0.959 0.959 0.959 0.023 0.023 0.039 0.052 0.041 1.135

Substream: MIXEDMole Flow kmol/sec H2O H2SO4 SO2 HI I2 H2 O2Mole Frac H2O H2SO4 SO2 HI I2 H2 O2Total Flow kmol/secTotal Flow kg/secTotal Flow cum/secTemperature CPressure barVapor FracLiquid FracSolid FracEnthalpy J/kmolEnthalpy J/kgEnthalpy MWEntropy J/kmol-KEntropy J/kg-KDensity kmol/cumDensity kg/cumAverage MWLiq Vol 60F cum/sec
116 117 118 119 120 121 125 127 129 142 219 226 233 315 317SP-102 TO-102 TO-102 HX-104 MX-101 TO-101S1 TO-102 TO-103 MX-101 PC-102 TO-101S1 KO-101 HX-101TO-103 SP-102 SP-102 TO-103 PC-102 HX-104 TO-101 TK-102 TK-102VAPOR VAPOR VAPOR LIQUID VAPOR MIXED LIQUID LIQUID LIQUID LIQUID MIXED MIXED MIXED LIQUID LIQUID
0.00 0.00 0.00 0.66 0.00 0.00 1.92 2.57 11.44 - 0.00 0.00 2.91 10.74 1.82 0.00 0.00 0.00 0.00 0.00 0.00 0.01 0.71 0.07 - - 0.00 0.00 - - 0.00 0.00 0.00 0.00 0.01 0.01 0.00 0.00 0.00 0.00 0.16 0.01 0.56 - - 0.00 0.00 0.00 0.00 - - 0.01 0.02 2.76 - - - - 1.21 0.00 0.00 0.00 0.00 0.01 - - 0.01 0.01 10.19 - - - - 10.61 0.01 0.00 0.00 0.00 0.00 - - 0.00 0.00 0.00 - - - - 0.00 0.00 0.72 0.36 0.36 0.00 0.00 0.00 0.00 0.00 0.00 - 0.36 0.00 0.00 - -
0.0039 0.0039 0.0039 0.9883 0.0556 0.0556 0.9881 0.7779 0.4678 - 0.0025 0.0556 0.8376 0.4760 0.9951 0.0000 0.0000 0.0000 0.0011 0.0000 0.0000 0.0026 0.2143 0.0029 - - 0.0000 0.0000 - - 0.0026 0.0026 0.0026 0.0000 0.9414 0.9414 0.0000 0.0001 0.0001 1.0000 0.3000 0.9414 0.1623 - - 0.0000 0.0000 0.0000 0.0021 - - 0.0065 0.0059 0.1127 - - - - 0.0538 0.0013 0.0000 0.0000 0.0000 0.0082 - - 0.0026 0.0018 0.4164 - - - - 0.4701 0.0030 0.0034 0.0034 0.0034 0.0000 - - 0.0000 0.0000 0.0000 - - - - 0.0000 0.0005 0.9901 0.9901 0.9901 0.0003 0.0030 0.0030 0.0002 0.0000 0.0001 - 0.6975 0.0030 0.0001 - -
0.73 0.36 0.36 0.67 0.01 0.01 1.94 3.30 24.46 0.00 0.52 0.01 3.47 22.56 1.8323.30 11.65 11.65 13.49 0.52 0.52 37.91 119.74 3151.24 0.17 21.67 0.52 88.45 3041.10 34.501.809 0.904 0.904 0.012 0.032 0.019 0.036 0.085 0.955 0.000 1.025 0.110 0.152 0.944 0.036
27.14029 27.14029 27.14029 46.5932 197.8134 48 80.47304 120 120 25 21.64315 47.66607 42.24105 154.7684 152.140210 10 10 10 10.1 10 10 10 10 13 12 2 12 40 401 1 1 0 1 0.9492604 0 0 0 0 0.9997489 0.999234 0.0112926 0 00 0 0 1 0 0.0507395 1 1 1 1 2.51E-04 7.66E-04 0.9887074 1 10 0 0 0 0 0 0 0 0 0 0 0 0 0 0
-1.75E+06 -1.75E+06 -1.75E+06 -2.82E+08 -2.86E+08 -2.95E+08 -2.81E+08 -4.00E+08 -1.39E+08 -3.20E+08 -9.01E+07 -2.92E+08 -2.90E+08 -1.27E+08 -2.75E+08-54670.4 -54670.4 -54670.4 -1.39E+07 -4.66E+06 -4.80E+06 -1.44E+07 -1.10E+07 -1.08E+06 -4.99E+06 -2.17E+06 -4.76E+06 -1.14E+07 -9.45E+05 -1.46E+07
-1.274 -0.637 -0.637 -187.656 -2.413 -2.487 -545.300 -1322.316 -3404.151 -0.846 -46.960 -2.465 -1006.758 -2872.983 -502.377-18618.6 -18618.6 -18618.6 -1.56E+05 10250.1 -12966.42 -1.56E+05 -2.01E+05 -1.77E+05 -76504.34 -12928.62 7541.72 -1.45E+05 -97278.41 -1.37E+05
-583.1286 -583.1286 -583.1286 -7718.356 166.9199 -211.1542 -7980.993 -5558.495 -1370.156 -1194.171 -310.8968 122.8147 -5675.485 -721.7114 -7237.5920.4035164 0.4035164 0.4035164 53.70252 0.2671153 0.441739 53.27269 39.0765 25.61334 21.2811 0.5085102 0.0765693 22.81287 23.8882 50.4666
12.8838 12.8838 12.8838 1088.461 16.40284 27.12601 1041.814 1416.496 3299.376 1363.37 21.14635 4.701919 581.5463 3219.854 952.130831.92881 31.92881 31.92881 20.26835 61.40732 61.40732 19.55625 36.2493 128.8147 64.0648 41.58492 61.40732 25.49202 134.7885 18.86655
0.039 0.019 0.019 0.012 0.000 0.000 0.036 0.086 1.009 0.000 0.028 0.000 0.083 0.936 0.033

Substream: MIXEDMole Flow kmol/sec H2O H2SO4 SO2 HI I2 H2 O2Mole Frac H2O H2SO4 SO2 HI I2 H2 O2Total Flow kmol/secTotal Flow kg/secTotal Flow cum/secTemperature CPressure barVapor FracLiquid FracSolid FracEnthalpy J/kmolEnthalpy J/kgEnthalpy MWEntropy J/kmol-KEntropy J/kg-KDensity kmol/cumDensity kg/cumAverage MWLiq Vol 60F cum/sec
318KO-101
LIQUID
0.01 - -
0.00 0.36 0.00
-
0.0399 - -
0.0002 0.9594 0.0005
- 0.37
91.210.024
153.490240
010
1.27E+0752102.61
4.75256952.48233.1804
15.6763828.739244.2421
0.023

201 202 203 204 205 206 207 208 209 210 211 212 213VV-201 EX-201CS TO-201 PP-201 RX-201 KO-201 VV-202 KO-202 VV-203 KO-203 VV-204 EX-202CS TO-201
VV-201 EX-201CS TO-201 PP-201 RX-201 KO-201 VV-202 KO-202 VV-203 KO-203 VV-204 EX-202CSLIQUID LIQUID MIXED LIQUID LIQUID MIXED LIQUID MIXED LIQUID MIXED LIQUID MIXED MIXED
Substream: MIXED Mole Flow kmol/sec H2O 2.910 2.910 2.910 4.234 4.234 4.234 3.874 3.874 3.565 3.565 3.187 3.187 3.187 H2SO4 - - 0.000 0.000 - 0.000 - 0.000 - 0.000 - 0.000 0.000 H2 - - - - - - - - - - - - - O2 - - - 0.000 - 0.364 0.006 0.006 0.000 0.000 0.000 0.000 0.000 SO2 0.000 0.000 0.000 0.000 - 0.727 0.164 0.164 0.017 0.017 0.000 0.000 0.000 SO3 0.727 0.727 0.727 1.504 1.504 0.777 0.777 0.777 0.777 0.777 0.777 0.777 0.777 Mole Frac H2O 0.800 0.800 0.800 0.738 0.738 0.694 0.804 0.804 0.818 0.818 0.804 0.804 0.804 H2SO4 - - 0.000 0.000 - 0.000 - 0.000 - 0.000 - 0.000 0.000 H2 - - - - - - - - - - - - - O2 - - - 0.000 - 0.060 0.001 0.001 0.000 0.000 0.000 0.000 0.000 SO2 0.000 0.000 0.000 0.000 - 0.119 0.034 0.034 0.004 0.004 0.000 0.000 0.000 SO3 0.200 0.200 0.200 0.262 0.262 0.127 0.161 0.161 0.178 0.178 0.196 0.196 0.196 Mass Frac H2O 0.474 0.474 0.474 0.388 0.388 0.388 0.489 0.489 0.504 0.504 0.480 0.480 0.480 H2SO4 - - 0.000 0.000 - 0.000 - 0.000 - 0.000 - 0.000 0.000 H2 - - - - - - - - - - - - - O2 - - - 0.000 - 0.059 0.001 0.001 0.000 0.000 0.000 0.000 0.000 SO2 0.000 0.000 0.000 0.000 - 0.237 0.074 0.074 0.008 0.008 0.000 0.000 0.000 SO3 0.526 0.526 0.526 0.612 0.612 0.316 0.436 0.436 0.488 0.488 0.520 0.520 0.520 Total Flow kmol/sec 3.637 3.637 3.637 5.739 5.739 6.102 4.821 4.821 4.359 4.359 3.965 3.965 3.965 Total Flow kg/sec 110.66 110.66 110.66 196.73 196.73 196.73 142.69 142.69 127.52 127.52 119.66 119.66 119.66Total Flow cum/sec 0.0763 0.0763 82.5710 0.1302 0.1302 0.7146 0.1209 1.4685 0.1043 6.6002 0.0891 22.3743 177.4686Temperature C 120.0 120.0 101.9 126.5 127.3 256.4 256.4 220.4 220.4 170.2 170.2 127.3 112.1Pressure bar 1.10 0.44 0.14 0.15 86.00 84.00 84.00 13.20 13.20 2.20 2.20 0.44 0.14Vapor Frac 0.00 0.00 0.10 0.00 0.00 0.21 0.00 0.10 0.00 0.09 0.00 0.07 0.19Liquid Frac 1.00 1.00 0.90 1.00 1.00 0.79 1.00 0.90 1.00 0.91 1.00 0.93 0.81Solid Frac 0.00 0.00 0.00 0.00 0.00 0.00 0.00 0.00 0.00 0.00 0.00 0.00 0.00Enthalpy J/kmol -3.38E+08 -3.38E+08 -3.34E+08 -3.53E+08 -3.52E+08 -2.91E+08 -3.17E+08 -3.17E+08 -3.24E+08 -3.24E+08 -3.32E+08 -3.32E+08 -3.28E+08Enthalpy J/kg -1.11E+07 -1.11E+07 -1.10E+07 -1.03E+07 -1.03E+07 -9.02E+06 -1.07E+07 -1.07E+07 -1.11E+07 -1.11E+07 -1.10E+07 -1.10E+07 -1.09E+07Enthalpy MW -1227.5 -1227.5 -1215.5 -2023.1 -2021.8 -1774.4 -1528.0 -1528.0 -1412.5 -1412.5 -1318.1 -1318.1 -1300.5Entropy J/kmol-K 6.64E+04 6.64E+04 7.68E+04 6.36E+04 6.36E+04 1.13E+05 8.95E+04 9.24E+04 8.06E+04 8.47E+04 7.34E+04 7.68E+04 9.10E+04Entropy J/kg-K 2.18E+03 2.18E+03 2.52E+03 1.85E+03 1.85E+03 3.50E+03 3.03E+03 3.12E+03 2.75E+03 2.90E+03 2.43E+03 2.54E+03 3.01E+03Density kmol/cum 47.66 47.66 0.04 44.08 44.09 8.54 39.89 3.28 41.78 0.66 44.48 0.18 0.02Density kg/cum 1450.0 1450.0 1.3 1511.3 1511.3 275.3 1180.7 97.2 1222.2 19.3 1342.3 5.3 0.7Average MW 30.43 30.43 30.43 34.28 34.28 32.24 29.60 29.60 29.25 29.25 30.18 30.18 30.18Liq Vol 60F cum/sec 0.0915 0.0915 0.0915 0.1570 0.1570 0.1765 0.1206 0.1206 0.1069 0.1069 0.0992 0.0992 0.0992

Substream: MIXEDMole Flow kmol/sec H2O H2SO4 H2 O2 SO2 SO3Mole Frac H2O H2SO4 H2 O2 SO2 SO3Mass Frac H2O H2SO4 H2 O2 SO2 SO3Total Flow kmol/secTotal Flow kg/secTotal Flow cum/secTemperature CPressure barVapor FracLiquid FracSolid FracEnthalpy J/kmolEnthalpy J/kgEnthalpy MWEntropy J/kmol-KEntropy J/kg-KDensity kmol/cumDensity kg/cumAverage MWLiq Vol 60F cum/sec
214 215 216 217 218 219 220 221 222 223 224 225 226EX-202HS HX-201 VV-205 KO-204 MX-201 EX-201HS HX-202 KO-205 MX-201 HX-203 KO-206KO-201 EX-202HS HX-201 VV-205 KO-204 MX-201 KO-202 EX-201HS HX-202 KO-205 KO-203 HX-203 KO-206VAPOR MIXED MIXED MIXED VAPOR MIXED VAPOR MIXED MIXED VAPOR VAPOR MIXED VAPOR
0.360 0.360 0.360 0.360 0.001 0.001 0.309 0.309 0.309 0.000 0.378 0.378 0.000 0.000 0.000 0.000 0.000 0.000 - 0.000 0.000 0.000 0.000 0.000 0.000 0.000
- - - - - - - - - - - - - 0.358 0.358 0.358 0.358 0.358 0.363 0.006 0.006 0.006 0.006 0.000 0.000 0.000 0.564 0.564 0.564 0.564 0.147 0.156 0.147 0.147 0.147 0.010 0.016 0.016 0.008 0.000 0.000 0.000 0.000 - - 0.000 0.000 0.000 0.000 0.000 0.000 0.000
0.281 0.281 0.281 0.281 0.002 0.002 0.669 0.669 0.669 0.010 0.958 0.958 0.056 0.000 0.000 0.000 0.000 0.000 - 0.000 0.000 0.000 0.000 0.000 0.000 0.000
- - - - - - - - - - - - - 0.279 0.279 0.279 0.279 0.707 0.697 0.013 0.013 0.013 0.375 0.000 0.000 0.003 0.440 0.440 0.440 0.440 0.290 0.300 0.318 0.318 0.318 0.615 0.042 0.042 0.941 0.000 0.000 0.000 0.000 - - 0.000 0.000 0.000 0.000 0.000 0.000 0.000
0.120 0.120 0.120 0.120 0.001 0.001 0.367 0.367 0.367 0.004 0.866 0.866 0.016 0.000 0.000 0.000 0.000 0.000 - 0.000 0.000 0.000 0.000 0.000 0.000 0.000
- - - - - - - - - - - - - 0.212 0.212 0.212 0.212 0.548 0.537 0.012 0.012 0.012 0.232 0.000 0.000 0.002 0.668 0.668 0.668 0.668 0.451 0.462 0.620 0.620 0.620 0.764 0.134 0.134 0.982 0.000 0.000 0.000 0.000 - - 0.000 0.000 0.000 0.000 0.000 0.000 0.000 1.281 1.281 1.281 1.281 0.506 0.521 0.462 0.462 0.462 0.016 0.394 0.394 0.008 54.04 54.04 54.04 54.04 20.87 21.67 15.18 15.18 15.18 0.80 7.85 7.85 0.52
0.5938 0.3057 0.1504 1.0131 0.9911 1.0243 1.3641 0.4706 0.0431 0.0321 6.5111 0.1051 0.1099256.4 137.3 48.0 20.5 20.5 21.6 220.4 130.0 48.0 48.0 170.2 48.0 47.784.00 83.40 82.80 12.00 12.00 12.00 13.20 12.60 12.00 12.00 2.20 2.10 2.00
1.00 0.75 0.33 0.39 1.00 1.00 1.00 0.41 0.03 1.00 1.00 0.02 1.000.00 0.25 0.67 0.61 0.00 0.00 0.00 0.59 0.97 0.00 0.00 0.98 0.000.00 0.00 0.00 0.00 0.00 0.00 0.00 0.00 0.00 0.00 0.00 0.00 0.00
-1.92E+08 -2.06E+08 -2.18E+08 -2.18E+08 -8.72E+07 -9.02E+07 -2.50E+08 -2.76E+08 -2.91E+08 -1.85E+08 -2.39E+08 -2.85E+08 -2.92E+08-4.56E+06 -4.89E+06 -5.18E+06 -5.18E+06 -2.11E+06 -2.17E+06 -7.61E+06 -8.40E+06 -8.86E+06 -3.59E+06 -1.20E+07 -1.43E+07 -4.76E+06
-246.4 -264.1 -279.8 -279.8 -44.1 -47.0 -115.5 -127.5 -134.4 -2.9 -94.4 -112.4 -2.52.01E+05 1.73E+05 -4.57E+09 8.43E+08 1.96E+05 1.96E+05 2.04E+05 1.47E+05 -2.78E+09 2.12E+05 1.98E+05 7.99E+04 2.42E+054.76E+03 4.11E+03 -1.08E+08 2.00E+07 4.75E+03 4.72E+03 6.22E+03 4.49E+03 -8.45E+07 4.12E+03 9.95E+03 4.01E+03 3.94E+03
2.16 4.19 8.52 1.26 0.51 0.51 0.34 0.98 10.72 0.48 0.06 3.75 0.0891.0 176.8 359.4 53.3 21.1 21.2 11.1 32.2 351.9 24.9 1.2 74.7 4.7
42.18 42.18 42.18 42.18 41.28 41.58 32.84 32.84 32.84 51.57 19.93 19.93 61.410.0558 0.0558 0.0558 0.0558 0.0270 0.0279 0.0138 0.0138 0.0138 0.0008 0.0077 0.0077 0.0004

Substream: MIXEDMole Flow kmol/sec H2O H2SO4 H2 O2 SO2 SO3Mole Frac H2O H2SO4 H2 O2 SO2 SO3Mass Frac H2O H2SO4 H2 O2 SO2 SO3Total Flow kmol/secTotal Flow kg/secTotal Flow cum/secTemperature CPressure barVapor FracLiquid FracSolid FracEnthalpy J/kmolEnthalpy J/kgEnthalpy MWEntropy J/kmol-KEntropy J/kg-KDensity kmol/cumDensity kg/cumAverage MWLiq Vol 60F cum/sec
227 228 229 230 231 232 233 234 235 236 237 238 239EJ-202 HX-204 EJ-201 HX-205 KO-206 MX-202 MX-202 PP-202 MX-202 EJ-201 MX-203TO-201 EJ-202 HX-204 EJ-201 HX-205 KO-204 MX-202 KO-205 KO-206 PP-202 HX-205 MX-203VAPOR VAPOR VAPOR MIXED VAPOR LIQUID LIQUID LIQUID LIQUID LIQUID MIXED LIQUID LIQUID
0.002 0.004 0.000 0.000 0.000 0.359 2.906 0.309 0.377 0.377 0.000 0.000 0.004 0.000 - - - - - - - - - - - -
- - - - - - - - - - - - - 0.000 0.000 0.000 0.000 0.000 0.000 0.000 0.000 0.000 0.000 - 0.000 0.000 0.000 0.000 0.000 0.000 0.000 0.417 0.563 0.137 0.009 0.009 - 0.000 0.000 0.000 - - - - 0.000 0.000 0.000 0.000 0.000 - - -
0.922 0.961 0.294 0.647 0.057 0.462 0.838 0.692 0.978 0.978 1.000 0.978 0.995 0.000 - - - - - - - - - - - -
- - - - - - - - - - - - - 0.000 0.000 0.000 0.000 0.000 0.000 0.000 0.000 0.000 0.000 - 0.000 0.000 0.078 0.039 0.706 0.353 0.943 0.537 0.162 0.308 0.022 0.022 - 0.022 0.005 0.000 - - - - 0.000 0.000 0.000 0.000 0.000 - - -
0.768 0.873 0.105 0.340 0.017 0.195 0.592 0.387 0.925 0.925 1.000 0.926 0.984 0.000 - - - - - - - - - - - -
- - - - - - - - - - - - - 0.000 0.000 0.000 0.000 0.000 0.000 0.000 0.000 0.000 0.000 - 0.000 0.000 0.232 0.127 0.895 0.660 0.983 0.805 0.408 0.612 0.075 0.075 - 0.074 0.016 0.000 - - - - 0.000 0.000 0.000 0.000 0.000 - - - 0.002 0.004 0.000 0.000 0.000 0.776 3.470 0.447 0.386 0.386 0.000 0.000 0.004
0.04 0.07 0.01 0.01 0.01 33.17 88.45 14.38 7.34 7.34 0.00 0.00 0.070.4487 0.2391 0.0132 0.0056 0.0018 0.0220 0.0744 0.0110 0.0072 0.0072 0.0008 0.0000 0.0001
46.1 99.3 48.0 108.2 48.0 20.5 42.2 48.0 47.7 47.9 170.0 48.0 48.10.11 0.48 0.38 2.10 2.00 12.00 12.00 12.00 2.00 12.00 7.91 2.00 2.001.00 1.00 1.00 0.99 1.00 0.00 0.00 0.00 0.00 0.00 1.00 0.00 0.000.00 0.00 0.00 0.01 0.00 1.00 1.00 1.00 1.00 1.00 0.00 1.00 1.000.00 0.00 0.00 0.00 0.00 0.00 0.00 0.00 0.00 0.00 0.00 0.00 0.00
-2.46E+08 -2.42E+08 -2.80E+08 -2.59E+08 -2.93E+08 -3.04E+08 -2.90E+08 -2.94E+08 -2.85E+08 -2.85E+08 -2.38E+08 -2.85E+08 -2.84E+08-1.14E+07 -1.22E+07 -5.54E+06 -7.56E+06 -4.77E+06 -7.11E+06 -1.14E+07 -9.15E+06 -1.50E+07 -1.50E+07 -1.32E+07 -1.50E+07 -1.56E+07
-0.5 -0.9 -0.1 -0.1 0.0 -235.7 -1006.7 -131.5 -110.0 -110.0 0.0 -0.1 -1.12.14E+05 2.05E+05 2.42E+05 2.12E+05 2.42E+05 1.39E+09 -7.07E+08 -2.87E+09 7.65E+04 7.65E+04 1.84E+05 7.66E+04 7.56E+049.91E+03 1.03E+04 4.79E+03 6.18E+03 3.94E+03 3.26E+07 -2.78E+07 -8.92E+07 4.02E+03 4.02E+03 1.02E+04 4.02E+03 4.15E+03
0.00 0.02 0.01 0.07 0.08 35.27 46.64 40.59 53.68 53.70 0.23 53.68 54.660.1 0.3 0.7 2.3 4.7 1508.3 1188.9 1306.5 1021.8 1022.2 4.1 1021.4 996.5
21.62 19.82 50.51 34.26 61.46 42.77 25.49 32.18 19.04 19.04 18.02 19.03 18.230.0000 0.0001 0.0000 0.0000 0.0000 0.0288 0.0826 0.0129 0.0073 0.0073 0.0000 0.0000 0.0001

Substream: MIXEDMole Flow kmol/sec H2O H2SO4 H2 O2 SO2 SO3Mole Frac H2O H2SO4 H2 O2 SO2 SO3Mass Frac H2O H2SO4 H2 O2 SO2 SO3Total Flow kmol/secTotal Flow kg/secTotal Flow cum/secTemperature CPressure barVapor FracLiquid FracSolid FracEnthalpy J/kmolEnthalpy J/kgEnthalpy MWEntropy J/kmol-KEntropy J/kg-KDensity kmol/cumDensity kg/cumAverage MWLiq Vol 60F cum/sec
240 241 242 243 244 BFW STEAMPP-203 MX-203 EJ-202 PP-204 MX-202 SG-201HX-204 PP-203 TO-201 PP-204 SG-201LIQUID LIQUID MIXED LIQUID LIQUID LIQUID VAPOR
0.004 0.004 0.002 1.861 1.861 0.002 0.002 - - - 0.000 - - - - - - - - - -
0.000 0.000 - 0.000 0.000 - - 0.000 0.000 - 0.000 0.000 - -
- - - 0.000 - - -
0.997 0.997 1.000 1.000 1.000 1.000 1.000 - - - 0.000 - - - - - - - - - -
0.000 0.000 - 0.000 0.000 - - 0.003 0.003 - 0.000 0.000 - -
- - - 0.000 - - -
0.988 0.988 1.000 0.999 0.999 1.000 1.000 - - - 0.000 - - - - - - - - - -
0.000 0.000 - 0.000 0.000 - - 0.012 0.012 - 0.001 0.001 - -
- - - 0.000 - - - 0.004 0.004 0.002 1.862 1.862 0.002 0.002
0.06 0.06 0.03 33.56 33.56 0.04 0.040.0001 0.0001 0.0082 0.0339 0.0339 0.0000 0.0091
48.0 48.1 170.0 46.1 46.2 38.0 170.10.38 2.00 7.91 0.11 12.00 1.00 7.910.00 0.00 1.00 0.00 0.00 0.00 1.001.00 1.00 0.00 1.00 1.00 1.00 0.000.00 0.00 0.00 0.00 0.00 0.00 0.00
-2.84E+08 -2.84E+08 -2.38E+08 -2.84E+08 -2.84E+08 -2.85E+08 -2.38E+08-1.56E+07 -1.56E+07 -1.32E+07 -1.58E+07 -1.58E+07 -1.58E+07 -1.32E+07
-1.0 -1.0 -0.4 -529.5 -529.4 -0.6 -0.57.56E+04 7.56E+04 1.84E+05 7.50E+04 7.50E+04 7.31E+04 1.84E+054.16E+03 4.16E+03 1.02E+04 4.16E+03 4.16E+03 4.06E+03 1.02E+04
54.73 54.73 0.23 54.93 54.96 55.12 0.23994.7 994.7 4.1 990.2 990.7 993.0 4.118.18 18.18 18.02 18.03 18.03 18.02 18.02
0.0001 0.0001 0.0000 0.0336 0.0336 0.0000 0.0000

1-138 3-1 3-2 3-3 3-4 3-5 3-6 3-7 3-8 3-9 3-10 3-11 3-12 3-13 3-14 3-15 3-16P3-11 SPLIT-1 HX-1 MIX-1 HX-2 MIX-1 HX-3 COLUMN MIX-4 HX-1 HX-5 SEP3-1 HX-4 SEP3-2 MIX-2 MIX-2
P3-11 SPLIT-1 HX-1 SPLIT-1 HX-2 MIX-1 HX-3 COLUMN MIX-4 HX-1 HX-5 SEP3-1 HX-4 SEP3-2 SEP3-1 SEP3-2LIQUID LIQUID LIQUID LIQUID LIQUID LIQUID LIQUID LIQUID VAPOR MIXED MIXED MIXED VAPOR MIXED VAPOR LIQUID LIQUID
Substream: MIXED Mole Flow kmol/s H2O 12.484 12.484 8.265 8.265 4.219 4.219 12.484 12.484 6.600 7.482 7.482 7.482 0.113 0.113 0.033 7.369 0.080 I2 10.141 10.141 6.714 6.714 3.427 3.427 10.141 10.141 0.001 0.248 0.248 0.248 0.001 0.001 0.001 0.247 0.000 HI 2.649 2.649 1.754 1.754 0.895 0.895 2.649 2.649 0.255 0.313 0.313 0.313 0.000 0.000 0.000 0.313 0.000 H2 - - - - - - - - 0.726 0.726 0.726 0.726 0.723 0.723 0.723 0.004 0.000 Mole Frac H2O 0.494 0.494 0.494 0.494 0.494 0.494 0.494 0.494 0.871 0.853 0.853 0.853 0.135 0.135 0.043 0.929 0.999 I2 0.401 0.401 0.401 0.401 0.401 0.401 0.401 0.401 0.000 0.028 0.028 0.028 0.001 0.001 0.001 0.031 0.000 HI 0.105 0.105 0.105 0.105 0.105 0.105 0.105 0.105 0.034 0.036 0.036 0.036 0.000 0.000 0.000 0.039 0.000 H2 - - - - - - - - 0.096 0.083 0.083 0.083 0.864 0.864 0.955 0.000 0.001 Total Flow kmol/s 25.27 25.27 16.73 16.73 8.54 8.54 25.27 25.27 7.58 8.77 8.77 8.77 0.84 0.84 0.76 7.93 0.08 Total Flow kg/s 3,137.7 3,137.7 2,077.3 2,077.3 1,060.4 1,060.4 3,137.7 3,137.7 153.2 239.1 239.1 239.1 3.7 3.7 2.3 235.4 1.4 Total Flow cum/s 0.952 0.955 0.632 0.729 0.323 0.366 1.096 1.115 7.654 9.016 1.393 0.939 0.769 0.643 0.642 0.169 0.002 Temperature C 102.3 106.7 106.7 263.0 106.7 250.0 259.0 271.6 261.0 273.0 203.2 154.0 154.0 113.0 113.0 154.0 113.0Pressure bar 1.01 41.06 41.06 40.56 41.06 40.56 40.56 40.06 40 40 39.5 39 39 38.5 38.5 39 38.5Vapor Frac 0.00 0.00 0.00 0.00 0.00 0.00 0.00 0.00 1.00 1.00 0.14 0.10 1.00 0.90 1.00 0.00 0.00Liquid Frac 1.00 1.00 1.00 1.00 1.00 1.00 1.00 1.00 0.00 0.00 0.86 0.90 0.00 0.10 0.00 1.00 1.00Solid Frac 0.00 0.00 0.00 0.00 0.00 0.00 0.00 0.00 0.00 0.00 0.00 0.00 0.00 0.00 0.00 0.00 0.00Enthalpy J/kmol -1.39E+08 -1.39E+08 -1.39E+08 -1.20E+08 -1.39E+08 -1.24E+08 -1.21E+08 -1.18E+08 -2.03E+08 -1.97E+08 -2.31E+08 -2.37E+08 -2.87E+07 -3.37E+07 -7.88E+06 -2.59E+08 -2.79E+08Enthalpy J/kg -1.12E+06 -1.12E+06 -1.12E+06 -9.70E+05 -1.12E+06 -9.95E+05 -9.78E+05 -9.49E+05 -1.00E+07 -7.21E+06 -8.48E+06 -8.70E+06 -6.49E+06 -7.62E+06 -2.63E+06 -8.73E+06 -1.55E+07Enthalpy MW -3507.5 -3502.4 -2318.7 -2014.5 -1183.7 -1055.2 -3069.7 -2979.0 -1538.8 -1724.0 -2028.2 -2079.2 -24.0 -28.2 -6.0 -2055.2 -22.2Entropy J/kmol-K -5.78E+04 -5.71E+04 -5.71E+04 -1.98E+04 -5.71E+04 -2.51E+04 -2.16E+04 -1.57E+04 -4.43E+04 -3.78E+04 -1.03E+05 -1.16E+05 -2.24E+04 -3.45E+04 -2.31E+04 -1.26E+05 -1.44E+05Entropy J/kg-K -4.65E+02 -4.60E+02 -4.60E+02 -1.60E+02 -4.60E+02 -2.02E+02 -1.74E+02 -1.26E+02 -2.19E+03 -1.38E+03 -3.79E+03 -4.26E+03 -5.05E+03 -7.80E+03 -7.70E+03 -4.24E+03 -7.96E+03Density kmol/cum 26.5437 26.48 26.48 22.94 26.48 23.33 23.06 22.67 0.99 0.97 6.30 9.34 1.09 1.30 1.18 46.92 52.61Density kg/cum 3295.2 3286.7 3286.7 2847.9 3286.7 2896.1 2862.9 2814.4 20.0 26.5 171.7 254.8 4.8 5.8 3.5 1392.4 949.2Average Mol Wt 124.14 124.14 124.14 124.14 124.14 124.14 124.14 124.14 20.20 27.27 27.27 27.27 4.43 4.43 2.99 29.68 18.04Liq Vol 60F cum/hr 1.397 1.397 0.925 0.925 0.472 0.472 1.397 1.397 0.236 0.284 0.284 0.284 0.056 0.056 0.054 0.228 0.002

Substream: MIXEDMole Flow kmol/s H2O I2 HI H2Mole Frac H2O I2 HI H2Total Flow kmol/sTotal Flow kg/sTotal Flow cum/sTemperature CPressure barVapor FracLiquid FracSolid FracEnthalpy J/kmolEnthalpy J/kgEnthalpy MWEntropy J/kmol-KEntropy J/kg-KDensity kmol/cumDensity kg/cumAverage Mol WtLiq Vol 60F cum/hr
3-17 3-21-APP 3-22 3-23 3-24 3-25 3-26 3-27 3-28 HP-1 HP-2 HP-3 HP-4 HP-5HX-3 V3-1 SEP3-3 COMPR MIX-4 HX-2 HX-6 HP-C HP-QH HP-V HP-QC
MIX-2 TRU2APP HX-3 V3-1 SEP3-3 COMPR SEP3-3 HX-2 HX-6 HP-C HP-QH HP-V HP-QCMIXED LIQUID LIQUID MIXED VAPOR VAPOR LIQUID LIQUID LIQUID VAPOR VAPOR LIQUID MIXED VAPOR
7.449 5.884 5.884 5.884 0.881 0.881 5.002 5.002 5.002 20.855 20.855 20.855 20.855 20.855 0.247 10.867 10.867 10.867 0.247 0.247 10.620 10.620 10.620 - - - - - 0.313 0.942 0.942 0.942 0.058 0.058 0.884 0.884 0.884 - - - - - 0.004 0.000 0.000 0.000 0.000 0.000 0.000 0.000 0.000 - - - - -
0.930 0.333 0.333 0.333 0.743 0.743 0.303 0.303 0.303 1.000 1.000 1.000 1.000 1.000 0.031 0.614 0.614 0.614 0.208 0.208 0.643 0.643 0.643 - - - - - 0.039 0.053 0.053 0.053 0.049 0.049 0.054 0.054 0.054 - - - - - 0.000 0.000 0.000 0.000 0.000 0.000 0.000 0.000 0.000 - - - - - 8.01 17.69 17.69 17.69 1.19 1.19 16.51 16.51 16.51 20.85 20.85 20.85 20.85 20.85
236.9 2,984.5 2,984.5 2,984.5 85.9 85.9 2,898.5 2,898.5 2,898.5 375.7 375.7 375.7 375.7 375.7 0.171 0.981 0.957 2.717 1.810 1.340 0.908 0.860 0.827 16.981 11.196 0.518 2.314 16.981 153.7 288.3 269.0 260.0 260.0 337.5 260.0 203.2 154.0 256.0 341.6 293.3 256.7 256.0
38.5 40.09 39.59 26 26 40 26 25.5 25 43.91 78.57 78.07 44.41 43.910.00 0.00 0.00 0.07 1.00 1.00 0.00 0.00 0.00 1.00 1.00 0.00 0.11 1.001.00 1.00 1.00 0.93 0.00 0.00 1.00 1.00 1.00 0.00 0.00 1.00 0.89 0.000.00 0.00 0.00 0.00 0.00 0.00 0.00 0.00 0.00 0.00 0.00 0.00 0.00 0.00
-2.59E+08 -6.27E+07 -6.78E+07 -6.78E+07 -1.59E+08 -1.56E+08 -6.13E+07 -6.90E+07 -7.32E+07 -2.37E+08 -2.35E+08 -2.64E+08 -2.64E+08 -2.37E+08-8.77E+06 -3.71E+05 -4.02E+05 -4.02E+05 -2.19E+06 -2.15E+06 -3.49E+05 -3.93E+05 -4.17E+05 -1.32E+07 -1.30E+07 -1.47E+07 -1.47E+07 -1.32E+07
-2077.5 -1108.4 -1199.2 -1199.2 -188.2 -185.2 -1011.0 -1139.5 -1208.9 -4952.6 -4891.0 -5512.8 -5512.8 -4952.6-1.26E+05 2.57E+04 1.73E+04 1.69E+04 -1.42E+03 -2.65E+02 1.82E+04 4.21E+03 -5.07E+03 -6.11E+04 -5.99E+04 -1.12E+05 -1.12E+05 -6.11E+04-4.27E+03 1.53E+02 1.02E+02 9.99E+01 -1.96E+01 -3.66E+00 1.03E+02 2.40E+01 -2.89E+01 -3.39E+03 -3.33E+03 -6.23E+03 -6.21E+03 -3.39E+03
46.96 18.04 18.49 6.51 0.66 0.89 18.18 19.20 19.96 1.23 1.86 40.28 9.01 1.231388.2 3042.7 3119.7 1098.3 47.5 64.2 3192.9 3371.2 3505.3 22.1 33.6 725.7 162.4 22.1
29.56 168.69 168.69 168.69 72.46 72.46 175.61 175.61 175.61 18.02 18.02 18.02 18.02 18.020.230 1.171 1.171 1.171 0.048 0.048 1.123 1.123 1.123 0.518 0.518 0.518 0.518 0.518

Hydrogen Plant Alternatives Study NGNP-HPS SHAW-HPA Section 8 � Appendices
March 2009
8.2.3 Process Flow Diagrams
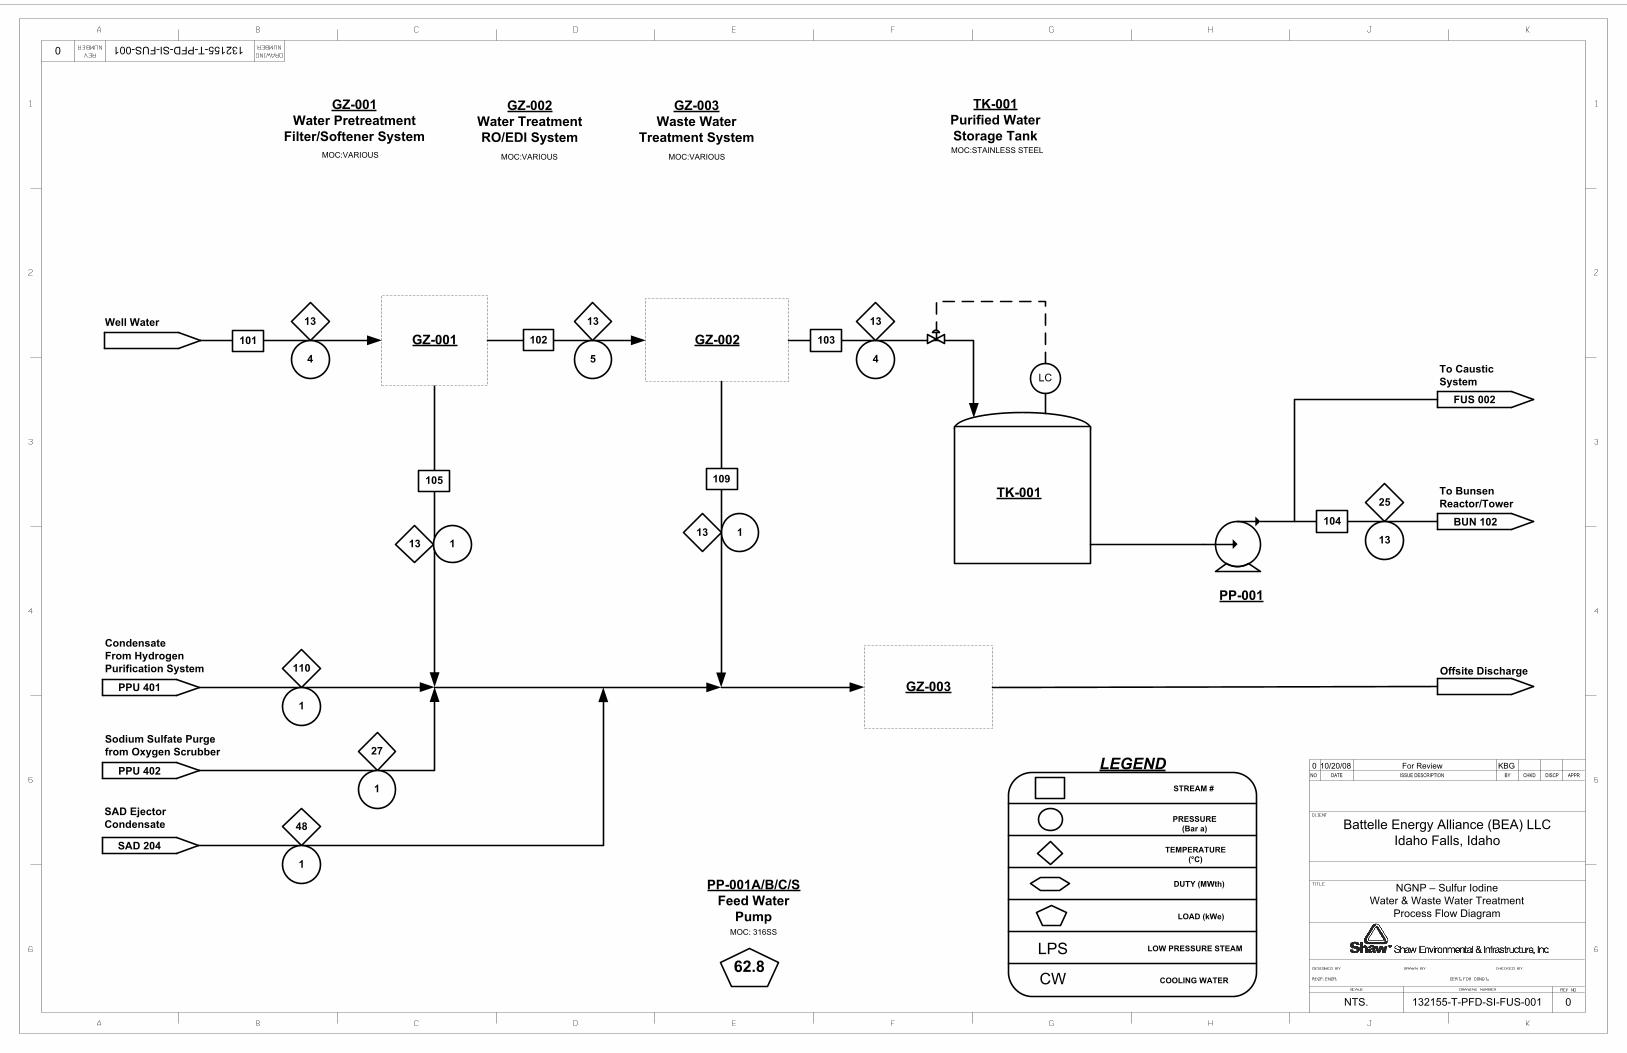
NO DATE ISSUE DESCRIPTION BY CHKD DISCP APPR
NTS.
Battelle Energy Alliance (BEA) LLCIdaho Falls, Idaho
132155-T-PFD-SI-FUS-001132155-T-PFD-SI-FUS-001
0
LPS
CW
STREAM #
PRESSURE (Bar a)
TEMPERATURE (°C)
DUTY (MWth)
LOAD (kWe)
LOW PRESSURE STEAM
COOLING WATER
LEGEND
Well Water101
4
13
GZ-001
105
GZ-002102
5
13
109
113
GZ-001Water Pretreatment
Filter/Softener System
GZ-002Water TreatmentRO/EDI System
MOC:VARIOUSMOC:VARIOUS
GZ-003
GZ-003Waste Water
Treatment SystemMOC:VARIOUS
Offsite DischargePPU 401
103
4
13
0
NGNP – Sulfur Iodine Water & Waste Water Treatment
Process Flow Diagram
CondensateFrom HydrogenPurification System
LC
TK-00125
PP-001
104
13
To BunsenReactor/Tower
BUN 102
TK-001Purified WaterStorage TankMOC:STAINLESS STEEL
PPU 402
Sodium Sulfate Purge from Oxygen Scrubber
To Caustic System
FUS 002
10/20/08 For Review KBG0
SAD 204
SAD Ejector Condensate
113
48
1
110
1
27
1
PP-001A/B/C/SFeed Water
PumpMOC: 316SS
62.8

NO DATE ISSUE DESCRIPTION BY CHKD DISCP APPR
NTS.
Battelle Energy Alliance (BEA) LLCIdaho Falls, Idaho
132155-T-PFD-SI-FUS-0020 132155-T-PFD-SI-FUS-002
0
LPS
CW
STREAM #
PRESSURE (Bar a)
TEMPERATURE (°C)
DUTY (MWth)
LOAD (kWe)
LOW PRESSURE STEAM
COOLING WATER
LEGEND
10% CausticTo TO-403
Sulfuric Acid Make-Up To TO-101
Sulfuric AcidFrom TK-102
Potable Water
LPS/CW
H2SO4 Transfer Pump
H2SO4 FeedPump
NaOH SolutionSupply Pump
PP-002
PP-002A/S PD-003 A/S PD-005A/S
NaOH Supply
H2SO4 Supply
PP-004A/SNaOH Transfer
PumpMOC: 20CB3 MOC: 20CB3
BUN 103
From Truck
From Truck
MOC: CS MOC: CS
0.3
TK-003
KO-001
VENT
1.5 0.3 7.7
LPS/CW
H2SO4 StorageTank
H2SO4 StorageTank Heater/
Cooler
Caustic StorageTank
NaOH StorageTank Heater/
Cooler
TK-002 HX-004 TK-003 HX-005
MOC: CS-TFE lined MOC: S:CS/T:20CB3
MOC: CS
MOC: CS
-0.2 -0.1
Sulfuric AcidDegassing
Drum
KO-001
TK-002
FUS 001
HX-004 HX-005
PP-003 PP-004 PP-005
PPU 402
14213
25
BUN 102
MOC: CS-TFE lined
10/20/08 For Review KBG0
NGNP – Sulfur IodideCaustic Feed System
Process Flow Diagram
10
120
Sulfuric AcidVent Scrubber
TO-004
MOC: CS-TFE lined
TO-004
WTD
To Waste Treatment and Disposal

NO DATE ISSUE DESCRIPTION BY CHKD DISCP APPR
NTS.
Battelle Energy Alliance (BEA) LLCIdaho Falls, Idaho
132155-T-PFD-SI-BUN 101132155-T-PFD-SI-BUN-101
0
LPS
CW
STREAM #
PRESSURE (Bar a)
TEMPERATURE (°C)
DUTY (MWth)
LOAD (kWe)
LOW PRESSURE STEAM
COOLING WATER
LEGEND
0
Iodine Feed fromHI Decomposition
HAD 301
33.5
154
3-17HAD 303
Recovered Water fromHI Decomposition
PC
CWHX-101
10
48
BUN 102
Returned Water To Bunsen Reactor
101
BUN 102
Iodine Feed To Bunsen Reactor
CWHX-102
PC
13
148
110A
RecoveredWater Cooler
HX-101Iodine Feed
Cooler
HX-102
2
48
226
Low Pressure SO2from SAD
SAD 204
MOC: 316L SS
PC-102Low Pressure SO2Feed Compressor
BUN 102
To Bunsen Reactor
10
198
226A
12
120
110B
SAD RecycledSO2 Cooler
HX-104
CWHX-104
10
48
121
10/20/08 For Review KBG0
NGNP – Sulfur IodideBunsen Reactor Feeds Process Flow Diagram
3-28156
24
-14.6 -61.3 -74
90.6
MOC: Shell – CSTubes – SS
MOC: Shell – CSTubes – Tantalum
MOC: Shell – CSTubes – Tantalum
PC-102

NO DATE ISSUE DESCRIPTION BY CHKD DISCP APPR
NTS.
Battelle Energy Alliance (BEA) LLCIdaho Falls, Idaho
132155-T-PFD-SI-BUN-102132155-T-PFD-SI-BUN-102
0
LPS
CW
STREAM #
PRESSURE (Bar a)
TEMPERATURE (°C)
DUTY (MWth)
LOAD (kWe)
LOW PRESSURE STEAM
COOLING WATER
LEGEND
NGNP – Sulfur IodideBunsen Reactor FeedsProcess Flow Diagram
0
TO-101Bunsen Reactor
PP-108 A/S
Bunsen ReactorTrim Cooler Pumps
MOC CI LINED TFE,MONELIMPELLER
TO-101
10
47
119
PP-108
Bunsen ReactionProducts to Separation
10
120
To ReverseBunsen Reactor
BUN 103
H2O/SO2 Liquid from AcidConcentration
12
42
233SAD 201
HX-112
TC
10120
115Z BUN 103
120Iodine Feed fromSection 300
BUN 101 110B
12
BUN 101
Recovered Water from HI Decomposition
10
48
Feed WaterFUS 001 104
13
25
H2SO4 FeedFUS 002 142
13
25
105
106
FC
Oxygen toSO2 Scrubber
To ReverseBunsen Reactor
BUN 103
FC
116
PC
117
118
9
27
9
27
SAD 201
BUN 103
Vapor from ReverseBunsen Reactor
O2/SO2 Vapor from Acid Decomposer
219
12
22
111A
12
48
HX-111Bunsen Reactor Trim Cooler
101
PPU 402
Recycled SO2From SAD
BUN 101 121
10
48
KBG
PP-109 A/B/S
Bunsen ReactorRecirculation Pumps
CW
PP-109CW
HX-111
HX-112 A/BBunsen Reactor Coolers
10/20/08 For Review0
-121-60.5
94 188
12
12
MOC: CS-TFE LINED, PACKING CERAMIC
MOC CI LINED TFE, MONEL IMPELLER
MOC: SHELL – CSTUBES – TANTALUM
MOC: SHELL – CSTUBES – TANTALUM

NO DATE ISSUE DESCRIPTION BY CHKD DISCP APPR
NTS.
Battelle Energy Alliance (BEA) LLCIdaho Falls, Idaho
132155-T-PFD-SI-BUN-103132155-T-PFD-SI-BUN-103
0
LPS
CW
STREAM #
PRESSURE (Bar a)
TEMPERATURE (°C)
DUTY (MWth)
LOAD (kWe)
LOW PRESSURE STEAM
COOLING WATER
LEGEND
NGNP – Sulfur Iodide Reverse Bunsen Reactor
Process Flow Diagram
0
Bunsen ReactionProducts
115Z
From Bunsen Reactor O2 ScrubberCollection Tray
TO-102Reverse Bunsen
Reactor
PP-110 A/B/C/SHI Feed Pumps
7109
32
To Bunsen Reactor
PP-110
Sulfuric Acid toAcid Decomposition
33
10
120
13
141
111
BUN 102
BUN 102
BUN 102
PC-101
MOC NI Alloy
PC-101Bunsen Reactor
O2 & SO2 Feed Compressor
LC
LC
9.5
120
HIx to Decomposition
9
47
119
Oxygen from Bunsen Reactor Tower
BUN 102
TK-102 A/BBunsen Decanter
118
9
27
CW
HX-103
12
48111A
34
111 7
129
127
1.1
120
HX-103Reverse Bunsen
Reactor Vapor Cooler
KBG
SAD 203
FUS 002
Acid to Storage TK-002
10/20/08 For Review0
HAD 301
1000 4170
-2.7
PP-111
PP-111 A/B/SReverse Bunsen Reactor
Feed Pumps
550
42
109
FC
8110
LC TK-102
MOC: CS – TFE Lined MOC: CS-TFE LINEDCERAMIC PACKING
MOC: SHELL – CSTUBES – TANTALUM
MOC CI Lined TFE, Monel ImpellerMOC CI Lined TFE, Monel Impeller
TO-102

NO DATE ISSUE DESCRIPTION BY CHKD DISCP APPR
NTS.
Battelle Energy Alliance (BEA) LLCIdaho Falls, Idaho
Sulfuric AcidFrom KO-202 KO-203
To KO-206
CW
KO-203Recycle Acid
LP Flash DrumMOC:Alloy B3 Clad CS
SAD-203
SAD-204
132155-T-PFD-SI-SAD-2010 131199-T-PFD-SI-SAD-201
0
LPS
CW
STREAM #
PRESSURE (Bar a)
TEMPERATURE (°C)
DUTY (MWth)
LOAD (kWe)
LOW PRESSURE STEAM
COOLING WATER
LEGEND
170
2.2
HX-203
225224
212To EX-202SAD-203
Water fromPP-204
To BunsenReaction Section 100
Ejector Condensatefrom PP-202
BUN 102
SAD-202
46
12244
233SAD-204
12
48236
2.1
48
NGNP – Sulfur IodideBunsen Reaction Feed & Acid Concentration System
Process Flow Diagram
For Review MM0 10/20/08
210LC
KO-205
LC
BUN 102
12
42
1248
22
12
SAD-203From HX-202 48
12
From KO-204
SAD-203From KO-205 21
12218 219
SAD-203 22312
21232
222
170
2.2
127
0.44
HX-203Recycle Acid
LP Flash Condenser
MOC:Alloy B3 Clad CS
KO-205HP Recycle AcidVapor KO Drum
MOC:316L SS
-18.1To BunsenReaction Section 100
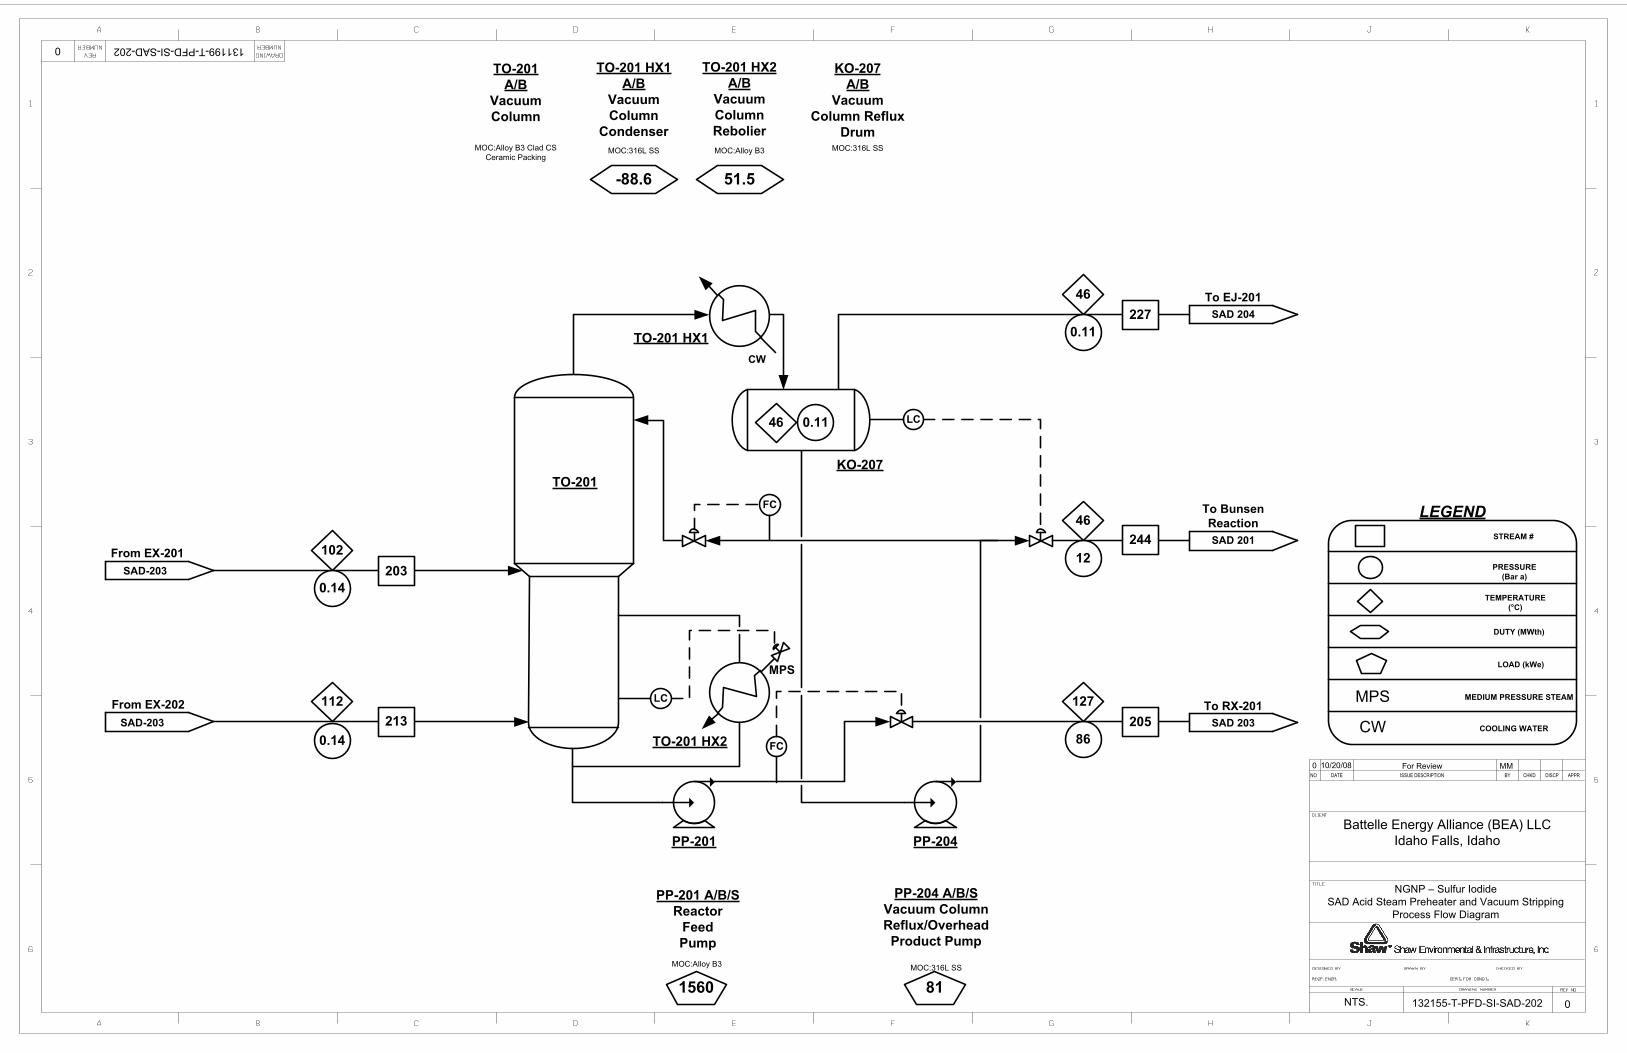
NO DATE ISSUE DESCRIPTION BY CHKD DISCP APPR
NTS.
Battelle Energy Alliance (BEA) LLCIdaho Falls, Idaho
TO-201
From EX-202
CW
To RX-201
To BunsenReaction
To EJ-201
TO-201A/B
VacuumColumn
TO-201 HX1A/B
Vacuum Column
Condenser
TO-201 HX2A/B
Vacuum ColumnRebolier
KO-207A/B
VacuumColumn Reflux
DrumMOC:Alloy B3 Clad CS
Ceramic PackingMOC:316L SS MOC:Alloy B3 MOC:316L SS
PP-201 A/B/SReactor
FeedPump
PP-204 A/B/SVacuum ColumnReflux/OverheadProduct Pump
MOC:Alloy B3 MOC:316L SS
SAD 204
SAD 201
SAD 203
SAD-203
SAD-203
132155-T-PFD-SI-SAD-2020 131199-T-PFD-SI-SAD-202
0
CW
STREAM #
PRESSURE (Bar a)
TEMPERATURE (°C)
DUTY (MWth)
LOAD (kWe)
COOLING WATER
LEGEND
MPS MEDIUM PRESSURE STEAM
MPS
51.5-88.6
102
0.14
112
0.14
PP-201
TO-201 HX2
PP-204
TO-201 HX1
1560 81
46 0.11
KO-207
22746
0.11
From EX-201203
NGNP – Sulfur IodideSAD Acid Steam Preheater and Vacuum Stripping
Process Flow Diagram
For Review MM0 10/20/08
46
86
12
127
244
205213
LC
FC
FC
LC

NO DATE ISSUE DESCRIPTION BY CHKD DISCP APPR
NTS.
Battelle Energy Alliance (BEA) LLCIdaho Falls, Idaho
RX-201
75% AcidFrom PP-201
Recycle AcidTo KO-203
Sulfuric Acid Decomposer
Reactor EffluentFlash Drum
Recycle AcidHP Flash Drum
Reactor Product Flash KO Drum
KO-204RX-201 A/B KO-201 A/B KO-202
To TO-201
To TO-201
From KO-203
MOC: Shell – Insulated CSTube TFE Lined CS Silicone Carbide Tubes
MOC:Alloy B3Clad CS
MOC:Alloy B3Clad CS
MOC:316L SS
SAD-202
SAD-201
SAD-201
SAD-202
SAD-202
132155-T-PFD-SI-SAD-2030 131199-T-PFD-SI-SAD-203
0
LPS
CW
STREAM #
PRESSURE (Bar a)
TEMPERATURE (°C)
DUTY (MWth)
LOAD (kWe)
LOW PRESSURE STEAM
COOLING WATER
LEGEND
H2SO4 Feed fromBunsen Reaction
BUN 103
KO-20184256
KO-202220 13
EX-202
EX-201
Helium Supply from NHSS
B/L
Helium Return to PCS
B/L
HX-202
HX-201 CW
CW
KO-20448 82.8
213
217
214
205
Reactor Product Condenser
HP Recycle AcidFlash Condenser
Recycle Acid Trim Cooler
203
127 212
Reactor Product Trim
Cooler
HX-201
-15.8
206
112
0.14
127
86
0.14
102
TBD
89
910
90
HX-202EX-202EX-201
-6.919.513.3
For Review MM0
NGNP – Sulfur IodideH2SO4 Decomposition and Acid Separation
Process Flow Diagram
10/20/08
MOC: 316L SS MOC: Shell – 20Cb3 Clad CSTubes – 316L SS/20Cb3
MOC:316L SSMOC:316L SS
208
127
0.44212
LC
LC
2.2
170210
PC
LC
PC
21
12232
120
10
SAD-201
SAD-201To KO-205
SAD-201To KO-205
22248
12
21
12218

NO DATE ISSUE DESCRIPTION BY CHKD DISCP APPR
NTS.
Battelle Energy Alliance (BEA) LLCIdaho Falls, Idaho
LPS
EJ-201
Vapor From KO-207
From HX-203
Low Pressure SO2 toBunsen Reaction
To KO-205
To WastewaterTreatment
CW
HX-205
KO-206
EJ-202
LPS
M
On/Off
KO-209
HX-204
CW
EJ-201A/BFirst Stage Steam
Ejector
HX-204First Stage
Ejector Condenser
KO-209Ejector Hotwell
EJ-202Second Stage Steam
Ejector
HX-205Second Stage
Ejector Condenser
KO-206 LP SO2
KO Drum
PP-203EJECTOR
Condensate Pump
PP-202 LP SO2
Condensate Pump
PP-203 PP-202
MOC: 316L SS MOC: 316L SSMOC: 316L SSMOC:316L SS MOC: 316L SS MOC: 316L SS
SAD-202
SAD-201
SAD-201
MOC: 316L SS MOC: 316L SS
-0.2 -0.1
FUS 001
0 131199-T-PFD-SI-SAD-204
LPS
CW
STREAM #
PRESSURE (Bar a)
TEMPERATURE (°C)
DUTY (MWth)
LOAD (kWe)
LOW PRESSURE STEAM
COOLING WATER
LEGEND
7.9242
0.1
46227
2.1
48225
229
228
235
226
236
230
170
48 0.4
170
48 2
990.5
1248
BUN 101
132155-T-PFD-SI-SAD-204 0
10/20/08 For Review MM0
NGNP – Sulfur IodideSO2 Recovery SystemProcess Flow Diagram
0.2 17
LCLC
231
48 2
0.4
48
106 2.1
2377.9
48
2239
240
48 0.4
23848
2

NO DATE ISSUE DESCRIPTION BY CHKD DISCP APPR
NTS.
Battelle Energy Alliance (BEA) LLCIdaho Falls, Idaho
HIx from BunsenReaction
BUN 103
TK-07
LC
FT
FT
FC
HAD 302
33
42
109
HX-1
HX-2
HX-3
41
263
3-3
3-5
41
250
40250
39
259
3-6
38
272
3-7
3-21
36
288
3-22
35.5
269
3-26
25
260
3-9
36
273
3-10
35.5
203
3-27
24.5203
HAD 302
HAD 303
Iodine & HIx toDistillation Column
Distillation Column Bottoms
Distillation ColumnBottoms to Separation
HAD 303
HAD 303
Iodine from Recovery
Water Vapor & H2from Recovery
CW
HX-6
3-28
24
156Iodine to BunsenReaction
BUN 101
Water & H2 to Recovery
HAD 303
Vapor HeatRecuperator
HX-1
304.2
132155-T-PFD-SI-HAD-301 0
KBG10/20/08 For Review0
NGNP – Sulfur Iodide HI Decomposition Distillation Feed
Process Flow Diagram
0 132155-T-PFD-SI-HAD-301
Recovered IodineHeat Recuperator
HX-2
128.5
Distillation ColumnFeed Mix Tank
TK-07
MOC: TANTALUM CLAD CS
Distillation ColumnFeed Preheater
HX-3
90.7
IodineCooler
HX-6
-69.5
MOC: SHELL – TANTALUM CLAD CS TUBES - TANTALUM
LPS
CW
STREAM #
PRESSURE (Bar a)
TEMPERATURE (°C)
DUTY (MWth)
LOAD (kWe)
LOW PRESSURE STEAM
COOLING WATER
LEGEND
3-2
3-4
MOC: SHELL – CS TUBES - TANTALUM
MOC: SHELL – TANTALUM CLAD CS TUBES - TANTALUM
MOC: SHELL – TANTALUM CLAD CS TUBES - TANTALUM

NO DATE ISSUE DESCRIPTION BY CHKD DISCP APPR
NTS.
Battelle Energy Alliance (BEA) LLCIdaho Falls, Idaho
KO-301
HP-QH
HP-C
TO-04
HAD 301
B/L
B/L
Helium Supplyfrom NHSS
Helium ReturnTo PCS
HAD 301
HAD 303
Column BottomsTo HX-3
3-21
36
288
38
2723-7
89
640
88
344
37
272
FC
LC
LC
LC
43256
79342
44257
78293
36
261
HP-1
HP-2
HP-3
HP-4
PC
Iodine & HIxFeed
Distillation ColumnVapor to Separation
3-8
132155-T-PFD-SI-HAD-302 0
KBG10/20/08 For Review0
0 132155-T-PFD-SI-HAD-302
NGNP – Sulfur Iodide HI Decomposition Distillation
Process Flow Diagram
HI Column Process CouplingHeat Exchanger
EX-06 A THRU F
MOC: SHELL – TANTALUM CLAD 304L SSTUBES TANTALUM
271.5
HI ReactiveDistillation Column
TO-04 A THRU F
MOC: TANTALUM CLAD CSCERAMIC PACKING
HI ColumnReboiler
HP-QH A THRU R
MOC: SHELL – TANTALUM CLAD CSTUBES - TANTALUM
622
HI ColumnSteam Drum
HP-QC A THRU F
MOC: SHELL – TANTALUM CLAD CSTUBES - TANTALUM
-560
MOC: CS
HP-C A thru F
Heat PumpCompressor
61,800
LPS
CW
STREAM #
PRESSURE (Bar a)
TEMPERATURE (°C)
DUTY (MWth)
LOAD (kWe)
LOW PRESSURE STEAM
COOLING WATER
LEGEND
EX-06
HI Column Condenser
HP-QC
KO-301 A THRU F
MOC: CS

NO DATE ISSUE DESCRIPTION BY CHKD DISCP APPR
NTS.
Battelle Energy Alliance (BEA) LLCIdaho Falls, Idaho
Distillation ColumnBottoms
HAD 301SEP 3-3
HAD 302
Vapor from Distillation Column
3-22
35.5
269
PC
HAD 301
SEP 3-1
3-26
25
Iodineto HX-2
LC26260
36
261
3-8
PC-05
HAD 301 3-10
35.5
203Water & H2from HX-1
CW
HX-5
BUN 101
Recovered Water to Bunsen Reaction
3-15
33.5
154
154 35
HAD 301
Vapor to Iodine Feed Conditioning
36
273
3-9
373 36
3-24
3-11
LC
CW
HX-4
33.5113
SEP 3-2
113 34.5LC
3-12
3-13
3-17
3-16
PPU 401
To Hydrogen Purification
3-14
132155-T-PFD-SI-HAD-303 0
NGNP – Sulfur Iodide HI Decomposition Iodine Recovery
Process Flow Diagram
KBG12/8/08 For Review0
0 132155-T-PFD-SI-HAD-303
Recovered WaterCooler
HX-5
MOC: SHELL CS TUBES – 304SS
-56.1
LPS
CW
STREAM #
PRESSURE (Bar a)
TEMPERATURE (°C)
DUTY (MWth)
LOAD (kWe)
LOW PRESSURE STEAM
COOLING WATER
LEGEND
Column BottomsKnockout Drum
SEP 3-3
MOC: CS TFE LINED
Recovered Water Knockout Drum
SEP 3-1
MOC: 304 SS
Hydrogen ProductCooler
HX-4
-4.2
Hydrogen ProductCondensate Knockout Drum
SEP 3-2
MOC: 304SSMOC: SHELL CS TUBES – 304SS
MOC: NI ALLOY
PC-05 Knockout Drum
Vapor Compressor
2750

NO DATE ISSUE DESCRIPTION BY CHKD DISCP APPR
NTS.
Battelle Energy Alliance (BEA) LLCIdaho Falls, Idaho
132155-T-PFD-SI-PPU-401 0
COB12/12/08 For Report0
NGNP – Sulfur Iodide HPS – Hydrogen Compression & Drying
Process Flow Diagram
0 132155-T-PFD-SI-PPU-401
LPS
CW
STREAM #
PRESSURE (Bar a)
TEMPERATURE (°C)
DUTY (MWth)
LOAD (kWe)
LOW PRESSURE STEAM
COOLING WATER
LEGEND
COB
Hydrogen CompressorDischarge Drum
HX-420 KO-426 DR-401 A/B
MOC:CS MOC:CS MOC:CS
MOC:CS
Hydrogen Iodine Adsorber
HX-421Hydrogen DryerRegen Cooler
Hydrogen CompressorAftercooler
CW
E
Recovered Water To
Wastewater Treatment
PB-401
KO-426
HX-420
PB-401Hydrogen
Compressor
PB-402Hydrogen Recirculation
BlowerMOC:CS MOC:CS
HAD 303
927 116
PC
40
2
-0.73-1.2
HX-401
38.5
113
3-14
LPS
FUS 001
KO-427
CWR
PB-402
Hydrogen Product to Pipeline
DR-402 A/B
MOC:CS
Hydrogen Drying Bed
Hydrogen DryerRegen KO Drum
KO-427
MOC:CS
HX-422
MOC:CS
Hydrogen Dryer Regen Heater
1.5(LPS)
DR-401A DR-401B DR-402A DR-402B
HX-421

NO DATE ISSUE DESCRIPTION BY CHKD DISCP APPR
NTS.
Battelle Energy Alliance (BEA) LLCIdaho Falls, Idaho
132155-T-PFD-SI-PPU-402 0
NGNP – Sulfur Iodide HPS – Oxygen Purification System
Process Flow Diagram
0 132155-T-PFD-SI-PPU-402
COB12/12/08 For Report0 COB
PB-403O2 Regen
Gas Recirc. Blower
PP-420 A/SNaOH PurgePump
TO-403SO2 Scrub
Tower
HX-430SO2
AdsorberRegen Cooler
HX-431Oxygen H2O
AdsorberRegen Cooler
DR-403 A/BOxygen H2O
Adsorber
DR-405 A/BSO2
Adsorber
HX-428SO2
AdsorberRegen Heater
HX-429Oxygen H2O
AdsorberRegen Heater
PP-420
PB-403
PH
LPS
CW
LPS
HX-430
HX-431
HX-429
HX-428
PB-404 E
CW
Fresh CausticFrom PP-005
Oxygen FromBunsen Reactor
Oxygen Product
PB-404Oxygen
Compressor
KO-428O2 Regen Gas
BlowerSuction Drum
Sodium SulfatePurge
TO-403
MOC:CS MOC:CS MOC:CS MOC:CS MOC:CS MOC:CS MOC:CS MOC:CS
FUS-002
MOC:CSMOC:CS MOC:CS
HX-432 A/BO2
Product Cooler
MOC:CS
To Offsite Storage
CW
HX-432
E
LPS
CW
STREAM #
PRESSURE (Bar a)
TEMPERATURE (°C)
DUTY (MWth)
LOAD (kWe)
LOW PRESSURE STEAM
COOLING WATER
LEGEND
43 8 1940
LC
LC
PC
PC
To Waste Treatment
27117
10
48
40
-0.1 -0.1 0.2 (LPS) 0.3 (LPS)
DR-403A DR-403B
DR-405A DR-405B
KO-428
FUS-001
BUN-102

Hydrogen Plant Alternatives Study NGNP-HPS SHAW-HPA Section 8 � Appendices
March 2009
8.2.4 Summary Plot Plan Layout


Hydrogen Plant Alternatives Study NGNP-HPS SHAW-HPA Section 8 � Appendices
March 2009
8.2.5 Sized Equipment List

1
Battelle Energy Alliance, LLC (BEA)
Next Generation Nuclear Plant
Idaho Falls, Idaho
Sulfur Iodine Hydrogen
Feed and Utility Supply
Equipment List
Shaw E&I Project No. 132155
ISSUE DATE DESCRIPTION ORIGR CHK’R SDE PEM INTERDISCIPLINE REVIEW
DISCIPLINE REV’R DATE
Process
Mechanical
Civil/Structural
Control Systems
Power Systems
Piping
Material & Corr.
0 11/18/2008 For Report COB COB COB
FILE NAME NGNP HPAS SI FUS Equip List 081203.doc
SHEET 1 of 7
DOC.NO. 132155-T-EQL-HPS-SI-FUS-0

Note: Above data (except for Item No. and name) shall not be used for design purposes. For this purpose the data on the relevant specification/data sheets shall be used
ISSUE DATE SHEET DOC NO
0 12/3/2008 2 of 7 132155-T-EQL-HPS-SI-FUS-0
EQUIPMENT LIST - TOWERS
Client: Battelle Energy Alliance (BEA), LLC Signature:
Unit: NGNP HPS Sulfur Iodine Location: Idaho Falls, Idaho
Mechanical Design Material Item No. Name Diameter
(mm) Height (mm)
Packing/ Trays Press
(bar g) Temp (°C) Shell C.A. (mm)
Packing Trays
PFD Remarks
HPS-FUS TO-004
Sulfuric Acid Vent Scrubber 4300 12900
30 m3 CS Chevron
disengaging packing
3.5 130 CS CS FUS 002 Spray tower

Note: Above data (except for Item No. and name) shall not be used for design purposes. For this purpose the data on the relevant specification/data sheets shall be used
ISSUE DATE SHEET DOC NO
0 12/3/2008 3 of 7 132155-T-EQL-HPS-SI-FUS-0
EQUIPMENT LIST – VESSELS / REACTORS
Client: Battelle Energy Alliance (BEA), LLC Signature:
Unit: NGNP Hybrid Sulfur Location: Idaho Falls, Idaho
Mechanical Design Item No. Name Diameter
(mm) Length (mm)
Horizon/ Vertical Pressure
bar (g) Temp (°C)
Material C.A. (mm) PFD Remarks
HPS-FUS KO-001
Sulfuric Acid Degassing Drum 3000 8000 Vertical 3.5 130 CS-TFE
Lined FUS 002

Note: Above data (except for Item No. and name) shall not be used for design purposes. For this purpose the data on the relevant specification/data sheets shall be used
ISSUE DATE SHEET DOC NO
0 12/3/2008 4 of 7 132155-T-EQL-HPS-SI-FUS-0
EQUIPMENT LIST – LOW PRESSURE TANKS
Client: Battelle Energy Alliance (BEA) LLC Signature:
Unit: NGNP Hybrid Sulfur Location: Idaho Falls, Idaho
Mechanical Design Item No. Name Diameter
(mm) Height (mm) Pressure
mm WG Temperature
(°C)
Material C.A. (mm) PFD Remarks
HPS-FUS TK-002
H2SO4 Storage Tank
6700 7300 150 130 CS-TFE Lined FUS 002
HPS-FUS TK-003
Caustic Storage Tank
12400 11000 150 75 CS FUS 002
HPS-FUS TK-001
Purified Water Storage Tank
22500 12800 150 75 316 SS FUS 001 Included in the cost of GZ-002
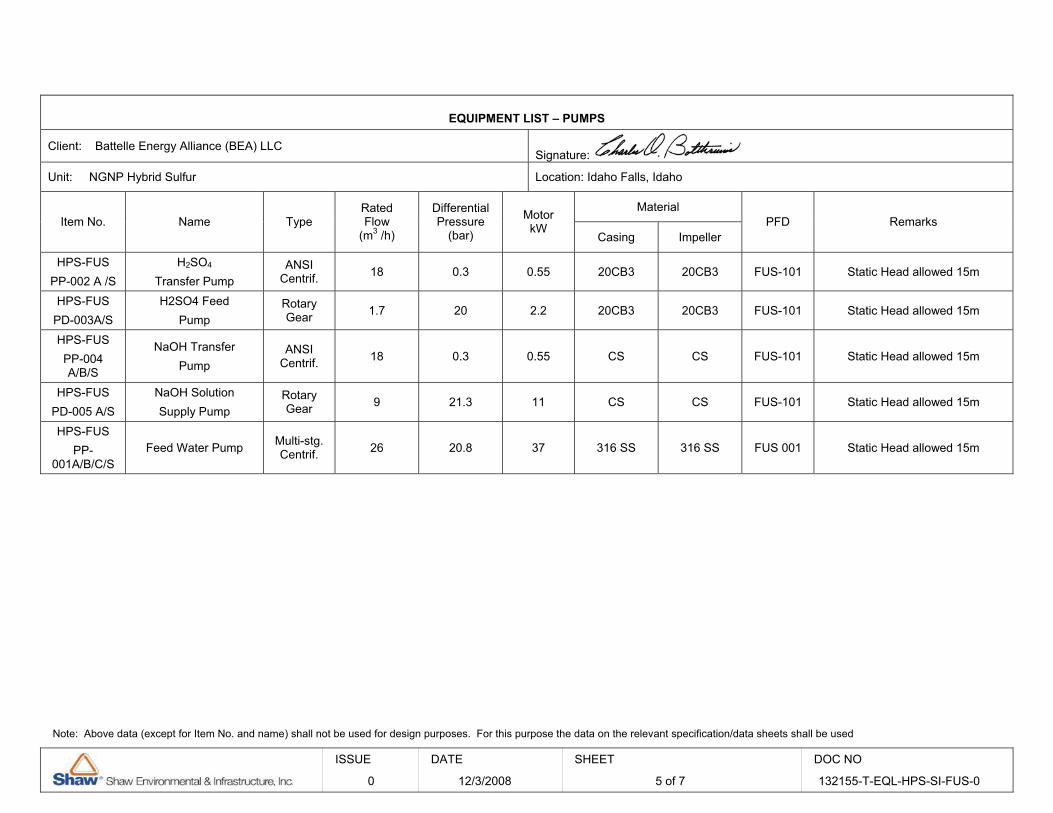
Note: Above data (except for Item No. and name) shall not be used for design purposes. For this purpose the data on the relevant specification/data sheets shall be used
ISSUE DATE SHEET DOC NO
0 12/3/2008 5 of 7 132155-T-EQL-HPS-SI-FUS-0
EQUIPMENT LIST – PUMPS
Client: Battelle Energy Alliance (BEA) LLC Signature:
Unit: NGNP Hybrid Sulfur Location: Idaho Falls, Idaho
Material Item No. Name Type
Rated Flow
(m3 /h)
Differential Pressure
(bar)
Motor kW
Casing Impeller PFD Remarks
HPS-FUS PP-002 A /S
H2SO4 Transfer Pump
ANSI Centrif. 18 0.3 0.55 20CB3 20CB3 FUS-101 Static Head allowed 15m
HPS-FUS PD-003A/S
H2SO4 Feed Pump
Rotary Gear 1.7 20 2.2 20CB3 20CB3 FUS-101 Static Head allowed 15m
HPS-FUS PP-004 A/B/S
NaOH Transfer Pump
ANSI Centrif. 18 0.3 0.55 CS CS FUS-101 Static Head allowed 15m
HPS-FUS PD-005 A/S
NaOH Solution Supply Pump
Rotary Gear 9 21.3 11 CS CS FUS-101 Static Head allowed 15m
HPS-FUS PP-
001A/B/C/S Feed Water Pump Multi-stg.
Centrif. 26 20.8 37 316 SS 316 SS FUS 001 Static Head allowed 15m
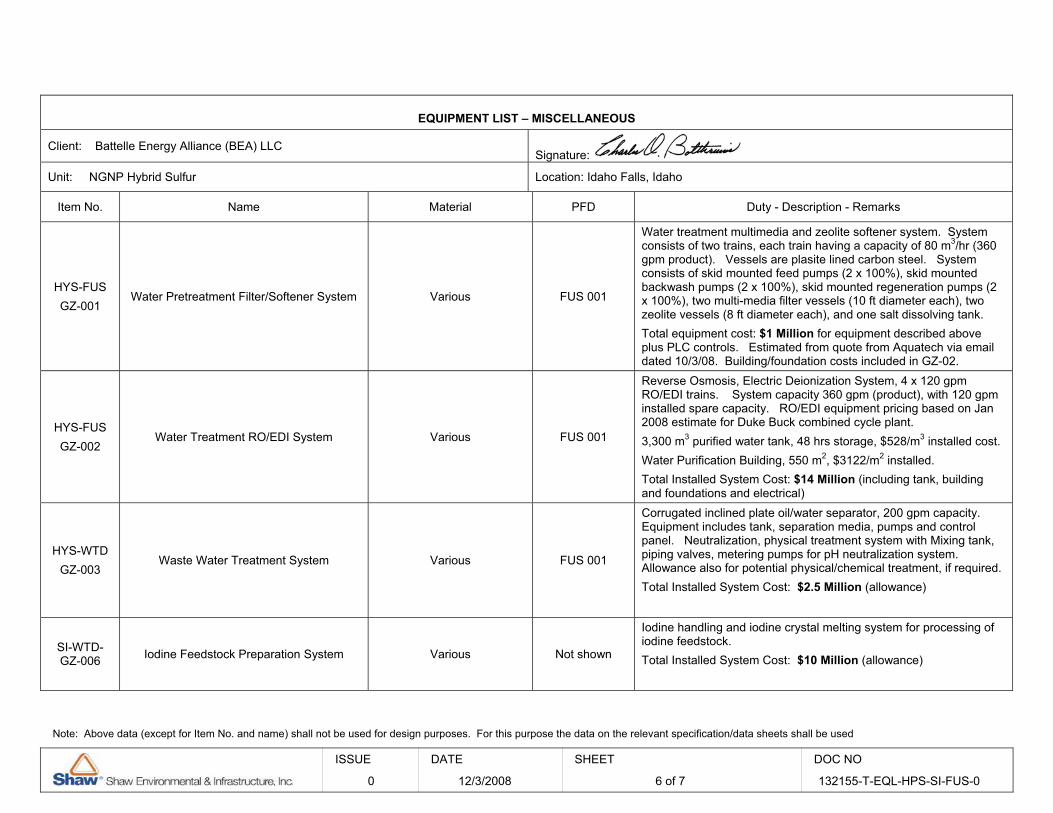
Note: Above data (except for Item No. and name) shall not be used for design purposes. For this purpose the data on the relevant specification/data sheets shall be used
ISSUE DATE SHEET DOC NO
0 12/3/2008 6 of 7 132155-T-EQL-HPS-SI-FUS-0
EQUIPMENT LIST – MISCELLANEOUS
Client: Battelle Energy Alliance (BEA) LLC Signature:
Unit: NGNP Hybrid Sulfur Location: Idaho Falls, Idaho
Item No. Name Material PFD Duty - Description - Remarks
HYS-FUS GZ-001
Water Pretreatment Filter/Softener System Various FUS 001
Water treatment multimedia and zeolite softener system. System consists of two trains, each train having a capacity of 80 m3/hr (360 gpm product). Vessels are plasite lined carbon steel. System consists of skid mounted feed pumps (2 x 100%), skid mounted backwash pumps (2 x 100%), skid mounted regeneration pumps (2 x 100%), two multi-media filter vessels (10 ft diameter each), two zeolite vessels (8 ft diameter each), and one salt dissolving tank. Total equipment cost: $1 Million for equipment described above plus PLC controls. Estimated from quote from Aquatech via email dated 10/3/08. Building/foundation costs included in GZ-02.
HYS-FUS GZ-002
Water Treatment RO/EDI System Various FUS 001
Reverse Osmosis, Electric Deionization System, 4 x 120 gpm RO/EDI trains. System capacity 360 gpm (product), with 120 gpm installed spare capacity. RO/EDI equipment pricing based on Jan 2008 estimate for Duke Buck combined cycle plant. 3,300 m3 purified water tank, 48 hrs storage, $528/m3 installed cost. Water Purification Building, 550 m2, $3122/m2 installed. Total Installed System Cost: $14 Million (including tank, building and foundations and electrical)
HYS-WTD GZ-003
Waste Water Treatment System Various FUS 001
Corrugated inclined plate oil/water separator, 200 gpm capacity. Equipment includes tank, separation media, pumps and control panel. Neutralization, physical treatment system with Mixing tank, piping valves, metering pumps for pH neutralization system. Allowance also for potential physical/chemical treatment, if required. Total Installed System Cost: $2.5 Million (allowance)
SI-WTD-GZ-006 Iodine Feedstock Preparation System Various Not shown
Iodine handling and iodine crystal melting system for processing of iodine feedstock. Total Installed System Cost: $10 Million (allowance)

Note: Above data (except for Item No. and name) shall not be used for design purposes. For this purpose the data on the relevant specification/data sheets shall be used
ISSUE DATE SHEET DOC NO
0 12/3/2008 7 of 7 132155-T-EQL-HPS-SI-FUS-0
EQUIPMENT LIST – HEAT EXCHANGERS
Client: Battelle Energy Alliance (BEA) LLC Signature:
Unit: NGNP Hybrid Sulfur Location: Idaho Falls, Idaho
Mechanical Design
Shell Tube Item No. Name Area
(m2) Material Pressure (bar g)
Temperature (oC)
Material Pressure (bar g)
Temperature (oC)
Type PFD Remarks
HPS-FUS HX-004
H2SO4 Storage Tank Heater/Cooler
1050 CS 3
150
20CB3 30 90
BEU FUS 002
HPS-FUS HX-005
NaOH Tank Heater/Cooler 2
CS 3
150
CS 23 90
Double Pipe FUS 002

1
Battelle Energy Alliance, LLC (BEA)
Next Generation Nuclear Plant
Idaho Falls, Idaho
Sulfur Iodine
Bunsen Reaction
Equipment List
Shaw E&I Project No. 132155
ISSUE DATE DESCRIPTION ORIGR CHK’R SDE PEM INTERDISCIPLINE REVIEW
DISCIPLINE REV’R DATE
Process
Mechanical
Civil/Structural
Control Systems
Power Systems
Piping
Material & Corr.
0 12/3/2008 For Estimate KBG
FILE NAME NGNP HPAS SI BUN Equipment List 081210 Rev 0.doc
SHEET 1 of 6
DOC.NO.132155-T-EQL-HPS-SI-BUN-0

Note: Above data (except for Item No. and name) shall not be used for design purposes. For this purpose the data on the relevant specification/data sheets shall be used
ISSUE DATE SHEET DOC NO
0 12/3/2008 2 of 6 132155-T-EQL-HPS-SI-BUN-0
EQUIPMENT LIST - TOWERS
Client: Battelle Energy Alliance (BEA) LLC Signature:
Unit: SULFUR IODINE Location: Idaho Falls, Idaho
Mechanical Design Material Item No. Name Diameter
(mm)Height (mm)
Packing/Trays Press
(bar g) Temp (°C) Shell C.A. (mm)
PackingTrays
PFD Remarks
HPS-BUNTO-101
Bunsen Reactor
Top: 2,000
Bottom:6,000
Top: 17,400 Bottom:3,900
Packing 10 120 TFE-Lined CS
KochFlexiramic 88 or equal
packing
BUN102
9 stages. 30 second detention time in bottom section.
HPS-BUNTO-102
Reverse Bunsen Reactor
Top: 1,700
Bottom:3,400
Top: 6,900
Bottom:3,200
Packing 8 110 TFE-Lined CS
KochFlexiramic 88 or equal
packing.
BUN103
5 stages. 30 second detention time in bottom section.

Note: Above data (except for Item No. and name) shall not be used for design purposes. For this purpose the data on the relevant specification/data sheets shall be used
ISSUE DATE SHEET DOC NO
0 12/3/2008 3 of 6 132155-T-EQL-HPS-SI-BUN-0
EQUIPMENT LIST – VESSELS / REACTORS
Client: Battelle Energy Alliance (BEA) LLC Signature:
Unit: SULFUR IODINE Location: Idaho Falls, Idaho
Mechanical Design Item No. Name Diameter
(mm)Length (mm)
Horizon/Vertical Pressure
(bar g ) Temp (°C)Material
C.A. (mm) PFD Remarks
HPS-BUNTK-102
A/BBunsen Decanter 5,500 15,200 Horizontal 10 150 TFE Lined
CS BUN 103
Assumes 5 minute detention time, 3 minute detention time in overflow sumps and additional 20% tank volume for vapor space.
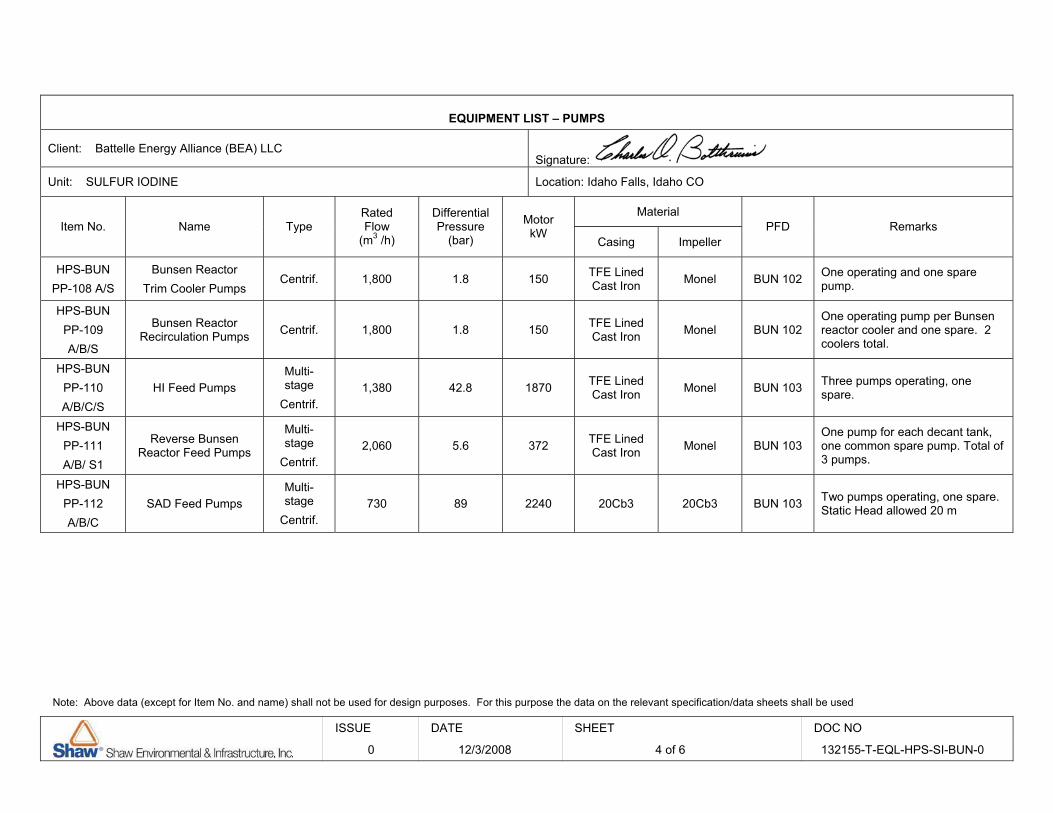
Note: Above data (except for Item No. and name) shall not be used for design purposes. For this purpose the data on the relevant specification/data sheets shall be used
ISSUE DATE SHEET DOC NO
0 12/3/2008 4 of 6 132155-T-EQL-HPS-SI-BUN-0
EQUIPMENT LIST – PUMPS
Client: Battelle Energy Alliance (BEA) LLC Signature:
Unit: SULFUR IODINE Location: Idaho Falls, Idaho CO
MaterialItem No. Name Type
RatedFlow
(m3 /h)
Differential Pressure
(bar)
MotorkW
Casing Impeller PFD Remarks
HPS-BUNPP-108 A/S
Bunsen Reactor Trim Cooler Pumps
Centrif. 1,800 1.8 150 TFE Lined Cast Iron Monel BUN 102 One operating and one spare
pump.
HPS-BUNPP-109A/B/S
Bunsen Reactor Recirculation Pumps Centrif. 1,800 1.8 150 TFE Lined
Cast Iron Monel BUN 102 One operating pump per Bunsen reactor cooler and one spare. 2 coolers total.
HPS-BUNPP-110A/B/C/S
HI Feed Pumps Multi-stage
Centrif.1,380 42.8 1870 TFE Lined
Cast Iron Monel BUN 103 Three pumps operating, one spare.
HPS-BUNPP-111A/B/ S1
Reverse Bunsen Reactor Feed Pumps
Multi-stage
Centrif.2,060 5.6 372 TFE Lined
Cast Iron Monel BUN 103 One pump for each decant tank, one common spare pump. Total of 3 pumps.
HPS-BUNPP-112A/B/C
SAD Feed Pumps Multi-stage
Centrif.730 89 2240 20Cb3 20Cb3 BUN 103 Two pumps operating, one spare.
Static Head allowed 20 m

Note: Above data (except for Item No. and name) shall not be used for design purposes. For this purpose the data on the relevant specification/data sheets shall be used
ISSUE DATE SHEET DOC NO
0 12/3/2008 5 of 6 132155-T-EQL-HPS-SI-BUN-0
EQUIPMENT LIST – COMPRESSORS / BLOWERS / VACUUM PUMPS
Client: Battelle Energy Alliance (BEA) LLC Signature:
Unit: SULFUR IODINE Location: Idaho Falls, Idaho
Driver
Item No. Name Type Capacity (Am 3/h)
SuctionPressure(bar a)
Differential Pressure
(bar) Type RatedPower (kW)
MaterialC.A.(mm) PFD Remarks
HPS-BUNPC-102
Low Pressure SO2Feed Compressor Reciprocating 440 2 8 Electric 90 316L SS BUN 101
SI-BUNPC-101
Bunsen Reactor O2and SO2 Feed Compressor
Centrifugal 7,060 7 6 Electric 1,120 NI Alloy BUN 103 2 Stage Compressor

Note: Above data (except for Item No. and name) shall not be used for design purposes. For this purpose the data on the relevant specification/data sheets shall be used
ISSUE DATE SHEET DOC NO
0 12/3/2008 6 of 6 132155-T-EQL-HPS-SI-BUN-0
EQUIPMENT LIST – HEAT EXCHANGERS
Client: Battelle Energy Alliance (BEA) LLC Signature:
Unit: SULFUR IODINE Location: Idaho Falls, Idaho
Mechanical Design
Shell Tube Item No. Name
Area(m2)
(Total) Material
Pressure (bar g) Temperature
(oC)
MaterialPressure (bar g)
Temperature (oC)
Type PFD Remarks
HPS-BUNHX-101
Recovered Water Cooler 155
CS2970
316L SS 36170
BEU BUN 101 Cooling Duty approximately 16 MW
HPS-BUNHX-102
Iodine Feed Cooler 530 CS1070
Tantalum 13180
BEU BUN 101 Cooling Duty approximately 67.4 MW.
HPS-BUNHX-104
SAD Recycled SO2Cooler 5
CS1070
316L SS 10230
BEU BUN 101 Cooling Duty approximately 0.082 MW.
HPS-BUNHX-111
Bunsen Reactor Trim Cooler 820
CS1070
Tantalum 12130
BEU BUN 102 One heat exchanger in parallel with HX-12 heat exchangers.
HPS-BUNHX-112
A/B
Bunsen Reactor Coolers 820
CS1070
Tantalum 12130
BEU BUN 102 Two heat exchangers in parallel.
HPS-BUNHX-103
Reverse Bunsen Reactor Vapor Cooler 95
CS1070
Tantalum 13170
BEU BUN 103 Cooling Duty approximately 2.7 MW.

1
Battelle Energy Alliance, LLC (BEA)
Next Generation Nuclear Plant
Idaho Falls, Idaho
Sulfur Iodine Hydrogen
Sulfuric Acid Decomposition
Equipment List
Shaw E&I Project No. 132155
ISSUE DATE DESCRIPTION ORIGR CHK’R SDE PEM INTERDISCIPLINE REVIEW
DISCIPLINE REV’R DATE
Process
Mechanical
Civil/Structural
Control Systems
Power Systems
Piping
Material & Corr.
0 12/2/2008 For Estimate COB TS COB COB
FILE NAME NGNP HPAS SI SAD Equipment List 081202.doc
SHEET 1 of 8
DOC.NO. 132155-T-EQL-HPS-SI-SAD-0

Note: Above data (except for Item No. and name) shall not be used for design purposes. For this purpose the data on the relevant specification/data sheets shall be used
ISSUE DATE SHEET DOC NO
0 12/2/2008 2 of 8 132155-T-EQL-HPS-SI-SAD-0
EQUIPMENT LIST - TOWERS
Client: Battelle Energy Alliance (BEA) LLC Signature:
Unit: NGNP Sulfur Iodine Location: Idaho Falls, Idaho
Mechanical Design Material Item No. Name Diameter
(mm) Height (mm)
Packing/ Trays Press
(bar g) Temp (°C) Shell C.A. (mm)
Packing Trays
PFD Remarks
HPS-SAD TO-201
A/B
Vacuum Column
Top: 5900
Bottom: 3700
14000 Packing 3.5 /FV
155 Alloy B3 Clad CS
Ceramic SAD-202
Koch Flexiramic 88 or equal packing
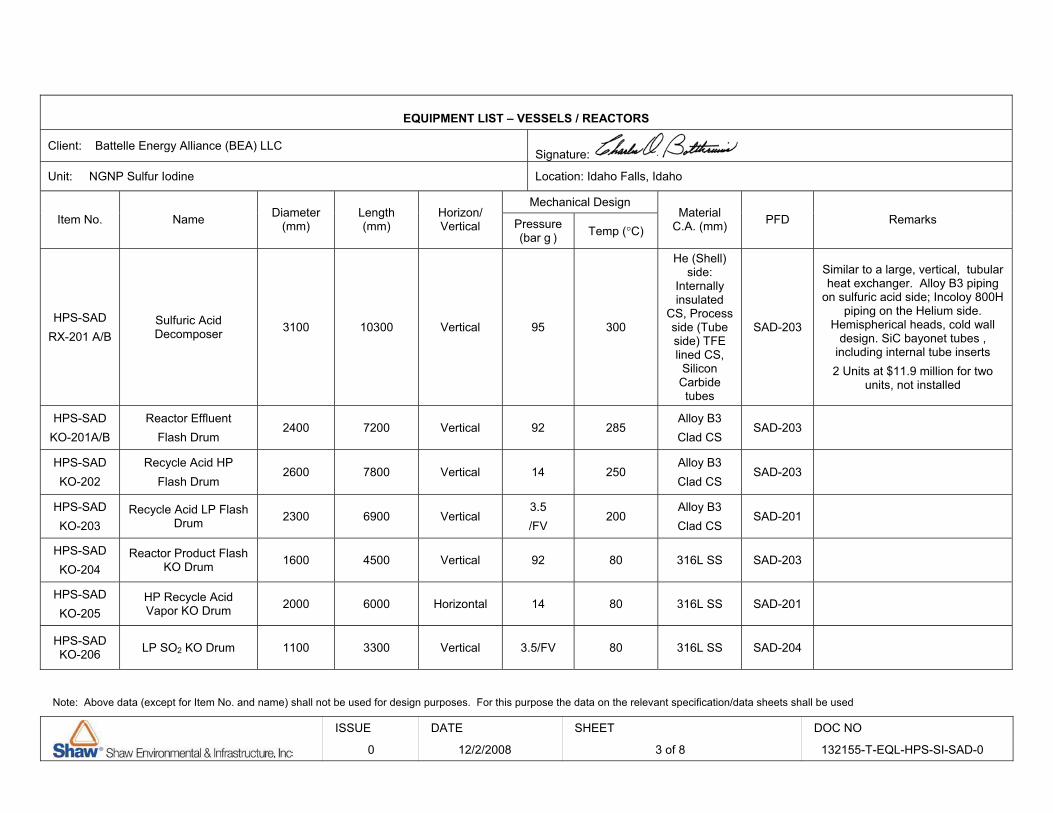
Note: Above data (except for Item No. and name) shall not be used for design purposes. For this purpose the data on the relevant specification/data sheets shall be used
ISSUE DATE SHEET DOC NO
0 12/2/2008 3 of 8 132155-T-EQL-HPS-SI-SAD-0
EQUIPMENT LIST – VESSELS / REACTORS
Client: Battelle Energy Alliance (BEA) LLC Signature:
Unit: NGNP Sulfur Iodine Location: Idaho Falls, Idaho
Mechanical Design Item No. Name Diameter
(mm) Length (mm)
Horizon/ Vertical Pressure
(bar g ) Temp (°C) Material
C.A. (mm) PFD Remarks
HPS-SAD RX-201 A/B
Sulfuric Acid Decomposer 3100 10300 Vertical 95 300
He (Shell) side:
Internally insulated
CS, Process side (Tube side) TFE lined CS, Silicon Carbide tubes
SAD-203
Similar to a large, vertical, tubular heat exchanger. Alloy B3 piping
on sulfuric acid side; Incoloy 800H piping on the Helium side.
Hemispherical heads, cold wall design. SiC bayonet tubes ,
including internal tube inserts 2 Units at $11.9 million for two
units, not installed
HPS-SAD KO-201A/B
Reactor Effluent Flash Drum
2400 7200 Vertical 92 285 Alloy B3 Clad CS
SAD-203
HPS-SAD KO-202
Recycle Acid HP Flash Drum
2600 7800 Vertical 14 250 Alloy B3 Clad CS
SAD-203
HPS-SAD KO-203
Recycle Acid LP Flash Drum 2300 6900 Vertical
3.5 /FV
200 Alloy B3 Clad CS
SAD-201
HPS-SAD KO-204
Reactor Product Flash KO Drum 1600 4500 Vertical 92 80 316L SS SAD-203
HPS-SAD KO-205
HP Recycle Acid Vapor KO Drum 2000 6000 Horizontal 14 80 316L SS SAD-201
HPS-SAD KO-206 LP SO2 KO Drum 1100 3300 Vertical 3.5/FV 80 316L SS SAD-204

Note: Above data (except for Item No. and name) shall not be used for design purposes. For this purpose the data on the relevant specification/data sheets shall be used
ISSUE DATE SHEET DOC NO
0 12/2/2008 4 of 8 132155-T-EQL-HPS-SI-SAD-0
EQUIPMENT LIST – VESSELS / REACTORS
Client: Battelle Energy Alliance (BEA) LLC Signature:
Unit: NGNP Sulfur Iodine Location: Idaho Falls, Idaho
Mechanical Design Item No. Name Diameter
(mm) Length (mm)
Horizon/ Vertical Pressure
(bar g ) Temp (°C) Material
C.A. (mm) PFD Remarks
HPS-SAD KO-207
A/B
Vacuum Column Reflux Drum
1300 3900 Horizontal
3.5/FV 80 316L SS SAD-202 One drum per TO-01 column train;
2 trains
HPS-SAD KO-209
Ejector Hotwell 1000 2000 Horizontal
3.5/ FV
100 316L SS SAD-204
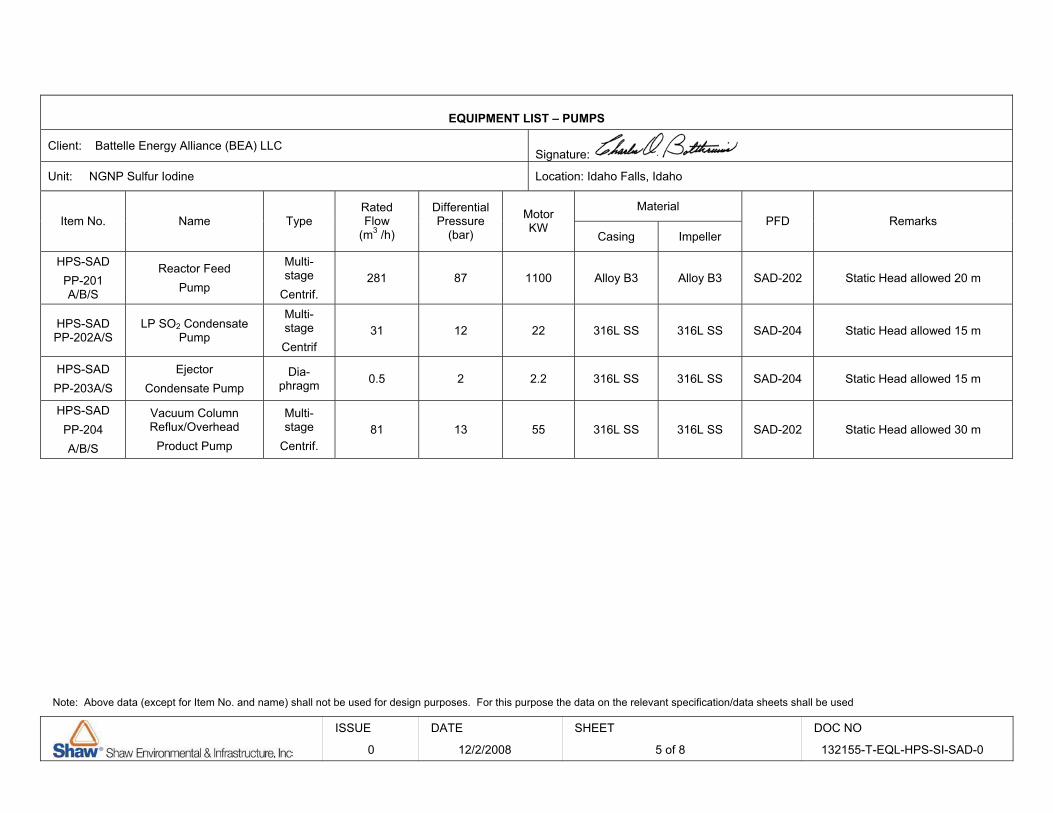
Note: Above data (except for Item No. and name) shall not be used for design purposes. For this purpose the data on the relevant specification/data sheets shall be used
ISSUE DATE SHEET DOC NO
0 12/2/2008 5 of 8 132155-T-EQL-HPS-SI-SAD-0
EQUIPMENT LIST – PUMPS
Client: Battelle Energy Alliance (BEA) LLC Signature:
Unit: NGNP Sulfur Iodine Location: Idaho Falls, Idaho
Material Item No. Name Type
Rated Flow
(m3 /h)
Differential Pressure
(bar)
Motor KW
Casing Impeller PFD Remarks
HPS-SAD PP-201 A/B/S
Reactor Feed Pump
Multi-stage
Centrif. 281 87 1100 Alloy B3 Alloy B3 SAD-202 Static Head allowed 20 m
HPS-SAD PP-202A/S
LP SO2 Condensate Pump
Multi-stage Centrif
31 12 22 316L SS 316L SS SAD-204 Static Head allowed 15 m
HPS-SAD PP-203A/S
Ejector Condensate Pump
Dia-phragm 0.5 2 2.2 316L SS 316L SS SAD-204 Static Head allowed 15 m
HPS-SAD PP-204 A/B/S
Vacuum Column Reflux/Overhead
Product Pump
Multi-stage
Centrif. 81 13 55 316L SS 316L SS SAD-202 Static Head allowed 30 m

Note: Above data (except for Item No. and name) shall not be used for design purposes. For this purpose the data on the relevant specification/data sheets shall be used
ISSUE DATE SHEET DOC NO
0 12/2/2008 6 of 8 132155-T-EQL-HPS-SI-SAD-0
EQUIPMENT LIST – COMPRESSORS / BLOWERS / VACUUM PUMPS
Client: Battelle Energy Alliance (BEA) LLC Signature:
Unit: NGNP Sulfur Iodine Location: Idaho Falls, Idaho
Driver
Item No. Name Type Capacity (Am 3/h)
Suction Pressure (bar a)
Differential Pressure
(bar) Type Rated Power (kW)
Material C.A.(mm) PFD Remarks
HPS-SAD EJ-201A/B
First Stage Vacuum Column Ejector
Steam Ejector
1000 0.11 0.5 - - 316L SS SAD-204
HPS-SAD EJ-202
Second Stage Vacuum Column Ejector
Steam Ejector
50 0.3 1.8 - - 316L SS SAD-204

Note: Above data (except for Item No. and name) shall not be used for design purposes. For this purpose the data on the relevant specification/data sheets shall be used
ISSUE DATE SHEET DOC NO
0 12/2/2008 7 of 8 132155-T-EQL-HPS-SI-SAD-0
EQUIPMENT LIST – HEAT EXCHANGERS
Client: Battelle Energy Alliance (BEA) LLC Signature:
Unit: NGNP Sulfur Iodine Location: Idaho Falls, Idaho
Mechanical Design
Shell Tube Item No. Name
Area (m2)
(Total)
Material Pressure (bar g)
Temperature (oC)
Material Pressure (bar g)
Temperature (oC)
Type PFD Remarks
HPS-SAD EX-201
HP Recycle Acid Flash Condenser 155
316 L SS 14
250
316L SS 10 50
BEU SAD-203
HPS-SAD EX-202
Reactor Product Condenser
215 20Cb3b Clad CS
63 155
316L ss/ 20CB3 91 285
DEU SAD-203
HPS-SAD HX-201
Reactor Product Trim Cooler
225 316 L SS
91 260
316 L SS 63 80
BEU SAD-203
HPS-SAD HX-202
Recycle Acid Trim Cooler 105
B3/CS 14
250
B3/CS 10 80
BEU SAD-203
HPS-SAD HX-204
EJ-201 Discharge Condenser
5 316L SS
7/ FV 130
316L SS 10 100
BEU SAD-204
HPS-SAD HX-205
EJ-202 Discharge Condenser
5 316L SS
7/FV 130
316L SS 10 100
BEU SAD-204

Note: Above data (except for Item No. and name) shall not be used for design purposes. For this purpose the data on the relevant specification/data sheets shall be used
ISSUE DATE SHEET DOC NO
0 12/2/2008 8 of 8 132155-T-EQL-HPS-SI-SAD-0
EQUIPMENT LIST – HEAT EXCHANGERS
Client: Battelle Energy Alliance (BEA) LLC Signature:
Unit: NGNP Sulfur Iodine Location: Idaho Falls, Idaho
Mechanical Design
Shell Tube Item No. Name
Area (m2)
(Total)
Material Pressure (bar g)
Temperature (oC)
Material Pressure (bar g)
Temperature (oC)
Type PFD Remarks
HPS-SAD TO-201 HX1 A/B
Vacuum Column Condenser
2830 316L SS 3.5/FV
126
CS/ 316L SS 3.5/FV
100 BXM SAD-202
One condenser shell per TO-201 column train; area shown is for one
shell
HPS-SAD TO-201 HX2 A/B
Vacuum Column Reboiler
345 CS 7
170
Alloy B3 5/FV 155
BEM SAD-202 One reboiler per TO-201 column; area shown is for one shell

1
Battelle Energy Alliance, LLC (BEA)
Next Generation Nuclear Plant
Idaho Falls, Idaho
Sulfur Iodine
Hydroiodic Acid Decomposition
Equipment List
Shaw E&I Project No. 132155
ISSUE DATE DESCRIPTION ORIGR CHK’R SDE PEM INTERDISCIPLINE REVIEW
DISCIPLINE REV’R DATE
Process
Mechanical
Civil/Structural
Control Systems
Power Systems
Piping
Material & Corr.
0 12/10/2008 For Estimate
FILE NAME 2008Dec03_SI_HI_Decomposition_ Equipment
ListRevA doc
SHEET 1 of 6
DOC.NO. 132155-T-EQL-HPS-SI-HAD-0
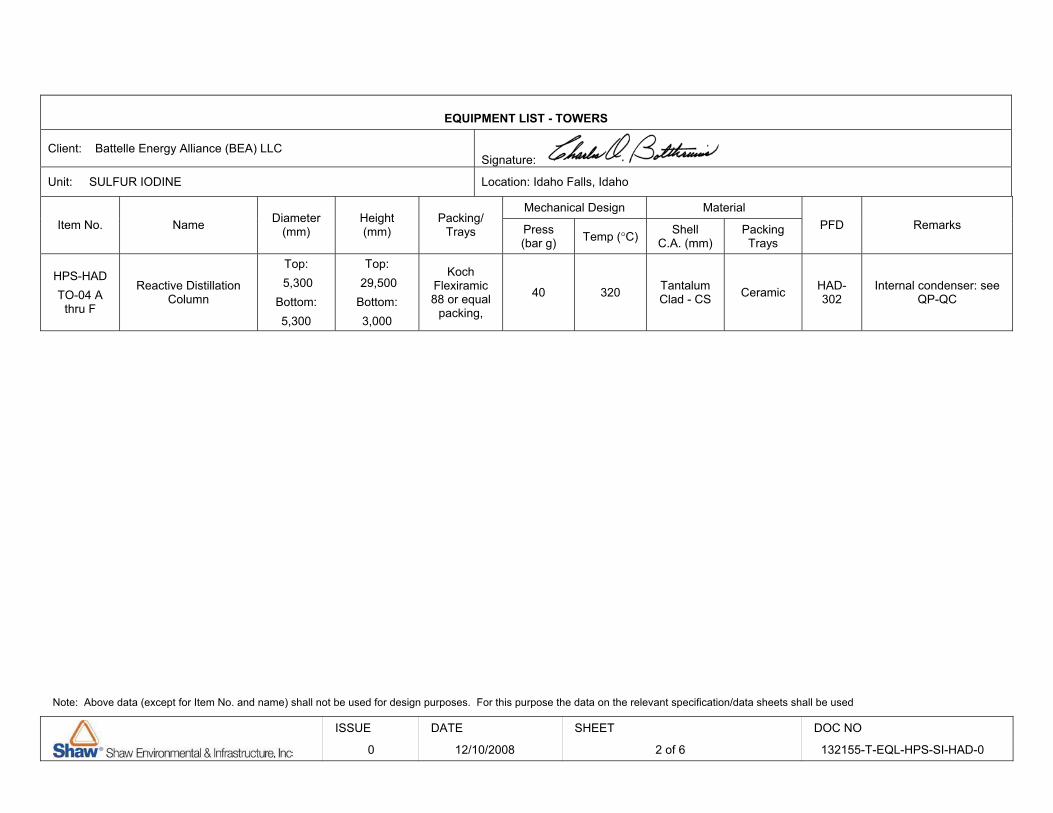
Note: Above data (except for Item No. and name) shall not be used for design purposes. For this purpose the data on the relevant specification/data sheets shall be used
ISSUE DATE SHEET DOC NO
0 12/10/2008 2 of 6 132155-T-EQL-HPS-SI-HAD-0
EQUIPMENT LIST - TOWERS
Client: Battelle Energy Alliance (BEA) LLC Signature:
Unit: SULFUR IODINE Location: Idaho Falls, Idaho
Mechanical Design Material Item No. Name Diameter
(mm) Height (mm)
Packing/ Trays Press
(bar g) Temp (°C) Shell C.A. (mm)
Packing Trays
PFD Remarks
HPS-HAD TO-04 A
thru F
Reactive Distillation Column
Top: 5,300
Bottom: 5,300
Top: 29,500 Bottom: 3,000
Koch Flexiramic 88 or equal
packing,
40 320 Tantalum Clad - CS Ceramic HAD-
302 Internal condenser: see
QP-QC

Note: Above data (except for Item No. and name) shall not be used for design purposes. For this purpose the data on the relevant specification/data sheets shall be used
ISSUE DATE SHEET DOC NO
0 12/10/2008 3 of 6 132155-T-EQL-HPS-SI-HAD-0
EQUIPMENT LIST – VESSELS / REACTORS
Client: Battelle Energy Alliance (BEA) LLC Signature:
Unit: SULFUR IODINE Location: Idaho Falls, Idaho
Mechanical Design Item No. Name Diameter
(mm) Length (mm)
Horizon/ Vertical Pressure
(bar g ) Temp (°C) Material
C.A. (mm) PFD Remarks
HPS-HAD TK-07
Distillation Column Feed Mix Tank 4,000 11,400 Horizontal 43 280 Tantalum
Clad CS HAD 301 145 m3 volume, for 2 minute mix time
HPS-HAD KO-301 A thru F
HI Column Steam Drum 2,800 8,400 Horizontal 48 285 CS HAD 302
HPS-HAD SEP 3-1
Recovered Water Knockout Drum 1,700 5,100 Vertical 38 205 304SS HAD 303
HPS-HAD SEP 3-2
Hydrogen Product Condensate Knockout
Drum 2,000 6,300 Vertical 37 145 304SS HAD 303
HPS-HAD SEP 3-3
Column Bottoms Knockout Drum 3,800 11,400 Vertical 28 290 Tantalum
clad CS HAD 303

Note: Above data (except for Item No. and name) shall not be used for design purposes. For this purpose the data on the relevant specification/data sheets shall be used
ISSUE DATE SHEET DOC NO
0 12/10/2008 4 of 6 132155-T-EQL-HPS-SI-HAD-0
EQUIPMENT LIST – COMPRESSORS / BLOWERS / VACUUM PUMPS
Client: Battelle Energy Alliance (BEA) LLC Signature:
Unit: SULFUR IODINE Location: Idaho Falls, Idaho
Driver
Item No. Name Type Capacity (Am 3/h)
Suction Pressure (bar a)
Differential Pressure
(bar) Type Rated Power (kW)
Material C.A.(mm) PFD Remarks
HPS-HAD HP-C
A thru F
Heat Pump Compressor
Axial Multistage 10,200 44 35 Electric 11,300 CS HAD 302 Divide into as many parallel units
as necessary to meet the duty
SI-HAD PC-05
Knockout Drum Vapor Compressor
Rotary Screw 6500 28 42 Electric 3000 316SS HAD-302

Note: Above data (except for Item No. and name) shall not be used for design purposes. For this purpose the data on the relevant specification/data sheets shall be used
ISSUE DATE SHEET DOC NO
0 12/10/2008 5 of 6 132155-T-EQL-HPS-SI-HAD-0
EQUIPMENT LIST – HEAT EXCHANGERS
Client: Battelle Energy Alliance (BEA) LLC Signature:
Unit: SULFUR IODINE Location: Idaho Falls, Idaho
Mechanical Design
Shell Tube Item No. Name
Area (m2)
(Total)
Material Pressure (bar g)
Temperature (oC)
Material Pressure (bar g)
Temperature (oC)
Type PFD Remarks
HPS-HAD HX-6
Iodine Cooler 370 CS 21
100
Tantalum 25 230
BEU HAD 301
HPS-HAD HX-1
Vapor Heat Recuperator 4,050
Tantalum Clad-CS 39
300
Tantalum 45 290
BEU HAD 301
HPS-HAD HX-2
Recovered Iodine Heat Recuperator
2,570 Tantalum Clad-CS
38 290
Tantalum 46 275
BEU HAD 301
HPS-HAD HX-3
HI Distillation Column Feed Preheater
5,330 Tantalum Clad-CS
39 315
Tantalum 42 300
BEU HAD 301
HPS-HAD EX-06
A thru F
HI Column Process Coupling Heat Exchanger
375
Tantalum Clad 304LSS
88 300
Tantalum 97 670
NKU HAD 302 One PCHX shell per column. Area shown is for one shell
HPS-HAD QP-QH A thru R
HI Column Reboiler 4,425 Tantalum Clad CS
71 300
Tantalum 86 370
NKU HAD-302 Three reboiler shells per column. Area
shown is for one shell. Three shells per column

Note: Above data (except for Item No. and name) shall not be used for design purposes. For this purpose the data on the relevant specification/data sheets shall be used
ISSUE DATE SHEET DOC NO
0 12/10/2008 6 of 6 132155-T-EQL-HPS-SI-HAD-0
EQUIPMENT LIST – HEAT EXCHANGERS
Client: Battelle Energy Alliance (BEA) LLC Signature:
Unit: SULFUR IODINE Location: Idaho Falls, Idaho
Mechanical Design
Shell Tube Item No. Name
Area (m2)
(Total)
Material Pressure (bar g)
Temperature (oC)
Material Pressure (bar g)
Temperature (oC)
Type PFD Remarks
HPS-HAD QP-QC
A thru F HI Column Condenser 9700
Internal to TO-04
Tantalum Clad CS 48 257
Internal U tube bundle HAD 302
HPS-HAD HX-5
Recovered Water Cooler
200 CS 31
100
304 SS 38 225
BEU HAD 303
HPS-HAD HX-4
Hydrogen Product Cooler
20 CS 31
100
304SS 38 180
BEU HAD 303

1
Battelle Energy Alliance, LLC (BEA)
Next Generation Nuclear Plant
Idaho Falls, Idaho
Sulfur Iodine Hydrogen
Product Purification
Equipment List
Shaw E&I Project No. 132155
ISSUE DATE DESCRIPTION ORIGR CHK’R SDE PEM INTERDISCIPLINE REVIEW
DISCIPLINE REV’R DATE
Process
Mechanical
Civil/Structural
Control Systems
Power Systems
Piping
Material & Corr.
0 12/11/2008 For Estimate COB KG COB COB
FILE NAME NGNP HPAS HyS Product purification
Equipment List 08.doc
SHEET 1 of 7
DOC.NO.
132155-T-EQL-HPS-SI-PPU-0

Note: Above data (except for Item No. and name) shall not be used for design purposes. For this purpose the data on the relevant specification/data sheets shall be used
ISSUE DATE SHEET DOC NO
0 12/11/2008 2 of 7 132155-T-EQL-HPS-SI-PPU-0
EQUIPMENT LIST - TOWERS
Client: Battelle Energy Alliance (BEA), LLC Signature:
Unit: NGNP HPS Sulfur Iodine Location: Idaho Falls, Idaho
Mechanical Design Material Item No. Name Diameter
(mm) Height (mm)
Packing/ Trays Press
(bar g) Temp (°C) Shell C.A. (mm)
Packing Trays
PFD Remarks
HPS-PPU TO-403
SO2 Scrub Tower
2200 7000 24.3 m3 of 1 inch IMTP
#25 Packing 10 70 CS CS
PPU 402

Note: Above data (except for Item No. and name) shall not be used for design purposes. For this purpose the data on the relevant specification/data sheets shall be used
ISSUE DATE SHEET DOC NO
0 12/11/2008 3 of 7 132155-T-EQL-HPS-SI-PPU-0
EQUIPMENT LIST – VESSELS / REACTORS
Client: Battelle Energy Alliance (BEA) LLC Signature:
Unit: NGNP HPS Sulfur Iodine Location: Idaho Falls, Idaho
Mechanical Design Item No. Name Diameter
(mm) Length (mm)
Horizon/ Vertical Pressure
(bar g) Temp (°C) Material
C.A. (mm) PFD Remarks
HPS-PPU DR-401 A/B
Hydrogen Iodine Adsorber 2600 5800 Vertical 53 150 CS PPU 401
2 beds @ 23.8 m3 of mol sieve or activated carbon allow
$150,000 per bed
HPS-PPU DR-402 A/B
Hydrogen Drying Bed 2600 5800 Vertical 53 150 CS PPU 401 2 beds @ 23.8 m3 of 3A mol sieve
$100,000 per bed
HPS-PPU DR-403 A/B
Oxygen H2O Adsorber 2400 6000 Vertical 10 100 CS PPU 402
2 beds @ 21.5 m3 of 3A mol sieve $91,000 per bed
HPS-PPU DR-405 A/B
SO2 Adsorber 2400 6000 Vertical 10 100 CS PPU 402 2 beds @ 21.5 m3 of 4A mol sieve
$83,000 per bed
HPS-PPU KO-426
Hydrogen Compressor Discharge Drum
850 2600 Vertical 53 150 CS PPU 401
HPS-PPU KO-427
Hydrogen Dryer Regen KO Drum
850 2400 Vertical 53 110 CS PPU 401
HPS-PPU KO-428
O2 Regen Gas Blower Suction
Drum 800 2400 Vertical 10 100 CS PPU 402
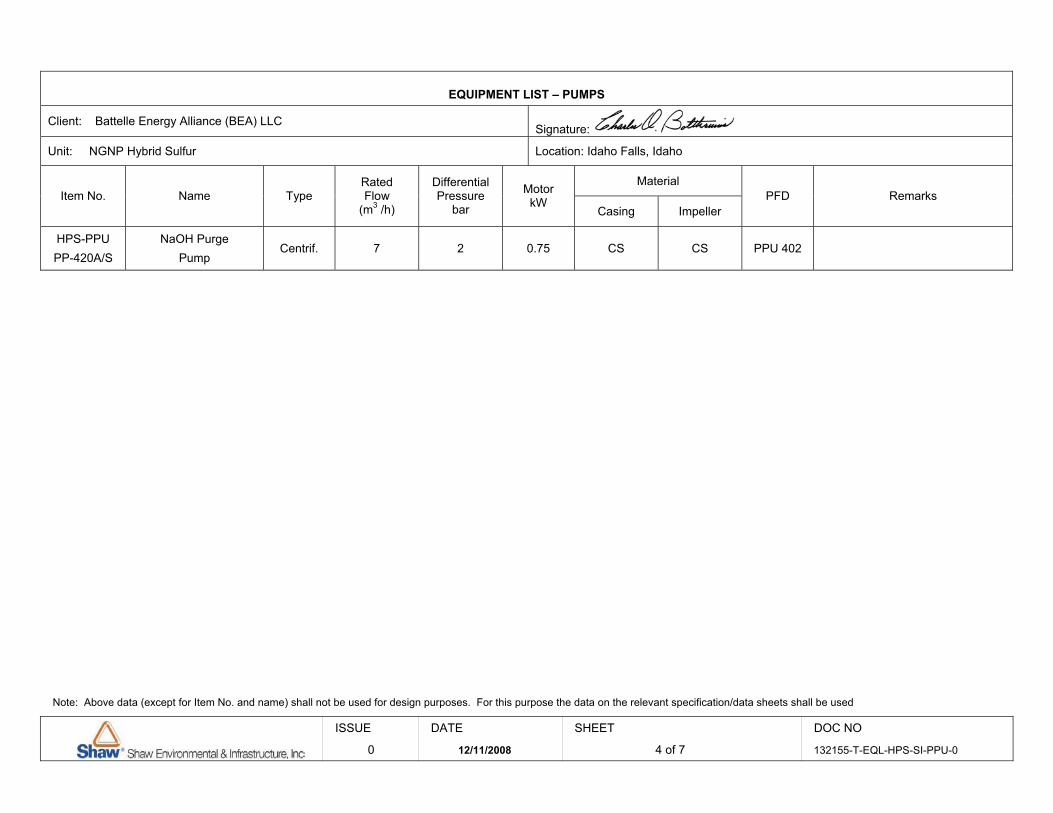
Note: Above data (except for Item No. and name) shall not be used for design purposes. For this purpose the data on the relevant specification/data sheets shall be used
ISSUE DATE SHEET DOC NO
0 12/11/2008 4 of 7 132155-T-EQL-HPS-SI-PPU-0
EQUIPMENT LIST – PUMPS
Client: Battelle Energy Alliance (BEA) LLC Signature:
Unit: NGNP Hybrid Sulfur Location: Idaho Falls, Idaho
Material Item No. Name Type
Rated Flow
(m3 /h)
Differential Pressure
bar
Motor kW
Casing Impeller PFD Remarks
HPS-PPU PP-420A/S
NaOH Purge Pump
Centrif. 7 2 0.75 CS CS PPU 402

Note: Above data (except for Item No. and name) shall not be used for design purposes. For this purpose the data on the relevant specification/data sheets shall be used
ISSUE DATE SHEET DOC NO
0 12/11/2008 5 of 7 132155-T-EQL-HPS-SI-PPU-0
EQUIPMENT LIST – COMPRESSORS / BLOWERS / VACUUM PUMPS
Client: Battelle Energy Alliance (BEA) LLC Signature:
Unit: NGNP Hybrid Sulfur Location: Idaho Falls, Idaho
Driver
Item No. Name Type Capacity (Am 3/h)
Suction Pressure (bar a )
Differential Pressure
(bar ) Type Rated Power (kW)
Material C.A.(mm) PFD Remarks
HPS-PPU PB-402
Hydrogen Recirculation Blower
Rotary Blower
400 52 1 Electric 170 CS PPU 401
HPS-PPU PB-401
Hydrogen Compressor Recipr. 1760 39.5 14.5 Electric 1120 CS PPU 401
HPS-PPU PB-403
O2 Regen Gas Recirc. Blower
Rotary Blower
460 10 4 Electric 45 CS PPU 402
HPS-PPU PB-404
Oxygen Compressor
3 Stage Centrif.
3670 8 33 Electric 1865 CS PPU 402 3 Stage Compressor w/ intercooler
and after cooler supplied as packaged unit.
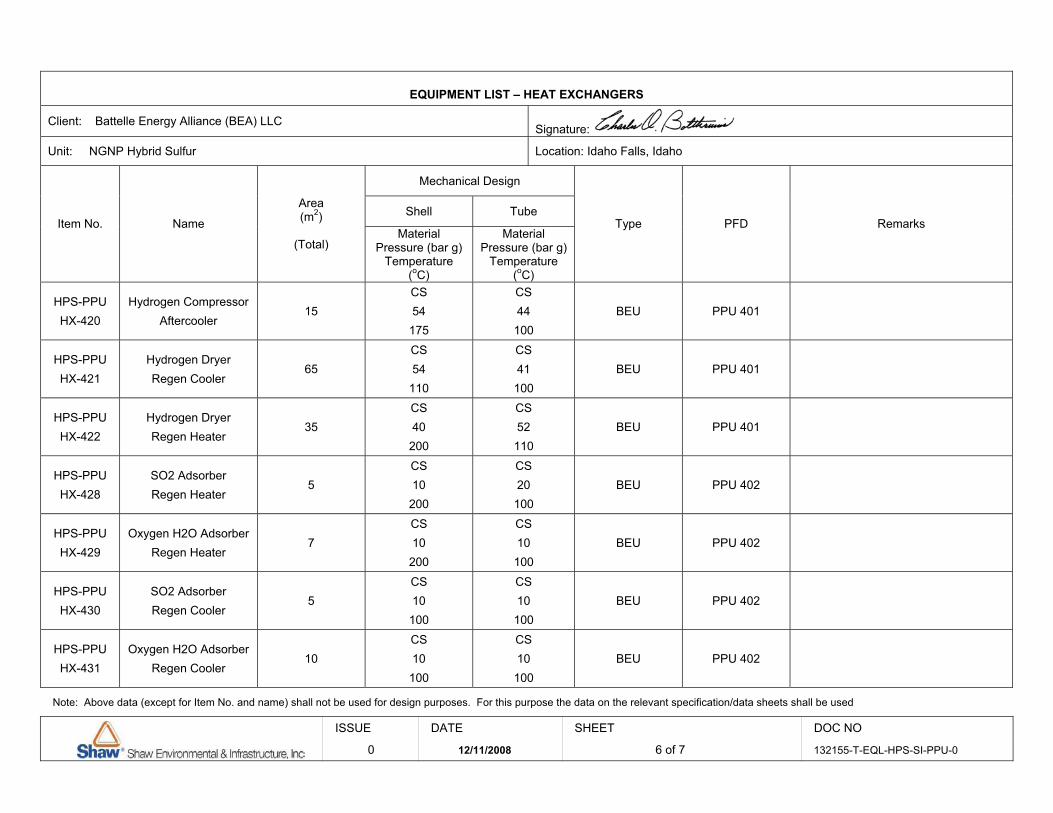
Note: Above data (except for Item No. and name) shall not be used for design purposes. For this purpose the data on the relevant specification/data sheets shall be used
ISSUE DATE SHEET DOC NO
0 12/11/2008 6 of 7 132155-T-EQL-HPS-SI-PPU-0
EQUIPMENT LIST – HEAT EXCHANGERS
Client: Battelle Energy Alliance (BEA) LLC Signature:
Unit: NGNP Hybrid Sulfur Location: Idaho Falls, Idaho
Mechanical Design
Shell Tube Item No. Name
Area (m2)
(Total)
Material Pressure (bar g)
Temperature (oC)
Material Pressure (bar g)
Temperature (oC)
Type PFD Remarks
HPS-PPU HX-420
Hydrogen Compressor Aftercooler
15 CS 54
175
CS 44 100
BEU PPU 401
HPS-PPU HX-421
Hydrogen Dryer Regen Cooler
65 CS 54
110
CS 41 100
BEU PPU 401
HPS-PPU HX-422
Hydrogen Dryer Regen Heater
35 CS 40
200
CS 52 110
BEU PPU 401
HPS-PPU HX-428
SO2 Adsorber Regen Heater
5 CS 10
200
CS 20 100
BEU PPU 402
HPS-PPU HX-429
Oxygen H2O Adsorber Regen Heater
7 CS 10
200
CS 10 100
BEU PPU 402
HPS-PPU HX-430
SO2 Adsorber Regen Cooler
5 CS 10
100
CS 10 100
BEU PPU 402
HPS-PPU HX-431
Oxygen H2O Adsorber Regen Cooler
10 CS 10
100
CS 10 100
BEU PPU 402

Note: Above data (except for Item No. and name) shall not be used for design purposes. For this purpose the data on the relevant specification/data sheets shall be used
ISSUE DATE SHEET DOC NO
0 12/11/2008 7 of 7 132155-T-EQL-HPS-SI-PPU-0
EQUIPMENT LIST – HEAT EXCHANGERS
Client: Battelle Energy Alliance (BEA) LLC Signature:
Unit: NGNP Hybrid Sulfur Location: Idaho Falls, Idaho
Mechanical Design
Shell Tube Item No. Name
Area (m2)
(Total)
Material Pressure (bar g)
Temperature (oC)
Material Pressure (bar g)
Temperature (oC)
Type PFD Remarks
HPS-PPU HX-432 A/B
O2 Product Cooler
110 CS 45
150
CS 37 100
BEU PPU 402

Hydrogen Plant Alternatives Study NGNP-HPS SHAW-HPA Section 8 � Appendices
March 2009
8.2.6 Preliminary Hazards Analysis
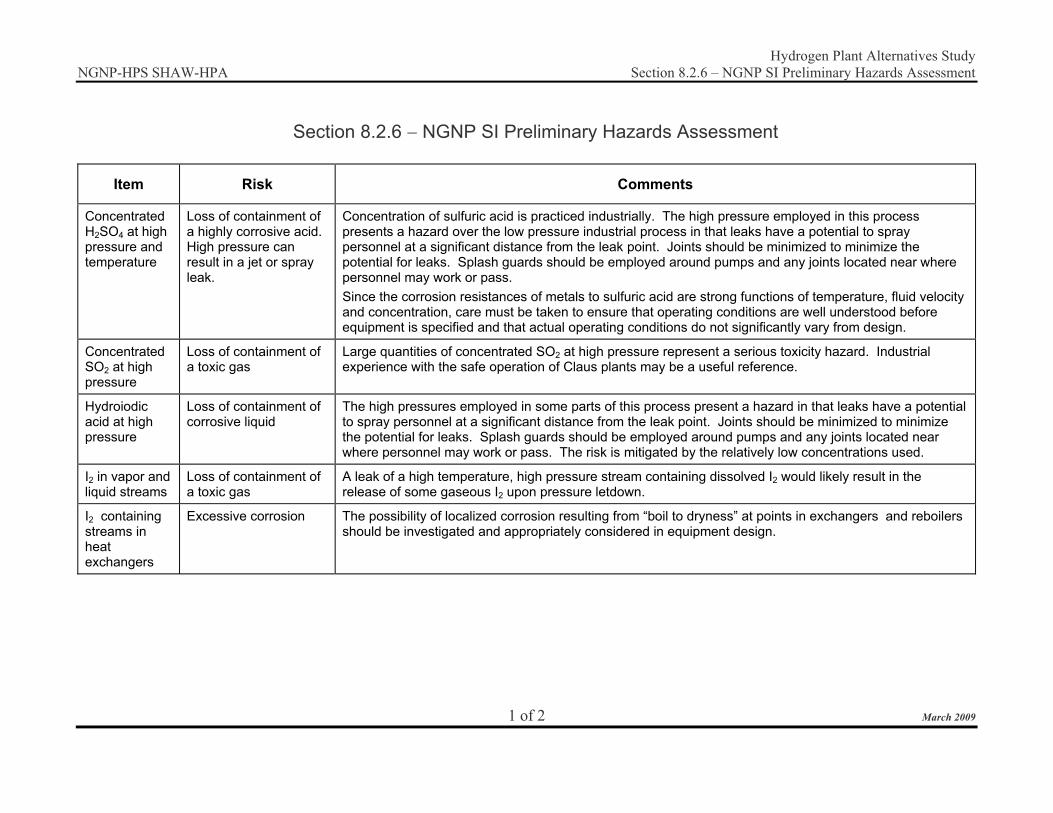
Hydrogen Plant Alternatives Study NGNP-HPS SHAW-HPA Section 8.2.6 – NGNP SI Preliminary Hazards Assessment
1 of 2 March 2009
Section 8.2.6 � NGNP SI Preliminary Hazards Assessment
Item Risk Comments
Concentrated H2SO4 at high pressure and temperature
Loss of containment of a highly corrosive acid. High pressure can result in a jet or spray leak.
Concentration of sulfuric acid is practiced industrially. The high pressure employed in this process presents a hazard over the low pressure industrial process in that leaks have a potential to spray personnel at a significant distance from the leak point. Joints should be minimized to minimize the potential for leaks. Splash guards should be employed around pumps and any joints located near where personnel may work or pass. Since the corrosion resistances of metals to sulfuric acid are strong functions of temperature, fluid velocity and concentration, care must be taken to ensure that operating conditions are well understood before equipment is specified and that actual operating conditions do not significantly vary from design.
Concentrated SO2 at high pressure
Loss of containment of a toxic gas
Large quantities of concentrated SO2 at high pressure represent a serious toxicity hazard. Industrial experience with the safe operation of Claus plants may be a useful reference.
Hydroiodic acid at high pressure
Loss of containment of corrosive liquid
The high pressures employed in some parts of this process present a hazard in that leaks have a potential to spray personnel at a significant distance from the leak point. Joints should be minimized to minimize the potential for leaks. Splash guards should be employed around pumps and any joints located near where personnel may work or pass. The risk is mitigated by the relatively low concentrations used.
I2 in vapor and liquid streams
Loss of containment of a toxic gas
A leak of a high temperature, high pressure stream containing dissolved I2 would likely result in the release of some gaseous I2 upon pressure letdown.
I2 containing streams in heatexchangers
Excessive corrosion The possibility of localized corrosion resulting from “boil to dryness” at points in exchangers and reboilers should be investigated and appropriately considered in equipment design.

Hydrogen Plant Alternatives Study NGNP-HPS SHAW-HPA Section 8.2.6 – NGNP SI Preliminary Hazards Assessment
2 of 2 March 2009
Item Risk Comments
H2 purification andcompression
Loss of containment of a flammable gas at high pressure and temperature resulting in a fire or explosion
The drying of H2 at elevated pressures is within industrial gases industry experience. Standard safety measures should be incorporated into the design. The compression of H2 to > 100 bar is within industrial gases industry experience. Standard safety measures should be incorporated into the design. Due to the flammability of H2, joints, and fittings should be avoided in this piping system. The possibilities of a jet fire or a confined vapor cloud explosion in the region of potential leak points should be considered in the development of the plant layout.
O2 purification andcompression
The enhanced flammability of materials in O2 resulting in an equipment fire
All piping, fittings and equipment exposed to > 25% oxygen must be oxygen-clean before start up. Fittings that are O2-cleaned at the factory must be shipped sealed. The use of soft materials and lubricants should be minimized with oxygen-enriched streams. Fluorinated compounds such as Teflon™ and Viton™ are normally used for seals and per-fluorinated materials as lubricants. The use of O2 as the regeneration gas for the TSA’s will require that the maximum regeneration temperature and pressure be considered in the specification of the materials of construction for the adsorber vessels (and piping that will be exposed to the hot gas).It is standard industry practice to place O2 compressors inside of barriers for containment and personnel protection in case of a fire. The frequency of fires in such equipment should be considered in plant layout
He exchange atdecomposer
Loss of containment of high pressure He or cross contamination between primary and secondary He streams due to acid corrosion of He heat exchange equipment
Keeping the pressure of the He stream above that of the decomposer should minimize acid leakage into the He in the event of a leak.
Water treatment
This system should be standard equipment routinely used in industry with standard safety measures.

Hydrogen Plant Alternatives Study NGNP-HPS SHAW-HPA Section 8 � Appendices
March 2009
8.2.7 Capital Cost Estimate

Hydrogen Plant Alternatives Study NGNP-HPS SHAW-HPA Section 8.2.7 � SI Capital Cost Estimate
1 of 13 March 2009
Section 8.2.7 � SI Capital Cost Estimate
8.2.7.1: Reference SI HPS With Tantalum Lining
BUN System Qty Cost
Equipment
Bunsen Reactor Top 3 1,305,000 Bunsen Reactor Btm 3 3,726,000 Bunsen Reactor Internals 3 700,000 Reverse Bunsen Reactor Top 3 594,000 Reverse Bunsen Reactor Btm 3 1,026,000 Reverse Bunsen Reactor Internals 3 207,000 Bunsen Decanter 6 7,913,000 Bunsen Reactor Trim Cooler Pump 6 1,289,000 Bunsen Reactor Recirculation Pumps 9 1,933,000 Hi Feed Pumps 12 31,692,000 Reverse Bunsen Reactor Feed Pumps 9 5,329,000 SAD Feed Pumps 9 31,376,000 Low Pressure SO2 Feed Compressor 3 939,000 Bunsen Reactor O2 and SO2 Feed Compressor 3 15,824,000 Recovered Water Cooler 3 465,000 Iodine Feed Cooler 3 3,265,000 SAD Recycled SO2 Cooler 3 71,000 Bunsen Reactor Trim Cooler 3 5,055,000 Bunsen Reactor Coolers 6 10,109,000 Reverse Bunsen Reactor Vapor Cooler 3 1,233,000
Subtotal Equipment 124,051,000
Installation Construction Labor 59,030,000 Expenses & Supplies 2,968,000 Construction Equipment 5,308,000 Vendor Services 300,000 Sub-subtotal Construction 67,606,000
Bulk Material 52,739,000 EPC Engineering 18,144,000 Spares 2,652,000 Freight 8,808,000 Other Costs - Catalyst, Desiccant 0 Subtotal Installation 149,949,000
BUN System Total 274,000,000

Hydrogen Plant Alternatives Study NGNP-HPS SHAW-HPA Section 8.2.7 � SI Capital Cost Estimate
2 of 13 March 2009
HAD System Qty Cost
Equipment Reactive Distillation Column Top 18 129,966,000 Reactive Distillation Column Btm 18 39,842,000 Reactive Distillation Column Internals 18 49,680,000 Distillation Column Feed Mix Tank 3 10,911,000 HI Column Steam Drum 18 3,759,000 Recovered Water KO Drum 3 393,000 Hydrogen Product KO Drum 3 612,000 Column Bottoms KO Drum 3 10,277,000 Heat Pump Compressor 18 87,025,000 KO Drum Vapor Compressor 3 16,092,000 Iodine Cooler 3 1,438,000 Vapor Heat Recuperator 3 19,437,000 Recovered Iodine Heat Recuperator 3 12,336,000 HI Distillation Column Feed Preheater 3 24,729,000 HI Column Process Coupling Heat Exchanger 18 16,386,000 HI Column Reboiler 54 536,226,000 HI Column Condenser 18 248,298,000 Recovered Water Cooler 3 265,000 Hydrogen Product Cooler 3 81,000 Helium Control Valves 36 7,200,000
Subtotal Equipment 1,214,953,000
Installation Construction Labor 230,085,000 Equipment & Supplies 11,731,000 Construction Equipment 20,978,000 Vendor Services 300,000
Sub-subtotal Construction 263,094,000 Bulk Material 325,743,000 EPC Engineering 38,232,000 Spares 23,003,000 Freight 76,503,000 Other Costs - Catalyst, Desiccant 0 Subtotal Installation 726,575,000
HAD System Total 1,941,528,000

Hydrogen Plant Alternatives Study NGNP-HPS SHAW-HPA Section 8.2.7 � SI Capital Cost Estimate
3 of 13 March 2009
SAD System Qty Cost
Equipment Vacuum Column Top & Bottom 6 9,390,000 Vacuum Column Internals 6 5,405,000 First Stage Vacuum Column Ejector 6 297,000 Second Stage Vacuum Column Ejector 3 99,000
Sulfuric Acid Decomposer 6 14,202,000 Sulfuric Acid Decomposer Internals 6 21,498,000 incl. cat. Reactor Effluent Flash Drum 6 10,155,000 Recycle Acid HP Flash Drum 3 1,017,000 Recycle Acid LP Flash Drum 3 653,000 Reactor ProductFlash KO Drum 3 1,136,000 HP Recycle Acid Vapor KO Drum 3 431,000 LP SO2 KO Drum 3 104,000 Vacuum Column Reflux Drum 6 257,000 Ejector Hotwell 3 63,000 Reactor Feed Pump 9 21,118,000 LP SO2 Condensate Pump 6 413,000 Ejector Condensate Pump 6 101,000
Vacuum Column Reflux/Ovhd Product Pump 9 821,000
HP Recycle Acid Flash Condenser 3 428,000 Reactor Product Condenser 3 1,299,000 Reactor Product Trim Cooler 3 623,000 Recycle Acid Trim Cooler 3 797,000 EJ-201 Discharge Condenser 3 71,000 EJ-202 Discharge Condenser 3 71,000 Vacuum Column Condenser 6 10,101,000 Vacuum Column Reboiler 6 2,187,000
Helium Control Valves 18 3,600,000
Subtotal Equipment 106,337,000 Installation
Construction Labor 61,023,000 Equipment & Supplies 3,052,000 Construction Equipment 5,461,000 Vendor Services 150,000 Sub-subtotal Construction 69,686,000

Hydrogen Plant Alternatives Study NGNP-HPS SHAW-HPA Section 8.2.7 � SI Capital Cost Estimate
4 of 13 March 2009
Bulk Material 82,181,000 EPC Engineering 17,982,000 Spares 2,633,000 Freight 8,750,000 Other Costs - Catalyst, Desiccant 1,000,000 Subtotal Installation 182,232,000
SAD System Total $288,569,000
FUS System Qty Cost
Equipment Sulfuric Acid Vent Scrubber 1 201,000 Sulfuric Acid Vent Scrubber Internals 1 159,000 Water Pretreatment Filter/Softener System 1 1,000,000 Water Treatment RO/EDI System 1 14,000,000 Waste Water Treatment System 1 1,000,000 Iodine Feedstock Preparation System 1 10,000,000 Sulfuric Acid Degassing Drum 1 125,000 H2SO4 Make-up Pump 2 41,000 H2SO4 Feed Pump 2 95,000 NaOH Make-up Pump 3 37,000 NaOH Solution Supply Pump 2 82,000 Feed Water Pump 4 276,000 H2SO4 Storage Tank 1 58,000 Caustic Storage Tank 1 118,000 H2SO4 Storage Tank Heater/Cooler 1 803,000 NaOH Tank Heater/Cooler 1 4,000 Subtotal Equipment 27,999,000
Installation Construction Labor 7,495,000 Equipment & Supplies 414,000 Construction Equipment 740,000 Vendor Services 0
Sub-subtotal Construction 8,649,000
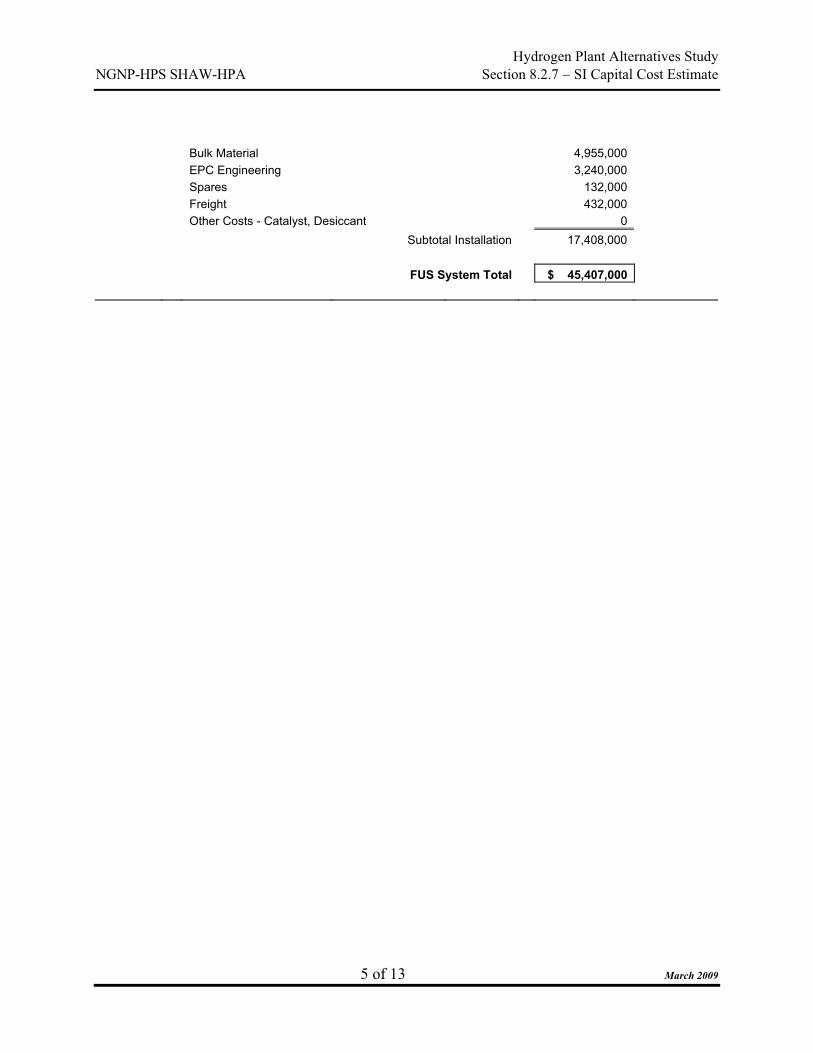
Hydrogen Plant Alternatives Study NGNP-HPS SHAW-HPA Section 8.2.7 � SI Capital Cost Estimate
5 of 13 March 2009
Bulk Material 4,955,000 EPC Engineering 3,240,000 Spares 132,000 Freight 432,000 Other Costs - Catalyst, Desiccant 0 Subtotal Installation 17,408,000
FUS System Total $ 45,407,000

Hydrogen Plant Alternatives Study NGNP-HPS SHAW-HPA Section 8.2.7 � SI Capital Cost Estimate
6 of 13 March 2009
PPU System Qty/Train Cost
SO2 Scrub Tower 3 283,000 SO2 Scrub Tower Internals 3 279,000 Hydrogen Iodine Adsorber 6 1,304,000 ints. & cat. Hydrogen Drying Bed 6 1,304,000 ints. & cat. Oxygen H2O Adsorber 6 386,000 ints. & cat. SO2 Adsorber 6 386,000 ints. & cat. Hydrogen Compressor Discharge Drum 3 58,000 Hydrogen Dryer Regen Heater Knockout Drum 3 56,000 O2 Regen Gas Blower Suction Drum 3 26,000 NaOH Purge Pump 6 102,000 Hydrogen Recirculation Blower 3 3,131,000 Hydrogen Compressor 3 5,244,000 O2 Regen Gas Recirc. Blower 3 2,528,000 Oxygen Compressor 3 11,571,000 Hydrogen Compressor Aftercooler 3 42,000 Hydrogen Dryer Regen Cooler 3 88,000 Hydrogen Dryer Regen Heater 3 64,000 SO2 Adsorber Regen Heater 3 21,000 Oxygen H2O Absorber Regen Heater 3 24,000 SO2 Adsorber Regen Cooler 3 21,000 Oxygen H2O Adsorber Regen Cooler 3 29,000 O2 Product Cooler 6 231,000 Subtotal Equipment 27,178,000
Installation Construction Labor 46,796,000 Equipment & Supplies 2,567,000 Construction Equipment 4,592,000 Vendor Services 0 Sub-subtotal Construction 53,955,000 Bulk Material 32,668,000 EPC Engineering 13,122,000 Spares 898,000 Freight 2,967,000 Other Costs - Catalyst, Desiccant 2,725,000 Subtotal Installation 106,335,000
PPU system total 133,513,000
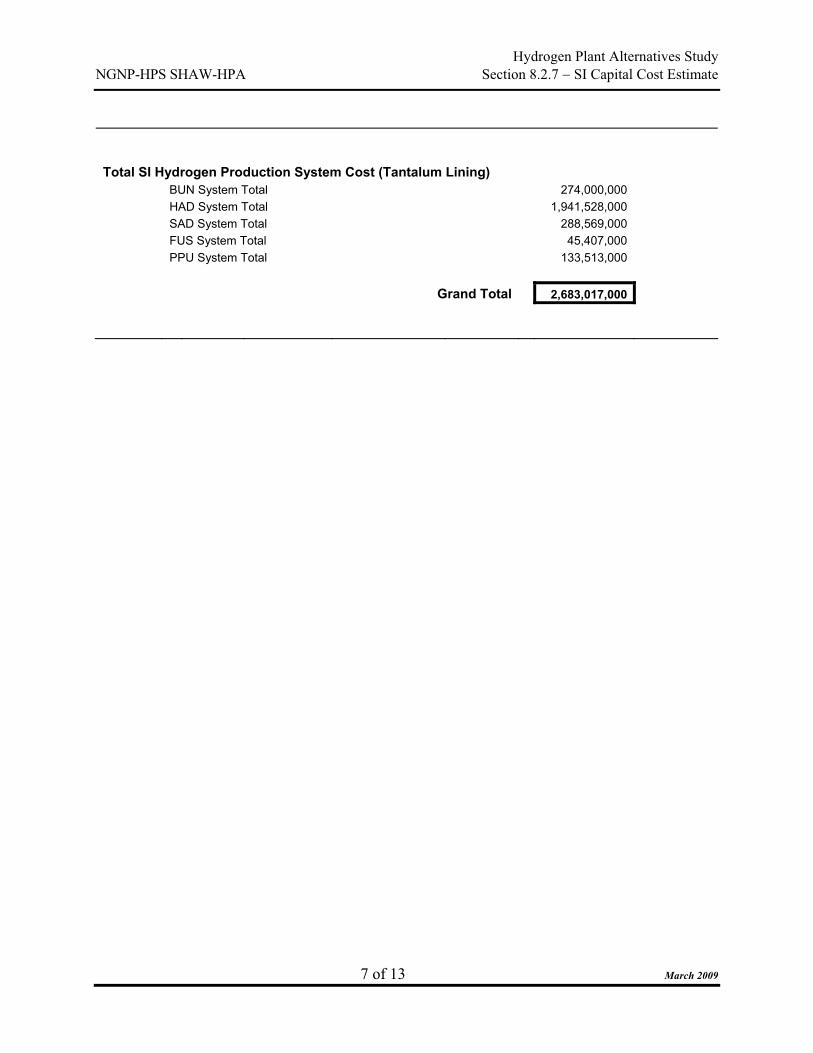
Hydrogen Plant Alternatives Study NGNP-HPS SHAW-HPA Section 8.2.7 � SI Capital Cost Estimate
7 of 13 March 2009
Total SI Hydrogen Production System Cost (Tantalum Lining) BUN System Total 274,000,000 HAD System Total 1,941,528,000 SAD System Total 288,569,000 FUS System Total 45,407,000 PPU System Total 133,513,000
Grand Total 2,683,017,000

Hydrogen Plant Alternatives Study NGNP-HPS SHAW-HPA Section 8.2.7 � SI Capital Cost Estimate
8 of 13 March 2009
8.2.7.2: SI HPS With Only Carbon Steel
BUN System Qty Cost
Equipment
Bunsen Reactor Top 3 435,000 Bunsen Reactor Btm 3 1,242,000 Bunsen Reactor Internals 3 583,000 Reverse Bunsen Reactor Top 3 198,000 Reverse Bunsen Reactor Btm 3 342,000 Reverse Bunsen Reactor Internals 3 173,000 Bunsen Decanter 6 2,282,000 Bunsen Reactor Trim Cooler Pump 6 834,000 Bunsen Reactor Recirculation Pumps 9 1,251,000 Hi Feed Pumps 12 19,763,000 Reverse Bunsen Reactor Feed Pumps 9 3,390,000 SAD Feed Pumps 9 17,125,000 Low Pressure SO2 Feed Compressor 3 641,000 Bunsen Reactor O2 and SO2 Feed Compressor 3 7,585,000 Recovered Water Cooler 3 133,000 Iodine Feed Cooler 3 252,000 SAD Recycled SO2 Cooler 3 21,000 Bunsen Reactor Trim Cooler 3 389,000 Bunsen Reactor Coolers 6 778,000 Reverse Bunsen Reactor Vapor Cooler 3 95,000 Subtotal Equipment 57,512,000
Installation Construction Labor 54,271,000 Expenses & Supplies 2,712,000 Construction Equipment 4,850,000 Vendor Services 300,000 Sub-subtotal Construction 62,133,000
Bulk Material 31,632,000 EPC Engineering 18,144,000 Spares 1,338,000 Freight 4,426,000 Other Costs - Catalyst, Desiccant 0 Subtotal Installation 117,673,000
BUN system total 175,185,000

Hydrogen Plant Alternatives Study NGNP-HPS SHAW-HPA Section 8.2.7 � SI Capital Cost Estimate
9 of 13 March 2009
HAD System Qty Cost
Equipment Reactive Distillation Column Top 18 43,865,000 Reactive Distillation Column Btm 18 13,448,000 Reactive Distillation Column Internals 18 41,400,000 Distillation Column Feed Mix Tank 3 1,380,000 HI Column Steam Drum 18 3,759,000 Recovered Water KO Drum 3 145,000 Hydrogen Product KO Drum 3 226,000 Column Bottoms KO Drum 3 872,000 Heat Pump Compressor 18 87,025,000 KO Drum Vapor Compressor 3 11,928,000 Iodine Cooler 3 206,000 Vapor Heat Recuperator 3 2,160,000 Recovered Iodine Heat Recuperator 3 1,371,000 HI Distillation Column Feed Preheater 3 2,748,000 HI Column Process Coupling Heat Exchanger 18 1,820,000 HI Column Reboiler 54 59,579,000 HI Column Condenser 18 27,589,000 Recovered Water Cooler 3 152,000 Hydrogen Product Cooler 3 46,000 Helium Control Valves 36 7,200,000 Subtotal Equipment 306,919,000
Installation Construction Labor 191,724,000 Equipment & Supplies 9,668,000 Construction Equipment 17,288,000 Vendor Services 300,000 Sub-subtotal Construction 218,980,000
Bulk Material 118,939,000 EPC Engineering 38,232,000 Spares 6,280,000 Freight 20,761,000 Other Costs - Catalyst, Desiccant 0 Subtotal Installation 403,192,000
HAD system total 710,111,000

Hydrogen Plant Alternatives Study NGNP-HPS SHAW-HPA Section 8.2.7 � SI Capital Cost Estimate
10 of 13 March 2009
SAD System Qty Cost
Equipment Vacuum Column Top & Bottom 6 2,008,000 Vacuum Column Internals 6 2,703,000 First Stage Vacuum Column Ejector 6 90,000 Second Stage Vacuum Column Ejector 3 30,000
Sulfuric Acid Decomposer 6 3,552,000 Sulfuric Acid Decomposer Internals 4 5,376,000 incl. cat. Reactor Effluent Flash Drum 6 2,063,000 Recycle Acid HP Flash Drum 3 222,000 Recycle Acid LP Flash Drum 3 109,000 Reactor ProductFlash KO Drum 3 351,000 HP Recycle Acid Vapor KO Drum 3 141,000 LP SO2 KO Drum 3 35,000 Vacuum Column Reflux Drum 6 86,000 Ejector Hotwell 3 22,000 Reactor Feed Pump 9 7,782,000 LP SO2 Condensate Pump 6 273,000 Ejector Condensate Pump 6 74,000
Vacuum Column Reflux/Ovhd Product Pump 9 544,000
HP Recycle Acid Flash Condenser 3 123,000 Reactor Product Condenser 3 289,000 Reactor Product Trim Cooler 3 178,000 Recycle Acid Trim Cooler 3 100,000 EJ-201 Discharge Condenser 3 21,000 EJ-202 Discharge Condenser 3 21,000 Vacuum Column Condenser 6 2,886,000 Vacuum Column Reboiler 6 398,000
Helium Control Valves 18 3,600,000 Subtotal Equipment 33,077,000
Installation Construction Labor 51,638,000 Equipment & Supplies 2,548,000 Construction Equipment 4,557,000 Vendor Services 150,000 Sub-subtotal Construction 58,893,000

Hydrogen Plant Alternatives Study NGNP-HPS SHAW-HPA Section 8.2.7 � SI Capital Cost Estimate
11 of 13 March 2009
Bulk Material 33,219,000 EPC Engineering 17,982,000 Spares 911,000 Freight 3,008,000 Other Costs - Catalyst, Desiccant 1,000,000 Subtotal Installation 115,013,000
SAD system total 148,090,000
FUS System Qty Cost
Equipment Sulfuric Acid Vent Scrubber 1 201,000 Sulfuric Acid Vent Scrubber Internals 1 159,000 Water Pretreatment Filter/Softener System 1 1,000,000 Water Treatment RO/EDI System 1 14,000,000 Waste Water Treatment System 1 1,000,000 Iodine Feedstock Preparation System 1 10,000,000 Sulfuric Acid Degassing Drum 1 44,000 H2SO4 Make-up Pump 2 25,000 H2SO4 Feed Pump 2 51,000 NaOH Make-up Pump 3 37,000 NaOH Solution Supply Pump 2 82,000 Feed Water Pump 4 223,000 H2SO4 Storage Tank 1 41,000 Caustic Storage Tank 1 118,000 H2SO4 Storage Tank Heater/Cooler 1 179,000 NaOH Tank Heater/Cooler 1 4,000 Subtotal Equipment 27,164,000
Installation Construction Labor 7,480,000 Equipment & Supplies 413,000 Construction Equipment 739,000 Vendor Services 0 Sub-subtotal Construction 8,632,000 Bulk Material 4,864,000 EPC Engineering 3,240,000 Spares 119,000 Freight 387,000 Other Costs - Catalyst, Desiccant 0 Subtotal Installation 17,242,000
FUS system total 44,406,000

Hydrogen Plant Alternatives Study NGNP-HPS SHAW-HPA Section 8.2.7 � SI Capital Cost Estimate
12 of 13 March 2009
PPU System Qty Cost
Equipment SO2 Scrub Tower 3 283,000 SO2 Scrub Tower Internals 3 279,000 Hydrogen Iodine Adsorber 6 1,304,000 ints. & cat. Hydrogen Drying Bed 6 1,304,000 ints. & cat. Oxygen H2O Adsorber 6 386,000 ints. & cat. SO2 Adsorber 6 386,000 ints. & cat. Hydrogen Compressor Discharge Drum 3 58,000 Hydrogen Dryer Regen Heater Knockout Drum 3 56,000 O2 Regen Gas Blower Suction Drum 3 26,000 NaOH Purge Pump 6 102,000 Hydrogen Recirculation Blower 3 3,131,000 Hydrogen Compressor 3 5,244,000 O2 Regen Gas Recirc. Blower 3 2,528,000 Oxygen Compressor 3 11,571,000 Hydrogen Compressor Aftercooler 3 42,000 Hydrogen Dryer Regen Cooler 3 88,000 Hydrogen Dryer Regen Heater 3 64,000 SO2 Adsorber Regen Heater 3 21,000 Oxygen H2O Absorber Regen Heater 3 24,000 SO2 Adsorber Regen Cooler 3 21,000 Oxygen H2O Adsorber Regen Cooler 3 29,000 O2 Product Cooler 6 231,000 Subtotal Equipment 27,178,000
Installation Construction Labor 46,796,000 Equipment & Supplies 2,567,000 Construction Equipment 4,592,000 Vendor Services 0 Sub-subtotal Construction 53,955,000 Bulk Material 32,668,000 EPC Engineering 13,122,000 Spares 898,000 Freight 2,967,000 Other Costs - Catalyst, Desiccant 2,725,000 Subtotal Installation 106,335,000
PPU system total 133,513,000

Hydrogen Plant Alternatives Study NGNP-HPS SHAW-HPA Section 8.2.7 � SI Capital Cost Estimate
13 of 13 March 2009
Total SI Hydrogen Production System Cost (Carbon Steel)
BUN System Total 175,185,000 HAD System Total 710,111,000 SAD System Total 148,090,000 FUS System Total 44,406,000 PPU System Total 133,513,000
Grand Total 1,211,305,00

Hydrogen Plant Alternatives Study NGNP-HPS SHAW-HPA Section 8 � Appendices
March 2009
8.2.8 Operating Cost Estimate

Hydrogen Plant Alternatives Study NGNP-HPS SHAW-HPA Section 8.2.8 � SI Operating Cost Estimate
1 of 5 March 2009
Section 8.2.8 - S-I Operating Cost Estimate
8.2.8.1: Overall Plant Operating Costs
Fixed Operation & Maintenance $/year Total plant staff (Direct labor) HPS 52 FTEs BOP 36 FTEs Total 88 FTEs Composite rate 50 $/hr Overhead rate 60 % Burdened rate 80 Annual labor $ 14,643,200 G&Arate 20 % G&A $ 2,928,640 Material costs for maintenance and repairs HPS $ 11,972,240 BOP $ 100,000 Total $ 12,172,240 Licenses Property Tax & Insurance $ 61,223,061 Other
Subtotal $ 90,967,141 Heat Use 1583.67 MWt Rate 30 $/MWt-h Cost $ 416,188,476
Total Fixed O&M $ 507,155,617

Hydrogen Plant Alternatives Study NGNP-HPS SHAW-HPA Section 8.2.8 � SI Operating Cost Estimate
2 of 5 March 2009
Variable Operation & Maintenance $/year Electric power consumption $ 202,842,832 rate 75 $/MWe-h annual cost Cooling water consumption $ 20,226,893 q 155,264 m3/hr = 2591.76 gal/kg H2
trains 6 7.19 m3/sec CS,u 0.016 $/m3 Process steam $ 18,705,596 q 284,720 kg/hr = 79.09 kg/sec trains 6 13.18 m3/sec p 7.9 bar CS,u 0.008 $/kg Process water supply – natural water q 201 m3/hr = 3.36 gal/kg H2
CS,u 0.068 $/m3 $ 112,725 softening q 181 m3/hr 0.079 $/m3 $ 117,332 RO/EDI q 143 m3/hr 0.403 $/m3 $ 472,881 Total Unit Cost 0.002 $/gal
Subtotal Water Cost $ 702,939

Hydrogen Plant Alternatives Study NGNP-HPS SHAW-HPA Section 8.2.8 � SI Operating Cost Estimate
3 of 5 March 2009
Other Material Costs $/year Decomposer Tubes $/hr in Replacement Capital
Make-up catalyst 567 $/hr $ 4,652,585 Iodine 17 $/hr $ 139,495 Mol seives 177 $/hr $ 1,452,394 Make-up acid 242 $/hr $ 1,985,759 Make-up caustic 662 $/hr $ 5,432,118 Total Other Material Costs $ 13,662,351
Waste treatment costs $ 34,210,262 q 18.7 kg/s CS,u 0.186 $/kg ÷ 3 = 0.06193 $/kg Solid waste disposal costs $ - $ 2,287 q 1.5 kg/hr CS,u 0.186 $/kg Total Unplanned Replacement Capital Cost Factor (% of total direct depreciable costs/year) 0.50 %
Total Variable O&M $ 251,420,671

Hydrogen Plant Alternatives Study NGNP-HPS SHAW-HPA Section 8.2.8 � SI Operating Cost Estimate
4 of 5 March 2009
8.2.8.2: Detail, Hydrogen Production System Operating Costs
NGNP HPAS SI Operating Usages and Costs [ All usages are on a per train basis and multiplied by the number of trains. SI Plant has Three (3) trains] Number of trains: 3 Staffing:
Operations: 7 per shift Maintenance 4 per shift 4 additional, day shift only Supervision & Engineering Plant Mgr, Assistant, Engineer and Administrative assistant.
Electricity Per train Total imported MWeh/h 226.1 75.4
Steam kg/h 284,720 94,907 Cooling Water
Plant total m3/h 155,264 51,755 Replacements
RO membranes ( included in process water cost) Decomposer tubes $ 653 $ 23,800 750 82,000 218
Process Water Usage 55.18 kg/s Density 999.6 kg/m3 Blowdown 1%
Supply 201 m3/h
Ulrich & Vasudevan, "How to estimate Utility Costs," Chem. Eng., Apr 2006, pp. 66-69: Natural Water Pumped and screened.
Softened $ 14 181 m3/h 0.079 $/m3
RO/EDI $ 58 143 m3/h 0.403 $/m3

Hydrogen Plant Alternatives Study NGNP-HPS SHAW-HPA Section 8.2.8 � SI Operating Cost Estimate
5 of 5 March 2009
Catalyst and Chemicals Water softening chemicals ( included in process water cost)
Hourly Costper plant as 100%,
kg/h per train, kg/h Cost, $ per
tonne
Iodine make-up $ 17 0.86 0.29 $ 20,000 Sulfuric Acid make-up $ 242 2108 1406 as 50% $ 115 Caustic $ 662 1720 1146 as 50% $ 385
Cost of a load or unit Loads or
units per train Life, hours Cost per train-hour
Decomposition catalyst $ 567 $ 1,888,432 2 20,000 $ 189
Mol sieves UOP Molsiv 3A & 4A $ 177 $ 283,991 1 4,800 $ 59
Subtotal Catalyst & Chemicals $ 1,666
Wastes
Liquid Effluent FromSoftening 5.52 kg/s
From RO/EDI 10.52 kg/s Sodium sulfite waste 2.63 kg/s
Total 18.67 kg/s 67,204 kg/h
0.186 $/kg 1/3 of Ulrich, " Conventional Liquid Waste"
Solid Wastes SiC tubes 1.5 kg/h 0.186 $/kg Ulrich, " Conventional Solid Waste"
Hydrogen Plant Alternatives Study NGNP-HPS SHAW-HPA Section 8 � Appendices
March 2009
8.3 HIGH TEMPERATURE STEAM ELECTROLYSIS
8.3.1 Simulation Diagrams 8.3.2 Mass and Energy Balances 8.3.3 Process Flow Diagrams 8.3.4 Summary Plot Plan Layout 8.3.5 Sized Equipment List 8.3.6 Preliminary Hazards Analysis 8.3.7 Capital Cost Estimate 8.3.8 Operating Cost Estimate

Hydrogen Plant Alternatives Study NGNP-HPS SHAW-HPA Section 8 � Appendices
March 2009
8.3.1 Simulation Diagrams

Temperature (C)
Pressure (bar)
Molar Flow Rate (kmol/sec)
Q Duty (MW)
W Power(kW)
P-KO-01
Q=-0.000
P-EX-09
Q=0.53913.04.00
1.000
1
21.04.00
0.900
3
H-EX-07Q=2.860
F-GZ-03
26.051.000.059
4
13.05.00
0.100
5
25.91.00
0.7976
F-B9
13.05.00
0.900
7
F-GZ-02
F-TK-01
25.84.00
0.9888
25.91.00
0.191
9
120.22.00
0.801
11
F-GU-01
Q=0.000
120.22.00
0.00212
27.00.85
0.626
13
120.22.00
0.803
14
F-PP-02
W=150.429
121.765.000.801
15
273.458.000.363
17
273.458.000.006
19
396.057.000.45720
E-HX-01
Q=17.542
693.353.800.850
21
H-B17
26.051.000.80122
26.050.000.708
23
H-PC-02
W=56.093
26.050.000.094
24
46.359.000.094
25
H-B19
121.760.000.36326
H-EX-03
Q=12.446
121.760.000.43827
273.458.000.438
29
H-EX-08
Q=0.628 H-B24
275.058.000.09431
396.057.000.88932
E-GZ-04C
Q=-0.006
E-GZ-04B
Q=175.979
870.056.000.889
33
800.056.001.243
34
800.055.000.88935
301.853.100.88936 302.4
53.100.85038
26.051.000.860
40
H-B27
800.054.500.850
41
800.054.500.039
42
285.553.100.039
43
F-GZPC1A
W=2754.306
GZ-HX-2Q=-2.531
F-GZPC1C
W=2513.282
E-HX-02Q=13.956
E-GZ-04E
800.055.000.35446
800.055.000.97947
320.853.600.979
48
176.92.38
0.62650
40.03.71
0.62651
176.59.31
0.626
52
870.056.000.626
53
H-EX-02
Q=5.468
H-EX-05
Q=4.529
274.559.000.438
2
274.559.000.363
10
141.752.900.97956
170.052.400.029
54
170.052.400.860
57
E-GZ-04D
Q=-1.481
844.155.000.979
59
P-EX-01
Q=5.526
45.951.700.86016
117.63.00
0.797
45
H-EX-04
Q=3.024
396.057.000.43318
273.558.000.457
28
709.354.300.979
30
H-EX-06
Q=10.318
H-B12
H-B20
273.458.000.433
39
H-B22
F-PE-01
W=-5156.430
-41.52.00
0.979
37
E-GZ-04A
Q=-2.631
800.056.000.889
44
F-PP-01W=6.814
25.94.00
0.79749
F-GZHX6Q=-2.525
176.442.470.62655
F-GZPC1B
W=2523.993
F-PC-01A
W=2517.239
GZ-HX1Q=-2.520
40.01.73
0.62658
177.24.36
0.62660
F-PC-01B
W=2529.890
F-HX-03AQ=-2.553
40.07.00
0.62661
176.517.570.62662
40.016.920.62663
F-HX-03BQ=-0.979
125.041.820.62664
F-PC-01C
W=965.479
176.357.000.626
65

Hydrogen Plant Alternatives Study NGNP-HPS SHAW-HPA Section 8 � Appendices
March 2009
8.3.2 Mass and Energy Balances

1 2 3 4 5 6 7 8 9 10 11 12 13 14 15F-GZ-02 H-EX-03 F-GZ-03 F-GZ-03 0 F-PP-01 P-EX-09 F-TK-01 0 H-EX-06 F-PP-02 0 F-GZPC1A F-GU-01 H-B19
0 H-EX-02 P-EX-09 P-KO-01 F-GZ-02 F-TK-01 F-GZ-02 F-GZ-03 F-TK-01 H-EX-05 F-GU-01 F-GU-01 0 F-B9 F-PP-02LIQUID MIXED LIQUID LIQUID LIQUID LIQUID LIQUID LIQUID LIQUID MIXED LIQUID VAPOR VAPOR MIXED LIQUID
Substream: MIXED Mole Flow kmol/sec HYDROGEN - - - - - - - - - - - - - - - OXYGEN - - - - - - - - - - - - 0.308 - - WATER 2.347 1.029 2.113 0.138 0.235 1.872 2.113 2.319 0.448 0.852 1.880 0.004 - 1.885 1.880 NITROGEN - - - - - - - - - - - - 1.160 - - Total Flow kmol/sec 2.347 1.029 2.113 0.138 0.235 1.872 2.113 2.319 0.448 0.852 1.880 0.004 1.469 1.885 1.880 Total Flow kg/sec 42.288 18.531 38.059 2.481 4.229 33.716 38.059 41.780 8.064 15.349 33.877 0.076 42.369 33.953 33.877 Total Flow cum/sec 0.042 0.024 0.038 0.002 0.004 0.034 0.038 0.042 0.008 0.020 0.036 0.067 43.111 0.103 0.036 Temperature C 13.0 274.5 20.9 26.0 13.0 25.9 13.0 25.8 25.9 274.5 120.2 120.2 27.0 120.2 121.7 Pressure bar 4.0 59.0 4.0 51.0 5.0 1.0 5.0 4.0 1.0 59.0 2.0 2.0 0.9 2.0 65.0 Vapor Frac 0.000 0.000 0.000 0.000 0.000 0.000 0.000 0.000 0.000 0.000 0.000 1.000 1.000 0.002 0.000Liquid Frac 1.000 1.000 1.000 1.000 1.000 1.000 1.000 1.000 1.000 1.000 1.000 0.000 0.000 0.998 1.000Solid Frac 0.000 0.000 0.000 0.000 0.000 0.000 0.000 0.000 0.000 0.000 0.000 0.000 0.000 0.000 0.000Enthalpy J/kmol -2.87E+08 -2.66E+08 -2.86E+08 -2.86E+08 -2.87E+08 -2.86E+08 -2.87E+08 -2.86E+08 -2.86E+08 -2.66E+08 -2.79E+08 -2.39E+08 5.28E+04 -2.79E+08 -2.78E+08Enthalpy J/kg -1.59E+07 -1.48E+07 -1.59E+07 -1.59E+07 -1.59E+07 -1.59E+07 -1.59E+07 -1.59E+07 -1.59E+07 -1.48E+07 -1.55E+07 -1.33E+07 1.83E+03 -1.55E+07 -1.55E+07Enthalpy MW -673.03 -273.55 -604.46 -39.34 -67.30 -534.80 -605.72 -662.70 -127.90 -226.59 -523.91 -1.01 0.08 -524.92 -523.56Entropy J/kmol-K -1.66E+05 -1.15E+05 -1.64E+05 -1.63E+05 -1.66E+05 -1.63E+05 -1.66E+05 -1.63E+05 -1.63E+05 -1.15E+05 -1.42E+05 -4.13E+04 5.91E+03 -1.42E+05 -1.42E+05Entropy J/kg-K -9226.9 -6405.0 -9112.6 -9042.3 -9227.2 -9043.0 -9227.2 -9044.0 -9043.0 -6405.0 -7891.6 -2294.7 204.9 -7879.0 -7882.0Density kmol/cum 55.5 42.1 55.4 55.5 55.5 55.3 55.5 55.3 55.3 42.1 52.3 0.1 0.0 18.3 52.5Density kg/cum 999.6 758.2 998.2 999.0 999.6 996.8 999.6 997.0 996.8 758.2 943.0 1.1 1.0 329.0 945.0Average MW 18.02 18.02 18.02 18.02 18.02 18.02 18.02 18.02 18.02 18.02 18.02 18.02 28.85 18.02 18.02Liq Vol 60F cum/sec 4.24E-02 1.86E-02 3.81E-02 2.49E-03 4.24E-03 3.38E-02 3.81E-02 4.19E-02 8.08E-03 1.54E-02 3.39E-02 7.61E-05 7.87E-02 3.40E-02 3.39E-02
Scale-up factor Plant capacity = 1.20E+08 SCFD (60°F)1 lb-mole = 379.56 SCF (60°F)1 kmol = 2.2046 lb-moles1 kmol = 836.78 SCF (60°F)Plant capacity = 1.43E+05 kmol/dayPlant capacity = 1.660 kmol/sScale-up factor = 2.347
Power Requirement E-GZ-04A -6.177E+00E-GZ-04B 4.132E+02E-GZ-04C -9.768E-03E-GZ-04D -3.471E+00
403.5 MWe
Thermal Requirement E-HX-01 4.119E+01E-HX-02 3.274E+01
73.9 MWth
Heat source rating 550 MWthHeat available for power generation 476.1 MWthRankine cycle efficiency 42%Power generated on site 199.9 MWeImported electricity 203.6 MWe

Substream: MIXEDMole Flow kmol/sec HYDROGEN OXYGEN WATER NITROGENTotal Flow kmol/secTotal Flow kg/secTotal Flow cum/secTemperature CPressure barVapor FracLiquid FracSolid FracEnthalpy J/kmolEnthalpy J/kgEnthalpy MWEntropy J/kmol-KEntropy J/kg-KDensity kmol/cumDensity kg/cumAverage MWLiq Vol 60F cum/sec
16 17 18 19 20 21 22 23 24 25 26 27 28 29 30P-EX-09 H-B12 H-B24 F-B9 H-B24 H-EX-06 H-B17 0 H-PC-02 H-EX-08 H-EX-05 H-EX-02 H-EX-07 H-B20 H-EX-03P-EX-01 H-EX-06 H-EX-04 H-B20 H-EX-07 H-EX-07 P-KO-01 H-B17 H-B17 H-PC-02 H-B19 H-B19 H-B12 H-EX-03 H-EX-04MIXED MIXED VAPOR MIXED VAPOR VAPOR VAPOR VAPOR VAPOR VAPOR LIQUID LIQUID VAPOR MIXED VAPOR
1.880 - - - 0.220 1.797 1.880 1.660 0.220 0.220 - - 0.220 - - - - - - - - - - - - - - - - 1.138
0.139 0.852 1.015 0.013 0.852 0.198 0.001 0.001 0.000 0.000 0.852 1.029 0.852 1.029 - - - - - - - - - - - - - - - 1.160
2.019 0.852 1.015 0.013 1.072 1.996 1.881 1.661 0.220 0.220 0.852 1.029 1.072 1.029 2.299 6.289 15.349 18.294 0.236 15.794 7.197 3.806 3.361 0.445 0.445 15.349 18.531 15.794 18.531 68.931 1.015 0.517 0.910 0.008 0.981 3.002 1.222 1.095 0.145 0.113 0.016 0.020 0.692 0.623 3.281 45.9 273.4 396.0 273.4 396.0 693.3 26.0 26.0 26.0 46.3 121.7 121.7 273.5 273.4 709.1 51.7 58.0 57.0 58.0 57.0 53.8 51.0 50.0 50.0 59.0 60.0 60.0 58.0 58.0 58.2 0.931 1.000 1.000 0.999 1.000 1.000 1.000 1.000 1.000 1.000 0.000 0.000 1.000 0.999 1.0000.069 0.000 0.000 0.001 0.000 0.000 0.000 0.000 0.000 0.000 1.000 1.000 0.000 0.001 0.0000.000 0.000 0.000 0.000 0.000 0.000 0.000 0.000 0.000 0.000 0.000 0.000 0.000 0.000 0.000
-1.89E+07 -2.38E+08 -2.31E+08 -2.38E+08 -1.81E+08 -3.87E+06 -4.43E+04 -4.43E+04 -4.43E+04 5.54E+05 -2.78E+08 -2.78E+08 -1.87E+08 -2.38E+08 2.16E+07-6.07E+06 -1.32E+07 -1.28E+07 -1.32E+07 -1.23E+07 -1.07E+06 -2.19E+04 -2.19E+04 -2.19E+04 2.74E+05 -1.55E+07 -1.55E+07 -1.27E+07 -1.32E+07 7.20E+05
-38.17 -202.37 -234.13 -3.11 -194.06 -7.72 -0.08 -0.07 -0.01 0.12 -237.22 -286.39 -200.77 -244.34 49.65-3.95E+04 -6.34E+04 -5.16E+04 -6.34E+04 -3.89E+04 5.04E+02 -3.25E+04 -3.23E+04 -3.23E+04 -3.18E+04 -1.42E+05 -1.42E+05 -4.94E+04 -6.34E+04 8.94E+03
-12686.0 -3517.6 -2866.6 -3520.2 -2637.7 139.8 -16066.4 -15982.9 -15982.9 -15727.6 -7880.7 -7880.7 -3353.9 -3520.2 298.22.0 1.6 1.1 1.7 1.1 0.7 1.5 1.5 1.5 1.9 52.4 52.4 1.5 1.7 0.76.2 29.7 20.1 29.7 16.1 2.4 3.1 3.1 3.1 3.9 944.6 944.6 22.8 29.7 21.0
3.12 18.02 18.02 18.02 14.73 3.61 2.02 2.02 2.02 2.02 18.02 18.02 14.73 18.02 29.991.03E-01 1.54E-02 1.83E-02 2.37E-04 2.72E-02 9.98E-02 1.01E-01 8.89E-02 1.18E-02 1.18E-02 1.54E-02 1.86E-02 2.72E-02 1.86E-02 1.23E-01

Substream: MIXEDMole Flow kmol/sec HYDROGEN OXYGEN WATER NITROGENTotal Flow kmol/secTotal Flow kg/secTotal Flow cum/secTemperature CPressure barVapor FracLiquid FracSolid FracEnthalpy J/kmolEnthalpy J/kgEnthalpy MWEntropy J/kmol-KEntropy J/kg-KDensity kmol/cumDensity kg/cumAverage MWLiq Vol 60F cum/sec
31 32 33 34 35 36 37 38 39 40 41 42 43 44 45H-B12 E-HX-01 E-GZ-04A E-GZ-04C H-B27 H-EX-05 0 H-B22 H-EX-04 P-KO-01 H-EX-07 H-EX-08 H-B22 E-GZ-04B F-B9
H-EX-08 H-B24 E-HX-01 E-GZ-04B E-GZ-04C H-B22 F-PE-01 H-EX-06 H-B20 P-EX-09 H-B27 H-B27 H-EX-08 E-GZ-04A P-EX-01VAPOR VAPOR VAPOR VAPOR VAPOR VAPOR VAPOR VAPOR MIXED MIXED VAPOR VAPOR VAPOR VAPOR LIQUID
0.220 0.220 0.220 1.880 1.880 1.880 - 1.797 - 1.880 1.797 0.083 0.083 0.220 - - - - 0.830 - - 1.138 - - - - - - - -
0.000 1.868 1.868 0.208 0.208 0.208 - 0.198 1.015 0.139 0.198 0.009 0.009 1.868 1.872 - - - - - - 1.160 - - - - - - - -
0.220 2.088 2.088 2.918 2.088 2.088 2.299 1.996 1.015 2.018 1.996 0.092 0.092 2.088 1.872 0.445 34.090 34.090 34.090 7.528 7.528 68.931 7.197 18.294 6.287 7.197 0.331 0.331 34.090 33.716 0.176 1.891 3.523 4.775 3.410 1.877 21.953 1.797 0.615 1.225 3.290 0.151 0.080 3.299 0.036 275.0 396.0 870.0 800.0 800.0 301.7 (42.8) 302.5 273.4 26.0 800.0 800.0 285.7 800.0 117.6 58.0 57.0 56.0 55.0 55.0 53.1 2.0 53.1 58.0 51.0 54.5 54.5 53.1 56.0 3.0 1.000 1.000 1.000 1.000 1.000 1.000 1.000 1.000 0.999 0.932 1.000 1.000 1.000 1.000 0.0000.000 0.000 0.000 0.000 0.000 0.000 0.000 0.000 0.001 0.068 0.000 0.000 0.000 0.000 1.0000.000 0.000 0.000 0.000 0.000 0.000 0.000 0.000 0.000 0.000 0.000 0.000 0.000 0.000 0.000
7.25E+06 -2.05E+08 -1.85E+08 6.86E+06 -5.07E+05 -1.60E+07 -2.00E+06 -1.60E+07 -2.38E+08 -1.95E+07 -5.07E+05 -5.07E+05 -1.66E+07 -1.88E+08 -2.79E+083.58E+06 -1.26E+07 -1.14E+07 5.87E+05 -1.40E+05 -4.45E+06 -6.67E+04 -4.44E+06 -1.32E+07 -6.27E+06 -1.40E+05 -1.40E+05 -4.59E+06 -1.15E+07 -1.55E+07
1.60 -428.20 -387.02 20.00 -1.06 -33.47 -4.60 -31.95 -241.22 -39.42 -1.01 -0.05 -1.52 -393.19 -521.81-1.59E+04 -4.44E+04 -2.20E+04 9.74E+03 3.62E+03 -1.55E+04 -7.49E+03 -1.55E+04 -6.34E+04 -4.14E+04 3.70E+03 3.70E+03 -1.65E+04 -2.47E+04 -1.43E+05
-7852.2 -2721.8 -1347.2 833.5 1004.0 -4306.3 -249.8 -4294.7 -3520.2 -13294.6 1025.2 1025.2 -4562.9 -1510.8 -7919.91.3 1.1 0.6 0.6 0.6 1.1 0.1 1.1 1.7 1.6 0.6 0.6 1.1 0.6 52.52.5 18.0 9.7 7.1 2.2 4.0 3.1 4.0 29.7 5.1 2.2 2.2 4.1 10.3 945.1
2.02 16.33 16.33 11.68 3.61 3.61 29.99 3.61 18.02 3.11 3.61 3.61 3.61 16.33 18.021.18E-02 4.55E-02 4.55E-02 1.49E-01 1.04E-01 1.04E-01 1.23E-01 9.98E-02 1.83E-02 1.03E-01 9.98E-02 4.60E-03 4.60E-03 4.55E-02 3.38E-02

Substream: MIXEDMole Flow kmol/sec HYDROGEN OXYGEN WATER NITROGENTotal Flow kmol/secTotal Flow kg/secTotal Flow cum/secTemperature CPressure barVapor FracLiquid FracSolid FracEnthalpy J/kmolEnthalpy J/kgEnthalpy MWEntropy J/kmol-KEntropy J/kg-KDensity kmol/cumDensity kg/cumAverage MWLiq Vol 60F cum/sec
46 47 48 49 50 51 52 53 54 55 56 57 58 59 60E-GZ-04E H-EX-04 H-EX-02 P-EX-01 GZ-HX1 F-GZPC1C F-GZHX6 E-GZ-04E F-GZ-03 F-HX-03B F-PE-01 P-EX-01 F-GZPC1B E-GZ-04D GZ-HX-2E-GZ-04C E-GZ-04D H-EX-03 F-PP-01 F-GZPC1A GZ-HX-2 F-GZPC1C E-HX-02 H-EX-05 F-PC-01B H-EX-02 H-EX-05 GZ-HX1 E-GZ-04E F-GZPC1BVAPOR VAPOR VAPOR LIQUID VAPOR VAPOR VAPOR VAPOR LIQUID VAPOR VAPOR VAPOR VAPOR VAPOR VAPOR
- - - - - - - - - - - 1.880 - - - 0.830 1.138 1.138 - 0.308 0.308 0.308 0.308 - 0.308 1.138 - 0.308 1.138 0.308
- - - 1.872 - - - - 0.069 - - 0.139 - - - - 1.160 1.160 - 1.160 1.160 1.160 1.160 - 1.160 1.160 - 1.160 1.160 1.160
0.830 2.299 2.299 1.872 1.469 1.469 1.469 1.469 0.069 1.469 2.299 2.019 1.469 2.299 1.469 26.562 68.931 68.931 33.716 42.369 42.369 42.369 42.369 1.240 42.369 68.931 6.289 42.369 68.931 42.369
1.348 3.738 1.963 0.034 23.109 10.305 5.918 2.576 0.001 1.315 1.467 1.570 22.101 3.938 12.635 800.0 800.0 320.9 25.9 176.9 40.0 176.5 870.0 170.0 176.4 142.0 170.0 40.0 844.0 177.2 55.7 55.7 59.2 4.0 2.4 3.7 9.3 55.0 52.4 42.5 55.0 52.4 1.7 55.0 4.4 1.000 1.000 1.000 0.000 1.000 1.000 1.000 1.000 0.000 1.000 1.000 1.000 1.000 1.000 1.0000.000 0.000 0.000 1.000 0.000 0.000 0.000 0.000 1.000 0.000 0.000 0.000 0.000 0.000 0.0000.000 0.000 0.000 0.000 0.000 0.000 0.000 0.000 0.000 0.000 0.000 0.000 0.000 0.000 0.000
2.54E+07 2.47E+07 8.89E+06 -2.86E+08 4.46E+06 4.16E+05 4.43E+06 2.67E+07 -2.75E+08 4.38E+06 3.31E+06 -1.25E+07 4.28E+05 2.62E+07 4.46E+067.93E+05 8.23E+05 2.96E+05 -1.59E+07 1.54E+05 1.44E+04 1.54E+05 9.24E+05 -1.52E+07 1.52E+05 1.10E+05 -4.01E+06 1.48E+04 8.74E+05 1.55E+05
21.05 56.75 20.43 -534.78 6.54 0.61 6.51 39.16 -18.90 6.44 7.60 -25.20 0.63 60.22 6.557.56E+03 1.23E+04 -7.62E+03 -1.63E+05 9.24E+03 -5.15E+03 -2.18E+03 1.25E+04 -1.33E+05 -1.50E+04 -1.82E+04 -2.19E+04 1.23E+03 1.38E+04 4.21E+03
236.1 410.8 -254.1 -9042.4 320.2 -178.6 -75.4 433.4 -7385.0 -520.4 -606.0 -7033.5 42.5 460.3 146.10.6 0.6 1.2 55.3 0.1 0.1 0.2 0.6 50.0 1.1 1.6 1.3 0.1 0.6 0.1
19.7 18.4 35.1 997.0 1.8 4.1 7.2 16.5 900.2 32.2 47.0 4.0 1.9 17.5 3.432.00 29.99 29.99 18.02 28.85 28.85 28.85 28.85 18.02 28.85 29.99 3.12 28.85 29.99 28.85
4.45E-02 1.23E-01 1.23E-01 3.38E-02 7.87E-02 7.87E-02 7.87E-02 7.87E-02 1.24E-03 7.87E-02 1.23E-01 1.03E-01 7.87E-02 1.23E-01 7.87E-02

Hydrogen Plant Alternatives Study NGNP-HPS SHAW-HPA Section 8 � Appendices
March 2009
8.3.3 Process Flow Diagrams

0
GZ-GF-01CDA Compressor Inlet
Filter
CWS
CWR
CWS
CWR
GZ-PC-01CDA Compressor
MM
GZ-KO-01
GZ-KO-02
GZ- GF-01
GZ-KO-01CDA #1 Interstage
K.O. Drum
To Waste Water Treatment
FUS 102
ATMOSPHERIC AIR
GZ-PC-01
GZ-HX-01
GZ-HX-02
GZ-HX-01CDA #1 Interstage
Cooler
GZ-KO-02CDA #2 Interstage
K.O. Drum
LPS
CWS/R
STREAM #
PRESSURE (Bar a)
TEMPERATURE (°C)
DUTY (MWth)
LOAD (kWe)
LOW PRESSURE STEAM
COOLING WATER SUPPLY/ RETURN
LEGEND
GZ-HX-02CDA #2 Interstage
Cooler
132155-T-PFD-HTSE-FUS-101
GZ-EH-08
GZ-GF-04 A/B/C FUS 104
GZ-GF-02 A/B
VENTTO ATMOSPHERE
GZ-KO-06
GZ-HX-06
CWS/ CWR
GZ-GF-04 A/B/CCDA Purifier Alumina
Beds
GZ-HX-06CDA
Aftercondenser
GZ-EH-08CDA
Regeneration Air Heater(electric)
GZ-KO-06CDA
Condensate K.O. Drum
GZ-GF-02 A/BCDA Polishing
Filter
132155-T-PFD-HTSE-FUS-101
COB
NTS.
Battelle Energy Alliance, LLC (BEA)Idaho Falls, Idaho
GZ-01CLEAN DRY AIR (CDA)
SYSTEM
13
0.852761
7
40To Sweep Gas Compressor
NGNP – High Temperature Steam ElectrolysisClean Dry Air SystemProcess Flow Diagram
0
15023300
-7.03
-7.01 -7.05
MOC:CS MOC:CS MOC:CS
MOC:CS
MOC:CS
MOC:CS MOC:CS
MOC:CS
MOC:CS
MOC:CS MOC:CS
Print date:12/15/2008 Print Time:4:28:19 PM

NTS. 132155-T-PFD-HTSE-FUS-102132155-T-PFD-HTSE-FUS-102
0
LPS
CW
STREAM #
PRESSURE (Bar a)
TEMPERATURE (°C)
DUTY (MWth)
LOAD (kWe)
LOW PRESSURE STEAM
COOLING WATER
LEGEND
Well Water
1
4
13GZ-02
5
113
GZ-03
7
5
13
3
4
20.9
9
125.9
EX-09Hydrogen Product
CoolerMOC: shell 304 ss
Tube 304 ss
1.5
EX-09
FUS 106
Hydrogen Product to Hydrogen Product Cooler
16
51.7
45.9
GZ-02Water Pretreatment
Filter/Softener System
GZ-03Water TreatmentRO/EDI System
MOC:VARIOUSMOC:CS
(WTD)GZ-05
(WTD)GZ-05
Waste WaterTreatment System
MOC:VARIOUS
Offsite DischargeWastes fromCDA System
FUS 101
5126
To Purified Water Storage Tank
FUS 1038
4
25.8
5126
0
NGNP – High Temperature Steam ElectrolysisWater & Waste Water Treatment
Process Flow Diagram
Battelle Energy Alliance, LLC (BEA)Idaho Falls, Idaho
From Hydrogen Feed Water Preheater
HRS 201 54
52.4
170
CondensateFrom Sweep GasCompressor
FUS 104
KO-01 LC
40
4
KO-01Condensate
Knockout DrumMOC:304 SS
To HydrogenPurification System
PPU 40122
51
26
CondensateFrom HydrogenPurification System
PPU 401
B/L
B/L
Print date:12/15/2008 Print Time:4:28:19 PM

NTS. 132155-T-PFD-HTSE-FUS-103132155-T-PFD-HTSE-FUS-103
0
LPS
CW
STREAM #
PRESSURE (Bar a)
TEMPERATURE (°C)
DUTY (MWth)
LOAD (kWe)
LOW PRESSURE STEAM
COOLING WATER
LEGEND
TK-01Purified WaterStorage Tank
MOC: 316 SS
PP-01A/BDeaerator Feed
PumpsMOC: 316 SS
From WaterTreatment
FUS 102
To Deaerator
FUS 106
0
NGNP – High Temperature Steam ElectrolysisPurified Water Storage & Sweep Gas Compressor
Process Flow Diagram
Battelle Energy Alliance (BEA) LLCIdaho Falls, Idaho
LC
TK-01 PP-01A/B
21.0
8
4
25.8
6
1
25.9
49
4
25.9
FC
Print date:12/15/2008 Print Time:4:28:19 PM

NTS. 132155-T-PFD-HTSE-FUS-104132155-T-PFD-HTSE-FUS-104
0
LPS
CW
STREAM #
PRESSURE (Bar a)
TEMPERATURE (°C)
DUTY (MWth)
LOAD (kWe)
LOW PRESSURE STEAM
COOLING WATER
LEGEND
0
NGNP – High Temperature Steam ElectrolysisPurified Water Storage & Sweep Gas Compressor
Process Flow Diagram
Battelle Energy Alliance (BEA) LLCIdaho Falls, Idaho
Sweep GasFrom CDA System
FUS 101
CWS
CWR KO-02AHX-03
CWS
CWR
To Sweep GasProcess CouplingHeat Exchanger
ELE 301
56
176.5
65
7
40
61
KO-02A&BSweep Gas Compressor
Interstage Knockout DrumsMOC: CS
18000
HX-04KO-02B
PC-01Sweep GasCompressor
MOC: CS
HX-03Sweep Gas Compressor
FirstInterstage Cooler
MOC: shell CS Tube CS
FUS 102
Condensate toWaste Water Treatment
PC-01
-7.11
HX-04Sweep Gas Compressor
SecondInterstage Cooler
-2.73
MOC: shell CS Tube CS
Print date:12/15/2008 Print Time:4:28:19 PM
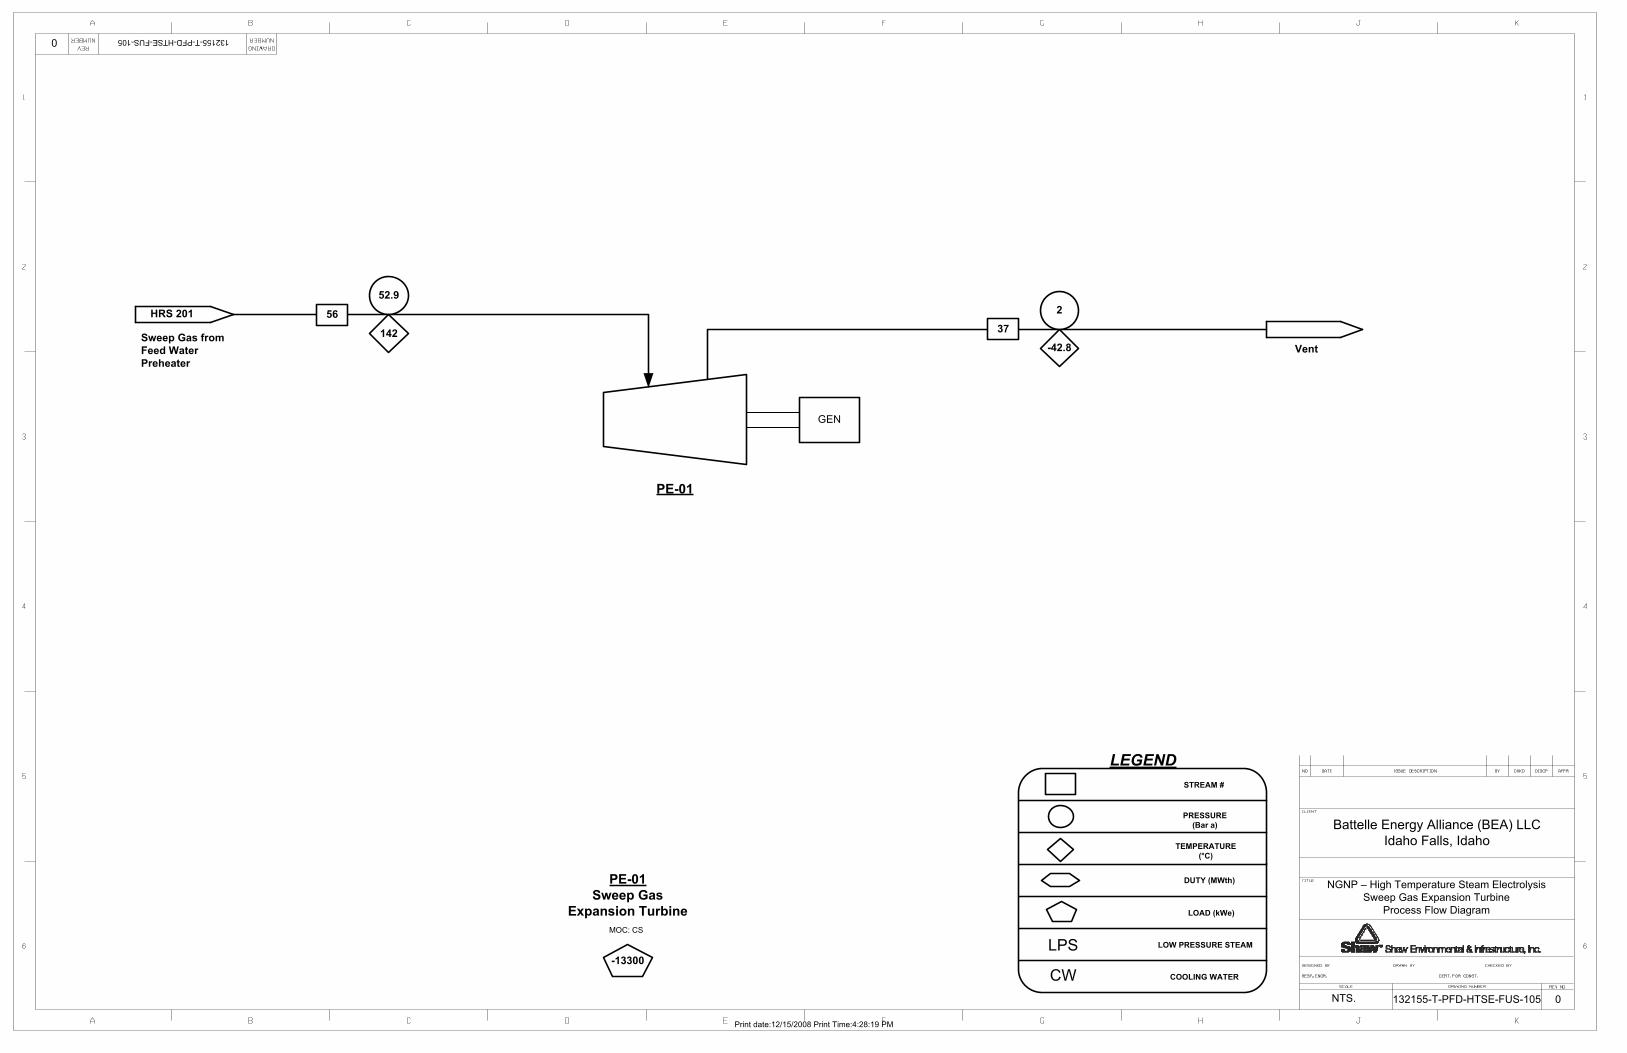
NTS. 132155-T-PFD-HTSE-FUS-105132155-T-PFD-HTSE-FUS-105
0
LPS
CW
STREAM #
PRESSURE (Bar a)
TEMPERATURE (°C)
DUTY (MWth)
LOAD (kWe)
LOW PRESSURE STEAM
COOLING WATER
LEGEND
Sweep Gas fromFeed Water Preheater
PE-01Sweep Gas
Expansion TurbineMOC: CS
Vent
37
2
-42.8
HRS 201
0
NGNP – High Temperature Steam ElectrolysisSweep Gas Expansion Turbine
Process Flow Diagram
Battelle Energy Alliance (BEA) LLCIdaho Falls, Idaho
-13300
PE-01
GEN
56
52.9
142
Print date:12/15/2008 Print Time:4:28:19 PM
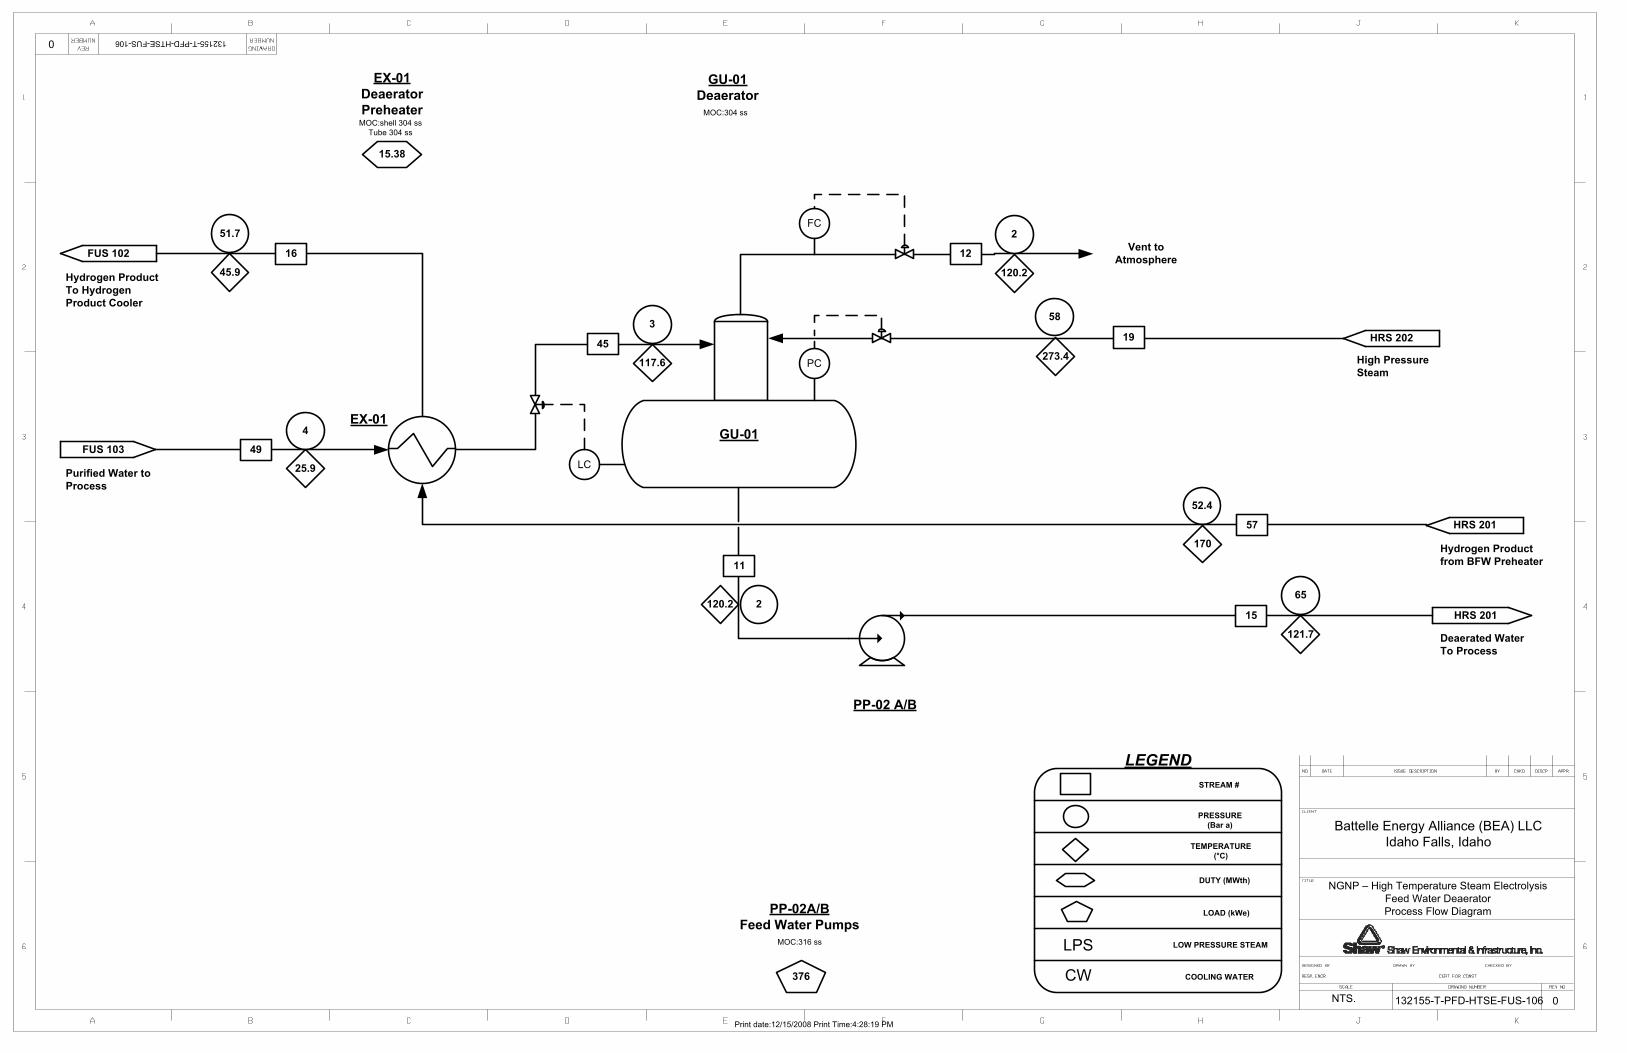
NTS. 132155-T-PFD-HTSE-FUS-106132155-T-PFD-HTSE-FUS-106
0
LPS
CW
STREAM #
PRESSURE (Bar a)
TEMPERATURE (°C)
DUTY (MWth)
LOAD (kWe)
LOW PRESSURE STEAM
COOLING WATER
LEGEND
Purified Water to Process
LC49
PP-02A/BFeed Water Pumps
GU-01Deaerator
HRS 202
High PressureSteam
FUS 102
FUS 103
EX-01
58
273.4
PP-02 A/B
Hydrogen ProductTo Hydrogen Product Cooler
45
GU-01
Vent to Atmosphere
19
Deaerated WaterTo Process
HRS 201
11
15
1216
HRS 201
Hydrogen Product from BFW Preheater
52.4
170
57
65
121.7
2120.2
2
120.2
3
117.6
4
25.9
51.7
45.9
EX-01DeaeratorPreheater
MOC:shell 304 ssTube 304 ss
15.38
MOC:304 ss
MOC:316 ss
376
PC
FC
NGNP – High Temperature Steam ElectrolysisFeed Water DeaeratorProcess Flow Diagram
Battelle Energy Alliance (BEA) LLCIdaho Falls, Idaho
0Print date:12/15/2008 Print Time:4:28:19 PM
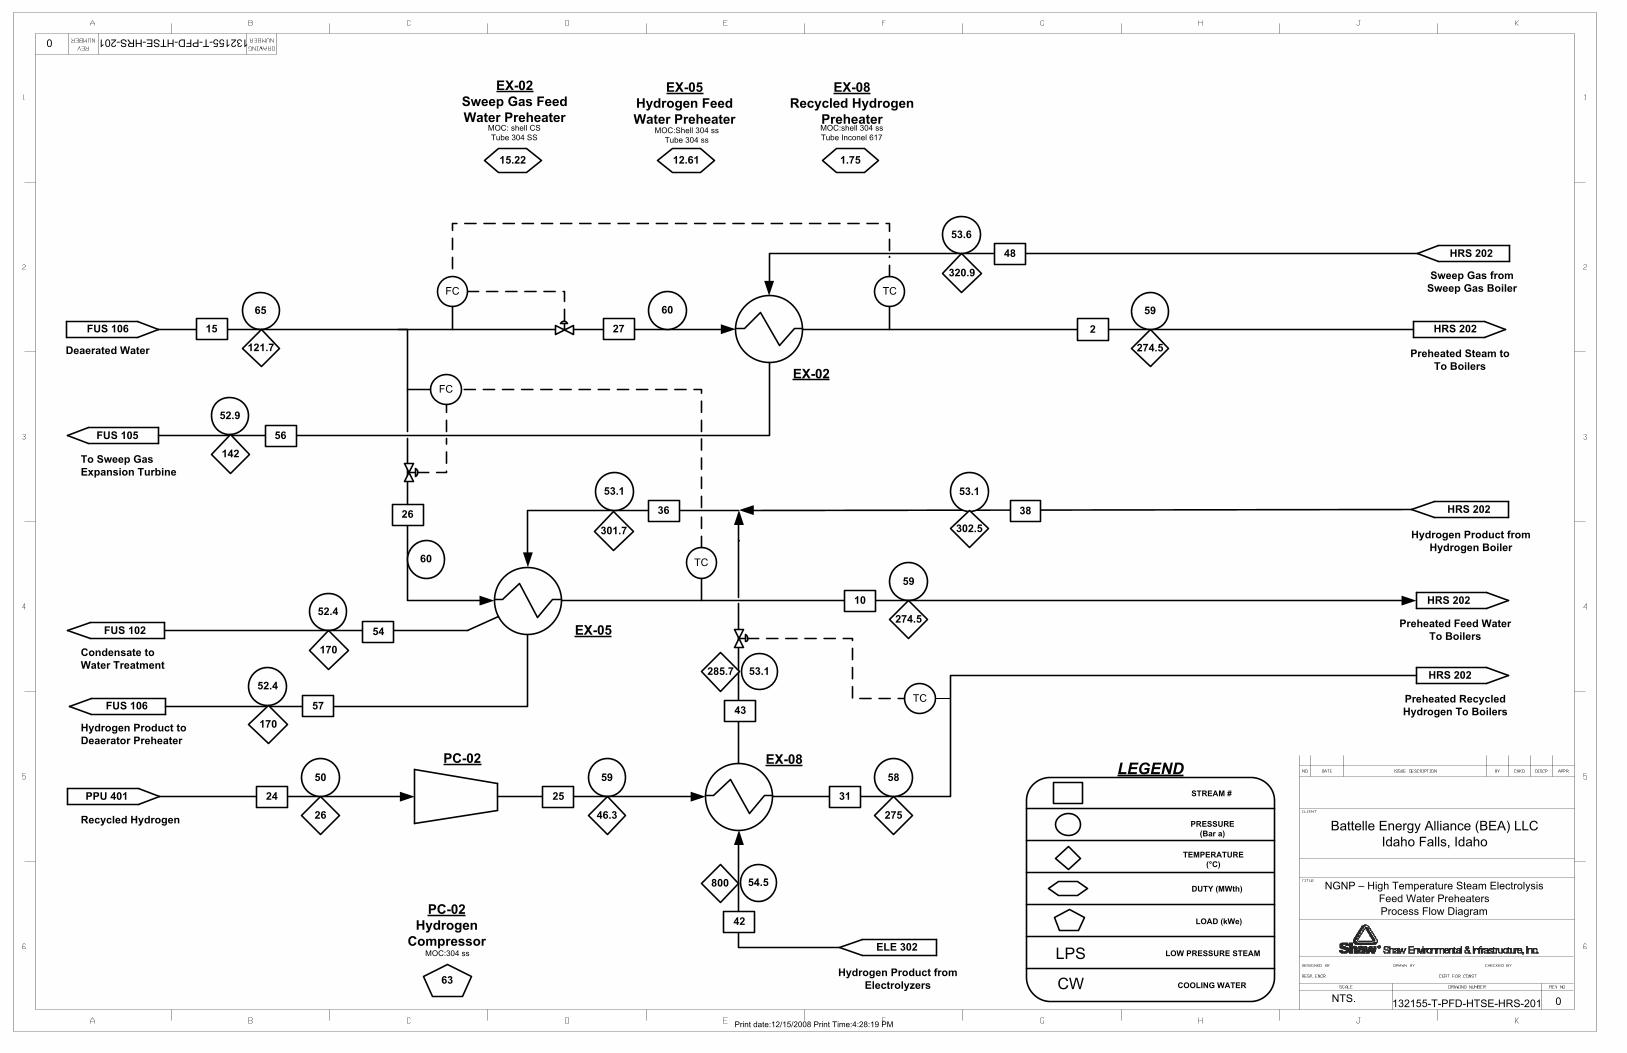
NTS. 132155-T-PFD-HTSE-HRS-201132155-T-PFD-HTSE-HRS-201
0
LPS
CW
STREAM #
PRESSURE (Bar a)
TEMPERATURE (°C)
DUTY (MWth)
LOAD (kWe)
LOW PRESSURE STEAM
COOLING WATER
LEGEND
EX-05Hydrogen FeedWater Preheater
EX-02Sweep Gas FeedWater Preheater
EX-02
EX-05
Deaerated Water
FUS 106
65
121.7
15
60
27
59
274.5
26
60
Preheated Feed WaterTo Boilers
HRS 202
Preheated Steam toTo Boilers
HRS 202
HRS 202
Hydrogen Product fromHydrogen Boiler
HRS 202
Sweep Gas fromSweep Gas Boiler
36
53.1
301.7
FUS 106
Hydrogen Product to Deaerator Preheater
57
52.4
170
48
53.6
320.9
Recycled Hydrogen
PPU 401
ELE 302
Hydrogen Product fromElectrolyzers
43
53.1285.7
38
53.1
302.5
EX-0859
46.3
42
54.5800
To Sweep Gas Expansion Turbine
FUS 105 56
52.9
142
EX-08Recycled Hydrogen
PreheaterMOC: shell CSTube 304 SS
MOC:Shell 304 ssTube 304 ss
MOC:shell 304 ssTube Inconel 617
12.61
58
275
31
15.22 1.75
0
NGNP – High Temperature Steam ElectrolysisFeed Water Preheaters Process Flow Diagram
Battelle Energy Alliance (BEA) LLCIdaho Falls, Idaho
Preheated Recycled Hydrogen To Boilers
HRS 202
59
274.5
2
10
FC
FUS 102
Condensate toWater Treatment
52.4
17054
25
50
26
24
PC-02Hydrogen
CompressorMOC:304 ss
PC-02
63
FC TC
TC
TC
Print date:12/15/2008 Print Time:4:28:19 PM

NTS. 132155-T-PFD-HTSE-HRS-202132155-T-PFD-HTSE-HRS-202
0
LPS
CW
STREAM #
PRESSURE (Bar a)
TEMPERATURE (°C)
DUTY (MWth)
LOAD (kWe)
LOW PRESSURE STEAM
COOLING WATER
LEGEND
Preheated WaterFrom Sweep GasFeed WaterPreheater
HRS 201
EX-03 EX-06
Steam & Recycled Hydrogen to Hydrogen Superheater
HRS 203
Steam to Sweep Gas Superheater
HRS 203
Hydrogen Product fromHydrogen Superheater
HRS 203
Sweep Gas fromSweep Gas Superheater
30
54.3
709.1
To Deaerator
FUS 106
HRS 201
EX-03Sweep Gas Boiler
EX-06Hydrogen Gas
BoilerMOC: shell Incoloy 800H
Tube 304 ss
MOC: shell 304 ssTube Incoloy 800H
28.7334.65
0
NGNP – High Temperature Steam ElectrolysisFeed Water Boilers
Process Flow Diagram
Battelle Energy Alliance (BEA) LLCIdaho Falls, Idaho
HRS 201
Preheated WaterFrom HydrogenFeed WaterPreheater
Sweep GasTo Feed WaterPreheaters
HRS 201
Hydrogen ProductTo Feed WaterPreheaters
48
53.6
320.9
38
53.1
302.5
59
274.5
10
59
274.5
2
LC
PC
HRS 201
21
53.8
693.3
HRS 203
FC
58
275
31
273.5
28
39
58 273.4
19273.4
58
Recycled Hydrogen
FCHRS 203
From Sweep Gas Superheater TC
HRS 04From Hydrogen Superheater TC
KO-03
KO-03Feed Steam Drum
MOC: 304 ss
Print date:12/15/2008 Print Time:4:28:19 PM

NTS. 132155-T-PFD-HTSE-HRS-203132155-T-PFD-HTSE-HRS-203
0
LPS
CW
STREAM #
PRESSURE (Bar a)
TEMPERATURE (°C)
DUTY (MWth)
LOAD (kWe)
LOW PRESSURE STEAM
COOLING WATER
LEGEND
EX-07Hydrogen Feed
Water Superheater
EX-04Sweep Gas Feed Water
Superheater
EX-04
EX-07
Steam fromBoiler
HRS 202
58
273.4
57
396
20
57
396
18
Superheated SteamTo Process Coupling Heat Exchanger
ELE 301
ELE 302
Hydrogen Product fromElectrolyzers
ELE 302
Sweep Gas fromElectrolyzers
41
54.5
800
HRS 202
Hydrogen Product toHydrogen Boiler
21
53.8
693.3
47
55
800
32
To Sweep GasBoiler
HRS 202 30
54.3
709.1
MOC:shell 304 ssTube Inconel 617
8.42 7.96
39
HRS 202
58
273.5
28Steam & RecycledHydrogen from Hydrogen Boiler
NGNP – High Temperature Steam ElectrolysisFeed Water Superheaters
Process Flow Diagram
Battelle Energy Alliance (BEA) LLCIdaho Falls, Idaho
0
HRS 03To Hydrogen Superheater FC TC
HRS 03
To Sweep Gas Superheater FC TC
MOC:shell 304 ssTube Inconel 617
Print date:12/15/2008 Print Time:4:28:19 PM

829
910
910
NTS. 132155-T-PFD-HTSE-ELE-301132155-T-PFD-HTSE-ELE-301
0
LPS
CW
STREAM #
PRESSURE (Bar a)
TEMPERATURE (°C)
DUTY (MWth)
LOAD (kWe)
LOW PRESSURE STEAM
COOLING WATER
LEGEND
HX-02Sweep Gas
Process Coupling Heat Exchanger
HX-01Superheated Steam
Process Coupling Heat Exchanger
HX-01
Superheated SteamFrom Superheaters
HRS 203
57
396
56
870 Superheated SteamTo Electrolyzer
ELE 302
Helium
48.84 38.85
32
NGNP – High Temperature Steam ElectrolysisProcess Coupling Heat Exchangers
Process Flow Diagram
Battelle Energy Alliance (BEA) LLCIdaho Falls, Idaho
0
33
To PCS
HX-02
Sweep GasFrom Sweep GasCompressor
FUS 104
57
176.5
56
870 Sweep GasTo Electrolyzer
ELE 302
Helium
65 53
To PCS
829
MOC:shell Inconel 617Tube Inconel 617
MOC:shell Inconel 617Tube Inconel 617
Print date:12/15/2008 Print Time:4:28:19 PM
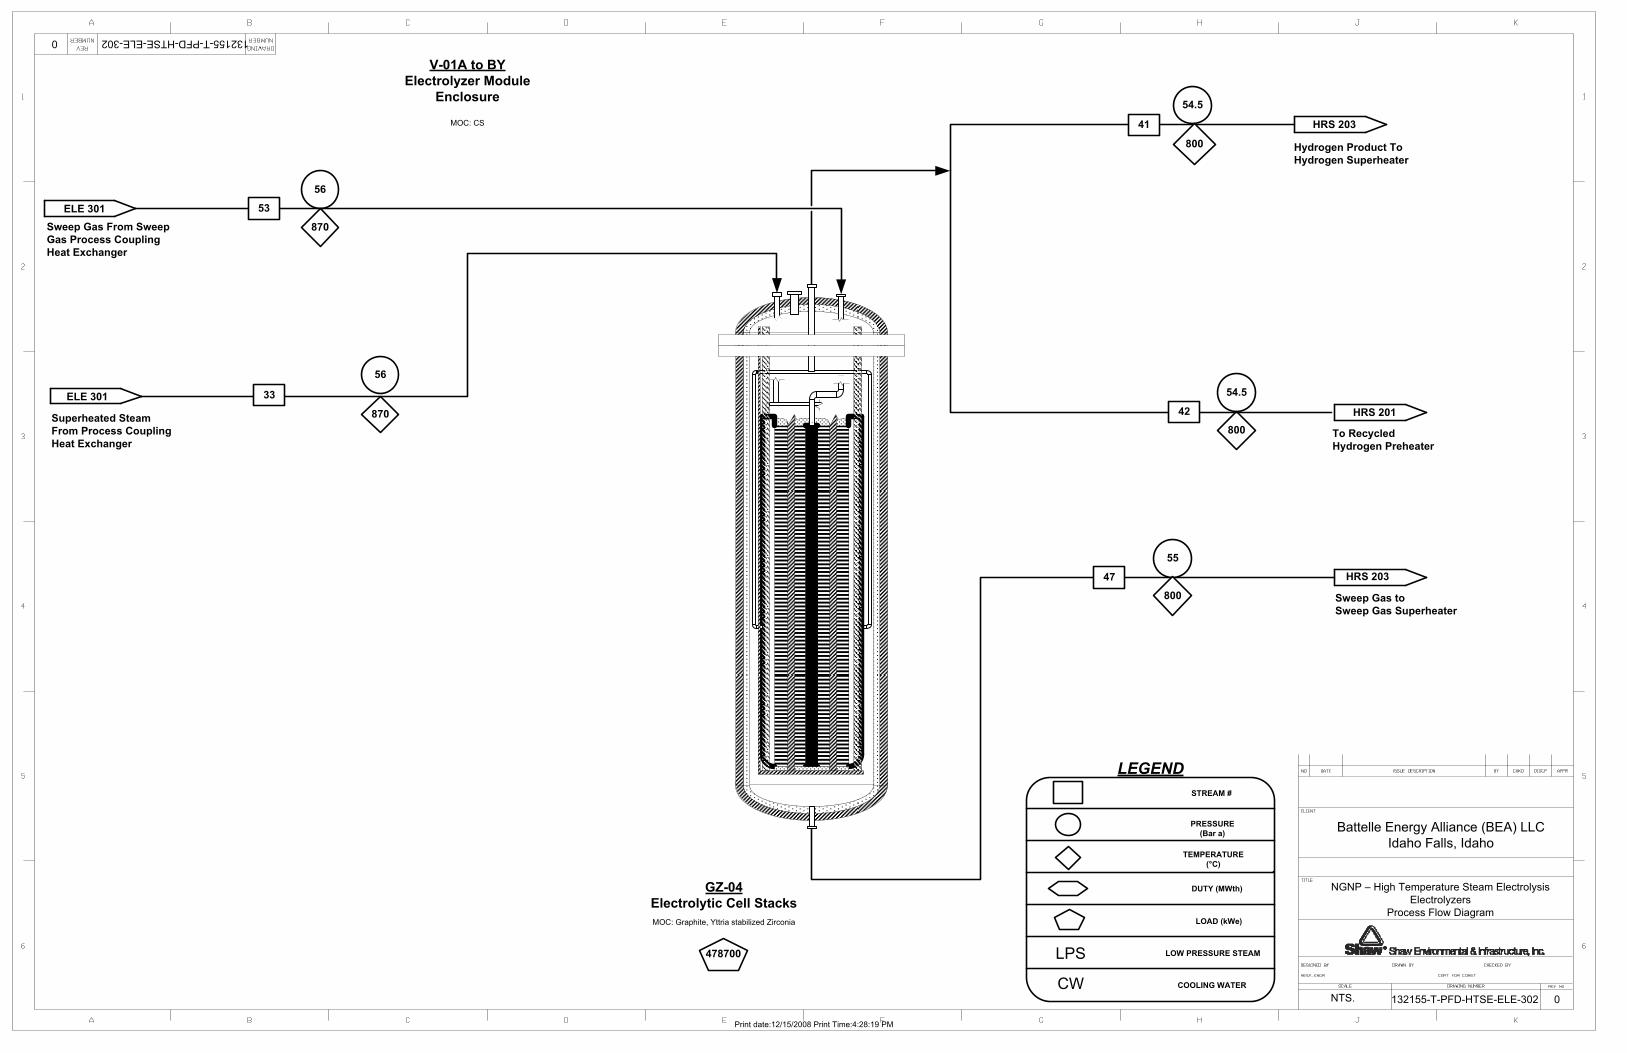
NTS. 132155-T-PFD-HTSE-ELE-302132155-T-PFD-HTSE-ELE-302
0
LPS
CW
STREAM #
PRESSURE (Bar a)
TEMPERATURE (°C)
DUTY (MWth)
LOAD (kWe)
LOW PRESSURE STEAM
COOLING WATER
LEGEND
ELE 301
56
870Superheated SteamFrom Process Coupling Heat Exchanger
HRS 20133
NGNP – High Temperature Steam ElectrolysisElectrolyzers
Process Flow Diagram
Battelle Energy Alliance (BEA) LLCIdaho Falls, Idaho
0
ELE 301
56
870Sweep Gas From Sweep Gas Process Coupling Heat Exchanger
53
HRS 203
Hydrogen Product ToHydrogen Superheater
41
54.5
800
54.5
800 To RecycledHydrogen Preheater
HRS 203
Sweep Gas toSweep Gas Superheater
47
55
800
42
V-01A to BYElectrolyzer Module
Enclosure
MOC: CS
GZ-04Electrolytic Cell StacksMOC: Graphite, Yttria stabilized Zirconia
478700
Print date:12/15/2008 Print Time:4:28:19 PM

NTS. 132155-T-PFD-HTSE-PPU-401132155-T-PFD-HTSE-PPU-401
00
NGNP – High Temperature Steam ElectrolysisHydrogen Product Purification
Process Flow Diagram
Battelle Energy Alliance (BEA) LLCIdaho Falls, Idaho
Hydrogen H2O AdsorberRegen Heater
Regen WaterKnockout Drum
PC
LC
Hydrogen H2O AdsorberRegen Cooler
HX-06 HX-05KO-04
KO-04
MOC:shell CSTube CS
MOC: shell CSTube CSMOC:CS
HX-05
CWS
DR-01A DR-01B
51
26 FUS 102
CWR
22 LPS
50
2623
To Waste Water Treatment
FUS 102
HX-06
PC
FC
50
2624 HRS 202
Hydrogen ProductFrom CondensateKnockout Drum
Recycled Hydrogen
Hydrogen Product toOffsite Pipeline
LPS
CW
STREAM #
PRESSURE (Bar a)
TEMPERATURE (°C)
DUTY (MWth)
LOAD (kWe)
LOW PRESSURE STEAM
COOLING WATER
LEGEND
Hydrogen H2OAdsorbers
DR-01A/B
MOC:CS
B/L
-3.3 3.8
Print date:12/15/2008 Print Time:4:28:19 PM

Hydrogen Plant Alternatives Study NGNP-HPS SHAW-HPA Section 8 � Appendices
March 2009
8.3.4 Summary Plot Plan Layout


Hydrogen Plant Alternatives Study NGNP-HPS SHAW-HPA Section 8 � Appendices
March 2009
8.3.5 Sized Equipment List
1
Battelle Energy Alliance, LLC (BEA)
Next Generation Nuclear Plant
Idaho Falls, Idaho
High Temperature Steam Electrolysis
Equipment List
Stone & Webster Project No. 132155
ISSUE DATE DESCRIPTION ORIGR CHK’R SDE PEM INTERDISCIPLINE REVIEW
DISCIPLINE REV’R DATE
Process
Mechanical
Civil/Structural
Control
Systems
Power Systems
C 12/17/08 Revised surface area of HX-01 & 02 TNS COB Piping
B 10/14/08 Revisions for estimate COB COB Material & Corr.
A For Estimate KBG MM COB COB
FILE NAME
2008Dec17_HTSE Equipment List RevC.doc
SHEET
1 of 10
DOC.NO.

Note: Above data (except for Item No. and name) shall not be used for design purposes. For this purpose the data on the relevant specification/data sheets shall be used
ISSUE DATE SHEET DOC NO
B 14-OCT-08 2 of 10
EQUIPMENT LIST – VESSELS / REACTORS
Client: Battelle Energy Alliance, LLC (BEA) Signature:
Unit: HIGH TEMPERATURE STEAM ELECTROLYSIS Location: Idaho Falls, Idaho (Use USGC for Estimate)
Mechanical Design
Item No. Name Diameter (mm)
Length (mm)
Horizon/ Vertical Pressure
(bar g) Temperature
(�C)
Material C.A. (mm) PFD Remarks
HTSE-FUS
KO-01 Condensate
Knockout Drum 1500 4500 Horizontal 55 65 304 ss FUS 102
HTSE-FUS
KO-02A/B
Sweep Gas Compressor
Interstage Knockout Drums
3200 9600 Horizontal 46 155 CS FUS 104
HTSE-HRS
KO-03 Feed Steam Drum 2900 17400 Horizontal 63 305 304 ss HRS 202
HTSE-PPU
KO-04 Regen Water
Knockout Drum 1500 2500 Vertical 55 65 CS PPU 401
HTSE-PPU
DR-01A/B Hydrogen H2O
Adsorbers 4300 5800 Vertical 55 65 CS PPU 401
HTSE-FUS
GU-01
Deaerator
(Heater)
(Storage)
2100
2100
1800
5100
Vertical
Horizontal 3 160 304 ss FUS 106
Kansas City Deaerator quote10/2/08 :
$ 270,000; Freight: $6700
HTSE-ELE
V-01A to BY Electrolyzer Module
Enclosure 2200 7300 Vertical 61 150 CS ELE 302
76 units. Full body flange on top head all nozzles enter through top head. Internally insulated: 50 mm Microtherm Slatted Super G and 50 mm Pyrogel 10350 (or equal)
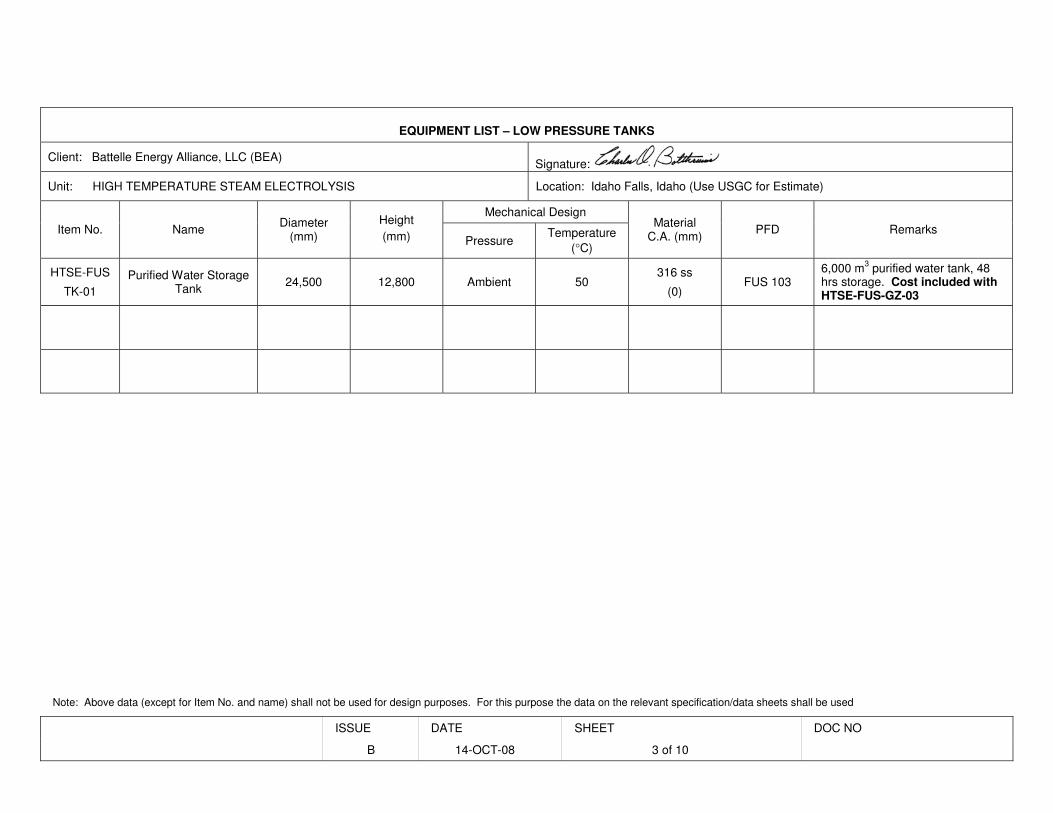
Note: Above data (except for Item No. and name) shall not be used for design purposes. For this purpose the data on the relevant specification/data sheets shall be used
ISSUE DATE SHEET DOC NO
B 14-OCT-08 3 of 10
EQUIPMENT LIST – LOW PRESSURE TANKS
Client: Battelle Energy Alliance, LLC (BEA) Signature:
Unit: HIGH TEMPERATURE STEAM ELECTROLYSIS Location: Idaho Falls, Idaho (Use USGC for Estimate)
Mechanical Design
Item No. Name Diameter (mm)
Height (mm) Pressure
Temperature (�C)
Material C.A. (mm)
PFD Remarks
HTSE-FUS
TK-01 Purified Water Storage
Tank 24,500 12,800 Ambient 50 316 ss
(0) FUS 103
6,000 m3 purified water tank, 48 hrs storage. Cost included with HTSE-FUS-GZ-03
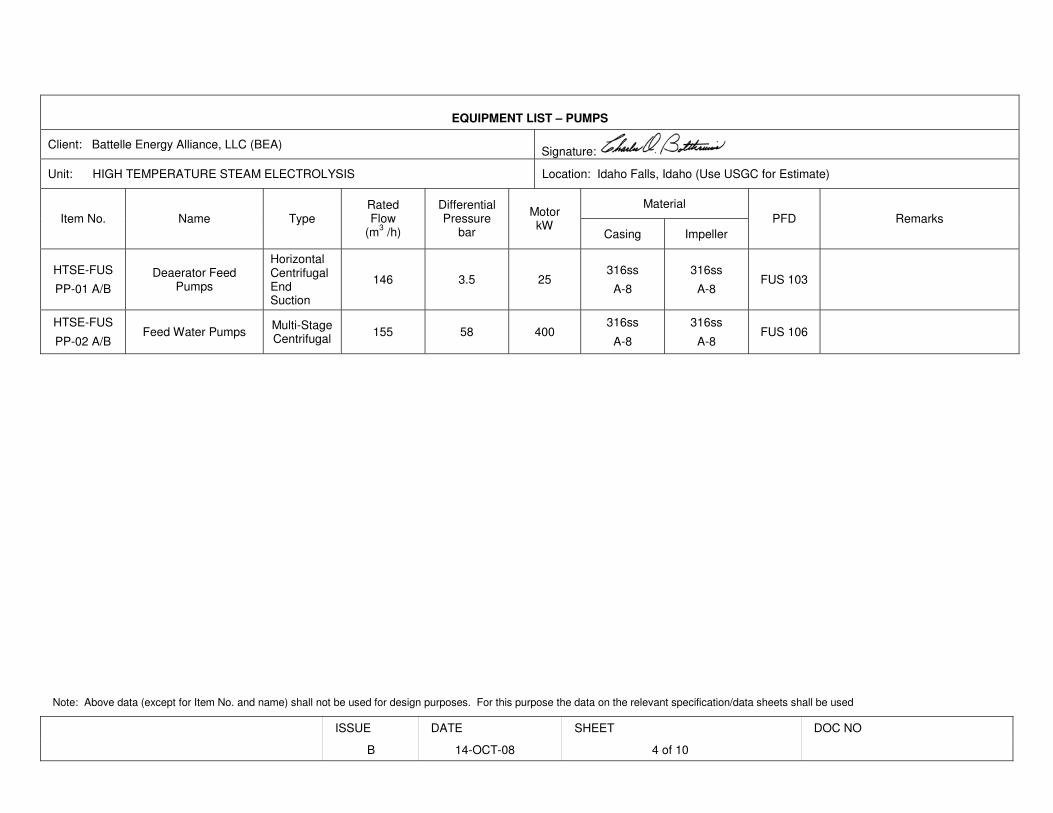
Note: Above data (except for Item No. and name) shall not be used for design purposes. For this purpose the data on the relevant specification/data sheets shall be used
ISSUE DATE SHEET DOC NO
B 14-OCT-08 4 of 10
EQUIPMENT LIST – PUMPS
Client: Battelle Energy Alliance, LLC (BEA) Signature:
Unit: HIGH TEMPERATURE STEAM ELECTROLYSIS Location: Idaho Falls, Idaho (Use USGC for Estimate)
Material Item No. Name Type
Rated Flow
(m3 /h)
Differential Pressure
bar
Motor kW
Casing Impeller PFD Remarks
HTSE-FUS
PP-01 A/B Deaerator Feed
Pumps
Horizontal Centrifugal End Suction
146 3.5 25 316ss
A-8
316ss
A-8 FUS 103
HTSE-FUS
PP-02 A/B Feed Water Pumps Multi-Stage
Centrifugal 155 58 400 316ss
A-8
316ss
A-8 FUS 106

Note: Above data (except for Item No. and name) shall not be used for design purposes. For this purpose the data on the relevant specification/data sheets shall be used
ISSUE DATE SHEET DOC NO
B 14-OCT-08 5 of 10
EQUIPMENT LIST – COMPRESSORS / BLOWERS / VACUUM PUMPS
Client: Battelle Energy Alliance, LLC (BEA) Signature:
Unit: HIGH TEMPERATURE STEAM ELECTROLYSIS Location: Idaho Falls, Idaho (Use USGC for Estimate)
Driver
Item No. Name Type Capacity (Am 3/h)
Suction Pressure (bar a )
Differential Pressure
(bar ) Type Rated Power (kW)
Material C.A.(mm) PFD Remarks
HTSE-FUS
PC-01 Sweep Gas Compressor
Multistage Centrifugal 23,200 7 50 Electric 15,200 CS FUS 104
Total capacity and power shown. If necessary to divide into
separate trains, number should be a multiple of 3
HTSE-HRS
PC-02 Hydrogen
Compressor Centrifugal 480 50 59 Electric 195 304 ss HRS 201
HTSE-FUS
PE-01
Sweep Gas
Expansion Turbine Turbo
Expander 6270 53 51 Generator 5160 CS FUS 105 Note this is a turbo expander. Power is estimated shaft power

Note: Above data (except for Item No. and name) shall not be used for design purposes. For this purpose the data on the relevant specification/data sheets shall be used
ISSUE DATE SHEET DOC NO
B 14-OCT-08 6 of 10
EQUIPMENT LIST – HEAT EXCHANGERS
Client: Battelle Energy Alliance, LLC (BEA) Signature:
Unit: HIGH TEMPERATURE STEAM ELECTROLYSIS Location: Idaho Falls, Idaho (Use USGC for Estimate)
Mechanical Design
Shell Tube Item No. Name
Area (m2)
(Total)
Material Pressure (bar g)
Temperature (oC)
Material Pressure (bar g)
Temperature (oC)
Type PFD Remarks
HTSE-FUS
EX-01 Deaerator Preheater 270
304 ss
56.5
200
304 ss
39
145
BFU FUS 106 2 shells in series; Area is for total of 2 shells
HTSE-HRS
EX-02 Sweep Gas Feed Water Preheater 950
CS
59
350
304 ss
65
350
BFU HRS 201 3 shells in series; Area is for total of 3 shells
HTSE-HRS
EX-03 Sweep Gas Boiler 335
304 ss
64
302
Incoloy 800H
59
737
BEM HRS 202
HTSE-HRS
EX-04 Sweep Gas Feed
Water Superheater 60
304 ss
63
425
Inconel 617
60
830
BFU HRS 203 2 shells in series; Area is for total of 2 shells
HTSE-HRS
EX-05 Hydrogen Feed Water
Preheater 965
304 ss
58
330
304 ss
65
305
BFU HRS 201 2 shells in series; Area is for total of 2 shells
HTSE-HRS
EX-06 Hydrogen Gas Boiler 335
Incoloy 800H
58
721
304 ss
64
305
BEM HRS 202

Note: Above data (except for Item No. and name) shall not be used for design purposes. For this purpose the data on the relevant specification/data sheets shall be used
ISSUE DATE SHEET DOC NO
B 14-OCT-08 7 of 10
EQUIPMENT LIST – HEAT EXCHANGERS
Client: Battelle Energy Alliance, LLC (BEA) Signature:
Unit: HIGH TEMPERATURE STEAM ELECTROLYSIS Location: Idaho Falls, Idaho (Use USGC for Estimate)
Mechanical Design
Shell Tube Item No. Name
Area (m2)
(Total)
Material Pressure (bar g)
Temperature (oC)
Material Pressure (bar g)
Temperature (oC)
Type PFD Remarks
HTSE-HRS
EX-07 Hydrogen Feed Water
Superheater 55
304 ss
63
425
Inconel 617
59
830
BFU HRS 203 2 shells in series; Area is for total of 2 shells
HTSE-HRS EX-08
Recycled Hydrogen Preheater 15
304 ss
64
305
Inconel 617
60
830
BFU HRS 201 2 shells in series; Area is for total of 2 shells
HTSE-FUS
EX-09 Hydrogen Product
Cooler 45
304 ss
56
75
304 ss
39
66
BEU FUS 102 Feed water used to cool hydrogen product gas before Hydrogen Purification System
HTSE-ELE
HX-01
Superheated Steam Process Coupling Heat
Exchanger 590
Inconel 617
68
900
Inconel 617
98
940
BFU ELE 301 2 shells in series; Area is for total of 2 shells
HTSE-ELE
HX-02
Sweep Gas Process Coupling Heat
Exchanger 430
Inconel 617
68
900
Inconel 617
98
940
BFU ELE 301 2 shells in series; Area is for total of 2 shells
HTSE-FUS
HX-03
Sweep Gas Compressor First Interstage Cooler
460
CS
18.5
205
CS
13
65
BEU FUS 104

Note: Above data (except for Item No. and name) shall not be used for design purposes. For this purpose the data on the relevant specification/data sheets shall be used
ISSUE DATE SHEET DOC NO
B 14-OCT-08 8 of 10
EQUIPMENT LIST – HEAT EXCHANGERS
Client: Battelle Energy Alliance, LLC (BEA) Signature:
Unit: HIGH TEMPERATURE STEAM ELECTROLYSIS Location: Idaho Falls, Idaho (Use USGC for Estimate)
Mechanical Design
Shell Tube Item No. Name
Area (m2)
(Total)
Material Pressure (bar g)
Temperature (oC)
Material Pressure (bar g)
Temperature (oC)
Type PFD Remarks
HTSE-FUS
HX-04
Sweep Gas Compressor Second
Interstage Cooler 55
CS
46
205
CS
32
65
BEU FUS 104
HTSE-PPU
HX-05
Hydrogen H2O Adsorber Regen
Heater 75
CS
38
200
CS
55
110
BEU PPU 401
HTSE-PPU
HX-06
Hydrogen H2O Adsorber Regen
Cooler 135
CS
38
65
CS
55
65
BEU PPU 401
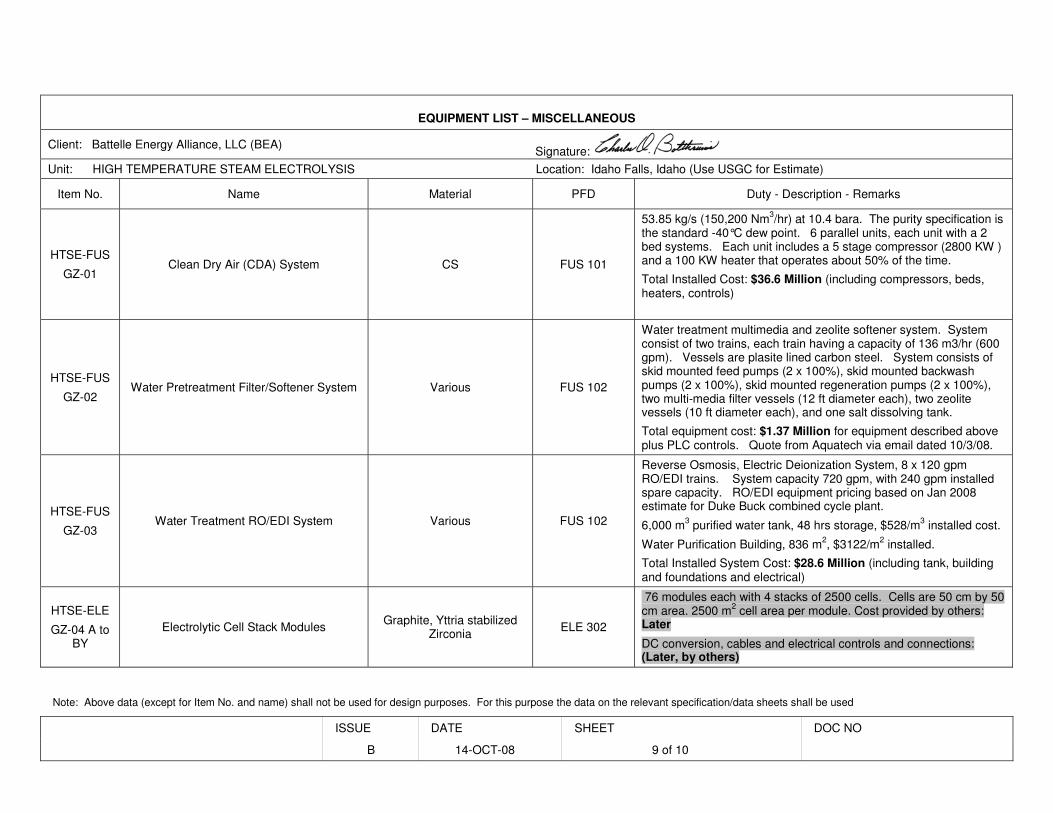
Note: Above data (except for Item No. and name) shall not be used for design purposes. For this purpose the data on the relevant specification/data sheets shall be used
ISSUE DATE SHEET DOC NO
B 14-OCT-08 9 of 10
EQUIPMENT LIST – MISCELLANEOUS
Client: Battelle Energy Alliance, LLC (BEA) Signature:
Unit: HIGH TEMPERATURE STEAM ELECTROLYSIS Location: Idaho Falls, Idaho (Use USGC for Estimate)
Item No. Name Material PFD Duty - Description - Remarks
HTSE-FUS
GZ-01 Clean Dry Air (CDA) System CS FUS 101
53.85 kg/s (150,200 Nm3/hr) at 10.4 bara. The purity specification is the standard -40°C dew point. 6 parallel units, each unit with a 2 bed systems. Each unit includes a 5 stage compressor (2800 KW ) and a 100 KW heater that operates about 50% of the time.
Total Installed Cost: $36.6 Million (including compressors, beds, heaters, controls)
HTSE-FUS
GZ-02 Water Pretreatment Filter/Softener System Various FUS 102
Water treatment multimedia and zeolite softener system. System consist of two trains, each train having a capacity of 136 m3/hr (600 gpm). Vessels are plasite lined carbon steel. System consists of skid mounted feed pumps (2 x 100%), skid mounted backwash pumps (2 x 100%), skid mounted regeneration pumps (2 x 100%), two multi-media filter vessels (12 ft diameter each), two zeolite vessels (10 ft diameter each), and one salt dissolving tank.
Total equipment cost: $1.37 Million for equipment described above plus PLC controls. Quote from Aquatech via email dated 10/3/08.
HTSE-FUS
GZ-03 Water Treatment RO/EDI System Various FUS 102
Reverse Osmosis, Electric Deionization System, 8 x 120 gpm RO/EDI trains. System capacity 720 gpm, with 240 gpm installed spare capacity. RO/EDI equipment pricing based on Jan 2008 estimate for Duke Buck combined cycle plant.
6,000 m3 purified water tank, 48 hrs storage, $528/m3 installed cost.
Water Purification Building, 836 m2, $3122/m2 installed.
Total Installed System Cost: $28.6 Million (including tank, building and foundations and electrical)
HTSE-ELE
GZ-04 A to BY
Electrolytic Cell Stack Modules Graphite, Yttria stabilized Zirconia ELE 302
76 modules each with 4 stacks of 2500 cells. Cells are 50 cm by 50 cm area. 2500 m2 cell area per module. Cost provided by others: Later
DC conversion, cables and electrical controls and connections: (Later, by others)

Note: Above data (except for Item No. and name) shall not be used for design purposes. For this purpose the data on the relevant specification/data sheets shall be used
ISSUE DATE SHEET DOC NO
B 14-OCT-08 10 of 10
EQUIPMENT LIST – MISCELLANEOUS
Client: Battelle Energy Alliance, LLC (BEA) Signature:
Unit: HIGH TEMPERATURE STEAM ELECTROLYSIS Location: Idaho Falls, Idaho (Use USGC for Estimate)
Item No. Name Material PFD Duty - Description - Remarks
HTSE-WTD-GZ-
05 Waste Water Treatment System Various FUS 102
Corrugated inclined plate oil/water separator, 200 gpm capacity. Equipment includes tank, separation media, pumps and control panel.
Total Equipment Cost for tank, media, controls, sludge pumps and oil transfer pumps: $32,100 (does not include freight, or interconnecting piping, foundations etc…) Quoted price from Pan America Environmental for Model OF-80 separator

Hydrogen Plant Alternatives Study NGNP-HPS SHAW-HPA Section 8 � Appendices
March 2009
8.3.6 Preliminary Hazards Analysis
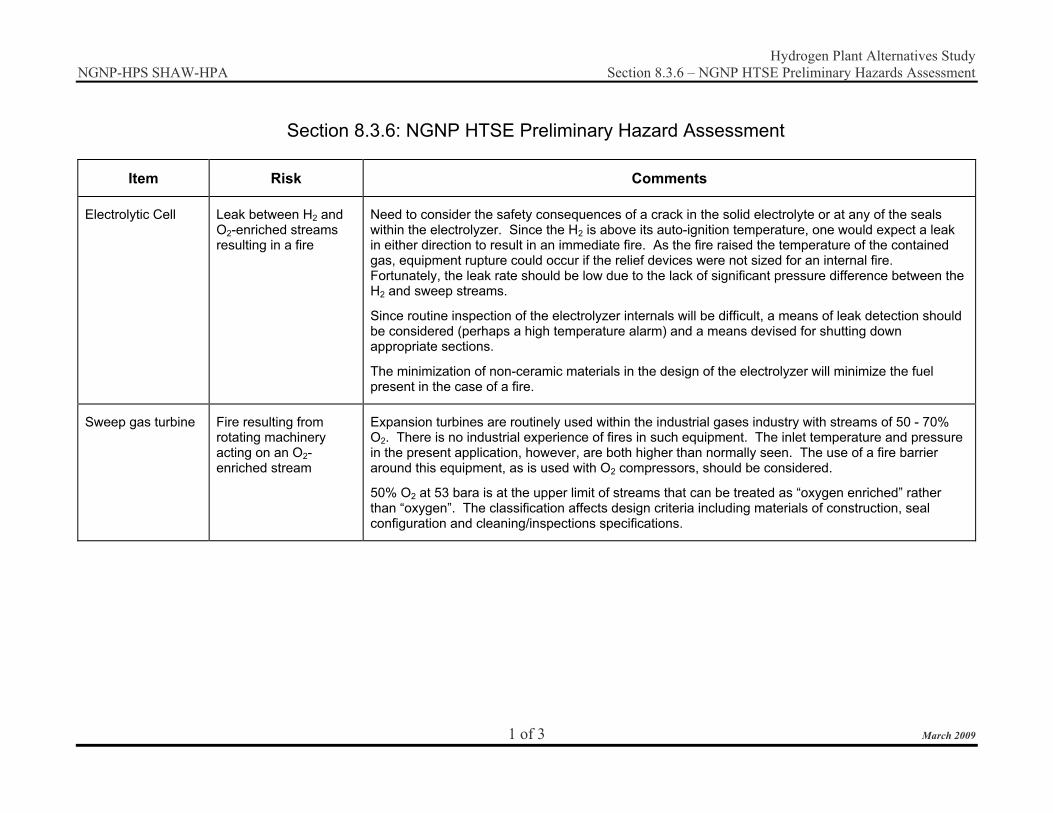
Hydrogen Plant Alternatives Study NGNP-HPS SHAW-HPA Section 8.3.6 – NGNP HTSE Preliminary Hazards Assessment
1 of 3 March 2009
Section 8.3.6: NGNP HTSE Preliminary Hazard Assessment
Item Risk Comments
Electrolytic Cell Leak between H2 and O2-enriched streams resulting in a fire
Need to consider the safety consequences of a crack in the solid electrolyte or at any of the seals within the electrolyzer. Since the H2 is above its auto-ignition temperature, one would expect a leak in either direction to result in an immediate fire. As the fire raised the temperature of the contained gas, equipment rupture could occur if the relief devices were not sized for an internal fire. Fortunately, the leak rate should be low due to the lack of significant pressure difference between the H2 and sweep streams.
Since routine inspection of the electrolyzer internals will be difficult, a means of leak detection should be considered (perhaps a high temperature alarm) and a means devised for shutting down appropriate sections.
The minimization of non-ceramic materials in the design of the electrolyzer will minimize the fuel present in the case of a fire.
Sweep gas turbine Fire resulting from rotating machinery acting on an O2-enriched stream
Expansion turbines are routinely used within the industrial gases industry with streams of 50 - 70% O2. There is no industrial experience of fires in such equipment. The inlet temperature and pressure in the present application, however, are both higher than normally seen. The use of a fire barrier around this equipment, as is used with O2 compressors, should be considered.
50% O2 at 53 bara is at the upper limit of streams that can be treated as “oxygen enriched” rather than “oxygen”. The classification affects design criteria including materials of construction, seal configuration and cleaning/inspections specifications.

Hydrogen Plant Alternatives Study NGNP-HPS SHAW-HPA Section 8.3.6 – NGNP HTSE Preliminary Hazards Assessment
2 of 3 March 2009
Item Risk Comments
Sweep gas- 50% O2 at high T & P
The enhanced flammability of materials in O2-enriched air resulting in an equipment fire
All piping, fittings and equipment exposed to > 25% oxygen must be oxygen-clean before start up. Fittings that are O2-cleaned at the factory must be shipped sealed.
At 56 bar and < 300°C, carbon steel might be used but velocity limits would need to be imposed to minimize the impact energy of any particles carried by the gas stream. The pipe should have a minimum thickness of 4.8 mm to minimize flammability. Special attention must be given to the material of construction of thin metal items such as filters and strainers and items in high velocity regions such as valve stems.
50% O2 at 870°C and 56 bar is far outside of the range of industrial experience. Certainly a Ni alloy would be required. At 50% oxygen, stainless steel may be acceptable with velocity limits. Testing would be recommended before final specification. The Marshall Space Flight Center has appropriate equipment for such testing.
The electrical connections and wiring within the electrolyzer must be designed for exposure to the O2-enriched sweep gas within the electrolyzer vessel.
The use of soft materials and lubricants should be minimized with oxygen-enriched streams. Fluorinated compounds such as Teflon™ and Viton™ are normally used for seals and per-fluorinated materials as lubricants. Temperature limits must of course be considered when using these materials..
H2 Loss of containment of a flammable gas at high pressure and temperature resulting in a fire or explosion
Materials of construction: Per API Publication 941, steel cannot be used with H2 at 56 bar above about 600°C. More exotic materials such as Inconel will need to be identified for the higher temperature equipment.
Due to the flammability of H2, mechanical joints should be avoided in this piping system.
The identification of appropriate seals may be an issue.
The possibilities of a jet fire or a confined vapor cloud explosion in the region of potential leak points should be considered in the development of the plant layout.
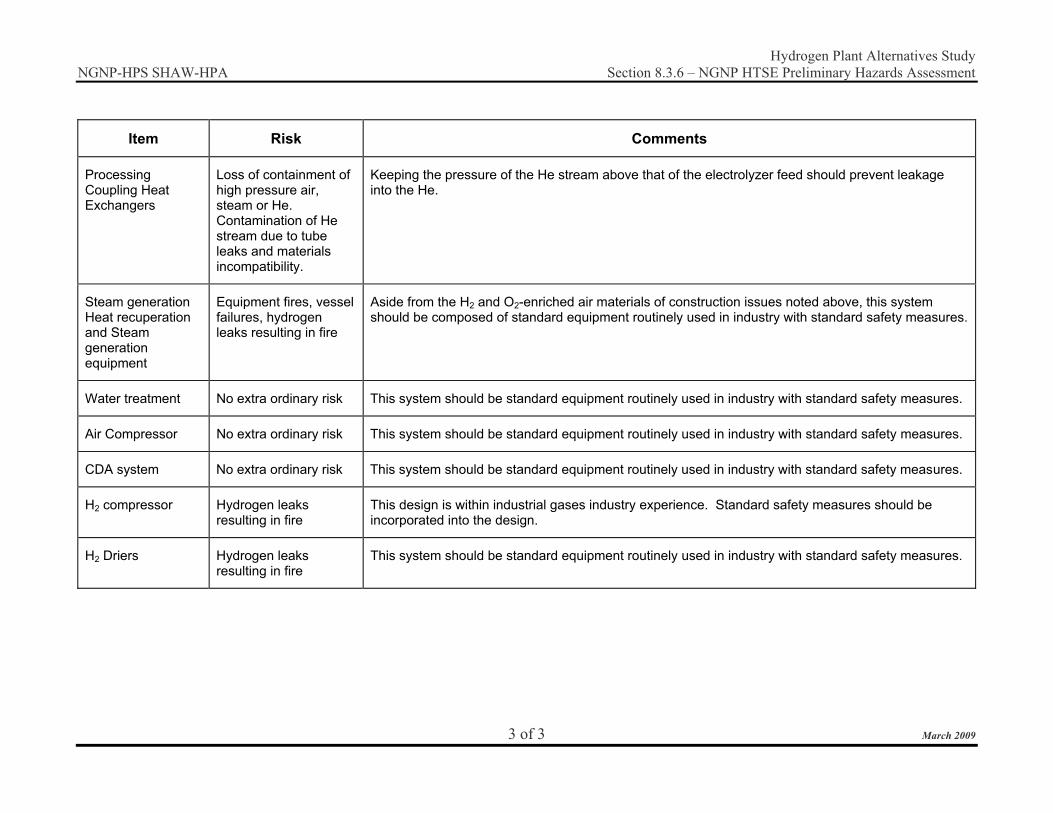
Hydrogen Plant Alternatives Study NGNP-HPS SHAW-HPA Section 8.3.6 – NGNP HTSE Preliminary Hazards Assessment
3 of 3 March 2009
Item Risk Comments
Processing Coupling Heat Exchangers
Loss of containment of high pressure air, steam or He. Contamination of He stream due to tube leaks and materials incompatibility.
Keeping the pressure of the He stream above that of the electrolyzer feed should prevent leakage into the He.
Steam generation Heat recuperation and Steam generation equipment
Equipment fires, vessel failures, hydrogen leaks resulting in fire
Aside from the H2 and O2-enriched air materials of construction issues noted above, this system should be composed of standard equipment routinely used in industry with standard safety measures.
Water treatment No extra ordinary risk This system should be standard equipment routinely used in industry with standard safety measures.
Air Compressor No extra ordinary risk This system should be standard equipment routinely used in industry with standard safety measures.
CDA system No extra ordinary risk This system should be standard equipment routinely used in industry with standard safety measures.
H2 compressor Hydrogen leaks resulting in fire
This design is within industrial gases industry experience. Standard safety measures should be incorporated into the design.
H2 Driers Hydrogen leaks resulting in fire
This system should be standard equipment routinely used in industry with standard safety measures.

Hydrogen Plant Alternatives Study NGNP-HPS SHAW-HPA Section 8 � Appendices
March 2009
8.3.7 Capital Cost Estimate

Hydrogen Plant Alternatives Study NGNP-HPS SHAW-HPA Section 8.3.7 � HTSE Capital Cost Estimate
1 of 4 March 2009
Section 8.3.7 � HTSE Capital Cost Estimate
ELE System Qty Cost
Equipment Electrolyzers Electrolytic Cell Stacks 1,881,579 Cell Stack Assembly 184,211 Electrolyzer Module Enclosure 151,500 Electrolyzer Module Enclosure Insulation 120,408 each module 2,337,697 total 76 177,665,000 Superheated Steam Process Coupling Exch 2 1,014,000 Sweep Gas Process Coupling Exch 2 748,000 Helium Control Valves 12 2,400,000 Subtotal Equipment 181,827,000
Installation Construction Labor 35,425,000 Equipment & Supplies 1,949,000 Construction Equipment 3,485,000 Vendor Services 300,000 Sub-subtotal Construction 41,159,000 Bulk Material 81,613,000 EPC Engineering 33,696,000 Spares 3,706,000 Freight 12,339,000 Other Costs - Catalyst, Desiccant 0 Subtotal Installation 172,513,000
ELE System Total 354,340,000
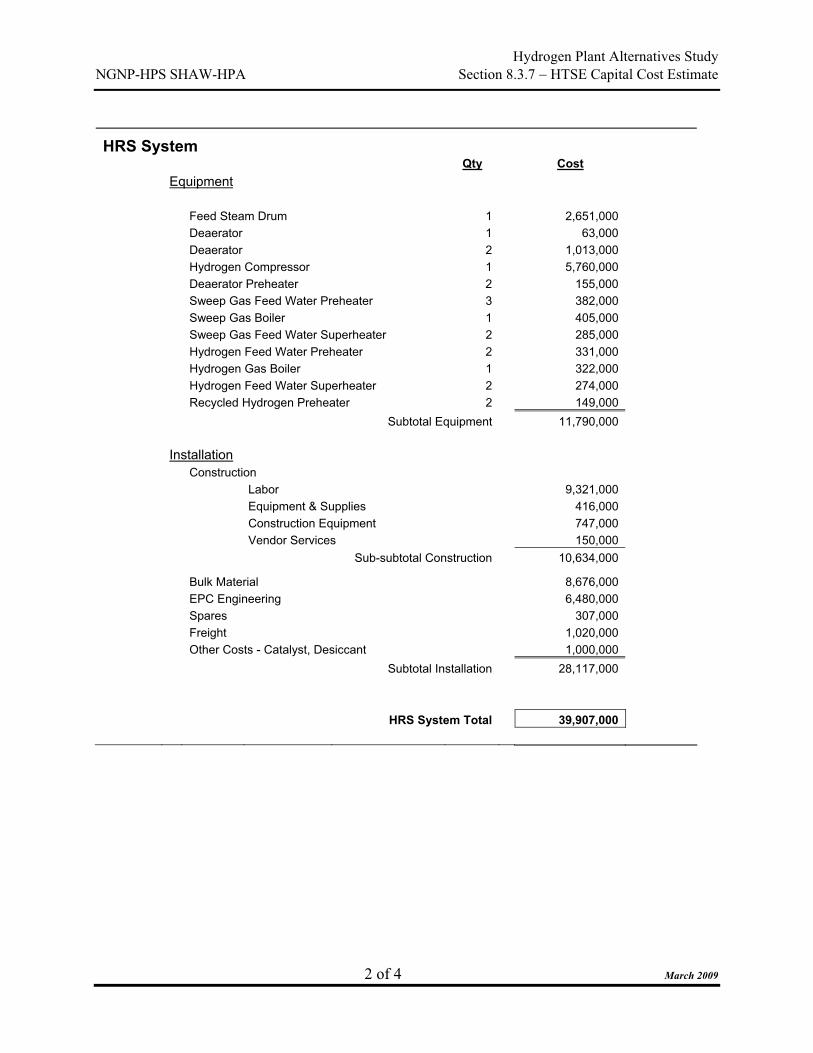
Hydrogen Plant Alternatives Study NGNP-HPS SHAW-HPA Section 8.3.7 � HTSE Capital Cost Estimate
2 of 4 March 2009
HRS System Qty Cost
Equipment Feed Steam Drum 1 2,651,000 Deaerator 1 63,000 Deaerator 2 1,013,000 Hydrogen Compressor 1 5,760,000 Deaerator Preheater 2 155,000 Sweep Gas Feed Water Preheater 3 382,000 Sweep Gas Boiler 1 405,000 Sweep Gas Feed Water Superheater 2 285,000 Hydrogen Feed Water Preheater 2 331,000 Hydrogen Gas Boiler 1 322,000 Hydrogen Feed Water Superheater 2 274,000 Recycled Hydrogen Preheater 2 149,000 Subtotal Equipment 11,790,000
Installation Construction Labor 9,321,000 Equipment & Supplies 416,000 Construction Equipment 747,000 Vendor Services 150,000 Sub-subtotal Construction 10,634,000
Bulk Material 8,676,000 EPC Engineering 6,480,000 Spares 307,000 Freight 1,020,000 Other Costs - Catalyst, Desiccant 1,000,000 Subtotal Installation 28,117,000
HRS System Total 39,907,000

Hydrogen Plant Alternatives Study NGNP-HPS SHAW-HPA Section 8.3.7 � HTSE Capital Cost Estimate
3 of 4 March 2009
FUS System Qty Cost
Equipment Clean Dry Air System 1 36,600,000 Water Pretreatment Filter/Softener System 1 1,370,000 Water Treatment RO/EDI System & Tank 1 28,600,000 Waste Water Treatment System 1 1,000,000 Condensate KO Drum 1 134,000 Sweep Gas Compressor Interstage KO Drums 4 1,125,000 Deaerator Feed Pumps 2 106,000 Sweep Gas Compressor 1 6,883,000 Sweep Gas Turbine 1 3,234,000 Hydrogen Product Cooler 1 43,000 Sweep Gas Compressor 1st Interstage Cooler 1 73,000 Sweep Gas Compressor 2nd Interstage Cooler 1 27,000 Subtotal Equipment 79,195,000
Installation Construction Labor 8,946,000 Equipment & Supplies 497,000 Construction Equipment 890,000 Vendor Services 0 Sub-subtotal Construction 10,333,000
Bulk Material 5,218,000 EPC Engineering 4,590,000 Spares 289,000 Freight 953,000 Other Costs - Catalyst, Desiccant 0 Subtotal Installation 21,383,000
FUS System Total 100,578,000

Hydrogen Plant Alternatives Study NGNP-HPS SHAW-HPA Section 8.3.7 � HTSE Capital Cost Estimate
4 of 4 March 2009
PPU System Qty/Train Cost
Equipment Hydrogen H2O Adsorbers 2 1,234,000 Regen Water KO Drum 1 40,000 Hydrogen H2O Adsorber Regen Heater 1 32,000 Hydrogen H2O Adsorber Regen Cooler 1 43,000 Subtotal Equipment 1,349,000
Installation Construction Labor 3,034,000 Equipment & Supplies 169,000 Construction Equipment 303,000 Vendor Services 0 Sub-subtotal Construction 3,506,000
Bulk Material 2,428,000 EPC Engineering 1,620,000 Spares 57,000 Freight 187,000 Other Costs - Catalyst, Desiccant 4,879,000 Subtotal Installation 12,677,000
PPU system total 14,026,000
Total HTSE Hydrogen Production System Cost ELE System Total 354,340,000 HRS System Total 39,907,000 FUS System Total 100,578,000 PPU System Total 14,026,000
Grand Total 508,851,000

Hydrogen Plant Alternatives Study NGNP-HPS SHAW-HPA Section 8 � Appendices
March 2009
8.3.8 Operating Cost Estimate
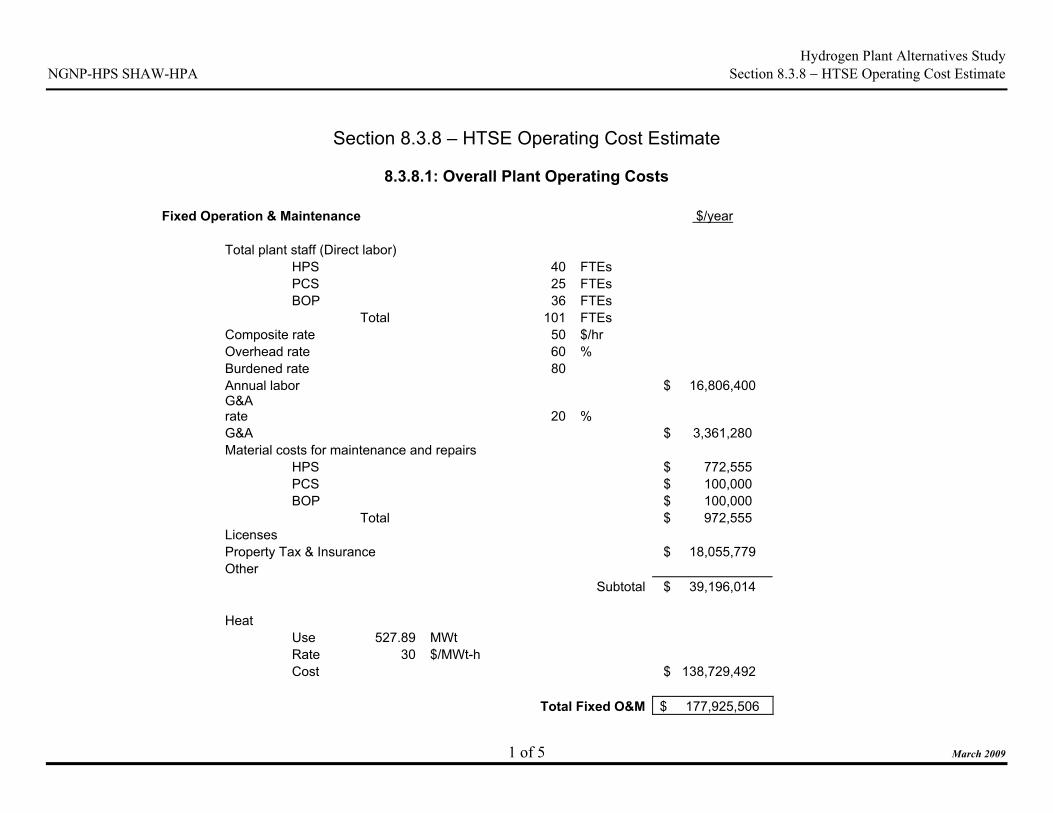
Hydrogen Plant Alternatives Study NGNP-HPS SHAW-HPA Section 8.3.8 � HTSE Operating Cost Estimate
1 of 5 March 2009
Section 8.3.8 – HTSE Operating Cost Estimate
8.3.8.1: Overall Plant Operating Costs
Fixed Operation & Maintenance $/year Total plant staff (Direct labor) HPS 40 FTEs PCS 25 FTEs BOP 36 FTEs Total 101 FTEs Composite rate 50 $/hr Overhead rate 60 % Burdened rate 80 Annual labor $ 16,806,400 G&Arate 20 % G&A $ 3,361,280 Material costs for maintenance and repairs HPS $ 772,555 PCS $ 100,000 BOP $ 100,000 Total $ 972,555 Licenses Property Tax & Insurance $ 18,055,779 Other
Subtotal $ 39,196,014 Heat Use 527.89 MWt Rate 30 $/MWt-h Cost $ 138,729,492
Total Fixed O&M $ 177,925,506

Hydrogen Plant Alternatives Study NGNP-HPS SHAW-HPA Section 8.3.8 � HTSE Operating Cost Estimate
2 of 5 March 2009
Variable Operation & Maintenance $/year Electric power consumption $ 224,887,754 rate 75 $/MWe-h annual cost Cooling water consumption $ 563,958 q 2664 m3/hr = 49.17 gal/kg H2
trains 2 0.37 m3/sec CS,u 0.026 $/m3 Process water
supply - natural water
q 184 m3/hr = 3.40 gal/kg H2
CS,u 0.069 $/m3 $ 103,766 softening q 166 m3/hr 0.079 $/m3 $ 107,608 RO/EDI q 132 m3/hr 0.403 $/m3 $ 436,506 Total Unit Cost 0.002 $/gal Total Water Cost $ 647,881 Other Material Costs
Electrolyzer refurbishment in Replacement Capital Mol sieves 109 $/hr $ 894,412 Total Other Material Costs $ 894,412
Waste treatment costs $ 28,502,454 q 15.58 kg/s CS,u 0.248 $/kg ÷ 4 = 0.06193 $/kg

Hydrogen Plant Alternatives Study NGNP-HPS SHAW-HPA Section 8.3.8 � HTSE Operating Cost Estimate
3 of 5 March 2009
Solid waste disposal costs $ - Total Unplanned Replacement Capital Cost Factor (% of total direct depreciable costs/year) 0.50 %
Total Variable O&M $ 255,496,458

Hydrogen Plant Alternatives Study NGNP-HPS SHAW-HPA Section 8.3.8 � HTSE Operating Cost Estimate
4 of 5 March 2009
8.3.8.2: Detail, Hydrogen Production System Operating Costs
NGNP HPAS HTSE Operating Usages [ All usages are on a per train basis. HTSE Plant has One (1) train] Operating hours per year 8200 Staffing:
Operations: 3 per shift Maintenance 5 per shift
4additional, day shift only ( these should cover the electrolyzer replacement labor)
Supervision & Engineering Plant Mgr, Assistant, Engineer and Administrative assistant.
Electricity Electrolysis total MWeh/h 478.7
Steam none Cooling Water
Plant total m3/h 2,664 Catalyst and Chemicals Hourly costs
Water softening chemicals (included in process water cost) Mole sieves $ 109
Replacements
Electrolyzers per module
costs Annual
Replacements Hourly costs Cell stacks $1,880,000 4 $917 Stack assembly/Refurbishing $184,000 7 $157 Enclosure $270,000 2 $66 Installation: Stack (replacement or refurbishing) 40 effort hours
Installation: Enclosure 50 effort hours
Included in maintenance hours
RO membranes ( included in process water cost)

Hydrogen Plant Alternatives Study NGNP-HPS SHAW-HPA Section 8.3.8 � HTSE Operating Cost Estimate
5 of 5 March 2009
Process Water Usage 50.16 kg/s Density 999.6 kg/m3 Boiler blowdown 2% Supply 184 m3/h Softened 166 m3/h RO/EDI 132 m3/h
Costs Supply 0.069 $/m3
Ulrich & Vasudevan, "How to estimate Utility Costs," Chem. Eng., Apr 2006, pp. 66-69: Natural Water Pumped and screened.
Softening 0.079 $/m3 RO/EDI 0.403 $/m3
Wastes
Liquid Effluent FromSoftening 5.02 kg/s
From RO/EDI 9.56 kg/s Blowdown 1.00 kg/s Total 15.58 kg/s 56,102 kg/h
0.248 $/kg 1/4 of Ulrich, " Conventional Liquid Waste"
Solid Wastes Damaged stacks no cost
Assumed damaged stacks are returned to the manufacturer for recycle
Vapor Effluent Sweep gas: no cost

Hydrogen Plant Alternatives Study NGNP-HPS SHAW-HPA Section 8 � Appendices
March 2009
8.4 TECHNOLOGY DEVELOPMENT
8.4.1 Technology Readiness Levels 8.4.2 Design Data Needs 8.4.3 Design Tasks

Hydrogen Plant Alternatives Study NGNP-HPS SHAW-HPA Section 8 � Appendices
March 2009
8.4.1 Technology Readiness Levels
Sulfuric Acid Decomposition TRLs (Page 1) Sulfur Dioxide Electrolysis TRLs (Page 12)
Bunsen Reaction and HI Decomposition TRLs (Page 22) High Temperature Steam Electrolysis TRLs (Page 32)

Hydrogen Plant Alternatives Study NGNP-HPS SHAW-HPA Section 8 � Appendices
1 of 49 March 2009
Sulfuric Acid Decomposition TRLs

Hydrogen Plant Alternatives Study NGNP-HPS SHAW-HPA Section 8 � Appendices
2 of 49 March 2009
TRL Rating Sheet
Document Number: 009 Revision:
� Facility � System � Subsystem � Structure � Component
Title: H2SO4 Decomposer Tubes and Tube Array
Description: an SSE of the H2SO4 Decomposer of the Sulfuric Acid Decomposition Section of the S-I and HyS HPS
Facility: � NHSS � HTS � HPS � PCS � BOP
Technology Readiness Level Next Lower
Rating Level Rating Next Higher Rating Level
Generic Definitions (abbreviated) Proof-of concept
Technology or component is tested at bench scale.
SSC demonstrated at experimental scale in relevant environment.
TRL 3 4 5
Basis for Rating (Attach additional sheets as needed) The silicon carbide bayonet tube H2SO4 Decomposer has been demonstrated as a separate component, as documented in reports by Sandia Laboratories [Ref. Parma, E., et al. “Modeling the Sulfuric Acid Decomposition Section for Hydrogen Production,” ANS Topical Meeting, June 24-28, 2007, Boston] and has functioned in the S-I ILS.
Outline of a plan to get from current level to next level (Attach additional sheets as needed)
Actions (list all) Schedule Cost (k$)
DDN(s) supported: HPS-SAD-01 through HPS-SAD-13
Subject Matter Expert Making Determination: meeting, Denver, 20NOV08
Date: 20NOV08 Originating Organization: - -
Rev. AUG08, DTA

Hydrogen Plant Alternatives Study NGNP-HPS SHAW-HPA Section 8 � Appendices
3 of 49 March 2009
TRL Rating Sheet
Document Number: 031 Revision:
� Facility � System � Subsystem � Structure � Component
Title: H2SO4 Decomposer Internal Manifolds and Seals
Description: an SSE of the H2SO4 Decomposer of the Sulfuric Acid Decomposition Section of the S-I and HyS HPS
Facility: � NHSS � HTS � HPS � PCS � BOP
Technology Readiness Level Next Lower
Rating Level Rating Next Higher Rating Level
Generic Definitions (abbreviated) Proof-of concept
Technology or component is tested at bench scale.
SSC demonstrated at experimental scale in relevant environment.
TRL 3 4 5
Basis for Rating (Attach additional sheets as needed) The silicon carbide bayonet tube H2SO4 Decomposer has been demonstrated as a separate component, as documented in reports by Sandia Laboratories [Ref. Parma, E., et al. “Modeling the Sulfuric Acid Decomposition Section for Hydrogen Production,” ANS Topical Meeting, June 24-28, 2007, Boston] and has functioned in the S-I ILS.
Outline of a plan to get from current level to next level (Attach additional sheets as needed)
Actions (list all) Schedule Cost (k$)
DDN(s) supported: HPS-SAD-01 through HPS-SAD-13
Subject Matter Expert Making Determination: meeting, Denver, 20NOV08
Date: 20NOV08 Originating Organization: - -
Rev. AUG08, DTA

Hydrogen Plant Alternatives Study NGNP-HPS SHAW-HPA Section 8 � Appendices
4 of 49 March 2009
TRL Rating Sheet
Document Number: 032 Revision:
� Facility � System � Subsystem � Structure � Component
Title: H2SO4 Decomposer Vessel
Description: an SSE of the H2SO4 Decomposer of the Sulfuric Acid Decomposition Section of the S-I and HyS HPS
Facility: � NHSS � HTS � HPS � PCS � BOP
Technology Readiness Level Next Lower
Rating Level Rating Next Higher Rating Level
Generic Definitions (abbreviated) Proof-of concept
Technology or component is tested at bench scale.
SSC demonstrated at experimental scale in relevant environment.
TRL 3 4 5
Basis for Rating (Attach additional sheets as needed) The silicon carbide bayonet tube H2SO4 Decomposer has been demonstrated as a separate component, as documented in reports by Sandia Laboratories [Ref. Parma, E., et al. “Modeling the Sulfuric Acid Decomposition Section for Hydrogen Production,” ANS Topical Meeting, June 24-28, 2007, Boston] and has functioned in the S-I ILS.
Outline of a plan to get from current level to next level (Attach additional sheets as needed)
Actions (list all) Schedule Cost (k$)
DDN(s) supported: HPS-SAD-01 through HPS-SAD-13
Subject Matter Expert Making Determination: meeting, Denver, 20NOV08
Date: 20NOV08 Originating Organization: - -
Rev. AUG08, DTA

Hydrogen Plant Alternatives Study NGNP-HPS SHAW-HPA Section 8 � Appendices
5 of 49 March 2009
TRL Rating Sheet
Document Number: 030 Revision:
� Facility � System � Subsystem � Structure � Component
Title: Decomposer Catalyst
Description: an SSE of the H2SO4 Decomposer of the Sulfuric Acid Decomposition Section of the S-I and HyS HPS
Facility: � NHSS � HTS � HPS � PCS � BOP
Technology Readiness Level Next Lower
Rating Level Rating Next Higher Rating Level
Generic Definitions (abbreviated) Technology concept and application formulated
Proof-of concept
Technology or component is tested at bench scale.
TRL 2 3 4
Basis for Rating (Attach additional sheets as needed) Performance and candidate catalytic materials have been identified, but not fully defined. Lab tests (SNL) have been performed, but one of the critical performance issues, catalyst life, has not been proven. Therefore all critical functions have not been proven in the laboratory. Candidate catalytic materials that have a reasonable operating life must be identified before the catalyst can be properly designed.
Outline of a plan to get from current level to next level (Attach additional sheets as needed)
Actions (list all) Schedule Cost (k$)
DDN(s) supported: HPS-SAD-2
Subject Matter Expert Making Determination: Charles O. Bolthrunis
Date: 08AUG07 Originating Organization: Shaw Stone & Webster
Modified: Daniel Allen Changed TRL 1 to TRL 3, consequence of review meeting in Denver, 07NOV08.
Date: 07NOV08 Originating Organization: Technology Insights
Rev. AUG08, DTA

Hydrogen Plant Alternatives Study NGNP-HPS SHAW-HPA Section 8 � Appendices
6 of 49 March 2009
TRL Rating Sheet
Document Number: 010 Revision:
� Facility � System � Subsystem � Structure � Component
Title: Decomposer Product Handling Equipment
Description: an SSE of the Sulfuric Acid Decomposition Section of the S-I and HyS HPS
Facility: � NHSS � HTS � HPS � PCS � BOP
Technology Readiness Level Next Lower
Rating Level Rating Next Higher Rating Level
Generic Definitions (abbreviated) SSC demonstrated at experimental scale in relevant environment
SSC demonstrated at pilot scale in relevant environment
SSC demonstrated at engineering scale in relevant environment
TRL 5 6 7
Basis for Rating (Attach additional sheets as needed) The design will be typical of standard technology. However, there need to be testing of compatibility with materials of construction. TRL 6 assigned because technology is definitely beyond demonstration of feasibility and functionality and has operated in relevant environments, but adequate scale of demonstration is unclear. Could be TRL 7 but needs demonstration in the operational environment to get to TRL 8.
Outline of a plan to get from current level to next level (Attach additional sheets as needed)
Actions (list all) Schedule Cost (k$)
DDN(s) supported: HPS-SAD-1, HPS-SAD-12, HPS-SAD-13, HPS-SAD-14
Subject Matter Expert Making Determination: Daniel Allen
Date: 29OCT08 Originating Organization: Technology Insights
Rev. AUG08, DTA

Hydrogen Plant Alternatives Study NGNP-HPS SHAW-HPA Section 8 � Appendices
7 of 49 March 2009
TRL Rating Sheet
Document Number: 011 Revision:
� Facility � System � Subsystem � Structure � Component
Title: H2SO4 Concentrator Vacuum Column
Description: an SSE of the Sulfuric Acid Decomposition Section of the S-I and HyS HPS
Facility: � NHSS � HTS � HPS � PCS � BOP
Technology Readiness Level Next Lower
Rating Level Rating Next Higher Rating Level
Generic Definitions (abbreviated) SSC demonstrated at experimental scale in relevant environment
SSC demonstrated at pilot scale in relevant environment
SSC demonstrated at engineering scale in relevant environment
TRL 5 6 7
Basis for Rating (Attach additional sheets as needed) Vapor-liquid equilibrium data is needed as well as adequate mass and heat transfer data. TRL 6 assigned because technology is definitely beyond demonstration of feasibility and functionality. Once the design concept has been defined, sub-scale testing will confirm readiness for the prototype system test (TRL 8).
Outline of a plan to get from current level to next level (Attach additional sheets as needed)
Actions (list all) Schedule Cost (k$)
DDN(s) supported: HPS-SAD-15
Subject Matter Expert Making Determination: Daniel Allen
Date: 29OCT08 Originating Organization: Technology Insights
Rev. AUG08, DTA
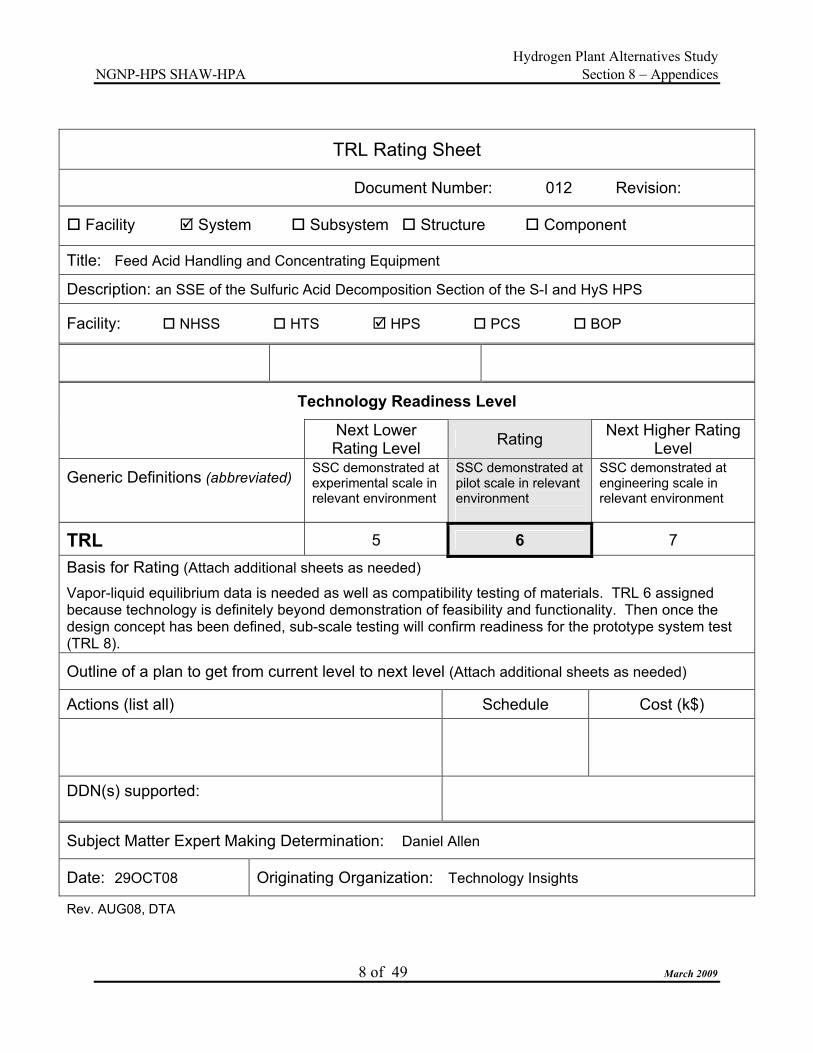
Hydrogen Plant Alternatives Study NGNP-HPS SHAW-HPA Section 8 � Appendices
8 of 49 March 2009
TRL Rating Sheet
Document Number: 012 Revision:
� Facility � System � Subsystem � Structure � Component
Title: Feed Acid Handling and Concentrating Equipment
Description: an SSE of the Sulfuric Acid Decomposition Section of the S-I and HyS HPS
Facility: � NHSS � HTS � HPS � PCS � BOP
Technology Readiness Level Next Lower
Rating Level Rating Next Higher Rating Level
Generic Definitions (abbreviated) SSC demonstrated at experimental scale in relevant environment
SSC demonstrated at pilot scale in relevant environment
SSC demonstrated at engineering scale in relevant environment
TRL 5 6 7
Basis for Rating (Attach additional sheets as needed) Vapor-liquid equilibrium data is needed as well as compatibility testing of materials. TRL 6 assigned because technology is definitely beyond demonstration of feasibility and functionality. Then once the design concept has been defined, sub-scale testing will confirm readiness for the prototype system test (TRL 8).
Outline of a plan to get from current level to next level (Attach additional sheets as needed)
Actions (list all) Schedule Cost (k$)
DDN(s) supported:
Subject Matter Expert Making Determination: Daniel Allen
Date: 29OCT08 Originating Organization: Technology Insights
Rev. AUG08, DTA

Hydrogen Plant Alternatives Study NGNP-HPS SHAW-HPA Section 8 � Appendices
9 of 49 March 2009
TRL Rating Sheet
Document Number: 013 Revision:
� Facility � System � Subsystem � Structure � Component
Title: Steam Ejectors and Vacuum Pump
Description: an SSE of the Sulfuric Acid Decomposition Section of the S-I and HyS HPS
Facility: � NHSS � HTS � HPS � PCS � BOP
Technology Readiness Level Next Lower
Rating Level Rating Next Higher Rating Level
Generic Definitions (abbreviated) SSC demonstrated at experimental scale in relevant environment
SSC demonstrated at pilot scale in relevant environment
SSC demonstrated at engineering scale in relevant environment
TRL 5 6 7
Basis for Rating (Attach additional sheets as needed) The design will be typical of standard technology. However, there need to be testing of compatibility with materials of construction. TRL 6 assigned because technology is definitely beyond demonstration of feasibility and functionality.
Outline of a plan to get from current level to next level (Attach additional sheets as needed)
Actions (list all) Schedule Cost (k$)
DDN(s) supported: HPS-SAD-1, HPS-SAD-10 through HPS-SAD-14
Subject Matter Expert Making Determination: Daniel Allen
Date: 29OCT08 Originating Organization: Technology Insights
Rev. AUG08, DTA
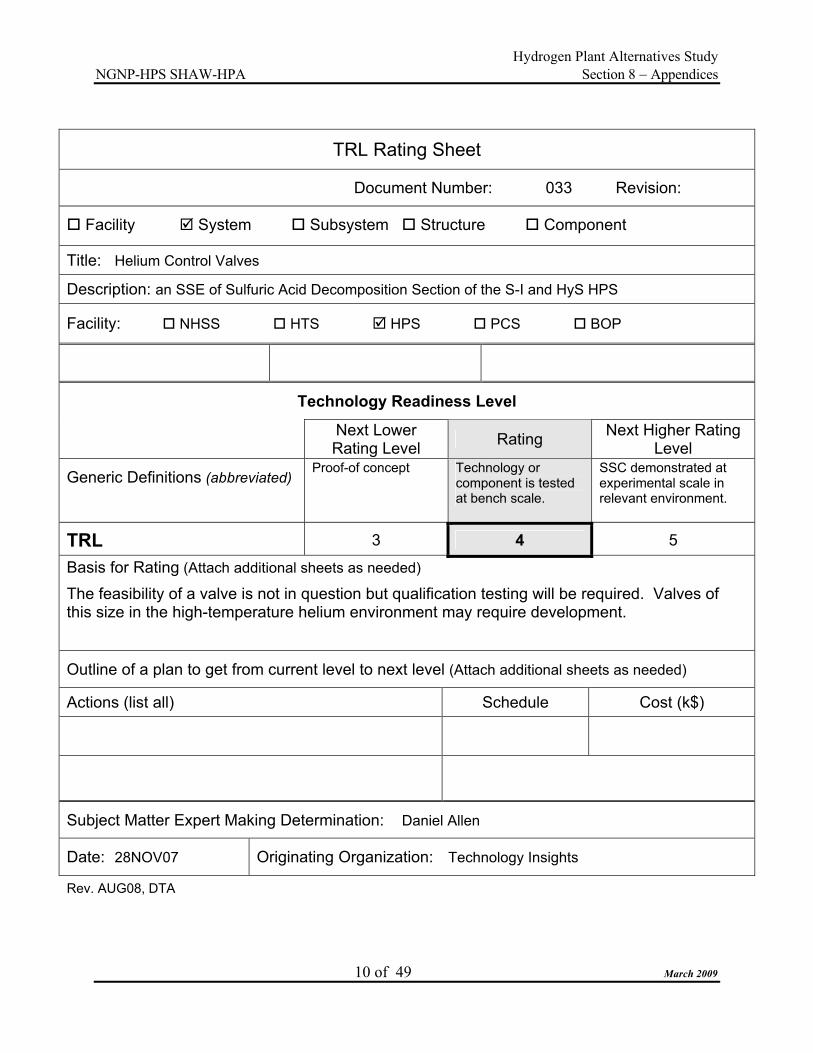
Hydrogen Plant Alternatives Study NGNP-HPS SHAW-HPA Section 8 � Appendices
10 of 49 March 2009
TRL Rating Sheet
Document Number: 033 Revision:
� Facility � System � Subsystem � Structure � Component
Title: Helium Control Valves
Description: an SSE of Sulfuric Acid Decomposition Section of the S-I and HyS HPS
Facility: � NHSS � HTS � HPS � PCS � BOP
Technology Readiness Level Next Lower
Rating Level Rating Next Higher Rating Level
Generic Definitions (abbreviated) Proof-of concept
Technology or component is tested at bench scale.
SSC demonstrated at experimental scale in relevant environment.
TRL 3 4 5
Basis for Rating (Attach additional sheets as needed) The feasibility of a valve is not in question but qualification testing will be required. Valves of this size in the high-temperature helium environment may require development.
Outline of a plan to get from current level to next level (Attach additional sheets as needed)
Actions (list all) Schedule Cost (k$)
Subject Matter Expert Making Determination: Daniel Allen
Date: 28NOV07 Originating Organization: Technology Insights
Rev. AUG08, DTA

Hydrogen Plant Alternatives Study NGNP-HPS SHAW-HPA Section 8 � Appendices
11 of 49 March 2009
TRL Rating Sheet
Document Number: 034 Revision:
� Facility � System � Subsystem � Structure � Component
Title: Sensors and Instruments
Description: an SSE of the Sulfuric Acid Decomposition Section of the S-I and HyS HPS
Facility: � NHSS � HTS � HPS � PCS � BOP
Technology Readiness Level Next Lower
Rating Level Rating Next Higher Rating Level
Generic Definitions (abbreviated) SSC demonstrated at experimental scale in relevant environment
SSC demonstrated at pilot scale in relevant environment
SSC demonstrated at engineering scale in relevant environment
TRL 5 6 7
Basis for Rating (Attach additional sheets as needed) Chief concerns in this sub-system are control valves (process side), sensors and other instruments in contact with aggressive environments. Previous experience applicable but not sufficient. TRL 6 assigned because technology is beyond demonstration of feasibility and functionality.
Outline of a plan to get from current level to next level (Attach additional sheets as needed)
Actions (list all) Actions (list all) Actions (list all) . .
DDN(s) supported: HPS-PCN-01, HPS-PCN-02, HPS-PCN-03
Subject Matter Expert Making Determination: Charles O. Bolthrunis
Date: 08AUG07 Date: 08AUG07
Modified: Daniel Allen Modified: Daniel Allen
Date: 28NOV08 Originating Organization: Technology Insights
Rev. AUG08, DTA

Hydrogen Plant Alternatives Study NGNP-HPS SHAW-HPA Section 8 � Appendices
12 of 49 March 2009
Sulfur Dioxide Electrolysis TRLs

Hydrogen Plant Alternatives Study NGNP-HPS SHAW-HPA Section 8 � Appendices
13 of 49 March 2009
TRL Rating Sheet
Document Number: 023 Revision:
� Facility � System � Subsystem � Structure � Component
Title: SO2 Electrolysis Cells
Description: an SSE of the Electrolyzer System (ELE) of the HyS HPS
Facility: � NHSS � HTS � HPS � PCS � BOP
Technology Readiness Level Next Lower
Rating Level Rating Next Higher Rating Level
Generic Definitions (abbreviated) Technology concept and application formulated
Proof-of concept
Technology or component is tested at bench scale.
TRL 2 3 4
Basis for Rating (Attach additional sheets as needed) Tests completed at SRNL constitute proof-of-principle. Testing at expected pressures has not been accomplished. All acceptable materials have not been identified and materials issues have not been quantified. A multicell stack has been demonstrated at bench-scale (3 cell stack, 160 sq. cm per cell) but suitable catalyst and membrane materials have not been determined to allow the individual components to work with suitable performance at the laboratory scale. Based on information available from the labs, Westinghouse, and industry, a basic cell configuration selection must be made shortly. .
Outline of a plan to get from current level to next level (Attach additional sheets as needed)
Actions (list all) Schedule Cost (k$) A number of membranes tested show formation of a sulfur-rich layer that degrades cell performance. Effects of membrane materials, fabrication methods, and operating conditions on transport of SO2 through the membranes have been hypothesized but are not fully understood at this time. Development and testing of candidate membranes must continue until a suitable membrane can be demonstrated. Electrocatalytic activity shown in testing to-date is not sufficient for target operating conditions: 0.5 A/cm2 at

Hydrogen Plant Alternatives Study NGNP-HPS SHAW-HPA Section 8 � Appendices
14 of 49 March 2009
0.6 V at 50 wt% sulfuric acid. Development and testing of candidate catalysts must continue until suitable activity can be achieved. Define operating conditions and conduct electrolyzer testing using the final selected Membrane-Electrode Assembly (MEA) at true process conditions (temperature, pressure, reactant concentration). This can only be completed after membrane selection and catalyst development are complete. Complete longevity tests using final selected MEA at true process conditions. This can only be completed after membrane selection and catalyst development are complete.
DDN(s) supported: HPS-ELE-01A through HPS-ELE-06
Subject Matter Expert Making Determination: Kathleen McHugh
Date: 10/20/08 Originating Organization: MPR
Modified: Daniel Allen Changed TRL 2 to TRL 3, basis discussion modified; DDNs added
Date: 29OCT08 Originating Organization: Technology Insights
Rev. AUG08, DTA
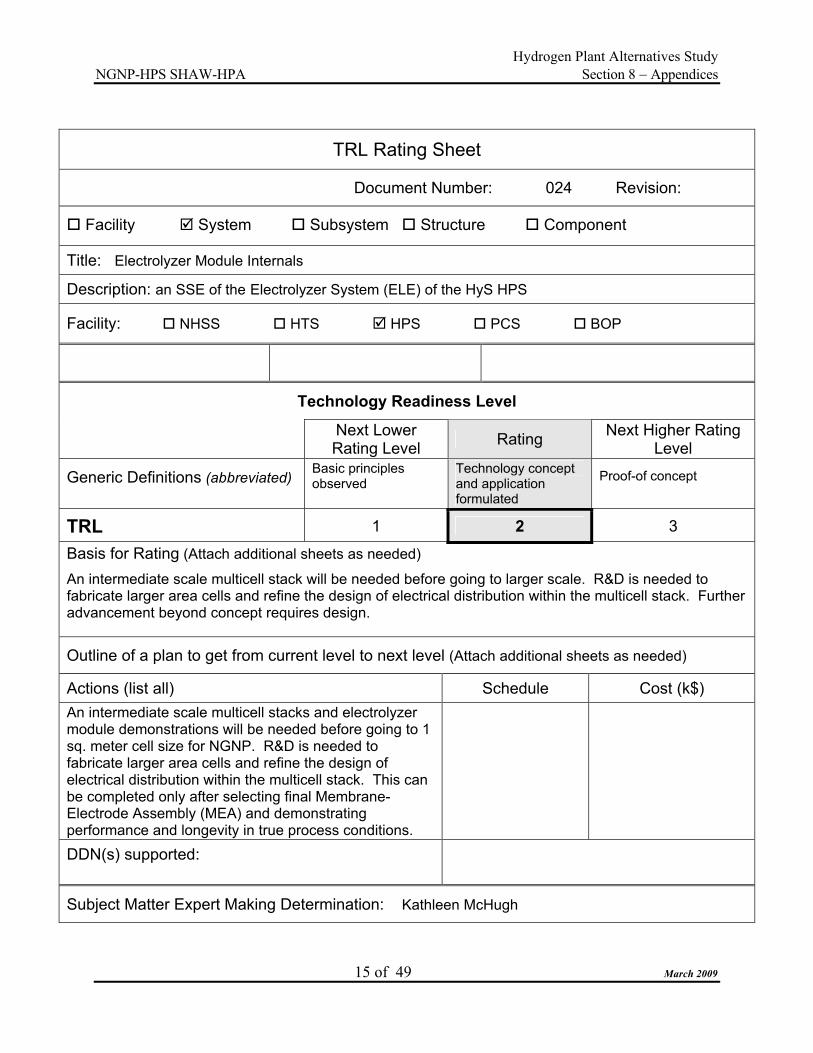
Hydrogen Plant Alternatives Study NGNP-HPS SHAW-HPA Section 8 � Appendices
15 of 49 March 2009
TRL Rating Sheet
Document Number: 024 Revision:
� Facility � System � Subsystem � Structure � Component
Title: Electrolyzer Module Internals
Description: an SSE of the Electrolyzer System (ELE) of the HyS HPS
Facility: � NHSS � HTS � HPS � PCS � BOP
Technology Readiness Level Next Lower
Rating Level Rating Next Higher Rating Level
Generic Definitions (abbreviated) Basic principles observed
Technology concept and application formulated
Proof-of concept
TRL 1 2 3
Basis for Rating (Attach additional sheets as needed) An intermediate scale multicell stack will be needed before going to larger scale. R&D is needed to fabricate larger area cells and refine the design of electrical distribution within the multicell stack. Further advancement beyond concept requires design.
Outline of a plan to get from current level to next level (Attach additional sheets as needed)
Actions (list all) Schedule Cost (k$) An intermediate scale multicell stacks and electrolyzer module demonstrations will be needed before going to 1 sq. meter cell size for NGNP. R&D is needed to fabricate larger area cells and refine the design of electrical distribution within the multicell stack. This can be completed only after selecting final Membrane-Electrode Assembly (MEA) and demonstrating performance and longevity in true process conditions.
DDN(s) supported:
Subject Matter Expert Making Determination: Kathleen McHugh

Hydrogen Plant Alternatives Study NGNP-HPS SHAW-HPA Section 8 � Appendices
16 of 49 March 2009
Date: 10/20/08 Originating Organization: MPR
Modified: Daniel Allen Changed TRL 3 to TRL 2, basis discussion and actions list modified
Date: 29OCT08 Originating Organization: Technology Insights
Rev. AUG08, DTA
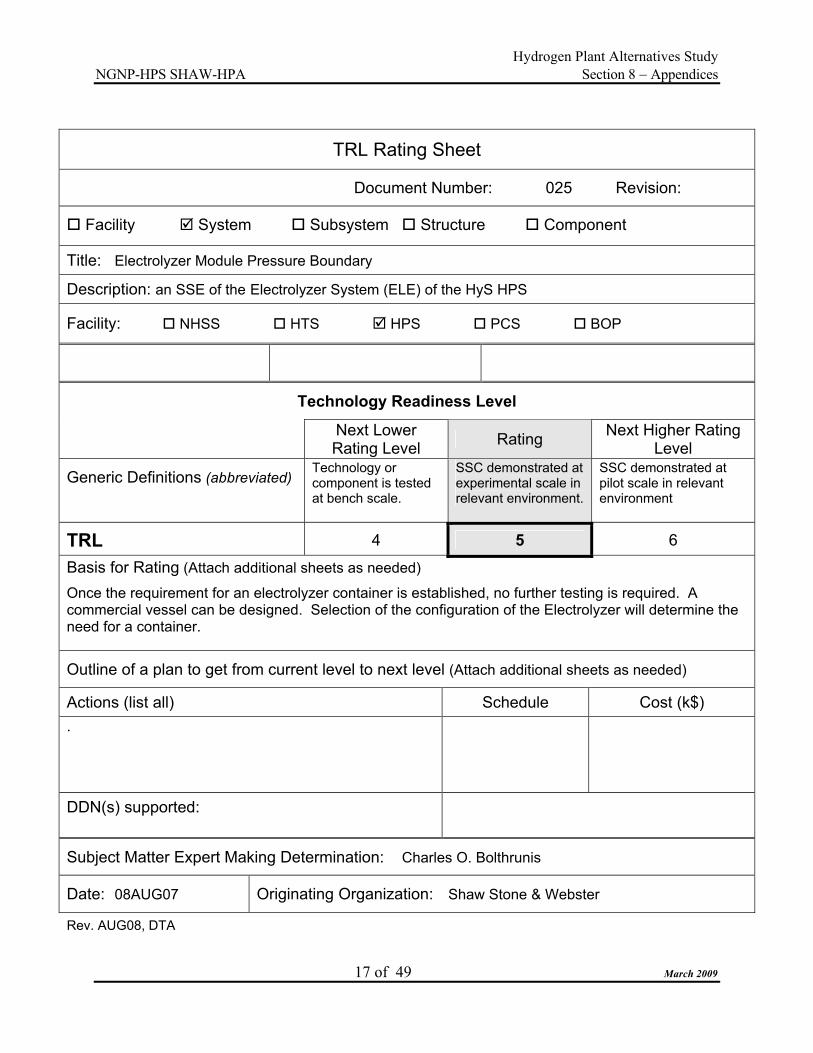
Hydrogen Plant Alternatives Study NGNP-HPS SHAW-HPA Section 8 � Appendices
17 of 49 March 2009
TRL Rating Sheet
Document Number: 025 Revision:
� Facility � System � Subsystem � Structure � Component
Title: Electrolyzer Module Pressure Boundary
Description: an SSE of the Electrolyzer System (ELE) of the HyS HPS
Facility: � NHSS � HTS � HPS � PCS � BOP
Technology Readiness Level Next Lower
Rating Level Rating Next Higher Rating Level
Generic Definitions (abbreviated) Technology or component is tested at bench scale.
SSC demonstrated at experimental scale in relevant environment.
SSC demonstrated at pilot scale in relevant environment
TRL 4 5 6
Basis for Rating (Attach additional sheets as needed) Once the requirement for an electrolyzer container is established, no further testing is required. A commercial vessel can be designed. Selection of the configuration of the Electrolyzer will determine the need for a container.
Outline of a plan to get from current level to next level (Attach additional sheets as needed)
Actions (list all) Schedule Cost (k$) .
DDN(s) supported:
Subject Matter Expert Making Determination: Charles O. Bolthrunis
Date: 08AUG07 Originating Organization: Shaw Stone & Webster
Rev. AUG08, DTA

Hydrogen Plant Alternatives Study NGNP-HPS SHAW-HPA Section 8 � Appendices
18 of 49 March 2009
TRL Rating Sheet
Document Number: 026 Revision:
� Facility � System � Subsystem � Structure � Component
Title: SO2 Absorber
Description: an SSE of the Sulfuric Acid Decomposition System (SAD) of the HyS HPS
Facility: � NHSS � HTS � HPS � PCS � BOP
Technology Readiness Level Next Lower
Rating Level Rating Next Higher Rating Level
Generic Definitions (abbreviated) SSC demonstrated at experimental scale in relevant environment
SSC demonstrated at pilot scale in relevant environment
SSC demonstrated at engineering scale in relevant environment
TRL 5 6 7
Basis for Rating (Attach additional sheets as needed) Absorption operations are used commonly throughout industry. Packed columns are available for use at all scales. Preliminary process parameters for the HyS process have been defined in a conceptual design flowsheet. Further flowsheet optimization for pilot scale is expected, which may impact key process parameters for separation equipment. This absorption column accepts streams containing SO2, H2O, H2SO4, and trace amounts of O2; a corrosion-resistant material will be needed. Pressure in the current flow sheet is too high for use of a glass-lined column; fabrication from a corrosion resistant metal (e.g., Hastelloy B3) may be needed. Equipment scaling and manufacturing processes for packed columns are well understood in industry, but the selected material will need to be tested in the operating environment for corrosion resistance.
Outline of a plan to get from current level to next level (Attach additional sheets as needed)
Actions (list all) Schedule Cost (k$)
Identify suitable materials of construction and test in process conditions. Complete optimization and prepare a design specification considering final operating conditions for the column for procurement at the pilot scale.
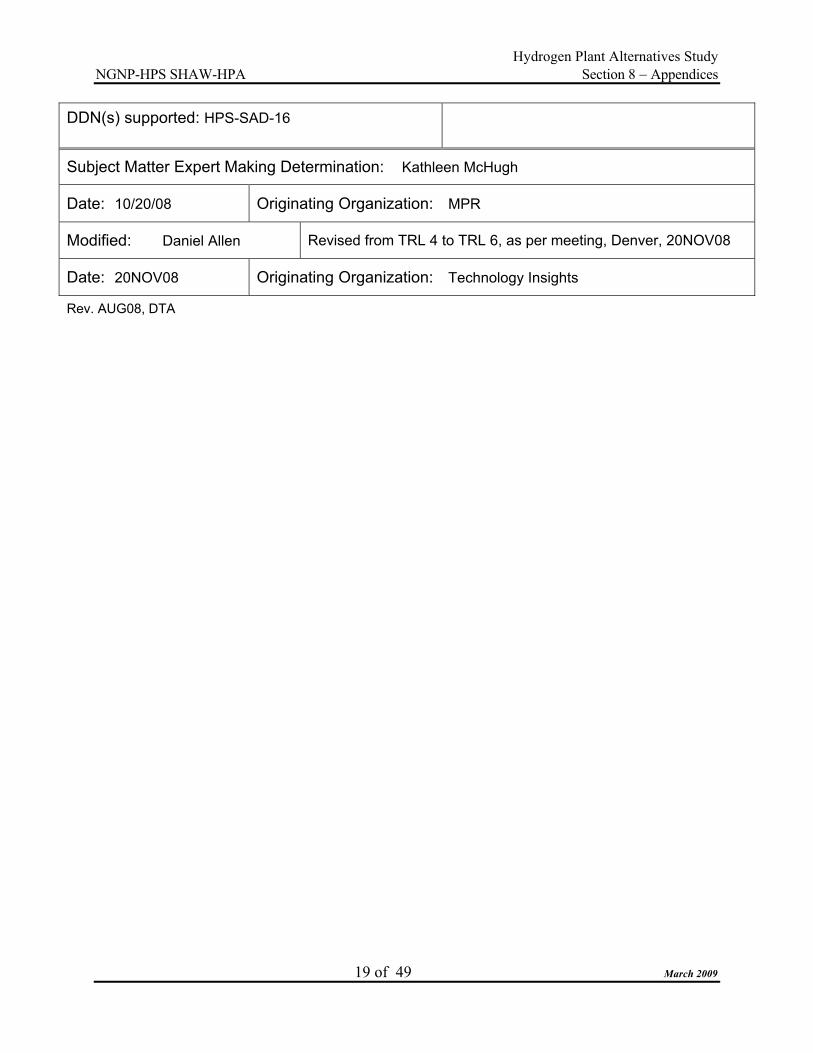
Hydrogen Plant Alternatives Study NGNP-HPS SHAW-HPA Section 8 � Appendices
19 of 49 March 2009
DDN(s) supported: HPS-SAD-16
Subject Matter Expert Making Determination: Kathleen McHugh
Date: 10/20/08 Originating Organization: MPR
Modified: Daniel Allen Revised from TRL 4 to TRL 6, as per meeting, Denver, 20NOV08
Date: 20NOV08 Originating Organization: Technology Insights
Rev. AUG08, DTA

Hydrogen Plant Alternatives Study NGNP-HPS SHAW-HPA Section 8 � Appendices
20 of 49 March 2009
TRL Rating Sheet
Document Number: 028 Revision:
� Facility � System � Subsystem � Structure � Component
Title: Water Treatment System
Description: an SSE of the Feed and Utility System (FUS) of the HyS HPS
Facility: � NHSS � HTS � HPS � PCS � BOP
Technology Readiness Level Next Lower
Rating Level Rating Next Higher Rating Level
Generic Definitions (abbreviated)
TRL U
Basis for Rating (Attach additional sheets as needed) Feed purification is critical to all water splitting technologies. Preliminary work on critical component tolerance has not yet been done. Commercially available feed water purification may not be adequate; process fluid purification may be required. TRL for this cannot be assigned until the requirements are known.
Outline of a plan to get from current level to next level (Attach additional sheets as needed)
Actions (list all) Schedule Cost (k$) .
DDN(s) supported: HPS-FUS-01, HPS-FUS-02, HPS-FUS-03
Subject Matter Expert Making Determination: Daniel Allen
Date: 27OCT08 Originating Organization: Technology Insights
Rev. AUG08, DTA

Hydrogen Plant Alternatives Study NGNP-HPS SHAW-HPA Section 8 � Appendices
21 of 49 March 2009
TRL Rating Sheet
Document Number: 029 Revision:
� Facility � System � Subsystem � Structure � Component
Title: Instrument and Controls System
Description: an SSE of the HyS HPS
Facility: � NHSS � HTS � HPS � PCS � BOP
Technology Readiness Level Next Lower
Rating Level Rating Next Higher Rating Level
Generic Definitions (abbreviated) SSC demonstrated at experimental scale in relevant environment
SSC demonstrated at pilot scale in relevant environment
SSC demonstrated at engineering scale in relevant environment
TRL 5 6 7
Basis for Rating (Attach additional sheets as needed) Chief concerns in this sub-system are control valves (process side), sensors, and other instruments in contact with aggressive environments. Previous experience applicable but not sufficient. TRL 6 assigned because technology is beyond demonstration of feasibility and functionality.
Outline of a plan to get from current level to next level (Attach additional sheets as needed)
Actions (list all) Schedule Cost (k$) .
DDN(s) supported: HPS-PCN-01, HPS-PCN-02, HPS-PCN-03
Subject Matter Expert Making Determination: Charles O. Bolthrunis
Date: 08AUG07 Originating Organization: Shaw Stone & Webster
Modified: Daniel Allen Revised from TRL 2 to TRL 6, basis discussion modified; DDNs added
Date: 27OCT08 Originating Organization: Technology Insights
Rev. AUG08, DTA

Hydrogen Plant Alternatives Study NGNP-HPS SHAW-HPA Section 8 � Appendices
22 of 49 March 2009
Bunsen Reaction and HI Decomposition TRLs

Hydrogen Plant Alternatives Study NGNP-HPS SHAW-HPA Section 8 � Appendices
23 of 49 March 2009
TRL Rating Sheet
Document Number: 014 Revision:
� Facility � System � Subsystem � Structure � Component
Title: Bunsen Reactor
Description: an SSE of the Bunsen Reaction Section of the S-I HPS
Facility: � NHSS � HTS � HPS � PCS � BOP
Technology Readiness Level Next Lower
Rating Level Rating Next Higher Rating Level
Generic Definitions (abbreviated) Technology concept and application formulated.
Proof-of concept
Technology or component is tested at bench scale.
TRL 2 3 4
Basis for Rating (Attach additional sheets as needed) General feasibility is supported by laboratory bench-scale tests and the initial operation of the S-I ILS. Bunsen reactors were operated successfully at GA in the 1980s, in France and more recently in Japan (for a period of a week). These experiments meet the required proof-of-concept. The critical functions have been proven. To advance, Basic thermodynamic data is needed. Compatibility with materials of construction uncertain, particularly with seals. Hydraulic, kinetic, and thermal design and analyses are needed.
Outline of a plan to get from current level to next level (Attach additional sheets as needed)
Actions (list all) Schedule Cost (k$) Successful completion of the ILS and its operation in integrated mode for X,XXX hours with no more than Y% degradation in output will advance the Bunsen Reactor to TRL 4.
DDN(s) supported: HPS-BUN-01 through HPS-BUN-06
Subject Matter Expert Making Determination: meeting, Denver, 20NOV08
Date: 20NOV08 Originating Organization: - -
Rev. AUG08, DTA

Hydrogen Plant Alternatives Study NGNP-HPS SHAW-HPA Section 8 � Appendices
24 of 49 March 2009
TRL Rating Sheet
Document Number: 015 Revision:
� Facility � System � Subsystem � Structure � Component
Title: Three-phase Separator
Description: an SSE of the Bunsen Reaction Section of the S-I HPS
Facility: � NHSS � HTS � HPS � PCS � BOP
Technology Readiness Level Next Lower
Rating Level Rating Next Higher Rating Level
Generic Definitions (abbreviated) Technology concept and application formulated.
Proof-of concept
Technology or component is tested at bench scale.
TRL 2 3 4
Basis for Rating (Attach additional sheets as needed) General feasibility is supported by laboratory bench-scale tests and the initial operation of the S-I ILS.
Outline of a plan to get from current level to next level (Attach additional sheets as needed)
Actions (list all) Schedule Cost (k$) Successful completion of the ILS and its operation in integrated mode for X,XXX hours with no more than Y% degradation in output will advance the Three-phase Separator to TRL 4.
DDN(s) supported:
Subject Matter Expert Making Determination: Daniel Allen
Date: 28NOV08 Originating Organization: Technology Insights
Rev. AUG08, DTA

Hydrogen Plant Alternatives Study NGNP-HPS SHAW-HPA Section 8 � Appendices
25 of 49 March 2009
TRL Rating Sheet
Document Number: 016 Revision:
� Facility � System � Subsystem � Structure � Component
Title: Reactive Still
Description: an SSE of the HI Decomposition Section of the S-I HPS
Facility: � NHSS � HTS � HPS � PCS � BOP
Technology Readiness Level Next Lower
Rating Level Rating Next Higher Rating Level
Generic Definitions (abbreviated) Basic principles observed
Technology concept and application formulated
Proof-of concept
TRL 1 2 3
Basis for Rating (Attach additional sheets as needed) Although results are unpublished, GA has done batch experiments in glass that produced relatively high H2 yield in I2-lean experiments. Independent ongoing experiments at ENEA (Italy) support this result. These experiments go beyond “Basic principles observed and reported in … research without well-defined application.” (TRL-1), but they are short of “critical function … proven” (TRL-4).
Outline of a plan to get from current level to next level (Attach additional sheets as needed)
Actions (list all) Schedule Cost (k$) Verification of kinetic and thermodynamic data will advance the Reactive Still to TRL 3.
DDN(s) supported: HPS-HID-01 through HPS-HID-08
Subject Matter Expert Making Determination: meeting, Denver, 20NOV08
Date: 20NOV08 Originating Organization: - -
Rev. AUG08, DTA

Hydrogen Plant Alternatives Study NGNP-HPS SHAW-HPA Section 8 � Appendices
26 of 49 March 2009
TRL Rating Sheet
Document Number: 018 Revision:
� Facility � System � Subsystem � Structure � Component
Title: Process Coupling Heat Exchanger
Description: an SSE of the HI Decomposition Section of the S-I HPS
Facility: � NHSS � HTS � HPS � PCS � BOP
Technology Readiness Level Next Lower
Rating Level Rating Next Higher Rating Level
Generic Definitions (abbreviated) Technology or component is tested at bench scale.
SSC demonstrated at experimental scale in relevant environment.
SSC demonstrated at pilot scale in relevant environment
TRL 4 5 6
Basis for Rating (Attach additional sheets as needed) The extreme high temperature would require testing of potential heat exchanger materials of construction to validate their ability to operate in those conditions. Current compact heat exchangers are made of materials capable of process temperatures and pressures, but the compatibility of the material with the process fluids needs to be tested. RL-5 assigned because technology is beyond demonstration of feasibility and functionality but has not operated in relevant environments.
Outline of a plan to get from current level to next level (Attach additional sheets as needed)
Actions (list all) Actions (list all) Actions (list all) The level can be increased to TRL 6 when materials are tested for the relevant environment, because at that point components will have been defined, acceptable technologies identified and technology issues quantified.
DDN(s) supported:
Subject Matter Expert Making Determination: Daniel Allen
Date: 27OCT08 Originating Organization: Technology Insights
Rev. AUG08, DTA

Hydrogen Plant Alternatives Study NGNP-HPS SHAW-HPA Section 8 � Appendices
27 of 49 March 2009
TRL Rating Sheet
Document Number: 031 Revision:
� Facility � System � Subsystem � Structure � Component
Title: Reactor Product Handling Equipment
Description: an SSE of the Balance of the S-I HPS
Facility: � NHSS � HTS � HPS � PCS � BOP
Technology Readiness Level Next Lower
Rating Level Rating Next Higher Rating Level
Generic Definitions (abbreviated) SSC demonstrated at experimental scale in relevant environment
SSC demonstrated at pilot scale in relevant environment
SSC demonstrated at engineering scale in relevant environment
TRL 5 6 7
Basis for Rating (Attach additional sheets as needed) Reactor product handling equipment (both Bunsen and HI Decomposition reactors) are pumping and handling very large streams of iodine and hydroiodic acid is a problem that has not been dealt with commercially. The large flows required are beyond the experience of chemical plants. The possibility of very large spills has to be considered. Economic solutions need to be found.
Outline of a plan to get from current level to next level (Attach additional sheets as needed)
Actions (list all) Schedule Cost (k$) .
DDN(s) supported: HPS-BUN-07, HPS-HID-09
Subject Matter Expert Making Determination: Daniel Allen
Date: 31OCT08 Originating Organization: Technology Insights
Rev. AUG08, DTA

Hydrogen Plant Alternatives Study NGNP-HPS SHAW-HPA Section 8 � Appendices
28 of 49 March 2009
TRL Rating Sheet
Document Number: 020 Revision:
� Facility � System � Subsystem � Structure � Component
Title: Feed Purification System
Description: an SSE of the Balance of the S-I HPS
Facility: � NHSS � HTS � HPS � PCS � BOP
Technology Readiness Level Next Lower
Rating Level Rating Next Higher Rating Level
Generic Definitions (abbreviated)
TRL U
Basis for Rating (Attach additional sheets as needed) The concept purification for feed streams (water and air) and the application are established. Requirements are not resolved and require operation of test loops. Until then the feasibility can’t be determined. .
Outline of a plan to get from current level to next level (Attach additional sheets as needed)
Actions (list all) Schedule Cost (k$) .
DDN(s) supported: HPS-FUS-01 through HPS-FUS-03
Subject Matter Expert Making Determination: Daniel Allen
Date: 16OCT08 Originating Organization: Technology Insights
Rev. AUG08, DTA

Hydrogen Plant Alternatives Study NGNP-HPS SHAW-HPA Section 8 � Appendices
29 of 49 March 2009
TRL Rating Sheet
Document Number: 021 Revision:
� Facility � System � Subsystem � Structure � Component
Title: Product Purification System
Description: an SSE of the Balance of the S-I HPS
Facility: � NHSS � HTS � HPS � PCS � BOP
Technology Readiness Level Next Lower
Rating Level Rating Next Higher Rating Level
Generic Definitions (abbreviated)
TRL U
Basis for Rating (Attach additional sheets as needed) Can not rate without requirements.
Outline of a plan to get from current level to next level (Attach additional sheets as needed)
Actions (list all) Schedule Cost (k$) .
DDN(s) supported: HPS-PPU-01, HPS-PPU-02
Subject Matter Expert Making Determination: Daniel Allen
Date: 29OCT08 Originating Organization: Technology Insights
Rev. AUG08, DTA

Hydrogen Plant Alternatives Study NGNP-HPS SHAW-HPA Section 8 � Appendices
30 of 49 March 2009
TRL Rating Sheet
Document Number: 022 Revision:
� Facility � System � Subsystem � Structure � Component
Title: Instrument and Controls System
Description: an SSE of the Balance of the S-I HPS
Facility: � NHSS � HTS � HPS � PCS � BOP
Technology Readiness Level Next Lower
Rating Level Rating Next Higher Rating Level
Generic Definitions (abbreviated) SSC demonstrated at experimental scale in relevant environment
SSC demonstrated at pilot scale in relevant environment
SSC demonstrated at engineering scale in relevant environment
TRL 5 6 7
Basis for Rating (Attach additional sheets as needed) Chief concerns in this sub-system are control valves (process side), sensors, and other instruments in contact with aggressive environments. Previous experience applicable but not sufficient. TRL 6 assigned because technology is beyond demonstration of feasibility and functionality.
Outline of a plan to get from current level to next level (Attach additional sheets as needed)
Actions (list all) Schedule Cost (k$) .
DDN(s) supported: HPS-PCN-01, HPS-PCN-02, HPS-PCN-03
Subject Matter Expert Making Determination: Charles O. Bolthrunis
Date: 08AUG07 Originating Organization: Shaw Stone & Webster
Modified: Daniel Allen Revised from TRL 2 to TRL 6, basis discussion modified; DDNs added
Date: 27OCT08 Originating Organization: Technology Insights
Rev. AUG08, DTA

Hydrogen Plant Alternatives Study NGNP-HPS SHAW-HPA Section 8 � Appendices
31 of 49 March 2009
TRL Rating Sheet
Document Number: 035 Revision:
� Facility � System � Subsystem � Structure � Component
Title: Helium Control Valves
Description: an SSE of the Balance of the S-I HPS
Facility: � NHSS � HTS � HPS � PCS � BOP
Technology Readiness Level Next Lower
Rating Level Rating Next Higher Rating Level
Generic Definitions (abbreviated) Proof-of concept
Technology or component is tested at bench scale.
SSC demonstrated at experimental scale in relevant environment.
TRL 3 4 5
Basis for Rating (Attach additional sheets as needed) The feasibility of a valve is not in question but qualification testing will be required. Valves of this size in the high-temperature helium environment may require development.
Outline of a plan to get from current level to next level (Attach additional sheets as needed)
Actions (list all) Schedule Cost (k$)
Subject Matter Expert Making Determination: Daniel Allen
Date: 28NOV07 Originating Organization: Technology Insights
Rev. AUG08, DTA

Hydrogen Plant Alternatives Study NGNP-HPS SHAW-HPA Section 8 � Appendices
32 of 49 March 2009
High Temperature Steam Electrolysis TRLs

Hydrogen Plant Alternatives Study NGNP-HPS SHAW-HPA Section 8 � Appendices
33 of 49 March 2009
TRL Rating Sheet
Document Number: 001 Revision:
� Facility � System � Subsystem � Structure � Component
Title: Solid Oxide Electrolyzer (SOE) Cells
Description: an SSE of the Electrolyzer Modules of the HTSE Electrolyzer System (ELE)
Facility: � NHSS � HTS � HPS � PCS � BOP
Technology Readiness Level Next Lower
Rating Level Rating Next Higher Rating Level
Generic Definitions (abbreviated) Technology concept and application formulated.
Proof-of concept
Technology or component is tested at bench scale.
TRL 2 3 4
Basis for Rating (Attach additional sheets as needed) The required environment requires the cells to operate under pressure and temperature. The cells have never been operated in a pressurized environment. The manufacturing process for the cells is still being identified. Currently the process is to hand-make each cell, which would not be effective for a pilot scale component which requires far more cells than are currently available. The cells currently have a high rate of degradation at operating temperature. This does not meet functionality requirements for this component. Reference: O’Brien, J.E., “Documentation of Short Stack and Button Cell Experiments Performed at INL and Ceramatec during FY-07,” September 2007.
Outline of a plan to get from current level to next level (Attach additional sheets as needed)
Actions (list all) Schedule Cost (k$) More research must be accomplished to determine a suitable manufacturing method for the electrolyzer cells. More research must be accomplished to increase cell longevity. Testing of the cells concurrently at the process temperature (800°C) and pressure (50 bar) must be accomplished.

Hydrogen Plant Alternatives Study NGNP-HPS SHAW-HPA Section 8 � Appendices
34 of 49 March 2009
DDN(s) supported: HPS-ELE-01B through HPS-ELE-6, HPS-ELE-10, HPS-ELE-11
Subject Matter Expert Making Determination: Demetrius Siachames
Date: 09SEP08 Originating Organization: MPR Associates
Modified: Daniel Allen Revised from TRL 2 to TRL 3, as per meeting, Denver, 20NOV08
Date: 20NOV08 Originating Organization: Technology Insights
Rev. AUG08, DTA

Hydrogen Plant Alternatives Study NGNP-HPS SHAW-HPA Section 8 � Appendices
35 of 49 March 2009
TRL Rating Sheet
Document Number: 002 Revision:
� Facility � System � Subsystem � Structure � Component
Title: Electrolyzer Manifolds
Description: an SSE of the Electrolyzer Modules of the HTSE Electrolyzer System (ELE)
Facility: � NHSS � HTS � HPS � PCS � BOP
Technology Readiness Level Next Lower
Rating Level Rating Next Higher Rating Level
Generic Definitions (abbreviated) Technology or component is tested at bench scale.
SSC demonstrated at experimental scale in relevant environment.
SSC demonstrated at pilot scale in relevant environment
TRL 4 5 6
Basis for Rating (Attach additional sheets as needed) The basic design of the manifolds is still being determined for the pilot scale. Design adequacy is supported by the CFD analyses done at INL on flow distribution and by the experimental results in cell stack tests where operation was satisfactory over a wide range of flow conditions. Reference: O’Brien, J.E., “Documentation of Short Stack and Button Cell Experiments Performed at INL and Ceramatec during FY-07,” September 2007.
Outline of a plan to get from current level to next level (Attach additional sheets as needed)
Actions (list all) Schedule Cost (k$) More research must be accomplished to determine a suitable solution for the electrolyzer manifold. A manifold system must be tested ate operating pressure and temperature.
DDN(s) supported:
Subject Matter Expert Making Determination: Demetrius Siachames
Date: 09SEP08 Originating Organization: MPR Associates

Hydrogen Plant Alternatives Study NGNP-HPS SHAW-HPA Section 8 � Appendices
36 of 49 March 2009
Modified: Daniel Allen Revised from TRL 3 to TRL 5, per 20NOV08 meeting in Denver
Date: 28NOV08 Originating Organization: Technology Insights
Rev. AUG08, DTA

Hydrogen Plant Alternatives Study NGNP-HPS SHAW-HPA Section 8 � Appendices
37 of 49 March 2009
TRL Rating Sheet
Document Number: 039 Revision:
� Facility � System � Subsystem � Structure � Component
Title: Seals
Description: an SSE of the Electrolyzer Modules of the HTSE Electrolyzer System (ELE)
Facility: � NHSS � HTS � HPS � PCS � BOP
Technology Readiness Level Next Lower
Rating Level Rating Next Higher Rating Level
Generic Definitions (abbreviated) Proof-of concept
Technology or component is tested at bench scale.
SSC demonstrated at experimental scale in relevant environment.
TRL 3 4 5
Basis for Rating (Attach additional sheets as needed) Basis is the stack demonstrations done at INL. Concern about the adequacy of the response to leaks and internal combustion were ameliorated in discussion.
Outline of a plan to get from current level to next level (Attach additional sheets as needed)
Actions (list all) Schedule Cost (k$)
DDN(s) supported:
Subject Matter Expert Making Determination: 20NOV08 meeting in Denver
Date: 20NOV08 Originating Organization: - -
Rev. AUG08, DTA

Hydrogen Plant Alternatives Study NGNP-HPS SHAW-HPA Section 8 � Appendices
38 of 49 March 2009
TRL Rating Sheet
Document Number: 003 Revision:
� Facility � System � Subsystem � Structure � Component
Title: Sweep Gas Coupling Heat Exchanger
Description: an SSE of the HTSE Electrolyzer System (ELE)
Facility: � NHSS � HTS � HPS � PCS � BOP
Technology Readiness Level Next Lower
Rating Level Rating Next Higher Rating Level
Generic Definitions (abbreviated) Technology or component is tested at bench scale.
SSC demonstrated at experimental scale in relevant environment.
SSC demonstrated at pilot scale in relevant environment
TRL 4 5 6
Basis for Rating (Attach additional sheets as needed) The extreme high temperature would require testing of potential heat exchanger materials of construction to validate their ability to operate in those conditions. Current compact heat exchangers are made of materials capable of process temperatures and pressures, but the compatibility of the material with the process fluids needs to be tested. Reference: UNLV, “Crack Growth Rate of Structural Materials for Heat Exchanger Applications,” August 2007; UCB, “Composite Heat Exchanger Fabrication Methods and Test Results,” February 2007; Ceramatec, “FY-07a Annual Report – Heat Exchanger Scale-up,” July, 2007; Xiuqing Li, Meggit Ltd., “Heat Exchangers for the Next Generation of Nuclear Reactors,” June, 2006.
Outline of a plan to get from current level to next level (Attach additional sheets as needed)
Actions (list all) Schedule Cost (k$) Determine industry available materials capable of high temperatures (800°C) and suitable for fluids considered. Test heat exchanger materials to determine their feasibility for continuous operation.
DDN(s) supported: HPS-ELE-07 through HPS-ELE-09

Hydrogen Plant Alternatives Study NGNP-HPS SHAW-HPA Section 8 � Appendices
39 of 49 March 2009
Subject Matter Expert Making Determination: Demetrius Siachames
Date: 09SEP08 Originating Organization: MPR Associates
Modified: Daniel Allen Revised from TRL 2 to TRL 5; removed requirement to test complete heat exchanger and left testing materials.
Date: 27OCT08 Originating Organization: Technology Insights
Rev. AUG08, DTA

Hydrogen Plant Alternatives Study NGNP-HPS SHAW-HPA Section 8 � Appendices
40 of 49 March 2009
TRL Rating Sheet
Document Number: 004 Revision:
� Facility � System � Subsystem � Structure � Component
Title: Process Coupling Heat Exchanger
Description: an SSE of the HTSE Electrolyzer System (ELE)
Facility: � NHSS � HTS � HPS � PCS � BOP
Technology Readiness Level Next Lower
Rating Level Rating Next Higher Rating Level
Generic Definitions (abbreviated) Technology or component is tested at bench scale.
SSC demonstrated at experimental scale in relevant environment.
SSC demonstrated at pilot scale in relevant environment
TRL 4 5 6
Basis for Rating (Attach additional sheets as needed) The high temperature would require testing of potential heat exchanger materials of construction to validate their ability to operate in those conditions. Current compact heat exchangers are made of materials capable of process temperatures and pressures, but the compatibility of the material with the process fluids needs to be tested. Reference: UNLV, “Crack Growth Rate of Structural Materials for Heat Exchanger Applications,” August 2007; UCB, “Composite Heat Exchanger Fabrication Methods and Test Results,” February 2007; Ceramatec, “FY-07a Annual Report – Heat Exchanger Scale-up,” July, 2007; Xiuqing Li, Meggit Ltd., “Heat Exchangers for the Next Generation of Nuclear Reactors,” June, 2006.
Outline of a plan to get from current level to next level (Attach additional sheets as needed)
Actions (list all) Schedule Cost (k$) Determine industry available materials capable of high temperatures (800°C) and suitable for fluids considered. Test heat exchanger materials to determine their feasibility for continuous operation.
DDN(s) supported: HPS-ELE-07 through HPS-ELE-09

Hydrogen Plant Alternatives Study NGNP-HPS SHAW-HPA Section 8 � Appendices
41 of 49 March 2009
Subject Matter Expert Making Determination: Demetrius Siachames
Date: 09SEP08 Originating Organization: MPR Associates
Modified: Daniel Allen Revised from TRL 2 to TRL 5; removed requirement to test complete heat exchanger and left testing materials.
Date: 27OCT08 Originating Organization: Technology Insights
Rev. AUG08, DTA

Hydrogen Plant Alternatives Study NGNP-HPS SHAW-HPA Section 8 � Appendices
42 of 49 March 2009
TRL Rating Sheet
Document Number: 005 Revision:
� Facility � System � Subsystem � Structure � Component
Title: Piping and Manifolds
Description: an SSE of the HTSE Electrolyzer System (ELE)
Facility: � NHSS � HTS � HPS � PCS � BOP
Technology Readiness Level Next Lower
Rating Level Rating Next Higher Rating Level
Generic Definitions (abbreviated)
TRL U
Basis for Rating (Attach additional sheets as needed) Manufacturing of required piping is technically possible, but has not been manufactured or tested in a laboratory setting to validate feasibility for the temperatures and pressures required. It is uncertain without further study and design work whether new technology is needed to accommodate pipe thermal expansion. Reference: INEEL, “High Temperature Electrolysis System Configuration Study.”
Outline of a plan to get from current level to next level (Attach additional sheets as needed)
Actions (list all) Schedule Cost (k$) An engineering solution requiring a pipe-in-pipe design will have to be developed and manufactured that can withstand 50 bar and 800°C. The engineering solution for a pipe-in-pipe will have to be tested at the required conditions.
DDN(s) supported: HPS-ELE-10 through HPS-ELE-13
Subject Matter Expert Making Determination: Demetrius Siachames
Date: 09SEP08 Originating Organization: MPR Associates

Hydrogen Plant Alternatives Study NGNP-HPS SHAW-HPA Section 8 � Appendices
43 of 49 March 2009
Modified: Daniel Allen Revised from TRL 2 to TRL U, as per 20NOV08 meeting in Denver
Date: 28NOV08 Originating Organization: Technology Insights
Rev. AUG08, DTA

Hydrogen Plant Alternatives Study NGNP-HPS SHAW-HPA Section 8 � Appendices
44 of 49 March 2009
TRL Rating Sheet
Document Number: 006 Revision:
� Facility � System � Subsystem � Structure � Component
Title: Heat Exchangers
Description: SSEs of the HTSE Heat Recovery System (HRS)
Facility: � NHSS � HTS � HPS � PCS � BOP
Technology Readiness Level Next Lower
Rating Level Rating Next Higher Rating Level
Generic Definitions (abbreviated) Technology or component is tested at bench scale.
SSC demonstrated at experimental scale in relevant environment.
SSC demonstrated at pilot scale in relevant environment
TRL 4 5 6
Basis for Rating (Attach additional sheets as needed) The extreme high temperature would require testing of potential heat exchanger materials of construction to validate their ability to operate in those conditions. Current compact heat exchangers are made of materials capable of process temperatures and pressures, but the compatibility of the material with the process fluids needs to be tested. Reference: UNLV, “Crack Growth Rate of Structural Materials for Heat Exchanger Applications,” August 2007; UCB, “Composite Heat Exchanger Fabrication Methods and Test Results,” February 2007; Ceramatec, “FY-07a Annual Report – Heat Exchanger Scale-up,” July, 2007; Xiuqing Li, Meggit Ltd., “Heat Exchangers for the Next Generation of Nuclear Reactors,” June, 2006.
Outline of a plan to get from current level to next level (Attach additional sheets as needed)
Actions (list all) Actions (list all) Actions (list all) Determine industry available materials capable of high temperatures (800°C) and suitable for fluids considered. Test heat exchanger materials to determine their feasibility for continuous operation.
DDN(s) supported: HPS-ELE-07 through HPS-ELE-09

Hydrogen Plant Alternatives Study NGNP-HPS SHAW-HPA Section 8 � Appendices
45 of 49 March 2009
Subject Matter Expert Making Determination: Demetrius Siachames
Date: 09SEP08 Originating Organization: MPR Associates
Modified: Daniel Allen Revised from TRL 2 to TRL 5
Date: 27OCT08 Originating Organization: Technology Insights
Rev. AUG08, DTA

Hydrogen Plant Alternatives Study NGNP-HPS SHAW-HPA Section 8 � Appendices
46 of 49 March 2009
TRL Rating Sheet
Document Number: 007 Revision:
� Facility � System � Subsystem � Structure � Component
Title: Feed Purification System
Description: an SSE of the HTSE Feed and Utility System (FUS)
Facility: � NHSS � HTS � HPS � PCS � BOP
Technology Readiness Level Next Lower
Rating Level Rating Next Higher Rating Level
Generic Definitions (abbreviated)
TRL U
Basis for Rating (Attach additional sheets as needed)Can not rate without requirements.
Outline of a plan to get from current level to next level (Attach additional sheets as needed)
Actions (list all) Schedule Cost (k$)
DDN(s) supported: HPS-FUS-01 through HPS-FUS-03
Subject Matter Expert Making Determination: Daniel Allen
Date: 27OCT08 Originating Organization: Technology Insights
Rev. AUG08, DTA

Hydrogen Plant Alternatives Study NGNP-HPS SHAW-HPA Section 8 � Appendices
47 of 49 March 2009
TRL Rating Sheet
Document Number: 008 Revision:
� Facility � System � Subsystem � Structure � Component
Title: Sweep Gas Turbine
Description: an SSE of the HTSE Feed and Utility System (FUS)
Facility: � NHSS � HTS � HPS � PCS � BOP
Technology Readiness Level Next Lower
Rating Level Rating Next Higher Rating Level
Generic Definitions (abbreviated) SSC demonstrated at pilot scale in relevant environment
SSC demonstrated at engineering scale in relevant environment
Integrated prototype demonstrated in operational environment.
TRL 6 7 8
Basis for Rating (Attach additional sheets as needed) Such as standard turbogenerator requires only design verification testing, presumably by the vendor to his standards in the design environment.
Outline of a plan to get from current level to next level (Attach additional sheets as needed)
Actions (list all) Schedule Cost (k$)
DDN(s) supported:
Subject Matter Expert Making Determination: Daniel Allen
Date: 02OCT08 Originating Organization: Technology Insights
Rev. AUG08, DTA

Hydrogen Plant Alternatives Study NGNP-HPS SHAW-HPA Section 8 � Appendices
48 of 49 March 2009
TRL Rating Sheet
Document Number: 037 Revision:
� Facility � System � Subsystem � Structure � Component
Title: Helium Control Valves
Description: an SSE of the HTSE
Facility: � NHSS � HTS � HPS � PCS � BOP
Technology Readiness Level Next Lower
Rating Level Rating Next Higher Rating Level
Generic Definitions (abbreviated) Proof-of concept
Technology or component is tested at bench scale.
SSC demonstrated at experimental scale in relevant environment.
TRL 3 4 5
Basis for Rating (Attach additional sheets as needed) The feasibility of a valve is not in question but qualification testing will be required. Valves of this size in the high-temperature helium environment may require development.
Outline of a plan to get from current level to next level (Attach additional sheets as needed)
Actions (list all) Schedule Cost (k$)
Subject Matter Expert Making Determination: Daniel Allen
Date: 28NOV07 Originating Organization: Technology Insights
Rev. AUG08, DTA
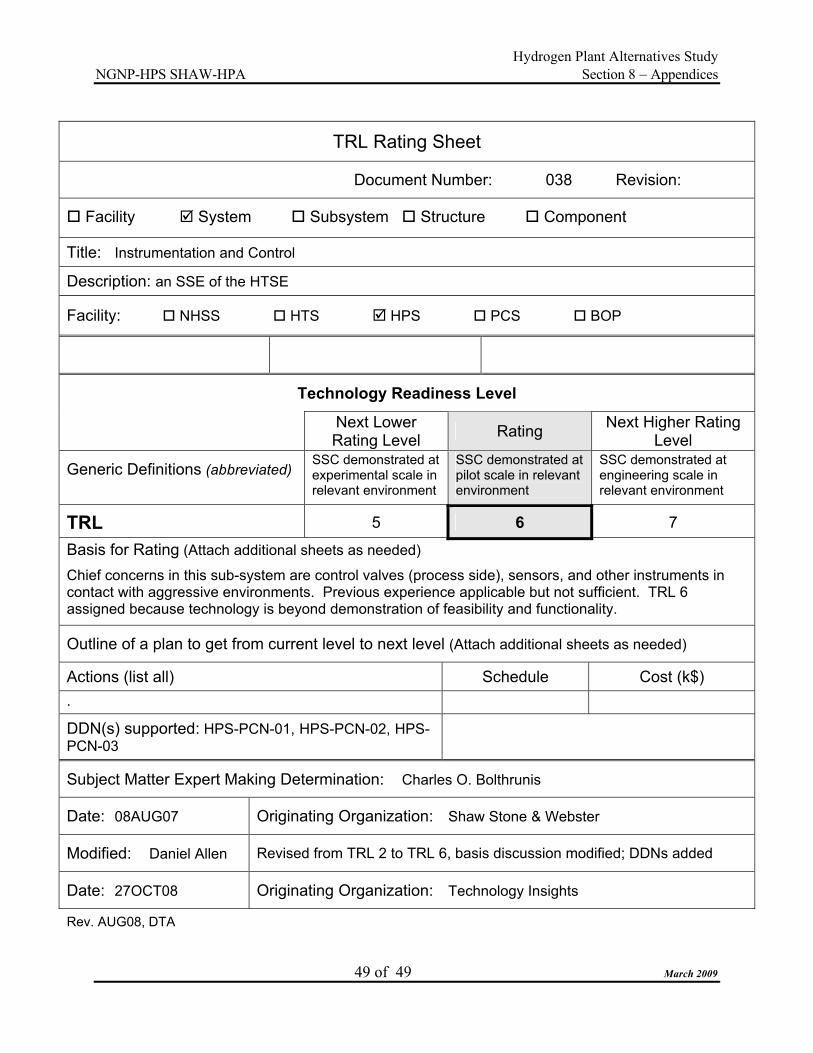
Hydrogen Plant Alternatives Study NGNP-HPS SHAW-HPA Section 8 � Appendices
49 of 49 March 2009
TRL Rating Sheet
Document Number: 038 Revision:
� Facility � System � Subsystem � Structure � Component
Title: Instrumentation and Control
Description: an SSE of the HTSE
Facility: � NHSS � HTS � HPS � PCS � BOP
Technology Readiness Level Next Lower
Rating Level Rating Next Higher Rating Level
Generic Definitions (abbreviated) SSC demonstrated at experimental scale in relevant environment
SSC demonstrated at pilot scale in relevant environment
SSC demonstrated at engineering scale in relevant environment
TRL 5 6 7
Basis for Rating (Attach additional sheets as needed) Chief concerns in this sub-system are control valves (process side), sensors, and other instruments in contact with aggressive environments. Previous experience applicable but not sufficient. TRL 6 assigned because technology is beyond demonstration of feasibility and functionality.
Outline of a plan to get from current level to next level (Attach additional sheets as needed)
Actions (list all) Schedule Cost (k$) .
DDN(s) supported: HPS-PCN-01, HPS-PCN-02, HPS-PCN-03
Subject Matter Expert Making Determination: Charles O. Bolthrunis
Date: 08AUG07 Originating Organization: Shaw Stone & Webster
Modified: Daniel Allen Revised from TRL 2 to TRL 6, basis discussion modified; DDNs added
Date: 27OCT08 Originating Organization: Technology Insights
Rev. AUG08, DTA

Hydrogen Plant Alternatives Study NGNP-HPS SHAW-HPA Section 8 � Appendices
March 2009
8.4.2 Design Data Needs

Hydrogen Plant Alternatives Study NGNP-HPS SHAW-HPA Section 8 � Appendices
1 of 3 March 2009
8.4.2 Design Data Needs
DDNs are formally prepared descriptions of the needed data for design calculations and
design decisions that are identified on the level of the SSCs. Below are tabulations of the summary titles of DDNs that apply to the three water splitting-based hydrogen production technologies identified for HTGR applications. The three hydrogen production technologies are Sulfur-Iodine (S-I), Hybrid Sulfur (HyS) and High Temperature Steam Electrolysis (HTSE).
These DDNs are keyed to the respective critical SSCs through entries on the TRL Summary Sheets for each SSC (see Section 8.4.1).
The table has descriptive titles only. Complete DDNs were prepared for the Hybrid Sulfur production technology as part of the Preconceptual Design [Ref. “NGNP and Hydrogen Production Preconceptual Design Report, Section 7: Hydrogen Production System,” NGNP-07-RPT-001, May 2007.], but those are in need of updating as a result of this study. That update and preparation of the other complete DDNs is beyond the present scope.
DDN Title
Design Data Needs for Sulfuric Acid Decomposition (SAD) HPS-SAD-01 Confirm Thermodynamic Data for the Sulfuric Acid Decomposition Process HPS-SAD-02 Develop a Commercial Sulfuric Acid Decomposition Catalyst HPS-SAD-03 Gather Decomposition Reaction Kinetics Data HPS-SAD-04 Test Silicon Carbide and other Ceramic Material in Decomposition Service HPS-SAD-05 Test Alloy 230 and Alloy 617 in a High Temperature Sulfuric Acid, Sulfur
Dioxide, and Oxygen Atmosphere. HPS-SAD-06 Develop a Method to Bond Alloy 230 or Alloy 617 or Similar Materials to
Silicon Carbide and other Ceramics. HPS-SAD-07 Develop Materials to Seal the Joints between Ceramic Decomposer
Elements and the Metallic Tube Sheet or Vessel. HPS-SAD-08 Test a Pilot-Scale Decomposer. HPS-SAD-09 Provide Data Supporting a Design Code Case HPS-SAD-10 Develop Gasket Materials and Design HPS-SAD-11 Develop Seal Materials and Design HPS-SAD-12 Develop Welding Materials HPS-SAD-13 Develop Cladding and Coating Materials HPS-SAD-14 Develop Piping Materials and Design Methods HPS-SAD-15 Measure the Height Equivalent to a Theoretical Plate (HETP) for the
Concentrator (Vacuum Tower) HPS-SAD-16 Measure the Height Equivalent to a Theoretical Plate (HETP) for the SO2
Absorber

Hydrogen Plant Alternatives Study NGNP-HPS SHAW-HPA Section 8 � Appendices
2 of 3 March 2009
Design Data Needs for Feed Purification (FUS) HPS-FUS-01 Identify Critical Impurities and Determine Critical Component Tolerance HPS-FUS-02 Develop Feed Water Purification Methods HPS-FUS-03 Develop Process Fluid Purification Methods
Design Data Needs for Bunsen Reaction (BUN) HPS-BUN-01 Confirm Thermodynamic Data for the Bunsen Reaction Process including
Phase Equilibria HPS-BUN-02 Gather Kinetic and Mass Transfer Data for the Bunsen Reaction in the
proposed reactor configuration HPS-BUN-03 Develop Gasket Materials and Design for Bunsen Reaction Environment HPS-BUN-04 Develop Seal Materials and Design for Bunsen Reaction Environment HPS-BUN-05 Develop Welding Materials for Bunsen Reaction Environment HPS-BUN-06 Develop Cladding and Coating Materials for Bunsen Reaction Environment HPS-BUN-07 Develop Piping Materials and Design Methods for Bunsen Reaction
Environment
Design Data Needs for Hydroiodic Acid Decomposition (HID)
HPS-HID-01 Demonstrate Hydroiodic Acid Reactive Distillation Decomposition in PrincipleHPS-HID-02 Confirm Thermodynamic Data for the Hydroiodic Acid Decomposition
Process including Phase Equilibria HPS-HID-03 Develop commercial HI Decomposition Catalyst HPS-HID-04 Gather Kinetic and Mass Transfer Data for the Hydroiodic Acid
Decomposition in the proposed reactor configuration based on the commercial catalyst
HPS-HID-05 Develop Gasket Materials and Design for Hydroiodic Acid Decomposition Environment
HPS-HID -06 Develop Seal Materials and Design for Hydroiodic Acid Decomposition Environment
HPS-HID -07 Develop Welding Materials for Hydroiodic Acid Decomposition Environment HPS-HID -08 Develop Cladding and Coating Materials for Hydroiodic Acid Decomposition
Environment HPS-HID-09 Develop Piping Materials and Design Methods for Hydroiodic Acid
Decomposition Environment
Design Data Needs for the Electrolyzers (including PCHX) (ELE) HPS-ELE-01A Develop a Cell Membrane HPS-ELE-01B Develop a Cell with a commercially acceptable activity and life HPS-ELE-02 Optimize Catalyst Loading in the Electrodes HPS-ELE-03 Develop a Cell Configuration and Materials HPS-ELE-04 Build and Test a Laboratory-scale Cell HPS-ELE-05 Build and Test Pilot-scale Cells HPS-ELE-06 Build and Test a Stack of Cells at Engineering Scale

Hydrogen Plant Alternatives Study NGNP-HPS SHAW-HPA Section 8 � Appendices
3 of 3 March 2009
HPS-ELE-07 Test Alloy 230 and Alloy 617 in High Temperature Helium and Air/Oxygen and Steam/Hydrogen Mixtures
HPS-ELE-08 Test a Pilot-Scale PCHX HPS-ELE-09 Provide Data Supporting a Design Code Case HPS-ELE-10 Develop Gasket Materials and Design HPS-ELE-11 Develop Seal Materials and Design HPS-ELE-12 Develop Welding Materials HPS-ELE-13 Develop Piping Materials and Design Methods
Design Data Needs for Product Purification (PPU) HPS-PPU-01 Identify Product Impurities HPS-PPU-02 Test Product Purification Methods
Design Data Needs for Instrument and Controls (PCN) HPS-PCN-01 Test Sensors in the Pilot Plant
HPS-PCN-02 Develop Valves for High-Temperature Acid Service
HPS-PCN-03 Test Valves in the Pilot Plant
HPS-PCN-04 Develop and Test High Temperature Helium Control Valves

Hydrogen Plant Alternatives Study NGNP-HPS SHAW-HPA Section 8 � Appendices
March 2009
8.4.3 Design Tasks

Hydrogen Plant Alternatives Study NGNP-HPS SHAW-HPA Section 8 � Appendices
1 of 2 March 2009
8.4.3 Design Tasks
Table 8.4.3-1: Design Tasks: Hybrid Sulfur
DTs Title HPS-HYS-DT-01 Analyze Data and Improve Process Simulation HPS-SAD-DT-02 Develop additional alternatives for the decomposition reactor HPS-SAD-DT-03 Complete thermal and hydraulic analyses of the alternatives using equilibrium data
only HPS-SAD-DT-04 Complete a conceptual mechanical design of each of the alternative concepts HPS-SAD-DT-05 Complete a thermal, hydraulic, and reaction analysis of each alternative
incorporating kinetic and heat transfer data from bench scale testing HPS-SAD-DT-06 Complete a thermal, hydraulic, and reaction analysis of each alternative
incorporating kinetic and heat transfer data from engineering or pilot scale testing HPS-SAD-DT-07 Develop a preliminary piping spec and materials selections for equipment HPS-SAD-DT-08 Size conceptual equipment and track economics as technology develops HPS-FUS-DT-09 Design a feed water purification system including equipment sizing and economics HPS-FUS-DT-10 Design a process fluid purification system including equipment sizing and
economics HPS-ELE-DT-11 Design an electrolysis system based on the electrolyzer design and track
economics HPS-PCN-DT-12 Identify appropriate valve materials and sensing devices for the aggressive
environments of the process technology HPS-HYS-DT-13 Develop P&IDs and operating outline including normal and abnormal transients HPS-HYS-DT-14 Perform appropriate hazard and operability reviews at designated stages in
process development
Table 8.4.3-2: Design Tasks: Sulfur Iodine
DTs Title HPS-SI-DT-01 Analyze Data and Improve Process Simulation HPS-SAD-DT-02 Develop additional alternatives for the decomposition reactor HPS-SAD-DT-03 Complete thermal and hydraulic analyses of the alternatives using equilibrium data
only HPS-SAD-DT-04 Complete a conceptual mechanical design of each of the alternative concepts HPS-SAD-DT-05 Complete a thermal, hydraulic, and reaction analysis of each alternative
incorporating kinetic and heat transfer data from bench scale testing HPS-SAD-DT-06 Complete a thermal, hydraulic, and reaction analysis of each alternative
incorporating kinetic and heat transfer data from engineering or pilot scale testing HPS-SAD-DT-07 Develop a preliminary piping spec and materials selections for SAD equipment HPS-SI-DT-08 Track equipment size and cost as development progresses HPS-FUS-DT-09 Design a feed water purification system including equipment sizing and economics

Hydrogen Plant Alternatives Study NGNP-HPS SHAW-HPA Section 8 � Appendices
2 of 2 March 2009
DTs Title HPS-FUS-DT-10 Design a process fluid purification system including equipment sizing and
economics HPS-PCN-DT-12 Identify appropriate valve materials and sensing devices for the aggressive
environments of the process technology HPS-SI-DT-13 Develop P&IDs and operating outline including normal and abnormal transients HPS-SI-DT-14 Perform appropriate hazard and operability reviews at designated stages in
process development HPS-BUN-DT-15 Design Alternative Bunsen Reactors HPS-BUN-DT-16 Complete thermal and hydraulic analyses of the alternatives using equilibrium data
only HPS-BUN-DT-17 Complete a conceptual mechanical design of each of the alternative concepts HPS-BUN-DT-18 Complete a thermal, hydraulic, and reaction analysis of each alternative
incorporating kinetic and heat transfer data from bench scale testing HPS-BUN-DT-19 Complete a thermal, hydraulic, and reaction analysis of each alternative
incorporating kinetic and heat transfer data from engineering or pilot scale testing HPS-BUN-DT-20 Develop a preliminary piping spec and materials selections for BUN equipment HPS-HID-DT-21 Design Alternative HI Decomposition Reactors HPS-HID-DT-22 Complete thermal and hydraulic analyses of the alternatives using equilibrium data
only HPS-HID-DT-23 Complete a conceptual mechanical design of each of the alternative concepts HPS-HID-DT-24 Complete a thermal, hydraulic, and reaction analysis of each alternative
incorporating kinetic and heat transfer data from bench scale testing HPS-HID-DT-25 Complete a thermal, hydraulic, and reaction analysis of each alternative
incorporating kinetic and heat transfer data from engineering or pilot scale testing HPS-HID-DT-26 Develop a preliminary piping spec and materials selections for HID equipment HPS-PPU-DT-27 Develop a preconceptual design for a product purification system
Table 8.4.3-3: Design Tasks: High Temperature Steam Electrolysis
DDN Title HPS-FUS-DT-01 Design a feed water purification system including equipment sizing and economics HPS-FUS-DT-02 Design a process fluid purification system including equipment sizing and economics HPS-ELE-DT-03 Design a cell stack suitable for operation at high temperature in a high pressure,
oxygen-rich environment HPS-ELE-DT-04 Design an economical stack enclosure that minimizes heat loss, sealing and stack
handling and maximizes safety HPS-ELE-DT-05 Design a conceptual plant layout and piping arrangement that accommodates
expected thermal expansion HPS-ELE-DT-06 Design and rate conceptual PCHXs

Hydrogen Plant Alternatives Study NGNP-HPS SHAW-HPA Section 8 � Appendices
March 2009
8.5 ECONOMIC MODEL

Hydrogen Plant Alternatives Study NGNP-HPS SHAW-HPA Section 8 � Appendices
1 of 3 March 2009
8.5. Economic Model
8.5.1 The Modeling Tool
The DOE has sponsored and published a specific tool for the comparison of hydrogen production technologies. This is a result of the H2A Production Analysis Program, which is part of the national Hydrogen Fuel Initiative, and which was conducted by a team from the various DOE divisions, the national laboratories, and industrial participants.
The primary objectives of the H2A Production Analysis Program have been as follows:
• Improve the consistency and transparency of the ground rules and assumptions for the economic analyses of hydrogen systems within the DOE hydrogen programs, as well as within related industry programs.
• Develop a tool for consistent analyses and reporting of the economics of hydrogen production and delivery systems, as well as for R&D direction and portfolio analyses.
• Validate the consistent ground rules, assumptions, and analyses methodology through deliberations with a select group of key industrial collaborators, including nuclear utility and vendor representatives.
The H2A model is a spreadsheet-based (Microsoft Excel) calculation tool that gives the required selling price of hydrogen for the input capital and operating cost factors for a hydrogen production plant and for the specified economic parameters, including the rate of return on investment. The units of the resultant price are dollars per kilogram, which serves to normalize the comparisons and happens to be approximately equal to the price of gasoline with the same energy content on a lower heating value basis. The results of H2A have been published on the DOE website [http://www.hydrogen.energy.gov/h2a_analysis.html.].
While the tool includes agreed-upon H2A reference values for several financial parameters, the user is also given the opportunity to vary parameters such as internal rate of return, plant life, feedstock costs, and tax rate, to examine the technology using their own basis. The calculation part of the tool uses a standard discounted cash flow rate of return analysis methodology to determine the hydrogen selling cost for the desired internal rate of return.
Inflation can be input to the model, but in the discounted cash flow analysis the effect of inflation is nullified except for a small impact on the tax depreciation. For this reason, the calculated selling price for hydrogen is the fixed or levelized price over the plant life in reference year dollars.
There are two versions of the tool – one formatted for central production of hydrogen and one for “forecourt” production. The latter is for analysis of smaller-scale hydrogen plants that would be integrated with dispensing of the hydrogen product to fuel cell vehicles. This study concerns large central production with transport to a relatively distant set of users, and so for these analyses only the former version applies.

Hydrogen Plant Alternatives Study NGNP-HPS SHAW-HPA Section 8 � Appendices
2 of 3 March 2009
In 2007, DOE reconvened the H2A participants to review and refine the modeling tools and update the cases to be modeled. Refinements to the modeling tools have been based on improvements for convenience and correction of small errors found in the interim by users and by the original developers. The analyses in this report utilize the latest (2007-2008) tool, which are referred to as H2A Production Model, version 2.0.
8.5.2. Summary of Economic Assumptions and Analysis Ground Rules
The following are the ground rules for the comparative H2A modeling for nuclear high-temperature hydrogen production technologies evaluated in this report. The H2A program not only produced an analysis tool for the comparison of costs for hydrogen technologies, but it also developed a set of assumptions for economic and financial factors that by general consensus could be applied to assure that the comparisons are on a reasonable basis. The H2A modeling tool as published [http://www.hydrogen.energy.gov/h2a_analysis.html.] is populated with these economic factors, which can be accepted or modified. For the most part the economic factors are the commonly agreed upon “default” values for future central hydrogen production plants developed in the H2A Production Analysis.
These are in general also the same ground rules used by Technology Insights for analyses of hydrogen costs for nuclear hydrogen technologies done previously for the H2A project and for the DOE Nuclear Hydrogen Initiative program.
� Use H2A modeling tool. � All HPS alternatives assumed to be commercially mature and evaluated for a consistent
2030 to 2070 service timeframe. � Generic HTR heat sources (NHSSs) at 550MWt core power, modeled for all cases as a
fixed operating cost of 30 $/MWth-h, based on the nuclear reactor core heat generation, but factored for reactor outlet temperature variation from the reference value. This cost is developed from the NHSS capital and operating costs for a commercial NGNP as part of the NGNP Preconceptual Design.
� Number of reactor modules determined by reference HPS output (142 million SCFD Hydrogen) with appropriate sharing factors for multiple modules.
� Capacity factor of overall plant is 8.200 hours per year (94%) � 100% equity financing with an after income tax internal rate of return (IRR) of 10%,
which is equivalent to financing at 25% equity and 75% dept with 20% IRR and 10% debt rate. Sensitivities to cover a range of IRR.
� Capital cost contingency adjustment is made to the total initial capital cost such that the resulting cost represents a mean or expected value. This cost is the baseline value from which hydrogen price sensitivity can be calculated. Periodic replacement capital includes the same contingency.
� Periodic capital replacements are added to the capital cash flow and depreciated over the useful lives. In addition, an allowance for an annual capital replacement of 0.5%/year is included.
� Facility lives of 30 years of operation. Any shorter life limiting components are replaced at designated intervals.

Hydrogen Plant Alternatives Study NGNP-HPS SHAW-HPA Section 8 � Appendices
3 of 3 March 2009
� Accelerated depreciation facility lives of 20 years and the MACRS schedule are applied for the energy source plants, as well as the hydrogen production plants.
� An effective income tax rate of 38.9 % is applied based on a federal tax rate of 35% and a state tax rate of 6%.
� Property tax and business insurance each 1% per year of the total initial overnight capital cost.
� Reference year dollars are 3rd Quarter 2008. � General inflation is zero. In H2A analyses one can apply a general inflation rate, but in
the model the results are deflated back to reference year dollars so inflation is nominally irrelevant.
� A nominal three year construction period is applied with 25%, 40% and 35% of the costs incurred respectively.
� A Gulf Coast site is assumed with an average burdened operating labor rate of 50 $/hour, plus a 20% G&A adder, applied consistently for the plant staffs, which are estimated separately for the different options along with the respective maintenance cost estimates.
� Plant startup is considered to occur over one year. In that period, revenues are assumed to be 50% of subsequent full-year revenues and variable costs are assumed to be 50% likewise. Fixed annual costs are taken at 100% in the startup year.
� The hydrogen delivery pressure at all production plant gates is consistently 50 bar (710 psig). If a lower pressure is supplied by the process, compression costs are added.
� Deficit or surplus electric power priced at 75 $/MW-h import and 60$/MW-h export before escalation. These are representative of today’s industrial electricity prices with the addition of a factor for increased overall electricity market cost due to future carbon penalty. This is a cost driving parameter that is varied in the sensitivity analyses.
� No central hydrogen storage is included at the production plants other than buffer storage, as required for efficient operations.
� A constant site size of 400 acres has been applied for all options at an assumed unit cost of 5,000 $/acre.
� Oxygen byproduct credit is included in the analysis. The reference credit is to be applied at 40 $/MT, which is about today’s industrial oxygen price.

Hydrogen Plant Alternatives Study NGNP-HPS SHAW-HPA Section 8 � Appendices
March 2009
8.6 COMPONENT COST DEVELOPMENT

Hydrogen Plant Alternatives Study NGNP-HPS SHAW-HPA Section 8 � Appendices
1 of 3 March 2009
8.6 Component Cost Development The capital costs in Appendices 8.1.7, 8.2.7 and 8.3.7 are in general for process plant components that are developed and available or that can be estimated based on components used in the process industry for which estimating algorithms are in hand. However, there are components of the hydrogen process systems that are unique and developmental at this stage, for which cost estimates are based on data from technology developers, as follows. These were prepared as costs for a mature plant excluding development and first-of-a-kind costs, although further development effort could lead to equipment cost changes. 8.6.1 Sulfuric Acid Decomposer Cost The cost used for the Sulfuric Acid Decomposer are scaled with heat transfer area from the design by Westinghouse as published in Lahoda, E.J., et al., “Optimization and Costs of the Westinghouse Hybrid Sulfur Process with the PBMR for the Production of Hydrogen,” 16th Pacific Basin Nuclear Conference (16PBNC), Aomori, Japan, Oct. 13-18, 2008, Paper ID P16P1241. The design of that Acid Decomposer is summarized in the first table below. The costs in the following table are further developed from that design considering learning factors and other cost reduction considerations, such as bulk purchases. The data are from the author, and initial catalyst cost is included.
Physical Parameters of the Decomposition Reactor
Material Length (m)
Inner Diameter
(m)
Outer Diameter
(m) Thickness
(m) Required per
Tube Total Required, Units
Gas Riser Tube SiC 0.75 0.034 0.042 0.004 4 3000
Concentrator Packing 13 mm Berl Saddle
0.23 0.103 1.92E-03 m3 1.44 m3
Bayonet Tube SiC 7.24 0.103 0.144 1 750 Support Tube (inner) SiC 6.7 0.02 0.028 0.004 1 750 Support Tube (outer) SiC 6.7 0.048 0.056 0.004 1 750 Gas Downflow Tube SiC 6.7 0.061 0.073 0.0061 1 750
Catalyst 1.20 0.073 0.103 0.005 m3 3.75 m3
Support Demister Packing
Flexeramic 5.50 2.28E-02 m
3 17.14 m3
Liquid Catch Ring SiC 0.05 0.020 0.103 0.005 1 750 Gas Distributing Plate SiC 0.01 0.103 0.01 1 750
Supporting Insulation
ZirCar Ceramics
6.7 0.028 0.048 0.01 1 750

Hydrogen Plant Alternatives Study NGNP-HPS SHAW-HPA Section 8 � Appendices
2 of 3 March 2009
Cost Estimate for the Decomposition Reactor
Bayonet Tube Total Required, Unit Price Per Unit
(USD) Price (USD) Gas Riser Tube 3000 $185.67 $557,000 Concentrator Packing 1.44 m3 $46.95 $2,385 Bayonet Tube 750 $12,379.19 $9,284,394 Support Tube (inner) 750 $943.66 $707,746 Support Tube (outer) 750 $2,988.26 $2,241,197 Gas Downflow Tube 750 $11,457.00 $8,592,750 Catalyst 3.75 m3 $696,580.00 $2,612,175 Support Demister Packing 17.14 m3 $132.24 $2,266 Liquid Catch Ring 750 $259.00 $194,250 Gas Distributing Plate 750 $679.25 $509,438 Supporting Insulation 750 $863.83 $647,874 Estimated Labor Hour 28,800 hr $60.00 $1,728,000 construction rental $400,000
Vessel Total Required, Unit Gasket 7.50E+02 $4.17 $3,130 Vessel Hemispherical Head 8.84E+04 kg $2,341,400 Vessel Plenum 2.90E+04 kg included Supporting Flanged Plate 2.30E+04 kg included Vessel Shell 1.65E+05 kg included Vessel Insulation 28.45 m3 $1,400.00 $39,832 Teflon Coating $190,400 Metal Supporting Spring 220 $10,511 Supporting Plate 15,862.93 kg included
Cost Total (USD) $30,064,748 8.6.2 Sulfur Dioxide Electrolysis Module Cost The cost used for the Sulfur Dioxide Electrolysis (SOE) module is as developed in the following tables. Note that costs are per square meter. The data is from Gorensek, M.B., et al., “Hybrid Sulfur Process Reference Design and Cost Analysis, Final Report,” Savannah River National Laboratory, unpublished.

Hydrogen Plant Alternatives Study NGNP-HPS SHAW-HPA Section 8 � Appendices
3 of 3 March 2009
SOE Cell Cost by Component Item Description Cost Basis $/m2 Membrane Nafion® 117 or equiv $300/m2 300 Gas diffusion layers Porous carbon $75/m2 (2 layers req’d) 150 Electrocatalyst 1 mg/cm2 Pt (total) $1500/troy oz 480 Bipolar plates 3/8-in graphite $200/m2 200 Seals, gaskets, etc. PEEK or equiv 50/m2 50 Cell assembly Automated 1 man-hr @$50/man-hr 50 Single cell cost basis 1,230
SOE Module Cost
Item Description Cost Basis $/m2 Individual cells 200 units SOE Cell Cost less 20%
for NOAK improvements 984
End plates, tie rods, & other pressure comp.
Carbon steel $20,000 total 100
Current collectors & connection to DC bus
Copper $8,000 total 40
Supply lines to cells 4 lines; every 10 cells $100 per line x 80 N/A Other piping connect. $4,000 N/A Instruments and misc. $2,000 N/A Module supports Weight = 8 t $10,000 total N/A Module assembly Off-site assembly 64 man-hr @$50/man-hr 16 Module installation 64 man-hr @$50/man-hr N/A Subtotal 1,140 Overhead Electrolyzer mfg. 20% of matls & labor 228 Total SDE Module cost basis 1,368
Hydrogen Plant Alternatives Study NGNP-HPS SHAW-HPA Section 8 � Appendices
March 2009
8.7 HPAS STUDY 90% REVIEW SLIDES
Hydrogen Plant Alternative Study
90% Technical Review Slides November, 20, 2008
76 pages

NGNP TEAM
Hydrogen Plant Alternatives Study (HPAS)90% Review
Shaw OfficesDenver, ColoradoNovember 6, 2008

NGNP TEAM
1. Welcome

NGNP TEAM
2. Review Agenda

Slide 4NGNP TEAM
Agenda
• Welcome; clarify expectations• Review Summary Agenda• Study Purpose & Objectives• Review Study Products (Deliverables)• Review Evaluation Criteria• Technical issues and progress
– HTSE– HyS (including sulfuric acid decomposition)– SI (Bunsen reaction and HI decomposition)
• Flow Diagram• Preliminary hazards review• Life-cycle costs• Technical risk assessment• Technology development roadmap

Slide 5NGNP TEAM
Agenda (Continued)
• Technology comparison– Cost of production– Sensitivity analyses– Capital cost– Hazards reviews– Technical risk
• Conclusions• Deliverable schedule

NGNP TEAM
3. Purpose & Objectives

Slide 7NGNP TEAM
Purpose & Objectives
• Provide basis for further development– Commercial Potential– Technology Readiness
• For three technologies– High temperature steam electrolysis (HTSE)– Hybrid sulfur (HyS)– Sulfur iodine (SI)

NGNP TEAM
4. Study Products

Slide 9NGNP TEAM
Study Deliverables
• Process flow sheets• Sized equipment lists• Capital cost estimates• Operating cost estimates• Economic model• Life-cycle cost of hydrogen• Sensitivity analyses• Preliminary hazards analysis and operability review• Technology readiness level scores (TRLs)• Design readiness level scores (DRLs)• Design data needs (DDNs)• Technology development plan (technology maturation plan)
– Scope– Schedule– Budget

NGNP TEAM
5. Evaluation Criteria

Slide 11NGNP TEAM
Study Process: Development of Criteria
Operating R isk
Cost of Hydrogen
Financing Hurdle
Economic Model and Parameters
Operating Cost Estimate
Com m ercial Potential
Technology Readiness
Process Basis
Budget
Technology Development
P lan Scope
Capital Cost Estimate
TRLsDRLsDDNs
Sized Equipment List, Hazard & Ops
Review
Technology R isk
Schedule

Slide 12NGNP TEAM
Study Basis
• Study Basis is for the base case for each technology• Sensitivity analyses are carried out around these base cases• Technologies studied
– HTSE; HyS & SI– Not Reactor technologies– Not specific combinations
• System energy balance– Baseline price for nuclear thermal energy– Excess heat used to generate electricity via a Rankine cycle, with variable
efficiency based on available temperature– Electricity deficit or surplus is balanced by the grid at a set price and charged
with a carbon penalty

Slide 13NGNP TEAM
Study Basis (continued)
• Plant size: 142 million SCFD (343 MT/day) hydrogen product • Plant baseline availability: 8200 hours per year average• Reactor thermal rating: 550 MWth
• Operating temperatures– Max Process side temperature: 870°C (Reactor Outlet Temperature [ROT] =
950°C)– The helium return temperature to the IHX is set by process requirements
• Reactor Inlet Temperature limits– Max is 500°C– Min is 350°C.

Slide 14NGNP TEAM
Study Basis: Plant Capacity
• Optimal use of process heat means using as much high temperature heat from the helium as possible consistent with the heat recovery scheme.
• Heat use is set by the minimum return temperature of helium from the PCHX.
• HTSE optimal use of process heat requires a plant capacity too large to be considered as a comparative baseline:
– 820 million SCFD– About 7 times the capacity of a large world-scale hydrogen plant today– Uses one HTGR and about 2800 MWe imported.
• Hybrid Sulfur and Sulfur Iodine optimum use requires 2 HTGRs to produce 142 million SCFD hydrogen
• 142 million SCFD selected as baseline capacity; optimal use for HTSE will be investigated in sensitivity analysis

NGNP TEAM
6. Technologies

NGNP TEAM
6.1 HTSE

Slide 17NGNP TEAM
Heat and Electricity Requirements for HTSE
0
50
100
150
200
250
300
350
400
0 100 200 300 400 500 600 700 800 900 1000 1100
�H�GT�S
850°C
�25%
Electric Energy Demand
Heat Demand
Total Energy Demand
Temperature (°C)
Energy (kJ/mole)
THERMODYNAMIC POTENTIALS OF HTSE VS. TEMPERATURE

Slide 18NGNP TEAM
Simplified HTSE Flow Diagram
INTERMEDIATE HEAT EXCHANGER
HELIUM FROM NUCLEAR HEAT
SOURCE PROCESS COUPLING HEAT EXCHANGER
AIR
ELECTROLYSIS CELLS
ELECTRICAL POWER
WATER
Helium
RECUPERATOR
HYDROGEN PRODUCT
AIR/ OXYGEN
Hydrogen Recycle
HYDROGEN/ WATER
SEPARA TION
Denotes Process Equipment Affected By Temperature Sensitivity
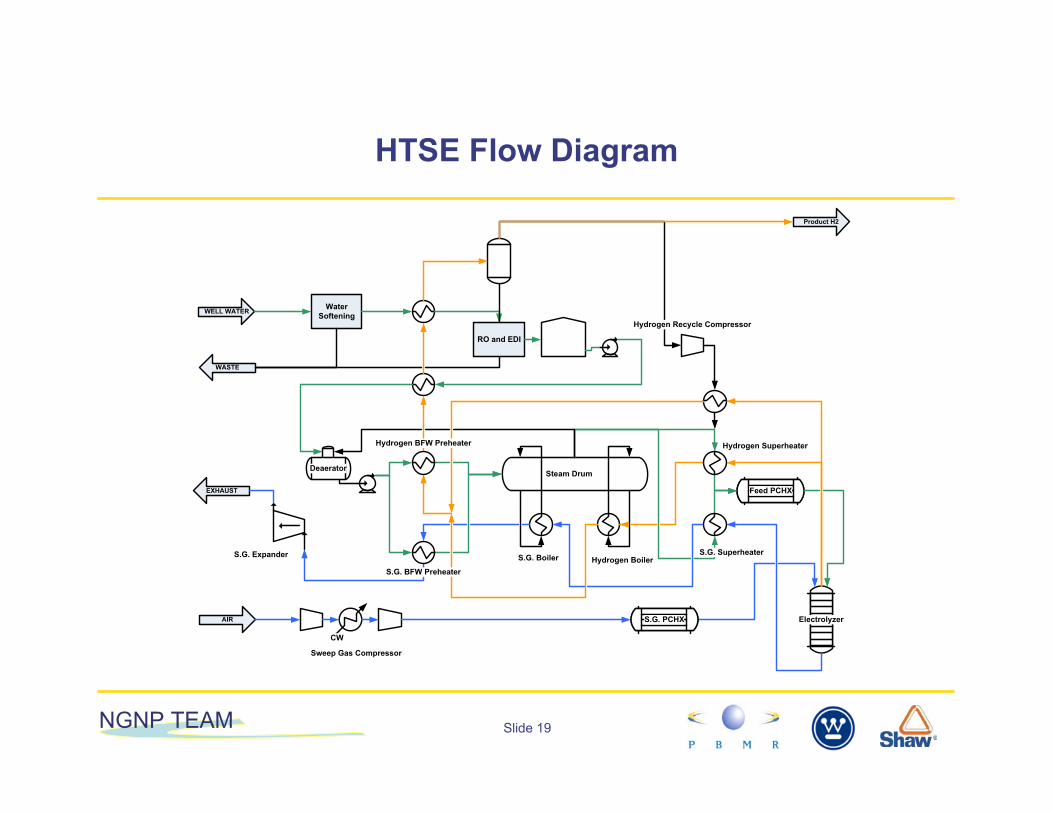
Slide 19NGNP TEAM
HTSE Flow Diagram
Water Softening
Sweep Gas Compressor
WELL WATER
WASTE
RO and EDI
Hydrogen BoilerS.G. Boiler
Steam Drum
Feed PCHX
Electrolyzer
Product H2
CW
AIR
S.G. Expander
EXHAUST
E-14Deaerator
S.G. BFW Preheater
Hydrogen BFW Preheater
Hydrogen Recycle Compressor
S.G. PCHX
Hydrogen Superheater
S.G. Superheater
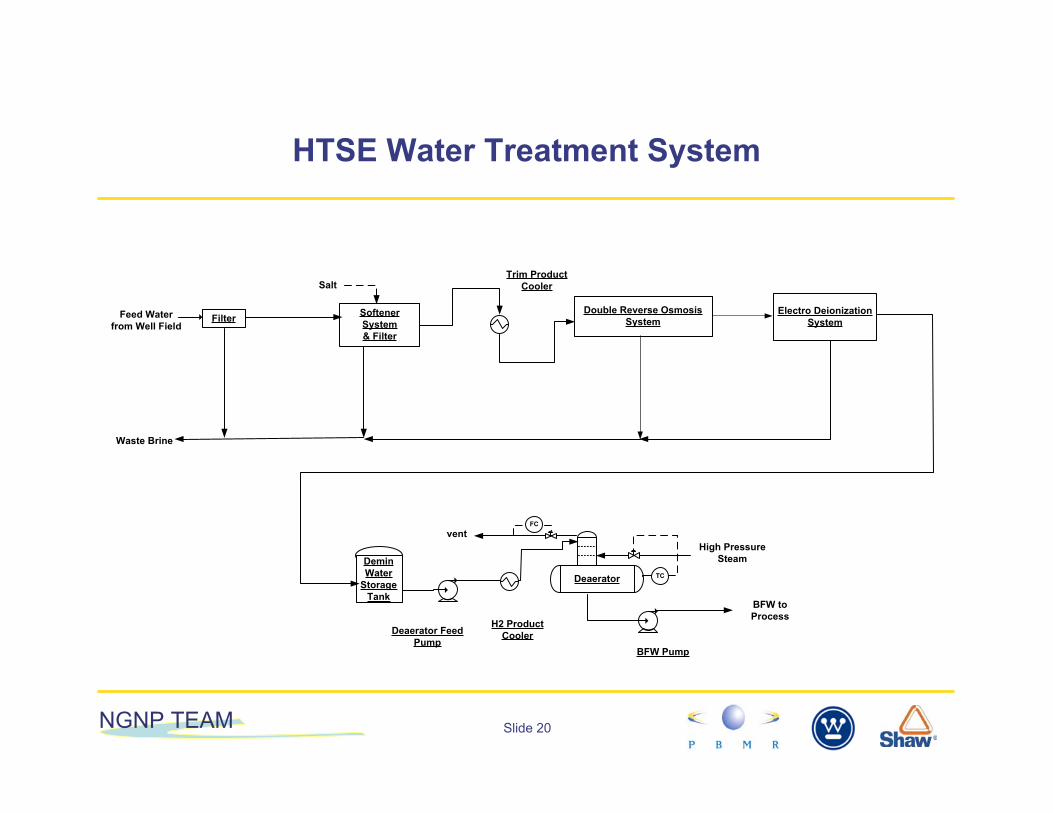
Slide 20NGNP TEAM
HTSE Water Treatment System
Feed Water from Well Field
SoftenerSystem& Filter
Waste Brine
Double Reverse Osmosis System
Electro Deionization System
DeminWater
Storage Tank
Deaerator
vent
BFW to Process
Filter
High Pressure Steam
TC
FC
H2 Product Cooler
Trim Product CoolerSalt
Deaerator Feed Pump
BFW Pump

Slide 21NGNP TEAM
HTSE Feed System
Water SofteningWELL WATER
WASTE
RO and EDI
Electrolyzers
Product H2
E-51
Deareator
Return Water
Steam DrumDeaerator
BFW Preheaters
SuperheatersFeed PCHX

Slide 22NGNP TEAM
HTSE Sweep Gas System

Slide 23NGNP TEAM
HTSE Product System

Slide 24NGNP TEAM
HTSE Flowsheet
• Nothing in the flowsheet is extraordinary upstream of the superheaters
• Technology is available to produce ultra-pure water feed– Requirements of the system are not clear– In-process treatment may be required
• Purity requirements of the sweep gas are not clear• High temperature materials are an issue• To use heat from an HTGR effectively with this technology, high
temperature helium valves are required • Process uses proportionately very little process heat; practical
delivery of the heat restricts it further– Sensible heat in feed and sweep gas provides some heat– Balance is made up by electricity– ASSUMPTION: No impact on current density

Slide 25NGNP TEAM
Heat and Electricity Requirements for HTSE
0
50
100
150
200
250
300
350
400
0 100 200 300 400 500 600 700 800 900 1000 1100
�H�GT�S
850°C
�25%
Electric Energy Demand
Heat Demand
Total Energy Demand
Temperature (°C)
Energy (kJ/mole)
THERMODYNAMIC POTENTIALS OF HTSE VS. TEMPERATURE

Slide 26NGNP TEAM
HTSE Process Heat
• Process Heat assumed to be supplied at 800°C
• Only sensible heat in feed and sweep gas ABOVE 800°C can realistically be used to supply this heat.
• Max process temperature is set at 870°C
• Only 70K delta T is available to provide process heat
• The remainder is supplied by electricity used for heating rather than electrolysis
• For 142 million SCFD hydrogen– 88 MWth process heat– 479 MWe for electrolysis and
remainder of process heat

Slide 27NGNP TEAM
HTSE Life Cycle Costs: Capital and Reliability
• Capital cost:– Total Installed Cost: Pending– Cell Stacks: $143 million (including in-place spares)– Stack assembly: $ 14 million (allow 10% for labor, seals, frame assembly,
tension bars, installation into enclosures, etc. )– Power supply: $ 87 million (including in-place spares)
• Reliability:– High temperature equipment will have a foreshortened life: Allow 10 years– Lower temperature equipment will be as reliable as any others handling pure
water and steam: 30 year life– Stacks will require frequent maintenance and replacement: 20 km of seals per
module; 76 modules in the plant = 1520 km of seals: Allow 7 year life; 11 module replacements per year.

Slide 28NGNP TEAM
HTSE Life Cycle Costs: Operating Costs
• Raw Material – Availability not an issue
• Maintenance– Seals and electrical connections– Water treatment facilities– Helium valves
• Inspection– Seal leaks – Internal insulation faults
• Waste disposal– Water treatment wastes
• Staff requirements: – Maintenance staff requirements:
» 5 maintenance personnel per shift plus » 5 day shift only
– Operating staff requirements:• Water treatment: 1 operator per shift• Heat recovery: 1 operator per shift• Electrolysis: 1 operator per shift• Management: 1 Plant manager; 1 Assistant; 1 Engineer and Administrative staff

Slide 29NGNP TEAM
HTSE Life Cycle Costs: Utilities, Catalyst and Chemicals
• Electrical usage– Electrolyzers: 478.7 MWe
– Other users: 28.6 MWe
– Generated on site: 194.2 MWe
– Imported electricity: 313.1 MWe
• Thermal usage– Hot helium: 87.7 MWth
• Other utilities – Water treatment chemicals:– Cooling Water: 34.2 MWth
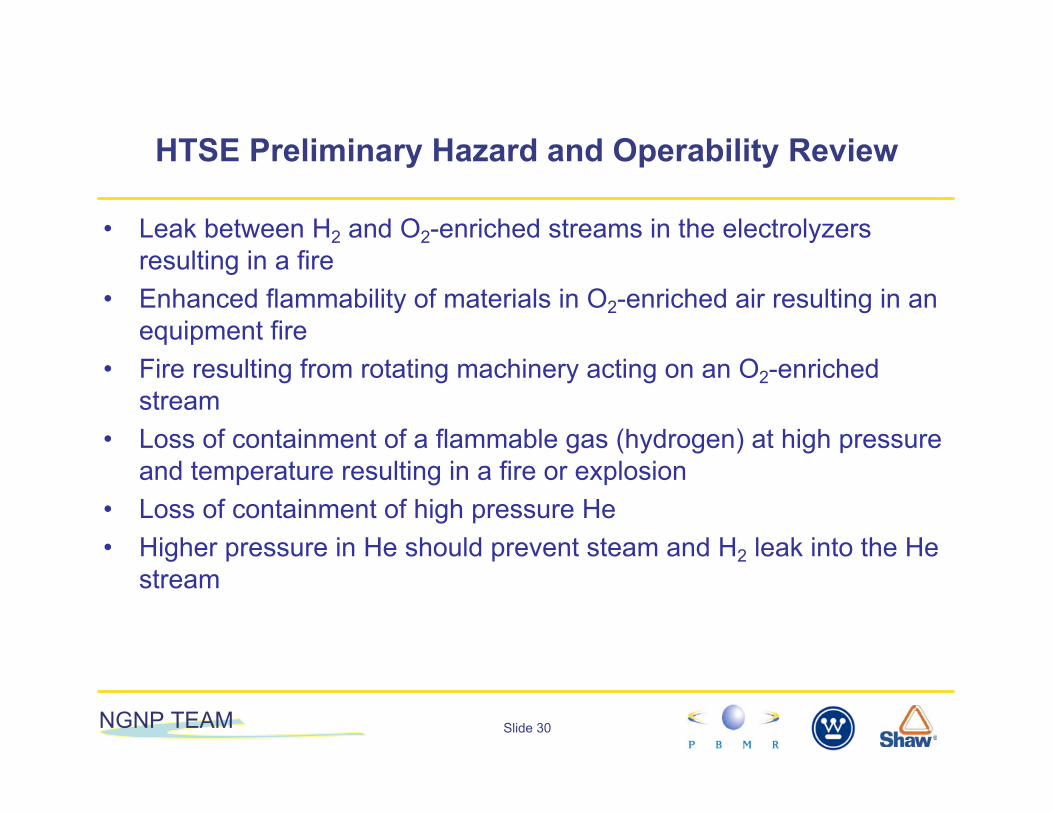
Slide 30NGNP TEAM
HTSE Preliminary Hazard and Operability Review
• Leak between H2 and O2-enriched streams in the electrolyzers resulting in a fire
• Enhanced flammability of materials in O2-enriched air resulting in an equipment fire
• Fire resulting from rotating machinery acting on an O2-enriched stream
• Loss of containment of a flammable gas (hydrogen) at high pressure and temperature resulting in a fire or explosion
• Loss of containment of high pressure He• Higher pressure in He should prevent steam and H2 leak into the He
stream

Slide 31NGNP TEAM
Electrolyzer: Elevation

Slide 32NGNP TEAM
Electrolyzer: Plan
Steel Shell
Insulation: 50 mm Microtherm Slatted Super G; 50 mm Pyrogel 10350
500 mm
200 mm
200 mm
Cells
Steam Inlet Mainfold
Air and Oxygen Sweep Gas out of Cells
Air Sweep Gas Inlet Manifold
Product Outlet ManifoldHydrogen Outlet
Sweep Gas Inlet
Steam Inlet
Ø2.00 m

Slide 33NGNP TEAM
Electrolyzer Enclosure Features
• Internally insulated carbon steel• Body flange to facilitate replacing internals• All nozzles except sweep gas exit in the top head• All internals are hung from the top head to accommodate
thermal expansion• Atmosphere is exit sweep gas to avoid wetting insulation• Manifolding appears adequate

Slide 34NGNP TEAM
HTSE Technical Issues
• Electrolysis Cell Poisoning– Rapid degradation; cause unknown– Suspect chromium or other alloying material picked up from stainless piping – Cell tolerance to contaminants needs to be established– Cause unknown; probability of success uncertain
• Electrolysis Cell Flow Distribution– Flow must be distributed evenly between 76 modules; 304 stacks; 760,000 cells– Uneven distribution causes inefficient operation and other problems– Flow distribution in cells will depend upon manufacturing and assembly variations– Tolerance and variability of distribution must be established– Possibly solved by higher flow rates and pressure drops; probability of
success fair to good

Slide 35NGNP TEAM
HTSE Technical Issues (continued)
• Reliable seals– Oxygen/ Hydrogen in electrolyzers– Cables into electrolyzer enclosures– Gaskets– Tension bars at high temperature– Conditions are very demanding; probability of success fair to poor
• Seals and electrical connections in very high temperature oxidizing atmosphere
– Conditions are very demanding; probability of success fair to poor• Thermal expansion of piping, equipment, tension bars, etc.
– Must be addressed with a combination of materials science and engineering– Probability of success poor
• Area Specific Resistance (ASR): – Needs to be confirmed for the cell technology being considered– Measurement assured; resulting economics uncertain

Slide 36NGNP TEAM
Partial Electrolyzer Layout

Slide 37NGNP TEAM
Technology Readiness Levels (TRLs)
U Uncertain at this phase in design and development.1 Basic principles observed and reported in white papers, industry literature, lab
reports, etc. 2 Technology concept and application formulated. 3 Proof-of concept: Analytical and experimental critical function and/or
characteristic proven in laboratory..4 Technology or Component is tested at bench scale to demonstrate technical
feasibility and functionality.5 SSC demonstrated at experimental scale in relevant environment.6 SSCs have been demonstrated at a pilot scale in a relevant environment.7 SSCs integrated engineering scale demonstration in a relevant environment.8 Integrated prototype of the SSC is demonstrated in its operational environment
with the appropriate number and duration of tests and at the required levels of test rigor and quality assurance.
9 The project is in final configuration tested and demonstrated in operational environment.
10 Commercial-scale demonstration is achieved.

Slide 38NGNP TEAM
TRLs of Critical SSCsHigh Temperature Steam Electrolysis
8PPU System (Product Purification Unit)7Sweep Gas TurbineUFeed Purification SystemUFUS System (Feed & Utility System)8Recirculator5Heat Exchangers5HRS System (Heat Recovery System)2Piping, Manifolds, Insulation5Process Coupling Heat Exchanger5Sweep Gas Coupling Heat Exchanger3Internal Manifolds4SOE Cells3Electrolyzer Module2ELE System (Electrolysis System)2Overall HTSE HPS

Slide 39NGNP TEAM
HTSE Roadmap: Part 1
Hydrogen Production System (HPS) Technology Development Road Map (TDRM)Process Technology #4: High Temperature Steam Electrolysis (HTSE)
NGNP Demo. Plant
TRL9
Tasks
Test and Demonstrate
ELE System Engineering
Prototype TestTasks
OPTIONAL
TasksTest and DemonstrateTRL
7
TasksTest and DemonstrateTRL
6
Overall System
ELE
Electrolyzer Module
Test at pressure?
no
yes
Operational environment?
Modes and duration?
no
yes
Electrolysis Cells
Integrated Lab Scale Experiment
(ILS)Cell Stack
Demonstrations
TRL 4
TasksPerformance stabilityInterconnectionsCell sealingFlow distribution
Cell Demonstration (partial stack)
TRL3
TasksPerformance stabilityInterconnectionsCell sealingFlow distribution
Decision Criteria
Buildable?
Cell Demonstration (button)
Tasks
Electrolyte performanceElectrode performacne
TRL2
Cell Design
Choices
Planar vs. tubularElectrode materialsElectrolyteSealing Technique
Decision CriteriaBuildable?
Electrolyzer Design
ChoicesPlanar vs. tubularElectrode materialsElectrolyteSealing Technique
System Concept
Sweep gas and configurationAdded heat or “autothermal”
Preconceptual Design
Conceptual Design
Decision CriteriaAt maximum heat input is it feasibleTubular may mean a penalty in efficiency in order to get a system that can be built at a reasonable scale.
Electrolyzer Re-Design
Redesign for 15x15 or 20x20 or 50x50Input from materials testsInput from ILS
Electrolyzer “Pilot” Test
#1
# 8
# 5
TDRM - HTSE 05.vsd27OCT08Page 1 of 2
Design Activity
Internal Manifolds
Full-scale Cell Demo. (partial
stack)Tasks
Performance stabilityInterconnectionsCell sealingFlow distributionThermal expansion
Final Design
Full-scale Stack Demonstrations
System Design
# 3
# 4
Electrolyzer Internals Test
# 2
Revisit Tubular Cell
Config.
TasksFlow balance cell-to-cellThermal loss
TRL5
TasksPerformance stabilityInterconnectionsCell sealingFlow distribution
Decision CriteriaMaximize Efficiency
Fabrication Development
TRL8
TRL3
TasksPerformance stabilityInterconnectionsCell sealingFlow distribution
1000 �/h1:16 module scale1:10,000 NGNP Demo.
5000 �/h * 1:4 module scale1:2000 NGNP Demo.
* Outputs and Scale factors are only representative; designs are not advanced enough to be specific.
TRL 4

Slide 40NGNP TEAM
HTSE Roadmap: Part 2
ELE HXs: Sweep Gas Coupling Heat ExchangerProcess Coupling Heat Exchanger
Piping, Manifolds, Insulation
TRL5
PCHX Materials Tests
TasksTest trial configurations at temperature with flow
PCHX Design
TRL2
Piping Design
Insulation Test
TasksVerify insulation
TasksTest representative section of HX at temp. and pressure with actual fluids
TRL6
HRS
HRS HXs
Recirculator
FUS
PPU
System Level DDNsMaterials of ConstructionIntegration and Operation
Design FUS
Design PPU
Materials Testing Facility
System Modeling
Tasks
Dynamic model of Overall System
Bechmark to data from experiments
Specify Instrumentation and Control System
HX Materials Test
TasksTest trial configurations at temperature with flow
Design Recirculator
Design HXsTRL5
#12
HX Pilot Test
TasksTest representative section of HX at temp. and pressure with actual fluids
# 9
TRL6
Here for completeness;already TRL-8
Tasks
Identify corrosion testing requirements
List of candidate materials to be tested
Conduct corrosion experiments
TDRM - HTSE 05.vsd27OCT08Page 2 of 2
TRL5
Here for completeness;already TRL-8
Sweep Gas Turbine Materials Test
TasksVerify Material Compatibility
PCHX Pilot Test
# 6
TRL7
PCHX Valve Design
Conceptual Design
Feed Purification System
#11
TRL8
TRL8
TRL U
#10
High Temp
Low Temp
High Temp
Low Temp
Thermal Design Analysis
TasksValidate Design Concept for Accommodating Thermal Expansion
# 7
Technology Development
?
Turbine Design

Slide 41NGNP TEAM
Design Data Needs for Feed Purification and Instrumentation and Controls
• HPS-FUS-01 Identify Critical Impurities and Determine Critical Component Tolerance
• HPS-FUS-02 Develop Feed Water Purification Methods
• HPS-FUS-03 Develop Process Fluid Purification Methods
• HPS-PCN-04 Develop and Test High Temperature Helium Control Valves

Slide 42NGNP TEAM
Design Data Needs for Electrolysis (including PCHX)
• HPS-ELE-01 Develop a Cell with a commercially acceptable activity and life
• HPS-ELE-02 Optimize Catalyst Loading in the Electrodes • HPS-ELE-03 Develop a Cell Configuration and Materials• HPS-ELE-04 Build and Test a Prototype Cell• HPS-ELE-05 Build and Test a Pilot-scale Cell• HPS-ELE-06 Build and Test a Stack of Cells in a Pilot Plant• HPS-ELE-07 Test Alloy 230 and Alloy 617 in High Temperature Helium
and Air/Oxygen and Steam/Hydrogen Mixtures • HPS-ELE-08 Test a Pilot-Scale PCHX • HPS-ELE-09 Provide Data Supporting a Design Code Case• HPS-ELE-10 Develop Gasket Materials and Design • HPS-ELE-11 Develop Seal Materials and Design • HPS-ELE-12 Develop Welding Materials• HPS-ELE-13 Develop Piping Materials and Design Methods
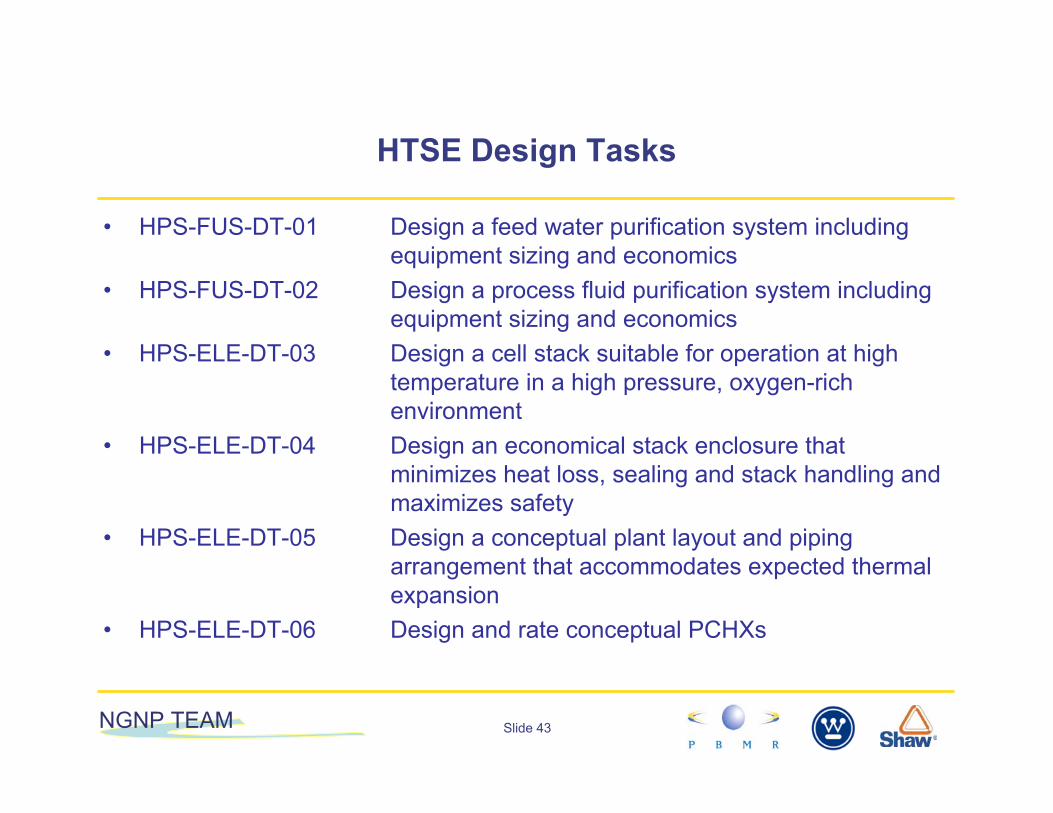
Slide 43NGNP TEAM
HTSE Design Tasks
• HPS-FUS-DT-01 Design a feed water purification system including equipment sizing and economics
• HPS-FUS-DT-02 Design a process fluid purification system including equipment sizing and economics
• HPS-ELE-DT-03 Design a cell stack suitable for operation at high temperature in a high pressure, oxygen-rich environment
• HPS-ELE-DT-04 Design an economical stack enclosure that minimizes heat loss, sealing and stack handling and maximizes safety
• HPS-ELE-DT-05 Design a conceptual plant layout and piping arrangement that accommodates expected thermal expansion
• HPS-ELE-DT-06 Design and rate conceptual PCHXs
NGNP TEAM
6.2 HyS

Slide 45NGNP TEAM
Hybrid Sulfur Cycle

Slide 46NGNP TEAM
Simplified Hybrid Sulfur Flow Diagram

Slide 47NGNP TEAM
HyS Flowsheet
• No separations or reactions appear unreasonable– Thermodynamic and VLE data is needed to confirm the validity of
separations• Some flows, especially around the vacuum tower are very high. • Four (4) trains of process equipment per reactor [eight (8) trains per 2-
reactor plant] are needed to fall within reasonable equipment and piping sizes
• Materials of construction for sulfuric acid, oxygen and sulfur dioxide in the same stream require further investigation
• Reasonable pressure drops have been incorporated • As in HTSE, sensitivity of key components to impurities have not been
established– Blowdown or a slipstream to be processed will probably be required
• Recovery of sulfur species from waste streams will probably be required
– Costed as blowdown, neutralizaton and disposal

Slide 48NGNP TEAM
Sulfuric Acid Decomposition Reactor Heating and Cooling Curves
Bayonet Reactor Heating and Cooling CurvesSRNL-WEC HyS Cycle 07-25-2008
75% H2SO4 feed, 86-bar pressure, 870°C peak process temperature, 2-bar pressure drop
100
200
300
400
500
600
700
800
900
020
040
060
080
01,0
00
Enthalpy, MW
Tem
pera
ture
, °C

Slide 49NGNP TEAM
Sulfuric Acid Decomposition Reactor Composite Utility Curves
• Heat required from He and cooling requirement is set by the pinch point
• Pinch point calculated assuming chemical and thermal equilibrium
• Departure from equilibrium can change the heating and cooling requirements
• Sensitivity to heat transfer resistance and reaction kinetics must be investigated, modeled and confirmed by testing
Bayonet Reactor Utility Composite CurveSRNL-WEC HyS Cycle 07-25-2008
75% H2SO4 feed, 86-bar pressure, 870°C peak process temperature, 2-bar pressure drop
100
200
300
400
500
600
700
800
900
0 50 100 150 200 250 300 350
Enthalpy, MW
Tem
pera
ture
, °C

Slide 50NGNP TEAM
HyS Life Cycle Costs: Capital and Reliability
• Capital cost (provisional):– Total Installed Cost: $1.2 billion (not including 2 HTGRs)– Decomposers: $156 million (equipment only)– Cells: $150 million (stacks only)– Power supply: $ 39 million
• Reliability:– High temperature equipment is either SiC or internally insulated– Lower temperature equipment will be as reliable as any similar chemical plant:
30 year life– Cell stacks will require frequent maintenance and replacement: corrosive
environment

Slide 51NGNP TEAM
HyS Life Cycle Costs: Operating Costs
• Raw Material – Availability not an issue
• Maintenance– Seals – Water treatment facilities
• Inspection– Piping and equipment lining faults
• Waste disposal– Water treatment wastes– Sulfur dioxide and blowdown neutralization
• Staff requirements: – Maintenance staff requirements:
» 3 maintenance personnel per shift (mechanical, electrical, controls) plus » 5 day shift only
– Operating staff requirements:• Water treatment: 1 operator per shift• Decomposition: 4 operators per shift• Electrolysis: 3 operator per shift• Management: 1 Plant manager; 1 Assistant; 1 Engineer and Administrative staff

Slide 52NGNP TEAM
HyS Life Cycle Costs: Utilities, Catalyst and Chemicals
• Electrical usage– Electrolyzers: 236 MWe
– Other users: Pending– Generated on site: 148 MWe
– Imported electricity: 88 MWe
• Thermal usage– Hot helium: 712 MWth
• Other utilities Pending– Water treatment chemicals– Cooling Water:– Replacement sulfuric acid:– Caustic for treating waste and blowdown:

Slide 53NGNP TEAM
HyS Preliminary Hazard and Operability Review
• Loss of containment of a highly corrosive acid. High pressure can result in a jet or spray leak.
• Loss of containment of a toxic gas • Loss of containment of a flammable gas at high pressure and temperature
resulting in a fire or explosion• The enhanced flammability of materials in oxygen resulting in an equipment
fire• Loss of containment of high pressure He or cross contamination between
primary and secondary He streams due to acid corrosion of He heat exchange equipment

Slide 54NGNP TEAM
Sulfuric Acid Decomposition Technical Issues
• Economic catalyst and basic data and analysis – Catalyst with economic life– Thermodynamic and VLE data– Thermo-hydraulic analysis with reaction kinetics – Probability of success fair
• Flow distribution between bayonet tubes– Good distribution is essential to efficient operation– High tube pressure drop will allow good distribution– New decomposer design may be required– Path forward unclear; probability of success fair
• Distribution of temperature across the reactor elements– Good distribution is essential to efficient operation – Longitudinal flow along tubes will provide good temperature distribution– Probability of success good, but possibly uneconomic

Slide 55NGNP TEAM
Sulfuric Acid Decomposition Technical Issues(Continued)
• Transition between SiC decomposer tubes and metallic vessel– Reliable seals– Forgiving design– Transition technology is being developed in other fields; thermal shielding
may be possible. Probability of success fair to good

Slide 56NGNP TEAM
HyS Electrolysis Technical Issues
• Electrolysis Cell Operation– Membrane permeability to sulfur species– Cell tolerance to contaminants needs to be established– Causes known; probability of success fair to good
• Electrolysis Materials of Construction– Economic materials depend upon coating integrity

Slide 57NGNP TEAM
TRLs of Critical SSCsSulfuric Acid Decomposition
6Steam ejectors and vacuum pump
6Feed acid handling and concentrating equipment
6Acid concentration vacuum column
6Decomposer product handling equipment
2Catalyst
2Acid Decomposer (decomposition reactor)[H2SO4 � ½O2 + SO2 + H2O]
2Acid Decomposition Section

Slide 58NGNP TEAM
Sulfuric Acid Decomposition: Part 1
Catalyst Bench Tests
Hydrogen Production System (HPS) Technology Development Road Map (TDRM)Process Technology #1: Sulfuric Acid Decomposition
NGNP Demo. PlantTasks
Test and Demonstrate
Overall System(S-I or HyS)
Acid Decomposer
S-I Integrated Lab Scale Experiment
(ILS)Initial
Demonstrations
Decision Discriminators
Corrosion resistanceHigh temperature operation, especially thermal expansionSealing and transition from ceramics to metalsThermal performance: (longitudinal and transverse temperature profiles in each tube and among tubes, recuperation, heat transfer rate)Ease of catalyst replacementHydraulic performance: (need for gravity flow, even flow distribution between tubes, pressure drop,etc.)
System Design
Prototype Test
Materials Testing
SiC Bayonet Tube
Candidate Configurations
Tubular Metal
Compact Metal
WEC Arrangement
SNL Arrangement
HyS Integrated Lab Scale Experiment
(ILS)
Tasksfor Acid Decomposer advancment
Backup ILS test
Pilot Test
Decomposer ModelSiC Compact
TDRM - Decomp 05.vsd27OCT08Page 1 0f 2
Preconceptual Design
Conceptual Design
Design Activity Final Design
# 1
# 2
Design
# 6
Thermodynamic Equilibrium Data
Verification
Reaction Kinetics
Verification
Redesign based on test data
Decomposer Design
Tasksfor materials other than the SiC tubes:
Identify corrosion testing requirementsList of candidate materials to be testedConduct pressure pulse and thermal cycle tests on seals
TasksConvective He heatingOne tube, full-scaleReference sealing configurationReplaceable CatalystRun startup/shutdown/accident transients500 hours
TRL 1
# 5
#13
Consider Integrated
Test
#16
choice advance
maintain alternate
Tasks
Catalyst trialProcess side flow distribution
Tasks
Materials compatibility
Tasks
Assemble results of design and test data
Tasks
Choose catalystCharacterize catalystLearn degradation mechanismsAccelerated testiing
TRL 2
TRL 6
TRL 4
Engineering Test
Tasks
19 full-length tubes1000 hours
#14
TRL 7
TRL 9
TRL 8
TRL 3
Tasks
Confirm extrapolations used in Conceptual Design flow sheetingStandard chem. engr. bench verification tests
Tasks
Test catalystsValidate catalyst form and supportBench tests for rates of reaction, etc.Determine whether Decomposer design is heat transfer or kinetics limitedCatalyst life-limit test
Catalyst
Thermal-Hydraulic Analysis
Tasks
Liquid distribution between tubes
# 4
# 3
decision
# 7
TRL 2
Decision Criteria
TRLEconomicsRisk assessmentProject objectives and schedules
ChoicesRequirements met and continue
orReview alternatives
# 8
Tasks
Final design sealsFull operational environmentDesign cycles2500 hours
S-I or HyS Integrated
TestsTasks
Test and Demonstrate

Slide 59NGNP TEAM
Sulfuric Acid Decomposition Roadmap: Part 2
Balance of System
Reactor Product And Recycle Flash
Vacuum Stripper
System Level DDNsIntegration and Operation System
Modeling
Tasks
Dynamic model of Overall System
Bechmark to data from experiments
Specify Instrumentation and Control System
VLE Data Verification
Design
Design
#15
Stripper Tower Design Data
Tasks
Experimentally verify vendor packing choiceDetermine Height Equivalent to the Theoretical Plate (HETP) and/or mass transfer factors
# 9
TRL 8
TRL 6
TRL 8
Decomposer Product Handling
Feed Acid Handling
Materials Test
Materials Test
TasksVerify Material Compatibility
Design TRL 6
TRL 8
Design TRL 6
TDRM - Decomp 05.vsd27OCT08Page 2 0f 2
TasksVerify Material Compatibility
Tasks
Get VLE (Vapor-Liquid Equilibirum) data for designTRL
6
TRL 8
#11
#10
#12

Slide 60NGNP TEAM
TRLs of Critical SSCsSulfur Dioxide Electrolysis
6Instrumentation and Control (I&C) System
8Product Purification System (PPU)
UWater Treatment System
UFeed and Utility System (FUS)
4SO2 Compression System
4SO2 Recovery System
4SO2 portions of the Acid Decomposition System (SAD)
5Electrolyzer Vessels
2Electrolyzer Internals
3SO2 Electrolysis Cells
2Electrolyzer System (ELE)

Slide 61NGNP TEAM
Sulfur Dioxide Electrolysis Roadmap: Part 1
Hydrogen Production System (HPS) Technology Development Road Map (TDRM)Process Technology #2: Sulfur Dioxide Electrolysis
NGNP Demo. Plant
Tasks
Test and Demonstrate
TasksTest and Demonstrate2500 hours
ELE
Electrolyzer Module
SOE Cells
Integrated Lab Scale Experiment
(ILS)
Single Cell testing at 100 C,
10 atm
TasksPerformance stabilityInterconnectionsCell sealingFlow distribution
Decision Criteria
Buildable?
Multi-cell Demonstration
Tasks
Electrolyte performanceElectrode performacne
Cell Design
Choices
Planar vs. tubularElectrode materialsElectrolyteSealing Technique
Decision CriteriaBuildable?
Electrolyzer Design
ChoicesPlanar vs. tubularElectrode materialsElectrolyteSealing Technique
System Concept
Sweep gas and configurationAdded heat or “autothermal”
Preconceptual Design
Conceptual Design
Decision CriteriaAt maximum heat input is it feasibleTubular may mean a penalty in efficiency in order to get a system that can be built at a reasonable scale.
Electrolyzer Re-Design
Redesign for 15x15 or 20x20 or 50x50Input from materials testsInput from ILS
Prototype Electrolyzer
Test
TDRM - HyS 03.vsd27OCT08Page 1 of 2
Design Activity
Internal Components
Cell Scale-up to 400 cm2
TasksPerformance stabilityInterconnectionsCell sealingFlow distributionThermal expansion
Final Design
Electrolyzer Engineering Scale Test
TasksPerformance stabilityInterconnectionsCell sealingFlow distribution1000 hours
System Design
Electrolyzer Internals Test
TasksPerformance stabilityInterconnectionsCell sealingFlow distribution
Decision CriteriaMaximize Efficiency
Overall HyS System (in combination with Acid Decompser)
3 cells500 hr
Optimized Cell Assembly
Demonstration
TasksPerformance stabilityInterconnectionsCell sealingFlow distribution
TasksFlow balance cell-to-cellThermal loss
TRL 3
# 2
TRL 9
TRL 2
Cell Stability Demonstration
Tasks
Electrolyte performanceElectrode performacne
TRL 4
TRL 6
TRL 7
Cell Scale-up to 1000 cm2
# 1
# 3
# 4 # 5
# 6
# 8 # 9Electrolyzer Pilot Scale
TestTasks
Performance stabilityInterconnectionsCell sealingFlow distribution500 hours
TRL 5
TasksPerformance stabilityInterconnectionsCell sealingFlow distribution
# 7
TRL 5
Prototype HPS Test
#10
IF NEEDED
Cell Scale-up to 1 m2
TasksPerformance stabilityInterconnectionsCell sealingFlow distribution
Tasks
Integrated Operation TRL 8
28 Nm3/h *1:15 module scale1:300 NGNP Demo.
280 Nm3/h *1:1.5 module scale1:30 NGNP Demo.
420 Nm3/h *1:1 module scale1:20 NGNP Demo.
200 �/h1:2000 module scale1:40,000 NGNP Demo.
* Outputs and Scale factors are only representative; designs are not advanced enough to be specific.
Design

Slide 62NGNP TEAM
Sulfur Dioxide Electrolysis Roadmap: Part 2
SAD
Acid Decomposer
SO2 Recovery and Compression Systems
FUS
PPU
Design FUS
Here for completeness;already TRL-8
TDRM - HyS 03.vsd27OCT08Page 2 of 2
Feed Purification System
Electrolyzer Vessel
Instrumentation & Control
Design I&C
System Modeling
TasksDynamic model of Overall SystemBechmark to data from experimentsSpecify Instrumentation and Control System
TRL 8
Acid and Caustic Storage Here for completeness;already TRL-8
see separate TDRM for Acid Decomposer
TRL4
TRL 8
TRL 6
TRL 5
Vessel Design
System Demo. Test
Tasks TRL 8
#13
TRL U
#12
Absorber Tower Design Data
Tasks
Experimentally verify vendor packing choiceDetermine Height Equivalent to the Theoretical Plate (HETP) and/or mass transfer factors
#11
TRL 8
Design PPU
DesignTRL 6

Slide 63NGNP TEAM
Design Data Needs for Sulfuric Acid Decomposition
• HPS-SAD-01 Confirm Thermodynamic Data for the Sulfuric Acid Decomposition Process • HPS-SAD-02 Develop a Commercial Sulfuric Acid Decomposition Catalyst• HPS-SAD-03 Gather Decomposition Reaction Kinetics Data • HPS-SAD-04 Test Silicon Carbide and other Ceramic Material in Decomposition Service• HPS-SAD-05 Test Alloy 230 and Alloy 617 in a High Temperature Sulfuric Acid, Sulfur
Dioxide, and Oxygen Atmosphere. • HPS-SAD-06 Develop a Method to Bond Alloy 230 or Alloy 617 or Similar Materials to Silicon
Carbide and other Ceramics. • HPS-SAD-07 Develop Materials to Seal the Joints between Ceramic Decomposer Elements
and the Metallic Tube Sheet or Vessel. • HPS-SAD-08 Test a Pilot-Scale Decomposer. • HPS-SAD-09 Provide Data Supporting a Design Code Case• HPS-SAD-10 Develop Gasket Materials and Design • HPS-SAD-11 Develop Seal Materials and Design • HPS-SAD-12 Develop Welding Materials• HPS-SAD-13 Develop Cladding and Coating Materials• HPS-SAD-14 Develop Piping Materials and Design Methods• HPS-SAD-15 Measure the Height Equivalent to a Theoretical Plate (HETP) for the
Concentrator (Vacuum Tower)• HPS-SAD-16 Measure the Height Equivalent to a Theoretical Plate (HETP) for the SO2
Absorber

Slide 64NGNP TEAM
Design Data Needs for Feed and Utility Supply, Electrolyzers, Product Purification, and Instrumentation and Control
• HPS-FUS-01 Identify Critical Impurities and Determine Critical Component Tolerance
• HPS-FUS-02 Develop Feed Water Purification Methods• HPS-FUS-03 Develop Process Fluid Purification Methods • HPS-ELE-01 Develop a Cell Membrane • HPS-ELE-02 Optimize Catalyst Loading in the Electrodes • HPS-ELE-03 Develop a Cell Configuration and Materials• HPS-ELE-04 Build and Test a Prototype Cell• HPS-ELE-05 Build and Test a Pilot-scale Cell• HPS-ELE-06 Build and Test a Stack of Cells in a Pilot Plant• HPS-PPU-01 Identify Product Impurities • HPS-PPU-02 Test Product Purification Methods• HPS-PCN-01 Test Sensors in the Pilot Plant • HPS-PCN-02 Develop Valves for High-Temperature Acid and/or Helium Service • HPS-PCN-03 Test Valves in the Pilot Plant
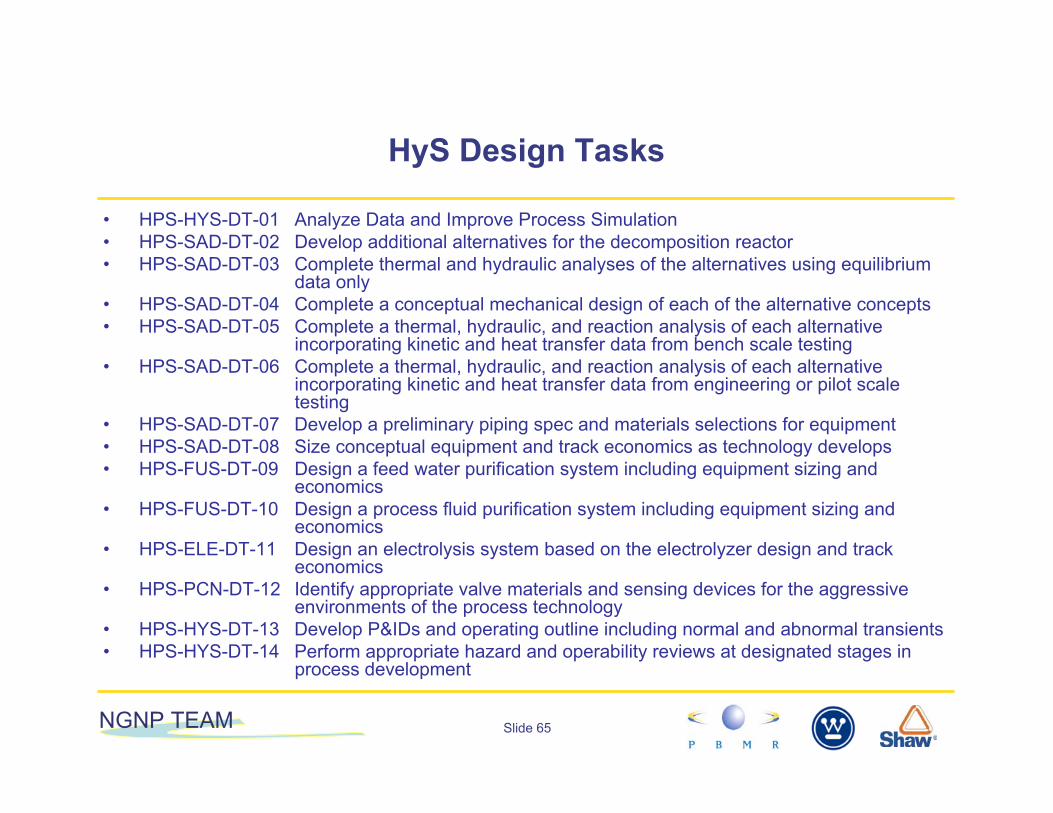
Slide 65NGNP TEAM
HyS Design Tasks
• HPS-HYS-DT-01 Analyze Data and Improve Process Simulation • HPS-SAD-DT-02 Develop additional alternatives for the decomposition reactor• HPS-SAD-DT-03 Complete thermal and hydraulic analyses of the alternatives using equilibrium
data only • HPS-SAD-DT-04 Complete a conceptual mechanical design of each of the alternative concepts• HPS-SAD-DT-05 Complete a thermal, hydraulic, and reaction analysis of each alternative
incorporating kinetic and heat transfer data from bench scale testing• HPS-SAD-DT-06 Complete a thermal, hydraulic, and reaction analysis of each alternative
incorporating kinetic and heat transfer data from engineering or pilot scale testing
• HPS-SAD-DT-07 Develop a preliminary piping spec and materials selections for equipment• HPS-SAD-DT-08 Size conceptual equipment and track economics as technology develops• HPS-FUS-DT-09 Design a feed water purification system including equipment sizing and
economics• HPS-FUS-DT-10 Design a process fluid purification system including equipment sizing and
economics• HPS-ELE-DT-11 Design an electrolysis system based on the electrolyzer design and track
economics• HPS-PCN-DT-12 Identify appropriate valve materials and sensing devices for the aggressive
environments of the process technology• HPS-HYS-DT-13 Develop P&IDs and operating outline including normal and abnormal transients• HPS-HYS-DT-14 Perform appropriate hazard and operability reviews at designated stages in
process development

NGNP TEAM
6.3 SI

Slide 67NGNP TEAM
Sulfur Iodine Cycle

Slide 68NGNP TEAM
Bunsen Reaction Flow Diagram
MIXINGVESSEL
CW
CW
BUNSENREACTOR
RECIRCULATIONPUMPS
RECIRCULATIONCOOLERS
REVERSEBUNSEN
REACTOR
ACIDSEPARATION
TO H2SO4 DECOMPOSITION
TO HIX DECOMPOSITION
O2/SO2 VAPOR FROMH2SO4 DECOMPOSITION
O2/SO2 VAPOR
IODINE FROMHIX TO DECOMPOSITION
HIX FROM HIXDECOMPOSITION
FEED WATER
H2SO4 FEED
OXYGEN
WATER
IODINE & HIX
H2SO4
IODINE & HIX
RECYCLED SO2 FROMH2SO4 DECOMPOSITION
OXYGENTo OXYGEN SCRUBBER

Slide 69NGNP TEAM
HI Decomposition Flow Sheet

Slide 70NGNP TEAM
SI Flowsheets
• No separations or reactions appear unreasonable– Thermodynamic and VLE data is needed to confirm the validity of reactions
and separations– Work at University of Virginia should be incorporated
• Iodine flows, are extremely high• Materials of construction for oxygen, sulfur dioxide, iodine and
hydroiodic acid require further investigation• Reasonable pressure drops have been incorporated • Sensitivity of key components to impurities have not been established
– Blowdown or a slipstream to be processed will probably be required– Effect of impurities on liquid/ liquid separation
• Several efforts to recover heat in simulations were judged impractical, probably uneconomic and were removed

Slide 71NGNP TEAM
SI Life Cycle Costs: Capital and Reliability
• Capital cost (Incomplete):– Total Installed Cost:– Decomposers: $156 million (equipment only) – Initial charge of chemicals:
• Reliability:– High temperature equipment is either SiC or internally insulated– Lower temperature equipment will be somewhat less reliable than similar
chemical plants because of aggressive environment: 30 year life, high maintenance
• Raw Material – Availability of iodine may be an issue
• Maintenance– Seals and gaskets – Water treatment facilities– Helium valves

Slide 72NGNP TEAM
SI Life Cycle Costs: Operating Costs
• Inspection– Piping seal leaks – Internal insulation faults
• Waste disposal– Water treatment wastes – Iodine contamination
• Staff requirements: – Maintenance staff requirements:
» 3 maintenance personnel per shift plus » 5 day shift only
– Operating staff requirements:• Water treatment: 1 operator per shift• Decomposition: 4 operators per shift• Bunsen and HI : 3 operators per shift• Management: 1 Plant manager; 1 Assistant; 1 Engineer and
Administrative staff

Slide 73NGNP TEAM
SI Life Cycle Costs: Utilities, Catalyst and Chemicals
Pending

Slide 74NGNP TEAM
SI Preliminary Hazard and Operability Review
Pending

Slide 75NGNP TEAM
Bunsen and HI Decomposition Technical Issues
• High Iodine Circulation Rate– Very large flows and equipment size– Thermodynamic necessity
• Effect of Contaminants– On reactions and catalysts– On liquid/liquid separations– Severity of problem unknown
• Materials of Construction, Reliable Seals and Gaskets– Conditions are very demanding; probability of economic success fair to
poor• Energy Integration
– Proposed solutions are practically unworkable– Probability of economic success fair to poor

Slide 76NGNP TEAM
TRLs of Critical SSCsBunsen Reaction and HI Decomposition
6Instrumentation and Controls
UProduct Purification
UFeed Purification
6Reactor Products Handling
UBalance of S-I Plant
5Process Coupling Heat Exchanger
5Recuperators
1Reactive Still
1HI Decomposition Systems
2Three-Phase Separator
2Bunsen Reactor
2Bunsen Reaction System
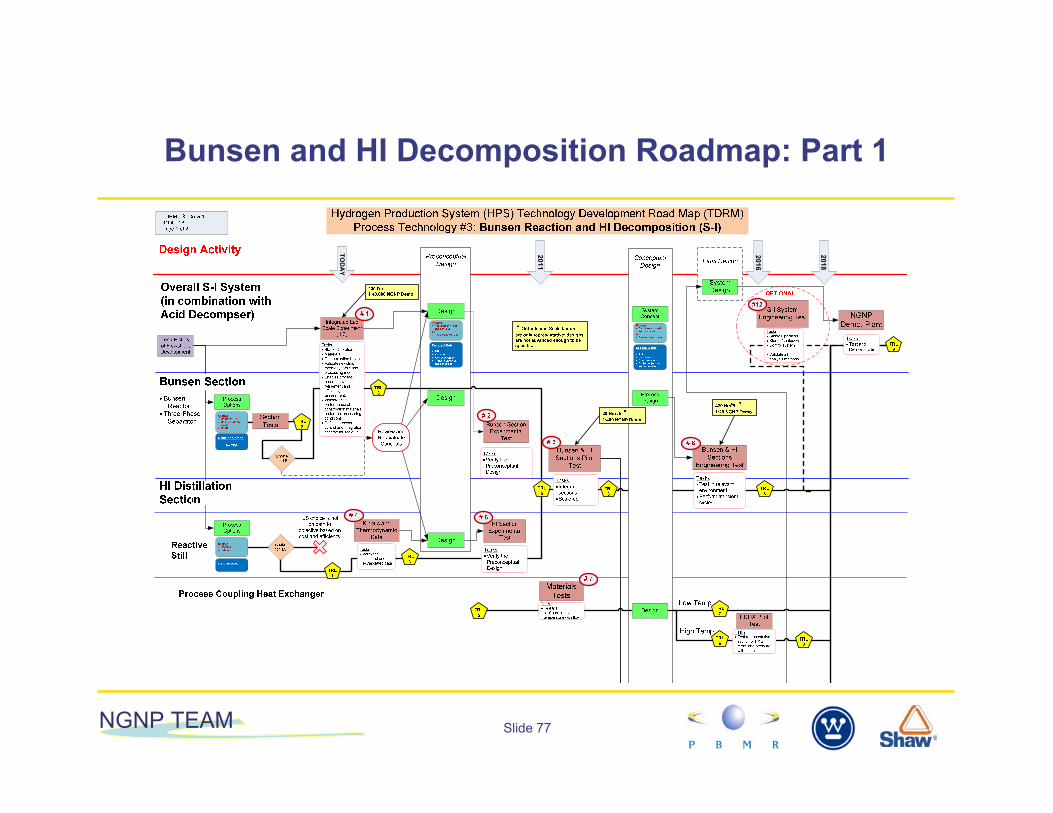
Slide 77NGNP TEAM
Bunsen and HI Decomposition Roadmap: Part 1
TOD
AY
2011
2018
2016

Slide 78NGNP TEAM
Bunsen and HI Decomposition Roadmap: Part 2
Balance of System
Product Purificaion
Instrumentation & Control
Feed Purification SystemDesign FUS
Design PPU
Design I&C
System Modeling
TasksDynamic model of Overall SystemBechmark to data from experimentsSpecify Instrumentation and Control System
TRL 6
TRL U
TRL 8
# 9
#11
Design Data
TDRM - S-I 05.vsd31OCT08Page 2 of 2
# 8
TRL U
#10
Reactor Products Handling Equipment
Design Materials Test
TasksVerify Material Compatibility
TRL 6
TRL 8
TasksFluid data for phase separtionMaterials data

Slide 79NGNP TEAM
Design Data Needs for the Bunsen Reaction and Product Purification Section
• HPS-BUN-01 Confirm Thermodynamic Data for the Bunsen Reaction Process including Phase Equilibria
• HPS-BUN-02 Gather Kinetic and Mass Transfer Data for the Bunsen Reaction in the proposed reactor configuration
• HPS-BUN-03 Develop Gasket Materials and Design for Bunsen Reaction Environment
• HPS-BUN-04 Develop Seal Materials and Design for Bunsen Reaction Environment
• HPS-BUN-05 Develop Welding Materials for Bunsen Reaction Environment
• HPS-BUN-06 Develop Cladding and Coating Materials for Bunsen Reaction Environment
• HPS-BUN-07 Develop Piping Materials and Design Methods for Bunsen Reaction Environment
• HPS-PPU-01 Identify Product Impurities • HPS-PPU-02 Test Product Purification Methods

Slide 80NGNP TEAM
Design Data Needs for Hydroiodic Acid Decomposition
• HPS-HID-01 Demonstrate Hydroiodic Acid Reactive Distillation Decomposition in Principle
• HPS-HID-02 Confirm Thermodynamic Data for the Hydroiodic Acid Decomposition Process including Phase Equilibria
• HPS-HID-03 Develop commercial HI Decomposition Catalyst• HPS-HID-04 Gather Kinetic and Mass Transfer Data for the Hydroiodic Acid
Decomposition in the proposed reactor configuration based on the commercial catalyst
• HPS-HID-05 Develop Gasket Materials and Design for Hydroiodic Acid Decomposition Environment
• HPS-HID -06 Develop Seal Materials and Design for Hydroiodic Acid Decomposition Environment
• HPS-HID -07 Develop Welding Materials for Hydroiodic Acid Decomposition Environment
• HPS-HID -08 Develop Cladding and Coating Materials for Hydroiodic Acid Decomposition Environment
• HPS-HID-09 Develop Piping Materials and Design Methods for Hydroiodic Acid Decomposition Environment

Slide 81NGNP TEAM
S I Design Tasks
• HPS-SI-DT-01 Analyze Data and Improve Process Simulation • HPS-SAD-DT-02 Develop additional alternatives for the decomposition
reactor• HPS-SAD-DT-03 Complete thermal and hydraulic analyses of the
alternatives using equilibrium data only • HPS-SAD-DT-04 Complete a conceptual mechanical design of each of the alternative concepts• HPS-SAD-DT-05 Complete a thermal, hydraulic, and reaction analysis of each alternative
incorporating kinetic and heat transfer data from bench scale testing• HPS-SAD-DT-06 Complete a thermal, hydraulic, and reaction analysis of each alternative
incorporating kinetic and heat transfer data from engineering or pilot scale testing
• HPS-SAD-DT-07 Develop a preliminary piping spec and materials selections for SAD equipment• HPS-SI-DT-08 Track equipment size and cost as development progresses• HPS-FUS-DT-09 Design a feed water purification system including equipment sizing and
economics• HPS-FUS-DT-10 Design a process fluid purification system including equipment sizing and
economics• HPS-PCN-DT-12 Identify appropriate valve materials and sensing devices for the aggressive
environments of the process technology

Slide 82NGNP TEAM
S I Design Tasks (continued)
• HPS-SI-DT-13 Develop P&IDs and operating outline including normal and abnormal transients
• HPS-SI-DT-14 Perform appropriate hazard and operability reviews at designated stages in process development
• HPS-BUN-DT-15 Design Alternative Bunsen Reactors• HPS-BUN-DT-16 Complete thermal and hydraulic analyses of the
alternatives using equilibrium data only • HPS-BUN-DT-17 Complete a conceptual mechanical design of each of the
alternative concepts• HPS-BUN-DT-18 Complete a thermal, hydraulic, and reaction analysis of
each alternative incorporating kinetic and heat transfer data from bench scale testing
• HPS-BUN-DT-19 Complete a thermal, hydraulic, and reaction analysis of each alternative incorporating kinetic and heat transfer data from engineering or pilot scale testing
• HPS-BUN-DT-20 Develop a preliminary piping spec and materials selections for BUN equipment

NGNP TEAM
7. Comparisons between Technologies

Slide 84NGNP TEAM
Economic Analysis Ground Rules - 1
• Use H2A modeling tool• All HPS alternatives assumed to be commercially mature and
evaluated for a consistent 2030 to 2070 service timeframe• Generic HTR heat sources (NHSSs) at 550MWt core power,
modeled for all cases as a fixed operating cost of TBD $/MWt-h, based on TBD, factored for reactor outlet temperature
• Number of reactor modules determined by reference HPS output (142 million SCFD Hydrogen) with appropriate sharing factors formultiple modules
• Capacity factor of overall plant is 8200 hours per year

Slide 85NGNP TEAM
Economic Analysis Ground Rules - 2
• 100% equity financing with an after income tax internal rate of return (IRR) of 10% (equivalent to D/E = 75/25 with 20% IRR and 10% debt rate). Sensitivities to cover range of financing options
• Capital cost contingency adjustment is made to the total initialcapital cost such that the resulting cost represents a mean or expected value. This cost is the baseline value from which hydrogen price sensitivity can be calculated. Periodic replacement capital includes the same contingency
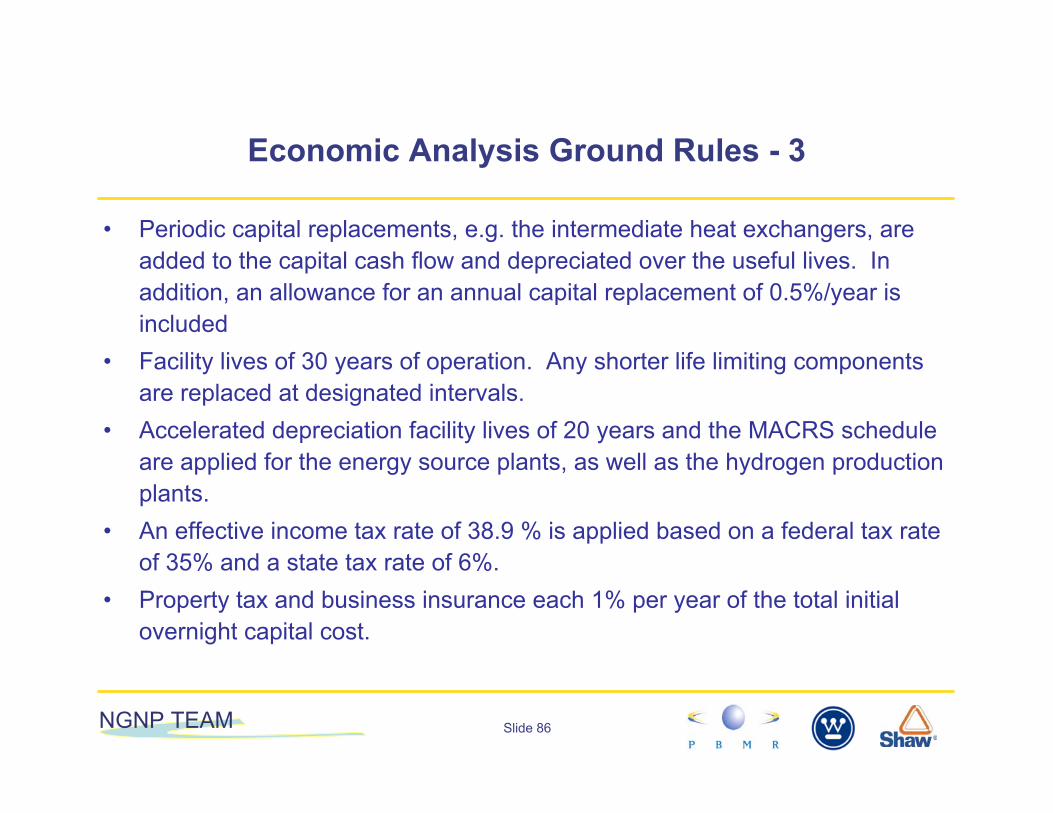
Slide 86NGNP TEAM
Economic Analysis Ground Rules - 3
• Periodic capital replacements, e.g. the intermediate heat exchangers, are added to the capital cash flow and depreciated over the useful lives. In addition, an allowance for an annual capital replacement of 0.5%/year is included
• Facility lives of 30 years of operation. Any shorter life limiting components are replaced at designated intervals.
• Accelerated depreciation facility lives of 20 years and the MACRS schedule are applied for the energy source plants, as well as the hydrogen production plants.
• An effective income tax rate of 38.9 % is applied based on a federal tax rate of 35% and a state tax rate of 6%.
• Property tax and business insurance each 1% per year of the total initial overnight capital cost.

Slide 87NGNP TEAM
Economic Analysis Ground Rules - 4
• Reference year dollars are 2nd Quarter 2008 • General inflation is zero. In H2A analyses one can apply a general
inflation rate, but in the model the results are deflated back to reference year dollars so inflation is nominally irrelevant.
• A nominal three year construction period is applied with 25%, 40% and 35% of the costs incurred respectively
• A Gulf Coast site is assumed with an average burdened operating labor rate of $50 /hour, plus a 20% G&A adder, applied consistently for the plant staffs, which are estimated separately for the different options along with the respective maintenance cost estimates

Slide 88NGNP TEAM
Economic Analysis Ground Rules - 5
• Plant startup is considered to occur over one year. In that period, revenues are assumed to be 50% of subsequent full-year revenues and variable costs are assumed to be 50% likewise. Fixed annualcosts are taken at 100% in the startup year
• The hydrogen delivery pressure at all production plant gates is consistently 50 bar (710 psig). If a lower pressure is supplied by the process, compression costs are added.
• Deficit or surplus electric power priced at 75 $/MWh import and 60$/MWh export.

Slide 89NGNP TEAM
Economic Analysis Ground Rules - 6
• No central hydrogen storage is included at the production plantsother than buffer storage, as required for efficient operations.
• A constant site size of 400 acres has been applied for all options at an assumed unit cost of 5000 $/acre.
• Oxygen byproduct credit is included in the analysis. The reference credit is to be applied at 40 $/MT, which is about today’s industrial oxygen price.

Slide 90NGNP TEAM
Baselines for Cost Comparison Hydrogen Price from SMR and Conventional Electrolysis
$2.00
$2.50
$3.00
$3.50
$4.00
$4.50
$5.00
$5.50
$6.00
$6.50
$7.00
$7.50
$8.00
40 45 50 55 60 65 70 75 80 85 90 95
Electricity price, 2008$/MWh
Hyd
roge
n pr
ice,
200
8$/k
g
Conventional Electrolysis Advanced Electrolysis Advanced SMR
5 6 7 8 9 10 11 12 13 14 15 16 17 18Natural Gas Price, 2008$/MMBtu
CO2 costs: 30 $/tonne from syngas, 100 $/tonne from flue gasEscalation: Natural Gas 2% Electricity 1% CO2 costs 1%
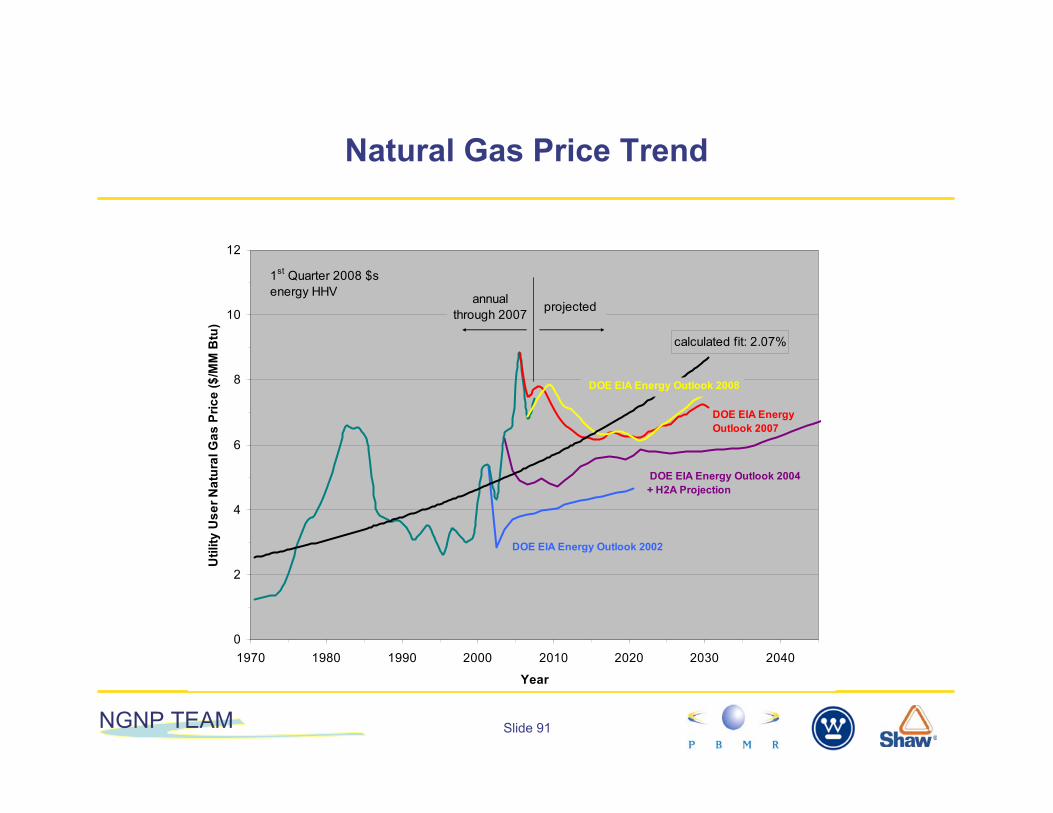
Slide 91NGNP TEAM
Natural Gas Price Trend
calculated fit: 2.07%
0
2
4
6
8
10
12
1970 1980 1990 2000 2010 2020 2030 2040
Year
Util
ity U
ser N
atur
al G
as P
rice
($/M
M B
tu)
DOE EIA Energy Outlook 2004 + H2A Projection
DOE EIA Energy Outlook 2002
DOE EIA EnergyOutlook 2007
DOE EIA Energy Outlook 2008
1st Quarter 2008 $senergy HHV
projected annualthrough 2007
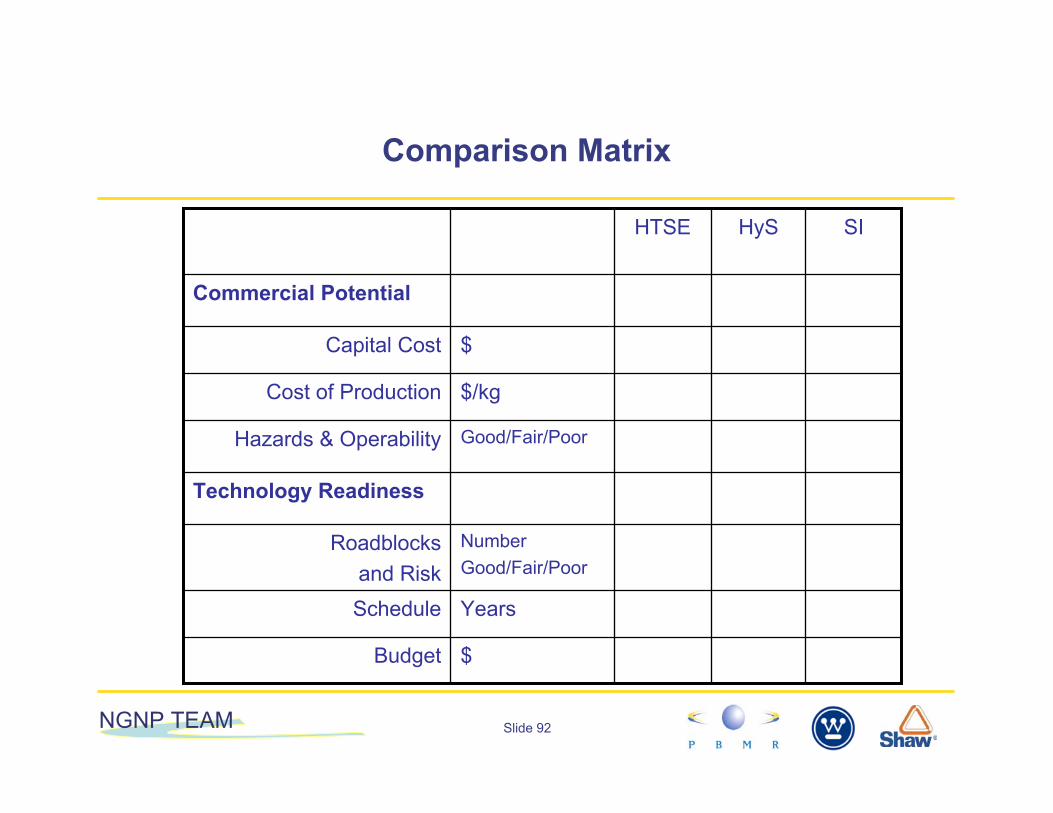
Slide 92NGNP TEAM
Comparison Matrix
HTSE
Technology Readiness
YearsSchedule
NumberGood/Fair/Poor
Roadblocksand Risk
$Budget
SIHyS
Good/Fair/PoorHazards & Operability
$/kgCost of Production
$Capital Cost
Commercial Potential
NGNP TEAM
8. Conclusions
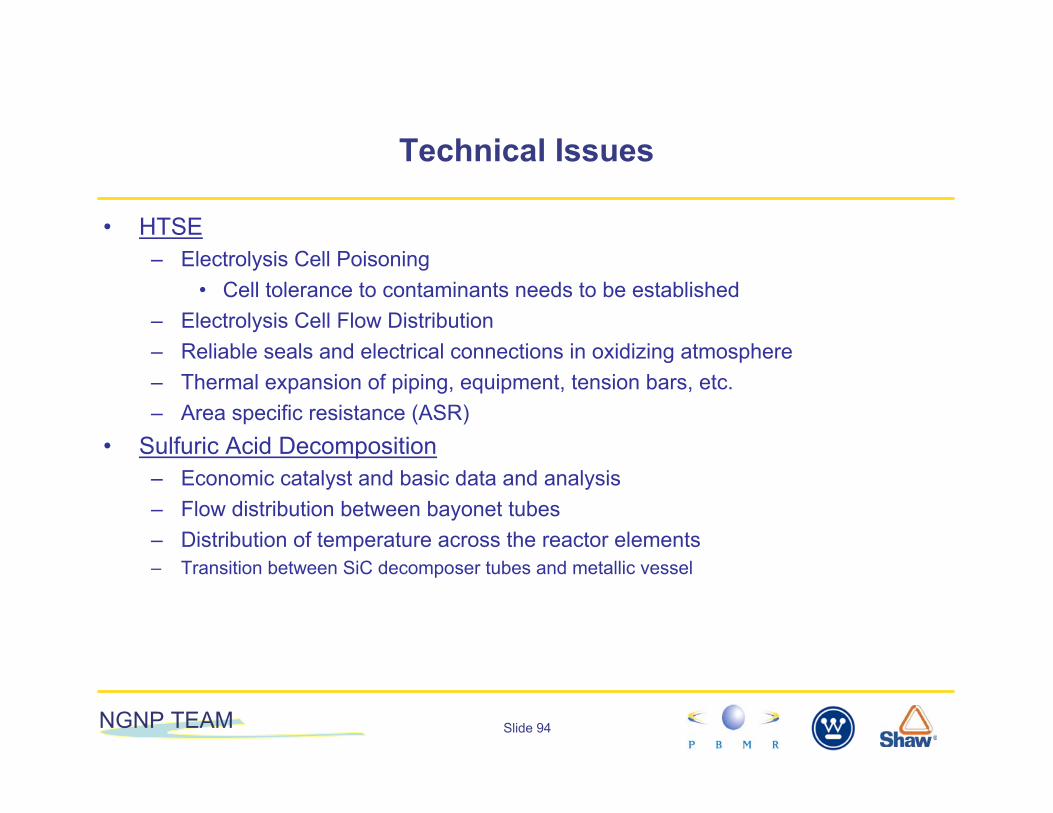
Slide 94NGNP TEAM
Technical Issues
• HTSE– Electrolysis Cell Poisoning
• Cell tolerance to contaminants needs to be established– Electrolysis Cell Flow Distribution– Reliable seals and electrical connections in oxidizing atmosphere– Thermal expansion of piping, equipment, tension bars, etc.– Area specific resistance (ASR)
• Sulfuric Acid Decomposition– Economic catalyst and basic data and analysis – Flow distribution between bayonet tubes– Distribution of temperature across the reactor elements– Transition between SiC decomposer tubes and metallic vessel

Slide 95NGNP TEAM
Technical Issues
• HyS Electrolysis– Membrane permeability to sulfur species– Cell tolerance to contaminants needs to be established– Electrolysis Materials of Construction
• Bunsen and HI Decomposition– High Iodine Circulation Rate– Effect of Contaminents– Materials of Construction, Reliable Seals and Gaskets– Energy Integration

Slide 96NGNP TEAM
Technical Issues

Slide 97NGNP TEAM
Conclusions: Process Simulation
• Simulations produced up to this study have been directed at maximizing thermal efficiency and have neglected certain practicalities and made unrealistic thermodynamic assumptions
• Practical heat integration must be simpler for commercial plants. Effort should not be expended to raise thermal efficiency by attempting to recover low quality heat
• Realistic pressure drops and temperature approaches are essential to practical process schemes

Slide 98NGNP TEAM
Conclusions: Major R&D Efforts
• More effort needed in gathering basic thermodynamic, equilibrium and physical property data for relevant process streams in the thermo-chemical processes
• Major gaps that will be on the critical path– Materials of construction– Seals and gaskets– Effect of impurities– Helium control valves

Slide 99NGNP TEAM
Conclusions: Barriers to Commercialization
• All these plants are much larger and more expensive (capital cost) in comparison with SMR plants of the same capacity; breakeven natural gas price for some lifecycle costs > 15$/MMBtu (tentative)
• Thermo-chemical plants will require multiple trains for each reactor raising capital costs
• Sulfur Iodine requires circulation of very large amounts of iodine for even modest hydrogen production. This will be a serious barrier to commercialization
• HTSE ill-suited to centralized use of high temperature process heat; better suited to distributed generation of hydrogen, possibly using integrated recuperator, inert sweep gas, process heat source other than nuclear
• HyS cell testing shows sulfur formation between electrolyte membrane and cathode electrode. Solution needed to assure stable operation

NGNP TEAM
9. Deliverable Schedule

Slide 101NGNP TEAM
Study Deliverables
• Process flow sheets• Sized equipment lists• Capital cost estimates• Operating cost estimates• Economic model• Life-cycle cost of hydrogen• Sensitivity analyses• Preliminary hazards analysis and operability review• Technology readiness level scores (TRLs)• Design readiness level scores (DRLs)• Design data needs (DDNs)• Technology development plan (technology maturation plan)
– Scope– Schedule– Budget

NGNP TEAM
THANK YOU!

NGNP TEAM
Backup

Slide 104NGNP TEAM
Technology Readiness Levels (TRLs)
SSC demonstrated at experimental scale in relevant environment. Components have been defined, acceptable technologies identified and technology issues quantified for therelevant environment. Demonstration methods include analyses, verification, tests, and inspection.
5
Technology or Component is tested at bench scale to demonstrate technical feasibility and functionality. For analytical modeling, use generally recognized benchmarked computational methods and traceable material properties.
4
Proof-of concept: Analytical and experimental critical function and/or characteristic proven in laboratory. Technology or component tested at laboratory scale to identify/screen potential viability in anticipated service.
3
Technology concept and application formulated. Issues related to performance identified. Issues related to technology concepthave been identified. Paper studies indicate potentially viablesystem operation
2
Basic principles observed and reported in white papers, industry literature, lab reports, etc. Scientific research without well-defined application.
1
Uncertain at this phase in design and development.U
Rating Level
Commercial-scale demonstration is achieved. Technological risks minimized by multiple units built and running through several years of service cycles – Multiple Units
10
The project is in final configuration tested and demonstrated inoperational environment.
9
Integrated prototype of the SSC is demonstrated in its operational environment with the appropriate number and duration of tests and at the required levels of test rigor and quality assurance. Analyses, if used support extension of demonstration to all design conditions. Analysis methods verified and validated. Technology issues resolved pending qualification(for nuclear application, if required). Demonstrated readiness for hot startup.
8
SSCs integrated engineering scale demonstration in a relevant environment.
7
SSCs have been demonstrated at a pilot scale in a relevant environment.
6
Rating Level

Hydrogen Plant Alternatives Study NGNP-HPS SHAW-HPA References
March 2009
9 REFERENCES [1] Parma EJ, Vernon ME, Gelbard F, Moore RC, Stone HBJ, Pickard PS. “Modeling the Sulfuric Acid Decomposition Section for Hydrogen Production.” Proc, 2007 Int Topical Mtg on Safety and Technol of Nucl Hydrogen Prodn, Control, & Mgmt, Boston, MA, Jun 24-28, 2007: 154-160. [2] The preceding three paragraphs and diagram are taken almost verbatim from, R. Greyvenstein (PBMR ), M.B. Gorensek, W.A. Summers (SRNL), C.O. Bolthrunis (The Shaw Group, Inc.), E.J. Lahoda (Westinghouse Electric Co.), D.T. Allen (Technology Insights), Hybrid Sulfur Process Reference Design and Cost Analysis, Final Report, Unpublished, SRNL-L1200-2008-00002, 11/14/08 Draft. [3] R. Greyvenstein (PBMR ), M.B. Gorensek, W.A. Summers (SRNL), C.O. Bolthrunis (The Shaw Group, Inc.), E.J. Lahoda (Westinghouse Electric Co.), D.T. Allen (Technology Insights), Hybrid Sulfur Process Reference Design and Cost Analysis, Final Report, Unpublished, SRNL-L1200-2008-00002, 11/14/08 Draft. [4] Hobbs, D., “Electrolyzer Component Development for the Hybrid Sulfur Process,” Presentation at the DOE-NE Nuclear Hydrogen Initiative Semi-annual Review, Aiken SC, October 7, 2008. [5] O'Brien, J.E., et al., “Performance Measurements of Solid-Oxide Electrolysis Cells for Hydrogen Production from Nuclear Energy,” presented at ICONE12, 25-29 April 2004, Arlington VA. [6] R. Greyvenstein (PBMR ), M.B. Gorensek, W.A. Summers (SRNL), C.O. Bolthrunis (The Shaw Group, Inc.), E.J. Lahoda (Westinghouse Electric Co.), D.T. Allen (Technology Insights), Hybrid Sulfur Process Reference Design and Cost Analysis, Final Report, Unpublished, SRNL-L1200-2008-00002, 11/14/08 Draft. [7] P.M. Mathias, J.E. Murphy, M.B. Gorensek, and J.P. O’Connell, “Integrated Flowsheet Development For The Sulfur-Iodine Cycle,” Prepared for U.S. Department of Energy, Nuclear Energy Research Initiative Project 05-006, December 4, 2007 [8] M.G. McKellar, J.E. O’Brien, E.A. Harvego, J.S. Herring, “Optimized Flow Sheet for a Reference Commercial-Scale Nuclear-Driven High-Temperature Electrolysis Hydrogen Production Plant,” INL/EXT-07-13573, November 14, 2007 [9] Herring, Steve, et. al.; “Laboratory-Scale high Temperature Electrolysis System”; 2006 DOE Hydrogen Fuel Cells & Infrastructure Technologies Program Review; Washington DC, May 17, 2006 [10] “NGNP and Hydrogen Production Preconceptual Design Report, Section 8: Power Conversion Systems,” NGNP-08-RPT-001, Westinghouse Electric Company LLC, May 2007. [11] “Summary of Bounding Conditions for Development of the NGNP Project,” INL/EXT-08-14370, JUN08. [12] “NGNP and Hydrogen Production Preconceptual Design Report, Section 19: Economic Assessments,” NGNP-19-RPT-001, Westinghouse Electric Company LLC, June 2007. [13] “GREET 1.7, 06/21/07 from Components_112107.xls from Amgad Elgowainy 11/21/07,” as tabulated in the H2A Central Hydrogen Production Model version_2.0, from http://www.hydrogen.energy.gov/h2a_analysis.html. [14] “04D_Future_Central_Hydrogen_Production_from_Natural_Gas_with_CO2_ Sequestration_version_2.0.1.xls,” developed by Mike Rutkowski, Parsons Corporation, 14AUG05, from http://www.hydrogen.energy.gov/h2a_analysis.html. [15] Economic Indicators, Chemical Engineering, MAY08
Hydrogen Plant Alternatives Study NGNP-HPS SHAW-HPA References
March 2009
[16] 2007: range 6.11 $/thou cu ft to 8.40 $/thou cu ft, average 7.57 $/thou cu ft, http://tonto.eia.doe.gov/dnav/ng/hist/n3035us3m.htm. [17] http://www.bloomberg.com/energy/, 31JUL08 [18] http://www.electrolysers.com [19] http://www.technologyreview.com/BizTech/wtr_16523,295,p1.html [20] “01D_Current_Central_Hydrogen_Production_from_Grid_Electrolysis_version_2.0.1.xls” and “02D_Future_Central_Hydrogen_Production_from_Grid_Electrolysis_version_2.0.1.xls,” developed by Johanna Ivy Levene, NREL, 08NOV05, from http://www.hydrogen.energy.gov/h2a_analysis.html. [21] Offer 106602, Norsk Hydro Electrolyzers AS, 08AUG02. [22] Levene, J., and T. Ramsden, “Summary of Electrolytic Hydrogen Production,” NREL/MP-560-41099, DRAFT dated January 2007 [23]National average for industrial sales in 2006: 61.6 $/MWh, [24] http://www.bloomberg.com/energy/, 31JUL08, [25] “NGNP and Hydrogen Conceptual Design Study, Metallic Component Schedule Risk and Cost Uncertainty Assessment Section,” Westinghouse Electric Company LLC, draft April 2008. [26] “High Temperature Gas-Cooled Reactors for the Production of Hydrogen: Establishment of the Quantified Technical Requirements for Hydrogen Production that will Support the Water-Splitting Processes at Very High Temperatures,” EPRI, Palo Alto, CA: 2004. 1009687. [27] “Modular High Temperature Gas-Cooled Reactor Commercialization and Generation Cost Estimates,” DOE-HTGR-90365, Gas-Cooled Reactor Associates, November 1993. [28] “NGNP Conceptual Design Study, Reactor Parametric Study,” NGNP-NHS 90-PAR, Westinghouse Electric Company LLC, August 2008. [29] O' Brien, Stoots, Herring, Lessing, Hartvigsen and Elangovan, " Performance of Solid-Oxide Electrolysis Cells for Hydrogen Production," Proceedings of ICONE12, 12th International Conference on Nuclear Engineering, ICONE 12-49479, April 25–29, 2004, Arlington, Virginia. [30] “NGNP and Hydrogen Production, Report on Design Readiness Levels and Design Technology Readiness Levels,” Westinghouse Electric Company LLC, September 2007. [31] “NGNP and Hydrogen Production Preconceptual Design Report, Section 7: Hydrogen Production System,” NGNP-07-RPT-001, May 2007. [32] “Technical Readiness Level Plan, Next Generation Nuclear Plant,” report INL/EXT-08-14251, draft, May 12, 2008. [33] “NGNP and Hydrogen Production Preconceptual Design Report, Special Study 20.7: NGNP By-Products and Effluents Study,” NGNP-20-RPT-006, January 2007. [34] Peterson, Per F., et al., “Development of C-SiC Ceramic Compact Plate Heat Exchangers for High Temperature Heat Transfer Applications,” AIChE Winter Meeting, San Francisco, November 16, 2006.

Hydrogen Plant Alternatives Study NGNP-HPS SHAW-HPA References
March 2009
[35] Mylavarapu, Sai K., et al., “Investigation of Printed Circuit Heat Exchanger for VHTRs,” 4th International Topical Meeting on High Temperature Reactor Technology, HTR2008-58097, September 28-October 1, 2008, Washington, DC. [36] Miu, K. K., et al., “The Development of Autocatalytic Structural Materials for Use in the Sulfur-Iodine Process for the Production of Hydrogen,” Transactions of the American Nuclear Society, 2006, vol. 94, pp. 613-614. [37] Hu, Tzu-Yu, et al., “Design and Cost of the Sulfuric Acid Decomposition Reactor for the Sulfur Based Hydrogen Processes,” 4th International Topical Meeting on High Temperature Reactor Technology, HTR2008-58009, September 28-October 1, 2008, Washington, DC. [38] Moore, R.C., et al., “H2SO4 Section Performance Assessment and the Next Generation Design” Sandia National Laboratories, September 15, 2007. [39] Terada, Atsuhiko, et al., “Research and Development on Hydrogen Production By Thermochemical Water-Splitting I-S Process,” 4th International Topical Meeting on High Temperature Reactor Technology, HTR2008-58088, September 28-October 1, 2008, Washington, DC. [40] “Preconceptual Engineering Services for the Next Generation Nuclear Plant (NGNP) with Hydrogen Production, NGNP and Hydrogen Production Preconceptual Design Studies Report,” General Atomics, 911107, 10JUL07, Sec. 3.8.1.1. [41] Herring, J.S., et al., “Test Plan for Three-Module Operation of the High Temperature Electrolysis Integrated Laboratory Scale Experiment,” INL/EXT-08-14303 rev 1, November 17, 2008. [42] Stoots, C.M., et al., “Conceptual Design Documentation for High-Temperature Electrolysis Pilot-Scale Experiment at 200 kW,” Idaho National Laboratory, August 15, 2005.