ANL-77-21.pdf - INL Digital Library
335
ANL-77-21 ANL-77-21 CONFERENCE ON HIGH TEMPERATURE SCIENCES RELATED TO OPEN-CYCLE, COAL-FIRED MHD SYSTEMS at Argonne National Laboratory Argonne, Illinois 60439 April 4-6, 1977 ANl-W Tefhn ^orv |Kpi«vi9 n-r<. •% p "fry, F^ '-•6l^'^T' |"ll jr ti&Mi. J vittmmm ARGONNE NATIONAL LABORATORY, ARGONNE, ILLINOIS Prepared for the U. S. ENERGY RESEARCH AND DEVELOPMENT ADMINISTRATION under Contract W-31-109-Eng-38
-
Upload
khangminh22 -
Category
Documents
-
view
0 -
download
0
Transcript of ANL-77-21.pdf - INL Digital Library

ANL-77-21 ANL-77-21
CONFERENCE ON
HIGH TEMPERATURE SCIENCES
RELATED TO
OPEN-CYCLE, COAL-FIRED MHD SYSTEMS
at
Argonne National Laboratory
Argonne, Illinois 6 0 4 3 9
April 4 -6 , 1977
ANl-W Tefhn ^orv
|Kpi«vi9 n-r<. •% p "fry, F^ '-•6l^'^T' | " l l jr
ti&Mi. J vittmmm
ARGONNE NATIONAL LABORATORY, ARGONNE, ILLINOIS
Prepared for the U. S. ENERGY RESEARCH
AND DEVELOPMENT ADMINISTRATION
under Contract W-31-109-Eng-38

V r'* r-t.^SJ&i
•Mmt)^
The facili t ies of Argonne National Laboratory ment. Under the t e r m s of a contract (W-31-109-Eng-Development Administrat ion, Argonne Universi t ies A the University employs the stnff and operates the L. progr,.
ny Research and of Chicago,
jjolicies and
MEMBERS OF ARGONNE UNI
The Un Carnegie-Mellon University Case Western Reserve University The University of Chicago University of Cincinnati Illinois Institute of Technology University of IlUnois Indiana University Iowa State University The University of Iowa
The University of Kans i-Loyola University Marquette Universit\
Ti l U n i v c i D i i y U l i v i i i i i i t —
University of Missoui Northwestern University University of Notre Dame
Ohio University The Pennsylvania Purdue University Saint Louis University )Outhern Illinois University The University of r.-,,^^ =,t A, Washington Univ< Wayne State University The University of Wisconsin
11.,=
NOTICE-
I e d
by the United States Government. Neither the United States nor the United States Energy Research and Development Administrat ion, nor any of their employees, nor any of then-cont rac tors , subcontractors , or their employees, makes any warranty, express or implied, or a s sumes any legal liability or responsibi l i ty for the accuracy, completeness or uso fulness of any information, appara tus , product or p roces -disclosed, or r ep resen t s that its use would not infringe privately-owned r ights . Mention of commerc ia l products , their manufacturers , or their suppl iers in this publication does not imply or connote approval or disapproval of the product by Argonne National Laboratory or the U. S. Energy Research and Development AdminiBtration
Available froti iNationai Technical Information .- ers ii ^
U. S. Department of Commerce 5285 Po r t Royal Road
Springfield, Virginia 22161 Printed < Micpoficl

Distribution Category: Coal Conversion and Utilization - MHD UC-90g
ANL-77-21
ARGONNE NATIONAL LABORATORY 9700 South Cass Avenue
Argonne, Illinois 60439
CONFERENCE ON HIGH TEMPERATURE SCIENCES RELATED TO OPEN-CYCLE, COAL-FIRED MHD SYSTEMS
at
Argonne National Laboratory Argonne, Illinois 60439
April 4-6, 1977
Sponsored by Argonne National Laboratory and the Argonne Universities Association


FOREWORD
This conference was organized to identify, encourage, and promote greater understanding through basic research of the problems encountered in open-cycle, coal-fired MHD generators. The development of this system presents many challenging areas of research in materials sciences, thermodynamics, kinetics, solid state and ion-molecule chemistry and physics, all focused on phenomena occurring at high temperatures.
The conference was jointly sponsored by Argonne National Laboratory and the Argonne Universities Association, with the endorsement of the National Research Council Committee on High Temperature Science and Technology, the Offices for Materials Sciences and Molecular, Mathematical and Geosciences in the Division of Physical Research and the Division of Magnetohydro-dynamics of ERDA.
The scope of the conference has been designed to improve interdisciplinary communication by involving (1) persons in MHD science and engineering; (2) persons in industry interested in materials research and development; and (3) persons in universities and national laboratories engaged in related basic research. The presentations in the introductory session describe the nature of the MHD system and identify the near-term problems. Sessions follow in Gas-Plasma Chemistry; Electronic, Ionic and Molecular Processes; Materials; Slag/Seed Properties and Slag/Seed Interactions.
R. J. Thorn, Chairman ANL-AUA Organizational Committee

ANL-AUA ORGANIZATIONAL COMMITTEE:
R. ). Thorn, Chairman, Argonne National Laboratory, Chemistry Division L. Burris, Chemical Engineering Division P. R. Fields, Chemistry Division
B. R. Frost, Materials Science Division P. W. G\\\es, Argonne Universities Association and The University of Kansas, Department
of Chemistry D. C. L. Price, Solid State Science Division W. C. Redman, Engineering Division R. E. Rowland, Radiological and Environmental Research
PROGRAM COMMITTEE:
R. J. Ackermann, Co-Chairman, Argonne National Laboratory, Chemistry Division C. E. Johnson, Co-Chairman, Argonne National Laboratory, Chemical Engineering Division C. B. Alcock, University of Toronto, Metallurgy Department A. T. Aldred, Argonne National Laboratory, Materials Science Division H. U. Anderson, University of Missouri-Rolla, Department of Ceramics Engineering H. K. Bowen, Massachusetts Institute of Technology, Department of Materials Science J. W. Hastie, National Bureau of Standards, Inorganic Materials Division J. C. Hindman, Argonne National Laboratory, Chemistry Division M. Inokut i , Argonne National Laboratory, Radiological and Environmental Research
Division ) . V. Martinez, Energy Research and Development Administration, Division of Physical
Research D. W. Norcross, University of Colorado, Joint Institute for Laboratory Astrophysics W. L. Primak, Argonne National Laboratory, Solid State Science Division D. W. Readey, Energy Research and Development Administration, Division of Physical
Research G. Rosenblatt, ,4rjonnc Universities Association and The Pennsylvania State University,
Department of Chemistry S. ). Schneider, National Bureau of Standards, Inorganic Materials Division M. Sluyter, Energy Research and Development Administration, Division of
Magnetohydrodynamics F. T. Smith, Stanford Research Institute, Molecular Physics Section
ADVISORY COMMITTEE:
W. D. Jackson, Energy Research and Development Administration, Division of Magne tohydrodynam ics
M. Petrick, Argonne National Laboratory, Engineering Division
E. S. Pierce, Energy Research and Development Administration, Division of Physical Research, Molecular, Mathematical and Geosciences
]. Plunkett, Montana Energy and MHD Research and Development Institute D. K. Stevens, Energy Research and Development Administration, Division of Physical
Research, Materials Sciences W. L. Worrell, National Research Council Committee on High Temperature Sciences and
Technology and the University of Pennsylvania, Materials Science Department P. S. Zygielbaum, Electric Power Research Institute
1 1
TABLE OF CONTENTS
INTRODUCTORY PLENARY TALKS
M. PETRICK, Chairman
The National MHD Program* W. D. JACKSON
Combustion and Characterization of Coal ADEL F. SAROFIM 1
The MHD Generator RICHARD J. ROSA 8
Status of MHD Materials S. J. SCHNEIDER 14
GAS-PLASMA CHEMISTRY
J. W. HASTIE, Chairman
Introductory Comments* J. W. HASTIE
Microstructure of Pulverized Coal Flames by Direct, Molecular Beam Mass Spectrometry
THOMAS A. MILNE and JACOB E. BEACHEY 19
Combustion Diagnostics R. A. HILL 25
Thermochemical Modeling of Combustion Plasma Mixtures F. E. SPENCER, JR., J. C. HENDRIE, JR., and D. J. WILDMAN 31
Theoretical Analysis of the Effects of Slag Condensation on Plasma Conductivity in Open Cycle Coal Fired MHD Generator
M. MARTINEZ-SANCHEZ, C. E. KOLB, and J. L. KERREBROCK 38
Mass Spectrometric Investigations of the Ion Chemistry of Certain Coal Impurities
WILLIAM J. MILLER 43
Thermodynamic Properties of Gas Phase Molecular Ions R. L. C. WU, C. LIFSHITZ, and T. 0. TIERNAN 49
Thermochemical Effects in Determination of Electrical Conductivity in Coal-Fired MHD Plasmas
C. L. LU, N. L. HELGESON, M. FARBER, and J. C. CUTTING 54
iii

GAS-PLASMA CHEMISTRY (Cont.)
Calculation of Equilibria between Gases and Condensed Phases
M. BLANDER and C. C. HSU 60
ELECTRONIC, IONIC, AND MOLECULAR PROCESSES
M. INOKUTI, Chairman
Negative Ion Energetics W. C. LINEBERGER and P. C. ENGELKING 67
Electron Momentum-Transfer Cross Sections and Their Relation to the Electrical Conductivity of MHD Plasmas
YUKIKAZU ITIKAWA 74
Electron Momentum-Transfer Cross Section for Carbon Monoxide
J. E. LAND 80
Electron Momentum-Transfer Cross Sections for Polar Molecules
L. A. COLLINS and D. W. NORCROSS 86
Evaluation of Electron-Molecule Collision Cross Sections Governing the Electrical Conductivity of MHD Plasmas
J. L. DEHMER and DAN DILL 91
Quantum Chemistry and the Characterization of MHD Systems
ARNOLD C. WAHL, WALTER B. ENGLAND, and ALBERT F. WAGNER 94
Semiclassical Perturbation Scattering Theory: Momentum Transfer in Electron-Polar Molecule Collision Processes
F. T. SMITH, D. MUKHERJEE, and A. P. HICKMAN 101
MATERIALS
H. U. ANDERSON and H. K. BOWEN, Chairmen
Materials Engineering and Design for Coal-Fired MHD Power Generators
L. M. RARING 107
Ceramic Materials in the MHD Channel B. R. ROSSING, J. H. SMITH, and L. H. CADOFF 113
iv

MATERIALS (Cont.)
Progress in the Testing of Refractories for Directly-Fired MHD Air Heater Service, II
J. E. FENSTERMACHER, JR., L. R. WHITE, and R. R. SMITH 114
A Refractory Ceramic-to-Metal Graded Structure R. J. ELBERT, A. D. BUTCHER, R. J. DUFALA, and R. BACON 121
Fusion-Cast Materials for MHD Applications R. N. McNALLY, L. J. MANFREDO, and P. BARDHAN 126
Transport Properties in the Spinel Electrode Module H. K. BOWEN 131
Advances in Lanthanum Chromite MHD Electrode Development F. J. BRODMANN and P. E. D. MORGAN 135
Electrical Conductivity, Volatilization, and Preparation of LaCrOo-Based Oxides
H. U. ANDERSON, R. MURPHY, S. SEMACHAIBOVORN, B. ROSSING, A. T. ALDRED, W. L. PROCARIONE, and R. J. ACKERMANN 142
The Electrical Conductivity and Thermal Expansion of Potential MHD Electrodes Based on Mixed Perovskites of Lanthanum Strontiui. Chromite and Strontium Zirconate
J. JACOBS, K. M. CASTELLIZ, W. MANUEL, and H. W. KING 148
Structural and Physical Properties of the La., Sr CrOo System ^'^ ^ ^
J. FABER, JR., M. H. MUELLER, W. L. PROCARIONE, A. T. ALDRED, H. W. KNOTT, and H. U. ANDERSON 154
Phase Equilibria in the (La,Sr)CrO,, System C. P. KHATTAK and D. E. COX . .^ 160
t X-Ray Photoelectron Spectra of La20o, Cr20o and LaCrOo
WEI-YEAN HOWNG, J. R. McCREARY, AND R. J. THORN . . . . 165
On the Nature of Extended Defects and Their Ordering in Fluorite-Related Refractory Oxides
L. EYRING and R. T. TUENGE 170
Thermal Breakdown in MgO Single Crystals at High Temperatures
R. A. WEEKS, E. SONDER, J. NARAYAN, K. F. KELTON, and J. C. PIGG I80
V

SLAG/SEED PROPERTIES
G. ROSENBLATT, Chairman
The Thermodynamic Properties of Slags D. R. GASKELL 185
Coal Slag Properties Related to MHD WEBSTER CAPPS 190
Electrical Conductivity of Molten Coal Slags/Potassium Seed Relating to Open Cycle MHD
J. LAMBERT BATES 196
Electrical Conductivity of a Montana Coal Ash R. POLLINA AND R. LARSEN 202
Some Thermionic Emission Properties of Synthetic Coal Slag
J. ANDERSON, G. L. LAPEYRE, R. J. SMITH, and M. WILSON 208
Vaporization and Condensation Kinetics Pertaining to Seed Injection and Recovery
KURT H. STERN 214
Some Vapor Pressure Data on K,^0-Containing Substances E. R. PLANTE 7 220
Stabilities of Some Potassium Compounds Important in High Temperature Processes
THOMAS C. EHLERT, LEFFORD LOWDEN, and LINDA SIMMONS 227
Vapor Pressure Measurement Studies on Slag-Seed Component Equilibria: The Silica-Potassium Oxide System
NAOMI ELIEZER, R. A. HOWALD, M. MARINKOVIC, and I. ELIEZER 230
A New Technique for High Temperature Vapor Pressure Measurements Applied to MHD Problems^
R. WOODRIFF, M. MARINKOVIC, and J. AMEND 236
The Thermodynamic Functions of Gaseous K,,SO/ and Cs^SO, in the Standard State ^ ^ ^
L. V. GURVICH, 0. V. DOROFEEVA, and V. S. YUNGMAN 241
SLAG/SEED INTERACTIONS
W. WORRELL, Chairman
Seed Recovery--Conversion of SOT to COo P. D. BERGMAN 247
vi

SLAG/SEED INTERACTIONS (Cont.)
Investigation of the Potential of Acid Washing of Coal Ash to Enhance Potassium Recovery in a High-Ash-Carryover, Direct Coal-Fired MHD System
L. SHEN, K. TEMPELMEYER, J. BREWER, and M. BEATON 254
Silica Vaporization and Condensation: A Potential Source of Fouling in Coal Combustion
ROBERT W. TAYLOR 260
Corrosion of Potential MHD Preheater Materials in Liquid Slag and Slag-Seed
W. D. CALLISTER, JR., W. C. SEYMOUR, and V. GRIFFITHS 265
Thermal Shock Behavior of Magnesia Chromite Ceramic Exposed to Coal Slag
A. KUMNICK and W. BEEZHOLD 270
Molybdeniom Stability in Coal Slags KENTON B. WRIGHT and ARTHUR E. MORRIS 276
Low Temperature Matrix IR and EPR Spectroscopic Studies of Reactions Intermediate in Reactions of Alkali Metal Atoms with H2O, CO, C2H2, C2H,, and CO2
R. H. HAUGE and J. L. MARGRAVE 283
The First 20 Years of MHD Development
ARTHUR KANTROWITZ 289
Conference Summary 293
Participants 299
* Oral presentation only.
Paper not presented orally.
VI1


INTRODUCTORY (PLENARY) TALKS
M. Petrick, Chairman
Argonne National Laboratory

COMBUSTION AND CHARACTERIZATION OF COAL
Adel F. Sarofim Massachusetts Institute of Technology
Cambridge, Massachusetts
INTRODUCTION
In the early stages of development of MHD as a viable option for energy conversion, emphasis had been properly placed on the novel and untried aspects of the MHD process. Combustors initially were therefore little more than plasma generators constructed for the sole purpose of testing channel performance. With the feasibility of MHD power generation demonstrated emphasis has shifted in the U.S. to the design of practical systems fired with coal. Research programs on coal-fired MHD systems can be categorized into those in which the combustor is used to generate an ash-laden plasma to test channels or component parts such as those at AVCO [1], MIT [2], and UTSI [3], and those directed at the development of design criteria for combustors to be incorporated into pilot and prototype MHD plants, most notably at BCURA [4], PERC [5,6], and the Krzhizhnavosky Power Institute [7]. The historical development of combustors for MHD is described adequately elsewhere [8,9] and the focus in this paper will be to touch on some of the fundamentals governing the performance of coal-fired combustors for MHD power production and some of the problems anticipated in the design and operation of large-scale units.
COMBUSTOR CONSTRAINTS
The constraints on a MHD combustor necessitate some delicate trade-offs in the selection of design and operating variables. The residence time must be selected to achieve high carbon burnout and uniform product distribution, without excess heat losses or slag vaporization. A high degree of slag removal must be achieved without excessive seed losses. Good mixing and high ash rejection must be achieved without excessive pressure drop. The combustor should be operated fuel rich to permit the NO ^ to decompose downstream of the MHD generator prior to the injection of secondary air for the completion of the combustion. Some operational goals have been selected for the 25 MWj. combustor for the Component Development and Integration Facility (CDIF) to be constructed in Butte, Montana. The maximum performance goals for the combustor are: air preheat temperatures up to 1867 K; fuel/air equivalence ratio down to 0.9; slag rejection above 90 percent; K2CO3 or K2SO4 seed in amounts up to 2 percent of total flow; stagnation pressure up to 10 atm.; pressure drop under 10 percent of stagnation; uniformity of flow to within 3 percent; temporal and spatial distributions of electrical conductivity to within 25 percent of nominal equilibrium value; and heat loss consistent with 5 percent loss in full scale plant. [10]

COAL CHARACTERISTICS
The coal characteristics of importance to MHD combustors are those affecting peak temperature (heating value, composition, and moisture content), the electrical conductivity (H/C ratio, and volatile mineral matter), the residence time required to achieve a high char burnout (volatile yields and char reactivity) and a characterization of the mineral matter in sufficient detail to determine the distribution of the mineral matter between vapor, entrained slag particles, and slag rejected to the wall.
Flame Temperatures
Calculations of equilibrium temperature and composition of coal combustion products have become routine [e.g., 11], but there continues to be a need for Improved thermodynamic inputs particularly for purposes of calculating plasma conductivity and the condensed phases of ash. As an illustration of composition and flame temperature consider the Montana Rosebud seam coal to be used in the CDIF with a gross heating value of 24,900 Kjoules/Kg dry coal (10,700 Btu/lb), an ultimate analysis (dry) of H=4.17, C=62.95, N=0.92, 0=14.98, S=0.95, and ash=16.03, with a composition of Al2O3=23.0, Ca0=14.7, Fe203=6.8, K20=0.9, Na20=4.1, P2O5=0.5, and SiO2=50, The calculated temperature [12] for this coal with 5 percent moisture with 95 percent of stoichiometric air requirements, an air preheat of 1867 K, and a 5 percent heat loss is 2871 K.
Volatile Yield
The rate limiting step in coal combustion is the combustion of the char remaining after the volatile release has been completed. The volatile matter given off by coal particles under the high temperatures and the very rapid heating conditions encountered in MHD combustors greatly exceeds that given by the standard ASTM proximate analysis test. Volatile yields of 60 to 80 percent are not uncommon for a coal that yields only 40 percent volatiles in the standard test procedure [13,14,15]. The implications of these enhanced volatile yields is profound, since an increase in volatile yield from 40 to 80 percent results in a three-fold decrease in the char residue to be burned. A plausable rationalization [14] for the enhanced yield of volatiles is that under slow heating conditions hydrogen is evolved early during pyrolysis and is not available to stabilize the large unstable polynuclear molecules that are produced when the coal is heated to high temperatures. Under the rapid heating conditions to high temperatures, the hydrogen does not have time to escape and is available to hydrogenate and stabilize some of the volatiles that would otherwise undergo condensation reactions to form char. A two-competing reaction model has been developed [14] that can adequately describe the devolatilization kinetics and yields but it is not predictive. Further effort is needed to establish, with confidence, the yields of pyrolysis products under MHD conditions.

Char Oxidation Kinetics
Models for the oxidation of burning char particles have been based largely on the pioneering studies at BCURA [16]. The rate of oxidation is assumed to be controlled by diffusion of oxygen to the surface and by surface reaction first order with respect to oxygen. The reactivity of the char particles, per unit external surface are, was reported as 8710 exp [-35,700/RT]grm/(cm2)(sec) (atm)• It is generally recognized that this rate includes the contribution of internal burning and that the order of the reaction on oxygen is often less than one. Allowance for these effects has been made for selected coal chars; for example. Smith and Tyler [17] report an "intrinsic reactivity" per unit area of reacting surface is 1.34 exp [-32,600/RT] grm/(cm )(sec) using a zeroth order reaction for oxygen for a brown coal char. The problem is further complicated by the observations for graphite that the reactivity at high temperatures (1700-2500 K) may actually decrease with increasing temperature as a consequence of the annealing of active sites on the surface [18,19]. Decreases in the reactivity of coal chars in the same temperature range as can be observed in the data of Kimber and Gray [20] suggesting that this effect is of importance to MHD applications and that extrapolation of the kinetics from lower temperatures using a constant activation energy may introduce appreciable error. Another factor of importance in MHD combustors is the high concentrations of oxygen and hydroxyl free radicals, the contribution of which to char oxidation have heretofore been neglected in the modelling of MHD combustors. Equilibrium mole fractions of 0, OH, and O2 at MHD combustor temperatures (2700) are in the range of 0.002, 0.006, and 0.02, respectively, under fuel lean conditions and 0.0015, 0.0057, and 0.01 under fuel rich conditions. The concentration of hydroxyl radical is high enough that it cannot be neglected particularly since its molecular diffusivity is approximately twice that of oxygen and its reaction rate constant with carbon is higher than the corresponding value for oxygen. The rate of oxidation of carbon by hydroxyl radicals has been found to be high corresponding to a collision effic-ciency of about 0.08 at 298 K [21] and about 0.1 at 1600 K [22]. From a consideration of the combination of the concentrations, mass transfer coefficient, and surface reaction it appears that the OH radical is at least as important as O2 as an oxidant at MHD combustor conditions.
Mineral Matter
Many of the challenges associated with the design of MHD combustors can be attributed to the problems of treating the mineral content in the coal. The mineral matter is distributed within the coal matrix as discrete islands, varying widely from coal to coal in size and composition. It is only with the relatively recent advances in low-temperature ashing, electron microscopy, and x-ray microanalytical techniques that characterization of the mineral matter has become possible and, therefore, the understanding of the behavior of the mineral matter in coal is still at a rudimentary stage. Studies at MIT [23] have followed the chemical and physical transformation of the mineral matter in two coals. The initial mineral matter consisted mainly of micron-sized crystals of kaolinite, calcium carbonate, calcium sulfate, and pyrites. A 50lJ particle of the coals studied contained of the order of 500 mineral particle inclusions. As the coal burned, the mineral inclusions decomposed, fused, and were retained on the receding coal particle surface until they aggolmer-ated to yield the final ash. Most of the agglomeration occurred during the

last stages of burnout. The relevance of the results to the performance of MHD combustors is that ash particles retain a size and composition determined by the original mineral matter from which they are derived. As a consequence, heat transfer to the particles will be greatly augmented over that which would be predicted from the final agglomerate size, and the vapor pressures that determine the vaporization rates will correspond to those of the separate ashed mineral constituents rather than the composite slag. It is also possible that some of the mineral matter may be separated by the forces acting on the particles in the strong turbulence fields characteristic of MHD combustors [24]. In the above referenced MIT studies vaporization of Si02 from ash in excess of that expected from the Si02 vapor pressure was observed. This was attributed to the reduction of Si02 to SiO, probably by CO, within the locally reducing atmosphere within a particle. As the temperature was increased above 2000 K, the reduction was found to proceed to SiC. Such reactions have also been observed in other C-Si02 systems [25,26,27]. It is important that the extent of the formation of these reactions under temperature-composition-histories of interest in MHD combustors be identified as the chemical composition of the mineral matter has a profound influence on the amount, composition, and size distribution of the mineral matter carried over to the combustor.
COMBUSTOR MODELLING
Combustion Kinetics
The residence times required to burn out coal in MHD combustors have been calculated for simple plug flow combustors by BCURA [4], MIT [28] and others. Refinement of these models is needed to take into account (a) devolatilization kinetics that can accurately describe volatile yields, (b) surface kinetics that allow for the annealing of active sites and for the role of OH and any other active oxidants, (c) the augmentation of the transport coefficient to the surface of a particle by the turbulence field, (d) the change in size and porosity of particles during combustion, (e) the differential between the surface and gas temperature, and, most important, (f) the aerodynamics and microscale mixing using models such as developed by Lewellen [29] to describe the flow in a two-phase system. The existing models predict residence time requirements of the order of 50 milliseconds for an MHD combustor. A number of the above factors, with the exception of (f), are of a nature to reduce the residence time requirements and it is possible that present combustor designs are overly conservative.
Heat Transfer
The dominant heat transfer contribution is by radiation. The carbon, water vapor, and CO contributions to the gas radiations can be predicted with reasonable accuracy [28] . The ash particles may also contribute significantly in a single stage combustor depending upon the size of the ash particles [24, 28]; this again underlines the need for a better understanding of the physical behavior of fly ash. The heat transfer to the walls can be reduced by the

surface coating of the walls with slag. For the high heat flux levels attainable in MHD combustors of the order of 1 MW/M^ it is reasonable to have an equilibrium thickness of ash buildup on the walls to form both a coating of the water-cooled surfaces and provide a resistance to heat transfer. The equilibrium layer of the ash layer can be calculated [4] and is sufficient to reduce the heat flux by as much as a factor of two depending upon the viscosity of the slag. The surface temperature of the slag will be in the vicinity of 1500 to 2000 K. An additional factor in reducing heat transfer will be due to the slag emissivity which usually is lower than that of tube metal surfaces.
Slag-Seed Interaction
An important constraint on combustors is that a high degree of removal of ash be achieved without any appreciable seed loss. Some uncertainty exists on the solubility of potassium in slags since ideal solution behavior is not to be expected. Gohashevic et.al., using potassium solubilities based on ideal solution theory, concluded that the slag surface temperature should be maintained at 2000 K or higher to reduce potassium losses to below one percent. They advocated addition of acidic components to increase the slag viscosity to bring its induced flow temperature into this range; such a modification would also aid in the reduction of heat losses. It must be recognized, however, that the slag is not an ideal solution and their criterion may be optimistic [see Spencer et.al., 31]. The estimation of seed loss should also take into account the kinetics of diffusion and absorption of potassium by the slag and any physical separation of seed in a swirling flow. From the gradient of potassium concentrations in their slag layers, BCURA [4] concluded that the physical separation of seed was responsible for the approximately 20 percent loss in potassium that they observed. Although there are uncertainties on the magnitude of the seed loss in the slag leaving a combustor, the problem can be alleviated by either decreasing the slag such as by two-stage combustion or in a single-stage combustor, by injecting the seed downstream of the zone in which most of the slag is removed. If the latter strategy is adopted, very fine particles or droplets must be used to ensure vaporization of the seed and a multiplicity of injectors must be used to ensure uniformity of distribution.
ENGINEERING PROBLEMS
The above discussion has been concerned with some of the basic kinetic processes which impose constraints on the design of MHD combustors. In engineering combustors to achieve the goals of high ash rejection, high combustion efficiencies and short residence times,the most formidable problems encountered are those (a) of achieving good mixing between fuel and air, with a reasonable pressure drop; (b) obtaining the swirl required to achieve a high slag rejection, particularly as the surface volume rate decreases with scale-up; (c) achieving a uniform coal feed to prevent oscillations (the distributed heat release of the relatively slow burning coals minimizes the dangers of acoustic oscillations); and (d) tapping the slag from a high pressure electrically isolated combustor. A number of problems with the slag can be overcome

by use of two-stage combustors as proposed by PERC for the CDIF [10]. Scaling of the combustors to the large scales planned for central-station power generation will probably require the use of a multiplicity of burners; otherwise the small aspect ratio imposed by the approximately fixed residence time would make mixing over the cross-section of the combustor an impossibly large problem.
A discussion on combustors would be incomplete without mention of diagnostics. Channel performance provides a global measure of plasma characteristics and is the ultimate test of combustor performance. Detailed measurements of temperature and electrical conductivity can be obtained using the sodium D-line reversal and electrical conductivity meter developed by Gohashevic et.al. [30], but there is clearly a need for a more direct measure of combustion efficiency and slag characteristics.
ACKNOWLEDGEMENTS
The author acknowledges support of his research on fundamental aspects of MHD combustion under ERDA contract No. E(49-18)-2215. The author wishes also to acknowledge discussions with researchers at PERC, AVCO, and UTSI, especially Mr. D. Bienstock, Dr. D. Stickler, and Dr. L.W. Crawford.
REFERENCES
1. Demirjiam, A., et.al.. Development Program for MHD Power Generation, Quarterly Report to ERDA under Contract No. E(49-18)-2015, AVCO, August, 1976.
2. Louis, J.F., Critical Contributions in MHD Power Generation, Annual Report to ERDA under Contract No. E(49-18)-2215, MIT, June, 1976.
3. Dicks, J.B., et.al.. Development Program for MHD Direct Coal-Fired Power Generation Test Facility, Quarterly Report to ERDA under Contract No. E (49-18)-1760, UTSI, October, 1975.
4. Heywood, J.B., and Womack, G.J., Open Cycle MHD Power Generation, Pergamon Press, 1969.
5. Bienstock, D., et.al., Coal Combustion Aspects of MHD Power Generation, Proceedings of Conference on American-Soviet Cooperation in the Field of MHD Power, 1973.
6. Bienstock, D,, et.al.. Bureau of Mines, RI7361, 1970.
7. Tager, S.A., et.al.. Fifth Int. Conf. MHD Electric Power Generation, Munich, April, 1971.
8. Way, S., Combustion Aspects of MHD Power Generation, Combustion Technology, Some Modern Developments, Palmer, Ed., Academic Press, 1974.
9. Tager, S.A., and Henry, J.M., Fuel and Combustion, Draft Chapter for US-USSR Text on MHD, 1976.

10. PERC, Development Program for a 25MW-Gasifier Combustor for Montana Com-Component Development and Integration Facility (CDIF), Report No. 4, June 1, 1976.
11. Feldmann, H.F., et.al., U.S. Bureau of Mines, Bulletin No. 655, 1970.
12. PERC, Development Program for a 25MW-Gasifier Combustion for Montana Component Development and Integration Facility (CDIF), Report No. 2, April, 1976.
13. Kimber, G.M., and Gray, M.D., Third Conference on Industrial Carbons and Graphite, p. 278, Society of Chemical Industry, London, 1971.
14. Kobayashi, H., Sc.D. Thesis in Mechanical Engineering, MIT, 1976.
15. Ubhayakar, S.K., et.al., Devolatilization of Pulverized Coal During Rapid Heating to be presented at 16th Symposium on the Engineering Aspects of MHD, May 1977.
16. Field, M.A., et.al.. Combustion of Pulverized Coal, BCURA, 1967.
17. Smith, I.W., and Tyler, R.J., Combustion Science and Technology, % 87-94 (1974).
18. Walls, J.R., and Strickland-Constable, R.F., Carbon, 1, 333 (1964).
19. Duval, X., Annls. Chim., j^, 903 (1955).
20. Kimber, G.M., and Gray, M.D., Combustion and Flame, U^, 360 (1967).
21. Mulcahy, M.F.R., and Young, C.B., Carbon, 13 (1975).
22. Fenimore, C.P., and Jones, G.W., J. Phys. Chem., 21, 593 (1967).
23. Padia, A.S., Sc.D. Thesis in Chemical Engineering, MIT, 1976.
24. Kobayashi, H., Howard, J.B., and Sarofim, A.F., "Coal Devolatilization at High Temperatures", 16th Symposium (Intl.) on Combustion, MIT, Aug., 1976.
25. Ladacki, M., AIAA J., 4-, 1445 (1966).
26. Raask, E. and D.M. Wilkins, J. Inst. Fuel, , 255 (June 1965).
27. Beecher, N., and Rosensweig, R.E., ARS J., _31, 532 (1961).
28. Sarofim, A.F., et.al., 6th International Conference on MHD Electrical Power Generation, Washington, D.C, 1975.
29. Lewellen, W.S., NASA CR-1772, July 1971.
30. Gohashevic, S.L., et.al., 6th International Conference on MHD Electrical Power Generation, Washington, D.C, 1975.
31. Spencer, F.E,, et.al.. Ibid.

THE MHD GENERATOR
Richard J. Rosa Montana State University
Bozeman, Montana
ABSTRACT
The function and operating conditions of the various parts of an MHD generator channel are reviewed as they relate to the design and materials requirements of the channel. Operating experience to date is briefly summarized.
The Environment
Let us begin by reviewing the environment in which the walls of an MHD generator channel operate. Approximate gas properties are, (1) a stagnation temperature of 2300 to 2900 K, (2) a static pressure of 1 to 5 atmospheres, and (3) a velocity of 500 to 1000 meters per second. Conditions imposed upon the walls of the channel are (1) a tangential electric field of 10 to 40 volts per centimeter, (2) an average current density of about 0.3 to 1 ampere per square centimeter, (3) seed and slag (which may interact with the walls in several ways), and (4) a heat transfer rate on the order of 100 watts per square centimeter.
This last condition is--in principle--optional. One might, for example, allow the wall surface temperature to rise to the gas stagnation temperature in which case the heat transfer rate would be zero. However, the prospects appear slim for finding a material capable of such a temperature while simultaneously, and satisfactorily, meeting the other imposed conditions. Consequently, most channel designs are based upon a surface temperature considerably lower than the gas stagnation temperature, usually lower than 2000 K, and hence a high heat transfer rate must be handled. This has important implications with regard to the kind of structures, materials, material thicknesses, and bonding techniques that are acceptable.
One might, of course, consider designs employing an intermediate surface temperature and intermediate heat transfer rate. However, it is difficult to find appropriate materials and structures. Such designs tend to have all of the problems and few of the advantages of the two more extreme options cited.
Classifying the channel walls by function, we have two types, insulator walls and electrode walls. In the case of the latter, we need to distinguish two sub-types: the anode and the cathode. The function and structure of each will be reviewed starting with the insulator wall.
Insulator Wall
The insulator wall has three principal tasks: (1) to insulate against a tangent electric field, (2) to absorb the heat flux, and (3) to withstand the effects of slag and seed.

The structure that is typically used to perform these tasks consists of water cooled metal segments, electrically isolated from one another and sized so that the voltage between segments induced by the tangential electric field does not exceed an amount likely to cause arcing (generally between 30 and 100 volts depending upon circumstances). Between the segments is an electric insulator which may range from a paper to a ceramic depending upon the temperature to be withstood. There may be a layer of refractory, cast, brazed, flame sprayed, keyed into slots, or in some other way bonded to the metal surface facing the gas. The layer of refractory must be thin (1 to 5 millimeters) in order to pass the heat flux and still remain within prescribed temperature limits. In a coal-fired generator this layer may consist only of the slag deposited from the gas.
In the foregoing and in what follows, I am speaking primarily with the wall structures evolved at AVCO in mind, since it is with those that I am most familiar. However, most channels built and tested both in this country and abroad employ this same basic structure even though they may differ greatly in detail.
It should be noted in passing that even if a refractory layer is employed, segmentation of the underlying metal structure is essential for electrical integrity. In the presence of an ionized gas, even the smallest pore or crack in a layer of insulation will eventually precipitate a major breakdown if the voltage across it exceeds the limits stated above.
Now let us consider the electrode walls. Because of the Hall effect, which produces an axial electric field, these walls must perform the same three tasks enumerated for the insulator walls plus a fourth task--that of passing current. The anode must absorb electrons and the cathode must emit electrons; or something must take place in the near vicinity of each that results in electrons being supplied to the gas on the cathode side of the channel and removed on the anode side--electrons being by a factor of about 100 the major current carriers in the bulk of the plasma. As a result, the basic structure of the electrode walls is similar to that of the insulator walls, i.e. they too consist of water-cooled metal segments. However, in order to facilitate current transport the top surface structure is usually different. Indeed the question of how best to design the top few millimeters of the electrode walls is the most important single question facing MHD developers.
Now let us consider the questions or problems involved in designing a generator to achieve long duration. Since time is limited, some simplification must be made, and to this end I have lumped the problems into three categories. These are: (1) seed penetration, (2) current concentration, and (3) plumbing and structure.
Seed Penetration
Relevant properties of the seed compounds, K^COo, KpSO., and KOH, which will deposit on and penetrate the walls are: (1) a nigh electrical conductivity if molten, (2) a moderate to high affinity for water, and (3) a high electrical conductivity in water solution.

It must be assumed that seed will eventually penetrate into esiery era and pore of the wall structure. As a result, there is danger of electric ^ shorting between adjacent metal segments if any part of their surface is temperature less than the local dew point for water or greater ^han tne^ ^^ melting point of whatever compounds are present. Also, of course, t ^ ^ - .g the danger of chemical attack on insulators and also the cracking due to expansion upon absorption of water.
below the dew point of water. This procedure "as oeen H"- nrnhlpm generator tests lasting up to 100 hours or so. Jhere tends to be a problem due to absorption of water from the atmosphere when the generator is die. Retention of ceramic insulators between segments ^ al2°/^P';°5^";- . ,°'^.. . porosity is desirable in order to avoid seed and water penetration, but this generally leads to cracking due to mechanical and thermal stress. A few hours of operation have been successfully accomplished with no insulators at all—only air gaps. However, in this as in the other matters touched on above, questions remain concerning possible long-term electrochemcial and other effects.
Current Concentration
With respect to the second problem area, current concentration on electrode walls--or on the "insulator" walls if they also by either accident or design carry current--it is useful to define four "barriers" that the current must penetrate as it flows to the walls. These are: (1) the gas boundary layer, (2) the gas-solid interface, (3) the slag and/or other ceramic layers, and (4) the slag-metal interface. In a large machine none of these "barriers" are capable of stopping the flow of current. We are thus not concerned with whether the current penetrates, only with how it penetrates.
Pertinent facts are: A. The average current density is modest compared to that ordinarily found in electrical equipment, but the total current flowing to an electrode wall is large--large enough to cause serious damage if it concentrates. B. The Hall effect tends to make current pile up at the edges of an electrode-the upstream edge of an anode, the downstream edge of a cathode. C. The electrical conductivity of both the gas and the slag are strongly temperature dependent. Consequently, if joule dissipation becomes a dominant term in the thermal balance of either, instability leading to current concentration may result. Now let us consider the requirements for stability in each barrier layer.
Stability Requirements
In the first barrier, the gas boundary layer, the temperature will fa]] from its free-stream value to the value at the wall. The average conductivity will fall accordingly, and the average joule dissipation will rise accordingly. It has been shown theoretically by Oliver, Solbes, and others that instability is to be expected if the gas conductivity at the wall falls below roughly one-tenth the free-stream value, which translates under typical
10

base-load coal-fired generator conditions, into a wall temperature below roughly 2000 K. Experiments give evidence that a somewhat lower temperature is allowable.
At the second barrier, the gas-solid interface, there should be no problem on the anode wall. The cathode, however, must emit electrons. To emit them uniformly over a wide area it must emit them thermionically. Almost nothing is known about what it takes to get this kind of emission under coal-fired MHD generator conditions. What evidence there is seems to indicate that a slag surface temperature of roughly 1800 K or higher is required. It is possible that small amounts of additive to either the slag or the boundary layer could significantly change the required temperature. Note that a slag surface temperature of about 1800 K is predicted with 100% slag carryover; while 1600 to 1700 K is predicted for 10% carryover.
The behavior of the third barrier, the slag layer, is similar to that of the gas boundary layer. Again there is a steep temperature and resultant conductivity gradient with instability predicted if the temperature at the base of the slag layer, i.e. at the slag-metal interface,falls below roughly 1500 K. However a substantially lower temperature may be possible since experiments at NBS, and MSU show that the conductivity of slag at low temperature is substantially influenced by variations in composition and in oxygen partial pressure.
At the fourth and final barrier, the slag (and/or ceramic)-metal interface, the primary requirement for stability is simply that there be good thermal and electrical contact across the interface. Experiments at Stanford have exhibited instability with slag on a stainless steel anode but stability with slag on an iron anode. In the latter case, corrosion at the interface was evidently responsible for providing good contact as well as enriching the bottom of the slag layer with iron oxide and thereby increasing its conductivity and stability.
A capsule, and necessarily incomplete summary of experimental results from long-duration channel testing, is the following:
1. Attempts to achieve complete current stability have not been successful. Eventually the electrodes always seem to wind up operating in an arc mode. While this has occurred for different reasons in different cases, the dominant reason has been wear at the slag-metal interface, mainly on the anode side, evidently due to the flow to the interface of negative oxygen ions, the principle charge carrier in slag at the interface temperature. To put this in perspective, the corrosion has not prevented accumulated times on an anode of 100 hours or more, but has been enough to raise doubts about longer durations, and has been enough to prevent maintenance of the interface at the temperature needed for stability.
2. Use of a cold copper-slag interface seems to date to have exhibited the least wear. If the arc mode is inevitable then evidently one should use a base metal of the highest possible thermal conductivity in order to most rapidly spread out the heat deposited at the
11

arc spot. One is faced with a dilemma: a high enough interface temperature to insure stability results in oxygen ion corrosion. A low enough interface temperature to suppress overall oxygen ion corrosion leads to arcs and the errosion typical of arc spots. At the moment, the second alternative seems to be the preferable one.
With respect to the problem of current concentration and electrode life, the present greatest need seems to be a way to eliminate oxygen ion corrosion by either eliminating the ion or limiting the corrosion.
Alternatively, if arcing is inevitable then we need to learn how to ensure that arc spots are small, and move around a lot. If each spot never carries more than a few amperes and never sits for a long time in one location, then there is a good possibility that arc errosion will be small enough to tolerate.
Now I would like to leave the question of stability and lifetime and talk briefly about yet another phenomenon related to the wall surface temperature. This phenomenon influences the total amount of power obtained from a generator.
Generator Power Output
For the reasons discussed above, the wall surface temperature is less than that of the gas. Therefore, a plot of the conductivity profile across the channel exhibits a strong dip at each wall. There may also be variations in the main stream due to imperfections in burner design or seed mixing. As a result, the average conductivity from wall to wall is, of course, less than the ideal free-stream value and results in a reduction in power output.
More importantly, however, such a conductivity pattern sets up strong eddy currents driven by the Hall effect. Current tends to flow upstream in regions of high conductivity and downstream in regions of low conductivity. These eddy currents are an added source of dissipation and can cause a large reduction in effective or apparent conductivity. Mathematically the situation is described by writing ohm's law as follows,
<a> j = <E>
G which is conventional except for the brackets denoting a wall to wall average, and the factor, G, which describes the effect of the eddy current, and is given exactly by,
1 1 2 G = < a > <—^> + (<a> <—^> - 1 ) B
or approximately by
G : 1 + ( ) 2 e2 a
Here: j is the current density, o is the conductivity, E is the net electromotive force, B is the Hall parameter, and Aa is the mean spacial fluctuation in conductivity. A calculation of G vs wall temperature under reasonably typical base-load channel conditions yields the following results:
12

Wall Surface T (°K) 2000 1800 1600 1400 1200
G 1.05 1.1 1.25 1.5 1.9
Observe that at 2000 K the eddy currents have a mere 5% effect, but below 1200 K the effect is to reduce a and power output by a factor of two or more. Thus there is a strong incentive for having a gas-solid interface temperature of 1600 K or higher.
Plumbing and Structure
The problems of plumbing and structure are singled out as a major area primarily because they are too often neglected even though they constitute the major bulk and cost of a channel. Also everything else is dependent upon them and failure of one or the other has probably cost more in time and dollars than the failure of anything else.
The central fact about generator hardware is that it has a lot of joints. The number of metal segments in a base-load channel may range anywhere from one thousand for window-frame construction to one million for peg construction. Each segment must have two electrically insulated water joints. They must be highly reliable, and ideally should be able to handle high pressure boiler feedwater, i.e. several thousand psi and 500°C or greater.
Structurally, the walls need to be thin--they occupy expensive space within the warm-bore of the magnet--and they need to be stiff. This is made difficult by the desirability of so many joints. It would be very useful to have structural sheet material which is electrically insulating, tough, stiff, does not char, and is good to at least 500°C. Most used now is epoxy fiberglass, which is not stiff, chars, and is poor above 150°C. There is room for improvement.
To summarize, again in capsule form. The two greatest needs of the channel development effort are: (1) more materials research tightly coupled to the needs and current problems of the generator designer-builder-operator. (Such "fire fighting" is not popular, but lamentably, that is what is needed); and (2) More generator testing; more facilities, more channels per facility, and--of course--more money.
13

STATUS OF MHD MATERIALS
S. J. Schneider Inorganic Materials Division National Bureau of Standards Washington, D. C. 20234
Open cycle magnetohydrodynamics (MHD) is an emerging technology of proven scientific feasibility. As the development of MHD proceeds from the study of scientific phenomena to the realities of the engineering device, attention must be focused sharply on the limiting aspects of the technology. For MHD, these are many, but materials issues appear to be paramount.
MHD service conditions are indeed severe, and these pose serious problems to the MHD designer. The combination of high temperatures, high velocity gases containing reactive chemical species, and, for certain components, electromagnetic effects, produce a very harsh environment within the MHD system. Containment and operating materials not only must resist erosion through vaporization and corrosion by alkali seed and by the products of combustion, but also must possess the requisite physical properties necessary for component operation (e.g., the MHD generator). The design of a device or component to withstand the rigors of these conditions requires knowledge and proper utilization of the basic physical and chemical properties of the candidate materials and process contaminants translated to within the context of the real engineering situation. Materials must be developed for, and qualified in, a specific engineering regime appropriate to the needs and requirements of the component. The solution of MHD materials problems lies in an integrated program involving the establishment of reference and engineering designs, materials selection to meet design requirements, the testing and qualification of both the materials and design, and finally, the optimization of the device through modification of design and of materials properties.
Unfortunately, there is no existing energy conversion system comparable to MHD which would serve as a technology base to build upon. There is, however, a firm materials base in the fundamental and applied sciences, as well as in the refractories and metallurgical industries, from which materials guidance can be obtained for MHD applications. This information in combination with that previously developed or currently being obtained in MHD programs has provided considerable insight to and solutions for pressing materials problems. In the United States, for instance, work is focused on the development of the generator, combustor and air-heater components for coal fired applications with notable progress being achieved through programs at ANL, AVCO, UTSI, Westinghouse, PERC and Fluidyne. Moreover, in the Soviet Union, the U-02 and the U-25 MHD pilot plant facilities have been used extensively to study overall systems operation and to aid in the development of specific components and materials for clean fuel systems. In particular, the U-02 unit has been successfully utilized as a test bed for materials/ designs. Associated materials programs are also underway in the USSR (Institute of High Temperatures), Japan, and Poland, and in the United States at the National Bureau of Standards, Westinghouse Research Laboratory, Battelle Northwest Laboratory, Fluidyne Corporation, the Massachusetts Institute of Technology, and others.
14

Table 1
SUMI-IARY OF SOME TEST RESULTS ON VARIOUS MHD-MATERIALS
Material
Ol
Lead-out Test Facility
clean or slag
surf.
°c
time (hrs.)
maximum current density A/cm^
(*n.s. = not stated)
Electrodes
- Zr02+ll%Ce02 „_3_,
(hot pressed)
- 50 ZrO -SOCeO, n.s.
- stabil. ZrO (Y, Mg, Ca, Sm) Pt ZrO^-CeO^, ZTQ.^.^&.p.^
- ZrOj-PrOj^gg-H.C.C. Pt
- ZrO (CaO) segmented
ceramic + spring-loaded contact to Cu
- Plasma sprayed Cr-W-alloy ZrO (CaO) pin structure
-BBZrOj-lSYjOj 82Zr02-180002 50ZrO2-50CeO2 VSCeOj-250002 80Ce02•ISZrO^•ZTa^Oj
Pt
Poznem (4MW^^)
U-25
Temp. (USSR)
U-25
U-25
U-02 [US-USSR joint test, Phase I]
clean
1500°C 2-4hrs. 2-3
1400-1500°C 100-300 2-3
2-47
" 1800 °C 100
" 1720 °C 127
0.3
Observations (by investigator)
burned out at 1680 'C current to be limited to 0.8 A/cm^
strong erosion
lifetime several hrs.
no visible change, some Pt melting
"maintained integrity"
erosion 8 mm (out of 20 mm initially) "promising"
strong seed penetration, at cathodes,
0-1.25 Ce02-loss, Some Zr02(Y)
de stabiliz ation, 6(out of 40) lead-outs failed
- 69Zr0 -120602-laCaO Ag-spring mixed with 30% LaCrO^ -^Ag-plate
Zr02(Y)
ETL (Japein)
Westing. slag
1400 anode 54 1200 cath.
1400-1900 10
appreciable damage
little damage; above 1500 "C (no slag layer)

Table 1 continued
Cs
-3MgAl204- 1^^304 (MAFF-31)
3MgAl203-lFe304 (1mm thicjcness)
Pt, Cu
alloy mesh
-hercynite Pt,Cu
Cu-clamp
Al- and Al-Fe chromite n.s.
(FeAl O^.Fe O ) 2 4 3 4
LaCrO3+40% Cr +3% Pd (cermet)
ZrB,
Sic (+Mo)
Sic
Stainless steel and Haynes 25
inconel(rail and "buttons") +copper
copper(bare)
copper
Pt
U-02 (US-USSR joint test-Phase II)
AVCO
U-02 (Phase II)
U-25
Westing.
ETL (Japan)
U-02(7)
Westing.
Vegas (Germany)
AVCO Marie VI
clean
slag
clean
clean
slag
clean
clean
slag
clean
slag
clean
slag
1700 100 0-1.5
1400-1500 5 (slag surface)
1650 100 0-0.8
1500-1700 100 n.s.
1500-1700 10 n.s.
•v-SOO °C 54 n.s.
-ulSOO ->C 7 n.s.
7 10 n.s.
1250 "C 90 n.s.
T (slag) = 95 1425
T (metal)= 930
" 2007 20
20
-detachment of metal-ceramic bond -Fe-oxide vaporiz. (top) -Fe-oxide exsolution
(bottom)
- most MAFF dissolved - some oxidation of
metal mesh - good continuous slag
layer
- hercynite melted
l i t t l e damage
l i t t l e damage; above 1500 "C no s l a g layer
strong o x i d a t i o n
oxidation t o K SiO erosion 1 mm/hr ^
oxidation, seed , react ion, eros ion , 0.3 mm/hr.
after 90 hrs . -oxide layer .Bmm
anode:large metal l o s s cathode:interelectrode
shorting
l i t t l e damage, strong arcing
appreciable damage on anode

Table 1 continued
copper (smooth)
copper (grooved)
Stanford
Stanford
slag
slag
T (slag) =^1425 T (Cu)=200 5
n.s. n.s.
slag does not bond to Cu
slag bonds firmly: 1-2 mm
Insulators
MgO (dense)
MgO (9B% T.D)
MgOC^gOt)
(modular)
MgO-spinel ('V/90%) (modular)
Mg0(83* T.D)
MgO(75% T.D)
ETL clean 1500°C n.s.
AI2O3
Westing.
U-02 and
U-25
U-02 & U-25
U-02 (US-USSR test Phase I)
Vegas
(Germany)
Poznan
slag
clean
clean
clean
clean
clean
1600°C
1800°C
1800 "C
1700''C
2000''C
2000''C
10
100-300
100-300
127
90
3
appreciable damage
little damage
good thermal stckbl. little seed attack
better than MgO for small heat fluxes
strong seed penetration, apprecieible craclting
strong seed penetra^
tion, destruction
after chut-dovm
performed reasonably partial melting
BN AVCO slag 20 top of plate broke
Preheaters Al O (cored brick)
Mg-Al-Fe-chromite
Combustors
ZrO.-concrete
Be-Cu + MgO + slag
AVCO
Fluidyne
U-02
AVCO
air
air & seed & zlcig
"clean"
slag
800-1600?
1525
2000-2100
n.s.
1000
5
300-600
'\-200
satisfactory; some cracks
little seed and slag attack
some damage
satisfactorily

The purpose of this paper, then is to set forth the current status of materials development in MHD through discussions on the scope and nature of the problems, definition of materials selection criteria, candidate materials, and, finally, descriptions of materials performance under real MHD conditions or those close to them (see Table 1). Emphasis will be placed on the materials aspects associated with the MHD generator. It is hoped that this discussion will aid in establishing a proper perspective in the basic sciences for the solution of materials problems inherent in MHD.
18

GAS-PLASMA CHEMISTRY
J. W. Hastie, Chairman
National Bureau of Standards


MICROSTRUCTURE OF PULVERIZED COAL FLAMES BY DIRECT, MOLECULAR BEAM MASS SPECTROMETRY
by
Thomas A. Milne Jacob E. Beachey
Midwest Research Institute 425 Volker Boulevard
Kansas City, Missouri 64110
INTRODUCTION
The complex nature of coal, the complicated fluid mechanics of actual combustors and the high temperatures Involved in open cycle, coal-fired MHD systems present a unique challenge to both the combustion and high temperature scientist. It is almost essential to simplify such systems to permit Interpretation of basic chemical processes. One approach involves (a) keeping the realism of pulverized coal combustion by burning the coal at one-atmosphere pressure or higher in premixed, laminar, aerodynamically simple, flat flames; and (b) sampling and detecting gaseous species through such flames by direct, free-jet, modulated, molecular beam mass spectrometry.
STABILIZING COAL DUST FLAMES During the course of work for ERDA [l] and the U.S. Bureau of Mines
[2] we have demonstrated that both flat and conical, open, premixed flames of coal dust and air can be stabilized on small burners. With bituminous coals, unaugmented flames in air have been maintained on burners ranging in diameter from 1 to 12 cm. With air and dusts in the range of 10 to 20 p,m, only compositions richer than stoichiometric have been stabilized. With sjmthetic "air" containing 28% O2, flames substantially leaner than stoichiometric are possible.
The achievement of reasonably unlfoirm flames is very much an empirical art. No completely satisfactory dust feeder exists and the behavior of dust clouds is unpredictable. The keys to achieving such burning, in our experience appear to be: (a) smooth feeding of the coal dust from a fluidized-bed feeder, (b) very turbulent mixing of the coal dust and air at the inlet of a conical transition section, (c) a short transition to laminar flow at the mouth of the burner, achieved by screen or honeycomb flow straighteners, and (d) vibration of all components contacting the coal dust. Figure 1 portrays several laminar flames utilized in our work. To the eye, the flame exhibits a striking similarity to gaseous hydrocarbon flames, showing a bright, narrow, primary reaction zone a few millimeters in width, followed by a char burning region.
19

la. Flat flame on inverted 6.3 cm
burner. lb. Conical flame on inverted 1 cm
pyrex tube burner.
Ic. Cluster of 7 conical flames on a Id. Flat flame on a 3 cm diameter
bundle of 8 mm tubes. burner.
le. Coal-air mixer, burner and honeycomb surrounding screens. 6.3 cm burner used to obtain profile shown in Figure 2.
Figure 1 - Photographs of Typical Flat and Conical Flames and Mixer
and Burner Used for Mass Spectrometry Probing.
20

DIRECT SAMPLING OF COAL DUST FLAMES
Though molecular beam mass spectrometry usually involves neutral species under Knudsen-cell conditions, extensions to the sampling of higher pressures [3] and to the sampling of ions [4] are now common. In our work, we are applying the techniques of direct, free-jet expansion, modulated molecular beam mass spectrometry to the characterization of the microstructure of coal dust-air flames. Typical results of profiles for stable reaction products and pollutant species are shown in Figure 2 [5,6]. The recently designed system being used to determine reactive species involving alkali metals and sulfur In near-stoichlometric, bituminous coal-air flames is shown in Figure 3. The basic operation of such a system has been described elsewhere [3]. The major phenomena encountered with this system in the sampling of neutrals from one atmosphere coal flames are: (a) Nucleation. The extreme cooling accompanying a shock-free nearly isentropic free-jet expansion, can produce extensive homogenous nucleation of both high and low temperature species [7j. (b) Background modulation. With the intense beams produced by free-jet expansion from one atmosphere the environment in the ion source region can be sufficiently altered so that background species are modulated to produce a phase-locked, but often out-of-phase signal, (c) Knock-on. In the free-jet expansion region, background molecules may be swept into the molecular beam, appearing as phase-locked signals, (d) Metastable noise. With an in-line mass spectrometer configuration, neutral, but electronically excited, species can strike surfaces in the ion detection region, causing a general phase-locked background signal, (e) Mass Separation. Free-jet expansion, molecular beam sampling usually leads to a preferential detection of heavier species, often approaching a dependence on the first power of the molecular weight [3,8]. (f) Temperature-Dependent Cracking Patterns. This problem, though always present in high temperature mass spectrometry, is complicated in free-jet sampling due to the large, but generally unknown, degree of rotational and vibrational cooling of sampled species [9]. (g) Particulate Noise. When particulates are present in hot combustion gases, large noise spikes averaging to a phase-locked signal across the entire spectrum are observed, (h) Orifice Plugging. In coal flames, the very heavy burden of particulates causes rapid plugging of small sampling orifices.
The significance of these phenomena for general coal-flame studies can be summarized as follows. Nucleation will probably not be important for high temperature flames with low concentrations of condensible vapor species [l]. Background modulation produces an unfortunate Interference at mass 40 (Ar+), making the direct detection of NaOH(g) parent problematical [l]. Knock-on will depend critically on the state of cleanliness of the first stage of the sampling system. In our case, interferences at critical masses such as 39 (KT^) appear to be at the 20 ppm level or less. Metastable noise and particulate noise, each currently present at the 10 ppm level [l], can very likely be reduced to below 1 ppm by careful beam alignment and alteration of system geometry to prevent the molecular beam from striking surfaces in the vicinity of the electron multiplier. Mass separation and free-jet cooling of sampled
21

0.004
0.003
0.002
0.001 -
1
/ z'
Nf
' ' ' ' 27+ (HCN)
30+ ( N O )
26-"(CN,C2 H2)
M * (SO2)
' t « * ( N C 2 )
• . ^ 34+ ( H2S )
48+ (SO) _. 1 1 1
1 2 3
DIstonce, cm
Figure 2 - Mass Spectral Profiles of Relatively Stable Species Sampled
From a Rich, Coal Dust-Air Flame. The Shaded Area Shows
the Location of the Bright Reaction Zone.
22

Figure 3 - Scale Schematic of Direct, Free-Jet, Molecular-Beam, Mass Spectrometric Sampling System For Coal-Air
Flame Probing
23

molecules are inherent problems and must be dealt with, by calibration where possible, for each circumstance. Orifice plugging can be delayed with mechanical cleaning devices [5].
APPLICATION TO COAL FLAMES OF INTEREST TO MHD
Our experience to date with the sampling of relatively low temperature, pulverized coal-air flames leads to optimism about the utility of this approach in the characterization of high temperature processes in the hot, combustion plasmas typical of open cycle, coal fired MHD. High temperature coal flames, using either preheated air or extra O2 should be easier to stabilize under lean or rich conditions than air flames. Orifice plugging could become more severe, and irreversible, if molten ash particles wet the probe and lead to coherent slag layer buildup. In principal, direct free-jet sampling from combustion systems at pressures greater than one atmosphere is straightforward. Young et al., [lO] have sampled dynamically an internal combustion engine cylinder at peak pressures of 270 psia. In practice however, for coal dust flames, the problems enumerated above may well become more severe• It is recommended that such sampling be demonstrated for one-atmosphere flames before contemplating the awesome complications of maintaining and sampling coal dust flames in pressurized systems.
REFERENCES
1. Milne, T. A., and J. E. Beachey, FE-2288-12, "Direct Sampling and Characterization of Gaseous Species Responsible for Fireside Corrosion in Fossil Fuel-Fired Systems," Third Quarterly Progress Report, October to December 1976, ERDA Contract No. E(49-18)-2288.
2. Milne, T. A., and J. E. Beachey, "Exploratory Studies of Flame and Explosion Quenching," Summary Technical Progress Report, June 1972 to December 1975, U.S. Bureau of Mines Contract No. H0122127.
3. Greene, F. T., J. Brewer, and T. A. Milne, J. Chem. Phys.. 40:1488 (1964). '^
4. Hayhurst, A. N., and N. R. Telford, Combustion and Flame, 28:67 (1977). 5. Milne, T. A., and J. E. Beachey, "The Microstructure of Pulverized Coal-
Air Flames. I. Stabilization on Small Burners and Direct Sampling Techniques. Paper to be published in Combustion Science and Technology, 1977.
6. Milne, T. A., and J. E. Beachey, Part II. "Gaseous Species, Particulate and Temperature Profiles," Paper to be published in Combustion Science and Technology, 1977.
7. Milne, T. A., J. E. Beachey, and F. T. Greene, J. Chem. Phys.. 57:2221 (1972). ^
8 . Sharma, P . K., E. L. Rnuth, and W. S. Young. , J . Chem. P h y s . , 6 4 : 4 3 4 5 ( 1 9 7 6 ) . " ^
9. M i l n e , T. A . , J . E Beachey , and F . T. Greene , J . Chem. P h y s . , 5j6:3007 ( 1 9 7 2 ) .
10. Young, W. S., W. E. Rodgers, C. A. Cullian, and E. C. Knuth, AIAA Journal. 9 :323 (1971).
24

COMBUSTION DIAGNOSTICS*
R. A. Hill Sandia Laboratories
Albuquerque, N. M. 87II5
One objective of Sandia Laboratories' Combustion Program is a continuing review of the applicability of state-of-the-art diagnostics to the characterization of the flow exiting high pressure combustors fired by coal or coal-derived fuels. Efficient and reliable operation of open-cycle, direct fired gas ttirbines or MHD channels will place constraints on the average values of pressure, gas temperature and velocity, particiilate loading density and particle size distribution at the combustor exit. Constraints also arise due to requirements that combustion-generated pollutants (CO, NO, SCU) be minimized.
Application of conventional diagnostic techniques, e.g., physical probes, for thermometry, velocimetry, and gas sample analysis will be severely limited by the combustor exhaust environment. Difficulties expected with conventional probe sampling include perturbation of both the flow and the local chemistry, probe plugging due to a high particle concentration, a tendency for the sample to react, and probe survival in a high temperature, hostile environment [1-3]• Laser diagnostic techniques, on the other hand, offer the possibility of in situ, non-intrusive, spatially resolved measurements [4]. These techniques (Doppler velocimetry, Mie scattering, Raman and fluorescence spectroscopy) have been successfully applied to relatively clean combustion gases; however, interference from background Ituninescence, stimulated fluorescence, and scattering from particles can affect, to varying degree, the application of laser techniques to "dirty" flow environments. In the following sections, the merits of several diagnostic systems for detection of species concentrations, gas temperature, and gas velocity are discussed. Specific laser techniques include
a. Pulsed Spontajieous Raman Scattering (PSRS) b. Coherent Anti-Stokes Raman Scattering (CARS) c. Stiimilated Anti-Stokes Raman Scattering (SARS) d. Resonance Fluorescence (RF)
for species concentration and temperature, e. Virtual Fringe Laser Velocimetry (VFLV)
for velocity, turbulence, and particle size.
Before examining these techniques, it is useful to estimate gas species and particulate concentrations expected at the exit of a coal-fired combustor. For a high-volatile bituminous coal (CIH^QOO_0^22,008^4-^.026) with a dry mineral matter free heating value of 7.9 kcal/g, a preheat temperature of lOOOK, a combustor outlet temperature of 280OK, and % ash content based on mass, a crude estimate of major species concentration gives [U]:
species/mole fraction: N2/O.75 CO2/O.I5 H^O/O.OG 0^/0.03
*This work was supported by the U. S. Energy Research and Development Administration.
25

species/mole fraction (cont'd): ^^^^ ^^-.u piJiii nu; x^OO ppm
where it is assumed that hCffo of the fuel bound nitrogen is converted to NO. Ash loading on a weight basis at the combustor exit is 3700 ppm. The amount of NO and SOo depend on the original sulfur and nitrogen content of the coal. These concentrations will also be affected by the addition of a seed material (KgSOi , K2CO3) used to obtain acceptable levels of conductivity.
SPECIE CONCENTRATION AND TEMPERATURE
Laser based methods depend on the Interaction of photons with rotational and vibrational energy levels of molecules and/or radicals, or with the electronic states of any species present at the combustor exit. This interaction can occur as inelastic photon scattering (vibrational or rotational Raman scattering), photon absorption ajid re-emission (resonance and nonresonance fluorescence) or a combination of these effects when the photon energy is nearly coincident with a resonant transition. In addition to these linear processes, nonlinear, m\alti-photon processes including CARS, SARS, and stimulated fluorescence are candidates as possible diagnostic probes.
Raman Scattering
A laser beam, incident on a gas sample, will suffer a small amount of scattering at the laser frequency (Rayleigh scattering) and an even smaller amount of scattering at frequencies characteristic of the scattering species (Raman scattering). These frequency shifts in the scattered radiation (Raman shifts) are a result of rotational energy changes (rotational Raman scattering) or vibrational energy changes (vibrational Raman scattering) in the scattering species. Raman shifts to the high (low frequency) side of the exciting line are referred to as anti-Stokes (Stokes) Raman shifts.
The intensity of the individual Raman lines depends directly on the species concentration and on the distribution of the molecules over the various rotational/vibrational states. At equilibrium, this distribution is described by a Boltzmann factor, so that measurements of the Raman intensities over a rotational/vibrational "band" will provide a measure of the rotational/vibrational temperature as well as a measure of the specie concentration. In general, for a gas mixttire, the pure rotational Raman spectra of the individual species will be superimposed and thus difficult to interpret. On the other hand, the Q-branch vibrational Raman spectra (AJ = 0 and Av = ±1, where J and v are the rotational and vibrational quantum numbers, respectively) of the individual species are usually well separated from each other and from the Rayleigh line at the exciting frequency.
The advajitages of the Raman technique for species concentration and temperature measurement include:
(a) The Raman-scattered signal is characteristic of the identity, temperature, and concentration of the scattering species.
(b) High spatial resolution (1 mm^ sample volumes). (c) In situ measurement (no physical probes in the flow).
26

(d) No excited electronic states are involved that can be quenched, i.e., collisionally deactivated; thus the Raman signal scales linearly with specie concentration.
Limitations of the Raman technique Include: (a) The requirement for optical access. Windows must be protected
from hot corrosive species and particle impact. (b) Spectral Interference due to background luminescence, particle
incandescence, stimulated fluorescence, and Mie scattering can limit signal/noise ratios.
(c) Small Raman cross sections require the use of high-power, pulsed lasers, and gated or synchronous detection. Signal integration times of the order of several minutes will be necessary using Intermediate power pulsed lasers.
Various techniques can be applied to minimize seme of these limitations. For example, multipass optics can be employed to increase the laser light fltix within the sample voltmie [5>6]. The effects of background Itmiinosity can be minimized using pulsed spontaneous Raman scattering (PSRS) with a cavity dumped, repetitively ptilsed argon ion laser. While the average laser power is about one-half that of a comparable continuous laser (2 watts), instaii-taneous peak powers of the order of 100 watts can be obtained at rates of 10° sec"-'-. A pair of high frequency counters are sequentially gated to count Raman signal plus background, followed by background alone. Using a multipass cell, and a gate duration of 20 nsec/pulse, this technique has provided a signal-to-background ratio twenty times better than that with a comparable continuous laser in a highly luminous, atmospheric pressure, premixed methane/air flame [7]. Laser induced fluorescence from particulates in the flow can be minimized recording the anti-Stokes spectra on the high frequency side of the exciting line. Specie concentrations of 100 ppm should be measurable to a few percent accuracy in times of the order of 1 minute in a 5 atm flame gas environment. Temperattire can be obtained frcm ratios of anti-Stokes Q-branch intensities to Stokes Q-branch intensities in nitrogen, or, in the presence of strong laser induced fluorescence, from ratios of "hot-band" anti-Stokes intensities in nitrogen.
Nonlinear Ramaji Techniques
These techniques employ two or more lasers to generate a Raman signal via the nonlinear susceptibility of molecular gases. While the nonlinear interaction is weak, its dependence on the laser power provides orders of magnitude more signal strength than PSRS. Spectral resolution with these techniques depends only on the laser linewidths; thus high resolution spectroscopy can be carried out without loss in signal strength. The signal is at a higher frequency than either laser which should avoid interference with laser induced fluorescence. A major disadvantage is the increased complexity, e.g., two synchronized pulsed laser sources are required, one laser must be tunable, and optical alignment is more critical than PSRS.
CARS (Coherent Anti-Stokes Raman Spectroscopy). This technique uses a parametric mixing process to produce radiation at the anti-Stokes frequency iDg_ corresponding to a pump frequency uu and probe frequency uug given by uUg_ = 2ou-u)g [8]. The anti-Stokes spectrum can thus be obtained by monitoring the intensity at uu while the probe (jUg is tuned thro\agh the Stokes spectrvmi. The output signal scales as the cube of the input power resulting in
27

increased sensitivity. Unforttmately, minority specie concentrations of 10-100 ppm are difficult to observe due to intrinsic nonresonate background signals [9].
SARS (Stim\aated Anti-Stokes Raman Spectroscopy). Rather than a parametric nonlinear mixing process, the SARS-technique involves the measurement of a loss (or gain) at the anti-Stokes (or Stokes) frequency [10]. For two laser frequencies at u)g and uu, SARS represents an induced absorption measurement at frequency uua resulting from a pump frequency at uu. An anti-Stokes probe is more appropriate than a Stokes probe as it should avoid fluorescent masking of the signal that is expected to occur in particulate laden flows. Other advantages of SARS include good discrimination against background luminescence, high spectral resolution with no loss in sensitivity, a spectral output similar to PSRS and thus easy to interpret, sensitvlty comparable to CARS, and the signal does not include nonresonant background signals.
Resonance Fluorescence
Resonance fluorescence involves transitions between allowed electronic states. The process involves the absorption of energy from the incident beam resulting in excitation of the species from the ground electronic state to an excited state, followed by emission as the absorber returns to a lower state. Because the absorption cross sections are orders of magnitude (lO°-to-10-'-'~') larger than Raman cross sections, the fluorescence technique offers an extremely sensitive probe for both atomic and molecular specie concentration measurement. Problems expected with the application of fluorescence techniques to the diagnostics of high press\ire flame gases Include uncertainties caused by collisional quenching of excited states, optical access, and spectral interference as mentioned with regard to Raman measurements. It may be possible to circumvent the quenching problem by using stimulated fluorescence to induce a transition prior to collisional deactivation. This two photon technique represents a resonaxit SARS method, if the two photons are absorbed simultaneously[ll].
VELOCITY AND PARTICLE SIZE
Because the extracted MHD power is proportional to the gas conductivity and to the square of the gas velocity, these items are of particular diagnostic interest. While some MHD channels have employed supersonic flow at the channel inlet, practical MHD generators are expected to operate in the high subsonic regime. Among several optical diagnostic techniques that have been successfully employed for velocity meastirements in high velocity, luminous environments, two methods are of particvilar interest because they provide a capability of measuring several parameters simultaneously.
High Resolution Interferometry
This technique employs a pressure scanned Fabry-Perot interferometer/ spectrometer system to determine widths and shifts of emission lines [12]. In particular, by choosing an appropriate viewing angle, it is possible to
28

record both red- and blue- Doppler shifted line profiles from one line-of-slght measurement. Data can be obtained as a function of radius by Able-inversion of lateral scans of an axisymmetry flow channel, or simply used as integrated line-of-sight information. The gas velocity can be obtained from the wavelength separation of the red- and blue- shifted components (their separation is twice the Doppler shift at the particular viewing angle) and is independent of an absolute wavelength calibration. The intrinsic line shift, i.e., a pressure shift due to Van der Waals or resonance interactions, or a Stark-shift due to free electrons, is given by the wavelength difference between an absolute line position and the midpoint of the red- and blue-shifted lines. If the pressure shift is independently known (or negligible), this Stark-shift can be used as a measure of the electron density. Also, if the pressure broadening of the line is known (or negligible), Doppler-broadening can be used as a measure of heavy particle, i.e., neutral species, temperature. This technique has been successfully applied to the study of a supersonic argon plasmajet, and will be applied to calibrate potassium spectral line shifts for application to MHD channel diagnostics.
Laser Velocimetry
This technique is undergoing rapid development and is presently being applied to diverse flow situations including an MHD channel [13]. In its simplest configuration, a laser beam is split into two beams of equal intensity which are focused and intersect in the measurement volume. As a particle moves through the fringe pattern formed by interference of the two coherent beams, the Mie scattered radiation is modulated at a frequency proportional to the particle velocity. In order to measure two velocity components simultaneously, it is necessary to establish two orthogonal fringe patterns at different laser wavelengths. Two separate and appropriately filtered detector systems are thus required to record simultaneous modulated signals frcm the measirrement volume.
A somewhat simpler system employs "virtual" fringes, rather than "real" fringes in the measurement volume. In this technique, as a particle moves through a voltmie illuminated by one laser beam, Mie scattered radiation is collimated, passed through a coarse transmission grating, ajid the restilting diffraction pattern is focused on a pinhole in front of the detector. Motion of the scattering particle causes the diffraction pattern to be scanned across the pinhole resulting in a modtilated signal whose frequency is prcportional to the particle velocity. Two velocity components can be measured simultaneously with two detector systems having orthogonal diffraction gratings. In this system, grating spacings can be chosen such that particle size information can be obtained from a broadening of the individual diffraction maxima. Such a system (VFLV) has been applied to the simultaneous measurement of two velocity components in the mixing region of a reacting HF chemical laser cavity [_lk'].
COMBUSTION SIMULATION FACILITY
A key element in our diagnostic development program is the Sandia combustion simulation facility. This facility is designed to permit the
29

evaluation of advanced combustion diaBiroKru..,>.. ^'-iniu.Ltto inr cuvxronments that simulate the conditions expected at the exit of high pressure coal-fired, o^ liquid-fuel-fired combustors. Energy input is achieved with a high-pressure arc-heater. Particulates, including fly ash and potassium seed materials, together with CO2, H2O and trace gases can be injected into the restilting high pressure, high temperature flow to obtain any desired mixture of combustion products. Maximtim test conditions include pressures to 7 atm, temperature to 3OOOK, sonic velocities, and mass flow rates to 90 g/s. With the facility, we can simulate the conditions expected at the exit of a high pressure combustor without the problem of fuel variability, and we can isolate, or enhance, certain phenomena in order to establish limitations on each diagnostic technique. In addition to laser diagnostics, optical diagnostics including emission and absorption spectroscopy can be carried out in this facility. For example, Stark shifts of potassium emission lines, calibrated in a seeded plasmajet, will be evaluated as a possible electron density diagnostic. PSRS will be evaluated as a technique for measuring minority specie concentrations, and as a temperature diagnostic using anti-Stokes Q-branch lines of Np.
REFERENCES
1. R. W. Ladenburg, Editor, Physical Measurements in Gas Dynamics and Combustion. Princeton University Press, Princeton, I95U.
2. J. Chedaille and Y. Brand, Measurements in Flames, Vol. 1 of Industrial Flames, International Flame Research Foundation, Crane, Russak, New York, 1972.
3. R. M. Fristrom and A. A. Westenberg, Flame Structtire, McGraw-Hill, New York, 1965.
k. H. W. Coleman, D. R. Hardesty, R. J. Cattolica, J. H. Pohl, L. A. Rahn, R. A. Hill and D. L. Hartley, "Diagnostics Assessment for Advanced Power Systems," Sandia Laboratories, SAND77-8216, I977.
5. R. A. Hill and D. L. Hartley, Appl. Opt. I3, 186 (197^^). 6. R. A. Hill, A. J. Mulac, and C. E. Hackett, "Retroreflecting Multipass
Cell for Raman Scattering," Appl. Opt. (accepted for publication). 7. A. J. Mulac, W. L. Flower, and R. A. Hill, to be published 8. P. R. Regnier, F. Moya, and J. P. E. Taran, AIAA Journal 12, 826 (197 1). 9. P. R. Regnier,and J. p. E. Taran, Appl. Phys. Lett. 23, 25o (1973). 10. A. Owyoung, "The Application of Third Order Nonlinear Optical Techniques
to the Diagnosis of Combusting Media," Sandia Laboratories, SA1O77-0005, 1977.
11. A. W. Johnson and J. B. Gerardo, "Density and Temperature Measurements with Lasers," Sandia Laboratories, SAND76-O728, I977.
12. p. P. Aeschliman and D. L. Evans, J. Quant. Spectrosc. Radiat. Transfer 16, 191 (1976). '
13. S. A. Self and C. H. Knager, "Diagnostic Methods in Combustion MHD Flows," AIAA Paper 76-310, I976; J. Energy 1, 25 (1977).
14. C. E. Hackett, "Laser Velocimetry Measurements in the Cavity of HF Chemical Laser," Sandia Laboratories, SAND76-93lij-, I977.
30

THERMOCHEMICAL MODELING OF COMBUSTION PLASMA MIXTURES
F. E. Spencer, Jr., J. C. Hendrie, Jr., and D. J. Wildman Pittsburgh Energy Research Center
U. S. Energy Research and Development Administration
Abstract
We report some recent results and outline identified problem areas in making thermodynamic predictions of the properties and behavior of combustion plasmas. An outline of this abstract is as follows:
1. Coal as a thermochemical feedstock: stoichiometry and enthalpy of formation.
2. Equilibrium calculation scheme.
3. Nonideality of coal-ash slag solutions.
4. Thermodynamic data uncertainties including ions and possible uncertainties in computation of thermodynamic functions.
5. Uncertainties in momentum transfer collision cross-sections.
1. Coal as a Thermochemical Feedstock
Making thermochemical predictions about the behavior of coal when reacted with other reagents (like air or hydrogen) requires knowledge of the heat of formation of coal from its elements. This is usually done by ignoring the mineral matter completely and assuming that C C02(g); S S02(g); H ^ 1/2 H20(l); N ->• 1/2 N2(g) in the combustion bomb used for a "heating-value" determination. The coal calorlmetrists are aware of two errors in this approach so they almost never report the direct measurements of heat evolved. The coal calorlmetrist is obliged by ASTM standards and USBM Bulletin 638 to reduce the observed heat by certain "Washburn corrections" for formation of acid (H2SO4 or HNO3 for example) and for formation of sulfate (H2SO4 or whatever). The intent of the standard corrections is to adjust the heat to that which would be evolved if only the four reactions have occurred.
Unfortunately two problems may be significant in this method of data treatment: (1) the coal mineral matter may enter into reactions in the calorimeter bomb which invalidate the assumptions, and (2) the materials produced may have widely divergent concentrations in the water produced, as a rotating bomb calorimeter is not required by the standards. Rossini's collection Experimental Thermochemistry points out that a rotating bomb calorimeter can be used to obtain uniformity of dilution for the acids produced in a calorimetric determination. The determination could then be corrected exactly using the heat of dilution data for the acids analyzed in the end products. We are not prepared to advocate such a complex change to the standard heating value determination.
31

To get an estimate on the uncertainty range for the terminal condition of coal in a calorimeter, we have collected from Wagman, Kubaschewski-Evans-Alcock, Waldaum-Robie and JANAF the heats of formation for about 180 different compounds which meet the criteria of plausibility for end products of the bomb burn:
(1) Oxygen always at -2 valence when in compound (2) Chlorine at -1 when in compound (3) Nitrogen N2, oxygen O2, chlorine CI2 allowed (zero valence) (4) Alkalies and hydrogen at +1 (5) Calcium, magnesium and iron at +2 (6) Aluminum and boron at +3 (ferric compounds also allowed) (7) Carbon, silicon and titanium at +4 (8) Phosphorous only at +5, nitrogen allowed +5, HNO3 (see below) (9) Sulfur only at +6 (sulfates)
In addition, various apparent heats of formation for dilution of HN03(1) and H2S04(1) and their salts are allowed and apparent heats of formation for hy-drated crystals are allowed. Gaseous H2O not allowed.
These data were used with the numerically-stable linear-programming code of R. H. Bartels (Contribution I/ll in Wilkinson and Reinsch: Linear Algebra) to find the minimtmi and maximum enthalpy of formation for the terminal-oxidation conditions of several typical coals. Suppose the stoichiometry of 1 kilogram of dry Illinois #6 coal, plus its moisture is (in g-atoms):
5058 Al 3724 Fe ,9281 N ,9179 SI
57.0311 C 58.6034 H
.0238 Na
.0155 Tl
.1275 Ca
.0602 K
.0021 P
.0564 Cl
.0549 Mg 1.1229 S
with oxygen present in the coal and a large excess of O2 included in the bomb.
Then, letting oxygen be a "free variable", the linear-programming code allows us to estimate minimal and maximal enthalpy solutions after combustion for the stoichiometry, the (plausible) minimal-enthalpy solution is (in g moles):
.5058 A1(0H)3 Gibbsite
.0007 Ca5(P04)30H Hydrapatite
57.03 C02(g)
.3724 FeO(OH) Goethite
.1240 CaS04(2H20) Gypsum
.0564 HCKDdOOO H2O)
.8679 HN03(1)(25H20)
,0603 KN03(c)
.9179 Si02(c) Quartz
26.96 H20(l)
.0549 MgS04(7H20) Epsomlte
.0155 Ti02(c) Rutile
,9321 H2SO4 (40 H2O)
.0119 Na2SO4(10H2O) Mirabilite
for an enthalpy of formation of -33.185 megajoules, for this kilogram of coal.
32

The maximal enthalpy solution for the same stoichiometry consists of an entirely different set of "terminal oxides" and has an enthalpy of -32.913 megajoules. This (plausible) maximal solution is:
57.02 C02(g)
28.18 H20(l)
.0843 Al6Si20i3 Mullite
.1275 CaO Lime
1.123 H2S04(1) Con. Sulfuric
.4641 N2(g)
.5630 Si02(gl)
.0141 CCl4(g) Carbon tetra
.1862 Fe2Si04 Fayalite
.0301 K20(c)
.0119 Na20
.0155 Ti02(c) Rutile
,0549 MgO Periclase
,0011 P205(c)
This range of uncertainty in the determination of the terminal conditions of the bomb calorimeter translates directly to an uncertainty of 20 kelvins in adiabatic reaction temperatures for combustion with stoichiometric air at 298.15 kelvins. Air-gasification temperatures are more uncertain.
This work will be reported later in a PERC Report of Investigations. The final manuscript will include a discussion of how the "titer correction" (when it has been reported by the analytical laboratory) may be used to reduce the uncertainty.
This work may result in work at PERC to improve characterization of calorimeter end-conditions.
2. Equilibrium Calculations
Equilibrium calculations form the basis of many other calculations such as (1) flame-temperature prediction, (2) phase separation such as potassia absorption by slag, (3) electrical- and other transport-property calculations, and (4) diffusion-controlled coal-particle-burnout models.
Empirically, it is known that the coal combustion mixtures of MHD interest consist of four phases (at best): gas, slag, condensed seed, and (during coal-particle burnout) a carbonaceous phase which disappears at equilibrium.
PERC has a robust computational method for multiphase-equilibrium calculations originally published as U. S. Bureau of Mines Report of Investigations 7786. In 1975 this program was extended to include nonideality in the ternary-liquid system KO]^/2-A103/2-Si02 (paper in Vlth International MHD Conference).
Further extensions under development will be the incorporation of quaternary-slag nonideality (adding CaO, say) and the inclusion of this equilibrium model as part of a coal particle burnout model.
33

The latter is a nonequilibrium process of course, but there Is reason to believe that it is diffusion controlled. Assuming the particle burnout Is diffusion controlled allows application of the multiphase-equilibrium code as part of a differential-equation-solving scheme. These results will be reported later. For now, however, let us mention that the heat of pyrolysis of coal is not known. We expect that a careful review by one versant with the physical chemistry of organic compounds may provide us with good estimates on this (these) number(s).
The quaternary-slag condensation model we are working on needs more hard data on potassia activities at interior points of the tetrahedron KOi/2-CaO-A103/2-S102.
Our recent work on solving the multiphase-equilibrium problem as rapidly as possible has led us to cast several of the time consuming procedures of the code into machine language. We would recommend all equilibrium codes be restructured to take advantage of the speed inherent in machines language code for those parts of the codes which are matrix and vector manipulations.
Six codes, summarized below, have been so rewritten:
Millisecond run time for benchmark
Code Description ALGOL COMPASS
QILB Calculates Equilibrium Products 413 79
LDFD Loads Corrector Function 324 63
SOLV Solves Linear System (Cholesky) 117 41
LDL LDR Load Jacobian Matrix 2116 353
DCPS Cholesky Factorization of Jacobian 475 108
Three factors are particularly important in this speed-up: (1) addressing of two-dimensional arrays has been optimized in the sense that most overhead is outside the tight loops; (2) high-speed memory registers have been used to store intermediate results; (3) zeros are detected and skipped directly-
The comparisons are for a CDC 3200 computer which is an old main-frame roughly comparable to the new minicomputer PDP 11/70.
Notice that we now use Cholesky Factorization for linear-system solving. Proof of the numerical stability will appear elsewhere,
3. Nonideality of Coal Slags
We reported the results for a ternary-slag condensation model based on a quartic Margules expansion in the Vlth International MHD Conference. Much additional data would be of use in the liquid range for the ternary system
34

KOi/2-A103/2~Si02. We do not, for example, have heats of fusion for the three identified interior compounds KAlSi04, KAlSi20g and KAlSi308. Other compounds might be located closer to KAIO2 as well.
Almost any kinds of thermodynamic data would be of use: potassia activities, heats of fusion etc. — just so long as it can be related to standard elements.
Similar data are required for, say, potassia activities in the quaternary system KOi/2-CaO-A103/2-Si02.
We would recommend that the measured data on slag activities be reported as such. Too many different solution models for silicate liquids exist to allow us to be satisfied with a particular solution model selected by an experimenter. If, for example, an experimenter were to report his results as a polynomial curve for potassia activity, this may not work well in the context of an activity coefficient model since the entropy contributions will be entirely different in the two approaches. This is not to say that additional thinking is not needed on the theory of these polymeric solutions—interpretation is to be encouraged.
In our computer implementation of our activity-coefficient (Margules) models, we have found it convenient to solve the activity-coefficient functions for those unique activity coefficients which correspond to a given gas-phase composition. Having done this, the decision as to whether the slag phase condenses or not follows directly the method of our RI 7786. This requires some thought as to its justifiability. Uniqueness of the three activity coefficients guarantees that we will have the correct coefficient when condensation does occur; when it does not occur, use uniqueness of y's and continuity to see that the coefficients are the correct ones to use in case additional slag material of the correct composition is added until condensation does occur. We expect to be writing additional papers on these problems, including the non-uniqueness which occurs with miscibllity gaps.
4. Thermodynamic Data Uncertainties
There are still several gases of potential interest in our systems for which unequivocal heats of formation are not available. Included among these are PO2, PO2, FeO, Fe02, Fe02, AlO, AIO2, AIO2, and KOH. All these species are particularly important because of their possible effects upon the free electron concentration in the gas phase of a potassium-seeded coal-combustion mixture. We are predominately interested in oxides which can be produced from the materials of a typical stoichiometry—for example that given in Section 1. We doubt that any oxide negative ions outside of groups 3 and 5 of a periodic table will be important to our work: e.g., CaO~ and MgO~ are not interesting.
We do not believe that any of the following negative ions will appear in damaging quantities in combustion plasmas:
HCO2 (formate), HCO3 (bicarbonate), thionate (SO2), N2O", NO", NO2, NO^, HCI2,
CO2, CO3, CO^, H20-0H~, O3, PO", S", NH2, PH2, NH~, and PH".
35

For these ions we have made calculations from measured data at low temperatures, extrapolating to our combustion temperature range using a vibration-rotation model. For all the ions listed in this paragraph the hxgh-tempera-ture equilibrium constants are so many orders of magnitude less ^^an one for the reaction: Parent + e" - Anion that we are certain they cannot compete for electrons with the free electron - even if electronic vibration contributions were Included. This can be seen from the summary table:
Summary of Estimated Equilibrium Constants for Negative Gaseous Ions
Reference States
C(c) + 2 02(g) + e"
1/2 P2(g) + 1/2 02(g) + e-
To Produce Anion
-• CO,
1/2 S2(g) + e"
3/2 H2(g) + 02(g) + e -• HO-OH
C02(g) + 1/2 02(g) + e' -• CO,
C02(g) + e
1/2 H2(g) + Cl2(g) + e"
1/2 N2(g) + 3/2 02(g) + e-
N2(g) + 1/2 02(g) + e"
1/2 S2(g) + 02(g) + e"
-• CO2
-• HCl"
-• NO,
-••N2O
-• SO 2
HCO" C02(g) + 1/2 H2(g) + 1/2 02(g) + e"^-^ 3
1/2 N2(g) + 1/2 02(g) + e" • NO"
C02(g) + 1/2 H2(g) + e~ • HCOO'
Anion Name if Established
(Monohydrated Hydroxide)
(Bichloride)
(Nitrate)
(Thionate)
(Bicarbonate)
(Formate)
logio K (2700K)'
-1.204
+1.731
0.293
-2.633
-3.718
-1.207
+2.260
-4.283
-5.546
+2.946
-1.269
-3.571
-3.481
Complete data are available at PERC for people interested in the details of the calculations. In some cases data for the parent neutral are not available, but this does not change the conclusions about the importance of the anions.
The work of Brewer and Rosenblatt on electronic contributions to thermodynamic functions of monoxides could very profitably be extended to metal dioxides. For example, the electronic contributions to the functions for FeO(g) are so large at combustion temperatures that we cannot fit the thermodynamic measurements available without them. A vibration-rotation model will not work. If this be true for FeO(g), then why not also for Fe02(g) and/or P02(g)
36

and/or S02(g) (how about CO2 while we are at it?).
Another area of very fundamental research needed involves molecules such as K2S04(g). Spirodonov at the University of Moscow has communicated that such a molecule may have the structure of an anion (SO4) tetrahedron orbited by K ions. The vibrational contributions for such a structure are not clear, but a "two-dimensional hindered rotor" treatment may lead to entirely different results from those which can be obtained assuming a rigid structure. Consider what happens to the functions for ethane when the "one-dimensional hindered rotor" contributions are included.
Thermodynamic data such as AHf298» S°298» ^^^ (lower) temperature heat capacity data are uncertain for some species occurring in other parts of an MHD plant, other than the combustion system or MHD duct. Include among these species potassium sulfide and polysulfides (crystal and liquid).
5. Uncertainties in Momentum Transfer Collision Cross Sections
Once a gas phase composition has been obtained (computed or measured) electrical transport properties can be computed using electron momentum-transfer cross section data — provided that the data are available for the important gaseous molecules present. Defining importance as molefraction times cross section, the least well known of the important cross-sections is that for KOH(g). A crude guess was given by Spencer and Phelps in a compilation published in the proceedings of the 15th U. S. MHD Symposium. Improvements are needed for other species mentioned there.
37

THEORETICAL ANALYSIS OF THE ETTJ^ZrT^j~Cil~iJzr^^^r^^^s^^.,SATION ON PLASMA CONDUCTIVITY IN OPEN CYCLE,
COAL FIRED MHD GENERATORS
by
M. Martinez-Sanchez, C E . K o l b a n d J . L . Kerrebrock
Aerodyne Research, Inc. Bedford, MA 01730
INTRODUCTION
The economic viability of coal fired MHD generators depends on thei r being able to maintain conductivity levels of the order of 1-2 mho/m down to backend temperatures of perhaps 2 0 0 0 O K . Careful attention must therefore be paid to effects which may adversely affect their conductivity. In this paper we report some resul ts pertaining to one such effect in coal combustion p lasmas . This effect involves the presence of small part icles of slag, originating from the coal ash, and thei r potentially important impact on the electron density.
Some ear l ie r work [l ,2] concentrated on the possibility of enhancing conductivity by adding a low work function aerosol . This approach was abandoned when the ra te of agglomeration proved to be too h i ^ . We focus attention instead on the naturally occurring slag vapor, which may, under certain conditions, originate a very finely dispersed aerosol by either homogeneous or ion induced nucleation in the MHD channel.
Slag Vaporization and Condensation
Equilibrium calculations using JANAF thermochemical data indicate complete vaporization of si l ica, iron oxide and magnesia, and par t ia l (~10%) vaporization of alumina, in the adiabatic combustion of a typical eastern coal with preheated air (1900OK, equivalence ratio 0.98) [3],What fraction of this equilibrium is actually reached in an MHD burner is difficult to predict in general , since effects like turbulent shaking of the parent coal par t ic les , locally non-stoichiometric a tmosphere , e tc , are not well e n o u ^ understood (at these high tempera tures in par t icu la r ) .
In order to assess the degree of slag vaporization, and to determine the probable range of conditions for slag vapor in the MHD channel, we have performed a simplified evaporation-condensation analysis . Plug flow at M = 0.15 is assumed in this combustor, and drops of sil ica, initially 10 jum in diameter and comprising about 1% of the total mass are allowed to evaporate to SiO with a vapor p r e s s u r e corresponding to a reducing atmosphere (PO2 - 10"^ atm). The rate of evaporation (and la ter , that of condensation) is limited by finite heat and m a s s diffusivities [ s ] . In order to account for the effect of scale , two sizes are considered, one r ep resen ta tive of a large, base load MHD generator, the other of a small experimental one. The mass flow rates were chosen as 400 and 3 kg/sec and the burner p r e s s u r e s 10 and 6 atm, respectively. The axial dimensions are shown in F igs . 1 and 2.
The flow in the nozzle was taken to isentropic, and the MHD section was modeled as a constant velocity, supersonic channel, with an entrance Mach no, of 1.5, and magnetic fields of 4 and 3 Tes la , respectively. As shown in Fig, 1 (large channel), the drops vaporize at a nearly constant t empera ture , some 260OK below that of the gas; by the end of the 3m burner , there is about 30% mass loss from each
38

Axial Generator DIslance, Xtm)
Figure 1. Temperature and Supersat-uration Ratio Plots For a Full Scale Generator
0,4 0.8 1.2 1.6 2.0 2.4 2.8 3.2 Axial Generation Distance, X(m)
Figure 2. Temperature and Supersat-uration Ratio Plots For An Experimental Scale Generator
particle, corresponding to a silica super-saturation ratio of only 0.0066. As the gas expands and cools in the nozzle, the particles lag behind in temperature, and keep a slow vaporization rate down to about mid-channel (even after the bulk vapor is supersaturated); from there on, condensation on the drops occurs, but its magnitude is insignificant due to the diffusion barrier and the very small bulk vapor concentration. Thus, heterogeneous condensation on the "d i r t " coming from the burner is unable to check the rise of supersaturation, which crosses unity near the channel entrance, and reaches values of 3 to 6 at mid-channel. If nucleation is not considered, the supersaturation reaches enormous levels (near 103 by the time, T = 20000K) , and this makes it almost inescapable that some kind of nucleation must indeed occur in the channel. These results are rather insensitive to the actual amount of slag vaporization in the burner, due to the exponential increase of the supersaturation (a 20% reduction of this vaporization only delays, by some 15 cm, the point of likely nucleation). However, the effect of particle size must be noted: for a r . m . s . radius less than 3 jira, condensation on the drops would be a significant factor.
In Fig. 2 (small generator), the main difference is that, because of the small channel length compared to the MHD interaction length, the core temperature never drops enough to produce vapor supersaturation. This may explain in part the lack of evidence for any significant effects of condensation on conductivity in experiments performed to date.
The actual path likely to be taken by the nucleation process is not understood as yet, but its occurrence seems necessary as soon as the supersaturation ratio, S, exceeds values like 4 to 8. The strongest possibilities are clustering on gaseous ions (for which there is ample evidence in atmospheric physics) and classical homogeneous nucleation. Straightforward application of the established nucleation theory indeed leads to the prediction that a nucleation front should appear at S =i 2-3 if the liquid surface tension is taken to be 320 djm/cm. However, a number of uncertainties remain involving the kinetics of the induction period, different stoichiometry of vapor and liquid, and true surface tension values.
39
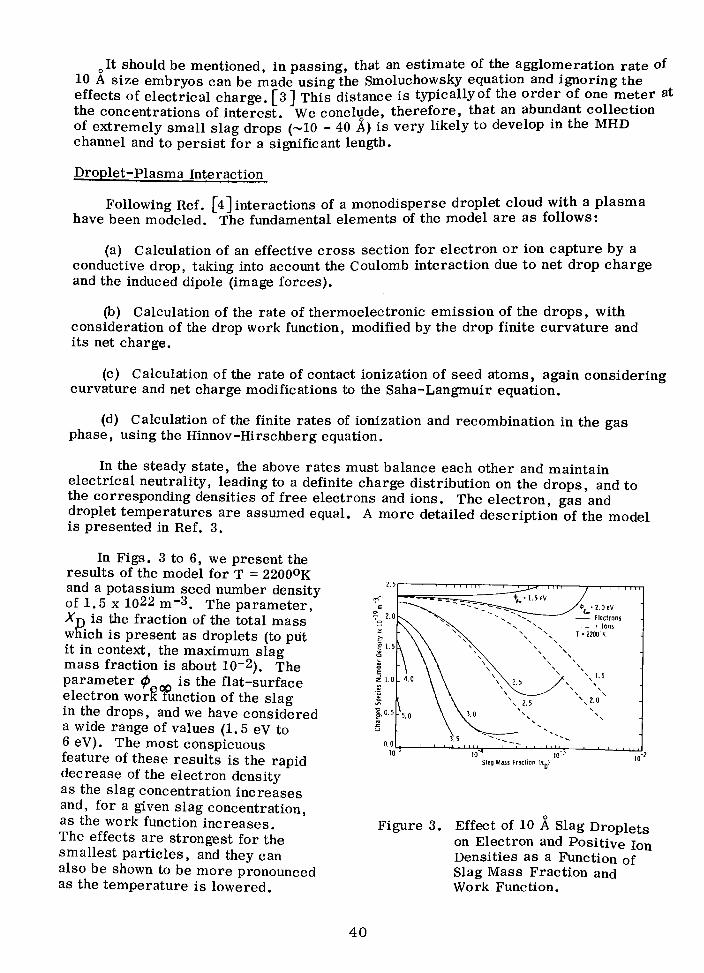
^It should be mentioned, in passing, that an estimate of the agglomeration rate of 10 A size embryos can be made using the Smoluchowsky equation and ignoring the effects of electrical charge, [ s ] This distance is typically of the order of one meter at the concentrations of interest . We conclude, therefore, that an abundant collection of extremely small slag drops (~10 - 40 A) is very likely to develop in the MHD channel and to pers is t for a significant length.
Droplet-Plasma Interaction
Following Ref. [4] interactions of a monodisperse droplet cloud with a plasma have been modeled. The fundamental elements of the model are as follows:
(a) Calculation of an effective cross section for electron or ion capture by a conductive drop, taking into account the Coulomb interaction due to net drop charge and the induced dipole (image forces).
(b) Calculation of the rate of thermoelectronic emission of the drops , with consideration of the drop work function, modified by the drop finite curvature and its net charge,
(c) Calculation of the rate of contact ionization of seed atoms, again considering curvature and net charge modifications to the Saha-Langmuir equation.
(d) Calculation of the finite rates of ionization and recombination in the gas phase, using the Hinnov-Hirschberg equation.
In the steady state, the above rates must balance each other and maintain electrical neutrality, leading to a definite charge distribution on the drops , and to the corresponding densities of free electrons and ions. The electron, gas and droplet temperatures are assumed equal. A more detailed description of the model is presented in Ref, 3.
In Figs. 3 to 6, we present the results of the model for T = 2200OK and a potassium seed number density of 1.5 X 10²² m~3. The parameter , Xjj is the fraction of the total mass which is present as droplets (to put it in context, the maximum slag mass fraction is about 10-2). The parameter <p is the flat-surface electron work function of the slag in the drops, and we have considered a wide range of values (1.5 eV to 6 eV). The most conspicuous feature of these results is the rapid decrease of the electron density as the slag concentration increases and, for a given slag concentration, as the work function increases . The effects are strongest for the smallest part icles , and they can also be shown to be more pronounced as the temperature is lowered.
10 " 10 • Slag Mass Fraction (.Xj.)
Figure 3 . Effect of 10 A Slag Droplets on Electron and Positive Ion Densities as a Ftinction of Slag Mass Fraction and Work Function.
40

10 " 10 • Slag Mass fraction (X-l
Figure 4. Effect of 20 A Slag Droplets on Electron Density as a Function of Slag Mass Fraction and Work Function
There is considerable uncertainty as to the value of 0eoo appropriate to s lags; the International Cri t ical Tables quote 4 ,5 eV for Si02 and higher values seem appropriate for AI2O3. The resul ts of Ref,[5]must be reinterpreted to indicate <peoo ^ 3-5 eV and d^eoo/dT ^ 0.0008 eV/OK for a coal slag with absorbed seed, in view of the unrea l i s t i cally low preexponentials assigned. If we use 3.5 eV as a tentative value, then, from the figures, it is c lear that for 40 A slag droplet m a s s concentrations more than about 10-4 (nmnber density about 1.5 x I0I6 m-3) the electron density will be substantially decreased. Extinction is reached at about three t imes that concentration. Stronger effects would occur initially, as the size of the nucleating droplets is likely to be c loser to 10 A. If agglomeration sets in, the effect will be to increase the drop radius at constant XT\, and is shown in Fig. 6 for <f>eao ~ ^ ^^'^ ^ ®^'' while mild effects occur at 0eoo = 2 eV, very substantial agglomeration would be needed to eliminate the effect of the par t ic les if 0eoo ~ ' ^V.
CONCLUSIONS
Our p r imary conclusions a r e :
(a) For " p r i m a r y " drops l a rge r than ~ 3 jum, insufficient condensation area is available to prevent the buildup of slag vapor supersaturation in large coal-fired MHD ducts .
Figure 5. Effect of 40 A Slag Droplets on Electron Density as a Function of Slag Mass Fraction and Work Function
(b) The reduction of the plasma conductivity due to the very small droplets likely to resul t from nucleation of this vapor can be very s trong, in par t icular if the slag has a work function above ~ 2.5 eV,
Fur ther work is necessary to clarify several of the questions ra i sed . Key uncertainties involve detailed nucleation mechanisms and r a t e s , the determination of work functions and surface tensions of s lags , and the experimental verification of the predicted effects. Work is proceeding along these l ines .
4 1

2.5
E : 2.0
£•
i 1.5
e i i . o o
^ s, 0.5
0.0
1 1 1 1 T 1 ' ' '
: 's,-"'"' " —rr\r^ "
Xp • 10"^ , - ' ' ' ' -
^ , ' • • 2eV
/ •t'MeV
N'' ' . • < ^ /
-t. / X -4 ^ '
" D " ' " _ _ _ - " . ; ' 3 « I O ^ -• • • • ' ' • '
10 20 o 30 Drop Radius (A)
Figure 6. Effect of Slag Drop Size on Electron Concentration for Fixed Drop Work Functions and Slag Mass Fractions
REFERENCES
1. Sodha, M.S. and Bender, E . , P roc . V. Intl. Symp. on MHD Elec . Power Gen. , VII, p 289, ENEA, Par i s 1964,
2. Waldie, B . and Fel ls , I . , "Electr ic i ty from MHD," Vienna, 1968, p 1161,
3 . Kolb, C . E . , Yousefian, V . , Wormhoudt, J . , Martinez-Sanchez, M . , and Kerrebrock, J . L , , "Characterization of Open Cycle MHD Generators -Quarterly Technical Report No. 2 , " Report No. ARI-RP-31 , Aerodyne Research, I nc , , January 1977.
4. Solbes, A. and Kerrebrock, J . L . , Phys . Fluids. !£ , 2179, 1967.
5. Peterson, C K . , Ure, R .W, , and Cutler, I . B . , Paper I I . 5 , 15th Symp. on Eng. Aspects of MHD, Philadelphia, 1967.
42

MASS SPECTROMETRIC INVESTIGATIONS OF THE ION CHEMISTRY OF CERTAIN COAL IMPURITIES
William J, Miller
AeroChem Research Laboratories, Inc, Princeton, New Jersey
INTRODUCTION
The use of coal as a fuel for MHD power generating devices presents a number of problems not associated with other fossil fuels. Among the more serious are those arising as a direct result of the presence of relatively high concentrations of a wide variety of impurities. These contaminants produce undesirable slags in the combustor, interact with alkali metal seed throughout the system and interfere with seed recovery schemes. They may also alter the charged species chemistry of the channel gases by forming negative ions that are stable at high temperatures, thus lowering the free electron concentration and altering channel conductivity. In principle, most of the effects of any of these impurities could be quite accurately predicted via calculations based on thermochemical equilibrium, provided the input thermodynamic data on critical species is available. Much of it is not. This paper is concerned only with the gas-phase species known or suspected to be present in coal combustion product streams and focuses on the interactions of these combustion products with charged species.
Attempts to predict the plasma properties of coal-fired MHD duct gases thermodynamically have made it all too apparent that there are serious deficiencies in our currently available body of knowledge on electron affinities, heats of formation and other thermochemical quantities for a large number of frequently encountered coal impurities [1,2]. Commonly employed thermochemical data compilations, of which the most notable and widely used is the JANAF Tables [3] do not contain listings for many species of likely importance and include several of questionable accuracy. We attempt here to summarize and provide references to the results of a series of thermodynamic studies of negative ions and potassium compounds in well-characterized laboratory flames, the temperatures and chemistry of which are directly relevant to MHD channel gases. The flames, experimental diagnostic methods and data interpretation procedures employed are described briefly; the results obtained are presented in the form of tables of electron affinities and equilibrium constants applicable at temperatures above 1700 K.
EXPERIMENTAL METHODS
The laboratory test flames employed as the media for most of these investigations comprise an extensive series of H2/O2/N2 flames which has been exhaustively studied and applied as a tool for thermochemical and kinetic research for more than 20 years (see e.g., Refs. 4-6) and a set of well-characterized CO/O2/N2 flames [7]. They are premixed, Meker-type, laminar flames supported on annular circular burners to given an inner test flame, to which the materials of interest are added, surrounded by an outer shroud flame of the same composition and temperature to prevent complications due to the entrainment of external gases or the presence of steep temperature and
43

concentration gradients at the edges O ^ ^ ^ M ^ ^ ^ ^ ^ ^ ^ so members of both series collectively afford the experimenter an overall temperature range of about 1500-2600 K at intervals of less than 100 K, and independent variations in [H] and [H2] greater than a factor of 100. The changes xn radical concentrations with flow time in these flames also have been quxte accurately determined; thus, the detailed local composition ^^ points in any flame corresponding to reaction times up to about 5 msec are well established. Additives are introduced either by direct injection as gases or vaporized liquids or from an aspirator in the form of an aerosol of aqueous solution. I°nifed species are produced by aspiration of solutions of alkalic metal salts. When the additives reach the high temperature combustion flame front, they react quickly with the abundant free radicals to produce, in general, simple combustion products (including ions and electrons) which then interact further at slower rates in the post-flame column of hot gases.
The diagnostic techniques for the determination of individual species concentrations have all been described in detail elsewhere; they include atomic absorption spectroscopy for alkali metal atoms, microwave cavity resonance for electrons [5], electrostatic probes for total positive ion concentrations [8], and a flame ion mass spectrometer [9] (shown schematically in Fig. 1) for determinations of relative negative ion concentrations.
The flame ion mass spectrometer shown is one member of a large family of such Instruments which have now become the prime diagnostic tool in studies of ionic and neutral species in combustion systems. These instruments, whether applied to studies of neutrals or ions, share the advantages inherent to mass spectrometry and the problems associated with obtaining representative, chemically frozen, gas samples. In principle the experimental objectives are the same: one must withdraw a gas sample from the system and then, somehow, terminate chemical reactions and separate the species of interest from the remainder of the sample. The first of these goals is accomplished by expanding the gas through a nozzle or orifice into a vacuum. The reduction in pressure accompanying the expansion effectively freezes all but the most rapid chemistry by decreasing the molecular collision frequency. In molecular beam work, the central portion of the expanding gas jet (comprising molecules which have not undergone collisions with the walls) is then separated from the remainder of the gas by a "skimmer" which allows the molecules near the axis to flow into a second chamber containing the mass spectrometer and its ion source. In the sampling of ions, the function of the skimmer is performed by electrostatic lenses shown schematically in Fig. 1.
The sampling orifice in typical instruments is usually placed at the tip of a cone. If condensable materials are present in the flame, the cone is constructed of a material (e.g., quartz or stainless steel) which will not conduct heat away rapidly thus allowing the tip to become hot and prevent condensation. The cone angle represents a compromise between being as large as possible on the inside to facilitate pumping and as small as possible on the outside to minimize disturbance to the flow of flame gases. In practice, overall cone angles of about 90° are typical. The extent to which the flame chemistry is frozen is the major concern in sampling. An analysis of this problem by Hayhurst and Telford [10] using a simple gas dynamic model of the sampling process, indicates the critical available time during which unwanted chemical reactions (i.e., those which occur under conditions not representative of the combustion system, e.g. at lower temperature) can occur is of the
44

order 10"^ sec. In the instance of an ion-molecule reaction between an ion at a concentration of 10*° cm~^ and a neutral free radical at 10*^ cm~^ (both of which are typical of flames at 1 atm), significant alteration of the ion concentration during sampling will occur only if the rate constant for the reaction is larger than about 10"^ cm molec"* sec"*. This large a value is not commonly encountered even among ion-molecule reactions.
Once ions have been sampled and focused into a mass spectrometer, the nature of the apparatus is unimportant except that its throughput efficiency will determine the signal strength at the ion detector. Quadrupole mass filters are the most commonly employed because of their high transmission efficiency and readily controllable resolution (one is always obtained at the expense of the other). Both positive and negative ions are routinely studied in these mass spectrometers and, by matching the initial orifice size to the combustion system pressure, flames at a few Torr to 1 atm pressure can be sampled.
DATA INTERPRETATION PROCEDURES
After determining the various charged species and metal atom concentrations in a number of flames at varying concentrations as functions of flow times, the results are combined with the known local concentration values of normal flame species such as H, 0, OH, H2, O2, and H2O to derive equilibrium constants for reactions of probable importance. Guidance in the selection of these reactions is obtained from known thermodynamic data or from deductions based on the behavior of the observed species as functions of [H], [H2], etc. The equilibrium constants so computed may then be plotted versus flow time in a specific flame to ascertain at which point a constant value is reached, i.e., to assure that the formation of the species being observed is not kinetically limited within the available flow time.
The fundamental thermochemical properties sought in these experiments are high temperature equilibrium constants from which the standard state free energies and enthalpies of formation for the negative ions and potassium-containing compounds are extracted. These fundamental parameters are deduced from the data in two ways: First, the equilibrium constants (K^) for a given process are computed from the instrumental results and bulk gas composition data, as indicated above, in a number of different flames spanning as wide a range of temperature as practicable. These values of K-j are then plotted vs. T~* and the slope of the best resultant straight line used to compute a value of AH (reaction) within that range of T. The AHS for the reaction under consideration is then derived by estimating, via statistical mechanics, the change in heat capacity associated with the process. This procedure comprises the so-called "second law" method [6],
The alternative "third law" calculation of AH? involves selecting the single best measured K, and extracting the basic heat change by computing the ratios of the electronic, translational, vibrational and rotational partition functions as indicated by the mass action expression. The "best" experimental K-j value to use in this exercise is the one in which the experimenter has greater confidence, whether due to a lack of scatter exhibited by the data or perhaps by the constancy and precision of the K-j values over a wider range of reaction (flow) time.
45
After obtaining second- and third . good agreement) for the enthalpy and free energy changes of the reaction, the desired individual species parameters can be calculated from the known thermochemical values of the other participants in the reaction. Obviously, one is dependent, in this final step, upon the availability of appropriate data; in the case of electron affinity calculations, i.e., for reactions of the type
+ A (1)
the thermodynamic information on the neutral species. A, is unfortunately of ten unknown or of questionable accuracy. It should be noted, though even m this case, that at least the high temperature equilibrium constants for negative ion formation in terms of common bulk gas species (e.g. H, OH, Hz, etc.; are still available for assessing the importance of particular reactions m other combustion situations.
RESULTS
The text and tables which follow summarize our current status of understanding with respect to the identities of potentially important neutral species and negative ions produced by the combustion of a number of coal impurities. The electron affinities of some of the more electrophilic ions are given in Table I. Equilibrium constants for their formation and for a few K-compound producing reactions are given in Table II, It will be noted immediately that a number of the electron affinity values are very high. Thus the potential for extensive electron scavenging exists for many contaminants. We hasten to add however, that a high electron affinity in itself is insufficient to present a problem; in general, the ion chemistry of MHD channel gases will be not far from equilibrium and the concentrations of the neutral precursors to negative ions may be very small. To obtain an approximation of the prospective importance of a negative ion one should first examine the equilibrium constants controlling the overall species distributions for the contaminant in question and then superimpose the ion-neutral equilibrium constants of Table II.
In addition to the data of Tables I and II, partial information of an inconclusive nature is available on vanadium and aluminum combustion products. Mass spectrometric studies [11] of flames containing V reveal the presence of HVOa" and H2V0z,~ presumably related through the reactions
e + H2VO3 ^ HVO3" + H (2)
and HVO3" + H2O ^ HjVOi." + H (3)
The apparent equilibrium constant for attachment is given by K = 1.5 x 10^ exp(-14700/T) but the second- and third-law analyses reduce to widely divergent results for ionic thermochemical parameters. Additional work on this system is planned for the near future and it will include a re-examination of vanadium neutral species chemistry. A more extensive investigation of the flame chemistry of aluminum is also in order. The information currently available [3,12,13] leaves doubt even as to the identity of the predominant gaseous compounds above liquid AI2O3. Painstaking efforts to observe negative ions in Al-containing flames have proven fruitless [2] despite the fact that
46
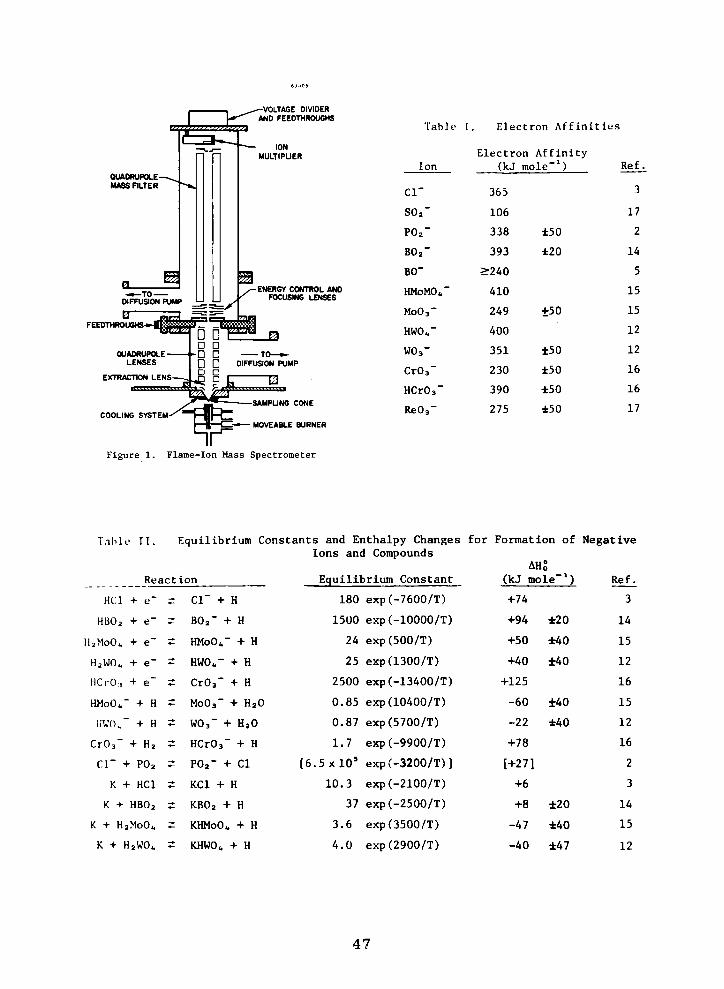
- • — T O DIFFUSION PUMP
FEEDTHROUGHS
-VOLTAGE DIVIDER AND FEEDTHROUGHS
ION MULTIPUER
-ENERGY CONTROL AND FOCUSING LENSES
QUADRUPOLE LENSES
EXTRACTION LENS
COOLING SYSTEM
DIFFUSION PUMP
SAMPUNG CONE
MOVEABLE BURNER
Figure 1. Flame-Ion Mass Spectrometer
Tablo I. Electron Affinities
Ion
Cl"
SOj"
PO2"
BO2"
BO"
HM0MO4"
MoOa"
HWO^-
WO3-
Cr03"
HCrOa"
ReOa"
Electron Affinity (kJ mole"')
365
106
338
393
>2A0
AlO
2A9
AOO
351
230
390
275
±50
±20
+50
±50
±50
±50
±50
Ref.
3
17
2
lA
5
15
15
12
12
16
16
17
Table II. Equilibrium Constants and Enthalpy Changes for Formation of Negative Ions and Compounds
Reaction
HCl + e"
HBO2 + e"
HjMoO;. + e"
HjWO^ + e"
HCrOj + e"
HMoO^" + H
iiVO," + H
CrO," + H2
Cl" + PO2
K + HCl
K + HBO2
K + HjMoOi
K + HjWO..
Cl" + H
BO2" + H
HMoOfc" + H
HWO4- + H
CrOa" + H
M0O3" + HjO
WOa" + HjO
HCrOa" + H
POj" + Cl
KCl + H
KBO2 + H
KHMoOt + H
KHWOfc + H
Equilibrium Constant
180 exp(-7600/T)
1500 exp(-10000/T)
2A exp(500/T)
25 exp(1300/T)
2500 exp(-13AO0/T)
0.85 exp(10A00/T)
0.87 exp(5700/T)
1.7 exp(-9900/T)
[6.5x10' exp(-3200/T)]
10.3 exp(-2100/T)
37 exp(-2500/T)
3.6 exp(3500/T)
A.O exp(2900/T)
AHS (kJ mole"')
+7A
+9A
+50
+A0
+125
-60
-22
+78
[+27]
+6
+8
-A 7
-AO
±20
±A0
±A0
±A0
±A0
±20
±A0
±A7
Ref.
3
lA
15
12
16
15
12
16
2
3
lA
15
12
47

AIO2" is supposedly a very stable ion i-j — ^..J^^^^^^^^« be present in adequate quantities. It presently appears that Al compounds can be neglected as potential negative ion sources but that the neutral species thermochemistry is badly in need of better definition.
ACKNOWLEDGMENT
This paper was prepared with the support of National Science Foundation
Grant No. ENG76-15609.
REFERENCES
1. Spencer, F.E,, Jr., et al, "Equilibrium Electron Density of Coal- Combustion Mixtures-Computer Study and Comparison with Experiment," 13th Symposium on Engineering Aspects of MHD, March 1973.
2. Miller, W.J., "Thermodynamic Properties of Some Negative Ions and Gaseous K-Compounds from the Combustion of Coal Impurities," 15th Symposium on Engineering Aspects of MHD, May 1976,
3. JANAF Thermochemical Tables, Dow Chemical Co,, Midland, MI.
4. Bulewicz, E.M., James, CG, , and Sugden, T,M. , Proc. Roy, Soc. A 235, 89 (1956),
5. Jensen, D. E. and Padley, P. J., Trans. Faraday Soc. , 2132 (1966).
6. Sugden, T.M., Trans. Faraday Soc. , 1465 (1956).
7. Hollander T., "Self-Absorption, Ionization and Dissociation of Metal Vapour in Flames," Thesis, Utrecht, 1964,
8. Calcote, H.F., Ninth Symposium (International) on Combustion (Academic Press, New York, 1963), p. 622.
9. Jensen, D.E, and Miller, W.J. , J. Chem. Phys. 53 , 3287 (1970).
10. Hayhurst, A.N, and Telford, N.R., Proc. Roy. Soc. A322, 483 (1971).
11. Miller, W.J., "Mass Spectrometric Study of Combustion Plasma," Final Report, AeroChem TP-300, NTIS AD 767 719, September 1973
12. Jensen, D.E. and Jones, G.A. , J. Chem. Phys. 60 , 3421 (1974).
13. Farber, M. et al, Faraday Symp. , Chem. Soc. 8, 121 (1974).
14. Jensen, D.E., Trans. Faraday Soc. i65, 2123 (1969).
15. Jensen, D.E. and Miller, W.J., Thirteenth Symposium (International) on Combustion (The Combustion Institute, Pittsburgh, 1971), p. 363.
16. Miller, W.J., J. Chem. Phys. , 2354 (1971).
17. Celotta, R.J., et al, J. Chem. Phys. 60, 1740 (1974).
48

THERMODYNAMIC PROPERTIES OF GAS PHASE MOLECULAR IONS
R.L.C. Wu, C. Lifshitz and T. 0. Tiernan Department of Chemistry, Wright State University
Dayton, Ohio 45431
INTRODUCTION
Thermochemical properties of gas phase molecular negative ions have been determined from translational energy thresholds for endoergic reactions in which these ions are involved. Excitation functions for these reactions were obtained using a tandem mass spectrometer. Three types of reactions have been studied — charge transfer, particle transfer and collision-induced dissociation. Previously reported experiments conducted in our laboratory [1-8] have shown that reliable values of molecular electron affinities, bond dissociation energies and ionic heats of formation may be obtained from such measurements. New data relating to C0~~ and 0^" will be presented in the present paper, and results obtained for several other ions of interest will be reviewed.
EXPERIMENTAL
An in-line tandem mass spectrometer previously described [1-8] was utilized in this study. The projectile ion is formed in the electron-impact ion source of the first stage mass spectrometer which produces a mass and energy analyzed beam which is impacted upon the target gas in the collision chamber. The energy spread of the projectile ion beam entering the collision cell is about +0.3 eV (LAB) over the ion energy range, 0.3 to about 180 eV (LAB). Pulse counting techniques are used to measure the product ion current.
Projectile ions are produced by dissociative electron attachment using appropriate source molecules or by ion molecule reactions occurring in the primary ion source. For example, Br~ is produced by the direct electron impact process, e +CHoBr —>CH3+Br~ while O^" is produced in a mixture of N„0 and 0„ by the sequence of reactions, e+N2O —>0~+N„, and 0 +0 —>0+0~~. Ozone was produced in these studies by a Tesla coil discharge through O2, the excess O2 being removed at -196°C [9]. Grease free, mercury free vacuum lines were employed and the fresh Oo was directly introduced either into the ion source or into the collision chamber, as required.
Data Treatment and Corrections for Ion Energy Distribution and Doppler Motion
The product ion Intensity I (E. ) is converted to an observed apparent ^ • m s 10
cross section [7J
a°^^ (E. ) = C[I (E. )/P,]/I (E. ) (1) app 10 s xo t p 10 tOn sabbatical leave from The Hebrew University of Jerusalem, 1976-77.
49

where I (E. ) is the primary ion intensity, E^^ is the nominal reactant Ion
energy in the laboratory frame, P . is the target gas pressure, and C Is a
conversion factor based on the intensity for the reaction 0~/N02, for which
the cross section is known.
Corrections for the ion energy distribution and Doppler motion of the neutral were applied as previously described [2,8]. A computer fitted excitation function based on these corrections, calculated using an assumed threshold function was compared in each case with the experimental data. The threshold behavior of the total cross section a for collision-induced dissociation reactions is known from theoretical considerations [10], The threshold functions for charge transfer and particle transfer have not been predicted theoretically. A model assuming a linear-plus-step function gave the best fit to most of the charge transfer data described here.
RESULTS AND DISCUSSION
Charge Transfer
Excitation functions were obtained for the charge transfer reactions of the projectile ions 0", OH", S~, SH~, F~, Cl~, Br~, I~, NH~, C2H~, N02' and 003" with O3. The experimental data points, as well as the computer fitted curve for the excitation function of the Br~/03 reaction are shown in Fig. 1.
z 3
<
1.0
0.8
^ 0.6 CC
< £ 0.4-o bJ OT sn tn O IT
o
0.2
— COMPUTER FIT O EXPERIMENT
Br + Oj—Br + or
2 4 6 8
LABORATORY ENERGY.eV
Figure 1. Cross Section for the Reaction Br~+03 ^ 03"+Br as a Function of Translational Energy. Points are experimental data. Solid line is the calculated "best-fit" excitation function.
50

The translational energy threshold of the linear-plus-step function threshold law employed for the computer fit (2,8 eV in the laboratory system), corresponds to an electron affinity of EA(03) =2.3 eV. Other projectile ions gave similar results leading to an average value for the electron affinity of ozone of 2,28 +0,1 eV.
Particle Transfer
Considerable caution must be exercised when employing translational energy thresholds for particle transfer reactions in order to calculate their endoergicities. Many exoergic and thermoneutral reactions involving negative ions were observed to demonstrate translational energy thresholds due to the presence of energy barriers in their respective potential surfaces. Notable examples are the reactions, 0~(H2,H)0H~, NH ~(H-,NH„)H and D (H ,HD)H~. The great advantage of beam experiments such as those
reported here is the ability to determine excitation functions for both the forward and reverse steps of a particular particle transfer reaction. The non-existence of a translational energy threshold in the exoergic direction ensures that the translational energy threshold in the endoergic direction is equal to the endoergicity. This principle has been applied in studying the ozone system for which the following particle transfer reactions were investigated: CO,
NO^ (02,NO)02 NO^ (o^,m^)o^' (02,002)03 . O2 (02,0)0^ ,
The experimental data points and the
corresponding computer fitted curve for the CO ~/02 reaction are shown in Fig. 2. The translational energy threshold yields a bond dissociation energy of D(02-0") = 1.6 +0.1.
w '0 I-
>-01 < cc t m <
o UJ CO y) CO o Q: o
6 -
4 -
CO3 + O2 — O3 + CO2
— COMPUTER FIT O EXPERIMENT
Qu o—o o m 2 3 4 5
LABORATORY ENERGY,eV
Figure 2. Cross Section for the Reaction CO3 +O2 —> O3" + CO2 as a Function of Translational Energy. Points are experimental data, solid line is the calculated "best-fit" excitation function.
51

Table I
BOND DISSOCIATION ENERGIES, HEATS OF FORMATION AND MOLECULAR ELECTRON AFFINITIES DERIVED FROM TRANSLATIONAL ENERGY THRESHOLDS FOR ENDOERGIC NEGATIVE ION REACTIONS
0~ - XO Bond Heat of Formation Electron Affinity of m-1
Dissociation Energy (eV) XO (eV) XO^ Ion
N0~
O 2 '
NO2'
N2O"
CO^'
S' 0H~(
m
CH^O)
5.0+0.1 (CID)* 0.91+0.1 (CID) 0.02+0.1 (CID); 0.015+0.1 (CT)
4.1+0.1 (CID) -0.44+0.1 (CID) 0.44+0.1 (CID); 0.45+0.1 (CT)
4.0 +0.1 (CID) -2.0 +0.1 (CID) 2.4 +0.1 (CID); 2.28 +0.1 (CT)
0.43 +0.1 (CID) 0.62 +0.1 (CID) 0.22 +0.1 (CID)
S C0„" 2.0 +0.1 (CID) -4.98 +0.1 (CID) 3.1 +0.2 (CID)
1 8+0.1 (PT) -0.80+0,l(CT) 2.22+0.1 (PT); 2.28+0.1 (CT) ~ ' -0.74+0.1(PT)
1.0+0.1 (CID) D(OH" -H2O)
*CID - collision-Induced dissociation; CT - charge transfer; PT - particle transfer

Collision-Induced Dissociation
Collisional dissociation thresholds have been measured to obtain the bond dissociation energies and heats of formation of molecular negative ions of 0»~, NO", NO^", N^0~, CO ~, 0 ~ and NO . Rare gas atoms, diatomic and triatomic molecules served as collision reaction partners in these experiments energy.
The corrected threshold data for CO yield a dissociation D(C02-0") = 2.0 +0.1.
Data obtained for various negative ion species using the techniques described are summarized in Table I. These results will be compared with similar data obtained in other ion-beam, flowing afterglow, flow-drift, photodestruction and collisional ionization studies [11-16].
ACKNOWLEDGEMENTS
This work was supported by the Air Force Office of Scientific Research under Contract No. F44620-76-C-0007 with Wright State University. The authors are grateful for the invaluable assistance of C. D. Miller with the tandem mass spectrometer, and for the assistance of Dr. T. Terwilliger in programming the computer fit calculations.
REFERENCES
1. C, Lifshitz, B. M, Hughes and T, 0. Tiernan, Chem, Phys. Lett. !_* 469 (1970).
2. T. 0. Tiernan, B. M. Hughes and C. Lifshitz, J. Chem. Phys. , 5692 (1971).
3. B. M. Hughes, C. Lifshitz and T. 0. Tiernan, J. Chem. Phys. _59, 3162 (1973).
4. C. Lifshitz, T. 0. Tiernan and B. M. Hughes, J. Chem. Phys. _59, 3182 (1973).
5. T. 0. Tiernan and R. P. Clow, Adv. Mass Spectrom. , 295 (1974). 6. T. 0. Tiernan, in 'Interactions Between Ions and Molecules,' edited by
P. Ausloos (Plenum, New York, 1974), pp. 601-604. 7. D. G. Hopper, A. C. Wahl, R. L. C. Wu and T, 0. Tiernan, J, Chem. Phys.
65, 5474 (1976). 8. T. 0. Tiernan and R.L.C. Wu, Adv. Mass Spectrom. , in press. 9. S. Braslavsky and J, Heicklen, Int, J, Chem, Kin, 8, 801 (1976).
10. C. Rebick and R. D. Levine, J. Chem. Phys. , 3942 (1973). 11. J. Berkowitz, W. A. Chupka and D. Gutman, J. Chem. Phys. bb^, 2733 (1971) 12. J. A. Rutherford, B. R, Turner and D. A. Vroom, J. Chem. Phys. 5i8,
5267 (1973). 13. D. Vogt, J. Mischke and W. Dreves, Physics Lett. 59A, 113 (1976). 14. I. Dotan and F. C. Fehsenfeld, to be published. 15. J. P. Moseley, P. C. Cosby, R. A. Bennett and J. R. Peterson, J. Chem.
Phys. 65., 2512 (1976). 16. E. W. Rothe, S. Y. Tang and G. P. Reck, J. Chem, Phys. 62 , 3829 (1975).
53

THERMOCHEMICAL E F F E C T ^ - . _ ^ ^ ON OF ELECTRICAL CONDUCTIVITY IN COAL-FIRED MHD PLASMAS
C-L . Lu, N. L. Helgeson, M. F a r b e r , and J . C. Cutting STD Research Corporat ion
Arcadia , CA 91006 INTRODUCTION
Realist ic modeling and design of MHD power gene ra to r s is dependent upon an accurate determination of the e lec t r i ca l conductivity of the flowing plasma. As is known, the power density of the genera tor is directly proportional to the conductivity, and the flow v a r i a b l e s , t empera tu re , p ressu re and velocity, a r e indirect ly affected through Lorentz forces and Joule dissipation. Since accura te exper imenta l techniques to measure e lec t r ica l conductivity in h igh- t empera tu re seeded, slag laden, combustion gases have yet to be developed, it is impor tant that careful thermochemical calculations be made in order to minimize experimental problems related to poor es t imates of conductivity.
The e lect r ica l conductivity, o", of a high t empera tu re p lasma has been discussed in detail by Demetriades [ l ] . The sca la r conductivity sr of a weakly ionized plasma i s , to a f irs t approximation, d i rect ly p r o portional to the electron number density n in the p lasma
2 ^ n e e 0" m v^ e t
where nig and e a re the electron mass and charge , respec t ive ly , and v is the total effective collision frequency which is a function of gas composition and electron-heavy part icle collision c ro s s sec t ions . Although kinetic and nonequilibrium effects a re important in some regions of the MHD generator duct, equilibrium calculations of e lectron number density a re required as a f irs t step in the MHD calculat ions . The re fo re , it is important that one be able to calculate the equil ibrium e lec t ron concentration of the high tempera ture plasma with a reasonable degree of accuracy. In this paper we will r e s t r i c t ourse lves to the d iscuss ion of equilibrium calculat ions.
In an open-cycle, coal-f ired MHD sys tem the combustion products a re a very complex mixture consisting of hundreds of chemical spec i e s . These include gas molecules , r ad ica l s , ions and condensed slag cons t i tuents . Thermochemical data for these individual species a r e needed to calculate the equilibrium composit ions, including the e lec t ron concentra t ion, of the mix ture . As the electron concentration in the p lasma under typical channel conditions is only of the order of 10"^ mole fraction or s m a l l e r , ions with comparable concentrations can have a grea t influence on the electron concentration. In comparison, the total effective coll is ion frequency is relatively insensitive to these minor spec i e s . Only a few major components make significant contributions to the effective coll ision frequency [ z ] . Among them a re Nz , Hz O, COz , CO, Oz , OH and SO2, for which accurate thermochemical data a re avai lable , and the seed m a t e r i a l . T h e r e fore, thermochemical data affect the conductivity p r imar i ly through thei r influence on the equilibrium elect ron concent ra t ions .
54

Coal dist inguishes itself from natura l gas and fuel oils in that it contains substant ial quantities of m i n e r a l ma t t e r which forms a res idue (ash or slag) when it is burned. The presence of ash reduces the flanae t empera tu re and simultaneously causes a reduction in the e lec t r i ca l conductivity of the combustion p roduc t s . In addition, gaseous species formed at high t empera tu re from ash components containing aluminum and potass ium, for example , tend to form ionic species which affect the conductivity. Thus Ai2 03(s) adverse ly affects the e lec t r i ca l conductivity both by reducing the combustion t empera tu re and by forming negative ions such as Ai Oz".
The STD Resea rch Corporat ion the rmochemica l data bank contains data for seve ra l hundred species that may be formed during the combustion of coal . It is not possible to t r e a t al l chemical species which might form under MHD channel conditions with equal facili ty, however , as adequate thermochemica l charac te r iza t ion for them is not avai lable . Therefore , STD Resea rch has placed considerable emphasis on de t e r mining which of the potential species a r e mos t important in e lec t r i ca l conductivity calcula t ions . This effort has a lso included evaluating and selecting the most rel iable of available thermochemica l data, and de te r mining the effect that the uncertainty in the rmochemica l data has on the e lec t r ica l conductivity.
Several examples a r e discussed below which i l lus t ra te these activit ies and which indicate a r e a s where further development work is des i rab le . These include (1) a species formed between the seed and flame const i tuents , KOH, for which improved exper imenta l data would significantly reduce the uncertainty of calculated plasma conductivities; (2) an ionic species from a slag component, A i O J , to show the effect of a slag derived species on conductivity; (3) an example which shows how the uncertainty in the elctron affinity of a major combustion product , COz , affects the plasma conductivity; (4) the resu l t s of an evaluation of published data of a spec ies , Ai (OH)2 , for possible incorporat ion into the STD Resea rch code, and (5) the resu l t s of the es t imat ion of t h e r m o chemical data for a spec ies , KAi O2 , for which data a re not avai lable , to determine whether exper imental data should be obtained.
For the purpose of our calculations we use a Montana Rosebud coal with an ult imate analysis as given in [ 3 ] . The coal , containing 10.39% ash , is a s sumed to be dried to 2% mois tu re and burned with 95% stoichiometr ic a i r . The combustion products a r e seeded with 1% by weight of potass ium in the form of K2CO3 . These conditions a re r e p resenta t ive of those envisioned for a typical MHD system design.
EXAMPLES
KOH
KOH is one of severa l major potassium-containing species formed during the high t empera tu re combustion of coal in an MHD sys tem. T h e r e fore it has been chosen to determine what effect uncer ta int ies in i ts thermochemica l data would have on the e lec t r i ca l conductivity.
The 1970 JANAF Tables [4] give a value of -55 .6 ± 3 Kca l /mol for the heat of formation for KOH at 298.15 K. Using this mean value
55

and the associated uncertainty l imits , STD Resea rch calculated the e lec t ron concentrations and conductivity. The resu l t s for a constant P r e s s u r e ol 4 a tm a re shown in F ig . 1, where the uncer ta int ies m conductivity a r e expressed as percent deviations from the conductivity at the median v a L of AH.. At 4 atm and 2500 K, the calculated conductivies d ffer by almost 50%'for the two extreme values of AHf The i-^portance of obtaining more accurate thermochemical data for K^H can sca rce ly be
over-emphasized. An accuracy to about ± J -^ .^^f ^ / " J ° J / ° ; , ^ 3 ^ 3 ' ' ^ i t h a desirable if one wishes to calculate the conductivity of ^he Plasma with a reasonable degree of confidence. We feel that it is feasible to achieve this degree of accuracy experimental ly.
>-
> I -o IO Q Z o o
< > UJ Q
UJ O
cr UJ CL
40
30
20
10
0
-10
-20
-30
-40
1 r 1
A H f = -55.6(JANAF medium value)
-
-
-_ ^
1 1 1 1
y ^ -
-
-
1 1900 2100 2300 2500 2700 2900
TEMPERATURE (K) 3100
Fig . 1 Effects of AHj. values of KOH on e lec t r i ca l conductivity, P = 4 a tm
AiOz"
In the high tempera ture combustion zone, the slag or ash compounds produce various gaseous species which may be strong e lect ron a b s o r b e r s . One of these is Ai Oz . The high electron affinity of AiOz tends to reduce the electron concentration and conductivity of the combustion g a s e s , making aluminum compounds a very undesirable ash component from the s tandpoint of MHD applicat ions. Unfortunately, the ash of most coals contains a considerable amount of a lumina. And the uncer ta int ies in t h e r m o chemical data for Ai O2" will be direct ly reflected in the uncer ta inty in the calculated conductivity. Spencer and co-workers [5] have examined
56

this effect using various values of AH, for Ai02 and found wide differences in computed e lec t ron dens i t i es .
The December 1968 JANAF Tables l is t a value of -145 ± 1 5 kca l / mol for AHf for A i 0 2~ based on bond energy e s t i m a t e s . Computer ca l culations using the above values resu l ted in conductivities ranging frona 1.11 to 3.72 m h o s / m , the median value being 3.06 m h o s / m . A recent Supplement (December 197 5) of the JANAF Tables presented a value of -140.9 ± 7 kca l /mol for AHf based on exper imenta l r esu l t s of Srivastava and co-workers [ 6 ] . This va lue , along with new values for the entropy and heat capacity, resu l ted in a higher conductivity of 3.46 m h o s / m (an increase of 13%) at the same t empera tu re and p r e s s u r e . The uncertainty in conductivity was also substantial ly reduced, the lower and upper l imits being 2.83 and 3.66 m h o s / m , respec t ive ly . In this c a s e , although it is clear that more p rec i se exper imenta l r e su l t s a r e des i rab le , especial ly for the heat capacity and entropy, it is not c lear how this can be achieved.
Because the proport ion and composition of ash in a coal vary considerably from one type of coal to another , the effects of other potentially important s lag-der ived negative ions , such as boron, chlor ine , fluorine, phosphorus and iron compounds, should also be invest igated.
CO2"
Although the thermodynamic proper t ies for major carbon, hydrogen, oxygen and nitrogen combustion species a re well cha rac te r i zed , some of their ionic constituents a r e not. In fact, the e lect ron affinity of many of these species a re not known to within 1 ev (23 kca l /mol ) . There fore , an example of the uncertainty in the e lectron affinity of CO2 , a major component of the combustion products , has been chosen to show its effect on the c onductivity.
The cur ren t JANAF Tables l ist a value of -105 ± 27 kca l /mol for the heat of formation of COz", corresponding to an e lect ron affinity of 11.5 kca l /mol for COz. The uncer ta inty , ± 27 kca l /mo l , is so large that COz" can be either an ext remely important species causing a dras t ic reduction in conductivity at one ext reme of the data (-132.5 kca l /mol ) ,o r an insignificant species whose concentration in the plasma is so smal l as to have negligible effects on conductivity at the other ext reme (-78.5 kca l / mol) . The calculated conductivity ranged from 1.8 to 8.6 m h o s / m at 4 atm and 2700 K within the uncertainty l imits of the JANAF data . At the median value of -105.5 kca l /mol CO2" was found to sti l l have a significant effect on the e lec t r i ca l conductivity.
During the past few yea r s the resu l t s of additional exper iments and further theore t ica l calculations for the e lectron affinity of COz have come to our attention [ 7 ] , [ 8 ] , [ 9 ] , This has led to a significant reduction in the uncertainty in AHf of COz" (-80.2 ± 5 kca l /mol ) . Using this new value our calculations indicated that the concentrat ion of COz was less than one half of a percent of the e lect ron concentration in the plasma and had little effect on the conductivity. In light of t h i s , it is also our conclusion that CO3" and CO4", which a re present at concent rations even snaaller than COz , will have no effects whatsoever on the MHD conductivity ca lcula t ions .
57

Ai(OH)z There has been some disagreement yet to be resolved as to whether
Ai(OH)2 is a major aluminum-containing species in the coal combustion products . Jensen and Jones [lO] using their flame photometric data deduced a value of -165 ± 10 kca l /mol for the heat of formation for Ai(OH)2. Computer calculations using this value showed Ai (OHh to be the dominant gaseous species containing aluminum. However, the rel iabil i ty of this value is in doubt. As pointed out by Srivastava et a l . , [ 6 ] , no Ai(OH)2 was actually identified in Jensen and Jones flame photomet r ic experiments and the reaction chemis t ry employed to deduce the AHf values was over-simplif ied. As stated in the JANAF T a b l e s , the use of flame spectra l methods has generally led to high values for d i s sociation energ ies .
Based on the above analysis and employing bond energy es t imates ,^ a AHf value of -150 kcal /mol or less negative would seem more r ea l i s t i c than the value of -165 ± 10 kcal /mol calculated from Jensen and Jones data. It is also in agreement with the JANAF s ta tement . Using this value our calculations indicated that A i 0 2 H , instead of Ai(OH)z, was the major spec ies . It was also found that the presence of Ai (OH)z had scarcely any noticeable effect on the calculated conductivity.
Even with the Jensen and Jones value, our calculations showed that the conductivity of the plasma changed very little for MHD condit ions. Therefore , whether or not Ai(OH)z is a dominant aluminum-containing species is of little significance as far as MHD power generat ion is concerned .
KAiOz At the present time the computer codes do not include the rmochemica l
data for many gaseous species formed as a resul t of react ions between the seed component and slag spec ies . An example would be KAi Oz , for which no experimental data a re available. To determine whether expe r i ments should be conducted to obtain more accurate data for KAi Oz , we est imated its AHf (-85 ± 30 kca l /mol ) , heat capacity and ent ropy. With these values it was found that the calculated KAi Oz concentrat ions were negligible for all conditions of in te res t . No effects on conductivity were observed within the est imated uncertainty l imi t s . There fo re , the p resence of KAiOz is not expected to have any appreciable effects on the e l ec t r i ca l conductivity.
SUMMARY
Thermochemical data for chemical species in the combustion products have widely different degrees of effects on the calculated conductivity. While an accuracy in AHf data to , say, 30 kca l /mol may be more than adequate for some species , cer ta in other species may requ i re accuracy to within less than 1 kca l /mol in order to achieve a reasonable degree of accuracy in the calculated conductivity of the p la sma . T h e r e fore , grea ter efforts should be directed to the study of the la t ter group. It is important that we identify these c r i t i ca l species and carefully review and evaluate available data for possible improvement . As we have seen above, more accurate data than present ly available a r e needed for a number of key species and this is where more exper imenta l work should be done.
58

REFERENCES
[ l ] S. T . Demetr iades and G. S. Argyropoulos , Phys . F lu ids , 9., 2136 (1966)
[2] C. D. Maxwell , S. T . Demet r i ades , G. S. Argyropoulos , N. J . Pate l and M. Eas t e r l i ng , P r o c . 13th Symposium on Engineering Aspects of Magnetohydrodynamics, Stanford, March 197 3
[3] N. J . Pa te l , W. A. Updike, C - L . Lu, and J . C. Cutting, P r o c . 15th Symposium on Engineering Aspects of Magnetohydrodynamics , Philadelphia, May 197 6
[4] JANAF Thermochemica l T a b l e s , Dow Chemical Co. , Midland,Mich. [5] F . E . Spencer , J . C. Hendr ie , D. Bienstock, P r o c . 13th Sym
posium on Engineering Aspects of Magnetohydrodynamics , Stanford, March 1973
[6] R. D. Sr ivas tava , O. M. Uy and M. F a r b e r , J . Chem. S o c . , Fa raday T r a n s . II, 68_, 1388 (1972)
[7] R. N. Compton, P . W. Reinhardt and C. D. Cooper , J . Chem. Phys . _63_, 3821 (1975)
[8] J . Pancansky, U. Wahlgren and P . S. Bagus, J . Chem. Phys . _62, 2740 (1975)
[9] M. Krauss and D. Newmann, Chem. Phys . Lett . ±±, 26 (1972) [10] D. E . Jensen and G. A. Jones , Fa raday T r a n s . I, _68_, 259 (1972)
59

CALCULATION OF EQUILIBRIA BET\ ^ASES*
M. Blander and C. C. Hsu Chemical Engineering Division Argonne National Laboratory Argonne, Illinois 60439
INTRODUCTION
We have performed calculations of equilibria between gases and condensed phases in studies of the origin of stony meteorites [1,2] as high-temperature condensates from a solar nebula. Meteorites are a unique example of a high temperature condensate where we have a large number of samples which have been carefully studied. They provide us with a testing ground for concepts important for understanding condensation of oxides at high temperature. Two of our inferences have a bearing on calculations of condensation and chemical reactions in coal fired MHD generators.
1. Even on a long time scale, kinetic factors play a major role in the chemistry of condensates at high temperatures.
2. The chemistry of molten silicates is far too complex to be handled by common solution theories. More sophisticated theories will have to be developed to describe silicate melts over large ranges of composition. These theories will be necessary for a description of the equilibria between seed and slag in a coal fired MHD generator.
In this paper are described some of our calculations on the formation of condensates from a nebula with the imposition of some very simple types of time-independent kinetic constraints (i.e., constraints of a go/no-go variety) to illustrate the kinds of non-equilibriimi predictions which are possible with such a calculation. Constrained equilibrium calculations are simple to perform when well defined kinetic limitations effectively block certain chemical reactions.
In addition, we discuss concepts in solution chemistry we have developed which should have applications for multicomponent silicate systems and which should be applicable to the interactions of the potassium seed with the silicate slag in a coal fired MHD generator. The equations developed will help to define the chemistry of such interactions and to define the characteristics of additives which will decrease the loss of potassium seed to the slag.
CONSTRAINED EQUILIBRIUM CALCULATIONS OF CONDENSATION
Most stony meteorites are considered to be condensates from a nebula of universal or solar composition with approximate relative abundances of some of the major species at temperatures under 2000 K as given in Table I.
Work performed under the auspices of the U. S. Energy Research and Development Administration.
60

Table I. Relative Abundances in Nebula
H2 H2O Mg Fe SiO Al Ca
1,000,000 1,800
80 68 76 6.5 5.7
Pressures in a nebula are considered to range from a high of one atmosphere down to very low pressures. Given the range of pressures and the relative abundances, one can calculate [3] the equilibrium condensates which would form from a cooling gas of solar composition. If we consider only the first five elements in Table I for simplicity, the major equilibrium reactions are:
Fe(g) -». Fe(s) (1)
2Mg(g) + SiO(g) + 3H20(g) -^ Mg2Si0i^(s) + 3H2 (2)
Mg(g) + SiO(g) + 2H20(g) ->• MgSi03(s) + 2H2 (3)
SiO(g) + Mg2SiOit(s) + H20(g) -»- 2MgSi03(s) + H2 (4)
Further reactions of these materials occur at such low temperatures that they are not likely to proceed at all. The materials produced in reactions (1) -(4) resemble very few of the stony meteorites, with most meteorites having a chemistry and mineralogy which is different.
The differences may arise because of kinetic factors which inhibit some of the possible reactions. For example, nucleation constraints should inhibit reaction (1). Predictions from nucleation theory are that the inhibition should be small at high pressures and temperatures and essentially complete at low pressures and temperatures• If gaseous iron cannot condense because of a nucleation constraint, its partial pressure and chemical potential is higher than that of pure metallic iron and reactions such as
2Fe(g) + SiO(g) + 3H20(g) -> Fe2Si0it(solid soln.) + 3H2(g) (5)
Fe(g) + H20(g) -^ FeO(s) + H2(g) (6)
3Fe(g) + 4H20(g) -> Fe30^(3) + 4H2(g) (7)
will be driven to completion. Thus, a kinetic constraint on the condensation of metallic iron leads to the formation of oxidized iron Instead.
In addition to a nucleation constraint on reaction (1), one also expects a constraint on reactions such as (4) which involve the reaction of a solid silicate with a gas to form another silicate. Examination of analogous equilibria in the meteorites indicates that such reactions freeze in at about 1325 K. With this constraint and the nucleation constraint as defined by nucleation theory Imposed on equilibrium calculations of condensation, we have been able to quantitatively calculate nebular condensates at different pressures. These results are summarized in Table II.
61

Table II. Nebular Condens
T(K)
1600
p = 10~^ atm. p = 10~^ atm.
(Fe)
Mg2Si0it
MgSlOs (Fe), Mg2S10it
Fe MgSlOg
(MgSi03) "Fe2SiO,t"
Fe
< in-^t p ^ 10~^ atm.
900
MgaSiO^
(Fe), (MgSiOg)
"Fe2Si04"
FeO
Fe30it
( ) parentheses denote substance that would form at equilibrium but reaction is constrained kinetically.
At pressures of 10"^ atmosphere the condensates resemble E-type chondritlc meteorites, at ^lO"** atmosphere they resemble C-type chondrites, and at about 10"^ atmosphere they resemble the ordinary chondritlc meteorites. Because of kinetic constraints, the same gas can produce very different chemistries and mineralogies. Thus, even on a long (cosmic) time scale, kinetic constraints must be taken into account in condensation calculations.
In addition to the two constraints discussed, another nucleation constraint should be significant. Because the surface free energies of solids are larger than liquids, there is a larger nucleation barrier for the condensation of solids than for liquids, and metastable liquids will form rather than the stable solid phase. If we consider the earliest nebular condensates, they should be mostly composed of AI2O3, CaO, Si02 and MgO. We have performed calculations which show that the first significant nonmetallic condensate is a liquid which contains 80-90% AI2O3 and 10-20% CaO and, as the temperature drops, the fraction of CaO and Si02 in the condensate increases. Except in a narrow range of composition, present solution theories for silicates proved to be inadequate to perform calculations in the CaO-Al203-Si02 system (which is essentially the same system as the MHD slag). We then proceeded to develop a theoretical framework for handling such complex liquids within the context of our computer program.
SOLUTION CHEMISTRY
In order to minimize the amount of data needed to accurately calculate the solution properties of silicates, including MHD slags, better equations for representing silicates need to be developed. There are two approaches for the solution chemistry of silicates we are considering. The first is based upon an empirical extension of conformal ionic solution theory [4,5] in which the ideal free energy of solution is expressed in terms of ion fractions (X^) and the excess free energy is expressed in terms of equivalent
G2

fractions (X') so that the molar free energy of mixing of oxides, AGj„, is given by the expression
AG = RT Z X. in X, + ZE A, .XlX! + ZE B .X'^X! + EEE C, .. XlXlX,' m 1 i i j i j i j i j Ijk 1 J k
(8)
The use of equivalent fractions in the excess free energy for molten salt systems has been shown to lead to a much better representation of the solution properties of ionic systems than the use of mole or ionic fractions. To utilize Eq. (8), data on the subsidiary binaries are needed. Although Eq. (8) is likely to be better than conventional solution theories for MHD slags (e.g., the CaO-Si02-K20-Al203 system), it is not likely to be successful over broad ranges of composition.
A second approach utilizes an empirical observation [6] for systems of two weakly interacting components both interacting strongly with a third component. For the system CaO-K20-Si02, this observation is that the activity coefficients are approximately linear functions of composition at constant mole fractions of Si02.
In Y- = ^20
\oO + X CaO [in y.]^
CaO
CaO = 0 [In y ]
CaO 'K2O \,0-^^CaO "' ' \,' = ° (9)
This linear equation permits one to estimate activity coefficients in the ternary (or higher order systems if extended) from a knowledge of the behavior of component i in the end member solutions,
In order to utilize Eq, (9) for solutions of K2O in a silicate slag, an expression for the activity coefficients of dilute solutions of K2O in the slag is needed. We have developed a statistical mechanical equation for this purpose [7] which, when adapted for dilute solutions of K2O in the binary solvent Ca0-Si02, is
1 ^-"^
'K2O Z!
Z
J Q i!(Z-i)! ^ca4r ^^»- RT (10)
where Z is a coordination number, and the energy parameters A in the model are given by
A = RT in Y_.-o S1O2
L = A? + (i-l)h + Z-I[RT ln(Y3,o,/Y;i02)-^^ ^"(^Cao/^Cao) (11)
and can be determined, in principle, with a knowledge of the solvent properties and only three measurements on dilute solutions of K2O in the binary solvent. With equations such as (9) and (10), the amount of data needed to complete the representation of ternary (or multicomponent) systems should be considerably reduced.
63

Equations (9) and (10) should hell- — ^ ^ ^ tics of additives which might be added to the slag to increase the activity coefficients of K2O, and thus decrease its solubility and decrease the loss of the seed material. For example, one would predict that lime (CaO) additions to the slag should decrease the loss of K2O,
CONCLUSIONS
1. Kinetic factors are important in high-temperature condensation>even on long time scales and should be even more Important for the short time scales in coal fired MHD generators. These kinetic factors can greatly alter the chemistry of the condensates so that the products differ considerably from that expected at equilibrium. This leads to major differences in the chemistry of condensates in different regimes of temperature and pressure.
2. In order to describe the solution chemistry in MHD slag systems, more advanced solution theories and approximations need to be developed and tested. Such theories will minimize the amount of data needed to accurately represent the thermodynamics of multicomponent silicate melts.
3. Solution theories help to define the characteristics of additives to slag which will greatly decrease the solubility and loss of potassium seed in the slag.
REFERENCES
1. M. Blander and L. H. Fuchs, Calcium-Aluminum Rich Inclusions in the Allende Meteorite: Evidence for a Liquid Origin, Geochim. Cosmochim. Acta 39, 1605-1619 (1975).
2. M. Blander, C. C. Hsu and L. Fuchs, Quantitative Computer Calculations of Constrained Equilibria in the Formation of Chondrites, Me teo r i t i c s 1 1 , 251 (1976) (Abst rac t ) .
3. S. Gordon and B. J . McBride, Computer Programs for Calculation of Complex Chemical Equilibrium Compositions, Rocket Performance, Incident and Reflected Shocks and Chapman-Jouguet Detonations, NASA SP-273 (1971).
4. M. L. Saboungl and M. Blander, Conformal Ionic Solution Theory for Additive Ternary Molten Ionic Systems, J . Chem. Phys. 6^, 212-220 (1975).
5. M. L. Saboungl and M. Blander, Topology of Liquidus Phase Diagrams of Charge Asymmetric Reciprocal Molten Salt Systems, J , Am. Ceram. Soc. 58 1-7 (1975). —
6. K. Hagemark, D. Hengstenberg and M. Blander, EMF Measurements in Additive Ternary Molten Salt Systems PbCl2-KCl-NaCl and PbCl2-CsCl-NaCl, J . chem. and Eng. Data 17, 216-221 (1972).
64

'• " / M t S " ? f r?"' '-^-.?'"'?' '" ' ^"W""!/ CoeffiHents of Dilute Solutions >^^iyievav%on, J . Electrochem. Soc. 124, 6-13 (1977) .
65
y£.^,L


NEGATIVE ION ENERGETICS*
W. C. Lineberger** and P. C. Engelking
Joint Institute for Laboratory Astrophysics University of Colorado and National Bureau of Standards
and Department of Chemistry, University of Colorado
Boulder, Colorado 80309
Because electrons are the most mobile charge carriers in an MHD plasma, electron sources and traps become of major interest. Besides electron recombination with positive ions, electron attachment to neutrals to form negative ions must be considered in models [1] of the MHD plasma, especially when coal containing an inorganic impurity is burned to produce the plasma flame. Although this trace impurity may be present in less than 1% amounts, its presence and its elemental composition may be a major factor determining plasma conductivity. For this reason a reliable knowledge of the electron affinities of both the major and minor molecular constituents of a coal flame is needed.
The recent review by Hotop and Lineberger [2] of the electron affinities of atoms makes clear the difficulties of both theoretical estimates and experimental determinations of these. In fact, about half the elements still have experimentally undetermined or unreliable electron affinity values. For example, the EA of the common element iron was left unmeasured until recently; fortunately its value [3] does not differ drastically from the previous theoretical extrapolations. However, our present theoretical understanding is not sufficient to prevent a major surprise as other elemental electron affinities are determined.
The major reason for this is our inability to think clearly beyond individual electron orbitals in atoms and molecules. This Hartree-Fock picture becomes more accurate as one moves to more nuclear charge in the direction of positive ions, but less accurate as one goes to excess electron charge in the negative ions. Negative ions derive their excess electron binding primarily from the correlation of electron motion, and often a known, stable negative ion is not even bound in the Hartree-Fock limit. For example, the use of individual electron orbital energies usually is a good indication of the energy needed to ionize a molecule (Koopman's Theorem), while this same electron orbital picture fails to predict correctly the binding of an extra electron to the molecule.
The lack of simple one electron-one orbital pictures of negative ions requires knowledge of the electron correlations as would be found in exact calculations. However, these calculations converge very slowly, and it
*This work was supported by the National Science Foundation through grant AER74-20552.
**Camille and Henry Dreyfus Teacher-Scholar.
67

would be helpful to have a semiempirical theory of electron correlation. For example, a good estimate of correlation energy beyond the Hartree-Fock limit can often [4] be found for molecules by using the correlation energy found by the difference of the empirical binding energy compared with the Hartree-Fock binding energy of the united atom.* These ideas as yet are not fully tested, but look promising (Fig. I).
Correlation change X - X "
® 1
Figure 1.
1 2 united atom A, eV
Correlation energy change in negative ion production, showing relationships of correlation in the diatomic to its united atom limit (Ref. 4).
By examining some simple molecules, first row hydrides, we see the difficulties an electron affinity theory must handle (Table I). For example, although the atomic sequence from B to F increases in electron affinity, N is anomalous in not forming a negative ion. Usually this is explained by assuming an unusual stability for neutral N derived from a "half" filled shell. Similarly, the molecules in the last row of Table I should gain additional stability for their negative ions by closing a shell, but except for BH^, OH and F, this doesn't seem to be an important factor.
Tables II and III include what is known about first and second row oxides. Among these are found species of MHD interest, for example, the group III oxides of boron and aluminum. Little is known accurately about these, although aluminum is a major coal impurity and boron, while a minor impurity, will exist almost entirely as gaseous compounds concentrated in the flame [5]. Presumably group IV oxides will be less important, while V, VI and VII oxides must be considered.
Some general rules can be noted. First, addition of hydrogen to elements in or to the left of group IV tends to destablize the electron affinity, while addition to groups V and VI tends to stabilize the electron affinity
I.e., merging all the nuclei into one and thus treating the resulting "atom."
68

with respect to that of the element. Secondly, a closed shell will have a negative or only weak electron affinity. Thirdly, an electronegative element such as oxygen will increase the electron affinity when substituted in a molecule. Fourth, an increase in molecular size will tend to stabilize electron affinity.
Table I. Electron affinities of first row hydrides.
Ill
B 0.24(1)^
BH <0?^
BH2 ?
BH3 7
BHit ~2?
IV
C 1.27(1)^
CH 1.238(8)^^
CH2 0.21(3)^
CH3 (~0)?
V
N <0^
NH 0.38(1)"
NH2 0.779(37)°
VI
0 1.465(5)^
OH 1.825(2)°
VII
F 3.339(5)^
Standard errors of the last digits in parentheses follow the EAs expressed in electron volts. A question mark indicates no experimental determination as yet.
^Ref. 2. \ef. 9. ' Ref. 10. ' Ref. 11. ^Ref. 12.
Table II. Electron affinities of first row oxides.
Ill
B 0.24^
BO , -3.1^
BO2 ^ -3.6°
BO 3 ?
^Ref. 2.
^Ref. 15.
IV
C 1.27^
CO <0
CO2 <0
CO3 -2.7^
\ef. 13.
^Ref. 16.
V
N <0^
NO 0.024^^
NO2 d 2.36
NO3 ^ 3.91
'^Ref.
%ef.
VI VII
0 F 1.465^ 3.339
Oo ^ c
0.44
O3 J e 2.3^
O4
7.
19.
OF >1.4^
FO2 ?
FO3 ?
'^Ref. 14.
^Ref. 22.
69

.y
Table III. Electron affinities of second row oxides
III
AX. 0.46^
AX,0 , -3.7^
AX,02, -4.1^
AAO3 ?
IV
Si 1.24^
SiO <0?
Si02 <0?
Si03 ?
V
p 0.74^
PO 1.092 ^
PO2 d -3.3^^
PO3 (>4)?
VI
S 2.077^
SO 1.09^
SO2 . 1.097
SO3 7
VII
cx, 3.614^
C£0 7
CX.O2 7
C^03 (4)?
^Ref. 2. ^Ref. 17. ' Ref. 8. ' Ref. 18.
^Ref. 20. ^Ref. 9.
Table IV shows some of these effects. The increasing electron affinities of phosphorous or iron oxides with increasing oxygen binding shows clearly the effect of an electron withdrawing element, along with an increased size of the ion. This latter size effect is shown by the iron carbonyl series: here CO has no strong electron withdrawal from the iron, so presumably the effect is primarily electronic delocalization.
Table IV. Electron affinity trends.
EA(eV)
a Ref.
\ef.
P PO PO2 PO3
Fe FeO Fe02
Fe FeCO Fe(C0)2 Fe(C0)3 Fe(C0)4
2. ^Ref.
3. ^Ref.
0.743(10)^ 1.092(10)^ 3.3^ >4(?)
0.164(35)* 1.492(20)^ >2.5e
0.164(35)** 1.256(20)** 1.221(20)** 2.0^ >2.5
8. ' Ref. 18.
21.
70

As can be seen, quantitative extrapolations are hazardous. It is only by reliable measurements that we can be sure. The method of photodetachment electron spectrometry [6] is one such direct method, determining electron affinities simply by measuring the electron energy produced from an ion with a photon of known energy: the difference in photon energy and electron energy is the electron affinity. An apparatus [7] for these measurements is shown schematically in Fig. 2. The ion source is an electric discharge plasma, and the ions that can be produced in this manner are generally those that are important in an MHD plasma.
ENERGY ANALYZER
SOURCE JV_
Figure 2.
MASS FILTER
Photodetachment electron spectrometer. Electrons produced by the interaction of the ion and photon beams are energy analyzed and detected. A multichannel analyzer (not shown) accumulates individual electron events to produce a spectrum of counts vs. energy.
u o CJ
0.5
(I, 1X0,0)
B (2, l)(l, 0) . x6
(3, l ) ( 2 ,0 )
E (0, I)
• I
(4 , l ) (3 , 0) •
ll / F
••.(0, Z)
\
x^^n — a 'a
H (0,0)
I (0,1)
V, ( 0 , 2 )
^_.^-1.0 1-5 2-0
ELECTRON ENERGY (eV)
2.5
Figure 3. Photoelectron energy spectrum of PO
71

One example of this method is the photodetachment electron spectrum [8] of P0~ shown in Fig. 3. A wealth of information is present. Not only is the adiabatic electron affinity derivable from the (0,0) peak location of the X^n PO -<- X^E~ P0~ transition, but potential curve information of both the ion and the neutral can be extracted. The spectrum provides vibrational frequencies of two electronic states of the ion (X^E~ and a^A), the term energy difference between these, and, from a Franck-Condon analysis of the relative vibrational intensities, the internuclear separation r^. This example should belle any belief that photodetachment studies are capable of measuring only "vertical" electron affinities. Photodetachment electron spectrometry produces the correct, adiabatic electron affinity and also the information necessary for deriving the molecular partition function and hence the thermodynamics of the ion at MHD temperatures.
So far this apparatus has utilized only the visible radiations from an Aril laser, limiting electron affinity determinations to 2.5 eV or less. More promising, and in the future, are accurate determinations of electron affinities in the 3.5 eV range or greater by utilizing new ultraviolet lasers. Already in our laboratory we have observed photodetachments resulting from the ultraviolet lasing of Arlll, which will be necessary for measuring the electron affinities of such compounds as the boron and aluminum oxides, PO2, Fe02, and others.
References
[1] F. E. Spencer, Jr., J. C. Hendrie, Jr. and D. Bienstock, Paper VII 4, 13th Symposium on Engineering Aspects of Magnetohydrodynamics (26-28 March 1973).
[2] H. Hotop and W. C. Lineberger, J. Phys. Chem. Ref. Data 4 , 539 (1975).
[3] P. C. Engelking and W. C. Lineberger (to be published).
[4] P. F. Zittel and W. C. Lineberger, J. Chem. Phys. 62, 1932 (1976).
[5] F. E. Spencer, private communication.
[6] H. S. W. Massey, Endeavour 35, 58 (1976).
[7] M. W. Siegel, R. J. Celotta, J. L. Hall, J. Levine and R. A. Bennett, Phys. Rev. k 6_, 607, 631 (1972).
[8] P. F. Zittel and W. C. Lineberger, J. Chem. Phys. ^ , 1236 (1976).
[9] R. J. Celotta, R. A. Bennett and J. L. Hall, J. Chem. Phys. 60, 1740 (1974). —
[10] A. Kasden, E. Herbst and W. C. Lineberger, Chem. Phys. Lett. 31, 78 (1975). —
[11] P. F. Zittel, G. B. Ellison, S. V. ONeil, E. Herbst, W. C. Lineberger and W. P. Reinhardt, J. Am. Chem. Soc. 92_, 3731 (1976).
[12] K. M. Griffing and J. Simons, J. Chem. Phys. 62 , 535 (1975).
[13] R. D. Srivastava, 0. M. Uy and M. Farber, Trans. Faraday Soc. 67, 2941 (1971). —
72

[14] E. Herbst, T. A. Patterson and W. C. Lineberger, J. Chem. Phys. ^ , 1300 (1974).
[15] W. A. Chupka, J. Berkowitz and D. Gutman, J. Chem. Phys. _52, 2733 (1971).
[16] J. C. J. Thynme and K. A. G. MacNeil, Int. J. Mass Spec. Ion Physics 2, 95 (1970).
[17] R. D. Srivastava, 0. M. Uy and M. Forber, Trans. Faraday Soc. , 1388 (1972).
[18] W. J. Miller, Paper IX.8, Proc. 15th Symposium on Engineering Aspects of MHD (May 1976).
[19] S. P. Hong, S. B. Woo and E. M. Helmy, Bull. Am. Phys. Soc. 23^, 170 (1976).
[20] D. Feldman, Z. Naturforsch. A25, 621 (1970).
[21] P. C. Engelking and W. C. Lineberger, J. Chem. Phys. (in press).
[22] J. A. Davidson, F. C. Fehsenfeld and C. J. Howard, Int. J. Chem. Kinetics (to be published).
73

ELECTRON MOMENTUM-TRANSFER CROSS SECTIONS AND THEIR RELATION TO TOE ELECTRICAL CONDUCTIVITY OF MHD PLASMAS
Yukikazu I t ikawa I n s t i t u t e of Space and Aeronautical Science, Univers i ty of Tokyo
Komaba, Meguroku, Tokyo 153, Japan
The e l e c t r i c a l conduct iv i ty i s one of the most important p r o p e r t i e s of an MHD plasma. I t i s determined e s s e n t i a l l y by the c o l l i s i o n s between e l ec t rons and various cons t i t uen t p a r t i c l e s of the plasma. Usually the e l e c t r i c a l conduct iv i ty of an ionized gas can be expressed in the form
6- = I^ll"" JL (1) me Ve^
where n is the density of the electrons and m and -e denote the i r mass and charge, respectively. The quantity v ^^ represents the coll is ional effect in the e lec t r i ca l conduction. In the present report , I show f i r s t how to evaluate v . from the knowledge of the col l is ion process in the plasma and then give a br ief summary of a survey on the relevant coll ision cross sections.
Transport properties concerning electrons in a gas are determined by the distr ibution function of the electron, f( r , 'v, t) . [1] The function is defined in such a way that the number of electrons at time t in the spat ia l volume ( ? , " ? + dr ) and in the velocity interval ( v*, A? + dv" ) is given by
4( ^ .yfA) 6r<^\}
(2)
Here f is normalized as
Once f is given, the electronic current i s calculated from the formula
J = - e J i -f(v-)du- . 3 It i s well known that f is a solution of the Boltzmann equation
(4)
T
where E is an applied e lec t r i c f ield. The terra on the right side (the coll ision term) describes the change in the dis t r ibut ion function due to the col l is ion.
For simplicity the following assumptions are made here: (i) The gas is weakly ionized. In other words, we take into account only the electron coll isions with neutral atoms or molecules (In the following, we consider a gas of single component, whose mass and density are denoted by M and N , respectively.) ( i i ) The gas is stationary and spat ia l ly uniform.
74

(6)
(7)
( i i i ) The applied f ield is not so strong that we can assume a weak anisotropy of the electron d i s t r ibu t ion .
On the assumption ( i i i ) , f is divided such that
(•^)
where E is the unit vector along the direction of E . Insert ing (5) into (4) and using the assumption ( i i ) , we have
_eE afo ^ (^ , \ y^e^ S V V-^t /cell .
To solve these equations, two methods have been proposed.
[A] Lorentzian method Here we make two more assumptions: (a) m /M « 1 (b) Consider e l a s t i c col l is ions only
Then the col l i s ion term for f is reduced to
The quantity Q i s the momentum-transfer cross section and defined by
'cs
where q( v, 6) is the differential cross section for elastic collision of electrons with neutral particles. Inserting (8) into (7), we easily obtain f.. . From the formula (3), the current is calculated to be
1 E ( J ^ 3i» d
Before evaluating (10) numerically, we have to solve eq.(6) to get f . Instead, we assume here f- to be Maxwellian and finally have the e l e c t r i c a l conductivity of the form
with the (1st kind) effective col l is ion frequency [2]
75

Here T is the electron temperature and K is the Boltzmann constant. TTie formula®(11) has been used, for instance, by Frost [3] and Kruger et al. [4]
[B] Chapman-Enskog method In this method, we assume at the outset that f is Maxwellian. Fur
thermore we expand f in terms of the orthonormal set of the Laguerre functions as follows:
' r = o (13)
Substituting this into eq.(7), we have a set of coupled equations for the coefficient P :
— 6,c~ 2^^^srr^ , (14)
where H is a numerical coefficient derived from the collision term. The electronic current is expressed in this case as
) - - ^ >ne ° • (15)
To obtain an exact solution, an infinite number of terms should be included in the expansion (13). In the actual calculation, however, we truncate the summation to the first N terms (called the N-th approximation),
(1) 1st approximation (N = 1) In this approximation, we easily obtain from (14)
p _ eE J _ VTe Moo • (16)
To evaluate H , we consider here only the elastic collision of electrons with neutral particles as before. Then we have
H. = - r with the (2nd kind) effective collision frequency [2]
(17)
•w^ V *
With the use of the formulas (16) - (18), the electrical conductivity is calculated to be
.2 I
6"-Tie e"
»ie W«^' . ^^^^
76
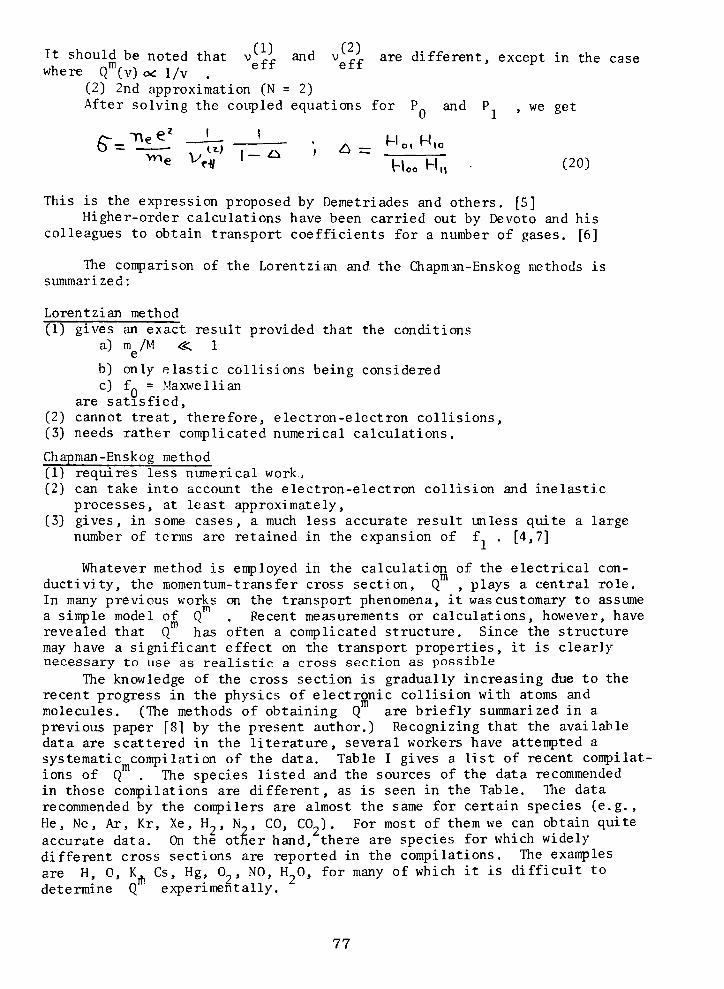
I t should be noted that v^.:, and v^/L are di f ferent , except in the case where Q' CV) OC 1/V . ® " ® "
(2) 2nd approximation (N = 2) After solving the coupled equations for P and P , we get
/ - -ne^' L- ' . M H.
'« ' ^ ' • Hoe H„ . (20)
This is the expression proposed by Demetriades and others. [5] Higher-order calculat ions have been carried out by Devoto and his
colleagues to obtain transport coefficients for a number of gases. [6]
The comparison of the Lorentzian and the Chapm-an-Enskog methods is summarized:
Lorentzian method (1) gives an exact resul t provided that the conditions
a) m /M « ; 1 e
b) only e l a s t i c col l is ions being considered c) f. = Maxwellian
are s a t i s f i ed , (2) cannot t r e a t , therefore, electron-electron co l l i s ions , (3) needs rather complicated numerical calculat ions. Chapman-Enskog method (1) requires less numerical work,, (2) can take into account the electron-electron col l is ion and ine las t i c
processes, at least approximately, (3) gives, in some cases, a much less accurate resul t unless quite a large
number of terms are retained in the expansion of f . [4,7]
Whatever method is employed in the calculation of the e l ec t r i ca l conduct ivi ty , the momentum-transfer cross section, Q , plays a central ro le . In many previous works on the transport phenomena, i t was customary to assume a simple model of 0" . Recent measurements or calculat ions, however, have revealed that Q has often a complicated s t ructure . Since the structure may have a s ignif icant effect on the transport proper t ies , i t i s clearly necessary to use as r e a l i s t i c a cross section as possible
The knowledge of the cross section is gradually increasing due to the recent progress in the physics of e lectronic col l is ion with atoms and molecules. (The methods of obtaining Q are br ief ly summarized in a previous paper [8] by the present author.) Recognizing that the available data are scattered in the l i t e r a t u r e , several workers have attempted a systematic compilation of the data. Table I gives a l i s t of recent compilations of Q . The species l i s t ed and the sources of the data recommended in those compilations are di f ferent , as is seen in the Table. The data recommended by the compilers are almost the same for certain species ( e . g . . He, Ne, Ar, Kr, Xe, H , N , CO, C0„). For most of them we can obtain quite accurate data. On the other hand, there are species for which widely different cross sections are reported in the compilations. The examples are H, 0, K, Cs, Hg, 0 , NO, HO, for many of which i t i s d i f f icu l t to determine Q ' experimentally.
77

Table I . Compilations of Q m
Compilations
Gi l a rd in i (1972) [ l ]
Kieffer(1973) [9]
I t ikawa(1974)[8]
Raeder(1975)[10]
Spencer(1976)[11]
H
o D A
He 0
O OO on
A
0
Ne Ar K
o o no D O
A D D
Kr Xe Cs Hg H^ N^
O O O o o O O D A O O O O O D O O
D D O O
O2 CO NO H^O
0 0 0 0 0 • 0 0 D 0 0 A A o n 0
C02
0 n 0 0 n
** others
Li, Na, N
NH3, N2O, CH4
OH
OH, CsOH, KOH, SO
There i s no symbol in the en t ry when the r e s p e c t i v e spec ies i s not covered by the compilat ion. When data sources c i t e d in d i f f e ren t compilations are d i f f e r en t for one s p e c i e s , d i f f e r e n t symbols are ased to i n d i c a t e the coverage of the s p e c i e s . For i n s t ance , there are four d i f f e r e n t types of values reccmmended for 0, whereas the same data are recommended for CO in a l l the compilat ions .
Other species (than l i s t e d here) included in the compi la t ion .
78

I am now p repa r ing t o r ev i s e my own compi la t ion . [8] Deta i led d i scuss ion about the cross s ec t i on of i n d i v i d u a l spec ies w i l l be presen ted in the forthcoming paper .
In conc lus ion , I wish to express my s i n c e r e thanks to Dr. M. Inokut i for p rov id ing me with the oppor tuni ty t o give a t a l k at t h i s conference. Tlie Yoshida Foundation of Science and Technology i s g r a t e f u l l y acknowledged for the t r a v e l suppor t .
References [ I ] For d e t a i l e s of e l e c t r o n t r a n s p o r t phenomena, see for example,
A. G i l a r d i n i : Low Energy Elec t ron Co l l i s ions in Gases (Wiley, New York,
• (1^ (2) [2] Numerical values of ^ ^f arid v^.^, for a number of atoms and molecules
are t a b u l a t e d i n , Y. l l iRawa: Phyl . Fluids 16^831 (1973). [3] L. S. F r o s t : J . Appl. Phys. 32_ 2029 (1961). [4] C. H. Kruger, M. Mitchner and U. Daybelge: AIAA J . 6_ 1712 (1968). [5] S. T. Demetriades and G. S. Argyropoulos: Phys. Fluids 9_ 2136 (1966);
G. S. Argyropoulos and M. A. Cas t ee l : J . Appl. Phys. 4J 4162 (1970). [6] For example, R. S. Devoto: Phys. Fluids _16_ 616 (1973). [7] S. Schweitzer and M. Mitchner: AIAA J . 5_ 351 (1967). [8] Y. I t ikawa: Atomic Data and Nuclear Data Tables 14_ 1 (1974). [9] L. J . K ie f fe r : JILA Inform. Center Rept. 13 (1973). [10] J . Raeder: MHD Power Genera t ion , ed. J . Raeder (Spr inger , B e r l i n , 1975)
p . 4 2 . [ I I ] F. E. Spencer , J r . and A. V. Phelps : Proc. 15th Synp. Eng. Aspects
of MHD (Univ. Pennsylvania , 1976) I X . 9 . I .
79

ELECTRON MOMENTUM-TRANSFER CROSS SECTION
FOR CARBON MONOXIDE
J. E. Land
Joint Institute for Laboratory Astrophysics University of Colorado and National Bureau of Standards
Boulder, Colorado 80309
Modeling calculations for MHD generators require a calculation of the electrical conductivity of the MHD plasma as a function of plasma composition and temperature [1]. The basic physical input data for this calculation is the electron-molecule momentum-transfer cross section, as a function of electron energy, for each atomic and molecular constituent of the plasma. These cross section data have been reviewed recently in the contexts of atmospheric physics [2,3], gas discharge and plasma physics [4], and MHD modeling [1]. When new experimental or theoretical results become available, these numerical data may be revised to improve the accuracy of the calculated conductivity. We report here such a revision, based on the analysis of recent electron swarm measurements, of the momentum-transfer cross section for carbon monoxide. This combustion product is expected to be present in coal-fired MHD generators at concentrations of 2 to 5% (mole fraction basis) for air-oxidizer systems, and correspondingly greater concentrations for oxygen-enriched systems [5].
METHOD
The momentum transfer cross section.
Q. (l-cosO) 4^ df2
can in principle be determined by measuring the absolute differential cross section da/dfi for electron scattering angles 6 from 0 to 180° and performing the angular integration, but the technical details of the experiment limit both the accuracy of this approach and the range of accessible energy and angle. In MHD applications, for which cross section data from approximately 0.1 to 1.5 eV are of greatest importance, the most abundant source of cross section information has been the analysis of data measured in electron swarm experiments [6-9]. In such experiments, electrons drift through a gas of density N and tenqjerature T under the influence of a weak electric field E; measurement can be made of the average drift velocity of the electrons, w, in the direction of E, or the characteristic electron energy e = eD/y, where D is the coefficient for electron diffusion perpendicular to the direction of E, and y = w/E is the electron mobility. Using well-established, recently Improved techniques [9], these quantities can be measured with good absolute accuracy, often a few percent or less. Unfortunately, however, Q^ cannot be calculated directly from these experimental results, since the experimental observables represent a folding of Qj,, with the electron energy distribution function, and the distribution function itself is normally unobservable. Rather it is customary in the method of swarm analysis to find Q^ iteratively, by adjusting Q^ (and the cross sections for rotational, vibrational, and electronic excitation) until the
80

values of w and e calculated using these cross sections agree with the experimentally measured values.
In order to calculate w and e from the assumed cross sections, it is necessary to numerically compute the electron distribution function for the electron swarm experiments, since the function is decidedly non-Maxwellian over much of the range of experimental conditions (1-11 to 300 K, E/N-10~^^ to lO" ** V-cm^) . [This is in contrast to the situation in a coal-fired MHD plasma (T=2700 K, E/N-10~^^ V-cm ), where the electron distribution function is close to a Maxwellian.] The present analysis used a computer program developed by A. V. Phelps and associates [6,10] which numerically solves the Boltzmann equation for the electron distribution function using a backward prolongation method; the drift velocity and characteristic energy are then calculated by taking the appropriate averages of Qjj, with the distribution function [10]. The theoretical basis for these computations is the spherical harmonic expansion approximation [11-13], and is distinct from the Chapman-Enskog approach [14]. The fact that this theory can accurately predict the results of two different types of swarm experiments, over several decades of the independent variable E/N, is indeed a convincing argument in favor of the swarm analysis method and the resulting cross sections [8].
SWARM DATA
The electron drift velocity data used in this analysis (Fig. 1) are the measurements of Pack et al. [15] at T = 77 K from E/N = 1 -19 1 X 10-17 v-cm2, and at 300 K from E/N = 1 x 10 7 o 1 x 10^ the recent measurements of Milloy [16] at 293 K from 1 x 10" '' to 1
10 ^ - 1 6 .
- l e '
t o and
10' •15
I 0 ® r — I 1—r-q 1 1—rT-| 1 1—r-r-| r 100
l L . _ L
10"'^ 10" E / N ( V - c m 2 )
Figure 1. Electron drift velocity w (upper curve) and characteristic energy e = eD/y (lower curve) as a function of the ratio of applied electric field to gas density, E/N. The solid curves show data measured in electron swarm experiments and the points were calculated from the cross section of Table 1.
81

The latter results are approximately 10% larger than those of Pack et al. near 2 x lO'^^ V-cm^. The measurements of Wagner et al. [17] agree with those of Pack et al. for E/N < 1 x IQIC, and with those of Milloy at higher E/N. The magnetic drift velocity data of Skinker and White [18] from 3 X 10-IS to 1.6 X IQ-IS were of only limited usefulness in the previous analysis of Hake and Phelps [19] and have been disregarded here.
at
The characteristic energy data (Fig T = 77 K for E/N = 1 x IQ-l^to 1.8 x
1) are from Warren and Parker [20] IQ-l^; Skinker and White [18],
T = 288 K, E/N = 1.8 x IQ-IS to 1.6 x 10"l^. and the recent measurements of Lakshminarasimha et al. [21], which extend the range of available data to very high energies (E/N = 1.4 x IQ-l'*, e = II eV) .
In summary, experimental data for both drift velocity and characteristic energy are now available for carbon monoxide from E/N = 1 x 10" to 1 X 10"^^ V-cm^ (e=0.007 to 1.5 eV), with an estimated accuracy of approximately 5% over most of this range, increasing to perhaps 10% for e in the highest and lowest decades of E/N. The absence of drift velocity data for E/N > 1 X 10⁻¹^ makes the uncertainty in Qj somewhat larger for energies above about 1.5 eV (as discussed below). At these higher energies, it was necessary to base the present analysis on the ionization coefficient data of Lakshminarasimha et al. [21] and Bhalla et al. [22], in addition to the characteristic energy data just discussed.
RESULTS
The momentum-transfer cross section determined in this analysis is given in Fig. 2 and Table 1. For energies less than 0.3 eV, the cross section data of Spencer and Phelps [1] provide a good fit to the swarm data; these QJJ values are based on the previous swarm analysis of Hake and Phelps [19] and are in good agreement with the close-coupling calculations of Crawford and Dalgarno [23]. At energies greater than 0.3 eV, however, where recent measurements [16,21] provide new information, significantly better agreement with the experimental data is obtained by modifying the Spencer-Phelps cross section. In the range from 0.4 to 1.0 eV, we have increased QJJ, by approximately 7%, and in the resonance region from 1 to 3 eV, we have increased Qjj, by 25%. At higher energies, we have found that only a
Sf)
O a: o
s-\6 -J u J I I LjJ I I LjJ I I !_!_
0.001 0.01 o.l I 10 ELECTRON ENERGY(eV)
100
Figure 2. Momentum-transfer cross section Q^ for carbon monoxide, as a function of incident electron energy, from the present swarm analysis.
82

Table 1. Momentum-transfer cross section Qm for carbon monoxide, as a function of incident electron energy, from the present swarm analysis.
E
(eV)
0 0.001 0.002 0.003 0.005 0.007 0.0085 O.OIO 0.015 0.02 0.03 0.04 0.05 0.07 0.10 0.15 0.20 0.25 0.30
Qm (10~16 cm2)
60.0 40.0 25.0 17.7 12.3 9.8 8.6 7.8 6.5 5.9 5.4 5.2 5.4 6.1 7.3 8.8 10.0 II.2 12.1
E
(eV)
0.35 0.40 0.50 0.70 1.0 1.2 1.3 1.5 1.7 1.9 2.1 2.2 2.5 2.8 3.0 3.3 3.6 4.0 4.5
Qm (10-16 cm2)
13.0 13.85 15.4 16.5 18.5 28.8 38.8 43.8 37.5 25.0 18.8 17.5 15.8 15.1 15.0 14.6 14.2 13.8 13.3
E
(eV)
5.0 6.0 7.0 8.0 10. 12. 15. 17. 20. 25. 30. 50. 75.
100.
Qm (10-16 cm2)
12.9 12.3 11.8 II.3 10.6 10.4 10.2 10.1 9.8 9.1 8.6 7.1 6.1 5.5
cross section which decreases with energy provides a fit to the characteristic energy and ionization coefficient data.
The values of w and e calculated from the momentum-transfer cross section determined here are shown in Fig. 1. The agreement with the experimental data is good, approximately ±5% (i.e., within the estimated error in the measured values) except at very low and very high E/N(<4xl0-lS and >2xl0-i^ V-cm^) where the experimental data are somewhat less reliable and the agreement is within 15%. Over the range of primary interest for MHD calculations (O.I to 1.5 eV), the agreement is very close, ±1 to 2%. From these considerations, the values of Q^ given in Table I are estimated to be accurate within ±10% for energies of 1.5 eV and less, but at higher energies, where drift velocity data are presently available, the values could be in error by as much as 30%.
SUMMARY
The present swarm analysis for carbon monoxide confirms the momentum-transfer cross-section values of Spencer and Phelps [1] for electron energies less than 0.3 eV. At higher energies, including the range which contributes most to plasma conductivity integrals for coal-fired MHD, a substantial revision of the cross section was found necessary for consistency with new experimental swarm data.
83

ACKNOWLEDGMENTS
We thank A. V. Phelps for his consultation and continued interest in this work, and H. B. Milloy for providing the drift velocity measurements. This work was supported by the National Science Foundation through grant AER74-20552 and was undertaken at the JILA Atomic Cross Section Information Center, a part of the (U.S.) National Standard Reference Data System.
REFERENCES
[1] F. E. Spencer and A. V. Phelps, "Momentum Transfer Cross Sections and Conductivity Integrals for Gases of MHD Interest," paper IX.9, Proc. of the 15th Symposium on Engineering Aspects of MHD, University of Pennsylvania, Philadelphia, May 1976.
[2] A. V. Phelps in Defense Nuclear Agency Reaction Rate Handbook, M. H. Bortner and T. Bauer, eds.. Second Ed. (Department of Defense Nuclear Information and Analysis Center, Santa Barbara, Calif., 1972).
[3] Y. Itikawa, Planet. Space Sci. 19, 993 (1971).
[4] Y. Itikawa, Phys. Fluids J^, 831 (1973).
[5] F. E. Spencer, Jr., U.S.E.R.D.A., Pittsburgh (private communication).
[6] L. S. Frost and A. V. Phelps, Phys. Rev. 121_, 1621 (1962).
[7] R. W. Crompton, Adv. Electron. Electron Phys. 2]_, 1 (1969).
[8] B. Bederson and L. J. Kieffer, Rev. Mod. Phys. «^, 601 (1971).
[9] L. G. H. Huxley and R. W. Crompton, The Diffusion and Drift of Electrons in Gases, (Wiley, New York, 1974).
[10] P. E. Luft, "Description of a Backward Prolongation Program for Computing Transport Coefficients," JILA Information Center Report 14 (Joint Institute for Laboratory Astrophysics, University of Colorado, Boulder 1975).
[11] W. P. Allis, Handbuch der Physik _21, 383 (1956).
[12] T. Holstein, Phys. Rev. 10^, 367 (1946).
[13] H. Margenau, Phys. Rev. , 508 (1946).
[14] S. Chapman and T. G. Cowling, The Mathematical Theory of Non-Uniform Gases, Third Ed. (Cambridge University Press, London, 1970).
[15] J. L. Pack, R. E. Voshall and A. V. Phelps, Phys. Rev. 127, 2084 (1962).
[16] H. B. Milloy, Australian National University, Canberra (private communication).
[17] E. B. Wagner, F. J. Davis, and G. S. Hurst, J. Chem. Phys. 47 3138 (1967). —
[18] M. F. Skinker and J. V. White, Phil. Mag. _46, 630 (1923).
[19] R. D. Hake and A. V. Phelps, Phys. Rev. 158, 70 (1967).
[20] R. W. Warren and J. H. Parker, Phys. Rev. 128, 2661 (1962).
84

[21] C. S. Lakshminarasimha, J. Lucas and N. Kontoleon, J. Phys. D ]_, 2545 (1974).
[22] M. S. Bhalla and J. D. Craggs, Proc. Phys. Soc. London 2|. 38 (1961).
[23] 0. H. Crawford and A. Dalgarno, J. Phys. B 4_, 494 (1971).
85

ELECTRON MOMENTUM TRANSFER CROSS SECTIONS
FOR POLAR MOLECULES*
L. A. Collins and D. W. Norcross**
Joint Institute for Laboratory Astrophysics University of Colorado and National Bureau of Standards
Boulder, Colorado 80309
Rotational-excitation collisions between electrons and polar molecules such as H2O, SO2 and KOH are thought to play an important role in determining the plasma conductivity of MHD generators. The molecule KOH, even in small concentrations, may make a significant contribution to the total plasma reactivity due to its very large momentum transfer cross section. Since momentum transfer cross sections are difficult to measure experimentally over the range of operating temperatures of these devices, a theoretical approach for calculating rotational-excitation cross sections is desirable.
The most powerful approach to solving such a theoretical scattering problem is 1) to calculate an interaction potential (energy surface) for the electron-molecule system from a Hartree-Fock or other molecular structure calculation, and 2) to perform the scattering calculation in the close-coupling formulation.
For systems like KOH, such procedures become very complicated both in the molecular structure calculation, due to the large number of electrons, and in the scattering calculation, due to the highly anisotropic interaction potential. Thus, the development of techniques to simplify the form of the potential surface and the scattering formulation would allow a more economical application of current methods to KOH and a wider variety of systems.
The collision formulation has been treated quite thoroughly in previous studies [1] through the Born [2] and Glauber [3] approximations, the close-coupling technique [4], and various semiclassical methods [5]. However, for strongly polar systems, only model potentials based on the asymptotic form of the interaction due to the permanent molecular dipole have so far been employed. While in some cases the model potentials have been further constrained to reproduce certain physical properties of the molecule, such as the electron affinity, no systematic comparison of the cross sections calculated with the model potentials and the full potential surface, which the models approximate, has been made.
*This work was partially supported by the National Science Foundation (U.S.) grant AER74-20552. Many of the calculations were performed at the Los Alamos Scientific Laboratory.
**Staff member. Laboratory Astrophysics Division, National Bureau of Standards.
86

Our approach to developing general methods for calculating excitation and momentum transfer cross sections for electron collisions with strongly polar systems has been to carry out an exhaustive study using the close-coupling formulation for a typical molecule in order to test the validity of approximating the full potential surface by simple model potentials; and, should one or more of the potentials give accurate cross sections, to develop a systematic procedure for generating such model potentials. This is being performed in parallel with a study of the validity of various simpler approaches to the solution of the scattering problem.
To carry out this study, we have selected the lithium fluoride (LiF) molecule since its dipole moment is large (D = 6.58 Debye) and its Hartree-Fock charge density, from which a full static e-LiF interaction potential energy surface may be calculated, is available [6]. In addition to the fact that the LiF system closely resembles the strongly polar systems of interest to MHD projects (KOH is estimated to have a dipole moment of about 7.8 Debye), the system is computationally easier to handle. Even with this simplification, we have been forced to develop new techniques for extending existing close-coupling collision codes to the LiF system.
Fully quantum mechanical close-coupling calculations of the rotational-excitation momentum transfer cross sections for LiF have been performed for electron energies from 0.15 eV to 7.0 eV, thereby spanning the range typical of the MHD plasma and accessible to crossed-beam experimental measurements. A variety of potential energy surfaces for the e--LiF interaction were employed including several simple dipole cut-off (DCO) potentials, the full static (S) surface, and a surface constructed by adding a local, model exchange potential [7] to the full static surface (SE). Calculations were also performed for a point dipole potential in the Born (B I), unitarized Born (B II), and exponential Born (B III) approximations [8].
The results of the various calculations for e-LiF collisions are summarized in Figure 1 where we plot the total momentum transfer collision strength (EOj ) as a function of the energy of the incident electron E. We also include results from Glauber [9] (G) and semiclassical [10] (SC)
CM
^5U
200
150
100
50
n
1 1 1—1—r—T I I I 1 1 l l l l l l
BI
SC Bm S E ^ ' \
•' ^ s ^
_ G
1 1 -1 1—1—1 1 1 1
10- 10
E (eV)
Figure 1
87

treatments. The results for the DCO potentials vary by as much as 25% for reasonable choices of the parameters, but, in comparison with the results using a more elaborate potential surface (SE), seem to suggest that it may be possible to devise relatively simple representations for the interaction potential which yield acceptable accuracy.
An exception to this general trend occurs at about 2.0 eV, where a strong resonance is found in the momentum transfer cross section. There is reason to believe [11] that this resonance may be a common feature in electron scattering by alkali halides in this energy range, and may serve, if verified experimentally, to complement measured electron affinities as a tool for testing model potentials.
Finally, we find that the B I approximation overestimates the momentum transfer cross section by about a factor of three. Away from the resonance, the B II and B III results tend to span the close-coupling calculations, with the B II giving better results In the intermediate energy regime and the B III becoming a better approximation at low and high energies. For nonresonant collisions, the B II and B III approximations are correct to better than 40% over the energy range considered. Judging from other CC calculations using DCO potentials to represent CsF and KI [4,12], estimates made from the B II and B III approximations may be valid to this level of accuracy for a wide range of highly polar molecules.
In the approximation in which the rotational Hamiltonian is neglected (fixed point dipole), the collision strength in the Born approximations is
2 3 D(Debye)
Figure 2
88

independent of energy and depends only on the permanent dipole moment D of the molecule. In Figure 2 we compare the A coefficients (derived from swarm experiments [1] at thermal energies by assuming the form A/v^ for a.^) for a number of weak to intermediate strength polar molecules (0.25 ^ D, Debye .$ 4.5) with the results from the various Born approximations. TheB III approximation gives the best agreement for D above 3.0 Debye. Unitarization does nothing to improve the Born approximation for molecules with smaller values of D, for which interactions other than that with the molecular dipole are expected to be quite important [1].
The B I, B II and B III approximations yield the values for A of 105, 23.2 and 42.3 cm** sec-^, respectively, for D = 7.77 Debye, the estimated dipole moment of KOH [13]. Based on our results for LiF and those shown in Figure 1, we conclude that the B III result is likely to be the most accurate for electron energies typical of the MHD plasma.
We further conclude that the B III results are not likely to be any less accurate for KOH than might be obtained using other simple approximations, such as the Glauber or semiclassical techniques. In view of the range of the results obtained for LiF using several simple DCO potentials in full close-coupling calculations, it would also appear that the use of this relatively expensive computational algorithm cannot be expected to yield results of much greater accuracy for KOH unless the interaction potential is more accurately specified. Given the development in computational techniques achieved during the course of the work on LiF reported here, it is now possible to contemplate calculations for KOH at a similar level of sophistication.
Crossed beam measurements of electron scattering by KOH at low energies would be very useful in this regard. Preliminary measurements [14] of this type for the angular distribution of electrons scattered from LiF at 5.4 eV yielded very encouraging agreement with the present SE results.
The current study of LIF will be completed by: i) extending the calculations to lower and higher energies, ii) investigating the effects of neglected interactions such as polarization, and iii) carrying out calculations of the electron affinity of LiF using the several model potentials discussed above. Preliminary results in these areas include calculations using the DCO potentials for electron energies down to 0.15 eV, which confirm the trend shown in Figure 2; and calculations in the vicinity of the resonance with a model polarization potential added to the SE potential, which suggest that the resonance may be in fact -0.3 eV lower in energy and somewhat narrower.
This latter result is particularly interesting, since the presence of such a resonance in this energy range for KOH (the resonance seems to be intimately tied to the alkali member of the alkali halides [15], and hence may also appear in KOH) could make a significant contribution to the thermally averaged momentum transfer cross section for electron energies typical of the MHD plasma.
89

References
[1] W. R. Garrett, Molec. Phys. 2^, 465 (1972) and references therein.
[2] S. Altschuler, Phys. Rev. JL07, 114 (1957); 0. H. Crawford, A. Dalgarno and P. B. Hays, Molec. Phys. jL3, 181 (1967).
[3] 0. Ashihara, I. Shimamura and K. Takayanagi, J. Phys. Soc. Japan 38, 1732 (1975).
[4] 0. H. Crawford and A. Dalgarno, J. Phys. B 4., 494 (1971); Y. Itikawa and K. Takayanagi, J. Phys. Soc. Japan , 1254 (1969); A. C. Allison, J. Phys. B , 325 (1975).
[5] A. S. Dickinson and D. Richards, J. Phys. B 8, 2846 (1975); F. T. Smith, D. L. Heustis, D. M. Mukherjee and W. H. Miller, Phys. Rev. Lett. 15, 1073 (1975).
A. D. McLean and M. Yoshimine, IBM J. Res. Dev. 2^, 1 (1967).
Kara, J. Phys. Soc. Japan 22, 710 (1967).
J. Seaton, Proc. Phys. Soc. 21^, 174 (I960).
Shimamura, private communication.
S. Dickinson, J. Phys. B (in press).
D. Jordan and W. Luken, J. Chem. Phys. M^, 2760 (1976).
Itikawa, J. Phys. Soc. Japan , 619 (1976); L. A. Collins and D. W. Norcross, Bull. Am. Phys. Soc. 2] , 1257 (1976).
[13] F. E. Spencer and A. V. Phelps, "Momentum Transfer Cross Sections and Conductivity Integrals for Gases of MHD Interest," paper IX.9, Proc. of the 15th Symposium on Engineering Aspects of MHD, University of Pennsylvania, Philadelphia, May 1976.
[14] S. Trajmar, private communication.
[15] W. C. Lineberger, private communication.
[6]
[7]
[8]
[9]
[10]
[11]
[12]
A
sn
M
I
A
K
I
90
EVALUATION OF ELECTRON-MOLECULE COLLISION CROSS SECTIONS GOVERNING THE ELECTRICAL CONDUCTIVITY OF MHD PLASMAS*
J. L. Dehmer Argonne National Laboratory, Argonne, Illinois 60439
and
Dan Dill ^ Department of Chemistry, Boston University, Boston, Massachuset ts 02215
The current effort to develop efficient coal-fired MHD power gen.^ra-tors has created the need to evaluate real is t ic electron-scattering cross sections for many of the compounds of S, N, C, O, K, Si, e t c . , present in the MHD plasma. These bas ic cross sect ions govern the electr ical conductivity of the MHD system and are therefore required to effectively model i t s efficiency and to identify molecular species which are especial ly detrimental to i ts performance. Unfortunately the range of electron energies (0-10 eV) and the variety of molecular targets relevant to this problem are not straightforwardly handled by present experimental or theoretical methods. This has stimulated recent work to deal with various aspects of the problem, as ev i denced by the papers presented in this sess ion . The emphasis of the present work i s on flexibility so that a large sampling of important molecular targets can be treated in a rea l i s t i c , quantum-mechanical way regardless of the size of the target system. Here we report on the initial testing of the multiple-scattering method as a means of achieving the required flexibility in the c a l culation of cross sections for electron-molecule scat ter ing.
The formulation of a MSM approach to electron-molecule scattering and molecular photoionization is well documented elsewhere, 1'2 so we will give only a very brief summary of the method here . Briefly, the model is based on partitioning the molecular field into closely packed spherical regions centered on each atomic si te and one surrounding the molecule. The one-electron wavefunctions are obtained by enforcing appropriate boundary conditions at the nuclei and at infinity, and by requiring that the wavefunction and i ts derivative be continuous on the spherical boundaries in the molecular field. Hence, the wavefunctions have full molecular symmetry, are mutually orthogonal, and have the appropriate long-range behavior, e . g . , a phase-shifted outgoing-wave-normalized plane wave for electron-molecule scattering.
* Work supported in part by the U . S . ERDA. Alfred P. Sloan Research Fellow.
91

Moreover, the MSM accurately descrities tne uuciecu siiiyu±aixLies which are distributed throughout the molecular field. This is essent ia l to the real is t ic treatment of electron-molecule dynamics. The main drawback is the approximate form imposed on the potential In order to achieve separability of the multicenter molecular field. The usefulness of MSM in the study of molecular photoionization has already been demonstrated in our first appl icat ion:^"^ K-shell photoionization in N2 and CO. We were able to real is t ical ly reproduce the entire discrete and continuum experimental spectrum and interpret the novel features as shape resonances stemming from i = 2 and 3 components of the final-state molecular wavefunction.
We have just completed the first application of the MSM to electron-molecule scattering: integrated elast ic e-N2 scattering over the range 0-1000 eV. This system represents a stringent test of the MSM since the dist inctive TTg shape resonance at 2.4 eV has been well character ized ' and accurate absolute cross sections over the entire range are avai lable . Our resu l t s , reported fully elsewhere, ° can be summarized as follows: (1) Semiquantitative agreement is achieved over four decades of the incident energy spectrum; (2) Good agreement is obtained for the position and magnitude of the -n-g shape resonance at 2.4 eV incident energy; and (3) Subresonant features in the cr^^ and 5g channels are observed between 5 and 25 eV incident energy. This prototype study is very encouraging, although we are pursuing means to improve aspects of the computed cross sections which do not agree quanti tat ively with experiment, e . g . , the excess a cross section near zero incident energy.
Since our main thrust is to treat more complex systems, we have r e cently generalized our code to treat molecules of arbitrary symmetry in a symmetry-adapted bas i s . We now have some preliminary results on e las t ic electron scattering from SFe- The routine manner in which this 70-electron system was handled bodes well for extensive application of the MSM to the large variety of molecular species present in the coal-fired MHD system. The main features emerging from the e-SFs calculation are shape resonances in the t i „ , t2g, and eg elast ic scattering channels . There i s experimental evidence^ for the t i ^ resonance, although it was not identified as such. The other resonances have not been observed owing to the sparsity of data in the range 0-50 eV. It i s instructive to note that the dominant features in inner-shell photoionizationlO of SFe are closely related to these e-SFs resonances . The close interconnection between strong spectral features in photoionization and electron-molecule scattering is a very important tool for interpreting and gaining insight into continuum properties of molecules .
The work to date has concentrated on systems whose cross sections are dominated by short-range, electron-core interact ions. The results have indicated the wide-spread presence of shape resonances in the kinetic energy range from 0-10 eV and underline the need for a quantum mechanical treatment of this part of the problem. We are presenUy adapting our treatment of the
92

external field surrounding the molecule to enable incorporation of dipole, quadrupole, e t c . moments in our calculat ion. At this stage it will be appropriate to incorporate the frame-transformation techniques described by Chang and Fano^l in order to achieve a unified, efficient means of treating cases in which both long-range and short-range interactions contribute In a non-negligible way.
References
1. Dan Dill and J. L. Dehmer, J. Chem. Phys. 6^, 692 (1974). 2 . J. Siegel, Dan Dill , and J. L. Dehmer, J. Chem. Phys. 61 , 3204 (1976). 3 . J. L. Dehmer and Dan Dill , Phys. Rev. Letters 35., 213 (1975). 4 . J. L. Dehmer and Dan Dill , J. Chem. Phys. 65., 5327 (1976). 5. J . L . Dehmer and Dan Dill, Proceedings of the 2nd International Confer
ence on Inner-Shell Ionization Phenomena—Invited Papers, March 29 — April 2, 1976, Freiburg, West Germany, Eds. W. Mehlhom and R. Brenn (FakuMt filr Physik, UniversitSt Freiburg, Freiburg, 1976), p . 221 .
6. Dan Dill , J. Siegel, and J. L. Dehmer, J. Chem. Phys. 65., 3158 (1976). 7 . See, e . g . , G. J. Schulz, Rev. Mod. Phys. 45., 378 (1973). 8. Dan Dill and J. L. Dehmer, submitted to Phys. Rev. A. 9. A. Chutjian, S. K. Srivastava, and S. Trajmar, In: Electronic and Atomic
Col l is ions: Abstracts of Papers of the DCth International Conference on the Physics of Electronic and Atomic Col l is ions , Seatt le, Washington, 24-30 July 1975, Eds. J. S. Risley and R. Geballe (University of Washington Press , Seat t le , 1975), p . 137.
10. J. L. Dehmer, J. Chem. Phys. 5£, 4496 (1972). 11 . E. S. Chang and U. Fano, Phys. Rev. A £, 173 (1972).
93

* QUANTUM CHEMISTRY AND THE CHARACTERIZATION OF MHD SYSTEMS
Arnold C. Wahl, Walter B. England and Albert F. Wagner Argonne National Laboratory Argonne, Illinois 60439
Because the flame systems in a seeded, coal-fired MHD generator are so complex, cooperative efforts involving plasma modelling and plasma diagnostics are essential. Both the modelling and the diagnostic work require that the nature and role of the chemical species in the flame be identified. For instance, modelling requires thermodynamic and kinetic information, while spectral diagnostics requires spectroscopic information. For many important plasma components, such as highly reactive molecular radicals, refractory inorganic oxides, and negative molecular ions, this information is incomplete and not readily measured.
The properties necessary for the characterization of small molecular radicals, oxides, and negative ions can be reliably calculated by quantum chemical techniques. We shall document the ability of the ANL Theoretical Chemistry Group to do such calculations in this presentation. In what follows, we shall first describe the information which is needed for modelling and diagnostics, and then briefly describe the quantum chemical techniques which are used in the Theoretical Chemistry Group to compute the necessary information. Finally, we will review past and current Theoretical Chemistry Group calculations which are relevant to MHD.
MHD PLASMA MODELLING AND DIAGNOSTICS
Modelling
Modelling studies consist of constructing a simulation computer code to accurately predict both the composition and the electrical transport properties of the gaseous flame components. In most models to date, the composition is determined under the assumption that the system is in equilibrium. The required input therefore consists of equilibrium constants connecting all of the chemical species present. Equilibrium constants can be computed from partition functions which in turn are computed from the energetics of isolated chemical reactants and products. These energetics,i.e., internal energy level spacings, reaction energies, ionization potentials, and electron affinities, are the types of information quantum chemistry supplies. Non-equilibrium models of composition require rate constants which in turn require the energetics of both the isolated and interacting reactants and products. This information, i.e., the potential energy surface, can also be calculated, although with difficulty.
Given the plasma composition, electrical transport properties are derived from a generalized Ohm's Law. The three major transport coefficients included in that law are the conductivity, the Hall coefficient, and the ion slip coefficient. All three coefficients essentially depend on the mean time between the collisions of the electrons and ions with themselves, with
Work supported by U.S. Energy Research and Development Administration.
94

each other, and with the neutral species in the plasma. These mean times are in turn inversely proportional to momentum transfer cross sections. Such cross sections depend on the nonreactive portion of the potential energy surface. For the largest, most important cross sections, i.e., those for collisions between oppositely charged species or between a charged species and a neutral dipole, useful estimates of cross section size can be obtained from only a few critical parameters such as the dipole moment. Quantum chemical techniques can be used to calculate either these critical parameters or the entire potential energy surface.
Spectral Diagnostics
For composition measurements, spectral line positions are sufficient to identify the species under investigation. These positions are determined by the energy level spacings for nuclear and electronic motion (electronic excitation energies). Spectral line intensities are needed for density and temperature measurements. These in turn depend on dipole transition moments for emission, absorption and fluorescence spectroscopy, and on polarizability transition moments for Raman spectroscopy. These transition moments and the energetics can be determined with accurate quantum chemical calculations.
Summary
Quantum chemistry can calculate energetics (for the modelling and diagnostics of plasma composition), transition moments (for diagnostic measurements of plasma density and temperature) and critical features or the entire-ity of the potential energy surface (for modelling of plasma composition and transport coefficients). This information is frequently difficult to obtain experimentally for chemical species of MHD interest.
QUANTUM CHEMICAL TECHNIQUES
Quantum mechanics tells us of the wave-particle duality, i.e., that nucleii and electrons are not discrete particles, but wave-like particles whose probability of being found at a particular point in space is given by the square of the wavefunction at that particular point. The wavefunction is never directly measured by experiment, but it contains all possible information about the system. Observable quantities, called expectation values, can be computed from the wavefunction according to the rules of quantum mechanics.
There are two basic approaches to the calculation of observable quantities, the Schroedinger approach and the Heisenberg approach. The two approaches are theoretically equivalent, but operationally different. The Schroedinger approach computes wavefunctions directly from which the experimental observables are extracted according to the rules of quantum mechanics. The Heisenberg approach computes the observables directly. Until recently, the Schroedinger approach has received the most attention in quantum chemistry. Computer codes for both approaches are available at ANL.
A partial differential eigenvalue equation is solved in the Schroedinger picture. The eigenvalue is the energy and the eigenfunction is the wavefunc-
95

tion. Solutions are obtained by expanding the wavefunction in a set of known basis functions. By invoking the variational principle, namely that the best expansion coefficients are those whose variation gives no first order change in the energy, the partial differential eigenvalue equation becomes an algebraic matrix equation for the unknown expansion coefficients.
The usual procedure is to expand the many-electron wavefunction in terms of (many-electron) configuration state functions which are made up of one-electron functions called orbitals. The orbitals are further expanded in terms of known one-electron functions. The configuration state function expansion is limited to only one term in the Hartree-Fock Self-Consistent-Field method (HF-SCF), and its coefficient is set equal to unity. The orbital expansion coefficients are then computed self-consistently. The physical model described by HF-SCF is that of individual electrons moving in the average field of the other electrons. In the Configuration Interaction method (CI), the orbital expansion coefficients are fixed and the configuration state function expansion coefficients are obtained by a matrix diagonallzation. In the Multi-Configuration Self-Consistent-Field method (MCSCF), both configuration state function and orbital expansion coefficients are computed self-consistently. CI and MCSCF correspond to models where the instantaneous electrostatic fields acting on the electrons are taken into account.
The equations of motion (EOM) are based on the Heisenberg approach and are a new and promising way of directly computing excitation energies and ionization potentials. EOM can be thought of as a quantum mechanical generalization of the classical equations of motion for an oscillator. Simply speaking, in EOM an excited electronic state is visualized as being like the ground state except for the promotion of one particle into an excited level. This promoted state can be described in terms of a pseudoparticle oscillating in response to the forces from the unpromoted particles in the system. With this description a quantum mechanical oscillator equation can be formulated whose solution gives the oscillator frequency of the pseudoparticle and the excitation operator that creates the pseudoparticle from the ground state wavefunction. The oscillator frequency is the excitation energy and the excitation operator is the operator that converts the ground state wavefunction into the excited state wavefunction. An ionized electronic state can be similarly treated.
In order to apply the method, the ground state wavefunction must be known. The pseudoparticle operator is expanded in terms of primitive creation and destruction operators whose forms are specified according to whether the pseudoparticle is for excitation or ionization processes. Expansion coefficients for the pseudoparticle excitation operator are obtained by solving the EOM matrix equations. EOM incorporates the effects of the instantaneous fields acting on the electrons.
Each of the methods we have just discussed varies in cost and is appropriate for a particular set of problems.
96

COMPUTED RESULTS RELEVANT TO MHD APPLICATIONS
OH
Accurate theoretical potential energy and dipole moment curves have been computed for the X II state of hydroxyl radical [1]. The theoretical dissociation energy is 4.53 eV as compared to the experimental value of 4.63 eV. The computed dipole moment is 1.674 D, in excellent agreement with the experimental value of 1.66 D. Computed spectroscopic constants typically differ from experiment by "v 1%. This agreement is displayed in Table I.
Table I. Spectral Parameters for X Il; OH obtained from a least-squares Hulbert-Hirschfelder fit.
I' R (bohrs) D (eV) lu (cm ') m X i™ ') " (t:" ') "etc™ ')
The.iry 1.838 A.702 3723.6 83.15 18.79 0.628
Exptl .^ 1.834 4.63 3735.2 82.81 18.87 0.714
G. Herzberg, Moleiyular Spectra and Molecular Structure (Van Nostrand, Princeton, 1967), Vol. 1.
The theoretical dipole moment function was subsequently used to calculate the absolute intensities of the transitions of the OH Meinel bands [2]. These calculated intensities are considered more complete than and at least as accurate as available experimental information.
NaO
Potential energy curves, spectroscopic constants, vertical and adiabatic ionization potentials, electron affinity and excitation energies, dipole and quadrupole moment functions, and other properties were computed for the Na-0 system [3]. Most of these quantities have not been measured experimentally but the calculations are consistent with available information. Thermodynamic functions were computed from these results and the formulae of statistical thermodynamics. The thermodynamic functions were then used to provide thermodynamic data for reactions involving NaO and NaO as shown in Table II.
Table II. Computed thermodynamic properties for the ground state of NaO(R) •
-(G°-Ho°2/T (H°-Ho°)/T S° _ C. _ T (cal deg * (cal deg"'* (cal deg '* (cal deg ^'
(°K) mole ') mole ') mole ') mole"')
273.15 298.15 400 600 800
1000
45.97 45.61 48.83 52.00 54.33 56.17
7.36 7.43 7.66 7.98 8.18 8.31
53.33 54.04 56.49 59.98 62.51 64.48
8.11 8.21 8.48 8.72 8.81 8.86
AlO
Potential energy curves and spectroscopic constants were computed for several states of AlO [4]. Overall agreement with experimental spectroscopic constants is good (typically within 5%). However, computed band oscil-
97

lator strengths for vibrational transitions in the ground electronic state disagree with other theoretical studies [5]. In the absence of experimental results, reliable band oscillator strengths will require further theoretical computations of improved accuracy.
The dissociation energy of O2 can be used to determine the electron affinity of Ol via a simple Hess cycle. This is possible since the electron affinity of o" and the dissociation energy of O2 are well known. The dissociation energy of O2 has not been measured experimentally, but accurate theoretical computations performed in our laboratory give 4.14 eV for this quantity [6]. This gives a value of 0.42 eV for the electron affinity of O2, in good agreement with the experimental value of 0.43 ± 0.003 eV.
NO2
Potential energy curves and spectroscopic constants were computed for several low-lying electronic states of NO2 [7]. The spectroscopic constants are displayed in Table III along with available experimental information.
Table III. A summary of the theoretical spectroscopic pa-rameters of the low-lyinR doublet states of N02.^
T (eV) R (A) 8 (deg) Ui(cm"') lD2(cm~') M(D)
C^Aa
B^Bf
A^Ba
ic Ai
1.84
1.66
(1.83)
1.18
(1.48)
0.00
(0.00)
1.27
1.20
(1.23)
1.26
1.20
110
180
(180)
102
134
(1.1934)(134. 1)
1360
1192
1461
(1430)
1351
(1358)
798
960
(925)
739
(700)
758
(757)
0.05
0.00
0.46
0.37
(0.32)
The experimental parameters are included in parenthesis. Only those for the ground state are known to a high degree of accuracy experimentally.
The X^Ai and A^Ba theoretical parameters are derived from the OVC-CI calculations, as are also Rg and Tg for B^Bi and Tg for C A2. All remaining values were calculated at the OVC level.
A value of 0)3=2040 cm ' was also calculated for the B B) state.
In the case of the ground electronic state, very good agreement with experiment is obtained. This suggests that the excited state spectral parameters are likewise reliable, although, as Table III indicates, few firm experimental results are available for comparison.
CO 2
The electronic spectrum of CO2 was calculated over a wide energy range [8,9,10]. In the high energy Rydberg portion of the spectrum, quantitative agreement of the calculations with the measured spectrum was obtained permitting the assignment of previously unassigned levels. The low energy valence portion of the spectrum is optically forbidden but has been probed by
98

electron impact studies. The calculated levels agree with resonance peaks in these studies to within 5% and permit assignment of these previously unassigned levels.
cot
Recent computations suggest that an unobserved electronic state in CO2 may play an important role in the kinetics of ion-molecule reactions [8]. These computations can be displayed in the form of an adiabatic correlation diagram (ACD) shown in Fig. 1. An ACD is a partial map of reaction pathways. Figure 1 displays calculated electronic energy levels for a linear and a symmetrically bent CO2" molecule and for an infinitely separated (0+CO)''" collision system. There are well established theoretical rules, based only on the symmetry of the system, that allow the connection of these levels as points on a continuous potential energy surface. For example, if an 0 collides with CO" at an angle and penetrates to a close enough distance so that the three atoms are in a symmetrically bent arrangement, then the electronic states and the potential energy of the system transform according to the lines given on the right hand side of Fig. 1.
0—c—0
0 + CO
'D,V
Figure I. Adiabotic correlation diagram for COg—"(CO + O*
Photoionization experiments on CO2 produce a symmetric linear CO2 in the C^Z+ state which very rapidly dissociates to 0+('*S) + CO( E"''). Figure 1 shows no direct reaction path (dotted line) from C^S^ ' ^ ° ^^^ observed products. Figure 1 does fhow a low energy reaction path (dashed line)from '*II cot to the observed products. The calculations suggest that the observed fast kinetics is due to the near degenerate conversion of C Z+ CO2 to 11^ CO2", followed by a steep downhill path to dissociated products.
SUMMARY
The above calculations demonstrate a capability of accurately obtaining information on the energetics, transition moments, and potential energy surfaces of small molecules of MHD interest. Such information can be of direct use to those involved in modelling and diagnostic studies.
99

REFERENCES
1. W. J. Stevens, G. Das, A. C. Wahl, M. Krauss and D. Neumann, J. Chem. Phys.,^, 3686 (1974).
2. F. H. Mies, J. Molec. Spectros.,53, 150 (1974).
3. P. A. G. O'Hare and A. C. Wahl, J. Chem. Phys.,56, 4516 (1972).
4. G. Das, T. Janis and A. C. Wahl, J. Chem. Phys.,^, 1274 (1974).
5. M. Yoshimine, A. D. McLean, and B. Liu, J. Chem. Phys. ,_54, 2573 (1971)
6. W. T. Zemke, G. Das and A. C. Wahl, Chem. Phys. Lett., lA, 310 (1972).
7. G. D. Gilllspie, A. U. Khan, A. C. Wahl, R. P. Hosteny and M. Krauss, J. Chem. Phys., M^, 3425 (1975).
8. W. B. England, B. J. Rosenberg, P. J. Fortune and A. C. Wahl, J. Chem. Phys. 65, 684 (1976).
9. W. B. England, W. C. Ermler and A. C. Wahl, J. Chem. Phys., , 2336 (1977).
10. W. England, D. Yeager and A. C. Wahl, J. Chem. Phys., 66, 2344 (1977).
100

SEMICLASSICAL PERTURBATION SCATTERING THEORY: MOMENTUM TRANSFER IN ELECTRON-POLAR MOLECULE COLLISION PROCESSES
F. T. Smith, D. Mukherjee, and A. P. Hickman Molecular Physics Center, Stanford Research Inst i tute, Menlo Park, CA 94025
The res is t iv i ty of the MHD plasma depends strongly on electron-molecule co l l i s ions , and particularly on the interactions of electrons with polar molecules such as KOH and H2O. Specific quantities which can be calculated are the differential scattering cross section (da/dO), the cross section for rotational excitation or de-exci tat ion CTJIJ, and the momentum transfer cross section a"^*, which is defined by
mt r der , _ « » . « , „ ^ = \ II ( 1 - c o s 6) sin Ode .
0 ^®
Until recently, es t imates of these quantities have been based almost entirely on the Bom approximation.^ This gives a simple formula depending on such parameters as the electron kinetic energy, the molecular dipole moment and moment of iner t ia , and the rotational s t a t e . From these cross sec t ions , thermal (or non-thermal) averages , r a t e s , and transport coefficients such as the res is t ivi ty can conveniently be obtained. These have provided the foundation for most res is t iv i ty calculat ions for MHD plasmas .
However, recent ev idence^ '^ indicates that the Bom approximation, while often rel iable for rotational excitation cross sec t ions , may overestimate the momentum transfer cross sect ions by as much as a factor of ten for molecules whose dipole moments are large (~ 7—10 debye). In this paper we will d i scuss the resul ts of a number of calculations with the newly-developed semi-c lass ica l perturbation scattering theory.^ This theory provides an extremely rapid means of computing scattering cross sections compared to such formally exact methods as quantum mechanical close coupling, and in most cases yields resul ts of much higher quantitative accuracy than the Bom approximation.
The bas ic features of the theory have been presented e lsewhere . Briefly, however, the theory combines the semiclass ica l S-matrix theory of Miller^ with c l a s s i ca l perturbation dynamics. The bas ic physical assumptions are that most trajectories are characterized by a small scattering angle, and that the interaction potential can be described by a simple analytic form such a s a dipole . For the case of polar molecules , these assumptions hold quite well because of the very long-range nature of the dipole interaction. A s ig nificant part of the scattering seems to be due to "distant" coll isions in which the incident electron does not penetrate the charge distribution of the target molecule, but only experiences the dipole field.
101

The following table exhibits the resul ts of several calculat ions in which the results could be compared with more elaborate techniques . We give the momentum transfer cross sections for 2.0 eV electrons incident on LiF, broken down into the components for several rotational transit ions out of the ground s t a t e .
mt ^0-*0
mt ^ 0 ^ 1
mt ^0-^2
mt ^ 0 - 3
Sum
Close Coupling
Static potential
26.4
34.1
35.6
14.6
110.6
Finite dipole
29-53
26-49
23-32
14-26
113-142
SPS (present)
Pure dipole
12.2
32.6
23.4
4 .7
72.9
Bom
Pure dipole
0
381
0
0
381
The close-coupling results are for the full potential due to the s ta t ic charge distribution of the molecule, and for an approximation based on a d i pole of finite length. The important points to notice are that the Bom result contains only a contribution from j = 0 to j = 1, and that the present calculations are much closer to the more elaborate calculat ions.
It i s convenient to d iscuss our detailed computational resul ts by l i s t ing the quantities upon which a" * depends. These are (1) the collision energy E, (2) the dipole strength p., or equivalently (for electrons) 3 = j i(debye)/2.542, (3) the rotational quantum numbers j ^ and jf, o r 7 = | Oi + Jf) and A i = j f - J i , and (4) the spacing of the rotational energy leve l s , which is related to the dimensionless parameter a = fi2/(2IE), where I i s the moment of inertia of the molecule.
Our results so far indicate that a"** i s nearly proportional to 1/E for a wide range of all the parameters, just as in the Bom approximations. The major dependence is on P, and in this case we see in particular that the Bom approximation is valid only for P £ 1, whereas the present approach does not have this limitation. This i s shown in the figure. The collision strength n is proportional to the energy E times the momentum transfer cross sec t ion . The results were obtained by varying the dipole strength of a molecule whose moment of inertia is that of CsF, and whose rotational quantum number is about 40, but the numerical values change very l i t t le over a wide range of these two parameters.
102

10.0 cr
CM
c £ cn c o
"o o
in C
E 3 * j C O)
E o
Gl
1.0 —
0.1 —
0.01
CM
0.001 0.01 0.1 1.0 10.0
n = " h 2 "
F i g u r e 1
In making pract ical calculat ions of plasma conductivity, i t i s very important to be able to predict the contributions to the res is t ivi ty from electron coll is ions with the various molecules in the mixture. Molecules with large dipole moments make the major contribution, and this can be estimated by u s ing the ideal ized model of a collision with a pure dipole molecule. Through the use of scaling rules based on the important dimensionless parameters of the problem, the resul ts of various calculat ions and measurements can be compared and predictions made for any other molecules for which key properties l ike the dipole moment and moment of inertia are known. There are only four inde pendent variables—for scal ing, these can be taken as P = mjxe/ti^, g = a(j + ^ ) , 4 j , and ( j + i ) . The cross sect ions sca le in the form of the collision strengths n which are both dimensionless and independent of the sign of Aj:
«Aj = "AJ ( P , g , j + i ) = 2mE
Aj
2j^ + l
2j + l
103

As Fig. 1 i l lus t ra tes , at small P the n ' s depend on P as
" A J ^ O ° ^ P ^ ' ^ ' ' ^ ^ ^ " A J = O"^'^^'
so that |AJ I = 1 dominates in the small-P limit. This corresponds to the first Bom approximation's selection rule Aj = ± 1 and i ts P^ factor. The figure a lso shows the departure from this power law In P for p ^ 1. This behavior i s seen in the large-p trend in the experimental data compiled by Garre t t . " Both this general trend and the size of the relative contributions from the various Aj components are in substantial agreement with what Is seen in quantal c a l -culations2»3 (allowing for differences due to detai ls of the potentials used) .
The trends shown in Fig. 1 at large P ( » 1) suggest that , with some osci l la t ions,
n '. ' — constant (~ 1 or 2),
and perhaps that
"total = ?. "AJ -^ ~ P • AJ
w^p-^s^"";*: = - ^ y (1-t o t a l TT Ll e V.
AJ
_ 1 2j + l
In fact,
j ^ m . t . ^ _2E_ y ^ m . t . Aj TTiJie V . Aj
AJ large j)
is a c lass ical (dimensionless) quantity, and dependent (in the c lass ica l limit) at most on the two parameters B = m|JLe/2IErot = P (J + i ) " 2 and e = E^-Q^/E = gO" + i ) . Further calculations will be needed in the large-p (classical) limit, and to delineate the details of the oscillatory component. Preliminary indications are that the dependence of Won B and e is very weak, and a lso that the dependence of the n^j^- on g is very weak for small as well as large p . The same thing holds for the j -dependence , which rapidly disappears at large j ,
being due to a small additive term proportional to (j + i ) - l that we have found negligible for j ^ 5 (the Bom approximation does not show a j -dependence separate from the g-dependence at a l l , and probably overestimates the low-j cross sections as a resul t ) .
Our tentative conclusion i s that the total momentum transfer cross section for electrons with any highly polar molecule in a rotational level j> ,5 and at any collision energy E can be estimated from the curve "SPS total" in Fig. 1. For a simple numerical approximation, one can use
2Ea"^-*-W ^ ^2iL
Tr|jie
fp ^^-T.s^-^^ 1.5 (0 .6 < p < ( j + i ) 2 )
104

For small dipole moments (P < 0. 6), this is just the Bom expression. For the molecules with larger dipole moments that are important for the MHD conductivi ty, the momentum transfer cross section and the resis t ivi ty will be l e s s than the Bom prediction. Since the average rotational level i s always expected to satisfy the condition CT+i)^ » P, the second approximation, W ^ 1.5, can be used .
This conclusion can be stated in another way by comparing the SPS result with Bom approximation:
, _ miJie ^ 9 m . t . ^ ^m. t .
, o . 9 m . t . 16 m. t . ^^'•P" I ^ ' ^ot ^ ^ ^ B •
Since the energy dependence is unchanged from Bom, thermal and other averages such as appear in the res is t ivi ty (proportional to a^-^-) or in the electron mobility and conductivity proportional to 1/a!"•*•) can be scaled very simply from the standard expressions based on the Bom model by using the multipl icat ive factor 16 tl 2/9 m|Jie (or i t s reciprocal) when P is large. In particular, the res is t iv i ty i s l inear in the dipole moment in the large-p (classical) region, and quadratic in the small-p (Bom) region.
In summary, the value of semiclass ica l perturbation scattering theory is that it can provide a rapid means of surveying the momentum transfer charac ter i s t ics of a large number of polar molecules . The results should be of sufficient accuracy to be of significant help in modelling the behavior of an MHD plasma.
This work has been supported in part by ERDA under contract AT(04-3)-115, P/A No. 84, by NSF under Grant CHE-7622621, and by AFOSR under contract F44620-75-C-0073.
References:
1. O. H. Crawford, A. Dalgarno, and P. B. Hayes , Molecular Physics 13, 181 (1967).
2 . Y. It ikawa, J. Phys. Soc. Jap. 4^, 619 (1976); O. Ashihara, I . Shimamura, and K. Takayanagi, J. Phys. Soc. Jap. 38., 1732 (1975).
3 . L. A. Collins and D. Norcross, Abstract for MHD Conference. 4. F . T. Smith, D. L. Hues t i s , D. Mukherjee, and W. H. Miller, Phys. Rev.
Lett. 35., 1073 (1975). 5 . W. H. Miller, J. Chem. Phys. 54., 5386 (1971). 6. W. R. Garrett , Molec. Phys. 24., 465 (1972).
105


MATERIALS
H. U. Anderson, Co-chairman
University of Missouri-Rolla
H. K. Bowen, Co-chairman
Massachusetts Institute of Technology


MATERIALS ENGINEERING AND DESIGN FOR COAL-FIRED MHD POWER GENERATORS
L. M. Raring Chief, Components Development Branch
Division of MHD, Fossil Energy U.S. Energy Research and Development Administration
Washington, D.C.
The strong national incentive to produce electricity directly from coal underscores magnetohydrodynamic (MHD) development. Independent studies have predicted coal-to-busbar efficiencies of 48-50 percent or more for combined open-cycle MHD steam systems [1] . These same studies estimated cost-of-electricity for a number of advanced energy conversion systems based on fossil fuel: The coal-fired MHD steam combinatio.1 was lowest. Moreover, this MHD system could use high sulfur coal with no additional stack gas clean-up because sulfur is removed in the MHD power cycle.
In considering materials for MHD power, two related observations become obvious: First, materials are crucial to commercial success; and second, material stresses, particularly in the generator, are unique. It should be noted also that the MHD "electromagnetic turbine" has no direct precursor in established power conversion technology.
As discussed in detail by other contributors to this conference, MHD power generation is based on the direct conversion of heat to electrical energy by expanding a heated, electrically conducting fluid through a magnetic field. Thus, the essential difference between an MHD generator and a conventional turbine-driven generator is that in the MHD generator the rotor is replaced by a high velocity, ionized working fluid.
We will consider the nature of the chemical, thermal, and electromagnetic stresses which prevail at various critical surface and subsurface regions of the generator interior walls from the viewpoint of the Materials Engineer. These stresses, in fact, dictate the essential design requirements for generator materials. No attempt will be made to explain electromagnetic phenomena. Reference 2 is recommended for source study of underlying electrodynamic and fluidynamic theory.
The critical function of the electrodes is to collect electric charges from the plasma. This is the first link in transporting current to the external load. Internal current flows from anodes across the core to cathodes and thence through the load circuit back to anodes. In passage across the core, the current transverses boundary layers (including the slag coating) on both electrodes. High conductivity is important to avoid excessive Joule losses.
In addition to the necessity for transverse current transport across the core, the wall structure must prevent current leakage in the axial direction. This requires that each electrode pair be electrically isolated from its upstream and downstream neighbors. The interelectrode Insulator, which serves this purpose, must be capable of withstanding potential differences of
107

up to 70 or 80 V. In some electrical designs, transverse current leakages must be blocked also between active sidewall elements at different potential levels.
Under generating conditions, MHD electrodes function somewhat similarly to those of a common battery. Electrochemical influences are analogous even though thermochemical and electrodynamic conditions are vastly different. The critical importance of interelectrode insulation also adds an additional dimension.
Electrochemical effects in the MHD channel are felt principally in the concentrations of positive ions at the cathode and negative ions at the anode. Seed flow, coal chemistry, slag carry-over, and combustion conditions all influence the species and concentrations at the electrode (and adjacent insulator boundary). The most aggressive species, as will be illustrated later, are oxygen at the anode (for metallic systems) and potassium, calcium, and iron at the cathode.
The electrodes present conflicting demands of temperature and current transfer. Higher temperatures minimize Joule losses in the boundary layer (slag and plasma) but accelerate chemical and structural degradation (electrically driven or otherwise). Lower temperature electrodes show opposite effects. High temperature electrodes, to promote "diffuse" current transfer, drive material selection choices to refractory cermets or ceramics. The principle constraint on high temperature, ceramic electrodes, are associated with electrochemical stresses, especially at the cathode surface where potassium species become aggressive. Slag becomes a lesser factor simply because it is difficult to maintain a significant slag coating at temperatures above about 1700C. Other thermally-dependent restraints on "hot" ceramic walls are imposed by structural stability and electrode-insulator compatibility characteristics. Electrical conductivity must be essentially electronic and this sharply limits the choice of material. The steep transverse thermal gradient experienced across the ceramic body dictates a low thermal coefficient of electrical conductivity.
Clean fuel, hot ceramic, electrode tests were conducted in the USSR U-02 test facility, a small-scale model of a complete MHD plant [3]. Thermal capacity is approximately 5 Mw and mass flow close to 1 kg/sec. The test assembly consists of 30 electrode pairs in a rectangular Faraday array.
Two series of tests were conducted, the first of which included electrodes made from (in mol percent) Zr02-12 Y2O3, three binary ZrOz-CeOz compo-compoaitions between 18 and 75 Ce02, and one ternary Zr02-75 Ce02-2 TaaOs composition. The second series' electrodes included a graduated composition, varying between Zr02-35 Ce02, at the gas side, to Zr02-78 Ce02-2 TazOg at the back side. Other electrodes were monolithic ceramics of each of the following compositions: ZrO2-50 Ce02, MgAl20i+-25 FeaOit, and two variants on a LaMgCrOa composition, e.g., LaQ.ggMgo.QsCrOj and LaMgo.05Cro.95O3- In the rirst series of tests, current lead-out was provided by brazing a platinum screen to the back side of the electrode. The platinum lead-out wire was welded to this screen. In the second series of tests, lead-out materials included platinum, inconel, and copper. Several different attachment methods were employed.
108

Electrode surface temperatures during the first series were calculated as between 1650C and 1800C, depending upon location along the approximately .5 m length of the electrode wall. Front end cathodes were hottest, with cathodes approximately 50 to lOOC hotter than anodes. Imposed voltages were regulated on each electrode pair separately to produce a specific current density level. The four electrode compositions could, therefore, be tested under four separate levels of current density ranging between 0 and 1.2 amps/cm^. Test time was 94 hours.
Post-test analyses were performed by the National Bureau of Standards [4]. Analytical data showed, generally, that:
(a) Maximum potassium concentrations were identified in regions adjacent to the interface between the electrode base and the MgO insulator cup. Lesser concentrations were noted in side wall interface regions near the bottom of the electrode. Potassium concentrations decreased to negligible levels in interface regions closer to the plasma surface. This selective concentration of potassium strongly suggests: (1) gaseous transport of K2CO3 through the relatively porous zirconia phosphate cement between the electrode and MgO, and (2) condensation of K2CO3 in the cooler (700-1300C) regions at the base of the electrodes and below.
(b) While the zirconia phosphate cement interface was probably the principle path of K2CO3 penetration, transport is believed to have been further facilitated by porosity in the MgO insulator, phase changes in the insulator and certain electrodes, and cracks in the MgO insulator. Evidence for these hypotheses are: (1) significant concentrations of K in the small grained, porous areas surrounding larger grains in the MgO structure, (2) XRD evidence of phase changes in certain electrodes and MgO insulators concomitant with potassium deposits, and (3) presence of potassium in cracks which originated at the corner between the side wall and base of the MgO cup.
(c) The effects described in (a) and (b), above, were much more pronounced on the cathode wall than on the anode wall. Considering the cathode wall only, the Zr02-Ce02 electrodes were most noticeably affected. Electrically loaded electrode pairs were affected more than those which did not carry an electric current.
(d) The degree of swelling and fragmentation of electrodes (i.e., protrusion above the original wall surface) was related qualitatively to potassium concentrations in the subsurface insulator-electrode interface regions. Thus, cathodes were much more affected than anodes; the equi-molar Zr02-Ce02 cathode showed the most severe damage, and electrical loading was again associated with intensified damage.
Simulated coal-fired tests are being conducted in a channel modeling experimental generator test rig, designated the Mark VI, by the AVCO Everett Research Laboratory, Inc. [5]. Essential elements of this test rig comprise an oil-fired combustor; the channel including the inlet nozzle and diffuser; instrumentation and controls; and a 30,000 gauss water-cooled iron core magnet . The channel was operated supersonlcally to obtain maximum power levels available with a 3T field. This was necessary to ensure that MHD stress levels would most nearly simulate base load central station duty conditions.
109

("MHD stress" is used here to express the engineering design conditions which generator materials would be required to sustain, analogous to the combined hot-corrosion, fatigue, and creep-rupture environment imposed on gas turbine materials.)
The Internal elements of the channel are mounted on fiberglass walls to form 108 segmented frames at an average angle of 45° relative to the channel axis. Each frame consisted of six electrically discontinuous inconel elements. Two different thermal designs were selected to provide electrode surface temperature of 540C and 1095C under operating test conditions.
Seed was injected as K2CO3 either dry or in an aqueous solution. Fly ash was Injected at a rate to simulate 25 percent ash carry-over from a coal combustor. The test was shut down after 103 hours of continuous thermal operation. Power levels of 200 kw or more were achieved over the first 98 hours. Average power density was 5 Mw/m^ with a peak density of 12.5 Mw/m . Maximum current density was approximately 1 amp/cm^ with Hall voltages up to 1500 v/m. The degradation of output power, beginning at hour 95, from above 200 kw to 100 kw, indicated a water leak and the test was terminated for this reason.
Post-test analyses were performed by the National Bureau of Standards [6]. The post-test analytical data differentiates between thermal and polarity effects. Major findings were:
(1) On the anode wall, electrode degradation was associated with oxidation. This is circumstantially demonstrated by comparison of erosion rates of the 540C and 1095C designs. The latter were much more severely attacked — eroded, in fact, to an extent approaching the heat transfer condition of the 540C design. Comparison of erosion rates as a function of current density suggests that anode oxidation is significantly reinforced by electrochemical activity.
(2) The dominant erosive force on the cathode wall was, most probably, an intense electrochemical stress concentration at the leading edge of the cathode. This view is supported by gross similarities in the nature of damage sustained by the two thermal designs. The 1095C design exhibited the same general type and localized concentration of erosion as the 540C design. The localized current concentration at the leading edge eroded the copper leading edge in both cases.
(3) Clear evidence of thermal influences are also recognizable in the cathode wall, e.g., the 540C design was less eroded than the 1095C design. However, the 1095C cathodes were not nearly as eroded as the 1095C anodes, pointing again to the strong oxidation potential at the anode, as would be expected. An additional source of thermally associated damage is exhibited in the potassium and calcium attack on the 1095C cathodes. The 540C cathodes, operating at lower temperature showed no such damage.
More recent tests of metal electrodes in the Mark VI experimental generator indicate that "cold" copper electrodes (<500C) are far superior to higher temperature, lower thermal conductivity materials. A series of four 20 to 25 hour tests showed negligible erosion of copper cathodes. Copper
110

anodes eroded on the leading edge but to a far lesser extent than nickel or cobalt base alloys of lower thermal conductivity. The presence of slag on the cold anode wall accelerates erosion (oxidation) of the leading edge. The relatively high thermal conductivity of TlNl (as compared to other Ni base alloys tested) was reflected In superior anode performance.
These tests exemplify the broad range of design conditions which are presently being considered in open cycle MHD generator development. In a simplistic view, the high temperature, ceramic material approach minimizes electrodynamic (arcing) stresses but intensfies chemical and electrochemical activity. Chemical reactivity of the seed with insulators, high temperature structural instabilities, and solid state diffusion are all potential threats to durability. Another potential source of trouble is the interface between the metal lead-out and the ceramic electrode. Thermal design presents here a delicate balance between conductivity of the ceramic and thermal resistance of the metal.
Contrasted with the high temperature ceramic design, the low temperature slag electrode system minimizes gross thermally-dependent chemical and electrochemical attack, but does not effectively eliminate the locally intense attack which presumably results from current concentrations or arcs at electrode edges. Experimental evidence strongly suggests that damage from this source can be considerably reduced by lowering the electrode temperature. Colder inconel anodes (540C) showed much less oxidation than warm (1095C) anodes. Similar improvement was observed in inconel cathode erosion (presumably by K attack) and Insulator damage. Additional evidence is available in the Improved performance obtained with cold copper electrodes. Evidently, the localized thermal spike produced by an arc (or current concentration) is less damaging when thermal diffusivity is highest. This points to the importance of high thermal conductivity insulators. The arcs, or current concentrations, typically appear at electrode edges, adjacent to the insulator. Rapid diffusion of these thermal effects depends strongly on both insulator and electrode temperatures and conductivities. Boron nitride is showing considerable promise for this purpose. Even higher conductivity, such as is available in BeO, could be expected to further dissipate arc heating at electrode edges. Another major advantage of such a high thermal conductance insulator is that the temperature of the slag, at the insulator surface, would be lowered. This would increase electrical resistivity across the interelectrode gap.
In a greatly simplified manner, then, engineering design selection between "hot" ceramic and "cold" metallic electrodes may translate to a choice between: (a) high temperature electrochemical problems involving a relatively narrow group of electronic conducting ceramic electrodes and dense, chemi-ally, inert and structurally stable ceramic insulators, and (b) mitigation of the destructive effect of arc discharge through rapid heat dissipation by a highly thermally-conductive electrode-insulator combination.
Ill

REFERENCES
1. Seikel, G. R., et al.. Proceedings of the Fifteenth Symposium on the Engineering Aspects of Magnetohydrodynamics, Philadelphia, Pennsylvania, May 24-26, 1976 (Available from Dr. John Fox, Department of Mechanical Engineering, University of Mississippi, University, Mississippi 38677).
2. Heywood, J. B. and G. J. Womack, Eds., Open Cycle MHD Powpr Generation, Pergamon Press, Oxford, England, 1969, pp. 395-465.
3. Rudlns, G., Defense Advanced Research Projects Agency Report R-1404-ARPA, January 1974, ARPA Order No.: 189-1, pp. 32-34.
4. Jackson, W. D., S. Schneider, et al.. Proceedings of the Fifteenth Symposium on Engineering Aspects of Magnetohydrodynamics, Philadelphia, Pennsylvania, May 24-26, 1976.
5. Petty, S., A. Solbes, et al., Proceedings of the Fifteenth Symposium on Engineering Aspects of Magnetohydrodjmamics, Philadelphia, Pennsylvania, May 24-26, 1976.
6. Hosier, W., T. Negas, et al.. Proceedings of the Fifteenth Symposium on Engineering Aspects of Magnetohydrodynamics, Philadelphia, Pennsylvania, May 24-26, 1976.
112

CERAMIC MATERIALS IN THE MHD CHANNEL
B. R. Rossing, J. H. Smith and L. H. Cadoff Westinghouse Research and Development Laboratories
Pittsburgh, Pennsylvania 15235
The development of an MHD generator (also termed the channel or duct) that can efficiently convert the thermal and kinetic energy of coal combustion gases into electrical energy for thousands of hours must be designated as the critical pacing item in the MHD system. The heart of the generator is an electrode system which allows for current transfer between the hot plasma core and the external load. There are many materials that have the required properties to function as either electrodes or insulators; however, the combination of high temperatures, slag and seed, high velocity gases, high thermal fluxes, high voltages, etc., will degrade the performance of most materials to unacceptable levels in only a few hours. The longest operation of electrodes using clean fuels is slightly more than 300 hours. While there is a general lack of long-duration testing under coal-fired conditions, it may be estimated that presently available materials may be operable for 100-200 hours. Therefore, the lifetime of electrodes and insulators must be increased by more than an order of magnitude to make coal-fired open-cycle MHD power generation a commercial reality. This must be accomplished by taking a holistic approach to the entire electrode/plasma system and to those processes that would degrade channel materials during operation. Materials selection, electrode design and generator operating conditions should be contingent upon considerations to avoid, or at least, minimize the effects of these processes.
This presentation will review the current understanding of channel material performance with particular reference to the degradation processes that may limit electrode-insulator (and generator) lifetimes.* Emphasis will be placed on the results of tests conducted over the past two years in the U.S. and in the U.S.S.R. on electrode and insulator materials. These tests have been carried out over a wide range of test conditions; in particular, where the wall temperature and ash content of the fuel have varied from very low to very high. These tests have been invaluable in defining the importance of various degradation processes. An understanding of channel material performance, in turn, will aid the materials specialist and electrode designer in the selection and use of electrode and insulator materials.
*Degradatlon will be used here in a broad sense to cover those processes leading to eventual inoperability of either electrodes or insulators.
113

PROGRESS IN THE TESTING OF REFRACTORIES FOR DIRECTLY-FIRED MHD AIR HEATER SERVICE, II *
J. E. Fenstermacher Jr., L.R. White, and R. R. Smyth
FluiDyne Engineering Corporation Minneapolis, Minnesota 55422
ABSTRACT
Previous test work on commercially available refractories demonstrated that magnesia-chrome and spinel-bonded magnesia bricks have superior corrosion resistance to the harsh environments that are expected to exist in directly-fired MHD air heaters. However, commercially available magnesia-chrome materials withstand neither the alternating oxidizing-reducing atmospheric conditions nor the thermal fluctuations that will occur in an actual MHD air heater system. Accordingly, the work described here has been focused on developmental refractories that are based on the MgO-Al O system. Simulative corrosion tests on such materials suggested that magnesium aluminate spinel is better suited for MHD air heater use than is magnesia, and subsequent SEM/EDX observations of corroded specimens confirmed this. These results are being used to guide the refractory development program toward improved spinel-based products.
INTRODUCTION
Progress in testing of ceramic materials for application in directly-fired MHD air heaters is reported. The test program is directed toward the development of an air heater system of the regenerative multiple-fixed-bed type. In such a system, each heater module is alternately heated by the MHD gas stream and cooled by the combustion air stream. The major development problems are caused by the presence of seed and ash in the gas stream. Ceramic materials that are resistant to corrosion under these conditions are needed and the heaters must be designed so as not to become plugged by seed and/or slag.
The tests have consisted of exposing material specimens to flowing gases that simulate the conditions that would exist in an MHD coal-fired power plant.
Test apparatus is shown in Figure 1 and is designed to simulate at least partially the conditions which will exist in an actual heater. Test bars and a small matrix have been exposed in cyclic fasion to a reducing gas stream laden with seed and slag at ' 1900 K and to an oxidizing stream at 'V' 1750 K. Seeding level was 1 w/o. Ash level was at 0.1 w/o and approximated 15% ash carry-overfrom a 15% ash coal. Both Montana and Illinois coal have been used.
*"This report was prepared as an account of work sponsored by the United States Government under ERDA Contract E(49-18)-2254. Neither the United States nor the United States ERDA, nor any of their employees, nor any of their contractors, subcontractors, or their employees, makes any warranty, express or implied, or assumes any legal liability or responsibility for the accuracy, completeness, or usefulness of any information, apparatus, product or process disclosed, or represents that its use would not infringe privately owned rights".
114

Test results have shown that magnesia alumina and magnesia chromia spinels resist corrosion due to the MHD environment better than any other refractories tested. Test results obtained prior to March 1976 have been summarized before . The spinels noted above have been studied fairly extensively over the past year. Magnesia alumina spinel is currently regarded as the best material for air heater service.
RESULTS
Test results have consisted of visual observation along with measurements of weight and length change, porosity, and sag. In general, increases in weight and length and decreases in porosity have been observed. Seed and slag are absorbed by the test specimens and cause the weight and porosity changes noted above. Dimensional changes and sag have been observed due to exposure to high temperature alone. The specimens are supported at their ends and are therefore under the stress of their own weight plus the force of the hot gas passing over them. Sag is a measure of hot strength, i.e., little or no sag correlates with high strength. Tables 1 and 2 show weight and length changes and sag for two samples of a magnesia-alumina spinel material. Note the poor high temperature strength of the rebonded spinel of Table 1.
Spinel refractories are not presently sold in the United States and the materials which have been tested are being developed by several manufacturers. One firm had previously developed a fusion cast material whose nominal chemical composition was 65% MgO and 35% Al^O,. While samples of this refractory were being evaluated, efforts continued to obtain test materials closer to a pure spinel since the above-mentioned material has excess magnesia.
Some physical properties of this fusion cast magnesia spinel refractory are listed below:
Apparent porosity Bulk density Modulus of rupture
4% 207 lb/ft , 5800 lb/in''
This material performed well in the simulated MHD environment; in fact, its corrosion resistance exceeded that of any refractory that had been tested up to that time. These results indicated that magnesium alum- Fig. 1. Cycling Hot Gas Flow Test Rig
115

^
TABLE 1 Weight and Length Changes and Sag for
Rebonded, Fused Grain MgO-Al O Spinel Material
Material Ccxie No. 52: 35% Al^O,, 65% MgO Density: 2.95 g/ Porosity: 15% MOR: 335 psi
1500 psi Temperature
Heat (K)
63
66
67
68
69.0
69.1
72
73
1800/1600
1800/1600
1800/1600
1800/1600
1900/1750
1900/1750
1900/1750
1900/1750
cc
@ 1500 @ 28
Seed
^2^°3 None
None
None
S^°4 S.^°4 ^2^°4
^2^°4
"C °C * Ash
None
C
K
None
C
C
C
C
Equiv. Ratio
1.1/0.5
1.1/0.5
1.1/0.5
1.1/0.5
1.1/0.5
1.1/0.5
1.1/0.5
1.1/0.5
Aw %
19.2
13.3
6.4
5.8
5.5
5.9
17.8
15.1
Al %
0.2
2.84
0.88
0.55
0.07
0.53
1.47
0.72
Sag
N.D.
1.91
0
1.56
N.D
2.84
0.5
0.17
* K = Kincaid . C = Colstrip
MOR = Modulus of Rupture
TABLE 2 Weight and Length Changes euid Sag for Fusion Cast MgO-Al O Spinel Material
Material Code No: Density: 3.; Poro MOR:'
Heat
59C
60
61
62
63
65.1
66
67
68
39, : 35
sity: 4% 6000
Temperature (K) Seed
1800/1600
1800/1600
1800/1600
1800/1600
1800/1600
1800/1600
1800/1600
1800/1600
1800/1600
^2S°4 K2SO4
K2CO3
K2CO3
K2CO3
' 2 °4 None
None
None
}5% Al^
* Ash
K
None
C
K
K
C
C
K
None
,0^, 65% MgO
Equiv. Ratio
1.1/0.5
1.1/0.5
1.1/0.5
1.1/0.5
1.1/0.5
1.1/0.5
1.1/0.5
1.1/0.5
1.1/0.5
Aw %
3.6
0.7
3.4
4.3
3.4
4.94
0.32
4.38
Al %
0.4
-0.4
0.2
0.5
0.0
1.33
0.32
0.38
Sag
0
0
0
0
0
0
0
0
* K = Kincaid + C = Colstrip
MOR = Modulus of Rupture
116

inate spinel offers good resistance to the MHD environment. However, its dense, relatively nonporous structure also contributed to its good performance.
The fusion castingprocess is hard to adapt to the manufacture of relatively intricate regenerator bed bricks. A reasonable alternative is to develop a rebonded refractory based on the fusion cast material, for a rebonded product can be fabricated into the desired shapes, and it should also retain most of the corrosion resistance that its fusion cast parent possesses. Several rebonded bricks were obtained and tested.
Striacturally, the rebonded bricks closely resemble ordinary commercial refractories. They consist of relatively large, chemically inert grains that are held together by a fine grained matrix.
Physical properties are listed below:
Apparent porosity 19.6% Modu Bulk density 179 lb/ft at roou temperature 1370 lb/in Apparent porosity 19.6% Modulus of rupture
at 1610 K (2440°F) 440 Ib/in^ at 1770 K (2730°F) 330 lb/in
The rebonded product performed quite well in corrosion tests, but had lower corrosion resistance and markedly inferior hot strength as compared to its fusion cast parent. Poorer corrosion resistance was probably due to higher porosity while poor high temperature strength was evidently characteristic of the particular samples that were tested. Rebonded samples would sag slightly when maintained at test temperatures for thirty hours in the test rig even with no seed or slag present. Fusion cast test pieces, on the contrary, did not sag appreciably during a standard corrosion test.
SEM/EDX Studies
SEM/EDX methods have been used to investigate the microstructural physical and chemical changes that occur in refractories exposed to simulated MHD conditions. Samples of both new and tested specimens have been studied. By comparing elemental maps obtained via X-ray scanning, sketches have been prepared to delineate the regions occupied by various elemental combinations. Figures 2 and 3 are examples of these sketches. The sketches from different locations in a given refractory have been studied to determine which phases were most corrosion resistant or how the slag components were distributed within a test specimen.
These microstructural studies have shown that periclase is more readily corroded than is magnesia alumina spinel. Workers at the National Bureau of Standards previously reported a similar conclusion regarding the fusion cast product . The four photographs that comprise Figure 4 illustrate this preferential periclase corrosion. Figure 4a is a photograph of a typical corroded region, and Figirres 4b through 4d are elemental distribution maps for magnesium, aluminum and silicon, respectively, for the same region of the specimen. The central part of the photographed area, where the magnesium and aluminiim distributions coincide, is most likely an unaltered spinel grain. In the pristine form, this spinel was apparently almost surrounded by periclase. During corrosion testing, most of this periclase reacted with silica in the slag, as Figure 4c suggests. Reaction with silica seems to be the first stage of periclase alteration in this environment, but the nature of this reaction is still undetermined. The most important lesson that was learned from these studies is that periclase seems to corrode much
117

more rapidly than adjacent spinel, which consequently is a preferred refractory for these conditions.
Spinel also suffers degradation in these corrosion tests, but its corrosion rate is significantly slower than that for periclase. It is still too early to say whether spinel corrodes at an acceptably slow rate. The spinel corrosion mechanism is also unknown at this time.
The SEM/EDX studies have also yielded information concerning the matrix of the rebonded magnesia-spinel refractory and how it differs from the fused granular portion. Figure 2 illustrates the typical large grain structure in the as-received rebonded bricks. Note that the spinel and the periclase appear in approximately equal amounts and that calci\jm and silicon are the principal impurities. Figure 3 shows a typical matrix region in the same pristine rebonded specimen. Here there is siibstantially more periclase than spinel, and the matrix also is much more porous than the fused grains. Since periclase has rather marginal high temperature load bearing ability, and since this marginal creep resistance would be further compromised by the relatively porous matrix, poor hot strength of this refractory is at least partially explained. The spinel grains in the matrix are rather small, which implies that they formed by chemical reaction during sintering. Moreover, some unreacted alumina seems to remain in the matrix. This is not surprising, for the reaction between alumina and magnesia to form spinel is quite sluggish. But any free alumina in the pristine refractory can be expected to react readily with the potassium-bearing MHD gas stream. As this occurs, silica may also be deposited at the site, where it can then react with any adjoining periclase. These observations help to explain the corrosion test results, and they also suggest how the rebonded magnesia-spinel product might be improved.
Several refractories whose chemical composition approximates that of magnesium alviminate have recently become available on a developmental basis, and this paper concludes with a preliminary report concerning these materials.
The first stoichiometric magnesia altimina spinel to be received was composed mainly of sintered spinel grains and a matrix whose composition was also assumed to approximate stoichiometric spinel. Porosity and density of
|«-10M — » |
Fig. 2 Composition Map Representing Typical Large Grain Structure in Pristine Rebonded Magnesia-Spinel
Fig. 3 Composition Map Representing Typical Matrix Structure in Pristine Rebonded Magnesia-Spinel
118

the as-received material are shown below:
Apparent porosity 13.1% Bulk density 189 lb/ft"
New, untested specimens contained many small microcracks. In spite of these microcracks, this refractory performed quite well in preliminary corrosion tests. Although the microcracks hindered a visual interpretation of the corrosion results, SEM/EDX studies proved useful.
The untested refractory was found to contain two solid phases. The major phase was spinel; however, there were also significant amounts of another phase whose approximate chemical composition was 90% alumina and 10% silica. In Figure 5, spinel appears as the darker phase, and the much lighter inclusions are the alimiinosilicate phase. As might be expected from previous work'- , the aluminosilicate phase offers virtually no resistance to corrosive attack by potassiiim-bearing vapors. After a 30-hour corrosion test, the larger aluminosilicate inclusions had virtually disappeared (see Fig. 6), although some vestiges remained in the smaller pores and channels (apparent radii approximately l-5y), Some spinel had begun to degrade, but the corrosion seemed to be in a very early stage, and it was confined to
View of mapped region (2000X) 4b Elemental map: Mg
4c Elemental map: Al 4d Elemental Map Si FIG.4 Elem. Maps of Preferential Periclase Corr. in Fusion Cast Magnesia-Spinel
119

localized regions, whose linear dimensions were usually less than ten microns.
If both the aluminosilicate phase and the microcrack network can be eliminated, then this kind of refractory will be evaluated more thoroughly.
Recently, a stoichiometric fused grain spinel refractory was received. Owing to test rig alterations, we have not been able to siibject this material to a standard corrosion test. However, the refractory has been tested at somewhat lower temperatures and the specimen performed well. While encouraging, this does not guarantee good performance at higher temperatures. SEM/ EDX observations of the pristine fused grain stoichiometric spinel indicate that almost the entire specimen is spinel, although some small periclase grains are distributed throughout the sample. Even smaller amounts of silica are present; these inclusions are probably located on grain boundaries. A few properties of this fused grain stoichiometric spinel are:
3 Apparent porosity 15.8% Bulk density 187 lb/ft Modulus of
rupture 2350 lb/in
Although corrosion tests at higher temperatures are needed, based on the information available now, this material should perform very well.
Acknowledgement
The authors wish to recognize the assistance of Ms. Beth Davidian of the University of Minnesota. Ms. Davidian performed the SEM/EDX analyses discussed in this paper.
Fig. 5 Pristine Stoichiometric Sintered Grain Spinel (55X). Dark Regions are Spinel, Ligher Inclusions the Aluminosilicate Phase.
References
Fig. 6 Corrosion Tested Stoichiometric Sintered Grain Spinel (55x). Large Holes Were Originally Occupied by the Aluminosilicate Phase.
1. Fenstermacher, J.E., DeCoursin, D.G. and Smyth, R. R., "Progress on v, Testxng of Refractories for Directly-Fired MHD Air Heater Service" I t teenth Symposium on the Engineering Aspects of Magnetohydrodynamic^ the University of Pennsylvania, Philadelphia, PA. May 1976 Frederikse, H.P.R., Negas, T. and Schneider, S.J., "Development Testdn and Evaluation of MHD Materials", pp. 53-61, July-September, 1976
120

A REFRACTORY CERAMIC-TO-METAL GRADED STRUCTURE
R. J. E lbe r t , A. D. Butcher , R. J. Dufala*, R. Bacon Union Carbide Corporat ion Carbon Produc t s Division P a r m a Technical Center
P a r m a , Ohio
INTRODUCTION
During the past s eve ra l y e a r s . Carbon Products Division of Union Carbide Corporat ion has been developing a graded c e r a m i c - t o - m e t a l s t ruc ture for application p r imar i l y as a high p r e s s u r e turbine abradable seal for a i rc ra f t turbine engines. The s t r u c t u r e ' s purpose is to improve the engine efficiency by closing down to lerances between the blade tips and the inside surface of the turbine housing. Because the engines will be operating at t empera tu re s approaching 3000°F (1650°C), superal loys and ce ramics which have good cor ros ion , e ros ion , oxidation, and t he rma l shock re s i s t ance a r e used. These meta l s and c e r a m i c s , when fabricated proper ly , resu l t in a unique s t ruc tu re which has the abili ty to mee t c r i t i ca l requ i rements for use as a high p r e s s u r e turbine abradable sea l . Several of the c r i t i ca l r equ i rements for the turbine seal a r e a lso requ i rements for the MHD channel lining.
met: F o r both applications the following c r i t i ca l requi rements mus t be
F i r s t , the s t ruc tu re must withstand seve re the rma l environments involving la rge the rma l s t r a i n s . This most c r i t i ca l requ i rement can be met through careful design of the s t ruc tu re and strong bonding of the ce r amic to its meta l subs t ra te .
Second, it naust be noneroding under high-velocity gas or par t ic le impingement. The ce ramic mus t have strong pa r t i c l e - t o -pa r t i c l e bonding.
Third , the s t ruc tu re must provide sufficient insulation to keep underlying meta l ha rdware at reduced t e m p e r a t u r e s without excess ive backside cooling. The insulative p roper t i e s of the s t ruc tu re can be obtained by proper s t ruc tu ra l design of the porous m a t e r i a l .
Fou r th , the s t ruc tu re mus t be sufficiently adaptable to be fitted onto the existing ha rdware . A meta l backing pe rmi t s this by allowing it to be held ei ther mechanical ly or to be b razed or welded to existing equipment.
P resen t ing paper .
1 2 1

A group of test coupons which meet these requirements has a l ready been prepared and submitted to ERDA for this application. Completed findings of their test have not yet been made available.
Additional requirements for MHD electrodes which a r e not r equ i r e ments for the present program on abradable seals include:
The thermal insulating ma te r i a l should be e lect r ica l ly conductive at the operating t empera tu re s .
The thermal insulating mate r ia l should be cor ros ion res is tant .
DESCRIPTION OF THE STRUCTURE
A photomicrograph of the s t ruc ture is shown in Figure 1. The present standard s t ruc ture utilizes an a l l - ce ramic top layer made of y t t r i a - or calcia-stabi l ized zirconia containing roughly 40% porosi ty. Below this is a graded region consisting of severa l l ayers in which a r e fractory metal , usually n icke l -chrome, is added to the ce ramic in p r o gress ively higher concentrat ions. The bottom layer of this porous , graded region is essential ly all meta l . The metal side is then brazed to a meta l subs t ra te , which is a nickel- or cobalt-based alloy.
^ ^ ^ ^ . \ r i •. •••••••.' • * '',7'^/-i- T^^^Sf^^K^^^^^^^^^^^^^^^^^^^
IKs(i'^.)^Z^.>»ds^wMiwJ^iJ^jMHHIH^^^^^B • " • BRAZE ^ ^ H
lY
Figure 1. Photomicrograph of Structure
The process for making this s t ruc ture is outlined schematical ly in Figure 2. Each layer is formed from a wet mix and stacked onto the p r e vious layer . The composite is then cold pressed . After drying, the green s t ructure is placed in contact with the substra te to which a braze coat has been applied, and then it is furnaced in a protective a tmosphere to achieve bonding throughout the s t ruc ture . A suitable bonding agent, such as sil ica is needed to achieve bonding in the zirconia phase.
122

CERAMIC SEAL FABRICATION
MIX METAL a CERAMIC RARTICLES; ' LIQUIDS
T
LAYUP i f ORM AND STACK INDIVIDUAL *- I ' LAYERS
PRESS COLD PRESS GREEN STRUCTURE; T ' DRY
F U R N A C E I BOND PARTICLES; BRAZE TO ' SUBSTRATE.
Figure 2. Figure 3. Thermal Shock Apparatus
PERFORMANCE EVALUATION
While hot gas erosion testing and room tempera ture abradabili ty testing have been done, the major thrus t of the evaluation has been thermal fatigue life. F igure 3 shows the thermal shock apparatus . A hydrogen/ oxygen flame is used to heat the ce ramic surface while either a i r cooling or gas torch heating is used to control the backside t empera tu re . F igure 4 shows the nominal thermal cycle to which the ce r amic - to -me ta l s t ruc tures a re subjected. The surface t empera tu re may be as high as the 3000° F (1650° C) shown or as low as 2400°F (13l5°C). Some experimental s t r uc tures have survived hundreds of such the rmal cycles . A recent specimen (Figure 5, photo) survived over 1000 cycles without delaminating.
2,000
1,000
IsURFAC^^^^^^^H
H H SUBSTRATE
^ , ^ 1 iriiiijii ^ 1
Sy REPEAT!
E
Figure 4. Typical Test Cycle
123

DESIGN PRINCIPLES
The s ingle m o s t difficult t echn ica l p r o b l e m in this a r e a is the a c h i e v e m e n t of adequa te t h e r m a l s t r e s s r e s i s t a n c e . Due to a m i s m a t c h in t h e r m a l expans ion coeff ic ients be tween the c e r a m i c s u r f a c e l a y e r and the m e t a l s u b s t r a t e , i n t e r n a l s t r e s s e s deve lop as soon as the s i n t e r e d s t r u c t u r e is cooled f r o m the furnac ing ope ra t i on . Since the m e t a l c o n t r a c t s f a s t e r than the c e r a m i c ( F i g u r e 6, d i a g r a m ) , the c e r a m i c is fo rced into c o m p r e s s ion and high s h e a r s t r e s s e s a r e developed in the t r a n s i t i o n r e g i o n n e a r the edges of the s t r u c t u r e . When the c e r a m i c s e a l is l a t e r subjec ted to a r e a l o r s imu la t ed engine e n v i r o n m e n t , d i f ferent t h e r m a l s t r e s s condi t ions a r e encoun t e r ed , s o m e l e s s s e v e r e , s o m e m o r e s e v e r e than the r o o m t e m p e r a t u r e s t a t e . F a i l u r e of the s t r u c t u r e usua l ly s t a r t s a t the high s h e a r s t r e s s r e g i o n s and p r o c e e d s as a de l amina t i on ( F i g u r e 7, photo) .
If a sound s t r u c t u r e can be ach ieved a t r o o m t e m p e r a t u r e , t hen the t h e r m a l expans ion m i s m a t c h tends to work in a f avorab le d i r e c t i o n under s t e a d y - s t a t e condi t ions in the engine ( F i g u r e 8, d rawing) . Since the c e r a m i c top su r f ace is in contac t with the hot g a s e s f r o m the c o m b u s t o r while the m e t a l s u b s t r a t e is a i r cooled , the d i f fe rence be tween the t e m p e r a t u r e changes of the c e r a m i c and the m e t a l componen ts tends to c o m p e n s a t e for the d i f ference be tween t h e r m a l expans ion coef f ic ien ts . Under t r a n s i e n t cond i t ions , such as engine s t a r t - u p , a c c e l e r a t i o n s , and d e c e l e r a t i o n s , m o r e complex and often m o r e s e v e r e s t r e s s s t a t e s a r e e n c o u n t e r e d .
F i g u r e 5. Segment Tes t ed for 1000 Cyc les
F i g u r e 6.
1 2 4

TRANS-LAMINAR SURFACE CRACKING SHEAR
Figure 7. Types of Thermal Shock Fa i lu re
COLD ENGINE HOT ENGINE
CERAMIC GRADED
METAL COOL—WA
CERAMIC GRADED
METAL
THERMAL STRAINS EQUAL
<1C<<1M /^TC >ATM <3-C ^ T C « < 1 M AT^^
Figure 8. Steady-State Affect of CTE Mismatch
Two aspects of this s t ruc ture tend to reduce thermal s t r e s s e s . F i r s t , the thermal expansion coefficient of the ma te r i a l in the t ransi t ion region changes gradually from that of the a l l - ce ramic to that of the a l l -metal . The transi t ion region is relat ively thick so that thermal mi sma tch s t ra ins do not reach excessive levels compared to those found in conventional thin coatings. Second, the s t ruc ture is porous , resulting in a "forgiving" mate r ia l which has a low modulus plus a bui l t - in c r a c k - a r r e s t capability, A drawback to the s t ruc ture is the inherent weakness of a porous meta l .
CONCLUSION
Fur the r major improvements in performance of this s t ruc ture a r e anticipated as new processing techniques a r e developed and more sophist i cated s t r e s s analysis methods a r e applied. In cooperation with Case Western Reserve University, we a r e developing computer p rograms for doing accura te thernnal s t r e s s calculations which we will then use to design optimum s t ruc tures for a variety of applications.
125

FUSION-CAST MATERIALS FOR MHD APPLICATIONS R. N. McNally, L. J. Manfredo and P. Bardhan
Corning Glass Works, Corning, New York
The elements leading to the degradation of structural materials in the MHD generator are analogous to those in a glass-tank or a steelmaking furnace. In these environments, the refractories are subjected to corrosive atmospheres, errosive action and thermal cycling. To successfully solve the materials problem for the MHD, materials scientists have to follow the glass and steelmakers viz., develop the appropriate microstructure for the desired properties. In this paper, we shall discuss the microstructures developed from the fusion casting of a few refractory materials that appear suited for the MHD system. Basic to the fusion-casting process is the occurrence of inert grains (as a result of reaction between the components in the molten state). The structure is an interlocking network of crystals which gives the bodies strength that does not deteriorate catastrophically at elevated temperatures, high abrasion resistance and good resistance to corrosion by slag. In particular the dense material has a high resistance to penetration by slag - a primary mode of degeneration of insulators and electrodes in the MHD channel.
Fused MgO(l) is an excellent insulator: the microstructure of such an insulator is shown in Figure 1. A silicate film is clearly discernible between adjacent periclase crystals although impurity levels are only-1%. This film leads to a loss of high temperature strength, in this material, from >6000 psi at room temperature to <700 psi at 1340 C. (2) By the addition of a second phase, however, one can isolate the silicate into pockets and thereby maintain the hot strength. The second phase also reduces the primary crystal size. This is done, for example, by the addition of chromium, aluminum or titanium-spinels.
Figures 2 (A & B) show a MgO-Transvaal chrome ore fusion-cast body, in which the isolation of the silicate leads to strength sufficient to prevent deformation under load at high temperatures. The spinel appears as both an intergranular and an Intragranular phase - the distribution of the spinel being closely related to the melting/freezing conditions.(2) A typical example of the effect of solidification rate is seen by comparing Figure 2A (rapid cooling) and 2B (slower cooling). In general, fusion-cast refractories have a grain-size distribution because of unequal solidification rates throughout the casting. The amount of intergranular spinel is limited by the fact that microcracks develop within the periclase grain with excessive spinel. This is probably related to the mismatch in the coefficients of thermal expansion of the periclase (139 x 10-7/°c) and the spinel (.89 x lO"^/
at hJh%"^^^"'^r^^"^?' S f ^ ^^S'^^"' °^ MgO-Transvaal Chrome Ore shows that eLnt?^/ r''? r^ '^^ ^°"" ^° "" ^ °1" solution and appear as the exsolyed spinel at lower temperatures. This phase instability in these materials during temperature cycling can be eliminated by the addition of
^iTA^l iS^f ""J °"^ f'!5 ^^^ ^° lattice, 2R+3 replace 3Mg+2, but with 1 Li+i + lR+3 replacing 2Mg+2 fewer vacancies occur, and a more stable structure results.
126

7 T f
r /
• -
ri^
£:.
^ ^ ^ ^ ^ ^ ^ ^ ^ ^ ^ ^ ^ ^ ^ ^ ^ ^ ^ ^ K s . .£.' -' i^-iS
>
0 •
' ' • > - . ) • - " <
'il . 0 0 ^
Figure 1 A photomicrograph of a polished section of fused-cast MgO refractory (>99% MgO). This sample shows the continuous silicate (dark gray) between the periclase crystals (medium gray). The black areas are pores.
Figure 2 Photomicrographs of polished sections of a fused-cast MgO-Transvaal Chrome Ore (55% : 45%) composition, (a) Solidified rapidly; (b) solidified slowly. Phases: primary periclase (medium gray), spinel (light gray), olivine (dark gray) and pores (black).
127

Cycling over a temperature range, between 1250 C and 16 50°C shows that refractories with Ll-O can be made to have little or no linear growth.
An analogous refractory material with excellent resistance to thermal stresses is the MgO-MgAl_0, system,(4) the fusion-cast microstructure of which is shown in Figure 3. In this the primary periclase crystals appear completely surrounded by the spinel because the former serve as crystalline sites for the periclase crystallizing out of the last liquid (of eutectic composition). This system offers the following advantages: first, it is less susceptible to the exsolution-dissolution of the spinel relative to the MgO-MgCr„0, system and second, (and more Important for the MHD environment) MgAl_0, Has a lower vapor pressure at higher temperatures (greater than 1600 C) than does MgCr-O, . (In MgO-Splnel systems, the fused microstructure can be further controlled by adjusting the Al-O^-Cr-O™ ratio. With high Al-O-ZCr-O-ratio the MgO crystals are smaller, there is less precipitated intragranular spinel and larger amount of intergranular spinel.)(5)
Similar microstructures can be obtained by fusing Al_0_-based refractories, As an example the Al-O^-CaO-eAl-O- system(6) is considered below.
Pure Al^O^ (>99%) crystallizes from the melt in a columnar fashion. The direction of growth of the crystals is essentially perpendicular to the freezing isotherm of the casting. This single-phase coarse-grained structure has poor thermal shock resistance (lasting only 1 cycle in the test described below); the planes of weakness between the oriented crystals provide the paths for easy fracture. It is found that by adding a second component, CaO, a fine Interlocking structure of corundum crystals and an alkaline-earth metal hexaluminate (CaO-eAl^O^) phase results as shown in Figure 4. The improvement in thermal shock resistance of such a refractory is shown in Table I. (The thermal shock test comprised of placing a 1" x 1" x 3" sample in a gas-oxygen furnace at 1650 C, holding for 10 minutes, then withdrawing it from the furnace and cooling to room temperature, constitutes one cycle.)
Table I
Thermal Shock Resistance of Al.O -Ca0-6A1 0_
98.79 mole % AI2O - 1.21 mole % CaO 97.67 mole % Al 0 - 1.44 mole % CaO - 0.89% F 96.42 mole % Alp^ - 3.58 mole % CaO 97.36 mole % ^^^ - 1.76 mole % CaO - 0.88% F
(Note that the formation of the Ca0-6A1 0, phase does not have an adverse effect on the shock resistance of Al o/--^both corundum and calcium hexaluminate phases have the same coefficient of thlrmal expansion - at 1000°C . 83 x 10"V°C) Metal fluoride addition improves both the manufacturability and the modulus ot rupture of the fusion-cast refractory, without affecting thermal shock resis-
Only a few examples of fusion-cast materials and their microstructures
128
Thermal Cycles to
13 11 22 23
Shock Failure

c.
t S . v •>•_- y^^f
Figure 3 Polished sections from a massive melted specimen of 65% MgO-35% A1„0- composition. (a) Rounded grains are periclase solid solution in a matrix of spinel solid solution; (b) after 3 weeks of heating at a 1400 C exsolved spinel appears as islands in periclase and exsolved periclase appears in spinel matrix.
DECREASING CRYSTAL ORIENTATION
INCREASING CoO-GAIsOs
Figure 4 Photomicrographs of thin section in the Al 0„-CaO system. As the amount of CaO increases, tne oriented (columnar) structure becomes more equiaxed. The primary phase is a-Al_0- with intergranular CaO' 6AI2O2. ^ ^
129

have been discussed. The same basic principles can be applied to the development of other novel materials. The tightly interlocked microstructure would be highly resistant to slag penetration in the MHD reactor environment. There are, however, some inherent disadvantages in the process: 1) macro-porosities can occur in the fusion-cast bodies; ii) there can be large variations in the composition, the structure and the grain-size across the cross-section of a casting due to unequal solidification rate and, iii) the rapid cooling of the melt can result in undesirable non-equilibrium phase assemblages. However, the technique offers an additional degree of freedom in the processing of ceramics in working towards a solution to the materials problem for the MHD system.
References
1. A. M. Alper, R. N. McNally and P. Papa, U.S. Pat. 3,332,740 (1970).
2. A. M. Alper, R. C. Doman and R. N. McNally, High Temperature Oxides (Alper, A. M., ed.) Vol. I, p. 209, Academic Press, N.Y. (1970).
3. R. C. Doman, A. M. Alper and R. N. McNally, Journal of Materials Science, 3^, 590 (1968).
4. A. M. Alper, R. N. McNally, P. H. Ribbe and R. C. Doman, J. Am. Cer. Soc. 45, 263 (1962).
5. A. M. Alper, in "Science of Ceramics" (Stewart, G. H. , ed.). Vol. 3, p 335, Academic Press, N.Y. (1967).
6. R. N. McNally and G. H. Beall, To be presented at the International Congress on Glass, Prague, Czechoslovakia, July 4-8, 1977.
130

TRANSPORT PROPERTIES IN THE SPINEL ELECTRODE MODULE H. K. Bowen
Massachusetts Institute of Technology Cambridge, Massachusetts
I. INTRODUCTION
Based on the desirable and the required properties of materials for MHD electrodes, insulators and current-leadouts [1-3], the spinel electrode module was conceived for use in coal-fired MHD generators. The module consists of an electrode based on FeA£20if-Fe30it that may contain other dopants, e.g., CraOa or MgO; aluminvmi oxide as the insulator although MgO or MgAAaOi* may also be used; and the current leadout — an iron based material, e.g., stainless steel. The important physical property data of this module are being measured and are reported briefly in this paper. More extensive reports appear in theses or ERDA-MHD research reports.
II. PHYSICAL PROPERTY DATA
Electrode
The electrical conductivity of FeAAaOit-FeaOi* solid solutions is totally electronic. At 1600°C, FeAilaOi* (hercynite) has a conductivity of 0.1 mho/cm and an activation energy of 0.8 eV. Between 75% FeAAaOi* and 25% FeA aOi, the conductivity varies between 10 and 100 mho/cm with a small P dependence and small activation between 0.2 to 0.05 eV. Conduction appears^to be by electron transfer between divalent and trivalent iron ions. Accurate determination of the phase boundaries in the Fe-AJi-0 system [5] has allowed calculations of the site occupancy [4] which correlates well with the conductivity data including compensation points in the conductivity-log P(02) data. The characteristics of total electronic conductivity and minimum temperature dependence of conduction are the most important selection criteria for electrical stability of electrode materials.[1] Increased magnetite additions increase the conductivity to 200 mho/cm.
The chemical stability features of the spinel electrode module were presented elsewhere [2], the important features being chemical compatibility with coal slags and favorable replenishment characteristics using coal slag or FeaOs/AAzOa additions to the combustion products. The highest operating temperature of the electrode material is 1780°C (leklzOi^) . The vapor pressure at these temperatures is less than 10 atm.[6]
Measurement of the iron diffusion coefficient to predict compositional redistribution of graded electrodes [3] and impurity penetration have been carried out. Interdiffusion and thermomigration experiments [7] have shown Ai transport to be of the same magnitude as Fe transport.
The diffusion coefficient of iron 59 in iron aluminate spinels was measured by means of serial sectioning.[8] The results were analyzed with a defect model assuming that the predominant defects were cation vacancies and iron interstitials. At 1380°C, diffusion occurs in FeaOi, and 75% Fe30it-25% FeA aOit by an Interstitial mechanism at low P , and a vacancy mechanism at high P . Diffusion is by the vacancy mechanism in 50% FeAilzOi* and 75% FeAAaOii? Results for FeA£20it indicate an interstitial mechanism.
131

_/
At 10~® atm O2, a curve of log D vs. 1/T exhibits a minimum for FesOi* and 25% FeAiizOi*. This effect is explained in terms of a mechanism change. D is essentially Independent of temperature in 50% FeA^aOi* and 75% FeAilaOi*.
The electrical conductivity [8] of low silica containing slags (7-17 w/o) was measured because the amount of silica in the layers on the channel walls will decrease as the back temperatures are increased, and the low silica slags are those which can be in equllibritim with the spinel electrode module. The model system was FeO'FeaOs-AilaOs-SiOa in the temperature range of 1000-1600°C and oxygen partial pressure of 10 ^ < P < 1 atm. The dc-data and the ac-conductlvity up to 10 KHz for compositions with more than 33 w/o FesOij were essentially equal, suggesting that the electrical conduction was predominantly electronic.
Several types of conductivity-temperature dependence were observed in air and were directly correlated with the phase chemistry of the system, particularly the crystallization sequences. The compositions studied crystallize to form multi-phase compositions of spinel, corundimi, mullite and/or iron alviminosilicate glasses. The electrical conductivity in the crystallized composites were interpreted with a multiphase conduction model.
In the first type of conductivity-temperature behavior in air, the electrical conductivity increased with decreasing temperature with no distinct discontinuity upon solidification. The dependence of electrical conduction on temperature was of three stages in all other cases. A sharp discontinuity was observed upon solidification. The activation energies for conduction in these crystallized composites of spinel, mullite and corundum varied from 0.39 to 2.97 eV, depending on whether iron-mullite or corundum was the matrix.
The electrical conductivity of iron aluminosilicate melts at 1550° and 1600°C were also measured as a function of oxygen partial pressure and were found to depend on the total iron concentration and the Fe_ /Fe ^ ratio. The conductivity decreased with increasing P at P > 10 ^ atm?^^Over a wide intermediate range of P (10 ^ < P <°io ^ a?^), the conductivity remained practically constant. ^Upon subsequent reduction at still lower P , the electrical conductivity decreased. The electrical conductivity of ali^the iron aluminosilicate melts studied was of the order of 0.1 - 0.2 mho/cm over the whole oxygen partial pressure range.
The results were analyzed according to the conduction band model and a thermally activated mechanism. Using the latter model, the fraction of Fe^^ ions in octahedral coordination was calculated.
Insulator
In order to design the electrode module forlong term use, data on the principal failure modes have been generated (loss of resistance due to Fe and K penetration and electrical strength loss-dielectric breakdown). Comparison of single crystal (sapphire) and polycrystalline alumina samples has shown that the electrical breakdown strength decreases from >10^ volt/cm at room temperature to ^ 10 volt/cm at 1400°C. [9] At temperatures less than 600°C, the polycrystalline material has a lower breakdown strength than sapphire. At higher temperatures this difference is undetectable; thus the quality of the
132

material and the preparation conditions of the surfaces are less important at higher temperatures.
Above IOOO°C the breakdown mechanism appears to be due to thermal run away. The breakdown strength - inverse temperature curves have a 1.1 eV slope. There are at least two important consequences of these observations. First, the absolute resistivity will be the important factor in determining the allowable electric field strengths for interelectrode insulators; and second, although the values of the allowable field strengths at high temperatures are larger than required by MHD generators, the breakdown is very sensitive to local thermal fluctuations. Thus loss of insulation can be due to Joule heating or due to localized heating from arcing above the insulator surface.
The electrical resistivity of iron doped AI2O3 has been measured to determine the allowable levels of iron contamination.[10] For example, the resistivity decreases at 1600°C and Pog = 10~^ atm from 10^ ohm'cm for pure AlzOs to 8 X 10^ 2.5 x 10^ and 2 x 10^ ohm cm for 0.08, 0.5 and 4.4% additions of FejOg respectively^ The oxygen pressure effects show a minimum in the resistivity at P02 = 10 atm. The activation energy for conduction is 4 eV.
The minimum resistivity corresponds to the solubility limit and exsolution of spinel. The 1500°C isotherm for the Fe-A^-0 system [5] outlines the solubility limit for corundtmi in equilibrium with spinel and hence the limiting conductivity as a function of oxygen potential. MHD conditions (P02 f 10~ ) should produce acceptable worst-case electrical properties in alumina. Since the dielectric breakdown appears to be thermally triggered at temperatures in excess of 1000°C, electrical strengths will therefore scale according to the inverse of conductivity and thus the inverse of the iron concentration as determined from the isothermal section at each temperature of interest. Values of 99.5% pure polycrystalline AJI2O3 are far in excess of 50 V/cm needed in the MHD system. Tracer diffusion studies [11] suggest Fe-penetration depths less than 0.1 mm in 1000 hours at 1630°C for "pure" polycrystalline alumina.
References
1. H. K. Bowen, "MHD Channel Materials Development Goals," Engineering Workshop on fflp Materials, Ed. A. L. Bement, published by Massachusetts Institute of Technology, Cambridge, Mass., 1975.
2. T. 0. Mason, W. T. Petuskey, W. W. Liang, J. W. Halloran, F. Yen, T. M. Pollak, J. F. Elliott and H. K. Bowen, "Properties and Thermochemical Stability of Ceramics and Metals in an Open-Cycle, Coal-Fired MHD System, Proceedings of 6th Inter. Conf. on Magnetohydrodynamic Electrical Power Generation, Washington, D. C., June, 1975.
3. H. K. Bowen, "Stabilization of MHD Electrodes," Proceedings of 2nd USA-USSR Symposium on MHD, Washington, D. C., June, 1975.
133

:—.-^
4. T. 0. Mason, "Defect Structure and Electrical Conductivity of FesOi*-FeA 0 Solid Solutions," Ph.D. research in progress.
5. C. E. Meyers, "Phase Boundaries and Activity Data in the Fe-AA-O System,' B. S. research in progress.
6. M. Yoshimura and H. K. Bowen, "Vaporization of MHD Electrodes and Insulators," M.I.T. Research Report.
7. J. W. Halloran, "Iron Diffusion In Iron Aluminate Spinels, Ph.D. Thesis, January, 1977, M.I.T.
8. C. F. Yen, "Electrical Conductivity in the FeO»Fe30i»-Ail203-Si02 System," Ph.D. Thesis, January, 1977, M.I.T.
9. M. Yoshimura and H. K. Bowen, "High Temperature Dielectric Breakdown in Ai!,20 3," submitted to J. Am. Ceram. Soc.
10. T. M. Pollak,"Electrical Conduction in Iron-doped Alumina," M. S. Thesis, May, 1976, M.I.T.
11. I. K. Lloyd, "Iron Impurity Diffusion in AilzOs," Ph.D. research in progress.
134

ADVANCES IN LANTHANUM CHROMITE MHD ELECTRODE DEVELOPMENT
F.J. Brodmann General Refractories Company
P.E.D. Morgan Franklin Institute Research Laboratories
Phila. Pa.
1. INTRODUCTION
Since Meadowcroft[l] and others[2] first proposed the use of lanthanum chromite as MHD electrode material, a considerable amount of R&D efforts have been spent to Improve the ceramic, electrical, and chemical properties of this material. In 1970, General Refractories started to sponsor several projects at the Franklin Institute to develop methods for producing high density ceramic bodies from lanthanum chromite. [3] In 1972, the Corporate Research Laboratories of General Refractories continued the projects on a larger scale and has produced since then several hundred pounds of lanthanum chromite for inhouse and outside testing.
2. DESCRIPTION OF THE MATERIAL PREPARATION METHOD
The preparation method developed for lanthanum chromite MHD electrodes is based on the synthesis of an active precursor powder composed of lanthanum chromate hydrate. [4] In the first figure, the flowsheet for the production of lanthanum chromite parts is illustrated. In the temperature controlled reaction tank chrome trloxide is dissolved in distilled water to form chromic acid, which is subsequently neutralized by adding lanthanum oxide and any doping agents. During the exothermic reaction cycle, the slurry is vigorously stirred and the temperature controlled not to exceed 80*'C. The yellow doped lanthanum chromate hydrate exhibits a one micron average particle size and rhombic symmetry as shown in Figure 2.
After passage through a spray dryer, the lanthanum chromate powder is briquetted and then calcined in an atmosphere controlled furnace. The yellow lanthanum chromite precursor starts to decompose at low temperature '\ 150° and by 600°C in air has turned to shades of green (for pure LaCr03) to chocolate brown (for doped LaCr03) and now shows only x-ray diffraction peaks for the pseudo cubic perovskite. The briquettes of lanthanum chromite are crushed and ball milled in acetone. The microstructure of the calcined and ball milled material is illustrated in Figure 3. The average particle size increased to a 2-3 micron average diameter and a pseudo cubic sjnranetry.
To prepare a free flowing pressing powder, we increased the particle size of the material to more than 50 microns by agglomeration. After the addition of binders and lubricants the aqueous suspension is spray dried to agglomerate the particles and dry out the moisture. The lanthanum chromite powder Is then
135

SYNTHESIS OF LaCr03 POWDER
B
FORMING OF ELECTRODE PARTS
FINISHING OF ELECTRODE PARTS
"CONTROLLED" ATMOSPHERE FURNACE
RECYCLE -200 VIBRATORY SCREEN DECKS
-35 +200
PACKING SHIPMENT
TESTING
HYDRAULIC PRESS
METALLIZING ELECTRICAL CXDNNECTION
DRYING OVEN
CONTROLLED ATMOSPHERE
.FURNACE
FIGURE 1 . MANUFACTURING FLOW SHEET FOR L a C r 0 3 MHD ELECTRODES
FIGURE 2 . COPRECIPITATED DOPED LANTHANUM CHROMATE HYDRATE. lOOOOX
136

FIGURE 3. CALCINED AND BALL MILLED DOPED LANTHANUM CHROMITE. 3000X
pressed hydraulically into electrode bars. After drying, the bars are high fired in a controlled atmosphere furnace. The microstructure of the fractured surface of the high fired lanthanum chromite bars is illustrated in Figure 4. The bulk density of this material is 92% of the theoretical density. The particle size is relatively uniform and averages about 5 microns in diameter. The residual porosity is located at grain boundary intersections. After machining to the final dimensions, the electrode bars are metallized for electrical connections.
PHYSICAL PROPERTIES OF VARIOUS LANTHANUM CHROMITE COMPOSITIONS
Pure lanthanum chromite is difficult to sinter and therefore has low strength, low electrical and thermal conductivity. The doping of lanthanum chromite with alkaline earth ions generally enhances the physical properties of the material. The highest density of 96.3% of theoretical was measured for strontium doped lanthanum chromite. The highest electrical conductivities were measured for magnesium doped formulations.
The electrical properties of the various lanthanum chromite compositions were tested on pressed bars of roughly 3.5" length and 0.5" cross section. The bars were electrically connected with platinum wire for a standard four point probe technique, placed into an electrical tube furnace, and the resistivity measured up to 1500''C. In Figure 5 the resistivity change as a
137

FIGURE 4. HIGH FIRED DOPED LANTHANUM CHROMITE. 3000X
function of temperature is illustrated for stoichiometric lanthanum chromite and various doped lanthanum chromite compositions. The resistivity curves of the doped and undoped formulations decrease up to about 1000°C before a minimum is reached. The magnesium doped composition has at room temperature and above a substantially lower resistivity than the strontium doped material. In Figure 6 the resistivity data of Figure 5 are displayed as Ig (p/T) against 1/T. At identical doping levels, the magnesium doped compositions display a lower activation energy than the strontium doped formulations. Pure lanthanum chromite has the highest activation energy with the maximum below 900°C.
The thermal expansion of lanthanum chromite depends on the doping element and its concentration. We measured for magnesium doped material lower thermal expansion coefficients than for strontium doped formulas. Figure 7 shows the thermal expansion curves of magnesium and strontium doped lanthanum chromite which have an inflection at about 300°C caused by a phase transformation. The material with the higher magnesium doping level displays the lowest thermal expansion coefficient.
X-ray diffraction intensity and lattice constant measurements of magnesium and strontium doped lanthanum chromite powders were used to investigate which lattice site, A or B, the dopant atoms enter. The intensities obtained from x-ray powder diffraction patterns were compared to calculated intensities for the doping element placed in the A or the B position. The measured intensities of lanthanum chromite doped with 20% magnesium oxide compare very well with computed intensities for B site replacement. The intensity data for 16%
138

100.0
CO CD
PURE LANTHANUM CHROMITE
200 400° 600" 800"
TEMPERATURE (°C)
1000 1200° 1400°
1400°C 800°C SOO C 200 C
*"-31 I 1 I I I I I I I I I I I I I I I I I I I i I I I ±L 5 10 15 20
, RECIPROCAL TEMPERATURE x 10^
25
FIGURE 5. RESISTIVITY - TEMPERATURE CURVES FOR VARIOUS LANTHANUM CHROMITE COMPOSITIONS
FIGURE 6. RESISTIVITY/TEMPERATURE AS A FUNCTION OF RECIPROCAL TEMPERATURE

4 5 6 7 8 9
TEMPERATURE DEGREES (HUNDREDS)
10 11 12
FIGURE 7. THERMAL EXPANSION OF STRONTIUM AND MAGNESIUM DOPED LANTHANUM CHROMITE
strontium doped lanthanum chromite are more difficult to interpret as a result of the somewhat lower symmetry (orthorhombic) of the crystal lattice compared to magnesium doped material. The roughly calculated intensity values are obtained by assuming that the strontium doped lanthanum chromite also crystallizes in the cubic symmetry system as intensities are not much affected by minor lattice distortions. Nevertheless, A-site occupation by strontium is indicated. The x-ray diffraction measurements also revealed that the lattice cell voltime increases with higher magnesium doping levels. The elementary cell dimensions increase in the direction of the ao and CQ axis while the bp axis shrinks in length. The higher anisotropy of the crystal lattices of heavier doped materials is not found to have any noticeable effect on the strength and thermal shock properties of lanthanum chromite. The lattice volume increases slightly with higher magnesium doping levels, whereas it decreases for strontium doped material confirming the intensity findings, for surely, if magnesium entered the A site, the lattice diameter would decrease and similarly, if strontium entered the B site, an expansion would be expected based on relative ionic radii.
140

4. SUMMARY
This paper describes primarily a ceramic manufacturing process which is scaled for the production of commercial quantities of MHD electrode parts from lanthanum chromite or other suitable material. The process incorporates various closely controlled processing steps to ensure the preparation of high density electrodes with homogeneous and reproducible properties. A microscopic study demonstrated the microstructure of material at different stages in the preparation process. A comparison of the electrical and thermal expansion properties of doped compositions showed that magnesium doped lanthanum chromite is superior to strontium doped material. Quantitative x-ray diffraction measurements proved the hypothesis that strontium is replacing lanthanum in the A site and magnesium is replacing chromium in the B site of the perovskite lattice. No second phases were recorded in the matrix of the doped formulations.
5. REFERENCES
1. D.B. Meadowcroft, Some Properties of Strontium-Doped Lanthanum Chromite, Brit. J. Appl. Phys., 1969, Ser. 2, Vol. 2.
2. M. Foex, CR. Acad. Sci., Paris, 1965, 260, p. 6389-92.
3. P.E.D. Morgan, Sintering of Chrome Systems, Ceramic Bulletin, May 1977.
4. U.S. 3,974,108, LaCr03 Electrodes and Method of Manufacture, Ronald Staut and Peter E.D. Morgan, August 10, 1976.
141

ELECTRICAL CONDUCTIVITY, VOLATILIZATION AND PREPARATION OF LaCr03 BASED OXIDES
H.U. Anderson, R. Murphy, and S. Semachaibovorn University of Mlssouri-RDlla
Rolla, Missouri B. Rossing
Westinghouse Electric Corporation Pittsburg, Pennsylvania
A. Aldred, W.L. Procarione, and R.J. Ackermann Argonne National Laboratory
Argonne, Illinois
INTRODUCTION
Most of the available data indicate that at 1750°C the volatilization rate of LaCr03 based oxides is such that electrodes made from them can be expected to recess about 1 cm in 10000 hrs which is too high for MHD application [1, 2] . In March of 1976 a series of vaporization experiments were carried out at our laboratories which indicated that several of the more de-sireous compositions did not have as high a volatilization rate at 10"- atm 02 as had previously been measured by Meadowcroft and Wimmer [1, 3] . However, a significant increase in rate occurred in air. It was suspected that water vapor was the reason for the increase in volatilization. Bowen estimates that the rate of weight loss of LaCr03 should be increased by 5-10 times in water vapor relative to a dry atmosphere [2] . This enhancement is due to the formation of Cr02 (OH) which is more volatile than the oxides of Cr. Our measurements tend to agree with Bowen.
Since our earlier measurements had indicated that the volatility of LaCr03 based compositions is somewhat dependent upon specific composition and density, an investigation was initiated in which the goal was to determine if sufficient amounts of Al could be substituted for Cr to significantly reduce the volatilization rate without increasing the room temperature resistivity to >50 f cm. (This is approximately the maximum resistivity a MHD electrode can have at room temperature before Joule heating becomes a problem.)
To make this study, a number of compositions based on La gsMg Q5Cr03 were prepared with Al substituted for Cr from 0 to 100%. The reason for choosing the composition La g Mg QcCr03 as our base was due to the fact that this is the composition that was "used in the last test in the Soviet UO-2 MHD facility.
EXPERIMENTAL
The LaCr03 based compositions that were used in this investigation were prepared by the liquid mix process and were calcined at 800° for 2 hours. The only milling used was in a shaker mill using plastic containers and plastic balls.
142

The powders were dry pressed with aid of 1/8 w% PVA binder into discshaped specimens in either a h" or 3/4" mold. The pressed units were then sintered to closed porosity density in the temperature range 1500 to 1750°C in atmospheres ranging from IO"-'--'- to 0.21 atm O2. The required conditions were dependent upon the particular composition. X-ray diffraction scans were made on all the compositions (both as powders and sintered discs) using GE XRD5 and XRD700 diffraction units. The x-ray data indicate that all of the compositions are single phase and rhombohedral at room temperature with the exception of the members near 100% Al which are orthorhombic.
Prior to making weight loss measurements each specimen was heated to 1000°C in air for several hovurs to help remove volatiles which might influence the measurements. The test specimens were then stacked on zirconia plaques in such a way that each disc had its surfaces free so volatilization would not be impeded. The specimens were then heated to 1740 +_ 15°C in a controlled atm. Mo wound furnace in flowing atmospheres of either N2 + 10"^ atm O2 or N2 + 10"^ atm O2 + IO"-*- atm H2O. A flow rate of 1 linear cm/sec was maintained throughout the experiments. The oxygen pressure was determined by sampling the gas stream with a solid state electrolytic cell. The water content was maintained at 10"^ atm by bubbling the gas through a 46°C water bath.
RESULTS
All of the weight change data accumulated so far are siammarized in Table I. It is evident from this table that the substitution of Al for Cr does decrease the rate of volatilization both in water vapor and in a dry atmosphere. However, the influence is most apparent in water vapor.
Electrical conductivity measurements were conducted at Argonne National Laboratory. The initial data are shown in figure 1. These data were all taken in an air atm. A few measurements have been made at 10"' atm of O2, but they were found to differ from those measured in air by only 10%. Therefore, conductivity variation with P02 is riot considered to be a problem. As can be seen from figure 1, the substitution of Al for Cr tends to increase the resistivity. The room temperature resistivity of La gsMg Q5AIO3 was measured and found it to be greater than 10 - S cm. Thus it appears that it is possible to vary the resistivity of room temperature of La_95Mg_o5Cr2-xAlx03 from <1 ficm to >loi- J cm by just changing the Al content.
Thermal expansion measurements were made at Westinghouse and are shown in figure 2. It can be observed that the addition of Al tends to increase the thermal expansion coefficient.
DISCUSSION AND CONCLUSIONS
By holding the composition La g^Mg QcCr] _xAljj03 constant, an effort was made to observe the variation in properties due to changing Al content rather than some extraneous influences (such as porosity, multiphases, etc.).
143

TABLE I
Measured Rate of Weight Loss at 1740°C
Specimen
.5Ce02'5Zr02 [3]
^^84S^16^^°3 f^i
MgCr204 [3]
^^95^^.05^^°3 f l
^.8^^2^^75^.25°3
La_QCa_2Cr03
^ ^ 8 ^ ^ 2 ^ ^ 75^^2503
^^.95^5.05^^°3
^.95^5,05^^95^\05°3
^.95"5.05^^9^\l°3
^.95^^.05^^85^\l5°3
^^95^5.05^^8^\2°3
^.95^5.05^^75^\25°3
^^95^^.05^^5^^5°3
^^95^5.05^^25^^75°3
^^95^^.05^^1^\9°3
^^95^5.05^1°3
MgAl^O^
MgO
atm A - Po„ = 10 -3 atm
-3 -1 atm B - P02 = 10 atm + 10 atm H O
Gas Flow Rate = 1 linear cm/sec
Weight Loss* yg/cm^/hr
atm A atm B
53
0-2
16
0
5.5
19
7
2
4.4
5.1
6.2
10.3
0
0-1
0
-
0
-
_
80
34
430
136
38
34
44
10-44
16
7-24
19-24
16-34
0-16
0-9
0
0-8
0-9
0
78
(air)
(air)
(air)
(air)
* Uncertainty in measurement = + 5 yg/cm^/hr
144

1 ' u I
E 2 0 >-H > -I I -U Z3
a
u (9 O _
8S § I I I
o o IO
TEMP. C O o o IO
M
La.98Mg.o6Cr|.xAlx03
Figure 1: Electrical conductivity of La g^Mg Q^Crj^.^AlxOs.
1.0
o CO
sr Q. X UJ _J < s a: Ul X
0.8
0.6
0.4
0.2
T 1 r T r
La.95Mg.05Cr|-xAlx03
200 4 0 0 600 800
TEMPERATURE (*»C.)
X'l.O X-.50 X=.25
X=0
J L 1000
Figure 2 : Thermal Expansion of La g5Mg QcCri_xAljj03.
145

- /
For all practical purposes, all of the compositions tested are single phase with the Al in solid solution in La ggMg Q^Cri^x^l^Os. Therefore, one should expect to have rather clean grain boundaries. In addition, all of the compositions were sintered to a closed porosity situation (density 93% of theoretical). These two factors should make the test specimens about as representative of each composition as can be prepared.
A number of significant observations can be made from Table I and fig
ures 1 and 2.
(1) The substitution of Ca or Sr into LaCr03 does not influence its volatilization rate either in 10~3 atm O2 or 10-3 atm O2 + IO"! atm H2O atmospheres. The addition of Al to compositions of this type also does not alter the volatilization rate.
(2) The substitution of Al for Cr in the basic composition La_g5Mg Q^-Cr03 tends to decrease weight loss rate both in moist and dry atmospheres.
(3) In 10*3 atm ©2 + 10"! atm H2O atmospheres, MgO is more volatile than La gsMg o5*- '-'3 which is the most volatile chromite composition in the Al substitution series.
(4) The replacement of 25 to 50 m% of the Cr by Al lowers the volatilization rate such that essentially no measurable weight loss could be measured for periods of time of up to 36 hours at 1740OC in flowing atmospheres of either lO'^ atm ©2 or lO'^ atm O2 + 10"! atm H2O.
(5) The replacement of greater than 50% of the Cr by Al increases the electrical resistivity out of the useful range for MHD electrode applications.
Evidently, the substitution of Al for Cr into LaCr03 helps suppress the volatilization of Cr either in the form of Cr oxides or Cr02 (OH) . We have no ready explanations for this result.
We considered the possibility that the Al formed a barrier on the surface which would make the volatilization of Cr difficult. However, if this were the case, we should see a change in electrical resistivity from the surface to the interior. We have checked this and found the electrical conductivity to be the same both on the surface and in the interior of a sintered specimen. Thus this cannot be the explanation.
It might be that the addition of Al tends to lower the activity of Cr in the LaCr03 structure. The data of Sasamoto and Sata have shown that this is apparently what happens when Cr is placed in LaCr03 as compared to Cr203 [4] . The Cr appears to be more stable in the perovskite structure of LaCr03 than in the corundum structure of Cr203 [5] . Thus it might not be unreasonable to consider that the additions of Al increases the stability of Cr in LaCr03.
Probably the most important result is that this study demonstrates that by the application of the "Verwey controlled ionic valency principle" and by the use of careful preparation techniques the properties of a complicated oxide can be systematically altered in a reproducible and controllable manner.
146

REFERENCES
1. D.B. Meadowcroft and J.M. Wimmer, "The Volatile Oxidation of Lanthanum Chromite", Paper 87-13-73, 75th Annual Meeting of the American Ceramic Society, Cincinnati, Ohio, April 29-May 3, 1973.
2. H.K. Bowen, "The Stability of Lanthanum Chromite in a MHD Environment", unpublished.
3. H.U. Anderson, "Special Testing for Westinghouse Electric Corporation", March 1976, unpublished.
4. T. Sasamoto and T. Sata, "Vaporization of Lanthanum Chromite at High Temperature in Vacuum", Yogyo Kyokai Shi, 79. d D 408-418 (1971).
5. M. Yoshimura and H.K. Bowen, "Review of the Vaporization Characteristics of Materials for MHD Electrodes and Insulators", unpublished.
147

THE ELECTRICAL CONDUCTIVITY A N D THERMAL EXPANSION OF POTENTIAL M H D ELECTRODES BASED O N MIXED PEROVSKITES OF LANTHANUM STRONTIUM
CHROMITE A N D STRONTIUM ZIRCONATE*
J . Jacobs, K . M . Caste l l iz , W. Manuel and H. W. K ing** At lant ic Industrial Research Inst ih j te, Ha l i fax , Nova Scot ia, Canada
INTRODUCTION
Strontium substituted lanthanum chromite has been widely considered as a possible electrode material for M H D , because of its relat ively high electr ical conductivi ty [ 1 ] , but its high temperahjre use is l imited by a high evaporation rate at temperahjres above 1600OC [ 2 ] . Strontium zirconate, on the other hand, has been considered for high temperature applications on the basis of its excellent high temperature stabi l i ty [ 3 ] , but its use as a ^ possible MHD electrode material is hampered by its relatively low electr ical conductivi ty [4] . A systematic investigation of ceramics wi th the composition (La^Sr •|5Cr03) •\_^ (SrZr03)j^ has thus been in i t ia ted, wi th the aim of optimizing the high temperature properties of these two perovskites.
MATERIALS
Ceramics of the series (La84Sr j z C r O o ) ^ (SrZr03)j^ and SiCr .Z r^^Oo were prepared by multiple f i r i ng , gr inding, and sieving of mixtures of La203 (Leico 99.96%)/ SrC03 (Baker 99%), C r203 (Fisher 98%) and Z r 0 2 (Anachemia 99%). The resulting powders were uniaxial ly pressed into discs 25mm in diameter and 2-4mm in thickness. These discs were sintered In air at 1400'^ for 2 hours in a Lindberg globar muffle furnace. The composition of selected samples was checked by quantitative chemical analysis.
A l l of the ceramics were examined under crossed polaroids in a petrographic m i croscope. Under these conditions. La g^Sr i z C r 0 3 appeared to be slate grey in colour, whi le SrZr03 appeared orange. Ceramics of intermediate compositions were found to be composed of varying proportions of these two phases. The degree of porosity of the ceramics was determined from quantitative measurements on petrographic micrographs and was found to vary between 25 and 65%.
The crystal structures of the ceramics were examined by X- ray d i f f rac t ion . The diffraction profiles of La g^Sr •|ACr03 showed asymmetric l ine broadening which was consistent wi th the minute rh'omboliedral distortions (R3m) reported previously by Castel l iz [63. As the line splitting was not resolved, the pattern was indexed as the cubic (PmSm) perovski te. This gave a latt ice parameter of a = 3.874 ± 0.004A, which agrees wel l w i th the previous results of Castell iz [6] and of Wold and Ward [7] . The structure of SrZrOo was confirmed to be the orthorhombic (Pnma) perovskite wi th latt ice parameters of a = 5 .804 ,
* This work was supported by a Special Project Grant Awarded by the Nat ional Research Council of Canada.
* * H . W . King is also with the Department of Engineering and Engineering-Physics, Dalhousie University, Hal i fax, Nova Scot ia, Canada.
148

b = 8.196 and c = 5.800A , which also agree wel l w i th previously reported crystallogra-phlc data [ 8 ] . Ceramics of intermediate composition were found to be composed of a mixture of the cubic and orthorhombic perovskites wi th the expected variations in X-ray diffracted intensity.
w » » « ^ l A l A n i T V
500 Temperature
1000 CO
1500
FIGURE 1 . Temperature dependence of AC resistivity (lOOHz) of various ceramics. "Present results, A Meadowcroft [ 2 ] , Anthony et a l . [ 5 ] .
ELECTRICAL RESISTIVITY
The electr ical resistivity of the ceramics was measured in a helium atmosphere over the temperature range from 20 to 1400°C, using a 4-point AC method at 100 Hz . The DC resistivity of several samples was measured, using the same 4-poInt probe. These were found to agree wi th in 10% of the respective AC results at temperatures below 6 0 0 ^ and to be sl ightly larger at higher temperatures. The samples were determined to be ohmic both at room temperature and at 1400'\Z . The results were corrected to a reference density of 5 0 % , on the basis of the quanti tat ive petrographic examination referred to above. As shown in Figure 1 , the resistivity of the SrZr03 ^^^amlc is of the order of 10^ ohm-cm at 1400°C, but increases very steeply on coo l ing , so that at room temperature It is ef fectively an Insulator. The resistivity of La g^Sr ] z C r 0 3 remains approximately constant at 10 " ' ohm-cm over the temperature range trom 500 - T400°C and rises t o ~ 6 x l 0 ~ ' ohm-cm
149
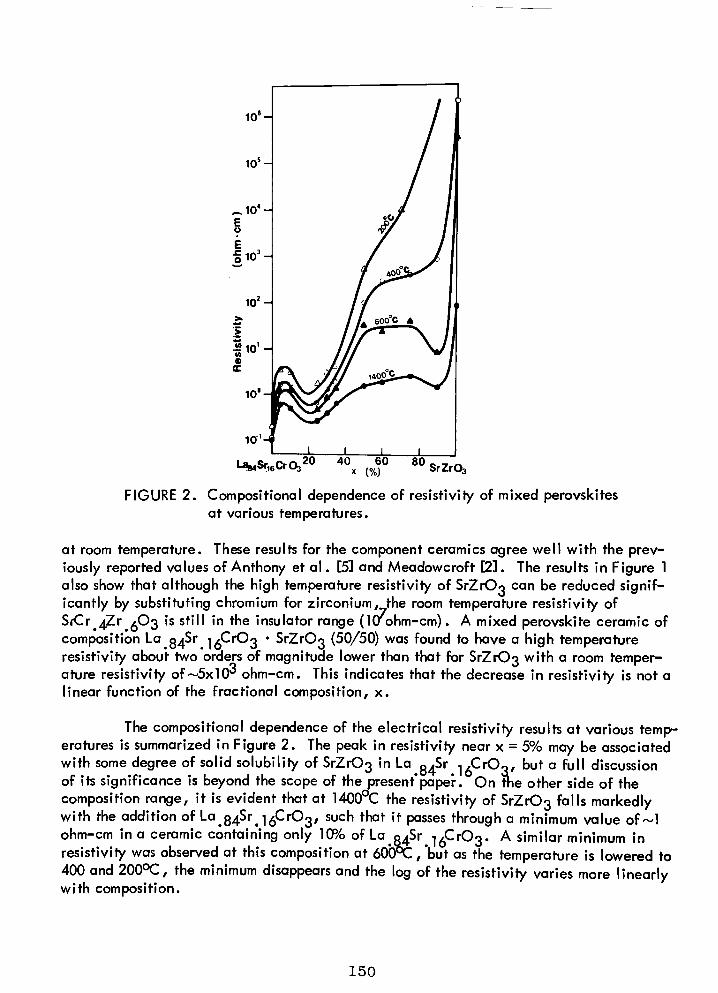
10 ' -
10 ' -
^ 1 0 ' -E o E
10 ' ->>
• >
«
7 1 J AO^Sfei.^
/ A 600°C A
1 \ I t ' / n""°C T i
1 0 ' •
Ufe,Sr,eCrO,20 40 80 SrZrOs
FIGURE 2 . Compositional dependence of resistivity of mixed perovskites at various temperatures.
at room temperature. These results for the component ceramics agree wel l w i th the previously reported values of Anthony et a l . [53 and Meadowcroft [23. The results in Figure 1 also show that although the high temperature resistivity of SrZr03 can be reduced significantly by substituting chromium for zirconium, the room temperature resistivity of SiCr 4Zr ^ 0 3 is st i l l in the insulator range ( l ( /ohm-cm) . A mixed perovskite ceramic of composition La g^Sr i^CrOg • SrZr03 (50/50) was found to have a high temperature resistivity about two orders of magnitude lower than that for SrZr03 ^''^'^ ° room temperature resistivity of ~5xl0'^ ohm-cm. This indicates that the decrease In resistivity is not a linear function of the fractional composition, x .
The compositional dependence of the electr ical resistivity results at various temperatures is summarized in Figure 2 . The peak in resistivity near x = 5% may be associated wi th some degree of solid solubil i ty of SrZr03 ' " '-^ 84^"^ 1 6 ' ^ ' ^ 3 ' '^"^ ° *^"" discussion of Its significance is beyond the scope of the present"paper. On me other side of the composition range, i t is evident that at 1400°C the resistivity of SrZr03 falls markedly w i th the addit ion of La g4Sr j ^ C r O g , such that i t passes through a minimum value of ~1 ohm-cm in a ceramic containing only lOP/o of La o4Sr • |^Cr03. ^ similar minimum in resistivity was observed at this composition at 60b°C, 'but as the temperature is lowered to 400 and 200°C, the minimum disappears and the log of the resistivity varies more l inearly wi th composition.
150

500 Temperature
1000 1500 CO
FIGURE 3 . Form of the linear thermal expansion of mixed perovskite ceramics.
THERMAL EXPANSION
The linear thermal expansion of the (La g^Sr 16^^03) i_x (^ ' " ^ ' ^3 )x ^s™'"''^s was also measured over the temperature range from 20 to 1 4 ( J 0 ' ^ , using a Theta magnetic-transducer dllatometer standardized against quartz and copper. The results for La 84^' ' . 1 6 ^ * ^ 3 ' S'"Zr03 are plotted in Figure 3 . The expansion plots for a l l of the ceramics In the series were found to fa l l between the values for the refractory oxides MgO and A I 2 O 3 . Linear thermal expansion coeff icients, calculated from data such as that In Figure 3 , are plotted against composition (x) in Figure 4 . The value of 9.6 x 10~°K~ determined for La 84Sr ] zCr03 , over the temperature range 20 - 1000*^ , agrees closely w i th the results reported by Meadowcroft [13. For S r Z r 0 3 , the equivalent expansion co ef f ic ient was calculated to be 1.05 x 10~^K~ . The thermal expansion coeff ic ient of the intervening ceramics Is not a linear function of composition, but the precise form of its variat ion w i l l be taken up in a later publ icat ion.
La84Sri6Cr03 20 80
SrZrOa 40 60
X (%)
FIGURE 4 . Coef f ic ient of linear thermal expansion between 20 and 1000°C for mixed perovskite ceramics.
151

La84Sri6Cr03 X (%)
SrZrOs
FIGURE 5. Weight loss determinations for mixed perovskite ceramics •1 h at 1700°C in st i l l a i r , A 1 h at 1850°C in f lowing burnt propane ( P Q = 0.075 a tm . ) .
WEIGHT LOSS MEASUREMENTS
The weight loss, per square cm of specimen surface, after heating the ceramics for 1 hour at 1700°C in st i l l air is shown in Figure 5 . Under these condit ions, SrZr03 showed an insignificant change In weight , whi le the weight loss of the mixed perovskite ceramics varied approximately linearly wi th the compositional parameter, x . The degree of weight loss was significantly diminished, for both La g/Sr ]6*^103 and the ceramic wi th x = 15%, when the atmosphere was changed to f lowing burnt propane, w i th a ca lc ulated oxygen partial pressure equal to 0.075 a tm, and the temperature was raised to 1850°C . These results are also consistent wi th a linear dependence of weight loss on fractional composition, x .
CONCLUSIONS
lower the The present results show that addit ion of 10% La g/Sr i ^CrOg high temperature resistivity of SrZrOg to a value more suitable
is suff icient to ^3 TO u vaiue more suiraole for MHD app l i
cations, without causing a significant depreciation of Its refractory properties In oxidizing atmospheres. The ceramic (La g4Sr j ^ C r O g ) j (SrZr03) 9 st i l l has a relat ively high room temperature resistivity, however, but this may be overcome by using electrodes In which the composition Is suitably graded to La g4Sr i^CrOg at the room temperature end. Such an electrode would have a uniform electr ical resistivity of the order of 1 ohm-cm and
152

remain compositional ly stable for long periods, even at very high operating temperatures, because inter-diffusion between the two perovskite phases Is Insignif icant.
ACKNOWLEDGEMENTS
The authors are grateful to M . Rockwell for assistance w i th the petrographic examination, E. Theophilus for assistance wi th the quanti tat ive chemical analysis, to S . G . Whiteway and W . C a l e y of the NRC At lant ic Research Laboratory for their assistance wi th the construction of the equipment for the high temperature measurements, and to G . P . Wilson for helpful advice and encouragement.
REFERENCES
1 . D.B. Meadowcroft , Br i t . J . A p p l . Phys., ser. 2 ,2 (1969) 1225.
2 . D.B. Meadowcroft , Proc. In t . Conf . on Strontium Containing Compounds, At lant ic
Industrial Research Inst i tute, Ha l i fax , N . S . , Canada (1973) 119.
3 . B.R. Rossing, J . A . Dl lmore, H .D . Smith, and W . E . Young, 15th Symposium on the
Engineering Aspects of M H D , P h i l a . , Pa (1976) I . 2 A .
4 . T .L . PIvovar and V . Y a . Tolstaya-Belik, High Temp. , 8 (1970) 1227.
5 . A T M . Anthony, A . G u l l l o t , T. Sata, J . - L . Bourgeois, Rev. Hautes Temper, et Refract. 3 (1966) 147
6 . K . M . Cas te l l i z , Proc. In t . Conf . on Strontium Containing Compounds, At lant ic
Industrial Research Inst i tute, Ha l i fax , N . S . , Canada (1973) 149.
7 . A . Wold and R. Ward, J . A m . Chem. Soc . , 76 (1956) 1029.
8 . N a t . Bur. Stds. ( U . S . ) , C i r c . 539, 9 (1959).
153

* STRUCTURAL AND PHYSICAL PROPERTIES OF THE La. Sr CrO„ SYSTEM
J. Faber, Jr., M. H. Mueller, W. L. Procarione, A. T. Aldred, and H. W. Knott, Argonne National Laboratory, Argonne, IL 60439 and H. U. Anderson, University of Missouri, Rolla, MO 65401
INTRODUCTION
LaCrOa, and the candidate MHD electrode material. Lag,ei+Sro.leCrOa, have been studied with X-ray powder diffraction, electrical conductivity and magnetic susceptibility techniques in the temperature range 4.2 <T< 2000 K. The purposes of our multiprobe approach are to (1) characterize the host material, LaCr03, and (2) study the effects of strontium doping on the parent LaCrOa material. The efforts reported here are part of a comprehensive program that focuses on the properties of ABO3 perovskite compounds, where A is a rare earth and B is a 3(f transition metal.
Our X-ray measurements are aimed at determining the structural differences between LaCrOs and the doped material. Lag. eitSro. le^rOs. Koehler and Wollan [1] studied LaCrOa with neutron powder diffraction, and observed an antiferromagnetic transition in the orthorhombic unit cell with Tjj = 320 K. Ruiz etal.[2] have observed a phase transformation at about 560 K that reflects a symmetry change from orthorhombic to rhombohedral above the transition. A number of magnetic susceptibility studies [3-5] report values of the Ne^l temperature that span 277 < Tjj < 320K. The considerations of sample purity and sample preparation may be Important. Ruiz et al. [2] reported results of conductivity studies on LaCrOs, and found that the ionic transference number, t^ < 0.05% at 1250 K. The incomplete d band produces electronic conductivity behavior in ABO3 perovskites that ranges from metallic-like to semiconducting depending upon the transition metal at the B site. The theory of conductivity has been considered in detail by Goodenough [6,7] and we shall test a localized-itinerant model in the spirit of this theory.
Meadowcroft [8] presented an introductory account of Sr-doped LaCrOs, and suggested it for MHD electrodes. Based on thermal expansion, density, resistivity and other thermo-chemlcal results, the idea was advanced that Sr acted as a sintering agent, reduced Cr203 volatility at high temperature and high PQ^. and Increased the electronic conductivity of the compound. Thermal expansion data [9] on Lag^gSrg.iCr03 show a small inflection at T 'v 560 K. Our results of high temperature X-ray diffraction studies on rhombohedral Lao.si+Sro. i6Cr03, also show unusual Bragg peak intensity changes at T' i-560 K. In addition, we observe a phase transition at T = 190 K that reflects a symmetry change from rhombohedral to orthorhombic. There is a definite correlation between the presence of a ferromagnetic component in the susceptibility and the occurrence of the lattice transition at T = 190 K. Magnetic susceptibility experiments sense, in part, the unpaired 3d electrons surrounding each transition metal ion and thus provide an extremely sensitive probe for different chromium oxidation states. The conductivity data suggest that p-type conductivity predominates in Lao. sitSro. i6Cr03 and that multivalent Cr ions arise from Sr doping.
*Work supported by the U. S. Energy Research and Development Administration.
154

SAMPLE PREPARATION
The samples were prepared by pyrolyzing amorphous organic precursors to ensure compositional homogeneity and high density. Details of this technique will be presented by Anderson et al. [10]. The X-ray and magnetic susceptibility results were obtained from samples fired at 1970 K in PQ = 10 ^ atm, and on the same samples oxidized at 1700 K In PQ = 1 atm. ^
RESULTS AND DISCUSSION
LaCr03 is an orthorhombic perovskite with ao= 5.5148(5) A, bo= 7.7578(7) A, and CQ = 5.4781(5) Aat 300K. When compared with the prototypical structure [11], GdFe03, our results show that the distortion from cubic perovskite is much less both in terms of lattice constants (BQ'^CQ, and bg'v v2 a j corresponds to a reduced cubic perovskite unit cell) and relative intensities obtained from X-ray film and diffractometer tracings. The La ions are positioned 'vO.2 A from their undistorted perovskite lattice sites. Thermal expansion data were obtained for 80 < T < 400 K. The unit cell volume shows a linear dependence with temperature. No significant change in volume-temperature dependence or discontinuity was observed for 250 < T < 350 K, which spans a reasonable range of temperature near Tjj. Anticipated magnetostrlctive effects are apparently below the level of ser.sitivity of the X-ray measurements. We should point out that the X-ray studies are principally sensitive to metal sublattlce phenomena because of the large atomic scattering factors for La and Cr, when compared to oxygen.
In the context of localized conduction process, the resistivity, p" T exp(-AE/kT), where AE Is the activation energy. The electrical conductivity, a, of LaCrOa at PQ = 1 atm does not show linear behavior when plotted as In(aT) versus T~^ (T >1500 K) Indicating that more than one conduction mechanism Is present (see Flg.l). At a lower oxygen partial pressure of IO"'* atm the conductivity is substantially decreased and the data now show an excellent fit to £n(aT) versus T~^ for
TEMPERATURE ( C)
•^ -3 10
600 1200 KXIO 800 600 500 400 300 . 1 1 1 1 1 1 1 > 1 I 1 1 1 1 :
-
. -•
• ' _
- .' LoCr03 PQ =IO- ' 'alm-
_ . -" . ~ - .*
. _
— .' — / ,' .
y , • -" • .** -- '* .' * -
. ,.• . ' • LoCrOj
• • * .'• - / • , *
' -• ^ .•• — . . • • • . • "
- » '* . • -- / ^ • • X • f • -r . • •
. . . . • • • •
- ••" ..-' ^
^..•* -, . • • • *
. . . - • Lo.a^Sr.igCrOj
- .•• ••
1 1 1 1 1 f 1 0.6 OS 1.0 1.2
lOOO/T ("K"')
1.4 I.e I.S
Fig. 1. Temperature Dependence of the Electrical Resistivity in the La^_ Sr CrO System. PQ = 1 atm. except as noted
2 above.
155

50
5.0
1.0
05
O.l
1 r T=I400°C
'-"o.84S'o,6C'03
900<T<1900 K with a thermal activation energy (0.54 eV) more than twice as large as for the PQ = 1 atm data (see Fig. 1). This result Indicates that the conductivity is p-type and that one of the conduction meclianisms Is suppressed to reduced PQJ* Replacement of some of the La "*" ions on the A site of the perovskite structure with Sr "*" ions should induce an intrinsic, localized conductivity because of the formation ' " of chromium ions of mixed valence to maintain charge neutrality. The conductivity data (see Fig. 1) for the 16 mole % Sr sample show a marked increase in conductivity and decrease in thermal activation T_ energy relative to pure LaCrOs, and an ex- S cellent fit to the dependence expected for S a localized mode of conduction up to approx- imately 1800 K. Additionally, the conducti- p vity is nearly independent of oxygen partial g pressure (see Fig. 2) in the range 1 to 10"^ § atm as would be expected after the introduction of a large number of charge carriers by the Sr doping. The conductivity results compare favorably with the results of Meadowcroft [8]', however, our data are much more extensive and tend to scale to higher conductivity values in general.
'-''o.9e^'o.oz^'°3
LoCrO,
lol
Magnetic susceptibility data on LaCr03 and Lao.sifSro. i6Cr03 have been obtained using the Faraday method. Magnetic suscept-ability results are shown in Fig. 3 and indicate that T^ is 288 K. The magnetic susceptibility of LaCrOs obeys the Curie-Weiss law (x"^°^T-e) at high temperature (500 - 1150 K) and the effective moment is consistent with the presence of Cr "*" ions, g The temperature dependence of the magnetic susceptibility of the 16 mole % Sr sample is again linear between 500 and 1150 K | « with a slope slightly different than in i LaCr03 and in agreement with the presence I of 16% Cr'*'*' ions with a lower effective "><%( moment than the Cr "*" ions.
In contrast with LaCr03, the strontium- z doped compound (Lag. ei+Sro. i6Cr03) , has rhombohedral symmetry at 300 K and the lattice constants (in an equivalent hexagonal representation) are aQ= 5.5006(6) A and CQ= 13.297(1) A. A study of polycrystalline material for 4.2 < T< 1200 K shows several structural changes. The rhombohedral angle, a-^, can be used as a measure of departure from the undistorted perovskite structure, and a is shown as a
10 10
Ftojfatm) ,6
Fig. 2. Oxygen Partial Pressure Dependence of the Electrical Conductivity in the La2_^r CrO^ System. Data are obtained iso-thermally for T = 1673 K.
400 600 800
TEMPERATURE C K )
Fig. 3. Dependence of the Inverse Susceptibility, x~ j as a function of T(°K) for Lai_^r^Cr07, where X = 0 and x = 0.16.
156

function of T in Fig. 4. A monotonic decrease of a^ from 60.59° at 300 K to 60.28° at 1200 K was observed. Extrapolation of these data suggests that the unit cell would become cubic (aj^=60°) at 1900 K. The cell volume shows a linear dependence on temperature; however, at T'v560K, a change in the relative intensities of the Bragg profiles occur. The apparent syimnetry above and below the transition is * rhombohedral. This behavior suggests the occurrence of an internal rearrangement of the atoms within the unit cell. °°
560.2 m
In Fig. 5, we show the low temperature magnetic susceptibility data for both LaCr03 and Lag . si+Sro. i6Cr03. For LaCr03, the annealed sample shows sharper features near Tjj, and the ferromagnetic contribution, a^, to the susceptibility nearly vanishes. The susceptibility maximum, while still present in the doped sample, is suppressed, broadened, and shifted to 'V.255 K. Below 200 K, a ferromagnetic component appears which increases rapidly and dominates the total magnetization reaching a value at and below ''150 K of 0.25 emu/g.
We have observed a phase transition in Lao.etfSro. leCrOs at T = 190 K that reflects a change in unit cell symmetry from rhombohedral to orthorhombic below the transition. In samples fired In a reducing atmosphere (PQ„'x-10"-^^ atm at 2100 K) the transition Is very broad, i.e., the transition occurs over AT = 50 K, and both phases appear simultaneously in this temperature interval. Samples annealed in PQ = 1 atm still show some hysteresis, but AT < 10 K. A reasonable fit to the experiment data is obtained for the orthorhombic space group Pnma. This group representation is identical to that for LaCr03 at room temperature. In Fig. 6 we show the lattice unit cell volume dependence on temperature for 80 < T < 300 K. The volumes are normalized to the hexagonal representation (i.e., the orthorhombic
Fig. 4. Dependence of the Rhombohedral Angle, a, as a Function of T(°K) for Laq^8kSro,isCr02. The dashed line is for a =60°, which corresponds to a cubic perovskite unit cell.
45
4 0
- 35
E
E - 30 g
s
25
2 0
^ ^ * 6
0 o
o- o
~ &
so • ! * * • •
A a
o
o
4 '^
1
100 150 200
aV
X » A
o o o o o ^ " T ^
Lo,_j, Sfjj CrOj
K AS RECD EQUIL IN Oj
0,0 o •
0.16 a *
0
o ^ / O j ^
1 1 > 1 1 1 1
2 5 0
of
a a a r
1
-
" -
-_
iS£??°°
:
--
-
_
^-
1 1 0 50 100 150 200 250 300
TEMPERATURE {'K)
Fig. 5. Dependence of the Magnetic Susceptibility and a^, the ferromagnetic component of x as a function of T(°K). Data for LaCrO^ and LaQ^Ql^SrQ^l^CrO•^ are presented.
157

349
n
<< UJ S
UN
IT-C
EL
L V
OL
U
M 7
' 1 1
'-<'0.84 Sfo.l6'^''°3
-
i i l l ' ' 1 1 1
1
i
1
i
1
i
1
1 1
f
i i
100 200 300
T(°K)
Fig. 6. Unit cell volume for Lao^8i^SrQ^i(,CrO^ as a function of TCK). The structure has rhombohedral symmetry for T > 190 K and orthorhombic for T < 190 K. The orthorhomoobic cell volume has been normalized to the rhombohedral cell volume (the factor is 3/2).
for the suppression of the transition on
cell volume is multiplied by 3/2). Since hysteresis effects were observed, the volume data suggest that this transition may be nearly first order. Detailed analysis of the peak intensities above and below the transition show that the attendant displacements of La(Sr) in the structure are complex and probably not simple shear motions. The mechanism for the transition is not clearly understood; however, a similar transformation has been reported for LaCr03 at 560 K. Many transition metal perovskites exhibit a number of transformations (cubic at high temperature, rhombohedral at intermediate temperature and orthorhombic at low temperature). From our experiments, it Is clear that the rhombohedral to orthorhombic transition has been suppressed approximately 370 K with the addition of 16 mole % Sr ions. The disordering influence of Sr on the A sublattlce (In ABO3) is responsible a temperature scale.
CONCLUSIONS
We have observed that Lag. B tSro. i6Cr03 has rhombohedral, not orthorhombic symmetry. Experiments on samples with lower strontium concentrations are planned to accurately locate the critical composition at which the sjnranetry change takes place. Our model for Lai_jjSrjjCr03 presumes that Sr^ ions substitute for La on the A sites and charge neutrality is maintained by multivalent Cr ions. The conductivity and susceptibility data confirm the model. Experiments on samples with higher dopant concentrations are in progress. The susceptibility and X-ray data show the disordering influence of Sr on the A sublattlce (recall that Tjj is suppressed ' 25 K for Lag ei+Sro. leCrOs), and clearly underscore the observed phase transition at T = 190 K. Experiments are planned to reexamine the transition in LaCr03 at 560 K.
REFERENCES
1. W. C. Koehler and E. 0. Wollan, J. Phys. Chem. Solids, 2 , 100 (1957). 2. J. S. Ruiz, A. M. Anthony, and M. Foex, C. R. Acad. Sci., Paris, B264,
1271 (1967). 3. G. H. Jonker, Physica, 2i0, 1118 (1954). 4. G. A. Candela, R. A. Forman, A. H. Kahn, D. B. Meadowcroft, and
J. Wimmer, 14th Symposium on Engineering Aspects of MHD, Univ. of Tennessee Space Institute, April 8-10, 1974.
158

5. G. A. Smolenskli, V. M. Yudin, E. S. Sher, and Y. E. Stolypln, Soviet Physics JETP, 16 , 622 (1963).
6. J. B. Goodenough, J. Appl. Phys. 37 , 1415 (1966). 7. J. B. Goodenough, Czech. J. Phys. B17, 304 (1967). 8. D. B. Meadowcroft, Brit. J. Appl. Phys. 2, 1225 (1969). 9. This reference appears as a private communication from Robinson and
Oldfield to Meadowcroft in Ref. 8. 10. H. U. Anderson, R. Murphy, S. Semachaibovorn, B. Rossing, A. T. Aldred,
W. L. Procarione, and R. J. Ackermannn, Paper in this conference. 11. P. Coppens and M. Eibschutz, Acta Cryst. _19 , 524 (1965).
159

PHASE EQUILIBRIA IN THE (La,Sr)Cr02 SYSTEM
C. P. Khattak and D. E. Cox
Brookhaven National Laboratory
Upton, New York 11973
The perovskite system (Lai_xSrx)Cr03 is under active consideration as a possible candidate for application as an electrode material in MHD ducts [1] because of its high electronic conductivity combined with very refractory properties. It is generally believed that the substitution of Sr2+ ions into LaCr03 leads to charge compensation by the formation of Cr^+ ions, as expressed by the formula (Lai_xSrx)(Cr|+xCr^+)03, thereby giving ehanced p-type conductivity [2]. However, by analogy to other perovskites containing 3d ions in high oxidation states, it is possible that oxygen vacancies may also be created, leading to the formation of fewer Cr^+ ions and consequently a lowering of the electronic conductivity. If this is the case, the electrical properties may vary according to whether the operating conditions are oxidizing or reducing. Furthermore, LaCr03 is known to undergo a transformation from orthorhombic to rhombohedral sjnranetry at about 280°C [3] with possible adverse consequences to its mechanical properties. This transformation temperature is lowered with the substitution of strontium [4],
The present paper describes the preparation and characterization of some of the materials in the (La] _jjSrx)Cr03 system and a study of the phase relationships. Particular attention has been given to the use of x-ray diffraction techniques to provide an estimate of the oxygen stoichiometry.
PREPARATION AND CHARACTERIZATION
Polycrystalline samples of LaCr03 were prepared by heating "Fisher certified" or equivalent grade La203 and Cr203 at 900°C, followed by grinding and refiring at 1500°C. As previously reported [4], synthesis in an oxygen atmosphere at 1500°C was found to be a satisfactory method for preparing single phase samples of Sr-substituted materials with essentially the full oxygen stoichiometry. This procedure was adopted for the formation of compounds (Lai_xSrx)Cr03 with x = 0.05, 0.16, 0.25, and 0.35. In all cases a single phase material was formed as shown by IRD-Guinier x-ray patterns using CuKai radiation. As in LaCr03, the sample of LaQ95Sro.05^^03 showed orthorhombic symmetry, whereas the other Sr-substituted compounds showed rhombohedral symmetry of the type reported for the high temperature form of LaCr03 [3]. The x-ray measurements previously reported indicated that the unit cell volumes were sensitive to the oxygen stoichiometry. Careful x-ray diffractometer scans were therefore carried out for a number of high angle peaks with CuK3 radiation in order to permit a reasonably precise determination of the lattice parameters. These are shown in Table I, together with the cell volumes per formula unit.
*Research supported by U.S. Energy Research and Development Administration.
160

TABLE I. Crystal symmetry and lattice parameters for Lai_xSrxCr03. V is the volume per formula unit and a^ refers to the pseudo-cubic cell.
X
0.0
0.05
0.16
0.25
* 0.25
0.35
1.0+
Structure
Orthorhombic
Orthorhombic
Rhombohedral
Rhombohedral
Rhombohedral
Rhombohedral
Cubic
Lattice Parameters
a b c
a b c
a c
a c
a c
a c
a c
= 5.514 = 5.479 = 7.758
= 5.513 = 5.476 = 7.752
= 5.501 =13.296
= 5.492 =13.297
= 5.504 =13.342
= 5.475 =13.299
= 5.399 =13.226
V o3 (A *)
58.59
58.51
58.07
57.89
58.34
57.54
55.66
1 a = v3" o
(1)
3.884^
3.8822
3.872, 4
3.868, 4
3.878, 4
3.860^ 6
3.818j^
* Corresponds to the reduced composition, La_ Tc^r^ „^CrO- OQJ.A Q-I
t Published data [5]. Lattice constants derived from cubic cell (a = 3.818 A ) .
The data in Table I permit an estimate of the oxygen stoichiometry in La2^_ SrxCr03 for values of x in the range of interest. A plot of the cell volumes as a function of composition for the whole system is shown in Fig. 1. The data for the end member SrCr03 have been taken from Chamberland [5]. It is seen that an approximately linear dependence holds in spite of the sjm-metry changes from orthorhombic in LaCr03 to rhombohedral for x = 0.1 to 0.35, and finally to cubic in SrCr03. Similar behavior is observed in a number of other perovskite systems in which symmetry changes are also involved [6,7,8] and strongly suggests that these materials are essentially fully oxidized.
161

59 r — \ 1 1 1 1 r
{La,_xSrx)Cr03_x/2
ro o <
H 2 3
< _l 3 S OC
o U-\ UJ
s 3
o >
58
57
56
{La|_xSrx)Cr03
55 0.0
LaCrO
FIG. 1
Also plotted In Fig. 1 is a point denoted by an open circle, which corresponds to a sample of LaQ 75SrQ^2503 which had been reduced in hydrogen at 1200°C. Weight loss measurements showed the composition to be Lao.75SrQ 25 ^ 02.89 * 0 01» ^^^ ^^ ^^ clear that oxygen loss is accompanied by a small but significant expansion in volume.
An analogy can be made with the compounds SrV03 and SrV02.9, in which an enlargement of the unit cell volume by 0.58A3 for 0.1 mole of oxygen defects has been reported [9], and the compounds Lao.8Sro.2Cr03 and LaQ^8^^0.2^^02.9, since the molar decrease in the amounts of V^+ and Cr "*" is identical, i.e. 0.2. If the volume decrease is assxamed to be the same for the same concentration of oxygen defects in the two systems, and a linear relationship is assumed to hold, the volume per formula unit for a fully reduced (Lai-xSrx)CrO_ ,„ series of compounds would correspond to
162

the broken line shown in Fig. 1. Thus we can now represent the two limiting situations in which the Sr substitution either causes the creation of oxygen defects (broken line) or leads to the formation of an equivalent number of Cr "*" ions (solid line). LaQ^75Sro.25Cr02.89+ 0.01 clearly represents an intermediate case, and the composition inferred from Fig. 1 agrees with that determined from the weight loss within the error limits.
STRUCTURAL STUDIES
X-ray and neutron diffraction intensity data were collected and analyzed as described previously [4]. The structural features of the orthrhombic and rhombohedral phases can be very simply described in terms of a model involving the tilting of rigid oxygen octahedra developed by Glazer [10]. In the case of LaCr03, there is tilting of roughly 11 deg. about a pseudo-cubic [110] axis and 5 deg. about the correspondirg [001] axis. The rhombohedral structure of Lao.75Sro.25Cr03 lias R3C symmetry and involves a tilt of roughly 9 deg. about a pseudo-cubic [111] axis.
Megaw and Darlington [11] have shown that there is a correlation between the tilt angles and the lattice parameters of rhombohedral perovskite systems. The observed rhombohedral parameters along with the calculated tilt angles based on this correlation are shown in Table II. The data in Table II show that there Is a decrease in the interaxial angle, a, and tilt angle, OJ, with increasing Sr content. This indicates an increasing tendency toward cubic symmetry, for which a is equal to 60°. A comparison of these angles for the oxidized and reduced phases for x = 0.25 shows a similar behavior indicating that the presence of oxygen defects acts towards stabilization of the cubic phase.
Table II. Rhombohedral lattice parameters, a and a, along with the calculated tilt angle, w, about a [111] pseudo-cubic axis for La, Sr CrO.
1-x X 3
X
0.16
0.25
0 .25*
0.35
a (A)
5.452
5.450
5.466
5.445
a (°)
60,59
60.51
60.46
60.37
0)
(°)
9.5
8.8
8.4
7.5
* Corresponds to the reduced composition, La_ -;cSr_ „cCr0- oqjrv n-i •
163

^
REFERENCES
1. D. B. Meadowcroft, P. G. Meier, and A. C. Warren, Energy Conversion 12, 145 (1972).
2. D. B. Meadowcroft, Brit. J. Appl. Phys. (J. Phys. D), Ser. 2, 2 , 1225 (1969).
3. J. S. Ruiz, A. M. Anthony, and M. Foex, C. R. Acad. Sci., Paris, B264, 1271 (1967).
4. C. P. Khattak and D. E. Cox, Mater. Res. Bull. _12, (1977 - in press).
5. B. L. Chamberland, Solid State Commun. _5» 663 (1967).
6. H. L. Yakel, Jr., Acta Cryst. i, 394 (1955).
7. P. M. Raccah and J. B. Goodenough, Phys. Rev, 155, 932 (1967).
8. D. E. Cox and A. W. Sleight, Proceedings of the Conference on Neutron Scattering, Gatlinburg, Edited by R. M. Moon, p. 45 (1976).
9. P. Dougier, J.C.C. Fan, and J. B. Goodenough, J. Solid State Chem. V^, Ul (1975).
10. A. M. Glazer, Acta Cryst. B^, 3884 (1972).
11. H. D. Megaw and C.N.W, Darlington, Acta Cryst. A31, 161 (1975).
164

X-RAY PHOTOELECTRON SPECTRA OF La202, Cr20 AND LaCrO *
Wei-Yean Howng, J. R. McCreary and R. J. Thorn Chemistry Division, Argonne National Laboratory,
Argonne, Illinois 60439
One of the techniques which can be used to investigate directly the electronic structures of ceramic materials is x-ray photoelectron spectroscopy. Since the electronic structure should furnish some basic understanding of the electronic conductivity, this technique should be useful in obtaining information needed in the design of electrodes for MHD generators. To examine the potential use of this technique, we have investigated the photoelectron spectra of lanthanum chromite and its two component oxides.
The lanthanum chromite was prepared from powders of Cr203 and La203 which had been heated to approximately 600°C in air for 8 hours. An equal molar mixture of the powders was heated at 1500-1650°C for 4.5 hours in vacuum of the order of 10~5 torr. The x-ray pattern of the annealed product displayed only lines corresponding to LaCr03. The pattern matched exactly line-for-line a pattern obtained with the lanthanum chromite prepared by H. U. Anderson et al., (see this volume). The photoelectron spectra were recorded with an ESCA36 made by GCA/McPherson; MgKa x-radiation (hV = 1253.6 eV) was used. The obtained spectra were corrected for the MgKa satellites and were 11-point smoothed. The measured orbital energies were corrected for the electrical charging (Q) of the samples through the use of the measured energy for the C(ls) orbital electrons of the carbon containment which is always present on the samples. The spectra are shown in Figs. 1, 2, 3 and 4. To obtain the ionization energies (I) referred to the gaseous ions and gaseous electrons,the charge-corrected values were adjusted for the crystalline potentials (Eg) and the work function of the spectrometer (4.3 eV). Thus
I = E, + Q + E +4.3 (eV) . b e
Values for Eg were obtained through the use of a computer program furnished by Van Gool and Piken [1]. This evaluation of the crystalline potential assumes that the compound is entirely ionic so that some adjustment is also needed to recognize that the compounds are not completely ionic. In studies with fluorides and oxides, McCreary and Thorn [2] and McCreary, Thorn, and Wagner [3] have shown that E^ + Q + Eg + 4.3 is a linear function of the ionicities calculated by Levine [4] from measured indices of refraction. Using the relation so established and the measured binding energies for the 0(ls) orbital reported herein, we obtain the values for the ionicities: La2O3/0.932; LaCrO3/0.845; and Cr2O3/0.780. The low value for Cr203 may be attributable to polarization of the Cr3+ ion through its low-lying electronic states of the F configuration.
The spectra for the La(3d) orbitals in both La203 and LaCr03 display intense satellites as shown in Fig. 1. This satellite has been assigned to multielectron charge transfer process [5]. The transfer is induced by sudden creation of an electron-hole in the inner core orbital in which an
165

-^
854 848 842 Binding Energy (eV)
836 830
Fig . 1. La^'''3d 3/2(H), La- ''"3d 1 /2 ( J ) , and s a t e l l i t e s ( I and K) of LaCrO^.
Valence Bands of
(b) LaCrO,
(eJCrgO,
(fJLOgOj
Fig. 2.
8 6 4 Binding Energy (eV)
Valence bands of La20 , Cr 0 , and LaCrO-.
166
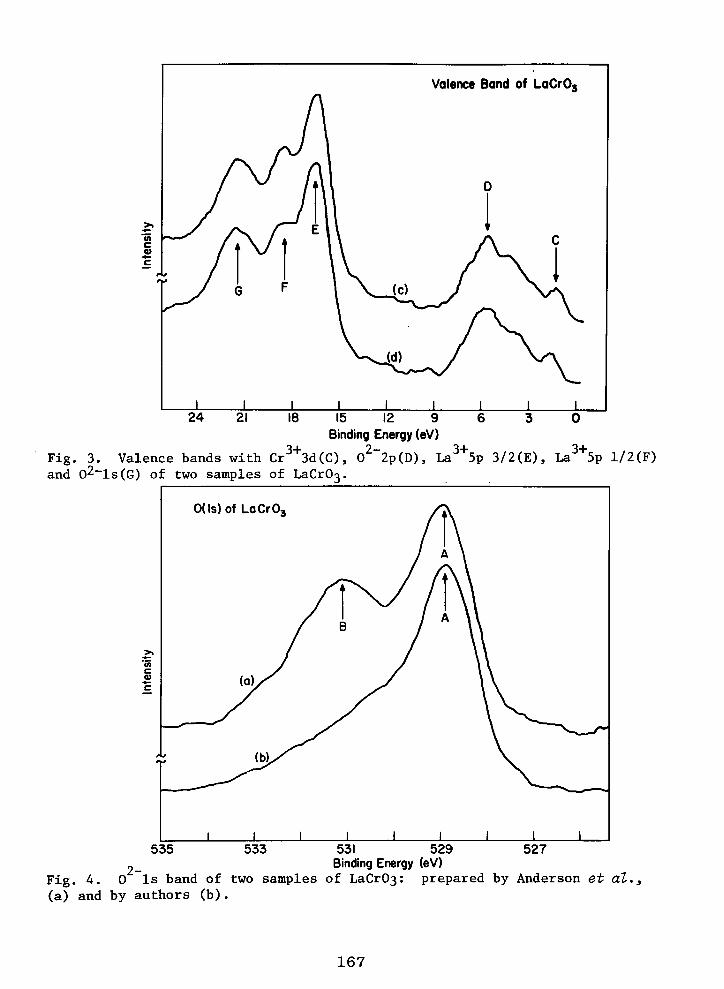
IB 15 12 9 Binding Energy (eV)
Fig. 3. Valence bands with Cr^"'"3d(C), 0^ 2p(D), La ''"5p 3/2(E), La' '''5p 1/2(F) and o2~ls(G) of two samples of LaCr03.
535 533 527 531 529 „_ Binding Energy (eV)
F i g . 4 . 0 I s band of two samples of LaCr03: prepared by Anderson et al., (a) and by authors (b) .
167

electron is promoted from the filled 0(2p) band to the empty lanthanum 4f band. Thus the photoionization processes are as follows. The primary process is
La- "*'(3d"'-% )cs + E^^ La^'^(3d^5p^)*cs + e(g),
and the secondary process is
La " (3d-'-°5p )cs + 0^"(2p^)as + Ej 2 ^
La- "'"(3d 5p 4f)cs + 0"'"~(2p )*cs + e(g)
in which cs and as denote cation and anion sites and the asterisk indicates that the ion is unrelaxed in the lattice. The difference is 4.0 eV.
In Figs. 2 and 3 are displayed the valence band spectra for La203, Cr203 and LaCr03. In this figure the zero is placed at the Fermi-edge of a metallic conductor. The features of these spectra are the o2-(2p) bands at 8.10, 7.50 and 5,70 eV, the La3+(5p) bands at 21.00 and 16.50 eV, and the Cr3+(3d) bands at 3.50 and 1.50 eV. All these values are uncorrected for electrical charging. The corrected values are listed in Table I. Some evidence exists for a shoulder on the o2-(2p) bands; this could be attributed to the Cr^+(3d) orbital electron. The charge transfer process of La(3d) indicates an empty La(4f) may exist at about 4 eV above 0(2p) and overlap the Cr(3d) band. Therefore, an electron can leave Cr(3d) and fall into the La(4f) empty band. This may also be the reason why the valence band is so broadened and overlaps the 0(2p) band. A broadened 3d band means the 3d-electron is not so localized in binary transitional metal oxides; the energy need for Mott transition [6],
3 3 2 4 3d- + 3d -^ 3d + 3d
is small. Hence, LaCr03 should have better intrinsic semi-conduction at room temperature. Conduction can also proceed through hopping between Cr3+ and La^"^ with relatively low activation energy.
The charge correction for LaCr03 is negligible and the 3d band edge is very close to Fermi-level. This suggests that LaCr03 has better electron conduction than the other oxides at room temperature. This is in agreement with the former discussion of the band broadening and overlapping.
Figure 4 shows the spectra of 0(ls) of LaCr03 prepared by Anderson (sample (a)) and by us (sample (b)). Sample (b) was preheated at 600°C for one day before sample mounting. An unbounded 0(ls) peak is observed as indicated by B in sample (a) spectrum. This peak can be removed by cleaning the sample surface with an argon-ion-gun. The existence of the unbounded oxygen peak is associated with the fact that LaCr03 can absorb water in air at room temperature.
168

Table I Orbital Binding Energies and Electrostatic Potentials
O r b i t a l
La(3d 3/2) S a t e l l i t e
La(3d 5/2) S a t e l l i t e
Cr(2p 3/2) Unident i f ied S a t e l l i t e
0 ( l s ) Bound Unbound
0(2s)
La(5p 1/2)
La(5p 3/2)
0(2p)
Cr(3d)
LaCr03
850.40 854.65
833.60 837.65
575.80 579.00
528.70
21.45
18.45
16.50
5.70
1.50
La203
528.70 531,35
17,75
4.85
Cr203
(577,15)^ 1576.15/
529.80
6.15
2,15
E l e c t r o s t a t i c P o t e n t i a l s
Ee(La)
Ee(Cr)
EeKO)
Ee2(0)
E l e c t r i c a l Charge (Q)
28.89
36.87
-22 .81
-22 .41
0.00
28.98
-19,99
-19.92
-3 .25
34.95
25.41
-1 .35
Unresolved doublet.
REFERENCES
[1] W. Van Gool and A. Piken, J. Materials Science, 4_, 95 (1969).
[2] J. R. McCreary and R. J. Thorn, manuscript submitted to J. Chem. Phys.
[3] J. R. McCreary, R. J. Thorn and L. Wagner, unpublished manuscript.
[4] B. F. Levine, J. Chem. Phys. 5£, 1463 (1973).
[5] C. K, J«irgensen and H. Berthou, Chem, Phys, Letters, 1^, 186 (1972).
[6] J. Hubbard, Proc. Roy. Soc, A276, 238 (1963).
169

ON THE NATURE OF EXTENDED DEFECTS AND THEIR ORDERING IN FLUORITE-RELATED REFRACTORY OXIDES
L. Eyring and R. T. Tuenge Department of Chemistry and
The Center for Solid State Science Arizona State University Tempe, Arizona 85281
INTRODUCTION
Fluorlte-related oxides are of interest as conductors, insulators and in some cases fuels and power sources in the new energy evoking technologies. Their use as MHD materials is not at issue in this brief discussion; rather it is the intent to set forth the details of the defect structure of this set of ubiquitous fluorlte-related compounds as models of high-temperature materials. The extent to which this effort is successful will advertise the relatively new^capability of Imaging crystalline materials at the sub unit-cell level of 3-4 A in an electron microscope.
Whatever the structure of stoichiometric substances at equilibrium at the absolute zero it is modified at higher temperatures by the introduction of defects. The defects may be missing or displaced atoms at equilibrium or not. Futhermore the defects may be simple or complex and in either case quite explicitly dependent upon the structure type and chemical nature of the host material. In short, all real solids at ordinary or high temperatures possess defects of many orders of complexity and deployment in the parent structure and these defects are the agents of reaction and transformation in solid state change.
It is imperative in any mechanistic study to have a catalog of the defect types which must be considered as agents of the reaction sequence. The literature of solid state reactions is cluttered with examples of proposed mechanisms based upon entities which do not even exist in the solid. For this reason a substantial effort to catalog the defect types which occur in any material of interest as well as to observe any indication of the evolution of these defect types is justified.
High-resolution transmission electron microscopy (HRTEM) as it has been developed in the past half-decade is eminently suited to the task at hand as discussed by Cowley [1]. Utilizing this technique it has been demonstrated that in favorable cases direct, intuitively interpretable images at a point-to-point resolution of 3-4A can be obtained. Such images then enable structure elucidation including defect types and modes of reaction to be directly envisioned. Commercial Instruments are available with this capability and progress is being made to improve the resolution by as much as a factor of two. Therefore, the future looks bright so far as removing a great deal of
170

uncertainty concerning the ultimate nature of real materials and the details of their reaction mechanisms.
THE CHEMICAL SYSTEM
Fluorlte-related materials are commonly encountered in energy conversion and storage practices. For studies to be described here and in their antecedents the rare earth oxides have been chosen for study as model systems for these materials. The oxides of cerium, praseodymium and terbium provide examples of fluorite-type dioxides (R0_), sesquioxides (C-type RoO„), nonstoichiometric oxides (R0„_„ and R„0„_r), a homologous series or intermediate oxides (R 0_ _ 4 _< n < <», n an inte ger) , and many other structurally significant features such as chemical hysteresis in phase reactions and psuedophase formation during chemical change.
STRUCTURAL RELATIONSHIPS
It should be expected that the fluorite substructure would dictate the structural principle which would correlate the vast number of related phases and their polymorphs and the panoply of defect tj^es responsible for their physical and chemical properties.
Kunzmann and Eyring [2] have begun this correlation with the determination of the unit cells of most of the phases occurring in the praseodymium and terbium oxide system. They have also described the defect arrangement along the a axis common to all observed members of the homologous series, R 0_ „, where 1 <_ n <^ °°. In addition, all members of the series with odd n have two axes (a_ and c) in common and hence may be considered as having common planes at two faces of each unit cell differing only by the thickness of fluorite-like material between these planes (i,e, the length of the b axis) Figure 1 shows the projection of the unit cells of the series on the (211) fluorite plane. The relationship between the odd and even members of the homologous series is evident,
IMAGING THE CRYSTAL STRUCTURE
As reviewed by Cowley [1] it has been possible to obtain direct information on structure and defects in transition metal oxides where the unit cell vectors are short in the direction of the electron beam and long in the other two directions. It was important to investigate the applicability of the technique to less favorable but more common cases such as the fluorite-related structures. This has been done for the lota phase (Pr^0^2) ^ ^^^ praseodymium oxide system (Skarnulis et al. [3]) where observed Images are compared with those obtained by many beam dynamical calculations. The iota phase is the only intermediate oxide whose structure is known [4], This work established the validity of the technique for these rare earth model systems.
In the remainder of the space allotted the extension of these investigations to the best known of the even-membered series, the beta phase (P ] 2 22
171

and to crystals undergoing reaction shall be illustrated. Figure 2 abstracts the essential elements of the proposed structure (PI) of the beta phase (n=«12) indicated In Figure 1. The black dots represent the rows of metal atoms in the parent fluorlte structure. The rows of six-coordinated metal atoms are marked by the larger dots. Open rectangles, representing rows of vacant oxygen positions, are represented across the body diagonal of their R0„ coordination cubes. Dashed lines connect these with the six seven-coordinated metal atoms resulting from the removal of oxygen. The six-coordinated metal atoms occur at the origin and at 2,6,2. The vectors between nearest neighbor RO, are all I [211]^ vectors suggesting the close (twinned) relationship to the primative unit cell sketched in Figure 1,
The acceptahility of the proposed ]P1 structure has been tested by comparing the calculated images (Figure 3) with those observed (Figures 4 and 5) . For the calculations the metal atoms around the oxygen vacancies were o relaxed as they are in the iota phase ( r_0,2) • Calculated Images at - 900A underfocus for crystals 27, 162 and 243A thick are given in Figure 3 The thin crystal Image is clearly the projection of the proposed structure where the oxygen vacancies are represented as white spots. Oscillating pairs of vacancies may be noted running vertically in the top calculated image. Notice especially that although the calculated images for thicker crystals (162 and 243A) do not correlate with the projected structure they do preserve the dimensional and translationally symmetric characteristics of the unit cell. This is of greatest importance for the study of phase reactions by this technique.
Figure 4 is an image of beta phase which agrees very well with that calculated for thin crystals (27A, top of Figure 3) . This suggests the validity of the proposed structure even though the thinness of the crystal imaged was not established. More often Images corresponding to thicker crystals are seen such as are shown in Figure 5, The sj.milarity of these images with those depicted in Figure 3 for 162 and 243A thick crystals is striking providing a weak further confirmation of the structure. Of greater importance is the obvious fact of recognlzability of the g phase at any thickness where contrast is observed.
An extended defect in the beta phase is illustrated in Figure 6. The unit cells on the lower right side are displaced upward by ab from those on the left. The defect runs vertically about three quarters of the way up then to the right. It is as though the primitive cell had failed to twin at that point, then recovered after one error.
Phase reactions between members of the homologous series is attended by intrinsic chemical hysteresis even when the structural changes are minimal such as the alteration of the b axis when odd-odd member reactions occur. This hysteresis suggests phase intergrowth which might be observed utllzing HRTEM, Figure 7 shows the result of reducing a crystal of zeta (PrqO.,,) phase, in the electron beam of the microscope, almost to iota (Pr O.,„) phase. (The numerals indicate members of the homologous series). Remember that transitions between odd-member phases require only the adjustment of the oxygen content as the distance between planes containing vacancies (the b_ axis) is changed . In this Illustration one observes a patch of n=7 on the left
172

CO
• • • •
• ' '•»«»_ • ^ ^
c I • • • I
• • • •
> • • • <
I • • • I
• • • I
. . . b I » a •
• • • '
I • • • I
I • • • I
e « » 1 I • • • I
\ » » » 1
• • • • •
14 •
12 •
13
10
12
Figure 1, Projections of the Unit Cells of Members of the Homologous_Series Along the Common a. Axis, [211 ] - .
I
I
• I
k-
.A
-7» - - * • <» ^
I*--. I **
; (Oil) [oTfl ;
i "" (a) ^^' ° oxygen vacancy
Figure 2. Diagrammatic Representations of the Proposed Structure of the Beta Phase with S3nnmetry PI , Indices refer to Fluorite Sub cell.

c • ^
H
o 0)
I -
> u 0)
m
O
CQ
U U 0) CQ
HJ 2
I cti a
CO CQ <ti CO
d l S
Cti O
pq H ^ M OJ
CO -^ OJ t!
cti cti
^3
Cti
• IL
w T! O ^
Cti " •-" r 1 a> cti LJ tM -|J
(D CO
. Q h a; o
<D Si
§0 :S +^ fe ^ o
174

•cti +-> <D
ffl t*-i O
too cti
<D SH
n o 3 SM
-i->
T H Cti - M CQ >. !H
u N D
<!}
3
fe
CU IH
pp
a
<
ti • H ^ o
.i:! C/2 (D
O KI
ro ^
.*"
100
v ^
cti
a o
. CQ ^ - 3 1—1
Fau
w g 3 CJ cti
4->
tn
tn
H
I B
CO
CO
> 1
u cvj
A O o • rH a) V cn
I in I
3 CQ -rH m P4 o
175

-••::---:::-'tr--t-:'-°:. .t--.v--.v.v--.v.v.--Av.v-'
Figure 7. Crysta l Structure Image from a ( 211) Zone Showing an Intergrowth Sequence: Pr7 Ol 2 - Prg Ol 4 - Prg Oi ^ -Pr8 0 i 4 ,
F igure 8, Domains of Sca O3 in a Matrix of Z r , Sc4 Ol 2 as seen in (111) Images.
F

ro O
<v
o £
ro ro
(a) (b) Figure 9. Electron Diffraction Patterns of Phases in
Erbia-Hafnia Ceramics^ a) the [111]„ Zone b) the [211]^ Zone. I F
177

adjacent to lamellae one unit cell thick of n=8, 9, and then 8 again. It would appear that the transformation occurs by a cooperative process In which the positions of the defect planes move parallel to each other. One should note that during transformation stacking sequences occur (e,g, n=8) which are not stable as a bulk phase.
The zlrconia-rare-earth oxides are of some interest as high temperature materials. The image (<111> fluorlte) of a crystal of 2^x^'^y^l,65 ^^ shown in Figure 8. In this case one sees an intergrowth of domains or SC2O2 in a matrix of Zr Sc,0j^2' There is a perfect topotactic relationship between the structures with the <111>„ coinciding with <111>_ _ and <111>
a &c_u« '3 A 19 in perfect register. In the thinner lower edge of the crystal the domains of Sc„0_ appear to extend all the way through the crystal as indicated by the simple hexagonal array of spots. However, in the thicker crystal there is an apparent overlay of phases as suggested by the complex spot array with a larger hexagonal p|ttern. The domains of Sc-0_ are fairly uniform in cross section at 70-100 A diameter. The diffraction diagram consists of an overlay of patterns of sharp spots corresponding to both phases,
A final example of the application of HRTEM to fluorite-related materials of possible high temperature use Is the erbia-hafnla system. Specimens prepared by M, Berard of the Ames Laboratory of ERDA were examined by electron diffraction (no images with interpretable contrast were obtained), Figure 9 compares diffraction patterns containing 90% Er_0_ and 33|% Er_0_ in the [211] and the [111] zones. The brightest spots are due to the fluorite substructure. Obviously 10% HfO» is accomodated in solution in Er_0_ without destroying the C-tjrpe structure. When 661% HfO» is present however only the fluorlte spots are sharp. The diffuse scatter xs due to considerable short-range order which has so far not been interpreted,
Allpress and Rossell [5] have observed similar scatter in the calcia-hafnia system in completely annealed samples. Their patterns were interpreted as due to domains about 30A in diameter of the (|)1 phase, CaHf,0_, embedded coherently in a number of specific orientations within the fluorite matrix, Hudson and Moseley [6] have obtained similar results for calcla-stabillzed zirconia and have interpreted their results according to [5] except also evoking precipitates of monocllnlc arO„,
CONCLUSIONS
Phase reactions and transformations at moderate to high temperatures Involve defects (usually extended) which are highly dependent on the host structure and the chemical properties of the elements involved, A cataloging of these structural defects and their evolution can, in many cases, be directly observed In HRTEM micrographs. Such observations are mandltory for an unambiguous determination of mechanisms.
Accurate mechanisms are essential to the understanding of chemical change during phase reactions.
178

ACKNOWLEDGMENT
The Energy Research and Development Administration has supported this research. Much of the work reported here was done by E, Summerville who will be more properly credited when the work is published In detail.
REFERENCES
1. J. M, Cowley, Annual Review of Materials Science 6, 53 (1976). 2. P. Kunzmann and L. Eyring, J, Solid State Chem, 14_ 229 (1975), 3. A, J, Skarnulis, E. Summerville and L, Eyring, submitted for publication, 4. R, B, Von Dreele, L. Eyring, A, L. Bowman and J. L, Yarnell, Acta Cryst,,
B31, 971 (1975), 5. J, G, Allpress and H. J. Rossell, J. Solid State Chem. 15 , 68 (1975). 6. B. Hudson and P. T. Moseley, J, Solid State Chem, 19 383 (1976),
179
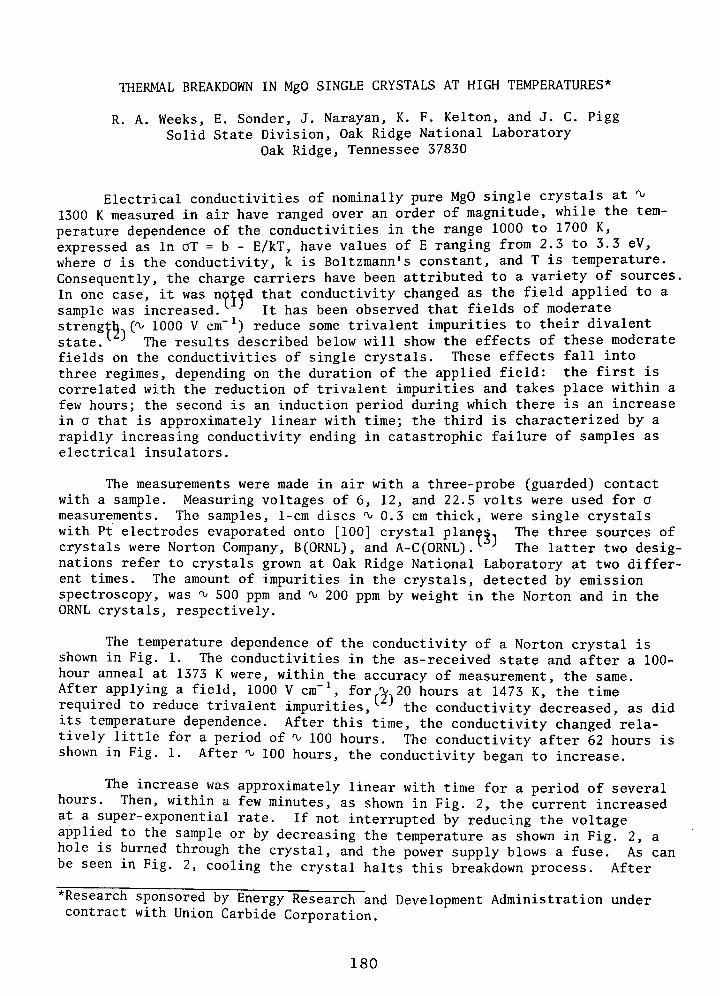
THERMAL BREAKDOWN IN MgO SINGLE CRYSTALS AT HIGH TEMPERATURES*
R. A. Weeks, E. Sonder, J. Narayan, K. F. Kelton, and J. C. Pigg Solid State Division, Oak Ridge National Laboratory
Oak Ridge, Tennessee 37830
Electrical conductivities of nominally pure MgO single crystals at 'v-1300 K measured in air have ranged over an order of magnitude, while the temperature dependence of the conductivities in the range 1000 to 1700 K, expressed as In aT = b - E/kT, have values of E ranging from 2.3 to 3.3 eV, where a is the conductivity, k is Boltzmann's constant, and T is temperature. Consequently, the charge carriers have been attributed to a variety of sources. In one case, it was noted that conductivity changed as the field applied to a sample was increased. It has been observed that fields of moderate strength ('> 1000 V cm"^) reduce some trivalent impurities to their divalent state.^ ^ The results described below will show the effects of these moderate fields on the conductivities of single crystals. These effects fall into three regimes, depending on the duration of the applied field: the first is correlated with the reduction of trivalent impurities and takes place within a few hours; the second is an induction period during which there is an increase in a that is approximately linear with time; the third is characterized by a rapidly increasing conductivity ending in catastrophic failure of samples as electrical insulators.
The measurements were made in air with a three-probe (guarded) contact with a sample. Measuring voltages of 6, 12, and 22.5 volts were used for a measurements. The samples, 1-cm discs ' 0.3 cm thick, were single crystals with Pt electrodes evaporated onto [100] crystal planes^ The three sources of crystals were Norton Company, B(ORNL), and A-C(ORNL).^ ^ The latter two designations refer to crystals grown at Oak Ridge National Laboratory at two different times. The amount of impurities in the crystals, detected by emission spectroscopy, was ' 500 ppm and "^ 200 ppm by weight in the Norton and in the ORNL crystals, respectively.
The temperature dependence of the conductivity of a Norton crystal is shown in Fig. 1. The conductivities in the as-received state and after a 100-hour anneal at 1373 K were, within the accuracy of measurement, the same. After applying a field, 1000 V cm"^ for a. 20 hours at 1473 K, the time required to reduce trivalent impurities,'- '' the conductivity decreased, as did its temperature dependence. After this time, the conductivity changed relatively little for a period of '\^ 100 hours. The conductivity after 62 hours is shown in Fig. 1. After ' 100 hours, the conductivity began to increase.
The increase was approximately linear with time for a period of several hours. Then, within a few minutes, as shown in Fig. 2, the current increased at a super-exponential rate. If not interrupted by reducing the voltage applied to the sample or by decreasing the temperature as shown in Fig. 2, a hole is burned through the crystal, and the power supply blows a fuse. As can be seen in Fig. 2, cooling the crystal halts this breakdown process. After
"Research sponsored by Energy Research and Development Administration under contract with Union Carbide Corporation.
180

cooling the crystal to "^ 900 K with the field still applied, the conductivity was measured as a function of increasing temperature.
The results of two such breakdown runs and the resulting conductivities are shown in Fig. 3. The curves shown in Fig. 3 are a least-squares fit of the data in Fig. 1 to the function In a T = b - E/kT. The conductivity after the first and second breakdowns increased approximately three-fold and sixfold, respectively, while the slope E was, within error, unchanged. Upon heating above "^ 1300 K, the enhanced conductivity begins to disappear, and after "^ 3 hours at 1470 K the conductivity and its temperature dependence follow closely the pre-breakdown curve. After an 87-hour anneal at 1470 K, the conductivity and its temperature dependence were in close agreement with the initial conductivity curve shown in Fig. 3. During the second regime, darkened regions appear in the crystal which extend from one electrode to the other as shown in Fig. 4(a).
Examination of the microstructure by electron microscopy of as-received crystals and crystals subjected to electric-field treatments shows that significant alterations in their microstructure have been produced by the electric field. Sub-grain boundaries observed in the as-received or annealed crystals have been described.^ It was found by transmission electron microscopy that in samples that had been subjected to electric fields sub-grain boundaries in the darkened regions are decorated with [100]-oriented dislocation loops (Fig. 4[b]) and that the regions between boundaries also contain loops, but at a much lower density. These loops have not heretofore been observed in MgO. Outside of the darkened regions, the number of these loops is at least two orders of magnitude smaller. The sub-boundaries in crystals after electric-field treatment and,subsequent annealing at 1573 K for 24 hours do not contain these features, as shown in Fig. 4(c).
The dependence of the conductivity of the two types of ORNL crystals upon a similar sequence of treatments is qualitatively the same as for the Norton crystals. The B(ORNL) crystals had a much higher and the A-C(ORNL)'s a much lower initial conductivity. The breakdown behavior during the third regime was sample dependent. For example, the current would increase rapidly, reach a maximum (of the order of that shown in Fig. 2), and then decrease to a value close to that of the second regime. This pattern was
Fig. 1. Conductivity of a Norton MgO crystal. All measurements were made in air. The measuring voltage was 6 volts; however, measurements at 12 and 22.5 volts showed the sample resistance to be ohmic. A treatment field of 1000 V cm" • was applied after an anneal of 100 hours. For the subsequent measurements of a, the treatment field was removed and a measuring voltage of 6, 12, and 22.5 volts used.
10"'
10-'
10-=
.ri-6 10
.rr^
— A
— a A
o A
% *ft <b \
' >. <\ •
ORNL -DWG 7 7 - 5 4 6 4
A
°
fi INITIAL CONDUCTIVITY * too hr HOC "C
o 1000 Vcm ' 62 hr IZOO-C '
, a . %*«
0 *
Oo
" o
E
— z ~
— — _
o
0.66 0.70 0.74 0.78 0.82 Q86 Q92 094
181

OHNL-DWG 7 7 - 5 4 6 1
observed repeatedly. In the ORNL crystals, the density of sub-grain boundaries was much smaller than in the Norton crystals. However, the development of the loops in the vicinity of the sub-grain boundaries was similar. On the other hand, the darkened regions in the ORNL crystals did not have the well-developed structure shown in Fig. 4, and did not extend across the sample.
FURNACE OFF 1208-0 1190'C -
I I
MgO 70-200-3
10
On the basis of these results, we suggest that: (1) The initial decrease in a with application of a moderate electric field is probably related to the reduction of trivalent impurities. (2) The conductivity after reduction is determined in part by the sub-grain boundary structure, and it is this factor which may produce the large crystal-dependent variations in a which we observe and which others have observed in nominally pure crystals.
(3) Changes in the sub-grain boundaries are correlated with the increased current flow. We speculate that this alteration of the sub-grain boundaries reduces the resistivity to current flow, without change in the activation energy, until joule heating along these current paths induces thermal breakdown.
TIME
Fig. 2. Dielectric breakdown of a Norton crystal. The current induced by the treatment field at the beginning of the treatment was '^ 200 times less than that just preceding breakdown.
ORNL-OWG 77-5462
Fig. 3. Conductivity of a Nor
ton MgO crystal after breakdown.
After breakdown shown in Fig. 2,
the sample was cooled to 1085 K
before removing the treatment
field. The symbol, [ , shows a
subsequently measured as the
temperature was increased and
after holding the sample at '^
1473 K for 3 hours with no
field applied; then [H shows
o measured after the 3 hours.
The symbols 0 and 01 are the data
taken in the same way following
the second breakdown. The two
curves are obtained from the
data in Fig. 1.
10-
10'
10
~ ^ ?:n - ^
— ~ -
-—
E
\ N
V. "V"
°iS
D O
^"S.
1
d
1
X .
o
1 1 1 1 1 = MgO 7 0 - 2 0 0 - 3 =
o 1500 VcfiT' APPLIED -
UNTIL BREAKDOWN -
DOWN IN ~ 4 min -» 1200*C ,87 hr Z
o
o "
o O 1
°
— E
-
V 0.70 0.78 0.82 0.86
1/r (K"'K10')
0.90
182

Fig. 4(a). Electric-field dark
ened region of a Norton MgO
crystal. The treatment field
was applied for 130 hours at
1373 K.
Fig. 4(b). Electron
micrograph showing
the sub-boundaries
decorated with dis
location loops (aver
age size 250 X) after
electric-field treat
ment.
183

Fig. 4(c). Sub-
boundaries after
electric-field treat
ment and subsequent
annealing for 24
hours at 1573 K.
References:
1. C. M. Osburn and R. W. Vest, J. Am. Cer. Soc. _54-, 428 (1971).
2. R. A. Weeks, E. Sonder, J. C. Pigg, and K. F. Kelton, J. de Phy. (Supp.), in press.
3. M. M. Abraham, C. T. Butler, and Y. Chen, J. Chem. Phys. 55 , 3752 (1971).
4. J. Narayan, J. Am. Cer. Soc. 56, 644 (1973).
184

SLAG/SEED PROPERTIES
G. Rosenblatt, Chairman
The Pennsylvania State University


THE THERMODYNAMIC PROPERTIES OF SLAGS D.R. Gaskell
University of Pennsylvania Philadelphia
The modern polymerization models of liquid silicates developed by Masson et. al. [l] consider that basic silicate melts contain linear or branching chain polysilicate ions, the most probable distributions of which are calculated by the application of the principles of polymer theory. In the case of linear chain formation themost probable distribution if,a geometric array of the ions SiO^ , Si^O^", Si^O^Q,...Si 0 3 + 1 - The free energy of formation of these melts is calculated as the sum of a chemical contribution, arising from the breaking of double oxygen bonds in the silica by the basic oxide to form the most probable distribution of silicate ions, and a configurational contribution which arises from mixing in the system. The former contribution is calculated in terms of A G ° , the free energy change for the reaction
2/3MO,,, + l/3SiO^,,, = l/3M^SiO,,, , , ^ , . ., (1) 2(1) 2 4(1,completely depolymerized)
and the latter contribution is calculated on the assumption of random mixing of 0^~, SiO^~and the Si03 segments of the polysilicate ions [23 . Theoretical free energies of mixing, AG'^, are shown as a function of A G ° and composition in Figure 1. Figure 2 shows a comparison between the theoretical and experimental free energies of mixing in PbO-Si02 melts at three temperatures. The values of A G ° obtained by curve-fitting, and listed at the upper right, are in close agreement with values obtained from thermochemical tabulations shown in the box. Figure 3 shows the results of curve-fitting with experimental free energies of mixing in the systems FeO-Si02, MnO-Si02 and CoO-Si02. Good fits are obtained in the first two sytems.
The deviations of the theoretical from the experimental free energies, which begin on the silica side of the minima in the curves is taken as being due to the appearance, in these melts, of significant concentrations of cyclic ions, the presence of which gives rise to a greater configurations entropy in the actual melts than is calculated on the assumption that only chain ions occur. This limit in the applicability of the theory is inherent in the theory itself, which, of necessity, presumes equal reactivities of all the singly-bonded oxygen present. Thus, as the silica content and/or the degree of silicate anion polymerization increase, a point is reached at which intraionic polymerization to form ring ions becomes probable. These compositions, the gel points in polymer theory, are shown as the vertical arrows in Figures 1, 2 and 3, and are in reasonable agreement with the points at which deviation of the theoretical curves from the experimental curves begin.
Figure 4 shows a comparison between the theoretical distrib-
185

0 2 0 3 0-4
mote fraction fllico
4 0 " - 1 RT
r 1
\ Thymodwmicol vahm
iGJIg^.--43-911)
—1 I 1
i 1194'
1 IIOO*
(1000*
A G ; , „ . - -40-31^
/^^'^loo-'-*'*^
^v^^^^-^i^:::^ "00" ^•^•-^sr: looo*
ffialsfniclion SiOj
0
40" RT
- 1
— r —1 1 ' 1 '
\
\ ^ \ N
\
\
. g«l point ta X,^ ' poljrfMf fhtory
/ 1
/ A R * • - 4 8 9 0 j
1 /
•=^^-^'^-sic^iOo6cr*'*'o^'
; / /
1 1
0 0-1 0-2 0-3 0-4 0-5
Figure 1 Figure 2 Figure 3
utions of silicate ions in PbO-SiO_ melts and the distributions measured by extraction of the silicate ions from quenched PbO-Si02 glasses as their trimethylsilyl derivatives. Although the experimental extraction technique does not yield completely quantitative results, the similarities between the theoretical and measured distributions is striking. Significant concentrations of the cyclic tetramer Si^O?", were detected in melts more acid than the orthosilicate.
12'
Trimethylsilyl extractions from iron blast furnace and open hearth steelmaking slags [33 have shown these systems to contain linear chain ions up to the tetramer and 3-, 4-, and 5-membered ring ions, which, in the case of the cyclic pentramer, contain up to four internal bridges. Ninety percent of the ions detected in the steelmaking slag were simple linear ions, with this figure being 85% for the blast furnace slags.
The upper half of Figure 5 shows the d chain polyphosphate ions measured in a 3PbO comparison with the random distribution cal theory, and the lower half shows experiment ties of PbO in PbO-P205 melts [5,6] . The sured activities are lower than the theoret values calculated on the assumption that PO unit. This, together with the observed non PO^- in the upper part of Figure 5, indicat strong interaction between 0^- and P0^~ ion This behavior could be interpreted in terms a phosphate ion in which the phosphorus is than four oxygens. Theoretical activities
istribution of linear .2P2O5 glass [43 in culated from polymer ally-measured activi-experimentally-mea-ically-ailowed minimum I" is the polymerizing -ideal behavior of es the existence of a s in these melts. of the formation of
coordinated by more calculated on the
186

" SiOj
'' \ / \ •/• \
\ \ \ \
^X
. -Jr - ^ ' -"^
% ' ' , - - - "
•2U7
Si30?0
14O12
1
mole fraction silico
forn)
SPbO.ZPjOs ( i • 4)
random dlifributlon
- /
0 6
0 6
-PbO
0 4
0 '2
^ S ^ I000»C
' ^ > ' ^ C a l « y S MoMon
Vs. \^^,.^o2'+po|"
Srldhor 8 Jaffas..^. \ \
o2-+ PCs' \ \
Figure 4
nwl* fraction PpO-
Figure 5
assumption of random mixing of 0^~ and POf~ ions are shown in Figure 5. This variation is in good agreement with the activities measured by Sridhar and Jeffes and, in accord with the requirements of the theory, gives activities lower than those measured by Caley and Masson.
Figure 6 shows the experimentally-measured activities of PbO in PbO-B20.3 melts [5,7] . Being intermediate in acidity between PoOc and SiO_, B-O., would be expected to form borate melts containing distributions of polyborate ions. Nuclear magnetic resonance studies of lead borate glasses have indicated that a significant proportion of the boron is in 4-fold coordination with oxygen [s] . However, Figure 6 shows that the experimental results do not agree with the assumptions of random mixing of o2-and B0^~ or 0^~ and Bo|~ ions.
TiO„ and AI2O-, form stable compounds with basic metal oxides in which the Ti4+ and Al "*" ions are octahedrally-coordinated by oxygen. From the crystallographic point of view, these compounds are regarded as being complex oxides, as opposed to inorganic salts formed as the products of acid-base reactions. This view is supported by the fact that solid "aluminates" and "titanates" exhibit significant ranges of non-stoichiometry, which would not be the case if they comprised cations and the oxyanions of the acids. Experimentally-measured activitites of FeO in FeO-Ti02 and FeO-MnO-Ti02 melts and of MnO in MnO-Ti02 melts have been successfully analysed by Bell et al. [9-II] in terms of Lumsden's regular solution model, which assumes 0^~ as the sole anionic species and random mixing of the cations present. Figure 7 shows, as the broken line, the activitites of MnO in MnO-Ti02 melts, with respect to liquid as the standard state, calculated by Bell from analysis of the activities of FeO in FeO-MnO-Ti02 melts. The
187

OS
0-6
PBO
0-4
0-2
C ' '
V^
oS-+B<:^--l :
1 1 1 1
tOOO'C
•
r Sridhar a Jtffea
-Kopoor a FrohtMTfl
•
I . 7~--—— 0-1 0-2 0-3 0-4
moM fractiofl B2O3
F i g u r e 6
Q.a
»P*lO
0 6
a •.p«rlm«nTot mtosuremtnt
frwnFeO-MnO-TlOg dflto (w.rMiquld)
Of obmt, convtrtco ro lolid tm. stolo
moM fraction TIO2
Figure 7
full line is the same variation with respect to solid as the standard state, and the circles are the experimental measurements of the activity of MnO in MnO-Ti02 melts. The agreement is essentially perfect.
By means of the same arguments it might be expected that the thermodynamic properties of aluminate melts would be amenable to interpretation in terms of random mixing of the cations. Comparison of the phase diagrams for the systems Si02-Ti02, which shows a wide range of liquid immiscibility, and Al203-Si02 and Al203-CaO, which show no liquid immiscibility, indicate that this is not necessarily the case. AI2O3 appears to be amphoteric in that Al can exist as a cation or as an aluminate anion, with the ratio of the concentrations of these species being determined by the overall basicity of the melt. No data exists which is amenable to examination in terms of this equilibrium, although evidence for the polymerization of aluminate ions is afforded by the ease with which CaO-Al203 melts can be quenched to form glasses.
188

REFERENCES
1. S.G. Whiteway, l.B. Smith and C.R. Masson, Can. J. Chem. (1970), vol. 48, p. 33, p. 201, p. 1456.
2. D.R. Gaskell, Met. Trans., (1977), vol. 8B, p. 131.
3. C.R. Masson, W.D. Jamieson and F.G. Mason, Physical Chemistry of Process Metallurgy; the Richardson Conference, Inst. Mining and Met. (London), (1974), p. 223.
4. C.J. Cripps-Clarke, R. Sridhar and J.H.E. Jeffes, ibid p.233.
5. R. Sridhar and J.H.E. Jeffes, Tran.I.M.M., (1969) vol. 78 p. C14.
6. W.F. Caley and C.R. Masson, Metal-Gas-Slag Reactions and Processes- The Electrochemical Soc. (1975) p. 140.
7. M.L. Kapoor and M.G. Frohberg, Can. Met. Quart. (1973), vol. 12, p. 137.
8. M. Leventhal and P.J. Bray, Physics. Chem. Glasses, (1965) vol. 6, p. 113.
9. I.e. Smith and H.B. Bell, Trans. I.M.M. (1971), vol. 80, p. C55.
10. E, Martin and H.B. Bell, Trans. I.M.M. (1974), vol. 83, P. C193.
11. E. Martin, O.I.H. Abdelkarim and H.B. Bell, Metal-Slag-Gas Reactions and PRocesses, The Electrochemical Soc. (1975)p 1.
189

COAL SLAG PROPERTIES RELATED TO MHD*
Webster Capps National Bureau of Standards
Washington, D.C. 20234
INTRODUCTION
The role of slags will profoundly affect the design and operation of coal-fired open cycle MHD systems. Selection of electrode and insulating materials, operating temperatures, and selection of a seed recovery system all depend on understanding the reaction rates between slag and seed, slag and wall, solubility of seed in slag, and such properties as thermal diffusivity, electrical conductivity, vaporation rates and phase relationships in complex silicate systems.
Because of the large variation in the composition of slags from different coals, it is not feasible to measure all properties of all coal entering a combustor. Therefore, means of predicting these properties from known compositions is the logical goal of these studies. This has been the approach of much of the work done on the characterization of coal slags.
VISCOSITY
The flow behavior of coal slags as a function of temperature is an important parameter in the operation of a MHD system. Wall temperatures will affect the run-off rate in combustors and will control the thickness • of the slag layer in channel and other down-stream areas of the system. Large temperature gradients within a channel will result in large viscosity gradients. It is important, therefore, to have a means of estimating the viscosity of coal slags in advance of combustion. Apparently, it is routine to make chemical analyses of incoming coal to power plants; the desirable and logical procedure, therefore, is to be able to relate the ash composition to viscosity and temperature. The major impurities in coal which make up the bulk of coal slag compositions form complex silicates. Chemical analyses report these as if they were individual oxides in a mixture, oxides of silicon, aluminum, iron, calcium and magnesium. Other oxides commonly reported are those of potassium, sodium, titanium, phosphorus, and sulfur, but they are usually present in amounts less than 3 or 4 percent. Some slags contain more SO3. The effect on viscosity of these minor ingredients is relatively small. Elliot, Gleiser and Ramakrishna [1] reviewed the literature on viscosity of steel slags. These slags are closely related to coal slags in that the major elements present are the same. The main difference is in the relative proportions of these oxides. The literature also contains work by geologists who have published methods of estimating viscosities of magmatic silicate rocks; however their compositional ranges do not apply to many coal slags. There is little data on viscosity of coal slags over the desired temperature range. Watt and Fereday [2], published
*This work was partially funded by the former Office of Coal Research, Dept. of the Interior, and by the Energy Research and Development Administration, Fossil Energy.
190

empirical equations that relate viscosity to composition based on measurements on British coal slags. Capps and Kauffman 13] made a series of synthetic slags and modified the Watt-Fereday equations in order to obtain better agreement with their measurements. The modified version is as follows:
, lO^M ^ ^ logiQH = + C
(T-150)2
where n is viscosity (poises)t, t is temperature (C),
M = 0.0104(SiO2) + 0.01(Al2O3) - 0.2963,
C = -0.0154(8102) - 0.0388(Al203) - 0.0162(Fe2O3)
-0.0089(CaO) - 0.0129(MgO) + 1.0468.
Oxides are expressed as weight percents.
Figure 1 gives viscosities of some slags that were measured, as well as values calculated by the Watt-Fereday equations and the NBS version. Table I gives the compositions of these slags. The data chosen for figure 1 shows varying degrees of success in the calculated methods. The NBS equations were derived from measurements on 23 synthetic coal slags. The average improvement of the NBS version over the "parent" equations is a factor of 2. Work is being continued to tailor the equations for best results on two "standard" coal slags, those from Montana Rosebud and Illinois #6 coals.
Figure 2 shows the effect of seed materials on viscosity of two series as a function of K2O concentration. One is high in silica and the other is relatively low in silica. Compositions appear in Table I.
The effect of SO3 on the viscosity is not clearly defined, but figure 3 gives a clue. Two different slags were made without SO3. These are made to resemble Montana Rosebud and Illinois #6 slags. Five percent SO3 was added to the Illinois slag and 27.3 percent SO3 was added to the Montana slag. The sulfate reduced the viscosity in both cases. SO3 content has not been checked by postmortem analysis and therefore it is not certain how much was retained by the slags.
Figure 4 shows the viscosity as a function of temperature of several combustor slags and a channel slag. Compositions are given in Table I. K-603 and K-779 came from the same coal and the same combustor. Viscosities are nearly identical, although one was a bottom ash and the other a flyash. This indicates little or no selective volatilization in spite of being separated in the combustor.
To convert from poises to pascal seconds multiply by 0.1,
191

M.osurld l / l i eOl l l l t l
— Coppi - Kouf fmon
Calculai.d Va lu i i
K Won -F . redoy
O Copps-KouMfnon, N6E
1400 ISOO
TEMPERATURE (C)
Figure 1. Viscosity vs temperature. Measured and calculated values of synthetic coal slags.
SYNTHETIC SLAGS FROM COAL ASH ANALYSES
High Sllico SariM BASE • K-517
o u 1400 C
Low Silica Striet BASE- K - 4 8 e
< 'C" mtll ervBtalMi*d)
K,0
15 20 25 30 CONCENTRATION (wt. %)
35
Figure 2. tion. K-517. K-488.
Viscosity vs K2O concentra-High-sillca base (0% K2O) is Low silica base (0% K2O) is
K - 2 8 3 PERC SEEDED FLY ASH. PITTSBURGH COAL K ' T 6 9 PCRC FLY ASH, ILLINOIS No 6 COAL K - 7 a 3 UTSI CHANNEL SLAG, ILLINOIS No 6 COAL K - f l 0 9 POWER PLANT BOTTOM ASH, ROSEBUD COAL K - T 7 9 POWER PLANT FLY ASH. ROSEBUD COAL
1400 ISOO
TEMPERATURE (C)
_ L . I 1400 ISOO
TEMPERATURE (C)
Figure 3. Viscosity vs temperature of synthetic Montana Rosebud and Illinois No. 6 coal slags with and without SO3.
Figure 4. Viscosity vs temperature of some combustor slags and a MHD channel slag.
Other factors also affect viscosity. Capps and Kauffman [4] measured an increase in viscosity when oxygen was bubbled through the melt and a decrease when bubbling was stopped. The oxidation state of the iron is the thing that was most likely altered by the oxygen treatment, but no quantitative results are available.
Geologists have recognized the role of H2O in changing the viscosity in rock systems, and it is quite likely that water from the seed and from the furnace atmosphere will alter the viscosity. Perhaps, this will be most important in pressurized coal gasification systems, but deserves investigation as applicable to MHD.
192

TABLE I
Compositions of coal slags in attached figures
(weight percents)
Melt No.
K-283
K-325
K-360
K-388
K-389
K-488
K-517
K-603
K-612
K-620
K-748
K-749
K-769
K-779
K-783
SiC
55
49.
50
40
30
40
60
55
22.
30.
48.
46
50
55
Ana
>2
8
4
7
4
tiy
A1203
25
13
25
30
30
15
25
19.5
15.7
21.5
21.5
20.4
23
19.5
sis not
FegOit
12.9
29.5
12
25
20
15
10
5.4
6.3
8.9
21.5
20.4
6.8
5.4
available
CaO
-
8
3
14
20
3
10
19.1
26.2
7.5
7.2
14.7
10
MgO
1.3
7.7
5
2
6
10
2
4
6.7
9.2
1.1
1
-
4
K2O
2.2
-
-
-
-
-
-
0.5
1.4
1.9
-
-
.9
.5
SO3
0.7
-
-
-
-
-
-
4.2
27.3
-
-
5
-
4.2
Ti02
0.7
-
-
-
-
-
-
4.2
1.2
1.7
-
-
-
4.2
P2O5 Na20
,12 .14
.5 4.1
,12 .14
LIQUIDUS TEMPERATURE
Liquidus temperature is an important coal slag property. It shows at what upper temperature limit crystal growth can proceed if given sufficient time. Crystallization imparts discontinuities in the viscosity and electrical conductivity. It also influences seed penetration into slag and wall materials. Slag can continue to flow even though crystals are present in the liquid, but flow is reduced when the crystal portion becomes dominant. Liquidus temperatures are usually obtained from phase diagrams, but data is lacking on multicomponent slags. Approximate values of liquidus temperature can be inferred from the NBS viscosity data. Accurate values cannot be determined because equilibrium conditions are not observed. Due to the nature of the instrument, no useful data can be obtained once crystals start to grow on the rotating member. Stable, glass-forming slags can often be supercooled, yielding valid viscosity data below the liquidus. Other melts that crystallize readily yield viscosity data only down to the liquidus. The inferred liquidus temperatures from the NBS data are considered to be within 20 °C of the equilibrium value. This information is useful because the slag layer in contact with the channel walls will be static at
193

y
the interface where time will permit crystallization if the wall temperature is below the liquidus. This gives an important lower operating limit.
THERMAL DIFFUSIVITY
The effective ^hermal diffusivity of a slag is a measure of its ability to transfer heat and therefore will affect the build-up of slag on the walls of the system in response to the temperature gradient between the plasma core and the channel walls. There is little data on slags. Bates [5] measured some real and some synthetic slags and obtained a range^of values from 0.003 to. 0.011 cm^ s"^ over a temperature range of 1600 °C. All slags showed a minimum value somewhere between 800 and 1200 °C.
ELECTRICAL CONDUCTIVITY
This property is probably one of the most important slag properties with respect to MHD. All of the power generated must pass through the slag. It is a part of the conductive path. The slag must not be too conductive, as short circuiting would occur between electrodes. Control of the conductivity, therefore, becomes necessary. Frederikse and Hosier 16] made conductivity measurements on slags in the liquid and solid ranges. They showed that the onset of crystallization causes anomalies in the conductivity. They found that the liquid slag is not affected by oxygen partial pressure but solid slag is. The conductivity is reduced as the oxygen pressure is reduced. The presence of oxygen favors the formation of trivalent iron ions at the expense of divalent ones. Apparently, the iron provides the charge transfer mechanism. This is borne out by Bates [7], who combined his data with that of Frederikse and Hosier to show that the conductivity is proportional to the iron concentration. Bates [5] also showed that the conductivity of a power plant slag increased with increasing K2O. Frederikse and Hosier [6], however, found that K2O, if added as K2S0tf, would decrease the conductivity. Capps and Kauffman [8] reported immiscibility of K2SO4 in a molten slag if the K2SO1+ exceeded about 25 percent. In smaller amounts, the K2S0it appeared to completely mix with the oxide slag into a single phase. This tendency for the K2S0t| to remain as an associated liquid is suggested as the reason the conductivity is reduced. K"*" is prevented from participating in the conduction process and the conducting species are diluted by the K2S0it.
VAPORIZATION
Plante [9] has shown the importance of vaporization studies in assessing the likelihood of slag fractionation and rejection, change of composition with passage through the channel, etc. He predicts that any slag vapors reaching the channel will tend to condense into droplets and get trapped at the walls to form a liquid layer. This layer will not change in composition due to selective vaporization and will remain stable as long as there is no change in the coal composition. Changes in the coal will be reflected in slag changes only slowly.
194

SEED-SLAG INTERACTION
Cook, McDaniel, and Negas [10] have reported results of phase equilibria studies which include systems closely related to seeded slags. Certain parts of the K20-Al203-FeO-Si02 system have been studied in detail. They conclude that potassium-alumino-silicates are very refractory and remain stable close to their melting points. They will remain stable in the presence of K2O rich vapors, but are apt to form mixtures of liquid and crystalline materials in the presence of much iron. The phases present in slags will have considerable influence over viscosity, conductivity, and reactivity, as well as the composition.
REFERENCES
[1] Elliott, J. F., Gleiser, M., and Ramakrishna, V., "Thermochemistry For Steelmaking, Thermodynamic and Transport Properties," Vol II, Addlson-Wesley Publishing Co. (1963).
[2] Watt, J. D. and Fereday, F. , Jour. Inst, of Fuel, 338 , 13], 99-103 (1969).
[3] Capps, W. and Kauffman, D. A., Open-Cycle Coal-Fired MHD, High Temperature Materials, NBS Quarterly Progress Report to Office of Coal Research, Dept. of Interior (September 30, 1974).
[4] Capps, W. and Kauffman, D. A., Open-Cycle Coal-Fired MHD, High Temperature Materials, NBS Quarterly Progress Report to Office of Coal Research, Dept. of Interior (March 3, 1976).
[5] Bates, J. L., International Conference on MHD Electric Power Generation, Wash., D.C, p. 163 (June 9-13, 1975).
[6] Frederikse, H. P. R. and Hosier, W. R., High Temperature MHD Materials, NBS Interim Report to Office of Coal Research, Dept. of Interior (August 1974).
[7] Bates, J. L., Properties of Molten Coal Slags Relating to Open Cycle MHD, Progress Report #1 to Natl. Science Foundation (1975).
[8] Capps, W., and Kauffman, D. A., Open Cycle Coal-Fired MHD, High Temperature Materials, NBS Quarterly Progress Report to Office of Coal Research, Dept. of Interior (June 30, 1973).
[9] Plante, E. R., Development, Testing and Evaluation of MHD Materials, NBS Quarterly Progress Report to ERDA-Fossil Energy (September 1976).
110] Cook, L. P., McDaniel, C. L., and Negas, T., Development, Testing and Evaluation of MHD Materials, NBS Quarterly Progress Report to ERDA-Fossil Energy (September 1976).
195

ELECTRICAL CONDUCTIVITY OF MOLTEN COAL SLAG/POTASSIUM SEED RELATING TO OPEN-CYCLE MHD
J. Lambert Bates Battelle, Pacific Northwest Laboratories
Richland, Washington
Molten ash from the coal burned in open-cycle MHD generators can condense and solidify on the electrodes, insulators, and walls of the MHD channel. This inorganic silicate can interact with the potassium seed. The resultant slag/seed layers can act as thermal, mechanical, or erosion barriers; interact chemically with the channel materials; and influence the electrical behavior of the channel.
Electrically, the liquid and solid slag layers can: (1) impede the current flow from the plasma to the electrodes; (2) create leakage currents in the walls of the channel; (3) act as a current diffuser or concentrator; (4) be an emission source or collector of electrons or Ions; and (5) if an ionic conductor, create polarization fields. These effects will be strongly influenced by the magnitude and type of electrical conduction of the slag layer. It is therefore important that this property be determined and the factors which affect it be understood. The purpose of this presentation is to discuss some of the variables which influence the electrical conductivity of molten and solid coal slags/seed. The electrical data used as examples, represent a variety of slag compositions measured in air [1-2] at 1000 Hz. However, data at other frequencies and in other atmospheres are also considered [1-4].
Four primary factors affect the electrical conductivity of coal slags: (1) temperature; (2) atmosphere, especially oxygen pressure; (3) structure and phases; and (4) composition. These factors are closely interrelatedj variations in one will result in changes in one or more of the others. Although not a property of the slag, the technique for measuring the electrical conductivity must be considered since It relates to the precision and accuracy of the data and to the evaluation of the mechanisms of conduction.
The electrical conductivity of molten and solid natural coal slags varies widely, especially at the lower temperatures (Figures 1 and 2). As potassium seed is added, the conductivity changes (Figures 3 and 4). From these [1-2] and other reported data [3-4], it has been possible to suggest a number of generalities relative to the factors mentioned above.
1. Atmosphere - The oxygen pressure of the combustion gas strongly affects the electrical conductivity of the slags with high iron content [3]. In general, the conductivity increases as the oxygen concentration increases. This is attributed to the transfer of electrons between the Fe''' and Fe''"3 ions in the slag. Little effect has been observed for the low iron containing slags. Above 1400°C, the electrical conductivity of all slags appears to be independent of the oxygen pressure.
2. Temperature - The electrical conductivity of slags increases with increasing temperature, except in some slags at temperatures where structural or phase changes occur. Below '\'1400 C, the temperature dependence of the electrical conductivity appears to be a function of both composition and structure. The data summarized in
196

1600 "C 1200 1000 800
NBS - SYNTHETIC SLAG (K-2161
NBS - (NATURAL SLACr (MHD-12)
0.8 0.9
lO fT (°K''l
0.8 0.9
l ( )3/T(0K-l l
Figure 1. Electrical conductivity of Figure 2. Electrical conductivity of Some natural coal ash slags (1000 Hz some high iron containing slags (1000 in air). Hz in air).
Figures 1 and 2 can be conveniently separated into three groups:
• Poorly conducting slags at lower temperatures which form two straight lines in the log a versus T~l curves with a break between 1100 and 1400°C (SMF and FMF) and with a large temperature dependence. These slags are low in iron and high in CaO and MgO.
• Slags which show nearly linear log a versus T~ curves at all temperatures, with a smaller temperature dependence than the slags described above. These slags are also low in iron, e.g., SOB, SHF, SWF.
• Slags which exhibit large irregularities in log a versus T~ curves on heating and cooling below '\'1400°C with a small temperature dependence. These slags, e.g., MHD-11 and 12, are high in iron. Thus composition will strongly influence the temperature dependence of the slags below ' '1400''C.
Above '^1400°C, the conductivities of all the slags fall within approximately two orders of magnitude, e.g., 0.05 to 0.5 ohm" cm" at 1500°C (Figure 5) . The slopes of the log a versus T"-"- curves are nearly the same (with the exception of the MHD-llB and SMF-0 slags) corresponding to an energy of 1.63 ±0.09 eV. Because of the relatively uniform and similar temperature dependence, free of structural and atmosphere effects above 1400"'C, it is in this temperature region where compositional variations of the slags can best be studied.
197
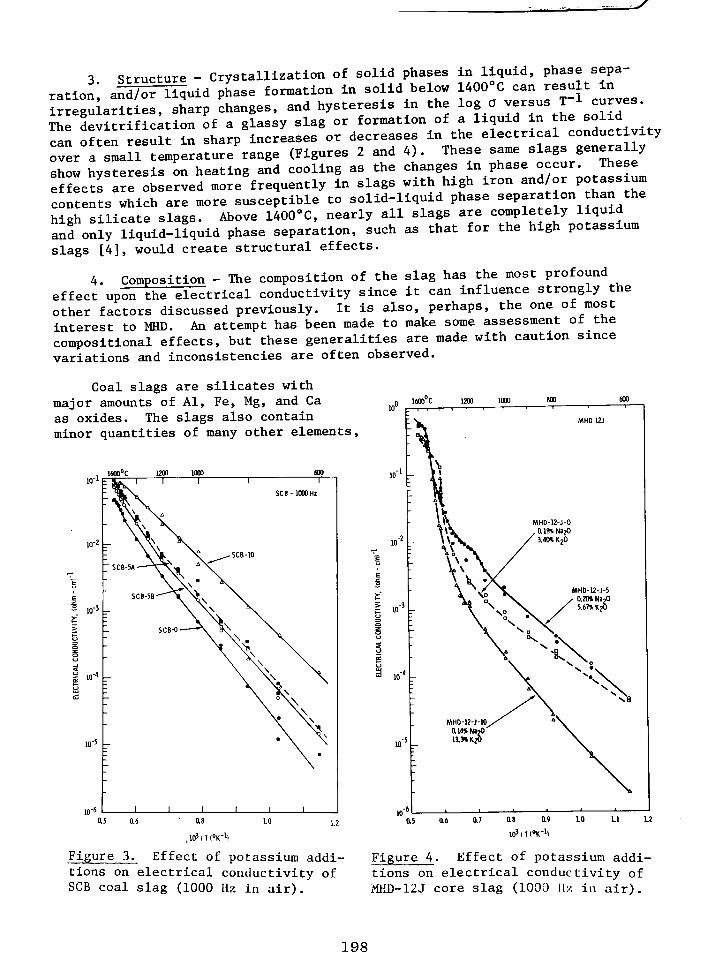
3 Structure - Crystallization of solid phases in liquid, phase separation and/or liquid phase formation in solid below 1400°C can result in irregularities, sSarp changes, and hysteresis in the log a - - - % ^ / ^ - - ^ ^ -The devitrification of a glassy slag or formation of a Ixquid in the solxd can o?ten resuU in sharp Increases or decreases in the electrical conductxvxty over a sLll temperature'range (Figures 2 and 4) . These same slags generally show hysteresis on heating and cooling as the changes in phase occur. These effLts are observed more frequently in slags with high iron ^"d or potassxum contents which are more susceptible to solid-liquid phase separation than the high silicate slags. Above 1400°C, nearly all slags are completely llquxd aid only liquid-liquid phase separation, such as that for the high potassium slags [4], would create structural effects.
4. Composition - The composition of the slag has the most profound effect upon the electrical conductivity since it can Influence strongly the other factors discussed previously. It is also, perhaps, the one of most interest to MHD. An attempt has been made to make some assessment of the compositional effects, but these generalities are made with caution sxnce variations and inconsistencies are often observed.
Coal slags are silicates with major amounts of Al, Fe, Mg, and Ca as oxides. The slags also contain minor quantities of many other elements.
, 1600°C 1200
10-' b % ^ I r
Figure 3. Effect of potassium additions on electrical conductivity of SCB coal slag (1000 Hz in air).
as
MHD-12-J-0 0.1911 Na20 3.40* K O
MHD-12-J-5 a20% NBJO
5.67* K2O
MHD-12-J-10 aUHNajO 13.WK20
as a9
lO'/Tl'K"')
1.2
Figure 4. Effect of potassium additions on electrical conductivity of MliD-12J core slag (1000 llx in air).
198

i6ao°c but for this discussion these are not considered. In addition, major amounts of potassium from the plasma can dissolve in the slag. The potential effects of these major elements on the electrical conductivity are summarized in Table I.
As discussed previously in this conference, the electrical conductivity of slags below 1400°C appears to increase with increasing iron content. Although this increase is approximately linear, the data are limited. Above 1400°C, the electrical conductivity does not appear to be dependent upon the iron concentration.
The addition of potassium generally increases the electrical conductivity over all temperature ranges (Figures 3 and 4). This uniform increase, generally observed for many slags, is illustrated in Figure 3. Also illustrated is the decrease in slope of the log a versus T~l as the potassium concentration increases. However, for one slag the conductivity below 1400°C increased with a 5% potassium addition, but decreased when an additional 5% was introduced (Figure 4); above 1400°C,
the electrical conductivity increased for all potassium concentrations. This decrease is probably related to apparent structural changes resulting from a crystalline phase in the high iron-potassium containing MHD-12J slag.
0.53 1 .54 0.55
Electrical conductivity o' some natural coal slags above 1400°C Figure 5.
(1000 Hz in air)
Table I. Compositional Effects On
Metal
K, Na Ca Fe Mn Al Mg Si
Potential Effect
Increase Increase Increase Increase
Electrical Conductivity of Silicates
Decrease/Increase Decrease Decrease
Possible Mechanism
Ionic Ionic Electronic Electronic
— — —
^[02] Effect
None Small Strong Moderate None Small —
Above 1400°C,the electrical conductivity of all slags increased approximately exponentially with total alkali oxide (K20+Na20) (Figure 6). With the exception of MHD-12J, the linear fit is very good with the log a versus (K2O+ Na20) tending to approach a common conductivity at the higher alkali oxide content.
199

The electrical conductivity above 1400°C increases with decreasing equivalent silica content (silica ratio) Rsi02 where
RSi02 = [Si02]/[Si02 + CaO + Fe203 + MgO].
The silica ratio over a range from 0.5 to 0.8 varies approximately linearly with the log a (Figure 7). At higher values, the conductivity tends to decrease more rapidly.
, MHD-IZJ
• SMF
/ , •
_ - - — _ - - - ' ^ SCF . . —TI; ' _ „ - - " " ' •--'''
l l l l l l
150CPC
V .— Tl p .
1 1
isocfc • HIGH IRON SLAGS
o LOW IRON SLAGS
Io?,j0 • 0.697-2.835 R j i j
> 10 i :
m * Na,0 + K,0 EQUIVALENT SILICA CONTENT
(SiO^I/ISiOjtCaOiFejO •MgOl
Figure 6. Electrical conductivity of Figure 7. Electrical conductivity at coal slags at 1500°C as function of 1500°C as a function of equivalent wt.% [K20+Na20] (1000 Hz in air). silica content (1000 Hz In air).
The transport properties of liquids are interrelated, i.e., diffusion, viscosity, and electrical conductivity, especially if ionic. For example, the Nernst-Einstein relationship between diffusion and electrical conductivity is well known. Since viscosity data for some of these slags are known, a cursory look at possible n-* relationships was made. The viscosity of molten coal slags has also been fouiid to vary with equivalent silica content [5]. Over a narrow Rsi02 range at constant temperature, the log ri varies approximately linearly with the equivalent silica content. Therefore, at any single temperature, the log q/log a should be constant at 1500°C:
Log^^a ^ 0.697 - 2.86Rsi02 ^^^ ^°Ho^ ~ ~^-^^ '^ 8.82Rsi02
where r\ is in poise and 0 in ohm cm"-*-viscosity is 5 poise or a calculated measured value of 0.09 ohm~-'-cm~-'-.
For the FMF-0 slag at 1500°C, the a of 0.076 ohm cm compared to a
For an MHD-llB-0 slag with a measured conductivity of 0.025 ohm" cm" , the calculated viscosity is 100 poise. The measured value of a similar slag with a slightly higher silica ratio, 0.75 to 0.79, was 125 poise. This correlation is also consistent with viscosity data of Capps at this Conference which indicates an increase in viscosity with increasing potassium content and the increase in conductivity with increasing potassium described in this paper. Considering the variables involved, these results suggest that further improved quantitative, empirical , and theoretical correlations between composition, viscosity, electrical, conductivity, and perhaps diffusion for the siliceous coal slag/seed systems may be possible.
200
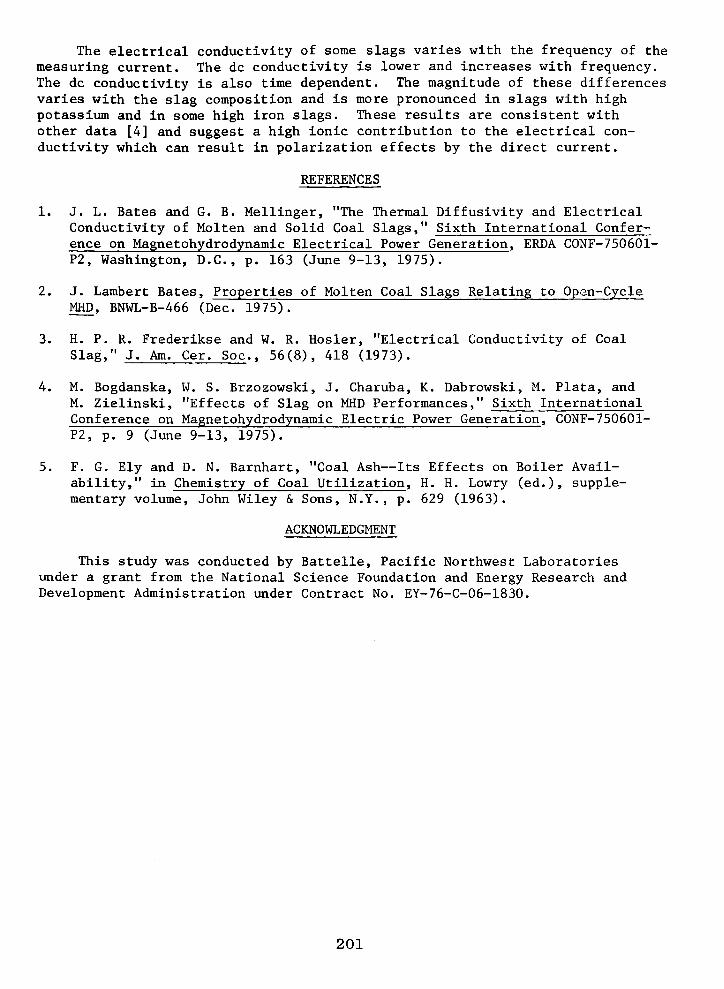
The electrical conductivity of some slags varies with the frequency of the measuring current. The dc conductivity is lower and increases with frequency. The dc conductivity is also time dependent. The magnitude of these differences varies with the slag composition and is more pronounced in slags with high potassium and in some high iron slags. These results are consistent with other data [4] and suggest a high ionic contribution to the electrical conductivity which can result in polarization effects by the direct current.
REFERENCES
1. J. L. Bates and G. B. Mellinger, "The Thermal Diffusivity and Electrical Conductivity of Molten and Solid Coal Slags," Sixth International Conference on Magnetohydrodynamic Electrical Power Generation, ERDA CONF-750601-P2, Washington, D.C, p. 163 (June 9-13, 1975).
2. J. Lambert Bates, Properties of Molten Coal Slags Relating to Open-Cycle MHD, BNWL-B-466 (Dec. 1975).
3. H. P. R. Frederikse and W. R. Hosier, "Electrical Conductivity of Coal Slag," J. Am. Cer. Soc. 56(8), 418 (1973).
4. M. Bogdanska. W. S. Brzozowski, J. Charuba, K. Dabrowski, M. Plata, and M. Zielinski, "Effects of Slag on MHD Performances," Sixth International Conference on Magnetohydrodynamic Electric Power Generation, CONF-750601-P2, p. 9 (June 9-13, 1975).
5. F. G. Ely and D. N. Barnhart, "Coal Ash—Its Effects on Boiler Availability," in Chemistry of Coal Utilization, H. H. Lowry (ed.), supplementary volume, John Wiley & Sons, N.Y., p. 629 (1963).
ACKNOWLEDGMENT
This study was conducted by Battelle, Pacific Northwest Laboratories under a grant from the National Science Foundation and Energy Research and Development Administration under Contract No. EY-76-C-06-1830.
201

J^
ELECTRICAL CONDUCTIVITY OF A MONTANA COAL ASH''" R. Pollina and R. Larsen Montana State University
Bozeman, Montana
In this report we present preliminary electrical conductivity studies of a typical Montana coal ash (as obtained from the power plant) with and without the additions of potassium seed, iron oxide, and alumina. The addition of alumina did not significantly lower the electrical conductivity at high temperature. This result may prove to be important for electrode replenishment if a more favorable chemical environment at the electrode-slag interface is ever necessary.
The conductivity of Rosebud ash was found to be only weakly dependent upon oxygen partial pressure. Graded samples of bottom ash with additions of K„CO- were studied to determine the effect of potassium seed addition on the conddctivity of Montana coal ash. Large additions (up to 30%) of K^CO, produce only small changes in the electrical conductivity at high temperatures but important and substantial changes at temperatures below approximately 1550 K.
INTRODUCTION
In an MHD generator channel the conductivity of the slag layer adhering to the walls of the generator must be in a range appropriate for the slag to act as a good conductor for the generator output current and yet must be low enough to prevent shorting of the axially directed Hall current. The mathematical analysis of this balance in seemingly opposing demands upon the slag conductivity has already been carried out [1]. However, yet to be determined is the criterion by which we judge the suitability of a given slag with respect to its electrical conductivity. The ultimate goal of this project is to satisfy demands of the designers for data necessary in modeling the output of the channel and to predict empirically the behavior of slag under any constraints which might occur when larger scale projects such as the CDIF become operational.
EXPERIMENTAL TECHNIQUE
The coal ash used in our experiments is from the Rosebud seam and was obtained from a local power company [2]. The combustor temperature was approximately 1900 K [3] and bottom and fly ash were supplied from the combustor and the base of the stack respectively. The samples were received in the form of powder, and each was homogenized and melted in alumina or platinum crucibles in air at 1700-1750 K for 1 to 36 hours and then air quenched. Corrosion of alumina crucibles was generally not observable until the seed content was increased. Above 10% K2CO- a changeover to platinum crucibles was necessary.
The bottom and fly ash compositions were essentially the same except for slightly higher concentrations of sulphur, potassium, and calcium in the bottom ash as seen in an intensity analysis [4] of the proton induced x-ray spectrum (PIX) of each sample.
Below 1800 K, samples were contained in alumina boats of 99.8% purity [5] (interior dimensions 25 x 4 x 4 mm.) and the conductivity was measured using the conventional 4-lead technique to separate polarization effects
202

from the true conductivity. Pulverized samples were placed in a crucible in which four leads had been suspended. A type B thermocouple (platinum-6% rhodium vs platinum-30% rhodium), which was checked periodically at the gold point, monitored the temperature.
The furnace was used with a controlled atmosphere for which a gas scrubbing system had been constructed [6]. Normally air and argon were mixed for the sample environment.
In a measurement, samples were raised to the maximum temperature of the run, and data was taken from the highest temperature downwards. After a run, the ceramic boats developed a web of cracks indicating that the slag had a lower thermal expansion than alumina. During or after a run, the platinum leads were sometimes eroded away. This always occurred at the outer or current carrying leads. Both these effects will be investigated further in the future.
Multiple tests of the electrical conductivity of Rosebud coal ash were run in air (oxygen partial pressure of 0.17 atm). To eliminate effects due to thermal cycling, two samples of Rosebud bottom ash with identical thermal history were measured twice giving each repetition of each sample the same thermal cycle. The conductivity is quite reproducible both between samples and between runs, indicating that conductivity measurements on coal slag are quite reliable.
RESULTS AND DISCUSSION
In Figure 1 we present results of a study of Rosebud coal ash conductivity at three different oxygen pressures as indicated in the figure. The solid line is drawn through the 10" atm data points. Here, as in all conductivity figures, the log of the conductivity in (ohm-cm)~ is plotted as a function of 10 /T(K). The top scale shows the corresponding Kelvin temperatures. Two regions of instability are noticeable. They are characterized by a sharp change in the electrical conductivity accompanied by long relaxation times. The first instability occurs at a reduced temperature of 6.1 K~ and the second at 7.15 K~ . These instabilities regularly appear in the Rosebud ash and generally occur at 6.2 +0.2 K"' (1615 K) and 7.2 +0.2 K"' (1390 K). They may be due to the mode of devitrification taking place within the sample. It is difficult to be more specific at present because of the large number of compounds which may crystallize at these temperatures from such a complex medium.
To determine the effect of a thermal cycling change on the conductivity behavior, a sample of bottom ash with the same thermal history was studied by changing the initial temperature of the run from 1725 K to 1825 K. Departures of the two curves from one another occurred only in the instability regions mentioned above. The higher temperature sample exhibited conductivity which is smoother but the instabilities evidenced themselves as longer equilibrium times necessary to obtain data at the instability temperatures. The dashed line in this figure is taken from data on Montana coal ash published by Bates [7]. It is in excellent agreement with our own data exceptfor some deviation below 1100 K. A comparison of the chemical compositions of our own Rosebud bottom ash and the Battelle sample designated SMF-0 is contained in Table 1 [8]. SMF-0 appears to be substantially more silica rich and alumina poor than our Rosebud ash.
203

^
IQ-'
10""
1-3
Table 1
The Compositions of MHD-12 and Two Montana Coal Ashes.
10
10"'
SiOj
Al^Oj
CaO MgO
KjO
Na^O
SOJ
TiO,
Rosebud
40.341
24.6
18.9
5.8
4.4
0.53
0.46
0.28
Ash MHD-
SOt
21
14
--2
12 SMF-0
47
20.7
21.9
6.6
S.O
0.43
0.40
--1.0
10"
— I — ^ ' ^ ^ \ 1 1 1 2CXXDKSJI667 1429 1250 11II 1000
Conductivity vs ICf/T(Kl Ash I -0~ .17 Atm Os -Ca- Ixtcr'Atm O j - O - IxlO'^Atm O2
SMF-0(Air I
QD
ID lO /KK)
Figure 1 Rosebud ash conductivity at varying oxygen pressure.
On completion of the controlled atmosphere system, a test was made of the efficacy of the system using a sample (MHD-12) obtained from, and previously characterized by, the National Bureau of Standards. It was felt that this would make an ideal "standard" with which to evaluate our system. Our results give good agreement with those of NBS [9] considering the presumably different thermal treatments the sample received, small thermocouple differences, and errors in determining sample geometry. These results serve to demonstrate the kind of reliability and reproducibility one can expect in the conductivity even between different laboratories. These results justify the conclusion that electrical conductivity measurements in the laboratory, can contribute significant and meaningful data relating to the behavior of slag in an MHD generator. What needs to be known is the sort of changes in composition the ash may be expected to undergo under MHD conditions so that the slag compositions studied in the laboratory will be similar to those of the wall condensate and will therefore yield data for engineering design calculations. The behavior of Rosebud bottom ash conductivity with varying oxygen pressure is quite different from MHD-12. Not only does the conductivity have a greatly reduced sensitivity to the oxygen pressure, as indicated in Figure 1, but the effect of reducing the oxygen content is reversed. Since the primary effect^of tlpe presence of oxygen on the electrical conductivity is through the Fe /Fe ratio, the reduced sensitivity shown in Figure 1 follows from the lower iron oxide content for the Montana coal. The difference in magnitudes of the conductivities of MHD-12 and Rosebud ash (labeled 5C) is shown in Figure 2. These differences are probably attributable to the reduced iron oxide content of Rosebud ash. Not enough information is available at present to say just how the Rosebud samples studied here relate to
204

the overall spectrum of compositions expected from the Rosebud seam. However, similarity of Rosebud ash in an oxygen environment to MHD-12 in an oxygen free environment should mean that Rosebud ash wi;fh its^apparently "absent" oxygen-dependent conducting mode (presumably Fe - Fe charge transfer) has a conductivity mechanism similar to MHD-12 in an oxygen free environment where that mode is quenched.
Two samples of iron enriched Rosebud ash were prepared by mixing the natural coal ash with 5% and 10% FSpO- to give total Fe^O^ concentrations of 9.2% and 14% respectively. The condQctivity data (in air, 0.17 atm. Op) for the two enriched samples and for the natural ash are shown in Figure 3. At temperatures below 1600 K and especially below 1450 K additional iron enhances the conductivity substantially. It has been noted by Bates [10] that the log of the electrical conductivity at both 1667 K and 1250 K appears to decrease approximately linearly with a decrease in the percentage of Fe20-. Our data for the iron enriched samples are in good agreement with Bates observation on the effect of Fe^O^ concentration at 1250 K, but the correlation is \/ery poor at the 1667 K isotnerm where no significant differences in conductivity between the three samples were observed. Data taken at other oxygen partial pressures (not shown) exhibit substantial sensitivity of conductivity to oxygen for the two enriched samples and indicate that 5% Fe^O^ content is the approximate cut-off in iron concentration. Below this iron oxide content, pressure does not appear to significantly affect slag conductivity. Iron content in coal slags is a sensitive composition variable at temperatures below 1600 K, and oxygen partial pressure is a sensitive variable at iron concentrations above 5% Fe^Oo. These effects would have considerable practical significance in an MHD generator utilizing iron containing electrodes, even if low iron coals were used as fuel.
Figure 4 displays the electrical conductivity data for Rosebud coal ash (Ash 1) with graded additions (10,20,30%) of KpCO, as seed. The corresponding potassium content of these samples is 7.14,21% K^O. Below approxmately 1540K there is a strong dependence of the conductivity on potassium content. This dependence increases with decreasing temperature. The potassium concentration dependence of conductivity above 1540K is weak and somewhat erratic in that different runs will shift the curves. This is exemplified by the behavior of the 10% sample above 1650K which has a slightly lower conductivity than Ash 1 in this run, but higher in another run. Much practical importance is placed on the strong low-temperature dependence of conductivity on potassium content since channel wall temperatures may be in this temperature region. All four of the samples displayed here were prepared simultaneously in platinum crucibles so their thermal history is similar.
Figure 5 shows some interesting results obtained by measuring the conductivity of Rosebud bottom ash with 20% alumina enrichment and with both 20% alumina and 20% KpCO, enrichment. On removing the latter two samples from the sample holdef after the experiments had terminated, no noticeable corrosion of the alumina boats was observed. This is in sharp contrast to earlier runs with seeded slag in which substantial corrosion was observed for the high seed concentration (20-30% K„CO-) slags. This corrosion inhibition effect gives added weight to the arguments of those who favor electrode replenishment. Several items are to be considered in Figure 5. The sample of 80% ash and 20% alumina ( ) illustrates the mild sensitivity of slag conductivity and alumina content. This is to be expected since alumina is an insulator and hence would not contribute charge carriers. Fe^O- and CaO
205

10
10'
o 10
10 =
10^
9 0 9
Conduclivny of Rosebud Ash vs FSgO^ Content
14% Fe^Oj fenriched) 5. ^ % Fe^Oj {enriched) '7.4% Fe^Oy (natural) Pt^ = 0.17 Atm
10
Figure 2. Comparison of Rosebud ash with MHD-12.
Figure 3. Rosebud ash conductivity for varying iron oxide content
10"
10-2
f3 -ID
ID'
10-
- I8I8K' 1538 ' 1333 ' 1176 ' 1053 ' 952 ' 870-
• ; • Conduct ivily vs IOVT(K)
+
• 0% K^CO^-Ash I X 10% * 20% + 30%
I I I
• 0%
I I 7 IC^/KK) IO II 12
Figure 4. Effect of seed on Rosebud ash conductivity.
10
10'
10=
' • \ I667K 1429
t* Conducti
\ k
IV \ \ \\ 'A \\ 'A\' \ \ \
\ \
1
1 1 1 1 1259 Mil 1000 952
vity Of Enriched Rosebud Ash
Bottom Ash
Ash raOKI + AI^Oj (20%)-Ash IBO%) + K^COj (20%)
Ash (eO%)+ Aip, (20%l + K^COj (20%)
\
\ ' N \
I . l .
10 12 IO'VT(K)
Figure 5. Effect of alumina enrichment on seeded and unseeded Rosebud ash.
206

would appear to supply the major contribution to the slag conductivity though we have not looked at CaO yet. It is interesting to note that below 1400 K alumina actually enhances the conductivity. Of equal interest is the fact that above 1667 K slag conductivity is virtually independent of the additives as was seen in Figure 4 above 1550 K. The 80% ash and 20% KpCO^ line ( ) is taken from the data of Figure 4 and is merely repeated nere for comparison. Again we note that the enhancement of conductivity contributed by the addition of 20% K2CO2 (14% KpO equivalent) appears to be significant only below 1667 K and therefore would matter little in a hot wall channel. Finally, we look at the sample 60% ash and 20% each of Al^O- and K2CO3. This sample was prepared because of the observed substantial decrease in corro-siveness on adding alumina. It was then decided to find out if this decreased corrosiveness was maintained in the presence of seeded slaq. and indeed it was, The alumina addition decreases the conductivity of a seeded slag but the decrease is only significant below 1250 K, where replenishment is unnecessary. This led us to the conclusion that electrode replenishment cannot be ruled out on the grounds that replenishment lowers the slag conductivity.
REFERENCES
[1] Design Considerations for Coal Fired MHD Generator Ducts. R.J. Rosa, Fifth International Conference on MHD Electrical Power Generation. Munich, 1971.
[2] Montana Power Company. Corette Plant, Billinga, Montana. [3] Montana Power Company, Private Communication. [4] This work was done by W. Beezhold and R. Burghard using the MSU ion beam
facility. 5] McDanel Refractories, Beaver Falls, Pennsylvania. 6] MSU/MHD Energy Research Office, Quarterly Report IV, Task Gl, Montana
State University. Bozeman, Montana, April, 1976. [7] Final Progress Report on Properties of Molten Coal Slags Relating to
Open Cycle MHD, Battelle, Pacific Northwest Laboratories, Richland, WA, December, 1975, BNWL-B-466.
[8] The data on Rosebud ash was supplied by W. Seymour, MERDI, and that on MHD-12 by W.R. Hosier, NBS. SMF-0 is a sample of Montana coal ash studied at Battelle. Pacific Northwest Laboratories. The data included here is from Reference 1.
[9] HPR Frederikse and W.R. Hosier, J. Am. Ceram. Soc. 56 . 418 (1973). [10] Progress Report No. 1 on Properties of Molten Coal Slags Related to
Open Cycle MHD. Battelle. Pacific Northwest Laboratories. Richland, WA, February, 1975.
t Work performed under MERDI Subcontract Number 77-002 and ERDA Contract Number EF-77-C-01-2524.
207

_y
SOME THERMIONIC EMISSION PROPERTIES OF SYNTHETIC COAL SLAG t J. Anderson, G.J. Lapeyre, R.J. Smith and M. Wilson
Montana State University Bozeman, Montana
INTRODUCTION
The thermionic emission properties of the electrodes in an MHD generator are of vital importance in determining the operating characteristics of the channel. If sufficient thermionic emission current is not available from the cathode, large voltages develop near the surface and arcing occurs which leads to electrode erosion and loss of efficiency. For slag-covered electrodes it is the thermionic properties of the slag layer that are relevant. Different design concepts to deal with the arcing problem include accepting arcs as inevitable or finding operating conditions where there is sufficient thermionic emission. In any case, knowledge of the thermionic emission properties of coal slags of various compositions is desirable to give intelligent direction to a choice among the available options.
We have, therefore, initiated an experimental program to investigate the thermionic properties of coal slag. The experimental method we elected to pursue, in the initial phases of the project, was to measure the emission from the heated slag into vacuum. This is the way such measurements are made for more conventional materials so that we could draw upon accumulated experience in analyzing the results. We believe that by eliminating the complications due to the presence of a surrounding medium it will be possible to isolate and study those properties intrinsic to the slag itself. Since the work function of any surface is largely determined by the atoms on the surface, we have included in our design an Auger electron spectrometer to identify the surface atoms in order to correlate our results with surface composition. The Auger unit is not yet in operation. We also included a mass spectrometer to identify evaporation and desorption products. Of course, the nature of the working medium in the channel will play an important role in determining the slag surface composition. However, we believe that results which lead to an understanding of the emission properties of well-characterized coal slag will serve as a firm basis for understanding and controlling the emission as it occurs in an actual channel.
In this paper we give a description of the experimental apparatus and procedure and some of the results we have obtained up to this point. The results relate more to the emission of positive ions from the heated slag than to electron emission.
EXPERIMENTAL
The essential part of the experimental apparatus is shown in Figure 1. The slag is held in a platinum container which is heated from underneath by electron bombardment to any desired temperature up to where the platinum melts. Instead of a cup, as shown, we are now using a flat platinum sheet, on which we place a thin wafer of slag about 6 mm diameter and 1 mm thick. The slag melts and coats the platinum nicely in a fairly thin (1-2 mm) layer. We are able to keep a vacuum of M x lO"^ torr in the work chamber well past the temperature at which the slag is quite fluid. The anode is a round tantalum
208

Auger Electronics
.y. Anode 1° Guord
6 Diffusion Pump
/,'_, ^ u — ^f>^ 1 -> 10 t uise - / / , -ll. * > Electronics ring—J-JFP*" V ' siog^fefpt
Cup
W , Filomen
^ ' Heater QI Supply
31.9 percent Al^O.,, 19.98 percent Fe„0. and 10.53 percent CaO. The natural slag was fly ash from the Corette plant in Butte, Montana, with the same four components plus MgO as the major con-stitutents (>1%).
RESULTS
For electron emission we analyze our data according to the Richardson-Dushman equation:
Figure 1. Measurement Geometry AT^exp{- §±.x
kT^ (1)
disc with an area of about 0.2 cm . The guard ring surrounds the anode and insures that only emission from the slag reaches the anode. The emission current is measured as a voltage drop a-cross a resistor in series with the anode. For possible large emission currents we have a circuit to apply the anode voltage in pulses, to hold down power dissipation at the anode. The currents we have measured so far are small, so we simply apply a variable DC bias.
The structure is held in a stainless steel vacuum chamber, pumped by a 6-inch oil diffusion pump with a liquid nitrogen cold trap. The slag temperature is measured with an optical pyrometer. We have so far assumed the slag is a black body, so the temperatures we quote here may be 50 K or so low.
The data we obtain are curves of anode current plotted against anode bias voltage (I-V curves). When the anode is biased negatively, we measure considerable amounts of current consisting of the emission of positive ions from the slag. We refer to this as negative current. The synthetic slags we are now running were obtained from the National Bureau of Standards MHD Materials Group. Most of the data presented here are for the type called "K214" which is a 4-component slag containing, by weight 37.6 percent SiOp.
where j is the current density in amps per square centimeters, T is the absolute temperature, e is the electron charge, k is Boltzmann's constant and A = 120 amps/cm deg . We use equation 1 to define an effective work function.
Figure 2 shows two I-V curves for K214 slag which illustrate several points related to this experiment. The upper right hand section shows the e-mission of electrons and as can be seen this emission is quite small.less than a microampere total current. It is difficult to keep stray currents below this level so the data displayed has a large component of such spurious current. However, at higher temperatures the actual electron emission is measureable; the I-V curves look identical in shape to those of Figure 2 and therefore are not displayed. Typi-ical emission current densities are 3.3 pma/cm at T=1630K. which corresponds to an effective work function of 4.5 eV. A work function of this magnitude is what one might expect for an "ordinary" material--that is a material without a surface layer of some element like potassium that specifically produces a low work function. We had anticipated that calcium would produce a low work function but that seems not to be the case.
The lower left portion of Figure 2 shows the emission of positive ions and it is worth some discussion of how
209

- 4 0 -30 -20 10 20 30 40 50 ANODE BIAS. VOLTS
Figure 2. Typical slag I-V Curve, showing ion and electron emission. Arrows indicate direction of sweeping bias.
UJ _ i < o sn
CD cc <
50
20
UJ 10 Q: cr. B 5 z o cn 2 sn
u
FLYASH +ION CURRENT
1 2 5 10 20 50 NEGATIVE ANODE BIAS, VOLTS
Figure 3. Log-log plot of ion current versus anode bias in space-charge region.
th is current is ident i f ied as such. The thermionic emission of ions is conceptually simi lar to that of electrons. In par t icu lar , the space charge l imited region of emission at low negative bias the current density, j , obeys the Child-Langmuir law. For plane-parallel geometry the law says that
(l/9Tr) v mTe" V^/^/d^ (2)
where V is the anode voltage; d is the anode-cathode spacing, and the other symbols have already been defined. We see that j varies as the 3/2-power of V and consequently a plot of log |j| versus log |V| should be a straight line with a slope of 3/2. Careful measurement shows that the I-V curve, in the space charge region is indeed concave downward. Figure 3 shows a plot of log IJIversus loglVl; the points do lie on a straight line with a slope of 1.35 j 0.05. Although the exponent is a bit less than 3/2 we do not regard the discrepancy as serious. There is in fact a power law. In addition, data taken at several temperatures show that, in the space charge region, all the data follow fairly closely to a universal curve independent of temperature, as equation 2 says it should. Equation 2 also shows that, from the universal curve it is possible to calculate the mass m of the charge carrier, assuming singly-charged particles. The value of m obtained from equation 2 depends on d , and so is prone to some error (d : 2.5 mm). We find m to be between 10 and 50 atomic mass units, which clearly indentifies the charge carriers as ions. Although one would be hard-pressed to explain a negative current otherwise, we find it satisfying to have a proof of the nature of the effect.
It should be noted that emission of ions has been observed previously by Hosier, Capps, and Plante. Upon heating a slag sample in an atmosphere of nitrogen and oxygen, they found ion emission currents in the nanoamp range. The surrounding medium or other experimental complications evidently made a rational analysis of their results difficult or impossible.
Figure 2 also shows another aspect of the present measurements. The upper ion current curve was taken sweeping the anode bias from negative values
210

0
2 50
< ^100
H
5 150 o 1-
^200 cn O
250
--
~
PCS. BIAS T
\'
1 1 1/ 1/
1
SWITCH TO NEGATIVE BIAS
if;40K ^
/ K2I4 SLAG / ION EMISSION
,1 ;-- STEADY
STATE EMISSION
I 2 3 TIME, SEC
o 10
sn 9: 5
-4
<
sn
g 10
CC OC •D O
10
- \
- \
~
^2/4 SLAG
+ ION CURRENT
O -- \^^^~~~--^2;
^•'•~'-~~..„_^[2^(9o^
1 , i~"~~T—1 2 4
TIME, SEC.
Figure 4. Time decay of ion current af ter switching from posi t ive to negative b ias .
Figure 5. Semi-log plot of decay of ion current.
towards zero, as the arrow indicates. The lower curve was for sweeping the bias the other way. For the lower curve, the decay in the left hand end of the curve is actually a time-dependent decay. If. instead of sweeping continuously, the bias is quickly switched from positive to large negative values. The magnitude of the ion current becomes instantaneously large and then decays in time to a steady state value, as shown in Figure 4. The decay is not a simple exponential, as Figure 5 shows. Figure 5 is a semi-log plot of ion current versus time after switching the bias negatively. The upper part of the decay curves seem to be fairly straight but then they level off.
The effect we are seeing can be explained in the following way. The species that constitutes the ion current desorb rapidly as ions but only slowly as neutral particles. With a negative bias, the rate determining step in the steady state is diffusion to the surface. The ions desorb as fast as they reach the surface and the surface is depleted relative to the bulk. A positive bias retards the emission and the ions accumulate at the surface. When the bias is switched negative, the accumulated ions desorb until a steady state is again attained. The variations in steady state emission current with temperature. Figure 6, are then more a measure of diffusion rates than desorption rates. If we assume that the accumulated quantity of ions on the surface is a monolayer or more, irrespective of temperature, then the maximum emission current at zero time in Fig. 5, can be regarded as being characteristic of the desorption process rather than diffusion. Figure 7 shows a plot of log maximum ion current versus reciprocal temperature for several temperatures. The slope of the straight line indicates an activation energy for the ion desorption process of 3.4 eV.
DISCUSSION
The desorption of positive ions from a hot surface is a process that has been known for many years. The effect has been used to study ionization
211

m^
2 o \ < > - •
K
CO
z LU Q I -Z UJ cc CE D O
+ 10
u
-10
-20
- 3 0
- K2I4SLAG
1 I 1 1
~ + IONS
-
I570°K >
I590V<____^
I630V<_ y
1 1 1 1
~ ELECTRONS
1 1 1
—
_
-
' " I l l -80 -60 -40 -20 O 20 40 60
ANODE BIAS, VOLTS
Figure 6. S teady-s ta te ion emission curves. In these runs, the e lec t ron current was dominated by leakage, hence the i r r e g u l a r shape.
2 2 O -3 \ 10 Sf)
2 5 < > H 2 sn Z -4 UJ 10 o •- 5 z ^ UJ cc % 2 o - 5
10
°K
1667 1429 1250 '1 1 1 1 1 1
, K2/4 SLAG \ ION CURRENT \ \ \ \ o\
\ q
'— A \ \ \ \ Xo \ \
IO'VT
Figure 7. Semi-log plot of maximum ion emission versvis reciprocal temperature.
potentials and work functions, since the ratio of ion current I^ to neutral atom current I can be obtained from the Saha-Langmuir equation
\J\ = 1/2 exp {(ct,-I)/kT} (3)
where I is the ionization potential of the desorbing particles. If I < cfi then most of the flux is ions. We have not yet determined the identity of the ions, but we are adapting our mass spectrometer to do so. One possibility is calcium. We have done some preliminary experiments with synthetic slag K304. which is much like K214 except that it contains magnesium in place of calcium. The ^/ery first measurements showed an ion current comparable to K214. but the current quickly dropped to low levels after a few runs. The current may have been due to a small calcium content which was quickly depleted. An obvious difficulty with calcium is that its ionization potential is too high, 6.08 eV. Fortunately it should be easy to settle the issue by experiment.
From our results we believe it quite likely that a certain amount of current flow through a slag-covered channel is due to ion injection from the anode. The current we have measured extrapolates to some tens of milliamps per square centimeter at 2000K. Whether this would have any influence on practical channel operation we do not know. One possible effect might be in the boundary layer near the anode. If there is local thermodynamic equilibrium in the boundary layer, then injection of positive ions could shift the equilibrium, deplete the electron concentration and affect the conductivity.
A final point has to do with the possibility of misinterpretation of thermionic emission measurements. If both the anode and cathode are slag covered and hot, then it may be difficult to separate out the component of ion current from that of electrons. In such a case, considerable care must be exercized in the interpretation of such experiments.
212

It would appear that the thermionic electron emission from the unseeded synthetic slag is yery small at the temperature where we have made measurements. Our observations are consistent with the well-founded assumption that it will require a potassium layer to lower the work function for sufficient emission. The possibility that the surface composition is not the same as the nominal bulk composition is self-evident. Because of this we place considerable importance on sample characterization methods such as Auger electron spectroscopy. Our results indicate that ion emission might be a significant process of charge transfer into the channel and we believe it may be a matter of some importance to investigate the consequence of this effect.
References
1. W.R. Hosier, W. Capps, and E.R. Plante. 14th Symposium. Engineering Aspects of MHD. Tullahoma, TN, April, 1974, p. IV.7.1.
2. J. Fine. T.E. Madey, and M.J. Scheer, Surface Science 3_, 227 (1965).
NOTE: Analysis performed after manuscript preparation re-opens the possibility that diffusion may be the rate-limiting step even in the decay portion of the emission curve.
tWork performed under MERDI Subcontract Number 77-002 and ERDA Contract Number EF-77-C-01-2524.
213

VAPORIZATION AND CONDENSATION KINETICS PERTAINING TO SEED INJECTION AND RECOVERY
Kurt H. Stern Chemistry Division, Naval Research Laboratory
Washington, D. C. 20375
In open-cycle MHD systems a seed material, commonly an inorganic potassium salt, is injected into the gas stream by heating and vaporizing the salt. Subsequently this materials is recovered by condensation on a cold surface. Thermodynamic aspects of this process, such as condensed phase-vapor equilibria, are being discussed by others at this conference and elsewhere[l], but little has been written of the rates and mechanisms whereby these processes occur. In this discussion the major features of vaporization and condensation kinetics are emphasized. Readers are referred to the cited references for details and mathematical derivations.
I. VAPORIZATION
A. Non-chemical Factors
In this category we include factors which are independent of the chemical nature of the material.
1. Heat Transfer. For all endothermlc, heterogeneous reactions, such as vaporization, heat must be supplied to the reaction interface. If this heat is not supplied sufficiently rapidly, the entire process is heat-transport limited and no information about chemical kinetics can be obtained from vaporization studies. Under extreme conditions of inhibited heat transport the reaction surface may actually be cooler than the nominal temperature, but the vaporization rate may still be heat-transport limited even when the system is isothermal [2].
2. Vapor Pressure. When the vapor pressure p above the vaporizing material equals the equilibrium pressure p the net vaporization rate is zero. For pressures between these two values this rate is proportional to (p ~p) • The presence of an inert gas quiescent above the vaporizing material generally lowers the rate, but if the gas is flowing, the vaporizing material is removed rapidly (p=0) and the maximum rate is obtained.
3. Particle Size. Whether this affects the size depends on the reaction mechanism. The same applies to the defect structure of the solid.
B. Crystals
Most of the information on vaporization kinetics comes from a comparison of the equilibrium vaporization rate, commonly obtained from Knudsen cell measurements, with the vaporization rate into a vacuum. Although the same basic theory applies to substances which are similar in the condensed state and the vapor as well as to dissociative vaporization, the mechanistic interpretations differ somewhat and are therefore treated separately. This also applies to liquids.
!• The solid and vapor species are chemically similar, e.g.
214

K2S0^(s) = K2S0^(g)
NaCl(s) = NaCl(g), (NaCl)2(g)
4As(s) = As^(g)
The basic theory is the Hertz-Knudsen-Langmuir (HKL) theory according to which the mass flux striking the surface from the equilibrium vapor is
J = P (M/277RT)-'- ^ (1) eq eq ' '
If not all the impinging molecules stick, the condensation flux is reduced by a factor a. When the substance vaporizes into a vacuum the flux leaving the surface must equal the flux condensing on the surface and
J = J = a P (M/2TrRT)-'- ^ (2) c,e v,o eq
a can be determined from experiment, but not yet generally calculated theoretically. The theory assumes that the system (gas -I- condensed phase) is isothermal. It is valid regardless of the nature of the surface (although a may vary with the surface) .
Most theoretical and experimental investigations are concerned with the interpretation of a in terms of a vaporization mechanism. All theories involve a minimum of two steps:
(1) Bulk crystal >- Surface state (2) Surface state > Vapor
Some theories, such as those of Hirth and Pound [3], which are descended from the theory of Kossel and Stranski [4,5], emphasize the importance of surface dislocations, such as kinks and ledges, on the rate. In these versions of the theory the first step is subdivided into more detailed steps such as
(la) Kink ^ Ledge (lb) Ledge > Adsorbed state
Thus, if the dislocation density is high, the surface will be the same as under equilibrium conditions and the rate-limiting step will be desorption.
A more "chemical" approach is taken by Searcy and coworkers [6] who apply absolute reaction rate theory to the vaporization process and develop a mechanism based on the experimentally determined activational enthalpy and entropy.
The general results of experimental studies may be summarized as follows:
(a) for substances that are monatomic in the vapor state a generally eguals unity, particularly if the dislocation density is high (>10^ cm ^) or for low index planes. For high index planes the Hirth and Pound theory [3] predicts a limiting value of 1/3 for a, but this theory has not been unambiguously confirmed;
(b) substances that are basically the same in the solid and vapor, e.g. halides^ usually have a near unity, although the bulk ->- surface step may become rate-determining as the melting point is approached, with a consequent
215

decrease of a below unity;
(c) substances that are different in the solid and vapor states_ frequently have very low values of a; e.g. for 4As(s) = AsL^(g) , a = 5 x 10 [8], for 2As203(s) = Asi+Oe (g), a ^ 10~^ [9]. Interpretation of these low a values involves some rate-limiting step in which the vapor species is produced at a dislocation site or in the mobile surface layer.
2. The solid decomposes into species which are chemically different,e.g.
CaCO^Cs) = CaO(s) -I- (02(g))
2ZnO(s) = 2Zn(g) + 02(g)
NH^Cl(s) = NH^Cg) + HCl(g)
a for reactions of this type is less than unity [6]
Reactions in which one of the products is a solid differ somewhat from the others since in this case a reaction interface moves along a solid-solid Interface (e.g. CaCOs/CaO) and the rate-determining step may be gas transport through the reaction product.
In many thermal decomposition studies, frequently carried out with powders, it was observed that the course of the reaction consisted of a slower initial stage, called the induction period, and a more rapid stage extending over most of the decomposition. The induction period has generally been associated with formation of nuclei of the solid product in the solid reactant. Elaborate theories of both the rate of nucleus formation and the growth of the nuclei have been worked out. When the surface is covered by nuclei the reaction front proceeds into the crystal, usually at a constant rate (for a summary and references see [10]). More recently Shannon [11] has applied absolute reaction rate theory to reactions of the type A(s) = B(s) -I-C(g), by taking into account the partition functions of the reactants and possible configurations of the activated complex.
The above theories are in principle all extensible to dissociative vaporization such as K2S0it(s) = (2K -I- SO2 + O2) (g) but relatively little has been done yet. Such experimental studies as exist (for a listing see [6]) indicate that a is considerably less than unity. Meschi and Searcy [12] have developed a mechanism in which desorption or dissociation from catalytic surface sites may be rate limiting. This type of approach could probably be successfully applied to salts used as seeds for MHD, such as KoSOu and K2CO3.
C. Liquids
The basic HKL theory applies to liquids in the same form as it does to solids. However, since the liquid surface is smooth and does not possess the defect structure that characterizes solids, the mechanistic interpretation of a is slightly different. The major vaporization theory is that of Eyring[13,14] who attributes values of a < 1 to hindered rotation, i.e. a mismatch of the rotational partition functions between condensed phase and vapor.
Experimental studies of liquid vaporization have generally been confined to simple liquids at ambient temperatures. High temperature vaporization and
216

decomposition studies of liquids are very scarce. Ewing and Stern [7] measured the vaporization rate of several alkali halides both for the solid and liquid states, a was continuous through the melting point. Well above the melting point a decreased gradually, consistent with a model in which the surface concentration decreased below its equilibrium value because the bulk phase could not supply surface molecules rapidly enough.
Studies of dissociative vaporization are also quite scarce. A comparison of the solid and liquid decomposition kinetics of KClOi [15] showed that although the liquid decomposed much faster than the solid, the activation enthalpies and entropies were the same for both, indicating the same rate-determining step for both - breaking a Cl-O bond. The results of Burns [16] on the dissociative vaporization of AI2O3, Ga203, and In203 are interesting because it seems to be the only case known in which a exhibits a discontinuity at the melting point. For all the vapor species emanating from the solid a 2: 0.3 just below the melting point, rising abruptly to unity for the same species just above the melting point.
II. CONDENSATION
Condensation is generally considered as a sequence of two steps: nucleation and growth of nuclei to form a bulk phase.
A. Nucleation
Nucleation may be homogeneous or heterogeneous. Further, homogeneous nucleation may itself be subdivided into two kinds: (a) nuclei are formed in the vapor, and (b) nuclei are formed by condensation on a surface chemically the same as the vapor. In all cases nucleation requires a supersaturated vapor.
1. Homogeneous nucleation on a surface. Molecules from the gas phase collide with a condensed phase of the same material and are incorporated in it. By the principle of microscopic reversibility the condensation process must proceed through the same intermediate steps involved in vaporization. The basic equations are given by the HKL theory (eqs. 1 and 2) with a now viewed as a condensation or sticking coefficient. Experiments in this field are difficult and few have been carried out. Schoonmaker and Tu [17] have made such measurements for NaCl condensation on oriented single crystals of NaCl. They showed that a = 1 if the crystal is clean, but less if the crystal surface is contaminated. At least when the surface is cold compared to the vapor source, the nuclei on the surface may be as small as a single molecule.
2. Nucleation in the vapor. So far the theory has been developed only for materials which are the same in the vapor and condensed states, i.e. the theory is applicable to K2S0it(g) ->• K2S0it(s,l), but has not yet explicitly been applied to chemical reactions such as (2K -1- SO2 -•- O2) (g) -^ K2S0it(s,l). Since nuclei are very small, the distinction between solid and liquid is largely irrelevant. The basic theory goes back to the Gibbs-Thomson equation according to which the vapor pressure above a curved surface exceeds that over a flat surface. Consequently nuclei can only grow from a supersaturated vapor. For a given supersaturation there exists a critical nucleus size above which nuclei will grow and below which they will vaporize. There have recently been important developments in this field. Since these have been
217

extensively covered [18a,b], they will not be further discussed here.
3. Heterogeneous nucleation. In this case nuclei are formed on a foreign surface and therefore this is the phenomenon most applicable to MHD when the seed material first strikes the solid wall on which condensation is to occur. The theory has been developed in great detail by Hirth and Pound |19] and will therefore not be further discussed here. One of the interesting conclusions is that nucleation will be most rapid when the surface is completely wetted by the condensate. In MHD it might therefore be possible to select a surface for this characteristic.
B. Bulk Condensation
1. Solids. From a fundamental viewpoint no new phenomena occur once nuclei have formed on a solid surface. If the surface is chemically the same as the vapor, then arriving molecules will coalesce with existing nuclei by surface diffusion and will eventually be incorporated into the crystal lattice. If the condensation is heterogeneous^the growth of nuclei must occur by heterogeneous surface diffusion. Hirth and Pound [19] have discussed the differences to be expected depending on whether the adatoms are strongly or weakly adsorbed. Once the foreign surface is completely covered the crystal continues to grow by mechanisms already discussed.
2. Liquids. If the system is above the melting point, the nuclei, whether suspended in the vapor phase or on a surface will be "liquid". The growth of drops in the vapor state is a rather complicated subject much of which has been developed for use in atmospheric physics where it has primarily been applied to water [20]. Eventually the droplets formed will fall under gravity and it "rains".
Ill. CONCLUSIONS
In general the theoretical aspects of vaporization have been more exhaustively treated than have those of condensation. This may be because, although the theories are of course coupled, vaporization theories are much more easily tested experimentally and this theory-experiment interplay is intellecturally stimulating. Also, condensation includes a phenomenon-homogeneous nucleation in the vapor - not well incorporated into condensation theories. In this latter area the greatest lack is a comprehensive theory of recombinant condensation applicable to such processes as (2K + SO2 + 02)g -^ K2S0(t(s,l). Finally, what is needed for MHD is a melding of the types of theories discussed in this paper with chemical engineering concepts of heat and mass flow, and gas dynamics, which will permit an analysis of conditions actually occurring in MHD reactors.
The kinetics of the bulk growth of liquid is treated by Eyring's theory [13,14] which takes the matching of rotational (orientational) effects of the impinging molecules into account. This was already discussed in the section on liquid vaporization.
Of greater interest to MHD is formation of bulk liquid as "rain" on a cold surface. Mori and Hljikata [21] have analyzed the condensation of K2S0it on a cold surface under conditions expected in MHD. They treat the phenomenon by allowing for the convection of K2SO4 and consider the condensation to consist of sequential steps: (a) formation of small liquid drops in the thermal boundary layer, (b) diffusion of vapor and droplets to the wall, and (c)
218
c;ondensation of vapor at the liquid film on the wall, and absorption of droplets by the film. The mass transfer rate could be calculated as a function of temperature, temperature gradient, and mass flow.
REFERENCES
1. I. Eliezer and R. A. Howald, J. Chem. Phys. 65 , 3053 (1976). 2. G. V. Narsimhan, Chem. Eng. Sci. 16 , 7 (1961). 3. J. P. Hirth and G. M. Pound, Prog. Mat. Sci. D^ (1963). 4. W. Kossel, Nach. Ges. Wiss, Gottingen 135 (1927). 5. I. N. Stranski, Z. Physik. Chem. 136, 259 (1928). 6. e.g. A. W. Searcy in "Chemical and Mechanical Behavior of Inorganic
Materials", A. W. Searcy, D. V. Ragone, and U. Columbo, eds., Wiley, New York. N.Y., 1970, Chapter 6.
7. C. T. Ewing and K. H. Stern, J. Phys. Chem. 79., 2007 (1975). 8. G. M. Rosenblatt, P. Lee, and M. B. Dowell, J. Chem. Phys. 45 , 3454 (1966). 9. L. Brewer and J. S. Kane, J. Phys. Chem. 59 , 105 (1955). 10. K. H. Stern and E. L. Weise, "High Temperature Properties and Decomposi
tion of Inorganic Salts. Part 2. Carbonates". Nat. Std. Ref. Data Ser. No. 30, Nat. Bur. Stds. (1969).
11. R. D. Shannon, Trans. Faraday Soc. 6£, 1902 (1964). 12. D. J. Meschi and A. W. Searcy, High Temp. Sci. 6, 221 (1974). 13. J. F. Kincaid and H. Eyring, J. Chem. Phys. 6, 620 (1938). 14. E. M. Mortensen and H. Eyring, J. Phys. Chem. 64 . 846 (1960). 15. A. E. Harvey, C. J. Wassink, T. A. Rodgers, and K. H. Stem, Ann.
N.Y. Acad. Sci. 1±, 971 (1960). 16. R. P. Burns, J. Chem. Phys. 44_, 3307 (1966). 17. R. C. Schoonmaker and L. C. Tu, J. Chem. Phys. 60 , 4650 (1970). 18. (a) F. F. Abraham, "Homogeneous Nucleation Theory", Academic Press,
New York, N.Y. 1974. (b) Disc. Faraday Soc. No. 61 (1976).
19. J. P. Hirth and G. M. Pound, "Condensation and Evaporation, Nucleation and Growth Kinetics", Pergamon, London (1963).
20. Yu. S. Sedunov, "Physics of Drop Formation in the Atmosphere", John Wiley and Sons, New York, N.Y. 1974.
21. Y. Mori and K. Hijikata, in 5th International Conference on Magneto-hydronamic Power Generation, Munich, 1971, Vol. I, pp. 545-551.
219
SOME VAPOR PRESSURE DATA ON K2O CONTAINING SUBSTANCES
E. R. Plante Institute for Materials Research National Bureau of Standards Washington, D. C. 20234
Open cycle MHD recjuires that an easily ionized element or "seed" be added to obtain an electron density sufficiently high that the combustion products can serve as a working fluid. A suitable element based on ionization potential and cost is potassium. The choice of materials to supply the K will be K2SO11 and/or K2CO3.
Use of potassium seed leads to several potential problem areas. Because the weight of seed required is 10 to 25% of the weight of coal burned, a large fraction of the seed must be recovered and recycled. Also, the potassium compounds increase the potential for corrosion problems such as reacting with or dissolving various components of the MHD system. To avoid the corrosion problem it has been suggested that liquified coal ash components can serve as a continually renewable protective layer for the electrode structure of an MHD channel which will protect it from erosion, corrosion, and destructive arcs while not appreciably degrading channel performance [1]. Others, however, believe that the presence of a large fraction of coal ash constituents will make it extremely difficult to recover a high percentage of the seed because of reaction with the coal slag. They believe that rejection of about 90% of the coal ash constituents at the combustor stage will allow for the desired level of seed recovery [2].
The vaporization behavior of K2CO3 and K2S0it are of importance to MHD technology because experience shows [1-3] that the bulk of recovered seed will be in the form of a solution of K2CO3 in K2S0it- Levin et al. [4] have indicated the phase behavior of this system. The major portion of the recovered seed is expected to be K2SO1+. The presence of a slight excess of K2CO3 over that required to adequately remove the SO2 produced by coal combustion is desirable for environmental reasons. Too much of an excess of K2CO3 is undesirable because of its greater tendency to react with slag or ceramic materials.
This paper will briefly review the thermodynamics involved in the vaporization of K2CO3 and K2SO4 and present the results of recent measurements made at NBS on K2O containing solutions and compounds.
Thermodynamic data for K2CO3 and K2SO1+ in the condensed phase have been reviewed and tabulated by JANAF [5]. In addition, data for relevant vapor species K, CO2, O2, and SO2 are also tabulated, making it possible to calculate the dissociation pressures. These data are of sufficient reliability for purposes of discussing MHD seed chemistry and are accepted without further discussion.
The vaporization characteristics of K2CO3 have been the subject of a review [6] and a number of investigations [7-12]. None of the vaporization work excepting the mass spectrometric study of Gorokhov [11] is consistent
220

with the vaporization behavior predicted for the dissociation reaction:
K2C03(c,£) = 2K(g) + 1/2 02(g) + CO2(g) (1)
Most measurements of the decomposition reaction have yielded pressures much higher than that predicted from the thermochemical data. Several workers have analyzed their data in terms of a reaction to produce K20(c,)l) and C02(g), apparently assuming that this reaction would give rise to a higher pressure than the dissociation reaction while, in fact, the predicted pressure is orders of magnitude less. To generate pressures greater than that predicted for reaction (1) requires the existence of very stable K-bearing molecules. It is probable that the poor agreement between measured and predicted dissociation pressures results from unidentified reactions with container materials or H2O in the case of transpiration measurements, poor experimental technique, or improper data analysis.
A nxomber of studies related to the vaporization properties of K2SO1+ [9-16] as well as reviews of this data [17-18] have been presented. Many investigators suspected the existence of molecular K2SO4(g) and its existence has been confijrmed by mass spectrometry. A major unresolved problem has involved the relative importance of the sublimation or evaporation of K2S0it according to reaction (2) as compared to the dissociation by reaction (3).
K2S0it(c,«.) = K2S04(g) (2)
K2S0it(c,«.) = 2K(g) + 02(g) + S02(g) (3)
Mass spectrometric measurements by Ficalora et al. [16] indicate that PK^SOI, is about the same as Pjr below the melting point. Additional mass spectrometric measurements by Gorokhov [11] indicate a K2S0it(g) pressure about five times higher than that of Ficalora et al. On the other hand, mass effusion measurements [9,14-15] give rates of effusion about thirty times greater than would be predicted by the thermodynamic data for the dissociation reaction.
The relative amount of K2S0it(g) in the vapor phase over pure K2SO11 can be quite important in design considerations for the seed recovery unit in an MHD plant because the dew point temperature of K2SO1+ will be increased by about 100 K if K2S0it(g) is only as important as Ficalora's [16] data, compared to Halstead's [14]. Experimental determinations of the K2S0it (g) condensation temperature during the British Project [19] indicated dew point temperatures about 30° below those predicted by Halstead's [14] data. This was considered reasonable agreement.
Additional mass spectrometric data was cited in the British Project [19] and by Halstead [14] which stated that new mass spectrometric results [20] indicated K2S0it pressures about 1/3 less than those observed by Halstead. However, a description of these measurements has apparently not been published. In the writer's opinion, the thermodynamic data for K2S0it{g) must be weighted in favor of the mass effusion data until mass spectrometric studies are performed in sufficient detail to unequivocally consider the problems resulting from uncertainties in electron ionization cross sections, ion fragmentation, and mass discrimination. The difference in the results is sufficiently important that mass effusion measurements at NBS are in progress as an independent check on Halstead's [14] data.
221

A comprehensive review of the thermodynamics of evaporation of K2SO1+ was recently presented by Eliezer and Howald [18]. They reported a "best" value for the heat of formation of K2SO4(g) using a modified version of Ciiblcciottl's [21] method.
Their treatment gives rise to thermodynamic data which yield K2SOit (g) pressures in essential agreement with Halstead's [14] measured pressures. The present state of affairs with respect to knowledge of the thermodynamic properties of the K2S04(g) molecule will not likely be improved without new careful measurements.
Some vapor pressure data on K2O containing materials obtained at NBS will be summarized in the concluding part of the paper. The purpose of these measurements has been to help provide data which can be used for predicting the equilibrium concentration of K2O in slag solutions and to predict the temperatures and K(g) overpressures at which MHD structural materials will resist corrosion. An example of the use of such data can be found in the paper by Spencer et al. [22].
Measurements were made by a weight loss technique using a microbalance system or by mass spectrometry using either a modulated beam time of flight or quadrupole instrument. Samples were enclosed in Pt crucibles using 1 mm or smaller effusion holes. Data obtained using the microbalance system are absolute weight loss data. Mass spectrometric data has been put on an absolute scale using a weight loss calibration. For most of the measurements the principal vaporization process is:
K20(a«l) = 2K(g) + 1/2 02(g) (4)
where the reduced activity is referenced to K20()l) . The mass spectrometer sensitivity for K of mass 39 is obtained from the measured weight loss of the cell that takes place during an experimental sequence using the equation:
k. = wGA/2irR/ [ac/ME (itt/r) ] (5) 1 i 1
where w is the weight loss of K2O, G is the fraction of K in K2O, A is the fraction of K in K, R is the gas constant, a is the orifice area, c is the Clausing factor for the orifice, l\ is the ion current observed during the time interval t at the temperature T and M is 39. Equation (5) is obtained by equating the pressure calculated using the Knudsen equation with the mass spectrometric pressure relationship. Pi = k^I+T. In cases where the vapor pressure depends on composition, the composition is determined from the integrated weight loss in the microbalance measurements or Zl+t/T in the mass spectrometer measurements. For further details of the theory and methods involved in the mass spectrometer measurement the reader is referred to Grimley [23].
Since Si02 is an important component of coal slag and the existence of several compounds with K2O is well known, preliminary measurements were made to determine the potassium pressure over the liquid solution region of the K20-Si02 system starting at the composition K20-2Si02. These measurements were made utilizing a microbalance system and a Pt Knudsen cell equipped with a 1 mm diameter effusion hole. Weight loss data were obtained at 40, 30, 20
222

and a few other compositions corresponding to the invariant two phase system K20-Si02(soln)-Si02(c). In these measurements, it was assumed that equilibrium had been obtained. This assumption was based on the preconceived notion (which turned out to be incorrect) that the rate of evaporation from the liquid phase would be fast. Some of this data was published [24-25] in graphic and equation form. There was an insufficient amount of data to determine if there was a dependence of the heat of evaporation on composition so it was assumed there was not. However, further measurements made on these solutions by mass spectrometry showed that the initial measurements did not correspond to equilibrium.
Similar studies were carried out on phases in the K2O-AI2O3 system. Measurements of the K pressure over the two phase regions KA102-K20*5Al203 and K20*9Al203-Al203 were obtained on the microbalance system. Here the phase identified as K20-5A1203 has a definite but unknown composition. In the two phase regions, the potassium pressure is independent of bulk composition. The potassium pressures measured over the two phase regions were presented in [25] .
For MHD, data are required on the activity of K2O in slag melts far more complex than two-component systems. Therefore, some measurements of the K pressure over two synthetic slags with compositions corresponding closely to those expected from the distribution of coal ash analysis were made. One of these slags, K531, was selected to represent a slag with high silica and alumina content, while a second slag K512 was a high calcia slag and was chosen to test the effect of calcia on the K2O activity. The object of these measurements was to compare the observed K pressure with the K pressure over K20-Si02 solutions. Generally, it was assumed the rate of transport of K2O through a slag may be strongly dependent on the slag viscosity and in order to measure K pressures at temperatures in which the slag was reasonably fluid, effusion cells with 1/2 mm diameter effusion orifices were used. This allows measurements to be made at higher temperatures and pressures but at reduced mass effusion rates compared to a larger orifice. The results of these measurements were presented [26] and showed surprisingly high K pressures when compared with the K pressures over K20-Si02 solutions. Since the original data on the K pressure over K20-Si02 solutions were obtained using a 1 mm diameter effusion hole, it was thought worthwhile to consider the possibility that these pressures did not correspond to equilibrium.
Additional measurements were therefore made on the K(g) pressures over K20-Si02 solutions using the quadrupole mass spectrometer equipped with a Knudsen cell having a 1/2 mm diameter orifice. Because the composition of the solution changes during the measurements and both the pressure and heat of vaporization may depend on composition, the data were separated into series if they had a common mass spectrometer constant and if the range of composition were considered wide enough to yield some information concerning the pressure dependence on composition. The data were fit by least squares to the equation:
log Pj = BO + Bl/T + B2N2 (6)
where N is the mole fraction of K2O in the melt. The results are summarized in Table 1 which lists the series identification, the number of data points.
223

Table 1
Least Squares Fit of K(g) Pressures over K20-Si02 i^) Solutions
Series
1104 1110 1115 1122 1123 1126 1129 All
No. Pts.
28 38 26 18 31 23 20
184
K2O wt. %
43.9 - 40.4 40.3 - 34.4 34.4 - 29.4 29.3 - 26.5 26.5 - 21.1 21.1 - 16.6 16.6 - 11.9 43.9 - 11.9
BO
4.482 4.790 4.559 5.349 4.491 4.784 4.735 4.721
S.D.
.131
.092
.076
.141
.067
.081
.092
.047
Bl
-15637 -15843 -15485 -15958 -15305 -15706 -15226 -15624
S.D.
192 115 98 218 93 113 182 72
B2
12.02 10.17 10.42
- 2.89 10.35 8.65
- 9.77 9.32
S.D.
1.29 .66 .83
3.53 1.05 1.76 5.46 .13
S.D.
.041
.038
.034
.047
.029
.030
.042
.057

the composition range, each coefficient and its standard deviation, and the standard deviation in log units of the K pressure. Examination of the Bl and B2 coefficients does not appear to reveal any systematic trend with composition, and a fit of all the data to a single equation with the temperature coefficient independent of temperature appears justified. Although some increase in the standard deviation in the fit is noticeable, the fit of the equation covering the composition range from 44 to 12 wt % K2O is remarkably good.
At K2O compositions below 20 wt % K2O and temperatures below 1100°C crystalline tridymite would precipitate from the melt if thermodynamic equilibrium were established and the liquid phase would become richer in K2O. No evidence that this process actually takes place was observed.
Measurements currently in progress involve observations of the K(g) pressure over 3-component melts containing K2O, Si02 and AI2O3 as well as compounds such as KitZr50i2- Future work is expected to include additional synthetic slags.
ACKNOWLEDGMENT
This work was sponsored in part by ERDA, Office of Fossil Fuels. Compositions of synthetic slags were made available by W. Capps, Inorganic Glass Section. T. Negas, R. Roth, C. Olson, and C. McDaniel of the Solid State Chemistry Section have been involved in several aspects of the vapor pressure measurements.
REFERENCES
[1] R.V. Shanklin, L.W. Crawford, J.F. Martin, J.B.Dicks, W.D. Jackson, C.R. Gamblin and C.H. Tsai. Paper II.8, 13th Symposiimi on Engineering Aspects of Magnetohydrodynamics, Stanford University (1973).
[2] D. Bienstock, P.D. Bergman, J.M. Henry, R.J. Demski, J.J. Demeter and K.D. Plants, Paper VII.l, Ibid.
[3] L. Crawford, K. Tempelmeyer, J. Martin and J. Muehlhauser, Sixth International Conference on Magnetohydrodynamic Power Generation, Washington, D.C. (1975) pg. 51-65.
[4] E.M. Levin, S.J. Schneider and E.R. Plante, Paper IV.5, 13th Symposium on Engineering Aspects of Magnetohydrodynamics, Stanford University (1973).
[5] JANAF Thermochemical Tables, Dow Chemical Co., Midland, Michigan.
[6] High Temperature Properties and Decomposition of Inorganic Salts Part 2, Carbonates, K.H. Stern and E.L. Weise, NSRDS-NBS 30 (1969).
[7] P. Lebeau, Ann. Chim. Phys., 6_, 246 (1905).
[8] J.P. Howarth and W.E.S. Turner, J. Soc. Glass Technol. Trans., 15, 353 (1931) .
[9] C. Kroger and J. Stratmann, Glastechn. Ber. 2i.f 311 (1961).
225

[10] T. Kosugi, Bull. Chem. Soc. Japan, 45 , 15 (1972).
[11] L.N. Gorokhov, High Temperature Technology, Proc. Third International Symposium on High Temperature Technology (1967) Butterworths, London, U.K.
[12] J. Dubois and J. Millet, C. R. Acad. Sci. 266, 852 (1968).
[13] I. Spitsyn and V. I. Shostak, J. Gen. Chem. USSR 21/ 1801 (1949).
[14] W.D. Halstead, Trans. Faraday Soc, 6£, 1966 (1970).
[15] T. Kosugi, Kogyo Kagaku Zasshi, 7£, 2089 (1967) .
[16] P.J. Ficalora, O.M. Uy, D.W. Muenow, and J.L. Margrave, J. Amer. Ceram. Soc, 5]^, 574 (1968) .
[17] K.H. Stern and E.L. Weise, High Temperature Properties and Decomposition of Inorganic Salts, Part I, Sulfates NSRDS-NBS 7 (1966).
[18] I. Eliezer and R.A. Howald, J. Chem. Phys. 65, 3053 (1976).
[19] J.B. Heywood and G.J. Womack, Open Cycle MHD Power Generation, pg. 672, Pergamon, Oxford (1969).
[20] P.J. Bowles, Unpublished data.
[21] D. Cubicciotti, J. Phys. Chem., 70, 2410 (1966).
[22] F.E. Spencer, Jr., J.C. Hendrie, and D. Bienstock, Sixth International Conference on Magnetohydrodynamic Electrical Power Generation, Washington, D.C. (1975) pg. 181-210.
[23] R. T. Grimley, in "The Characterization of High Temperature Vapors", J. L. Margrave, Ed., John Wiley and Sons, Inc, New York, N.Y. (1967) (Chapter 8).
[24] E.R. Plante, Proceedings of NSF-OCR Engineering Workshop on MHD Materials, Massachusetts Institute of Technology (1974) pg. 301-311.
[25] E.R. Plante, C D . Olson and T. Negas, Sixth International Conference on Magnetohydrodynamic Electrical Power Generation, Washington, D.C, (1975) pg. 211-218.
[26] L. Cook, E. Plante, T. Negas, R.S. Roth and C D . Olson, Paper II.4, Proceedings of the 15th Symposium on Engineering Aspects of Magnetohydrodynamics, Philadelphia, Pa. (1976).
226

STABILITIKS Oi' iOMS POTASSIUM COMPOUNDS IMPORTANT IN HIGH TSMPERATURS PROCESSES
Thomas C. Ehlert, Lefford Lowden, Linda Simmons Chemistry Department Marquette University Milwaukee, m 53233
INTRODUCTION
Our primary interest has been in tracing potassium compounds in a blast furnace. Sodium and potassium enter a furnace in trace amounts but very large steady-state concentrations are quickly reached. To have some idea as to the form and distribution of potassium in a furnace we are usine; a computer proBiram called 30LQA3, written in FORTRAN-IV by Dr. Gunnar Eriksson at the University of Uraea, Sweden. Equilibrium is assumed and the program calculates the composition given the initial composition, the temperature, and the thermal functions of the compounds involved. The lack of reliable thermodynamic data for a number of potassium compounds prompted us to undertake studies of KCN, K2C0o, K_0, some of the potassium silicates, and potassium-graphite.
METHOD
Effusion beam-mass spectrometry was the primaiy method used in our studies. Details of the apparatus and method, as well as the KCN, KJZO^, and K^O results will appear in the April, 1977 issue of the Journal of Physical Cnemistry. It suffices to say here that platinum effusion cells were used and pressure calibrations were internal, i.e. based upon sample weight loss.
RESULTS
KCN. KCN sublimes without decomposition. From 700 K up to the boiling point, estimated as l405 K, the vapor consists predominantly of dimer (D), although the monomer (M) abvmdance is substantial and a small amount of tri-mer (T) is also present. Sublimation pressures are given by
Ln Py, (atm) = -(25,930 - 600)/T + 17.37 - 0.17
Ln PQ (atm) = -(29,762 ± 500)/T + 22.32 - 0.l6
Ln P,p (atm) = -(36,796 t 600)/T + 2 1.39 - 0.20
Differential thermal analysis shows KCN has no first order transitions between room temperature and the melting point, 908 t 1 K. At 850 second law values of the heat of sublimation to M, D, and T are 51.5 1 1.2, 59.1 t 1.0, and 73.1 - 1.2 kcal mol-1, respectively. For M the third law heat of sublimation is in approximate agreement with the second law value but for D the agreement is very poor. At 298 K the heat; of formation of the gaseous K, D, and T are 2i»..2 1 1.5, 7.0 1 3. and -8.3 1 i kcal mol-1, respectively. The dimerization and trimerization ehthalpies at 850 K are -ki and -81 kcal mol-J
227

K CO . Between 1037 and 118 + K the sublimation pressure of K2C0» is
-• -2 given by
^^° . Ln Patm = -(36,700 ± 900)/T + 15.65 t 0.9
Decomposition to KgO (c) and CO2 (g) is more important than sublimation and
obeys the equation
Ln Patm^COg) = -(30,'^50 t i000)/T + 1'<..69 t 0.9
Sublimation of K 0 obeys the equation
Ln Patm(^'2°^ " -(38,170 + 800)/T + 17.28 + 0.7
DecomDOsition of KgO is extensive, as shown by the expression for the equilibrium constant for the decomposition reaction
K2O (g) = 2K (g) + IO2 (g) (1)
Ln K(l) = -(38.600 + 1,100)/T + 17.9 ± 1.0
At 1100 K the heat of formation of gaseous potassium carbonate is -23'J-_ kcal mol"l, t^e sublimation heats for the carbonate and the oxide are 73.0 - 2. and 75.8 + lA kcal mol"^, respectively, the heats of formation of the gaseous and solid K^O are -76.8 t 2 and -153 + ^ kcal mol-1, respectively. The oxide and carbonate appear to be mutually insoluble.
K^0*x3i02 In order to study the KpO - SiO system mixtures of KgCO. • * and 310 (quartz) were reacted In the effusion cell and the CO pressure was used to monitor the course of the reaction. It is not at all certain that equilibrium is achieved in this system. In fact, reducing the cell orifice area from 3.7 x 10~3 cm^ to 1.1 x 10"3 cm caused the CO pressure to increase five fold. Mor are we certain as to what phases to exTsect. Available evidence indicates that E 0* ^SiO^ is the most silica-rich compound in this system so we assumed tnat the observed, initial COp pressure was due to the reaction
KgCO^Cc) + i^SiOgCc) = K20.i^Si02(c) + C02(g) (2)
Initially the CO pressure decreased with time in all cases although the decrease was more pronounced with silica-rich mixtxires, suggesting a lack,of surface area as the cause. Using the highest pressure attained at 816 K^ i*. x 10-°atm,. gives 20,200 cal mol-^ as the standard free energy change for (2). Using JANAF thermal fiinctions gives the standard :Cree energy of formation of KgO.ifSiOg at 816 K as-838 kcal mol"^. Over a silica-poor mixture the highest pressure reached at 966 K, corresponds to AQi = -795 kcal mol"^, again for the tetrasilicate. In the composition region corresponding to (2) the temperature dependence of the CO pressure from 833 to 863 K, temperatures sufficiently low as to yield constant pressures at each temperature, indicated the enthalpy change for (2) is 80 ± 5 kcal mol-^ From this
228

the heat of formation of the tetrasilicate can be estimated to be -972 kcal mol" . One bit of evidence for the attainment of equilibrium came from a , silica-poor mixture over which the CO^ pressure remained constant at 'f x 10" atm as the mole ratio of silica to potassia varied from 4.3 to 1.4. P(CO ) later became constant at 2.4 x 10"''' atm at 966 K as the ratio varied from^ 0.53 to 0.48. The later region would correspond to the formation of the ortho-silicate, 2K20*Si02. In the region from 4.3 to 1.4 mole ratio of silica to potassia, however, the phase diagram (l) shows both the tetrasilicate and the disilicate so one would not expect the pressure to remain constant I More information is needed regarding the stable phases.
K-Graphite. This system was of interest because it is well known that even poorly graphitized carbon will hold large amounts of potassium as intercalated metal. We monitored the potassium pressure as a function of time and of temperature, starting with compositions near KCQ. Here too the literature offers conflicting versions of the phase diaa;ram. We found that KCn exerted a constant vapor cressure ziven by the equation
Ln Patm = -(13.790)/T + 12.93
in exact agreement with EMF studies (2). Later, the potassium pressure fell slowly while at a constant 526 K, only to again become constant at a composition corresponding to KC^^. Reference (2) indicates the phase expected to be KGpK although later work seems to indicate it is ''C./-. As the potassium content is reduced the potassium pressure decreases and higher temperatures are needed to maintain a reasonable rate of composition change. Other constant pressure stages are reached, obviously corresponding to some of the"numerous other KC compounds known to exist. However, the transitions are not easily detected ?Sass spectrometrically probably because our samples were too-small to maintain equilibrium conditions. To test this would, unfortunately, require vaporizing a very large amount of p -tassium into the mass spectrometer. It is interesting to note that heating to l400 K is need-to deplete the potassium content of spectrographic grade graphite.
ACKNOWLEDGEMENTS
This work would not have been possible without the financial support of International Minerals and Chemical Corp. Numerous stimulating discussions with Dr. James Currier of IMC are also acknowledged.
REFE^NCES
(1) R.W. Goranson and F.C. Kracbk, J, Phys. Chem. , 925 (1932) (2) 3. Aronson, F. Salzano, and D. Bellafiore, J. Chem. Phys. 42, 434 (1968).
229
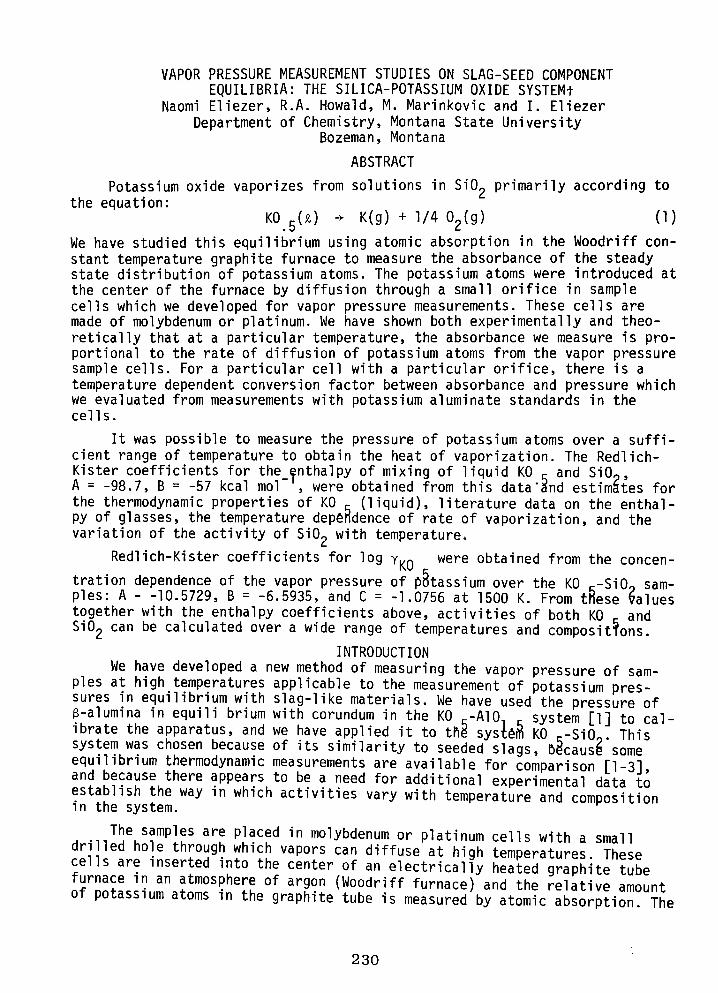
VAPOR PRESSURE MEASUREMENT STUDIES ON SLAG-SEED COMPONENT EQUILIBRIA: THE SILICA-POTASSIUM OXIDE SYSTEMt
Naomi Eliezer, R.A. Howald, M. Marinkovic and I. Eliezer Department of Chemistry, Montana State University
Bozeman, Montana
ABSTRACT
Potassium oxide vaporizes from solutions in SiOp primarily according to the equation:
KOgCii) - K(g) + 1/4 02(g) (1) We have studied this equilibrium using atomic absorption in the Woodriff constant temperature graphite furnace to measure the absorbance of the steady state distribution of potassium atoms. The potassium atoms were introduced at the center of the furnace by diffusion through a small orifice in sample cells which we developed for vapor pressure measurements. These cells are made of molybdenum or platinum. We have shown both experimentally and theoretically that at a particular temperature, the absorbance we measure is proportional to the rate of diffusion of potassium atoms from the vapor pressure sample cells. For a particular cell with a particular orifice, there is a temperature dependent conversion factor between absorbance and pressure which we evaluated from measurements with potassium aluminate standards in the cells.
It was possible to measure the pressure of potassium atoms over a sufficient range of temperature to obtain the heat of vaporization. The Redlich-Kister coefficients for the_enthalpy of mixing of liquid KO r and SiOp, A = -98.7, B = -57 kcal mol" , were obtained from this data"and estimates for the thermodynamic properties of KO g (liquid), literature data on the enthalpy of glasses, the temperature dependence of rate of vaporization, and the variation of the activity of SiO„ with temperature.
Redlich-Kister coefficients for log Y|^O ^^^^ obtained from the concentration dependence of the vapor pressure of potassium over the KO c-SiOo samples: A - -10.5729, B = -6.5935, and C = -1.0756 at 1500 K. From these Values together with the enthalpy coefficients above, activities of both KO ^ and Si02 can be calculated over a wide range of temperatures and compositions.
INTRODUCTION We have developed a new method of measuring the vapor pressure of sam
ples at high temperatures applicable to the measurement of potassium pressures in equilibrium with slag-like materials. We have used the pressure of e-alumina in equili brium with corundum in the KO r-AlO, _ system [1] to calibrate the apparatus, and we have applied it to the sysieffi KO n-SiO This system was chosen because of its similarity to seeded slags, bicausisome equilibrium thermodynamic measurements are available for comparison [1-3] and because there appears to be a need for additional experimental data to establish the way in which activities vary with temperature and composition in the system. *^
. -n J^^i-^?'"^^!^ "" P^^^^^ " molybdenum or platinum cells with a small dri led hole through which vapors can diffuse at high temperatures. These cells are inserted into the center of an electrically heated graphite tube furnace in an atmosphere of argon (Woodriff furnace) and the relative amount of potassium atoms in the graphite tube is measured by atomic absorption. The
230

measured absorbance normally increases within 5 to 15 minutes to a steady state value, where the rate of diffusion out of the cell equals the rate at which potassium atoms leave through the ends and walls of the graphite tube. For a particular sample cell, the steady state absorbance is proportional to the pressure of potassium atoms inside the cell. There is, however, a substantial exponential temperature dependence for the proportionality constant:
P = c^g^^ e" /* "" (absorbance) (2)
The value of 39 kcal mol" is the average obtained with two separate graphite tubes with cells filled with a mixture of corundum and potassium e-alumina. The equilibrium vapor pressures for this system are known from the work of Plante et al. [1].
Equation 2 also fits the temperature dependence observed in a second graphite tube furnace. The agreement between the data in the different furnaces is a clear indication that the value 39 Kcal mol" , depends more on the nature of the potassium-graphite interaction (diffusion coefficients and the equilibrium constant for compound formation) than on the geometry of a particular Woodriff furnace. EXPERIMENTAL
1. Preparation and Analysis of Samples
Samples in the system KO c-AlO, r were prepared by grinding together and then heating weighed amounts Of AKo" and KHCO- in covered platinum crucibles in a gas furnace. The temperature was gradually increased to around 1000°C during 1 to 4 hours, then to 1000-1100°C where it was kept for 8-12 hours, and finally to 1250°C for another 8-12 hours. About 600 mg of each sample were prepared.
KO c-SiO 2 samples were prepared by grinding mixtures of potassium silicate and either potassium bicarbonate or silica, heating to 630-650°C for about 5 hours, grinding again and storing in a desiccator. The potassium content of samples was determined by dissolving them and measuring potassium concentration in the solutions using the Varian Atomic Absorption Spectrophotometer, model 1100.
2. Potassium Vapor Pressure Measurements
These measurements were carried out by atomic absorption using a graphite furnace. The essential features of the furnace are described in [4], and its modifications for vapor pressure measurements are reported in [5]. The temperature of the area where the sample is introduced was measured by optical pyrometer. The sample cells were made of platinum or molybdenum. Molybdenum has sufficient strength at high temperatures to allow the use of cells with a screw closure. Molybdenum has a tendency to stick, and, to prevent sealing the cell into the furnace, the pedestal on which the molydbenum cells sits was rotated during the time the cell was in the furnace. With the molybdenum cells different tops with different hole sizes could be screwed onto the base holding any particular sample. However, for loading platinum cups, the bottom was sawed off, the sample was introduced and the bottom was welded back on.
Calibration was carried out for each cup, before and several times between measurements. A KO c-AlO-, r sample was put in the furnace and plateau transmittance values we^e recif-aed. The same procedure was followed for measurements of K0.5-Si02 samples.
231
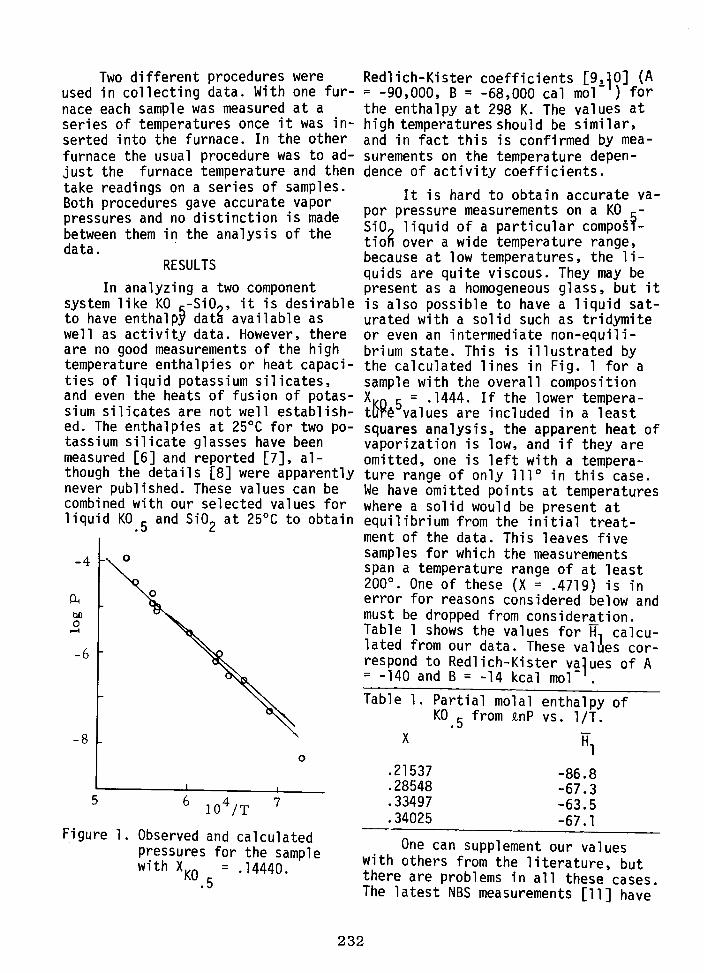
Two different procedures were used in collecting data. With one furnace each sample was measured at a series of temperatures once it was inserted into the furnace. In the other furnace the usual procedure was to adjust the furnace temperature and then take readings on a series of samples. Both procedures gave accurate vapor pressures and no distinction is made between them in the analysis of the data.
RESULTS
In analyzing a two component system like KO c-Si02, it is desirable to have enthalpy data available as well as activity data. However, there are no good measurements of the high temperature enthalpies or heat capacities of liquid potassium silicates, and even the heats of fusion of potassium silicates are not well established. The enthalpies at 25°C for two potassium silicate glasses have been measured [6] and reported [7], although the details [8] were apparently never published. These values can be combined with our selected values for liquid KO c and SiO„ at 25°C to obtain
.0 c
-4
OH
O
10^/T
Figure 1 Observed and calculated pressures for the sample with X
KO .5 .14440.
Redlich-Kister coefficients [9,10] (A = -90,000, B = -68,000 cal mol" ) for the enthalpy at 298 K. The values at high temperatures should be similar, and in fact this is confirmed by measurements on the temperature dependence of activity coefficients.
It is hard to obtain accurate vapor pressure measurements on a KO n-SiOp liquid of a particular composition over a wide temperature range, because at low temperatures, the liquids are quite viscous. They may be present as a homogeneous glass, but it is also possible to have a liquid saturated with a solid such as tridymite or even an intermediate non-equilibrium state. This is illustrated by the calculated lines in Fig. 1 for a sample with the overall composition XwQ g = .1444. If the lower temperature values are included in a least squares analysis, the apparent heat of vaporization is low, and if they are omitted, one is left with a temperature range of only 111° in this case. We have omitted points at temperatures where a solid would be present at equilibrium from the initial treatment of the data. This leaves five samples for which the measurements span a temperature range of at least 200°. One of these (X = .4719) is in error for reasons considered below and must be dropped from consideration. Table 1 shows the values for H, calculated from our data. These values correspond to Redlich-Kister values of A = -140 and B = -14 kcal mol"'.
Table 1. Partial molal enthalpy of KO g from £nP vs. 1/T.
X * H,
.21537
.28548
.33497
.34025
1
-86.8 -67.3 -63.5 -67.1
One can supplement our values with others from the literature, but there are problems in all these cases, The latest NBS measurements [11] have
232

not been published yet. The available values [1] have been analyzed without any allowance for a composition dependence of the heat of vaporization. Preston and Turner [12] have accurately measured the rate of evaporation of potassium oxide from KO c-SiOp glasses over a wide temperature range, but the heats of vaporization which they found are too low to correspond to the process:
KO 5 (soln) -> K(g) + 1/4 O2 (g) (3)
The most reasonable interpretation of their data is that they were measuring evaporation by the process:
KO g (soln) + 1/2 HgO (g) - KOH (g) (4)
U sing values selected for the thermodynamic properties of KOH (g) [13] gives H, values consistent with ours and with the one average value in [1]- These values correspond to Redlich-Kister coefficients of A = -104,000 and B = -33,000. A combined least squares treatment of our values and those in [12] gives A = -125,000, B = -13,000 cal mol"'.
It is clear from these determinations, summarized in Table 2, that A is around -100,000 cal mol" , but the value for B is not fixed very closely. A good value for B can be obtained, however, from the temperature dependence of log Yp- Log YO is known at several temperatures and compositions from the phase diagram measurements. [2] We have selected T = 1784 K, X = .102, K = .94293, log YO = .0212, because we have a substantial amount of vapor pressure data at this temperature. The other point selected is T = 1150 K, X = .293, K = .76281, log YO = .0330. Using our values for log YI as function of composition at 1784 K, one can get log YO ~ --Ol at X = .2 93, T = 1784 K by a Gitpbs-Duhem integration. This corresponas to a value of H„ = 600 j 400 cal mol"' for X = .293. This establishes the equation: A - 1.828B = 7000 ± 5000. The linear combination orthogonal to this is A + .5470B which sum is -, approximately -130000 (Table 2). This gives A = -98000, B = -58000 cal mol" . Once enthalpy values are chosen, we have consideraMy more data on log Y-I and a better value can be obtained for log YO and H^. This process converges in two steps to the final Redlich-Kister valaes, A ^ -97600, B = -57000.
of by the
Every measured potassium pressure can be converted.to an activity KO g by assuming that PQ = 1/4 P| and dividing PJ^PQ '' = .707 P,^^
corresponding product of the pressures in equilibrium with pure liquid KO g at the experimental temperature. Pure liquid KO g cannot be prepared and ' handled at these temperatures, and so the thermodynamic properties assigned to it cannot be checked experimentally. Table 3 shows the values selected for
Table 2. Redlich-Kister coefficients for enthalpy in the KO c-Si02 system.
A B " A + .547B
our data rate of vaporization [12] joint least squares enthalpy of glasses, 25°C [6-8] selected, including log YO data
140 104 125
90 98.7
-14 -33 -13 -68 -57
-148 -122 -132 -127 -130
233

liquid KO g along with ones for SiO^ selected to fit the JANAF [14] values, and values for various solids considered later in this paper. paper
Table 3. Thermodynamic properties for the pure materials.
"°298 "°1000 ^°1000 adequation
KO g(s)
KO il)
Si02(i!.)
K2Si40g(c)
kcal mol"
- 43.2 - 37.2
- 36.506 - 27.944
-216.01 -205.01
-1062.124 -1005.366
10.09
23.57
18.20277
90.5716
a
9.097
11.45
16.61
85.081
bxlO^
.96
1.8
3.2268
9.0876
cxlO^
1.2384
-3.1173
The calculated activities can be divided by the mole fractions to get activity coefficients at the experimental temperature, and these values can be corrected to a standard temperature of 1500 K using the equation:
d log Y^/ d (1/T) = - H^ / 4.575628 (5)
and values of H, from the Redlich-Kister equation:
H^ = (l-x)^[-97600 - 57000 (-1 + 4X)] (6)
The values of log Y-I corrected to 1500 K are plotted in Fig. 2. Compositions which would have silid present at equilibrium appear twice in Fig. 2., as diamonds assuming a non-equilibrium glass of the stoichiometric composition and as squares for the equilibrium liquid composition from the phase diagram of Kracek et al. [2]. Most of these points are closer to the line when the equilibrium liquid assumption is used, but for some, the stoichiometric glass is clearly a better approximation. A choice has been made for each point and the corresponding square or diamond is shown in solid black. An increased experimental scatter for points at mole fractions above 0.4 is clearly evident in Fig. 2. This is probably related to the problems of maintaining a uniform known composition when the vapor pressure of KO c is relatively high. The effect is most pronounced at lower temperatures"and higher KO concentrations, and is sufficient to prevent an accurate determination of the heat of vaporization of K O ^ from the sample at X = .4719 with our apparatus.
The points in Fig. 2 were fitted well by the Redlich-Kister coefficients A = -10.5729, B = -6.5935, and C = -1.0756. The solid line in Fig. 2 is calculated from these values. From the activities of KO and SiO„ along the liquidus curve for tridymite, we can evaluate the RedlTch-Kister coefficients for solid tridymite. Similarly from the liquidus curve for K-^i 0 we can evaluate the thermodynamic properties of this solid (Table 3). F^o^ these parameters it is possible to calculate a phase diagram for the KO -SiO system. Also the equilibrium vapor pressure of potassium over a KO^t--Si§o liquid can be calculated as a function of temperature and composition. ^ The solid lines in Fig. 1 were calculated in this way.
234

-5 r
O
-7
Figure 2. Log YI vs mole fraction.
REFERENCES
[I] E.R. Plante, CD. Olson, and T. Negas, Sixth International Conference on MHD Electrical Power Generation, Vol. II, 211 (1975).
2] F.C. Kracek, N.L. Bowen, and G.W. Morey, J. Phys. Chem., 41, 1183 (1937). ;3] R.J. Callow, Trans. Farad. Soc, 46 , 663 (1950). 4] R. Woodriff, Applied Spectroscopy, 28 , 413 (1974). 5] R. Woodriff, M. Marinkovic, and J. Amend, These proceedings. 6] Kracek, Neuvonen, Burley and Gordon, Ann. Rept. Director of the Geo
physical Laboratory, Geophysical Lab. Paper 1215, 69 (1953). [7] K.K. Kelley, Bureau of Mines, Report of Investigations 5901, 1 (1962). [8] F.C. Kracek and K.J. Neuvonen, Am. J. Science, 250A, 293(1952) [9] R.A. Howald and I. Eliezer, Metallurgical Trans., 8i, 190 (1977). [10] 0. Redlich, A.T. Kister, and CD. Turnquist, Chem. Eng. Progr., Symp.
Ser., 48 no. 2 , 49 (1952). [II] E.R. Plante, Private Communication. [12] E. Preston and W.E.S. Turner, J. Soc. Glass Technology, 27, 122 (1933). [13] I. Eliezer and R.A. Howald, J. Chem. Phys., 65^3053 (19761. [14] JANAF Thermochemical Tables, Nat. Stand Ref. Data Ser. Nat. Bur. Stand.
37 (1971).
t Work performed under MERDI Subcontract Number 77-002 and ERDA Contract Number EF-77-C-01-2524.
235

A NEW TECHNIQUE FOR HIGH TEMPERATURE VAPOR PRESSURE MEASUREMENTS APPLIED TO MHD PROBLEMS
by R. Woodriff, M. Marinkovic, and J. Amend
Department of Chemistry Montana State University Bozeman, Montana 59715
The presence of coal slag, and possibly potassium compounds as a seed to increase electrical conductivity of combustion gases, seems to be unavoidable in a coal-fired, open cycle MHD power generator. Among the other properties of the coal slag, the data on vapor pressure of potassium are needed for the proper design of the system and developing seed recovery procedure.
The constant-temperature graphite furnace was originally developed for analytical purposes at Montana State University. However, it appeared that the furnace could be easily redesigned and applied to vapor pressure measurements at high temperatures. In this report a brief description of remodeled furnace, its capability for measurement of vapor pressure of potassium, and some actual data are presented.
INTRODUCTION
The operation of the furnace is illustrated in Fig. 1. The sample-containing cell inserted into the furnace is heated by conduction and radiation until it reaches equilibrium with the environment. Vapor escapes through the orifice on the top of the cell and enters into the heater tube where the possible molecular compounds are destroyed due to highly reducing atmosphere. The free atoms formed are removed from the optical path by diffusion mechanisms . Steady-state concentration of free atoms established in the heater tube is monitored by measuring absorption of resonance radiation from the primary source. The application of the technique described is based on the following assumptions: (a) Vapor loss from the cell and from the heater tube is diffusion controlled, and (b) vapor pressure within the cell is not disturbed by the vapor leak out of the orifice.
The vapor escaping rate can be assessed from first Fick's law:
dm dt
where D is coefficient of diffusion, dp/dx is density gradient in the directiDn of diffusion, and S is cross-sectional area of the o r i f i c e . If we neglect vapor density in the heater tube compared to the vapor density in the c e l l the escaping ra te is given by the expression:
2 dm _ 77 _ d
"dt r °P IT 2 where d is the diameter of the orifice, 1 is the length of the orifice, and p is the vapor density in the cell.
The evaporation rate was estimated by means of the following expression:
236

M 277RT
where G is the mass of vapor which the sample loses per unit time, per unit surface area in a vacuum, P is saturated vapor pressure at temperature T, and M is molecular weight of vapor. In the presence of a nonreacting gas the evaporation rate is lower. From the data described in the literature [l], it follows that the evaporation rate at atmospheric pressure and temperatures close to that involved in the described measurement, is approximately one-sixtieth of that in a vacuum.
Using estimates based on eq. 2 and 3, and keeping in mind the effect of argon which fills the furnace at„atmospheric pressure, calculations for our set-up (d /l=0.05 mm, and 0.1 cm cross-sectional area of the sample) indicate that the evaporation rate exceeds the escaping rate by the several hundred times. This estimation shows that vapor density within the cell is not appreciably disturbed by vapor leak.
APPARATUS
The constant temperature furnace and its use for analytical purposes have been described in detail elsewhere [2,3]. The essential parts of the modified furnace are shown schematically in Fig. 1. The heat tube 1 and the side tube 2_ are connected with T-tube connection 3_ in such a way that good electrical and gas-tight contact is made. The whole system is heated with three phase a.c. current which makes it possible to obtain relatively uniform temperatures along the T-tube connection. Since the sample containing cell is enclosed in the chamber it is heated by conduction and radiation. For this study a heater-tube and side-tube were made of POCO FXI graphite. Outer diameter was 9.27 mm and wall thickness was 0.67 mm. A sample containing cell 4_ makes a seal with its top to the T-tube connection. The graphite rod 5_ is used to insert the cell into the furnace, and at the same time it is coupled with the cell and makes the cell rotate with the speed of 1 rev/min. Molybdenum cells have a tendency to stick to the graphite parts, presumably due to carbide formation. Rotation of the cell prevents this from occurring. Different materials and different shapes of the cell have been tested.
Platinum cells have been used up to temperatures of about 1800K. They were made from sheet platinum about .36 mm for the walls and about .5 mm for the ends. Diffusion holes 0.15 to 0.2 mm were used. The welding was done with a small oxyacetylene torch using 0.5 mm wire as welding rod. The samples were welded into the cell and to replace samples the bottom was cut off with a fine bladed jeweler's saw. Cells are chucked with the hole down for welding. Some radiation from the weld causes low melting silica slags to melt at the surface. Unless the slag is broken up and caused to fall to the bottom of the cell when it is turned over, it tends to be forced out of the pinhole as liquid . This not only changes the pinhole but the slag in the reducing atmosphere of the furnace causes deterioration of the platinum so that the cells last for only two or three runs instead of ten or twenty.
For most purposes molybdenum is superior to platinum. It has a high melting point, it is relatively cheap and easy to machine, and melted slags do not creep along the walls. Different designs of the molybdenum cell have been tested. Cells made in two parts that screw together have proved to be very
237

serviceable. The possible vapor leak through the thread is flushed out of the optical path through the vents on the T-tube connection by the argon stream introduced through the side tube. By a separate experiment it has been proven that vapor leak affects the results less than one percent.
As a primary source a conventional potassium hollow-cathode lamp with modulated power supply was used. This lamp was current regulated and pulsed at a frequency of approximately 60 hz; the hollow-cathode power supply also furnished the synchronizing signal for the lock-in amplifier. By pulsing the light source, it was possible to dispense with the conventional rotating optical chopper. This also eliminated interference from broad-band light from the hot furnace, which had been reflected from the front of the hollow-cathode lamp, chopped by the rotating chopper, and added to the hollow-cathode signal by the lock-in amplifier. Absorbance was measured at 404 nm wavelength. The temperature of the T-tube connection was assumed to be equal to the temperature of the cell. The temperature was measured through the side window on furnace case with an optical pyrometer.
RESULTS AND DISCUSSION
The response time for potassium, i.e., the time required for absorbance to attain a steady state after the cell is inserted into the furnace was unexpectedly long and ranges from 2 minutes at 2100 K to 60 minutes at 1500 K. This can be explained by the assumption that part of the potassium vapor is absorbed and stored in the heater tube and T-tube connection. The time required to attain equilibrium between the vapor phase and the potassium which is absorbed in the graphite is responsible for long response time [4]. It is interesting to note that for atomic absorption measurements carried out on lead placed in a molybdenum cell, the absorbance increased rapidly, leveled off and stayed constant. Actual measurements are not made until the absorbance has attained steady state.
The result of Eq. 2, i.e., that vapor leaksthrough the orifice and consequently the absorbance is proportional to the orifice size (d^/l), has been experimentally checked. The smallest orifice used in this work was'0.34 mm in dia. and about 3 mm long (d^/i = 0.04). It is easy to drill such a hole into a molybdenum cell with an ordinary drill. Using cells with different orifices, it was found that proportionality between absorbance and orifice size exists up to the orifice size of d2/i = o.2 mm. This experiment confirms that the escape of vapor does not disturb the equilibrium within the cell when the proper size of the cell and orifice is used. It should be kept in mind that at higher vapor pressures the escape rate of potassium vapor becomes high enough that change in potassium composition may occur- this is especially significant for low potassium samples. J- &
As the interaction of potassium vapor and graphite in the furnace is rather complicated the proposed technique can be used only as a relative one. This means that reference material of known vapor pressure is required. As reference materials of known vapor pressure of potassium we used the recently proposed two-component system of K2O - AI2O3 [5]. These materials are easily reproducible and have well-defined vapor pressures which depend only on the temperature as long as the bulk composition remains within certain limits The potassium pressure in N/m2 of these materials are given by the expression-
238

•\ \ vTv-^-^ s \ 1 •vA^ err
- Ui
f
y. \ V V V T — T —
A R G O N
Fig. 1. Essential Parts of Constant Temperature Furnace,
10
01 J \ L J 1 I I \ I L 10000/r (K"')
Fig. 2. Vapor Pressure of Potassium Over Coal Slag Containing Two Percent of K2O.
o = Points obtained by the procedure based on Eq. 6. ^= Points obtained by the procedure based on Eq. 8.
239

LogP (KAIO2 - K2O.5AI2O3) = - ^^^^^ + 10.4945 4
214SS LogP (K2O.9AI2O3 - AI2O3) = ^ + 12.4925 5
Measurements of the unknown vapor pressure can be carried out in two ways . If the absorbances for the sample and reference material fall into a range in which they can be measured at the same temperature, then the ratio of absorbances corrected for the orifice size is equal to the ratio of the vapor pressures, i.e.:
Px \/(</l)
A/(dVl) where A is absorbance, and index x is referred to the sample of unknown pressure. However, the linear response range of the atomic absorption technique is rather narrow so that frequently absorbances have to be measured at different temperatures. In that case an extrapolation of experimental curve can be used. For our particular furnace and for potassium P-alumina as a standard we have used the following experimentally-found relationship:
Log — § = -J:^^+ 8.4256 7
dVl ^ Taking into account Eq, 5, the following expression is obtained which is valid for our particular set-up.
A 82Q7 Log P = Log —S- 2±I1_ + 4.066 8
dVl ^ The furnace has been used for the vapor pressure measurements of potas
sium over potassium oxide - silica solutions as well as potassium vapor over some coal slags. Fig. 2 shows some data obtained for coal slag. The precision of the procedure based on Eq. 6, defined as a standard deviation of the single determination, was estimated to be about 20 percent. Further improvement in precision is possible and it is mainly dependent upon improvement of temperature monitoring.
ACKNOWLEDGEMENT
Support of this work by the Energy Research and Development Administration under Contract No. E(49-18)-1811 is gratefully acknowledged.
Thanks are due to the National Science Foundation for support of the basic work and for loan of equipment to the present project
Authors thank N. Eliezer for the preparation of standard samples.
REFERENCES
1. G. R. Fonda, Phys. Rev., 31, 260 (1928). 2. R. Woodriff and G. Ramelow, Spectrochim. Acta, 23B, 665 (1968). 3. R. Woodriff and R. Stone, Appl. Opt., ]_, 337 (1968). 4. R. Woodriff, M. Marinkovic and R. Howald, (to be published). 5. E. R. Plante, C. D. Olson and T. Negas, 6th International Conference on
MHD Electrical Power Generation, Washington, DC, June 9-13, 1975 Volume II, p. 211. e , , , ,
240

THE THERMODYNAMIC FUNCTIONS OF GASEOUS K2S0^ AND Cs2S0^ IN THE STANDARD STATE
L. V. Gurvich, 0. V. Dorofeeva and V. S. Yungman Institute for High Temperatures, Chemical Thermodynamic Department
Moscow 127412, USSR
In order to calculate the composition and thermodynamic properties of the combustion products of natural fuels containing ionizing seeds it is important to take into account the molecular compounds of the alkali metals. In the combustion products of coal and residual oil the important compounds are the sulfates, especially the gaseous potassium and cesium sulfates.
In this paper we present tables of the thermodynamic properties of K2SO4 (g) and CS2SO4 (g) in the standard state from 100 to 3000 K. The calculations were made using the rigid-rotator harmonic oscillator approximation with the molecular constants given in Table 1. The structural parameters were taken from electron diffraction measurements of Spiridonov and Lutoshkin [1] and Ugarov et al. [2]. These measurements showed that the molecules M2XO4 have D2(i symmetry and consist of 2 planar four-membered rings at right angles to each other:
The frequencies were obtained by Belyaeva et al. [3, 4], from infrared spectra of the molecules isolated in an argon matrix and from theoretical calculations for an ionic model with polarized ions. The calculated model gave good agreement with the observed frequencies.
The uncertainty in the tabulated thermodynamic functions is large. It results primarily from the uncertainties in the frequencies, especially VI and V2. Also these frequencies, involving the M-0 vibration, are probably very anharmonic, as the amplitude of vibration is large [2].
241

Table 1
Molecular constants for K2S0^ and Cs2S0^
Assignment and Degeneracy
vi(2), E
V2(l), A
V3(2), E
V4(l), B2
^5(1), B2
'6(l>' ^2
V7(2), E
vsd). B2
V9(l), A2
Vio (2), E
^11 (1), 2
Atoms Involved
M-O
M-O
M-0
M-O
SO4
SO4
SO4
SO4
SO4
SO4
SO4
r(M-O), X
r(S-O), A
< OSO
< OMO
Frequencv. cm"^ K2S0^
62*
195
230*
262*
464
515
608*
640*
985
1098*
1128
2.45 ± 0.03
1.47 ± 0.01
109° ± 10°
0 0
59 ± 5
CS2SO4
35
98
160*
196*
460
500
610*
628*
984
1100*
1125
2.60 ± 0.03
1.48 ± 0.01
109° ± 10°
0 0
55 ± 5
These frequencies have been observed experimentally,
242

Thermodynamic Prop(
T
K
100
200
298.15
300
400
500
600
700
800
900
1000
1100
1200
1300
1400
1500
1600
1700
1800
1900
2000
2100
2200
2300
2400
2500
2600
2700
2800
2900
3000
C°(T)
15.381
21.428
25.916
25.988
29.246
31.480
33.006
34.067
34.823
35.376
35.791
36.108
36.356
36.552
36.711
36.840
36.947
37.037
37.113
37.177
37.232
37.280
37.321
37.358
37.390
37.418
37.443
37.466
37.486
37.504
37,520
Table 2
erties of K„SO, 2 4
$°(T)
cal deg mol
53.747
62.828
69.378
69.489
74.998
79.771
84.006
87.818
91-287
94.470
97.410
100.141
102.690
105.081
107.331
109.456
111.469
113.382
115.202
116.940
118.602
121.194
121.722
123.191
124.606
125.969
127.285
128-558
129-788
130-980
132.136
(g) in the
S'd)
1
65.225
77.842
87.278
87.439
95-389
102-171
108-054
113-227
117-828
121-963
125-713
129-139
132-292
135-210
137.925
140-463
142.844
145.086
147-206
149.214
151.122
152.940
154-675
156-335
157-926
159-453
160-921
162-334
163-697
165-013
166-285
Standard State
H°(T)-H°(0)
cal mol
1,148
3.003
5,337
5,385
8,157
11,200
14,429
17,786
21,232
24,744
28,303
31,899
35,522
39,168
42,832
46,509
50,199
53,898
57,606
61,320
65,041
68,767
72,497
76,231
79,968
83,708
87,452
91,197
94,945
98,694
102,445
243

Table 3
Thermodynamic Properties of Cs SO,(g) in the Standard State
T
K
100
200
298.15
300
400
500
600
700
800
900
1000
1100
1200
1300
1400
1500
1600
1700
1800
1900
2000
2100
2200
2300
2400
2500
2600
2700
2800
2900
3000
C°(T)
17.458
22.316
26.302
26.367
29.400
31.535
33.008
34.061
34-310
35-361
35.775
36.093
36.341
36.539
36.699
36.829
36.937
37.028
37.104
37.169
37.225
37.273
37.315
37.352
37.385
37.413
37.439
37.462
37.482
37.500
37.517
$°(T)
cal deg mol
60.793
71.113
78.245
78.364
84.205
89.185
93.560
97.474
101.018
104.259
107.245
110.014
112.595
115.013
117.286
119.430
121.460
123.388
125.222
126.971
128.644
130.246
131.783
133.783
134.682
136.052
137.374
138.652
139.888
141.085
142.246
S°(T) -1
74.112
87.748
97.432
97.595
105.620
112.424
118.313
123.485
128.085
132.219
135.967
139.392
142.544
145.460
148.174
150.711
153.091
155.334
157.452
159.460
161.368
163.186
164.920
166.580
168.170
169.697
171.165
172.578
173.941
175.257
176.528
H°(T)-H°(0)
cal mol
1,332
3,327
5,721
5,769
8,566
11,619
14,851
18,208
21,654
25,164
28,722
32,316
35,938
39,582
43,244
46,921
50,609
54,308
58,115
61,728
65,448
69,773
72,903
76,636
80,373
84,113
87,856
91,601
95,348
99,097
102,848
244

Table 4
Calculated enthalpy of sublimation of ^SO and Cs-SO,
Substance
K2SO4
Cs„S0, 2 4
A^H" (0)* Kcal-mol"
Second Law
87.5 ± 1.7
78.7 ± 3.0
Third Law
83 ± 0.5
77.8 ± 0.5
The uncertainties are twice the standard deviations of the calculated values.
245

An estimate of the magnitude of the uncertainty can be obtained from a comparison of the enthalpy of sublimation of K2S04(c) and Cs2S04(c) calculated by the Second and Third Law treatments of the vapor pressure data of Gorokhov and Efimova [5]. These authors obtained accurate mass-spectrometric and effusion data for both salts. The results of their measurements can be expressed by the following equations:
For K2S04(c): log P (atm) = 7.390 - (16450 ± 350)/T; (1171-1331 K)
For Cs2S04(c): log P (atm) = 7.086 - (14590 + 700)/T; (1063-1278 K)
Table 4 gives the results of the calculations of AsH''(0) by both methods. As can be seen from the table the resulting values for CS2SO4 by both methods are in agreement. For K2SO4 the difference is larger. It is difficult to explain this in terms of the anharmonicity of the low frequency non-stretching vibrations.
In general we estimate the uncertainty in the tempered Gibbs energy functions 0(T) to be 1, 3, and 5 cal.mol"l'K"l at 298, 1000, and 3000 K respectively.
References
1. Spiridonov, V. P., Lutoshkin, B. I., Vestnik Mosk. Univ, Ser. Khim., 1950, 509.
2. Ugarov, V. V., Ezhov, Yu. S., Rambidi, N. G., J. Molec. Structure, 1975, 25^ 357.
3. Belyaeva, A. A., Dvorkin, M. I., Shcherba, L. D., Opt. i Spektr., 1975, 38, 308.
4. Belyaeva, A. A., Dvorkin, M. I., Shcherba, L. D., Opt. i Spektr. 1975, 38, 516. '
5. Institute for High Temperatures, Annual Report 1975, "Nauka" 1976.
246

SLAG/SEED INTERACTIONS
W. Worrell, Chairman
University of Pennsylvania


SEED RECOVERY - CONVERSION OF SO, TO CO, 4 3
by
P. D. Bergman U. S. Energy Research and Development Administration Pittsburgh Energy Research Center, Combustion Division
Pittsburgh, Pennsylvania
Two serious concerns must be dealt with in the realm of seed recovery - one environmental and the other economic. All coal-based advanced power cycles must be designed to meet stringent SO emission standards. In addition to its elevated efficiency, one of the most compelling advantages of open-cycle MHD power generation is its self-contained sulfur removal system. The Pittsburgh Energy Research Center (PERC) has demonstrated that the SO levels produced by high-temperature coal combustion can be lowered to any desired emissions standard by the addition of K CO as the MHD seeding compound (1,2). The spent MHD seed consists primarily of K SO , but may also contain K CO , KCl, MHD fly ash, and insoluble-potassium-alummum-silicate compounds. Trace quantities of other potassium-sulfur-oxygen compounds, such as K S and K S„0 , are also thermodynamically possible under an appropriate set of plant operating conditions. In order for this sulfur removal technique to succeed, the sulfur-bearing spent seed must be reprocessed to produce a partially desulfurized seed (primarily K CO ), prior to being recycled back to the MHD combustor. Sufficient sulfur must be removed from the spent seed to partially balance the sulfur contained in the original coal, so that the EPA standard for new coal-fired central-station power plants, 1.2 lb SO-/10 Btu of coal burnt can be adhered to. Also, the MHD seed must be captured in sufficient quantities such that the expense of seed makeup does not constitute a sizable fraction of system coal costs. This would vitiate a major advantage of MHD energy conversion-reduced coal costs. In general, seed recovery levels of 95-99% have been deemed economically acceptable and appear to be within the reach of existing collection technology.
If an open-loop throwaway system were employed, in which no attempt was made to convert the K SO, product back to the original K C0„ seed, then prodigious quantities of sulfate would be produced, well beyond the capability of global agriculture to usefully absorb. Another alternative to consider would be an indirect throwaway process, such as the double alkali process, in which K SO, could be regenerated back to K CO , by reaction with limestone and/or lime in solution, with the resultant precipitate of calcium salts discarded. A heavy CaSO -CaSO sludge must be disposed of in an environmentally acceptable fashion. In essence, an air pollution problem is being exchanged for a water pollution and land use problem. Hence, it appears preferable to focus on a continuous closed loop seed regeneration process in which an economically valuable byproduct, such as sulfur or sulfuric acid, is recovered. Sulfur is one of the easiest chemicals to store and transport. These considerations have prompted the formulation of the PERC desulfurization scheme.
The chemistry of this scheme involves two steps; an initial reduction of K SO, to K S with a CO-H„ producer gas, followed by a desulfurization step in which K„S reacts with CO^ and H O to yield K C0„ and an H.S-rich off-gas. These two steps are given by Equations (1) and (2).
247

K^SO^ + X CO + (4-x) H^ ->- K^S + X CO2 + (4-x) H2O (D
X can vary between 0 and 4.
K2S + CO2 + H2O ->• K2CO + H2S (2)
The low-Btu producer gas for seed reduction is obtained from coal by air-blown gasification. The H2S released in the second step may be readily converted to elemental sulfur by means of the Claus process, a commercially proven technique for cleaning sour gases.
Another promising recovery process is a variant of the Aqueous Carbonate Process (ACP), devised by Atomics International (3,4). This flue gas desulfurization (FGD) process has been predicated on the use of a scrubbing solution of sodium salts, and is presently in the pilot plant stage of development. Some modifications would be undoubtedly necessary to transform the regeneration subsystem of this process into one adapted to potassium salts. The relevant reactions are described by Equations (3) and (4).
K2S0^ + 2C - K2S + 2CO2 (3)
K^S + CO2 + H2O K2CO2 + H2S (4)
The altered ACP method initially involves direct carbon reduction, using coal or petroleum coke, of molten K„S0, to form K„S and to evolve gaseous C0„. The molten K„S from the first step is then quenched in water and carbonated to reform fresh K„CO„, together with the simultaneous production of H„S. KHCO^ is also formed in the carbonation sequence and must be converted to K C0_ by thermal decomposition. The sodium analogs of both these reactions take place in various chemical recovery cycles employed in the paper and pulp Industry. A major advantage of both recovery techniques is that the chemical processing steps are totally detached from the overall power plant, which would tend to simplify any maintenance problems.
A large body of literature exists on the general subject of the reactions of alkali sulfates, with various reducing agents to form sulfur-free end products, some of it dating to the eighteen fifties (5-8). In recent years, investigators at Atomics International have been active in this research (9,10). Workers at PERC have concentrated exclusively on elimination of sulfur from both a spent seed/fly ash extract collected from a pilot MHD combustor system and a simulated fly ash/seed mixture (11,12). The kinetics of reactions (1) and (2) have been explored in depth, and it has been established that under appropriate operating conditions (reduction at 750 C, regeneration at 500 C) these reactions can be carried out to a high degree of completion. There is some evidence that these reactions may possibly be combined into a single reaction. The system flow sheet, shown in Figure 1, consists of two parts, a seed recovery portion in which the spent seed is separated from the MHD fly ash, and a desulfurization portion In which a predetermined quantity of potassium sulfate is regenerated back to the carbonate. The leaching and evaporation operations employed to separate the residual fly ash from the collected spent seed makes desirable the utilization of a staged combustion system at the front end of the MHD plant. Otherwise, substantial MHD seed losses will occur in the slag leaving a single-stage combustor (13). Seed
248

Seed Loss From MHO Plant
Seed Ash . From MHD Clint
Solution Tink 100°C
Condensate
Ash Seed
l e s i d u e " "
llecycle Water For Solution
-S leam 115°C,25ps ig
F i l t e r
Potassium Salt Solution
Seed Mahe-Up
K2SO,
To MHD Combustor
38° C
K2SO,-K2CD3
Seed Sypass
K2SO4-K2CO3
D i f - C a s To Heat Recovery
Coolini Water
I Condenser
-Steam n 5 ° C , 2 5 p s i g
Condensate
Reducer D l l -Cas TPSit
Reduction
> •
"Reactor 7S0°C
Producer Cas
1449°C
9 p s i |
K2S.K2SO4,
K2CD3
Steam .
500°C
Regenerated
Seed 500°C
.. Regeneration^ ,
Reactor 500° C
Tai l Cas To MHD
Plant 122° C - • -
Spsig
Regenerator
D f l - C a s
C laus
Plant Air
25°C
Spsig
Sulfur
152°C
Coal
(3%S.411H2D.
10% Ash, 13.500
Btu / lb HV)
Air 538°C -
ISpsig
Figure 1 DESULFURIZATION SCHEME FOR COMBINED CYCLE MHD POWER PLANT BE 76 64 2
2 4 9

extraction experiments at PERC, using boiling water, revealed that potassium recoveries exceeding 99% were obtainable for a combustor slag rejection level of 95%. This accentuates the value of clean combustion in securing high seed recovery levels.
The major advantage of the PERC desulfurization system is that the MHD seeding compound Itself can tie up all the sulfur in the coal without the introduction of any foreign scrubbing compounds. The system is inherently more economic than conventional SO- scrubbing systems because one is treating a solid potassium salt rather than processing large volumes of combustion gas. Recent cost estimates place the capital cost of the PERC scheme in the neighborhood of $29/kW for a 1000 MW(e) MHD power plant, burning a 3% sulfur Pittsburgh high-volatile A bituminous coal, with S0„ emissions limited to the EPA standard of 1.2 lb S0„/10 Btu (14). A report prepared by a panel of experts formed under the auspices of the U. S. Department of Coiranerce concluded that a capital cost of $64-$119/kW would be incurred for S0„ control using existing technology under similar circumstances (lime/limestone scrubbing on Eastern coal) (15). Naturally, cost estimates of this nature are fraught with a considerable measure of uncertainty, depending on the assumptions of the particular investigators.
The question of potentially excessive energy consumption in the PERC scheme has evoked concern among researchers in the field. An analysis of these energy requirements was recently completed (14). For a Montana subbituminous coal containing 1.1 wt% sulfur, a 3.0 wt% sulfur Pittsburgh high-volatile A bituminous coal, and a 4.5 wt% sulfur Illinois #6 coal (dry basis), cycle efficiency penalties of 0.2, 1.2, and 2.1 points, respectively, were exacted to achieve SO, emissions limited to the required EPA standard of 1.2 lb S0„/10 Btu for a new coal-fired power plant. This trend is shown in Figure 2. It is presumed that the seed treatment system can be closely integrated into the MHD power plant, with the recovered energy from the seed processing operations being utilized in the larger MHD plant. These results compare favorably with energy consumption figures for conventional flue gas desulfurization control techniques, as indicated by Table 1 (16).
It appears that the energy consumed by throwaway FGD processes are less sensitive to variations in coal sulfur level than the PERC scheme. This is because the substantial quantities of electricity and steam which must be utilized to operate the scrubbing and stack gas reheat systems are not influenced by the sulfur level of the coal and remain fairly constant. These components are absent from an MHD power plant because of the self-contained nature of the SO removal system.
There are a number of unsolved problems in this area to which the next phase of engineering development must address itself. A small pilot plant should be built to study seed handling and treatment in an integrated, continuous fashion. The leaching-filtration operations must be analyzed with regard to preferred mode of operation and type of equipment desired. Existing industrial experience on the crystallization and evaporation of K SO, should be employed in dealing with the MHD seed-fly ash extract. Impurities such as other potassium compounds and trace metals may complicate these procedures. Fouling and corrosion of evaporative heat transfer surfaces may pose additional uncertainties. The reduction and regeneration reactors must be optimized with
250

3.5
3.0
E 3 2.5 -
z 5
2.0
o > o 5 1.5
1.0
13
US 0.5
SO2 y' SOn Emission Level: 1.2 Ib. V \ , Btu
SUBBITUMINOUS A
PITTSBURGH HIGH-VOLATILE A BITUMINOUS
MONTANA 'SUBBITUMINOUS C
NORTH DAKOTA LIGNITE
0 100 200 300 400 500
POUNDS SULFUR/106 BTU IN ENTERING COAL
Figure 2 Energy Consumed In Seed Regeneration Versus Type Of
Coal Employed
BE-76 179
TABLE 1 . DESULFURIZATION EFFICIENCY PENALTY » (1000 MWe, NEW PLANT, 3.5% SULFUR COAL - 90% SO REMOVAL)
Efficiency Penalty (Cycle Points)
Original Plant Efficiency
(%)
Throw-away Processes
Limestone Slurry Lime Slurry
(1.56) (1.39)
39.2 37.9
Recovery Processes
Magnesia Slurry Wellman-Lord Cat-Ox PERC MHD Aqueous Carbonate
(2.27) (4.31) 0.30 (1.72) (2.40)
39.2 39.2 39.2 50.0 37.9
251

regard to reactant conversion, residence time, and reactor dimensions. Seed feeding and transporting systems must also be tested and perfected.
Research in this area has been handicapped because of a lack of sufficient funding. Even though seed processing appears to be a rather mundane operation, the success of MHD as a viable method of advanced energy conversion is contingent on economic and efficient seed recovery and sulfur removal. The seed processing loop must be closed.
References
1. Bienstock, D., R. J. Demski, and J. J. Demeter. Environmental Aspects of MHD Power Generation. Presented at 1971 Intersociety Energy Conversion Engineering Conference, August 3-6, 1971, Boston, Massachusetts.
2. Bienstock, D., P. D. Bergman, J. M. Henry, R. J. Demski, J. J. Demeter, and K. D. Plants. Air Pollution Aspects of MHD Power Generation. Presented at 13tb Symposium Engineering Aspects of MHD. March 26-28, 1973, Stanford University, Stanford, California, VII.l.
3. Botts, W. V. and D. C. Gehri. Regenerative Aqueous Carbonate Process (ACP) for Utility and Industrial SO- Removal Applications. Preprint, Am. Chem. Soc. 164th National Meeting, Los Angeles, California, April, 1974.
4. Gehri, D. C. and R. D. Oldenkamp. Status and Economics of the Atomics International Aqueous Carbonate Flue Gas Desulfurization Process. Proceedings, Sjnnposium on Flue Gas Desulfurization, vol II, March, 1976, New Orleans, Louisiana, pp 787-816.
5. Meller, J. W. A Comprehensive Treatise on Inorganic and Theoretical Chemistry. The Alkali Metals. Volume II, Longmans, Green and Co., 1946, pp 672-720.
6. Budnikoff, P. P. and E. Shilov. J. Chem. Ind., 47, 1925, pp 111.
7. White, J. F. M. and A. H. White. Manufacture of Sodium Sulfide. Ind. Eng. Chem., vol 28, January, 1936, pp 244-6.
8. Nyman, C. J. and T. D. O'Brien. Catalytic Reduction of Sodium Sulfate. Ind. Eng. Chem., vol 39, August, 1947, pp 1019-21.
9. Oldenkamp, R. D. and E. D. Margolin. The Molten Carbonate Process for Sulfur Oxide Emissions, Chem. Engr. Prog., vol 65, November, 1969, pp 73.
10. Yosim, S. J., L. F. Grantham, D. E. McKenzie, and G. C. Stegmann. The Chemistry of the Molten Carbonate Process for SO- Removal From Stack Gases. Div. Fuel Chem. Preprint, Am. Chem. Soc. 164th Nat. Meeting, New York, NY, 1972, pp 98-104.
252

11. Feldmann, H. F., W. W. Simons, J. J. Gallagher, and D. Bienstock. Kinetics of Recovering Sulfur From the Spent Seed in an MHD Power Plant. Environmental Science and Technology, vol 4, 1970, pp 496-502.
12. Joubert, J. I., P. F. Mossbauer, T. C. Ruppel, and D. Bienstock. Kinetics of Regeneration of Spent Seed From MHD Power Generation System. Presented at 15th Sjnnposium Engineering Aspects of MHD, May 24-26, 1976, University of Pennsylvania, Philadelphia, Pa., VII.4.
13. Heywood, J. B. and G. J. Womack, Eds. Open-Cycle MHD Power Generation. Pergamon Press, London, 1969, 795 pp.
14. Bergman, P. D., W. Sawko, T. George, D. Gyorke, and D. Bienstock. Economic and Energy Considerations in MHD Seed Regeneration. To be presented at 16th Symposium Engineering Aspects of MHD, May 16-18, 1977, University of Pittsburgh, Pittsburgh, Pa.
15. Commerce Technical Advisory Board. Report on Sulfur Oxide Control Technology. PB-246 667, U. S. Department of Commerce, Washington, DC, September 10, 1975, pp 6.
16. McGlamery, G. G. and R. L. Torstick, et al. Detailed Cost Estimates for Advanced Effluent Desulfurization Processes. Prepared by Tennessee Valley Authority. EPA-600/2-75-006, Muscle Shoals, Alabama, January, 1975.
253

INVESTIGATION OF THE POTENTIAL OF ACID WASHING OF COAL ASH TO ENHANCE POTASSIUM RECOVERY IN A HIGH ASH CARRYOVER
DIRECT COAL-FIRED MHD SYSTEM*
L. Shen, K. Tempelmeyer, J. Brewer, and M. Beaton The University of Tennessee Space Institute
ABSTRACT
Results of weak acid washing of collected slag materials in a high ash carryover direct coal-fired MHD system to recover potassium seed are reported. This method is much more effective than water washing.
INTRODUCTION
Efficient recovery of seed material is an economic requirement in coal-fired MHD generator systems. Chemical analyses of various samples show the presence of a varying amount of potassium which apparently cannot be recovered by water washing. It is particularly critical In the case of slag chunk since only a small amount of potassium from the chunk is water soluble. In the present experiments, 15% to 30% of the collected potassium material is in the form of chunks. While this proportion will decrease as the system size increases, it may develop that the economic feasibility of K-seed recovery will center about removing it from the chunk-like pieces. It is expected that acid can dissolve portions of potassium compound which is water insoluble such that the overall solubility of slag materials will be Increased as will be the seed recovery efficiency. This work attempts to investigate the feasibility of enhancing potassium seed recovery efficiency by washing slag materials in dilute acid.
EXPERIMENTS AND DISCUSSION
Seed recovery tests have been carried out in the University of Tennessee Space Institute MHD Laboratory. The test leg which is in use at the present is schematically shown in Figure 1. Slag layers were removed at various locations of the system for some runs and the collected fine dust and chunklike pieces were removed from the cyclone and from the baghouse when it was in use after each run. The chunk-like material has about the same chemical composition as the sample removed from the walls at the MHD generator exit and at the radiant boiler exit. Consequently, it is believed that the chunk pieces collected by the cyclone were blown off the walls of the system upstream of the cyclone. The chunk material has a relatively low concentration of potassium and sulfur and is not very water soluble. The dust, on the other hand, is rich in potassium and sulfur and is highly water soluble.
Potassium recovery tests were carried out by washing slag materials collected from the bottom of the cyclone twice at room temperature for a total one hour in 200 cc dilute acid which was stirred occasionally. Slag material collected from the cyclone which is sieved through 50 mesh is referred to as dust and the remainder is called the "chunk". For most of the acid washing experiments, approximately 2 gm of H2S0^ was used to wash 10 gm of slag. It * Work supported by ERDA under Contract No. EX-76-C-01-1760
254

SlBulatcd Coabustor Generator ptffuser
f. —f~] Sampling
K^
j h l i r r ^ I I I ("Radiant Boiler"
Variable Length
Figure 1. Schematic of Test Leg
Cooler
\ /siag/See \ / Scparatli \_/ Cyc J on
ghouse or I
Scrubber
was found that the solubility of slag in acid did not depend on the concentration of acid used for washing; rather it depended on the amount of acid used in the test. It was also found that for a given amount of acid and a fixed total washing time, solubility was increased by merely 2% if slag was washed four times instead of once. Since K-SO, is readily soluble in water and the interest of this work is to study the solubility of slag materials in acid, all the results discussed in the report are the solubility of slag materials which are prewashed by water.
About 34.5% of the dust was soluble in water and the soluble substance was mainly K-SO, as shown by the EDX analysis (Figure 2a). Then, if the water-washed dust was next acid washed, 26% of the dust was found to be soluble in acid. The soluble substance from the water-washed dust had an appreciable amount of K in addition to A£, Si, Fe and S as shown in the (Figure 2b) EDX analysis. Part of the sulfur shown in Figure 2b was due to the H-SO, added. The overall solubility of dust after water washing plus acid washing was 51.5% which agreed well with the result if dust was directly washed by acid.
Figure 2a. Soluble Substance in Figure 2b. Water From Dust
Soluble Substance in Acid From Water-Washed Dust
255

Experiments were also carried out by washing slag materials at water boiling temperature in order to find the effect of temperature on solubility. Results showed that solubility did not depend on the temperature when experiments were conducted in water washing. However it was concluded that temperature had an adverse affect on solubility when acid was used. On the average, the solubility at boiling temperature was 1 to 6% lower than that at room temperature, depending on amount of acid used, source of slag and how often the solution was stirred. In most experiments, the solution was occasionally stirred during the course of test. If the solution was stirred constantly by a magnetic stirrer, the solubility could be 8 to 20% higher than that if the solution was only occasionally stirred, depending again on amount of acid used, source of slag and the temperature. The decrease of acid solubility at higher temperature is due to partial precipitation of SiO upon heating, leaving soluble potassium in the solution.
Figures 3 and 4 Illustrate that the solubility of dust and crushed chunk respectively from potassium sulfate or potassium carbonate seeded coal increase with increasing amount of acid used for washing. Slag materials from potassium carbonate seeded coal are slightly less soluble in dilute acid solution and become more soluble in concentrated acid solution than the slag materials from potassium sulfate seeded coal. The chunk was crushed to pass through 50 mesh sieve and 80% of the crushed chunk was of the size in the range of 75 p to 300 y. The size of particle is a determinant factor for the solubility as shown in Table I. Two batches of crushed chunk were made. The average particle size of one was about 25% smaller than that of other; consequently the solubility of the former was up to 50% greater than that of the latter. The results of the coarser are shown in Figure 4. The acid solubility was lower than the values shown in Figure 4 if the chunk was not crushed and washed for 24 hours.
Wt. ef Acid ,„„ Wt. of SJ.g * loo
-' ' " M mil
— Crunhed Chunk Materia)
100 Vt. of Slag X 100
Figure 3 Solubility of Dust with H2S0^ Acid Washing
Figure 4 Solubility of Crushed Chunk with H2SO, Acid Washing
256

Slag Type
Chunk with K-SO, Seed
I 4
Chunk with K2C0^ Seed
Wt. of Acid/Wt. of Slag
20% 56%
20% 56%
Particle Size (y) 150 to 300
8.13 13.50
4.90 14.17
75 to 150
10.21 16.42
9.10 17.17
44 to 75
17.82 23.12
17.62 28.20
<44
18.15 47.45
18.35 44.35
TABLE I EFFECT OF PARTICULATE SIZE OF GROUND CHUNK ON SOLUBILITY
10
.1
Hours
Another variable investigated was the washing time. In Figure 5, the solubilities of chunk from potassium carbonate seeded coal are plotted against washing time. The acid solubility increases with time and approaches a limit asymptotically. These results indicate that the chemical reaction is immediate and it is beneficial to grind the chunk in order to enhance the solubility. Solubility of dust and crushed chunk in acid were increased only by 3% when washing time was extended from 10 minutes to 6 hours.
Besides H2S0^, HNO , HCl, H2SO and other acids were also used to compare their effectiveness. Because of the difference in molecular weight and variation of the ionization constant for these acids [1], the solubility in each acid varied if same amount of acid was used in each case. However, if acid washings were carried out such that the amount of effective reducing hydrogen was maintained constant, then the solubilities were comparable among the first four acids (Table II). H SO- can be as effective as H„SO, to dissolve water insoluble slag materials, if more H_SO- is used due to the small value of ionization constant for HSO~.
Except for HF, the measured solubility is directly proportional to the ionization constant. The exceptionally low value for HF is believed to be due to the insolubility of certain fluorides (FeF-, FeF- for example. ) in water. Before the measured solubility increased with the amount of HF acid, it actually decreased to a minimum of nearly zero when the ratio of weight of acid to weight of slag was in the neighborhood of 20%. As more acid was added, these fluorides dissolved in acid; then the measured solubility increased.
The chemical analyses of a typical washed coal ash are given in Table III. The major portion of potassium in the flyash can be removed by water washing. However, acid washing following water washing further reduces the residual potassium content. There is no appreciable difference in the chemi-
Figure 5. Acid Solubility As A Function of Washing Time
257

cal composition of the washed dust in which one was treated by simple acid washing and the other was water washed, followed by acid washing. The chemical composition of slag chunk remains essentially unchanged after water washing. It does, however, change after acid washing (see Table III).
Acid
HCl
HNO^
H2S0^
H2SO3
H3PO,
HF
HCO H
CH2CO2H
Ionization Constant
K. 1
large
large
large
l.SxlO"'
7.5x10"-
6.7x10"'' -4
1.8x10
1.8x10"""
Slag with K2S0^ Seed
Wt. of Acid Wt. of Slag
14.73 %
25.39 %
20.28 %
33.81 %
40.74 %
8.22 %
19.17 %
24.74 %
Sol.%
26.22
25.98
25.23
24.39
15.55
1.22
12.79
4.70
Slag with K CO^ Seed
Wt. of Acid Wt. of Slag
15.66 %
26.23 %
20.89 %
33.57 %
41.45 %
20.21 %
24.83 %
Sol.%
20.63
23.77
22.46
19.63
8.70
11.55
2.91
TABLE II SOLUBILITY OF DUST FROM SULFATE AND CARBONATE SEED - RUN WASHED IN DIFFERENT ACID WITH SAME AMOUNT OF EFFECTIVE REDUCING HYDROGHJ
SPECIMEN
Unwashed Dust
Water Washed Dust
H SO, Washed Dust Following Water Washing
H-SO, Washed Dust 2 4
H-SO, Washed Dust 2 4
Unwashed Chunk
Water Washed Chunk
H„SO, Washed Crushed Chunk 2 4
K %
19.30
11.50
8.15
8.02
4.38
15.60
16.20
7.77
Fe %
5.88
8.36
10.51
9.56
8.85
9.42
9.19
5.94
S %
6.34
1.21
1.90
1.90
2.95
0.51
0.26
0.54
Al %
4.55
6.87
5.31
5.08
3.21
11.72
10.94
6.20
Si %
11.08
15.14
14.34
13.23
12.47
20.67
19.86
9.79
"•use 7 gm of H SO, TABLE III CHEMICAL ANALYSES OF SELECTED SPECIMENS
Besides K, there are other elements such as Al, Fe, and SI which are also soluble in acid. In order to use the recovered seed, it is necessary to remove the undesired elements. Experiments were conducted to investigate the possibility of precipitating AlJ) and SiO„ from the solution which contained all soluble substances. As expected, this can be accomplished by adding KOH, K2CO- or Ca(0H)2 to the solution. It was also found that most of the Si and some Al and Fe can be removed simply by filtering the precipitant from the solution without using any chemical. The soluble solution from acid washing was dried in an oven and the collected substance was crushed and water washed. About 12% of the collected substance was precipitant. The
258

precipitant was filtered out and it contained mostly Si and Fe. Most of the K still remained in the solution. Figures 6a to 6c present the EDX analyses of the soluble solution from acid washing, of precipitant and of the solution respectively. These results show this approach to be promising.
Figure 6a. Soluble Substance in Acid From Dust
Figure 6b. Precipitant Figure 6c. Soluble Substance After Precipitation
CONCLUDING REMARKS
Acid washing to recover potassium is found to be more effective than water washing, and seed recovery in coal-fired system of 95% and higher may be achievable. Most coals in this country contain between 0.5% and4% of sulfur which constitutes the prime pollutant in a coal-fired power plant. The acid needed to wash the slag materials for seed recovery is available in the power plant so that not only the sulfur pollution can be reduced also it is a vital part in the seed recovery process of an MHD system.
REFERENCE
[1] C. W. Keenan and J. H. Wood, General College Chemistry, Fourth Edition, Harper and Row Publishers.
259
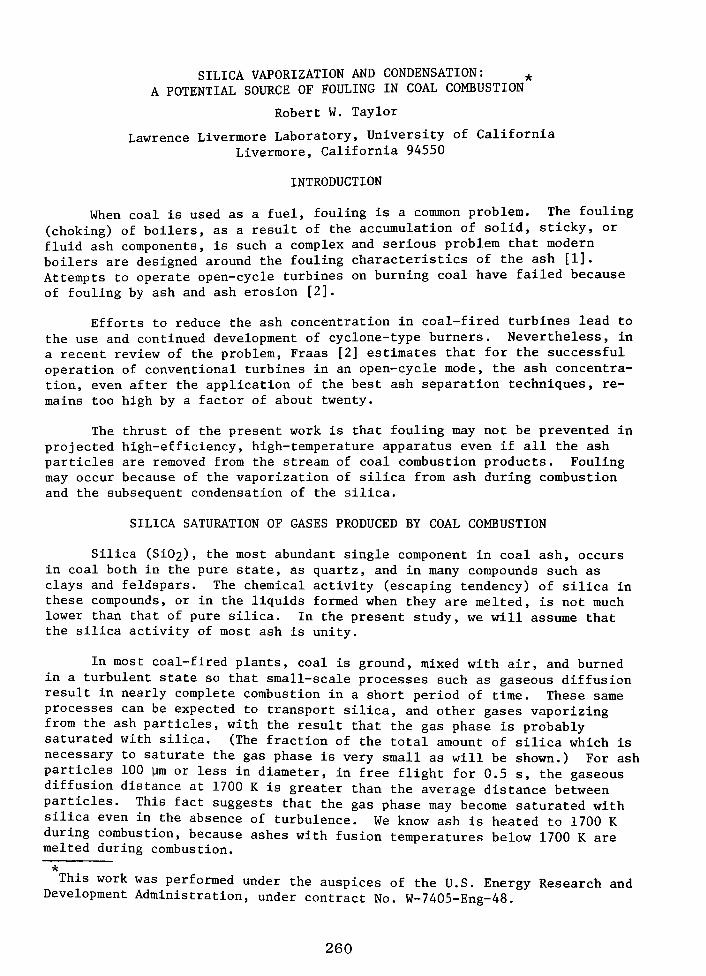
SILICA VAPORIZATION AND CONDENSATION: ^ A POTENTIAL SOURCE OF FOULING IN COAL COMBUSTION
Robert W. Taylor
Lawrence Livermore Laboratory, University of California Livermore, California 94550
INTRODUCTION
When coal is used as a fuel, fouling is a common problem. The fouling (choking) of boilers, as a result of the accumulation of solid, sticky, or fluid ash components, is such a complex and serious problem that modern boilers are designed around the fouling characteristics of the ash [1]. Attempts to operate open-cycle turbines on burning coal have failed because of fouling by ash and ash erosion [2].
Efforts to reduce the ash concentration in coal-fired turbines lead to the use and continued development of cyclone-type burners. Nevertheless, in a recent review of the problem, Fraas [2] estimates that for the successful operation of conventional turbines in an open-cycle mode, the ash concentration, even after the application of the best ash separation techniques, remains too high by a factor of about twenty.
The thrust of the present work is that fouling may not be prevented in projected high-efficiency, high-temperature apparatus even if all the ash particles are removed from the stream of coal combustion products. Fouling may occur because of the vaporization of silica from ash during combustion and the subsequent condensation of the silica.
SILICA SATURATION OF GASES PRODUCED BY COAL COMBUSTION
Silica (Si02), the most abundant single component in coal ash, occurs in coal both in the pure state, as quartz, and in many compounds such as clays and feldspars. The chemical activity (escaping tendency) of silica in these compounds, or in the liquids formed when they are melted, is not much lower than that of pure silica. In the present study, we will assume that the silica activity of most ash is unity.
In most coal-fired plants, coal is ground, mixed with air, and burned in a turbulent state so that small-scale processes such as gaseous diffusion result in nearly complete combustion in a short period of time. These same processes can be expected to transport silica, and other gases vaporizing from the ash particles, with the result that the gas phase is probably saturated with silica. (The fraction of the total amount of silica which is necessary to saturate the gas phase is very small as will be shown.) For ash particles 100 ym or less in diameter, in free flight for 0.5 s, the gaseous diffusion distance at 1700 K is greater than the average distance between particles. This fact suggests that the gas phase may become saturated with silica even in the absence of turbulence. We know ash is heated to 1700 K during combustion, because ashes with fusion temperatures below 1700 K are melted during combustion.
""* This work was performed under the auspices of the U.S. Energy Research and
Development Administration, under contract No. W-7405-Eng-48.
260

FACTORS AFFECTING THE AMOUNT OF SILICA VAPORIZED
The principal factors which fix the equilibrium vaporization of silica are the pressures of oxygen and steam.
I O V T (K"-^)
+j ta
cu s-(/> m cu S-Q.
ro Q.
Ol
o
-2
-4
-6
-8
10
8 7 6 5
1 1 ' / '
Steam (1 a t m ) / /
- / / -
- Carbon (a) /
/ Dry air (1 atm) (b)
/ , / 1 , 1 1200 1600
(K)
2000
Fig. 1. Partial pressure of gaseous species in equilibrium with pure silica, (Si02)s H' shown as a function of temperature and environment. When silica is heated in equilibrium with carbon (a), the principal silicon-bearing gas is SiO. When heated in air (b), the principal silicon-bearing gas is Si02, and the resulting partial pressure is much less than (a). When heated in steam at a pressure of 1 atm (dashed line), the principal gas is Si(OH)4.
The oxygen pressure is fixed by the air/coal ratio used in combustion. The steam pressure is fixed by the hydrogen content of the coal and, to a lesser extent, by the water content of the coal and the humidity of the air.
When heated in air, the vapor pressure of either silica or ash saturated with silica is very low, as shown in Fig. 1. The principal reaction is:
SiO„. g. = SiO-. . 2(s,£) 2(g) (1)
When silica is heated in a gas containing components such as C, CO, or H2, which have a strong demand for oxygen, a large amount of silica can get into the gas phase due to the formation of SiO(g) as follows:
SiO„. .. SiO, , 2(s,l) (g) + IO2 (2)
The equilibrium constant for this reaction is:
K^ = (pSiO)(p02)"'- /aSi02(g ^ , (3)
where p02 is the oxygen partial pressure. The assumption is made that ash is saturated with silica in which case the chemical activity of silica equals unity (aSiO^/ nN = 1), and
pSiO = K2(p02)""'"'' • (4)
In practice, the maximum range for p02 in combustion is between 0.2 atm, in air, and 10"^^ atm, the partial pressure of oxygen in equilibrium with carbon (graphite), at about 1070 K and a total pressure of 1 atm.
The amount of silica that can be transported by a gas saturated with carbon (soot-bearing) is a million-fold greater than the amount that can be transported by dry air at the same temperature (see Fig. 1).
261

A key question may be the amount of silica vaporized during combustion itself when the ash-forming minerals are in direct contact with coal. During this process, the gas phase next to the minerals is rich in CO and H2 which may enhance vaporization of the silica minerals in ash to SiO, ..
STEAM-INDUCED SILICA VAPORIZATION FROM ASH
In reviewing the thermodynamics of the silica-steam system, Krikorian [3] found Si(0H)4 to be the most abundant silicon-containing gaseous molecule at low steam pressures and under oxidizing conditions. The reaction can be written:
^^°2(s,il) + 2H2O = Si(OH)^(g^ , (5)
pSi(OH)^ = K^(aSi02) (pH20)^ . (6)
For equilibration of the gas phase with ash saturated with silica (aSiO_ = 1), then:
pSi(OH)^ = K^(pH20)^ . (7)
The equilibrium constant (K5) can be calculated from the Gibbs free-energy change, AG, for the reaction:
K = exp - AG/RT . (8)
The free-energy can be calculated from the enthalpy change for the reaction (AH°^o) ^nd from the free-energy function (-G-j; - HQ/T) , which are given in [3] and [4]. Figure 2 shows, for different partial pressures of steam, the partial pressure of Si(OH)4(g) as a function of temperature. The partial pressure of Si (OH) 4(g) in equilibrium with silica at 1 atm steam is shown as a function of temperature in Fig. 1.
SILICA CONDENSATION
As combustion-product gases travel through a turbine, both the total pressure and the temperature decrease. This results in a potential condensation of silica. As shown in Fig. 2, a pressure drop by a factor of 10 results in a drop in the Si (OH) 4 concentration by a factor of 100, and a drop in temperature from 1700 to 900 K, at the same pressure, results in a decrease in the Si(OH)4(g) concentration by a factor of ~10. Thus as combustion-product gases from coal pass through a turbine or heat exchanger, almost all the silica in the gas phase can condense.
POTENTIAL GROWTH RATE OF SILICA SCALE
The amount of silica necessary to saturate the gas phase in a coal-burning apparatus depends upon the coal-to-air ratio and the hydrogen content of the coal. We can estimate the growth rate of the silica layer if we know the gas flux through an apparatus and assume that all of the silica is deposited uniformly on the surface of the apparatus. For example, the accumulation of scale on the surface of a 200-MW turbine, with an inlet
262

800 1200 1600
Gas inlet temperature (K)
Fig. 3. Rate of growth of silica scale if all the vaporized silica is deposited in the turbines of a 200-MW, open-cycle plant operating for one year. Subbituminous coal fuel and a pressure of 9 atm are assumed. The planned inlet temperatures of about 1600 K will significantly increase efficiency over present-day, closed-cycle plants.
Fig. 2. Partial pressure of Si(OH)4 gas shown as a function of temperature and of the partial pressure of steam. Silica saturation is assumed.
temperature of 1623 K at 9 atm pressure and burning subbituminous coal in an air-rich mode, is estimated to be 2.7 cm per year as shown in Fig. 3.
CONCLUSIONS
The transport of silica from coal ash to the gas phase and then to the surfaces of heat exchangers or turbines can be a serious problem, particularly at the high temperatures projected for improved coal utilization. The problem is most severe in combustion at low oxygen pressures or high steam pressures.
The amount of silica that can be transported in the gas phase has been shown to depend upon the square of the steam pressure [3]. Thus, with respect to this vapor-transport mechanism, coals that contain little hydrogen (high-rank coals) should demonstrate the lowest fouling tendency.
The actual thickness of the silica layer on high-temperature equipment depends upon the fraction of the condensed silica which sticks. In this report, the estimate of the maximum average thickness of the silica layer is based on the assumption that all of the silica sticks and that the deposition is of uniform thickness. Neither of these assumptions is correct, but they
263

balance one another. Only a small fraction of the total amount of silica which condenses will stick, and it will probably tend to stick at only a few locations.
REFERENCES
1. Steam, Its Generation and Use, (Babcock and Wilcox Co., N.Y. , 1972) 38 ed., Chap. 15, p. 7.
2. A. P. Fraas, "Survey of Turbine Bucket Erosion, Deposits, and Corrosion," presented at Gas Turbine Conference and Products Show, Houston, Texas, March 1975 (Gas Turbine Division, Amer. Soc. of Mech. Eng.).
3. 0. H. Krikorian, "Thermodynamics of the Silica-Steam System," in 1970 Symposium on Engineering with Nuclear Explosives, Vol. I, p. 481-492, (available from National Technical Information Service, U.S. Dept. of Commerce, 5285 Port Royal Road, Springfield, Virginia 22151).
4. JANAF Thermochemical Tables, Dow Chemical Co., Thermal Research Laboratory, Midland, Mich. (1967 Data).
264

CORROSION OF POTENTIAL MHD PREHEATER MATERIALS IN LIQUID SLAG AND SLAG-SEED*
W. D. Canister, Jr., W. C. Seymour, and V. Griffiths Montana College of Mineral Science and Technology
Butte, Montana
ABSTRACT
Potential MHD air preheater refractory ceramic materials were tested as to their corrosion resistance by performing rotating rod corrosion tests in molten slag and slag-seed mixtures. Tests were conducted in air on cylindrical, one-half inch diameter specimens which were rotated at 25 rpm, and at temperatures between 1450°C and 1650°C. The maximum corrosion time was 168 hours. Two different compositions of synthetic coal slag containing SiO?, AI2O3, CaO, and Fe203 were employed. Up to 30 weight percent K2SO4 (18.8% K2O) was added as seed to both slags. Tests on a relatively high purity, polycrystalline and fully dense alumina revealed (a) that the slag which contained more CaO and less Si02 (the more basic slag) was more corrosive at 1550°C, and (b) that the amount of corrosion increased by about a factor of five in going from 1550°C to 1650°C. Specimen expansion instead of corrosion was observed for this alumina which was corroded in the acidic slag and 18.8% K2O. For both slags, the amount of corrosion first increased and then decreased with increasing K2O content; this may be due to a viscosity change, and/or formation of a new phase between the alumina and slag-seed constituents.
Several commercially available refractory materials were tested in the acidic slag containing 11.9% K2O at 1450°C. Of these, chrome-spinel and chrome-alumina were the most corrosion resistant, whereas magnesia-alumina spinels are most susceptible to corrosion.
I. INTRODUCTION
The viability of efficient MHD conversion of fossil fuel into electrical energy depends on finding materials which can withstand the severe environments and high temperatures. One component which has some rigid material requirements is the preheater which is used to preheat the air prior to combustion. The design which is proposed to be most efficient for this purpose is the regenerative type which is directly firedCT] and which uses coal as a fuel. The heat exchange medium will consist of a large tower of refractory bricks, and hot exhaust gases and air to be preheated alternately flow through the brick checkerwork. Preheat temperatures may reach as high as 1700°C, and the hot duct exhaust gases will contain slag particulates resulting from impurities in the coal, as well as a potassium salt seed which is added to increase the electrical conductivity of the plasma; this slag-seed at the temperatures of preheater operation is very corrosive to any material with which it comes in contact.
Several constraints are imposed on a material which can be used in the
*Th1s Research was sponsored by the Energy Research and Development Administration, Contract No. EF-77-C-01-2524, MERDI Subcontract No. 77-001
265

preheater; it must: tolerate this high temperature environment without excessive corrosion, withstand stresses which are introduced, and thermal shock because of temperature cycling, and it must be produced and fabricated economically.
This research was undertaken to simulate in a laboratory setting anticipated preheater corrosion conditions, to test high purity and dense refractory materials as to their resistance to corrosion by slags and slag-seeds, and to corrosion test commercially available refractory ceramics as to their potential for preheater use.
II. PROCEDURE
The simulated MHD preheater corrosion environment in this work is achieved by rotating a cylindrical refractory rod in a molten slag or slag-seed bath at a constant rate while maintaining isothermal conditions. The initial specimen diameter is h inch; it is immersed in the bath to a depth of about one inch, and rotated at an angular velocity of 25 rpm.
Two different slag compositions have been synthesized containing the four oxides Si02, AI2O3, CaO and Fe203. One is an acidic slag with a composition representing an average of these oxides found in a number of slags which are derived from U.S. coals. This slag is denoted as slag A, and its composition is shown in Table I, The other slag is more basic, with a composition typical of Montana coal slag. This slag is designated as slag B, and its composition is also presented in Table I. The potassium seed is added as K2SO4, and slag-seed compositions containing as much as 30 weight percent K2SO4 have been used for the corrosion tests.
Platinum-30% rhodium cylindrical crucibles are used to contain the slags and slag-seeds during the corrosion tests; they have an inside diameter of 1-3/4 inches. This particular platinum alloy withstands these corrosive environments in air and maintains its mechanical integrity at these elevated^ temperatures. All tests thus far have been conducted in air (at an elevation of 5500 feet) and between temperatures of 1450°C and 1650°C.
III. RESULTS AND DISCUSSION
After corrosion, some specimens exhibited exaggerated corrosion at the position corresponding to the slag-air interface; in fact, the duration of some corrosion runs was limited because the specimen "necked off" at this point during the experiment. Cooper and Kingery[2], testing stationary sapphire rods, observed this same effect in a molten Ca0-Al203-Si02 bath, which they suggested as being a result of natural convection. It is possible that natural convection effects are comparable to those resulting from forced convection because of rotation; or perhaps the oxygen in the air may influence the corrosion behavior at the slag-air interface.
A. Tests on Fully Dense Polycrystalline A1?0?
1. Slag A
A number of corrosion tests have been made on fully dense and polycrystalline aluminum oxide which contains less than 0.5 weight percent of impurities;
266

the average grain size of this material is approximately 16 microns. Figure 1 shows how time of exposure affects the percent of specimen thickness reduction, using slag A without K2SO4 added, and up to 30% weight percent K2SO4 (18.8% K2O), at 1550°C, and for times as long as 168 hours. Data was collected at other seed compositions which are not included; the behavior was generally the same as for the K2O concentrations shown. Thickness measurements were made away from the slag-line region and at 0.1 inch intervals; the data points are average values, whereas the error bars represent the computed standard deviations.
Several observations are worth noting. First of all, the thickness reduction did not consistently increase with time except for the 11.9% K2O tests. Specimens which were exposed to the slag-seed containing 18.8% K2O for 48 and 134 hours actually experienced some slight expansion. Moreover, seed concentration had no consistent effect on the amount of corrosion; the thickness reduction increased in going from slag to slag plus 11.9% seed, and then decreased at 18.8% K2O.
At this point in the investigation, we are not in a position to fully explain these results. The actual expansion of two of the 18.8% K2O specimens could conceivably be a result of the formation of a new phase at the surface of the corrosion specimen due to a reaction between the alumina and slag-seed constituents. A study[3] on the physical properties of alumina exposed to molten K2SO4 at 1300°C for extended periods (1000 hours) revealed substantial volume expansion (up to 12%); this was explained by the formation of a e-alumina outer layer by reaction between the K2SO4 and the a-alumina specimen. Preliminary x-ray analyses on the outer portions of the expanded specimens in Figure 1, have not revealed the presence of a 6-alumina phase, but some lattice parameter alteration has been observed.
The general increase in corrosion in going from no seed to 11.9% K2O, and then the subsequent decrease at 18.8% K2O, may be a result of both the influence of K2O on the viscosity of the slag-seed, and the possible formation of a new solid phase near the specimen surface, as explained in the preceding paragraph. The viscosity of the slag-seed influences the boundary-layer thickness of the slag in contact with the rotating specimen; the boundary layer acts as a diffusion barrier to corrosion. Increasing the viscosity increases the thickness of the boundary layer, thus slowing any reactions between the slag-seed constituents and the rotating specimen. In addition, greater viscosity may reduce the mobility of slag species. It has been observed that some comparable coal slags exhibit a maximum in viscosity with approximately 15 weight percent K2O added[4].
2. Slag B
Figure 2 shows the corrosion-time dependence of this fully dense and high purity polycrystalline alumina when exposed to the more basic slag B with KpO additions ranging up to 18.8%. Tests were conducted at both 1550°C and 1650°C, and one data point is included for slag A. For slag B and slag-seed at 1550°C, thickness reduction increased with time for all seed compositions, which was not always the case for tests in slag A (Figure 1). Nor did any of the specimens expand when tested in slag B.
From this data it is evident that slag B is more corrosive than slag A at
267

1550°C. Corrosion times were much shorter for these tests, because of the increased rate of attack. The thickness reduction in slag B increased dramatically when the temperature was raised from 1550°C to 1650°C. Although no tests were made at 1550°C using 5.7% K2O, it is estimated that the rate of corrosion was Increased by about a factor of five when the temperature increased to 1650°C.
Furthermore, the dependence of corrosion on seed content in slag B was generally the same as it was for slag A; i.e., corrosion increased as seed was added to the slag up to 8.7% K2O, but it showed a subsequent and substantial decrease at 18.8%. The possible reasons for this behavior have already been explained.
B. Tests on Commercial Refractories
A number of commercially available refractory materials have been tested to determine their resistance to corrosion by slag A with 11.9% K2O (20% K2SO4). Specimen geometry was as described previously. Tests were made at K S C C , since, in general, the resistance to corrosion was less than that of the dense alumina. Material types include chrome-spinel, chrome-alumina, magnesia-chrome, alumina, and alumina-magnesia spinel. The chrome-spinel and chrome-alumina were highly resistant to corrosion in this particular slag-seed; in fact, tests made at 1550°C have shown it to withstand corrosion better than the dense alumina. The alumina and magnesia-chrome corroded a moderate amount at 1450°C, whereas, the magnesia-alumina spinels were highly susceptible to corrosion.
A comparison of the intrinsic properties of these materials is not possible because of the presence of impurities, porosity, and grain boundaries, all of which probably influence the corrosion behavior.
IV. CONCLUSIONS
Laboratory simulation of MHD preheater slag and slag-seed corrosion conditions by means of rotating rod corrosion tests on refractory ceramics, in air, and using K2SO4 seed, have led to the following conclusions:
1) The amount of corrosion on a dense and polycrystalline alumina is dependent on the slag composition of slag-seed mixtures. For two slags containing the same four constituents (Si02, AI2O3, CaO, and Fe203), the one which is more basic (contains more CaO and less Si02) corrodes this material more rapidly at 1550°C.
2) For the more basic slag, the corrosion rate is increased by about a factor of five in going from 1550°C to 1650°C.
3) For both slags, corrosion rate appears initially to increase as K2O content increases up to 9% or 12%, after which corrosion rate decreases as the K2O concentration is increased to 18,8 weight percent. This may be due to a change in slag viscosity with an attendant alteration in the slag-seed boundary layer thickness, and/or formation of a new phase at the surface of the alumina by reaction with slag-seed constituents.
4) Some alumina specimens experienced an expansion of dimensions rather
268

than a reduction due to corrosion when exposed to the more acidic slag which contained 18.8% K2O.
5) Of several commercial materials tested in the more acid slag containing 11.9% K2O at 1450°C, chrome-spinel and chrome-alumina appear to be the most corrosion resistant, while magnesia-alumina spinels are most susceptible to corrosion.
"
"
"
-
0
0
•
A SLAQ, 0 % K2O
A SLAa, I I . S X K2O
A SLAQ,l8.a% K2O
^ ^ ^ * \ ^ ^
1 I " •-
f
- ^
— 1 1 1 r r - 1 r •
1 ^
^ ^ ^
"
•
0 — .
^ BO 100 120
CORROSION TIME (HOURS)
Figure 1. Corrosion versus time data for polycrystalline alumina corroded at 1550°C in slag A and slag-seeds. CORROSION TIME (HOURS)
Table I . Compositions of Two Slags Used in This Invest igat ion
Component
SiOo AI2O3 CaO Fe203
Composition Slag A (Wt %)
55 25 10 10
Composition Slag B (Wt %)
45 25 25
5
Figure 2. Percent thickness reduction versus time for dense and polycrystalline alumina specimens which were corroded at 1550°C and 1650°C in slag B with various seed compositions, and unseeded slag A at 1550°C.
REFERENCES
1. N. N. Ault, "Product Definition and Processing for MHD Preheater Materials", Proceedings of NSF-OCR Engineering Workshop on MHD Materials, 20-22 November 1974, Massachusetts Institute of Technology, pp. 241-252.
2. A. R. Cooper, Jr., and W. D. Kingery, "Dissolution in Ceramic Systems: I-Molecular Diffusion, Natural Convection, and Forced Convection Studies of Sapphire Dissolution in Calcium Aluminum Silicate", J. Am. Ceram. Soc, 47 [1] 37-43, 1964
3. S. Korenaga, S. Kose, M. Iwasa, K. Takura, and M. Furukawa, "Physical and Chemical Properties of AI2O3 Ceramics Treated in Molten K2SO4 for a Long Period", Yogyo-Kyokai-Shi, 84_ [4] 38-46, 1976.
4. W. Capps, National Bureau of Standards, Washington, D, C , Private Communication.
269

THERMAL SHOCK BEHAVIOR OF MAGNESIA CHROMITE CERAMIC EXPOSED TO COAL SLAGt A. Kumnick and W. Beezhold Montana State University
Bozeman, Montana
INTRODUCTION
Corhart*RFG (RFG), a fused-grain magnesia chromite ceramic, has been selected as the bed material for initial heat exchanger experiments at Montana State University (MSU). The MSU heat exchanger, of the packed bed regenerative type, operates at temperatures as high as 1875 K, and will be used to determine the effects of slag deposition on air preheaters in coal-fired MHD systems [1]. The selection of RFG was based primarily on recent Fluidyne Engineering Corporation [2] test results in which RFG exhibited excellent high temperature strength and corrosion resistance to slag and potassium seed attack. Subsequent slag and seed corrosion tests by Callister [3] have verified Fluidyne's corrosion results. However, detailed data concerning the effects of slag on the physical properties of RFG are not available. The purpose of this paper is to present new results on the thermal shock behavior of RFG ceramic with and without high temperature exposure to coal slag. Using a modulus of rupture (MOR) test, our results indicate that the loss of strength for unexposed ceramic depends on the thermal cycling history and that exposure to slag produces additional loss of strength for all cases examined.
RFG CHARACTERIZATION
The chemical analysis of RFG by weight percent (as supplied by the manufacturer) is: 55-56% MgO, 20% Cr203, 8.0% AI2O3, 11.0% FeO, 2.5% SiOp, 0.5% CaO, 0.3% F„, and 1.5% TiO,. Our x-ray diffraction results, using a powdered sample ground to pass a 300 mesh sieve, suggest the presence of at least three phases. The major two include MgO (periclase) and a spinel with a probable formula of the type (Mg, Fe)0 • (Al, Cr, Fe)„0-. The third phase has not been conclusively identified. The microstructure Of "as received" RFG is similar to that reported by Kingery et al [4] for chrome-magnesite brick in which five phases are identified. The five include MgO (periclase) and an (Mg,Fe)0 • (Al, Cr, ^e)r.O^ type spinel as major components, while MgFeoO-(magnesioferrite), MgCaSiO. (monticellite), and Mg„SiO-(fosterite) are'^mTnor constituents. ^ ^ 4
The grain size of RFG, as shown in Fig. 1, is variable and, as in the case of most fusion cast products, generally large. On the basis of Kingery et al [4] the light angular grains are spinel while the rounded ones are periclase with a magnesioferrite precipitate. The \jery dark areas are porosity The presence of monticellite or fosterite is not clearly evident with 48 percent HF etch us^d to enhance the structure. The bulk density was determined
1 Jl V^ .W"!" ,^°? Ib/ff'), in good agreement with the manufacturer^ value of 3.27 x 10" kg/m" (204 Ib/ff^).
The absorption of slag by RFG was investigated by room temperature density measurements on impregnated and unimpregnated specimens by weighing in air and water. The density of unimpregnated material was determined before and after water penetration so the apparent porosity could be measured.
270

The density of slag impregnated material was determined without water penetration. The exclusion of water was insured by a thin coating of beeswax applied after specimens were oven dried. The density of unimpregnated material without water absorption was 3.32 + .1 x 10 kg/m in good agreement with the previously mentioned bulk density. With water absorption the same material exhibited a density of 3.85 i .2 x 10" kg/m . The 16% difference between these two values is a measure of the apparent porosity of RFG and agrees well with the manufacturer^ value of 14%. The density of slag impregnated material was found to be 3.53 j 0.1 x 10 kg/m , indicating that slag is not filling all of the available porosity. It is possible, although unlikely, that slag leaves the material between the time of removal from the liquid slag and cooling to where flow is impossible.
RESULTS
The room temperature modulus of rupture (MOR) was determined in three points bending over a span of 57 mm with a crosshead speed of 0.64 mm/min. Samples were prepared by core drilling RFG brick; these right cylinders were approximately 16.8 mm in diameter and 74.3 mm long. Slag impregnation was done by immersion in melted Rosebud fly ash which represents a typical Montana coal. The ash composition in weight percent was 40.34% SiO^, 24.6% AUO-, 18.9% CaO, 5.8% MgO, 4.4% FegOg, 0.53% KpO, 0.46% Na^O, anfl 0.28% SO-T " The slag always appeared to completely penetrate the RFG samples in a time less than the 45 minute immersion time.
Seven thermal and/or slag treatments were performed on different groups of specimens followed by density determination and MOR testing. The various treatments were intended to isolate strictly thermal shock effects from thermal shock coupled with slag effects. These treatments were as follows:
1. As received, no additional treatment. 2. Slowly heated to 1723 K, held 45 min, slowly cooled to room
temperature (heating and cooling rate : 150 K/hr). 3. Slowly heated to 1723 K, held 45 min, air cooled. 4. Rapidly heated to 1723 K, held 45 min, slowly cooled to
room temperature, (heating rate ; 3200 K/hr). 5. Rapidly heated to 1723 K, held 45 min, air cooled. 6. Slowly heated to 1723 K, slag impregnated for 45 min, air
cooled. 7. Rapidly heated to 1723 K, slag impregnated for 45 min, air
cooled.
The average MOR of 15.6 MPa (2.27 x 10" psi) for "as received" material agrees well with the manufacturer's value of 17.2 MPa (2.5 x 10 psi). As shown in Fig. 2, thermal shock treatments (2) through (5) cause average MOR reductions ranging from 25 to 60 percent. The presence of thermal shock and slag, treatments (6) and (7), causes a further MOR reduction of about a factor of two over (2) through (5). The overall reductions of (6) and (7) compared with "as received" material are 78 percent and 90 percent respectively.
DISCUSSION
Our measured decrease in MOR due to thermal shock can be compared directly with that in other materials, if two conditions are satisfied. First, the thermal cycles should be similar and second, the materials should exhibit
271

Figure 1. Corhart RFG microstructure. 48% HF etch. (500x)
15
O
a.
a> 3 'cL 3
DC I • 4 -
o M
•a o
(I)
(2)
(3)
(\) As received
(2) Slowly heated, slowly cooled
(3) Slowly heated, air cooled
(4) Rapidly heated, slowly cooled
(5) Rapidly heated, air cooled
(6) Slowly heated, slag, air cool
(7) Rapidly heated, slag, air cool
(4)
(5)
(6)
1
2,20
1.45 CO Q.
w O
0.72
(7)
Figure 2. Modulus of rupture (MOR) results for various thermal cycles,
272

Jinuiirimuuiiiuiuiiiriwtwiiiiwuuiir,: .
Figure 3. Fractured as cut sample (left). Slag impregnated sample after fracture (center). As cut sample (right).
273

%
(a) (b)
(c)
Figure 4. Scanning electron microscope view of fracture surfaces, (a) as cut (400x); (b) heat rapidly, air cool (480x); (c) heat slowly, slag impregnate, air cool (450X).
274

similar thermal shock parameters. Of the many thermal shock parameters which have been proposed, [5] the one expressed in Equation 1 is useful for our experimental conditions.
R... = - ^ — ^ (1) S,2 (1 - V)
where S. = tensile strength, v = Poisson's ratio, and E = modulus of elasticity. ^
In the case of RFG where S^ =-,17.2 MPa, v = 0.2, and E = 1.1 x 10^ MPa, the value of R" ' is 4.7 x 10"^Pa"'.
Nakayama [6] has tested a Chamotte brick with R'" = 6.0 x 10"^Pa" in thermal shock by radiation heating, and observed a 50 to 70 percent MOR reduction for temperature differences comparable with this work. Room temperature specimens were placed in a furnace, allowed to equilibrate, and cooled in the annealing powder sil-o-cell. Tha above treatment is intermediate between cases (4) and (5) in Fig. 2 for which 25 and 60% reductions in MOR respectively were observed. More complete correlation with other results requires uses of additional thermal shock resistance parameters [£]; these, however, require knowledge of the surface fracture energy which, as yet, has not been measured.
The detailed mechanism of the additional factor of 2 in MOR reduction by slag penetration is not clear. The appearance of the fracture surfaces for slag-impregnated and slagless samples is wery different to the unaided eye, as may be seen in Fig. 3. However, at higher magnification under a scanning electron microscope (SEM), no clear distinction in the fracture surfaces is observed, as shown in Fig. 4. Therefore, the fracture surface differences, if present, are subtle. The density measurements suggest that the fracture process is not simply related to a filling of voids by slag and subsequent crack nucleation associated with thermal expansion differences on cooling.
REFERENCES
[1] MSU/MHD Energy and Research Office, Annual Report # MSU/MHD-76-ARI, Task E, Montana State University, Bozeman, MT, September, 1976.
2] R. Smith, Private Communication. '3] W. Canister, Private Communication. ^4] W.D. Kingery, H.K. Bowen, and D.R. Uhlmann, "Introduction to Ceramics",
Second Edition, p. 542, 546, John Wiley and Sons, Inc., New York, 1976. [5] D.P.H. Hasselman, Bull. Am. Ceram. Soc, 4i (12) 1033-37, 1970. [6] J. Nakayama, "Fracture Mechanics of Ceramics: Vol. 2 Microstructure
Materials and Applications," Ed. R.C. Bradt, D.P.H. Hasselman, and F.F. Lange (New York Plenum Press, 1973), pp. 759-78.
4-Work performed under MERDI Subcontract Number 77-002 and ERDA Contract Number EF-77-C-01-2524.
*A registered trademark.
275

MOLYBDENUM STABILITY IN COAL SLAGS
Kenton B. Wright and Arthur E. Morris Department of Metallurgical Engineering
University of Missouri-Rolla Rolla, MO 65401
INTRODUCTION
The operation of a practical MHD generator requires that a number of important materials problems be solved. The development of a stable electrode is one of the more difficult of the problems to be solved. Recent publications have summarized the criteria for stability of candidate electrode materials in MHD generators [l-4]. Both ceramic and metal electrode materials have been proposed.
Metal electrodes have certain advantages, such as good electrical and thermal conductivity, ease of power takeoff, and resistance to thermal shock. The most commonly mentioned drawback to the use of refractory metals is their relatively poor oxidation resistance. Molybdenum, for example, foirms non-protective volatile oxides when exposed to gases having oxygen pressures above about 10~5 atm at temperatures in the vicinity of 1400°C, as shown in Fig. 1.
For coal-fired MHD systems, the electrodes are expected to be covered by a layer of molten slag, or slag-seed mixture. The stability of a metal electrode covered with slag will therefore not be nearly so affected by the oxygen pressure in the gas as an uncovered electrode. The factors that influence metal or compound stability in MHD slag/seed/gas environments have been discussed in recent publications [2,3]. Because no metal or ceramic is expected to be thermodynamically stable in such an environment, the kinetic factors are of greatest interest in determining the relative stabilities of candidate materials.
STABILITY CRITERIA FOR MOLYBDENUM IN SLAGS
ThermodjTiamlc calculations are useful in identifying materials which are relatively more stable than others, in order to select those materials which have the least tendency to react in the environment. Kinetic considerations are useful in identifying the corrosion mechanism and the rate-controlling step, so that external variables can be manipulated to give the lowest possible rate of corrosion.
Thermodynamic Considerations
The thermodynamic data on molybdenum oxides has been summarized by Gulbransen [5], and plotted in Fig. 1. The results show that at 1400°C, M0O2 is the only stable solid oxide up to an oxygen pressure of about 10~3 atm. However, the sum of the partial pressures of the volatile monomer and trimer trioxides reaches about 1 atm when the oxygen pressure is about 10"^ atm. Thus any molybdenum oxide that dissolves in the slag, and makes its way to the
276
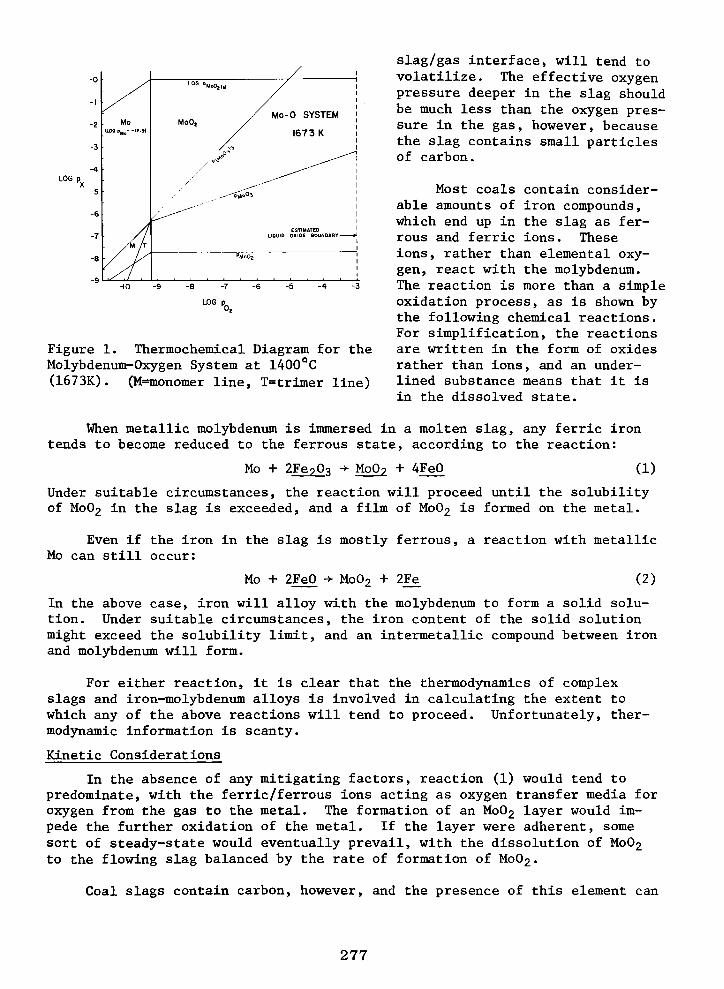
LOG p
LJOG P
Figure 1. Thermochemical Diagram for the Molybdenum-Oxygen System at 1400''C (1673K). (M=monomer line, T=trimer line)
slag/gas interface, will tend to volatilize. The effective oxygen pressure deeper in the slag should be much less than the oxygen pressure in the gas, however, because the slag contains small particles of carbon.
Most coals contain considerable amounts of iron compounds, vrtiich end up in the slag as ferrous and ferric ions. These ions, rather than elemental oxygen, react with the molybdenum. The reaction is more than a simple oxidation process, as is shown by the following chemical reactions. For simplification, the reactions are written in the form of oxides rather than ions, and an underlined substance means that it is in the dissolved state.
When metallic molybdenum is immersed in a molten slag, any ferric iron tends to become reduced to the ferrous state, according to the reaction:
Mo + 2Fe?03 -> MoO? -I- 4Fe0 (1)
Under suitable circumstances, the reaction will proceed vintil the solubility of M0O2 in the slag is exceeded, and a film of M0O2 is formed on the metal.
Even if the iron in the slag is mostly ferrous, a reaction with metallic Mo can still occur:
Mo + 2Fe0 -> M0O2 + 2Fe (2)
In the above case, iron will alloy with the molybdenum to form a solid solution. Under suitable circumstances, the iron content of the solid solution might exceed the solubility limit, and an intermetallic compound between iron and molybdenum will form.
For either reaction, it is clear that the theirmodynamics of complex slags and iron-molybdenum alloys is involved in calculating the extent to which any of the above reactions will tend to proceed. Unfortunately, ther-modjmamic information is scanty.
Kinetic Considerations
In the absence of any mitigating factors, reaction (1) would tend to predominate, with the ferric/ferrous ions acting as oxygen transfer media for oxygen from the gas to the metal. The formation of an M0O2 layer would impede the further oxidation of the metal. If the layer were adherent, some sort of steady-state would eventually prevail, with the dissolution of M0O2 to the flowing slag balanced by the rate of formation of M0O2.
Coal slags contain carbon, however, and the presence of this element can
277

change the above considerations significantly. On account of the powerful reducing effect of carbon, the slags in the vicinity of each carbon particle should be practically free of ferric iron, and if enough carbon was present, some metallic iron could form. The kinetics of molybdenum corrosion in a djmamic system are thus expected to be very complex, with many factors influencing the overall rate.
MOLYBDENUM-SLAG REACTIONS
At least a dozen variables can be listed which might be important in the overall rate of corrosion of molybdenum in a slag. Only experimental work can determine which are actually important. The purpose of our experimental work was to examine the effect of some of these variables on molybdenum corrosion, and to obtain basic data on the solubility of M0O2 in a typical coal slag, and to examine the nature of any reaction films formed on the metal.
Preliminary Work
The effect of slag composition and carbon additions to the slag was studied first, in order to give an idea of the nature of the slags, experimental techniques necessary, and to give an indication of what type of studies should be performed in detail. Synthetic and actual slags were used, and the temperature was fixed at 1400°C.
A vertical controlled-atmosphere tube furnace was found to be suitable for establishing a controlled atmosphere over the slag. High-purity alumina crucibles showed only a small reaction with most slags, and 1.3 mm diam. molybdenum wire was a convenient sample. All tests were static.
As expected, the corrosion of the wire was greatest in slags highest in iron. Increased oxygen content of the furnace atmosphere increased the corrosion of the wire, and the effect of oxygen pressure was greatest for the high-iron slags. The presence of carbon in the slags decreased the amount of corrosion. Metallographic examination showed one or more reaction products at the slag/metal interface; a subsurface reaction layer was present in the molybdenum when larger amounts of carbon were added.
The higher corrosiveness of slags high in iron oxides is probably explained by the effect of silica on destabilizing the ferrous iron [6,7], and on the lower solubility of MoOj in higher-silica slags [8]. For slags having a silica content of about 50%, molybdenum was virtually unaffected after 4 hr under an atmosphere of pure nitrogen.
Based on the preliminary experiments, a more systematic study was undertaken to examine the nature of the corrosion process in more detail. The objectives of the follow-up study were:
1. Determine the solubility of M0O2 in slag. 2. Determine the nature and extent of reaction products at the slag/
metal Interface.
3. Determine the iron content of the molybdenum wire. 4. Determine the effect of oxygen pressure, KzSOi seed, and time on the
above objectives.
278

Follow-up Work
All experiments were carried out at 1400 C in a controlled-atmosphere tube furnace, using high-purity alumina crucibles, which were 15 mm diameter and 25 mm tall. Slag was obtained from the Union Electric Company Sioux cyclone boiler ("bottom slag"). The oxygen pressure was controlled by CO/CO2 gas mixtures, or CO2/O2 mixtures for higher oxygen pressures. Runs were carried out for time periods up to 24 hr. All tests were static. After each run, the sample was sectioned by diamond saw, and mounted and polished for metallographic and microprobe analysis. Samples of slag were also analyzed for various elements by atomic absorption and conventional wet chemical techniques.
Starting Materials. The bottom slag from the Sioux cyclone burner analyzed 50% Si02, 20% AI2O3, 17% FeO, 7% CaO, 1% MgO, 0.3% S, and 2% alkali elements. The as-received slag was remelted in an iron crucible to give a homogeneous liquid, and then poured into cold steel molds. The flyash from the same boiler had about the same composition, but contained about 2% carbon as opposed to the 0.06% carbon of the bottom slag.
The molybdenum samples were 1.3 mm wire, which contained approximately 0.3% Fe as the major impurity. M0O2 was prepared by mixing Mo and M0O3 powders in stoichiometric proportions, and heating to llOO'C in a sealed and evacuated silica capsule. The M0O2 product was checked by x-ray diffraction and gravimetric analysis.
MoO? Solubility Experiments. Finely ground M0O2 and pulverized slag were mixed in various proportions and equilibrated in CO/CO2 mixtures with 45% CO2 (oxygen pressure = 10~8-8 atm). The Union Electric slag saturated at about 1.1% M0O2. The solubility increases with increasing oxygen pressure, the exact extent of which has yet to be determined.
Reaction Product at Slag/Metal Interface. A variety of short (4-6 hr) and long (16 or more hr) runs were performed, over a range of oxygen pressure from 10~11 to 10-3.1 atm. On the shorter rims, the reaction layer was relatively thin (1 - 2pm), and the appearance seemed to be relatively independent of oxygen pressure. Longer runs gave a more well-defined and thicker film, especially at the higher oxygen pressure.
Fig. 2 shows a microprobe trace for iron and molybdenum across the slag/ metal interface at an oxygen pressure of 10"•'--'• in the gas. The layer is less than 5 pm thick. Iron has diffused into the molybdenxim, and molybdenum has diffused into the slag. The molybdenum content of the slag is about 1.3%, which is higher than the 0.8% Mo obtained from the M0O2 solubility measurements .
Microprobe analysis of the reaction layer shows it to be M0O2, with about 11% Fe (the same iron content as the slag). The photomicrograph shows the layer to be poorly adherent, and with irregularly shaped particles.
Fig. 3 shows the microprobe trace for iron and molybdenum across the slag/metal interface at an oxygen pressure of IQ-^-l atm. In comparison to the data in Fig. 2, the wire has corroded much more, the reaction layer is thicker, and the molybdenum in the slag is higher. In addition, the wire
279

shows much less iron. The photomicrograph shows the reaction layer well-locked with the underlying molybdenum. Microprobe analysis showed the layer to be M0O2, with less than 1% iron.
• ? REACTION ZONE
WT, %
14
12
10
e
6
4
z
UNSEEDED SLAG
1400° C, 16 HOURS
7 % CO2 - pg . 10""
-~
F.
(
ORIGINAL !^ WIRE SURFACE
L 40 32 24 16 e 0 8 16 24 32
DISTANCE FROM SURFACE ( |lM)
Figure 2. Microprobe Scan and Photomicrograph of Slag/Metal Interface. Unseeded Slag, Oxygen Pressure = lO-H atm. Magnification 1250X.
10
WT % 8
6
UNSEEDED SLAG
1400 ° C , 16 HOURS
1 % COj - p . lo"
40 32 24 16 8 0 8 16 24 32
DISTANCE FROM SURFACE ( ||M 1
Figure 3. Microprobe Scan and Photomicrograph of Slag/Metal Interface. Unseeded Slag, Oxygen Pressure = 10-3-1 atm. Magnification 1250X.
Effect of Seeded Slag. All seeded slag experiments were performed with the Union Electric slag, with 10% K2S0^ added in powder form. In many cases, the seeded slag tended to climb out of the crucible, and so long-time runs with thicker slag layers were difficult.
The solubility of M0O2 was increased in the seeded slag to 4% Mo (at the same oxygen pressure as was used in the unseeded solubility experiments). Photomicrographs of the seeded solubility sample showed M0O2 particles in the slag that had dissolved and reprecipitated as a result of thermal
280

ratcheting, so the value of 4% is believed to be very reliable as a saturation concentration.
The slag/metal interface was examined at low oxygen pressures (10~H atm) and the results are shown in Fig. 4. The reaction layer shows irregularly spaced particles, with a much greater recession of the wire than in the corresponding conditions for unseeded slag. The iron content of the molybdenum wire approaches 8% at the wire surface, which is close to the iron saturation value from the phase diagram. The reaction product could not be clearly identified in this run. The molybdenum content of the slag is high for a greater distance away from the interface than in the absence of seed.
The slag/metal interface was examined after a run at high (10-^.1 atm) oxygen pressures, and the results are shown in Fig. 5. The reaction layer is similar to the unseeded high oxygen case, but thinner. The reaction layer is M0O2. The Moly concentration in the slag of 4% is in good agreement with the solubility measurements. The iron content of the molybdenum wire is the lowest of all experiments.
-SLAO «*DBEACTIOH PRODUCTS
40 32 24 16 8 0 8 16 24 32
DISTANCE FROM SURFACE ( |lM )
12
10
WT. % 8
6
- ^ REACTION ZONE
SEEDED SLAG
1400 "C , 10 HOURS
4 0 32 24 16 8 0 8 16 24 32 40
DISTANCE FROM SURFACE ( p M )
Figure 4. Microprobe Scan of Slag/ Figure 5. Microprobe Scan of Slag/ Metal Interface. 10% K2SQ^Seed Added, Metal Interface. 10% K2SO4 Seed Oxygen Pressure = IQ-H atm. Added, Oxygen Pressure = 10" • atm.
DISCUSSION OF RESULTS AND CONCLUSIONS
Under the experimental conditions used for this study, molybdenum reacts with the slag to form a more or less adherent film or reaction layer, and some iron from the slag diffuses into the molybdenum. Under oxidizing conditions, and probably under reducing conditions, the film formed is M0O2. In a high silica slag (at low oxygen pressures) the Mo solubility is about 1%, and increases with increasing oxygen pressure. In a slag seeded with 10% K2S0^ the reaction rates and molybdenum solubility are increased.
In some preliminary experiments, the extent of molybdenum corrosion under oxidizing conditions was decreased by the presence of carbon in the slag.
281

However, excess carbon precipitated iron, which then alloyed with the molybdenum. Slags high in silica and low in iron were found to exhibit a much less corrosive effect on molybdenum than slags higher in iron, and lower in silica.
The results of the work to date indicate that if the oxygen potential at the slag/metal interface can be kept low, the corrosion of molybdenum is minimal. Control of the oxygen pressure might be achieved by control of the amount of unburned carbon that is contained in the slag. The presence of seed in the slag increases the corrosion of molybdenum as compared to the unseeded condition, so that greatest stability would occur if the seed concentration at the slag/metal interface was kept low. The iron content of the molybdenum increases with decreasing oxygen pressure, but no evidence of any intermetallic compound formation was observed in the results to date.
REFERENCES
1. Bates, J. L., "Properties of Molten Coal Slags Relating to Open Cycle MHD", Final Report BNWL-B-466, Dec. 1975.
2. Rossing, B., Westinghouse Research Lab., private communication. Information compiled for ECAS report under sponsorship of NASA and ERDA.
3. Bowen, H. K. et al., "Chemical Stability and Degradation of MHD Electrodes", 14th Symposium on Engineering Aspects of MHD, U. of Tenn. Space Inst., Tullahoma, Tenn., April 1974, p. IV.1.1.
4. Schneider, S. J., et al., "High Temperature MHD Materials", Interim Report NBSIR 74-543, OCR-14-32-0001-1230, August 1974.
5. Gulbransen, E. A., "Thermochemistry and the Oxidation of Refractory Metals at High Temperature", Corrosion, Jan. 1970, Vol. 26, no. 1, pp. 19-28.
6. Muan, A., "Phase Equilibria in the System FeO-Fe203-SiOo". Trans. AIME 1955, Vol. 203, pp. 965-976.
7. Timucin, M. and A. E. Morris, "Phase Equilibria and Thermodynamic Studies in the System CaO-FeO-Fe203-Si02", Met. Trans., 1970, Vol. 1, pp. 3193-3201.
8. Thome, J. K. et al., "Partition Coefficient of Molybdenum in the Fe-Mo-Si-0 System", Met. Trans., 1970, Vol. 1, pp. 2125-2132.
282

LOW TEMPERATURE MATRIX IR AND EPR SPECTROSCOPIC STUDIES OF REACTIONS INTERMEDIATE IN REACTIONS OF ALKALI METAL ATOMS
WITH H2O, CO, C2H2, C2H^ AND COl,
R. H. Hauge and J. L. Margrave Rice University, Chemistry Department
Houston, Texas 77001
In systems which are undergoing rapid temperature changes such as occur in MHD power generation,[1] one must consider whether chemical equilibrium is established. Obviously an understanding of reaction mechanisms and rates is a necessity. Flame studies have provided important reaction rate data for the alkali metals [2]; however, high temperature studies do not in general provide insight into the nature of the reaction intermediates. Low temperature matrix studies [3] of high temperature reactions provide an opportunity to study reaction intermediates since most reactions carried out at high temperature possess sufficient activation energy so as to prevent anything but simple association at low temperature. Knowledge of reaction intermediate structures and stabilities permits the prediction of reaction rate temperature dependence and aids in the prediction of unmeasured reaction rates from measured rates.
Two important reactions of potassium in MHD systems concern its ionization and reaction with H„0. It is possible that combustion gases play a catalytic role in the ionization of potassium as indicated by the following reactions:
M + i" -> M"'"A~ ^ M'''A + e
M'^'A M"^ + A
Ionization occurs by transfer into molecular orbitals of A from which it leaves. This allows for a more gradual change in potential energy of the electron in comparison to direct ionization processes. Thus ionization cross sections for collisions of a hot molecule of A with an alkali metal atom might vary as a function of the ability of A to accept an electron from an alkali atom and the stability of the charge transfer complex. Charge transfer seems to be dependent on the presence of low lying molecular excited states. The stability of the complex would depend on the electron affinity of A. The amount of structural change occuring in A when it accepts the electron will also influence the probability of transfer. Less structural change should result in more probable electron transfer. Finally, increased density of electronic, vibrational, and rotational states of A, i.e. polyatomic species and transition metal molecular species, should increase the role of A in ionization processes.
283

A number of combustion gas components complexed with alkali metals are listed in Table I.
1
Bonding Changes
with
lABLE I
in A when
an Alkali Metal
Complexed
Atom
X
s CO
NO
% SiO
CO,
NO2
SO2
^2^2
S«4
A(^5)
1827
2140
1876
1555
1230
2350
1618
1362
3290
3090
M"' •A"(\5)(cm"-'-)
1780
1600
1350
1100
1000
1600
1244
1042
2900
2370
%A\5
2
25
28
29
19
32
23
23
12
23
X(a)
180
134
120
Aa
-46
-19
-10
Ref.
4
5
6
7
5
8
9
10
5
5
Their frequency shifts and bond angle changes indicate the effect of electron transfer to A. In all cases essentially complete electron transfer is indicated by comparison of measured frequencies to known anion values of A and by the loss of alkali nuclear spin splitting of the unpaired electron in EPR studies of the complex.
Thus all of the gases listed could play a catalytic role in ionization. Those with the more positive electron affinities (e.v.)[ll] such as, C (3.5), N02(2.3), SO (1.0) should be more effective per collision. The smaller bond angle change of SO should also enhance its effectiveness.
The complex of an alkali metal atom and water is interesting in that H2O has little electron affinity and no low lying molecular orbitals; thus complete charge transfer is not expected. Also the complex may undergo further reaction to form the hydroxide and a hydrogen atom if additional energy is provided. The minimum energy required is obtained from bond energy differences as follows:
284

Li + H2O
Na + H2O
K + H2O
M + H O
^ LiOH + H + 15 kcal/mole
-> NaOH + H + 37 kcal/mole
^ KOH + H + 33 kcal/mole
^ M -'.OH -
EPR spectra of the mono-water and di-water complexes of lithium are shown in Figure 1.
J M^-lm ».. :.A/uMtmi^
3/2
^Li (H^O)^
N * ^ Vi^|k«Nu«i«iw>tMiMMWi mm/*
\ \ + H O
Ar Matrix
h25 0e-
^'^ h\ (H2OI -1/2 -3/2
3/2 1/2 -1/2 -3/2
1/2 -1/2
H (Oe)
Figure 1
EPR Spectra of Lithium-water Complexes
Analysis of lithium and hydrogen nuclear hyperfine splitting clearly shows a reduction 34% and 60% in lithium 2s orbital character of the unpair electron for mono-water and di-water complexes respectively. Hydrogen nuclear split-, ting indicates the hydrogens to be equivalent in both complexes. The loss in .2s orbital character is taken as a measure of charge transfer to water.
285
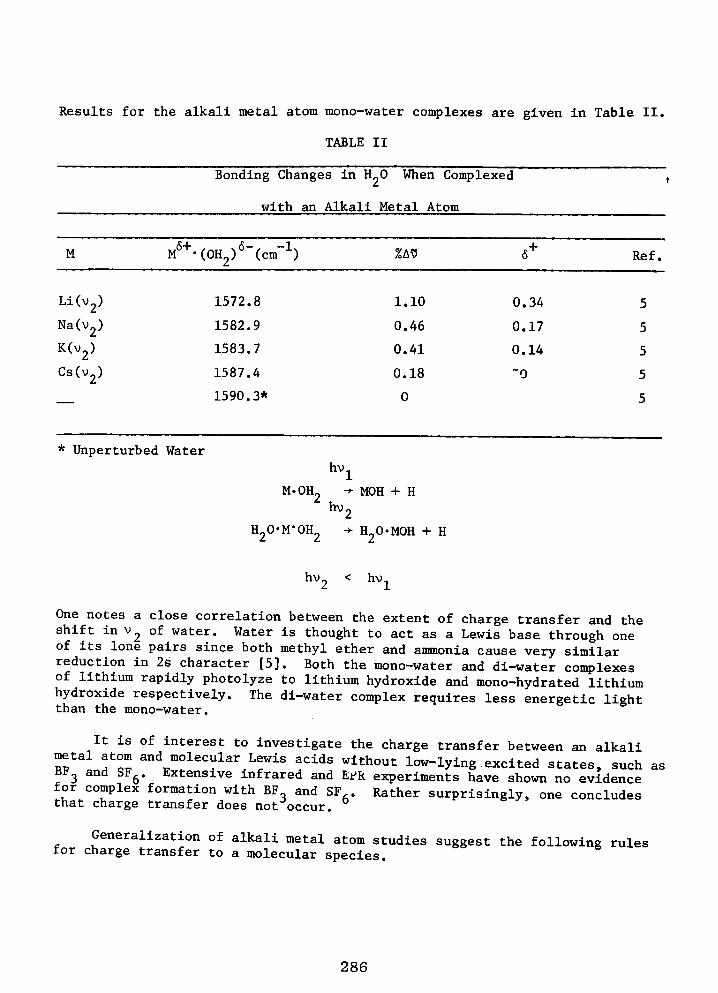
Results for the alkali metal atom mono-water complexes are given in Table II.
TABLE II
Bonding Change
with an
>s in E^O When Complexed
Alkali Metal Atom
1
M
Li(v2)
Na(v2)
K(V2)
Cs(v2)
—
* Unperturbed
M " -(0H2)' "(cm~ )
1572.8
1582.9
1583.7
1587.4
1590.3*
Water
M.OH_
hv^
-f- MOH
%A^
1.10
0.46
0.41
0.18
0
+ H
6^
0.34
0.17
0.14
~0
Ref.
5
5
5
5
5
hv2
H20'M-0H2 -> H20'M0H + H
hV2 < hv.
One notes a close correlation between the extent of charge transfer and the shift in V2 of water. Water is thought to act as a Lewis base through one of its lone pairs since both methyl ether and ammonia cause very similar reduction in 2s character [5]. Both the mono-water and di-water complexes of lithium rapidly photolyze to lithium hydroxide and mono-hydrated lithium hydroxide respectively. The di-water complex requires less energetic light than the mono-water.
It is of interest to investigate the charge transfer between an alkali ITLTZ ^"'^/°l^'=f^^Lewis acids without low-lying excited states, such as BF3 and SFg. Extensive infrared and EfR experiments have shown no evidence for complex formation with BF and SF Rather surprisingly, one concludes that charge transfer does not occur.
Generalization of alkali metal atom studies suggest the following rules for charge transfer to a molecular species.
286
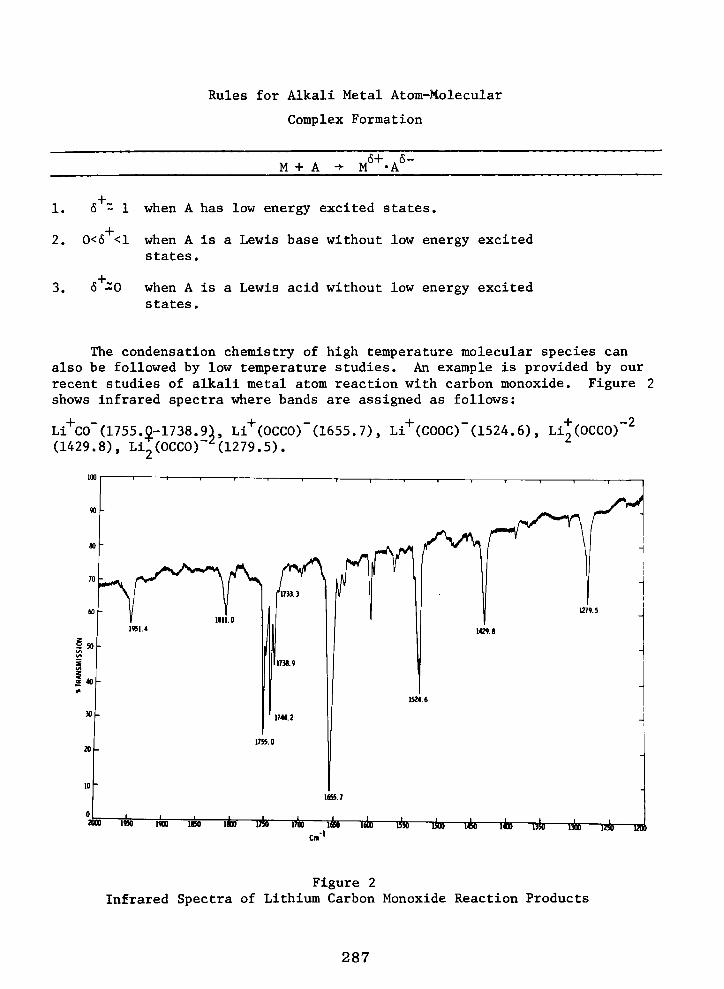
Rules for Alkali Metal Atom-Molecular
Complex Formation
M + A M 'A
1. c.+~ 1 when A has low energy excited states,
2. 0<6 <1 when A is a Lewis base without low energy excited states.
3. 6-0 when A is a Lewis acid without low energy excited states.
The condensation chemistry of high temperature molecular species can also be followed by low temperature studies. An example is provided by our recent studies of alkali metal atom reaction with carbon monoxide. Figure 2 shows infrared spectra where bands are assigned as follows:
Li"'"C0"(1755.0-1738.9), Li'*"(0CC0)"(1655. 7) , Li''"(C00C)"(1524.6) , Li2(0CC0)~^ (1429.8), Li2(0CC0)~^(1279.5).
^ i w i w ieo i4e i/so iJm i s lili! \ia liog—i^o i^gg—BJB n l n — n i r "TJBb
Figure 2 Infrared Spectra of Lithium Carbon Monoxide Reaction Products
287

If the matrix is annealed,all species rapidly convert to the stable salt Li„ (0CC0)~ . The rapid reaction at low temperatures (20K)indicates the CO anion is a very reactive species. The above salt and analogous salts of the other alkali metals can be obtained as stable room temperature solids.
Similarly,co-condensation reactions with C0„ leads to oxalate salts at room temperature.
The condensation chemistry of potassium is likely to occur primarily through potassium hydroxide since it is the most abundant potassium molecular species at high temperature. Also as the temperature drops rapid reaction of potassium atoms with abimdant water will create additional potassium hydroxide. It would appear very useful to study co-condensation mechanisms of KOH with CO, CO-, SO-, NO, NO etc. individually and as mixtures where competitive reaction rates are evident.
This work has been supported by the National Science Foundation and the Robert A. Welch Foundation. Liquid helium was obtained with the aid of a grant from the U.S. Office of Naval Research.
REFERENCE
1. A.B. Haywood and G.J. Womack. ed. "Open-Cycle Magnetohydrodynamic Power Generation," Pergamon, Oxford (1969).
2. J.W. Hastie "High Temperature Vapors," Academic Press, N.Y. (1975).
3. R.H. Hauge, J.W. Hastie, J. L. Margrave, "Matrix Isolation Spectroscopy" in Spectroscopy in Inorganic Chemistry, J.R. Ferraro and CN. Rao, eds.. Academic Press, 57 (1970)
4. L.E. Brus and V.E. Bondybey J. Chem. Phys. 63, 3123 (1975).
5. R.H. Hauge and J.L. Margrave unpublished data.
6. D.E. Tevault and J. Andrews J. Phys Chem. 77, 1646 (1973).
7. L. Andrews J. Chem. Phys. 50, 4288 (1969).
8. M.E. Jacox and D.E. Milligan Chem. Phys. Letters, 28, 163(1974).
9. D.E. Milligan and M.E. Jacox J. Chem. Phys. 55, 3404(1971)
10. D.E. Milligan and M.E. Jacox J. Chem. Phys. 55, 1003(1971).
11. J.L. Franklin and P.W. Harland Ann. Rev. Phys Chem. 25, 485(1974)
288

^^i^^WH

_^
yvP^^^^^

THE FIRST 20 YEARS OF MHD DEVELOPMENT*
Arthur Kantrowitz, Chairman Avco Everett Research Laboratory, Inc.
Everett, Massachusetts
It is now 19 years since Richard Rosa, working at the Avco Everett Research Laboratory, first produced an operable MHD generator. This generator produced 10 KW for 10 seconds. If generators of that size had commercial uses, MHD power would have been a reality long since. The problem has been that no efficient MHD generator has ever been designed for very low power. To be efficient, the power generated must be large compared to the heat lost to the walls. The result is that only large scale MHD generators (for commercial fuels, hundreds or thousands of MW) have commercial potential. It was demonstrated (Mk V, 32 MW for one minute) some 13 years ago that it was indeed possible to produce large powers with MHD generators if one did not simultaneously face the problems inherent in long durations. Recent American experience, (Mk VI, 200 KW for 95 hours) shows that for long durations we can also produce power under the conditions (i.e., 1 amp/cm^ electrode current, electric field strengths of 1.25 KV/meter in the presence of coal slag which will be present with coal combustion) which are expected in a commercial plant. However, it is necessary to scale this power output up by a factor of several thousand before we reach commercial scale. If, for example, we were to do this in cautious steps of a factor of 5 (the scaleup to the CDIF) we would need 5 such steps to reach commercial scale, and if each such step took 6 years, and if these steps could not proceed concurrently, the achievement of hundreds of MW would take 30 years. This analysis makes it clear that it will be absolutely necessary to take bold, courageous steps in order to develop MHD in a timely way. Academician Sheindlin, the High Temperature Institute, and the Soviet people as a whole are to be commended on the magnificent courage they showed in taking the bold steps needed to develop MHD. I am sure everyone in a world faced with limited fossil fuel supplies will be grateful for these courageous steps. In June of 1964 a Soviet delegation led by the late Academician Mlllionshekov visited Cambridge, Massachusetts and asked to see the Mk V generator. This permission was granted and we like to think that it helped in making the courageous Soviet decision to proceed with the U-25. What has happened to the American program since 1959?
The history is remarkably like the biblical parable about the seven lean years and the seven fat years. During the seven fat years (Fig. 1) we were able to follow up on the first successful MHD generator with a 1500 KW and finally the 32,000 BCW short duration generators, together with some success with very low power for up to 200 hours. Other important achievements also followed out of this program, such as the stabilized superconducting coil and electrostatic precipitation of seed, etc. In these years, the MHD program was largely privately financed and was led very courageously by Philip Sporn who was then Chairman and President of
This talk, which is essentially identical to that given at the Conference, was presented at the World Electrotechnical Congress (Moscow, June 1977).
289

MHD DEVELOPMENT HISTORY 5 0 - 1
cn o 40-
cn oc <
to CO o
LJ O
1° O UL - I O UJ
UJ ?
3 0 -
LEGEND:
ACTUAL
O- O CORRECTED FOR INFLATION
• _ • 1966 PILOT PLANT PROPOSAL
20-
< —
? - lo
ss 68224
Fig. 1. Descriptions of each of these achievements are to be found in the list of references which are arranged in chronological order.

American Electric Power Company. During these years we were able to demonstrate that MHD generators could, with development, be made to achieve their designed power. Thus, the physics of MHD plasmas have been amply confirmed. A number of milestones were set by the utility companies sponsoring this project. We were required to demonstrate that we could build large scale superconducting magnets, that we could recover seed economically, that with the concept we were using we could replenish electrodes as needed, and finally that the predicted economics could show promise for MHD. At that time the fuel prices used for economic calculations were 25c: per million BTU (that price, as everyone knows, is just part of the good old days). We ended up with a prediction that MHD power with the initial designs, which hopefully could achieve 50% efficiency, would be about 10% more expensive than conventional power. The utility companies were persuaded to proceed because they saw great potential for improving the economics of MHD. This was a very far sighted policy and in many ways it matched the courage shown by our Soviet colleagues. These seven vigorous years culminated in a proposal to build a pilot plant which was estimated by the American Electric Power Company to produce 30 MW for months of duration and to cost 30 million 1966 dollars. For a time it looked as though this proposal would be approved and the U.S. Government would contribute 1/3 of the cost. Unfortunately, these funds were not forthcoming. Following this decision not to fund this pilot plant in 1966, American MHD declined to a holding effort for seven lean years. This lean period was brought to an end by the interest of Senator Mike Mansfield in efficiently utilizing the enormous coal reserves of his home state of Montana. His influence was crucial in starting a new MHD program.
At the present time, it is my position that American MHD program needs to start a pilot plant before it can make advances comparable with the great advances that have been made by the Soviet Union. Lacking such a program, we have undertaken a profusion of academic research programs which would be much more exciting if they related to an American MHD pilot plant. It is my hope that our energy needs will spur the courage necessary for this important action. Because of the magnificent success of our Soviet colleagues, it will now take much less courage than it would have for us to start a pilot plant in 1966, as was originally proposed.
Hope has been raised that the United States will undertake an accelerated program that will lead to an early pilot plant. In a recent appearance before the U. S. Congress, Dr. Robert Fri, Acting Administrator of the U. S. Energy Research and Development Administration (ERDA), and Dr. Philip White, Assistant Administrator for Fossil Energy, expressed the desirability of going ahead with the Engineering Test Facility and asked the Congress for the funds needed to undertake a development program that will make MHD commercially available in the early 1990's. The Congress will make its decision during the summer months and we are hopeful that with its anticipated support and the enthusiasm of Dr. Fri and Dr. White the United States will have an Engineering Test Facility within the next several years.
291

REFERENCES
For Fig. 1
1. "An Experimental MHD Power Generator", Rosa, R. J., J. Appl. Phys., 31: 735-736 (April 1960) also AERL Research Laboratory Rept. AMP 42, January 1960.
2. 3rd Annual Report (1963) of the MHD Generator Development Program (AERL).
3. 6th Annual Report (1966) - MHD Generator Development Program (AERL).
4. 5th Annual Report (1965) of the MHD Generator Development Program (AERL).
5. "Performance of a Self Excited MHD Generator", Mattsson, Ducharme, et al. Research Report 238, Contract AF 33 (615)-1862, October 1965.
6. 6th Annual Report (1966) of the MHD Generator Development Program (AERL) Appendix A of this report.
7. Sixth Annual Report of the MHD Generator Development Program, 1966, AERL arid AEP Service Co.
8. "Research Studies and the Development of MHD Generators and Accelerators", Teno, Brogan, Petty, et al. Final Report Contract AF 40 (600)-1043, October 1969.
9. "Control Techniques for Nitrogen Oxides in MHD Power Plants", Hals, F. and Lewis, P. F., ASME Paper 72-WA/Ener-5.
Same Paper in 12th Symposium on Engineering Aspects of MHD, ANL March 27-29, 1972, attached to AERL March 1972 Monthly Progress Report, Experimental MHD Power Plant Development Program, for MHD Power Plant Steering Committee.
10. "Air Pollution Aspects of MHD Power Generation", Bienstock, D., Bergman, P. D., et al. Paper VII, 1, Proceedings of the 13th Symposium, Engineering Aspects of MHD, Stanford University, March 1973.
11. "Progress in Development of Auxiliary MHD Power Plant Components at Avco Everett Research Laboratory, Inc,", Hals, F. A., Becker, F. E., Gannon, R. E., Stelnle, H. F., Stickler, D. B. and Kivel, B., ASME Paper 74-WA/ Ener-6.
12. "On Direct Coal Fired MHD Generator", Wu, Dicks, et al. Paper 1.2, Proceedings of the 14th Sysmposium, Engineering Aspects of MHD, UTSI, Tullahoma, April 1974.
13. Report on Mark VI 100 Hour Duration Test Petty, Solbes, Enos, Morenski, US-USSR Colloquium on MHD Power Generation, Moscow USSR, October 1976. Also, "Progress on the Mark VI Long Duration MHD Generator", Petty, Solbes, Enos, Dunton, Paper IV. 5., Proceedings of the 15th Symposium, Engineering Aspects of MHD, Philadelphia, May 1976.
292

SUMMARY
The conference served to identify many of the problems encountered in open-cycle, combustion-fired MHD generators and some of the contributions which basic science can make to the solutions. One of the more difficult objectives was to expose active research not directly applicable to the MHD system, but indirectly related to it through potentially usable techniques and scientific understandings. Another objective was to expose to the scientific community the crucial areas which limit the operational lives of current open-cycle, combustion-fired MHD generators. The achievement of these objectives require communication between the engineering and scientific communities and coordination between and within each group.
Much of the effort related to the basic sciences appears to be fragmented. Aside from the unifying influence of those doing the modeling, there seems to be little evidence of an overall guiding influence which continually assesses the crucial directions and gives a semblance of the longer range planning. In a sense, this area is left neglected between the highly directed engineering effort and the efforts in the purer sciences. On the basis of the number ('v. 200) and interests of the participants, we believe that some lines of communication between these two groups have been initiated. Problems of communications are always severe the first time an interaction is undertaken among engineers, plasma scientists, and materials scientists, all with different technical backgrounds. Hence it may take more than one meeting of this type to overcome the differences in vocabulary and in focus of scientific interest and to develop a mutual appreciation of each other's points of view and of the contribution each can make to the solution of problems with an ultimate impact on society. Communication should improve steadily if there are iterations of this effort at intervals of a year or so.
In the first session, an overview of the status of the MHD generator was presented. Among the presentations, was a short, narrated film on the Soviet generating unit which provided a vivid frame of reference for promoting the exchange of ideas during the meeting. The diversity of subjects treated by the papers in sessions that followed served to illustrate the issue central to the conference, namely, that the development of coal-fired MHD generators as a viable part of the energy technology requires the assistance of fundamental research in diverse areas.
Efficient power generation requires that the MHD plasma maintain a high conductivity. The conductivity is proportional to the density and mobility of electrons. Both of these quantities, determined by electronic, ionic, and molecular processes, were the central theme of discussion in two of the sessions.
There is a paucity of information on the nature of MHD plasmas and the fundamental energy transfer processes occurring therein. Even diagnostics to monitor events in the plasma need further development despite the fact that some of the presentations were received very well and were highlights of the conference. Admittedly, the plasma is a complex mixture of particles, ions, atoms and molecules, but the need for understanding its role in MHD power generation is essential. Reliable measurements on its behavior must
293

be made. The presence of magnetic and electric fields will make the analysis formidable but it appears partially tractable. Ultimately, the nature and mobility of charge carriers must be followed by delineating their interaction with the molten slag. The influence of the boundary layer needs considerable attention.
There seems to be much activity directed toward modeling and estimating concentrations, conductivity, and particulate effects in the gas-plasma but often they are based on inadequate data. One illustration of the difficulties encountered in predicting species concentration and conductivity is the question concerning the stability of AIO2. With regard to the inadequate data, perhaps more emphasis is needed on semi-empirical procedures. Although these procedures are not as elegant as molecular orbital calculations, they might be more reliable, especially for polyatomic species. By using the best of the concepts and results of atomic and molecular theories together with systematic empirical correlations, one might improve that the reliability of estimated thermochemical quantities.
Under temperatures and pressures expected for the MHD plasma, the reactions among gaseous species are rapid, and one usually assumes that the electron density is determined by local thermodynamic equilibria among all the species. However, an examination of possible chemical kinetic effects would be useful. Deviations from the equilibria may occur where concentration and temperature gradients are steep, e.g., in the boundary layer near the duct walls or in shock waves. One kind of thermodynamic equilibrium (a limiting case) would have the photon spectrum be the black-body spectrum at the thermodynamically defined temperature, but with departures from equilibrium one should establish whether the photon spectrum departs from equilibrium while the compositional equilibrium is maintained, or whether the electron energy spectrum departs substantially from thermodynamic equilibrium while the compositional equilibrium is maintained. Thus, interests should focus on identifying circumstances where non-equilibrium effects may cause significant deviations from the model of local thermodynamic equilibrium at places such as near surfaces or other strong gradients, in cool regions where reaction rates are slow, or in connection with processes like the growth of particles where full equilibrium may not be attained. In addition, the discussions should recognize that interactions among the particles are mediated not only by collisions with the gas or with each other, but also by radiative transport. The influence of radiation between the highly emissive particles on the maintenance of equilibrium or deviations from it needs to be examined.
Some of the molecular properties used in the thermodynamic calculations are well known, but certainly not all of them. Quantum-chemical calculations can fill gaps in our knowledge for species not readily amenable to experimental or empirical study. In addition, there are two principal sources of uncertainty, which may imply a possible reduction of the electron density. First, electron capture by particulates and slag is a matter of some concern. Although the principles for estimating the magnitude of this effects are known, the current uncertainty of a crucial parameter, the effective work function of the slag, prevents a firm prediction. (This topic exemplifies
294

connections of molecular physics with material sciences not adequately emphasized in the Conference). Second, equally damaging to the conductivity would be the capture of an appreciable fraction of electrons by gaseous species resulting in negative ions. Therefore, the energetics of molecular negative ions is important; knowledge in this area is expanding rapidly owing to powerful experimental techniques including use of tunable dye lasers. In this connection, it should be noted that while some species that might occur in the MHD plasma have large electron affinities, these generally are comparatively large polyatomics that will be relatively unstable (because of entropy effects) at MHD temperatures. Thus, information on energetics must be supplemented by other thermodynamic data to determine stability.
The knowledge of the electron mobility, in contrast, is very far from established. The connection of the electron mobility with microscopic molecular properties such as electron-collision cross-sections is complex, and our current knowledge of those cross sections is incomplete. Probably the most important of the cross-section data concern highly polar molecules such as H2O and KOH. Four of the papers presented represent the major lines of attack on challenging problems in this area. The different approaches discussed in these papers are complementary to each other with respect to their ranges of applicability and to the insight they offer.
In spite of various qualifications, the Conference certainly stimulated many molecular scientists to think about the application of their work to specific questions connected with the basic plasma properties pertinent to the MHD power generation. With the full record of the Conference at hand, it may be desirable to formulate a comprehensive program for future basic work necessary for MHD technology. It is doubtful that many scientists have a thorough conceptualization of all the practical plasma problems in MHD in terms of the fundamental processes. However, a carefully selected group knowledgeable on separate problems could be brought together to identify and place into some priority the problems capable of solution with research in atomic and molecular sciences. Such a gathering should be encouraged to provide a summary usable as a guide for future research in this area.
Materials are crucial to the commercial success of MHD generators. Feasible power generation requires that the electrode-insulator assembly withstand the erosive reactions of arcing and the corrosive reactions of the slag, or that these reactions be minimized. The gradients in the boundary layer promote arcing and the high temperatures promote mutual solubilities. The use of high temperature ceramic electrodes minimizes energy losses but accelerates the chemical and structural degradation; lower temperature metallic electrodes show the opposite effects. The most aggressive species are oxygen at the anode for metallic systems and potassium, calcium, and iron at the cathode for ceramic systems. The Conference identified some of the problems associated with corrosion by slags, chemical stability, thermal conductivity, thermal expansion, electrical conductivity, and thermal shock.
The presentations on lanthanum chromites and iron aluminates with various additives such as strontia, magnesia, magnetite, and combined with zirconates show that the properties of these perovskites and spinels can be
295
systematically altered and controlled. These studies suggest that in the near future enough information will be available so that materials experts can produce an oxide system to meet the conditions required by the design parameters, including the possibility of graded electrodes to compensate for temperature gradients. At the very least, these multicomponent oxides serve as prototypes to identify the kind of materials science which is needed.
Several topics related to the science of materials were not discussed. Among these were the fundamentals of electronic conducting ceramics, arcing phenomena at ceramic surfaces, electron emission of ceramics, diffusion of impurities into electrode and insulating materials, prediction of volatilities of components from multi-component systems, mechanical properties, and solid state reactions between electrode materials and slags especially at phase boundaries and as controlled by microstructure. One important area which the Conference was unable to cover concerns erosion of the channel by. the plasma. This involves questions of gas-phase boundary layer plasma behavior, arc erosion, ion-surface collisions, and low-energy sputtering. Questions which arise are: What are the dominant mechanisms for transport of mass, charge, and energy from the plasma to the surface, and vice-versa, through the boundary layer? What is the role of thermionic emission? How efficient is gas-surface energy transfer at the gas-electrode interfaces of cold copper electrodes? Electrical breakdown of insulators is a particularly severe problem. More basic research of this phenomenon is needed.
The problems associated with materials are so critical and the nature of materials science is so complex that solutions require not so much isolated experimentation of material properties but rather investigations more fully coordinated to the phenomena which occur in the generator. We do not yet know whether materials or designs exist or can be invented which permit adequate operational times, but we probably do know materials properties well enough to suggest that only through basic studies of both the phenomena which lead to the deleterious effects and the materials properties taken as a total system can one achieve orders of magnitude improvement in materials performance.
At the temperatures produced in the combustor and the MHD generator a significant fraction of the inorganic minerals of coal vaporize and subsequently condense either as particulates or as slags. Hence, information related to partial vapor pressures and other thermodynamic properties of aluminosilicates containing potassium, calcium, iron, sulfate, etc. are needed to understand these processes. During the past two decades, the high temperature thermodynamic behavior of many of the binary systems have been characterized. Thus, data for silica, alumina, magnesia, potassium sulfate, and potassium carbonate are sufficiently reliably known. Investigations of some of the ternary systems such as K-Si-O have been initiated and were discussed at the Conference. Extensions of these measurements are needed to furnish the data used for the thermodynamic modeling of the gaseous phase. However, because the condensed phases in the systems are multicomponent. It is not feasible to derive thermodynamic descriptions of the sublimation
296

through measurements alone. Some effort directed toward the understanding of the structure and bonding in these systems is needed so that more interpretation and prediction can be accomplished. Scientifically, the aluminosilicates with the additional components should be interesting because they contain both ionic and covalent bonding and the chains of polysilicates. In particular, extensions of the description presented in terms of the silicate chains to macroscopic properties such as viscosity are desired.
Calculations and modeling associated with the vaporization and condensation of silica have identified the grosser features of these processes. However, the effects of the various conditions existing in the MHD system on these processes are not well known. For example, silica sublimes at the lowest oxygen pressures existing in laboratory-produced vacuo to gaseous Si02. In contact with a reductant such as carbon, it sublimes to gaseous SiO. During the combusion of coal some of the silica may be in contact with carbonaceous material at temperatures above 1000''C and some of it may be isolated. Consequently, a non-equilibrium mixture of Si02 and SiO may be produced. If subsequently, the SiO attains equilibrium with oxygen at sufficiently high pressures, then Si02 will condense as particulates. If SIO condenses otherwise, then a disproportionatlon will occur to SIO2 and Si. Thus, the process of condensation to form either particulates or slags can be a non-equilibrium one in which the saturation line and the onset of nucleation can be described only through more study and observations concerning what actually exists in the MHD environment.
Related questions concerning heterogeneous processes in the gas stream are: What are the size distributions and chemical compositions of particulates at various positions in the gas stream? How important are particulates in channel erosion? Do particulates cause plasma instability? Do particulates act as nucleation or growth centers for slag or for seed?
Much work must be done in understanding transport and electrical properties of aluminosilica melts. One was impressed not so much with the limited knowledge of the chemistry of slags as much as with the absence of the knowledge of the physics. In this regard, the study of the thermionic emission properties of coal slags was one of the highlights. The problem of arcing vs uniform current emission is in serious need of a solution.
Among the questions which were asked are the following: What degree of fundamental understanding currently exists concerning the slag behavior found in MHD prototypes? To what extent does one understand the underlying, microscopic reasons for the observed effects of potassium addition upon slag electrical conductivity and upon slag viscosity (corrosive activity)? Molten slag plays a very important role in the MHD channel,and slag behavior is one area where fundamental scientific understanding might be useful immediately to the design engineer.
One area which requires further study is the chemistry of seed recovery. The questions are: How pure is the seed condensate? What chemical problems are encountered in reprocessing and repurifying the condensed seed? What contaminants cause difficulties in seed repurification? At what stages of
297

the cycle are these Introduced? To what extent do they come from the coal (unavoidable) and to what degree from construction materials (conceivably avoidable)? Also, there was no discussion of the physical processes such as chemical kinetics and heat and mass transfer which control the nucleation and growth of the seed being recovered.
Another area neglected by the Conference concerns environmental questions. How does emission of SO2, SO3, NOx, and particulates in MHD compare with other methods of burning coal? Will the MHD cycle make it necessary to modify the clean-up procedures being developed, or in use, for conventional coal power plants? Are any new environmental problems Introduced by the MHD cycle, for example, by the seed injection and recovery process? Are there chemical problems Involved in the use of K2CO3-K2SO4 as seed to remove SO2?
These are some of the questions asked by the scientists who are interested in knowing how their researches can contribute to solutions of the problems. If one examines some of the papers presented at the 16th Sjmiposium on Engineering Aspects of Magnetohydrodynamics, one finds some of the answers to these questions. But in so doing one recognizes the issue which fostered the conference on the basic sciences related to MHD systems, i.e., the deficiency of communication between the engineering and scientific communities.
Among the approximately 50 papers presented at this Conference and at the 16th Symposium on Engineering Aspects of Magnetohydrodynamics in Pittsburgh in May, 1977, only five are the same. Hence, the duplication is small, but the overlap is significant. The two conferences were intended to serve different purposes, but they cannot help to promote greater understanding of the contributions which the basic sciences can make if they are entirely Isolated. In organizing this Conference, we sensed a desire on the part of several persons to have a forum wherein the scientific aspects could be stressed, and to make a contribution if an understanding of the crucial problems were identified. Hence, some continuation of the exchange of information between the two communities seems to be desired.
R. H. J. M. C. J. G. F. R.
J. Ackermann U. Anderson Berkowitz Inokuti E. Johnson V. Martinez Rosenblatt T. Smith J. Thorn
298
List of Participants
R. J. Ackermann Chemistry Division Argonne National Laboratory Argonne, Illinois 60439
D. P. Aeschliman Department 5217 Sandia Laboratories Albuquerque, New Mexico 87115
A. T. Aldred Materials Science Division Argonne National Laboratory Argonne, Illinois 60439
W. Amend Engineering Division Argonne National Laboratory Argonne, Illinois 60439
H. U. Anderson Ceramic Engineering Department University of Missouri-Rolla 105 Fulton Hall Rolla, Missouri 65401
J. R. Anderson Physics Department Montana State University Bozeman, Montana 59715
N. N. Ault Industrial Ceramics Division Norton Company New Bond Worcester, Massachusetts 01606
K. Barclay Montana Energy & MHD R & D Institute P. 0. Box 3809 Butte, Montana 59701
P. Bardhan Ceramic Research Coming Glass Works Coming, New York 14830
J. L. Bates Materials Department Battelle-Pacific Northwest Laboratories P. 0. Box 999 Richland, Washington 99352
R. G. Bautista Department of Chemical Engineering Iowa State University Ames, Iowa 50011
M. S. Beaton Energy Conversion Division University of Tennessee Space Institute Tullahoma, Tennessee 37388
P. D. Bergman Combustion Division Pittsburgh Energy Research Center 4800 Forbes Avenue Pittsburgh, Pennsylvania 15234
M. Blander Chemical Engineering Division Argonne National Laboratory Argonne, Illinois 60439
D. Bomkamp Engineering Division Argonne National Laboratory Argonne, Illinois 60439
H. K. Bowen Materials Science Department Massachusetts Institute of Technology Cambridge, Massachusetts 02139
M. G. Bowman Chemistry & Materials Science Department University of California Los Alamos Scientific Laboratory P. 0. Box 1663 Los Alamos, New Mexico 87545
299

F. J. Brodmann Corporate Research and Development General Refractories Company 50 Monimient Road Bala Cynwyd, Pennsylvania 19004 K. L. Brun Ceramic Department Energoinvest Corporation Lxikavica, Sarajevo Yugoslavia 71000
W. L. Buck Components Technology Division Argonne National Laboratory Argonne, Illinois 60439
K. Burba Engineering Division Argonne National Laboratory Argonne, Illinois 60439
J. A. Burkhart NASA - Lewis Research Center Cleveland, Ohio 44135
R. P. Burns Department of Chemistry University of Illinois P. 0. Box 4348 Chicago, Illinois 60680
L. H. Cadoff Ceramic Science Department Westinghouse R & D Beulah Road Pittsburgh,Pennsylvania 15235
F. A. Cafasso Chemical Engineering Division Argonne National Laboratory Argonne, Illinois 60439
W. D. Callister Metallurgy Department Montana Tech West Park Street Butte, Montana 59701
W. Capps Inorganic Glass Section National Bureau of Standards Washington, D. C. 20234
L. Carlson Engineering Division Argonne National Laboratory Argonne, Illinois 60439
E. D. Cater Department of Chemistry The University of Iowa Iowa City, Iowa 52242
W. K. Chen Materials Science Division Argonne National Laboratory Argonne, Illinois 60439
L. Chow Engineering Division Argonne National Laboratory Argonne, Illinois 60439
J. Cost U. S. Energy Research and Development Administration Division of Physical Research Washington, D. C. 20545
T. Dean Department of Chemistry Marquette University 535 North 14th Street Milwaukee, Wisconsin 53233
L. D. DeDominicis General Electric Company P. 0. Box 8555 Philadelphia,Pennsylvania 19101
J. L. Dehmer Radiological & Environmental Research Division Argonne National Laboratory Argonne, Illinois 60439
300

p. M. Dehmer Radiological & Environmental Research Division Argonne National Laboratory Argonne, Illinois 60439
T. C. Dellinger Space Sciences Laboratory General Electric Company P. 0. Box 8555 Philadelphia, Pennsylvania 19101
L. Domingues Trans-Tech, Inc. 12 Meem Avenue Gaithersburg, Maryland 20760
E. Doss Engineering Division Argonne National Laboratory Argonne, Illinois 60439
R. Drzyzgula Materials Science Division Argonne National Laboratory Argonne, Illinois 60439
R. J. Dufala Metals & Ceramics Department Union Carbide Corporation 12900 Snow Road Parma, Ohio 44130
T. L. Eddy Mechanical Engineering & Mechanics West Virginia University Morgantown, West Virginia 26506
T. Ehlert Department of Chemistry Marquette University 535 North 14th Street Milwaukee, Wisconsin 53233
P. C. Engelking Joint Institute for Laboratory Astrophysics University of Colorado Boulder, Colorado 80301
W. B. England Chemistry Division Argonne National Laboratory Argonne, Illinois 60439
L. Eyring Department of Chemistry Arizona State University Tempe, Arizona 85281
J. Faber, Jr. Materials Science Division Argonne National Laboratory Argonne, Illinois 60439
E. G. Farrier Union Carbide Corporation Snow Road Parma, Ohio 44130
D. C. Fee Chemical Engineering Division Argonne National Laboratory Argonne, Illinois 60439
A. Fischer Chemical Engineering Division Argonne National Laboratory Argonne, Illinois 60439
T. J. Fisher Safety Department Montana Energy & MHD Research Development Institute, Inc. 225 South Idaho Street Butte, Montana 59701
H. F. Franzen Department of Chemistry Iowa State University Ames Laboratory 333 Spedding Hall Ames, Iowa 50011
G. A. Gallup Department of Chemistry University of Nebraska Lincoln, Nebraska 68588
301

D. R. Gaskell Metallurgy Department University of Pennsylvania Philadelphia, Pennsylvania 19174
J. B. Gerardo Laser Physics Research Sandia Laboratories Albuquerque, New Mexico 87115
P. W. Gilles Department of Chemistry The University of Kansas Lawrence, Kansas 60045
R. J. Golik TRW DSSG ESL - Rl/1044 One Space Park Redondo Beach, California 90278
P. Grayson Miami Research Laboratory Eagle-Picher Indistries, Inc. Miami, Oklahoma 74354
V. Griffiths Research Department Montana College of Mineral Science & Technology West Park Street Butte, Montana 59701
L. V. Gurvich Institute for High Temperature Koroviinskoye Shossee 127412 Moscow, 1-412, U.S.S.R.
J. HafStrom Engineering Division Argonne National Laboratory Argonne, Illinois 60439
J. H. S. Haggin Chicago News Bureau Chemical & Engineering News 176 West Adams Street Chicago, Illinois 60603
J. W. Halloran Materials Science Department The Pennsylvania State University 218 Mineral Industries University Park, Pennsylvania
16802
J. A. Hardgrove Combustion Department TRW Systems One Space Park Redondo Beach, California 90278
J. W. Hastie Inorganic Chemistry Department National Bureau of Standards Washington, D. C. 20234
R. H. Hauge Department of Chemistry Rice University Houston, Texas 77001
W. Haupin Process Metallurgy Department Alcoa Laboratories Alcoa Center, Pennsylvania 15069
N. L. Helgeson STD Research Corporation P. 0. Box "C" Arcadia, California 91006
H. Herman Engineering Division Argonne National Laboratory Argonne, Illinois 60439
A. P. Hickman Stanford Research Institute Menlo Park, California 94025
D. L. Hildenbrand Stanford Research Institute 333 Ravenswood Avenue Menlo Park, California 94025
R. A. Hill Department 5217 Sandia Laboratories Albuquerque, New Mexico 87115
302

J. C. Hindman Chemistry Division Argonne National Laboratory Argonne, Illinois 60439
C. Hirayama Research Laboratories Westinghouse Electric Corp. 1310 Beulah Road Pittsburgh, Pennsylvania 15235
R. A. Howald Department of Chemistry Montana State University Bozeman, Montana 59715
C. Hsu Chemical Engineering Division Argonne National Laboratory Argonne, Illinois 60439
R. H. Huebner Radiological & Environmental Research Division Argonne National Laboratory Argonne, Illinois 60439
R. Hjmdman Montana Energy & MHD Research & Development Institute, Inc. 225 South Idaho Street Butte, Montana 59701
K. Im Engineering Division Argonne National Laboratory Argonne, Illinois 60439
M. Inokuti Radiological & Environmental Research Division Argonne National Laboratory Argonne, Illinois 60439
H. S. Isaacs Department of Applied Science Brookhaven National Laboratory Building 815 Upton, New York 11973
Y. Itikawa Institute of Space & Aeronautical Science University of Tokyo 4-6-1 Komaba, Meguroku Tokyo 153, Japan
W. D. Jackson Division of MHD U. S. Energy Research and Development Administration Washington, D. C. 20545
J. K. Jacobs Atlantic Industrial Research Institute 1360 Barrington Street Halifax, Nova Scotia B3J 2X4
C. E. Johnson Chemical Engineering Division Argonne National Laboratory Argonne, Illinois 60439
M. T. Johnson Advanced Energy Systems Westinghouse P. 0. Box 10864 Pittsburgh, Pennsylvania 15236
T. Johnson Engineering Division Argonne National Laboratory Argonne, Illinois 60439
B. W. Jone s Environmental Engineering Department Montana Energy & MHD Research & Development Institute, Inc. P. 0. Box 3809 Butte, Montana 59701 A. Kantrowitz AVCO Research Laboratories Everett, Massachusetts
D. P. Karim Department of Physics Northwestern University Evanston, Illinois 60201
303

J. J. Kaufman Department of Chemistry The John Hopkins University Charles and 34th Streets Baltimore, Maryland 21218
D. Keefer Materials Technology Idaho National Engineering Laboratory Idaho Falls, Idaho 83401
D. Killpatrick Engineering Division Argonne National Laboratory Argonne, Illinois 60439
H. W. King Atlantic Industrial Research Institute 1360 Barrington Street Halifax, Nova Scotia B3J 3X4
C. E. Kolb Aerodyne Research, Inc. Bedford Research Park Bedford, Massachusetts 01730
K. Kuczen Engineering Division Argonne National Laboratory Argonne, Illinois 60439
R. W. Kugel Chemistry Division Argonne National Laboratory Argonne, Illinois 60439
A. Kumnick MHD Research Montana State University Bozeman, Montana 59715
J. E. Land Joint Institute for Laboratory Astrophysics University of Colorado Boulder, Colorado 80309
G. J. Lapeyre Physics Department Montana State University Bozeman, Montana 59715
H. Larson NASA - Ames Research Center Mountain View, California 94040
R. B. Leamer TRW Defense Space Systems Gp. 2030 M Street, N.W. #800 Washington, D. C. 20036
E. M. Leavens Boeing Engineering Construction P. 0. Box 3999 Seattle, Washington 98124
C. -Y. Li Bard Hall Cornell University Ithaca, New York 14850
C. E. Lifshitz Department of Chemistry Wright State University Colonel Glenn Highway Dayton, Ohio 45431
W. C. Lineberger Joint Institute for Laboratory Astrophysics University of Colorado Boulder, Colorado 80309
L. Lowden Chemistry Department Marquette University 535 North 14th Street Milwaukee, Wisconsin 53233
C. -L. Lu STD Research Corporation P. 0. Box "C" Arcadia, California 91006
J. A. McClure Energy, Inc. P. 0. Box 736 Idaho Falls, Idaho 83401
304

D. F. McVey Sandia Laboratories Albuquerque, New Mexico 87115
J. H. Macek Physics Department University of Nebraska Lincoln, Nebraska 68588
J. V. Martinez Division of Physical Research U. S. Energy Research and Development Administration Washington, D. C. 20545
M. Martinez-Sanchez Massachusetts Institute of Technology Cambridge, Massachusetts 02139
G. Matson Montana Energy & MHD Research & Development Institute, Inc. 225 South Idaho Street Butte, Montana 59701
R. A. Miller Materials Science Branch NASA - Lewis Research Center 21000 Brookpark Road MS 106-1 Cleveland, Ohio 44106
W. J. Miller AEROCHEM Research Laboratory, Incorporated P. 0. Box 12 Princeton, New Jersey 08540
T. A. Milne Environmental & Materials Sciences Midwest Research Institute 425 Volker Boulevard Kansas City, Missouri 64110
A. E. Morris Met. Engr. University of Missouri Rolla, Missouri 65401
M. H. Mueller Materials Science Division Argonne National Laboratory Argonne, Illinois 60439
M. Noone General Electric Company P. 0. Box 8555 Philadelphia, Pennsylvania 19101
D. W. Norcross NBS-JILA University of Colorado Boulder, Colorado 80301 S. Omori Space Division General Electric Company L9517, Building 100 P. 0. Box 8555 Philadelphia, Pennsylvania 19101
J. Patten Engineering Division Argonne National Laboratory Argonne, Illinois 60439
V. Pearson Engineering Division Argonne National Laboratory Argonne, Illinois 60439
J. C. Person Radiological & Environmental Research Division Argonne National Laboratory Argonne, Illinois 60439
C. R. Petersen University of Tennessee Space Institute Tullahoma, Tennessee 37388
M. Petrick Engineering Division Argonne National Laboratory Argonne, Illinois 60439
305
E. G. Pewitt Office of the Director Building 205 Argonne National Laboratory Argonne, Illinois 60439
E. R. Plante Inorganic Chemistry Section National Bureau of Standards A-329 Materials Building Washington, D. C. 20234
J. D. Plxmkett MERDI, Incorporated 225 South Idaho Street Butte, Montana 59701
R. B. Poeppel Materials Science Division Argonne National Laboratory Argonne, Illinois 60439
I. Pollack Engineering Division Argonne National Laboratory Argonne, Illinois 60439
R. J. Pollina Department of Physics Montana State University Bozeman, Montana 59715
W. Primak Solid State Science Division Argonne National Laboratory Argonne, Illinois 60439
P. B. Probert New Products Department Babcock & Wilcox Company 20 South Van Buren Barberton, Ohio 44203
M. Raring U. S. Energy Research and Development Administration Division of MHD Washington, D. C. 20545
D. W. Readey Division of Physical Research U. S. Energy Research and Development Administration Washington, D. C. 20545
C. W. Redman Engineering Division Argonne National Laboratory Argonne, Illinois 60439
F. D. Retallick Projects Department Westinghouse P. 0. Box 10864 Pittsburgh, Pennsylvania 15236
R. J. Rosa Montana State University Bozeman, Montana 59715
G. M. Rosenblatt The Pennsylvania State University 128 Davey Laboratory University Park, Pennsylvania
16802
B. R. Rossing Westinghouse R & D Laboratories 1310 Beulah Road Pittsburgh, Pennsylvania 15235
A. P. Rowe NASA - Lewis Research Center 21000 Brookpark Road Cleveland, Ohio 44135
R. G. Sachs, Director Argonne National Laboratory Argonne, Illinois 60439
A. F. Sarofim Chemical Engineering Department Massachusetts Institute of Technology 77 Massachusetts Avenue Cambridge, Massachusetts 02139
306

V. H. Schmidt Department of Physics Montana State University Bozeman, Montana 59715
S. J. Schneider Inorganic Materials Division National Bureau of Standards Washington, D. C. 20234
W. C. Sejmiour Metallurgy Department Montana Tech West Park Street Butte, Montana 59701
L. N. Shen MHD Division The University of Tennessee Space Institute Tullahoma, Tennessee 37388
R. N. Singh Materials Science Division Argonne National Laboratory Argonne, Illinois 60439
A. Sistino Engineering Division Argonne National Laboratory Argonne, Illinois 60439
J. G. Smeggil Materials Department United Technologies Research Center Silver Lane East Hartford, Connecticut 06108
F. T. Smith Stanford Research Institute Menlo Park, Califomia 94025
S. Smith Engineering Division Argonne National Laboratory Argonne, Illinois 60439
R. R. Smyth FluiDyne Engineering Corporation 5900 Olson Highway Minneapolis, Minnesota 55422
E. A. Snajdr Refractories Division Combustion Engineering P. 0. Box 828 Valley Forge, Pennsylvania 19482
B. Snyder Engineering Division Argonne National Laboratory Argonne, Illinois 60439
E. Sonder Solid State Division Oak Ridge National Laboratory P. 0. Box X Oak Ridge, Tennessee 37830
F. E. Spencer, Jr. Pittsburgh Energy Research Center 4800 Forbes Avenue Pittsburgh, Pennsylvania 15213
M. Srinivasan Engineering Division Argonne National Laboratory Argonne, Illinois 60439
G. E. Staats Energy Conversion Division Rejmolds Metals Company 412 South Court Street Suite 302 Florence, Alabama 35630
D. Stahl Engineering Division Argonne National Laboratory Argonne, Illinois 60439
K. H. Stern Chemistry Division Naval Research Laboratory 455 Overlook Avenue Washington, D. C. 20375
J. J. Stiglich Miami Research Laboratory Eagle-Picher Indistries, Inc. Miami, Oklahoma 74354
307

E. K. Storms Los Alamos Scientific Laboratory CMB-3 Los Alamos, New Mexico 87544
A. Svirmickas Chemistry Division Argonne National Laboratory Argonne, Illinois 60439
J. B. Taylor Chemistry Department National Research Cotincil Montreal Road Ottawa, Ontario Canada KIA 0R9
R. W. Taylor Chemistry Department Lawrence Livermore Laboratory Livermore, California 94550
K. E. Tempelmeyer Energy Conversion Division University of Tennessee Space Institute Tullahoma, Tennessee 37388
M. Tetenbaum Chemical Engineering Division Argonne National Laboratory Argonne, Illinois 60439
R. J. Thorn Chemistry Division Argonne National Laboratory Argonne, Illinois 60439
T. 0. Tiernan Department of Chemistry Wright State University Colonel Glenn Highway Dayton, Ohio 45431
A. F. Wagner Chemistry Division Argonne National Laboratory Argonne, Illinois 60439
W. Wahnsiedler Physical Chemistry Division Alcoa Laboratories Alcoa Center, Pennsylvania 15069
R. A. Weeks Solid State Division Oak Ridge National Laboratory P. 0. Box X Oak Ridge, Tennessee 37830
A. B. Witte Fluid Physics - Rl/1032 TRW DSSG One Space Park Redondo Beach, California 90278
W. L. Worrell LRSM Building KI University of Pennsylvania Philadelphia, Pennsylvania 19104
K. B. Wright Metallurgical Engineering University of Missouri-Rolla 101 Fulton Hall Rolla, Missouri 65401
R. L. C. Wu Department of Chemistry Wright State University Colonel Glenn Highway Dayton, Ohio 45431
A. F. Yanders Argonne Universities Association Argonne National Laboratory Argonne, Illinois 60439
G. E. Youngblood SST Department Montana Energy and MHD P. 0. Box 3809 Butte, Montana 59701
B. Zauderer MHD Programs General Electric Company P. 0. Box 8555 Philadelphia, Pennsylvania 19101
T. Zinneman Engineering Division Argonne National Laboratory Argonne, Illinois 60439
308

Distribution of ANL-77-21
Internal
M. Nevitt R. Laney Betsy Ancker-Johnson E. G. Pewitt L. Burris P. R. Fields B. R. Frost M. Petrick D.C.L. Price R. E. Rowland A. Krisciunas ANL Contract Copy ANL Libraries (5) TIS Files (6) Conference Chairman (75) Participants from Argonne (54)
External
ERDA-TIC for distribution per UC-90g (266) Manager, ERDA-CH Chief, Chicago Patent Group President, Argonne Universities Association Chemistry Division Review Committee:
J. Bigeleisen, Univ. Rochester Flygare, Univ. Illinois Franzen, Iowa State Univ. Herschbach, Harvard Univ. Muetterties, Cornell Univ. Rasmussen, Lawrence Berkeley Lab. Rowland, Univ. California, Irvine Wang, SUNY at Buffalo
Participants (129)
w . H. D. E. J . F . J .
H F R L 0 S H
309