19950510 0981i - - INL Research Library Digital Repository
742
DOE/EM-0232 Volume II: Site Summaries March 1995 1 °4. , C.CT E MAY 2 1995 s ..14x-urnent hcs been approved public rQlease and sal -e; its ciarAAtioAonia unlimited. U.S. Department of Energy Office of Environmental Management 19950510 0981i Estimating the Cold War Mortgage The 1995 Baseline Environmental Management Report
-
Upload
khangminh22 -
Category
Documents
-
view
0 -
download
0
Transcript of 19950510 0981i - - INL Research Library Digital Repository

DOE/EM-0232
Volume II:Site SummariesMarch 1995
1 °4. ,
C.CT E
MAY 2 1995
s ..14x-urnent hcs been approvedpublic rQlease and sal-e; its
ciarAAtioAonia unlimited.
U.S. Department of EnergyOffice of EnvironmentalManagement
19950510 0981i
Estimatingthe Cold WarMortgage
The 1995 BaselineEnvironmental ManagementReport

This report has been reproduced directly from the best available copy.
Available to DOE and DOE contractors from the Office of Scientific and TechnicalInformation, P.O. Box 62, Oak Ridge, TN 37831; prices available from (615) 576-8401.
Available to the public from the U.S. Department of Commerce, Technology Administra-tion, National Technical Information Service, Springfield, VA 22161.(703) 487-4650.

DOE/EM-0232
Volume II:Site SummariesMarch 1995
Accesio41Or-
NTI S CRPA DTIC1...14;arploucied
Jo:Attic:6410n _
By'
Distribution
AvilobWty Coces• _ -_Avaii a/ or
$pecial
U.S. Department of Energy
Office of EnvironmentalManagement
5
Estimatingthe Cold WarMortgage
The 1995 BaselineEnvironmental ManagementReport
-
Printed with soy ink on recycled paper

Table of ContentsVOLUME II SITE SUMMARIES
READER'S GUIDE 1
ALASKA AK 1
Amchitka Island Test Site (Nevada Offsite Program) AK 2
ARIZONA AZ 1
CALIFORNIA CA 3
Energy Technology Engineering Center CA 3
General Atomics CA 15
General Electric Vallecitos Nuclear Center CA 23
Geothermal Test Facility CA 29
Laboratory for Energy-Related Health Research CA 35
Lawrence Berkeley Laboratory CA 43
Lawrence Livermore National Laboratory CA 53
Stanford Linear Accelerator Center CA 67
Oxnard CA 77
Sandia National Laboratories CA 83
COLORADO CO 1
Grand Junction Projects Office Site CO 3
Rocky Flats Environmental Technology Site CO 11
Colorado UMTRA Sites CO 41
Gunnison CO 42
Maybell CO 46
Naturita CO 50
Rifle CO 54
Union Carbide Corporation and Old North Continent CO 58
Rio Blanco Site CO 62
Rulison Site CO 62
CONNECTICUT CT 1
Connecticut FUSRAP Sites CT 3
Combustion Engineering Site CT 4
FLORIDA FL 1
Pinellas Plant FL 3
1

HAWAII HI 1
IDAHO ID 1
Argonne National Laboratory - West ID 3
Idaho National Engineering Laboratory (and Idaho Chemical Processing Plant) ID 11
ILLINOIS IL 1
Argonne National Laboratory - East IL 3
Fermi National Accelerator Laboratory IL 11
Site A/Plot M, Palos Forest Preserve IL 17
Illinois FUSRAP Sites IL 21
Madison IL 22
IOWA IA 1
Ames Laboratory IA 3
KENTUCKY KY 1
Maxey Flats Disposal Site KY 3
Paducah Gaseous Diffusion Plant KY 7
MARYLAND/WASHINGTON D.C.MD/DC 1
Environmental Management Program Headquarters MD/DC 3
Maryland FUSRAP Sites MD/DC 9
W.R. Grace & Company MD/DC 10
MASSACHUSETTS MA 1
Massachusetts FUSRAP Sites MA 3
Chapman Valve MA 4
Shpack Landfill MA 6
Ventron MA 8
MICHIGAN MI 1
Michigan FUSRAP Sites MI 3
General Motors MI 4
MISSISSIPPI MS 1
Salmon Site (Nevada Offsite Program) MS 2
2

MISSOURI MO 1
Kansas City Plant MO 3
Weldon Spring Site Remedial Action Project MO 17
Missouri FUSRAP Sites MO 23
St. Louis Downtown Site MO 24
St. Louis Airport Storage Site MO 26
St. Louis Airport Site Vicinity Properties MO 28
Latty Avenue Properties MO 30
NEBRASKA NE 1
Hallam Nuclear Power Facility NE 3
NEVADA NV 1
Nevada Test Site NV 3
Central Nevada Test Site, Project Shoal Site, Tonopah Test Range
(Nevada Offsite Program) NV 22
NEW JERSEY NJ 1
Princeton Plasma Physics Laboratory NJ 3
New Jersey FUSRAP Sites NJ 11
DuPont & Company NJ 12
Maywood Chemical Works NJ 14
Middlesex Sampling Plant NJ 16
New Brunswick Laboratory NJ 18
Wayne Site NJ 20
NEW MEXICO NM 1
Inhalation Toxicology Research Institute NM 3
Los Alamos National Laboratory NM 11
Sandia National Laboratories - Albuquerque NM 29
South Valley Superfund Site NM 43
Albuquerque Operations Office NM 47
Waste Isolation Pilot Plant and
National Transuranic Waste Program Office NM 51
Uranium Mill Tailings Remedial Action Project NM 59
New Mexico UMTRA Sites NM 63
Ambrosia Lake NM 64
Gnome-Coach Site and Gasbuggy Site (Nevada Offsite Program) NM 68
3

NEW YORK NY 1
Brookhaven National Laboratory NY 3
Separation Process Research Unit NY 13
West Valley Demonstration Project NY 19
New York FUSRAP Sites NY 25
Ashland Oil #1 NY 27
Ashland Oil #2 NY 29
Bliss & Laughlin Steel NY 31
Colonie Site NY 33
Linde Air Products NY 35
Seaway Industrial Park NY 37
NORTH DAKOTA ND 1
North Dakota UMTRA Sites ND 3
Belfield and Bowman ND 4
OHIO OH 1
Battelle Columbus Laboratories OH 3
Fernald Environmental Management Project OH 9
Mound Plant OH 21
Piqua Nuclear Power Facility OH 31
Portsmouth Gaseous Diffusion Plant OH 35
Reactive Metals, Inc OH 43
Ohio FUSRAP Sites OH 49
Alba Craft OH 50
Associated Aircraft Tool Manufacturing OH 52
Baker Brothers OH 54
B&T Metals OH 56
HHM Safe Site OH 58
Luckey OH 60
Painesville OH 62
OREGON OR 1
PENNSYLVANIA PA 1
SOUTH CAROLINA SC 1
Savannah River Site SC 3
4

TENNESSEE TN 1
Oak Ridge Associated Universities and
Oak Ridge InFtitute for Science and Education TN 3
Oak Ridge K-25 Site TN 11
Oak Ridge National Laboratory TN 23
Oak Ridge Reservation TN 43
Oak Ridge Y-12 Site TN 51
Formerly Utilized Sites Remedial Action Program Office TN 63
TEXAS TX 1
Pantex Plant TX 3
UTAH UT 1
Monticello Millsite and Vicinity Properties UT 2
WASHINGTON WA 1
Hanford Site WA 3
WYOMING WY 1
GLOSSARY GL 1
5

READER'S GUIDE TO THE SITE SUMMARIES
INTRODUCTION
Volume II presents the site data that was used
to generate the Department of Energy's (DOE)
initial Baseline Environmental ManagementReport (BEMR). The raw data was obtained by
DOE field personnel from existing information
sources and anticipated environmentalmanagement strategies for their sites and wastempered by general assumptions and guidancedeveloped by DOE Headquarters personnel.
This data was then integrated by DOEHeadquarters personnel and modified toensure that overall constraints such as funding
and waste management capacity wereaddressed.
The site summaries are presented by State and
broken out by discrete activities and projects.
The Volume I Glossary has been repeated tofacilitate the reader's review of Volume II.
The information presented in the sitesummaries represents the best data andassumptions available as of February 1, 1995.Assumptions that have not been mandated byformal agreement with appropriate regulators
and other stakeholders do not constitutedecisions by the Department nor do theysupersede existing agreements. In addition,actions requiring decisions from externalsources regarding unknowns such as future
land use and funding/scheduling alternatives,
as well as internal actions such as theDepartment's Strategic Realignment initiative,
will alter the basis and general assumptions
used to generate the results for this report.
Consequently, the numbers presented in the sitesummaries do not represent outyear budgetrequests by the field installations.
SITE SUMMARY FORMAT
The site summaries provided in this volume
give specific information about the activities
and projected costs at each site as requested bythe National Defense Authorization Act. The
site summaries are organized alphabetically by
State. Each summary provides a briefdiscussion of the site's current, and futuremissions followed by discussions of the projectsand activities necessary to remediate the site.Costs and schedules are also provided. Theprojects are divided into five activities (asdefined by Volume I, Section 2.3):environmental restoration, waste management,nuclear material and facility stabilization,landlord activities, and program management.
The cost tables provide costs for the activitiesidentified in the site summaries. The annualcosts are provided for each year from 1995through the year 2000, and then 5-year averageannual costs are provided until the project oractivity is complete. Costs for all five activities
at sites that have only environmentalrestoration missions — FUSRAP, UMTRA, andNevada Offsites — are typically includedwithin the scope of environmental restorationactivities.
Waste Management support activities that theEnvironmental Management program performs
at facilities managed by other DOE programs,
such as the laboratories operated by EnergyResearch and Defense Programs, will continue
for the foreseeable future. However, for thepurpose of this analysis, waste managementsupport of other DOE programs was truncated
in 2030 or six years after the completion ofenvironmental restoration activities.
1

APPROACH FOR THE SITESUMMARIES
To ensure compliance with the requirements setforth in the National Defense Authorization Act(Volume I, Appendix A), DOE Headquartersdeveloped a guidance package instructing thefield installations on how to prepare their costdata and site summaries. The guidance wasrefined by conferring with congressionalstaffers, stakeholders, and DOE field officerepresentatives. The guidance includedrelevant portions of the overall methodology(Volume I, Appendix C) and nationalassumptions regarding the EnvironmentalManagement program (Volume I, Section 3.3).
The field compiled their data and initial write-ups using existing information sources andprofessional judgement (regarding anticipatedoutcome of undefined segments of their scopethat were not addressed globally by theguidance package). These initial submittalswere reviewed by Headquarters programmanagers and BEMR project representatives,and returned to the field with specificrecommendations.
Following the field's second submission of theirsite summaries, BEMR project representativesintegrated the results in accordance with themethodology defined in Appendix C of VolumeI. Additional review cycles were conducted byfield and headquarters representatives after theintegration model compiled and modified thefield submittal to meet funding, waste capacity,and other programmatic constraints. Theresults of this iteration were used to form thebase case analysis as defined in Section 3 ofVolume I.
SITE SUMMARY RESULTS
The numbers shown in the site summaries' costtables for 1995 reflect the Congressionalappropriation. Costs portrayed for 1996 reflectthe Department's most recent CongressionalBudget submittal. The numbers presented for1997-2000 reflect the funding level required tomeet existing compliance agreements asidentified by the Environmental Managementprogram's recently conducted budget shortfallanalysis (Volume I, Section 4.1.1). Outyearsfunding is capped at the FY 2000 level.
To maintain consistency with FY 1995-2000numbers already published by the Departmentas noted above, the first 6 years of cost data arereported in current year dollars. However,constant dollars are used for both the outyearsand the total cost as it is a more appropriateapproach for long-range cost projections.
2

PROJECT CHARIOT
(COMPLETED) *
AMCHITKA ISLANDTEST SITE
*Summaries are not provided for
facilities with completed remedial
actions.
ALASKA
Estimated State Total
Alaska - Amchitka
(Thousands of Current 1995 Dollars)*
241
1996:
1,05
199 1998 1999 2000
100 100 100 100
• Costs for FY 1995 reflect Congressional Appropriation, costs for FY 1996 reflect EM budget submission, costs for FY 1997-2000 reflect Budget Shortfall Scenario, costs for
shaded area assume 3% annual inflation.
Five-Year Averages (Thousands of Constant 1995 Dollars)"
FY 1995.2000 2005 2010 2015 2020 2025 2030
Alaska - Amchitka 235 100 46 32 18 9 7
2035 2040 2045 2050 2055 2060 2065 Life Cycle"
Alaska - Amchitka 7 2 0 0 0 0 0 2,480
Costs reflect a five•year average in constant 1995 dollars, except in FY 1995 • 2000, which is a six-year average.
"' Total Life Cycle Is the sum of annual costs In constant 1995 dollars,
AK 1

AMCHITKA ISLAND TEST SITE(Nevada Offsite Program)
The Amchitka Island Test Site location is administered by the Nevada Operations Office. A morethorough description of the environmental activities managed by the Nevada Operations Office canbe found in the Nevada Site Summary. All costs for waste management activities, program manage-ment, and relevant landlord activities attribute to the Department are provided for within the scopeof environmental restoration. There are no offsites with either current or planned nuclear materialand facility stabilization activity needs. Funding for all sites is 100 percent defense.Amchitka Island is the southernmost island of the Rat Island Group in the Aleutian chain.
Bird Rock*1;:)
Aleut Point
North WestCamp
LEGEND
0
0
A
01
Test site name
1 mile radiussurvey area(ca. 2,000 acres)
SCALE
5
8
10 Miles
4)
C.r
16 Kilometers
0
dp
MILROW
Base CampSt. MakariusPoint
. ivakin0) Point
46W61Z,
i.:1> Omegaer Point
EastCape
AK 2

Estimated Site Total
(Thousands of Current 1995 Dollars)•
FY 1995 1996 1997 1998 1999 2000
Environmental Restoration 1,051 141 100 100
• Costs for FY 1995 reflect Congressional Appropriation, costs for FY 1996 reflect EM budget submission, costs for FY 1997-2000 reflect Budget Shortfall Scenario, costs for
shaded area assume 3% annual inflation.
Five-Year Averages (Thousands of Constant 1995 Dollars)•*
FY 1995-2000 2005 2010 2015 2020 2025 2030
Environmental Restoration 235 100 46 32 18 9
2035 2040 2045 2050 2055 2060 2065 Life Cycle***
Environmental Restoration 7 2 0 0 0 0 0 2,480
Costs reflect a five-year average in constant 1995 dollars, except in FY 1995 - 2000, which is a six-year average.
*** Total Life Cycle is the sum of annual costs in constant 1995 dollars.
PAST, PRESENT, AND
FUTURE MISSIONS
Amchitka was the site of three nucleardetonations, conducted October 1965, October1969, and November 1971. The first detonation,Long Shot, was a nuclear test detection researchexperiment. The next detonation, Milrow Shot,was a high-yield seismic calibration test. Thelast detonation, Cannikan Shot, was a test of aproposed warhead for the Spartan missile.
There are numerous locations associated withthe Amchitka Site; however, responsibility forthe various sites has not been assigned since theU.S. Army Corps of Engineers, U.S. Navy, U.S.Fish and Wildlife Service, and the Departmenthave all conducted activities at this location.The vicinity of the site is being monitored aspart of the Long-Term Hydrological MonitoringProgram.
ENVIRONMENTAL
RESTORATION
Funding for this activity provides for thecontinued synthesis and evaluation ofinformation collected during the monitoring ofthe Amchitka Site in Alaska. The activity willdefine the magnitude and extent ofcontamination and the risks associated withthat contamination through the evaluation ofinformation on the two sites. This process willinclude the characterization of the physicalsetting and the testing area, the definition of theoccurrence of contamination, and theidentification of the pathways to reach apotential receptor. The risks to receptors willalso be calculated using standard riskassessment procedures. Should risks exceedacceptable limits, remedial actions at the Alaskatest sites will be initiated. For this estimate,
AK 3

remediation was assumed to include removal ofdrilling mud pits, landfills, and auxiliaryfacilities (sewage lagoon, Kirilof dock, topcamp, drums and debris, south hangar, andhazardous waste storage area) formerlyassociated with the testing on Amchitka Island.These remediation activities were assumed tobegin and be complete in 1996.
FUNDING AND COST
INFORMATION
The following tables present fundinginformation and major activity milestones forthe Amchitka Island Test Site.
Environmental Restoration Activity Costs
Five-Year Averages (Thousands of Constant 1995 Dollars)*
FY 1995 - 2000 2005 2010 2015 2020 2025 2030
Environmental RestorationAssessment 24 0 0Remedial Actions 158 0 0Surveillance And Maintenance 54 100 46 32 18 9 7
Total 235 100 46 32 18 9 7
2035 2040 2045 2050 2055 2060 2065 Life Cycle*
Environmental Restoration
Assessment 0 0 0 0 0 0 0 143Remedial Actions 0 0 0 0 0 945Surveillance And Maintenance 7 2 0 0 0 0 1,392
Total 7 2 0 0 0 0 0 2,480
' Costs reflect a five-year average in constant 1995 dollars, except in FY 2000, which is a six-year average.
Total Life Cycle is the sum of annual costs in constant 1995 dollars.
AK 4

Defense Funding Estimate
Five-Year Averages (Thousands of Constant 1995 Dollars)•
FT 1995 - 2000 2005 2010 2015 2020 2025 2030
Environmental Restoration 235 100 46 32 18 9 7
2035 2040 2045 2050 2055 2060 2065 Life Cycle**
Environmental Restoration 7 2 0 0 0 0 0 2,480
• Costs reflect a five-year average in constant 1995 dollars, except in FY 2000, which is a six•year average.
• Total Life Cycle is the sum of annual costs in constant 1995 dollars.
Major Activity Milestones
ACTIVITY TASK COMPLETION DATE
Environmental Restoration Fiscal Year
Complete Assessment 1996
Complete Remediation 1996
Complete Surveillance and Maintenance 2032
For further information on this site please contact: Public Participation Office (702) 295-4652
Public Affairs Office (702) 275-3521
Technical Liaison: Bobbie McClure (702) 295-1862
AK 5

AK 6

Ar zany
TUBA CITY(COMPLETEDUMTRA SITE)*
MONUMENT VALLEY(COMPLETED UMTRA SITE)*
*Summaries are not provided forfacilities with completed remedialactions. Any ongoing surveillance andmonitoring costs for these facilities areprovided in the table below.
ARIZONAEstimated State Total
Completed UMTRA Surveillance & Monitoring
(Thousands of Current 1995 Dollars)*
fl 1995 1996 1997 1998 1999 2000
1,589 2,046 3,483 7,616 9',125 6,776
• Costs for FY 1995 reflect Congressional Appropriation, costs for FY 1996 reflect EM budget submission, costs for FY 1997-2000 reflect Budget Shortfall
Scenario, costs for
shaded area assume 3% annual inflation.
Five-Year Averages (Thousands of Constant 1995 Dollars)**
FY 1995-2000 2005 2010 2015 2020 2025 2030 Life Cycle*
Completed UMTRA Surveillance & Monitoring 5,430 9,285 9,879 13,619 0 0 0 196,495
** Costs reflect a five-year average in constant 1995 dollars, except in FY 1995 - 2000, which is a six-year average.
*** Total Life Cycle is the sum of annual costs in constant 1995 dollars.
AZ 1

Baseline Environmental IWIanagement Reilert,
AZ 2

LABORATORY FOR EN ERG r.RELATED HEALTH RESEA(LEHR)
UNIVERSITY OF CALIFORNIA,
G ILMAN HALL, BERKELEY(COMPLETED FUSRAP SITE)*
LAWRENCE BERKELEYLABORATORY
STANFORD LINEARACCELERATOR CENTER
OXNARD SITE
ENERGY TECHNOLOGYENGINEERING CENTER (ETEC),
SANTA SUSAN A FIELDLABORATORY
LAWRENCE LIVERMORENATIONAL LABORATORY(MAIN SITE AND SITE 300)
GENERAL ELECTRIC VALLECITOSNUCLEAR CENTER
b4.',4444 SANDIA NATIONAL LABORATORY -
" • LIVERMO RE
SALTO N SEA TEST BASE(REPORTED UNDER SANDIA -ALBUQUERQUE OFFSITE AREAS)
/C)
GENERAL ATOMICS
GEOTHERMALTEST FACILITY
ROCKWELL INTERNATIONAL(FORMERLY ATOMICINTERNATIONAL)
* Summaries are not providedfor facilities with completedremedial actions.
CALIFORNIA
CA 1

Estimated State Total
(Thousands of Current 1995 Dollars) *
99 1996 1997 1998 19 200Energy Technology Engineering Center 8,494 13,125 17,025: 14 5 14,633 14,541General Atomics 2,700 3,0405077 4,062 0 0General Electric Vallecitos Nuclear Center 360 105 764 2,761 890 3,445Geothermal Test Facility 7,962 7,595 14,8791 14,551 13,903 14,650Laboratory for Energy-Related Health Research 7,057 7,321 5,2891 3,549 2,823 3,004Lawrence Berkeley Laboratory 13,905 13,175 12,520 12,232 12,393 14,753Lawrence Livermore National Laboratory 70,710 88,360 79,534 87,531 91;76890,763Oxnard 3,500 7,725 3,711,639 0Sandia National Laboratories - Livermore 4,904 5,476 4,883 4,932 2,339 2,299Stanford Linear Accelerator Center 6,259 6,101 6,370.'6,692 6,837 7,009
Total 125,851 152,029 50,054 152,801 148,585 150,464
Costs for FY 1995 reflect Congressional Appropriation, costs for FY 1996 reflect EM budget submission, costs for FY 1997-2000 reflect Budget Shortfall Scenario, costs forshaded area assume 3% annual inflation.
Five-Year Averages (Thousands of Constant 1995 Dollars)** FY 1995-2000 2005 2010 2015 2020 2025 2030Energy Technology Engineering Center 12,737 23,881 22,152 4,310 966 233 0General Atomics 2,699 0 0 0 0 0 0General Electric Vallecitos Nuclear Center 1,689 619 580 549 469 401 342Geothermal Test Facility 1,223 0 0 0 0 0 0Laboratory for Energy-Related Health Research 4,575 971 841 732 625 6 0Lawrence Berkeley Laboratory 11,793 9,584 7,087 1,062 1,060 6,977 5,672Lawrence Livermore National Laboratory 80,919 79,753 58,311 52,264 49,497 41,118 38,343Oxnard 2,763 0 0 0 0 0 0Sandia Notional Laboratories - Livermore 3,726 3,714 3,714 3,714 3,714 3,714 3,010Stanford Linear Accelerator Center 6,073 4,811 4,551 4,520 4,500 4,483 3,604
Total 128,196 123,393 97,234 73,152 66,831 62,931 50,972
....., 2035 2040 2045 2050 2055 2060 2065 Life C de***Energy Technology Engineering Center 0 0 0 0 0 0 0 334,131General Atomics 0 0 0 0 0 0 0 16,194General Electric Vallecitos Nuclear Center 0 0 0 0 0 0 0 25,233Geothermal Test Facility 0 0 0 0 0 0 0 7,336Laboratory for Energy-Related Health Research 0 0 0 0 0 0 0 43,310Lawrence Berkeley Laboratory 0 0 0 0 0 0 0 287,975Lawrence Livermore National Laboratory 6,628 2,291 1,500 1,280 519 0 0 2,173,021Oxnard 0 0 0 0 0 0 0 16,576Sandia National Laboratories - Livermore 0 0 0 0 0 0 0 130,240Stanford Linear Accelerator Center 92 0 0 0 0 0 0 169,244
Total 6,720 2,291 1,500 1,280 519 0 0 3,203,268
▪ Costs reflect a five-year average in constant 1995 dollars, except in FY 1995 - 2000, which is a six-year average.• Total Life Cycle is the sum of annual costs in constant 1995 dollars.
CA 2

ENERGY TECHNOLOGY ENGINEERING CENTER
The 2700-acre Santa Susana Field Laboratory is located in the Simi Hills of Ventura County, ap-
proximately 30 miles northwest of downtown Los Angeles, California. Department of Energy
(DOE) operations are conducted in Rockwell International-owned and DOE-owned facilities on a
290-acre site. The Energy Technology Engineering Center portion of the Santa Susana Field Labora-
tory consists of Government-owned buildings occupying 90 acres of the 290-acre site. The land is
owned by Rockwell International.
Building 100Trench
RD-34Offsite Wells in3-well cluster
Building 886Sodium DisposalFacility
Building 133Hazardous MaterialTreatment Facility
RMDF
RD-33Offsite Wells in3-well cluster
Building 024
Building 059
Note: Drawing is not to scale
Building 020Rockwell Hot Lab
Building064
Building 029RCRAHazardous WasteStorage Facility
Building 005Molten Salt ProcessDevelopment Unit
0 Decommissioning
E2 Remedial Action
E0 Waste Management
CA 3

MOP
Estimated Site Total
Environmental RestorationWaste ManagementNuclear Material and Facility StabilizationDirectly Appropriated LandlordProgram Management
Total
(Thousands of Current 1995 Dollars)*
FY 1995 1996 1997
8,494 13,125 17,025
1998 1999 2000
7,0673,5251,2503,500
14,852 14,633 14,541
Costs for FY 1995 reflect Congressional Appropriation, costs for FY 1996 reflect EM budget submission, costs for FY 1997-2000 reflect Budget Shortfall Scenario, costs forshaded area assume 3% annual inflation.
Five-Year Averages (Thousands of Constant 1995 Dollars)**
FY 1995-2000 2005 2010 2015 2020 2025 2030 Life Cycle***Environmental Restoration 6,074 4,531 322 157 39 0 0 61,688Waste Management 3,483 3,522 3,081 2,384 58 4 0 66,143Nuclear Material and Facility Stabilization 2,005 13,386 17,350 634 344 28 0 170,736Directly Appropriated Landlord 497 1,000 500 500 500 200 0 16,482Program Management 677 1,443 899 636 25 1 0 19,081
Total 12,737 23,881 22,152 4,310 966 233 0 334,131
" Costs reflect a five-year average in constant 1995 dollars, except in FY 1995 - 2000, which is a six-year average."' Total Life Cycle is the sum of annual costs in constant 1995 dollars.
PAST, PRESENT, AND
FUTURE MISSIONS
Part of Area IV at Santa Susana FieldLaboratory was set aside in the mid-1950's fornuclear reactor development and testing.Research was primarily related to thedevelopment of sodium-cooled nuclearpowerplants and space power systems usingsodium and potassium as coolants. The EnergyTechnology Engineering Center occupies 90acres within Area IV and was formed in themid-1960's as a DOE laboratory for thedevelopment of liquid metal, heat-transfersystems in support of the Liquid Metal Fast
Breeder Reactor Program. Operations atBuilding 20, the Rockwell International HotLaboratory, were in support of DefensePrograms while other facilities at the EnergyTechnology Engineering Center supportedother DOE research programs, including theSystems for Nuclear Auxiliary Power program.Operations in all nuclear reactors and someother facilities in Area IV had ended by themid-1970's.
Nuclear Energy activities at the EnergyTechnology Engineering Center wereterminated at the end of 1994. Currently,Energy Technology Engineering Center'sprimary mission is applied engineeringdevelopment of emerging energy technologies,
CA 4

including conservation, environmental, solar,geothermal, and fossil energy. Environmentalrestoration and decommissioning activitiesbegan at this site in the early 1970's. In 1980,DOE began a systematic decontamination ofremaining excess facilities formerly used forreactor development. As decommissioningactivities are completed and buildings arecertified for release for unrestricted use, theywill be transferred to Rockwell International.Total Life Cycle costs for activities at this siteare provided in the Estimated Site Total table.
The Office of Energy Efficiency is currently thelandlord for the Energy TechnologyEngineering Center. It is anticipated that thefacility landlord responsibilities includinginfrastructure management and surveillanceand maintenance of current Office of EnergyEfficiency facilities will be the responsibility ofEnvironmental Management beginning in FY1996.
Current long-term plans are to allow privatesector companies and State, Federal, andforeign organizations to use a number of thefacilities for an as-yet undefined period.
ENVIRONMENTAL
RESTORATION
Research and development activities, pastdisposal and handling practices, and solventuse and disposal at the Energy TechnologyEngineering Center resulted in contaminationof former research buildings, several existingand former waste management facilities, andsite soil and ground water. Becauseenvironmental restoration activities have beenconducted at the site since the early 1970's,many of the initially contaminated facilitieshave already been remediated. TheEnvironmental Restoration Projects tablecontains the costs for environmental restorationactivities at the Energy Technology EngineeringCenter. These costs are broken down byactivity in the Environmental RestorationActivity Costs table.
Radioactive contaminated sites resulted fromnuclear activities performed primarily in the1960's. These activities included the operationof 10 reactors and 7 criticality test facilities, fuelfabrication, reactor and used fuel disassembly,small-scale laboratory work, and onsite storageof nuclear material. Over the period of 1974 to
Environmental Restoration Projects
Five-Year Averages (Thousands of Constant 1995 Dollars)*
FY 1995 - 2000 2005 2010 2015 2020 2025 2030 Life Cycle"
Environmental Restoration 6,074 4,531 322 0 0 0 60,709
Facility Decommissioning 0 0 0 157 39 0 0 979
Total 6,074 4,531 322 157 39 0 0 61, 688
' Costs reflect a five-year average in constant 1995 dollars, except in FY 1995-2000, which is a six-year average.
• Total Life Cycle is the sum of annual costs in constant 1995 dollars.
CA 5

1989, a decommissioning activities program atthe Energy Technology Engineering Centerremoved in excess of 99 percent of the man-made radioactivity generated at the site. Theremaining unconfined radioactivity has beenmeasured at less than 0.1 curie, which is muchless than the radioactivity in the naturalenvironment at Santa Susana Field Laboratory.Confined radioactivity is estimated to be lessthan 10 curies and is controlled in activated orcontaminated structures that are locked, fenced,and within a guarded perimeter.
The remaining contaminated buildings at theEnergy Technology Engineering Centercurrently in the Environmental Managementprogram are Buildings 012, 020, 024, and 059.These buildings are undergoing or arescheduled for decommissioning activities.
Building 012, the System for Nuclear AuxiliaryPower Critical Facility contains structuralmaterial contaminated by low-levelradioactivity. The Rockwell International HotLab, which was contaminated as a result ofstorage of radioactive and other material usedfor research, has been undergoingdecontamination since 1987.
Building 059, a System for Nuclear AuxiliaryPower reactor test facility, containsaboveground and belowground units. Theaboveground unit is referred to as the LargeLeak Test Rig, and the belowground unit isreferred to simply as Building 059. Both werecontaminated as a result of research operations.
Past radioactive and hazardous materialhandling and disposal practices also resulted incontamination at several existing or formerdisposal units. Facilities undergoingenvironmental restoration include the SodiumDisposal Facility (Building 886), the Building056 landfill, and the Radioactive MaterialsDisposal Facility. Previous operations at someof these facilities also resulted in thecontamination of adjacent soils. The SodiumDisposal Facility, which is currently undergoingpost-remediation independent verification as
part of Resource Conservation and RecoveryAct (RCRA) closure, was contaminated as aresult of storage of radioactive materials. TheBuilding 056 landfill contains contaminationdue to past disposal activities. Buildings 021,022, and 075, which make up the RadioactiveMaterials Disposal Facility, containradioactivity due to storage activities.
The use of solvents at or near the site,presumably in connection with rocket testsoutside of Area IV, has resulted in ground-water contamination. The release of unknownquantities of cleaning solvents in the mid-1960'sresulted in volatile organic compoundscontamination of ground water. Ground waterhas also been contaminated in certain areaswith tritium, gross alpha and beta radioactivity,and radium 226 and 228. Ground-waterextraction and pumping at Energy TechnologyEngineering Center has limited the lateralextent of the ground-water contamination, butcomplete site characterization and ground-water remediation is continuing.
Environmental restoration activities includesite-wide assessment, the development of aremedial action plan, and the remediation ofcontaminated media and the Building 056Landfill. The results of an integrated site-widesoil and ground-water assessment will be usedin developing a site-wide remedial action plan,which is scheduled for completion in FY 1995.The remedial action plan will identify allactivities required to remediate the site foreventual release for unrestricted use. Soilremediation at contaminated buildings will beconducted as part of decommissioningactivities. Energy Technology EngineeringCenter Solid Waste Management Unitsidentified in the RCRA Facility Assessment willalso be remediated and include the Building056 Landfill whose closure is scheduled to startin FY 1996 and be completed in FY 1999.
Decommissioning activities involve DOE-owned surplus facilities and RCRA closure ofthe Sodium Disposal Facility and the
CA 6

Radioactive Materials Disposal Facility. Allcleanup is being conducted in a manner topermit unrestricted future use. Thedecommissioning activities also includes thesurveillance and maintenance of facilitiesawaiting funding for decommissioningactivities. Additional work includes thepackaging, shipping, and disposal of bothhazardous and nonhazardous waste generatedby decommissioning activities.
Decommissioning activities have beencompleted at many of the former nuclearresearch sites and are currently underway atBuildings 012, 020, and 059. Completion isexpected in FY 1996 at Buildings 012 and 059and demolition of Building 020 in FY 2000.Decommissioning activities are scheduled tobegin at Building 057, the Large Leak Test Rig,in FY 1998. RCRA closure of the former sodiumdisposal facility is scheduled for completion bythe end of FY 1995. Decommissioning disposaltasks include the disposal of a moderator cask(a former onsite transport cask) and waste fromthe closure of the Sodium Disposal Facility,both scheduled to occur in FY 1995.
The Radioactive Materials Disposal Facility isused in support of decommissioning activitiesand contains a decontamination facility andtemporary storage area for radioactive andmixed waste prior to offsite disposal. A smallamount of transuranic waste from a previousdecommissioning activities program istemporarily stored at the Radioactive MaterialsDisposal Facility. Following completion ofother decommissioning activities requiringcontinuing operation of the RadioactiveMaterials Disposal Facility, it will also bedecommissioned, probably beginning in FY1999.
WASTE MANAGEMENT
Waste management operations at the EnergyTechnology Engineering Center include thedisposal of hazardous, radioactive, and mixedwaste, corrective activities at the SodiumComponents Test Installation, and Tiger TeamWaste Management related activities, as well asthe continuity of operations at the RadioactiveMaterials Disposal Facility and HazardousWaste Management Facility. Costs for theHazardous Waste Facility are represented in theMajor Waste Management Projects table.
Management of low-level mixed waste willinclude onsite treatment of several mixed-wastestreams and onsite storage of mixed waste priorto offsite disposal. Waste managementactivities at the Energy Technology EngineeringCenter have included operations waste fromthe various research units. Presently, much ofthe waste handled is residual material fromformer research activities and decommissioningactivities or environmental restorationgenerated waste from facility closures andremediation. Waste management activities willcontinue until all environmental restoration andfacility stabilization activities are complete (FY2025) (see the Waste Management ActivityCosts table).
The Energy Technology Engineering Centerthat operates the Hazardous WasteManagement Facility for the handling,treatment, and disposal of nonradioactivesurplus and alkali metal waste. The EnergyTechnology Engineering Center is preparing aPart B Operation Plan for RCRA permitting ofthe Radioactive Materials Disposal Facility. ARCRA Part A permit application has beensubmitted to EPA and California. TheRadioactive Materials Disposal Facility iscurrently operating under interim status.
The continuity of operations, performed incompliance with the RCRA permit, includeswaste characterization, certification,minimization, packaging, and offsite disposal.
CA 7

Corrective actions consist of developing a wasteminimization plan, upgrading the RadioactiveMaterials Disposal Facility stack samplingsystem, and designing and installing ahazardous waste collection system.
Waste Treatment
Onsite treatment is currently performed onsurplus sodium and three mixed waste streams.Sodium is currently treated at the thermaloxidation unit in Building 133 of the HazardousWaste Management Facility, and the endproduct must be disposed as a hazardouswaste. To replace this system, a new sodiumcleaning unit at the existing ComponentHandling and Cleaning Facility will becompleted in FY 1996. Operations at Building133 will be phased out starting in FY 1998, andthe building will undergo RCRA closure. Allradioactive waste at the Energy TechnologyEngineering Center is stored and processed inthe Radioactive Materials Disposal Facilityprior to disposal.
Two types of low-level mixed waste will berecycled. The first waste type consists ofsodium metal slightly contaminated withradioactive manganese to be converted tosodium hydroxide and used as a reagent toneutralize an electropolish solution. Thesecond waste type consists of lead shieldingwith low-level radioactivity to be treated onsiteby crystalline ice blasting and chelatingtreatment. The resultant lead material will be
free of radioactivity and then be recycled.Treatment and disposal options foruncharacterized and future potential mixedwaste will be evaluated after characterization iscomplete.
Waste Storage
Decommissioning-activities waste is storedtemporarily in the Radioactive MaterialsDisposal Facility and the Hazardous WasteManagement Facility. All radioactive andmixed waste generated at Energy TechnologyEngineering Center is stored at the RadioactiveMaterials Disposal Facility.
The total volume of characterized, low-levelmixed waste currently stored at the EnergyTechnology Engineering Center is 3.58 cubicmeters and includes the electropolish solutionand high-efficiency particulate air filter systembag filters. There is one uncharacterized mixed-waste stream, paint chips potentially containinglead, but the current volume stored at EnergyTechnology Engineering Center has yet to bedetermined. The mixed transuranic wastestored onsite consists of one brick (0.001 cubicmeters) of lead shielding. Future potentialmixed waste streams include salt corescontaining chromium; analytical waste; variouswaste resulting from decommissioningactivities of Building 20 (high-efficiencyparticulate air filter pre-filters, high-efficiency
Major Waste Management Projects
Five-Year Averages (Thousands of Constant 1995 Dollars)*
FY 1995-2000 2005 2010 2015 2020 2025 2030 Life Cycle"
Hazardous Waste Handling Facility 333 0 0 0 0 0 0 2,000
Costs reflect a five-year average- in constant 1995 dollars, except in FY 1995-2000, which is a six-year average.
Total Life Cycle s the sum of annual costs in constant 1995 dollars.
Note: These projects represent a subset of waste management activities. Associated program management costs are built-in to the estimates provided.
CA 8

particulate air filter bag filters, drain-linedebris, vacuum catch barrels, and spray paintcans); and various waste from other futureremedial and decommissioning activities. Thiswaste is not fully characterized, and noestimate of total volume is available. TheRadioactive Materials Disposal Facility isscheduled to undergo decommissioningactivities starting in FY 1999.
Waste Disposal
Waste disposal occurs offsite at various DOEand commercial facilities. Radioactive activitieswaste will be disposed at the Nevada Test Sitewith the exception of high-efficiency particulateair filter bag filters to be disposed at theEnvirocare Facility in Utah. All otherradioactive waste except the mixed transuranicwaste will be disposed at DOE Hanford. Onebrick of lead shielding contaminated withtransuranic elements will be disposed at theWaste Isolation Pilot Project. Hazardous wastewill be disposed at permitted treatment,storage, and disposal facilities.
MOM
NUCLEAR MATERIAL AND
FACILITY STABILIZATION
The Energy Technology Engineering Center hasnot yet entered the Environmental Managementfacility stabilization program. The 44 facilitiesat the Energy Technology Engineering Centeranticipated to enter the program include asodium laboratory, a liquid metals chemical lab,and hazardous materials storage facilities. Theresulting waste types will include low-levelmixed, low-level, transuranic, and hazardous.It is assumed for purposes of this report thesefacilities will incrementally begin stabilizationin 1996. Surveillance and maintenance will beperformed to ensure any contaminationexisting will remain contained within thefacility and the facility will not deteriorate priorto decommissioning activities and restorationactivities. Repairs will be made when necessaryto maintain the Federal Government'sinvestment in the facility. See the LandlordCost Estimate table for total costs in this area.
This report assumes the stabilization andmaintenance process at the Energy TechnologyEngineering Center will be completed by 2025.
Waste Management Activity Costs
Five-Year Averages (Thousands of Constant 1995 Dollars)*
FY 1995 - 2000 2005 2010 2015 2020 2025 2030 Life Cycle'
Treatment
low-level Mixed Waste 231 188 97 18 0 0 0 2,895
low-level Waste 115 523 137 122 51 4 0 4,875
Storage and Handling
Low-level Waste 0 1 5 3 3 0 0 59
Hazardous Waste 3,137 2,810 2,842 2,241 4 0 0 58,315
Total 3,483 3,522 3,081 2,384 58 4 0 66,143
Costs reflect a five-year average in constant 1995 dollars, except in FY 1995-2000, which is a six-year average.
'• Total Life Cycle is the sum of annual costs in constant 1995 dollars.
CA 9

Complete costs are found in the NuclearMaterial and Facility Stabilization Projectstable.
LANDLORD FUNCTIONS
The Office of Energy Efficiency is currently thelandlord for the Energy TechnologyEngineering Center. It is anticipated the facilitylandlord responsibilities includinginfrastructure management and surveillanceand maintenance of current Office of EnergyEfficiency facilities will be the responsibility ofEnvironmental Management beginning in FY1996.
PROGRAM MANAGEMENT
Program management costs for both theenvironmental restoration program and thewaste management program are found in theProgram Management Cost Estimate table.Program management tasks supporting theenvironmental restoration program at theEnergy Technology Engineering Center include:
• personnel management;
• maintenance of site-wide environmental data;
• strategic planning;
• financial management;
• interaction between DOE, external regulatory agencies,and the public;
• permitting;
• monitoring of project progress;
• provision of a technical advisory board;
• coordination of independent verification contractors;and
• administrative support.
Program management tasks supporting thewaste management program at the EnergyTechnology Engineering Center include:
• facility management;
• personnel management and training;
• administrative support;
• document, guidance, and procedure preparation andrevision;
• database and waste tracking management;
• liaison with DOE and external regulatory agencies;
• audits;
• budget preparation and control; and
• waste minimization planning.
Nuclear Material and Facility Stabilization Cost Estimate
Five-Year Averages (Thousands of Constant 1995 Dollars)•
FY 1995 - 2000 2005 2010 2015 2020 2025 2030 Life Cycle
Nuclear Material and Facility Stabilization 2,005 13,386 17,350 634 344 28 0 170,736
• Costs reflect a five-year average in constant 1995 dollars, except in FY 1995-2000, which is a six-year average.
• Total Life Cycle is the sum of annual costs in constant 1995 dollars.
CA 10

DOE's Oakland Operations Office and the Stateof California have an Agreement-in-Principleproviding for technical and financial support tothe State for its activities at Energy TechnologyEngineering Center and five other DOE sites inCalifornia. The activities includeenvironmental oversight, monitoring, access,emergency preparedness, and other initiativesto ensure compliance with Federal, State, andlocal regulations applicable at the site.
FUNDING AND COST
INFORMATION
The following tables present fundinginformation and major activity milestones forthe Energy Technology Engineering Center.
Landlord Cost Estimate
Five-Year Averages (Thousands of Constant 1995 Dollars)*
FY 1995 - 2000 2005 2010 2015 2020 2025 2030 Life Cycle**
Directly Appropriated Landlord 497 1,000 500 500 500 200 0 16,482
• Costs reflect a five-year average in constant 1995 dollars, except in FY 1995-2000, which is a six-year average.
• Total Life Cycle is the sum of annual costs in constant 1995 dollars.
Program Management Cost Estimate
Five-Year Averages (Thousands of Constant 1995 Dollars)*
FY 1995-2000 2005 2010 2015 2020 2025 2030 Life Cycle*"
Program Management 677 1,443 899 636 25 1 0 19,081
• Costs reflect a five-year average in constant 1995 dollars, except in FY 1995-2000, which is a six-year average.
• Total Life Cycle is the sum of annual costs in constant 1995 dollars.
CA 11

Defense Funding Estimate
Five-Year Averages (Thousands of Constant 1995 Dollars)•
FY 1995 - 2000 2005 2010 2015 2020 2025 2030 Life Cycle"
Waste Management 3,483 3,522 3,081 2,384 58 4 0 66,143Nuclear Material and Facility Stabilization 2,005 13,386 16,945 70 344 0 0 165,750Directly Appropriated Landlord 497 1,000 500 500 500 200 0 16,482Program Management 368 880 770 606 15 1 0 13,570
Total 6,353 18,788 21,296 3,560 916 205 0 261,946
Costs reflect a five-year average in constant 1995 dollars, except in FY 1995-2000, which is a six-year average.
Total Life Cycle is the sum of annual costs in constant 1995 dollars.
Nondefense Funding Estimate
Five-Year Averages (Thousands of Constant 1995 Dollars)*
FY 1995 - 2000 2005 2010 2015 2020 2025 2030 Life Cycle"
Environmental Restoration 6,074 4,531 322 157 39 0 0 61,688Nuclear Material and Facility Stabilization 0 0 405 564 0 28 0 4,986Program Management 309 563 129 30 10 0 0 5,511
Total 6,383 5,093 856 751 49 28 0 72,185
• Costs reflect a five-year average in constant 1995 dollars, except in FY 1995-2000, which is a six-year average.
Total Life Cycle is the sum of annual costs in constant 1995 dollars.
CA 12

Major Activity Milestones
ACTIVITY TASK COMPLETION DATE
Nuclear Material and Facility Stabilization
Assessment & Remediation
Fiscal Year
Initiate Facility Stabilization 1996
Complete Facility Surveillance and Monitoring 2025
Final Site-Wide Remedial Action Plan 1995
Complete Site-Wide Assessment 2004
Environmental Restoration Fiscal Year
Assessment & Remediation Complete Site-Wide Remediation 2010
Decommissioning Activities (Nondefense) Begin Decommissioning Activities 1995
Complete RCRA Closure of the SDF' 1995
Complete Decommissioning Activities of Buildings 012 and 059 (belowground) 1996
Complete Closure of the Radioactive Material Disposal Facility 1999
Complete RCRA Closure of Building 056 Landfill Decommissioning Activities (Defense) 1999
Decommissioning Activities of Building 020 Support Rooms and Outside Area 1996
Decommissioning Activities of Building 020 Storage Airlock and Basement 1997
Decommissioning of Building 020 2000
Waste Management Fiscal Year
Construction of New Sodium Cleaning Unit for the CHCF2 1996
Waste Management Complete 2025
'Sodium
Component Handling and Cleaning Facility
For further information on this site, please contact : Public Participation OfficePublic Affairs OfficeTechnical Liaison: Rich Fallejo
(510) 637-1812(818) 586-5326(510) 637-1639
CA 13

CA 14

GENERAL ATOMICS
General Atomics occupies approximately 120 acres on two contiguous sites 13 miles north of SanDiego, California. The two sites are referred to as the Main Site and the Serrano Valley Area.
Security Station
• North Security Station
441)
• IISouth Security Station
San DiegoSupercomputer
CA 15

Estimated Site Total
(Thousands of Current 1995 Dollars)*
FY 1995 1996 1997 1998 1999 2000
Environmental Restoration 2,266 2,53 4,227 3,382Program Management434 505 850 680
Total 2,700 3,040 5,077 4,062
• Costs for FY 1995 reflect Congressional Appropriation, costs for FY 1996 reflect EM budget submission, costs for FY 1997-2000 reflect Budget Shortfall Scenario, costs forshaded area assume 3% annual inflation.
Five-Year Averages (Thousands of Constant 1995 Dollars)**
FY 1995-2000 2005 2010 2015 2020 2025 2030 Life Cycle***
Environmental Restoration 2,308 0 0 0 0 0 0 13,847Program Management 391 0 0 0 0 0 0 2,348
Total 2,699 0 0 0 0 0 0 16,194
Costs reflect a five-year average in constant 1995 dollars, except in FY 1995 - 2000, which is a six-year average.
*" Total Life Cycle is the sum of annual costs in constant 1995 dollars.
PAST, PRESENT, AND
FUTURE MISSIONS
In support of the Department of Energy (DOE)and its predecessor agencies, as well ascommercial customers, General Atomics hasmaintained a fully operational Hot Cell Facilityat the Main Site for over 30 years. The Hot CellFacility has been used for numerousexaminations of DOE fuels, structural material,and instrumentation. General Atomicsactivities at the Hot Cell Facility primarilysupported the High Temperature Gas-CooledReactor Program. The Hot Cell Facility iscurrently the only facility at General Atomics inthe Environmental Management program. TheHot Cell Facility became contaminated withvarying amounts of radioactive materials andsmall amounts of hazardous materials. General
Atomics decided to shut down the Hot CellFacility because of reduced demand andcontinuing private industrial developmentaround the site. The decommissioningactivities of the Hot Cell Facility will eliminatethe potential for future environmental releasesand make the Hot Cell Facility available forother uses. Environmental Management costsassociated with the General Atomics facility arefound in the Estimated Site Total table.
The Hot Cell Facility occupies Building 23 andthe outdoor service yard at General Atomic'sMain Site. The interior of Building 23 hasapproximately 7,000 square feet of floor spaceconsisting of offices, three hot cells, anoperating gallery, and auxiliary areas. Thefacility has been used for numerousexaminations of DOE fuels, structural material,and instrumentation. Operations in Building 23have been performed subject to Nuclear
CA 16

Regulatory Commission Special NuclearMaterial License No. SNM-696 and theCalifornia Department of Health ServicesRadioactive Material License No. 0145-80.
Building 23 is surrounded by 41,740 square feetof fenced service yard including severalconcrete pads used for staging heavyequipment and making material transfers intoand out of the building. The remaining area iscomprised of asphalt, soil, scattered smallrocks, and disturbed vegetation. There is a 400-square-foot metal ancillary building and twoaboveground waste storage tanks.
ENVIRONMENTAL
RESTORATION
The Environmental Restoration Projects tableprovides costs for all environmental restorationactivities at General Atomics. The NondefenseFunding Cost Estimate table shows the sourceof funding for environmental restorationactivities. These costs are presented by activityin the Environmental Restoration Activity Coststable.
The examination of irradiated fuel, structuralmaterial, and instrumentation in the Hot CellFacility has contaminated the facility withmixed fission and mixed activation products.Preliminary radiological surveys and a siteevaluation show 2,250 cubic meters of low-levelwaste, low-level mixed waste, undeterminedamounts of asbestos, lead, and other hazardousmaterials. Contamination is confined withinthe boundaries of the Hot Cell Facility, andhealth risks to General Atomics workers andthe public are likely to be extremely limited.The exact nature and extent of soil and ground-water contamination are currently beingdefined, and potential risks will need to bereviewed after this assessment is completed.
The Hot Cell Facility is currently removingirradiated fuel material from the ThermionicFuel Element and High Temperature Gas-Cooled Reactor and Reduced EnrichedResearch Test Reactor programs and the NewProduction Reactor program process. The HotCell Facility is also in the process of removingcontaminated (low-level) equipment wasteabandoned by the DOE Program officesmentioned above.
The Hot Cell Facility site will be released forunrestricted use to the Nuclear RegulatoryCommission from General Atomics.
The Hot Cell Facility is presently undergoingdecommissioning activities. The scope of theGeneral Atomics decommissioning activitiesproject includes dispensation of NewProduction Reactor program process andequipment waste and Reduced EnrichedResearch Test Reactor, Thermionic FuelElement, and High Temperature Gas-CooledReactor irradiated fuel material. Hot CellFacility decommissioning activities arecurrently being performed in three phases:
• Phase 1 provides for disposal of waste material andirradiated fuel materials remaining in the Hot Cell fromprevious DOE contracts; determination of the magni-tude and extent of contamination through characteriza-tion; and preparation of all required Health & Safetyand National Environmental Policy Act documenta-tion.
• Phase 2 includes decommissioning activities of the HotCell Facility; decontamination outside Hot Cell Facilitysurface and subsurface areas; packaging, shipment, anddisposal of radioactive and nonradioactive waste; andsoil remediation.
• Phase 3 includes the closure site survey, submittal ofthe closure report, and obtaining approval fromregulatory agencies and DOE for release of the Hot Cell
CA 17

Facility site for unrestricted use.
Site and waste characterizations are beingperformed. Detailed characterization willinclude:
• radiological surveys to determine the locations andconcentrations of radiological contamination,
• hazardous material surveys to identify and locatehazardous materials and waste contamination, and
• asbestos surveys to identify the extent and nature ofasbestos contamination.
Decontamination operations at the Hot CellFacility are currently scheduled to commence inFY 1995. The standard approach will be to usesimpler and more passive methods first,advancing to more aggressive methods asneeded. Passive decontamination techniqueswill be used when indicated as appropriate bythe results of radioactive surfacecharacterization. These techniques includestandard vacuuming, damp cloth wiping, and,to a limited degree, hand washing/scrubbingoperations. When these passive methods fail to
reduce surface contamination to releasablelevels, more aggressive decontaminationmethods will be used. In order of preference,these methods are:
• dry abrasive blasting with a vacuum,
• scabbing and scarification, and
• washing with ultra-high-pressure water.
If contamination is found within Hot CellFacility structural elements, demolishing thebuilding will be reconsidered. The current planis for DOE to remove all contamination from inand around the Hot Cell Facility and return thefacility to General Atomics for unrestricted use.The costs of the Hot Cell Facilitydecommissioning will be split between DOE (76percent) and General Atomics (24 percent).
WASTE MANAGEMENT
Waste Treatment, Storage andDisposal Operations
Waste management activities associated withoperational wastes are funded by NuclearEnergy and Defense Programs. Environmental
Environmental Restoration Activity Costs
Five-Year Averages (Thousands of Constant 1995 Dollars)*
FY 1995 - 2000 2005 2010 2015 2020 2025 2030 Life Cyde**
Environmental RestorationAssessment 364 0 0 0 0 0 0 2,182Facility Decommissioning 1,944 0 0 0 0 0 0 11,665
Total 2,308 0 0 0 0 0 0 13,847
• Costs reflect a five-year average in constant 1995 dollars, except in FY 1995-2000, which is a six-year average.
• Total Life Cycle is the sum of annual costs in constant 1995 dollars.
CA 18

restoration is funding waste characterization,packaging, and disposal of waste from the HotCell Facility. In addition, there is HighTemperature Gas-Cooled Reactor irradiatedfuel material waste. The total waste from thedecommissioning of the Hot Cell Facilityrequiring disposal will be 2,250 cubic meters oflow-level and low-level mixed, and anundetermined amount of hazardous waste.Decommissioning activities will not generateany transuranic, mixed-transuranic, or high-level waste. All low-level waste generated bydecommissioning activities will be disposed ofat the Hanford site in Washington State.
All mixed waste will be treated and disposed atDOE Hanford except:
• the elemental mercury mixed waste stream that will be
the subject of an onsite treatability study or will be sent
to Idaho National Engineering Laboratory for treat-
ment;
• the corrosives mixed-waste stream that will be sub-
jected to onsite neutralization, filtration, and stabiliza-
tion; and
• the organic liquid mixed waste stream that will be
subjected to incineration and stabilization at the Idaho
National Engineering Laboratory.
All mixed waste storage and onsite treatmentactivities will be performed at GeneralAtomics's Mixed Waste Management Facility.The current mixed waste onsite consists ofresidual stored low-level mixed material fromprevious DOE activities. The current inventoryof characterized mixed waste totals 8.35 cubicmeters. No additional generation of thesecharacterized mixed waste streams is expectedthrough FY 1997.
Preferred treatment options for characterizedmixed waste streams include:
• compaction and stabilization of inorganic debris at
DOE Hanford;
• macroencapsulation of elemental lead at DOE Hanford;
• stabilization of inorganic sludge and particulates at
DOE Hanford;
• incineration and stabilization of organic liquids atIdaho National Engineering Laboratory; and
• onsite neutralization, filtration, and stabilization ofcorrosives.
An onsite treatability study will be conductedconcerning the elemental mercury; however,the treatment option recommended by theDOE's Oakland Operations Office for theelemental mercury mixed waste stream istreatment at the Idaho National EngineeringLaboratory. The estimated mixed wastevolumes for onsite treatment and disposal atDOE Hanford are 1.46 cubic meters and 6.89cubic meters, respectively.
The estimated volume of uncharacterizedmixed waste streams is 32 cubic meters andincludes corrosives, ignitables, organic liquids,inorganic debris, and aqueous liquids.
Future generation estimates of waste streamsare 20 cubic meters of inorganic debris, whichconsists of miscellaneous scrap metal from theHot Cell Facility decommissioning and highefficiency particulate air filters from the NewProduction Reactor, and 5 cubic meters ofwastewater containing zinc and possibly othermetals from the Hot Cell Facilitydecommissioning.
Mixed waste generated at General Atomics isstored at the Mixed Waste Management Facility,which is an interim status waste storage facilityunder RCRA. The Mixed Waste ManagementFacility consists of three areas that aredesignated as container storage areas for mixedwaste. These areas are called Mixed WasteManagement Facility 1, Mixed WasteManagement Facility 2, and Mixed WasteManagement Facility 3. The total storagecapacity in these three areas is approximately580 cubic meters (equivalent to 2,758 55-gallondrums), which far exceeds the current andprojected mixed waste inventory at GeneralAtomics.
CA 19

NUCLEAR MATERIAL AND
FACILITY STABILIZATION
The General Atomics site is already undergoingdecommissioning and, therefore, will notrequire nuclear material and facilitystabilization.
LANDLORD FUNCTIONS
The General Atomics facility is privately ownedand operated. The DOE Office ofEnvironmental Management maintains the HotCell Facility. The Hot Cell Facility maintenancecosts are accounted for within the scope ofenvironmental restoration. The Hot CellFacility will be released for unrestricted use.
PROGRAM MANAGEMENT
Program management at the site supports theintegration of environmental restorationactivities at General Atomics. Associated costsare found in the Program Management CostEstimate table. These activities include:
• tracking, collecting, and reporting costs;
• preparation of programmatic documents;
• coordinating permitting and public involvement;
• liaison with external regulatory agencies; and
• establishing, documenting, and maintaining technical,cost, and schedule baselines.
FUNDING AND COST
INFORMATION
The following tables present fundinginformation and major activity milestones forthe General Atomics Center.
Program Management Cost Estimate
Five•Year Averages (Thousands of Constant 1993 Dollars)*
FY 1995.2000 2005 2010 2015 2020 2025 2030 Life Cyde"
Program Management 391 0 0 0 0 0 0 2,348
• Costs reflect a five-year average In constant 1995 dollars, except In FY 1995-2000, which Is a six-year average,
" Total Life Cycle is the sum of annual costs in constant 1995 dollars,
CA 20

Nondefense Funding Estimate
Five-Year Averages (Thousands of Constant 1995 Dollars)*
FY 1995 - 2000 2005 2010 2015 2020 2025 2030 Life Cycle**
Environmental Restoration 2,308 0 0 0 0 0 0 13,847
Program Management 391 0 0 0 0 0 0 2,348
Total 2,699 0 0 0 0 0 0 16,194
• Costs reflect a five-year average in constant 1995 dollars, except in FY 1995-2000, which is a six-year average.
Total Life Cycle is the sum of annual costs in constant 1995 dollars.
Major Activity Milestones
ACTIVITY TASK COMPLETION DATE
Environmental Restoration Fiscal Year
Hot Cell Facility Decommissioning Phase I Ship Irradiated Fuel to ORNL for Interim Storage 1995
Site and Facility Characterization 1995
Hot Cell Facility Decommissioning Phase II Begin Decommissioning 1995
Complete Decommissioning 1997
Hot Cell Facility Decommissioning Phase III Complete Final Closure Report 1998
Release Site with Unrestricted Use to General Atomics 1998
For further information on this site, please contact : Public Participation OfficePublic Affairs OfficeTechnical Liaison: Rich Fallejo
(510) 637-1812(818) 586-5326(510) 637-1639
CA 21

CA 22

GENERAL ELECTRIC VALLECITOS NUCLEAR CENTER
The General Electric Vallecitos Nuclear Center, a nuclear facility privately owned and operated by
General Electric, occupies approximately 1,600 acres in Pleasanton, Alameda County, California.
444 4.
~ riserBaas
Bldg 109
8 I tr..„s , F.11LL
I r,.17?"(Indust.
woe,schargeg
0 0
40/
/
040
015
au 108
103
New GaudGaudStatbn
I BI.IN
p
Loaan0G
105
020020
‘\ Fence Line
201 217
201
Vi'204
911 214200
Bldg 200 AreaGEM Site 210
\.*
•
•
Js
HazariatD:nel'arStorage Bldg. NO 0
52
'71‘
.5••
— Bldg 300 AreaVBIND. EVESA Site
Core
Substation V • at,
am f Lake Lee me
Bldg 400 Area Joa 30
30
2 351
Fence Line
Bldg 100 Area • cpQe
omie.Ditch /
/
102H
1020
Sile Water Tan
Drainage Ditch
• ttr,"::'2.;
CA 23

Estimated Site Total
Environmental RestorationProgram Management
Total
(Thousands of Current 1995 Dollars)*
FY 1995
360
1996
105
1997
764
1998
2761
1999 2000
3,890 3,445
• Costs for FY 1995 reflect Congressional Appropriation, costs for FY 1996 reflect EM budget submission, costs for FY 1997-2000 reflect Budget Shortfall Scenario, costs forshaded area assume 3% annual inflation.
Five-Year Averages (Thousands of Constant 1995 Dollars)**
FY 1995-2000 2005 2010 2015 2020 2025 2030 Life Cycle***Environmental Restoration 1,447 584 499 480 410 351 300 21,807Program Management 242 94 81 69 59 50 43 3,427
Total 1,689 679 580 549 469 401 342 25,233
• Costs reflect a five-year average in constant 1995 dollars, except in FY 1995 - 2000, which is a six-year average.*** Total Life Cycle is the sum of annual costs in constant 1995 dollars.
PAST, PRESENT, AND
FUTURE MISSIONS
Two work locations at the General ElectricVallecitos Nuclear Center will be remediated ofcontamination caused by past Department ofEnergy (DOE) activity. These are the high-levelHot Cell No. 4 and the Emission SpectrographEnclosure known as the "Glovebox". Bothwork locations have been idle for more than 10years. The Hot Cell No. 4 and the Glovebox arethe only locations at the General ElectricVallecitos Nuclear Center with which DOE iscurrently involved in remediation. The currentDOE mission at the Center is the cleanup of HotCell No. 4 for return to General Electric anddecontamination and disposal of the Glovebox.The costs for all Environmental Managementactivities at the site are presented in theEstimated Site Total table.
Hot Cell No. 4 is one of four hot cellsconstructed by General Electric in 1958 for post-irradiation examination of uranium fuel andirradiated reactor components. The other threehot cells are on the complex but DOE has hadno involvement with them and is, therefore, notresponsible for them. The hot cells are locatedin the Radioactive Materials Laboratory inBuilding 102. Between 1965 and 1967, Hot CellNo. 4 was decontaminated, equipped with astainless steel liner to contain plutonium, anddedicated to the study of mixed oxide fuel rodsin support of the Atomic Energy Commission'sfast breeder reactor development programs.The fuel rod examination activities wereconducted almost exclusively for DOE. In 1978,Hot Cell No. 4 was placed in a standbycondition but was used by Lawrence LivermoreNational Laboratory for 6 months in 1981 and1982, and by the General Electric VallecitosNuclear Center for corporate business for less
CA 24

than 10 days per year thereafter. DOE plans todecontaminate Hot Cell No. 4, remove thealpha enclosure, and certify the cell free oftransuranic contamination so it will be suitable
to support future General Electric commercial
usage.
The Glovebox is located in the AnalyticalChemistry Laboratory in Building 103, and is a
3-foot-wide, 9-foot-long, 6-foot-high, stainlesssteel enclosure installed by the General ElectricVallecitos Nuclear Center in 1968 for emissionspectrographic analyses of mixed-oxide fuelspecimens for DOE. It has not been used since1980, and DOE plans to decontaminate anddispose of the Glovebox.
ENVIRONMENTAL
RESTORATION
The Environmental Restoration Projects tableprovides costs for all environmental restorationactivities at General Electric Vallecitos NuclearCenter. The Nondefense Funding Estimatetable shows the source of funding forenvironmental restoration activities. Thesecosts are presented by activity in theEnvironmental Restoration Project Activity
Costs table. No active processes or experimentsinvolving DOE research are currently operatingor planned at General Electric VallecitosNuclear Center. Fuel examination activities inHot Cell No. 4 and the Glovebox resulted inradioactive contamination. On the basis ofprocess knowledge, the likelihood of anyhazardous components being found in eitherHot Cell No. 4 or the Glovebox is small;however, the two locations and their associatedwaste have not been fully characterized forhazardous components, and the potential forthe generation of mixed waste duringdecommissioning activities is unknown.
Contamination is currently confined within theboundaries of Hot Cell No. 4 and the Glovebox,and the potential health risk to the GeneralElectric Vallecitos Nuclear Center site workersand the public is extremely low. However, sitecharacterization has not been completed, andthe potential risk will have to be reassessedonce site contamination has been betterprofiled.
Hot Cell No. 4 and the Glovebox have beencontaminated with various fission products andactivation products as a result of fuelexamination activities. Two radioactive wastestreams will be generated duringdecontamination activities: 1) nonaqueous and
Environmental Restoration Activity Costs
Five-Year Averages (Thousands of Constant 1993 Dollars)*
FY 1995.2000 2005 2010 2015 2020
Environmental RestorationAssessmentFacility Decommissioning
Total
53 0 01,394 584 499
0 0480 410
1,447 584 499 480 410
2025 2030 Life Cycle**
0 0 320
351 300 21,487
351 300 21,807
• Coats reflect a five-year average In constant 1995 dollars, except In FY 1995-2000, which Is a six•year average.
•• Total Life Cycle is the sum of annual costs In constant 1995 dollars.
CA 25

remotely-handled transuranic waste in the formof construction debris and equipment, and 2)nonaqueous low-level waste, also in the form ofconstruction debris and equipment.
On the basis of radiological surveys and siteevaluations, the quantity of contaminatedmaterials to be removed duringdecontamination activities is approximately 20cubic meters. This material will be disposed ofas transuranic waste. Additionally, removal ofthe steel liner will result in approximately 13cubic meters of waste. Contamination iscurrently confined within the boundaries ofHot Cell No. 4 and the Glovebox.
Site and waste characterization of Hot Cell No.4 and the Glovebox have not been performed.Initial characterization of the two locations willbegin in FY 1995 and will include radiologicalsurveys to determine locations andconcentrations of radioactive contamination.Following characterization, it will bedetermined whether mixed waste will begenerated through decommissioning activities.The facility will develop a schedule to conducttreatment technology assessment, followed bydevelopment of a site treatment plan toexamine treatment alternatives for the mixedwaste.
The standard decontamination approach will beto use simpler and more passive methods first,advancing to more aggressive methods ifneeded. When feasible, passivedecontamination techniques will be applied asdictated by radioactive surface characterization.These techniques include standard vacuuming,damp cloth wiping and, to a limited degree,hand washing/scrubbing operations. Whenthese passive methods fail to reduce surfacecontamination to acceptable levels, moreaggressive decontamination methods will beused. In order of preference, thesedecontamination methods include dry abrasiveblasting with a vacuum, scabbing andscarification, and washing with ultra-high-pressure water.
Preparations to begin decontaminationoperations, including the development ofrequired documents, are scheduled tocommence in FY 1997. Decommissioning andremoval of the Glovebox is scheduled tocommence at the end of FY 1997.Decommissioning of Hot Cell No.4 willcommence in FY 1998. The removal anddecommissioning of remote and manned wastein Hot Cell No. 4 will commence in FY 2000.Cost for decommissioning activities will be splitbetween DOE and the General ElectricVallecitos Center. The division of costs will benegotiated in FY 1995. Treatment and disposaloptions will be considered once any mixedwaste stream is generated and characterized.
Low-level and transuranic waste will bepackaged to meet DOE Hanford's criteria. Thelow-level waste will be transported to Hanfordfor burial. The remotely-handled transuranicwaste will be shipped to Hanford for storage.For the purpose of this cost analysis, disposal inthe Waste Isolation Pilot Plant was assumed.The facility may need to design and license anew shielded storage and shipping containerfor transuranic waste to meet Hanford SiteRadioactive Solid Waste Acceptance Criteria.The initial design and licensing of the newcontainer will occur in FY 1997. Given theexpected amount of transuranic waste,decommissioning activities are scheduled tooccur over an extended period with completionexpected in FY 2030.
WASTE MANAGEMENT
All DOE activities at the General ElectricVallecitos Nuclear Center, including wastemanagement, are funded and managed withinthe scope of environmental restoration. Nomixed wastes are currently present onsite anddecommissioning activities will attempt to use
CA 26

processes that will not result in the generation
of low-level mixed waste or mixed transuranic
waste. The quantity of mixed waste, ifgenerated, will not exceed 2 cubic meters.
NUCLEAR MATERIAL AND
FACILITY STABILIZATION
There are no current or planned nuclearmaterial and facility stabilization activities at
the General Electric Vallecitos Nuclear Center
site.
LANDLORD FUNCTIONS
General Electric is the owner and operator of
the General Electric Vallecitos Nuclear Center
and is responsible for all landlord activities at
the site.
PROGRAM MANAGEMENT
Program management at the site supports theintegration of environmental restorationactivities at the General Electric VallecitosNuclear Center and includes:
• tracking, collecting, and reporting costs;
• preparing programmatic documents;
• coordinating permitting and public involvement with
appropriate units of the General Electric Vallecitos
Nuclear Center;
• managing personnel;
• funding for independent verification contractor
activity;
• acting as liaison with external regulatory agencies; and
• establishing, documenting, and maintaining technical,
cost, and schedule baselines.
See the Program Management Cost Estimate
table for costs associated with these activities.
FUNDING AND COST
INFORMATION
The following tables present fundinginformation and major activity milestones for
the General Electric Vallecitos Nuclear Center.
Program Management Cost Estimate
Five-Year Averages (Thousands of Constant 1995 Dollars)•
FY 1995 - 2000 2005 2010 2015 2020 2025 2030 Life Cycle*
Program Management 242 94 81 69 59 50 43 3,427
• Costs reflect a five-year average in constant 1995 dollars, except in FY 1995-2000, which Is a six-year average.
" Total Life Cycle Is the sum of annual costs in constant 1995 dollars.
CA 27

Nondefense Funding Estimate
Five-Year Averages (Thousands of Constant 1995 Dollars)FY 1995.2000 2005 2010 2015 2020 2025 2030 Life Cycle**
Environmental Restoration 1,447 584 499 480 410 351 300 21,807Program Management 242 94 81 69 59 50 43 3,427
Total 1,689 679 580 549 469 401 342 25,233
• Costs reflect a five-year average in constant 1995 dollars, except in FY 1995-2000, which is a six-year average.Total Life Cycle is the sum of annual costs in constant 1995 dollars,
Major Activity MilestonesACTIVITY TASK COMPLETION DATE
Environmental Restoration Fiscal Year
Preliminary Waste Characterization
Begin Decontamination and Removal of Glovebox
Begin Decontamination of Hot Cell No. 4
Release of Hot Cell No. 4 to General Electric
1995
1997
1998
2030
For further information on this site, please contact : Public Participation OfficePublic Affairs OfficeTechnical Liaison: Rich Fallejo
(510) 637-1812(510) 637-1809(510) 637-1639
CA 28

....••
.• •
Geothermal WellMESA 6-1
Geothermal Wellin MESA 8-1
GEOTHERMAL TEST FACILITY
The East Mesa Geothermal Test Facility, an inactive Department of Energy (DOE) geothermal
research facility, is in the Imperial Valley, Imperial County, California, about 20 miles east of
El Centro and 1.5 miles north of Interstate Highway 8.
To Ormesa Geothermal Project
InjectionWell
Access Road MESA 5-1
Abandoned Geothermal WellMESA 31-1 Located Approximately
1.
1 Mile North .,
Geothermal WellMESA 6-2
Wetlands Area
GEO Corporation(GEO 1) UtilizationFacility
Magma PowerProject
East Highland Canal
Hot Spring Well
Ormesa II Project
BrineHoldingPond
Prop
oa
CA 29

Estimated Site Total
(Thousands of Current 1995 Dollars)*
FY 1995 1996 1997 1998 1999 2000
Environmental Restoration 2,000 2,000 1,000 1,500Program Management' 7,595 12,879 12,551 12,903 13,150
Total 7,962 7,595 14,879 14,551 13,903 14,650
• Costs for FY 1995 reflect Congressional Appropriation, costs for FY 1996 reflect EM budget submission, costs for FY 1997-2000 reflect Budget Shortfall Scenario, costs forshaded area assume 3% annual inflation.
• Program Management Costs for FY 1996-2000 include DOE Oakland Operations Office Costs.
Five-Year Averages (Thousands of Constant 1995 Dollars)**
FY 1995-2000 2005 2010 2015 2020 2025 2030 Life Cycle***Environmental Restoration 983 0 0 0 0 0 0 5,898Program Management 240 0 0 0 0 0 0 1,438
Total 1223 0 0 0 0 0 0 7,336
• Costs reflect a five-year average in constant 1995 dollars, except in FY 1995 - 2000, which is a six-year average.
*** Total Life Cycle is the sum of annual costs in constant 1995 dollars.
PAST, PRESENT, AND
FUTURE MISSIONS
In 1968, the U.S. Bureau of Reclamationconstructed the East Mesa Geothermal TestFacility for the investigation and developmentof geothermal resources in the East Mesa area.DOE became the site operator in 1978 andcontinued the site's energy research mission.
The 82-acre site includes a 6-acre, PVC-linedholding pond installed in 1972 to temporarilystore and evaporate brine blowdown water, aswell as untreated brine extracted in thegeothermal exploration process. Geothermalresearch activities at the site were discontinuedin 1987 as commercial scale geothermal powerdeveloped in the region.
Once restoration activities are complete, thefacility will be turned over to the U.S. Bureau ofLand Management for unrestricted use.Environmental Management program costs arepresented in the Estimated Site Total table forthe Geothermal Test Facility.
ENVIRONMENTAL
RESTORATION
The Environmental Restoration Projects tableprovides costs for all environmental restorationactivities at the Geothermal Test Facility. Thesecosts are presented by activity in theEnvironmental Restoration Activity Costs table.
CA 30

No active processes or experiments involving
DOE research are currently operating orplanned at Geothermal Test Facility. Sources ofcontamination are related to past operations at
the site; however, hazardous waste may begenerated during site restoration and disposed
at a permitted Class I or II landfill.
Untreated brine extracted during geothermalexploration and brine blowdown water were
stored in a holding pond at the facility. Storage
of brine in the holding pond resulted incontamination of sediments due to theconcentration of water soluble salts and theprecipitation of minerals. The volume ofcontaminated sediments is estimated at 9,150
cubic meters. On the basis of previoussampling, the quantity of hazardous waste to be
generated from restoration activities is expected
to be minimal.
A field investigation report on the brineholding pond was prepared in 1992; and a sitecharacterization study of the balance of the site
was completed in 1993.
Contamination of the brine pond resulted fromsalts and minerals concentrated in sediment byevaporation. Decontamination activities willgenerate two waste streams: nonaqueous soil/debris contaminated with arsenic andnonaqueous, nonhazardous debriscontaminated with salts and minerals.
During an asbestos survey conducted in 1992three types of materials were identified ascontaining asbestos. These materials included:
• a joint compound used around pipe joints and flanges,
• cooling tower millboard, and
• floor tile and mastic inside the yellow laboratorybuilding.
These asbestos-containing materials will beremoved and disposed offsite at an appropriatedisposal facility. Several other areas containingpotentially airborne asbestos were remediated.
Under the terms of the lease agreementbetween DOE and U.S. Bureau of LandManagement, the site must be restored to itsoriginal condition.
Environmental Restoration Activity Costs
Five-Year Averages (Thousands of Constant 1995 Dollars)*
FY 1995-2000 2005 2010 2015 2020 2025 2030 Life Cyde**
Environmental RestorationAssessmentRemedial Actions
Total
57 0 0
926 0 0 0 0 0 0
3435,554
983 0 0 0 0 0 0 5,898
• Costs reflect a five-year average in constant 1995 dollars, except in FY 1995-2000, which is a six-year average.
• Total Life Cycle is the sum of annual costs in constant 1995 dollars.
CA 31

WASTE MANAGEMENT
No treatment of hazardous, radioactive, ormixed wastes occurs now or is anticipated inthe future. Generated hazardous waste will bestored in accordance with generatorrequirements for non-permitted facilities. Anyhazardous waste to be generated, bydecontamination efforts, will be treated anddisposed at appropriate facilities. Wastemanagement at the Geothermal Test Facility isconducted within the scope of environmentalrestoration.
NUCLEAR MATERIAL AND
FACILITY STABILIZATION
There are no current or planned nuclearmaterial and facility stabilization activities atthe Geothermal Test Facility.
LANDLORD FUNCTIONS
The Department's Office of Energy Efficiency iscurrently the landlord at the Geothermal TestFacility and is responsible for associatedactivities and costs.
PROGRAM MANAGEMENT
Because the Geothermal Test Facility is aninactive site and no restoration activities areunderway, there are no current sitemanagement tasks other than planning forfuture potential restoration efforts. Oncefunding is available for restoration, programmanagement will include typical managementtasks such as strategic planning, liaison withDOE and external regulatory agencies,scheduling, document preparation, budgetcontrol, and financial forecasting. See theProgram Management Cost Estimate table forcosts associated with these activities.
Program management costs include overallprogram management costs for the DOEOakland Operations Office. These costs includefunding for the agreements-in-principleprogram, grants, program support and wastemanagement.
FUNDING AND COST
INFORMATION
The following tables present fundinginformation and major activity milestones forGeothermal Test Facility.
Program Management Cost Estimate
Five-Year Averages (Thousands of Constant 1995 Dollars )*FY 1995-2000 2005 2010 2015 2020 2025 2030 Life Cyde**
Program Management 240 0 0 0 0 0 0 1,438
'Costs reflect a five-year average in constant 1995 dollars, except in FY 1995-2000, which is a six-year average.
"Total Life Cycle is the sum of annual costs in constant 1995 dollars.
CA 32

Nondefense Funding Estimate
Five-Year Averages (Thousands of Constant 1995 Dollars)'
FY 1995 - 2000 2005 2010 2015 2020 2025 2030 Life Cycle'
Environmental Restoration 983 0 0 0 0 0 0 5,898
Program Management 240 0 0 0 0 0 0 1,438
Total 1,223 0 0 0 0 0 0 7,336
•Costs reflect a five-year average in constant 1995 dollars, except in FY 1995-2000, which is a six-year average.
"Total Life Cycle is the sum of annual costs in constant 1995 dollars.
Major Activity Milestones
ACTIVITY TASK COMPLETION DATE
Environmental Restoration Fiscal Year
Complete Site Characterization 1997
Start Site Remediation Activities 1998
Complete Decommissioning and Site Remediation Activities 1999
For further information on this site, please contact : Public Participation OfficePublic Affairs OfficeTechnical Liaison: Rich Fallejo
(510) 637-1812(510) 637-1809(510) 637-1639
CA 33

CA 34

LABORATORY FOR ENERGY RELATED HEALTH RESEARCH
The Laboratory for Energy Related Health Research, a former Department of Energy (DOE) facility,
is located 1.5 miles south of the main campus of the University of California at Davis and is cur-rently undergoing restoration activities. The 15-acre site is owned by the University of California at
Davis and has been leased to DOE since 1958.
Ra-226Seepage
Pits
Leach Line
Ra-226SepticTanks
DOERadioactiveTrench Area
Tanker
JShop
Main Office
Laboratories
Clinic
Office Storage
Cell BiologyLaboratory
Sr-90 Leach Field
Imhoff Sludge Tanks
UCD Radioactive Trench Area
SmallAnimalBldg
--1
Toxic PollutantResearch
Geriatrics 1 Geriatrics 2 Dog Pens
Old UDCDog Pens .4111--- Landfills
S
NE Co-60 Anne
UCD RadioactiveHole Area
140 CI Co-60 Source
Co-60 Bldg
— Environmental Assessment,Decommissioning
RemediationIIISurveyed and Released
CA 35
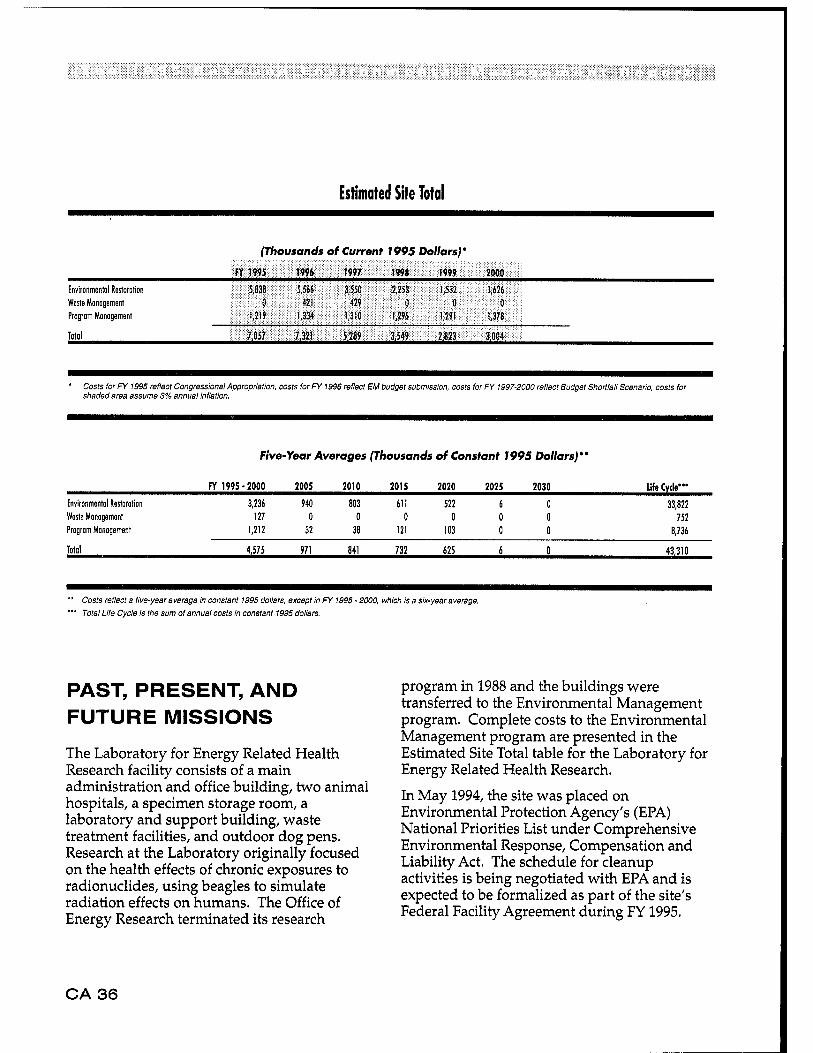
Estimated Site Total
(Thousands of Current 1995 Dollars)*
FY 1995 1996 199/ 1998 1999 2000P.
Environmental RestorationWaste ManagementProgram Management
Total 7,057 7,321 5,289 54 2,823 3,004
• Costs for FY 1995 reflect Congressional Appropriation, costs for FY 1996 reflect EM budget submission, costs for FY 1997-2000 reflect Budget Shortfall Scenario, costs forshaded area assume 3% annual inflation.
Five-Year Averages (Thousands of Constant 1995 Dollars)**
FY 1995.2000 2005 2010 2015 2020 2025 2030 life Cycle***
Environmental Restoration 3,236 940 803 611 522 6 0 33,822Waste Management 127 0 0 0 0 0 0 752Program Management 1,212 32 38 121 103 0 0 8,736
Total 4,575 971 841 732 625 6 0 43,310
** Costs reflect a five-year average in constant 1995 dollars, except in FY 1995 . 2000, which is a six-year average."• Total Life Cycle is the sum of annual costs In constant 1995 dollars.
PAST, PRESENT, AND
FUTURE MISSIONS
The Laboratory for Energy Related HealthResearch facility consists of a mainadministration and office building, two animalhospitals, a specimen storage room, alaboratory and support building, wastetreatment facilities, and outdoor dog pens.Research at the Laboratory originally focusedon the health effects of chronic exposures toradionuclides, using beagles to simulateradiation effects on humans. The Office ofEnergy Research terminated its research
program in 1988 and the buildings weretransferred to the Environmental Managementprogram. Complete costs to the EnvironmentalManagement program are presented in theEstimated Site Total table for the Laboratory forEnergy Related Health Research.
In May 1994, the site was placed onEnvironmental Protection Agency's (EPA)National Priorities List under ComprehensiveEnvironmental Response, Compensation andLiability Act. The schedule for cleanupactivities is being negotiated with EPA and isexpected to be formalized as part of the site'sFederal Facility Agreement during FY 1995.
CA 36

ENVIRONMENTAL
RESTORATION
Environmental restoration activity objectives atthe Laboratory for Energy Related HealthResearch include:
• assess the nature and extent of site contamination;
• determine and negotiate cleanup levels;
• decommission contaminated buildings;
• remove onsite radioactive, chemical, and mixed waste
sources;
• remediate soils and ground water and underground
tank systems, as required; and
• verify the site and associated facilities have been
adequately cleaned and meet established criteria for
transfer to the University of California at Davis for
unrestricted use.
Prior to returning the Laboratory for EnergyRelated Health Research to the University ofCalifornia at Davis, the remainingcontaminated facility (Cobalt 60 Building) and500 outside dog pens will requiredecommissioning activities. In addition, soilremediation may be required, and a treatmentsystem for ground water may need to bedesigned. The Laboratory is scheduled torelease the 18 site buildings to the University ofCalifornia at Davis for unrestricted use by FY1997. The Environmental Restoration Projectstable provides costs for all environmentalrestoration activities at the Laboratory forEnergy Related Health Research. TheNondefense Funding Estimate table shows thesource of funding for environmental restorationactivities. These costs are presented by activityin the Environmental Restoration Activity Coststable.
Remediation of the soils and the septic tanksystem may continue beyond FY 2000. TheLaboratory for Energy Related Health Researchfacilities will be transferred to the University of
California at Davis for unrestricted use onceenvironmental restoration activities arecompleted. However, ground-waterremediation, if required, may continue after thetransfer of the facilities to the University ofCalifornia at Davis.
The primary radionuclides used in researchwere strontium-90 and radium-226. Disposal ofresearch-derived waste contributed tocontamination in onsite trenches and possiblyan onsite landfill. Soil, gravel, and groundwater have been impacted by site wastehandling and disposal. Ground water at thesite has been found to contain nitrates,chromium, chloroform, tritium, and carbon-14at levels above EPA primary drinkingstandards.
Decommissioning activities have beencompleted at many of the Laboratory forEnergy Related Health Research facilities. Oneremaining contaminated building is currentlyundergoing decommissioning activities, whichis scheduled to be completed in FY 1995.
Underground settling and domestic septic tanksystems, potentially contaminated withradioactive and hazardous chemicals, willundergo characterization in FY 1995. The sitealso has more than 500 outdoor dog pensbelieved to be contaminated with radioactivematerials and chlordane. These pens willundergo cleanup starting in FY 1995.
Radioactive waste was buried onsite by boththe University of California at Davis and DOEin shallow unlined trenches in the south,southwest, and central areas. A six-acre,inactive, unlined, leaking landfillindependently operated by the University ofCalifornia at Davis, is also onsite and maycontain contaminants due to disposal ofLaboratory facility waste. Finally, thousands ofresearch samples containing both radioactiveand hazardous chemicals are onsite and mustundergo characterization to allow offsitetreatment or disposal.
CA 37

Restoration activities at the Laboratory forEnergy Related Health Research will includesoil and ground-water assessment, remediation,and the decommissioning of certain facilities.
Site-wide soil characterization and assessmentactivities will consist of drilling and samplingsoil borings in onsite burial trenches, leachfields, and seepage pits (University ofCalifornia at Davis and DOE areas) as well asthe characterization and remediation ofunderground tanks. It is estimatedapproximately 623 cubic meters of low-levelradioactively contaminated soil and gravel arepresent onsite at depths ranging from a fewinches to approximately 6 feet. Thecontaminated soil at these locations will beremediated as necessary.
Ground-water characterization and assessmentwill include installing and sampling deep andshallow ground-water monitoring wells. Theextent of ground-water contamination is notfully characterized although preliminary dataindicate onsite and offsite ground-watercontamination. The data from a remedialinvestigation will be used to conduct afeasibility study of ground water and soilremediation if required.
The Remedial Investigation/Feasibility Study isscheduled for completion by FY 1997. Theremedial design for soil and soil remediationare scheduled for completion by FY 2000. Theremedial design for ground water is scheduledfor completion by FY 2000. The disposal ofcharacterization waste will be completed by FY1997. Ground-water remediation costs for theLaboratory for Energy Related Health Researchfacilities are not included in the BaselineEnvironmental Management Report baseline.However, ground-water remediation, ifrequired, is likely to consist of pumping andtreatment.
The preliminary estimate of the volume ofcontaminated soil and ground water requiringdisposal or treatment from FY 1995 on is 5,645cubic meters of low-level and low-level mixedradioactive waste. All waste from restorationactivities will be shipped to DOE Hanford.
The decommissioning activities at the twoanimal hospitals, the Specimen Storage Room,and the Imhoff facility have been completed,and the facilities are awaiting clearance by anindependent verification. The Cobalt 60
Environmental Restoration Activity Costs
Five-Year Averages (Thousands of Constant 1995 Dollars)*
FY 1995-2000 2005 2010 2015 2020 2025 2030 Life Cycle"
Environmental RestorationAssessment 1,194 0 0 0 0 0 0 7,167Remedial Actions 773 112 95 7 6 5,775Facility Decommissioning 1,269 828 707 603 515 0 0 20,880
Total 3,236 940 803 611 522 6 0 33,822
• Costs reflect a five-year average in constant 1995 dollars, except in FY 1995-2000, which is a six-year average.
• Total Life Cycle is the sum of annual costs in constant 1995 dollars.
CA 38

Building decontamination will be completed inFY 1995, with independent verification in FY1996. Outdoor dog pens will be removed fromthe site in FY 1996.
Waste resulting from decommissioningactivities will consist of low-level wasteincluding sludge, dry active waste, andcontaminated soils, as well as, hazardous wasteincluding asbestos, chemical, and biologicalwaste. It is estimated decommissioningactivities from FY 1995 onward will generate440 cubic meters of low-level waste and 35cubic meters of low-level mixed waste.
The environmental monitoring program at theLaboratory for Energy Related Health Researchconsists of air, ground water, surface water, soil,and radiation monitoring at routine intervals.The monitoring program will continue for theduration of site restoration activities.
WASTE MANAGEMENT
Given the fact DOE-funded research at theLaboratory for Energy Related Health Researchhas ceased, there are no ongoing routineoperations associated with DOE programsproducing waste. The Laboratory for Energy
Related Health Research operates an InterimStatus storage facility under a ResourceConservation and Recovery Act Part A Permit.The major waste streams identified consist ofresidual waste from past research activities andwaste generated from the environmentalrestoration actions. To facilitate waste handlingand loading, an existing onsite facility has beenrenovated to serve as a waste-staging facility.
Waste Treatment
Due to the lack of characterization data, theLaboratory for Energy Related Health Researchhas not identified treatment options for any ofits mixed radioactive waste. No treatment ofhazardous waste is conducted or will beconducted onsite.
Waste Storage
Storage of environmental restoration generatedwaste will occur at a renovated waste stagingfacility prior to disposal. The preliminaryestimated volume of contaminated soil andground water requiring treatment or disposal is5,645 cubic meters of low-level waste and low-level mixed waste. The estimated volume ofdecommissioned waste from FY 1995 onward is440 cubic meters of low-level waste and 35cubic meters of low-level mixed waste.
Waste Management Activity Costs
Five-Year Averages (Thousands of Constant 1995 Dollars)*
FY 1995-2000 2005 2010 2015 2020 2025 2030 Life Cycle"
Storage and Handling
Low-level Mixed Waste 127 0 0 0 0 0 0 752
• Costs reflect a five-year average in constant 1995 dollars, except in FY 1995-2000, which is a six-year average.
▪ Total Life Cycle is the sum of annual costs in constant 1995 dollars.
CA 39

Waste Disposal
Hazardous waste will be disposed offsite atpermitted treatment, storage, and disposalfacilities. Low-level waste will be disposed ofat the Hanford DOE site. The disposal site forlow-level mixed waste is to be determined inthe Federal Facility Compliance Act process.
NUCLEAR MATERIAL AND
FACILITY STABILIZATION
There are no current or planned nuclearmaterial and facility stabilization activities atthe Laboratory for Energy Related HealthResearch.
LANDLORD FUNCTIONS
The University of California owns the land atthe Laboratory for Energy Related HealthResearch, and DOE owns the buildings. TheEnvironmental Management program isresponsible for quarterly monitoring andbuilding surveillance and maintenance. Thecosts of these activities are accounted for withinthe scope of environmental restoration.
PROGRAM MANAGEMENT
Program management at the site supports theenvironmental restoration activities at theLaboratory for Energy Related Health Research.Associated costs are found in the ProgramManagement Cost Estimate table. Theseactivities include:
• tracking, collecting, and reporting costs;
• overseeing technical, health and safety, and qualityassurance activities;
• preparing programmatic documents;
• coordinating permitting and public involvement;
• subcontracting;
• establishing, documenting, and maintaining technical,cost, and schedule baselines; and
• developing and implementing a waste minimizationplan emphasizing waste reduction, segregation, andminimization.
A Memorandum of Agreement was executedbetween DOE and the University of California forthe decommissioning activities of the Laboratoryfor Energy Related Health Research facilities. TheMemorandum of Agreement identified the rolesof DOE and the University of California at Davis
Program Management Cost Estimate
Five-Year Averages (Thousands of Constant 1995 Dollars)*FY 1995-2000 2005 2010 2015 2020 2025 2030 Life Cycle*"
Program Management 1,212 32 38 121 103 0 0 8,736
• Costs reflect a five-year average in constant 1995 dollars, except in FY 1995-2000, which is a six-year average.
▪ Total Life Cycle is the sum of annual costs in constant 1995 dollars.
CA 40

in the conduct of the environmental restorationproject. Independent verification of decontami-nation projects will be performed by a contractor(the Oak Ridge Institute for Science andEducation) to verify the facility has beendecontaminated according to established cleanupgoals. DOE's Oakland Operations Office hassigned an Agreement-In-Principle with the Stateof California to ensure building decommissioningactivities and site restoration activities complywith the State of California environmentalregulations. As part of the Agreement-In-Principle, State technical staff will review majoractivity work plans and perform spot checksurveys and onsite monitoring.
FUNDING AND COST
INFORMATION
The following tables present fundinginformation and major activity milestones forthe Laboratory for Energy-Related HealthResearch.
Nondefense Funding Estimate
Five-Year Averages (Thousands of Constant 1995 Dollars)"
FY 1995 - 2000 2005 2010 2015 2020 2025 2030 life Cycle"
Environmental Restoration 3,236 940 803 611 522 6 0 33,822
Waste Management 127 0 0 0 0 0 0 752
Program Management 1,212 32 38 121 103 0 0 8,736
Total 4,575 971 841 732 625 6 0 43,310
'Costs reflect a flve•year average In constant 1995 dollars, except In FY 1995.2000, which Is a slx•year average.
•'Total Life Cycle Is the sum of annual costs In constant 1995 dollars.
CA 41

Major Activity Milestones
ACTIVITY TASK COMPLETION DATE
Environmental Restoration Fiscal Year
Characterization/Assessment Activities Draft Site-Wide Remedial Investigation Report for Soil and Ground Water 1997
Soil Remedial Design 2000
Remediation Activities Soil Remediation 2000
Ground Water Remedial Design 1997
Outyear Remediation 2025
Decommissioning Activities Decommissioning of Imhoff Building and Tank Remediation 1995
Decommissioning of Tank Trailer 1995
Decommissioning of Co-60 Building and Dog Pens 1995
Outyear Decommissioning Activities 2020
Release to UCD Imhoff Building Site, Underground Tanks, and Tank Trailer 1995
Dog Pens and Co-60 Building 1997
Waste Management Fiscal Year
Incorporation of Treatment Evaluation of LLMW Waste Streams intoSite Treatment Plan
Disposal of Existing and ER Waste
1995
1997
For further information on this site, please contact : Public Participation OfficePublic Affairs OfficeTechnical Liaison: Rich Fallejo
(510) 637-1812(510) 637-1809(510) 637-1639
CA 42

LAWRENCE BERKELEY LABORATORY
The 134-acre Lawrence Berkeley Laboratory site is located on the western side of Berkeley Hillsadjacent to the University of California, Berkeley campus. The site is leased to the Department ofEnergy (DOE) by the University of California and is bordered on the north by single-family resi-dences and on the west by multifamily dwellings, student residence halls, and commercial buildings.
Potential BevatronContamination Ring
Site
C
N
S
ExistingHazardousWaste HandlingFacility (HWHF)
The Sitewide Environmental RestorationProject includes groundwater wells andsoil gas wells accross the entire site.
Proposed HWHFSite
CA 43

Estimated Site Total
(Thousands of Current 1995 Dollars)*
FY 1995 .1996 1997 1998 1999 2000
Environmental RestorationWaste ManagementProgram Management
Total
3,106 3,4008,072
3,400;8,233'760
5,2978,3981,058
13,905 13,175 12,520 12,232 12,393 14)53
• Costs for FY 1995 reflect Congressional Appropriation, costs for FY 1996 reflect EM budget submission, costs for FY 1997-2000 reflect Budget Shortfall Scenario, costs forshaded area assume 3% annual inflation.
Five-Year Averages (Thousands of Constant 1995 Dollars)**
FY 1995 - 2000 2005 2010 2015 2020 2025 2030 Life Cycle"
Environmental Restoration 2,965 2,264 113 96 82 56 0 30,846Waste Management 7,934 5,489 5,489 5,496 5,517 5,492 4,538 207,706Program Management 895 1,831 1,485 1,470 1,461 1,429 1,134 49,422
Total 11,793 9,584 7,087 7,062 7,060 6,977 5,672 287,975
" Costs reflect a five-year average In constant 1995 dollars, except in FY 1995 - 2000, which is a six-year average.
"' Total Life Cycle is the sum of annual costs in constant 1995 dollars.
PAST, PRESENT, AND
FUTURE MISSIONS
The Lawrence Berkeley Laboratory has beenleased to DOE since the early 1930's by theUniversity of California for a wide range ofenergy-related research activities includingresearch in nuclear and high-energy physics,accelerator research and development,materials research, research in chemistry,geology, and molecular biology, and biomedicalresearch.
As part of Lawrence Berkeley Laboratory'senergy research mission, the facility hasdeveloped and operated national experimentalfacilities including:
• three large accelerators such as the Bevatron, the SuperHeavy Ion Linear Accelerator, and the 88-inch Cyclotron;
• several small accelerators;
• the National Center for Electron Microscopy;
• the Human Genome Center;
• a number of radiochemical laboratories;
• several large gamma irradiators;
• the National Tritium Labeling Facility; and
• the newly completed Advanced Light Source.
The future use of the facility is expected to besimilar to its past and current use for energyrelated research. In accordance with changingresearch requirements, some facilities may be
CA 44

decommissioned or converted for newmissions. Because the land occupied byLawrence Berkeley Laboratory is owned by theUniversity of California, the installation will becleaned to the standards required forunrestricted use. The total costs associated withthe Lawrence Berkeley Laboratory are in theEstimated Site Total table. All funding isnondefense as shown in the NondefenseFunding Estimate table.
ENVIRONMENTAL
RESTORATION
Laboratory operations at Lawrence BerkeleyLaboratory generate low-level and low-levelmixed radioactive waste. The types ofhazardous waste handled at Lawrence BerkeleyLaboratory include polychlorinated biphenyls,corrosive liquids, organic solvents, heavymetals, water-reactive chemicals, oxidizingagents, flammable liquids, strong acids, andasbestos. Mixed radioactive waste streamsinclude lab-packed liquids and solids withacids, alkalines, reactives, oxidizers, organicliquids, induced lead and mercury waste,scintillation fluids, and contaminated debris.The costs associated with environmentalrestoration activities are found in theEnvironmental Restoration Projects table below.These costs are broken down by activity in theEnvironmental Restoration Project ActivityCosts table on the following page.
Past practices resulted in radioactive andhazardous soil and ground-watercontamination. Lawrence Berkeley Laboratoryperforms research in energy sciences,biosciences and general sciences. In performingthis research many types of chemicals, someradioactive and some hazardous, have beenused in the operations at these facilities, or insupport shops, or have been produced as wastefrom these facilities. Contamination occurringat these research facilities as a result of past
waste management practices were standard forthe day, routine operations that causedemissions of materials, and limited leaks andspills of materials. The predominantcontaminants identified to date are solvents inground water. The potential contaminantsources identified to date are several sewersystems and aboveground and undergroundstorage tanks. The current site-wideinvestigation is designed to determine thelateral and vertical extent of contamination atLawrence Berkeley Laboratory by volatileorganic compounds, metals, and tritium. Theresults of past investigations indicate thecontamination is restricted to localized areasnear the sources, but this has yet to beconfirmed. To date, five plumes ofcontaminated ground water have beenidentified at Lawrence Berkeley Laboratory.These plumes include:
• solvent plumes south of Building 71, north of Building7 (probably related to an abandoned sump), and eastand south of Building 6;
• a tritium plume southeast of Building 75 (the NationalTritium Labeling Facility); and
• a plume of petroleum hydrocarbons from the formerlocation of an underground fuel tank south of Building 7.
The quantity and extent of potential soil andground-water contamination have not beenfully characterized, and a site-wide publichealth and environmental risk assessment hasyet to be performed.
The principal environmental concerns atLawrence Berkeley Laboratory involve soil andground-water contamination from pastoperations. Corrective action measuresinitiated in compliance with a Regional WaterQuality Control Board Order in October 1988,focused on contamination detected in anetwork of hydraugers. Lawrence BerkeleyLaboratory was issued a Resource Conservationand Recovery Act (RCRA) Part B permit forhazardous waste storage on May 4, 1993. Thispermit indicated the corrective actions required
CA 45

at Lawrence Berkeley Laboratory and is nowthe primary driver for the remedial actions.The California Department of Toxic SubstancesControl completed a RCRA facility assessmentof Lawrence Berkeley Laboratory in November1992 and required Lawrence BerkeleyLaboratory to conduct RCRA facilityinvestigations of several solid wastemanagement units.
A RCRA facility investigation is ongoing todetermine the source and extent of soil andground-water contamination. The RCRA facilityinvestigation is being conducted using a phasedapproach with all RCRA facility investigationtasks scheduled for completion in FY 1997. ARCRA corrective measures study will begin in FY1996 and be completed in FY 1998. RCRAcorrective measure designs will be finalized in FY1999 and implemented in FY 2001.
RCRA closure of the existing Hazardous WasteHandling Facility is scheduled to commence inFY 1996 after the completion of the newHazardous Waste Handling Facility. RCRAclosure of the existing facility is scheduled forcompletion by FY 1998. The intention is a one-time final closure of the Hazardous Waste
Handling Facility with no postclosure carerequired because all waste, equipment,structures, and contaminated soils will beremoved.
The existing hazardous waste handling facilityincludes Buildings 75, 75A, and 69; theCorporation Yard; and the Building 77 coolantevaporator. It handles a variety of organicsolvents, waste acids, oxidizers, corrosiveliquids, waste oil, polychlorinated biphenyls,asbestos, metal sludge, mercury waste, wastecoolant, and contaminated soils.
Contamination is considered to be restricted tothe actual Hazardous Waste Handling Facilitystructures and the shallow surface soil in theimmediate vicinity and is not expected to haveimpacted ground water. To reduce the healthrisk and expense of moving waste to the newHazardous Waste Handling Facility, theremaining radioactive and mixed waste,estimated at 613 cubic meters, stored in theexisting Hazardous Waste Handling Facilitywill be shipped to either the Hanford site orother DOE approved facilities in FY 1995.Closure of the hazardous waste handlingfacility will generate approximately 50 cubic
Environmental Restoration Activity Costs
Five-Year Averages (Thousands of Constant 1995 Dollars)*
FY 1995 - 2000 2005 2010 2015 2020 2025 2030 Life C cle**
Environmental RestorationAssessment 1,293 0 0 0 0 0 0 7,760Remedial Actions 1,672 2,264 113 96 82 56 0 23,086
Total 2,965 2,264 113 96 82 56 0 30,846
• Costs reflect a five-year average in constant 1995 dollars, except in FY 1995-2000, which is a six-year average.
• Total Life Cycle is the sum of annual costs in constant 1995 dollars.
CA 46

meters of low-level waste, 10 cubic meters inthe form of concrete rubble, and 40 cubic metersof contaminated soil. Rinsate from the closureof the hazardous waste handling facility willgenerate approximately 870 drums or 181 cubicmeters of wastewater. The hazardous wastefrom the Hazardous Waste Handling Facilityclosure will be disposed at offsite treatment,storage, and disposal facilities.
Several interim actions have been taken toprevent the migration of known contaminantsat the site. These actions include extraction andtreatment of ground water at three locations,treatment of effluent from the hydraugers nearBuilding 51, and excavation of contaminatedsoils in source areas. Future cleanup strategiesare yet to be developed but may includeground water and soil gas extraction and treat-ment, and soil removal. Storage and disposalrequirements for environmental restorationgenerated waste are yet to be determined andwill depend on the results of the RCRA facilityinvestigations and corrective measure studiesand the types of remediation selected.
WASTE MANAGEMENT
Waste management activities include thetransport, limited treatment, storage, anddisposal of hazardous, radioactive (includingtransuranic), and mixed radioactive waste.Current sources of this waste include normallaboratory operations and restoration interimactions. Future sources include environmentalrestoration generated waste from the closure ofthe existing Hazardous Waste Handling Facilityand any remedial actions currently occurring inBuildings 75, 75A, and 69; the CorporationYard; the Building 77 coolant evaporator; andadjacent storage yards (see the Major WasteManagement Projects table for associated costs).These costs are presented by waste type in theWaste Management Activity Costs table of theHazardous Waste Handling Facility. Tofacilitate the development of this life cycle cost
estimate, an arbitrary cutoff date of 2030 hasbeen assigned to all sites that have completedenvironmental restoration but maintainongoing waste management support of otherDOE programs (Energy Research, DefensePrograms, etc.).
Lawrence Berkeley Laboratory operates under aRCRA Part B permit issued on May 4, 1993, toallow consolidation, neutralization, andsolidification of mixed radioactive waste, andtemporary storage of hazardous andradioactive waste prior to disposal. Theexisting hazardous waste handling facility isscheduled for RCRA closure by FY 1998. Areplacement Hazardous Waste HandlingFacility is under construction and planned forcompletion in FY 1996.
Key facility compliance actions concern airemissions and wastewater and sanitary sewerdischarge. The Environmental ProtectionAgency (EPA) and DOE have negotiated aFederal Facility Compliance Agreement tobring Lawrence Berkeley Laboratory into fullcompliance with Federal and State lawsgoverning air emissions by FY 1995.
Lawrence Berkeley Laboratory has an agreementin place with the East Bay Municipal UtilityDistrict regarding wastewater dischargecompliance. Quarterly inspections and samplingare being conducted by the East Bay MunicipalUtility District. By FY 1995, Lawrence BerkeleyLaboratory expects to meet all requirementsconcerning its sanitary sewer permit.
Other near-term goals for waste management atLawrence Berkeley Laboratory include themonitoring or removal of inadequateunderground storage tanks in FY 1995, and theinstallation of deionization regenerationequipment in FY 1996. A further priority of thewaste management activity at LawrenceBerkeley Laboratory is the waste minimizationactivity focusing on implementing recyclingopportunities, toxicity reductions, materialssubstitution, and source process modifications.
CA 47

Waste TreatmentThere is an onsite neutralization unit atLawrence Berkeley Laboratory permitted underLawrence Berkeley Laboratory's existingHazardous Waste Handling Facility RCRA PartB permit. The permit allows for the storage ofmixed radioactive waste streams and treatment.Onsite treatment of Federal Facility ComplianceAct mixed waste will consist of theneutralization of two low-level mixed wastestreams estimated at slightly over 3 cubicmeters including lab packed, flammable andnonflammable, acidic and alkaline solutionsand solids with metals and radionuclides.These wastes will then be sent to DOE Hanfordfor disposal or treatment. Mixed radioactivewaste will be sent to the Oak Ridge NationalLaboratory for chemical oxidation treatment.All other mixed waste will be sent to DOEHanford for incineration, stabilization, and/ormicroencapsulation. The onsite amalgamationof liquid-induced mercury will be the subject ofa treatability study.
Water pumped from the site hydraugers iscurrently treated with an activated carbonsystem with the treated water being used toreplace cooling-tower water according to anagreement between Lawrence BerkeleyLaboratory, the California State WaterResources Control Board, and the East BayMunicipal Utility District. Wastewatergenerated by Lawrence Berkeley Laboratoryenvironmental cleanup activities will be
disposed offsite at appropriate disposalfacilities. No other treatment of hazardouswaste occurs at the site, and none will occur inthe future other than preprocessing orminimization to conform with waste storageand disposal requirements.
Waste StorageWaste handled at Lawrence BerkeleyLaboratory includes a wide range of chemicalsoriginating from the many research andsupport facilities onsite. Storage of mosthazardous waste is for less than 90 days. TheRCRA Part B permit allows storage of somehazardous waste in designated areas for up toone year. Storage of low-level waste and low-level mixed waste also occurs prior to shipmentto DOE Hanford.
Current annual generation estimates include350,000 pounds of hazardous waste andapproximately 36 cubic meters of low-levelwaste. The volume of low-level mixed wastestored as of mid 1994 was approximately 6cubic meters. The projected generation of low-level mixed waste through 1997 is an additional4 cubic meters. Also, the total volume of mixedwaste potentially generated fromenvironmental restoration activities is estimatedat 1.6 cubic meters. Transuranic waste has beenaccumulating at Lawrence Berkeley Laboratorysince the mid-1970's, but in 1993 the inventory
Major Waste Management Projects
Five-Year Averages (Thousands of Constant 1995 Dollars)*
1995-2000 2005 2010 2015 2020 2025 2030 life(ydes
Hazardous Waste Handling Facility 333 0 0 0 0 0 0 2,000
* Costs reflect a five-year average in constant 1995 dollars, except in FY 1995 -2000, which is a six-year average.
Total Life Cycle is the sum of annual costs in constant 1995 dollars.
Note: These projects represent a subset of waste management activities. Associated program management costs are built-in to the estimates provided.
CA 48

consisted of fewer than ten 55-gallon drums.Storage of transuranic waste will continuepending the opening of a disposal facility (theWaste Isolation Pilot Plant).
The existing Hazardous Waste HandlingFacility consists of several separate buildings,but Lawrence Berkeley Laboratory willconsolidate all waste handling and monitoringactivities at the improved Hazardous WasteHandling Facility when it is completed in FY1996.
Waste Disposal
Hazardous wastes from Lawrence BerkeleyLaboratory are disposed of at a variety of offsitepermitted disposal, treatment, and recyclingfacilities. In 1992, Lawrence BerkeleyLaboratory received authorization from theDOE Hanford Facility and the State ofWashington to ship low-level and low-levelmixed waste to DOE Hanford. The estimatedamount of low-level waste to be disposed in FY1995 and FY 1996 is 39 cubic meters for eachyear. This amount will increase to 59 cubicmeters in FY 1997. Approximately threequarters of a cubic meter of mixed reactiveswaste will be sent to Oak Ridge NationalLaboratory for chemical oxidation treatment.
Approximately 6.5 cubic meters of other mixedwaste not treated onsite or sent to Oak Ridgewill be sent to DOE Hanford for treatment,stabilization, and/or microencapsulation.
NUCLEAR MATERIAL AND
FACILITY STABILIZATION
There are no current or planned nuclearmaterial and facility stabilization activities atLawrence Berkeley Laboratory.
LANDLORD FUNCTIONS
The Office of Energy Research is the DOElandlord for Lawrence Berkeley Laboratory.The University of California owns the land andleases it to DOE. Key landlord activitiesinclude permitting and monitoring.
Waste Management Activity Costs
Five-Year Averages (Thousands of Constant 1995 Dollars)•
FY 1995.2000 2005 2010 2015 2020 2025 2030 life Cyde**
TreatmentLow-Level Mixed Waste 1,721 1,191 1,191 1,198 1,219 1,194 1,086 45,720
low-level Waste 1,038 718 718 718 718 718 587 27,125
Hazardous Waste 5,174 3,580 3,580 3,580 3,580 3,580 2,864 134,861
Total 7,934 5,489 5,489 5,496 5,517 5,492 4,538 207,706
• Costs reflect a five-year average In constant 1995 dollars, except In FY 1995-2000, which Is a slx•year average.
• Total Life Cycle is the sum of annual costs In constant 1995 dollars.
CA 49

PROGRAM MANAGEMENT
Program management tasks supporting theenvironmental restoration at Lawrence BerkeleyLaboratory include personnel management;maintenance of site-wide environmental data;strategic planning; financial management;interaction with DOE, external regulatoryagencies, and the public; permitting;monitoring of project progress; provision of atechnical advisory board; and administrativesupport. Associated costs are presented in theProgram Management Cost Estimate table.
Program management tasks supporting thewaste management at the Lawrence BerkeleyLaboratory include facility management;personnel management and training;administrative support; document, guidance,and procedure preparation and revision; data-
base and waste-tracking management; liaisonwith DOE and external regulatory agencies;audits; contractor oversight; budget preparationand control; and waste minimization planning.
DOE's Oakland Operations Office and the Stateof California have an Agreement-in-Principleproviding for technical and financial support tothe State for its activities at Lawrence BerkeleyLaboratory and five other DOE sites inCalifornia. The support includesenvironmental oversight, monitoring, access,emergency preparedness, and other activities toensure compliance with Federal, State, and localregulations applicable to the site.
Program Management Cost Estimate
Five-Year Averages (Thousands of Constant 1995 Dollars)*
FY 1995-2000 2005 2010 2015 2020 2025 2030 Life Cycle**
Program Management 895 1,831 1,485 1,470 1,461 1,429 1,134 49,422
- Costs reflect a five-year average in constant 1995 dollars, except in FY 1995-2000, which is a six-year average.
" Total Life Cycle is the sum of annual costs in constant 1995 dollars.
CA 50

41'
FUNDING AND COST
INFORMATION
The following tables present fundinginformation and major activity milestones forthe Lawrence Berkeley Laboratory.
Nondefense Funding Estimate
Five-Year Averages (Thousands of Constant 1995 Dollars)*
FY 1995-2000 2005 2010 2015 2020 2025 2030 Life Cycle**
Environmental Restoration 2,965 2,264 113 96 82 56 0 30,846
Waste Management 7,934 5,489 5,489 5,496 5,517 5,492 4,538 207,706
Program Management 895 1,831 1,485 1,470 1,461 1,429 1,134 49,422
Total 11,793 9,584 7,087 7,062 7,060 6,977 5,672 287,975
* Costs reflect a live-year average in constant 1995 dollars, except in FY 1995-2000, which is a six-year average.
** Total Life Cycle is the sum of annual costs in constant 1995 dollars.
CA 51

Major Activity Milestones
ACTIVITY TASK COMPLETION DATE
Environmental Restoration Fiscal Year
Site-Wide Assessment 2000RFI-Soil and Ground Water Report' 1997(MS-Soil and Ground Water Report ' 1997
Corrective Measures Final Design' 1999
Site-Wide Remediation 2025Corrective Measures Implementation 2001RCRA Closure of Existing HWHF
Begin Closure 1996Complete Closure 1998
Waste Management Fiscal Year
Removal of Inadequate USTs 1995Full Compliance with NESHAPS 1995Installation of Deionization/Regeneration Equipment 1996New HWHF Construction 1996Site-Wide Hazardous Waste Management Complete 2030Treatment of Low-Level and Low-Level Mixed Waste Complete 2030
' Completion dates are for submission of reports to regulatory authorities.
2 Completion date is for submission to DOE HO.
CMS = Corrective Measure Study
HWHF = Hazardous Waste Handling Facility
NESHAPS = National Emission Standards and Hazardous Air Pollutants
RCRA = Resource Conservation and Recovery Act
RFI = RCRA Facility Investigation
USTs = Underground Storage Tanks
For further information on this site, please contact : Public Participation OfficePublic Affairs OfficeTechnical Liaison: Rich Fallejo
(510) 637-1812(510) 486-5771(510) 637-1639
CA 52

LAWRENCE LIVERMORE NATIONAL LABORATORY
Main Site
The Main Site of the Lawrence Livermore National Laboratory occupies approximately one square
mile in the Livermore-Amadore Valley on the eastern border of the City of Livermore, California.
The site, which is also known as the Livermore site, is approximately 50 miles east of San Francisco
and about one-half mile from the City of Livermore.
(71-)
l‘g
(;)(J(;')
(.)
Malipad Area
Building 490 Area
Trailer BASS Area
Unpile Drainage Dienes
Salvage Yard
Bulldog 5I0 Area
Building 511 Aree
Building 419 Area
(91) Treatment FaciliMG Idea
(
,50) MW 501 Area
(10 Building 191 Area
2) TFF Area
(SD) Budding 331 Area
(IS) Sodding 292 Area
(te) Arroyo Saco
DIS.Irl Lending Mal
Site 300
Site 300 of the Lawrence Livermore National Laboratory is a remote high-explosives testing facilityapproximately 15 miles southeast of the Laboratory's Main Site and 10 miles southwest of the Townof Tracy, California. The site occupies 11 square miles (some 7000 acres) in Alameda and SanJoaquin Counties. It hosts several areas for high-explosives processing and fabrication and testing,facilities for the thermal testing of high-explosives components, several instrumented firing tables forexplosives testing, an advanced test-particle accelerator, and various general services facilities suchas a motor-pool shop and machine shops.
General Services Area
HEPA Bulldog BIGOpera. Ural
CA 53

Estimated Site Total
Thousands of Current 1995 Dollars)*
FY 1995 1996 1997 1998 1999 2000
Environmental Restoration 20,935 21,143 26,430 26,903 27,895 28,679Waste Management 44,710 61,368 47,217 49,577 52,049 50,132Nuclear Material and Facility Stabilization 00 0 4,845 4,845 4,845Program Management 5,065 5,849 5,887 6,206 6,979 7,107
Total 70,710 d 88,360 79,534 87,531 91,768 90,763
• Costs for FY 1995 reflect Congressional Appropriation, costs for FY 1996 reflect EM budget submission, costs for FY 1997-2000 reflect Budget Shortfall Scenario, costs forshaded area assume 3% annual inflation.
Five-Year Averages (Thousand( of Constant 1995 Dollars)**
FY 1995-2000 2005 2010 2015 2020 2025 2030
Environmental Restoration 23,420 15,539 11,196 7,639 4,620 3,876 3,017Waste Management 47,276 33,877 33,873 34,170 35,076 33,952 27,859Nuclear Material and Facility Stabilization 4,506 1,979 0 0 0 0 0Program Management 5,717 28,358 13,242 10,455 9,801 9,289 7,467
Total 80,919 79,753 58,311 52,264 49,497 47,118 38,343
2035 2040 2045 2050 2055 2060 2065 Life Cycle***
Environmental Restoration 2,231 1,387 1,185 1,012 519 0 401,623Waste Management 3,174 430 2 0 0 0 1,295,718Nuclear Material and Facility Stabilization 0 0 0 0 0 0 36,929Program Management 1,223 474 314 268 0 0 438,757
Total 6,628 2,291 1,500 1,280 519 0 0 2,173,027
Costs reflect a five-year average in constant 1995 dollars, except in FY 1995 - 2000, which is a six-year average.
Total Life Cycle is the sum of annual costs in constant 1995 dollars.
PAST, PRESENT, AND
FUTURE MISSIONS
Main Site
The Livermore Main Site was purchased by theU.S. Navy in 1942 and was initially used as aflight training base and engine overhaul facility.The transition from Navy operations to researchbegan in 1950, when the Atomic Energy
Commission authorized the construction of amaterials-test accelerator at the site. TheCommission established the University ofCalifornia Radiation Laboratory, Livermore Site(the predecessor of the Lawrence LivermoreNational Laboratory) as a laboratory for nuclearweapons research.
The current mission of the Lawrence LivermoreNational Laboratory is research, testing, anddevelopment focusing on national defense andsecurity, energy, the environment, and
CA 54

biomedicine. The Laboratory's specific defense
mission is the research, testing, anddevelopment of technologies related to nuclearweapons. The mission has been broadened
over the years to meet national needs, such as
the enhancement of economic competitiveness
and science education. These missions areexpected to continue for the foreseeable future.
Site 300
Site 300 was purchased from local ranchers in
the 1950's. The surrounding area is agricultural
and has an average population density of less
than one person per square mile.
The site's former and current mission is the
research and testing of nonnuclear high-explosive components for the Department of
Energy's (DOE) nuclear weapons program.
The Department plans to continue using Site
300 for the testing of high-explosivescomponents. Should these plans change in the
future, institutional control over the site will be
maintained by identifying another governmentmission for the site.
The Estimated Site Total table found on theprevious page presents the total costs for boththe Main Site and Site 300. These costs arepresented by the defense and nondefenseallocation in the Defense Funding Estimate andNondefense Funding Estimate tables.
ENVIRONMENTAL
RESTORATION
Main Site
Past operations involving the handling andstorage of hazardous materials at theLaboratory's Main Site resulted in the release
and subsequent migration of contaminants into
soil and ground water. Nineteen differentsource areas have been identified in variousparts of the site. The Main Site was placed on
Environmental Restoration Projects
Five-Year Averages (Thousands of Constant 1995 Dollars)*
FY 1995-2000 2005 2010 2015 2020 2025 2030
Decommissioning 0 608 1,317 1,013 1,013 1,013 1,013
Main Site Restoration 13,151 8,172 5,828 4,231 2,991 2,224 1,900
Site 300 Restoration 10,269 6,759 4,051 2,395 616 639 104
Total 23,420 15,539 11,196 7,639 4,620 3,876 3,017
2035 2040 2045 2050 2055 2060 2065 Life Cycle**
DecommissioningMain Site Restoration
Site 300 Restoration
6081,623
0
01,387
0
01,185
0
01,012
0
0519
0
0
00
32,929234,258134,436
Total 2,231 1,387 1,185 1,012 519 0 0 401,623
• Costs reflect a five-year average in constant 1995 dollars, except in FY 1995-2000, which is a six-year average.
Total Life Cycle is the sum of annual costs in constant 1995 dollars.
CA 55

the National Priorities List of theEnvironmental Protection Agency (EPA) in1987. Costs for environmental restorationactivities at the Main Site are presented in theEnvironmental Restoration Projects table on thefollowing page. These costs are broken downby activity in the Environmental RestorationProject Activity Costs table.
The major contaminants in soil and groundwater are volatile organic compounds and fuelhydrocarbons. Subsequently, chlorinatedhydrocarbons have been detected in groundwater at concentrations of up to 10 parts permillion.
A further source of ground-watercontamination is an underground fuel-storagetank that released approximately 17,000 gallonsof leaded gasoline between 1961 and 1979.Tritium has also been detected in an onsitemonitoring well at concentrations above thedrinking water standards. To date, only onesource of tritium, a 1991 leak from a tank atBuilding 292, has been identified. Ongoinginvestigations are focused on profiling allremaining sources of ground-watercontamination.
Environmental Restoration Activity Costs
Five-Year Averages (Thousands of Constant 1995 Dollars)*FY 1995-2000 2005 2010 2015 2020 2025 2030
Facility DecommissioningFacility Decommissioning 0 608 1,317 1,013 1,013 1,013 1,013
Main Site RestorationRemedial Actions 13,151 8,172 5,828 4,231 2,991 2,224 1,900
Site 300 RestorationAssessment 3,208 0 0 0 0 0 0Remedial Actions 5,718 6,116 3,083 1,686 399 341 0Surveillance And Maintenance 56 642 968 710 217 298 104Facility Decommissioning 1,287 0 0 0 0 0 0
Total 23,420 15,539 11,196 7,639 4,620 3,876 3,017
2035 2040 2045 2050 2055 2060 2065 Life Cycle*"Facility Decommissioning
Facility Decommissioning 608 0 0 0 0 0 0 32,929Main Site Restoration
Remedial Actions 1,623 1,387 1,185 1,012 519 0 0 234,258Site 300 Restoration
Assessment 0 0 0 19,250Remedial Actions 0 0 0 0 0 0 92,428Surveillance And Maintenance 0 0 0 0 0 15,038Facility Decommissioning 0 0 0 0 0 0 7,720
Total 2,231 1,387 1,185 1,012 519 0 0 401,623
* Costs reflect a five-year average in constant 1995 dollars, except in FY 1995-2000, which is a six-year average.
Total Life Cycle is the sum of annual costs in constant 1995 dollars.
CA 56

The primary ground-water contamination at
the Main Site is a 1.4-square-mile plume,consisting mainly of trichloroethene threatening
private wells and the water wells of the nearby
City of Livermore. Private wells threatened by
the plume have been closed and their users
were provided with an alternative water
supply. The trichloroethene plume is notexpected to affect the municipal wells for the
next 70 years, while the planned remediation to
reduce the concentrations of contaminants toacceptable levels is expected to take onlyslightly more than 50 years.
Decommissioning activities are planned for fivebuildings currently listed in the NuclearMaterial and Facility Stabilization SurplusFacilities Inventory. These facilities include theChemistry Building (#212), the Reactor DomeBuilding (#281), the Environmental LaboratoryBuilding (#412), the Chemistry laboratoryFacility (#212) and the Heavy Element Building
(#251). Operations at these facilities includechemistry and material science laboratoryanalysis, analytical laboratory operations, andmultifunction research laboratory analysis.Some of these operations included workingwith nuclear material. As a result,decommissioning activities will include thecleanup and disposal of radioactive andhazardous materials including asbestos. Thedecommissioning effort will include allplanning characterization, decontamination,demolition, and disposal of all buildingmaterials such that the resultant vacant sitescan be landscaped for soil retention. DOE hasnegotiated agreements with the EPA and the
State of California for cleaning up the site onthe basis the site will continue to be used byDOE for research and development.
Currently, DOE is using new pump-and-treatmethods to remediate ground water at fivetreatment units, and further migration of the
plume of contaminated ground water is beingcontained by means of onsite extraction wells.
In fiscal year 1993, more than 73 million gallons
of ground water was extracted and treated to
remove organic solvents, and more than 10,000gallons of gasoline was recovered. Ground-water treatment plans have been proposed toreduce the concentrations of solvents, gasoline,and other contaminants to levels below thosespecified in drinking-water standards.
Tritium in ground water will be allowed todecay naturally in place. Wastes contaminatedwith volatile organic compounds generated byremedial actions are placed in granular-activated carbon canisters and removed tooffsite treatment facilities.
Site 300
Past operations involving the processing,testing, and deactivation of explosive materialsresulted in soil and ground-watercontamination at the site. The sources ofcontamination included leaking pipes, disposal
sites (landfills, debris piles, drywells, andevaporation ponds), and spills. Thecontaminants include high-explosivecompounds, including beryllium, lead, anduranium; halogenated hydrocarbons (mainlytrichloroethene and perchloroethene); andtritium. In 1990, Site 300 was placed on theEPA's National Priorities List primarily becauseseveral plumes of volatile organic compoundshad been detected in ground water offsite.Costs for environmental restoration activities at
Site 300 are presented in the EnvironmentalRestoration Projects table. These costs arebroken down by activity in the EnvironmentalRestoration Project Activity Costs table.
All major ground-water plumes have sincebeen delineated. The major area of concern at
Site 300 is the General Services Area, a support
area with machine shops, administrative offices,
motor-pool facilities, and other supportfacilities. At several locations in this area,solvents were discharged into drywells or theground. These practices, long discontinued,resulted in soil and ground-watercontamination. Trichloroethene plumes havereached the shallow alluvial aquifer in the
CA 57

Corral Hollow Basin and into the regionalaquifer at the GSA area. The contaminatedground water threatens two water-supply wellsmonitored regularly. DOE has made a formalagreement with their users to providealternative water supplies. Upon securing thealternative water supplies, the original wellswill be deactivated and converted intomonitoring wells. At present, the levels ofcontamination in ground water and soil do notpose health risks to site workers. In the areawhere high explosives are processed, lowconcentrations of volatile organic compoundsand high explosives are present in soil andperched water-bearing zones.
A thermal testing facility in Building 834 hasbeen operating since 1957. Before 1994, thisfacility used trichloroethene as its heat transferfluid. In the 1950's, 1960's, and 1970's,trichloroethene was released into the groundthrough pipe leaks and spills. In the 1980's, thefacility piping and solvent storage areas wereupgraded to prevent further releases.Information about operations and data fromsite characterization indicate up to 550 gallonsof trichloroethene was released in the area ofBuilding 834. Most of this material is stillpresent in the soil and ground water.
The ground water at Building 834 is perched ona lens of clay that, together with another claylens and 280 feet of unsaturated sediments,physically separates it from the regional aquifer.The perched ground water has no pathwayaway from the site, and therefore the site posesno risk to the public. Contaminantconcentrations in soil and ground water arevery high at Building 834, and it is believedpockets of free product trichloroethene (densenonaqueous phase liquid) are present. DOEplans to use the Building 834 area to testvolatile organic compounds and densenonaqueous phase liquid cleanup technologies.
Located in the ground water of Pits 3 and 5 andthe Building 850 area, a low-level tritium plumeis emanating from Pits 3 and 5 at the closed
landfill and from the Building 850 firing table.The tritium plume is entirely onsite, and fateand transport calculations indicate tritiumconcentrations offsite are well below bothFederal and State drinking water standards. Inaddition, polychlorinated biphenyls (PBCs),volatile organic compounds, and depleteduranium have been detected in the operableunit. The extent of PBCs and uraniumcontamination in soil and volatile organiccompound contamination in ground water inthis area is still being investigated.
At Pit 6, volatile organic compounds from theclosed landfill have contaminated theuppermost aquifer; however, ground waterfrom this unit flows to the surfaceapproximately 500 feet west of the landfill onDOE land where the contaminants slowlyevaporate. The concentrations of volatileorganic compounds in the ground water havedropped significantly since 1987.
Several facilities not discussed above, such asthe Building 832 Canyon, have been identifiedas sites where hazardous spills, leaks, ordischarges may have occurred. Although thesefacilities do not pose current health orenvironmental risks, they could requireremediation in the future.
It is assumed future use of Site 300 willcontinue to include the diverse types ofresearch operations currently being conductedand the site will remain a Federal facility. Nobuildings are slated for decommissioningactivities, and no future residential use isanticipated.
The environmental restoration at Site 300focuses on the assessment and remediation ofreleases of solvents, tritium, and high-explosivecomponents from landfills, drywells, spills,leaks, and other sources at the site. Particularattention centers on:
• weapons component testing areas and solvent releasesfrom Buildings 833 and 834,
CA 58

solvent releases from debris piles and drywells at the
southeast General Services Area,
• solvent and high-explosive component releases from
the High-Explosive Process Area,
• tritium releases from the Building 850 firing table and
the Pit 7 landfill complex, and
solvent releases from the Pit 6 landfill.
In 1991, the treatment of trichloroethenecontaminated ground water began at theeastern General Services Area. The easternGeneral Services Area plume extends offsite
and down the Corral Hollow alluvial channel
for approximately 1 mile. By the end of fiscal
year 1993, 12.8 million gallons of contaminated
ground water had been treated and discharged
to an ephemeral stream. At the central General
Services Area, ground water from a shallowalluvial aquifer is being remediated fortrichloroethene contamination with both pump-
and-treat and soil-vapor-extraction systems.
Resource Conservation and Recovery Act(RCRA) closure of the High Explosive Burn Pitswill begin once the new explosive wastetreatment facility is operational, currentlyscheduled for the end of fiscal year 1997.Closure of the High Explosive Burn Pits will befollowed by postclosure monitoring.
Following technology testing, Building 834 willbe remediated to risk-based standards. DOE ispursuing an exemption for this activity fromthe Central Valley Regional Water QualityControl Board Basin Plan. It is assumed theCentral Valley Regional Water Quality ControlBoard will not require EnvironmentalManagement's environmental restorationactivity to perform solid waste assessment testsof the Site 300 landfills.
WASTE MANAGEMENT
The Waste Management Projects table containscosts for all waste management activities at theMain Site and Site 300. For costs allocated bywaste type see the Waste Management ActivityCosts table.
Main Site
Waste management activities at theLaboratory's Main Site include the treatment,storage, and offsite disposal of chemicallyhazardous waste, low-level radioactive waste,mixed hazardous and low-level radioactivewaste, transuranic waste, and mixed
Major Waste Management Projects
Five-Year Averages (Thousands of Constant 1995 Dollars)*
FT 1995.2000 2005 2010 2015 2020 2025 2030 Life Cycle**
Decontamination and Waste Facility
Mixed Waste Management Facility
10,33311,500
1,0000
00
00
00
00
00
67,00069,000
• Costs reflect a five-year average in constant 1995 dollars, except in FY 1995-2000, which is a six-year average.
▪ Total Life Cycle is the sum of annual costs in constant 1995 dollars.
Note: These projects represent a subset of Waste Management activities. Associated program management costs are built-in to the estimate provided.
CA 59

transuranic waste. The waste managementfacilities at the Main Site are operated under aninterim permit under the RCRA Part A pendingthe approval of a RCRA Part B permitapplication.
The generation of some types of waste at theMain Site is expected to be significantlydecreased in the near future. For example, thegeneration of hazardous waste solids areprojected to decrease from 311,849 pounds and149 cubic meters in 1994 to 261,677 pounds and140 cubic meters by the year 2000, and thegeneration of liquid mixed waste is projected to
decrease from 5,699 gallons in 1994 to 3,902gallons by 2000. These reductions are primarilythe result of waste minimization efforts.However, the generation of solid low-levelradioactive waste is expected to increase from254,976 pounds in 1994 to 319,527 pounds by2000.
Waste Treatment
Waste treatment at the Laboratory's Main Site islimited to liquid hazardous waste, low-levelradioactive waste, and low-level mixed waste.It consists of filtration and the precipitation of
Waste Management Activity Costs
Five-Year Averages (Thousands of Constant 1995 Dollars)•
FY 1995-2000 2005 2010 2015 2020 2025 2030
TreatmentTransuranic Waste 2,347 1,716 1,716 1,716 1,716 1,716 1,430Low-Level Mixed Waste 5,961 4,358 4,358 4,655 5,569 4,445 3,644Low-level Waste 2,467 1,804 1,804 1,804 1,804 1,804 1,495
Storage and HandlingTransuranic Waste 5,775 3,563 3,563 3,563 3,563 3,563 3,350Low-Level Mixed Waste 15 10 9 8Low-level Waste 4 1 1 1 1 1
Hazardous Waste 30,684 22,424 22,421 22,423 22,423 22,423 17,939Sanitary Waste 23 0 0 0 0 0 0
Total 47,276 33,877 33,873 34,170 35,076 33,952 27,859
2035 2040 2045 2050 2055 2060 2065 Life Cyde*"Treatment
Transuranic Waste 230 0 0 0 0 0 65,283Low-Level Mixed Waste 632 0 0 0 0 174,070Low-level Waste 206 0 0 0 68,402
Storage and HandlingTransuranic Waste 2,103 428 0 0 0 153,136Low-Level Mixed Waste 0 0 0 0 228Low-level Waste 1 2 2 0 0 0 90
Hazardous Waste 2 0 0 0 0 834,372Sanitary Waste 0 0 0 0 0 0 137
Total 3,174 430 2 0 0 0 0 1,295,718
' Costs reflect a five-year average in constant 1995 dollars, except in FY 1995-2000, which is a six-year average,
Total Life Cycle is the sum of annual costs in constant 1995 dollars.
CA 60

metals and radioactive constituents. Variouswaste management facilities are available inseveral of the buildings and building complexes
at the site. They include shredders and sizereduction units for low-level radioactive andlow-level mixed waste; equipment forsolidifying liquid hazardous, low-levelradioactive, and low-level mixed waste; awastewater filtration unit for various types ofwastes; a silver recovery unit; and a wastewatertreatment tank farm. In addition, a transport-
able treatment unit for metals recovery isavailable. After chemical analysis to confirm it
meets discharge standards, wastewater isdischarged to the local sanitary sewer.
In 1992, the Laboratory began a project todesign and construct a pilot-scale treatmentsystem for low-level mixed radioactive andorganic waste without incineration. This project
will provide engineering and designinformation for the deployment of full-scaletreatment capabilities at other DOE sites. Thepilot plant will be used to test treatmenttechnologies at least through fiscal year 2000.
Waste Storage
The Laboratory operates licensed waste-storagefacilities. These facilities, located in variousbuildings, serve both the Main Site and Site 300.They include container storage units; areas forstoring hazardous, low-level radioactive, low-level mixed radioactive waste, or transuranicwaste; a storage tank farm for hazardous, low-level, and low-level mixed waste; and portabletank and tank trailer storage facilities.Estimates of practical storage capacity at thevarious units are 850 cubic meters forhazardous waste, 1,606 cubic meters for low-level waste, 1,695 cubic meters for low-levelmixed waste, and 1,059 cubic meters fortransuranic waste.
Waste Disposal
No waste is disposed at the LawrenceLivermore National Laboratory. Low-levelsolid radioactive waste is sent to the NevadaTest Site for disposal. Low-Level Mixed Wasteis stored at the Main Site until a disposal site orsites is selected; the disposal site may be theDepartment's facilities at Hanford or a licensedcommercial site. Hazardous waste is sent tolicensed offsite disposal facilities. Transuranicwaste will be kept in storage until the WasteIsolation Pilot Plant in New Mexico is available.
Site 300
Waste generated at Site 300 includes explosivewaste from testing activities, waste fromvarious other operations, and environmentalrestoration generated waste. The WasteManagement department of LawrenceLivermore National Laboratory operates apermitted treatment, storage, and disposalfacility at Building 883 at Site 300 and aninterim status explosives treatment facility atthe High-Explosive Burn Pits. The focus ofwaste management at Site 300 is the storage,treatment, and disposal of hazardous, mixed,aqueous, and low-level radioactive waste atboth facilities.
The Waste Minimization Project is also a wastemanagement facility at Site 300 and aims toreduce the amounts and toxicity of hazardous,radioactive, mixed, and nonhazardous waste.Waste management activities at Site 300 alsoinclude the confirmatory gravel sampling andanalysis plan. This plan addresses thecharacterization of newly generated debris fromfiring table operations.
Waste Treatment
Currently, the only treatment of wasteconducted at Site 300 is the burning ofexplosive waste at the High Explosive BurnPits. The burning of explosive waste at theHigh Explosive Burn Pits will cease when the
CA 61

new Explosive Waste Treatment Facility iscompleted. A RCRA Part B application hasbeen submitted for the Explosive WasteTreatment Facility, and construction of this newfacility is scheduled to be completed by the endof FY 1997. Residual waste from the HighExplosive Burn Pits are either transferred towaste management units at the LawrenceLivermore National Laboratory Main Site ordisposed offsite at permitted treatment, storage,and disposal facilities. Some onsite treatmentof restoration waste is performed at Site 300including in situ vapor extraction treatment ofvadose-zone volatile organic compoundcontaminated soils and aboveground pumpingand treating of volatile organic compoundcontaminated ground water.
Waste Storage
Building 883 is the only permitted storage unit atSite 300. Building 883 has a RCRA Part B permitfor the storage of explosives waste prior totreatment. Explosives waste is currently treatedat the High Explosive Bum Pits and will betreated in the future at the new Explosive WasteTreatment Facility. There are also several wasteaccumulation areas at Site 300 where waste isstored for less than 90 days. Waste accumulatedat Site 300 is either disposed offsite at permittedfacilities or transferred to the various wastemanagement facilities at the Lawrence LivermoreNational Laboratory Main Site.
Waste Disposal
No waste is currently disposed at Site 300 or theLawrence Livermore National Laboratory MainSite. Lawrence Livermore National Laboratorylow-level waste solids are disposed at theNevada Test Site. Federal Facility ComplianceAct mixed waste is currently stored atLawrence Livermore National Laboratory MainSite pending determination of ultimatedisposal. Hazardous waste is disposed offsiteat permitted treatment, storage, and disposalfacilities. Construction of the proposed MixedWaste Management Facility at the Main Sitemay reduce the amount of offsite disposal fromLawrence Livermore National Laboratory.
NUCLEAR MATERIAL AND
FACILITY STABILIZATION
The Lawrence Livermore National Laboratoryhas not yet entered the EnvironmentalManagement facility stabilization process, but itis assumed for purposes of this report it will doso in 1998. The facilities at the LawrenceLivermore National Laboratory anticipated toenter the program include a chemistry building,a heavy element facility, and a reactor dome.The resulting waste types will include low-levelmixed, transuranic, low-level, and hazardous.This report assumes that the stabilization andmaintenance process at the Lawrence
Nuclear Material and Faciity Stabilization Cost Estimate
Five-Year Averages (Thousands of Constant 1995 Dollars)*
FY 1995-2000 2005 2010 2015 2020 2025 2030 Life Cycle**
Nuclear Material and Facility Stabilization 4,506 1,979 0 0 0 0 0 36,929
• Costs reflect a five-year average in constant 1995 dollars, except in FY 1995-2000, which is a six-year average.
Total Life Cycle is the sum of annual costs in constant 1995 dollars.
CA 62

Livermore National Laboratory will becompleted by 2007. See the Nuclear Material
and Facility Stabilization Projects table forassociated costs.
LANDLORD FUNCTIONS
DOE's Office of Defense Programs conducts
most of the research and development atLawrence Livermore National Laboratory and
is responsible for landlord functions at Main
Site and Site 300.
PROGRAM MANAGEMENT
Main Site/Site 300
Program Management tasks supporting theenvironmental restoration activity at LawrenceLivermore National Laboratory Main Site andSite 300 include personnel management, strategicplanning, financial management, interaction with
DOE and external regulatory agencies,
monitoring of project progress, andadministrative support. The total cost forprogram management activities are presented inthe Program Management Cost Estimate table.
Program management tasks supporting wastemanagement activities at Lawrence LivermoreNational Laboratory Main Site and Site 300include facility management; personnelmanagement and training; administrativesupport; document, guidance, and procedurepreparation and revision; data base and wastetracking management; liaison with DOE andexternal regulatory agencies; inspections andaudits; budget preparation and control; andwaste minimization planning. Wasteminimization planning includes evaluation,training, and implementation of the followingprograms:
• recycling;
• substitution of less hazardous or nonhazardous raw
materials;
• volume and/or toxicity reductions; and
• source process modifications.
Program Management
Five-Year Averages (Thousands of Constant 1995 Dollars)**
FY 1995-2000 2005 2010 2015 2020 2025 2030
Program Management 5,717 28,358 13,242 10,455 9,801 9,289 7,467
2035 2040 2045 2050 2055 2060 2065 Life Cycle**
Program Management 1,223 474 314 268 0 0 0 438,757
• Costs reflect a five-year average in constant 1995 dollars, except in FY 1995-2000, which is a six-year average.
Total Life Cycle is the sum of annual costs in constant 1995 dollars.
CA 63

The Waste Minimization program is regulatedby the California Hazardous Waste SourceReduction and Management Review Act.
DOE and the State of California have anAgreement-in-Principle providing for technicaland financial support to the State for itsactivities at Lawrence Livermore NationalLaboratory Main Site and the Site 300.Technical and financial support includesenvironmental oversight, monitoring, access,emergency preparedness, and other initiatives
to ensure compliance with applicable Federal,State, and local regulations.
FUNDING AND COST
INFORMATION
The following tables present fundinginformation and major activity milestones forthe Lawrence Livermore National Laboratory.
Defense Funding Estimate
Five-Year Averages (Thousands of Constant 1995 Dollars)*FY 1995-2000 2005 2010 2015 2020 2025 2030
Environmental Restoration 23,420 15,539 11,196 7,639 4,620 3,876 3,017Waste Management 47,276 33,877 33,873 34,170 35,076 33,952 27,859Nuclear Material and Facility Stabilization 4,506 1,592 0Program Management 5,717 28,358 13,242 10,455 9,801 9,289 7,467
Total 80,919 79,366 58,311 52,264 49,497 47,118 38,343
2035 2040 2045 2050 2055 2060 2065 Life Cycle**Environmental Restoration 2,231 1,387 1,185 1,012 519 0 0 401,623Waste Management 3,174 430 2 0 0 0 0 1,295,718Nuclear Material and Facility Stabilization 0 0 0 0 0 0 0 34,992Program Management 1,223 474 314 268 0 0 0 438,757
Total 6,628 2,291 1,500 1,280 519 0 0 2,171,091
Costs reflect a five-year average in constant 1995 dollars, except in FY 1995-2000, which is a six-year average.
• Total Life Cycle is the sum of annual costs in constant 1995 dollars.
Nondefense Funding Estimate
Five-Year Averages (Thousands of Constant 1995 Dollars)•FY 1995-2000 2005 2010 2015 2020 2025 2030 Life Cycle**
Nuclear Material and Facility Stabilization 0 387 0 0 0 0 0 1,937
• Costs reflect a five-year average in constant 1995 dollars, except in FY 1995-2000, which is a six-year average.
▪ Total Life Cycle is the sum of annual costs in constant 1995 dollars.
CA 64

Major Activity Milestones
ACTIVITY TASK COMPLETION DATE
Environmental Restoration Fiscal Year
Begin Operation of B518 Vapor Extraction System - Main Site 1995
Begin Operation of Treatment Facility GI - Main Site 1996
Issue Compliance Monitoring Plan - Main Site 1996
Issue Contingency Plan - Main Site 1997
RCRA High-Explosive Burn Pit Closure - Site 300 1998
Submit Final OU No. 2 Record of Decision (ROD) to Regulatory Agencies - Site 300 1996
Submit Final OU No. 1, No. 3, No. 4, and No. 5 RODs to Regulatory Agencies - Site 300 1997
Submit Final OU No. 6 ROD to Regulatory Agencies - Site 300 1998
Begin Operation of Trailer 5475 Water Treatment Facility - Main Site 1998
Initiate OU No. 1 and OU No. 3 Final Remedies - Site 300 1998
Initiate OU No. 2 Final Remedy - Site 300 1997
Initiate OU No. 4 Final Remedy - Site 300 1999
Issue Remedial Design #4 - Main Site 1997
Begin Operation of Trailer 5475 Vapor Treatment Facility - Main Site 1999
Begin Operation of TFG-2 1999
Begin Operation of TFE 1999
Nuclear Material and Facility Stabilization Fiscal Year
Complete Facility Stabilization and Maintenance Activities 2007
Waste Management Fiscal Year
Construction of the Explosive Waste Treatment Facility 1997
Completion of Pilot Test Treatment at the Mixed Waste Management Facility 2000
For further information on this site, please contact: Public Participation OfficePublic Affairs OfficeTechnical Liaison: Rich Fallejo
(510) 637-1812(510) 422-6900(510) 637-1639
CA 65

CA 66

STANFORD LINEAR ACCELERATOR CENTER
The 426-acre Stanford Linear Accelerator Center is a high energy research facility owned and oper-
ated by Stanford University under contract to the Department of Energy (DOE). The site is located
on the San Francisco Peninsula between San Francisco and San Jose, California.
Plating shop chemical
Underground
3.0 MegawattPower Supply
storage building
-01111%miiimmiii\ent Tank
.... Substation 505
Radoactive and Mixed 41
Power Sup ply
Waste Storage Yard
\
Hazardous Waste StorageYard Eroded Asphalt Area
Former HazardousWaste Storage Area
San np quit°
IR-8PowerSap Ply
IR-8, IR-6
Master Substation Dainage Dtches
SearsvilleLake
UI
CA 67

Estimated Site Total
(Thousands of Current 1995 Dollars)*
FY 1995 1996 1997 1998 1999 2000
Environmental RestorationWaste ManagementProgram Management
Total
96B5,089202
8834,998226
1,0015,097272
x,2365,302299
1,2855,409315
6,259 6,107 6,370 6,692 6,817 7,009
Costs for FY 1995 reflect Congressional Appropriation, costs for FY 1996 reflect EM budget submission, costs for FY 1997-2000 reflect Budget Shortfall Scenario, costs for shadedarea assume 3% annual inflation.
Five-Year Averages (Thousands of Constant 1995 Dollars)**
FY 1995 - 2000 2005 2010 2015 2020 2025 2030
Environmental Restoration 1,013 327 119 96 82 70 50Waste Management 4,813 3,507 3,507 3,507 3,507 3,507 2,821Program Management 246 977 925 918 912 907 732
Total 6,073 4,811 4,551 4,520 4,500 4,483 3,604
FY 2035 2040 2045 2050 2055 2060 2065 Life Cyde***
Environmental Restoration 13 0 0 0 9,868Waste Management 64 0 0 0 0 0 130,971Program Management 16 0 0 0 28,406
Total 92 0 0 0 0 0 0 169,244Costs reflect a five-year average in constant 1995 dollars, except in FY 1995 - 2000, which is a six-year average.
*** Total Life Cycle is the sum of annual costs in constant 1995 dollars.
PAST, PRESENT, AND
FUTURE MISSIONS
The Stanford Linear Accelerator Center wasestablished in 1962 as a research facility for highenergy particle physics. The Center's fourmajor experimental facilities are the LinearAccelerator, the Positron Electron ProjectStorage Ring, the Stanford Positron ElectronAsymmetric Ring, and the Stanford LinearAccelerator Center Linear Collider.
The Stanford Linear Accelerator's currentmission as a center of research anddevelopment using high energy acceleratorsand experimental apparatus is assumed not to
change for the time period of this estimate.With no change in mission, the future use of thesite will be consistent with current activities.However, because Stanford University ownsthe facility land, should facilities bedecommissioned they will be cleaned to thestandards required for unrestricted use. TheOffice of Energy Research is the DOE landlordat the Stanford Linear Accelerator Center. Costestimates are in Stanford Linear AcceleratorCenter Estimated Site Total table.
CA 68

ENVIRONMENTAL
RESTORATION
The Stanford Linear Accelerator Centergenerates mainly hazardous waste and smallamounts of radioactive and mixed waste. Thehazardous waste streams include:
• waste oils from machine shops, motor pools, pumps,and compressors;
• waste solvents from various degreasers, assemblyshops, and "clean" operations;
• oils contaminated with polychlorinated biphenyls andPCB's;
• wastewater from the plating shop and its associatedwastewater treatment facility;
• aqueous liquids with metals from metal-cleaningactivities; and
• soil, clothing, and asphalt from the cleanup of spillsand leaks.
A small amount of radioactive waste arisesfrom the accumulation of corrosion productssuch as induced-radioactivity-containingcopper in cooling water, resin-bed filters, andpipe and other metal pieces from theaccelerator. A limited amount of low-levelmixed waste could be generated whenhazardous substances such as solvents are usedto clean activated material or when oil invacuum pumps serving the accelerator areirradiated by beam particles.
Past waste management practices and facilityoperations have resulted in the contamination ofsoils by polychlorinated biphenyls, petroleumhydrocarbons, lead, and other metals and thecontamination of ground water by volatileorganic compounds. The known sources ofground water contamination are a former leakingunderground storage tank, the plating shop, anda former hazardous waste storage yard. The
Environmental Restoration Activity Costs
Five-Year Averages (Thousands of Constant 1995 Dollars)*
FY 1995-2000 2005 2010 2015 2020 2025 2030
Environmental RestorationAssessment 556 108 0 0 0 0 0
Remedial Actions 457 108 0 0 0 0 0
Surveillance And Maintenance 0 111 119 96 82 70 50
Total 1,013 327 119 96 82 70 50
2035 2040 2045 2050 2055 2060 2065 Life Cycle**
Environmental RestorationAssessment 0 0 0 0 0 0 3,878
Remedial Actions 0 0 0 0 0 3,285
Surveillance And Maintenance 13 0 0 0 0 0 2,704
Total 13 0 0 0 0 0 0 9,868
• Costs reflect a five-year average in constant 1995 dollars, except in FY 1995-2000, which is a six-year average.
• Total Life Cycle is the sum of annual costs in constant 1995 dollars.
CA 69

known sources of soil contamination areInteraction Regions (IR) 6 and 8 drainage ditches,the 3.0-megawatt Power Supply, the InteractionRegion 8 Power Supply, the Master Substationinactive area, and the Substation 505 PowerSupply. Forty discrete areas of contaminationhave been identified to date.
Soil contamination has been found both on andoffsite. To date, ground-water contaminationhas only been found onsite. The extent of soiland ground-water contamination is notcompletely defined. Potential site risks will beassessed once site characterization is complete.
A preliminary assessment completed in 1993identified approximately 40 discrete areas ofcontamination requiring some degree ofremedial action. The EnvironmentalRestoration Projects table provides the total costfor environmental restoration activities at theStanford Linear Accelerator Center. These costsare broken down by activity in theEnvironmental Restoration Project ActivityCosts table. Environmental restorationactivities compose a significant portion of thetotal nondefense funding as shown in theNondefense Funding Cost Estimate table.Because of the large number of sites, theStanford Linear Accelerator Center has chosen asite-wide approach to the remedialinvestigation that will integrate soil andground-water concerns at all sites, replacing theindividual sampling and analysis activities thathave occurred to date at previously identified"high-priority" sites. Soil and ground-waterinterim actions are scheduled to commence inFY 1995, depending upon funding. In addition,ground-water monitoring will continue at thesite of a former leaking underground storagetank, and a ground-water peripheralmonitoring network will be completed betweenFY 1996 and FY 1999.
The remedial investigation reports oncontaminated soil and ground water arescheduled for completion in FY 1998. The site-wide feasibility study is scheduled for
completion in FY 1999. The site-wide record ofdecision is scheduled to be completed by FY2000. Stanford Linear Accelerator Center hasdefined four sites requiring Interim RemovalActions by FY 2001. These sites includeInteraction Region 8 Drainage Channel,Substation 505, Plating Shop, and lower SalvageYard. The work performed at each site willinclude excavation of contaminated soil andconfirmation sample collection and analysis toensure cleanup standards have been met.Remediation of the Stanford Linear AcceleratorCenter site based on the record of decision willbe required in the outyears beyond FY 2000. Atthis time this remediation effort has not beenplanned. Current estimates of contaminatedmedia requiring treatment or disposal are 1,337cubic meters of volatile organic compoundcontaminated ground water, 628 cubic meters ofpolychlorinated biphenyl contaminated soil,and 925 cubic meters of polychlorinatedbiphenyl and lead contaminated soil.
WASTE MANAGEMENT
Hazardous waste is generated by operationssuch as vehicle, equipment and general facilitymaintenance, and the operations of the platingshop and its associated waste treatment plant.Approximately 350 tons of hazardous waste aregenerated annually. Other waste streams aremore variable, and the volume generateddepends on the level of activity in the highenergy research program. Restoration interimactions are expected to generate waste startingin FY 1995.
Radioactive waste includes low-level and low-level mixed waste generated through a varietyof means:
• activation due to proximity to the beam line (largestvolume),
• sealed sources and standards no longer in use;
CA 70

• resin beds used in water recirculation, and
• solvents contaminated by their use in fabrication.
Approximately 84 cubic meters of low-levelwaste and 1 cubic meter of low-level mixedwaste are expected to be generated annually atthe Stanford Linear Accelerator Center.
Other scheduled waste management projectsinclude the installation of an oil/waterseparator and the waste minimization program.A new oil/water separator at InteractionRegion 8 is scheduled for completion by earlyFY 1995. The waste minimization programfocuses on implementing recyclingopportunities, toxicity reductions, materialssubstitution, and source process modifications.
The Stanford Linear Accelerator Center hasoperating permits and contracts with the SouthBay System Authority and the West Bay SanitaryDistrict (sanitary sewer limits and pretreatmentstandards), the Bay Area Air Quality Manage-ment District (operating permits for air sourcesand pollution devices), the Regional Water
Quality Control Board (National PollutionDischarge Elimination System Permit and WasteWater Discharge Permit), and the San MateoCounty Office of Environmental Health ResourceConservation Recovery Act (RCRA) generatorpermit. The costs for waste managementactivities at the Stanford Linear AcceleratorCenter are provide below.
Waste StorageThe four major storage areas for hazardous andradioactive waste currently onsite include theChemical Storage Area, the PolychlorinatedBiphenyl Storage Area, the Radioactive MaterialStorage Yard, and Building 660 at InteractionRegion 6. Specific waste accumulation sites arelocated throughout the facility. The smallamount of radioactive waste generated by theStanford Linear Accelerator Center is stored inthe fenced and bermed radioactive materialstorage yard while awaiting disposal at a DOE
Waste Management Activity Costs
Five-Year Averages (Thousands of Constant 1995 Dollars)*
FY 1995-2000 2005 2010 2015 2020 2025 2030
TreatmentLow-level Waste 1,260 918 918 918 918 918 750Hazardous Waste 3,554 2,589 2,589 2,589 2,589 2,589 2,071
Total 4,813 3,507 3,507 3,507 3,507 3,507 2,821
2035 2040 2045 2050 2055 2060 2065 life Cycle**
TreatmentLow-level Waste 64 0 0 0 0 0 0 34,574Hazardous Waste 0 0 0 0 0 0 0 96,396
Total 64 0 0 0 0 0 0 130,971
• Costs reflect a five-year average in constant 1995 dollars, except in FY 1995-2000, which is a six-year average.
• Total Life Cycle Is the sum of annual costs in constant 1995 dollars.
CA 71

approved facility. When experiments arecompleted, accelerator components andcommercially procured radioactive materialsare either recycled or stored pending disposal.
Approximately 15 percent of all radioactivematerial is declared waste by the Center. Thenew Radioactive and Mixed Waste StorageFacility is scheduled to be completed in FY1995. The Radioactive Material Storage Yardwill then be used solely as a staging area toreceive, segregate, and process material and tostore recyclable radioactive material.Interaction Region 6 is also used to storerecyclable radioactive material. The separateRadioactive and Mixed Waste Storage Facilitywill be used exclusively for nonrecyclableradioactive and mixed waste storage prior totreatment or disposal offsite.
The Stanford Linear Accelerator Centercurrently has about one cubic meter of low-level mixed waste in storage and coordinatesstaging and ultimate disposal of land disposalrestricted mixed waste with DOE Hanford.
Waste Disposal
The Stanford Linear Accelerator Center doesnot dispose of any hazardous, radioactive, ormixed waste onsite. Hazardous waste ismanifested and sent offsite to permittedtreatment, storage, and disposal facilities fortreatment, disposal, or recycling. Someradioactive material is recycled at the Center,and some is sent to non-Center recyclers.
Radioactive and mixed waste is shipped toHanford for treatment and disposal or to otherapproved DOE facilities. Current estimates forannual disposal are 350 tons of hazardouswaste, 84 cubic meters of low-level radioactivewaste, and 1 cubic meter of low-level mixedwaste. Future volumes will depend on the levelof research activity.
NUCLEAR MATERIAL AND
FACILITY STABILIZATION
There are no current or planned nuclearmaterial and facility stabilization activities atthe Stanford Linear Accelerator Center.
LANDLORD FUNCTIONS
The Office of Energy Research is the DOElandlord at the Stanford Linear AcceleratorCenter while Stanford University owns thefacility land. It is expected that DOE's EnergyResearch program will continue to be thelandlord and current operations will continueat the Stanford Linear Accelerator Center forthe foreseeable future. The EnvironmentalManagement program is not expected to takeon significant increased landlordresponsibilities.
PROGRAM MANAGEMENT
The Program Management Cost Estimate tableprovides costs for both EnvironmentalRestoration and Waste Management activities.Program management tasks supporting theenvironmental restoration activity at theStanford Linear Accelerator Center include:
• personnel management;
• strategic planning;
• maintenance of site-wide environmental data;
• financial management;
• interaction with DOE, external regulatory agencies,and the public;
• permitting;
• monitoring of project progress and auditing; and
CA 72

• administrative support.
Program management tasks supporting wastemanagement activities at the Center include:
• facility management;
• personnel management and training;
• administrative support;
• spill control support;
• document, guidance, and procedure preparation andrevision;
• database and waste-tracking management;
• audits of treatment, storage, and disposal facilities thatreceive hazardous waste from the Center;
• payment of disposal and inspection fees;
• budget preparation and control; and
• waste minimization planning.
DOE and the State of California have anAgreement-in-Principle providing for technicaland financial support to the State for itsactivities in environmental oversight,monitoring access, facility emergencypreparedness, and initiatives to ensurecompliance with applicable Federal, State, andlocal laws at the Center and five other DOEfacilities in California.
The Stanford Linear Accelerator Centercurrently has a compliance order from theCalifornia Regional Water Quality ControlBoard for monitoring ground water at the siteand for the characterization and remediation ofa former tank site.
FUNDING AND COST
INFORMATION
The following tables present fundinginformation and major activity milestones forthe Stanford Linear Accelerator Center.
Program Management Cost Estimate
Five-Year Averages (Thousands of Constant 1995 Dollars)FY 1995 - 2000 2005 2010 2015 2020 2025 2030
Program Management 246 977 925 918 912 907 732
2035 2040 2045 2050 2055 2060 2065 Life Cycle*
Program Management 16 0 0 0 0 0 0 28,406
' Costs reflect a five-year average In constant 1995 dollars, except In FY 1995-2000, which Is a six-year average,
- Total Life Cycle Is the sum of annual costs In constant 1995 dollars.
CA 73

Nondefense Funding Estimate
Five-Year Averages (Thousands of Constant 1995 Dollars)*
FY 1995 - 2000 2005 2010 2015 2020 2025 2030
Environmental Restoration 1,013 327 119 96 82 70 50
Waste Management 4,813 3,507 3,507 3,507 3,507 3,507 2,821
Program Management 246 977 925 918 912 907 732
Total 6,073 4,811 4,551 4,520 4,500 4,483 3,604
2035 2040 2045 2050 2055 2060 2065 Life Cycle*
Environmental Restoration 13 0 0 0 0 0 0 9,868
Waste Management 64 0 0 0 0 0 0 130,971
Program Management 16 0 0 0 0 0 0 28,406
Total 92 0 0 0 0 0 0 169,244
Costs reflect a five-year average in constant 1995 dollars, except in FY 1995-2000, which is a six-year average.
Total Life Cycle is the sum of annual costs in constant 1995 dollars.
CA 74

Major Activity Milestones
ACTIVITY TASK COMPLETION DATE
Environmental Restoration Fiscal Year
Complete Site-Wide Assessment 2001
Complete Interactive Region-8 Drainage Channel Interim Action 1997
Complete Substation 505 Interim Action 1999
Plating Shop Interim Action 2000
Lower Salvage Yard Interim Action 2001
Complete Site-Wide Remediation 2031
Complete Surveillance and Monitoring Activities 2005
Waste Management Fiscal Year
Install New Oil-Water Separator at IR-8 1995
Complete Radioactive and Mixed Waste Storage Facility Construction 1995
Complete Hazardous Waste Management Activities 2030
Complete Low-Level Waste Treatment Activities 2031
For further information on this site, please contact : Public Participation OfficePublic Affairs OfficeTechnical Liaison: Rich Fallejo
(510) 637-1812(415) 926-2204(510) 637-1639
CA 75

CA 76

OXNARD SITE
The Oxnard site is a 14-acre area located in the industrial section of Oxnard, California, approxi-mately 50 miles northwest of Los Angeles.
Concrete Padsfor Former
Propane TanksParking
VisitorParking
cn
Asphalt Surface Road
I I I I 3 Ton Overhead Crane
Sn Concrete Dock
Building 35 Ton Overhead Crane
Stock Yard
MetallurgyLab
0
Building 2
Concrete Pad
EmployeeParkingArea
Concrete1 1 o
Pit -o= t Building 4
Building 5
Pit
Building 6
Pit
Concrete Pad
Unpaved Area(Employee Fitnessand Running Track)
JDie Yard
Tank Yard
Building 7
BoneYard
nve ay
Pacific AvenueMountian View Avenue
CA 77

Estimated Site Total
(Thousands of Current 1995 Dollars)
FY 1995 1996 1997 1998 1999 2000
Environmental RestorationProgram Management
Total 3,500 i 7,725 3,713 1,639
Five-Year Averages (Thousands of Constant 1995 Dollars)*
FY 1995 - 2000 2005 2010 2015 2020 2025 2030 Life Cycle**
Environmental Restoration 2,414 0 0 0 0 0 0 14,484
Program Management 349 0 0 0 0 0 0 2,092
Total 2,763 0 0 0 0 0 0 16,576
` Costs reflect a five-year average in constant 1995 dollars, except in FY 1995-2000, which is a six-year average.
Total Life Cycle is the sum of annual costs in constant 1995 dollars.
PAST, PRESENT, AND
FUTURE MISSIONS
Oxnard is a 45-year-old industrial plantoriginally used from 1949 to 1981 to producefarm equipment. A contractor for theDepartment of Energy (DOE), Precision Forge,occupied the site from 1981 to 1984. TheDepartment purchased the property in 1984and will continue to produce forgings forweapon parts through calendar year 1995. Thefacility will then be returned to private concernsfor economic development. DOE-Rocky Flats isthe current landlord but landlord respons-ibilities will likely transfer to EnvironmentalManagement (EM) following completion ofproduction. The Grand Junction Projects Office,Grand Junction, Colorado, has recentlyassumed responsibility for the remediation ofthe Oxnard site.
ENVIRONMENTAL
RESTORATION
The Oxnard facility has been contaminatedduring its use as a metals-forging plant. Possiblehazardous contaminants include polychlorinatedbiphenyls (PCBs), organic lubricants andcoolants, chlorinated solvents, and heavy metals.While several environmental sampling programshave been conducted to determine the type ofcontamination, an extensive site assessment hasnot been performed and the extent of contam-ination has not been defined. Preliminary assess-ments indicated low concentrations of PCBs (lessthan 50 parts per million) and the presence oftetrachloroethane and fuel products in soil gases.
CA 78

The next step is a characterization of the site.This will include collecting and analyzing soiland ground-water samples and assessinghydrogeologic conditions.
Depending on the extent of contamination,corrective measures may include the excavationof contaminated soils, the demolition andreplacement of concrete structures, the disposalof contaminated materials, the installation of awater treatment system, and site restoration.Remediation of the Oxnard site is currentlyplanned for completion in FY 1997. Regulatorydrivers for this project will be defined whencharacterization activities are completed.
WASTE MANAGEMENT
There are no current or planned wastemanagement activities conducted at Oxnard.
NUCLEAR MATERIAL AND
FACILITY, STABILIZATION
There are no current or planned nuclearmaterial and facility stabilization activities atthe Oxnard site.
LANDLORD FUNCTIONS
The landlord functions for Oxnard are managedthrough the Grand Junction Projects Office.Please see the Colorado site summary for details.
PROGRAM MANAGEMENT
Program management services are tracked andcharged to waste management andenvironmental restoration activity budgets.However, for the purpose of this reportprogram management costs are discretelyidentified.
FUNDING AND COST
INFORMATION
The following tables present fundinginformation and major activity milestones forthe Oxnard Site.
Environmental Restoration Activity Costs
Five-Year Averages (Thousands of Constant 1995 Dollars)*
FY 1995-2000 2005 2010 2015 2020 2025 2030 life Cycle**
Oxnard
Assessment 638 0 0 0 0 0 3,828
Remedial Actions 1,776 0 0 0 0 0 10,656
Total 2,414 0 0 0 0 0 0 14,484
• Costs reflect a five-year average in constant 1995 dollars, except in FY 1995-2000, which is a six-year average.
• Total Life Cycle is the sum of annual costs in constant 1995 dollars.
CA 79

Program Management Cost Estimate
Five-Year Averages (Thousands of Constant 1995 Dollars)**
FY 1995-2000 2005 2010 2015 2020 2025 2030 Life Cycle
Program Management 349 0 0 0 0 0 0 2,092
Costs reflect a five-year average in constant 1995 dollars, except in FY 1995-2000, which is a six-year average.
• Total Life Cycle is the sum of annual costs in constant 1995 dollars.
Defense Funding Estimate
Five-Year Averages (Thousands of Constant 1995 Dollars)*
FY 1995-2000 2005 2010 2015 2020 2025 2030 Life Cycle*
Environmental Restoration 2,414 0 0 0 0 0 0 14,484
• Costs reflect a five-year average in constant 1995 dollars, except in FY 1995-2000, which is a six-year average.
• Total Life Cycle is the sum of annual costs in constant 1995 dollars.
Nondefense Funding Estimate
Five-Year Averages (Thousands of Constant 1995 Dollars)*
FY 1995 - 2000 2005 2010 2015 2020 2025 2030 Life Cycle**
Program Management 349 0 0 0 0 0 0 2,092
Costs reflect a five-year average in constant 1995 dollars, except in FY 1995-2000, which is a six-year average.
• Total Life Cycle is the sum of annual costs in constant 1995 dollars.
CA 80

Major Activity Milestones
ACTIVITY TASK COMPLETION DATE
Environmental Restoration Fiscal Year
ER Characterization Complete
ER Remediation Complete
1995
1997
For further information on this site, please contact : Public Participation OfficePublic Affairs OfficeTechnical Liaison: Marilyn Bange
(505) 845-5951(505) 845-6202(505) 845-5160
CA 81

CA 82

SANDIA NATIONAL LABORATORIES/CALIFORNIA
Sandia National Laboratories/California is located in Alameda County, California, about 40 mileseast of San Francisco. It occupies about 413 acres of land in the Livermore Valley, and its bound-aries start approximately 3 miles east of the Livermore City Center.
BUILDING 961RADIOACTIVEMIXED WASTESTORAGE
Note: Drawing is notto scale
SANDIA DRI
// 8TH ST.
FOOTHILL LOOP
z
THUNDERBIRD
3RD. ST.
4TH ST
BUILDING 927CLASSIFIEDRADIOACTIVE WASTESTORAGE VAULT
BUILDING 962-2HAZARDOUS WASTESTORAGE
EXPLOSIVE WASTEINCINERATOR FACILITY
CA 83

Estimated Site Total
(Thousands of Current 1995 Dollars)*
FY 1995
Environmental Restoration 2208.8Waste Management 1809Program Management 886
Total 4903.8
1996 1997 1998 1999 2000
2667.21821988
22361760887
2193.61839899
32.81839467
5476.2 4883 4931.6 2338.8 2299
• Costs for FY 1995 reflect Congressional Appropriations, costs for FY 1996 reflect EM budget submission, costs for FY 1997-2000 reflect Budget Shortfall Scenario, costs forshaded area assume 3% annual inflation.
Five-Year Averages (Thousands of Constant 1995 Dollars)**
FY 1995-2000 2005 2010 2015 2020 2025 2030 Life Cycle***
Environmental Restoration 1,490 0 0 0 0 0 0 8,943Waste Management 1,690 2,971 2,971 2,971 2,971 2,971 2,408 96,447Program Management 545 743 743 743 743 743 602 24,850
Total 3,726 3,714 3,714 3,714 3,714 3,714 3,010 130,240
• Costs reflect a five-year average in constant 1995 dollars, except in FY 1995 - 2000, which is a six-year average.
▪ Total Life Cycle is the sum of annual costs in constant 1995 dollars.
PAST, PRESENT, AND
FUTURE MISSIONS
Sandia National Laboratories/California wasestablished in 1956 to conduct research anddevelopment in the interest of national security,with principal emphasis on nuclear weaponsdevelopment and engineering, excluding theactual nuclear materials. This primary missioncontinues unchanged at present and is expectedto remain the same for the foreseeable future.
ENVIRONMENTAL
RESTORATION
Contamination at the Sandia site has resultedfrom the disposal of hazardous wastes andaccidental spills. A comprehensive assessmentof contamination, begun in 1984, identified apotential for problems at the site of a fuel-oilspill, an old Navy landfill, and the site of an oldcommercial car repair shop, known as theTrudell site. Questions were also raised in 1988about five other sites. However, contaminantsin soil samples from these sites were found tobe below the action levels specified in theResource Conservation and Recovery Act(RCRA). The Regional Water Quality Control
CA 84

Board has informed Sandia that no furtheraction is required at these sites. The Board hasprimary regulatory responsibility for the siteunder cleanup orders 88-142 and 89-184.
Environmental restoration is scheduled to becompleted in FY 1999. Costs estimates aregiven in the Environmental Restoration Projectstable.
Fuel/Oil Spill
In 1975, an accidental puncture of anunderground transfer line released 59,500gallons of diesel fuel from an aboveground fueltank into the soil. The ground water has beenmonitored since 1985 and shows occasionallow-level contamination with fuel-oilcomponents. The total volume of soilcontaminated with diesel oil is estimated at112,000 cubic yards.
Several bench-scale tests of methods forcleaning up the spill indicate that the mosteffective means is in-place biologicalremediation. This technique uses bacteria thatdigests the oil, with nutrients and oxygenadded to stimulate their activity. A pilot studyof this technique is now in progress. Itaddresses about 18 percent of the total area ofcontamination. After the pilot study iscompleted, Sandia expects to start full-scalebiological remediation. Cleanup is expected toproceed at a rate of 20,000 cubic yards of soilper year and is to be completed in FY 1999.
Pending full cleanup, the Regional WaterQuality Control Board has directed Sandia toimplement an interim treatment for groundwater. This interim treatment uses carbon bedsto filter out the contaminants and an oil/waterseparator.
Navy Landfill Site
The Navy landfill, located at the southern endof the Sandia site, was used intermittently from1940 to 1960 for the disposal of general
construction debris and machine turnings.Over the past 5 years, quarterly monitoring ofground water beneath the landfill hasconsistently shown chromium and nitrateconcentrations that were higher than drinkingwater standards and nickel concentrations thatwere above the 1993 maximum concentrationlimit. However, several investigations havefound no evidence that hazardous materialswere buried at the landfill.
Because no evidence of hazardous wastedisposal has been found, Sandia has submitteda recommendation of No Further Action to theRegional Water Quality Control Board. TheBoard has reviewed the results of theinvestigations at the Navy landfill and Sandia'srequest. The Board is now requesting a formalclosure plan.
Nonetheless, Sandia does intend to implementother remedial actions at the Navy landfillbecause of risks identified in the environmentalimpact statement—namely, the possibility thatan earthquake could affect the stability of thelandfill. This was deemed a potential threat toonsite workers. Sandia plans to cap the landfilland to use other stabilization and erosion-control measures as appropriate.
The Trudell Site
The Trudell Site, which housed a commercialcar repair shop, was purchased by theDepartment of Energy (DOE) in 1987 and DOEagreed to remediate the site as part of a land-purchase agreement. The site was cleaned upin 1989 and 1990, and soil contaminated withoil, lead, and low levels of chlorinated solventswas shipped to an approved landfill fordisposal. The Regional Water Quality ControlBoard certified the cleanup as completed inDecember 1990, but it did require Sandia tocontinue ground-water monitoring indefinitely.This estimate assumes that wate managementactivities conducted by the EnvirnomentalManagement program in support of thelaboratory's on-going Defense Programs
CA 85

mission will be truncated in the year 2030. Thisassumption was used for all DOE laboratorieswhere clean up is completed prior to 2030 andthe Environmental Mangement program is notthe site landlord.
WASTE MANAGEMENT
Four types of waste are generated at the Sandiasite: low-level radioactive waste, low-levelmixed waste, hazardous chemical waste,including substances controlled by the ToxicSubstances Control Act (e.g., asbestos,polychlorinated biphenyls (PCBs), andbiohazardous waste). Low-level and mixedwaste are generated from the site's research anddevelopment activities. The generation ratesfor low-level mixed waste and hazardouschemical waste are expected to remain fairlyconstant through FY 2000. Sandia has shippedits mixed waste to Sandia NationalLaboratories/New Mexico.
This estimate assumes that waste managementactivities conducted by the EM program insupport of the Laboratory's ongoing DefensePrograms mission will be truncated in the year2030. This assumption was used for all DOElaboratories where clean up is completed priorto 2030 and the EM program is not the sitelandlord.
Waste TreatmentSandia is conducting research to identifypreferred methods for treating the wastecurrently in storage and those to be generated.
The options available for low-level radioactivewaste treatment are compaction, encapsulation,stabilization, or consolidation, depending onthe form of the waste. Both these approachesreduce volumes and disposal costs.
Examples of treatment options for Sandia/California's low-level mixed waste include wetoxidation, thermal desorption, and chemicalstabilization/solidification. Since all of themixed waste at Sandia/California has beenshipped to Sandia/New Mexico, it will betreated there. Some of the waste such as tritiumscintillation vials and non-halogenated clearsolvents has been and will continue to betransferred to an approved government orcommercial facility for treatment and disposal.
Hazardous chemical waste is typicallycompacted, consolidated, or commingled toreduce volume, liability, and costs before treat-ment and disposal at a licensed commercialfacility.
Environmental Restoration Activity Costs
Five-Year Averages (Thousands of Constant 1995 Dollars)`
FY 1995-2000 2005 2010 2015 2020 2025 2030
Environmental Restoration
Remedial Actions 1,490 0 0 0 0
Life Cycle**
0 8,943
▪ Costs reflect a five-year average in constant 1995 dollars, except in FY 1995-2000, which is a six-year average.• Total Life Cycle is the sum of annual costs in constant 1995 dollars.
CA 86

Waste Storage
Separate storage facilities are provided for low-level and mixed waste (buildings 961 and 968/129 respectively) and hazardous chemical waste(building 962-2). Storage volumes varyaccording to disposal schedules. For example,low-level waste is stored until a full truckloadof waste certified to be suitable for disposal atthe Nevada Test Site is accumulated. No newstorage facilities are planned at present.
Waste Disposal
No waste is disposed at the Sandia site atLivermore. Low-level waste is shipped to theNevada Test Site for disposal. Some low-levelmixed waste is shipped to a licensed commer-cial facility in Florida. Hazardous waste isshipped to licensed commercial facilities.
NUCLEAR MATERIAL AND
FACILITY STABILIZATION
There are no current or planned nuclearmaterial and facility stabilization activities atSandia National Laboratory/California.
LANDLORD FUNCTIONS
Defense Programs is the landlord of SandiaNational Laboratories/California, butEnvironmental Management program providesand maintains the infrastructure that it requres.
PROGRAM MANAGEMENT
Program management represents cross-cuttingactivities associated with all waste types andnot directly in support of specific operations orprojects.
Management activities can be divided intocategories, such as support for theenvironmental safety and health program;quality assurance; the training of personnel andcontractors; emergency response; fireprotection, centralized engineering andmaintenance; and safeguards and security.
An important management function is regulatorysupport to ensure compliance with environ-mental regulations and laws. This includesproviding guidance on regulations and policydevelopment as well as compliance tracking.
Waste Management Activity Costs
Five-Year Averages (Thousands of Constant 1995 Dollars)*
FY 1995-2000 2005 2010 2015 2020 2025 2030 Life Cyde".
TreatmentLow-level Waste 1,027 1,805 1,805 1,805 1,805 1,805 1,476 58,666
Hazardous Waste 663 1,166 1,166 1,166 1,166 1,166 932 37,781
Total 1,690 2,971 2,971 2,971 2,971 2,971 2,408 96,447
` Costs reflect a five-year average in constant 1995 dollars, except in FY 1995-2000, which is a six-year average.
Total Life Cycle is the sum of annual costs in constant 1995 dollars.
CA 87

Management is also responsible for the waste-minimization program which tracks theamount of waste generated at the site andencourages the use of waste reduction methods.
Program management also providesopportunities for public involvement byholding public hearings, soliciting commentson environmental plans and reports, andproviding information (e.g., the EnvironmentalProtection newsletter).
Program management services are tracked andcharged through the budgets for wastemanagement and environmental restorationactivities. For the purposes of this report, 20percent of the site's budget has been allocatedfor program management activities. These costsare described in the Program Management CostEstimate table.
FUNDING AND COST
INFORMATION
The following tables present fundinginformation and major activity milestones forSandia National Laboratories/California.
Program Management Cost Estimate
Five-Year Averages (Thousands of Constant 1995 Dollars)*FY 1995-2000 2005 2010 2015 2020 2025 2030 Life Cycle"
Program Management 545 743 743 743 743 743 602 24,850
• Costs reflect a five-year average in constant 1995 dollars, except in FY 1995-2000, which is a six-year average.
Total Life Cycle is he sum of annual costs in constant 1995 dollars.
Defense Funding Estimate
Five-Year Averages (Thousands of Constant 1995 Dollars)*FY 1995-2000 2005 2010 2015 2020 2025 2030 Life Cycle"
Waste Management 1,690 2,971 2,971 2,971 2,971 2,971 2,408 96,447Program Management 545 743 743 743 743 743 602 24,850
Total 3,461 3,714 3,714 3,714 3,714 3,714 3,010 121,294
• Costs reflect a five-year average in constant 1995 dollars, except in FY 1995-2000, which is a six-year average.
• Total Life Cycle is the sum of annual costs in constant 1995 dollars.
CA 88

Nondefense Funding Estimate
Five-Year Averages (Thousands of Constant 1995 Dollars)*
FY 1995-2000 2005 2010 2015 2020 2025 2030 Life Cycle**
Environmental Restoration 1,490 0 0 0 0 0 0 8,943
• Costs reflect a five-year average in constant 1995 dollars, except in FY 1995-2000, which is a six-year average,
** Total Life Cycle is the sum of annual costs in constant 1995 dollars.
Major Activity Milestones
ACTIVITY TASK COMPLETION DATE
Environmental Restoration Fiscal Year
Sandia/California Fuel Oil Spill Remediation Completed 1999
Navy Landfill Remediation Completed 1997
Defense Programs Truncate waste management support 2029
For further information on this site, please contact : Public Participation OfficePublic Affairs OfficeTechnical Liaison: Ted Pietock
(505) 845-5951(505) 294-3135(505) 845-5649
CA 89

CA 90

MAY BELL
PROJECT RIO BLANCO
PROJECT RULISON
GRAND JUNCTIONPROJECT 5 OFFICE
CLIMAX MILL SITE(COMPLETED UMTRA SITE)
NAT UR IT A
UN ION CARBIDECORPORAT ION/
Ow NORTH CONTINENT(SLICK ROCK)
NEW RIFLE MILL
GUNNISON
Ow RIFLE MILL
ROCKY FLAT SENVIRONMENT ALTECHNOLOGY SIT E
DU RAN GO(COMPLETED UMTRA S IT E)*
*Summaries are not provided for facilities with completed
remedial actions. Any ongoing surveillance andmonitoring costs for these facilities are provided in the
table below.
COLORADO
CO 1

Estimated State Total
(Thousands of Current 1995 Dollars)•
FY 1995 1996 1997 1998 1999 2000
Grand Junction Project Office Site 18,750 26,840 32,810 29,380 36,700 54,180Gunnison 4,250 2,030 1,210 560 1,730 740Maybe!! 11,970 9,760 4,2701 250 50Naturita 14,340 7,410 2.370 460 29D 910Old Rifle and New Rifle 21,521 5,801 708 2,051 2,081 939Rio Blonco/Rulison 7D 70 70 1,070 2,070 1,170Rocky Flats 704,350 718,060 725,700 775,910 804,910 784,870Union Carbide Corporation 10,790 9,910 630 420 670 1,240Completed UMTRA-Surveillance & Monitoring 20,690 20,530 23,890 20,190 7,000 1,620
Total 806,731 800,411 791,658 830,291 855,501 845,669• Costs for FY 1995 reflect Congressional Appropriation, costs for FY 1996 reflect EM budget submission, costs for FY 1997-2000 reflect Budget Shortfall Scenario, costs for
shaded area assume 3% annual inflation.
Five-Year Averages (Thousands of Constant 1995 Dollars)••
FY 1995-2000 2005 2010 2015 2020 2025 2030Grand Junction Project Office Site 22,980 23,216 27,084 28,857 28,752 17,313 18,936Gunnison 1,863 691 690 0 0 0 0Maybell 4,653 0 0 0 0 0 0Naturita 4,561 552 429 0 0 0 0Old Rifle and New Rifle 5,858 691 783 0 0 0 0Rio Blanco/Rulison 696 105 25 21 12 8 6Rocky Flats 697,965 544,186 752,899 517,420 523,778 538,708 516,196Union Carbide Corporation 4,187 737 614 195 0 0 0Completed UMTRA-Surveillance & Monitoring 16,623 1,006 1,145 183 0 0 0
Total 759,386 571,183 783,669 546,676 552,542 556,029 535,139
FY 2035 2040 2045 2050 2055 2060 2065 Life Cycle***Grand Junction Project Office Site 0 0 0 0 0 0 0 858,669Gunnison 0 0 0 0 0 0 0 18,078Maybe!! 0 0 0 0 0 0 0 27,921Naturita 0 0 0 0 0 0 0 32,271Old Rifle and New Rifle 0 0 0 0 0 0 0 42,515Rio Blanco/Rulison 1 0 0 0 0 0 0 5,073Rocky Flats 537,065 458,188 623,452 597,082 639,337 236,371 0 36,611,203Union Carbide Corporation 0 0 0 0 0 0 0 32,852Completed UMTRA-Surveillance & Monitoring 0 0 0 0 0 0 0 111,407
Total 537,066 458,188 623,452 597,082 639,337 236,371 0 37,739,989
• Costs reflect a five-year average in constant 1995 dollars, except in FY 1995 - 2000, which is a six-year average.• Total Life Cycle is the sum of annual costs in constant 1995 dollars.
CO 2

GRAND JUNCTION PROJECTS OFFICE
The Grand Junction Projects Office site is located on a 56.4-acre site, 2 miles south of the City of
Grand Junction in western Colorado.
Temporary Hazardousand Mixed Storage "
Building 42 SAA, TSA
(..Uranium
MillingActivity
Tailings
SAA = Satellite Accumulation AreaTSA = Temporary Storage Area for Toxic Substances
NORTH POND
1 1
Building 7SAA. TSA
Building 20SAA, TSA
Building 31ASAA
1 1
Building3022 SAA
1Building938 SAA
IlL.,
O
Building 61A-C
Source StorageR udni doancgtl 36
SAA, TSA
is
'viBuilding12-SAA
Sample Archive StorageBuilding 33SAA, TSA
CO 3

Estimated Site Total
(Thousands of Current 1995 Dollars)*
FT 1995 1996 1997 1998 1999 2000
Environmental RestorationDirectly Appropriated LandlordProgram Management
Total
10,470 15,980 21,020 15,060 17,9806,140 1,590 7,490 11,240 15,040Z140 3,270 4,300 3,080 3,680
25,67023,2605,250
18,750 26,840 32,810 29,380 36,700 54,180 • Costs for FY 1995 reflect Congressional Appropriation, costs for FY 1996 reflect EM budget submission, costs for FY 1997-2000 reflect Budget Shortfall Scenario, costs for
shaded area assume 3% annual inflation.
Five-Year Averages (Thousands of Constant 1995 Dollars)**
FY 1995-2000 2005 2010 2015 2020 2025 2030 Life Cycle***Environmental Restoration 16,283 16,096 19,964 21,737 21,632 10,193 11,816 604,889Directly Appropriated Landlord 6,538 7,100 7,100 7,100 7,100 7,100 7,100 252,231Program Management 158 20 20 20 20 20 20 1,549
Total 22,980 23,216 27,084 28,857 28,752 17,313 18,936 858,669
• Costs reflect a five-year average in constant 1995 dollars, except in FY 1995 - 2000, which is a six-year average.• Total Life Cycle is the sum of annual costs in constant 1995 dollars.
PAST, PRESENT, AND
FUTURE MISSION
The site was originally established in 1943under the Manhattan Engineer District.Between 1943 and 1946, the U.S. VanadiumCorporation constructed and operated auranium refinery for the Federal Government atthe site.
In 1947, the Grand Junction Projects Office Sitebecame the Colorado Raw Materials Office forthe Atomic Energy Commission andadministered the U.S. defense-related uraniumexploration and purchase programs through1970. From 1974 through 1984, the sitemanaged the National Uranium ResourceEvaluation program.
The primary mission of the Grand JunctionProjects Office site is to support EnvironmentalManagement (EM) in remedial action,decommissioning, and technology developmentand demonstration.
Current assignments for the Grand JunctionProjects Office include the Monticello (Utah)Superfund Program that encompasses theMonticello Remedial Action Project, theMonticello Vicinity Properties Project, and theMonticello Surface and Groundwater RemedialAction Project; the Grand Junction ProjectsOffice Remedial Action Project; Oxnard; theLong-Term Surveillance and MaintenanceProgram for remediated sites that are theDepartment of Energy's (DOE) responsibility;the DOE Uranium Leasing Project; landlord
CO 4

operation and maintenance activities; andwaste management. Additional information on
the Monticello and Oxnard sites is contained in
the Utah and California sections, respectively.
The Grand Junction Projects Office providesdirect support to Environmental Management
in the areas of site characterization, projectintegration and coordination, remedial design,remedial action, independent verification,assessment of technology needs, geosciences,
and analytical chemistry. This support currently
accounts for 50 percent of the Grand Junction
Projects Office funded activities and is expected
to increase in succeeding years. Therefore,landlord activities for the Grand JunctionProjects Office are planned to be ongoing, andcosts estimates are provided through FY 2030.
ENVIRONMENTAL
RESTORATION
A pilot-plant uranium recovery program at theGrand Junction Projects Office site was initiated
in 1953 with the construction of a small facilityintended for research and development of a
resin-in-pulp milling process. It is estimated
that between May 1953 and December 1954,when the plant was dismantled, a total of 2,600
tons of uranium ore was processed. All but 25
tons of this ore was leached with sulfuric acid.
After 1954, the pilot-plant program wasdedicated to amenability testing of uraniumores and to the development and testing of newuranium milling processes. A new larger pilotplant was constructed in the south portion ofthe Grand Junction Projects Office facility.From 1954 until it was closed in 1958, the pilot-
plant operated 3 shifts, 24 hours a day, 7 days a
week. Approximately 30,000 tons of uranium
ore were processed.
The Grand Junction Projects Office Remedial
Action Project was established to remediate the
Grand Junction Projects Office site. Pilot-plant
operations at the site were believed to be almostexclusively responsible for the contaminatedmaterial buried at the facility. Thecontaminated material consisted of uraniummill tailings, ore, and related processequipment.
The selected alternative was to removecontaminated materials from the site and co-dispose with Uranium Mill Tailings RemedialAction Program tailings at the Uranium MillTailings Remedial Action disposal site at theCheney Disposal Cell. Complete removal ofcontaminated material will eliminate bothradiation contamination and the futurepotential for contamination of the GunnisonRiver adjacent to the site. Removal ofcontaminated material also will allow for thenatural dispersion and elimination ofcontaminants in the alluvial aquifer beneath thesite.
Radioactive waste at the Grand JunctionProjects Office facility totaling 414,000 tons hasbeen excavated and hauled to the CheneyDisposal Cell. The material will be compactedand covered with an earthen radon barrier andan erosion-protection layer of rock.
Because the ground-water system ischaracterized by flushing of the alluvial aquifer,
cleansing of the affected ground water shouldensue. Ground-water modeling indicates thatthe shallow alluvial aquifer will flush itself ofcontaminants in 50 to 80 years, which is withincompliance with the proposed Uranium MillTailings Remedial Action ground-waterregulations (100-year cleanup).
Upon removal of tailings and othercontaminated material, affected areas of theGrand Junction Projects Office facility havebeen recontoured, reconstructed, andrevegetated as appropriate. Currently,contaminated portions of the Grand JunctionProject Office facility are being restored forunrestricted use. Ultimately, no tailings-related
CO 5

environmental hazards are anticipated toremain at the facility. The facility will initiate along-term monitoring program to verify passiveground-water restoration.
The mission of the Long-Term Surveillance andMaintenance Program is to provide long-termcare and custody of all completed DOE remote/offsite remedial action project sites as well asother sites, as assigned. Care of these sitesincludes inspections, security, environmentalmonitoring, site maintenance, regulatorycompliance, compliance reporting, recordsmanagement, public relations, emergencyresponse, and further remedial action, ifrequired.
The Uranium Leasing Project is made up of twoseparate functions — the DOE Uranium LeaseManagement and Test Pit Maintenance. TheGrand Junction Projects Office provides thenecessary managerial and administrativesupport for the Uranium Leasing ManagementProgram. The program administers 43 DOEuranium lease tracts covering 25,000 acres inColorado (38 sites), Utah (4 sites), and New
Mexico (1 site). The Test Pit MaintenanceProgram maintains the four DOE calibrationfacilities located in Colorado, New Mexico,Texas, and Wyoming, in operational condition.
WASTE MANAGEMENT
Treatment Storage andDisposal OperationsWaste management activities at the GrandJunction Projects Office are funded within thescope of environmental restoration activities.
The primary source of operationally generatedwaste at the Grand Junction Projects Officeoriginates from the analytical laboratory.Secondary sources of operational waste arefrom facility maintenance and office supportfunctions. The cumulative quantities ofregulated waste from these sources areextremely low compared to other DOE sites.The 1993 Annual Waste Management Reportlists the Grand Junction Projects Office'sResource Conservation and Recovery Act
Environmental Restoration Activity Costs
Five-Year Averages (Thousands of Constant 1995 Dollars)*
FY 1995 - 2000 2005 2010 2015 2020 2025 2030 Life Cyde*Environmental Restoration
Assessment 4,766 1,472 1,706 1,977 2,291 2,655 3,077 94,481Remedial Actions 0 14,624 18,258 19,760 19,342 7,538 8,739 441,305Facility Decommissioning 11,477 0 0 0 0 0 0 68,862Long Term Surveillance and Monitoring 40 0 0 0 0 0 0 241
Total 16,283 16,096 19,964 21,737 21,632 10,193 11,816 604,889
- Costs reflect a five-year average in constant 1995 dollars, except in FY 1995-2000, which is a six-year average.
Total Life Cycle is the sum of annual costs in constant 1995 dollars.
CO 6

(RCRA) regulated, State regulated, ToxicSubstances Control Act (TSCA) regulated, andmixed-Toxic Substances Control Act wastegeneration rate as less than 1 metric ton each.
Commercial treatment, storage, and disposalfacilities will be used for hazardous waste.Candidate waste streams will be evaluatedindividually for offsite shipment determination.Sanitary wastes are directed to the localpublicly owned treatment works. Specificdisposal options for environmental restorationwaste from Comprehensive EnvironmentalResponse, Compensation and Liability Act(CERCLA) sites will be evaluated based on therecord of decision for the remediation project.The Grand Junction Projects Office SiteTreatment Plan and resulting consentagreement will address onsite waste streamsincluding specific treatment facilities andtreatment technologies.
The Grand Junction Projects Office acts asProgram Manager for the Mixed WasteTreatment Program, supporting theAlbuquerque Operations Office in pursuing theoverall objective of the program to reduce theinventory of mixed waste existing at the ninesites managed by the Albuquerque OperationsOffice, in accordance with Site Treatment Plansrequired by the Federal Facility ComplianceAgreement. In addition to the programmanagement responsibilities, the GrandJunction Projects Office is also tasked withdeveloping portable treatment technologies foruse at other Albuquerque Operations Officesites.
The implementation phase of the programinvolves the deployment of the mobiletreatment units to the various AlbuquerqueOperations Office sites and treatment of themixed waste inventory.
The Grand Junction Projects Office will also beresponsible for the physical operation,maintenance, and refabrication/refurbishment
of those portable treatment units developed at
the Grand Junction Projects Office. Theseinclude the thermal desorption, evaporativeoxidation, and wastewater evaporator units.Refabrication/refurbishment will be requiredonce during the second phase of the program tomaintain the treatment capability.
NUCLEAR MATERIAL AND
FACILITY STABILIZATION
There are no current or planned nuclearmaterial and facility stabilization activities atthe Grand Junction Projects Office.
LANDLORD FUNCTIONS
The EM landlord function is to ensurecompliance with all regulations and ordersapplicable to the operation of a Federal facility.This responsibility includes providing a safe,secure, and environmentally sound workplacefor personnel assigned to the various GrandJunction Projects Office programs. Landlordsupport provides for the planning operation,energy management program, general sitemaintenance, major maintenanceimprovements, safeguards and security,medical services, environmental monitoring,and most support services at the GrandJunction Projects Office.
Landlord activities include routine preventiveand corrective maintenance activities and majormaintenance activities necessary to extend theuseful life of the existing facilities. Work force,materials, subcontract services, engineeringservices, and management from the landlordprogram organization supports thenonprogrammatic compound activity andprovides for continued efficient operation,safeguards and security, environmentalmonitoring, and personnel safety and health atthe Grand Junction Projects Office.
CO 7

PROGRAM MANAGEMENT
The Grand Junction Projects Office has noseparate funding for program management. Allprogram management activities are performedwithin the budget for environmental restorationactivities. For the purposes of this report, 17percent of the Environmental Restoration sitesbudget has been allocated for programmanagement activities for FY 1995-FY 2000.
Public Participation
Monthly city, county, and regulatory agencyinformation and discussion meetings and Site-Specific Advisory Board meetings form the coreof Grand Junction Projects Office stakeholderand public participation activities.Additionally, ongoing communication andinteraction is maintained with the communitiesin which the Grand Junction Projects Office ismanaging environmental restoration programsthrough an active Speakers Bureau, site tours,educational outreach programs concentratingon the sciences and environmental topics, andthe issuance of regular press releases to updateproject progress and future work schedules.
Stakeholders include, but are not limited toregulators, Federal, State, and local electedofficials; Native Americans; Monticello Site-Specific Advisory Board; local communities;property owners; several departments withinthe States of Utah and Colorado; U.S. ForestService; Bureau of Land Management;environmental groups; and recreational groups.
Waste Minimization andPollution PreventionAwareness Program
The Grand Junction Projects Office WasteMinimization and Pollution PreventionAwareness Program focuses on efforts thatprovide improved protection of health and theenvironment and result in a reduction in overallcosts, liabilities, and risks associated with thetreatment and disposal of wastes. This isaccomplished through hazardous materialsubstitution, the recycling of various materials(including used oil and spent lead/acidbatteries, paper and cardboard), as well aswaste minimization and pollution preventiontraining. Other activities include the formationof Waste Minimization Committees to helpformulate methods for the reduction of all typesof onsite generated wastes, included non-regulated solid wastes.
Landlord Cost Estimate
Five-Year Averages (Thousands of Constant 1995 Dollars)*FY 1995 - 2000 2005 2010 2015 2020 2025 2030 Life Cycle"
Directly Appropriated Landlord 6,538 7,100 7,100 7,100 7,100 7,100 7,100 252,231
• Costs reflect a five-year average in constant 1995 dollars, except in FY 1995-2000, which is a six-year average.
Total Life Cycle is the sum of annual costs in constant 1995 dollars.
CO 8

FUNDING AND COST
INFORMATION
The following tables present fundinginformation and major activity milestones for
the Grand Junction Projects Office.
Program Management Cost Estimate
Five-Year Averages (Thousands of Constant 1995 Dollars)*
FY 1995 - 2000 2005 2010 2015 2020 2025 2030 Life Cycle**
Program Management 158 20 20 20 20 20 20 1,549
• Costs reflect a five-year average in constant 1995 dollars, except in FY 1995-2000, which is a six-year average.
• Total Life Cycle is the sum of annual costs in constant 1995 dollars.
Nondefense Funding Estimate
Five-Year Averages (Thousands of Constant 1995 Dollars)*
FY 1995-2000 2005 2010 2015 2020 2025 2030 Life Cyde**
Environmental Restoration 16,283 16,096 19,964 21,737 21,632 10,193 11,816 604,889
Directly Appropriated landlord 6,538 7,100 7,100 7,100 7,100 7,100 7,100 252,231
Program Management 158 20 20 20 20 20 20 1,549
Total 22,980 23,216 27,084 28,857 28,752 17,313 18,936 858,669
• Costs reflect a five-year average in constant 1995 dollars, except in FY 1995-2000, which is a six-year average.
• Total Life Cycle is the sum of annual costs in constant 1995 dollars.
Major Activity Milestones
ACTIVITY TASK COMPLETION DATE
Environmental Restoration Fiscal Year
Grand Junction Project OfficeRemedial Action Project
Complete site assessment/remediation and reconstruction 2030
For further information on this site, please contact: Public Participation Office (505) 845-5951Public Affairs Office (505) 845-5136Technical Liaison: Chris Pennal (303) 248-6011
CO 9

CO 10

374Liquid Waste Treatment
371PlutoniumRecoveryBuildng
559 Plutonium AnalyticalLaboratory
Sage Avenue J569
Racioactive AssayDeterminations
Catus Avenue
707Manufacturing
Sul icing
664Waste Storage
r
ROCKY FLATS ENVIRONMENTAL TECHNOLOGY SITE
The Rocky Flats Environmental Technology Site is located in northern Jefferson County, approxi-mately 16 miles northwest of Denver, Colorado. The site encompasses 11 square miles including the"buffer zone" that surrounds the site.
774Liquid Waste Treatment 776/777
Waste Management & SNM771
Plutonium Recovery Packing/Storage Bulicings
Facility 7 779Plutonium Development Building
750Support Build ng
778Waste Storage
964Waste Storage
995
Spruce Sanitary Waste
981Of Support Build ng
Patrol Road
Central Avenue
889 886Decon Facility Criticality Lab
865Weapons R&D
(Transferred To EM)
881 Support Builrfing
904Pad WasteStorage
CO 11

Estimated Site Total
(Thousands of Current 1995 Dollars)*
FY 1995 1996 1997 1998 1999 2000
Environmental Restoration 160,950 176,270 166,910 167,360 179,980 195,290Waste Management 180,930 206,120 227,690 271,910 300,440 298,080Nuclear Material and Facility Stabilization 207,790 166,950 159,010 154,740 153,130 147,100Directly Appropriated Landlord 117,900 122,800 127,2101 131,460 127,110 108,520Program Management 36,780 45,920 44,880 50,440 44,250 35,880
Total 704,350 718,060 i 725,700 775,910 804,910 784,870' Costs for FY 1995 reflect Congressional Appropriation, costs for FY 1996 reflect EM budget submission, costs for FY 1997-2000 reflect Budget Shortfall Scenario, costs for
shaded area assume 3% annual inflation.
Five-Year Averages (Thousands of Constant 1995 Dollars)**
FY 1995-2000 2005 2010 2015 2020 2025 2030
Environmental Restoration 161,824 85,733 106,664 132,431 145,253 216,177 271,635Waste Management 228,094 285,131 255,465 254,233 253,197 236,731 152,419Nuclear Material and Facility Stabilization 154,052 58,050 271,316 4,920 277 230 11Directly Appropriated Landlord 113,980 81,320 81,320 81,320 81,320 12,467 12,467Program Management 40,015 33,951 38,135 44,517 43,731 73,103 79,664
Total 697,965 544,186 752,899 517,420 523,778 538,708 516,196
FY 2035 2040 2045 2050 2055 2060 2065 Life Cycle***
Environmental Restoration 379,450 337,389 467,596 447,645 459,190 174,211 0 17,087,804Waste Management 73,153 37,051 35,000 34,942 28,963 0 0 9,599,996Nuclear Material and Facility Stabilization 0 0 0 0 0 0 0 2,598,336Directly Appropriated Landlord 12,467 12,467 12,467 12,467 12,467 9,974 0 2,796,494Program Management 71,995 71,282 108,389 102,028 138,717 52,186 0 4,528,573
Total 537,065 458,188 623,452 597,082 639,337 236,371 0 36,611,203
• Costs reflect a five-year average in constant 1995 dollars, except in FY 1995 - 2000, which is a six-year average.
• Total Life Cycle is the sum of annual costs in constant 1995 dollars.
CO 12

PAST, PRESENT, AND
FUTURE MISSIONS
Built in 1951, the Rocky Flats Plant's primarymission from 1952 to 1989 was the productionof components for nuclear weapons. The finalproducts included components and assembliesmanufactured from uranium, plutonium,beryllium, stainless steel, and other metals.Production activities included metalworking,fabrication and component assembly,plutonium recovery and purification, andassociated quality control functions. Inaddition, research and development inchemistry, physics, metallurgy, materialstechnology, nuclear safety, and mechanicalengineering were conducted to advance theplant's mission.
In 1989, many of the plant's productionfunctions were suspended, and full operationsto produce nuclear weapons components arenot scheduled to resume. In January 1992, inresponse to a changing international politicalclimate, President Bush announced the decisionto cancel the W-88 warhead program. Thisdecision resulted in the discontinuation ofnuclear production at Rocky Flats. Althoughproduction of nonnuclear componentscontinued through September 1994, thetermination of nuclear production changed theprimary mission of the site from nuclearweapons production to cleanup and restoration.
The site's new mission focuses onenvironmental management and possibleeconomic development. The approach beingtaken is to reduce risk and accelerate cleanup.A description of the strategy to accomplish themission involves remediation, waste storage,treatment and disposal, consolidation ofmaterials, deactivation of buildings, anddecommissioning. Accelerated cleanupactivities, including removal of hot spots andsome capped areas, will occur until 2012.Stabilization and repackaging of plutonium-containing materials, removal of plutonium
from the ducts, and Resource Conservation andRecovery Act (RCRA) closures of tanks willoccur between 1995 and 2010. Consolidation ofspecial nuclear materials, classified documents,and other sensitive materials into fewer, morecentralized locations also is planned. Interimalternative use of many facilities for wastestorage is expected. Deactivation of plutoniumand nonplutonium facilities will generallyoccur before 2010. Special nuclear material andresidues are assumed to be removed from thesite by 2010. Decommissioning activities willdominate site activities after 2020. Wastetreatment, storage, and disposal, which isongoing, will continue until 2055 when the lastplutonium-contaminated facility is expected tobe dismantled.
The timeline described provides only a roughestimate for outyear activities and is only onerange of alternatives. This alternative wasuseful for analysis because it demonstrates theextremely large waste volumes to be generated.It is also a conservative approach to cleanupand was chosen so as not to preclude anendstate determination. The sequence of eventsis derived from the current understanding ofsite priorities. Funding allocations dictate thelength of the schedule. The availability ofdisposal sites also has the potential to become amajor schedule constraint, if relatedassumptions prove invalid.
The ultimate use of Rocky Flats will be basedsignificantly on stakeholder input and couldrange from totally unrestricted use to totallyrestricted use, or a combination of the two. Thecurrent interim use and scenario description arenot intended to prejudice the endstate. Thededication of the northwest corner of RockyFlats for use by the National Renewable EnergyLaboratory will continue.
The restoration activities are conducted by theDepartment of Energy's (DOE) EnvironmentalManagement program. However, theDepartment's Defense Programs funding will
CO 13

continue to fund Defense Programs-relatedspecial nuclear materials mission requirementsand scope for as long as the special nuclearmaterial remains at the site.
ENVIRONMENTAL
RESTORATION
In the process of fulfilling its national securitymission, Rocky Flats used materials andprocesses contaminating facilities, soil, groundwater, and surface water with chemical andradioactive substances (plutonium, americium,
and uranium). Ground-water and surfacewater contamination is a potential concern dueto the close proximity of a major metropolitanarea downstream from the site. Contaminationin shallow ground water has been detected inmany areas including the 881 Hillside Area; 903Pad, Mound, and East Trenches Areas; the SolarEvaporation Ponds; Present Landfill; and theWest Spray Field. In most cases, thecontaminants of concern are associated withvolatile organic compounds that includechemical products previously used as cleaningand degreasing solvents. Inorganic, dissolvedmetals and some radionuclides also have beendetected in localized areas.
Environmental Restoration Projects
Five-Year Averages (Thousands of Constant 1995 Dollars)*
FY 1995-2000 2005 2010 2015 2020 2025 2030
881 Hillside 1,806 1,062 1,222 569 1,431 1,226 1,226903 Pad & East Trenches 12,444 4,204 4,875 5,610 6,504 4,860 4,860Facility Decommissioning 23,827 23,729 37,160 55,180 56,408 137,296 192,978Landfill 3,460 441 527 528 636 739 685Offsite Projects 1,062 0 0 0 0 0 0Plant Areas/Facilities 25,737 19,561 21,319 23,134 25,973 18,909 18,864Program Management 21,787 21,917 21,917 21,917 21,917 21,917 21,917Rocky Flats Treatment/Storage/Disposal 28,618 11,937 16,687 22,194 28,570 28,194 28,194Solar Pond 28,705 1,988 2,305 2,653 3,076 2,298 2,298Spray Fields 419 0 0 0 0 0 0Surface Water 13,959 888 653 646 737 737 614
Total 161,824 85,733 106,664 132,431 145,253 216,177 271,635
2035 2040 2045 2050 2055 2060 2065 Life Cycle**
881 Hillside 1,226 164 164 164 984 0 0 58,035903 Pad & East Trenches 655 655 655 655 3,930 0 0 261,984Facility Decommissioning 224,258 230,680 355,888 337,592 433,732 174,211 0 11,438,515landfill 96 96 96 96 576 0 0 43,363Offsite Projects 0 0 0 0 0 0 0 6,374Plant Areas/Facilities 10,349 2,928 2,928 2,928 17,568 0 0 976,725Program Management 0 0 0 0 0 0 0 788,233Rocky Flats Treatment/Storage/Disposal 142,465 102,465 107,465 105,809 0 0 0 3,141,598Solar Pond 310 310 310 310 1,860 0 0 260,814Spray Fields 0 0 0 0 0 0 0 2,511Surface Water 91 91 91 91 540 0 0 109,651
Total 379,450 337,389 467,596 447,645 459,190 174,211 0 17,087,804
• Costs reflect a five-year average in constant 1995 dollars, except in FY 1995-2000, which is a six-year average.▪ Total Life Cycle is the sum of annual costs in constant 1995 dollars.
CO 14

Soil contamination is highest east and southeastfrom the temporary storage area (903 Pad)where steel drums were used to storeplutonium-contaminated industrial oils from1958 to 1968. Some plutonium particlesentrapped in the fine fraction of top soil wereblown by winds and deposited on soils in aneast-southeast direction. Soils sampled in 1993showed the highest plutonium concentrationsin soil samples taken from the eastern portionof the buffer zone.
There are more than 400 structures at the RockyFlats Environmental Technology Site. Of thesestructures, 19 contain the majority of specialnuclear material, classified products,radioactive and hazardous inventories, andradioactive and chemical contamination. Majorbuilding contamination table depicts the typesof contaminants at each of the major buildingsat the site. The remainder of the facilities areuncontaminated or marginally contaminatedsupport facilities.
The Rocky Flats Environmental Technology Sitehas identified and prioritized 177 contaminatedsites that are located both onsite and offsite.These sites have been grouped into 16 operableunits according to location and type ofcontamination. The Department is assessingcontamination in these operable units and isimplementing cleanup activities. Sites withpotentially higher health and environmentalrisks are being addressed before sites withpotentially lower risk. Individual operable unitactivities assume a specific future land usescenario.
The legal framework establishing the scope andschedule for projects in the environmentalrestoration program is the InteragencyAgreement. The Interagency Agreementintegrates the authority and jurisdiction of theComprehensive Environmental Response,Compensation and Liability Act (CERCLA) andResearch and Conservation Recovery Act(RCRA). Therefore, the investigative phase ateach operable unit is referred to as a RCRA
Facility Investigation/Remedial Investigation,and the selection of remedial alternatives isreferred to as a Corrective Measure Study/Feasibility Study. The National EnvironmentalPolicy Act process is also completed inconjunction with the RCRA process.
The primary objective of the environmentalrestoration program is to assess and clean upRocky Flats in compliance with applicableenvironmental laws and regulations. Otherobjectives of the program are treatment,storage, and disposal of environmentalrestoration waste and deactivation,decontamination, decommissioning, anddemolition. Activities associated with thesefunctions include characterizing the extent andnature of contamination and its potential risks;removing or stabilizing contaminant sources;remediating contaminated soils, ground water,and surface water; deactivation,decontamination, decommissioning, anddemolition of surplus facilities; and surveillanceand postclosure monitoring.
The following activities for each operable unitmust be performed to fulfill environmentalrestoration objectives at Rocky Flats. Inaddition to these activities, surveillance andmonitoring activities are required after theclosure of each operable unit.
Operable Unit 1 Activities(Hillside 881)
The alluvial water in Operable Unit 1, alsocalled the Hillside 881, was contaminatedduring the 1960's and 1970's with solvents andradionuclides from leaking drums, scrapmetals, sludge, and liquid waste. Majorcontaminants at the operable unit areradionuclides and organic compounds.Restoration activities include the cleanup ofvolatile organic compounds in the groundwater and polycyclic aromatic hydrocarbonsand plutonium in the surface soils.
CO 15

Funding for interim actions will provide for theoperation, maintenance, and processimprovement of Building 891's ground-watertreatment facility and for the coordination ofplant services to operate the facility. Alsoincluded is the remediation of the French Drain,which was constructed to prevent contaminatedground water from reaching Woman Creek.
In FY 1995, the Department will submit adetailed analysis in the Final CorrectiveMeasures Study/Feasibility Study Reportsubmitted to the Environmental ProtectionAgency (EPA) and the Colorado Department ofPublic Health and Environment for review andcomment. In FY 1994, the Final Phase III RCRAFacility Investigation/Remedial Investigationwas delivered to the regulatory agencies forapproval. The record of decision phase willcommence in FY 1995, with completionscheduled for the first quarter of FY 1996.
Activities related to performance monitoringinclude monitoring of remediation operationsand documentation of the performance asrequired by regulatory directives. Theseactivities will extend into FY 2035.
Project support activities include administrativetasks, training requirements, contingency,Assessment Management Reserve, RemedialManagement Reserve, Assessment andFinancial Commitments, Remedial FinancialCommitments, and wetlands monitoring andreporting. Project support activities will extendthe life of the project.
Operable Unit 2 Activities (903Pad & East Trenches)In Operable Unit 2; which contains the 903 Pad,Mound, and East Trenches; the storage of wastedrums during the 1950's and 1960's allowedhazardous and radioactive materials to leakinto the soil. In addition, the East Trenches areaof the unit was used for disposal of plutonium-and uranium-contaminated waste and sanitarysewage sludge. Radionuclides and organic
compounds are the potential majorcontaminants at the operable unit. The scope ofOperable Unit 2 restoration activities includesthe support of the cleanup of low-levelradionuclides (plutonium, americium, anduranium), volatile organic compounds, andmetals.
Funding for interim remedial actionremediation supports the continuation of theField Treatability Unit operations andmaintenance, which provide treatment of SouthWalnut Creek surface water. This operationwill continue until FY 1998. The funding alsosupports testing and operations of the SoilVapor Extraction Unit to remove residual free-phase volatile organic compoundcontamination in the subsurface soils. Somesoils contaminated with organics and metalsmay be excavated and removed to onsiteRCRA-compliant storage cells or shipped tocommercial storage. The RemedialInvestigation Report, which summarizes thevalidated data obtained from the fieldinvestigation in accordance with regulatorguidance, will be completed during FY 1995.The feasibility study, along with the submissionand agency approval of the CorrectiveMeasures Study/Feasibility Study Report, willbe completed during FY 1997. The record ofdecision will commence in FY 1997 and isscheduled to be completed in FY 1998. Thecompletion of the Title II design of the remedialaction design is expected in FY 1998.
Funding for safety analysis report activitiessupports the development of a safety analysisreport in accordance with Departmentdirectives to ensure the Title II design andproposed operating procedures meet or exceedsafety standards. These activities also providefull documentation and complete self-auditingof design before construction begins. Thecorrective action and remedial actionconstruction will begin in FY 1999 and will becomplete in FY 2001.
CO 16

Performance monitoring includes activities tomonitor remediation operations and to providedocumentation of restoration performance asrequired by EPA and DOE directives.
Project support includes administrative tasks,training requirements, contingency, AssessmentManagement Reserve, Remedial ManagementReserve, Assessment Financial Commitments,Remedial Financial Commitments, andwetlands monitoring and reporting. Projectsupport activities will continue through the lifeof the project.
Operable Unit 3 Activities(Offsite Areas)
Operable Unit 3, the Offsite Areas, contains soilcontamination caused resuspension of soils bythe wind from the 903 Pad and by fires in 1957and 1969. The potential major contaminants areradionuclides. The scope of Operable Unit 3restoration activities includes the support of thecleanup of low-level radionuclides (plutonium,americium, and uranium).
In FY 1996, the Department will complete andsubmit the Final Phase I, RCRA FacilityInvestigation/Remedial Investigation Reportand will also prepare and submit a Draft andFinal Remedial Investigation Report. Studiesare inconclusive, as to the extent ofcontamination, and the total extent will not beknown until the RCRA Facility Investigation/Remedial Investigation Report is completed.Preliminary evaluation of this operable unitindicates that it is a candidate for no furtherremedial action.
In FY 1996, the Draft and Final CorrectiveMeasures Study/Feasibility Study Reports willbe prepared and submitted to EPA and theColorado Department of Public Health andEnvironment for review and approval. AtOperable Unit 3, the Department will utilize thesite-wide treatability study for actinides insurficial soils to support its feasibility study. In
FY 1997, the Final Corrective Measures Study/Feasibility Study Environmental AssessmentReport will be complete. The No Further ActionRecord of Decision process will be completed inFY 1997.
Operable Unit 4 Activities(Solar Ponds)
Operable Unit 4, the Solar Ponds, contains soiland ground water contaminated as a result ofpond leakage during the 1960's and 1970's.Radionuclides, nitrates, metals, and solvents arethe potential major contaminants at the unit.Activities planned for Operable Unit 4 includeremoving water from the ponds, providing atreatment facility to replace the ponds asevaporation-treatment and storage units forpond-related contaminated ground water,removing and disposing of pond sludge incompliance with regulations, assessing thenature and extent of contamination at theponds, completing a RCRA closure of theimpoundments; and remediating the ponds asneeded.
The disposal of the pond sludge is currentlybeing planned and negotiated with theregulators. The current proposal is to covernegligibly radioactive and hazardouscontaminated soil and liners with anengineered cover (cap). Sludge and pondcretewill also be included under the cap. The fivetypes of restoration activities at Operable Unit 4include: treatment, storage, and disposal;interim remedial action for water management;interim measure remediation; final action at theSolar Ponds; and project support. The activitiesin each of the categories are described below.
Activities related to treatment, storage, anddisposal include the disposal of pond waste,media, and materials; the selection oftechnology and design to construct pond wastetreatment facilities; the transportation of waste;the maintenance of storage units; and the
CO 17

development and implementation of permits,procedures, and plans related to operation,partial closure, and document preparation toensure compliant operations. A scoping reporthas begun and could allow for treatment andearly disposal of low-level waste to an offsitewaste disposal facility.
The objective of remediation for watermanagement is to treat all trench and pondwater. Activities in the Interim RemedialAction for Water Management includechoosing, designing, and installing facilities tostore and treat water from the Solar Ponds andfrom the Interceptor Trench System to collectcontaminated ground water downgradientfrom the ponds. Funding for these activitieswill provide for the reuse of treated water as asubstitute for commercial raw water in theRocky Flats utilities system.
The Interim Measure Interim Remedial ActionDecision Document will implement thetreatment system, procedures, and plans relatedto operation and partial closure, and it willcontain other documents as necessary to ensurecompliant operation. Funding will support theongoing, routine operation of the dedicatedwater treatment facility and supportingoperations.
The Interim Measure Remediation involvesclosing the Solar Ponds in compliance withRCRA and DOE requirements. This includesassessment and remediation activities. Theassessment includes environmentalinvestigations, analyses, evaluations, anddocumentation of the nature and extent ofsource and soil contamination. Theremediation includes selection, design, andimplementation of the partial-closure remedychosen by the agencies. The closure remedy islikely to be a combination of clean-partialclosure, capping waste, and environmentalmedia in compliance with State of Colorado
requirements, and post-partial closuremonitoring. The Final Phase I Interim MeasureInterim Remedial Action Decision Documentwill be complete in FY 1995.
Final Action at the Solar Ponds involvesassessment and remediation activities. Theassessment includes environmentalinvestigations, analyses, evaluations, anddocumentation of the nature and extent ofcontamination. The remediation includesselection and implementation of theappropriatetechnical approach. The Work Planfor these activities will be completed in FY 1998.
Project support activities include datacollection, analysis, reporting, regulatoryanalysis, and other activities required tomanage the Solar Ponds.
Operable Unit 5 Activities(Surface Water)
Soil and ground water in Operable Unit 5, theWoman Creek Drainage area, have beencontaminated by contact with general plantwaste, ash from the burning of depleteduranium, and surface-water runoff thatoccurred from the 1950's to the 1970's. Thepotential major contaminants at the unitinclude uranium, metals, solvents, pesticides,polychlorinated biphenyls (PCBs), and otherorganic compounds.
The scope of Operable Unit 5 remediationactivities involves the cleanup of soilscontaining uranium, metals, and organics(leachate containing beryllium). It is assumedthe original landfill will be covered or capped.The remedy may also involve a "leachate"collection system to ensure the stability andintegrity of the cover over time. Any requiredtreatment of collected leachate will likely beconducted at an existing site treatment system.In FY 1996, remedial investigation activitiesinvolve completing and submitting the FinalPhase I RCRA Facility Investigation/RemedialInvestigation Report to the regulatory agencies.
CO 18

The primary activities of the CorrectiveMeasures Study/Feasibility Study in FY 1995are to prepare, submit, and finalize the DraftCorrective Measures Study/Feasibility StudyReport. The Corrective Action Decision/Recordof Decision will be finalized in FY 1998. TheSafety Analysis Report will be completed in FY1999, providing full documentation andcomplete self-auditing of design beforeconstruction commences.
Under remedial action construction, pre-construction activities will be procured andsubcontracted during FY 1998. In FY 1998,Rocky Flats will begin construction of a landfillcap.
Activities included in performance monitoringare the monitoring of remediation operationsand the provision of performancedocumentation as required by EPA and DOEdirectives. Performance monitoring at this unitbegins in FY 2000 and continues for 30 years.Project support activities include analysis,reporting, regulatory analysis, and otheractivities required to manage the Woman Creekpriority drainage.
Operable Unit 6 Activities(Surface Water)
Operable Unit 6, the Walnut Creek Drainagearea, contains sediments, soils, and groundwater contaminated from the 1950's to the1970's by materials from detention ponds, sprayfields, sludge disposal areas, and soil dumpareas. Radionuclides, metals, volatile organiccompounds, and PCBs comprise the potentialmajor contaminants at the unit. The scope ofthis remediation in Operable Unit 6, the WalnutCreek area, involves supporting the cleanup ofpond sediments containing radionuclides,PCBs, and volatile organic compounds.
In the remedial investigation activities area, theDepartment will complete and submit the FinalPhase I RCRA Facility Investigation/RemedialInvestigation Report to the regulatory agenciesin FY 1996.
The primary activities of the CorrectiveMeasures Study/Feasibility Study in FY 1996are to prepare, submit, and finalize the DraftCorrective Measures Study/Feasibility StudyReport. In FY 1998, a No Further Action Recordof Decision will be completed.
Performance monitoring activities includemonitoring the remediation operations andproviding performance documentation asrequired by EPA and DOE directives. Activitiesin the project support category include analysis,reporting, regulatory analysis, and otheractivities required to manage the Walnut Creekpriority drainage.
Operable Unit 7 Activities(Landfill)
The ground water, surface water, and soils atOperable Unit 7, the Present Landfill, werecontaminated by tritium and hazardous wastedisposal. The potential major contaminants atthe unit are metals, radionuclides, and organiccompounds. The scope of Operable Unit 7involves the support of the cleanup of volatileorganic compounds, metals, radionuclides, andasbestos. Field work will confirm the nature,extent, and risk from potential contaminants atthis unit.
Under the interim measure decision category,the Department will receive approval by theregulatory agencies in FY 1996 to construct andoperate the Interim Measure via approval of theInterim Measure Decision Document. The tasksunder this activity include the ConceptualDesign, Title I Design, Title II Design, and TitleIII Design for closure of the landfill.
CO 19

Performance monitoring includes monitoring ofthe remediation operations and providesdocumentation of the performance as requiredby EPA and DOE directives.
The Final Action Plan includes preparation ofthe Final Action Plan for review and approvalby the regulatory agencies. The Final ActionPlan will describe the final action to beundertaken for remediation of the RCRA site.The final action will include post-closure care ofthe landfill. Under the final action decision, theDepartment will obtain an approved FinalAction Plan on the final action from theregulatory agencies. Final action engineeringincludes preparation of postclosure care designdocuments for the final action, includingprocess diagrams, cost estimates, and a draftconstruction schedule. The documents will besubmitted to the regulatory agencies forcomments and approval. Final constructionwill be completed according to approveddesign documents, on schedule, and on budgetin accordance with the interagency groupschedule. Project support activities includedata collection, analysis, and reporting;regulatory analysis; and other activitiesrequired to manage the present landfill.
Operable Unit 11 Activities(Spray Fields)
Operable Unit 11, the West Spray Field,contains soils and ground water that have beencontaminated by sprayed application of SolarPond water. Potential contaminants identifiedconsist of primarily nitrates, but also metals,inorganics, radionuclides, and sewage effluent.The scope of Operable Unit 11 will likely bereduced to activities required to complete ajustification for no further action.
The initial phase of the RCRA FacilityInvestigation investigated the nature and extentof contamination within the source and soils.The next phase investigated the nature andextent of contamination from Operable Unit 11
that may have migrated outside the boundariesof the West Spray Field. The Phase I riskassessment evaluated only risk from theupward pathways (i.e., exposure from airtransport or direct contact). Phase II looks atexposure from contaminated ground water orsurface water. The combined phases approachwill provide a focused, streamlinedinvestigation that will allow the earlyevaluation of risk of contamination from allpathways. The RCRA Facility Investigation/Remedial Investigation will support a NoFurther Action Justification Document forOperable Unit 11.
In FY 1995, the Department will first developand submit a Draft Proposed Plan inaccordance with the requirements andschedules set forth in the Statement of Workand then submit a final Proposed Plan forpublic comment in accordance with Section 117of CERCLA.
Project support activities include datacollection, analysis, and reporting; regulatoryanalysis; and other activities required tomanage the West Spray Field.
Operable Unit 15 Activities(Plant Areas/Facilities)
Operable Unit 15, the Inside Building Closures,contains surface soils and concrete potentiallycontaminated by the release of hazardousconstituents. Solvents, beryllium, and uraniumare the potential major contaminants at the unit.Only one release has been documented inOperable Unit 15, and the aim of the restorationactivities is to determine whethercontamination is present in the area.
During FY 1995, the Final Phase I RCRAFacility Investigation/Remedial InvestigationReport will be completed. The draft and finalCorrective Action Decision/Record of Decisionis scheduled for completion in FY 1997.Performance monitoring activities includemonitoring of the remediation operations and
CO 20

providing documentation of the performance asrequired by EPA and DOE directives. Projectsupport activities include data collection,analysis, and reporting; regulatory analysis;and other activities required to manage theInside Building Closures.
Operable Unit 16 Activities(Plant Areas/Facilities)
Operable Unit 16, the Low Priority Sites,include insignificant historical sources ofcontamination, and no significant potentialcontaminants. Operable Unit 16 includesmiscellaneous leak and waste treatment sitesconsidered the least likely to cause health orenvironmental problems. The soils at thesesites may have been contaminated by organics,solvents, and nickel carbonyl. The only facilityincluded in this operable unit is portions ofBuilding 707. Building 707 was a productionfacility where foundry, machining, andassembly operations took place. A Final NoFurther Action Justification Document wassubmitted in 1992. The document providestechnical justification for no additionalinvestigation or remediation at the sevencontaminated sites.
The Colorado Department of Public Health andthe Environment granted approval of thejustification document in 1993. The followingactivities, which fall under the categories ofrecords of decision and project support, arenecessary to close out the operable unitadministratively.
Upon approval of the proposed plan and afterpublic comment (comment period ended inJanuary 1994), a record of decision wasprepared and submitted to the regulatoryagencies in 1994. EPA and the ColoradoDepartment of Public Health approved therecord of decision in the first quarter of FY 1995.
Project support activities include datacollection, analysis, and reporting; regulatoryanalysis; and other activities required tomanage the Low-Priority Sites.
Industrial Area Activities (PlantAreas/Facilities)
The Industrial Area at Rocky Flats consists ofOperable Units 8, 9, 10, 12, 13, and 14. All ofthese operable units are being investigatedtogether due to their proximity to each other. Inthis area, surface soils, ground water,fiberglassing areas, cooling tower ponds, andburn pits are contaminated, and asphalt andconcrete have been contaminated by multiplesolvent spills. Acid leaks, waste spills, fuel tankspills, lithium metal destruction, and leakingdrums, pipes, and storage tanks are among thesources of contamination. Potential majorcontaminants at the unit are radionuclides,acids, solvents, caustics, metals, and organiccompounds. Ninety-five individualcontaminated sites comprise the IndustrialArea. Eleven of these sites will likely bereduced to activities required to complete a NoFurther Action Justification Document in FY1995. Thirty-nine of the sites have the potentialfor early actions during FY 1998 and FY 1999,and 45 sites will be investigated through thedeactivation, decontamination,decommissioning, and demolition remedialinvestigation/feasibility study process.
Activities under limited field investigationsinclude surficial gamma radiation surveys,surficial soil sampling, vertical profilesampling, ground-water monitoring, soil gassampling, soil borings and subsurfacesampling, and tank residue sampling andinspection. The potential for early actions/nofurther actions include tank removals inprogress at Operable Units 8 and 10. Additionaltank removals are in the planning stage forOperable Units 8 and 9.
CO 21

RCRA Facilities Investigation/RemedialInvestigation fieldwork activities are inprogress. Project support activities include datacollection, analysis, and reporting; regulatoryanalysis; and other activities required tomanage the Industrial Area operable units.Nonintrusive field work has been completed inall Industrial Area operable units exceptOperable Unit 8. Some intrusive field work isbeing deferred until decommissioning activitiesare complete.
Treatment, Storage, andDisposalThe remediation of the Rocky Flats site's 16operable units will generate a variety of wastecontaminated with both hazardous andradioactive constituents, including wastederived from investigative activities (i.e., drillcuttings and purge water) and waste generatedfrom operable unit cleanup activities (i.e.,
Environmental Restoration Activity Costs
Five-Year Averages (Thousands of Constant 1995 Dollars)*
FY 1995-2000 2005 2010 2015 2020 2025 2030
Hillside 881Assessment 470 0 0 0 0 0 0Remedial Actions 1,336 1,062 1,222 569 581 164 164Surveillance And Maintenance 0 0 0 0 850 1,062 1,062
903 Pad & East TrenchesAssessment 7,208 0 0 0 0 0 0Remedial Actions 5,235 4,204 670 1,405 2,300 655 655Surveillance And Maintenance 0 0 4,204 4,205 4,205 4,205 4,205
Facility DecommissioningAssessment 4,839 5,273 7,200 8,936 7,686 25,647 15,628Surveillance And Maintenance 0 0 0 0 807 884 1,651Facility Decommissioning 18,988 18,456 29,959 46,244 47,915 110,765 175,698
LandfillAssessment 416 0 0 0 0 0 0Remedial Actions 3,045 0 69 133 133 96 96Surveillance And Maintenance 0 447 459 395 504 643 590
Offsite ProjectsAssessment 1,062 0 0 0 0 0 0
Plant Areas/FacilitiesAssessment 20,185 6,089 1,874 0 0 0 0Remedial Actions 5,262 13,375 11,655 12,441 11,346 2,928 2,928Surveillance And Maintenance 289 97 7,790 10,692 14,627 15,981 15,936
Program ManagementAssessment 21,787 21,917 21,917 21,917 21,917 21,917 21,917
Rocky Flats Treatment/Storage/DisposalEnvironmental Restoration T/S/D 28,618 11,937 16,687 22,194 28,570 28,194 28,194Solar Pond
Assessment 2,155 0 317 665 1,088 310 310Remedial Actions 26,550 0 0 0 0 0 0Surveillance And Maintenance 0 1,988 1,988 1,988 1,988 1,988 1,988
Spray FieldsAssessment 419 0 0 0 0 0 0
Surface WaterAssessment 2,672 0 0 0 0 0 0Remedial Actions 11,179 235 0 0 91 91 91Surveillance And Maintenance 107 653 653 646 646 646 523
Total 161,824 85,733 106,664 132,431 145,253 216,177 271,635• Costs reflect a five-year average in constant 1995 dollars, except in FY 1995-2000, which is a six-year average.
CO 22

Environmental Restoration Activity Costs (contd.)
Five-Year Averages (Thousands of Constant 1995 Dollars)*
2035 2040 2045 2050 2055 2060 2065 Life Cycle**
Hillside 881Assessment 0 0 0 0 0 0 2,820
Remedial Actions 164 164 164 164 984 0 35,040
Surveillance And Maintenance 1,062 0 0 0 0 0 20,175
903 Pod & East TrenchesAssessment 0 0 0 0 0 0 0 43,250
Remedial Actions 655 655 655 655 3,930 0 113,619
Surveillance And Maintenance 0 0 0 0 0 0 0 105,116
Facility DecommissioningAssessment 0 0 0 0 0 0 0 380,884
Surveillance And Maintenance 3,258 4,784 5,888 8,783 2,638 258 144,754
Facility Decommissioning 221,000 225,896 350,000 328,809 431,094 173,953 10,912,877
LandfillAssessment 0 0 0 0 0 0 0 2,493
Remedial Actions 96 96 96 96 576 0 25,684
Surveillance And Maintenance 0 0 0 0 0 0 0 15,185
Offsite ProjectsAssessment 0 0 0 0 0 0 0 6,374
Plant Areas/FacilitiesAssessment 0 0 0 0 0 0 0 160,923
Remedial Actions 2,928 2,928 2,928 2,928 17,568 0 451,341
Surveillance And Maintenance 7,421 0 0 0 0 0 0 364,461
Program ManagementAssessment 0 0 0 0 0 0 0 788,233
Rocky Flats Treatment/Storage/DisposalEnvironmental Restoration T/S/D 142,465 102,465 107,465 105,809 0 0 0 3,141,598
Solar PondAssessment 310 310 310 310 1,860 0 0 41,867
Remedial Actions 0 0 0 0 0 0 0 159,300
Surveillance And Maintenance 0 0 0 0 0 0 0 59,648
Spray FieldsAssessment 0 0 0 0 0 0 0 2,511
Surface WaterAssessment 0 0 0 0 0 0 0 16,033
Remedial Actions 91 91 91 91 540 0 74,134
Surveillance And Maintenance 0 0 0 0 0 0 0 19,484
Total 379,450 337,389 467,596 447,645 459,190 174,211 0 17,087,804
• Costs reflect a five-year average in constant 1995 dollars, except in FY 1995-2000, which is a six-year average,
• Total Life Cycle is the sum of annual costs in constant 1995 dollars.
contaminated soils and pond sludge). Many ofthese remediation activities will generatesecondary waste streams requiring follow-uptreatment, storage, and disposal.
Contaminated media from the operable unitswill be transported to treatment facilities, whichwill have the capability to treat contaminatedsoils, surface water, and ground water. Thenature, number, and siting of these activitieswill be determined as requirements and needs
are defined in the RCRA FacilitiesInvestigation/Remedial Investigation plans,feasibility studies, and corrective actiondecisions/records of decision of the variousoperable units.
Handling facilities for storage will be necessaryuntil environmental restoration-generatedwaste can be characterized and final dispositioncan be accomplished. Additional wastehandling and storage requirements may beidentified in the course of RCRA Facilities
CO 23

Investigation/Remedial Investigation fieldworkat the various operable units. RCRA permitswill be required for any new waste storagefacilities.
Currently, the design and construction of thetreatment, storage, and disposal facilities arebeing planned. These facilities include a soilwashing facility, site-wide treatment facility,decontamination pad upgrades, an interim bulkstorage facility (in FY 1995 through FY 1997), aninvestigation derived material storage facility inFY 1995, and a pre-filtration facility.
The FY 1995 through FY 2020 waste disposalcosts included in the environmental restorationcost estimate are for Operable Unit 4 only. Allother environmental restoration activitiesassumed environmental restoration waste willbe delivered to onsite waste managementfacilities for subsequent treatment, storage, anddisposal. These subsequent treatment, storage,and disposal costs are not included in either theenvironmental restoration or wastemanagement cost estimate for this period.Disposal costs for the soil excavated fromunderneath buildings were not included in thecost forecasts because it is assumed this soil willbe treated, if appropriate, and returned to theexcavation site. Offsite disposal will not benecessary. The FY 2020 through FY 2055disposal costs excluding costs for transuranicwaste have been estimated.
DecommissioningDecommissioning activities include equipmentremoval and other activities necessary torelease plutonium, nonplutonium, and supportbuildings for decommissioning anddismantlement. Deactivation activities aredescribed in the Nuclear Material and FacilityStabilization section below. The projecteddisposition of the site consists of variable landuse conditions. The Protection Area and theIndustrial Area are assumed to be cleaned up toindustrial use standards and to remain underpermanent institutional control. The BufferZone is assumed to be cleaned up to variable,although primarily, recreational use standards.Water control ponds located in the buffer zoneare assumed not to be remediated to an openspace or recreational land use condition.
The major activities needed to complete thedecommissioning process include facility-specific management, surveillance andmaintenance, characterization, environmentalsafety and health, engineering, internaldecommissioning operations, structuraldecommissioning operations, subgradedecommissioning operations, and close-out andverification.
Major Waste Management Projects
Five-Year Averages (Thousands of Constant 1995 Dollars)*
FY 1995.2000 2005 2010 2015 2020 2025 2030 Ufe Cyde
Building 374 Liquid Waste Treatment 12,033 9,020 8,760 8,540 8,360 5,360 0 272,400Building 774 Treatment (Sludge Immobilization) 1,133 1,260 0 0 0 0 13,100Comprehensive Treatment Mangement Plan System 4,650 10,700 2,940 0 0 0 96,100
• Costs reflect a five-year average in constant 1995 dollars, except in FY 1995-2000, which is a six-year average.
• Total Life Cycle is the sum of annual costs in constant 1995 dollars.
Note: These projects represent a subset of waste management activities. Associated program management costs are built-in to the estimates provided.
CO 24

Environmental RestorationProgram Management andMiscellaneous
Program management support activitiesinclude planning, control, reporting,coordination, and oversight for environmentalrestoration activities; administrative support;administrative record; NEPA documentationrelated to RCRA; interagency grouprenegotiations; safety and health assessment;maintenance of the Rocky Flats EnvironmentalData Base System; quality assurance; andcommunity relations.
Cost Estimate
The cost estimate for the environmentalrestoration activities (summarized in Table 2and detailed in Table 9) is based on directremediation costs, including engineeringdesign, inspection, assessment,characterization, construction, and projectmanagement costs.
WASTE MANAGEMENT
The goal of the Rocky Flats waste managementprogram is to reduce, eliminate, or mitigateenvironmental liabilities by managing wastesafely and effectively. There are four primarysources of waste: (1) existing inventories frompast generation, (2) waste from environmentalrestoration/decontamination anddecommissioning activities, (3) waste fromfacility stabilization and maintenance activities,and (4) materials generated by wastemanagement and treatment activities.
Nine types of waste are generated and/orstored at Rocky Flats. This waste includesresidues, mixed residues, transuranic waste,transuranic-mixed waste, low-level waste, low-level mixed waste, hazardous waste, otherregulated waste, and sanitary waste.
In general, management of waste follows athree-step process: treatment, storage, anddisposal. This process is not necessarilysequential for all waste streams. For example, awaste type may need to be treated before andafter storage to comply with both storage anddisposal waste acceptance criteria. Anotherwaste type may not need to be treated or storedbut can be sent directly to disposal aftergeneration.
Waste Treatment
The objective of waste treatment is to processand package for disposal the solid and liquidwaste generated at Rocky Flats. Waste-treatment costs encompass both existing andplanned treatment systems, as well assurveillance and maintenance of the majorwaste treatment facilities.
Waste management activities will providetreatment of the secondary waste streams, andthe storage and disposal of both primary andsecondary restoration wastes. The cost estimatefor this document does include the treatment ofthe secondary waste.
Existing Treatment Operations
Rocky Flats has several waste treatmentfacilities to process and package liquid andsolid waste generated at the site for safestorage, transport, and disposal. There are fiveexisting treatment facilities: Building 374,Building 774, Buildings 776/777, and theSewage Treatment Plant (Building 995). Thesefacilities represent the key treatment operationsat the Rocky Flats.
Building 374 is used for treatment of chemicallycontaminated radioactive and nonradioactiveaqueous wastewater from process, laboratory,and utility buildings throughout the site. Thelargest sources of water treated in this buildingare laundry and incidental waters (e.g., solarpond water, runoff, and various building drainsystems), which account for half of the
CO 25

approximately 14 million gallons of waterprocessed in Building 374 annually. Liquidwaste processed in Building 374 is convertedinto solid waste (saltcrete), and distilled waterused by site utilities in boilers and coolingtowers. Costs associated with Building 374liquid waste treatment activities include capitalimprovements to the evaporator system, thebuilding maintenance and surveillance, andfacility upgrades.
The facilities in Building 774 are used fortreatment of transuranic-mixed, low-levelmixed, and organic liquid waste forms. Wastetreated in Building 774 includes liquid wastefrom Building 774 (i.e., water from ground-water accumulation systems, decontaminationshowers, utility systems, and nonproductionsystems); miscellaneous solutions fromBuilding 559, 371, 771, and 779; and any organicliquid waste from Buildings 707, 776, and 777.The Bottle Box operation located in Building774 is used for solidification of laboratory wasteand the stabilization of liquid residues.
Building 776 processing includes repackagingwaste combustibles, metal, glass, and largehigh-efficiency particulate air filters in the SizeReduction Vault; adding cement to immobilizemoisture in waste filter media, insulation, andglovebox filters in the Size Reduction Vault; andsize-reducing large items or equipment,machinery, and gloveboxes in the AdvancedSize Reduction Facility. This facility is currentlynonoperational, but soft combustible material,glass, and light metal waste can be compactedin the Supercompaction and RepackagingFacility. Building 777, which is contiguous withBuilding 776, houses several RCRA storageunits.
Building 889 was used for the volume reductionand packaging of uranium-contaminatedequipment and other low-level and low-levelmixed waste generated outside the ProtectedArea. This facility has not been operational forseveral years and has been turned over fordecommissioning.
The Sewage Treatment Plant is used fortreatment of liquid sanitary waste produced atRocky Flats, including wastewater generatedfrom sanitary drains located outside the processareas. Liquid sanitary waste is treated in anactivated sludge process. The sludge producedis dried and packaged in lined plywood boxes.The water is treated to comply with the terms ofthe Rocky Flats National Pollutant DischargeElimination System permit and then pumped toponds on Walnut Creek. Packaged sludge iscurrently stored onsite, pending offsite disposalat the Nevada Test Site or Hanford.
Residue management includes not only themanagement of residues but also thecoordination and design of acceleratedtreatment of selected residues for shipment anddisposal. It is estimated these liquid residueswill be drained from tanks and pipes, andtreatment will be concluded by FY 1999.
Planned Treatment Systems Upgrades
The Comprehensive Treatment andManagement Plan, a requirement of the LandDisposal Restricted Federal Facility ComplianceAgreement II, outlined a series of steps foronsite treatment of low-level mixed andtransuranic-mixed waste, offsite treatment ofmixed waste, and/or recharacterization;however, this agreement expired in 1993. A SiteTreatment Plan is being developed as requiredby the Federal Facility Compliance Act of 1992,which contains requirements similar to theLand Disposal Restricted Federal FacilityCompliance Agreement II. Pending thecompletion of the Site Treatment Plan,treatment systems for mixed waste willcontinue to be developed according to the LandDisposal Restricted Federal Facility ComplianceAgreement II.
Funding requests have been initiated for eachof the Comprehensive Treatment andManagement Plan treatment systems. Thetreatment systems detailed in the plan willensure all low-level mixed waste could betreated onsite to meet land disposal restriction
CO 26

Planned Treatment System Upgrades
Treatment Unit Planned Upgrade
Comprehensive Treatment andManagement Plan System 1 A
Destruction of organic contaminants (including PCBs) and volume reduction ofcombustible mixed waste by thermal treatment.
Comprehensive Treatment andManagement Plan System 1B
Destruction of organic contaminants (including PCBs) and volume reduction ofcombustible mixed waste by nontherrnal means such as alkaline chlorination,alcohol-base-driven dechlorination, hot dodecane wash, and oxidation.
Comprehensive Treatment andManagement Plan System 2/4B
Immobilization of radionuclides, metals, and low concentrations of organiccompounds utilizing one of the following immobilization technologies:cementation, plymer solidification, or microwave solidification. (Note: Wastefeeds will consist primarily of inorganic process residues, although the systemmay include capability to treat some nonmetal debris and other solids.)
Comprehensive Treatment andManagement Plan System 3
Immobilization of radionuclides, metals, and low concentrations of organiccompounds using cementation or polymer solidification.
Comprehensive Treatment andManagement Plan System 4A
Cementation or polymer solidification of radionuclides, metals, and lowconcentrations of organic compounds present in the nitrate salts generatedfrom water-treatment processes in Building 374.
Comprehensive Treatment andManagement Plan System 5
Removal of organic compounds or radioactive contamination from the surfacesof various solid waste types by volatization or cleaning/stripping.
Comprehensive Treatment andManagement Plan System 6
Immobilization of sludges and previously solidified process residualscontaminated with metals and low concentrations of organic compounds usingcementation or solidification.
Comprehensive Treatment andManagement Plan Path F
Treatment by repackaging or immobilization of solid transuranic-mixed wastenot meeting Waste Isolation Pilot Plant waste acceptance criteria ortransportation requirements.
Building 374 Waste Treatment Restore operability, improve RCRA compliance, improve safety items, andcreate additional water storage capacity. Replaces components necessary toreduce equipment failures significantly, ensure safe operation of the facility, andadd instruments and data collection equipment to meet RCRA reportingrequirements.
Building Treatment Plant Meet regulatory compliance, including installation of a mechanical de-wateringand drying system, improvements to the electrical system, structuralrehabilitation to extend the useful life of the sewage treatment plant to 2015,construction and installation of influent/effluent holding tanks,nitrification/denitrification capability, and modifications to the equalizationbasins.
CO 27

requirements in the event offsite treatmentfacilities do not become available andtransuranic-mixed waste could be treated onsiteto meet transportation requirements and WasteIsolation Pilot Plant waste acceptance criteria.In addition, upgrades to existing treatmentsystems in Buildings 374 and 774 and thesewage treatment plant are underway. TheComprehensive Treatment and ManagementPlan systems and planned treatment systemupgrades are described as follows. Changes tothe Draft Site Treatment Plan are not includedhere.
These treatment facilities will each operate over10-year periods. Some of these operations willcontinue until 2018. Once the initial processingis completed, additional facility lifespans willremain. This capacity may be useful fortreatment of the waste streams generated fromdeactivation, decontamination, anddecommissioning activities. Since treatmentcapacity will be needed until 2055, furtherevaluation of the facilities will be required.
Residue Strategy
An implementation strategy for solid residuesmay consist of one or more or a combination ofthe following paths: ship as waste, ship asresidue, or remove actinides at Rocky Flats tominimize waste sent to the Waste Isolation PilotPlant. Stored liquid residues are being treatedeither through the Building 774 Bottle Box, thePrecipitation Process, or the Building 371Caustic Waste Treatment Process. Costs forthese activities are included in the WasteManagement Cost Table.
Waste Regulatory Programs
Waste regulatory programs encompass day-to-day compliance activities, such as inventory,labeling, documentation, staging, storage,inspection, and surveillance of wastecontainers. About 16,000 cubic yards ofhazardous and mixed wastes stored at the siterequire management according to RCRA. The
RCRA Regulatory Program providespreparation of the necessary permitmodification applications and changes tointerim status, preparation and implementationoversight of active unit closure plans,dissemination of guidance to generators andhandlers of hazardous and mixed wastes,management of RCRA training, and legislationreviews. This program also consists of thedevelopment and maintenance of regulated-waste compliance documentation and RCRAand Toxic Substances Control Act inspections ofRCRA-regulated hazardous waste and PCBcontainer and tank storage facilities.
Waste Certification
The waste certification program supports theindependent certification of waste packagingfor shipments of radioactive waste to treatmentand disposal sites, such as the Nevada Test Site,Hanford, and the Waste Isolation Pilot Plant.Specifically, the activities support thecertification of radioactive waste packaging.
Waste Characterization
Waste characterization encompasses wastesampling and analysis, development ofanalytical methods, and the documentation andverification of site waste streams. Much of thewaste generated at Rocky Flats in the past wascharacterized solely by process knowledge,resulting in overly conservative wastecategorization and exacerbating the wastestorage problems at the site.
The Backlog Waste Recharacterization effort isone example of the attempts to bettercharacterize these production-era wastes. It isanticipated this effort will be completed in FY1995, and 10 percent of the hazardous andmixed backlog waste will be reclassified asnonhazardous, nonmixed waste as a result ofthis process.
Examples of capital equipment projects plannedto upgrade instrumentation and methodologyin existing laboratory space include a passive-
CO 28

active drum counter, an anion analyzer, an
infrared x-ray spectrometer, and an Inductively
Coupled Plasma spectrometer. In addition,
analytical instruments critical to wastecharacterization will need to be installed.
Surveillance and Maintenance ofBuildings 664, 776, and 777
Surveillance and maintenance of Buildings 664,
776, and 777 consist of baseline activitiesdesigned to maintain compliance with safetyrequirements, environmental regulations, and
waste management requirements. Theseactivities include maintaining facility safety
envelopes, periodic surveillance, tracking of
vital safety systems, inspection of equipment,
corrective and preventative maintenance of
facilities and equipment, and management ofadministrative controls.
Waste Storage
In addition to storage of all waste generated at
the site, costs encompass construction andoperation of storage facilities, waste regulatory
programs, waste certification, wastecharacterization, and surveillance andmaintenance of storage facilities.
Low-level and low-level mixed wastescomprise the majority of waste stored at the
site. At present, most of Rocky Flats' waste
types must be kept in interim storage pending
the permitting or construction of offsite waste
disposal sites. This includes the mostvoluminous waste type, low-level mixed waste.
In the meantime, waste is continually generated
at a steady rate as necessary baseline operations
are performed. Scheduled remediationactivities will create increasingly burdensome
demands on already burdened storage facilities.
Storage Facility Construction andOperations
There are numerous waste storage facilities at
Rocky Flats, and storage operations areexpected to increase based on environmental
cleanup and other generating activities. Inorder for cleanup to begin, a significant amount
of additional storage capacity must be locatedand/or constructed onsite.
Several existing buildings will be converted tostorage to help meet the storage needs. Also,
the construction of a new Centralized WasteStorage Facility will provide 25,000 square feet(3,700 cubic yards) of compliant storage forlow-level, low-level mixed, and hazardouswaste. Construction of this facility wascompleted in February 1995, and operations
have been initiated.
Waste Disposal
Waste disposal activities include the shipment
of saltcrete to Envirocare for processing low-level radioactive waste for shipment to theNevada Test Site and Hanford; the preparation,transportation, and disposal of hazardous, andother regulated waste by commercial vendors;
and the disposal of sanitary waste in the onsitelandfill.
Only sanitary waste is disposed of onsite atRocky Flats. Construction of the first cell of a
new sanitary landfill to replace the existingsanitary landfill began in FY 1994. This newlandfill will consist of four individual cells and
will have a capacity of approximately 611,200
cubic meters to meet Rocky Flats' solid sanitarywaste disposal requirements for the next 20years. Each cell will be equipped with adouble-liner system, a leachate collectionsystem, a leak detection system, a methane gas
collection system, and a baler system toenhance waste volume reduction and recycling,
and will have an estimated operational life of
five years.
CO 29

Hazardous waste is routinely shipped offsite;the initial shipment of low-level saltcrete toEnvirocare will take place in FY 1995. Excesschemical inventories will be dispositioned andwill not require onsite treatment. Forradioactive site waste types, compliant onsitewaste storage areas are reaching allowablevolume limits, and offsite disposal facilities arenot available. Many of the problems associated
with waste disposal, such as the availability ofoffsite disposal facilities, are beyond the controlof Rocky Flats. The site can and willaggressively pursue those activities associatedwith the preparation of waste to meet theprojected waste acceptance criteria for offsitedisposal facilities.
Waste Management Activity Costs
Five-Year Averages (Thousands of Constant 1995 Dollars) *
rr 1995-2000 2005 2010 2015 2020 2025 2030Treatment
Transuranic Waste 29,843 34,135 34,135 34,135 34,135 34,951 37,688Low-Level Mixed Waste 23,400 52,848 52,848 52,848 52,848 43,411 4,532Low-Level Waste 38,299 39,356 39,356 39,356 39,356 39,356 31,784
Storage and HandlingTransuranic Waste 28,564 45,151 14,819 14,814 14,814 16,496 19,546Low-Level Mixed Waste 54,777 53,099 53,027 53,027 53,027 43,054 2,530Low-Level Waste 19,212 23,836 24,294 24,030 24,081 24,524 21,402Hazardous Waste 3,547 5,414 5,694 4,731 3,645 3,647 3,645Sanitary Waste 1,362 1,399 1,399 1,399 1,399 1,399 1,399
Other 29,091 29,893 29,893 29,893 29,893 29,893 29,893
Total 228,094 285,131 255,465 254,233 253,197 236,731 152,419
2035 2040 2045 2050 2055 2060 2065 Life Cycle*Treatment
Transuranic Waste 28,795 1,351 0 0 0 0 0 1,375,672Low-Level Mixed Waste 0 0 0 0 0 0 1,437,067Low-Level Waste 1,199 0 0 0 0 0 1,378,609
Storage and HandlingTransuranic Waste 4,057 739 59 0 0 0 0 823,862Low-Level Mixed Waste 0 0 0 0 0 0 1,617,470Low-Level Waste 4,165 23 0 0 0 0 0 847,057Hazardous Waste 3,645 3,645 3,649 3,649 3,649 0 0 246,350Sanitary Waste 1,399 1,399 1,399 1,399 1,399 0 0 85,139
Other 29,893 29,893 29,893 29,893 23,914 0 0 1,788,771
Total 73,153 37,051 35,000 34,942 28,963 0 0 9,599,996
Costs reflect a five-year average in constant 1995 dollars, except in FY 1995 - 2000, which is a six-year average.
Total Life Cycle is the sum of annual costs in constant 1995 dollars.
CO 30

Waste Management Cost Estimate
The cost estimate for the waste management
program includes the storage, treatment, anddisposal of existing waste inventories as well as
future waste to be generated by routineoperations of the site, including environmentalrestoration, and nuclear material and facilitystabilization activities. Costs for wasteminimization activities are included in theProgram Management Cost table.
Currently, a substantial amount of storage atRocky Flats is associated with the use ofavailable storage space in plutonium operationsbuildings located in the Protected Area.Operations within plutonium buildings requiresubstantial indirect support in the form ofhealth and safety, safeguards, and securityrequirements. The costs related to storage inthese buildings are driven upwards by theindirect costs associated with using theplutonium buildings.
In addition, the presence of mixed radioactivewastes dictate regulatory inspection andmonitoring requirements be met. Theserequirements include RCRA and otherenvironmental laws, orders, and agreements.The State of Colorado and EPA require dailyand monthly inspections of mixed wastestorage areas and various waste sampling,analysis, and characterization activities. Thesecompliance actions also increase the direct andindirect costs of waste storage at the site.
There will be a need to operate existing facilitiesduring the post-2020 period. As the backlog ofexisting waste is eliminated, new wastegenerated by restoration activities will take itsplace. Also, operation of existing storage areaswill be needed to stage and prepare forshipments and to respond to fluctuations inshipping rates. The operation costs for existingstorage facilities in the post-2020 period havebeen included.
NUCLEAR MATERIAL AND
FACILITY STABILIZATION
Facility stabilization, maintenance, andmonitoring involves the management of EMfacilities until their ultimate disposition isdetermined and achieved. Site facilities includechemical processing plants and buildingscontaminated with radiological and hazardousmaterials. The major activities for the siteunder this category are facility operations,surveillance and maintenance, stabilization offacilities, and consolidation and storage ofspecial nuclear materials.
Operations, Surveillance andMaintenance
The largest contributor to the annual cost offacility operations has been the cost of safelyoperating and maintaining the 19 buildingsstoring or handling radioactive and otherhazardous materials. These buildings wereoriginally used for manufacturing processesand were designed to allow safe work on fissilematerials or other radioactive materials. Afterbeing placed in service, these facilities wereconstantly operated, monitored, andmaintained to ensure public, environmental,and worker safety.
Several buildings have been in service foralmost 40 years. Older buildings have highermaintenance requirements and upgrades toensure ongoing safety. Operation andsurveillance and maintenance activities arerecurring activities continuing until thebuildings are decommissioned or turned overfor commercial reuse.
Buildings awaiting shutdown remain staffed toaccomplish building baseline activities.Building baseline activities are designed tomaintain compliance with operational safetyrequirements, environmental regulations, andwaste management requirements. Also
CO 31

included are activities to meet radiologicalrequirements, criticality safety requirements,industrial safety requirements, and fire codes.Management, operations, facility-specifictraining, and maintenance activities are allaimed at supporting compliance with theserequirements and providing general buildingsupport in the areas of health and safetyoperations; nuclear safety; technical,administrative, and custodial support; utilityservices; and waste management activities.
Stabilization and MaterialStabilization of facilities include solid andliquid stabilization; stabilization of equipment,systems, or facilities; and plutoniumrepackaging and stabilization. These high-priority activities are necessary to placematerials in a stable configuration for safestorage and management, and to begin theprocess of deactivating facilities.
Currently there remains approximately 30 cubicmeters of actinide solutions stored in tanks,pipes, and bottles primarily in Buildings 371and 771. These liquids remain in the same mid-process locations and configurations they werein when production was halted in 1989. Theseradioactive solutions present a liability due tothe slow, long-term degradation of theircontainers. Additionally, the plutonium in thesolutions can precipitate out over time andcollect in the bottom of tanks and piping,complicating safety and removal.
To reduce the risk, the solutions are beingconverted to solids and then stored andmanaged as waste or special nuclear materialdepending on their plutonium concentrationlevels. In addition, the solutions need to beremoved from the tanks and piping to facilitateRCRA closure, which is a key initial step in thedecontamination of Building 771. The liquidstabilization program (RCRA closure) isexpected to be completed by FY 2003.
In 1990, plutonium operations were halted.Some glovebox exhaust systems containedmore than recommended levels of fissilematerial. Some of these ducts have beenremediated, while others have been evaluatedto show they do not pose any significant hazardin their present condition. Ducts will beevaluated to establish their safe condition, andthen will be removed and dispositioned duringdecommissioning of each building. In themeantime, safety evaluations will identify thenecessary conditions and controls required tomaintain the duct material in a safeconfiguration. The remaining solidstabilization activities are discussed in thesection below.
Stabilization activities are required for surplusbuildings, equipment, systems, modules, andother ancillary structures. Examples ofactivities performed during stabilization areremoval of chemicals, removal of spent nuclearmaterial, de-energizing electrical and pressuresources, isolating and/or removing gloveboxes,and process-line draining and isolation.
The removal of materials, system configurationchanges, and level of encapsulation will bedetermined by the scope of the requesteddeactivation. Plans are in various stages. Forexample, planning is under way to deactivatetwo modules in Building 707. Additional areasidentified for deactivation include rooms inBuilding 779 and 886 and all of Building 889.These areas are being planned in conjunctionwith decommissioning activities.
Special Nuclear MaterialConsolidation and StorageCurrently, Rocky Flats has over 14 tons ofplutonium, including special nuclear material,stored in 22 vaults and vault-type roomslocated within 8 buildings in a highly protectedportion of the Industrial Area called theProtected Area. The special nuclear material isin various physical and chemical forms and is
CO 32

contained in a variety of packaging andcontainers. The large presence of this materialposes potential risks to health and safety due toits toxicity if it is inhaled or ingested by humans
or animals. The solid material inventoryremains primarily in temporary packaging,which will eventually show signs ofdegradation.
In some of the packages, plutonium is incontact with plastic, which is subject toradiation damage and may eventuallycompromise the integrity of containment. Themetallic portion of the inventory is subject tooxidization, and some of the oxides formed areunstable and pyrophoric. As the packagingcontinues to age, the potential for release ofpackage contents increases. Therefore, it isnecessary to stabilize and upgrade thepackaging and storage configuration.
Plutonium residues, both liquid and solid, willbe completely repackaged, treated, stored, andshipped, allowing key plutonium processingbuildings to be stabilized. Ventilation of solidresidues should be completed by FY 1998, withtreatment of solid residues beginning by FY2003 and scheduled for completion by FY 2011.Liquid stabilization is scheduled for completionin Building 371 by FY 2001 and for Building 771
by FY 2003. All residues are planned forshipment to the Waste Isolation Pilot Plant by
FY 2020. Current plans as of March 1995 is toaccelerate this schedule consistent with therecommendation of the Defense NuclearFacility Safety Board.
The thermal stabilization activities will reducepyrophoricity and remove contaminants torender the plutonium material safe for storage.Thermal stabilization will be complete in FY2000 and will involve several processes. The700 area plutonium will be thermally stabilizedat 500°C pending the verification of anotherfurnace to operate at 800°C. Then, theremaining material, except Building 371 oxides,will be stabilized using the 800° furnace. After a1,000°C furnace is operational in Building 371,the 700 area oxides will be re-stabilized alongwith the stabilization of the Building 371oxides.
Long-term interim storage of plutonium onsiteis necessary until a national DOE decision on anultimate long-term storage location is reached.However, the current storage containers onsitewere never intended for long-term storage andtherefore, a new storage container must bedesigned.
Special nuclear material will be consolidatedinto Building 371 by FY 2000 pending offsiteshipment. Shipment of special nuclear materialis planned by FY 2007, with removal of the
Nuclear Material and Facility Stabilization Cost Estimate
Five-Year Averages (Thousands of Constant 1995 Dollars)*
FY 1995 - 2000 2005 2010 2015 2020 2025 2030 life Cyde"
Nuclear Material and Facility Stabilization 154,052 58,050 271,316 4,920 277 230 11 2,598,336
• Costs reflect a five-year average in constant 1995 dollars, except in FY 1995 - 2000, which Is a six-year average.
" Total Life Cycle is the sum of annual costs in constant 1995 dollars.
CO 33

material completed by FY 2020. To consolidatethe special nuclear material, buildingmodifications must be completed in Building371 in addition to shipping more than 2,000items to Oak Ridge, Savannah River, and theLos Alamos National Laboratory. Specialnuclear material will no longer be located at theRocky Flats. Packaging of special nuclearmaterial for long-term storage will becompleted by 2002. In addition, consolidationof special nuclear material will reduce annualoperating costs by reducing safeguards andsecurity costs in various facilities.
LANDLORD FUNCTIONS
Beginning in FY 1994, landlord responsibilityfor Rocky Flats was transferred from theAssistant Secretary for Defense Programs to theAssistant Secretary for EnvironmentalManagement. Landlord responsibility, whichhas been assumed by the Office of NuclearMaterial and Facility Transition, includescertain site-wide activities not assigned to directsite programs. The segregation of activities tothe landlord and infrastructure categoryfollows DOE Headquarters guidance onfunding sources. The landlord andinfrastructure activities support the directprograms.
The landlord activities cover a wide range ofsite functions required for maintaining theinfrastructure at the site. Some examples ofthese types of functions are described below.
Environmental MonitoringEnvironmental monitoring includes airmonitoring and assessment; chemical trackingand reporting; surface-water monitoring andassessment; ground-water monitoring andseismic monitoring; and monitoring ecologyand the National Environmental Protection Act
requirements for biological flora and faunaassessment and protection along withenvironmental impact mitigation planning anddocumentation. In addition to monitoring,numerous reporting activities are ongoing tomaintain compliance with environmentalregulations.
Building Upgrades andRefurbishment
Maintaining the infrastructure requires manytypes of refurbishments, replacements, andupgrades. Due to the aging facilities, projectsmust be completed to replace electrical,mechanical, or other infrastructure systems.Included in these projects are the upgrades tothe central steam plant to be completed in FY1995, replacement of the main site substation tobe completed in FY 1998, and the replacementof specific portions of the plutonium heating,ventilation, and air conditioning system.
In addition to replacing these systems, a projectis underway to upgrade, replace, or closeRCRA-regulated underground storage tanks tomeet current performance standards. Thisproject will be completed in FY 1999.
Fire Security ReplacementProject
The fire/security system will be replaced by FY2000 to provide a new security alarm, fire area,and security requirements change due to thesite's new mission.
Safeguards and SecurityAnother important landlord responsibility is toprovide safeguards and security for theprotection of spent nuclear material and sitepersonnel. Several projects are scheduled to
CO 34

ensure continuing success in this area. Areplacement of the plant alarm/warningnotification system will be completed in FY2000.
The Master Safeguards and Security Agreementrequires projects of varying sizes to becompleted in order to protect special nuclearmaterial adequately. These projects are foundin multiple buildings and provide multipletypes of equipment to provide better security.Examples of these projects are the upgrading ofperimeter intrusion equipment and theprovision of a glovebox line to consolidateplutonium handling.
Health and SafetyHealth and safety encompasses nuclear safety,emergency management, industrial hygiene,occupational safety, and radiation protection.
Additionally, there are several capital projectsplanned to upgrade the site. These include newequipment, air monitoring improvements, andhealth physics improvements. New equipmentsuch as an alpha spectroscopy analysis systemand an emergency body counter are needed toensure the ongoing success of radiologicalprotection. Air monitoring improvementsinclude a representative effluent sampler
Landlord Cost Estimate
Five-Year Averages (Thousands of Constant 1995 Dollars)*
FY 1995-2000 2005 2010 2015 2020 2025 2030
Directly Appropriated Landlord 113,980 81,320 81,320 81,320 81,320 12,467 12,467
2035 2040 2045 2050 2055 2060 2065 Life Cycle"
Directly Appropriated Landlord 12,467 12,467 12,467 12,467 12,467 9,974 0 2,796,494
Costs reflect a five-year average in constant 1995 dollars, except in FY 1995 - 2000, which is a six-year average.
" Total Life Cycle is the sum of annual costs in constant 1995 dollars.
Program Management Cost Estimate
Five-Year Averages (Thousands of Constant 1995 Dollars)*
FY 1995-2000 2005 2010 2015 2020 2025 2030
Program Management 40,015 33,951 38,135 44,517 43,731 73,103 79,664
2035 2040 2045 2050 2055 2060 2065 Life Cycle**
Program Management 71,995 71,282 108,389 102,028 138,717 52,186 0 4,528,573
- Costs reflect a five-year average in constant 1995 dollars, except in FY 1995 - 2000, which is a six-year average.
" Total Life Cycle is the sum of annual costs in constant 1995 dollars.
CO 35

system and ambient air particulate samplersystem. Both of these systems are required tomeet current compliance with standards forradionuclide air monitoring. In addition,replacing two alarm monitoring systems inplutonium processing and support buildingswill meet current requirements for airbornealpha-radiation monitoring.
PROGRAM MANAGEMENT
Program management at Rocky Flats providespayments and grants to the State of Colorado,DOE Subcontractor Support, and WasteMinimization.
Agreement-In-PrincipleThe Agreement-In-Principle was executed in1989 between DOE and Colorado Departmentof Public Health and Environment. In thisagreement, the Department committed to anexpanded environmental monitoring program,an acceleration of cleanup activities at somecontaminated sites, several initiatives forachieving a more comprehensiveenvironmental management system, anenhanced emergency response, and allocationof additional funds to the State of Colorado toadminister oversight programs at the site.Annual payments to the State for theseactivities began in 1990 and will continueindefinitely.
DOE Subcontractor SupportDOE Rocky Flats Field Office has subcontractedsupport to assist in oversight of the operatingcontractor in the area of waste andenvironmental compliance. This support isexpected to continue at some level throughoutthe life of the Environmental Managementprogram.
Waste Minimization/PollutionPrevention
The Waste Minimization/Pollution PreventionProgram includes the programmatic andadministrative functions necessary for a fullycompliant Waste Minimization/PollutionPrevention Program at the site. The objectives ofthis program are to reduce the volume andtoxicity of all site waste streams through sourcereduction, recycling, reuse, and reclamation.This category includes costs for coordinatingsite-wide nongenerator-specific WasteMinimization/Pollution Prevention and includesplanning and regulatory reporting, employeetraining and awareness programs, site-wideassessments and technical assistance, technologyand information exchange, and communityinvolvement.
FUNDING AND COST
INFORMATION
The following tables present fundinginformation and major activity milestones forRocky Flats.
CO 36

Nondefense Funding Estimate
Five-Year Averages (Thousands of Constant 1995 Dollars)*
FY 1995 - 2000 2005 2010 2015 2020 2025 2030 lifeCyde”
Nuclear Material and Facility Stabilization 0 0 0 4,642 0 11 11 23,319
Costs reflect a five-year average in constant 1995 dollars, except in FY 1995 - 2000, which is a six-year average.
Total Life Cycle is the sum of annual costs in constant 1995 dollars.
Defense Funding Estimate
Five-Year Averages (Thousands of Constant 1995 Dollars)*
FY 1995 - 2000 2005 2010 2015 2020 2025 2030
Environmental Restoration 161,824 85,733 106,664 132,431 145,253 216,177 271,635
Waste Management 228,094 285,131 255,465 254,233 253,197 236,731 152,419
Nuclear Material and Facility Stabilization 154,052 58,050 271,316 278 277 219 0
Directly Appropriated Landlord 113,980 81,320 81,320 81,320 81,320 12,467 12,467
Program Management 40,015 33,951 38,135 44,517 43,731 73,103 79,664
Total 697,965 544,186 752,899 512,778 523,778 538,697 516,185
2035 2040 2045 2050 2055 2060 2065 Life Cycle"
Environmental Restoration 379,450 337,389 467,596 447,645 459,190 174,211 0 17,087,804
Waste Management 73,153 37,051 35,000 34,942 28,963 0 0 9,599,996
Nuclear Material and Facility Stabilization 0 0 0 0 0 0 0 2,575,017
Directly Appropriated landlord 12,467 12,467 12,467 12,467 12,467 9,974 0 2,796,494
Program Management 71,995 71,282 108,389 102,028 138,717 52,186 0 4,528,573
Total 537,065 458,188 623,452 597,082 639,337 236,371 0 36,587,884
• Costs reflect a five-year average in constant 1995 dollars, except in FY 1995 - 2000, which is a six-year average.
- Total Life Cycle is the sum of annual costs in constant 1995 dollars.
CO 37

Major Activity Milestones
ACTIVITY TASK COMPLETION DATE
Environmental Restoration Fiscal Year
Submit Final CAD/ROD for OU 1 1996
Complete Assessment Phase--OU 1 1995
Complete Remediation Phase--OU 1 2015
Complete Surveillance and Maintenance-0U 1 2055
Complete Assessment Phase--OU 2 2000
Complete Remediation Phase--OU 2 2030
Complete Surveillance and Maintenance—OU 2 2055
Complete Assessment Phase--OU 3 1997
Complete Remediation Phase--OU 4 2000
Complete Surveillance and Maintenance--OU 4 2030
Complete Assessment Phase--OU 5 1997
Complete Remediation Phase--OU 5 1999
Complete Surveillance and Maintenance--OU 5 2055
Complete Assessment Phase--OU 6 1997
Complete Remediation Phase--OU 6 2001
Complete Assessment Phase--OU 7 1995
Complete Remediation Phase--OU 7 2000
Complete Surveillance and Maintenance--OU 7 2030
Complete Assessment--Plant Areas/Facilities 2008
Complete Remediation--Plant Areas/Facilities 2055
Complete Surveillance and Maintenance--Plant Areas/Facilities 2035
Complete Assessment Phase--OU 11 1996
Complete Decommissioning 2060
CO 38

Major Activity Milestones (cont'd)
ACTIVITY TASK COMPLETION DATE
Nuclear Material and Facility Stabilization Fiscal Year
Complete Stabilization--Plutonium Buildings/Facilities 2010
Complete Surveillance and Maintenance--Plutonium Buildings/Facilities 2012
Complete Stabilization--Non-plutonium Buildings/Facilities 2010
Complete Surveillance and Maintenance--Non-plutonium Buildings/Facilities 2012
Complete Stabilization--Facilities/General Support Buildings 2010
Complete Surveillance and Maintenance--Facilities/General Support Buildings 2012
Complete Stabilization--Miscellaneous Buildings 2024
Complete Surveillance and Maintenance--Miscellaneous Buildings 2026
Waste Management Fiscal Year
Complete Waste Processing RP—TRU-Mixed Treatment to meet WIPP Criteria 2018
Complete Waste Processing amP--am Solvent-Contaminated Waste Treatment-Thermal 2017Complete Waste Processing amp-Lim Solvent-Contaminated-Non-Thermal 2024
Complete Waste Processing CTMP--LLM Buildings 374/774 Sludge Immobilization 2017
Complete Waste Processing amp-um Building 374 Salt Immobilization 2017
Complete Waste Processing amp--Lim Miscellaneous Waste Forms Immobilization 2016
Complete Waste Processing amp-um Surface Organic Contaminant 2017Removal/Lead Decontamination
Path A Reclassification Complete 1998
Begin Shipping LLM Waste to Nevada Test Site 1998
Complete CTMP Mixed Waste Treatment of Plutonium LLWM inventory (non-ER) 2022
Complete Construction of Building 374 Upgrades 1999
Complete Treatment of Solid Residues 2011
Complete Closure Mixed Residue Tanks 2017
Complete Hazardous Excess Material Disposition 1997
For further information on this site, please contact: Public Participation Office (303) 966-4888
Public Affairs Office (303) 966-5993
Technical Liaison: Gary Reid (303) 966-5156
CO 39

CO 40
i

COLORADO UMTRA SITES
The Gunnison mill site, the Maybell mill site, the former Naturita site, and the inactive uranium
processing sites at Rifle are five of 24 uranium mill processing sites designated by the Uranium Mill
Tailings Radiation Control Act for DOE remediation. Most uranium ore mined in the United States
in the 1960's was processed by private firms for the Atomic Energy Commission, a predecessor of the
U.S. Department of Energy (DOE). The Act was passed in 1978 in response to public concerns
regarding potential health hazards from long-term exposure to uranium mill tailings. It authorized
the DOE to stabilize, dispose of, and control uranium mill tailings and other contaminated material
at 24 uranium mill processing sites and vicinity properties. Uranium Mill Tailings Remedial
Action (UMTRA) activities are funded through the Albuquerque Operations Office.
The model used to estimate costs for this report provides costs for each of the UMTRA sites located
in each State. All costs for waste management activities, program management, and relevant land-
lord activities attributable to the Department are provided for within the scope of environmental
restoration. There are no UMTRA sites with either current or planned nuclear material and facility
stabilization activity needs. Funding for all sites is 100 percent nondefense. For a general discus-
sion of UMTRA and associated costs, see the UMTRA Site Summary found in the New Mexico
section.
CO 41

GUNNISON(Uranium Mill Tailings Remedial Action Project)
The Gunnison mill site is located southwest of the City of Gunnison and adjacent to the Gunnisonairport. The site covers 61 acres.
1 /\, 0;17''-'-'! /\ 9coe1-, 1,. L. /\! \,0, [—
GUNNISON ‘*1 \Nf j /\NATIONAL I '-' r. /\FOREST I
/\
/\ \ .
/\ /\
PROCESSINGi SITE
Blue MesaReservoir
C
DISPOSAL SITE
Gunnison Co.- - — - — - _
Saguactte Co.r---1. i 1—fl....:- -
I -1'-i
I !I
1
I i I I U• 0 NNISON NATIONAL FOREST
COLORADO
Denver
LI
Map Location
LEGEND
0 U.S. HIGHWAY
49 STATE HIGHWAY
EPHEMERAL STREAM
5 0 5 MILES
8 0 8 KILOMETERS
CO 42

Estimated Site Total
(Thousands of Current 1995 Dollars)*
FY 1995 1996 1997 1998 199 200
Environmental Restoration 4,250 2,030 ,210 1,730 40
• Costs for FY 1995 reflect Congressional Appropriation, costs for FY 1996 reflect EM budget submission, costs for FY 1997-2000 reflect Budget Shortfall Scenario, costs for
shaded area assume 3% annual inflation.
Five-Year Averages (Thousands of Constant 1995 Dollars)**
FY 1995-2000 2005 2010 2015 2020 2025 2030 Life Cycle***
1,863 691 690 0 0 0 0 18,078
Costs reflect a five-year average in constant 1995 dollars, except in FY 1995 - 2000, which is a six-year average.
*** Total Life Cycle is the sum of annual costs in constant 1995 dollars.
PAST, PRESENT, AND
FUTURE MISSIONS
The mill was owned and operated by theGunnison Mining Co. from 1958 to 1961 whenGunnison Mining merged with Kermac NuclearFuels Corporation, a subsidiary of Kerr-McGeeOil Industries, in late 1961. Kermac operatedthe mill until it closed in 1962. The site is nowowned by the State of Colorado.
DOE will maintain control of the site andcontinue long-term surveillance andmaintenance.
ENVIRONMENTAL
RESTORATION
Thirty-nine acres of the site were covered bytailings. Approximately 345,485 cubic yards ofuranium mill tailings exist onsite. The activitiesat Gunnison have resulted in contaminated soiland windblown material.
Remedial action construction is ongoing atGunnison. To date, DOE has completed thehauling of contaminated materials to a disposalsite. In 1995, DOE plans to complete theplacement of a disposal cell cover, as well as theconstruction of long-term site surveillance andmaintenance features, e.g., site fencing, surveymonuments. DOE also plans to completerestoration of the processing site. Remediationis expected to be completed in Fiscal Year 1998.The following table shows the costs forenvironmental restoration projects at this site.All funding is from nondefense sources.
CO 43

Environmental Restoration Activity Costs
Five-Year Averages (Thousands of Constant 1995 Dollars)*
FY 1995 - 2000 2005 2010 2015 2020 2025 2030 Life Cyde"
UMTRA-Ground Woter - ColoradoRemedial Actions 782 691 690 0 0 0 0 11,593
UMTRA-Soils - ColoradoRemedial Actions 1,081 0 0 0 0 0 0 6,485
Total 1,863 691 690 0 0 0 0 18,078
Costs reflect a five-year average in constant 1995 dollars, except in FY 1995 - 2000, which is a six-year average.
Total Life Cycle is the sum of annual costs in constant 1995 dollars.
Nondefense Funding Estimate
Five-Year Averages (Thousands of Constant 1995 Dollars)*
FY 1995-2000 2005 2010 2015 2020 2025 2030 Life Cycle**
Environmental Restoration 1,863 691 690 0 0 0 0 18,078
• Costs reflect a five-year average in constant 1995 dollars, except in FY 1995-2000, which is a six-year average.
— Total Life Cycle is the sum of annual costs in constant 1995 dollars.
For further information on this site, please contact: Public Participation Office (505)845-5951
Public Affairs Office (505)845-6202
Technical Liaison: Jody Metcalf (505)845-6146
CO 44

CO 45

MAYBELL
(Uranium Mill Tailings Remedial Action Project)
The MaybeII mill site and tailings pile are located approximately 25 miles west of the Town of Craig,Colorado. The site covers 110 acres, and there are an additional 182 acres of land containing con-tamination.
MAYBELL
Eagle TAILINGS SITEPark
. Dtaw. —
-v 44 \I
cica'. sr4(0 SUNBEAM r \ 04 D f t co.q,'• 0,1 co t
X Sugarloafpeak
r cc% coci -- g• , co.) t
c ,. io.u, .c - *
: fON/e/
00,000°C.1:
t )1i:MountainsJuniper
LittleLay Creek if
II'
01 )MAYBELL,a)
-,5 . (ft*
p3 )„ ,,"0/ . i „e !II
1,14... ,.
i lin/
if? /u
0.0/ . //
•/#
# r.
H
• BOXELDERSPRING
X JuniperMountain
COLORADO
Denver
Map Location
1
as
= = =
0
GovernmentBridge
LEGEND
U.S. HIGHWAY
STATE HIGHWAY
EPHEMERAL STREAM
DIRT ROAD
2 MILES
1 0 4 KILOMETERS
CO 46

Estimated Site Total
(Thousands of Current 1995 Dollars)*
T 1995 1996 1997 1998 1999 2000
Environmental Restoration 11,9711 4,270 250
• Costs for FY 1995 reflect Congressional Appropriation, costs for FY 1996 reflect EM budget submission, costs for FY 1997-2000 reflect Budget Shortfall Scenario, costs forshaded area assume 3% annual inflation.
Five-Year Averages (Thousands of Constant 1995 Dollars)**
FT 1995 - 2000 2005 2010 2015 2020 2025 2030 Life Cycle***
Environmental Restoration 4,653 0 0 0 0 0 0 27,921
• Costs reflect a five-year average in constant 1995 dollars, except in FY 1995 - 2000, which is a six-year average.
▪ Total Life Cycle is the sum of annual costs in constant 1995 dollars.
PAST, PRESENT, AND
FUTURE MISSIONS
There are several open-pit mines surroundingthe site. The additional contamination onvicinity properties was deposited by wind orwater erosion from the site. Union CarbideCorporation operated the site from 1957 to1964.
DOE will maintain control of the site andcontinue long-term surveillance andmaintenance.
ENVIRONMENTAL
RESTORATION
Approximately 2.8 million cubic yards ofuranium mill tailings exist onsite. The activitiesat this site have also resulted in windblown andwaterborne contamination and buried milldebris. Planning is currently ongoing forremediation of the Maybell site. Remedialaction will consist of site preparation, tailingsexcavation, and production of erosionprotection materials. Remediation will beinitiated and completed at all six vicinityproperties associated with the site. Siteremediation is expected to be completed inFiscal Year 1999. The following table shows thecosts for environmental restoration projects atthis site. All funding is from nondefensesources.
CO 47

Environmental Restoration Projects
Five-Year Averages (Thousands of Constant 1995 Dollars)*
FY 1995-2000 2005 2010 2015 2020 2025 2030 Life Cycle**
UMTRA-Ground Water - Colorado 64 0 0 0 0 0 0 384
UMTRA-Soils - Colorado 4,590 0 0 0 0 0 0 27,537
Total 4,653 0 0 0 0 0 0 27,921
' Costs reflect a five-year average in constant 1995 dollars, except in FY 1995 - 2000, which is a six-year average.
Total Life Cycle is the sum of annual costs in constant 1995 dollars.
Nondefense Funding Estimate
Five-Year Averages (Thousands of Constant 1995 Dollars)*
FY 1995-2000 2005 2010 2015 2020 2025 2030 Life Cyde*
Environmental Restoration 4,653 0 0 0 0 0 0 27,921
Costs reflect a five-year average in constant 1995 dollars, except in i Y 1995 - 2000, which is a six-year average.
Total Life Cycle is the sum of annual costs in constant 1995 dollars.
For further information on this site, please contact: Public Participation Office (505)845-5951
Public Affairs Office (505)845-6202
Technical Liaison: Jody Metcalf (505)845-6146
CO 48

CO 49

NATURITA
(Uranium Mill Tailings Remedial Action Project)
This former mill site is located 2 miles northwest of the Town of Naturita in Montrose County,Colorado. The site is a 53-acre site.
4444
COKE OVENBORROW SITE
NOTE:13 ROAD MILES FROMNATURITA PROCESSING SITETO URAVAN SITE
NATURITAPROCESSING
SITE HOPKINS•MONTROSECOUNTY AIRPORT
n
Montrose Co.
If DRY FLATSDISPOSAL SITE
pr#coutir
ca
COLORADO
Denver
ElMap Location
NATURITA
LEGEND
0 STATE HIGHWAY
= DIRT ROAD
CO 50

Estimated Site Total
(Thousands of Current 1995 Dollars)*
FY 1995 1996 1997 1998 1999 2000
Environmental Restoration 14,340 7,410 2,370 460 290
• Costs for FY 1995 reflect Congressional Appropriation, costs for FY 1996 reflect EM budget submission, costs for FY 1997-2000 reflect Budget Shortfall Scenario, costs forshaded area assume 3% annual inflation.
Five-Year Averages (Thousands of Constant 1995 Dollars)**
FY 1995-2000 2005 2010 2015 2020 2025 2030 Life Cycle•••
Environmental Restoration 4,561 552 429 0 0 0 0 32,271
Costs reflect a five-year average in constant 1995 dollars, except in FY 1995 - 2000, which is a six-year average.
"' Total Life Cycle is the sum of annual costs in constant 1995 dollars.
PAST, PRESENT, AND
FUTURE MISSIONS
The mill was operational from 1939 until theend of World War II by the VanadiumCorporation of America for vanadium recovery.It reopened in 1947 under contract to theAtomic Energy Commission, and uraniumconcentrates were shipped to the AtomicEnergy Commission until the mill was shutdown in 1958. The mill was dismantled in 1963and in 1967, Vanadium Corporation of Americawas merged into Foote Mineral Co., andownership of the site passed to Foote. Theportion of the site formerly occupied by tailingswas purchased by Ranchers Exploration andDevelopment Corporation in 1976.
The Department of Energy will maintaincontrol of the site and continue long-termsurveillance and maintenance.
ENVIRONMENTAL
RESTORATION
Approximately 704,000 tons of uranium milltailings existed onsite, and were removed byRanchers Exploration from 1977-1979. Theactivities at this site have resulted inwaterborne and windblown contamination,contaminated soil, and associated debris andrubble.
Planning is currently ongoing at Naturita. Todate, DOE has completed the final sitecharacterization, the identification of culturalresources, finalized the EnvironmentalAssessment and Remedial Action Plan, startedprocessing site demolition, and initiatedvicinity property remedial action. In 1995, DOEplans to receive approval of the FinalEnvironmental Assessment and the FinalRemediation Action Plan, select the disposalsite processing site demolition. Soilremediation is expected to be completed in FY1998 with ground-water remediation completed
CO 51

in FY 2010. The following table shows the costsfor Environmental Restoration projects at thissite. All funding is from nondefense sources.
Environmental Restoration Projects
Five-Year Averages (Thousands of Constant 1995 Dollars)•
FY 1995-2000 2005 2010 2015 2020 2025 2030 Life Cycle**
UMTRA-Ground Water - Colorado 392 552 429 0 0 0 0 7,255
UMTRA-Soils - Colorado 4,169 0 0 0 0 0 0 25,016
Total 4,561 552 429 0 0 0 0 32,271
Costs reflect a five-year average in constant 1995 dollars, except in FY 2000, which is a six-year average.
Total Life Cycle is the sum of annual costs in constant 1995 dollars.
Nondefense Funding Estimate
Five-Year Averages (Thousands of Constant 1995 Dollars)*
FY 1995-2000 2005 2010 2015 2020 2025 2030 Life Cycle**
Environmental Restoration 4,561 552 429 32,271
* Costs reflect a five-year average in constant 1995 dollars, except in FY 1995 - 2000, which is a six-year average.
Total Life Cycle is the sum of annual costs in constant 1995 dollars.
For further information on this site, please contact: Public Participation Office
Public Affairs Office
Technical Liaison: Jody Metcalf
(505) 845-5951
(505) 845-6202
(505) 845-6146
CO 52

CO 53

RIFLE
(Uranium Mill Tailings Remedial Action Project)
The inactive uranium-processing sites at Rifle lie in the Colorado River valley near the City of Rifle.The sites are about 2 miles apart and are referred to as the Old Rifle and New Rifle sites. Old Rifle isa 22-acre site; New Rifle covers approximately 33 acres.
Rio Blanco Co.
Garfield Eo7 ----------ESTES GULCHDISPOSAL SITE
OLD RIFLEPROCESSING SITE
NEWCASTLE
60 NEW RIFLE
Garfield Co. o PROCESSING SITE_______ _ _ — _
Mesa Co.Grand
GLENWOODSPRINGS
GRAND JUNCTION
COLORADO
❑ Denver
Map Location
Mesa
National
Forest1.
04:1•1 j 8
`.411fteN° of sI C,
LEGEND
70 INTERSTATE HIGHWAY
0 U.S. HIGHWAY
CD STATE HIGHWAY
10 0
10 0
10 20 MILES
40 KILOMETERS
C054

Estimated Site Total
(Thousands of Current 1995 Dollars)*
FY 1995 1996 « 1997
Environmental Restoration
2000
• Costs for FY 1995 reflect Congressional Appropriation, costs for FY 1996 reflect EM budget submission, costs for FY 1997-2000 reflect Budget Shortfall Scenario, costs for
shaded area assume 3% annual inflation.
Five-Year Averages (Thousands of Constant 1995 Dollars)**
FY 1995-2000 2005 2010 2015 2020 2025 2030 Life Cycle***
Environmental Restoration 5,858 691 763 0 0 0 0 42,515
Costs reflect a five-year average in constant 1995 dollars, except in FY 1995 - 2000, which is a six-year average.
*** Total Life Cycle is the sum of annual costs in constant 1995 dollars.
PAST, PRESENT, AND
FUTURE MISSIONS
The Old Rifle site operated from 1924 to 1932for the recovery of vanadium from roscoeliteore. The process was altered to includerecovery of uranium from 1947 to 1958. TheNew Rifle mill operated from 1958 to 1973 aspart of the complex of upgraders, includingthose located at Slick Rock, Colorado, andGreen River, Utah.
The disposal cell will remain under control ofthe Department of Energy, and long-termsurveillance and maintenance will continue.
ENVIRONMENTAL
RESTORATION
Approximately 259,000 cubic yards of uraniummill tailings exist at Old Rifle, and 2 millioncubic yards exist at New Rifle. Activities at thissite have resulted in the construction of millbuildings, other associated contaminateddebris, and contaminated windblown materials.
The hauling of tailings to a disposal cell iscurrently ongoing at Rifle. To date, DOE hasalso completed subpile excavation. In 1995,DOE plans to complete the tailings haul, coverplacement, and remediation at the site. Soilremediation is expected to be completed inFiscal Year 1998 with ground-water remediationcompleted in 2010. The following table showsthe costs for environmental restoration projectsat this site. All funding is from nondefensesources.
CO 55

FUNDING AND COST
INFORMATION
The following tables present fundinginformation and major activity milestones forOld Rifle. Remediation Action Plan, select thedisposal site, and complete processing sitedemolition. Soil remediation is expected to becompleted in Fiscal Year 1998 with ground-water remediation completed in Fiscal Year2010. The following table shows the costs forenvironmental restoration projects at this site.All funding is from nondefense sources.
Environmental Restoration Projects
Five-Year Averages (Thousands of Constant 1995 Dollars)•FY 1995 - 2000 2005 2010 2015 2020 2025 2030 Life Cycle.*
UMTRA-Ground Water - Colorado 952 691 783 0 0 0 0 13,078UMTRA-Soils - Colorado 4,906 0 0 0 0 0 0 29,437
Total 5,858 691 783 0 0 0 0 42,515
' Costs reflect a five-year average in constant 1995 dollars, except in FY 1995 - 2000, which is a six-year average.
• Total Life Cycle is the sum of annual costs in constant 1995 dollars.
Nondefense Funding Estimate
Five-Year Averages (Thousands of Constant 1995 Dollars)*FY 1995-2000 2005 2010 2015 2020 2025 2030
Environmental Restoration 5,858 691 783
Life Cyde
42,515
• Costs reflect a five-year average in constant 1995 dollars, except in FY 1995 - 2000, which is a six-year average.
• Total Life Cycle is the sum of annual costs in constant 1995 dollars.
For further information on this site, please contact: Public Participation Office
Public Affairs Office
Technical Liaison: Jody Metcalf
(505) 845-5951
(505) 845-6202
(505) 845-6146
CO 56

CO 57

UNION CARBIDE CORPORATION AND
OLD NORTH CONTINENT
(Uranium Mill Tailings Remedial Action Project)
The Union Carbide Corporation and the Old North Continent sites are 1 mile apart and locatednorthwest of the post office at Slick Rock in the Dolores River Valley. The Union Carbide Corpora-tion site covers 93 acres, and the Old North Continent site covers 17 acres.
LA SALJCT.
NATURITA
UNCOMPAHGRENATIONAL FOREST
NORTH CONTINENT ri—UPATRA SITE
LL.Ll
MONTICELLO
I DOVCREEK
Iari
co
s 1 -2,„
COLORADO
Denver
Map Location
10
Cg
0
Mesa Co.Montrose Co.
L Montrose Co.1 San Miguel Co. •
1-7
San Miguel Co.
Dolores Co.
SAN JUANNATIONAL FOREST
LEGEND
U.S. HIGHWAY
STATE HIGHWAY
NATIONAL FOREST
10 20 MILES
10 0•••1111 MEM .111111111111111111
•INIM MIN
20 40 KILOMETERS
CO 58

Estimated Site Total
(Thousands of Current 1995 Dollars)*
FY 1995 1996 1997 1998 1999 2000
Environmental Restoration .10,790 9,9 630 420 670 1,240
• Costs for FY 1995 reflect Congressional Appropriation, costs for FY 1996 reflect EM budget submission, costs for FY 1997-2000 reflect Budget Shortfall Scenario, costs for
shaded area assume 3% annual inflation.
Five-Year Averages (Thousands of Constant 1995 Dollars)**
FY 1995.2000 2005 2010 2015 2020 2025 2030 Life Cycle•"
Environmental Restoration 4,187 737 614 195 0 0 0 32,852
Costs reflect a five-year average in constant 1995 dollars, except in FY 1995 - 2000, which is a six-year average.
*** Total Life Cycle is the sum of annual costs in constant 1995 dollars.
PAST, PRESENT, AND
FUTURE MISSIONS
Union Mines Development Corporation, a U.S.Government-established corporation, acquiredthe site in 1945 for the specific purpose ofsupplying uranium and vanadium for theManhattan Project of World War II. The U.S.Government took title to the site in 1949. TheUnion Carbide Corporation site was acquiredby Union Carbide in 1956, and the Old NorthContinent site was acquired a year later.
The processing site will be restored in 1996when remedial action will be 100-percentcomplete.
ENVIRONMENTAL
RESTORATION
The cleanup options include moving tailings tothe Burrow Canyon disposal site. TheDepartment of Energy (DOE) has identifiedfour vicinity properties in the Slick Rock area.Cleanup of these properties will consist ofremoving the contaminated materials anddisposing of them at the preferred disposal site.The Environmental Restoration Projects tablebelow shows the costs. All funding is fromnondefense sources.
CO 59

Environmental Restoration Projects
Five-Year Averages (Thousands of Constant 1995 Dollars)*FY 1995-2000 2005 2010 2015 2020 2025 2030 Life Cyde**
UMTRA-Ground Water - Colorado 531 737 614 195 0 0 0 10,918UMTRA-Soils - Colorado 3,656 0 0 0 0 0 0 21,934
Total 4,187 737 614 195 0 0 0 32,852
• Costs reflect a five-year average in constant 1995 dollars, except in FY 1995 - 2000, which is a six-year average.
• Total Life Cycle is the sum of annual costs in constant 1995 dollars.
Nondefense Funding Estimate
Five-Year Averages (Thousands of Constant 1995 Dollars)•FY 1995 - 2000 2005 2010 2015 2020 2025 2030 Life Cycle
Environmental Restoration 4,187 737 614 195 0 0 0 32,852
• Costs reflect a five-year average in constant 1995 dollars, except in FY 1995 - 2000, which is a six-year average.
Total Life Cycle is the sum of annual costs in constant 1995 dollars.
For further information on this site, please contact: Public Participation Office (505)845-5951
Public Affairs Office (505)845-6202
Technical Liaison: Jody Metcalf (505)845-6146
CO 60

CO 61

RULISON AND RIO BLANCO SITES(Nevada Offsite Program)
The Rulison and Rio Blanco Sites are administered at the Nevada Operations Office. A more thor-ough description of the environmental activities managed by the Nevada Operations Office can befound in the Nevada Site Summary. All costs for waste management activities, program manage-ment, and relevant landlord activities attributable to the Department are provided for within thescope of environmental restoration. There are no Offsites with either current or planned nuclearmaterial and facility stabilization activity needs. Funding for all sites is 100 percent defense.The Rulison Site is located 14 miles (22 kilometers) southwest of Rifle, Colorado. The Rio BlancoSite is located 36 miles (58 kilometers) northwest of Rifle, Colorado.
?
GRAND JUNCTION
MEEKER
RIO BLANCO
RIFLE• RULISON SITE
CO 62

Estimated Site Total
Environmental Restoration
(Thousands of Current 1995 Dollars)*
FY 1995
• Costs for FY 1995 reflect Congressional Appropriation, costs for FY 1596 reflect EM budget submission, costs for FY 1997-2000 reflect Budget Shortfall
Scenario, costs for
shaded area assume 3% annual inflation.
Five-Year Averages (Thousands of Constant 1995 Dollars)**
FY 1995-2000 2005 2010 2015 2020 2025 2030
Environmental Restoration 696 105 25 21 12 8 6
2035 2040 2045 2050 2055 2060 2065 Life Cycle***
Environmental Restoration 1 0 0 0 0 0 0 5,073
Costs reflect a five-year average in constant 1995 dollars, except in FY 1995 - 2000, which is a six-year average.
*** Total Life Cycle is the sum of annual costs in constant 1995 dollars.
PAST, PRESENT, AND
FUTURE MISSIONS
Both the Rulison and Rio Blanco tests were
conducted under the Plowshare Program,
which was a series of nuclear and conventional
tests by the Atomic Energy Commission to
explore peacetime uses of nuclear explosives.
The tests were designed to increase gas
production from a low-permeability sandstone.
The Project Rulison detonation took place in
September 1969 at a depth of 8,426 feet (2,568
m.) in a sandstone formation. The shot was the
second of the nuclear gas production
stimulation experiments in the Plowshare
Program. The Project Rio Blanco test, which
consisted of the near simultaneous detonation
of three 33 kiloton devices in a 7,000-foot (2,130
m.) well in May 1973, was the third gasproduction stimulation experiment in thePlowshare Program. The surrounding areas of
the two sites are being monitored as part of the
Long-Term Hydrological Monitoring Program.
CO 63

ENVIRONMENTAL
RESTORATION
Funding for this activity provides forevaluation and remediation of the Rio Blancoand Rulison gas stimulation testing sites inColorado. This activity will define themagnitude and extent of contamination and theassociated risks to human health and theenvironment through the evaluation ofinformation on the two test areas. This processincludes characterizing the physical setting,determining the presence of contamination, andidentifying pathways to potential receptors.Risks to receptors will also be calculated usingstandard risk assessment procedures. Shouldrisks exceed acceptable limits, the requirementsfor risk reduction through remediation or otheractions will be established. For this estimate,remediation was assumed to include removal ofthe pond sediment from the drilling mud pit at
Rulison and the removal of contaminatedsurface soils associated with drilling mud at RioBlanco. Rio Blanco remediation activities wereassumed to be complete in 2000. Rulisonactivities were assumed to begin in 1997 and becomplete in 1999. In addition to assessmentactivities, any requirements for site cleanup orlong-term monitoring at the Colorado locationswill be established as part of this activity.
Environmental Restoration Activity Costs
Five-Year Averages (Thousands of Constant 1995 Dollars)*FY 1995 - 2000 2005 2010 2015 2020 2025 2030
Nevada Offsite - ColoradoAssessment 66 65 0 0 0 0 0Remedial Actions 630 0 0 0 0 0 0Surveillance And Maintenance 0 40 25 21 12 8 6
Total 696 105 25 21 12 8 6
2035 2040 2045 2050 2055 2060 2065 Life Cyder•Nevada Offsite - Colorado
AssessmentRemedial ActionsSurveillance And Maintenance
001
000
000
00
000
000
000
7223,781570
Total 1 0 0 0 0 5,073
• Costs reflect a five-year average in constant 1995 dollars, except in FY 1995 - 2000, which is a six-year average.
• Total Life Cycle is the sum of annual costs in constant 1995 dollars.
CO 64

Defense Funding Estimate
Five-Year Averages (Thousands of Constant 1995 Dollars)*
FY 1995-2000 2005 2010 2015 2020 2025 2030
Environmental Restoration 696 105 25 21 12 8 6
2035 2040 2045 2050 2055 2060 2065 Life Cyde**
Environmental Restoration 1 0 0 0 0 0 0 5,073
Costs reflect a five-year average in constant 1995 dollars, except in FY 1995 - 2000, which is a six-year average.
Total Life Cycle is the sum of annual costs in constant 1995 dollars.
Major Activity Milestones
ACTIVITY TASK COMPLETION DATE
Environmental RestorationFiscal Year
Complete Assessment 2004
Complete Remediation 2000
Complete Surveillance and Maintenance 2031
For further information on this site, please contact: Public Participation Office (702)295-4652
Public Affairs Office (702)275-3521
Technical Liaison: Bobby McClure (702)295-/862
CO 65

CO 66

COMBUSTION ENGINEERING SITE
SEYMOUR SPECIALTY WIRE CO.,
RUFFERT BUILDING
(COMPLETED FUSRAP SITE)*
* A summary is not provided
for a facility with completed
remedial action.
CONNECTICUT
Estimated State Total
(Thousands of Current 1995 Dollars)*
fY 1995 1996 199/ 1998 1999 2000
Connecticut - FUSRAP 100 190 1320 2040 1,040 0
• Costs for FY 1995 reflect Congressional Appropriation, costs for FY 1996 reflect EM budget submission, costs for FY 1997-2000 reflect Budget Shortfall Scenario, costs for
shaded area assume 3% annual inflation.
Five-Year Averages (Thousands of Constant 1995 Dollars)**
FY 1995-2000 2005 2010 2015 2020 2025 2030 Life Cycle*
Connecticut FUSRAP 695 0 0 0 0 0 0 4,171
** Costs reflect a five-year average in constant 1995 dollars, except in FY 1995 - 2000, which is a six-year average.
Total Life Cycle is the sum of annual costs in constant 1995 dollars.
CT 1

CT 2

CONNECTICUT FUSRAP SITES
Combustion Engineering is the only active Connecticut site within the Formerly Utilized Sites
Remedial Action Program (FUSRAP). The program was established in 1974 under the provisions of
the Atomic Energy Act to identify previously decontaminated Manhattan Engineer District and
Atomic Energy Commission sites to evaluate their radiological condition and to take appropriate
remedial action where necessary. FUSRAP encompasses 46 sites in 14 States and is funded through
the Oak Ridge Operations Office. The model used to estimate costs for this report provides one cost
for all of the FUSRAP sites located in each State. All costs for waste management activities, pro-
gram management, and relevant landlord activities attributable to the Department are provided for
within the scope of environmental restoration. There are no FUSRAP sites with either current or
planned nuclear material and facility stabilization activity needs. Funding for all sites is 100 per-
cent nondefense. For a general discussion of FUSRAP and associated costs, see the FUSRAP Site
Summary found in the Tennessee section.
Estimated Site Total
Environmental Restoration - FUSRAP
(Thousands of Current 1995 Dollars)*
1995 1996 1997 1998 1999 2000
100 190 820 2,040 1,040 0
• Costs for FY 1995 reflect Congressional Appropriation, costs for FY 1996 reflect EM budget submission, costs for FY 1997-2000 reflect Budget Shortfall Scenario, costs for
shaded area assume 3% annual inflation.
Five-Year Averages (Thousands of Constant 1995 Dollars)**
FY 1995-2000 2005 2010 2015 2020 2025 2030 Life Cycle*
Environmental Restoration - FUSRAP 695 0 0 0 0 0 0 4,171
• Costs reflect a five-year average in constant 1995 dollars, except in FY 1995 - 2000, which is a six-year average.
*** Total Life Cycle is the sum of annual costs in constant 1995 dollars.
Nondefense Funding Estimate
Five-Year Average (Thousands of Constant 1995 Dollars)*
FY 1995-2000 2005 2010 2015 2020 2025 2030 Life Cycle*
Environmental Restoration - FUSRAP 695 0 0 0 0 0 0 4,171
• Costs reflect a five-year average in constant 1995 dollars, except in FY 2000, which is a six-year average.
• Total Life Cycle is the sum of annual costs in constant 1995 dollars.
CT 3

COMBUSTION ENGINEERING(Formerly Utilized Sites Remedial Action Program)
CT 4

COMBUSTION ENGINEERING
(Formerly Utilized Sites Remedial Action Program)
The Combustion Engineering site is located in Windsor, Connecticut.
PAST, PRESENT, AND
FUTURE MISSIONS
During the late 1940's and early 1950's,Combustion Engineering supplied nonnuclear
component parts to the Atomic EnergyCommission reactor projects. In 1955,Combustion Engineering was contracted by the
Atomic Energy Commission to design asubmarine nuclear powerplant facility thatultimately led to the manufacture, assembly,
testing, and operation of the S1C PrototypeReactor Facility. An amendment to the contract
called for development and fuel fabrication
work involving high-enriched uranium (i.e.,
enriched to contain more than 20 percent of the
isotope uranium-235). In the early 1960's,Combustion Engineering began commercial
reactor fuel fabrication that did not involve the
use of high-enriched uranium. The Atomic
Energy Commission's work continued until
July 1967.
Future use of this site depends on resolution of
the cleanup decision documents. Because this
is a Nuclear Regulatory Commission licensed
facility, these documents will include the land
use that the Nuclear Regulatory Commission
deems suitable.
For further information on this site please contact:
ENVIRONMENTAL
RESTORATION
A radiological survey found residual high-enriched uranium within buildings, insidesome sewer lines, in a drum -burial area, and in
portions of the surrounding soil. Thedesignation of this site is restricted to the areas
that were affected by Atomic EnergyCommission contractual activities. It does not
include areas used for commercial activities.This site was added to the FUSRAP program on
June 30, 1994. Remediation of some areas wasperformed by Combustion Engineering in 1986.
Public Participation OfficePublic Affairs OfficeTechnical Liaison: Melyssa Noe
(615) 576-1590(615) 576-0885(615) 241-3315
CT 5

CT 6

Florida
P I N ELLAS PLANT
FLORIDA
Estimated State Total
FY 1995
(Thousands of Current 1995 Dollars)*
1996 1997 1998 1999 2000
Pinellas 7,637 43,656 39,700 8,100 2,800 2,000
• Costs for FY 1995 reflect Congressional Appropriation, costs for FY 1996 reflect EM budget submission, costs for FY 1997-2000 reflect Budget Shortfall Scenario, costs for
shaded area assume 3% annual inflation.
Five-Year Averages (Thousands of Constant 1995 Dollars)**
FY 1995-2000 2005 2010 2015 2020 2025 2030 Life Cycle'
Pinellas 16,511 26,968 0 0 0 0 0 233,910
Costs reflect a five-year average in constant 1995 dollars, except in FY 1995 - 2000, which is a six-year average.
Total Life Cycle is the sum of annual costs in constant 1995 dollars.
FL 1

Base ine Environmental Man ent tenor,
FL 2

d ra
PINELLAS PLANT
The Pinellas Plant occupies a 99.2-acre site approximately 6 miles north of St. Petersburg in PinellasCounty, Florida. Pinellas County is located on a peninsula bordered on the west by the Gulf ofMexico and on the east and south by Tampa Bay.
Trench Site
West Pond Spray Irrigation Site Former Diesel Fuel Spill Area
Former PistolRange
Current Fire DepartmentTraining Tank
Metallic Anomaly
Tank Farm
Building 1000/1040
Former Fire DepartmenTraining Tank
Former Incinerator Site Ditc
Former Incinerator Site
Industrial WastewaterNeutralization Facility
Old DrumStorage Site
Southwest Ditch
p I I
Northeast Siteand East Pond
Reactive Metal Treatment Facility
Industrial Drain L k
Building 100
Machine Coolant TreatmentSystem (within Building 100)
Building 500 Spill Site
FL 3

• • eaine E n v oarneata age po
Estimated Site Total
PI 1993
(Thousands of Current 1995 Dollars)*
1996 1997 1998 1999 2000
Environmental RestorationWaste ManagementNuclear Material and Facility StabilizationDirectly Appropriated LandlordProgram Management
Total
300
6,41102,3565,01:10
29,5!01400
7,000
26,5200
7,637 93,656 39,700 8,100 ,800 2,000
• Costs for FY 1995 reflect Congressional Appropriation, costs for FY 1996 reflect EM budget submission, costs for FY 1997-2000 reflect Budget Shortfall Scenario, costs for
shaded area assume 3% annual inflation.
Five-Year Averages (Thousands of Constant 1995 Dollars)*
FY 1995 - 2000 2005 2010 2015 2020 2025 2030 Life Cycle***111111111.11101N.
Environmental Restoration 3,326 20,173 0 0 0 0 0 120,820
Waste Management 1,584 5,436 0 0 0 0 36,685
Nuclear Material and Facility Stabilization 2,519 0 0 0 0 0 15,113
Directly Appropriated Landlord 8,937 0 0 0 0 0 53,620
Program Management 146 1,359 0 0 0 0 7,673
Total 16,511 26,968 0 0 0 0 0 233,910
• Costs reflect a five-year average in constant 1995 dollars, except in FY 1995 - 2000, which is a six-year average.
— Total Life Cycle is the sum of annual costs in constant 1995 dollars.
PAST, PRESENT, AND
FUTURE MISSIONS
The Pinellas Plant has been part of theDepartment of Energy's (DOE) nuclearweapons complex since the plant opened in1957. The plant's first assignment was thedevelopment and production of neutrongenerators, which are used as external initiatorsin nuclear weapons. The product line wasexpanded to include lightning-arresterconnectors, capacitors, magnetics,optoelectronic devices, and other components.
In September 1994, the plant stoppedproducing weapons-related components and
has transitioned from a defense mission to anenvironmental management mission. Thelandlord for the site is now EnvironmentalManagement.
The current mission is to achieve a safeshutdown of the facility and prepare the site foralternative uses as a community resource foreconomic development. The transition includesmoving material and equipment to other DOEsites to continue production of certain productsand assemblies. Material and equipment notneeded at other DOE sites will be processed asexcess and then may be scrapped or transferredto the Community Reuse Organization if it canaid economic development initiatives.
FL 4

The Tampa Bay Defense Transition Task Force,an organization representing the surroundingcommunities, has prepared a future-use planthat envisions the plant as a manufacturing"mall." The mall would consist of businessesoperated by the current management andoperating contractor and other businessesrecruited by local economic developmentorganizations. The establishment of thiscommercial manufacturing technology center atthe site is supported by the National Institute ofStandards and Technology and the State ofFlorida.
Waste management and environmentalrestoration activities should be completed byFY 2000; however, it is possible that ground-water remediation will continue throughapproximately FY 2005. Therefore, costestimates through FY 2005 have been includedfor planning purposes.
ENVIRONMENTAL
RESTORATION
Ground-water contamination from volatileorganic compounds is the main environmentalconcern at the Pinellas Plant. In February 1990,the U.S. Environmental Protection Agencyidentified 15 solid waste management units thatmay have environmental contamination as aresult of past plant activities. Environmentalinvestigations later revealed that 12 of theseunits do not pose a threat to public health or theenvironment. Contaminant concentrationsexceeding drinking water standards have beendetected in ground water at the remaining threeunits: the Northeast Site, the Old Drum StorageArea, and Building 100 Industrial Drain Leaks.
During site characterization and routine soil,water, and ground-water monitoring, twoadditional areas, the West Fenceline Area andthe Wastewater Neutralization/Building 200
Area, were identified as having ground-watercontamination exceeding protective standards.Two of the five solid waste management units,the Old Drum Storage Area and Building 100Industrial Drain Leaks were combined,resulting in four onsite areas that requirefurther action. The fifth site is a privatelyowned 4.5-acre parcel of land adjacent to thePinellas Plant where ground-watercontamination exists from activities conductedduring previous DOE ownership. Localizedground-water contamination is the primaryconcern at all five sites. The contaminants arelimited to the surficial aquifer below the plantsite and have not contaminated deeper geologicunits.
Priorities for remedial action at the five solidwaste management units have been established,taking into account such factors as toxicity,volume or extent of potential contamination,the mobility of contaminants, and offsitemigration. These priorities call for completingthe following activities in FY 1996: the interimremediation activities currently beingconducted at the 4.5-acre and Northeast Sites,Resource Conservation and Recovery ActFacility Assessment and Investigation at thetwo newly identified solid waste managementunits, and planned interim corrective measuresat the West Fenceline Area. Remediation ofground water, by pumping and treatment ofthree contaminant plumes, is to be completedby FY 2020. The completion of the RemedialAction Plan for the 4.5-acre site will occur in FY1996. In addition, the Corrective MeasuresStudy at the solid waste management unitsidentified for further action is scheduled forcompletion in FY 1997.
The decommissioning of the Pinellas Plant hasbeen addressed by the Decontamination andDecommissioning Summary Site Plan. Thisplan contains three scenarios for the plant:complete commercialization, partialdecommissioning, and completedecommissioning. Current plans call forconverting the plant for future
FL 5

The;.' emerat 1)
commercialization. However, cost estimates fora worst-case scenario were also developed.This scenario assumes that all conversionactivities fail and the plant must be fullydecommissioned. The estimate covers all wastedisposal costs for this decommissioningscenario.
WASTE MANAGEMENT
The main objective of the waste managementactivities is to safely treat, store, and dispose ofall hazardous and radioactive waste generatedduring decommissioning and environmentalrestoration activities while meeting applicableFederal, State and local requirements. Theseactivities include the cleanup of processequipment, storage areas, and production areas.The majority of waste treatment, storage, anddisposal activities beyond FY 1995 focus on safeshutdown. These cleanup activities willgenerate both low-level radioactive and
hazardous chemical waste, and they maygenerate low-level mixed waste as well. After1997, waste management will be limited towaste generated by environmental restoration.
Low-level radioactive waste from the cleanupof tritium processing areas, includinglaboratories, will consist of approximately 200B-25 boxes of waste and 220 55-gallon drums.Hazardous waste generated from the cleanup ofprocess areas will consist of approximately2,000 55-gallon drums and 30 twenty-yard "roll-off" containers of hazardous debris.
Waste TreatmentThe Pinellas Plant treats hazardous andnonhazardous waste such as machine coolant;aqueous solutions from plating baths; andreactive paper, powders, and metals. Theseactivities will be completed during FY 1995 andFY 1996 to meet the accelerated plant shutdownschedule for cleaning up equipment andprocess areas.
The Pinellas Plant has been assigned the task ofdeveloping a mercury amalgamation mobiletreatment unit for low-level mixed radioactive
Environmental Restoration Activity Costs
Five-Year Averages (Thousands of Constant 1995 Dollars)*
FY 1995-2000 2005 2010 2015 2020 2025 2030 Life Cycle.*
Environmental RestorationAssessment 128 0 0 0 765
Remedial Actions 2,107 73 0 0 13,005
Facility Decommissioning 1,092 20,100 0 0 0 107,050
Total 3,326 20,173 0 0 0 0 0 120,820
• Costs reflect a five-year average in constant 1995 dollars, except in FY 1995-2000, which is a six-year average.
• Total Life Cycle is the sum of annual costs in constant 1995 dollars.
FL 6

orl
waste. This mobile unit will be developed byFY 1996 and will be used to treat similar low-level mixed waste at other sites operated by theDepartment.
Waste Storage
The Pinellas site has two buildings for storageof waste. Building 1040 contains three bays:Bay 1 can contain up to 3,520 gallons of solid/liquid waste such as halogenated solvents andignitable liquids; Bay 2 can contain up to 1,760gallons of nonliquid reactive waste; Bay 3 canstore 660 gallons of hazardous and non-regulated waste. Radioactive waste is storedonsite in Building 100 until shipments can bemade to the Savannah River Site. New curielimits per container impact how much materialwill be accepted by Savannah River. Somematerial being disposed of exceeds this limit.The Pinellas Plant is working with DOE andSavannah River to ensure removal of allradioactive waste before the end of FY 1997.
The plant's shutdown activities requireadditional storage containers for hazardous,nonhazardous, and low-level radioactive waste.The cost for these containers has been includedin the waste management estimates.Environmental remediation and thedismantlement of war reserve products willalso generate a need for more waste containers.
Most of these costs will be incurred during FY1995, although some costs will carry over intoFY 1996 and FY 1997.
Waste DisposalWaste disposal activities will be accelerated asmore frequent shipments are necessary tocomply with the Pinellas Plant's HazardousWaste Operating Permit and regulatoryrequirements. The plant instituted a "seven-point" reuse program for virgin material. Thisprogram identifies several potentialopportunities for the reuse of virgin materialbefore disposing of it as waste. Economic
Waste Management Activity Costs
Five-Year Averages (Thousands of Constant 1995 Dollars)*
FY 1995-2000 2005 2010 2015 2020 2025 2030 Life Cycle**Treatment
Low-Level Waste 471 307 0 0 0 0 0 4,361Storage and Handling
Low-Level Waste 102 41 0 0 0 0 0 817Hazardous Waste 1,010 5,088 0 0 0 0 0 31,500
Total 1,584 5,436 0 0 0 0 0 36,685
• Costs reflect a five-year average in constant 1995 dollars, except in FY 1995-2000, which is a six-year average.
• Total Life Cycle is the sum of annual costs in constant 1995 dollars.
FL 7

T e 1 9 5 •
development at Pinellas has the potential forusing not only virgin, but also in-process,material for new business. If new businessesuse these materials, disposal costs will bereduced.
Hazardous waste is disposed of throughcommercial facilities. Radioactive waste istransferred to the Savannah River Site;however, the Pinellas site is currently workingon an application to dispose of someradioactive waste at the Nevada Test Site.
NUCLEAR MATERIAL AND
FACILITY STABILIZATION
As mentioned in the above text, DOE willcomplete the sale of the Pinellas Plant andproperty to the County of Pinellas CommunityReuse Organization. The Community ReuseOrganization will lease back to the Department
those portions of the facility that are requiredfor the completion of the production mission.Other portions of the facility will be leased toMartin Marietta Specialty Components for theirplanned commercial production requirements.
DOE's mission will be completed in FY 1997and facility stabilization activities will begin atthat time. These activities include drainingprocess lines and equipment, draininghydraulic fluids from surplus equipment, fixingand stabilizing process contamination, andother general housekeeping activities to makethe facility ready for new tenants for the county.
With the exception of one room containingtritium contamination and some NuclearRegulatory Commission licensed sealedcalibration sources, there are no nuclearmaterials at the Pinellas Plant andcontamination is limited to the tritium area. Itis anticipated that tritium operations will
Nuclear Material and Facility Stabilization Cost Estimate
Five-Year Averages (Thousands of Constant 1995 Dollars)*
FY 1995-2000 2005 2010 2015 2020 2025 2030 Life (vie**
Nuclear Material and facility Stabilization 2,519 0 0 0 0 0 0 15,113
• Costs reflect a five-year average in constant 1995 dollars, except in FY 1995-2000, which is a six-year average.
" Total Life Cycle is the sum of annual costs in constant 1995 dollars.
Landlord Cost Estimate
Five-Year Averages (Thousands of Constant 1995 Dollars)*
FY 1995-2000 2005 2010 2015 2020 2025 2030 Life Cycle**
Directly Appropriated Landlord 8,937 0 0 0 0 0 0 53,620
• Costs reflect a five-year average in constant 1995 dollars, except in FY 1995-2000, which is a six-year average.
• Total Life Cycle is the sum of annual costs in constant 1995 dollars.
FL 8

Flo Ida
continue under an Nuclear RegulatoryCommission license, and decommissioning ofthe tritium operations will be delayed until theend of its useful life.
LANDLORD FUNCTIONS
Landlord activities encompass several differentfunctional areas and cost items. These includesupport for the environmental, safety, andhealth program; site planning and projectmanagement; utilities; and management andadministration (e.g., human resources,procurement, taxes, and logistics support).Support within these categories is the minimumamount of activity necessary to provide acaretaker function while maintainingcompliance with applicable Federal, State, andlocal laws and regulations.
PROGRAM MANAGEMENT
The Pinellas Plant has no separate funding forprogram management. Program managementcosts for environmental restoration activitiesafter FY 2000 are included within the
environmental restoration scope. However,some program management activities cross-cutall environmental restoration and wastemanagement projects and are not directly insupport of specific base operations or projects.They include regulatory support, contractortraining, quality assurance, support for publicparticipation, Safe Shutdown/Transition andDecommissioning Activities and FederalFacility Compliance Act management, wastecertification, and waste minimization.
Waste minimization emphasizes the need tominimize handling, storage, and disposal costs.The waste minimization coordinator, alongwith process-waste assessment teams, willidentify ways to reduce waste streams duringshutdown. Some alternatives include returningchemicals to vendors, investigatingtechnological developments to reduce cleanupcosts, and recycling chemicals to new businessor other local businesses.
FUNDING AND COST
INFORMATION
The following tables present fundinginformation and major activity milestones forPinellas Plant.
Program Management Cost Estimate
Five-Year Averages (Thousands of Constant 1995 Dollars)*FY 1995 - 2000 2005 2010 2015 2020 2025 2030 Life Cycle*
Program Management 146 1,359 0 0 0 0 0 7,673
• Costs reflect a five-year average in constant 1995 dollars, except in FY 1995-2000, which is a six-year average.
▪ Total Life Cycle is the sum of annual costs in constant 1995 dollars.
FL 9

Ii117 nvi
Defense Funding Estimate
.0
Five-Year Averages (Thousands of Constant 1995 Dollars
FY 1995-2000 2005 2010 2015 2020 2025 2030 Life Cycle*"
Environmental Restoration 3,326 20,173 0 0 0 0 0 120,820
Waste Management 1,584 5,436 0 0 0 0 0 36,685
Nuclear Material and Facility Stabilization 2,519 0 0 0 0 0 0 15,113
Directly Appropriated Landlord 8,937 0 0 0 0 0 0 53,620
Program Management 146 1,359 0 0 0 0 0 7,673
Total 16,511 26,968 0 0 0 0 0 233,910
Costs reflect a five-year average in constant 1995 dollars, except in FY 1995-2000, which is a six-year average.
Total Life Cycle is the sum of annual costs in constant 1995 dollars.
Major Activity Milestones
ACTIVITY TASK COMPLETION DATE
Environmental Restoration: Fiscal Year
4.5 Acre Site Remedial Action & Closure Completion 2000
Wastewater Neutralization Area/Building 200 RFI Plan/Fieldwork/Report 1996
Corrective Measures Study Plan/Report 1996
Northeast Site Environmental Assessment (EA) & Statement of Basis 1995
Confirmation Study & Final Corrective Measures Complete 2014
Old Drum Storage Area/Building 100 CM Fieldwork Construction Complete 1996
Confirmation Study & Final CM Complete 2014
Decommissioning Begin Decommissioning Planning 1996
Decommissioning Complete Decommissioning Designs, Safety Analysis, & Readiness Reviews 1998
Initiate Decommissioning 1998
Waste Management: Fiscal Year
Site Treatment Plan Submit the Final Status Report and Contingency Plan to the State of Florida 1995
Affirmative Procurement Affirmative Procurement Program Annual Report 1994 & 1995
For further information on this site, please contact: Public Participation Office
Public Affairs Office
Technical Liaison: Dave Ingle
(505) 845-5951
(505) 845-6202
(813) 541-8943
FL 1 0

KAUAI TEST FACILITY*
* Costs for activities performed by theEnvironmental Management program at theKauai Test Facility are accounted for within thescope of the Sandia National Laboratories,Albuquerque, Offsite Areas.
HAWAII
HI 1

HI 2

XtVi;:lh It
LOWMAN
(COMPLETED UMTRA SITE)*
V'frr-'Ag;M/f4e-VgSr
IDAHO NATIONAL
ENGINEERING LABORATORY
(INEL)
IDAHO
NV:
ARGONNE NATIONAL
LABORATORY—WEST(WITHIN INEL)
'Summaries are not provided for facilities withcompleted remedial actions. Any ongoingsurveillance and monitoring costs for thisfacility is provided in the following table.
ID 1

Estimated State Total
• :MlfS,'
(Thousands of Current 1995 Dollars)*
FY 1995 1996 1997 1998 1999 2000
Argonne Notional Laboratory -West 4,466 5,178 18,487 22,659 38,102 16,617Idaho National Engineering Laboratory 462,106 492,084 517,3701 505,017 501,650 497,549Completed UMTRA - Surveillance and Monitoring 0 110 0 0 0 0
Total 466,572 497,372 535,857 527,676 539,752 514,166
• Costs for FY 1995 reflect Congressional Appropriation, costs for FY 1996 reflect EM budget submission, costs for FY 1997-2000 reflect Budget Shortfall Scenario, costs forshaded area assume 3% annual inflation.
Five-Year Averages (Thousands of Constant 1995 Dollars)**
FY 1995-2000 2005 2010 2015 2020 2025 2030
Argonne National Laboratory-West 15,973 6,579 6,058 6,070 5,973 5,949 5,718Idaho National Engineering Laboratory 460,765 561,620 622,025 565,682 573,202 535,736 647,357Completed UMTRA - Surveillance and Monitoring 20 0 0 0 0 0 0
Total 476,759 568,199 628,082 571,752 579,175 541,686 653,076
2035 2040 2045 2050 2055 2060 2065
Argonne Notional Laboratory-West 0 0 0 0 0 0 0Idaho National Engineering Laboratory 624,746 421,505 326,635 292,887 35,395 7,062 6,946Completed UMTRA - Surveillance and Monitoring 0 0 0 0 0 0 0
Total 624,746 421,505 326,635 292,887 35,395 7,062 6,946
2070 2075 2080 2085 2090 2095 2100 Life Cycle***
Argonne National Laboratory-West 0 0 0 0 0 0 0 277,570Idaho National Engineering Laboratory 5,890 4,879 4,960 2,976 1 1 0 28,962,566Completed UMTRA- Surveillance and Monitoring 0 0 0 0 0 0 0 122
Total 5,980 4,879 4,960 2,976 1 1 0 29,240,258
** Costs reflect a five-year average in constant 1995 dollars, except in FY 1995-2000, which is a six-year average.
*** Total Life Cycle is the sum of annual costs in constant 1995 dollars.
ID 2

ARGONNE NATIONAL LABORATORY-WEST
Argonne National Laboratory-West is located on the Idaho National Engineering Laboratory site, 42miles northwest of Idaho Falls, Idaho. Argonne National Laboratory-West is managed by the Departmentof Energy's (DOE) Chicago Operations Office.
Future WasteHandling Building
Building 767ExperimentalBreeder ReactorPCB Cleanup
To U.S.Highway 20
Radioactive Scrap andWaste Facility LinerInstallation
IndustrialWaste Pond
Building 752,Central LiquidWaste ProcessingArea D&D
ANL SewageLagoons
Future SodiumProcessingFacility
RadioactiveLiquid WasteTreatmentFacility
ID 3

Estimated Site Total
(Thousands of Current 1995 Dollars)*
FY 1995 1996 1997 1998 1999 1 2000
Environmental Restoration 956 1,903 2,431 2,474 2,505 2,566Waste Management 3,167 2,808 15,557 19,669 35,064 13,500Program Management 343 467 491 516 533 551
Total 4,466 5,178 18,487 22,659 38,102 16,617
• Costs for FY 1995 reflect Congressional Appropriation, costs for FY 1996 reflect EM budget submission, costs for FY 1997-2000 reflect Budget Shortfall Scenario, costs forshaded area assume 3% annual inflation.
Five-Year Averages (Thousands of Constant 1995 Dollars)**
FY 1995-2000 2005 2010 2015 2020 2025 2030 Life Cycle***
Environmental Restoration 1,966 527 72 85 19 0 0 15,311Waste Management 13,559 5,817 5,768 5,767 5,759 5,759 5,535 253,377Program Management 448 235 217 217 195 190 183 8,883
Total 15,973 6,579 6,058 6,070 5,973 5,949 5,718 277,570
• Costs reflect a five-year average in constant 1995 dollars, except in FY 1995-2000, which is a six-year average.
- Total Life Cycle is the sum of annual costs in constant 1995 dollars.
PAST, PRESENT, AND
FUTURE MISSIONS
The primary mission of Argonne NationalLaboratory-West has been support of liquidmetal reactor research and development for theIntegral Fast Reactor Program. With thetermination of the Integral Fast Reactorprogram, the resources at Argonne NationalLaboratory will be redirected to higher prioritymissions of DOE. The redirected activities atArgonne National Laboratory-West will includetechnology development for spent nuclear fueland waste treatment, reactor and fuel cyclesafety, and decommissioning. Surplus facilitiesat the site including the Experimental BreederReactor-II and the Transient Reactor TestFacility will be shut down. The future use ofthe site will be for research and development;potentially for waste treatment activities.
ENVIRONMENTAL
RESTORATION
Argonne National Laboratory-West generatesprimarily solid radioactive waste, althoughsome gaseous waste (600 curies/year total) isreleased from the 10 exhaust stacks. Theradioactive waste consists of radionuclides,mixed fission products, activation products,tritium, uranium, thorium, and daughterproducts. Mixed waste, primarily solid wastecontaining elemental sodium, is also generatedin small quantities. Hazardous waste consistsprimarily of paint removers and analyticalchemical waste, along with some heavy metals,polychlorinated biphenyls (PCBs), organics,corrosives, and dioxins/furans. All waste isgenerated during routine operations atArgonne National Laboratory-West facilities,some of which have been in operation since thelate 1950's.
ID 4

On December 21, 1989, the Idaho NationalEngineering Laboratory was added to theEnvironmental Protection Agency's (EPA's)National Priorities List under theComprehensive Environmental Response,Compensation and Liability Act (CERCLA). OnDecember 9, 1991, the Idaho NationalEngineering Laboratory Federal FacilityAgreement/Consent Order was signed andapproved by DOE, EPA, and the IdahoDepartment of Health and Welfare. ArgonneNational Laboratory-West is included in thisFederal Facility Agreement and is designated asWest Area Group 9.
Waste Area Group 9 Assessment
Waste Area Group 9 sites being investigatedinclude tanks and wastewater handling/disposal systems such as ditches, ponds, pits,and drains. The boundary of Waste Area Group9 is basically the Argonne National Laboratory-West administrative boundary, althoughoperations that extended or extend outside thefence are included.
There are 36 Solid Waste Management Unitsand 1 Land Disposal Unit being investigatedunder the Federal Facility Agreement/ConsentOrder. Eighteen Solid Waste ManagementUnits have been designated as no-action unitsin the Federal Facility Agreement/ConsentOrder.
Waste Area Group 9 assessment activities willbe performed under an accelerated RemedialInvestigation/Feasibility Study schedule,resulting in approximately one year of schedulecompression. Planned activities included oneTrack 1 study, which is essentially complete;two Track 2 studies; and one RemedialInvestigation/Feasibility Study. The Track 1study involves the analysis of existing data,evaluation of risk potential, and developmentof a summary report. These studies have been
used to evaluate whether or not the 10associated Solid Waste Management Units willproceed through a Track 2, an interim action, ora Remedial Investigation/Feasibility Study. Atthis time, two of the Track 1 sites are expectedto have follow-on actions performed in FY 1995.
The Track 2 studies will include field work toenable regulators and DOE to reach con-clusions on the action required for theassociated Solid Waste Management Units.Based on recent discussions, only two of theTrack 2 Solid Waste Management Units havebeen identified as sites that require samplingand updated risk assessments before beingrecommended for "no further action." ARemedial Investigation/Feasibility Study willalso be completed for 4 Solid WasteManagement Units and 1 Land Disposal Unit.Following completion of Track 1 and Track 2studies and some additional pre-RemedialInvestigation/Feasibility Study sampling, theRemedial Investigation/Feasibility Study willbe performed, the final record of decision willbe drafted, and post-record of decisionactivities will begin. Remedial action will becompleted by 2005 with ground-watermonitoring continuing through 2016.
Central Liquid Waste Processing AreaDecommissioning
Surveillance and maintenance will continueuntil funding is available to complete NationalEnvironmental Policy Act documentation. TitleI, Title II, and Title III engineering for thedecommissioning will begin and will includeplans for removal of radioactivelycontaminated process equipment. The actualdecommissioning is expected to be complete inFY 1999.
ID 5

7M.
Cost of Environmental Restoration
The estimated costs of environmentalrestoration at Argonne National Laboratory-West are given in the table below.
WASTE MANAGEMENT
Waste will continue to be shipped to IdahoNational Engineering Laboratory for treatment,storage, and disposal. The bulk sodium wastelocated at Argonne National Laboratory-Westwill be treated between FY 1997 and FY 1999.At assumed funding levels, a centralized wastehandling facility will be constructed and readyfor use in FY 1999.
Environmental restoration activities arescheduled to end in FY 2020. However,laboratory operations will continue to generatewaste. Continuing waste managementactivities in support of ongoing programs areprojected at a cost of approximately$5.7 million per year. To facilitate thedevelopment of this Life Cycle cost estimate, anarbitrary cutoff date of 2030 has been assignedto all sites that have completed environmentalrestoration but maintain ongoing wastemanagement support of other Departmentprograms (Nuclear Energy, Energy Research,etc.).
Waste management activities includecontinuing hazardous waste management fromcollection through disposal; radioactive (low-level, transuranic, low-level mixed, andtransuranic mixed) waste management;implementation of Resource Conservation andRecovery Act (RCRA) Part B Permitrequirements for the Radioactive Scrap andWaste Facility; development of the RCRA Part BPermit for Building 703 sodium storage;training; industrial waste system operationsand disposal; waste minimization activities;development of a Wastewater Land Applicationpermit; and operation of the Radioactive LiquidWaste Transfer Facility.
Waste Treatment
The scope of activities in this category includesall activities necessary to provide a treatmentfacility, the Remote Treatment Facility, forradioactive sodium waste in compliance withprovisions of the RCRA Land Disposalrestrictions and the Federal Facility ComplianceAct. The Remote Treatment Facility willprovide the capability to remove and processsodium from radioactive material of thecategories of waste produced or stored atArgonne National Laboratory-West. Theoptions analysis for this facility will becomplete in FY 1996.
Environmental Restoration Activity Costs
Five-Year Averages (Thousands of Constant 1995 Dollars)*
FY 1995 - 2000 2005 2010 2015 2020 2025 2030 Life Cycle**
Environmental RestorationAssessment 1,422 0 0 0 0 0 0 8,531Remedial Actions 230 406 0 0 0 0 0 3,406Surveillance And Maintenance 0 121 72 85 19 0 0 1,484Facility Decommissioning 315 0 0 0 0 0 0 1,890
Total 1,966 527 72 85 19 0 0 15,311
• Costs reflect a five-year average in constant 1995 dollars, except in FY 1995-2000, which is a six-year average.
• Total Life Cycle is the sum of annual costs in constant 1995 dollars.
ID 6

Wft 0.SM'aaMa%
Major Waste Management Projects
"rk
Five-Year Averages (Thousands of Constant 1995 Dollars)*
1995.2000 2005 2010 2015 2020 2025 2030 Life Cycle**
Remote Mixed Waste Treatment Facility 8,427 0 0 0 0 50,600
Waste Handling Facility 474 0 0 0 0 2,800
Costs reflect a five-year average in constant 1995 dollars, except in FY 1995-2000, which is a six-year average.
"Total Life Cycle is the sum of annual costs in constant 1995 dollars.
Note: These projects represent a subset of waste management activities. Associated program management costs are built-in to the estimates provided.
Waste Management Activity Costs
Five-Year Averages (Thousands of Constant 1995 Dollars)*
FY 1995-2000 2005 2010 2015 2020 2025 2030 Life Cycle
Treatment
Transuranic Waste 220 57 57 57 57 57 47 2,989
Low-Level Waste 5,557 3,970 3,970 3,970 3,970 3,970 3,970 152,458
Storage and Handling
Low-Level Mixed Waste 4/ 10 10 9 0 0 0 413
Low-Level Waste 2,450 446 398 398 398 398 451 27,144
Hazardous Waste 3,540 878 878 878 878 878 702 46,702
Sanitary Waste 1,745 455 455 455 455 455 364 23,661
Total 13,559 5,817 5,768 5,767 5,759 5,759 5,535 253,377
• Costs reflect a five-year average in constant 1995 dollars, except in FY 1995-2000, which is a six-year average.
" Total Life Cycle is the SUM of annual costs in constant 1995 dollars.
Waste Storage
This category includes costs and equipmentassociated with the upgrade of the RadioactiveScrap and Waste Facility. Included isreplacement of liners and cathodic protectionfor continuing compliance with Idaho NationalEngineering Laboratory's RCRA Part B Permit.
A Waste Handling Facility for low-level,hazardous, mixed, and sanitary wastegenerated at Argonne National Laboratory-West is to be designed and constructed to
replace a temporary structure currently in use.The Waste Handling Facility will provide asingle location for processing and shippingwaste generated at Argonne NationalLaboratory-West facilities. An EnvironmentalAssessment and a conceptual design for theWaste Handling Facility have been completed.
ID 7

Waste Disposal
All waste generated at Argonne NationalLaboratory-West is shipped to the IdahoNational Engineering Laboratory for disposal.
NUCLEAR MATERIAL AND
FACILITY STABILIZATION
Argonne National Laboratory-West currently isnot planned to undergo nuclear material andfacility stabilization.
LANDLORD FUNCTIONS
At present, landlord activities at ArgonneNational Laboratory-West are primarily theresponsibility of DOE's Nuclear Energyprogram. The Environmental Managementprogram at Argonne National Laboratory-Westsupports landlord activities through apercentage of overhead that is calculated on anannual basis.
PROGRAM MANAGEMENT
Water and soil samples will be analyzed. Thisbaseline information will then be used toconduct risk assessment for the RemedialInvestigation/Feasibility Study process. Safetyanalyses will be conducted for all restorationprojects as the need is established. Regulatorycorrective action for projects and/or activitiesunder regulations such as Toxic SubstancesControl Act, RCRA, CERCLA, and FederalInsecticide, Fungicide, and Rodenticide Act willbe evaluated. An Agreement-in-Principlesigned with the State of Idaho on May 21, 1990,is also funded.
FUNDING AND COST
INFORMATION
The following tables present fundinginformation and major activity milestones forArgonne National Laboratory-West.
Program Management Cost Estimate
Five-Year Averages (Thousands of Constant 1995 Dollars)*
FY 1995-2000 2005 2010 2015 2020 2025 2030 Life Cycle**
Program Management 448 235 217 217 195 190 183 8,883
Costs reflect a five-year average in constant 1995 dollars, except in FY 1995-2000, which is a six-year average.
— Total Life Cycle is the sum of annual costs in constant 1995 dollars.
ID 8

Nondefense Funding Estimate
Five-Year Averages (Thousands of Constant 1995 Dollars)*
FY 1995 - 2000 2005 2010 2015 2020 2025 2030 Life Cycle*
Environmental Restoration 1,966 527 72 85 19 0 0 15,311
Waste Management 13,559 5,817 5,768 5,767 5,759 5,759 5,535 253,377
Program Management 448 235 217 217 195 190 183 8,883
Total 15,973 6,579 6,058 6,070 5,973 5,949 5,718 277,570
Costs reflect a five-year average in constant 1995 dollars, except in FY 1995-2000, which is a six-year average.
— Total Life Cycle is the sum of annual costs in constant 1995 dollars.
Major Activity Milestones
ACTIVITY TASK COMPLETION DATE
Environmental Restoration: Fiscal Year
Begin
Complete Decommissioning Activities
1998
1999
Waste Management: Fiscal Year
Begin 1998
Centralized Waste Handling Facility Complete 1999
Remote MW Treatment Facility—Complete Options Analysis 1996
For further information on this site, please contact: Public Participation Office (708) 252-8796
Public Affairs Office (708) 252-2010
Technical Liaison: Michael Ferrigan (708) 252-2570
ID 9

ID 10

IDAHO NATIONAL ENGINEERING LABORATORY
IDAHO CHEMICAL PROCESSING PLANT
The Idaho National Engineering Laboratory occupies 890 square miles in a remote desert area in
southern Idaho along the western edge of the Eastern Snake River Plain. There are no permanent
residences within its borders, and the nearest major community, the City of Idaho Falls, is located
42 miles to the southeast. The Laboratory consists of 10 major operating areas at the site and several
facilities in the City of Idaho Falls. One area has been designated a National Historic Landmark.
ANL-W Argonne National Laboratory -West
CFA Central Facilities AreaEBR-I Experimental Breeder Reactor I
CPR Idaho Chemical Processing Plant
NRF Naval Reactor FacilityPBF Power Burst FacilityRWMC Radioactive Waste Management Complex
TAN Test Area NorthTRA Test Reactor Area
Terreton
To Idaho Falls
LOCATION OF SITES ON INEL
Ja
Old WasteCalcining Facility
Fuel StorageArea
Underground FuelStorage Area
p
E2 Percolationlsonds
Ash Avenue
0
N
IDAHO CHEMICAL PROCESSINGPLANT SITE MAP
ID 11

Estimated Site Total
(Thousands of Current 1995 Dollars)*
FY 1995 1996 1997 l 1998 1999 2000
Environmental Restoration 96,467 93,252 93,518 63,616 59,806 61,5513Waste Management 199,300 215,300 233,900 > 253,200 246,900 246,000Nuclear Material and Facility Stabilization 38,400 45,800 47,000 47,520 48,660 49,360Directly Appropriated Landlord 95,900 105,300 107,700 106,680 108,440 108,040Program Management 32,039 32,432 35,252 34,001 37,844 32,591
Total 462,106 492,084 517,370 505,017 501,650 497,549Costs for FY 1995 reflect Congressional Appropriation, costs for FY 1996 reflect EM budget submission, costs for FY 1997-2000 reflect Budget Shortfall Scenario, costs forshaded area assume 3% annual inflation.
Five-Year Averages (Thousands of Constant 1995 Dollars)"
FY 1995-2000 2005 2010 2015 2020 2025 2030
Environmental Restoration 73,268 74,827 88,233 88,735 88,530 87,084 86,965Waste Management 215,348 324,107 384,470 335,984 343,274 319,574 408,723Nuclear Material and Facility Stabilization 42,745 27,006 8,669 265 93 90 4Directly Appropriated Landlord 97,804 93,100 93,100 93,100 93,100 81,780 97,000Program Management 31,601 42,580 47,552 47,598 48,206 47,209 54,666
Total 460,765 561,620 622,025 565,682 573,202 535,736 647,357
2035 2040 2045 2050 2055 2060 2065
Environmental Restoration 86,896 69,517 0 0 628 1,999 2,833Waste Management 395,666 240,215 212,511 193,277 2,517 483 474Nuclear Material and Facility Stabilization 4,397 27,288 48,787 46,756 25,594 1,060 0Directly Appropriated Landlord 86,860 49,920 46,660 35,780 6,325 3,000 3,000Program Management 50,927 34,565 18,678 17,074 330 520 639
Total 624,746 421,505 326,635 292,887 35,395 7,062 6,946
2070 2075 2080 2085 2090 2095 2100 Life Cycle*"
Environmental Restoration 2,292 1,516 1,559 935 0 0 0 3,852,348Waste Management 127 3 1 1 1 1 0 17,099,130Nuclear Material and Facility Stabilization 0 0 0 0 0 0 0 1,206,508Directly Appropriated Landlord 3,000 3,000 3,000 1,800 0 0 0 4,554,446Program Management 561 360 400 240 0 0 0 2,250,131
Total 5,980 4,879 4,960 2,976 1 1 0 28,962,566
Costs reflect a five-year average in constant 1995 dollars, except in FY 1995-2000, which is a six-year average.
Total Life Cycle is the sum of annual costs in constant 1995 dollars.
ID 12

PAST, PRESENT, AND
FUTURE MISSIONS
In the 1940's, large portions of the site were
used by the Navy for aerial bombing practice,testing naval artillery and bunkers for storingexplosives, and ordnance disposal. In 1949, the
Atomic Energy Commission established theNational Reactor Testing Station, thepredecessor of the Idaho National EngineeringLaboratory. Eventually, the site contained thelargest concentration of nuclear reactors in theworld, including the first reactor in the world togenerate usable amounts of electricity. Most of
the reactors were phased out after completing
their research missions, and only the Advanced
Test Reactor is currently operating. One of the
major facilities at the site, the Idaho ChemicalProcessing Plant, was used for many years toreprocess spent nuclear fuel by employing achemical separation technique to recover fissilematerials to be used as fuel by the SavannahRiver Site reactors. In the mid-1950's, theNational Reactor Testing Station beganreceiving and storing radioactive wastegenerated at other sites operated by theDepartment of Energy (DOE). In the mid-1970's, the site was renamed the Idaho NationalEngineering Laboratory.
The Idaho National Engineering Laboratory is
now a diversified national laboratory withexpertise in advanced engineering technology.
Its diverse missions include conductingresearch and testing on the safety of nuclearreactors; developing, demonstrating, and usingengineering technology and systems to improve
the national security and nuclear defense as
well as the production and use of energy;environmental restoration; developing andtesting technologies for the storage of spentnuclear fuel and highly radioactive waste;providing storage for certain types of
radioactive and chemical waste from other U.S.defense facilities; and managing the low-levelradioactive waste generated and disposed of atthe site.
The Idaho National Engineering Laboratorywas designated a National EnvironmentalResearch Park in 1975. All land within theLaboratory is protected as an outdoor labora-tory for the study of ecological relationshipsand the response of the ecosystem totechnological research and development as wellas agricultural uses.
ENVIRONMENTAL
RESTORATION
Environmental restoration activities at theIdaho National Engineering Laboratory aredesigned to identify and evaluate potentiallycontaminated areas, devise cleanup strategies,and carry out cleanup as needed. In addition,environmental activities include thedecommissioning of selected facilities at theLaboratory.
The program is conducted within the framework of the Federal Facility Agreement/Consent Order with both the U.S.Environmental Protection Agency (EPA) andthe State of Idaho. This entails preparing anassessment and proposed remediation plan forthe site; submitting the plan for comment tovarious stakeholders (e.g., the State, Federalagencies, and interested members of thepublic); and then identifying in a "record ofdecision" which of the alternatives described in
the plan had been selected as the appropriatecourse of action for a particular area. Therecord of decision thus reflects input from thestakeholders and has the concurrence of theState as well as EPA.
For purposes of environmental restoration, theLaboratory has been divided into 10 "wastearea groups" composed of operable units; the
ID 13

Environmental Restoration Projects
Five-Year Averages (Thousands of Constant 1995 Dollars)*
FY 1995 - 2000 2005 2010 2015 2020 2025 2030
Decomissioning 8,622 29,576 8,214 1,633 1,238 188 69Waste Area Group 1 11,858 381 4 0 0 0 0Waste Area Group 10 7,274 4,523 2,252 2,244 3,492 0 0Waste Area Group 2 864 112 112 112 90 0 0Waste Area Group 3 (ICPP) 3,029 11,044 1,372 2,198 510 0 0Waste Area Group 4 2,921 246 0 0 0 0 0Waste Area Group 5 1,361 854 0 0 0 0 0Waste Area Group 7 - Other RWMC 6,228 28,091 76,279 82,548 83,199 86,896 86,896Waste Area Group 7 - Pit 9 31,110 0 0 0 0 0 0
Total 73,268 74,827 88,233 88,735 88,530 87,084 86,965
2035 2040 2045 2050 2055 2060 2065
Decomissioning 0 0 0 0 0 795 1,524Waste Area Group 1 0 0 0 0 0 0 0Waste Area Group 10 0 0 0 0 0 0 0Waste Area Group 2 0 0 0 0 0 0 0Waste Area Group 3 (ICPP) 0 0 0 0 628 1,204 1,309Waste Area Group 4 0 0 0 0 0 0 0Waste Area Group 5 0 0 0 0 0 0 0Waste Area Group 7 - Other RWMC 86,896 69,517 0 0 0 0 0Waste Area Group 7 - Pit 9 0 0 0 0 0 0 0
Total 86,896 69,517 0 0 628 1,999 2,833
2070 2075 2080 2085 2090 2095 2100 Life Cycle**
Deromissioning 2,030 1,516 1,559 935 0 0 0 298,121Waste Area Group 1 0 0 0 0 0 0 0 73,075Waste Area Group 10 0 0 0 0 0 0 0 106,201Waste Area Group 2 0 0 0 0 0 0 0 7,311Waste Area Group 3 (ICPP) 262 0 0 0 0 0 0 110,807Waste Area Group 4 0 0 0 0 0 0 0 18,756Waste Area Group 5 0 0 0 0 0 0 0 12,436Waste Area Group 7 - Other RWMC 0 0 0 0 0 0 0 3,038,979Waste Area Group 7 - Pit 9 0 0 0 0 0 0 0 186,661
Total 2,292 1,516 1,559 935 0 0 0 3,852,348
• Costs reflect a five-year average in constant 1995 dollars, except in FY 1995-2000, which is a six-year average.
• Total Life Cycle is the sum of annual costs in constant 1995 dollars.
ID 14

w-1/441iie
latter are multiple locations grouped together
by similar contamination problems orboundaries. In general, the operable unitswithin each waste area group are independent
of each other, but operable units can haveoverlapping problems.
Since 1986, 450 potentially contaminated areas
have been identified, and these areas involve
103 operable units. It is assumed all major sitesrequiring remediation have been identified, but
continuing investigations may lead to thediscovery of additional areas. Each operableunit is carefully monitored whether or notremediation has begun. Environmentalrestoration at each waste area group beginswith an assessment of the area to determine thenature and extent of contamination and thepotential risk to human health and safety or theenvironment. Once the cleanup requirementsfor a particular group are understood,environmental remediation begins and iscarried out to completion.
For scoping purposes, future land use isassumed to be industrial and DOE-controlledbased on studies conducted by DOE thatconcluded no residential uses are likely within
the next 100 years at the Idaho NationalEngineering Laboratory.
Environmental restoration activities includeplanning for the treatment, storage, anddisposal of waste generated by environmentalrestoration. Waste that can be treated or storedwill be transferred to waste managementactivities. For waste that cannot be treated,stored, or disposed of at the site, planning fordisposal and payment for packaging will be theresponsibility of environmental restoration.
Waste Area Group 1: Test AreaNorth
Waste Area Group 1 covers 125 acres andconsists of 6 industrial areas at Test Area North
that include the Technical Support Facility,Water Reactor Research Test Facility, Cask
?-4
Testing Project, Loss-of-Fluid Test Facility,Initial Engine Test Facility, and SpecificManufacturing Capability Facility. In the past,the largest program at Test Area North was theLoss-of-Fluid Test Reactor. Constructed in1965-1975 and now closed, it was a scaled-down version of a commercial pressurized-water reactor. It was used to perform morethan 40 loss-of-coolant experiments simulatingreactor accidents. Today, the largest project inTest Area North is the Specific ManufacturingCapability Project, which develops andproduces armor for U.S. Army tanks. Inaddition, a variety of research programs remainactive.
This group is divided into 11 operable units,including underground storage tanks, pits,evaporation ponds, and a railroad turntable. Itcontains 71 potential release sites at whichhazardous, radioactive, and mixed waste (i.e.,waste that contains both radioactive materialsand hazardous chemicals) are present. Possiblecontaminants include asbestos, petroleumproducts, acids and bases, radioactive rubbleand water, laboratory bottles, and sanitarywaste. Both ground-water and soil remediationwill be conducted in this waste area group.
The only site in this group where contaminantsare clearly migrating is the ground-watercontamination site under Test Area North. Allother sites are not expected to havecontamination deeper than 25 feet. Definitiveinformation on the extent and magnitude ofcontamination will be gathered over the nextthree years.
Waste Area Group 2: TestReactor Area
Waste Area Group 2 is associated with the TestReactor Area that contains two shutdownreactors. These reactors are the Materials TestReactor, a 40-megawatt light-water reactor that
operated between 1952 and 1970, and theEngineering Test Reactor, a 175-megawatt
ID 15

VPKW,
''filekta
pressurized light-water reactor that operatedbetween 1957 and 1982. Today, the Test ReactorArea houses extensive facilities for studying theeffects of radiation on materials, fuels, andequipment. One of these, the Advanced TestReactor, is used to test materials under reactorconditions and to produce radioisotopes formedicine, research, and industry.
Waste Area Group 2 is divided into 13 operableunits consisting of 51 potential release sites.These sites include leaching ponds,underground storage tanks, rubble piles,cooling towers, an injection well, french drains,and assorted spills that may have releasedhazardous and radioactive waste. Possiblecontaminants include petroleum products,acids, alkalies, polychlorinated biphenyls(PCBs), radioactive materials, and heavymetals. However, the extent of soilcontamination at the Test Reactor Area is notcompletely defined.
The strategy for cleaning up the soils in thisgroup focuses on excavating the contaminatedsoils, consolidating them in a specified location,and covering them with a soil or clay cap toprevent wind-blown contamination. Forpotential uses of this area in the future, therecord of decision specifies that residential usesmay be permitted in 125 years, following thedeployment of institutional controls andground-water monitoring.
Waste Area Group 3: IdahoChemical Processing Plant
Waste Area Group 3 conducts environmentalcleanup at the Idaho Chemical Processing Plant,which had been used for reprocessing spentreactor fuel to recover plutonium and uraniumfor nuclear weapons. The plant is now areceiving-and-packaging facility forGovernment-owned nuclear fuels from researchand defense reactors. Its other function is todevelop technologies for the treatment andstorage of high-level radioactive waste andspent nuclear fuel.
The Idaho Chemical Processing Plant is dividedinto 14 operable units consisting of 83 potentialrelease sites. Contaminants include organicchemical compounds, radioactive materials,metals, corrosives, petroleum waste, and mixedwaste.
Most of the known contamination at the IdahoChemical Processing Plant is below the surfaceof the soil. The full extent cannot bedetermined until detailed characterizationstudies are completed; however, from what isknown about the practices and the chemicalprocesses used at the plant, the quantity ofcontaminated material is estimated to beapproximately 66,662 cubic yards ofcontaminated soil and 8,500 gallons ofcontaminated liquid. Definitive information onextent and magnitude will be gathered over thenext three years.
Remediation treatments for the Idaho ChemicalProcessing Plant include installing a soil cap toprevent contaminated soils from beingdispersed by the wind or retrieval andtreatment to reduce the volume. Institutionalcontrols to limit access in the future may also benecessary.
Waste Area Group 4: CentralFacilities Area
Many technical and support services for theLaboratory are located at the Central FacilitiesArea. These services include environmentalmonitoring and calibration laboratories,hazardous waste storage, communications,security, fire protection, warehouses, vehicleand equipment pools, and bus operations.
This group is divided into 13 operable unitsconsisting of 45 potential release sites. Thesesites include spills, underground storage tanks,a landfill, evaporation ponds, leach fields, andleach pits. Potential contaminants includechemicals, solvents, PCBs, asbestos,radionuclides, unexploded ordnance, heavymetals, and construction debris. The
ID 16

ra, Ii
contamination is believed to be containedwithin the boundaries of Waste Area Group 4.Remediation treatments for this group arefocused on soils.
Waste Area Group 5: PowerBurst Facility and AuxiliaryReactor Areas
Two reactors are present in this area. One is thePower Burst Facility, once used as the severe-damage testing ground for commercial-reactorfuels. This reactor has been leased to the Idaho
Brain Tumor Center and will be used to treatbrain tumors with neutron radiation. The otherreactor is the Special Power Excursion Reactor
Test IV facility built in 1960 to provide aprototype for testing the safety of water-poolreactors. This facility was placed on standbystatus in 1970.
Also located near the Power Burst Facility is theWaste Experimental Reduction Facility, which
uses various volume-reduction methods to treatlow-level radioactive waste generated at theIdaho National Engineering Laboratory; astorage facility for mixed waste; and a storagefacility for hazardous and mixed waste. Thelatter are referred to collectively as the WasteReduction Operations Complex.
There are three auxiliary reactor areas.Auxiliary Reactor Area I was constructed in the
late 1950's to provide support facilities forvarious Laboratory programs and was activeuntil the spring of 1988. Auxiliary ReactorArea II housed the Stationary Low PowerReactor No. 1, which was operated by the Armybetween August 1958 and December 1961. The
reactor was destroyed in an accident on January
3, 1961. After cleanup, the three main buildings
were converted into offices and welding shops.
These facilities have not been used since 1986.Area III was the site of a plant used between1960 and 1965 to test gas-cooled reactors for the
Army. After 1966, the plant served as alaboratory for testing reactor components andinstruments. The facility has not been usedsince 1988.
Waste Area Group 5 is divided into 13 operableunits with 48 potential release sites. These sitesinclude evaporation ponds, sanitary sewers,waste sumps, a waste-burial ground, andstorage tanks. Potential contaminants arepetroleum products, hazardous waste,radioactive materials, metals, radioactivelycontaminated soil, rubble, and debris.
The extent of soil and ground-watercontamination is not defined. Several sites arescheduled to undergo remedial activities bydecommissioning and will be characterized orverified as cleaned up by that program, whileothers are scheduled to be characterized andassessed for potential risks under theenvironmental restoration activity.Remediation treatments for this group will befocused on soils.
Waste Area Group 6:Experimental Breeder Reactor-Iand the Boiling Water ReactorExperiment Area
Waste Area Group 6 consists of theExperimental Breeder Reactor-I and the BoilingWater Reactor Experiment Facility. Both ofthese were test reactors that have since beendecommissioned. Experimental BreederReactor-I is now a National Historic Landmark.It was the first nuclear reactor in the world togenerate usable amounts of electricity. The area
of the Boiling Water Reactor Experimenthoused five reactors, which operated between1953 and 1964. These facilities weredecommissioned between 1979 and 1992. Thebuildings and equipment were completelydismantled and removed, and no operations
ID 17

other than monitoring are conducted. Potentialcontaminants from past operations are organicand inorganic chemicals, radioactive materials,and metals.
Waste Area Group 6 consists of 5 operable unitswith 20 potential release sites, including theburial site for the Boiling Water ReactorExperiment-I, a trash dump, fuel-oil tanks,septic tanks and a leach pond, and soilscontaminated with petroleum and radioactivematerials.
The extent of soil and ground-watercontamination is not completely defined,although ground-water contamination is notexpected to be a problem. No further studiesare planned for the near term, and there is nocleanup strategy at present.
Waste Area Group 7:Radioactive Waste ManagementComplex
The Radioactive Waste Management Complexwas established in 1952 as a controlled area forthe disposal of solid radioactive wastegenerated by the Idaho National EngineeringLaboratory and other sites operated by DOE.Since 1954, the facility has received defensewaste for storage.
This waste-group area contains the largestenvironmental restoration project at theLaboratory, cleanup of the Subsurface DisposalArea. This area began to be used for the burialof solid radioactive waste in 1952. In 1953, theAtomic Energy Commission decided solidradioactive waste from the Rocky Flats Plant inColorado would be sent to Idaho for disposal.The first shipment from Rocky Flats wasreceived in crates and drums in 1954. Until1969, the waste was dumped into pits andtrenches. Today, the Subsurface Disposal Areais a fenced area surrounded by a flood-controldike and a drainage channel.
In 1970, retrievable interim storage wasestablished for transuranic waste and for alpha-emitting low-level waste formerly categorizedas transuranic waste. Transuranic waste iscontaminated with long-lived radionuclides(e.g., plutonium) and, therefore, requirespermanent disposal in a geologic repository,which was not planned for Idaho. Received insteel drums or boxes, this waste was stacked onasphalt pads in the Transuranic Storage Areawhile awaiting shipment to a repository.
Five operable units have been identified at thiscomplex, including the Transuranic StorageArea and the Subsurface Disposal Area. Allinvestigations and decisions are scheduled to becompleted by 1999. The extent of contaminantmigration from various operable units iscurrently being determined. Both organicmaterials and transuranic radionuclides havebeen detected among migrating contaminants.
The Subsurface Disposal Area is a confirmedrelease site. Environmental monitoring hasshown transuranic radionuclides have migratedto the 110-foot sedimentary interbed beneaththe Radioactive Waste Management Complex.Trace organic compounds have been detected inthe Snake River Plain Aquifer, which is located600 feet below the surface at this location. Theretrieval of transuranic and alpha-emitting low-level waste from the Subsurface Disposal Areaaccounts for the significant cost estimated forenvironmental restoration in the years beyond2005.
Five records of decision are planned for theSubsurface Disposal Area. The plannedtechnology to be used on the organiccontaminants in the unsaturated zone is vaporvacuum and extraction. The cleanup strategyfor five operable units — transuranic pits andtrenches, nontransuranic pits and trenches,radioactive metals in the unsaturated zone, soilvaults, and the acid pit — will be considered inanother record of decision. It is expected these
ID 18

areas will be stabilized and capped with clayafter potential "hot spots" from the transuranicand nontransuranic pits and trenches have beenremoved and treated.
The cleanup strategy for six other operableunits (e.g., releases from the TransuranicStorage Area and septic tanks) will beconsidered under the comprehensive record ofdecision for the entire waste area group. It isexpected no action will be deemed necessary.
Major cleanup efforts are underway for the pre-1970 buried transuranic waste at Pit 9 and thePad A retrievable transuranic waste storagearea. The baseline plans for Pad A are toperform a limited action consisting ofrecontouring and monitoring. Proof-of-processtests have been conducted for 2 processesinvolving physical separation and chemicalextraction for materials contaminated withtransuranic radionuclides at concentrationsgreater than 10 nanocuries per gram of waste.Storage for waste generated by the Pit 9 projectwill be provided in the Transuranic StorageArea. Test results will support a 1996 decisionon full-scale retrieval and treatment of Pit 9 pre-1970 transuranic waste.
Waste Area Group 8: NavalReactors Facility
Waste Area Group 8 is the Naval ReactorsFacility that contains prototype naval reactorsused for research and development and fortraining naval personnel. Due to its ongoingnational security mission, costs for Waste AreaGroup 8 have not been evaluated for thisreport. It is assumed Waste Area Group 8 willremain within the jurisdiction of theDepartment's Office of Naval Reactors for theforeseeable future.
Waste Area Group 10:Miscellaneous Areas
Waste Area Group 10 includes areas in andaround the Laboratory that cannot beaccommodated by the other defined groups.They include the regional Snake River PlainAquifer and other surface disposal sites andponds not included in the other groups. Theboundaries of Waste Area Group 10 areLaboratory boundaries or beyond, as necessaryto encompass real or potential environmentalimpacts.
This group consists of 12 specifically identifiedand 4 generally identified sites divided into 7operable units. Specific sites include the LiquidCorrosive Chemical Disposal Area locatedbetween Waste Area Groups 6 and 7, theOrganic Moderated Reactor Experiment leachpond located between Waste Area Groups 4 and5, and former ordnance areas (including the oldnaval ordnance disposal area) located atnumerous sites within the Idaho NationalEngineering Laboratory.
Remediation treatments for this group arefocused on the soils. Remedial actions are alsoproposed to reduce potential hazards fromunexploded ordnance.
Decommissioning
The environmental restoration activity is alsoresponsible for the decommissioning of selectedLaboratory facilities. These activities entail thesafe caretaking of radioactively contaminatedsurplus facilities after they have been shutdown. Facilities are either decontaminated forreuse or, if they pose a potential threat tohuman health and the environment, completelydemolished and removed. Specific activitiesinclude assessing the size and scope of theproblem, deciding on the approach,dismantling equipment, decontaminating ordemolishing structures, removingcontaminated soils if needed, and recontouringand reseeding the site.
ID 19

KR+ -43 rr
Described below are the units designatedsurplus facilities and scheduled fordecommissioning.
Army Reentry Vehicle Facility
The Army Reentry Vehicle Facility consisted ofan earth-covered bunker, a test pit, and a lean-to shed covering the test pit. The test pit wascontaminated with low-level beta and gammaradiation. The test pit and lean-to shed weredismantled and removed in 1989, but adumpster in the bunker contains four drums ofmixed waste that consists of radioactivelycontaminated sodium-potassium liquid metal.In addition to being radioactive, this waste ishazardous because it is reactive with air; it willtherefore require treatment by a specialchemical process. Once the waste has beenremoved, the bunker will be demolished andthe site returned to its original condition. Thisproject is scheduled to be completed in FY 1997.
Auxiliary Reactor Area I
Dismantling is scheduled for building ARA-626, building ARA-627, the hot cells, the septicsystems, and all other structures in this area,which will be restored to its original state. Theextent of the contamination existing inassociated soil areas around these structures isgenerally not well characterized. The schedulecalls for completion in FY 1997.
Auxiliary Reactor Areas II and III
The facility of interest in Area I is the StationaryLow Power Reactor No. 1, which was destroyedin an accident on January 3, 1961. After athorough cleanup, the three main buildingswere converted into offices and welding shops,but these facilities have not been used since1986. The buildings are being dismantled, andall area utilities are being removed. Theequipment used for cleaning up the reactor hasbeen decommissioned. Though most of the
contamination is confined within two steel-framed buildings and one cinder-blockbuilding, some of the soils around the buildingsare contaminated.
Auxiliary Reactor Area III housed a facility fortesting gas-cooled reactors for the Army. After1966, the facility served as a laboratory forcomponent and instrument testing. It has notbeen used since 1988. Decommissioning willentail removing the exhaust stack, piping, thehot-waste tank and lines, concrete, andmiscellaneous items in the reactor buildings.Once this has been done, all buildings exceptone will be released for unrestricted use. Theproject will be completed in FY 1997.
Materials Test Reactor
The Materials Test Reactor, shut down since1970, is a complex of 18 buildings andstructures. Some of these facilities have beendecontaminated and are being used for otherLaboratory programs. The reactor vessel is stillin place, all coolant has been drained, andauxiliary portable shielding has been emplacedto reduce external radiation. The reactor vesseland its supports are heavily contaminated withradioactivity. Contamination is primarilycontained within 15 buildings and structures,an exhaust stack, and retention tanks. All ofthese contaminated areas are periodicallysurveilled and maintained as necessary. Theextent of contamination in surrounding soils isgenerally not well known at present. Theproject is scheduled to be completed in FY 2003.
Contaminated-Clothing Laundry in theCentral Facilities Area
Building CFA-669 was formerly used as alaundry for clothing contaminated with bothradioactive and nonradioactive materials. Thisbuilding is being dismantled, and itsdecommissioning will be completed in FY 1995.Contamination is largely confined to onecinder-block building.
ID 20

Engineering Test Reactor
The Engineering Test Reactor, shut down in1982, is a complex of 11 buildings andstructures. Some of these structures have beendecontaminated and are being used for otherLaboratory programs. The reactor vessel is still
in place, but all coolant has been drained. Itsdecontamination poses problems similar tothose identified for the Materials Test Reactor.Contamination is largely confined within eightstructures, four hold tanks, and one exhauststack. However, the extent of contamination inthe surrounding soils is not well defined atpresent. The project is scheduled to becompleted in FY 2005.
Boiling Water Reactor ExperimentFacility
The Boiling Water Reactor Experiment facilityhoused four separate experimental reactors thatoperated between 1953 and 1964. The facilityhas not been used since 1964.Decommissioning was conducted in FY 1979,1984-1987, and 1989-1992; activities includedtotal dismantlement, removal, and disposal ofthe equipment and buildings. The foundationsof the turbine building were decontaminated,demolished to below grade, and left in place.The three underground storage tanks wereremoved and disposed of. The raw watersystem, electrical substation, and security fencewill be removed and disposed of whendecommissioning of the reactor building iscompleted. Contamination is primarilyconfined to the belowground reactor buildingand the subreactor room sump. The site will berestored and seeded with native grasses andwill be available for reuse. All these activitieswill be completed by October 1996.
Special Power Excursion Reactor TestIV
The Special Power Excursion Reactor Test IVfacility has been in standby status since 1970.Decommissioning was completed in FY 1993.
Work that remains to be completed includes
removing and preparing for disposal the mixedwaste contained in a holdup tank, dismantlingand removing the tank and its piping, removingand disposing of contaminated soil, recyclingnoncontaminated piping, backfilling thetrenches, and recontouring and reseeding thearea. Contamination is primarily confined to a60,000-gallon waste holding tank and 450 feet of6-inch black iron pipe. Small areas ofcontaminated soil are also present.
Ancillaries for the Loss-of-Fluid TestFacility
The Loss-of-Fluid Test Facility has already beendecommissioned, and most of the ancillaryequipment has already been removed from thevarious facilities at the Test Area North inwhich it was stored. The work remaining to bedone is dismantling the mobile test facility anddisposing of the low-level radioactive wastethus generated. The project is scheduled forcompletion in FY 1998.
Decontamination Shop in Test AreaNorth
The TAN-607 decontamination shop was usedfor decontaminating tools and small equipmentfrom Laboratory and non-Laboratory facilities.It was shut down in 1987. Recommendationsfor decommissioning actions include theremoval of all contaminated equipment,including tanks and piping, anddecontaminating the space within the largerTAN-607 facility to make the area available forreuse. Characterization of the shop wascompleted in FY 1994. Contamination wasfound to be largely confined to the tanks andpiping.
Test Train Assembly Facility
This facility, located in the basement of theMaterials Test Reactor building, was used tobuild and disassemble nuclear fuel assembliestested at the Power Burst Facility.Decontamination will remove and treatradioactively contaminated shielding water and
ID 21

remove the residual radioactive contaminationfrom the canal walls, floor, and associatedequipment. Some of the areas have beendecontaminated and are being used for otherLaboratory programs.
Fuel removal was scheduled to start in FY 1994,and decontamination will be completed in FY1999.
Idaho Chemical Processing Plant
Although the Idaho Chemical Processing Plantremains an active facility, several of its areas arein transition: they are either being consideredfor decommissioning or being reviewed fornew uses. However, decisions on actualdispositions have not been made. The affectedfacilities are briefly described below.
The Waste Calcining Facility was originallyconstructed for technology demonstration;however, the facility was used to calcine liquidhigh-level waste until the New Waste CalciningFacility was constructed. Decommissioning isscheduled to start in FY 1998, and somepreliminary activities have already begun.Plans for decommissioning are preliminary;and call for removing the abovegroundstructure, process equipment, and utilities andsealing the below ground structure.
The CPP-603 Fuel Storage Facility providedspent-fuel storage from the early 1950's untilthe CPP-666 Fuel Storage Basin was built in1985. Though it continues to store spent fuel,this facility is being phased out. Assessmentand characterization for decommissioning arescheduled to start in FY 1997.
The CPP-640 Headend Processing Facility wasused for processing stainless-steel and graphitespent fuel are no longer needed. Assessmentand characterization for decommissioning willstart in FY 1996.
The CPP-709 and CPP-734 Service WasteMonitoring Facilities were used for many yearsto monitor the service-waste discharges, thesefacilities have been replaced with updatedfacilities and equipment. They are scheduledfor assessment in FY 1995. Decommissioningare scheduled to begin the same year.
The CPP-601 and CPP-631 Fuel ProcessingComplex has been in continuous operationsince the early 1950's and, though still inlimited use, is being phased out. Assessmentand cleanup for CPP-631 are scheduled forcompletion in FY 1996. Assessment anddecontamination for CPP-601 are scheduled tostart in FY 1996.
The Tank Farm for High-Level Liquid Waste isunder assessment and characterization for thedecommissioning of this facility which isscheduled to begin in FY 1996. Preliminary planscall for removing all aboveground structures andutilities and sealing the tanks in place.
ID 22

= II 1:ir,,,ZigZilr*
Environmental Restoration Activity Costs
1111041111110", fat t
Five-Year Averages (Thousands of Constant 1995 Dollars)*
FY 1995-2000 2005 2010 2015 2020 2025 2030
Facility DecommissioningFacility Decommissioning 8,622 29,576 8,214 1,633 1,238 188 69
Waste Area Group 1Assessment 552 0 0 0 0 0 0
Remedial Actions 11,306 381 4 0 0 0 0
Waste Area Group 2Assessment 397 0 0 0 0 0 0
Remedial Actions 466 112 112 112 90 0 0
Waste Area Group 5Assessment 700 0 0 0 0 0 0
Remedial Actions 661 854 0 0 0 0 0
Waste Area Group 10Assessment 2,115 360 0 0 0 0 0
Remedial Actions 5,159 4,164 2,252 2,244 3,492 0 0
Waste Area Group 3 0 CPP)Assessment 1,278 204 0 0 0 0 0
Remedial Actions 1,751 10,839 1,372 2,198 510 0 0
Facility Decommissioning 0 0 0 0 0 0 0
Waste Area Group 4Assessment 597 0 0 0 0 0 0
Remedial Actions 2,324 246 0 0 0 0 0
Waste Area Group 7 - Other RWMCAssessment 2,558 204 206 206 395 0 0
Remedial Actions 3,670 27,886 76,072 82,342 82,804 86,896 86,896
Waste Area Group 7 - Pit 9Remedial Actions 31,110 0 0 0 0 0 0
Total 73,268 74,827 88,233 88,735 88,530 87,084 86,965
2035 2040 2045 2050 2055 2060 2065
Facility DecommissioningFacility Decommissioning 0 0 0 0 0 795 1,524
Waste Areo Group 1Assessment 0 0 0 0 0 0 0
Remedial Actions 0 0 0 0 0 0 0
Waste Area Group 2Assessment 0 0 0 0 0 0 0
Remedial Actions 0 0 0 0 0 0 0
Waste Area Group 5Assessment 0 0 0 0 0 0 0
Remedial Actions 0 0 0 0 0 0 0
Waste Area Group 10Assessment 0 0 0 0 0 0 0
Remedial Actions 0 0 0 0 0 0 0
Waste Area Group 3 OOP)Assessment 0 0 0 0 0 0 0
Remedial Actions 0 0 0 0 0 0 0
Facility Decommissioning 0 0 0 0 628 1,204 1,309
Waste Area Group 4Assessment 0 0 0 0 0 0 0
Remedial Actions 0 0 0 0 0 0 0
Waste Area Group 7 - Other RWMCAssessment 0 0 0 0 0 0 0
Remedial Actions 86,896 69,517 0 0 0 0 0
Waste Area Group 7 - Pit 9Remedial Actions 0 0 0 0 0 0 0
Total 86,896 69,517 0 0 628 1,999 2,833
ID 23

Environmental Restoration Activity Costs (contd.)
Five-Year Averages (Thousands of Constant 1995 Dollars)*
2070 2075 2080 2085 2090 2095 2100 Life Cycle**
Facility Decommissioning
Facility Decommissioning 2,030 0 1,559 935 0 0 0 298,121
Waste Area Group 1
Assessment 0 0 0 0 3,312
Remedial Actions 0 0 0 69,763
Waste Area Group 2
Assessment 0 0 0 0 2,384
Remedial Actions 0 0 0 0 0 0 0 4,926
Waste Area Group 5
Assessment 0 0 0 0 0 0 0 4,200
Remedial Actions 0 0 0 0 0 0 0 8,236
Waste Area Group 10
Assessment 0 0 0 0 14,489
Remedial Actions 0 0 0 0 0 0 0 91,712
Waste Area Group 3 (ICPP)Assessment 0 0 0 0 0 8,687
Remedial Actions 0 0 0 0 0 85,106
Facility Decommissioning 262 0 0 0 17,014
Waste Area Group 4Assessment 0 0 0 0 3,580
Remedial Actions 0 0 0 15,176
Waste Area Group 7 - Other RWMCAssessment 20,411
Remedial Actions 0 0 0 0 3,018,568
Waste Area Group 7 - Pit 9
Remedial Actions 0 0 0 0 0 0 0 186,661
Total 2,292 0 1,559 935 0 0 0 3,852,348
• Costs reflect a five-year average in constant 1995 dollars, except in FY 1995-2000, which is a six-year average.
Total Life Cycle is the sum of annual costs in constant 1995 dollars.
Technical Support Facilities in the TestArea North
The support facilities consist of buildings,structures, pits, and equipment used to supportvarious activities at the Test Area North. Twofacilities, the TSF-606 calibration well in buildingTAN-606 and the TAN-616 Liquid WasteTreatment Facility, have been identified ascandidates for decommissioning. Assessment andcharacterization for these facilities were started inFY 1993, but methods for decontamination havenot been determined. Both facilities are to bedecommissioned by FY 2002.
WASTE MANAGEMENT
Waste management is a major program at theIdaho National Engineering Laboratory, whichtreats and stores various waste, includingradioactive waste, chemical waste, mixed wastethat is both radioactive and chemicallyhazardous, and industrial waste. In addition,for many years the Laboratory has receivedradioactive waste from other sites operated byDOE, the most notable being transuranic waste.
Each type of waste requires a different strategyfor management as each has specific
ID 24

VMQ
requirements for treatment, storage, anddisposal. For low-level radioactive waste,burial in engineered and monitored pits isacceptable. For others, like the large quantitiesof transuranic waste stored in Idaho, disposal isnot available at present; it must await decisionsabout the safety of a permanent geologicrepository - the Waste Isolation Pilot Plant -in New Mexico. If the decision is favorable andtimely, shipments from Idaho will start in 1998.Disposal for high-level waste must await theopening of a geologic repository yet to be builtand for which a site, though identified, has notyet been approved. No disposal for this wasteis expected soon and all of these factorscomplicate the waste management problem andadd to its cost.
The management strategy for each type ofwaste also depends on the consent orders andagreements DOE has entered into with the Stateof Idaho and EPA.
Negotiations are now underway with theNational Governors Association and the Stateof Idaho regarding the management anddisposal of certain waste - in particular, issuesof equity among and between various States,transportation, and disposal.
Site costs are adjusted (negative numbers in theWaste Management tables) to reflect fundingtransferred to the Idaho National EngineeringLaboratory site to account for costs associatedwith the disposal of environmental restorationactivity waste generated at other DOE facilities.
High-Level Radioactive WasteAt the Idaho National Engineering Laboratory,high-level radioactive waste is confined to theIdaho Chemical Processing Plant. The plantgenerated all of the high-level waste throughreprocessing spent fuel for the recovery ofuranium and krypton. Since April 1992, thefinal month of spent nuclear fuel reprocessingat the Idaho Chemical Processing Plant, nohigh-level liquid waste has been generated withthe exception of residual waste from other
Major Waste Management Projects
Five-Year Averages (Thousands of Constant 1995 Dollars)*
FY 1995-2000 2005 2010 2015 2020 2025 2030
IWPF 5,750 40,800 18,080 24,800 16,060 0 011W Disposal Facility 2,267 10,940 6,640 6,180 6,280 36,200 6,320WCSF 10,833 5,000 5,000 5,000 3,400 0 0WIF (ICPP) 55,767 108,200 96,600 70,200 53,800 53,800 53,800
2035 2040 2045 2050 2055 2060 2065 Life Cycle**
IWPF 0 0 0 0 0 0 533,20011W Disposal Facility 6,180 6,280 7,060 3,800 0 493,000WCSF 0 0 0 0 0 157,000WIF (ICPP) 53,800 53,800 50,400 34,800 0 3,480,600
o Costs reflect a five-year average in constant 1995 dollars, except in FY 1995-2000, which is a six-year average.
• Total Life Cycle is the sum of annual costs in constant 1995 dollars.
Note: These projects represent a subset of waste management activities. Associated program management costs are built-in to the estimates provided.
ID 25

treatment processes like decontamination.These treatments are expected to generateapproximately 538 cubic meters of liquid wasteper year over the next 5 years.
Three different types of high-level waste arestored at the Idaho Chemical Processing Plant:high-level liquid waste, sodium-bearing liquidwaste, and calcined solid waste. Although thesodium-bearing liquid waste does not meet thedefinition of high-level waste, it is managed ashigh-level waste at the plant. The high-levelwaste is considered to be a mixed wastebecause of the chemicals it contains. It istherefore subject to the land-disposalrestrictions of the Resource Conservation andRecovery Act (RCRA) and is included in theconsent order signed with the State of Idahoand EPA. The Department is negotiating withthe Scate to determine best treatment andstorage strategies until a repository becomesavailable. The current strategy is to convertliquid waste to calcined solid waste and then toimmobilize the calcine by vitrifying it intoborosilicate glass.
Waste Treatment
Liquid high-level waste and sodium-bearingwaste are treated at the New Waste CalciningFacility, which converts them to a granularsolid. Calcining reduces the volume of thewaste at a ratio of 3:1 and changes the wastefrom a corrosive liquid to a more stable,noncorrosive form.
Other treatment facilities include the ProcessEquipment Waste Evaporator, which convertsliquid waste into high- and low-activitystreams. Compared with the original volume,the high-activity fraction is small. Thisreduction, about 30:1, conserves space in thestorage tanks. The evaporator processes about1.4 million gallons of waste annually, reducingthe waste sent to the high-level waste tank farmto about 38,000 gallons.
Finally, the high-level waste must be treated orconditioned to produce a final waste formsuitable for permanent disposal. DOE isstudying the feasibility of a proposed facility,the Waste Immobilization Facility, designed toseparate high-level waste and the sodium-bearing waste into two fractions, one with high-level waste and the other with low-level waste.The low-level waste fraction can beencapsulated in either grout or cement, whilethe high-level fraction can be vitrified intoborosilicate glass. The technologies andfacilities for treating and conditioning thesewastes, however, have yet to be determined.Plans and schedules for the facility are likely todepend on the requirements of the FederalFacility Compliance Act and the outcome ofnegotiations with the State of Idaho.
Waste Storage
Liquid and solid high-level wastes have beenstored at the Idaho Chemical Processing Plantsince the early 1950's and 1960's. The liquidwaste is temporarily stored in the stainless-steeltanks of the high-level waste tank farm. It isprocessed into a solid form (calcine) and thenstored in the calcine solids storage facilities.
The current inventories in storage areapproximately 1,000 cubic meters of high-levelliquid waste, 6,900 cubic meters of sodium-bearing liquid waste, and 3,700 cubic meters ofcalcine.
The high-level waste tank farm is capable ofstoring more than 3 million gallons of liquidwaste in 11 stainless-steel tanks contained inunderground concrete vaults. These tanks werebuilt in the mid-1950's and mid-1960's. Sevencalcine storage facilities, including 4 newlyconstructed, are providing interim storage forapproximately 3,700 cubic meters of calcine.Here the solid calcine is stored in stainless-steelbins enclosed within massive abovegroundreinforced-concrete vaults with walls 4 feetthick. Each vault contains three to seven bins.Five of these facilities are full, and the sixth is
ID 26

partially filled. New bins and vaults will beconstructed as needed. The stored waste isretrievable, except for the No.1 Calcine SolidStorage Facility. However, DOE is planning todevelop and construct a system for retrievingthe calcine from this facility.
Since their installation, many modifications andimprovements have been made to the storagefacilities to improve safety and performance.For example, most of the transfer piping at thetank farm is being replaced with double-encased lines and lined sumps with radiationmonitors. Additionally, the tanks have beenprovided with more-accurate level-measuringequipment.
However, many of the storage facilities needupgrading or replacement to fully meet therequirements of RCRA. Furthermore,insufficient storage space could result inviolation of a consent order signed with theState of Idaho. Fines and restrictions on wastegeneration could result.
Waste Disposal
No high-level waste has been or will bedisposed of at the Laboratory. This waste isdestined for permanent disposal in a geologicrepository.
Spent Nuclear FuelThe spent fuel currently comes from two activesources, the Naval nuclear program and theAdvanced Test Reactor on the Idaho NationalEngineering Laboratory. Fuel currently storedat Idaho has come from the above sources,other government and university researchreactors, and special-case commercial reactors,including the damaged spent fuel and coredebris from the Three Mile Island II reactor inPennsylvania. Furthermore, the Laboratoryexpects to continue receiving spent fuel fromNaval reactors and the Advanced Test Reactor.Depending on the outcome of the Spent
.44.vv045%1440̀
Nuclear Fuel Programmatic EnvironmentalImpact Statement Record of Decision, it ispossible the Laboratory will receive additionalspent fuel from other DOE sites.
All of the spent fuel will be eventually shippedto a geologic repository. Although currentplans predict a repository will be availableabout 2015, it will not accept large quantities ofDOE waste during the first several years ofoperation, and it is unknown when spent fuelfrom the Laboratory will be accepted. Untilthat time, the Laboratory will have to providesafe, monitored storage facilities from whichthe fuel can be readily retrieved whennecessary.
Before shipment to the repository, the spent fuelwill have to be loaded into multipurposecanisters that can be used for transportationand for permanent disposal. Multipurposecanisters are also suitable for dry storage ifextended storage is needed. The life-cycle costestimate provided assumes that fuel loadinginto multipurpose cannisters starts in 2025. TheLaboratory expects to use 600 multipurposecanisters. With this schedule, the spent fuel atthe Laboratory will be loaded and ready to shipby 2035.
Spent fuel is stored at various Laboratoryfacilities. Most of these facilities providestorage in water-filled, fuel storage basin, butsome dry storage is also available. The facilitiesin which most of the spent fuel is stored are theIdaho Chemical Processing Plant, the PowerBurst Facility, and a storage pool at the TestArea North; the latter contains mostly damagedreactor-core debris from the Three Mile Islandreactor.
The storage pool at Test Area North was built inthe 1950's and is not considered adequate forlong-term interim storage. The spent fuel willtherefore be removed and transferred to drystorage by FY 2000. The CPP-603 storage poolsin the Idaho Chemical Processing Plant and thepool in the Power Burst Facility will also beemptied.
ID 27

The Department is evaluating the feasibility ofconsolidating all of the Laboratory-stored spentfuel at the Idaho Chemical Processing Plant. Ifnecessary, the fuel will be repackaged at theplant.
Transuranic Waste
From 1952-1970, approximately 60,000 cubicmeters of transuranic waste was buried at thedisposal site at the Radioactive WasteManagement Complex. Since 1970, 40,000 cubicmeters of DOE defense-generated and othertransuranic waste have been stored inretrievable storage in a earthen covered berm atthe Radioactive Waste Management Complex.Most of this transuranic waste originated fromRocky Flats. Over 60 percent of the DOEcomplex transuranic waste inventory is at theIdaho National Engineering Laboratory.
Waste Treatment
If necessary for disposal, transuranic waste willbe treated at the Idaho Waste ProcessingFacility or applicable private sector facility,which will repackage the waste or treat wastesthat cannot meet transportation criteria orcriteria for acceptance at the Waste IsolationPilot Plant. The latter will affect the design ofthe Idaho Waste Processing Facility.
The Department is developing a WasteCharacterization Facility in which drums oftransuranic waste will be opened and the wastewill be examined, sampled, characterized andrepackaged. The data thus obtained will beused in analyses required to demonstratecompliance with the Waste Isolation PilotPlant's RCRA permit for disposal.Construction will be completed in July 1998,and operations will start in January 1999.Laboratories for this facility will be provided byupgrading the existing laboratory capability.
Waste Storage
Interim storage for transuranic waste isprovided in two air-supported buildings at theTransuranic Storage Area of the RadioactiveWaste Management Complex and the soilcovered berm. To improve the storage facilities,the Department is constructing seven newengineered storage modules that comply with aconsent order with the State of Idaho and thestorage requirements of RCRA. The first fourmodules have been completed, and the rest willbe available by August 1995. Additionalmodules will be constructed as needed. ByJanuary 1, 1998, waste currently stored in twoair-support buildings will be emplaced in thenew storage modules.
A retrieval enclosure is being constructed at theTransuranic Storage Area. It will cover wastestored beneath an earthen and geofabric cover.The enclosure will provide increased protectionfor the stored waste containers, enhancedcontainment for contaminated areas, andprovide year-round capability for retrieving thestored waste. Construction of the RetrievalEnclosure began in 1993 and is scheduled forcompletion in 1996. Retrieval operations willcommence in 1997 to support shipments to theWaste Isolation Pilot Plant for disposal.Multiple-shift operations will start in FY 2000 toensure all waste has been retrieved by 2014.
In FY 1997, the Department plans to reactivatethe Stored Waste Examination Pilot Plant toproduction-level operations. The reactivationwill depend on the availability of final waste-acceptance criteria from the Waste IsolationPilot Plant in late FY 1996. Final waste-acceptance criteria from the Waste IsolationPilot Plant are needed to ensure examinedwaste can be shipped for disposal. Multiple-shift operations are planned in FY 2000 toensure waste examination is finished before theWaste Isolation Pilot Plant closes in 2023.
A characterization study of remotely handledtransuranic waste began in FY 1994 to providedata needed for the Waste Isolation Pilot Plant.
ID 28

Shipments of remotely handled transuranicwaste to the Waste Isolation Pilot Plant arescheduled to start in FY 2000 and end in FY2005.
Waste Disposal
The Department expects to start receivingtransuranic waste at the Waste Isolation PilotPlant in 1998 if approval by EPA and the Stateof New Mexico is granted in a timely manner.In the meantime, the Laboratory is activelysupporting the activities needed to achieve afavorable decision on disposal. In particular, itis characterizing the current inventory ofaccessible transuranic waste, identifyingrequirements for waste characterization, anddeveloping advanced methods forcharacterization. The objective is to providedata for the documentation of regulatorycompliance and to implement standardized andcost-effective waste-characterization methods atother Department sites with inventories oftransuranic waste.
Alpha-Contaminated Low-LevelWaste
"Alpha-contaminated low-level waste" orsimply "alpha-low-level waste" is low-levelradioactive waste that is contaminated withalpha-emitting transuranic radionuclides atconcentrations between 10 and 100 nanocuriesper gram of waste. Before 1982, this waste wasconsidered to be transuranic waste, which wasthen defined as waste contaminated withplutonium and other transuranics atconcentrations of 10 or more nanocuries pergram of waste. The Idaho NationalEngineering Laboratory does not allow suchwaste to be disposed of at the site as low-levelwaste. Some of this waste may containhazardous constituents and thus may requiremanagement as mixed waste.
Waste Treatment
To develop the needed treatment capability forAlpha low-level waste, the Department isproceeding on two parallel paths. The firstpath is developing Phase I of the Idaho WasteProcessing Facility. Phase I of the Idaho WasteProcessing Facility would provide capability tomeet legal requirements for chemicallyhazardous constituents. The second path willevaluate and help develop treatmentcapabilities in the private sector. TheDepartment has contracts with three private-sector companies for feasibility studies thatidentify alternative approaches and techniquesthe private sector might employ to treat alpha-contaminated and transuranic mixed waste.The results of the feasibility studies will then beused to start a phased development oftreatment facilities.
A decision about the approach to follow will bemade in FY 1997.
Waste Storage
Before 1982, this waste was received from theRocky Flats Plant and other sources astransuranic waste and was stored in theTransuranic Storage Area pending shipment toa repository. Since the definition of transuranicwaste has changed, approximately 45 percent ofthe 2.3 million cubic feet of waste stored astransuranic waste is expected to be reclassifiedas alpha-contaminated low-level waste.
Waste Disposal
Final disposal decisions, however, will be basedon the results of the negotiations under way bythe National Governors' Association. Thesenegotiations are expected to establish one ormore locations for the disposal of treated mixedwaste, including alpha-contaminated low-levelwaste, by October 1995. The Department willnot start any Idaho-specific work until theconsent order under the Federal FacilityCompliance Act is signed in October 1995.
ID 29

OF-
Special-Case Waste, Greater-Than-Class-C Waste, andSealed Radiation Sources
Special-case waste is radioactive waste ownedor generated by DOE and does not fit into themanagement plans developed for the majortypes of radioactive waste.
Greater-Than-Class-C waste is waste in whichthe concentrations of certain radionuclidesexceed the limits specified by the U.S. NuclearRegulatory Commission for waste defined asClass C low-level waste. Greater-Than-Class-Cwaste is generally not acceptable for near-surface disposal. DOE is responsible forproviding safe disposal for these wastes in afacility licensed by the U.S. Nuclear RegulatoryCommission.
Sealed radiation sources are capsulescontaining radioactive materials. DOE isresponsible for the disposal of such materials ifthey cannot be reused or recycled and areclassified as waste and meet the definition ofGreater-Than-Class-C.
All of these waste types will require disposal ina geologic repository. No activities are beingconducted at the Laboratory to support thedisposal. The effort is focused on storage.
Treatment for special-case waste or Greater-Than-Class-C waste is also not planned.However, some special-case waste could bemade acceptable for disposal as low-levelwaste. Evaluation of this material indicatesthese structures can be sized for placement intodisposal canisters for disposal at theRadioactive Waste Management Complex. Thecanisters are grouted for shielding purposes,which makes the disposal package acceptable,and a special-case waste stream is eliminated.
Special-case waste is stored in several facilitiesat the Idaho National Engineering Laboratory,including Argonne National Laboratory-West,the Radioactive Waste Management Complex,the Test Reactor Area, the Idaho Chemical
Processing Plant, and Test Area North. Most ofthese facilities also have some potential special-case waste, as do the Power Burst Facility, theNaval Reactor Facility, and SpecialManufacturing Capability facilities.
Preliminary evaluations have been made of thestorage requirements for the special-case waste,but more effort is planned for determining thefuture capacity and configuration needs. Thiswill allow a final decision to be made aboutstorage requirements in Idaho. To facilitatedecisionmaking and to manage materials andwaste at the Laboratory as effectively andefficiently as possible, activities planned toevaluate storage requirements for sealedsources, special-case waste, and potentialGreater-Than-Class-C waste will becoordinated. This will ensure selection of thebest storage configuration to meet therequirements of each waste stream or potentialwaste stream.
Low-Level Waste and Low-Level Mixed Waste
Waste Treatment
Low-Level Waste
About 60 percent of the non-incinerable low-level waste generated at the Idaho NationalEngineering Laboratory is sent to the sizing andcompacting facility to be volume reduced priorto disposal at the Radioactive WasteManagement Complex. The remaining 40percent of the non-incinerable low-level wasteis sent directly to the Radioactive WasteManagement Complex for disposal. Sizing andcompaction operations were resumed in FY1995. Incinerable low-level waste is currentlysent offsite for treatment. The ash is returnedfor disposal at the Radioactive WasteManagement Complex. If incineration isresumed at the Waste Experimental Reduction
ID 30

Facility for low-level mixed waste, low-levelwaste will be incinerated at the WasteExperimental Reduction Facility between mixedwaste campaigns.
For the purposes of this estimate, low-levelwaste treatment at the Waste ExperimentalReduction Facility is expected to stop in FY2009, and from 2010 through 2055 all low-levelwaste treatment (incineration, compaction, andsize reduction) is likely to be conducted by theprivate sector. All residues from thesetreatments will be returned and disposed of atthe Idaho National Engineering Laboratory.
Low-Level Mixed Waste
A major factor in decisions about the treatmentand storage of low-level mixed waste in thevery near term will be a consent order underthe Federal Facility Compliance Act. This orderwill resolve questions about timing andlocation for the treatment and storage of all ofthe Laboratory's low-level mixed wastes.
The low-level mixed waste backlog currentlystored at the Waste Experimental ReductionFacility and other facilities at Idaho NationalEngineering Laboratory will be treated byincineration at the Waste ExperimentalReduction Facility or by non-incinerationtreatment technologies at the Waste ReductionOperations Complex or by the private sector.Lead represents more than 50 percent of thebacklog of the low-level mixed waste and isexpected to be decontaminated by the privatesector. Newly generated low-level mixed wastewill be treated by incineration at the WasteExperimental Reduction Facility or by non-incineration treatment technologies at the WasteReduction Operations Complex or by theprivate sector.
Low-level mixed waste that does not requirerepackaging and low-level mixed waste thatwill allow for the greatest volume reductionwill be incinerated first. Repackaging willbecome available in FY 1998. For selected
I •!'""'""
waste, repackaging at the Waste ExperimentalReduction Facility and other facilities operatingwith RCRA permits may start earlier toexpedite the incineration of the mixed waste.
The inventory of low-level mixed waste thatrequires repacking will either be small enoughto allow treatment in the three-year windowfrom FY 1996 to FY 1999, or private sectorcapabilities will accomodate the excess volume.
Private sector treatment of non-incinerable low-level mixed waste will be available to treatsome of the backlog and ongoing IdahoNational Engineering Laboratory low-levelmixed waste.
At present, private sector capabilities fortreating low-level mixed waste are limited, andfuture private sector capabilities are difficult toquantify. However, the capability to treat low-level mixed waste in the private sector will beperiodically assessed.
After December 1997, newly generated low-level mixed waste will be subject to all of therequirements of RCRA. Current allowancesunder the Federal Facility Compliance Act, suchas storing land-disposal-restricted mixed wastefor more than a year, will not be available.
To ensure the Idaho National EngineeringLaboratory is capable of meeting all RCRArequirements, DOE will start in FY 1996 todetermine long-range needs for non-alphamixed waste treatment for the Laboratory. InFY 1999, DOE will decide whether long-rangetreatment will be conducted in the Idaho WasteProcessing Facility, in the private sector, at theWaste Experimental Reduction Facility, or atsome other currently unidentified facility eitheron or off the Idaho site. This decision willconsider the large quantities of low-level mixedwaste that could be generated duringenvironmental restoration as well asdecommissioning at the Idaho NationalEngineering Laboratory.
ID 31

Waste Storage
Low-Level Waste
The low-level waste backlog currently stored atthe Waste Experimental Reduction Facility andother facilities on the Idaho NationalEngineering Laboratory will continue to bestored until the waste can be treated at theWaste Experimental Reduction Facility and atcommercial facilities. After processing of thebacklog is completed, all newly generated low-level waste will be temporarily stored atgenerator facilities until it can be shippeddirectly to the Waste Experimental ReductionFacility. At the Facility, the low-level waste willbe treated or staged for shipment to the privatesector for treatment. An activity will beinitiated in FY 2005 to evaluate long-termstorage and staging needs. This activity willdevelop information to support a decision in FY2009, to determine the long-range storage andstaging needs for private sector processing ofthe low-level waste. Direct shipment of low-level waste from generators to offsite facilitiesfor processing will be considered in thisdecision.
Low-Level Mixed Waste
Low-level mixed waste that has been treated, oris awaiting treatment, will be stored at existingstorage facilities at the Waste ReductionOperations Complex until FY 2000.
Waste Disposal
Low-Level Waste
The disposal of low-level waste will continue atthe Radioactive Waste Management ComplexSubsurface Disposal Area until FY 2004. At thattime, the Subsurface Disposal Area closure willbegin. A new low-level waste disposal facilitywill be located at the Laboratory at either a newlocation or at the present site. The location ofthe new facility has not been determined, but
design will be completed in FY 2000.Construction will be completed, and the newfacility will be ready to accept low-level wastein 2005.
Low-Level Mixed Waste
The Department will work with the NationalGovernors' Association to select sites that willdispose of treated low-level mixed waste. NoIdaho-specific work on site selection or facilitydesign will be completed until after the FederalFacility Compliance Act consent order is signedin October 1995.
Before the signing of the Federal FacilityCompliance Act consent order, DOE willcontinue to evaluate private-sector facilities forthe disposal of low-level mixed waste. Whereprivate sector facilities prove to be cost-effectiveand environmentally compliant alternatives toonsite disposal, DOE will continue to considertheir use.
After the Federal Facility Compliance Actconsent order is signed, offsite disposal facilitieswill be readied for the receipt of treated listedlow-level mixed waste and treated listed low-level waste. Most low-level waste at theLaboratory is considered a listed mixed waste.Shipment of treated low-level mixed waste andlow-level waste to these offsite disposalfacilities will begin in FY 1999 and continue asnecessary to support Laboratory plutonium-contaminate operations.
Hazardous Waste
A goal of zero generation of hazardous wastehas been tentatively set for the year 2010.Decommissioning, environmental restoration,and other legacy waste is not considered newlygenerated hazardous waste. In addition, anypotential hazardous waste recycled is notconsidered newly generated hazardous waste.
ID 32

sra 0
Waste Treatment
Commercial treatment, storage and disposalfacilities under contract with the Laboratorywill treat and dispose of the Laboratory'shazardous waste in compliance with applicableregulations. The Laboratory ships hazardouswaste directly from the generator to an offsitecommercial facility for treatment.
Not all hazardous waste generated at the IdahoNational Engineering Laboratory is shipped toan offsite treatment storage and disposal facilityfor disposition. Some Laboratory hazardouswaste can be treated in generator treatmentplants, particularly "problem" hazardouswaste.
Waste Storage
The Waste Reduction Operations Complexprovides for onsite transportation and storageof Idaho National Engineering Laboratoryhazardous waste. In addition, some generatorsprovide storage for hazardous waste generatedat their facilities. The laboratory-generatedhazardous waste is shipped directly fromgenerator storage facilities to offsite treatment,storage and disposal facilities.
Hazardous waste that requires storage at theIdaho National Engineering Laboratory isplaced in the hazardous waste storage facility.The hazardous waste storage facility, which wasconstructed in 1943, has provided storage forthe Laboratory's hazardous waste for over 8years. Because of the age of this facility,continual corrective maintenance is required toremain in compliance with regulations.
In the future, hazardous waste is expected to bestored in the Waste Experimental ReductionFacility Waste Storage Building. The existinghazardous waste storage facility will be utilizedfor storage of problem hazardous waste (i.e.,hazardous waste that does not have a treatmentidentified) and any RCRA time-limited wasteuntil the Waste Experimental Reduction FacilityWaste Storage Building modifications have
been completed. At that time, around mid-FY1998, all hazardous waste storage activities willbe relocated to the Waste ExperimentalReduction Facility Waste Storage Building, anda decision will be made concerning RCRAclosure of the hazardous waste storage facility.This decision will be based on the Laboratory'sstorage needs for RCRA-regulated waste.
Waste Disposal
Hazardous waste is treated and disposed atoffsite treatment, storage, and disposal facilities.
Industrial and CommercialWaste
Industrial and commercial waste generated atthe Laboratory is sent to the site's landfill fordisposal. Industrial and commercial waste isthe same as sanitary waste described elsewherein the report. In addition to solid wastedisposal, some treatment processes can beperformed at the landfill. For example, some1,500 cubic yards of petroleum-contaminatedsoils, gravel, sand, and the like will be treatedthere annually. The contaminated soils will belandfarmed in a 2-acre area at the landfill. Afterthe soil is treated, it can be used for landfillcover. The treatment area will eventually beused for solid waste disposal. Air emissionsfrom landfarming activities are well below thelimits defined by the Clean Air Act.
A wood-recycling program has beenestablished. Scrap lumber is recycled intowood chips to be used as landscaping mulch orto augment landfill cover material. In addition,the wood chips can be compacted in apelletizer, which is part of a waste-to-fuelprogram. Since September 1993, more than21,000 cubic yards of scrap lumber has beenconverted into mulch instead of being disposedof in the landfill.
A proposed waste-to-fuel program would usescrap lumber chips and paper for compaction ina pelletizer. The pellets would replace the coal
ID 33

The 1995 Baseline /iv ron * n t PO
used in onsite boilers. The high-pressurecompaction process produces a fuel form thatprovides energy at a level slightly below that ofcoal, with considerably less residual ash. Adecision about feasibility will be made at theend of FY 1997. If a decision is made to developthis capability, the pelletizer would beginoperation at this time.
Industrial wastes are not stored. However,waste collection activities and maintenance ofdumpsters constitutes a significant portion ofthe work required to properly manage IdahoNational Engineering Laboratory industrial andcommercial waste.
The current Landfill Complex disposaloperations are located in a 12-acre gravelremoval area at the Idaho National EngineeringLaboratory. The Landfill Complex hashistorically received between 60,000 and110,000 cubic yards of uncompacted solid wasteannually to dispose or recycle as required. Thesolid waste volume actually disposed in thelandfill each year uses 3 to 4 acres of space,assuming no shallow rock beds are encounteredthat limit the depth of excavation. At this rate,the current 12-acre disposal area of the LandfillComplex will reach capacity in mid-1996.Landfill Complex operations will then beextended into an adjacent 225-acre area that isdefined as part of the Landfill Complex in theNational Environmental Policy Actdocumentation.
The 225-acre area will provide industrial andcommercial waste disposal capacity for at least30 years based on the current usage rate andassuming no shallow rock beds areencountered. This rate will be continuallyevaluated to determine the actual life of theLandfill Complex. In FY 2020, if required, adecision will be made concerning future solidwaste disposal needs and capacity. A strategyfor providing long-term capability for disposalof solid waste beyond the projected life of theLandfill Complex will be developed asnecessary. As sections of the landfill reach
capacity, they will be closed and a final coverwill be placed over them in compliance with theConditional Use Permit, at a minimum.Current final coverage practices exceed theassumed requirements of the permit.
Another function performed within the LandfillComplex boundaries is the handling anddisposal of asbestos waste. A designated areaexists on the west side of Lincoln Road for theseactivities. Asbestos generated frommaintenance projects and decommissioningactivities is boxed, placed in the designateddisposal area, and disposed.
Underground Storage TankProgram
The Idaho National Engineering LaboratoryTank Management Program includes oversightof all Laboratory tanks. Laboratory tanks havebeen profiled and categorized according toRCRA regulations. The following tank classeswere identified, and a technical approach,priority, and schedule were developed for eachtank category:
Active regulated tank systems nondeferred (gas/diesel)and deferred (emergency generator),
Active nonregulated tank systems (heating fuel),
Abandoned/out-of-service petroleum tank systems,and
Abandoned/out-of-service hazardous/radioactive tanksystems (environmental restoration activity).
Using the four categories, a systematic technicalapproach is in progress to remove, replace, orupgrade Laboratory tanks. As of June 1993, allof the identical abandoned or out-of-servicepetroleum tank systems had been removed.
In 1991, three active regulated tanks wereupgraded and seven active regulated tankswere replaced. In 1992, six regulated tankswere replaced, with followup work on the
ID 34

Waste Management Activity Costs
Five-Year Averages (Thousands of Constant 1995 Dollars)*
FY 1995 - 2000 2005 2010 2015 2020 2025 2030
TreatmentHigh-Level Waste 0 1,311 2,400 4,615 0 0 0
Transuranic Waste 6,122 15,089 24,798 29,694 37,031 27,152 20,509
Low-Level Mixed Waste 18,372 18,225 14,946 15,659 15,359 14,995 15,111
Low-Level Waste 0 5,088 5,088 5,088 5,088 6,184 9,323
Storage and HandlingHigh-Level Waste 54,482 98,576 92,485 68,302 59,441 62,949 66,825
Spent Nuclear Fuel 52,537 50,211 39,504 36,366 36,182 36,182 35,443
Transuranic Waste 4 603 34,330 36,753 24,599 6,398 2,256
Low-Level Mixed Waste 12,661 19,965 7,854 0 0 0 0Low-Level Waste 107 471 635 761 916 1,071 1,260
DisposalHigh-Level Waste 0 0 0 0 0 0 0
Spent Nuclear Fuel 0 46,150 88,239 62,764 62,764 62,764 145,649
Low-Level Mixed Waste 573 2,986 2,444 3,007 3,004 2,996 2,990
Low-Level Waste 2,982 6,757 13,172 14,548 14,545 14,537 14,211
Hazardous Waste 15,499 9,297 8,640 8,283 8,283 8,283 8,283
Sanitary Waste 5,199 4,918 4,918 4,918 4,918 4,918 4,918
OtherDecommissioning 0 0 0 0 25,918 25,918 36,717
Waste Management TSD 47,820 45,227 45,227 45,227 45,227 45,227 45,227
Inter-Site Disposal AssessmentLow-Level Mixed Waste -2 -138 -90 0 0 0 0Low-Level Waste -1,009 -629 -119 0 0 0 0
Total 215,348 324,107 384,470 335,984 343,274 319,574 408,723
2035 2040 2045 2050 2055 2060 2065
TreatmentHigh-Level Waste 0 0 0 0 0 0 0Transuranic Waste 3,256 0 0 0 0 0 0Low-Level Mixed Waste 15,094 15,151 11,573 4,516 730 0 0
Low-Level Waste 6,014 5,088 4,255 749 184 41 41
Storage and HandlingHigh-Level Waste 95,623 95,623 95,623 95,623 0 0 0Spent Nuclear Fuel 35,812 0 0 0 0 0 0Transuranic Waste 536 6 7 7 0 0 0Low-Level Mixed Waste 0 0 0 0 0 0 0Low-Level Waste 1,279 326 328 313 333 384 208
DisposalHigh-Level Waste 23,075 23,075 23,075 23,075 0 0 0Spent Nuclear Fuel 108,914 0 0 0 0 0 0Low-Level Mixed Waste 2,380 0 0 0 2 5 0Low-Level Waste 12,857 10,122 0 0 1 52 225
Hazardous Waste 8,283 8,283 25 417 1,269 0 0Sanitary Waste 4,918 4,918 0 0 0 0 0Other
Decommissioning 32,397 32,397 32,397 32,397 0 0 0Waste Management TSD 45,227 45,227 45,227 36,182 0 0 0
Inter-Site Disposal AssessmentLow-Level Mixed Waste 0 0 0 0 0 0 0Low-Level Waste 0 0 0 0 0 0 0
Total 395,666 240,215 212,511 193,277 2,517 483 474
ID 35

The 1995 Etas lirte Environmental Mart goose epor
Waste Management Activity Costs (contd.)
Five-Year Averages (Thousands of Constant 1995 Dollars)*2070 2075 2080 2085 2090 2095 2100 Life Cycle**
TreatmentHigh-Level Waste 0 0 0 0 0 0 41,627
Transuranic Waste 0 0 0 0 0 0 824,378Low-Level Mixed Waste 0 0 0 0 0 0 817,021
Low-Level Waste 0 0 0 0 0 261,152Storage and Handling
High-Level Waste 0 0 0 0 0 0 4,482,238Spent Nuclear Fuel 0 0 0 0 0 1,663,723Transuranic Waste 0 0 0 0 0 0 0 527,500Low-Level Mixed Waste 0 0 0 0 0 0 0 215,069Low-Level Waste 0 42,091
DisposalHigh-Level Waste o 0 0 0 0 0 0 461,500
Spent Nuclear Fuel o 0 0 0 0 0 0 2,886,221Low-Level Mixed Waste o 0 0 0 0 0 0 102,512
Low-Level Waste 126 2 0 0 0 0 523,667
Hazardous Waste o o 0 0 0 0 439,722Sanitary Waste o 0 0 0 0 0 0 227,906Other
Decommissioning 0 0 0 0 1,090,709Waste Management TSD 2,503,041
Inter-Site Disposal AssessmentLow-Level Mixed Waste 0 -1,155Low-Level Waste -9,791
Total 127 3 1 1 1 1 0 17,099,130
• Costs reflect a five-year average in constant 1995 dollars, except in FY 1995-2000, which is a six-year average.
• Total Life Cycle is the sum of annual costs in constant 1995 dollars.
Helicopter Fueling Tank to be finished byMarch 1995. In 1993, six active regulateddeferred tanks were replaced. The remaining15 active non-regulated tanks in the programwere combined into one package to beaddressed in 1994. Nine were replaced in 1994,two will be finished by spring of 1995, and theremaining will be removed and replaced as thebuildings they support are dispositioned in thenear future.
In addition to the tank removal andreplacement program, a tank tightness programis in place. The tightness program was initiatedin 1989, when 16 tanks were tested. Tanks thatdid not pass were removed. Five tanks were
tested in 1993 to ensure compliance; all fivetanks passed. Inventory control is performedon a daily basis by the area tank landlord, andtank reconciliation forms are submitted to theTank Management Program monthly to ensurethese checks are being made.
ID 36

dalyttot
NUCLEAR MATERIAL AND
FACILITY STABILIZATION
The early deactivation and stabilization ofnuclear facilities will allow for a significantreduction in the surveillance and maintenanceactivities required to maintain the safetyenvelope at these facilities.
Current Surplus FacilitiesStabilization Activities
The Idaho National Engineering Laboratory iscurrently working to stabilize facilities at theIdaho Chemical Processing Plant. Thesefacilities belonged to Defense Programsoperations to reprocess Navy fuel to recoveruranium for future use. In April 1992, thedecision was made to stop reprocessing Navyfuel, thus transferring the facilities associatedwith this mission to EnvironmentalManagement.
These buildings contain contaminatedprocesses that need to be started up, and a finalprocess run needs to be performed. Thisincludes final uranium collection andsolidification to convert the process materials toa stable storage form and achieve accountabilitymeasurement and the process systems must becleaned out to protect the public, the in-plantwork force, and environment. The majority ofthe flush and draining stabilization activitiesassociated with the process in these buildingswill be completed by mid FY 1995.
The outstanding activities at the IdahoChemical Processing Plant are the ROVER andWaste Calcine Facility projects. These arecomplex projects with many unresolvedtechnical questions and are currently inconceptual design to address the problems andthe best approach to resolve them.
Future Contaminated Surplus Facilities
The surplus facility inventory and assessmentidentified 40 assets at the Idaho NationalEngineering Laboratory that are not currentlyowned by Environmental Management but aresurplus or will be surplus in the next 5 years.Of the 40 assets, 12 were excluded because theywere currently a part of the environmental
Nuclear Material and Facility Stabilization Cost Estimate
Five-Year Averages (Thousands of Constant 1995 Dollars)'
FT 1995 - 2000 2005 2010 2015 2020 2025 2030
Nuclear Material and Foray Stabilization 42,745 27,006 8,669 265 93 90 4
2035 2040 2045 2050 2055 2060 2065 Life Cycle"
Nuclear Material and Facility Stabilization 4,397 27,288 48,787 46,756 25,594 1,060 0 1,206,508
• Costs reflect a five-year average in constant 1995 dollars, except in FY 1995-2000, which is a six-year average.
• Total Life Cycle is the sum of annual costs in constant 1995 dollars.
ID 37

The 1995 Basel rte Ertvironthentall Marta erneht FleP
restoration activity. The remaining assets wereranked and compiled with the rest of theDepartment's complex. Three assets wereidentified to be high ranking (PBF-620, PBF-732,and TRA-660). Nuclear Energy is the currentowner of these assets, and they are scheduled tobe turned over to Environmental Managementin FY 1996.
Noncontaminated Surplus Facilities
Environmental Management currently owns108 surplus assets at the Idaho NationalEngineering Laboratory. These surplus assetsare noncontami-nated and do not meet thecriteria for acceptance into thedecommissioning program. These assets wereevaluated and ranked with the surplus facilityinventory and assessment ranking model. InFY 1994, five assets were demolished, and oneasset was identified to be demolished in FY1995.
LANDLORD FUNCTIONS
The Idaho National Engineering Laboratorylandlord program supports identified andprioritized general plant projects and line itemconstruction projects that will correctdeficiencies in environmental, utility, fire, andfacility-infrastructure systems. Also, generalpurpose capital equipment will be acquired andmanaged in support of the Laboratory'smissions and goals. Additionally, the landlordprogram provides an integrated andcomprehensive facility planning system thatincorporates the Idaho National EngineeringLaboratory's strategic long-range and short-range goals.
The Laboratory's infrastructure requirementsare dictated by site development plans and theother programs and their specific needs. Theinfrastructure program provides continuousprogram management and integrated facilityplanning as well as coordination and external
interface on infrastructure issues. It alsosupports day-to-day general purposeequipment. It also facility needs such asbuilding and structure maintenance, electricalpower, railroad lines, transportation equipment,water supply, steam, roads, fire equipment andtraining, safeguards and security,telecommunications, computer systems,medical services, laboratory support andsanitary landfill. Priority is given to haltingdecay or deterioration of the physicalinfrastructure, providing support services, andcontinuing a systematic restoration.
PROGRAM MANAGEMENT
Program management and support workencompasses management activities notdirectly related to specific remediation anddecommissioning activities. Programmanagement is necessary to ensure theprogram is effectively planned, executed, andcontrolled. Program management establishesthe technical, cost, and schedule baseline for thepurpose of achieving cost, schedule, andtechnical goals.
Activities included within programmanagement are technical support andintegration, quality and compliance assurance,program planning and reporting, strategicplanning, technical support, training,community relations, and data and samplemanagement for the program.
Tasks include maintenance of administrativerecord files, document control, library services,financial services, planning and scheduling,systems engineering, cost and schedule control,development of multi-access system for data,personnel training, and routine reporting.Quality and compliance assurance providesindependent safety, quality, environmentalreviews, and oversight of all program work.
ID 38

Other support includes U.S. Geologic Surveysupport, Program Management Planning andIntegration, Program ManagementDocumentation, Independent Safety ReviewCommittee, and Program ManagementTraining. Roadmapping and Waste Stream
tracking are also supported within programmanagement.
FUNDING AND COST
INFORMATION
The following tables present fundinginformation and major activity milestones forIdaho National Engineering Laboratory-IdahoChemical Processing Plant.
Landlord Cost Estimate
Five-Year Averages (Thousands of Constant 1995 Dollars)*
FY 1995-2000 2005 2010 2015 2020 2025 2030
Directly Appropriated Landlord 97,804 93,100 93,100 93,100 93,100 81,780 97,000
2035 2040 2045 2050 2055 2060 2065
Directly Appropriated Landlord 86,860 49,920 46,660 35,780 6,325 3,000 3,000
2070 2075 2080 2085 2090 2095 2100 Life Cycle**
Directly Appropriated Landlord 3,000 3,000 3,000 1,800 0 4,554,446
' Costs reflect a five-year average in constant 1995 dollars, except in FY 1995-2000, which is a six-year average.
Total Life Cycle is the sum of annual costs in constant 1995 dollars.
Program Management Cost Estimate
Five-Year Averages (Thousands of Constant 1995 Dollars)*
FY 1995.2000 2005 2010 2015 2020 2025 2030
Program Management 31,601 42,580 47,552 47,598 48,206 47,029 54,666
2035 2040 2045 2050 2055 2060 2065
Program Management 50,927 34,565 18,678 17,074 330 520 639
2070 2075 2080 2085 2090 2095 2100 Life Cycle*
Program Management 561 360 400 240 2,250,131
• Costs reflect a five-year average in constant 1995 dollars, except in FY 1995-2000, which is a six-year average.
" Total Life Cycle is the sum of annual costs in constant 1995 dollars.
ID 39

Th •1.1*07<tm I P
Defense Funding Estimate
Five-Year Averages (Thousands of Constant 1995 Dollars)'
FY 1995-2000 2005 2010 2015 2020 2025 2030
Environmental Restoration 73,268 74,827 88,233 88,735 88,530 87,084 86,965Waste Management 215,348 324,107 384,470 335,984 343,274 319,574 408,723Nuclear Material and Facility Stabilization 42,745 25,694 8,494 89 93 86 0Directly Appropriated Landlord 97,804 93,100 93,100 93,100 93,100 81,780 97,000Program Management 31,601 42,580 47,552 47,598 48,206 47,029 54,666
Total 460,765 560,308 621,850 565,507 573,202 535,553 647,354
2035 2040 2045 2050 2055 2060 2065
Environmental Restoration 86,896 69,517 0 0 628 1,999 2,833Waste Management 395,666 240,215 212,511 193,277 2,517 483 474Nuclear Material and Facility Stabilization 4,397 27,288 48,787 45,877 23,655 0 0Directly Appropriated Landlord 86,860 49,920 46,660 35,780 6,325 3,000 3,000Program Management 50,927 34,565 18,678 17,074 330 520 639
Total 624,745 421,504 326,636 292,008 33,455 6,003 6,946
2070 2075 2080 2085 2090 2095 2100 Life Cyde"•
Environmental Restoration 2,292 1,516 1,559 935 0 0 0 3,852,348Waste Management 127 3 1 1 1 1 0 17,099,130Nuclear Material and Facility Stabilization 0 0 0 0 0 0 0 1,178,768Directly Appropriated Landlord 3,000 3,000 3,000 1,800 0 0 0 4,554,446Program Management 561 360 400 240 0 0 0 2,250,131
Total 5,979 4,879 4,960 2,976 1 1 0 28,962,566
• Costs reflect a five-year average in constant 1995 dollars, except in FY 1995-2000, which is a six year average.
Total Life Cycle is the sum of annual costs in constant 1995 dollars.
ID 40

Major Activities Milestones
ACTIVITY TASK COMPLETION DATE
Environmental Restoration Activities: Fiscal Year
WAG 1 Test Area North-Assessment 1998
WAG 2 Test Reactor Area -Assessment 1998
WAG 3 Idaho Chemical Processing Plant - Assessment 2003
WAG 4 Central Facilities Areas-Assessment 2000
WAG 5 Power Burst Facility and Auxiliary Reactor Area-Assessment 2000
WAG 7 Radioactive Waste Management Complex-Miscellaneous-Assessment 2020
WAG 10 Miscellaneous Areas-Assessment 2002
WAG 1 Test Area North-Remediation 2006
WAG 2 Test Reactor Area Remediation 2020
WAG 3 Idaho Chemical Processing Plant-Remediation 2020
WAG 4 Central Facilities Areas-Remediation 2003
WAG 5 Power Burst Facility and Auxiliary Reactor Area-Remediation 2003
WAG 7 Radioactive Waste Management Complex-Miscellaneous-Remediation 2039
WAG 7 Radioactive Waste Management Complex-Pit 9-Remediation 1999
WAG 10 Miscellaneous Areas-Remediation 2020
WAG 1 Test Area North-Decommissioning 2030
WAG 2 Test Reactor Area-Decommissioning 2021
WAG 3 Idaho Chemical Processing Plant-Decommissioning 2066
WAG 4 Central Facilities Areas-Decommissioning 2071
WAG 5 Power Burst Facility and Auxiliary Reactor Area-Decommissioning 2017
WAG 10 Miscellaneous Areas-Decommissioning 2071
Idaho Falls Facilities-Decommissioning 2083
Waste Management Activities: Fiscal Year
EIS Record of Decision 1995
Idaho Waste Processing Facility (IPWF)-Construction 2003
Waste Characterization Storage Facility (WCSF)-Construction 1996
ID 41

T e 1 95 Baseline Env, rn nta t IA1i1a€' e. rt." e
Major Activities Milestones (cont)
ACTIVITY TASK COMPLETION DATE
Waste Management Activities
Treatment
Storage and Handling
Disposal
Fiscal Year
Low-level Waste Disposal Facility (LLW)-Construction 2000
Waste Immobilization Facility (WIF) Phase I-Construction 2001
Waste Immobilization Facility (WIF) Phase II-Construction 2006
Idaho Waste Processing Facility (IWPF)-Operations 2009
Waste Immobilization Facility (WIF) Phase I-Operations 2008
Waste Immobilization Facility (WIF) Phase II-Operations 2015
Waste Characterization Storage Facility (WCSF)-Operations 1999
Spent Nuclear Fuel-remove fuel north $ mid basins CPP-603 1996
Spent Nuclear Fuel-complete CP-666 hase I rerack 1997
Spent Nuclear Fuel-complete long-term storage of Three Mile Island II fuel 2001
Spent Nuclear Fuel-consolidate all INEL fuel at Idaho Chemical Processing Plant 2005
Spent Nuclear Fuel-remove fuel south basin CPP-603 2000
Low-Level Waste Disposal Facility (LLW) 2005
Complete Hazardous Waste Operations 2054
Complete High-Level Waste Operations 2050
Complete Spent Nuclear Fuel Operations 2035
Complete Low-Level Waste Operations 2094
Complete Low-Level Mixed Waste Operations 2094
Complete Transuranic Waste Operations 2049
Complete Sanitary Waste Operations 2040
Nuclear Materials & Facility Stabilization Activities Fiscal Year
WAG 1 Test Area North-Stabilization 2001
WAG 2 Test Reactor Area-Stabilization 2010
WAG 3 Idaho Chemical Processing Plant-Stabilization 2049
WAG 4 Central Facilities Areas-Stabilization 2054
WAG 5 Power Burst Facility and Auxiliary Reactor Area-Stabilization 2000
WAG 6 Boiling Water Reactor Experiment Area-Stabilization 2010
WAG 7 Radioactive Waste Management Complex-Miscellaneous-Stabilization 2010
Idaho Falls Facilities-Stabilization 2054
ID 42

daho
Major Activities Milestones (cont)
ACTIVITY TASK COMPLETION DATE
Nuclear Materials & Facility Stabilization Activities Fiscal Year
WAG 1 Test Area North-Surveillance and Maintenance 2003
WAG 2 Test Reactor Area-Surveillance and Maintenance 2012
WAG 3 Idaho Chemical Processing Plant-Surveillance and Maintenance 2051
WAG 4 Central Facilities Areas-Surveillance and Maintenance 2056
WAG 5 Power Burst Facility and Auxiliary Reactor Area-Surveillance and Maintenance 2002
WAG 6 Boiling Water Reactor Experiment Area-Surveillance and Maintenance 2012
WAG 7 Radioactive Waste Management Complex-Surveillance and Maintenance 2012
Idaho Falls Facilities-Surveillance and Maintenance 2056
Landlord Activities Fiscal Year
Complete Infrastructure Activities at Idaho Chemical Processing Plant 2052
Complete Infrastructure Activities at Idaho National Engineering Laboratory 2094
For further information on this site, please contact: Public ParticipationPublic Affairs OfficeTechnical Liaison: Bill Leake
(208) 526-5922(208) 526-0833(208) 526-1713
ID 43

The 1995 Baseline Env onmenta Management Report
ID 44

FERMI NATIONAL
ACCELERATOR
LABORATORY
GRANITE CITY STEEL
(COMPLETED FUSRAP SITE)*
MADISON
UNIVERSITY OF CHICAGO
(COMPLETED FUSRAP SITE)*
ILLINOIS NATIONAL GUARD ARMORY
(COMPLETED FUSRAP SITE)*
ARGONNE NATIONAL
LABORATORY-EAST
SITE A/PLOT M,
PALOS FOREST PRESERVE
*Summaries are notprovided for facilities withcompleted remedialactions.
ILLINOIS
IL 1

Estimated State Total
Argonne National Laboratory-EastFermi Notional AcceleratorSite A/Plot M, Palos ForestFUSRAP-Illinois
Total
(Thousands
995. 1996'.
of Current 1995 Dollars)*
1997 1998 199 100?:
812 986 f,810 40,149 31,947 42,740
• Costs for FY 1995 reflect Congressional Appropriation, costs for FY 1996 reflect EM budget submission, costs for FY 1997-2000 reflect Budget Shortfall Scenario, costs for
shaded area assume 3% annual inflation.
Five-Year Averages (Thousands of Constant 1995 Dollars)**
FY 1995-2000 2005 2010 2015 2020 2025 2030
Argonne National Laboratory-East 28,017 22,842 22,680 17,792 17,578 17,142 14,002
Fermi National Accelerator 3,341 2,320 2,320 2,320 2,320 2,320 1,879
Site A/Plotht, Palos Forest 1,509 196 0 0 0 0 0
FUSRAP-Illinois 72 316 0 0 0 0 0
Total 32,939 25,674 25,000 20,112 19,898 19,462 15,881
2035 2040 2045 2050 2055 2060 2065 Life Cycle***
Argonne Notional Laboratory-East 4,048 462 0 0 0 0 750,832
Fermi National Accelerator 0 0 0 0 0 0 87,427
Site A/PlottA, Palos Forest 0 0 0 0 0 0 0 10,035
FUSRAP-Illinois 0 0 0 0 0 0 0 2,010
Total 4,048 462 0 0 0 0 0 850,304
** Costs reflect a five-year average in constant 1995 dollars, except in FY 1995 - 2000, which is a six-year average.
*** Total Life Cycle is the sum of annual costs in constant 1995 dollars.
IL 2

ARGONNE NATIONAL LABORATORY-EAST
Argonne National Laboratory-East is located in Argonne, Illinois. It occupies a 1,700-acre tract inDuPage County, approximately 22 miles southwest of Chicago.
800 Area Landfill
Building 200M-Wing Hot CellsDecommissioning
WESTGATE
Building 200 PlutoniumGloveboxesDecommissioning
RD.
Builcing 329Mixed Waste Storage
CP-5 ReactorDecommissioning
cc
Lime Sludge Pond
100 Area
w301 Hot CellsDecommissioning
cc
EAS
c.cc.
ac,oc><c•
Builcing 306Waste Management
BLUFF RD. I
7
WOOD DR.
Canal WaterTreatmentPlant
Radioactive Waste Storage Area
0cn
EM Facilities
Disposal or Contamination Areas
Sawmill Creek
East AreaSewage TreatmentPlant
570 Hoking Pond
570 Area SanitaryWastewater Treatment Plants
325C Waste Storage Builcing
Experimental BoilingWater ReactorDecommissioning
317/319/ENE Area
IL 3

Estimated Site Total
(Thousands of Current 1995 Dollars)*
FY 1995 1996 1997
Environmental RestorationWaste ManagementProgram Management
Total
8,650 5,189 12,89016,135 13,144 17,902
1,549
25,781 19,060 I 32,341
1998 1999 2000
13,370 14,247 16,68318,816 16,385 19,0621,605 1,666 1,726
33,791 32,298 37,411
' Costs for FY 1995 reflect Congressional Appropriation, costs for FY 1996 reflect EM budget submission, costs for FY 1997-2000 reflect Budget Shortfall Scenario, costs for
shaded area assume 3% annual inflation.
Five-Year Averages (Thousands of Constant 1995 Dollars)**
FY 1995-2000 2005 2010 2015 2020 2025 2030
Environmental Restoration 11,090 5,223 5,385 1,393 99 860 19
Waste Management 15,665 15,829 15,829 16,169 17,235 16,054 13,788
Program Management 1,262 1,789 1,467 230 245 228 196
Total 28,017 22,842 22,680 17,792 17,578 17,142 14,002
2035 2040 2045 2050 2055 2060 2065 Life Cyde***
Environmental Restoration 0 0 0 0 0 0 131,440
Waste Management 3,991 456 0 0 0 0 590,740
Program Management 57 6 0 0 0 0 28,653
Total 4,048 462 0 0 0 0 0 750,832
Costs reflect a five-year average in constant 1995 dollars, except in FY 1995 - 2000, which is a six-year average.
"' Total Life Cycle is the sum of annual costs in constant 1995 dollars.
PAST, PRESENT, AND
FUTURE MISSIONS
Argonne National Laboratory-East beganoperations in 1945 in support of theDepartment of Energy (DOE) and itspredecessor agencies.
Argonne National Laboratory-East currentlyconducts research in a number of areasincluding advanced-reactor development,superconductivity, improvements in the use ofcoal for power generation, and electrochemicalenergy sources. Other projects include the useof superconducting magnets for improved
particle accelerators, fundamental studies of thechemistry of coal, the immobilization ofradioactive waste for safe disposal, medical-radioisotope technology, genetics research,materials engineering, carcinogenesis, and thebiological effects of low levels of radiation.Environmental research includes investigationsinto the biological activity of energy-relatedmutagens and carcinogens, and theenvironmental effects of acid rain.
Argonne National Laboratory-East is expectedto continue operating as a multi-programnational laboratory dedicated to research anddevelopment for the foreseeable future.
IL 4

ENVIRONMENTAL
RESTORATION
The soils and ground water at ArgonneNational Laboratory-East have beencontaminated as a result of accidental spills,past materials management practices, andformer waste-disposal practices. Thecontaminants of concern include volatile andsemi-volatile organic compounds, metals,polychlorinated biphenyls (PCBs), and a varietyof radionuclides. At present, thesecontaminants do not pose an immediate threatto the workforce or the general public.
Environmental restoration activities at ArgonneNational Laboratory-East are not currentlysubject to interagency agreements or othercompliance orders. These activities, includingsurveillance and monitoring, are expected toconclude by 2030 at the funding levels in thesite baseline cost estimate.
To improve efficiency, environmental activitieshave been organized by project type and/orgeographic area. Each section below describes aproject unit on this basis.
Treatment Sites
Projects under this grouping are sites wherecontamination is known or suspected in soils,ground water, and sediments as a result offormer point source discharges. The pointsources include a wastewater treatment system,coal storage yard, leaking sewer lines, a pond,cooling tower blowdown, and inadvertent airdischarges and spills. Contaminants includelow concentrations of various radionuclides,polynuclear aromatic hydrocarbons, volatileand semi-volatile organic compounds, PCBs,arsenic, chromium and pesticides. The extent ofcontamination will not be known untilinvestigations are completed. These projects arescheduled for completion in 2003.
Solid Waste Storage/Disposal
This project consists of the investigation andremediation of contamination which may haveresulted from a sanitary landfill, a solid wastelandfill, chemical disposal wells (french drains),retired and active underground fuel productstorage tanks, a paint solvent disposal area, anda waste oil storage area. Contaminants beinginvestigated in soils and ground water includearomatic hydrocarbons, chlorinated benzenes,heavy metals, laboratory waste, and generalrubbish and construction debris. It is assumedcontaminants have migrated; however, theextent of migration will not be known untilinvestigations have been completed in 1998.Should remediation be required, it is scheduledfor completion in 2005.
Mixed Waste Storage/Disposal
This project concerns characterization andpotential remediation of a geographicallycontiguous area. The sources of contaminationincluded two landfills, two french drains, and aradioactive staging area. Contaminants includevolatile and semi-volatile organic compounds,PBCs, lead, and low levels of radionuclides.Preliminary characterization indicatescontaminants have migrated into the aquiferand beyond the site boundary. Additionalcharacterization is under way to define theextent of contamination. Remediation isscheduled for completion in 2010.
Remedial Support Activities
The scope of this project supports otherremedial activities by focusing efforts on site-wide investigation of hydrogeologic conditions,solid waste management units and inactivewaste sites. The intent is to quantify the extentof contamination present in soils, ground water,surface water, and sediments and to identifyany additional sources of contamination. Allactivities are scheduled for completion in 2010.
IL 5

Facilities Conversion
The Experimental Boiling-Water Reactor isundergoing decommissioning; it will beconverted to a facility for storing transuranicwaste. The shutdown reactor is contaminatedwith cobalt-60, iron-55, nickel-63, contaminatedand activated lead, and trace quantities of otherradionuclides. Most of the contamination isfixed on reactor components, piping, structures,and the like, but some loose contamination ispresent as well. This project is scheduled forcompletion in 1995.
Reactor Facililties
The focus of this project group is thedecommissioning of six small research reactors,scheduled for completion in 2001. The reactorsare the CP-5, Juggernaut, JANUS, ZPR, ATSR,and the Fast-Neutron Generator. Contaminantscurrently present in the reactors includeactivation product, residual tritium, cobalt-60,trace amounts of uranium-235 and uranium-238, activated and contaminated lead,beryllium, cadmium, and oxidized fuel.Contamination is confined to reactor areas. Nosoil or ground-water contamination is expectedto be found.
Support Facilities
Decommissioning of research reactor supportfacilities also is scheduled for completion in2001. The facilities include plutonium gloveboxes, surplus retention tanks for radioactiveliquids, an ion exchange facility, and acyclotron. Contaminants include mixed fissionproducts, plutonium-239, and americium-241.Contamination is confined to equipment andstructures in individual facilities, and is notanticipated in environmental media outside thefacilities.
WASTE MANAGEMENT
Argonne National Laboratory-East currentlymanages hazardous, low-level radioactive, low-level mixed, and transuranic waste. It isassumed Argonne National Laboratory-Eastwill continue to operate under the direction ofDOE's Office of Energy Research for theforeseeable future. Environmental restorationactivities will conclude by 2030 at the assumedfunding levels. However, laboratory operationswill continue to generate waste. Continuingwaste management activities in support of
Environmental Restoration Activity Costs
Five-Year Averages (Thousands of Constant 1995 Dollars)*
FY 1995-2000 2005 2010 2015 2020 2025 2030 Life Cycle"
Environmental RestorationAssessment 2,937 419 0 0 0 0 0 19,715Remedial Actions 1,741 3,907 4,268 0 0 0 0 51,322Surveillance And Maintenance 24 535 1,117 1,393 99 860 19 20,262Facility Decommissioning 6,388 363 0 0 0 0 0 40,140
Total 11,090 5,223 5,385 1,393 99 860 19 131,440
• Costs reflect a five-year average in constant 1995 dollars, except in FY 1995-2000, which is a six-year average.
▪ Total Life Cycle is the sum of annual costs in constant 1995 dollars.
IL 6

ongoing programs are projected at a cost ofapproximately $15 million per year. Tofacilitate the development of this life cycle costestimate, an arbitrary cutoff date of 2029 hasbeen assigned to all sites that have completedenvironmental restoration but maintainongoing waste management support of otherDOE programs (Energy Research, DefensePrograms, etc.). Waste management support ofother Department programs at this site aretruncated at 2036; six years after the completionof restoration activities.
Waste management activities at ArgonneNational Laboratory-East are addressingcurrent National Pollutant DischargeElimination System permit noncompliances andpotential noncompliances, and upgradingBuilding 306 to conform to all waste-handlingregulations and DOE Orders to support safeworking conditions and increase the efficiencyin waste management operations.Improvements are planned to the electrical,HVAC, and fire protection systems; and to thephysical plant to provide for more effectiveradiological control.
Waste Treatment
Argonne National Laboratory-East currentlyengages in limited onsite treatment of wasteprior to shipment to offsite facilities fordisposal. Treatment technologies include
neutralization for hazardous waste,neutralization/precipitation for liquidinorganic mixed waste, and a neutralization/precipitation process for liquid transuranicwaste. Treatment is expected to continue aswaste is generated by ongoing research anddevelopment activities. Large-scale treatmentfacilities are not planned at this time.
Waste Storage
New hazardous, radioactive, and mixed wastestorage facilities will be constructed to provideadequate space, effect economical wasteshipments, and conform to present andanticipated waste storage regulations. TheLow-Level Waste Bin Storage project is plannedfor the outyears. Argonne National Laboratory-East stores waste in accordance with theprovisions of its pending ResourceConservation and Recovery Act Part B Permit.
Waste Disposal
Hazardous waste is sent to commercial facilitiesfor recycling, treatment, or disposal. Low-levelradioactive waste is currently sent to DOE'sfacility in Hanford, Washington, for disposal.Low-level mixed radioactive waste is sent toHanford for storage pending treatment.
Major Waste Management Projects
Five-Year Averages (Thousands of Constant 1995 Dollars)*
FY 1995-2000 2005 2010 2015 2020 2025 2030 life Cycle**
Wade Storage Project 600 0 0 0 0 0 0 3,600
• Costs reflect a five-year average in constant 1995 dollars, except in FY 1995-2000, which is a six-year average.
• Total Life Cycle is the sum of annual costs in constan• 1995 dollars.
Note: These projects represent a subset of waste management activities. Associated program management costs are built-in to the estimates provided.
IL 7

NUCLEAR MATERIAL AND
FACILITY STABILIZATION
There are no current or planned nuclearmaterial and facility stabilization activities atthe Argonne National Laboratory-East site.
LANDLORD FUNCTIONS
The DOE's Office of Energy Research isprimarily responsible for landlord functions atArgonne National Laboratory-East. The Officeof Environmental Management supports thesefunctions by contributing a percentage ofoverhead, which is calculated annually basedon programs funded at the Laboratory.
PROGRAM MANAGEMENT
Program management at Argonne NationalLaboratory-East is dedicated to programplanning and direct management of projects,and to waste minimization activities. ArgonneNational Laboratory-East does not fund anygrants or Agreements-in-Principle at this time.
FUNDING AND COST
INFORMATION
The following tables present fundinginformation and major activity milestones forArgonne National Laboratory-East.
Waste Management Activity Costs
Five-Year Averages (Thousands of Constant 1995 Dollars)*
FY 1995-2000 2005 2010 2015 2020 2025 2030
TreatmentTransuranic WasteLow-Level Mixed WasteLow-Level Waste
Storage and HandlingTransuranic Waste
Hazardous Waste
Total
1,815854914
2,090983
1,053
2,090983
1,053
7,059 5,920 5,9205,022 5,783 5,783
2,0901,3231,053
2,0902,3891,053
2,0901,2081,053
1,7341,044861
5,920 5,920 5,920 5,5225,783 5,783 5,783 4,626
15,665 15,829 15,829 16,169 17,235 16,054 13,788
2035 2040 2045
TreatmentTransuranic WasteLow-Level Mixed WasteLow-Level Waste
Storage and HandlingTransuranic Waste
Hazardous Waste
Total
24940973
3,2600
000 0
0 0456
2050 2055 2060 2065 Life Cycle**
0 000
0
0 0 0 00 0 0 0
73,06646,81236,478
236,545197,839
3,991 456 0 0 0 0 0 590,740
• Costs reflect a five-year average in constant 1995 dollars, except in FY 1995-2000. which is a six-year average.
▪ Total Life Cycle is the sum of annual costs in constant 1995 dollars.
IL 8

Program Management Cost Estimate
Five-Year Averages (Thousands of Constant 1995 Dollars) *
FY 1995.2000 2005 2010 2015 2020 2025 2030
Program Management 1,262 1,789 1,467 230 245 228 196
2035 2040 2045 2050 2055 2060 2065 Life Cyde**
Program Management 57 6 0 0 0 0 0 28,653
• Costs reflect a five-year average in constant 1995 dollars, except in FY 1995-2000, which is a six-year average.
" Total Life Cycle is the sum of annual costs in constant 1995 dollars.
Defense Funding Estimate
Five-Year Averages (Thousands of Constant 1995 Dollars)*
FY 1995-2000 2005 2010 2015 2020 2025 2030
Waste Management 313 317 317 323 345 321 276
Program Management 94 130 104 5 5 5 4
Total 408 446 420 328 350 326 280
2035 2040 2045 2050 2055 2060 2065 Life Cycle*
Waste Management 80 9 0 0 0 0 0 11,813
Program Management 1 0 0 0 0 0 0 1,830
Total 81 9 0 0 0 0 0 13,643
• Costs reflect a five-year average in constant 1995 dollars, except in FY 1995-2000, which is a six-year average.
• Total Life Cycle is the sum of annual costs in constant 1995 dollars.
IL 9

Nondefense Funding Estimate
Five-Year Averages (Thousands of Constant 1995 Dollars)*
FY 1995-2000 2005 2010 2015 2020 2025 2030
Environmental Restoration 11,090 5,223 5,385 1,393 99 860 19Waste Management 15,352 15,513 15,513 15,846 16,890 15,733 13,512Program Management 1,167 1,659 1,363 225 240 223 192
Total 27,609 22,396 22,260 17,464 17,229 16,817 13,722
2035 2040 2045 2050 2055 2060 2065 Life Cycle**
Environmental Restoration 0 0 0 0 0 0 0 131,440Waste Management 3,911 447 0 0 0 0 0 578,926Program Management 56 6 0 0 0 0 0 26,823
Total 3,966 454 0 0 0 0 0 737,189
* Costs reflect a floe-year average in constant 1995 dollars, except in FY 1995-2000, which is a six-year average.
Total Life Cycle is the sum of annual costs in constant 1995 dollars.
Major Activity Milestones
ACTIVITY TASK COMPLETION DATE
Environmental Restoration Fiscal Year
Facilities Conversion - Project Complete 1995
Reactor Facilities - Project Complete 2001
Support Facilities - Project Complete 2001
Treatment Sites - Project Complete 2003
Solid Waste Storage/Disposal - Project Complete 2005
Remedial Support Activities - Project Complete 2010
Mixed Waste Storage/Disposal - Project Complete 2010
Waste Management Fiscal Year
PCB Sludge Disposal - Project Complete 1996
Waste Storage Project - Complete Phase I 1996
Waste Storage Project - Complete Phase II 1999
Waste Management Operations - Complete 2036
For further information on this site, please contact : Public Participation Office
Public Affairs Office
Technical Liaison: Michael Ferrigan
(708) 252-8796
(708) 252-2010
(708) 252-2570
IL 10

FERMI NATIONAL ACCELERATOR LABORATORY
The Fermi National Accelerator Laboratory is located in Batavia, Illinois, about 30 miles west of theCity of Chicago.
Proposed Low-LevelRadioactive Waste Sortingand Repackaging Building
I
Main Ring Perforated
MP Pipe Field(Chromate ContaminationCleanup)
•
RailyardStorage Area
Radioactive MaterialsProcessing andStorage Area
Hazardous WasteStorage Area
Soil Contamination CleanupAround Main Ring
IL 11

Estimated Site Total
(Thousands of Current 1995 Dollars)*
FY 1995 1996 1997
Waste Management 4,918 2,751
1998 1999 2000
3,526 3,779
• Costs for FY 1995 reflect Congressional Appropriation, costs for FY 1996 reflect EM budget submission, costs for FY 1997-2000 reflect Budget Shortfall Scenario, costs forshaded area assume 3% annual inflation.
Five—Year Averages (Thousands of Constant 1995 Dollars)**
FY 1995-2000 2005 2010 2015 2020 2025 2030 Life Cycle***
Waste Management 3,341 2,320 2,320 2,320 2,320 2,320 1,879 87,427
" Costs reflect a five-year average in constant 1995 dollars, except in FY 1995 - 2000, which is a six-year average.
Total Life Cycle is the sum of annual costs in constant 1995 dollars
PAST, PRESENT AND
FUTURE MISSIONS
The Fermi National Accelerator Laboratorybegan its mission as a single-program researchand development facility for the Department ofEnergy (DOE) in 1972 when the first acceleratorat the laboratory began operations.
The Fermi National Accelerator Laboratory'smission is to conduct research in high-energyphysics. This involves acceleration andcollision of subatomic particles and anexamination of the products of theseinteractions. Protons are accelerated using aseries of five machines of increasing size andcapability. After acceleration, protons may beextracted and sent to one of the three fixedtarget areas, or they may be kept in theaccelerator and used in collisions with
antiprotons traveling in the opposite direction.The information gained from these studiescontributes to understanding the basic nature ofmatter and forces.
It is assumed the Fermi National AcceleratorLaboratory will continue to operate as anational high energy physics acceleratorlaboratory under the direction of the Office ofEnergy Research for the foreseeable future.
ENVIRONMENTAL
RESTORATION
There are no current or planned environmentalrestoration activities at the Fermi NationalAccelerator Laboratory. All costs and activitiesassociated with the Resource Conservation andRecovery Act (RCRA) corrective action areprovided in the following waste managementsection.
IL 12

WASTE MANAGEMENT
The Fermi National Accelerator Laboratory has
no plans for treatment or disposal facilities
onsite. Continuing waste management
activities in support of ongoing programs are
projected at a cost of approximately $2.3 million
per year. To facilitate the development of this
life-cycle cost estimate, an arbitrary cutoff date
of 2030 has been assigned to all sites that
maintain ongoing waste management support
of other Department programs (Energy
Research, Defense Programs, etc.).
The Fermi National Accelerator Laboratory
currently has minor soils contamination related
to testing and refilling polychlorinated biphenyl
(PCB) containing electric transformers. The
Laboratory is currently undertaking a RCRA
Facility Investigation for 21 solid waste
management units that may represent potential
releases to the environment from former
operations at the site. Specific sources of
contamination, transport mechanisms, degree
of contamination, and risk assessment data will
not be available until completion of Phase II of
the RCRA Facility Investigation in FY 1998.
As a condition of its RCRA Part B permit, the
Fermi National Accelerator Laboratory
undertook a Phase I investigation. The Phase I
report was transmitted to the IllinoisEnvironmental Protection Agency (EPA) on
August 31, 1994. Milestones related to potential
future work are based on comments and
directions from this agency. Should additional
work be required as a result of Phase I, Phase II
is expected to begin in 1996, following
Laboratory preparation, and Illinois EPA
approval, of a RCRA Facility Investigation
Phase II workplan during FY 1995, and
completion of the study in 1998.
Cleanup of PCB contamination in the Fermi
National Accelerator Laboratory's Main Ring
continues as the Main Ring is shut down each
year for routine maintenance. Environmental
restoration activities are currently completed
under the waste management activities
funding.
Waste Treatment
The Fermi National Accelerator Laboratory
does not treat hazardous or radioactive waste
onsite. All waste is sent offsite for appropriate
treatment, as required.
Waste Storage
To facilitate its waste operations, the Fermi
National Accelerator Laboratory is currently
constructing a new storage facility. This facility
is identified in the waste management projects
as the Waste Handling Building, the name used
in the list of projects required to be addressed
by the FY 1994 National Defense Authorization
Act to serve as the focal point for all low-level
Major Waste Management Projects
Waste Handling Building
Five-Year Averages (Thousands of Constant 1995 Dollars)*
FY 1995-2000 2005 2010
416 0 0
2015 2020 2025 2030
0 0 0 0
Life Cycle"
2,500
* Costs reflect a five-year average in constant 1995 dollars, except in FY 1995-2000, which is a six-year average.
• Total Life Cycle is the sum of annual costs in constant 1995 dollars.
Note: These projects represent a subset of waste management activities. Associated program management costs are built-in to the
estimates provided.
IL 13

radioactive, nonhazardous waste activities.This facility will replace currently outdatedfacilities and is expected to be complete in 1996.All waste is collected, handled, andstored in accordance with the provisions of theFermi National Accelerator Laboratory'sRCRA Part B Permit.
Waste DisposalRadioactive waste is shipped to DOE'sHanford, Washington facility for disposal.Commercial facilities and brokers are used forhazardous waste.
NUCLEAR MATERIAL ANDFACILITY STABILIZATION
There are no current or planned nuclearmaterial and facility stabilization activities atthe Fermi National Accelerator Laboratory.
LANDLORD FUNCTIONS
At the present time, landlord activities at theFermi National Accelerator Laboratory areprimarily the responsibility of DOE's Office ofEnergy Research. The EnvironmentalManagement program at the Laboratorysupports landlord activities through apercentage of overhead calculated on anannual basis, based on programs funded at theLaboratory. There are no plans for theEnvironmental Management program toassume landlord functions at the site.
PROGRAM MANAGEMENT
Program management at the Fermi NationalAccelerator Laboratory involves programplanning, management of small projects, wasteminimization activities, and ongoing wastemanagement activities. Program managementactivities are not separated from routineoperations. The Laboratory does not fund anygrants or Agreements-in-Principle at this time.
Waste Management Activity Costs
Five-Year Averages (Thousands of Constant 1995 Dollars)*FY 1995-2000 2005 2010 2015 2020 2025 2030 Life Cycle**
TreatmentLow-Level Waste
Hazardous Waste1,634
1,7061,135
1,1851,135
1,1851,135
1,1851,135
1,1851,135
1,185931
94842,829
44,598Total 3,341 2,320 2,320 2,320 2,320 2,320 1,879 87,427
• Costs reflect a five-year average in constant 1995 dollars, except in FY 1995-2000, which is a six-year average.▪ Total Life Cycle is the sum of annual costs in constant 1995 dollars.
IL 14

FUNDING AND COST
INFORMATION
The following tables present funding
information and major activity milestones for
Fermi National Accelerator Laboratory.
Nondefense Funding Estimate
Waste Management
Five-Year Averages (Thousands of Constant 1995 Dollars)**
FY 1995 - 2000 2005 2010 2015 2020 2025 2030
3,341 2,320 2,320 2,320 2,320 2,320 1,879
life Cycle**
87,427
* Costs reflect a five-year average in constant 1995 dollars, except in FY 1995-2000, which is a six-year average.
Total Life Cycle is the sum of annual costs in constant 1995 dollars.
Major Activity Milestones
ACTIVITY TASK COMPLETION DATE
Waste ManagementFiscal Year
Waste Handling Facility - Complete Construction 1996
Complete RCRA Facility Investigation 1998
For fitrther information on this site, please contact: Public Participation Office (708) 252-8796
Public Affairs Office (708) 252-2010
Technical Liaison: Michael Ferrigan (708) 252-2570
IL 15

SITE A/PLOT M, PALOS FOREST PRESERVE
Site A/Plot M is located in the Palos Forest Preserve in Cook County, Illinois.
Oes
DU PAGE COUNTY
COOK COUNTY
?•G c‘SX`\9 .•••
.••
•Church _
Forest Preserve
PLOT M,DECOMMISSIONED
C)SITE ADECOMMISSIONED
OldSepticDrain
HorsecollarSlough
c"--;
TomahawkSlough
IL 16

Estimated Site Total
(Thousands of Current 1995 Dollars)*
FY 1995
Environmental Restoration
1998 1999 2000
2832 1968 1060
• Costs for FY 1995 reflect Congressional Appropriation, costs for FY 1996 reflect EM budget submission, costs for FY 1997-2000 reflect
Budget Shortfall Scenario, costs for
shaded area assume 3% annual inflation.
Five-Year Averages (Thousands of Constant 1995 Dollars)**
FY 1995 - 2000 2005 2010 2015 2020 2025 2030 Life Cycle***
Environmental Restoration 1,509 196 0 0 0 0 0 10,035
Costs reflect a five-year average in constant 1995 dollars, except in FY 1995-2000, which is a six-year average.
*** Total Life Cycle is the sum of annual costs in constant 1995 dollars.
PAST, PRESENT, AND
FUTURE MISSIONS
Site A/Plot M was the site of early activities
undertaken by the Manhattan Engineer District
(a predecessor of the Department of Energy)
between 1943 and 1956. Site A contained two
experimental nuclear reactors and associated
laboratories. Plot M was used for the burial of
radioactive waste from experiments at Site A.
Initial work involved research anddevelopment for nuclear fuels for use in
defense activities.
Environmental restoration, surveillance, and
maintenance activities at Site A are expected to
continue as long as the entombed bioshield
remains in place. There are no plans to remove
the bioshield at this time.
Site A/Plot M has no current mission and it is
assumed Site A/Plot M will eventually be
returned to the Cook County Forest Preserve
District for unrestricted use (the current owner)
as part of the Palos Forest Preserve.
ENVIRONMENTAL
RESTORATION
Environmental media of concern include soils
and ground water. Contaminants may include
various radioisotopes, and volatile organic
compounds, semi-volatile organic compounds,
and heavy metals. Transport mechanisms,
degree of contamination, and potential threats
to workers and the general public are currently
being investigated. Data concerning these areas
will be available in FY 1996.
Current environmental restoration activities
include continued surveillance and monitoring
of ground water and surface streams for a
variety of hazardous compounds andradioisotopes. In addition, a comprehensive
investigation of potential contamination at Site
A is currently being conducted, with the final
report expected in FY 1995. Pending analyses
of data from the investigation and discussion
with the current site owner and local regulators,
remedial activities may be conducted at the site.
IL 17

Costs and scope of possible remedial activitieshave not been included in the total life cyclecost estimate for this project. Assumingremedial activities are deemed unnecessary, thisproject is expected to conclude in 1996, withlong-term surveillance and maintenancecontinuing indefinitely. If remedial activitiesare required, the project is expected to becompleted by 2005.
WASTE MANAGEMENT
ACTIVITIES
All waste generated as a result of investigationsand remediation at Site A/Plot M will betreated and disposed of at appropriate offsitelocations. There are no plans to constructtreatment, long-term storage, or disposalfacilities at Site A/Plot M. Management ofwaste will be funded within the scope ofenvironmental restoration activities.
Waste TreatmentNo treatment activities are carried out or areplanned for Site A/Plot M. Waste is sent offsitefor treatment, if required.
Waste StorageInvestigation-derived waste is collected,packaged, and classified for shipment to offsitefacilities.
Waste DisposalWastes are shipped to appropriate offsitefacilities for disposal.
NUCLEAR MATERIAL ANDFACILITY STABILIZATION
There are no current or planned nuclearmaterial or facility stabilization activities at SiteA/Plot M.
LANDLORD FUNCTIONS
At the present time, landlord activities at SiteA/Plot M are the responsibility of the currentowner; the Cook County Forest PreserveDistrict.
Environmental Restoration Activity Costs
Five-Year Averages (Thousands of Constant 1995 Dollars)'FT 1995-2000 2005 2010 2015 2020 2025 2030 life Cycle*
Long Term Surveillance And Monitoring 1,509 196 0 0 0 0 0 10,035
• Costs reflect a five-year average in constant 1995 dollars, except in FY 2000, which is a six-year average.
▪ Total Life Cycle is the sum of annual costs in constant 1995 dollars.
IL 18

Program management at Site A/Plot M is
concerned with surveillance and maintenance,
investigation, and review and analysis of data.
These activities are performed by operations
office personnel on a level-of-effort basis.
PROGRAM MANAGEMENT FUNDING AND COST
INFORMATION
The following tables present fundinginformation and major activity milestones for
A/Plot M, Palos Forest Preserve.
Defense Funding Estimate
Five-Year Averages (Thousands of Constant 1995 Dollars)*
FY 1995-2000 2005 2010 2015
Environmental Restoration 755 98 0 0
2020 2025 2030 Life Cycle**
0 0 0 5,018
• Costs reflect a five-year average in constant 1995 dollars, except in FY 1995-2000, which is a six-year average.
** Total Life Cycle is the sum of annual costs in constant 1995 dollars.
Nondefense Funding Estimate
Environmental Restoration
Five—Year Averages (Thousands of Constant 1995 Dollars)*
FY 1995-2000 2005 2010 2015 2020 2025 2030
755 98 0 0 0 0 0
Life Cycle**
5,018
• Costs reflect a five-year average in constant 1995 dollars, except in FY 1995-2000, which is a six-year average.
▪ Total Life Cycle is the sum of annual costs in constant 1995 dollars.
Major Activity Milestones
ACTIVITY TASK COMPLETION DATE
Environmental Restoration and Associated Waste Management Fiscal Year
Site A Characterization - Complete Characterization Activities 1995
Determination if Remedial Action is Warranted 1996
Site A Surveillance and Maintenance - Complete Remedial Action, if Warranted 2005
For fitrther information on this site, please contact: Public Participation Office (708) 252-8796
Public Affairs Office (708) 252-2010
Technical Liaison: Michael Ferrigan (708) 252-2570
IL 19

IL 20

ILLINOIS FUSRAP SITES
Madison is the only active Illinois facility within the Formerly Utilized Sites Remedial Action
Program (FUSRAP). The program was established in 1974 under the provisions of the Atomic
Energy Act to identify previously decontaminated Manhattan Engineer District and Atomic Energy
Commission sites to reevaluate their radiological condition and to take appropriate remedial action
where necessary. FUSRAP encompasses 46 sites in 14 States and is funded through the Oak Ridge
Operations Office.
The model used to estimate costs for this report provides one cost for all of the FUSRAP sites located
in each State. All costs for waste management activities, program management, and relevant land-
lord activities attributable to the Department are provided for within the scope of environmental
restoration. There are no FUSRAP sites with either current or planned nuclear material and facility
stabilization activity needs. Funding for all sites is 100 percent nondefense. For a general discus-
sion of FUSRAP and associated costs, see the FUSRAP Site Summary found in the Tennessee
section.
Estimated Site Total
Illinois-FUSRAP
(Thousands of Current 1995 Dollars)*
FY 1995 1996 1997 1998 1999
0 0 0
2000
430
* Costs for FY 1995 reflect Congressional Appropriation, costs for FY 1996 reflect EM budget submission, costs for FY 1997-2000 reflect Budget Shortfall Scenario, costs for
shaded area assume 3% annual inflation.
Five-Year Averages (Thousands of Constant 1995 Dollars)**
FY 1995 - 2000 2005 2010 2015 2020 2025 2030 Life Cycle***
Illinois-FUSRAP 72 316 0 0 0 0 0 2,010
Costs reflect a five-year average in constant 1995 dollars, except in FY 1995-2000, which is a six-year average.
"' Total Life Cycle is the sum of annual costs in constant 1995 dollars.
Nondefense Funding Estimate
Five-Year Averages (Thousands of Constant 1995 Dollars)*
FY 1995 - 2000 2005 2010 2015 2020 2025 2030 Life Cycle**
Environmental Restoration 72 316 0 0 0 0 0 2,010
Costs reflect a five-year average in constant 1995 dollars, except in FY 1995-2000, which is a six-year average.
"Total Life Cycle is the sum of annual costs in constant 1995 dollars.
IL 21

MADISON(Formerly Utilized Sites Remedial Action Program)
This former Dow Chemical Company plant is located at College and Weaver Streets in Madison,Illinois, across the Mississippi River from St. Louis, Missouri.
STATE SI•
mERI CIA AvE•
N7 BLDG. NB BLDG.
SURVEY AREA
N6 BLDG.
./Z
N9BLDG.
10 BLDG
N5 BLDG.
VENICEFENCE LINE
MADISON
V)
ciLd
_JOU
WEAVER SI*
IL 22

PAST, PRESENT, AND
FUTURE MISSIONS
Madison, covering a total of 735 acres, extrudeduranium for the Atomic Energy Commissionfrom 1957 to 1960. The plant consists of a large,multi-sectional complex of 10 interconnectingbuildings with a total area under roof ofapproximately 1.4 million square feet.
The facility was used for uranium extrusionand rod-straightening work. These activitieswere performed in Building 6, a largemultistory metal building with a concrete floor.The site is currently used for extrudingaluminum and magnesium metal and forstoring equipment and parts. This site will bereleased for unrestricted use followingcompletion of cleanup.
For further information on this site, please contact:
ENVIRONMENTAL
RESTORATION
The waste volume is estimated to be 10 cubicyards. The waste is uranium contaminated andclassified as low-level radioactive waste. Theonly identified contamination is uranium in thedust on roof support beams.
No remedial action has been conducted to date.
Public Participation OfficePublic Affairs OfficeTechnical Liaison: Melyssa Noe
(615) 576-1590(615) 576-0885(615) 241-3315
IL 23

IL 24

AMES LABORATORY
IOWA
Estimated State Total
FY 99
(Thousands of Current 1995 Dollars)*
19 1997 199 1999 2000
Ames 1670 785 826 851
• Costs for FY 1995 reflect Congressional Appropriation, costs for FY 1996 reflect EM budget submission, costs for FY 1997-2000 reflect Budget Shortfall Scenario, costs for
shaded area assume 3% annual inflation.
Five-Year Averages (Thousands of Constant 1995 Dollars)**
FY 1995-2000 2005 2010 2015 2020 2025 2030 Life Cycle*
Ames 898 554 486 309 306 285 195 16,059
Costs reflect a five-year average in constant 1995 dollars, except in FY 1995 - 2000, which is a six-year average.
"' Total Life Cycle is the sum of annual costs in constant 1995 dollars.
IA 1

IA 2

AMES LABORATORY
Ames Laboratory is located on the campus of Iowa State University in Ames, Iowa. The AmesLaboratory is managed by the Department of Energy (DOE) Chicago Operations Office.
IA 3

Estimated Site Total
(Thousands of Current 1995 Dollars)*
1996 1997 1998 1999 2000
Environmental RestorationWaste ManagementProgram Management
Total ,670 a 851
• Costs for FY 1995 reflect Congressional Appropriation, costs for FY 1996 reflect EM budget submission, costs for FY 1997-2000 reflect Budget Shortfall Scenario, costs forshaded area assume 3% annual inflation.
Five-Year Averages (Thousands of Constant 1995 Dollars)**
FY 1995 - 2000 2005 2010 2015 2020 2025 2030 Life Cycle***
Environmental Restoration 388 113 72 0 0 0 0 3,255
Waste Management 300 239 239 240 237 221 151 8,442Program Management 210 201 175 69 69 64 44 4,362
Total 898 554 486 309 306 285 195 16,059
Costs reflect a five-year average in constant 1995 dollars, except in FY 1995 - 2000, which is a six-year average.
*** Total Life Cycle is the sum of annual costs in constant 1995 dollars.
PAST, PRESENT, AND
FUTURE MISSIONS
Ames Laboratory began operations in 1942under the Manhattan Engineer District (apredecessor of DOE) during World War II toconduct research and development in supportof the war effort. Ames Laboratory conductsbasic and intermediate-range applied researchin physical, mathematical, and engineeringsciences that underlie energy technologies andother areas of national importance. In addition,Ames Laboratory uses its unique strengths inmaterials preparation and processing, chemicalsciences, and materials reliability to solvecomplex materials problems in energyproduction and utilization.
It is assumed Ames Laboratory will continue tooperate under the direction of DOE's Office ofEnergy Research for the foreseeable future.Environmental restoration activities arescheduled to end in 2010 at assumed fundinglevels. However, laboratory operations willcontinue to generate waste. Continuing wastemanagement activities in support of ongoingprograms are projected at a cost ofapproximately $240,000 per year. To facilitatethe development of this life-cycle cost estimate,an arbitrary cutoff date of 2030 has beenassigned to all sites that have completedenvironmental restoration but maintainongoing waste management support of otherDepartment programs (Energy Research,Defense Programs, etc.).
IA 4

ENVIRONMENTAL
RESTORATION
The principal environmental media of concernat Ames Laboratory are soils and ground water.The principal contaminants of concern arediesel fuel, uranium, thorium, tritium, mercury,thallium, potassium, lithium, and kerosene.Contamination is a result of accidental spillsand past materials and waste managementpractices such as use of an 80,000-square-footwaste burial site (known as the ChemicalDisposal Site) near the Iowa State UniversityApplied Sciences complex from 1958 through1966.
The primary current restoration activity isinvestigation and remediation of the AmesChemical Disposal Site. There are noenforceable agreements governing this task;however, Comprehensive EnvironmentalResponse, Compensation, and Liability Actregulations are being followed to complete thisnon-time critical removal action.
Characterization and removal activities beganin 1990, and are expected to be complete in FY1995. Preliminary data indicate ground wateronsite exceeds maximum contaminant levels forradionuclides; additional characterization isunderway to assess potential offsitecontamination, and is expected to be completein 1997. At this time, ground-water monitoringis expected to be conducted for four quarters.At the end of that time, the need for additionalmonitoring and/or remediation will benegotiated with the regulators.
A second restoration activity currentlyunderway is monitoring a diesel fuel spillwhich occurred more than 20 years ago. Thefaulty tank was removed at that time, however,contaminated soils were left in place. The areaof contamination is currently beneath abuilding, and cannot be removed withoutstructural damage to the building. AmesLaboratory expects to continue to monitor thearea of contamination regularly to ensureground water does not become contaminated.
Environmental Restoration Activity Costs
Five-Year Averages (Thousands of Constant 1995 Dollars) *
FY 1995-2000 2005 2010 2015 2020 2025 2030 Life (vie**
Environmental RestorationAssessment 257 0 0 0 0 0 0 1,540Surveillance And Maintenance 131 113 72 0 0 0 0 1,715
Total 388 113 72 0 0 0 0 3,255
' Costs reflect a five-year average in constant 1995 dollars, except in FY 1995-2000, which is a six-year average.
Total Life Cycle is the sum of annual costs in constant 1995 dollars.
IA 5

WASTE MANAGEMENT
No large-scale treatment, storage, or disposalfacilities are planned for the Ames Laboratory.Ames Laboratory manages hazardous, low-level radioactive, and very small amounts oflow-level mixed waste (less than .04 cubicmeters are expected in 1996). Ames expects tocontinue to ship its hazardous and low-levelradioactive waste to offsite facilities fortreatment and/or disposal, as appropriate.Low-level mixed waste will be brokered forinclusion in larger shipments for treatmentand/or disposal, as appropriate.
Waste Treatment
Ames does not treat waste onsite; all waste isshipped offsite for treatment, as required.
Waste Storage
All waste is collected in satellite accumulationareas and then brought to a central staging areafor packaging and certification for shipmentand disposal.
Waste Disposal
Hazardous waste is brokered and disposed byappropriate commercial firms; low-level wasteis shipped to DOE's Hanford, Washington,facility.
NUCLEAR MATERIAL ANDFACILITY STABILIZATION
There are no current or planned nuclearmaterial and facility stabilization activities atAmes Laboratory.
Waste Management Activity Costs
Five-Year Averages (Thousands of Constant 1995 Dollars)*
FY 1995-2000 2005 2010 2015 2020 2025 2030 Life Cyde*
Treatmentlow-Level Waste 67 54 54 54 52 36 3 1,660
Storage and HandlingLow-Level Waste 0 0 0 0 0 0 0
Hazardous Waste 233 185 185 185 185 185 148 6,774
Total 300 239 239 240 237 221 151 8,442
• Costs reflect a five-year average in constant 1995 dollars, except in FY 1995-2000, which is a six-year average.
Total Life Cycle is the sum of annual costs in constant 1995 dollars.
IA 6

LANDLORD FUNCTIONSAt the present time, landlord activities at AmesLaboratory are primarily the responsibility ofDOE's Office of Energy Research. TheEnvironmental Management program at AmesLaboratory supports landlord activities througha percentage of overhead calculated on anannual basis, based on programs funded at theLaboratory. There are no plans for theEnvironmental Management program toassume landlord functions at the site.
PROGRAM MANAGEMENTProgram management at Ames Laboratoryconsists of program planning and directmanagement of projects, and wasteminimization activities. Ames Laboratory doesnot fund any grants or Agreements-In-Principleat this time.
FUNDING AND COST
INFORMATION
The following tables present fundinginformation and major activity milestones forAmes Laboratory.
Program Management Cost Estimate
Five-Year Averages (Thousands of Constant 1995 Dollars)*
FY 1995-2000 2005 2010 2015 2020 2025 2030 Life Cyde**Program Management 210 201 175 69 69 64 44 4,362
* Costs reflect a five-year average in constant 1995 dollars, except in FY 1995-2000, which is a six-year average.
"Total Life Cycle is the sum of annual costs in constant 1995 dollars.
Defense Funding Estimate
Five-Year Averages (Thousands of Constant 1995 Dollars)*
FY 1995-2000 2005 2010 2015 2020 2025 2030 Life Cycle**Environmental Restoration 388 113 72 0 0 0 0 3,255Program Management 138 132 106 0 0 0 0 2,017
Total 526 245 178 0 0 0 0 5,272
• Costs reflect a five-year average in constant 1995 dollars, except in FY 1995-2000, which is a six-year average.
" Total Life Cycle is the sum of annual costs in constant 1995 dollars.
IA 7

Nondefense Funding Estimate
Five-Year Averages (Thousands of Constant 1995 Dollars)*
FY 1995 - 2000 2005 2010 2015 2020 2025 2030 Life Cycle**
Woste Management 300 239 239 240 237 221 151 8,442
Program Management 71 69 69 69 69 64 44 2,345
Total 371 308 309 309 306 285 195 10,787
• Costs reflect a five-year average in constant 1995 dollars, except in FY 1995-2000, which is a six-year average.
Total Life Cycle is the sum of annual costs in constant 1995 dollars.
Major Activity Milestones
ACTIVITY TASK COMPLETION DATE
Environmental Restoration Fiscal Year
Chemical Disposal Site - Submit Final Remedial Action Plan 1995
Underground Storage Tank Removal - Submit Completion Report 1999
Chemical Disposal Site - Submit Final Completion Report 2010
Complete Environmental Restoration Activities 2010
Waste Management Ongoing Non-EM Program Costs Truncated 2030
For fiirther information on this site, please contact: Public Participation OfficePublic Affairs OfficeTechnical Liaison: Michael Ferrigan
(708) 252-8796(708) 252-2010(708) 252-2570
IA 8

MAXEY FLATSDISPOSAL SITE
PADUCAH GASEOUSDIFFUSION PLANT
KENTUCKYEstimated State Total
(Thousands of Current 1995 Dollars)*
FY 1995 9 1997 19 199! 200Maxey Flats 2,200 8,000 8,00 8,000 )00: 1401)Paducah Gaseous Diffusion Plant 59,000 58,600 61;040 j..62,300 56,000 4,100Total - Kentucky 61,200 66,600 000 70,300 57,200 65)
• Costs for FY 1995 reflect Congressional Appropriation, costs for FY 1996 reflect EM budget submission, costs for FY 1997-2000 reflect Budget Shortfall Scenario, costs forshaded area assume 3% annual inflation.
Five-Year Averages (Thousands of Constant 1995 Dollars)`•
FY 1995-2000 2005 2010 2015 2020 2025
Maxey Flats 4,767 0 0 0 0 0Paducah Gaseous Diffusion Plant 55,202 80,307 102,488 81,541 155,313 154,732Total - Kentucky 59,969 80,307 102,488 81,541 155,313 154,732
FY 2030 2035 2040 2045 2050 2055 Life Cycle*
Maxey Flats 0 0 0 0 0 0 28,600Paducah Gaseous Diffusion Plant 129,828 127,916 84,873 74,631 10,483 378 5,342,353Total - Kentucky 129,828 127,916 84,873 74,631 10,483 378 5,370,953
Costs reflect a five-year average in constant 1995 dollars, except in FY 1995 - 2000, which is a six-year average.
"' Total Life Cycle is the sum of annual costs in constant 1995 dollars.
KY 1

KY 2

MAXEY FLATS
The Maxey Flats low-level waste disposal site is located about 9 miles northwest of Morehead,Kentucky; 65 miles northeast of Lexington, Kentucky; and 200 miles southeast of Cincinnati, Ohio.The 280-acre site is owned by the Commonwealth of Kentucky.
KY 3

Estimated Site Total
Environmental Restoration
(Thousands of Current 1995 Dollars)*
fY 1995 1996 1997 1998 1999 2000
2,200 8,000 8,00018,000 1,200 1,200
• Costs for FY 1995 reflect Congressional Appropriation, costs for FY 1996 reflect EM budget submission, costs for FY 1997-2000 reflect Budget Shortfall Scenario, costs for
shaded area assume 3% annual inflation.
Five-Year Averages (Thousands of Constant 1995 Dollars)**
FY 1995 -2000 2005 2010 2015 2020 2025 2030 Life Cycle*
Environmental Restoration 4,767 0 0 0 0 0 0 28,600
— Costs reflect a five-year average in constant 1995 dollars, except in FY 1995 - 2000, which is a six-year average.
••• Total Life Cycle is the sum of annual costs in constant 1995 dollars.
PAST, PRESENT, AND
FUTURE MISSIONS
Maxey Flats was opened under a leasearrangement between the State of Kentuckyand the Nuclear Engineering Company (nowU.S. Ecology, Inc.) of Louisville, Kentucky, inJanuary 1963. The site contains long-livedradionuclides brought to the site from researchlaboratories, electric utilities, Government andprivate health-care facilities, manufacturingcompanies, and nuclear powerplantsthroughout the United States. The hazardousrefuse was buried in 51 trenches measuring upto 650 feet long, 70 feet wide, and 30 feet deep.A total of 4.75 million cubic feet of radioactivewaste is estimated to have been buried at theMaxey Flats site. U.S. Ecology, Inc. operatedMaxey Flats until commercial operations wereterminated in 1977.
ENVIRONMENTAL
RESTORATION
In 1986, the Environmental Protection Agency(EPA) notified 832 Potentially ResponsibleParties, including the Department of Energy(DOE), that Maxey Flats had been placed on theSuperfund National Priorities List. Theseparties include other Federal agencies, Federalcontractors, medical facilities, physicians,clinics, industry, State agencies, transporters,broker/haulers, and the land owner. ARemedial Investigation/Feasibility Study wascompleted in 1991, and the Record of Decisionwas issued by the EPA on September 30, 1991.Westinghouse Electric Corporation is currentlyunder contract to the State of Kentucky tomanage the site.
KY 4

As a designated Potentially Responsible Party,DOE is responsible for funding a portion of thecleanup. It is assumed, for purposes of thisreport, that the remediation of Maxey Flats willbe completed by the State of Kentucky byFY 2000. The Department's estimated annualmonetary contribution toward the remediation,proportional to the level of effort required bythe State of Kentucky, is provided in theEstimated Site Total table.
Defense Funding Estimate
Five-Year Averages (Thousands of Constant 1995 Dollars)`
FY 1995 - 2000 2005 2010 2015 2020 2025 2030 Life Cycle**
Environmental Restoration 4,767 0 0 0 0 0 0 28,600
*Costs reflect a five-year average in constant 1995 dollars, except in FY 1995-2000, which is a six-year average.
**Total Life Cycle is the sum of annual costs in constant 1995 dollars.
For further information on this site, please contact: Public Participation OfficePublic Affairs OfficeTechnical Liaison: William Wisenbaker
(202) 586-7633(202) 586-5820(301) 427-1619
KY 5

KY 6

PADUCAH GASEOUS DIFFUSION PLANT
The Paducah Gaseous Diffusion Plant is located 10 miles west of Paducah, Kentucky. The siteencompasses 750 acres inside a 3,422-acre tract of property owned by the Department of Energy(DOE).
N
S
J
-
D&Da - Feed Plant ComplexJ
- Metals Plant
KY 7

Estimated Site Total
(Thousands of Current 1995 Dollars)*
FY 1995 1996 1997 1998 1999 2000
Environmental RestorationProgram Management 5,400
50,400 51,7008,200 9,300
51,200 46,000 55,60011,100 10,000 8,500
Total 59,0 50,600 61,000 62,300 56,000 64,100
* Costs for FY 1995 reflect Congressional Appropriation, costs for FY 1996 reflect EM budget submission, costs for FY 1997-2000 reflect Budget Shortfall Scenario, costs forshaded area assume 3% annual inflation.
Five-Year Averages (Thousands of Constant 1995 Dollars)'•
FY 1995 - 2000 2005 2010 2015 2020 2025 2030
Environmental Restoration 47,118 71,186 93,234 78,556 149,148 132,810 114,677Program Management 8,084 8,851 9,265 2,985 6,165 21,922 15,151
Total 55,202 80,037 102,498 81,541 155,313 154,732 129,828
FY 2035 2040 2045 2050 2055 2060 2065 Life Cycle***
Environmental Restoration 111,275 72,554 61,845 2,812 378 0 0 4,725,084Program Management 16,640 12,319 12,785 7,671 0 0 0 617,270
Total 127,916 84,873 74,631 10,483 378 0 0 5,342,353
** Costs reflect a five-year average in constant 1995 dollars, except in FY 1995 - 2000, which is a six-year average.
Total Life Cycle is the sum of annual costs in constant 1995 dollars.
PAST, PRESENT, AND
FUTURE MISSIONS
The past and present mission of the PaducahGaseous Diffusion Plant has primarily focusedon the separation of uranium isotopes bygaseous diffusion. The process producesenriched uranium used as fuel in commercialpowerplants. Although the plant is leased andoperated by the U.S. Enrichment Corporation,environmental restoration and related wastemanagement activities are conducted by DOEas the agency with property responsibility.
The mission of the Paducah Gaseous DiffusionPlant will continue until the separation ofuranium isotopes is no longer needed by theU.S. Enrichment Corporation or the FederalGovernment. The ultimate use of the site is yetto be decided. However, since long-termsurveillance, maintenance, and institutionalcontrols will continue indefinitely, limitingfuture uses, it is assumed the site will be usedby the Federal Government for some type ofindustrial activity.
KY 8

ENVIRONMENTAL
RESTORATION
The remedial action sites are not being cleanedup for unrestricted use, therefore institutionalcontrols will be required. Interim correctivemeasures, such as hydraulic containment ofcontaminated ground water, have beenrequired by the Environmental ProtectionAgency (EPA) and the Commonwealth ofKentucky.
The operation of the Paducah GaseousDiffusion Plant has produced a number ofcontaminated areas, both at the site and beyondits boundaries. Ground water northwest of thesite has been found to be contaminated with theradionuclide technetium-99. Technetium-99was introduced at Paducah by the Reactor FuelsProgram, which involved the reprocessing ofspent nuclear fuel.
The chlorinated solvent trichloroethylene,formerly used for cleaning metal andmachinery parts, has been identified in ground-water plumes both to the northwest and
northeast of the site. Polychlorinated biphenyl(PCB) contamination is present at the site and inoffsite drainage ditches. PCBs were used inelectrical equipment, in hydraulic systems, andas a fire retardant.
The Paducah Plant areas under investigationhave been divided into 24 waste area groups,and there are 200 potential release sites (solidwaste management units) from whichcontaminants could migrate. Not all of the 24waste area groups are discussed herein becausemany will require no further remedial action orare not yet a part of the environmentalrestoration activities. Also, some waste areagroups have been combined in the followingtext because the same remedial actions will beapplied. In all cases, the excavated soil will belandfilled, if clean, or sent to offsite treatmentand disposal facilities if contaminated.
Waste Area Groups 1 and 7
Waste Area Group 1 includes one active sewagetreatment plant, one active training area, andone trichloroethylene spill site. Waste Area
Environmental Restoration Projects
Five-Year Averages (Thousands of Constant 1995 Dollars)*
FY 1995-2000 2005 2010 2015 2020 2025 2030
Environmental Restoration 45,108 69,386 78,117 43,419 49,433 12,653 6,545
GDP Decomissioning 2,010 1,799 15,117 35,137 99,716 120,157 108,132
Total 47,118 71,186 93,234 78,556 149,148 132,810 114,677
2035 2040 2045 2050 2055 2060 2065 Life Cycle**
Environmental Restoration 4,496 1,564 624 2,812 378 0 0 1,617,788
GDP Decomissioning 106,779 70,990 61,221 0 0 0 0 3,107,296
Total 111,275 72,554 61,845 2,812 378 0 4,725,084
* Costs reflect a five-year average in constant 1995 dollars, except in FY 1995 - 2000, which is a six-year average.
Total Life Cycle is the sum of annual costs in constant 1995 dollars.
KY 9

Group 7 is comprised of five undergroundstorage tanks at an active water treatment plant,an inactive sanitary sewage treatment plant,one toluene spill site, and a burn area. Theremedial actions for these waste area groupsinclude removal of the tanks, excavation ofcontaminated soils, backfilling the excavations,and capping the soil. Leachate from the areawill be collected and monitored. Remediationwill be completed in FY 2015.
Waste Area Groups 6, 17 and 18
Waste Area Group 6 includes tanks, a sump, aPCB spill site, and a trichloroethylene releasesite near Building C-400 This group alsoincludes an area west of the boundary fenceformerly used for testing the integrity ofuranium hexafluoride storage cylinders.Suspected contaminants include PCBs,trichloroethylene, and technetium-99.
Waste Area Group 17 consists of 37 scatteredpotential release sites. The suspectedcontaminants are radionuclides.
The plant storm sewer system (Waste AreaGroup 18) is a network of buried piping used tocollect surface, building roof, and floordrainage. The drainage is discharged througheffluent ditches to the north-south diversionditch and Big Bayou and Little Bayou Creeks.Suspected contaminants include PCBs andradionuclides. The PCBs, trichloroethylene,and radionuclides may have been discharged tothe sewer system in the past. Floor drains inmost buildings are now plugged to preventinadvertent discharges to the sewer systemsfrom spills.
No remediaLactions have been identified forthese waste area groups, as yet.Characterization is expected to be completed inFY 2010.
Waste Area Group 8
This group is located inside the northeastcorner of the security fence and consists of fourpotential release sites including a uraniumhexafluoride vaporization facility (C-337-A),two switchyards (C-535 and C-537), and apump house and cooling tower (C-637). Also inthis group is an active diked storage area forwaste PCBs and an effluent ditch.Environmental restoration, which will includesoil excavation and backfilling, is estimated tobe completed in FY 2025.
Waste Area Group 9
Waste Area Group 9, located near the center ofthe plant, consists of nine potential release sites,four of which are known to be contaminated.The first confirmed release site involves soilcontaminated by a diesel oil spill that occurredon the east side of the C-600 storage tanks. Thesecond confirmed release site involves soilcontamination around a pipeline and vaults atthe Chromate Reduction Facility. Contaminantsinclude PCBs, uranium, and technetium-99.The third site involves a storm sewer sumpbuilding that received wastewaters from abuilding used for the assembly of electricalcomponents. The fourth site, the acetylene-building drain pits (C-729), received waste froman acetylene generation process.
The other sites, for which contaminants havenot yet been identified, are an underground oil-storage tank (C-750-D), an acid-neutralizationtank (C-722), a waste-oil tank (C-601), and amotor-cleaning shop (C-728). The diesel oiltanks, the acid-neutralization tank, otherunderground storage vessels, a portion of thepipeline, the sump, and the drains will beexcavated and removed or grouted in place.The surrounding soil will also be excavated andremoved. The remedial actions are to becompleted in FY 2025.
KY 10

Waste Area Groups 10 and 16
Waste Area Group 10 includes one holdingpond, one aboveground storage tank, and onecooling tower. Contaminants of concerninclude PCBs and sulfuric acid.
Waste Area Group 16 contains two areascontaminated with PCBs and one abovegroundtank. This group is contaminated withuranium, pentachlorophenol, and petroleumhydrocarbons. Remediation for both of thesegroups will require the excavation and removalof contaminated soil.
Waste Area Groups 12 and 15
Waste Area Group 12 is associated with thechromate reduction facility, which was used totreat chromated cooling water before discharge.The chromate added to the cooling waterserved as a corrosion inhibitor in systems inwhich it was used. The chromate was laterreplaced by a phosphate-based corrosioninhibitor. The facility's sludge lagoon and thefull-flow lagoon contain chromium, PCBs, anduranium. In-place vapor extraction will beused in the lagoons to remove thecontaminants. The lagoons will then bestabilized, backfilled, and covered with amultilayered cap. The chromate reductionfacility will be demolished and removed, andits site will be restored. These actions arescheduled for completion in FY 2045.
Waste Area Group 15 is located in the northernportion of the plant. It consists of a warehouse,a former storage area for PCB transformers, two4,000-gallon underground diesel tanks, and anacid-neutralization lagoon. The site of thetransformer-storage area will be excavated andbackfilled. The underground tanks will beremoved, and the sites will be excavated andbackfilled. The completion of remediation isscheduled for FY 2025.
Waste Area Group 13
Waste Area Group 13 includes four lagoonsassociated with the influent water treatmentplant and an earthen berm in the southwestportion of the plant. The sediments in thelagoons and the soils within and adjacent to theberm may be contaminated with PCBs andmercury. In- place vapor extraction will beused to treat the lagoons, which will then bestabilized, backfilled, and covered with amultilayered cap. The soils at the earthen bermwill be washed and removed, and the berm willbe backfilled. These actions will be completedin FY 2009.
Underground Storage Tanks
The potential release sites at the Paducah siteinclude five underground storage tanks otherthan those assigned to the waste area groupsdiscussed above. All of these tanks are withinthe boundaries of the plant. Three of the tankshave been removed. The other two will be leftin place and monitored.
Offsite Ground Water
Contamination with trichloroethylene,technetium-99, and other substances may bepresent at ground-water wells north of thePaducah Gaseous Diffusion Plant. The sourceand extent of the contamination will bedetermined in investigations scheduled to endin FY 2009. At the northwest contaminationplume, an interim remedial action will beimplemented, including the construction ofwells to be used to pump out and treat theground water. Other actions include extensionof the municipal waterline and completion ofconstruction and beginning of operation ofcorrective actions for the trichloroethylene andtechnetium-99 ground-water contaminationand sources. Interim actions also are plannedfor the northeast plume as well as containment
KY 1 1

actions for the sources of both plumes.Remediation will be completed in FY 2020.Long-term monitoring will continueindefinitely.
Support Facilities for RemedialActions
Various support facilities are needed for theinvestigations of contamination and remedialactions. The facilities constructed to dateinclude a field-support laboratory and an offsitedecontamination pad for the decontaminationof equipment used in remedial actions and
investigations. Facilities to be constructedinclude a storage facility for waste fromenvironmental restoration activities and astaging area.
Decommissioning
At present, only two facilities in the Paducahplant are scheduled for decommissioning theMetal Reduction Facility and the Feed PlantComplex. They are under routine surveillanceand maintenance to preserve the integrity ofthe structures and provide containment forradioactive and hazardous waste.
Environmental Restoration Activity Costs
Five-Year Averages (Thousands of Constant 1995 Dollars)•
FY 1995.2000 2005 2010 2015 2020 2025 2030
Environmental RestorationAssessment 10,507 14,632 22,894 6,632 4,644 4,637 4,793Remedial Actions 33,629 51,076 51,677 32,786 42,006 7,577 106Surveillance And Maintenance 971 3,679 3,546 4,002 2,783 440 1,646
GDP DecommissioningAssessment 1,765 1,331 852 731
Surveillance And Maintenance 245 469 0 0 0 0Surveillance And Maintenance - (Post Stabilization) 0 0 0 3,285 1,066Facility Decommissioning 0 0 14,265 31,121 98,650 120,157 108,132
Total 47,118 71,186 93,234 78,556 149,148 132,810 114,677
2035 2040 2045 2050 2055 2060 2065 Life Cycle**
Environmental RestorationAssessment 497 302 34 0 0 0 358,358Remedial Actions 229 1,263 590 2,812 378 0 1,154,273Surveillance And Maintenance 3,771 0 0 0 0 0 0 105,156
GDP Decomissioning
Assessment 0 0 0 0 0 0 25,154Surveillance And Maintenance 0 0 0 0 3,816Surveillance And Maintenance - (Post Stabilization) 0 0 0 21,155Facility Decommissioning 106,779 70,990 61,221 0 0 3,056,571
Total 111,275 72,554 61,845 2,812 378 0 0 4,725,084
• Costs reflect a five-year average in constant 1995 dollars, except in FY 1995-2000, which is a six-year average.
Total Life Cycle is the sum of annual costs in constant 1995 dollars.
KY 12

Eventually, when uranium enrichment is no
longer needed, the rest of the Paducah Plant
will be shut down and subsequentlydecommissioned. Under the provisions of the
lease with U. S. Enrichment Corporation,shutdown and stabilization activities are theresponsibility of the leasee. All wastes and in-
process uranium will be removed prior todecommissioning by the Department. Residual
uranium will be removed from the interior of
process equipment by mobile gaseousdecontamination system, subsequent to that all
contaminated process equipment will betransported to a single decontamination facility
to be constructed and operated at the Oak
Ridge Reservation.
After decontamination and volume reduction,
the waste will be returned to the Paducah site
for disposal. The process buildings remaining,
after the removal of the process equipment and
auxiliaries, will then be decontaminated. All of
the interior surfaces are assumed to becontaminated. The facilities will be cleaned of
radioactive and hazardous materials, andresultant material disposed of in appropriately
designed disposal facilities. The majorhazardous materials are asbestos in theinsulation for the piping systems and transite
siding of all buildings, and PCBs that are found
throughout the electrical equipment, theventilation systems of the process buildings,
and in local areas of the floors in thesebuildings. The facilities will be treated to
remove surface contamination for unrestricted
release. Building materials like transite siding
and roofing are likewise contaminated and are
to be totally removed and disposed. All that
will remain will be the superstructure of thefacilities.
WASTE MANAGEMENT
Waste Treatment, Storage andDisposal
Waste management at Paducah is within thescope of environmental restoration activities. It
entails managing waste generated from plant
operation before July 1, 1993 (i.e., the "legacy"
wastes), and waste generated by environmental
restoration after July 1, 1993. The waste types
include low-level radioactive waste, low-level
mixed waste, hazardous waste, and industrial
and sanitary waste.
Waste management activities at the PaducahGaseous Diffusion Plant include characterizing
of waste to ensure proper legal classification,
including waste sampling and analysis;treatability studies for mixed waste; andpackaging prior to shipment offsite. Atpresent, low-level mixed waste is sent to anapproved commercial facility in Utah fortreatment and disposal. It is assumed, in thefuture, this waste will be sent to the incinerator
at the K-25 Site in Oak Ridge, Tennessee. Any
mixed waste not accepted at this incinerator
will be shipped to approved commercialfacilities. Oil contaminated with radionuclides
will be managed as a mixed waste.
There are several existing waste storage areas at
Paducah, with both interior and exteriorstorage in accordance with ResourceConservation and Recovery Act requirements.
These include the C-746-Q Mixed Waste Storage
Area, the Toxic Substances Control Act (TSCA)
Phase I Storage Area, and the C-746-A and B
Storage Facilities.
Two major storage projects at Paducah arescheduled for completion in FY 1996. These
projects involve the construction of newfacilities for storing mixed waste and TSCA
waste. In addition, two fabric-membrane
structures for the storage of low-level waste are
to be constructed.
KY 13

The Paducah Plant provides disposal only forsanitary and industrial waste. A landfill isavailable at the site for this waste.
Low-level radioactive waste is shipped to theDepartment's facilities at the HanfordReservation in the State of Washington. It isassumed these shipments will continue.
Contaminated scrap metal and contaminatedcombustible materials are shipped to offsitecommercial facilities. Mixed waste is sent to theTSCA incinerator at the K-25 Site where itsultimate disposal is the same as that assumedfor other TSCA waste.
Program Management Cost Estimate
Five-Year Averages (Thousands of Constant 1995 Dollars)*FY 1995-2000 2005 2010 2015 2020 2025 2030
Program Management 8,084 8,851 9,265 2,985 6,165 21,922 15,151
2035 2040 2045 2050 2055 2060 2065 Life Cyde**Program Management 16,640 12,319 12,785 7,671 0 0 617,270
• Costs reflect a five-year average in constant 1995 dollars, except in FY 1995-2000, which is a six-year average.
** Total Life Cycle is the sum of annual costs in constant 1995 dollars.
Defense Funding Estimate
Five-Year Averages (Thousands of Constant 1995 Dollars)*FY 1995.2000 2005 2010 2015 2020 2025 2030
Environmental Restoration 47,118 71,186 93,234 78,556 149,148 132,810 114,677Program Management 8,084 8,851 9,265 2,985 6,165 21,922 15,151
Total 55,202 80,037 102,498 81,541 155,313 154,132 129,828
2035 2040 2045 2050 2055 2060 2065 Life Cyde**Environmental Restoration 111,275 72,554 61,845 2,812 378 0 0 4,725,084Program Management 16,640 12,319 12,785 7,671 0 0 0 617,270
Total 127,916 84,873 74,631 10,483 378 0 0 5,342,353
• Costs reflect a five-year average in constant 1995 dollars, except in FY 1995-2000, which is a six-year average.
** Total Life Cycle is the sum of annual costs in constant 1995 dollars.
KY 14

Major Activity Milestones
ACTIVITY TASK COMPLETION DATE
Environmental RestorationFiscal Year
Subcontractor Staging Area - Complete Construction 1995
(-400-C Nickel Stripper - Complete Construction 1995
(-409 Pilot Plant - Complete Construction 1995
(-403 Neutralization Pit Closure - Complete Construction 1995
Well Abandonment - Complete Construction 1996
N/S Ditch Design/Construction - Complete Construction 1996
Waste Storage Facility-Phase I - Complete Construction 1996
NW Plume-Containment PP/ROD - Complete Construction 1999
NE Plume RI/FS - Complete Remediation 1999
WAG 6 RFI Work Plan - Remediation Complete 2004
WAG 22 RI/FS - Remediation Complete 2005
WAG 23 Treatability Studies - Remediation Complete 2007
WAG 13 RFI - Remediation Complete 2009
WAG 17 RFI Field Work - Remediation Complete 2009
WAGs 1 & 1 RI/FS - Remediation Complete 2015
WAGs 2, 3,14 RFI - Remediation Complete 2015
WAGs 5, 11 RFI - Remediation Complete 2020
Groundwater OU - Remediation Complete 2020
Surface Water OU - Remediation Complete 2020
WAGs 8, 9 RFI - Remediation Complete 2025
WAG 18 RFI - Remediation Complete 2025
WAG 19 - Remediation Complete 2025
WAG 20 - Remediation Complete 2025
WAG 21 - Remediation Complete 2025
WAG 15 RFI - Remediation Complete 2025
C-340 D&D - Complete D&D 2025
C-410 D&D - Complete D&D 2030
WAG 12 RFI - Remedation 2045
WAGs 10, 16 RFI - Remediation Complete 2055
For further information on this site, please contact: Public Participation OfficePublic Affairs OfficeTechnical Liaison: Robert Edwards
Bill Cahill
(615) 576-1590(615) 576-0885(502) 462-2859(615) 241-4830
KY 15

KY 16

W. R. GRACE & COMPANY
HEADQUARTERS4
MARYLAND / WASHINGTON, D.C.
Estimated State Total
(Thousands of Current 1995 Dollars)*
9951. 1996 1997 1998 1999360 9,230Maryland • FUSRAP
Headquarters 1 004 390 1,125,110 1,328,360 1,422,660 1,504,040
Total 1,004,390 1,125,110. 1,328,360 1,423,020 1,513,270
2000
1,578,640
• Costs for FY 1995 reflect Congressional Appropriation, costs for FY 1996 reflect EM budget submission, costs for FY 1997-2000 reflect Budget Shortfall Scenario, costs for
shaded area assume 3% annual inflation.
Five-Year Averages (Thousands of Constant 1995 Dollars)**
FY 1995-2000 2005 2010 2015 2020 2025 2030
Maryland - FUSRAP 1,633 0 0 0 0 0 0Headquarters 1,246,187 1,101,460 1,119,615 976,818 946,630 730,375 786,249
Total 1,247,820 1,101,460 1,119,615 976,818 946,630 730,375 786,249
FY 2035 2040 2045 2050 2055
Maryland - FUSRAP 0 0 0Headquarters 653,295 491,967 315,458 194,145 132,475
Total 653,295 491,967 315,458 194,145 132,475
FY 2060 2065 2070 2075 2080 Life Cycle***
Maryland - FUSRAP 0 0 0 0 0 9,797
Headquarters 40,423 4,616 4,479 3,145 3,155 44,998,643
Total 40,423 4,616 4,479 3,145 3,155 45,008,440
Costs reflect a five-year average in constant 1995 dollars, except in FY 1995 - 2000, which is a six-year average.
*** Total Life Cycle is the sum of annual costs in constant 1995 dollars.
MD/DC 1

MD/DC 2

ENVIRONMENTAL MANAGEMENT PROGRAM
HEADQUARTERS
The Environmental Management Headquarters staff is located in the Washington, D.C., metropoli-
tan area. Senior managers, including the Assistant Secretary and staff, work in Washington, D.C.,
at the James Forrestal Building, which is in close proximity to other Federal agency Headquarters
facilities, the White House, and Capitol Hill. The majority of the Environmental Management
technical staff is located in facilities in nearby Germantown and Gaithersburg, Maryland.
i MiddlebrookRoad
Germantown Campus
Quince Orchard
Maryland
Forrestal Building
MD/DC 3

Estimated Site Total
(Thousands of Current 1995 Dollars)*
FY 1995 1446 1997 1998 1999 2000Program Management 332,750 373,560 442,260 474,140 501,650 526,780Program Direction 332,750 373,560 442,260 474,140 501,650 526,780Technology Development 318,890 357,990 423,840 # 454,380 480,740 504,830Transportation Management 20,000 20,000 20,000 20,000 20,000 20,000
Total 1,004,390 1,125,110 1,328,360 1,422,660 1,504,040 1,578,390
Costs for FY 1995 reflect Congressional Appropriation, costs for FY 1996 reflect EM budget submission, costs for FY 1997-2000 reflect Budget Shortfall Scenario, costs forshaded area assume 3% annual inflation.
Five-Year Averages (Thousands of Constant 1995 Dollars)**
FY 1995-2000 2005 2010 2015 2020 2025 2030Program Management 425,974 229,928 233,788 203,428 197,010 96,880 91,669Program Direction 413,880 434,470 441,764 384,396 372,268 366,405 346,697Technology Development 386,333 417,062 424,063 368,994 357,352 257,090 337,883Transportation Management 20,000 20,000 20,000 20,000 20,000 10,000 10,000
Total 1,246,187 1,101,460 1,119,615 976,818 946,630 830,375 786,249
2035 2040 2045 2050 2055 2060 2065Program Management 75,968 56,917 36,663 22,337 15,054 4,183 250Program Direction 287,316 215,261 138,660 84,478 56,934 15,821 945Technology Development 280,011 209,789 135,135 82,330 55,487 15,419 921Transportation Management 10,000 10,000 5,000 5,000 5,000 5,000 2,500
Total 653,295 491,967 315,458 194,145 132,475 40,423 4,616
2070 2075 2080 2085 2090 2095 2100 Life Cycle***Program Management 234 76 77 0 0 0 0 8,878,150Program Direction 884 288 293 0 0 0 0 18,217,680Technology Development 861 281 285 0 0 0 0 17,032,813Transportation Management 2,500 2,500 2,500 0 0 0 0 870,000
Total 4,479 3,145 3,155 0 0 0 0 44,998,643
Costs reflect a five-year average in constant 1995 dollars, except in FY 1995 - 2000, which is a six-year average.Total Life Cycle is the sum of annual costs in constant 1995 dollars.
MD/DC 4

PAST, PRESENT, AND
FUTURE PROGRAM
FUNCTION
The Environmental Management program was
established on October 4, 1989, as a result of aSecretarial task force that assessed theDepartment of Energy's (DOE) defense wastemanagement, environmental response, and
cleanup activities. The program consolidated in
one place environmental restoration and wastemanagement activities formerly managedwithin Defense Programs, Nuclear Energy, and
Energy Research. The EnvironmentalManagement program was originally organized
as the Office of Environmental Restoration and
Waste Management and which is now theOffice of Environmental Management.
Today, the Environmental Managementprogram has approximately 800 Federalemployees at Headquarters and approximately
19,200 Federal employees in the field.Headquarters is responsible for providingdirection, resources, and priorities to the fieldstaff for the successful completion of safe andenvironmentally acceptable project andactivities. The Headquarters staff acts as aninformation advocate providing analysis,options, and information to shape policy andstrategy while advocating for the programs toCongress and the Office of Management andBudget. The Headquarters staff also acts as thenational manager measuring performance andintegrating field activities across the complex.
The field Environmental Management staff isresponsible for implementing Headquarterspolicy, guidance, and direction. The field staff
ensures safe and environmentally acceptableoperations and is responsible for day-to-daymanagement of activities and resources.
Headquarters staff maintains ongoing andcontinuous communication with the field and is
available to assist with site issues, whenappropriate.
Some specific activities provided byHeadquarters staff include:
• Establishing policy and conducting program reviews to
ensure adherence to policy;
• Preparing a program-wide budget based on field input;
• Coordinating with Congress and other Federal agen-
cies, including regulators (e.g., Environmental Protec-
tion Agency, Defense Nuclear Facilities Safety Board,
Nuclear Regulatory Commission) on the national level;
• Coordinating with national stakeholder organizations,
labor unions, industry groups, and environmental
groups;
• Coordinating with State Governors (e.g., National
Governors' Association, Western Governors' Associa-
tion) and Indian Tribes;
• Managing national initiatives, such as Waste Minimiza-
tion and Pollution Prevention, the National Low-Level
Waste Program, the Transportation Management
Program, and the Federal Facility Compliance Act task
force;
• Managing the Technology Development program;
• Overseeing site-safety programs;
• Preparing national reports, such as this report, the
Waste Management Programmatic Environmental
Impact Statement, and the Integrated Risk Study; and
• Developing program strategic plans, including
developing options and new strategies.
FUNDING ASSUMPTIONS
For purposes of developing life-cycle costestimates for the Baseline EnvironmentalManagement Report, the assumption was made
that financial accounts originated atHeadquarters would be continued to beestimated as such. The national accounts ofTechnology Development, Program Direction,
MD/DC 5

Headquarters. In fact, after the accounts havebeen established at Headquarters, the majorityof these accounts are eventually allocated to thefield locations. The following is a briefdescription of these accounts, and their relativedistribution to field operations.
PROGRAM DIRECTION
Program Direction provides funding to pay forall Federal full-time equivalents atHeadquarters and the field offices. Theprogram direction accounts provide funding forsalaries, benefits, travel, and training.Approximately 75 percent of this account isreallocated to field operations.
PROGRAM MANAGEMENT
Program Management/Support activities atHeadquarters provide general technicalcontractor support services for all elements ofthe Headquarters Environmental Managementdirected activities. Approximately 70 percentof this account is transferred to field operations.
TRANSPORTATION
MANAGEMENT
The transportation program provides for DOE-wide development and implementation ofeffective strategies, techniques, methods, andpolicy guidance for safe, secure, efficient, andcost-effective transportation of DOE materials,including hazardous materials, particularlyradioactive, hazardous substances, andhazardous and mixed wastes. Approximately95 percent of these funds are transferred to fieldoperations for the development of agency-widelogistics management tools, training, andtechnology to address DOE transportation and
packaging requirements. BaselineEnvironmental Management Report estimatesfor waste transportation costs are calculatedwithin the cost estimates for waste managementand environmental restoration.
TECHNOLOGY
DEVELOPMENT
The Technology Development program isresponsible for managing an aggressivenational program for applied research,development, demonstration, testing, andevaluation for environmental cleanup, wastemanagement, and related technologies.Approximately 91 percent of this account istransferred to field operations.
The Office of Environmental Management hasstructured its technology development programto focus on the five major problem areasdiscussed below. A wide spectrum ofindividuals participates in management ofthese programs, including Headquarters, field,technology users, regulators, and otherstakeholders. The goal is to maximizedevelopment of technologies that are cost-effective, accepted, and ultimately used.
Mixed Waste Characterization,Treatment, and DisposalAvailable technologies are inadequate fromtechnical and/or regulatory standpoints.Mixed waste goals are to perform radioactivedemonstrations as early as possible and topursue versatile treatment technologies (e.g.,plasma, molten metal, and vitrification) as wellas nonthermal treatment options.
MD/DC 6

Radioactive Tank WasteRemediation
Many tanks are leaking, and characterization,retrieval, and treatment are technically difficult.Tank goals are to develop technology foranalyzing tank structural integrity and tankwaste, to develop and demonstratetechnologies for retrieval of radioactivematerials from tanks, and to developradioactive extraction technologies. Theseactivities will decrease risk and reduce volumeof waste for disposal.
Contaminant PlumeContainment and Remediation
Goals for this focus area are to develop thecapability to treat soil inplace and ground-water contaminated with heavy metals or densenonaqueous phase liquids, and to developtechnology to control the spread ofcontaminated plumes.
Landfill Stabilization
Landfill goals are to develop technology forcontainment and in situ stabilization of buriedwaste and to develop technology for retrieval,characterization, contaminant control, andsubsequent treatment of landfill waste. Theseactivities will result in systems that reduce riskto the public and workers, and decreaseremediation cost.
M D/DC 7

Defense Funding Estimate
Five-Year Averages (Thousands of Constant 1995 Dollars)*FY 1995 - 2000 2005 2010 2015 2020 2025 2030
Program Management 425,974 229,928 233,788 203,428 197,010 96,880 91,669Program Direction 413,880 434,470 441,764 384,396 372,268 366,405 346,697Technology Development 386,333 417,062 424,064 368,994 357,352 357,090 337,883Transportation Management 20,000 20,000 20,000 20,000 20,000 10,000 10,000
Total 1,246,187 1,101,460 1,119,615 976,818 946,630 830,375 786,249
2035 2040 2045 2050 2055 2060 2065
Program Management 75,968 56,917 36,663 22,337 15,054 4,183 250Program Direction 287,316 215,261 138,660 84,478 56,934 15,821 945Technology Development 280,011 209,789 135,135 82,330 55,487 15,419 921Transportation Management 10,000 10,000 5,000 5,000 5,000 5,000 2,500
Total 653,295 491,967 315,458 194,145 132,475 40,423 4,616
2070 2075 2080 2085 2090 2095 2100 Life Cycle**Program Management 234 76 77 0 0 0 0 8,878,150Program Direction 884 288 293 0 0 0 0 18,217,674Technology Development 861 281 285 0 0 0 0 17,032,813Transportation Management 2,500 2,500 2,500 0 0 0 0 870,000
Total 4,479 3,145 3,155 0 0 0 0 44,998,643
o Costs reflect a five-year average in constant 1995 dollars, except in FY 1995 - 2000, which is a six-year average.
• Total Life Cycle is the sum of annual costs in constant 1995 dollars.
For further information on this site, please contact: Public Participation OfficePublic Affairs OfficeTechnical Liaison: Terry Tyborowski
(202) 586-7633(202) 586-5820(202) 586-6302
MD/DC 8

MARYLAND FUSRAP SITES
The W R. Grace and Company facility is the only Maryland site within the Formerly Utilized SitesRemedial Action Program (FUSRAP). The program was established in 1974 under the provisions ofthe Atomic Energy Act to identify previously decontaminated Manhattan Engineer District andAtomic Energy Commission sites to reevaluate their radiological condition and to take appropriateremedial action where necessary. FUSRAP encompasses 46 sites in 14 States and is funded throughthe Oak Ridge Operations Office. The model used to estimate costs for this report provides one costfor all of the FUSRAP sites located in each State. All costs for waste management activities, pro-gram management, and relevant landlord activities attributable to the Department are provided forwithin the scope of environmental restoration. There are no FUSRAP sites with either current orplanned nuclear material and facility stabilization activity needs. Funding for all sites is 100 per-cent nondefense. For a general discussion of FUSRAP and associated costs, see the FUSRAP SiteSummary found in the Tennessee section.
Estimated Site Total
(Thousands of Current 1995 Dollars)*
FY 1995 1996 1997 1990 1999 2000
Maryland - FUSRAP 9,230
* Costs for FY 1995 reflect Congressional Appropriation, costs for FY 1996 reflect EM budget submission, costs for FY 1997-2000 reflect Budget Shortfall Scenario, costs for
shaded area assume 3% annual inflation.
Five-Year Averages (Thousands of Constant 1995 Dollars)**
FY 1995 - 2000 2005 2010 2015 2020 2025 2030 Life Cyck***
Maryland - FUSRAP 1,633 0 0 0 0 0 0 9,797
• Costs reflect a five-year average in constant 1995 dollars, except in FY 1995 - 2000, which is a six-year average.
• Total Life Cycle is the sum of annual costs in constant 1995 dollars.
Nondefense Funding Estimate
Five-Year Averages (Thousands of Constant 1995Dollars)*
FY 1995 - 2000 2005 2010 2015 2020 2025 2030 Life Cyde
Environmental Restoration 1,633 0 0 0 0 0 0 9,797
Costs reflect a five-year average in constant 1995 dollars, except in FY 1995 - 2000, which is a six-year average.
• Total Life Cycle is the sum of annual costs in constant 1995 dollars.
MD/DC 9

W.R. GRACE AND COMPANY
(Formerly Utilized Sites Remedial Action Program)
The W.R. Grace and Company site is a 260-acre former thorium-processing facility located in CurtisBay, Maryland.
CURTIS BAY
PROCESSING ANDSTORAGE BUILDINGS
BUILDING 23
SCALE: 1-= 1500'
MD/DC 10

PAST, PRESENT, AND
FUTURE MISSIONS
In 1955, Rare Earths, Inc. contracted with theGovernment to extract thorium and rare earthsfrom naturally-occurring monazite sands. W.R.Grace assumed ownership of the site andcontinued operations until 1958.Approximately 998 tons of thorium ore wereprocessed at the facility. Thorium developmentwork was conducted in one building (No. 23),and the wastes were buried onsite in an areacovering about 4 acres. The disposal area is afew hundred feet south of Curtis Bay and isbordered on the south and west by a Baltimoreand Ohio Railroad spur running over the Graceproperty.
Future use of this site depends on the outcomeof the remedial action decision documents.
For further information on this site, please contact:
ENVIRONMENTAL
RESTORATION
Surface contamination has been detected at alllevels of the building and equipment. Somebuilding renovation has been conducted, andthe waste material is currently stored onsite.Limited remedial investigation/action has beenconducted at the site.
Public Participation OfficePublic Affairs Office
Technical Liaison: Melyssa Noe
(615) 576-1590(615) 576-0885(615) 241-3315
MD/DC 11

MD/DC 12

CHAPMAN VALVEVENTRON
SHPACK LANDFILL
MASSACHUSETTS
Estimated State Total
(Thousands of Current 1995 Dollars)*
FY 1995 1996 1997 1998 1999 2000
Massachusetts-FUSRAP 2,300 1,550 6,130 7,780 180 0
• Costs for FY 1995 reflect Congressional Appropriation, costs for FY 1996 reflect EM budget submission, costs for FY 1997-2000 reflect Budget Shortfall Scenario, costsfor shaded area assume 3% annual inflation.
Five-Year Averages (Thousands of Constant 1995 Dollars)**
FY 1995 - 2000 2005 2010 2015 2020 2025 2030 Life Cycle"'
Massachusetts - FUSRAP 2,977 0 0 0 0 0 0 17,865
• Costs reflect a five-year average in constant 1995 dollars, except in FY 1995 - 2000, which is a six-year average.
• Total Life Cycle is the sum of annual costs in constant 1995 dollars.
MA 1

MA 2

MASSACHUSETTS FUSRAP SITES
Chapman Valve, Shpack Landfill, and Ventron constitute the Massachusetts sites within the For-merly Utilized Sites Remedial Action Program (FUSRAP). The program was established in 1974under the provisions of the Atomic Energy Act to identify previously decontaminated ManhattanEngineer District and Atomic Energy Commission sites to reevaluate their radiological conditionand to take appropriate remedial action where necessary. FUSRAP encompasses 46 sites in 14States and is funded through the Oak Ridge Operations Office.
The model used to estimate costs for this report provides one cost for all of the FUSRAP siteslocated in each State. All costs for waste management activities, program management, and rel-evant landlord activities attributable to the Department are provided for within the scope of envi-ronmental restoration. There are no FUSRAP sites with either current or planned nuclear materialand facility stabilization activity needs. Funding for all sites is 100 percent nondefense. For ageneral discussion of FUSRAP and associated costs, see the FUSRAP Site Summary found in theTennessee section.
Estimated Site Total
(Thousands of Current 1995 Dollars)*
FY 1995 1996 1997 1998 1999 2000Mossochusetts-FUSRAP 2,300 1,550 6,130 1,780 180
• Costs for FY 1995 reflect Congressional Appropriation, costs for FY 1996 reflect EM budget submission, costs for FY 1997-2000 reflect Budget Shortfall Scenario, costs forshaded area assume 3% annual inflation.
Five-Year Averages (Thousands of Constant 1995 Dollars)**
FY 1995-2000 2005 2010 2015 2020 2025 2030 Life Cyde**•Massachusetts-FUSRAP 2,977 0 0 0 0 0 0 17,865
Costs reflect a five-year average in constant 1995 dollars, except in FY 1995-2000, which is a six-year average.
*** Total Life Cycle is the sum of annual costs in constant 1995 dollars.
Nondefense Funding Estimate
Five-Year Averages (Thousands of Constant 1995 Dollars)*
FY 1995.2000 2005 2010 2015 2020 2025 2030 Life Cycle**Massachusetts-FUSRAP 2,977 0 0 0 0 0 0 17,865
'Costs reflect a five-year average in constant 1995 dollars, except in FY 1995-2000, which is a six-year average.
**Total Life Cycle is the sum of annual costs in constant 1995 dollars.
MA 3

54,1134mliet
CHAPMAN VALVE
(Formerly Utilized Sites Remedial Action Program)
The Chapman Valve site is located in Indian Orchard, a suburb of Springfield, Massachusetts.
0
31
456'•0*
C? 15 2/43 FLOOR SHOVER 0
PIPE fWEL~11I 1_
£15 13 III IAC 21
Al2
*SE
A24
SIE
a
A10
A.4 "
AIR
A'
4C
A20
—0-0i # I Pt3 --0-
13 /d/ A22 •
25
/// r.
/ RI i 0 17
/ ZalvE--k,2I T C3
ii t3 CAGE
I I •2 I I
R2: ROTARY DRYER
A30 32
A TA.34 A30
SNOT BLAST R004CMEZZANINE —"
SUP •28
A31 33
A •35 37
MEZZANINE 14420 •
E222 AREA REQUIRING REMOVAL OF wOOTIEN BLOCKS /44io mmal01.0
STEEL RAIL TRACKS OTC] DIP Tux
• BIASED BORERCLE 0 CENTRIFUGE
A SYSTEMATIC BOREHOLE 0 FLEIRACEPt3
PIPE TRENCH 0 STEEL PLATE
•5E
SCALE
0 30 60 FEET
0 5 II MOTORS
MA 4

huis fiat
PAST, PRESENT, AND FUTUREMISSIONSFrom January to November 1948, the facilitymachined uranium for Brookhaven NationalLaboratory in Building 23. Approximately one-third of the building was separated formachining operations by a floor-to-ceilingwooden partition more than 50 feet high,creating a space 200 feet in length and 60 feet inwidth. This partition has since been removed.The building has been vacant since 1987 whenthe current owner discontinued allmanufacturing at Indian Orchard. The site willbe released for unrestricted use followingcompletion of cleanup.
For fiirther information on this site, please contact:
ENVIRONMENTAL RESTORATIONFollowing the uranium processing activities,which ceased in November 1948, the site wasdecontaminated to levels acceptable at thattime. Today's more stringent cleanupguidelines prompted the Department of Energyto designate Chapman Valve a FUSRAP site in1992. The waste volume is estimated to be 100cubic yards of low-level waste (uranium-contaminated debris and soil).
No remedial action has been conducted at thesite to date.
Public Participation OfficePublic Affairs OfficeTechnical Liaison: Melyssa Noe
(615) 576-1590(615) 576-0885(615) 241-3315
MA 5

SHPACK LANDFILL
(Formerly Utilized Sites Remedial Action Program)
The Shpack Landfill site covers about 8 acres. About 5.5 acres lie within the boundaries of the Town
of Norton, and the remaining 2.5 acres lie within the Town of Attleboro.
000'
ti
O
O
O
UNION AO/
1/2 •tarsPad fram•dorm. 3110
220 ham•
0
MA 6

PAST, PRESENT, AND FUTUREMISSIONS
The Shpack Landfill was a private landfill thatreceived "industrial" waste contaminated withradioactive residues from local operations.Some radioactive waste was associated withDepartment of Energy (DOE) predecessors.Chemical as well as radioactive wastes weredisposed of at the private dump site.
Enriched uranium was found at this site in theearly 1980's. DOE conducted an emergencyremoval and took possession of the uranium.Currently, DOE is supporting the potentiallyresponsible party in the remedial investigation.
Future use of this site depends on the resolutionof the Comprehensive EnvironmentalResponse, Compensation, and Liability Actprocess that is underway.
For further information on this site, please contact:
ENVIRONMENTAL RESTORATIONThe waste volume is estimated to be 9,370 cubicyards and consists of uranium residues andradium. A security fence was installed aroundthe site in October 1981. The site is on theEnvironmental Protection Agency's NationalPriorities List.
Public Participation OfficePublic Affairs OfficeTechnical Liaison: Melyssa Noe
(615) 576-1590(615) 576-0885(615) 241-3315
MA 7

srreetwemitaisinamewurr.rxwnwrieorottagoaneeparot
VENTRON
(Formerly Utilized Sites Remedial Action Program)
The Ventron site is located in Beverly, Massachusetts.
FENCE
ST( BC4140ARY
MA 8

tgge • ""60, •
PAST, PRESENT, AND FUTUREMISSIONS
From 1942 to 1948, the Metal HydridesCorporation was under contract to theManhattan Project and the Atomic EnergyCommission to convert uranium oxide touranium metal powder. This procedure andlater operations involving the recovery ofuranium from scrap uranium and turningsfrom the fuel fabrication plant at the HanfordReservation, were conducted at the foundry sitein Beverly, Massachusetts.
During contract operations, three buildingswere used for uranium work. As a result of a1948 Atomic Energy Commission radiationsurvey, two wooden buildings that housed thefoundry facilities were demolished sometimebetween 1948 and 1950. Two other buildingshave since been erected at these locations. Theremaining original building, Building A,contained furnace and leaching facilities, amixing room, a drying room, and an analyticallaboratory. The fate of the rubble from the twodemolished buildings (including equipment,platforms, etc., from within the buildings) isunknown. Ocean dumping was the methodrecommended for disposal of the contaminatedrubble and equipment, but confirmation of theactual disposal could not be obtained.
For further information on this site, please contact:
/
•
The Metal Hydrides Corporation became theVentron Corporation in 1965, and in late 1976,Morton Thiokol, Inc., acquired control of thecompany. Today, the Ventron Facility remainsunder the control of Morton Thiokol, Inc., andoperations ceased in 1995.
Future use of this site depends on resolution ofthe decision documents for cleaning up the site.
ENVIRONMENTAL RESTORATION
The Oak Ridge National Laboratory conducteda screening survey of the site in 1977. Based onthe results of the Oak Ridge NationalLaboratory's measurements, it was determinedthat a radiological survey of the entire site wasneeded. A radiological designation survey ofthe outdoor portion of the site was conductedin 1980, and the buildings and structures on thesite were surveyed in 1982. In May 1991,surveys of the vicinity properties found them tobe free of contamination. In 1992, theDepartment of Energy completed initial sitecharacterization.
The waste volume is estimated to be 5,000 cubicyards of low-level radioactive waste. The majorcontaminant is uranium. The Department hasconducted initial remedial action at the siteincluding some interior decontamination andthe replacement of the main building roof.
Public Participation OfficePublic Affairs OfficeTechnical Liaison: Melyssa Noe
(615) 576-1590(615) 576-0885(615) 241-3315
MA 9

%MO &t.
MA 10

GENERAL MOTORS
MICHIGAN
Estimated State Total
(Thousands of Current 1995 Dollars)*
22 1995 1996 1997 1998 1999 2000
Michigan - FUSRAP 1,100
• Costs for FY 1995 reflect Congressional Appropriation, costs for FY 1996 reflect EM budget submission, costs for FY 1997-2000 reflect Budget Shortfall Scenario, costs forshaded area assume 3% annual inflation.
Five-Year Averages (Thousands of Constant 1995 Dollars)**
FY 1995.2000 2005 2010 2015 2020 2025 2030 life Cycle**
Mkhigon - FUSRAP 230 0 0 0 0 0 0 1,383
▪ Costs reflect a five-year average in constant 1995 dollars, except in FY 1995 - 2000, which is a six-year average.
▪ Total Life Cycle is the sum of annual costs in constant 1995 dollars.
MI 1

MI 2

MICHIGAN FUSRAP SITES
General Motors is the only Michigan site within the Formerly Utilized Sites Remedial ActionProgram (FUSRAP). The program was established in 1974 under the provisions of the AtomicEnergy Act to identify previously decontaminated Manhattan Engineer District and Atomic EnergyCommission sites to reevaluate their radiological condition and to take appropriate remedial actionwhere necessary. FUSRAP encompasses 46 sites in 14 States and is funded through the Oak RidgeOperations Office.
The model used to estimate costs for this report provides one cost for all of the FUSRAP sites located ineach State. All costs for waste management activities, program management, and relevant landlordactivities attributable to the Department are provided for within the scope of environmental restoration.There are no FUSRAP sites with either current or planned nuclear material and facility stabilizationactivity needs. Funding for all sites is 100 percent nondefense. For a general discussion of FUSRAP andassociated costs, see the FUSRAP Site Summary found in the Tennessee section.
Estimated Site Total
(Thousands of Current 1995 Dollars)•
EY 1995 19% 1997 1998 199 2000
Environmental Restoration 1,100 190 90
• Costs for FY 1995 reflect Congressional Appropriation, costs for FY 1996 reflect EM budget submission, costs for FY 1997-2000 reflect Budget Shortfall Scenario, costs for
shaded area assume 3% annual inflation.
Five-Year Averages (Thousands of Constant 1995 Dollars)••
FY 1995 - 2000 2005 2010 2015 2020 2025 2030 Life Cycle***
Environmental Restoration 230 0 0 0 0 0 0 1,383
• Costs reflect a five-year average in constant 1995 dollars, except in FY 1995 - 2000, which is a six-year average.
• Total Life-Cycle is the sum of annual costs in constant 1995 dollars.
Nondefense Funding Estimate
Five-Year Averages (Thousands of Constant 1995 Dollars)*
FY 1995 - 2000 2005 2010 2015 2020 2025 2030 Life Cycle"
Environmental Restoration 230 0 0 0 0 0 0 1,383
'Costs reflect a five-year average in constant 1995 dollars, except in FY 1995-2000, which is a six-year average.
"Total Life Cycle is the sum of annual costs in constant 1995 dollars.
***Costs shown do not include program management costs.
MI 3

GENERAL MOTORS
(Formerly Utilized Sites Remedial Action Program)
The General Motors site is located in Adrian, Michigan.
GENERAL MOTORSADRIAN r PLANT•
VICINITY•MAP•
1 REGRINO
2 FORMER URANIUM EXTRUSIONOPERATIONS AREA
3 PLASTIC INJECTION MOLDINGMACHINES
4 OFFICE BUILDING
5 MAINTENANCE
8 PAINT ROOM
7 ASSEMBLY
8 SHIPPING
9 GARAGE
10 BOILER HOUSE
11 RAIL DOCK
MI 4

PAST, PRESENT, AND
FUTURE MISSIONS
The facility started out in 1941 as an aluminumextrusion plant making parts for the U.S. ArmyAir Force. During the 1950's, the BridgeportBrass Company, a division of National Distillersand Chemical Corporation, operated a SpecialMetals Extrusion Plant in Adrian, Michigan,under contract with the Atomic EnergyCommission. The product of this operationwas material for uranium fuel elements forreactors at the Hanford Reservation and at theSavannah River Plant. The work included asemi-production pilot plant and developmentalextrusion work on thorium and depleted,natural, and slightly enriched (up to 2.1percent) uranium. Only a small fraction of theoverall facility was involved in support of theAtomic Energy Commission work. At thecompletion of work by the Bridgeport BrassCompany, one large extrusion press wasshipped to Reactive Metal, Inc., in Ashtabula,Ohio. The plant was sold to Martin MariettaCorporation in the early 1960's. It was used bythat company until 1974, when it was sold toGeneral Motors, Chevrolet ManufacturingDivision.
Future plans are to remediate this site inFY 1995, and return it for use withoutradiological restrictions.
For further information on this site, please contact:
ENVIRONMENTAL
RESTORATION
Earlier cleanup/decontamination effortsremoved the majority of the contamination.Most of the remaining contamination is in drainlines under the facility. The waste volume isestimated to be 200 cubic yards and consists ofuranium residues.
Public Participation OfficePublic Affairs OfficeTechnical Liaison: Melyssa Noe
(615) 576-1590(615) 576-0885(615) 241-3315
MI 5

MI 6

MISSISSIPPI
Estimated State Total
Mississippi - Salmon
(Thousands of Current 1995 Dollars)*
FY 1995
750
1996
2,000
199 1998 1999 2000
• Costs for FY 1995 reflect Congressional Appropriation, costs for FY 1996 reflect EM budget submission, costs for FY 1997-2000 reflect Budget
Shortfall Scenario, costs for
shaded area assume 3% annual inflation.
Five-Year Averages (Thousands of Constant 1995 Dollars)**
FY 1995 - 2000 2005 2010 2015 2020 2025 2030 Ude Cycle***
Mississippi - Salmon 520 50 36 30 20 16 10 3,924
Costs reflect a five-year average in constant 1995 dollars, except in FY 1995 - 2000, which is a six-year average.
"' Total Life Cycle is the sum of annual costs in constant 1995 dollars.
MS 1

SALMON SITE(Nevada Offsite Program)
The Salmon Site is administered by the Nevada Operations Office. A more thorough description ofthe environmental activities managed by the Nevada Operations Office can be found in the NevadaTest Site narrative. All costs for waste management activities, program management, and relevantlandlord activities attributable to the Department are provided for within the scope of environmentalrestoration. There are no offsites with either current or planned nuclear material and facility stabili-zation activity needs. Funding for all sites is 100 percent defense.The Salmon Site, located 21 miles (34 kilometers) southwest of Hattiesburg, Mississippi, was usedfor the Salmon and Sterling tests, as well as for nonnuclear gas detonations in the Miracle Playprogram.
To McComb
MISSISSIPPILOUISIANA
Bogalusa
Columbia
To Jackson c To Laurel
To New Orleans
Purvis
Hattiesburg
To Mobile
MS 2

Estimated Site Total
(Thousands of Current 1995 Dollars)*
FY 1995
Environmental Restoration
1996
750 2,000
1997 1998 1999 2000
100
' Costs for FY 1995 reflect Congressional Appropriation, costs for FY 1996 reflect EM budget submission, costs for FY 1997-2000 reflect
Budget Shortfall Scenario, costs for
shaded area assume 3% annual inflation.
Five-Year Averages (Thousands of Constant 1995 Dollars)**
Environmental Restoration FY 1995-2000 2005 2010 2015 2020 2025 2030 life Cycle"
520 50 36 30 20 16 10 3,924
" Costs reflect a five-year average in constant 1995 dollars, except in FY 1995 - 2000, which is a six-year average.
— Total Life Cycle is the sum of annual costs in constant 1995 dollars.
PAST, PRESENT, AND
FUTURE MISSIONS
The Salmon and Sterling tests were conducted
to evaluate the seismic response of dome salt to
nuclear explosives. The Miracle Play program
tests were conducted to provide data for
seismic decoupling studies. The Salmon test
was conducted at a depth of 2,717 feet (828
meters) in the Tatum Salt Dome in October
1964. The Sterling test was detonated in the
Salmon cavity in December 1966. The Miracle
Play program consisted of two methane-oxygen
explosions conducted in the Salmon/Sterling
cavity and included Diode Tube in February
1969 and Humid Water in April 1970.
Following testing, there was a cleanup
operation that included soil excavation and
recovery, and decommissioning of facilities.
Sampling in the vicinity of the dome initiated in
1972 confirmed the presence of radioactivity
that had been injected into the Cook Mountain
Limestone. The results indicated radioactivity
is contained onsite and the potential for offsite
migration is low. An extensive monitoring
program was instituted in 1977, with more than
170 exploratory borings, extensive soil
sampling and analysis, and ground-water
sampling.
ENVIRONMENTAL
RESTORATION
Funding provides for the implementation of a
Remedial Investigation/Feasibility Study and,
subsequently, the method to be chosen to
remediate the Salmon site. The RemedialInvestigation/Feasibility Study will address the
tritium plume in the shallow aquifer; determine
if the contaminants in the shot cavity are
leaking through the plugged placement hole or
MS 3

the plugged drillback holes; and determine ifthe contaminants injected into the deep,nonpotable aquifer are migrating into the nexthigher aquifer through the plugged injection ormonitoring wells or through channels in theclay layer separating the two aquifers. TheRemedial Investigation effort will includecharacteriziation of the nature and extent of anycontamination found, a detailed sitecharacterization, and a risk assessment todetermine the potential threat to human healthand the environment. The Feasibility Studywill identify the applicable, relevant, andappropriate requirements and assess alternativeremediation strategies.
The Remedial Investigation/Feasibility Studywill include installation of ground-watermonitoring wells; soil and ground-watersampling and laboratory testing; biota samplingand analysis; risk analysis; identification of
applicable, relevant, and appropriateregulations; development of treatmentalternatives; screening of those alternatives;postscreening field investigation; detailedanalysis of postscreening alternatives; andselection of an appropriate risk-basedremediation alternative. The extent andmagnitude of contamination will be furtherdefined, and an appropriate remedial actionwill be taken as required by the regulatoryauthority. Any requirements for site cleanup orlong-term monitoring will be part of thisactivity. For this estimate, remediation wasassumed to include removal of the buried mudpits at surface ground zero and thecontaminated surface soils associated withdisposal activities at the Reynolds Electric andEngineering Company, Inc. Pits on the Salmonsite. The remediation activities were assumedto begin in 1995 and be completed in 1999.
Environmental Restoration Activity Costs
Five-Year Averages (Thousands of Constant 1995 Dollars)'FY 1995-2000 2005 2010 2015 2020 2025 2030 life Cycle.*
Environmental Restoration
Assessment
Remedial Actions223281
00
00
00
00
00
00
1,3391,685
Surveillance And Maintenance 16 50 36 30 20 15 10 899Total 520 50 36 30 20 15 10 3,924
• Costs reflect a five-year average in constant 1995 dollars, except in FY 1995-FY 2000, which is a six-year average.
Total Life Cycle is the sum of annual costs in constant 1995 dollars.
MS 4

Defense Funding Estimate
Five-Year Averages (Thousands of Constant 1995 Dollars)*
FY 1995 - 2000 2005 2010 2015 2020 2025 2030 Life Cyde**
Environmental Restoration 520 50 36 30 20 15 10 3,924
• Costs reflect a five-year average in constant 1995 dollars, except in FY 1995-2000, which is a six-year average.
"Total Life Cycle is the sum of annual costs in constant 1995 dollars.
Major Activity Milestones
ACTIVITY TASK COMPLETION DATE
Environmental Restoration Fiscal Year
Complete Assessment 1998
Complete Remediation 1999
Complete Surveillance & Maintenance 2055
For further information on this site please contact: Public Participation OfficePublic Affairs OfficeTechnical Liaison: Bobbie McClure
(702) 295-4652(702) 275-3521(702) 295-1862
MS 5

MS 6

KANSAS CITYPLANT
ST. LOUIS AIRPORT SITE VICINITYPROPERTIES
ST. LOUIS AIRPORT SITE
LATTY AVENUEPROPERTIES
ST. LOUIS DOWNTOWN SITE
MISSOURI
WELDON SPRING SITEREMEDIAL ACTION PROJECT
MO 1

Estimated State Total
(Thousands of Current 1995 Dollars)*
FY 11995
Kansas Gty Plant 11,818Weldon Spring Site 55,000Missouri-FUSRAP 17,230
Total 84,048
1996 1997 1998 1999 2000
18,116
67,50028,740
19,212 19,853 26,10465,600 65,500 80,10023,420 43,580 53,920
25,95269,00051,160
114,356 108,232 128,933 160,124 146,112
* Costs for FY 1995 reflect Congressional Appropriation, costs for FY 1996 reflect EM budget submission, costs for FY 1997-2000 reflect Budget Shortfall Scenario, costs forshaded area assume 3% annual inflation.
Five-Year Averages (Thousands of Constant 1995 Dollars)**FY 1995-2000 2005 2010 2015 2020 2025 2030
Kansas Gty Plant 17,692 10,711 11,157 11,454 11,560 11,670 10,207Weldon Spring Site 62,166 17,750 0 0 0 0 0Missouri-FUSRAP 36,198 27,536 13,739 16,363 6,015 0 0
Total 116,056 55,998 24,896 27,817 17,575 11,670 10,207
FY 2035 2040 2045 2050 2055 2060 2065 Life Cyc1e***Kansas Gty Plant 31 0 0 0 0 0 0 440,097Weldon Spring Site 0 0 0 0 0 0 0 461,750Missouri-FUSRAP 0 0 0 0 0 0 0 535,450Total 31 0 0 0 0 0 0 1,437,297
Costs reflect a five-year average in constant 1995 dollars, except in FY 1995 - 2000, which is a six-year average.*** Total Life Cycle is the sum of annual costs in constant 1995 dollars.
MO 2

KANSAS CITY PLANT
The Kansas City Plant is part of the Bannister Federal Complex, which occupies a 300-acre site 12
miles south of downtown Kansas City, Missouri. The plant occupies 141 acres of this reservation.
In addition to the Department of Energy (DOE), the other occupants of the complex are the General
Services Administration, the Department of Defense, the Federal Aviation Administration, the
National Oceanic and Atmospheric Administration, and the Internal Revenue Service. The complex
is zoned for heavy industry while the surrounding area consists of single- and multiple-family
dwellings, commercial establishments, industrial districts, and public use lands.
89th
Contaminated FlowCollection/Treatment
ti Demolition Lot & L-Lot
MW Packaging &Storage Facility
e
BannisterRoad
Test Cells Tank Farm
IndianCreek
Indus rial WastewaterPretreatment Facility
FormerS. Lagoo
(?>, Poaa
MO 3

Estimated Site Total
(Thousands of Current 1995 Dollars)*
2995
Environmental RestorationWaste ManagementProgram Management
1996 1997 1998 199 2000
Total 11,818 16,11619,212 19,853 26,104 25,95 • Costs for FY 1995 reflect Congressional Appropriation, costs for FY 1996 reflect EM budget submission, costs for FY 1997-2000 reflect Budget Shortfall Scenario, costs for
shaded area assume 3% annual inflation.
Five-Year Averages (Thousands of Constant 1995 Dollars)**
FY 1995-2000 2005 2010 2015 2020 2025 2030
Environmental Restoration 7,968 1,396 1,618 1,766 1,819 1,874 1,930Waste Management 7,186 6,332 6,332 6,332 6,332 6,332 5,072Program Management 2,538 2,984 3,207 3,356 3,409 3,464 3,205
Total 17,692 10,711 11,157 11,454 11,560 11,670 10,207
2035 2040 2045 2050 2055 2060 2065 life Cycle*
Environmental Restoration 0 0 0 0 0 99,822Waste Management 25 0 0 0 0 0 226,898Program Management 6 0 0 0 0 113,377
Total 31 0 0 0 0 0 0 440,097
• Costs reflect a five-year average in constant 1995 dollars, except in FY 1995 - 2000, which is a six-year average.
• Total Life Cycle is the sum of annual costs in constant 1995 dollars.
PAST, PRESENT, AND
FUTURE MISSIONS
The Kansas City Plant was established in 1942to build aircraft engines for the Navy. AfterWorld War II, it was used for storage and in1949 was selected for manufacturingnonnuclear components for nuclear weapons.In the early 1960's, the General ServicesAdministration began warehouse operations inthe western portion of the building.
The plant has been selected as the facility inwhich all of the Department's nonnuclearmanufacturing for nuclear weapons will beconsolidated. It is assumed that this missionwill continue indefinitely.
MO 4

ENVIRONMENTAL
RESTORATION
The main sources of contamination at theKansas City Plant resulted from accidentalspills and leaks during manufacturing. Thesespills and leaks have contaminated soils withvolatile organic compounds, polychlorinatedbiphenyls (PCBs), and petroleum hydrocarbons.Some of these contaminants, mainly the volatileorganics, have migrated through the soil andhave contaminated the ground water. The soilconsists mainly of clayey-silt down to bedrockat about 40 feet. Ground-water treatment beganin 1988 and is continuing.
Forty-one solid-waste management units wereoriginally identified at the Kansas City Plant.Twenty-seven of these have either beenremediated or found to require no furtheraction. Remedial actions at the remaining unitswill be completed by FY 2001, as required bythe consent order between the Department ofEnergy (DOE) and the U.S. EnvironmentalProtection Agency (EPA). However, thefunding levels in the EnvironmentalRestoration Projects table may not be sufficientto implement the consent order with thespecified remediation technologies. If theremediation technology agreed to by EPAcannot be funded in the targeted year, theschedule in the consent order will berenegotiated.
Each active environmental restoration project isdescribed below. For most of these projects, theassumed remediation technology is soilexcavation and offsite disposal.
Department 26: SoutheasternQuadrant of MainManufacturing Building
PCB-contamination of subsurface soils wassuspected at this location due to the heat-transfer fluid (Therminol FR-1) that had beenused in the Department 26's plastics moldingoperations. The PCBs were released whenspills occurred (e.g., piping system leaks). In1974, the heat-transfer fluid was replaced with anon-PCB bearing fluid, and Department 26remains operational. The soils beneath the floorwill be excavated to a depth of 20 feet andshipped to an approved chemical waste landfillfor disposal.
Department 27 (Inside):Northeastern Quadrant of MainManufacturing Building
The presence of PCBs was suspected in thesubsurface soils beneath this quadrant becauseof the past use of Therminol FR-1 to control thetemperature of molds used to form rubber andfilled elastomer components. Leaks in the heat-transfer system may have allowed the PCBs toseep into the underlying soil through joints andcracks in equipment foundation pits.Therminol FR-1 was replaced with a non-PCBfluid in 1974. Department 27 remainsoperational.
The assumed remediation technology isexcavation and offsite disposal. Remediationwill entail the decommissioning and relocationof production equipment; thedecommissioning, demolition, and disposal ofinterior walls and partitions; thedecommissioning of the concrete slab above thebasement area; excavation to 20 feet below theexisting floor; and restoration of the floor slaband utilities. The contaminated soils will beshipped to an approved landfill for disposal.
MO 5

Miscellaneous ContaminatedSoils
This project involves four potentiallycontaminated areas including the north lot,building 16, the abandoned fuel lines, and theloading and unloading area for fuel-oil tanks.
The northwest corner of the plant's northparking lot was apparently used as a stagingarea before being converted to paved parkingspace. An old aerial photograph shows drumsin this area. The contents of the drums, theirdisposition, and the occurrence of any leaks orspills from these drums are unknown. Anotherold photograph shows a blackened area on theground surface that may have been used as aburn area.
Building 16 houses an in-ground centrifugeused to test weapon components and a mold-flushing facility. The concrete centrifugechamber has a sump where water andhydraulic fluid from equipment leaks haveaccumulated. The mold-flushing facilityincludes a below-grade storage area for spentflushing solvents. A 3,000-gallon steel tank isburied outside the building to capture fire-sprinkler water from mold flushing. Thesethree areas are considered potential sources forsoil contamination.
The abandoned fuel lines were installed whenthe Kansas City Plant was constructed in theearly 1940's. The network of buried pipes wasused to transfer fuels, kerosene, oils, rustinhibitors, and solvents from truck and railcarunloading stations to underground storagetanks and from tanks to the mainmanufacturing building.
The fuel-oil tanks consist of two aboveground400,000-gallon steel tanks, a loading-and-unloading area, and associated piping. Thetanks were constructed to store jet fuel andwere later converted to store No. 6 fuel oil.Although the tanks were initially surroundedby an earthen berm to contain spills, the bermhas been replaced by concrete walls. The floor
of the containment area has always consisted ofunlined earth. The loading and unloading areawas originally designed for railcars, but in themid-1980's rail lines were removed and the areawas converted for tanker/truck access.
Petroleum products were occasionally spilledon the ground at the loading and unloadingarea. In-tank steam coils were used to heat theNo. 6 fuel oil, and, during the winter of 1989, aleaking pipe inside the north tank allowedsteam condensate to enter the tank, causing thetank to overflow and spill fuel oil onto the floorof the containment area.
Miscellaneous PCB SitesThis project includes an electrical substationand underground ductbank that are suspectedto be contaminated with PCBs. Although thesubstation is currently being used, it isscheduled to be replaced by a new substation inanother location. The substation is housed in asmall shed attached to the north side of themanufacturing support building.
A release of PCBs is thought to have beencaused by a lightning strike at the substation.While the source of PCBs in the electricalductbank west of the east boilerhouse is notknown, the source could be a substation or the1950's-vintage lead-jacketed high-voltage cableinside the ductbank. This cable was known tocontain electrical insulation made of PCB-impregnated paper.
Decommissioning, demolition, and disposal ofbuilding structures and electrical components isthe approved remediation approach. Interimremediation is in progress.
Northeast Area and the Outfall001 RacewayThe northeast area encompasses thenortheastern portion of the Kansas City Plantand includes lands administered by the GeneralServices Administration, the Internal Revenue
MO 6

Service, and the Union Pacific Railroad.Ground-water contamination here is principallytrichloroethylene and its degradation products,1, 2-dichloroethene and chlorothene. A numberof activities may have been the source ofcontamination, but the actual release events andsequence are unknown. Possible sources ofcontamination include random dumping in anarea of low relief, dumping in unlined pits,dumping in an unlined trench that once crossedthe area, leaking pipelines, and a wastewaterlagoon.
The 001 Outfall is the discharge point for the001 storm sewer system draining the northcentral and northeastern portions of the KansasCity Plant. It passes through an area of groundwater and soil contamination derived from pastwaste handling practices (i.e., dumping), which,according to old aerial photographs, occurredfrom the late 1940's through the 1950's. Thearea has also been affected by past dischargesthrough the 001 stormwater outfall. Inaddition, surface soils have been affected alongan open drainageway of the outfall betweentwo railroad tracks.
Old aerial photographs show ponds in and justnorth and west of the former north lagoon.This area was originally low lying and poorlydrained. Photographs indicate that materialwas dumped in the area from makeshift haulroads. Both liquid and solid materials appearto have been deposited.
Plating Building
The plating building was constructed in 1957 toprovide onsite metal plating. It was taken outof service after a new facility was constructed in1987. Portions of its structure, includingconcrete floors and walls, were found to containheavy metals, PCBs, cyanide, and totalpetroleum hydrocarbons. This project coversremediation of building 57, the waste-oil tank,substation 18, and Department 26 outside sites.
Building 57 was a steel building constructed ona concrete foundation in 1957. The buildingwas demolished during the period from 1989through 1990, and the site was paved over withasphalt.
An abandoned 26,000-gallon waste-oil tank isburied under the north foundation wall ofbuilding 57. This tank was constructed in 1942to recover spent anti-rust oil from operations inthe main manufacturing building. The tank wasabandoned and filled with sand in the early1950's. Sampling indicates the tank contentsare contaminated with PCBs, possibly fromspills from substation 18. The soil immediatelyaround the tank is also saturated withpetroleum, probably from leaks in the pipingfor the oil-recovery system.
Substation 18 was constructed in 1957 toprovide electrical power for the platingbuilding. It included an oil-filled transformercontaining approximately 750 gallons of PCB-based cooling oil (Aroclor 1260). Multiple spillsoccurred and were cleaned up during the 30-year operation of the building. The PCBtransformer was removed from this substationin 1989 when the plating building wasdemolished. PCB contamination from thismanagement unit may have migrated into thewaste oil tank and into surrounding soil.
A heating-and-cooling system for injectionmolding in Department 26 area was constructedin 1965. This system was located in the gapimmediately outside the west and south wallsof the plating building. A buried 10,000-gallontank supplied a PCB heat-transfer fluid(Therminol FR-1) for the system. The PCBsseem to have migrated to bedrock in somelocations. The tank and piping system wasremoved and replaced with a PCB-free systemin 1983. Remediation will require soil removalto depths ranging from 10 feet to bedrock (40feet). The total quantity of contaminated soil isestimated to be 12,000 tons.
MO 7

South Lagoon
The South Lagoon is in the northeast quadrantof DOE's property. It was constructed in 1975to assist the North Lagoon in receivingindustrial wastewaters from the Kansas CityPlant and was in operation until 1988. Theindustrial wastewater system carried rinsewaters, drain input, and treated cooling watersfrom various processes, including electroplatingand degreasing.
Ground-Water Treatment andMonitoring
Ground-water monitoring in support ofremedial activities is required by the ResourceConservation and Recovery Act (RCRA). At theKansas City Plant, contaminant migration fromthe points of release is tracked over the entiresite. The tracking uses monitor wells installedfor the various remediation activities. Thisproject also covers the treatment of threeplumes of contaminated ground water. Thetreatment system uses ultraviolet light andhydrogen peroxide to treat ground waterpumped from production wells. Effluent fromthis system is discharged to the city sanitarysewer under a pretreatment permit.
Trichloroethylene Still AreaThe trichloroethylene still area containsmultiple release sites: the formertrichloroethylene still, the classified wasteburial trenches, the oil house, Department 95,the former aluminum-chip handling facility, theformer sales building, the waste-transfer spillarea, the abandoned sump, and the Department20 sump.
The former trichloroethylene still is on the eastend of the main manufacturing building. From1950 to 1952, the north end of the dock wasused for a solvent recovery still to reclaim spentsolvents, primarily trichloroethylene. Solvent
contamination has been found to the full depthto bedrock (40 feet) beneath this area. Theassumed remediation technology is excavationand disposal of 876 tons of contaminated soil.
The burial trenches for classified waste werelocated in the area known as the barrel lot.Little information about the burials is availablebecause the project was classified, and theburial occurred in the early 1950's. This iswithin the area of influence of the existingground-water treatment system, and it isassumed that no further soil removal will berequired.
The oil house is mainly used to store oil andcoolants in drums and cans. Occasionally,solvents have also been stored there. Shallowtrenches in the floor were used to capture andcontain spills. Trench overflows were directedto a gravel-filled pit on the north side of thebuilding. The trenches have been plugged forat least 15 years, and current operations are notconsidered a source of contamination. Theassumed remediation technology is excavationand disposal of 454 tons of contaminated soil.
The former waste transfer spill area wasreportedly located south of Building 89. Anemployee stated that liquid waste was broughtto the site from other areas at the Kansas CityPlant in metal containers and transferred to two500 to 750 gallon holding tanks. The liquidwaste transferred at this site were thought to becoolants, solvents, oil, paint, and kitchen grease.During transfer operations, unknown quantitiesof liquids were reported to have been spilled.This site was in operation sometime between1955 and 1979. The assumed remediationtechnology is excavation and disposal of 2,520tons of contaminated soil and debris.
The abandoned sump is located betweenBuildings 89 and 96, immediately east of thewaste-transfer spill area and is covered with alarge concrete slab. The assumed remediationtechnology is excavation and disposal of 315tons of contaminated soil and debris.
MO 8

The Department 20 sump was a concrete pitthat housed a vapor degreaser that usedtrichloroethylene to clean parts manufacturedin Department 20 from the mid-1960's to mid-1980's. The vapor degreaser unit was known tohave leaked during its use. This unit has beenremoved, and the sump has been filled withsand and capped with concrete. The assumedremediation technology is demolition,excavation, and disposal of 81 tons ofcontaminated soil and debris.
Sump in the MaintenanceVehicle Repair Shop
There are four areas of concern associated withthe sump of the maintenance-vehicle repairshop: the sump pits, building 54, a reportedunderground tank, and the test cell area.
The sump pits were built in 1970 to house ahydraulic vehicle lift. Vehicles used andrepaired at the Kansas City Plant were routinelywashed on the lift before repair. It was reportedin 1990 that the pits would almost fill up withwastewater from the washes, but would neveroverflow. The lift has been decommissioned.
Building 54 was constructed to test jet engines.The building's basement housed electric motorsused to circulate water through cooling towers.An underground concrete vault west of thebuilding served as a sump for the coolingtower.
An underground tank has been reportedsoutheast of Building 54. Previous samplinghas indicated a potential problem withhazardous constituents in its vicinity.
Sampling has also indicated a possible releaseof hazardous constituents near the test cells.These cells were constructed in the early 1940's.Although little is known about their early uses,it is likely that the use of fuels, oils, anddegreasers was widespread during peakmanufacturing. The assumed remediationtechnology is excavation and offsite disposal.
WASTE MANAGEMENT
The Kansas City Plant generates classified andnonclassified hazardous waste and smallquantities of low-level radioactive waste as wellas low-level mixed radioactive waste. Theprincipal hazardous substances include acids,alkalies, ignitable waste, miscellaneous toxic
Environmental Restoration Activity Costs
Five-Year Averages (Thousands of Constant 1995 Dollars)*
FY 1995 - 2000 2005 2010 2015 2020 2025 2030 life (yds*"
Environmental RestorationAssessment 40 0 0 0 0 239
Remedial Actions 7,928 1,396 1,618 1,766 1,819 1,874 1,930 99,583
Total 7,968 1,396 1,618 1,766 1,819 1,874 1,930 99,822
* Costs reflect a five-year average in constant 1995 dollars, except in FY 1995-2000, which is a six-year average.
Total Life Cycle is the sum of annual costs in constant 1995 dollars.
MO 9

waste, nonfriable asbestos, oil, PCBs, solvents,wastewater-treatment sludge, and medicalinfectious waste from the employee medicaldepartment.
The plant provides temporary onsite storage,but hazardous wastes are neither treated nordisposed of at the site. Hazardous waste istransported for offsite treatment to approvedcommercial treatment and disposal facilities.The disposal of liquid and solid sanitary wasteis the responsibility of the landlord (DefensePrograms).
In 1993, the hazardous waste generated at theKansas City Plant totaled 26,124.4 metric tons,most of which, 25,339 metric tons, was wasteregulated by the Toxic Substances Control Act(TSCA), and 768 metric tons was wasteregulated by RCRA. The remaining 17.4 metrictons was State-regulated waste. Hazardouswaste generation is expected to continue at thepresent rate. The quantity of low-levelradioactive waste was only 0.121 cubic meterand is expected to be minimal in the future,with an estimated annual generation rate of .06to .015 cubic meters per year.
Radioactive WasteThe Kansas City Plant does not generate anyhigh-level radioactive waste. Small quantitiesof low-level radioactive and low-level mixedwaste are generated by the disassembly and
testing of irradiated components, scheduledreplacements of exit signs that contain smallamounts of tritium for illumination, thereplacement or excess of x-ray sources, andmixed-waste segregation (chemical "depotting"process).
Low-level waste is shipped to the Nevada TestSite for disposal. Shipments are madeinfrequently, when a sizable quantity of wasteaccumulates. The last shipment was made in1985, and another is expected in FY 1995. Atpresent approximately 330 cubic feet ofclassified and unclassified low-level waste is instorage.
Since FY 1994, the plant has aggressivelypursued a plan to eliminate all mixed waste instorage. To this end, a chemical process hasbeen used to segregate the radioactive andhazardous components from electronicassemblies. This eliminated two mixed-wastestreams. In July and August 1994 the plantestablished a vendor-return program for smokedetectors, thereby preventing the generation ofa mixed waste containing transuranicradionuclides. These approaches will continueto be applied in an effort to reduce the potentialfor creating mixed wastes.
Major Waste Management Projects
Five-Year Averages (Thousands of Constant 1995 Dollars)*
FT 1995 - 2000 2005 2010 2015 2020 2025 2030 life Cycle"
Modify Demolition Lot 167 0 0 0 0 0 1,000Replace Industrial Waste Piping 500 0 0 0 0 0 1,000 8,000
• Costs reflect a five-year average in constant 1995 dollars, except in FY 1995-2000, which is a six-year average.
• Total Life Cycle is the sum of annual costs in constant 1995 dollars.
NOTE: These projects represent a subset of waste management activities. Associated program management costs are built-in to the estimates provided.
MO 10

Hazardous WasteThe major contributors of hazardous waste aremachining, plating and etching processes, anddegreasing operations. Used oil from metalmachining and equipment lubricationcontributes to the waste totals and is managedas hazardous waste under Missouri regulations.
The numerous laboratories and smalldepartments within the plant also generatemiscellaneous hazardous waste in smallamounts. These items are combined, whenpractical, for controlled disposal. Wastecontaminated with PCBs and asbestos is alsoroutinely generated in cleanup and thedecommissioning of inactive facilities. Wastecontaining PCBs is shipped off the site fordisposal every 30 days.
The Kansas City Plant does not treat anyhazardous waste regulated by RCRA. The onlytreatment that is performed at the site is thepretreatment of wastewater (dilute acid, caustic,cyanide, chrome, and industrial wastes) frommanufacturing. The pretreatment is performedat the industrial wastewater pretreatment
facility, which destroys or removes hazardouschemicals like cyanide and chromium. Thepretreatment facility also dewaters sludge,reducing its volume. The sludge is shipped to alicensed disposal site.
Resource recovery and recycling are performedat various locations throughout the plant, withthe wastewater piped to the pretreatmentfacility. To make these activities more efficient,the Department is considering a consolidatedresource-recovery facility for future funding. Itwill consolidate all resource-recovery activitiesthat generate wastewater in one location,conveniently near the industrial wastewaterpretreatment facility.
At present, storage for hazardous waste isprovided at a tank farm, which contains fivebulk storage tanks for acids, alkalies, solvents,and oil and at various locations in the plant. Allhazardous-waste storage, except for the tankfarm and the storage of lead-acid batteries atthe L-lot, will be consolidated into an enclosedarea.
Waste Management Activities
Five-Year Averages (Thousands of Constant 1995 Dollars)•
FY 1995.2000 2005 2010 2015 2020 2025 2030
TreatmentLow-Level Waste 408 360 360 360 360 360 294
Hazardous Waste 6,778 5,972 5,972 5,972 5,912 5,972 4,778
Total 7,186 6,332 6,332 6,332 6,332 6,332 5,072
2035 2040 2045 2050 2055 2060 2065 Life Cycle**
TreatmentLow-Level Waste 25 0 0 0 0 0 0 13,044
Hazardous Waste 0 0 0 0 0 0 0 213,854
Total 25 0 0 0 0 0 0 226,898
• Costs reflect a five-year average in constant 1995 dollars, except in FY 1995-2000, which is a six-year average.
• Total Life Cycle is the sum of annual costs in constant 1995 dollars.
MO 11

NUCLEAR MATERIAL AND
FACILITY STABILIZATION
There are no current or planned nuclearmaterial and facility stabilization activities atthe Kansas City Plant.
LANDLORD ACTIVITIES
The Department's Office of Defense Programsis the landlord at the Kansas City Plant and isresponsible for associated costs and activities.
PROGRAM MANAGEMENT
Program management cuts across all activitiesat the site. Additional continuity-of-operationselements to be incorporated in outyears includemaintenance of waste-certification program (FY2001-2005), evaluation of generator reportingeffectiveness (FY 2006-2010), (FY 2011-2015),and program management update and review(FY 2011-2015).
Area Support
Area Support programs have site-wideapplicability and include environmental, safety,health, quality assurance, training, emergencymanagement, fire protection, centralizedengineering and maintenance, procurement ofcapital equipment, and safeguards and securityactivities.
Regulatory SupportRegulatory Support programs provideenvironmental regulatory oversight andprogrammatic guidance; ensure compliancewith pertinent environmental regulations andlaws; disseminate regulatory guidance andnotices received from regulatory agencies;
represent issues on site-wide task terms andcommittees; coordinate roles, responses, oractions for the Federal Facility AgreementOperable Unit Groupings; coordinate externalsurveillance's, audits, or appraisals; andcoordinate participation in scheduled meetingswith the regulators.
Operations Integration
Operations Integration programs develop,implement, and conduct training programs asrequired by DOE Order 5480.20 to ensure thatpersonnel and subcontractors have satisfied alltraining requirements. In addition, theprograms establish and maintain performanceexpectations, measurements, and reports;provide Total Quality, Award Fee, Milestone,Commitments, and Issue Tracking programssupport; provide subcontract coordinatorreview, processing, and status of purchaseorders and requisitions; review, storage, andmaintenance of documents; and prepare,review, implement, and maintain procedures.
Program Integration andPlanning
Program Integration activities include thedevelopment of near- and long-term plans forthe management of all waste streams asidentified in the Waste Management Plans.Near-term integration activities include themaintenance of the technical privatizationcontracts and initiatives, and implementation ofan interim storage strategy and a containermanagement plan. Long-term activities includeperforming pre-conceptual project activities,such as studies required to establish a pathforward for the development of future line itemprojects. Program planning activities includethe management of the Solid Waste Life-CycleBaseline, the development of Annual OperatingPlans, Outyear Budgets, and associated
MO 12

schedules, and the preparation of routinereports, such as the Progress Tracking Systemreport and the Baseline EnvironmentalManagement Report.
Quality Assurance
This includes quality assurance activities forenvironmental restoration. The qualityassurance group will divide its activitiesbetween the quality engineering functions andthe quality systems functions. The qualityengineering functions include providingsupport projects with regard to qualityassurance requirements; reviewing andapproving project and procurement documents;validating and closing various types ofdeficiency reports; conducting assessments; andperforming periodic, management-initiatedsurveillance. The quality systems functions willinclude developing and maintaining QualityAssurance program and implementingprocedures; trending and tracking conditionsidentified as adverse to quality until correctiveaction has been verified and the related report
is closed; maintaining Quality Assuranceregulatory requirements; coordinating externalaudits and waste management audits; andperforming self-assessments.
Federal Facility Compliance ActManagementThe Kansas City Plant will continue thedevelopment, testing, and implementation ofmixed waste treatment technologies to beapplied to mixed waste streams at other DOEsites.
Waste MinimizationThis includes coordinating the development,promotion, implementation, and reporting ofsite-wide waste reduction activities. Wastereduction is an integral part of site operationswith the waste-generating line organizationhaving ultimate responsibility forimplementation and funding of waste reductionactivities. Activities include establishing site-wide recycling and source reduction programs
Program Management Cost Estimate
Five-Year Averages (Thousands of Constant 1995 Dollars)*
FY 1995 - 2000 2005 2010 2015 2020 2025 2030
Program Management 2,538 2,984 3,207 3,356 3,409 3,464 3,205
2035 2040 2045 2050 2055 2060 2065 Life Cyde**
Program Management 6 0 0 0 0 113,377
• Costs reflect a five-year average in constant 1995 dollars, except in FY 1995-2000, which is a six-year average.
Total Life Cycle is the sum of annual costs in constant 1995 dollars.
MO 13

for all waste streams. Near-term objectives areto reduce the disposal volume of sanitary,hazardous, and low-level waste streams.Objectives by the year 2000 include thereduction of total releases of toxic chemicals tothe environment; offsite transfers of suchchemicals for treatment and disposal; and thereduction of the volume of newly generated(non-legacy decommissioning andenvironmental restoration waste) low-level,hazardous, and sanitary waste streams throughcontinued waste stream characterization.Reductions are to be achieved by sourcereduction to the maximum extent practicable.
Public Participation
The Kansas City Plant Public Participationprogram consists of a bi-monthly newsletter,plant tours, community surveys, access to
regulatory deliverables, stakeholder meetings,and a community involvement group. Due tothe nature of the environmental risk at theplant, public concern has been minimal.
Program management services are tracked andcharged through the budgets for wastemanagement and environmental restorationactivities. For the purposes of this report, 20percent of the site's budget has been allocatedfor program management activities for FY 1995-FY 2000.
FUNDING AND COST
INFORMATION
The following tables present fundinginformation and major activity milestones forthe Kansas City Plant.
Defense Funding Estimate
Five-Year Averages (Thousands of Constant 1995 Dollars)*
FY 1995-2000 2005 2010 2015 2020 2025 2030
Environmental Restoration 7,968 1,396 1,618 1,766 1,819 1,874 1,930Waste Management 7,168 6,332 6,332 6,332 6,332 6,332 5,072Program Management 2,538 2,984 3,207 3,356 3,409 3,464 3,205
Total 17,674 10,711 11,157 11,454 11,560 11,670 10,207
2035 2040 2045 2050 2055 2060 2065 Life (yds**
Environmental Restoration 0 0 0 0 0 99,822
Waste Management 25 0 0 0 0 0 0 226,898Program Management 6 0 0 0 0 0 0 113,377
Total 31 0 0 0 0 0 0 440,097
• Costs reflect a five-year average in constant 1995 dollars, except in FY 1995-2000, which is a six-year average.
• Total Life Cycle is the sum of annual costs in constant 1995 dollars.
MO 14

Major Activity Milestones
ACTIVITY TASK COMPLETION DATE
Environmental Restoration:
Department 26
Department 27
Maintenance Shop Sump
Ground-Water Treatment and Monitoring
Miscellaneous Contaminated Sites
Miscellaneous PCB Sites
Northeast Area/Outfall 001
Plating Building
TCE Still Area
Kansas City Plant
Waste Management:
Operations
Operations
Modi Demolition Lot
Replace Industrial Waste Piping
Fiscal Year
Complete Remediation
Complete Remediation
Complete Remediation
Complete Remediation
Complete Remediation
Complete Remediation
Complete Remediation
Complete Remediation
Complete Remediation
Complete Environmental Restoration
2000
1999
2000
2001
2000
1998
1999
2000
2000
2030
Fiscal Year
Submit Final Site Treatment Plan to the State of Missouri
Replace Waste Acid and Alkaline Tanks
Complete Modification of Demolition Lot
Complete Replacement of Industrial Waste Piping
All Waste Management Activities Complete
1995
1996
1997
1998
2029
For further information on this site, please contact: Public Participation OfficePublic Affairs OfficeTechnical Liaison: Diane Solcher
(505) 845-5951(505) 845-6202(816) 997-5118
MO 15

MO 16

WELDON SPRING SITE REMEDIAL ACTION PROJECT
The Weldon Spring site is about 30 miles west of St. Louis, Missouri. The site consists of 229 acres.
Raffinate Pits
O 400 800 feet
I I II I
O 100 200 Meters
Water TreatmentPlant
•St •04,4$0 • ...
S I I • .1ehrails
•
Structures being dismantled
State Route 94
MO 17

Estimated Site Total
(Thousands of Current 1995 Dollars)*
FY 1995 1996 1997 1998 1999 2000
Environmental Restoration 33,300 43,900 42,500 42,700 59,300 49,600
Program Management 21,700 23,600 23,100 22,800 20,800 19,400
Total 55,000 67,500 65,600 65,500 80,100 69,000
Costs for FY 1995 reflect Congressional Appropriation, costs for FY 1996 reflect EM budget submission, costs for FY 1997-2000 reflect Budget Shortfall Scenario, costs for
shaded area assume 3% annual inflation.
Five-Year Averages (Thousands of Constant 1995 Dollars)**
FY 1995-2000 2005 2010 2015 2020 2025 2030 Life Cycle***
Environmental Restoration 41,755 10,556 0 0 0 0 0 303,312
Program Management 20,411 7,194 0 0 0 0 0 158,438
Total 62,166 17,750 0 0 0 0 0 461,150
Costs reflect a five-year average in constant 1995 dollars, except in FY 1995 - 2000, which is a six-year average.
*— Total Life Cycle is the sum of annual costs in constant 1995 dollars.
PAST, PRESENT, AND
FUTURE MISSIONS
Weldon Spring was part of a site used by theU.S. Army as an ordnance works in the 1940's.In the 1950's and 1960's, the Atomic EnergyCommission used the site for processinguranium ore in the Weldon Spring chemicalplant. The plant was subsequently inactivatedand no activities were carried out at the WeldonSpring site until remediation was undertaken.
The U.S. Environmental Protection Agencyplaced the site on the National Priorities List in1989. The current mission for Weldon Spring isto eliminate potential hazards to the public andthe environment. The Department of Energy(DOE) is conducting a comprehensive remedialaction program to complete this mission. Thecost of the cleanup for the chemical plant isshared by the Department of the Army; whichis currently contributing 22 percent of theoverall funding for the project.
Remedial action at Weldon Spring is scheduledfor completion in 2003. A section of the site willbe used as a permanent disposal area for wastes
resulting from cleanup of the site. This areawill continue to be monitored after remedialaction is completed. Future plans are to makesurplus real property available for other uses tothe extent practicable. The landlord at the siteis DOE's Environmental Management program.
ENVIRONMENTAL
RESTORATION
To support the remedial actions at WeldonSpring, DOE conducts radiological, chemical,and geotechnical investigations includingextensive site characterizations to determine thetype and extent of contamination.Investigations will continue as monitoringactivities after remedial action is completed.
Contamination is found in three major areas atthe Weldon Spring site including an old quarrysite approximately three miles south of theraffinate pits, four waste lagoons (raffinatepits), and the chemical plant. Somecontamination is also present in adjacent("vicinity") properties.
MO 18

The quarry is a 9-acre site that was used in the1950's and 1960's for the disposal of wastegenerated by uranium-ore processing. Itcontains 126,630 cubic yards of soil and rubblecontaminated with radionuclides and 3 milliongallons of water contaminated withradionuclides and chemicals. Thesecontaminated materials will be removed fromthe quarry, treated, and disposed of in theonsite disposal facility. Additional residualcontamination in the quarry will be removedfollowing initial remediation, depending on theresults of further assessment and monitoring.Quarry restoration will be complete by FY 2002.
The four waste lagoons were used to storecontaminated residue from uranium-oreprocessing. They contain 407,930 cubic yards ofraffinate sludge and contaminated soil. Theyalso contain 57 million gallons of contaminatedwater. The raffinate sludge and contaminatedsoil will be excavated, treated, and disposed ofin the onsite disposal facility. The raffinate pitsremediation will be completed by FY 2001.
The chemical plant is a complex of 44 buildingsand other structures where uranium ore wasprocessed. It contains 347,996 cubic yards ofcontaminated soil and building materials. Thebuildings and structures are being dismantled,and the surrounding soils excavated asappropriate. All waste and contaminatedmaterials will be treated and disposed of in theonsite disposal facility. Dismantling of 43 of thebuildings and structures has been completedand the building foundation will be removed
by FY 1998. The remaining structure is aResource Conservation and Recovery Actmaterial storage building and will bedismantled in FY 1999.
Approximately 25,400 cubic yards ofcontaminated soil is present at the vicinityproperties beyond the boundaries of theWeldon Spring site. They include lakes andwildlife areas contaminated from the runoff ofuranium during plant operations. The lakewaters, however, show no discernable levels ofcontamination. Contaminated soil will beexcavated and hauled to the onsite disposalfacility for storage until it can be placed in thepermanent disposal facility. Surface andground waters will continue to be monitoredfor the foreseeable future. The vicinityproperties will be remediated by FY 2000.
WASTE MANAGEMENT
Waste management at Weldon Spring isconducted as part of ongoing environmentalrestoration activity. A record of decision signedin September 1993, determined the disposal ofwaste would take place in an engineereddisposal facility at Weldon Spring.
Environmental Restoration Projects
Five-Year Averages (Thousands of Constant 1995 Dollars)*
FT 1995-2000 2005 2010 2015 2020 2025 2030 Life Cyde**
Environmental Restoration 41,755 10,556 0 0 0 0 0 303,312
' Costs reflect a five-year average in constant 1995 dollars, except in FY 1995 - 2000, which is a six-year average.
• Total Life Cycle is the sum of annual costs in constant 1995 dollars.
MO 19

Waste Treatment
A waste processing facility will be constructedfor reducing the volume of wastes from thedismantling of buildings and structures beforepermanent isolation in the disposal facility. Thewaste processing facility is scheduled to becompleted by FY 1997. In addition, a water-treatment plant will be constructed to treatcontaminated liquid wastes and process waterfrom remedial actions. The Weldon Spring sitehas an onsite sanitary treatment plant servicedby a septic company.
Waste Disposal
Disposal will be provided in an engineeredfacility. The onsite disposal facility will be alined facility with a leachate collection system.Building waste, soil, and equipment will beplaced into the disposal facility. The waste willthen be entombed with a stabilized cementmaterial produced from raffinate pit sludge.The disposal facility is designed to hold 1.2million cubic yards of waste. Construction willbe completed by FY 2003.
NUCLEAR MATERIAL AND
FACILITY STABILIZATION
Nuclear Material and Facility Stabilizationactivities are not anticipated to be conducted atthis installation.
LANDLORD FUNCTIONS
Landlord or support functions are needed forthe environmental restoration activity at theWeldon Spring site. They include analyticallaboratory services; janitor and guard services;groundskeeping; maintenance and repair foradministrative facilities and vehicles; design,construction, and operation of support
buildings and facilities; construction andmaintenance of access roads and parking areas;installation and operation of site utilities; andequipment and supplies for safe fieldoperations.
PROGRAM MANAGEMENT
Program management provides funding for thesite's project integration task including projectmanagement, administration, andimplementation. Additional programmanagement functions include environmental,safety, and health; interfaces with regulatoryagencies; guidance for, and verification of,regulatory compliance; design, construction,and procurement management; cost andschedule management; and quality assurance.
FUNDING AND COST
INFORMATION
The following tables present fundinginformation and major activity milestones forthe Weldon Spring Site Remedial Action Project.
MO 20

Program Management Cost Estimate
Five-Year Averages (Thousands of Constant 1995 Dollars)
FY 1995-2000 2005 2010 2015 2020 2025 2030 Life Cycle**
Program Management 20,411 7,194 0 0 0 0 0 158,438
• Costs reflect a five-year average in constant 1995 dollars, except in FY 1995-2000, which is a six-year average.
▪ Total Life Cycle is the sum of annual costs in constant 1995 dollars.
Nondefense Funding Estimate
Five-Year Averages (Thousands of Constant 1995 Dollars)*
FY 1995 - 2000 2005 2010 2015 2020 2025 2030 Life Cyde**
Environmental Restoration 41,755 10,556 0 0 0 0 0 303,312
Program Management 20,411 7,194 0 0 0 0 0 158,438
Total 62,166 17,750 0 0 0 0 0 461,750
Costs reflect a five-year average in constant 1995 dollars, except in FY 1995-2000, which is a six-year average.
• Total Life Cycle is the sum of annual costs in constant 1995 dollars.
MO 21

Major Activity Milestones
ACTIVITY TASK COMPLETION DATE
Environmental Restoration Fiscal Year
Complete Dismantling of Chemical Plant Buildings 1995
Initiate Chemical Stabilization/Solidification Facility Title II Design 1995
Complete Quarry Bulk Waste Removal 1996
Complete Development of Soil Borrow Area 1996
Complete Soil Borrow Area Haul Road 1996
Begin Disposal Facility Construction 1997
Begin Raffinate Pit Remediation 1998
Complete Removal of Building Foundations 1998
Begin Quarry Restoration 1999
Complete Ground Water Record of Decision 1999
Complete Quarry Residuals Record of Decision 1999
Complete Vicinity Properties Remefiation 2000
Complete Remediation of Raffinate Pits 2001
Complete Placement of Waste in Disposal Facilities 2002
Complete All Environmental Restoration Activities 2003
For further information on this site, please contact: Public Participation OfficePublic Affairs OfficeTechnical Liaison: Steve McCracken
(615) 576-1590(615) 576-0885(314) 441-8978
MO 22

:•0
MISSOURI FUSRAP SITES
The St. Louis Downtown Site, Latty Avenue Properties, St. Louis Airport, St. Louis Airport Vicin-ity Properties, and St. Louis Downtown Site constitute the Missouri sites within the FormerlyUtilized Sites Remedial Action Program (FUSRAP). The program was established in 1974 underthe provisions of the Atomic Energy Act to identify previously decontaminated Manhattan EngineerDistrict and Atomic Energy Commission sites to reevaluate their radiological condition and to takeappropriate remedial action where necessary. FUSRAP encompasses 46 sites in 14 States and isfunded through the Oak Ridge Operations Office. The model used to estimate costs for this Reportprovides one cost for all of the FUSRAP sites located in each State. All costs for waste managementactivities, program management, and relevant landlord activities attributable to the Department ofEnergy (DOE) are provided for within the scope of environmental restoration. There are noFUSRAP sites with either current or planned nuclear material and facility stabilization activityneeds. Funding for all sites is 100 percent nondefense. For a general discussion of FUSRAP andassociated costs see the FUSRAP Site Summary found in the Tennessee section.
Estimated Site Total
(Thousands of Current 1995 Dollars)*
EY 1995 99 9 19 1999 00
Missouri-FUSRAP 0 8,740 23,4 0 43,580 8,920 160
• Costs for FY 1995 reflect Congressional Appropriation, costs for FY 1996 reflect EM budget submission, costs for FY 1997-2000 reflect Budget Shortfall Scenario, costs forshaded area assume 3% annual inflation.
Five-Year Averages (Thousands of Constant 1995 Dollars)**
FY 1995-2000 2005 2010 2015 2020 2025 2030 Life Cycle***Missouri-FUSRAP 36,198 27,536 13,739 16,363 6,015 0 0 535,450
• Costs reflect a five-year average in constant 1995 dollars, except in FY 1995 - 2000, which is a six-year average.
*** Total Life Cycle is the sum of annual costs in constant 1995 dollars.
Nondefense Funding Estimate
Five-Year Averages (Thousands of Current 1995 Dollars)•
FY 1995.2000 2005 2010 2015 2020 2025 2030 Life Cycle**Environmental Restoration 36,198 27,536 13,739 16,363 6,015 0 0
• Costs reflect a five-year average in constant 1995 dollars, except in FY 1995 - 2000, which is a six-year average.
" Total Life Cycle is the sum of annual costs in constant 1995 dollars.
535,450
MO 23

ST. LOUIS DOWNTOWN SITE
(Formerly Utilized Sites Remedial Action Program)
The St. Louis Downtown Site is located on Mallinckrodt, Inc. property in an industrial area in theeastern part of St. Louis near the McKinley Bridge crossing of the Mississippi River. The site covers45 acres and includes many buildings. Vicinity properties include several businesses surroundingthe site.
J
DESTREHAN ST.---1.--I--
CONTAMINATED AREA
TRENCH BOUNDARY
RAILROAD
MO 24

PAST, PRESENT, AND
FUTURE MISSIONS
In 1942, the Mallinckrodt Chemical Works setup an industrial scale process to recoveruranium from high grade uranium ore from theBelgian Congo. Over the next 15 years,Mallinckrodt conducted a variety of uraniumprocessing and recovery operations for the U.S.Army and the Atomic Energy Commission. By1957, the company had processed more than50,000 tons of natural uranium products.
The site is currently owned by Mallinckrodt. Atthe time of the Manhattan Engineer District andthe Atomic Energy Commission operation, thesites were owned by Mallinckrodt andleased by Atomic Engineering Commission.During closeout of the St. Louis operations in1957, buildings owned by the Government wereeither demolished or transferred toMallinckrodt as part of a settlement. Of the 60buildings involved in the operation within theMallinckrodt facility, fewer than 20 buildingsremain. A number of new buildings have beenconstructed on the site.
For further information on this site, please contact:
Future use of this site depends on resolution ofthe record of decision for the St. Louis sites.Options range from institutional controls/sitemaintenance to construction of a local disposalcell (for all four St. Louis sites) to shipment ofall waste to another disposal site.
ENVIRONMENTAL
RESTORATION
The waste volume at this site is estimated to be246,000 cubic yards. Wastes are primarily theresidues from the processing of high gradeuranium ore. DOE has in the past and will inthe future conduct removal actions in supportof the site owners renovations and expansionactivities.
Public Participation OfficePublic Affairs OfficeTechnical Liaison: Melyssa Noe
(615) 576-1590(615) 576-0885(615) 241-3315
MO 25

St LOUIS AIRPORT SITE
(Formerly Utilized Sites Remedial Action Program)
The St. Louis Airport Storage Site is a 21.7-acre tract located about 15 miles northwest of downtownSt. Louis and adjacent to the northern boundary of the Lambert-St. Louis International Airport.
FUSRAP SITES
.2):
v/t44..
(Fa.
1'.
•N
•
LAITY• AVENUE —
PROPERTIES I
/
, •
444011PERSHALL RD.
LATTY AVE. MI
HAZELWOODI AVENUE
ST. LOUISAIRPORT SITE
44-o1/4
LAMBERT-ST. LOUISINTERNATIONAL AIRPORT
..20111.
> BERKELEY5
----0003
I--IP
TO DOWNTOWNST. LOUIS
P
M0 26

PAST, PRESENT, AND
FUTURE MISSIONS
The site was used for the storage of residues
and contaminated equipment that resulted
from uranium processing activities conducted
at the St. Louis Downtown Site from 1946 to
1953. No buildings exist at St. Louis Airport
Site and it is surrounded by fencing. The
property was owned by the U.S. Government
from 1946 until 1973, when it was transferred to
the City of St. Louis via Quitclaim Deed (with
full disclosure of use restrictions).
Future use of this site depends on resolution of
the record of decision for the St. Louis sites.
Options range from institutional controls/site
maintenance, to construction of a local disposal
cell (for all four St. Louis sites), to shipment of
all wastes to another disposal site.
For further information on this site, please contact:
ENVIRONMENTAL
RESTORATION
This site is on the Environmental Protection
Agency's National Priorities List. Most of the
concentrated residues were sold and removed
from the site in 1966 and 1967. Onsite
structures were razed, buried on the site, and
covered with 1 to 3 feet of clean fill. Buried
deposits of uranium, radium, and thorium
remain on the site. The waste volume at the St.
Louis Airport Site is estimated to be 250,000
cubic yards. Wastes are primarily the residues
from the processing of high-grade uranium ore.
Public Participation Office
Public Affairs OfficeTechnical Liaison: Melyssa Noe
(615) 576-1590(615) 576-0885(615) 241-3315
MO 27

ST. LOUIS AIRPORT SITE VICINITY PROPERTIES(Formerly Utilized Sites Remedial Action Program)
The St. Louis Airport Storage Site Vicinity Properties consist of 78 properties along transportationroutes, the Norfolk and Western Railroad, the ball field, and Coldwater Creek, which flows 500 feetalong the western border of St. Louis Airport Site and then for 1,000 feet adjacent to the LattyAvenue Site. The vicinity properties are located in the Cities of Hazelwood and Berkeley, Missouri.
FUSRAP SITES
'N %
I. .
.%.
0
rNMI
P RSHALL RD.
1- "I.
L.ATTY AVE
HAMLWOODj AVENUE
ts"
ST. LOUISAIRPORT SITE
t\,)
N.
es.
et` LAMBERT-ST. LOUISINTERNATIONAL AIRPORT 0
!,12
giT
BERKELEY
Nibs, RA
Sy.4f4,9<ea
TO DOWNTOWNST. LOUIS
CID
MO 28

PAST, PRESENT, AND
FUTURE MISSIONS
These properties were primarily contaminated
by materials from the St. Louis Airport Site and
its associated activities. Future use of this site
depends on resolution of the record of decision
for the St. Louis sites. Options range from
institutional controls / site maintenance, to
construction of a waste disposal cell (for all four
St. Louis sites), to shipment of all waste to
another disposal site.
For further information on this site, please contact:
ENVIRONMENTAL
RESTORATION
The waste volume at these vicinity properties is
estimated to be 90,000 cubic yards. Wastes are
primarily soils and sediment containing
residues from the processing of high-grade
uranium ore that migrated from the St. Louis
Airport Site or the Latty Avenue Site viaenvironmental forces or during haulingoperations between the two sites.
In FY 1995, approximately 1,400 cubic yards of
waste was removed from these properties and
shipped to Envirocare, Inc. in Utah for disposal.
Public Participation OfficePublic Affairs OfficeTechnical Liaison: Melyssa Noe
(615) 576-1590(615) 576-0885(615) 241-3315
MO 29

LATTY AVENUE PROPERTIES(Formerly Utilized Sites Remedial Action Program)
The Latty Avenue Properties Site is located at 9200 Latty Avenue, Hazelwood, Missouri, in aheavily industrialized area approximately 1 kilometer (0.75 miles) north of the St. Louis Airport.There are three buildings on the site and the Hazelwood Interim Storage Site.The Hazelwood Interim Storage Site and the adjacent Futura Coating properties (three buildings)are on the Environmental Protection Agency's National Priorities List. The 12-acre site includes theHazelwood Interim Storage Site and 6 vicinity properties.
a= 5-
I
I I 111•• I I I BUILDING
PROPERTY BOUNDARY
STORN SEER
STORE/ATER DRAINAGE
FENCE
RAILROAD
-7:
1
\
1••
•\
FUTURACOATINGS
, .
r STORM SEWER INLET
TRAILERSDECON
•F•cturY,
:SE 01.1
I I.EkENT:,:r
I 1
HISS
MO 30

PAST, PRESENT, AND
FUTURE MISSIONS
The waste originated as processing residue
from uranium production at the St. Louis
Downtown plant from 1942 through the late
1950's. The waste was transported to the
nearby St. Louis Airport Site for storage and
then was purchased by the Commercial
Discount Corporation of Chicago in 1967 and
transported to the Latty Avenue Site. This
material was sold to the Cotter Corporation in
1969 and was dried and shipped to their
facilities in Canon City, Colorado. Before the
present owner (Futura Coating Company)
occupied the site, a radiologicalcharacterization revealed thorium and radium
contamination in excess of Department of
Energy (DOE) guidelines in and around the
buildings and in the soil. Congress authorized
DOE to cleanup the site in 1983.
The waste is primarily soil containing low-level
waste residues resulting from the processing of
high-grade uranium ore. Future use of this site
depends on resolution of the record of decision
for the St. Louis sites. Options range from
employing long-term institutional controls, to
construction of a local disposal cell (for all four
St. Louis FUSRAP sites), to shipment of all
waste to another disposal site.
For further information on this site, please contact:
ENVIRONMENTAL
RESTORATION
Residues from the cleanup of some of these
properties has been placed on two covered
onsite storage piles. The larger waste pile is
approximately 100 meters long, 60 meters wide,
and 9 meters high. The smaller pile isapproximately 60 meters long, 25 meters wide,
and 5 meters high. The waste volume for the
site, including both piles, and belowgrade
waste onsite and from the vicinity properties is
estimated to be 211,000 cubic yards.
Remedial actions have included clearing the
site and surveying adjacent properties;constructing a decontamination facility and
installing a perimeter fence; excavating and
backfilling the shoulders of Latty Ave. and
covering the contaminated soils; surveying
services; material testing; and monitoring well
installation. Remediation is anticipated to be
complete by FY 2009.
Public Participation OfficePublic Affairs OfficeTechnical Liaison: Melyssa Noe
(615) 576-1590(615) 576-0885(615) 241-3315
MO 31

MO 32

* Ongoing surveillance and monitoring
costs are provided in the table below.
HALLAM NUCLEAR POWERFACILITY (COMPLETED)*
NEBRASKA
Estimated State Total
Hallam
(Thousands of Current 1995 Dollars)*
Y 1995 1996 1997 199 1999 2000
21 22 22 23 23 25
• Costs for FY 1995 reflect Congressional Appropriation, costs for FY 1996 reflect EM budget submission, costs for FY 1997-2000 reflect Budget
Shortfall Scenario, costs for
shaded area assume 3% annual inflation.
Five-Year Averages (Thousands of Constant 1995 Dollars)**
FY 1995-2000 2005 2010 2015 2020 2025 2030 Life Cycle***
Hallam 21 27 0 0 0 0 0 261
" Costs reflect a five-year average in constant 1995 dollars, except in FY 1995 - 2000, which is a six•year average.
*** Total Life Cycle is the sum of annual costs in constant 1995 dollars.
NE 1

NE 2

HALLAM NUCLEAR POWER FACILITY
The Hallam Nuclear Power Facility is located in Hallam, Nebraska. Activities at the site are man-
aged through the Department of Energy Chicago Operations Office.
fr ,
I II II IL _ _
r)I
Lincoln Way
Admin Bldg.
West Dr.
i
/I
in
SewageTreatmentPlant
Exhibit Bldg.
Road A
Pump House
L.H. X.Cells
EntombedReactor
NE 3

Estimated Site Total
(Thousands of Current 1995 Dollars)*
95 1996 1997: 1998 1999 2000Environmental Restoration 21 22 22 23 23 2
' Costs for FY 1995 reflect Congressional Appropriation, costs for FY 1996 reflect EM budget submission, costs for FY 1997-2000 reflect Budget Shortfall Scenario, costs forshaded area assume 3% annual inflation.
Five-Year Averages (Thousands of Constant 1995 Dollars)•*
FY 1995 - 2000 2005 2010 2015 2020 2025 2030 Life Cycle***Environmental Restoration 21 27 0 0 0 0 0 261
Costs reflect a five-year average in constant 1995 dollars, except in FY 1995 - 2000, which is a six-year average."' Total Life Cycle is the sum of annual costs in constant 1995 dollars.
PAST, PRESENT, ANDFUTURE MISSIONS
The Hallam Nuclear Power Facility was a 240megawatt (thermal) sodium-cooled graphite-moderated nuclear reactor built and operatedas a demonstration project by the AtomicEnergy Commission between 1962 and 1964. In1965, the Atomic Energy Commissionterminated its agreement with ConsumersPublic Power District for operation of thefacility, and in 1967, Nebraska Public PowerDistrict (formerly Consumers Public PowerDistrict) was authorized to decommission anddismantle the facility. This activity ended in1969, and the facility was retired by the AtomicEnergy Commission in 1971. As a successoragency to the Atomic Energy Commission, DOEnow has responsibility for the buildings at theHallam Nuclear Power Facility.
Hallam Nuclear Power Facility has no currentmission. Activities at the site are limited to
semi-annual surveillance and maintenance,which is expected to end in FY 2005.
It is assumed the buildings comprising theHallam Nuclear Power Facility will be returnedto Nebraska Public Power District in 2005.Future use of the facility is assumed to remainrestricted.
ENVIRONMENTAL
RESTORATION
There is no known environmentalcontamination at the site. Potentialcontaminants include nickel-63, cobalt-60, iron-55, manganese-54, samarium-151, cesium-137,strontium-90, and tritium; however, all suchmaterials are contained within the entombmentstructure in Area 1 (reactor vessel and vesselcontainment structures), Area 2 (fuel storage pit3 thimbles), or Area 3 (moderator elementstorage cells). The contaminants within the
NE 4

structure consist of activation products in the
stainless steel reactor vessel and its internals.
Lesser amounts of activation products aredispersed in the carbon steel thermal shield and
guard vessel surrounding the reactor vessel and
in the compartment liner itself.
At the time the reactor was decommissioned
and dismantled, the reactor and most of theradioactive materials were removed from the
site. All bulk sodium was removed from the
site, and residual sodium was reacted withsteam to form sodium hydroxide, removing thepotential for hydrogen formation at a later dateshould water leak into the facility. Remainingwithin the compartment are the reactor vesseland surrounding guard vessel, with associateddouble-walled piping and most of the reactorvessel internals.
Fuel Storage Pit 3 contains a number ofstainless steel thimbles formerly used to storespent fuel elements. The storage pool wasdrained, and the thimbles now contain processtubes, control rod tubes, dummy elements, and
a spent neutron source. To assure leaktightness, closures and dust covers for eachthimble have been welded in place and theinterspace has been filled with expandingconcrete. Storage Area 3 consists of 12moderator-element storage cells containing 3canistered moderator elements that experienced
cladding failures during reactor operation. Anumber of parts, such as pumps, valves, andsegments of piping are stored in these cells.
The moderator cells were sealed by welding the
plug casings to the cell liners and filling thespace above the plugs with expanding concrete.The basement level of the facility containedradioactive waste disposal equipment, whichhas been either removed or decontaminated, asappropriate. All reactor compartments havebeen sealed, and the surface of the below-gradeconcrete structure was covered with sand, awaterproof polyvinyl membrane, and acovering of earth. The cover was sloped forproper drainage, and drain tile was installed atthe periphery. Above-grade structures havebeen weatherproofed by a layer of polyvinylsheet and a protective cover of concrete.
Current environmental restoration activitiesinclude continued semiannual surveillance andmonitoring, and characterization of a reportedperched ground-water system in the vicinity ofthe Hallam Nuclear Power Facility. Surveillanceand monitoring includes radiological samplingand analysis, and continuous monitoring ofperched ground-water levels in twopiezometers at the site. No further action isplanned at this time.
WASTE MANAGEMENT
ACTIVITIES
There are no current or planned wastemanagement activities at the Hallam NuclearPower Facility site.
Environmental Restoration Projects
Five-Year Averages (Thousands of Constant 1995 Dollars)*
FY 1995-2000 2005 2010 2015 2020 2025 2030 Life Cycle**
Long Term Surveillance and Monitoring 21 27 0 0 0 0 0 261
'Costs reflect a five-year average in constant 1995 dollars, except in FY 1995-2000, which is a six-year average.
"Total Life Cycle is the sum of annual costs in constant 1995 dollars.
NE 5

NUCLEAR MATERIAL AND
FACILITY STABILIZATION
There are no current or planned facilitystabilization, maintenance, or monitoringactivities at the Hallam Nuclear Power Facility.
LANDLORD FUNCTIONS
At the present time, landlord activities atHallam Nuclear Power Facility are theresponsibility of the land owner, the NebraskaPublic Power District.
PROGRAM MANAGEMENT
Program management at Hallam NuclearPower Facility is concerned with managementof the semiannual surveillance and monitoringactivities, and review and analysis of the data.These activities are performed by ChicagoOperations Office personnel on a level-of-effortbasis.
FUNDING AND COST
INFORMATION
The following tables present current andprojected funding information and majorEnvironmental Management program activityand project costs projected through completionfor the Hallam Nuclear Power Facility.
Nondefense Funding Estimate
Five-Year Averages (Thousands of Constant 1995 Dollars)*FY 1995-2000 2005 2010 2015 2020 2025 2030 Life Cycle**
Environmental Restoration 21 27 0 0 0 0 0 261
• Costs reflect a five-year average in constant 1995 dollars, except in FY 1995-2000, which is a six-year average.
Total Life Cycle is the sum of annual costs in constant 1995 dollars.
Major Activity Milestones
ACTIVITY TASK COMPLETION DATE
Environmental Restoration Fiscal Year
Submit Final Annual Report at conclusion of monitoring FY 2005
Environmental restoration activities completed FY 2005
For further information on this site, please contact: Public Participation Office (708) 252-8796Public Affairs Office (708) 252-2010Technical Liaison: Michael Ferrigan (708) 252-2570
NE 6

PROJECT SHOALTEST AREA
•••••-• ••
TONOPAH TESTRANGE
CENTRAL NEVADA TEST AREA(PROJECT FAULTLESS SITE)
NEVADA TEST SITE
NEVADAEstimated State Total
(Thousands of Current 1995 Dollars)*
Y 1995 1996 1997 .1998 1999 2000
Nevada Test SiteCentral Nevado/Tonopah/Shoal Test She
Total- Nevada
93,244 101,404 106,320
2,937 3,424 2,6079,911 1110,718
762
68,437 96,181 104,828 108,927 101,160 111,480
• Costs for FY 1995 reflect Congressional Appropriation, costs for FY 1996 reflect EM budget submission, costs for FY 1997-2000 reflect Budget Shortfall Scenario, costs for
shaded area assume 3% annual inflation.
Five-Year Averages (Thousands of Constant 1995 Dollars)**
FY 1995 -2000 2005 2010 2015 2020 2025 2030
Nevada Test Site 89,195 153,876 162,722 124,447 50,569 29,806 26,965
Central Nevada/Tonopah/Shoal Test She 1,840 550 80 100 50 130 120
Total - Nevada 91,035 154,426 162,802 124,547 50,619 29,936 27,085
FY 2035 2040 2045 2050 2055 2060 2065 Life Cycle*.
Nevada Test She 15,035 9,408 4,106 3,327 2,317 465 0 3,450,388
Central Nevada/Tonopah/Shoal Test She 100 52 32 22 4 0 0 17,240
Total - Nevada 15,135 9,460 4,138 3,349 2,321 465 0 3,467,628
** Costs reflect a five-year average in constant 1995 dollars, except in FY 1995 - 2000, which is a six-year average.
*** Total Life Cycle is the sum of annual costs in constant 1995 dollars.
NV 1

NV 2

3.
NEVADA TEST SITE
Currently, the Nevada Operations Office manages sites in 10 locations and retains responsibility forprevious testing activity by the Department of Energy (DOE) and its predecessors. The largest ofthese locations is the multifunctional Nevada Test Site, a 1,350-square-mile Federal reservationsituated about 65 miles northwest of Las Vegas. The Nevada Test Site contains the Town of Mer-cury, which provides temporary residence for some of the work force. Other principal Departmentalsites are the North Las Vegas complex in North Las Vegas Nevada and the Remote Sensing Labcomplex on Nellis Air Force Base, Nevada. The locations of past testing off the Nevada Test Siteinclude the Central Nevada Test Area, the Tonopah Test Range, and the Shoal Event Site in Nevada;the Amchitka Island Site in Alaska; the Rio Blanco and Rulison Gas simulation Test Sites in Colo-rado; the Gasbuggy and Gnome—Coach Test Sites in New Mexico; and the Salmon Test Site inMississippi. The Nevada Offsite locations are depicted on the Nevada Offsite Locations map.
SHOALTEST
CENTRAL NEVTEST AREA
NEVADA TES' SITEEM FACILITY LOCATIONS
Area 25E-MAD (BLDG 3900)Test Cell W (BLDG 3124)Test Cal W (BLDG 311Test Cell 1C1 (BLDG 3210)R.MAD pax) 3110)JR. Hot Cel S3L DO 3161)
Arm 5Waste Pracessing Faddy (BLDG 543)RWMS Office (BLDG 5-7)Podel &Smits BLDG (BLDG 5-10)Cleft Lunch RtntSleck (BLDG 5-18)Storage and MUMenance Shed (BLDG 521)PITSTench 3Tench 8
*LIM alr P°'
lend, 1D2CTench 1D4C
aisk'alertRIO BLANCO
x
A
OASBUOGY
NEVADA OFF-SITE LOCATIONS
a D„.AMCHITKA
PROJECT GNOME
rCOACH SITE
WM.
SALMON SITE
Note: Drawing is not
to scale
Area 15EPA Ferro (BLDG 1608)
Area 3U3ahatU3.cUSupport Faciltiee
Area 23BLDG 23132(MERCURY)
PIT 3Mixed Waste Managetrent Unit (Proposed)
Hamadous Waste AccurrMallco Sik
ToansmanIc Waste Stomps Pad
Groat, Confinement Diescaal
Strategic M3 lanais Stomp° Yad
NV 3

Estimated Site Total
Environmental RestorationWaste ManagementNuclear Material and Facility StabilizationProgram Management
Total
1995
(Thousands of Current 1995 Dollars)*
1996 1997. 1998 1999 2000
57,505
5,402150
17,661
6 101,404 106 320 1 11'0,711• Costs for FY 1995 reflect Congressional Appropriation, costs for FY 1996 reflect EM budget submission, costs for FY 1997-2000 reflect Budget Shortfall Scenario, costs for
shaded area assume 3% annual inflation.
Five-Year Averages (Thousands of Constant 1995 Dollars)**
FT 1995 - 2000 2005 2010 2015 2020 2025 2030
Environmental Restoration 44,637 65,644 83,570 83,078 18,344 900 1,345Waste Management 29,216 32,706 32,940 29,662 26,418 24,515 21,879Nuclear Material And Facility Stabilization 109 40,935 34,581 1,635 0 0 0Program Management 15,233 14,591 11,631 10,071 5,817 4,391 3,740
Total 89,195 153,876 162,722 124,447 50,569 29,806 26,965
2035 2040 2045 2050 2055 2060 2065 life Cycle**
Environmental Restoration 1,172 1,712 1,260 910 0 0 0 1,557,449Waste Management 11,839 6,573 2,431 2,064 1,979 397 0 1,142,309Nuclear Material and Facility Stabilization 0 0 0 0 0 0 0 386,413Program Management 2,024 1,124 416 353 338 68 0 364,216
Total 15,035 9,408 4,106 3,327 2,317 465 0 3,450,388
Costs reflect a five-year average in constant 1995 dollars, except in FY 1995 - 2000, which is a six-year average.
** Total Life Cycle is the sum of annual costs in constant 1995 dollars.
PAST, PRESENT, AND
FUTURE MISSIONS
For over 40 years, the primary mission of theDOE's Nevada Operations Office was toconduct field testing of both nuclear andconventional explosives in connection with theresearch and development of nuclear weapons.The Nevada Test Site was established in 1950when President Truman authorized acontinental weapons testing area at the LasVegas Bombing and Gunnery Range. SinceJanuary 1951, the primary mission of theNevada Test Site has been testing nuclearweapons.
In addition to weapons tests, the site has alsohosted secondary missions, including thefollowing: neutron and gamma-ray interactionstudies; open-air nuclear reactor, nuclearengine, and nuclear furnace tests; hazardousmaterials spill response testing; andexperiments involving radioactive andnonradioactive materials conducted by theDepartment of Defense. In the 1950's, above-ground atmospheric tests were the predominatesite activity. Above-ground testing of nuclearweapons ceased in 1963, and the offsite testsended in 1973. Since October 1992, the NevadaOperations Office has suspended subsurfacenuclear testing as well, but it maintains areadiness posture to resume if deemednecessary by the President.
NV 4

At present, the Nevada Test Site is one of theprimary low-level waste disposal sites for theDepartment of Energy complex. It is assumedthis role will continue in support of theEnvironmental Management program.
Use of the Nevada Test Site and other NevadaOperations Office resources for technologyinitiatives will increase significantly in thefuture. The Nevada Test Site will remain underDOE ownership and institutional control untilnew directions in mission and land use aredetermined. The Nevada Operations Office isundergoing significant changes to becompatible with the future strategic plans of theDepartment. In general, the NevadaOperations Office intends to develop and/orenhance capabilities for remote field operationsin connection with nuclear requirements; formanagement of special nuclear materials; forenvironmental stewardship of facilities; fornonnuclear research and experimentation; andfor technology transfer through partnershipwith private industry, national laboratories, andother Federal, State, and local entities.
ENVIRONMENTAL
RESTORATION
There are approximately 2,000 potential areasrequiring some level of investigation andpossible remediation at the Nevada Test Site.Approximately 1,030 of these areas are relatedto the underground testing of nuclear weapons;more than 100 resulted from abovegroundtesting. The remaining areas include wastedisposal facilities, leachfields, landfills, storagetanks, injection wells, inactive and abandonedbuildings, associated equipment contaminatedby prior operations, spill areas, and hundredsof small sites where unregulated disposal orstorage of waste materials occurred duringoperations.
Beyond the Nevada Test Site, DOE hasconducted nuclear testing activities at ninelocations in five States. Amchitka Island wasthe site of three underground nucleardetonations for seismic studies, calibration, andwarhead development. Two nuclear
Environmental Restoration Projects
Five-Year Averages (Thousands of Constant 1995 Dollars)*
FY 1995-2000 2005 2010 2015 2020 2025 2030
Industrial Sites and Facilities 13,009 35,968 62,362 60,898 18,094 720 1,225Plutonium Contaminated Soils 9,170 19,916 21,138 22,140 200 150 100Underground Test Areas 22,458 9,760 70 40 40 30 20
Total 44,637 65,644 83,570 83,078 18,334 900 1,345
2035 2040 2045 2050 2055 2060 2065 life Cycle*
Industrial Sites and Facilities 1,172 1,712 1,260 910 0 0 0 999,656Plutonium Contaminated Soils 0 0 0 0 0 0 373,241Underground Test Areas 0 0 0 0 0 0 184,551
Total 1,172 1,712 1,260 910 0 0 0 1,557,449
• Costs reflect a five-year average in constant 1995 dollars, except in FY 1995 - 2000, which is a six-year average.
• Total Life Cycle is the sum of annual costs in constant 1995 dollars.
NV 5

detonations were conducted in drilled wells totest enhancement of gas production in tightsands at two sites near Rifle, Colorado, as partof the Plowshare Program which exploredpeacetime uses for nuclear explosives. As partof seismic coupling studies, two nuclear andtwo nonnuclear detonations were conducted ina shared cavity in the Tatum Salt Dome nearHattiesburg, Mississippi. Nuclear detonationswere conducted in bedded salt deposits nearCarlsbad, New Mexico, and in sandstone nearFarmington, New Mexico, to determinewhether a nuclear explosion could stimulate therelease of natural gas. Both experiments werepart of the Plowshare Program. Finally, nuclearexplosive tests were conducted near Fallon,Nevada, at the Tonopah Test Range, and at theCentral Nevada Test Area. The test at Fallonwas conducted to improve the ability to detectand identify underground nuclear explosions;tests at the Tonopah Test Range were conductedto evaluate delivery systems; and thenonnuclear special experiments at the CentralNevada Test Area was conducted to determinethe behavior of seismic waves. Contaminantsresulting from these tests include organiccompounds; radionuclides; metals such asberyllium; lead; hydrocarbons; drilling mud;and residues from plastics, epoxy, and drillinginstrumentation.
Specific assumptions under Future Missionaddress land use planning for the Nevada TestSite and for the offsites. A formal land use planfor the Nevada Test Site has been delayedbecause both the Site Wide EnvironmentalImpact Statement and a Strategic PlanningInitiative to determine future uses of theNevada Test Site are underway. Formal landuse plans for the offsite locations are notanticipated in the foreseeable future. Formalrisk assessments will also be conducted. Asthese activities are completed, the informationwill be reflected in annual updates of theBaseline Environmental Management Report.
Because the Nevada environmental restorationprojects are still in the early stages ofcharacterization, the remedial strategies havenot been fully developed. As the technologiesare developed further, remedial strategies willbe updated and will be reflected in futureBaseline Environmental Management Reports.Because of these uncertainties, definitive costprojections are not available. Treatment andstorage costs for the wastes generated duringthe assessment and remediation phases of theproject are included within the scope ofenvironmental restoration funding.
To determine the expected costs and wastevolumes for the potential release sites not yetcharacterized, parametric modeling was used.In some areas where parametric estimating datawas lacking, assumptions were generated byproviding bounding conditions that allow anestimate to be generated. In some instances,site size and known conditions were used toestimate contaminated volumes.
Estimates generated for this document did notinclude active sites and sites not transitioned tothe Environmental Management (EM) program.Such sites include, but are not limited to,nuclear device and nuclear engine tests sites,nuclear shots in the Pacific (including BikiniAtoll), the Liquified Gaseous Fuels Test Facility,and contaminated sites remaining underDepartment of Defense funding. (Projectedtransfers are addressed in Nuclear Materialsand Facility Stabilization projects.)
To facilitate the estimating process, twoassumptions have been made. The first is thatactivated metals are considered a source andare estimated in the mediums of rubble/debrisand low-level radioactive waste. The second isradon is not considered to be a significantsource because it is controlled by ventilation inthe tunnels and it exists at near-backgroundlevels for surface-based activities.
Each site or facility has not been specificallyidentified by name in this document becausethere are over 2,000 sites. For this reason, most
NV 6

sites are simply identified as NevadaEnvironmental Restoration Program Sites.Only those sites identified in the NevadaEnvironmental Restoration Program WorkBreakdown Structure have been specified byname.
Industrial Sites and FacilitiesThe Industrial Sites and Facilities activity iscomprised of several subprojects that include:
• Source Groupings-Assessment and Remediation
• Resource Conservation and Recovery Act (RCRA)Closures - Assessment and Remediation
• Environmental Restoration Sites Inventory
• Postclosure Care, and
• Decommissioning Activities Facility Assessment andRemediation.
These subprojects will be conducted underRCRA until regulatory uncertainties areclarified in a regulatory agreement with theState of Nevada. Identified plans and activitiesthat require revision, modification, orredefinition will be implemented inconsultation with the cognizant regulatoryauthority.
The Source Groupings subproject includes theassessment and remediation of "like" wasteunits: tunnel muck piles, tunnel ponds, sumpsand injection wells, inactive tanks, leachfields,contaminated waste sites, atmospheric testdebris, and miscellaneous other sites. Thesubject waste units are the result or byproductof testing and support activities in the past atthe Nevada Test Site.
The RCRA Closures subproject provides forclosure of several industrial sites that werenamed in the RCRA Part B Permit Application.These Waste Units were generally in use morerecently than Source Groupings Waste Units.Included in this activity are the development
and implementation of characterization plansand closure plans following State of Nevadaapproval, and management of wastes generatedby characterization and closure activities.
Characterization of these sites will beaccomplished in three phases. The firstgenerally consists of researching processknowledge, planning the field effort,development of Data Quality Objectives and, ifnecessary, gathering preliminary data. Thesecond phase employs more intrusivetechniques, such as drilling, to determinewhether contaminants have migrated. A lastphase, if needed, is employed to define morefully the vertical and lateral extent ofcontamination.
When characterization is complete, closureplans will be developed. Closure may be in theform of (1) "clean closure," i.e., excavation orremoval of all contamination, and/orremediation of the media to achievepredetermined cleanup levels, or (2) closure inplace, leaving the waste in place, usuallystabilized, solidified, or covered with anengineered cap. Some closures may beachieved through a combination of removal/remediation and closure in place. In somecases, no action may be appropriate. Closureusing the Streamlined Approach forEnvironmental Restoration will beimplemented when appropriate.
The Environmental Restoration Sites Inventorysubproject provides for conducting aninventory of all known Departmentalenvironmental restoration sites to determinerestoration responsibilities and identify newsites. The inventory will include validation ofinformation through photographic monitoringand through field verification includingsurveying using global positioning systemtechniques. New sites may be identifiedthrough review of archived literature,photographs, and site visits. An establisheddatabase that compiles all the information oneach site will be maintained. Existing and
NV 7

newly identified sites will be assigned to ProjectData Sheets as information about planneddisposition for each site is determined. Theinventory fulfills the Nevada Test Site RCRAPart B applicable requirement to list solid wastemanagement units.
The Postclosure Care subproject consists ofmonitoring activities that must take place tocomply with RCRA Postclosure Care PermitApplications submitted to the State of Nevada.The activities consist of collecting periodicmeasurements and/or samples frommonitoring wells, effluent streams, etc., asstipulated in each unit's Postclosure CarePermit. Condition inspection and maintenanceof any remedial systems such as caps or activesystems is included as applicable. Sampleanalysis and preparation of a report for eachmonitoring period is included as well.
The Decommissioning Activities subprojectinvolves assessment and remediation offacilities that have no planned future use andwhich are or may be contaminated fromDepartmental mission-related activities.Assessment tasks include characterization anddesign activities. A site-specific work plan forthe characterization effort will be prepared, andpermits will be obtained for assessment,including a National Environmental Policy Act(NEPA) determination, in addition toendangered species clearance. Surveys tocomply with the Historic Preservation Act of1966 will be completed.
Facility characterization will be conducted ateight multistructure facilities currently includedin the decommissioning activities at the NevadaTest Site. Characterization includes periodicsurveillance and maintenance beforedecommissioning takes place (to documentbuilding deterioration), characterizationplanning, sample collection and analysis, datamanagement, data evaluation, risk/doseassessment, and assessment report preparation.The Facility Assessment Report will documentand discuss the nature and extent of
contamination present in each facility, releasecriteria calculations, the risk/dose assessment,and findings. A design will be prepared whichspecifies the construction/demolition activitiesnecessary for remediation. Remediation fordecommissioning purposes will be conductedafter completion of design activities.Remediation activities may include one or moreof the following: dismantlement, demolition,encapsulation, entombment, or other operationsto achieve the designated dispositionalternative for each facility.
Remediation activities will includedecommissioning options, which will includeone or more of the following: dismantlement,demolition, encapsulation, entombment, orother operations to achieve the designateddisposition alternative for each facility.
Plutonium Contaminated Soils
This activity provides for a ComprehensiveEnvironmental Response, Compensation andLiability Act (CERCLA) RemedialInvestigation/Feasibility Study andremediation of contaminated surface soils onthe Nevada Test Site, Tonopah Test Range, andNellis Air Force Range. This includes Area 13,where contamination is the result of weaponstesting activities. Activities will proceed asCERCLA actions until uncertainties are clarifiedin a regulatory agreement with the State ofNevada. Included in this activity is the workinitiated as part of the TechnologyDevelopment Integrated DemonstrationProgram, now identified as Treatability Studiesfor Soils Media.
Safety tests at the sites have resulted inplutonium contamination of surficial soils overlarge areas. Historic sampling and testing atthe safety test locations have shown that at least3,200 acres of soils are contaminated withplutonium at levels in excess of 40 picocuriesper gram. When including atmospheric tests,
NV 8

the acreage contaminated in excess of 40picocuries per gram increases to approximately27,000 acres on the locations listed above.
The Remedial Investigation/Feasibility Studywill focus on determining the potential riskassociated with resuspension of plutoniumcontaminated soils at the Nevada Test Site, theTonopah Test Range, and the Nellis Air ForceRange, as well as areas with mixed fissionproducts, primarily from atmospheric orshallow cratering events. The RemedialInvestigation/Feasibility Study work willcharacterize the sites and will identify andevaluate the applicable, relevant, andappropriate regulations to guide remediation.Performing a Remedial Investigation/Feasibility Study at the Tonopah Test Range andNellis Air Force Range is complicated by anumber of logistical and technical factors. Useof the areas for other Nevada Operations Officeoperations and/or Department of Defenseoperations may constrain access to the site forfield investigations.
To overcome some of the technical difficultiesassociated with completing the RemedialInvestigation/Feasibility Study, developmentand testing of new analytical and remedialtechnologies are currently underway. Progressis occurring in research, development, testing,and evaluation of technologies for the collection(excavation) of soils and in the physicalseparation of plutonium, americium, uranium,and other transuranics from the soils.
One or more Interim Removal Actions will beimplemented using the streamlined approachfor environmental restoration. The first suchactivity will be at the Double Tracks site on theNellis Air Force Range, just west of the TonopahTest Range. Other actions may be implementedon sites at the Tonopah Test Range in an effortto clean up the Tonopah Test Range beforeremediation of the Nevada Test Site. Disposalof contaminated soil resulting from theseactions will likely require permitting andconstructing a Uranium Mill Tailings Remedial
Action Project—type facility at the Tonopah TestRange, or alternatively, transporting soils acrossthe Nellis Air Force Range for disposal incraters on the Nevada Test Site. Thistransportation will require some new roadconstruction. The cost difference for eitheroption is not believed to be the determiningfactor.
Underground Test AreasThe Underground Test Area Operable Unitactivity provides for CERCLA RemedialInvestigation/Feasibility Study activities andfor monitoring at the Nevada Test Site.Activities will proceed as CERCLA actions untiluncertainties are clarified in a regulatoryagreement with the State of Nevada.
Two phases are incorporated into performingthe Underground Test Area RemedialInvestigation/Feasibility Study. Phase Irepresents an initial Remedial Investigation/Feasibility Study consisting of both dataanalysis and data collection activities. Phase IIis predicated on a decision analysis strategy toobjectively evaluate reasonable remedialalternatives for the Underground Test AreaOperable Unit.
Phase I activities include assessment activitiesand field activities. Assessment activitiesinclude the evaluation of existing data;modeling of regional ground water flow andsolute transport; and a preliminary riskassessment. Field activities will provide anevaluation of drilling and data collectiontechniques, and they will involve the collectionof new characterization data. The Phase I effortis expected to last through FY 1996. Regionalmodeling and baseline risk assessments arecurrently ongoing as part of Phase I and will bemodified to include near field modeling resultsfor input into the decision analysis. Thedecision analysis model will incorporateprobabilistic uncertainties from the regionaland near-field ground-water flow and solutetransport modeling results; preliminary risk
NV 9

assessment; future land use; stakeholder/regulatory concerns; and the results of theFocused Feasibility Study.
Tke Phase II work scope is focused ondeveloping a decision analysis model forselecting a remedial alternative, coupled withthe design and installation of a compliancemonitoring network. The decision analysisresults will provide probabilities pertaining to
cost and implementation and to other criteriaaffecting potential technically feasible remedialactions. These results in turn will beincorporated into a focused feasibility study.The focused feasibility study will screen andevaluate potential interim remedial actions toidentify an interim remedy. Phase II fieldactivities will include installing monitoringwells in locations specified by modeling results
Environmental Restoration Activity Costs
Five-Year Averages (Thousands of Constant 1995 Dollars)•
FY 1995-2000 2005 2010 2015 2020 2025 2030
Industrial Sites and FacilitiesAssessment 4,319 2,684 3,084 0 0 0 0
Remedial Actions 8,690 33,175 59,030 60,784 17,900 0 0
Surveillance And Maintenance 0 0 0 114 194 720 1,225
Facility Decommissioning 0 109 248 0 0 0 0
Plutonium Contaminated SoilsAssessment 2,530 2,200 2,450 5,000 0 0 0
Remedial Actions 6,640 17,716 18,688 17,140 200 150 100
Underground Test AreasAssessment 6,999 0 0 0 0 0 0
Remedial Actions 15,459 9,660 0 0 0 0 0
Surveillance And Maintenance 0 100 70 40 40 30 20
Total 44,637 65,644 83,570 83,078 18,334 900 1,345
2035 2040 2045 2050 2055 2060 2065 Life Cycle**
Industrial Sites and FacilitiesAssessment 0 0 0 0 0 0 0 54,752Remedial Actions 0 0 0 0 0 0 0 906,583
Surveillance And Maintenance 1,172 1,712 1,260 910 0 0 36,537
Facility Decommissioning 0 0 0 0 0 0 1,784
Plutonium Contaminated SoilsAssessment 0 0 0 0 0 0 0 63,432
Remedial Actions 0 0 0 0 0 0 0 309,809
Underground Test AreasAssessment 0 0 0 0 0 41,996
Remedial Actions 0 0 0 0 141,055
Surveillance And Maintenance 0 0 0 0 0 1,500
Total 1,172 1,712 1,260 910 0 0 0 1,557,449
• Costs reflect a five-year average in constant 1995 dollars, except in FY 1995 - 2000, which is a six-year average.
Total Life Cycle is the sum of annual costs in constant 1995 dollars.
NV 10

to delineate the extent of contaminantmigration. Collectively, the wells will act as amonitoring network to assess migration beyondthe plume boundary. During well installation,characterization data will be collected to refinemodeling results for help in locating futuremonitoring wells. For this cost estimate, thecosts only include monitoring.
Long-term monitoring of underground testareas will continue. Sites/facilities — such ascavities created by test shots or disposal wellscreating a greater hazard to remediate than toleave as is — will be closed in place. This alsoassumes there is no threat to the public or to theenvironment due to migration or natural barrierfailure.
The Underground Test Area has alreadyconducted a dose risk evaluation to determinethe threat to the workers and to the public.Given the anticipated tritium concentrations of107 picocuries per liter, the maximum doses toworkers during normal events areapproximately 2.8 millirem per week. Thisdose compared to an administrative control of500 millirem per year (or an average 9.5millirem per week) for Nevada Test Siteworkers indicates that the work is within theNevada Test Site limits. These doses werecalculated using pessimistic scenarios to ensurethat even the most improbable events arebounded.
Offsite Locations
The Offsite Locations (non-Nevada Test Sites)include nine sites in Nevada, New Mexico,Alaska, Colorado, and Mississippi used forunderground nuclear explosive tests andexperiments. The purposes of the tests were tostudy the peaceful uses of nuclear explosionsand to perform studies related to undergroundseismic effects and warhead development.
The Offsite Locations were studied extensivelyprior to any testing, and the data from thestudies will be used to conduct ground-water
flow modeling. These models will be used todetermine relative risk posed by each of theoffsite locations. Additional data collectionmay be needed to complete the modeling and/or the risk assessment, but this cannot bedetermined until the extent of the existinginformation for each site is known. Long-termland use at the offsite locations is assumed to beunrestricted surficial use, but subsurface rightswill continue to be restricted.
Most of the work planned for the Offsitelocations will not involve dealing withhazardous or radioactive waste. A summary ofOffsite Locations' history is included underindividual State descriptions of contamination.
WASTE MANAGEMENT
The Nevada Test Site serves as a major disposalfacility for low-level waste generated by otherDOE installations. Historically, approximately50 percent of the 481,000 cubic meters of wastedisposed at the Nevada Test Site was generatedonsite. Approximately 99 percent of waste nowreceived, however, is from offsite generators.The Nevada Test Site is expected to receive upto 20,000 cubic meters of low-level waste peryear. The volumes are based on current rates.The Nevada Test Site will receive 2,000 to 6,000cubic meters per year of low-level mixed wastefrom offsite generators in FY 2005-2045. Thevolumes are based on modeled generators'projections for this report. Site costs areadjusted (negative numbers in the WasteManagement Tables) to reflect fundingtransferred to the Nevada Test Site to accountfor costs associated with the disposal ofenvironmental restoration activity wastesgenerated at other Departmental facilities.Waste management activities also includestorage of mixed transuranic waste;construction of a Liquid Waste TreatmentSystem for treatment of onsite low-level wasteand mixed waste; and identification and
NV 11

accumulation of Nevada Test Site-generatedhazardous waste for disposal at a U.S. EPA-licensed offsite facility.
Commercial facilities will continue to be usedfor treatment and disposal of hazardous waste.Sanitary waste will continue to be theresponsibility of the Defense Programslandlord.
Waste Treatment
The Nevada Test Site is planning to build twowaste treatment facilities, the Liquid WasteTreatment System and the Transuranic WasteCertification Building. The decision frameworkand methodology used to identify, evaluate,and select treatment technologies and processeswere developed in accordance with the DraftSite Treatment Plan development frameworkunder the Federal Facility Compliance Act.
Liquid Waste Treatment System
This project is scheduled to be constructed inArea 6 during FY 1996 for handling, treating,and storing very large quantities of low-levelwaste and mixed waste effluents. Over4 million gallons of liquid waste may begenerated yearly from major Nevada Test Siteprograms including the Underground Test
Storage Remedial Investigation/FeasibilityStudy project. The Liquid Waste TreatmentSystem will have process systems for solidsseparation of contaminated drilling andsampling effluent, for stabilization of residualmixed waste sludge, and for drying of residuallow-level waste sludge. The system will alsohave a series of above ground, double-linedreservoirs for volume reduction of liquidthrough evaporation. Treatment of RCRAhazardous waste will start in FY 1997.
Transuranic Waste CertificationBuilding
This project is scheduled to be constructed inFY 1999 for breaching, sampling, and certifyingall Nevada Test Site mixed transuranic waste(612 cubic meters) for disposal at the WasteIsolation Pilot Plant in Carlsbad, New Mexico.This facility, to be located at the Area 5Radioactive Waste Management Site, isnecessary to certify that waste meets the WasteIsolation Pilot Plant Waste Acceptance Criteriaprior to shipping transuranic waste offsite. It isassumed operations will last five years andshipment will occur in 2005.
One low-level mixed waste stream in thecurrent Nevada Operations Office inventory ischaracterized sufficiently to determine fully
Major Waste Management Projects
Five-Year Averages (Thousands of Constant 1995 Dollars)*
1995-2000 2005 2010 2015 2020 2025 2030 Life Cycle**
liquid Waste Treatment Storage 500 0 0 0 0 0 0 3,000
LIN Disposal Facility 0 9,200 10,800 12,400 14,400 0 0 234,000
Mixed Waste Storage Pad 167 0 0 0 0 0 0 1,000
TRU Waste Certification Building 333 0 0 0 0 0 0 2,000
• Costs reflect a five-year average in constant 1995 dollars, except in FY 1995 - 2000, which is a six-year average.
—Total Life Cycle is the sum of annual costs in constant 1995 dollars.
Note: These projects represent a subset of waste management activities. Associated program management costs are built-in to the estimates provided.
NV 12

what technologies and capabilities are requiredfor safe, environmentally sound, and complianttreatment and disposal. Area 23 ScintillationVials consist of xylene-based scintillationcocktails generated from studies conducted atthe Nevada Test Site for tritium migration in theenvironment. Approximately 15 liters of thescintillation cocktails are contaminated withtritium. These vials were shipped offsite to acommercial vendor (Quadrex) for treatmentand disposal during December 1994.
The decision to retrieve waste or leave it ingreater confinement disposal boreholes iscontingent upon performance assessmentsrequired by 40 CFR 191 and/or upon riskassessments required by the CERCLA NationalContingency Plan or RCRA Corrective Action.For this cost estimate, it was assumed the wastewas left in place.
Waste Storage
Waste is accumulated and/or stored at one ofthree facilities at the Nevada Test Site,depending on its waste type. The following isbrief summary of these facilities.
Transuranic Pad Cover Building
Construction was completed in FY 1994 on acovered structure to enclose part of the existing2-acre asphalt pad used for storage ofapproximately 612 cubic meters of transuranicwaste. This will protect the containers fromweathering before the waste is shipped to theWaste Isolation Pilot Plant. The transuranic padcover building has the capacity to store up to2,600 cubic meters.
Mixed Waste Storage Pad
Construction of this project is scheduled to becompleted in FY 1997. It consists of a coveredconcrete pad and apron with secondarycontainment to store Nevada Test Site mixed
waste prior to treatment at onsite or offsitefacilities. The pad is designed to store up to1,600 cubic meters.
Expanded Hazardous WasteAccumulation Site
This project is scheduled to be constructed inFY 1997 and will provide for a 275 square-meterexpansion of the existing Hazardous WasteAccumulation Site to compliantly storehazardous waste before it is shipped to acommercial facility. The expansion is requiredto avoid exceeding the 90-day accumulationlimit while the analysis of waste samples iscompleted. The Nevada Operations Officeproposes to permit the Hazardous WasteAccumulation Site as a RCRA Treatment,Storage, and Disposal facility, allowing storageup to one year prior to shipment offsite fortreatment and disposal.
Waste Disposal
The Nevada Test Site accepts and disposes low-level waste at the Area 3 and Area 5 RadioactiveWaste Management Sites from approved DOEand Department of Defense facilities across theUnited States. Currently, there are 13 approvedgenerators. Approval to ship waste to theNevada Test Site is granted only after the wastegenerator certifies all waste meets the NevadaTest Site's rigorous acceptance standardsestablished in the Nevada Test Site DefenseWaste Acceptance Criteria, Certification, andTransfer Requirements (NVO-325, Rev. 1). Atthe current rate of land use, the facility can beexpected to provide disposal capacity of3,000,000 cubic meters in the next 100 years.The Nevada Operations Office conducts sitemonitoring and characterization activities insupport of the low-level waste disposaloperations at the Areas 3 and 5 RadioactiveWaste Management Sites. Other projects tosupport low-level waste disposal include use of
NV 13

the best available technology for closure ofexisting and future waste disposal units toprotect public health and the environment.
The Nevada Test Site is one of the sites beingevaluated for disposal of mixed waste. Aperformance evaluation will be conducted to
address the collection of site-specific datarelated to the natural surroundings, geologicalsetting, ground water and surface watercharacteristics, and other factors related to thedisposal capabilities of the site. Thisinformation will then be used to evaluate thesite and to determine the types and quantities
Waste Management Activity Costs
Five-Year Averages (Thousands of Constant 1995 Dollars)*FY 1995 - 2000 2005 2010 2015 2020 2025 2030
TreatmentTransuranic Waste 1,616 1,375 1,375 1,375 1,375 1,375 1,137Low-Level Mixed Waste 11,127 9,471 9,471 9,471 9,471 9,471 7,953Low-Level Waste 80 365 186 153 17 0 0
Storage and HandlingTransuranic Waste 3,427 2,462 2,462 2,462 2,462 2,462 2,314Low-Level Waste 0 0 1 1 0 0 0
DisposalLow-Level Mixed Waste 1,694 6,401 5,732 6,609 3,846 3,682 4,110Low-Level Waste 11,815 12,671 17,697 11,829 5,433 3,694 2,534
Hazardous Waste 3,908 3,460 3,863 3,326 3,326 3,326 3,326Sanitary Waste 594 506 506 506 506 506 506Inter-Site Disposal Assessment
Low-Level Mixed Waste -1 0 0 0 0 0 0Low-Level Waste -5,042 -4,005 -8,353 -6,068 -17 0 0
Total 29,216 32,706 32,940 29,662 26,418 24,515 21,879
2035 2040 2045 2050 2055 2060 2065 Life Cyde**Treatment
Transuranic Waste 149 0 0 0 0 0 0 50,504Low-Level Mixed Waste 1,503 0 0 350,812Low-Level Waste 0 0 0 0 0 0 0 4,086
Storage and HandlingTransuranic Waste 1,453 296 0 0 0 0 0 102,414Low-Level Waste 0 0 0 0 0 0 0 8
DisposalLow-Level Mixed Waste 3,057 2,082 2,070 1,758 1,685 338 0 217,013Low-Level Waste 1,845 362 360 306 293 59 0 356,307
Hazardous Waste 3,326 3,326 0 0 0 0 159,853Sanitary Waste 506 506 0 0 0 0 0 23,785Inter-Site Disposal Assessment
Low-Level Mixed Waste 0 0 0 0 0 0 0 -7Low-Level Waste 0 0 0 0 0 0 0 -122,468
Total 11,839 6,573 2,431 2,064 1,979 397 0 1,142,309
' Costs reflect a five-year average in constant 1995 dollars except in FY 1995-2000, which is a six-year average.
"Total Life Cycle is the sum of annual costs in constant 1995 dollars.
NV 14

of waste suitable for disposal at the NevadaTest Site. For the purposes of the BaselineEnvironmental Management Report analysis, amixed-waste disposal facility is assumed to beconstructed to receive offsite waste as soon asFY 1998.
It is important to note the identification ofmixed waste disposal activities at the NevadaTest Site will follow State and Federalregulations for siting and permitting. It willalso include public involvement in thedecisionmaking process and during preparationof the site-wide Environmental ImpactStatement. The Nevada Test Site could bedisposing of mixed waste as soon as FY 1998 ifit is approved through the aforementionedprocess.
Other Projects in the Environmental Restorationtable consist of capital construction projects tosupport waste disposal operations for the Area3 and Area 5 Radioactive Waste ManagementSites at the Nevada Test Site. A closure cap isscheduled for construction for a waste pit at theArea 3 Radioactive Waste Management Site.Reconstruction of Road 5-01 to maintain safetransportation to the Area 5 Radioactive WasteManagement Site is scheduled to be completedin FY 1997. Other projects scheduled in FY 1994consist of an upgrade to the power distributionline to the Radioactive Waste ManagementSites. Projects scheduled in FY 1995 consist of a
controlled area access building and a 25-yearstorm protection dike for the Area 5 RadioactiveWaste Management Site.
Future projects consist of capital constructionline item projects to support waste disposaloperations for the Nevada Test Site.Construction of the Area 3 and 5 pit closures areplanned to begin in FY 2005 and to last through2020. The closures of waste pits are dependentupon the amount of low-level waste theNevada Test Site receives in the next 10 yearsfrom offsite generators.
NUCLEAR MATERIALS AND
FACILITY STABILIZATION
The facility stabilization and maintenanceprocess began at the Nevada Test Site in 1995.All of the 289 Nevada Test Site facilities arecurrently in the stabilization process. Some ofthese facilities include buildings and equipmentused to evaluate nuclear test effects, explosivesmagazines, fallout shelters, railroad boxcarsused for storage, and various office buildings.The resulting waste types include the following:hazardous, transuranic, low-level, and low-level mixed. This report arbitrarily assumes thestabilization and maintenance process at theNevada Test Site will be completed by 2012.
Nuclear Material and Facility Stabilization Cost Estimate
Five-Year Averages (Thousands of Constant 1995 Dollars)*
FY 1995.2000 2005 2010 2015 2020 2025 2030 Life Cycle"
Nuclear Material and Facility Stabilization 109 40,935 34,581 1,635 0 0 0 386,413
Costs reflect a five-year average in constant 1995 dollars except in FY 1995-2000, which is a six-year average.
**Total Life Cycle is the sum of annual costs in constant 1995 dollars.
NV 15

LANDLORD FUNCTIONS
At the Nevada Operations Office,Environmental Management programs pay anallocation for contractor indirect costs, as wellas select common support activities, which areprovided by three management and operating(M&O) contractors and managed by theDepartment. The common support costallocation pool was reduced by approximately$31 million from $68 million in FY 1995 byremoving activities which could be rechargeddirectly to the benefitting programs based uponuse.
In FY 1996, the Nevada Operations Office willundergo a major change in M&O contractors.The three integrated M&O contracts expire anda single M&O contract will replace them. Thiswill preclude the need for the NevadaOperations Office to allocate indirect-typecommon benefitting costs to participatingprograms because the single M&O contractorwill manage those activities as they would anyother indirect cost. However, as the NevadaOperations Office mission changes andrefocuses in the years ahead, it is uncertain howthe Environmental Management budget will beimpacted. As other programs are reduced, theremaining programs may have to assume alarger percentage of the indirect costs of the
Nevada Operations Office, and the cost ofdoing Environmental Management business atthe Nevada Operations Office could increasedramatically.
Until the present, most infrastructure plant andcapital equipment items have been budgeted byDefense Programs. In FY 1996, DefensePrograms budgeted $37 million for plant andcapital equipment to support all activities at theNevada Operations Office. In FY 1997 andoutyears, the other programs, includingEnvironmental Management, may have tobegin budgeting for additional plant andcapital items provided by Defense Programs.
PROGRAM MANAGEMENT
Environmental RestorationEnvironmental restoration activities conductedwithin this work scope support the NevadaOperations Office. Environmental restorationactivities will characterize and remediateenvironmental conditions at the Nevada TestSite and at the offsite locations. The costcategories for this scope include Agreements-in-Principle, Grants, and Project ManagementSupport. Program Direction withinenvironmental restoration is a separate fundingprocess and is not included in this section.
Program Management Cost Estimate
Five-Year Averages (Thousands of Constant 1995 Dollars)*FY 1995-2000 2005 2010 2015 2020 2025 2030
Program Management 15,233 14,591 11,631 10,071 5,817 4,341 3,740
2030 2040 2045 2050 2055 2060 Life Cycle**Program Management 2,024 1,124 416 358 338 68 364,216
• Costs reflect a five-year average in constant 1995 dollars, except in FY 1995 - 2000, which is a six-year average.
• Total Life Cycle is the sum of annual costs in constant 1995 dollars.
NV 16

Agreements-in-Principle
This effort funds the States of Alaska,Mississippi, and Nevada to provide oversightof the Nevada Operations Office environmentalrestoration activities. The Agreements-in-Principle describe the understandings andcommitments between the parties regarding theDepartment's provision of technical andfinancial support for State activities inenvironmental oversight, monitoring, siteaccess, and emergency response initiatives.Activities in Colorado and New Mexico will beaddressed in amendments to existingAgreements-in-Principle managed by otherDepartmental offices.
Grants
This effort provides for educational andresearch opportunities for students and facultyat the University of Nevada at Reno and theUniversity of Nevada at Las Vegas in support oftechnical programs being conducted at theNevada Test Site.
Project Management Support
The Project Management Support activityprovides for administrative and technicalproject management support and projectplanning, including Activity Data Sheetdevelopment; project control, including ProjectTracking System and PerformanceMeasurement System reporting; InteragencyAgreement support; programmatic QualityAssurance and Self Assessment support;programmatic health and safety support;community relations support, including publicinvolvement; general environmental support;and development of the Site-WideEnvironmental Impact Statement.
Waste Management
Waste management activities conducted withinthis scope support the Nevada OperationsOffice Waste Management mission and its
activities for treatment, storage, and disposal.The cost categories for this scope include wasteminimization and program management.Program direction within Waste Management isincluded within funding for programmaticactivities.
Waste Minimization/PollutionPrevention
The Nevada Operations Office has developed aWaste Minimization and Pollution Preventionawareness program for activities under itspurview. The program is two-tiered, site-wideand generator specific. The Nevada OperationsOffice publishes the site-wide program planand guidance. Each generator is responsible fordeveloping a generator-specific implementationplan. To minimize generation of mixed waste,plans and procedures have been developedlimiting the number and type of hazardousmaterials to be purchased or brought into anexclusionary zone. Wherever possible,nonhazardous substitute materials are used inplace of hazardous materials.
Program Management
Activities related to program managementconsist of the Performance MeasurementSystem that supports the Department'sProgress Tracking System; cost estimating,scheduling, self validation, and valueengineering efforts; the development of theActivity Data Sheets; site strategic planningrequired by Departmental Headquarters;administrative, technical, and legal services;and community relations regardingEnvironmental Management activities inNevada.
Negotiations with the State of Nevada for aFederal Facility Agreement will be completed inFY 1995. The Nevada Operations Office willcomplete development of a site-wideEnvironmental Impact Statement in FY 1996.
NV 17

Development of a Comprehensive Land UsePlan for the Nevada Test Site will also becompleted in FY 1996.
Program Direction
Funding under this category is used for theNevada Operations Office Waste ManagementDivision, which provides staff oversight andmanagement of the treatment, storage, anddisposal of waste.
Public ParticipationCurrent and potential EnvironmentalManagement programs at the Nevada Test Sitegenerate a high level of public interest inNevada and surrounding States. In response tothis interest, and in conjunction withDepartmental guidelines, a public participationprogram has been developed by the NevadaOperations Office as a mechanism for providingconsistent dialogue and interaction between theorganization and its stakeholders. The NevadaOperations Office is providing financial andhuman resources to identify the public'sconcerns, needs, and values prior to makingdecisions; to provide timely information to thepublic and solicit comments on the Nevada TestSite plans, activities, and priorities; to fulfill allapplicable State and Federal regulatory
requirements regarding public involvement;and to establish and maintain an activeCommunity Advisory Board for Nevadaprograms.
Public meetings are scheduled to presentinformation to be used to develop documentssuch as Environmental Impact Statements,Activity Data Sheets, land use plans, andtransportation plans. Every effort is made bythe Nevada Operations Office to maintain acontinuous dialogue with city, county, and Stateofficials, as well as local Native Americancommunities and other interested members ofthe public who may be affected by NevadaOperations Office activities. A primary goal forthe Environmental Management publicparticipation program is to communicateeffectively to the stakeholders to fosterunderstanding of the Department's mission toprotect human health and the environment.
FUNDING AND COSTINFORMATIONThe following tables present fundinginformation and major activity milestones forNevada Test Site.
NV 18

Defense Funding Estimate
Five-Year Averages (Thousands of Constant 1995 Dollars)*
FY 1995 - 2000 2005 2010 2015 2020 2025 2030
Environmental Restoration 44,637 65,644 83,570 83,078 18,334 900 1,345
Waste Management 29,365 33,134 33,197 29,789 26,418 24,515 21,879
Nuclear Material and Facility Stabilization 109 40,935 32,946 0 0 0 0
Program Management 15,259 14,665 11,675 10,093 5,817 4,391 3,740
Total 89,370 154,378 161,388 122,960 50,569 29,806 26,965
2035 2040 2045 2050 2055 2060 2065 Life Cycle*
Environmental Restoration 1,172 1,712 1,260 910 0 0 0 1,557,449
Waste Management 11,839 6,573 2,431 2,064 1,979 397 0 1,147,257
Nuclear Material and Facility Stabilization 0 0 0 0 0 0 0 370,064
Program Management 2,024 1,124 416 353 338 68 0 365,070
Total 15,035 9,408 4,106 3,327 2,317 465 0 3,439,839
• Costs reflect a five-year average in constant 1995 dollars, except in FY 1995 - 2000, which is a six-year average.
• Total Life Cycle is the sum of annual costs in constant 1995 dollars.
Nondefense Funding Estimate
Five-Year Averages (Thousands of Constant 1995 Dollars)*
FY 1995 - 2000 2005 2010 2015 2020 2025 2030 Life Cyde**
Waste Management -148 -428 -257 -126 0 0 0 -4,948
Nuclear Material and Facility Stabilization 0 0 1,635 1,635 0 0 0 16,349
Program Management -27 -73 -44 -22 0 0 0 -854
Total -175 -507 1,334 1,487 0 0 0 10,547
• Costs reflect a five-year average in constant 1995 dollars, except in FY 1995-2000, which is a six-year average.
• Total Life Cycle is the sum of annual costs in constant 1995 dollars.
NV 19

Major Activity Milestones
ACTIVITY TASK COMPLETION DATE
Environmental Restoration
Industrial Sites and Facilities
Plutonium-Contaminated Soils
Underground Test Areas
NTS Offsite Locations
Fiscal Year
Begin Remediation
Complete Assessment
Complete Remediation
Complete Surveillance and Maintenance
Complete Assessment
Complete Remediation
Complete Assessment
Complete Remediation
Complete Surveillance and Maintenance
Complete Assessment
Complete Remediation
Complete Surveillance and Maintenance
1995
2010
2020
2050
2015
2030
1996
2002
2030
2006
2015
2050
Waste Management: Treatment
Liquid Waste Treatment System
TRU Waste Certification Building
Treatment: TRU Certification Building
Liquid Waste Treatment Operations
Fiscal Year
Complete Construction of Liquid Waste Treatment Facility
Complete Construction of TRU Waste Certification Building
Complete Operations
Complete Treatment Operations
1996
1998
2004
2024
Waste Management: Storage/Handling
TRU Pad Cover Building
Expanded Hazardous Waste Storage Unit
Mixed Waste Storage Pad
Retrieve and Certify TRU Waste
Fiscal Year
Complete Construction of TRU Storage Pad Cover Building
Complete Construction of Expanded Hazardous Waste Storage Unit
Complete Construction of Mixed Waste Storage Pad
Ship TRU Waste to WIPP
1994
1997
1997
2005
Waste Management: Disposal
Construction
Operations
Fiscal Year
Complete Mixed Waste Disposal Unit
Start operation of LLW Disposal Facility
Complete Operable Unit 3
Complete Operable Unit 4
Complete Disposal of LLW and LLMW
1998
2010
2024
2035
2059
For fiirther information on this site, please contact: Public Participation Office (702) 295-4652Public Affairs Office (702) 295-3521Technical Liaison: Chuck Morgan (702) 295-0938
NV 20

NV 21

CENTRAL NEVADA TEST AREA, PROJECT SHOAL SITE &TONOPAH TEST RANGE(Nevada Offsite Program)
The Nevada Offsite locations are administered by the Nevada Operations Office. A more thoroughdescription of the EM environmental responsibilities for the Nevada Operations Office can be foundin the Nevada Test Site narrative. All costs for waste management activities, program management,and relevant landlord activities attributable to the Department are provided for within the scope ofenvironmental restoration. There are no Offsites with either current or planned nuclear materialand facility stabilization activity needs. Funding for all sites is 100 percent defense.The Central Nevada Test Area was a nuclear testing area, located in south-central Nevada, 60 milesnortheast of the City of Tonopah. The Project Shoal Site is a weapons test location located 30 milessoutheast of Fallon, Nevada. The Tonopah Test Range is located in the northwestern portion of theNellis Air Force Range, about 150 miles northwest of Las Vegas and 40 miles southeast of Tonopah,Nevada.
r — - — - — - — - — - — - — - —
•
•
CentralNevadaTest
Tonopah Area
Test Range
NevadTest Site
NV 22

Estimated Site Total
1:x..1995
Environmental Restoration
(Thousands of Current1995 Dollars)*
Costs for FY 1995 reflect Congressional Appropriation, costs for FY 1996 reflect EM budget submission, costs for FY
1997-2000 reflect Budget Shortfall Scenario, costs for
shaded area assume 3% annual inflation.
Five-Year Averages (Thousands of Constant 1995 Dollars)"
FY 1995-2000 2005 2010 2015 2020 2025 2030
Environmental Restoration 1,840 550 80 100 50 130 120
2035 2040 2045 2050 2055 2060 2065 Life Cycle***
Environmental Restoration 100 52 32 22 4 0 0 17,240
Costs reflect a five-year average in constant 1995 dollars, except in FY 1995 - 2000, which is a six-year average.
"" Total Life Cycle is the sum of annual costs in constant 1995 dollars.
PAST, PRESENT, AND
FUTURE MISSIONS
The Central Nevada Test Area was used for one
subsurface nuclear test (Project Faultless)
detonated in January 1968 to determine the
behavior of seismic waves in the geologic
structure typical of the area. The Central
Nevada Test Area is no longer in use. The land
surface has been released for unrestricted use,
with access controlled by the Department.
Subsurface intrusion restrictions, however, are
still in effect.
Project Shoal was conducted to determine the
effect of a nuclear detonation in a granite rock
formation and also to compare the seismic
activity of natural earthquakes with activity
from an underground nuclear explosion. It was
a 12-kiloton device detonated at a depth of
1,211 feet (369 meters) in October 1963 to
improve the ability to detect underground
nuclear explosions.
The Tonopah Test Range is a research facility
with the mission to test the mechanical
operation and delivery systems for nuclear
ordnance and other defense-related projects.
The site was used to test ordnance delivery
systems employing mock-ups of nuclear
weapons, and tests with conventional
explosives. The Tonopah Test Range is located
in the northwestern corner of the Nellis Air
Force Range and is still actively used by both
Sandia National Laboratories and the Air Force.
The Shoal Site and Central Nevada Test Area
are being monitored as part of the Long-Term
Hydrological Monitoring Program conducted
by EPA.
ENVIRONMENTAL
RESTORATION
Funding for this activity provides for the
evaluation of data collected at the Central
Nevada Test Area and the Project Shoal site,
NV 23

and the implementation of the RCRA workplans for the Tonopah Test Range. There arethree properties associated with the CentralNevada Test Area, 1 associated with ProjectShoal, and 42 under study at the Tonopah TestRange. This activity will define the magnitudeand extent of surficial contamination and therisks associated with that contaminationthrough the evaluation of information on theCentral Nevada Test Area and the Project Shoalsite. This process will include thecharacterization of the physical setting of thetesting area, the definition and occurrence ofcontamination, and the identification of thepathways to a potential receptor. The risks toreceptors will also be calculated using standardrisk assessment procedures. Should risksexceed acceptable limits, the requirements forrisk reduction through remediation or otheractions will be established. In addition toassessment activities, any requirements for site
cleanup or long—term monitoring at the CentralNevada Test Area and Shoal site will beestablished as part of this activity.
Test sites have been grouped into sourcecategories. Assessment activities at theTonopah Test Range will be conducted inaccordance with a RCRA Facility InvestigationWork Plan that will contain each of the sourcecategories. U.S. Air Force-operated sites are notincluded in this technical scope because theyare funded through the Department of Defense.Ancillary support facilities on and adjacent tothe Tonopah Test Range associated with thehistoric tests as part of Operation Roller Coasterare included, although the actual shot areas arefunded through the Soils Media Operable Unit.Sites that exceed RCRA action levels will besubject to remediation under this technicalscope. Remediation may consist of soilremoval, in situ cleanup methods (e.g.,
Environmental Restoration Activity Costs
Five-Year Averages (Thousands of Constant 1995 Dollars)*FY 1995-2000 2005 2010 2015 2020 2025 2030
Nevado Offsite - NevadaAssessmentRemedial ActionsSurveillance And Maintenance
Total
5321,308
0
1504000
20600
01000
0050
00
130
00
120
1,840 550 80 100 50 130 120
2035 2040 2045 2050 2055 2060 2065 Life Cyde**Nevada Offsite - Nevada
AssessmentRemedial ActionsSurveillance And Maintenance
Total
00
100
0052
0032
0022
004
000
00
4,04410,6462,550
100 52 32 22 4 0 0 17,240
• Costs reflect a five-year average in constant 1995 dollars, except in FY 1995 - 2000, which is a six-year average." Total Life Cycle is the sum of annual costs in constant 1995 dollars.
NV 24

Ang
bioremediation), or ground-water treatment.
Conventional unexploded ordnance will be
detonated in place. Any explosive residue will
be flashed on range, rendering debrisnonhazardous, recyclable debris, ornonhazardous solid waste. Assessment
activities at the Central Nevada Test Area and
Shoal Site will be conducted in accordance with
CERCLA. To assemble this estimate,remediation was assumed to consist of removal
of mud pits at the Central Nevada Test Area
and monitoring at the Shoal Site. Theseactivities were assumed to begin in 1998 and be
completed in 2015.
Defense Funding Estimate
Five-Year Averages (Thousands of Constant 1995 Dollars)*
FY 1995-2000 2005 2010 2015 2020 2025 2030
Environmental Restoration 1,840 550 80 100 50 130 120
2035 2040 2045 2050 2055 2060 2065 Life Cycle**
Environmental Restoration 100 52 32 22 4 0 0 17,240
• Costs reflect a five-year average in constant 1995 dollars, except in FY 1995 - 2000, which is a six-year average.
• Total Life Cycle is the sum of annual costs in constant 1995 dollars.
Major Activity Milestones
ACTIVITY TASK COMPLETION DATE
Nevada OffsiteFiscal Year
Complete Assessment
Complete Remediation
Complete Surveillance and Maintenance
2006
2015
2051
For further information on this site, please contact: Public Participation Office (702) 295-4652
Public Affairs Office (702) 295-3521
Technical Liaison: Bobbie McClure (702) 295-1862
NV 25

NV 26

MIDDLESEX MUNICIPAL LANDFILL(COMPLETED FUSRAP SITE)*
MIDDLESEX SAMPLING PLANT MAYWOOD CHEMICALWORKS
PRINCETON PLASMAPHYSICS LABORATORY
0
DUPONT &COMPANY
KELLEX/PIERPOINT SITE(COMPLETED FUSRAPSITE)*
WAYNE INTERIM STORAGE SITE
NEW BRUNSWICKLABORATORY
*Summaries are not provided
for facilities with completed
remedial actions.
NEW JERSEYEstimated State Total
Princeton Plamo Physics Laboratory
FUSRAP
Total - New Jersey
(Thousands of Current 1995 Dollars)*
400 1998 1999 200
7:A92 8,001 8601 1229 6,630
11,000 23,790; 2060. 35;692 $1,800 Acaq
• Costs for FY 1995 reflect Congressional Appropriation, costs for FY 1996 reflect EM budget submission, costs for FY 1997-2000 reflect
Budget Shortfall Scenario, costs for
shaded area assume 3% annual inflation.
Five-Year Averages (Thousands of Constant 1995 Dollars)**
FY 1995 - 2000 2005 2010 2015 2020 2025 2030 life Cyc1e*"
7,985 3,742 3,562 3,793 3,763 3,755 3,459
32,592 23,055 14,054 11,738 0 0 0
158,287439,785Princeton Plama Physics Laboratory
FUSRAP
Total - New Jersey 40,577 26,797, 17,616 15,531 3,763 3,755 3,459 598,072
Costs reflect a five-year average in constant 1995 dollars, except in FY 1995 - 2000, which is a six-year average.
•'• Total Life Cycle is the sum of annual costs in constant 1995 dollars.
NJ 1

NJ 2

PRINCETON PLASMA PHYSICS LABORATORY
The Princeton Plasma Physics Laboratory is located adjacent to the Princeton University Campus in
Princeton, New Jersey. It was established in the 1950's to conduct research on nuclear fusion.
C I
Hazmat Facility
■ EM Facility
[2:1 CERCLA Survey Area
Boneyard
DetentionBasin
NJ 3

Estimated Site Total
Environmental RestorationWaste ManagementProgram Management
Total
(Thousands of Current 1995 Dollars)*
FY 1995 1996
4
100t 1990
9,911
1999
,630
2000
6,395
• Costs for FY 1995 reflect Congressional Appropriation, costs for FY 1996 reflect EM budget submission, costs for FY 1997-2000 reflect Budget Shortfall Scenario, costs forshaded area assume 3% annual inflation.
Five-Year Averages (Thousands of Constant 1995 Dollars)**
FY 1995-2000 2005 2010 2015 2020 2025 2030 Life Cycle*Environmental Restoration 918 274 95 325 296 287 172 12,756Waste Management 6,559 3,083 3,083 3,083 3,083 3,083 2,913 130,992Program Management 508 385 385 385 385 385 374 14,538
Total 7,985 3,742 3,562 3,793 3,763 3,155 3,459 158,287
" Costs reflect a five-year average in constant 1995 dollars, except in FY 1995 - 2000, which is a six-year average,Total Life Cycle is the sum of annual costs in constant 1995 dollars.
PAST, PRESENT, AND
FUTURE MISSIONS
Fusion research at Princeton began in the early1950's with the construction of small devices tostudy magnetic confinement of plasmas (hot,ionized gases). Research at Princeton PlasmaPhysics Laboratory began in 1959 withconstruction of a model C-stellarator (a largerscale device for confining plasmas), which waslater coverted to a pulse-operated tokamakdevice. There are currently two major researchdevices at the Princeton Plasma PhysicsLaboratory, the Tokamak Fusion Test Reactorand the Princeton Beta Experiment-Modification.
The Princeton Plasma Physics Laboratory hasplayed a major role in the Department ofEnergy's (DOE) magnetic fusion energyprogram aimed at developing fusion as anenvironmentally attractive, and sustainableenergy source. The Princeton Plasma PhysicsLaboratory continues to conduct fusionresearch and development focusing on asuccession of larger and more powerful devicesfor magnetic confinement. It is assumed thePrinceton Plasma Physics Laboratory willcontinue to operate as a national laboratoryfocused on fusion research for the foreseablefuture.
NJ 4

ENVIRONMENTAL
RESTORATION
A completed Comprehensive EnvironmentalResponse, Compensation and Liability Actinventory report identified eleven potentialcontamination "source" areas for the Princeton
Plasma Physics Laboratory. These sources are
any areas where a hazardous substance wasmanaged, plus associated media impacted bycontamination migration. Several areas were
found to have contaminant levels below"action" levels, and several others have beencombined to facilitate investigation.Contamination sources include formerwastewater treatment plant facilities, soilcontaminant from several localized sites, a
cooling tower and its adjacent soils, thechromate reduction pits, and a hazardous waste
satellite accumulation area.
The principal environmental media of concern
at the Princeton Plasma Physics Laboratory is
ground water, and to a lesser extent, soil. Theprincipal contaminants of concern are volatileorganic compounds (petroleum hydrocarbons
and solvents).
tPi15"..
The preliminary remedial action strategydeveloped for these areas includes soil vaporextraction with possible off-gas treatment forsoils contaminated with volatile organiccompounds, and limited excavation andtreatment for potential chromium contaminated
soils. This strategy may change once theRemedial Investigation/Remedial AlternativeAnalysis has been completed in 1996.Remediation is expected to get underway in1997, and residual soil and/or ground-waterimpacts from petroleum hydrocarbons whichleaked from underground storage tanks may beincorporated into the remediation system, ifwarranted. Waste generated as a result ofremedial actions will be funded and managedwithin environmental restoration activities.
WASTE MANAGEMENT
ACTIVITIES
The Princeton Plasma Physics Laboratory isexpected to continue to operate under thedirection of the DOE's Office of EnergyResearch for the foreseeable future.Environmental restoration activities arescheduled to end by 2030 at assumed fundinglevels. However, Laboratory operations will
Environmental Restoration Activity Costs
Five-Year Averages (Thousands of Constant 1995 Dollars)*
FY 1995 - 2000 2005 2010 2015 2020 2025 2030 lire Cyde"
Environmental RestorationAssessmentRemedial Actions
Total
45 0873 274
0 0 0
95 325 2960 0
287 172
27012,486
918 274 95 325 296 287 172 12,756
• Costs reflect a five-year average in constant 1995 dollars, except in FY 1995-2000, which is a six-year average.
Total Life Cycle is the sum of annual costs in constant 1995 dollars.
NJ 5

continue to generate waste. Continuing wastemanagement activities in support of ongoingprograms are projected at a cost ofapproximately $3 million per year, well abovethe figure associated with environmentalrestoration activities. To facilitate thedevelopment of the baseline environmentalmanagement life-cycle cost estimate, anarbitrary cut-off date of 2029 has been assigned
to all sites that have completed environmentalrestoration but maintain ongoing wastemanagement support of other Departmentprograms (Energy Research, Defense Programs,etc.).
Waste management costs in FY 1997 reflect thedecision by Energy Research to retrofit theTokamak Fusion Test Reactor and to transfer
Waste Management Activity Costs
Five-Year Averages (Thousands of Constant 1995 Dollars)*
FY 1995-2000 2005 2010 2015 2020 2025 2030 Treatment
Low-Level Mixed WasteLow Level Waste
Hazardous WasteSanitary Waste
Total
3,238276
2,866178
1,522130
1,34784
1,522130
1,34784
1,522130
1,34784
1,522130
1,34784
1,522130
1,34784
1,376106
1,34784
Life Cycle*
64,3615,436
57,6203,573
6,559 3,083 3,083 3,083 3,083 3,083 2,913 130,992
Costs reflect a five-year average in constant 1995 dollars, except in FY 1995-2000, which is a six-year average.
Total Life Cycle is the sum of annual costs in constant 1995 dollars.
Major Waste Management Projects
Five-Year Averages (Thousands of Constant 1995 Dollars)*
1995-2000 2005 2010 2015 2020 2025 2030Radioactive Waste Storage 333 0 0 0 0
Life cycle-2,000
• Costs reflect a five-year average in constant 1995 dollars, except in FY 1995-2000, which is a six-year average.
Total Life Cycle is the sum of annual costs in constant 1995 dollars.
Note: These projects represent a subset of waste management activities. Associated program management costs are built-in to the estimates provided.
NJ 6

the resulting waste to Princeton Plasma PhysicsLaboratory's waste management activity forstorage, handling, and disposal. TheRadioactive Waste Storage Facility is a newfacility intended to support dismantlement ofthe Tokamak Fusion Test Reactor. The facilitywill handle prepackaged radioactive wastematerials generated by Tokamak Fusion TestReactor dismantlement, and by futureexperimental activities.
Waste Treatment
Princeton Plasma Physics Laboratory does nottreat waste onsite. All wastes are shipped toappropriate facilities offsite for treatment.
Waste Storage
Radioactive and mixed waste resulting fromexperimental operations conducted at PrincetonPlasma Physics Laboratory are currentlyhandled and stored in a Resource Conservationand Recovery Act-permitted 90-day outdoorstorage area prior to direct shipment to offsiteapproved depositories.
Waste Disposal
Waste is shipped to offsite facilities for disposal.Radioactive waste is currently shipped toDOE's Hanford facility in Washington.Hazardous waste is handled by commercialbrokers and facilities.
NUCLEAR MATERIAL AND
FACILITY STABILIZATION
There are no current or planned nuclearmaterial or facility stabilization activities atPrinceton Plasma Physics Laboratory.
LANDLORD FUNCTIONS
Currently, landlord activities at PrincetonPlasma Physics Laboratory are theresponsibility of DOE's Office of EnergyResearch. The Environmental Managementprogram at the Princeton Plasma PhysicsLaboratory supports landlord activities througha percentage of overhead which is calculated onan annual basis, based on programs funded atthe Laboratory. There are no plans for theEnvironmental Management program toassume landlord functions at the site.
PROGRAM MANAGEMENT
Program management at Princeton PlasmaPhysics Laboratory is limited to programplanning and direct management of projects,and to waste minimization activities. PrincetonPlasma Physics Laboratory does not fund anygrants or Agreements-In-Principle at this time.
FUNDING AND COST
INFORMATION
The following tables present fundinginformation and major activity milestones forPrinceton Plasma Physics Laboratory.
NJ 7
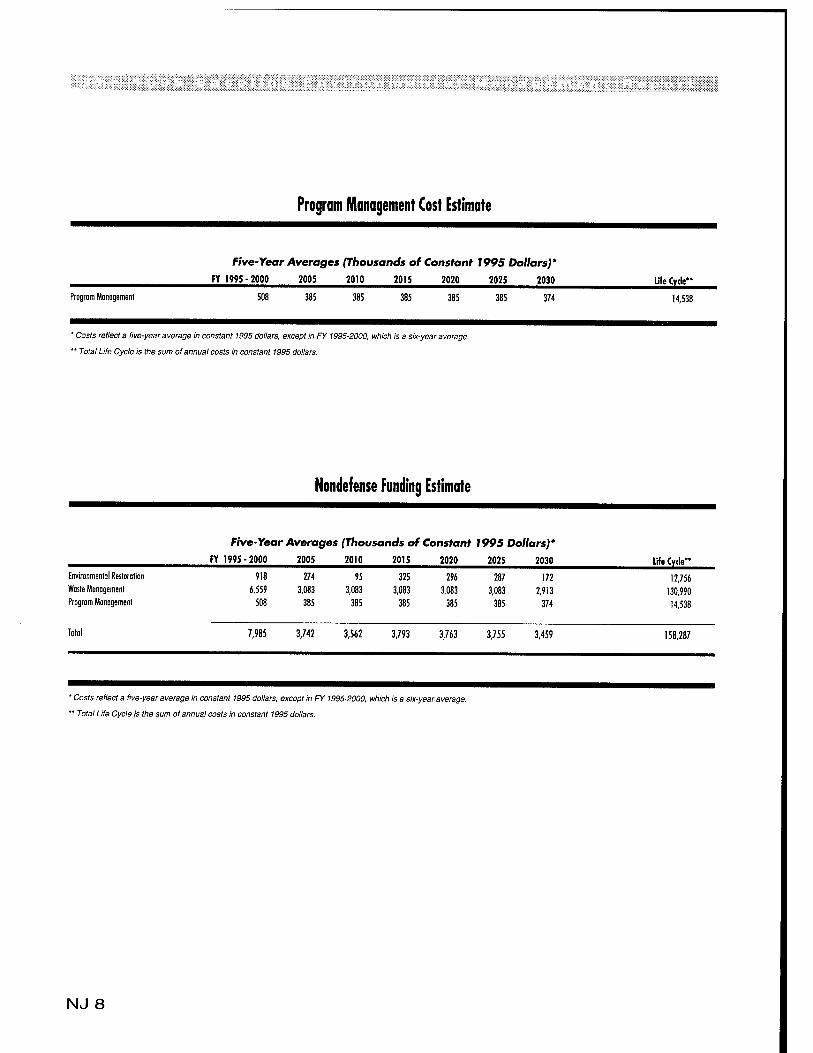
Program Management Cost Estimate
Five-Year Averages (Thousands of Constant 1995 Dollars)*FY 1995 - 2000 2005 2010 2015 2020 2025 2030 Life Cyde**
Program Management 508 385 385 385 385 385 374 14,538
• Costs reflect a five-year average in constant 1995 dollars, except in FY 1995-2000, which is a six-year average.
Total Life Cycle is the sum of annual costs in constant 1995 dollars.
Nondefense Funding Estimate
Five-Year Averages (Thousands of Constant 1995 Dollars)'
FY 1995 - 2000 2005 2010 2015 2020 2025 2030 Life Cycle**
Environmental Restoration 918 274 95 325 296 287 172 12,756Waste Management 6,559 3,083 3,083 3,083 3,083 3,083 2,913 130,990Program Management 508 385 385 385 385 385 374 14,538
Total 7,985 3,742 3,562 3,793 3,763 3,755 3,459 158,287
• Costs reflect a five-year average in constant 1995 dollars, except in FY 1995-2000, which is a six-year average.
Total Life Cycle is the sum of annual costs in constant 1995 dollars.
NJ 8

Major Activity Milestones
ACTIVITY TASK COMPLETION DATE
Environmental Restoration Fiscal Year
Ground Water Character./Remediation - Submit Title I
Ground Water Character./Remediation - Submit Title II
1997
1998
Waste Management Fiscal Year
Waste Operations - Complete TFTR waste disposal 2000
UST Remediation - Complete disposal of contaminated soils 1995
Stormwater Detention Cell - Start Construction 1997
Stormwater Detention Cell - Complete Construction 1997
Radioactive Waste Handling Facility - Start Construction 1995
Radioactive Waste Handling Facility - Complete Construction 1996
For further information on this site, please contact: Public Participation Office
Public Affairs Office
Technical Liaison: Michael Ferrigan
(708) 252-8796
(708) 252-2010
(708) 252-2570
NJ 9

NJ 10

NEW JERSEY FUSRAP SITES
DuPont, Middlesex, Maywood, Wayne, and New Brunswick constitute the New Jersey sites withinthe Formerly Utilized Sites Remedial Action Program (FUSRAP). The program was established in1974 under the provisions of the Atomic Energy Act to identify previously decontaminated Manhat-tan Engineer District and Atomic Energy Commission sites to reevaluate their radiological condi-tion and to take appropriate remedial action where necessary. FUSRAP encompasses 46 sites in 14States and is funded through the Oak Ridge Operations Office. The model used to estimate costs forthis report provides one cost for all of the FUSRAP sites located in each State. All costs for wastemanagement activities, program management, and relevant landlord activities attributable to theDepartment are provided for within the scope of environmental restoration. There are no FUSRAPsites with either current or planned nuclear material and facility stabilization activity needs. Fund-ing for all sites is 100 percent nondefense. For a general discussion of FUSRAP and associated costssee the FUSRAP Site Summary found in the Tennessee section.
Estimated Site Total
(Thousands of Current 1995 Dollars)*
$Y 199 1996 199/ 19: 199 100
Environmental Restoration 21,000 23,790 22,060 35,690 51,800 42,01
• Costs for FY 1995 reflect Congressional Appropriation, costs for FY 1996 reflect EM budget submission, costs for FY 1997-2000 reflect Budget Shortfall Scenario, costs forshaded area assume 3% annual inflation.
Five-Year Averages (Thousands of Constant 1995 Dollars)*
FY 1995-2000 2005 2010 2015 2020 2025 2030
Environmental Restoration 32,592 23,055 14,054 11,738
Life Cycle•••
439,785
" Costs reflect a five-year average in constant 1995 dollars, except in FY 1995 - 2000, which is a six-year average.
*** Total Life Cycle is the sum of annual costs in constant 1995 dollars.
Nondefense Funding Estimate
Five-Year Averages (Thousands of Constant 1995 Dollars)*
FY 1995-2000 2005 2010 2015 2020 2025 2030
Environmental Restoration 32,592 23,055 14,054 11,738
life Cycle**
439,785
Costs reflect a five-year average in constant 1995 dollars, except in FY 1995 - 2000, which is a six-year average.
Total Life Cycle is the sum of annual costs in constant 1995 dollars.
NJ 11

DUPONT AND COMPANY
(Formerly Utilized Sites Remedial Action Program)
This 700-acre site was referred to as the Chambers Dye Works of DuPont. It is located in bothPennsville and Penns Grove Townships on the north shore of the Delaware River, near the DelawareMemorial Bridge and adjacent to the residential community of Deepwater.
DUPONTCHAMBERS \WORKS
SURVEYED AREAS:CI BUILDING J-26 (FORMERLY BUILDING J-16)0 F CORRAL (PARKING LOT)0 BUILDING 845
0 EAST BURIAL AREA0 LAGOON A0 CENTRAL DRAINAGE DITCH
NJ 12

PAST, PRESENT, AND
FUTURE MISSIONS
DuPont operations included development of aprocess for converting uranium oxide touranium tetrafluoride; production of uraniumperoxide, uranium metal, and uraniumhexafluoride; and various related researchactivities. These activities took place between1942 and 1947. Following initial decontami-nation activities, the site was released to thecurrent owner, E.I. du Pont de Nemours andCompany, in 1948.
The final remedial action at the site depends onresolution of the decision document. Optionsrange from onsite disposal to removal to anoffsite location for disposal.
For fiirther information on this site, please contact:
ENVIRONMENTAL
RESTORATION
Of the three buildings involved with uraniumresearch activities, two were demolished andone has since been used as a warehouse. Theremaining building is contaminated. Rubblefrom the two buildings that were demolishedwas buried in an onsite lagoon and burial area.Other contaminated areas include a wastelagoon, a central drainage ditch, and a wasteburial area. The waste volume for this site isestimated to be 8,270 cubic yards.
Public Participation Office
Public Affairs Office
Technical Liaison: Melyssa Noe
(615) 576-1590
(615) 576-0885
(615) 241-3315
NJ 13
MAYWOOD CHEMICAL WORKS
(Formerly Utilized Sites Remedial Action Program)
The Maywood site is located in a highly developed area in Maywood and Rochelle Park, BergenCounty, New Jersey, and consists of approximately 12 acres with several warehouses and processingbuildings. The Maywood site located at 100 Hunter Avenue consists of an interim storage facilityand several vicinity properties. There are 83 vicinity properties, some of which have been remedi-ated.
N ROCHELLE PARK
I
> IT
IMAYWOOD CHEMICAL WORKS-,
NJ 14
PAST, PRESENT, AND
FUTURE MISSIONS
From 1916 to 1956, Maywood Chemical Worksprocessed monazite sands to extract thoriumfor use in gas lamp mantles and for othercommercial uses. Processing was stopped in1956 after about 40 years of production.Maywood produced thorium and lithium forthe Atomic Energy Commission during the1940's and 1950's.
The site was added to Environmental ProtectionAgency National Priorities List in 1983.Congressional action assigned cleanupresponsibility to the Department of Energy(DOE) in the same year. The land wastransferred to DOE ownership to provide aninterim storage site for the waste from vicinityproperties until a decision is made regarding itsfinal disposition.
Future use of this site depends on resolution ofthe record of decision for the Maywood site.Options range from construction of a localwaste disposal cell (for all Maywood waste,including those on vicinity properties) toshipment of all waste to another disposal site.Vicinity properties will be released forunrestricted use following cleanup.
ENVIRONMENTAL
RESTORATION
The waste consists of tailings from thorium oreprocessing. The waste volume is estimated tobe 395,000 cubic yards. Waste from the thoriumprocessing was slurried to dike areas west ofthe plant. Some of the waste was removed foruse as fill on nearby properties, therebycontaminating the properties. Twenty-sixvicinity property remediations have taken placewith the storage of contaminated material atMaywood. The interim storage pile will beremoved to a commercial disposal facility.
For further information on this site, please contact: Public Participation Office (615) 576-1590
Public Affairs Office (615) 576-0885
Technical Liaison: Melyssa Noe (615) 241-3315
NJ 15

MIDDLESEX SAMPLING PLANT
(Formerly Utilized Sites Remedial Action Program)
The site located in the Borough of Middlesex New Jersey, approximately 35 miles northeast ofTrenton.
. —.—.........; OD,. SOUTH AVE.
••••../.......
7-9 1 rIIIMMIIIII•IIII•
MO / •e.r-• • --,i• n
I.VI/
low••/\./. .•• 1:047 :7
PM
1••/i
not ••
.•
i
i
4 mum
•va:oi xIIMII,
NM PU IIIVa• AVENUE
... (..
I
>...
/ ..;.• •
..........d /•p•
./
/ 0_______--,.. .._ ...:..•...MUNI VREET
ms.
or
NNCSART AV:NUE
s
Nsie
! f. I i f
0 WeilIONIONIN
NC ONII Mit
VI MIE INVIU.111 IN
N
• 10111•INS WU. IN LOWEROMMINSIVI STSTEN
11•Parrf UOIIOMI
IMM
• far 119.
NJ 16

PAST, PRESENT, AND
FUTURE MISSIONS
The Middlesex Sampling Plant Site at 239Mountain Avenue was used for sampling,weighing, assaying, and storing uranium andthorium ores between 1943 and 1955. The bulkof the Belgian Congo uranium ores and otheruranium ores used by the United States washandled at this site. The residue from theprocessing of these ores was temporarily storedat Middlesex prior to its return to the vendor.The property covers 9.6 acres and includes fourbuildings. More than 70 percent of the site iscovered with asphalt. All Atomic EnergyCommittee activities ended in 1967. The sitewas used as a training center by the U.S. MarineCorps from 1969 to 1979, and placed inDepartment of Energy custody in 1980.
The final remedy at the site depends onresolution of the decision document. Optionsrange from onsite disposal to removal to anoffsite location for disposal.
ENVIRONMENTAL
RESTORATION
There are two storage piles that containapproximately 88,400 cubic yards of waste.Most of the waste is tailings from the uraniumores. There is also some mixed waste,containing lead, that is from the Middlesexlandfill vicinity property.
Cleanup of vicinity properties, including thelandfill, has been completed. Completeremediation is expected by FY 2011.
For further information on this site, please contact: Public Participation Office (615) 576-1590Public Affairs Office (615) 576-0885
Technical Liaison: Melyssa Noe (615) 241-3315
NJ 17

NEW BRUNSWICK SITE
(Formerly Utilized Sites Remedial Action Program)
The site is located about 30 miles from New York City and 60 miles from Philadelphia and covers 5.6acres in a densely populated area; 30,000 people live within a mile of the site.
PROPERTY BOUNDARY
—0— EXISTING FENCE
EXISTING RAILROAD
SOU
54 101 UEI
N450
0400
N550 }
N300
N250
0200
N ISO
NI00
NSO
IS SO 41000 .0
IIiL.
..,
..................................................CRAWL ROAD .. ..........
.. ...._... "
ASPHALTPAD
CONCRETEPAO
CONCRETEPAO
1
I
Z .
1, J
NJ 18

PAST, PRESENT, AND
FUTURE MISSIONS
From 1948 to 1977 the New Brunswick Site wasused as a general chemistry laboratory by theAtomic Energy Commission to the Departmentof Energy. In 1977, the facility was deactivated,and operations were transferred to the ArgonneNational Laboratory in Illinois. Industrialplants are adjacent to the site. The laboratorywas comprised of a large main building, aplutonium laboratory complex, a hot-cellbuilding, and nine ancillary structures.
This site will be released for unrestricted usefollowing completion of cleanup activities.
For further information on this site, please contact:
ENVIRONMENTAL
RESTORATION
The total estimated volume of contaminatedsoil at the site is 4,500 cubic yards. The waste islow-level radioactive waste and containsradium and uranium. The laboratory has beendecommissioned. The site is currently beingmonitored under a surveillance andmaintenance program. Complete remediationis expected by FY 2011.
Public Participation Office (615) 576-1590
Public Affairs Office (615) 576-0885
Technical Liaison: Melyssa Noe (615) 241-3315
NJ 19

WAYNE SITE
(Formerly Utilized Sites Remedial Action Program)
The 6.4-acre Wayne site is located at 868 Black Oak Ridge Road about 1.9 miles north of Wayne,New Jersey.
6
A SAMPLING LOCATION
••••.-••• mama 01104 C.1 STREAMSTORM SEEN COICUIT
,..........i ........I. .7
i ; I "-..14.1 i
i 1 1 1i
S . ij
SON
• IN 4N flu
Ti•
14 MIMS
NJ 20

PAST, PRESENT, AND
FUTURE MISSIONS
From 1948 through 1971, Rare Earths, Inc. andW.R. Grace and Company processed monazitesand (thorium ore) to recover thorium andother rare earth metals for use in themanufacturing of industrial products such asmantles for gas lanterns. In 1954, Rare Earthreceived a license from the Atomic EnergyCommission to continue operations. TheDavison Chemical Division of W.R. Graceacquired the facility in 1957, and processingactivities continued until 1971.
Waste and residue from the processingoperations included ore tailings, tritiumsludges, and sulfate precipitates. Processingceased in 1971 when the facility was licensedonly for storage. The site was partiallydecontaminated by W.R. Grace in 1974. Somebuildings were razed and the resulting rubbleand processing equipment were buried on theproperty. The remaining buildings weredecontaminated, and the disposal areas on thesite were covered with clean fill. The storagelicense for the W.R. Grace plant was terminatedin 1975 following site decommissioning. TheDepartment of Energy acquired the site in 1984under a Congressional mandate.
The site is surrounded by a chain link fence andcontains one office building, a warehouse and a2.7-acre interim waste storage pile. Severalvicinity properties were contaminated at thissite and have been remediated.
For further information on this site, please contact:
Future use of this site depends on resolution ofthe record of decision for the Wayne site.Options range from construction of a localdisposal cell (for all Wayne waste, includingthose from vicinity properties) to shipment toanother site disposal facility.
ENVIRONMENTAL
RESTORATION
Process solid waste from the thoriumoperations was buried onsite and liquid wastewas released to local storm drains. The stormdrains empty into Sheffeld Brook, whichoverflows its banks during periods of heavyrainfall causing contamination to spread tonearby low lying areas. Remediation of thesevicinity properties has been completed.
The Wayne Site is used specifically as aninterim storage site for contaminated materialremoved during cleanup of the site and vicinityproperties. The remedial investigation wascompleted in 1991-1992.
The volume of the waste (onsite and vicinityproperty) is estimated to be 109,000 cubic yardsand consists of radioactively contaminated soiland building rubble generated during previouscleanup actions. The pile covers 16 waste burialpits of various sizes. The contaminants areprimarily thorium contaminated material andthorium tailings. Remediation is anticipated tobe complete by FY 2011.
Public Participation OfficePublic Affairs OfficeTechnical Liaison: Melyssa Noe
(615) 576-1590(615) 576-0885(615) 241-3315
NJ 21

NJ 22

PROJECTGASBUGGY SITE
SHIPROCK (COMPLETEDUMTRA SITE)*
AMBROSIA LAKE
ALBUQUERQUEOPERATIONS OFFICE
INHALATION TOXICOLOGYRESEARCH INSTITUTE
URANIUM MILL TAILINGSREMEDIAL ACTION PROJECT
PAGANO SALVAGE YARD(COMPLETED)
HOLLOMAN AIR FORCE BASEREPORTED UNDER SANDIA-ALBUQUERQUE OFFSITE AREAS)
CHUPADERA MESA WHITESANDS MISSILE RANGE(TR IN ITY TEST FALLOUT[COMPLETED FUSRAP])*
LOS ALAMO SNATIONAL LAB
BAYO CANYON(COMPLETEDFUSRAP SITE)*
PROJECTGNOME -COACH SITE
ACID/PUEBLOCANYON(COMPLETEDFUS RAP SITE)*
SOUTH VALLEYSITE
SANDIA NATIONALLABORATORIES-ALBUQUERQUE
WASTE ISOLATIONPILOT PLANT
Summaries are not provided for facilities with completedremedial actions. Any ongoing surveillance and monitoringcosts for this facility is provided in the table below.
NEW MEXICO
NM 1

Estimated State Total
(Thousands of Current 1995 Dollars)*
FY 1995 1996 1997 1998 1999 2000
Albuquerque Federal Office 1,760 28,284 9,837 30,332 31,824 32,763Ambrosia Lake 390 260 0 0 0 0Gasbuggy/Gnome-Coach Test Sites 130 1,48 1,480 3,130 3,280 2,130Inhalation Toxicology Research Institute 2,694 2,644 1,368=1,272 1,080 1,080Los Alamos National Laboratory 164,150 188,900 210,600 4,180 223,700 226,000Sandia National Laboratories - Albuquerque 46,213 42,911 56,372 56,700 55,773 58,049South Valley Superfund Site 2,136 4,590 = 956 735 735 735Waste Isolation Pilot Project 174,050 186,700 193,400 195,800 197,400 198,500Completed UMTRA-S&M 980 770 700 330 50 50
Total 422,503 456,539 497,723 493,079 513,842 511,307
• Costs for FY 1995 reflect Congressional Appropriation, costs for FY 1996 reflect EM budget submission, costs for FY 1997-2000 reflect Budget Shortfall Scenario, costs forshaded area assume 3% annual inflation.
(Five-Year Thousands of Constant 1995 Dollars)*
FY 1995-2000 2005 2010 2015 2020 2025 2030
Albuquerque Federal Office 25,485 14,940 14,443 14,697 15,740 18,071 17,568Ambrosia Lake 119 0 0 0 0 0 0Gasbuggy/Gnome-Coach Test Sites 1,817 175 80 47 16 8 6Inhalation Toxicology Research Institute 1,340 547 547 547 547 547 466los Alamos National Laboratory 173,057 148,407 133,880 104,302 102,465 101,874 90,486Sandia National laboratories -Albuquerque 49,009 42,900 41,056 28,407 26,317 25,672 21,467South Valley Superfund Site 1,576 871 972 880 0 0 0Waste Isolation Pilot Project 167,409 158,444 148,656 140,836 129,460 129,460 129,460Completed UMTRA-S&M 509 46 9 0 0 0 0
Total 420,321 366,330 339,644 289,716 274,545 275,633 259,452
FY 2035 2040 2045 2050 2055 2060 2065 Life Cycle
Albuquerque Federal Office 0 0 0 0 0 0 0 630,205Ambrosia Lake 0 0 0 0 0 0 0 715Gosbuggy/Gnome-Coach Test Sites 1 0 0 0 0 0 0 12,569Inhalation Toxicology Research Institute 0 0 0 0 0 0 0 24,052Los Alamos National Laboratory 0 0 0 0 0 0 0 4,445,415Sandia National laboratories -Albuquerque 0 0 0 0 0 0 0 1,223,145South Valley Superfund Site 0 0 0 0 0 0 0 23,066Waste Isolation Pilot Project 129,460 129,460 129,460 103,568 0 0 0 7,645,776Completed UMTRA-S&M 0 0 0 0 0 0 0 3,327
Total 129,461 129,460 129,460 103,568 0 0 0 14,008,270
• Costs reflect a five-year average in constant 1995 dollars, except in FY 1995 - 2000, which is a six-year average.
▪ Total Life Cycle is the sum of annual costs in constant 1995 dollars.
NM 2

INHALATION TOXICOLOGY RESEARCH INSTITUTE
The Inhalation Toxicology Research Institute is located on the Kirtland Air Force Base directly southof the City of Albuquerque, New Mexico.
ti BIM 9252Waste Treatment Facility
NM 3

Estimated Site Total
(Thousands of Current 1995 Dollars)*
FY 1995 1996 1997 1998 1999 000
Environmental RestorationWade ManagementProgram Management
Total 2,694 ',644 1,368 1,272 • 1,080 ,080
• Costs for FY 1995 reflect Congressional Appropriation, costs for FY 1996 reflect EM budget submission, costs for FY 1997-2000 reflect Budget Shortfall Scenario, costs forshaded area assume 3% annual inflation.
Five-Year Averages (Thousands of Constant 1995 Dollars)**
FY 1995-2000 2005 2010 2015 2020 2025 2030 life Cycle***
Environmental Restoration 503 0 0 0 0 0 0 3,016Waste Management 499 438 438 438 438 438 373 15,805Program Management 339 109 109 109 109 109 93 5,237
Total 1,340 547 547 547 547 547 466 24,052
** Costs reflect a five-year average in constant 1995 dollars, except in FY 1995-2000, which is a six-year average.
*** Total Life Cycle is the sum of annual costs in constant 1995 dollars.
PAST, PRESENT, AND
FUTURE MISSIONS
The Inhalation Toxicology Research Institutewas established in 1960 to conduct research onthe human health consequences of inhalingairborne radioactive materials. In the mid-1970's, the research program was expanded toinvestigate the potential health effects ofairborne chemicals released from energy useand energy production sources, such as coal
combustion and gasification plants, solarcollectors, and light duty diesel engines.Beginning in the 1980's, the program shifted tomore basic research on the human respiratorytract and its response to inhaled toxicants.
The Institute's current mission includesresearch, education, and technology transfer. Itconducts high-quality research and linkslaboratory results with epidemiologicalfindings to identify and reduce human healthrisks. Its basic and applied research will
NM 4

continue for the foreseeable future. Research
will evolve as energy generation technologies
develop to maximize health and safety for
energy workers and the public.
The Institute's research is directed by the Office
of Energy Research. EnvironmentalManagement (EM) is responsible for the
disposition of research-generated waste and for
remediating a few contaminated areas.
ENVIRONMENTAL
RESTORATION
The Institute's scientists conduct experiments
using small quantities of radioactive materials
and hazardous chemicals to determine potential
detrimental effects of inhaling such substances.
These toxic materials are potential sources of
contamination at the site.
Contamination is known to be present in three
areas at the site. The Institute is currently
planning or conducting remediation of these
areas. These projects are expected to be
completed in FY 1996. The site will continue to
be an industrial site within the secured confines
of the Kirtland Air Force Base. All remediation
will be performed to industrial standards.
Underground Fuel Tanks andFuel Lines
Leaks from underground fuel-storage tanks
and piping have contaminated surrounding
soils. All of the tanks and underground piping
have been removed. Remediation work at four
of the five storage tank sites has been
completed by the Department of Energy (DOE)
and approved by the New Mexico Environment
Department in accordance with the Resource
Conservation and Recovery Act (RCRA). Some
minor assessment work remains at the final site
and will be completed in FY 1995.
Holding Ponds for Low-levelRadioactive Waste
Between 1963 and 1985, the Institute held low-
level liquid radioactive waste in ponds lined
with concrete and plastic. The concrete
contains some surface contamination, and 3
Environmental Restoration Activity Costs
Environmental RestorationAssessmentRemedial ActionsSurveillance And Maintenance
Total
Five-Year Averages (Thousands of Constant 1995 Dollars)*
FY 1995-2000 2005 2010 2015 2020 2025 2030
8338238
000
000
000
00
000
life Cycle**
4972,290229
503 0 0 0 0 0 0 3,016
• Costs reflect a five-year average in constant 1995 dollars, except in FY 1995-2000, which is a six-year average.
•' Total Life Cycle is the sum of annual costs in constant 1995 dollars.
NM 5

inches of soil beneath the ponds containradioactive elements. In 1990, the contents ofthe ponds, including sludge and the plasticliner, were removed and sent to the NevadaTest Site for disposal. These ponds are beingdecommissioned, with completion scheduledfor FY 1995.
Sewage LagoonsBetween 1963 and 1992, liquid sanitary sewagewas discharged to lagoons (consisting of 6 cellswithin a 10-acre area). These lagoons wereused for the treatment of all sewage generatedat the Institute. They have been out of servicesince May 1992, when the Institute began usingthe city sewer system.
Slightly elevated levels of nitrite have beenfound in the ground water beneath the lagoons.The plan is to complete closure of these lagoonsin FY 1995 and to continue monitoring andassessing the ground water until a finalagreement with State regulatory officials isreached on how to proceed with remediationefforts.
WASTE MANAGEMENT
The main objective of waste management at theInhalation Toxicology Research Institute is tomanage hazardous and radioactive wastesafely; minimize waste generated from allactivities; and handle all generated waste in anenvironmentally sound manner. This analysisassumes that Environmental Management willcontinue to manage waste from energy researchat Inhalation Toxicology Research Institutethrough fiscal year 2030.
The Institute generates small quantities ofvarious types of waste, including radioactivewaste, hazardous waste, and mixed waste. In1993, the Institute generated about 32 cubicmeters of low-level waste, 0.5 cubic meter oftransuranic waste, 1 cubic meter of low-levelmixed waste, 7 metric tons of hazardous waste,0.1 metric ton of waste regulated by the ToxicSubstances Control Act (TSCA), and 522 metrictons of sanitary waste.
Waste Management Activity Costs
Five-Year Averages (Thousands of Constant 1995 Dollars)•FT 1995 - 2000 2005 2010 2015 2020 2025 2030 Life Cycle"
TreatmentLow-Level Mixed WasteLow-Level Waste
Hazardous Waste
Total
108161230
96142200
96142200
96142200
96142200
96142200
96116160
3,5195,1037,182
499 438 438 438 438 438 373 15,805
• Costs reflect a five-year average in constant 1995 dollars, except in FY 1995-2000, which is a six-year average.▪ Total Life Cycle is the sum of annual costs in constant 1995 dollars.
NM 6

Plans for the Management ofInhalation Toxicology Research
Institute Waste
Inhalation Toxicology Research Institute waste
is packaged and stored in two RCRA waste
storage buildings. These buildings are also
used for storing low-level radioactive,
transuranic, mixed, and hazardous waste.
The Institute has shipped all of its low-level
mixed waste to Sandia National Laboratory
New Mexico for treatment, storage, and
disposal. Existing transuranic waste is
scheduled to be transferred to storage facilities
at Sandia National Laboratories on the Kirtland
Air Force Base for consolidation. Small
amounts of transuranic waste generated in the
future will also be transferred to Sandia
National Laboratories for storage until disposal
at the Waste Isolation Pilot Plant begins.
The Institute will continue to store low-level
waste in an interim storage facility. Once
capabilities for treating mixed waste are
developed, low-level mixed waste will be
transferred to Sandia National Laboratories for
treatment by the Lead Decontamination Unit
and discrete quantities of nitric acid digest
waste may be treated at the Inhalation
Toxicology Research Institute and sent to the
Nevada Test Site for disposal as low-level
waste. In FY 1995, the Institute will submit a
Proposed Mixed Waste Site Treatment Plan to
the State of New Mexico in compliance with the
Federal Facilities Compliance Act.
The Institute will continue discharging liquid
sanitary waste to the Albuquerque Sewage
Treatment Plant. Solid sanitary waste will
continue to be shipped offsite to theAlbuquerque City Landfill. In FY 1999, a
wastewater pretreatment unit will be installed
at the Institute to meet local regulatory
standards.
A waste processing building and upgrades to
existing onsite storage is being designed, with
construction to be completed in FY 1996. The
current onsite storage areas will require
upgrading in the future. The hazardous waste
storage area will be upgraded in FY 1999, and
the low-level waste storage area will be
upgraded between FY 1997 and FY 2004.
NUCLEAR MATERIAL AND
FACILITY STABILIZATION
There are no current or planned nuclear
material and facility stabilization activities at
the Inhalation Toxicology Research Institute.
LANDLORD FUNCTIONS
The DOE's Office of Energy Research is the
landlord for this site.
PROGRAM MANAGEMENT
The Inhalation Toxicology Research Institute
has no separate funding for programmanagement. All program management
activities are performed within wastemanagement and environmental restoration
activities. This estimate employed a factor
based on current and anticipated program
management needs to create an independent
cost category. Program and management
activities at the site consume approximately 20
percent of the total budget.
FUNDING AND COST
INFORMATION
The following tables present fundinginformation and major activity milestones for
the Inhalation Toxicology Research Institute
NM 7

Program Management Cost Estimate
Five-Year Averages (Thousands of Constant 1995 Dollars)•FT 1995 - 2000 2005 2010 2015 2020 2025 2030 life Cycle**
Program Management 339 109 109 109 109 109 93 5,237
* Costs reflect a five-year average in constant 1995 dollars, except in FY 1995-2000, which is a six-year average.
• Total Life Cycle is the sum of annual costs in constant 1995 dollars.
Nondefense Funding Cost Estimate
Five-Year Averages (Thousands of Constant 1995 Dollars)*FY 1995 - 2000 2005 2010 2015 2020 2025 2030 Life Cyde**
Environmental Restoration 503 0 0 0 0 0 0 3,016Waste Management 499 438 438 438 438 438 373 15,805Program Management 339 109 109 109 109 109 93 5,237Total 1,340 547 547 547 547 547 466 24,052
• Costs reflect a five-year average in constant 1995 dollars, except in FY 1995-2000, which is a six-year average.
Total Life Cycle is the sum of annual costs in constant 1995 dollars.
NM 8

Major Activity Milestones
ACTIVITY TASK COMPLETION DATE
Environmental Restoration:Fiscal Year
Diesel Oil Assessment Final Report 1995
Remedial Action Plan Complete 1995
Hot Pond Final Report 1995
Groundwater Remedial Action Plan Complete 1995
Sanitary lagoons Assessment Fieldwork Complete 1995
Sanitary Lagoons Assessment Results Complete 1995
Sanitary Lagoons Remediation Complete 1996
Lagoon and Groundwater Final Report Complete 1997
Waste Management:
Final Site Treatment Plan 1995
Hazardous Waste Storage Area Upgrade 1999
Low Level Waste Storage Area Upgrade 1997 - 2004
All Waste Management Activities Complete 2035
For further information on this site, please contact: Public Participation OfficePublic Affairs OfficeTechnical Liaison: Ted Pietrok
(505) 845-5951(505) 845-6202(505) 845-5649
NM 9

NM 10

LOS ALAMOS NATIONAL LABORATORY
The Los Alamos National Laboratory occupies about 43 square miles in Los Alamos County, New
Mexico. It is about 60 miles north-northeast of Albuquerque and 25 miles northwest of Santa Fe.
The site lies on the Pajarito Plateau, which is made up of finger-like mesas ranging in elevation from
6200 to 7800 feet.
TA-50
123 EM Facilities
NM 11

Estimated Site Total
(Thousands of Current 1995 Dollars)*
FY 1995 1996' 1197 1998 1999 2000 Environmental RestorationWaste ManagementNuclear Material and Facility StabilizationProgram Management
Total
72,16059,1 60
88,88060,960
0 6,800 1.830 2260
85,040 85,04076,960 72,240
93,760 98,80078,240 74,880
8,100 8,400 = 8,100 ,90090,500 39,100 43,000 43,420
164,150 ,9 210,600 204,780 223,700 226,000
• Costs for FY 1995 reflect Congressional Appropriation, costs for FY 1996 reflect EM budget submission, costs for FY 1997-2000 reflect Budget Shortfall Scenario, costs forshaded area assume 3% annual inflation.
Five-Year Averages (Thousands of Constant 1995 Dollars)**
FY 1995-2000 2005 2010 2015 2020 2025 2030Environmental RestorationWaste ManagementNuclear Material and Facility StabilizationProgram Management
Total
85,801 52,820 26,240 0 0 0 065,184 72,746 82,350 83,296 81,972 81,499 72,38910,693 4,655 4,703 182 0 0 011,380 18,186 20,587 20,824 20,493 20,375 18,097
173,057 148,407 133,880 104,302 102,465 101,874 90,486
Life Cycle***
910,1042,762,363111,854661,093
4,445,415
** Costs reflect a five-year average in constant 1995 dollars, except in FY 1995 - 2000, which is a six-year average.*** Total Life Cycle is the sum of annual costs in constant 1995 dollars.
PAST, PRESENT, AND
FUTURE MISSIONS
The Los Alamos National Laboratory wasestablished in 1943 for the design,development, and testing of nuclear weapons.Supporting this mission were researchprograms in nuclear physics, hydrodynamics,conventional explosives, chemistry, metallurgy,radiochemistry, and biology.
In addition to research, an important functionof the laboratory has been the processing ofplutonium metal and alloys from the nitratesolution feedstock provided by otherproduction facilities. The processing ofplutonium metal continued from 1945 until1978. Other operations included thereprocessing of nuclear fuel, polonium andactinium processing, and the production ofnuclear weapons components.
NM 12

Although the Laboratory's current mission
remains focused on national defense, it has
been broadened to include research in medium-
energy physics, space nuclear systems,controlled thermonuclear fusion, lasers, nuclear
safeguards, space physics, biomedicine,computational science, materials science, andenvironmental management. Because of its
position between academic and industrial
research, the Laboratory has an important role
in expediting the development andcommercialization of emerging technologies.
This mission is expected to continue into the
foreseeable future.
Current projections of land and facilityrequirements for the next 20 years indicate that
the Laboratory needs to retain most of the 43
square miles of its site, either for structures,
roads, utilities, firing sites, or for a buffer area
for environmental research. However, theDepartment of Energy (DOE) is considering the
transfer of up to 7,000 acres to the Los Alamos
County for industrial and commercial use.
These parcels are deemed to be in excess ofprogrammatic needs.
The Laboratory's requirements for land will bereviewed by the recently established Future SiteUse Integration Team, which, in consultationwith the general public, will recommendtransfer or retention for various parcels of land,particularly in the environmental researchbuffer area. The landlord for the Laboratory isDefense Programs.
ENVIRONMENTAL
RESTORATION
Ever since the Laboratory was established,many of its operations required the use ofhazardous chemicals and radioactive materials
like plutonium and uranium. The use of these
materials resulted in the contamination offacilities and, in some cases, of the surroundingenvironment. A major source of environmental
pollution was the management of waste, which
was discharged into water or air or buried in
land disposal areas in accordance withstandards in effect at that time. In addition to
hazardous chemicals and radioactive materials,
the contaminants of concern include explosive
Environmental Restoration Projects
Five-Year Averages (Thousands of Constant 1995 Dollars)*
FY 1995 - 2000 2005 2010
Field Unit 1 26,933 4,680 8,700
Field Unit 2 8,120 5,800 1,300
Field Unit 3 9,308 2,000 1,360
Field Unit 4 14,160 17,500 4,140
Field Unit 5 9,085 11,840 3,940
Field Unit 6 18,195 11,000 6,800
Total 85,801 52,820 26,240
2015 2020 2025 2030 life Cycle
0 0 0 0 228,500
0 0 0 0 84,218
0 0 0 0 72,647
0 0 0 0 193,159
0 0 0 0 133,410
0 0 0 0 198,169
0 0 0 0 910,104
• Costs reflect a five-year average in constant 1995 dollars, except in FY 1995-2000, which is a six-year average.
Total Life Cycle is the sum of annual costs in constant 1995 dollars.
NM 13

residues and asbestos. Asbestos, while nolonger used, is generated as a waste duringfacility modifications and duringdecommissioning.
Environmental restoration has identifiedapproximately 2,100 potential release sites. Theprimary mechanisms for the release ofcontaminants are the runoff of surface waterthat carries potentially contaminated sedimentsand the erosion of soil to exposure buriedcontaminants. The main pathways by whichreleased contaminants can reach people livingbeyond the boundaries of the site areinfiltration into alluvial aquifers and airbornedispersion of particulate matter.
To identify releases that could pose a health riskto surrounding communities, ground-waterand air monitoring programs have beenimplemented. Limited data gathered so farindicate that risks to the health and safety of thepublic are minimal.
By the end of FY 1994, 50 of the approximately2,100 potential release sites had beenremediated, no further action was proposed for300 sites, and 1,100 sites were slated forinvestigation or cleanup; for the remainingsites, action is still pending. All cleanupactivities are expected to be completed by FY2010.
Whenever warranted and possible, theexpedited cleanup approach is used. Thisapproach permits a site-specific remediation tobe planned, designed, and implementedwithout proceeding through the entirecorrective action process. For complicatedactions, like remediating the former materialdisposal areas, environmental restoration willuse the conventional corrective action processto evaluate exposures, compare alternatives,and prepare detailed plans and specificationsfor the action. Some sites may require interimactions before an expedited cleanup or final
remediation. For these sites, the project willconcentrate on removing the source of thecontamination before investigating the finalcorrective measure.
Detailed funding requirements forenvironmental restoration activity are given inthe Environmental Restoration Projects, andmajor activity milestones are presented in themilestones table at the end of this section.
Corrective actions and remedial designs willmeet requirements of the Laboratory's ResourceConservation and Recovery Act (RCRA)operating permit and the U.S. EnvironmentalProtection Agency (EPA) corrective actionHazardous and Solid Waste Amendmentrequirements of the RCRA operating permit.The State of New Mexico issued the RCRApermit but EPA retains authority over theHazardous and Solid Waste Ammendmentportion of the permit.
The potential release sites slated for furtheraction have been combined into six field unitsfor investigation and remediation.
Field Unit 1
Field Unit 1 consists of 664 potential releasesites. It includes all of the Los Alamos Countytownsite potential release sites that are on landno longer owned by DOE. It also includes sitesat the old plutonium-processing facility, thoseat the main technical area, and other sites atvarious technical areas. In addition, this fieldunit contains several of the Laboratory's oldmaterial-disposal areas as well as the LosAlamos municipal sanitary landfill. Theprimary potential contaminants of concern areradionuclides, volatile organic compounds, andinorganic compounds, including heavy metals.
Some of the early Laboratory sites includedadministrative buildings, laboratories, andresearch facilities, many of which handledradioactive and hazardous organic andinorganic substances. These areas were cleanedof radioactive material in the 1960's before
NM 14

being released to the county of Los Alamos or
sold to private owners. However, with the
increasingly stringent laws governinghazardous waste, the areas are subject toreinvestigation and remediation as part ofenvironmental restoration activities.
The main technical area of the Laboratory
includes potential release sites associated with
principal administration buildings, shops,warehouses, several large laboratory buildings
housing diverse programs, and numerous
smaller buildings serving specialized functions.
Also included are the gas-fired electricalgeneration plant, gas station and garage, and
sewage treatment plant.
Site characterization is under way across the
entire field unit except for one area, which will
begin site characterization in July 1997.
Projected activities for FY 1995 includereporting to the EPA on investigations required
by RCRA for 104 potential release sites;completing investigations at 46 sites; andcompleting cleanup at 17 sites. Remediation is
to be completed by FY 2007.
Field Unit 2
Field Unit 2 consists of 301 potential release
sites associated with 14 technical areas. This
unit includes active and inactive firing sites, a
facility for research on nuclear criticality, a 0.5-
mile-long linear proton accelerator, and
associated experimental research areas. The
primary contaminants of concern areradionuclides, high explosives, organics, and
heavy metals.
The inactive firing sites which were used
starting in the early 1940's, were used forexperiments involving explosive charges
ranging from a few pounds to 2 tons. At one of
the active firing sites, more than 30,000 test
shots were performed, with an estimated 2,200
to 4,400 pounds of depleted uranium expended.
All of the experiments were above ground
detonations. The resulting waste products vary
widely in terms of particle size, from fine dust
to shrapnel. Larger pieces of shrapnel havetraveled up to 3,000 feet. Metal pieces that wereprojected downward penetrated the ground to
a depth of several yards. In other tests,projectiles were fired at targets. In some cases,
the projectiles penetrated the target and wereembedded into the adjacent canyon walls.
The nuclear criticality experiments wereconducted in three separate buildings. In one
of the buildings, mockup studies of fissionreactors and studies of a plasma-core powerreactor were also performed. This site remains
active and is also used for the development of
treaty-verification technology.
The 0.5-mile-long linear proton accelerator, still
in operation, is used for basic research onsubatomic particles, isotope production, and
accelerator-technology development.
Site characterization is presently going on in all
areas of the field unit except for two which are
scheduled to begin characterization next year.
Projects scheduled for FY 1995 are the completeinvestigation of all material disposal areas; the
first phase of sampling for 127 potential release
sites; and a survey of all firing sites. Inaddition, the closure of surface impoundments
at area TA-53 will begin, and 12 expeditedcleanups are planned for completion. All
interim actions are to be completed by FY 2003,
and remediation will be completed by FY 2010.
Field Unit 3
Field unit 3 consists of 555 potential release
sites associated with 10 technical areas. Itincludes old sites, where high explosives were
developed and processed, initiators for nuclear
weapons were tested, and reactor components
were developed. The primary contaminants of
concern are radionuclides, high explosives,volatile and semivolatile organics,polychlorinated biphenyls (PCBs), asbestos,
pesticides, and herbicides.
NM 15

Much of the contamination in this field unitresulted from operations established duringWorld War II to develop, fabricate, and testexplosive components for nuclear weapons.Various other facilities included areas forphotofission experiments, a mortar impact area,an air-gun firing range and other gun-firingsites, a burning ground, laboratories, storagebuildings, sumps, and material disposal areas.In many of the experiments, beryllium-containing weapons initiators were tested, andin some experiments uranium componentswere used. A high-pressure tritium facility wasalso in operation until 1990.
One site in this field unit was used to developnuclear reactors for the propulsion of spacerockets. Experiments included the structuraltesting of fuel elements made of uranium-loaded graphite, which were tested until theyfailed. The site was also used to developmethods for uranium-isotope separation and totest lasers for exciting uranium hexafluoridegas of various enrichments. Experimental solarbuildings and solar ponds were built later;these ponds have since been converted tosanitary waste lagoons.
All sites in this unit are being characterized,except for one area which is scheduled to begincharacterization next year. Projected activitiesfor FY 1995 include completing phase Isampling at 26 sites and starting phase IIsampling at one site. Field work is scheduled tobegin at approximately 75 sites. All interimactions are to be completed by FY 2001, andremediation is to be completed by FY 2007.
Field Unit 4
Field Unit 4 consists of 260 potential releasesites and 19 canyons on the Pajarito Plateau; areactor site; and various heavily industrializedsites. The primary contaminants of concern areradionuclides, high explosives, volatile andsemivolatile organic compounds, andinorganics, including heavy metals. Most of thecontamination resulted from various operations
dating from as early as 1944, and mostcontamination associated with such facilities assurface impoundments and disposal areas,experimental reactors, wastewater treatmentand septic systems, aboveground andunderground storage tanks, sanitary andindustrial waste effluent lines, PCBtransformers, firing sites, incinerators, chemicalprocessing, and shops for machiningradioactive materials.
The Pajarito Plateau is a system of finger-likemesas extending from the Jemez Mountains,with canyons between each mesa.Contamination may have occurred in 19canyons from various Laboratory operationsboth on the mesas and within the canyonsthemselves. Many of the canyons extendbeyond the current boundaries of theLaboratory and eventually drain into the RioGrande in New Mexico. The environmentalrestoration activity will investigate anypotential offsite contamination from potentialrelease sites that discharge into the canyons.
Radioactive contaminants (primarily tritium,cesium 137, and strontium 90) have beendetected in alluvial ground waterdowngradient of two sites located in one of themain canyons within the Laboratory'sboundaries. One of the sites houses the OmegaWest Reactor. This reactor, no longeroperational, was an 8-megawatt water-cooledreactor fueled with highly enriched uranium; itwas used for basic research in nuclear physics.The other site was used in developingweapons-boosting systems and conductinglong-term studies on weapon subsystems.
Site characterization is in progress across thefield unit except for one area. Field activitiesprojected for FY 1995 include completing phaseI characterization for all remaining potentialrelease sites. Interim actions and remediationwill be completed in FY 2005 and 2010,respectively.
NM 16

mi"
Field Unit 5
Field unit 5 consists of 312 potential releasesites associated with several areas used forexplosives development, primary wastemanagement facilities, and one offsite arealocated on land owned by the U.S. ForestService and leased by DOE. Many of theLaboratory's material disposal areas are alsolocated within this field unit. The primarycontaminants of concern are radionuclides, highexplosives, volatile organic compounds, andmetals.
Much of the contamination in this field unitresulted from high-explosives research anddevelopment and from testing at abovegroundfiring sites. Other contributors tocontamination were research into various
methods for assembling fissionable material toproduce nuclear bombs and the testing,development, and production of bombdetonators.
This unit contains all of the Laboratory's retiredand operating waste management facilitiesother than the very early landfills, which arepart of field unit 1. One of the retired facilitiessites, established in 1948, consists of several pitsand shafts that contain a very diverse mixtureof contaminants, including low-level,transuranic, hazardous, and mixed waste.Another landfill was established in 1974 toreplace this historical site and continues tooperate today. The Laboratory's radioactivelandfill is also part of this field unit. Anotherburied material disposal area was used in the
Environmental Restoration Activity Costs
Five-Year Averages (Thousands of Constant 1995 Dollars)*
FY 1995 - 2000 2005 2010 2015 2020 2025 2030 Life Cycle**
Field Unit 1Assessment 17,130 2,740 0 0 0 0 0 116,483
Remedial Actions 9,803 1,940 8,700 0 0 0 0 112,018
Field Unit 2Assessment 6,882 240 0 0 0 0 42,491
Remedial Actions 1,238 5,560 1,300 0 0 0 0 41,726
Field Unit 3Assessment 7,922 1,660 0 0 0 0 55,830
Remedial Actions 1,386 340 1,360 0 0 0 0 16,818
Field Unit 4Assessment 14,160 5,000 900 114,459
Remedial Actions 0 12,500 3,240 0 0 0 0 78,700
Field Unit 5Assessment 7,847 740 0 0 0 0 50,784
Remedial Actions 1,238 11,100 3,940 0 0 0 0 82,626
Field Unit 6Assessment 14,061 0 0 0 0 84,365
Facility Decommissioning 4,134 11,000 6,800 0 0 0 0 113,804
Total 85,801 52,820 26,240 0 0 0 0 910,104
Costs reflect a five-year average in constant 1995 dollars, except in FY 1995-2000, which is a six-year average.
" Total Life Cycle is the sum of annual costs in constant 1995 dollars.
NM 17

early 1960's and currently contains largeamounts of various waste materials, includingplutonium and lead. This unit also contains theLaboratory's liquid-waste treatment plant, builtin 1963. The plant receives liquid waste fromacross the Laboratory, treats it to remove targetcontaminants, and monitors and then releasesthe treated liquid effluent through an approvedoutfall.
Located 37 miles west of the Laboratory, FentonHill, is a site for research on geothermal energy.Formerly operated by the Laboratory and nowinactive, the site is located on land leased byDOE. A few potential release sites have beenidentified here.
Field activities projected for FY 1995 includeextensive surveying and soil sampling, shallowboring and drilling, and the removal of threeseptic tanks. Remediation and any final interimactions are to be completed in FY 2007.
Field Unit 6
Field unit 6 covers activities related todecommissioning facilities that are no longerneeded. Decommissioning is the removal ofcontamination and the actions taken todemolish facilities. When it is determined that acontaminated facility is no longer needed for itsoriginal purpose, the decommissioningprogram decontaminates the facility but doesnot demolish it if it can be used for anotherpurpose. If the building cannot be used foranother purpose, it is demolished.
The decommissioning projects includebuildings from the former plutonium-processing facility (discussed as part of fieldunit 1), which was used from the late 1940's tothe early 1970's; a phase separator pit usedfrom the mid-1960's through the early 1990's; aformer tritium facility used from the mid-1950'sthrough the late 1980's; many abandonedbuildings contaminated with high explosives
and used from the 1950's to the 1980's; and theOmega West Reactor (discussed under fieldunit 4), which was used from the mid-1950's tothe early 1990's.
As funding becomes available and other sitesare identified as excess, the decommissioningproject will decommission those buildings. Thedecommissioning project coordinates closelywith the environmental restoration activity inidentifying potential contaminants in andaround buildings slated for decommissioning.
Activities for FY 1995 include a preliminaryassessment of the Omega West Reactor; thecomplete characterization of filter buildings atarea TA-21; and the start of the sitecharacterization for other buildings. In FY1996, work will continue at areas TA-21 and TA-16. In FY 1997, 25 buildings at area TA-21 willbe decommissioned, and in FY 1999 the tritiumfacility at area TA-33 will be decommissioned.
WASTE MANAGEMENT
Ongoing activities and operations at theLaboratory continue to generate waste fromprocessing effluents, separating isotopes,manufacturing, research and developmentprograms in basic and applied chemistry,testing and manufacturing explosives, cleaningchemically contaminated equipment, andworking with radioactive materials. Activitiesthat generate waste are located in 33 technicalareas at the Laboratory.
The waste types generated at the Laboratoryinclude radioactive waste (transuranic wasteand mixed transuranic waste, low-levelradioactive waste and low-level mixed waste,and accelerator-produced radioactivematerials); hazardous chemical waste;biological waste; medical waste; and sanitarysolid and liquid waste. The Laboratory doesnot generate any high-level waste. Some spentnuclear fuel is kept in interim storage, butfunding for its management is provided byDefense Programs, and spent fuel is, therefore,
NM 18

not included in the activities described here.The facilities generating waste are responsiblefor ensuring that each type of waste meets theacceptance criteria for disposal. This entailsdetermining the characteristics of the waste,packaging it, and labeling the packages.
The Laboratory has initiated an effort tominimize the generation of radioactive andhazardous chemical waste. To this end, itconducts applied studies as well as researchand development on methods for reducing thevolume of solid and liquid radioactive andhazardous waste. Waste minimization andpollution prevention should greatly reduce thevolume of waste and the costs of itsmanagement.
Waste Treatment
The Laboratory has several facilities for thetreatment of radioactive waste: the RadioactiveLiquid Waste Treatment Facility, which servicesboth liquid transuranic and liquid low-levelwaste; the Controlled Air Incinerator, whichcould potentially accept transuranic, and mixedwaste; and the Waste Characterization,Reduction, and Repackaging Facility, whichservices solid transuranic waste.
The Radioactive Liquid Waste TreatmentFacility consists of a primary chemicaltreatment and ion-exchange plant and apretreatment plant for removing plutonium andother actinide elements from liquid transuranicwaste. This facility, however, is 30 years oldand is to be replaced with a new treatmentfacility designed to remove essentially allactinides (99.999 percent) from liquidtransuranic waste. The new facility wasexpected to start operating in FY 2004, butbecause of funding problems, it is assumed forthe purposes of this report that operation willstart in FY 2009.
The Controlled Air Incinerator operated fornine years as part of a research anddevelopment program. Currently it is notoperating because the off-gas system is beingupgraded to improve reliability and reducerisks of environmental pollution. DOE isconsidering operating the Controlled AirIncinerator for routine waste treatment.Operation of the incinerator for routine wastetreatment is dependent upon the developmentof incineration standards by the New MexicoEnvironmental Department andrecommendations in the final site-wideenvironmental impact statement for the Los
Major Waste Management Projects
Five-Year Averages (Thousands of Constant 1995 Dollars)*
1995.2000 2005 2010 2015 2020 2025 2030 Life Cycle**
Controlled-Air Incinerator 5,133 4,680 4,680 4,680 4,680 4,680 4,680 171,200
Hazardous Waste Treatment Facihiy 833 0 0 0 0 0 0 5,000
High Explosives Waste Water Treatment 883 0 0 0 0 0 5,300
Mixed Waste Recovery and Storage 1,125 0 0 0 0 0 0 6,750
TRU Waste Remediation 4,833 2,800 200 200 400 0 400 49,000
• Costs reflect a five-year average in constant 1995 dollars, except in FY 1995-2000, which is a six-year average.
.* Total Life Cycle is the sum of annual costs in constant 1995 dollars.
NOTE: These projects represent a subset of waste management activities. Associated program management costs are built-in to the estimates provided.
NM 19

Alamos National Laboratory. A significantupgrade to the Controlled Air Incineratorfacility is proceeding prior to a decision beingmade in the site-wide environmental impactstatement whether to operate the Controlled AirIncinerator. If so, the incinerator will be usedfirst to incinerate low-level mixed waste andthen to incinerate newly generated and storedtransuranic waste.
Mixed transuranic waste will require treatmentto meet the Waste Isolation Pilot Plant WasteAcceptance Criteria. In the event the nomigration petition variance is not approved,mixed transuranic waste will require treatmentto meet RCRA Land Disposal Requirements.The Controlled Air Incinerator is beingconsidered as an option for the conditionaltreatment of mixed transuranic waste to meetRCRA Land Disposal Restrictions.
The Laboratory expects to build a newtreatment facility for solid transuranic waste.
Transuranic Liquid Waste
Transuranic liquid waste is radioactive wastecontaminated with plutonium and other long-lived elements with atomic numbers higherthan that of uranium in concentrations greaterthan 100 nanocuries per gram of waste.Because this waste will remain radioactive formany thousands of years, it requires disposal ina geologic repository (the Waste Isolation PilotPlant near Carlsbad, New Mexico).
At the Laboratory, liquid transuranic waste isproduced at the Los Alamos Plutonium Facility(TA-55), from where it is transported by apipeline to the Radioactive Liquid WasteTreatment Facility at TA-50. This facilityconsists of a primary chemical treatment andion-exchange plant and a pretreatment plant forremoving plutonium and other actinides. Thepretreatment plant has demonstrated that morethan 99 percent of the actinides can be removedfrom the waste stream. Residual transuranicwaste sludge remains after treatment. Thissludge is loaded into 55-gallon steel drums,
solidified, and transported to Area G forstorage. The industrial pipeline that transportsthe liquid transuranic waste from theplutonium facility to treatment was recentlyreplaced with a double-wall piping system.
Transuranic Solid Waste
The program for treating solid transuranicwaste has the following objectives:characterizing existing transuranic waste todetermine that it meets the criteria foracceptance at the Waste Isolation Pilot Plant;certifying that all newly generated transuranicwaste meets these acceptance criteria; andreducing the volume of the waste, stabilizingthe waste, and repackaging it. Most of thesefunctions will be performed at the WasteCharacterization, Reduction, and RepackagingFacility.
The Waste Characterization, Reduction, andRepackaging Facility was originally designed torepackage and reduce the volume of metallicwaste gloveboxes, process equipment, andconduct work. This facility is being modified toperform waste characterization. Themodifications consist of installing a glovebox inwhich the contents of waste drums can beremoved and installing a glovebox forcharacterizing the contents of waste drums.
Future plans are to develop a new facility forcharacterizing and processing transuranic solidwaste. The new facility will have the capabilityof repackaging, stabilizing, and characterizingcontact handled transuranic waste, which ischaracterized by low levels of radiation at thesurface of the drum, and accounts for most ofthe transuranic waste. Remote handledtransuranic waste, which has relatively highlevels of radiation at the surface and must behandled by remote control. This facility willuse chemical reactors, induction furnaces,microwave smelters, and plasma-arc furnacesto treat the waste. Phase I is expected to befully operational by FY 2006 and phase II by FY2009.
NM 20

Transuranic Mixed Waste
Transuranic mixed waste contains both longlived transuranic radionuclides and chemicallyhazardous constituents. The need for treatingthis waste and the degree of treatment will bedriven by the waste acceptance criteria for theWaste Isolation Pilot Plant, which is expected tostart receiving waste in FY 1998.
The construction of a new Transuranic WasteTreatment Facility is planned for FY 2003.However, for purposes of this report, it isassumed that the construction of this facilitywill be delayed to FY 2009. This means that theLaboratory may not be able to start timelyshipments of transuranic mixed waste thatrequires treatment to meet the Waste IsolationPilot Plant Waste Acceptance Criteria. TheControlled Air Incinerator and the WasteCharacterization, Reduction, and RepackagingFacility are potential options for the treatmentof transuranic mixed waste.
Low-Level Liquid Radioactive Waste
One of the treatment facilities for low-levelliquid waste is the primary chemical treatmentand ion-exchange plant at the RadioactiveLiquid Waste Treatment Facility. The chemicaltreatment separates actinides and otherradionuclides from the plant influent wastestream. The liquid waste is transported fromthe Los Alamos Plutonium Facility in anindustrial pipeline that has recently beenupgraded. The residual radioactive sludgeremaining after treatment is loaded into drums,solidified, and transported to Area G fordisposal.
Low-Level Solid Radioactive Waste
Low-level solid radioactive waste is currentlynot treated at the Laboratory. However, a two-ton compactor is expected to becomeoperational in 1995.
Low-Level Mixed Waste
As a result of the land disposal restrictions ofRCRA, the Laboratory is striving to developcapabilities to treat the low-level mixed wastecurrently in storage. It is proposed thatcombustible low-level mixed waste will betreated in the Controlled Air Incinerator if thedecision from the Environmental ImpactStatement is for operation. A schedule forworking off the entire inventory of low-levelmixed waste in storage will then be establishedin an agreement with EPA.
To treat low-level mixed waste that is notincinerated as well, as investigate potentiallymore efficient alternative, the Department plansto develop the Hazardous Waste TreatmentFacility. This facility will have four treatmentrooms and a metal building for drum storage.The treatment equipment will be skid-mountedto allow multiple uses and multiple treatmentsfor a variety of waste. Several mobile treatmentunits are being developed to support part ofthis project. These units will require upgradingafter 12 years of use. Processes needed forwaste not currently addressed will bedeveloped systematically. Construction will becompleted in FY 1998.
Another facility that will have the capability totreat mixed waste will be the Mixed WasteDisposal Facility. As currently planned, it willbe used primarily to treat waste generated byenvironmental restoration as well asdecommissioning. The treatment facilities willinclude a plant for treating leachate wastewater,a thermal desorption plant, and a plant forstabilizing metals. These facilities are plannedfor completion by FY 2004, FY 2009, and FY2009, respectively.
Hazardous Chemical Waste
Nearly all of the Laboratory's chemical waste istreated at commercial offsite facilities, but theLaboratory does perform volume reduction forsome waste (e.g., crushing scintillation vials)and treatment of barium sands. In the future
NM 21

these hazardous wastes, which cannot behandled by commercial facilities, will be treatedat the Hazardous Waste Treatment Facility to bedeveloped, and other undetermined offsitelocations.
High-Explosives Wastewater
High-explosives wastewater is treated bygravity settlement in a sump and thendischarged from outfalls operated with permitsunder the National Pollutant PreventionDischarge Elimination System. Initially, therewere 21 such outfall discharges fromwidespread technical areas that process highexplosives. Waste minimization efforts havereduced the number of outfalls from 21 to 2.
Dissolved constituents are not removed by thistreatment. As a result, there are oftencompliance issues associated with the NationalPollutant Prevention Discharge EliminationSystem permit. The Laboratory is under anadministrative order from EPA to treat all high-explosives wastewater by FY 1997 and hasagreed to this requirement. To meet thisobligation, the Laboratory is developing a high-explosives wastewater treatment facility thatwill collect and treat these wastewaters withstepped filtration. The ultimate goal for thisfacility is zero discharge with completerecycling of the system water. Construction isscheduled for completion in FY 1997.
Sanitary Waste
Liquid sanitary waste is treated by aconsolidation and collection system, whichreplaced eight existing wastewater-treatmentfacilities and 30 septic tanks. This new facilityprovides state-of-the-art treatment and alaboratory for analyzing both the process andthe effluent streams. It is expected to meet allLaboratory needs for the next 20 years.
Solid sanitary waste will be managed anddisposed of at the Laboratory's site until 2003,after which the waste will go to a regionalcommercial disposal facility.
Waste Storage
Transuranic Solid Waste andTransuranic Mixed Waste
The Laboratory currently stores transuranicsolid waste in five configurations in Area G.Transuranic solid waste generated before 1979is stored in belowground arrays in pits andtrenches at Area G, while waste generated from1979 to 1991 was placed in "bermed" storage, amethod of storing on asphalt pads in dense-pack arrays under earthen cover. Wastegenerated after 1991 is stored in tension-support fabric domes in arrays that can beinspected, as required by RCRA. Remote-handled transuranic waste, which requiresstorage with radiation shielding, is kept incanisters lowered into shafts at Area G.
In January 1993, the State of New Mexico issueda compliance order to the Laboratory to bringthe bermed-stored transuranic waste tocomplete compliance with RCRA. In order tocomply with this order, the Laboratory initiatedthe Transuranic Waste Inspectable StorageProject. The objective is to retrieve the wastestored under earthen cover at Pads 1, 2, and 4 atArea G and place it into inspectable storage.The project consists of four phases. The projectrequires the construction of a retrieval domeand two storage domes. The first phase ofconstruction is to be completed in June 1995,and the project is scheduled for completion inFY 2002.
Low-Level Mixed Waste
Low-level mixed solid and liquid waste arepresently segregated, packaged, and stored atthe Radioactive Storage and Disposal Facility inArea G (solids) and Area L (liquids) ininspectable arrays under tension-support fabricdomes. The present storage capacity isinadequate for supporting the Laboratory'supcoming treatment facilities, specifically theHazardous Waste Treatment Facility and theControlled Air Incinerator. The Laboratory has,
NM 22

therefore, initiated the development of theMixed Waste Receiving and Storage Facility,which will be adjacent to the Hazardous WasteTreatment Facility. The facility will be a high-bay structure, with three segregated areas formixed-waste handling, segregation, staging,and storage. The largest storage area will holdnonflammable mixed waste. The second areawill store flammable mixed waste, and the thirdarea will be used for repackaging, bulking, andpreparing liquid and solid mixed waste forincineration. Construction is anticipated to becompleted in FY 1998.
Low-level mixed waste generated byenvironmental restoration activity will requirestorage until all components of the MixedWaste Disposal Facility are completed in FY2009. It is estimated that 50,000 cubic meters oflow-level mixed waste will be generated beforethis facility opens. If necessary, the laboratorywould store this waste in self-supporting fabricdomes. All storage facilities will have RCRApermits.
Hazardous Chemical Waste
Hazardous chemical waste is stored at Area L instorage sheds with RCRA permits. This facilitywill continue to package, bulk, and preparehazardous chemical waste for offsite treatmentand disposal for the foreseeable future. Thereare currently no plans to replace this facilitybecause the Laboratory expects generation ratesto start decreasing with the implementation ofvery stringent waste minimization andpollution prevention programs.
Waste Disposal
Transuranic Solid Waste
The Laboratory's transuranic waste is destinedfor disposal in the Waste Isolation Pilot Plant,which is expected to open in 1998. The exactdate for shipping transuranic waste from the
...........
Laboratory is unknown at present. However,the Laboratory is pursuing plans to certify asmuch waste as possible by the 1998 openingdate of the Waste Isolation Pilot Plant.
Low-Level Solid Waste
Low-level solid waste, mainly trashcontaminated with transuranic elements atconcentration of less than 100 nanocuries pergram, has been landfilled since 1957 in shaftsand large pits at Area G, the RadioactiveDisposal and Storage Facility. The shafts are 1to 12 feet in diameter and up to 65 feet deepand may be lined or unlined. They are used forwaste requiring special handling or morecontainment than that provided by burial inpits; examples are waste contaminated withtritium, mixed fission products and mixedactivation products, highly activated pieces ofequipment, solids contaminated with PCBs,animal tissue, beryllium, graphite powders, andhigh-efficiency particulate air filters notmeeting the particulate requirements fordisposal in pits.
The current disposal facility has a remainingcapacity of 22,000 cubic meters. At currentoperational generation rates andimplementation of waste minimization, Area Ghas an operational life of 10 years. However, ifenvironmental restoration activity cleanups areaccelerated as presently planned, Area G willreach its useful design life by the end of FY1997. The expansion of Area G is pending anddependent on decisions made in conjunctionwith the site-wide environmental impactstatement. As an alternative to the expansion ofArea G, the Laboratory is exploring otheroptions for the disposal of low-level waste inthe future (e.g., the Nevada Test Site).
NM 23

Low-Level Mixed Waste
The Mixed Waste Disposal Facility, planned forcompletion in FY 2009, will provideapproximately 12 acres of disposal area for upto 363,200 cubic meters of mixed waste. Mostof the waste proposed for disposal at thisfacility will be soil and debris.
Hazardous Chemical Waste
Hazardous chemical waste is shipped offsite fordisposal in facilities with RCRA permits. Thisarrangement will continue for the foreseeablefuture.
Administratively Controlled Waste
Administratively controlled waste is waste notregulated by RCRA and TSCA, but is deemedby the Laboratory to be inappropriate fordisposal at the Los Alamos County SanitaryLandfill site. Examples are classified computer
equipment and magnetic tapes or any wastescontrolled for national security purposes.These wastes are disposed of in the Area JLandfill at Technical Area 54. Future plans fordisposal will depend on the future strategy forsanitary waste disposal. If the Laboratory sites anew sanitary landfill, these wastes will bedisposed at the new facility. If not, analternative site will be identified when Area Jreaches capacity.
Sanitary Solid Waste
Sanitary solid waste generated by theLaboratory is currently disposed of at theSandia Canyon site (Technical Area 61) on EastJemez Road. Owned by DOE, this site servesthe landfill needs of both the Laboratory and ofLos Alamos County. The County has operatedthis landfill under a Special Use Permit fromDOE since 1971.
Waste Management Activity Costs
Five-Year Averages (Thousands of Constant 1995 Dollars)•
FT 1995-2000 2005 2010 2015 2020 2025 2030 Life Cyde**
TreatmentTransuranic Waste 8,202 12,064 12,064 12,064 10,833 10,363 10,363 387,977
Low-Level Mixed Waste 12,879 9,160 9,731 8,748 8,671 8,671 8,671 345,528
Low-Level Waste 585 1,082 1,082 1,082 1,082 1,082 1,082 35,967
Storage and HandlingTransurank Waste 3,316 3,954 3,192 3,192 3,192 3,192 3,013 118,572
Low-Level Mixed Waste 1,217 1,200 1,157 1,157 1,157 1,157 1,023 41,563
Low-Level Waste 1,139 1,319 1,142 1,142 1,142 1,142 1,006 41,303
DisposalLow-Level Mixed Waste 20 158 340 378 361 359 327 9,739
Low-Level Waste 1,157 8,919 18,664 20,646 20,646 20,646 18,994 549,519
Hazardous Waste 10,877 10,351 10,437 10,348 10,348 10,348 8,278 365,814
Sanitary Waste 2,837 2,699 2,699 2,699 2,699 2,699 2,159 95,298
OtherWaste Management TSD 22,956 21,840 21,840 21,840 21,840 21,840 17,472 771,093
Total 65,184 72,746 82,350 83,296 81,972 81,499 72,389 2,762,363
' Costs reflect a five-year average in constant 1995 dollars, except in FY 1995-2000, which is a six-year average.
" Total Life Cycle is the sum of annual costs in constant 1995 dollars.
NM 24

The existing sanitary landfill is expected toreach the end of its useful life by 2003. At thattime, either a new landfill will have to beconstructed or provisions made for offsitedisposal. The Laboratory is at present planningthe construction of a new sanitary landfill atTA-49 East as the preferred option for the long-term disposal of sanitary solid waste. Forpurposes of this report, completion of thesanitary landfill is assumed to be FY 2004.
NUCLEAR MATERIAL AND
FACILITY STABILIZATION
The facility stabilization and maintenanceprocess began at the Los Alamos NationalLaboratory in 1995. There are 45 Los Alamosfacilities slated to undergo this process. Thirty-five facilities have already begun stabilizationand include an accelerator building, fourlaboratories, a cooling system building andnumerous storage facilities. It is assumed forthe purposes of this report that the remaining10 facilities, which include a laboratory, a
contaminated surge tank, drainage basins and acontaminated waste pit, will begin in 1996. Theresulting waste types will include: hazardous,high-level, transuranic, low-level, and low-levelmixed. This report arbitrarily assumes that thestabilization and maintenance process at theLos Alamos National Laboratory will becompleted by the year 2013.
LANDLORD FUNCTIONS
Defense Programs is the landlord for thelaboratory. Costs for environmentalmanagement activities are burdened at a rate toset apart landlord activities. Landlord andinfrastructure charges are applied to wastemanagement and environmental restorationthrough a fiscal-year facility space tax persquare foot. The charges can be broken downinto the categories of unmetered utilities,maintenance (janitorial services, electricalservices, roof building, general buildingmaintenance, custodial services, waste services,snow removal, and parking lots), andoperations (oversight of space).
Nuclear Material and Facility Stabilization Cost Estimate
Five-Year Averages (Thousands of Constant 1995Dollars)*
FY 1995-2000 2005 2010 2015 2020 2025 2030 life Cycle
Nuclear Material and Facility Stabilization 10,693 4,655 4,703 182 0 0 0 111,854
• Costs reflect a five-year average in constant 1995 dollars, except in FY 1995-2000, which is a six-year average.
• Total Life Cycle is the sum of annual costs in constant 1995 dollars.
NM 25

PROGRAM MANAGEMENT
Program management represents cross-cutactivities associated with all waste types andnot directly in support of specific operations orprojects. It provides overall support anddirection for ongoing environmentalremediation and for waste treatment, storage,and disposal activities at the Laboratory. Inaddition to program management (i.e., theplanning and management of resources andinformation to accomplish project goals,budgets, and schedules) and facilitymanagement (the care, maintenance, andreplacement of existing facilities and facility-related equipment), it includes activities likequality assurance; personnel training;document development and control; recordsand data management; financial planning andproject controls; analytical support for wastemanagement and environmental restoration;and waste minimization and pollutionprevention. Future direction (e.g., deciding onnew facilities and processes) and specialprojects are also included.
An important function of program managementis providing health and safety oversight for allwaste management and environmentalrestoration activities. This includes monitoringeffluent streams and environmental media (e.g.,biota and ambient air) in the vicinity of wastemanagement facilities and environmentalrestoration projects. Other tasks includemaintaining safety programs and supportingsafety functions for occupational and chemicalsafety, radiological and radiation safety, andemergency response.
One major activity is related to regulatorycompliance. It includes obtainingenvironmental permits; enforcing, monitoring,and tracking compliance; and activitiesmandated by various compliance orders andcompliance agreements. This activity alsoincludes the tracking and monitoring ofprogress for milestones mandated by theagreement under the Federal Facility
Compliance Act. A more detailed descriptionof the regulatory function and the regulatoryprotocols for environmental restoration andwaste management is given in the introductionto this volume.
Finally, program management is responsible forproviding opportunities for stakeholderinvolvement and public participation. Tasksinclude conducting tours of waste managementor environmental restoration facilities andoperations; preparation for, and participationin, public meetings; meetings with stake-holders; the preparation of responses to writteninquiries from stakeholders; and thepreparation of public information materials.
Program management services are tracked andcharged through the budgets for wastemanagement and environmental restorationactivities. For the purposes of this report, 20percent of the site's budget has been allocatedfor program management activities for FY 1995- 2000. Program management costs forenvironmental restoration activities after FY2000 are included within the environmentalrestoration scope.
FUNDING AND COST
INFORMATION
The following tables present fundinginformation and major activity milestones forthe Los Alamos National Laboratory.
NM 26

Program Management Cost Estimate
Five-Year Averages (Thousands of Constant 1995 Dollars)•
FY 1995 - 2000 2005 2010 2015 2020 2025 2030 Life Cyde**
Program Management 11,380 18,186 20,587 20,824 20,493 20,375 18,097 661,093
• Costs reflect a five-year average in constant 1995 dollars, except in FY 1995-2000, which is a six-year average.
• Total Life Cycle is the sum of annual costs in constant 1995 dollars.
Defense Funding Estimate
Five-Year Averages (Thousands of Constant 1995 Dollars)*
FY 1995 - 2000 2005 2010 2015 2020 2025 2030 Life Cyde
Environmental Restoration 85,801 52,820 26,240 0 0 0 0 910,104Waste Management 60,868 72,746 82,350 83,296 81,972 81,499 72,389 2,762,363Nuclear Material and Facility Stabilization 10,693 4,655 4,703 182 0 0 0 111,854Program Management 11,380 18,186 20,587 20,824 20,493 20,375 18,097 661,093
Total 146,042 148,407 133,703 104,120 102,465 101,874 90,486 4,445,415
• Costs reflect a five-year average in constant 1995 dollars, except in FY 1995-2000, which is a six-year average.• Total Life Cycle is the sum of annual costs in constant 1995 dollars.
NM 27

Major Activity Milestones
ACTIVITY TASK COMPLETION DATE
Environmental Restoration
Waste Management
fiscal Year
Field Units 1,2,3,5 Assessment Completed 2005
Field Unit 4 Assessment Completed 2010
Field Unit 6 Assessment Completed 2000
Field Unit 1,2,3,4,5,6, Remediation 2010
Complete Construction of the Hazardous Waste Treatment Facility 1998
Complete Construction of the High Explosive Wastewater Treatment System 1997
Complete Construction of the Mixed Waste Receiving and Storage Facility 1998
Submit final Federal Facility Compliance Act Site Treatment Plan to New MexicoEnvironment Department 1995
Start Operation of the Hazardous Waste Treatment Facility 1999
Certification of Compliance for Transuranic Waste 2003
Complete Construction of the Industrial Waste System 1995
Complete Low-Level Mixed Waste Work-Off Plan for the Hazardous WasteTreatment Facility 1997
Start Operation of the Mixed Waste Disposal Facility 1999
Waste Management Activities Completed 2040
For further information on this site, please contact: Public Participation OfficePublic Affairs OfficeTechnical Liaison: Ted Taylor
(505) 845-5951(505) 845-6202(505) 665-7203
NM 28

SANDIA NATIONAL LABORATORIES/NEW MEXICO
Sandia National Laboratories/New Mexico occupies several parcels of land covering 2820 acres at
the Kirtland Air Force Base directly south of Albuquerque, New Mexico.
AREA 1
S
CD =0
BLDG 958.PACKAGING 8 STORAGHAZARDOUS WASTEMANAGEMENT FACILITY
C-JBLDG 697
I1'411N., BLDG 6715
THERMALDESTRUCTIONFACILITY
INACTIVELOW-LEVELWASTELANDFILL
Al
AREA
9
II
3
BLDG 6920.RADIOACTIVEMIXED WASTEMANAGEMENTFACILITY
AND
ALBUOUEROUEINTERNATIONAL
AIRPORT AREA 2A
AREA 4 AAREA 5
TO EDGEWOOD SITE
CHEMICALINACTIVE
WASTELANDFILL
NM 29

Estimated Site Total
(Thousands of Current 1995 Dollars)*
FY1995 1996 199 1998 1999 2000
Environmental RestorationWaste ManagementNuclear Material and Facility StabilizationProgram Management
23,29512,5372,6007,780
19,734 = 24,76613,296 19,2792,610 2,6107,271 9,716
22,432 22,29521,801 21,1552,610 2,6109,857 9,713
25,4262,61010,081
Total 46,212 42,911 56,371 56,700 55,773 58,049
• Costs for FY 1995 reflect Congressional Appropriation, costs for FY 1996 reflect EM budget submission, costs for FY 1997-2000 reflect Budget Shortfall Scenario, costs forshaded area assume 3% annual inflation.
Five-Year Averages (Thousands of Constant 1995 Dollars)**
FY 1995-2000 2005 2010 2015 2020 2025 2030 Life Cycle***
Environmental Restoration 20,555 10,631 10,448 2,090 513 61 0 242,047Waste Management 17,383 20,476 20,485 20,514 20,644 20,489 17,173 703,203Nuclear Material and Facility Stabilization 2,610 2,598 2,151 105 0 0 0 39,924Program Management 8,462 9,195 7,971 5,698 5,161 5,122 4,293 237,971
Total 49,009 42,900 41,056 28,407 26,317 25,672 21,467 1,223,145
** Costs reflect a five-year average in constant 1995 dollars, except in FY 1995 - 2000, which is a six-year average.
*** Total Life Cycle is the sum of annual costs in constant 1995 dollars.
PAST, PRESENT, AND
FUTURE MISSIONS
Sandia National Laboratories/New Mexico wasestablished to conduct research anddevelopment in the interests of nationalsecurity, with emphasis on nuclear weapondevelopment and engineering. Sandia hasevolved into a multi-program Laboratory withexpertise in a broad range of scientific andtechnical fields, including fundamental energyresearch, energy conservation and renewableenergy, nuclear reactor safety and reliability,
nuclear waste management, andmagnetic-confinement fusion. Recent missionchanges have resulted in a decline in weaponsresearch and development and an increase inwork on nuclear safeguards and security,environmental sciences, and the transfer oftechnologies to private industry. Sandia willcontinue to pursue its defense and nondefensemission for the foreseeable future.
Defense Programs is the landlord for the Sandiasite and will continue to use the property insupport of its missions. Any unused land willbe returned to the Department of Defense withcontinued restricted access (i.e., military andindustrial use).
NM 30

ENVIRONMENTAL
RESTORATION
Environmental contamination at Sandiaoccurred from a wide variety of activities. Theprincipal sources included firings conductedover many years to test weapons and weaponscomponents; discharges of radioactive liquidsand hazardous chemicals into the environment;oil spills; disposal of radioactive waste andhazardous chemicals in landfills; rocketlaunches; and burning of certain waste, such ashigh explosives. The contaminated facilitiesrange from reactors to artillery ranges to scrapyards.
The assessment of environmentalcontamination at Sandia's site began formallyin 1984, when the Department of Energy (DOE)started to identify, assess, and remediatepotentially hazardous waste sites in response tothe Comprehensive Environmental Response,Compensation and Liability Act. This programidentified 117 sites with potentialcontamination. A similar investigation wasconducted by the U.S. EnvironmentalProtection Agency in 1987. These programs
Environmental Restoration Projects
ultimately defined a working inventory ofpotential "solid waste management units."Current investigations are intended todetermine the nature and extent of hazardousand radioactive contamination and to restoreany sites where such materials pose a threat tohuman health or the environment.
For this report, contaminated sites at Sandia aregrouped into four geographical areas: NorthTechnical Areas, South Technical Areas, firingranges, anu the Thunder Range. Sandia is alsoresponsible for two offsite areas: Kauai andSalton Sea. In addition, a group of site-wideactivities has been established.
North Technical Areas
These areas include Technical Areas I and II andseven buildings which requiredecommissioning. Technical Area I, whichcontains office buildings and laboratories andhouses most of Sandia's staff, has been inexistence since 1945. It contains 15environmental restoration sites, including amotor pool, a tank farm, a waste oil tank, a
Five-Year Averages (Thousands of Constant 1995 Dollars)*
FY 1995.2000 2005 2010 2015 2020 2025 2030 Life Cycle*
Facility Decommissioning 0 0 0 1,005 251 0 0 6,279
Firing Ranges 5,184 2,099 1,984 206 0 0 0 52,542
North Tech Areas 6,077 3,138 3,108 323 0 0 0 69,305
Offsite 695 60 0 0 0 0 0 4,466
SBe•wide Activities 1,901 15 0 0 0 0 0 11,483
South Tech Areas 3,245 3,261 3,315 345 261 61 0 55,683
Thunder Range 3,454 2,059 2,042 212 0 0 0 42,290
Total 20,555 10,631 10,448 2,090 513 61 0 242,047
Costs reflect a five-year average In constant 1995 dollars, except in FY 1995.2000, which is a six-year average.
** Total Life Cycle is the sum of annual costs In constant 1995 dollars.
NM 31

reclamation yard, a wastewater treatment plant,an acid-waste sewer line, and miles of sanitarysewer lines. Potential contaminants includepetroleum hydrocarbons, polychlorinatedbiphenyls (PCBs), heavy metals, radionuclides,and organic compounds. Initial soil samplingindicates that contaminants like petroleum-fuelhydrocarbons and heavy metals are restricted tothe soils above the water table. The depth toground water is about 480 feet.
Technical Area II is an active 43-acre explosives-testing facility. Potential sources ofcontamination include a chemical disposal pit; aradioactive-waste landfill; a classified-wastelandfill; seven septic systems; a storage yard forradioactive materials; a decommissioning siteand uranium-calibration pits; firing sites; andan explosives-burn pit. Sampling to dateindicates contamination with volatile andsemivolatile organic compounds, high-explosives compounds, PCBs, andradionuclides, but the contamination isrestricted to the soils above the water table. Thedepth to ground water is about 300 feet.
Preliminary site characterization has beenconducted in both technical areas. Foururanium calibration pits were removed atTechnical Area II in 1994. Future activities willinclude completing characterization (includingsurface and subsurface geophysical andenvironmental investigations); conductingvoluntary corrective measures at Buildings 838and 839 in Technical Area I; conductingvoluntary corrective measures at site 114 inTechnical Area II, and conducting remediation.
The North Technical Areas contain sevenbuildings that could pose a risk to humanhealth and the environment: Building 863 inTechnical Area I and Buildings 901, 906, 907,919, 935, and 940 in Technical Area II. Thesebuildings will be decommissioned.
South Technical AreasThis group includes Technical Areas III and V,the chemical waste landfill, the mixed wastelandfill, and the liquid waste disposal system.
Technical Areas III and V, which cover about1,920 acres, have been the site of nuclear andnonnuclear weapons testing since 1953. Theseareas contain 20 active and inactiveenvironmental restoration sites, includingburial sites, oil spills, sump and drain releases,two rocket sled tracks, and storage and salvageyards. Sampling to date indicates the presenceof contamination with volatile organiccontaminants, semivolatile organiccontaminants, metals, high-explosivescompounds, PCBs, and radionuclides. Thecontamination is restricted to the soils abovethe water table. Depleted uranium is scatteredalong both rocket sled tracks, but it wasremoved from the short sled track in October1994.
At the chemical waste landfill, which coversabout 1.9 acres, approximately 20,000 cubicyards of chemical and hazardous waste wereburied in unlined pits and trenches from 1962to 1985. The depth to ground water is about500 feet. The chlorinated solventtrichloroethylene has been found in groundwater at levels slightly above detection limits.Chromium has been detected also, but it maybe a natural constituent of the ground water.
At the mixed waste landfill, which covers about2.6 acres, approximately 3,700 cubic yards oflow-level radioactive waste was buried inunlined pits and trenches from 1959 to 1988.The depth to ground water is about 500 feet.Contamination from volatile organiccompounds and tritium is restricted to the soilsabove the water table.
The liquid waste disposal system, whichconsists of a below grade drain field, threeholding tanks, and two surface impoundments,received radioactive discharge water from theSandia Experimental Reactor Facility between
NM 32

1963 and 1971. The radioactive elements in thedischarge water were short-lived activationproducts in the water used to cool the reactor.Extensive sampling of ground water and soilsshows the presence of radioactivity, but theradiation level is not higher than that of naturalbackground. At one of the surfaceimpoundments, PCBs are present in sludge.The chlorinated solvent trichloroethylene hasbeen found in ground water near the liquidwaste disposal system at levels slightly abovedetection limits.
Preliminary site characterization has beencompleted. A voluntary corrective measureunder way at the gas cylinder disposal pitinvolves the removal of gas cylinders, thermalbatteries, and various debris. Future activitiesin the South Technical Areas will include thecompletion of characterization (includingsurface and subsurface geophysical andenvironmental investigations), voluntarycorrective measures at chemical waste landfill75, and remediation.
Firing Ranges
The sites of concern at the firing ranges are theseptic tanks and drain fields and the Foothills,Canyons, and Central Coyote Test Areas.
Twenty-three environmental restoration siteshave been identified for the 42 separate septicand drainage systems scattered across theSandia site. These systems were used mainlyfor liquid and sanitary waste and are currentlybeing evaluated for chemical contamination.They received waters from facilities conductingweapons components tests from 1958 to 1991.Potential contaminants, most likely restricted tothe soils above the water table, includeradionuclides, solvents, high-explosivescompounds, metals, and photochemicals. Thedepth to ground water probably varies from 50to 500 feet.
The Foothills Test Area, which consists of 10inactive environmental restoration sites, hasbeen used for field testing since the late 1950's.A wide range of contaminants, includingorganic compounds, metals and high-explosives materials, and radionuclides may bepresent. The depth to ground water across thearea probably varies from 50 to 100 feet.
The Canyons Test Area consists of 14environmental restoration sites (9 active, 5inactive) and 4 proposed sites. Some of thesesites are still used; they are scattered overseveral thousand acres in three large canyons inthe Manzanita Mountains at the eastern end ofthe Kirtland Air Force Base, on land withdrawnfrom the U.S. Forest Service. Potential sourcesof contaminants include burn sites, rocket-launch sites, dumps, and a surfaceimpoundment. Principal contaminantsprobably include depleted uranium, metals, jetfuel, and other organic compounds. The depthto ground water is estimated to vary across thearea from 50 to 100 feet.
The Central Coyote Test Area contains 14inactive sites that include six test sites, twoburn sites, an artillery range, a trash dump, aborrow pit, two scrap yards, and an unstaffedseismic observatory. The principalcontaminants probably include high-explosivescompounds, metals, jet fuel, radionuclides,volatile organic compounds, and asbestos. Thedepth to ground water across the area isestimated to vary from 50 to 100 feet.
Preliminary site characterization has beenconducted. Future activities at the firing rangeswill include the completion of characterization(including surface and subsurface geophysicaland environmental investigations), voluntarycorrective measures, and remediation.Voluntary corrective measures will be carriedout at the following sites: septic tanks anddrain fields; sites 58 and 8, Building 9990, andthe TRUPAK "boneyard" (a storage area for theremnants of the TRUPAK transportation casksfor transuranic waste that were subjected to
NM 33

various destructive tests) in the Foothills TestArea; sites 10 and 60 in the Canyons Test Area;and sites 11, 47, 57B, 68, 21, and 22 in theCentral Coyote Test Area.
Also present in the firing-range group is acorrugated-metal burn structure in LuranceCanyon. This structure will bedecommissioned, like the seven sites discussedabove, under the Technical Areas North.
Thunder RangeThunder Range includes projects in the TijerasArroyo and the Southwest Test Area. TheTijeras Arroyo has 17 environmental restorationsites (7 active, 10 inactive) distributed overseveral miles of the arroyo and its tributariesthat together drain thousands of acres of theKirtland Air Force Base and the Sandia site.The main channel, approximately 100 feet deepand 1 mile wide in some places, empties intothe Rio Grande less than 2 miles from theSandia site boundary. A wide range ofcontaminants like metals, radionuclides, andorganic compounds may be present. The depthto ground water is estimated to be about 500feet.
The Southwest Test Area contains 24environmental restoration sites (11 inactive, 13active) and has been used for field testingexplosives since the 1960's. A wide range ofcontaminants such as metals, high-explosivecompounds, radionuclides, and organiccompounds may be present. The depth toground water is about 500 feet.
Preliminary site characterization has beenconducted. Future activities include thecompletion of characterization (includingsurface and subsurface geophysical andenvironmental investigations), voluntarycorrective measures, and remediation.
This project seeks to integrate regional, ratherthan site-specific, geologic and hydrologicinformation into a regional hydrogeologicframework for all the environmental restoration
sites distributed across the Kirtland Air ForceBase and the Sandia site. This project does notinclude responsibility for characterizing orremediating individual environmentalrestoration sites.
Offsite AreasThe Kauai Test Facility is located on the westerncoast of the island of Kauai in Hawaii withinthe Navy's Pacific Missile Range Facility. The182-acre site is operated by Sandia NationalLaboratory/New Mexico and supports theDepartment's research and developmentactivities, including rocket launches ofnonnuclear payloads. Since the mid-1970's theKauai Test Facility has been in operation,conducting an average of three or four tests peryear. Contamination is suspected in threepotential release sites that include the rocketlaunch pads, a drum storage area, and aphotography laboratory. In 1994, sampling wasconducted to determine the extent ofcontamination. Based on the results of thesesamples, Sandia National Laboratory/NewMexico plans to submit a request to theEnvironmental Protection Agency-Region X forapproval of a no-further-action-decision.
Salton Sea Test Base (located in ImperialCounty, California) was used for Atomic EnergyCommission/Sandia National Laboratory testactivity from the mid-1940's through the early1960's. Test activity in these years contributedto environmental contamination at some 23sites within Salton Sea Test Base. The test base,which is currently in the Site Inspection phaseof the CERCLA process, is also the subject ofaccelerated base realignment and closureactivity to return properties to localcommunities.
The Sandia Offsite Areas also include onebuilding at Holloman Air Force Base (nearAlbuquerque) where laboratory activitiesgenerated a variety of wastes.
NM 34

Costs
The Estimated Site Total table gives estimatedcosts for site characterization, remediation, andwaste disposal. Remediation costs for theNorth Technical Areas, South Technical Areas,firing ranges, and Thunder Range are based on
the assumptions that, as indicated by currentlyavailable information, there is no ground-watercontamination and that the standard forremediating each of the sites is futureresidential use. Assumptions about future landuse control the extent of remediation and thevolumetric estimate of contaminated soil. Moredetailed estimates of costs for various wastemanagement activities are given in the WasteManagement Activity Costs table at the end ofthis summary.
Treatments based on commercially availabletechnologies were chosen for each of thecontaminant scenarios listed below (thespecified treatments are not intended to providethe maximum volume reduction possible).
• For hazardous chemicals only (metals or organics):
clearing and grubbing, followed by excavation and
landfill disposal.
• For radionuclides and metals: clearing and grubbing,
followed by excavation, soil washing, and landfill
disposal.
• For radionuclides and organics or radionuclides with
metals and organics: clearing and grubbing, followed
by excavation, low-temperature thermal desorption,
soil washing, and landfill disposal.
Environmental Restoration Activity Costs
Five-Year Averages (Thousands of Constant 1995 Dollars) *
FY 1995 - 2000 2005 2010 2015 2020 2025 2030 Life C de**1•1111•1,
Facility DecommissioningFacility Decommissioning 0 0 0 1,005 251 0 0 6,279
Firing RangesAssessment 4,039 137 0 0 0 0 0 24,921
Remedial Actions 1,144 1,962 1,984 206 0 0 0 27,621
North Tech AreasAssessment 4,699 89 0 0 0 28,638
Remedial Actions 1,274 3,029 3,108 323 0 39,943
Surveillance And Maintenance 104 19 0 0 0 0 0 723
Off siteAssessment 695 60 0 0 0 0 0 4,466
Sitewide ActivitiesAssessment 1,901 15 0 0 0 0 0 11,483
South Tech AreasAssessment 1,526 30 0 0 0 0 0 9,307
Remedial Actions 1,459 3,231 3,315 345 0 0 0 43,208
Surveillance And Maintenance 259 0 0 0 261 61 0 3,168
Thunder RangeAssessment 2,657 67 0 0 0 0 0 16,276
Remedial Actions 798 1,991 2,042 212 0 0 0 26,014
Total 20,555 10,631 10,448 2,090 513 61 0 242,047
• Costs reflect a five-year average in constant 1995 dollars, except in FY 1995-2000, which is a six-year average.
• Total Life Cycle is the sum of annual costs in constant 1995 dollars.
NM 35

The cost estimates assume that a total of 41 siteswill be remediated. All other sites are assumedto require no further action or voluntarycorrective measures only. It is assumed, indetermining these estimates, that remediationat all sites will be completed by FY 2011.
WASTE MANAGEMENT
The wastes for which EnvironmentalManagement is responsible at Sandia are low-level radioactive waste, low-level mixed waste,hazardous chemical waste, solid industrialwaste, and sanitary waste. The hazardouschemical waste includes PCBs and asbestos,which are regulated by the Toxic SubstancesControl Act. Sandia operations also generatesmall quantities of transuranic waste, but nohigh-level waste is generated or handled atSandia.
The current annual volumes of waste fromoperations are 3,400 cubic feet of low-levelwaste; 600 cubic feet of low-level mixed waste;about 800 kilograms of transuranic waste;260,000 kilograms of chemical waste; 40,000pounds of PCBs; 3,920 cubic yards of asbestos;and 26,000 cubic yards of solid waste. Thesequantities are not expected to changesignificantly for the next 30 years except forchemical waste, which is expected to increase to300,000 kilograms in FY 1996 and 450,000kilograms annually thereafter.
The total volumes of waste from remediationare roughly estimated to be 119,000 cubic yardsof hazardous waste, 28,000 cubic yards of low-level radioactive waste, and 8,300 cubic yards oflow-level mixed waste.
Decommissioning will generate a variety ofwaste, including about 3,000 cubic yards ofconcrete, 250 tons of debris steel, and about1,200 cubic yards of asbestos. The quantities ofradioactive and chemical waste will be
relatively small (e.g., 175 fifty-five-gallon drumsof low-level radioactive waste) because much ofthis material will be removed beforedecommissioning during facility stabilization.
To address waste management needs, severalnew facility changes are under consideration.They include an explosives-waste storagefacility, a nuclear materials management facility,a facility for demilitarized and classified waste,office space for the Hazardous WasteManagement Facility, and office space for wastemanagement personnel. In addition, to supportits changing mission, Sandia is developingwaste management strategies and plans fornew projects and processes at the Laboratories,such as the production of radiopharmaceuticalsin Technical Area V.
Waste TreatmentSandia uses only simple neutralization andsolidification to treat its various waste streams.However, low-level mixed waste will be treatedin accordance with the strategies identified inthe mixed waste site treatment plan. Theplanned Radioactive and Mixed WasteManagement Facility, expected to startoperating in September 1995, will provide themeans to open, treat, and repackage low-levelwaste and low-level mixed waste.
Processes that may be used at the Radioactiveand Mixed Waste Management Facility arescreening, neutralization, encapsulation,chemical stripping, crushing, precipitation, ionexchange, demineralization, shredding andbaling, and stabilization. Treatment capacitywill vary with the treatment process, but thefacility may accommodate 55 cubic meters oflow-level and low-level mixed waste per year.
Sandia continues to support technologydevelopment for the treatment of low-levelmixed waste.
NM 36

During FY 2005-2015, facility maintenance and
upgrades will be needed for the use of mobile
treatment units to maintain compliance with
the Federal Facility Compliance Act.Equipment for treating low-level waste and
process water will also be maintained, and
capital equipment will be purchased as needed.
Upgrades to the treatment facilities in the
Radioactive and Mixed Waste Management
Facility and the Hazardous Waste Treatment
Facility are expected. Treatment activities for
outyears to 2030 will include pursuing new and
existing treatment options for low-level mixed
waste, updating the equipment for the mobile
treatment units, and maintaining or upgrading
existing treatment facilities as needed.
Waste Storage
Sandia collects and packages waste fromgenerator locations, transports them to onsite
storage facilities, and ships waste to offsite
disposal facilities. It purchases, installs, and
maintains equipment necessary for thecharacterization and safe storage and handling
of waste, such as waste assay equipment for
mixed waste.
Hazardous chemical waste generated by
research, development, and testing activities is
collected from generator locations, segregated
by hazard class, and transported to theHazardous Waste Management Facility for
storage. All low-level waste and low-level
mixed waste are stored at generator sites or at
an approved aboveground interim storage site
at Technical Area III. For the latter, the waste is
kept in containers approved by the U.S.Department of Transportation. All low-level
waste packages are currently stored at the site
pending approval for disposal at the Nevada
Test Site.
In addition Sandia supports unique waste
storage needs such as providing interim storage
for transuranic waste from the Inhalation
Toxicology Research Institute, which is also
located at the Kirtland Air Force Base.
Existing waste storage facilities at Sandia
include the Hazardous Waste Management
Facility (Buildings 958 and 959), which is used
for hazardous chemical waste; the interim
storage site at Technical Area III, which is used
for the storage of low-level radioactive and low-
level mixed waste; and the High-Bay Waste
Storage Facility (Building 6596) and theChemical Waste Storage Facility (Building 920),
both of which are used for mixed waste. Sandia
also uses offsite storage in bunkers at the
Manzano storage complex, which is owned by
the Department of Defense. These bunkers are
used for explosives, classified, anddemilitarized waste.
The following facilities need to be modified in
FY 1995:
• The High Bay Waste Storage Facility needs upgrading
to bring it into compliance with legal and regulatory
requirements for storing radioactive and mixed waste.
• The Radioactive/Mixed Waste Management Facility
(Building 6920) needs paving for the outdoor storage of
radioactive waste and for access to the Real-Time-
Radiography Facility (Building 6635), which is used to
examine waste containers. The facility also requires
building modifications to be fully operational.
• The Chemical Waste Storage Facility requires the
construction of a 1,200-square-foot addition to store
PCB-contaminated material.
• The Manzano bunkers require improvements to
maintain compliance with legal and regulatory
requirements.
Also in FY 1995, a substantial effort will be
required to develop and prepare the permitapplications for the Hazardous WasteManagement Facility. In FY 2000 and later
years of the Life Cycle, all waste storagefacilities will be maintained and upgraded to
maintain compliance with applicableregulations.
NM 37

Waste DisposalSandia has two landfills formerly used forhazardous, low-level, and mixed waste. Exceptfor the classified waste landfill, Sandia nolonger uses onsite disposal. It ships solid wasteto local commercial facilities, liquid sanitarywaste to municipal facilities, some radioactivewaste to other facilities owned by DOE (i.e., theNevada Test Site), and some low-level mixedwaste to commercial facilities. For some wastestreams, disposal options have not yet beenidentified; for others, such as transuranic waste,identified disposal options (i.e., the WasteIsolation Pilot Plant in New Mexico) are not yetavailable.
Detailed estimates of costs for various wastemanagement activities are given in the WasteManagement Activities table at the end of thissummary.
NUCLEAR MATERIAL ANDFACILITY STABILIZATIONWhen a facility is transferred from DefensePrograms to Environmental Management, itundergoes a process of stabilization in whichthe facility is shut down, radioactive andhazardous materials are removed, and otheractions are taken as necessary to mitigate animmediate threat to health and safety. Oncethis is accomplished, the facility is maintainedand monitored as appropriate further pendingaction, which is usually decommissioning.
This process began at Sandia in 1995. Of the 12Sandia facilities slated for this process, 11 havealready begun stabilization. These facilitiesinclude laboratories and a storage facility. It isassumed that the remaining facility (acorrugated burn structure) will begin thestabilization process in 1996. This reportassumes that stabilization and maintenance atSandia will be completed by 2013.
Waste Management Activity Costs
Five-Year Averages (Thousands of Constant 1995 Dollars)*FY 1995-2000 2005 2010 2015 2020
TreatmentLow-Level Mixed WasteLow-Level WasteHazardous WasteSanitary Waste
Total
6,314 7,4375,409 6,3715,546 6,535113 133
7,4376,3716,545133
7,4796,3716,532133
7,6086,3716,532133
17,383 20,476 20,485 20,514 20,644
2025 2030 Life Cycle**
7,453 6,634 258,1246,371 5,207 217,7666,532 5,226 222,783133 106 4,529
20,489 17,173 703,203
• Costs reflect a five-year average in constant 1995 dollars, except in FY 1995-2000, which is a six-year average.
Total Life Cycle is the sum of annual costs in constant 1995 dollars.
NM 38

LANDLORD FUNCTIONS
Defense Programs is the landlord of SandiaNational Laboratories/New Mexico, butEnvironmental Management provides andmaintains the infrastructure needed forenvironmental restoration, waste management,
and facility stabilization, as discussed belowunder program management.
PROGRAM MANAGEMENT
Program management represents cross-cutactivities associated with all waste types andnot directly in support of specific operations orprojects. It provides overall support anddirection for ongoing environmentalremediation and for waste treatment, storage,and disposal activities at the laboratory. Inaddition to program management (i.e., theplanning and management of resources andinformation to accomplish project goals,budgets, and schedules) and facilitymanagement (the care, maintenance, andreplacement of existing facilities and facility-related equipment), it includes activities likequality assurance, personnel training,document development and control, recordsand data management and environmentalrestoration, and waste minimization andpollution prevention. Future direction (e.g.,deciding on new facilities and processes) andspecial projects are also included.
Management activities at Sandia are dividedinto categories, such as support for theenvironment, safety, and health program;quality assurance; the training of personnel andcontractors; emergency response; fireprotection, centralized engineering, andmaintenance; and safeguards and security.
An important management function is toensure compliance with pertinentenvironmental regulations and laws. Thisincludes guidance on regulations and policy aswell as compliance tracking. Another isoperations integration for the establishmentand maintenance of performance expectations,measurements, and reports, support tracking,and the development and maintenance ofoperating plans and procedures.
Management is also responsible for the wasteminimization program. This program tracksthe amount of waste generated at the site andencourages the use of waste reduction methods.In the future it will assess opportunities forpreventing pollution from priority wastestreams, increase recycling efforts, and ensurethe procurement of recycled products.
The entire Environmental Managementprogram emphasizes participation bystakeholders, such as representatives ofregulatory agencies, State and localgovernments, local residents, the public, andvarious organizations interested inenvironmental activities. Opportunities for
Nuclear Material and Facility Stabilization Cost Estimate
Five-Year Averages (Thousands of Constant 1995 Dollars)*
FY 1995.2000 2005 2010 2015 2020 2025 2030 Life Cycle**
Nuclear Material and Facility Stabilization 2,610 2,598 2,151 105 0 0 0 39,924
• Costs reflect a flve•year average In constant 1995 dollars, except In FY 1995.2000, which Is a sikyear average.
• Total Life Cycle Is the sum of annual costs In constant 1995 dollars.
NM 39

participation are provided by holding publichearings, soliciting comments onenvironmental plans and reports, andproviding information.
The public participation program at Sandia isbased on recommendations by a communityrelations team that represents both the publicand the employees. The team has developed astrategic plan for the public participationprogram. The major objectives of this plan areto establish a process for forming a site-specificadvisory board, to identify priorities for sharinginformation with the public, and to measureSandia's commitment to building mutual trustthrough communication and cooperation.
Program Management services are tracked andcharged through the budgets for wastemanagement and environmental restorationactivities. For FY 1995-2000, programmanagement activities at the site consumeapproximately 20 percent of the total budget.
Breakdown of CostsSandia National Laboratories/New MexicoDefense Funding Estimate table shown belowprovides defense funding for environmentalrestoration, waste management, facilitystabilization and maintenance, and landlordfunctions at Sandia National Laboratories/NewMexico. In addition, the EnvironmentalRestoration Activity Costs Table provides costestimates for environmental restoration at eachof the major site areas discussed in thissummary, and the Waste Management ActivityCosts table gives estimates for waste treatment,storage, and disposal.
FUNDING AND COST
INFORMATION
The following tables present fundinginformation and major activity milestones forthe Sandia National Laboratories -Albuquerque.
Program Management Cost Estimate
Five-Year Averages (Thousands of Constant 1995 Dollars)*FY 1995.2000 2005 2010 2015 2020 2025 2030 Life Cycle"
Program Management 8,462 9,195 7,971 5,698 5,161 5,122 4,293 237,971
• Costs reflect a five-year average in constant 1995 dollars, except in FY 1995-2000, which is a six-year average
• Total Life Cycle is the sum of annual costs in constant 1995 dollars
NM 40

Defense Funding Estimate
Five-Year Averages (Thousands of Constant 1995 Dollars)*
FT 1995 - 2000 2005 2010 2015 2020 2025 2030 Life Cyde**
Waste Management 17,383 20,476 20,485 20,514 20,644 20,489 17,173 703,203
Nuclear Material and Facility Stabilization 2,610 2,598 2,047 0 0 0 0 38,880
Program Management 3,757 5,119 5,121 5,129 5,161 5,122 4,293 172,268
Total 23,750 28,193 27,653 25,643 25,804 25,611 21,467 914,351
Costs reflect a five-year average in constant 1995 dollars, except in FY 1995-2000, which is a six-year average.
" Total Life Cycle is the sum of annual costs in constant 1995 dollars.
Nondefense Funding Estimate
Five-Year Averages (Thousands of Constant 1995 Dollars) *
FT 1995 - 2000 2005 2010 2015 2020 2025 2030 Life Cycle""
Environmental Restoration 20,555 10,631 10,448 2,090 513 61 0 242,047
Nuclear Material and Facility Stabilization 0 0 104 105 0 0 0 1,044
Program Management 4,705 4,076 2,850 569 0 0 0 65,703
Total 25,260 14,707 13,403 2,764 513 61 0 308,794
' Costs reflect a five-year average in constant 1995 dollars, except In FY 1995-2000, which is a six-year average.
" Total Life Cycle is the sum of annual costs in constant 1995 dollars.
NM 41

Major Activity Milestones
ACTIVITY TASK COMPLETION DATE
Environmental Restoration: Fiscal Year
North Technical Areas Remediation Completed
South Technical Areas Remediation Completed
Firing Ranges Remediation Completed
Thunder Range Remediation Completed
Site-Wide Activities Assessment Completed
Offsite Locations Assessment Completed
Waste Management:
2011
2011
2011
2011
2001
2002
Submit Affirmative Procurement Annual Report for FY 1995 1995
Submit Annual Waste Reduction Report for PI' 1995 1995
Submit Mixed Waste RCRA Part B Permit Application 1133.013 1995
Submit Final Site Treatment Plan to State of New Mexico FY 1995, 1133.015 1995
Start Operations at Radioactive and Mixed Waste Management Facility, 1133.026 1995
Complete Radioactive and Mixed Waste Management Facility Waste AcceptanceCriteria 1995
Submit Final NEPA Document for Interim Storage Treatment Facility 1995
Complete Movement of Radioactive and Mixed Waste from Interim Storage Site 1995
Complete Upgrades to Interim Storage Facility, 1137.02 1995
Submit Final Site Treatment Plan to State of New Mexico, Federal FacilitiesCompliance Act September annually
For further information on this site, please contact: Public Participation OfficePublic Affairs OfficeTechnical Liaison: Ted Pietrok
(505) 845-5951(505) 844-6601(505) 845-5649
NM 42

SOUTH VALLEY SUPERFUND SITE
The South Valley Superfund Site is located in the south valley area of Albuquerque, New Mexico.
The site covers an area of 1 square mile. The site houses industrial facilities that require environmen-
tal cleanup under the Comprehensive Environmental Response, Compensation and Liability Act.
1Z:
cL)
• I
CO. II
CO II
CV III
G alena
of
GE Plant 83
San JoseWell No. 6
Pg .k44
III1 1114 "0 k
.11,;11! ... i 1111111,. k
li ".1 ................................................... Iii .............. :::: ................. lo
I! ...... : 1,01111 A.T. & S. F. R.R.,,,,, iiii
:,. fle. L 'tti."' -1117 ir 7...'" 1 l I 'I,„0 ,11 1 Approximate Boundary
Sup erfund Study Area
NM 43

Estimated Site Total
(Thousands of Current 1995 Dollars)*
FY 1995 1996
Environmental Restoration 2136 4590
1997
956
1998
735
• Costs for FY 1995 reflect Congressional Appropriation, costs for FY 1996 reflect EM budget submission, costs for FY 1997-2000 reflect Budget Shortfall Scenario, costs forshaded area assume 3% annual inflation.
Five-Year Averages (Thousands of Constant 1995 Dollars)**
FY 1995-2000 2005 2010 2015 2020 2025 2030 Life Cycle***Environmental Restoration 1,576 871 972 880 0 0 0 23,066
• Costs reflect a five-year average in constant 1995 dollars, except in FY 1995 - 2000, which is a six-year average.— Total Life Cycle is the sum of annual costs in constant 1995 dollars.
PAST, PRESENT, AND
FUTURE MISSIONS
From 1951 to 1967, the site was owned by theAtomic Energy Commission. The Commissionbuilt the South Valley Works there for themanufacturing of nonnuclear components fornuclear weapons. From 1967 to 1983, the plantwas owned by the U.S. Air Force and operatedby General Electric. At that time, the SouthValley Works was renamed Plant 83. In 1983,the plant was bought by General Electric, whichremains the current owner.
The U.S. Environmental Protection Agency(EPA) has identified three parties that arepotentially responsible for cleaning up thecontamination generated by past operations atthe site: the Department of Energy (DOE), theU.S. Air Force, and General Electric. All threeparties are responsible for meeting therequirements stated in two records of decision.
The three parties reached an agreementoutlining the percentage of cleanup costs thateach party was responsible for providing.General Electric is currently responsible foroperating the facility. The Department's onlyremaining mission at this site is to successfullycomplete the requirements of both records ofdecision and to reimburse General Electric forthe percentage of cleanup costs as specified bythe settlement agreement. The Department'smission at the site will end when environmentalrestoration has been completed.
ENVIRONMENTAL
RESTORATION
At the South Valley site, ground-watercontamination is present in both shallow anddeep aquifers, which are separated by animpermeable clay layer. The EPA believes thatindustrial activities under all three of the site'sowners contributed to contamination with
NM 44

solvents, primarily trichloroethylene anddichloroethane. Soil contamination at several
areas resulted from spills and solvents leaking
from waste storage areas. The extent ofcontamination is low enough that no action
beyond cleanup with a pilot-scale vacuum
extraction system is expected to be necessary.
Planned activities include ground-waterremediation in the shallow aquifer with a
pump-and-treat system that involves extracting
contaminated water, treating it, and then
reinjecting the water into the aquifer. Ground
water in the deep aquifer will be remediated
with a pump-and-treat system that is expected
to become operational during FY 1996. Theremaining remediation activities will be related
to operation, maintenance, and monitoring.
These activities are expected to continue into
FY 2015.
Under the terms of the settlement agreement,
DOE does not manage the cleanup project but
is liable for reimbursing General Electric for the
cleanup costs. The Department will fund 43.2
percent of the cleanup costs incurred by
General Electric in meeting the EPA cleanup
standards.
WASTE MANAGEMENT
The Department is not involved in any wastemanagement activities because it neither owns
nor operates the facility. It is expected that the
ground-water treatment will not create anywaste streams.
NUCLEAR MATERIAL ANDFACILITY STABILIZATION
Under the terms of the settlement agreement,
the Department only funds a portion of thecleanup project. The Department is notresponsible for facility stabilization,maintenance, or monitoring.
LANDLORD FUNCTIONS
The Department has no landlord functions at
this site.
PROGRAM MANAGEMENT
For this report, the program managementresponsibilities for South Valley are performed
under the Albuquerque Operations Office cost
estimate.
Environmental Restoration Activity Costs
Five-Year Averages (Thousands of Constant 1995 Dollars)*
FY 1995-2000 2005 2010 2015 2020 2025 2030 Life Cycle**
Environmental Restoration
Remedial Actions 1,576 871 972 880 0 0 0 23,066
Costs reflect a five-year average in constant 1995 dollars, except in FY 1995-2000, which is a six-year average.
Total Life Cycle is the sum of annual costs in constant 1995 dollars.
NM 45

FUNDING AND COSTINFORMATIONThe following tables present fundinginformation and major activity milestones forSouth Valley.
Defense Funding Estimate
Five-Year Averages (Thousands of Constant 1995 Dollars)*FY 1995 - 2000 2005 2010 2015 2020 2025 2030 Life Cycle"
Environmental Restoration 1,576 871 972 880 0 0 0 23,066
• Costs reflect a five-year average in constant 1995 dollars, except in FY 1995-2000, which is a six-year average.
" Total Life Cycle is the sum of annual costs in constant 1995 dollars.
Major Activity MilestonesACTIVITY TASK COMPLETION DATE
Environmental Restoration: Fiscal Year
Shallow Ground-Water Remediation
Deep Ground-Water Remediation
Start Cleanup 1994
End Cleanup 1997
Start Cleanup 1995
End Cleanup 2015
• Costs reflect a live-year average in constant 1995 dollars, except in FY 1995-2000, which is a six-year average.
" Total Life Cycle is the sum of annual costs in constant 1995 dollars.
For further information on this site, please contact: Public Participation OfficePublic Affairs OfficeTechnical Liaison: John Corimer
(505) 845-5951(505) 845-6202(505) 845-5956
NM 46

ALBUQUERQUE OPERATIONS OFFICE
The Albuquerque Operations Office is located on Kirtland Air Force Base directly south of the City
of Albuquerque, New Mexico.
Video Teleconference Center (basement)
384
6
0C)
FitnessCenter
387
Sou hParking
397Shipping &Receiving
North Guard Date
380' j 1—.1 - n•
••
South Campus
SC3 SC4
SC1
LI
SC5
SC6
1. Conference CenterRooms A, B, C, D, E
2. Conference Room 104
3. Conference Room 118
4. Conference Room 315
5. Conference Room 316
6. Overflow Training MOD 7
7. Conference Room 388
8. Conference Room 392
9. Video teleconference
NM 47

Estimated Site Total
1445 1996
of Current 1995 Dollars)*
1996 2000
Program Management 31,760 28,284 29,837 30,332 31,824 32,763
• Costs for FY 1995 reflect Congressional Appropriation, costs for FY 1996 reflect EM budget submission, costs for FY 1997-2000 reflect Budget Shortfall Scenario, costs forshaded area assume 3% annual inflation.
Five-Year Averages (Thousands of Constant 1995 Dollars)**
FT 1995 - 2000 2005 2010 2015 2020 2025 2030 Life Cycle**Program Management 25,485 14,940 14,443 14,697 15,740 18,071 17,568 630,205
Costs reflect a five-year average in constant 1995 dollars, except in FY 1995 - 2000, which is a six-year average.*** Total Life Cycle is the sum of annual costs in constant 1995 dollars.
PAST, PRESENT, AND
FUTURE MISSIONS
The historical mission of the AlbuquerqueOperations Office has been research,development, production, and maintenance ofnuclear weapons. In recent years ,this missionhas evolved to include environmentalmanagement, science and technology,technology transfer and commercialization, andnational energy objectives. In conjunction withthis evolving mission, the AlbuquerqueOperations Office is charged through itsenvironmental management programs, withresponsibility for the safe and efficient cleanupof national laboratories and production plantswithin its complex, the sites in the uranium milltailings program, and the development of theWaste Isolation Pilot Plant.
The Albuquerque Operations Office maintainsoversight responsibilities for 11 facilitiesoperated by the Department of Energy (DOE):the Grand Junction Project Office, Colorado; the
Inhalation Toxicology Research Institute, NewMexico; the Kansas City Plant, Missouri; LosAlamos National Laboratory, New Mexico; thePantex Plant, Texas; the Pinellas Plant, Florida;Sandia National Laboratories, California;Sandia National Laboratories, New Mexico; theSouth Valley Superfund Site, New Mexico; theUranium Mill Tailings Project Office, Colorado;and the Waste Isolation Pilot Plant,New Mexico.
ENVIRONMENTAL
RESTORATION
There are no current or planned environmentalrestoration activities at the AlbuquerqueOperations Office.
NM 48

WASTE MANAGEMENT
There are no current or planned wastemanagement activities at the AlbuquerqueOperations Office location.
NUCLEAR MATERIAL AND
FACILITY STABILIZATION
There are no current or planned nuclearmaterial and facility stabilization projects at theAlbuquerque Operations Office location.
LANDLORD FUNCTIONS
Landlord costs are not applicable at theAlbuquerque Operations Office.
PROGRAM MANAGEMENT
Program management oversight is provided toAlbuquerque Operations Office facilities toensure that environmental managementactivities are conducted within a framework ofmanagerial and financial control. Guidance isdeveloped and updated routinely to help thefacilities under the Albuquerque OperationsOffice establish and maintain management andproject control systems that facilitate efficientwork and provide useful information aboutprogress. Personnel annually review and refinework scopes, as well as cost and scheduleestimates contained in Albuquerque OperationOffice sites baseline documents.
Operations office personnel also conductanalyses of technical work plans as well ashealth and safety plans. Environmentalcompliance planning and oversight is another
routine function conducted to ensureconsistency with the objectives and goals of theenvironmental management program andcompliance during implementation.
In addition, operations office personnel provideoversight in the areas of public participation,preparation of environmental documents (e.g.,environmental impact statements),development of performance measures, and theestablishment of risk-based priorities for facilityenvironmental management activities. Theseinitiatives help manage an effective publicoutreach program, institutionalize effectivetotal-cost management practices, and ensurethat activities that reduce risks to theenvironment and the public are performed in atimely manner.
The Life Cycle cost estimate for theAlbuquerque Operations Office is given in theEstimated Site Total table.
Waste Minimization
One of the objectives of environmentalmanagement is reducing the amount of wastegenerated. The Albuquerque Operations Officehas established a waste minimization program.The Albuquerque Operations Office has centraloversight responsibilities for the wasteminimization program and directly managesfunding.
The waste minimization staff at each siteprovides program leadership, tracking andreporting of the amounts of waste generated,employee training, technical support forevaluating methods to reduce and recyclewaste, and information and technologyexchange to share successful waste reductionmethods with other sites and industry.Program leadership at the sites is supplementedby Federal employees at both AlbuquerqueOperations Office and the area offices.
NM 49

Agreements-In-PrincipleAgreements-in-Principle are grants given toaffected States. Their objective is to providefunds needed by the States for meaningfulparticipation in the environmental managementprogram. This includes obtaining the technicalsupport necessary for the State's oversight ofthe DOE's environmental management projectsand working with the Department to assesscompliance with applicable Federal, State, andlocal laws and regulations. Agreements-in-principles also cover emergency responseplanning and training for incidents that mayoccur at the Department's sites. In addition,they provide funding for activities related topublic awareness and information.
Currently, the Albuquerque Operations Officehas Agreements-in-Principle with the States ofNew Mexico, Missouri, Florida, and Texas. Theactivities authorized for these States are notintended for use as direct support for Stateregulatory activities (issuance of permits andenforcement actions). The intent is to supportnonregulatory activities, such as the monitoringof discharges, emissions, or biologicalparameters, as necessary to verify theeffectiveness of the Department'senvironmental management programs.
Innovative Treatments forEnvironmental RemediationA consortium of representatives from DOE, theU.S. Environmental Protection Agency, theStates, and industry has been established togenerate cost and performance data oninnovative treatments for environmentalremediation. The objective of the consortium isto accelerate use of this data throughout thecomplex. The Albuquerque Operations Officeserves as the technical program coordinator forinterfacing with the members of theconsortium. This interface helps establishtechnical advisory and performance-evaluationgroups for the demonstration of theseinnovative treatments.
FUNDING AND COSTINFORMATIONThe following tables present fundinginformation and major activity milestones forthe Albuquerque Operations Office.
Defense Funding Estimate
Five-Year Averages (Thousands of Constant 1995 Dollars)•FY 1995 - 2000 2005 2010 2015 2020 2025 2030 life Cyde•'
Program Management 25,485 14,940 14,443 14,697 15,740 18,071 17,568 630,205
• Costs reflect a five-year average In constant 1995 dollars, except In FY 1995-2000, which Is a six-year average.
• Total Life Cycle Is the sum of annual costs In constant 1995 dollars.
For further information on this site, please contact: Public Participation OfficePublic Affairs OfficeTechnical Liaison: Sandy Norris
(505) 845-5951(505) 845-6202(505) 845-6362
NM 50

WASTE ISOLATION PILOT PLANT AND NATIONAL
TRANSURANIC WASTE PROGRAM OFFICE
The Waste Isolation Pilot Plant is located in southeastern New Mexico. Its occupies about 10,240acres in Eddy County, 26 miles from the City of Carlsbad. The Department of Energy (DOE)Carlsbad Area Office, which manages both the Waste Isolation Pilot Plant program and the NationalTransuranic Program Office, is located in the City of Carlsbad.
0CC
N
Install PermanentElectrical ServiceUP
Jl
U Existing
El Planned
• Radioactive Materials Area
❑ Physical Security Area
456
Railroad
454
P
485•
Training Building
■413 B
■413 A
RadiologicallyControlled Area
1313
13
NM 51

Estimated Site Total
(Thousands of Current 1995 Dollars)*
FY 1995 1996 1997 1998 1999 2000
Waste Management 139 185 149,360 154,720 156,640 157,920 158,800Program Management 34,865 37,340 38,680 39,160 39,480 39,700
Total 174,050 186,700 193,400 195,800 197,400 198,500
• Costs for FY 1995 reflect Congressional Appropriation, costs for FY 1996 reflect EM budget submission, costs for FY 1997-2000 reflect Budget Shortfall Scenario, costs forshaded area assume 3% annual inflation.
Five-Year Averages (Thousands of Constant 1995 Dollars)**
FY 1995-2000 2005 2010 2015 2020 2025 2030
Waste Management 141,779 126,755 118,925 112,669 103,568 103,568 103,568Program Management 25,630 31,689 29,731 28,167 25,892 25,892 25,892
Total 167,409 158,444 148,656 140,836 129,460 129,460 129,460
FY 2035 2040 2045 2050 2055 2060 2065 Life Cycle***
Waste Management 103,568 103,568 103,568 82,854 0 0 0 6,163,729Program Management 25,892 25,892 25,892 20,714 0 0 0 1,482,047
Total 129,460 129,460 129,460 103,568 0 0 0 7,645,776
Costs reflect a five-year average in constant 1995 dollars, except in FY 1995 - 2000, which is a six-year average.
"' Total Life Cycle is the sum of annual costs in constant 1995 dollars.
PAST, PRESENT, AND
FUTURE MISSION
The Waste Isolation Pilot Plant
The Waste Isolation Pilot Plant was authorizedby Congress in 1979 as a facility fordemonstrating the safe disposal of radioactivewaste from defense activities and otherprograms of the Federal Government. Theradioactive waste to be accepted at the WasteIsolation Pilot Plant is transuranic waste andmixed transuranic waste. Transuranic waste isradioactive waste that, regardless of source orform, is contaminated with alpha-emitting
transuranic radionuclides (i.e., plutonium andother elements with atomic numbers higherthan that of uranium) with half-lives longerthan 20 years and in concentrations greater than100 nanocuries per gram of waste. Mixedtransuranic waste is transuranic waste that alsocontains hazardous chemicals.
The Waste Isolation Pilot Plant is a geologicrepository mined about 2,150 feet below thesurface in a massive formation of rock salt. Itconsists of an area in which experiments areconducted to study the properties of the hostrock, access drifts, and a much larger wastedisposal area. The repository has surfacefacilities in which waste will be received andinspected and four shafts that connect thesurface facilities with the underground.
NM 52

The basic mission of the Waste Isolation PilotPlant is to provide permanent disposal fortransuranic waste from defense activities. Nohigh-level waste or spent fuel is to be emplacedthere. At present, the near-term mission is tocomplete various scientific studies and todemonstrate the Waste Isolation Pilot Plant willprovide permanent waste isolation in a mannerthat is safe and environmentally acceptable viacompliance documents to be submitted to theU.S. Environmental Protection Agency (EPA)and the State of New Mexico.
The National TransuranicProgram Office
The mission of the National TransuranicProgram Office is to ensure that transuranicmixed waste owned by DOE is effectively andsystematically managed from its generation toits final disposal.
The National Transuranic Program Office willdevelop strategic plans and program guidancefor the generation, characterization,certification, packaging, transport, and disposalof transuranic waste. It will develop and directthe implementation of program guidance.
The Office will assess compliance with programguidance and ensure that activities arecoordinated among all the sites at whichtransuranic waste is generated or stored.
ENVIRONMENTAL
RESTORATION
No environmental restoration is needed at theWaste Isolation Pilot Plant site. The WasteIsolation Pilot Plant has not received or handledany radioactive waste, and no radioactive wastehas been used in the tests conducted at theplant. All activities have been and areconducted in strict compliance withenvironmental regulations. Oversight isprovided by State and Federal agencies.
WASTE MANAGEMENT
Waste Treatment and Storage
The Waste Isolation Pilot Plant will accept onlythose containers of transuranic waste that arecertified to meet the final Waste Isolation PilotPlant waste acceptance criteria, to be issued inDecember 1996. The Waste Isolation Pilot Plantwill therefore not routinely treat the transuranicwaste it receives. However, repackaging mayoccasionally be needed when waste containersare damaged. The costs for these activities areincluded with the costs of disposal, which willbe the main function of the Waste Isolation PilotPlant. No surface storage for transuranic wastewill be provided at the Waste Isolation PilotPlant site.
Waste Disposal
Disposal Capacity
By law, the maximum capacity for the WasteIsolation Pilot Plant is 6.2 million cubic feet forboth contact-handled and remote-handledwaste. The plant's design capacity for contact-handled transuranic waste is 500,000 cubic feetper year, and its capacity for remote-handledwaste is approximately 10,000 cubic feet peryear.
Disposal Strategy
On October 21, 1993, Secretary of Energy HazelR. O'Leary announced a revised strategy forshowing compliance for disposal at the WasteIsolation Pilot Plant. The strategy directs theDepartment to eliminate planned radioactivewaste testing at Waste Isolation Pilot Plant infavor of increased offsite experimental and testactivities. This strategy allows the Departmentto accelerate the preparation of the draftcompliance-demonstration documents to besubmitted to EPA and the State of New Mexico.The purpose of these documents is todemonstrate that the Waste Isolation Pilot Plant
NM 53

meets EPA's criteria for the permanent disposalof transuranic waste and to seek EPA'scertification of compliance. No transuranicwaste can be received at the Waste IsolationPilot Plant until this certification is granted.The revised strategy calls for draft compliancedocuments to be submitted to EPA and theState of New Mexico in March 1995, and finaldocuments in December 1996.
The preparation of compliance documents isbeing supported by waste characterization andsupport activities at the Idaho NationalEngineering Laboratory, Rocky FlatsEnvironmental Technology Site, ArgonneNational Laboratory-East, Argonne NationalLaboratory-West, and the Oak Ridge NationalLaboratory
The revised strategy calls for performanceassessments conducted to evaluate compliancewith the applicable EPA regulations, laboratorytests with transuranic mixed waste performedat sites other than the Waste Isolation PilotPlant, and studies to establish that seals to beused in closing the repository will perform asexpected.
Because a decision by the Secretary on thesuitability of Waste Isolation Pilot Plant fordisposal is scheduled to be made in FY 1998,the Department will start activities required tore-establish readiness of the Waste IsolationPilot Plant only after achieving sufficientconfidence that compliance will bedemonstrated. Actual waste emplacementactivities are expected to continue for at least 25years.
Disposal Operations with TransuranicWaste
If EPA certifies the Department's complianceapplication on DOE's current schedule, theWaste Isolation Pilot Plant will start receivingwaste in 1998. To be accepted at the WasteIsolation Pilot Plant for disposal, the waste willhave to be certified that it meets the WasteIsolation Pilot Plant waste acceptance criteria.
Additional waste-disposal panels will beexcavated as needed while transuranic waste isbeing emplaced in another panel of therepository. The design calls for a total of eightpanels, containing seven rooms each 300 feetlong, 33 feet wide, and 13 feet high. Most of thewaste disposal area will be used for contact-handled transuranic waste, which has relativelylow levels of radiation at the waste containersurface and can be directly handled by workers.
The active period of receiving andemplacement of waste will last at least 25 years.This period will start the day the first drum oftransuranic waste is received. At the end of thisperiod five years will be required to prepare therepository for permanent closure by backfillingthe disposal panels and access drifts, sealing theshafts and boreholes, and decommissioning thesurface facilities. Monuments and markers willbe erected at the site to warn people about thepresence of the repository. Institutional controlsover the site are assumed to be maintained for100 years.
Waste Generated at the Waste IsolationPilot Plant
Industrial waste generated at the WasteIsolation Pilot Plant is disposed of in an offsitelicensed municipal landfill. Sanitary waste isdisposed of by an onsite sewage treatmentfacility. Hazardous waste is disposed of in alicensed treatment and storage disposal facility.Liquid low-level radioactive waste generated atthe Waste Isolation Pilot Plant will be solidified(not considered treatment under the ResourceConservation Recovery Act Part B Permit) andplaced in the repository . Solid low-level wastegenerated at the Waste Isolation Pilot Plant willbe packaged and placed in the repository.
Transuranic Waste DisposalCost Modeling
For the purposes of this estimate, the WasteIsolation Pilot Plant was assumed to be thedisposal location for all transuranic waste
NM 54

managed by the Environmental Managementprogram, regardless of current legal restrictionson waste origin, capacity, and wastecharacteristics. Assumptions were made inorder to perform a complete systems analysisregarding disposal of transuranic waste with nodifferentiation of source (defense ornondefense, current state (pre-1970 buriedwaste or post-1970 retrievably stored), andactivity level (remote or contact-handled).
This estimate provides initial insight into whatthe integrated waste management disposalrequirements are under the Department'schange in mission, (e.g., the overwhelmingmajority of future transuranic waste will bederived from either remediation at previouslyused burial sites or facility stabilization anddecommissioning). The total amount oftransuranic waste needing disposal in the basecase is 182,600 cubic meters. In consideration ofthe uncertainty in waste generation estimates,for the purpose of this analysis, the WasteIsolation Pilot Plant was considered to be filledto capacity and no other repository wasconstructed.
In a similar sense, the Waste Isolation PilotPlant did not track the origin (defense ornondefense) of waste nor the source term, soother legal bounds may be exceeded in the basecase analysis. Waste Isolation Pilot Plant iscurrently authorized to receive only defensewaste, which is the overwhelming majority ofall transuranic waste. The source term isimportant since there is a legal limit on remote-handled waste activity (total curies) and doselimits. The base case assumptions do notpreclude future decisions and analysisregarding transuranic waste management.Important legal and programmatic changeswould be needed to implement base caseassumptions.
An assessment of the technical validity ofkeeping the Waste Isolation Pilot Plant open foran extended time period has not beenperformed as part of this estimate. CurrentWaste Isolation Pilot Plant planning is based ona 25-year operations period to reach capacity in2023 with subsequent closure period (assumingall defense-related and no buried waste) at acost of approximately $5 billion (1995-2028) in1995 dollars. Receipt of all transuranic waste,
Waste Management Activity Costs
Five-Year Averages (Thousands of Constant 1995 Dollars)*
FY 1995 - 2000 2005 2010 2015 2020 2025 2030
DisposalTransuranic Waste 141,779 126,755 118,925 112,669 103,568 103,568 103,568
2035 2040 2045 2050 2055 2060 2065 lffeCydie•
DisposalTransuranic Waste 103,568 103,568 103,568 82,854 0 0 0 6,163,729
' Costs reflect a five-year average In constant 1995 dollars, except In FY 1995-2000, which is a six-year average.
" Total Life Cycle is the sum of annual costs in constant 1995 dollars.
NM 55

as predicted in this analysis, would cost $7.6billion (1995-2049) in 1995 dollars, and keep theWaste Isolation Pilot Plant operating for 21additional years.
NUCLEAR MATERIAL AND
FACILITY STABILIZATION
There are no current or planned nuclearmaterial and facility stabilization activities atWaste Isolation Pilot Plant.
LANDLORD FUNCTIONS
The Waste Isolation Pilot Plant site landlordcosts are included in its program total costs andare funded within waste management.
PROGRAM MANAGEMENT
The Waste Isolation Pilot Plant has no separatefunding for program management. Allprogram management activities are performedwithin the budgets for waste managementactivities. For the purposes of this report, 20percent of the site's budget has been allocatedfor program management activities for FY 1995-2000.
FUNDING AND COST
INFORMATION
The following tables present fundinginformation and major activity milestones forthe Waste Isolation Pilot Plant.
Program Management Cost Estimate
Five-Year Averages (Thousands of Constant 1995 Dollars)'
FY 1995-2000 2005 2010 2015 2020 2025 2030
Program Management 25,630 31,689 29,731 28,167 25,892 25,892 25,892
2035 2040 2045 2050 2055 2060 2065 Life Cycle**
Program Management 25,892 25,892 25,892 20,714 0 0 0 1,482,047
' Costs reflect a five-year average in constant 1995 dollars, except in FY 1995-2000, which is a six-year average.
" Total Life Cycle is the sum of annual costs in constant 1995 dollars.
NM 56

Defense Funding Estimate
Five-Year Averages (Thousands of Constant 1995 Dollars)*
FY 1995-2000 2005 2010 2015 2020 2025 2030
Waste Management 141,779 126,755 118,925 112,669 103,568 103,568 103,568Program Management 25,630 31,689 29,731 28,167 25,892 25,892 25,892
Total 167,409 158,444 148,656 140,836 129,460 129,460 129,460
2035 2040 2045 2050 2055 2060 2065 Life Cycle"
Waste Management 103,568 103,568 103,568 82,854 0 0 0 6,163,729Program Management 25,892 25,892 25,892 20,714 0 0 0 1,482,047
Total 129,460 129,460 129,460 103,568 0 0 0 7,645,776
• Costs reflect a five-year average in constant 1995 dollars, except in FY 1995-2000, which is a six-year average.
• Total Life Cycle is the sum of annual costs in constant 1995 dollars.
Major Activity Milestones
ACTIVITY TASK COMPLETION DATE
Waste Management:
National Transuranic Waste Program Office
National Transuranic Waste Program Office
National Transuranic Waste Program Office
National Transuranic Waste Program Office
Waste Isolation Pilot Plant
Waste Isolation Pilot Plant
Waste Isolation Pilot Plant
Waste Isolation Pilot Plant
Waste Isolation Pilot Plant
Waste Isolation Pilot Plant
National Transuranic Waste Program Office
Waste Isolation Pilot Plant
Waste Isolation Pilot Plant
Waste Isolation Pilot Plant
Fiscal Year
Develop Alternatives and Strategies to Dispose of All Transuranic Waste.
Waste Inventory Definition to Final Compliance Package.
Issue final Waste Isolation Pilot Plant Waste Acceptance Criteria
Submit Comprehensive Transuranic Waste Disposal Plan to Congress.
No-Migration Determination Issued by Environmental Protection Agency
Issue Final Disposal Phase Supplemental Environmental Impact StatementRecord of Decision
Issue Decommissioning and Post Decommissioning Land Management Plan
EPA Certification of Compliance with 40 CFR 191, Issuance of RCRA Part B Permit
1995
1996
1996
1997
1997
1998
1998
1998
Secretary of Energy Decision to Operate Waste Isolation Pilot Plant as a Disposal Facility 1998
Begin Contact-Handled Disposal Operations
Fabrication of First Remote-Handled Cask complete.
Begin Remote-Handled Disposal Operations
Full Disposal Operations
Site Restoration
1998
1998
1999
2000 - 2023 (2049)*
2025 - 2030 (2059)*
• See text, Transuranic Waste Disposal Cost Modeling on pg. NM 52.
For further information on this site, please contact: Public Participation OfficePublic Affairs OfficeTechnical Liaison: Della Conway
(505) 845-5951(505) 234-7327(505) 234-7319
NM 57

NM 58

URANIUM MILL TAILINGS REMEDIAL ACTION
PROGRAM OFFICE
24 Surface and Ground-Water Sites in 10 States
There are 24 designated Uranium Mill Tailings Remedial Action (UMTRA) sites located in 10States. These States include Arizona (2 sites), Colorado (9 sites), Idaho (1 site), New Mexico (2sites), North Dakota (2 sites), Oregon (1 site), Pennsylvania (1 site), Texas (1 site), Utah (3 sites),and Wyoming (2 sites). The UMTRA Program Office is located in Albuquerque, New Mexico.
Lakeview*• •
Lowman*
Salt Lake itr•
Green River'.
NaturitaMexican
Har•
Spook*.
• Riverton*
• Belfield
• Bowman
• Edgemont
••
• fiff Climax Millrmison
• Slick4RGock2
• Durango*
• Shiprock*
•Ambrosia Lake
*Completed sites
1 Old Rifle and New Rifle
2 Union Carbide and Old North Continent
Note: Edgemont, South Dakota(Vicinity Properties Only)
Falls City•
Canonsburg*•
NM 59

PAST, PRESENT, AND
FUTURE MISSIONS
The U.S. Congress passed the Uranium MillTailings Radiation Control Act in 1978 inresponse to public concerns regarding potentialhealth hazards from long term exposure toradiation from uranium mill tailings. The Actauthorized the Department of Energy (DOE) tostabilize, dispose of, and control uranium milltailings and other contaminated material at 24uranium mill processing sites andapproximately 5,000 vicinity properties.
Most uranium ore mined in the United States inthe 1950's and 1960's was processed by privatefirms for the Atomic Energy Commission, apredecessor of DOE. The processing plantswere shut down, and the tailings piles from milloperations were abandoned. The tailings pilespresent a potential long term health hazardbecause they contain low-level radioactive andother hazardous materials that migrated tosurrounding soil, ground water, and surfacewater. Furthermore, the piles often emit radongas. The tailings, and other ontaminatedmaterial were also used as fill dirt orincorporated into various constructionmaterials at numerous offsite locations (vicinityproperties).
The mission is to remediate 24 designatedprocessing sites as required by the Act. By theend of FY 1995, 15 sites will have beencompleted and 7 sites will be under activeremediation. The final two sites will beginremediation in FY 1996.
Remediated processing sites will not bereturned to the public for either limited orunrestricted use until compliance withEnvironmental Protection Agency (EPA)standards for ground water have been metthrough the Uranium Mill Tailings Ground-water Compliance Project. Also,approximately 5,000 vicinity properties are
being remediated by the project. Disposal cellscontaining the contaminated material will bemaintained by the Federal Government asdefined in the long-term surveillance plan.
ENVIRONMENTAL
RESTORATION
Former uranium processing activities at most ofthe 24 inactive mill sites resulted incontamination of ground water beneath, and insome cases, downgradient of the sites. Thiscontaminated ground water often has elevatedlevels of contaminants such as uranium ornitrates. After completion of the Uranium MillTailings Ground-Water Compliance Project; allof the sites will be returned, at least in part, tothe State as identified in the UMTRA SurfaceProject Plan.
For the 11 sites using the stabilize-in-place orstabilize-onsite disposal option, only theportion of the site not having a disposal cell willbe available for restricted use. The portion ofthe site that contains the disposal cell will bemaintained by the Federal Government underthe Long-Term Surveillance and Maintenanceprogram. For the 13 remaining sites using therelocation option, the entire site will beavailable for unlimited use. In most cases, thetitle to the site will return to the State or to theoriginal owners.
A programmatic environmental impactstatement will be used as a decisionmakingframework for determining the project wideground-water compliance strategy. Theprogrammatic approach proposed, in theUMTRA Ground-Water ProgrammaticEnvironmental Impact Statement, is to evaluatespecific conditions at each site and select acompliance strategy that will meet theapplicable EPA standards. The proposedcompliance strategies reflect the variety of
NM 60

ground-water conditions anticipated at theUMTRA sites. These strategies range from nofurther action required to engineered remedialactions.
The draft programmatic environmental impactstatement is scheduled to be published in thespring of 1995. In conjunction with thatactivity, the project is proceeding withpreparation of site-specific baseline riskassessments. These assessments serve toevaluate risks to human health and theenvironment by collecting field data andperforming calculations and simulations. Withone exception, the baseline risk assessmentswill be complete by FY 1995. The last baselinerisk assessment is scheduled for completion inFY 1996. Site observational work plans forapplicable sites began in FY 1994 and willcontinue through 2004 per the project schedule.
The site observational work plans will definethe technical scope, objectives, and strategiesfor the anticipated activities at the site fromcharacterization through engineering designand remediation. Site-specific environmentalassessments, borrowing from the programmaticframework defined in the programmaticenvironmental impact statement, will describeeach site's compliance strategy. Because theyfollow the completion of the site observationalwork plans, preparation of environmentalassessments will be initiated in FY 1996 andcontinue, according to the project schedule,through FY 2005.
The site-specific remedial action plans willdescribe regulatory compliance strategies forthe sites where active remediation strategies areproposed. The remedial action plans willcontain sufficient information for the NuclearRegulatory Commission, States, and Tribes toconcur upon the selection of the compliancestrategy. Remedial action plans will be initiatedjust prior to finalization of environmental
assessments and publishing of the Findings ofNo Significant Impacts in the Federal Register.They are scheduled to begin in FY 1997 andcontinue through FY 2007.
Each site's compliance strategy will ultimatelybe consistent with the proposed action in theUMTRA Ground Water ProgrammaticEnvironmental Impact Statement. This impactstatement will reflect the results of site-specificrisk evaluations. The UMTRA Ground-WaterCompliance Project, for purposes of creating abudget estimate, has proposed three primarycompliance strategies. These strategies includeno further action, passive, and active.
Although no decisions can be made prior torelease of the programmatic environmentalimpact statement, budget preparation needsrequire that site-specific scenarios be addressedas described above. For budgeting purposesonly, two sites were suggested for activecompliance strategies. The remaining siteswould have passive (natural flushing) strategiesimposed, additional characterization, or nofurther action. This would mean that activeremediation could begin as early as FY 2002,with completion possible by FY 2014.
Future assessment efforts for the UMTRASurface Project will center around theassessment of new vicinity properties(particularly Climax Mill in Grand Junction,Colorado) and the certification and licensing ofall completed disposal cells. Remediation willconsist of completing those six sites startedprior to FY 1995, starting the cleanup of the lastfive processing sites in FY 1995 and FY 1996,and completing cleanup of all sites by the endof FY 1998. Activities in FY 1999 will consist offinalization of site and vicinity propertycompletion reports.
NM 61

WASTE MANAGEMENT
Waste management at all UMTRA sites isconducted within the scope of environmentalrestoration activities.
NUCLEAR MATERIAL AND
FACILITY STABILIZATION
There are no current or planned nuclearmaterial and facility stabilization activitiesrequired at the UMTRA sites.
LANDLORD FUNCTIONS
Landlord activities are the responsibility of theowner at each site. In cases where DOE willmaintain control of the site and continue long-term surveillance and maintenance, landlordcosts are represented in the UMTRA life cyclecost estimate for the State in which that site islocated.
For further information on this site, please contact:
PROGRAM MANAGEMENT
Program management supports managementefforts for the National Environmental PolicyAct process, site characterization and licensing,public information/participation, qualityassurance audits, program and managementsupport for the technical assistance contractor,special studies, document control, technicalassistance contractor site and technicalmanagement, cost and schedule controls,planning and preparation of the Federalbudget, and the Environmental ManagementProgress Tracking System. Also included isindirect support required by the DOE ProgramOffice for operations and coordination.
Public Participation OfficePublic Affairs OfficeTechnical Liaison: Jody Metcalf
(505) 845-5951(505) 845-6202(505) 845-6146
NM 62

NEW MEXICO UMTRA SITES
The Ambrosia Lake former processing site is one of 24 uranium mill processing sites designated bythe Uranium Mill Tailings Radiation Control Act for remediation by the Department of Energy(DOE) . Most uranium ore mined in the United States in the 1960's was processed by private firmsfor the Atomic Energy Commission, a predecessor of DOE. The Act was passed in 1978 in responseto public concerns regarding potential health hazards from long term exposure to uranium milltailings. It authorized the DOE to stabilize, dispose of, and control uranium mill tailings and othercontaminated material at 24 uranium mill processing sites and vicinity properties. Uranium MillTailings Remedial Action (UMTRA) activities are funded through the Albuquerque OperationsOffice.
The cost estimate model used for this report provides costs for each of the UMTRA sites. All costsfor waste management activities, program management, and relevant landlord activities attributableto DOE are provided for within the scope of environmental restoration. There are no Uranium MillTailings Radiation Control Act sites with either current or planned nuclear material and facilitystabilization activity needs. Funding for all sites is 100 percent nondefense.
NM 63

AMBROSIA LAKE(Uranium Mill Tailings Remedial Action Project Site)
The Ambrosia Lake former processing site is located in McKinley County, approximately 85 milesnorthwest of Albuquerque.
Colorado
New Mexico
LEGEND
25 INTERSTATE HIGHWAY
0 U.S. HIGHWAY
53 STATE HIGHWAY
20 0 40 MILES
20 0 80 KILOMETERSMEM
ALBUQUERQUE
Santa Fe
NEW MEXICO
Map Location
NM 64

Estimated Site Total
(Thousands of Current 1995 Dollars)*
Y 1995 1996 1997 1998 1999 2000
Environmental Restoration 390 260
Costs for FY 1995 reflect Congressional Appropriation, costs for FY 1996 reflect EM budget submission, costs for FY 1997-2000 reflect Budget Shortfall Scenario, costs for
shaded area assume 3% annual inflation.
Five-Year Averages (Thousands of Constant 1995 Dollars)**
FY 1995-2000 2005 2010 2015 2020 2025 2030 Life Cycle***
Environmental Restoration 119 0 0 0 0 0 0 715
" Costs reflect a five-year average in constant 1995 dollars, except in FY 1995 - 2000, which is a six-year average.
Total Life Cycle is the sum of annual costs in constant 1995 dollars.
PAST, PRESENT, AND
FUTURE MISSIONS
The mill was built in 1957 and was originallyoperated by the Phillips Petroleum Company.United Nuclear Corporation purchased andoperated the mill for a brief period in 1963.United Nuclear shut down milling operationsin 1963, but retained ownership of the site. Anion exchange system was operated at the site byUnited Nuclear in the late 1970's to early 1980'sto extract uranium from mine water.Homestake Mining purchased United's interestin 1981.
DOE will maintain control of the site andcontinue long term surveillance andmonitoring.
ENVIRONMENTAL
RESTORATION
The activities at this site have resulted incontaminated soil, millsite rubble, andwindblown material.
Surface remediation is ongoing at AmbrosiaLake. Approximately 2 million cubic yards ofuranium tailings exist onsite and some 396,000tons of tailings have been removed and used asmine fill. To date, DOE has buried allcontaminated and uncontaminated millstructure debris, and folded the north half ofthe tailings pile over the south half. DOE hasalso completed the cleanup of windblownmaterial and constructed a radon barrier andbedding layer. In 1995, DOE plans to completesite restoration and place erosion protectionmaterial. Remediation is expected to becompleted in April 1995. The following tableshows the costs for environmental restorationprojects at this site. All funding is fromnondefense sources.
NM 65

FUNDING AND COSTINFORMATION
The following tables present fundinginformation and major activity milestones forAmbrosia Lake.
Environmental Restoration Projects
Five-Year Averages (Thousands of Constant 1995 Dollars)*FY 1995.2000 2005 2010 2015 2020 2025 2030 Life Cycle**
UMTRA-Ground Water • New Mexico 23 0 0 0 0 0 0 137UMTRA-Soils - New Mexico 96 0 0 0 0 0 0 578
Total 119 0 0 0 0 0 0 715
• Costs reflect a five-year average in constant 1995 dollars, except in FY 1995-2000, which is a six-year average.
*" Total Life Cycle is the sum of annual costs in constant 1995 dollars.
Nondefense Funding Estimate
Five-Year Averages (Thousands of Constant 1995 Dollars)*FY 1995-2000 2005 2010 2015 2020 2025 2030 Life Cycle*
Environmental Restoration 119 0 0 0 0 0 0 715
Costs reflect a five-year average in constant 1995 dollars, except in FY 1995-2000, which is a six-year average.
Total Life Cycle is the sum of annual costs In constant 1995 dollars.
For further information on this site, please contact: Public Participation OfficePublic Affairs OfficeTechnical Liaison: Jody Metcalf
(505) 845-5951(505) 845-6202(505) 845-6146
NM 66

NM 67

GNOME-COACH SITE AND GASBUGGY SITE(Nevada Offsite Program)
R 30 E
32 .7,0_33 35 '. •. 36 SHELL
• A
O,_ 1
I..., \
''0,0,
I.ONTROL POINt
12
LOC*, um,
..t
gh.
4 J
•
13
54AP •P A
CD
Ilt CAR::AD
Lov., • :it' PAAtAGA SNORE
•WATES CITE ‘ Sill
e.
No
22 23 24
r.146.4..s.25urtv Id 144Q _
t--. 2
\28
.7---"L-i—'
'P''''
oo
32
It33 ' . ...2sHAr,INI8NO
,, ealRFIce35 36
3400-„,,
CONTOUR INTERVAL 100 law
GASBUGGY SITE
22
23
S
GNOME-COACH SITE
DECONTAMINATION
PR rtLLGB-I
0 ' ISETICR
e- WET= RUM
CONCRETEPAD
"RED TANK'
SEPARATORS
,Act
WA=SAM
EPTIC TICK TO GO-D-1540. SR Or CB-ER
TO STATE NIGHTLY I7—..-f.\\\\
NM 68

Estimated Site Total
(Thousands of Current 1995 Dollars)*
FY 1995
Environmental Restoration
1998 1999 2000
3,130 3,280 2,130
* Costs for FY 1995 reflect Congressional Appropriation, costs for FY 1996 reflect EM budget submission, costs for FY 1997-2000 reflect Budget Shortfall Scenario, costs for
shaded area assume 3% annual inflation.
(Five-Year Thousands of Constant 1995 Dollars)**
FY 1995 - 2000 2005 2010 2015 2020 2025 2030
Environmental Restoration 1,817 175 80 47 16 8 6
2035 2040 2045 2050 2055 2060 2065 Life Cycle***
Environmental Restoration 1 0 0 0 0 0 0 12569
** Costs reflect a five-year average in constant 1995 dollars, except in FY 1995 - 2000, which is a six-year average.
** Total Life Cycle is the sum of annual costs in constant 1995 dollars.
PAST, PRESENT, AND
FUTURE MISSIONS
The Gnome-Coach and Gasbuggy sites were
part of the Plowshare Program, which was a
series of nuclear and conventional tests by the
Atomic Energy Commission to explorepeacetime uses of nuclear explosives. The
Project Gnome detonation occurred in bedded
salt in December 1961. The test ventedradioactivity to the atmosphere. As a result,
Project Coach, another experiment scheduled
for this location, was cancelled. The Gasbuggy
Site was used for a single subsurface nuclear
test conducted in December 1967 to determine
whether or not nuclear explosions wouldstimulate release of natural gas not recoverable
by conventional methods. It was the first joint
government/industry gas stimulationexperiment. The vicinity of the sites is beingmonitored as part of the long-term hydrologicalmonitoring program.
ENVIRONMENTALRESTORATION
Funding for this activity provides for continued
synthesis and evaluation of informationcollected during monitoring of the Gasbuggy
and Gnome-Coach sites in New Mexico. This
activity will define the magnitude and extent ofcontamination and risks associated with thatcontamination through evaluation ofinformation. This process will include thecharacterization of the physical setting andtesting areas, the definition of the occurrence of
NM 69

contamination, and the identification ofpathways to reach a potential receptor. Therisks to receptors will also be calculated usingstandard risk assessment procedures. Shouldrisks exceed acceptable limits, remedial actionsat the New Mexico test sites will be initiated.For this estimate, remediation was assumed toinclude removal of contaminated surface soil
due to venting at the Gnome-Coach Site andfaulty well pipe repairing and monitoring at theGasbuggy Site. Remediation at Gnome-Coachwas assumed to begin in 1998 and be completein 2000. Activities at the Gasbuggy site wereassumed to begin in 1995 and be completed in1999.
Environmental Restoration Activity Costs
Five-Year Averages (Thousands of Constant 1995 Dollars)*FY 1995-2000 2005 2010 2015 2020 2025 2030
Nevada Off site - New MexicoAssessment 1,163 65 0 0 0 0 0Remedial Actions 654 0 0 0 0 0 0Surveillance And Maintenance 0 110 80 47 16 8 6
Total 1,817 175 80 47 16 8 6
2035 2040 2045 2050 2055 2060 2065 Life Cycle"Nevada Off site - New Mexico
Assessment 0 0 0 0 0 0 7,301Remedial Actions 0 0 0 0 3,923Surveillance And Maintenance 0 0 0 0 1,345
Total 1 0 0 0 0 12,569
• Costs reflect a five-year average in constant 1995 dollars, except in FY 1995-2000, which is a six-year average.
Total Life Cycle is the sum of annual costs in constant 1995 dollars.
NM 70

Defense Funding Estimate
Five-Year Averages (Thousands of Constant 1995 Dollars)*
FY 1995 - 2000 2005 2010 2015 2020 2025 2030
Environmental Restoration 1,817 175 80 47 16 8 6
2035 2040 2045 2050 2055 2060 2065 Life Cycle*
Environmental Restoration 1 0 0 0 0 0 0 12,569
• Costs reflect a five-year average in constant 1995 dollars, except in FY 1995-2000, which is a six-year average.
• Total Life Cycle is the sum of annual costs in constant 1995 dollars.
For further information on this site, please contact: Public Participation Office (702) 295-4652
Public Affairs Office (702) 275-3521
Technical Liaison: Bobbie McClure (702) 295-1862
NM 71

NM 72

SEAWAY INDUSTRIAL PARK
LINDE AIR
PRODUCTS
ASHLAND OIL
(1 & 2)
NIAGARA FALLS
VICINITY PROPERTY*
(COMPLETED FUSRAP SITE)
NIAGARA FALLS
STORAGE SITE
(COMPLETED FUSRAP SITE)
BLISS & LAUGHLIN
STEEL
SEPARATIONS PROCESS
RESEARCH UNIT
WEST VALLEY
DEMONSTRATION PROJECT
BAKER & WILLIAMS ••••"".....'41.
WAREHOUSE
(COMPLETED FUSRAP SITE)*
NEW YORKEstimated State Total
COLONIE INTERIM
STORAGE SITE
BROOKHAVEN NATIONAL
LABORATORY
*Summaries are not providedfor facilities with completedremedial actions.
Brookhaven National Laboratory
Separation Process Research Unit
West Valley Demonstration Project
New York - FUSRAP
TOTAL
FY 1943
25,606
125,00020,800'
1997 1998
(Thousands of Current 1995 Dollars)*
19961,038'.
130,000 135,00 142,000
28,930 36,200 22,880
1999
45,415
2000
3';000160,00024,760
171,406 189,968 212,989 206,622 213,715 240,179
• Costs for FY 1995 reflect Congressional Appropriation, costs for FY 1996 reflect EM budget submission, costs for FY 1997-2000 reflect Budget Shortfall Scenario, costs for
shaded area assume 3% annual inflation.
Brookhaven National LaboratorySeparation Process Research Unit
West Valley Demonstration Project
New York - FUSRAP
Total
Five-Year Averages (Thousands of Constant 1995 Dollars)**
FY 1995 - 2000 2005 2010 2015 2020 2025 2030 Life Cycle*
36,638 28,273 18,819 11,588 9,395 7,440 5,813 626,473
431 29,400 0 0 0 0 149,588
135,451 118,240 93,440 108,000 125,440 145,280 0 3,764,705
25,209 16,956 13,890 12,911 0 0 0 370,041
197,729 192,869 126,148 132,499 134,835 152,720 5,813 4,910,807
*" Costs reflect a five-year average in constant 1995 dollars, except in FY 1995 - 2000, which is a six-year average.
** Total Life Cycle is the sum of annual costs in constant 1995 dollars.
NY 1

NY 2

BROOKHAVEN NATIONAL LABORATORY
Brookhaven National Laboratory is located in Upton, New York, on Long Island, about 75 miles
from New York City. It is managed through the Department of Energy (DOE) Chicago Operations
Office.
811 WasteConcentration
Building
a
LL
E
ProposedNew Hazardous
Waste ManagementFacility
„os; tobs- Location of Current
\$‘1'1' Management FacilityHazardous Waste
.,
Site Boundary
• •
NY 3

Estimated Site Total
(Thousands of Current 1995 Dollars)*
FY 1995 1996 1997 1998 1999 2000
Environmental RestorationWaste ManagementNuclear MaterialProgram Management
Total
11,075 21,9921 31,87412,206 7,520 8,030
0 126 4542,325 1,400
25,606 31,038 41,789
31,2108,600454
1,478
34,6368,800454
1,525
41,2959,000454
1,670
41,742 45,415 52,419
' Costs for FY 1995 reflect Congressional Appropriation, costs for FY 1996 reflect EM budget submission, costs for FY 1997-2000 reflect Budget Shortfall Scenario, costs forshaded area assume 3% annual inflation.
Five-Year Averages (Thousands of Constant 1995 Dollars)**
FY 1995-2000 2005 2010 2015 2020 2025 2030 Life Cyde***
Environmental Restoration 26,363 18,985 9,432 3,498 2,525 311 0 330,567Waste Management 8,421 5,831 5,721 5,716 5,714 5,704 4,651 217,212Nuclear Material 324 437 1,038 35 0 0 0 9,491Program Management 1,530 3,020 2,628 2,339 1,428 1,426 1,163 69,203
Total 36,638 28,273 18,819 11,588 9,395 7,440 5,813 626,473
• Costs reflect a five-year average in constant 1995 dollars, except in FY 1995 - 2000, which is a six-year average.- Total Life Cycle is the sum of annual costs in constant 1995 dollars.
PAST, PRESENT, AND
FUTURE MISSIONS
Brookhaven National Laboratory is the formersite of a U.S. Army installation (Camp Upton)and has been involved in research anddevelopment activities in support of DOE andits predecessor agencies' missions since 1947.Brookhaven National Laboratory's currentmission is to conduct fundamental research,including conception, design, construction, andoperation of large, complex research facilities.
These facilities are used to carry out both basicand applied research in high energy andnuclear physics; in basic energy sciences
emphasizing fundamental research onbiological, chemical, and physical phenomenaunderlying energy-related transfer, conversion,and storage systems; and in the life sciences,nuclear medicine, and medical applications ofnuclear techniques. As a national resource,Brookhaven National Laboratory makesavailable, when feasible, its unique facilitiesand expertise to State and Federal agencies andto the private sector. It is assumed BrookhavenNational Laboratory will continue to operate asa multi-program national laboratory for theforeseeable future.
Environmental restoration activities willconclude in 2025 at the assumed funding levels.However, laboratory operations will continue
NY 4

to generate waste. Continuing wastemanagement activities in support of ongoingprograms are projected at a cost ofapproximately $5.7 million per year. Tofacilitate the development of this life-cycle costestimate, an arbitrary cutoff date of 2029 has
been assigned to all sites that have completedenvironmental restoration but maintainongoing waste management support of otherDepartment programs (Energy Research,Defense Programs, etc.).
ENVIRONMENTAL
RESTORATION
The principal environmental medium ofconcern at Brookhaven National Laboratory is
ground water. Because Brookhaven NationalLaboratory is situated over a sole-sourceaquifer providing potable water for Long
Island, the Environmental Protection Agency
(EPA) placed Brookhaven National Laboratory
on the National Priorities List in 1989. As a
result, Brookhaven National Laboratory'senvironmental restoration activities are focused
on remediation of contamination resulting from
past research and development work that may
have migrated through soils, surface water, and
related transport mechanisms into the aquifer.Characterization investigations are beingcompleted to clarify the extent of remediationneeded. Contaminants of concern includemetals, organic compounds, and radionuclidessuch as tritium and cesium-137. Contaminationoccurred as a result of accidental spills and/orpast operating practices.
Brookhaven National Laboratory signed anInteragency Agreement with the EnvironmentalProtection Agency and the New York StateDepartment of Environmental Conservationwhich became effective in 1992. TheInteragency Agreement integrates requirementsof the Comprehensive EnvironmentalResponse, Compensation and Liability Act(CERCLA), the Resource Conservation andRecovery Act (RCRA), the NationalEnvironmental Policy Act, and Stateregulations. In addition, the InteragencyAgreement divides Brookhaven NationalLaboratory into "Areas of Concern" that havebeen grouped into Preliminary Assessment/SiteInspection Areas of Concern, sites where adocumented release occurred; Operable Units,groupings of Areas of Concern based on similaractivities, similar contaminants, and/orgeographic continuity; and a RemovalActivities unit which describes the interimremoval actions across the site.
Environmental Restoration Projects
Five-Year Averages (Thousands of Constant 1995 Dollars)*
FY 1995 - 2000 2005 2010 2015 2020 2025 2030 life Cycle*
Environmental Restoration 26,363 18,985 9,432 2,028 1,272 311 0 318,316
Facility Decommissioning 0 0 0 1,470 980 0 0 12,251
Total 26,363 18,985 9,432 3,498 2,252 311 0 330,567
• Costs reflect a five-year average in constant 1995 dollars, except in FY 1995-2000, which is a six-year average.
Total Life Cycle is the sum of annual costs in constant 1995 dollars.
NY 5

In general, Brookhaven National Laboratoryexpects to continue with the remedialinvestigation work currently underway asspecified by the Interagency Agreement.Remedial activities will be designed andcompleted as dictated by results frominvestigations at specific operable units, withground-water remediation and prevention offurther contamination being the focus ofrestoration activities. Contaminants, media,and risk are presented by grouping below.
Operable Unit ISources of contamination have included theHazardous Waste Management Facility, inoperation since 1949; two landfill areas, bothnow closed; and two stormwater runoffrecharge basins. Contaminants includeuranium and plutonium isotopes, cesium-137,tritium, strontium-90, organics, and metals.Contaminated media at Operable Unit I consistof soil, ground water, surface water, surfacesediment, air, flora and fauna. The extent ofcontamination is unknown, pending ground-water contamination has migrated offsite. It isanticipated the Remedial Investigation/Feasibility Study for this Operable Unit will becompleted in 1997, and remedial activitiesindicated by the results of data analysis willfollow. At this time, Brookhaven NationalLaboratory expects to initiate remedial action in1998 and complete all work under OperableUnit I by 2013.
Operable Unit IISources of contamination have included theBrookhaven Graphite Research Reactor, theWaste Concentration Facility, the AlternateGradient Synchrotron Department scrapyards,and the site sewage system. Contaminantsinclude cesium-137, cobalt-60, strontium-90,cesium-134, organics, and inorganics.Contaminated media at Operable Unit IIinclude soil and ground water. The extent ofcontamination is unknown, pending
completion of the Remedial Investigation. Theassessment portion of Operable Unit II isexpected to be completed by 2000, with anysubsequent remediation activities that may berequired completed by 2014.
Operable Unit IIISources of contamination have included abuilding transfer line and underground storagetanks; Bubble Chamber Area; water supply anddistribution system, a monitoring well; thePhysic's Department's Cloud Chamber Group;the old firehouse, two production supply wells;the site sewage system, warehouse area, andseveral buildings, including former chemistrybuildings. Contaminants include organics,inorganics, tritium, strontium-90, cesium-137,sodium-22, and cobalt-60. Contaminated mediaat Operable Unit III include soil, ground water,surface water, surface sediment, air, flora andfauna. The extent of contamination is not fullyknown (ground-water contamination hasmigrated offsite), pending completion of aremedial investigation. The RemedialInvestigation/Feasibility Study portion forOperable Unit III is expected to be completedby 2000, with any required remedial actionsconcluded in 2014.
Operable Unit IVThe sources of contamination include theCentral Steam Facility, the ReclamationFacility; two water supply wells, the sitesewage system, and a recharge basin.Contaminants include organics, inorganics,uranium, plutonium, and europium isotopes,strontium-90, tritium, cesium-137, and radium-226. Contaminated media at Operable Unit IVinclude soil and ground water. RemedialInvestigations were completed for OperableUnit IV in 1994. The extent of contaminationwill be fully known on completion of aFeasibility Study, with remedial activities, ifrequired, expected to be completed by 2012.
NY 6

Operable Unit V
The sources of contamination are the SewageTreatment plant, the Satellite Disposal Area,and the site sewage system. Contaminantsinclude tritium, strontium-90, cesium-137,organics, and inorganics. Contaminated mediaat Operable Unit V include soil, ground water,surface water, surface sediment, air, flora andfauna. The extent of contamination is not fullyknown (some ground-water contamination hasmigrated offsite) and awaits the results of theRemedial Investigation/Feasibility Study forOperable Unit V which is expected to concludein 1999. Remedial activities that may benecessary are expected to conclude in 2015.
Operable Unit VI
The primary source of contamination has been
the Upland Recharge Experiment at the UplandRecharge Area/Meadow Marsh. Thisexperiment involved study of the application ofsewage to various types of environments(wetlands, meadows, forests) to evaluatesewage treatment. Sewage came from bothBrookhaven National Laboratory and the town
of Brookhaven and was contaminated.Contaminants include tritium and ethylenedibromide (organics, pesticides, herbicides,
inorganics, other radionuclides are suspected).Contaminated media at Operable Unit VIinclude soil, ground water, surface water,sediment, air, flora, and fauna. The extent ofcontamination is unknown, pendingcompletion of a Remedial Investigation;ground-water contamination has migratedoffsite. The Remedial Investigation/FeasibilityStudy for Operable Unit VI is currentlyscheduled to begin in 2000 and conclude in2005. Should remedial actions be required, theyare expected to conclude in 2014.
Operable Unit VII
Sources of contamination are soils removedfrom the Hazardous Waste ManagementFacility and spread at other sites forlandscaping purposes, the former Low-MassCriticality Facility, and a Particle Beam"Dump." Contaminants include cesium-137and other radionuclides. Contaminated mediaat Operable Unit VII include soil, ground water,surface water, sediment, air, flora, and fauna.The extent of contamination is unknown,pending completion of a remedialinvestigation/feasibility study which isexpected to begin in 1998 and conclude in 2004.Remedial activities required as a result of theinvestigation will conclude in 2016.
Environmental Restoration Activity Costs
Five-Year Averages (Thousands of Constant 1995 Dollars)*
FY 1995-2000 2005 2010 2015 2020 2025 2030 Ufe Cycle"
Environmental RestorationAssessment
Environmental RestorationRemedial ActionsSurveillance And MaintenanceFacility Decommissioning
12,761 2,304 790
13,568 16,671 7,492
35 10 1,150
0 0 0
0 0 0 0 92,035
5981,4301,470
01,272980
03110
0 205,21021,07112,251
Total 26,363 18,985 9,432 3,498 2,252 311 0 330,567
• Costs reflect a five-year average in constant 1995 dollars, except in FY 1995-2000, which Is a six-year average.
▪ Total Life Cycle Is the sum of annual costs In constant 1995 dollars.
NY 7

Preliminary Assessment/SiteInvestigations
This task is intended to provide sufficientadditional data for sites to either eliminate themfrom further consideration or include them inan existing operable unit for further study andremediation. At the present time, a total of 550Areas of Environmental Interest have beenidentified for further study. Contaminationsources and specific contaminants areunknown; they are assumed to be organics,metals, and radionuclides. The extent ofcontamination remains unknown pendingcompletion of ongoing field investigation anddata analysis. These investigations areexpected to be complete in 1998. Additionalareas of concern discovered during theseinvestigations will be incorporated intooperable units for further investigation andremediation, if appropriate.
Removal ActivitiesThe sources of contamination include the "D"waste tanks, underground storage tanks,cesspools, the Spray Aeration Project, a projectto treat volatile organics in ground water, andsoils at several buildings. Contaminantsinclude tritium, strontium-90, cobalt-60,cesium-137, actinium-228, radon-226, radon-228, thorium-232, and organics. Media are soil,
ground water, and structures. The extent ofcontamination is unknown, pendingcompletion of field data analysis. Theassessment portion of this work has beencompleted. A total of seven separate removalactions will be completed by 2007.
Cost of EnvironmentalRestoration
The estimated costs of environmentalrestoration at Brookhaven National Laboratoryare given in the table below.
WASTE MANAGEMENT
Brookhaven National Laboratory currentlymanages hazardous waste, low-levelradioactive waste, and low-level mixed waste.Limited treatment of waste to reduce volumeand stabilize them prior to shipment to offsitefacilities for treatment and disposal is expectedto continue as waste is generated by on-goingresearch and development activities. Large-scale treatment trains and onsite waste disposalfacilities are not planned at this time. Handlingof restoration-derived waste will be addressedwithin environmental restoration funding.
Major Waste Management Projects
Five-year Averages (Thousands of Constant 1995 Dollars)*
FY 2000 2005 2010 2015 2020 2025 2030 Life Cycle.*
Waste Handling Facility 833 0 0 0 0 0 0 5,000
• Costs reflect a five-year average in constant 1995 dollars, except in FY 2000, which is a six-year average.
Total Life Cycle is the sum of annual costs in constant 1995 dollars.
NOTE: These projects represent a subset of waste managements costs. Program management costs are built-in to the estimates provided.
NY 8

The Environmental Management program atBrookhaven National Laboratory continues to •be responsible for management of hazardousand radioactive waste generated during routineresearch and development activities conductedfor a variety of programs managed by DOE andother Federal agencies.
Construction of the Waste Management Facility,as it is referred to by the site, began in 1995 andis expected to be complete in 1996.
The Waste Management Facility is identified inthe table below as the Waste Handling Facility,the name used in the list of projects identifiedby Congress to be included in this report. Thefacility is designed to improve the effectiveness,efficiency, and environmental safeguards ofBrookhaven National Laboratory's hazardousand radioactive waste management operations,and ensure compliance with Federal, State, andlocal environmental regulations. Uponcompletion of the facilities, all chemical andliquid waste handling operations andradioactive waste storage requirements will betransferred from existing facilities.
Waste Treatment
Treatment of waste is limited to size andvolume reduction, consolidation, andpackaging for shipment to offsite treatment anddisposal facilities.
Waste Storage
Brookhaven National Laboratory stores wastein accordance with the provisions of its RCRAPart B Permit (large-quantity generator status).There are currently no plans to increase thestorage times or capacities onsite.
Waste Disposal
Hazardous waste is sent to commercial facilitiesfor disposal; low-level waste is shipped toDOE's Hanford, Washington facility fordisposal; and low-level mixed waste iscurrently shipped to DOE's Hanford site forstorage pending any required treatment.
Waste Management Activity Costs
Five-Year Averages (Thousands of Constant 1995 Dollars)*
FY 1995-2000 2005 2010 2015 2020 2025 2030 Life Cycle**
TreatmentLow-Level Mixed Waste 1,020 705 705 705 705 705 653 27,013
Low-Level Waste 38 128 13 13 11 1 0 1,060
Storage and HandlingLow-Level Waste 0 0 0 0 0 0 0 4
Hazardous Waste 7,021 4,856 4,861 4,856 4,856 4,856 3,885 182,972
Sanitary Waste 343 142 142 142 142 142 113 6,165
Total 8,421 5,831 5,721 5,716 5,714 5,704 4,651 217,212
• Costs reflect a five-year average in constant 1995 dollars, expect in FY 1995-2000, which is a six-year average.
Total Life Cycle is the sum of annual costs in constant 1995 dollars.
NY 9

NUCLEAR MATERIAL AND
FACILITY STABILIZATION
Brookhaven National Laboratory has not yetentered the Environmental Management facilitystabilization program, but it is assumed forpurposes of this report it will do so in 1996.
This report assumes the stabilization andmaintenance process at Brookhaven NationalLaboratory will be completed by the year 2015.The 24 facilities at Brookhaven NationalLaboratory anticipated to enter this programinclude a graphite research reactor, severalstorage tanks including radioactive water tanks,various waste storage facilities, offices, and awarehouse. Resulting waste types will includelow-level, transuranic, low-level mixed andhazardous waste.
LANDLORD FUNCTIONS
At the present time, landlord activities atBrookhaven National Laboratory are primarilythe responsibility of DOE's Energy Researchprogram. The Environmental Managementprogram at Brookhaven National Laboratorysupports landlord activities through apercentage of overhead which is calculated onan annual basis, based on programs funded atthe laboratory.
PROGRAM MANAGEMENT
Program management at Brookhaven NationalLaboratory is limited to program planning anddirect management of projects, and to wasteminimization activities. Brookhaven NationalLaboratory does not fund any grants orAgreements-in-Principle at this time.
FUNDING AND COST
INFORMATION
The following tables present current andprojected funding information and majorEnvironmental Management Program activitycosts projected through 2035 for BrookhavenNational Laboratory.
Nuclear Material and Facility Stabilization Cost Estimate
Five-Year Averages (Thousands of Constant 1995 Dollars)*
FT 1995 - 2000 2005 2010 2015 2020 2025 2030 Life Cycle*
Nuclear Material and Facility Stabilization 324 437 1,038 35 0 0 0 9,491
• Costs reflect a five-year average In constant 1995 dollars, except in FY 1995-2000, which Is a six-year average.
"Total Life Cycle is the sum of annual costs in constant 1995 dollars,
NY 10

Program Management Cost Estimate
Five-Year Averages (Thousands of Constant 1995 Dollars)*
FY 1995 - 2000 2005 2010 2015 2020 2025 2030 Life Cycle **
Program Management 1,530 3,020 2,628 2,339 1,428 1,426 1,163 69,203
• Costs reflect a five-year average in constant 1995 dollars, expect in FY 1995-2000, which is a six-year average.
• Total Life Cycle is the sum of annual costs in constant 1995 dollars.
Defense Funding Estimate
Five-Year Averages (Thousands of Constant 1995 Dollars)*
FY 1995-2000 2005 2010 2015 2020 2025 2030 Life Cycle**
Nuclear Material and Facility Stabilization 324 437 1,038 0 0 0 0 9,316
• Costs reflect a five-year average in constant 1995 dollars, except in FY 2000, which is a six-year average.
• Total Life Cycle is the sum of annual costs in constant 1995 dollars.
Nondefense Funding Estimate
Five-Year Averages (Thousands of Constant 1995 Dollars)*
FY 1995-2000 2005 2010 2015 2020 2025 2030 Life Cycle**
Environmental Restoration 26,363 18,985 9,432 3,498 2,252 311 0 330,567
Waste Management 8,421 5,831 5,721 5,716 5,714 5,704 4,651 217,212
Nuclear Material and Facility Stabilization 0 0 0 35 0 0 0 175
Program Management 1,530 3,020 2,628 2,339 1,428 1,426 1,163 69,203
Total 36,314 27,837 17,781 11,588 9,395 7,440 5,813 617, 157
• Costs reflect a five-year average in constant 1995 dollars, expect in FY 1995-2000, which is a six-year average.
▪ Total Life Cycle is the sum of annual costs in constant 1995 dollars.
NY 11

Major Activity Milestones
ACTIVITY TASK COMPLETION DATE
Environmental Restoration Fiscal Year
Complete Remedial Action 2016
For further information on this site, please contact: Public Participation Office (708) 252-8796Public Affairs Office (708) 252-2010Technical Liaison: Michael Ferrigan (708) 252-2570
NY 12

SEPARATIONS PROCESS RESEARCH UNIT
The Separations Process Research Unit is located at the Knolls Atomic Power Laboratory operatedfor the Office of Naval Reactors. The site is in Schenectady, New York. The Separations ProcessResearch Unit is managed by the Department of Energy (DOE) Chicago Operations Office.
The Separations Process Research Unit consists of four buildings and a tank farm with six 10,000-gallon, and one 5,000-gallon stainless steel tanks.
Lower LevelParking Lot
H-2Radioactive WasteProcessing Facility
K-6Former WasteStorage Facility
Mohawk River
K-5Former Liquid WasteCollection Basins
ChemistryLaboratory
RadioactiveMaterialLaboratory
NY 13

Estimated Site Total
(Thousands of Current 1995 Dollars)'
Ft 1995 144b 1997 1998 1999 2000
Environmental Restoration 0 0 3000
• Costs for FY 1995 reflect Congressional Appropriation, costs for FY 1996 reflect EM budget submission, costs for FY 1997-2000 reflect Budget Shortfall Scenario, costs for
shaded area assume 3% annual inflation.
Five-Year Averages (Thousands of Constant 1995 Dollars)"
FY 1995 - 2000 2005 2010 2015 2020 2025 2030 Life Cycle***
Environmental Restoration 431 29,400 0 0 0 0 0 149,588
Costs reflect a five-year average in constant 1995 dollars, except in FY 1995 - 2000, which is a six-year average.
*** Total Life Cycle is the sum of annual costs in constant 1995 dollars.
PAST, PRESENT, AND
FUTURE MISSIONS
The Separations Process Research Unit wasconstructed and operated by the Atomic EnergyCommission as a pilot plant for developmentand testing of two chemical processes forextracting both uranium and plutonium fromirradiated fuel. The Separations ProcessResearch Unit was operated from 1950 to 1953by the Knolls Atomic Power Laboratory, andsupported operations at Hanford, Washingtonand at the Savannah River Site.
The Separations Process Research Unit iscurrently on stand-by status pendingdecommissioning through a signedMemorandum of Agreement with the Office ofNaval Reactors. Certain non-contaminatedportions of the facility are now in use by theKnolls Atomic Power Laboratory for theiroperations.
The current mission for the EnvironmentalManagement program at the SeparationsProcess Research Unit is to complete
decontamination and environmentalrestoration, including waste managementactivities by 2010 at the assumed funding levels.The Environmental Management programexpects to decontaminate the facility to "freerelease" status as defined by DOE Order 5400.5.It will be verified by an independentverification contractor, and returned to theKnolls Atomic Power Laboratory.
Once the Separations Process Research Unit hasbeen decontaminated and released to the KnollsAtomic Power Laboratory, the future use of theSeparations Process Research Unit site isdependent on programs funded at the KnollsAtomic Power Laboratory. Future use of thesite has not been determined at this time.
ENVIRONMENTAL
RESTORATION
Previous limited cleanup performed within twoof the four Separations Process Research Unitbuildings included removal of liquid and
NY 14

sludge from the process tanks, and limiteddecontamination of equipment, process lines,and interior spaces. Only residual radioactivecontamination was left on the floors, walls,pipes, equipment surfaces, process pipes, tanks,and equipment. All seven Separations ProcessResearch Unit waste tanks were drained;however, the tanks currently contain solid/semi-solid radioactive residue. Soilsimmediately adjacent to the buildings and atthe fringes of the parking lot are contaminatedwith low levels of radioactivity which resultedfrom storage of radioactive waste drumsawaiting shipment to offsite disposal locations.Contaminants of concern include plutoniumand long-lived fission products, principallystrontium-90 and cesium-137. The proposedaction is the decommissioning of four buildingsand associated unit structures such as the tankfarm, vaults, and pipe tunnels; and removal ofsoils contaminated by Separations ProcessResearch Unit activities.
At present, no quantitative characterizationdata for hazardous or toxic waste are available.The possible presence of hazardous or toxicmaterials was not considered duringpreparation of the life-cycle cost estimate for theSeparations Process Research Unitdecommissioning work.
Surveillance and monitoring activities prior todecommissioning will be performed by KnollsAtomic Power Laboratory in accordance with
the terms of the Memorandum of Agreementsigned in September 1992 between the DOEOffices of Naval Reactors and EnvironmentalManagement.
Environmental restoration activities willinvolve, sequentially:
• Dismantling, packaging, and disposal of all processsystems as radiological waste;
• Decontamination of remaining building surfaces, andsurvey of them to verify acceptance as "free release" asdefined in DOE Order 5400.5;
• Dismantling of building roof, corrugated transit siding,and structural steel;
• Mechanical break-up and removal of all concrete walls,floors, and foundations; and
• Removing contaminated soil around buildings andpackaging it for disposal in parallel with buildingdemolition.
The building excavation will be surveyed toverify all radiological contamination abovereleasable limits, as defined by DOE Oder5400.5, has been removed. Additionalexcavation of contaminated material will beperformed, as necessary. After verificationsurveys are accepted, the excavation will bebackfilled and compacted to the original grade,and the site will be returned to the KnollsAtomic Power Laboratory for its use.
Environmental Restoration Activity Costs
Five-Year Averages (Thousands of Constant 1995 Dollars)•
FT 1995 • 2000 2005 2010 2015 2020 2025 2030 life Cycle"
Facility Decommissioning 431 29,400 0 0 0 0 0 149,588
• Costs reflect a five-year average in constant 1995 dollars, except In FY 1995.2000, which Is a six-year average.
** Total Life Cycle is the sum of annual costs In constant 1995 dollars,
NY 15

WASTE MANAGEMENT
ACTIVITIES
Treatment, Storage andDisposal Operations
The current cost estimate for the SeparationsProcess Research Unit assumes only low-levelradioactive waste is present at the facility. Thiswaste will be packaged and shipped fordisposal at one of the approved DOE facilities.Waste not contaminated with radiological orhazardous materials will be disposed of at thelocal landfill. Where appropriate, wastereduction techniques will be applied beforewaste is shipped offsite.
Waste generated by decommissioning activitieswill be shipped to approved hazardous wasteor radiological waste treatment and/or disposalfacilities. There are no plans to construct long-term treatment, storage, or disposal facilities atthe Separations Process Research Unit. Allwaste management requirements will befunded within the environmental restorationactivities.
No onsite treatment facilities or operations arecurrently planned for the Separations ProcessResearch Unit. Treatment required will beperformed by either commercial or DOEfacilities.
Storage and handling activities are expected tobe confined to those necessary to prepare wastefor shipment offsite.
All waste will be disposed of at offsite facilities.There are no plans for disposal at theSeparations Process Research Unit facility.
NUCLEAR MATERIAL AND
FACILITY STABILIZATION
There are no current or planned nuclearmaterial and facility stabilization activities atthe Separations Process Research Unit site.
LANDLORD FUNCTIONS
In accordance with the terms of theMemorandum of Agreement signed inSeptember 1992, between the DOE Offices ofNaval Reactors and EnvironmentalManagement, landlord and infrastructure costswill be borne by Knolls Atomic PowerLaboratory. The essence of this agreementrequires the Office of Naval Reactors provideaccess to all available information on theSeparations Process Research Unit facility;make arrangements to vacate the SeparationsProcess Research Unit buildings prior to thestart of Environmental Management programwork; remove all materials associated with thecurrent users, provide continuing surveillance;maintenance and security until the start ofEnvironmental Management program work;and provide utility services to the extentpractical during Environmental Managementprogram work.
PROGRAM MANAGEMENT
Program management at the SeparationsProcess Research Unit is concerned withdecontamination planning, project control, anddecommissioning management. At this time,these activities are performed by ChicagoOperations Office staff on a level-of-effort basis.
NY 16

FUNDING AND COST
INFORMATION
The following tables present current andprojected funding information and majorEnvironmental Management program activityand project costs projected through 2005 for theSeparations Process Research Unit.
Defense Funding Estimate
Five-Year Averages (Thousands of Constant 1995 Dollars)**FY 1995 - 2000 2005 2010 2015 2020 2025 2030 life Cycle*
Environmental Restoration 431 29,400 0 0 0 0 0 149,588
• Costs reflect a five-year average in constant 1995 dollars, except in FY 1995-2000, which is a six-year average.
** Total Life Cycle is the sum of annual costs in constant 1995 dollars.
Major Activity MilestonesACTIVITY TASK COMPLETION DATE
Environmental Restoration Fiscal Year
Complete Decontamination 2010
For further information on this site, please contact: Public Participation Office (708) 252-8796Public Affairs Office (708) 252-2010Technical Liaison: Michael Ferrigan (708) 252-2570
NY 17

NY 18

WEST VALLEY DEMONSTRATION PROJECT
The West Valley Demonstration Project is sited on a 3,300-acre tract 30 miles south of Buffalo, NewYork. This site is also the location of the Western New York Nuclear Services Center. The WestValley Demonstration Project occupies approximately 230 acres of this New York State-ownedproperty. The Department of Energy (DOE) manages West Valley Demonstration Project oversightresponsibilities through the DOE Area Office located onsite. This office reports to the Department'sOhio Field Office located in Miamisburg, Ohio.
•
AG Storage
WasteStorageArea
Lagoons
•
NYS LicensedDisposal Area (SDA
Fuel Receiving andStorage Area (FRS)
N RC Licensed DispoArea (N DA)
Old Processing Building
o 410i
Waste TankFarm
1,,111
New VitrificationFadlity
.10
vii\,, Drum CellFadlity
Warehouses
iso
Offices • EM FadlitiesIS] Disp osal Areas
NY 19

Estimated Site Total
FY 1995
Waste Management 127,100
(Thousands of Current 1995 Dollars)*
1996
137,500
1997
140.200'
1998 1999 2000
149,100 156,800 164,300
• Costs for FY 1995 reflect Congressional Appropriation, costs for FY 1996 reflect EM budget submission, costs for FY 1997-2000 reflect Budget Shortfall Scenario, costs for
shaded area assume 3% annual inflation.
Five-Year Averages (Thousands of Constant 1995 Dollars)•`
FY 1995-2000 2005 2010 2015 2020 2025 2030 Life Cycle***
Waste Management 135,450 118,240 93,440 108,000 125,440 145,280 0 3,754,705
Costs reflect a five-year average in constant 1995 dollars, except in FY 1995-2000, which is a six-year average.
*** Total Life Cycle is the sum of annual costs in constant 1995 dollars.
PAST, PRESENT, AND
FUTURE MISSIONS
There is no historic Department of Energymission at West Valley or the Western New YorkNuclear Services Center. From 1966 to 1972,Nuclear Fuel Services, Inc. operated a nuclearfuel reprocessing plant at the Western NewYork Nuclear Services Center under contract tothe State of New York in a commercial venture.The plant, which reprocessed uranium andplutonium from spent nuclear fuel, generatedapproximately 600,000 gallons of liquid high-level waste stored in underground tanks. In1972, nuclear fuel reprocessing operations werediscontinued in accordance with provisions inthe contract. The State of New York remainedas the owner of the site.
On October 1, 1980, Congress passed the WestValley Demonstration Project Act (the"Act")[Public Law 96-368]. The Act chargedDOE with the responsibility for demonstratingthe technology for the safe solidification and
cleanup of the high-level waste and facilitiesused during cleanup. Additionally, the Actrequired the Department to develop containerssuitable for the permanent disposal of thesolidified high-level radioactive waste and totransport the waste to an appropriate Federalrepository for permanent disposal.
By provisions in the Act, low-level andtransuranic waste produced in the West ValleyDemonstration Project are to be disposed ofunder applicable licensing requirements.Further, the tanks and other facilities in whichthe solidified high-level radioactive waste wasstored, the facilities used in the solidification ofthe waste, and any material and hardware usedin connection with the demonstration projectare to be decommissioned.
After evaluation of alternatives presented in anenvironmental impact statement, DOE selectedvitrification as the treatment process to stabilizethe high-level waste for ultimate disposal. NewYork State, through its Energy Research andDevelopment Authority, cooperates in the WestValley Demonstration Project and currently
NY 20

contributes approximately 10 percent of theproject's costs. During Phase I, the high-levelwaste will be immobilized in borosilicate glassand stored onsite, pending completion of aSpent Nuclear Fuel and High-Level WasteProgrammatic Environmental ImpactStatement. During Phase II, the project facilitiesused will be decommissioned, following areview of alternative actions in a West Valleysite-specific Environmental Impact Statementand the issuance of a record of decision.
Currently, the principal activities at the WestValley Demonstration Project are centered onthe construction, testing, and startupengineering and operations associated with thevitrification facility. Vitrification processoperations are scheduled to commence inJanuary 1996 and proceed through the thirdquarter of FY 1998, at which time the 600,000gallons of high-level waste would be solidified.
In addition to the highly radioactive liquidwaste stored at the West Valley site, there are125 irradiated fuel elements owned by DOEcontained in a water-filled storage pool whileawaiting disposition. Final disposition of the125 fuel elements is not a part of the WestValley Demonstration Project, but disposition ofthese fuel elements is included in the finalSpent Nuclear Fuel and High-Level WasteProgrammatic Environmental Impact Statementand Idaho National Engineering LaboratoryEnvironmental Restoration and WasteManagement Environmental Impact Statement.
Upon fulfillment of the requirements of the Act,and after its responsibilities with respect to thestored fuel elements have been met, DOE'sobligations at the site will have been completed.Future disposition of the site, under NuclearRegulatory Commission (NRC) license, will bethe responsibility of the State of New York.
ENVIRONMENTAL
RESTORATION
West Valley site contamination is the result ofthe commercially-conducted fuel reprocessingoperations. DOE is only responsible for thecleanup of facilities used during thedemonstration of the vitrification process.When this mission is completed, theDepartment will turn the project site over toNew York State for final disposition.
DOE and the State of New York are jointlypreparing an environmental impact statementto address project completion and final closurealternatives and cleanup options for the site.
Resource Conservation and Recovery Act(RCRA) facility investigations are beingconducted to ascertain the nature and extent ofreleases of hazardous waste or constituents.
Several alternatives are being considered forsite closure under the Environmental ImpactStatement Record of Decision. The three"Action" Alternatives (including DOE and NewYork State Energy Research and DevelopmentAuthority responsibilities) are defined asfollows:
I. Removal and Release to AllowUnrestricted Use - The entire site wouldbe decontaminated as needed. Allstructures, both permanent andtemporary, would be demolished andremoved. All radioactive, mixed, andhazardous waste generated, exhumed, orremoved, except the high-level waste heel,would be transferred for centralizedonsite characterization, treatment, andpackaging, followed by offsite disposal.The site would be returned to a naturalstate and would be eligible forunrestricted release.
NY 21

II. Removal, On-Premises Waste Storage,and Release to Allow Unrestricted Use -For Alternative II, the entire site would bedecontaminated, as needed. Allstructures would be demolished andremoved. All radioactive, mixed, andhazardous waste generated, exhumed, orremoved, except the high-level waste heel,would be transferred for centralizedonsite characterization, treatment, andpackaging, followed by onsite storage.The site, except for the storage area,would be returned to a natural state andwould be eligible for unrestricted release.The storage area and an existing drum cellwould be provided with a long-termcontinuous maintenance and monitoringprogram for an indefinite period.
III. In-Place Closure and On-Premises Low-Level Waste Disposal - For this site-widealternative, two approaches have beenconsidered:
a. Monolith - Decontamination andfixation would be performed. TheProcess Building, the High-LevelWaste Tank Farm, and the VitrificationFacility would be backfilled with low-density concrete. Any radioactivewaste generated would be disposed ofin the backfilled buildings. NuclearRegulatory Commission-licensedDisposal Area and State-LicensedDisposal Area burial grounds wouldbe stabilized with the waste left inplace. Waste currently stored onsite inthe Chemical Process Cell WasteStorage Area and the Lag Storage Areawould be placed inside the ProcessBuilding and/or the VitrificationFacility prior to backfilling. A long-term continuous monitoring andmaintenance program would beinstituted.
b. Capped Rubble Pile - Facilities wouldreceive decontamination and fixationprior to dismantlement. This wouldrequire special equipment and theconstruction of a new confinementstructure around the Process Buildingand the Vitrification Facility to controlthe spread of radioactivity duringdismantlement and minimizeexposure to workers. Rubble wouldremain in place and would be cappedwith clean rubble and concrete.Nuclear Regulatory Commission-licensed Disposal Area and State-licensed Disposal Area burial groundswould be stabilized with the waste leftin place. Any radioactive wastegenerated would be disposed ofwithin an onsite radioactive wastedisposal facility. A long-termcontinuous monitoring andmaintenance program would beinstituted.
Note: There are two paths, and therefore, two cost estimates forOption III. This provides for a total of four cost estimates usedfor this project.
WASTE MANAGEMENT
All site activities, including high-level wastesolidification, decontamination,decommissioning, RCRA corrective measures,and other necessary site remedial activities, arecategorized as waste management operations.An environmental impact statement is beingdrafted for the completion of the West ValleyDemonstration Project and final site closure.
The record of decision may include theselection of one of the alternatives or acombination of several. The budgetaryrequirements for completion of the West ValleyDemonstration Project are an average of the
NY 22

estimated costs of the three "Action"Alternatives. These alternatives presentdiffering actions to address the different areasof the site:
I. The process building, including itsequipment, would be disassembled andremoved; or entombed in concrete; ordisassembled, grouted, and capped.
II. The High-Level Waste Tank Farm and theVitrification Facility would bedisassembled and removed; or entombedin concrete; or grouted and capped.
III. a. Disposal areas, such as the NuclearRegulatory Commission DisposalArea and a construction landfill, maybe exhumed, with waste either sentoffsite for disposal or kept onsite inmonitored retrievable storage.
b. Under this option, the facilities wouldbe reduced to rubble; the rubblewould remain in place and would becapped with clean rubble andconcrete.
In similar fashion, the alternatives will evaluateactions for the balance of the support facilitiesnow in place and will evaluate build/no buildactions for new waste storage and handlingfacilities.
Categorization of future waste activitiesincludes waste treatment, waste storage/handling, and waste disposal. These threewaste activity categories are described asfollows:
• Waste Treatment. Vitrification of high-level waste will
be performed in accordance with the Phase I Environ-mental Impact Statement, with planned completion in
1998. The Phase II Environmental Impact Statementwill define treatment and disposal options for low-level, transuranic, and high-level waste residuals.
• Waste Storage/Handling. Solidified high-level wastewill be stored onsite until a Federal repository or otheroffsite storage and disposal option is available. Low-level waste will be volume-reduced, repackaged, andstored disposal-ready, pending the Environmental
Impact Statement Record of Decision.
• Waste Disposal. Low-level class A waste will bedisposed on a case-by-case basis as disposal optionsbecome available.
All other radioactive waste will be retainedpending receipt of the Environmental ImpactStatement Record of Decision. Hazardouswaste will be disposed in accordance withregulatory requirements.
Waste Management Activity Costs
Five-Year Averages (Thousands of Constant 1995 Dollars)*
FY 1995.2000 2005 2010 2015 2020 2025 2030 Life Cycle*"
Decommissioning 135,450 118,240 93,440 108,000 125,440 145,280 0 3,754,705
• Costs reflect a five-year average in constant 1995 dollars, except in FY 1995-2000, which is a six-year average.
Total Life Cycle is the sum of annual costs in constant 1995 dollars.
NY 23

NUCLEAR MATERIAL AND
FACILITY STABILIZATION
There are no current or planned nuclearmaterial and facility stabilization activities atthe West Valley Demonstration Project site.
LANDLORD FUNCTIONS
There will be no long-term DOE presence orfuture mission at the West ValleyDemonstration Project. Upon completion of thedemonstration, operational responsibility willbe returned to the State of New York for finaldisposition. As such, there are no DOElandlord activities associated with the project.
PROGRAM MANAGEMENT
Program Management costs are considered partof the overall demonstration project costs andhave been included in the waste managementcategory in the respective tables.
FUNDING AND COST
INFORMATION
The following tables present fundinginformation and major activity milestones forthe West Valley Demonstration Project.
Nondefense Funding Estimate
Five-Year Averages (Thousands of Constant 1995 Dollars)*FY 1995-2000 2005 2010 2015 2020 2025 2030 life Cycle*
Waste Management 135,450 118,240 93,440 108,000 125,440 145,280 0 3,754,705
• Costs reflect a five-year average in constant 1995 dollars, except in FY 1995-2000, which is a six-year average.
Total Life Cycle is the sum of annual costs in constant 1995 dollars.
For further information on this site, please contact: Public Participation OfficePublic Affairs OfficeTechnical Liaison: Dan Sullivan
(513) 865-3968(513) 865-3968(716) 942-4016
NY 24

NEW YORK FUSRAP SITES
Ashland Oil #1 and #2, Bliss and Laughlin Steel, Colonie, Linde Air Products Niagara Falls Stor-age Site, and Seaway Industrial Park constitute the New York sites currently within the FormerlyUtilized Sites Remedial Action Program (FUSRAP). The program was established in 1974 underthe provisions of the Atomic Energy Act to identify previously decontaminated Manhattan EngineerDistrict and the Atomic Energy Commission sites to reevaluate their radiological condition and totake appropriate remedial action where necessary. FUSRAP encompasses 46 sites in 14 states and isfunded through the Oak Ridge Operations Office. The model used to estimate costs for this reportprovides one cost for all of the FUSRAP sites located in each state. All costs for waste managementactivities, program management, and relevant landlord activities attributable to the Department ofEnergy (DOE) are provided for within the scope of environmental restoration. There are noFUSRAP sites with either current or planned nuclear material and facility stabilization activityneeds. Funding for all sites is 100 percent nondefense. For a general discussion of FUSRAP andassociated costs see the FUSRAP Site Summary found in the Tennessee section.
Estimated Site Total
1995
(Thousands of Current 1995 Dollars)*
1996 1997 1991
New York-FUSRAP 20,800 28,930 ,880
1999
18,300
2000
24,760
• Costs for FY 1995 reflect Congressional Appropriation, costs for FY 1996 reflect EM budget submission, costs for FY 1997-2000 reflect Budget Shortfall Scenario, costs for
shaded area assume 3% annual inflation.
Five-Year Averages (Thousands of Constant 1995 Dollars)**
FY 1995-2000 2005 2010 2015 2020 2025 2030 Life Cycle***
New York-FUSRAP 25,209 16,956 13,890 12,911 0 0 0 370,041
** Costs reflect a five-year average in constant 1995 dollars, except in FY 1995-2000, which is a six-year average.
*** Total Life Cycle is the sum of annual costs in constant 1995 dollars.
Nondefense Funding Estimate
Five-Year Averages (Thousands of Constant 1995 Dollars)*
FT 1995 - 2000 2005 2010 2015 2020 2025 2030 Life Cycle**
Environmental Restoration 25,209 16,956 13,890 12,911 0 0 0 370,041
- Costs reflect a five-year average in constant 1995 dollars, except in FY 1995-2000, which is a six-year average.
** Total Life Cycle is the sum of annual costs in constant 1995 dollars.
NY 25

NY 26

ASHLAND OIL #1
(Formerly Utilized Sites Remedial Action Program)
Ashland Oil 1 is a 10.8-acre site that is part of the former Ashland Oil Company refinery inTonawanda, New York.
vsa 9•: rnum au.0 COMMITS
ORA !NAGE
RA ILROAO
NY 27

PAST, PRESENT, AND
FUTURE MISSIONS
In 1943, 11 acres known as the Haist propertywere leased for the Federal Government by theManhattan Engineer District. The ManhattanEngineer District purchased the property fromE. Haist and co-owners in 1944. The tractserved as a disposal site for uranium orerefinery residues generated by Linde AirProducts (a division of Union CarbideCorporation) in Tonawanda, New York.Residues composed essentially of low-gradeuranium ore tailings were deposited on theformer Haist property from 1944 to 1946.Approximately 8,000 tons of residuescontaining 0.54 percent uranium were spreadout over roughly two-thirds of the site. In 1949,the site was assigned to the jurisdiction of theGeneral Services Administration. In 1958,following a radiological survey, the AtomicEnergy Commission released the property foruse with no radiological restrictions. In 1960,the General Services Administration transferredownership of the property to the Ashland OilCompany.
For further information on this site, please contact:
The Ashland Oil 1, Ashland Oil 2, the formerLinde Air Products, and Seaway Industrial Parksites are included in the Tonawanda integratedenvironmental documentation process tocomply with requirements of NationalEnvironmental Policy Act and ComprehensiveEnvironmental Response, Compensation andLiability Act. Future use of this site depends onresolution of the record of decision forTonawanda. Options range from constructionof a local disposal cell (for all 4 Tonawandasites) to shipment of all waste to anotherdisposal site.
ENVIRONMENTAL
RESTORATION
In 1974, contaminated material was transportedfrom the Ashland Oil 1 site to the SeawayIndustrial Park. Remedial action is expected tobe complete by 1999.
Public Participation Office (615) 576-1590Public Affairs Office (615) 576-0885Technical Liaison: Melyssa Noe (615) 241-3315
NY 28

ASHLAND OIL #2
(Formerly Utilized Sites Remedial Action Program)
Ashland Oil 2 is a 100-acre site owned by the Ashland Oil Company located in Tonawanda, New
York.
9' WTWIN CELLCONOUI TS
DRAINAGE
RAILROAD
SCALE
0 .25 .5 MILES
0 .4 .S It ILOKTERS
NY 29

PAST, PRESENT, AND
FUTURE MISSIONS
Ashland Oil 2 is associated with the integratedprocess for the Tonawanda sites. Since 1974,the Ashland Oil Company has transported anunknown amount of the uranium residuesfrom the Ashland Oil 1 site to the Ashland Oil 2site. Contaminated soils cover approximately100 acres. The Ashland Oil 2 property is vacantand is covered by vegetation. No commercialoperations are currently being conducted.
Future use of this site depends on resolution ofthe record of decision for Tonawanda. Optionsrange from construction of a local disposal cell(for all 4 Tonawanda sites) to shipment of allwaste to another disposal site.
For fiirther information on this site, please contact:
ENVIRONMENTAL
RESTORATION
Contaminated soil excavated during AshlandOil 1 construction activities in 1974 wasdeposited at Ashland Oil 2 for disposal. Thewaste consists of soil contaminated with low-grade uranium residues. The waste volume isestimated to be 52,100 cubic yards. Remedialaction is expected to be complete by 1999.
Public Participation OfficePublic Affairs OfficeTechnical Liaison: Melyssa Noe
(615) 576-159(615) 576-0885(615) 241-3315
NY 30

BLISS & LAUGHLIN STEEL
(Formerly Utilized Sites Remedial Action Program)
The former Bliss and Laughlin facility is located at 110 Hopkins Street in Buffalo, New York.
OM=
r-1SPECIAL"'"r IFINISHING L -AREA
TRUCKLOADINGAREA
ccVf
VI
I
PROPERTY UNE
FEET0 60
20METERS
NY 31

PAST, PRESENT, AND
FUTURE MISSIONS
During the 1950's, Bliss & Laughlin SteelCompany performed uranium matching androd straightening operations for the AtomicEnergy Commission. Bliss & Laughlin SteelCompany shipped their products to othermanufacturers and their waste to the AtomicEnergy Commission. A small degree ofuranium contamination was found inapproximately 100 square feet of the floor. Theless than one-acre site is currently an activesteel plant.
Future use of this site depends on the resolutionof the decision document for cleaning up thesite. Options range from no action to removalof all material and shipment for disposal offsite.
For further information on this site, please contact:
ENVIRONMENTAL
RESTORATION
The site consists of a single large building witha floor area of 12,000 square meters. Sincemachining operations began in the 1950's, onlyminor changes have been made to the mainstructure and equipment has been rearrangedor replaced to varying degrees. The area whereuranium machining is suspected to have takenplace occupies about 300 square meters of floorspace in the southeast portion of the building.The contamination involves low-levelradioactive waste containing trace amounts ofuranium. Approximately 20 cubic yards ofcontaminated debris will be generated duringremediation.
Public Participation OfficePublic Affairs OfficeTechnical Liaison: Melyssa Noe
(615) 576-1590(615) 576-0885(615) 241-3315
NY 32

COLONIE SITE
(Formerly Utilized Sites Remedial Action Program)
The Colonie Site is located on Central Avenue in a mixed light-industrial, commercial, and residen-
tial area within Colonie and adjacent to Albany, New York.
•••"*. 1loo."1. TONI OF
COLONIEPROPERTY
BUILDING
PROPERTY BOUNDARY
EXISTING FENCE
RAILROAD TRACKS
SCALE
001 0 200 FEET
01
30 SO METERS
IOIAXII SUBSTATION- NIAGARA ED
INTERIM SIGN GE PILE
CENTRAL MIME •
FACILITY BUILDING
BAY 2
-r -
I SAY 3
NY 33

PAST, PRESENT, AND
FUTURE MISSIONS
The Colonie Site was formerly owned byNational Lead Industries, Inc., but was assignedto the Formerly Utilized Sites Remedial ActionProgram (FUSRAP) by Congressional action in1983. The 11-acre site consists of plantbuildings with process equipment for uraniummaterial and is enclosed by a chain-link fence.The main building covers 3 acres (120,000square feet). All of the former National LeadIndustries plant buildings and some of thegrounds are radioactively contaminated. Thereare 56 vicinity properties. In the 1950's,National Lead Industries, Inc. beganmanufacturing uranium products at Colonieunder a license issued by the Atomic EnergyCommission. Work at the plant includedfabrication of slightly enriched uranium fuelelements, chemical processing of non-irradiated, slightly enriched uranium scrap, andfabrication of shielding components, ballastweights, and projectiles from depleteduranium.
For further information on this site, please contact:
Future use of this site depends on the resolutionof the decision document for cleaning up thebalance of the site. Options range from noaction to removal of all materials to disposaloff site.
ENVIRONMENTAL
RESTORATION
All but three of the vicinity properties havebeen remediated. The main building at the siteis currently undergoing decontamination anddemolition. The waste volume for soils isestimated to be 52,500 cubic yards and consistsof uranium waste residues and some heavymetals. The building waste volume includesover 2.6 million pounds of metal and 5,900cubic yards of building rubble. Theremediation is anticipated to be complete in FY1998.
Public Participation OfficePublic Affairs OfficeTechnical Liaison: Melyssa Noe
(615) 576-1590(615) 576-0885(615) 241-3315
NY 34

LINDE AIR PRODUCTS
(Formerly Utilized Sites Remedial Action Program)
The former Linde Air Products (now owned by Praxair, Inc.) property in Tonawanda is about 135
acres and is bordered on the north and east by other industrial and residential properties; on the
south by small businesses, industries, and undeveloped land; and on the west by a golf course. The
Ashland Oil 1, Ashland Oil 2, and Seaway Industrial Park sites are nearby.
x rTWIN CELLCLWOUI TS
ORA I RACE
RAILROAD
SCALE
0'I5 .5 NILES
<4 01
.0 !LOVERSWOODWARD AK.
NY 35

PAST, PRESENT, AND
FUTURE MISSIONS
Linde performed uranium separationoperations and ore processing from 1940through 1948. Wastes were consolidated on site.Five buildings were involved in uraniumseparation and conversion processes. Building14 was used as a pilot plant for uraniumseparation and is currently used for fabricationfacilities, research laboratories, and offices.Building 30 was the primary uraniumprocessing building and has been converted toa shipping and receiving warehouse. Building31, used in the uranium separation process, isnow used for maintenance and offices.Building 37, used in the uranium separationprocess, was demolished by the site owner.Building 38, currently used for storage, wasused for uranium dioxide fluorination toproduce uranium tetrafluoride. Building 90 is anew building constructed in an area wheretailings were removed from the site at the closeof operations.
For further information on this site, please contact:
Future use of this site depends on resolution ofthe record of decision for Tonawanda. Optionsrange from construction of a local disposal cell(for all 4 Tonawanda sites) to shipment of allwaste to another disposal site.
ENVIRONMENTAL
RESTORATION
Residual low-level contaminated soil wasremoved from the construction area and placedin two wind rows on the site. These piles ofcontaminated soil were subsequentlyconsolidated in a pile west of Building 90. Thewaste volume is estimated to be 70,000 cubicyards. Wastes are the tailings from theprocessing or ores containing uranium.Remedial action is expected to be complete by1999.
Public Participation OfficePublic Affairs OfficeTechnical Liaison: Melyssa Noe
(615) 576-1590(615) 576-0885(615) 241-3315
NY 36

SEAWAY INDUSTRIAL PARK
(Formerly Utilized Sites Remedial Action Program)
The Seaway Industrial Park Site covers approximately 93 acres and is located in Tonawanda, New
York. This site is in an industrial area and is bounded by Ashland Oil Company, Inc. and other
industries.
1
610/10ISLAND
4-
ASK me I
. 1.r,.. TWIN
CELL.g. CONDUITS......0.
SOLE
ORA IMAGE
RAILROAD
, 0 .25 . 5 441115
KKOVARO AVE. 0 .4 .1 it ILCIE TEAS
NY 37

PAST, PRESENT, AND
FUTURE MISSIONS
In 1974, some of the residues deposited on theAshland Oil 1 property were excavated by theAshland Oil Company. The residues weretransported to the Seaway Industrial Park,which covers 100 acres, and deposited intothree areas, A, B, and C. The present use of theSeaway industrial park is as a sanitary landfill.
Future use of this site depends on resolution ofthe record of decision for Tonawanda. Optionsrange from construction of a local wastedisposal cell (for all 4 Tonawanda sites) toshipment of all waste to another disposal site.
For further information on this site, please contact:
ENVIRONMENTAL
RESTORATION
Approximately 6,000 cubic yards ofcontaminated soil, containing mostly low-gradeuranium ore tailings, were disposed of at theSeaway sanitary landfill after being excavatedfrom Ashland Oil 1 in 1974. The waste volumeis estimated to be 117,000 cubic yards. Some ofthe waste is covered with about 40 feet of soiland refuse. Contamination is limited to about14 acres of the site.
Remedial action is expected to be complete by1999.
Public Participation OfficePublic Affairs OfficeTechnical Liaison: Melyssa Noe
(615) 576-1590(615) 576-0885(615) 241-3315
NY 38

.43
B ELF IELDBo WMA N
NORTH DAKOTA
Estimated State Total
(Thousands of Current 1995 Dollars)*
$9 1995
North Dakota • UMTRA
1996 1997 1998 1999 2000
• Costs for FY 1995 reflect Congressional Appropriation, costs for FY 1996 reflect EM budget submission, costs for FY 1997-2000 reflect Budget Shortfall Scenario, costs for
shaded area assume 3% annual inflation.
Five-Year Averages (Thousands of Constant 1995 Dollars)**
FT 1995-2000 2005 2010 2015 2020 2025 2030 Life Cycle.*
North Dakota • UMTRA 4,204 516 0 0 0 0 0 27,805
Costs reflect a five-year average in constant 1995 dollars, except in FY 1995 - 2000, which is a six-year average.
*** Total Life Cycle is the sum of annual costs in constant 1995 dollars.
ND 1

ND 2
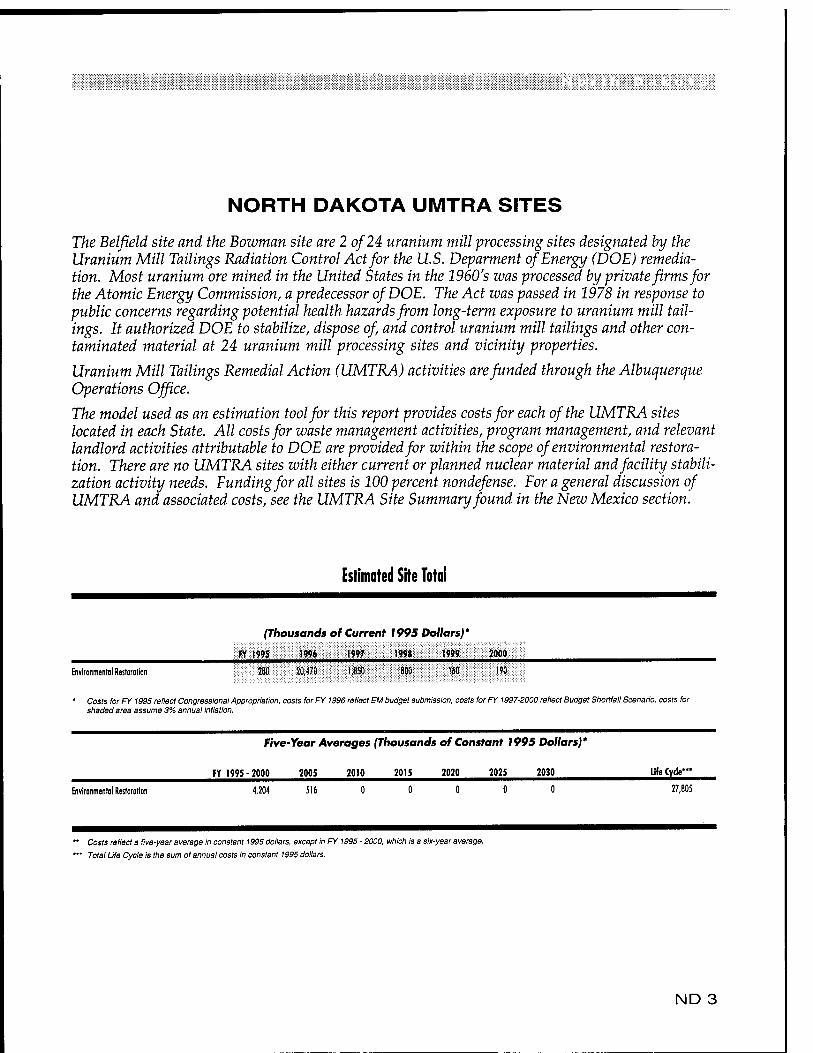
NORTH DAKOTA UMTRA SITES
The Belfield site and the Bowman site are 2 of 24 uranium mill processing sites designated by theUranium Mill Tailings Radiation Control Act for the U.S. Deparment of Energy (DOE) remedia-tion. Most uranium ore mined in the United States in the 1960's was processed by private firms forthe Atomic Energy Commission, a predecessor of DOE. The Act was passed in 1978 in response topublic concerns regarding potential health hazards from long-term exposure to uranium mill tail-ings. It authorized DOE to stabilize, dispose of, and control uranium mill tailings and other con-taminated material at 24 uranium mill processing sites and vicinity properties.
Uranium Mill Tailings Remedial Action (UMTRA) activities are funded through the AlbuquerqueOperations Office.
The model used as an estimation tool for this report provides costs for each of the UMTRA siteslocated in each State. All costs for waste management activities, program management, and relevantlandlord activities attributable to DOE are provided for within the scope of environmental restora-tion. There are no UMTRA sites with either current or planned nuclear material and facility stabili-zation activity needs. Funding for all sites is 100 percent nondefense. For a general discussion ofUMTRA and associated costs, see the UMTRA Site Summary found in the New Mexico section.
Estimated Site Total
(Thousands of Current 1995 Dollars)*
81` 1995 1996 1997. 1998 1999 2000
Environmental Restoration 20,470 860 800
• Costs for FY 1995 reflect Congressional Appropriation, costs for FY 1996 reflect EM budget submission, costs for FY 1997-2000 reflect Budget Shortfall Scenario, costs for
shaded area assume 3% annual inflation.
Five-Year Averages (Thousands of Constant 1995 Dollars)*
FY 1995-2000 2005 2010 2015 2020 2025 2030 Life Cycle**
Environmental Restoration 4,204 516 0 0 0 0 0 27,805
▪ Costs reflect a five-year average in constant 1995 dollars, except in FY 1995 - 2000, which is a six-year average.
*** Total Life Cycle is the sum of annual costs in constant 1995 dollars,
ND 3

BELFIELD AND BOWMAN
(Uranium Mill Tailings Remedial Action Project)
The Belfield site is located in southwestern North Dakota, one mile southeast of the Town of Belfieldin Stark County. The former ashing site occupies 10.7 acres. The Bowman site is located sevenmiles west of Bowman, North Dakota. The site is located on nearly level land near the head ofSpring Creek, a part of the Grand River drainage basin. The Bowman site is approximately 12 acres.
IL_ ___J____
BELFIELDDESIGNATEDSITE
BELFIELD
Billings County
iroWC-3u-nt-y-
Golden Valley ICounty I
co
TO BOWMAN
NORTH DAKOTA
In* Bismarck
• WHITE BUTTE
H
DICKINSON
tt River
Stark County-
_
Hettinger County
Slope County I Hettinger County-----------L--------~—~—,
10
LEGEND
O INTERSTATE HIGHWAY
CD U.S. HIGHWAY
0 10 20 MILES
10 0 10 20 30 KILOMETERS
ND 4Map Location

1
PAST, PRESENT, AND
FUTURE MISSIONS
Union Carbide Corporation leased the Belfieldsite for an ashing operation from 1964 to 1966.Dakota Industries leased the site in 1968 for claycalcination operations to produce cat litter. In1972, LP Anderson Construction Company ofMiles City, Montana, purchased one of thebuildings and leased a portion of the site forconstruction equipment, maintenance, andstorage. Another building on the site housed ahoney processing operation. Cenex Exploration,an agricultural cooperative, maintains an oil andgas exploration office and shop adjacent to thesite. There is no discernible pile remaining.
During ashing operations from 1963 to 1967, theBowman site was owned by Viola Soderstrom,who leased the property to Kermac NuclearFuels Corporation, a subsidiary of Kerr-McGeeOil Industries. The property was subsequentlypurchased by the Milwaukee Road and leasedby Bowman Grain, Inc. Ashing operations weresuspended in February 1967, and the AtomicEnergy Commission Source Material Licensewas terminated on May 16, 1967.
Site use will remain restricted until surfaceremediation and ground-water compliance isachieved.
ENVIRONMENTALRESTORATION
No mill tailings pond or pile is present becausethe ash was shipped to another location.However, activities at these sites have resultedin contaminated soil, gravel, and rubble, aswell as contaminated windblown soil. Allactivity has been suspended pendingresolution of State funding issues. The costsfor environmental restoration projects at thissite are shown in the following table. Allfunding is from nondefense sources.
ND 5

Environmental Restoration Projects
Five-Year Averages (Thousands of Constant 1995 Dollars)*
FY 1995 - 2000 2005 2010 2015 2020 2025 2030 Life Cycle**
UMTRA-Ground Water - North Dakota 235 516 0 0 0 0 0 3,990
UMTRA-Soils - North Dakota 3,969 0 0 0 0 0 0 23,815
Total 4,204 516 0 0 0 0 0 27,805
'Costs reflect a five-year average in constant 1995 dollars, except in FY 1995-2000, which is a six-year average.
**Total Life Cycle is the sum of annual costs in constant 1995 dollars.
Nondefense Funding Estimate
Five-Year Averages (Thousands of Constant 1995 Dollars)*
FY 1995-2000 2005 2010 2015 2020 2025 2030 Life Cycle**
Environmental Restoration 4,204 516 0 0 0 0 0 27,805
*Costs reflect a five-year average in constant 1995 dollars, except in FY 1995-2000, which is a six-year average.
**Total Life Cycle is the sum of annual costs in constant 1995 dollars.
For further information on this site, please contact : Public Participation Office (505) 845-5951
Public Affairs Office (505) 845-6202
Technical Liaison: Jody Metcalf (505) 845-6146
ND 6

LUCKEY
MOUND PLANT
PIQUA NUCLEAR POWER PLANT
FERNALDENVIRONMENTAL
MANAGEMENT PROJECT
ALBA CRAFT
HHM SAFE SITE
ASSOCIATEDAIRCRAFT AND TOOLMANUFACTURING
PAINESVILLE SITE
BAKER BROS.
Q-_ REACTIVEMETALS, I NC.
B&T METALS
BATTELLE COLUMBUSLABORATORIES
laviiiiir
PORTSMOUTH GASEOUSDIFFUSION PLANT
OHIO
OH 1

Estimated State Total
(Thousands of Current 1995 Dollars)*
FY 1995 1996 1997 1998 1999 2000
Battelle-Columbus Laboratories
Fernald Environmental Management
Mound PlantPiqua Nuclear Power Facility
Portsmouth Gaseous Diffusion Plant
Reactive Metals, Co., Extrusion PlantOhio - FUSRAP
19,155 21,105
307,100113,978
12
86,5006,590 11,12410,600 4,660
22,105301,800130,456
23,302 22,497 19,285
325,600 310,200 473,700
132,352 133,874 146,1584 14
80,000 105,100 102,700 119,500
13,102 13,888 14,721 15,163
12,250 10,980 16,260 23,290
Total - Ohio 465,695 544,479 559,726 611,286 600,266 797,110
• Costs for FY 1995 reflect Congressional Appropriation, costs for FY 1996 reflect EM budget submission, costs for FY 1997-2000 reflect Budget Shortfall Scenario, costs for
shaded area assume 3% annual inflation.
Five-Year Averages (Thousands of Constant 1995 Dollars)**
FY 1995 - 2000 2005 2010 2015 2020 2025 2030
Battelle-Columbus Laboratories 19,968 3,392 0 0 0 0 0
Fernald Environmental Management 303,558 392,948 169,914 88,772 23,586 19,606 14,612
Mound Plant 117,674 86,061 104,538 59,845 31,342 5,474 29
Piqua Nuclear Power Facility 12 16 0 0 0 0 0
Portsmouth Gaseous Diffusion Plant 87,567 88,867 152,733 266,232 257,364 294,295 279,074
Reactive Metals, Co., Extrusion Plant 9,588 12,890 7,523 68 474 749 0
Ohio - FUSRAP 12,955 18,773 19,520 0 0 0 0
Total-Ohio 551,323 602,947 454,227 414,918 312,766 320,124 293,715
FY 2035 2040 2045 2050 2055 2060 2065 Life Cycle"'
Battelle-Columbus Laboratories 0 0 0 0 0 0 0 136,770
Fernald Environmental Management 4,246 1,453 200 240 400 160 0 5,402,034
Mound Plant 0 0 0 0 0 0 0 2,142,490
Piqua Nuclear Power Facility 0 0 0 0 0 0 0 152
Portsmouth Gaseous Diffusion Plant 222,705 52,901 17,028 2,323 1,599 1,065 0 8,706,321
Reactive Metals, Co., Extrusion Plant 0 0 0 0 0 0 0 166,053
Ohio - FUSRAP 0 0 0 0 0 0 0 269,194
Total -Ohio 226,951 54,354 17,228 2,563 1,999 1,225 0 16,823,014
▪ Costs reflect a five-year average in constant 1995 dollars, except in FY 1995 - 2000, which is a six-year average.
• Total Life Cycle is the sum of annual costs in constant 1995 dollars,
OH 2

BATTELLE COLUMBUS LABORATORIES
Battelle Columbus Laboratories is located in Columbus, Ohio. It includes two separate plants: onein downtown Columbus at King Avenue (nine buildings) and the other, the West Jefferson site (sixbuildings) in more rural surroundings. Department of Energy (DOE) activities are managed byDOE's Chicago Operations Office.
Nuclear Sciences Area
Medical andEnvironmentalSciences Area
.. JS-12....................................
Engineering Area
JS-1
0
JS-1
OH 3

Estimated Site Total
Environmental RestorationProgram Management
Total
(Thousands of Current 1995 Dollars)*
FY 1995
3,400
1997
18,9703,135
1998
19,8803,422
19,8952,602
19,1 21,105 22,105 23,302 22,497 19,285
• Costs for FY 1995 reflect Congressional Appropriation, costs for FY 1996 reflect EM budget submission, costs for FY 1997-2000 reflect Budget Shortfall Scenario, costs for
shaded area assume 3% annual inflation.
Five-Year Averages (Thousands of Constant 1995 Dollars)**
FY 1995 - 2000 2005 2010 2015 2020 2025 2030 Life Cycle***
Environmental Restoration 17,273 2,992 0 0 0 0 118,598
Program Management 2,695 400 0 0 0 0 18,172
Total 19,968 3,392 0 0 0 0 0 136,770
Costs reflect a five-year average in constant 1995 dollars, except in FY 1995 - 2000, which is a six-year average.
*** Total Life Cycle is the sum of annual costs in constant 1995 dollars.
PAST, PRESENT AND
FUTURE MISSIONS
Battelle Columbus Laboratories performedatomic research and development for theDepartment of Energy (DOE) and itspredecessor agencies between 1943 and 1986.Nuclear research included fabrication ofuranium and fuel elements; reactordevelopment; submarine propulsion; fuelreprocessing; and safety studies of reactorvessels and piping.
Battelle Columbus Laboratories is currentlyundergoing decommissioning under theEnvironmental Management program and as acondition of its Nuclear RegulatoryCommission license. Once decommissioninghas been completed to "free release" criteria
identified in DOE Order 5400.5, the BattelleColumbus Laboratories facilities will bereturned to Battelle Memorial Institute withoutradiological restrictions.
It is assumed all 15 Battelle ColumbusLaboratories facilities will be returned toBattelle Memorial Institute afterdecommissioning. Since Battelle ColumbusLaboratories facilities are privately owned, alldecisions regarding future use rest withBattelle. The Battelle Columbus LaboratoriesDecommissioning Project is a cost-share projectbetween the DOE (90 percent share) andBattelle Memorial Institute (10 percent share).
OH 4

ENVIRONMENTAL
RESTORATION
The type and extent of contamination variesfrom building to building, depending on thenature of nuclear research historicallyperformed. Most of the contamination inlaboratory and metal fabricating areas at thedowntown King Avenue site is due to uranium,thorium, and associated daughter products.The more rural West Jefferson site, location of alarge hot cell facility and a decommissionedresearch reactor, has also been contaminated bytransuranics, mixed fission products, andactivation products. All buildings containingradioactive materials have been evaluatedthrough a project hazard assessment and havebeen shown to be of low risk to workers and thepublic.
The principal contaminated media at bothBattelle Columbus Laboratories sites arefacilities and equipment. Small areas of surfacesoils may also be contaminated. Ground-watercontamination is not anticipated at either site.
Environmental restoration work at BattelleColumbus Laboratories includes pre-decommissioning and surveillance andmaintenance, task coordination andmanagement, assessment, characterization,relocation of equipment and furnishings,decontamination of equipment and facilities,decontamination and/or remediation ofcontaminated soils surrounding facilities, andpost-decontamination inspections, surveys,
compilation of certification documents, andpreparation of release documents. Once thedecommissioning effort has been completed,plans will be developed and implemented torestore the buildings and sites to usableconditions. At the assumed funding levels,Battelle Columbus Laboratories'decommissioning effort is expected to becompleted by FY 2005.
WASTE MANAGEMENT
Waste Treatment, Storage andDisposal
Waste generated by decommissioning activitiesinclude low-level radioactive waste, low-levelmixed waste, transuranic waste, and hazardouswaste. Low-level waste and low-level mixedwaste are shipped offsite to approved DOEdisposal facilities; transuranic waste is currentlybeing stored onsite pending opening of anapproved transuranic waste disposal site suchas the Waste Isolation Pilot Plant; andhazardous wastes are shipped to approvedcommercial treatment and disposal facilities.Battelle Columbus Laboratories has no plans toconstruct long-term treatment, storage, ordisposal facilities at its locations. Battelleoperates a Resource Conservation Recovery Act(RCRA) Part A hazardous waste managementfacility with minimal storage capacity. Wastemanagement costs are included within thescope of environmental restoration activities.
Environmental Restoration Activity Costs
Five-Year Averages (Thousands of Constant 1995 Dollars)"FY 1995 - 2000 2005 2010 2015 2020 2025 2030 Life Cycle*
Environmental Restoration 17,273 2,992 0 0 0 0 0 118,598
' Costs reflect a five-year average in constant 1995 dollars, except in FY 1995 - 2000, which is a six-year average.• Total Life Cycle is the sum of annual costs in constant 1995 dollars.
OH 5

Battelle Columbus Laboratories does not treatwaste onsite. All waste are shipped toappropriate facilities for treatment, asnecessary, prior to disposal.
Hazardous and radioactive waste generated bydecontamination operations are collected,reduced in volume and packaged, classified,and stored temporarily pending offsiteshipment. Transuranic waste are currentlystored onsite pending the opening of the WasteIsolation Pilot Plant in New Mexico.
Low-level waste and low-level mixed waste areshipped to DOE's Hanford, Washington facilityand to Envirocare; hazardous waste is sent tocommercial treatment facilities. Wasteoperations are funded and managed within thescope of environmental restoration, and will becomplete in 2005.
NUCLEAR MATERIAL AND
FACILITY STABILIZATION
There are no current or planned nuclearmaterial and facility stabilization activities atBattelle Columbus Laboroatories.
LANDLORD FUNCTIONS
Under the current contract with DOE, landlordcosts for Battelle Columbus Laboratories are theresponsibility of Battelle Memorial Institute.
PROGRAM MANAGEMENT
Program management at Battelle ColumbusLaboratories is concerned withdecontamination planning, project control, anddecommissioning management. BattelleColumbus Laboratories does not fund anygrants or Agreements-In-Principle at this time.
FUNDING AND COST
INFORMATION
The following tables present fundinginformation and major activity milestones forthe Battelle Columbus Laboratories.
Program Management Cost Estimate
Five-Year Averages (Thousands of Constant 1995 Dollars)*
FY 1995 - 2000 2005 2010 2015 2020 2025 2030 Life Cyde**
Program Management 2,695 400 0 0 0 0 0 18,172
• Costs reflect a five-year average in constant 1995 dollars, except in FY 1995-2000, which is a six-year average.
• Total Life Cycle is the sum of annual costs in constant 1995 dollars.
OH 6

Defense Funding Estimate
Five-Year Averages (Thousands of Constant 1995 Dollars)*FY 1995 - 2000 2005 2010 2015 2020 2025 2030 Life Cyde**
Environmental Restoration 1,727 299 0 0 0 0 0 11,860Program Management 270 40 0 0 0 0 0 1,817
Total 1,997 339 0 0 0 0 0 13,671
• Costs reflect a five-year average in constant 1995 dollars, except in FY 1995-2000, which is a six-year average.
• Total Life Cycle is the sum of annual costs in constant 1995 dollars.
Nondefense Funding Estimate
Five-Year Averages (Thousands of Constant 1995 Dollars) *FY 1995-2000 2005 2010 2015 2020 2025 2030 Life Cycle*"
Environmental Restoration 15,546 2,693 0 0 0 0 0 106,739Program Management 2,426 360 0 0 0 0 0 16,355
Total 17,972 3,053 0 0 0 0 0 123,094
• Costs reflect a five-year average in constant 1995 dollars, except in FY 1995-2000, which is a six-year average.• Total Life Cycle is the sum of annual costs in constant 1995 dollars.
Major Activity Milestones
ACTIVITY TASK COMPLETION DATE
Environmental Restoration Fiscal Year
Complete King Avenue Decommissioning 1997
Complete West Jefferson Decommissioning 2000
Environmental Restoration Activities completed 2005
For further information on this site, please contact: Public Participation Office (708)252-8796Public Affairs Office (708)252-2010Technical Liaison: Michael Ferrigan (708)252-2570
OH 7

OH 8

FERNALD ENVIRONMENTAL MANAGEMENT PROJECT
The former Fernald Feed Materials Production Center is located on a 1,050-acre tract that overlapsthe boundary between Hamilton and Butler Counties near the southwest corner of Ohio. It isapproximately 20 miles northwest of Cincinnati. The Great Miami River flows nearby in a south-erly direction, approximately one mile east of the site. Paddy's Run, a small stream, runs southwardalong the western boundary of the site. The Great Miami Aquifer flows beneath the Fernald site.The former production facilities and supporting infrastructure comprise approximately 136 acres ofthe 1,050-acre site.
Paddy's RunCreek
/\
Brooke✓ille-Shandon Road
OH 9

Estimated Site Total
(Thousands of Current 1995 Dollars)*
FY 1995 1996
Environmental Restoration 159,000 177)00Directly Appropriated Landlord 63,100 52,300Program Management 86,500 77,100
Total 308,600 307,100
1997x, 1998
187,4001210,40049,000;49,00065,400 66,200200
301,800 325,600
1999 2000
195,700 327,60049,300 70,00065,200 76,100
310,200 473,700
• Costs for FY 1995 reflect Congressional Appropriation, costs for FY 1996 reflect EM budget submission, costs for FY 1997-2000 reflect Budget Shortfall Scenario, costs forshaded area assume 3% annual inflation.
Five-Year Averages (Thousands of Constant 1995 Dollars)**
FY 1995 - 2000 2005 2010 2015 2020 2025 2030
Environmental Restoration 184,184 244,800 69,078 33,588 12,868 12,630 8,862Directly Appropriated Landlord 51,515 57,840 45,560 24,680 3,360 2,088 2,506Program Management 67,859 90,308 55,276 30,504 7,358 4,888 3,244
Total 303,558 392,948 169,914 88,772 23,586 19,606 14,612
2035 2040 2045 2050 2055 2060 2065 Life Cycle***
Environmental Restoration 70 200 200 240 400 160 0 3,020,548Directly Appropriated Landlord 4,176 1,253 0 0 0 0 1,016,403Program Management 0 0 0 0 0 0 0 1,365,046
Total 4,246 1,453 200 240 400 160 0 5,402,034
• Costs reflect a five-year average in constant 1995 dollars, except in FY 1995 - 2000, which is a six-year average.
*** Total Life Cycle is the sum of annual costs in constant 1995 dollars.
PAST, PRESENT, ANDFUTURE MISSIONS
The Fernald Feed Materials Production Center,later renamed the Fernald EnvironmentalManagement Project, was constructed in theearly 1950's to convert uranium ore intouranium metal, and then to fabricate theuranium metal into target elements for reactorsthat produced weapons-grade plutonium andtritium. Production operations spanned morethan 36 years until they were suspended on July10, 1989. Following necessary notifications, the
facility was formally shut down on June 19,1991. During the facility's production mission,over 500 million pounds of high-purityuranium products were yielded to support U.S.defense initiatives.
In 1986, the U.S. Environmental ProtectionAgency (EPA) and the Department of Energy(DOE) entered into a Federal FacilityCompliance Agreement coveringenvironmental impacts associated with siteactivities. The Fernald site was placed on EPA'sNational Priorities List in 1989. A ConsentAgreement was signed by DOE and EPA in
OH 10

1990 and amended in 1991. This agreementestablished five operable units, as follows:
• Operable Unit 1- Waste Pit Area
• Operable Unit 2 - Other Waste Areas
• Operable Unit 3 - Former Production Area
• Operable Unit 4 - Silos 1 through 4
• Operable Unit 5 - Environmental Media
The Ohio EPA is an active participant in theComprehensive Environmental Response,Compensation and Liability Act (CERCLA)process and is the lead agency overseeing thetreatment, storage, and disposal of hazardouswaste.
In addition to the five operable units, there isremnant production waste, referred to as legacywaste, which is stored in containers at theFernald site. This waste has been designatedfor permanent disposal.
Fernald's current mission is environmentalrestoration, consistent with the remediesdefined in a final record of decision for eachoperable unit and in an approved Treatment,Storage, and Disposal Plan.
The future use of all areas at Fernald iscurrently under consideration by the FernaldCitizens' Task Force. A preliminaryrecommendation is that there should be nonew agricultural or residential uses on theFernald property following its remediation.Evaluations are continuing regarding thepotential for establishing recreational,commercial/industrial, or undeveloped openspace (i.e., green space) on the portions ofFernald property outside the area of anengineered, onsite disposal facility. Formalrecommendations on waste disposition andland use will be presented in a final reportfrom the Task Force scheduled for release inJuly 1995.
All areas of Fernald, with the exception of anengineered, onsite disposal facility, areassumed to attain cleanup levels which provide
for: (1) the protection of persons engaged in on-property industrial and/or recreational uses,and (2) the protection of an offsite farmer. Theremedies would provide a maximum estimatedrisk to a future industrial or recreational user ofthe Fernald property within an acceptablerange of 10-5 to 10-6. The engineered, onsitedisposal facility will be established as acontinuing, restricted access area. The GreatMiami Aquifer is scheduled to be remediatedand returned to its full beneficial use by FY2028.
The projected life-cycle costs for the FernaldEnvironmental Management project areprovided in the following table.
ENVIRONMENTAL
RESTORATION
During production, many uranium-bearingmaterials were used in the manufacturingprocess. These materials included uraniumconcentrates, recyclable enriched residues,uranium hexafluoride, and a variety of recycleduranium metals (both depleted and enriched)from various facilities. In the productionprocesses, Fernald produced large quantities ofsolid and liquid low-level radioactive waste.Air was the predominant pathway by which thefacility released radioactive particles, butFernald also routinely released radionuclidesinto the soil and water, as well. In addition tothe former production facilities, the majorsources of contamination include:
• six low-level waste storage pits;
• a burnpit;
• a clearwell;
• two concrete silos containing radium-bearing residues;
• one concrete silo containing metal oxides;
• the South Field area, which was a depository of
soil and construction debris with low levels of
radioactivity; and
• two flyash disposal areas.OH 11

Two lime sludge ponds and a solid wastelandfill are additional sources of contamination.
Several primary release mechanisms -including air, wastewater discharge, spills,leaks, and land disposal - provided the vehiclesfor transport of contaminants to environmentalmedia and, subsequently, to potential humanand ecological receptors. Secondary releases,such as, resuspension in air of contaminatedsoil through wind action, contributed to furthercontaminant migration and transport to othermedia.
Water releases to the environment occurredthrough leaking wastewater lines, dischargesinto the Great Miami River and Paddy's Run,and stormwater runoff. Surface water runoff isa significant pathway for the migration of
contaminants in environmental media. Therehave been offsite environmental impacts to theGreat Miami Aquifer and to surface soilsadjacent to the site.
Risks to human and ecological receptors havebeen evaluated for the site as it presently existsand for simulated conditions up to 1,000 yearsin the future. The results demonstrate thatexisting concentrations of radiological andchemical contamination in both the sourcematerial and the environmental media poserisks to human and ecological receptors atlevels sufficient to trigger the need for remedialactions.
Potential noncarcinogenic health effects for awaste site are assessed in terms of an EPAhazard index for each contaminant of concern.A threshold hazard index value of 1.0 (unitless)
Environmental Restoration Projects
Five-Year Averages (Thousands of Constant 1995 Dollars)*
FY 1995 - 2000 2005 2010 2015 2020 2025 2030
Fernald Treatment/Storage/Disposal 8,659 3,660 3,660 2,722 2,094 2,094 1,256Operable Unit 1 49,930 48,322 60 66 60 66 66Operable Unit 2 27,969 43,838 900 720 0 0 0Operable Unit 3 51,699 112,598 29,650 0 0 0Operable Unit 4 21,038 1,508 0 0 0 0 0Operable Unit 5 24,889 34,874 34,808 30,080 10,714 10,470 7,540
Total 184,184 244,800 69,078 33,588 12,868 12,630 8,862
2035 2040 2045 2050 2055 2060 2065 Life Cycle"
Fernald Treatment/Storage/Disposal 0 0 0 0 0 0 0 129,382Operable Unit 1 30 0 0 o o 0 0 542,931Operable Unit 2 0 0 0 o o 0 0 395,106Operable Unit 3 0 0 0 0 0 0 0 1,021,434Operable Unit 4 0 0 0 0 0 0 0 133,771Operable Unit 5 40 200 200 240 400 160 0 797,961
Total 70 200 200 240 400 160 0 3,020,548
• Costs reflect a five-year average in constant 1995 dollars, except in FY 1995-2000, which is a six-year average.
▪ Total Life Cycle is the sum of annual costs in constant 1995 dollars.
OH 12

has been established as the level above whichthere is the potential for noncarcinogenic effectson exposed individuals. For current land usewith access controls, the hazard index rangesfrom 1.8 to 260, depending on the receptor. Forfuture land use — without any removal ofcontaminated sources, and with somewhat lessrestrictive controls than the site access controlsnow employed — the hazard index would rangefrom 37 to 260.
Carcinogenic risk is the potential for acontaminant to induce human cancer and isexpressed as an incremental lifetime cancer risk.Contaminants present in sufficientconcentrations to create an excess lifetimecancer risk within or less than the range of 1chance in 10,000 to 1 chance in 1,000,000 areconsidered acceptable to the EPA. For currentland use with access controls, the incrementallife cancer risk ranges from 1 in 100,000 for asite worker to 1 in 100 for an offsite farmer. Forfuture land use — without any removal ofcontaminated sources, and with somewhat lessrestrictive controls than the site access controlsnow employed — the incremental lifetime cancerrisk would range from 1 in 14,000 to 1 in 5.
These elevated risk factors, both carcinogenicand noncarcinogenic, support the need forenvironmental restoration efforts at Fernald.
Operable Units
A brief description and status of each operableunit and the low-level legacy waste restorationactivities are given below:
Operable Unit 1
The Operable Unit 1 area consists of six wastepits, a burn pit, and a clearwell. All wastematerial would be excavated, treated by dryingto meet waste acceptance criteria, then shippedto a commercial disposal facility. Contaminatedsurface soils and soils beneath the waste areaswould be forwarded to Operable Unit 5 forfinal disposition. Residual water, which
includes surface water, perched ground waterincidental to waste unit remediation, andresidual process water, will be treated atFernald's Advanced Wastewater TreatmentFacility. All impacted Operable Unit 1 materialis being processed as a low-level waste.
Both the Remedial Investigation and theFeasibility Study/Proposed Plan/Environmental Assessment were approved bythe EPA, and the Operable Unit 1 Record ofDecision was approved by the EPA on March 1,1995. Remedial design work is underway. Afield demonstration program has been initiatedto evaluate dewatering and waste excavationtechniques further. Remedial action activitiesare scheduled to commence during June 1996.
Operable Unit 2
Operable Unit 2 consists of five waste units andtheir associated berms, liners, and soils.Specifically, the waste units include the SolidWaste Landfill, the Lime Sludge Ponds, theInactive Flyash Pile, the South Field Depository,and the Active Flyash Pile. Construction andoperation of an engineered, onsite disposalfacility is also an Operable Unit 2 function. Allmaterial in Operable Unit 2 waste units whichexceeds the required cleanup levels will beexcavated, processed for size reduction andmoisture control, and disposed of in the onsitedisposal facility. An exception will be anexpected small fraction of excavated materialthat will exceed the onsite disposal facilitywaste acceptance criteria. This latter materialwill be shipped to a commercial disposalfacility. Surface water and perched groundwater incidental to waste unit remediation willbe treated at Fernald's Advanced Waste WaterTreatment Facility. All impacted Operable Unit2 material is classified as low-level waste.
The Operable Unit 2 Remedial Investigation isapproved by the EPA, and the FeasibilityStudy/Proposed Plan/EnvironmentalAssessment is conditionally approved by theEPA. Additionally, the draft record of decision
OH 13

is under review by the EPA. A predesigninvestigation has been initiated to determinethe area with the most suitable geology for anengineered, onsite disposal facility. Remedialaction activities are scheduled to commenceduring August 1996. Under current plans,Operable Unit 2 will be assigned the long-termsurveillance and monitoring responsibility forany onsite disposal facility followingcompletion of assigned remedial actions.
Active Operable Unit 2 environmentalrestoration activities that are being conductedas CERCLA Removal Actions include the SouthField Surface Seep Control Project andcontinued maintenance of the Active FlyashPile and the Paddy's Run Erosion ControlStructure.
Operable Unit 3
Operable Unit 3 consists of all artificialaboveground and belowground structures atFernald that are not included in the otheroperable units. This includes existing storagepads, roads, the wastewater treatment system,the sewer and electrical systems, railroads,fences, inventory, drums, and material piles.Most of these are located within the 136-acreformer production area at the Fernald site.
There are 128 buildings designated fordecommissioning and dismantling. Eachstructure is initially processed by the Fernaldsafe shutdown project to remove residualprocess wastes, and then gross contamination isremoved from above-grade surfaces. Oncegross decontamination is complete, all asbestos,electrical lines, and heating, ventilating, and airconditioning ductwork are removed. Thestructural components are then dismantled,followed by the structure's foundations andassociated below-grade facilities. MostOperable Unit 3 materials are currentlyclassified as low-level waste.
For Operable Unit 3, DOE estimates that 36percent of low-level radioactive waste materialwill be shipped to the Nevada Test Site for
burial, 2 percent of waste will be recycled, andthe remaining 62 percent will be placed in anonsite disposal facility. Existing facilities will beused for interim storage until the onsitedisposal facility is ready to receive wastematerial. Evaluations are in progress todetermine the feasibility of recycling structuraland low-grade steels and disposing of concreteand asbestos siding in the onsite disposalfacility. Contaminated soils will be excavatedand dispositioned by Operable Unit 5. Anysurface water and perched ground water thatare generated incidental to facility remediationwill be treated at the Fernald Advanced WasteWater Treatment Facility.
An Operable Unit 3 Interim record of decisionhas been approved by the EPA for thedecommissioning and dismantling of plant areabuildings. Most of the buildings in the formerFernald process area will be decommissionedand dismantled as an interim remedial action.Treatment and final disposition of thedismantled material will be defined in the finalrecord of decision. The Remedial Investigationand Feasibility Study/Proposed Plan to supportthe final record of decision are in thedevelopment stage.
Active Operable Unit 3 environmentalrestoration activities being conducted asCERCLA removal actions include: safeshutdown; asbestos abatement;decommissioning and dismantling of the Plant1 Ore Silos and Plant 7; the Plant 1 Storage PadUpgrade project; and the removal andtemporary storage of contaminated media atthe former Fire Training Facility.
Operable Unit 4
The K-65 residues and cold metal oxides will beremoved from Silos 1, 2, and 3 and treated in anonsite vitrification facility. The sludges fromthe decant sump tank will also be removed and
OH 14

vitrified. Following treatment, the vitrifiedresidues will be containerized and transportedoffsite for disposal at the Nevada Test Site. Silo4 is empty except for some infiltration water.
Following removal of residues, the concrete silostructures and associated facilities will bedemolished. Construction debris will beprocessed for size reduction and permanentlystored in the Fernald onsite disposal facility.Contaminated soils immediately adjacent andunder the silos would be forwarded toOperable Unit 5 for final disposition. Residualwater, which includes surface water, perchedground water, and residual process water, willbe treated at the Fernald Advanced WasteWater Treatment Facility.
All residue material in the silos and decantsump tank are classified as "by-productmaterial" as defined in section 11, paragraphe(2), of the Atomic Energy Act of 1954, asamended. All contaminated soils, concretedebris, and ground water will be processed aslow-level waste.
Both the Operable Unit 4 RemedialInvestigation and the Operable Unit 4Feasibility Study/Proposed Plan/Environmental Impact Statement are approvedby the EPA. The final record of decision wassigned by the EPA on December 7, 1994. Aspart of the remedial design phase, a pilot plantis being constructed to evaluate further thevitrification process. Construction of the pilotvitrification plant commenced during FY 1994.Remedial action activities were scheduled tocommence during March 1995.
Operable Unit 5
Operable Unit 5 consists of contamined soils(except those associated with Operable Unit 2),on-property and off-property ground water,surface water, flora, and fauna. Remedialactivities involve excavation and transport tothe onsite disposal facility soil that exceedsrequired cleanup levels; excavation ofcontaminated soil that exceeds the onsite waste
acceptance criteria and its shipment to acommercial disposal facility; extraction andtreatment of contaminated storm water runoff.Operable Unit 5 operations will fund theconstruction of the Advanced Waste WaterTreatment Facility. Most waste is tentativelydesignated as low-level waste, with a smallfraction potentially classified as low-levelmixed waste.
Cleanup levels for site soils are beingestablished in the Operable Unit 5 FeasibilityStudy for a wide range of land use objectives.Final cleanup levels will be established in theOperable Unit 5 Record of Decision, once landuse recommendations are formalized by theFernald Citizens' Task Force.
The Remedial Investigation is conditionallyapproved by the EPA, and the FeasibilityStudy/Proposed Plan is undergoing review bythe EPA. Remedial action activities arescheduled to commence during October 1996.
Active Operable Unit 5 environmentalrestoration activities that are being conductedas CERCLA Removal Actions include theremoval and treatment of contaminated,perched ground water located beneath theformer plant area; use of a surface water runoffcontrol and treatment system for the Waste PitArea; and use of an offsite ground-watermigration control system to minimizemigrations into the Great Miami Aquifer. Theground-water migration control system willextract ground water and treat surface watersprior to their subsequent discharge to the GreatMiami River. Installation of additionaladvanced wastewater treatment capacity isintegral to the removal actions.
Low-Level Legacy Waste
Fernald's legacy of low-level waste is incontainerized storage. It consists largely ofwastes generated as part of activities associatedwith former production operations andmaintenance activities, utility operations, and
OH 15

laboratory analyses. Approximately 80 percentof the 167,400 cubic yards of low-level wastematerial has been shipped to the Nevada TestSite as a CERCLA removal action. Theremaining 20 percent is scheduled for disposalat the Nevada Test Site during FY 1995 and FY1996.
That legacy waste which is classified as low-level mixed waste is being processed as aFederal Facility Compliance Act action. A drafttreatment, storage, and disposal plan has beensubmitted to the Ohio EPA for review andapproval. Low-level mixed waste associatedwith the hydrofluoric acid neutralizationsystem, the uranyl nitrate hexahydratetreatment system, and the wastewatertreatment system will be treated using existing,onsite facilities and will be shipped for finaldisposition at the Nevada Test Site. Wastedesignated for stabilization or chemicalprocessing will be treated by a mobile vendorand disposed of at the Nevada Test Site.Selected low-level mixed waste was treatedduring FY 1993 and FY 1994 at the ToxicSubstance Control Act incinerator at the DOEK-25 Site in Oak Ridge, Tennessee. Theremaining waste is scheduled for finaldisposition from FY 1995 through FY 1997.Disposal of treated low-level mixed waste atexisting commercial facilities is being explored.
WASTE MANAGEMENT
Treatment, Storage andDisposal OperationsProduction operations at the former FernaldFeed Materials Production Center weresuspended during FY 1989 and the facility wasformally shut down during FY 1991. Allcurrent activities at Fernald are associated withenvironmental restoration. Fernald's wastemanagement organizational costs are fundedwithin the scope of environmetal restorationactivities. Legacy low-level waste are being
dispositioned as stated in the preceding section.
NUCLEAR MATERIAL AND
FACILITY STABILIZATION
A facility stabilization activity titled "safeshutdown" was initiated at Fernald to placeexisting equipment and structures in the formerplant area in a safe, shutdown configuration.Safe shutdown activities include programplanning and scheduling; engineering; isolationof process equipment, piping systems andassociated utilities; the removal and packagingof residual process or excess materials; and thedisposition of materials to an approved onsite,interim, storage location. All safe shutdownactivities fall under the responsibility ofOperable Unit 3 and are funded within thescope of environmental restoration.
LANDLORD FUNCTIONS
Landlord provides for common environmental,safety, and health functions not associated withrestoration activities. Responsibilities includethe operation and maintenance of the Fernaldsteam plant; compressed air system; potablewater treatment system; process watertreatment system; cooling water system;sanitary waste treatment system; site utilities;office buildings and warehouses; vehiclemaintenance; and maintenance of former plantarea buildings, roads, and parking facilities.Maintenance of the remedial actionconstruction infrastructure, such as,construction office facilities, laydown areas,interim storage areas, roads, and parking, arealso landlord functions. Landlord is alsoresponsible for site custodial services, porterservice, the site laundry, offsite facility leasesand maintenance, inventory control, and sitesecurity.
OH 16

Environmental Restoration Adivity Costs
Five-Year Averages (Thousands of Constant 1995 Dollars)*
FY 1995-2000 2005 2010 2015 2020 2025 2030
Environmental Restoration TSD 8,659 3,660 3,660 2,722 2,094 2,094 1,256
Operable Unit 1Assessment 3 0 0 0 0 0 0
Remedial Actions 49,927 48,310 0 0 0 0 0
Surveillance and Maintenance 0 12 60 66 60 66 66
Operable Unit 2Assessment 75 0 0 0 0 0 0
Remedial Actions 27,894 43,658 o 0 o 0 o
Surveillance and Maintenance 0 180 900 720 0 0 o
Operable Unit 3Assessment 3,163 0 5,930 0 0 0 o
Facility Decommissioning 48,536 112,598 23,720 o 0 o 0
Operable Unit 4Assessment 1,088 0 0 0 0 0 o
Remedial Actions 19,950 1,470 o o 0 o 0
Surveillance and Maintenance 0 38 0 o 0 0 0
Operable Unit 5Assessment 285 0 0 0 0 o 0
Remedial Actions 24,603 34,874 34,808 30,080 10,714 10,470 7,540
Surveillance and Maintenance 0 0 0 0 0 0 0
Total 184,184 244,800 69,078 33,588 12,868 12,630 8,862
2035 2040 2045 2050 2055 2060 2065 Life Cycle**
Environmental Restoration TSD o o 0 0 0 0 0 129,382
Operable Unit 1Assessment 0 0 o 0 0 0 0 19
Remedial Actions 0 0 0 0 0 0 0 541,112
Surveillance and Maintenance 30 0 0 0 0 0 0 1,800
Operable Unit 2Assessment o 0 o 0 0 0 o 450
Remedial Actions o 0 0 0 0 0 o 385,656
Surveillance And Maintenance 0 0 o 0 o 0 0 9,000
Operable Unit 3Assessment o 0 0 0 0 o 0 48,628
Facility Decommissioning 0 o o o o 0 0 972,806
Operable Unit 4Assessment 0 0 o 0 o 0 0 6,529
Remedial Actions o 0 0 0 0 0 0 127,051
Surveillance and Maintenance 0 0 0 o 0 0 0 192
Operable Unit 5Assessment 0 0 0 0 0 0 0 1,713
Remedial Actions 0 0 0 0 0 0 0 790,049
Surveillance and Maintenance 40 200 200 240 400 160 o 6,200
Total 70 200 200 240 400 160 0 3,020,548
'Costs reflect a five-year average in constant 1995 dollars, except in FY 1995-2000, which is a six-year average.
Total Life Cycle is the sum of annual costs in constant 1995 dollars.
OH 17

PROGRAM MANAGEMENT
Fernald program management includesperforming legal and public affairs functions toensure conformance to applicable Federal andState laws and regulations, with dueconsideration of stakeholder concerns.Program management activities also includethose associated with executive and technicalmanagement, business management required toimplement the Project Management System perDOE Orders 4700.1 and 4700.5, management ofcontractual and related issues, qualityassurance, regulatory and technologymanagement, systems integration, DOEoversight, ongoing litigation, and regulatoryoversight. Oversight of waste minimizationactivities is also a program managementfunction, whereas actual implementation is partof the operating unit and legacy wasteenvironmental activities.
Technology DevelopmentTechnology programs conducts vigoroustechnology development programs which haveintegrated several cost-saving improvementsinto Fernald activities in areas such as roboticsand materials handling technology; cleanupand integrated demonstrations involvinguranium in soils, including real-timemonitoring and analysis; and decontaminationby plant update. Technology programs alsoconducts advanced development work throughspecial contracts with the Alliance of OhioUniversities and the Historically Black Collegesand Universities/Minority InstituteEnvironmental Technology and WasteManagement Consortium.
Landlord Cost Estimate
Five-Year Averages (Thousands of Constant 1995 Dollars)*
FY 1995-2000 2005 2010 2015 2020 2025 2030
Directly Appropriated Landlord 51,515 57,840 45,560 24,680 3,360 2,088 2,506
2035 2040 2045 2050 2055 2060 2065 Life Cycle**
Directly Appropriated Landlord 4,176 1,253 0 0 0 0 0 1,016,403
• Costs reflect a five-year average in constant 1995 dollars, except in FY 1995-2000, which is a six-year average.
" Total Life Cycle is the sum of annual costs in constant 1995 dollars.
Program Management Cost Estimate
Five-Year Averages (Thousands of Constant 1995 Dollars)*
FY 1995.2000 2005 2010 2015 2020 2025 2030 Life Cycle**
Program Management 67,859 90,308 55,276 30,504 7,358 4,888 3,244 1,365,046
• Costs reflect a five-year average in constant 1995 dollars, except in FY 1995 - 2000, which is a six-year average.
• Total Life Cycle is the sum of annual costs in constant 1995 dollars.
OH 18

FUNDING AND COST
INFORMATION
The following tables present fundinginformation and major activity milestones forFernald.
Defense Funding Estimate
Five-Year Averages (Thousands of Constant 1995 Dollars)*
FY 1995 - 2000 2005 2010 2015 2020 2025 2030
Environmental Restoration 184,184 244,800 69,078 33,588 12,868 12,630 8,862
Directly Appropriated Landlord 51,515 57,840 45,560 24,680 3,360 2,088 2,506
Program Management 67,859 90,308 55,276 30,504 7,358 4,888 3,244
Total 303,558 392,948 169,914 88,772 23,586 19,606 14,612
2035 2040 2045 2050 2055 2060 2065 Life Cycle**
Environmental Restoration 70 200 200 240 400 160 0 3,020,548
Directly Appropriated Landlord 4,176 1,253 0 0 0 0 0 1,016,403
Program Management 0 0 0 0 0 0 0 1,365,046
Total 4,246 1,453 200 240 400 160 0 5,402,034
• Costs reflect a five-year average in constant 1995 dollars, except in FY 1995-2000, which is a six-year average.
Total Life Cycle is the sum of annual costs in constant 1995 dollars.
OH 19

Major Activity Milestones
ACTIVITY TASK COMPLETION DATE
Fiscal Year
Operable Unit 1 - Final Record of Decision Signed by EPA 1995Waste Pit Area Remedial Action Starts 1996
Remedial Action Ends 2004
Operable Unit 2 - Final Record of Decision Signed by EPA 1995Other Waste Areas Remedial Action Starts 1996
Remedial Action Ends: Waste Areas 2001Remedial Action Ends: Onsite Disposal Facility 2014
Operable Unit 3 -Former Production Area
Interim Remedial Action Starts 1995Final Remedial Investigation Report Submitted to EPA 1996Final Feasibility Study Report Submitted to EPA 1996Final Record of Decision Signed by EPA 1996Final Remedial Action Ends 2010
Operable Unit 4 - Vitrification Pilot Plant Project Started 1994Silos 1 through 4 Final Record of Decision Signed by EPA 1994
Remedial Action Starts 1995Remedial Action Ends 2003
Operable Unit 5 -Environmental Media
Final Record of Decision Signed by EPA 1996Remedial Action Starts 1997Remedial Action Ends: Soils 2014Remedial Action Ends: Ground Water 2028
Legacy Waste Site Treatment Plan Submitted to Ohio EPA 1995Removal Action Ends: Low-Level Waste 1996Removal Action Ends: Low-Level Mixed Waste 1997
For further information on this site, please contact: Public Participation OfficePublic Affairs OfficeTechnical Liaison: Dave Lojek
(513) 865-3968(513) 865-3968(513) 648-3127
OH 20

MOUND PLANT
The Mound Plant is located within the southern city limits of Miamisburg in southwestern Ohio.
The site occupies 306 acres of land overlooking Miamisburg and the Great Miami River. The Day-
ton metropolitan area is 10 miles northeast of the plant.
Low-Level Alpha & BetaWastewater Treatment,
Glassmelter Thermal Unit,Bldg WD, WDA
Hazardous WasteStorage Facili SD Building
Bdg 72
Waste Mgmt Bldg,SW Building Bldg 91
R Building
Radwaste &Mixed Waste Storage,
Bldg 23
Building 21
RadwasteStorage,
Bldg 31 and 31A
Building 33
• Magazine 53
SM Bulldog
PP Building 38
Building 102
QI
OH 21

Estimated Site Total
Environmental RestorationWaste ManagementNuclear Material and Facility StabilizationDirectly Appropriated LandlordProgram Management
Total
(Thousands of Current 1995 Dollars)*
FY 1995 1996
46,694 54,0079,236 8,389
17,100 17,60029,300 16,600
13,060
1991 199$ 1999 2000
54,805 53,682 64,6079,485 7,46418,700 19,20030,900 40,10013,107 14,787
45,238 113,978 130,456 32,352 133,,874 146,158
' Costs for FY 1995 reflect Congressional Appropriation, costs for FY 1996 reflect EM budget submission, costs for F1' 1997-2000 reflect Budget Shortfall Scenario, costs forshaded area assume 3% annual inflation.
Five-Year Averages (Thousands of Constant 1995 Dollars)**
FY 1995-2000 2005 2010 2015 2020 2025 2030 Life Cycle***
Environmental Restoration 46,053 16,747 20,149 11,119 4,022 935 541,183Waste Management 8,507 6,113 6,356 6,184 5,120 271 23 171,374Nuclear Material and Facility Stabilization 27,598 17,816 32,780 1,104 0 0 0 424,086Directly Appropriated Landlord 27,202 34,800 34,800 34,800 20,000 4,000 805,211Program Management 8,314 10,585 10,453 6,638 2,200 268 6 200,635
Total 117,674 86,061 104,538 59,845 31,342 5,474 29 2,142,490
• Costs reflect a five-year average in constant 1995 dollars, except in FY 1995 - 2000, which is a six-year average.
• Total Life Cycle is the sum of annual costs in constant 1995 dollars.
PAST, PRESENT, AND
FUTURE MISSIONS
Since 1947, Mound has been an integratedresearch, development, and production facilityfor defense and nondefense programsconducted by the Department of Energy (DOE)and its predecessors. Mound's past missionsfor defense programs included the fabricationof components for nuclear weapons as well asdevelopment and testing of both nuclear andnonnuclear components. Additionalmanufacturing roles at Mound included theproduction of stable isotopes for medical,industrial, and general research; the production
of small chemical heat sources; the recoveryand purification of tritium; the fabrication ofradioisotope (plutonium-238) electrical powersources for spacecraft; and surveillance ofexplosive and radioactive weaponscomponents.
The Department has stopped defenseoperations at the Mound Plant and plans totransfer them to other sites. The primarymission of the Mound Plant is nowenvironmental management. Activities includeenvironmental restoration, decommissioning,and waste management. These programsshould continue through approximately FY2022. The City of Miamisburg envisions the siteas a commercial mall or an industrial park.
OH 22

Economic development at the Mound site will
be a closely coordinated effort between thegeneral public, the Ohio EnvironmentalProtection Agency, the Ohio HealthDepartment, the City of Miamisburg, and DOE.Environmental Management (EM) assumed fulllandlord responsibility for the Mound Plant onOctober 1, 1994.
ENVIRONMENTAL
RESTORATION
Approximately 125 confirmed and potentialrelease sites have been documented at theMound Plant. Because its past operations were
so diverse, the plant used a variety ofradioactive materials and chemicals. The mainradioactive contaminants of concern areplutonium and tritium. The chemicalcontaminants of concern include variousvolatile organic compounds in the form ofsolvents, paints, and industrial cleaning agents.
There have been only two offsite accidentalreleases of radioactive material. The firstoccurred in 1969, when liquid waste containingplutonium leaked into soil at the site andmigrated offsite after a pipeline ruptured.Heavy rain moved this soil into the bed of theMiami-Erie canal, where it adhered tosubsurface clay. The second release occurred in1989, when a small quantity of tritium gasescaped through a plant stack after an accidentin a laboratory. Continuous testing, including a1990 study by the National Institutes of Health,
has found no adverse health effects to residents
of Montgomery County attributable to theMound Plant.
Currently, the Mound program is conducting aremedial investigation of the site and plans tocomplete remedial actions in FY 2015. TheEnvironmental Protection Agency (EPA)oversees the environmental restorationactivities at Mound.
Operable Units
The areas involved have been divided intooperable units. Originally, nine operable unitshad been defined, but three of the units havebeen found to require no further action. Theenvironmental restoration project is negotiatingwith applicable regulators to define the cleanuplevels for each operable unit. Future usedesignations will likely reflect a commercial/industrial scenario. The six remaining operableunits are discussed below.
Operable Unit 1: Area B
Operable Unit 1 addresses an old landfill, thesite's sanitary landfill, and an overflow pondthat have been contaminated with volatileorganic compounds. Part of this area wasformerly used for open burning and wastedisposal. The main concern is thatcontaminants released by these practices maybe migrating into the Buried Valley Aquifer thatunderlies the southwest corner of the originalMound Plant.
The investigative phase for Operable Unit 1was completed in June 1993. This unit is thefirst operable unit at Mound to transition fromassessment to remediation. Remedial actionsare scheduled to be completed in FY 1997-1998.In estimating cost for environmental restorationat this unit, it was assumed that in situbioremediation technologies will be used.
Operable Unit 2: Main Hill
Operable Unit 2 addresses the source andpathways of possible contaminants at Mound'sMain Hill. Offsite ground water seeps atMound's North Hillside area are alsoaddressed. Tritium releases that are known tohave occurred in the past have been trackedsince the 1970's; the extent of volatile organiccompound contamination remains uncertain.
Investigative field work will be complete in FY1998; the remedial action is scheduled to start inFY 2001 and to be complete in FY 2003. The
OH 23

estimate for environmental restoration of thisunit assumes that in situ bioremediationtechnologies would be used for treating anycontaminated soils.
Operable Unit 4: Miami-Erie Canal
Operable Unit 4 addresses contamination in theold Miami-Erie Canal bed in Miamisburg. Itcovers the canal, the north and south pondwithin the park, the overflow creek from thecanal to the Great Miami River, and thedrainage ditch from Mound's west propertyline to the canal. Of concern is plutoniumcontamination introduced into the canal frompast plant operations and non-routineequipment malfunctions. Both the plutoniumand tritium have been monitored since the1970's and have been found to present noimminent danger to human health or theenvironment. Initial characterization of thecanal was completed in February 1993.
Remediation will consist of excavating andremoving contaminated soils from the canalbed. The initial removal action will beconducted in FY 1995-2002. The canal bed willcontinue to be monitored for the presence ofcontamination and additional remedial actionswill be carried out if necessary. Remediation isanticipated to be complete in FY 2008.
Operable Unit 5: South Property
This operable unit addresses onsite soil areas inthe southern portions of the Mound Plant andspecific areas suspected of containingradioactive materials. It covers areas known asthe Special Metallurgical/Plutonium ProcessingHill, the Buried Valley, and the New Property.Although available data indicates that most ofOperable Unit 5 is not contaminated, there aresmall "pockets" of plutonium and thorium soilcontamination.
Because there is a potential commercial futureuse designation for the new property portion ofOperable Unit 5, remedial investigation fieldwork for this section was accelerated to becompleted in FY 1995. In addition, interimresponse actions will be completed in FY 1995for three other areas: the fire fighting trainingarea, the radionuclide-contaminated septic tankin area 7, and fuel and oil contaminated soilaround the powerhouse. In FY 2001-2003,remedial investigation field work will resumefor the remainder of Operable Unit 5. Theexpected remedial action for this unit isremoval of the contaminated septic tank and insitu bioremediation of contaminated soils. Allcleanup for this unit will be completed in FY2006-2015.
Environmental Restoration Activity Costs
Five-Year Averages (Thousands of Constant 1995 Dollars)*FY 1995-2000 2005 2010 2015 2020 2025 2030 Life Cycle**
Environmental Restoration 46,053 16,747 20,149 9,996 0 0 0 510,784Facility Decommissioning 0 0 0 1,122 4,022 935 0 30,399
Total 46,053 16,747 20,149 11,119 4,022 935 0 541,183
Costs reflect a five-year average in constant 1995 dollars, except in FY 1995-2000, which is a six-year average.
Total Life Cycle is the sum of annual costs in constant 1995 dollars.
OH 24

Operable Unit 6: DecommissioningSites
Operable Unit 6 verifies the results ofdecommissioning at Mound. Eighty-eightbuildings at the Mound site have beendesignated for safe shutdown or transition.After decommissioning, every site will beevaluated to ensure that regulatory cleanupstandards are met. For the purposes of thisreport it was assumed that the standards forcleaning up soil areas will be consistent with anindustrial future use designation.
The remediation work is scheduled to becompleted by FY 2009, but the shipment anddisposal of contaminated material will continuethrough FY 2010.
Operable Unit 9: Site-wide and OffsiteActivities
Operable Unit 9 addresses the totalenvironmental effects of any contaminationattributable to Mound that may be found in theair, ground water, soils, surface water, andsediments as well as plant and animal life. Itcovers the entire plant and the area within 20miles of the plant. Of concern are thecumulative onsite and offsite impacts of allother operable units. The schedule for activities
in this unit is therefore at least partly dependent
on the work performed at the other operableunits. Investigative field work is to becompleted in FY 2005, and the remediationdecision is scheduled for FY 2007 and FY 2008.
It is expected that the decision will be torecommend no further action. However, airmonitoring will be initiated in FY 2008.
WASTE MANAGEMENT
The principal waste types at the Mound Plant
are low-level radioactive waste, hazardouschemical waste from laboratories, and smallamounts of low-level mixed waste andtransuranic waste. The low-level radioactive
waste consists of contaminated soils fromdecommissioning and sludge resulting from theprocessing of wastewater contaminated withalpha- and beta-emitting radionuclides. Allwaste generated in the future will be wastegenerated during environmental restoration.
Waste Treatment
The Mound Plant treats two of its wastestreams: wastewater contaminated with alpha-and beta-emitting radionuclides and reactivehazardous waste. The wastewater is convertedto a low-level sludge that can be solidified fordisposal. Reactive hazardous waste is burnedto render it nonreactive.
The Mound Plant is developing twotechnologies for the treatment of low-levelmixed waste: a packed-bed reactor with silentdischarge plasma and a technology for thecapture of tritium. Both of these technologiesare being developed as mobile treatment units.Mound is also planning to use an existing glassmelter for treating some of the plant's mixedwaste. The treatment of mixed waste will startin FY 1996 and will be completed in FY 2001.
In addition, Mound plans to evaluatebiodegradation as a treatment for the mixedwaste known as "scintillation cocktails."
Waste Storage
The Mound Plant's inventory of waste is storedin four areas. Low-level waste is temporarilystored in trailers. Transuranic waste is stored inBuilding 31. Low-level mixed waste is stored inBuilding 23, and hazardous waste is stored inBuilding 72. The storage buildings are incompliance with applicable regulations.
Waste Disposal
Transuranic waste will be shipped to the WasteIsolation Pilot Plant for disposal. All hazardouswaste will be disposed of by a commercial
OH 25

contractor. All low-level waste and treated low-level mixed waste will be disposed of at theNevada Test Site or another acceptablegovernment or commercial facility. Shipmentsof low-level waste are expected to continuethrough FY 2016.
NUCLEAR MATERIAL AND
FACILITY STABILIZATION
The nuclear material and facility stabilizationprocess began at the Mound Plant in 1995 (adescription of this process, includingbreakdown of cost model categories and thenational scheduling scenario, is provided inVolume I, Section 3). Of the 99 Mound facilitiesslated to undergo this process, 97 have alreadybegun stabilization. Some of these facilities
include storage tanks, ceramic developmentand production facilities, detonatormanufacturing and storage facilities. It isassumed for purposes of this report that the tworemaining facilities, a small area warehouse andgarage will begin stabilization process in 1996.The resulting waste types include hazardous,transuranic, low-level, and low-level mixed.This report assumes that the stabilization andmaintenance process at the Mound Plant will becompleted by the year 2016.
LANDLORD FUNCTIONS
Landlord activities encompass many differentfunctional areas and cost items. They includesupport for the environmental, safety andhealth program; site planning and project
Landlord Cost Estimate
Five-Year Averages (Thousands of Constant 1995 Dollars)*
FY 1995-2000 2005 2010 2015 2020 2025 2030 Life Cycle**
Directly Appropriated Landlord 27,202 34,800 34,800 34,800 20,000 4,000 0 805,211
° Costs reflect a five-year average in constant 1995 dollars, except in FY 1995-2000, which is a six-year average.
" Total Life Cycle is the sum of annual costs in constant 1995 dollars.
Nuclear Material and Facility Stabilization Cost Estimate
Five-Year Averages (Thousands of Constant 1995 Dollars)*FY 1995.2000 2005 2010 2015 2020 2025 2030 Life Cycle**
Nuclear Material and Facility Stabilization 27,598 17,816 32,780 1,104 0 0 0 424,086
° Cost shown include program management costs with each project.
" Costs reflect a five-year average in constant 1995 dollars, except in FY 1995-2000, which is a six-year average.
OH 26

management; utilities; management andadministration, such as human resources,procurement, taxes, logistics support, and fees.Support within these categories is the minimumamount of activity necessary to provide acaretaker function for the Mound Plant whilemaintaining compliance with existing Federal,State, and local laws and regulations.
PROGRAM MANAGEMENT
Environmental Management program activitiesrepresent crosscut activities associated with allwaste types and not directly in support ofspecific base operations or projects. Theseactivities can be categorized into the followinggroups: Area Support, Regulatory Support,Environmental Restoration andDecommissioning Contractor Training, QualityAssurance for Environmental Restoration,Transition and Decommissioning Departments,
Special Projects/Citizens Advisory Board,Federal Facility Compliance AgreementManagement, Waste Minimization, and WasteCertification.
Program management services are tracked andcharged to the projects through the budgets forwaste management and environmentalrestoration activities. However, for thepurposes of this report, program managementactivities were estimated at 20 percent forFY1995 - FY 2000. The outyear estimates werecalculated using a factor provided by themodel.
FUNDING AND COST
INFORMATION
The following tables present fundinginformation and major activity milestones forFernald.
Program Management Cost Estimate
Five-Year Averages (Thousands of Constant 1995 Dollars)*
FY 1995-2000 2005 2010 2015 2020 2025 2030 Life Cycle**
Program Management 8,314 10,585 10,453 6,638 2,200 268 6 200,635
• Costs reflect a five-year average in constant 1995 dollars, except in FY 1995-2000, which is a six-year average.
**Total Life Cycle is the sum of annual costs in constant 1995 dollars.
OH 27

Defense Funding Estimate
Five-Year Averages (Thousands of Constant 1995 Dollars)•
FY 1995 - 2000 2005 2010 2015 2020 2025 2030 life Cyde**
Environmental Restoration 45,634 16,747 20,149 9,996 0 0 0 508,270Waste Management 8,507 6,113 6,356 6,184 5,120 271 23 171,374Nuclear Material and Facility Stabilization 27,598 17,816 32,331 575 0 0 0 419,198Directly Appropriated landlord 27,202 34,800 34,800 34,800 20,000 4,000 0 805,211Program Management 8,314 10,585 10,453 6,638 2,200 268 6 200,635
Total 117,255 86,061 104,090 58,193 27,320 4,538 29 2,104,688
• Costs reflect a five-year average in constant 1995 dollars, except in FY 1995-2000, which is a six-year average.
• Total Life Cycle is the sum of annual costs in constant 1995 dollars.
Nondefense Funding Estimate
Five-Year Averages (Thousands of Constant 1995 Dollars)*
FY 1995-2000 2005 2010 2015 2020 2025 2030 Life Cycle**
Environmental Restoration 419 0 0 1,122 4,022 935 0 32,913Nuclear Material and Facility Stabilization 0 0 448 529 0 0 0 4,888
Total 419 0 448 1,652 4,022 935 0 37,802
• Costs reflect a five-year average in constant 1995 dollars, except in FY 2000, which is a six-year average.
• Total Life Cycle is the sum of annual costs in constant 1995 dollars.
OH 28

Major Activity Milestones
ACTIVITY TASK COMPLETION DATE
Environmental Restoration:
All Operable Units
All Operable Units
Operable Unit 1: Area B
Operable Unit 2: Main Hill
Operable Unit 4: Miami-Erie Canal
Operable Unit 5: South Property
Operable Unit 6: Decommissioning Sites
Operable Unit 9: Site-wide and Offsite Activities
Operable Unit 1: Area B
Operable Unit 2: Main Hill
Operable Unit 4: Miami-Erie Canal
Operable Unit 5: South Property
Operable Unit 6: Decommissioning Sites
Operable Unit 9: Site-wide and Offsite Activities
Fiscal Year
Remedial Investigation Report (RIR) Submitted to EPA
Feasibility Study Report/Proposed Plan Submitted to EPA
Assessment Completed
Assessment Completed
Assessment Completed
Assessment Completed
Assessment Completed
Assessment Completed
Remediation Completed
Remediation Completed
Remediation Completed
Remediation Completed
Remediation Completed
Remediation Completed
1996-2007
1996-2007
1999
2000
2007
2005
2006
2015
1999
2003
2008
2015
2006
2010
Waste Management:
Federal Facility Compliance Act
Waste Characterization
Site Treatment Plan Development
Site Treatment Plan Development
Site Treatment Plan Development
Site Treatment Plan Development
Site Treatment Plan Development
Site Treatment Plan Development
Fiscal Year
Submit Proposed Site Treatment Plan to the State of Ohio
Complete Drum Opening Facility
Packed Bed Reactor Title I Complete
Packed Bed Reactor Title II Complete
Complete Glass Melter Operating Procedures
Start Glass Melter ORR
Complete Tritium Capture Waste Inventory Report
Complete Construction on Building 72
Waste Management Activities Completed
1995
1995
1995
1995
1995
1995
1995
1995
2030
For further information on this site, please contact: Public Participation OfficePublic Affairs OfficeTechnical Liaisons: Bill Rummell/Art Kleinreth
(505) 845-5951(513) 648-3153(513) 865-3597
OH 29

OH 30

PIQUA NUCLEAR POWER FACILITY
The Piqua Nuclear Power Facility is located in Piqua, Ohio. It is managed by Department ofEnergy's Chicago Operations Office.
DECOMMISSIONED
•Fuel Storage Reactor
Pool
Office Area
2nd floor CI3nd f oor
LL,
RailroadTack
OH 31

Estimated Site Total
Five-Year Averages (Thousands of Current 1995 Dollars)*
FY 1995 1996 1997 1998 1999 2000
Environmental Restoration
• Costs for FY 1995 reflect Congressional Appropriation, costs for FY 1996 reflect EM budget submission, costs for FY 1997-2000 reflect Budget Shortfall Scenario, costs forshaded area assume 3% annual inflation.
Five-Year Averages (Thousands of Constant 1995 Dollars)**
FY 1995-2000 2005 2010 2015 2020 2025 2030 Life Cycle**
Environmental Restoration 12 16 0 0 0 0 0 152
Costs reflect a five-year average in constant 1995 dollars, except in FY 1995-2000, which is a six-year average.
*** Total Life Cycle is the sum of annual costs in constant 1995 dollars.
PAST, PRESENT, AND
FUTURE MISSIONS
Piqua Nuclear Power Facility contained a 45.5megawatt (thermal) organically cooled andmoderated reactor built and operated as ademonstration project by the U.S. AtomicEnergy Commission between 1963 and 1966.The Piqua Nuclear Power Facility was ownedby the Atomic Energy Commission andoperated under contract by the City of Piqua.Operations were discontinued in 1966, and thecontract with the City of Piqua for operationand maintenance of the facility was terminatedin 1967.
The Piqua Nuclear Power Facility wasdismantled and decommissioned between 1967and 1969; the reactor fuel, coolant, and most ofthe radioactive materials were removed fromthe site. Piping and equipment inside thereactor building were removed ordecontaminated. The reactor vessel, concrete
shielding, and fixed components within thereactor vessel were left in place, securelycontained in the reactor complex. The mainfloor of the reactor building was covered by awaterproof material and a layer of concrete torender the areas containing the radioactivematerial completely inaccessible to water andpersonnel. The reactor vessel and the spacesbetween the vessel and the cavity liner werefilled with dry, quartz sand to reducecondensation from moisture "breathed" in andto hold such moisture near its entry point if itdoes enter. Before placing the top shield plug, a"time capsule" was placed on top of the reactorvessel. The "time capsule" containsengineering documents, drawings, andphotographs describing the reactor complexstructure in detail.
The Piqua Nuclear Power Facility is currentlyundergoing routine surveillance andmaintenance under the Department of Energy's(DOE) Environmental Management program.
OH 32

Based on a 1968 contract with the AtomicEnergy Commission and the City of Piqua, onceradioactive materials have decayed, the facilitywill be returned to the City of Piqua.
The use of the property carries an absoluteprohibition against breaching the barrier thatencloses the radioactive source. Thisprohibition is expected to remain in placeindefinitely. The Environmental Managementmission at the site is currently scheduled to endin FY 2005, and no further activities areplanned. At that time, the site would betransferred to the City of Piqua.
ENVIRONMENTAL
RESTORATION
There is currently no contamination in evidenceoutside the containment structure at PiquaNuclear Power Facility. Radiologicalcontaminants consist of activation productsdispersed in the stainless steel materials thatconstituted the reactor vessel and its internals.Lesser amounts of activation products aredispersed in the carbon steel thermal shield andguard vessel that surround the reactor vessel, inthe compartment liner itself, and in thereinforcing bar and concrete outside the reactorcompartment. The inventory of primaryradionuclides remaining in the storagestructure includes iron-55, cobalt-60, carbon-14,and beryllium-10.
Current activities consist of annual collectionand analysis of radiological smears, sumpwater and sludge samples, facility tap watersamples, radiation surveys, radon samples, andvisual inspection of the containment structure.Annual surveillance and maintenance activitiesare expected to conclude in 2005. No furtheraction is planned at this time.
WASTE MANAGEMENT
There are no waste management activities at thePiqua Nuclear Power Facility. No waste iscurrently generated, treated, or stored, andthere are no plans to do so.
NUCLEAR MATERIAL AND
FACILITY STABILIZATION
The Piqua Nuclear Power Facility currently hasno nuclear material and facility stabilizationactivities.
LANDLORD FUNCTIONS
Landlord activities at the Piqua Nuclear PowerFacility are the responsibility of the City ofPiqua.
PROGRAM MANAGEMENT
Program management at Piqua Nuclear PowerFacility consists of annual review of thesubcontract for sampling and inspection, andreview of the analytical results. These activitiesare accomplished by DOE Chicago OperationsOffice staff on a level-of-effort basis.
FUNDING AND COST
INFORMATION
The following tables present current andprojected funding information and majorEnvironmental Management program activityand project costs projected through 2100 for thePiqua Nuclear Power Facility.
OH 33

Nondefense Funding Estimate
Five-Year Averages (Thousands of Constant 1995 Dollars) *
FY 1995-2000 2005 2010 2015 2020 2025 2030 Life Cycle**
Environmental Restoration 12 16 0 0 0 0 0 152
• Costs reflect a five-year average in constant 1995 dollars, except in FY 1995-2000, which is a six-year average.
** Total Life Cycle is the sum of annual costs in constant 1995 dollars.
Major Activity Milestones
ACTIVITY TASK COMPLETION DATE
Environmental Restoration Fiscal Year
Submit Final Report upon Conclusion of Monitoring 2005
Release the Site to City of Piqua Submit Final Report 2005
For further information on this site, please contact: Public Participation Office (708)252-8796Public Affairs Office (708)252-2013Technical Liaison: Michael Ferrigan (708)252-2570
OH 34

-47,144,
PORTSMOUTH GASEOUS DIFFUSION PLANT
The Portsmouth Gaseous Diffusion Plant lies 20 miles north of Portsmouth, Ohio, and 70 milessouth of Columbus, Ohio. It occupies approximately 3,700 acres.
0111
X-114
X-734
X-7727H
X-3012
X-3344OTF
r X-2307F
X-7725
X-751
X-734A
■
ofX-1007AV
X-231A
X-231B
ELM
X-749
X•1744
X 11A
o.
l‘NEOBP
X-744Y
Oh
X-749A
0I
S0110.00019•310101
Boundaries of SWMU Quadrants
OH 35

Estimated Site Total
(Thousands of Current 1995 Dollars)*
FY 1995 996 1997 1998 1999 2000
Environmental Restoration 68,600 74,400 67,800' 86,400 84,400 103,700
Program Management 6,900 12,100' 12,20064 18,700 18,300 15,800
Total 75,500 86,500 000 105,100 102,700 119,500
• Costs for FY 1995 reflect Congressional Appropriation, costs for FY 1996 reflect EM budget submission, costs for FY 1997-2000 reflect Budget Shortfall Scenario, costs for
shaded area assume 3% annual inflation.
Five-Year Averages (Thousands of Constant 1995 Dollars)"
FY 1995-2000 2005 2010 2015 2020 2025 2030
Environmental Restoration 74,708 73,938 133,045 229,811 222,641 246,046 207,444
Program Management 12,858 14,929 19,688 36,421 34,723 48,248 71,630
Total 87,567 88,867 152,733 266,232 257,364 294,295 279,074
FY 2035 2040 2045 2050 2055 2060 2065 Life Cycle**
Environmental Restoration 165,401 42,414 12,309 1,667 1,599 1,065 7,135,148
Program Management 57,304 10,487 4,719 6550 0 1,571,173
Total 222,705 52,901 17,028 2,323 1,599 1,065 0 8,706,321
Costs reflect a five-year average in constant 1995 dollars, except in FY 1995-2000, which is a six-year average.
*** Total Life Cycle is the sum of annual costs in constant 1995 dollars.
PAST, PRESENT, AND
FUTURE MISSIONS
Construction of the Portsmouth GaseousDiffusion Plant began in late 1952. First cell onstream was realized in September, 1954. A gascentrifuge uranium enrichment program wasestablished in the 1980's at Portsmouth.However, full operation was neverimplemented.
The principal mission of the PortsmouthGaseous Diffusion Plant is the separation ofuranium isotopes by gaseous diffusion. Theprocess produces enriched uranium used as
fuel in commercial powerplants. Although theplant is now managed by the U.S. EnrichmentCorporation, environmental restoration andrelated waste management activities areconducted by the Department of Energy (DOE).These activities are focused on the cleanup ofenvironmental pollution as well as thedecommissioning of inactive and surplusfacilities.
The current mission of the Portsmouth plantwill continue until the separation of uraniumisotopes is no longer needed by U.S.Enrichment Corporation or the FederalGovernment. The future land use of the sitewill be determined at a later date. However,
OH 36

since long-term surveillance, maintenance, andinstitutional controls will continue indefinitely,limiting future uses, it is assumed that the sitewill be used by the Federal Government forsome type of industrial activity.
ENVIRONMENTAL
RESTORATION
The cleaning and changeout of processequipment at the Portsmouth plant generatedspent solvents and other contaminants thatwere disposed of in onsite landfills and surfaceimpoundments. The contaminants includechlorinated solvents, such as trichloroethylene,chlorinated solvents mixed with radionuclidesin low concentrations, metals, andpolychlorinated biphenyls (PCBs). Additionalsources of contamination are uranium depositsin process equipment and radionuclides inbuildings, cooling towers, burial grounds, andwastewater ponds. Trichloroethylene is themain contaminant of concern in the ground-water systems at the Portsmouth site. To date,no ground-water contamination has migratedoffsite.
Potential Release Sites andTheir RemediationTo facilitate remediation and the restorationprocess, the site was divided into fourquadrants based in large part on ground-waterflow. Quadrants with the greater potential riskfrom ground-water contamination have higherpriority and are investigated first.
The initial investigations for each potentialrelease site, directed at identifying thecontaminants, the extent of their migration, andtheir sources have been completed and initialcorrective-measures are underway.
Soon after environmental restoration started,five of the potential release sites were identifiedas requiring no further action. Since then, fourmore sites (chromium sludge lagoons, a facilityfor the disposal of contaminated materials, afacility for the disposal of classified materials,and an incinerator) have been certified forclosure. Remedial actions have been completedat three other sites (an unrestricted andrestricted-waste storage facility, a waste-oiltank, and a storage facility).
Specific remedial actions have been identifiedfor five other potential release sites. Apermanent cap is to be installed, by spring 1997,on the oil bioremediation plot wheremicroorganisms have been used to digest theoil contaminant. Similarly, an engineered cap isto be emplaced over the landfill. Waste will beremoved from four other sites including aholding pond, a radiological storage yard, aneutralization pit, and a waste-neutralizationpit.
Underground and AbovegroundStorage Tanks
There are 10 underground and abovegroundstorage tanks within the scope of theenvironmental restoration activity atPortsmouth. Three of these tanks were neverplaced into service and are to be removed. Oneother underground storage tank did not passtightness tests and has been since removed. Sixabandoned aboveground storage tanks will alsobe demolished. Surrounding soils will becharacterized and, if necessary, excavated andtreated according to regulatory limits onpetroleum contamination in soil.
Decommissioning
Currently one abandoned facility, the X-705incinerator and storage pad, is scheduled fordemolition. Its structures, utilities, andequipment will be removed.
OH 37

Eventually, when the uranium-enrichmentprocesses are no longer needed, the Portsmouthplant will be shut down and decommissioned.Under provisions in the United StatesEnrichment Corporation lease of the plant, thestabilization or shutdown activities are theresponsibility of the leasee. Beforedecontamination, highly enriched uranium willbe removed. After an orderly shutdown,including the removal of the residual uraniumfrom the interior of the process equipment, allcontaminated process equipment will be
transported to a single decontamination facilityto be constructed and operated on the OakRidge Reservation. After decontamination andvolume reduction, the wastes will be returnedto the Portsmouth site for disposal.
The process buildings remaining after theremoval of the process equipment andauxiliaries will then be decontaminated. It isassumed all interior surfaces are contaminated.Radioactive and other hazardous materials willbe removed and disposed in approved disposal
Environmental Restoration Activity Costs
Five-Year Averages (Thousands of Constant 1995 Dollars)*
FY 1995-2000 2005 2010 2015 2020 2025 2030
Environmental RestorationAssessment 11,746 12,391 987 371 54 0 0
Remedial Actions 16,074 17,238 4,018 148 0 2 826Facility Decommissioning 0 16,548 108,928 213,977 220,666 244,749 206,618
Long-Term Surveillance and Monitoring 1,113 1,109 1,074 785 626 0 0
Facility Decommissioning 4,992 4,525 17,299 11,542 0 0 0
Waste Management 40,784 19,468 707 0 0 0 0
Surveillance and Maintenance 0 2,659 32 2,988 1,295 1,295 0
Total 74,708 73,938 133,045 229,811 222,641 246,046 207,444
2035 2040 2045 2050 2055 2060 2065 Life Cycle**
Environmental RestorationAssessment 287 1,810 1,667 1,667 1,599 1,065 0 179,952
Remedial Actions 2,805 40,604 10,642 0 0 0 0 477,85Facility Decommissioning 162,309 0 0 0 0 0 0 5,868,976
Long-Term Surveillance and Monitoring 0 0 0 0 0 0 0 24,65Facility Decommissioning 0 0 0 0 0 0 0 196,777
Waste Management 0 0 0 0 0 0 0 345,582
Surveillance and Maintenance 0 0 0 0 0 0 0 41,349
Total 165,401 42,414 12,309 1,667 1,599 1,065 0 7,135,148
• Costs reflect a five-year average in constant 1995 dollars, except in FY 1995-2000, which is a six-year average.
• Total Life Cycle is the sum of annual costs in constant 1995 dollars.
OH 38

facilities. The major hazardous materials areasbestos, which is found in the insulation forpiping systems and in the transite siding of allthe buildings, and PCBs, which are foundthroughout the electrical equipment, theventilation systems of the process buildings,and in local areas of the floors of thesebuildings. The facilities will be treated toremove surface contamination to allow forunrestricted release. Building materials liketransite siding and the roofing are likewisecontaminated and will be totally removed. Allthat will remain will be the superstructure ofthe facilities.
Surveillance and MaintenanceA surveillance and maintenance program hasbeen implemented to inspect and repairpotential release sites already cleaned up or thatrequire no further action. These sites are thesludge lagoons, the contaminated materialsdisposal facility, the classified-materialsdisposal facility, and the oil biodegradationplot. Other sites will be added to the long-termsurveillance and maintenance program ascorrective actions are completed. Surveillanceand maintenance will continue, as required, forverification of completeness of the correctiveaction. Gas centrifuge enrichment programfacilities destined for decommissioning areundergoing surveillance and maintenance.(The decommissioning cost for these facilitiesare not included in this estimate pendingformal designation as surplus facilities.)
Ground-Water ProtectionA ground-water protection program has beenestablished for the Portsmouth site. Its purposeis to coordinate and support environmentalrestoration projects concerned with or affectingthe ground water. This program is alsoresponsible for the operation and maintenance
of the ground-water treatment facilities at thePortsmouth plant. Any interim actionsrequired to stop the migration of ground wateroffsite also are managed under this program.
Ground water is sampled at specific wellsinstalled in and around the plant to determinethe extent of any contamination, to identify thecontaminants, and to determine their sources.The characterization effort has been helped bythe potential release site investigationsperformed for the environmental restorationactivity. Additional ground-water samplingwill be required to monitor rate of contaminantsand to determine the extent of contamination.
WASTE MANAGEMENT
Waste management activities at the PortsmouthGaseous Diffusion Plant are conducted withinthe scope of environmental restorationactivities. They involve waste generated fromplant operations before July 1, 1993. The typesof waste include transuranic waste, low-levelradioactive waste, low-level mixed waste,hazardous chemical waste, sanitary waste, andindustrial waste. All generated waste ischaracterized and labeled by type at the site ofgeneration or accumulation. All waste shippedoffsite for disposal must be certified to meet theacceptance criteria for disposal at the particulardisposal facility.
Two new waste-management facilities will beconstructed at the Portsmouth plant. Theseinclude a facility for sorting and repackaginglow-level mixed waste and a facility forhousing equipment used for handlinghazardous and radioactive waste.
Treatment, Storage andDisposal OperationsThe waste streams to be treated include selectedaqueous wastes, contaminated soils, organicliquids, and contaminated sludges. For low-
OH 39

level mixed waste and hazardous chemicalwaste, the goal of treatment is to meet ResourceConservation and Recovery Act land disposalrestrictions.
Low-level radioactive waste will continue to betreated to stabilize the waste and to reduce itsvolume. Low-level waste will be shipped toDOE's Hanford facility in Washington State.
Liquid and solid mixed waste will be sent to theK-25 Site at the Oak Ridge Reservation inTennessee or to an approved commercialfacility, if available. In addition, mobiletreatment trains for mixed waste may also beused at the Portsmouth site.
Four onsite storage facilities will manage thewaste generated by environmental restorationactivities until disposal can be completed.Storage-related activities include wastehandling, placement of wastes into storage,maintenance and surveillance of storagefacilities, procurement of handling equipment,and realignment of existing storage.
Sanitary waste, metal, wood, rubbish (includingasbestos) will be disposed of in the onsite solid-waste landfill or in construction-spoils areas.Low-level radioactive waste will be shipped toDOE's burial grounds at the Hanford Site, andtransuranic waste will be shipped to the WasteIsolation Pilot Plant. The low-level mixedwaste and hazardous waste treated at the K-25Site will be disposed in the same way as otherToxic Substance Control Act waste. Theremaining mixed and hazardous chemicalwaste will be disposed at the commercialfacility where they are treated.
NUCLEAR MATERIAL AND
FACILITY STABILIZATION
As stated in the lease dated July 1, 1993, theU.S. Enrichment Corporation is responsible forremoving all waste created during their
operations and cleaning the facilities atPortsmouth. When the facilities are transferredto DOE, this report assumes they will passdirectly into the decommissioning program,negating the requirement for any nuclearmaterial and facility stabilization activities.
LANDLORD FUNCTIONS
The landlord at the site is the DOE NuclearEnergy program.
PROGRAM MANAGEMENT
Program management, through the technicalintegration and contract managementfunctions, provides essential technical support,administrative integration, and oversight toenvironmental restoration and wastemanagement. This support is aimed atensuring the proper identification,characterization, remediation, and revitalizationof contaminated sites. It includes technicalprograms, technical oversight, communityrelations, the integration of environmentalrestoration with waste management, andbusiness management.
FUNDING AND COST
INFORMATION
The following tables present current andprojected funding information and majorEnvironmental Management program activityand project costs projected through 2100 for thePortsmouth Gaseous Diffusion Plant.
OH 40

Program Management Cost Estimate
Five-Year Averages (Thousands of Constant 1995 Dollars)*
FY 1995-2000 2005 2010 2015 2020 2025 2030
Program Management 12,858 14,929 19,688 36,421 34,723 48,248 71,630
2035 2040 2045 2050 2055 2060 2065 Life Cycle**
Program Management 57,304 10,487 4,719 655 0 0 0 1,571,173
• Costs reflect a five-year average in constant 1995 dollars, except in FY 1995-2000, which is a six-year average.
Total Life Cycle is the sum of annual costs in constant 1995 dollars.
OH 41

Defense Funding Estimate
Five-Year Averages (Thousands of Constant 1995 Dollars)'
FY 1995 - 2000 2005 2010 2015 2020 2025 2030
Environmental Restoration 74,708 73,938 133,045 229,811 222,641 246,046 207,444Program Management 12,858 14,929 19,688 36,421 34,723 48,248 71,630
Total 87,566 88,867 152,733 266,232 257,364 294,295 279,074
2035 2040 2045 2050 2055 2060 2065 Life Cycle"
Environmental Restoration 165,401 42,414 12,309 1,667 1,599 1,065 0 7,135,148Program Management 57,304 10,487 4,719 655 0 0 0 1,571,173
Total 222,705 52,901 17,028 2,323 1,599 1,065 0 8,706,321
• Costs reflect a five-year average in constant 1995 dollars, except in FY 1995-2000, which is a six-year average.
• Total Life Cycle is the sum of annual costs in constant 1995 dollars.
Major Activity Milestones
ACTIVITY TASK COMPLETION DATE
Environmental Restoration Fiscal Year
Portsmouth RCRA (New) Closures - Remediation Complete
Consent Decree (Old) Closures - Remediation Complete
Portsmouth Tanks - Remediation Complete
Complete Gas Centrifuge Enrichment Program Decommissioning
Complete all Environmental Restoration Activities
1999
1999
1996
2015
2060
For further information on this site, please contact: Public Participation OfficePublic Affairs OfficeTechnical Liaisons: John Sheppard
Bill Cahill
(615) 576-1590(615) 576-0885(615) 897-5510(615) 241-4830
OH 42

REACTIVE METALS, INC.
Reactive Metals, Inc. (RMI Titanium Co.) Extrusion Plant is located in northern AshtabulaCounty,'Ohio, about 3 miles northeast of the center of the City of Ashtabula and approximately 1mile south of Lake Erie. The plant is located in a sparsely populated and highly industrialized area,with a number of chemical production and metal conversion plants located nearby.
FIELDS BROOKCERCLA INVESTIGATION
Area C
Area A
Area B
cc;z,
Area F_
Area D
Area E
Private Residence —in
Ritz Lounge CD. - - - - -
Northcoast AutoCrushing & Scrap
411
O
RMI CompanyMetals Plant
Residential Area
Road
OH 43

Estimated Site Total
(Thousands of Current 1995 Dollars)*
991995 1446 1997: 1998 19 2000Environmental RestorationProgram Management
Total 6,590 11.124 13102 8 14,721 15,163
* Costs for FY 1995 reflect Congressional Appropriation, costs for FY 1996 reflect EM budget submission, costs for FY 1997-2000 reflect Budget Shortfall Scenario, costs forshaded area assume 3% annual inflation.
Five-Year Averages (Thousands of Constant 1995 Dollars)`•
FY 1995-2000 2005 2010 2015 2020 2025 2030 Life Cycle"'
Environmental Restoration 7,466 10,635 6,089 68 474 749 0 134,876Program Management 2,122 2,255 1,434 0 0 0 0 31,177
Total 9,588 12,890 7,523 68 474 749 0 166,053
Costs reflect a five-year average in constant 1995 dollars, except in FY 1995-2000, which is a six-year average.
*** Total Life Cycle is the sum of annual costs in constant 1995 dollars.
PAST, PRESENT, AND
FUTURE MISSIONS
The Reactive Metals, Inc. Titanium Co. (RMI)Extrusion Plant produced uranium billets andrefined them into various sizes and shapes foruse by the Department of Energy (DOE) and itspredecessor agencies from 1962 to 1988.
The current mission of the RMIDecommissioning Project is to safely removethe extrusion facility from service and to reduceresidual radioactive and organic contaminationto a level that permits the extrusion facility, site,and adjacent areas to be released forunrestricted use. Decommissioning activities,as well as remediation, at the RMI site areprojected to be complete by the year 2025. Atthat time, the facilities will be returned to RMI.
ENVIRONMENTAL
RESTORATION
The RMI facility consists of buildings andequipment that have both radiological andchemical contamination. Contamination is aresult of past extrusion activities, whichconsisted of heating uranium metal, forcing itinto various molds, and machining the shape torefine it for use by DOE's office of DefensePrograms. Transport mechanisms includefugitive dust, leaching from soils into groundwater, and surface transport into sediments.The primary media of concern are facilities andequipment, soils, and ground water.Contaminants of concern include uranium andtechnetium-99, and trichloroethylene; bariumchloride and lead may also be of concern.
OH 44

Remediation of a proposed Corrective ActionManagement Unit has been identified as part ofthe facility's Resource Conservation andRecovery Act Part B permit. The CorrectiveAction Management Unit consists of a smallwastewater evaporation pond used during pastextrusion plant operations, a swale north of theevaporation pond, and a seepage pond at thebase of the escarpment north of the extrusionplant. Sampling and analysis have indicatedboth soils and ground water are contaminatedwith trichloroethylene, uranium, andtechnetium-99.
RMI expects to remove radiological andhazardous contaminants from the site and fromadjacent property to permit future unrestricteduse consistent with regulatory and contractualobligations. The cost estimate assumes therequired technology to complete these activitieswill be available.
Facility equipment will be decontaminated andreleased for unrestricted use, packaged anddisposed as low-level waste, or disposed inaccordance with applicable regulations.Buildings below the unrestricted releasecriteria for radiological contaminants may beleft onsite. Most buildings will be disassembledand removed from the site. Contamination onthe slab and sub-slab will also be removed.These activities are expected to be completed in2025.
Soils characterization for hazardous andradiological constituents will be completed, andsoils will be excavated and packaged fordisposal. Excavated areas will be filled withclean backfill. Soils remediation is expected tobe completed in 2010. Ground-watercharacterization will be completed, and anappropriate remediation technology selected.Ground-water remediation is scheduled forcompletion by 2020. The degree ofcontamination and the potential threat toworkers and the public is being assessed as partof the characterization activities.
WASTE MANAGEMENT
Treatment, Storage, andDisposal Operations
Waste generated by decommissioning andremediation activities will be shipped toapproved hazardous waste or radiologicalwaste treatment and/or disposal facilities. RMIhas no plans to construct long-term treatment,storage, or disposal facilities at its location.Waste handling activities at RMI are fundedand managed within the scope ofenvironmental restoration and will concludewhen the environmental restoration activitiesare completed.
Environmental Restoration Activity Costs
Five-Year Averages (Thousands of Constant 1995 Dollars)*
FY 1995 - 2000 2005 2010 2015 2020 2025 2030 Life Cycle**
Environmental RestorationAssessment 1,834 0 0 0 0 0 0 11,007
Surveillance And Maintenance 0 0 0 0 0 749 0 3,747
Facility Decommissioning 5,632 10,635 6,089 68 474 0 0 120,123
Total 7,466 10,635 6,089 68 474 749 0 134,876
• Costs reflect a five-year average in constant 1995 dollars, except in FY 1995-2000, which is a six-year average.
• Total Life Cycle is the sum of annual costs in constant 1995 dollars.
OH 45

No waste is treated onsite, and there are noplans to construct treatment facilities onsite. Allwaste is sent offsite for treatment, as necessary,prior to disposal. Wastes are collected; reducedin volume; and packaged, classified, and storedtemporarily pending offsite shipment toappropriate treatment and/or disposalfacilities. Radioactive waste is shipped toDOE's Nevada Test Site, and hazardous wasteis sent to appropriate commercial facilities.
NUCLEAR MATERIAL AND
FACILITY STABILIZATION
There are no current or planned nuclearmaterial and facility stabilization activities atthe RMI site.
LANDLORD FUNCTIONS
Landlord/Infrastructure costs are currentlyfunded within the scope of environmentalrestoration activities. These "site services" costsinclude security for buildings and grounds,maintenance and testing of site equipment,maintenance of site utilities, and equipmentprocurement. Landlord costs will end by 2025when the environmental restoration activitiesare completed.
PROGRAM MANAGEMENT
Program management at RMI is concerned withdecontamination and remediation planning,project control, and decommissioningmanagement. RMI does not fund any grants orAgreements-In-Principle at this time. Themiscellaneous area includes general andadministrative, fee, contingency, and projectoversight.
FUNDING AND COST
INFORMATION
The following tables present fundinginformation and major activity milestones forthe RMI Titanium Co., Extrusion Plant.
Program Management Cost Estimate
Five-Year Averages (Thousands of Constant 1995 Dollars)*FY 1995-2000 2005 2010 2015 2020 2025 2030 Life Cycle**
Program Management 2,122 2,255 1,434 0 0 0 0 31,177
• Cost shown include program management costs with each project.
• Costs reflect a five-year average in constant 1995 dollars, except in FY 1995-2000, which is a six-year average.
OH 46

Defense Funding Estimate
Five-Year Averages (Thousands of Constant 1995 Dollars)*
FY 1995 - 2000 2005 2010 2015 2020 2025 2030 Life Cyde*
Environmental Restoration 7,466 10,635 6,089 68 474 749 0 134,876
Program Management 2,122 2,255 1,434 0 0 0 0 31,177
Total 9,588 12,890 7,523 68 474 749 0 166,053
• Costs reflect a five-year average in constant 1995 dollars, except in FY 1995-2000, which is a six-year average.
• Total Life Cycle is the sum of annual costs in constant 1995 dollars.
Major Activity Milestones
ACTIVITY TASK COMPLETION DATE
Environmental Restoration Fiscal Year
Submit Corrective Action Management Unit Design to EPA 1997
Complete Soil Remediation 2010
Complete Decommissioning Activities 2025
For further information on this site, please contact: Public Participation Office (708)252-8796
Public Affairs Office (708)252-2010
Technical Liaison: Michael Ferrigan (708)252-2570
OH 47

OH 48

OHIO FUSRAP SITES
Alba Craft, Associate Aircraft, Baker Brothers, B&T Metals, HHM Safe Company, Luckey, and
Painesville constitute the Ohio sites within the Formerly Utilized Sites Remedial Action Program
(FUSRAP). The program was established in 1974 under the provisions of the Atomic Energy Act to
identify previously decontaminated Manhattan Engineer District and Atomic Energy Commission
sites, to reevaluate their radiological condition, and to take appropriate remedial action where neces-
sary. FUSRAP encompasses 46 sites in 14 States and is funded through the Oak Ridge Operations
Office.
The model used to estimate costs for this report provides one cost for all of the FUSRAP sites located
in each State. All costs for waste management activities, program management, and relevant
landlord activities attributable to the Department of Energy (DOE) are provided for within the scope
of environmental restoration. There are no FUSRAP sites with either current or planned nuclear
material and facility stabilization activity needs. Funding for all sites is 100 percent nondefense.
For a general discussion of FUSRAP and associated costs, see the FUSRAP Site Summary found in
the Tennessee section.
Estimated Site Total
(Thousands of Current 1995 Dollars)*
FY 1995
Ohio-FUSRAP 10,600
1996
4,660
1997 1998 1999 2000
12,250 10,980 16,260 23,290
• Costs for FY 1995 reflect Congressional Appropriation, costs for FY 1996 reflect EM budget submission, costs for FY 1997-2000 reflect Budget Shortfall Scenario, costs for
shaded area assume 3% annual inflation.
FY 1995-2000
Ohio-FUSRAP
Five-Year Averages (Thousands of Constant 1995 Dollars)**
2005 2010 2015 2020 2025 2030 Life Cycle".
12,955 18,773 19,520 0 0 0 0 269,194
▪ Costs reflect a five-year average in constant 1995 dollars, except in FY 1995 - 2000, which is a six-year average.
*** Total Life Cycle is the sum of annual costs in constant 1995 dollars.
Nondefense Funding Estimate
Five-Year Averages (Thousands of Constant 1995 Dollars)*
FY 1995-2000 2005 2010 2015 2020 2025 2030 Life Cycle`
Ohio-FUSRAP 12,955 18,773 19,520 0 0 0 0 269,194
• Costs reflect a five-year average in constant 1995 dollars, except in FY 1995-2000, which is a six-year average.
• Total Life Cycle is the sum of annual costs in constant 1995 dollars.
OH 49

ALBA CRAFT LABORATORY(Formerly Utilized Sites Remedial Action Program)
The Alba Craft site is located at 10-14 West Rose Avenue, Oxford, Ohio.
oIo
MFRS OF EXCAYAT IMF
I°15
100 FELT0
30 IIETERS
OH 50

PAST, PRESENT, AND
FUTURE MISSIONS
The former Alba Craft Laboratory facility was
"U" shaped (open on the south side), with a
total area of approximately 8,000 square feet.
The facility is located in a residentialneighborhood with an apartment buildinglocated approximately 20 feet from the rear of
the building. Alba Craft provided a variety ofmachine shop services on uranium metal. Early
work included general machining anddevelopmental machining of threaded slugs
from the Savannah River Site. Final operations
were on a production scale and consisted ofhollow drilling and turning of slugs for theSavannah River and Hanford reactors.
This site will be released for unrestricted useupon completion of the Certification Docket.
ENVIRONMENTAL
RESTORATION
The outdoor portion of a 1992 survey foundthat soil samples contained residual radioactivecontamination, with most occurring in the top 6inches of soil. There are also gamma readingswith no measurable beta, which indicates thepresence of subsurface contamination.Generally, all of the old concrete iscontaminated. The interior portion of thesurvey found that all floor surfaces werecontaminated to some extent. Contamination of
the walls was spotty and usually occurred nearthe floor. Window ledges, electrical switchboxes, old work benches, and other horizontalsurfaces where dust could settle and beundisturbed showed uranium contamination.
Most overhead structures such as electricaljunction boxes, lights, and trusses were found
to be contaminated.
Remediation of the Alba Craft Site was initiated
in August 1994 and will be completed in 1995.Remediation to date has includeddecontamination and demolition of thebuilding on the Alba Craft Site. Total wastevolume was 2,800 cubic yards.
For further information on this site, please contact: Public Participation Office (615)576-1590
Public Affairs Office (615)576-0885
Technical Liaison: Melyssa Noe (615)241-3315
OH 51

ASSOCIATED AIRCRAFT TOOL MANUFACTURING(Formerly Utilized Sites Remedial Action Program)
The former Associate Aircraft facility is located at 3660 Dixie Highway in Fairfield, Ohio, which islocated near Cincinnati.
41"-------FORMER R. •ASSOCIATEAIRCRAFT
(FORCECONTROL)
OH 52

PAST, PRESENT, AND
FUTURE MISSIONS
The facility is an active machine shop with atotal area of approximately 25,000 square feet.In 1956, Associated Aircraft machined uraniumslugs which included hollow drilling, reaming,and turning slugs for the Atomic EnergyCommission. It is estimated that approximately95,000 slugs were machined at this site duringthe eight-month period of operation. Themachining work was confined to only part ofthe building. The facility has not beensignificantly altered since uranium machiningoperations took place.
The site will be released for unrestricted usefollowing completion of cleanup.
ENVIRONMENTAL
RESTORATION
The waste volume is estimated to be 690 cubicyards of uranium contaminated material.Cleanup activities are currently underway.
For further information on this site, please contact: Public Participation Office (615)576-1590
Public Affairs Office (615)576-0885
Technical Liaison: Melyssa Noe (615)241-3315
OH 53

BAKER BROTHERS(Formerly Utilized Sites Remedial Action Program)
The Baker Brothers site is located at 2551-2555 Harleau Place at the intersection with Post Street inToledo, Ohio.
UQ.
0
1.1•••••••••
POST ST.
Asphalt
AUTO PARKING
No.14
Asphalt
Iliffat0T
*setalt
O
AUTO ►AtxllG
Graves
ISLINGTON ST.
C1:01:0CTE PADNo.10
No.3
, N D.6
No.3A
'MTO 50 100 200001=2:ammerO 10 20 40 PO
<TM
r
H
OH 54

PAST, PRESENT, AND
FUTURE MISSIONS
During the time that uranium fabrication workwas conducted at Baker Brothers, thecommercial site consisted of several 1920'sbuildings of brick with saw-tooth roofs andconcrete floors. It was bounded to thenorthwest by several railroad tracks and asiding entered the site. Three of the fourbuildings used by Baker Brothers remain. Thefacility was used for machining large quantities
of uranium rods to produce finished slugs inthe mid 1940's. There is one vicinity property
of this site, located in Ottawa Lake, Michigan.
This site will be released for unrestricted useupon completion of cleanup.
ENVIRONMENTAL
RESTORATION
The waste volume is estimated to be 2,500 cubicyards and consists primarily of uranium-contaminated soil (classified as low-levelradioactive waste).
Remediation of the vicinity property has beencompleted.
For fiirther information on this site, please contact: Public Participation Office (615)576-1590
Public Affairs Office (615)576-0885
Technical Liaison: Melyssa Noe (615)241-3315
OH 55

B&T METALS(Formerly Utilized Sites Remedial Action Program)
B&T Metals is located at 425 West Town Street on the southwest side of Columbus, Ohio.
McDOWELL
rRICH STREET
-I I
BRICKBRICK ROAD
EXTRUSION
WALNUT STREET
MAIN OFFICE
GRASS GRASS
4-1.÷3;
C0001
PARKING
STORAGEBLDG.
PARKING
TOWN STREET
PROPERTY BOUNDARY
OH 56

PAST, PRESENT, AND
FUTURE MISSIONS
As of 1988, the B&T Metals site consisted of
three buildings: (1) the main office; (2) astorage building, and (3) an extrusion building,
the latter of which did not exist at the time of
the uranium work (extruding uranium billets
into rods). The work was limited to thenorthwest corner of the main office building,
the largest of the three structures.Approximately 168,054 tons of uranium billets
were extruded into rods during the 1940's.Uranium fires were experienced during theextrusion process.
B&T Metals site will be released for unrestricted
use following completion of cleanup.
ENVIRONMENTAL
RESTORATION
No remedial action has been conducted at thissite to date. The waste volume is estimated tobe 1,000 cubic yards and consists of uraniumcontaminated material.
For further information on this site, please contact: Public Participation Office (615)576-1590
Public Affairs Office (615)576-0885
Technical Liaison: Melyssa Noe (615)241-3315
OH 57

HHM SAFE COMPANY(Formerly Utilized Sites Remedial Action Program)
The HHM Safe Company building is located in Hamilton, Ohio.
OH 58

PAST, PRESENT, AND
FUTURE MISSIONS
The former Herring-Hall-Marvin SafeCompany machined uranium slugs fromuranium billets for the Manhattan Project and
the Atomic Energy Commission intermittently
from the 1940's to the early 1950's. Therelatively small-scale uranium matchingstopped in August 1951.
The 300,000 square-foot facility was owned byHerring-Hall-Marvin Safe Company and sold atan unknown date to the Diebold Safe Company.
In spring of 1994, Diebold sold the unoccupiedfacility to another party, while retaining interest
in the property.
This site will be released for unrestricted useupon completion of the Certification Docket.
Mga
ENVIRONMENTAL
RESTORATION
The first radiological surveys performed on thefirst and second floor resulted in spots of excessradionuclide concentrations that have alreadybeen removed. The third floor was surveyedlater, and contamination was identified inseveral areas.
Remediation of the site was initiated inDecember 1994 and completed in 1995.Primary scope was decontamination of thethird floor. Total waste volume was 20 cubicyards.
For further information on this site, please contact: Public Participation Office (615)576-1590
Public Affairs Office (615)576-0885
Technical Liaison: Melyssa Noe (615)241-3315
OH 59

LUCKEY(Formerly Utilized Sites Remedial Action Program)
The site is located in Luckey, Ohio, approximately 22 miles southeast of Toledo, at 21200 LuckeyRoad.
LIAM NOY me—S
IMPII iw
AmOININ.
WM a
•••••••01=
IIMME
rill fl .Slts 1
Mill NM
N
1.131110
•••••••• 1114
•"••••••••ra WAY
.•••••• .,,-- ,
,...... c----- .. .r — .
I • - %.1 ,
OH 60

PAST, PRESENT, AND
FUTURE MISSIONS
The Luckey site is generally L-shaped andencompasses approximately 40 acres.Structures at the site include large production,warehouse and related buildings,transportation systems, and utility buildings.Several active and inactive lagoons and spoilareas are present. Numerous open areas arevegetated, mostly with grasses and brush. In1951, about 1,000 tons of contaminated scrapsteel was shipped from the Lake OntarioStorage Area to the Luckey site, to be used forcontrolling chlorine fumes at a Painesville, Ohiofacility.
The site will be released for unrestricted usefollowing completion of cleanup.
ENVIRONMENTAL
RESTORATION
The waste volume is estimated to be 64,000cubic yards and consists of beryllium ore andberyllium production residues and traces ofuranium.
No remedial action has been conducted at thesite to date.
For further information on this site, please contact: Public Participation Office (615)576-1590
Public Affairs Office (615)576-0885Technical Liaison: Melyssa Noe (615)241-3315
OH 61

PAINESVILLE
(Formerly Utilized Sites Remedial Action Program)
The Painesville site is located approximately 22 miles northeast of Cleveland, at 720 Fairport-Nursery Road.
OH 62

PAST, PRESENT, AND
FUTURE MISSIONS
The Painesville site is the location of theformerly government-owned NationalIndustrial Reserve Plant for magnesiumproduction. About a third of the site'sapproximately 150 acres was covered by largebuildings and rail lines. Some of the originalbuildings are still in use but others have beenremoved.
This site will be released for unrestricted usefollowing completion of cleanup.
ENVIRONMENTAL
RESTORATION
The waste volume is estimated to be 104,000cubic yards and consists of uraniumcontaminated material.
No remedial action has been conducted at thesite to date.
For further information on this site, please contact: Public Participation Office (615)576-1590Public Affairs Office (615)576-0885Technical Liaison: Melyssa Noe (615)241-3315
OH 63

OH 64

Oreg0n
ALBANY METALLURGICAL—r---'-0RESEARCH CENTER
(COMPLETED FUS RAP SITE)*
LAKEVI EW(COMPLETED UMTRA SITE)*
OREGONEstimated State Total
*Summaries are notprovided for facilities withcompleted remedialactions. Any ongoingsurveillance and monitoringcosts for these facilities areprovided in the table below.
(Thousands of Current 1995 Dollars)*
rY 1995 1996 1997 1998 1999 2000
Completed UMTRA Surveillance & Monitoring 320 190 230 160 1,130
• Costs for FY 1995 reflect Congressional Appropriation, costs for FY 1996 reflect EM budget submission, costs for FY 1997-2000 reflect Budget Shortfall Scenario, costs forshaded area assume 3% annual inflation.
Five-Year Averages (Thousands of Constant 1995 Dollars)**
FY 1995 - 2000 2005 2010 2015 2020 2025 2030 Life Cycle"'Completed UMTRA Surveillance & Monitoring 388 339 36 7 0 0 0 4,241
Costs reflect a five-year average in constant 1995 dollars, except in FY 1995 - 2000, which is a six-year average.
*** Total Life Cycle is the sum of annual costs in constant 1995 dollars.
OR 1

OR 2

e n n tory . n 1 a
ALIQUIPPA FORGE(COMPLETED FUSRAP SITE)*
SHIPPINGPORT ATOMICPOWER STATION(COMPLETED FUSRAPSITE)*
CANONSBURG(COMPLETED UMTRA SITE)*
C. H. SCHNOOR(COMPLETED FUSRAP SITE)*
*Summaries are not provided forfacilities with completed remedialactions. Any ongoing surveillance andmonitoring costs for these facilities areprovided in the table below.
PENNSYLVANIAEstimated State Total
(Thousands of Current 1995 Dollars)*
FT 199 1996 1997 998 1999 2000
Completed UMTRA Surveillance & Monitoring 190 21 250 200Pennsylvania-FUSRAP 780 190 0
Total 97 470 210 250 80 200
• Costs for FY 1995 reflect Congressional Appropriation, costs for FY 1996 reflect EM budget submission, costs for FY 1997-2000 reflect Budget Shortfall Scenario, costs forshaded area assume 3% annual inflation.
Five-Year Averages (Thousands of Constant 1995 Dollars)**
FY 1995.2000 2005 2010 2015 2020 2025 2030 life Cycle***
Completed UMTRA Surveillance & Monitoring 231 492 151 0 0 0 0 4,602Pennsylvania-FUSRAP 160 0 0 0 0 0 0 961
Total 932 492 151 0 0 0 0 5,564
Costs reflect a five-year average in constant 1995 dollars, except in FY 1995 - 2000, which is a six-year average.
** Total Life Cycle is the sum of annual costs in constant 1995 dollars.
PA 1

PA2

SAVANNAH RIVER SITE
SOUTH CAROLINA
Estimated State Total
(Thousands of Current 1995 Dollars)*
FY 1995 1996 1997 1998 1999 2000
Savannah River Site 721,200 ,275,600 1,516,600 1,599,100 1,651,100 1,774,500
• Costs for FY 1995 reflect Congressional Appropriation, costs for FY 1996 reflect EM budget submission, costs for FY 1997-2000 reflect Budget Shortfall Scenario, costs forshaded area assume 3% annual inflation.
Five-Year Averages (Thousands of Constant 1995 Dollars)**
FY 1995-2000 2005 2010 2015 2020 2025 2030
Savannah River Site 1,184,027 1,499,052 1,789,949 1,466,002 1,607,487 1,343,457 1,460,935
FY 2035 2040 2045 2050 2055 2060 2065 Life Cycle***
Savannah River Site 1,223,712 988,743 403,294 324,737 19,906 0 0 67,640,532
" Costs reflect a five-year average in constant 1995 dollars, except in FY 1995 - 2000, which is a six-year average.
"' Total Life Cycle is the sum of annual costs in constant 1995 dollars.
SC 1

SC 2

SAVANNAH RIVER SITE
The Savannah River Site is located in west-central South Carolina and bordered on the southwest bythe Savannah River. The closest major population centers are Aiken, South Carolina, and Augusta,Georgia. The total area of the site is approximately 325 square miles, with production facilitiesoccupying less than 5 percent of the site.
Area CSotlfenralt)oaracttvee Hazardous
aste•MSted Waste
SAVANNAH RIVER SITE
Wasted•H avy WaterComponent-TeatReaCtor
Area FAfirgh LevelTankFaen & Ev
Area•High-Levet Waste TankFarm & Evaporator
•Beta-Gamma Incinerator•High-Level WasteMaintenance FaddyEffitent neatment Faddy Replacement High-Levet WasteEvaporator•New Waste Transfer Fealty*Extended Sludge Proce gAln.tank Precipitation•Gonsolidated Incineration
Facility
AreaAreaaste Disposal
Facility•E-Area Vault Storage•/H301*e00#411ottRioility•WaitWeeitifidatid0,,1%04,•.q1W/100t DisposalFacliify ;'•mixottivottiCsosiAgoigip,'q'TIQW#f*Fil•
Area•Defense WasteProcessing FatSt
SC 3

Estimated Site Total
(Thousands of Current 1995 Dollars)*
FY 1995 1996
Environmental Restoration
Waste ManagementNuclear Material and Facility Stabilization
Directly Appropriated LandlordProgram Management
Total
97,400481,700332,000233,500131,000
:..721,200 1,275,600
1997 1998 1999 2000
99,400 100,600 104,100 107,900
567,400 605,100 624,900 712,200421,000 444,600 459,900 476,000
292,100 308,500 319,100 330,300136 700 140,300
1,516,600 1,599,100 1,651,100 1,774,500
• Costs for FY 1995 reflect Congressional Appropriation, costs for FY 1996 reflect EM budget submission, costs for FY 1997-2000 reflect Budget Shortfall Scenario, costs for
shaded area assume 3% annual inflation.
Five-Year Averages (Thousands of Constant 1995 Dollars)**
FY 1995.2000 2005 2010 2015 2020 2025 2030
Environmental Restoration 88,248 80,326 93,834 118,720 218,630 358,629 535,322
Waste Management 427,789 729,264 834,366 798,964 835,469 566,422 565,979
Nuclear Material and Facility Stabilization 324,209 232,978 364,772 18,669 12,556 27,886 287
Directly Appropriated Landlord 225,465 186,217 186,217 186,217 186,217 186,217 186,217
Program Management 118,317 270,267 310,761 323,433 354,615 204,304 173,130
Total 1,184,027 1,499,052 1,789,949 1,466,002 1,607,487 1,343,457 1,460,935
FY 2035 2040 2045 2050 2055 2060 2065 Life Cycle***
Environmental Restoration 613,927 504,154 226,811 36,602 5,872 0 0 14,493,617
Waste Management 291,689 195,262 115,946 272,065 9,998 0 0 28,643,853
Nuclear Material and Facility Stabilization 0 0 0 0 0 0 0 5,230,981
Directly Appropriated Landlord 186,217 186,217 0 0 0 0 8,801,468
Program Management 131,879 103,110 60,537 16,070 4,036 0 10,470,612
Total 1,223,712 988,743 403,294 324,737 19,906 0 0 67,640,532
• Costs reflect a five-year average in constant 1995 dollars, except in FY 1995 - 2000, which is a six-year average.
• Total Life Cycle is the sum of annual costs in constant 1995 dollars.
PAST, PRESENT, AND
FUTURE MISSIONS
The Savannah River Site was established by theAtomic Energy Commission in 1950 to producenuclear materials for national defense (tritiumand plutonium-239), medical, and spacemission (plutonium-238) use. The SavannahRiver Plant produced nuclear materials bymanufacturing fuel elements, irradiating target
components in reactors, and chemically orthermally extracting the desired nuclearmaterials from the targets. In addition, theplant chemically reprocessed spent nuclear fuelto recover uranium-235.
The fuel and target manufacturing facilities andthe five production reactors are not in operationat this time. The facilities used to reprocessspent nuclear materials are operated asrequired. Current reprocessing operationsconsist of providing plutonium-238 for
SC 4

National Aeronautic and Space Administrationmissions. Otherwise, it is assumed there will beno further processing activities in the chemicalseparations plants.
The mission of the Savannah River Site isevolving as emphasis is shifted from nuclearmaterial production to environmentalmanagement. The emphasis on environmentalmanagement does not preclude the SavannahRiver Site's remaining a major defenseinstallation with a capability for processing andpurifying tritium and plutonium separation.
In the foreseeable future, the Savannah RiverSite will continue to be owned by theGovernment and it will provide land for theDepartment of Energy's defense activities withadequate isolation from population centers.The central industrial area will be used byDefense Programs for continued activities andby Environmental Management for maintainingand monitoring the buried and stored wasteremaining at the site. The central industrialarea includes radioactive waste disposal areasrestricted as long as necessary to ensureprotection of human health and theenvironment. The goal for restoration is tohave all land and ground water located near theperimeter of the Savannah River Siteremediated to permit unrestricted use. In someinstances, technologies may not be available toattain that goal for ground water. In thosespecial cases, hydraulic controls will be used toprevent spreading of hazardous contaminantsuntil effective technologies are found.
While a land-use policy has not beenestablished to date, the site will continue tosupport environmental ecological research,forest management, historical programs, andarcheological programs. The central industrialsite area is to be used for continued DefensePrograms activities and environmentalmanagement activities, such as the treatmentand storage of waste and the disposal andmonitoring of waste materials that remainonsite.
ENVIRONMENTAL
RESTORATION
The operations at the Savannah River Site usedmore than 1,000 facilities potentiallycontaminated with hazardous and radioactivematerials. The migration of contaminants fromthese structures through the soil has resulted inground-water contamination. A major public-health concern is the possible offsite migrationof these contaminants.
Sound remedial solutions will be developedutilizing public input and concurrence. Theimplementation of these solutions will be basedon protecting offsite populations and onsiteworkers.
More than 90 areas are of concern, and arecurrently being characterized or remediated atthe Savannah River Site. Additionally, there areapproximately 400 potential areas undergoingpreliminary evaluation. The waste sites alreadycleaned up will require long-term surveillanceand monitoring.
Waste Area Group 1: Fuel andTarget Fabrication
This group encompasses potential release sitesresulting from fuel and target fabrication inAreas A and M and the Savannah RiverTechnology Center. Nine release sites havebeen identified and found to be contaminatedwith volatile organic compounds (e.g.,trichloroethylene and tetrachloroethylene) andmetals (e.g., aluminum, zinc, arsenic, cadmium,chromium, lithium, mercury, and lead) used indeveloping, testing, manufacturing, andcleaning of reactor fuel and targets. Past wastedischarges from these facilities resulted in soiland ground-water contamination.
SC 5

Technologies assumed for cleanup include soilmixing, biological remediation through theaction of microorganisms, soil washing, theinjection of grout to immobilize contaminants,and excavation.
The ground water in Areas A and Area M hasbeen contaminated, mainly withtrichloroethylene and tetrachloroethylene.Remediation started in 1985, and additionalground-water cleanup units are being designedor constructed with a forecasted installationdate of 1998. These operations useconventional technologies: pumping thecontaminated water out at an extraction well
and decontaminating it, or using an air stripperto force an air stream through the water causingany volatile organics present to evaporate.Completion of all Waste Area Group 1 activitiesis scheduled for 2025.
Waste Area Group 2: CentralShops Area
The Central Shops Area is located in theapproximate center of the Savannah River Site;it contains machine shops, equipment repairshops, material and equipment storage
Environmental Restoration Projects
Five-Year Averages (Thousands of Constant 1995 Dollars)*
Fr 1995 - 2000 2005 2010 2015 2020 2025 2030
Waste Area Group 1 12,065 11,708 6,307 5,925 5,938 2,270 0
Waste Area Group 2 2,257 3,391 709 0 0 0 0
Waste Area Group 3 9,405 20,114 26,820 10,619 6,763 819 0
Waste Area Group 4 31,475 19,180 14,618 13,456 17,990 6,828 0
Waste Area Group 5 4,810 5,481 8,012 3,293 3,301 1,356 0
Waste Area Group 6 9,291 10,796 4,784 2,590 2,600 2,602 2,596
Waste Area Group 7 1,015 1,197 24,125 919 919 919 919
Waste Area Group 8 9,023 8,459 8,459 8,982 8,982 8,982 8,982
Waste Area Group 9 8,907 0 0 72,936 172,137 334,853 522,826
Total 88,248 80,326 93,834 118,720 218,630 358,629 535,322
2035 2040 2045 2050 2055 2060 2065 Life Cycle**
Waste Area Group 1 0 0 0 0 0 0 0 233,126Waste Area Group 2 0 0 0 0 0 0 0 34,045
Waste Area Group 3 0 0 0 0 0 0 0 382,102
Waste Area Group 4 0 0 0 0 0 0 549,213Waste Area Group 5 0 0 0 0 0 0 136,082Waste Area Group 6 1,044 0 0 0 0 0 190,803Waste Area Group 7 10,000 25,000 33,640 0 0 0 494,282Waste Area Group 8 7,133 8,982 0 0 0 398,925
Waste Area Group 9 595,749 470,173 193,171 36,602 5,872 0 12,075,039
Total 613,927 504,154 226,811 36,602 5,872 0 0 14,493,617
* Costs reflect a five-year average in constant 1995 dollars, except in FY 1995-2000, which is a six-year average.
Total Life Cycle is the sum of annual costs in constant 1995 dollars.
SC 6

buildings, and offices. Seven potential releaseunits are located here: seepage basins, aburning and rubble pit, a sludge lagoon, andthe site of a small (0.01 acre) hydrofluoric acidspill. Contaminants include metals andorganics. Radionuclides were found at two ofthe sites, while the sludge lagoon has organiccontaminants only. Remediation technologiesinclude soil washing, in situ vitrification, and"landfarming." Ground-water contaminationhas not been detected at this time. Completionof all Waste Area Group 2 activities is scheduledfor 2010.
Waste Area Group 3: ReactorUnits
Seventeen potential release sites are associatedwith the five production reactors: six at the L-Reactor, five at the K-Reactor, three at the R-reactor, two at the P-Reactor, and one at the C-Reactor. These sites include eight burning andrubble pits, five equipment maintenance areas,three seepage basins, and a sludge deposit.The major contaminants in the burning andrubble pits are arsenic, chromium, lead, andvolatile organics (i.e., trichloroethylene andtetrachloroethylene). The major radionuclidesare strontium-90, cesium-137, cobalt-60, andtritium. The remediation technologies for thisgroup include thermal desorption, in situ soilvitrification, and soil mixing.
Past practices of purging contaminated reactor-basin water into unlined seepage basins, otherreactor operations, and occasional accidentalreleases caused ground-water contamination inall five reactor areas. Each reactor ground-water area is approximately 20 acres, and thedegree and type of contamination vary.Contaminants include tritium, otherradionuclides, metals, and chlorinated volatileorganics. The concentrations of certainradionuclides have recently exceeded thedrinking water standards. Specific cleanupmethods will be based on full characterizationand feasibility studies. Monitoring andsampling continue, and additional monitoring
wells are planned. Potential cleanuptechnologies include pump and treat systemswith reverse osmosis, air strippers, and in situbioremediation. Completion of all Waste AreaGroup 3 activities is scheduled for 2025.
Waste Area Group 4: GeneralSeparations Area
The general separations area includes twochemical reprocessing plants in the F and HAreas, burial grounds between the two areas,and high-level waste tank farms. The 11potential release sites consist of seepage andretention basins, radioactive waste burialgrounds, an abandoned undergroundradioactive liquid transfer line that leaked,abandoned process sewer lines, burning andrubble pits, radioactive waste solvent tanks, alow-level waste disposal facility, and oneemptied high-level waste storage tank (theremainder of the high-level waste storage tanksand treatment facilities are addressed in WasteArea Group 9). It is assumed this estimate willnot include any additional processing activitiesin the chemical separations plants.
Major contaminants are strontium-90, cesium-139, cobalt-60, and tritium; lead, arsenic,mercury, and chromium; and volatile organics.The remedial actions for this group includecapping for the burial grounds and disposalfacility, thermal desorption, and soil mixing.
Operation of the seepage basins resulted incontaminated ground water in the uppermostaquifer with hazardous and radioactiveconstituents. The major contaminants aretritium, strontium, uranium, cadmium, andlead. The removal action specified for theground water is a pump and treat system.
Over the years, condensed cooling water fromseveral production reactors has contaminatedground water with tritium at concentrationsabove drinking water standards. As there is noknown technology to remediate tritium-contaminated ground water, hydraulic controls
SC 7

will be employed to prevent additionalmigration of this contaminated plume.Completion of all Waste Area Group 4 activitiesis scheduled for 2025.
Waste Area Group 5: TNX andD-Area
The TNX facilities were used for experimentalwork and the development and demonstrationof new processes. The adjacent D-Area containsthe largest powerplant (coal-fired) at theSavannah River Site as well as facilities forheavy water production and purification.There are 9 potential release sites located here,ranging in size from 0.3 to 39 acre. They consistof seepage basins, ash basins, burning andrubble pits, and burial grounds. The majorcontaminants are arsenic, chromium, lead, andvolatile organics.
The old TNX seepage basin received variouschemical waste, liquid low-level radioactivewaste, and leakage from process sewers andequipment maintenance. It is nowcontaminated with thorium, uranium, andtritium. Remedial actions are likely to includebiological remediation, soil washing, andcapping.
The old TNX seepage basin was the maincontributor to ground-water contamination inthis waste area group. Volatile organics are themost widespread contaminants, but theconcentrations of nitrates, mercury, and alpha-emitting radionuclides (e.g., plutonium) alsoexceed the primary drinking water standard.Trichloroethylene has been detected at theseepline in the Savannah River Swamp wherethe ground-water plume outcrops; however, nocontaminants have been detected in theSavannah River. Currently, there is no offsiterisk from the ground-water contamination.
Monitoring and analysis are continuing, and atest recovery well is being installed to perform apumping test and determine the hydraulicparameters of the aquifer. In addition to thepumping system, the recovery well has an airSC 8
stripper and a recirculation well to rapidlyreduce the contamination in the heart of theplume. The results of this test will be used todesign and install a recovery well system.Completion of all Work Area Group 5 activitiesis scheduled for 2025.
Waste Area Group 6:Miscellaneous UnitsThe following potential release sites have beenfound to need remedial action: the coal-pilerunoff basins in Areas A, C, D, F, H, K, and P;the acid and caustic basins in Areas F, H, K, L, P,and R; the Road A chemical basin; chemical,metal, and pesticide pits; the Burma Road site;and the sanitary landfill. These sites range insize from less than 0.1 to more then 50 acres atthe sanitary landfill. The contaminants aremetals at the coal pile runoff basins; the acidand caustic basins; the Road A chemical basin;and the chemical, metal, and pesticide pits.Organic chemicals are present at the BurmaRoad site; the sanitary landfill; and thechemical, metal, and pesticide pits.
The remediation technologies are vaporextraction (chemical, metal, and pesticide pitsand the sanitary landfill); capping (the sanitarylandfill); and soil washing (the Road A chemicalbasin and the coal-pile runoff basins). Clean fillis recommended for the acid and caustic basins.
The sanitary landfill is a trench-and-filloperation and received about 840,000 cubicyards of sanitary waste between 1974 and 1993.The ground water beneath the landfill iscontaminated, mainly with organic solvents,because contaminants from the landfill havemigrated downward through the soils. Theselected remedy is in situ biologicalremediation designed to stimulate the aerobicbiodegradation of the volatile organiccompounds. Nutrients for the microorganismswill be introduced through wells, and air willbe injected at an abundant, steady flow to cause

some of the contaminants to volatilize andmove up out of the ground water into theunsaturated zone. Completion of all Waste AreaGroup 6 activities is scheduled for 2035.
Waste Area Group 7: Site-Evaluation Units
Of the approximately 400 potential waste sitesbeing evaluated, as listed in Appendix G of theFederal Facility Agreement, about three-fourthsare expected to require no further action. Theremainder will require further investigative andremedial actions. There is little informationabout these sites. Thus, in order to estimateremediation costs, these sites were grouped into13 groups. Distinct assumptions for eachgroup, similar to the assumptions used forother sites with similar characteristics, werethen developed and used to estimate costs.Completion of all Waste Area Group 7 activitesis scheduled for 2045.
Waste Area Group 8:Surveillance and Maintenance
After remediation has been completed, post-closure activities such as inspections,maintenance, and monitoring are performed.In addition, the following activities areperformed: investigative derived wastemanagement is required to control potentiallycontaminated byproducts generated fromassessment and monitoring activities; the Wastecharacterization/certification program willdevelop and implement activities to reducewaste generation and ensure compliance withwaste management practices; and newtechnology demonstrations perform thecontrolled tests and pilot programs forimplementing new remediation methods.Completion of all Waste Area Group 8 activitiesis scheduled for 2040.
Waste Area Group 9: FacilityDecommissioning Activities
Surplus facilities at the Savannah River Site willrequire decommissioning. These facilities havebeen grouped into four categories based oncommon characteristics. In estimating costs, itwas assumed that, except for the high-levelwaste storage tanks, most of the facilities willbe available for decommissioning after 2021,and decommissioning activities will becompleted by 2030. For the high-level wastetanks, decommissioning will begin in 2010 andwill continue until completion in 2035.Completion of all Waste Area Group 9 activitiesis scheduled for 2055.
Nuclear Reactors
There are five production reactors and oneresearch reactor at Savannah River. Theproduction reactors (designated C, K, L, R, andP) are large concrete structures (750,000 to 1million square feet) contaminated withradioactivity and hazardous material. All of theproduction reactors have been declared surplusexcept for the K-Reactor which is beingdeactivated and is expected to be declaredsurplus in the near future. The R-Reactor wasshut down in 1964, the C-Reactor in 1985, andthe P- and L-Reactors in 1990. The researchreactor (Heavy Water Test ComponentsReactor) was shut down and deactivated in theearly 1960's. It is assumed for purposes of thisestimate that all reactors will be decommis-sioned and left in place.
Chemical Reprocessing Plants
Because of their size, high levels ofcontamination, and complexity, the chemicalreprocessing plants, or separations facilities,present the greatest challenge fordecommissioning. The major facilities in theplants are the reprocessing "canyons." These
SC 9

buildings will be decontaminated, and theprocess equipment will be removed; however,the structures themselves will not be removedat this time. All of the support structures (i.e.,powerhouse, waste handling facilities, etc.) willbe removed.
Higher Risk FacilitiesThe higher risk facilities have a considerableamount of contamination with radioactivityand a higher priority for decommissioning. Atpresent, none of the facilities has completedstabilization activities. In time, facilities will beadded to this category.
The assumed scope of decommissioning for thehigher-risk facilities is total decontamination,removal of all process equipment, removal of
Environmental Restoration Activity Costs
Five-Year Averages (Thousands of Constant 1995 Dollars)*FY 1995 - 2000 2005 2010 2015 2020 2025 2030
Waste Area Group 1Assessment 6,231 4,605 4,054 4,315 4,326 1,654 0Remedial Actions 5,833 7,103 2,253 1,610 1,612 616 0
Waste Area Group 2Assessment 1,598 826 0 0 0 0 0Remedial Actions 659 2,565 709 0 0 0 0
Waste Area Group 3Assessment 5,363 2,356 1,374 0 0 0 0Remedial Actions 4,042 17,758 25,445 10,619 6,763 819 0Surveillance And Maintenance 0 0 0 0 0 0 0
Waste Area Group 4Assessment 11,638 1,635 1,040 1,228 1,119 1,103 0Remedial Actions 19,837 17,545 13,578 12,228 16,872 5,725 0Surveillance And Maintenance 0 0 0 0 0 0 0
Waste Area Group 5Assessment 1,296 103 0 0 0 0 0Remedial Actions 3,514 5,378 8,012 3,293 3,301 1,356 0
Waste Area Group 6Assessment 5,904 1,086 71 0 0 0 0Remedial Actions 3,387 9,710 4,713 2,590 2,600 2,602 2,596Surveillance And Maintenance 0 0 0 0 0 0 0
Waste Area Group 7Assessment 1,015 261 5,307 202 202 202 202Remedial Actions 0 936 18,819 717 717 717 717
Waste Area Group 8long Term Surveillance And Monitoring 9,023 8,459 8,459 8,982 8,982 8,982 8,982
Waste Area Group 9Assessment 8,907 0 0 0 0 0 0Facility Decommissioning 0 0 0 72,936 172,137 334,853 522,826
Total 88,248 80,326 93,834 118,720 218,630 358,629 535,322
SC 10

Environmental Restoration Activity Costs (cont'd)
Five-Year Averages (Thousands of Constant 1995 Dollars)*
2035 2040 2045 2050 2055 2060 2065 Life Cycle
Waste Area Group 1Assessment 0 0 0 0 132,155
Remedial Actions 0 0 0 0 100,971
Waste Area Group 2Assessment 0 0 0 0 13,718
Remedial Actions 0 0 0 0 20,327
Waste Area Group 3Assessment o 0 0 0 0 0 50,832
Remedial Actions o 0 0 0 0 331,268
Surveillance And Maintenance o 0 0 0 0 2
Waste Area Group 4Assessment o 0 0 0 0 100,453
Remedial Actions o 0 0 0 0 0 448,758
Surveillance And Maintenance o 0 0 0 0 0 2
Waste Area Group 5Assessment 0 0 0 0 8,295
Remedial Actions 0 0 0 0 0 0 0 127,788
Waste Area Group 6Assessment 0 0 0 0 0 0 41,211
Remedial Actions 1,044 0 0 0 0 0 149,591
Surveillance And Maintenance 0 0 0 0 0 0 2
Waste Area Group 7Assessment 2,200 5,500 7,401 0 0 0 0 113,475
Remedial Actions 7,800 19,500 26,239 0 0 0 0 380,807
Waste Area Group 8Long Term Surveillance And Monitoring 7,133 8,982 0 0 0 0 0 398,925
Waste Area Group 9Assessment 0 0 0 0 0 0 0 53,444
Facility Decommissioning 595,749 470,173 193,171 36,602 5,872 0 0 12,021,595
Total 613,927 504,154 226,811 36,602 5,872 0 0 14,493,617
• Costs reflect a five-year average in constant 1995 dollars, except in FY 1995-2000, which is a six-year average.
Total Life Cycle is the sum of annual costs in constant 1995 dollars.
structures to grade level, and restoration of thesite. At some time in the future, the groundareas may be released for completelyunrestricted use.
Surplus NoncontaminatedFacilities
The surplus noncontaminated facilities in thedecommissioning program are the supportfacilities (i.e., administrative buildings) that
have been, or will be, surplus property as theSavannah River Site continues to reduce itsproduction mission. These facilities have nochemical or radionuclide contamination, norwill they contain hazardous waste. They willbe dismantled to grade level, and thefoundations will be removed. At completion,their respective sites will be available forunrestricted use.
SC 11

Major Waste Management Projects
Five-Year Averages (Thousands of Constant 1995 Dollars)*
1995-2000 2005 2010 2015 2020 2025 2030
CIF 14,333 19,880 19,880 19,880 19,880 19,880 19,880Defense Waste Processing 154,417 138,400 137,800 138,000 137,600 59,400 0F/H Area Tank Farms Operations 88,883 105,000 104,800 101,000 89,000 3,660 0Glass Water Storage Building 0 12,780 8,160 0 0 0 0Hazardous Waste and LLMW Vaults 23,667 77,600 58,800 52,200 52,200 52,200 52,200HLW Removal Project 32,450 40,400 40,400 3,880 0 0 0ITP 54,233 50,600 56,000 55,000 53,000 2,440 0ITP/DWPF Benzine Abatement 2,467 0 0 0 0 0 0M Area Waste Treatment 6,883 640 680 700 700 180 0Saltstone 11,433 11,360 12,920 12,920 12,860 620 0Saltstone Vauhs HLW Disposal 6,383 6,460 5,580 6,340 3,440 0 0Tank Farm Upgrades 8,717 13,880 12,240 5,400 0 0 0TRU Facility 0 2,200 5,800 6,540 6,560 6,560 6,540TRU Waste Retrieval 317 0 0 0 0 0 0
2035 2040 2045 2050 2055 2060 2065 Life Cycle**
CIF 19,880 19,880 19,880 0 0 0 0 980,600Defense Waste Processing 0 0 0 0 0 0 0 3,982,500F/H Area Tank Farms Operations 0 0 0 0 0 0 0 2,550,600Glass Water Storage Building 0 0 0 0 0 0 0 104,700Hazardous Waste and UMW Vaults 52,200 52,200 52,200 250,200 0 0 0 3,903,000HLW Removal Project 0 0 0 0 0 0 0 618,100ITP 0 0 0 0 0 0 0 1,410,600ITP/DWPF Benzine Abaitment 0 0 0 0 0 0 0 14,800M Area Waste Treatment 0 0 0 0 0 0 0 55,800Saltstone 0 0 0 0 0 0 0 322,000Saltstone Vaults HLW Disposal 0 0 0 0 0 0 0 147,400Tank Farm Upgrades 0 0 0 0 0 0 0 209,900TRU Facility 8,740 7,020 6,540 0 0 0 0 282,500TRU Waste Retrieval 0 0 0 0 0 0 0 1,902
Costs reflect a five-year average in constant 1995 dollars, except in FY 1995-2000, which is a six-year average.
Total Life Cycle is the sum of annual costs in constant 1995 dollars.
Note: These projects represent a subset of waste management activities. Associated program management costs are built-in to the estimates provided.
SC 12

Costs of EnvironmentalRestoration
Tables showing the estimated cost ofenvironmental restoration and a more detailed
tabulation by activity are given at the end of
this summary.
WASTE MANAGEMENT
The Savannah River Site has extensive facilities
for the treatment, storage, and disposal ofradioactive and other wastes. The existingfacilities will need upgrading, and several newfacilities are scheduled to come on line after the
year 2000.
In estimating costs, it was assumed, except for
the high-level waste storage tanks, most of thefacilities will be available for decommissioning
after 2021. The last high-level waste tanks will
be available for decommissioning in 2035.
Waste Treatment
The Savannah River Plant provides onsitetreatment for high-level radioactive waste, low-
level radioactive waste, low-level mixed waste,and hazardous chemical waste. The varioustypes of waste are defined in the introduction to
this volume.
High-Level Waste
Salt solution removed from the high-level waste
storage tanks is chemically treated in the In-
Tank Precipitation Facility to precipitateradionuclides. The decontaminated filtrate isstripped of benzene and transferred to the
Saltstone Facility for disposal. The concentratedprecipitate is stored in a precipitate feed tankand later transferred to the Late Wash Facilityfor treatment to remove nitrites.
The sludge from the high-level waste storagetanks is transferred to a tank at the ExtendedSludge Processing Facility, where it is washedin water and sodium hydroxide to remove saltsand aluminum. The washed sludge is stored ina tank until transfer to the Defense WasteProcessing Facility.
At the Defense Waste Processing Facility, thewashed sludge and the precipitate from the In-Tank Precipitation Facility are combined withglass frit to form glass logs. This facility usescomplex chemical processes to prepare theprecipitate and sludge for mixing and eventualvitrification in the glass melter. It also removesorganics from the precipitate and removes andrecovers mercury from the precipitate andsludge. The vitrification process permanentlyimmobilizes the high-level waste by producingglass logs solidified in stainless-steel canisters.The canisters are temporarily installed in theGlass Waste Storage Facility until a permanentrepository is available. All of the existing high-level waste will be vitrified by 2021.
The decontaminated filtrate from the In-TankPrecipitation Facility is processed in theSaltstone Facility, where it is blended withcement, flyash, and blast-furnace slag to formgrout. The grout is pumped into disposalvaults where it hardens into solidnonhazardous waste for permanent isolation.
Low-Level Waste
At present, solid low-level radioactive waste isplaced in rigid metal containers and disposed
in low activity disposal vaults or shallow land
SC 13

burial. In 1996, incineration will start in theConsolidated Incineration Facility to incinerateapproximately 25 percent of the low-level wastefor volume reduction, based on the record ofdecision for the Waste ManagementEnvironmental Impact Statement. Another newtreatment plant will be the Size-ReductionFacility to reduce the size of large pieces ofequipment (i.e., reprocessing vessels, pumps,and agitators) for more cost-effective disposal.
Three new treatment plants are scheduled tocome on line in 2006. One is the SuperCompactor, which will have a 10:1 compactionratio to reduce the volume of the waste.Another is the Soil-Sort Facility to be used toisolate and remove small particles ofradioactive material dispersed throughout soil.Both contaminants and clean soil are assayedcontinuously during processing to documentthe level of radioactivity and to determinewhether the clean soil meets release criteria.The third is the Non-Alpha Vitrification Facilityto be used to process low-level, mixed, andhazardous chemical wastes. The treatment willconsist of several processes to prepare waste forvitrification, vitrify the waste, and treat thegases and liquids generated in vitrification.
Mixed Waste
At present, mixed waste is not treated at theSavannah River Site. In 1996, however,vitrification of mixed-waste sludge from the M-Area will start. In 1996, the ConsolidatedIncineration Facility will Start processing mixedwaste. This incinerator is expected to processthe entire inventory of burnable mixed andhazardous chemical waste within 3 to 4 years ofstartup. After 2006, the mixed waste to beincinerated will be pretreated in thecontainment building that will have fiveseparate bays for processing low-level, mixed,and hazardous chemical waste; containeropening and sorting; size reduction;
decontamination; and macroencapsulation andrepackaging characterization. Waste will beprocessed through each bay, as necessary, toproperly handle each waste container.
Hazardous Chemical Waste
At present, the only offsite treatment atapproved commercial facilities is available forhazardous chemical waste. However, measuresare being implemented to reduce the hazardouswaste inventory by 90 percent. In 1996, most ofthe hazardous waste (approximately 90 percentof the total inventory) will commence treatmentin the consolidated incinerator.
Transuranic Waste
There are no treatment facilities for transuranicwaste at the Savannah River Site. Treatment forsome transuranic waste, however, will berequired for acceptance at the WasteIsolationPilot Plant. For this reason, a newtreatment facility will be developed, called theTransuranic Waste Certification,Characterization and Alpha VitrificationFacility. The Alpha Vitrification Facility will beused only for plutonium-238 waste, which hashigh heat output, and will not meet expectedwaste acceptance criteria for Waste IsolationPilot Plant.
The certification and characterization facilitywill provide the capability to segregate low-level waste and low-level mixed waste fromtransuranic waste. The latter is distinguishedby the concentration (100 or more nanocuriesper gram of waste) of plutonium and otheralpha-emitting long-lived transuranics. It willopen and inspect transuranic waste containersand examine, sort, characterize, assay, andrepackage their contents to meet the WasteIsolation Pilot Plant waste acceptance criteria.Several options for this facility are beingconsidered: converting and using existing
SC 14

facilities (e.g., the P-Reactor and the Naval
Fuels Facility), using privatized andcommercial ventures, or building a new plant.Completion is scheduled for 2007.
After characterization and certification,transuranic waste will be shipped to the AlphaVitrification Facility, where it will be mixed
with frit and additives and then vitrified. Thevitrified waste will be returned to thecertification facility for final certification and
then shipped to the Waste Isolation Pilot Plant
for disposal. The Alpha Vitrification Facility is
scheduled to come on line in 2008. Waste found
to have transuranic concentrations of less than
100 nanocuries per gram of waste will becertified to be plutonium-contaminated, orlong-lived, low-level waste. This waste is notconsidered transuranic waste and will not be
accepted at the Waste Isolation Pilot Plant. It
will be kept in storage vaults until itsdisposition is decided.
High-Level Waste
The decontaminated waste will be processedthrough each bay as necessary to properlyhandle each waste container.
Waste Storage
The Savannah River Site provides storagefacilities for all radioactive and other hazardouswastes as well as spent nuclear fuel.
High-Level Waste
The tank farms in the F- and H-Areas consist of
51 high-level-waste storage tanks, although 7 of
these tanks are used in waste treatment. The
tanks range in capacity from 750,000 to 1.3million gallons. Twenty-four of the tanks have
single walls, and 27 tanks have double walls.Underground transfer piping, valve stations
and transfer equipment, cooling and ventilationsystems, and monitoring systems are installed
on all tanks. Since the 1950's, the tanks have
received high-level waste from the chemicalreprocessing plants as well as severalmiscellaneous small waste streams from otherfacilities.
The waste management program at theSavannah River Site is currently installingmixing and transfer pumps on 47 of the tanks toallow slurrying and waste transfer to the In-Tank Precipitation and Extended SludgeProcessing facilities for treatment. In addition,upgrades of the tank farms (e.g., providing airsampling for monitoring) are planned or underway to correct deficiencies and bring operationsinto compliance.
Before being pumped into the tanks, high-levelwaste is sent to one of two active evaporatorsfor volume reduction (two other evaporatorshave been shut down) and then stored in thewater-cooled storage tanks. A large evaporator,with twice the capacity of existing evaporators,is under construction and is scheduled to becompleted in 1997 and operating around 2000.One tank has been completely emptied, andsingle-walled tanks no longer receive high-level
waste.
Transfers of high-level waste are directed toappropriate tanks through diversion boxes andpump pits, which are concrete undergroundstructures housing valves, small transfer tanks,and pumps. A containment building is beinginstalled over the diversion box in the H-Area.
It will allow access to the equipment in badweather and reduce the radiation exposuresreceived by workers. In addition, one of the olddiversion boxes is being replaced with one ofcurrent design; known as the New Waste-Transfer Facility, it will have an enclosurebuilding with a remotely operated crane and acontrol room.
Storage will also be provided for high-levelwaste vitrified in the Defense Waste ProcessingFacility. The Glass-Waste Storage Building will
have sufficient capacity to provide up to 10years of interim storage for vitrified-wastecanisters until a permanent repository isavailable.
SC 15

However, the current repository scheduleshows disposal starting in 2016 requiringadditional storage capacity at the SavannahRiver Site. This storage has been added for thepurpose of this estimate.
Low-Level Waste
No separate storage facilities are provided forroutine low-level waste because this waste isplaced in burial grounds or disposal vaults atthe Savannah River Site after treatment andpackaging. However, no disposal site isavailable at present for plutonium-contaminated, or long-lived, low-level waste.This waste will be stored in the Long-Lived-Waste Storage Building until treatment ordisposal technologies are developed for thiswaste.
Hazardous Chemical Waste
Hazardous chemical waste is stored in threebuildings and on outside asphalt pads.Building 710-B in the B-Area is an enclosedbuilding with an actual usable capacity ofapproximately 145 cubic meters. Building 645-N in the N-Area is a partially enclosed metalbuilding with a slab on-grade concrete floorsubdivided into cells to be used to storeseparate classes of hazardous chemical waste indrums. Its actual usable capacity is about 170cubic meters. Building 645-4N is an enclosedmetal building with a single-slab concrete padfloor and an actual usable capacity of 425 cubicmeters. This building is limited to toxic wastewith no ignitable or corrosive materialsallowed.
Outside storage pads are available on theasphalt paving adjacent to storage buildings645-N and 645-4N. No liquids are allowed, andthe actual usable capacity is about 1,800 cubicmeters. With the Consolidated IncinerationFacility scheduled to start up in 1996, the totalstorage capacity is sufficient to accommodatethe hazardous chemical waste generated at the
Savannah River Site until the year 2002, whenthe waste will be managed in the disposalvaults to be constructed for hazardous andmixed wastes.
Mixed Waste
At present, storage for mixed waste is providedin four buildings. Building 645-2N is anenclosed metal building containing 6 cells withconcrete floors; its actual usable capacity isapproximately 560 cubic meters. Building 316-M is an enclosed metal building with a concretepad floor and an actual storage capacity ofabout 120 cubic meters. Buildings 643-29E and643-43E are partially enclosed metal structureswith concrete pad floors and storage capacitiesof approximately 120 and 620 cubic meters,respectively. Outside storage for mixed wasteis available at Transuranic Pads 6 through 13,with most of the waste currently stored atPad 9.
Additional storage capacity, due to startoperating in 1996, is needed to accommodatestabilized sludge in the M-Area and to providededicated storage for the stabilized ash andblowdown, a mixed waste, from the incinerator.At design discharge rates, the incinerator willrun out of storage capacity in 2.5 to 3 years, orby the year 1999. An existing pad in the M-Area is available and appropriate for thisfunction.
Storage for liquid mixed waste presentsdifferent requirements. About 30,000 gallons ofsolvent from the PUREX chemical separationprocess is currently stored in 2 storage tanks.Both tanks must pass annual integrity tests toremain in service, and they can remain inservice for a maximum of 15 years. This 15-year period will end in October 1996. The twotanks will remain in service until four newsolvent tanks are constructed and placed inservice in October 1996. The new tanks will be
SC 16

30,000-gallon double-walled undergroundstorage tanks with features like cathodicprotection, leak detection and collection, andsampling ports.
Transuranic Waste
Transuranic and mixed transuranic wastes arestored in 55-gallon steel drums, concreteculverts, concrete casks, and carbon-steel boxes.Transuranic waste generated since 1974 isstored on 17 storage pads in the Solid-WasteManagement Facility. Six of these pads are"mounded" (wholly or partly buried), and fourare covered for protection from weather. Twoadditional pads are permitted to accept onlynonmixed transuranic waste, but the storagepermit will be revised to allow mixedtransuranic waste on the pads. The drums inthe five wholly mounded pads will be retrievedand overpacked because they are beginning toexceed their 20-year design life. Retrievaloperations will begin in 1996.
The preferred storage strategy for transuranicwaste at the Savannah River Site is to usesurplus-reactor buildings to provide betterprotection. The current plan is to modify the R-Reactor for the storage of non-mixedtransuranic waste and to modify the P-Reactorfor mixed transuranic waste (mostly drumsfrom the pads and the retrieval operation).Using the reactors for other, higher-priorityprograms, however, may preempt their use forthe storage of transuranic waste. If the reactorsare not available, a storage area equivalent toeight existing storage pads will be built in theSolid-Waste Management Facility.
Spent Nuclear Fuel
Existing spent nuclear at the Savannah RiverSite is currently stored underwater. The strategyfor future storage of spent nuclear fuel is todevelop dry aboveground storage. Toaccommodate the dry-storage option, theSavannah River Site will keep spent fuel in wetstorage while technology is developed and dry-
storage facilities are constructed. All of thespent fuel will be eventually disposed in ageologic repository. Until that time, theSavannah River Site will provide safe,monitored storage facilities from which the fuelcan be readily retrieved, when necessary.
Waste Disposal
High-Level Waste
No permanent disposal for high-level wastewill be provided at the Savannah River Site.High-level waste will be vitrified and shippedto a geologic repository (assumed to be at YuccaMountain in Nevada for the purposes of thisreport) for permanent disposal. This repositoryis currently scheduled to open in 2010.
Low-Level Waste
Low-level waste is disposed by burial intrenches or emplacement in vaults, dependingpartly on the characteristics of the waste. Todate, most low-level waste has been buried inengineered trenches several acres in size andapproximately 20 feet deep. Once filled, thetrench is backfilled, often with suspect soilsshowing no detectable contamination.
Another option for low-level waste is materialmanagement in a low-activity-waste vault, asubgrade concrete vault divided into 12 cellsand has a capacity of 34,000 cubic meters. Thisvault, which is part of the Solid-WasteManagement Facility, is expected to be filledup in about 4 years. However, if theconsolidated incinerator is allowed to burnsome of the low-level waste for volumereduction, the life of the vault will be extended6.6 years, to the year 2001. The first set of thesevaults is in operation.
Separate facilities are provided forintermediate-level waste, that is, waste whoseradioactivity is greater than that of low-levelwaste. These facilities consist of trenches,usually 20 feet deep and 10 feet wide, and
SC 17

underground concrete vaults. Forintermediate-level waste without tritium, thevault has seven cells each with a capacity of 904cubic meters. At projected generation rates, thisvault will fill up in 6.5 years. For intermediate-level tritium waste, the vault has only two cellsand a total capacity of about 1,800 cubic meters.It is adjacent to the vault for non-tritium waste.At projected generation rates, this vault will fillup in 7.3 years.
Disposal in aboveground vaults will also beprovided for plutonium-contaminated low-level waste, that is, waste certified to becontaminated with transuranic radionuclides atconcentrations below 100 nanocuries per gramof waste. (This waste is also called "long-lived,low-level waste" and "alpha low-level waste.")Plutonium-contaminated waste withouthazardous chemicals will be disposed in thelow-activity waste vault inside the Solid-WasteManagement Facility. The first set of low-activity waste vaults is in operation.
Mixed plutonium-contaminated waste will alsobe sent to the Solid-Waste Management Facility,where it will be emplaced in vaults constructedespecially for hazardous and mixed waste.
Each vault will have individual waste cells withtemporary removable covers. Each cell willhave a mobile gantry crane for wasteemplacement and for handling the temporarycovers. Each cell will also be protected with asystem to detect and collect any leachateaccumulating in the cell. The first set of vaultsfor hazardous and mixed wastes will becompleted in 2002.
Hazardous Chemical and MixedWastes
As already mentioned, the inventory ofhazardous waste at Savannah River is expectedto be reduced by 90 percent. In 1996, most of thehazardous waste will begin being treated in theconsolidated incinerator. The remaining wastewill be emplaced in the above-described vaultsfor hazardous and mixed wastes. These vaultswill also accept the flyash and blowdown fromthe incinerator classified as mixed waste. Asstated above, the first set of these vaults will becompleted in 2002.
Transuranic Waste
Transuranic and mixed transuranic waste willbe shipped to the Waste Isolation Pilot Plant inNew Mexico for disposal. Shipments areexpected to begin in 1998.
Nuclear Material and Facility Stabilization Cost Estimate
Five-Year Averages (Thousands of Constant 1995 Dollars) *
FY 1995 - 2000 2005 2010 2015 2020 2025 2030 Life Cycle**
Nuclear Material and Facility Stabilization 324,209 232,978 364,772 18,669 12,556 27,886 287 5,230,981
' Costs reflect a five-year average in constant 1995 dollars, except in FY 1995-2000, which is a six-year average.
Total Life Cycle is the sum of annual costs in constant 1995 dollars.
SC 18

Waste Management Activity Costs
Five-Year Averages (Thousands of Constant 1995 Dollars)*
FY 1995 - 2000 2005 2010 2015 2020 2025 2030
TreatmentHigh-Level Waste 163,048 215,186 253,977 293,436 335,905 17,222 0
Transuranic Waste 0 22,309 20,495 9,372 9,372 9,372 9,372
Low-Level Mixed Waste 17,178 23,735 23,219 23,179 23,179 23,179 23,179
Low-Level Waste 13,946 21,047 20,260 20,168 20,168 20,168 20,168
Storage and HandlingHigh-level Waste 113,701 189,103 210,338 166,197 152,486 7,022 0
Spent Nuclear Fuel 30,813 79,587 115,870 106,339 103,330 139,278 101,490
Transuranic Waste 7,318 9,011 6,894 6,764 6,256 6,305 6,477
low-Level Mixed Waste 2,977 3,857 3,857 3,857 3,857 4,235 5,741
Low-Level Waste 944 920 1,415 1,132 1,132 2,263 6,221
DisposalHigh-Level Waste 0 0 0 0 0 150,480 150,480
Spent Nuclear Fuel 0 0 0 0 0 0 26,919
Low-Level Mixed Waste 33,234 100,429 85,482 79,352 79,322 78,757 74,385
Low-Level Waste 18,802 30,475 34,786 34,798 34,725 34,715 34,533
Hazardous Waste 10,224 12,432 14,131 11,550 11,561 11,631 11,539
Sanitary Waste 2,188 3,182 2,680 2,680 2,680 2,680 2,680
OtherDecommissioning 455 2,174 25,080 24,257 35,614 43,233 76,912
Waste Management TSD 12,962 15,884 15,884 15,884 15,884 15,884 15,884
Inter-Site Disposal Assessment
Low-Level Waste 0 -66 0 0 0 0 0
Total 427,789 729,264 834,366 798,964 835,469 566,422 565,979
2035 2040 2045 2050 2055 2060 2065 Life Cycle**
TreatmentHigh-level Waste 0 0 0 0 0 0 0 6,556,914
Transuranic Waste 9,372 7,501 3,069 378 0 0 0 503,047
Low-Level Mixed Waste 23,179 23,179 6,263 0 0 0 0 1,064,511
Low-Level Waste 20,168 20,168 4,232 0 0 0 0 916,399
Storage and HandlingHigh-Level Waste 0 0 0 0 0 0 0 4,307,940
Spent Nuclear Fuel 65,542 0 0 0 0 0 0 3,742,058
Transuranic Waste 6,564 6,306 1,885 139 0 0 0 326,916
Low-Level Mixed Waste 5,832 5,688 3,148 1,874 0 0 0 227,576
Low-Level Waste 3,959 4,379 4,856 35 0 0 0 137,223
DisposalHigh-Level Waste 0 0 0 0 0 0 0 1,504,800
Spent Nuclear Fuel ' 26,752 0 0 0 0 0 0 268,356
Low-Level Mixed Waste 66,393 68,372 68,198 265,213 9,998 0 0 5,078,909
Low Level Waste 33,828 32,745 23,815 4,330 0 0 0 1,606,564
Hazardous Waste 11,537 11,537 480 96 0 0 0 543,806
Sanitary Waste 2,680 2,680 0 0 0 0 0 122,842
OtherDecommissioning 0 0 0 0 0 0 0 1,039,076
Waste Management ISO 15,884 12,707 0 0 0 0 0 697,248
Inter-Site Disposal Assessment
Low-Level Waste 0 0 0 0 0 0 0 -331
Total 291,689 195,262 115,946 272,065 9,998 0 0 28,643,853
• Costs reflect a five-year average in constant 1995 dollars, except in FY 1995-2000, which is a six-year average.
*" Total Life Cycle is the sum of annual costs in constant 1995 dollars.
SC 19

Spent Nuclear FuelAll of the spent fuel will be eventually shippedto a geologic repository for disposal.
Sanitary Waste
Until November 1994, most sanitary waste wasdisposed at the interim sanitary landfill todispose of material from offices andconstruction. In November 1994, a commercialcompany started disposing sanitary waste at anoffsite facility. Offices not located at theSavannah River Site use a commercial landfill.Demolition and construction debris is used atthe site for erosion control and backfill wherepossible; the remainder is hauled to the BurmaRoad landfill.
NUCLEAR MATERIAL AND
FACILITY STABILIZATION
When a facility is transferred from DefensePrograms to Environmental Management, itundergoes a process of stabilization in whichnuclear materials are stabilized (if necessary),the facility is shut down, radioactive andhazardous materials are removed, and otheractions are taken as necessary to mitigate animmediate threat to health and safety. Oncethis is accomplished, the facility is maintainedand monitored as appropriate pending furtheraction, which is usually decommissioning.
Nuclear material and facility stabilization at theSavannah River Site began in 1995. Of the1,382 facilities scheduled to undergo thisprocess, 1,260 have already begun stabilizationactivities. They include storage facilities forhazardous materials and chemicals, wastewatertreatment plants, a metallurgy laboratory, twochemical processing canyons, and plutonium-storage facilities. It is assumed the remaining122 facilities will incrementally beginstabilization in 1996. They include six reactors,a plant for producing heavy water, and storage
Landlord Cost Estimate
Five-Year Averages (Thousands of Constant 1995 Dollars)*FY 1995-2000 2005 2010 2015 2020 2025 2030
Directly Appropriated Landlord 225,465 186,217 186,217 186,217 186,217 186,217 186,217
2035 2040 2045 2050 2055 2060 2065 Life Cycle*.
Directly Appropriated Landlord 186,217 186,217 0 0 0 0 0 8,801,468
• Costs reflect a five-year average in constant 1995 dollars, except in FY 1995-2000, which is a six-year average.
▪ Total Life Cycle is the sum of annual costs in constant 1995 dollars.
SC 20

for radioactive materials. The wastes resultingfrom the stabilization process will include high-level, transuranic, low-level, mixed low-level,
and hazardous chemical wastes. This reportassumes stabilization and maintenance at theSavannah River Site will be completed by the
year 2030.
LANDLORD FUNCTIONS
Landlord functions at the Savannah River Siterecently transferred to the EnvironmentalManagement program. EnvironmentalManagement's landlord functions are directedat providing a safe workplace and theinfrastructure needed to support all siteprograms. This includes the maintenance ofbuildings, the maintenance of heating and air-conditioning equipment, groundskeeping,roadway upkeep, the maintenance of electricaldistribution systems and other utilities,safeguards and security, radiation protection,transportation and hauling services, real-property management, and emergencypreparedness.
PROGRAM MANAGEMENT
Program management consists of a widevariety of activities cutting across all aspects ofenvironmental management and are notintended to directly support specific projects oroperations at the Savannah River Site. Most ofthese activities are general programmanagement tasks, applicable to any majorprogram at DOE, while others are specific toenvironmental management activities.
Prominent categories of activities in generalprogram management are area supportprograms, regulatory support, operationsintegration, program integration, and programcontrols and analysis. Area support includesenvironmental, safety, and health programs;quality assurance; training; emergencymanagement; fire protection; centralizedengineering and maintenance; safeguards; andsecurity. Specific environmental supportincludes providing financial assistance toGeorgia and South Carolina in supportingemergency preparedness, and to South Carolinafor oversight of Savannah River Siteenvironmental activities.
Program Management Cost Estimate
Five-Year Averages (Thousands of Constant 1995 Dollars)*
FY 1995 - 2000 2005 2010 2015 2020 2025 2030
Program Management 118,317 270,267 310,761 323,433 354,615 204,304 173,130
2035 2040 2045 2050 2055 2060 2065 Life Cyde'•
Program Management 131,879 103,110 60,537 16,070 4,036 0 0 10,470,612
• Costs reflect a five-year average in constant 1995 dollars, except in FY 1995-2000, which is a six-year average.
▪ Total Life Cycle is the sum of annual costs in constant 1995 dollars.
SC 21

The various tasks of regulatory support includeregulatory oversight and programmaticguidance; implementation and monitoring ofcompliance with pertinent environmentalregulations and laws; and coordination ofexternal surveillance, audits, and appraisals.
Operations integration involves developing,implementing, and conducting trainingprograms; establishing and maintaining
performance expectations and measurements;and preparing, reviewing, implementing, andmaintaining procedures. Program integration,on the other hand, requires the development ofnear- and long-term plans for all remedialactions and waste streams. Near-termintegration tasks include the coordination ofprivate-sector initiatives and the implemen-tation of interim storage strategies for differentwaste types.
Defense Funding Estimate
Five-Year Averages (Thousands of Constant 1995 Dollars)•
FY 1995-2000 2005 2010 2015 2020 2025 2030
Environmental Restoration 88,248 80,326 93,834 118,720 218,630 358,629 535,322Waste Management 427,789 729,264 834,366 798,964 835,469 566,422 565,979Nuclear Material and Facility Stabilization 324,209 232,978 358,289 7,487 12,546 27,604 5Directly Appropriated Landlord 225,465 186,217 186,217 186,217 186,217 186,217 186,217Program Management 118,317 270,267 310,761 323,433 354,615 204,304 173,130
Total 1,184,027 1,499,052 1,783,466 1,434,820 1,607,477 1,343,175 1,460,653
2035 2040 2045 2050 2055 2060 2065 Life Cycle**
Environmental Restoration 613,927 504,154 226,811 36,602 5,872 0 0 14,493,617Waste Management 291,689 195,262 115,946 272,065 9,998 0 0 28,643,853Nuclear Material and Facility Stabilization 0 0 0 0 0 0 0 5,139,795Directly Appropriated Landlord 186,217 186,217 0 0 0 0 0 8,801,468Program Management 131,879 103,110 60,537 16,070 4,036 0 0 10,470,612
Total 1,223,712 988,743 403,294 324,737 19,906 0 0 67,549,346
• Costs reflect a five-year average in constant 1995 dollars, except in FY 1995-2000, which is a six-year average.
• Total Life Cycle is the sum of annual costs in constant 1995 dollars.
Nondefense Funding Estimate
Five-Year Averages (Thousands of Constant 1995 Dollars) *
FY 1995-2000 2005 2010 2015 2020 2025 2030 life Cycle**
Nuclear Material and Facility Stabilization 0 0 6,483 11,182 9 281 281 91,181
• Costs reflect a five-year average in constant 1995 dollars, except in FY 1995-2000, which is a six-year average.
• Total Life Cycle is the sum of annual costs in constant 1995 dollars.
SC 22

Major Activity Milestones
ACTIVITY TASK COMPLETION DATE
Environmental Restoration Fiscal Year
Waste Area Group (WAG)-1 Projects 2025
WAG-1 Assessment 2025
WAG-1 Remediation 2025
WAG-2 Projects 2010
WAG-2 Assessment 2005
WAG-2 Remediation 2010
WAG-3 Projects 2025
WAG-3 Assessment 2010
WAG-3 Remediation 2025
WAG-4 Projects 2025
WAG-5 Projects 2025
WAG-5 Assessment 2005
WAG-5 Remediation 2025
WAG-6 Projects 2035
WAG-6 Assessment 2010
WAG-6 Remediation 2035
Remediation of Sanitary landfill 2035
WAG-7 Projects 2045
WAG-7 Assessment 2045
WAG-7 Remediation 2045
WAG-8 Projects 2055
WAG-9 Projects 2000
WAG-9 Assessment 2000
SC 23

Major Activity Milestones (cont'd)
ACTIVITY TASK COMPLETION DATE
Environmental Restoration (cont'd) Fiscal Year
All Other Environmental Restoration Activities 2055
Other ER Assessment Activities 2025
Other ER Decommissioning Activities 2055
Other ER Long-Term Surveillance & Maintenance Activities 2040
Other ER Remediation Activities 2025
Waste Management (by facility/activity) Fiscal Year
Consolidated Incineration Facility Activities 2045
Defense Waste Processing Facility (DWPF) Activities 2025
F/H Area Tank Farm Operations 2025
Glass Waste Storage Building Activities 2010
Hazardous Waste & Low-Level Mixed Waste (LLMW) Vaults Activities 2065
High-Level Waste (HLW) Decontamination & Decommissioning Activities 2030
HLW Removal Project 2015
In-Tank Precipitation Facility (ITP) Activities 2025
ITP/DWPF Benzene Abatement 2000
Low-Level Waste (LLW) Disposal 2050
M Area Waste Treatment Activities 2025
Mixed Waste (MW) Treatment Activities 2045
Activities at Saltstone Facility 2025
Saltstone Vaults HLW Vaults Activities 2020
Spent Nuclear Fuel Activities 2025
Tank Farm Upgrades 2025
Transuranic Waste (TRU) Facilities 2045
TRU Waste Retrieval Activities 1997
All Other WM Project Activities 2055
All Other WM Operations 2055
SC 24

Major Activity Milestones (cont'd)
ACTIVITY TASK COMPLETION DATE
Nuclear Material and FacilityStabilization Projects
Fiscal Year
NM&FS Activities 2030
For further information on this site, please contact: Public Participation Office (803) 725-5752
Public Affairs Office (803) 725-2889
Technical Liaison: Shayne Farrell (803) 725-5921
SC 25

SC 26

ELZ A GATE SITE (COMPLETED FUSRAP SITE)*OAK RIDGE RESERVATION OFFSITEOAK RIDGE Y-1 2 SITEOAK RIDGE K-25 SITEOAK RIDGE ASSOCIATEDUNIVERSITIES
OAK RIDGE NATIONAL LAB
*Summaries are not providedfor facilities with completedremedial actions.
TENNESSEEEstimated State Total
Five-Year Averages (Thousands of Constant 1995 Dollars)*
FY 1995 1996 1997 1998 1999 2000
Oak Ridge Associated UniversitiesOak Ridge K-25 SiteOak Ridge National LaboratoryOak Ridge Reservation OffsiteOak Ridge Y-12 Plant
Total
1,000 400254,000 240,400200,00 159,70015,700 14,40077,250 119,000
547,950 533,900
1,100 1,400 3,800337,500 396,500 391,400217,800 220,300 254,20021,300 18,200 38,200148,800 160,700 230,160
726,500 797,100 917,760
4,400400,800289,30029,500233,660
957,660
* Costs for FY 1995 reflect Congressional Appropriation, costs for FY 1996 reflect EM budget submission, costs for FY 1997-2000 reflect Budget Shortfall Scenario, costs for
shaded area assume 3% annual inflation.
Five-Year Averages(Thousands of Constant 1995 Dollars)**
FY 1995-2000 2005 2010 2015 2020 2025 2030
Oak Ridge Associated Universities 1,533 874 790 390 342 46 4
Oak Ridge K-25 Site 336,193 276,696 312,872 312,681 364,164 489,927 468,750
Oak Ridge National Laboratory 217,335 387,062 359,565 360,547 305,471 232,141 172,172
Oak Ridge Reservation Offsite 20,067 11,860 8,583 8,373 5,610 740 710
Oak Ridge Y-12 Plant 141,179 179,345 179,258 143,451 108,025 169,752 104,418
Total 716,306 855,837 861,067 825,441 783,612 892,606 766,054
FY2035 2040 2045 2050 2055 2060 2065 Life Cycle'
Oak Ridge Associated Universities 0 0 0 0 0 0 0 21,425
Oak Ridge K-25 Site 424,765 330,898 276,099 205,146 209,267 530 46 20,476,360
Oak Ridge National Laboratory 116,918 73,026 15,951 123 10 5 1 11,418,969
Oak Ridge Reservation Offsite 552 440 0 0 0 0 0 373,873
Oak Ridge Y-12 Plant 72,105 51,184 3,917 19,459 18,620 254 21 6,098,658
Total 614,340 455,548 295,966 224,729 227,898 789 68 38,389,285
Costs reflect a five-year average in constant 1995 dollars, except in FY 1995 - 2000, which is a six-year average.
"' Total Life Cycle is the sum of annual costs in constant 1995 dollars.
TN 1
TN 2

0/10U
YJNOARY.- •" 1 •1
118
LEESE RvATION A00 E°K SIOCI E
1 I VAqow
• GREEK ROAD -
THE OAK RIDGE ASSOCIATED UNIVERSITIESPROGRAM AND THE OAK RIDGE INSTITUTE FOR
SCIENCE AND EDUCATION
The South Campus Facility, one of three research facilities discussed in this report, is located in OakRidge, Tennessee. It was established in 1945 and is operated by the Oak Ridge Associated Universi-ties. The Freels Bend Area hosts facilities supporting research conducted at the South CampusFacility. This area is southwest of the South Campus and is bounded on three sides by the ClinchRiver.
The Scarboro Operations Site of the Oak Ridge Institute for Science and Education was one ofseveral Government-owned facilities assigned to Oak Ridge Associated Universities and the OakRidge Institute for Science and Education in 1981. At present, the site consists of 25 buildings and3 concrete pads on 164 acres within the Oak Ridge Reservation.
OM( Rill_ - jE TURNPIKE
fiftVESTIUTARY 15
°rim.
IF
E ONCEK
MELTON IP"
,NPRA. al,
LOUDON CO KNOX co
I OAK RIDGE CITY
BOUNDARY
UNION VALLEY ROAD
so
South Campus Facility
scAneono—ItEtHEIVelEY/30:6715(77
Freels Bend Area N FACILITY 4' ti i;I
! i II I.. I . 1i I ‘ '''t .g 4 4 ,,, i:,*
D, i 1 i n 1 •-• IIr 1
1"1. \
9,,...... J
I Tip
kilometers20
0 1 2miles
0.TON"tt
NORTH
ods GAO
O
09
OR ROAD
•
ANDERSONCO
KNOX CO
TN 3

Estimated Site Total
Fr 1995
(Thousands of Current 1995 Dollars)*
1996 1997 1998 1999 2000
Environmental RestorationNuclear Material and Facility StabilizationProgram Management
Total
900 500 800400 400200 200
2,800 3,500400 400600 500
1,000 400 1,100 1,400 3,800 4,400
• Costs for FY 1995 reflect Congressional Appropriation, costs for FY 1996 reflect EM budget submission, costs for FY 1997-2000 reflect Budget Shortfall Scenario, costs for
shaded area assume 3% annual inflation.
Five-Year Averages (Thousands of Constant 1995 Dollars)**
FY 1995 - 2000 2005 2010 2015 2020 2025 2030 Life Cycle***
Environmental Restoration 1,268 155 76 5 283 46 4 10,460
Nuclear Material and Facility Stabilization 127 401 394 32 0 0 0 4,898
Program Management 137 318 320 353 58 0 0 6,067
Total 1,533 874 790 390 342 46 4 21,425
• Costs reflect a five-year average in constant 1995 dollars, except in FY 1995 - 2000, which is a six-year average.
• Total Life Cycle is the sum of annual costs in constant 1995 dollars.
PAST, PRESENT, AND
FUTURE MISSIONS
Established in 1946, Oak Ridge AssociatedUniversities is a private not-for-profitconsortium of 82 colleges and universities. Itsmission is to provide and develop capabilitiescritical to the Nation's technologyinfrastructure, particularly in energy, education,health, and the environment. The consortiumprovides its university members with access toFederal research facilities and conducts researchinvolving the use of various radionuclides andchemicals for the Department of Energy (DOE)and other member institutions. Oak RidgeAssociated Universities is also the managingand operating contractor for the Oak RidgeInstitute for Science and Education.
The South Campus Facility was originallyestablished in 1945 to study accidentalirradiation of cattle during testing of the firstatomic bomb near Alamogordo, New Mexico.The scope of research soon included studies onthe introduction and migration of radioisotopesin the food chain as well as various otheragricultural problems.
The Freels Bend Area was used to supportresearch conducted at the South CampusFacility. Its facilities used test animals toinvestigate the effects of irradiation at low doserates and at variable dose rates. The testanimals were subsequently observed over aperiod of time for exposure effects. TheScarboro Operations Site of the Oak RidgeInstitute for Science and Education was onceoperated by the University of Tennessee as acomparative animal research laboratory and anagricultural experiment station.
TN 4

The mission of the Oak Ridge AssociatedUniversities and the Oak Ridge Institute forScience and Education continues to be servingthe needs of its member universities and DOE.Although some facilities at the Institute'sScarboro Operations Site will be turned over toEnvironmental Management for possibledecommissioning, most facilities will remain inuse for research.
The future use of the Freels Bend Area, theSouth Campus Facilities, and the ScarboroOperations Site will be decided after thecompletion of any required remedial action. Itis assumed the facilities of the Oak RidgeAssociated Universities and the Oak RidgeInstitute for Science and Education willcontinue to be used as research anddevelopment and study facilities for themember universities and DOE.
ENVIRONMENTAL
RESTORATION
Surveys conducted at various research facilitiesin the Oak Ridge area have indicated somedegree of both radionuclide and chemicalcontamination are present at the South CampusFacility, the Freels Bend Area, and the ScarboroOperations of the Oak Ridge Institute forScience and Education. The South CampusFacility and the Freels Bend Area have beenincluded in the National Priorities List by the
U.S. Environmental Protection Agency (EPA)under the Comprehensive EnvironmentalResponse, Compensation and Liability Act(CERCLA). Environmental Management plansto conduct a complete characterization ofcontamination at these facilities. Once a recordof decision is approved for a site, remedialdesign, and then remedial action willcommence.
The South Campus FacilityThe South Campus Facility was used forresearch with a variety of animals. The primarycontamination of concern is a plume of thechlorinated solvent trichloroethylene. Thisplume is present in a small aquifer but does notextend beyond the site boundary. The source ofthe chlorinated solvent, used for such purposesas metal cleaning, was an automobile shop onthe site before Oak Ridge AssociatedUniversities took over custodianship of the site.
A remedial investigation at the South CampusFacility was conducted in FY 1993. The areasinvestigated were the wastewater treatmentplant, ponds, various laboratories, and animal-containment facilities. A demonstration-scaletreatability study has been implemented todetermine whether trichloroethane can beremoved through the use of wetland activities.The design and specification package for thewetlands test cells was completed, and theinitial construction and planning of thevegetation was completed in June 1994.
Environmental Restoration Projects
Five-Year Averages (Thousands of Constant 1995 Dollars)*FY 1995-2000 2005 2010 2015 2020 2025 2030 Life Cycle*
Environmental Restoration 1,268 155 76 5 283 46 4 10,460
• Costs reflect a five-year average in constant 1995 dollars, except in FY 1995 - 2000, which Is a six-year average.
Total Life Cycle is the sum of annual costs in constant 1995 dollars.
TN 5

However, until the treatability study provessuccessful, the assumed final action for theSouth Campus Facility is to build a facility forpumping and treating the ground water.
Freels Bend Area
At the Freels Bend Area, animals wereirradiated at the Low-Dose-Rate IrradiationFacility and the Variable-Dose-Rate IrradiationFacility and then observed over a period of timeto determine the effects of radiation. Theanimal carcasses were disposed of at threelandfills at the site.
The initial survey indicated contaminants ofconcern are radionuclides, organic chemicals,and metals. The source of the organic and tracemetal contaminants is assumed to be from thedecayed animal carcasses. The source forradionuclides, to the extent they are present,has not been determined.
A site investigation was performed at the FreelsBend Area in FY 1993. The regions investigatedincluded those associated with the irradiationfacilities , the animal-carcass landfills , andthree small impoundments in which herds ofcontrol animals were kept. The findings of the
investigation indicated no further action wasneeded, and regulators have concurred. DOEdoes plan, however, to perform a smallmaintenance action at Freels Bend.
Scarboro Operations Site
At the Scarboro Operations Site of the OakRidge Institute for Science and Education,radionuclides were used in experimentation. Apreliminary survey indicates three buildings(isotope laboratory, large-animal containmentfacility, and isolation barn) show evidence ofcontamination with americium-241, while twobuildings also have strontium-90, europium-152, europium-154, and cesium-137contamination. The isotope laboratory iscontaminated with carbon-14, tritium, cobalt-60, and cadmium-109. Two buildings may alsocontain asbestos.
WASTE MANAGEMENT
All waste management activities for the OakRidge Associated Universities and the OakRidge Institute for Science and Education are
Environmental Restoration Activity Costs
Five-Year Averages (Thousands of Constant 1995 Dollars)*
FY 1995 - 2000 2005 2010 2015 2020 2025 2030 life Cycle*
Environmental RestorationAssessment 178 0 0 0 0 0 0 1,069
Remedial Actions 1,090 155 76 5 0 0 0 7,721
Surveillance And Maintenance 0 0 0 0 283 46 4 1,670
Total 1,268 155 76 5 283 46 4 10,460
• Costs reflect a five-year average in constant 1995 dollars, except in Fr 1995-2000, which is a six-year average.
Total Life Cycle is the sum of annual costs in constant 1995 dollars.
TN 6

VN4
part of and funded by the environmentalrestoration program. It is assumed all wastegenerated by this program will be sent to wastemanagement facilities at the Oak RidgeNational Laboratory.
NUCLEAR MATERIAL AND
FACILITY STABILIZATION
The Oak Ridge Institute for Science andEducation has not yet entered the facilitystabilization program, but it is assumed it willdo so in 1996. The six institute facilitiesexpected to enter this program include anisolation barn, an isotope laboratory, and avariable-dose-rate irradiation facility. Thisreport assumes the stabilization andmaintenance process for facilities at the institutewill be completed by 2013.
LANDLORD FUNCTIONS
The Oak Ridge Associated Universitiesprogram is not responsible for landlord orinfrastructure functions other than thoserequired by environmental restoration orfacility stabilization and maintenance.
PROGRAM MANAGEMENT
Program management provides for prime-contractor support to the environmentalrestoration program. Financial funding is alsoprovided for the State of Tennessee to supportits independent monitoring and oversight ofDOE facilities as outlined in an agreement withthe State. Program management also providesessential technical support, administrativeintegration, and oversight services to ensureproper identification, characterization,remediation, and revitalization of contaminatedsites. These support areas include technicalprograms, technical oversight, communityrelations, analytical projects, integration ofmanagement activities for waste generated inenvironmental restoration, and businessmanagement.
FUNDING AND COST
INFORMATION
The following tables present fundinginformation and major activity milestones forOak Ridge Institute for Science and Education.
Nuclear Material and Facility Stabilization Cost Estimate
Five-Year Averages (Thousands of Constant 1995 Dollars)*
FY 1995-2000 2005 2010 2015 2020 2025 2030 Life Cycle*
Nuclear Material and Facility Stabilization 127 401 394 32 0 0 0 4,898
• Costs reflect a five-year average in constant 1995 dollars, except in FY 1995-2000, which is a six-year average.
*" Total Life Cycle is the sum of annual costs in constant 1995 dollars.
TN 7

Program Management Cost Estimate
Five-Year Averages (Thousands of Constant 1995 Dollars)*
FY 1995 - 2000 2005 2010 2015 2020 2025 2030 life Cycle**
Program Management 137 318 320 353 58 0 0 6,067
• Costs reflect a five-year average in constant 1995 dollars, except in FY 1995-2000, which is a six-year average.
Total Life Cycle is the sum of annual costs in constant 1995 dollars.
Nondefense Funding Cost Estimate
Five-Year Average (Thousands of Constant 1995 Dollars)**
FY 1995 - 2000 2005 2010 2015 2020 2025 2030 Life Cycle
Nuclear Material and Facility Stabilization 9 28 28 0 0 0 0 334
• Costs reflect a five-year average in constant 1995 dollars, except in FY 1995-2000, which is a six-year average.
Total Life Cycle is the sum of annual costs in constant 1995 dollars.
Defense Funding Estimate
Five-Year Averages (Thousands of Constant 1995 Dollars)*
FY 1995 - 2000 2005 2010 2015 2020 2025 2030 Life Cycle**
Environmental Restoration 1,268 155 76 5 283 46 4 10,460
Nuclear Material and Facility Stabilization 118 373 366 0 0 0 0 4,564
Program Management 137 318 320 353 58 0 0 6,067
Total 1,532 858 774 358 342 46 4 21,091
• Costs reflect a five-year average in constant 1995 dollars, except in FY 1995-2000, which is a six-year average.
** Total Life Cycle is the sum of annual costs in constant 1995 dollars.
TN 8

Major Activity Milestones
ACTIVITY TASK COMPLETION DATE
Environmental Restoration Fiscal Year
South Campus Facility - Remediation Complete 2011
Complete all Environmental Restoration Activities 2030
Nuclear Material and Facility Stabilization Fiscal Year
Complete all Nuclear Material and Facility Stabilization Activities 2013
For further information on this site, please contact: Public Participation Office (615) 576-0314Public Affairs Office (615) 576-0885Technical Liaison: Marianne Heiskell (615) 576-0314
TN 9

TN 10

OAK RIDGE K-25 SITE
The Oak Ridge K-25 Site occupies 1,500 acres adjacent to the Clinch River, 13 miles west of OakRidge, Tennessee.
1. K-1232 Chemical Recovery Facility2. K-1407 Central Neutralization Facility3. K-1419 Sludge Fixation Facility4. K-25 BOldng-Withdrawal Alley & Vaults5. K-33 Process Builcing6. K-711 Hazardous Waste Storage Facility7. K-726 Storage Build hg (TSCA)8. K-770 Contami noted Scrap Metal Storage Yard9. K-1025 -C Hazardous Waste Storage Facility10. K-1036,4 Hazardms Waste Storage Facility11.K-1202 Tank Storage Facility12. K-1302 Compressed Gas Cylinder Storage
13. K-1420-A Hazardous Waste Storage Tank14. ORR Storage Facility (ORRSF)-future15. K-27 Builcing.Withdrawal Alleys & Vaults-future16. K-31 Operating and Cell Floor-future17. K-1065 A-E Pond Waste Storage Facility-future18. K-1423 Waste Staging Facility-1 ubre19. K-1024 FT-1 Filter Test Facility20. K-1071 Trash Compactor21. K-1313-A Rubb Tent II Waste Storage22. K-1413 Treatment Tank23. K-1423 Y-12 Dernonstralon Project24. TSCA Incinerator
TN 11

Estimated Site Total
(Thousands of Current 1995 Dollars)*
FY 1995 1996 1997 1998 1999 2000
Environmental Restoration 116,700 85,700 129,100 101,500 93,200 100,200Waste Management 104,600 120,000 166,600 254,000 259,000 256,600Dire* Appropriated Landlord 19,100 17,900 18,700 19,000 19,000 28,800Program Management 13.600 16,800 23,100 22,000 20,200 15,200
Total 254,000 240,400 337,500 396,500 3/1,400 400,800
• Costs for FY 1995 reflect Congressional Appropriation, costs for FY 1996 reflect EM budget submission, costs for FY 1997-2000 reflect Budget Shortfall Scenario, costs forshaded area assume 3% annual inflation.
Five-Year Averages (Thousands of Constant 1995 Dollars)**
FY 1995-2000 2005 2010 2015 2020 2025 2030
Environmental Restoration 97,287 66,466 73,345 62,917 109,491 191,732 249,382Waste Management 177,009 140,182 164,531 167,685 169,106 168,269 117,709Directly Appropriated Landlord 40,894 27,100 27,100 27,100 27,100 27,100 27,100Program Management 21,003 42,948 47,895 54,978 58,468 102,827 94,558
Total 336,193 276,696 312,872 312,681 364,164 489,927 488,750
2035 2040 2045 2050 2055 2060 2065 Life Cycle***
Environmental Restoration 228,289 167,713 196,817 148,297 151,301 0 0 8,812,471Waste Management 89,508 74,207 7,887 669 540 424 37 6,565,825Directly Appropriated Landlord 27,100 27,100 27,100 27,100 27,100 0 0 1,735,864Program Management 79,868 61,878 44,295 29,080 30,326 106 9 3,362,200
Total 424,765 330,898 276,099 205,146 209,267 530 46 20,476,360
Costs reflect a five-year average in constant 1995 dollars, except in FY 1995 - 2000, which is a six-year average.
*** Total Life Cycle is the sum of annual costs in constant 1995 dollars.
PAST, PRESENT, AND
FUTURE MISSIONS
The K-25 Plant was built between 1943 and1946 as part of the Manhattan Project. Itsmission was to produce enriched uranium bythe gaseous-diffusion process. The plant wasexpanded between 1950 and 1954. Through1964, the site was used primarily for theproduction of highly enriched uranium for
nuclear weapons. However, from 1959 to 1969production shifted to commercial-grade, low-enrichment uranium to support the nuclearpower industry. In 1985, the gaseous-diffusionfacilities were placed on standby and were shutdown permanently in 1987. The site alsoserved as host for centrifuge facilitiesconstructed as part of a program for thedevelopment and demonstration of uranium-enrichment technology. These facilities havealso been shut down.
TN 12

The K-25 Site was designated the Center forEnvironmental Technology and the Center forWaste Management in May 1993. It is thecentral location for Oak Ridge Reservation'senvironmental restoration and wastemanagement program. This mission ofsupporting DOE's Environmental Managementprogram is expected to continue for theforeseeable future.
The ultimate use of the site is yet to be decided.However, since Government surveillance,maintenance, and institutional controls at thesite will have to be continued indefinitely,future uses will be limited.
ENVIRONMENTAL
RESTORATION
Most of the K-25 process facilities wereconstructed in the 1940's and 1950's. The wastegenerated in those days, and much of theconstruction material, process fluids, and theauxiliary materials used in the gaseous-diffusion process, are now consideredhazardous and are regulated under today'sstandards. Past operations generated platingwaste, waste solutions, trash contaminated withradioactivity, debris, and other materialscapable of polluting the environment.Environmental pollution resulted fromaccidental leaks and spills and discharges ofradionuclides or chemicals into the
Environmental Restoration Projects
Five-Year Averages (Thousands of Constant 1995 Dollars)*
FY 1995 - 2000 2005 2010 2015 2020 2025 2030
External Areas 4,478 4,055 483 0 0 0 0Ground Water Project 9,468 8,020 19,960 9,971 4,354 0 0K-25 Decommissioning 63,579 47,468 44,642 48,520 76,521 172,720 237,770
Main Plant Area 7,421 5,148 6,381 2,543 10,932 2,529 2,687
Pond Waste Management Project 10,670 0 0
Process Areas 37 0 0 0 16,191 16,483 8,926
Surveillance and Maintenance Project 1,635 1,774 1,879 1,883 1,494
Total 97,287 66,466 73,345 62,917 109,491 191,732 249,382
2035 2040 2045 2050 2055 2060 2065 Life Cyde**
External Areas 0 0 0 0 0 0 0 49,560
Ground Water Project 0 0 0 0 0 0 268,329
K-25 Decommissioning 226,973 167,685 196,817 148,297 151,301 0 0 7,975,051
Main Plant Area 396 0 0 0 0 197,601
Pond Waste Management Project 0 0 0 0 0 0 0 64,017
Process Areas 919 28 0 0 0 212,956
Surveillance and Maintenance Project 0 0 0 0 0 0 0 44,957
Total 228,289 167,713 196,817 148,297 151,301 0 0 8,812,471
'Costs reflect a five-year average in constant 1995 dollars, except in FY 1995-2000, which is a six-year average.
" Total Life Cycle is the sum of annual costs in constant 1995 dollars.
TN 13

environment. It also resulted from themigration or deposition of contaminants fromthe K-25 Plant during gaseous-diffusionoperations or from storage and burial groundsonce deemed acceptable under standards thenin existence.
The shutdown K-25 facilities contain largequantities of asbestos; oils; and equipmentcontaining polychlorinated biphenyls (PCBs),coolants, lubricating oils, and radioactivematerials. These materials will be managed inplace (see the discussion under "Process Plant"below) until they can be removed and treated,stored, or disposed. In many of the facilities,contamination has become fixed on equipmentand structures, and these must, therefore, behandled like hazardous or low-level radioactivewaste. The facilities also hold special nuclearmaterial, residual radionuclides (mainlyuranium), and classified hardware andmaterials to be managed in place untilappropriately dispositioned.
Contamination in soils, ground and surfacewaters, and old waste sites is being addressedby remedial action. Unless there is animmediate threat to the environment, safety,and/or health, these contaminants will bemanaged in place until remediation can becompleted. After remediation, the site will stillrequire institutional controls, and some areas,such as old waste-disposal grounds, will not beavailable for other uses in the future. Otherareas are assumed to be used for industrialpurposes in the future.
For environmental restoration, operable unitsconsisting of solid waste management unitshave been identified for the K-25 Site. Mostoperable units will proceed through the formalremediation process of a remedial investigationand feasibility study through remedial design,remedial action, and verification. Some unitsmay encompass areas requiring interim actionsas new information becomes available. The K-25 Site has been divided into three major areas,including the main plant, the process plant, andthe external plant.
TN 14
Main Plant
The Main Plant includes the main plantlaboratory, centrifuge enrichment facilities, andadministrative areas. It includes several ponds,waste-accumulation areas, cooling towers, acidpits, and burial grounds.
The contamination includes a variety ofhazardous as well as mixed wastes resultingfrom operations at the gaseous-diffusionfacilities and the laboratories in the Main Plant.The remedial actions will include removal oftanks and other smaller contaminated units,and containment structures in locations withlarger areas of contamination. The centrifugefacilities were constructed as part of theprogram for technology development anddemonstration that was carried out at the sitebetween 1960 and 1985. A large portion of thefacilities in these buildings currently containscontaminated equipment and process materials.A surveillance and maintenance program isbeing used to keep the facilities in a safecondition prior to decommissioning. Thedecommissioning will involve the removal ofcontaminated equipment and materials,discussed earlier, and the decontamination offloors and walls, decontamination ofcentrifuges and piping materials, and disposalof waste materials.
Process PlantThe process plant area contains most of thegaseous-diffusion facilities requiringdecommissioning. The program foraccomplishing this is divided into two phases.The first phase consists of safe-shutdownactivities involving the surveillance andmaintenance of facilities and the removal ofhazardous materials and equipment. Thesecond phase entails the ultimate disposition ofequipment internally contaminated withuranium and the final disposition of process

and auxiliary buildings. Surveillance andmaintenance will continue into phase two at aprogressively decreasing rate as buildings aredecommissioned.
Residual uranium will be removed from theinterior of process equipment by a mobilegaseous decontamination system, and then allcontaminated process equipment will betransported to a single decontamination facilityon the Oak Ridge Reservation. Afterdecontamination and volume reduction, thewaste will be returned to the K-25 Site fordisposal. The process buildings remaining afterthe removal of the process equipment andauxiliaries will then be decontaminated. All ofthe interior surfaces are assumed to becontaminated. The facilities will be cleaned ofradioactive and hazardous materials, whichwill be disposed of in appropriately designeddisposal facilities. The major hazardousmaterials are asbestos in the insulation for thepiping systems and in the transite siding of allbuildings, and PCBs that are found throughoutthe electrical equipment, the ventilationsystems of the process buildings, and in localareas of the floors in these buildings. Thefacilities will be treated to remove surfacecontamination to prepare them for unrestrictedrelease. Building materials like transite sidingand roofing are likewise contaminated and areto be totally removed and disposed of. All thatwill remain will be the superstructure of thefacilities.
The K-25 Site also provides storage for specialnuclear materials not considered waste; inparticular, approximately 5,000 cylinders ofdepleted uranium hexafluoride. Othermaterials stored inside the K-25 buildingsinclude approximately 55,000 fifty-five-gallondrums of lithium hydroxide, a strongly alkalinecrystalline or granular solid, stored in about300,000 square feet of warehouse space. Safetydocumentation from the K-25 Site is kept up todate to identify the hazards and risks associated
with the storage of these materials (as well asother hazards related to the process buildings)to protect site workers, the public, and theenvironment.
External Plant
The external plant area includes two operableunits west of the K-25 Site and outside theperimeter fence. The K-901 Operable Unitcontains the following release units: a burialground, a landfarm, the North Disposal Area,the South Disposal Area, and a holding pond.The K-770 Operable Unit contains the followingrelease sites: the beryllium building,contaminated debris, the scrap-metal yard, aswitchyard, the property sales building, sludgebeds and Imhoff tanks, and the storage buildingfor waste regulated under the ResourceConservation and Recovery Act. Also presenthere is the coal and bottom-ash pile listed as anearly action. There are five study areas havingsingle release sites, and one study area hasthree release sites. This estimate assumesremedial action will include containment or nofurther action alternatives.
Ground Water
The ground water at the K-25 Site is treated asone unit. This estimate assumes that a two-phase remedial investigation and feasibilitystudy will be conducted and a decision of nofurther action will result. Ground-watermonitoring will be continued throughout thelife cycle of the program.
Pond-Waste Project
This project resulted from a canceled effort todewater and repack more than 70,000 drums ofpartially solidified and raw sludge stored onexternal pads at the K-25 Site. Current activitiesinclude the decontamination and demobilization
TN 15

Environmental Restoration Activity Costs
Five-Year Averages (Thousands of Constant 1995 Dollars)•
FY 1995-2000 2005 2010 2015 2020 2025 2030
External AreasAssessment 1,472 0 0 0 0 0 0Remedial Actions 3,006 4,055 483 0 0 0 0
Ground Water ProjectAssessment 9,468 8,020 19,960 9,971 4,354 0 0
K-25 Facility DecommissioningAssessment 44,987 45,504 36,936 19,148 22,192 9,082 44,719Facility Decommissioning 18,593 1,964 7,106 29,372 54,329 163,638 193,051
Main Plant AreaAssessment 3,110 3,861 5,556 1,391 7,729 854 0Remedial Actions 4,311 1,287 826 1,152 3,202 1,674 2,687
Pond Waste Management ProjectRemedial Actions 10,670 0 0 0 0 0 0
Process AreasAssessment 37 0 0 0 16,191 2,114 0Remedial Actions 0 0 0 0 0 14,369 8,926
Surveillance and Maintenance ProjectAssessment 1,635 1,774 1,879 1,883 1,494 0 0
Total 97,287 66,466 73,345 62,917 109,491 191,732 249,382
2035 2040 2045 2050 2055 2060 2065 Life Cyde••
External AreasAssessment 0 0 0 0 0 0 0 8,832Remedial Actions 0 0 0 0 0 0 0 40,728
Ground Water ProjectAssessment 0 0 0 0 0 0 0 268,329
K-25 Facility DecommissioningAssessment 59,318 15,642 8,779 0 0 0 0 1,576,518Facility Decommissioning 167,655 152,043 188,038 148,297 151,301 0 0 6,398,533
Main Plant AreaAssessment 0 0 0 0 0 0 0 115,619Remedial Actions 396 0 0 0 0 0 0 81,983
Pond Waste Management ProjectRemedial Actions 0 0 0 0 0 0 0 64,017
Process AreasAssessment 0 0 0 0 0 0 0 91,744Remedial Actions 919 28 0 0 0 0 0 121,213
Surveillance and Maintenance ProjectAssessment 0 0 0 0 0 0 0 44,957
Total 228,289 167,713 196,817 148,297 151,301 0 0 8,812,471
Costs reflect a five-year average in constant 1995 dollars, except in FY 1995 - 2000, which is a six-year average.
- Total Life Cycle is the sum of annual costs in constant 1995 dollars.
TN 16

of vendor equipment, the repackaging ofexternally stored drums and their placement intocompliant storage, and the offsite treatment anddisposal of sludge previously stored in drums.
WASTE MANAGEMENT
K-25 Site generates low-level radioactive waste,low-level mixed waste, aqueous waste, andhazardous chemical waste, including liquidorganic waste. These waste streams requiredifferent methods of treatment and differentstrategies for disposal. Definitions of wastetypes are given in the introduction to thisvolume.
The current generation rates for the waste are asfollows: low-level radioactive waste, 150,000cubic feet; low-level mixed waste, 6 millioncubic feet; hazardous chemical waste, 25,000cubic feet; and sanitary waste, 90,000 cubic feet.These waste volumes are based on FY 1993 andFY 1994 actual figures and, as such, do notinclude volumes of waste from environmentalrestoration or facility stabilization activities.With the exception of environmental restorationactivity waste, waste generation is assumed toremain effectively constant for the baselineperiod.
Waste Treatment
Waste treatment will be specifically designed tosupport disposal, assuming the applicablewaste acceptance criteria are available.Treatment activities are focused around theneed to provide the treatment capabilityrequired by the Resource Conservation andRecovery Act for mixed waste (i.e., waste withrestrictions on land disposal). To provide theneeded capability, a private-sector participationprogram will identify and implement private-sector technologies and strategies to facilitatethe management of mixed waste, such as thedesign, construction, ownership, and operationof private-sector facilities for waste treatment,packaging, transportation, and disposal.
Waste-treatment operations at the K-25 Siteinclude the incineration of liquid waste at anincinerator built to comply with the ToxicSubstances Control Act, and treatment of liquidwaste at the Central Neutralization Facility.The incinerator and the Central NeutralizationFacility will be upgraded to meet morerestrictive regulatory requirements and toprocess greater volumes and more-diversewaste streams. Liquid sanitary waste disposalsystems will also be upgraded. In addition tothese major projects, current infrastructurerepairs will be required throughout theplanning horizon to maintain the operability ofwaste-treatment facilities.
Major Waste Management Projects
Five-year Averages (Thousands of Constant 1995 Dollars) *
1995-2000 2005 2010 2015 2020 2025 2030 Life Cyde*
Central Neutralization Facility 3,083 2,120 0 0 0 0 0 29,100
LLW Disposal Facility 6,400 14,520 19,660 20,800 20,800 20,800 3,900 540,800
Mixed Waste Infrastructure 34,817 35,600 23,200 23,200 23,200 23,200 4,360 872,700
TSCA Incinerator Upgrade 2,250 0 0 0 0 0 0 13,500
• Costs reflect a five-year average in constant 1995 dollars, except in FY 1995 - 2000, which is a six-year average.
Total Life Cycle is the sum of annual costs in constant 1995 dollars.
Note: These projects represent a subset of waste management activities. Associated program management costs are built-in to the estimates provided.
TN 17

Waste StorageThe K-25 Site has facilities to store low-levelradioactive, fissile, mixed low-level, PCBs, andhazardous chemical waste. Waste in storage isnondestructively examined to certify it meetsthe acceptance criteria at the receiving disposalfacilities.
Waste storage facilities consist of modifiedportions of former uranium enrichment processbuildings. Vaults used to store hazardous, mixed,and PCB waste have had interim diking installed,floors coated with chemical resistant sealant, andlightning and fire protection upgrades.
Waste Management Activity Costs
Five-Year Averages (Thousands of Constant 1995 Dollars)*
FY 1995-2000 2005 2010 2015 2020 2025 2030
TreatmentLow-Level Mixed Waste 84,645 54,217 54,217 54,217 56,710 65,454 59,357Low-Level Waste 4,780 12,166 12,166 12,166 12,166 10,473 1,718
Storage and HandlingTransuranic Waste 3,461 750 168 0 0 1 5Low-Level Mixed Waste 1,443 3,887 4,627 4,627 4,905 5,748 4,333Low-level Waste 2,463 574 574 574 574 574 574
DisposalLow-Level Mixed Waste 4,595 5,975 12,066 14,904 13,961 11,986 8,524Low-Level Waste 13,509 37,339 55,195 55,393 55,413 48,606 17,861
Hazardous Waste 16,923 5,953 5,933 5,956 6,056 6,107 6,017Sanitary Waste 9,263 3,960 4,224 4,488 3,960 3,960 3,960Other
Waste Management T/S/D 35,928 15,360 15,360 15,360 15,360 15,360 15,360
Total 177,009 140,182 164,531 167,685 169,106 168,269 117,709
2035 2040 2045 2050 2055 2060 2065 Life Cycle*
TreatmentLow-Level Mixed Waste 54,538 44,446 4,288 0 0 0 0 2,745,097Low-Level Waste 494 494 494 494 494 403 34 347,491
Storage and HandlingTransuranic Waste 3 4 0 0 0 0 25,415Low-Level Mixed Waste 2,919 2,417 807 85 0 180,429Low-Level Waste 574 651 766 0 0 41,956
DisposalLow-Level Mixed Waste 5,444 3,833 1,380 0 0 0 0 417,936Low-Level Waste 282 187 153 90 47 21 4 1,433,998
Hazardous Waste 5,934 5,928 0 0 0 0 0 340,960Sanitary Waste 3,960 3,960 0 0 0 0 0 217,936Other
Waste Management T/S/D 15,360 12,288 0 0 0 0 0 814,606
Total 89,508 74,207 7,887 669 540 424 37 6,565,825
' Costs reflect a five-year average in constant 1995 dollars, except in FY 1995 - 2000, which is a six-year average.
Total Life Cycle is the sum of annual costs in constant 1995 dollars.
TN 18

Waste Disposal
Disposal for the low-level radioactive wastegenerated at the K-25 Site will be provided at
central disposal facilities to be developed for
the Oak Ridge Reservation. Costs for disposal
of K-25 waste are accounted here as shown in
the waste management projects and activities
tables. The construction of the facilities isscheduled to start in FY 1999, and the start of
operations is expected in FY 2004. Wasteincapable of accommodation at this centralfacility will be shipped to other DOE sites.Operations also provide for use of offsite DOE-
owned facilities as well as private capability for
disposal of low-level mixed and hazardous
waste.
NUCLEAR MATERIAL AND
FACILITY STABILIZATION
K-25 currently has no nuclear material orfacility stabilization activity. The entire facility
is currently undergoing decommissioning.
LANDLORD FUNCTIONS
The Office of Environmental Management haslandlord responsibilities at the K-25 Site. Theseresponsibilities include providing for capitalequipment and construction needs,maintaining the infrastructure and equipment,
and providing general site support (i.e., generaladministration;implementation of theenvironmental, safety, and health program; andsecurity). The landlord responsibilities willcontinue until the site has been closed.
PROGRAM MANAGEMENT
Program management, through the technicalintegration and contract-managementfunctions, provides essential technical support,administrative integration, and oversight toenvironmental restoration and wastemanagement. This support is aimed atensuring the proper identification,characterization, remediation, and revitalization
of contaminated sites. It includes technicalprograms, technical oversight, communityrelations, the integration of environmentalrestoration with waste management, andbusiness management.
Program Management Cost Estimate
Five-Year Averages (Thousands of Constant 1995 Dollars)*
FY 1995 - 2000 2005 2010 2015 2020 2025 2030
Program Management 21,003 42,948 47,895 54,978 58,468 102,827 94,558
2035 2040 2045 2050 2055 2060 2065 Life Cyde**
Program Management 79,868 61,878 44,295 29,080 30,326 106 9 3,362,200
• Costs reflect a five-year average in constant 1995 dollars, except in FY 1995-2000, which is a six-year average.
Total Life Cycle is the sum of annual costs in constant 1995 dollars.
TN 19

Included in program management is fundingfor the State of Tennessee to support itsindependent monitoring and oversight ofactivities and facilities as outlined in theAgreement-in-Principle with the State.
FUNDING AND COST
INFORMATION
The following tables present fundinginformation and major activity milestones forK-25.
Landlord Cost Estimate
Five-Year Averages (Thousands of Constant 1995 Dollars)*FY 1995-2000 2005 2010 2015 2020 2025 2030
Directly Appropriated Landlord 40,894 27,100 27,100 27,100 27,100 27,100 27,100
2035 2040 2045 2050 2055 2060 2065 Life Cycle**
Directly Appropriated Landlord 27,100 27,100 27,100 27,100 27,100 0 0 1,735,864
• Costs reflect a five-year average in constant 1995 dollars, except in FY 1995-2000, which is a six-year average.
Total Life Cycle is the sum of annual costs in constant 1995 dollars.
Defense Funding Estimate
Five-Year Averages (Thousands of Constant 1995 Dollars)*FY 1995-2000 2005 2010 2015 2020 2025 2030
Environmental Restoration 97,287 66,466 73,345 62,917 109,491 191,732 249,382Waste Management 177,009 140,182 164,531 167,685 169,106 168,269 117,709Directly Appropriated Landlord 40,894 27,100 27,100 27,100 27,100 27,100 27,100Program Management 21,003 42,948 47,895 54,978 58,468 102,827 94,558
Total 336,193 276,696 312,872 312,681 364,164 489,927 488,750
2035 2040 2045 2050 2055 2060 2065 Life Cyde**Environmental Restoration 228,289 167,713 196,817 148,297 151,301 0 0 8,812,471Waste Management 89,508 74,207 7,887 669 540 424 37 6,565,825Directly Appropriated Landlord 27,100 27,100 27,100 27,100 27,100 0 0 1,735,864Program Management 79,868 61,878 44,295 29,080 30,326 106 9 3,362,200
Total 424,765 330,898 276,099 205,146 209,267 530 46 20,476,360
• Cost reflect a five-year average in constant 1995 dollars, except in FY 1995 - 2000, which is a six-year average.
- Total Life Cycle is the sum of annual costs in constant 1995 dollars.
TN 20

Major Activity Milestones
ACTIVITY TASK COMPLETION DATE
Environmental Restoration Fiscal Year
K-25 Decommissioning of PCB Electrical Components - Complete Decommissioning 1995
K-25 Decommissioning Electrical Compliance - Complete Construction 1995
Powerhouse Area Demolition - Complete Demolition 1996
K-1070 SW31 Spring - Complete Remediation 1996
K-1407 B&C Ponds - Complete Remediation 1996
UF6 Cylinder Yard & Refurbish Facility - Complete Construction 1997
K-25 Emergency Notification System - Complete Construction 1997
K-1417 & K-1419 RCRA Closure - Complete Remediation 1998
PWMP - Sludge Treatment - Complete Remediation 1998
PWMP - Repackaging & Equipment Decontamination - Complete Remediation 1998
K-25 Cooling Tower Demolition - Complete Demolition 2000
Uranium Deposit Removal - Complete Remediation 2002
UF6 Cylinders Inspection & Integrity Assessment - Complete Remediation 2002
K-901 OU - Complete Remediation 2006
K-1070 OU - Complete Remediation 2006
K-770 OU - Complete Remediation 2007
K-1007 OU - Complete Remediation 2009
K-25 Converter Shell Disposal - Complete Remediation 2015
K-25 Centrifuge Facilities Decommissioning - Complete Decommissioning 2018
K-25 Rad Characterization & Decontamination - Complete Decontamination 2020
K-1401 OU - Complete Remediation 2025
K-25 OU - Complete Remediation 2025
K-1407 OU - Complete Remediation 2025
K-25 Decommissioning Asbestos Removal - Complete Removal 2030
K-1004 OU - Complete Remediation 2030
K-29 OU - Complete Remediation 2035
K-1410 OU - Complete Construction 2035
K-1420 OU - Complete Remediation 2035
TN 21

Major Activity Milestones (cont'd)
ACTIVITY TASK COMPLETION DATE
Environmental Restoration (cont'd) Fiscal Year
K-1413 OU - Complete Remediation 2035
K-33 OU - Complete Remediation 2035
K-1064 OU - Complete Remediation 2040
Complete K-25 Environmental Restoration Activities 2055
Waste Management Fiscal Year
Complete CNF Pipeline Extension 1995
Complete Sewage Collection System Rehabilation Facility 1996
Complete TSCA Off-Gas Upgrade 1999
Complete CNF Upgrades 2000
Complete K-25 Waste Management Activities 2060
For fitrther information on this site, please contact: Public Participation Office
Public Affairs Office
Technical Liaison: Mike Travaglini
Bill Gilbert
(615) 576-1590
(615) 576-0885
(615) 576-0848
(615) 576-1817
TN 22

OAK RIDGE NATIONAL LABORATORY
The Oak Ridge National Laboratory occupies approximately 2,900 acres in Melton and Bethel
Valleys, 10 miles southwest of downtown Oak Ridge, Tennessee. The Laboratory is part of the U.S.
Department of Energy's (DOE) Oak Ridge Reservation.
OAK RIDGE NATIONAL LABORATORY WASTE MANAGEMENT SITE MAP
White Oak Avenue
Liquid Low-levelEvaporator FacilityT-1
Bethel Wiley Low-
Contractors Level System Upgrade
Landfill FT-1
TRU Waste Storage Facilitesand Facility CertificationS-I
SWSA 8 WashManagement Facility2.2
Irv-Ineroleir nriva
Whim flak Alvonna
Central Radioactive GasDisposal FacilityD-1
ORNL PWTP ORNL NRWTP
Bethel Valley 1-2 T-4
Process WasteStorage Wks
T-13
Melton Valley Drive
Homogeneous ReactorExperiment
7831 CompactorFacility
Ti5 SWSA 5
Ay. (South Area)sa
Melton Valley Storage Tanks
-.81111.—Storage■ Site forEASC and UNSP5.3
Melton ValleySolidificaton Facility1-7
High FluxIsotope Reach
Bethel Valley PircessWaste Collection limke
1-8
7507 PCBStorage Facility
lb 7600
NFS "'"FS-2
SWSA7(PtiliPosed)
FS-4
FS-3
Chemical HazardousWeill* Storage(71300 Arse)St3
Insert For H. P. R. Area NearThe 7000 Ana
TN 23

Estimated Site Total
Y 1995
(Thousands of Current 1995 Dollars)*
1996 1997 1998 1999 2000
Environmental RestorationWaste ManagementNuclear Material and Facility StabilizationProgram Management
Total
67,700 63,500116,500 72,80013,656 13,1006,800 10,300'
70,70D'118,50015,90012,700
200,200 159,700 217,800
68,900120,10016,30015,000
85,000133,90016,90018,400
76,300182,8001;7,5001,2,700;
220,300 254,200 209,300
M1111111111=P'
• Costs for FY 1995 reflect Congressional Appropriation, costs for FY 1996 reflect EM budget submission, costs for FY 1997-2000 reflect Budget Shortfall Scenario, costs forshaded area assume 3% annual inflation.
Five-Year Averages (Thousands of Constant 1995 Dollars)**
FY 1995-2000 2005 2010 2015 2020 2025 2030
Environmental Restoration 68,969 142,689 157,942 209,749 164,306 72,151 45,006Waste Management 114,240 166,425 127,119 104,506 107,037 105,971 82,592Nuclear Material and Facility Stabilization 13,655 11,670 15,927 5,926 1,665 2,162 2,466Program Management 20,472 66,278 58,677 40,977 32,463 51,857 42,108
Total 217,335 387,062 359,565 360,547 305,471 232,141 172,172
2035 2040 2045 2050 2055 2060 2065 Life-cycle***
Environmental Restoration 9,116 2,706 423 0 0 0 0 4,434,247Waste Management 72,298 51,588 12,172 99 8 4 1 4,834,533Nuclear Material and Facility Stabilization 5,953 47 0 0 0 0 0 307,385Program Management 29,546 18,686 3,355 25 2 1 0 1,842,801
Total 116,918 73,026 15,951 123 10 5 1 11,418,966
** Costs reflect a five-year average in constant 1995 dollars, except in FY 1995 - 2000, which is a six-year average.
Total Life Cycle is the sum of Annual Costs in constant 1995 dollars.
PAST, PRESENT, AND
FUTURE MISSIONS
Weapons research facilities were established atthe site of the Oak Ridge National Laboratoryin 1943. Initially, Oak Ridge operated a pilot-scale nuclear reactor to serve as the prototypefor today's production reactors and a pilot plantfor reprocessing nuclear fuel to recover
plutonium and uranium for nuclear weapons.Its role in the development of nuclear weaponsdecreased over time, but the scope of its workwas expanded to include production ofisotopes, fundamental research in a variety ofsciences, research involving hazardous andradioactive materials, environmental research,and radioactive waste disposal.
Today, the Oak Ridge National Laboratory isone of the country's largest multidisciplinary
TN 24

and multiprogram laboratories and researchfacilities. Its primary mission is to performleading-edge nonweapons research anddevelopment. Other missions includecontributing to the national initiative toimprove science and mathematics education.
The Oak Ridge National Laboratory is expectedto remain an important national research anddevelopment facility well into the future. Theultimate use of the site is yet to be decided;however, any future uses will be limited bylong-term surveillance, maintenance, andinstitutional controls expected to continueindefinitely.
Environmental restoration activities willconclude in 2045 at the assumed funding level.However, laboratory operations will continueto generate waste and, as a result, wastemanagement activities in support of ongoingprograms will continue. Nevertheless, tofacilitate the development of this life-cycle costestimate, an arbitrary cutoff date of 2029 insupport of nonenvironmental managementprogram activities has been assigned to all siteshaving completed environmental restorationbut maintaining ongoing waste managementsupport of other DOE programs (EnergyResearch, Defense Programs, etc.). Wastemanagement activities costs beyond 2029 areonly those associated with ongoingenvironmental restoration activities.
ENVIRONMENTAL
RESTORATION
Since its establishment in 1943, operations atthe Oak Ridge National Laboratory haveproduced a legacy of contaminated facilities;soils and waters polluted with radionuclides,heavy metals, and chemicals from waste-disposal practices with insufficientcontainment; and environmental pollution fromspills and leaks. The Oak Ridge Reservation,
including Oak Ridge National Laboratory, wasadded to the Environmental ProtectionAgency's (EPA) National Priorities List inDecember 1989.
The environmental restoration program hasidentified about 350 sites contaminated withradioactivity or hazardous chemicals. Becauseof the large number of contaminated sites andthe complexity of the hydrologic conditions atOak Ridge, the sites have been combined into20 waste area groups generally defined bysmall watersheds containing contiguous andsimilar waste sites. In some cases, grouping isnecessary because individual sites arehydrologically inseparable. The use of groupsallows perimeter monitoring of both groundwater and surface water and the developmentof a response protective of human health andthe environment.
Waste area groups are comprised of one ormore operable units, a ComprehensiveEnvironmental Response, Compensation andLiability Act (CERCLA) term. Several solidwaste management units, storage areas forhazardous solid waste, can be combined into ansingle operable unit. Most of the solid wastemanagement units are related to theLaboratory's operations in the management ofboth solid and liquid radioactive waste.
Of the 20 waste area groups, 9 are activeprojects in the environmental restorationprogram: groups 1, 2, 4, 5, 6, 7, 10, 11, and 13.Another active project is the Laboratory'sground-water program. Except for group 2, thewaste area groups are sources of contaminantsfor other areas. Each of the contaminant-sourcewaste area groups will be characterized. It willthen be possible to identify small operable unitsand to set priorities for remediation andcleanup.
TN 25

Environmental Restoration Projects
Five-Year Average (Thousands of Constant 1995 Dollars)*
FY 1995-2000 2005 2010 2015 2020 2025 2030
Bethel Valley 0 10 6,253 8,024 6,512 545 1,343Decommissioning 7,589 6,295 25,140 63,315 106,960 60,095 33,221Main Plant 16,239 68,714 30,154 5,899 4,898 901 154Melton Valley 34,992 55,412 82,684 114,536 30,127 7,731 8,031Oak Ridge National Laboratory 5,278 7,352 8,722 9,753 8,262 2,291 1,968Surveillance and Maintenance Project 4,870 4,903 4,986 4,978 3,951 0 0
Total 68,969 142,688 157,942 209,748 164,305 72,150 45,005
2035 2040 2045 2050 2055 2060 2065 Life (yde***
Bethel Valley 1,043 0 0 0 0 0 118,664Decommissioning 4,276 0 0 0 0 0 1,542,059Main Plant 302 117 10 0 0 0 0 653,206Melton Valley 2,741 1,990 262 0 0 0 1,716,825Oak Ridge National Laboratory 680 0 0 0 0 226,826Surveillance and Maintenance Project 0 0 0 0 0 123,321
Total 9,116 2,705 423 0 0 0 0 4,434,247
Costs reflect a five-year average in constant 1995 dollars, except in FY 1995 - 2000, which is a six-year average.
*** Total Life Cycle is the sum of annual costs in constant 1995 dollars.
Waste Area Groups 1 and 3: theBethel Valley Area
Waste Area Group 1: the Main PlantArea
Waste Area Group 1, the Laboratory's mainplant area, contains about half the remedialaction sites identified to date. It lies within theBethel Valley portion of the White Oak Creekdrainage basin. The total area of the basin inBethel Valley is about 2,040 acres. The bedrockconsists of limestone, siltstone, and calcareousshale.
Most of the sites in this group were used tocollect and to store low-level waste in tanks,ponds, and waste treatment facilities, but somealso include landfills and spill and leak sitesidentified during the last 40 years.
Contaminated ground water from some ofthese sites reaches White Oak Creek and itstributaries through seeps. Twelve gunite tanks,centrally located in Waste Area Group 1,received liquid radioactive waste from researchactivities from 1943 through the late 1970's.These tanks contain an estimated 95 percent ofthe radioactivity inventory in Waste AreaGroup 1. Because this group hosts an operatingmultifunctional site with a large work force,remediation will be technically and logisticallycomplicated.
Waste Area Group 1 is divided into 10 operableunits, and each operable unit has its ownremediation process and schedule. Remedialactions will be performed in the near future forthree units: the gunite tanks, the surfaceimpoundments, and a contaminant plume incorehole 8. Early actions are planned for some
TN 26

of the tanks in a steel-tanks unit. Finalremediation of the ground water, pipelines, andstorm drains in this waste area group, andsediments in White Oak Creek should bedelayed until other contaminant sources andsoil units have been remediated.
Proposed treatability studies for the gunitetanks will demonstrate sluicing technologies forremoving the tank contents includingconventional sluicing with a nozzle, usingmixer pumps, and using a manipulator arm.
Surface impoundment remediation is beingconducted under the streamlined approach forenvironmental restoration, one of only five suchprojects at DOE sites across the United States.Principal radionuclide contaminants arestrontium-90, cesium-137, and tritium.
A removal action for the plume in corehole 8 isplanned for FY 1995. The plume transportscontaminants, mainly strontium-90, westwardto First Creek via discrete ground-waterflowpaths and seepage into the Laboratory'sstorm drains. Sampling in First Creek indicatesthis plume is a major source of strontium-90 tothe White Oak Creek drainage. The origin of thecontamination is unknown at this time.
Waste Area Group 3
Waste Area Group 3 is about 0.6 mile west ofthe main plant area. It covers Solid-WasteStorage Area 3, a closed scrap-metal yard, andan active landfill. Storage Area 3 and the closedscrap-metal yard are inactive landfills known tocontain radioactive solid waste and surplusmaterials generated at Oak Ridge from 1946 to1979. The active landfill, opened in 1975, isused to dispose of uncontaminated constructionmaterials and steam plant fly ash. Waste AreaGroup 3 is located along a drainage divide,with most surface and ground waterdischarging into White Oak Creek. It is of lowrisk, and no action is planned for the immediate
future.
Waste Area Groups 2, 4through 10, and 12: the MeltonValley Area
Waste Area Group 2
Waste Area Group 2 encompasses a portion ofWhite Oak Creek, the Melton Branch (atributary of White Oak Creek) and its floodplains, White Oak Lake, and the White OakCreek Embayment at the confluence of theClinch River. This group is downgradient fromall contaminant-source waste area groups in thewatershed. It, therefore, receives and integratescontaminants released from the nine waste areagroups in the watershed: groups 1, 3 through 9,and 17. Consequently, group 2 is termed an"integrator" group, and it is a conduit forcontaminants moving through the surface-water system to White Oak Creek and, thus, tooffsite areas.
There is little doubt Waste Area Group 2 is asource of continuing contaminant release(radionuclides and hazardous chemicals) toClinch River. While it is known this groupreceives ground water contaminated by otherwaste area groups, the extent to which thisgroup may be contributing to ground-watercontamination is yet to be determined.Sampling and monitoring activities arecontinuing, and a Remedial Investigation workplan has been prepared.
No interim remedial actions are scheduled forWaste Area Group 2 in the immediate future,and final remediation will follow completion ofremediation for upgradient waste area groups.The principal goals of remedial action are toreduce potential offsite risks by identifying andsupporting efforts to clean up contaminantsources in upgradient groups and within group2.
Interim corrective measures are, however, likelyto be implemented for soils and sediments ingroup 2; they have been contaminatedprimarily with cesium-137 and cobalt-60 from
TN 27

upgradient sources and have high priority forremediation. Unlike surface water or groundwater, these soils and sediments are relativelystationary and do represent a significantpotential source of particle-boundcontaminants. Possible interim correctiveactions are stabilization (e.g., by capping oradding simple erosion barriers) or removal.Another option is soil solidification by in-placevitrification.
Waste Area Group 4
Waste Area Group 4 is located in Melton Valleyabout 0.5 mile southwest of the Laboratory'smain plant. It is associated with Solid WasteStorage Area 4, and it also containsexperimental pilot pits in area 7811 and liquidlow-level waste transfer lines connecting themto Storage Area 4. Solid Waste Storage Area 4was opened in 1951 for routine burial of solidlow-level radioactive waste. From 1955 to 1963,when Oak Ridge served as the burial groundfrom waste from the southern region, StorageArea 4 received a wide variety of poorlycharacterized waste (including radioactivewaste) consisting of paper, clothing, equipment,filters, animal carcasses, and laboratory waste.About half of the waste was received from 50agencies other than Oak Ridge. The waste wasplaced in trenches, in shallow auger holes, andin ground piles for covering at a later date.
From 1954 to 1975, liquid low-level waste wastransported in underground transfer lines fromstorage tanks at the main plant to waste pitsand trenches in Waste Area Group 7 and later tothe hydrofracture facility. The Pilot Pits Areawas constructed for pilot-scale studies ofradioactive-waste disposal from 1955 to 1959.Three large concrete cylinders containingexperimental equipment remain embedded inthe ground. A control building and an asphaltpad in this area have previously been used forstorage.
The major contaminants at Waste Area Group 4are strontium-90, tritium, cesium-137, and asmall amount of cobalt-60. This group is amajor contributor of strontium-90 and tritiumto the White Oak Creek, accounting for about18 percent of the strontium-90 dischargeobserved at White Oak Dam over the past 3years. Moreover, about 40 percent of thestrontium-90 discharge from Waste Area Group4 can be attributed to seepage from threediscrete areas in which "bathtubbing" occurs intrenches: waste trenches are flooded from thesubsurface during storms or high ground-waterconditions, water leaches contaminants out ofthe waste, and contaminated water seeps intothe soil at the downgradient end of the trench.
An investigation has been conducted to confirmthe location and behavior of bathtubbingtrenches. It is likely to be followed by aninterim remedial action to hydrologically isolatethe bathtubbing trenches, thereby reducingcontaminant discharges. A decision and aninitial design for remedial action are scheduledfor FY 1995.
Waste Area Group 5
Group 5 is directly south of the Laboratory'smain plant in Melton Valley. It encompasses 80acres, approximately 60 acres of which wasused for waste disposal. It consists of SolidWaste Storage Area 5, which was opened in1959 when Solid Waste Storage Area 4 nearedcapacity, and surrounding land. Both the OldHydrofracture Facility and the NewHydrofracture Facility (see the description ofWaste Area Group 10) are within its boundaries.
There are two distinct geographical areas inSolid Waste Storage Area 5: Storage Area 5North and Storage Area 5 South. The northarea was used mainly for disposal oftransuranic waste. From 1959 to 1963, it servedas the regional burial ground for transuranicwaste from the southeastern region. Before1970, transuranic waste was buried in unlinedtrenches and auger holes. After 1970, retrievable
TN 28

aboveground storage was required. The southarea was used mainly for disposal of low-levelradioactive waste. However, an unknownquantity of transuranic waste was buried intrenches and auger holes in the south areabefore designation of Solid Waste Storage Area5 North as the Transuranic Waste Storage Area.Storage Area 5 was closed in 1973.
Waste Area Group 5 also includes a trench-and-dump area that is not well defined; it was usedfor disposal of segregated low-level radioactivewaste that was contaminated with plutonium.This waste was buried in trenches and coveredwith a slab of concrete.
Waste Area Group 5 is a major contributor ofstrontium-90 and tritium to Melton Branch andthe creek into which it flows, White Oak Creek.Current information shows most of thesecontaminants come from seepage in fourdiscrete areas. The specific sources of thecontamination are currently unknown.
To remedy contamination of White Oak Creekwith strontium, an in-place treatment systemfor contaminated seep water was installed as aninterim measure in two of the seepage areas inNovember 1994. The treatment is based on theuse of hydrous silicate minerals (zeolite) tocapture strontium.
Waste Area Group 6
Waste Area Group 6 consists of Solid WasteStorage Area 6, the emergency waste basin, andthe explosives-detonation trench. Solid WasteStorage Area 6 is in Melton Valley, about 1.2miles south of the Laboratory's main plant.Waste burials started here in 1969 and wereexpanded to full-scale operation in 1973, whenSolid Waste Storage Area 5 was closed.Approximately 19 acres of this 68-acre site hasbeen used for waste disposal.
Storage Area 6 has received low-levelradioactive waste and chemical, biological, andmixed waste (e.g., solvents, laboratoryglassware and equipment, and protective
clothing). Vast improvements in disposaltechniques occurred in 1986 and 1987. Disposalin unlined trenches was replaced with disposalof waste in approved containers, and criteria forwaste acceptance were defined andimplemented.
The emergency waste basin was constructed in1961 for storing liquid waste that could not bedischarged into White Oak Creek. The basinhas a capacity of 15 million gallons, but has notbeen used to date. Sampling of the basin'ssmall drainage has shown the presence of someradioactivity, but the source of thiscontamination is not known.
Waste Area Group 6 has low priority forremediation because it accounts for only about2 percent of the risk due to all the contaminantsdischarged at White Oak Dam. An earlierdecision to construct an extensive temporaryclosure system for this group has beenabandoned. This group will, however, bemonitored to determine the total annualdischarges of tritium and strontium-90.
The monitoring will be directed at estimatingtotal annual discharges from flow paths atsurface water sites where monitoring gages arepresent, along the ungaged perimeter, and fromshallow and deep ground-water systems.Future annual assessments of Waste AreaGroup 6 will be based on successive annualmonitoring results. Resources will be directedto flow paths where the largest contaminantreleases occur.
Waste Area Group 7
Waste Area Group 7 is about 1 mile south of theLaboratory's main plant area. The major sites inthis Group are seven pits and trenches usedfrom 1951 to 1966 for disposal of liquid low-level waste. Waste Area Group 7 also includesa decontamination facility, three leak sites, astorage area containing shielded transfer tanks
TN 29

and other equipment, and seven fuel wells usedto dispose of acid solutions primarilycontaining enriched uranium fromHomogeneous Reactor Experiment fuel.
Early remedial actions for this group includedemonstrating in situ soil vitrification andupgrading the existing cap and surfacedrainage to control contaminant migration fromall pits and trenches. In situ vitrificationinvolves melting the entire mass ofcontaminated soil into a chemicallyhomogeneous and durable glassmicrocrystalline waste form. The meltdissolves and incorporates radionuclides andnonvolatile hazardous elements like heavymetals and destroys organic components. Mostsemivolatile organics are retained in the melt,and the small quantity of material escapingfrom the melt is captured and treated.
Remediation will include vitrification in wastepits, waste trenches, and auger holes drilled forthe Homogeneous Reactor Experiment. Then,the site will be backfilled and capped, and afrench drain will be installed. Contaminatedsoils at the locations of underground pipelineleaks and decontamination facility soils will beexcavated, consolidated in one place, andcapped. The excavated areas will be backfilledwith clean soil and revegetated.
Waste Area Group 8
Waste Area Group 8 is about 0.6 mile south ofthe main plant. It includes the inactive Molten-Salt Reactor and the operating High FluxIsotope Reactor with associated tank and pipingsystems, six pipeline-leak sites and an oldtransfer line, five surface impoundments, aspoils area, and waste-storage facilitiesoperated with a permit issued under theResource Conservation and Recovery Act.Low-level liquid waste and process waste fromthe reactor facilities are collected in tanks andthen pumped to the main plant area for storageand treatment. Surface and ground waters
from Waste Area Group 8 discharge into MeltonBranch. This waste area group has not beeninvestigated. It is of low risk, and no action isplanned in the immediate future.
Waste Area Group 10
Waste Area Group 10 consists of injection wellsand subsurface grout sheets constructed forhydrofracturing experiments conducted in thelate 1950's and 1960's. The facilities built forthese experiments, the Old HydrofractureFacility and the New Hydrofracture Facility, arelocated in Waste Area Group 5. The site of thefirst hydrofracture experiment is located withinin the boundaries of Waste Area Group 7. Here,in 1959, grout consisting of diatomaceous earthand cement was experimentally injected into anunderground shale formation to observe thefracture pattern created in the shale and toidentify potential operating problems. The siteof the second hydrofracture experiment is inWaste Area Group 8. The second hydrofractureexperiment was designed to duplicate, in scale,an actual disposal operation; however,radioactive tracers were used instead of actualwaste. Bentonite, cement, and water taggedwith cesium-137 were used in formulating thegrout.
The Old Hydrofracture Facility is about onemile southwest of the Laboratory's main plantnear the southwest corner of Waste Area Group5. Commissioned in 1963, it served as a pilotplant to demonstrate the feasibility of usinghydrofracturing. The waste used inexperiments contained strontium-90, cesium-137, curium-244, and other transuranic andunidentified radionuclides. The NewHydrofracture Facility was more advanced butdid not operate as anticipated and is no longerused.
The New Hydrofracture Facility is 900 feetsouthwest of the Old Hydrofracture Facility onthe south side of Melton Branch. It wasconstructed to replace the older facility, a pilotproject, and to serve as the operational system
TN 30

for disposal of liquid low-level radioactivewaste at the Oak Ridge National Laboratory.The waste used in the injections wereconcentrated liquid low-level waste and somesludge removed from the gunite tanks; thelatter contained strontium-90, cesium-137,curium-244, transuranic, and otherradionuclides. Only enough liquid waste andsludge for demonstration purposes was used.
At Waste Area Group 10, samples from 23 of theexisting 47 wells at the Old HydrofractureFacility will be taken to characterize the wasteand to provide data for protecting workersduring the plugging of fracture wells. If deepground-water remediation is required, apotential remedy is to plug the deep wells inWaste Area Group 10 so ground water cannotescape, monitor the grout sheets, and usecomputer models to predict potential effects onthe deep ground-water system.
Waste Area Groups 11 and 13:External Areas
Waste Area Group 11
Waste Area Group 11, the White Wing ScrapYard, is a largely wooded area of about 30 acreslocated in the McNew Hollow area on thewestern edge of East Fork Ridge. It is not onthe Oak Ridge National Laboratory site but ison the Oak Ridge Reservation. Starting in theearly 1950's, this scrap yard was used foraboveground storage of contaminated materialfrom the Oak Ridge National Laboratory, the K-25 Site, and the Y-12 Plant. The material fromthe Laboratory was mainly contaminated steeltanks; trucks; earth-moving equipment;assorted large pieces of steel, stainless steel, andaluminum; and reactor cell vessels removedduring cleanup of Building 3019 at theLaboratory.
The dates when the scrap was deposited at theyard are uncertain, as is the date when the yardwas closed. In 1966, cleanup began by movingcontaminated materials to Solid Waste Storage
Area 5 and uncontaminated scrap to acommercial contractor. Cleanup continued atleast into 1970, and removal of contaminatedsoil began in the same year. Nonetheless, somescrap metal, concrete, and other trash remain atthe yard.
Numerous radioactive areas, steel drums, andpolychlorinated biphenyl-contaminated soilwere identified at Waste Area Group 11 duringsurface radiological investigations conductedduring 1989 and 1990. The amount of materialor contaminated soil remaining in the area isnot known. Remedial actions for the WhiteWing Scrap Yard will include removingcontaminated debris and excavating andconsolidating contaminated soils and sedimentsfrom radioactive hot spots.
Waste Area Group 13
Waste Area Group 13 is a 6-acre fenced arealocated approximately 330 feet north of ClinchRiver and 1.3 miles south of the intersection ofBethel Valley Road and Tennessee State Route95. It is not on the Oak Ridge NationalLaboratory site, but is on the Oak RidgeReservation. It contains 8 cesium-137 test plotsand an experimental area for the study ofrunoff. Each of eight test plots is 33 by 33 feetand enclosed in sheet metal extending 18 inchesbelow the surface and 24 inches above-grade.As part of a nuclear weapons falloutexperiment in 1968, Oak Ridge scientistsdispersed cesium-137 fused to sand particles ininto four of the eight plots. Since the watertable in this area is only some 8 feet below thesurface, the cesium-137 could migrate throughground water at the site. As a remedial action,soils at the site were excavated in 1993 and 1994to a depth of 3.5 to 4 feet. Monitoring willcontinue to ensure the excavation reduced risksto acceptable levels.
TN 31

Environmental Restoration Activity Costs
Five-Year Averages (Thousands of Constant 1995 Dollars)*
FY 1995.2000 2005 2010 2015 2020 2025 2030
Bethel ValleyAssessment 0 10 6,254 4,265 0 0 0
Remedial Actions 0 0 0 3,760 6,512 445 0
Surveillance And Maintenance 0 0 0 0 0 101 1,344
Facility DecommissioningAssessment 2,383 1,542 11,113 2,589 11,548 56 0
Facihty Decommissioning 5,449 4,753 14,028 63,968 99,006 60,625 33,507
Ground- Water ProjectAssessment 5,448 7,353 7,462 7,461 5,948 0 0
Surveillance And Maintenance 0 0 1,260 2,293 2,314 2,291 1,969
Main PlantAssessment 5,753 34,309 19,132 1,941 231 0 0
Remedial Actions 10,996 34,346 10,555 2,369 460 99 0
Surveillance And Maintenance 11 59 468 1,590 4,208 803 154
Melton ValleyAssessment 19,315 13,942 37,968 35,825 6,969 5,709 5,576
Remedial Actions 14,149 41,408 44,187 78,136 22,834 59 0
Surveillance And Maintenance 436 62 530 576 324 1,964 2,456
Surveillance and Maintenance ProjectSurveillance And Maintenance 5,027 4,904 4,987 4,978 3,951 0 0
Total 68,969 142,689 157,942 209,749 164,306 72,151 45,006
2035 2040 2045 2050 2055 2060 2065 Life Cycle**
Bethel VolleyAssessment 0 0 0 0 0 0 0 52,642
Remedial Actions 0 0 0 0 0 0 0 53,583
Surveillance And Maintenance 1,043 0 0 0 0 0 0 12,440
Facility DecommissioningAssessment 0 0 0 0 0 0 0 148,540
Facility Decommissioning 4,348 598 150 0 0 0 0 1,437,606
Ground- Water ProjectAssessment 0 0 0 0 0 0 0 173,808
Surveillance And Maintenance 680 0 0 0 0 0 0 54,034
Main PlantAssessment 0 0 0 0 0 0 0 312,582
Remedial Actions 0 0 0 0 0 0 0 305,123
Surveillance And Maintenance 303 117 11 0 0 0 0 38,627
Mehon ValleyAssessment 0 0 0 0 0 0 0 645,838
Remedial Actions 0 0 0 0 0 0 0 1,018,017
Surveillance And Maintenance 2,742 1,990 263 0 0 0 0 57,148
Surveillance and Maintenance ProjectSurveillance And Maintenance 0 0 0 0 0 0 0 124,259
Total 9,116 2,706 423 0 0 0 0 4,434,247
* Costs reflect a five-year average in constant 1995 dollars, except in FY 1995 - 2000, which is a six-year average.
** Total Life Cycle is the sum of annual costs in constant 1995 dollars.
TN 32

Ground-Water Program
The ground-water program focuses oninvestigating the extent of contamination indeep ground water and pathways by whichcontaminants reach the deep ground water. Itis divided into two operable units: Bethel Valleyand Melton Valley. The program addressescontaminant transport by ground waterbetween and beneath contaminant sources andmigration potential of contamination related tohydrofracturing (see the discussion underWaste Area Group 10). Data will be analyzed todetermine the potential for ground-waterinflow or outflow beneath surface-watersheddivides, the role of subsidence (karst) inproviding contaminant routes, the effects ofsubsurface retardation processes on long-termcontaminant migration, the depth of potentialcontaminant circulation and the long-termcontainment of hydrofracture contaminants atdepth, and the point at which ground waterleaves the Oak Ridge National Laboratory site.The ground-water assessment will provide data
on the nature and extent of ground-watercontamination and tools for evaluating futurepotential risks to onsite and offsite users ofground water.
WASTE MANAGEMENT
The Oak Ridge National Laboratory generatesliquid and solid low-level radioactive waste,low-level mixed waste, transuranic waste,hazardous waste, and sanitary/industrialwaste. Quantities of waste generated annuallyare estimated at 640 cubic feet for transuranicwaste, 40,000 cubic feet for liquid low-levelradioactive waste, 70,000 cubic feet for solidlow-level waste, 30,000 cubic feet for low-levelmixed waste, 2,400 cubic feet for hazardouschemical waste, and 25 million cubic feet forsanitary waste. These waste volumes are basedon FY 1993 and FY 1994 actual figures and, assuch, do not include volumes of waste from
Major Waste Management Projects
Five-Year Averages (Thousands of Constant 1995 Dollars)*
1995-2000 2001-2005 2006-2010 2011-2015 2016-2020 2021-2025 2026-2030 life Cycle"
Bethell Valley FFA Upgrade 2,933 0 0 0 0 0 0 17,600
Bethel! Valley LLW Collection 4,183 0 0 0 0 0 0 25,100
Central Waste Verification/OF Operations 3,367 4,680 3,000 3,000 3,000 3,000 560 106,400
FFA LLW Tank Compliance 9,617 2,140 0 0 0 0 0 68,400
Melton Valley LLW Collection 1,717 0 0 0 0 0 0 10,300
Melton Valley Storage Tank 6,483 0 0 0 0 0 0 38,900
Process Waste Treatment 3,433 0 0 0 0 0 0 20,600
Sanatary Sewer System Upgrade 1,483 0 0 0 0 0 0 8,900
TRU Processing Facility 20,383 43,000 15,400 8,600 0 0 0 457,300
TRU Technology Development 9,500 3,140 9,040 16,740 0 0 0 201,600
* Costs shown include program management costs with each project
"Costs reflect a five-year average in constant 1995 dollars, except in FY 1995 - 2000, which is a six-year average.
Note: These projects represent a subset of waste management activities. Associated program management costs are built-in to the estimates provided.
TN 33

environmental restoration or facilitystabilization activities. The Laboratory alsomanages the spent nuclear fuel program for theOak Ridge Reservation.
The Oak Ridge National Laboratory served asthe regional burial ground for transuranicwaste from the southeastern region from 1959to 1963 and for low-level and other hazardouswaste from 1955 to 1963. These facilities aremanaged as an environmental restorationactivity.
In the future, while waste generation isexpected to effectively remain constant, changesin emphasis from waste storage to treatmentand disposal are expected. The term "storage"is used to mean retrievable waste remainingwithin the waste management activities area.Retrieval of waste disposed in burial grounds,or otherwise previously viewed as disposed,would be subject to the outcome of theCERCLA process. Solid low-level waste willcontinue to be disposed onsite at Oak RidgeNational Laboratory in accordance withapplicable waste acceptance criteria.Additionally, offsite disposal will be pursuedfor remaining solid low-level waste at otherDOE facilities in compliance with their wasteacceptance criteria.
Treatment for low-level mixed waste will beprovided through a combination of pre-treatment and treatment in existing onsitefacilities and use of treatment capability to besupplied by the private sector. Transuranicwaste will be treated onsite to meet the WasteIsolation Pilot Plant waste acceptance criteriafor disposal at that facility.
Waste Treatment
Treatment systems will be designed to supportdisposal, assuming the applicable wasteacceptance criteria are available. Where
available and cost-effective, the use of private-sector capabilities will take precedence over theconstruction of capital facilities at theLaboratory's site.
Treatment activities are focused around theoperation of liquid-waste collection, transfer,and treatment systems, as well as the provisionof capability to treat transuranic waste. Themajority of liquid radioactive waste is treatedvia conventional technologies for dischargethrough a National Pollutant DischargeElimination System permitted outfall. Theremaining liquid waste is routinely solidified toextend the operating life of storage tanks. TheLaboratory is collaborating with the Office ofEnvironmental Management's TechnologyDevelopment program to develop andimplement needed treatment capabilities forliquid waste and sludge.
The current waste-treatment facilities at theLaboratory include systems for collection,transfer, treatment, and storage or discharge ofliquid radioactive waste; collection, transfer andtreatment of radioactive gaseous waste; andutilization of the Toxic Substances Control ActIncinerator for low-level mixed wastetreatment. Liquid radioactive waste is collectedin storage tanks and routed throughunderground transfer lines to centralevaporators for concentration. The concentrateis sent to the Melton Valley Storage Tanks forstorage; condensate is sent to the Process WasteTreatment Plant for further treatment prior torelease. Radioactive gaseous waste collectedfrom multiple laboratory facilities are filtered,sampled, monitored, and released to theatmosphere via a 250-foot stack. Low-levelmixed waste meeting Toxic Substances ControlAct Incinerator or other on-reservation wasteacceptance criteria is treated onsite.
To replace the existing aged facilities, a newProcess Waste Treatment Facility has beenproposed. It will use ion-exchange media, ahighly effective method for radioisotoperemoval. This processs will significantly reduce
TN 34

secondary waste streams, principally liquidlow-level waste, and lessen storage demands inthe Melton Valley Storage Tanks. Constructionis scheduled to start in FY 1998, and startup isexpected in FY 2000.
The Laboratory has the lead for the Oak RidgeReservation to identify and implement neededcapability for characterization, storage,retrieval, and repackaging of transuranic waste.Waste packages leaving this facility will becertified to meet the waste acceptance criteria ofWaste Isolation Pilot Plant for disposal. To thisend, the Laboratory is proposing a transuranicprocessing facility. This proposed facilityreplaces the Waste Handling and PackagingPlant proposed earlier. The facility will be ableto accept transuranic waste from other sites andcertify the waste packages to the WasteIsolation Pilot Plant Waste Acceptance Criteria.As a funded 1998 line item, the TransuranicWaste Processing Facility could beginshipments about FY 2005, assuming the WasteIsolation Pilot Plant activities proceed asplanned.
The sanitary waste system is currently beingupgraded to provide improvements incollection and transfer system upgrades. Theseupgrades will meet the provisions of the CleanWater Act, as specified in the Laboratory'sNational Pollutant Discharge EliminationSystem permit.
Waste Storage
Storage activities involve ensuring allrequirements of the process are met. Theseinclude verification of compliance withacceptance criteria. Depending on surface dose,solid low-level waste is retrievably stored inaboveground or below grade facilities at OakRidge National Laboratory or transported to K-25 Site for storage in former process buildings.Based on surface dose, transuranic waste is
classified as either contact-handled or remote-handled and stored in specially procuredcontainers in metal buildings or protectedbunkers.
Spent nuclear fuel is currently storedunderwater. Future spent fuel storage mayinclude dry, aboveground facilities. Low-levelmixed waste storage includes classifying,packaging, collecting, and transporting waste inaccordance with applicable regulations.Sufficient resources must be available to ensurewaste in 90-day accumulation areas is collectedwithin the allotted time. Once placed in storagefacilities, routine daily, weekly and monthlyinspections of stored waste and storage facilitiesoccur. Additional activities include repackagingor overpacking damaged or failed wastecontainers, repackaging stored waste to meetregulatory requirements, and maintainingwaste-storage information. Repackaging andbatching operations are conducted to betterutilize storage space and to segregate non-compatible waste.
The agreement with EPA and the State ofTennessee under the Federal FacilityCompliance Act requires the Laboratory toupgrade tank systems used to store liquid low-level radioactive waste and low-level mixedwaste. Secondary containment, materialscompatibility leak detection, and cathodicprotection are some of the requirements.Several major projects have been implementedto provide the upgrades. They pertain to low-level liquid waste collection and transfersystems at Melton Valley and Bethel Valley.
To meet expected requirements fornondestructive assay and examination, theCentral Waste Verification Facility is beingpursued for solid low-level waste and contact-handled transuranic waste for the Oak RidgeReservation after FY 2000. Upgradedverification capability is required to facilitatewaste treatment, storage and disposal,
TN 35

Waste Management Activity Costs
Five-Year Averages (Thousands of Constant 1995 Dollars)*
FY 1995-2000 2005 2010 2015 2020 2025 2030
TreatmentTransuranic Waste 55,487 57,812 26,034 26,034 27,548 27,608 26,421
Low-Level Mixed Waste 2,240 3,189 3,189 3,1893,336 3,850 3,4921718
Low-Level Waste 2,226 12,612 12,660 12,660 12,660 10,533
Storage and HandlingSpent Nuclear Fuel 6,313 160 2,560 0 0 0 0
Transuranic Waste 12,866 53,017 39,337 19,342 19,471 19,663 18,088
Low-Level Mixed WasteLow-Level Waste
6483,8736,787 3,882
4,5603,702
4,4913,702 5
4,7604,1664,20654,86279 225
DisposalLow-Level Waste 1,072 6,589 9,740 9,775 9,779 8,578 3,152
Hazardous WasteSanitary Waste
6,2394,201
5,9314,000
5,9764,000
5,9524,000
5,9564,000
5,939
0040
5,9314,000
OtherWaste Management T/S/D 16,160 15,360 15,360 15,360 15,360 15,360 15,360
Total 114,240 166,425 127,119 104,506 107,037 105,971 82,592
2035 2040 2045 2050 2055 2060 2065 Life Cycle**
TreatmentTransuranic Waste 23,230 9,790 834 0 0 0 0 1,459,478
Low-Level Mixed Waste 3,208 2,615 252 0 0 0 0 145,039
Low-Level Waste 476 329 27 0 0 0 0 331,733
Storage and HandlingSpent Nuclear Fuel 0 0 0 0 0 0 0 51,475
Transuranic Waste 16,989 14,002 2,006 0 0 0 0 1,086,770
law-Level Mixed Waste 2,833 2,346 784 83 0 0 0 171,464
Low-Level Waste 225 255 300 0 0 0 0 147,316
DisposalLow-Level Waste 50 33 27 16 8 4 1 245,188
Hazardous Waste 5,929 5,929 4,743 0 0 0 0 298,862
Sanitary Waste 4,000 4,000 3,200 0 0 0 0 201,208
OtherWaste Management T/S/D 15,360 12,288 0 0 0 0 0 696,001
Total 72,298 51,588 12,172 99 8 4 1 4,834,533
Costs reflect a five-year average in constant 1995 dollars, except in FY 1995 - 2000, which is a six-year average.
Total Life Cycle is the sum of annual costs in constant 1995 dollars.
TN 36

assuming greater utilization of offsite disposaland private sector capability and increases inwaste expected from environmental restorationactivities.
Waste Disposal
All spent fuel will be eventually shipped awayfor disposal in a geologic repository. Therepository location is assumed to be YuccaMountain in Nevada. Disposal at the OakRidge National Laboratory is limited to solidlow-level waste. This waste is disposed at theInterim Waste Management Facility, the onlyoperating low-level-waste disposal unit on theOak Ridge Reservation. The facility, located atSolid-Waste Storage Area 6, uses abovegrade,tumulus-type facilities. Tumulus disposalprovides greater isolation of waste from theenvironment, significantly decreasing thepotential for contaminant release from the site.Waste is placed in metal boxes measuring 4 feetby 4 feet by 6 feet. Each box is then placed in aconcrete vault with only slightly largerdimensions. The void space between the boxand the vault is filled with grout. Filled vaultsare then placed onto engineered, reinforcedconcrete pads. Each pad accommodatesapproximately one year's worth of wastegeneration. When pads are filled, they are
covered with a multilayer cap to prevent orreduce infiltration of water through the waste.Leachate collection and monitoring is providedfor each pad. All waste placed on the pad meetthe Interim Waste Management Facility wasteacceptance criteria for disposal.
All spent nuclear fuel will eventually beshipped away for disposal in a geologicrepository. The repository location is assumedto be Yucca Mountain in Nevada. Disposaloperation activities involve ensuring wasteacceptance criteria are met and collecting,staging, inspecting, nondestructivelyexamining, compacting, and finally disposingof waste. Hazardous chemical waste and low-level mixed waste are shipped to offsitefacilities for disposal. This effort is coordinatedthrough central Oak Ridge Reservationinitiatives.
NUCLEAR MATERIAL AND
FACILITY STABILIZATION
The facility stabilization and maintenanceprocess began at the Oak Ridge NationalLaboratory in 1995. Of the 88 Oak Ridge
Nuclear Material and Facility Stabilization Cost Estimate
Five-Year Averages (Thousands of Constant 1995 Dollars)*
FY 1995-2000 2005 2010 2015 2020 2025 2030
Nuclear Material and Facility Stabilization 13,655 11,670 15,827 5,296 1,665 2,162 2,466
2035 2040 2045 2050 2055 2060 2065 life Cycle"
Nuclear Material and Facility Stabilization 5,958 47 0 0 0 0 0 307,385
Costs reflect a five-year average in constant 1995 dollars, except in FY 1995 - 2000, which is a six-year average.
"Total Life Cycle is the sum of annual costs in constant 1995 dollars.
TN 37

National Laboratory facilities slated to undergothis process, 19 have already begunstabilization. They include contaminatedstorage tanks and ancillary facilities of the BulkShielding Reactor. It is assumed stabilizationfor the remaining 69 facilities will start in 1996.These facilities include the Oak Ridge NationalLaboratory Graphite Reactor, the BulkShielding Reactor Facility, the Oak RidgeResearch Reactor, the High Flux IsotopeReactor, the DOSAR Facility, theSuperconductivity Laboratory, the HealthPhysics Research Reactor, and the LowIntensity Test Reactor. The resulting wastetypes will include: low-level transuranic, low-level mixed, and hazardous. This reportarbitrarily assumes the stabilization andmaintenance process at the Oak Ridge NationalLaboratory will be completed by 2037.
LANDLORD FUNCTIONS
The Department of Energy's Office of EnergyResearch is the landlord for the Oak RidgeNational Laboratory.
PROGRAM MANAGEMENT
Program management, through the technicalintegration and contract-managementfunctions, provides essential technical support,administrative integration, and oversight toenvironmental restoration and wastemanagement. This support is aimed atensuring proper identification, characterization,remediation, and revitalization of contaminatedsites. It includes technical programs, technicaloversight, community relations, the integrationof environmental restoration with wastemanagement, and business management.
Included in program management is financialfunding for the State of Tennessee to support itsindependent monitoring and oversight ofactivities and facilities as outlined in theAgreement-In-Principle with the State.
FUNDING AND COST
INFORMATION
The following tables present fundinginformation and major activity milestones forthe Oak Ridge National Laboratory.
Program Management Cost Estimate
Five-Year Averages (Thousands of Constant 1995 Dollars)*
FY 1995 - 2000 2005 2010 2015 2020 2025 2030
Program Management 20,472 66,278 58,677 40,997 32,463 51,857 42,108
2035 3040 2045 2050 2055 2060 2065 Life Cycle**
Program Management 29,546 18,686 3,355 25 2 1 0 1,842,801
Costs reflect a five-year average in constant 1995 dollars, except in FY 1995 - 2000, which is a six-year average.,
Total Life Cycle is the sum of annual costs in constant 1995 dollars.
TN 38

Defense Funding Estimate
Five-Year Averages (Thousands of Constant 1995 Dollars)**
FY 1995-2000 2005 2010 2015 2020 2025 2030
Environmental Restoration 0 0 0 0 0 0 0Waste Management 99,389 144,790 110,593 90,920 93,122 92,195 71,855Nuclear Material and Facility Stabilization 0 0 0 • 0 0 0 0Program Management 17,606 56,999 50,462 35,257 27,919 44,597 36,213
Total 116,994 201,789 161,055 126,177 121,040 136,792 108,068
2035 2040 2045 2050 2055 2060 2065 Life Cycle
Environmental Restoration 0 0 0 0 0 0 0 0Waste Management 62,900 44,881 10,590 86 7 3 1 4,206,043Nuclear Material and Facility Stabilization 0 0 0 0 0 0 0 0Program Management 25,409 16,070 2,886 21 2 1 0 1,584,809
Total 83,826 60,951 13,476 107 9 4 1 5,790,852
• Costs reflect a five-year average in constant 1995 dollars, except in FY 1995 - 2000, which is a six-year average.
** Total Life Cycle is the sum of annual costs in constant 1995 dollars.
Nondefense Funding Estimate
Five-Year Averages (Thousands of Constant 1995 Dollars)**
FY 1995-2000 2005 2010 2015 2020 2025 2030
Environmental Restoration 68,969 142,689 157,942 209,749 164,306 72,151 45,006Waste Management 14,851 21,635 16,525 13,586 13,915 13,776 10,737Nuclear Material and Facility Stabilization 13,655 11,670 15,827 5,296 1,665 2,162 2,466Program Management 2,866 9,279 8,215 5,740 4,545 7,260 5,895
Total 100,341 185,273 198,510 234,370 184,430 95,349 64,104
2035 2040 2045 2050 2055 2060 2065 Life Cycle
Environmental Restoration 9,116 2,706 423 0 0 0 0 4,434,247Waste Management 9,399 6,706 1,582 13 1 0 0 628,489Nuclear Material and Facility Stabilization 5,958 47 0 0 0 0 0 307,385Program Management 4,136 2,616 470 3 0 0 0 257,992
Total 28,609 12,075 2,475 16 1 1 0 5,628,113
• Costs reflect a five-year average in constant 1995 dollars, except in FY 1995 - 2000, which is a six-year average.
Total Life Cycle is the sum of annual costs in constant 1995 dollars.
TN 39

Major Activity Milestones
ACTIVITY TASK COMPLETION DATE
Environmental Restoration Fiscal Year
WAG 1 Tank Content Removal - Complete Construction 1995
WAG 1 North and South Tank Farms - Interim Action Complete 1995
WAG 5 Seeps - Interim Action Complete 1995
WAG 6 Monitoring and Operations - Interim Action Complete 1995
WAG 7 Remediation - Interim Action Complete 1995
WAG 11 Remediation - Interim Action Complete 1995
WAG 2 EA Hot Sediment Stabilization - Interim Action Complete 1997
Waste Evaporator Facility - Bldg. 3506 - Complete Decommissioning 1997
Fission Product Pilot Plant - Bldg. 3515 - Complete Decommissioning 1998
WAG 10 (OHF) Wells - Interim Action Complete 2000
Old Hydrofracture Facility - Bldg. 7852 - Complete Decommissioning 2001
WAG 1 Surface Impoundments - Complete Remediation 2002
WAG 1 Corehole 8 - Complete Remediation 2006
WAG 5 OU - Complete Remediation 2007
WAG 1 Underground Piping Storm Drain OU - Complete Remediation 2009
WAG 4 Seeps - Interim Action Complete 2010
WAG 1 Ground water OU - Complete Remediation 2010
WAG 1 North and South Tank Farms - Complete Remediation 2010
WAG 10 Remedial Investigation/P&A - Complete Construction 2010
Metal Recovery Facility - Bldg. 3505 - Complete Decommissioning 2012
Coolant Salt Facility - Bldg. 9201-3- Complete Decommissioning 2015
Oil Storage Tanks - 9201-3 Complete Decommissioning 2015
WAG 1 Contaminated Soils OU - Complete Remediation 2015
Molten Salt Loop - Bldg. 9201-3- Complete Decommissioning 2015
Shielded Transfer Tanks - Complete Decommissioning 2015
Decontamination Facility - Bldg. 9419-1- Complete Remediation 2015
WAG 1 White Oak Creek Floodplain Soils/Sed. OU - Complete Remediation 2015
WAG 10 - Complete Remediation 2015
TN 40

ON.
Major Activity Milestones (cont'd)
ACTIVITY TASK COMPLETION DATE
Environmental Restoration (cont'd) Fiscal Year
WAG 1 Steel Tank Systems 01.1- Complete Remediation 2015
WAG 11 Remediation - Complete Remediation 2016
WAG 2 RI - Complete Remediation 2020
WAG 9 Remediation - Complete Remediation 2020
Homogeneous Reactor Experiment - Bldg. 7500 - Complete Remediation 2020
WAG 8 Remediation - Complete Remediation 2020
WAG 4 Remediation - Complete Remediation 2020
Graphite Reactor - Bldg. 3001 - Complete Decommissioning 2021
WAG 7 Remediation - Complete Remediation 2020
Fission Product Development Lab - Bldg. 3517 - Complete Decommissioning 2021
Low Intensity Test Reactor - Bldg. 3005 - Complete Decommissioning 2025
WAG 3 Remediation -Complete Remediation 2025
WAG 1 SWSA 1 OU - Complete Remediation 2025
High Level Chem Development Lab - Bldg. 3005 - Complete Decommissioning 2030
Molten Salt Reactor - Bldg. 7503 - Complete Decommissioning 2030
Oak Ridge Research Reactor - Bldg. 3042 - Complete Decommissioning 2030
Complete all Environmental Restoration activities 2045
Nuclear Material and Facility Stabilization Fiscal Year
ORNL WAG 1 - Stabilization 2010
Complete all Stabilization Activities 2040
Waste Management Fiscal Year
Complete Construction of LLLW Collection and Transfer System forBethel Valley (Phase 1) 1994
Complete Construction of LLLW Collection and Transfer System for Melton Valley 1996
Complete Construction of Melton Valley Storage Tank Capacity Increase 1998
Complete Construction of Bethel Valley FFA Upgrade 1999
Complete all Waste Management Activities 2045
For further information on this site, please contact: Public Participation Office
Public Affairs Office
Technical Liaison: John Sweeney
Mac Roddye
(615) 576-1590
(615) 576-0885
(615) 576-5904
(615) 576-1801
TN 41

TN 42

OAK RIDGE RESERVATION OFFSITE PROGRAM
The Clinch River and Watts Bar Reservoir; the flood plain of the Lower East Fork Poplar Creek; twoprivately owned sites in Knoxville, Tennessee; and three privately owned sites in Oak Ridge, Tennes-see, have been contaminated with hazardous materials from operations at the Oak Ridge Reservationand other sources. The Clinch River and Watts Bar Reservoir system, which encompasses 120 rivermiles in length and 44,000 acres in surface area, is used for municipal and industrial water supplies,sport fishing, boating, swimming, tourism, and residential development. The Lower East ForkPoplar Creek begins at Lake Reality (outside the east end of the Y-12 Plant of the Oak Ridge Reserva-tion) and flows for 14 miles through residential, commercial, agricultural, and open-use areas in theCity of Oak Ridge. Environmental restoration at these sites is addressed by the Oak Ridge Reserva-tion Offsite Program.
S
TN 43

Estimated Site Total
Environmental RestorationProgram Management
Total
(Thousands of Current 1995 Dollars)*
5 4,400 ,300 18200 30.200 29,5
• Costs for FY 1995 reflect Congressional Appropriation, costs for FY 1996 reflect EM budget submission, costs for FY 1997 - 2000 reflect Budget Shortfall Scenario, costs forshaded area assume 3% annual inflation.
Five-Year Averages (Thousands of Constant 1995 Dollars)**
FY 1995-2000 2005 2010 2015 2020 2025 2030
Environmental Restoration 17,996 14,349 8,450 8,140 5,652 1,650 1,546Program Management 2,236 2,647 1,460 1,516 1,307 375 334
Total 20,232 16,996 9,910 8,656 6,959 2,025 1,880
2035 2040 2045 2050 2055 2060 2065 Life Cycle•••
Environmental Restoration 1,310 1,332 0 0 0 0 0 319,512Program Management 253 297 0 0 0 0 0 54,361
Total 1,563 1,629 0 0 0 0 0 373,873
• Costs reflect a five-year average in constant 1995 dollars, except in FY 1995 - 2000, which is a six-year average.
• Total Life Cycle is the sum of annual costs in constant 1995 dollars.
PAST, PRESENT AND
FUTURE MISSIONS
The mission of the Oak Ridge ReservationOffsite Program is to evaluate and, if necessary,remediate contamination at the subject sites.This will be accomplished under the Oak Ridgeenvironmental restoration program, whichbegan in October 1989.
The Clinch River environmental restorationprogram is a part of the Oak Ridge ReservationOffsite program. It addresses the transport ofwaterborne contaminants beyond the
boundaries of the Oak Ridge Reservation.Primary areas of investigation include MeltonHill Reservoir, the Clinch River from MeltonHill Dam to its confluence with the TennesseeRiver, the White Oak Creek Embayment, andthe Watts Bar Reservoir.
Most of the properties included in the offsiteprogram are owned by private individuals ororganizations intending to maintain ownership.Although some of the Lower East Fork PoplarCreek is on property owned by the Departmentof Energy (DOE), it is considered to be watersof the State of Tennessee.
TN 44

ENVIRONMENTAL
RESTORATION
Much of the contamination at the river siteswas transported from Oak Ridge Reservationfacilities by three tributaries of the Clinch River:the White Oak Creek, the Bear Creek, and theLower East Fork Poplar Creek. Many differentcontaminants are present, ranging fromradionuclides to heavy metals and organicchemical compounds. The contaminationresulted not only from operations at the OakRidge Reservation but also from industrial,urban, and residential activities as well asagricultural runoff.
The Clinch River and Watts BarReservoir
The Clinch River and Watts Bar Reservoir isincluded in the National Priorities List ofcontaminated sites. The contaminants includemetals (mercury, lead, arsenic, selenium, andchromium); organic compounds(polychlorinated biphenyls, (PCBs) dioxin, andchlordane); and radionuclides (cesium-137,cobalt-60, tritium, and strontium-90). The
cesium-137 is found in deep sediments withinthe channel. PCBs are present in fish, but DOEoperations are not the only source of the PCBs.The Clinch River and Watts Bar Reservoirreceives effluents from facilities at the OakRidge Reservation as well as effluents frommunicipal and industrial water-treatmentplants and runoff from agricultural, urban, andresidential areas.
Monitoring the condition of the Clinch Riverand Watts Bar Reservoir will continue throughFY 2000 to permit a long-term assessment of theeffectiveness of remediation of the Oak RidgeReservation. The first phase of thecharacterization of the Clinch River/Watts BarReservoir system has been completed, andphase II is ongoing. The record of decision willbe in two parts, with the record of decision forthe Lower Watts Bar Reservoir expected in FY1995 and the record of decision on the ClinchRiver/Poplar Creek expected in FY 1997. It isassumed the Lower Watts Bar Reservoir willrequire no further action. The assumed finalactions for the Clinch River/Watts BarReservoir system will be institutional controlsand a long-term assessment of effectiveness ofremediation at the Oak Ridge Reservation. Theinstitutional controls and monitoring areassumed to continue until at least FY 2019.
Environmental Restoration Projects
Five-Year Averages (Thousands of Constant 1995 Dollars) *
FY 1995-2000 2005 2010 2015 2020 2025 2030
Environmental Restoration 17,996 14,349 8,450 8,140 5,652 1,650 1,546
2035 2040 2045 2050 2055 2060 2065 Life Cycle'
Environmental Restoration 1,310 1,332 0 0 0 0 0 319,512
• Costs reflect a five-year average in constant 1995 dollars, except in FY 1995 - 2000, which is a six-year average.
" Total Life Cycle is the sum of annual costs in constant 1995 dollars.
TN 45

Lower East Fork Poplar Creek
The Lower East Fork Poplar Creek flows 14miles through residential, commercial,agricultural, and open-use areas in the City ofOak Ridge. This remediation site is on theNational Priorities List. The principalcontaminants of concern are mercury andmercury compounds. The contaminants in theflood plain of the creek include heavy metals,radionuclides, PCBs, and polychlorinatedhydrocarbons from past operations at DOE's Y-12 Plant. Other contaminants are present in thesediments.
The assumed remedial action is the clearing ofland; removal of soils contaminated withmercury; and land restoration includingplanting trees, installing riprap, seeding, andmulching. The cleared trees from the site willbe chipped and used for backfill, and the trunkswill be transported to the construction landfillof the Y-12 Plant for disposal. Debris andcontaminated soils will be transported to adisposal unit that the Department will build atthe Y-12 Plant. In addition, surveillance andmonitoring will be performed regularly afterremediation is complete.
The characterization and the Feasibility Studyhave been completed for the Lower East ForkPoplar Creek, and the record of decision isexpected in FY 1996. Remediation is scheduledto be completed in FY 2005.
Unregulated Projects
The unregulated projects in the Oak RidgeReservation Offsite Program are five privatelyowned sites. They are referred to asunregulated because they are not conductedunder the Federal Facility Compliance Act andare not regulated by the ComprehensiveEnvironmental Response, Compensation andLiability Act or the Resource Conservation and
Recovery Act. However, the Department hasentered into agreements with the State ofTennessee to remediate these properties to theextent of its responsibility.
The unregulated projects consist of the site ofthe Atomic City Auto Parts in Oak Ridge; arailspur owned by CSX Transportation, Inc., inOak Ridge; the Solway drums site in Knoxville;a sewage digester owned by Western Sewage inOak Ridge; and the David Witherspoon, Inc.site in Knoxville.
Atomic City Auto Parts in the past receivedsurplus government materials from the OakRidge Reservation facilities operated by DOEand its predecessor agencies. It is an autosalvage yard. The site is privately owned andoperated and is listed as a Tennessee Superfundsite. Studies at Atomic City Auto Parts havedetected the presence of heavy metals, solvents,PCBs, organic chemicals dioxin and furan, andradioactive materials. The site is currentlyregulated under a consent order between theTennessee Department of the Environment andConservation and DOE. The order calls for atwo-phase cleanup action involvingconstructing support facilities for the secondphase of remedial action and removal ofcontaminated materials, which will be sent tothe K-25 Site at the Oak Ridge Reservation fordisposal. The first phase of the Atomic CityAuto Parts cleanup action is completed. Thecompletion of phase II is scheduled for FY 2001.
The Solway drums site is a privately owned sitein a rural residential area in Knox County. Itsowner had improperly stored some 265 drumsof various oils and solvents reportedlypurchased from the Union Carbide Corporationwhen Union Carbide was manager of the OakRidge Reservation. The presence of thesedrums at Solway was reported to DOE onJanuary 10, 1994. The drums, along with 66boxes of soil excavated from the area where thedrums had leaked, were shipped to the K-25Site by the Tennessee Department of theEnvironment and Conservation. Their contents
TN 46

had been characterized only for shippingpurposes. The waste was placed in interimstorage pending complete characterization. Thewaste has been transferred into compliantstorage now that characterization has beencompleted. The costs for final disposal will beincluded within the waste management activityat the K-25 Site.
The Western Sewage digester was part of thesewage-treatment system serving the Y-12 Plantand the west side of the City of Oak Ridge from1942 until it was decommissioned in 1982. Apreliminary analysis of liquid samples founduranium and low levels of cesium-137 andcobalt-60. The Department has agreed to assistthe City of Oak Ridge by conducting acharacterization of the digester contents toidentify proper disposal. The contents of thedigester will be passed through the city's waste-treatment system, and it is assumed the level ofcontamination in solids from the digester willbe non-existent or so low they can be
landfarmed like the other solids from thetreatment system. The concrete walls and floorinside the digester are assumed not to havecontaminant levels warranting removal fromthe site. Characterization to determine the truesituation has been started.
David Witherspoon Inc., an industrial site,accepted scrap metal and other materials frommany sources. Several of these materials arealleged to have originated from facilities ownedby the Department. Some of the scrap metal atthe site is contaminated with radionuclides.The David Witherspoon site is listed as aTennessee Superfund site and is subject to StateSuperfund regulations. On December 1, 1992,the Department signed an agreed consent orderfor this site; subsequently the Departmentremoved the contaminated material andtransferred it to the K-25 Site in Oak Ridge fordisposal. Further action is required on this site.The Department is negotiating an agreementwith the State to establish deliverables andschedules.
Environmental Restoration Activity Costs
Five-Year Averages (Thousands of Constant 1995 Dollars)*
FY 1995-2000 2005 2010 2015 2020 2025 2030
Environmental RestorationAssessment 1,275 0 0 0 0 0 0
Remedial Actions 11,965 4,281 0 0 0 0 0
Surveillance And Maintenance 4,956 10,068 8,450 8,140 5,652 1,650 1,546
Total 17,996 14,349 8,450 8,140 5,652 1,650 1,546
2035 2040 2045 2050 2055 2060 2065 Life Cycle**
Environmental RestorationAssessment 0 0 0 0 0 0 0 7,650
Remedial Actions 0 0 0 0 0 0 0 93,197
Surveillance And Maintenance 1,310 1,332 0 0 0 0 0 219,279
Total 1,310 1,332 0 0 0 0 0 320,126
• Costs reflect a five-year average in constant 1995 dollars, except in FY 1995 - 2000, which is a six-year average.
Total Life Cycle is the sum of annual costs in constant 1995 dollars.
TN 47

The preceeding table presents estimated costsof environmental restoration. A more detailedtabulation by remedial activity is given infollowing funding and cost informationsections.
WASTE MANAGEMENT
Waste management for the Oak RidgeReservation Offsite Program is funded withinthe scope of environmental restoration activites.Generally, waste generated by remediation willbe shipped to the K-25 Site at the Oak RidgeReservation for storage or to commercialfacilities for treatment or disposal. Costs formanaging this stored waste at K-25 and fortreatment and disposal of the waste will beincluded within waste management activity atthe K-25 Site since it will have become K-25'sresponsibility.
NUCLEAR MATERIAL AND
FACILITY STABILIZATION
There are no nuclear material and facilitystabilization activities in the Oak RidgeReservation Offsite program.
LANDLORD FUNCTIONS
The Oak Ridge Reservation Offsite program isnot responsible for landlord or infrastructurefunctions other than those required forenvironmental restoration.
PROGRAM MANAGEMENT
Program management provides for prime-contractor support to the environmentalrestoration program. Financial funding is alsoprovided for the State of Tennessee to supportits independent monitoring and oversight ofDepartment of Energy facilities as outlined inan agreement with the State. Programmanagement also provides essential technicalsupport, administrative integration, andoversight services to ensure properidentification, characterization, remediation,and revitalization of contaminated sites. Thesesupport areas include technical programs,technical oversight, community relations,analytical projects, integration of themanagement activities for waste generated inenvironmental restoration, and businessmanagement.
FUNDING AND COST
INFORMATION
The following tables present fundinginformation and major activity milestones forthe Oak Ridge Reservation Offsite program.
TN 48

Program Management Cost Estimate
Five-Year Averages (Thousands of Constant 1995 Dollars)*
FY 1995 - 2000 2005 2010 2015 2020 2025 2030 life Cycle`•
Program Management 2,236 2,647 1,460 1,516 1,307 375 334 6,067
2035 2040 2045 2050 2055 2060 2065 life Cyde
253 297 0 0 0 0 0 54,361
• Costs reflect a five-year average in constant 1995 dollars, except in FY 1995 - 2000, which is a six-year average.
Total Life Cycle is the sum of annual costs in constant 1995 dollars.
Defense Funding Estimate
Five-Year Averages (Thousands of Constant 1995 Dollars)•
FY 1995 - 2000 2005 2010 2015 2020 2025 2030
Environmental Restoration 12,435 9,621 3,495 3,187 1,710 1,650 1,546
Program Management 1,667 1,939 873 895 803 347 313
Total 14,112 11,560 4,369 4,082 2,513 1,997 1,859
2035 2040 2045 2050 2055 2060 2065 Life Cycle**
Environmental Restoration 1,310 1,332 0 0 0 0 0 193,256
Program Management 253 297 0 0 0 0 0 38,652
Total 1,562 1,629 0 0 0 0 0 231,908
• Costs reflect a five-year average in constant 1995 dollars, except in FY 1995 - 2000, which is a six-year average.
" Total Life Cycle is the sum of annual costs in constant 1995 dollars.
TN 49

Nondefense Funding Estimate
Five-Year Averages (Thousands of Constant 1995 Dollars)'FY 1995 - 2000 2005 2010 2015 2020 2025 2030 life Cyde"
Environmental Restoration 5,561 4,728 4,955 4,953 3,942 0 0 126,256Program Management 559 709 587 622 505 28 22 15,709
Total 6,120 5,437 5,541 5,575 4,447 28 22 141,966
Costs reflect a five-year average in constant 1995 dollars, except in FY 1995 - 2000, which is a six-year average.
" Total Life Cycle is the sum of annual costs in constant 1995 dollars.
Major Activity Milestones
ACTIVITY TASK COMPLETION DATE
Environmental Restoration Fiscal Year
Solway Drums Site - Interim Action Complete 1995
Atomic City Auto Parts, Phase II - Interim Action Complete 1995
Lower East Fork Poplar Creek OU - Remediation Complete 2005
Atomic City Auto Parts - Remediation Complete 2001
Complete all Environmental Restoration Activities 2040
For further information on this site, please contact: Public Participation Office (615) 576-1590Public Affairs Office (615) 576-0885Technical Liaison: Marianne Heiskell (615) 576-0314
TN 50

‘4441aP3?
OAK RIDGE Y-12 PLANT
The Oak Ridge Y-12 Plant occupies 811 acres in the Bear Creek Valley, about 2 miles from down-
town Oak Ridge, Tennessee.
Oil Dike 1
S
MAP* & NAME
I. West End Treatment Facility (WETF)
and VkitSt Tank Farm
2. Uranium Chip Oxidation Facility
3. Waste Coolant Processing Facility
4. Central Pollution Control Facility
5. Plating Rinsewater Treatment Facility (FRU)
6. Waste Feed Preparation Facility (9401-4)
7. Groundwater Treatment Facility
8. Sludge Handling Facility
Y-12 WASTE MANAGEMENT SITE
MAP # & NAME
9. Industrial Waste Compaction Facility
10 .Waste Material Preparation Facility
11. Uranium Oxide Storage Vaults
12. RCRA Staging & Storage Facility
13. Classified Waste Storage
14. Waste Oil/Solvent Storage/Organic Liquid
Storage Area #7
15. Contaminated Scrap Metal Storage (CSMS)
16. PCB Waste Storage
MAP # & NAME
17. Low-Level Waste Storage Area
18. Containerized Waste Storage Area (CWSA)
19. East Chestnut Ridge Waste Pile (ECRWP)
20. Organic Liquid Storage Area
21. Construction Spoil Area I
22. Industrial Landfill IV (ILF IV)
23. Mixed/PCB Waste Storage
24. Sanitary/Industrial Waste Baler
25. Landfills V & VII
26. Landfills VI
TN 51

Estimated Site Total
Environmental RestorationWaste ManagementNuclear Material and Facility StabilizationProgram Management
Total
(Thousands of Current 1995 Dollars)*
995 19945
77,250
30„9005,700
1997 1991
59/200
27,40012,900
160.70__.
199'
15,
2000
75,400109,70037,160
* Costs for FY 1995 reflect Congressional Appropriation, costs for FY 1996 reflect EM budget submission, costs for FY 1997 - 2000 reflect Budget Shortfall Scenario, costs forshaded area assume 3% annual inflation.
Five-Year Averages (Thousands of Constant 1995 Dollars)** FY 1995-2000 2005 2010 2015 2020 2025 2030Environmental Restoration 49,498 64,538 61,101 58,370 38,705 66,877 28,884Waste Management 65,607 52,518 52,242 51,943 52,152 53,132 46,628Nuclear Material and Facility Stabilization 9,988 37,621 42,995 13,245 0 0 0Program Management 16,086 25,168 22,920 19,892 17,168 49,753 28,906
Total 141,179 179,345 179,258 143,450 108,025 169,752 104,418
2035 2040 2045 2050 2055 2060 2065 Life Cyck***Environmental RestorationWaste ManagementNuclear Material and Facility StabilizationProgram Management
6,99544,074
021,036
3,36338,257
09,564
1,9971,5360
384
19,045331083
18,310248062
0203051
01704
2,137,9122,360,044529,236
1,071,466Total 72,105 51,184 3,917 19,459 18,620 254 21 6,098,658
▪ Costs reflect a five-year average in constant 1995 dollars, except in FY 1995 - 2000, which is a six-year average.▪ Total Life Cycle is the sum of annual costs in constant 1995 dollars.
PAST, PRESENT, AND
FUTURE MISSIONS
Built in 1943 as part of the Manhattan Project,the Y-12 Plant was established to separateuranium isotopes by an electromagneticprocess. When the process was discontinuedafter World War II, the Y-12 Plant role changedto manufacturing nuclear weapons componentsand developmental engineering. At present,the Y-12 Plant is adjusting to new programmatic
changes while maintaining safe and reliablenuclear weapons processing technologies ofnational importance. Its current role includesnuclear weapons component disassembly andmaterial storage; serving as a keymanufacturing technology center for thedevelopment and demonstration of uniquematerials, components, and services; andtransferring technologies developed for highlyspecialized military purposes to supportcommercial manufacturing industries. The
TN 52

•• -ket*4',V
mission of the Y-12 Plant is assumed to remain
the same for the foreseeable future, although
some surplus facilities and areas may be turned
over to Environmental Management.
After the various contaminated areas at the
plant have been cleaned up, they will still
require institutional controls over their use;
many sites will not have any future use (e.g.,
burial grounds with an engineered cap). Some
of the surplus facilities, once they have beendecommissioned, could be used for other
industrial uses, most likely by the Department
of Energy (DOE). The ultimate use of the site is
yet to be decided. However, the requirement
for long-term surveillance, maintenance, and
institutional controls will limit future uses of
the site.
ENVIRONMENTAL
RESTORATION
The Y-12 Plant contains many facilities used for
the treatment, storage, or disposal of hazardous
and radioactive materials. Altogether, 217 wastemanagement units, consolidated into operable
units, have been identified here. Examples
include landfills, incinerators, storage areas,aboveground and underground tanks, surfaceimpoundments, and treatment plants. The
units are under investigation to determinewhether remediation is required and, if so, the
best technology for the remediation. In order of
increasing mobility, the contaminants present at
the Y-12 Plant are metals, radionuclides, volatile
organic compounds, and nitrates.
Environmental Restoration Projects
Bear CreekBuilding 9201-4Chestnut RidgePlant Upper East Fork Poplar (reek
Sitewide Activities
Y-12 Decommissioning Facilities
Total
Five-Year Averages (Thousands of Constant 1995 Dollars)*
FY 1995 - 2000 2005 2010 2015 2020 2025
5,705 3,763 2,869 1,181 164 1,516
27,833 37,740 38,760 19,402 0 0
2,114 9,284 938 384 0 0
9,392 8,742 6,754 8,035 11,796 27,508
4,413 4,978 11,358 7,429 9,018 23,389
40 32 422 21,939 17,727 14,463
2030
55100
14,8578,4725,004
Bear (reekBuilding 9201-4Chestnut RidgePlant Upper East Fork Poplar Creek
Sitewide ActivitiesY-12 Decommissioning Facilities
Total
49,498 64,538 61,101
2035 2040 2045
146 1,569 1,997
1,849 1,793 0
0 0 0
0 0 0
0 0 0
5,000 0 0
58,370 38,705 66,877 28,884
2050 2055 2060 2065 Life Ode**
84518,200
0
00
11018,200
0000
000000
000000
107,792846,72165,718444,811349,698323,172
6,995 3,363 1,997 19,045 18,310 0 0 2,137,912
• Costs reflect a five-year average in constant 1995 dollars, except in FY 1995 - 2000, which is a six-year average.
Total Life Cycle is the sum of annual costs in constant 1995 dollars.
TN 53

Significant progress has been made at the Y-12Site in environmental restoration. All but oneof 10 units with interim status under theResource Conservation and Recovery Act(RCRA) have been closed. These units are foursurface impoundments and five land-basedunits. In addition, considerable work has beenconducted to isolate and reroute mercury-contaminated underground drainage.
The waste management units have beenconsolidated into three hydrologic orgeographical units: the Chestnut Ridgehydrologic region, the Bear Creek Valley group,and the Upper East Fork Poplar Creek.
Chestnut Ridge HydrologicRegion
The Chestnut Ridge hydrologic region consistsof several operable units. A series of trenches inthis region were used for the disposal ofhazardous chemical waste until 1984 andnonhazardous waste disposal until 1988. Thesepractices have affected the ground water. Inaddition, the settling basin of the coal-ash pondfilled up with sediments and overflowed intoMcCoy Branch. From 1967 to 1989, coal ashwas transported by waters of the McCoyBranch to Rogers quarry.
Remedial action on Chestnut Ridge sites willconsist of collecting and transportingcontaminated ground water from wastetrenches to treatment facilities at the Y-12 Plant.For the filled coal-ash pond, stabilization withsurface-water rerouting is the recommendedoption for remediation. These activities are tobe completed in 2005. Existing data indicatesthe Rogers quarry poses very little risk and willbe monitored without any planned remediationunless monitoring data changes significantly.
The Bear Creek Valley RegionThe Bear Creek Valley grouping consists of theS-3 ponds, four unlined surface impoundmentscontaining effluent contaminated with nitrates,uranium and lesser concentrations of heavymetals and organic solvents, oil-retentionponds, an oil "landfarm," waste burial groundsand a site used for a boneyard and burnyard;two spoil areas and a storage yard; Bear Creeksediments; and Bear Creek ground water. Theprimary contaminants in the S-3 ponds werenitrates and uranium, with some heavy metalsand organic solvents. During operations,effluent pumping into the pond was as high as5,500 gallons per day. The oil landfarm wasused for dumping waste oils and coolantscontaining beryllium compounds, depleteduranium, polychlorinated biphenyls (PCBs),and chlorinated organic compounds.Operations ceased in 1982, and in 1990 thelandfarm was allowed by the State of Tennesseeand the U.S. Environmental Protection Agencyto close after actions were completed accordingto the approved closure plan.
The burial grounds cover an area of about15,000 square feet. Here trenches wereexcavated to a depth of 14 to 25 feet and filledwith hazardous and nonhazardous solid andliquid waste, including volatile organiccompounds.
One of the spoil areas, known as the Rust SpoilArea, was used for the disposal of scrapmaterial from renovation and maintenance aswell as approximately 100,000 cubic yards ofnonuranium contaminated construction spoils.Contaminants include solvents, asbestos,mercury, and uranium. The SY-200 Yardprovided aboveground storage for PCB-containing transformers, lead shielding plates,and radioactively contaminated materials. Soilcontamination is of primary concern in bothspoil areas and the storage yard.
Bear Creek has been polluted with bothcontaminated surface and ground waters. Thecontaminants in surface water are mainly PCBs,
TN 54

uranium, and cadmium; contaminants in
ground water are nitrates, volatile organic
compounds, radionuclides, trace metals, and
PCBs from waste handling and storage in the
past. Dense, nonaqueous phase liquids have
been discovered at a depth of 270 feet below the
Bear Creek burial grounds.
Planned remedial action in the Bear Creek
Valley is to cover an additional 10 acres with a
cap meeting the requirements of RCRA. At the
boneyard and burnyard, approximately 2,000
cubic yards of soil is to be excavated and
relocated to a portion of the site to be capped.
In the storage yard, approximately 1,000 cubic
yards of soil is to receive the same treatment,
and an estimated 1.25 acres of the yard itself
will be capped. The Rust Spoil Area will be
capped, and a leachate collection system is to be
installed around the perimeter. Theremediation of the Rust Spoil Area will be
completed in FY 2001.
The Bear Creek flood plain (about 12 acres) will
be cleared of contaminated vegetation and soils.
Contaminated ground water will betransported to other Y-12 Plant treatment
facilities. Remedial action for the ground water
will occur in phases. Wells with dense,nonaqueous phase liquids (deep core, 1,000
feet) are to be fitted with equipment designed
to allow vertically discrete ground-water
sampling and allow for a geophysical study to
better define fracture systems in Bear Creek
Valley. The ground-water study will be
concluded no later than FY 2002.
Upper East Fork Poplar Creek
The flow of the Upper East Fork Poplar Creek is
completely derived from plant runoff and
ground water. (The discharge points for plant
runoff are operated with permits under the
National Pollutant Discharge Elimination
System.) This operable unit includes ground
water, a storm-sewer system, areas in which
mercury had been used, an abandoned pipeline
that carried nitric acid, salvage yards, and 175
individual study-area sites. The primarycontaminants are radionuclides (depleted
uranium, uranium-235), organic compounds
(PCBs, petroleum products and solvents), and
heavy metals (mercury, lead, chromium,beryllium).
Remediation for the Upper East Fork Poplar
Creek is likely to require a combination of
technologies. Ground-water treatment is
assumed to include a treatment facility based
on chemical processes (ion exchange),
biological remediation through the action of
microorganisms, and possibly othertechnologies. Full remediation may require the
installation of caps over certain areas,
demolition of buildings and equipment, soil
excavation, and construction of a facility for
treating mercury-contaminated wastewater.
Remediation of the Upper East Fork Poplar
Creek will be complete by FY 2010.
Decommissioning
Building 9201-4 is the only facility currently in
the Y-12 decommissioning program. Current
plans call for decontaminating the building for
reuse. Other facilities for decontamination will
continue to be identified as the Y-12 Plant
focuses on new and changing missions..
TN 55

Environmental Restoration Activity Costs
Five-Year Averages (Thousands of Constant 1995 Dollars)*FY 1995-2000 2005 2010 2015 2020 2025 2030
Bear CreekAssessment 1,574 68 1,203 496 0 0 0Remedial Actions 4,131 3,282 1,055 566 164 0 0Surveillance And Maintenance 0 413 611 119 0 1,516 551
Building 9201-4Assessment 4,267 3,544 1,384 726 0 0 0Surveillance And Maintenance 0 0 0 0 0 0 0Facility Decommissioning 23,566 34,195 37,377 18,675 0 0 0
Chestnut RidgeAssessment 166 0 0 0 0 0 0Remedial Actions 1,948 9,284 0 0 0 0 0Surveillance And Maintenance 0 0 938 384 0 0 0
Plant Upper East Fork Poplar CreekAssessment 4,386 3,676 58 0 3,550 27,508 14,857Remedial Actions 5,005 2,371 4,770 0 0 0 0Surveillance And Maintenance 0 2,695 1,926 8,035 8,246 0 0
Site-wide ActivitiesAssessment 4,413 4,978 11,358 7,429 9,018 5,677 1,731Facility Decommissioning 0 0 0 0 0 17,713 6,741
Y-12 Decommissioning FacilitiesAssessment 40 3 422 10 0 0 0Facility Decommissioning 0 28 0 21,929 17,727 14,463 5,004
Total 49,498 64,538 61,101 58,370 38,705 66,877 28,884
2035 2040 2045 2050 2055 2060 2065 Life Cyde**Bear Creek
Assessment 0 0 0 0 0 0 0 18,282Remedial Actions 0 0 0 0 0 0 0 50,120Surveillance And Maintenance
Building 9201-4146 1,569 1,997 845 110 0 0 39,390
Assessment 0 0 0 0 0 0 0 53,873Surveillance And Maintenance 1,849 1,793 0 18,200 18,200 0 0 200,213Facility Decommissioning
Chestnut Ridge0 0 0 0 0 0 0 592,635
Assessment 0 0 0 0 0 0 0 995Remedial Actions 0 0 0 0 0 0 0 58,111Surveillance And Maintenance
Plant Upper East Fork Poplar Creek0 0 0 0 0 0 0 6,612
Assessment 0 0 0 0 0 0 0 274,560Remedial Actions 0 0 0 0 0 0 0 65,741Surveillance And Maintenance
Site-wide Activities0 0 0 0 0 0 0 104,509
Assessment 0 0 0 0 0 0 0 227,428Facility Decommissioning
Y-12 Decommissioning Facilities0 0 0 0 0 0 0 122,270
Assessment 0 0 0 0 0 0 0 2,414Facility Decommissioning 5,000 0 0 0 0 0 0 320,758
Total 6,995 3,363 1,997 19,045 18,310 0 0 2,137,912
• Costs reflect a five-year average in constant 1995 dollars, except in FY 1995 - 2000, which is a six-year average.
*' Total Life Cycle is the sum of annual costs in constant 1995 dollars.
TN 56

1995-2000 2005
Industrial Compaction Facility L700 1,080
landfill, Phase II 1,533 180
Oil Dike 7/8 Upgrades 283 0
Mont Drains Waste Water Treatment 267 0
Production Woste Storage 600 880
Several buildings at the Y-12 site previously
supported the Laboratory and therefore are
included in environmental restoration activities
at the Oak Ridge National Laboratory. These
facilities are the Molten-Salt Corrosion Loop,
the Coolant Salt Technology Facility, and a
decontamination facility. Surveillance and
monitoring are currently being performed on
these facilities until they can be decontaminated
for reuse.
WASTE MANAGEMENT
The waste generated at the Y-12 Plant consists
of low-level radioactive waste, low-level mixed
waste, sanitary waste and hazardous waste.
These waste types are defined in the
introduction to this report. Each type of waste
requires a specific approach to its treatment,
storage, and disposal.
The estimated annual volumes of waste
generated at the Y-12 Plant are as follows: low-
level radioactive waste, 200,000 cubic feet; low-
level mixed waste, 70,000 cubic feet; hazardous
waste, 360,000 cubic feet; and sanitary waste, 9
million cubic feet. These waste volumes are
based on FY 1993 and FY 1994 actual figures
and, as such, do not include volumes fromenvironmental restoration and facilitystabilization activities.
The plant has several waste management
facilities. These facilities and support programs
will be maintained and upgraded as required to
ensure continued capability for safe treatment,
storage, and disposal. Necessary enhancements
to waste management capabilities and capacity
are being implemented as part of an integrated
strategy for the Oak Ridge Reservation.However, where available and cost effective,
the use of private-sector facilities will take
precedence over construction of new capital
facilities for DOE.
Waste Treatment
Current waste treatment facilities at the Y-12
Plant include systems for collection, transfer,
treatment and discharge of liquid waste;
volume reduction of low-level radioactive solid
waste, and waste drum cleaning operations.
Liquid waste is designated as nitrate or
nonnitrate bearing and treated in separate
treatment chains. The Central Pollution Control
Facility treats and discharges nonnitrate dilute
wastewater, acidic and caustic waste and
Major Waste Management Projects
Five-Year Averages (Thousands of Constant 1995 Dollars)*
2010 2015 2020 2025 2030 Life Cycle
1,08036000
880
1,080 1,080 1,080 200
180 180 180 180
0 0 0 0
0 0 0 0
860 880 860 160
38,20015,5001,7001,600
26,200
' Costs reflect a five-year average in constant 1995 dollars, except in FY 1995 - 2000, which is a six-year average.
Total Life Cycle is the sum of annual costs in constant 1995 dollars.
Note: These projects represent a subset of waste management activities. Associated program management costs are built into the
estimates provided.
TN 57

plating rinse waters. This facility can alsoperform pretreatment for nitrate bearingstreams. The West End Treatment Facilityprocesses nitrate bearing wastewater consistingof nitric acid waste, nitrate bearing rinse waters,waste coolants, and bio-denitrification sludge.Solid low-level waste treatment consists ofburning depleted uranium chips frommachining operations in a controlled facility.The resulting uraniuim oxide is stored in vaults.Additionally, compactor/shredder operationsare conducted for solid low-level waste. The
drum cleaning facility is used to clean anddecontaminate empty 55-gallon metal drumscontaining residues of PCBs, RCRAcontaminants and radioactive materials.
Low-level mixed waste, subject to land-disposalrestrictions of RCRA, will be treated at the Y-12Plant if appropriate technology (e.g.,incineration) is available. Incompatible wasteat the Y-12 Plant will be sent to commercialfacilities for treatment and disposal.
Waste Management Activity Costs
Five-Year Averages (Thousands of Constant 1995 Dollars)•FY 1995-2000 2005 2010 2015 2020 2025 2030
TreatmentLow-Level Mixed Waste 3,982 6,379 6,379 6,379 6,672 7,700 6,983Low-Level Waste 956 6,083 6,083 6,083 6,083 5,236 859
Storage and HandlingTransuranic Waste 2,549 1,381 309 0 0 I 5Low-Level Mixed Waste 576 3,865 4,555 4,491 4,760 5,579 4,206Low-Level Waste 0 0 0 0 0 0 0
Hazardous Waste 30,753 6,162 6,269 6,344 5,990 5,968 5,928Sanitary Waste 7,407 7,920 7,920 7,920 7,920 7,920 7,920Other
Waste Management TSD 19,385 20,727 20,727 20,727 20,727 20,727 20,727
Total 65,607 52,518 52,242 51,943 52,152 53,132 46,628
2035 2040 2045 2050 2055 2060 2065 Life Cyder"Treatment
Low-Level Mixed Waste 6,416 5,229 504 0 0 0 0 287,094Law-Level Waste
Storage and Handling247 247 247 247 247 202 17 165,139
Transuranic Waste 3 3 0 0 0 0 0 23,799Low-Level Mixed Waste 2,833 2,346 783 83 0 0 0 170,963Low-Level Waste 1 2 1 2 0 42
Hazardous Waste 5,928 5,928 0 0 0 0 0 427,102Sanitary WasteOther
7,920 7,920 0 0 0 0 0 361,243
Waste Management TSD 20,727 16,582 0 0 0 0 0 924,663Total 44,074 38,257 1,536 331 248 203 17 2,360,044
• Costs reflect a five-year average in constant 1995 dollars, except in FY 1995 - 2000, which is a six-year average.
• Total Life Cycle is the sum of annual costs in constant 1995 dollars.
TN 58

In the near term, two major improvements are
expected in the treatment capabilities of the Y-
12 Plant. One is development of the Industrial
Waste Compaction Facility. This facility will
allow the plant to compact solid sanitary and
industrial waste in a location adjacent to onsite
disposal facilities. Compaction willsignificantly extend landfill life.
The second improvement is an upgrading of
the Drains Wastewater Treatment system. This
project will reroute the flow of wastewater
streams from building drains to appropriate
treatment systems to improve compliance with
Federal wastewater discharge requirements.
Waste Storage
Storage facilities at the Y-12 Plant consist of
bulk tank storage for hazardous and mixed
waste oils and solvents, bulk tank storage forbio-denitrification sludges; container storage
for low-level mixed, PCB, hazardous and
security classified waste; and long term storage
of solid low-level waste. Modifications to the
West End Treatment Facility will providepretreatment to nitrate bearing wastewaters.
The pretreatment process will significantly
reduce the volume of sludge produced forwhich no disposal is currently available.
The Y-12 Plant also is developing its capabilities
to conduct nondestructive assays of various
waste types and certify compliance with
acceptance criteria. Improvements in thesecapabilities will greatly increase the quantity of
waste removed from storage for eventualtreatment and disposal.
Waste Disposal
The Y-12 Plant provides landfills at its site fornonhazardous sanitary/industrial waste andconstruction debris generated not only at the
plant but also at other parts of the Oak RidgeReservation. These landfills annually acceptapproximately 30 million pounds of sanitary
and industrial waste not disposed at commer-
cial or municipal facilities. The existinglandfills will be nearly filled in mid-1997, andplans have been made to provide additional
capacity at that time.
Low-level radioactive waste is no longerdisposed at the Y-12 Plant. It is currently being
stored pending availability of offsite disposalcapability at other DOE sites or planned onsite
low-level waste disposal facilities.
Disposal for hazardous chemical waste and
mixed low-level waste will be provided at
offsite facilities licensed to dispose of wasteregulated under the RCRA. The disposal of
these wastes will be coordinated throughcentral disposal services at the Oak RidgeReservation.
Nuclear Material and Facility Stabilization Cost Estimate
Five-Year Averages (Thousands of Constant 1995 Dollars)*
FT 1995 - 2000 2005 2010 2015 2020 2025 2030 Life Cycle*
Nuclear Material and Facility Stabilization 9,988 37,621 42,995 13,245 0 0 0 529,236
• Costs reflect a five-year average in constant 1995 dollars, except in FY 1995 - 2000, which is a six-year average.
Total Life Cycle is the sum of annual costs in constant 1995 dollars.
TN 59

NUCLEAR MATERIAL ANDFACILITY STABILIZATION
When a facility is transferred from DefensePrograms to the Environmental Managementprogram, it undergoes a process of stabilizationin which the facility is shut down, radioactiveand hazardous materials are removed, andother actions are taken as necessary to mitigatean immediate threat to health and safety. Oncethis is accomplished, the facility is maintainedand monitored as appropriate pending furtheraction, which is usually decommissioning.
Facility stabilization and maintenance began atthe Y-12 Plant in 1995. Of the 10 facilities slatedto undergo this process, one, a storage buildingfor dye-penetrant waste, has begunstabilization. In 1996 stabilization will start atone of the remaining nine facilities. The wasteresulting from the stabilization will includetransuranic, low-level radioactive, low-levelmixed, high-level, and hazardous chemicalwaste. Currently projections indicatestabilization and maintenance at the Y-12 Plantwill be completed by 2016.
LANDLORD FUNCTIONS
PROGRAM MANAGEMENT
Program management, through the technicalintegration and contract managementfunctions, provides essential technical support,administrative integration, and oversight toenvironmental restoration and wastemanagement. This support is aimed atensuring the proper identification,characterization, remediation, and revitalizationof contaminated sites. It includes technicalprograms, technical oversight, communityrelations, the integration of environmentalrestoration with waste management, andbusiness management.
Included in program management is financialfunding for the State of Tennessee to support itsindependent monitoring and oversight ofactivities and facilities, as outlined in theAgreement-In-Principle with the State.
FUNDING AND COST
INFORMATION
The following tables present fundinginformation and major activity milestonesfor Y-12.
The Landlord responsibility for the Y-12 Plantrests with DOE's Office of Defense Programs.
Program Management Cost Estimate
Five-Year Averages (Thousands of Constant 1995 Dollars)*FY 1995.2000 2005 2010 2015 2020 2025 2030
Program Management 16,086 25,168 22,920 19,892 17,168 49,753 28,906
2035 2040 2045 2050 2055 2060 2065 life CycleProgram Management 21,036 9,564 384 83 62 51 4 1,071,466
' Costs reflect a five-year average in constant 1995 dollars, except in F)' 1995 - 2000, which is a six-year average.
"TotalLffeCycleisthesun7olannualcostsinconstant1995dollam
TN 60

Defense Funding Estimate
Five-Year Averages (Thousands of Constant 1995 Dollars)•
FY 1995 - 2000 2005 2010 2015 2020 2025 2030
Environmental Restoration 45,508 63,247 59,879 57,203 37,931 65,539 28,307
Waste Management 65,607 52,518 52,242 51,943 52,152 53,132 46,628
Nuclear Material and Facility Stabilization 9,788 36,869 42,135 12,981 0 0 0
Program Management 16,086 25,168 22,920 19,892 17,168 49,753 28,906
Total 139,989 177,802 177,176 142,018 107,251 168,424 103,840
2035 2040 2045 2050 2055 2060 2065 We Cycle**
Environmental Restoration 6,855 3,295 1,957 18,664 17,944 0 0 2,095,153
Waste Management 44,074 38,257 1,536 331 248 203 17 2,360,045
Nuclear Material and Facility Stabilization 0 0 0 0 0 0 0 518,651
Program Management 21,036 9,564 384 83 62 51 4 1,071,471
Total 71,966 51,117 3,877 19,078 18,254 254 21 6,045,300
Costs reflect a five-year average in constant 1995 dollars, except in FY 1995 - 2000, which is a six-year average.
Total Life Cycle is the sum of annual costs in constant 1995 dollars.
Nondefense Funding Estimate
Five-Year Averages (Thousands of Constant 1995 Dollars)*
FY 1995 - 2000 2005 2010 2015 2020 2025 2030
Environmental Restoration 990 1,291 1,222 1,167 774 1,338 578
Waste Management 0 0 0 0 0 0 0
Nuclear Material and Facility Stabilization 200 752 860 265 0 0 0
Program Management 0 0 0 0 0 0 0
Total 1,190 2,043 2,082 1,432 774 1,338 578
2035 2040 2045 2050 2055 2060 2065 Life Cycle**
Environmental Restoration 140 67 40 381 366 0 0 42,758
Waste Management 0 0 0 0 0 0 0 0
Nuclear Material and Facility Stabilization 0 0 0 0 0 0 0 10,585
Program Management 0 0 0 0 0 0 0 0
Total 140 67 40 381 366 0 0 53,343
• Costs reflect a five-year average in constant 1995 dollars, except in FY 1995 - 2000, which is a six-year average.
Total Life Cycle is the sum of annual costs in constant 1995 dollars.
TN 61

Major Activity Milestones
ACTIVITY TASK COMPLETION DATE
Environmental Restoration Fiscal Year
Building 9201-4 Y-12 D&D Hazard Abate - Interim Action Complete 1995
BCV OU - 2 RI\FS\PP\ROD - Remediation Complete 2001
Reduction of Mercury in Plant Effluents - Interim Action Complete 2001
BCV OU -1 RIFFS- Remediation Complete 2003
CR OU - 2 FAQ RI/FS/ROD Remediation Complete 2005
UEFPC OU -1 Remediation Complete 2010
Building 9201 - 4 Asbestos Removal - Interim Action Complete 2015
Building 9201 - 4 D&D Complete 2016
BCV OU - 4 GW RI/FS - Remediation Complete 2020
Complete all Environmental Restoration Activities 2055
Waste Management Fiscal Year
Complete construction of Steam Plant Ash Disposal Facility 1995
Complete construction of Classified Solid Waste Storage Faciity 1995
Complete construction of Plant Drain Rerouting Project 1996
Complete upgrades to Oil Dikes 7/8 1998
Complete construction of Industrial Landfill V and Construction/Demolition 1999of Landfill VII, Phase II
Complete all Waste Management Activities 2061
For further information on this site, please contact: Public Participation Office (615) 576-1590
Public Affairs Office (615) 576-0885
Technical Liaison: Sherry Lankford (615) 576-9559
Joyce Segar (615) 576-0850
TN 62

LtA
FORMERLY UTILIZED SITES REMEDIAL
ACTION PROGRAM (FUSRAP)
Missouri Sites New York Sites
• Lany Avenue Properties, Hazelwood
• St. Louis Airport Site, St. Louis -j-
• St. Louis Airport Site Vicinity Prop., St. Louis
St. Louis Downtown Site, St. Louis
New Jersey Sites
•t Maywood Interim Storage Site, Maywood
9" Wayne Interim Storage Site, Wayne/Pequannock
t Middlesex Sampling Plant, Middlesex
t New Brunswick Site, New Brunswick
Du Pont & Company, Deepwater
Niagara Falls Storage Site, Lewiston
Colonie Interim Storage Site, Colonie
Ashland I. Tonawanda
Ashland 2, Tonawanda
Linde Center, Tonawanda
Seaway Industrial Park, Tonawanda
Bliss & Laughlin Steel, Buffalo
Additional Sites
Albacraft, Oxford, OHAssociate Aircraft, Fairfield, OH
B&T Metals, Columbus, OH
Baker Brothers, Toledo, OH
Chapman Valve, Indian Orchard, MA
CE Site, Windsor, CT
General Motors, Adrian, MI
Granite City Steel, Granite City, IL
HHM Safe Co., Hamilton, OH
Luckey Site, Luckey, OHMadison Site. Madison, ILPainesville Site, Painesville, OH
Seymour Specialty Wire, Seymour, CT
• Shpack Landfill, Norton, MA
Ventron Corporation, Beverly, MA
W.R. Grace & Company, Curtis Bay, MD
Completed Sites
Acid/Pueblo Canyon, Los Alamos, NM
Albany Research Center, Albany. OR
Aliquippa Forge, Aliquippa, PA
Bayo Canyon, Los Alamos, NM
C.H. Schnoor, Springdale, PAChupadera Mesa. White Sands Missile
Range, NMElza Gate Site, Oak Ridge, TNKellex/Pierpoint, Jersey City, NJMiddlesex Municipal Landfill, Middlesex, NJ
National Guard Armory, Chicago, IL
Niagara Falls Storage Site Vicinity Prop.,
Lewiston, NYUniversity of California, Berkeley, CA
University of Chicago, Chicago, IL
Baker and Williams Warehouses, New York City
0 REMEDIAL ACTION • REMEDIAL ACTION
ONGOING OR PLANNED COMPLETEDt DOE-OWNED • NPL SITE
OR -LEASED SITE
STATE WITHFUSRAP SITES)
PAST, PRESENT, AND
FUTURE MISSIONS
The Manhattan Engineer District and itsimmediate successor, the Atomic EnergyCommission, conducted several programsduring the 1940's and 1950's involving research,development, processing, and production ofuranium and thorium, and storage ofprocessing residues. Nearly all of this workinvolved some participation by privatecontractors and institutions.
Privately owned and institutionally owned sitescontaminated during this early period of thenuclear program were decontaminated orstabilized in accordance with survey methodsand guidelines then in existence. These siteswere subsequently released for other uses.Since that time, however, radiologicalguidelines have become more stringent andreevaluation is required.
Established in 1974 under the provisions of theAtomic Energy Act, the Formerly Utilized SitesRemedial Action Program (FUSRAP) isrequired to identify previously decontaminatedsites used by the Manhattan Engineer District
TN 63

and the Atomic Energy Commission, reevaluatetheir radiological condition, and takeappropriate remedial action where necessary.FUSRAP encompasses 46 sites in 14 States,including 5 sites associated with commercialventures added by the Energy and WaterDevelopment Appropriations Acts of 1984 and1985 (PL 98-50 and PL 98-360, respectively).
Following appropriate remediation,certification documents will be issued for eachsite that will list any restrictions regardingfuture use of the site.
ENVIRONMENTAL
RESTORATION
Sites that became contaminated during theAtomic Energy Commission era were cleanedup and released for use under the guidelines ineffect at the time. Because those cleanup anddisposal guidelines were not as strict as today'sguidelines, trace amounts of radioactivematerials remained at some of the sites. Overthe years, some of these radioactive materials atthe sites became dispersed throughout soil andrubble due to earth-moving activities andbuilding demolition. Waste was spread byerosion, wind, and transport of materials ontosome vicinity properties.
None of the sites pose an immediate health riskto the public or environment under currentland uses. The contaminated materials havevery low concentrations, and people are notexposed to them for long periods of time.Although these materials do not pose animminent threat, they will remain radioactivefor thousands of years, and health risks couldincrease if the land use was to change. Most ofthe contaminated material remainsuncontrolled and is subject to continuedmigration.
Continued congressional authorization hasbeen provided each year in the passage ofsubsequent Energy and Water DevelopmentAppropriations Acts. The Department ofEnergy has entered into three Federal FacilitiesAgreements with the Environmental ProtectionAgency for five FUSRAP sites currently on theNational Priorities List.
Remedial actions are designed to reduce oreliminate the health risks of exposure toradioactive contaminants and may includeexcavating and disposing contaminatedmaterial prior to disposal. The following listshows FUSRAP sites by State.
WASTE MANAGEMENT
All waste management and programmanagement activities within FUSRAP areconducted within the scope of environmentalrestoration.
NUCLEAR MATERIAL AND
FACILITY STABILIZATION
There are no current or planned nuclearmaterial and facility stabilization activitiesrequired for sites within the FUSRAP program.
LANDLORD FUNCTIONS
Because most of these sites are owned bycommercial entities, FUSRAP is not responsiblefor landlord/infrastructure activities other thanthose required by ongoing environmentalrestoration. Therefore, all landlord costsassociated with the program are providedwithin the scope of environmental restoration.
TN 64

fir
FUSRAP Sites (by State)
STATE / NO. OF SITES SITE
CALIFORNIA: 1 site University of California, Berkeley *
CONNECTICUT: 2 sites Combustion Engineering, Windsor
Seymour Specialty Wire Co., Seymour *
ILLINOIS: 4 sites Illinois National Guard Armory, Chicago *
University of Chicago, Chicago *
Madison, Madison
Granite City Steel, Granite City *
MARYLAND: 1 site W. R. Grace & Company, Curtis Bay
MASSACHUSETTS: 3 sites Chapman Valve, Indian Orchard
Ventron, Beverly
Shpack Landfill, Norton (1)
MICHIGAN: 1 site General Motors, Adrian
MISSOURI: 4 sites St. Louis Downtown Site, St. Louis
St. Louis Airport Site Vicinity Properties,St. Louis (1)
Lofty Avenue Properties, Hazelwood (1)
St. Louis Airport Site, St. Louis (1)
NEW JERSEY: 7 sites DuPont & Company, Deepwater
Middlesex Municipal Landfill, Middlesex*
Middlesex Sampling Plant, Middlesex
Maywood, Maywood/Rochelle Park (1)
Wayne, Wayne (1)
New Brunswick Site laboratory, NewBrunswick
Kellex/Pierpont, Jersey City *
STATE / NO. OF SITES SITE
NEW YORK: 9 sites Ashland 1, Tonawanda
Ashland 2, Tonawanda
Seaway Industrial Park, Tonawanda
Linde Air Products, Tonawanda
Bliss & Laughlin Steel, Buffalo
Niagara Falls Storage Site VicinityProperties, Lewiston *
Colonie, Colonie
Baker & Williams Warehouses, New York *
Niagara Falls Storage Site, Lewiston
OHIO: 7 sites Alba Craft, Oxford
Luckey, Luckey
Painesville Site, Painesville
HHM Safe Co., Hamilton
Baker Brothers, Toledo
B&T Metals, Columbus
Associated Aircraft and Tool Manufacturing,Fairfield
PENNSYLVANIA: 2 sites C. H. Schnoor, Springdale *
Aliquippa Forge, Aliquippa *
NEW MEXICO: 3 sites Acid /Pueblo Canyons, Los Alamos*
Bayo Canyon, Los Alamos*
Chupadera Mesa, White Sands MissileRange *
OREGON: 1 site Albany Research Center, Albany *
TENNESSEE: 1 site Elza Gate, Oak Ridge *
(1) NPL Sites
• Completed Sites
TN 65

Major Activity Milestones
ACTIVITY COMPLETION DATE
Environmental Restoration Fiscal Year
Connecticut Complete Assessment 1997
Connecticut Complete Remedial Action 1999
Illinois Complete Assessment 2000
Illinois Complete Remedial Action 2000
Maryland Complete Assessment 1998
Maryland Complete Remedial Action 2000
Massachusetts Complete Assessment 1996
Massachusetts Complete Remedial Action 1998
Michigan Complete Assessment 1995
Michigan Complete Remedial Action 1995
Missouri Complete Assessment 1996
Missouri Complete Remedial Action 2000
New Jersey Complete Assessment 1996
New Jersey Complete Remedial Action 2000
New York Complete Assessment 2000
New York Complete Remedial Action 2000
Ohio Complete Assessment 2000
Ohio Complete Remedial Action 2000
Note: Completion dates pertain to the last FUSRAP site within the State.
For further information on this site, please contact: Public Participation Office
Public Affairs Office
Technical Liaison: Melyssa Noe
(615) 576-1590
(615) 576-0885
(615) 241-3315
TN 66

*Summaries are not provided for facilitieswith completed remedial actions. Anyongoing surveillance and monitoring costsfor this facility are provided in the tablebelow.
FALLS CITY (COMPLETEDUMTRA SITES)*
TEXASEstimated State Total
(Thousands of Current 1995 Dollars)*
17(1995' '199
Pantex Plant 40,43 0,136r 1,290 4,776 34,430 33,12!Completed UMTRA Surveillance & Monitoring 2,640 2,940 1,520 4,570
Total 43,0 10,626 . 2 36,296 35,300: 37,699:
▪ Costs for FY 1995 reflect Congressional Appropriation, costs for FY 1996 reflect EM budget submission, costs for FY 1997-2000 reflect Budget Shortfall Scenario, costs forshaded area assume .3% annual inflation.
Five-Year Averages (Thousands of Constant 1995 Dollars)**
FY 1995-2000 2005 2010 2015 2020 2025 2030
Pantex Plant 30,278 19,545 23,847 28,791 18,954 15,644 12,791Completed UMTRA Surveillance & Monitoring 2,306 1,396 921 669 0 0 0
Total 32,585 20,941 24,768 29,460 18,954 15,644 12,791
FY 2035 2040 2045 2050 2055 2060 2065 Life Cycle"
Pantex Plant 1,121 0 0 0 0 0 0 785,136Completed UMTRA Surveillance & Monitoring 0 0 0 0 0 0 0 28,771
Total 1,121 0 0 0 0 0 0 813,907
▪ Costs reflect a five-year average in constant 1995 dollars, except in FY 1995 - 2000, which is a six-year average.
▪ Total Life Cycle is the sum of annual costs in constant 1995 dollars.
TX 1

TX 2

PANTEX PLANT
The Pantex Plant is located in the panhandle of Texas, about 17 miles northeast of downtown Ama-rillo. The site covers about 16,000 acres.
FM 293
PANTEX SITE BOUNDARY BurningGrounds
Igloo 4-50HazardousWasteStorage
Igloo 4-19BRadioactive
WasteStorage
Classified
11-7 N PadHazardousWasteStorage
coco2u.
S
ConexContainers
Igloo 4-56B
TX 3

Estimated Site Total
(Thousands of Current 1995 Dollars)*
ftt19$,, 1996 97. 1998 199 14
Environmental RestorationWaste ManagementNuclear Material and Facility StabilizationProgram Management
Total
• Costs for FY 1995 reflect Congressional Appropriation, costs for FY 1996 reflect EM budget submission, costs for FY 1997-2000 reflect Budget Shortfall Scenario, costs for
shaded area assume 3% annual inflation.
Five-Year Averages (Thousands of Constant 1995 Dollars)**
FY 1995.2000 2005 2010 2015 2020 2025 2030
Environmental Restoration 11,130 872 10,949 2,737 0 0Waste Management 12,422 12,514 13,840 12,522 12,557 12,515 10,233
Nuclear Material and Facility Stabilization 2,609 2,615 6,547 109 0 0 0Program Management 4,118 3,544 3,460 5,211 3,659 3,129 2,558
Total 30,278 19,545 23,847 28,791 18,954 15,644 12,791
FY 2035 2040 2045 2050 2055 2060 2065 life Cycle**
Environmental Restoration 0 0 0 0 0 139,572
Waste Management 897 0 0 0 0 0 449,920
Nuclear Material and Facility Stabilization 0 0 0 0 0 62,007
Program Management 224 0 0 0 0 0 133,637
Total 1,121 0 0 0 0 785,136
▪ Costs reflect a five-year average in constant 1995 dollars, except in FY 1995 - 2000, which is a six-year average.
*** Total Life Cycle is the sum of annual costs in constant 1995 dollars.
PAST, PRESENT, AND
FUTURE MISSIONS
The Pantex Plant was built by the U.S. Army in1942 as a conventional bomb plant. It wasdecommissioned after World War II and sold toTexas Tech University as excess governmentproperty. In the 1950's, the Atomic EnergyCommission recovered 10,000 acres of the site,renovated portions of the plant, and
constructed new facilities for the manufactureof high explosives used in nuclear weapons andfor the final assembly of nuclear weapons.During the mid-1960's, the plant was expandedwhen it assumed weapons maintenance andmodification tasks from plants closed in SanAntonio, Texas, and Clarksville, Tennessee. Thelast expansion came with the closing of a sisterplant in Burlington, Iowa in 1975. Pantex hasbeen the only plant of its type sinceBurlington's closing in 1975.
TX 4

The mission of the Pantex Plant is fabricatinghigh explosives for nuclear weapons,assembling nuclear weapons, maintaining andevaluating nuclear weapons in the stockpile,and dismantling nuclear weapons as they areretired from the stockpile. At present theprincipal operation is disassembly of nuclearweapons.
The basic mission is not expected to change inthe foreseeable future. The Pantex Plant willcontinue to be the only facility for thedismantlement and maintenance of the nation'snuclear weapons stockpile. It will also provideinterim storage for plutonium in a facility theDepartment of Energy (DOE) plans to develop.The Pantex Plant is managed by DOE's Officeof Defense Programs, which will continue toserve as the landlord.
ENVIRONMENTAL
RESTORATION
The production of high-explosives componentsfor nuclear weapons has resulted in thecontamination of soils, primarily from organicsolvents and high explosives. In addition, testsof weapons components have contaminatedsome areas with high explosives and heavymetals. The contaminants may migrate tosubsurface soils and eventually to groundwater. Ground-water contamination has beendetected in the perched aquifer, located a fewhundred feet above the Ogallala Aquifer. InMay 1994, the U.S. Environmental ProtectionAgency (EPA) placed Pantex on the NationalPriorities List. The Amarillo Area Office iscurrently negotiating a tri-party Federal FacilityAgreement with the EPA and the State of TexasNatural Resources Conservation Commission.
Environmental restoration activities at thePantex Plant are conducted in compliance witha Resource Conservation Recovery Act (RCRA)permit issued by the Texas Natural Resources
Conservation Commission in April 1991. Theybegan in 1992 and are expected to be completedby FY 2000 because the environmentalrestoration program has been accelerated.
Operable UnitsPantex has 144 solid waste management unitsgrouped into 15 operable units for investigationpurposes. The latter included 110 potentialrelease sites identified at the plant. RCRAFacility Investigations have been completed forall operable units. For operable units PX-3 andPX-4, no further action is recommended. UnitPX-15, the Hypalon Pond, was closed in 1992.Voluntary corrective actions are being taken atseveral sites with no further actions planned atseveral other sites. Brief descriptions of theactive operable units follow.
Operable Unit PX-1: Burning GroundSites
No further action is recommended for all closedburning ground sites except for the flashingpits, which will require further investigation. Avoluntary corrective action is planned toaccelerate cleanup. Removal and disposal orincineration is planned for the contaminatedsoil. This project is scheduled for completion infall 1997.
Operable Unit PX-2: High PriorityPotential Release Sites
No further action is recommended for six ofthese potential release sites. However, avoluntary corrective action will be conducted attwo sites. One is building FS-16, where thesurface impoundment and sump will beremoved; the other is the FS-22 container, whichwill also be removed. In both cases, samplingwill be conducted in the area to confirmcleanup. One site, the concrete sump inbuilding 12-68, requires further investigation.
TX 5

A recommendation of no further action isexpected to be submitted to the Texas NaturalResources Conservation Commission in thespring of 1996.
Operable Unit PX-5: Fire Training AreaBurn Pits
A voluntary corrective action studyrecommended the removal and offsite disposalof contaminated soil. The investigationconcluded the soil contamination at the FireTraining Area Burn Pits is restricted to theupper four feet. Remediation, with designstarting in FY 1995, will involve the removal ofshallow contaminated soil, sampling, andreclamation. Closeout is expected by fall 1995.
Operable Unit PX-6: Ground Water inZone 12 North
An expedited site characterization is to beconducted by the Argonne National Laboratory.Three additional wells for monitoring perchedaquifers and one well for monitoring theOgallala aquifer were proposed. Ground-watermonitoring is also conducted for several otheroperable units that are a potential source ofcontaminants to ground water.
Operable Unit PX-7: Landfills
Preliminary data packages are still beingvalidated. The landfills are expected to befurther investigated to determine levels ofcontamination. The extent of remediation willnot be known until all investigations have beencompleted. It is nonetheless expectedremediation can be completed by the year 2000.
Operable Unit PX-8: Ditches andPlayas
Three of the six water flow systems in thisoperable unit require additional surface andsubsurface sampling. Two of the six requireadditional sampling of surface areas only. Thesixth flow system requires the drilling of
additional subsurface monitoring wells. Thislast activity will become part of the Zone 12ground-water assessment, scheduled forsummer 1997.
Operable Unit PX-9: Firing Sites
Soil investigations for the firing sites arescheduled for Spring 1995. They will befollowed by surveying and recovering visibledepleted uranium from surface and nearsurface soils. Any depleted uranium will besent to the Nevada Test Site for disposal. Acloseout of this operable unit is expected bysummer 1997.
Operable Unit PX-10: LeakingUnderground Storage Tanks atBuildings 12-35 and 16-1
Further investigation of potential sources oftrichloroethylene is recommended, but it will beconducted under Operable Unit PX-12. On thebasis of the RCRA Facility Investigation,corrective action is not recommended for thesite of the underground storage tank at building16-1. Additional field work is required tofurther characterize the site of the undergroundstorage tank at building 12-35.
Operable Unit PX-11: MiscellaneousSites with Explosives and RadioactiveMaterials
Soil investigations are in process and avoluntary corrective action is planned. It willcombine in situ bioremediation, soil removal,and offsite disposal. The project is expected tobe closed out in the summer of 1997.
Operable Unit PX-12: MiscellaneousChemical Spills and Releases
No further action will be recommended for 8 ofthe 17 sites and voluntary corrective action isrecommended for the remaining 9 sites. A one-
TX 6

year treatability study is planned to study theground water at Operable Unit PX-15, theHypalon Pond. The project is scheduled forcompletion in Spring 1998.
Operable Unit PX-13: SupplementalVerification Sites
No further action was recommended for 7 of 8supplemental verification sites. Site 8 in Zone10, an abandoned landfill, is included in theRCRA Facility Investigation for Operable UnitPX-7 landfill because of its proximity to thesanitary landfills. Decisions of no further actionare being pursued for spring 1996.
Operable Unit PX-14: UndergroundStorage Tanks at Other Locations
No further action was recommended for allsites in this operable unit except forunderground storage tank 9 that requiresfieldwork. Six additional borings will be drilledto determine the extent of contamination bypetroleum hydrocarbons. A treatability studywill be conducted at the site of this
underground tank. Ground-water monitoringwill be conducted under Operable Unit PX-12.Additional investigations are underway toinclude bioventing operations. Closeout isexpected by summer 1996.
Waste from EnvironmentalRestorationThe assessment activities at 12 of 14 operableunits have resulted in the determination that 97percent of the waste material generated isnonhazardous. In situ remediation will be theprimary technology used for remediation of thehazardous waste. As a result, this waste willnot be sent to waste management for treatmentand disposal.
Pantex has implemented strategies to reducethe amount of waste generated duringinvestigations, as well as the amount of wastehandled, treated, or disposed of during sitecleanups. A key point of this strategy isminimizing the amount of waste generated
Environmental Restoration Activity Costs
Five-Year Averages (Thousands of Constant 1995 Dollars)*
FY 1995 - 2000 2005 2010 2015 2020 2025 2030 life Cyde*
Environmental RestorationAssessment 5,488 0 0 0 0 0 0 32,930Remedial Actions 5,641 872 0 38,210
Facility DecommissioningFacility Decommissioning 0 0 0 10,949 2,737 0 0 68,432
Teal 11,130 872 0 10,949 2,737 0 0 139,572
• Costs reflect a five-year average in constant 1995 dollars, except in FY 1995-2000, which is a six-year average.
Total Life Cycle is the sum of annual costs in constant 1995 dollars.
TX 7

during remedial feasibility investigations byusing sonic drilling, geophysical and soil gassurvey techniques, and other types of surveysthat generate minimal waste.
WASTE MANAGEMENT
Pantex operations generate various types ofwaste. The waste produced by the assemblyand dismantlement of weapons includes highexplosives and solvents. These operations alsoproduce radioactive process water, debriscontaminated with radioactive materials, liquidand solid low-level waste, low-level mixedwaste, hazardous waste, sanitary waste, heavymetals, and solvents. Waste is also produced byvarious support operations, such as thechemistry laboratories, maintenance, and thevehicle fleet.
Pantex does not currently generate any high-level radioactive waste or transuranic waste.
Four drums of transuranic waste generatedfrom an isolated event are being stored at theplant and will be sent to another DOE site forstorage until they can be shipped to the WasteIsolation Pilot Plant for disposal.
In 1993, the quantities of waste managed atPantex were 130 cubic meters of low-levelradioactive waste; 37.5 cubic meters of low-level mixed waste; 1615.26 metric tons ofhazardous waste regulated by RCRA, the Stateof Texas, or the Toxic Substances Control Act;and 304 metric tons of sanitary waste. In thefuture, the volume of operations-generatedwaste is expected to decrease due to wasteminimization efforts and reduceddismantlement levels.
Waste Treatment
For low-level mixed waste, Pantex hasdeveloped a site treatment plan, as required bythe Federal Facility Compliance Act. The plan
Waste Management Activity Costs
Five-Year Averages (Thousands of Constant 1995 Dollars)*
FY 1995-2000 2005 2010 2015 2020 2025 2030
TreatmentLow-Level Mixed Waste 1,456 1,466 1,466 1,477 1,512 1,470 1,286
Low-Level Waste 4,547 4,579 4,579 4,579 4,579 4,579 3,774
Hazardous Waste 6,280 6,327 7,654 6,325 6,325 6,325 5,060
Sanitary Waste 140 141 141 141 141 141 113
Total 12,422 12,514 13,840 12,522 12,557 12,515 10,233
2035 2040 2045 2050 2055 2060 2065 Life Cycle**
TreatmentLow-Level Mixed Waste 454 0 0 0 0 0 0 54,394
Low-Level Waste 443 0 0 0 0 0 162,852
Hazardous Waste 0 0 0 0 0 0 227,754
Sanitary Waste 0 0 0 0 0 0 4,920
Total 897 0 0 0 0 0 0 449,920
• Costs reflect a five-year average in constant 1995 dollars, except in FY 1995-2000, which is a six-year average.
• Total Life Cycle is the sum of annual costs in constant 1995 dollars.
TX 8

calls for the development and use of (1) existingonsite facilities, (2) commercial treatment, and(3) onsite treatment using mobile treatmentunits. The engineering and fabrication of themobile treatment units will start in FY 1996.Validation and startup will occur in FY 1998,with regular treatment operations beginning inFY 2000. Mobile treatment units are expected torequire upgrading every 12 years (in FY 2010and FY 2022).
A proposed Hazardous Waste Treatment andProcessing Facility is designed for low-levelwaste, mixed waste, and hazardous waste. Itwill also accommodate the mobile treatmentunits. Construction is anticipated to becompleted in FY 1999, with processingbeginning in FY 2000.
Waste contaminated with high explosives istreated at the Pantex Plant burning grounds.Burning ground ash is packaged and disposedof offsite. At present, the burning grounds arebeing upgraded, with completion expected inFY 1997. Alternatives to burning, such as basehydrolysis and molten-salt extraction, are beingexplored.
Treatment for low-level radioactive wasteconsists of stabilization and solidification tomeet the acceptance criteria for the Nevada TestSite. Low-level waste is shipped to Nevada TestSite for disposal.
Waste Storage
A RCRA hazardous waste staging facility hasbeen designed and is planned for completion inFY 1996. This facility will provide storage for1,600 drums of hazardous, mixed, and low-levelradioactive waste. The staging facility willrequire upgrading in FY 2026.
Waste Disposal
For the near future, two quarterly shipments oflow-level waste will be shipped to the NevadaTest Site annually. Hazardous waste is shippedmonthly and one shipment of low-level mixedwaste was made in FY 1994.
NUCLEAR MATERIAL AND
FACILITY STABILIZATION
The facility stabilization and maintenanceprocess began at Pantex in 1995. All eightPantex facilities have begun stabilization. Someof these facilities include a chlorinationbuilding, a digester, explosives machining,synthesis buildings, and an electricalsubstation. It is assumed for the purposes ofthis report that the remaining facility (a sewagetank) will begin the stabilization process in1996. This report assumes the stabilization andmaintenance process at Pantex will becompleted by 2015.
Nuclear Material and Facility Stabilization Cost Estimate
Five-Year Averages (Thousands of Constant 1995 Dollars)`
FY 1995 - 2000 2005 2010 2015 2020 2025 2030 Life Cycle*"
Nuclear Material and Facility Stabilization 2,609 2,615 6,547 109 0 0 0 62,007
• Costs reflect a five-year average in constant 1995 dollars, except in FY 1995-2000, which is a six-year average.
Total Life Cycle is the sum of annual costs in constant 1995 dollars.
TX 9

LANDLORD FUNCTIONS
The Department's Office of Defense Programsis the landlord at Pantex and is responsible forassociated costs and activities.
PROGRAM MANAGEMENT
Pantex has no separate funding for programmanagement. All program management activitiesare performed within the budgets for wastemanagement and environmental restorationactivities. This estimate employed a factor basedon current and anticipated program needs tocreate an independent cost category. For FY1995-FY 2000, program management activities at the
site consume approximately 20 percent of the totalbudget. Program management activities induded inthe budget for the Environmental Managementprogram consist of general program management,quality assurance, waste minimization, publicparticipation, and activities related to theenvironment, safety, and health.
FUNDING AND COST
INFORMATION
The following tables present fundinginformation and major activity milestones forPantex.
Program Management Cost Estimates
Five-Year Averages (Thousands of Constant 1995 Dollars)•FY 1995-2000 2005 2010 2015 2020 2025 2030
Program Management 4,118 3,544 3,460 5,211 3,659 3,129 2,558
2035 2040 2045 2050 2055 2060 2065 Life Cycle*
Program Management 224 0 0 0 0 133,637
° Costs reflect a five-year average in constant 1995 dollars, except in FY 1995-2000, which is a six-year average.
Total Life Cycle is the sum of annual costs in constant 1995 dollars.
TX 10

Defense Funding Estimate
Five-Year Averages (Thousands of Constant 1995 Dollars)*
FY 1995-2000 2005 2010 2015 2020 2025 2030
Environmental Restoration 11,130 872 0 0 0 0 0
Waste Management 12,422 12,514 13,840 12,522 12,557 12,515 10,233
Nuclear Material and Facility Stabilization 2,609 2,615 6,446 0 0 0 0
Program Management 4,118 3,544 3,460 5,211 3,659 3,129 2,558
Total 31,901 19,545 23,746 17,733 16,216 15,644 12,791
2035 2040 2045 2050 2055 2060 2065 life Cyde
Environmental Restoration 0 0 0 0 0 0 0 71,140
Waste Management 897 0 0 0 0 0 0 449,920
Nuclear Material and Facility Stabilization 0 0 0 0 0 0 0 60,957
Program Management 224 0 0 0 0 0 0 133,637
Total 1,121 0 0 0 0 0 0 715,654
• Costs reflect a five-year average in constant 1995 dollars, except in FY 1995-2000, which is a six-year average.
• Total Life Cycle is the sum of annual costs in constant 1995 dollars.
Nondefense Funding Estimate
Five-Year Averages (Thousands of Constant 1995 Dollars)*
FY 1995-2000 2005 2010 2015 2020 2025 2030 Life Cyde
Environmental Restoration 0 0 0 10,949 2,737 0 0 68,432
Nuclear Material and Facility Stabilization 0 0 101 109 0 0 0 1,050
Total 0 0 101 11,058 2,737 0 0 69,482
• Costs reflect a five-year average in constant 1995 dollars, except in FY 1995-2000, which is a six-year average.
• Total Life Cycle is the sum of annual costs in constant 1995 dollars.
TX 11

Major Activity MilestonesACTIVITY TASK COMPLETION DATE
Environmental Restoration:
Misc Chem Spills and Release Sites
Landfills
Fire Training Area Burn Pits
Firing Sites
Former Cooling Tower
Misc HE/Rad
Hypalon Pond
Ditches and Playas
High Priority Potential Release Sites
OSTP Sludge Beds
Supplemental Verification Sites
Leaking USTs at Bldgs 12-35 and 16-1
Underground Storage Tanks at Other Locations
Zone 12 Ground Water
Burning Grounds
Fiscal Year
Permit Modification Based on No Further Action/Voluntary Corrective Action
Complete Corrective measures construction
Permit Modification Based on No Further Action/Voluntary Corrective Action
Permit Modification Based on No Further Action/Voluntary Corrective Action
Permit Modification Based on No Further Action
Permit Modification Based on No Further Action/Voluntary Corrective Action
Permit Modification Based on No Further Action
Permit Modification Based on No Further Action/Voluntary Corrective Action
Permit Modification Based on No Further Action/Voluntary Corrective Action
Permit Modification Based on No Further Action
Permit Modification Based on No Further Action
Permit Modification Based on No Further Action
Permit Modification Based on No Further Action/Voluntary Corrective Action
Complete corrective measures
Permit modification based on No Further Action
1998
1998
1995
1997
1995
1997
1995
1997
1996
1995
1996
1995
1996
1999
1996
Waste Management:
Proposed Site Treatment Plan
Hazardous Waste Treatment & ProcessingFacility
Mobile Treatment Units
Hazardous Waste Staging Facility
All Waste Management Activities
Fiscal Year
Submit to State of Texas
Complete Construction
Final Design (Title II) Complete
Complete Construction
Complete
1995
1999
1996
1996
2030
For further information on this site, please contact: Public Participation OfficePublic Affairs OfficeTechnical Liaison: Dan Ferguson
(505) 845-5951(806) 477-3120(806) 477-3126
TX 12

t.VA„'VV
SALT LAKE CITY(COM P LET EDUMTRA S IT E)*
GREEN RIVER(COMPLETED UMTRA S IT E)*
MONT !CELLO M ILLS IT E ANDVICINITY PROPERTIES
MEXICAN HAT(COMPLETED UMTRA S IT E)*
* Summaries are not provided for facilities withcompleted remedial actions. Any ongoingsurveillance and monitoring costs for thesefacilities are provided in the table below.
UTAH
Estimated State Total
(Thousands of Current 1995 Dollars)•
1995i11990 1997 199Monticello MillsiteCompleted UMTRA Surveillance 8 Monitoring
Total • Utah
• Costs for FY 1995 reflect Congressional Appropriation, costs for FY 1996 reflect EM budget submission, costs for FY 1997-2000 reflect Budget Shortfall Scenario, costs for
shaded area assume 3% annual inflation.
Five-Year Averages (Thousands of Constant 1995 Dollars)**
FY 1995-2000 2005 2010 2015 2020 2025 2030 Life Cydem
Monticello White 22,525 0 0 0 0 0 0 135,148
Completed UMTRA Surveillance 8 Monitoring 1,035 820 0 0 0 0 0 10,314
Total • Utah 23,560 820 0 0 0 0 0 145,462
** Costs reflect a five-year average in constant 1995 dollars, except in FY 1995 - 2000, which is a six-year average.
*** Total Life Cycle is the sum of annual costs in constant 1995 dollars.
UT 1

MONTICELLO PROJECTS
. . . ...... . . •
•• • ••..• - • • • • • • • • • • - • ............. .......................................• • • • • •• • • • • • .........••••.•••••••••••
.fr7"7 ••J "•.... • ••• ........
IOUs II•
•••••••••••••••••••
Z
Of• .';• • • • • • ',a • • .• .• .• .•• • • • • • •
• • • • • • •••
.• .• .• .•• • •••
•
T. 33 S.
T. 34 I.
A. 13 T.. O. P C.
DE
LUNN°
0.411101T VIP 11101111fSOUNONOC1
101M WOO= WIT 11114.911
WITS away 111411 ANO1401110111.0 14.110110141.room=
30001 VW
NOM
MOWN O 0101ASUL MI IT IS 0101101101 10O10= 01C MUM NO 0011110110011 01010104111111MID WHIM NOM 1110.14016 110 4101/1171.11 CES01FIDOOPIA14 10 APPIIKVIMATC 11111 0010101
14401311
OF 10101211114 MIX NO W01 011101 0001.10110L
33S.T. T. 34 S.
UT 2

MONTICELLO PROJECTS
Monticello Projects consist of the Monticello Mill Tailings Site and the Monticello Vicinity Proper-ties Site. The Monticello Mill Tailings Site is composed of three operable units: the mill site, a 110-acre acre tract located along Montezuma Creek, south of the City of Monticello, San Juan County,Utah; 23 peripheral properties located north and south of the mill site; and the surface and groundwater located beneath the tailings piles. The Monticello Vicinity Properties Site encompasses 411vicinity properties located outside the boundary of the Monticello Mill Tailings Site.
Estimated Site Total
Environmental RestorationProgram Management
Total
(Thousands of Current 1995 Dollars)*
,70t. 700 9,480
• Costs for FY 1995 reflect Congressional Appropriation, costs for FY 1996 reflect EM budget submission, costs for FY 1997-2000 reflect Budget Shortfall Scenario, costs for
shaded area assume 3% annual inflation.
Five-Year Averages (Thousands of Constant 1995 Dollars)**
FY 1995-2000 2005 2010 2015 2020 2025 2030 Life Cycle***
Environmental Restoration 22,275 0 0 0 0 0 0 133,650
Program Management 250 0 0 0 0 0 0 1,497
Total 22,525 0 0 0 0 0 0 135,148
▪ Costs reflect a five-year average in constant 1995 dollars, except in FY 1995 - 2000, which is a six-year average.
*** Total Life Cycle is the sum of annual costs in constant 1995 dollars.
PAST, PRESENT, AND
FUTURE MISSIONS
The mill was constructed in 1942 by theVanadium Corporation of America with fundsfrom the Defense Plant Corporation. The millproduced vanadium and a uranium-vanadiumsludge for the Manhattan Project.
The Atomic Energy Commission bought the sitein 1948. Uranium milling, the processing ofuranium ore, commenced September 15, 1949,
and continued until January 1, 1960, when themill was permanently closed. Residues fromuranium milling, known as mill tailings, wereleft in place at the millsite. The tailings piles atthe millsite were stabilized and covered withsoil in 1961 to limit their dispersal or use. Partof the land was transferred for a period of timeto the Bureau of Land Management, butotherwise the site remained under the control ofthe Atomic Energy Commission and now theDepartment of Energy (DOE).
UT 3

The mission of the Monticello Projects is toensure that the environmental impactsassociated with past activities at the site areidentified and investigated and thatappropriate action is taken to protect publichealth and welfare and the environment. TheGrand Junction Projects Office is responsible forremediation of the Monticello Projects. Theprojects will be considered complete when allsites have been remediated to the extentspecified in an agreement entered into by DOE,EPA, and the State of Utah under the FederalFacility Agreement and when waste generatedin the remediation has been safely disposed.
Environmental Management will retainresponsibility for surveillance and monitoringat all of the remediated areas as long asnecessary to ensure adequate protection ofhuman health and the environment. Future useof the existing Monticello millsite, followingcleanup, has yet to be determined. TheMonticello Site-Specific Advisory Board, alongwith other State, county, and city organizations,will participate in the analysis and decision offuture land uses for the property during FY1995.
ENVIRONMENTAL
RESTORATION
Uranium mill tailings and by-product materialsproduced during uranium millingcontaminated the millsite, peripheral propertiesand surface and ground water. Contaminationalso occurred in the City of Monticello fromwindblown materials and from the use of milltailings as construction and fill materials.Although the process of milling recovers about93 percent of the uranium, the tailings thatremain contain several radioactive elements,including uranium, thorium, radium,polonium, and radon. The total volume oftailings, process related contaminated material,and tailings contaminated soil is estimated at 3million cubic yards.
The remedial action project for the MonticelloMill Tailings Site has been divided into threeoperable units to differentiate between theaffected tracts of land or the kinds ofcontamination. The selected remedial action forthe project is established in the record ofdecision for the Monticello Mill Tailings Site.
Environmental Restoration Activity Costs
Five-Year Averages (Thousands of Constant 1995 Dollars) *FY 1995 - 2000 2005 2010 2015 2020 2025 2030 Life Cyde**
Environmental Restoration 22,275 0 0 0 0 0 0 133,650
* Costs reflect a five-year average in constant 1995 dollars, except in FY 1995-2000, which is a six-year average.Total Life Cycle is the sum of annual costs in constant 1995 dollars.
UT 4

Operable Unit I: Mill Tailings
and Millsite Property
Operable Unit I includes the 78 acres of the
original millsite. This land now houses the
impoundments that contain the original mill
tailings, the tailings removed from the
Monticello peripheral properties (Operable Unit
II), and the tailings removed from the
Monticello vicinity properties. The tailings
piles are within the flood plain of Montezuma
Creek. They are also partially in contact with a
shallow alluvial aquifer underlying the site.
The volume of contaminated material in the
mill area is estimated at 100,000 cubic yards,
and the volume of tailings, contaminated soil,
by-product material, and contaminatedbuilding material in the tailings impoundments
is estimated at approximately 1.4 million cubic
yards (2 million tons).
For Operable Unit I, the selected remedial
action is excavating the tailings at the millsite
and hauling them, together with any other
contaminated material, to a permanent
repository south of the millsite. The repository
is designed to permanently contain the
estimated 2.6 million cubic yards of uranium/
vanadium mill tailings that will be excavated
from the millsite and other properties in the
vicinity of Monticello, Utah. The repository
will be lined with a combination of synthetic
and natural liner materials to achievecompliance with minimum technologicalrequirements established in the ResourceConservation and Recovery Act (RCRA) for
containment of hazardous wastes in a landfill.
After the placement of the tailings, the
repository will be sealed with a water balance
cover consisting of revegetated soil and a
capillary break over a 60 millimeter thick
polyethylene cover liner. Beneath thepolyethylene layer will be an additional soil
barrier to control radon emissions.
The millsite will be remediated to the standards
specified in 40 CFR 192, Subpart A, for radium-
226. For locations in which contamination is
much higher than in the surrounding areas,
cleanup will be based on the "hot-spot" criteria
established for remedial actions at "formerly
utilized sites" (i.e., sites used in the early stages
of the nuclear weapons program). Standards
for thorium, uranium, and heavy metals will be
established through a risk assessment.Remediation for this operable unit is scheduled
to be completed in FY 2000.
Operable Unit II: PeripheralProperties
The Monticello peripheral properties include
DOE-owned and private land to the north and
south of the old millsite land that had been
leased for the stockpiling of ore and adjoining
areas where contaminants were deposited by
wind or surface water. A total of 25 properties
covering approximately 300 acres around the
site contain most of the estimated 300,000 cubic
yards of peripheral property material requiring
remediation. The peripheral properties also
include the streambed and banks of a 3.3 mile
length of Montezuma Creek extending from the
millsite to the confluence of Montezuma and
Vega Creeks.
The selected remedy for Operable Unit II is to
remove contaminated tailings and to haul them
to the tailings repository to be constructed
south of the old millsite. For areas where
tailings exist in and along the banks ofMontezuma Creek, the cleanup will be based
on the standards in 40 CFR 192, Subpart A, for
radium-226 and the "hot-spot" criteriaestablished for formerly utilized sites. The
remedial action is scheduled for completion in
FY 2000.
UT 5

Operable Unit III: SurfaceWater and Ground WaterOperable Unit III includes all ground waterbeneath the tailings piles extendingapproximately 2 miles downstream. Thevolume of contaminated water is estimated at163 acre feet (an acre foot is equivalent to325,853 gallons). At present, this alluvialaquifer is not used as a private or publicdrinking water source and is separated from thedeeper Burro Canyon aquifer by a rockformation known as the Dakota Sandstone. TheBurro Canyon aquifer, which is being used fordrinking water, has not been contaminated.
The surface water included in Unit III consistsof Montezuma Creek, which flows through themillsite. Montezuma Creek is a small perennialstream with headwaters in the AbajoMountains immediately west of Monticello.
Operable Unit III may include the remediationof peripheral properties in the canyon ofMontezuma Creek. Cleanup standards, ifrequired for the remediation of metals(including thorium and uranium) will bedeveloped through a risk assessment. Thisadditional remediation may be necessary toensure the elimination of surface and groundwater contamination in Montezuma Creek andthe associated alluvial aquifer.
The remedial action for Operable Unit III hasnot yet been selected. The draft record ofdecision for the selected remediation ofMonticello Surface and Ground-water RemedialAction Project is currently planned for FY 2000.The standards for cleanup will be based onanalyses of costs and benefits applied to thepotential impacts of ground-watercontamination.
Monticello Vicinity PropertiesThe objective of the Monticello VicinityProperties Project is to remediate the businessand residential properties in the City ofMonticello that are contaminated bywindblown materials and by the use of milltailings as construction and fill materials. Thevicinity properties are included in the EPA'sNational Priorities List.
The selected remedy for vicinity properties is toremove the tailings and to haul them to theMonticello millsite for disposal with the millsitetailings. This remedy will be applied to anestimated 411 vicinity properties. The cleanupwill be based on the standards in 40 CFR 192,Subpart A, for radium-226. For areas wheretailings were deposited by wind, the "hot-spot"criteria established for formerly utilized siteswill be used. Remediation of the Monticellovicinity properties is scheduled for completionin FY 1997.
WASTE MANAGEMENT
Waste management for the Monticello project islimited to the disposal of the uranium milltailings and other contaminants that will beexcavated from the various operable units. Thecosts for these activities and the repository inwhich the tailings will be stabilized areincluded in the estimated costs forenvironmental restoration.
NUCLEAR MATERIAL ANDFACILITY STABILIZATION
There are no nuclear material and facilitystabilization activities currently beingconducted at this site.
UT 6

LANDLORD FUNCTIONS
Landlord activities for this site are managed out
of the Grand Junction Projects Office. Please
see this Colorado site summary for additional
information.
PROGRAM MANAGEMENT
The Monticello Project has no separate funding
for program management. All programmanagement activities are performed within
the environmental restoration activities. For the
purposes of this report, 17 percent of theenvironmental restoration funding is allocated
for the following program management
activities. The necessary program management
activities are included in the budget forenvironmental restoration activities shown in
the Program Management Cost Estimate table.
Monthly city, county, and regulatory agency
information and discussion meetings and Site-
Specific Advisory Board meetings form the core
of Grand Junction Project Office stakeholder
and public participation activities. Additionally,
ongoing communication and interaction is
maintained with the communities in which the
Grand Junction Project Office is managingenvironmental restoration programs through a
Speakers Bureau, site tours, educationaloutreach programs, concentrating on thesciences and environmental topics, and the
issuance of regular press releases to update
project progress and future work schedules.
FUNDING AND COST
INFORMATION
The following tables present fundinginformation and major activity milestones for
Monticello.
Program Management Cost Estimate
Program Management
Five-Year Averages (Thousands of Constant 1995 Dollars)'
FY 1995 - 2000
250
2005 2010
0 0
2015 2020
0
2025 2030
0 0
Life Cycle"
1,497
• Costs reflect a five-year average in constant 1995 dollars, except in FY 1995-2000, which is a six-year average.
• Total Life Cycle is the sum of annual costs in constant 1995 dollars.
UT 7

Defense Funding Estimate
Five-Year Averages (Thousands of Constant 1995 Dollars)*FY 1995 - 2000 2005 2010 2015 2020 2025 2030 Life Cycle**
Program Management 250 0 0 0 0 0 0 1,497
• Costs reflect a five-year average in constant 1995 dollars, except in FY 1995-2000, which is a six-year average.▪ Total Life Cycle is the sum of annual costs in constant 1995 dollars.
Nondefense Funding Estimate
Five-Year Averages (Thousands of Constant 1995 Dollars)*FY 1995 - 2000 2005 2010 2015 2020 2025 2030 Life Cycle*
Environmental Restoration 22,275 0 0 0 0 0 0 133,650
• Costs reflect a five-year average in constant 1995 dollars, except in FY 1995-2000, which is a six-year average.• Total Life Cycle is the sum of annual costs in constant 1995 dollars.
Major Activity MilestonesACTIVITY TASK COMPLETION DATE
Environmental Restoration Fiscal Year
Monticello Remedial Action Project Complete Site Remediation & Reconstruction FY 2000Monticello Vicinity Properties Complete Remedial Action FY 1997Monticello Surface and Ground Water Issue Draft Record of Decision FY 2000
For further information on this site, please contact: Public Participation Office
Public Affairs Office
Technical Liaison: Marilyn Bange
(505) 845-5951
(505) 845-6202
(505) 845-5150
UT 8

Washington
HANFORD SITE
WASHINGTON
Estimated State Total
Hanford
(Thousands of Current 1995 Dollars)*
FT 1995 19961,440,522 1,353,417
19971,926,300
19982,190,000
19992,423,400
2000 2, 340 600
• Costs for FY 1995 reflect Congressional Appropriation, costs for FY 1996 reflect EM budget submission, costs for FY 1997-2000 reflect
Budget Shortfall Scenario, costs for
shaded area assume 3% annual inflation.
Five-Year Averages (Thousands of Constant 1995 Dollars)**
FT 1995 - 2000 2005 2010 2015 2020 2025 2030
Hanford 1,791,097 1,920,824 1,741,852 1,608,698 1,431,569 1,636,315 1,498,239
2035 2040 2045 2050 2055 2060 2065 Life Cycle"'
Hanford 1,179,364 901,380 387,388 95,923 36,906 22,240 0 73,050,072
** Costs reflect a five-year average in constant 1995 dollars, except in FY 1995 - 2000, which is a six-year average.
Total Life Cycle is the sum of annual costs in constant 1995 dollars.
WA 1

$5 B rt e • ',Irk■ flm ental ep
WA 2

Washington
HANFORD SITE
The Hanford Site occupies approximately 560 square miles of arid steppe in the southeastern part of
the State of Washington. The site is in an isolated, sparsely populated location near the Columbia
River forming its eastern boundary. The nearest communities are Richland, at the southern border
of the site; Kennewick, 15 miles to the southeast; and Pasco, 11 miles to the southeast. The Hanford
Site consists of five operating areas.
The selection criteria for the site called for a large remote tract of land with room for a manufactur-
ing area measuring at least 12 by 16 miles, space for laboratories at least 8 miles from the nearest
reactor or processing plant, and abundant supplies of water and electricity. Hence, production
reactors were located along the Columbia River (the 100 Area); chemical processing plants and
associated facilities (e.g., waste tanks) were located on a plateau near the center of the Site (the 200
Area); and fuel fabricationbuildings, laboratories, and other support facilities were located near the
site's southern boundary (the 300 Area). In 1967, part of the Hanford Site was designated an Arid
Land Ecology Reserve by the Atomic Energy Commission.
PriestRapidsDam
Hanford SiteBoundary
North Slope Area
•
ProductionReactorAreas
ChemicalProcessing
Area
RPHigh-levelWasteTanks
Arid LandsEcology Reserve
Kilometers
o 4 8 12
0 2 4 6 8
Miles
Gablemountain
Old HanfordTownsite
CivilianPower
Reactors
eFast Flux Test
Facility
R&D Area
Benton City
Ri
anced NuclearFuels
RichlandPumphouse
Pasco
Kennewick
WA3

ent Man Report
Estimated Site Total
(Thousands of Current 1995 Dollars)*
FY 1995 1996 1997 1998 1999 2000Environmental Restoration 140,522 121,000 161,300 164,300 167,600 170,600Waste Management 979,000 916,000 1,312,000 1,603,000 1,834,000 1,772,000Nuclear Material and Facility Stabilization 186,000 187,000 211,000 171,700 174,800 153,000Directly Appropriated Landlord 46,000 28800 121,000 129,000 120,000 115,000Program Management 89,000 100,617 121,000 122,000 127,000 130,000
Total 1,440,522 1,353,417 1,926,300 2,190,000 2,423,400 2,340,600
• Costs for FY 1995 reflect Congressional Appropriation, costs for FY 1996 reflect EM budget submission, costs for FY 1997-2000 reflect Budget Shortfall Scenario, costs forshaded area assume 3% annual inflation.
Five-Year Averages (Thousands of Constant 1995 Dollars)**
FY 1995-2000 2005 2010 2015 2020 2025 2030Environmental Restoration 142,745 150,037 162,694 174,817 170,141 157,446 179,463Waste Management 1,288,334 1,131,376 971,716 922,448 788,683 969,374 851,219Nuclear Material and Facility Stabilization 168,476 85,483 99,719 19,087 19,790 3,548 158Directly Appropriated Landlord 85,314 109,467 109,467 109,467 109,467 109,467 109,467Program Management 106,227 444,461 398,256 382,879 343,488 396,480 357,932
Total 1,791,097 1,920,824 1,741,852 1,608,698 1,431,569 1,636,315 1,498,239
2035 2040 2045 2050 2055 2060 2065 life Cycle**Environmental Restoration 237,541 251,809 206,599 18,349 13,306 7,400 0 9,504,410Waste Management 697,966 464,165 89,140 30,827 0 0 0 42,314,577Nuclear Material and Facility Stabilization 0 0 0 0 0 0 0 2,149,786Directly Appropriated Landlord 18,588 18,588 18,588 18,593 18,600 12,840 0 4,324,881Program Management 225,269 166,818 73,062 28,154 5,000 2,000 0 14,756,358Total 1,179,364 901,380 387,388 95,923 36,906 22,240 0 73,050,072
Costs reflect a five-year average in constant 1995 dollars, except in FY 1995 - 2000, which is a six-year average.*** Total Life Cycle is the sum of Annual costs in constant 1995 dollars.
WA 4

Washington
PAST, PRESENT, AND
FUTURE MISSIONS
In January 1943, the U.S. Government selected
the Columbia Basin as the location for the
Nation's first full-sized plutonium production
operations. Immediately after the site was
acquired, the Government began building 3
reactors, 3 chemical processing plants (forrecovering plutonium from irradiated fuel), and
64 underground waste storage tanks. Alaboratory was built to support the fabrication
of reactor fuel fabrication and other production
activities. The plutonium produced at Hanford
was used in the world's first nuclear weapons.
A major expansion program was started in the
late 1940's to increase the Nation's plutonium
production. From 1947 to 1955, some 15,000
workers built 5 additional plutoniumproduction reactors, 2 additional chemicalprocessing plants, 1 plutonium finishing plant,
and 81 additional underground waste storage
tanks. A ninth reactor, the N-Reactor, was built
between 1959 and 1963. Unlike the preceding
eight reactors, whose sole purpose wasproducing plutonium, the N-Reactor alsoproduced steam for the generation of electricity.
In the 1960's, though the main missionremained the same, Hanford's activities saw
dramatic changes. Plutonium production was
sharply curtailed. By 1971, eight of the nine
production reactors had been shut down. By
1972, all related chemical processing facilities,including the Plutonium-Uranium Extraction
Plant, had ceased operation. The Plutonium-
Uranium Extraction Plant and the Uranium
Oxide Plant were restarted for a briefproduction period in the early 1980's, but the
plants are now permanently shut down. With
these developments, Hanford's resources and
capabilities were redirected toward nonmilitary
applications of nuclear energy; solar,geothermal, and fossil energy; and energyconservation. During this period, a full-sized
advanced test reactor, the Fast Flux Test Facility,
and the Fuels and Materials ExaminationFacility were added in the 400 Area for large-
scale nuclear fuels testing in support of nuclear
energy research.
Plutonium production at Hanford ended in
1989. Although energy-related research will
continue at the site for the Department of
Energy (DOE) Office of Energy Research, the
primary mission now and for the foreseeable
future is environmental management. Thelandlord at the Hanford Site is EnvironmentalManagement.
ENVIRONMENTAL
RESTORATION
Environmental Contamination
Early Hanford planners thought waste cleanup
would start in the peaceful years expectedimmediately after World War II. Whatfollowed, however, was the Cold War and an
arms race continuing for decades. Plutoniumproduction was always the top priority, and not
until the late 1980's did environmentalmanagement finally receive seriousconsideration. As a result, radioactive andchemically hazardous waste has beenaccumulating at Hanford since 1943. Itaccounts for approximately two-thirds of all the
nuclear waste, by volume, in the DOE complex.
Environmental contamination, that is, thepresence in soil or ground water of radioactive
materials or hazardous chemicals aboveestablished limits, is present in most areas of
the Hanford Site. It is not within well defined
boundaries and is generally the result of past
liquid waste discharges. Depending on the
location, the primary contaminants are tritium,
carbon tetrachloride, chromium, nitrates,
cobalt, strontium, cesium, technetium, iodine,plutonium, and uranium. The total estimated
volumes of contaminated soil and ground
WA 5

The 1 91 15 13 41 11 4, 1 i 4, 1E 11 II i 41 11 111 4, 11 't al a 11 41 10 22 22 ie por
water are very large, about 64 million cubicmeters and 2.7 billion cubic meters,respectively. The site-wide ground-waterplume containing tritium, iodine, and nitratescomprises the largest part of the estimatedvolume, 2.7 billion cubic meters.
Tritium, the most common radioactivecontaminant in the soil and the ground water atHanford, is concentrated in places, especiallynear reactor sites and chemical processingareas. It moves freely, but the amountsreaching the Columbia River become so dilutedthey are no longer hazardous. Tritium levels inthe Columbia River are comparable to those
occurring naturally in Oregon and westernWashington. And since tritium's radioactivehalf-life is about 12 years, its radioactivity hasalready diminished significantly and willvirtually disappear in approximately 100 years.Nitrates, from chemical processing, are the mostcommon chemical contaminant. They areusually found in combination with otherchemicals.
In October 1989, the Hanford Site was placedon the National Priorities List under theComprehensive Environmental Response,Compensation and Liability Act (CERCLA).
Environmental Restoration Projects
Five-Year Averages (Thousands of Constant 1995 Dollars)*FY 1995-2000 2005 2010 2015 2020 2025 2030
100 Area1100 Area200 Area - Fast200 Area - West300 AreaEnvironmental Restoration Disposal Facility (EROF)Fodlity DecommissioningLong-Term Surveillance and MonitoringSite-Wide Activities
30,9671,0332,8497,82513,51426,36551,637
1638,390
100,1310
8,30510,23626,851
2274,287
120,0930
010,23627,851
2274,287
120,4490000
12,23637,618
2274,287
108,4360000
12,23644,955
2274,287
65,0610
43,37400
10,23634,260
2274,287
00
43,37465,06223,85610,23632,421
2274,287
Total 142,745 150,037 162,694 174,817 170,141 157,446 179,463
2035 2040 2045 2050 2055 2060 2065 Life Cycle.*100 Area1100 Area200 Area - East200 Area - West300 AreaEnvironmental Restoration Disposal Facility (EROF)Facility DecommissioningLong-Term Surveillance and MonitoringSite-Wide Activities
30,4000
26,02582,41143,37410,23640,581
2274,287
38,0000
97,59247,712
010,23642,911
22715,131
7,6000
71,56813,012
010,23632,266
22771,690
0
0
04,09412,449
911,715
0000
13,30600
000000
7,40000
000000000
3,136,6546,199
1,426,7621,087,933458,762659,287
2,074,15911,647
643,065Total 237,541 251,809 206,599 18,349 13,306 7,400 0 9,504,470
• Costs reflect a five-year average in constant 1995 dollars, except in FY 2000, which is a six-year average.▪ Total Life Cycle is the sum of annual costs in constant 1995 dollars.
WA 6

Washi ton
Hanford's waste is found in at least 1,391locations across the site. Of these, about 10percent contain radioactive waste, about 10percent contain chemically hazardous waste, 12
percent contain nonhazardous waste, and 75percent contain mixed radioactive andhazardous waste. These percentages maychange as the site is further assessed. Also,billions of liters of liquids were discharged to
the soil. The full extent of soil contamination is
not known yet, but about 200 square miles ofground water are contaminated. In most cases,however, the contamination does not exceeddrinking-water standards and, hence, is notconsidered to be as serious a problem as otherproblems that Hanford faces.
The chemical processing of irradiated fuelsgenerated the largest portion of Hanford's
waste volumes. The resulting high-levelradioactive waste was an alkaline slurrycontaining heavy metals, organic and inorganic
salts, uranium, plutonium, and mixed fissionproducts. It was piped into underground tanks
for storage. Other waste streams fromprocessing (e.g., cooling water andcondensates) were discharged to the ground.Fuel fabrication and irradiation activitiesproduced large and concentrated volumes of
waste as well.
Approximately 350 million liters of waste werepumped into 149 single-shell tanks between
1944 and 1980.
Sixty-six of the single-shell tanks may have
leaked as much as 3.8 million liters or more of
waste into the nearby soil. Most of the waste
from these tanks has remained trapped in thesurrounding soil. It is not believed these leaks
pose any immediate risk to workers or theenvironment, specifically the ground water.
The reactors and the chemical processing plants
used large amounts of Columbia River water.
Ponds and cribs were commonly used todispose of these liquid waste, which weremostly clean or contained only small amounts
of chemicals or radioactivity. Most of these
contaminants were trapped and are still held bythe soil. The ponds, some of which were aslarge as 80 acres, generally received the cleanestwaste streams, clean enough to meet drinking-water standards. The cribs were undergroundstructures into which radioactive liquideffluents were discharged to allowradionuclides to filter slowly through the soilsabove the ground water. At Hanford, cribswere the most common means for the disposalof slightly radioactive liquid waste. Thispractice was widespread because the site's soilswere thought to filter and trap radioactivematerials, allowing much of the material todecay before reaching the ground water.Unfortunately, not all of the contaminants weretrapped. Large amounts of contaminatedsediments did migrate downward from thecribs, and some contaminants have been foundin the ground water. About 454 million liters oflow-level wastewater was diverted to cribsfrom single-shell tanks for disposal.
Disposal of wastewater resulted in thecontamination of both soil and ground water.The natural direction for ground-water flowgenerally is from west to east, toward theColumbia River. In most cases, however,samples show much of the ground wateroutside this area meets or exceeds drinking-water quality standards.
For several years in the late 1940's and early1950's, some wastewaters were dischargeddirectly into the ground through 11 deep wellsknown as reverse wells. One wasapproximately 90 meters deep and reached theground water. They now contain an estimated
250 cubic meters of contaminated sediments.The 67 french drains at the Hanford Site are amuch shMlower version (about 3 meters deep)
of the reverse wells and function like smallcribs with coarse rock or gravel in the bottom.
WA 7

The 1995 Elese ifse En ironme po
Assumptions About Future Useand Remediation GoalsThe Hanford Site has been divided into sixgeographical areas for cleanup purposes: theHanford reach of the Columbia River; thereactors on the Columbia River (100 Area); theCentral Plateau (200 Area); the 1100 Areaincluding the Arid Land Ecology Reserve; areasnorth of the river (North Slope); and all otherareas (including the 300, 400, and 600 Areas).Remediation alternatives have been defined.They are based on two remediation goals andcleanup scenarios developed by the HanfordFuture Site Uses Working Group.
The two remediation goals are defined asfollows:
• Unrestricted land use: Contamination does notpreclude any human uses. However, access or certainuses may be prohibited for other reasons (i.e., physicalhazards or environmental sensitivity).
• Restricted land use: Access to a particular area islimited because of potential risk. An example is anexcluded area to be used only for the management ordisposal of radioactive and hazardous materials, withcontrol maintained by DOE.
The cleanup scenarios call for all othergeographical areas, except the Central Plateau(200 Area), to be remediated for unrestrictedland use. The Central Plateau would be left forrestricted uses because it is the site for ongoingwaste management activities. Other waste sitesin the 200 Area will be remediated in placethrough the use of barrier technology. Acontinual monitoring program will be in effect.
The areas adjoining the Columbia River wouldbe remediated for unrestricted use. This meansminimizing the amount of chromium andstrontium entering the river and also reducingground-water contamination. Both the Arid
Land Ecology Reserve and the North Slope havealready been remediated for unrestricted landuse. The remediations were completed in FY1994.
Restoration of the 100 AreaThe 100 Area encompasses six reactor areas withnine former production reactors, many inactivesupport structures, and former waste disposalsites. According to the cleanup scenarios, thisarea would be remediated for unrestricted landuse. The environmental remediation will befinished in 2043, with total cleanup (includingthe decommissioning of the reactors and otherstructures) completed by 2032. The estimatedcost represents 40 percent of the totalenvironmental restoration cost at Hanford.
To clean up the 100 Area, 9 reactor buildingsand 148 reactor-related facilities will bedemolished; millions of cubic yards of soil willbe excavated and moved to disposal facilities.
When the reactors are demolished, the reactorblocks (each weighing 10,000 to 20,000 tons) willbe transported roughly 10 to 15 miles to aReactor-Block Disposal Facility on the CentralPlateau. Virtually all contaminated soil will beexcavated and disposed of at the EnvironmentalRestoration Disposal Facility on the CentralPlateau (the 200 Area). Landfills forcontaminated waste (protective clothing, tools,used parts discarded during maintenance, andscrapped equipment) will also be excavated andtransported to a disposal facility on the CentralPlateau. Ground water contaminated throughthe discharge of contaminated reactor coolingwater to seepage pits near each of the reactorswill be pumped from wells and treated. Thetreated water will be returned to the aquifer.
Before demolishing any facilities, the nature andextent of the contamination inside the structuresmust be assessed to protect the health and safetyof the workers, to prevent the further spread ofcontamination to the environment duringdemolition, and to maximize the amount of
WA8

Wash r*tito 11
material to be recycled or discarded incomparatively inexpensive "construction-debris" landfills. Contaminated demolitiondebris will be disposed of in the EnvironmentalRestoration Disposal Facility.
The facilities in the 100 Area to be assessed,decontaminated, and demolished are roughlyequivalent in area to 50 football fields. Sincethese are industrial facilities, there are alsomiles of pipe, conduit, and wire and thousandsof tons of mechanical and electrical equipmentto be removed.
Field investigations to sample and analyzecontaminated soils and waste, preliminaryassessments of environmental risks to identifyhigh priority sites, and engineering evaluationsto determine appropriate remediationtechniques will be completed for mostcontaminated soil and solid waste sites by theend of FY 1995. Field tests to evaluate specificcleanup technologies will also be conducted.They include the excavation of solid waste froma burial ground, the removal and treatment ofchromium-contaminated ground water, and theexcavation and "washing" of soils to reduce thevolume of contaminated soil. These tests will belargely completed by the end of FY 1995 exceptfor soil washing, which will be continued in FY1996.
Records of decision for most high priority sitesare expected by the end of FY 1995. Remedialdesign for the final cleanup of high prioritysites at three reactor areas will begin in late FY1995 and for the other three reactor areas in FY1996. Cleanup will start first at the 100-BCReactor area in late FY 1995. Remediation ofthe soil will be completed in the year 2023.
Restoration of the CentralPlateau
Restoration of the Central Plateau (the 200Area) is planned to be complete by 2047,including decommissioning activities. TheCentral Plateau is the only geographical area at
Hanford not to be remediated for unrestricteduse. However, its remediation will be a majoreffort, with 817 waste sites to be contained, 44facilities to be demolished, billions of gallons ofcontaminated ground water, and 60,000 cubicyards of transuranic waste. Its cost will represent40 percent of the total environmental restorationcost at Hanford.
The 817 waste sites in this area total nearly 10,000acres. They include many landfills containingcontaminated protective clothing, tools, andequipment used during the fabrication of nuclearfuels. Low-level waste would be disposed in situusing appropriate barrier technology. For thepurposes of this estimate transuranic waste wasassumed to be exhumed. Following riskassessments, it may be considered impractical toremove much of the transuranic waste because itis so extensive, and retrieval or removal activitiescould pose unnecessary hazards to workers,while posing little real risk to the surroundingpublic. In place of excavation and disposal,engineered barriers might be used, which aredesigned to prevent water and animals fromreaching and spreading the contamination.Current plans for ground water are to selectivelyremove mass contamination by pumping groundwater to the surface, treating it, and thenreturning it to the aquifer.
For estimating costs, it was assumed that thebuildings in this area would have theirequipment removed, undergo surfacedecontamination, be demolished, collapsed withthe rubble, capped, and monitored.
Restoration of the 300 Area
Restoration of the 300 area, includingdecommissioning activities, is expected to becomplete by 2035, with most of the workoccurring between 2030 and 2035. To clean upthis area, 90 waste sites must be excavated,including 5 million cubic yards of soil, with 2.7million cubic yards of soil transported todisposal facilities. In addition, 2,000 cubic yardsof transuranic waste must be packaged and
WA9

9 as.eline, Envir rimenta Mena em. e n Report
moved to the Central Plateau for retrievablestorage until it can be shipped to the WasteIsolation Pilot Plant in New Mexico. Theestimated cost represents 7 percent of the totalenvironmental restoration cost for Hanford.
The soil and ground-water contamination inthis area resulted mainly from liquid and solidwaste discharges during the fabrication ofnuclear fuels. Except for the transuranic waste,the characteristics of the waste sites and thecleanup remedies closely parallel those for the100 Area. For this Baseline Report, it wasassumed the 300 Area buildings will have theirequipment removed, undergo surfacedecontamination, and be demolished, with therubble removed to another area.
The present strategy for the ground water in the300 Area is to monitor the ground water todetermine whether contaminants are spreading.It is expected the ground-water contaminationin the 300 Area will be found to pose no threatto the Columbia River or other aquifers.
Restoration of the 1100 Area
The 1100 Area cleanup includes the Arid LandsEcology Reserve, the largest research naturalarea in the State of Washington, and one of thefew remaining large tracts of shrub steppevegetation. Cleanup efforts were completed onthe Arid Lands Ecology Reserve in 1994. The1100 Area Cleanup is planned to be complete in1995; funding accounts for less than 1 percent ofthe total Hanford cleanup cost.
Other waste sites include hazardous wastestaging areas, storage yards, and various tanksand pits used in past equipment maintenanceactivities. These activities are complete or willbe complete by the end of FY 1995. Ground-water monitoring and analysis at the HornRapids landfill, located near the most northernpoint of the Yakima River on the site map, will
also be complete by the end of FY 1995. Allother areas (300, 400, and 1100 Areas) would beremediated to meet the industrial land usescenario.
Radiation Area Maintenance
Contaminated waste sites are potential healthand safety hazards to Hanford workers and thesurrounding community. Contamination canpotentially be spread for miles if windblowndust and vegetation (primarily tumbleweeds)are not controlled. The maintenance activitiesinclude:
• responsibility for 582 square miles, the total Hanfordsite;
• surveillance and maintenance of 400 waste sites;
• vegetation control for 4,600 acres per year;
• stabilization of 1,400 acres for radioactive surfacecontamination; and
• 3 percent of total environmental restoration cleanupcosts.
To control these risks, surveillance andmaintenance will continue for each waste sitepending final remedial action. The surveillanceand maintenance activities consist of quarterlysurveillance and inspection, routineradiological surveys, a minimum of annualherbicide applications, removal of deep rootedvegetation and routine corrective actions tocontrol remaining areas of surfacecontamination and the repair or barricading ofhazardous areas to meet minimum safetycriteria.
Vegetation management and interimstabilization are significant activities of thesafety maintenance program. Interimstabilization is the term used to describe theactivities required to prevent the spread ofradioactive surface contamination fromindividual waste sites. Interim stabilization
WA 10

gton
activities should be complete in FY 1997. Apriority ranking system has been used toevaluate risks and determine the order in whichindividual sites will be stabilized. Surveillanceand maintenance activities will continuethrough the completion of waste siteremediation currently planned for the year2050. Annualized surveillance andmaintenance costs will continue as long as thesite is occupied.
Decommissioning Activities
Surplus facilities at the Hanford Site willrequire decommissioning. The majority ofsurplus facilities at Hanford are located in the100 and 200 areas and consist of shutdownreactors, chemical separation and processingplants, waste handling facilities, and supportstructures. A site-wide asbestos abatementprogram will also be conducted in preparationfor the decommissioning process. Decommis-sioning activities will initiate in 2002 and arescheduled to be complete in 2057.
During FY 1993, the Richland Operations Officeimplemented an Agreement-In-Principle toaccelerate decommissioning activities at theHanford Site. The Agreement-In-Principle isaimed at reducing the number of potentialsafety hazards, reduce surveillance andmaintenance costs, and demonstratemeaningful cleanup progress.
Shutdown Reactors
All 9 production reactors were constructed inthe 100 Area along the Columbia River in thenorthern part of the Hanford Site. With theexception of the N-reactor, all were shutdownby 1971. The N-reactor was placed on standbyin 1988. In March 1989, Hanford drafted anenvironmental impact statement for the eightreactors scheduled for cleanup (all but N-reactor). These reactors are contaminated withradioactivity and hazardous material. Thedecommissioning sequence for the reactors is
described in the Restoration of the 100 Areassection. Decommissioning activities for thereactors (not including the Reactor BlockFacility) are scheduled to be complete in 2043.
In addition to the production reactors, a testbreeder reactor, the Fast Flux Test Facility, wasconstructed in the 400 Area. This 400 megawattsodium cooled test reactor began full poweroperation in 1982 and conducted fuel, materials,isotope, and power experiments. Decommis-sioning activities for the Fast Flux Test Facility(not including the Reactor Block Facility) arescheduled to be complete in 2017.
Chemical Separation andProcessing Plants
Overall, Hanford has constructed 10 chemicalprocessing plants on the plateau in the 200Area, and all were operational by the late1950's. These 800-foot-long canyon buildingswere used to separate plutonium from uraniumtarget material through the bismuth phosphateprocess.
The processing buildings include the PlutoniumUranium Extraction Plant, where spent fuel wasprocessed to extract plutonium and unuseduranium; the Uranium-Oxide Plant, to converturanium nitrate to uranium oxide powder forrecycling; and the Plutonium Finishing Plant(PFP or Z-Plant) where plutonium metal wasfashioned. In addition, Hanford had the use ofB-Plant for the bismuth phosphate processing,and to separate and purify cesium andstrontium for encapsulation; C-Plant (StrontiumSemiworks) for separation and processdevelopment; S-Plant, for separation throughsolvent extraction; T-Plant for bismuthphosphate process separation, andsubsequently as a decontamination and repairfacility; and U-Plant for chemical separationand processing.
Plutonium production at Hanford ended in1989, with the Plutonium Uranium ExtractionPlant and the Uranium-Oxide Plant ceasing
WA 1 1

9 Baseline Mane!nv ronmentai ej. PotrFis.
operations in 1992 and 1993, respectively. As aresult of waste management activities, thePlutonium Finishing Plant may have to bereactivated. These processing plants arecontaminated by both radioactivity andhazardous materials. Decommissioning willrequire decontamination, removal ofequipment, and demolition of structures withno further mission. At present, new missionsare assigned to two processing plants; T-Plant isserving as a decontamination facility, and B-Plant is serving as a storage facility. Thedecommissioning sequence for the surplusprocessing plants is described in theRestoration of the Central Plateau (200 Area)section. Decommissioning activities for thechemical separation and processing plants arescheduled to be complete in 2057.
Waste-Handling Facilities
There are 149 single-shell and 28 double-shelltanks storing high-level waste in the 200 Area.These tanks and associated waste treatment andhandling facilities are described in the WasteManagement section. Decommissioningactivities for the high-level waste handlingfacilities are scheduled to be complete in 2057.
The K-Basins in the 100 Area provide storagefor spent fuel. The problems at the K-Basins aredescribed in the Waste Management/SpentNuclear Fuel Storage section.Decommissioning activities for the K-Basins arescheduled to be complete in 2016.
Several facilities are scheduled to process andtreat low-level waste, low-level mixed waste,and transuranic waste. Decommissioningactivities for these facilities are scheduled to becomplete in 2057.
A Reactor-block Disposal Facility will beexcavated on the Central Plateau.Decommissioning activities for the Reactor-block Disposal Facility are scheduled to becomplete in 2050. An EnvironmentalRestoration Disposal Facility will also be
constructed on the Central Plateau for thedisposition of contaminated soil.Decommissioning activities for theEnvironmental Restoration Disposal Facility arescheduled to be complete in 2057.
Support Structures
The 300 Area originally fabricated fuel elementsfor the production reactors. Currently, the areahouses laboratories, technical shops, andengineering offices for research anddevelopment work. At present, the 300 Areafacilities associated with the continuingfunction of the Multi-Program Laboratory arenot counted as surplus. The 1100 Area, locatedin the southern part of the site, performs vehiclemaintenance and general warehousingoperations. The decommissioning sequence forthe support structures are described in theRestoration of the 300 Areas and Restoration ofthe 1100 Ares sections. Some facilities will bedecontaminated, released, and revitalized ifeconomically justified. Decommissioningactivities for the support facilities are scheduledto be complete in 2021.
Asbestos Abatement
Asbestos abatement is a site-wide program toremove asbestos from all facilities currentlyposing a hazard to occupants and to removeasbestos prior to surplus facilities demolition.The near-term focus is on occupied facilitiesthat represent high asbestos-exposure risks.Priority 'A' is used to designate occupiedfacilities with friable asbestos that has beendamaged and is accessible. Priority 'B' is usedto designate occupied facilities with friableasbestos that is not damaged or accessible.Abandoned facilities are designated priority'C'. By the end of FY 1998, all 29 high-priority(priority 'A' and 'B') sites will be completed.Beginning in FY 1999, the focus of the asbestosabatement program will shift to the removal of
WA 12

Was'lin t O fr*
asbestos from the reactors and surplus facilitiesin the 100 and 200 Areas prior to theirdemolition. Asbestos abatement activities arescheduled to be complete in 2048.
Postclosure Surveillance andMaintenance
Some waste sites are remediated in place. Theengineered covers described for 200 Area wastesites are the primary example of thisremediation strategy. Postclosure surveillanceand maintenance involves periodic visits to thesites to check on the integrity of the cover. Thisactivity is planned to the year 2047. Thepostclosure surveillance and maintenanceactivities represent one tenth of one percent oftotal environmental restoration cleanup costs.
Environmental RestorationDisposal FacilityThe Environmental Restoration Waste DisposalFacility is located on a portion of the landbetween the 200 East and the 200 West Areas.This facility will be used for disposal of thelow-level radioactive waste and hazardouswaste from the environmental restorationprogram cleanup of the Hanford Site. Themajority of this waste is contaminated soil andconstruction rubble. Construction of the firstphase of the Environmental RestorationDisposal Facility will start in 1995 and becompleted in July 1996, and the facility will befully operational by October 1, 1996. Thefacility will then receive waste continuously forthe following 50 years. Facility construction hasbeen developed based on the followingmeasures with the resulting cost factor:
• 14 million cubic yards of waste capacity,
• 1,000-year minimum design life, and
• 7 percent of total environmental restoration cleanupcost.
The location for the disposal facility wasselected because it is geologically stable,located outside of the 100 year flood plain,distant (over seven miles) from the ColumbiaRiver, far from the water table (240 feet), andlocated adjacent to lands not planned to berecovered for public use in the foreseeablefuture.
The disposal capacity of this facility will beconstructed in phases to ensure the capacitywill match the final volume of waste. The firstphase of construction will store 1 million cubicyards.
To ensure the safe isolation of the waste to bedeposited, the facility must be well engineered.The risk is rain water and snow melt will enterthe contaminated soil and spread thecontamination. To prevent this occurrence,RCRA requires a double liner beneath thecontaminated material and a collection systembetween the liners to detect and collect anyleaking liquid passing the first liner. Asportions of the facility are filled, a cover isconstructed over the top of the contaminatedwaste. The top cover is designed to conductwater away from the contaminated soil andprevent any spread of contaminants. The costsfor the facility also includes the equipment,offices, staff, and decontamination facilitiesnecessary for approximately 50 years ofoperation.
WASTE MANAGEMENT
The waste management program accounts forthe majority of Life Cycle costs at Hanford.Much of the emphasis is placed on tank waste,which when processed will ultimately yieldvitrified high-level and low-level wastefractions. Waste management programs atHanford are divided into five key areas: (1) the
WA 13

renment I Management Report
Environmental Restoration Activity Costs
Five-Year Averages (Thousands of Constant 1995 Dollars)*
FY 1995 - 2000 2005 2010 2015 2020 2025 2030
100 AreaAssessment 3,877 0 0 0 0 0 0
Remedial Actions 27,090 100,131 120,093 120,449 108,436 65,061 0
Facility Decommissioning 0 0 0 0 0 0 01100 Area
Remedial Actions 1,033 0 0 0 0 0 0200 Area - East
Assessment 477 0 0 0 0 0 0
Remedial Actions 2,372 0 0 0 0 43,374 43,374
300 AreaAssessment 532 0 0 0 0 0 0
Remedial Actions 12,982 8,305 0 0 0 0 23,856
Environmental Restoration Disposal Facility (ERDF) 26,365 10,236 10,236 12,236 12,236 10,236 10,236
Facility DecommissioningAssessment 9,636 0 0 0 0 0 0
Facility Decommissioning 42,002 26,851 27,851 37,618 44,955 34,260 32,421
Long-Term Surveillance and MonitoringLong-Term Surveillance and Monitoring 163 227 227 227 227 227 227
Site-Wide ActivitiesAssessment 1,882 0 0 0 0 0 0
Remedial Actions 6,509 4,287 4,287 4,287 4,287 4,287 4,287
Total 142,745 150,037 162,694 174,817 170,141 157,446 179,463
2035 2040 2045 2050 2055 2060 2065 Life Cycl'
100 AreaAssessment 0 0 0 0 0 0 0 23,263
Remedial Actions 0 0 0 0 0 0 0 2,733,391
Facility Decommissioning 30,400 38,000 7,600 0 0 0 0 380,000
1100 AreaRemedial Actions 0 0 0 0 0 0 0 6,199
200 Area - EastAssessment 0 0 0 0 0 0 0 2,863
Remedial Actions 26,025 97,592 71,568 0 0 0 0 1,423,899
200 Area - WestAssessment 0 47,712 0 0 0 0 0 245,260
Remedial Actions 82,411 0 13,012 0 0 0 0 842,674
300 AreaAssessment 0 0 0 0 0 0 0 3,192
Remedial Actions 43,374 0 0 0 0 0 0 455,571
Environmental Restoration Disposal Facility (ERDF)Environmental Restoration TSD 10,236 10,236 10,236 4,094 0 0 0 659,287
Facility DecommissioningAssessment 0 0 0 0 0 0 0 57,814
Facility Decommissioning 40,581 42,911 32,266 12,449 13,306 7,400 0 2,016,346
Long-Term Surveillance and MonitoringLong-Term Surveillance and Monitoring 227 227 227 91 0 0 0 11,647
Site-Wide ActivitiesAssessment 0 0 0 0 0 0 0 11,292Remedial Actions 4,287 15,131 71,690 1,715 0 0 0 631,773
Total 237,541 251,809 206,599 18,349 13,306 7,400 0 9,504,470
• Costs reflect a five-year average in constant 1995 dollars, except in FY 1995-2000, which is a six-year average.
▪ Total Life Cycle IS the sum of annual costs in constant 1995 dollars.
WA 14

asitirtg
Tank Waste Remediation System programmanaging high-level waste, (2) spent nuclearfuel storage at the K-Basins and other locations,(3) cesium and strontium capsule managementat the Waste Encapsulation and Storage Facilityat B-Plant, (4) liquid waste management, and(5) solid waste management. Each wastemanagement program is described in thefollowing sections with regard to treatment,storage and handling, and disposal activities.
High-Level Waste TanksApproximately 350 million liters of waste wereput into single-shell tanks from Hanford SiteProcesses between 1944 and 1980. The tankscurrently hold about 230 million liters of waste,including low-level, hazardous, or plutonium-contaminated salt cake and sludge. Most of it isnow solid, though pockets of liquids and semi-liquid also are in the tanks. Sixty-six of the 149single-shell tanks may have leaked as much as3.8 million liters or more of waste into thenearby soil. In addition to the single-shelledtanks, there are newer double-shell tanksholding about 90 million liters of liquidradioactive, hazardous waste. The first of thesetanks was put in use in 1971. No double-shelltanks have leaked to date.
The tanks now contain a mixture of salt cake,liquid, and sludges with both radioactive andhazardous components. Sludge consistsprimarily of solids (hydrous metal oxides)precipitated from the neutralization of acidwaste. Salt cake consists of the various saltsformed from the evaporation of water from thewaste. Liquids exist as supernatant (liquidabove solids) and interstitial liquid (liquidfilling the void between solids) in the tanks.There waste types do not necessarily exist asdiscrete layers, but are intermingled to differentdegrees. Some sludges and salt cake maycontain interstitial liquids and be relatively soft,while others are drier and harder.
The tank waste is mostly inorganic. It consistsprimarily of sodium hydroxide; sodium salts ofnitrate, nitrite, carbonate, aluminate, andphosphate; and hydrous oxides of aluminum,iron, and manganese. The radioactivecomponents consist primarily of mixed longlived fission product radionuclides such asstrontium-90; cesium-137; and elements such asuranium, plutonium, and americium.Complexed waste contains the chelating agentsEDTA and HEDTA. There may also bedetectable halogenated and nonhalogenated
Major Waste Management Projects
Five-Year Averages (Thousands of Constant 1995 Dollars)*
FY 1995 - 2000 2005 2010 2015 2020 2025 2030 Life Cycle*.TWRS Characterization 126,508 206,890 250,240 248,030 146,030 47,090 1,190 5,256,400TWRS HLW (Vitrification) 37,967 283,730 235,110 255,850 253,300 250,750 242,930 7,836,1501WRS LLW (Vitrification) 79,192 171,020 244,120 247,690 225,590 324,360 5,610 6,567,100TWRS Operations, Maintenance 195,925 162,010 136,510 121,550 110,500 97,580 55,250 4,592,550MRS Tank Farm Upgrade 159,092 107,294 0 0 0 0 0 1,491,021TWRS Waste Pre-Treatment 102,425 143,480 138,040 122,060 120,190 13,430 0 3,300,550
' Costs reflect a five-year average in constant 1995 dollars, except in FY 1995 - 2000, which is a six-year average.
" Total Life Cycle is the sum of annual costs in constant 1995 dollars.
NOTE: These projects represent a subset of waste management activities. Associated program management costs are built-in to the estimates provided.
WA 15

Tlie Be a I Environmental asietteme.n.t.-
organic compound contamination. The mixedwaste in some tanks may have detectableamounts of heavy metals such as lead,chromium, and cadmium.
Chemical processing activities in the 200 Eastand 200 West areas designed to separateplutonium from spent nuclear fuel generatedthe majority of waste stored in the high-levelunderground storage tanks. The tanks containradioactive slurries generated by one of thefollowing processes: the bismuth phosphateprocess, the tributyl phosphate process, thereduction oxidation process, the plutonium-uranium extraction process, and the B-Plantwaste fractionation process. Other tank wastewas generated in smaller volumes fromresearch and development programs,laboratory processes, and Plutonium FinishingPlant operations.
All of the fuel processing methods generatedacidic waste streams. Sodium hydroxide orcalcium carbonate was added to the wastebefore being transferred to the tanks toneutralize the acid, minimizing tank corrosion.The tanks currently contain moderately tostrongly alkaline solutions. Additional post-processing of some of the waste to recoverplutonium and uranium, or to reduce thevolume of high-level waste, has resulted in theaddition of ferrocyanide and some organiccompounds listed as hazardous.
In addition to the major processes listed above,the following installations have also generatedwaste streams:
• C Plant (Hot or Strontium Semiworks). A pilot plant
for chemical separation processes and equipmentdevelopment, C Plant was retired in 1967. A smallamount of waste was generated totaling 3.04 million
liters (803,000 gal); however, the waste is typically high
in strontium content.
• Vaults. Several smaller waste treatment facilities,
known as vaults, were built near the tank farms to
settle, evaporate, neutralize and condition plant waste
to reduce the waste volumes directed to the tanks and
to make the waste alkaline to minimize corrosion. Vault
configurations vary, but generally consist of a seg-mented, underground, concrete structure with a steeltank in each segment interconnected with piping.Equipment is accessed through concrete cover blocks atground level. The vaults adjoin the related tank farms
and processing plants with AR, BSR, and CR Vaults in
200 East, and TXR, UR, and WR Vaults in 200 West
areas.
• Miscellaneous Past Sources and Waste. There arevarious other sources of waste, as well as other material
added to the tanks. Some waste is from the 300 Area,
100 Area production reactors, various laboratories, and
catch tanks. Unique additions to the waste includedlaboratory waste; shroud tubes; ceramic balls; experi-
mental fuel elements; and relatively small amounts of
enriched uranium, plutonium, cobalt-60, and natural
uranium. Also, diatomaceous earth was added toTanks BX-102, SX-113, TY-106, TX-116, TX-117, and U-
104 to absorb residual supernatant liquors. For thesame reason, type 2 Portland cement was added toTank BX-105 in 1966. Miscellaneous waste streamsinclude: Hanford defense residual liquor, Hanfordlaboratory operations, filtered Hanford Site water,phosphate decontamination waste from N-reactor, andnoncomplexed waste.
The double-shell tanks continue to receivewaste generated by decommissioning andcleanup operations in the 100, 200, 300, and 400Areas. Hanford High-Level Waste Inventoriesare summarized on page WA 17. Waste streamscontinue to be directed to the double-shell tanksand are identified as: effluents associated withimplementing the deactivation program for thePlutonium-Uranium Extraction Plant, as wellas, routine maintenance and operations; wastefrom B Plant maintenance activities andcondensate; T Plant, laboratory waste from the222-S Laboratory in the 200 West Area and the300 Area laboratories; miscellaneous wastestreams from ion exchange resin regeneration;and equipment flush water.
Using a systems approach, waste managementactivities for tank waste at Hanford have beendefined as the tank waste remediation system.
WA 16

ashingten
For the purpose of this analysis, seven separateprograms describe tank waste remediationsystem activities: pretreatment; low-level waste(vitrification); high-level waste (vitrification)characterization and waste retrieval; operations,maintenance and safety; tank farm upgrades;and high-level waste disposal. Each of theseprograms are discussed below within theappropriate treatment, storage, or disposalsection.
Solid Waste OverviewThe solid waste streams are generally all thesolid materials, containerized liquids, or semi-solid materials generated in the course of alloperations at the Hanford Site not identified asNuclear Material, Tank Waste, or Liquid Wastecategories. In addition, permission has beengranted for some solid waste to come fromother sites in the Department's complex toHanford. The primary waste source is storedwaste retrieval. Considerable inventories ofradioactive and mixed waste have beenaccumulating in trenches, caissons, andbuildings at Hanford since 1970. These wastewill be retrieved for appropriate treatment asfacilities become available.
Solid wastes are classified as transuranic, low-level, low-level mixed, hazardous, and sanitarywastes. Each waste stream is managed under
different regulatory and Departmentalrequirements. Hazardous and sanitary wastesare handled by a combination of onsite andoffsite capabilities.
Waste Treatment
High-Level Waste Treatment
High-level waste treatment at Hanford is asubset of the tank waste remediation system.Four programs are described below. Theseprograms are designed to: characterize andremove wastes, separate wastes into high-leveland low-level waste fractions, and separatelyvitrify the high-level and low-level wastes forsubsequent storage and disposal.
Tank Waste Remediation SystemCharacterization and Waste Retrieval
The objective of the characterization program isto provide tank waste characterization data in atimely and cost-effective manner to supportresolution of safety issues, ongoing operations,and tank waste disposal.
The program is currently establishing andimplementing the data quality objectivesprocess and increasing sampling and analyticallaboratory capabilities. In addition to actualtank sampling, the program is utilizinghistorical tank waste characterization
Hanford Site High-level Waste Volumes
TANK FARMS WASTES HIGH-LEVEL WASTE GENERATION TOTALS PERCENT CONTRIBUTION TO TOTAL
Liquid
Sludge
Salt Cake
Slurry
Total:
25,100 cubic meters
46,000 cubic meters
93,000 cubic meters
94,700 cubic meters
258,800 cubic meters
9.6%
17.8%
35.9%
36.6%
100%
Source: Integrated Data Base for 1993: U.S. Spent Fuel and Radioactive Waste Inventories, Projections, and Characteristics; March 1994 (DOE/RW-0006, Rev. 9).
WA 17

e 95 Basel ne onnte
information where available. The results of theanalysis of each tank is issued in a tankcharacterization report, as well as input to thelocal electronic database. The current baselinecalls for the issuance of tank characterizationreports for all 177 Hanford waste tanks bySeptember 1999.
The objective of the waste retrieval program isto remove waste from aging single-shell tanksand transfer the waste to double-shell tanks,mobilize sludges in double-shell tanks for intank treatment or transfer to treatment facilities,and retrieve waste from miscellaneousunderground tanks. The program will utilizeknown waste retrieval technical solutions to themaximum extent possible (e.g., sluicing,Savannah River mixer pumps, etc.) and developand implement new technologies for wasteretrieval (e.g., long-reach manipulators), asrequired. Preparations are underway for theinitiation of sluicing retrieval of the firsttank(106-C) in October 1997. The currentbaseline calls for the completion of retrieval ofwaste from all single-shell tanks by the end of2018 and closure of the single-shell tank farmsby September 2024.
Tank Waste Remediation SystemWaste Pretreatment
The objective of the tank waste remediationsystem waste pretreatment program is toseparate tank waste into its low-level waste and
• high-level waste fractions by processing in newpretreatment facilities. Best availabletechnology will be used to design thepretreatment facilities with the goal ofminimizing the volumes of the high-level wastefraction and maximizing the radionuclidesinventory in the high-level waste fraction. Thepretreated low-level waste will be vitrified anddisposed onsite. The pretreated high-levelwaste will be vitrified and stored onsite, untilan offsite Federal geologic repository isavailable. Studies are currently underway todetermine the waste separations processes andto select the pretreatment facility concepts. The
current program baseline calls for the 1) start ofhot operations of the Low-Level WastePretreatment Facility in December 2004, 2) startof hot operations of the High-Level WastePretreatment Facility in June 2008, and 3)completion of the pretreatment processing ofHanford tank waste by December 2028.
Tank Waste Remediation System Low-Level Waste (Vitrification)
The objective of the low-level waste program isto vitrify all low-level tank waste by the end of2035 and, as a near-term contingency, maintainthe Grout Facility in a standby condition. Theprogram will utilize commercially availablemelters and other key processing technologiesas much as possible. The program has contractsin place with several commercial meltervendors, and melter tests with Hanford wastesimulants are currently being conducted. Fromthe results of these tests, the reference melterand reference low-level glass formulation willbe selected and incorporated into the design ofthe low-level waste vitrification facility. Thecurrent program baseline calls for the (1)initiation of hot operations of the Low-LevelWaste Vitrification Facility by June 2005, and (2)completion of vitrification of Hanford low-leveltank waste by December 2035. The vitrifiedlow-level waste will be disposed of onsite in the200 Areas at Hanford by the tank wasteremediation system program.
In this analysis, the low-level waste costsresulting from treatment of high-level wastesare accounted as high-level waste activity costs.This approach is consistent with programplanning at Hanford.
Tank Waste Remediation System High-Level Waste (Vitrification)
The objective of the high-level waste program isto vitrify all high-level tank waste by the end of2035. The program will vitrify the high-levelwaste, place the vitrified waste in stainless steelcanisters, and store the immobilized wasteonsite until shipped to an offsite geologic
WA 18

repository for disposal. Interface with theSavannah River vitrification facility and therepository program is ongoing. However, therecurrently exists much uncertainty in theprogram in the areas of canister size, wasteloading, and disposition of the cesium andstrontium capsules.
The current program baseline calls for the (1)initiation of hot operations of the High-LevelWaste Vitrification Facility by December, 2009,and (2) completion of the vitrification ofHanford high-level tank waste by December,2035. The vitrified high-level waste will bestored onsite until it is shipped to an offsitegeologic repository for disposal.
The Hanford Site manages its transuranic, low-level, low-level mixed, and hazardous wastetypes within its liquid effluent and solid wasteprograms. The treatment activities associatedwith these programs are described in thefollowing sections.
Liquid Effluent/Hanford EnvironmentalCompliance
In 1986, the Department committed to Congressits facilities would eliminate the untreateddischarge of radioactive liquid to the soilcolumn by 1995. Subsequently in 1989, theDepartment, the U.S. Environmental ProtectionAgency (EPA), and the Washington StateDepartment of Ecology entered into a formalcompliance agreement governing plannedactions for major effluent stream discharges.The agreement required implementation of bestavailable technology for treatment ofwastewater. In addition, it was agreed topermit the liquid effluent discharges underWashington State Department of Ecologyregulations for disposal of wastewaterdischarges to the soil column. Theseagreements were formalized in a complianceorder containing specific timetables forcompletion of the required upgrades. Basedupon these agreements, the Department andWestinghouse Hanford Company are designing
and constructing liquid waste treatmentfacilities for the Hanford Site. These facilitiesbegan operation in 1994, with additionalfacilities becoming operational from 1995through 1997.
Current and future site liquid effluent streams,including liquid effluents from site cleanupactivities, will be managed under a systemsapproach. An integrated liquid effluenttreatment system using a combination of localand central treatment systems will bedeveloped. Implementation responsibility oflocal treatment systems will remain with thegenerating programs; central treatmentcapabilities will be implemented by thisprogram. This program is also responsible forclosing liquid waste disposal sites anddeactivating facilities required for centralizedtreatment capabilities.
Specific activities associated with these goalsand responsibilities include:
• start, operate, and clean out the Liquid EffluentRetention Facility to support the operation of the 242-AEvaporator and the requirements identified in the Tri-Party Agreement;
• start and operate the 200 Area Effluent TreatmentFacility to process the liquid inventory stored in theLiquid Effluent Retention Facility and other wastestreams from plants in the 200 Area, and to support thecontinued operation of the 242-A Evaporator;
• start and operate the 200 Area Treated EffluentDisposal Facility to collect and treat certain effluentstreams from the 200 Area using best available technol-ogy prior to disposal at a permitted facility;
• operate and maintain the 307 Basins as the collectionand verification facility for the retention process sewerand the 340 Facility as the collection point for the low-level radioactive liquid waste system wastewaters,including waste regulated under the Resource Conser-vation and Recovery Act (RCRA);
• replace the existing 340 Facility Storage Vault to allowfor RCRA compliance as a treatment and storagefacility; and
WA 19

;995:3: selin v r 0 merit
• implement best available technology at Phase II streamfacilities to treat effluents prior to disposal.
Solid Waste
The planned activities associated with thetreatment portion of the solid waste programinclude:
• The processing of high-dose waste and high-dosecontaminated equipment to meet applicable standardsfor disposal, storage, re-use, or free release. Theequipment to be processed will consist of, as a mini-mum, tank farms long-length contaminated equipment,Plutonium-Uranium Extraction Plant towers, andcontaminated equipment stored in the T-Plant canyon.
• The processing of low-level hazardous contaminatedequipment to meet Debris Rule standards for disposalor free release, or decontaminate and repair equipmentfor return to service. The waste to be processedincludes low-level waste generated at Hanford, eitherfrom facility operations or from the site cleanup effort.
• Characterization and sampling of low-level and mixedwaste to confirm generator characterizations.
• Waste Receiving and Processing Module 1 will receiveretrieved and newly generated solid contact handledradioactive waste (low-level, low-level mixed, andtransuranic waste) in 55-gallon drums. Drums will beinspected, assayed, and opened if necessary. Wastecontents will be sorted, analyzed, segregated, andrepackaged. Waste found to be low-level will bedisposed onsite. Waste that is found to be mixed ortransuranic will be stored onsite to await furthertreatment or final disposal. Empty drums and wastewill be compacted as appropriate.
• Waste Receiving and Processing Module 2A providesnonthermal treatment and repackaging for contact-handled low-level mixed waste.
• A facility (formerly known as Waste Receiving andProcessing Module 2B) will receive retrieved andnewly generated solid remote handled radioactivewaste, and will also receive oversized contact-handledradioactive waste. This facility will be operated as acharacterization, size reduction, treatment, andrepackaging facility for the waste. Final scope of thefacility will be addressed as part of the M-33 Tri-Party
Agreement milestone.
• A Thermal Treatment Facility would provide treatmentof that portion of the low-level and transuranic mixedwaste requiring incineration to meet standards foroffsite disposal. An acceptable alternative to construc-tion of a Thermal Treatment Facility would be the useof an offsite vendor or other Departmental site forwaste requiring thermal treatment. The use of anoffsite entity would entail the eventual return of ashwaste residue to the Hanford site for disposal (low-level waste) or storage (transuranic waste). This vendorapproach was recognized as part of the Federal FacilityCompliance Act Process and is subject to obtainingagreement from EPA and the State of WashingtonDepartment of Ecology.
• Metallic sodium inventory from the Hallam andSodium Reactor Experiment reactors will be treated fordisposal or reuse in accordance with State and landdisposal restrictions prior to disposal or for reuse. Thesolid waste program provides for disposition ofhazardous waste generated by onsite programs. Theprogram is responsible for arranging for transportationof hazardous waste to an offsite treatment, storage ordisposal site.
Waste Storage
High-Level Waste Storage
High-level waste storage at Hanford is a subsetof the tank waste remediation system. Twoprograms are described below which addressthe operations, maintenance, and safetyactivities and tank farm upgrades.
Tank Waste Remediation SystemOperations, Maintenance and Safety
The objectives of the operations andmaintenance and safety programs are to (1)provide safe operations of underground storagetanks and related facilities, (2) establish a finalsafety base in FY 2001, and (3) mitigate andsolve waste tank safety issues. Ongoingactivities with the operations and maintenanceprogram include improvement to the tank farmconduct of operations, maintenance of tank
WA 20

farm facilities, and operation of the 242-AEvaporator to achieve waste volume reductionof tank waste. In addition, the program is inthe process of pumping interstitial liquids fromthe inactive single-shell tanks (interimstabilization) and disconnecting piping toprevent further liquid intrusion (isolation). Thecurrent baseline calls for the completion ofsingle-shell tank interim stabilization bySeptember 2000.
The waste tank safety program has theresponsibility for resolution and mitigation ofwaste tank safety issues in the undergroundstorage tanks. Safety issues for both single-shell and double-shell tanks have been raised.These issues are in the areas of flammable gasgeneration, organics, ferrocyanide, high heat,and criticality. Ongoing activities within theprogram include installation of upgradedtemperature monitoring capability inferrocyanide tanks, vapor characterization of allferrocyanide and organic tanks, vapor spacemonitoring of all flammable gas tanks. A mixerpump has been installed in the highest priorityflammable gas tank (101-SY). It has beendetermined this pump has successfullymitigated gas generation in the tank. Thecurrent baseline calls for the mitigation/resolution of tank safety issues for high prioritywatch list tanks by September 2001.
Tank Waste Remediation System TankFarm Upgrades
The objective of the tank farm upgradesprogram is to improve the tank farminfrastructure through implementation ofplanned capital projects and improve thetechnical integration and planning processes.The program currently has several ongoingconstruction projects. These include tank-farmventilation upgrades, replacement of the cross-site transfer and aging waste transfer lines, andthe design of new double-shell waste storagetanks. In addition, design activities areunderway for upgrades to tank farm facilities
for electrical, transfer systems, instrumentationsystems, and double-shell tank ventilationsystems. The current baseline states the tankfarm upgrades will be completed by June 2010.
Spent Nuclear Fuel Storage
The spent nuclear fuel project is responsible forthe continued safe, environmentally sound, andcost-effective storage of N-Reactor spent fuelstored in the K-Basins. N-Reactor fuel, fromirradiation activities, includes 954 metric tons ofheavy metal (in assembly form) encapsulated in3,815 closed canisters stored in the 105 K-WestBasin, and 1,146 metric tons of heavy metal (inassembly form) encapsulated in 3,667 opencanisters stored in the 105 K-East Basin. Thereis also 0.5 metric ton of heavy metal of singlepass reactor fuel in 185 elements at the 100 K-East and 100 K-West Basins remaining from theirradiation activities at the first 8 productionreactors. The fuel in the 105 K-East Basin hasexperienced significant corrosion, resulting insludge accumulation in the basin and thecanisters. There may be some irradiated singlepass reactor fuel elements remaining fromprevious storage in the sludge at the bottom ofthe N-Reactor Fuel Storage Basin.
Technical issues at the K-Basins include:
• the inadequacy of the K-Basins to support interimstorage of N-Reactor fuel,
• the deteriorating condition of the N-Reactor spent fuelinventory, and
• the inadequate condition of major support systems atthe K-Basins.
The spent nuclear fuel project is responding tothese issues by:
• upgrading conduct of operations to comply with DOEOrders;
• providing safe existing storage and resolving vulner-abilities;
WA 21

ne nv ronme
• involving stakeholders in decision-making for thespent nuclear fuel projects;
• implementing an N-Reactor fuel characterizationprogram to better understand fuel condition;
• pursuing expedited removal of the fuel inventory fromthe K-Basins; and
• aggressively defining and pursuing implementationactivities tied to the approved path forward, whichaggressively manages N-Reactor fuel through interimstorage.
The path forward provides for a facility to beused to stage, condition, and store the fuel.Removal of fuel from the K-Basins will start byDecember 1997, and the fuel will be removedfrom the K-Basins by December 1999. Fuelconditioning will be closely coupled withremoval from the K-Basins. To expedite theremoval, decisions for actions prior to interimstorage will be determined by theenvironmental impact statement on near-termmanagement of spent fuel from the K-Basins atthe Hanford Site. The interim storage locationwill be determined by the Spent Nuclear FuelProgrammatic Environmental ImpactStatement.
In addition to storage at the K-Basins, there aresome materials remaining from fuel fabrication,including nonirradiated uranium, unclad metalbillets, clad metal assemblies, and some scrapmaterial in the 300 Area buildings. The 300 Areaalso has miscellaneous irradiated fuel from fuelfabrication testing activities, located in the 308Building and fuel in the 324, 325, and 327Buildings. The spent nuclear fuel project willmanage these materials.
In addition to the fuel stored at the K-Basins,there is some nuclear material remaining fromprocessing, including nonirradiated Fast FluxTest Facility fuel assemblies stored atPlutonium Finishing Plant and the Fast FluxTest Facility; and irradiated fuel from the FastFlux Test Facility currently stored there. The
site also has Shippingport PWR Core II unusedand spent fuel from offsite commercial nuclearactivities in association with the EnergyResearch and Development Administration,stored at T-Plant; and single pass reactor fuelfrom irradiation activities at the first eightproduction reactors at Hanford, consisting of2.88 metric tons of heavy metal in 779 fuelelements stored at Plutonium-UraniumExtraction Plant. The spent nuclear fuel projectwill also manage these materials.
For this analysis, costs for disposal in a geologicrepository were included. Disposal wasassumed to be complete by 2035.
B Plant/WESF Cesium and StrontiumStorage
The B Plant Complex program element isresponsible for the safe, secure, andenvironmentally sound management of the BPlant and Waste Encapsulation StorageFacilities. The Waste Encapsulation StorageFacility currently stores 1137 cesium capsulesand 601 strontium capsules from processingactivities. The B Plant Complex is managed toprovide containment of stored radioactive andhazardous materials until their final disposal.The mission of these facilities is in transition toa long-term, stable, minimum cost operation.B Plant is a treatment, storage, and disposalpermitted facility and will continue as a solid/mixed waste interim storage and treatmentfacility for low-level liquid waste. The WasteEncapsulation Storage Facility is not atreatment, storage, and disposal permittedfacility. Cesium capsules currently stored at BPlant, commercial irradiators, and selectedcesium capsules from Department controlledfacilities will be retrieved and stored at theWaste Encapsulation Storage Facility. Requiredactivities include operating shipping casks usedto transport radioactive material; oversight oftasks required to receive shipments from otherfacilities; and providing for disposition ofcapsules, pellets, and powder at Pacific
WA 22

Waste Management Activity Costs
Five-Year Averages (Thousands of Constant 1995 Dollars)*
FY 1995-2000 2005 2010 2015 2020 2025 2030
Treatment10gh-Level Waste 339,167 507,960 472,192 410,176 301,784 222,088 75,208
Transuranic Waste 42,056 22,126 22,126 22,126 22,126 33,973 36,299
Low-Level Mixed Waste 21,288 72,471 72,471 72,471 72,472 106,545 80,249
Low-Level Waste 43,878 44,586 44,586 44,586 44,586 41,674 29,629
Storage and HandlingHigh-Level Waste 346,700 151,096 74,256 57,120 44,744 34,136 16,592
Spent Nuclear Fuel 138,414 120,360 65,824 50,864 39,576 34,680 26,248
Transuranic Waste 85,586 47,696 32,933 32,933 32,933 32,960 33,054
Low-Level Mixed Waste 105,081 25,847 0 0 0 12,385 59,861
Low-Level Waste 36,964 10,506 0 0 0 1,596 7,716
DisposalHigh-Level Waste 0 0 0 0 0 204,000 204,000
Spent Nuclear Fuel 0 0 0 0 0 0 26,656
Low-Level Mixed Waste 1,335 4,649 10,138 4,854 3,168 3,105 3,005
Low-Level Waste 13,695 39,121 97,445 105,227 105,188 105,022 104,367
Hazardous Waste 45,741 35,119 35,308 35,092 35,107 35,093 35,081
Sanitary Waste 49,043 37,624 37,624 37,624 37,624 37,624 37,624
OtherDecommissioning 0 0 0 34,211 34,211 49,327 60,466
Waste Management TSD 19,765 15,164 15,164 15,164 15,164 15,164 15,164
Inter-Site Disposal AssessmentLow-Level Mixed Waste -81 -2,424 -6,938 0 0 0 0Low-Level Waste -297 -526 -1,414 0 0 0 0
Total 1,288,334 1,131,376 971,716 922,448 788,683 969,374 851,219
2035 2040 2045 2050 2055 2060 2065 Life Cycle**
TreatmentHigh-Level Waste 0 0 0 0 0 0 0 11,982,040
Transuranic Waste 22,423 18,411 2,842 0 0 0 0 1,264,587
low-Level Mixed Waste 60,053 8,334 0 0 0 0 0 2,853,054
Low-Level Waste 23,895 5,845 0 0 0 0 0 1,660,215
Storage and HandlingHigh-Level Waste 0 0 0 0 0 0 0 3,969,923
Spent Nuclear Fuel 45,152 0 0 0 0 0 0 2,744,006
Transuranic Waste 33,011 29,708 13,592 1,745 0 0 0 1,966,336
Low-Level Mixed Waste 41,284 0 0 0 0 0 0 1,327,373
Low-Level Waste 5,321 0 0 0 0 0 0 347,485
DisposalHigh-Level Waste 197,200 197,200 0 0 0 0 0 4,012,000
Spent Nuclear Fuel 26,656 0 0 0 0 0 0 266,560
Low-Level Mixed Waste 2,577 1,533 0 0 0 0 0 173,154
Low-Level Waste 98,423 64,198 0 0 0 0 0 3,677,126
Hazardous Waste 35,081 35,081 35,081 14,032 0 0 0 1,924,827
Sanitary Waste 37,624 37,624 37,624 15,050 0 0 0 2,062,606
OtherDecommissioning 54,101 54,101 0 0 0 0 0 1,432,080
Waste Management TSD 15,164 12,131 0 0 0 0 0 709,986
Inter-Site Disposal AssessmentLaw-Level Mixed Waste 0 0 0 0 0 0 0 -47,293
Low-Level Waste 0 0 0 0 0 0 0 -11,489
Total 697,966 464,165 89,140 30,827 0 0 0 42,314,577
Costs reflect a five-year average in constant 1995 dollars, except in FY 1995 -2000, which is a six-year average.
Total Life Cycle is the sum of annual costs in constant 1995 dollars.
WA 23

Northwest Laboratory and Oak Ridge NationalLaboratory. In addition, this activity providesfor the encapsulation of single containedisotopes from Pacific Northwest Laboratoryand Oak Ridge National Laboratory as requiredto meet Waste Encapsulation Storage Facilitypool cell configuration requirements.
Solid Waste Storage
The planned activities associated with thestorage portion of the solid waste program are:
• provide verification and sampling capabilities for low-level waste and mixed waste;
• maintain certification for at least one Government-owned liquid waste tank car. Liquid waste tank carservices are essential to maintain less than 90-daystorage requirements for facilities not having liquidwaste storage permits and for transfer of liquid wasteto other storage and disposal facilities;
• provide transuranic waste storage capacity at theTransuranic Storage and Assay Facility;
• provide storage capacity for low-level mixed waste,radioactive waste contaminated with PCBs, transuranicwaste, and Greater-Than-Class-C waste at the CentralWaste Complex;
• provide adequate remote handled waste storagecapacity in the Special Case Waste Storage Facility forinterim dry storage of non-regulated, remote-handledlow-level and transuranic mixed waste;
• provide adequate mixed waste storage capacity to meetforecasted demands and treatment facility feedhandling in the Phase V, Enhanced Radioactive andMixed Waste Storage Facility. These facilities willprovide interim and long term storage for waste andmaterial handling capacities; and
• maintain adequate dangerous waste storage capacity inthe Non-radioactive Dangerous Waste Storage Facility(616 Building) to provide Toxic Substances Control Act(TSCA) and RCRA interim storage and offsite shipmentcapabilities for non-radioactive dangerous waste perwaste acceptance criteria 173-303 and TSCA.
Waste Disposal
High-Level Waste Disposal
Costs were included in this estimate fordisposal of high-level waste in a deep geologicrepository. Costs take the form of fees to bepaid to the Office of Civilian Radioactive WasteManagement.
Other Wastes
Liquid Effluent Disposal/HanfordEnvironmental Compliance
The 200 Area Treated Effluent Disposal Facilityindustrial sewer will collect the treatedwastewater streams from various plants in the200 Areas and dispose of the clean effluent at 2new 20,235-square meter (5-acre) pondspermitted by Washington State.
The same facility will collect and dispose oftreated liquids at a State approved landdisposal structure selected to minimize thetritium migration time to the river.
The 300 Area Treated Effluent Disposal Facilityprovides collection, treatment, and disposal forlaboratory wastewater, boiler blowdown, steamcondensate, spent softener regenerant, andheating, ventilation, and air conditioningcondensate generated in the 300 Area. Thetreated wastewater is discharged to the riverunder the conditions of a National PollutantDischarge Elimination System permit. Solidwaste generated from the 300 Area liquideffluent treatment process will be shipped to alandfill.
Solid Waste Disposal
Disposal functions provide for the ultimatedisposition of the radioactive solid waste bothon and off the Hanford Site. Disposal facilityperformance is based on the level of
WA 24

containment required for the particular type ofwaste being disposed. Separate disposalfunctions are identified for transuranic waste,low-level mixed waste, and low-level waste.
The disposal of transuranic waste is planned forthe Waste Isolation Pilot Plant site in NewMexico; the destination for Greater-Than-Class-C waste has not yet been determined.
Radioactive Mixed Waste Disposal Trencheswill provide disposal capability for low-levelmixed waste. The 200 Area solid radioactivemixed waste will be drummed and sent tointerim storage at the central waste complexawaiting future treatment. These operationswill be conducted in RCRA permitted facilitiesunder the regulatory authority of EPA and theState of Washington Department of Ecology.The Low-Level Burial Grounds in the 200 Areawill continue to provide disposal capability forlow-level waste for the duration of the Hanfordlife cycle. Hazardous wastes are shipped offsitefor commercial treatment and disposal. Thesepractices are in accordance with the RCRA andWashington State Administrative Coderegulations.
17
On-site solid waste costs are adjusted (negativenumbers in the waste management tables) toreflect funding transferred to the Hanford Siteto account for costs associated with the disposalof environmental restoration activity wastegenerated at other Departmental facilities.
NUCLEAR MATERIAL AND
FACILITY STABILIZATION
The nuclear material and facility stabilizationprocess began at Hanford in 1995. Of the 379Hanford facilities scheduled to undergo thisprocess, 311 facilities have already begunstabilization. Some of these facilities includethe Applied Chemistry and PlutoniumLaboratories; plutonium, uranium, andchemical storage facilities; Plutonium-UraniumExtraction Canyon and Material Plant; and N-fuel and reactor fuel manufacturing facilities. Itis assumed for purposes of this report theremaining 68 facilities will incrementally beginthe stabilization process in 1996. These facilitiesinclude the Fast Flux Test Facility, the Uranium-
Nuclear Material and Facility Stabilization Cost Estimate
Five-Year Averages (Thousands of Constant 1995 Dollars)*
FY 1995-2000 2005 2010 2015 2020 2025 2030 Life Cycle**
Nuclear Material and Facility Stabilization 168,476 85,483 99,719 19,087 19,790 3,548 158 2,149,786
• Costs reflect a five-year average in constant 1995 dollars, except in FY 1995-2000, which is a six-year average.
Total Life Cycle is the sum of annual costs in constant 1995 dollars.
WA 25

Oxide Plant, contaminated storage facilitiesfacilities; reactor service facilities; and theradiosurgery facility. The resulting waste typesfrom the stabilization of these facilities willinclude: low-level mixed, high-level,transuranic, low-level, and hazardous waste.This report arbitrarily assumes the nuclearmaterial and facility stabilization process atHanford will be completed by 2027.
The preceeding table represents how theHanford facilities have been categorized for thefacility stabilization and maintenance portion ofthe cost estimate. The first column of the tableidentifies the cost model categories, the secondcolumn identifies the number of applicablefacilities, and the third column identifies thetotal cost for performing the surveillance,maintenance, and deactivation for each costcategory (FY 1995 direct dollars only).
LANDLORD FUNCTIONS
The landlord program is responsible forreplacement or enhancement of the HanfordSite general-purpose facilities andinfrastructure systems in support of all missionareas. Included are buildings, systems, andequipment that by design or use are notdedicated to a single program mission. Theprogram material management responsibilitiesare currently limited to managing variousnonradioactive contaminated facilities,including both surplus and active generalpurpose buildings. Disposal responsibilitiesconcentrate on decommissioning of thenonradioactive general use facilities.
PROGRAM MANAGEMENT
Program Management includes all activitiesperformed by general support servicescontractors. The funding for these activities is
Landlord Cost Estimate
Five-Year Averages (Thousands of Constant 1995 Dollars) *
FY 1995-2000 2005 2010 2015 2020 2025 2030
Directly Appropriated Landlord 85,314 109,467 109,467 109,467 109,467 109,467 109,467
2035 2040 2045 2050 2055 2060 2065 Life Cycle"Directly Appropriated Landlord 18,588 18,588 18,588 18,593 18,600 12,840 9,000 4,324,881
Costs reflect a five-year average in constant 1995 dollars, except in FY 1995-2000, which is a six-year average.
Total Life Cycle is the sum of annual costs in constant 1995 dollars.
WA 26

also used to provide grants to the States andIndian Tribes, as well as funding for theHanford Advisory Board, downwinderlitigation, and payment in lieu of taxes to thelocal counties.
Program support costs associated with a directprogram onsite (e.g., tank waste remediationsystems) are included within the programdollars under the appropriate headings and arenot included in the Program Managementsection.
Hanford EnvironmentalManagement Program
The Hanford environmental managementprogram was established in 1986 to incorporatea structured approach toward achievingenvironmental compliance at the Hanford Site.The program scope focuses on regulatorycompliance support through the identificationand resolution of site-wide environmentalissues, providing guidance to facilities oncompliance activities, coordinating site-widereport preparation and providing integration ofTri-Party Agreement activities. Currentplanned activities are scheduled throughFY 2000 with similar ongoing regulatoryactivities assumed until cleanup is complete.
Site Planning & Integration
The Hanford site planning and integrationactivities provide integrated baselinemanagement over the execution of work atHanford. The top-level, long-range planningdocument is the Hanford Strategic Plan, whichprovides overall direction and also providesinformation to drive the subsequentdevelopment of the Hanford Mission Plan.
RCRA Monitoring
The RCRA and operational monitoringprogram is responsible for monitoring ofground water, air emissions, and surface areas
surrounding the RCRA treatment, storage, anddisposal facility either permitted or seeking apermit; and operational facilities regulated byDOE orders and the Atomic Energy Act toensure continued safe, environmentally sound,and cost-effective treatment, storage, anddisposal of hazardous and radioactive materialsand waste at the Hanford Site.
The objectives associated with the RCRA andoperational monitoring program are to
• repair, maintain, and decommission ground-waterwells to ensure valid and consistent sampling of theground water;
• utilize contracted laboratory services for impartialanalysis of samples;
• operate, maintain, and perform surveillance of bothactive and inactive waste sites to monitor and quantifypotential contamination spread;
• operate gaseous effluent monitoring systems forPlutonium-Uranium Extraction Plant, PFP, 222-S Lab,tank farms, and Uranium Oxide facilities;
• operate and maintain the seismic array for Hanfordand Eastern Washington in conjunction with theUniversity of Washington; and
• operate and maintain near field environmentalmonitoring and reporting of events, as required by law.
Specific planning for this area currently hasbeen completed through the year 2000, and it isanticipated activities of similar complexity andcost will continue throughout the life cycle.
Analytical Services
Analytical Services are guided by the overallmission as outlined in the Hanford MissionPlan and by requirements outlined in the Tri-Party Agreement. Hanford Site programs willdefine analytical services requirements.Construction of new laboratories, enhance-ments to existing laboratories and multiple
WA 27

Fa'Atiti •port
commercial laboratory contracts are crucialelements of the analytical services program.Analytical services works directly withprogram clients to estimate the neededanalytical support. This includes participationin the data quality objectives process and jointdevelopment of the statements of work.Laboratory services include consulting onsampling, field screening, andrecommendations or appropriate analyses;conduct of analyses to strict procedure control;data and report preparation; followup clientassistance; and adherence to strict qualitycontrol.
FUNDING AND COST
INFORMATION
The following tables present fundinginformation and major activity milestones forHanford.
Program Management Cost Estimate
Five-Year Averages (Thousands of Constant 1995 Dollars)*
FY 1995 - 2000 2005 2010 2015 2020 2025 2030
Program Management 106,227 444,461 398,256 382,879 343,488 396,480 357,932
2035 2040 2045 2050 2055 2060 2065 Life Cycle*"
Program Management 225,269 166,818 73,062 28,154 5,000 2,000 0 14,756,358
Costs reflect a five-year average in constant 1995 dollars, except in FY 1995-2000, which is a six-year average.
Total Life Cycle is the sum of annual costs in constant 1995 dollars.
WA 28

Washington
Defense Funding Estimate
Five-Year Averages (Thousands of Constant 1995 Dollars)•
FY 1995 - 2000 2005 2010 2015 2020 2025 2030
Environmental Restoration 142,745 150,037 162,694 174,817 170,141 157,446 179,463
Waste Management 1,276,005 1,123,134 970,419 913,375 780,948 959,832 842,859
Nuclear Material and Facility Stabilization 168,287 85,366 97,443 14,878 19,606 3,206
Directly Appropriated Landlord 85,314 109,467 109,467 109,467 109,467 109,467 109,467
Program Management 105,355 441,292 396,886 379,596 340,599 393,061 354,898
Total 1,777,707 1,909,296 1,736,909 1,592,133 1,420,760 1,623,012 1,486,687
2035 2040 2045 2050 2055 2060 2065 Life Cyde**
Environmental Restoration 237,541 251,809 206,599 18,349 13,306 7,400 0 9,504,470
Waste Management 691,138 459,645 88,248 30,519 0 0 0 41,956,618
Nuclear Material and Facility Stabilization 0 0 0 0 0 0 0 2,112,214
Directly Appropriated landlord 18,588 18,588 18,588 18,593 18,600 12,840 0 4,324,881
Program Management 223,562 165,688 72,839 28,077 5,000 2,000 0 14,649,620
Total 1,170,829 895,730 386,274 95,537 36,906 22,240 0 72,637,804
• Costs reflect a five-year average in constant 1995 dollars, except in FY 1995-1996, which is a six-year average.
" Total Life Cycle is the sum of annual costs in constant 1995 dollars.
Nondefense Funding Estimate
Five-Year Averages (Thousands of Constant 1995 Dollars)•
FY 1995-2000 2005 2010 2015 2020 2025 2030
Waste Management 12,329 8,242 1,297 9,073 7,735 9,542 8,361
Nuclear Material and Facilily Stabilization 189 117 2,277 4,209 184 342 158
Program Management 872 3,169 1,370 3,283 2,889 3,419 3,034
Total 13,391 11,528 4,943 16,565 10,809 13,304 11,552
2035 2040 204S 2050 2055 2060 2065 life Cycle"'
Waste Management 6,828 4,520 891 308 0 0 0 357,958
Nuclear Material and facility Stabilization 0 0 0 0 0 0 0 37,572
Program Management 1,707 1,130 223 77 0 0 0 106,738
Total 8,535 5,650 1,114 385 0 0 0 502,268
Costs reflect a five-year average in constant 1995 dollars, except in FY 1995-2000, which is a six-year average.
Total Life Cycle is the sum of annual costs in constant 1995 dollars.
WA 29

T 1 995 Baseline v rarinte rut *I ;;port,
Major Activity Milestones
ACTIVITY TASK COMPLETION DATE
Environmental Restoration
100 Area:
200 Area:
300 Area:
1100 Area:
Fiscal Year
Initiate First Reactor Cleanup (BC Reactor) 1995
M-16-94-04-T02 Completion Pretreatment & Removal of 1997
All N Reactor Fuel Storage Basin Waters
Complete 100 Area Assessment 2000
Complete 100 Area Remediation 2025
Complete 100-F Decommissioning Activities 2043
M-70-00 ERDF To Be Operational 1996
Complete 200 Area Assessment 1996
Complete 200-East Decommissioning Activities (221-B Plant/WESF) 2044
Complete 200 Area Remediation 2045
Complete 200 Area Cleanup (including Decommissioning) 2047
Complete 200-West Decommissioning Activities (221-T Process Plant) 2057
Complete 300 Area Assessment 1995
Complete 300 Area Remediation 2035
Complete 300 Area Cleanup (including Decommissioning) 2050
Complete 1100 Area Cleanup (including Decommissioning)
Complete 1100 Area Remediation
1995
1996
Waste Management Fiscal Year
Treatment:
Tank Waste Remediation System Waste Pretreatment:
Initiate Hot Operations of the Low-Level Waste Pretreatment Facility 2004
Initiate Hot Operations of the High-Level Waste Pretreatment Facility 2008
Complete the Pretreatment Processing of Hanford Tank Waste 2028
Tank Waste Remediation System Low-Level Waste (Vitrification):
Initiate Hot Operations of the Low-Level Waste Vitrification Facility 2005
WA 30

Washington
Major Activity Milestones (Continued)
ACTIVITY TASK COMPLETION DATE
Waste Management Fiscal Year
Treatment:
Tank Waste Remediation System Waste Pretreatment:
Initiate Hot Operations of the Low-Level Waste Pretreatment Facility 2004
Initiate Hot Operations of the High-Level Waste Pretreatment Facility 2008
Complete the Pretreatment Processing of Hanford Tank Waste 2028
Tank Waste Remediation System Low-Level Waste (Vitrification):
Initiate Hot Operations of the Low-Level Waste Vitrification Facility 2005
Complete Vitrification of Hanford Low-Level Tank Wastes 2035
Tank Waste Remediation System High-Level Waste (Vitrification):
Initiate Hot Operations of the High-Level Waste Vitrification Facility 2009
Complete Vitrification of Hanford High-Level Tank Waste 2035
Tank Waste Remediation System Characterization and Waste Retrieval:
Issue Tank Characterization Reports for 177 Hanford High-Level Waste Tanks 1999
Retrieve Waste from all Remaining Single-Shell Tank Farms 2018
Complete Closure of All Single-Shell Tank Farms 2024
Liquid Effluent:
Solid Waste:
Initiate 200 Area Effluent Treatment Facility Operations 1995
Complete Construction of project W-007H, B Plant Process Condensate Facility 1995
Complete Construction of Project W-291; 200 Areas Effluent Best Available
Technology (BAT)/All Known and Reasonable Technology (AKART) Implementation 1995
Initiate Operation of WRAP 1
Initiate Mixed Waste Stabilization Treatment contract
1997
1999
Storage And Handling Fiscal Year
Tank Waste Remediation Systems Operations, Maintenance and Safety:
Close all Unreviewed Safety Questions for DSTs and SSts
Complete Single-Shell Tank Interim Stabilization
1998
2000
WA 31

he 1995 Baseline Enviro elite a irk 9e ebit Report
Major Activity Milestones (Continued)
ACTIVITY TASK COMPLETION DATE
Tank Waste Remediation System Tank Farm Upgrades:
Complete Construction of project W-030 Tank Farm Ventilation Upgrades 1996
Complete Construction of Project W-058 Replacement of Cross-Site 1997
Mitigate/Resolve Tank Safety Issues for High Priority Watch List Tanks 2001
Complete Construction of Project W-314A Tank Farm Integrated 2002
Instrumentation System Upgrades
Complete Construction of Project W-314B Double-Shell Tank Ventilation Upgrade 2002
Complete Construction of Project W-314C Transfer System Upgrades 2003
Complete Construction of Project W-314d Tank Farm Electrical Upgrade 2004
Complete Tank Farm Upgrades 2010
K-Basins:
Solid Waste:
Other:
Initiate Removal of Fuel from the K Basins 1997
Complete Removal of Fuel from the K Basins 1999
Complete Storage of K-Basins SNF 2035
Start Definitive Design for Phase V Mixed Waste Storage Facility 1995
Initiate Retrieval Operations of TRU Waste from 200E Burial Grounds 1998
Complete Construction for Phase V Mixed Waste Storage Facility 2000
Complete Solid Waste Storage 2035
Complete B-Cell aeanout 2001
Disposal Fiscal Year
High-Level Waste (Tank Waste Remediation System):
Complete HLW Vitrification at HWVP 2035
Ship Final High-Level Waste Canisters to Offsite Geologic Repository for Disposal 2040
Low-Level Waste:
Complete LLW Vitrification 2035
Complete LLW Disposal 2040
Complete LLMW Disposal 2040
WA 32

Washington
Major Activity Milestones (Continued)
ACTIVITY TASK COMPLETION DATE
Liquid Waste:
Transuranic Waste
Spent Nuclear Fuel:
Hazardous Waste:
Complete Construction of W-049H: 200 Area Treated Effluent Disposal Facility (TEDF) 1995
Complete TRU Waste Disposal
Complete Disposal for SNF
Complete Disposal of Hazardous Waste from WM
2049
2035
2047
Nuclear Material And Facility Stabilization Fiscal Year
UO3Plant Deactivation Completed 1995
Commerce Fuel Wash & Transfer to Dry Storage 1995
Complete ORNL Ship of WESF Residue 1998
Nuclear Material and Facility Stabilization Completed 2027
Complete RCRA and Operations Monitoring 2035
Complete Landlord Activities 2047
For further information on this site, please contact: Public Participation OfficePublic Affairs OfficeTechnical Liaison: Kerry Cameron
(509) 376-7501(509) 376-7501(509) 376-8035
WA 33

e 1995 Baseline Env ronmenta.I Management Report
WA 34

RIVERTON(COMPLETEDUMTRA SITE)*
1111 ), 4, M rl 13
SPOOK(COMPLETEDUMTRA SITE)*
*Summaries are not provided forfacilities with completed remedialactions. Any ongoing surveillance andmonitoring costs for these facilities areprovided in the table below.
WYOMINGEstimated State Total
Completed UMTRA Surveillance 8 Monitoring
(Thousands of Current 1995 Dollars)*
1Y 1995 1998 1991 1998 1999 00
170 630 2,530 7,020
• Costs for FY 1995 reflect Congressional Appropriation, costs for FY 1996 reflect EM budget submission, costs for FY 1997-2000 reflect Budget Shortfall Scenario, costs for
shaded area assume 3% annual inflation.
Five-Year Averages (Thousands of Constant 1995 Dollars)**
FY 1995-2000 2005 2010 2015 2020 2025 2030 Life Cycle***
Completed UMTRA Surveillance 8 Monitoring 2,342 1,999 1,135 1,260 0 0 0 36,027
Costs reflect a five-year average in constant 1995 dollars, except in FY 1995 - 2000, which is a six-year average.
*** Total Life Cycle is the sum of annual costs in constant 1995 dollars.
WY 1

Wyoming
WY 2

The 1995 Baseline Environmental Management Report
Glossary
Actinides. Elements with atomic numbers from 90 to 103.
Alternative cases. Alternative cases reflect ways the base case could change if vari-
ous policy decisions were made. The cases examine four areas most likely to affect
total costs: (1) land use, (2) program scheduling, (3) technology development, and
(4) waste management configuration.
Base case. The primary total program estimate in the 1995 Baseline Report that
best represents the most likely activities and costs under current projections.
Baseline. A quantitative expression of planned costs, schedule, and technical re-
quirements for a defined project. Baselines should include criteria to serve as a
standard for measuring the status of resources and the progress of a project.
Baseline Environmental Management Report (Baseline Report). Congressionally
mandated report prepared by the Secretary of Energy to estimate the cost and
schedule of cleaning up the Nation's nuclear weapons complex.
Bioremediation. The process of using microorganisms to degrade or break down
hazardous materials. The Department of Energy has used this remediation tech-
nique on Environmental Management projects.
Canyon. A slang term for a chemical separations plant; inspired by the plant's
long, high, narrow structure. Not all chemical separations plants are canyons.
Chemical separation. A process for extracting uranium and plutonium from dis-
solved spent nuclear fuel and irradiated targets. The fission products that are left
behind are high-level waste. Chemical separation is also known as reprocessing.
Cold War. A conflict over ideological differences (the United States and the former
Soviet Union) carried on by methods short of sustained military action."
Cold War Mortgage. The cost and effort associated with addressing the unprec-
edented environmental legacy of 50 years of nuclear weapons production.
Comprehensive Environmental Response, Compensation and Liability Act.
A Federal law, enacted in 1980, that governs the cleanup of hazardous, toxic, and
radioactive substances. The Act and its amendments created a trust fund, com-
monly known as Superfund, to finance the investigation and cleanup of aban-
doned and uncontrolled hazardous waste sites. Also commonly referred to by
its acronym, CERCLA.
Constant dollars. Constant dollars represent a dollar value adjusted for changes
in prices. Dollars in the future are adjusted by stripping out inflation by dividing
current dollar amounts by an appropriate index, a process known as deflating. The
result is a constant dollar series as it would exist if prices and transactions were
the same in all subsequent years as the base year. Any changes in such a series
would reflect only changes in the real volume of goods and services. The Baseline
Report cost projections are in constant dollars.
Current dollars. Current dollars represent the dollar value of goods or services in
terms of prices current at the time the goods or services were sold (inflation factors
are present).
GL 1

Glossary
Decommissioning. Retirement of a nuclear facility, including decontamination
and/or dismantlement.
Decontamination. Removal of unwanted radioactive or hazardous contaminationby a chemical or mechanical process.
Department of Energy. The cabinet-level U.S. Government agency responsible fornuclear weapons production and energy research and the cleanup of hazard-ous and radioactive waste at its sites. It was created from the Energy Research andDevelopment Administration and other Federal Government functions in 1977.
Discounting. The process of converting a stream of returns or costs incurred overtime to a single present value.
End-States. The state that exists after a site has been treated or remediated.
Enriched uranium. Uranium that, as a result of the process of enrichment, hasmore uranium-235 than natural uranium.
Environmental contamination. The release into the environment of radioactive,hazardous, and toxic materials.
Environmental Impact Statement. A report that documents the information re-quired to evaluate the environmental impact of a project. Such a report informsdecisionmakers and the public of the reasonable alternatives that would avoid orminimize adverse impacts or enhance the quality of the environment.
Environmental Management program. An Office of the Department of Energythat was created in 1989 to oversee the Department's waste management and envi-ronmental cleanup efforts. Originally called the Office of Environmental Resto-ration and Waste Management, it was renamed in 1993.
Environmental Protection Agency. A Federal agency responsible for enforcingenvironmental laws, including the Resource Conservation and Recovery Act; theComprehensive Environmental Response, Compensation and Liability Act; andthe Toxic Substances Control Act. The Environmental Protection Agency wasestablished in 1970.
Environmental restoration. Environmental restoration is usually described as"cleanup." But it encompasses a wide range of activities, such as stabilizing con-taminated soil; treating ground water; decommissioning process buildings,nuclear reactors, chemical separations plants, and many other facilities; and ex-huming sludge and buried drums of waste.
Federal Facility Compliance Act. A Federal act that requires the Depai [ment to de-velop and submit to States or the U.S. Environmental Protection Agency plans for de-veloping mixed-waste treatment capacity and technologies.
Fissile. Capable of being split by a low-energy neutron. The most common fissileisotopes are uranium-235 and plutonium-239.
Fissile material. A specific set of nuclear materials, such as uranium-235 and plu-tonium-239, that may be used in making a nuclear explosive for a weapon. It doesnot include fissile materials present in spent nuclear fuel or irradiating targetsfrom reactors.
GL 2

The 1995 Baseline Environmen al M 9ement Report
Formerly Utilized Sites Remedial Action Program (FUSRAP). This Federal programwas initiated in 1974 to identify and remediate sites around the country that werecontaminated during the 1940's and 1950's as a result of research and develop-ment, processing and production of uranium and thorium, and storage of process-
ing residues.
Gaseous diffusion. The process used to make enriched uranium in the
United States.
Geologic repository. The Department plans to build a geologic repository to dis-
pose of high-level waste. The repository is yet to be built. A site for a repository
has been identified but not yet approved. The repository is not expected to start
accepting Departmental wastes before the year 2016.
"Greenfields." The most unrestricted alternative case characterized by actively re-
moving or destroying contaminants in all media. These cases are "ideals" imprac-
tical to implement as alternatives.
Half-life. The half-life of a radioactive isotope is the time it takes for a quantity of
that isotope to lose half of its radioactivity. A half-life is the time it takes for half
the number of atoms in a sample to undergo radioactive decay.
Highly enriched uranium. Uranium with more than 20 percent of the ura-
nium-235 isotope, used for making nuclear weapons and also as fuel for some iso-
tope-production, research, and power reactors. Weapons-grade uranium is a
subset of this group.
In situ. In place.
"Iron fence." The most-restricted alternative case for land use. Iron fence is char-
acterized by containing, rather than actively remediating, contaminated sites. This
means that soil and buried waste sites would be capped, ground-water contamina-
tion would be controlled from spreading by hydraulic controls and barriers, and
facilities would be entombed.
Irradiate. To expose to ionizing radiation, usually in a nuclear reactor. Targets are
irradiated to produce isotopes.
Isotopes. Forms of the same chemical element that differ only by the number of
neutrons in their nucleus. Most elements have more than one naturally occurring
isotope. Many isotopes have been produced in reactors and scientific laboratories.
Land use. The ultimate uses to be permitted for currently contaminated lands,
waters, and structures at each Department of Energy installation. Land-use deci-
sions will strongly influence the cost of environmental management.
Landlord. Activities that involve the physical operation and maintenance of De-
partment of Energy installations. Specific tasks vary from installation to installa-
tion but generally include provision of utilities, maintenance, and general
infrastructure for the entire installation.
Life-cycle cost estimate. The cost to complete the mission of the Environmental
Management program.
GL 3

Glossary
Manhattan Project. The U.S. Government project that produced the first nuclear
weapons during World War II. Started in 1942, the Manhattan Project formally
ended in 1946. The Hanford Site, Oak Ridge Reservation, and Los Alamos Na-tional Laboratory were created for this effort. Named for the Manhattan EngineerDistrict of the U.S. Army Corps of Engineers.
National Defense Authorization Act. The Federal law, enacted in 1994, that re-quired the Secretary of Energy to prepare the Baseline Report. See Appendix A fora description of what the Act required.
National Environmental Policy Act. A Federal law, enacted in 1970, that requiresthe Federal Government to consider the environmental impacts of, and alterna-tives to, major proposed actions in its decisionmaking processes. Commonly re-ferred to by its acronym, NEPA.
Nonproliferation. Efforts to prevent or slow the spread of nuclear weapons andthe materials and technologies used to produce them.
Nuclear material and facility stabilization. An Environmental Management sub-program that manages the transfer to Environmental Management of the responsi-bilities and facilities that formerly belonged to the nuclear weapons program.Several sites already have been transferred to Environmental Management for de-activation and subsequent cleanup. As other sites are transferred to EnvironmentalManagement, the existing resources (funding and personnel) also will be trans-ferred to Environmental Management.
Nuclear reactor. A device that sustains a controlled nuclear fission chain reaction.
Nuclear weapons complex. The chain of foundries, uranium enrichment plants,reactors, chemical separation plants, factories, laboratories, assembly plants, andtest sites that produces nuclear weapons. Sixteen major U.S. facilities in 12 Statesformed the nuclear weapons complex.
Operable unit. The cleanup of a site can be divided into a number of operableunits, depending on the complexity of the problems associated with the site. Oper-able units may address geographical portions of a site, specific site problems, orinitial phases of an action or may consist of any set of actions performed over timeor any actions that are concurrent but located in different parts of a site.
Plutonium. A man-made fissile element. Pure plutonium is a silvery metal that isheavier than lead. Material rich in the plutonium-239 isotope is preferred for manu-facturing nuclear weapons, although any plutonium can be used. Plutonium-239has a half-life of 24,000 years.
Production reactor. A nuclear reactor designed to produce manmade isotopes. Tri-tium and plutonium are made in production reactors. The United States has 14such reactors: 9 at the Hanford Site and 5 at the Savannah River Site. Some re-search reactors are also used to produce isotopes.
Polychlorinated biphenyls (PCBs). A group of commercially produced organicchemicals used since the 1940's in industrial applications throughout the nuclearweapons complex. Most notably, PCBs are found in many gaskets and large elec-trical transformers and capacitors in the gaseous diffusion plants. PCBs have beenproven to be toxic to both humans and laboratory animals.
GL 4

The 1995 as+1 was Er v ra rmerrtaM Marik',age!,era Report
Present Value. The sum that, when available now and invested at a prevailing in-
terest rate, will equal a given value at a defined date in the future.
Program direction. Activities that include salaries and benefits for all Federal full-time equivalents at Headquarters and the field officies.
Program management. Activities that include planning, monitoring, and reporting
of ongoing activities, cost/schedule tracking, clerical, other administrative sup-
port, and grants to States and localities.
Program scheduling. How environmental management activities will be priori-
tized and how rapidly the money will be spent. One of the four alternative cases
analyzed as part of the Baseline Report.
Radioactive. Of, caused by, or exhibiting radioactivity.
Radioactivity. The spontaneous emission of radiation from the nucleus of an atom.
Radionuclides lose particles and energy through this process.
Radioisotope. A radioactive isotope.
Record of Decision (ROD). A public document that explains which cleanup alter-
natives will be used at National Priorities List sites where, under CERCLA, trust
funds pay for the cleanup.
Radionuclide. A radioactive species of an atom. For example, tritium, stron-
tium-90, and uranium-235 are radionuclides.
Reprocessing. Synonymous with chemical separations.
Research reactor. A class of nuclear reactors used to do research into nuclear phys-ics, reactor materials and design, and nuclear medicine. Some research reactors
also produce isotopes for industrial and medical use.
Residual contamination standards. The amount and concentrations of contami-nants in soil, water, and other media that will remain following environmentalmanagement activities. One of the four alternative cases analyzed as part of theBaseline Report.
Resource Conservation and Recovery Act (RCRA). A Federal law enacted in 1976
to address the treatment, storage, and disposal of hazardous waste.
Rocky Flats Environmental Technology Site. Plutonium processing and manufac-turing plant located 21 miles northwest of Denver, Colorado. Rocky Flats made theplutonium triggers of nuclear weapons. Started operations in 1951.
Saltcake. A cake of dry crystals of nuclear waste found in high-level waste tanks.
Site characterization. An onsite investigation at a known or suspected contami-
nated waste or release site to determine the extent and type(s) of contamination.
Spent nuclear fuel. This includes all nuclear fuel generated by Department of En-ergy production reactors, university and Government research reactors, foreign re-search reactors that use fuel of U.S. origin, and naval nuclear propulsion reactors.
Stakeholder. Anyone interested in, or affected by, Department of Energyactivities. Stakeholders have varying levels of concern about the EnvironmentalManagement program and varying levels of expertise.
GL 5

Glossary
Superfund. A term commonly used to refer to the Comprehensive Environmental
Response, Compensation and Liability Act (CERCLA).
Surplus Facility Inventory Assessment. A 2-year assessment, beginning in Octo-ber 1993, that baselines the Department's surplus inventory and the effort to char-acterize those assets for transfer to the Office of Environmental Management.
Technology development. Technology development considers how future tech-nologies may influence programs costs. One of the four alternative cases analyzedas part of the Baseline Report.
Unadjusted total life-cycle costs. Total life-cycle costs without productivity sav-ings.
Uranium. The basic material for nuclear technology. It is a slightly radioactivenaturally occurring heavy metal that is more dense than lead. Uranium is 40 timesmore common than silver.
Uranium mill. A plant where uranium is separated from ore taken from mines.
Uranium mill tailings. The sandlike materials left over from the separation of ura-nium from its ore. More than 99 percent of the ore becomes tailings.
Vitrification. The process by which waste is transformed from a liquid or sludgeinto an immobile solid—trapping radionuclides and preventing waste from con-taminating soil, ground water, and surface water. The Department of Energy hasselected vitrification processes to solidify and stabilize certain forms of radioactiveand hazardous waste. This process does not reduce radioactivity. Borosilicate glassis the material that the Department of Energy will use to immobilize its high-levelradioactive waste.
Waste Isolation Pilot Plant. A geologic repository intended to provide permanentdisposal deep underground for transuranic waste. The Waste Isolation Pilot Plant isexpected to open in 1998 if approved.
Waste management. Waste management includes treating, storing, and disposingof a variety of wastes, including high-level radioactive waste, transuranic waste,low-level radioactive waste, and low-level mixed waste, hazardous chemical waste,and sanitary waste.
Waste management configuration. Refers to Department of Energy installationsthat will treat, store, and dispose of wastes. Waste management configuration isone of five alternative cases analyzed as part of the Baseline Report.
GL 6