Built-in Self-Calibration and Digital-Trim Technique for 14-Bit SAR ADCs Achieving ±1 LSB INL
Upload
independentCategory
view
0download
0
RESEARCH ARTICLE
Expression profiling of proteins in L-threonine
biosynthetic pathway of Escherichia coli by using
antibody microarray
Min-Kyu Han1, Mi-Young Hong1, Dohoon Lee1, Dong-Eun Lee1, Geon Youp Noh2,Jin-Ho Lee3, Sung-Ho Kim2 and Hak-Sung Kim1
1 Department of Biological Sciences, Korea Advanced Institute of Science and Technology, Guseong-dong,Daejeon, Korea
2 Division of Applied Mathematics, Korea Advanced Institute of Science and Technology, Guseong-dong,Daejeon, Korea
3 R&D Center of Bioproducts, Institute of Science and Technology, CJ Corp., Gyeonggi-do, Korea
We demonstrate the use of an antibody (Ab) microarray for a comparative expression profiling ofproteins in an L-threonine biosynthetic pathway of Escherichia coli between a parental strain(W3110) and L-threonine overproducing mutant (TF5015). On the basis of a global comparativetranscriptome analysis between the two strains, 28 analytical target proteins were selected andsubjected to a production of polyclonal Abs against them. An Ab microarray was constructed byspotting a set of produced antibodies on a glass slide, and was employed for a comparativeexpression profiling of the proteins between the two strains by a two-color fluorescence assaymethod. The performance of the Ab microarray was evaluated with respect to cross-reactivity ofthe antibodies, dye-labeling efficiency, and the nature of antigenic proteins. Of these, the cross-reactivity of the used antibodies was found to mainly cause the deviation of the observed expres-sion ratios from the expected ones. To offset the deviations, correction factors were derived from astatistical analysis and introduced. As a result, ten proteins were categorized to be up-regulated,while one was down-regulated in TF5015. Expression profiling of proteins using the Ab micro-array was further verified by comparison with Western blotting and 2-DE.
Received: May 1, 2006Revised: July 14, 2006
Accepted: July 17, 2006
Keywords:
Antibody microarrays / Cross-reactivity / Expression profiling / L-threonine biosynthe-sis
Proteomics 2006, 6, 5929–5940 5929
1 Introduction
In the post-genomic era, the wealth of proteomic informa-tion and complexity of intracellular signaling processes haverequired an efficient analytical approach to accomplish arapid, low-volume and multiplexed assay in a high-through-put manner [1, 2]. Such methods can be effectively used forbasic biological research, diagnoses of diseases, identifica-tion of therapeutic markers and targets, and profiling ofresponses to toxins and pharmaceuticals [3–9]. A large num-
Correspondence: Professor Hak-Sung Kim, Department of Bio-logical Sciences, Korea Advanced Institute of Science and Tech-nology 373-1, Guseong-dong, Yuseong-gu, Daejeon 305-701,KoreaE-mail: [email protected]: 182-42-869-2610
Abbreviations: Ab, antibody; cat, chloramphenicol acetyltrans-ferase; His6, hexahistidine; IgG, immunoglobulin G; KO, knock-out; LB, Luria-Bertani; MBP, maltose binding protein; NHS,N-hydroxysuccinimide
DOI 10.1002/pmic.200600324
© 2006 WILEY-VCH Verlag GmbH & Co. KGaA, Weinheim www.proteomics-journal.com
5930 M.-K. Han et al. Proteomics 2006, 6, 5929–5940
ber of studies have shown the utility of antibody (Ab) arraysfor the quantitation of specific proteins and the discovery ofbiomarkers based on a comparative profiling of the proteinexpression between sample and reference pools [7, 10, 11]. Inaddition, the feasibility and performance of Ab microarrayswere evaluated with respect to parallel quantitation for anti-gen-antibody interactions and parameters for microarrayfabrication [12–15]. Notable advances have been made in thedevelopment of an Ab microarray, offering some advantagesin terms of sample volume, high-throughput analysis, andsimplicity over conventional methods, including Westernblotting and 2-DE. However, despite a number of studiesregarding the utility of an Ab microarray, its reliability in theexpression profiling of proteins remains a challenge [16].
Here, we demonstrate the use of an Ab microarray for acomparative expression profiling of proteins in the L-threo-nine biosynthetic pathway of Escherichia coli between W3110and TF5015 through a two-color fluorescence assay. For this,28 target proteins involved in L-threonine biosynthesis wereselected on the basis of our previous study on a tran-scriptome analysis between the two strains [17], and werethen subjected to a production of polyclonal Abs. We con-structed an Ab microarray with the produced antibodies, andinvestigated the factors affecting the performance of the Abmicroarray. Expression profiling of the proteins between thetwo strains was performed with reasonable reliabilitythrough a statistical analysis. The utility of the microarraywas further verified by comparison with Western blottingand 2-DE, the details of which are reported here.
2 Materials and methods
2.1 Expression and purification of E. coli proteins
For the amplification of target genes as listed in Table 1, a setof primers for each gene was designed based on a respectivesequence taken from a Swiss-Prot database. Each gene wasPCR-amplified from the genomic DNA of an E. coli W3110strain using Pfu DNA polymerase and corresponding prim-ers. Genes coding ThrA, PtsG, and OppA were cloned into aconstitutive expression vector system, pHCEIA (NcoI)(Takara, Shiga, Japan), with the insertion of a hexahistidine(His6)-tag at the N terminus. In the case of PtsG, only thecytoplasmic domain [18] was cloned because serious cell lysisoccurred when the whole protein was overexpressed. Thegenes coding for Ppc, AceB, ThrC, and a C-terminal frag-ment of Ppc monomer were cloned into pMAL-c2x (NewEngland Biolabs, Beverly, MA, USA) for a maltose bindingprotein (MBP)-fused expression. All remaining genes werecloned into pQE30 (Qiagen, Chatsworth, CA, USA) for aHis6-tag fusion at the N terminus. All restriction reactions ofplasmid were treated with calf intestinal alkaline phospha-tase to prevent self ligation. The constructed plasmid wastransformed into an E. coli JM109 by electroporation, andtransformed cells were cultured in a Luria-Bertani (LB) me-
dium. When OD600 nm reached about 0.5, E. coli cells har-boring inducible vectors (e.g., pQE30 and pMAL-c2x) wereinduced by addition of isopropyl-b-D-thiogalactopyranosideinto a culture medium at a final concentration of 1 mM. Asfor pHCEIA (NcoI), host cells were cultured for 12 h tomaximize the expression level of protein.
His6-tagged and MBP-fused proteins were purified fromE. coli lysates according to the manufacturer’s instructions.His6-tagged proteins were loaded to Ni-nitrilotriacetic acidresin followed by elution with a 250 mM imidazole solution.MBP-fused proteins purified through amylose resin weretreated with Factor Xa and further purified according to themanufacturer’s instructions. Purity of the acquired proteinswas confirmed by SDS-PAGE (Fig. 1A, top). Protein con-centration was determined using a standard protein assay kit(Bio-Rad Laboratories, Hercules, CA, USA). Protein sampleswere stored at 2207C until further use.
2.2 Construction of E. coli knockout mutant
A specific gene of E. coli was deleted according to the methodby Datsenko et al. with a slight modification [19]. Briefly,500 nucleotides at the N and C termini of the target genewere PCR-amplified from the genomic DNA of W3110. Inparallel, the chloramphenicol acetyltransferase (cat) genewas amplified from pKD3. The acquired three PCR productswere assembled by overlapping PCR in the order of N-ter-minal, cat, and C-terminal sequences. The integratedsequences were transformed into pKD46-harboring compe-tent cells induced by arabinose to express a l Red recombi-nase system. The transformed cells were then incubated for8 h at room temperature to give rise to recombination be-tween transformed and genomic DNA sequences. Replace-ment of the target gene in the host cells with transformedDNA renders cells resistant to chloramphenicol, and antibi-otic-resistant transformants can be selected on a LB-agarmedium containing 25 mg/mL chloramphenicol. Construc-tion of a knockout (KO) mutant was finally verified by PCR.
2.3 Preparation of Abs
Abs against 28 target proteins of E. coli were produced from arabbit according to standard procedures [20]. Briefly, about200 mg purified antigenic protein was mixed with Freund’scomplete adjuvant, followed by the first injection into therabbit. Every 2 weeks, the same amount of antigen contain-ing Freund’s incomplete adjuvant was introduced into thesame rabbit until the induction of each Ab was detected. Thegeneration of the respective Ab in serum was confirmed byWestern blotting. Each Ab against the cognate antigen waspurified from the serum for construction of the Ab micro-array. Briefly, cyanogen bromide-activated Sepharose resin(Sigma-Aldrich, St. Louis, MO, USA) was first activated byrinsing with refrigerated 1 mM HCl and a conjugation buf-fer (0.1 M sodium bicarbonate buffer containing0.25 M NaCl, pH 8.3). The activated resin was incubated
© 2006 WILEY-VCH Verlag GmbH & Co. KGaA, Weinheim www.proteomics-journal.com

Proteomics 2006, 6, 5929–5940 Protein Arrays 5931
Table 1. List of E. coli proteins used in Ab microarray assays
ID no. Gene name Protein name Function Correctionfactora)
0 Anti-human immunoglobulin G antibody Internal standard for normalization –
1 ppc Phosphoenolpyruvate carboxylase Energy metabolism 2.0832 thrA Aspartokinase/homoserine dehydrogenase I Amino acid biosynthesis 2.5823 gapA Glyceraldehyde 3-phosphate dehydrogenase A Energy metabolism 2.5374 pfkA 6-Phosphofructokinase isozyme 1 Energy metabolism 2.3865 ptsG PTS system, glucose-specific IIBC component Transport 2.4376 aceA Isocitrate lyase Cell Structure 2.2707 gltA Citrate synthase Central intermediary metabolism 2.3478 proA Gamma-glutamyl phosphate reductase Amino acid biosynthesis 2.0849 pgk Phosphoglycerate kinase Energy metabolism 2.261
10 fba Fructose-bisphosphate aldolase class II Energy metabolism 1.71611 sdhA Succinate dehydrogenase flavoprotein subunit Energy metabolism 2.25212 pgi Glucose-6-phosphate isomerase Energy metabolism 2.36113 pgm Phosphoglucomutase Carbon compound catabolism 2.32514 pckA Phosphoenolpyruvate carboxykinase Central intermediary metabolism 1.60415 mdh Malate dehydrogenase Energy metabolism 1.52016 pfkB 6-Phosphofructokinase isozyme 2 Energy metabolism 2.48217 dapB Dihydrodipicolinate reductase Amino acid biosynthesis 2.17418 zwf Glucose-6-phosphate 1-dehydrogenase Energy metabolism 2.17219 eno Enolase Energy metabolism 2.43520 icdA Isocitrate dehydrogenase Central intermediary metabolism 1.77621 aspC Aspartate aminotransferase Amino acid biosynthesis 1.45122 asd Aspartate-semialdehyde dehydrogenase Amino acid biosynthesis 1.81923 thrB Homoserine kinase Amino acid biosynthesis 2.03424 aceB Malate synthase A Cell structure 2.15825 thrC Threonine synthase Amino acid biosynthesis 2.05326 yfiD Hypothetical protein yfiD Energy metabolism 1.92227 ahpC Alkyl hydroperoxide reductase subunit C Sulfate starvation-induced protein 1.54728 oppA Periplasmic oligopeptide-binding protein Transport 2.101
29 Anti-bovine serum albumin antibody Negative control –
a) Correction factors were estimated through statistical analysis of the data from the calibration tests as described in the Materials andMethods section.
Figure 1. (A) SDS-PAGE of purified target proteins from E. coli (top) and affinity-purified antibodies against cognate proteins (bottom).(B) Layout of Ab spots in a microarray for profiling of differential expression of 28 target proteins, including an internal standard (S) and anegative control (N). Spotted antibodies in quadruplicate were visualized using Cy3-labeled protein A.
© 2006 WILEY-VCH Verlag GmbH & Co. KGaA, Weinheim www.proteomics-journal.com
5932 M.-K. Han et al. Proteomics 2006, 6, 5929–5940
overnight with an antigenic protein solution (,8 mM) at 47C.After the remaining reactive groups of the antigen-coupledresin were blocked by immersion in a 1 M Tris-HCl buffer(pH 8.0) at room temperature for 2 h, the blocked resin waspacked in a column under atmospheric pressure. To removesimply adsorbed proteins, the antigen-coupled resin wasthen washed by flowing ten volumes of the 0.1 M sodiumacetate buffer containing 0.5 M NaCl (pH 4.0) and PBS.After a thorough washing with PBS, the column was incu-bated with diluted anti-serum for 3 h at room temperature,followed by a washing with ten volumes of PBS. Ab bound tothe antigen-coupled resin was finally eluted by running0.2 M glycine-HCl (pH 2.7). Eluted Ab fractions were imme-diately neutralized, collected, and desalted with PBS. All pu-rified Abs were concentrated to about 0.5 mg/mL with anAmicon concentrator (Millipore, Billerica, MA, US), ana-lyzed to estimate the purity using SDS-PAGE (Fig. 1A, bot-tom), and then stored below 2207C until further use.
2.4 Preparation and dye-labeling of proteins
For cultivation of both strains, a 250-mL flask was filled with20 mL fermentation medium (pH 7.0) containing 1.4 g glu-cose, 40 mg KH2PO4, 340 mg (NH4)2SO4, 20 mgMgSO4?7H20, 0.2 mg MnSO4?4H2O, 0.2 mg FeSO4?7H2O,0.6 g CaCO3, 3 mg methionine, and 40 mg yeast extract [17].When growth of the cells in the flask reached an early sta-tionary phase, a aliquot of 1.5 mL was centrifuged, re-sus-pended with PBS, and then lysed using a sonicator (Sonics &Material, Newtown, CT, USA). Following the separation of asupernatant by centrifugation, the resulting E. coli lysateswere dialyzed using a membrane with a molecular cutoff of12 kDa (Spectrum medical industries, LA, CA, USA) toremove free amino acids in lysates for an efficient labeling offluorescent dyes. As the internal standard protein for nor-malization of detected signals, human immunoglobulin G(IgG) was added to the dialyzed lysates, and final concentra-tions of IgG and lysate were adjusted to be 200 ng/mL and1 mg/mL, respectively.
To probe the differential expression of target proteinsbetween W3110 and TF5015 on the Ab microarray, celllysates and other proteins were labeled with N-hydroxy-succinimide ester (NHS)-linked Cy3 or Cy5 dye (AmershamBiosciences, Buckinghamshire, UK). Either Cy3 or Cy5 dyewas added into the cell lysate (1 mg/mL in PBS) in the dark,and the reaction mixture was placed for 30 min at roomtemperature with a gentle mixing every 10 min. After thecoupling reaction was stopped by the addition of 1 M Tris-HCl (pH 8.0), dye-labeled proteins were separated from freedyes using gel filtration chromatography and concentrated to1 mg/mL. From spectroscopic titration using a UV-Vis spec-trophotometer, a labeled ratio of dye to protein was found tobe about 1 for the lysates from both strains. To label andinspect the integrity of the Ab spots, a mixture of protein Afrom Staphylococcus aureus (10 mg/mL) and ovalbumin(1 mg/mL) was labeled with NHS-linked Cy3 dye and used.
For assessment of the cross-reactivity of antibodies, a mix-ture of purified proteins (concentration of each protein was200 ng/mL) containing ovalbumin (1 mg/mL) was labeledwith either Cy3 or Cy5 dye and used.
2.5 Fabrication of Ab microarray and read out
The Ab microarray was constructed by spotting antibodiesonto an epoxy-coated glass slide (Slide E; Schott Nexterion,Jena, Germany) using a robotic arrayer (Microsys, CartesianTechnologies, Irvine, CA, USA) equipped with CMP 3 spot-ting pins (Telechem International, Sunnyvale, CA, USA). Asshown in Fig. 1B, a single Ab microarray was composed of aset of 28 antibodies raised against E. coli proteins, anti-hu-man IgG (Sigma-Aldrich, St. Louis, MO, USA), and anti-BSA (Sigma-Aldrich) as the internal standard and negativecontrol, respectively, and each Ab was spotted in quad-ruplicate. All protein solutions for spotting were prepared inPBS supplemented with 0.5% trehalose, and a relativehumidity of the arrayer was maintained at 70%. Followingincubation at room temperature for 3 h after spotting, theAb-spotted slide was taken out of the arrayer and subse-quently blocked with PBS supplemented with either5% BSA, 3% TopBlock (Fluka, Buchs, Switzerland), or5% skimmed milk for 3 h. After a thorough washing withPBS, the Ab microarray was incubated with dye-labeled bio-logical samples in the dark for 1 h. Prior to fluorescencedetection, the Ab microarray was consecutively washed withPBS, PBS containing 0.1% Tween-20 (PBST), and distilledwater followed by drying with N2 gas. Fluorescence inten-sities emitted from Cy3- and Cy5-specific channels were readout using a fluorescence scanner (GenePix Personal 4100A;Axon instruments, Union City, CA, USA), and analyzedusing GenePix Pro 4.1 software provided by the manu-facturer. Intensities of Cy3 and Cy5 taken from all spots werecorrected for background intensity, subjected to normal-ization against the average intensity of Cy5/Cy3 estimatedfrom anti-human IgG spots, and their median values werecollected. Raw spots showing either obvious defects or anS/N less than 2 were discarded prior to further analysis. Inthis way, assays of the Ab microarray were carried out intriplicate each day for 3 days, and accordingly, the resultingratios represent the average of 32 values for each Ab spot.
To assess the extent of cross-reactivity of Ab, the lysates ofW3110 and its KO mutants were used. The lysates from KOmutants and W3110 were separately labeled with Cy5 dye asdescribed above, and each lysate was loaded onto the Abmicroarray. If an Ab has no cross-reactivity, no fluorescenceintensity would be observed from the Ab when lysate from aKO mutant is applied to the Ab microarray because the Ab-specific antigenic protein is not expressed. On the contrary,an Ab with high cross-reactivity would display high Cy5intensity even for lysate from a KO mutant. Thus, it is infer-red that the relative fluorescence intensity from lysate of aKO mutant against that from W3110 on the respective Abspot can represent the degree of cross-reactivity. In this
© 2006 WILEY-VCH Verlag GmbH & Co. KGaA, Weinheim www.proteomics-journal.com
Proteomics 2006, 6, 5929–5940 Protein Arrays 5933
regard, we compared the signal intensity of Cy5-labeled KOlysate with that of Cy5-labeled W3110 lysate for specific anti-bodies after normalization of array-to-array variation usingan internal standard. A set of these data versus the measuredones from Fig. 2A were then subjected to K-means analysisto evaluate the extent of cross-reactivity of each Ab anddeviation of the measured ratio from the expected one.
2.6 Statistical analysis
The measured ratios using a comparative fluorescence assaywere found to be biased from the expected ones, and a cor-rection factor was introduced to offset the deviations. To thisend, we performed calibration tests using a set of artificiallymingled E. coli lysates. Experimentally obtained data weresubjected to regression analysis where a measured ratio fromthe target protein was defined as a predictor variable (Xij, i = 1,2, . . ., 9, j = 1, 2, . . ., ni) and an expected, real one as a re-sponse variable (Yij, i = 1, 2, . . ., 9, j = 1, 2, . . ., ni). Accord-ingly, a no-intercept regression model was assumed [yij =b̂ xij 1 eij, eij , N (0, s2)], and this seemed appropriate to ananalysis of the Ab microarray data. In this model, the value ofb̂ was estimated for each Ab by a least square method (yij =b̂ xij), and correspondingly, appropriateness of the model wasassessed based on the coefficient of determination (R2). Onthe other hand, a K-means analysis was employed todemonstrate and classify the seriousness of cross-reactivityof the Ab for analysis of E. coli lysates. In the process of data-mining clustering, we first partitioned experimentallyobtained items into K initial clusters, processed through thelist of items, and then assigned an item to the cluster whosecentroid (mean value) is nearest. In a serial process, the sec-ond step was repeated until no more reassignment tookplace, as the centroid was recalculated for the cluster receiv-ing a new item and for the cluster losing the item. Mean-while, the effect of alternative labeling of Cy5 and Cy3 dyeswas tested for W3110 and TF5015 lysates. The outcome wasrepresented by estimation of a Cy5/Cy3 intensity ratio for agiven condition, multiplication by a measured ratio from a
reverse labeling test, and then conversion into a log2 base. Ifthe ultimate value is close to ‘zero’, this denotes no effect ofalternative labeling on dye-labeling efficiency for the corre-sponding Ab.
2.7 Western blotting, 2-DE, and MALDI-MS
Cell lysate (100 mg) from either W3110 or TF5015 was pre-pared as described above and applied to SDS-PAGE forseparation. The developed gel was equilibrated with transferbuffer (30 mM glycine, 48 mM Tris, 0.037% SDS, and20% methanol, pH 8.3), and proteins on the gel were electro-transferred onto an NC membrane (Amersham Biosciences,Buckinghamshire, UK). The blotted membrane was incu-bated with a 1000-fold diluted antiserum raised against eachprotein, and then with a 2000-fold diluted anti-rabbit IgGconjugated with a horseradish peroxidase. Ab-bound pro-teins were visualized using an immuno-blot assay kit (Bio-Rad), and the thicknesses of the visible bands were estimatedusing ImageJ software (National Institute of Health,Bethesda, MD, USA).
2-DE and MALDI-TOF MS were carried out according toprocedures described previously [17]. Briefly, W3110 andTF5015 lysates were dissolved in 400 mL rehydration buffer(8 M urea, 2% CHAPS, 18 mM DTT, 0.5% IPG buffer) andloaded onto 18-cm IPG strips (pH 3–10 L type) (AmershamBiosciences). Following incubation for 12 h, proteins werefocused on the IPG strip by applying a serial of voltages at500 V for 1 h, 1000 V for 1 h, and finally, 8000 V for 12 h.Thereafter, separation of proteins in the second dimensionwas conducted by SDS-PAGE. After fixation and CBB stain-ing, a 2-DE gel was scanned, and densities of spots wereaveraged from three different gel images. Protein spots dis-playing distinctly different intensities between W3110 andTF5015 were excised followed by digestion with a 20 ng se-quencing-grade trypsin (Promega, Madison, WI, USA). Apool of digested peptides was analyzed by MALDI-MS(Voyager-DE STR, Applied Biosystems, Drive Foster City, CA,USA). In a peptide fingerprint, peaks derived from
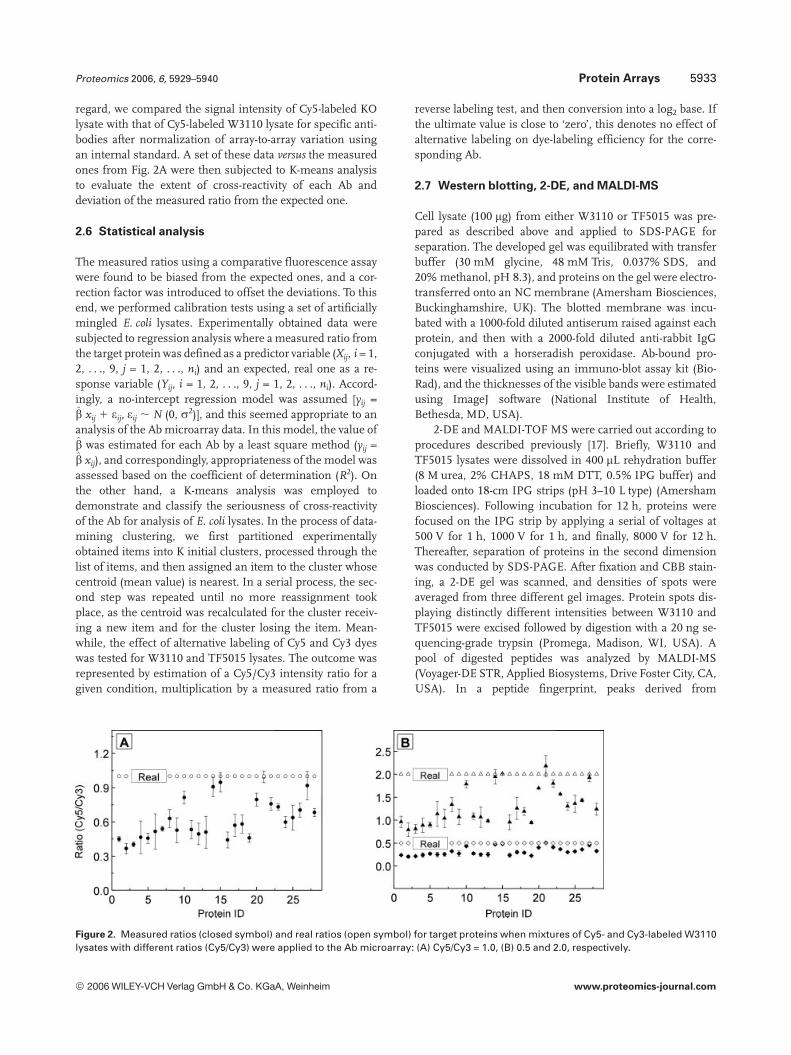
Figure 2. Measured ratios (closed symbol) and real ratios (open symbol) for target proteins when mixtures of Cy5- and Cy3-labeled W3110lysates with different ratios (Cy5/Cy3) were applied to the Ab microarray: (A) Cy5/Cy3 = 1.0, (B) 0.5 and 2.0, respectively.
© 2006 WILEY-VCH Verlag GmbH & Co. KGaA, Weinheim www.proteomics-journal.com

5934 M.-K. Han et al. Proteomics 2006, 6, 5929–5940
autodigestion of trypsin were used as an internal calibration.Trypsin-digested protein was identified using Protein Pro-spector (http://prospector.ucsf.edu/) and based on compar-ison with an E. coli reference gel provided by SWISS-2DPAGE (http://tw.expasy.org/ch2d//).
3 Results and discussion
3.1 Construction of Ab microarray
We previously conducted comparative analyses of tran-scriptome and proteome between prototropic E. coli W3110and L-threonine overproducing TF5015 strains to get someinsight into global regulation in modulating an L-threoninebiosynthetic pathway using a DNA macroarray and 2-DEintegrated with MALDI-MS [17]. As a result, 54 of4290 genes in total (1.3%) were found to give rise to differ-ential expression profiles in TF5015. The current analyticalmethods are unlikely to precisely decipher the differentialexpression of all kinds of proteins in biological systems. The2-DE technique is known to be ineffective for the analysis oflow-abundance, large, and hydrophobic proteins such asmembrane proteins [21]. In contrast, Ab microarrays havebeen reported to capture and detect even large or low-abun-dance proteins in complex biological samples with sufficientsensitivity in a high-throughput manner [6, 13]. In this con-text, we attempted a microarray-based approach to identifydifferentially expressed proteins in an L-threonine biosyn-thesis pathway between W3110 and TF5015. For this, weselected 28 target genes and corresponding proteins, whichappear to be linked with the L-threonine over-productionability of TF5015, based on a transcriptome analysis [17]. Assummarized in Table 1, most of the selected proteins areinvolved in energy metabolism, amino acid biosynthesis,catabolism of the carbon compound, central intermediarymetabolism, cell structure, sulfate starvation response, andtransport [17].
Antibodies against the 28 selected target proteins wereobtained from sera of immunized rabbits through affinitypurification using corresponding target proteins (Fig. 1A). Aset of 28 antibodies, together with antibodies as an internalstandard (anti-human IgG) for normalization and a negativecontrol (anti-BSA), were arrayed onto an epoxy-coated glassslide in quadruplicate for each Ab. The layout of the spottedantibodies was then probed by incubating the prepared Abmicroarray with a solution of Cy3-labeled protein A (Fig. 1B).Spots with uniform morphology and strong fluorescenceemission indicate reliability of the arraying conditions usedin this work.
3.2 Ab microarray assays
The constructed Ab microarray was subjected to analysis ofcomplex biological samples. When the Ab microarray wastreated with E. coli lysates, intensities of background signals
were usually less than 5% of the genuine signal intensitiesfrom Ab spots. This indicates that use of 5% BSA, 3% Top-Block, or 5% skimmed milk was effective for the blocking ofnon-spotted areas, preventing nonspecific adsorption of pro-teins. Signals from Ab spots were corrected against thebackground signal and normalized using the average valueof the Cy5/Cy3 intensity ratio from internal standard spots.In a two-color fluorescence assay, a number of normalizationmethods have been attempted to compensate for the dis-crepancies in labeling efficiencies and quantum yields ofdyes [22]. In this study, human IgG as an internal standardwas added in the same quantity into two different biologicalsamples for labeling with Cy3 and Cy5 dyes.
We first tested whether the constructed Ab microarrayyields a reliable profiling of protein expressions. Severalreports have shown that the experimentally observed ratiosusing protein microarrays often display serious deviationfrom the expected, real ones in comparative analysis [2, 5,12]. For instance, Miller et al. [5] reported that Ab microarrayassays and ELISA revealed significant variation in correlationparameters when the abundance of proteins between cancerand normal sera were analyzed. In this context, we con-ducted calibration tests using a set of E. coli lysates with apredetermined ratio of dye-labeled proteins to examine whe-ther the measured ratios from Ab microarray assays are wellcorrelated with the expected ones. Cy5- and Cy3-labeledW3110 lysates were mixed at three different ratios, 0.5-, 1.0-,and 2.0-fold (Cy5/Cy3), and applied to Ab microarrays. As aresult, we observed the deviation of the measured ratios fromthe expected ones for all the tested ratios (Fig. 2). This dis-crepancy seemed to be caused by various factors includingcross-reactivity of Ab, inconsistency of dye-labeling effi-ciency, low concentration of antigens, and loss of Ab reactiv-ity during spotting [5]. It is inferred that direct use of theexperimentally measured ratios does not reflect a real one ina biological sample, leading to erroneous interpretation ofthe expression profiling of proteins.
3.3 Factors affecting the performance of Ab
microarray
To gain some insights into the factors causing the dis-crepancy between the measured ratios and the expectedones, we first assessed the cross-reactivities of spotted anti-bodies. The lysates from W3110 and its KO mutants lackingspecific genes were used. Seven proteins were chosen bytaking into consideration the extent of deviation from thereal ratios (Fig. 2). The lysates of KO mutants and W3110were separately labeled with Cy5 dye, and each lysate wasapplied to an Ab microarray. We reasoned that comparativeanalysis of the fluorescence intensity of a given spot betweenKO mutant and W3110 lysates would reveal the extent ofcross-reactivity of the corresponding Ab. We determined therelative intensities from seven Ab spots between the Cy5-labeled KO mutant and Cy5-labeled W3110 lysates, and plot-ted them against the observed ratios of selected proteins that
© 2006 WILEY-VCH Verlag GmbH & Co. KGaA, Weinheim www.proteomics-journal.com
Proteomics 2006, 6, 5929–5940 Protein Arrays 5935
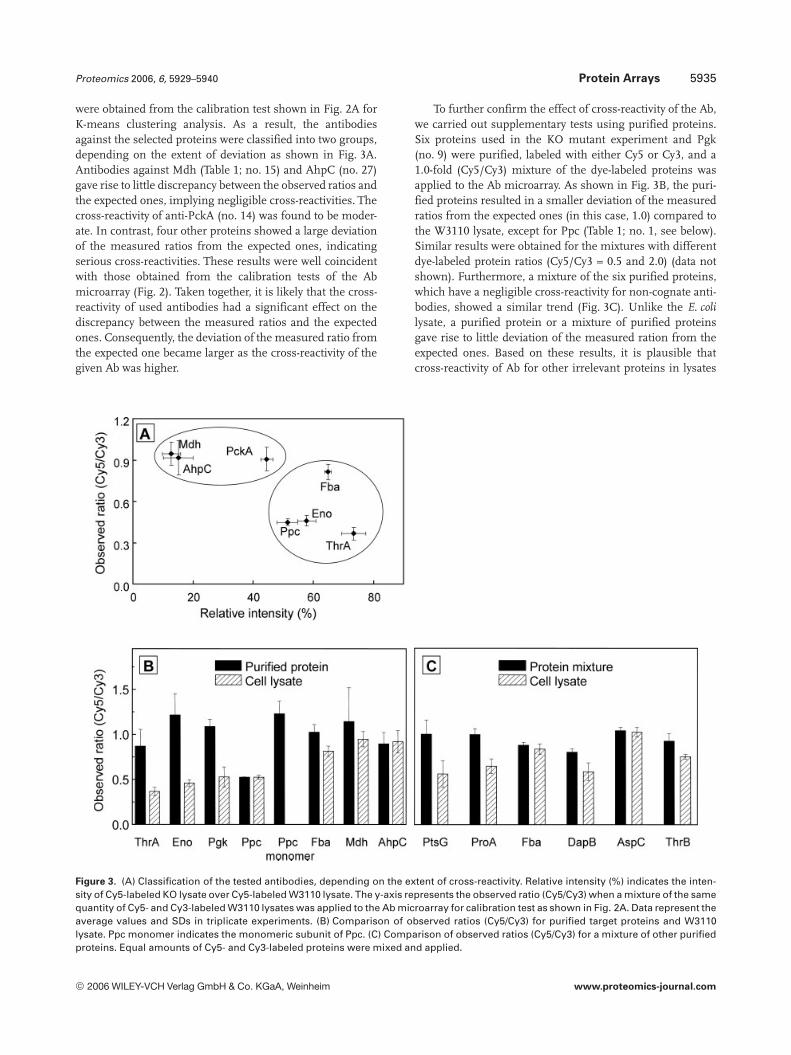
were obtained from the calibration test shown in Fig. 2A forK-means clustering analysis. As a result, the antibodiesagainst the selected proteins were classified into two groups,depending on the extent of deviation as shown in Fig. 3A.Antibodies against Mdh (Table 1; no. 15) and AhpC (no. 27)gave rise to little discrepancy between the observed ratios andthe expected ones, implying negligible cross-reactivities. Thecross-reactivity of anti-PckA (no. 14) was found to be moder-ate. In contrast, four other proteins showed a large deviationof the measured ratios from the expected ones, indicatingserious cross-reactivities. These results were well coincidentwith those obtained from the calibration tests of the Abmicroarray (Fig. 2). Taken together, it is likely that the cross-reactivity of used antibodies had a significant effect on thediscrepancy between the measured ratios and the expectedones. Consequently, the deviation of the measured ratio fromthe expected one became larger as the cross-reactivity of thegiven Ab was higher.
To further confirm the effect of cross-reactivity of the Ab,we carried out supplementary tests using purified proteins.Six proteins used in the KO mutant experiment and Pgk(no. 9) were purified, labeled with either Cy5 or Cy3, and a1.0-fold (Cy5/Cy3) mixture of the dye-labeled proteins wasapplied to the Ab microarray. As shown in Fig. 3B, the puri-fied proteins resulted in a smaller deviation of the measuredratios from the expected ones (in this case, 1.0) compared tothe W3110 lysate, except for Ppc (Table 1; no. 1, see below).Similar results were obtained for the mixtures with differentdye-labeled protein ratios (Cy5/Cy3 = 0.5 and 2.0) (data notshown). Furthermore, a mixture of the six purified proteins,which have a negligible cross-reactivity for non-cognate anti-bodies, showed a similar trend (Fig. 3C). Unlike the E. colilysate, a purified protein or a mixture of purified proteinsgave rise to little deviation of the measured ration from theexpected ones. Based on these results, it is plausible thatcross-reactivity of Ab for other irrelevant proteins in lysates
Figure 3. (A) Classification of the tested antibodies, depending on the extent of cross-reactivity. Relative intensity (%) indicates the inten-sity of Cy5-labeled KO lysate over Cy5-labeled W3110 lysate. The y-axis represents the observed ratio (Cy5/Cy3) when a mixture of the samequantity of Cy5- and Cy3-labeled W3110 lysates was applied to the Ab microarray for calibration test as shown in Fig. 2A. Data represent theaverage values and SDs in triplicate experiments. (B) Comparison of observed ratios (Cy5/Cy3) for purified target proteins and W3110lysate. Ppc monomer indicates the monomeric subunit of Ppc. (C) Comparison of observed ratios (Cy5/Cy3) for a mixture of other purifiedproteins. Equal amounts of Cy5- and Cy3-labeled proteins were mixed and applied.
© 2006 WILEY-VCH Verlag GmbH & Co. KGaA, Weinheim www.proteomics-journal.com
5936 M.-K. Han et al. Proteomics 2006, 6, 5929–5940
mainly caused the serious deviation of the observed ratiosfrom the expected ones.
As shown in Fig. 3B, Ppc resulted in a large discrepancybetween the observed ratio and the expected one. Unlikeother tested proteins, this deviation was not mitigated evenwhen a purified form of Ppc was used. Thus, we reasonedthat the size of the protein might affect the result, becausePpc is a homotetrameric protein and has a relatively largemolecular mass (396 kDa). The size effect was investigatedusing a C-terminal fragment of Ppc monomer (27 kDa)instead of an intact multimeric large protein. The use of thepurified monomeric Ppc yielded a measured ratio approach-ing the real one (Fig. 3B), which indicates that the size oftarget proteins has an effect on the performance of the Abmicroarray.
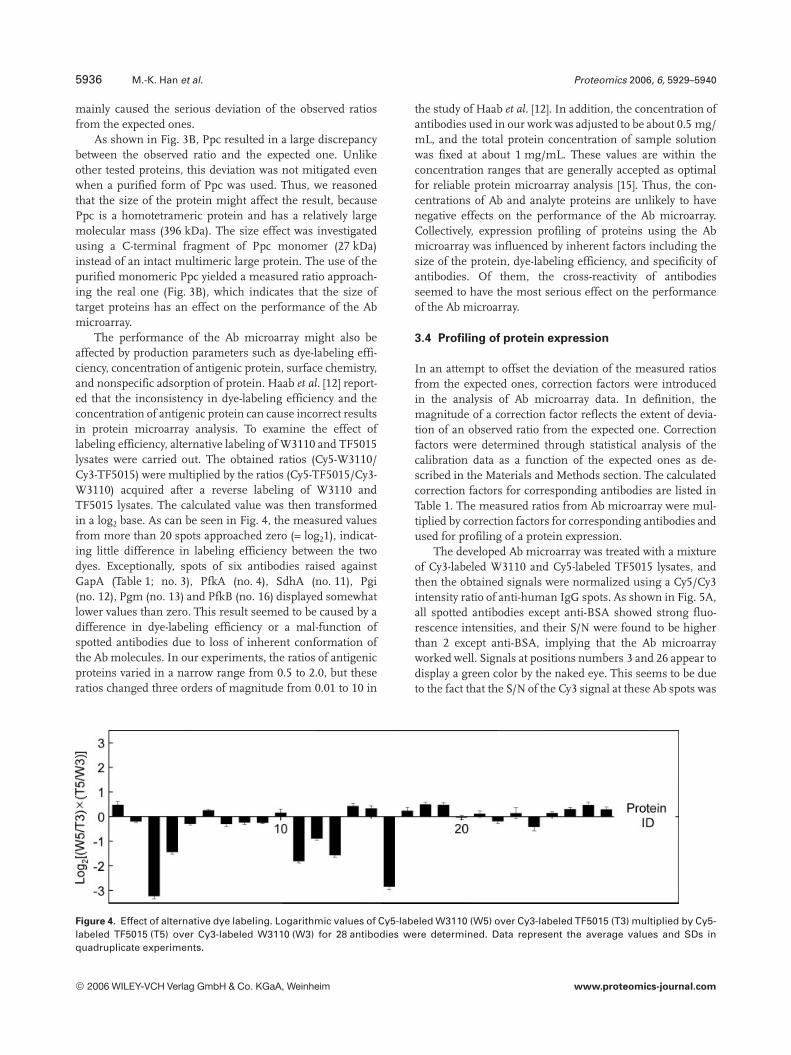
The performance of the Ab microarray might also beaffected by production parameters such as dye-labeling effi-ciency, concentration of antigenic protein, surface chemistry,and nonspecific adsorption of protein. Haab et al. [12] report-ed that the inconsistency in dye-labeling efficiency and theconcentration of antigenic protein can cause incorrect resultsin protein microarray analysis. To examine the effect oflabeling efficiency, alternative labeling of W3110 and TF5015lysates were carried out. The obtained ratios (Cy5-W3110/Cy3-TF5015) were multiplied by the ratios (Cy5-TF5015/Cy3-W3110) acquired after a reverse labeling of W3110 andTF5015 lysates. The calculated value was then transformedin a log2 base. As can be seen in Fig. 4, the measured valuesfrom more than 20 spots approached zero (= log21), indicat-ing little difference in labeling efficiency between the twodyes. Exceptionally, spots of six antibodies raised againstGapA (Table 1; no. 3), PfkA (no. 4), SdhA (no. 11), Pgi(no. 12), Pgm (no. 13) and PfkB (no. 16) displayed somewhatlower values than zero. This result seemed to be caused by adifference in dye-labeling efficiency or a mal-function ofspotted antibodies due to loss of inherent conformation ofthe Ab molecules. In our experiments, the ratios of antigenicproteins varied in a narrow range from 0.5 to 2.0, but theseratios changed three orders of magnitude from 0.01 to 10 in
the study of Haab et al. [12]. In addition, the concentration ofantibodies used in our work was adjusted to be about 0.5 mg/mL, and the total protein concentration of sample solutionwas fixed at about 1 mg/mL. These values are within theconcentration ranges that are generally accepted as optimalfor reliable protein microarray analysis [15]. Thus, the con-centrations of Ab and analyte proteins are unlikely to havenegative effects on the performance of the Ab microarray.Collectively, expression profiling of proteins using the Abmicroarray was influenced by inherent factors including thesize of the protein, dye-labeling efficiency, and specificity ofantibodies. Of them, the cross-reactivity of antibodiesseemed to have the most serious effect on the performanceof the Ab microarray.
3.4 Profiling of protein expression
In an attempt to offset the deviation of the measured ratiosfrom the expected ones, correction factors were introducedin the analysis of Ab microarray data. In definition, themagnitude of a correction factor reflects the extent of devia-tion of an observed ratio from the expected one. Correctionfactors were determined through statistical analysis of thecalibration data as a function of the expected ones as de-scribed in the Materials and Methods section. The calculatedcorrection factors for corresponding antibodies are listed inTable 1. The measured ratios from Ab microarray were mul-tiplied by correction factors for corresponding antibodies andused for profiling of a protein expression.
The developed Ab microarray was treated with a mixtureof Cy3-labeled W3110 and Cy5-labeled TF5015 lysates, andthen the obtained signals were normalized using a Cy5/Cy3intensity ratio of anti-human IgG spots. As shown in Fig. 5A,all spotted antibodies except anti-BSA showed strong fluo-rescence intensities, and their S/N were found to be higherthan 2 except anti-BSA, implying that the Ab microarrayworked well. Signals at positions numbers 3 and 26 appear todisplay a green color by the naked eye. This seems to be dueto the fact that the S/N of the Cy3 signal at these Ab spots was
Figure 4. Effect of alternative dye labeling. Logarithmic values of Cy5-labeled W3110 (W5) over Cy3-labeled TF5015 (T3) multiplied by Cy5-labeled TF5015 (T5) over Cy3-labeled W3110 (W3) for 28 antibodies were determined. Data represent the average values and SDs inquadruplicate experiments.
© 2006 WILEY-VCH Verlag GmbH & Co. KGaA, Weinheim www.proteomics-journal.com

Proteomics 2006, 6, 5929–5940 Protein Arrays 5937
Figure 5. (A) Representative fluorescence images of the Abmicroarray after incubation with a mixture of Cy5-labeled TF5015and Cy3-labeled W3110 lysates. Scattered plots of Cy5 versus Cy3intensities taken from an Ab microarray after treatment with abinary mixture of Cy3-labeled W3110 and Cy5-labeled TF5015 (B)and Cy3- and Cy5-labeled W3110 lysates (C). In all tests, two dif-ferently labeled E. coli lysates were mixed in equal quantity.
much higher than that of Cy5. However, Cy5-labeled TF5015lysate evidently expressed the corresponding proteins whenanalyzed using a scanner. We compared the intensity dis-tributions of the mixture of Cy3- and Cy5-labeled W3110lysates with that of Cy3-labeled W3110 and Cy5-labeledTF5015 lysates, and observed that the latter resulted in amore widely scattered distribution (R2 = 0.59) of Cy5 versusCy3 intensities (Fig. 5B) than the former (R2 = 0.94)(Fig. 5C). This result indicates that the developed Ab micro-
array can decipher the difference in protein expression levelbetween W3110 and TF5015.
We performed the protein expression profiling betweenCy3-labeled W3110 and Cy5-labeled TF5015 lysates by usingthe developed Ab microarray. Thirty two values of Cy5/Cy3ratio were acquired from 8 independent experiments foreach target protein, normalized, and corrected using a cor-responding correction factor (see above). The resulting ratioswere finally converted into a log2 base for simplicity to dis-criminate up- and down-regulation of a given protein inTF5015 compared with W3110. For instance, proteins show-ing a ratio greater than 1.0 were defined to be up-regulated,and those showing a ratio less than 21.0 to be down-regu-lated. Based on these criteria, ten proteins in total wereidentified to be up-regulated (Fig. 6), including Ppc (Table 1;no. 1), ThrA (no. 2), GltA (no. 7), ProA (no. 8), PckA (no. 14),Mdh (no. 15), IcdA (no. 20), ThrB (no. 23), AceB (no. 24),and ThrC (no. 25). In contrast, YfiD (no. 26) was found to bedown-regulated. Other proteins showed no significant dif-ference in expression levels between two strains.
As shown in Fig. 7, the developed Ab microarray exhib-ited a good reproducibility and reliability for the profiling of aprotein expression. On a slide containing three arrays com-posed of quadruplicate Ab spots, the spot-to-spot variationswere generally less than 7% of CV. Slides constructed ondifferent days showed CVs lower than 20%. Based on theresults taken from 32 different trials, these values are com-parable with other protein microarray assays [14, 23, 24].Thus, it is apparent that the developed Ab microarrayallowed a one-shot assay for a number of target proteins in athroughput and reproducible manner.
3.5 Verification of Ab microarray assay
To validate the expression profiling of proteins by Ab micro-array, we performed Western blotting and 2-DE. Expressionsof the target proteins in W3110 and TF5015 were comparedby measuring the thicknesses of visualized bands in Westernblotting and densities of scanned spots in 2-DE (Fig. 8). Theresults, together with those from microarray analysis, aresummarized in Table 2. In general, a 2-DE technique hasbeen regarded as effective for analysis of diverse cellularproteins resolved depending on the pI and molecular weightof the protein, but is ineffective for large proteins, and thosewith low abundance, or embedded in a membrane [22].Likewise, 2-DE analysis classified OppA (Table 1; no. 28) asup-regulated in TF5015, but the Ab microarray and Westernblotting yielded a non-differential expression of membraneproteins OppA (no. 28) and PtsG (no. 5). Up-regulations ofPpc (no. 1) and ThrA (no. 2) were detected both in the Abmicroarray and Western blotting analyses, but not in 2-DE,which seems to be due to the large size of the target proteins.These results indicate that the Ab microarray can analyzesome proteins that are undetected on 2-DE. Most of the dif-ferences in protein expression between TF5015 and W3110observed in the microarray were also identified at least in one
© 2006 WILEY-VCH Verlag GmbH & Co. KGaA, Weinheim www.proteomics-journal.com

5938 M.-K. Han et al. Proteomics 2006, 6, 5929–5940
Figure 6. Profiling of protein expression. Measured ratios (open bars) were adjusted using correction factors after normalization (see textfor details). The corrected ratios (closed bars) are shown as log2 values. Threshold values set for up-regulation (log22 = 1) and down-reg-ulation (log20.5 = 21) are depicted as two horizontal lines. Data represent the average values and SDs from 32 independent measure-ments.
Figure 7. Inter-array and inter-slide variations of Ab microarray assays. Data indicate the average values and SDs from 32 independentmeasurements.
of the other analyses. For example, the up-regulation of GltA(no. 7), IcdA (no. 20), AceB (no. 24), and ThrC (no. 25), andthe down-regulation of YfiD (no. 26) in TF5015, wererevealed by both the Ab microarray and 2-DE analyses. Mostof these differences were also detected by Western blottinganalysis, except for GltA and ThrC. From these results, it isevident that the Ab microarray identifies most of the differ-entially expressed proteins that are detected by traditionalmethods.
Unlike 2-DE, the Ab microarray assays additionally clas-sified Ppc (no. 1), ThrA (no. 2), ProA (no. 8), PckA (no. 14),Mdh (no. 15), and ThrB (no. 23) to be up-regulated inTF5015, which was also confirmed by Western blotting. Inparticular, ThrA (no. 2), ThrB (no. 23), and ThrC (no. 25) are
key constituent enzymes of THR operon that is involved inan L-threonine biosynthetic pathway [17]. ThrA and ThrBwere newly revealed to be up-regulated by the Ab microarrayin addition to the ThrC that was also identified by 2-DE. Mdhand PckA are involved in the citric acid cycle, which is a crit-ical step for synthesis of aspartate, a precursor of L-threonine.Almost all other up-regulated proteins identified by the Abmicroarray and additional assays are also parts of the citricacid cycle. Some differences revealed by 2-DE and Westernblotting did not appear in the Ab microarray analysis: Nodifference in the expression levels of AceA (no. 6) and SdhA(no. 11) between the two strains was observed in the Abmicroarray assay, but these proteins were analyzed to be up-regulated in TF5015 by 2-DE or Western blotting. This result
© 2006 WILEY-VCH Verlag GmbH & Co. KGaA, Weinheim www.proteomics-journal.com

Proteomics 2006, 6, 5929–5940 Protein Arrays 5939
Figure 8. (A) Western blotting of28 target proteins in W3110 (left)and TF5015 (right) lysates.(B) Spot images of 28 targetproteins in W3110 (left) andTF5015 (right) lysates from 2-DE.Spots showing same densitiesin both strains are not displayed.
Table 2. Expression levels of target proteins in TF5015 deter-mined by Ab microarray, Western blotting, and 2-DE.:up-regulated (m), down-regulated (,), and no difference(–) compared to W3110
IDno.
Protein Abmicroarray
Westernblotting
2-DE
1 Ppc m m –2 ThrA m m –3 GapA – – –4 PfkA – – –5 PtsG – – –6 AceA – – m
7 GltA m – m
8 ProA m m –9 Pgk – – –
10 Fba – – –11 SdhA – m m
12 Pgi – – –13 Pgm – – –14 PckA m m –15 Mdh m m –16 PfkB – – –17 DapB – – –
Table 2. Continued
IDno.
Protein Abmicroarray
Westernblotting
2-DE
18 Zwf – – –19 Eno – – –20 IcdA m m m
21 AspC – – –22 Asd – – –23 ThrB m m –10 Fba – – –24 AceB m m m
25 ThrC m – m
26 YfiD , , ,
27 AhpC – – –28 OppA – – ,
seems to be caused by the strict threshold levels for up- anddown-regulations that we employed in our analysis of the Abmicroarray data. From a comparison with conventionalmethods including Western blotting and 2-DE, the Abmicroarray seems to provide a reliable expression profiling ofproteins.
© 2006 WILEY-VCH Verlag GmbH & Co. KGaA, Weinheim www.proteomics-journal.com

5940 M.-K. Han et al. Proteomics 2006, 6, 5929–5940
4 Concluding remarks
An Ab microarray was constructed and used for the expres-sion profiling of relevant proteins between an amino acid-overproducing mutant and its parental E. coli strain. For areliable profiling, the factors affecting the performance of theAb microarray were investigated in detail. We found that thecross-reactivity of the antibodies was the main cause of thedeviation of the observed ratios from the expected ones. Tooffset the deviations, the correction factors for respectiveantibodies were introduced through statistical analysis, andused for expression profiling of proteins. As a result, of28 tested proteins, 10 were shown to be up-regulated, and1 down-regulated in a mutant strain. The validity of the Abmicroarray data was further confirmed using Western blot-ting and 2-DE. The demonstrated capability of the Abmicroarray-based analysis in a reliable and reproduciblemanner will greatly facilitate the utility of the Ab microarrayin the discovery of biomarkers and the diagnosis of diseases,as well as in the expression profiling of proteins.
This work was supported by National Research Laboratoryprogram of Ministry of Science and Technology, Nano-MedicalProject of Ministry of Health and Welfare, R&D program ofFusion Strategies for Advanced Technologies of Ministry of Com-merce, Industry and Energy, and Brain Korea 21 of Ministry ofEducation and Human Resources Development, Korea.
5 References
[1] Madoz-Gurpide, J., Wang, H., Misek, D. E., Brichory, F.,Hanash, S. M., Proteomics 2001, 1, 1279–1287.
[2] Andersson, O., Kozlowski, M., Garachtchenko, T., Nikoloff, C.et al., J. Proteome Res. 2005, 4, 758–767.
[3] Espejo, A., Cote, J., Bednarek, A., Richard, S., Bedford, M. T.,Biochem. J. 2002, 367, 697–702.
[4] Jahn-Schmid, B., Harwanegg, C., Hiller, R., Bohle, B. et al.,Clin. Exp. Allergy 2003, 33, 1443–1449.
[5] Miller, J. C., Zhou, H., Kwekel, J., Cavallo, R. et al., Proteom-ics 2003, 3, 56–63.
[6] Sukhanov, S., Delafontaine, P., Proteomics 2005, 5, 1274–1280.
[7] Nielsen, U. B., Cardone, M. H., Sinskey, A. J., MacBeath, G.,Sorger, P. K., Proc. Natl. Acad. Sci. USA 2003, 100, 9330–9335.
[8] Zhu, H., Klemic, J. F., Chang, S., Bertone, P. et al., Nat. Genet.2000, 26, 283–289.
[9] Zhu, H., Bilgin, M., Bangham, R., Hall, D. et al., Science 2001,293, 2101–2105.
[10] Sreekumar, A., Nyati, M. K., Varambally, S., Barrette, T. R. etal., Cancer Res. 2001, 61, 7585–7593.
[11] Wang, C. C., Huang, R., Sommer, M., Lisoukov, H. et al., J.Proteome Res. 2002, 1, 337–343.
[12] Haab, B. B., Dunham, M. J., Brown, P. O., Genome Biol. 2001,2, 1–13.
[13] Kusnezow, W., Jacob, A., Walijew, A., Diehl, F., Hoheisel, J.D., Proteomics 2005, 3, 254–264.
[14] Angenendt, P., Glokler, J., Murphy, D., Lehrach, H., Cahill, D.J., Anal. Biochem. 2002, 309, 253–260.
[15] de Wildt, R. M. T., Mundy, C. R., Gorick, B. D., Tomlinson, I.M., Nat. Biotechnol. 2000, 18, 989–994.
[16] Angenendt, P., Drug Discov. Today 2005, 10, 503–511.
[17] Lee, J. H., Lee, D. E., Lee, B. U., Kim, H. S., J. Bacteriol. 2003,185, 5442–5451.
[18] Burh, A., Flukiger, K., Erni, B., J. Biol. Chem. 1994, 269,23437–23423.
[19] Datsenko, K. A., Wanner, B. L., Proc. Natl. Acad. Sci. USA2000, 97, 6640–6645.
[20] Ausubel, F. M., Brent, R., Kingston, R. E., Moore, D. D., Seid-man, J. G. et al., Short Protocols in Molecular Biology, WileyJohn & Sons, New York1999.
[21] Patton, W. F., Schulenberg, B., Steinberg, T. H., Curr. Opin.Biotechnol. 2002, 13, 321–328.
[22] Quackenbush, J., Nat. Genet. 2002, 32, 496–501.
[23] Steinhauer, C., Ressine, A., Marko-Varga, G., Laurell, T. et al.,Anal. Biochem. 2005, 341, 204–213.
[24] Lin, Y., Huang, R., Chen, L., Lisoukov, H. et al., Proteomics2003, 3, 1750–1757.
© 2006 WILEY-VCH Verlag GmbH & Co. KGaA, Weinheim www.proteomics-journal.com
Copyright © 2022 FDOKUMEN