
New Sol-Gel Coatings to Improve Casting Quality - DTU
344
General rights Copyright and moral rights for the publications made accessible in the public portal are retained by the authors and/or other copyright owners and it is a condition of accessing publications that users recognise and abide by the legal requirements associated with these rights. Users may download and print one copy of any publication from the public portal for the purpose of private study or research. You may not further distribute the material or use it for any profit-making activity or commercial gain You may freely distribute the URL identifying the publication in the public portal If you believe that this document breaches copyright please contact us providing details, and we will remove access to the work immediately and investigate your claim. Downloaded from orbit.dtu.dk on: Mar 16, 2022 New Sol-Gel Coatings to Improve Casting Quality Nwaogu, Ugochukwu Chibuzoh Publication date: 2011 Document Version Publisher's PDF, also known as Version of record Link back to DTU Orbit Citation (APA): Nwaogu, U. C. (2011). New Sol-Gel Coatings to Improve Casting Quality. DTU Mechanical Engineering.
-
Upload
khangminh22 -
Category
Documents
-
view
3 -
download
0
Transcript of New Sol-Gel Coatings to Improve Casting Quality - DTU
General rights Copyright and moral rights for the publications made accessible in the public portal are retained by the authors and/or other copyright owners and it is a condition of accessing publications that users recognise and abide by the legal requirements associated with these rights.
Users may download and print one copy of any publication from the public portal for the purpose of private study or research.
You may not further distribute the material or use it for any profit-making activity or commercial gain
You may freely distribute the URL identifying the publication in the public portal If you believe that this document breaches copyright please contact us providing details, and we will remove access to the work immediately and investigate your claim.
Downloaded from orbit.dtu.dk on: Mar 16, 2022
New Sol-Gel Coatings to Improve Casting Quality
Nwaogu, Ugochukwu Chibuzoh
Publication date:2011
Document VersionPublisher's PDF, also known as Version of record
Link back to DTU Orbit
Citation (APA):Nwaogu, U. C. (2011). New Sol-Gel Coatings to Improve Casting Quality. DTU Mechanical Engineering.
New Sol-Gel Coatings to Improve Casting Quality
A PhD Thesis
By
Ugochukwu Chibuzoh Nwaogu
Supervisor: Niels Skat Tiedje, PhD. (Associate Professor)
Department of Mechanical Engineering, Technical University of Denmark.
December, 2011.


To my humble family
i

ii

“My interest is in the future becauseI am going to spend the rest of my life there”
Albert Einstein
iii

iv
Preface
This is a PhD Thesis on “New Sol-Gel Coatings to Improve Casting Quality” whichwas carried out and submitted to the Department of Mechanical Engineering at theTechnical University of Denmark (DTU), in partial fulfillment of the requirementsfor the award of the degree of Doctor of Philosophy (PhD). The work presentedherein was supervised by Associate Professor Niels Skat Tiedje within the period ofNovember, 2008 to December, 2011. The expertise of the nine industrial partnersand one research institute was reasonably harnessed for the success of this work.In view of the large amount of data collected from all the experiments performedat the DTU foundry and laboratories, and the industrial tests in the companies,the most significant results and analyses along with a rich literature survey arepresented.I will not say it was an easy task to come this far, however, determination coupledwith a very friendly working environment was the driving force. Being a memberof the Casting research group at DTU MEK, under Niels Skat Tiedje has been asource of inspiration and motivation. The exposure was inestimable and workingwith industrial partners exposed me to a high calibre brain-storming.Coming back to Denmark from Germany after my Masters Degree in MaterialsScience at Technical University of Hamburg, Germany (after being an exchangestudent at Aalborg University, Denmark in 2007) was a decision I needed no guid-ance to make for several reasons. Again, the site of liquid metal for the very firsttime at Funfrap foundry in Aveiro, Portugal, during the early part of my Mastersstudy in Materials Science at University of Aveiro, Portugal, was amazing. Thatalso enhanced my decision to take up the PhD in Casting Technology at DTU,among three other PhD offers in different countries in Europe. I wanted to be partof the group working with liquid metals and associated areas.Having reached this stage of my studies and looking back from a vantage position,the path was rigorous, I must say. Amidst challenges, I acquired lots of knowledgeand skills, I had to learn effective time management and team work. Workingsmartly and systematically, I overcame lots of the challenges. Effective literaturestudy and ideas from the industrial partners, opened my thoughts to the directionof the project coupled with the guidance of my supervisor. Innovative and creativethinking became part of the success story.Today, I am happy I have come this far.Ugochukwu Chibuzoh Nwaogu.
v

vi
Acknowledgements
I want to thank in a special way, my supervisor, Dr. Niels Skat Tiedje, for grant-ing me this rare opportunity to carry out this PhD studies with him at DTU.Your understanding, consistent motivation, unflinching support and encourage-ment, excellent directives and the creation of a friendly and humorous workingenvironment, are second to none. I enjoyed working with you.I remain grateful to the following people - Professor Jesper Hattel, Dr. JesperThorborg, Dr. Cem Tutum, Jakob Skov Nielsen, Nikolaj Kjelgaard Vedel-Smith,Jens Ole Frandsen, Anette Fournais kaltoft, Ole Munch, Peter Sanderhoff, MichaelWenani Nielsen and Elham Moumeni and other PhD students in the Modellingand Casting Technology groups, who have contributed in one way or the other tomake this work a reality. I say thank you! I am also grateful to Pia Holst Nielsen,the MPP secretary, for her express handling of my official affairs.Many thanks to my partners at Danish Technological Institute, Aarhus, ThomasPoulsen and Claus Bischoff, for their total devotion to this project and for ensuringthat it got to completion with their experimental and administrative supports.These acknowledgements will not be complete if I do not express my profoundgratitude to the many people employed in the nine industrial partners whom Ihave worked with. I thank them for their expertise discussions and constructivecriticisms, which helped in no small measures to improve the quality of the work.In another context, I want to specially thank Frese Metal- og Stålstøberi A/S foralways providing my working materials and also for granting me days of industrialvisit which exposed me well. In a similar notion, I also want express my gratitudeto the following foundries for also granting me days of industrial visit. They areJohan Jensen & Søn Metalstøberi, Dania A/S, Vald Birn A/S and Vestas CastingsKristiansand, Norway.With inestimable happiness and joy that knows no bounds, I appreciate my parentsand siblings for their encouragements and moral support. I remain highly indebtedto my beautiful and lovely wife, Evelyn, for her love, devotion and for being withme through thick and thin since we got married, five years ago. The men of thehouse, my sons, Toby and Niels (Niels came within the period of the PhD studies,hence he got my supervisor’s first name) are my source of joy and the quest tomake them happy all the time keeps me going. I love you boys!Last but not the least, I would like to express my appreciation to Technical Uni-versity of Denmark, for offering me employment throughout this PhD studies andalso for providing a very friendly and flexible working environment.
vii

viii
Contents
1 Introduction 11.1 Background . . . . . . . . . . . . . . . . . . . . . . . . . . . . . . . 11.2 Scope of Thesis . . . . . . . . . . . . . . . . . . . . . . . . . . . . . 31.3 Goals . . . . . . . . . . . . . . . . . . . . . . . . . . . . . . . . . . . 31.4 Project Partners . . . . . . . . . . . . . . . . . . . . . . . . . . . . . 4
1.4.1 C. C. Jensen A/S . . . . . . . . . . . . . . . . . . . . . . . . 41.4.2 Dania A/S . . . . . . . . . . . . . . . . . . . . . . . . . . . . 41.4.3 Danish Technological Institute (DTI) . . . . . . . . . . . . . 41.4.4 DISA Industries A/S . . . . . . . . . . . . . . . . . . . . . . 51.4.5 Frese Metal- og Stålstøberi A/S . . . . . . . . . . . . . . . . 51.4.6 Johan Jensen & Søn Metalstøberi . . . . . . . . . . . . . . . 51.4.7 Nordsjællands Metalstøberi . . . . . . . . . . . . . . . . . . 51.4.8 Sibelco Nordic A/S (formerly PV Sand) . . . . . . . . . . . 51.4.9 Vald. Birn A/S . . . . . . . . . . . . . . . . . . . . . . . . . 51.4.10 Vestas Castings Group A/S . . . . . . . . . . . . . . . . . . 6
2 Mould and Core Dynamics 72.1 Concept of Order-Packing of Granular Materials . . . . . . . . . . . 7
2.1.1 Some Theoretical Relationships . . . . . . . . . . . . . . . . 82.1.2 Practical Applications . . . . . . . . . . . . . . . . . . . . . 112.1.3 Grain Distribution – Laws of Probability . . . . . . . . . . . 112.1.4 Influence of Particle Geometry . . . . . . . . . . . . . . . . . 11
2.2 Phenomena Affecting Mould and Core Dynamics . . . . . . . . . . 142.2.1 Heat Transfer . . . . . . . . . . . . . . . . . . . . . . . . . . 14
2.2.1.1 Resistance from the Solid Phase . . . . . . . . . . . 152.2.1.2 Resistance from the Mould/Metal Interface . . . . 152.2.1.3 Resistance from the Mould . . . . . . . . . . . . . 17
2.2.2 Pressure from Metal . . . . . . . . . . . . . . . . . . . . . . 182.2.2.1 Pressure from Melt . . . . . . . . . . . . . . . . . . 182.2.2.2 Pressure due to Casting Expansion/Contraction on
Solidification . . . . . . . . . . . . . . . . . . . . . 19
ix

2.2.3 Gas Pressure in Moulds and Cores . . . . . . . . . . . . . . 192.2.4 Explosive Reactions . . . . . . . . . . . . . . . . . . . . . . . 20
2.2.4.1 General Mould Gas Explosions . . . . . . . . . . . 202.2.4.2 Water Explosions . . . . . . . . . . . . . . . . . . . 21
2.2.5 Transformation Zones . . . . . . . . . . . . . . . . . . . . . 212.2.6 Metal-Mould Reactions . . . . . . . . . . . . . . . . . . . . . 23
2.2.6.1 Mould Surface Reactions . . . . . . . . . . . . . . . 252.2.6.2 Metal Surface Reactions . . . . . . . . . . . . . . . 26
2.3 Defects Associated with Mould and Core Dynamics . . . . . . . . . 272.3.1 Expansion related defects . . . . . . . . . . . . . . . . . . . 27
2.3.1.1 Veins/Fins . . . . . . . . . . . . . . . . . . . . . . 282.3.1.2 Buckle, Scabbing and Rat-Tail . . . . . . . . . . . 29
2.3.2 Adherence Sand Defects . . . . . . . . . . . . . . . . . . . . 302.3.2.1 Metal Penetration . . . . . . . . . . . . . . . . . . 302.3.2.2 Burn-On and Burn-In . . . . . . . . . . . . . . . . 32
2.3.3 Gas Related Defects . . . . . . . . . . . . . . . . . . . . . . 342.3.3.1 Pin Holes . . . . . . . . . . . . . . . . . . . . . . . 342.3.3.2 Blow Holes . . . . . . . . . . . . . . . . . . . . . . 35
3 Surface Technology 373.1 Surface Topography . . . . . . . . . . . . . . . . . . . . . . . . . . 38
3.1.1 Surface Topography Measuring Instruments . . . . . . . . . 383.1.2 Surface Profile Measurement . . . . . . . . . . . . . . . . . . 39
3.1.2.1 Evaluation Length . . . . . . . . . . . . . . . . . . 393.1.2.2 Total Transverse Length . . . . . . . . . . . . . . . 393.1.2.3 Profile Filtering . . . . . . . . . . . . . . . . . . . . 403.1.2.4 Surface Profile Parameters . . . . . . . . . . . . . . 403.1.2.5 Profile Specification Standards . . . . . . . . . . . 423.1.2.6 Symbols for Surface Texture . . . . . . . . . . . . . 42
3.1.3 Area Surface Texture Characterization . . . . . . . . . . . . 433.1.3.1 Areal Filtering . . . . . . . . . . . . . . . . . . . . 433.1.3.2 Areal Parameters . . . . . . . . . . . . . . . . . . 443.1.3.3 Area Specification Standards . . . . . . . . . . . . 45
4 Simulations 474.1 Mesh Generation . . . . . . . . . . . . . . . . . . . . . . . . . . . . 474.2 Simulations . . . . . . . . . . . . . . . . . . . . . . . . . . . . . . . 48
4.2.1 Horizontally-Parted Moulds . . . . . . . . . . . . . . . . . . 494.2.2 Vertically-Parted (DISA) Moulds . . . . . . . . . . . . . . . 494.2.3 Temperature Distribution in the Cores . . . . . . . . . . . . 50
x
4.2.4 Metallostatic Pressure Distribution . . . . . . . . . . . . . . 574.2.5 Predicted Defects Associated with Moulding Materials . . . 58
5 Materials and Approach 635.1 Coating Production and Formulations . . . . . . . . . . . . . . . . . 63
5.1.1 Sol-Gel Process . . . . . . . . . . . . . . . . . . . . . . . . . 635.1.1.1 Precursors . . . . . . . . . . . . . . . . . . . . . . 645.1.1.2 Hydrolysis Ratio . . . . . . . . . . . . . . . . . . . 645.1.1.3 Catalyst Type/Amount . . . . . . . . . . . . . . . 655.1.1.4 Solvent Type . . . . . . . . . . . . . . . . . . . . . 665.1.1.5 Sol → Gel → Film Transformation . . . . . . . . . 66
5.1.2 Sol-Gel Reaction Mechanism Involved in this Study . . . . . 685.1.3 Novel Sol-Gel Foundry Coatings Investigated . . . . . . . . . 695.1.4 Sol-Gel Coating as Additive to Existing Foundry Coatings . 70
5.1.4.1 Experimental Design using Taguchi Approach . . . 715.1.4.2 Data Analysis from Taguchi Experimental Design . 72
5.2 Wet Coating Characterization . . . . . . . . . . . . . . . . . . . . . 735.2.1 Specific Gravity . . . . . . . . . . . . . . . . . . . . . . . . . 735.2.2 Viscosity . . . . . . . . . . . . . . . . . . . . . . . . . . . . . 745.2.3 oBaumé Parameter . . . . . . . . . . . . . . . . . . . . . . . 74
5.3 Coating Application on Cores and Moulds . . . . . . . . . . . . . . 755.4 Core-Coating Interaction and Analyses . . . . . . . . . . . . . . . . 76
5.4.1 Weight of Wet and Dry Coating on Cores . . . . . . . . . . 765.4.2 Moisture Content . . . . . . . . . . . . . . . . . . . . . . . . 765.4.3 Core Surface Coverage . . . . . . . . . . . . . . . . . . . . . 765.4.4 Coating Penetration into the Cores . . . . . . . . . . . . . . 765.4.5 Core-Coating Refractory Material Interaction . . . . . . . . 765.4.6 Permeability . . . . . . . . . . . . . . . . . . . . . . . . . . . 77
5.5 Mechanical Properties of Coated Core Materials . . . . . . . . . . . 775.5.1 Tensile Test . . . . . . . . . . . . . . . . . . . . . . . . . . . 785.5.2 Bending or Flexural Test . . . . . . . . . . . . . . . . . . . . 785.5.3 Compression Test . . . . . . . . . . . . . . . . . . . . . . . . 795.5.4 Statistical Evaluation of Mechanical Properties . . . . . . . 79
5.5.4.1 Theory of Weibull Distribution . . . . . . . . . . . 795.6 Casting Process . . . . . . . . . . . . . . . . . . . . . . . . . . . . . 81
5.6.1 Horizontally-Parted Moulds . . . . . . . . . . . . . . . . . . 825.6.2 Vertically-Parted (DISA) Moulds . . . . . . . . . . . . . . . 845.6.3 Data Acquisition . . . . . . . . . . . . . . . . . . . . . . . . 85
5.7 Analyses of the Surface Quality of Castings . . . . . . . . . . . . . . 85
xi
5.7.1 Prediction of Surface Reactions . . . . . . . . . . . . . . . . 855.7.2 Surface Roughness Measurement . . . . . . . . . . . . . . . 855.7.3 Surface and Interfacial Microstructural Examination . . . . 86
6 Results 876.1 Screening Tests Results with Nanoparticle SG Coatings . . . . . . . 886.2 Wet Coating Characterization . . . . . . . . . . . . . . . . . . . . . 926.3 Core-Coating Interaction Results and Analyses . . . . . . . . . . . . 93
6.3.1 Mass of Wet and Dry Coating on Cores . . . . . . . . . . . . 946.3.2 Moisture Content . . . . . . . . . . . . . . . . . . . . . . . . 946.3.3 Core Surface Coverage . . . . . . . . . . . . . . . . . . . . . 966.3.4 Coating Penetration into the Cores . . . . . . . . . . . . . . 966.3.5 Core-Coating Refractory Material Interaction . . . . . . . . 976.3.6 Permeability of Coated Cores . . . . . . . . . . . . . . . . . 99
6.4 Behaviour of Sol-Gel Material with other Refractory Materials . . . 1006.5 Sol-Gel Stock as Additive to other Foundry Coatings . . . . . . . . 1016.6 Mechanical Properties of Core Materials at Ambient Temperature . 1026.7 Thermal Behaviour of Moulding Materials . . . . . . . . . . . . . . 1046.8 Analyses of the Surface of Castings . . . . . . . . . . . . . . . . . . 109
6.8.1 Prediction of Surface Reaction Products . . . . . . . . . . . 1096.8.2 Surface Quality of Castings . . . . . . . . . . . . . . . . . . 113
6.8.2.1 Sol-Gel Filter Dust Coating on Cold Box and FuranCores . . . . . . . . . . . . . . . . . . . . . . . . . 113
6.8.2.2 Varying Sol-Gel Content and Solid Content to getThree Different Formulations . . . . . . . . . . . . 120
6.8.2.3 Using Sol-Gel Component as Additive to FoundryCoatings with Cold box and Furan Cores . . . . . . 124
6.8.2.4 Using Sol-Gel Component as Additive to FoundryCoatings with Green Sand Moulds . . . . . . . . . 126
6.8.3 Interfacial Microstructure . . . . . . . . . . . . . . . . . . . 134
7 Case Studies 1417.1 Casting: Part for X-Ray Detector, Hospital Equipment. . . . . . . . 141
7.1.1 First Trials . . . . . . . . . . . . . . . . . . . . . . . . . . . 1427.1.1.1 Coatings Used . . . . . . . . . . . . . . . . . . . . 1427.1.1.2 Conclusions from First Trials . . . . . . . . . . . . 142
7.1.2 Second Trials . . . . . . . . . . . . . . . . . . . . . . . . . . 1427.1.2.1 Coating Used . . . . . . . . . . . . . . . . . . . . . 1427.1.2.2 Conclusions from Second Trials . . . . . . . . . . . 143
7.2 Casting . . . . . . . . . . . . . . . . . . . . . . . . . . . . . . . . . 143
xii
7.2.1 First Trials . . . . . . . . . . . . . . . . . . . . . . . . . . . 1437.2.1.1 Conclusion from First Trials . . . . . . . . . . . . . 144
7.2.2 Second Trials . . . . . . . . . . . . . . . . . . . . . . . . . . 1457.2.2.1 Coating Used . . . . . . . . . . . . . . . . . . . . . 1457.2.2.2 Conclusions from Second Trials. . . . . . . . . . . . 147
8 Discussion 1498.1 Refractory Coatings . . . . . . . . . . . . . . . . . . . . . . . . . . . 149
8.1.1 Nanoparticle Sol-Gel Coatings . . . . . . . . . . . . . . . . . 1508.1.2 Filter Dust Sol-Gel Coatings . . . . . . . . . . . . . . . . . . 1518.1.3 Sol-Gel Additive to Foundry Coatings . . . . . . . . . . . . . 1538.1.4 Development of New Foundry Coatings . . . . . . . . . . . . 1548.1.5 Conditioning of Coatings in the Foundry . . . . . . . . . . . 155
8.2 Mechanical Properties of Moulding Materials . . . . . . . . . . . . . 1608.3 Mass and Heat Transport at Core-Metal Interface . . . . . . . . . . 1628.4 Mould-Metal Interaction . . . . . . . . . . . . . . . . . . . . . . . . 1658.5 Casting Surface Quality . . . . . . . . . . . . . . . . . . . . . . . . 167
9 Summary 1719.1 Conclusions . . . . . . . . . . . . . . . . . . . . . . . . . . . . . . . 1719.2 Recommendations for Further Work . . . . . . . . . . . . . . . . . . 173
xiii

xiv
List of Figures
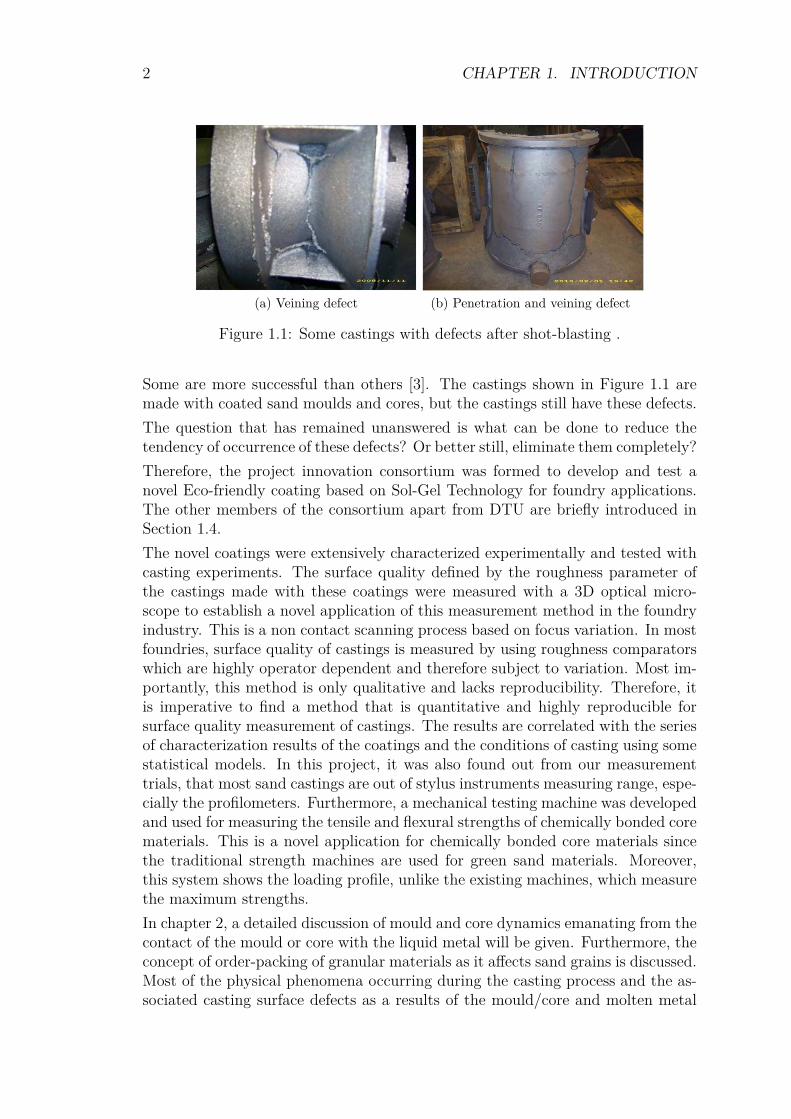
1.1 Some castings with defects after shot-blasting . . . . . . . . . . . . . 2
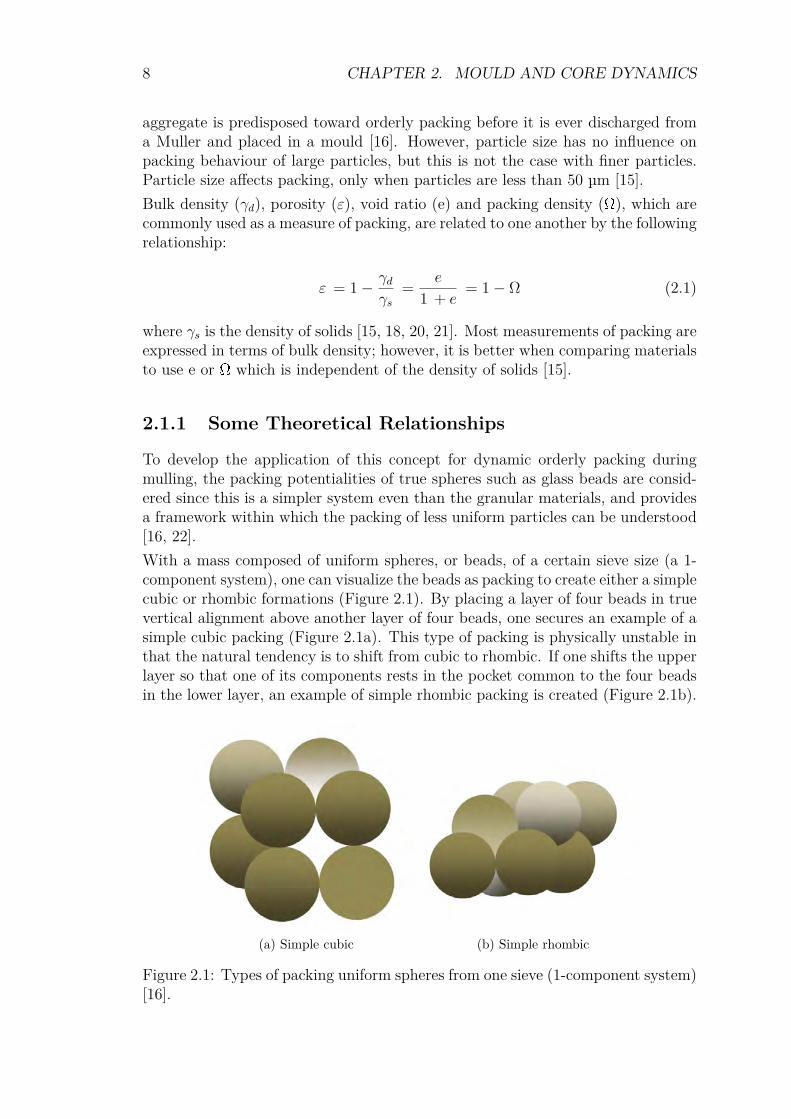
2.1 Types of packing uniform spheres from one sieve (1-component sys-tem) [16]. . . . . . . . . . . . . . . . . . . . . . . . . . . . . . . . . 8
2.2 Types of packing uniform spheres from one sieve (2-component sys-tem) [16]. . . . . . . . . . . . . . . . . . . . . . . . . . . . . . . . . 10
2.3 Schematic portrayal of range in sizes retained on No. 70 sievedemonstrate non-uniformity on any sieve [16]. . . . . . . . . . . . . 11
2.4 Classification of sand grain shapes. . . . . . . . . . . . . . . . . . . 122.5 Temperature distribution in a cast, solidifying metal melt [29]. . . . 142.6 Sketch of the temperature profile during casting in a sand mould [29]. 162.7 Gas evolution from various binder systems [30]. . . . . . . . . . . . 202.8 The schematic structure of the transformation zones in a green sand
mould during casting [36]. . . . . . . . . . . . . . . . . . . . . . . . 212.9 Ellingham diagram - change in standard free energy of reaction
versus temperature diagram for various oxidation reaction. . . . . . 262.10 Linear expansion - Temperature curves for mould materials [30]. . . 282.11 Veining or finning and sand burn-on defects on casting surface. . . . 292.12 A schematic showing mould surface defects [30]. . . . . . . . . . . . 302.13 Pressure balance during metal penetration in moulding aggregates
[66]. . . . . . . . . . . . . . . . . . . . . . . . . . . . . . . . . . . . 312.14 Metal penetration. . . . . . . . . . . . . . . . . . . . . . . . . . . . 332.15 Metal penetration micrograph showing the metal (light area) and
sand (dark area). . . . . . . . . . . . . . . . . . . . . . . . . . . . . 332.16 A casting with closely adhering sand layer [70]. . . . . . . . . . . . 342.17 Pin holes defect [70]. . . . . . . . . . . . . . . . . . . . . . . . . . . 352.18 Blow holes defects [70]. . . . . . . . . . . . . . . . . . . . . . . . . . 36
3.1 Surface topography measurement instruments. . . . . . . . . . . . . 393.2 Length measures on a profile [76]. . . . . . . . . . . . . . . . . . . . 393.3 A graphical representation of the derivation of Ra [74]. . . . . . . . 413.4 Surface texture symbol with identification labels in engineering draw-
ings [72]. . . . . . . . . . . . . . . . . . . . . . . . . . . . . . . . . . 43
xv
4.1 Enmeshment of the geometries. . . . . . . . . . . . . . . . . . . . . 484.2 CAD model for the horizontally-parted mould. . . . . . . . . . . . . 494.3 CAD model for the vertically-parted mould. . . . . . . . . . . . . . 494.4 Temperature distribution in the cores during solidification. . . . . . 514.5 Temperature distribution in the cores during filling. . . . . . . . . . 524.6 Temperature distribution in the cores during solidification. . . . . . 534.7 Temperature profiles in the cylindrical cores of varying thicknesses
showing critical temperature of silica sand and VTZ. . . . . . . . . 544.8 Temperature profiles in cylindrical cores at different thermocouple
locations. . . . . . . . . . . . . . . . . . . . . . . . . . . . . . . . . 554.9 Temperature profiles in the rectangular cores in vertically-parted
moulds. . . . . . . . . . . . . . . . . . . . . . . . . . . . . . . . . . 564.10 Scaled temperature profiles in the rectangular cores in vertically-
parted moulds . . . . . . . . . . . . . . . . . . . . . . . . . . . . . . 574.11 Pressure distribution in the melt during filling. . . . . . . . . . . . . 594.12 Pressure distribution in the melt during filling. . . . . . . . . . . . . 604.13 Predicted defect locations in the horizontally-parted moulds. . . . . 614.14 Predicted defect locations in the vertically-parted moulds. . . . . . 62
5.1 Schematic representation of gel densification for (a) acid and (b)base catalyzed systems [91]. . . . . . . . . . . . . . . . . . . . . . . 65
5.2 Schematic of the steady state dip-coating process [95]. . . . . . . . . 675.3 The structure of the precursors. . . . . . . . . . . . . . . . . . . . . 685.4 Coating making process, the mixing. . . . . . . . . . . . . . . . . . 715.5 Taguchi’s quadratic loss function. . . . . . . . . . . . . . . . . . . . 735.6 Measurement of viscosity by efflux time [99]. . . . . . . . . . . . . . 755.7 The spray-coating process of green sand moulds. . . . . . . . . . . . 755.8 A permmeter and sample holder for measuring the permeability of
the cores. . . . . . . . . . . . . . . . . . . . . . . . . . . . . . . . . 775.9 Measurement of the mechanical properties of chemically bonded
sand materials. . . . . . . . . . . . . . . . . . . . . . . . . . . . . . 785.10 Standard tensile test specimen (dog bone) for sand materials (di-
mensions in mm). . . . . . . . . . . . . . . . . . . . . . . . . . . . . 785.11 A schematic showing the bending test set-up. . . . . . . . . . . . . 795.12 A schematic of the compression test specimen and set-up. . . . . . . 795.13 The mould pattern used for the horizontally-parted moulds. . . . . 835.14 The core and casting dimensions for the horizontally-parted moulds. 835.15 The horizontally-parted moulds experimental set-up. . . . . . . . . 835.16 The casting layout for the vertically-parted moulds. . . . . . . . . . 84
6.1 A schematic showing the flow of the work. . . . . . . . . . . . . . . 87
xvi
6.2 Poor surface coverage of sol-gel coatings containing nanoparticles. . 886.3 Non uniform nanoparticles sol-gel coating penetration into the cores. 896.4 Agglomeration of the nanoparticles in the bulk of the core. . . . . . 906.5 Surface of iron castings made with nanoparticle sol-gel coatings. . . 916.6 Surface of aluminium alloy castings made with nanoparticle sol-gel
coatings. . . . . . . . . . . . . . . . . . . . . . . . . . . . . . . . . . 926.7 Mystery of oBaumé parameter as the only coating quality control
parameter. . . . . . . . . . . . . . . . . . . . . . . . . . . . . . . . . 936.8 Variation of mass of wet and dry coating with dipping time and
percentage solid content. . . . . . . . . . . . . . . . . . . . . . . . 946.9 Moisture content of each of the cold box and furan core with similar
treatments. . . . . . . . . . . . . . . . . . . . . . . . . . . . . . . . 956.10 Heating curves of each of the treatments showing the vapour trans-
port zones for cold box (CG) and furan (FG) cores. . . . . . . . . . 956.11 Core surface coverage by different coatings. . . . . . . . . . . . . . 966.12 Uniform coating penetration into the cores from the filter dust coat-
ing. . . . . . . . . . . . . . . . . . . . . . . . . . . . . . . . . . . . 976.13 Micrographs of coating penetration in cold box by coatings. . . . . 976.14 Core-coating interaction. . . . . . . . . . . . . . . . . . . . . . . . . 986.15 Permeability of uncoated and coated cores. . . . . . . . . . . . . . 996.16 Uniform colour of various coatings on the cured cold box cores. . . . 1026.17 Flexural strength of cold box core materials coated with filter dust
coating containing various amounts of sol-gel components. . . . . . 1036.18 Tensile strength of cold box core materials coated with filter dust
coating containing various amounts of sol-gel components. . . . . . 1036.19 Thermal profiles in cold box cores coated with different sol-gel filter
dust coatings showing the silica sand TTZ. . . . . . . . . . . . . . 1046.20 Thermal profiles in coated cold box cores. . . . . . . . . . . . . . . 1056.21 Thermal profiles in coated furan cores. . . . . . . . . . . . . . . . . 1066.22 Thermal profiles in cold box core used in the vertically-parted moulds.1076.23 Thermal degradation of furan and cold box cores. . . . . . . . . . . 1086.24 Predicted oxidation reactions likely to occur in the mould with liq-
uid metal. . . . . . . . . . . . . . . . . . . . . . . . . . . . . . . . 1106.25 Predicted carburization reactions likely to occur in the mould with
liquid metal. . . . . . . . . . . . . . . . . . . . . . . . . . . . . . . . 1116.26 Predicted sulphurization reactions likely to occur in the mould with
liquid metal. . . . . . . . . . . . . . . . . . . . . . . . . . . . . . . . 1126.27 The coated cores with random coating heights. . . . . . . . . . . . . 1136.28 Surface quality of castings made with uncoated and cores coated
with sol-gel filter dust coating. . . . . . . . . . . . . . . . . . . . . . 1146.29 Comparison of surface quality of castings made with uncoated and
coated cold box cores. . . . . . . . . . . . . . . . . . . . . . . . . . 115
xvii
6.30 Comparison of surface quality of castings made with uncoated andcoated furan cores. . . . . . . . . . . . . . . . . . . . . . . . . . . . 116
6.31 Experimental casting showing areas of defects in agreement withnumerical simulations in the horizontally-parted mould. . . . . . . . 116
6.32 Sol-gel filter dust coating containing 40% solid content and 9% sol-gel content. . . . . . . . . . . . . . . . . . . . . . . . . . . . . . . . 118
6.33 Surface roughness estimation of the casting surface around the corescoated with 40% solid content sol-gel coating. . . . . . . . . . . . . 118
6.34 Surface roughness estimation of the casting surface around the corescoated with 50% solid content sol-gel coating. . . . . . . . . . . . . 119
6.35 Sol-gel filter dust coating containing 60% solid content and 9% sol-gel content. . . . . . . . . . . . . . . . . . . . . . . . . . . . . . . . 119
6.36 Experimental casting showing areas of defects in agreement withnumerical simulations in the vertically-parted mould. . . . . . . . . 120
6.37 Surface quality of castings showing the influence of sol-gel coatingtype on 3 s dipping of cold box cores. . . . . . . . . . . . . . . . . . 121
6.38 Surface quality of castings showing the influence of dipping time inCoating 2 on surface quality of castings. . . . . . . . . . . . . . . . 122
6.39 Influence of sol-gel coating type on the surface quality of castingswith different location of coated cores. . . . . . . . . . . . . . . . . 123
6.40 Surface roughness estimation of the casting surface around the corescoated with three different sol-gel coatings. . . . . . . . . . . . . . . 123
6.41 The surface of castings made with uncoated cold box and furan cores.1246.42 The effect of addition of sol-gel component to a commercial coating
on surface quality castings made with cold box cores. . . . . . . . . 1246.43 The effect of addition of sol-gel component on surface quality of
castings made with furan cores. . . . . . . . . . . . . . . . . . . . . 1256.44 Vice castings . . . . . . . . . . . . . . . . . . . . . . . . . . . . . . . 1266.45 Casting layout and descriptions. . . . . . . . . . . . . . . . . . . . . 1276.46 Surface processing in Scanning Probe Image Processor (SPIP). . . . 1286.47 The difference between waviness and roughness. The reason for
filtering. . . . . . . . . . . . . . . . . . . . . . . . . . . . . . . . . . 1286.48 A typical 3D surface texture of a processed casting surface for rough-
ness measurement in SPIP. . . . . . . . . . . . . . . . . . . . . . . . 1296.49 Surface roughness results described by Sa values for multilayer ap-
plication of W230 + 20% sol-gel component. . . . . . . . . . . . . . 1306.50 A comparison of the front and reverse faces of the castings in the
coated prints. . . . . . . . . . . . . . . . . . . . . . . . . . . . . . . 1316.51 Plots of the various measurements comparing two prints at the same
height in the mould. . . . . . . . . . . . . . . . . . . . . . . . . . . 1326.52 Surface roughness of the castings around the coated core area. . . . 1336.53 Typical microstructure of cast iron. . . . . . . . . . . . . . . . . . . 135
xviii
6.54 Interface microstructure of ductile and grey iron castings with coldbox cores-unetched. . . . . . . . . . . . . . . . . . . . . . . . . . . 136
6.55 Interface microstructure of ductile and grey iron castings with furancores-unetched. . . . . . . . . . . . . . . . . . . . . . . . . . . . . . 137
6.56 Observed defects at castings interface with coated cores-unetched. . 1386.57 Interfacial microstructure of grey iron casting in contact with dif-
ferent surfaces-etched with Nital solution. . . . . . . . . . . . . . . 140
7.1 Castings from first trials. . . . . . . . . . . . . . . . . . . . . . . . . 1427.2 Castings from second trials. . . . . . . . . . . . . . . . . . . . . . . 1437.3 Castings from first trial. . . . . . . . . . . . . . . . . . . . . . . . . 1447.4 Summary of surface quality of castings from first trial by roughness
evaluation. . . . . . . . . . . . . . . . . . . . . . . . . . . . . . . . . 1447.5 The coated cores for the second trial casting at Vald. Birn. . . . . . 1457.6 Castings from second trial. . . . . . . . . . . . . . . . . . . . . . . . 146
8.1 XRD micro-analysis on uncoated and coated silica sand cold boxcores. . . . . . . . . . . . . . . . . . . . . . . . . . . . . . . . . . . . 152
8.2 Electrical double layer model [134]. . . . . . . . . . . . . . . . . . . 1558.3 Higher precision of the new STM over the traditional STM. . . . . . 1608.4 Schematic of the liquid solid contact (vertical scale exaggerated)
showing the constriction of the heat flux as it passes through themicrocontact area at the interface and the temperature profile atthe interface [145]. . . . . . . . . . . . . . . . . . . . . . . . . . . . 163
8.5 The model of the mass and heat transports at the mould/core-metalinterface. . . . . . . . . . . . . . . . . . . . . . . . . . . . . . . . . . 165
8.6 Proposed model for the thermo-mechanical degradation of the mould-ing materials at the core-metal interface during metal penetration. . 167
8.7 The difference between waviness and roughness. . . . . . . . . . . . 170
xix

xx

List of Tables
2.1 Important characteristics of some mono-size sphere packing. . . . . 102.2 Calculation of Grain Finesness Number (GFN) [27] . . . . . . . . . 13
3.1 ISO specification standards [74, 83]. . . . . . . . . . . . . . . . . . . 423.2 Comparison of profile and areal analyses [84]. . . . . . . . . . . . . 43
5.1 Expected product of sol-gel process depending on the rates of hy-drolysis and condensation [92]. . . . . . . . . . . . . . . . . . . . . . 64
5.2 Properties of the Sol-gel stock precursors. . . . . . . . . . . . . . . . 695.3 Different sol-gel coatings investigated in the preliminary tests. . . . 705.4 The parameters and levels for the investigation. . . . . . . . . . . . 715.5 The L9 orthogonal array of experiments for the parameters and their
levels. . . . . . . . . . . . . . . . . . . . . . . . . . . . . . . . . . . 725.6 Chemical composition of the core sand. . . . . . . . . . . . . . . . . 825.7 The melt composition. . . . . . . . . . . . . . . . . . . . . . . . . . 82
6.1 Observations of first-time and direct mixing of sol-gel stock withrefractory materials. . . . . . . . . . . . . . . . . . . . . . . . . . . 100
6.2 Observations in remixing coating precipitates after standing for aperiod of time. . . . . . . . . . . . . . . . . . . . . . . . . . . . . . 100
6.3 Properties of the various foundry coatings. . . . . . . . . . . . . . . 1016.4 Observations after allowing coating suspensions to stand for a period
of time. . . . . . . . . . . . . . . . . . . . . . . . . . . . . . . . . . 1026.5 Summary of percentage roughness reduction with coating Prints 2
and 4 relative to the uncoated Prints 1 and 3 for front and reversefaces. . . . . . . . . . . . . . . . . . . . . . . . . . . . . . . . . . . . 134
7.1 Casting conditions at Johan Jensen & Søn Metalstøberi. . . . . . . 1417.2 Casting conditions at Vald. Birn A/S. . . . . . . . . . . . . . . . . 1437.3 Summary of casting defects (veinings) assessment for different coatings147
8.1 Measures to control coating consistency in the foundry shop [108,139, 140]. . . . . . . . . . . . . . . . . . . . . . . . . . . . . . . . . 157
8.2 Measures for processing finished coating in the foundry shop [108, 140].158
xxi

8.3 Measures to determine coating-core interaction in the foundry shop[108, 139, 140]. . . . . . . . . . . . . . . . . . . . . . . . . . . . . . 159
xxii
Abstract
Sand casting is one of the oldest casting methods. The greatest advantage ofsand casting is that almost any metal can be poured in the sand and there isalmost no limit on the size, shape, or weight of the part. Sand casting providesthe most direct route from pattern to casting. Among the limitations involved insand casting is the need for fettling and machining in order to finish the castings,especially castings having rough surfaces, veinings, or finnings, and other surfacedefects. In this regard, this project deals with the understanding and reduction orelimination of the occurrence of these mentioned defects on the castings made insand moulding materials by use of novel refractory coatings.The project involves the development of novel foundry coatings using the SOL-GELTechnology. The idea was to harness the possibilities offered by this technologyto produce environmentally-friendly refractory foundry coatings. This process isa novel application for foundry coating development.In the approach for this research project, intensive efforts were made to understandcasting technology, the behaviour (mechanical and thermal) of moulding materials(at ambient and elevated temperatures), foundry coating technology and purposes,mould-metal reactions, metallurgy, modelling and simulations of casting processes,and surface metrology of castings.In the experimental approach, several coating formulations were prepared bothwith nanoparticle refractory materials (TiO2, ZnO) and microparticle refractorymaterials (filter dust, zircon, china clay, olivine, aluminium silicates). However,the nanoparticle refractory materials proved incompatible with the sand grains forfoundry coating production. Therefore, the bulk of the work was centred on themicro-sized refractory materials which showed positive results.The coatings were extensively characterized experimentally. The wet properties(density, oBaumé parameter, viscosity) and dry properties (penetration, coverage,layer thickness, moisture, permeability) as they apply to foundry industry, weremeasured and presented. The results show that the particle size, the particlesize distribution, and the percentage solid content play a significant role in therheology of the coatings. The percentage solid content is directly proportional tothe density, oBaumé parameter, viscosity, coverage, layer thickness and inverselyproportional to the penetration, moisture content and permeability.In this project, a new Strength Testing Machine (STM) for moulding materials wasbuilt and calibrated in-house for the determination of the mechanical propertiesof moulding materials. Coated moulding materials were tested for strengths (ten-sile, bending and compression) using the new STM, to determine the effect of the
xxiii
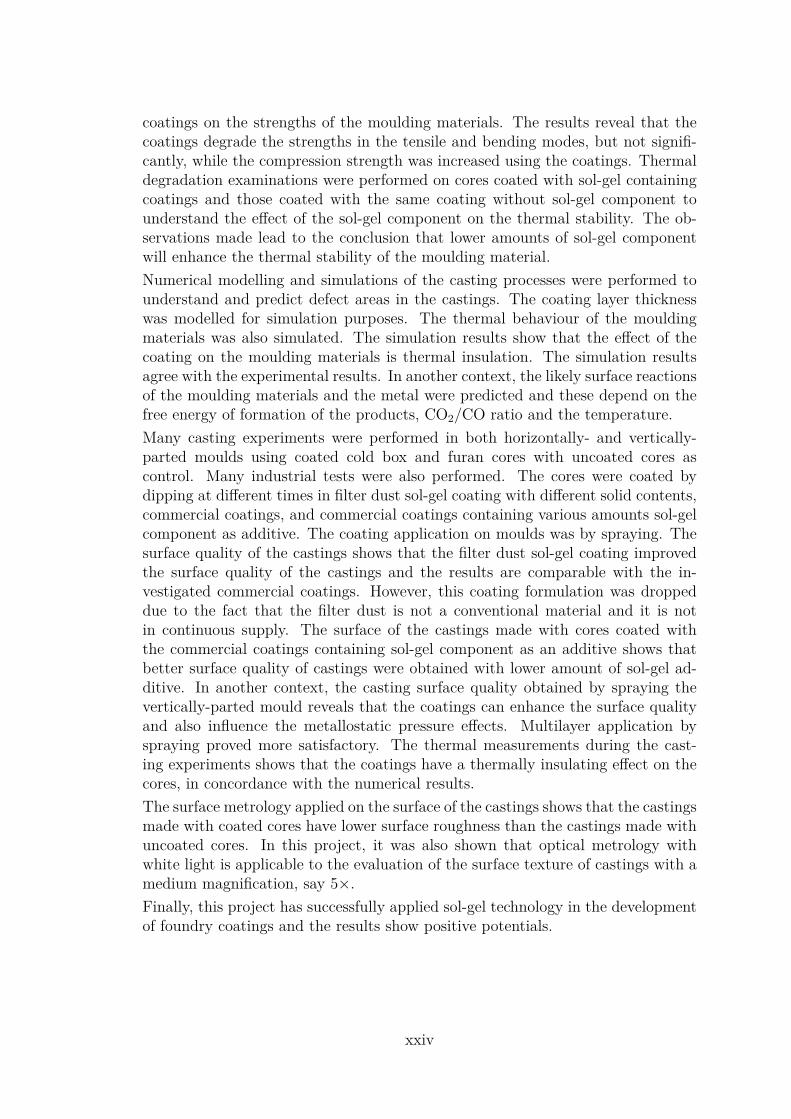
coatings on the strengths of the moulding materials. The results reveal that thecoatings degrade the strengths in the tensile and bending modes, but not signifi-cantly, while the compression strength was increased using the coatings. Thermaldegradation examinations were performed on cores coated with sol-gel containingcoatings and those coated with the same coating without sol-gel component tounderstand the effect of the sol-gel component on the thermal stability. The ob-servations made lead to the conclusion that lower amounts of sol-gel componentwill enhance the thermal stability of the moulding material.Numerical modelling and simulations of the casting processes were performed tounderstand and predict defect areas in the castings. The coating layer thicknesswas modelled for simulation purposes. The thermal behaviour of the mouldingmaterials was also simulated. The simulation results show that the effect of thecoating on the moulding materials is thermal insulation. The simulation resultsagree with the experimental results. In another context, the likely surface reactionsof the moulding materials and the metal were predicted and these depend on thefree energy of formation of the products, CO2/CO ratio and the temperature.Many casting experiments were performed in both horizontally- and vertically-parted moulds using coated cold box and furan cores with uncoated cores ascontrol. Many industrial tests were also performed. The cores were coated bydipping at different times in filter dust sol-gel coating with different solid contents,commercial coatings, and commercial coatings containing various amounts sol-gelcomponent as additive. The coating application on moulds was by spraying. Thesurface quality of the castings shows that the filter dust sol-gel coating improvedthe surface quality of the castings and the results are comparable with the in-vestigated commercial coatings. However, this coating formulation was droppeddue to the fact that the filter dust is not a conventional material and it is notin continuous supply. The surface of the castings made with cores coated withthe commercial coatings containing sol-gel component as an additive shows thatbetter surface quality of castings were obtained with lower amount of sol-gel ad-ditive. In another context, the casting surface quality obtained by spraying thevertically-parted mould reveals that the coatings can enhance the surface qualityand also influence the metallostatic pressure effects. Multilayer application byspraying proved more satisfactory. The thermal measurements during the cast-ing experiments shows that the coatings have a thermally insulating effect on thecores, in concordance with the numerical results.The surface metrology applied on the surface of the castings shows that the castingsmade with coated cores have lower surface roughness than the castings made withuncoated cores. In this project, it was also shown that optical metrology withwhite light is applicable to the evaluation of the surface texture of castings with amedium magnification, say 5×.Finally, this project has successfully applied sol-gel technology in the developmentof foundry coatings and the results show positive potentials.
xxiv
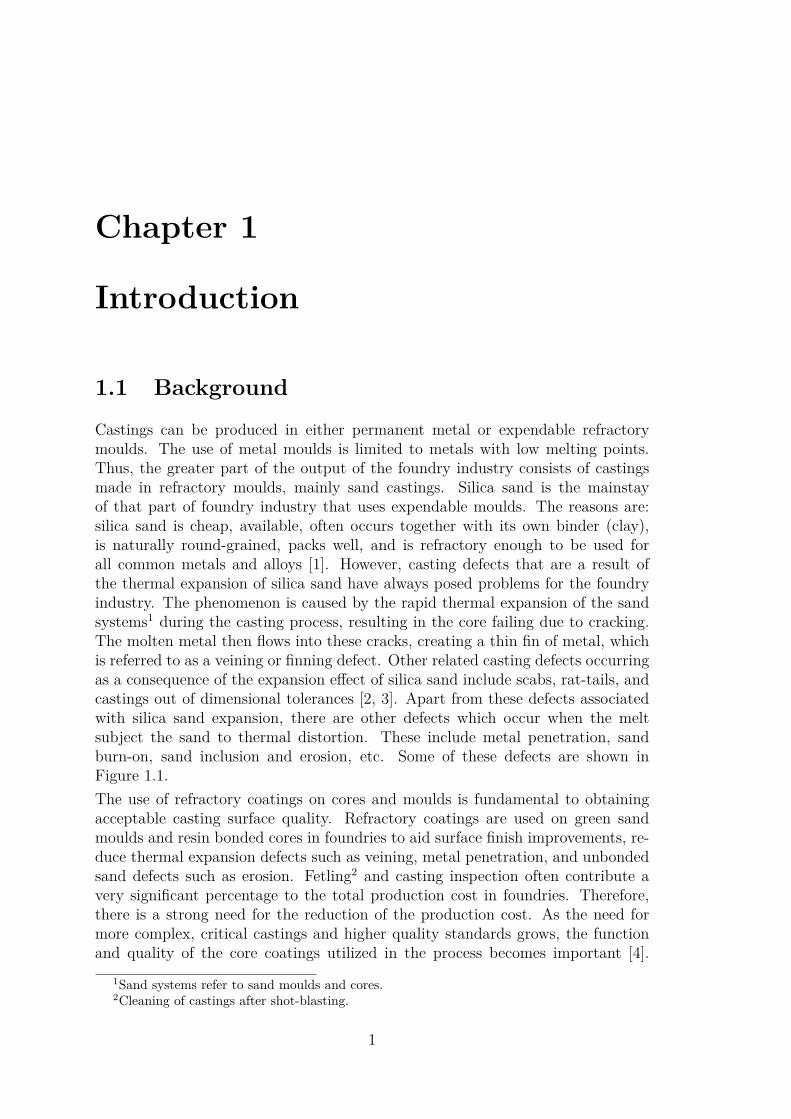
Chapter 1
Introduction
1.1 BackgroundCastings can be produced in either permanent metal or expendable refractorymoulds. The use of metal moulds is limited to metals with low melting points.Thus, the greater part of the output of the foundry industry consists of castingsmade in refractory moulds, mainly sand castings. Silica sand is the mainstayof that part of foundry industry that uses expendable moulds. The reasons are:silica sand is cheap, available, often occurs together with its own binder (clay),is naturally round-grained, packs well, and is refractory enough to be used forall common metals and alloys [1]. However, casting defects that are a result ofthe thermal expansion of silica sand have always posed problems for the foundryindustry. The phenomenon is caused by the rapid thermal expansion of the sandsystems1 during the casting process, resulting in the core failing due to cracking.The molten metal then flows into these cracks, creating a thin fin of metal, whichis referred to as a veining or finning defect. Other related casting defects occurringas a consequence of the expansion effect of silica sand include scabs, rat-tails, andcastings out of dimensional tolerances [2, 3]. Apart from these defects associatedwith silica sand expansion, there are other defects which occur when the meltsubject the sand to thermal distortion. These include metal penetration, sandburn-on, sand inclusion and erosion, etc. Some of these defects are shown inFigure 1.1.The use of refractory coatings on cores and moulds is fundamental to obtainingacceptable casting surface quality. Refractory coatings are used on green sandmoulds and resin bonded cores in foundries to aid surface finish improvements, re-duce thermal expansion defects such as veining, metal penetration, and unbondedsand defects such as erosion. Fetling2 and casting inspection often contribute avery significant percentage to the total production cost in foundries. Therefore,there is a strong need for the reduction of the production cost. As the need formore complex, critical castings and higher quality standards grows, the functionand quality of the core coatings utilized in the process becomes important [4].
1Sand systems refer to sand moulds and cores.2Cleaning of castings after shot-blasting.
1
2 CHAPTER 1. INTRODUCTION
(a) Veining defect (b) Penetration and veining defect
Figure 1.1: Some castings with defects after shot-blasting .
Some are more successful than others [3]. The castings shown in Figure 1.1 aremade with coated sand moulds and cores, but the castings still have these defects.The question that has remained unanswered is what can be done to reduce thetendency of occurrence of these defects? Or better still, eliminate them completely?Therefore, the project innovation consortium was formed to develop and test anovel Eco-friendly coating based on Sol-Gel Technology for foundry applications.The other members of the consortium apart from DTU are briefly introduced inSection 1.4.The novel coatings were extensively characterized experimentally and tested withcasting experiments. The surface quality defined by the roughness parameter ofthe castings made with these coatings were measured with a 3D optical micro-scope to establish a novel application of this measurement method in the foundryindustry. This is a non contact scanning process based on focus variation. In mostfoundries, surface quality of castings is measured by using roughness comparatorswhich are highly operator dependent and therefore subject to variation. Most im-portantly, this method is only qualitative and lacks reproducibility. Therefore, itis imperative to find a method that is quantitative and highly reproducible forsurface quality measurement of castings. The results are correlated with the seriesof characterization results of the coatings and the conditions of casting using somestatistical models. In this project, it was also found out from our measurementtrials, that most sand castings are out of stylus instruments measuring range, espe-cially the profilometers. Furthermore, a mechanical testing machine was developedand used for measuring the tensile and flexural strengths of chemically bonded corematerials. This is a novel application for chemically bonded core materials sincethe traditional strength machines are used for green sand materials. Moreover,this system shows the loading profile, unlike the existing machines, which measurethe maximum strengths.In chapter 2, a detailed discussion of mould and core dynamics emanating from thecontact of the mould or core with the liquid metal will be given. Furthermore, theconcept of order-packing of granular materials as it affects sand grains is discussed.Most of the physical phenomena occurring during the casting process and the as-sociated casting surface defects as a results of the mould/core and molten metal
1.2. SCOPE OF THESIS 3
interaction, will be discussed. Chapter 3 will briefly discuss Surface Technology.The parameters for the characterization of surface roughness and ISO standardsdealing with surface texture characterization according to literature are presented.Chapter 4 deals with the modelling and simulations of casting processes, elucidat-ing anticipated defect areas in the model. Chapter 5 covers materials and approachadopted in the execution of the research. In this chapter, different areas of theproject and methods of investigation are presented. Chapter 6 presents the sum-mary of the results from different areas of the project. Chapter 7 shows the resultsfrom industrial trials as case studies. Chapter 8 deals with the discussion of theresults, findings of this research, and further knowledge. Chapter 9 presents thesummary of the work by showing the important deductions from the research asconclusions while also providing the lead for future work. Another important sec-tion of this thesis is the supplements part. The supplements present the differentpublications of the results from the various areas of the research.
1.2 Scope of ThesisThe scope of this thesis is to enhance surface quality of castings using novel sol-gelcoatings on moulds and cores thereby saving energy and cost in the fetling shopsof the foundries.The main idea is to develope a novel foundry coating using the sol-gel process.This process has been applied in different areas of coating production for variousapplications such as membrane application, thermal barrier, corrosion and wearresistant coatings, self cleaning, etc. but has not been applied in the develop-ment of foundry coatings. Therefore, this is a novel application of this process infoundry coating production. The sol-gel process has an advantage that the systemcan easily be controlled to get a tailored microstructure. The coatings investigatedin this study were produced by the Sol-Gel group in the Materials Testing Divi-sion at Danish Technological Institute, Aarhus, Denmark. Therefore, this studyconcentrates on investigating and understanding the behaviour of the coatings onthe cores and making castings with the coated cores to elucidate the performanceof the coating in improving the surface quality of the castings.
1.3 GoalsThe goals of the project include:
• To analyse how sol-gel coatings adhere to the surface of cores produced withdifferent binder systems.
• To analyse how the coatings behave when subjected to the heat treatmentresulting from direct contact with liquid metal during casting.
• To describe surface reactions between the coatings, cores, and castings duringmould filling and solidification.

4 CHAPTER 1. INTRODUCTION
• To suggest model equations for the surface reactions.
• To determine the mechanical properties of core materials onto which thecoatings are applied.
• To propose mode of fracture of the cores and coatings.
• To characterize the surface quality of the castings made with cores coatedwith sol-gel coatings and to quantify the surface roughness of some standardsurface comparators.
• To investigate the interfacial microstructure of the casting in contact withthe coated moulding materials.
1.4 Project Partners
This project, apart from being hosted and carried out at Technical Universityof Denmark, DTU, Mechanical Engineering laboratories, has other partners thathave in one way or the other contributed immensely with their foundry expertiseto the milestone so far reached in the research. A brief introduction of each isprovided below.
1.4.1 C. C. Jensen A/S
C. C. Jensen A/S is a family-owned international company, established in 1953, andbased in Denmark. Their uniqueness is based on combination of tradition, innova-tion, and technical expertise. C. C. Jensen has a global network of 9 subsidiaries,5 affiliate companies, 1 joint venture partner and more than 40 distributors [5].
1.4.2 Dania A/S
Dania A/S was established in 1947. Dania manufactures and supplies series pro-duced machine moulded components in grey iron and nodular iron with weightsranging from 0.5 to 60 kg, preferably complex and core intensive castings. Daniaalso offers surface treatment and machining services [6].
1.4.3 Danish Technological Institute (DTI)
The Danish Technological Institute (DTI) applies and disseminates research- andtechnologically-based knowledge for the Danish and international business sectors.They provide consultancy and standardisation services [7]. The coatings beinginvestigated in this project are produced by the Sol-Gel group at DTI.

1.4. PROJECT PARTNERS 5
1.4.4 DISA Industries A/S
DISA Industries is a complete foundry supplier and provides cutting edge mouldingtechnology, core solutions, and global technical services. DISA Industries is popu-larly known for the production of the automatic moulding machine, DISAMATIC,for vertically-parted green sand moulds [8].
1.4.5 Frese Metal- og Stålstøberi A/S
Frese Metal- og Stålstøberi A/S has more than 65 years of foundry experience andspecialises in making complicated, core intensive, single or series production ofquality castings in corrosion resistant materials such as bronze, aluminium bronzeand stainless steel using an automatic moulding No-bake process [9].
1.4.6 Johan Jensen & Søn MetalstøberiJohan Jensen & Søn Metalstøberi was established in 1892. This means that theyhave more than a century’s worth of experience in the area of grouting3 and cast-ing equipment for all purposes. Their customer base ranges from large cementfactories, shipyards, and large machinery factories to small local blacksmiths [10].
1.4.7 Nordsjællands MetalstøberiNordsjællands Metalstøberi A/S is the largest aluminium sand-casting foundry inDenmark. This foundry produces castings in any kind of standardized aluminiumalloys suited for sand forms. They produce items from 1 gram to several hundredkilos [11].
1.4.8 Sibelco Nordic A/S (formerly PV Sand)The company was founded in 1971. From middle of June 2010, the company namewas changed from PV Sand A/S to Sibelco Nordic A/S. Sibelco Nordic A/S is aleading manufacturer and supplier of many products for foundries, the offshore-industry, surface treatment, construction industry and sport & leisure [12]. Thiscompany participated in the development of the coatings being investigated.
1.4.9 Vald. Birn A/SBirn provides optimum manufacturing process for a broad spectrum of machine-moulded castings weighing up to approximately 80 kg in medium and large volumeswith and without cores. Birn produce a wide range of standard cast materials ingrey iron and nodular iron. Apart from manufacturing cast components, Birnoffers machining, surface treatment, and assembly services [13].
3To fill or finish with a thin mortar or plaster.

6 CHAPTER 1. INTRODUCTION
1.4.10 Vestas Castings Group A/SVestas Castings Group A/S under Vestas Nacelles A/S is a subsidiary of VestasWind Systems A/S. In Vestas Casting Group A/S, the weight of the castingsranges from 100 kg to 20 tonnes. The main activity of Vestas Castings Groupis the casting of items in high strength ductile iron and grey cast iron for windturbines. The components cast are primarily rotor hubs, blade hubs, main beams,bearing houses, base frames, stiffeners, and torque arms. These components arecast in moulds of furan resin bonded sand [14].
Chapter 2
Mould and Core Dynamics
2.1 Concept of Order-Packing of Granular Ma-terials
Packing can be defined as any manner of arrangement of solid units, in whicheach constituent unit is supported and held in position in the earth’s gravitationalfield by tangential contacts with its neighbours. The packing of aggregate ma-terials affects their physical properties such as bulk density, porosity, pore sizedistribution, pore shape, aggregate strength, and tortuosity1 [15]. The concept oforder-packing embraces the manner in which the sizing and shaping of aggregateparticles contribute to the orderly packing in a refractory matrix. By promotingthe orderly packing, it is possible to obtain an improvement of density and stabilityfrom the physical arrangement of aggregate particles, as well as, from the additionof binders to fill the voids and cement the particles [16, 17, 18]. The packing ofaggregate materials is influenced by particle size, particle size range, sphericity2,roundness3 and surface roughness of the aggregate materials, cementing materials(binders), moisture content, and water surface tension [15, 19]. Particles have acertain geometric form or shape with varying degree of roundness. It is generallyaccepted that the sphericity and roundness of particles are significant factors indetermining the physical properties of aggregate materials. The properties whichare likely to be influenced by particle sphericity and roundness include the voidratio, pore size distribution, number of points of contact, compressibility, cohesion,friction, and strength. Void ratio of sands increases with decreasing sphericity andusually with decreasing roundness [15].It has been discovered that factors such as grain shape and distribution, rammeddensities, and surface stabilities, do influence the casting results obtained withfoundry sands. Formerly, it was assumed that the order-packing is establishedwithin a mould by ramming forces. The more modern concept holds that throughthe dynamic grouping and packing of compatible particle sizes during mulling, an
1Tortuosity is a term used to describe diffusion in porous media.2Sphericity is a measure of the degree to which the shape of a particle approaches that of a
sphere.3Roundness is basically a measure of angularity of the particle corners regardless of shape.
7
8 CHAPTER 2. MOULD AND CORE DYNAMICS
aggregate is predisposed toward orderly packing before it is ever discharged froma Muller and placed in a mould [16]. However, particle size has no influence onpacking behaviour of large particles, but this is not the case with finer particles.Particle size affects packing, only when particles are less than 50 µm [15].Bulk density (γd), porosity (ε), void ratio (e) and packing density (W), which arecommonly used as a measure of packing, are related to one another by the followingrelationship:
ε = 1− γdγs
= e
1 + e= 1− Ω (2.1)
where γs is the density of solids [15, 18, 20, 21]. Most measurements of packing areexpressed in terms of bulk density; however, it is better when comparing materialsto use e or W which is independent of the density of solids [15].
2.1.1 Some Theoretical Relationships
To develop the application of this concept for dynamic orderly packing duringmulling, the packing potentialities of true spheres such as glass beads are consid-ered since this is a simpler system even than the granular materials, and providesa framework within which the packing of less uniform particles can be understood[16, 22].With a mass composed of uniform spheres, or beads, of a certain sieve size (a 1-component system), one can visualize the beads as packing to create either a simplecubic or rhombic formations (Figure 2.1). By placing a layer of four beads in truevertical alignment above another layer of four beads, one secures an example of asimple cubic packing (Figure 2.1a). This type of packing is physically unstable inthat the natural tendency is to shift from cubic to rhombic. If one shifts the upperlayer so that one of its components rests in the pocket common to the four beadsin the lower layer, an example of simple rhombic packing is created (Figure 2.1b).
(a) Simple cubic (b) Simple rhombic
Figure 2.1: Types of packing uniform spheres from one sieve (1-component system)[16].
2.1. CONCEPT OF ORDER-PACKING OF GRANULAR MATERIALS 9
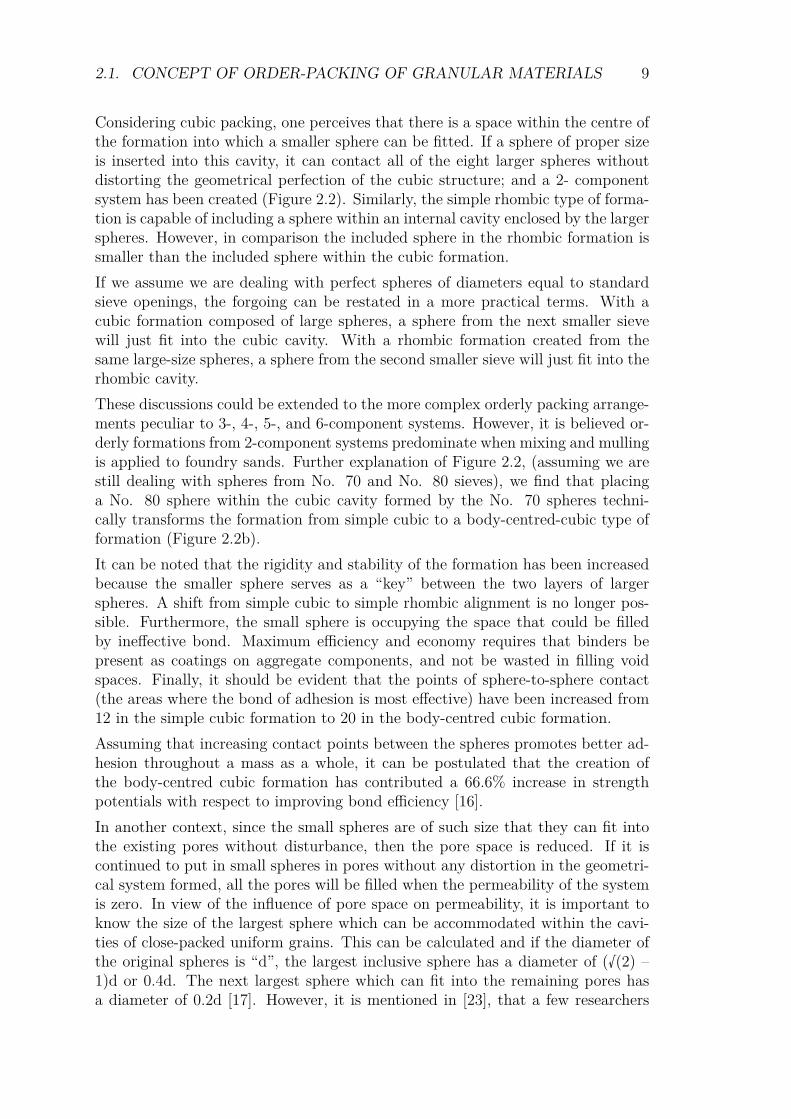
Considering cubic packing, one perceives that there is a space within the centre ofthe formation into which a smaller sphere can be fitted. If a sphere of proper sizeis inserted into this cavity, it can contact all of the eight larger spheres withoutdistorting the geometrical perfection of the cubic structure; and a 2- componentsystem has been created (Figure 2.2). Similarly, the simple rhombic type of forma-tion is capable of including a sphere within an internal cavity enclosed by the largerspheres. However, in comparison the included sphere in the rhombic formation issmaller than the included sphere within the cubic formation.If we assume we are dealing with perfect spheres of diameters equal to standardsieve openings, the forgoing can be restated in a more practical terms. With acubic formation composed of large spheres, a sphere from the next smaller sievewill just fit into the cubic cavity. With a rhombic formation created from thesame large-size spheres, a sphere from the second smaller sieve will just fit into therhombic cavity.These discussions could be extended to the more complex orderly packing arrange-ments peculiar to 3-, 4-, 5-, and 6-component systems. However, it is believed or-derly formations from 2-component systems predominate when mixing and mullingis applied to foundry sands. Further explanation of Figure 2.2, (assuming we arestill dealing with spheres from No. 70 and No. 80 sieves), we find that placinga No. 80 sphere within the cubic cavity formed by the No. 70 spheres techni-cally transforms the formation from simple cubic to a body-centred-cubic type offormation (Figure 2.2b).It can be noted that the rigidity and stability of the formation has been increasedbecause the smaller sphere serves as a “key” between the two layers of largerspheres. A shift from simple cubic to simple rhombic alignment is no longer pos-sible. Furthermore, the small sphere is occupying the space that could be filledby ineffective bond. Maximum efficiency and economy requires that binders bepresent as coatings on aggregate components, and not be wasted in filling voidspaces. Finally, it should be evident that the points of sphere-to-sphere contact(the areas where the bond of adhesion is most effective) have been increased from12 in the simple cubic formation to 20 in the body-centred cubic formation.Assuming that increasing contact points between the spheres promotes better ad-hesion throughout a mass as a whole, it can be postulated that the creation ofthe body-centred cubic formation has contributed a 66.6% increase in strengthpotentials with respect to improving bond efficiency [16].In another context, since the small spheres are of such size that they can fit intothe existing pores without disturbance, then the pore space is reduced. If it iscontinued to put in small spheres in pores without any distortion in the geometri-cal system formed, all the pores will be filled when the permeability of the systemis zero. In view of the influence of pore space on permeability, it is important toknow the size of the largest sphere which can be accommodated within the cavi-ties of close-packed uniform grains. This can be calculated and if the diameter ofthe original spheres is “d”, the largest inclusive sphere has a diameter of (√(2) –1)d or 0.4d. The next largest sphere which can fit into the remaining pores hasa diameter of 0.2d [17]. However, it is mentioned in [23], that a few researchers
10 CHAPTER 2. MOULD AND CORE DYNAMICS
(a) Expanded formation (b) Compact formationSmall size diameter = 0.732 R and Large size diameter = R
Figure 2.2: Types of packing uniform spheres from one sieve (2-component system)[16].
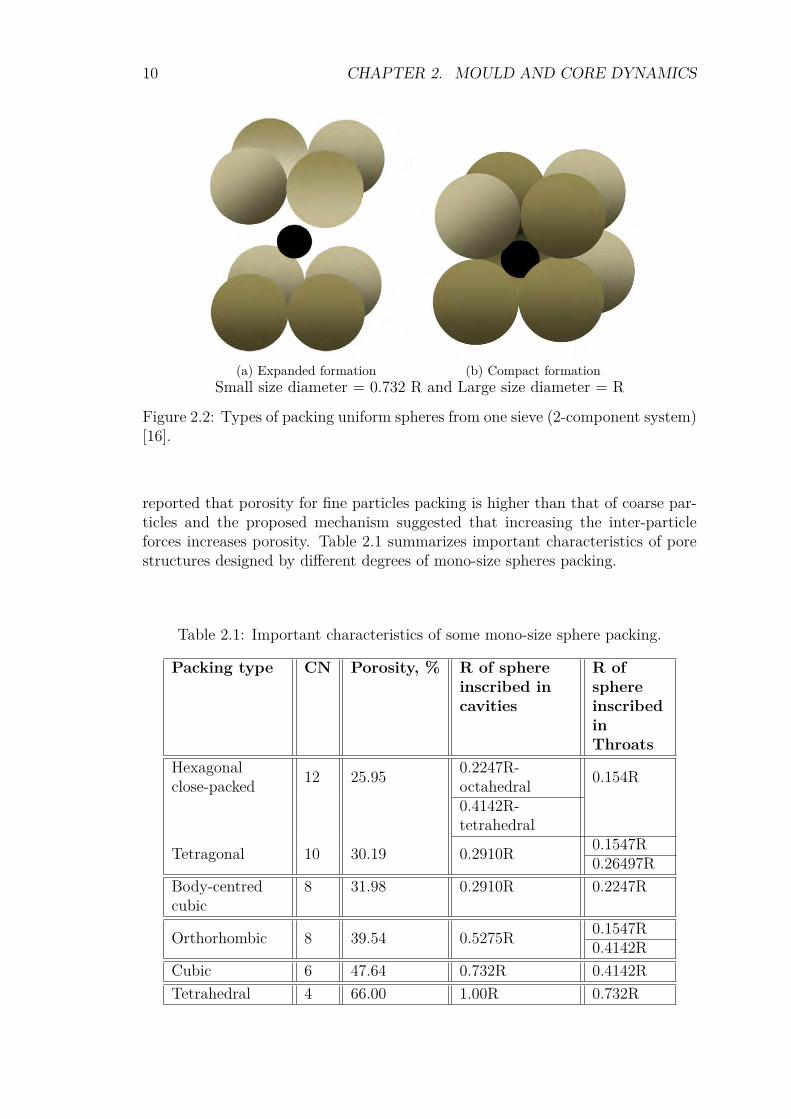
reported that porosity for fine particles packing is higher than that of coarse par-ticles and the proposed mechanism suggested that increasing the inter-particleforces increases porosity. Table 2.1 summarizes important characteristics of porestructures designed by different degrees of mono-size spheres packing.
Table 2.1: Important characteristics of some mono-size sphere packing.
Packing type CN Porosity, % R of sphereinscribed incavities
R ofsphereinscribedinThroats
Hexagonalclose-packed 12 25.95 0.2247R-
octahedral 0.154R
0.4142R-tetrahedral
Tetragonal 10 30.19 0.2910R 0.1547R0.26497R
Body-centredcubic
8 31.98 0.2910R 0.2247R
Orthorhombic 8 39.54 0.5275R 0.1547R0.4142R
Cubic 6 47.64 0.732R 0.4142RTetrahedral 4 66.00 1.00R 0.732R
2.1. CONCEPT OF ORDER-PACKING OF GRANULAR MATERIALS 11
2.1.2 Practical Applications
The concept for dynamic orderly packing is not applicable to natural sands. Mostnatural sands contain a high percentage of clay and silt-like materials; and mullingis used to plasticize the clay and create rather thick coatings upon individualgrains. Upon being rammed together, portions of the clay coatings are forced intothe voids between adjacent sand grains. As a generalization, one can state thatthe density and stability of natural sand is more dependent upon the bond thandistribution of sand grains; synthetic sands, being the most used moulding sand,are more dependent upon distribution of sand grains than bond. However, mullingis required to develop the characteristics of both.
2.1.3 Grain Distribution – Laws of Probability
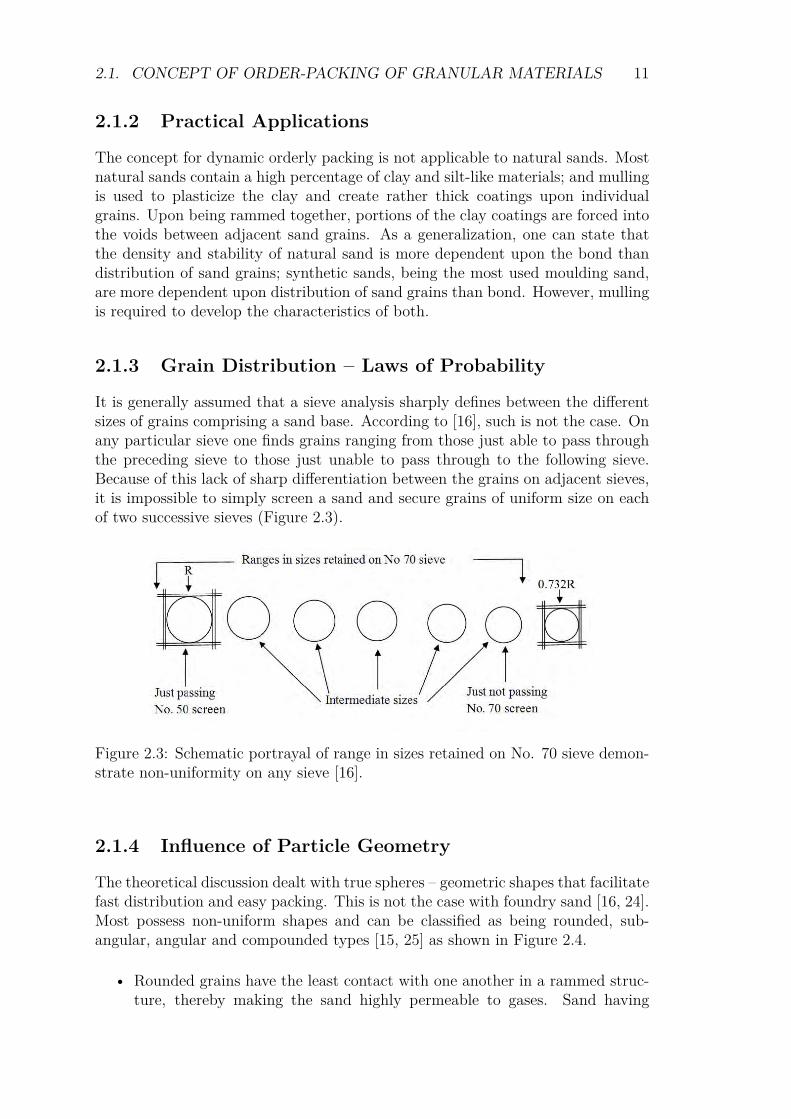
It is generally assumed that a sieve analysis sharply defines between the differentsizes of grains comprising a sand base. According to [16], such is not the case. Onany particular sieve one finds grains ranging from those just able to pass throughthe preceding sieve to those just unable to pass through to the following sieve.Because of this lack of sharp differentiation between the grains on adjacent sieves,it is impossible to simply screen a sand and secure grains of uniform size on eachof two successive sieves (Figure 2.3).
Figure 2.3: Schematic portrayal of range in sizes retained on No. 70 sieve demon-strate non-uniformity on any sieve [16].
2.1.4 Influence of Particle Geometry
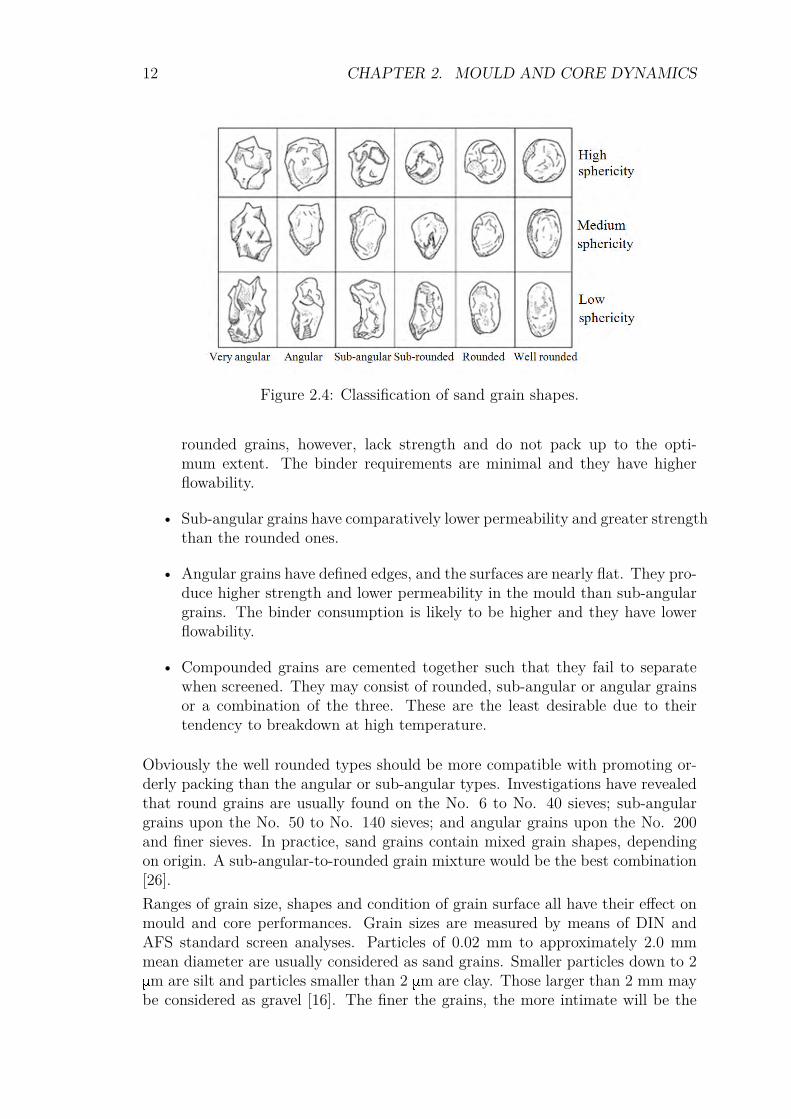
The theoretical discussion dealt with true spheres – geometric shapes that facilitatefast distribution and easy packing. This is not the case with foundry sand [16, 24].Most possess non-uniform shapes and can be classified as being rounded, sub-angular, angular and compounded types [15, 25] as shown in Figure 2.4.
• Rounded grains have the least contact with one another in a rammed struc-ture, thereby making the sand highly permeable to gases. Sand having
12 CHAPTER 2. MOULD AND CORE DYNAMICS
Figure 2.4: Classification of sand grain shapes.
rounded grains, however, lack strength and do not pack up to the opti-mum extent. The binder requirements are minimal and they have higherflowability.
• Sub-angular grains have comparatively lower permeability and greater strengththan the rounded ones.
• Angular grains have defined edges, and the surfaces are nearly flat. They pro-duce higher strength and lower permeability in the mould than sub-angulargrains. The binder consumption is likely to be higher and they have lowerflowability.
• Compounded grains are cemented together such that they fail to separatewhen screened. They may consist of rounded, sub-angular or angular grainsor a combination of the three. These are the least desirable due to theirtendency to breakdown at high temperature.
Obviously the well rounded types should be more compatible with promoting or-derly packing than the angular or sub-angular types. Investigations have revealedthat round grains are usually found on the No. 6 to No. 40 sieves; sub-angulargrains upon the No. 50 to No. 140 sieves; and angular grains upon the No. 200and finer sieves. In practice, sand grains contain mixed grain shapes, dependingon origin. A sub-angular-to-rounded grain mixture would be the best combination[26].Ranges of grain size, shapes and condition of grain surface all have their effect onmould and core performances. Grain sizes are measured by means of DIN andAFS standard screen analyses. Particles of 0.02 mm to approximately 2.0 mmmean diameter are usually considered as sand grains. Smaller particles down to 2mm are silt and particles smaller than 2 mm are clay. Those larger than 2 mm maybe considered as gravel [16]. The finer the grains, the more intimate will be the
2.1. CONCEPT OF ORDER-PACKING OF GRANULAR MATERIALS 13
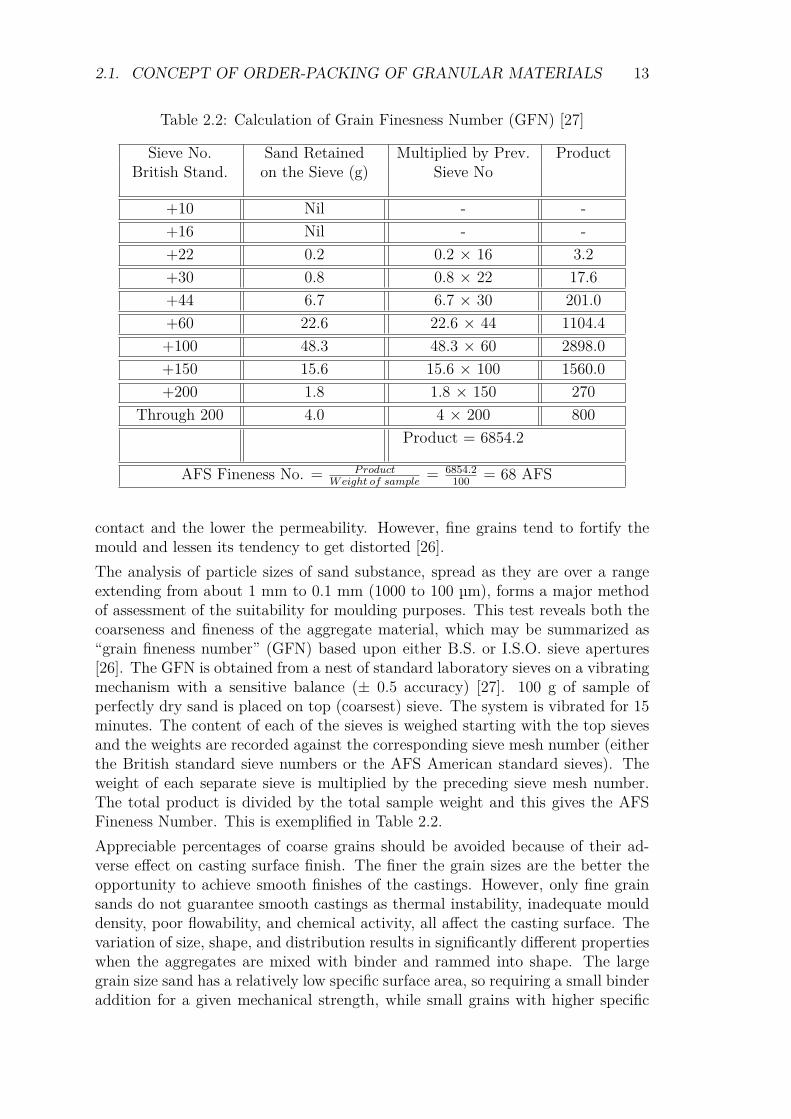
Table 2.2: Calculation of Grain Finesness Number (GFN) [27]
Sieve No. Sand Retained Multiplied by Prev. ProductBritish Stand. on the Sieve (g) Sieve No
+10 Nil - -+16 Nil - -+22 0.2 0.2 × 16 3.2+30 0.8 0.8 × 22 17.6+44 6.7 6.7 × 30 201.0+60 22.6 22.6 × 44 1104.4+100 48.3 48.3 × 60 2898.0+150 15.6 15.6 × 100 1560.0+200 1.8 1.8 × 150 270
Through 200 4.0 4 × 200 800Product = 6854.2
AFS Fineness No. = ProductWeight of sample
= 6854.2100 = 68 AFS
contact and the lower the permeability. However, fine grains tend to fortify themould and lessen its tendency to get distorted [26].The analysis of particle sizes of sand substance, spread as they are over a rangeextending from about 1 mm to 0.1 mm (1000 to 100 µm), forms a major methodof assessment of the suitability for moulding purposes. This test reveals both thecoarseness and fineness of the aggregate material, which may be summarized as“grain fineness number” (GFN) based upon either B.S. or I.S.O. sieve apertures[26]. The GFN is obtained from a nest of standard laboratory sieves on a vibratingmechanism with a sensitive balance (± 0.5 accuracy) [27]. 100 g of sample ofperfectly dry sand is placed on top (coarsest) sieve. The system is vibrated for 15minutes. The content of each of the sieves is weighed starting with the top sievesand the weights are recorded against the corresponding sieve mesh number (eitherthe British standard sieve numbers or the AFS American standard sieves). Theweight of each separate sieve is multiplied by the preceding sieve mesh number.The total product is divided by the total sample weight and this gives the AFSFineness Number. This is exemplified in Table 2.2.Appreciable percentages of coarse grains should be avoided because of their ad-verse effect on casting surface finish. The finer the grain sizes are the better theopportunity to achieve smooth finishes of the castings. However, only fine grainsands do not guarantee smooth castings as thermal instability, inadequate moulddensity, poor flowability, and chemical activity, all affect the casting surface. Thevariation of size, shape, and distribution results in significantly different propertieswhen the aggregates are mixed with binder and rammed into shape. The largegrain size sand has a relatively low specific surface area, so requiring a small binderaddition for a given mechanical strength, while small grains with higher specific
14 CHAPTER 2. MOULD AND CORE DYNAMICS
area need a larger binder addition to achieve the same strength [28]. Furthermore,the distribution of grain sizes in a sand has a strong influence on their ease ofbonding. A narrow or very broad range of grain sizes will require larger percent-ages of binders than will a moderate screen-spread sand to develop a given levelof green strength. Fines, silt, and clay are to be avoided or kept to a minimumin this case. Liquid binders, when properly mixed with sand, form a very thincoating on the grains [16].
2.2 Phenomena Affecting Mould and Core Dy-namics
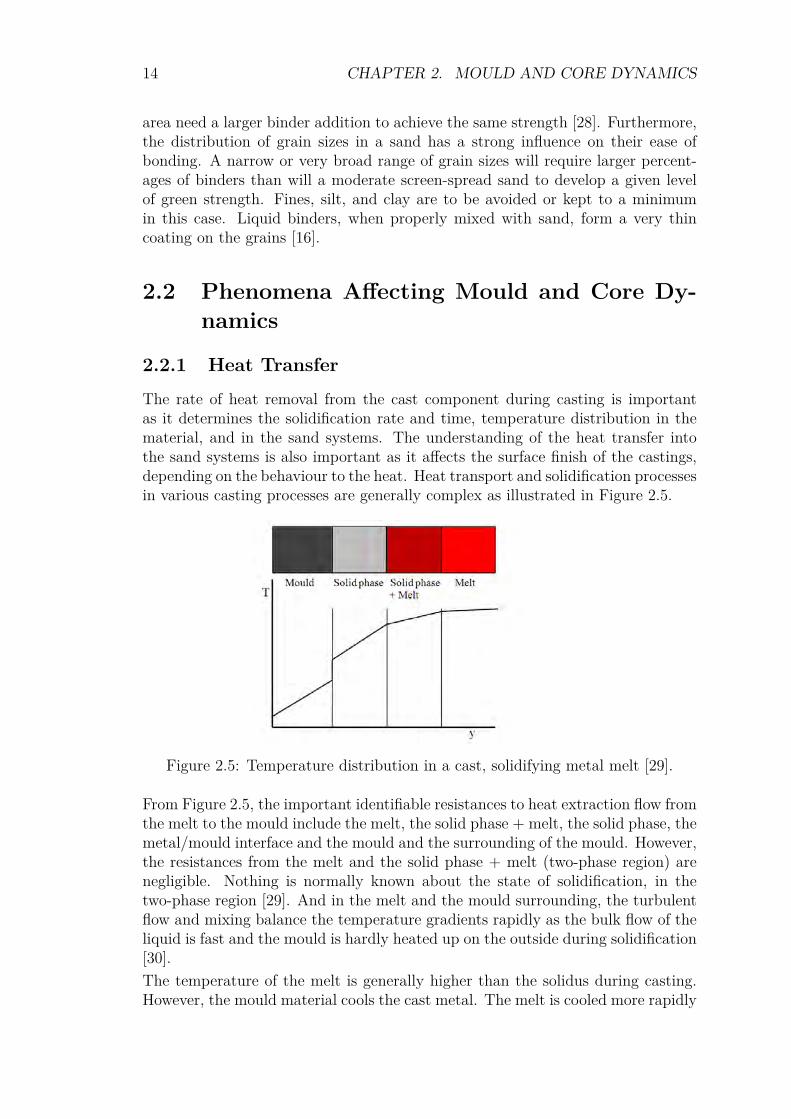
2.2.1 Heat TransferThe rate of heat removal from the cast component during casting is importantas it determines the solidification rate and time, temperature distribution in thematerial, and in the sand systems. The understanding of the heat transfer intothe sand systems is also important as it affects the surface finish of the castings,depending on the behaviour to the heat. Heat transport and solidification processesin various casting processes are generally complex as illustrated in Figure 2.5.
Figure 2.5: Temperature distribution in a cast, solidifying metal melt [29].
From Figure 2.5, the important identifiable resistances to heat extraction flow fromthe melt to the mould include the melt, the solid phase + melt, the solid phase, themetal/mould interface and the mould and the surrounding of the mould. However,the resistances from the melt and the solid phase + melt (two-phase region) arenegligible. Nothing is normally known about the state of solidification, in thetwo-phase region [29]. And in the melt and the mould surrounding, the turbulentflow and mixing balance the temperature gradients rapidly as the bulk flow of theliquid is fast and the mould is hardly heated up on the outside during solidification[30].The temperature of the melt is generally higher than the solidus during casting.However, the mould material cools the cast metal. The melt is cooled more rapidly
2.2. PHENOMENA AFFECTING MOULD AND CORE DYNAMICS 15
at the surface, which is in contact with the sand system. Consequently, solidifi-cation starts at this surface and the solidification front moves inwards into themelt.
2.2.1.1 Resistance from the Solid Phase
For heat flow from a liquid metal poured at its melting point Tm against a mouldwall with initial temperature T0, the transient4 heat problem can be describedby the partial differential equation for heat conduction in 1-D, given by Fourier’ssecond law,
∂T
∂t= αs
∂2T
∂x2 (2.2)
Fourier’s 3-D form of the heat conduction equation is given by
∂T
∂t= αs
(∂2T
∂x2 + ∂2T
∂y2 + ∂2T
∂z2
)(2.3)
αs is the thermal diffusivity of the solid and it is expressed as
α = ksρscsp
(2.4)
whereks is thermal conductivityρs is densitycsp is heat capacity at constant pressure.The boundary conditions in Eq. 2.2 are x = 0, T = T0; at x = S, T = Tmand at the solidification front the rate of heat evolution must balance the rate ofconduction down the temperature gradient [30, 31, 32]. The relationship is givenby:
Hρs
(∂S
∂t
)= ks
(∂T
∂x
)(2.5)
H is the latent heat of solidification.However, if the rate of evolution of heat is faster than the rate of conduction,there will be local overheating of the mould leading to production of castings withsurface defects [33].
2.2.1.2 Resistance from the Mould/Metal Interface
It is reported in [30] that in many casting processes, heat flow is controlled toa significant extent by the resistance of the mould/metal interface. This occurswhen both the metal and the mould have reasonably good thermal conductivity,
4The temperature is a function of both position and time.
16 CHAPTER 2. MOULD AND CORE DYNAMICS
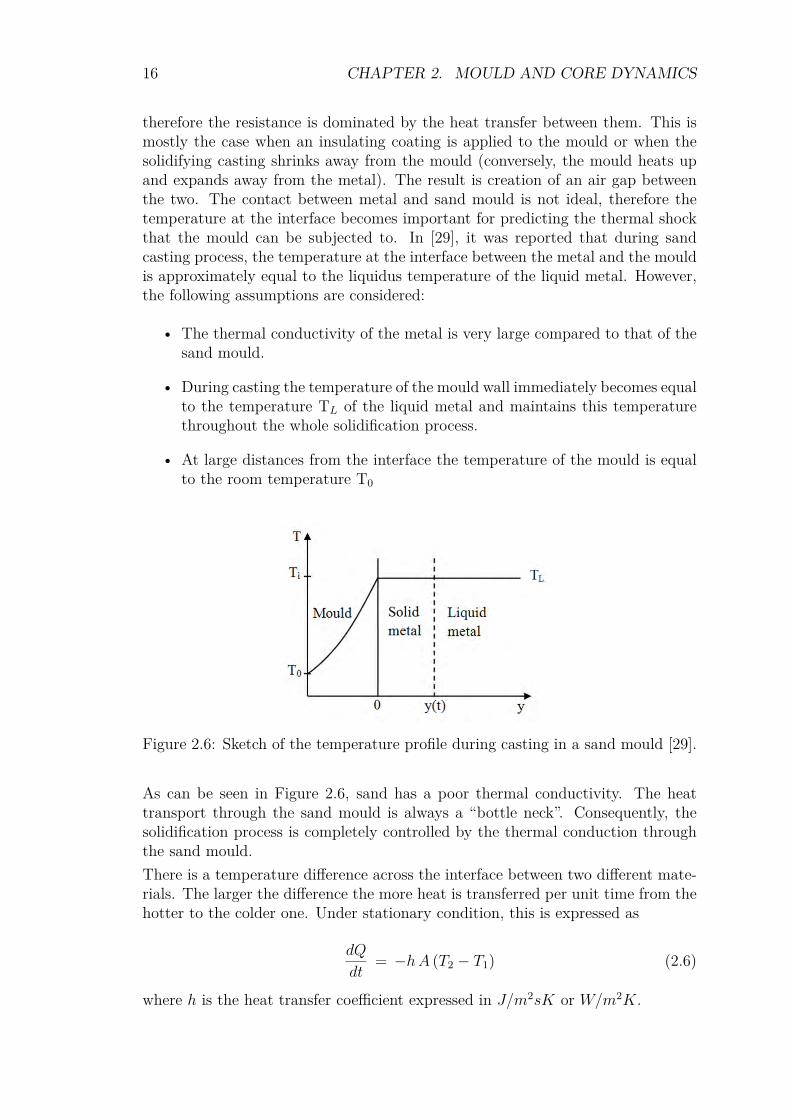
therefore the resistance is dominated by the heat transfer between them. This ismostly the case when an insulating coating is applied to the mould or when thesolidifying casting shrinks away from the mould (conversely, the mould heats upand expands away from the metal). The result is creation of an air gap betweenthe two. The contact between metal and sand mould is not ideal, therefore thetemperature at the interface becomes important for predicting the thermal shockthat the mould can be subjected to. In [29], it was reported that during sandcasting process, the temperature at the interface between the metal and the mouldis approximately equal to the liquidus temperature of the liquid metal. However,the following assumptions are considered:
• The thermal conductivity of the metal is very large compared to that of thesand mould.
• During casting the temperature of the mould wall immediately becomes equalto the temperature TL of the liquid metal and maintains this temperaturethroughout the whole solidification process.
• At large distances from the interface the temperature of the mould is equalto the room temperature T0
Figure 2.6: Sketch of the temperature profile during casting in a sand mould [29].
As can be seen in Figure 2.6, sand has a poor thermal conductivity. The heattransport through the sand mould is always a “bottle neck”. Consequently, thesolidification process is completely controlled by the thermal conduction throughthe sand mould.There is a temperature difference across the interface between two different mate-rials. The larger the difference the more heat is transferred per unit time from thehotter to the colder one. Under stationary condition, this is expressed as
dQ
dt= −hA (T2 − T1) (2.6)
where h is the heat transfer coefficient expressed in J/m2sK or W/m2K.
2.2. PHENOMENA AFFECTING MOULD AND CORE DYNAMICS 17
Poor contact between the materials will result in a poor response time [34] anda thin layer of air between them. Air is a poor conductor and heat transfer issignificantly reduced [29].The amount of heat per unit area, which is transported into the mould per unittime in the negative direction through the interface between the mould and themetal is given by
∂q
∂t= −
√kmould ρmould cmouldp
πt(Ti − T0) (2.7)
where Ti is the interface temperature.This amount of heat consists of only solidification heat because the temperature inthe liquid phase (TL) is constant in the solid phase and the melt. The solidificationheat per unit area and unit time is given by
∂q
∂t= −ρs(−4H) dyL
dt(2.8)
where dyL/dt is the solidification rate, i.e. the velocity of the solidification frontin the melt. The thickness of the solidifying layer as a function time is given byEq. 2.9:
yL(t) = 2√π
Ti − T0
ρs(−4H)√kmould ρmould cmouldp
√t (2.9)
In Eq. 2.9, the second factor describes the metal while the third factor describes themould. It can also be seen from this equation that the thickness of the solidifyinglayer is a parabolic function of time. The solidification rate is rapid initially butdecreases successively when the solidified layer grows.The geometry of the mould wall has influence on the ability to extract the heatfrom the melt. Heat is transferred more rapidly in a concave mould area than ina planar surface because in a planar surface, heat spreads into a larger volume.Conversely, heat is transferred more slowly into a convex mould/casting area thanin a planar one, because the heat spreads into a smaller volume than in a planarcase [29].
2.2.1.3 Resistance from the Mould
The rate of solidification of castings made in silica sand moulds is generally con-trolled by the rate at which heat can be absorbed by the mould. The sand mouldacts as an insulator, keeping the casting warm. Ceramic, investment and plas-ter moulds are even more insulating, preventing premature cooling of the melt,enhancing fluidity to give adequate ability to fill thin sections for which thesecasting processes are renowned. Unfortunately, the extremely slow cooling canlead to poor mechanical properties.The product (kmould ρmould cmouldp ) in Eq. 2.7 is a useful parameter to assess the rateat which various moulding materials can absorb heat [30]. This (kmould ρmould cmouldp ) 1
2
is defined as the cooling power of the moulding material.
18 CHAPTER 2. MOULD AND CORE DYNAMICS
2.2.2 Pressure from Metal
2.2.2.1 Pressure from Melt
The pressure from the melt is observed in three different forms namely staticpressure due to depth, dynamic pressure due to flow and buoyancy forces. In thestatic condition, the expected linear increase in the size of a casting as the feederheight is increased is evident from the expression of pressure, p; density, ρ; height,h and acceleration due to gravity, g:
p = ρgh (2.10)
The effect of density is also noteworthy. The air gap seems sensitive to the hy-drostatic pressure. Generally, the air gap is reduced as the hydrostatic pressure isincreased with depth [30].In the dynamic situation, the flow in the liquid is driven by the difference inpressure, p between two points. This is given by Bernoulli’s equation (Eq. 2.11)according to the principle of continuity (Eq. 2.12) for an incompressible liquid:
p1 + ρgh1 +(ρv2
12
)= p2 + ρgh2 +
(ρv2
22
)(2.11)
A1v1 = A2v2 = Av (2.12)
where A is the area of surface [29].The pressure p, of the impact of a free jet of metal against a mould wall is givenby
p = ρv2 (2.13)
where v is the velocity of the incoming melt. This is the pressure experienced bythe mould if impacted by a stream of metal jetting from an ingate. From Eq. 2.13,the dependence on squared velocity entells the need to keep the velocity throughthe ingates low. The effect of density is also clear and emphasizes the problem forthe heavier alloys compared to the lighter alloys.The buoyancy effect is very important, because liquid metals are so dense, andtherefore exert buoyancy force that makes it difficult for internal cores to remainsubmerged in the liquid metal. This becomes important in the design of core printsfor cores that will be completely submerged in the melt. Thin long cores withhigh ratio of length to diameter may buckle if its expansion is not accommodatedat the ends. The high floatation force will ensure that the buckling is in theupward direction. Silica sand cores in liquid magnesium are almost as dense asthe melt, and therefore experience little or no buoyancy. Zircon sand core inliquid aluminium is even closer to neutral buoyancy coupled with its low thermalexpansion [30].
2.2. PHENOMENA AFFECTING MOULD AND CORE DYNAMICS 19
2.2.2.2 Pressure due to Casting Expansion/Contraction on Solidifica-tion
The expansion/contraction of most metals during solidification generate high pres-sure that expands and deforms the moulds. This expansion is homogeneous5 andany internal holes will also enlarge in proportion.However, if the mould is rigid and able to withstand this pressure, then the ex-pansion/contraction of the cast material will no longer be homogeneous. At leastpart of the expansion will be forced to occur inwards, largely closing any internalporosity present in the casting. By this mechanism, rigid moulds produce soundercast iron castings. The expansion of the iron is the result of the precipitation ofgraphite during solidification. Ductile iron is more demanding for rigid mouldsthan grey iron. Thus, general experience is that ductile iron is more difficult tocast sound.Considering the fact that grey iron exhibits coupled growth of the eutectic. Thismeans that the austenite and the graphite phases grow together, and the expansionof the graphite and the shrinkage of the austenite approximately cancel. On theother hand, ductile iron exhibits divorced growth of the eutectic phases, withsignificant shrinkage due to the freezing of austenite, preceding the expansion dueto the formation of graphite [30, 35].
2.2.3 Gas Pressure in Moulds and Cores
There is a vigorous evolution of volatile materials from moulds and cores whenthey come in contact with the liquid metal. In green sand moulds and many otherbinder systems the main component of this volatilization is water. In other moulds,the gases generated diffuse away through the bulk of the mould. In green sandmoulds, due to the presence of clay and other fines, the permeability of the gasesbecomes difficult. The venting of the moulds was done by needling with wires.In cores, however, the escape of gases is limited to the area of the core prints toprevent the metal being damaged by passage of gas bubbles through it becausethe cores are usually covered by the liquid metal. Furthermore, the rate of heatingof the core is greater than that of the mould because the core is much smallerin size and it is usually surrounded on several sides by hot metal. All these fac-tors contribute to the internal pressure within the cores rising significantly [30].Two groups of researchers have done much work on gas evolution from green sandmoulds [36, 37], chemically bonded sand cores [37, 38, 39] and shell cores [40]. Asa fact, they did not measure the pressure due to these gases in the sand systems.However, Winardi et al. [36], concluded that green sand produces a greater vol-ume of gases at higher rates than any other bonded sand in the foundry due to itshigh moisture and combustible concentrations while Tiedje et al. [39], quantifiedthe amount of each identified compound evolved from the respective binders in-vestigated. The rate of out-gassing or gas evolution is very different for differentbinders as shown in Figure 2.7.
5i.e. takes place uniformly throughout the material.
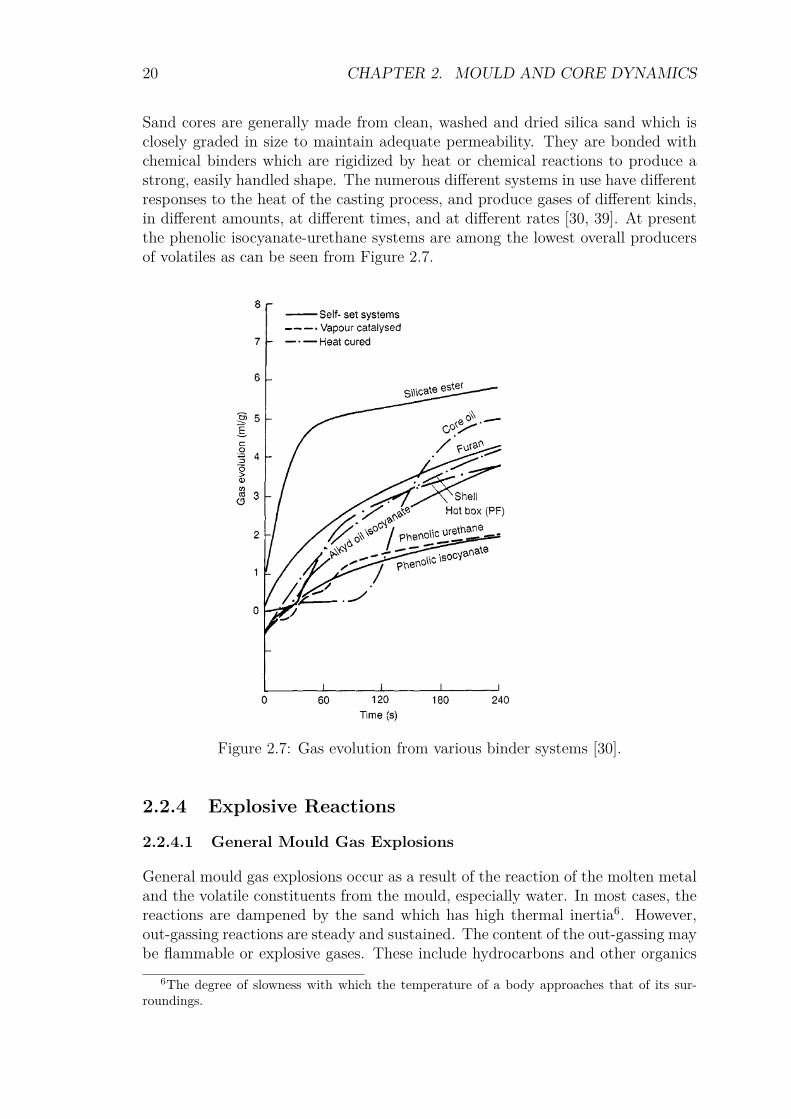
20 CHAPTER 2. MOULD AND CORE DYNAMICS
Sand cores are generally made from clean, washed and dried silica sand which isclosely graded in size to maintain adequate permeability. They are bonded withchemical binders which are rigidized by heat or chemical reactions to produce astrong, easily handled shape. The numerous different systems in use have differentresponses to the heat of the casting process, and produce gases of different kinds,in different amounts, at different times, and at different rates [30, 39]. At presentthe phenolic isocyanate-urethane systems are among the lowest overall producersof volatiles as can be seen from Figure 2.7.
Figure 2.7: Gas evolution from various binder systems [30].
2.2.4 Explosive Reactions
2.2.4.1 General Mould Gas Explosions
General mould gas explosions occur as a result of the reaction of the molten metaland the volatile constituents from the mould, especially water. In most cases, thereactions are dampened by the sand which has high thermal inertia6. However,out-gassing reactions are steady and sustained. The content of the out-gassing maybe flammable or explosive gases. These include hydrocarbons and other organics
6The degree of slowness with which the temperature of a body approaches that of its sur-roundings.
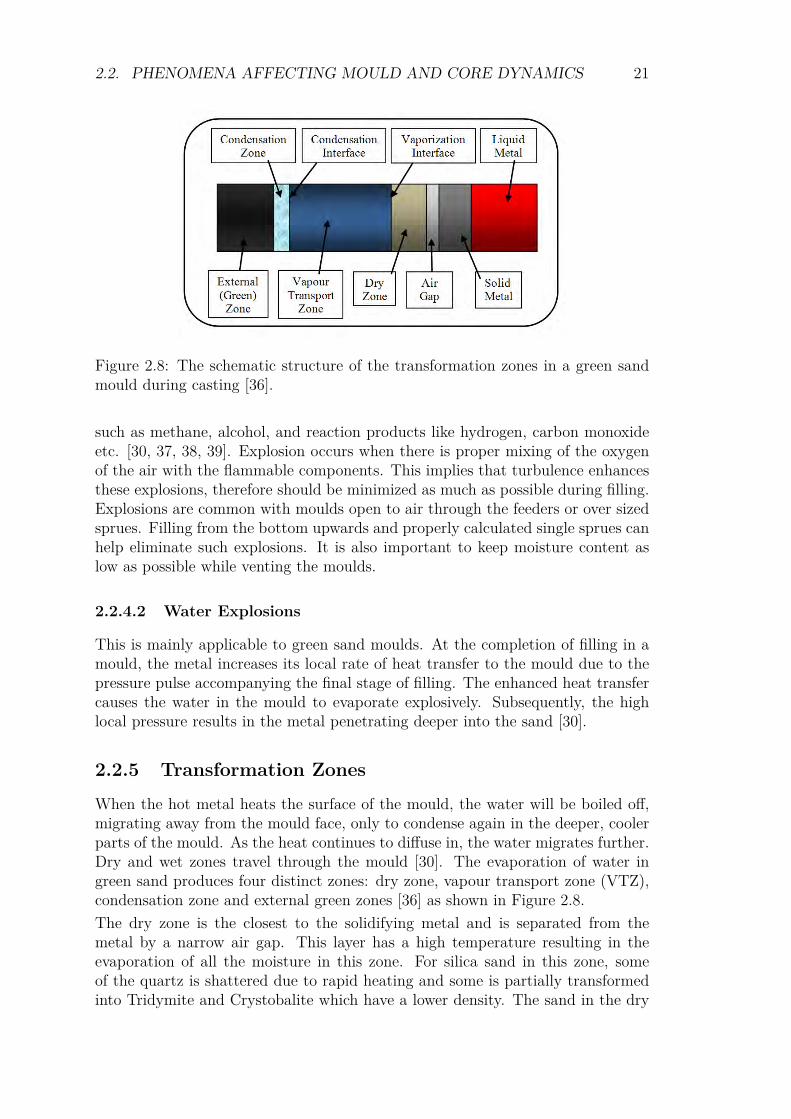
2.2. PHENOMENA AFFECTING MOULD AND CORE DYNAMICS 21
Figure 2.8: The schematic structure of the transformation zones in a green sandmould during casting [36].
such as methane, alcohol, and reaction products like hydrogen, carbon monoxideetc. [30, 37, 38, 39]. Explosion occurs when there is proper mixing of the oxygenof the air with the flammable components. This implies that turbulence enhancesthese explosions, therefore should be minimized as much as possible during filling.Explosions are common with moulds open to air through the feeders or over sizedsprues. Filling from the bottom upwards and properly calculated single sprues canhelp eliminate such explosions. It is also important to keep moisture content aslow as possible while venting the moulds.
2.2.4.2 Water Explosions
This is mainly applicable to green sand moulds. At the completion of filling in amould, the metal increases its local rate of heat transfer to the mould due to thepressure pulse accompanying the final stage of filling. The enhanced heat transfercauses the water in the mould to evaporate explosively. Subsequently, the highlocal pressure results in the metal penetrating deeper into the sand [30].
2.2.5 Transformation ZonesWhen the hot metal heats the surface of the mould, the water will be boiled off,migrating away from the mould face, only to condense again in the deeper, coolerparts of the mould. As the heat continues to diffuse in, the water migrates further.Dry and wet zones travel through the mould [30]. The evaporation of water ingreen sand produces four distinct zones: dry zone, vapour transport zone (VTZ),condensation zone and external green zones [36] as shown in Figure 2.8.The dry zone is the closest to the solidifying metal and is separated from themetal by a narrow air gap. This layer has a high temperature resulting in theevaporation of all the moisture in this zone. For silica sand in this zone, someof the quartz is shattered due to rapid heating and some is partially transformedinto Tridymite and Crystobalite which have a lower density. The sand in the dry
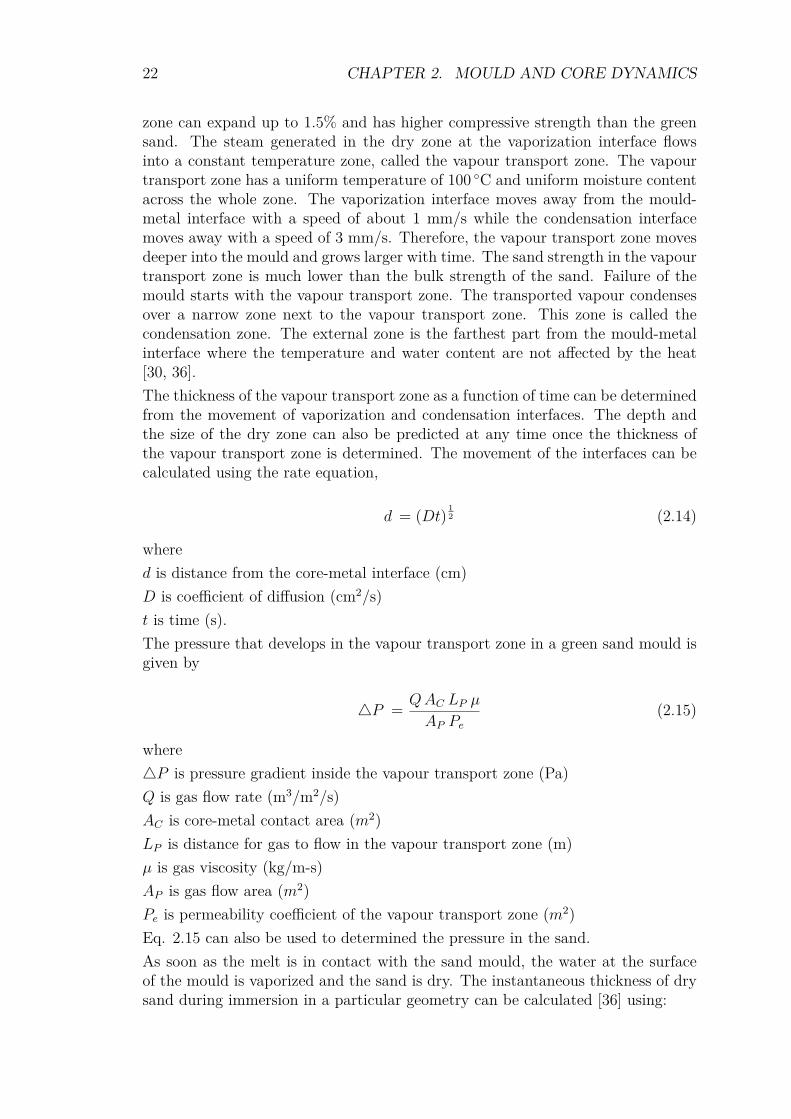
22 CHAPTER 2. MOULD AND CORE DYNAMICS
zone can expand up to 1.5% and has higher compressive strength than the greensand. The steam generated in the dry zone at the vaporization interface flowsinto a constant temperature zone, called the vapour transport zone. The vapourtransport zone has a uniform temperature of 100 C and uniform moisture contentacross the whole zone. The vaporization interface moves away from the mould-metal interface with a speed of about 1 mm/s while the condensation interfacemoves away with a speed of 3 mm/s. Therefore, the vapour transport zone movesdeeper into the mould and grows larger with time. The sand strength in the vapourtransport zone is much lower than the bulk strength of the sand. Failure of themould starts with the vapour transport zone. The transported vapour condensesover a narrow zone next to the vapour transport zone. This zone is called thecondensation zone. The external zone is the farthest part from the mould-metalinterface where the temperature and water content are not affected by the heat[30, 36].The thickness of the vapour transport zone as a function of time can be determinedfrom the movement of vaporization and condensation interfaces. The depth andthe size of the dry zone can also be predicted at any time once the thickness ofthe vapour transport zone is determined. The movement of the interfaces can becalculated using the rate equation,
d = (Dt) 12 (2.14)
whered is distance from the core-metal interface (cm)D is coefficient of diffusion (cm2/s)t is time (s).The pressure that develops in the vapour transport zone in a green sand mould isgiven by
4P = QAC LP µ
AP Pe(2.15)
where4P is pressure gradient inside the vapour transport zone (Pa)Q is gas flow rate (m3/m2/s)AC is core-metal contact area (m2)LP is distance for gas to flow in the vapour transport zone (m)µ is gas viscosity (kg/m-s)AP is gas flow area (m2)Pe is permeability coefficient of the vapour transport zone (m2)Eq. 2.15 can also be used to determined the pressure in the sand.As soon as the melt is in contact with the sand mould, the water at the surfaceof the mould is vaporized and the sand is dry. The instantaneous thickness of drysand during immersion in a particular geometry can be calculated [36] using:

2.2. PHENOMENA AFFECTING MOULD AND CORE DYNAMICS 23
r = R −[LWaterWWater
Qρπ lSand
](2.16)
wherer is instantaneous depth of dry sand (m)R is total sand radius (m)LWater is heat of vaporization of water (J/kg)WWater is amount of water in the sand (kg)Q is heat from melt (J/kg)ρ is density of sand (kg/m3)lSand is area of the core (m2)It is important to note than the rate of advance of the evaporation front is depen-dent on the amount of water present in the mould. Higher water content makesslower progress. This is because more heat is required to move the front and thisextra heat will require extra time to arrive. The extra ability of the mould to ab-sorb heat is also reflected in the faster cooling rates of castings made in moulds withhigher water content. Furthermore, measurements of the thermal conductivity ofvarious moulding sands have confirmed that the apparent thermal conductivity ofthe moisture-condensation zone is about three or four times that of dry sand [30].Vapour transport zones are present in various degrees in chemically bonded sands[41].
2.2.6 Metal-Mould ReactionsThe feasibility of a chemical reaction to occur is based on the free energy change ofthe system. This energy is referred to as Gibb’s Free Energy (G) and is defined asthe energy associated with a chemical reaction that can be used to do work. Thefree energy (G) of a system is the sum of the its enthalpy7 (H) and the product ofthe Kelvin temperature (T) and the entropy8 (S) of the system (Eq. 2.17)[42, 43]:
G = H − TS (2.17)
Chemical reactions involve a change in free energy 4G [44, 45] given by
4G = 4H − T4S (2.18)
In the standard state conditions, the result is the standard-state free energy change(4G0) given by
4G0 = 4H0 − T4S0 (2.19)
The standard conditions referred to here are ambient temperature and atmosphericpressure. The definition of the free energy change of a system as seen in equations
7Entalpy is the heat of the system.8Entropy is a measure of the disorder in a system.

24 CHAPTER 2. MOULD AND CORE DYNAMICS
2.18 and 2.19 shows the relative importance of the enthalpy and entropy termsas driving forces behind a particular reaction. The change in the free energy ofthe system measures the balance between the two driving forces that determinewhether the reaction is spontaneous. The enthalpy and entropy terms have differ-ent sign conventions [46].Favourable Unfavourable
4H0 < 0 4H0 > 0
4S0 > 0 4S0 < 0
The Gibb’s Free Energy for the formation of products in the standard conditionsis called the free energy of formation, 4G0
f . The standard-state free energy of areaction (r) can also be calculated from
4G0r =
∑4G0
f, Products −∑4G0
f,Reactants (2.20)
Therefore, for a hypothetical reaction such as: a A + b B → c C + d D, the totalfree energy of reaction is given by
4G0r = c4G0
f, C + d4G0f,D − a4G0
f,A − b4G0f,B (2.21)
However, the following equation (Eq. 2.22) relates the standard-state free energyof reaction with the free energy of reaction at any moment in time during a reaction(not at standard conditions):
4G = 4G0 + RTlnQ (2.22)
where4G is free energy change at any moment4G0 is the standard-state free energy changeR is the ideal gas constant = 8.314J/mol-KlnQ is the natural log of the reaction quotient9.The net direction of a chemical reaction such as the one above will be from higherto lower energy [45]. Summing up the whole arguments, the following deductionswere made on Gibbs Free Energy change as a measure of the driving force for achemical reaction to occur:4G0 < 0 → Reaction proceeds spontaneously
4G0 = 0 → System at equilibrium
4G0 > 0 → Reaction will not occur
9The reaction quotient is the mathematical product of the concentrations (or partial pressures)of the product of a reaction divided by the mathematical product of the concentrations (or partialpressures) of the reactants of a reaction at any moment.
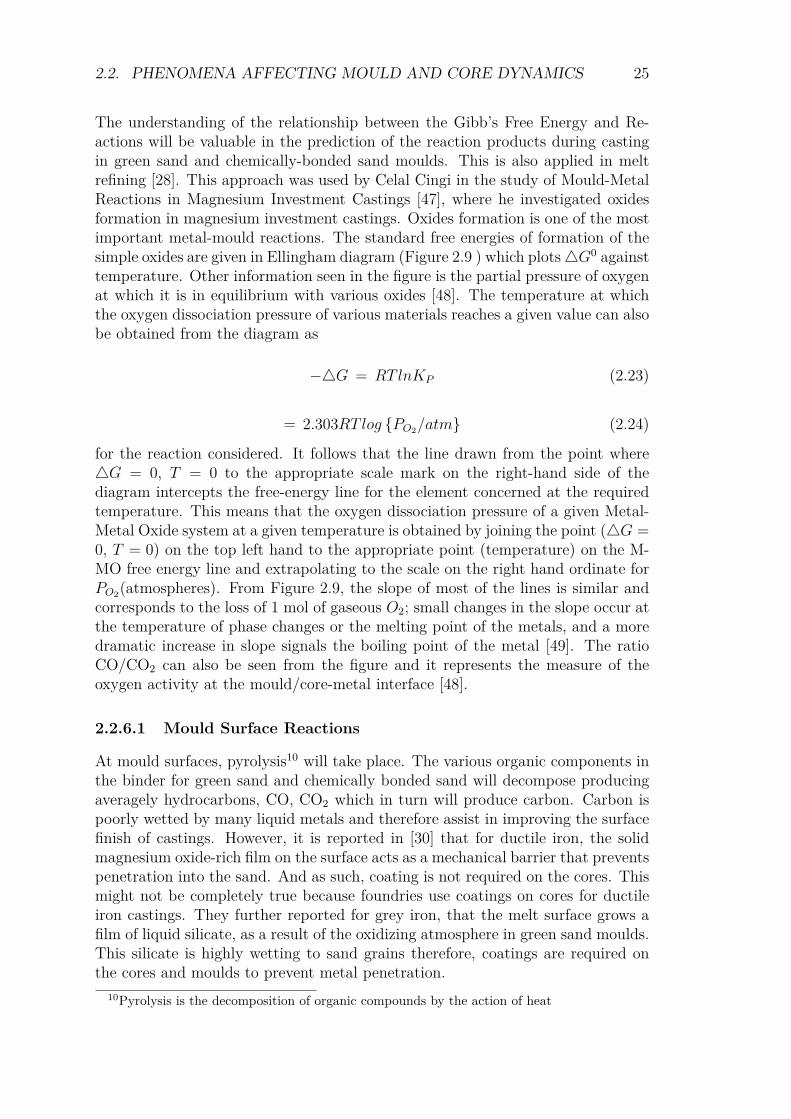
2.2. PHENOMENA AFFECTING MOULD AND CORE DYNAMICS 25
The understanding of the relationship between the Gibb’s Free Energy and Re-actions will be valuable in the prediction of the reaction products during castingin green sand and chemically-bonded sand moulds. This is also applied in meltrefining [28]. This approach was used by Celal Cingi in the study of Mould-MetalReactions in Magnesium Investment Castings [47], where he investigated oxidesformation in magnesium investment castings. Oxides formation is one of the mostimportant metal-mould reactions. The standard free energies of formation of thesimple oxides are given in Ellingham diagram (Figure 2.9 ) which plots4G0 againsttemperature. Other information seen in the figure is the partial pressure of oxygenat which it is in equilibrium with various oxides [48]. The temperature at whichthe oxygen dissociation pressure of various materials reaches a given value can alsobe obtained from the diagram as
−4G = RTlnKP (2.23)
= 2.303RTlog PO2/atm (2.24)
for the reaction considered. It follows that the line drawn from the point where4G = 0, T = 0 to the appropriate scale mark on the right-hand side of thediagram intercepts the free-energy line for the element concerned at the requiredtemperature. This means that the oxygen dissociation pressure of a given Metal-Metal Oxide system at a given temperature is obtained by joining the point (4G =0, T = 0) on the top left hand to the appropriate point (temperature) on the M-MO free energy line and extrapolating to the scale on the right hand ordinate forPO2(atmospheres). From Figure 2.9, the slope of most of the lines is similar andcorresponds to the loss of 1 mol of gaseous O2; small changes in the slope occur atthe temperature of phase changes or the melting point of the metals, and a moredramatic increase in slope signals the boiling point of the metal [49]. The ratioCO/CO2 can also be seen from the figure and it represents the measure of theoxygen activity at the mould/core-metal interface [48].
2.2.6.1 Mould Surface Reactions
At mould surfaces, pyrolysis10 will take place. The various organic components inthe binder for green sand and chemically bonded sand will decompose producingaveragely hydrocarbons, CO, CO2 which in turn will produce carbon. Carbon ispoorly wetted by many liquid metals and therefore assist in improving the surfacefinish of castings. However, it is reported in [30] that for ductile iron, the solidmagnesium oxide-rich film on the surface acts as a mechanical barrier that preventspenetration into the sand. And as such, coating is not required on the cores. Thismight not be completely true because foundries use coatings on cores for ductileiron castings. They further reported for grey iron, that the melt surface grows afilm of liquid silicate, as a result of the oxidizing atmosphere in green sand moulds.This silicate is highly wetting to sand grains therefore, coatings are required onthe cores and moulds to prevent metal penetration.
10Pyrolysis is the decomposition of organic compounds by the action of heat
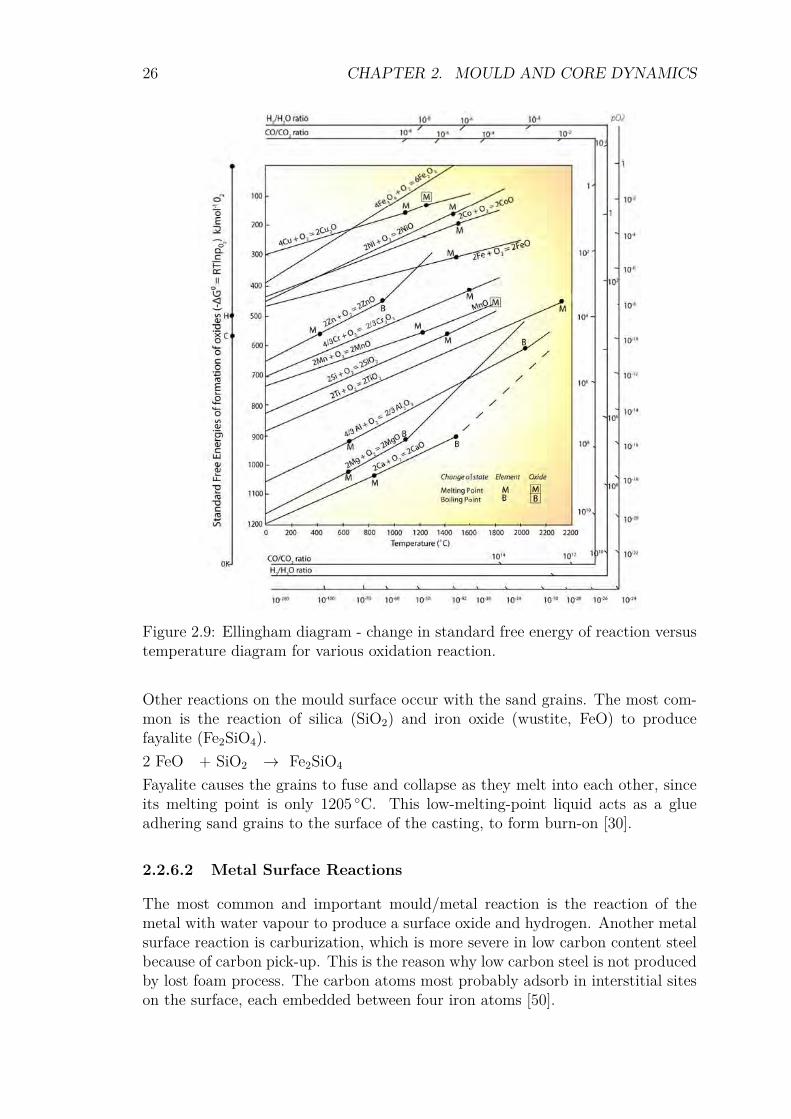
26 CHAPTER 2. MOULD AND CORE DYNAMICS
Figure 2.9: Ellingham diagram - change in standard free energy of reaction versustemperature diagram for various oxidation reaction.
Other reactions on the mould surface occur with the sand grains. The most com-mon is the reaction of silica (SiO2) and iron oxide (wustite, FeO) to producefayalite (Fe2SiO4).2 FeO + SiO2 → Fe2SiO4
Fayalite causes the grains to fuse and collapse as they melt into each other, sinceits melting point is only 1205 C. This low-melting-point liquid acts as a glueadhering sand grains to the surface of the casting, to form burn-on [30].
2.2.6.2 Metal Surface Reactions
The most common and important mould/metal reaction is the reaction of themetal with water vapour to produce a surface oxide and hydrogen. Another metalsurface reaction is carburization, which is more severe in low carbon content steelbecause of carbon pick-up. This is the reason why low carbon steel is not producedby lost foam process. The carbon atoms most probably adsorb in interstitial siteson the surface, each embedded between four iron atoms [50].
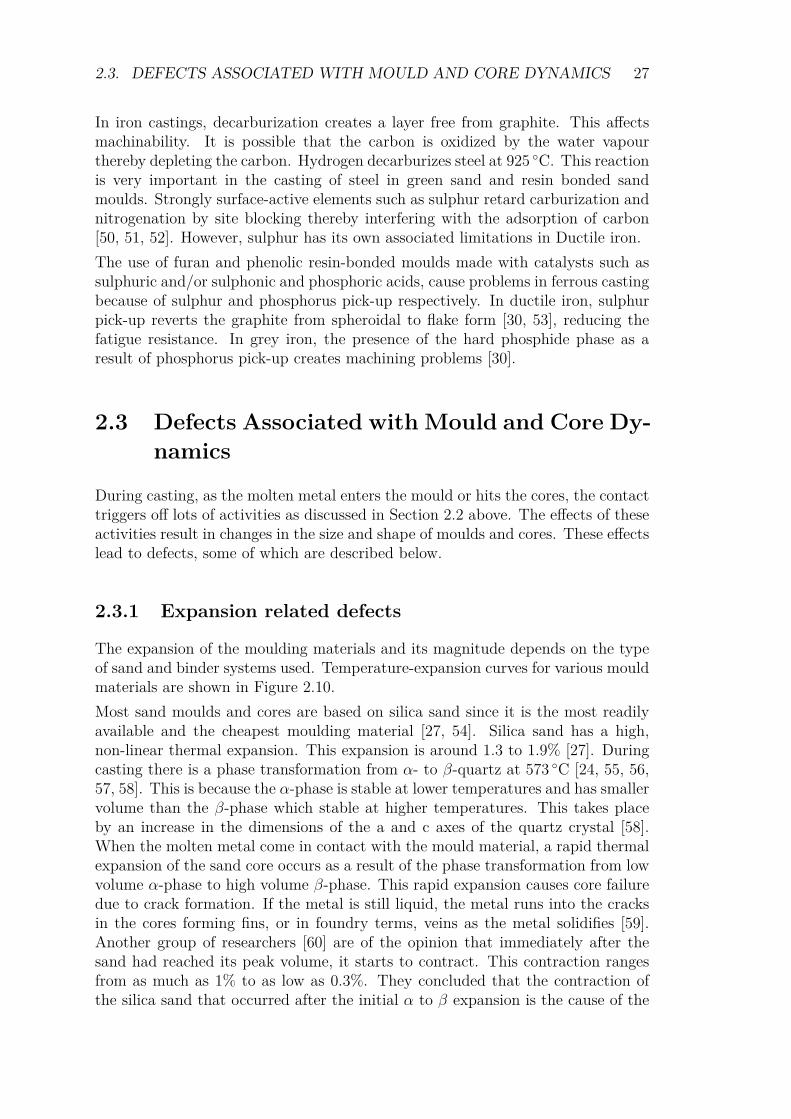
2.3. DEFECTS ASSOCIATED WITH MOULD AND CORE DYNAMICS 27
In iron castings, decarburization creates a layer free from graphite. This affectsmachinability. It is possible that the carbon is oxidized by the water vapourthereby depleting the carbon. Hydrogen decarburizes steel at 925 C. This reactionis very important in the casting of steel in green sand and resin bonded sandmoulds. Strongly surface-active elements such as sulphur retard carburization andnitrogenation by site blocking thereby interfering with the adsorption of carbon[50, 51, 52]. However, sulphur has its own associated limitations in Ductile iron.The use of furan and phenolic resin-bonded moulds made with catalysts such assulphuric and/or sulphonic and phosphoric acids, cause problems in ferrous castingbecause of sulphur and phosphorus pick-up respectively. In ductile iron, sulphurpick-up reverts the graphite from spheroidal to flake form [30, 53], reducing thefatigue resistance. In grey iron, the presence of the hard phosphide phase as aresult of phosphorus pick-up creates machining problems [30].
2.3 Defects Associated with Mould and Core Dy-namics
During casting, as the molten metal enters the mould or hits the cores, the contacttriggers off lots of activities as discussed in Section 2.2 above. The effects of theseactivities result in changes in the size and shape of moulds and cores. These effectslead to defects, some of which are described below.
2.3.1 Expansion related defects
The expansion of the moulding materials and its magnitude depends on the typeof sand and binder systems used. Temperature-expansion curves for various mouldmaterials are shown in Figure 2.10.Most sand moulds and cores are based on silica sand since it is the most readilyavailable and the cheapest moulding material [27, 54]. Silica sand has a high,non-linear thermal expansion. This expansion is around 1.3 to 1.9% [27]. Duringcasting there is a phase transformation from α- to β-quartz at 573 C [24, 55, 56,57, 58]. This is because the α-phase is stable at lower temperatures and has smallervolume than the β-phase which stable at higher temperatures. This takes placeby an increase in the dimensions of the a and c axes of the quartz crystal [58].When the molten metal come in contact with the mould material, a rapid thermalexpansion of the sand core occurs as a result of the phase transformation from lowvolume α-phase to high volume β-phase. This rapid expansion causes core failuredue to crack formation. If the metal is still liquid, the metal runs into the cracksin the cores forming fins, or in foundry terms, veins as the metal solidifies [59].Another group of researchers [60] are of the opinion that immediately after thesand had reached its peak volume, it starts to contract. This contraction rangesfrom as much as 1% to as low as 0.3%. They concluded that the contraction ofthe silica sand that occurred after the initial α to β expansion is the cause of the
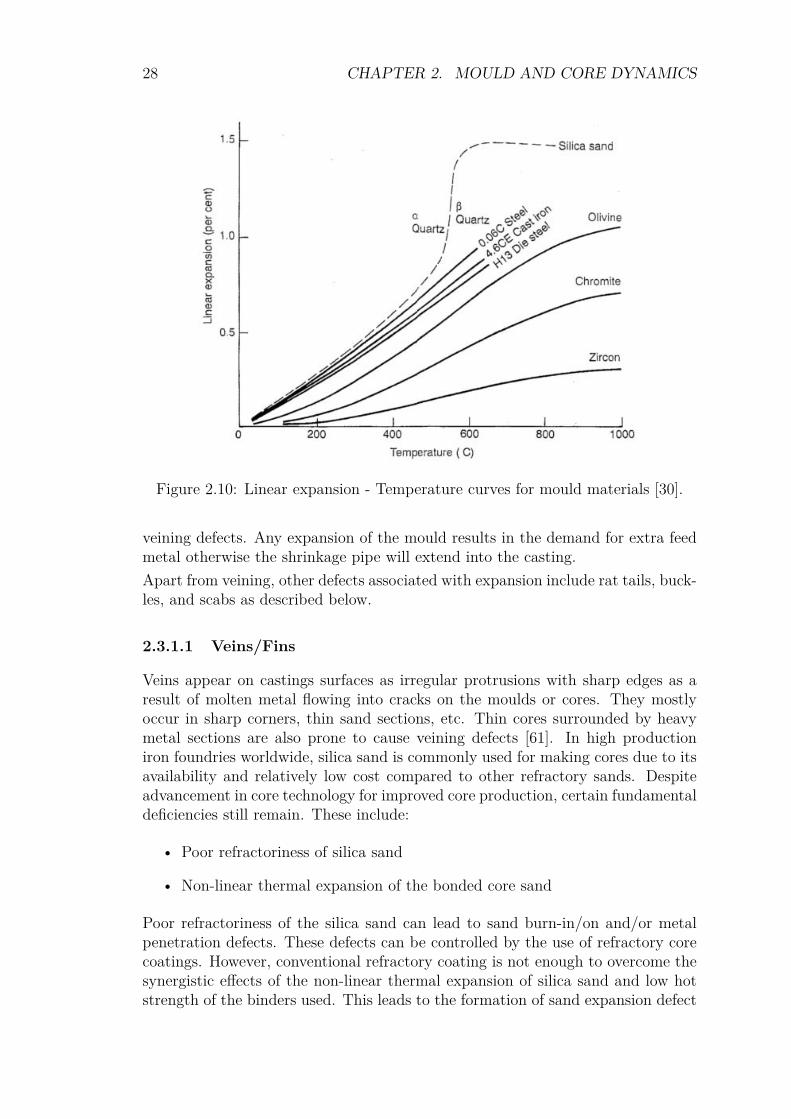
28 CHAPTER 2. MOULD AND CORE DYNAMICS
Figure 2.10: Linear expansion - Temperature curves for mould materials [30].
veining defects. Any expansion of the mould results in the demand for extra feedmetal otherwise the shrinkage pipe will extend into the casting.Apart from veining, other defects associated with expansion include rat tails, buck-les, and scabs as described below.
2.3.1.1 Veins/Fins
Veins appear on castings surfaces as irregular protrusions with sharp edges as aresult of molten metal flowing into cracks on the moulds or cores. They mostlyoccur in sharp corners, thin sand sections, etc. Thin cores surrounded by heavymetal sections are also prone to cause veining defects [61]. In high productioniron foundries worldwide, silica sand is commonly used for making cores due to itsavailability and relatively low cost compared to other refractory sands. Despiteadvancement in core technology for improved core production, certain fundamentaldeficiencies still remain. These include:
• Poor refractoriness of silica sand
• Non-linear thermal expansion of the bonded core sand
Poor refractoriness of the silica sand can lead to sand burn-in/on and/or metalpenetration defects. These defects can be controlled by the use of refractory corecoatings. However, conventional refractory coating is not enough to overcome thesynergistic effects of the non-linear thermal expansion of silica sand and low hotstrength of the binders used. This leads to the formation of sand expansion defect
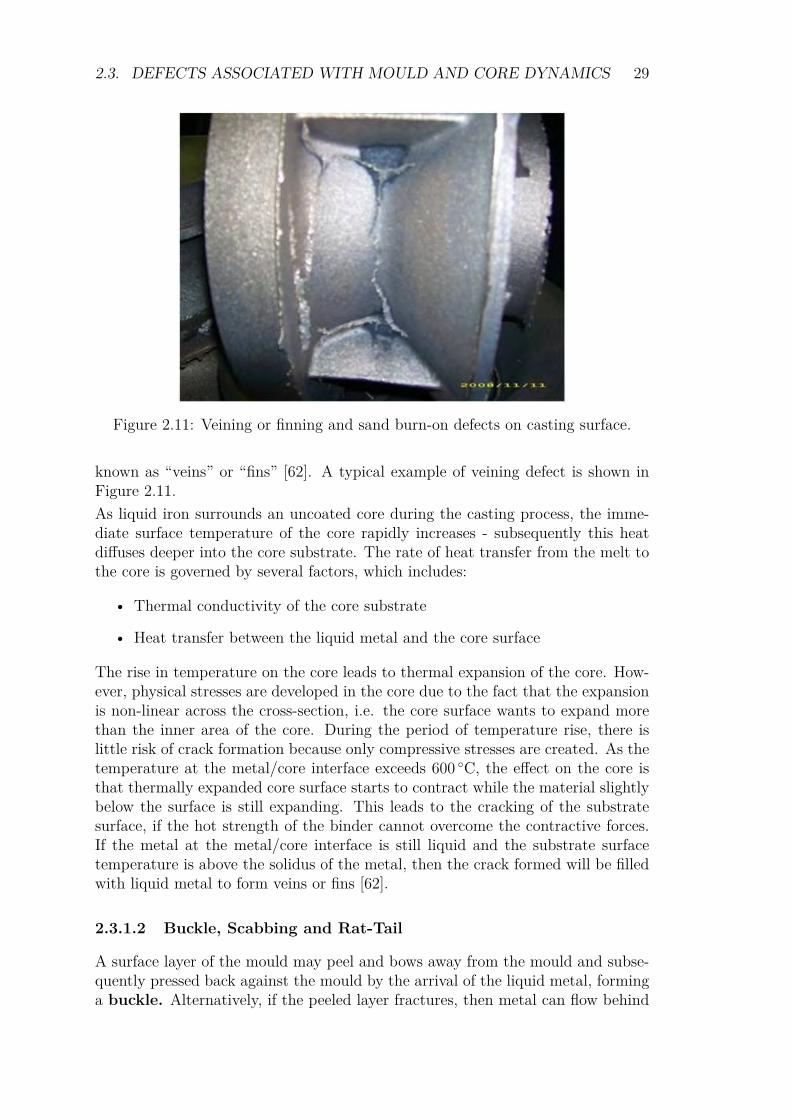
2.3. DEFECTS ASSOCIATED WITH MOULD AND CORE DYNAMICS 29
Figure 2.11: Veining or finning and sand burn-on defects on casting surface.
known as “veins” or “fins” [62]. A typical example of veining defect is shown inFigure 2.11.As liquid iron surrounds an uncoated core during the casting process, the imme-diate surface temperature of the core rapidly increases - subsequently this heatdiffuses deeper into the core substrate. The rate of heat transfer from the melt tothe core is governed by several factors, which includes:
• Thermal conductivity of the core substrate
• Heat transfer between the liquid metal and the core surface
The rise in temperature on the core leads to thermal expansion of the core. How-ever, physical stresses are developed in the core due to the fact that the expansionis non-linear across the cross-section, i.e. the core surface wants to expand morethan the inner area of the core. During the period of temperature rise, there islittle risk of crack formation because only compressive stresses are created. As thetemperature at the metal/core interface exceeds 600 C, the effect on the core isthat thermally expanded core surface starts to contract while the material slightlybelow the surface is still expanding. This leads to the cracking of the substratesurface, if the hot strength of the binder cannot overcome the contractive forces.If the metal at the metal/core interface is still liquid and the substrate surfacetemperature is above the solidus of the metal, then the crack formed will be filledwith liquid metal to form veins or fins [62].
2.3.1.2 Buckle, Scabbing and Rat-Tail
A surface layer of the mould may peel and bows away from the mould and subse-quently pressed back against the mould by the arrival of the liquid metal, forminga buckle. Alternatively, if the peeled layer fractures, then metal can flow behind
30 CHAPTER 2. MOULD AND CORE DYNAMICS
Figure 2.12: A schematic showing mould surface defects [30].
fractured surface, forming a scab. When no metal flows into the fractured surface,a rat-tail is formed. A schematic of these defects is illustrated in Figure 2.12
2.3.2 Adherence Sand Defects
These defects have to do with combination of moulding material and the metal.There are different types of such defects with different mechanisms of occurrence.The defects include metal penetration, Burn-on, Burn-in, surface roughness, etc.
2.3.2.1 Metal Penetration
According to I. L. Svensson et al. [63], Draper and Gaindhar proposed a generaldefinition of metal penetration accepted by the foundry industry, as the conditionin which cast metal has entered into the inter-granular spaces of the moulding ma-terial beyond the first layer of sand grains. Many research [64, 65, 66, 67] have beencarried out on this type of defect because of the high demand for quality surfacefinish. Syvestro [64] identified and described different types of metal penetrationnamely, mechanical penetration, chemical (reaction) penetration, vapour penetra-tion, water explosion penetration, and eutectic exudation penetration dependingon the nature of their causes.The requirements for penetration to occur are described by Eq. 2.25 [67].
Ppen = − 2σcosθrp
(2.25)
where,
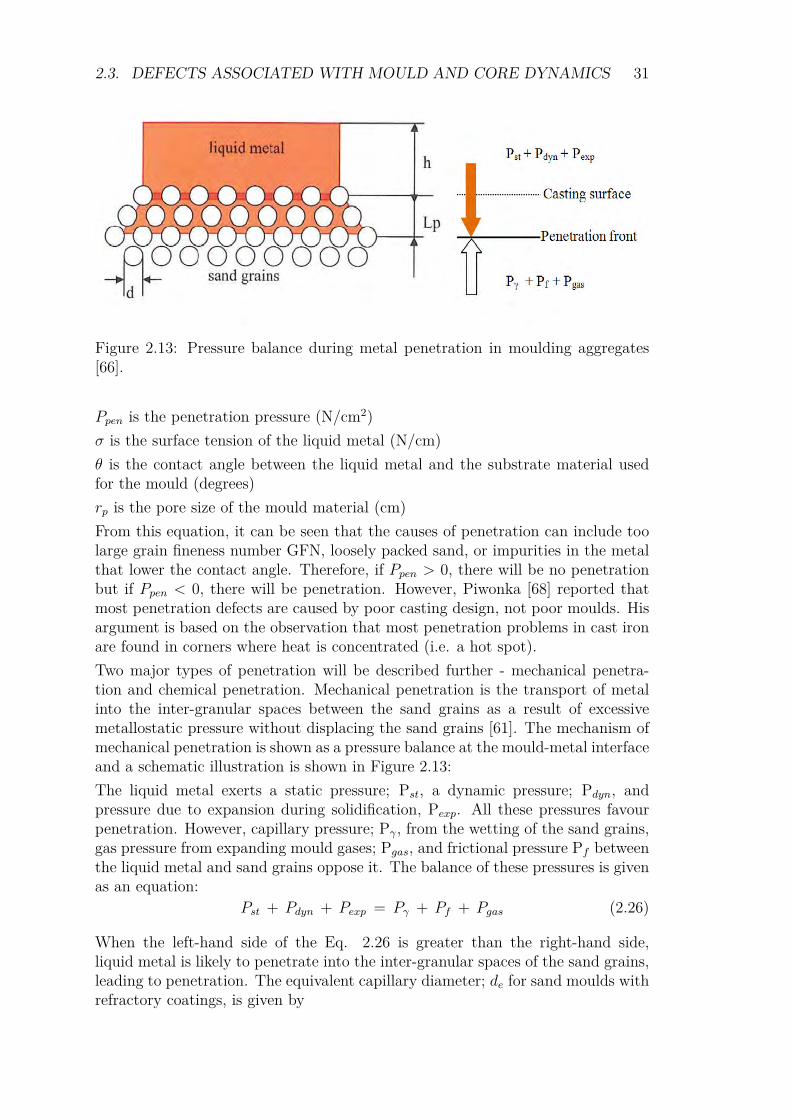
2.3. DEFECTS ASSOCIATED WITH MOULD AND CORE DYNAMICS 31
Figure 2.13: Pressure balance during metal penetration in moulding aggregates[66].
Ppen is the penetration pressure (N/cm2)σ is the surface tension of the liquid metal (N/cm)θ is the contact angle between the liquid metal and the substrate material usedfor the mould (degrees)rp is the pore size of the mould material (cm)From this equation, it can be seen that the causes of penetration can include toolarge grain fineness number GFN, loosely packed sand, or impurities in the metalthat lower the contact angle. Therefore, if Ppen > 0, there will be no penetrationbut if Ppen < 0, there will be penetration. However, Piwonka [68] reported thatmost penetration defects are caused by poor casting design, not poor moulds. Hisargument is based on the observation that most penetration problems in cast ironare found in corners where heat is concentrated (i.e. a hot spot).Two major types of penetration will be described further - mechanical penetra-tion and chemical penetration. Mechanical penetration is the transport of metalinto the inter-granular spaces between the sand grains as a result of excessivemetallostatic pressure without displacing the sand grains [61]. The mechanism ofmechanical penetration is shown as a pressure balance at the mould-metal interfaceand a schematic illustration is shown in Figure 2.13:The liquid metal exerts a static pressure; Pst, a dynamic pressure; Pdyn, andpressure due to expansion during solidification, Pexp. All these pressures favourpenetration. However, capillary pressure; Pγ, from the wetting of the sand grains,gas pressure from expanding mould gases; Pgas, and frictional pressure Pf betweenthe liquid metal and sand grains oppose it. The balance of these pressures is givenas an equation:
Pst + Pdyn + Pexp = Pγ + Pf + Pgas (2.26)
When the left-hand side of the Eq. 2.26 is greater than the right-hand side,liquid metal is likely to penetrate into the inter-granular spaces of the sand grains,leading to penetration. The equivalent capillary diameter; de for sand moulds withrefractory coatings, is given by
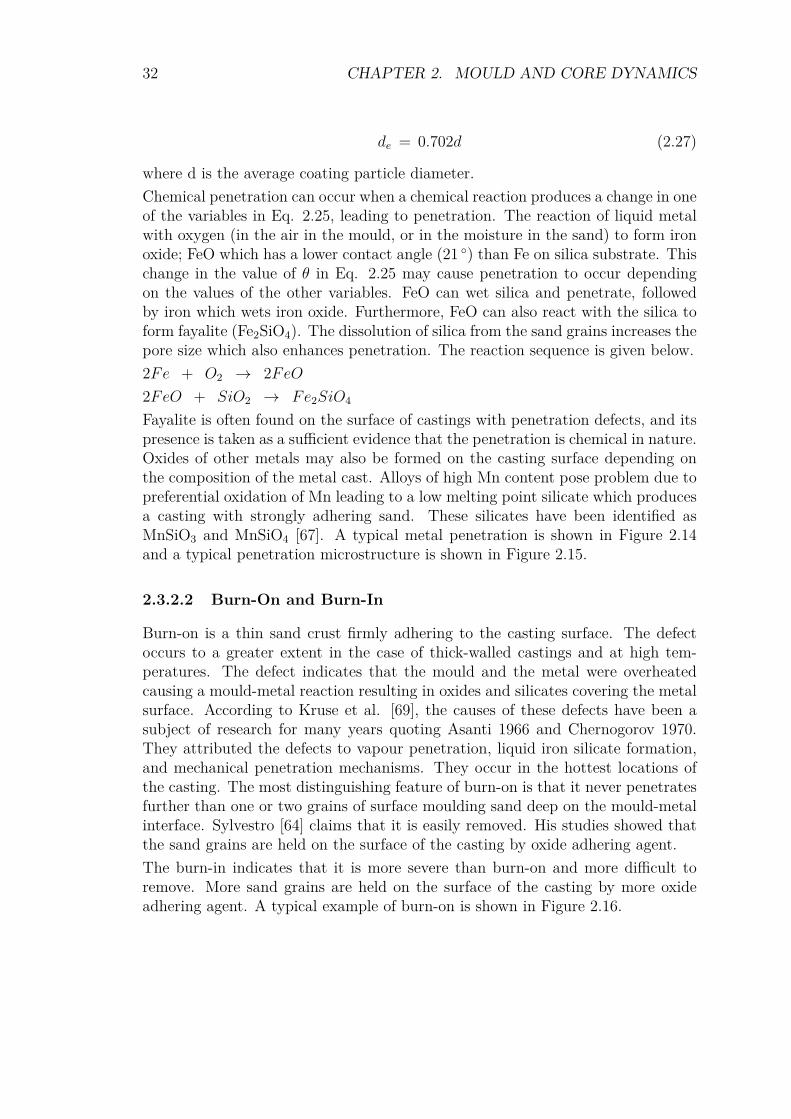
32 CHAPTER 2. MOULD AND CORE DYNAMICS
de = 0.702d (2.27)
where d is the average coating particle diameter.Chemical penetration can occur when a chemical reaction produces a change in oneof the variables in Eq. 2.25, leading to penetration. The reaction of liquid metalwith oxygen (in the air in the mould, or in the moisture in the sand) to form ironoxide; FeO which has a lower contact angle (21 ) than Fe on silica substrate. Thischange in the value of θ in Eq. 2.25 may cause penetration to occur dependingon the values of the other variables. FeO can wet silica and penetrate, followedby iron which wets iron oxide. Furthermore, FeO can also react with the silica toform fayalite (Fe2SiO4). The dissolution of silica from the sand grains increases thepore size which also enhances penetration. The reaction sequence is given below.2Fe + O2 → 2FeO2FeO + SiO2 → Fe2SiO4
Fayalite is often found on the surface of castings with penetration defects, and itspresence is taken as a sufficient evidence that the penetration is chemical in nature.Oxides of other metals may also be formed on the casting surface depending onthe composition of the metal cast. Alloys of high Mn content pose problem due topreferential oxidation of Mn leading to a low melting point silicate which producesa casting with strongly adhering sand. These silicates have been identified asMnSiO3 and MnSiO4 [67]. A typical metal penetration is shown in Figure 2.14and a typical penetration microstructure is shown in Figure 2.15.
2.3.2.2 Burn-On and Burn-In
Burn-on is a thin sand crust firmly adhering to the casting surface. The defectoccurs to a greater extent in the case of thick-walled castings and at high tem-peratures. The defect indicates that the mould and the metal were overheatedcausing a mould-metal reaction resulting in oxides and silicates covering the metalsurface. According to Kruse et al. [69], the causes of these defects have been asubject of research for many years quoting Asanti 1966 and Chernogorov 1970.They attributed the defects to vapour penetration, liquid iron silicate formation,and mechanical penetration mechanisms. They occur in the hottest locations ofthe casting. The most distinguishing feature of burn-on is that it never penetratesfurther than one or two grains of surface moulding sand deep on the mould-metalinterface. Sylvestro [64] claims that it is easily removed. His studies showed thatthe sand grains are held on the surface of the casting by oxide adhering agent.The burn-in indicates that it is more severe than burn-on and more difficult toremove. More sand grains are held on the surface of the casting by more oxideadhering agent. A typical example of burn-on is shown in Figure 2.16.
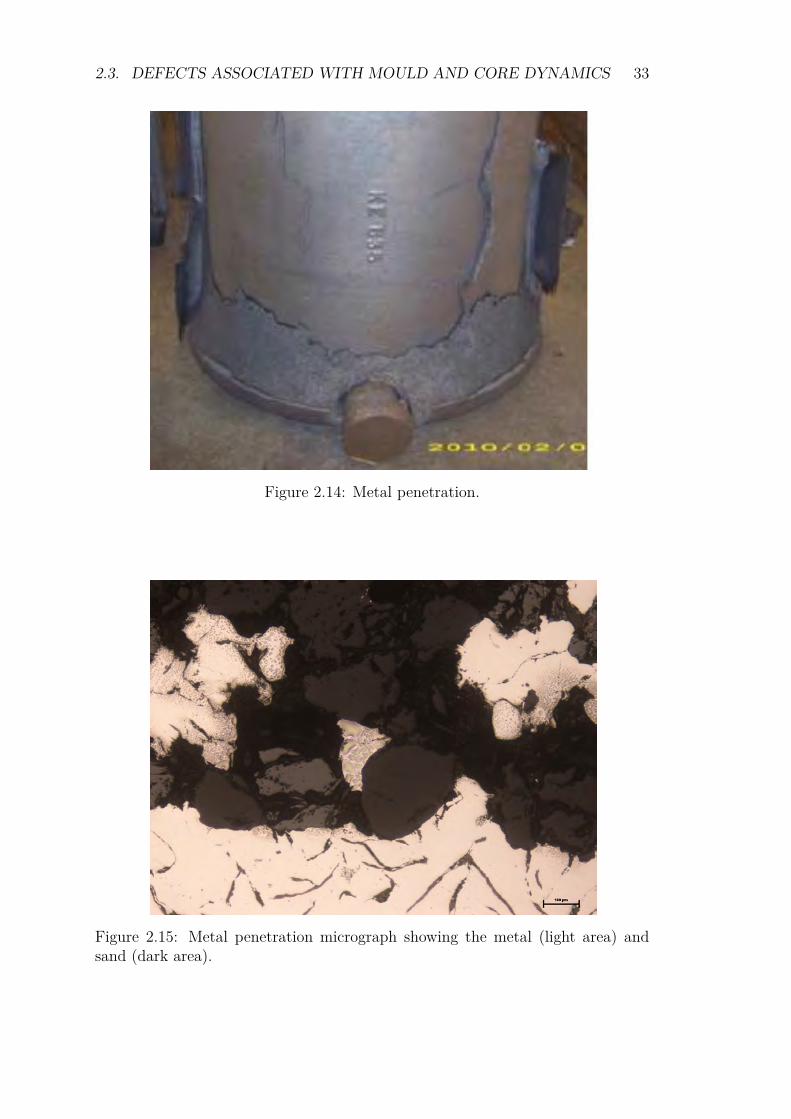
2.3. DEFECTS ASSOCIATED WITH MOULD AND CORE DYNAMICS 33
Figure 2.14: Metal penetration.
Figure 2.15: Metal penetration micrograph showing the metal (light area) andsand (dark area).
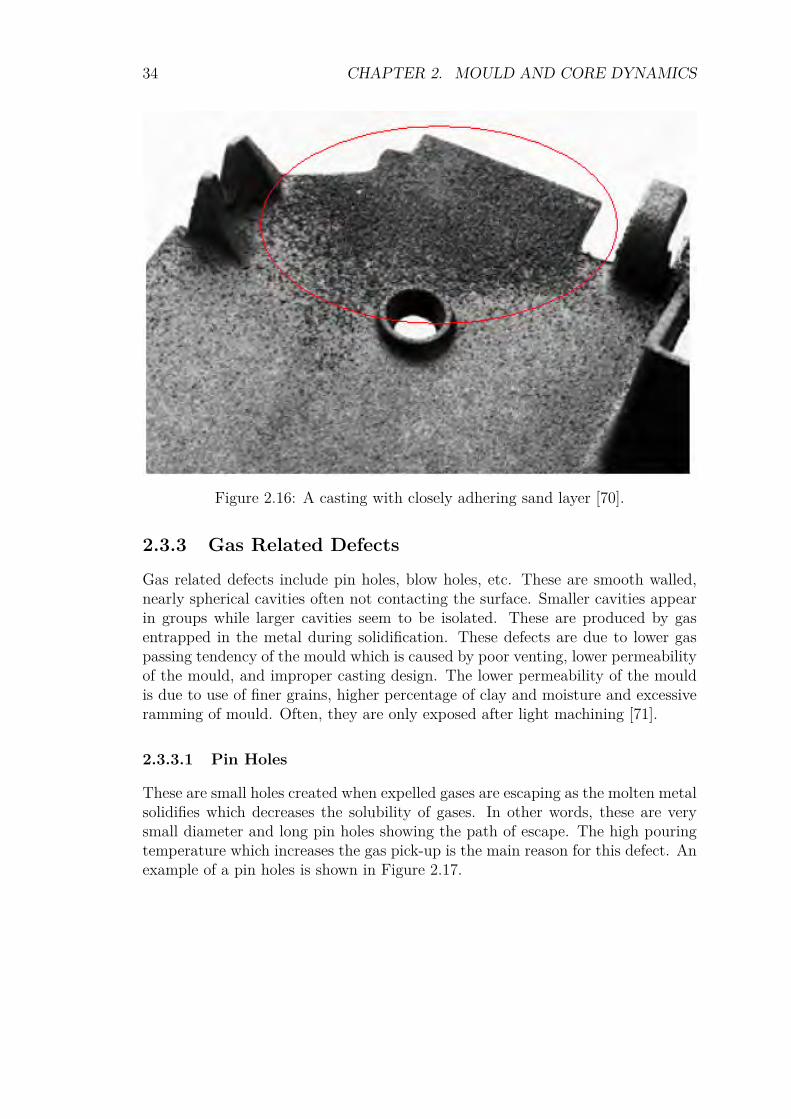
34 CHAPTER 2. MOULD AND CORE DYNAMICS
Figure 2.16: A casting with closely adhering sand layer [70].
2.3.3 Gas Related DefectsGas related defects include pin holes, blow holes, etc. These are smooth walled,nearly spherical cavities often not contacting the surface. Smaller cavities appearin groups while larger cavities seem to be isolated. These are produced by gasentrapped in the metal during solidification. These defects are due to lower gaspassing tendency of the mould which is caused by poor venting, lower permeabilityof the mould, and improper casting design. The lower permeability of the mouldis due to use of finer grains, higher percentage of clay and moisture and excessiveramming of mould. Often, they are only exposed after light machining [71].
2.3.3.1 Pin Holes
These are small holes created when expelled gases are escaping as the molten metalsolidifies which decreases the solubility of gases. In other words, these are verysmall diameter and long pin holes showing the path of escape. The high pouringtemperature which increases the gas pick-up is the main reason for this defect. Anexample of a pin holes is shown in Figure 2.17.
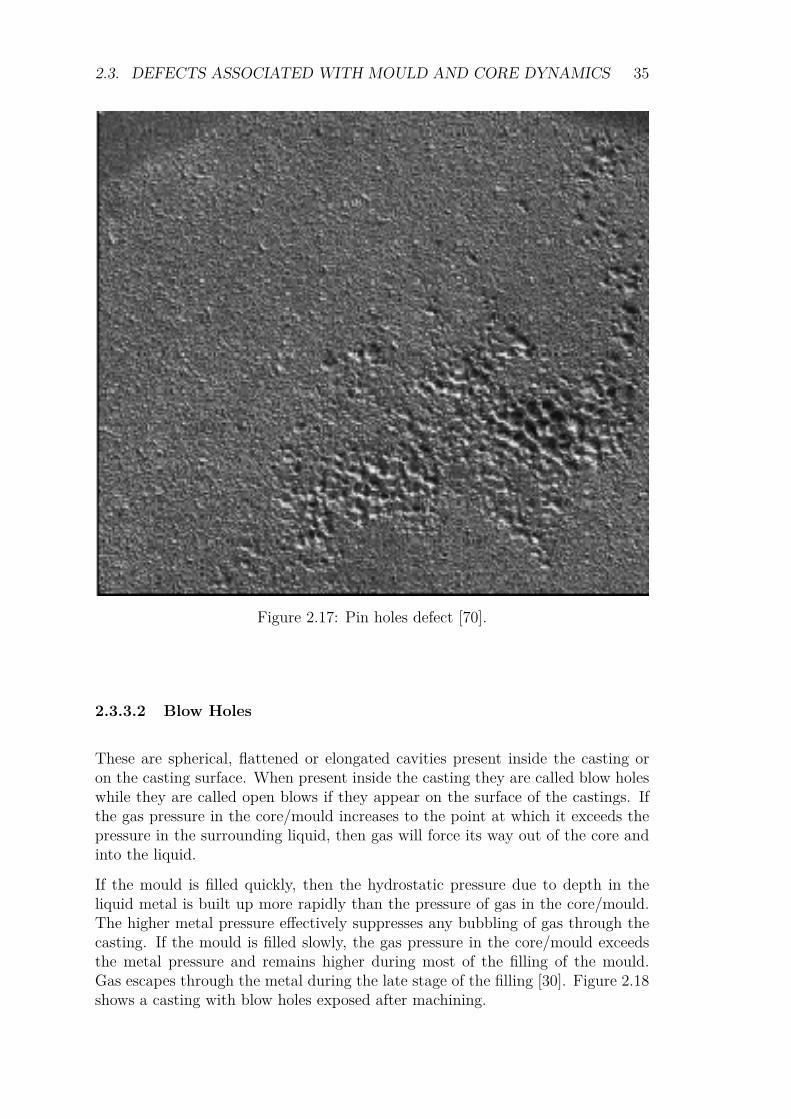
2.3. DEFECTS ASSOCIATED WITH MOULD AND CORE DYNAMICS 35
Figure 2.17: Pin holes defect [70].
2.3.3.2 Blow Holes
These are spherical, flattened or elongated cavities present inside the casting oron the casting surface. When present inside the casting they are called blow holeswhile they are called open blows if they appear on the surface of the castings. Ifthe gas pressure in the core/mould increases to the point at which it exceeds thepressure in the surrounding liquid, then gas will force its way out of the core andinto the liquid.
If the mould is filled quickly, then the hydrostatic pressure due to depth in theliquid metal is built up more rapidly than the pressure of gas in the core/mould.The higher metal pressure effectively suppresses any bubbling of gas through thecasting. If the mould is filled slowly, the gas pressure in the core/mould exceedsthe metal pressure and remains higher during most of the filling of the mould.Gas escapes through the metal during the late stage of the filling [30]. Figure 2.18shows a casting with blow holes exposed after machining.
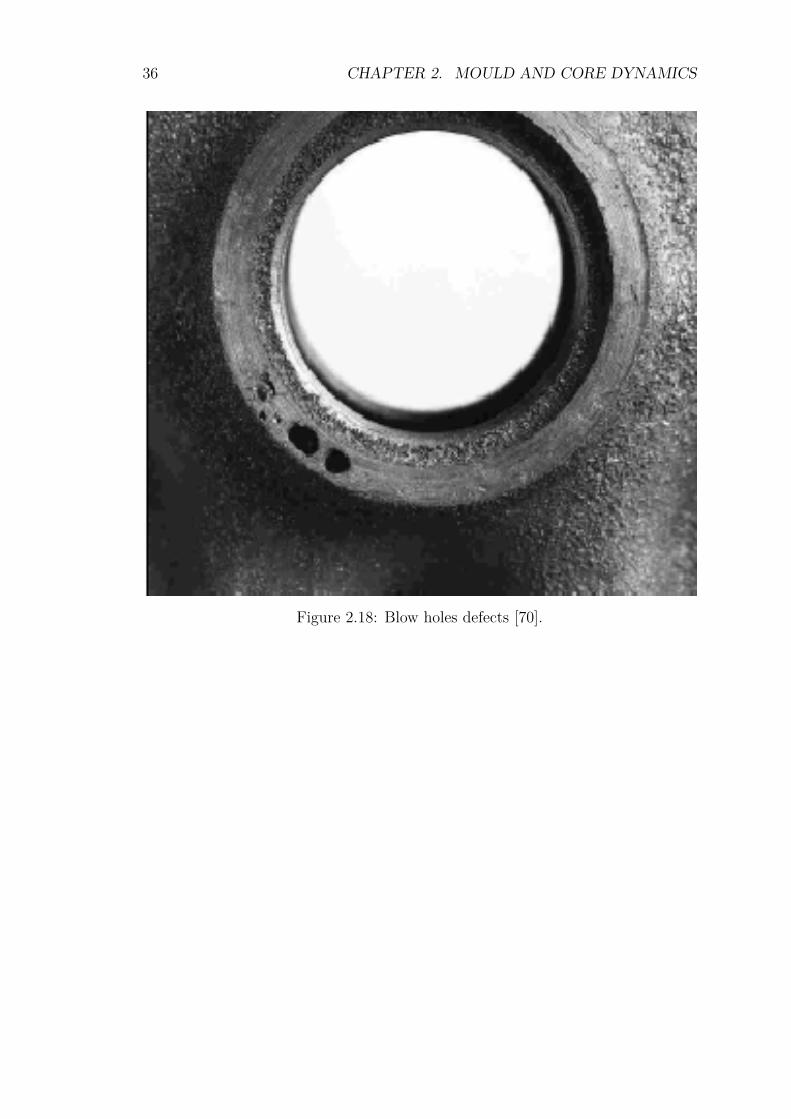
36 CHAPTER 2. MOULD AND CORE DYNAMICS
Figure 2.18: Blow holes defects [70].
Chapter 3
Surface Technology
Surface technology is concerned with: (1) defining the characteristics of a sur-face, (2) surface texture, (3) surface integrity, and (4) the relationship betweenmanufacturing processes and the characteristics of the resulting surface [72]. How-ever, in this project the primary concern is mainly with surface texture (surfacetopography).The main goal of this project is to use the novel coatings to improve the surfacequality of the castings. The coatings are applied to the cores to produce a smoothsurface finish, free from veining defects, metal penetration, burn-on/in, scabs,buckles, etc., and with very low surface roughness. Therefore, it is very importantto make surface characterization of the surface of the castings. The parameters ofinterest in the assessment of the quality of the surface of castings are the surfacetexture and microstructural evolution around the metal-mould interface for bothgrey iron and ductile iron followed by the expected reactions taken place at thecasting surface during the casting process.All surfaces have their own characteristics, which collectively are referred to assurface texture. Surface texture is identified in terms of well defined and mea-surable quantities such as flaws1, lay2, roughness, and waviness3. Roughness isdefined as closely spaced, irregular deviations on a small scale; it is expressed interms of its height, width, and distance along the surface [73]. Surface roughness isdescribed by various parameters which include maximum profile peak height, Rp;maximum profile valley depth, Rv; maximum height profile, Rz; mean height ofthe profile elements, Rc; and total height of the surface, Rt. All these are referredto as amplitude profile parameters (peak to valley). The other group is referredto as amplitude parameters (average of ordinates) and includes the arithmeticmean value, Ra; and the root-mean-square roughness, Rq [74]. The Ra and Rqparameters are generally and commonly used to describe the surface roughness ofa substrate. For its simplicity, the arithmetic mean value (Ra) was adopted in-ternationally in the mid-1950s and used widely in engineering practice. The unitsused for surface roughness are micron (µm) or µin (1 µm = 40 µin or 1 µin = 0.025µm) [73]. In this project, the Ra values will be considered as the parameter to
1Random irregularities such as scratches, cracks, holes, depressions, tears or inclusions.2Direction of the predominant pattern.3Deviation from a flat surface.
37
38 CHAPTER 3. SURFACE TECHNOLOGY
assess the quality of the surface of the castings while introducing areal (surface)parameters (Sa and Sq).
3.1 Surface Topography
3.1.1 Surface Topography Measuring InstrumentsLine profiling methods produce a topographic profile, z(x). This measurementis commonly performed with a stylus instrument (Figure 3.1a). A typical stylusinstrument gives height information and it consists of a stylus that is in physicalcontact with the surface being measured and a transducer that converts the verticalmovement of the stylus into an electrical signal. The electrical signal is amplifiedand processed or converted into a digital signal via an A/D converter and thenanalysed using a computer. The part of the stylus in contact with the surface isusually a diamond tip with a radius of curvature ranging from 2 µm to 10 µm. Themajor disadvantages of using a stylus instrument is that it requires direct physicalcontact with the specimen, which limits the measuring speed [74, 75].There are also non contact optical instruments that measure the actual surfacetopography by either scanning a beam or using the field of view (profile and arealmethods), and those that measure a statistical parameter of the surface, usuallyby analysing the distribution of scattered light (area integrating methods). Manyoptical instruments use a microscope objective to magnify the features on thesurface being measured. Magnification varies from 2.5× to 100× depending onthe application and the surface of the specimen. Instruments using a microscopeobjective have two identified fundamental limitations [74]. Firstly, the numerical(or angular) aperture (NA) determines the largest slope angle on the surface thatcan be measured and also has effects on the optical resolution. The NA of anobjective is given by
NA = n sinα (3.1)
where n is the refractive index of the medium between the objective and thesurface (usually air, so n is approximated to 1) and α is the acceptance angle ofthe aperture. The acceptance angle determines the slopes on the surface of thespecimen that can physically reflect back into the objective lens and hence bemeasured. The second limitation is the optical resolution of the objective. Theresolution determines the minimum distance between two lateral features on asurface that can be measured. The resolution is approximately given by
r = λ
2NA (3.2)
where λ is the wavelength of the radiation. For a theoretically perfect opticalsystem (i.e. aberration free), the optical resolution is given by Rayleigh criterion,where the 1
2 in Eq. 3.2 is replaced by 0.61 [74]. A stylus instrument and an opticalinstrument are presented in Figure 3.1.
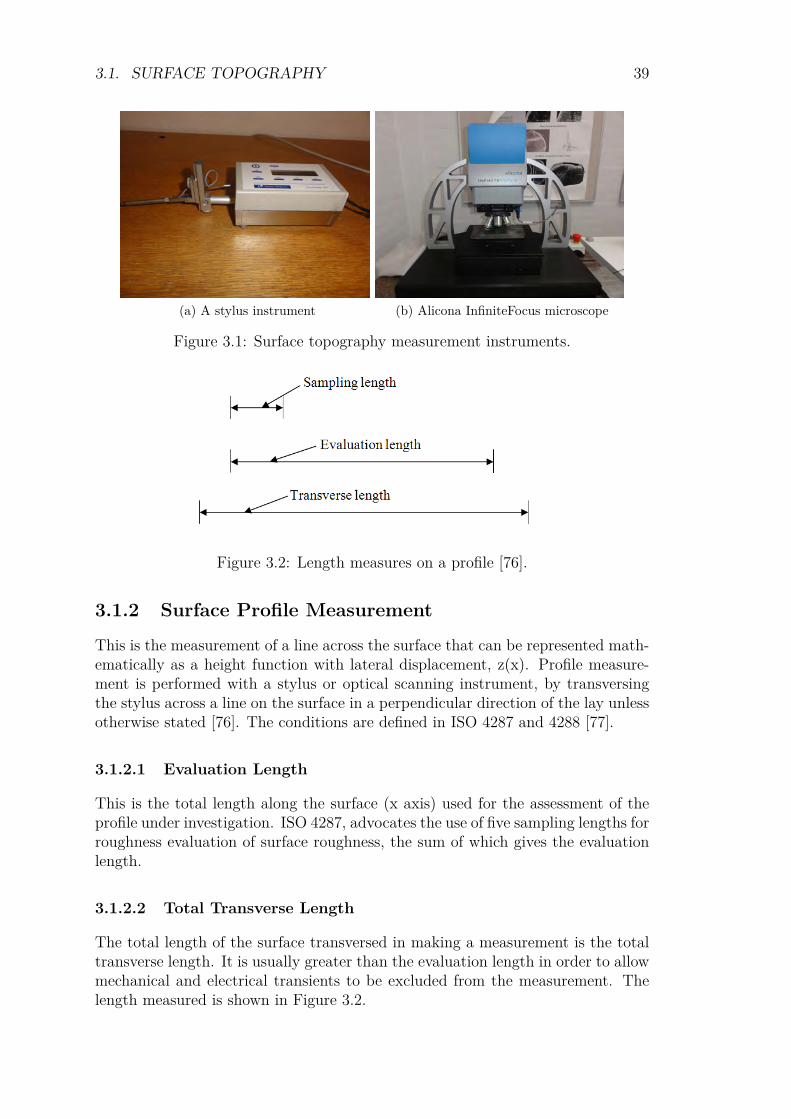
3.1. SURFACE TOPOGRAPHY 39
(a) A stylus instrument (b) Alicona InfiniteFocus microscope
Figure 3.1: Surface topography measurement instruments.
Figure 3.2: Length measures on a profile [76].
3.1.2 Surface Profile Measurement
This is the measurement of a line across the surface that can be represented math-ematically as a height function with lateral displacement, z(x). Profile measure-ment is performed with a stylus or optical scanning instrument, by transversingthe stylus across a line on the surface in a perpendicular direction of the lay unlessotherwise stated [76]. The conditions are defined in ISO 4287 and 4288 [77].
3.1.2.1 Evaluation Length
This is the total length along the surface (x axis) used for the assessment of theprofile under investigation. ISO 4287, advocates the use of five sampling lengths forroughness evaluation of surface roughness, the sum of which gives the evaluationlength.
3.1.2.2 Total Transverse Length
The total length of the surface transversed in making a measurement is the totaltransverse length. It is usually greater than the evaluation length in order to allowmechanical and electrical transients to be excluded from the measurement. Thelength measured is shown in Figure 3.2.
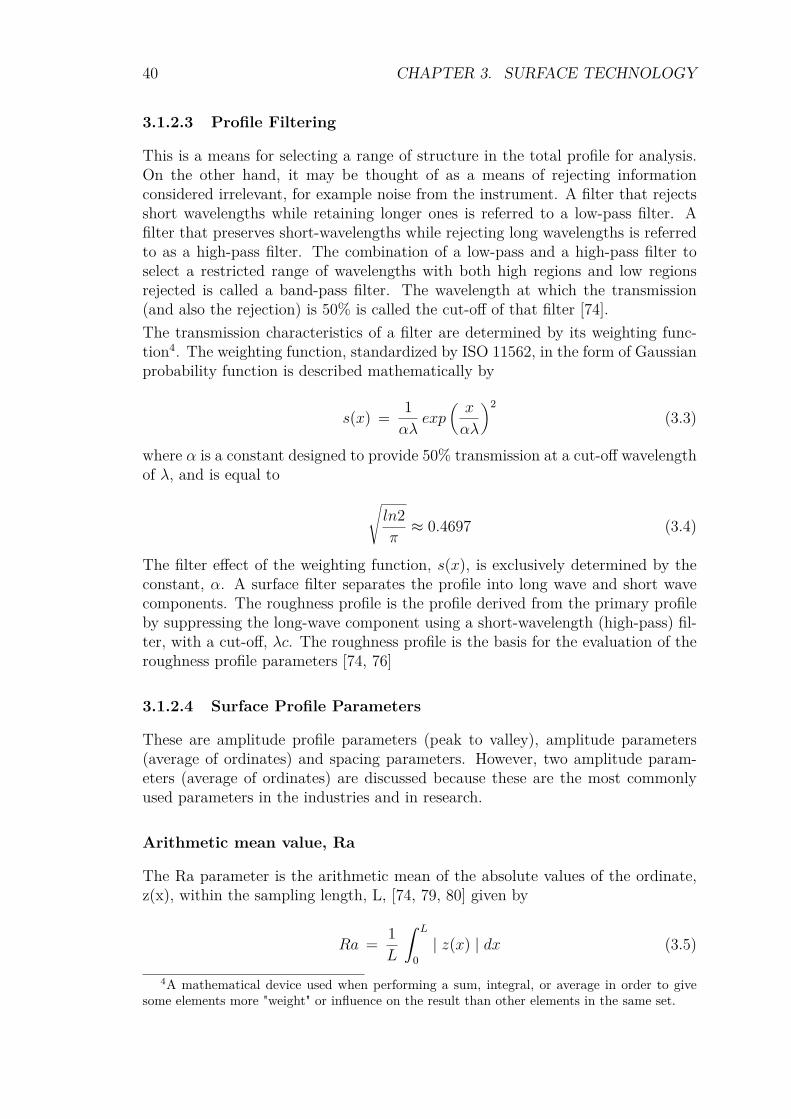
40 CHAPTER 3. SURFACE TECHNOLOGY
3.1.2.3 Profile Filtering
This is a means for selecting a range of structure in the total profile for analysis.On the other hand, it may be thought of as a means of rejecting informationconsidered irrelevant, for example noise from the instrument. A filter that rejectsshort wavelengths while retaining longer ones is referred to a low-pass filter. Afilter that preserves short-wavelengths while rejecting long wavelengths is referredto as a high-pass filter. The combination of a low-pass and a high-pass filter toselect a restricted range of wavelengths with both high regions and low regionsrejected is called a band-pass filter. The wavelength at which the transmission(and also the rejection) is 50% is called the cut-off of that filter [74].The transmission characteristics of a filter are determined by its weighting func-tion4. The weighting function, standardized by ISO 11562, in the form of Gaussianprobability function is described mathematically by
s(x) = 1αλ
exp(x
αλ
)2(3.3)
where α is a constant designed to provide 50% transmission at a cut-off wavelengthof λ, and is equal to
√ln2π≈ 0.4697 (3.4)
The filter effect of the weighting function, s(x), is exclusively determined by theconstant, α. A surface filter separates the profile into long wave and short wavecomponents. The roughness profile is the profile derived from the primary profileby suppressing the long-wave component using a short-wavelength (high-pass) fil-ter, with a cut-off, λc. The roughness profile is the basis for the evaluation of theroughness profile parameters [74, 76]
3.1.2.4 Surface Profile Parameters
These are amplitude profile parameters (peak to valley), amplitude parameters(average of ordinates) and spacing parameters. However, two amplitude param-eters (average of ordinates) are discussed because these are the most commonlyused parameters in the industries and in research.
Arithmetic mean value, Ra
The Ra parameter is the arithmetic mean of the absolute values of the ordinate,z(x), within the sampling length, L, [74, 79, 80] given by
Ra = 1L
ˆ L
0| z(x) | dx (3.5)
4A mathematical device used when performing a sum, integral, or average in order to givesome elements more "weight" or influence on the result than other elements in the same set.
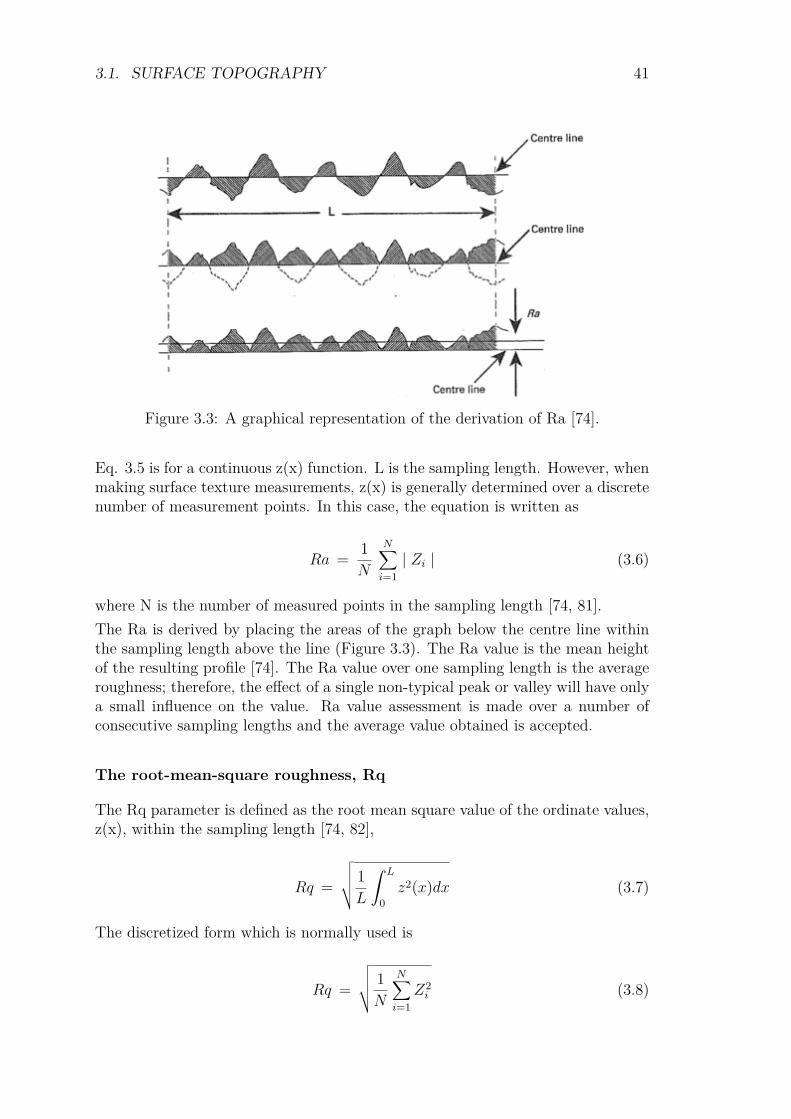
3.1. SURFACE TOPOGRAPHY 41
Figure 3.3: A graphical representation of the derivation of Ra [74].
Eq. 3.5 is for a continuous z(x) function. L is the sampling length. However, whenmaking surface texture measurements, z(x) is generally determined over a discretenumber of measurement points. In this case, the equation is written as
Ra = 1N
N∑i=1| Zi | (3.6)
where N is the number of measured points in the sampling length [74, 81].The Ra is derived by placing the areas of the graph below the centre line withinthe sampling length above the line (Figure 3.3). The Ra value is the mean heightof the resulting profile [74]. The Ra value over one sampling length is the averageroughness; therefore, the effect of a single non-typical peak or valley will have onlya small influence on the value. Ra value assessment is made over a number ofconsecutive sampling lengths and the average value obtained is accepted.
The root-mean-square roughness, Rq
The Rq parameter is defined as the root mean square value of the ordinate values,z(x), within the sampling length [74, 82],
Rq =
√√√√ 1L
ˆ L
0z2(x)dx (3.7)
The discretized form which is normally used is
Rq =
√√√√ 1N
N∑i=1
Z2i (3.8)
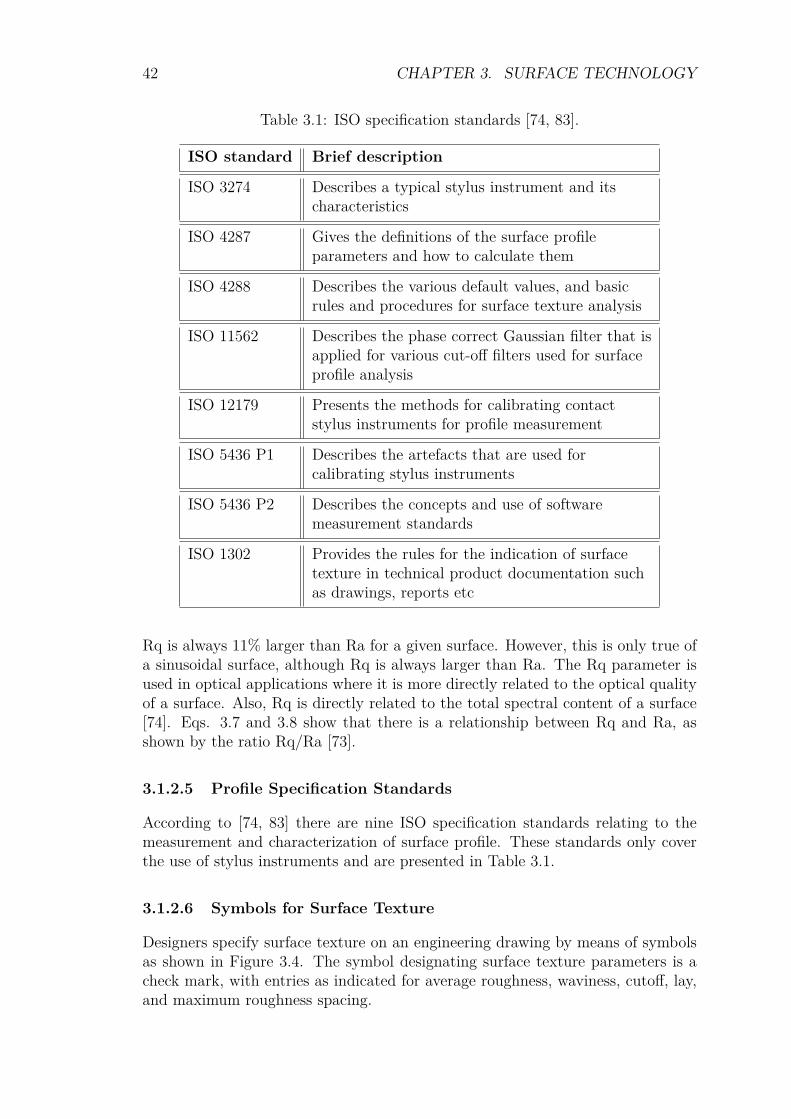
42 CHAPTER 3. SURFACE TECHNOLOGY
Table 3.1: ISO specification standards [74, 83].
ISO standard Brief description
ISO 3274 Describes a typical stylus instrument and itscharacteristics
ISO 4287 Gives the definitions of the surface profileparameters and how to calculate them
ISO 4288 Describes the various default values, and basicrules and procedures for surface texture analysis
ISO 11562 Describes the phase correct Gaussian filter that isapplied for various cut-off filters used for surfaceprofile analysis
ISO 12179 Presents the methods for calibrating contactstylus instruments for profile measurement
ISO 5436 P1 Describes the artefacts that are used forcalibrating stylus instruments
ISO 5436 P2 Describes the concepts and use of softwaremeasurement standards
ISO 1302 Provides the rules for the indication of surfacetexture in technical product documentation suchas drawings, reports etc
Rq is always 11% larger than Ra for a given surface. However, this is only true ofa sinusoidal surface, although Rq is always larger than Ra. The Rq parameter isused in optical applications where it is more directly related to the optical qualityof a surface. Also, Rq is directly related to the total spectral content of a surface[74]. Eqs. 3.7 and 3.8 show that there is a relationship between Rq and Ra, asshown by the ratio Rq/Ra [73].
3.1.2.5 Profile Specification Standards
According to [74, 83] there are nine ISO specification standards relating to themeasurement and characterization of surface profile. These standards only coverthe use of stylus instruments and are presented in Table 3.1.
3.1.2.6 Symbols for Surface Texture
Designers specify surface texture on an engineering drawing by means of symbolsas shown in Figure 3.4. The symbol designating surface texture parameters is acheck mark, with entries as indicated for average roughness, waviness, cutoff, lay,and maximum roughness spacing.
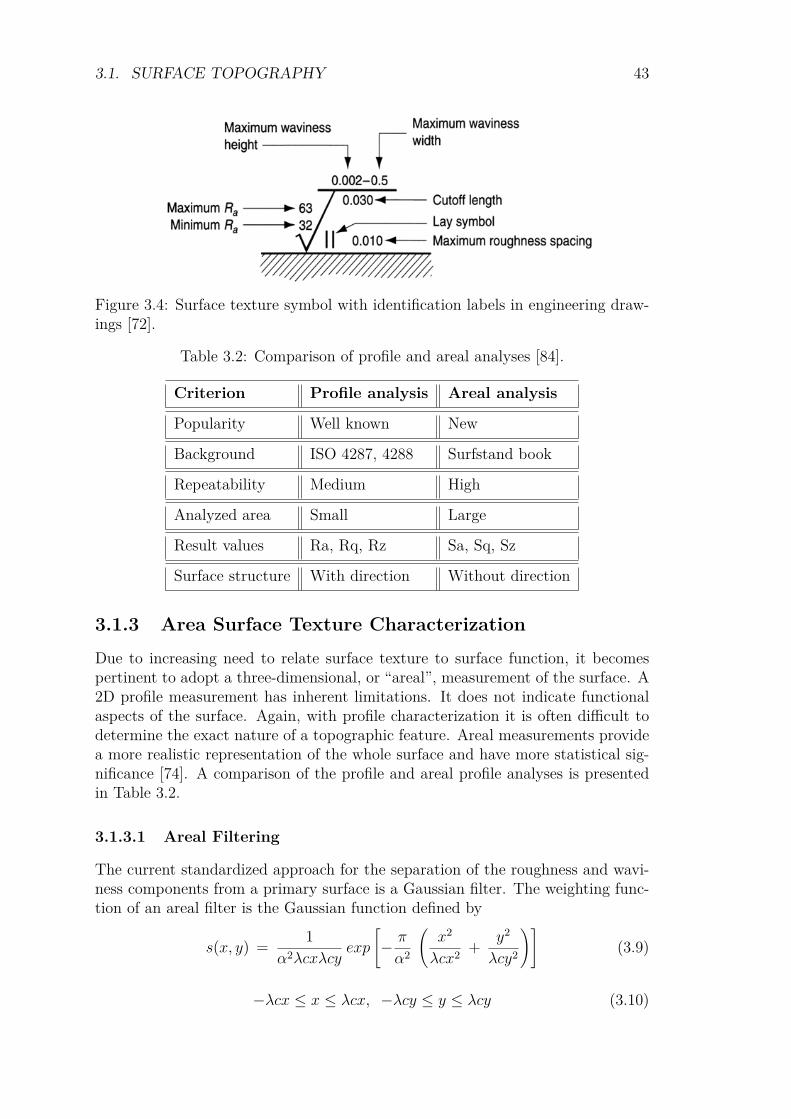
3.1. SURFACE TOPOGRAPHY 43
Figure 3.4: Surface texture symbol with identification labels in engineering draw-ings [72].
Table 3.2: Comparison of profile and areal analyses [84].
Criterion Profile analysis Areal analysis
Popularity Well known New
Background ISO 4287, 4288 Surfstand book
Repeatability Medium High
Analyzed area Small Large
Result values Ra, Rq, Rz Sa, Sq, Sz
Surface structure With direction Without direction
3.1.3 Area Surface Texture CharacterizationDue to increasing need to relate surface texture to surface function, it becomespertinent to adopt a three-dimensional, or “areal”, measurement of the surface. A2D profile measurement has inherent limitations. It does not indicate functionalaspects of the surface. Again, with profile characterization it is often difficult todetermine the exact nature of a topographic feature. Areal measurements providea more realistic representation of the whole surface and have more statistical sig-nificance [74]. A comparison of the profile and areal profile analyses is presentedin Table 3.2.
3.1.3.1 Areal Filtering
The current standardized approach for the separation of the roughness and wavi-ness components from a primary surface is a Gaussian filter. The weighting func-tion of an areal filter is the Gaussian function defined by
s(x, y) = 1α2λcxλcy
exp
[− π
α2
(x2
λcx2 + y2
λcy2
)](3.9)
−λcx ≤ x ≤ λcx, −λcy ≤ y ≤ λcy (3.10)
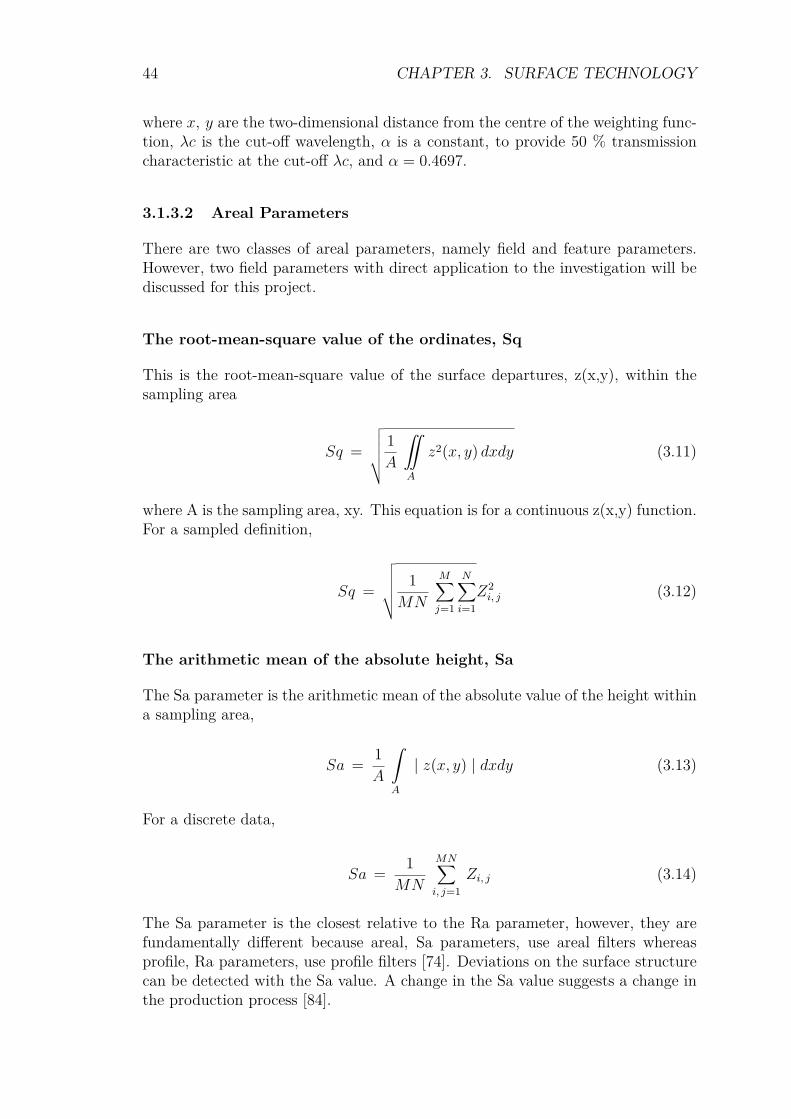
44 CHAPTER 3. SURFACE TECHNOLOGY
where x, y are the two-dimensional distance from the centre of the weighting func-tion, λc is the cut-off wavelength, α is a constant, to provide 50 % transmissioncharacteristic at the cut-off λc, and α = 0.4697.
3.1.3.2 Areal Parameters
There are two classes of areal parameters, namely field and feature parameters.However, two field parameters with direct application to the investigation will bediscussed for this project.
The root-mean-square value of the ordinates, Sq
This is the root-mean-square value of the surface departures, z(x,y), within thesampling area
Sq =√√√√√ 1A
¨
A
z2(x, y) dxdy (3.11)
where A is the sampling area, xy. This equation is for a continuous z(x,y) function.For a sampled definition,
Sq =
√√√√√ 1MN
M∑j=1
N∑i=1Z2i, j (3.12)
The arithmetic mean of the absolute height, Sa
The Sa parameter is the arithmetic mean of the absolute value of the height withina sampling area,
Sa = 1A
ˆ
A
| z(x, y) | dxdy (3.13)
For a discrete data,
Sa = 1MN
MN∑i, j=1
Zi, j (3.14)
The Sa parameter is the closest relative to the Ra parameter, however, they arefundamentally different because areal, Sa parameters, use areal filters whereasprofile, Ra parameters, use profile filters [74]. Deviations on the surface structurecan be detected with the Sa value. A change in the Sa value suggests a change inthe production process [84].

3.1. SURFACE TOPOGRAPHY 45
3.1.3.3 Area Specification Standards
The areal specification standards are at various stages of development. The ideais to have the profile standards as a subset of the areal standards. All the arealstandards are part of ISO 25178.

46 CHAPTER 3. SURFACE TECHNOLOGY
Chapter 4
Simulations
Computerized simulation programmes for casting processes have been developedsince the early 1980s. These simply reproduce the trial-and-error methods pre-viously applied on real casting processes on a computer. This is both quickerand cheaper, and also enables a better understanding of metal behaviour to beobtained [85, 86].A series of casting processes were simulated using a commercial software, MAG-MASOFT®, in order to predict the temperature distribution around the cores,sand penetration, burn-on, and hot spot areas including other relevant criteria inthe study of casting defects such as pressure distribution during pouring. Theinfluence of coating layer deposit on the cores was also elucidated with respect tothermal behaviour of the cores. The simulation included both filling and solid-ification so that it is possible to assess how the melt flow and the heat transferinteraction with the mould and core surfaces.
4.1 Mesh GenerationMesh are small volumes in which calculations are performed. Complex geometriesare divided into these small volumes. Fluid flow and heat transfer is calculatedusing Navier-Stokes equation and the heat transfer equation respectively. In com-bination with mass and energy balances, these equations describe fluid flow andheat transfer in and out of individual volumes. Thermal fields and flow velocitiescan be used in various criteria functions to describe the risk of mould erosion,formation of shrinkage porosity, local microstructure, etc. A fine mesh is dividedinto many elements while a coarse mesh has few elements. The finer the mesh themore accurate the results and the longer the simulation time. In the simulationof the casting processes, MAGMA 5.1 version was used and it has the ability togenerate mesh automatically while maintaining the accuracy and simulation time.The Magma 5.1 mesh generation creates the mesh of the geometry using one ofthe following four modes [87]:
• Number of Elements
• Minimal Wall Thickness
47
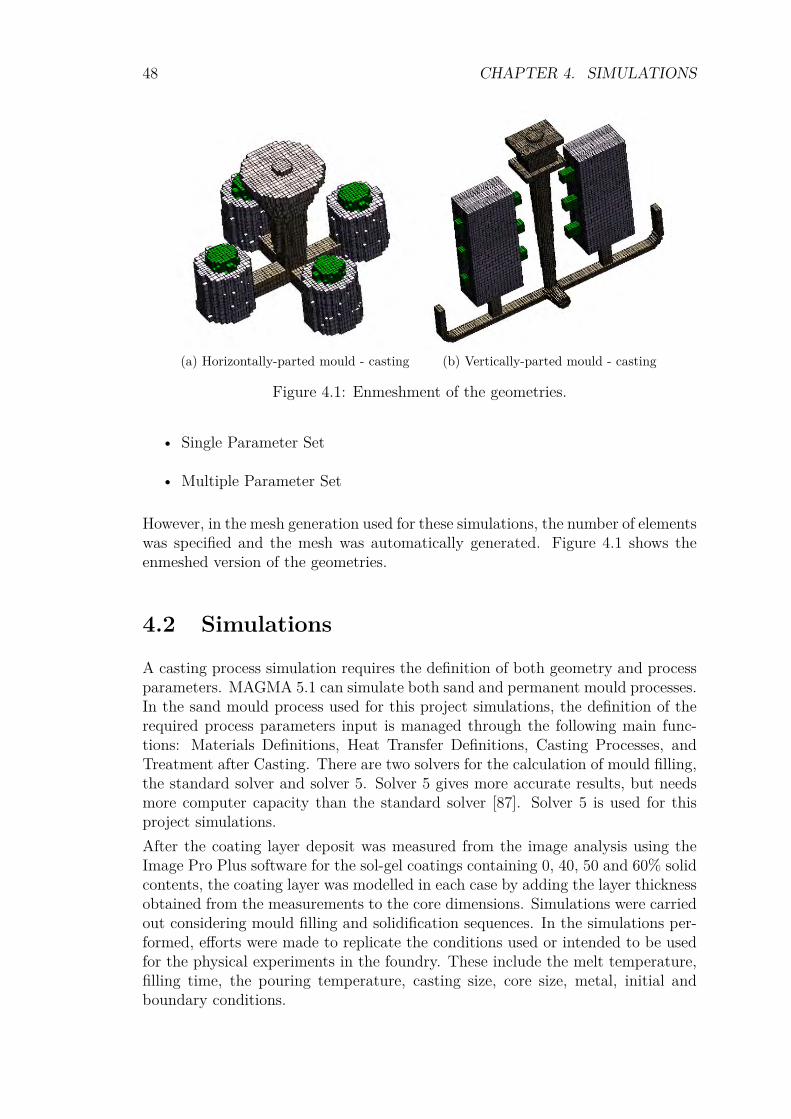
48 CHAPTER 4. SIMULATIONS
(a) Horizontally-parted mould - casting (b) Vertically-parted mould - casting
Figure 4.1: Enmeshment of the geometries.
• Single Parameter Set
• Multiple Parameter Set
However, in the mesh generation used for these simulations, the number of elementswas specified and the mesh was automatically generated. Figure 4.1 shows theenmeshed version of the geometries.
4.2 Simulations
A casting process simulation requires the definition of both geometry and processparameters. MAGMA 5.1 can simulate both sand and permanent mould processes.In the sand mould process used for this project simulations, the definition of therequired process parameters input is managed through the following main func-tions: Materials Definitions, Heat Transfer Definitions, Casting Processes, andTreatment after Casting. There are two solvers for the calculation of mould filling,the standard solver and solver 5. Solver 5 gives more accurate results, but needsmore computer capacity than the standard solver [87]. Solver 5 is used for thisproject simulations.After the coating layer deposit was measured from the image analysis using theImage Pro Plus software for the sol-gel coatings containing 0, 40, 50 and 60% solidcontents, the coating layer was modelled in each case by adding the layer thicknessobtained from the measurements to the core dimensions. Simulations were carriedout considering mould filling and solidification sequences. In the simulations per-formed, efforts were made to replicate the conditions used or intended to be usedfor the physical experiments in the foundry. These include the melt temperature,filling time, the pouring temperature, casting size, core size, metal, initial andboundary conditions.
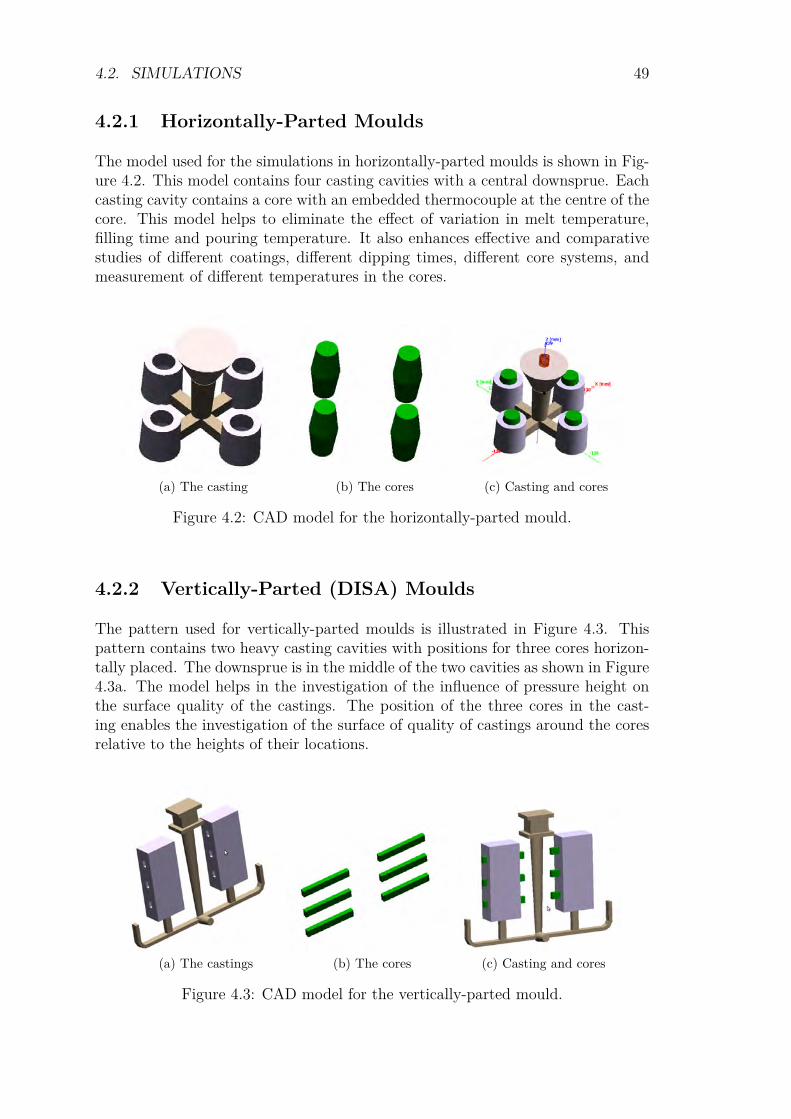
4.2. SIMULATIONS 49
4.2.1 Horizontally-Parted Moulds
The model used for the simulations in horizontally-parted moulds is shown in Fig-ure 4.2. This model contains four casting cavities with a central downsprue. Eachcasting cavity contains a core with an embedded thermocouple at the centre of thecore. This model helps to eliminate the effect of variation in melt temperature,filling time and pouring temperature. It also enhances effective and comparativestudies of different coatings, different dipping times, different core systems, andmeasurement of different temperatures in the cores.
(a) The casting (b) The cores (c) Casting and cores
Figure 4.2: CAD model for the horizontally-parted mould.
4.2.2 Vertically-Parted (DISA) Moulds
The pattern used for vertically-parted moulds is illustrated in Figure 4.3. Thispattern contains two heavy casting cavities with positions for three cores horizon-tally placed. The downsprue is in the middle of the two cavities as shown in Figure4.3a. The model helps in the investigation of the influence of pressure height onthe surface quality of the castings. The position of the three cores in the cast-ing enables the investigation of the surface of quality of castings around the coresrelative to the heights of their locations.
(a) The castings (b) The cores (c) Casting and cores
Figure 4.3: CAD model for the vertically-parted mould.
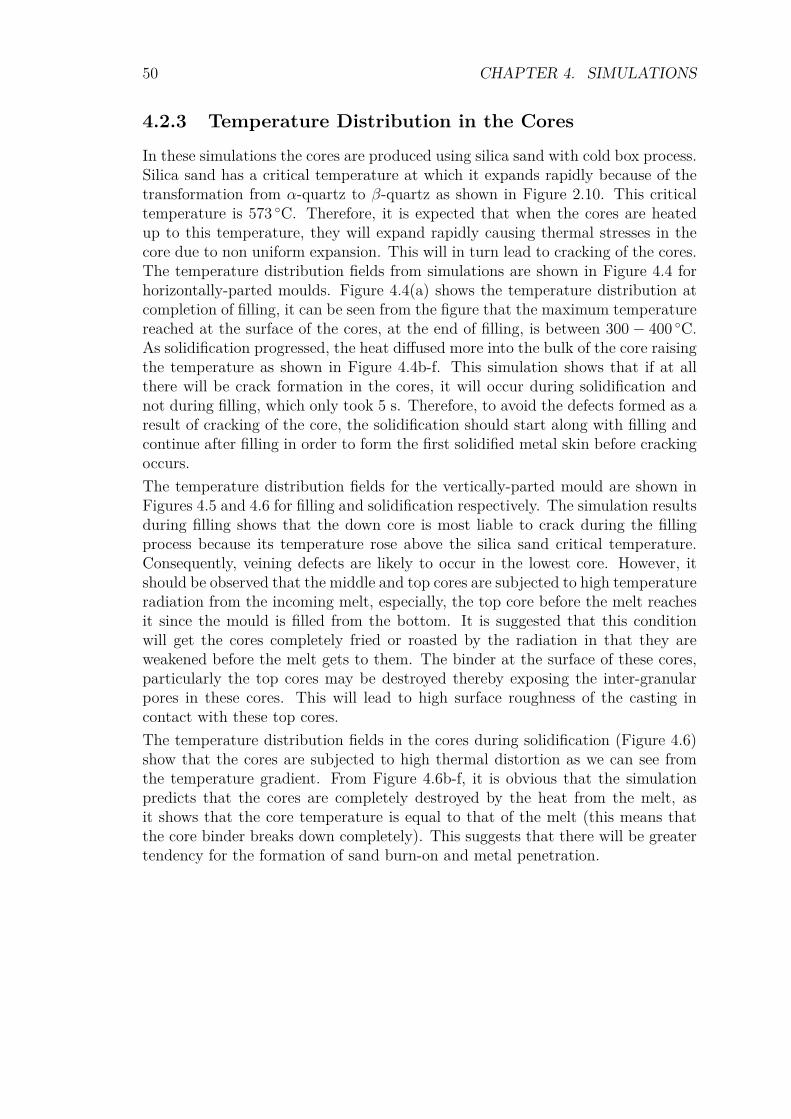
50 CHAPTER 4. SIMULATIONS
4.2.3 Temperature Distribution in the CoresIn these simulations the cores are produced using silica sand with cold box process.Silica sand has a critical temperature at which it expands rapidly because of thetransformation from α-quartz to β-quartz as shown in Figure 2.10. This criticaltemperature is 573 C. Therefore, it is expected that when the cores are heatedup to this temperature, they will expand rapidly causing thermal stresses in thecore due to non uniform expansion. This will in turn lead to cracking of the cores.The temperature distribution fields from simulations are shown in Figure 4.4 forhorizontally-parted moulds. Figure 4.4(a) shows the temperature distribution atcompletion of filling, it can be seen from the figure that the maximum temperaturereached at the surface of the cores, at the end of filling, is between 300 − 400 C.As solidification progressed, the heat diffused more into the bulk of the core raisingthe temperature as shown in Figure 4.4b-f. This simulation shows that if at allthere will be crack formation in the cores, it will occur during solidification andnot during filling, which only took 5 s. Therefore, to avoid the defects formed as aresult of cracking of the core, the solidification should start along with filling andcontinue after filling in order to form the first solidified metal skin before crackingoccurs.The temperature distribution fields for the vertically-parted mould are shown inFigures 4.5 and 4.6 for filling and solidification respectively. The simulation resultsduring filling shows that the down core is most liable to crack during the fillingprocess because its temperature rose above the silica sand critical temperature.Consequently, veining defects are likely to occur in the lowest core. However, itshould be observed that the middle and top cores are subjected to high temperatureradiation from the incoming melt, especially, the top core before the melt reachesit since the mould is filled from the bottom. It is suggested that this conditionwill get the cores completely fried or roasted by the radiation in that they areweakened before the melt gets to them. The binder at the surface of these cores,particularly the top cores may be destroyed thereby exposing the inter-granularpores in these cores. This will lead to high surface roughness of the casting incontact with these top cores.The temperature distribution fields in the cores during solidification (Figure 4.6)show that the cores are subjected to high thermal distortion as we can see fromthe temperature gradient. From Figure 4.6b-f, it is obvious that the simulationpredicts that the cores are completely destroyed by the heat from the melt, asit shows that the core temperature is equal to that of the melt (this means thatthe core binder breaks down completely). This suggests that there will be greatertendency for the formation of sand burn-on and metal penetration.
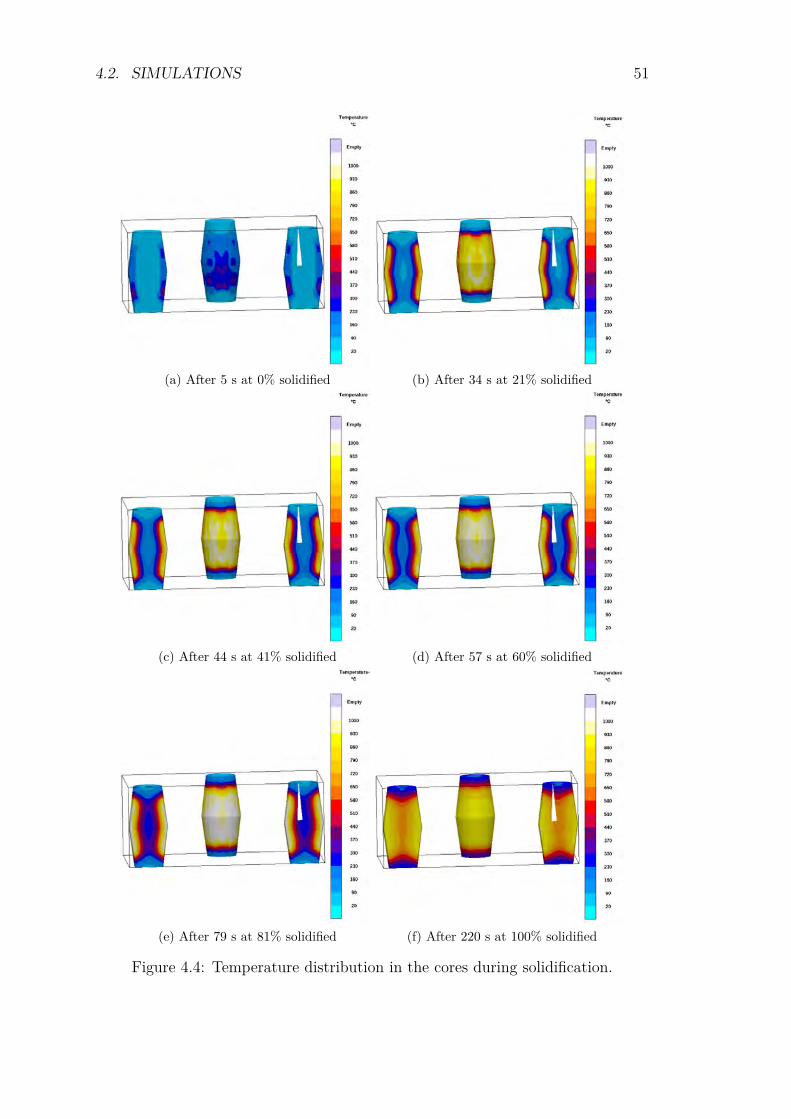
4.2. SIMULATIONS 51
(a) After 5 s at 0% solidified (b) After 34 s at 21% solidified
(c) After 44 s at 41% solidified (d) After 57 s at 60% solidified
(e) After 79 s at 81% solidified (f) After 220 s at 100% solidified
Figure 4.4: Temperature distribution in the cores during solidification.
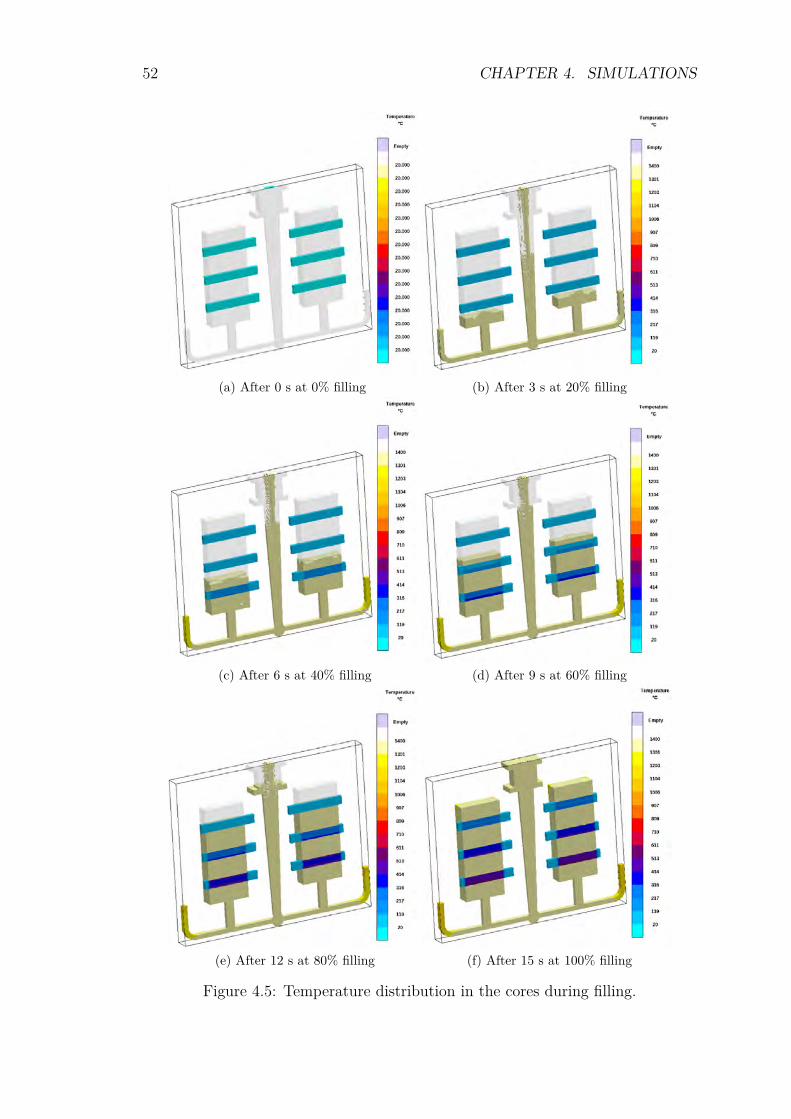
52 CHAPTER 4. SIMULATIONS
(a) After 0 s at 0% filling (b) After 3 s at 20% filling
(c) After 6 s at 40% filling (d) After 9 s at 60% filling
(e) After 12 s at 80% filling (f) After 15 s at 100% filling
Figure 4.5: Temperature distribution in the cores during filling.
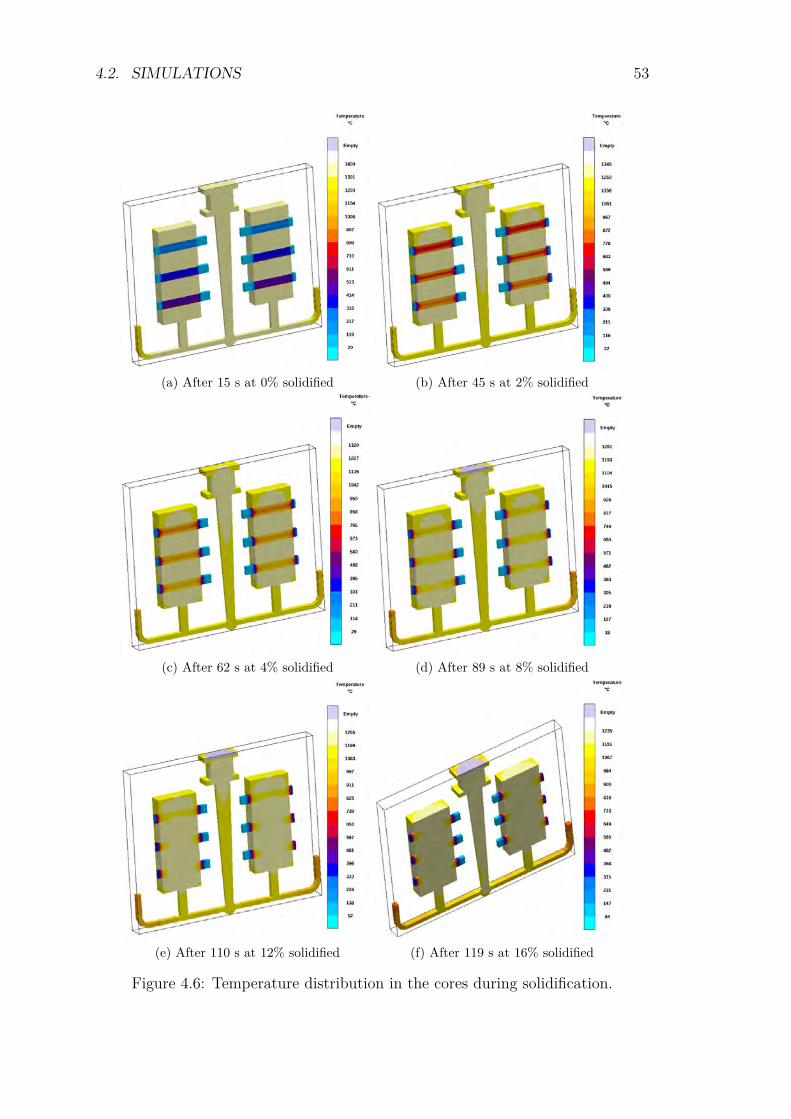
4.2. SIMULATIONS 53
(a) After 15 s at 0% solidified (b) After 45 s at 2% solidified
(c) After 62 s at 4% solidified (d) After 89 s at 8% solidified
(e) After 110 s at 12% solidified (f) After 119 s at 16% solidified
Figure 4.6: Temperature distribution in the cores during solidification.
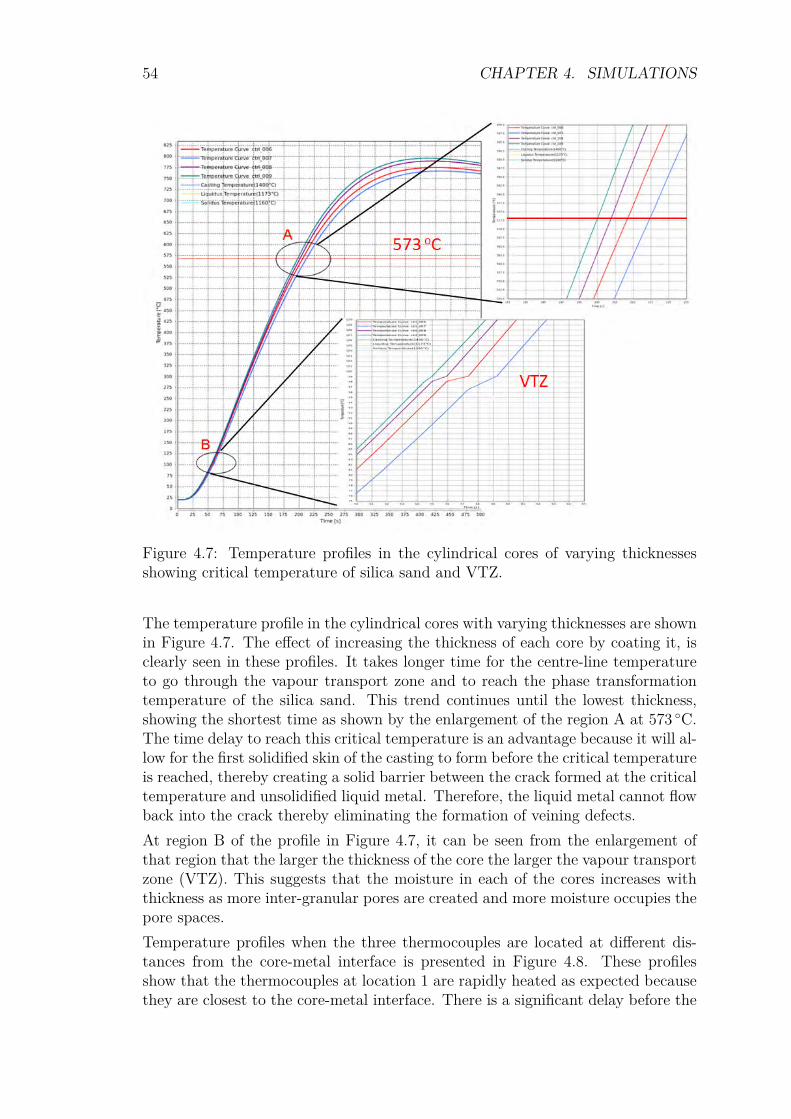
54 CHAPTER 4. SIMULATIONS
Figure 4.7: Temperature profiles in the cylindrical cores of varying thicknessesshowing critical temperature of silica sand and VTZ.
The temperature profile in the cylindrical cores with varying thicknesses are shownin Figure 4.7. The effect of increasing the thickness of each core by coating it, isclearly seen in these profiles. It takes longer time for the centre-line temperatureto go through the vapour transport zone and to reach the phase transformationtemperature of the silica sand. This trend continues until the lowest thickness,showing the shortest time as shown by the enlargement of the region A at 573 C.The time delay to reach this critical temperature is an advantage because it will al-low for the first solidified skin of the casting to form before the critical temperatureis reached, thereby creating a solid barrier between the crack formed at the criticaltemperature and unsolidified liquid metal. Therefore, the liquid metal cannot flowback into the crack thereby eliminating the formation of veining defects.At region B of the profile in Figure 4.7, it can be seen from the enlargement ofthat region that the larger the thickness of the core the larger the vapour transportzone (VTZ). This suggests that the moisture in each of the cores increases withthickness as more inter-granular pores are created and more moisture occupies thepore spaces.Temperature profiles when the three thermocouples are located at different dis-tances from the core-metal interface is presented in Figure 4.8. These profilesshow that the thermocouples at location 1 are rapidly heated as expected becausethey are closest to the core-metal interface. There is a significant delay before the
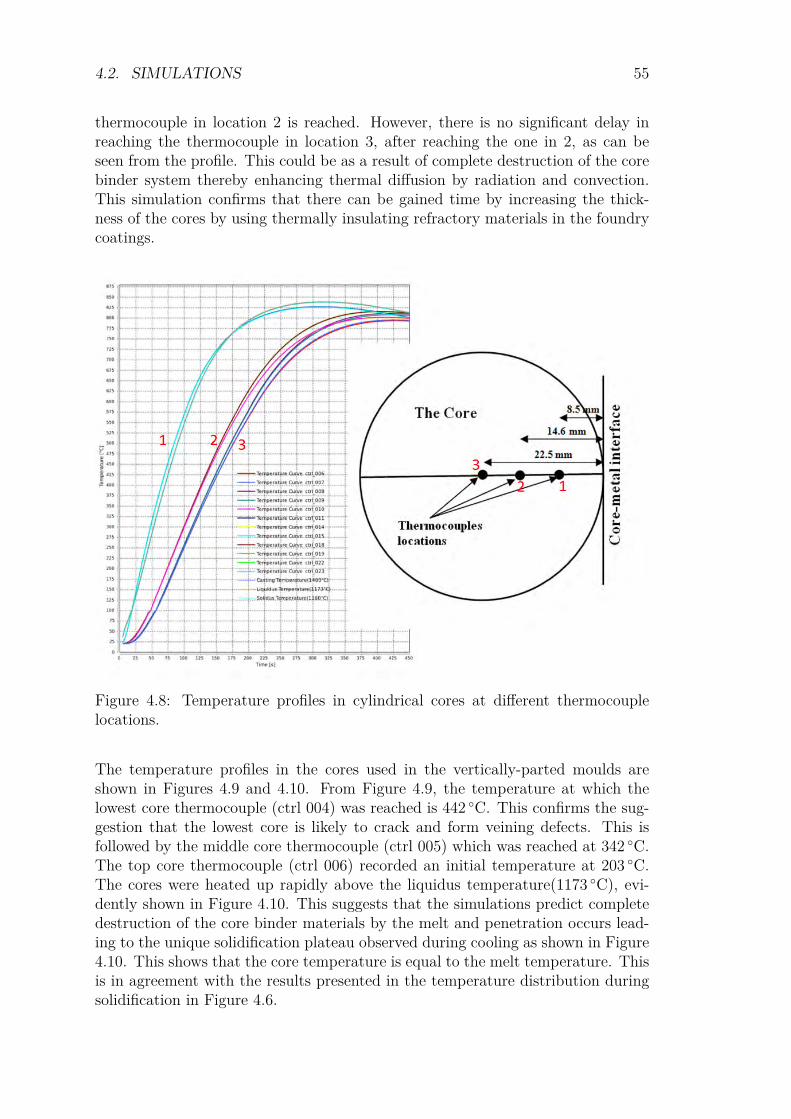
4.2. SIMULATIONS 55
thermocouple in location 2 is reached. However, there is no significant delay inreaching the thermocouple in location 3, after reaching the one in 2, as can beseen from the profile. This could be as a result of complete destruction of the corebinder system thereby enhancing thermal diffusion by radiation and convection.This simulation confirms that there can be gained time by increasing the thick-ness of the cores by using thermally insulating refractory materials in the foundrycoatings.
Figure 4.8: Temperature profiles in cylindrical cores at different thermocouplelocations.
The temperature profiles in the cores used in the vertically-parted moulds areshown in Figures 4.9 and 4.10. From Figure 4.9, the temperature at which thelowest core thermocouple (ctrl 004) was reached is 442 C. This confirms the sug-gestion that the lowest core is likely to crack and form veining defects. This isfollowed by the middle core thermocouple (ctrl 005) which was reached at 342 C.The top core thermocouple (ctrl 006) recorded an initial temperature at 203 C.The cores were heated up rapidly above the liquidus temperature(1173 C), evi-dently shown in Figure 4.10. This suggests that the simulations predict completedestruction of the core binder materials by the melt and penetration occurs lead-ing to the unique solidification plateau observed during cooling as shown in Figure4.10. This shows that the core temperature is equal to the melt temperature. Thisis in agreement with the results presented in the temperature distribution duringsolidification in Figure 4.6.
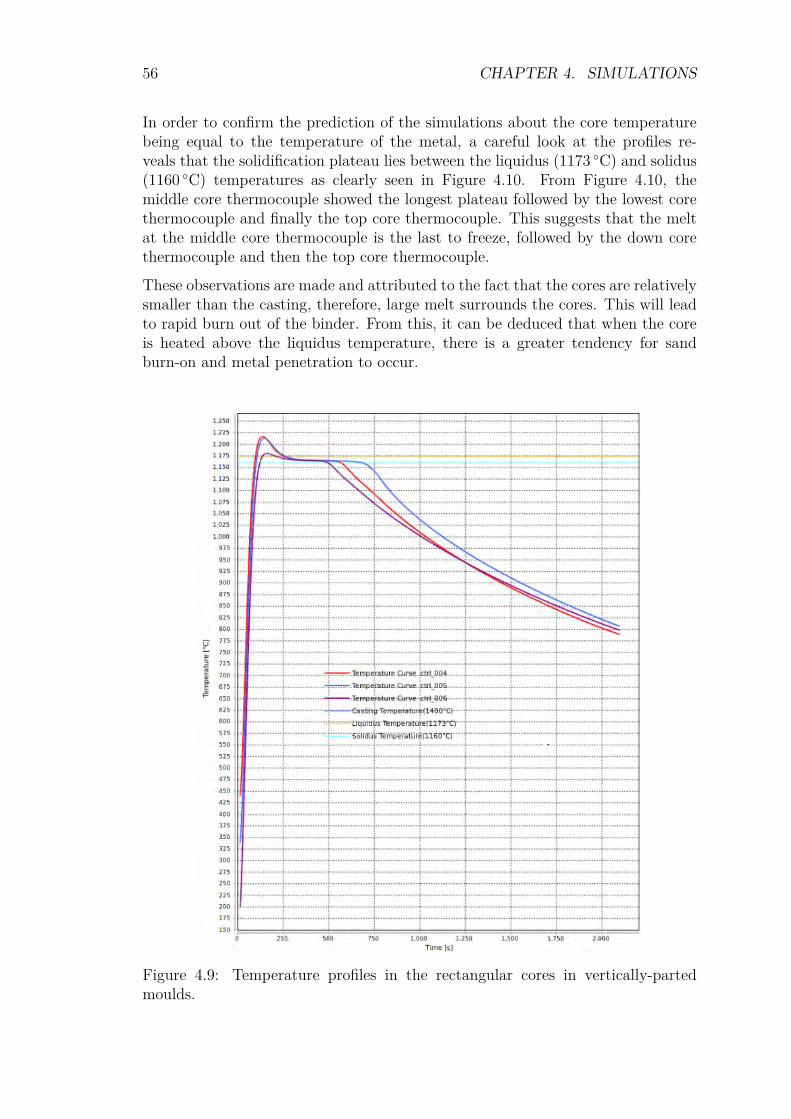
56 CHAPTER 4. SIMULATIONS
In order to confirm the prediction of the simulations about the core temperaturebeing equal to the temperature of the metal, a careful look at the profiles re-veals that the solidification plateau lies between the liquidus (1173 C) and solidus(1160 C) temperatures as clearly seen in Figure 4.10. From Figure 4.10, themiddle core thermocouple showed the longest plateau followed by the lowest corethermocouple and finally the top core thermocouple. This suggests that the meltat the middle core thermocouple is the last to freeze, followed by the down corethermocouple and then the top core thermocouple.
These observations are made and attributed to the fact that the cores are relativelysmaller than the casting, therefore, large melt surrounds the cores. This will leadto rapid burn out of the binder. From this, it can be deduced that when the coreis heated above the liquidus temperature, there is a greater tendency for sandburn-on and metal penetration to occur.
Figure 4.9: Temperature profiles in the rectangular cores in vertically-partedmoulds.

4.2. SIMULATIONS 57
Figure 4.10: Scaled temperature profiles in the rectangular cores in vertically-parted moulds
4.2.4 Metallostatic Pressure Distribution
Metallostatic pressure has a significant effect in large castings. Its effect in smallcastings is not quite pronounced. The tendency of metal penetration increases withmetallostatic pressure at constant average grain sizes of the moulding sand [88]. Asa result of this, the surface quality of the lower part of large castings differ from theupper part of the same casting. The simulated metallostatic pressure distributionin the cylindrical castings during filling is shown in Figure 4.11. It can be seenthat as the mould is being filled, the metallostatic pressure keeps changing andincreasing, reaching highest pressure at the bottom at completion of filling. Thisis why it is sometimes referred to as pressure height effect, because it depends onthe height involved and melt density. Due to the small size of this castings, themetallostatic pressure did not increase significantly as illustrated in Figure 4.11and may not have any adverse effect on the surface quality of the castings.
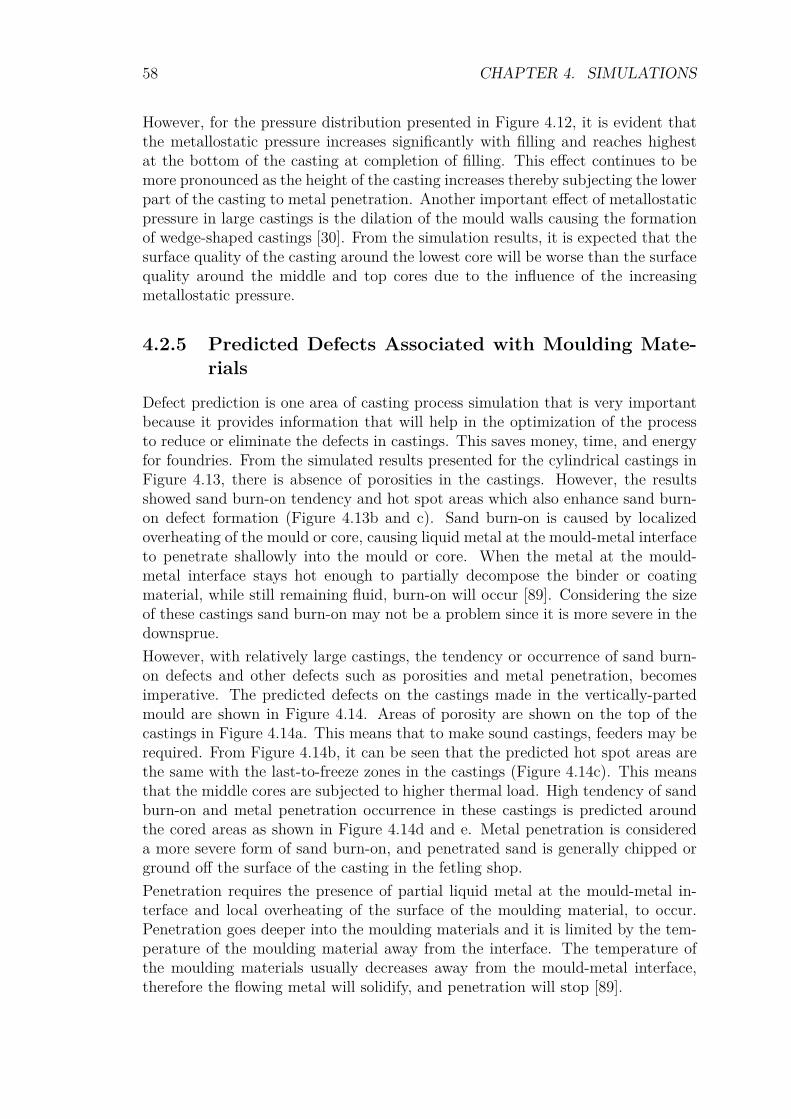
58 CHAPTER 4. SIMULATIONS
However, for the pressure distribution presented in Figure 4.12, it is evident thatthe metallostatic pressure increases significantly with filling and reaches highestat the bottom of the casting at completion of filling. This effect continues to bemore pronounced as the height of the casting increases thereby subjecting the lowerpart of the casting to metal penetration. Another important effect of metallostaticpressure in large castings is the dilation of the mould walls causing the formationof wedge-shaped castings [30]. From the simulation results, it is expected that thesurface quality of the casting around the lowest core will be worse than the surfacequality around the middle and top cores due to the influence of the increasingmetallostatic pressure.
4.2.5 Predicted Defects Associated with Moulding Mate-rials
Defect prediction is one area of casting process simulation that is very importantbecause it provides information that will help in the optimization of the processto reduce or eliminate the defects in castings. This saves money, time, and energyfor foundries. From the simulated results presented for the cylindrical castings inFigure 4.13, there is absence of porosities in the castings. However, the resultsshowed sand burn-on tendency and hot spot areas which also enhance sand burn-on defect formation (Figure 4.13b and c). Sand burn-on is caused by localizedoverheating of the mould or core, causing liquid metal at the mould-metal interfaceto penetrate shallowly into the mould or core. When the metal at the mould-metal interface stays hot enough to partially decompose the binder or coatingmaterial, while still remaining fluid, burn-on will occur [89]. Considering the sizeof these castings sand burn-on may not be a problem since it is more severe in thedownsprue.However, with relatively large castings, the tendency or occurrence of sand burn-on defects and other defects such as porosities and metal penetration, becomesimperative. The predicted defects on the castings made in the vertically-partedmould are shown in Figure 4.14. Areas of porosity are shown on the top of thecastings in Figure 4.14a. This means that to make sound castings, feeders may berequired. From Figure 4.14b, it can be seen that the predicted hot spot areas arethe same with the last-to-freeze zones in the castings (Figure 4.14c). This meansthat the middle cores are subjected to higher thermal load. High tendency of sandburn-on and metal penetration occurrence in these castings is predicted aroundthe cored areas as shown in Figure 4.14d and e. Metal penetration is considereda more severe form of sand burn-on, and penetrated sand is generally chipped orground off the surface of the casting in the fetling shop.Penetration requires the presence of partial liquid metal at the mould-metal in-terface and local overheating of the surface of the moulding material, to occur.Penetration goes deeper into the moulding materials and it is limited by the tem-perature of the moulding material away from the interface. The temperature ofthe moulding materials usually decreases away from the mould-metal interface,therefore the flowing metal will solidify, and penetration will stop [89].
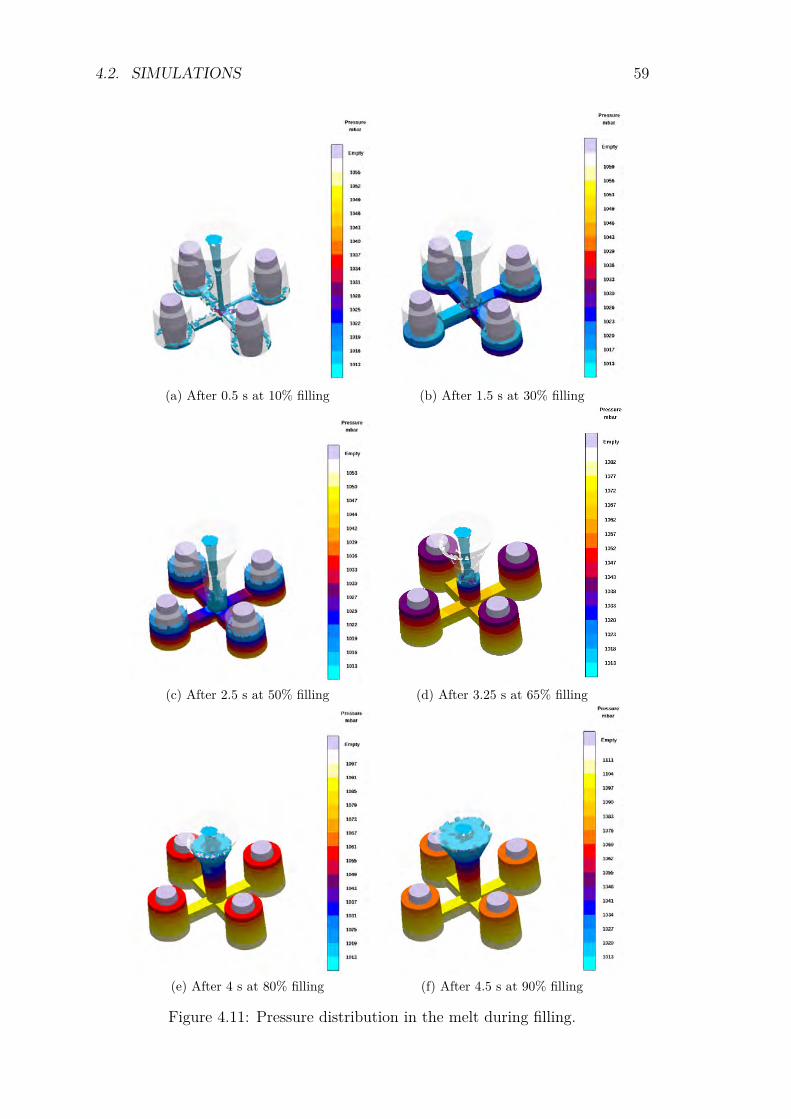
4.2. SIMULATIONS 59
(a) After 0.5 s at 10% filling (b) After 1.5 s at 30% filling
(c) After 2.5 s at 50% filling (d) After 3.25 s at 65% filling
(e) After 4 s at 80% filling (f) After 4.5 s at 90% filling
Figure 4.11: Pressure distribution in the melt during filling.
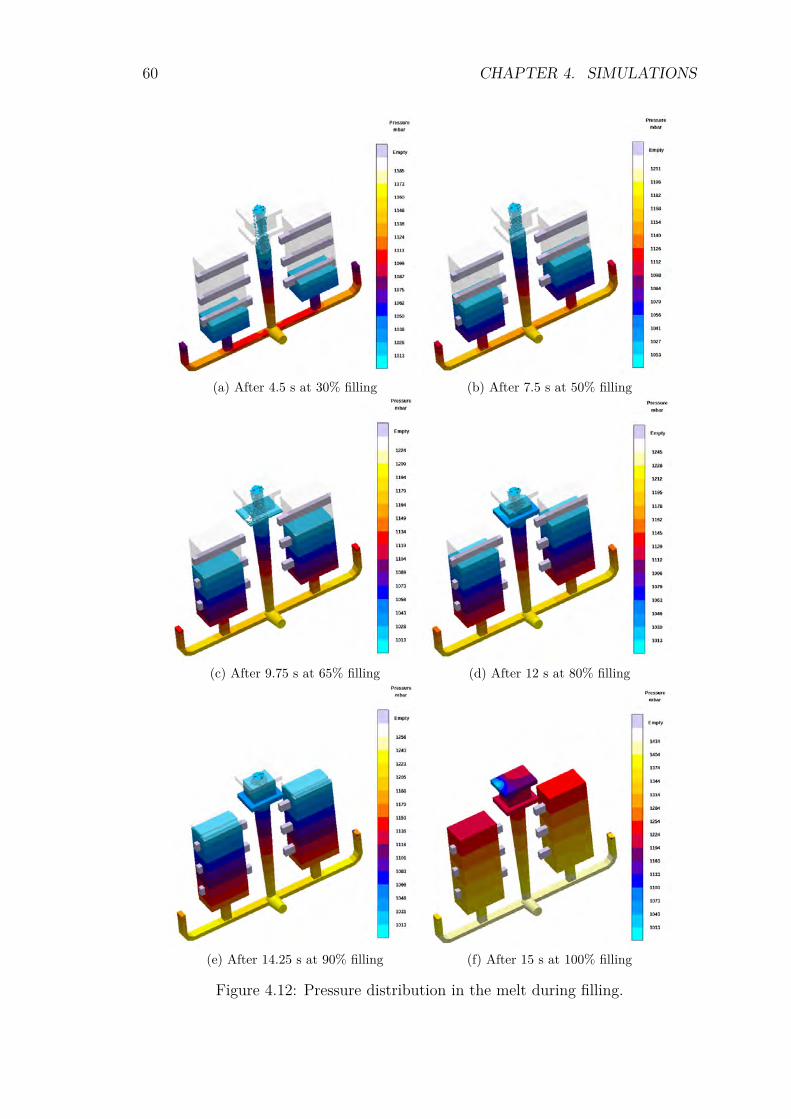
60 CHAPTER 4. SIMULATIONS
(a) After 4.5 s at 30% filling (b) After 7.5 s at 50% filling
(c) After 9.75 s at 65% filling (d) After 12 s at 80% filling
(e) After 14.25 s at 90% filling (f) After 15 s at 100% filling
Figure 4.12: Pressure distribution in the melt during filling.
4.2. SIMULATIONS 61
(a) Porosity (b) Sand burn-on
(c) Hot spot
Figure 4.13: Predicted defect locations in the horizontally-parted moulds.
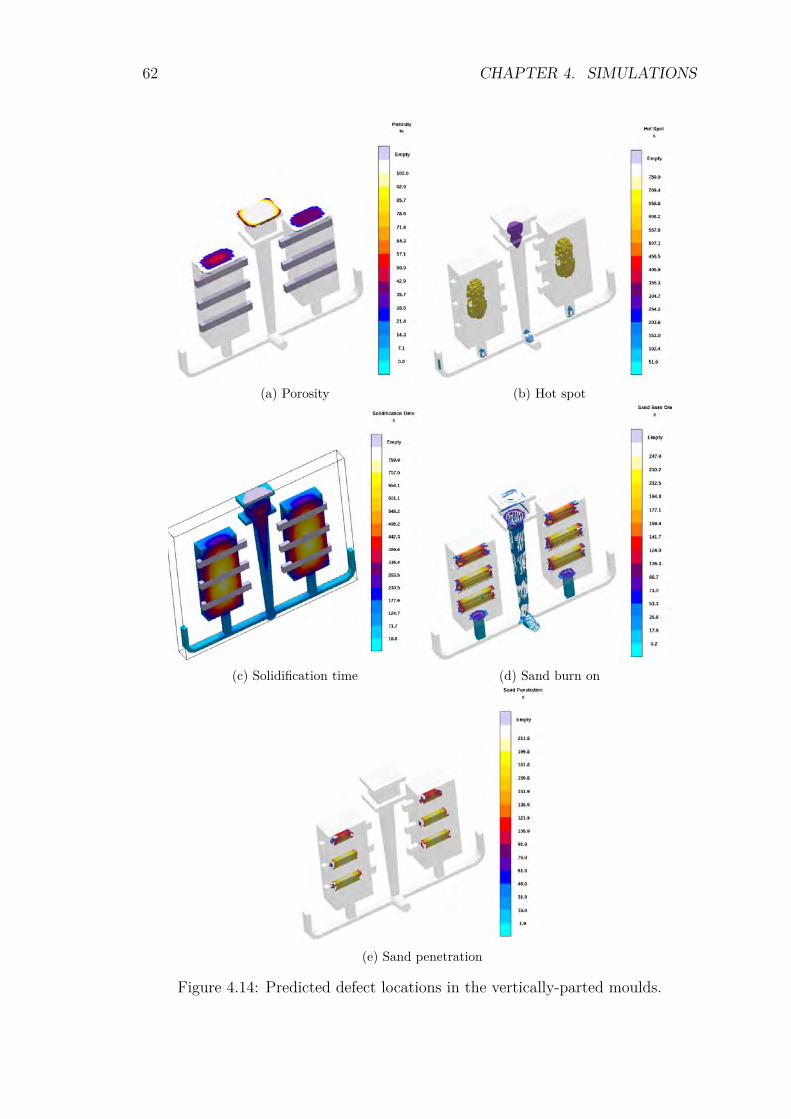
62 CHAPTER 4. SIMULATIONS
(a) Porosity (b) Hot spot
(c) Solidification time (d) Sand burn on
(e) Sand penetration
Figure 4.14: Predicted defect locations in the vertically-parted moulds.
Chapter 5
Materials and Approach
5.1 Coating Production and Formulations
5.1.1 Sol-Gel Process
The basic sol-gel process involves the sequential hydrolysis and polycondensationof inorganic or metal organic precursors in aqueous acid or base with a mutualco-solvent with the formation of colloids or clusters [90]. Sol-gel chemistry is theprocess in which a sol1 agglomerates to form a gel2. This process is driven bythe van der Waals forces. In the sol-gel process two distinct reactions take place:hydrolysis of the alkoxy groups and condensation of the resulting hydroxyl groups.The relative rates of these two reactions are governed by the concentration of thereagents and the presence of acidic or basic catalysts. The process takes place bydissolving the alkoxide in alcohol and hydrolyzing the solution by adding waterunder acidic, basic, or neutral conditions as shown in the hypothetical reactionequation below:M(OR)Z + H2O → M(OR)Z−1(OH) + ROHThe hydrolyzed species then condenses as shown in the following reaction equa-tions:When the hydrolyzed species react amongst themselves in a process called oxola-tion, water is released,M(OR)Z−1(OH) + M(OR)Z−1(OH) → (RO)Z−1M-O-M(OR)Z−1 + H2OWhen the hydrolyzed species react with another alkoxysilane in a process calledalkoxolation, alcohol is releasedM(OR)Z−1(OH) + M(OR)Z → (RO)Z−1M-O-M(OR)Z−1 + ROHIn these reactions, metal-organic precursors are used. The most commonly usedmetal alkoxides are represented by M(OR)Z , where R represents an organic (typ-ically alkyl) group and M represents a metal.
1Sol is defined as dispersions of solid particles having at least one dimension in the range of1-100 nm in liquid media.
2Gel is defined as a 3-dimensional network of the dispersed solid particles in a liquid medium.
63
64 CHAPTER 5. MATERIALS AND APPROACH
The unique property of the sol-gel process is the ability to allow a better controlof the whole process and synthesis of tailor-made structures from the molecularprecursors to the products. Table 5.1 shows commonly accepted rules of thumbused as starting point in sol-gel chemistry and material development based onrelative hydrolysis and condensation rates [91].
Table 5.1: Expected product of sol-gel process depending on the rates of hydrolysisand condensation [92].
Hydrolysis Condensation Results
Slow Slow Colloids/sols
Fast Slow Polymeric sols/gels
Fast Fast Colloidal gels or precipitates
Slow Fast Controlled precipitation
If the stoichiometry of water to alkoxide ratio is changed, this leads to a change insol concentration and pH affecting the sol reaction conditions. These inter-relatedparameters are type of precursor, hydrolysis ratio, catalyst type/amount, and typeof solvent.
5.1.1.1 Precursors
In order to gain control over the hydrolysis-condensation process, the precursorreactivity which comes from the nature of metal or metalloid, during the processhas to be decreased. Electronegativity or degree of unsaturation in a metal or met-alloid alkoxide leads to different reactivities in these materials. As the orbital sizeincreases, the valence electrons become less tightly bound, which leads to a lowerelectronegativity, ionization potential, and higher reactivity. Another property ofthe metal alkoxide that has to be taken into account is its molecular structure.The full coordination of many metals often cannot be satisfied in metal alkoxidesM(OR)n. This is due to the fact that the oxidation state Z of the metal is lowerthan its usual coordination number N which defines the degree of unsaturation.Higher degree of unsaturation results in higher reactivity [91]. It is establishedthat the hydrolysis rate of metal alkoxides decreases with increasing size of thealkoxy group (e.g. ethoxide > propoxide > butoxide). This is a consequence ofsteric hinderance and overcrowding of the transition state, thus leading to slowerreaction rates [93].
5.1.1.2 Hydrolysis Ratio
The hydrolysis ratio is expressed by the molar ratio of water to metal alkoxide.The stoichiometrically needed ratio of H2O:Si(OR)4 for complete hydrolysis of the
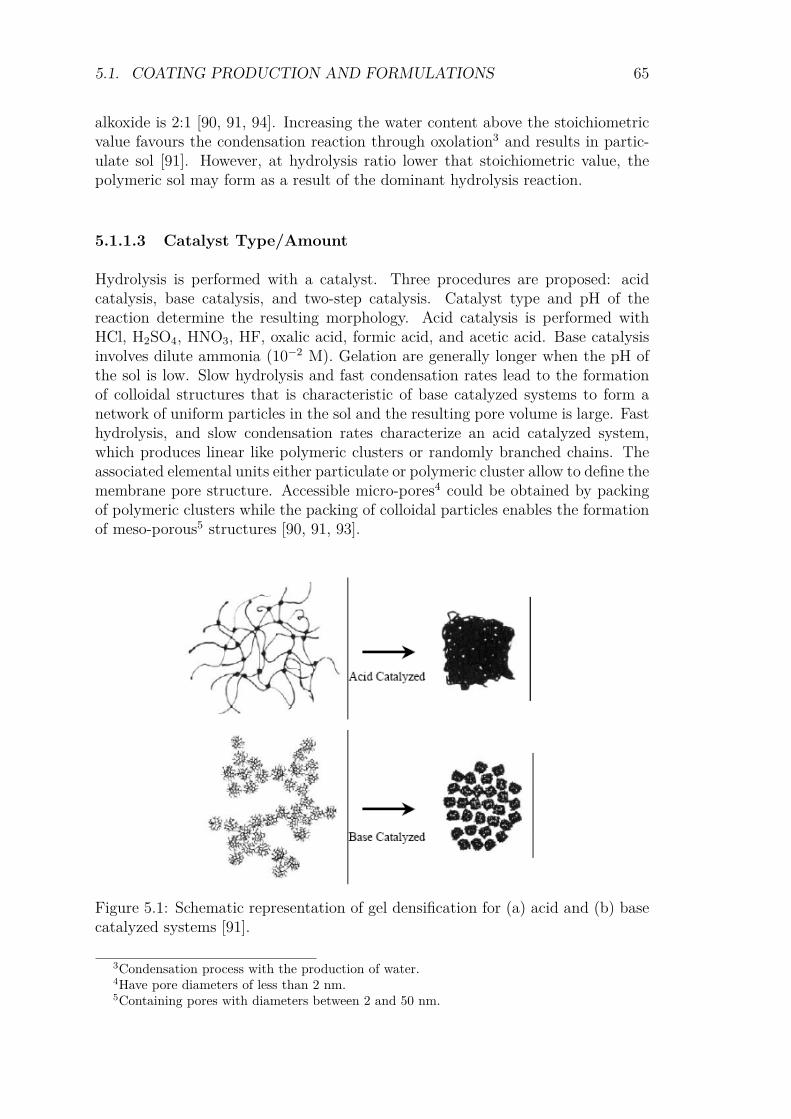
5.1. COATING PRODUCTION AND FORMULATIONS 65
alkoxide is 2:1 [90, 91, 94]. Increasing the water content above the stoichiometricvalue favours the condensation reaction through oxolation3 and results in partic-ulate sol [91]. However, at hydrolysis ratio lower that stoichiometric value, thepolymeric sol may form as a result of the dominant hydrolysis reaction.
5.1.1.3 Catalyst Type/Amount
Hydrolysis is performed with a catalyst. Three procedures are proposed: acidcatalysis, base catalysis, and two-step catalysis. Catalyst type and pH of thereaction determine the resulting morphology. Acid catalysis is performed withHCl, H2SO4, HNO3, HF, oxalic acid, formic acid, and acetic acid. Base catalysisinvolves dilute ammonia (10−2 M). Gelation are generally longer when the pH ofthe sol is low. Slow hydrolysis and fast condensation rates lead to the formationof colloidal structures that is characteristic of base catalyzed systems to form anetwork of uniform particles in the sol and the resulting pore volume is large. Fasthydrolysis, and slow condensation rates characterize an acid catalyzed system,which produces linear like polymeric clusters or randomly branched chains. Theassociated elemental units either particulate or polymeric cluster allow to define themembrane pore structure. Accessible micro-pores4 could be obtained by packingof polymeric clusters while the packing of colloidal particles enables the formationof meso-porous5 structures [90, 91, 93].
Figure 5.1: Schematic representation of gel densification for (a) acid and (b) basecatalyzed systems [91].
3Condensation process with the production of water.4Have pore diameters of less than 2 nm.5Containing pores with diameters between 2 and 50 nm.
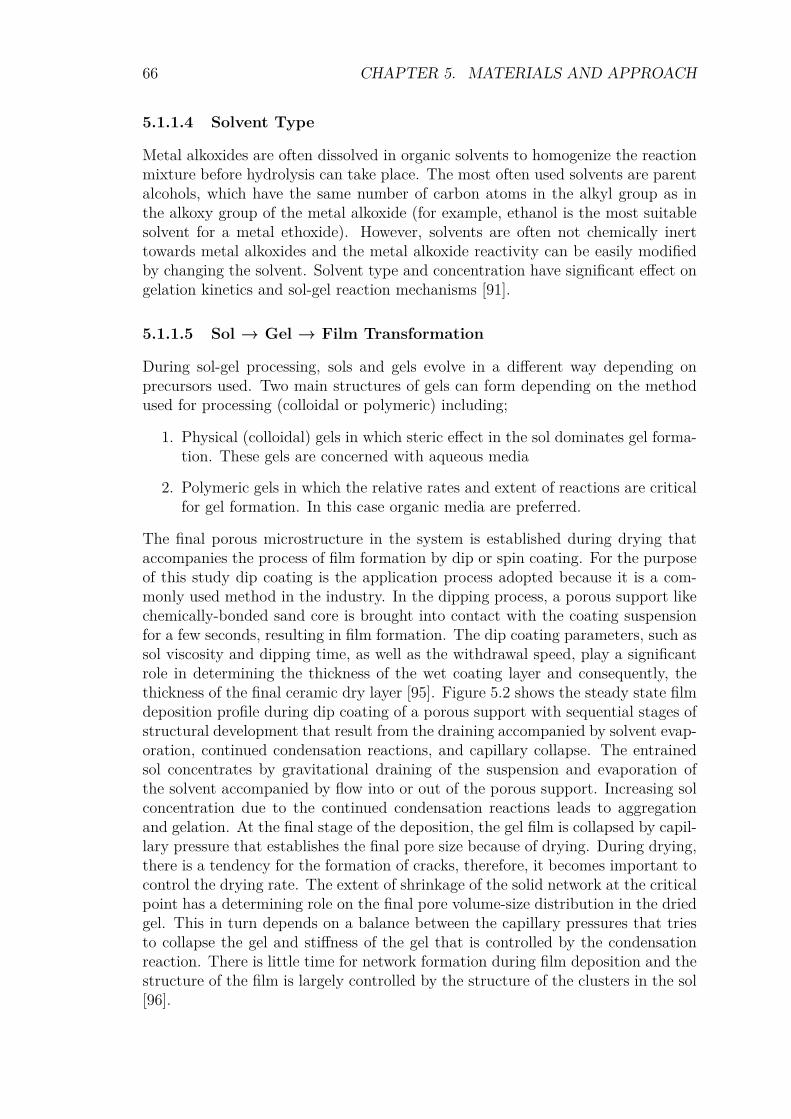
66 CHAPTER 5. MATERIALS AND APPROACH
5.1.1.4 Solvent Type
Metal alkoxides are often dissolved in organic solvents to homogenize the reactionmixture before hydrolysis can take place. The most often used solvents are parentalcohols, which have the same number of carbon atoms in the alkyl group as inthe alkoxy group of the metal alkoxide (for example, ethanol is the most suitablesolvent for a metal ethoxide). However, solvents are often not chemically inerttowards metal alkoxides and the metal alkoxide reactivity can be easily modifiedby changing the solvent. Solvent type and concentration have significant effect ongelation kinetics and sol-gel reaction mechanisms [91].
5.1.1.5 Sol → Gel → Film Transformation
During sol-gel processing, sols and gels evolve in a different way depending onprecursors used. Two main structures of gels can form depending on the methodused for processing (colloidal or polymeric) including;
1. Physical (colloidal) gels in which steric effect in the sol dominates gel forma-tion. These gels are concerned with aqueous media
2. Polymeric gels in which the relative rates and extent of reactions are criticalfor gel formation. In this case organic media are preferred.
The final porous microstructure in the system is established during drying thataccompanies the process of film formation by dip or spin coating. For the purposeof this study dip coating is the application process adopted because it is a com-monly used method in the industry. In the dipping process, a porous support likechemically-bonded sand core is brought into contact with the coating suspensionfor a few seconds, resulting in film formation. The dip coating parameters, such assol viscosity and dipping time, as well as the withdrawal speed, play a significantrole in determining the thickness of the wet coating layer and consequently, thethickness of the final ceramic dry layer [95]. Figure 5.2 shows the steady state filmdeposition profile during dip coating of a porous support with sequential stages ofstructural development that result from the draining accompanied by solvent evap-oration, continued condensation reactions, and capillary collapse. The entrainedsol concentrates by gravitational draining of the suspension and evaporation ofthe solvent accompanied by flow into or out of the porous support. Increasing solconcentration due to the continued condensation reactions leads to aggregationand gelation. At the final stage of the deposition, the gel film is collapsed by capil-lary pressure that establishes the final pore size because of drying. During drying,there is a tendency for the formation of cracks, therefore, it becomes important tocontrol the drying rate. The extent of shrinkage of the solid network at the criticalpoint has a determining role on the final pore volume-size distribution in the driedgel. This in turn depends on a balance between the capillary pressures that triesto collapse the gel and stiffness of the gel that is controlled by the condensationreaction. There is little time for network formation during film deposition and thestructure of the film is largely controlled by the structure of the clusters in the sol[96].
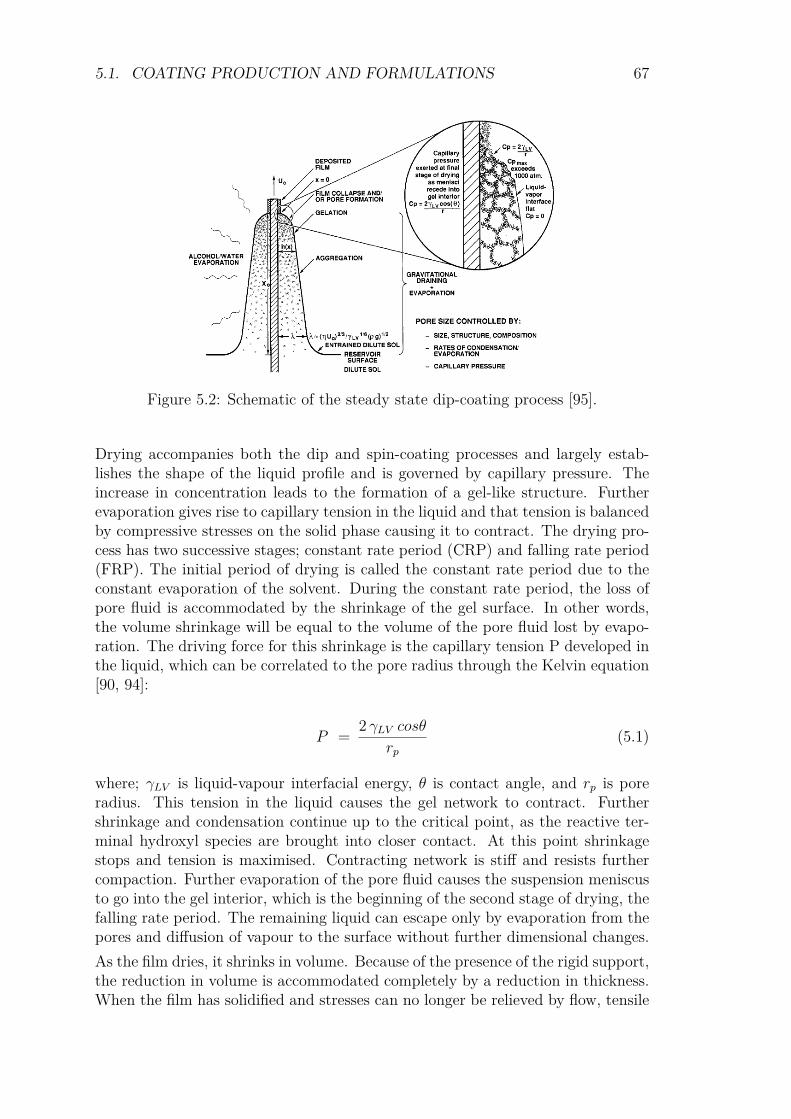
5.1. COATING PRODUCTION AND FORMULATIONS 67
Figure 5.2: Schematic of the steady state dip-coating process [95].
Drying accompanies both the dip and spin-coating processes and largely estab-lishes the shape of the liquid profile and is governed by capillary pressure. Theincrease in concentration leads to the formation of a gel-like structure. Furtherevaporation gives rise to capillary tension in the liquid and that tension is balancedby compressive stresses on the solid phase causing it to contract. The drying pro-cess has two successive stages; constant rate period (CRP) and falling rate period(FRP). The initial period of drying is called the constant rate period due to theconstant evaporation of the solvent. During the constant rate period, the loss ofpore fluid is accommodated by the shrinkage of the gel surface. In other words,the volume shrinkage will be equal to the volume of the pore fluid lost by evapo-ration. The driving force for this shrinkage is the capillary tension P developed inthe liquid, which can be correlated to the pore radius through the Kelvin equation[90, 94]:
P = 2 γLV cosθrp
(5.1)
where; γLV is liquid-vapour interfacial energy, θ is contact angle, and rp is poreradius. This tension in the liquid causes the gel network to contract. Furthershrinkage and condensation continue up to the critical point, as the reactive ter-minal hydroxyl species are brought into closer contact. At this point shrinkagestops and tension is maximised. Contracting network is stiff and resists furthercompaction. Further evaporation of the pore fluid causes the suspension meniscusto go into the gel interior, which is the beginning of the second stage of drying, thefalling rate period. The remaining liquid can escape only by evaporation from thepores and diffusion of vapour to the surface without further dimensional changes.As the film dries, it shrinks in volume. Because of the presence of the rigid support,the reduction in volume is accommodated completely by a reduction in thickness.When the film has solidified and stresses can no longer be relieved by flow, tensile
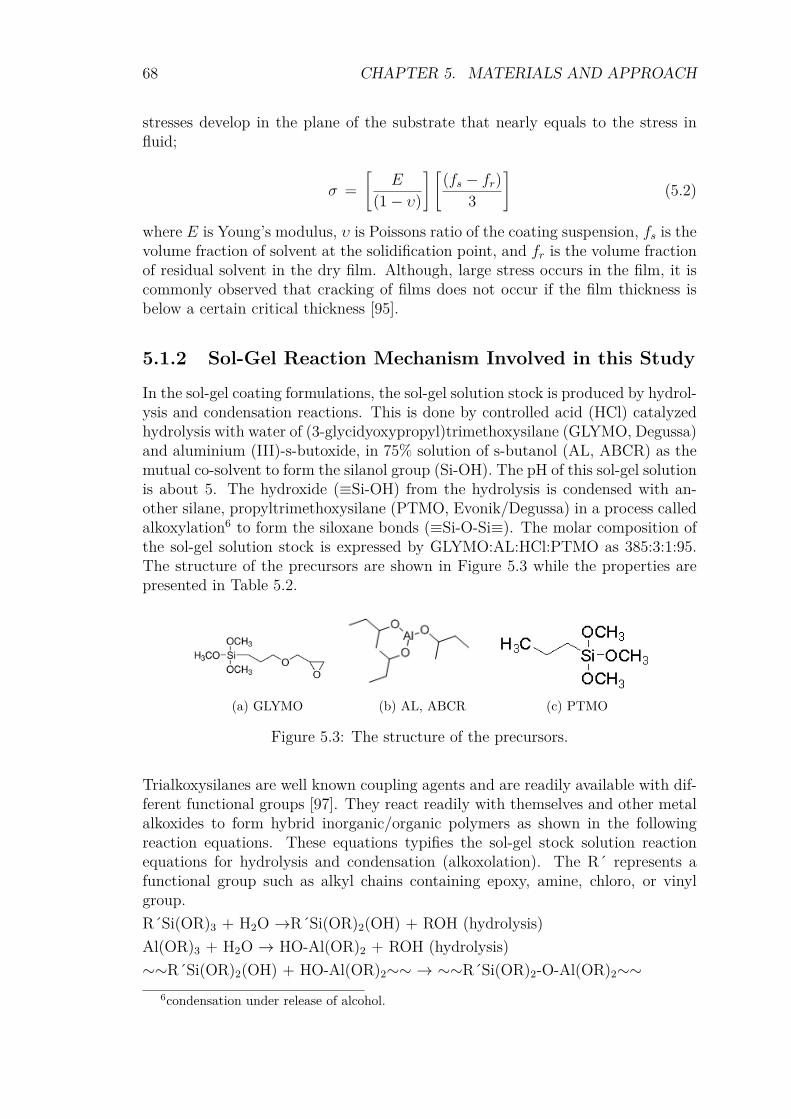
68 CHAPTER 5. MATERIALS AND APPROACH
stresses develop in the plane of the substrate that nearly equals to the stress influid;
σ =[
E
(1− υ)
] [(fs − fr)
3
](5.2)
where E is Young’s modulus, υ is Poissons ratio of the coating suspension, fs is thevolume fraction of solvent at the solidification point, and fr is the volume fractionof residual solvent in the dry film. Although, large stress occurs in the film, it iscommonly observed that cracking of films does not occur if the film thickness isbelow a certain critical thickness [95].
5.1.2 Sol-Gel Reaction Mechanism Involved in this StudyIn the sol-gel coating formulations, the sol-gel solution stock is produced by hydrol-ysis and condensation reactions. This is done by controlled acid (HCl) catalyzedhydrolysis with water of (3-glycidyoxypropyl)trimethoxysilane (GLYMO, Degussa)and aluminium (III)-s-butoxide, in 75% solution of s-butanol (AL, ABCR) as themutual co-solvent to form the silanol group (Si-OH). The pH of this sol-gel solutionis about 5. The hydroxide (≡Si-OH) from the hydrolysis is condensed with an-other silane, propyltrimethoxysilane (PTMO, Evonik/Degussa) in a process calledalkoxylation6 to form the siloxane bonds (≡Si-O-Si≡). The molar composition ofthe sol-gel solution stock is expressed by GLYMO:AL:HCl:PTMO as 385:3:1:95.The structure of the precursors are shown in Figure 5.3 while the properties arepresented in Table 5.2.
(a) GLYMO (b) AL, ABCR (c) PTMO
Figure 5.3: The structure of the precursors.
Trialkoxysilanes are well known coupling agents and are readily available with dif-ferent functional groups [97]. They react readily with themselves and other metalalkoxides to form hybrid inorganic/organic polymers as shown in the followingreaction equations. These equations typifies the sol-gel stock solution reactionequations for hydrolysis and condensation (alkoxolation). The R´ represents afunctional group such as alkyl chains containing epoxy, amine, chloro, or vinylgroup.R´Si(OR)3 + H2O →R´Si(OR)2(OH) + ROH (hydrolysis)Al(OR)3 + H2O → HO-Al(OR)2 + ROH (hydrolysis)∼∼R´Si(OR)2(OH) + HO-Al(OR)2∼∼ → ∼∼R´Si(OR)2-O-Al(OR)2∼∼
6condensation under release of alcohol.
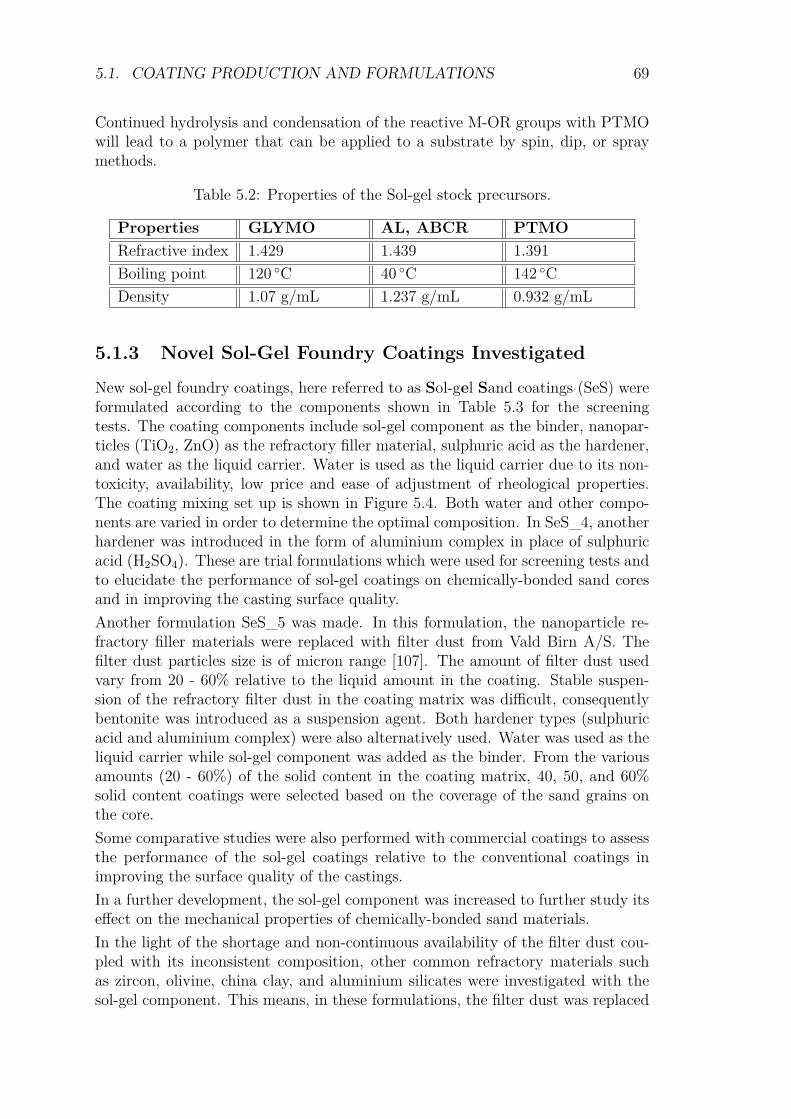
5.1. COATING PRODUCTION AND FORMULATIONS 69
Continued hydrolysis and condensation of the reactive M-OR groups with PTMOwill lead to a polymer that can be applied to a substrate by spin, dip, or spraymethods.
Table 5.2: Properties of the Sol-gel stock precursors.
Properties GLYMO AL, ABCR PTMORefractive index 1.429 1.439 1.391Boiling point 120 C 40 C 142 CDensity 1.07 g/mL 1.237 g/mL 0.932 g/mL
5.1.3 Novel Sol-Gel Foundry Coatings InvestigatedNew sol-gel foundry coatings, here referred to as Sol-gel Sand coatings (SeS) wereformulated according to the components shown in Table 5.3 for the screeningtests. The coating components include sol-gel component as the binder, nanopar-ticles (TiO2, ZnO) as the refractory filler material, sulphuric acid as the hardener,and water as the liquid carrier. Water is used as the liquid carrier due to its non-toxicity, availability, low price and ease of adjustment of rheological properties.The coating mixing set up is shown in Figure 5.4. Both water and other compo-nents are varied in order to determine the optimal composition. In SeS_4, anotherhardener was introduced in the form of aluminium complex in place of sulphuricacid (H2SO4). These are trial formulations which were used for screening tests andto elucidate the performance of sol-gel coatings on chemically-bonded sand coresand in improving the casting surface quality.Another formulation SeS_5 was made. In this formulation, the nanoparticle re-fractory filler materials were replaced with filter dust from Vald Birn A/S. Thefilter dust particles size is of micron range [107]. The amount of filter dust usedvary from 20 - 60% relative to the liquid amount in the coating. Stable suspen-sion of the refractory filter dust in the coating matrix was difficult, consequentlybentonite was introduced as a suspension agent. Both hardener types (sulphuricacid and aluminium complex) were also alternatively used. Water was used as theliquid carrier while sol-gel component was added as the binder. From the variousamounts (20 - 60%) of the solid content in the coating matrix, 40, 50, and 60%solid content coatings were selected based on the coverage of the sand grains onthe core.Some comparative studies were also performed with commercial coatings to assessthe performance of the sol-gel coatings relative to the conventional coatings inimproving the surface quality of the castings.In a further development, the sol-gel component was increased to further study itseffect on the mechanical properties of chemically-bonded sand materials.In the light of the shortage and non-continuous availability of the filter dust cou-pled with its inconsistent composition, other common refractory materials suchas zircon, olivine, china clay, and aluminium silicates were investigated with thesol-gel component. This means, in these formulations, the filter dust was replaced
70 CHAPTER 5. MATERIALS AND APPROACH
with each of these refractory materials. The density of the refractory materialsfollows this trend: Zircon > Olivine > China clay > Aluminium silicate. Threedifferent coating compositions consisting of water with respectively 10, 25, 50%sol-gel stock were prepared. To each of these compositions, 50% of each refractorymaterial was added. All prepared samples were left standing for a period of timeand then the precipitates were scraped to determine the ease of mixing each intosuspension again.
Table 5.3: Different sol-gel coatings investigated in the preliminary tests.
Sol-gel coating Components TypesSeS_1 sol-gel component
50% wt. water
1 and 10% nanoparticles TiO2, ZnOhardener H2SO4
SeS_2 sol-gel component
water
1 and 10% nanoparticles TiO2, ZnOhardener H2SO4
SeS_3 sol-gel component
60 and 65% wt. water
50 and 150% nanoparticles TiO2, ZnOhardener H2SO4
SeS_4 sol-gel component
85% wt. water
nanoparticles TiO2, ZnOhardener H2SO4, Al (III)-s-butoxide,
75 % in s-butanol
5.1.4 Sol-Gel Coating as Additive to Existing Foundry Coat-ings
The sol-gel component was tested as an additive to existing foundry coatings.In this experiment, various amount of sol-gel component was added to existingfoundry coatings. Due to the number of coated cores involved, Taguchi approachto experimental design was applied to reduce the number of experimental runs forcasting purposes and analysis.
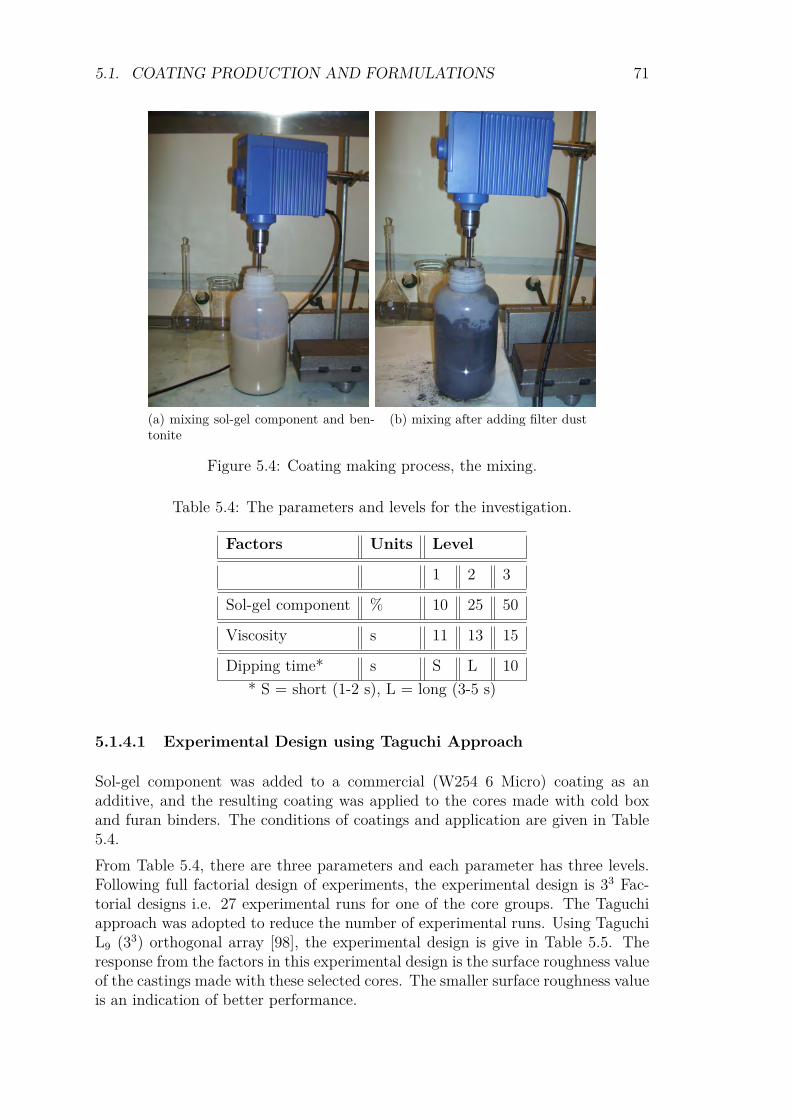
5.1. COATING PRODUCTION AND FORMULATIONS 71
(a) mixing sol-gel component and ben-tonite
(b) mixing after adding filter dust
Figure 5.4: Coating making process, the mixing.
Table 5.4: The parameters and levels for the investigation.
Factors Units Level
1 2 3
Sol-gel component % 10 25 50
Viscosity s 11 13 15
Dipping time* s S L 10* S = short (1-2 s), L = long (3-5 s)
5.1.4.1 Experimental Design using Taguchi Approach
Sol-gel component was added to a commercial (W254 6 Micro) coating as anadditive, and the resulting coating was applied to the cores made with cold boxand furan binders. The conditions of coatings and application are given in Table5.4.From Table 5.4, there are three parameters and each parameter has three levels.Following full factorial design of experiments, the experimental design is 33 Fac-torial designs i.e. 27 experimental runs for one of the core groups. The Taguchiapproach was adopted to reduce the number of experimental runs. Using TaguchiL9 (33) orthogonal array [98], the experimental design is give in Table 5.5. Theresponse from the factors in this experimental design is the surface roughness valueof the castings made with these selected cores. The smaller surface roughness valueis an indication of better performance.
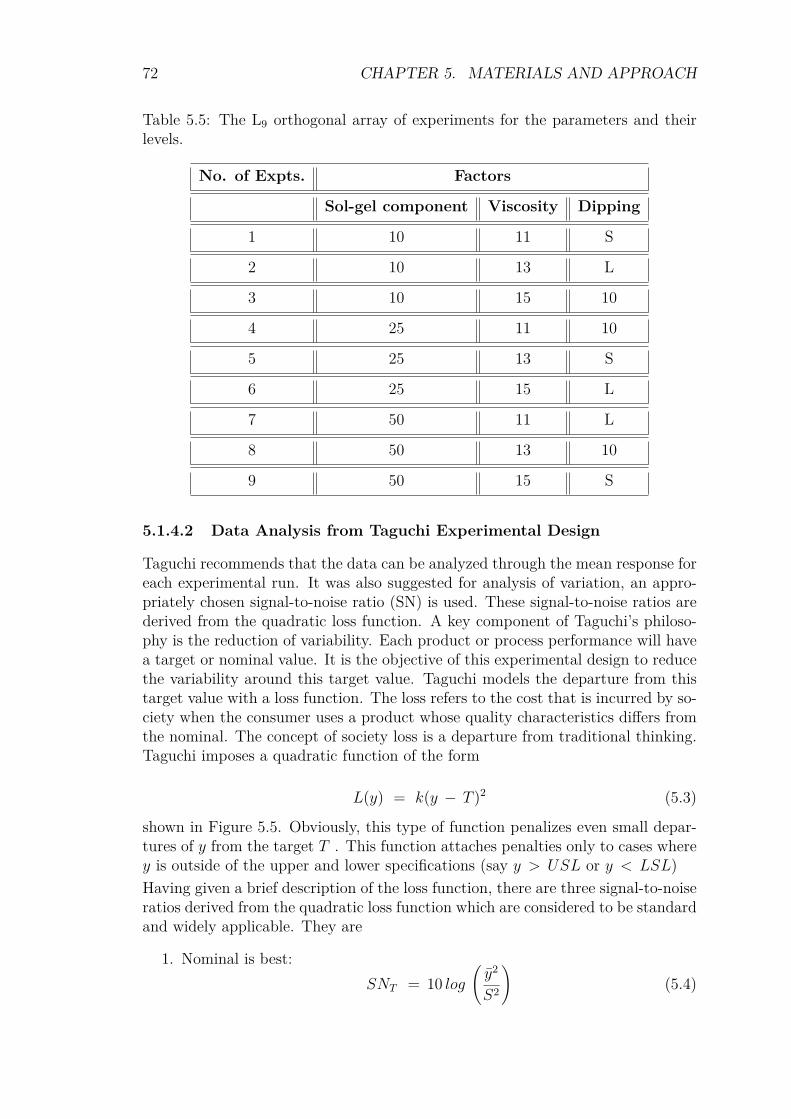
72 CHAPTER 5. MATERIALS AND APPROACH
Table 5.5: The L9 orthogonal array of experiments for the parameters and theirlevels.
No. of Expts. Factors
Sol-gel component Viscosity Dipping
1 10 11 S
2 10 13 L
3 10 15 10
4 25 11 10
5 25 13 S
6 25 15 L
7 50 11 L
8 50 13 10
9 50 15 S
5.1.4.2 Data Analysis from Taguchi Experimental Design
Taguchi recommends that the data can be analyzed through the mean response foreach experimental run. It was also suggested for analysis of variation, an appro-priately chosen signal-to-noise ratio (SN) is used. These signal-to-noise ratios arederived from the quadratic loss function. A key component of Taguchi’s philoso-phy is the reduction of variability. Each product or process performance will havea target or nominal value. It is the objective of this experimental design to reducethe variability around this target value. Taguchi models the departure from thistarget value with a loss function. The loss refers to the cost that is incurred by so-ciety when the consumer uses a product whose quality characteristics differs fromthe nominal. The concept of society loss is a departure from traditional thinking.Taguchi imposes a quadratic function of the form
L(y) = k(y − T )2 (5.3)
shown in Figure 5.5. Obviously, this type of function penalizes even small depar-tures of y from the target T . This function attaches penalties only to cases wherey is outside of the upper and lower specifications (say y > USL or y < LSL)Having given a brief description of the loss function, there are three signal-to-noiseratios derived from the quadratic loss function which are considered to be standardand widely applicable. They are
1. Nominal is best:SNT = 10 log
(y2
S2
)(5.4)
5.2. WET COATING CHARACTERIZATION 73
Figure 5.5: Taguchi’s quadratic loss function.
2. Larger the better:
SNL = − 10 log(
1N
N∑i=1
1y2i
)(5.5)
3. Smaller the better:
SNS = − 10 log(
1N
N∑i=1
y2i
)(5.6)
where y is sample mean, S is sample standard deviation (S2 is the sample variance),yi is the sample, and N is the number of observations in a sample.The SN ratios are expressed in a decibel (dB) scale. SNT is used if the objectiveis to reduce variability around a specific target, SNL if the system is optimizedwhen the response is as large as possible, and SNS if the system is optimizedwhen the response is as small as possible. Factor levels that maximize the appro-priate SN ratio are optimal [98]. Therefore, smaller the better i.e Eq. 5.6 for thesurface roughness will be selected for obtaining the optimum combination of theparameters and their levels.Descriptive statistics and analysis of variance (ANOVA) were also applied to dis-tinguish the means of the target response (surface roughness, Ra value).
5.2 Wet Coating Characterization
5.2.1 Specific Gravity
The specific gravity of the sol-gel coating slurry was measured with a picnometer.This measurement was also performed on the commercial coatings. This parametergives an idea of the solid content of the coating which determines the coatingdensity.
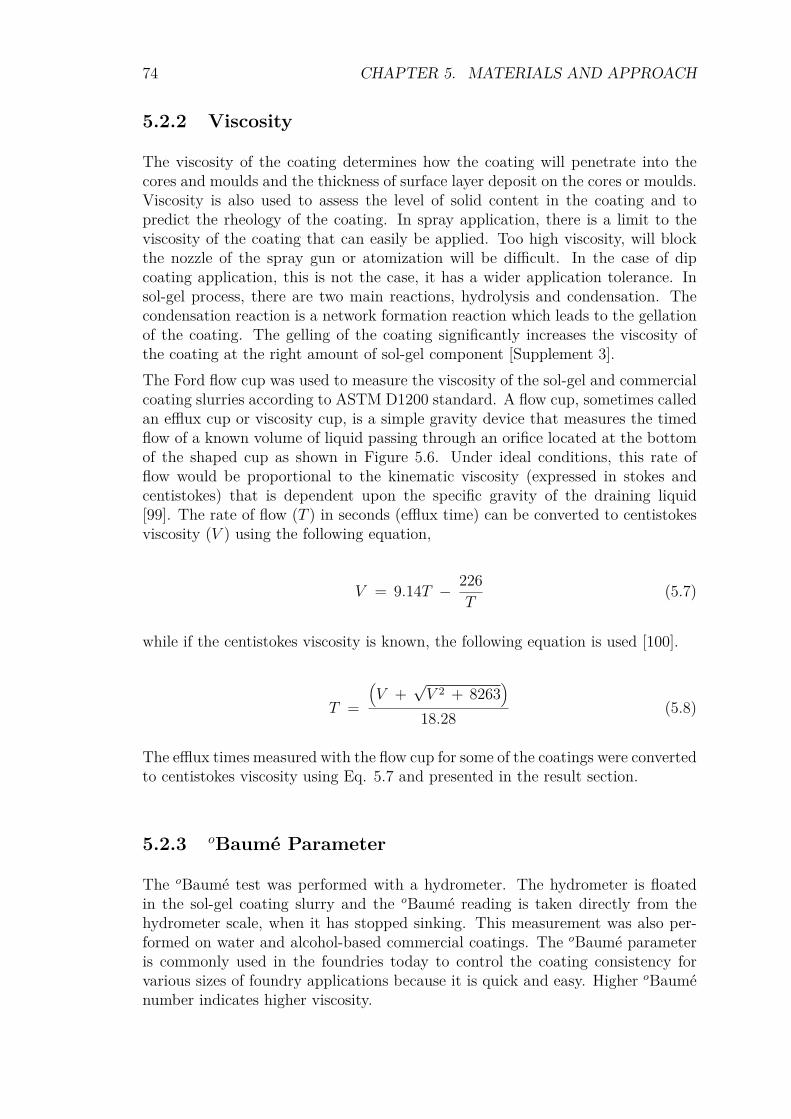
74 CHAPTER 5. MATERIALS AND APPROACH
5.2.2 Viscosity
The viscosity of the coating determines how the coating will penetrate into thecores and moulds and the thickness of surface layer deposit on the cores or moulds.Viscosity is also used to assess the level of solid content in the coating and topredict the rheology of the coating. In spray application, there is a limit to theviscosity of the coating that can easily be applied. Too high viscosity, will blockthe nozzle of the spray gun or atomization will be difficult. In the case of dipcoating application, this is not the case, it has a wider application tolerance. Insol-gel process, there are two main reactions, hydrolysis and condensation. Thecondensation reaction is a network formation reaction which leads to the gellationof the coating. The gelling of the coating significantly increases the viscosity ofthe coating at the right amount of sol-gel component [Supplement 3].The Ford flow cup was used to measure the viscosity of the sol-gel and commercialcoating slurries according to ASTM D1200 standard. A flow cup, sometimes calledan efflux cup or viscosity cup, is a simple gravity device that measures the timedflow of a known volume of liquid passing through an orifice located at the bottomof the shaped cup as shown in Figure 5.6. Under ideal conditions, this rate offlow would be proportional to the kinematic viscosity (expressed in stokes andcentistokes) that is dependent upon the specific gravity of the draining liquid[99]. The rate of flow (T ) in seconds (efflux time) can be converted to centistokesviscosity (V ) using the following equation,
V = 9.14T − 226T
(5.7)
while if the centistokes viscosity is known, the following equation is used [100].
T =
(V +
√V 2 + 8263
)18.28 (5.8)
The efflux times measured with the flow cup for some of the coatings were convertedto centistokes viscosity using Eq. 5.7 and presented in the result section.
5.2.3 oBaumé Parameter
The oBaumé test was performed with a hydrometer. The hydrometer is floatedin the sol-gel coating slurry and the oBaumé reading is taken directly from thehydrometer scale, when it has stopped sinking. This measurement was also per-formed on water and alcohol-based commercial coatings. The oBaumé parameteris commonly used in the foundries today to control the coating consistency forvarious sizes of foundry applications because it is quick and easy. Higher oBauménumber indicates higher viscosity.

5.3. COATING APPLICATION ON CORES AND MOULDS 75
Figure 5.6: Measurement of viscosity by efflux time [99].
5.3 Coating Application on Cores and Moulds
The cold box and furan cores were dip-coated with different times at all stages ofthe experiments in order to replicate the foundry applications.
The green sand moulds were spray-coated. The distance from the spray gun to themould was 10-15 cm. Some mould cavities were given single layer spray-coatingwhile some were given multilayer spray-coating. The spray coating process isshown in Figure 5.7.
(a) Grill (b) Vice
Figure 5.7: The spray-coating process of green sand moulds.
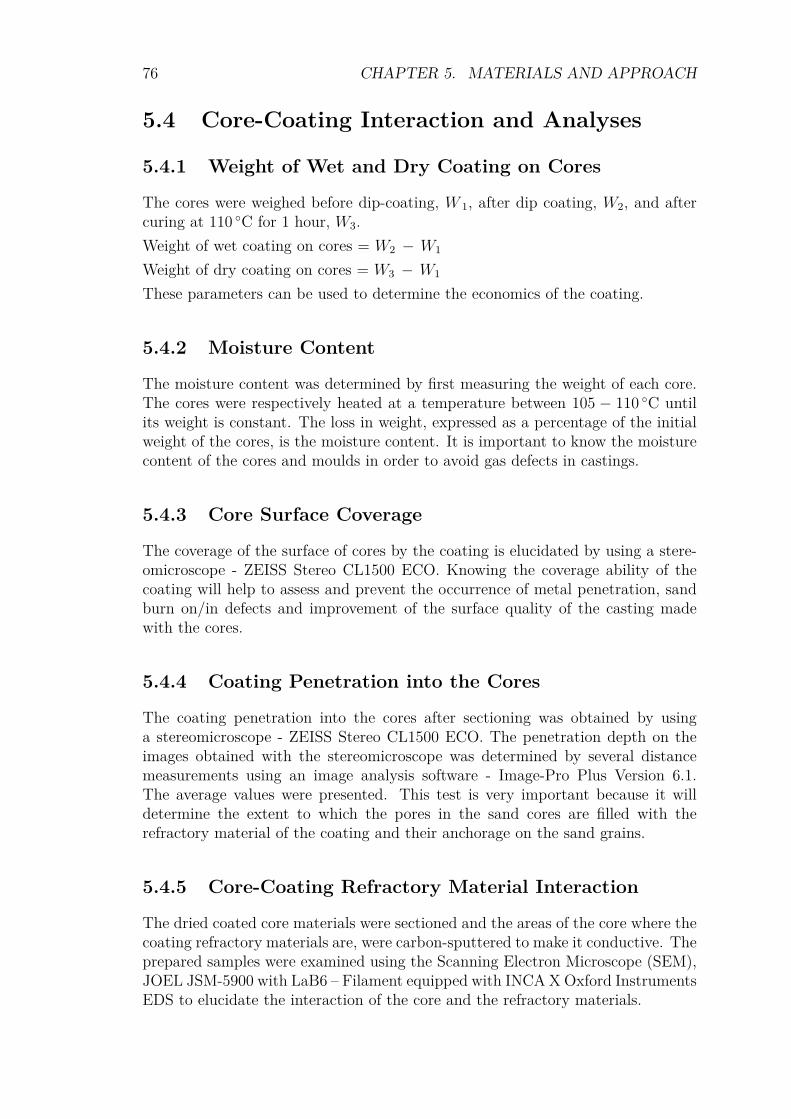
76 CHAPTER 5. MATERIALS AND APPROACH
5.4 Core-Coating Interaction and Analyses
5.4.1 Weight of Wet and Dry Coating on Cores
The cores were weighed before dip-coating, W 1, after dip coating, W2, and aftercuring at 110 C for 1 hour, W3.Weight of wet coating on cores = W2 − W1
Weight of dry coating on cores = W3 − W1
These parameters can be used to determine the economics of the coating.
5.4.2 Moisture Content
The moisture content was determined by first measuring the weight of each core.The cores were respectively heated at a temperature between 105 − 110 C untilits weight is constant. The loss in weight, expressed as a percentage of the initialweight of the cores, is the moisture content. It is important to know the moisturecontent of the cores and moulds in order to avoid gas defects in castings.
5.4.3 Core Surface Coverage
The coverage of the surface of cores by the coating is elucidated by using a stere-omicroscope - ZEISS Stereo CL1500 ECO. Knowing the coverage ability of thecoating will help to assess and prevent the occurrence of metal penetration, sandburn on/in defects and improvement of the surface quality of the casting madewith the cores.
5.4.4 Coating Penetration into the Cores
The coating penetration into the cores after sectioning was obtained by usinga stereomicroscope - ZEISS Stereo CL1500 ECO. The penetration depth on theimages obtained with the stereomicroscope was determined by several distancemeasurements using an image analysis software - Image-Pro Plus Version 6.1.The average values were presented. This test is very important because it willdetermine the extent to which the pores in the sand cores are filled with therefractory material of the coating and their anchorage on the sand grains.
5.4.5 Core-Coating Refractory Material Interaction
The dried coated core materials were sectioned and the areas of the core where thecoating refractory materials are, were carbon-sputtered to make it conductive. Theprepared samples were examined using the Scanning Electron Microscope (SEM),JOEL JSM-5900 with LaB6 – Filament equipped with INCA X Oxford InstrumentsEDS to elucidate the interaction of the core and the refractory materials.
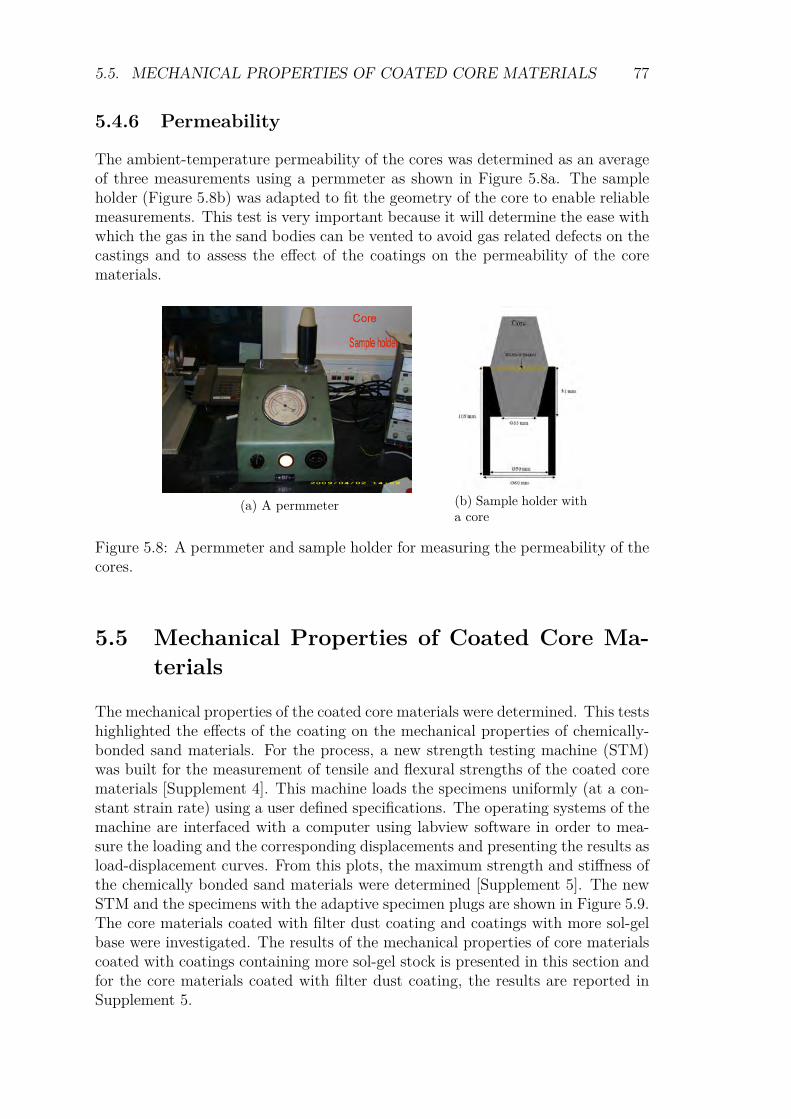
5.5. MECHANICAL PROPERTIES OF COATED CORE MATERIALS 77
5.4.6 Permeability
The ambient-temperature permeability of the cores was determined as an averageof three measurements using a permmeter as shown in Figure 5.8a. The sampleholder (Figure 5.8b) was adapted to fit the geometry of the core to enable reliablemeasurements. This test is very important because it will determine the ease withwhich the gas in the sand bodies can be vented to avoid gas related defects on thecastings and to assess the effect of the coatings on the permeability of the corematerials.
(a) A permmeter (b) Sample holder witha core
Figure 5.8: A permmeter and sample holder for measuring the permeability of thecores.
5.5 Mechanical Properties of Coated Core Ma-terials
The mechanical properties of the coated core materials were determined. This testshighlighted the effects of the coating on the mechanical properties of chemically-bonded sand materials. For the process, a new strength testing machine (STM)was built for the measurement of tensile and flexural strengths of the coated corematerials [Supplement 4]. This machine loads the specimens uniformly (at a con-stant strain rate) using a user defined specifications. The operating systems of themachine are interfaced with a computer using labview software in order to mea-sure the loading and the corresponding displacements and presenting the results asload-displacement curves. From this plots, the maximum strength and stiffness ofthe chemically bonded sand materials were determined [Supplement 5]. The newSTM and the specimens with the adaptive specimen plugs are shown in Figure 5.9.The core materials coated with filter dust coating and coatings with more sol-gelbase were investigated. The results of the mechanical properties of core materialscoated with coatings containing more sol-gel stock is presented in this section andfor the core materials coated with filter dust coating, the results are reported inSupplement 5.
78 CHAPTER 5. MATERIALS AND APPROACH
(a) The new STM (b) The specimens and adaptors
Figure 5.9: Measurement of the mechanical properties of chemically bonded sandmaterials.
5.5.1 Tensile Test
The “dog bone” specimens were used for the tensile test experiment using thenew STM with proper adaptor for the tensile test (Figure 5.9b). Three specimenstreated with the same conditions were tested and the results were averaged andstandard deviations were determined. The dimensions of the specimen are shownin Figure 5.10.
Figure 5.10: Standard tensile test specimen (dog bone) for sand materials (dimen-sions in mm).
5.5.2 Bending or Flexural Test
The bar specimens were used for the bending or flexural test using the new STMwith the right adaptor for the bending test (Figure 5.9b). Three specimens of thesame treatment were also used for the test. The dimensions of the specimen is 172mm × 22 mm × 22 mm with a curvature radius of 11 mm at both ends. The setup is shown below.
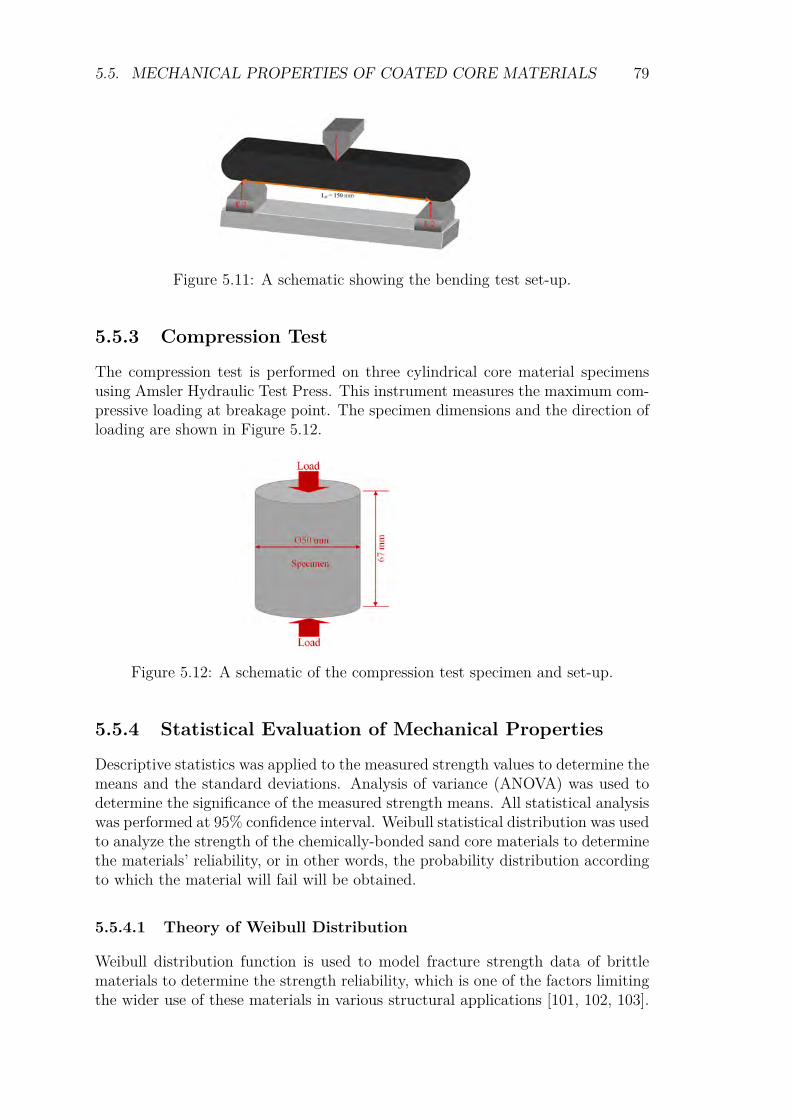
5.5. MECHANICAL PROPERTIES OF COATED CORE MATERIALS 79
Figure 5.11: A schematic showing the bending test set-up.
5.5.3 Compression Test
The compression test is performed on three cylindrical core material specimensusing Amsler Hydraulic Test Press. This instrument measures the maximum com-pressive loading at breakage point. The specimen dimensions and the direction ofloading are shown in Figure 5.12.
Figure 5.12: A schematic of the compression test specimen and set-up.
5.5.4 Statistical Evaluation of Mechanical Properties
Descriptive statistics was applied to the measured strength values to determine themeans and the standard deviations. Analysis of variance (ANOVA) was used todetermine the significance of the measured strength means. All statistical analysiswas performed at 95% confidence interval. Weibull statistical distribution was usedto analyze the strength of the chemically-bonded sand core materials to determinethe materials’ reliability, or in other words, the probability distribution accordingto which the material will fail will be obtained.
5.5.4.1 Theory of Weibull Distribution
Weibull distribution function is used to model fracture strength data of brittlematerials to determine the strength reliability, which is one of the factors limitingthe wider use of these materials in various structural applications [101, 102, 103].
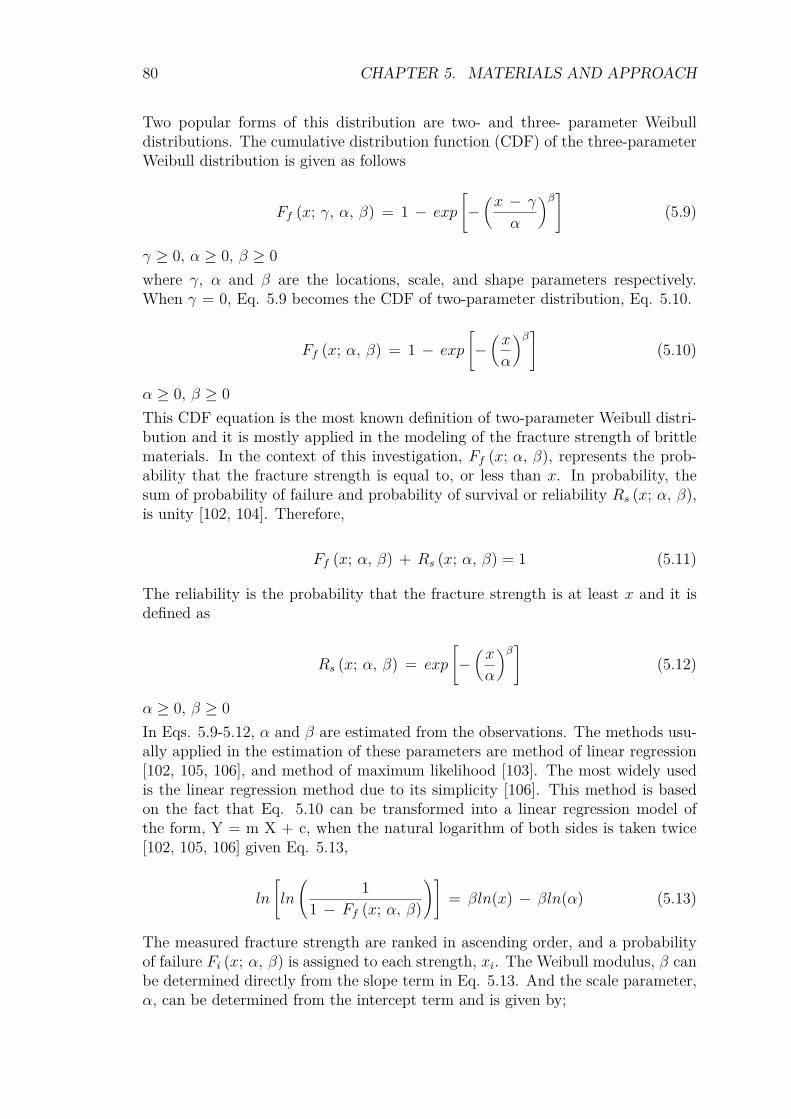
80 CHAPTER 5. MATERIALS AND APPROACH
Two popular forms of this distribution are two- and three- parameter Weibulldistributions. The cumulative distribution function (CDF) of the three-parameterWeibull distribution is given as follows
Ff (x; γ, α, β) = 1 − exp
[−(x − γ
α
)β](5.9)
γ ≥ 0, α ≥ 0, β ≥ 0where γ, α and β are the locations, scale, and shape parameters respectively.When γ = 0, Eq. 5.9 becomes the CDF of two-parameter distribution, Eq. 5.10.
Ff (x; α, β) = 1 − exp
[−(x
α
)β](5.10)
α ≥ 0, β ≥ 0This CDF equation is the most known definition of two-parameter Weibull distri-bution and it is mostly applied in the modeling of the fracture strength of brittlematerials. In the context of this investigation, Ff (x; α, β), represents the prob-ability that the fracture strength is equal to, or less than x. In probability, thesum of probability of failure and probability of survival or reliability Rs (x; α, β),is unity [102, 104]. Therefore,
Ff (x; α, β) + Rs (x; α, β) = 1 (5.11)
The reliability is the probability that the fracture strength is at least x and it isdefined as
Rs (x; α, β) = exp
[−(x
α
)β](5.12)
α ≥ 0, β ≥ 0In Eqs. 5.9-5.12, α and β are estimated from the observations. The methods usu-ally applied in the estimation of these parameters are method of linear regression[102, 105, 106], and method of maximum likelihood [103]. The most widely usedis the linear regression method due to its simplicity [106]. This method is basedon the fact that Eq. 5.10 can be transformed into a linear regression model ofthe form, Y = m X + c, when the natural logarithm of both sides is taken twice[102, 105, 106] given Eq. 5.13,
ln
[ln
(1
1 − Ff (x; α, β)
)]= βln(x) − βln(α) (5.13)
The measured fracture strength are ranked in ascending order, and a probabilityof failure Fi (x; α, β) is assigned to each strength, xi. The Weibull modulus, β canbe determined directly from the slope term in Eq. 5.13. And the scale parameter,α, can be determined from the intercept term and is given by;
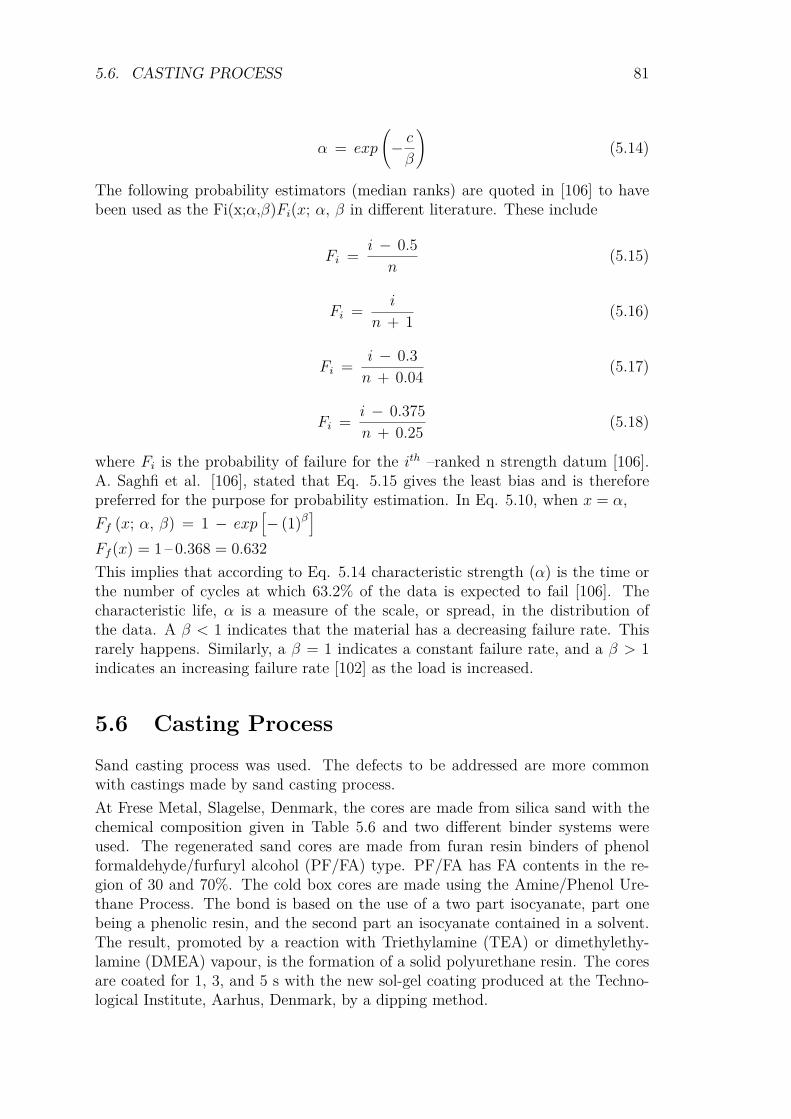
5.6. CASTING PROCESS 81
α = exp
(− cβ
)(5.14)
The following probability estimators (median ranks) are quoted in [106] to havebeen used as the Fi(x;α,β)Fi(x; α, β in different literature. These include
Fi = i − 0.5n
(5.15)
Fi = i
n + 1 (5.16)
Fi = i − 0.3n + 0.04 (5.17)
Fi = i − 0.375n + 0.25 (5.18)
where Fi is the probability of failure for the ith –ranked n strength datum [106].A. Saghfi et al. [106], stated that Eq. 5.15 gives the least bias and is thereforepreferred for the purpose for probability estimation. In Eq. 5.10, when x = α,Ff (x; α, β) = 1 − exp
[− (1)β
]Ff (x) = 1 – 0.368 = 0.632This implies that according to Eq. 5.14 characteristic strength (α) is the time orthe number of cycles at which 63.2% of the data is expected to fail [106]. Thecharacteristic life, α is a measure of the scale, or spread, in the distribution ofthe data. A β < 1 indicates that the material has a decreasing failure rate. Thisrarely happens. Similarly, a β = 1 indicates a constant failure rate, and a β > 1indicates an increasing failure rate [102] as the load is increased.
5.6 Casting ProcessSand casting process was used. The defects to be addressed are more commonwith castings made by sand casting process.At Frese Metal, Slagelse, Denmark, the cores are made from silica sand with thechemical composition given in Table 5.6 and two different binder systems wereused. The regenerated sand cores are made from furan resin binders of phenolformaldehyde/furfuryl alcohol (PF/FA) type. PF/FA has FA contents in the re-gion of 30 and 70%. The cold box cores are made using the Amine/Phenol Ure-thane Process. The bond is based on the use of a two part isocyanate, part onebeing a phenolic resin, and the second part an isocyanate contained in a solvent.The result, promoted by a reaction with Triethylamine (TEA) or dimethylethy-lamine (DMEA) vapour, is the formation of a solid polyurethane resin. The coresare coated for 1, 3, and 5 s with the new sol-gel coating produced at the Techno-logical Institute, Aarhus, Denmark, by a dipping method.
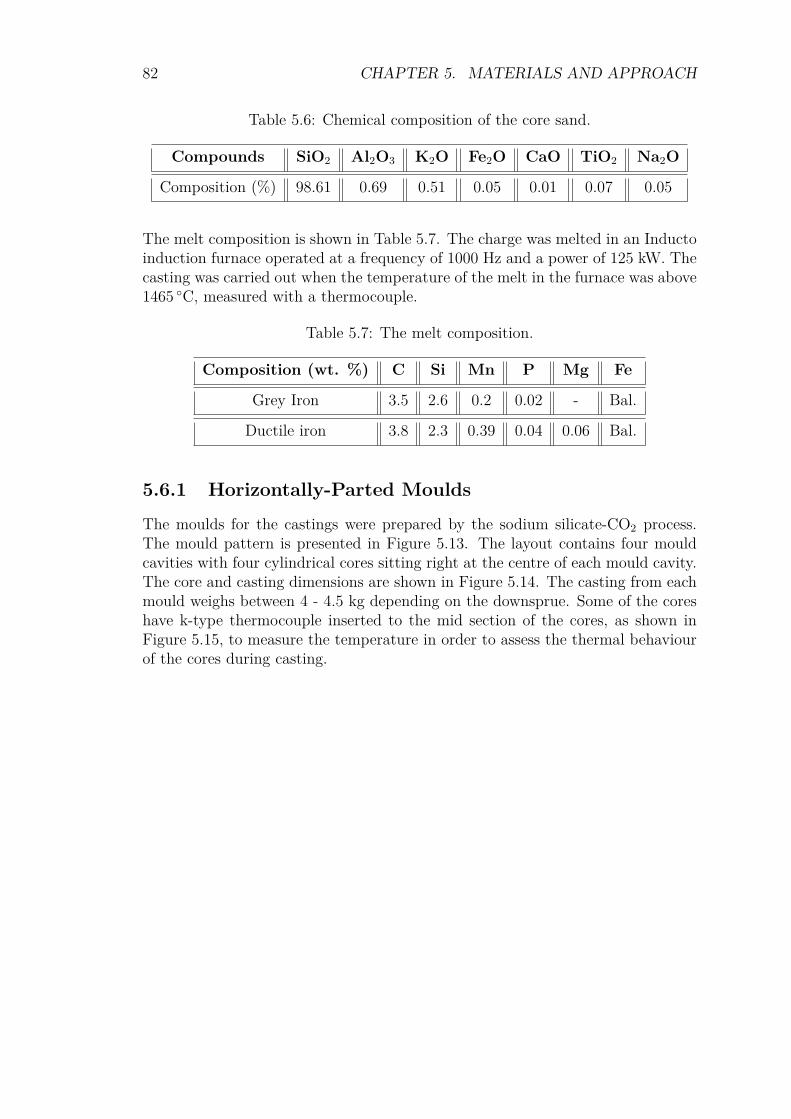
82 CHAPTER 5. MATERIALS AND APPROACH
Table 5.6: Chemical composition of the core sand.
Compounds SiO2 Al2O3 K2O Fe2O CaO TiO2 Na2O
Composition (%) 98.61 0.69 0.51 0.05 0.01 0.07 0.05
The melt composition is shown in Table 5.7. The charge was melted in an Inductoinduction furnace operated at a frequency of 1000 Hz and a power of 125 kW. Thecasting was carried out when the temperature of the melt in the furnace was above1465 C, measured with a thermocouple.
Table 5.7: The melt composition.
Composition (wt. %) C Si Mn P Mg Fe
Grey Iron 3.5 2.6 0.2 0.02 - Bal.
Ductile iron 3.8 2.3 0.39 0.04 0.06 Bal.
5.6.1 Horizontally-Parted MouldsThe moulds for the castings were prepared by the sodium silicate-CO2 process.The mould pattern is presented in Figure 5.13. The layout contains four mouldcavities with four cylindrical cores sitting right at the centre of each mould cavity.The core and casting dimensions are shown in Figure 5.14. The casting from eachmould weighs between 4 - 4.5 kg depending on the downsprue. Some of the coreshave k-type thermocouple inserted to the mid section of the cores, as shown inFigure 5.15, to measure the temperature in order to assess the thermal behaviourof the cores during casting.
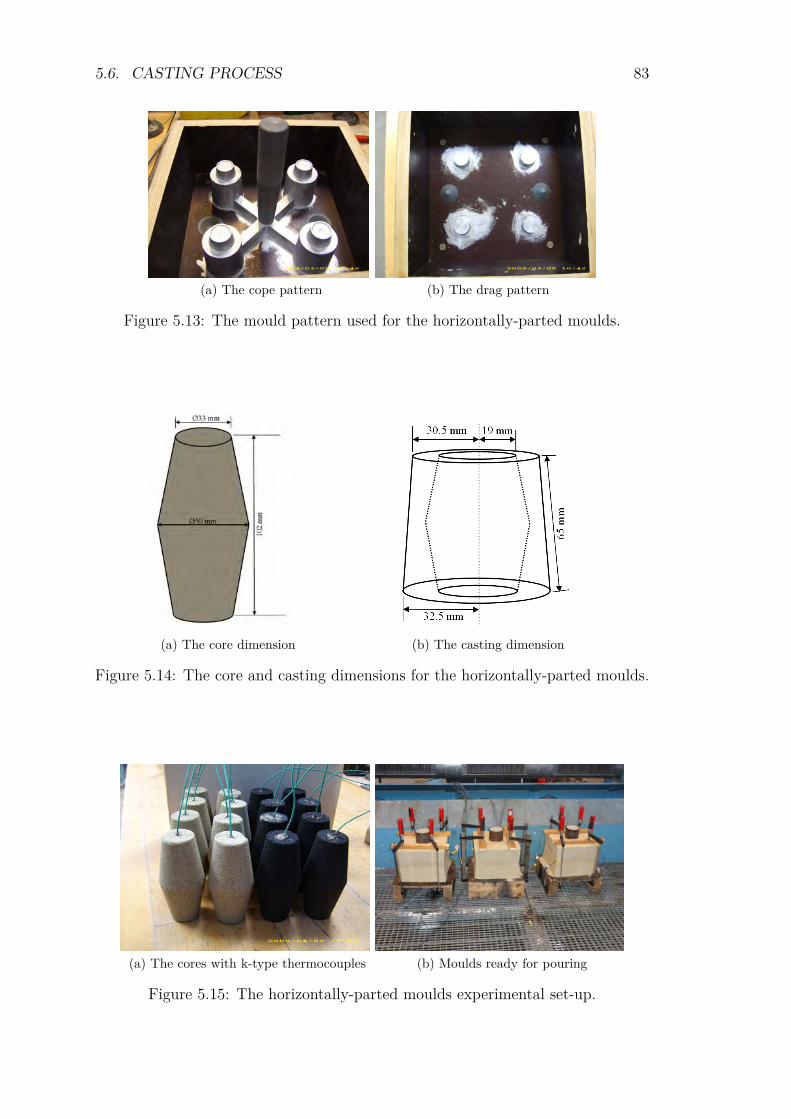
5.6. CASTING PROCESS 83
(a) The cope pattern (b) The drag pattern
Figure 5.13: The mould pattern used for the horizontally-parted moulds.
(a) The core dimension (b) The casting dimension
Figure 5.14: The core and casting dimensions for the horizontally-parted moulds.
(a) The cores with k-type thermocouples (b) Moulds ready for pouring
Figure 5.15: The horizontally-parted moulds experimental set-up.
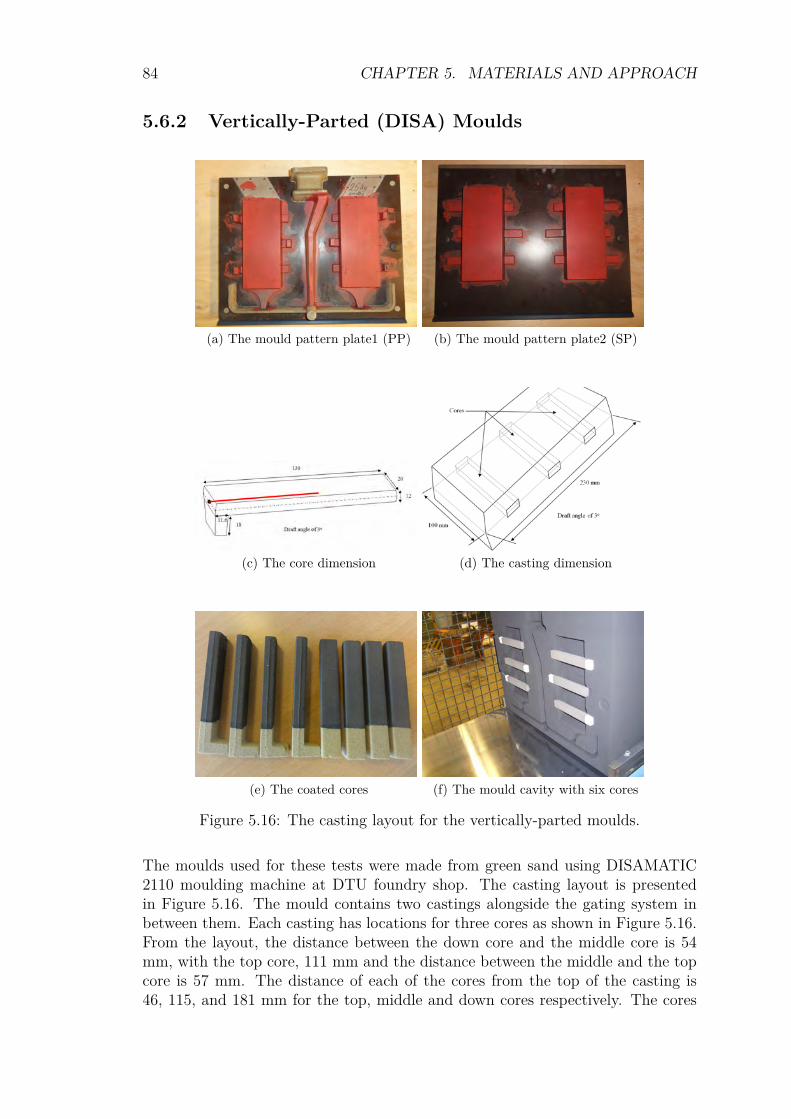
84 CHAPTER 5. MATERIALS AND APPROACH
5.6.2 Vertically-Parted (DISA) Moulds
(a) The mould pattern plate1 (PP) (b) The mould pattern plate2 (SP)
(c) The core dimension (d) The casting dimension
(e) The coated cores (f) The mould cavity with six cores
Figure 5.16: The casting layout for the vertically-parted moulds.
The moulds used for these tests were made from green sand using DISAMATIC2110 moulding machine at DTU foundry shop. The casting layout is presentedin Figure 5.16. The mould contains two castings alongside the gating system inbetween them. Each casting has locations for three cores as shown in Figure 5.16.From the layout, the distance between the down core and the middle core is 54mm, with the top core, 111 mm and the distance between the middle and the topcore is 57 mm. The distance of each of the cores from the top of the casting is46, 115, and 181 mm for the top, middle and down cores respectively. The cores
5.7. ANALYSES OF THE SURFACE QUALITY OF CASTINGS 85
are surrounded by large amount of liquid metal in order to provoke surface defectsaround the casting interface with the cores, so that the performance of the coatingson the cores can be assessed. Due to the geometry of the castings, only one of thecores has a k-type thermocouple inserted to its mid section, to assess the level ofthermal shock on the core.
5.6.3 Data AcquisitionThe temperature profiles in the cores, when they are in contact with the melt, wasmeasured by using TIG welded k-type thermocouples (Ø= 0.2 mm) embeddedin the cores up to the mid section. These thermocouples were connected to theDASYLab data acquisition system laboratory software, version 8.
5.7 Analyses of the Surface Quality of Castings
5.7.1 Prediction of Surface ReactionsReactions take place when the liquid metal comes in contact with the mould ma-terials. Considering the fact that the moulds may contain oxygen (from mois-ture) and sulphur, these elements will enhance oxidation and sulphurization whilethe metal may undergo decarburization and/or sulphurization with the elements.These reactions can affect the properties of the cast components. The Web Toolsoftware is used to predict the likely surface reactions and to construct the corre-sponding Ellingham diagrams.
5.7.2 Surface Roughness MeasurementSurface roughness of various castings were measured. The performance of thecoatings in improving the surface quality of castings will reflect on the surfaceroughness of the castings. The lower the surface roughness values the better thecoatings performance. However, castings free from veining, scabs and metal pen-etration defects are also indications of the coatings positive performance. For de-tailed surface roughness measurement, both profile and areal measurements weremade using the 3D Alicona “InfiniteFocus” microscope (IFM) G4 to build a true3D colour images of surfaces and microscopic structures. It was also used to makeextensive surface characterization of the standard surface comparators, used inthe foundries, to enhance comparison with the cast component surfaces obtained.This is a novel application in foundry applications and a detailed Technical Re-port on this approach for foundry application is provided in Supplement 7. Thesystem is shown in Figure 3.1b. The operating principle combines the small depthof focus of an optical system with vertical scanning to provide topographical andcolour information from the variation of focus. This non-destructive method useswhite light which is delivered through a beam splitter to a series of selectable,infinity-corrected, high-Numerical Aperture (NA) objectives contained in a six-place nosepiece (2.5×, 5×, 10×, 20×, 50× and 100×). The specimen’s reflected
86 CHAPTER 5. MATERIALS AND APPROACH
light is projected through the beam splitter onto a colour digital sensor. The vari-ation of sharpness is now utilized for extracting depth information. The operatingprinciple, Focus-Variation, has been added to the latest ISO standard for classify-ing surface texture methods. The new draft of ISO norm 25178 for the first timeincludes standardized parameters to classify optically area based measurements[84]. In this project, for consistency, the measurement conditions are maintained.
5.7.3 Surface and Interfacial Microstructural ExaminationThe microstructure of the cast components at the interface between the castingand the coated cores or moulds were examined using an optical microscope. Thespecimens were ground and polished accordingly to mirror surface. A set of thespecimens were etched with Nital solution while the other set were left unetched.The etched specimens were used to study the effect of the coating on the matrice ofthe cast components while the unetched specimens were used to study the effectson the graphite flake and nodule size and distribution around the interface in greyand ductile iron respectively.

Chapter 6
Results
The results will be presented according to the following schematic showing theflow of the work (Figure 6.1).
¨¨Figure 6.1: A schematic showing the flow of the work.
87
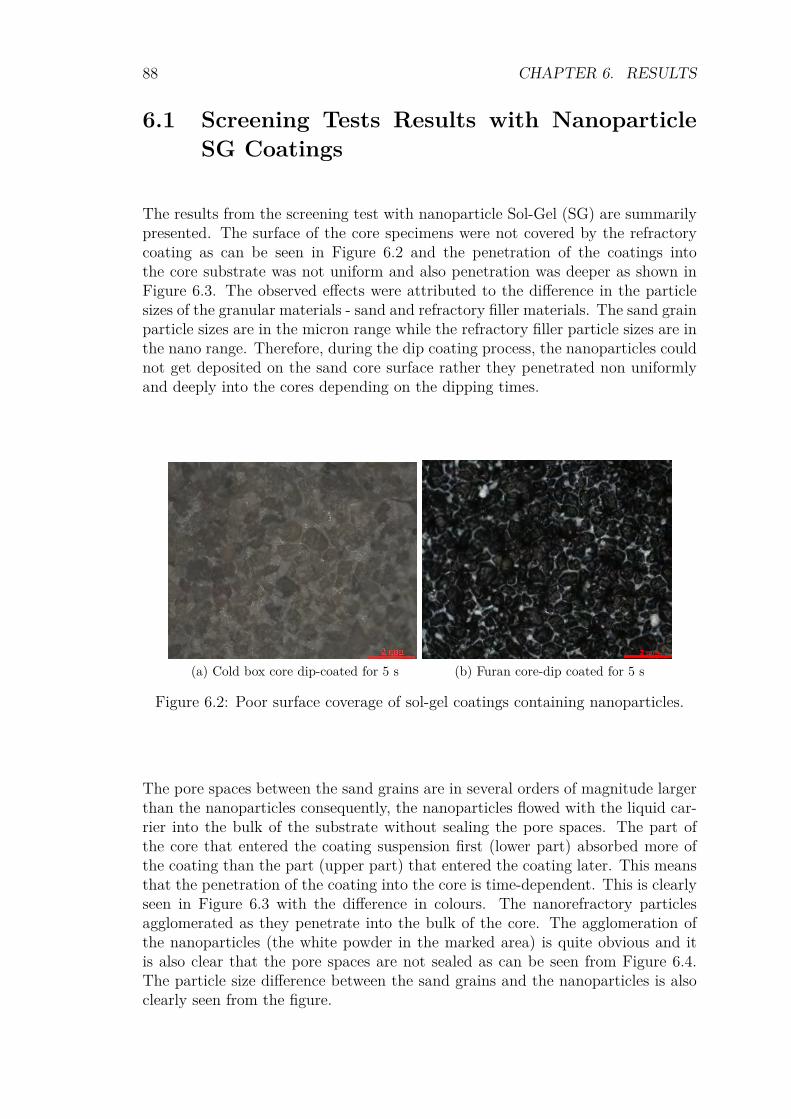
88 CHAPTER 6. RESULTS
6.1 Screening Tests Results with NanoparticleSG Coatings
The results from the screening test with nanoparticle Sol-Gel (SG) are summarilypresented. The surface of the core specimens were not covered by the refractorycoating as can be seen in Figure 6.2 and the penetration of the coatings intothe core substrate was not uniform and also penetration was deeper as shown inFigure 6.3. The observed effects were attributed to the difference in the particlesizes of the granular materials - sand and refractory filler materials. The sand grainparticle sizes are in the micron range while the refractory filler particle sizes are inthe nano range. Therefore, during the dip coating process, the nanoparticles couldnot get deposited on the sand core surface rather they penetrated non uniformlyand deeply into the cores depending on the dipping times.
(a) Cold box core dip-coated for 5 s (b) Furan core-dip coated for 5 s
Figure 6.2: Poor surface coverage of sol-gel coatings containing nanoparticles.
The pore spaces between the sand grains are in several orders of magnitude largerthan the nanoparticles consequently, the nanoparticles flowed with the liquid car-rier into the bulk of the substrate without sealing the pore spaces. The part ofthe core that entered the coating suspension first (lower part) absorbed more ofthe coating than the part (upper part) that entered the coating later. This meansthat the penetration of the coating into the core is time-dependent. This is clearlyseen in Figure 6.3 with the difference in colours. The nanorefractory particlesagglomerated as they penetrate into the bulk of the core. The agglomeration ofthe nanoparticles (the white powder in the marked area) is quite obvious and itis also clear that the pore spaces are not sealed as can be seen from Figure 6.4.The particle size difference between the sand grains and the nanoparticles is alsoclearly seen from the figure.
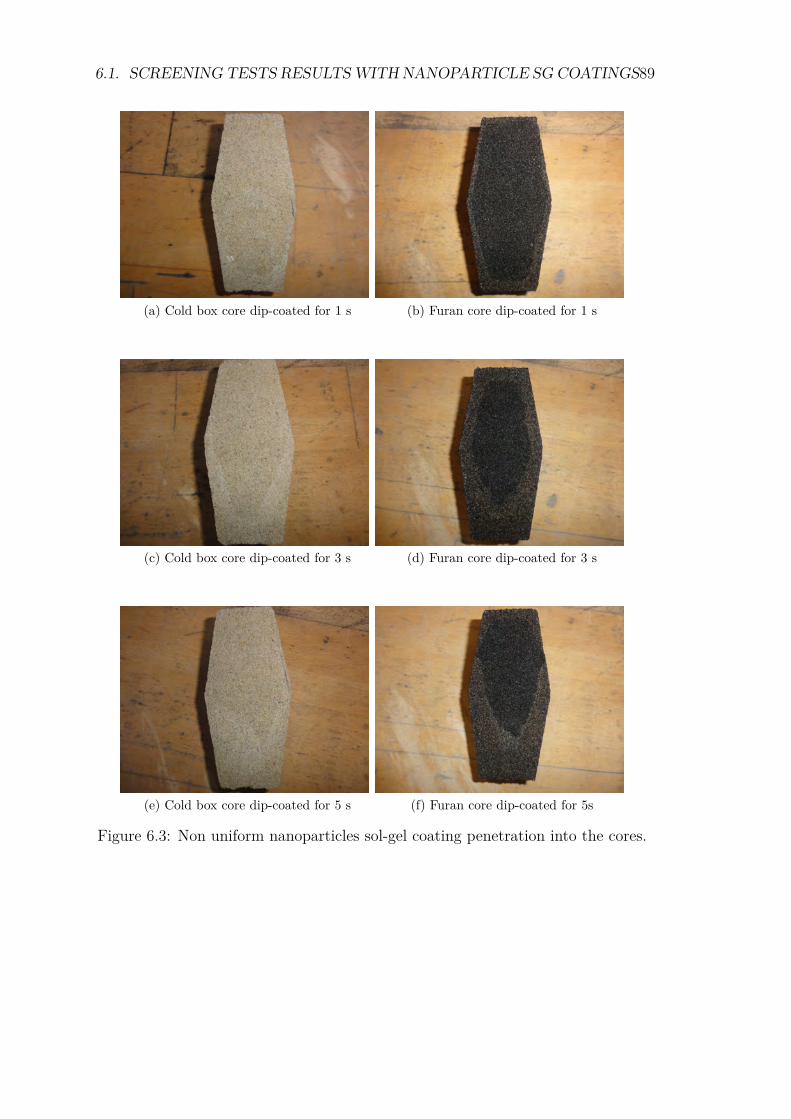
6.1. SCREENING TESTS RESULTSWITH NANOPARTICLE SG COATINGS89
(a) Cold box core dip-coated for 1 s (b) Furan core dip-coated for 1 s
(c) Cold box core dip-coated for 3 s (d) Furan core dip-coated for 3 s
(e) Cold box core dip-coated for 5 s (f) Furan core dip-coated for 5s
Figure 6.3: Non uniform nanoparticles sol-gel coating penetration into the cores.
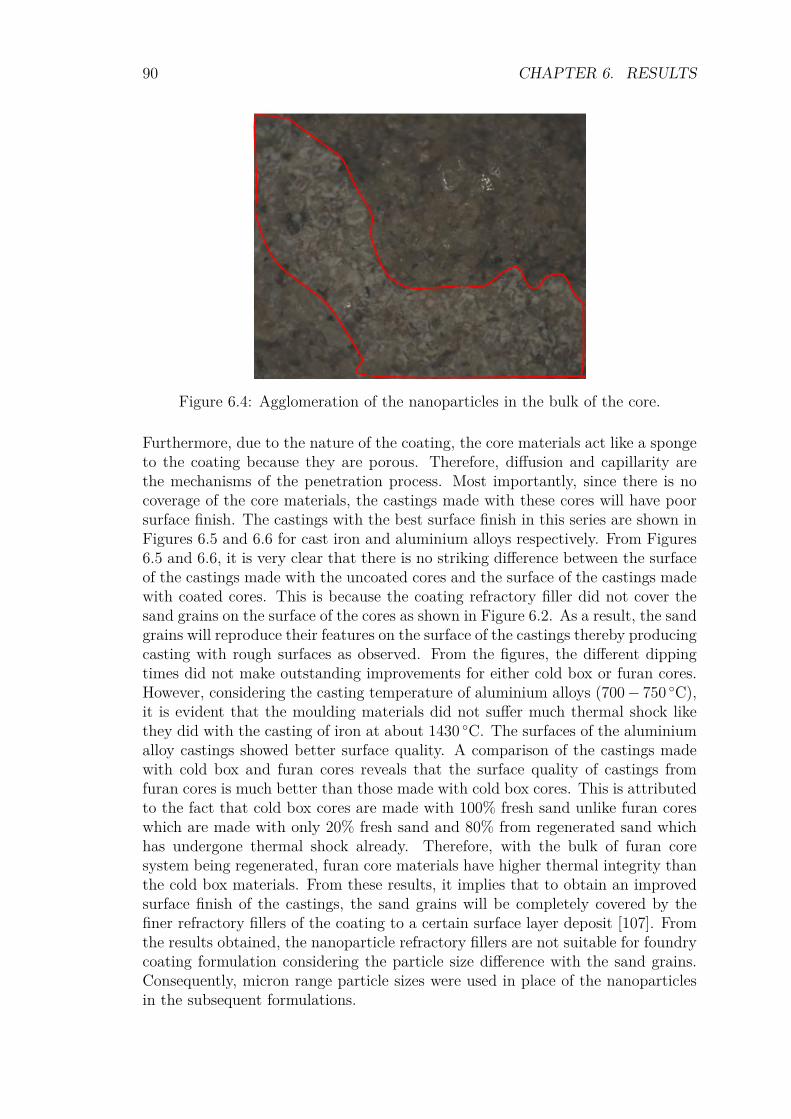
90 CHAPTER 6. RESULTS
Figure 6.4: Agglomeration of the nanoparticles in the bulk of the core.
Furthermore, due to the nature of the coating, the core materials act like a spongeto the coating because they are porous. Therefore, diffusion and capillarity arethe mechanisms of the penetration process. Most importantly, since there is nocoverage of the core materials, the castings made with these cores will have poorsurface finish. The castings with the best surface finish in this series are shown inFigures 6.5 and 6.6 for cast iron and aluminium alloys respectively. From Figures6.5 and 6.6, it is very clear that there is no striking difference between the surfaceof the castings made with the uncoated cores and the surface of the castings madewith coated cores. This is because the coating refractory filler did not cover thesand grains on the surface of the cores as shown in Figure 6.2. As a result, the sandgrains will reproduce their features on the surface of the castings thereby producingcasting with rough surfaces as observed. From the figures, the different dippingtimes did not make outstanding improvements for either cold box or furan cores.However, considering the casting temperature of aluminium alloys (700− 750 C),it is evident that the moulding materials did not suffer much thermal shock likethey did with the casting of iron at about 1430 C. The surfaces of the aluminiumalloy castings showed better surface quality. A comparison of the castings madewith cold box and furan cores reveals that the surface quality of castings fromfuran cores is much better than those made with cold box cores. This is attributedto the fact that cold box cores are made with 100% fresh sand unlike furan coreswhich are made with only 20% fresh sand and 80% from regenerated sand whichhas undergone thermal shock already. Therefore, with the bulk of furan coresystem being regenerated, furan core materials have higher thermal integrity thanthe cold box materials. From these results, it implies that to obtain an improvedsurface finish of the castings, the sand grains will be completely covered by thefiner refractory fillers of the coating to a certain surface layer deposit [107]. Fromthe results obtained, the nanoparticle refractory fillers are not suitable for foundrycoating formulation considering the particle size difference with the sand grains.Consequently, micron range particle sizes were used in place of the nanoparticlesin the subsequent formulations.
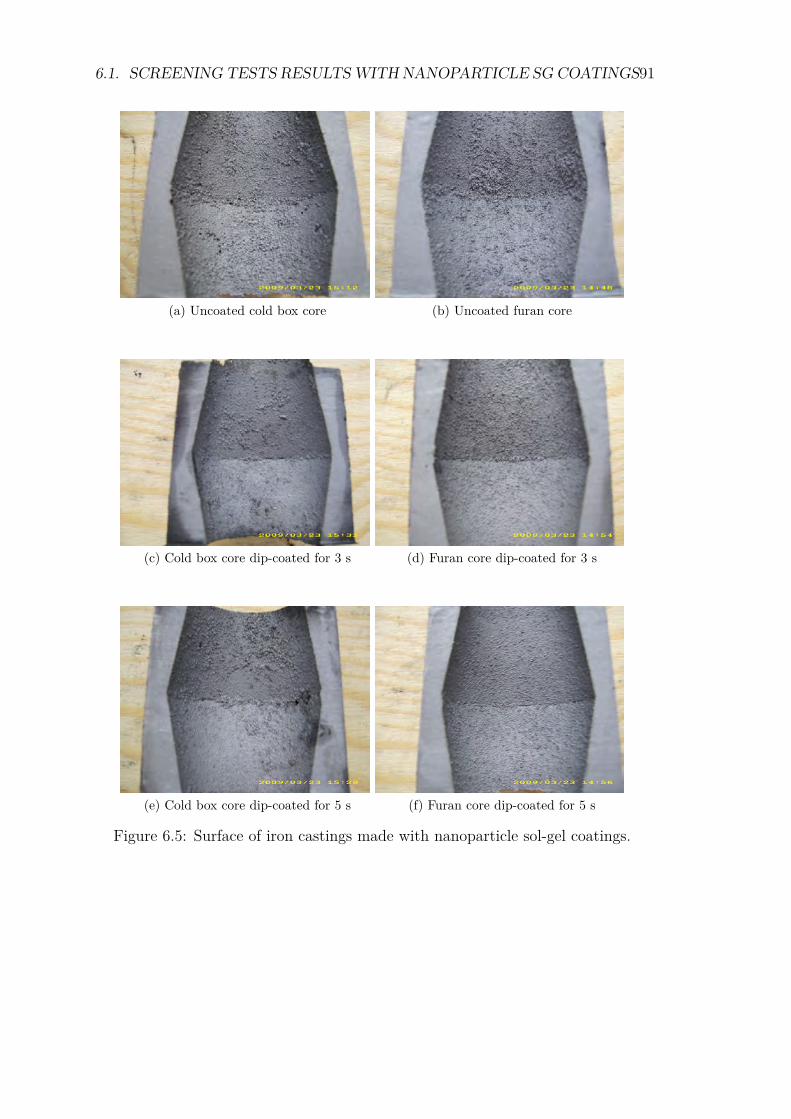
6.1. SCREENING TESTS RESULTSWITH NANOPARTICLE SG COATINGS91
(a) Uncoated cold box core (b) Uncoated furan core
(c) Cold box core dip-coated for 3 s (d) Furan core dip-coated for 3 s
(e) Cold box core dip-coated for 5 s (f) Furan core dip-coated for 5 s
Figure 6.5: Surface of iron castings made with nanoparticle sol-gel coatings.
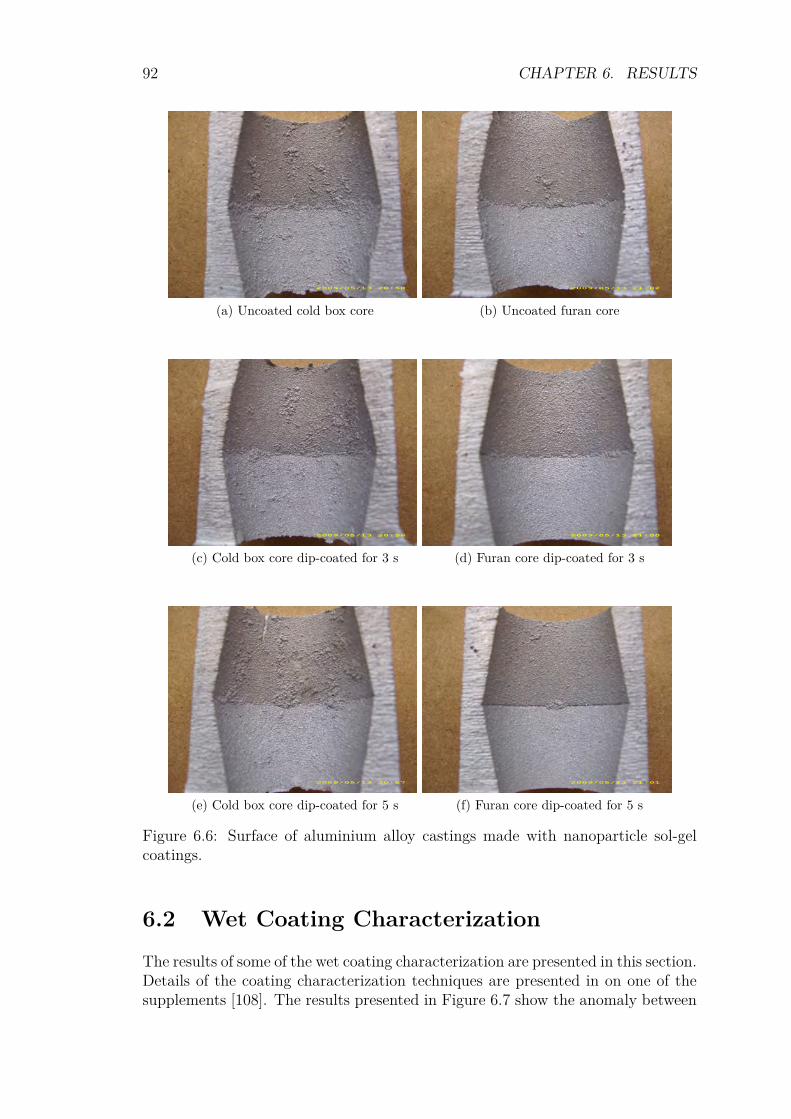
92 CHAPTER 6. RESULTS
(a) Uncoated cold box core (b) Uncoated furan core
(c) Cold box core dip-coated for 3 s (d) Furan core dip-coated for 3 s
(e) Cold box core dip-coated for 5 s (f) Furan core dip-coated for 5 s
Figure 6.6: Surface of aluminium alloy castings made with nanoparticle sol-gelcoatings.
6.2 Wet Coating CharacterizationThe results of some of the wet coating characterization are presented in this section.Details of the coating characterization techniques are presented in on one of thesupplements [108]. The results presented in Figure 6.7 show the anomaly between
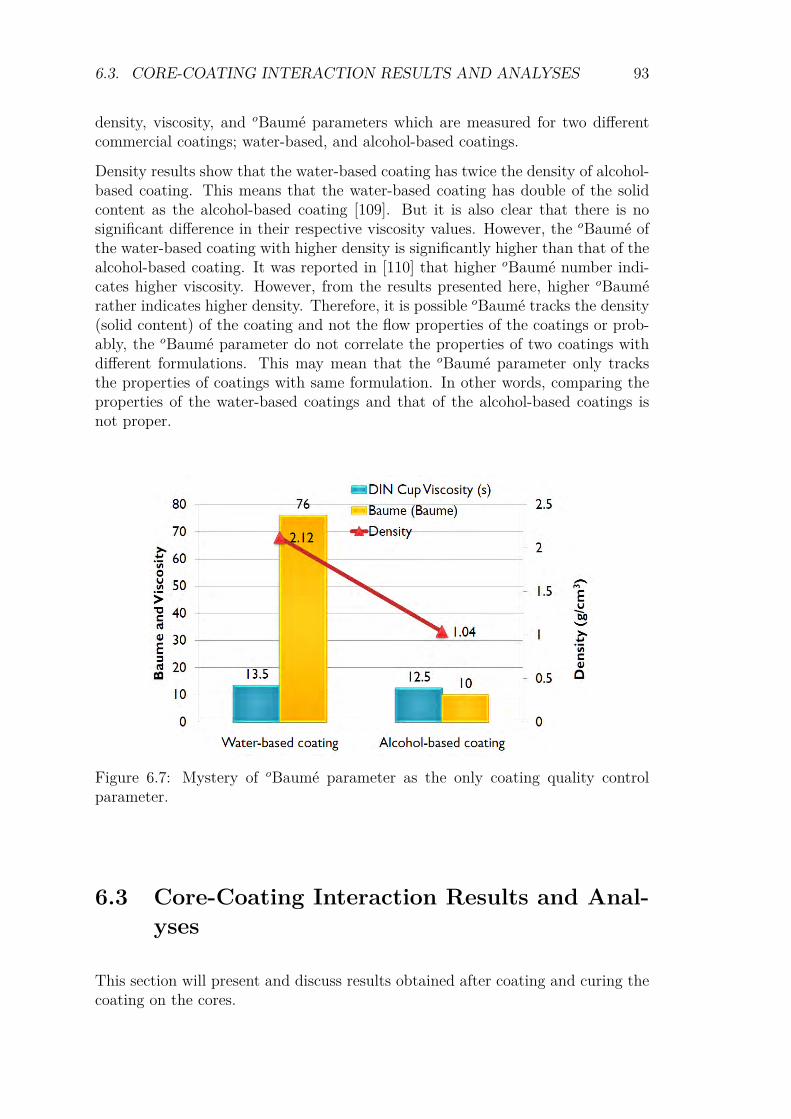
6.3. CORE-COATING INTERACTION RESULTS AND ANALYSES 93
density, viscosity, and oBaumé parameters which are measured for two differentcommercial coatings; water-based, and alcohol-based coatings.
Density results show that the water-based coating has twice the density of alcohol-based coating. This means that the water-based coating has double of the solidcontent as the alcohol-based coating [109]. But it is also clear that there is nosignificant difference in their respective viscosity values. However, the oBaumé ofthe water-based coating with higher density is significantly higher than that of thealcohol-based coating. It was reported in [110] that higher oBaumé number indi-cates higher viscosity. However, from the results presented here, higher oBaumérather indicates higher density. Therefore, it is possible oBaumé tracks the density(solid content) of the coating and not the flow properties of the coatings or prob-ably, the oBaumé parameter do not correlate the properties of two coatings withdifferent formulations. This may mean that the oBaumé parameter only tracksthe properties of coatings with same formulation. In other words, comparing theproperties of the water-based coatings and that of the alcohol-based coatings isnot proper.
Figure 6.7: Mystery of oBaumé parameter as the only coating quality controlparameter.
6.3 Core-Coating Interaction Results and Anal-yses
This section will present and discuss results obtained after coating and curing thecoating on the cores.
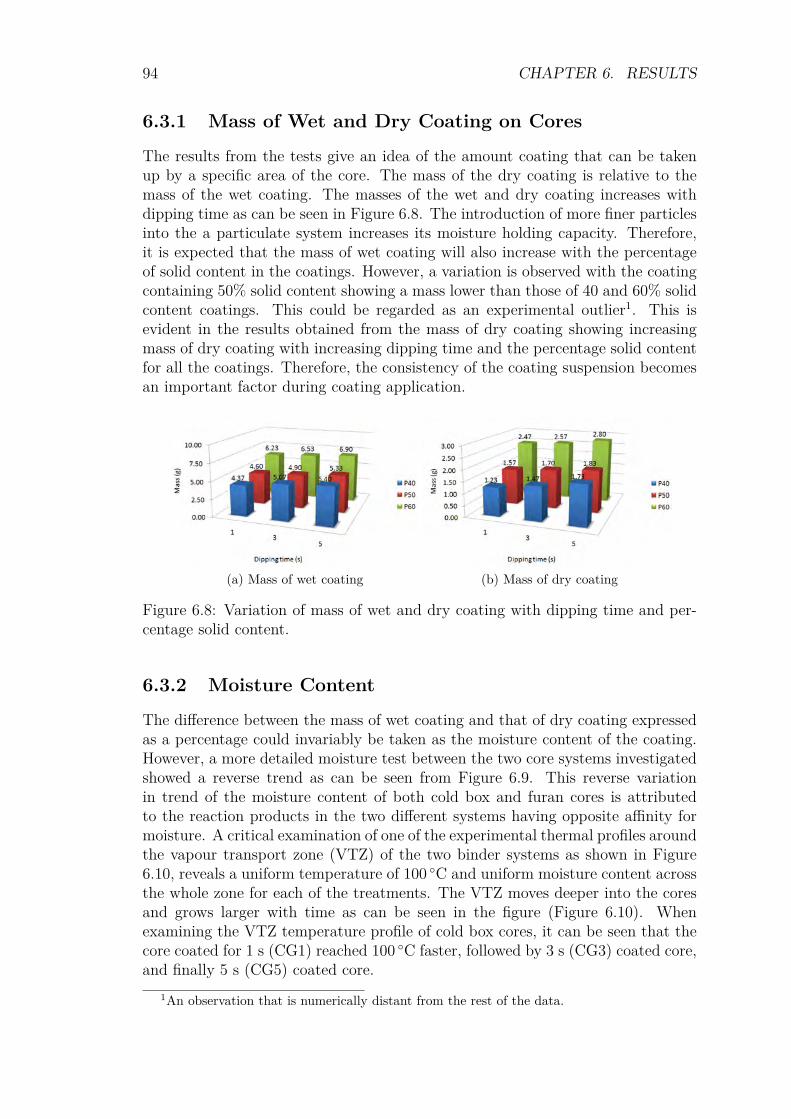
94 CHAPTER 6. RESULTS
6.3.1 Mass of Wet and Dry Coating on CoresThe results from the tests give an idea of the amount coating that can be takenup by a specific area of the core. The mass of the dry coating is relative to themass of the wet coating. The masses of the wet and dry coating increases withdipping time as can be seen in Figure 6.8. The introduction of more finer particlesinto the a particulate system increases its moisture holding capacity. Therefore,it is expected that the mass of wet coating will also increase with the percentageof solid content in the coatings. However, a variation is observed with the coatingcontaining 50% solid content showing a mass lower than those of 40 and 60% solidcontent coatings. This could be regarded as an experimental outlier1. This isevident in the results obtained from the mass of dry coating showing increasingmass of dry coating with increasing dipping time and the percentage solid contentfor all the coatings. Therefore, the consistency of the coating suspension becomesan important factor during coating application.
(a) Mass of wet coating (b) Mass of dry coating
Figure 6.8: Variation of mass of wet and dry coating with dipping time and per-centage solid content.
6.3.2 Moisture ContentThe difference between the mass of wet coating and that of dry coating expressedas a percentage could invariably be taken as the moisture content of the coating.However, a more detailed moisture test between the two core systems investigatedshowed a reverse trend as can be seen from Figure 6.9. This reverse variationin trend of the moisture content of both cold box and furan cores is attributedto the reaction products in the two different systems having opposite affinity formoisture. A critical examination of one of the experimental thermal profiles aroundthe vapour transport zone (VTZ) of the two binder systems as shown in Figure6.10, reveals a uniform temperature of 100 C and uniform moisture content acrossthe whole zone for each of the treatments. The VTZ moves deeper into the coresand grows larger with time as can be seen in the figure (Figure 6.10). Whenexamining the VTZ temperature profile of cold box cores, it can be seen that thecore coated for 1 s (CG1) reached 100 C faster, followed by 3 s (CG3) coated core,and finally 5 s (CG5) coated core.
1An observation that is numerically distant from the rest of the data.
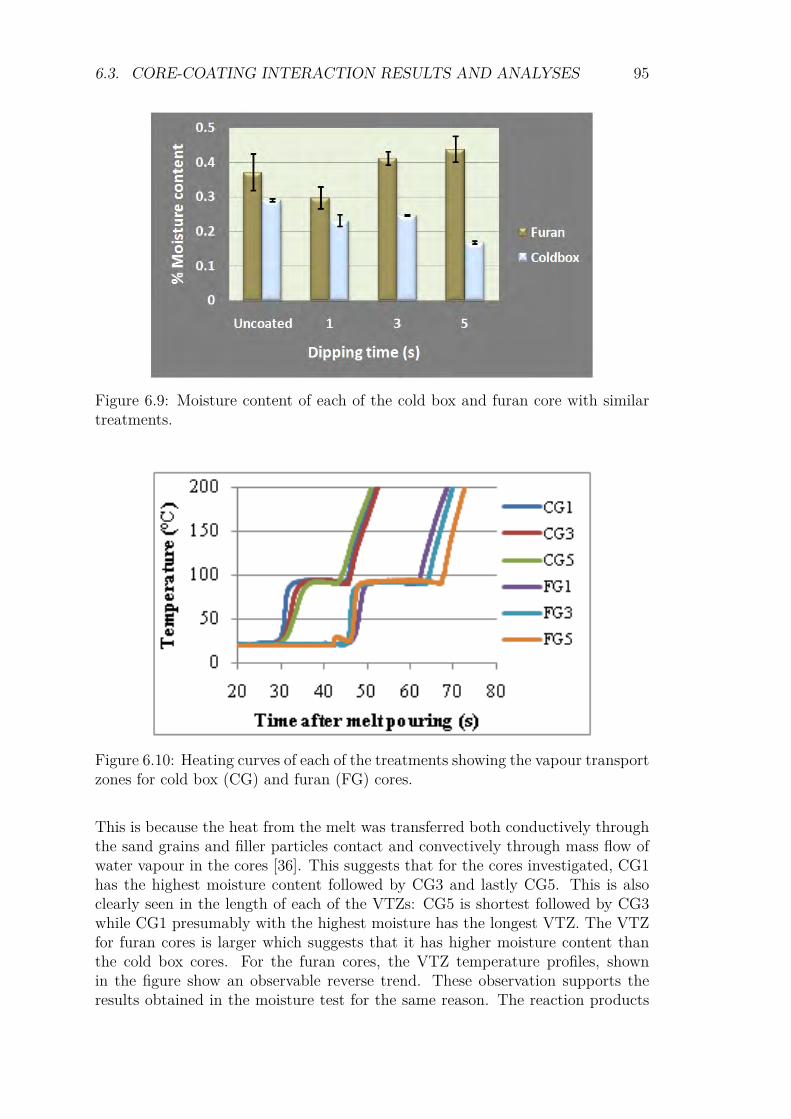
6.3. CORE-COATING INTERACTION RESULTS AND ANALYSES 95
Figure 6.9: Moisture content of each of the cold box and furan core with similartreatments.
Figure 6.10: Heating curves of each of the treatments showing the vapour transportzones for cold box (CG) and furan (FG) cores.
This is because the heat from the melt was transferred both conductively throughthe sand grains and filler particles contact and convectively through mass flow ofwater vapour in the cores [36]. This suggests that for the cores investigated, CG1has the highest moisture content followed by CG3 and lastly CG5. This is alsoclearly seen in the length of each of the VTZs: CG5 is shortest followed by CG3while CG1 presumably with the highest moisture has the longest VTZ. The VTZfor furan cores is larger which suggests that it has higher moisture content thanthe cold box cores. For the furan cores, the VTZ temperature profiles, shownin the figure show an observable reverse trend. These observation supports theresults obtained in the moisture test for the same reason. The reaction products
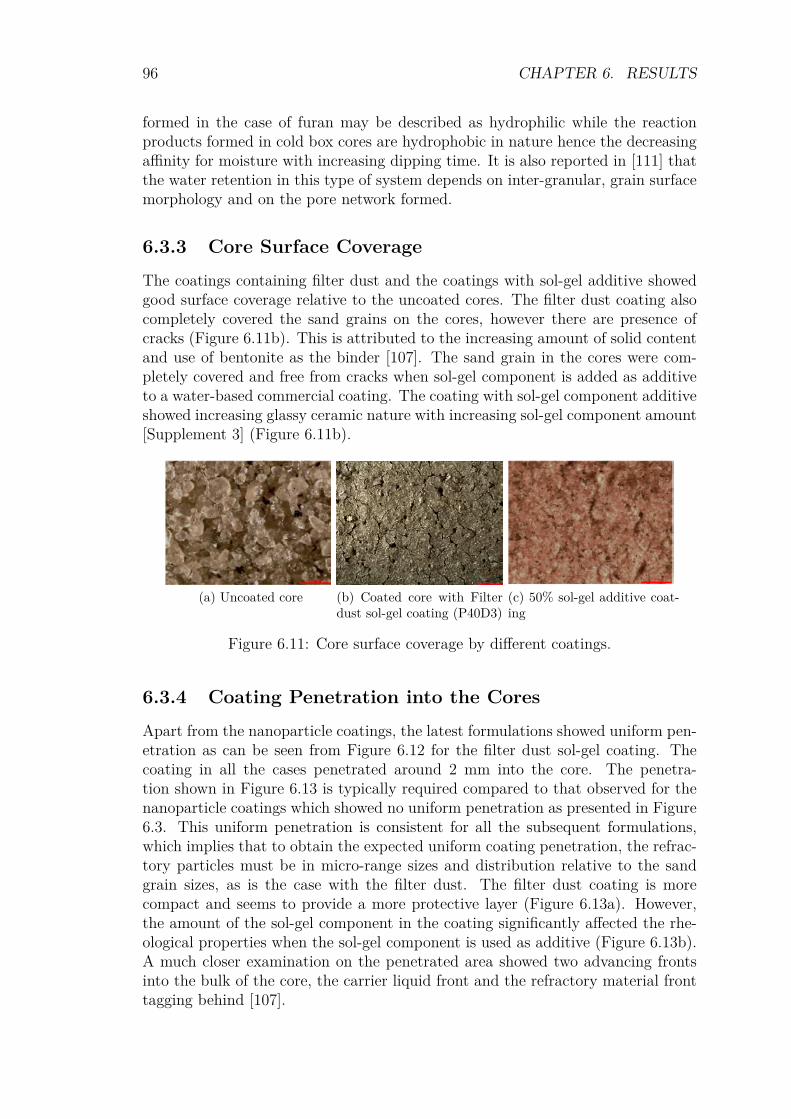
96 CHAPTER 6. RESULTS
formed in the case of furan may be described as hydrophilic while the reactionproducts formed in cold box cores are hydrophobic in nature hence the decreasingaffinity for moisture with increasing dipping time. It is also reported in [111] thatthe water retention in this type of system depends on inter-granular, grain surfacemorphology and on the pore network formed.
6.3.3 Core Surface CoverageThe coatings containing filter dust and the coatings with sol-gel additive showedgood surface coverage relative to the uncoated cores. The filter dust coating alsocompletely covered the sand grains on the cores, however there are presence ofcracks (Figure 6.11b). This is attributed to the increasing amount of solid contentand use of bentonite as the binder [107]. The sand grain in the cores were com-pletely covered and free from cracks when sol-gel component is added as additiveto a water-based commercial coating. The coating with sol-gel component additiveshowed increasing glassy ceramic nature with increasing sol-gel component amount[Supplement 3] (Figure 6.11b).
(a) Uncoated core (b) Coated core with Filterdust sol-gel coating (P40D3)
(c) 50% sol-gel additive coat-ing
Figure 6.11: Core surface coverage by different coatings.
6.3.4 Coating Penetration into the CoresApart from the nanoparticle coatings, the latest formulations showed uniform pen-etration as can be seen from Figure 6.12 for the filter dust sol-gel coating. Thecoating in all the cases penetrated around 2 mm into the core. The penetra-tion shown in Figure 6.13 is typically required compared to that observed for thenanoparticle coatings which showed no uniform penetration as presented in Figure6.3. This uniform penetration is consistent for all the subsequent formulations,which implies that to obtain the expected uniform coating penetration, the refrac-tory particles must be in micro-range sizes and distribution relative to the sandgrain sizes, as is the case with the filter dust. The filter dust coating is morecompact and seems to provide a more protective layer (Figure 6.13a). However,the amount of the sol-gel component in the coating significantly affected the rhe-ological properties when the sol-gel component is used as additive (Figure 6.13b).A much closer examination on the penetrated area showed two advancing frontsinto the bulk of the core, the carrier liquid front and the refractory material fronttagging behind [107].
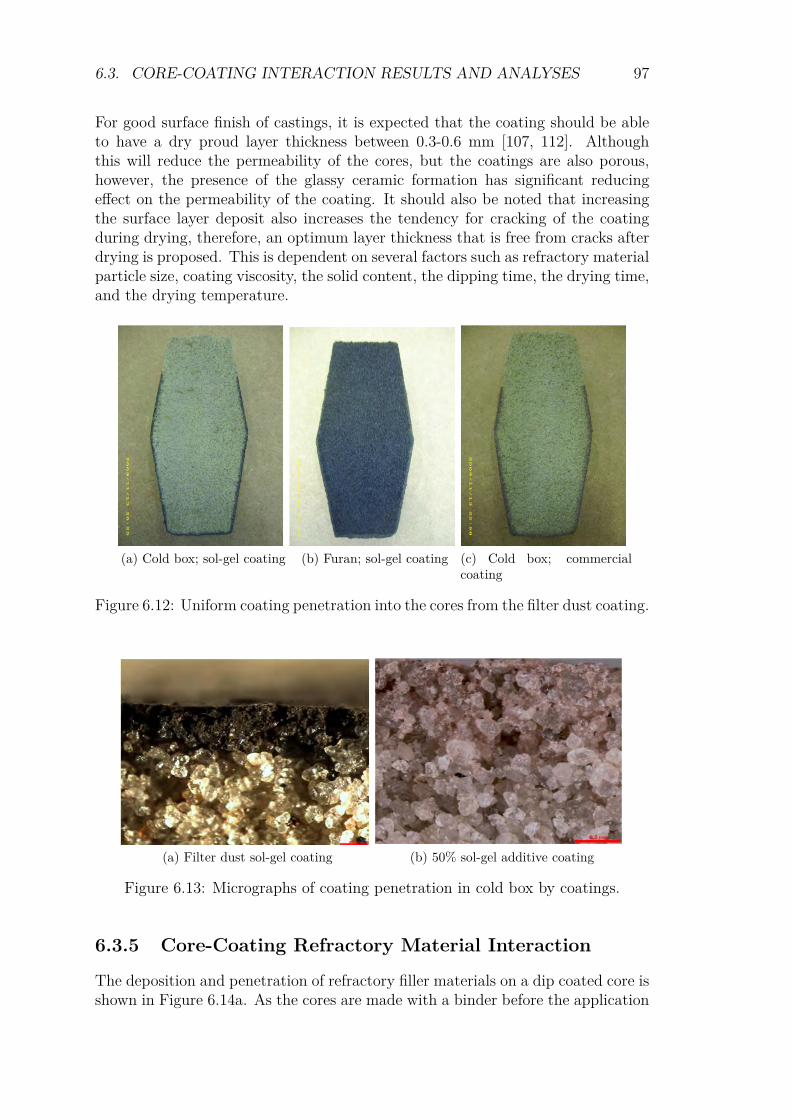
6.3. CORE-COATING INTERACTION RESULTS AND ANALYSES 97
For good surface finish of castings, it is expected that the coating should be ableto have a dry proud layer thickness between 0.3-0.6 mm [107, 112]. Althoughthis will reduce the permeability of the cores, but the coatings are also porous,however, the presence of the glassy ceramic formation has significant reducingeffect on the permeability of the coating. It should also be noted that increasingthe surface layer deposit also increases the tendency for cracking of the coatingduring drying, therefore, an optimum layer thickness that is free from cracks afterdrying is proposed. This is dependent on several factors such as refractory materialparticle size, coating viscosity, the solid content, the dipping time, the drying time,and the drying temperature.
(a) Cold box; sol-gel coating (b) Furan; sol-gel coating (c) Cold box; commercialcoating
Figure 6.12: Uniform coating penetration into the cores from the filter dust coating.
(a) Filter dust sol-gel coating (b) 50% sol-gel additive coating
Figure 6.13: Micrographs of coating penetration in cold box by coatings.
6.3.5 Core-Coating Refractory Material Interaction
The deposition and penetration of refractory filler materials on a dip coated core isshown in Figure 6.14a. As the cores are made with a binder before the application
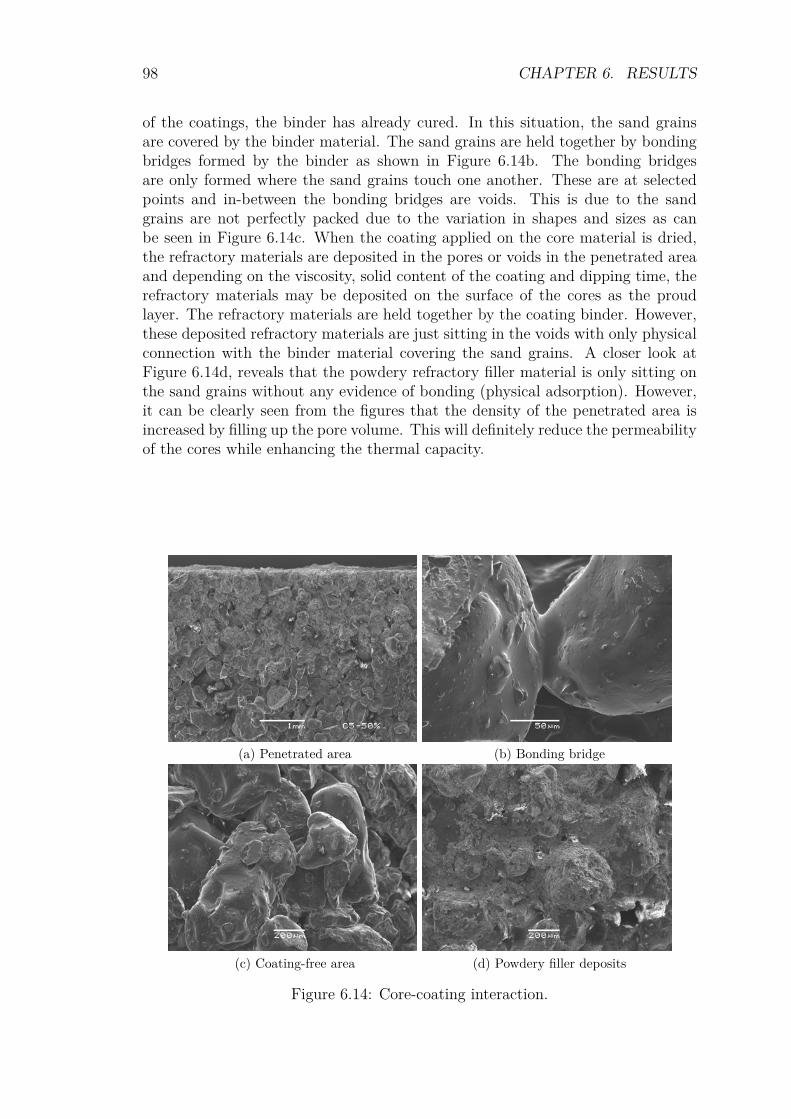
98 CHAPTER 6. RESULTS
of the coatings, the binder has already cured. In this situation, the sand grainsare covered by the binder material. The sand grains are held together by bondingbridges formed by the binder as shown in Figure 6.14b. The bonding bridgesare only formed where the sand grains touch one another. These are at selectedpoints and in-between the bonding bridges are voids. This is due to the sandgrains are not perfectly packed due to the variation in shapes and sizes as canbe seen in Figure 6.14c. When the coating applied on the core material is dried,the refractory materials are deposited in the pores or voids in the penetrated areaand depending on the viscosity, solid content of the coating and dipping time, therefractory materials may be deposited on the surface of the cores as the proudlayer. The refractory materials are held together by the coating binder. However,these deposited refractory materials are just sitting in the voids with only physicalconnection with the binder material covering the sand grains. A closer look atFigure 6.14d, reveals that the powdery refractory filler material is only sitting onthe sand grains without any evidence of bonding (physical adsorption). However,it can be clearly seen from the figures that the density of the penetrated area isincreased by filling up the pore volume. This will definitely reduce the permeabilityof the cores while enhancing the thermal capacity.
(a) Penetrated area (b) Bonding bridge
(c) Coating-free area (d) Powdery filler deposits
Figure 6.14: Core-coating interaction.
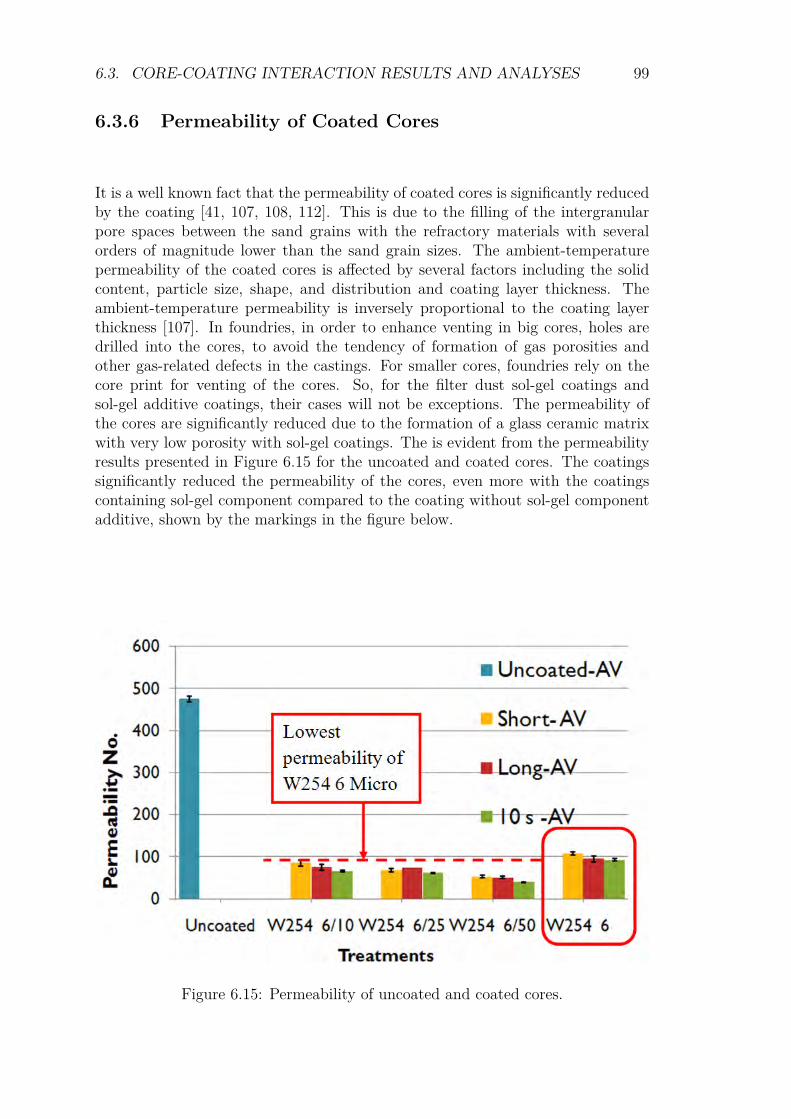
6.3. CORE-COATING INTERACTION RESULTS AND ANALYSES 99
6.3.6 Permeability of Coated Cores
It is a well known fact that the permeability of coated cores is significantly reducedby the coating [41, 107, 108, 112]. This is due to the filling of the intergranularpore spaces between the sand grains with the refractory materials with severalorders of magnitude lower than the sand grain sizes. The ambient-temperaturepermeability of the coated cores is affected by several factors including the solidcontent, particle size, shape, and distribution and coating layer thickness. Theambient-temperature permeability is inversely proportional to the coating layerthickness [107]. In foundries, in order to enhance venting in big cores, holes aredrilled into the cores, to avoid the tendency of formation of gas porosities andother gas-related defects in the castings. For smaller cores, foundries rely on thecore print for venting of the cores. So, for the filter dust sol-gel coatings andsol-gel additive coatings, their cases will not be exceptions. The permeability ofthe cores are significantly reduced due to the formation of a glass ceramic matrixwith very low porosity with sol-gel coatings. The is evident from the permeabilityresults presented in Figure 6.15 for the uncoated and coated cores. The coatingssignificantly reduced the permeability of the cores, even more with the coatingscontaining sol-gel component compared to the coating without sol-gel componentadditive, shown by the markings in the figure below.
Figure 6.15: Permeability of uncoated and coated cores.

100 CHAPTER 6. RESULTS
6.4 Behaviour of Sol-Gel Material with other Re-fractory Materials
Table 6.1: Observations of first-time and direct mixing of sol-gel stock with refrac-tory materials.
Test Refractory filler/50% Observations on mixing
1 Zircon Poor mixing
2 Olivine Bubble formation probably due to thereaction of alkaline olivine with acidsol-gel stock
3 China clay Viscosity gradually increases withincreasing amount of sol-gel stock
4 Aluminium silicate Poor mixing
Table 6.2: Observations in remixing coating precipitates after standing for a periodof time.
Test Refractory filler/50% Standingtime/h
Scrapping and mixing
1 Zircon 1.5 Easy to mix intosuspension. Increasingsol-gel stock increaseshardness of precipitate.
2 Olivine 2 Easy to mix intosuspension. Precipitateharder than in the case ofZircon with increasingamount of sol-gel stock.
3 China clay 2.5 Easy mixing intosuspension. No precipitatewas observed.
4 Aluminium silicate 2 Easy to mix intosuspension. Precipitatehardness comparable toZircon.
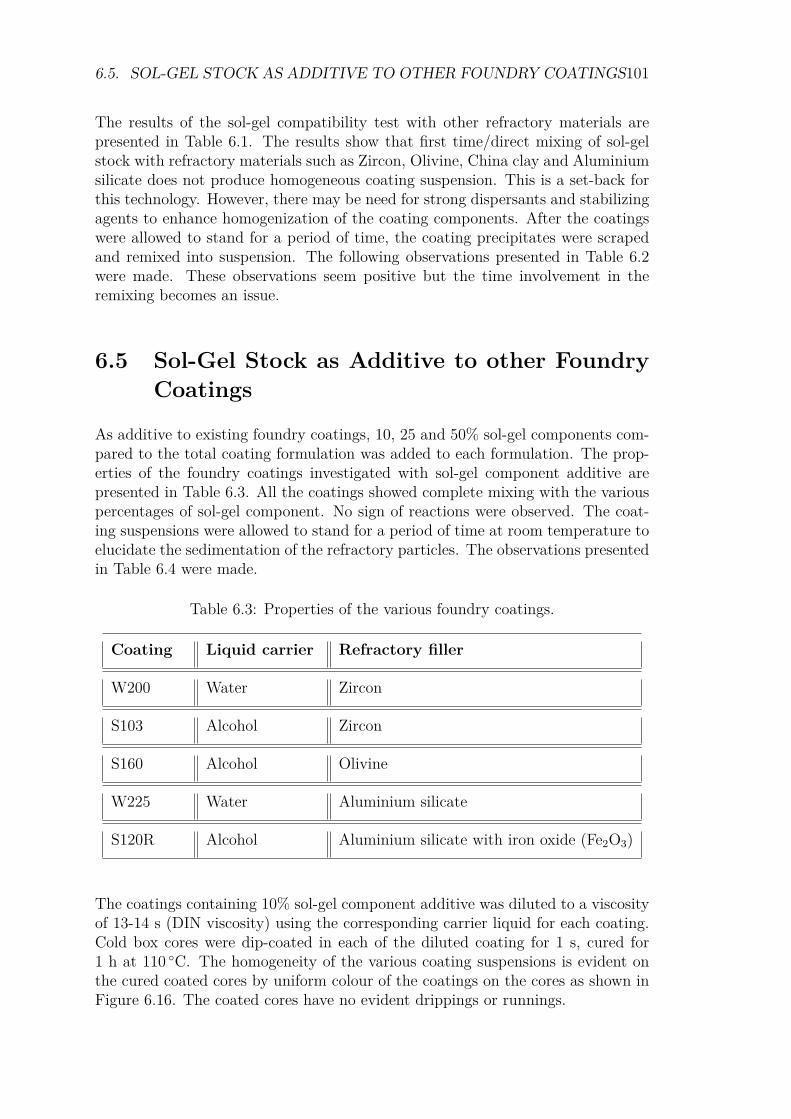
6.5. SOL-GEL STOCK AS ADDITIVE TO OTHER FOUNDRY COATINGS101
The results of the sol-gel compatibility test with other refractory materials arepresented in Table 6.1. The results show that first time/direct mixing of sol-gelstock with refractory materials such as Zircon, Olivine, China clay and Aluminiumsilicate does not produce homogeneous coating suspension. This is a set-back forthis technology. However, there may be need for strong dispersants and stabilizingagents to enhance homogenization of the coating components. After the coatingswere allowed to stand for a period of time, the coating precipitates were scrapedand remixed into suspension. The following observations presented in Table 6.2were made. These observations seem positive but the time involvement in theremixing becomes an issue.
6.5 Sol-Gel Stock as Additive to other FoundryCoatings
As additive to existing foundry coatings, 10, 25 and 50% sol-gel components com-pared to the total coating formulation was added to each formulation. The prop-erties of the foundry coatings investigated with sol-gel component additive arepresented in Table 6.3. All the coatings showed complete mixing with the variouspercentages of sol-gel component. No sign of reactions were observed. The coat-ing suspensions were allowed to stand for a period of time at room temperature toelucidate the sedimentation of the refractory particles. The observations presentedin Table 6.4 were made.
Table 6.3: Properties of the various foundry coatings.
Coating Liquid carrier Refractory filler
W200 Water Zircon
S103 Alcohol Zircon
S160 Alcohol Olivine
W225 Water Aluminium silicate
S120R Alcohol Aluminium silicate with iron oxide (Fe2O3)
The coatings containing 10% sol-gel component additive was diluted to a viscosityof 13-14 s (DIN viscosity) using the corresponding carrier liquid for each coating.Cold box cores were dip-coated in each of the diluted coating for 1 s, cured for1 h at 110 C. The homogeneity of the various coating suspensions is evident onthe cured coated cores by uniform colour of the coatings on the cores as shown inFigure 6.16. The coated cores have no evident drippings or runnings.
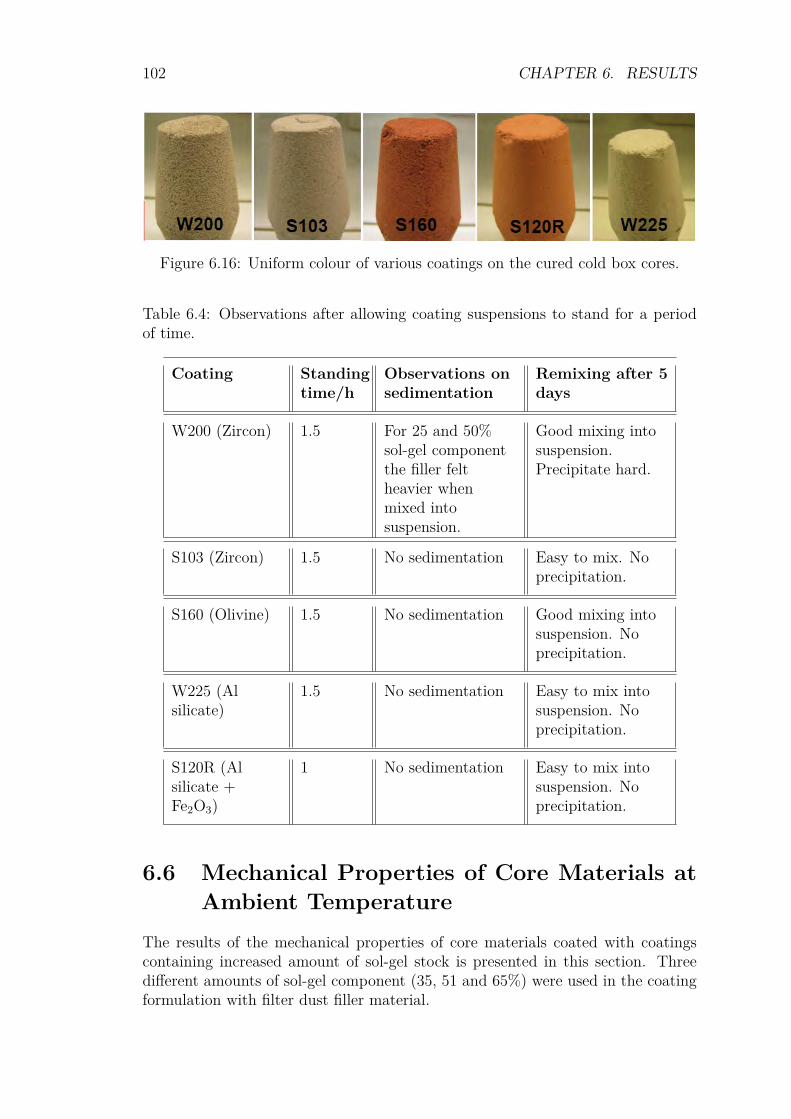
102 CHAPTER 6. RESULTS
Figure 6.16: Uniform colour of various coatings on the cured cold box cores.
Table 6.4: Observations after allowing coating suspensions to stand for a periodof time.
Coating Standingtime/h
Observations onsedimentation
Remixing after 5days
W200 (Zircon) 1.5 For 25 and 50%sol-gel componentthe filler feltheavier whenmixed intosuspension.
Good mixing intosuspension.Precipitate hard.
S103 (Zircon) 1.5 No sedimentation Easy to mix. Noprecipitation.
S160 (Olivine) 1.5 No sedimentation Good mixing intosuspension. Noprecipitation.
W225 (Alsilicate)
1.5 No sedimentation Easy to mix intosuspension. Noprecipitation.
S120R (Alsilicate +Fe2O3)
1 No sedimentation Easy to mix intosuspension. Noprecipitation.
6.6 Mechanical Properties of Core Materials atAmbient Temperature
The results of the mechanical properties of core materials coated with coatingscontaining increased amount of sol-gel stock is presented in this section. Threedifferent amounts of sol-gel component (35, 51 and 65%) were used in the coatingformulation with filter dust filler material.
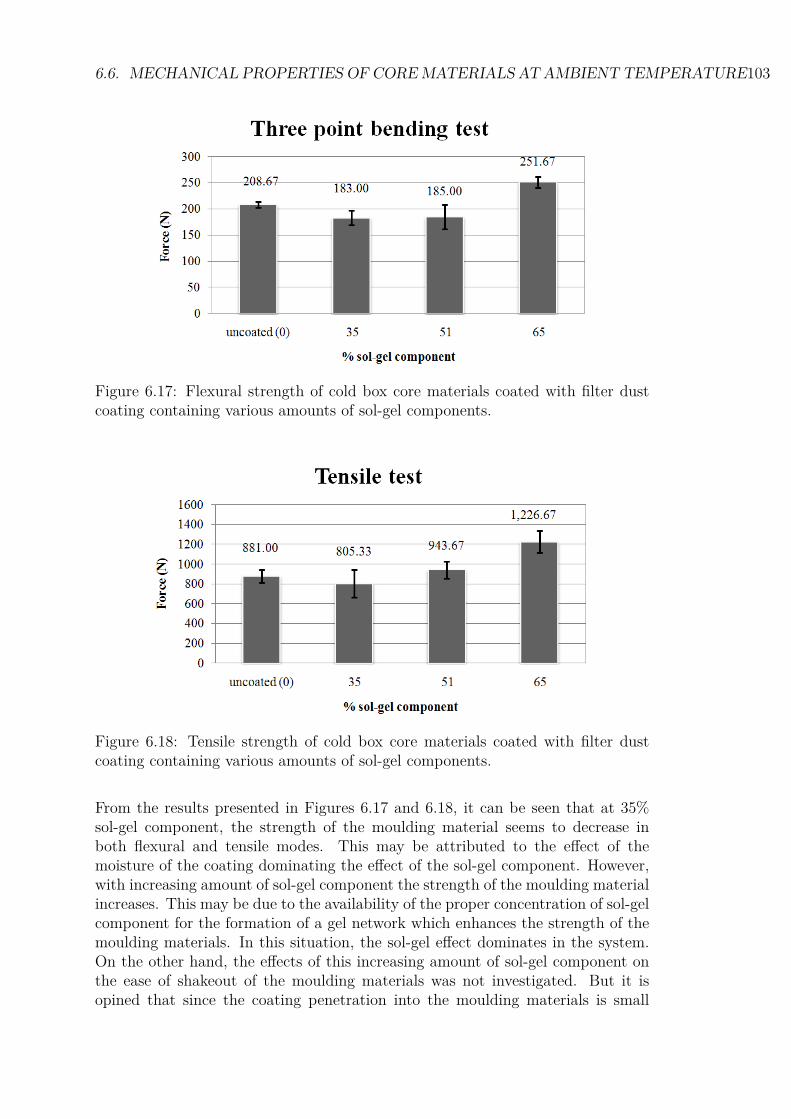
6.6. MECHANICAL PROPERTIES OF COREMATERIALS AT AMBIENT TEMPERATURE103
Figure 6.17: Flexural strength of cold box core materials coated with filter dustcoating containing various amounts of sol-gel components.
Figure 6.18: Tensile strength of cold box core materials coated with filter dustcoating containing various amounts of sol-gel components.
From the results presented in Figures 6.17 and 6.18, it can be seen that at 35%sol-gel component, the strength of the moulding material seems to decrease inboth flexural and tensile modes. This may be attributed to the effect of themoisture of the coating dominating the effect of the sol-gel component. However,with increasing amount of sol-gel component the strength of the moulding materialincreases. This may be due to the availability of the proper concentration of sol-gelcomponent for the formation of a gel network which enhances the strength of themoulding materials. In this situation, the sol-gel effect dominates in the system.On the other hand, the effects of this increasing amount of sol-gel component onthe ease of shakeout of the moulding materials was not investigated. But it isopined that since the coating penetration into the moulding materials is small
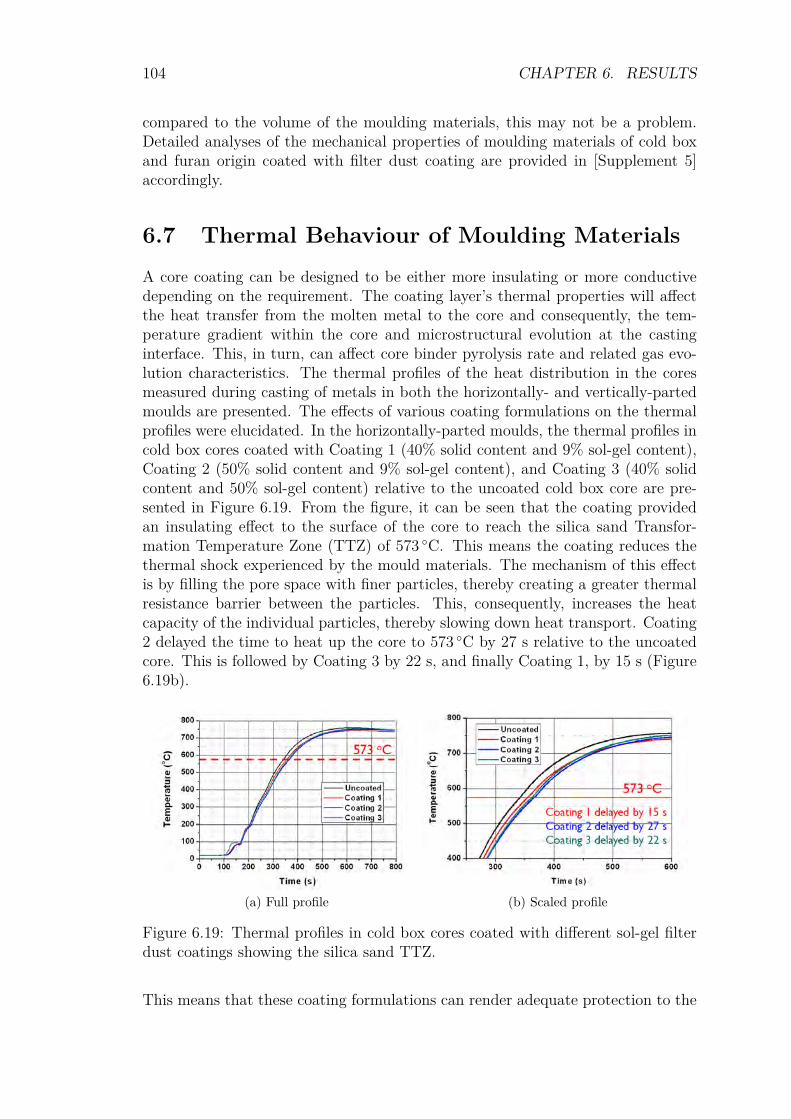
104 CHAPTER 6. RESULTS
compared to the volume of the moulding materials, this may not be a problem.Detailed analyses of the mechanical properties of moulding materials of cold boxand furan origin coated with filter dust coating are provided in [Supplement 5]accordingly.
6.7 Thermal Behaviour of Moulding MaterialsA core coating can be designed to be either more insulating or more conductivedepending on the requirement. The coating layer’s thermal properties will affectthe heat transfer from the molten metal to the core and consequently, the tem-perature gradient within the core and microstructural evolution at the castinginterface. This, in turn, can affect core binder pyrolysis rate and related gas evo-lution characteristics. The thermal profiles of the heat distribution in the coresmeasured during casting of metals in both the horizontally- and vertically-partedmoulds are presented. The effects of various coating formulations on the thermalprofiles were elucidated. In the horizontally-parted moulds, the thermal profiles incold box cores coated with Coating 1 (40% solid content and 9% sol-gel content),Coating 2 (50% solid content and 9% sol-gel content), and Coating 3 (40% solidcontent and 50% sol-gel content) relative to the uncoated cold box core are pre-sented in Figure 6.19. From the figure, it can be seen that the coating providedan insulating effect to the surface of the core to reach the silica sand Transfor-mation Temperature Zone (TTZ) of 573 C. This means the coating reduces thethermal shock experienced by the mould materials. The mechanism of this effectis by filling the pore space with finer particles, thereby creating a greater thermalresistance barrier between the particles. This, consequently, increases the heatcapacity of the individual particles, thereby slowing down heat transport. Coating2 delayed the time to heat up the core to 573 C by 27 s relative to the uncoatedcore. This is followed by Coating 3 by 22 s, and finally Coating 1, by 15 s (Figure6.19b).
(a) Full profile (b) Scaled profile
Figure 6.19: Thermal profiles in cold box cores coated with different sol-gel filterdust coatings showing the silica sand TTZ.
This means that these coating formulations can render adequate protection to the
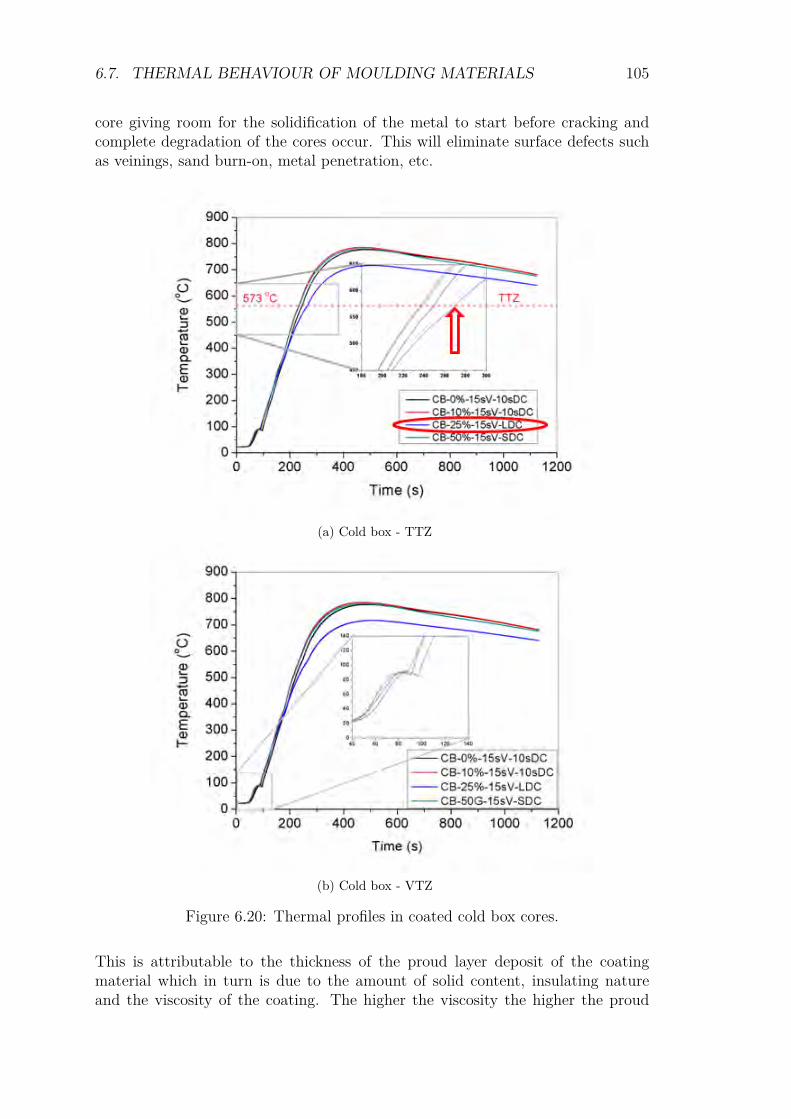
6.7. THERMAL BEHAVIOUR OF MOULDING MATERIALS 105
core giving room for the solidification of the metal to start before cracking andcomplete degradation of the cores occur. This will eliminate surface defects suchas veinings, sand burn-on, metal penetration, etc.
(a) Cold box - TTZ
(b) Cold box - VTZ
Figure 6.20: Thermal profiles in coated cold box cores.
This is attributable to the thickness of the proud layer deposit of the coatingmaterial which in turn is due to the amount of solid content, insulating natureand the viscosity of the coating. The higher the viscosity the higher the proud
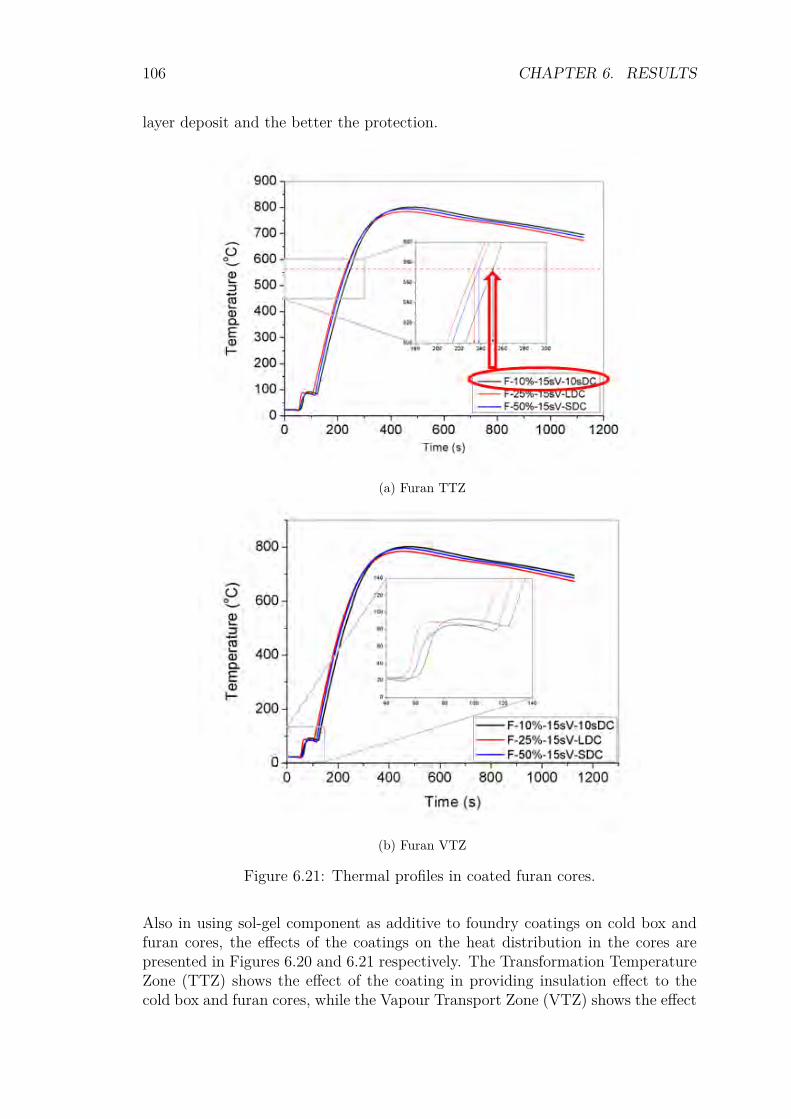
106 CHAPTER 6. RESULTS
layer deposit and the better the protection.
(a) Furan TTZ
(b) Furan VTZ
Figure 6.21: Thermal profiles in coated furan cores.
Also in using sol-gel component as additive to foundry coatings on cold box andfuran cores, the effects of the coatings on the heat distribution in the cores arepresented in Figures 6.20 and 6.21 respectively. The Transformation TemperatureZone (TTZ) shows the effect of the coating in providing insulation effect to thecold box and furan cores, while the Vapour Transport Zone (VTZ) shows the effect
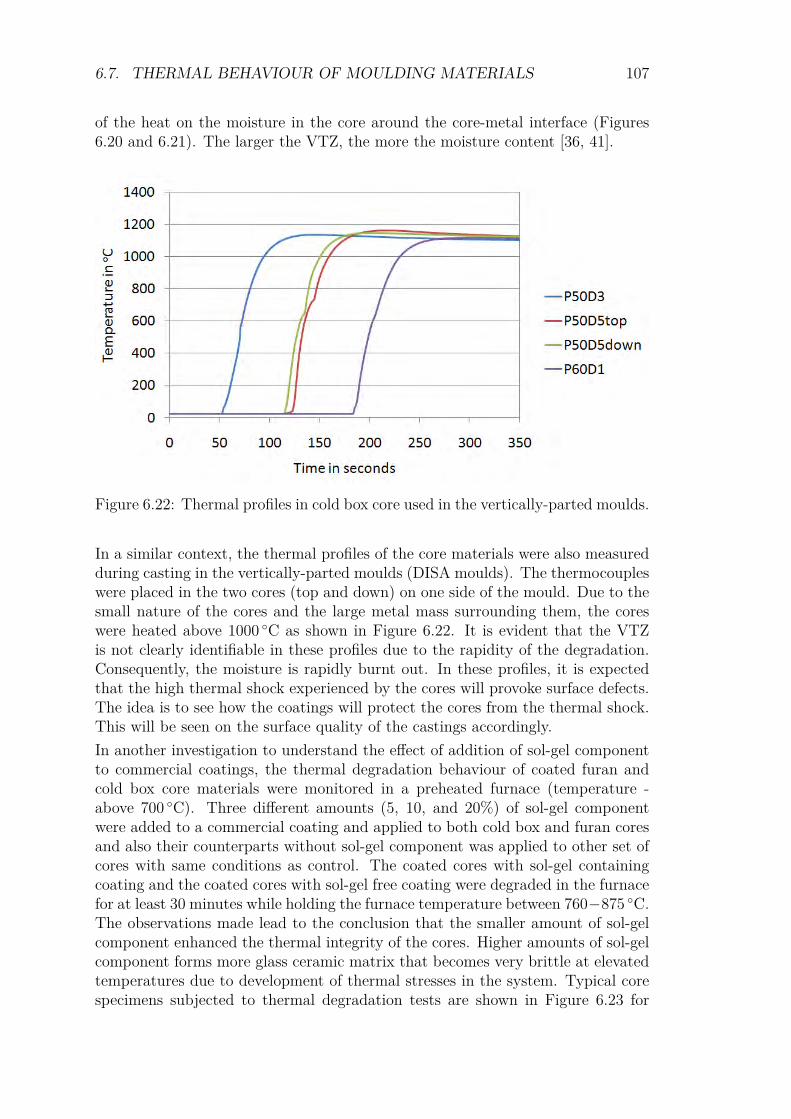
6.7. THERMAL BEHAVIOUR OF MOULDING MATERIALS 107
of the heat on the moisture in the core around the core-metal interface (Figures6.20 and 6.21). The larger the VTZ, the more the moisture content [36, 41].
Figure 6.22: Thermal profiles in cold box core used in the vertically-parted moulds.
In a similar context, the thermal profiles of the core materials were also measuredduring casting in the vertically-parted moulds (DISA moulds). The thermocoupleswere placed in the two cores (top and down) on one side of the mould. Due to thesmall nature of the cores and the large metal mass surrounding them, the coreswere heated above 1000 C as shown in Figure 6.22. It is evident that the VTZis not clearly identifiable in these profiles due to the rapidity of the degradation.Consequently, the moisture is rapidly burnt out. In these profiles, it is expectedthat the high thermal shock experienced by the cores will provoke surface defects.The idea is to see how the coatings will protect the cores from the thermal shock.This will be seen on the surface quality of the castings accordingly.In another investigation to understand the effect of addition of sol-gel componentto commercial coatings, the thermal degradation behaviour of coated furan andcold box core materials were monitored in a preheated furnace (temperature -above 700 C). Three different amounts (5, 10, and 20%) of sol-gel componentwere added to a commercial coating and applied to both cold box and furan coresand also their counterparts without sol-gel component was applied to other set ofcores with same conditions as control. The coated cores with sol-gel containingcoating and the coated cores with sol-gel free coating were degraded in the furnacefor at least 30 minutes while holding the furnace temperature between 760−875 C.The observations made lead to the conclusion that the smaller amount of sol-gelcomponent enhanced the thermal integrity of the cores. Higher amounts of sol-gelcomponent forms more glass ceramic matrix that becomes very brittle at elevatedtemperatures due to development of thermal stresses in the system. Typical corespecimens subjected to thermal degradation tests are shown in Figure 6.23 for
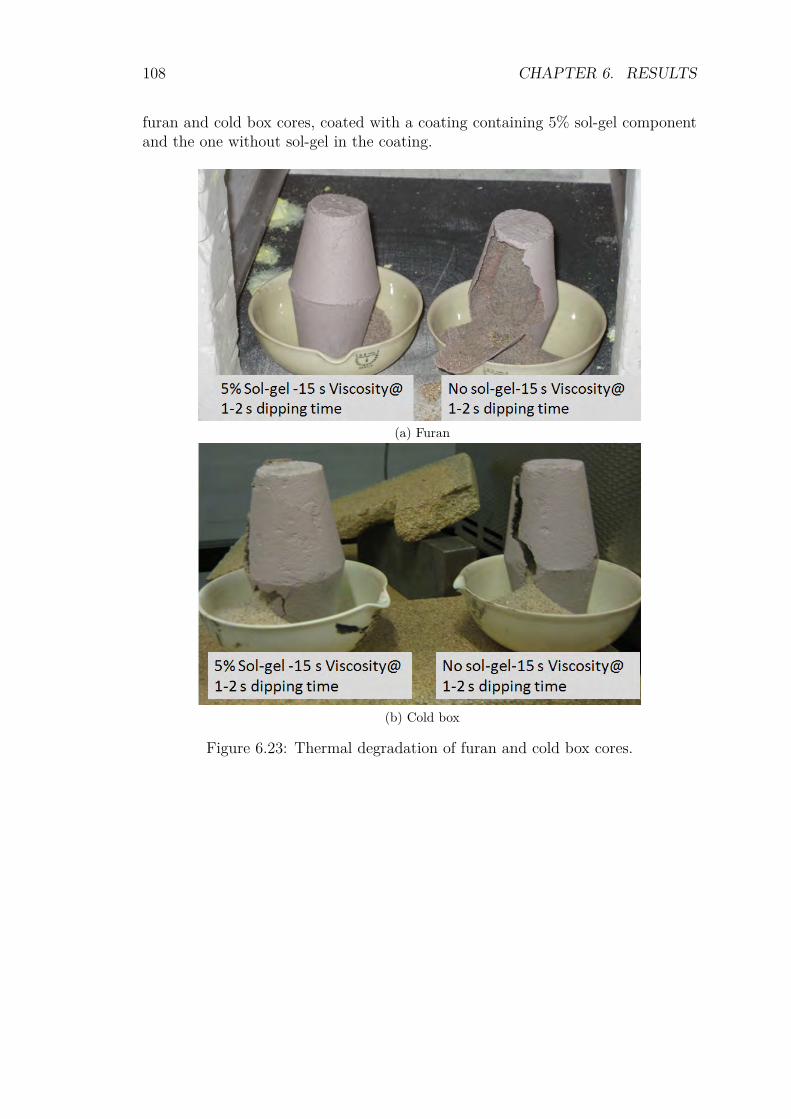
108 CHAPTER 6. RESULTS
furan and cold box cores, coated with a coating containing 5% sol-gel componentand the one without sol-gel in the coating.
(a) Furan
(b) Cold box
Figure 6.23: Thermal degradation of furan and cold box cores.
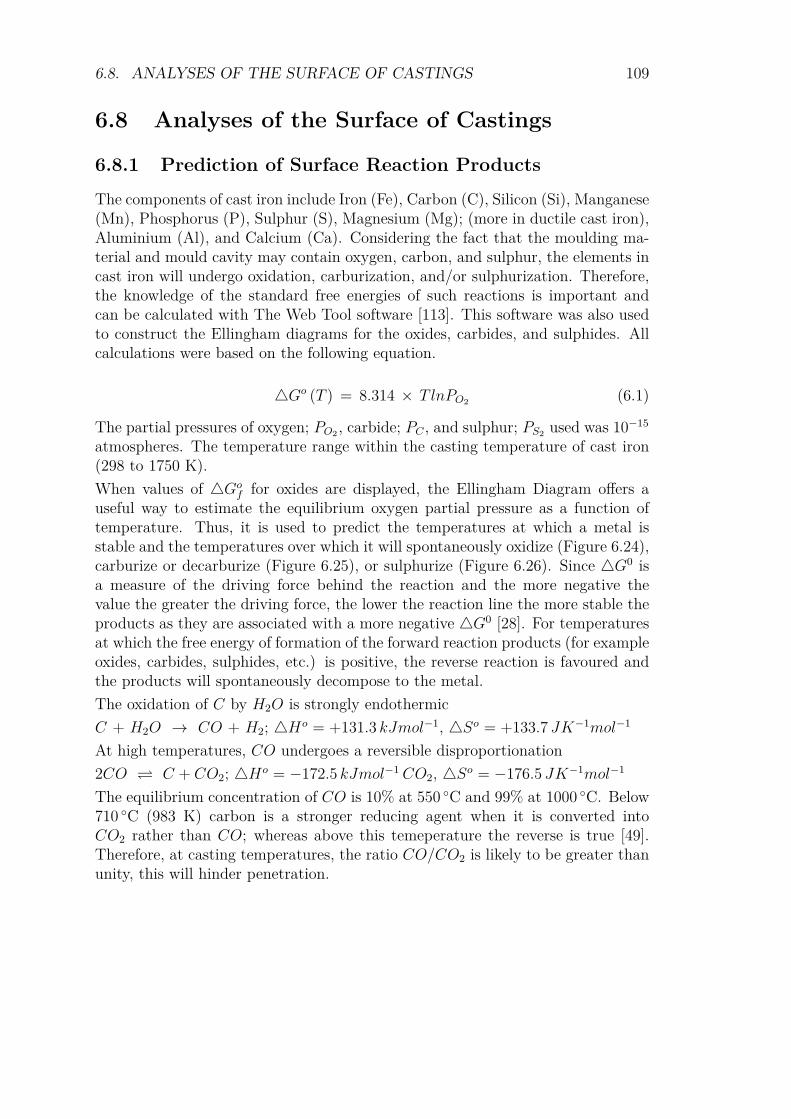
6.8. ANALYSES OF THE SURFACE OF CASTINGS 109
6.8 Analyses of the Surface of Castings
6.8.1 Prediction of Surface Reaction ProductsThe components of cast iron include Iron (Fe), Carbon (C), Silicon (Si), Manganese(Mn), Phosphorus (P), Sulphur (S), Magnesium (Mg); (more in ductile cast iron),Aluminium (Al), and Calcium (Ca). Considering the fact that the moulding ma-terial and mould cavity may contain oxygen, carbon, and sulphur, the elements incast iron will undergo oxidation, carburization, and/or sulphurization. Therefore,the knowledge of the standard free energies of such reactions is important andcan be calculated with The Web Tool software [113]. This software was also usedto construct the Ellingham diagrams for the oxides, carbides, and sulphides. Allcalculations were based on the following equation.
4Go (T ) = 8.314 × T lnPO2 (6.1)
The partial pressures of oxygen; PO2 , carbide; PC , and sulphur; PS2 used was 10−15
atmospheres. The temperature range within the casting temperature of cast iron(298 to 1750 K).When values of 4Go
f for oxides are displayed, the Ellingham Diagram offers auseful way to estimate the equilibrium oxygen partial pressure as a function oftemperature. Thus, it is used to predict the temperatures at which a metal isstable and the temperatures over which it will spontaneously oxidize (Figure 6.24),carburize or decarburize (Figure 6.25), or sulphurize (Figure 6.26). Since 4G0 isa measure of the driving force behind the reaction and the more negative thevalue the greater the driving force, the lower the reaction line the more stable theproducts as they are associated with a more negative 4G0 [28]. For temperaturesat which the free energy of formation of the forward reaction products (for exampleoxides, carbides, sulphides, etc.) is positive, the reverse reaction is favoured andthe products will spontaneously decompose to the metal.The oxidation of C by H2O is strongly endothermicC + H2O → CO + H2; 4Ho = +131.3 kJmol−1, 4So = +133.7 JK−1mol−1
At high temperatures, CO undergoes a reversible disproportionation2CO C + CO2; 4Ho = −172.5 kJmol−1 CO2, 4So = −176.5 JK−1mol−1
The equilibrium concentration of CO is 10% at 550 C and 99% at 1000 C. Below710 C (983 K) carbon is a stronger reducing agent when it is converted intoCO2 rather than CO; whereas above this temeperature the reverse is true [49].Therefore, at casting temperatures, the ratio CO/CO2 is likely to be greater thanunity, this will hinder penetration.
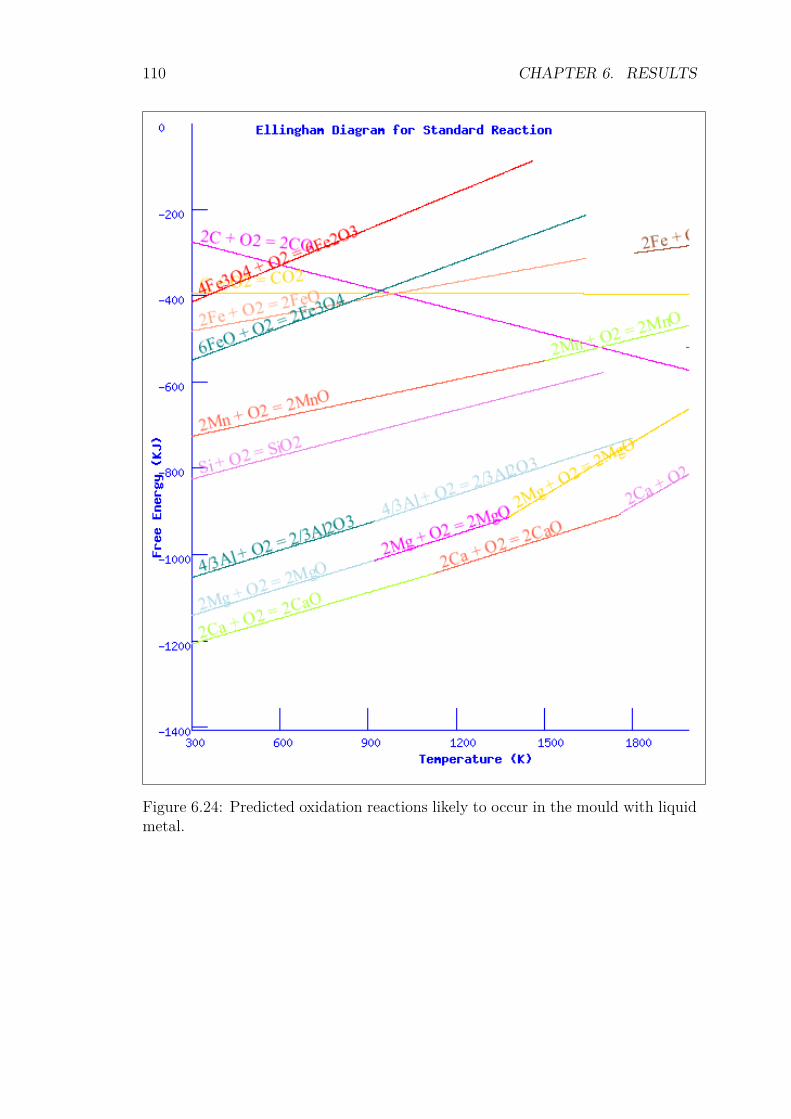
110 CHAPTER 6. RESULTS
Figure 6.24: Predicted oxidation reactions likely to occur in the mould with liquidmetal.
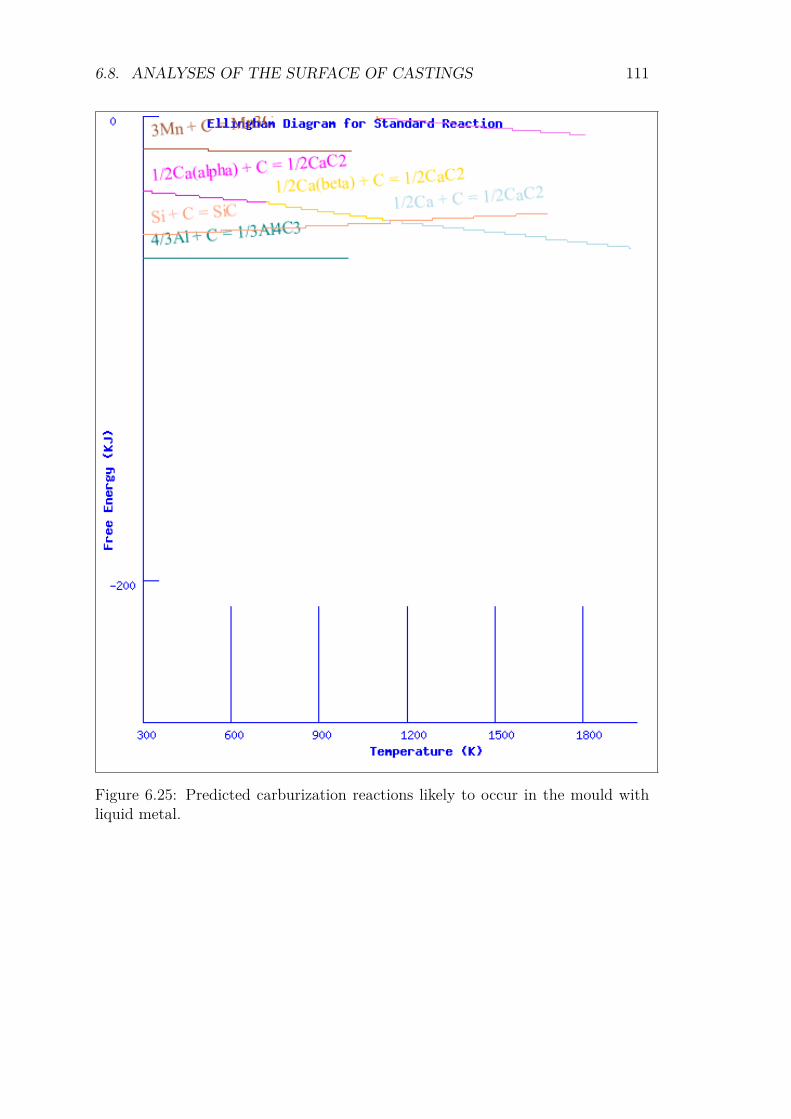
6.8. ANALYSES OF THE SURFACE OF CASTINGS 111
Figure 6.25: Predicted carburization reactions likely to occur in the mould withliquid metal.
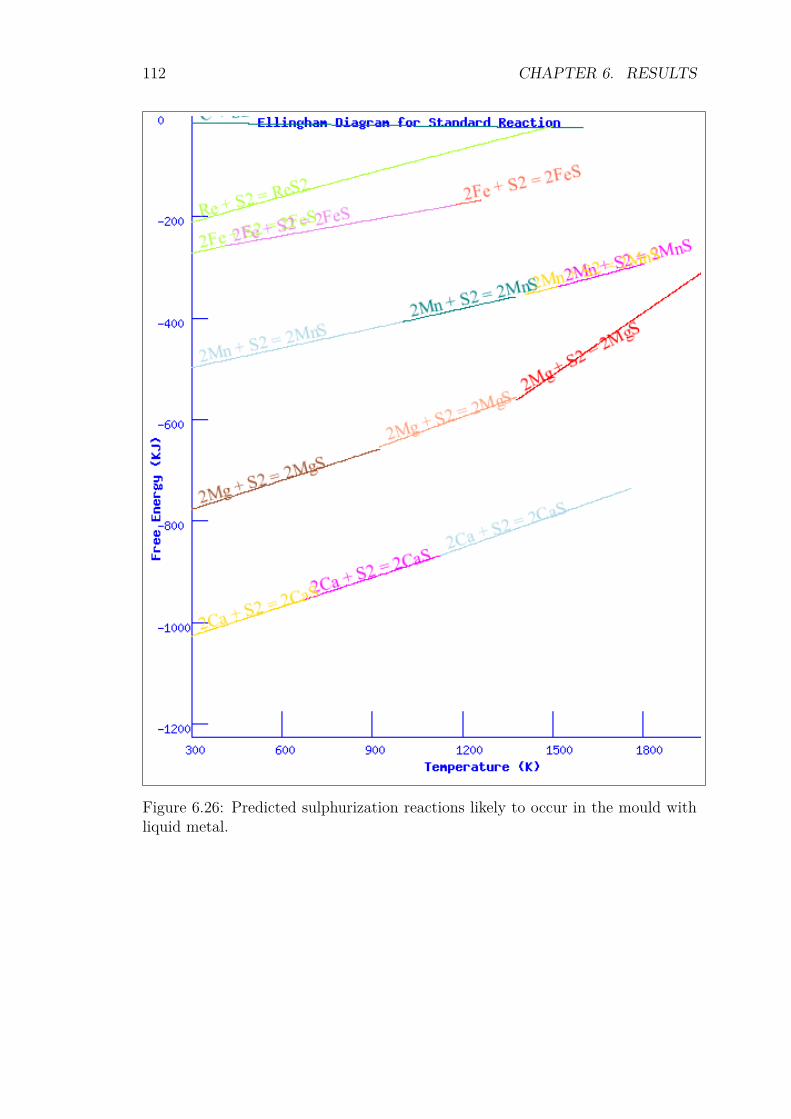
112 CHAPTER 6. RESULTS
Figure 6.26: Predicted sulphurization reactions likely to occur in the mould withliquid metal.

6.8. ANALYSES OF THE SURFACE OF CASTINGS 113
6.8.2 Surface Quality of CastingsThe improvement of the surface quality of castings by use of novel sol-gel coatingsis the main objective of this research. The use of high thermal resistant coatingrefractory materials of micron-size range relative to the sand grains used for pro-ducing the moulding materials, has a significant impact on the performance offoundry coatings. The fine details of the refractory materials deposited as surfacelayer on the moulding materials will reflect on the surface quality of the castings.This gives improved surface finish of the cast components by reducing roughness,metal penetration, veining defects, etc. The photographs of the surface of cast-ings produced with various sol-gel coating formulations with micron-size refractorymaterials, in horizontally-parted and vertically-parted moulds, are presented forvisual examination. Some comparisons with commercial foundry coatings are alsoprovided. On seeing the improvement achieved by the sol-gel filter dust coating,the surface quality of the casting surfaces was estimated by measuring the surfaceroughness for subsequent approaches.
6.8.2.1 Sol-Gel Filter Dust Coating on Cold Box and Furan Cores
The cores for these castings were not completely coated in order to allow forventing. However, the cores were not uniformly coated to a particular heighteither (the coated heights are not the same) as shown in Figure 6.27. The coatedpart of the cores is on the lower part of the castings. Therefore, for some castingsthe effect of the part of the core without coating may be seen. This part of thecastings should be ignored in the assessment of the surface quality of these castingswhere they occur. But, it can serve as a control to check the performance of thecoating on the coated part over uncoated part.
Figure 6.27: The coated cores with random coating heights.
The castings made with uncoated and 1 s dip-coated cold box and furan cores
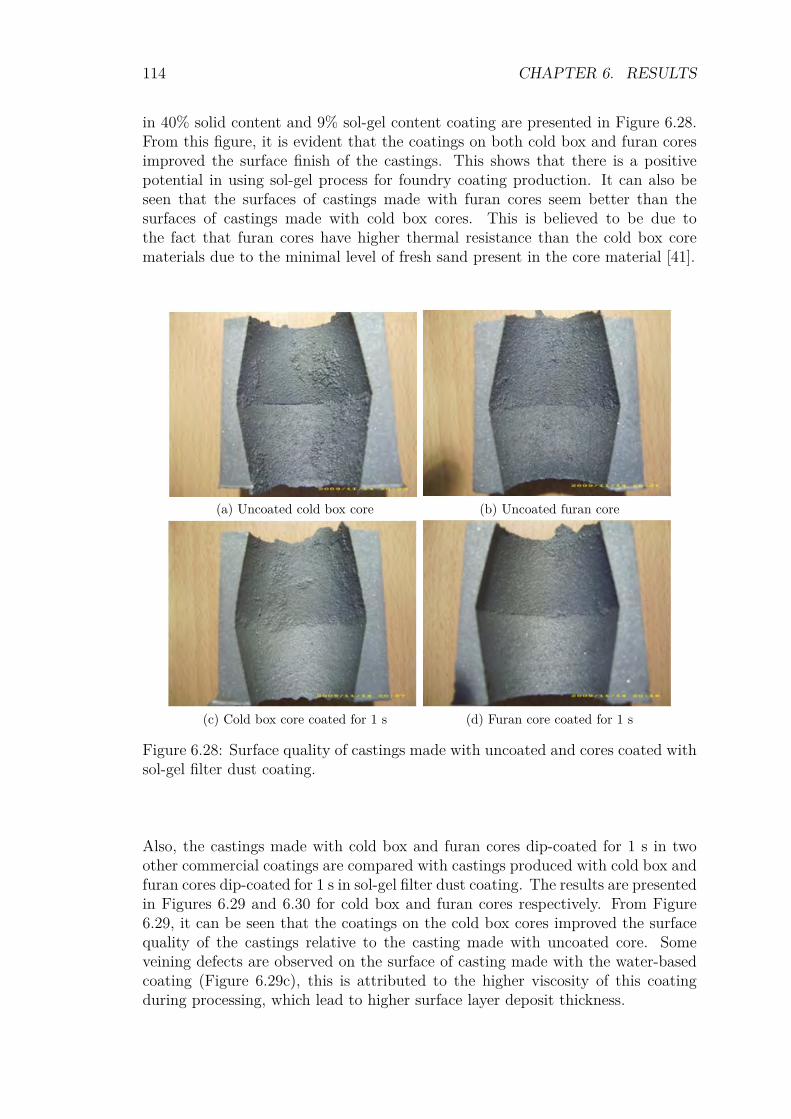
114 CHAPTER 6. RESULTS
in 40% solid content and 9% sol-gel content coating are presented in Figure 6.28.From this figure, it is evident that the coatings on both cold box and furan coresimproved the surface finish of the castings. This shows that there is a positivepotential in using sol-gel process for foundry coating production. It can also beseen that the surfaces of castings made with furan cores seem better than thesurfaces of castings made with cold box cores. This is believed to be due tothe fact that furan cores have higher thermal resistance than the cold box corematerials due to the minimal level of fresh sand present in the core material [41].
(a) Uncoated cold box core (b) Uncoated furan core
(c) Cold box core coated for 1 s (d) Furan core coated for 1 s
Figure 6.28: Surface quality of castings made with uncoated and cores coated withsol-gel filter dust coating.
Also, the castings made with cold box and furan cores dip-coated for 1 s in twoother commercial coatings are compared with castings produced with cold box andfuran cores dip-coated for 1 s in sol-gel filter dust coating. The results are presentedin Figures 6.29 and 6.30 for cold box and furan cores respectively. From Figure6.29, it can be seen that the coatings on the cold box cores improved the surfacequality of the castings relative to the casting made with uncoated core. Someveining defects are observed on the surface of casting made with the water-basedcoating (Figure 6.29c), this is attributed to the higher viscosity of this coatingduring processing, which lead to higher surface layer deposit thickness.
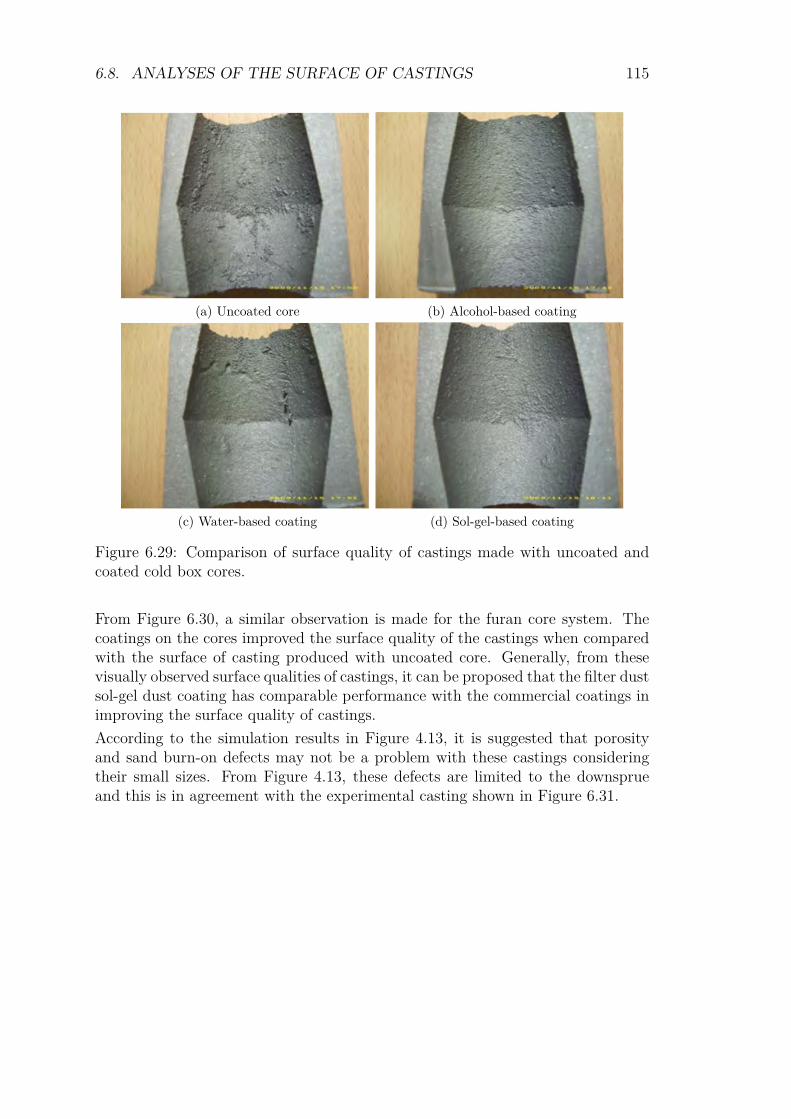
6.8. ANALYSES OF THE SURFACE OF CASTINGS 115
(a) Uncoated core (b) Alcohol-based coating
(c) Water-based coating (d) Sol-gel-based coating
Figure 6.29: Comparison of surface quality of castings made with uncoated andcoated cold box cores.
From Figure 6.30, a similar observation is made for the furan core system. Thecoatings on the cores improved the surface quality of the castings when comparedwith the surface of casting produced with uncoated core. Generally, from thesevisually observed surface qualities of castings, it can be proposed that the filter dustsol-gel dust coating has comparable performance with the commercial coatings inimproving the surface quality of castings.According to the simulation results in Figure 4.13, it is suggested that porosityand sand burn-on defects may not be a problem with these castings consideringtheir small sizes. From Figure 4.13, these defects are limited to the downsprueand this is in agreement with the experimental casting shown in Figure 6.31.
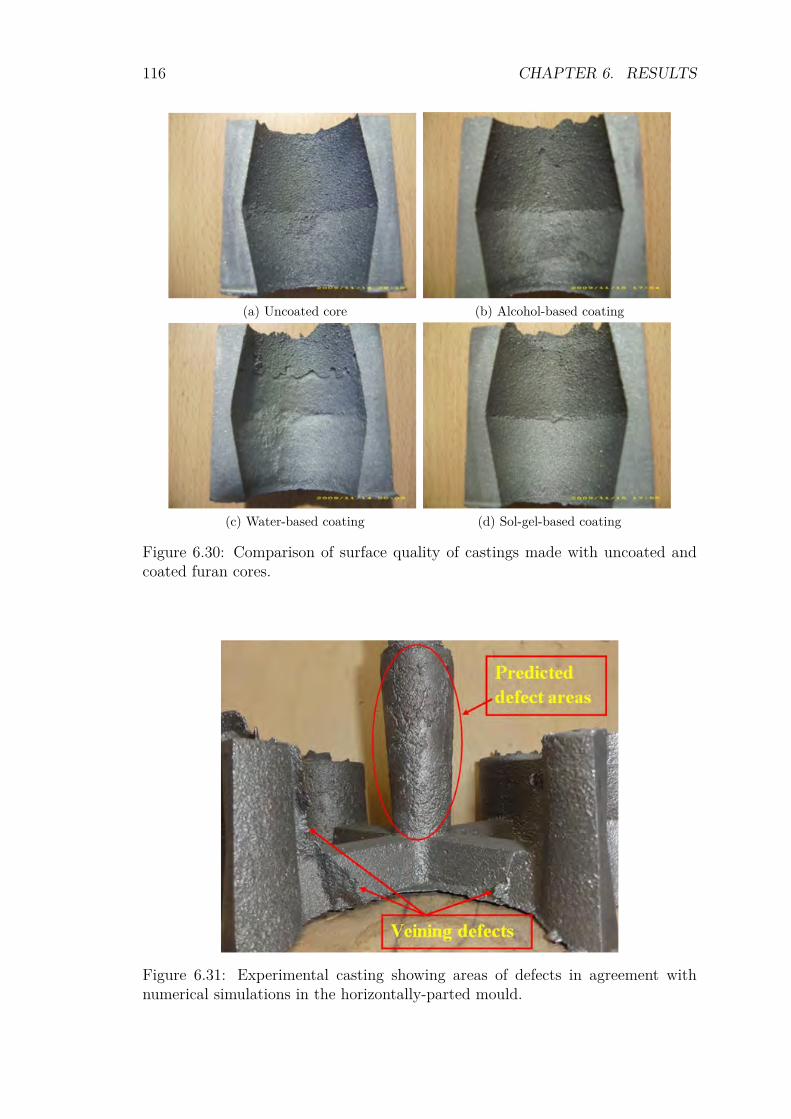
116 CHAPTER 6. RESULTS
(a) Uncoated core (b) Alcohol-based coating
(c) Water-based coating (d) Sol-gel-based coating
Figure 6.30: Comparison of surface quality of castings made with uncoated andcoated furan cores.
Figure 6.31: Experimental casting showing areas of defects in agreement withnumerical simulations in the horizontally-parted mould.
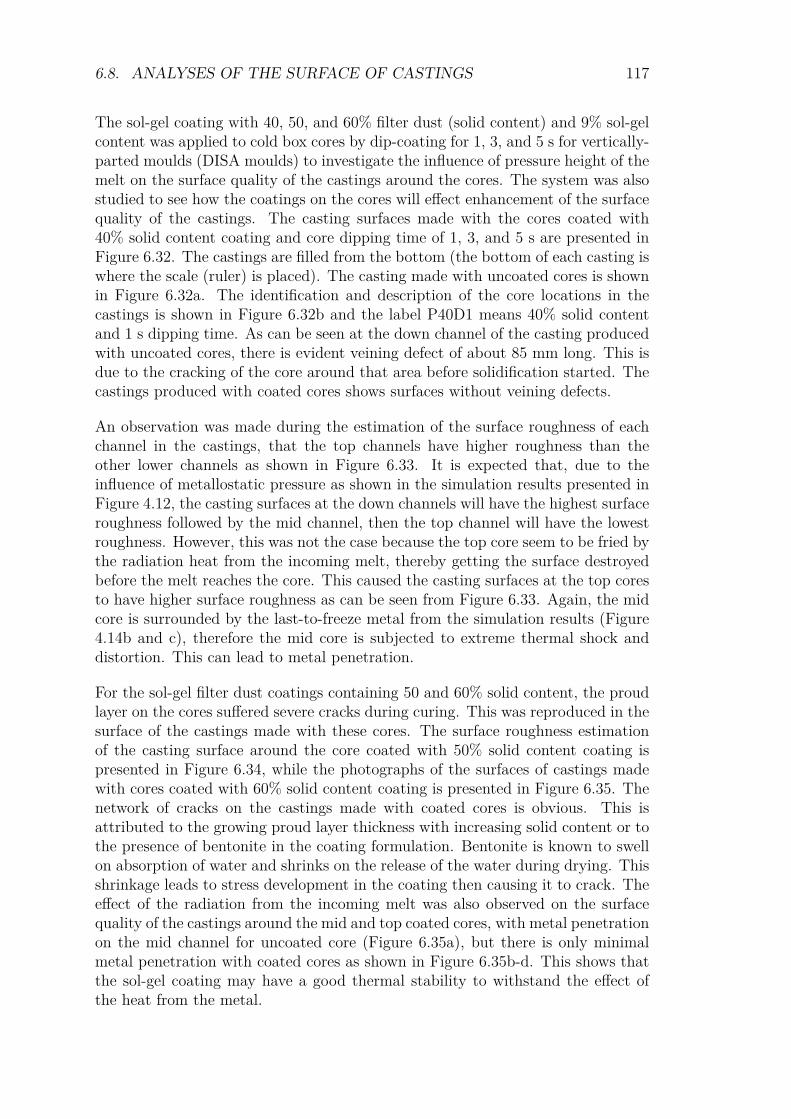
6.8. ANALYSES OF THE SURFACE OF CASTINGS 117
The sol-gel coating with 40, 50, and 60% filter dust (solid content) and 9% sol-gelcontent was applied to cold box cores by dip-coating for 1, 3, and 5 s for vertically-parted moulds (DISA moulds) to investigate the influence of pressure height of themelt on the surface quality of the castings around the cores. The system was alsostudied to see how the coatings on the cores will effect enhancement of the surfacequality of the castings. The casting surfaces made with the cores coated with40% solid content coating and core dipping time of 1, 3, and 5 s are presented inFigure 6.32. The castings are filled from the bottom (the bottom of each casting iswhere the scale (ruler) is placed). The casting made with uncoated cores is shownin Figure 6.32a. The identification and description of the core locations in thecastings is shown in Figure 6.32b and the label P40D1 means 40% solid contentand 1 s dipping time. As can be seen at the down channel of the casting producedwith uncoated cores, there is evident veining defect of about 85 mm long. This isdue to the cracking of the core around that area before solidification started. Thecastings produced with coated cores shows surfaces without veining defects.
An observation was made during the estimation of the surface roughness of eachchannel in the castings, that the top channels have higher roughness than theother lower channels as shown in Figure 6.33. It is expected that, due to theinfluence of metallostatic pressure as shown in the simulation results presented inFigure 4.12, the casting surfaces at the down channels will have the highest surfaceroughness followed by the mid channel, then the top channel will have the lowestroughness. However, this was not the case because the top core seem to be fried bythe radiation heat from the incoming melt, thereby getting the surface destroyedbefore the melt reaches the core. This caused the casting surfaces at the top coresto have higher surface roughness as can be seen from Figure 6.33. Again, the midcore is surrounded by the last-to-freeze metal from the simulation results (Figure4.14b and c), therefore the mid core is subjected to extreme thermal shock anddistortion. This can lead to metal penetration.
For the sol-gel filter dust coatings containing 50 and 60% solid content, the proudlayer on the cores suffered severe cracks during curing. This was reproduced in thesurface of the castings made with these cores. The surface roughness estimationof the casting surface around the core coated with 50% solid content coating ispresented in Figure 6.34, while the photographs of the surfaces of castings madewith cores coated with 60% solid content coating is presented in Figure 6.35. Thenetwork of cracks on the castings made with coated cores is obvious. This isattributed to the growing proud layer thickness with increasing solid content or tothe presence of bentonite in the coating formulation. Bentonite is known to swellon absorption of water and shrinks on the release of the water during drying. Thisshrinkage leads to stress development in the coating then causing it to crack. Theeffect of the radiation from the incoming melt was also observed on the surfacequality of the castings around the mid and top coated cores, with metal penetrationon the mid channel for uncoated core (Figure 6.35a), but there is only minimalmetal penetration with coated cores as shown in Figure 6.35b-d. This shows thatthe sol-gel coating may have a good thermal stability to withstand the effect ofthe heat from the metal.
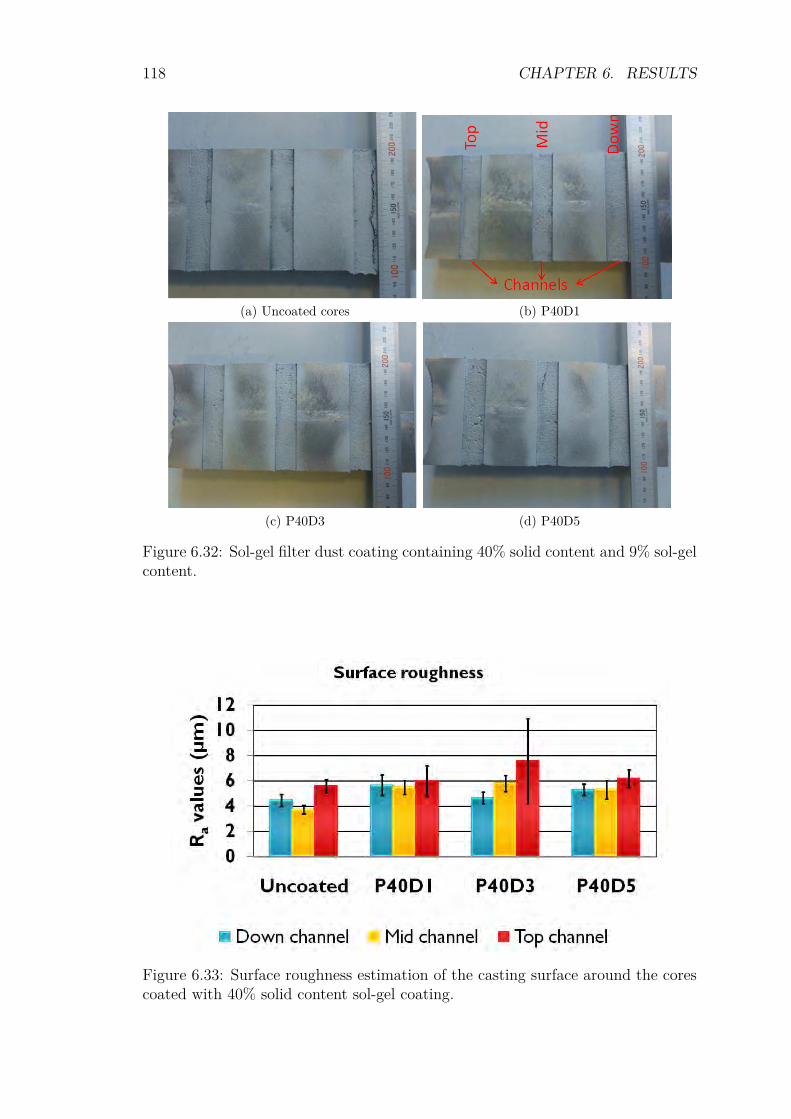
118 CHAPTER 6. RESULTS
(a) Uncoated cores (b) P40D1
(c) P40D3 (d) P40D5
Figure 6.32: Sol-gel filter dust coating containing 40% solid content and 9% sol-gelcontent.
Figure 6.33: Surface roughness estimation of the casting surface around the corescoated with 40% solid content sol-gel coating.
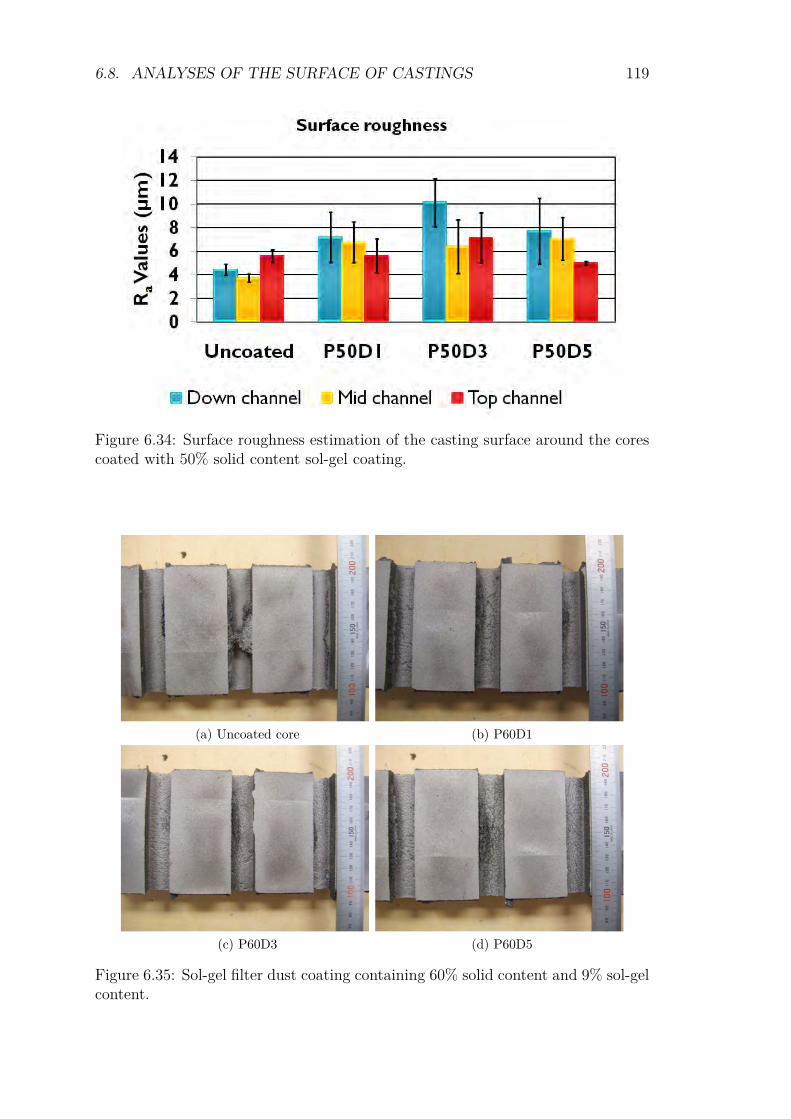
6.8. ANALYSES OF THE SURFACE OF CASTINGS 119
Figure 6.34: Surface roughness estimation of the casting surface around the corescoated with 50% solid content sol-gel coating.
(a) Uncoated core (b) P60D1
(c) P60D3 (d) P60D5
Figure 6.35: Sol-gel filter dust coating containing 60% solid content and 9% sol-gelcontent.
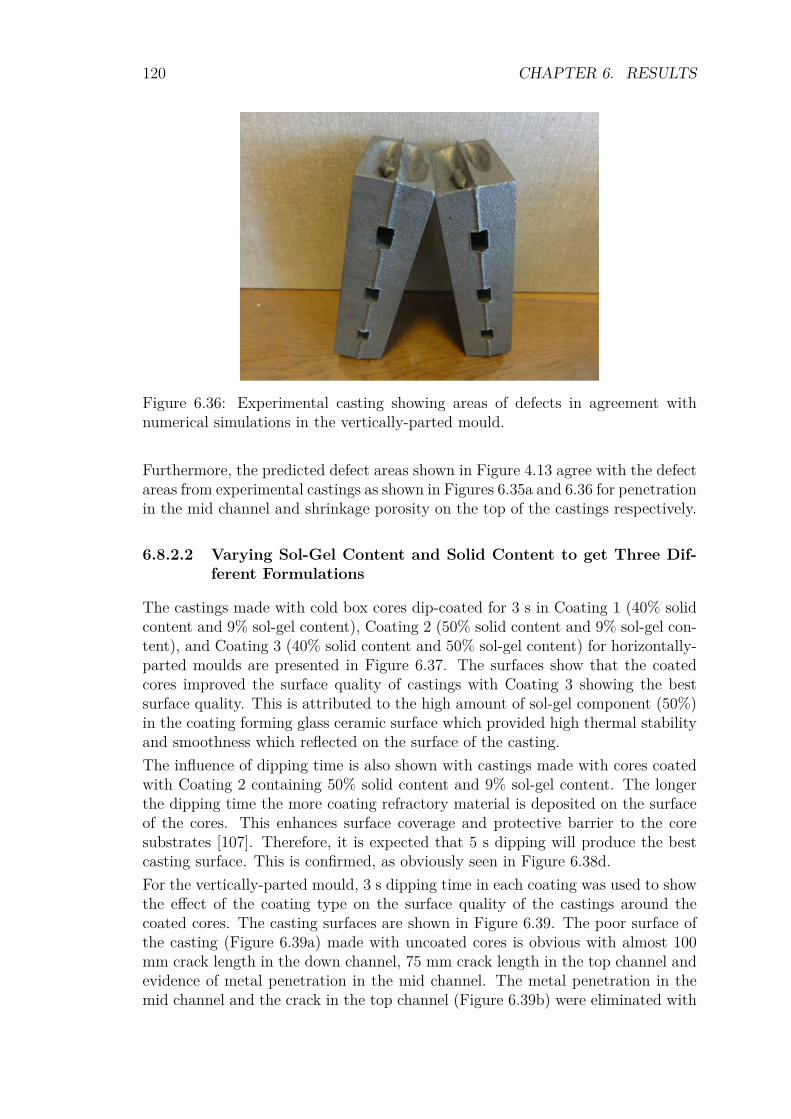
120 CHAPTER 6. RESULTS
Figure 6.36: Experimental casting showing areas of defects in agreement withnumerical simulations in the vertically-parted mould.
Furthermore, the predicted defect areas shown in Figure 4.13 agree with the defectareas from experimental castings as shown in Figures 6.35a and 6.36 for penetrationin the mid channel and shrinkage porosity on the top of the castings respectively.
6.8.2.2 Varying Sol-Gel Content and Solid Content to get Three Dif-ferent Formulations
The castings made with cold box cores dip-coated for 3 s in Coating 1 (40% solidcontent and 9% sol-gel content), Coating 2 (50% solid content and 9% sol-gel con-tent), and Coating 3 (40% solid content and 50% sol-gel content) for horizontally-parted moulds are presented in Figure 6.37. The surfaces show that the coatedcores improved the surface quality of castings with Coating 3 showing the bestsurface quality. This is attributed to the high amount of sol-gel component (50%)in the coating forming glass ceramic surface which provided high thermal stabilityand smoothness which reflected on the surface of the casting.The influence of dipping time is also shown with castings made with cores coatedwith Coating 2 containing 50% solid content and 9% sol-gel content. The longerthe dipping time the more coating refractory material is deposited on the surfaceof the cores. This enhances surface coverage and protective barrier to the coresubstrates [107]. Therefore, it is expected that 5 s dipping will produce the bestcasting surface. This is confirmed, as obviously seen in Figure 6.38d.For the vertically-parted mould, 3 s dipping time in each coating was used to showthe effect of the coating type on the surface quality of the castings around thecoated cores. The casting surfaces are shown in Figure 6.39. The poor surface ofthe casting (Figure 6.39a) made with uncoated cores is obvious with almost 100mm crack length in the down channel, 75 mm crack length in the top channel andevidence of metal penetration in the mid channel. The metal penetration in themid channel and the crack in the top channel (Figure 6.39b) were eliminated with
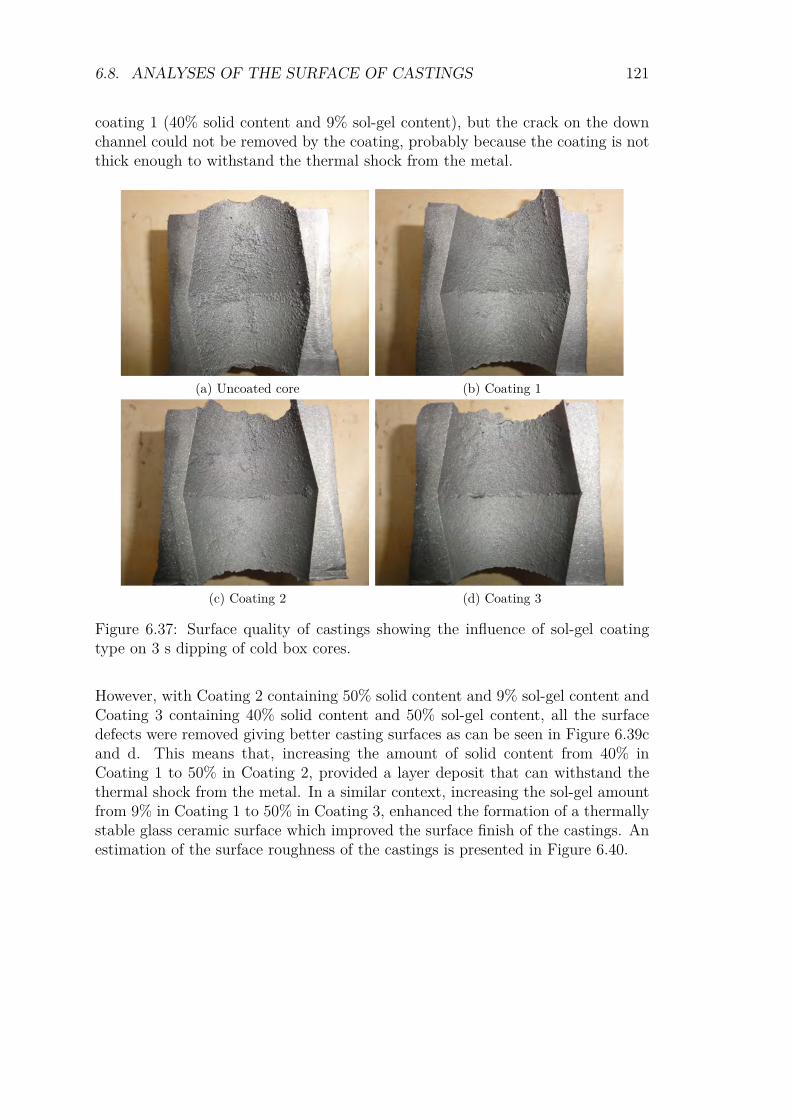
6.8. ANALYSES OF THE SURFACE OF CASTINGS 121
coating 1 (40% solid content and 9% sol-gel content), but the crack on the downchannel could not be removed by the coating, probably because the coating is notthick enough to withstand the thermal shock from the metal.
(a) Uncoated core (b) Coating 1
(c) Coating 2 (d) Coating 3
Figure 6.37: Surface quality of castings showing the influence of sol-gel coatingtype on 3 s dipping of cold box cores.
However, with Coating 2 containing 50% solid content and 9% sol-gel content andCoating 3 containing 40% solid content and 50% sol-gel content, all the surfacedefects were removed giving better casting surfaces as can be seen in Figure 6.39cand d. This means that, increasing the amount of solid content from 40% inCoating 1 to 50% in Coating 2, provided a layer deposit that can withstand thethermal shock from the metal. In a similar context, increasing the sol-gel amountfrom 9% in Coating 1 to 50% in Coating 3, enhanced the formation of a thermallystable glass ceramic surface which improved the surface finish of the castings. Anestimation of the surface roughness of the castings is presented in Figure 6.40.
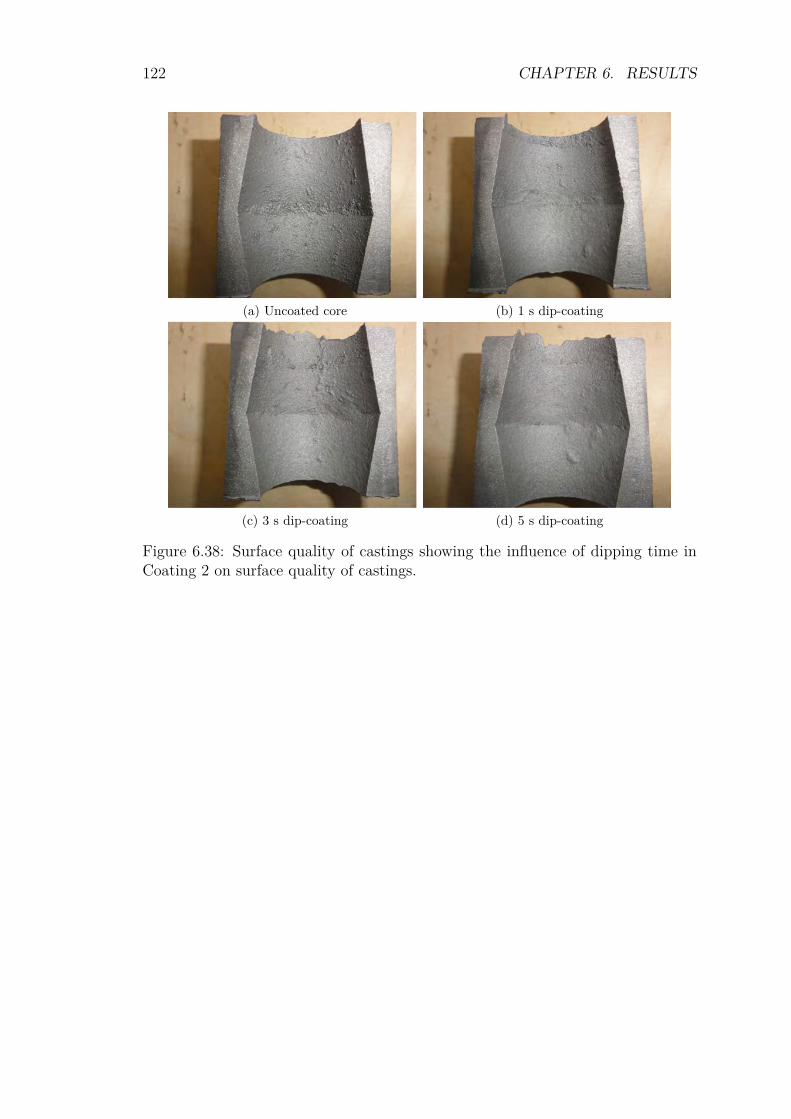
122 CHAPTER 6. RESULTS
(a) Uncoated core (b) 1 s dip-coating
(c) 3 s dip-coating (d) 5 s dip-coating
Figure 6.38: Surface quality of castings showing the influence of dipping time inCoating 2 on surface quality of castings.
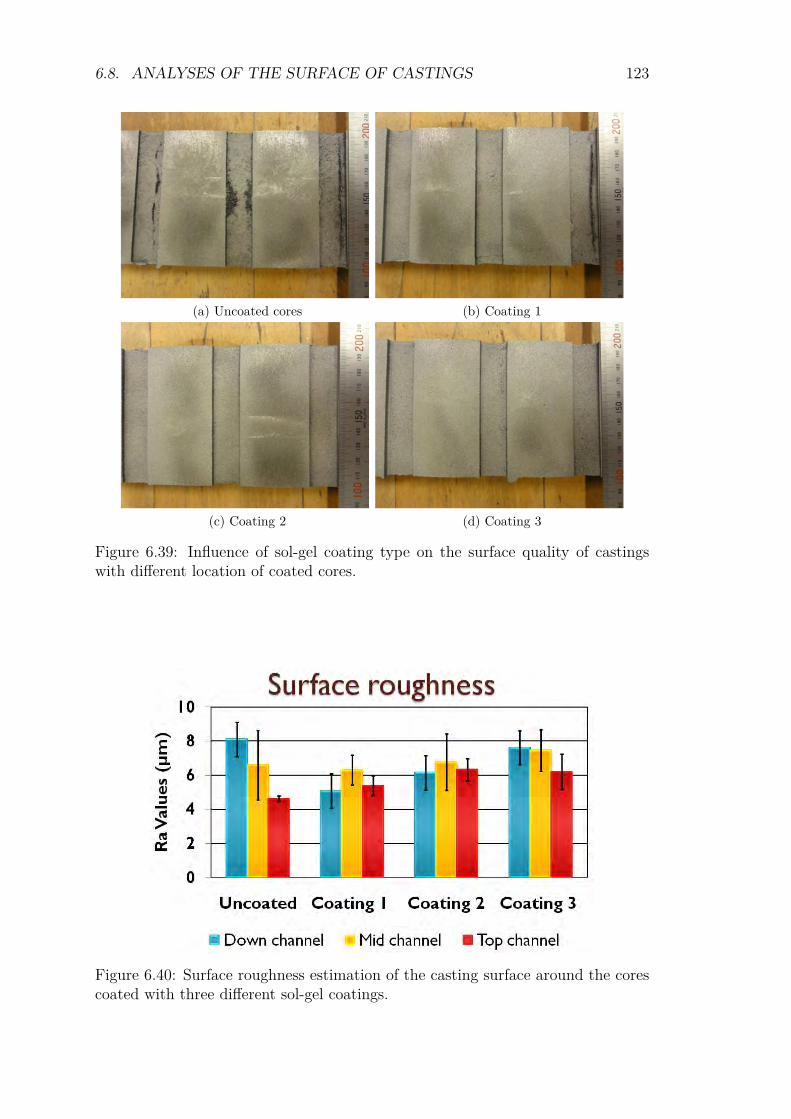
6.8. ANALYSES OF THE SURFACE OF CASTINGS 123
(a) Uncoated cores (b) Coating 1
(c) Coating 2 (d) Coating 3
Figure 6.39: Influence of sol-gel coating type on the surface quality of castingswith different location of coated cores.
Figure 6.40: Surface roughness estimation of the casting surface around the corescoated with three different sol-gel coatings.
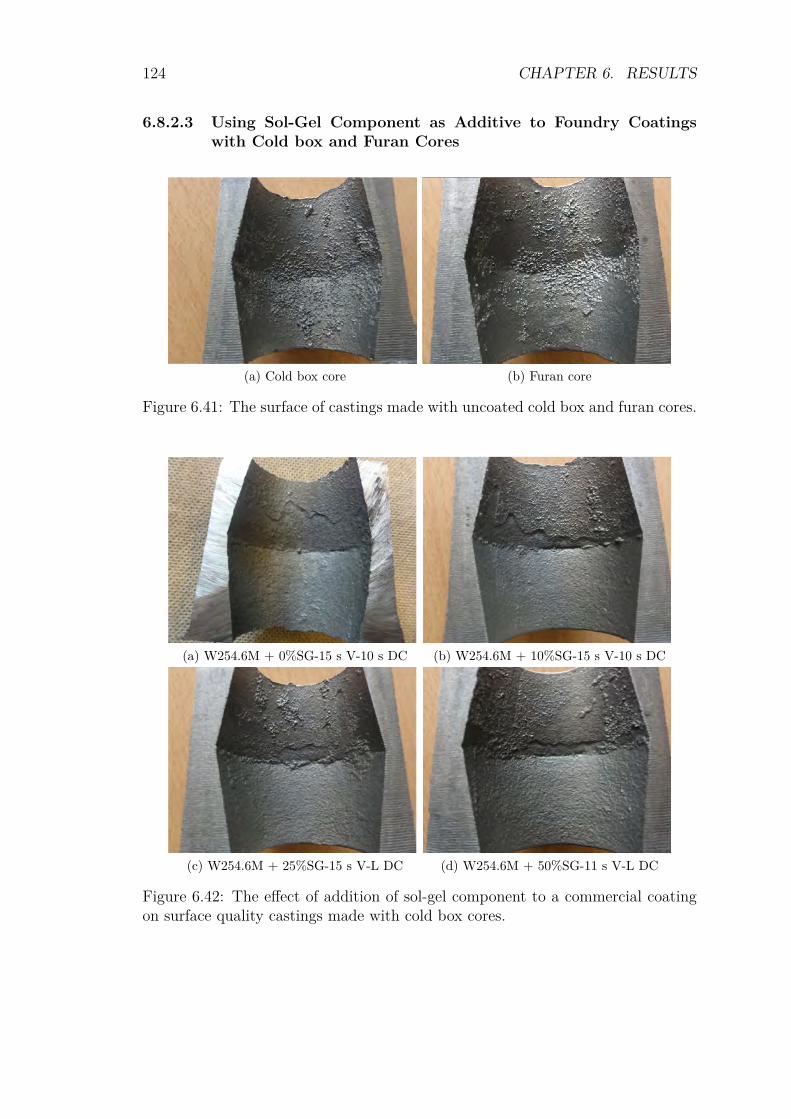
124 CHAPTER 6. RESULTS
6.8.2.3 Using Sol-Gel Component as Additive to Foundry Coatingswith Cold box and Furan Cores
(a) Cold box core (b) Furan core
Figure 6.41: The surface of castings made with uncoated cold box and furan cores.
(a) W254.6M + 0%SG-15 s V-10 s DC (b) W254.6M + 10%SG-15 s V-10 s DC
(c) W254.6M + 25%SG-15 s V-L DC (d) W254.6M + 50%SG-11 s V-L DC
Figure 6.42: The effect of addition of sol-gel component to a commercial coatingon surface quality castings made with cold box cores.
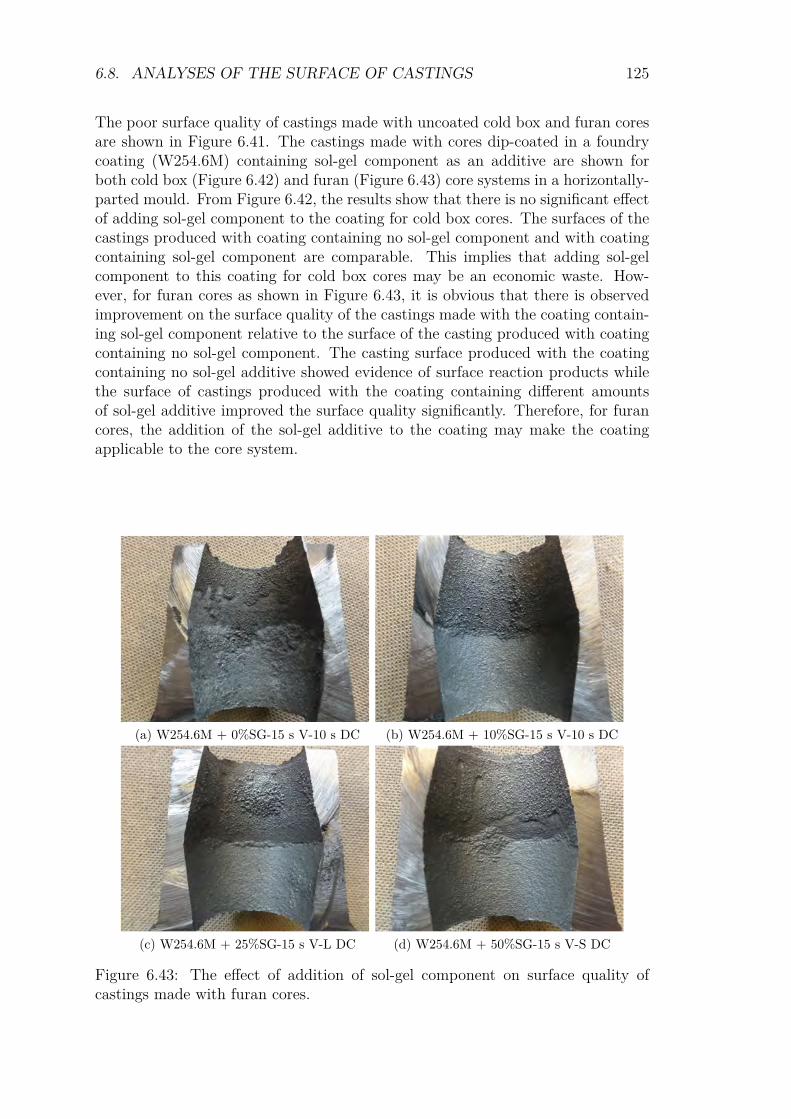
6.8. ANALYSES OF THE SURFACE OF CASTINGS 125
The poor surface quality of castings made with uncoated cold box and furan coresare shown in Figure 6.41. The castings made with cores dip-coated in a foundrycoating (W254.6M) containing sol-gel component as an additive are shown forboth cold box (Figure 6.42) and furan (Figure 6.43) core systems in a horizontally-parted mould. From Figure 6.42, the results show that there is no significant effectof adding sol-gel component to the coating for cold box cores. The surfaces of thecastings produced with coating containing no sol-gel component and with coatingcontaining sol-gel component are comparable. This implies that adding sol-gelcomponent to this coating for cold box cores may be an economic waste. How-ever, for furan cores as shown in Figure 6.43, it is obvious that there is observedimprovement on the surface quality of the castings made with the coating contain-ing sol-gel component relative to the surface of the casting produced with coatingcontaining no sol-gel component. The casting surface produced with the coatingcontaining no sol-gel additive showed evidence of surface reaction products whilethe surface of castings produced with the coating containing different amountsof sol-gel additive improved the surface quality significantly. Therefore, for furancores, the addition of the sol-gel additive to the coating may make the coatingapplicable to the core system.
(a) W254.6M + 0%SG-15 s V-10 s DC (b) W254.6M + 10%SG-15 s V-10 s DC
(c) W254.6M + 25%SG-15 s V-L DC (d) W254.6M + 50%SG-15 s V-S DC
Figure 6.43: The effect of addition of sol-gel component on surface quality ofcastings made with furan cores.
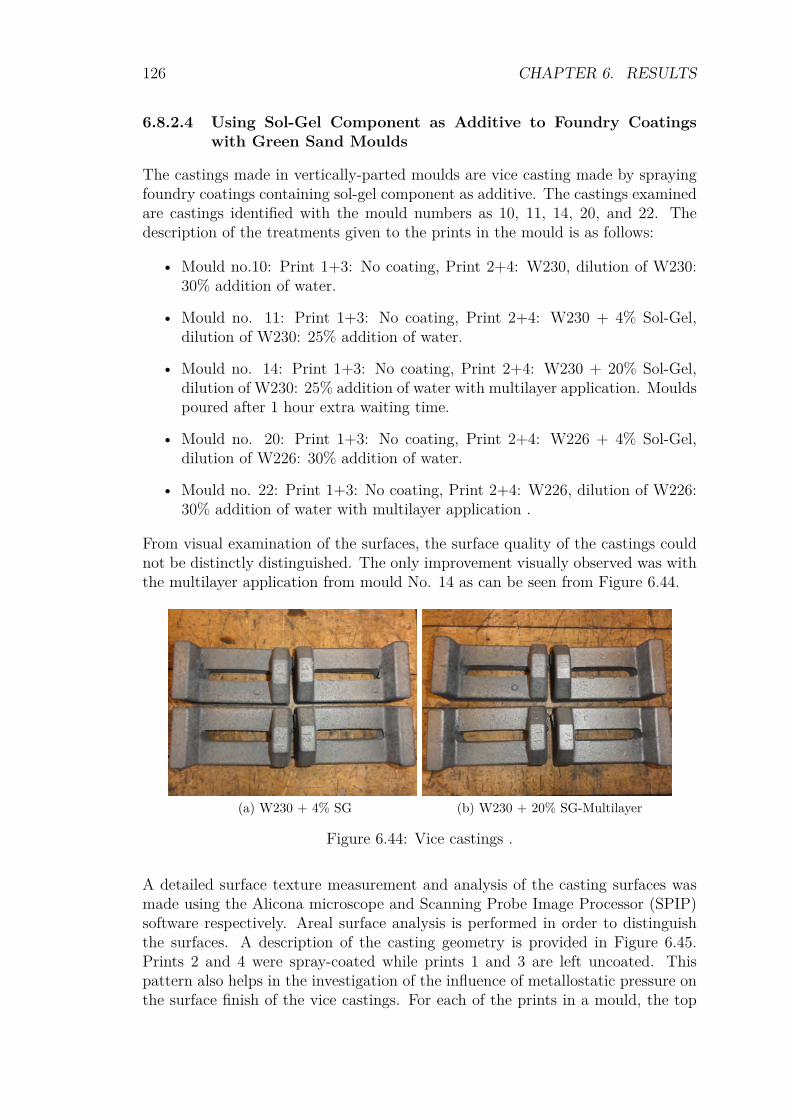
126 CHAPTER 6. RESULTS
6.8.2.4 Using Sol-Gel Component as Additive to Foundry Coatingswith Green Sand Moulds
The castings made in vertically-parted moulds are vice casting made by sprayingfoundry coatings containing sol-gel component as additive. The castings examinedare castings identified with the mould numbers as 10, 11, 14, 20, and 22. Thedescription of the treatments given to the prints in the mould is as follows:
• Mould no.10: Print 1+3: No coating, Print 2+4: W230, dilution of W230:30% addition of water.
• Mould no. 11: Print 1+3: No coating, Print 2+4: W230 + 4% Sol-Gel,dilution of W230: 25% addition of water.
• Mould no. 14: Print 1+3: No coating, Print 2+4: W230 + 20% Sol-Gel,dilution of W230: 25% addition of water with multilayer application. Mouldspoured after 1 hour extra waiting time.
• Mould no. 20: Print 1+3: No coating, Print 2+4: W226 + 4% Sol-Gel,dilution of W226: 30% addition of water.
• Mould no. 22: Print 1+3: No coating, Print 2+4: W226, dilution of W226:30% addition of water with multilayer application .
From visual examination of the surfaces, the surface quality of the castings couldnot be distinctly distinguished. The only improvement visually observed was withthe multilayer application from mould No. 14 as can be seen from Figure 6.44.
(a) W230 + 4% SG (b) W230 + 20% SG-Multilayer
Figure 6.44: Vice castings .
A detailed surface texture measurement and analysis of the casting surfaces wasmade using the Alicona microscope and Scanning Probe Image Processor (SPIP)software respectively. Areal surface analysis is performed in order to distinguishthe surfaces. A description of the casting geometry is provided in Figure 6.45.Prints 2 and 4 were spray-coated while prints 1 and 3 are left uncoated. Thispattern also helps in the investigation of the influence of metallostatic pressure onthe surface finish of the vice castings. For each of the prints in a mould, the top
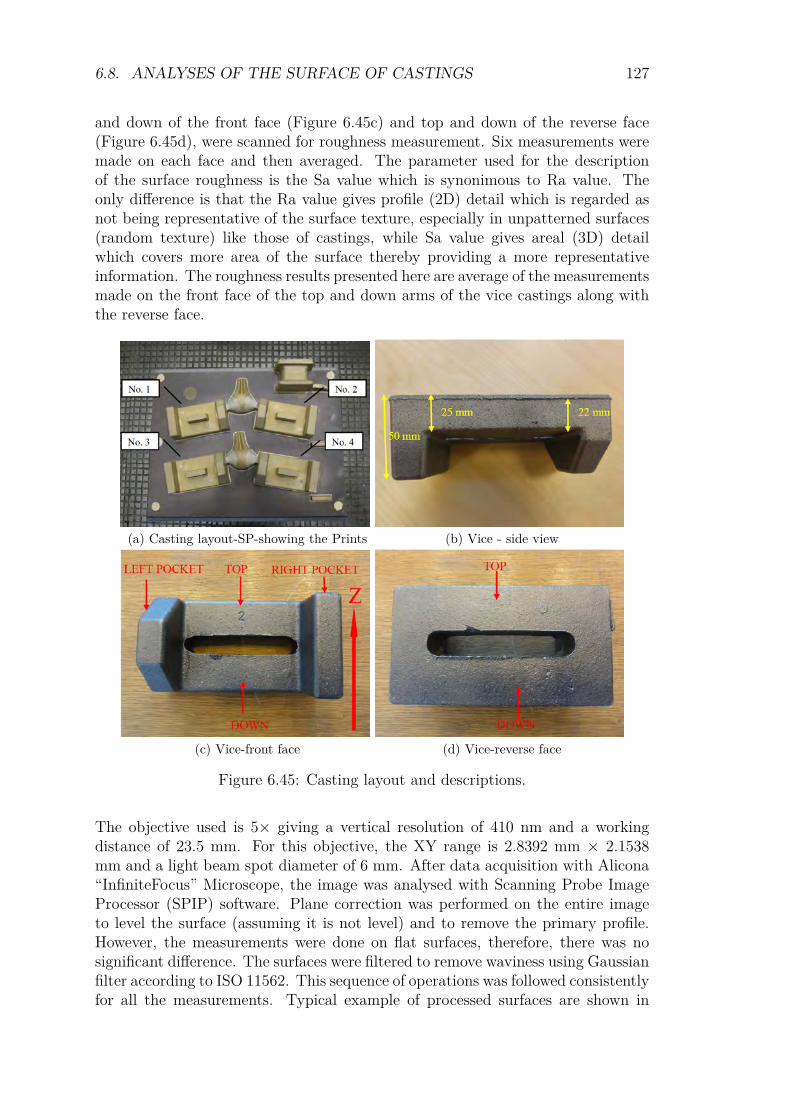
6.8. ANALYSES OF THE SURFACE OF CASTINGS 127
and down of the front face (Figure 6.45c) and top and down of the reverse face(Figure 6.45d), were scanned for roughness measurement. Six measurements weremade on each face and then averaged. The parameter used for the descriptionof the surface roughness is the Sa value which is synonimous to Ra value. Theonly difference is that the Ra value gives profile (2D) detail which is regarded asnot being representative of the surface texture, especially in unpatterned surfaces(random texture) like those of castings, while Sa value gives areal (3D) detailwhich covers more area of the surface thereby providing a more representativeinformation. The roughness results presented here are average of the measurementsmade on the front face of the top and down arms of the vice castings along withthe reverse face.
(a) Casting layout-SP-showing the Prints (b) Vice - side view
(c) Vice-front face (d) Vice-reverse face
Figure 6.45: Casting layout and descriptions.
The objective used is 5× giving a vertical resolution of 410 nm and a workingdistance of 23.5 mm. For this objective, the XY range is 2.8392 mm × 2.1538mm and a light beam spot diameter of 6 mm. After data acquisition with Alicona“InfiniteFocus” Microscope, the image was analysed with Scanning Probe ImageProcessor (SPIP) software. Plane correction was performed on the entire imageto level the surface (assuming it is not level) and to remove the primary profile.However, the measurements were done on flat surfaces, therefore, there was nosignificant difference. The surfaces were filtered to remove waviness using Gaussianfilter according to ISO 11562. This sequence of operations was followed consistentlyfor all the measurements. Typical example of processed surfaces are shown in
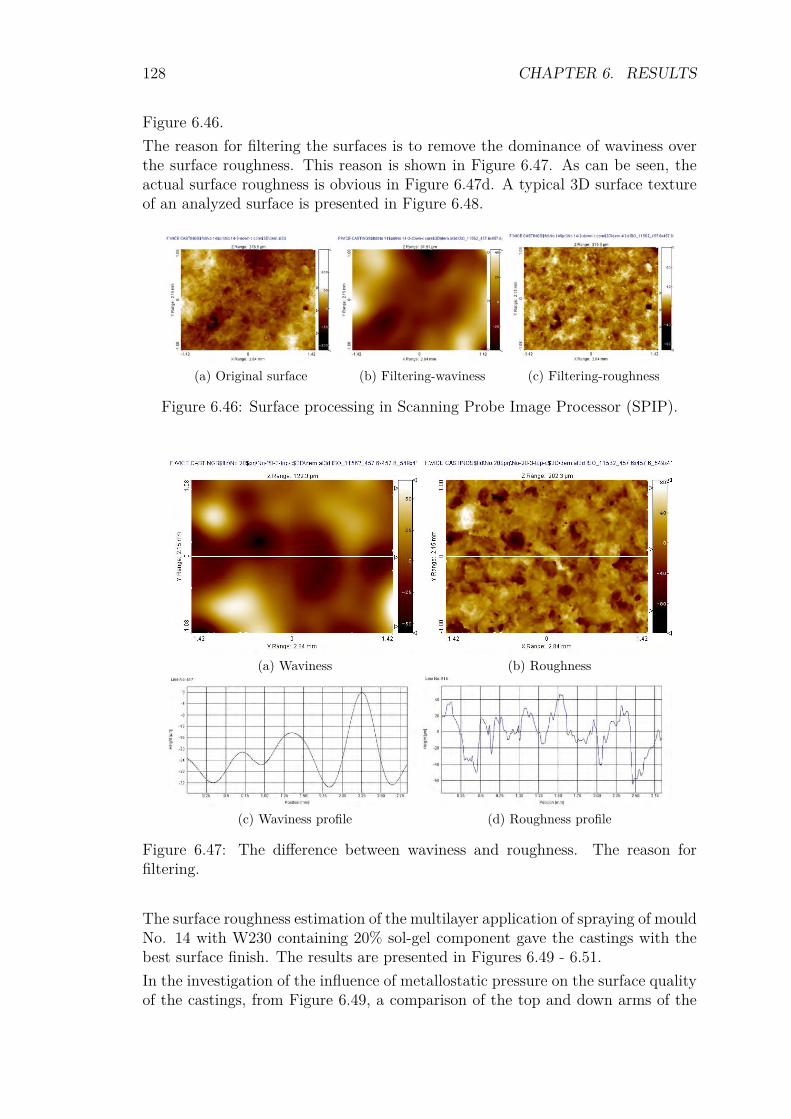
128 CHAPTER 6. RESULTS
Figure 6.46.The reason for filtering the surfaces is to remove the dominance of waviness overthe surface roughness. This reason is shown in Figure 6.47. As can be seen, theactual surface roughness is obvious in Figure 6.47d. A typical 3D surface textureof an analyzed surface is presented in Figure 6.48.
(a) Original surface (b) Filtering-waviness (c) Filtering-roughness
Figure 6.46: Surface processing in Scanning Probe Image Processor (SPIP).
(a) Waviness (b) Roughness
(c) Waviness profile (d) Roughness profile
Figure 6.47: The difference between waviness and roughness. The reason forfiltering.
The surface roughness estimation of the multilayer application of spraying of mouldNo. 14 with W230 containing 20% sol-gel component gave the castings with thebest surface finish. The results are presented in Figures 6.49 - 6.51.In the investigation of the influence of metallostatic pressure on the surface qualityof the castings, from Figure 6.49, a comparison of the top and down arms of the
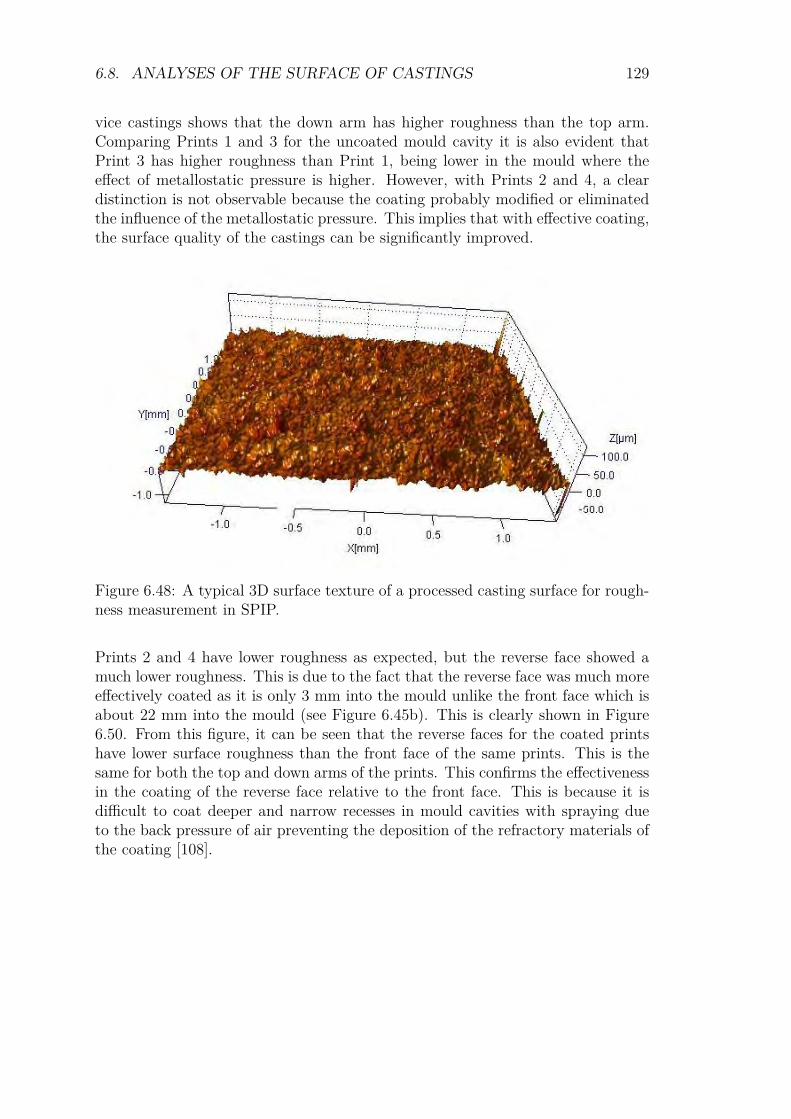
6.8. ANALYSES OF THE SURFACE OF CASTINGS 129
vice castings shows that the down arm has higher roughness than the top arm.Comparing Prints 1 and 3 for the uncoated mould cavity it is also evident thatPrint 3 has higher roughness than Print 1, being lower in the mould where theeffect of metallostatic pressure is higher. However, with Prints 2 and 4, a cleardistinction is not observable because the coating probably modified or eliminatedthe influence of the metallostatic pressure. This implies that with effective coating,the surface quality of the castings can be significantly improved.
Figure 6.48: A typical 3D surface texture of a processed casting surface for rough-ness measurement in SPIP.
Prints 2 and 4 have lower roughness as expected, but the reverse face showed amuch lower roughness. This is due to the fact that the reverse face was much moreeffectively coated as it is only 3 mm into the mould unlike the front face which isabout 22 mm into the mould (see Figure 6.45b). This is clearly shown in Figure6.50. From this figure, it can be seen that the reverse faces for the coated printshave lower surface roughness than the front face of the same prints. This is thesame for both the top and down arms of the prints. This confirms the effectivenessin the coating of the reverse face relative to the front face. This is because it isdifficult to coat deeper and narrow recesses in mould cavities with spraying dueto the back pressure of air preventing the deposition of the refractory materials ofthe coating [108].
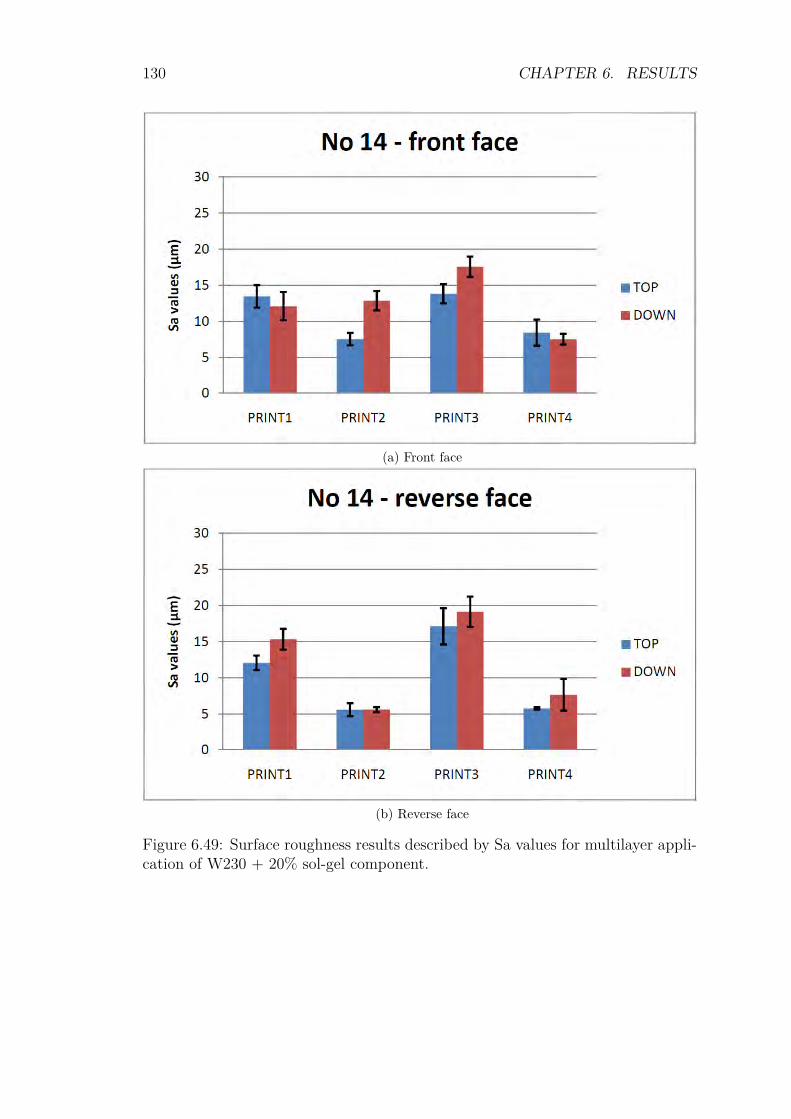
130 CHAPTER 6. RESULTS
(a) Front face
(b) Reverse face
Figure 6.49: Surface roughness results described by Sa values for multilayer appli-cation of W230 + 20% sol-gel component.
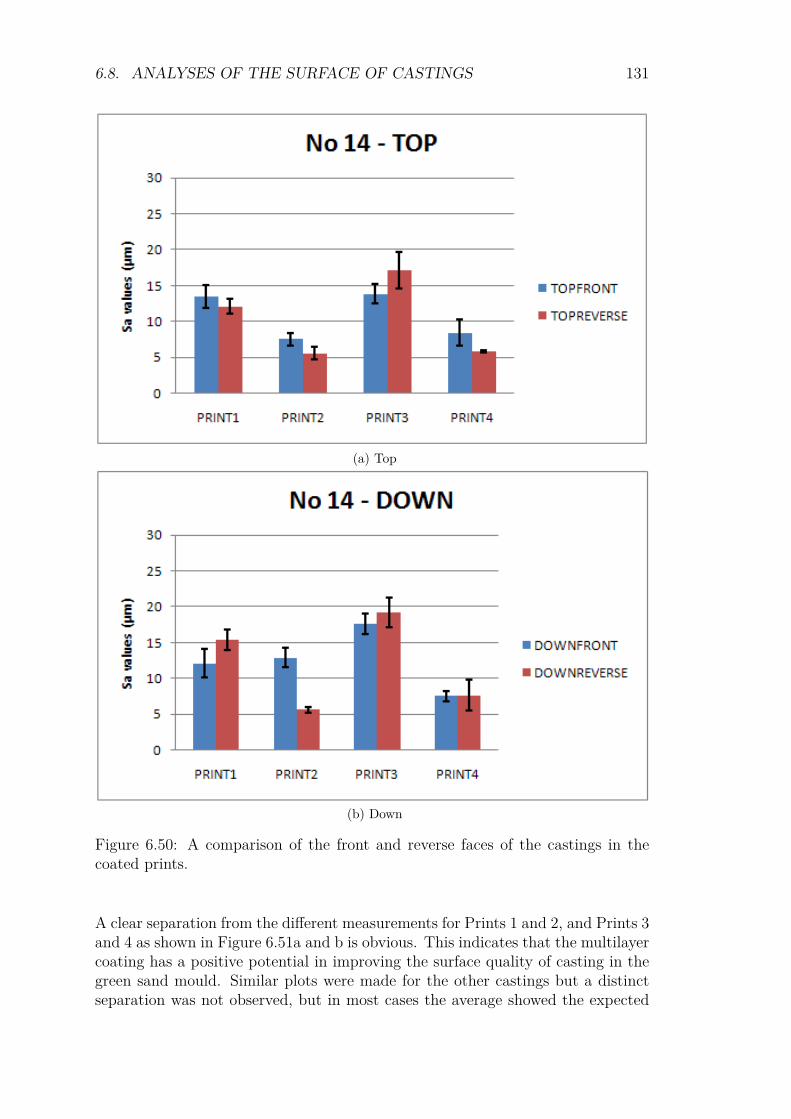
6.8. ANALYSES OF THE SURFACE OF CASTINGS 131
(a) Top
(b) Down
Figure 6.50: A comparison of the front and reverse faces of the castings in thecoated prints.
A clear separation from the different measurements for Prints 1 and 2, and Prints 3and 4 as shown in Figure 6.51a and b is obvious. This indicates that the multilayercoating has a positive potential in improving the surface quality of casting in thegreen sand mould. Similar plots were made for the other castings but a distinctseparation was not observed, but in most cases the average showed the expected
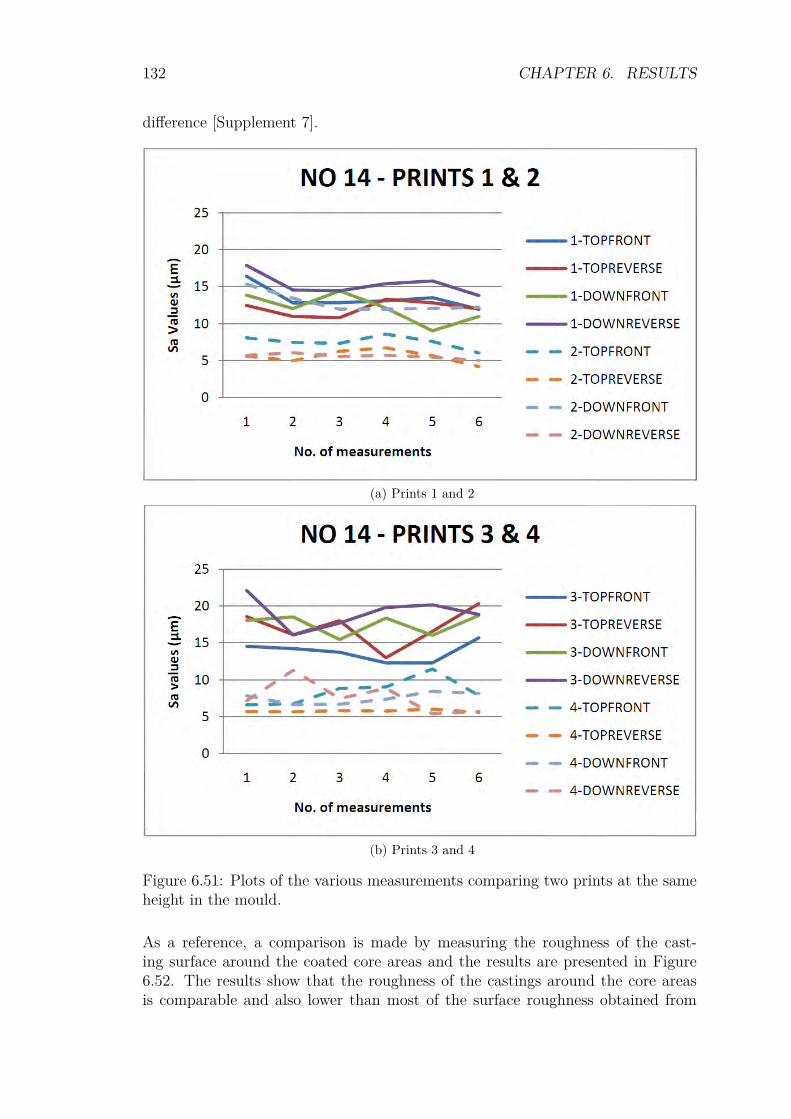
132 CHAPTER 6. RESULTS
difference [Supplement 7].
(a) Prints 1 and 2
(b) Prints 3 and 4
Figure 6.51: Plots of the various measurements comparing two prints at the sameheight in the mould.
As a reference, a comparison is made by measuring the roughness of the cast-ing surface around the coated core areas and the results are presented in Figure6.52. The results show that the roughness of the castings around the core areasis comparable and also lower than most of the surface roughness obtained from
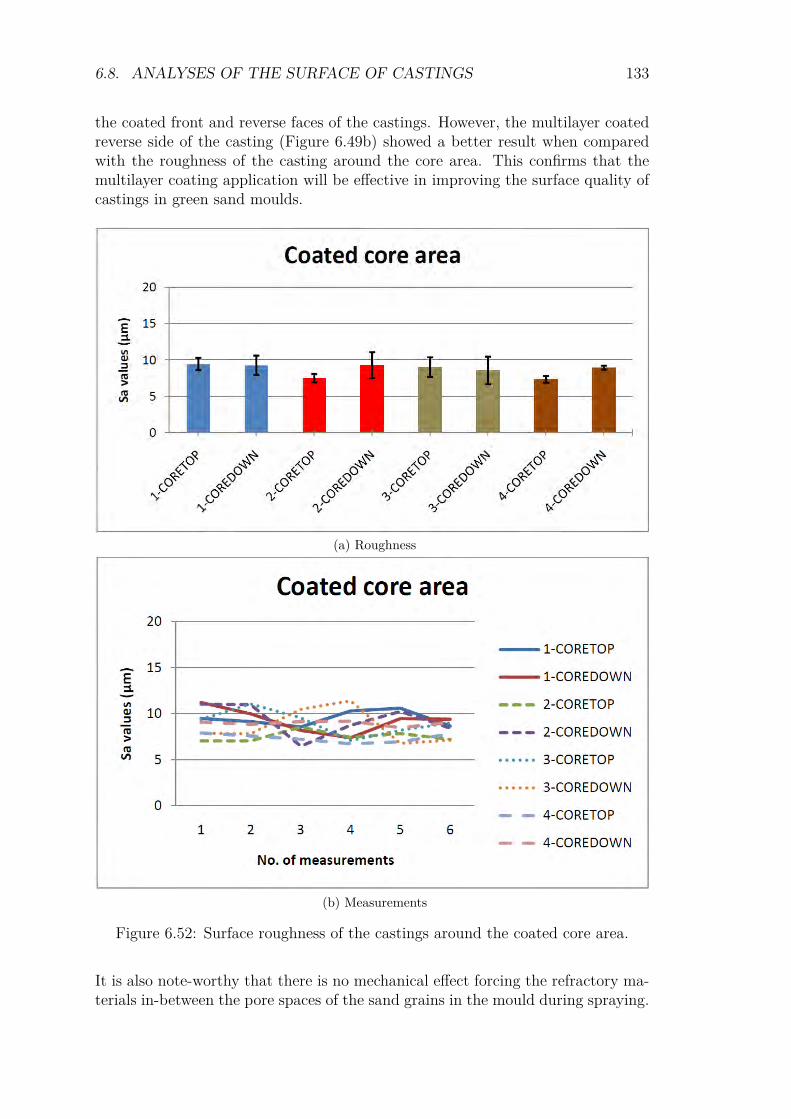
6.8. ANALYSES OF THE SURFACE OF CASTINGS 133
the coated front and reverse faces of the castings. However, the multilayer coatedreverse side of the casting (Figure 6.49b) showed a better result when comparedwith the roughness of the casting around the core area. This confirms that themultilayer coating application will be effective in improving the surface quality ofcastings in green sand moulds.
(a) Roughness
(b) Measurements
Figure 6.52: Surface roughness of the castings around the coated core area.
It is also note-worthy that there is no mechanical effect forcing the refractory ma-terials in-between the pore spaces of the sand grains in the mould during spraying.
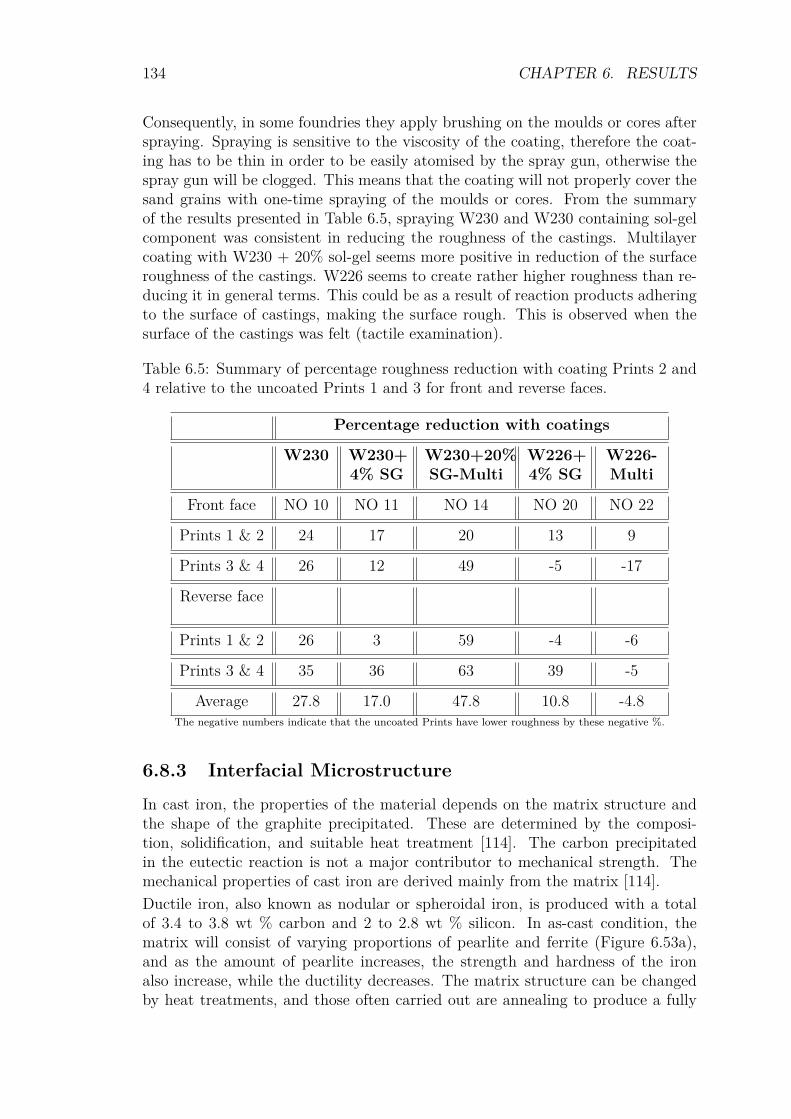
134 CHAPTER 6. RESULTS
Consequently, in some foundries they apply brushing on the moulds or cores afterspraying. Spraying is sensitive to the viscosity of the coating, therefore the coat-ing has to be thin in order to be easily atomised by the spray gun, otherwise thespray gun will be clogged. This means that the coating will not properly cover thesand grains with one-time spraying of the moulds or cores. From the summaryof the results presented in Table 6.5, spraying W230 and W230 containing sol-gelcomponent was consistent in reducing the roughness of the castings. Multilayercoating with W230 + 20% sol-gel seems more positive in reduction of the surfaceroughness of the castings. W226 seems to create rather higher roughness than re-ducing it in general terms. This could be as a result of reaction products adheringto the surface of castings, making the surface rough. This is observed when thesurface of the castings was felt (tactile examination).
Table 6.5: Summary of percentage roughness reduction with coating Prints 2 and4 relative to the uncoated Prints 1 and 3 for front and reverse faces.
Percentage reduction with coatings
W230 W230+4% SG
W230+20%SG-Multi
W226+4% SG
W226-Multi
Front face NO 10 NO 11 NO 14 NO 20 NO 22
Prints 1 & 2 24 17 20 13 9
Prints 3 & 4 26 12 49 -5 -17
Reverse face
Prints 1 & 2 26 3 59 -4 -6
Prints 3 & 4 35 36 63 39 -5
Average 27.8 17.0 47.8 10.8 -4.8The negative numbers indicate that the uncoated Prints have lower roughness by these negative %.
6.8.3 Interfacial MicrostructureIn cast iron, the properties of the material depends on the matrix structure andthe shape of the graphite precipitated. These are determined by the composi-tion, solidification, and suitable heat treatment [114]. The carbon precipitatedin the eutectic reaction is not a major contributor to mechanical strength. Themechanical properties of cast iron are derived mainly from the matrix [114].Ductile iron, also known as nodular or spheroidal iron, is produced with a totalof 3.4 to 3.8 wt % carbon and 2 to 2.8 wt % silicon. In as-cast condition, thematrix will consist of varying proportions of pearlite and ferrite (Figure 6.53a),and as the amount of pearlite increases, the strength and hardness of the ironalso increase, while the ductility decreases. The matrix structure can be changedby heat treatments, and those often carried out are annealing to produce a fully
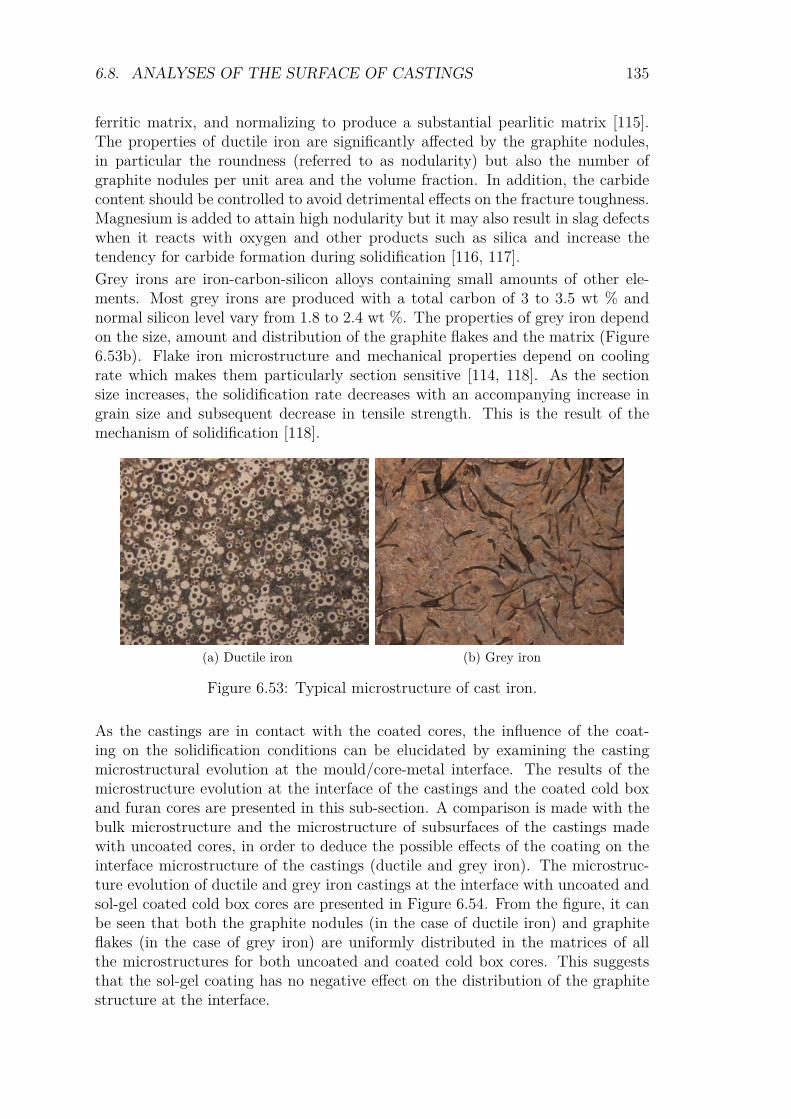
6.8. ANALYSES OF THE SURFACE OF CASTINGS 135
ferritic matrix, and normalizing to produce a substantial pearlitic matrix [115].The properties of ductile iron are significantly affected by the graphite nodules,in particular the roundness (referred to as nodularity) but also the number ofgraphite nodules per unit area and the volume fraction. In addition, the carbidecontent should be controlled to avoid detrimental effects on the fracture toughness.Magnesium is added to attain high nodularity but it may also result in slag defectswhen it reacts with oxygen and other products such as silica and increase thetendency for carbide formation during solidification [116, 117].Grey irons are iron-carbon-silicon alloys containing small amounts of other ele-ments. Most grey irons are produced with a total carbon of 3 to 3.5 wt % andnormal silicon level vary from 1.8 to 2.4 wt %. The properties of grey iron dependon the size, amount and distribution of the graphite flakes and the matrix (Figure6.53b). Flake iron microstructure and mechanical properties depend on coolingrate which makes them particularly section sensitive [114, 118]. As the sectionsize increases, the solidification rate decreases with an accompanying increase ingrain size and subsequent decrease in tensile strength. This is the result of themechanism of solidification [118].
(a) Ductile iron (b) Grey iron
Figure 6.53: Typical microstructure of cast iron.
As the castings are in contact with the coated cores, the influence of the coat-ing on the solidification conditions can be elucidated by examining the castingmicrostructural evolution at the mould/core-metal interface. The results of themicrostructure evolution at the interface of the castings and the coated cold boxand furan cores are presented in this sub-section. A comparison is made with thebulk microstructure and the microstructure of subsurfaces of the castings madewith uncoated cores, in order to deduce the possible effects of the coating on theinterface microstructure of the castings (ductile and grey iron). The microstruc-ture evolution of ductile and grey iron castings at the interface with uncoated andsol-gel coated cold box cores are presented in Figure 6.54. From the figure, it canbe seen that both the graphite nodules (in the case of ductile iron) and graphiteflakes (in the case of grey iron) are uniformly distributed in the matrices of allthe microstructures for both uncoated and coated cold box cores. This suggeststhat the sol-gel coating has no negative effect on the distribution of the graphitestructure at the interface.
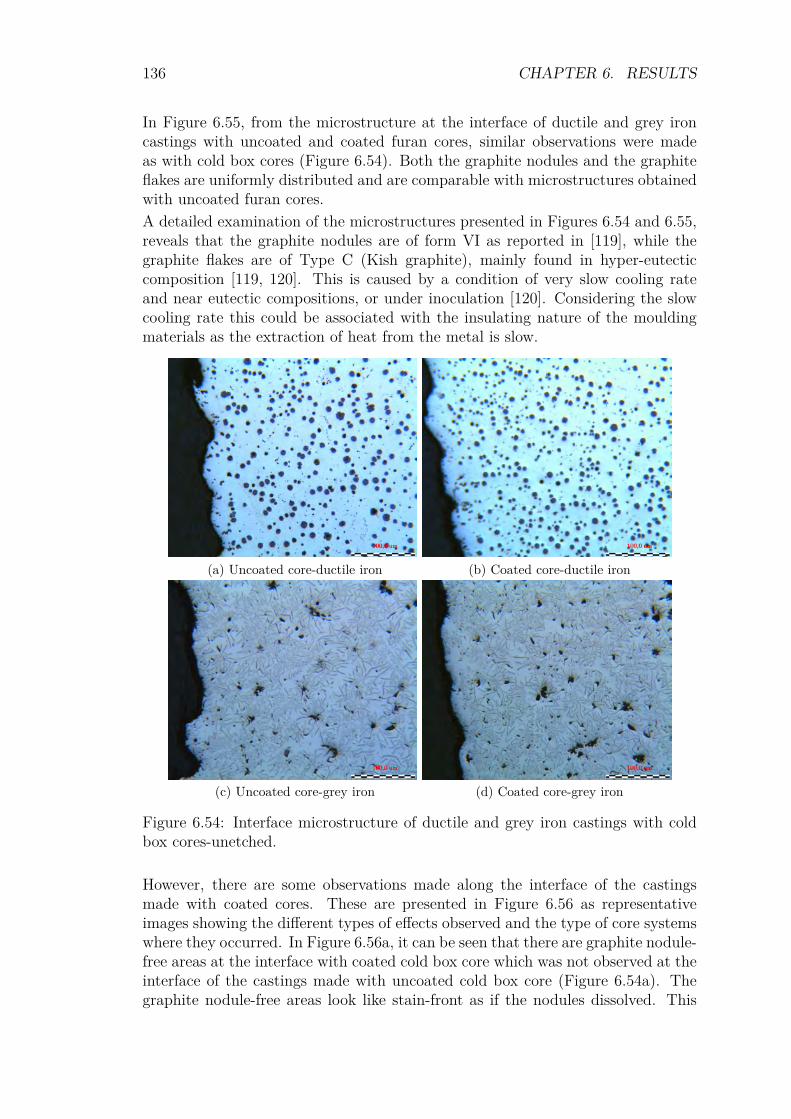
136 CHAPTER 6. RESULTS
In Figure 6.55, from the microstructure at the interface of ductile and grey ironcastings with uncoated and coated furan cores, similar observations were madeas with cold box cores (Figure 6.54). Both the graphite nodules and the graphiteflakes are uniformly distributed and are comparable with microstructures obtainedwith uncoated furan cores.A detailed examination of the microstructures presented in Figures 6.54 and 6.55,reveals that the graphite nodules are of form VI as reported in [119], while thegraphite flakes are of Type C (Kish graphite), mainly found in hyper-eutecticcomposition [119, 120]. This is caused by a condition of very slow cooling rateand near eutectic compositions, or under inoculation [120]. Considering the slowcooling rate this could be associated with the insulating nature of the mouldingmaterials as the extraction of heat from the metal is slow.
(a) Uncoated core-ductile iron (b) Coated core-ductile iron
(c) Uncoated core-grey iron (d) Coated core-grey iron
Figure 6.54: Interface microstructure of ductile and grey iron castings with coldbox cores-unetched.
However, there are some observations made along the interface of the castingsmade with coated cores. These are presented in Figure 6.56 as representativeimages showing the different types of effects observed and the type of core systemswhere they occurred. In Figure 6.56a, it can be seen that there are graphite nodule-free areas at the interface with coated cold box core which was not observed at theinterface of the castings made with uncoated cold box core (Figure 6.54a). Thegraphite nodule-free areas look like stain-front as if the nodules dissolved. This
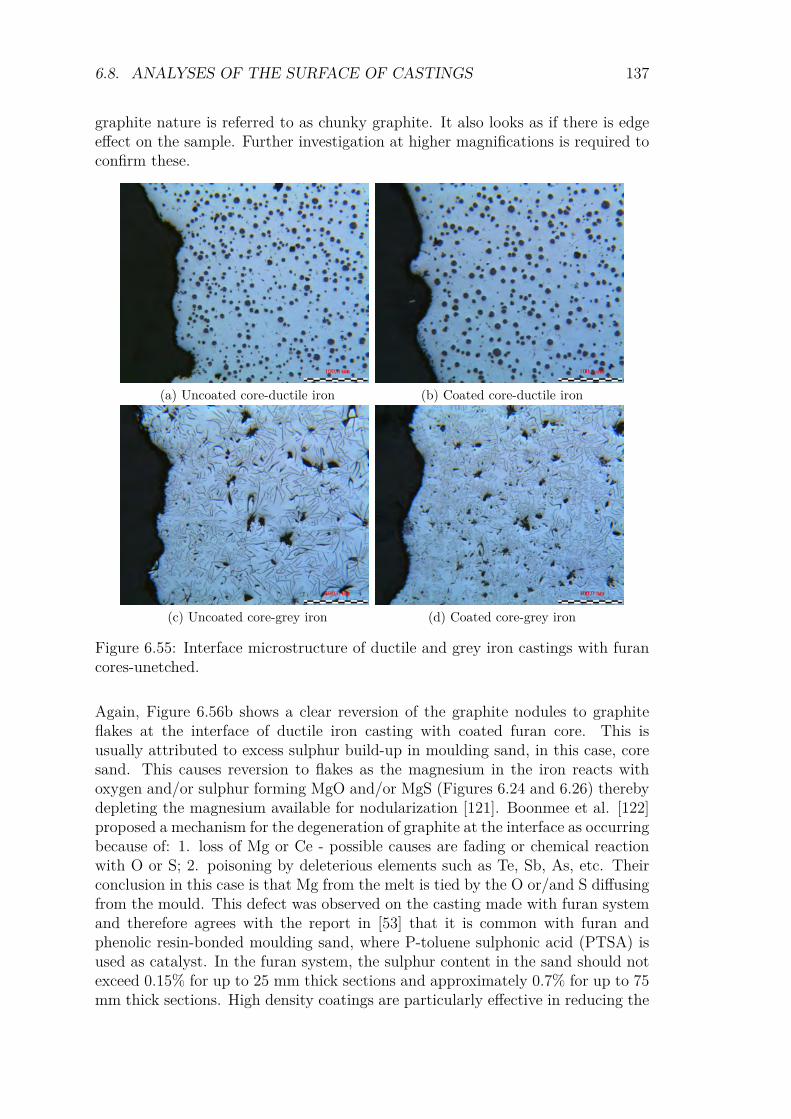
6.8. ANALYSES OF THE SURFACE OF CASTINGS 137
graphite nature is referred to as chunky graphite. It also looks as if there is edgeeffect on the sample. Further investigation at higher magnifications is required toconfirm these.
(a) Uncoated core-ductile iron (b) Coated core-ductile iron
(c) Uncoated core-grey iron (d) Coated core-grey iron
Figure 6.55: Interface microstructure of ductile and grey iron castings with furancores-unetched.
Again, Figure 6.56b shows a clear reversion of the graphite nodules to graphiteflakes at the interface of ductile iron casting with coated furan core. This isusually attributed to excess sulphur build-up in moulding sand, in this case, coresand. This causes reversion to flakes as the magnesium in the iron reacts withoxygen and/or sulphur forming MgO and/or MgS (Figures 6.24 and 6.26) therebydepleting the magnesium available for nodularization [121]. Boonmee et al. [122]proposed a mechanism for the degeneration of graphite at the interface as occurringbecause of: 1. loss of Mg or Ce - possible causes are fading or chemical reactionwith O or S; 2. poisoning by deleterious elements such as Te, Sb, As, etc. Theirconclusion in this case is that Mg from the melt is tied by the O or/and S diffusingfrom the mould. This defect was observed on the casting made with furan systemand therefore agrees with the report in [53] that it is common with furan andphenolic resin-bonded moulding sand, where P-toluene sulphonic acid (PTSA) isused as catalyst. In the furan system, the sulphur content in the sand should notexceed 0.15% for up to 25 mm thick sections and approximately 0.7% for up to 75mm thick sections. High density coatings are particularly effective in reducing the
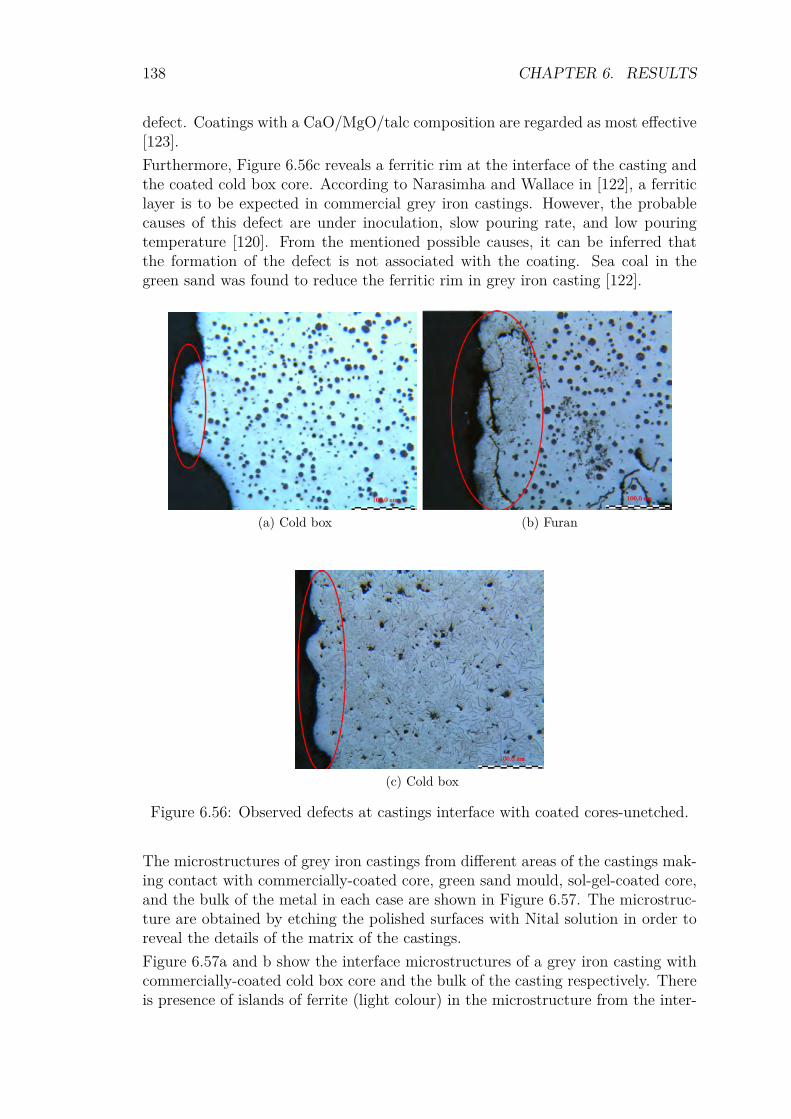
138 CHAPTER 6. RESULTS
defect. Coatings with a CaO/MgO/talc composition are regarded as most effective[123].Furthermore, Figure 6.56c reveals a ferritic rim at the interface of the casting andthe coated cold box core. According to Narasimha and Wallace in [122], a ferriticlayer is to be expected in commercial grey iron castings. However, the probablecauses of this defect are under inoculation, slow pouring rate, and low pouringtemperature [120]. From the mentioned possible causes, it can be inferred thatthe formation of the defect is not associated with the coating. Sea coal in thegreen sand was found to reduce the ferritic rim in grey iron casting [122].
(a) Cold box (b) Furan
(c) Cold box
Figure 6.56: Observed defects at castings interface with coated cores-unetched.
The microstructures of grey iron castings from different areas of the castings mak-ing contact with commercially-coated core, green sand mould, sol-gel-coated core,and the bulk of the metal in each case are shown in Figure 6.57. The microstruc-ture are obtained by etching the polished surfaces with Nital solution in order toreveal the details of the matrix of the castings.Figure 6.57a and b show the interface microstructures of a grey iron casting withcommercially-coated cold box core and the bulk of the casting respectively. Thereis presence of islands of ferrite (light colour) in the microstructure from the inter-
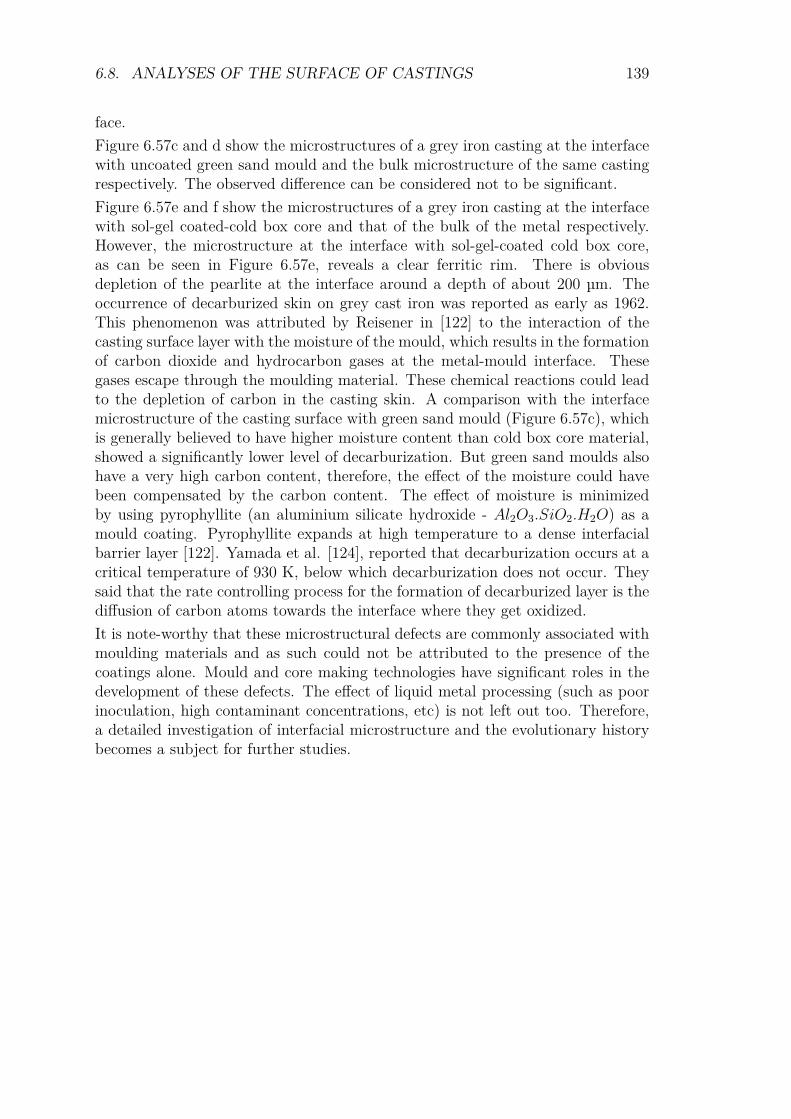
6.8. ANALYSES OF THE SURFACE OF CASTINGS 139
face.Figure 6.57c and d show the microstructures of a grey iron casting at the interfacewith uncoated green sand mould and the bulk microstructure of the same castingrespectively. The observed difference can be considered not to be significant.Figure 6.57e and f show the microstructures of a grey iron casting at the interfacewith sol-gel coated-cold box core and that of the bulk of the metal respectively.However, the microstructure at the interface with sol-gel-coated cold box core,as can be seen in Figure 6.57e, reveals a clear ferritic rim. There is obviousdepletion of the pearlite at the interface around a depth of about 200 µm. Theoccurrence of decarburized skin on grey cast iron was reported as early as 1962.This phenomenon was attributed by Reisener in [122] to the interaction of thecasting surface layer with the moisture of the mould, which results in the formationof carbon dioxide and hydrocarbon gases at the metal-mould interface. Thesegases escape through the moulding material. These chemical reactions could leadto the depletion of carbon in the casting skin. A comparison with the interfacemicrostructure of the casting surface with green sand mould (Figure 6.57c), whichis generally believed to have higher moisture content than cold box core material,showed a significantly lower level of decarburization. But green sand moulds alsohave a very high carbon content, therefore, the effect of the moisture could havebeen compensated by the carbon content. The effect of moisture is minimizedby using pyrophyllite (an aluminium silicate hydroxide - Al2O3.SiO2.H2O) as amould coating. Pyrophyllite expands at high temperature to a dense interfacialbarrier layer [122]. Yamada et al. [124], reported that decarburization occurs at acritical temperature of 930 K, below which decarburization does not occur. Theysaid that the rate controlling process for the formation of decarburized layer is thediffusion of carbon atoms towards the interface where they get oxidized.It is note-worthy that these microstructural defects are commonly associated withmoulding materials and as such could not be attributed to the presence of thecoatings alone. Mould and core making technologies have significant roles in thedevelopment of these defects. The effect of liquid metal processing (such as poorinoculation, high contaminant concentrations, etc) is not left out too. Therefore,a detailed investigation of interfacial microstructure and the evolutionary historybecomes a subject for further studies.
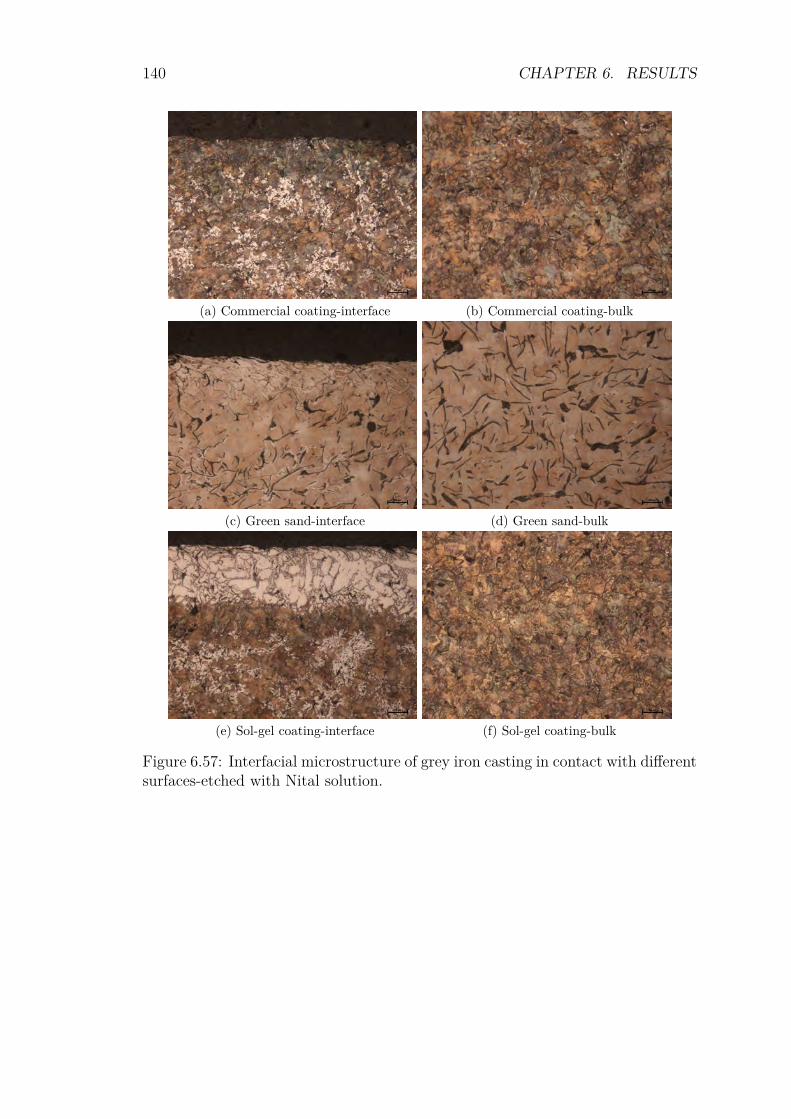
140 CHAPTER 6. RESULTS
(a) Commercial coating-interface (b) Commercial coating-bulk
(c) Green sand-interface (d) Green sand-bulk
(e) Sol-gel coating-interface (f) Sol-gel coating-bulk
Figure 6.57: Interfacial microstructure of grey iron casting in contact with differentsurfaces-etched with Nital solution.

Chapter 7
Case Studies
Objective• Testing coating formulations to assess their performance.
• Elimination of surface defects to improve the surface quality of the castings.
7.1 Casting: Part for X-Ray Detector, HospitalEquipment.
Foundry: Johan Jensen & Søn Metalstøberi
Table 7.1: Casting conditions at Johan Jensen & Søn Metalstøberi.
Alloy CuSn6Pb22 (Bronze)
Casting size 800 × 800 × 400 mm
Wall thickness 10 mm
Casting weight 124 kg
Poured weight 165 kg
Pouring temperature 1120 C
Pouring time 15 - 20 s
Mould Horizontally-parted furan sand mould
Cores Furan sand cores
141
142 CHAPTER 7. CASE STUDIES
7.1.1 First Trials
7.1.1.1 Coatings Used
1. Traditional coating (Zirconia)2. W 235.1 (aluminium silicate)3. W 235.1 + 5% sol-gel component
(a) Traditional coating (Zirconium) (b) W 235.1 (aluminium silicate)
(c) W 235.1 + 5% sol-gel component
Figure 7.1: Castings from first trials.
7.1.1.2 Conclusions from First Trials
• Sol-gel modified coating performs better than reference coating.
• Traditional coating preforms better than sol-gel modified coating.
7.1.2 Second Trials
7.1.2.1 Coating Used
1. Traditional coating + 5% sol-gel component2. Traditional coating + 10% sol-gel component
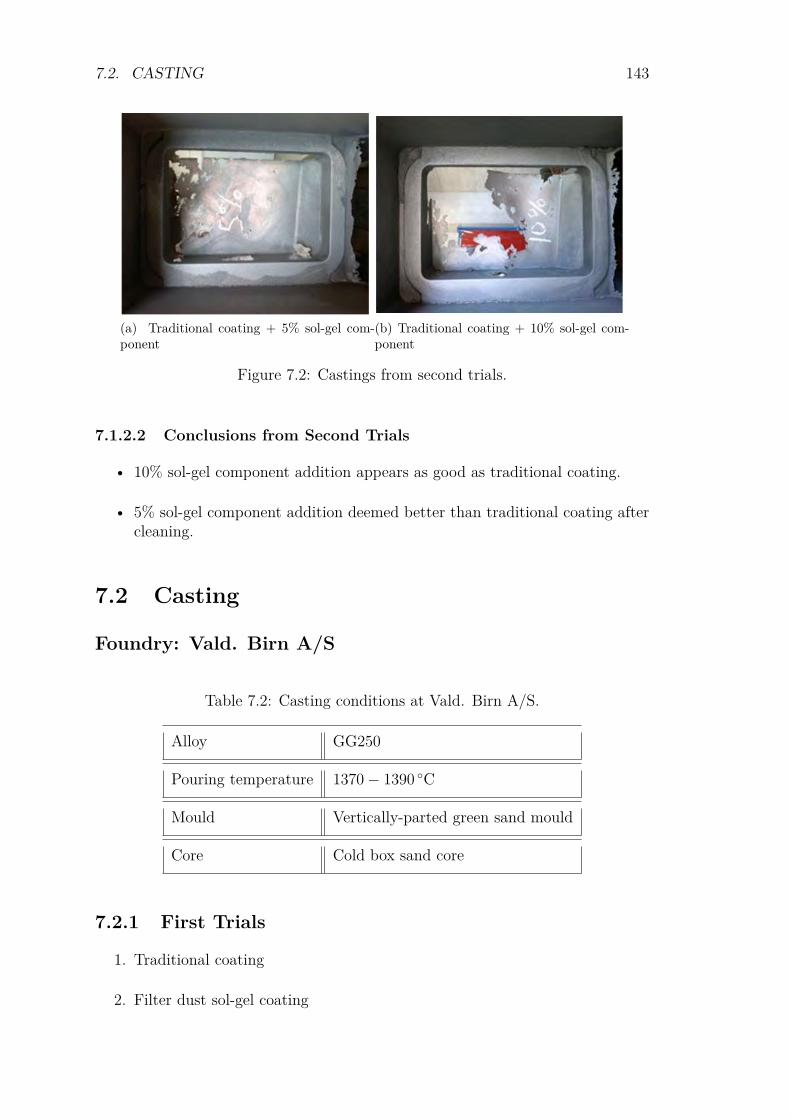
7.2. CASTING 143
(a) Traditional coating + 5% sol-gel com-ponent
(b) Traditional coating + 10% sol-gel com-ponent
Figure 7.2: Castings from second trials.
7.1.2.2 Conclusions from Second Trials
• 10% sol-gel component addition appears as good as traditional coating.
• 5% sol-gel component addition deemed better than traditional coating aftercleaning.
7.2 Casting
Foundry: Vald. Birn A/S
Table 7.2: Casting conditions at Vald. Birn A/S.
Alloy GG250
Pouring temperature 1370− 1390 C
Mould Vertically-parted green sand mould
Core Cold box sand core
7.2.1 First Trials
1. Traditional coating
2. Filter dust sol-gel coating
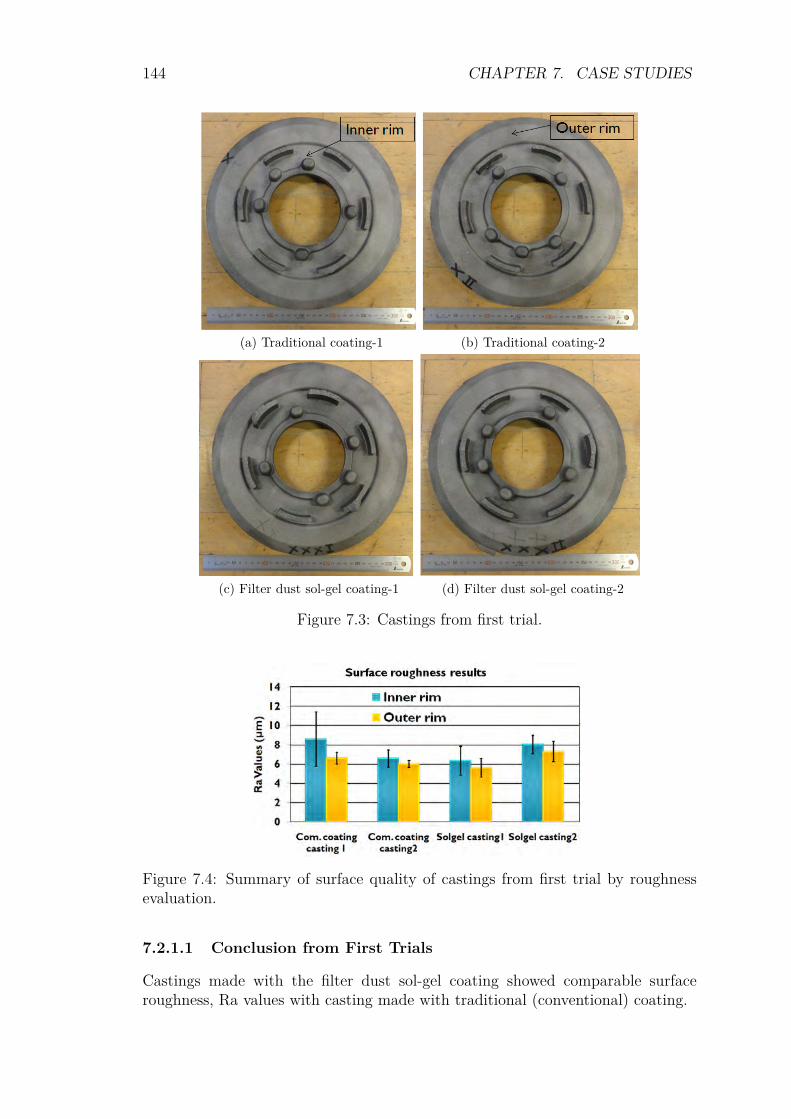
144 CHAPTER 7. CASE STUDIES
(a) Traditional coating-1 (b) Traditional coating-2
(c) Filter dust sol-gel coating-1 (d) Filter dust sol-gel coating-2
Figure 7.3: Castings from first trial.
Figure 7.4: Summary of surface quality of castings from first trial by roughnessevaluation.
7.2.1.1 Conclusion from First Trials
Castings made with the filter dust sol-gel coating showed comparable surfaceroughness, Ra values with casting made with traditional (conventional) coating.
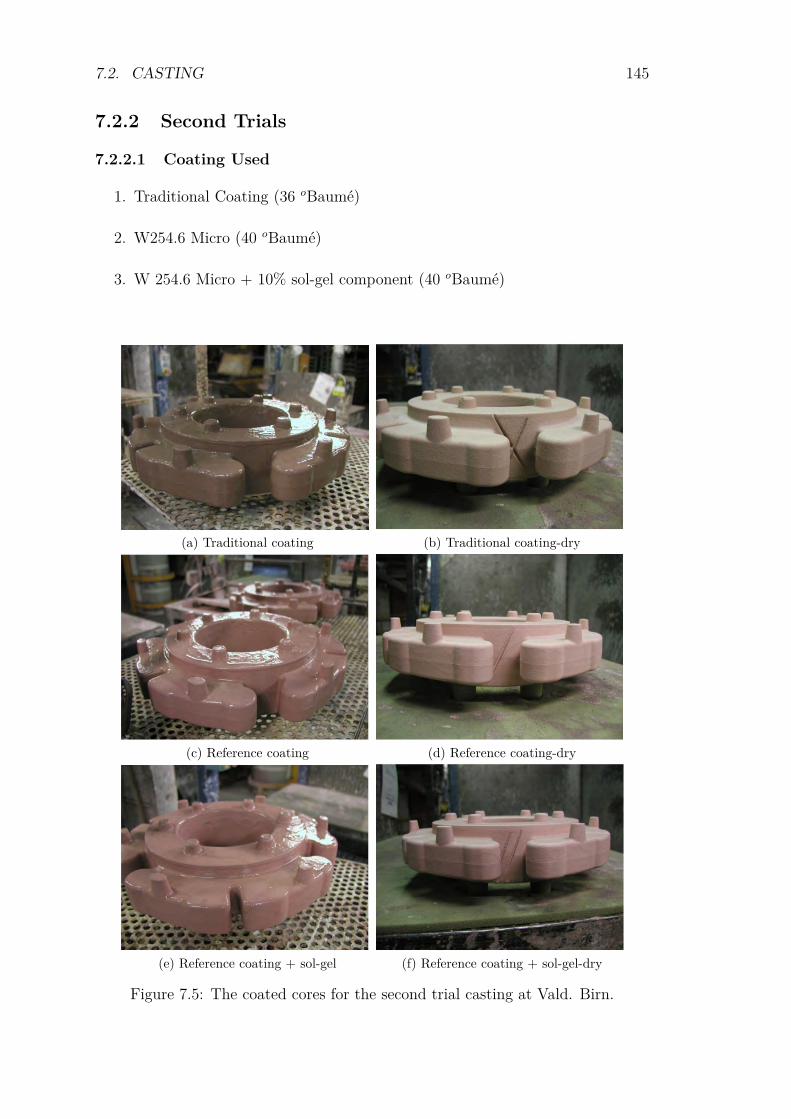
7.2. CASTING 145
7.2.2 Second Trials
7.2.2.1 Coating Used
1. Traditional Coating (36 oBaumé)
2. W254.6 Micro (40 oBaumé)
3. W 254.6 Micro + 10% sol-gel component (40 oBaumé)
(a) Traditional coating (b) Traditional coating-dry
(c) Reference coating (d) Reference coating-dry
(e) Reference coating + sol-gel (f) Reference coating + sol-gel-dry
Figure 7.5: The coated cores for the second trial casting at Vald. Birn.
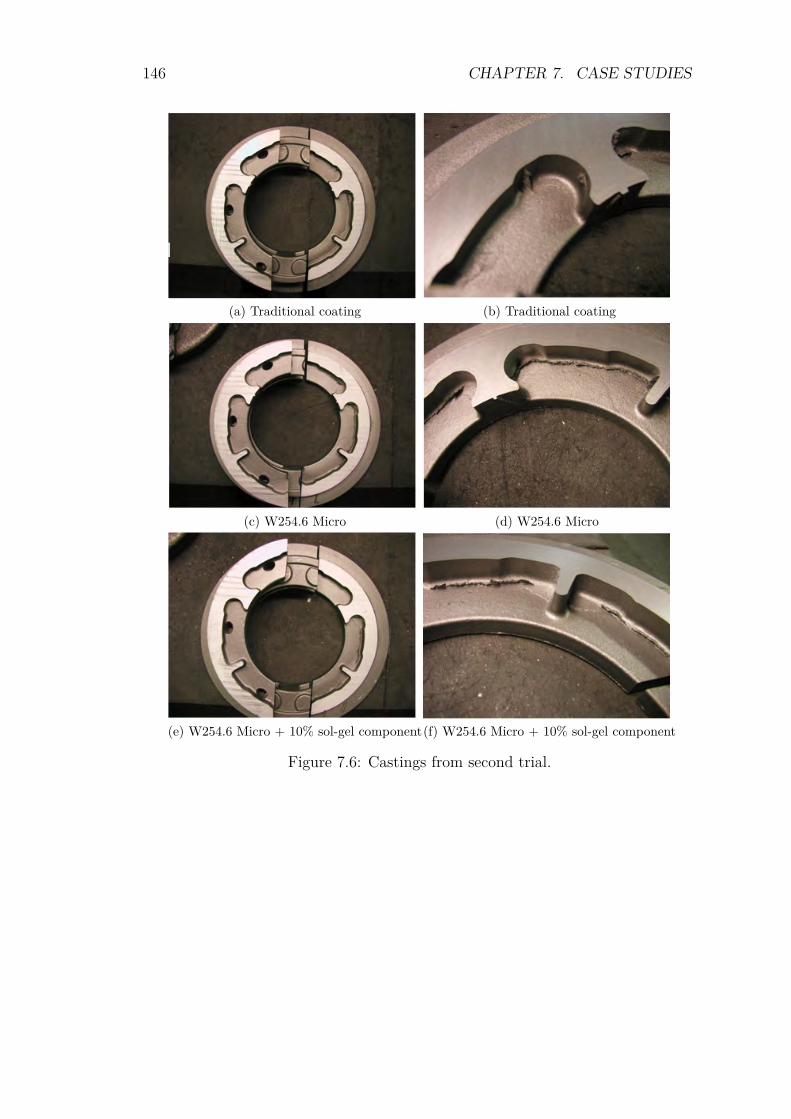
146 CHAPTER 7. CASE STUDIES
(a) Traditional coating (b) Traditional coating
(c) W254.6 Micro (d) W254.6 Micro
(e) W254.6 Micro + 10% sol-gel component(f) W254.6 Micro + 10% sol-gel component
Figure 7.6: Castings from second trial.

7.2. CASTING 147
Table 7.3: Summary of casting defects (veinings) assessment for different coatings
Category(veiningdefects)
Traditionalcoating
Referencecoating
Reference coating+ 10% sol-geladditive
0-none - - 2
1-very few 5 - 5
2-few 7 3 7
3-some 8 8 5
4-many - 9 -
5-very many - - -
7.2.2.2 Conclusions from Second Trials.
• Tendency for runners and drips – only few drips remain after curing of tra-ditional coating.
• Tendency to form drips and runners – also present upon drying of referencecoating.
• Reference with sol-gel component seems visually to flow differently on thecores.
• Addition of sol-gel component seems to greatly decrease veining defects com-pared to the reference coating.

148 CHAPTER 7. CASE STUDIES
Chapter 8
Discussion
8.1 Refractory Coatings
The foundry industry is under pressure to produce cleaner, thinner and bettertolerance castings. Despite the tolerances achieved in the core shop at room tem-perature, the distortion of the core upon exposure to molten metal and rapidheating may introduce additional variances to the finished castings. New resinsand sand systems are being developed to meet these requirements, however, thefoundry has pressed refractory coating manufacturers to produce coatings capa-ble of enhancing the performance of chemically-bonded sand systems. To date,refractory coating’s primary function has been to enhance casting surface finishand minimise metal penetration defects by reducing the capillary dimensions ofthe substrate and by changing the surface tension of the substrate surface [125].In the US, most core applications limited the dry coating deposit to 0.1-0.25 mm.In Europe, dry coating deposits on sand cores are much heavier ranging from 0.25-0.40 mm and have shown some anti-veining properties. This means that coatingdeposits can reduce the thermo-mechanical stress development in resin bondedsand core systems [126].The formulations of foundry coatings involves the dispensing and mixing of aparticulate refractory material or a blend of particulate refractory materials anda carrier liquid for the particulate refractory materials and other additives. Adetailed review of foundry coatings technology provided the different types of re-fractory materials for foundry coatings, binders, carrier liquids, and other additivesalongside different characterization parameters for coatings [108]. The discussionpresented here will deal with the observations from the results obtained from thesol-gel coating project carried out. Other knowledge-based arguments which em-phasize the enhancement of foundry coating performance from literature will beprovided.Hollow parts of sand castings are formed by disposable cores. The most commontype is the resin-bonded sand cores, in which the resin is designed to break downafter casting, allowing the sand to flow out of the cored cavity. When the metalfirst enters the mould, the mould and cores experience lots of activities. Theyheat up and expand while the core also experiences buoyancy forces which will
149
150 CHAPTER 8. DISCUSSION
tend to make it float. This is not a problem with liquid magnesium where thedensity difference with silica sand is near zero. Similar neutral buoyancy appliesto aluminium vs. zircon sand system [127]. Buoyancy becomes a problem for thecommon systems such as aluminium vs. silica sand and liquid iron (or other densemetals such as copper and steel) vs. silica sand. This is particularly so for the latermetals because of their high casting temperatures and high density. Floatationforces have to be withstood by adequate mechanical support of the cores, usuallyby good print design and location. Furthermore, the heating up and expansionof the mould and core lead to distortion and also thermal stress development inthe mould and core, leading to cracking. This is followed by the occurrence of aseries of defects which can be arrested by the application of refractory coatingswhich form a physical and thermal barrier to the metal poured. As a physicalbarrier, the coating can prevent the diffusion of liquid metal into the mouldingmaterials. The permeability of the coating also plays a role in the elimination ofthe evolved gases. Coatings for high temperature casting production should havegood permeability for gas and good thermal resistance to avoid expansion relateddefects. Both parameters depend directly on the coating thickness: it has to bethick enough to provide the needed thermal protection and thin enough as to allowdiffusion of gas for escape if applied on the mould [128]. If it is suspected thatthe path of evolved gas exit will be through the molten metal, a coating with highpermeability would be preferred to allow evolved gases from the core and coatingto pass more easily through the coating layer. Conversely, if it is found that thegas must pass through the core print to vent to the atmosphere, then a relativelylow-permeability core coating with high core sand permeability would be moreadvantageous [129].
8.1.1 Nanoparticle Sol-Gel Coatings
The quality and performance of a coating is directly related to the stability of thecoating suspension, rheological behaviour, and the materials of the coating. Fromthe preliminary investigations of the first formulated sol-gel coating containingnanoparticle refractory materials (TiO2 and ZnO), the behaviour of the nanopar-ticle sol-gel coatings when applied on core materials revealed the significance ofparticle size (PS) and particle size distribution (PSD). It is seen that if the PSand PSD of the refractory materials are not compatible with the PS of the sandgrains, the coating cannot cover the surface of the cores. In this situation, thenanorefractory materials just penetrated into the core material with the carrierliquid, obeying capillary effect. The sand grains of the core were not covered bythe coating. Therefore, there was no refractory deposit on the surface of the cores.The surface quality of the castings made with these cores is poor. This implies thatthe use of nanorefractory materials for coating development requires high mass ofthe refractory materials-to-volume of carrier liquid ratio, in order to build up ahigh solid content and high viscosity to reduce the level of penetration and makea surface deposit of the refractory materials to cover the surface of the cores. Thismeans producing expensive coatings. The PS and PSD of the refractory fillersfor foundry coatings are typically in the range of 49-75 µm (200-300 mesh) [130].
8.1. REFRACTORY COATINGS 151
Therefore, the use of nanorefractory particles is not suitable for foundry coatingproduction.
8.1.2 Filter Dust Sol-Gel Coatings
The nanorefractory materials were replaced with filter dust. The filter dust re-fractory materials had a bulk average particle size of about 15 µm [107]. This PSseems also fine compared to the expected range given in literature. With the useof filter dust, the rheology of the sol-gel filter dust coating changed significantly.This was observed from the uniform penetration into the cores and complete sur-face coverage of the cores by the filter dust coating. It was reported in [130] thatif the coating contains high amount of bentonite or the refractory materials areexcessively fine, an increased tendency to cracking on drying is encountered. Thiscan be possible explanations to the appearance of cracks on the surface of thecores coated with filter dust coating [107]. In controlled investigations, it is sug-gested that 3-4% bentonite and 0.2-0.3% sodium alginate solutions proved mostsatisfactory as suspension agents. It is also reported that the bentonite can be re-placed with cellulose compounds such as carboxymethyl cellulose [16, 130]. Thesecompounds do not crack during curing.Ideally, a coating should be mechanically stable, resistant to thermal shock, in-ert to liquid metal, harmless as a contaminant in the moulding sand, and safe inthe working environment. It was expected that the filter dust from sand mould-ing lines would be particularly useful because it has already undergone a thermaltreatment that makes it more stable and it has a particle size and particle sizedistribution that is useful for the foundry coatings. Most of the coating character-ization techniques used in this study are the ones used in the foundry to control theconsistency of finished coating products. The consistency needs to be controlled tosuit the particular mode of application. Coatings are applied by brush or swab, bydipping, flow coating, or by spraying. In this study, the characterization param-eters for monitoring the coating consistency include oBaumé parameter, viscosityand density (specific gravity). It was reported in [130] that thixotropic1 propertiesof the coating are suitable for brushing, allowing free flow to avoid dragging of thesand surface, and enabling brush marks to disappear before the viscosity increasesagain and strengthens the film. Spray coating requires thinner consistency, moresuited for atomization for the formation of fine droplets. This means that the spraymethod is viscosity-limited and would require multilayer application for good sur-face coverage [Supplement 7]. Dip coating requires pseudoplastic or shear thinningbehaviour2, which means rapid response to shear forces encountered as the coreenters the bath. This is the most effective technique for rapid production, beingwidely employed for cores, including complex units and assemblies. Flow coatingor overpour is more suitable for larger cores and moulds, the coating is pumpedfrom a tank and discharged over the required surface through a fan-shaped nozzle.
1Fluids apparent viscosity decreases under stress, and recovers its initial viscosity with timewhen unloaded.
2Fluids show a large decrease in viscosity when the shear rate is increased.
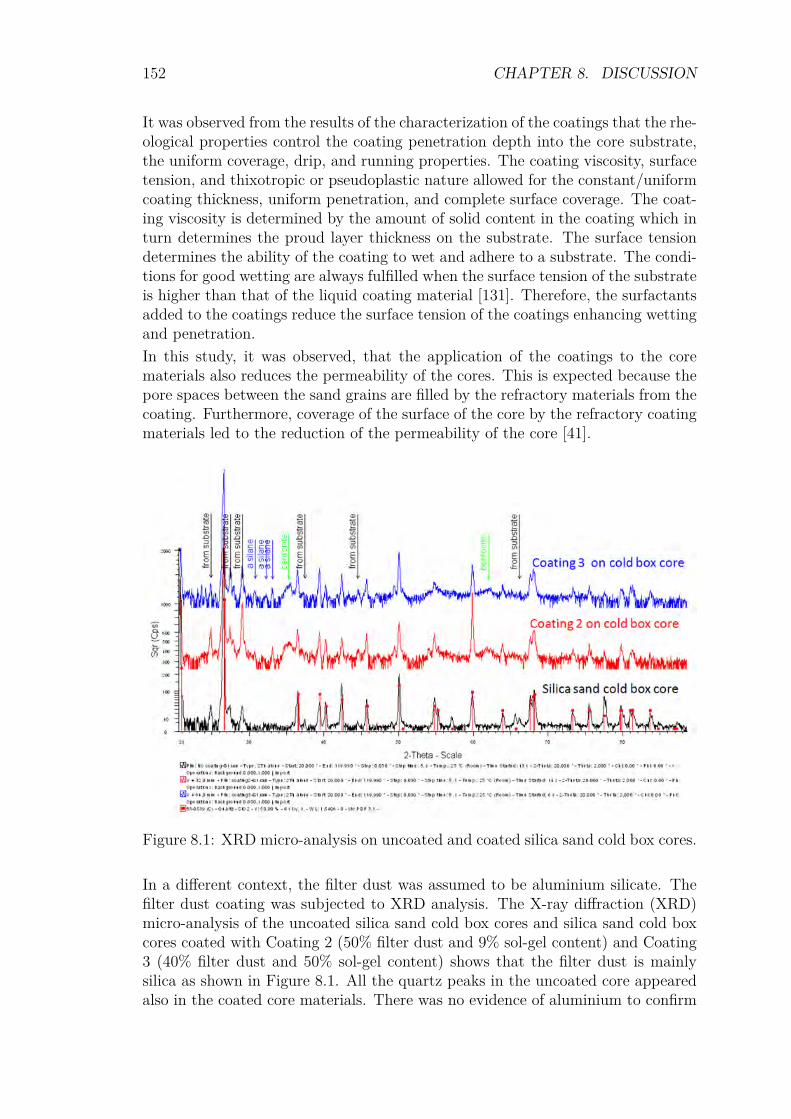
152 CHAPTER 8. DISCUSSION
It was observed from the results of the characterization of the coatings that the rhe-ological properties control the coating penetration depth into the core substrate,the uniform coverage, drip, and running properties. The coating viscosity, surfacetension, and thixotropic or pseudoplastic nature allowed for the constant/uniformcoating thickness, uniform penetration, and complete surface coverage. The coat-ing viscosity is determined by the amount of solid content in the coating which inturn determines the proud layer thickness on the substrate. The surface tensiondetermines the ability of the coating to wet and adhere to a substrate. The condi-tions for good wetting are always fulfilled when the surface tension of the substrateis higher than that of the liquid coating material [131]. Therefore, the surfactantsadded to the coatings reduce the surface tension of the coatings enhancing wettingand penetration.In this study, it was observed, that the application of the coatings to the corematerials also reduces the permeability of the cores. This is expected because thepore spaces between the sand grains are filled by the refractory materials from thecoating. Furthermore, coverage of the surface of the core by the refractory coatingmaterials led to the reduction of the permeability of the core [41].
Figure 8.1: XRD micro-analysis on uncoated and coated silica sand cold box cores.
In a different context, the filter dust was assumed to be aluminium silicate. Thefilter dust coating was subjected to XRD analysis. The X-ray diffraction (XRD)micro-analysis of the uncoated silica sand cold box cores and silica sand cold boxcores coated with Coating 2 (50% filter dust and 9% sol-gel content) and Coating3 (40% filter dust and 50% sol-gel content) shows that the filter dust is mainlysilica as shown in Figure 8.1. All the quartz peaks in the uncoated core appearedalso in the coated core materials. There was no evidence of aluminium to confirm
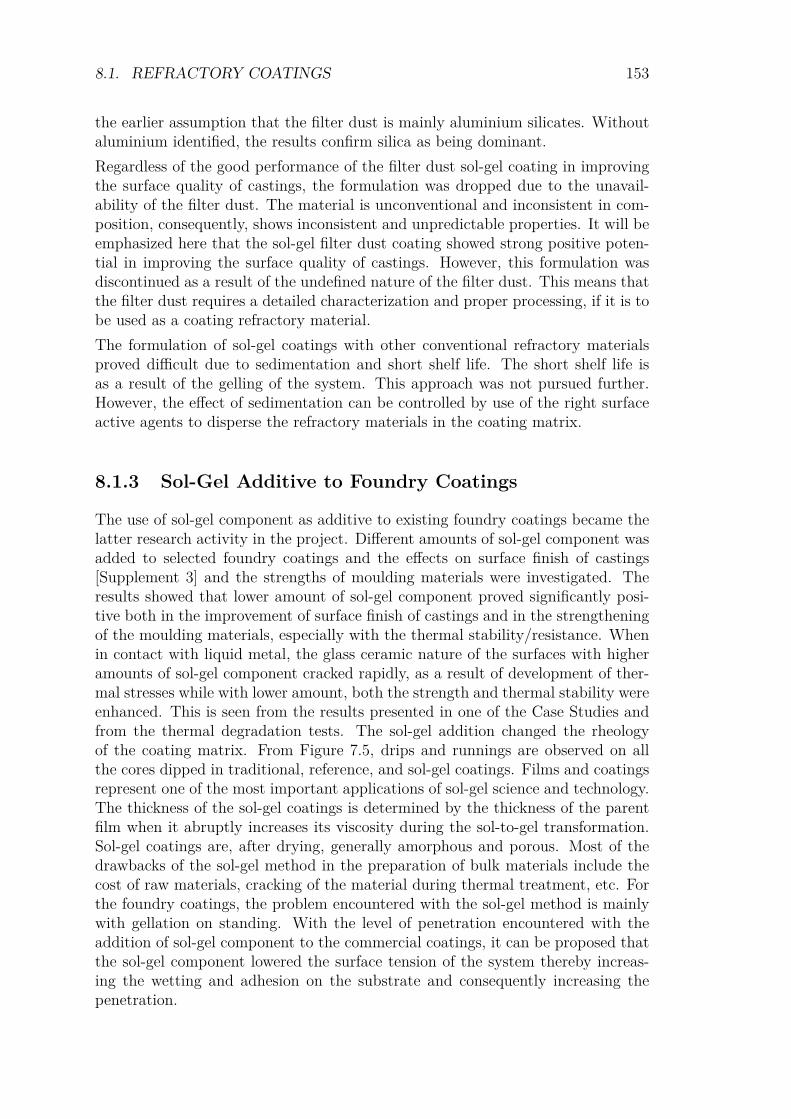
8.1. REFRACTORY COATINGS 153
the earlier assumption that the filter dust is mainly aluminium silicates. Withoutaluminium identified, the results confirm silica as being dominant.Regardless of the good performance of the filter dust sol-gel coating in improvingthe surface quality of castings, the formulation was dropped due to the unavail-ability of the filter dust. The material is unconventional and inconsistent in com-position, consequently, shows inconsistent and unpredictable properties. It will beemphasized here that the sol-gel filter dust coating showed strong positive poten-tial in improving the surface quality of castings. However, this formulation wasdiscontinued as a result of the undefined nature of the filter dust. This means thatthe filter dust requires a detailed characterization and proper processing, if it is tobe used as a coating refractory material.The formulation of sol-gel coatings with other conventional refractory materialsproved difficult due to sedimentation and short shelf life. The short shelf life isas a result of the gelling of the system. This approach was not pursued further.However, the effect of sedimentation can be controlled by use of the right surfaceactive agents to disperse the refractory materials in the coating matrix.
8.1.3 Sol-Gel Additive to Foundry Coatings
The use of sol-gel component as additive to existing foundry coatings became thelatter research activity in the project. Different amounts of sol-gel component wasadded to selected foundry coatings and the effects on surface finish of castings[Supplement 3] and the strengths of moulding materials were investigated. Theresults showed that lower amount of sol-gel component proved significantly posi-tive both in the improvement of surface finish of castings and in the strengtheningof the moulding materials, especially with the thermal stability/resistance. Whenin contact with liquid metal, the glass ceramic nature of the surfaces with higheramounts of sol-gel component cracked rapidly, as a result of development of ther-mal stresses while with lower amount, both the strength and thermal stability wereenhanced. This is seen from the results presented in one of the Case Studies andfrom the thermal degradation tests. The sol-gel addition changed the rheologyof the coating matrix. From Figure 7.5, drips and runnings are observed on allthe cores dipped in traditional, reference, and sol-gel coatings. Films and coatingsrepresent one of the most important applications of sol-gel science and technology.The thickness of the sol-gel coatings is determined by the thickness of the parentfilm when it abruptly increases its viscosity during the sol-to-gel transformation.Sol-gel coatings are, after drying, generally amorphous and porous. Most of thedrawbacks of the sol-gel method in the preparation of bulk materials include thecost of raw materials, cracking of the material during thermal treatment, etc. Forthe foundry coatings, the problem encountered with the sol-gel method is mainlywith gellation on standing. With the level of penetration encountered with theaddition of sol-gel component to the commercial coatings, it can be proposed thatthe sol-gel component lowered the surface tension of the system thereby increas-ing the wetting and adhesion on the substrate and consequently increasing thepenetration.
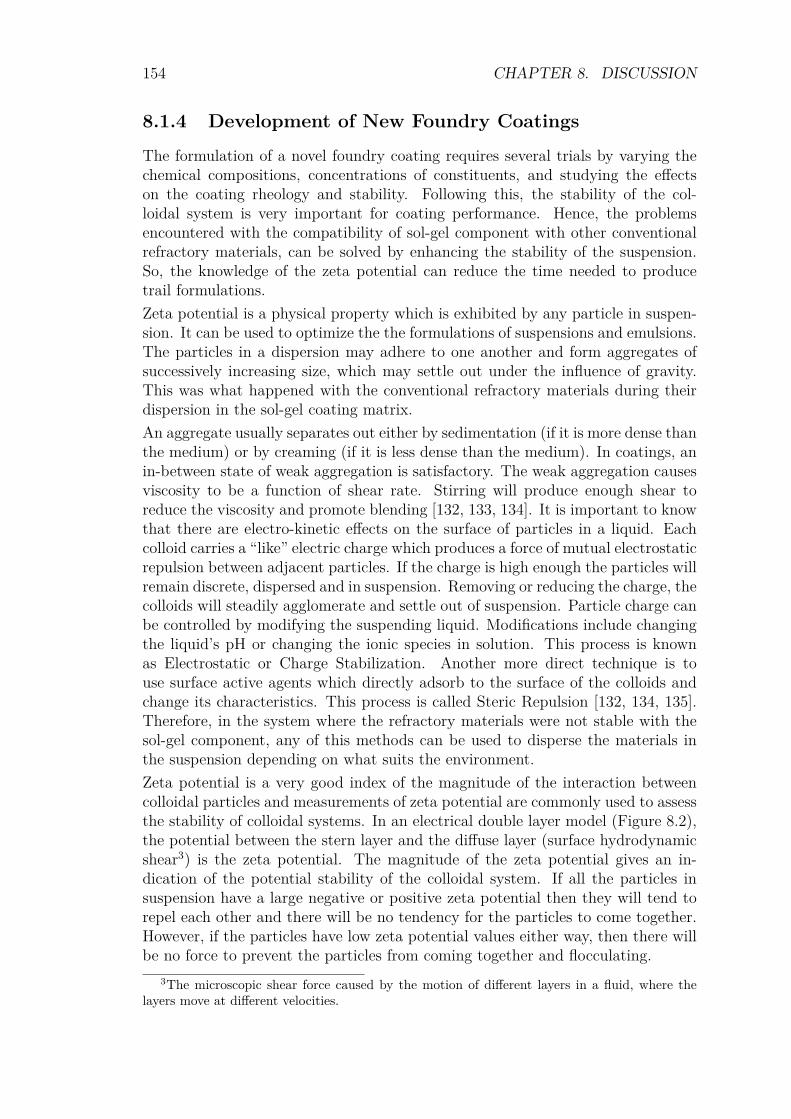
154 CHAPTER 8. DISCUSSION
8.1.4 Development of New Foundry CoatingsThe formulation of a novel foundry coating requires several trials by varying thechemical compositions, concentrations of constituents, and studying the effectson the coating rheology and stability. Following this, the stability of the col-loidal system is very important for coating performance. Hence, the problemsencountered with the compatibility of sol-gel component with other conventionalrefractory materials, can be solved by enhancing the stability of the suspension.So, the knowledge of the zeta potential can reduce the time needed to producetrail formulations.Zeta potential is a physical property which is exhibited by any particle in suspen-sion. It can be used to optimize the the formulations of suspensions and emulsions.The particles in a dispersion may adhere to one another and form aggregates ofsuccessively increasing size, which may settle out under the influence of gravity.This was what happened with the conventional refractory materials during theirdispersion in the sol-gel coating matrix.An aggregate usually separates out either by sedimentation (if it is more dense thanthe medium) or by creaming (if it is less dense than the medium). In coatings, anin-between state of weak aggregation is satisfactory. The weak aggregation causesviscosity to be a function of shear rate. Stirring will produce enough shear toreduce the viscosity and promote blending [132, 133, 134]. It is important to knowthat there are electro-kinetic effects on the surface of particles in a liquid. Eachcolloid carries a “like” electric charge which produces a force of mutual electrostaticrepulsion between adjacent particles. If the charge is high enough the particles willremain discrete, dispersed and in suspension. Removing or reducing the charge, thecolloids will steadily agglomerate and settle out of suspension. Particle charge canbe controlled by modifying the suspending liquid. Modifications include changingthe liquid’s pH or changing the ionic species in solution. This process is knownas Electrostatic or Charge Stabilization. Another more direct technique is touse surface active agents which directly adsorb to the surface of the colloids andchange its characteristics. This process is called Steric Repulsion [132, 134, 135].Therefore, in the system where the refractory materials were not stable with thesol-gel component, any of this methods can be used to disperse the materials inthe suspension depending on what suits the environment.Zeta potential is a very good index of the magnitude of the interaction betweencolloidal particles and measurements of zeta potential are commonly used to assessthe stability of colloidal systems. In an electrical double layer model (Figure 8.2),the potential between the stern layer and the diffuse layer (surface hydrodynamicshear3) is the zeta potential. The magnitude of the zeta potential gives an in-dication of the potential stability of the colloidal system. If all the particles insuspension have a large negative or positive zeta potential then they will tend torepel each other and there will be no tendency for the particles to come together.However, if the particles have low zeta potential values either way, then there willbe no force to prevent the particles from coming together and flocculating.
3The microscopic shear force caused by the motion of different layers in a fluid, where thelayers move at different velocities.
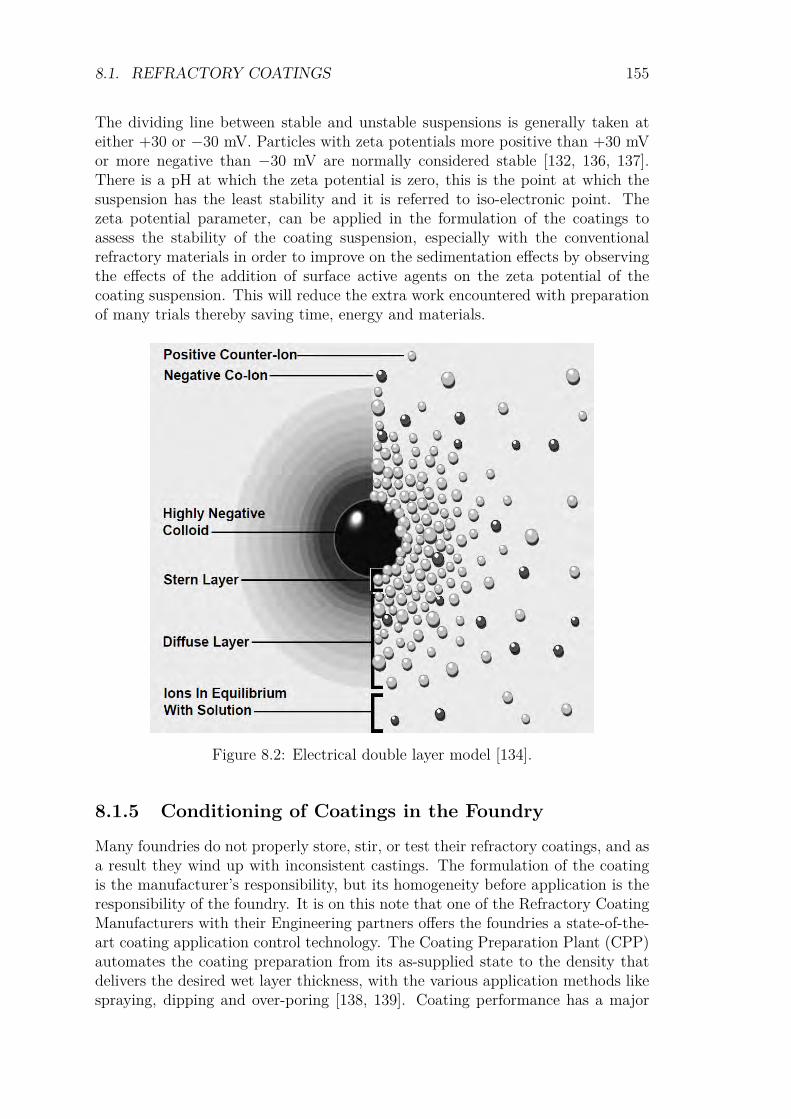
8.1. REFRACTORY COATINGS 155
The dividing line between stable and unstable suspensions is generally taken ateither +30 or −30 mV. Particles with zeta potentials more positive than +30 mVor more negative than −30 mV are normally considered stable [132, 136, 137].There is a pH at which the zeta potential is zero, this is the point at which thesuspension has the least stability and it is referred to iso-electronic point. Thezeta potential parameter, can be applied in the formulation of the coatings toassess the stability of the coating suspension, especially with the conventionalrefractory materials in order to improve on the sedimentation effects by observingthe effects of the addition of surface active agents on the zeta potential of thecoating suspension. This will reduce the extra work encountered with preparationof many trials thereby saving time, energy and materials.
Figure 8.2: Electrical double layer model [134].
8.1.5 Conditioning of Coatings in the Foundry
Many foundries do not properly store, stir, or test their refractory coatings, and asa result they wind up with inconsistent castings. The formulation of the coatingis the manufacturer’s responsibility, but its homogeneity before application is theresponsibility of the foundry. It is on this note that one of the Refractory CoatingManufacturers with their Engineering partners offers the foundries a state-of-the-art coating application control technology. The Coating Preparation Plant (CPP)automates the coating preparation from its as-supplied state to the density thatdelivers the desired wet layer thickness, with the various application methods likespraying, dipping and over-poring [138, 139]. Coating performance has a major

156 CHAPTER 8. DISCUSSION
impact on casting quality. When coating preparation is not right, it will reflect onthe surface quality of the castings. By understanding the basics of coatings andhow to evaluate them, foundries are better prepared to recognize potential failurebefore it happens. For this reason, it makes sense to do some form of coatingmonitoring in the foundry shop. Based on the results from the investigationscarried out in this research and information from literature, some of the followingcontrol measures described Tables 8.1-8.3 are recommended, to control foundryrefractory coatings to enhance the quality and performance on castings.

8.1. REFRACTORY COATINGS 157
Table 8.1: Measures to control coating consistency in the foundry shop [108, 139,140].
Parameter Description
Specific
Gravity (SG)
To assure that the formulation is consistent, test SG regularly. The additives and binders
may produce rheological effects or effects related to the surface energies of the liquid. The
net effect is that the defining equation varies with each manufacturer and each coating
formula, and therefore, it must be adjusted for each mixture: SG = MM − D
, where M = 145
and D = oBaume. The proper control strategy is to measure SG of the coating and
occasionally estimate the rheological effects with careful oBaumé and/or viscosity
measurements. Many foundries use oBaumé to control their coatings, but this test alone is
not enough to maintain a coating consistency. The SG can be used to determine when the
coating must be diluted or thickened.
Solids The solid content of a coating should be checked occasionally, depending on usage. If a new
drum is opened everyday, then it only needs to be tested once. If the use is one drum per
week, it might be best to check the drum twice. For solids test, a clean watch glass is
weighed , 20 mls coating sample is put in the glass, and it is then reweighed. The carrier
(solvent) is driven off by drying at 102 C. The watch glass is reweighed after the coating
has dried, and the remaining percent solids is calculated. Some foundries use a “settling” or
sediment test in which a graduated cylinder is filled with coating and the solid content is
estimated by volume that settles to the bottom, usually for 24 hrs. This test does not yield
a true volume or weight percent solids, however, the results should be reasonably
reproducible, if compared at the same settling time.
Viscosity Viscosity is a measure of a liquid’s internal friction, or resistance to flow. For foundry
applications, Ford flow cup or equivalent is a good measure. These cups hold a given
volume and have carefully constructed drain holes at the bottom. The cup is dipped in the
liquid and withdrawn. The drain time is measured and a chart is used to convert this time
to centipoise. The viscosity will change (usually it decreases) while being stirred. For this
reason, the mixer should always be turned off, prior to testing the coating. Also,
temperature is a critical factor in determining viscosity. The results can indicate variations
in the nature of the solvent due to aging, temperature, over-mixing, or some reactions with
the container. It can also point towards a major problem with the binders or the
suspending agents.
oBaumé The oBaumé test is the most common test used in foundries to control coatings because it
is quick and easy. After mixing the coating sample thoroughly, immediately float the
hydrometer in the coating slurry. When it stops sinking, read the oBaumé directly from the
hydrometer scale. This relates to density and solid content of the coating.
pH The pH indicates changes in the coating. This is measured using a pH meter or pH paper.
It measures the acidity or alkalinity of the coating.
Runs and
Drips
Runs and drips viscosity is measured by removing a hydrometer from the coating, holding
it an angle of 45 and observing the way the coating runs off (stream, drip, or a
combination of both).

158 CHAPTER 8. DISCUSSION
Table 8.2: Measures for processing finished coating in the foundry shop [108, 140].
Activity Description
Vendor
certification
The first step in assuring the quality of the refractory coating is to make sure that
they are certified by the manufacturer. The vendor should certify the chemical
purity of the raw materials and should be contractually bound to inform you of any
change in the formulation. One of the easiest incoming quality assurance check is to
weigh the container (or check the manufacturer’s recorded weight on the shipping
invoice). If the wrong mineral was used, there usually will be a major discrepancy.
Reconstitution Storage of coating allows time for its suspended refractory materials to settle out,
and the vibrations during shipment accelerate this settling of minerals. Coatings
should not be stored more than 30-90 days, depending on the formulation, without
vigorous, complete remixing. Encountering any resistance along the sides, or the
stirring rod cannot touch the bottom of the container, the solids in the coating may
have settled, hence, the coating needs reconstitution.
Shop stirring A cake of sediment at the bottom of a container can mean that the coating is not
properly stirred. The binders and suspension agents in the coating may become
more diluted in the coating used. This could mean that the moulds and cores may
not receive the full benefit of the refractory coating. Operating a mixer
continuously will cause a coating to lose solvent, since the internal friction actually
heats up the liquid. Coatings should be stirred for 5 mins. in every 1 hr. The mixer
can be shut off overnight or on weekends, and the drum properly covered to
minimize evaporation. For next time use, the contents should be stirred
continuously for 15-30 mins.
Consistent
application
High solid coatings will change in viscosity and gel with prolonged over mixing. It is
better to turn off the stirrer during spraying. As the solvent evaporates, a coating
becomes stiffer and more likely to drag sand when brushed or swabbed on the core
or mould surface.
Change over The time when a new system has been tested successfully and replaces the old
coating. When changing containers, there should be enough room in the new
container to add and stir in the residual material from the old one. Refractory
coatings should be stored inside, under moderate conditions. Coatings allowed to
freeze may loose binder and exposure to direct sunlight may cause the coatings to
loose solvent and cake.

8.1. REFRACTORY COATINGS 159
Table 8.3: Measures to determine coating-core interaction in the foundry shop[108, 139, 140].
Parameter Description
Core
degradation
Core degradation varies from coating to coating. The longer a core stays wet, the
more core degradation will take place, so it is key to put cores into an oven heat
zone as quickly as possible after the core is dipped. Most coatings use surfactants as
wetting agents to allow the coating to penetrate the proper depth. These
surfactants change the surface tension of the water, making degradation worse.
Coating
deposit
Once the optimum oBaumé level is defined to achieve a good surface finish to the
castings, the amount of coating thickness can be determined. It can be Wet Layer
Thickness (WLT) or Dry Layer Thickness (DLT). WLT is measured with the
elcometer. It is always consistent with the DLT. For DLT, coating is removed from
the flat surface on a core and the difference in the cored surface and the coated
surface is measured. The amount of surface deposit can be used as a reference for
future comparisons and making decisions about coating allowance in tooling design.
Comparing test results with the coating thickness, among oBaumé, percent solids,
and viscosity, viscosity shows the strongest correlation.
Coating
penetration
The distance the coating penetrates the core is an important feature to a coating’s
success. A coating that lies entirely on the surface of the core is not anchored well
and will most likely spall away. A coating that penetrates too much will over
degrade the core. Coating penetration is also a function of core density. A core that
is blown too tightly resists coating penetration while a core blown softly acts like a
sponge and absorbs too much water. Any evaluation of coating penetration should
be done on a core that is of normal production quality. Core release agents may
waterproof the core and affect coating penetration. Penetration is evaluated by
simply breaking or cutting a coated dried core and observing how far the coating
penetrates the core.
Coating
permeability
Coating permeability is the amount of gas that can pass through the coating. The
level of permeability is dictated by both the type and amount of refractory
materials that are used in the coating formula and the dry film thickness deposit on
the core. The permeability of the coating on the core is measured using a
laboratory permmeter. The permeability of the coating at the coating-metal
interface may be different from that measured on the core. Some constituents of the
coating may quickly thermally decompose, leaving voids that result in higher
permeability. Some may soften and flux resulting in lower permeability.
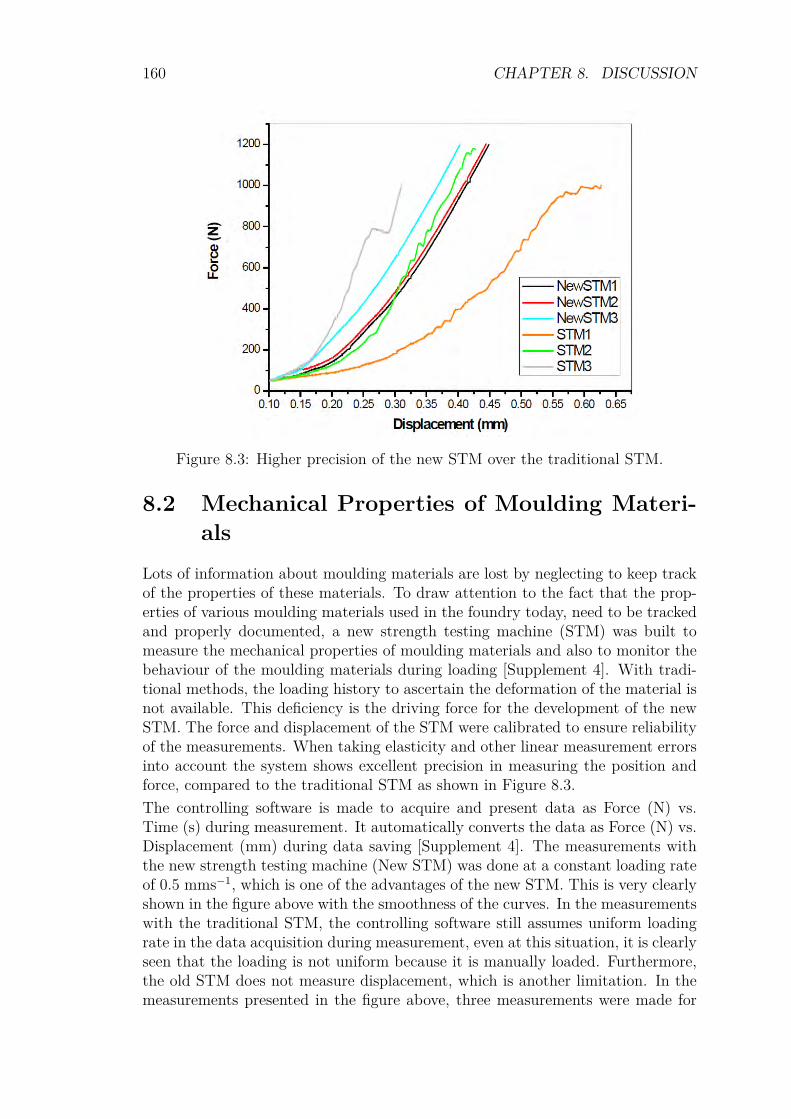
160 CHAPTER 8. DISCUSSION
Figure 8.3: Higher precision of the new STM over the traditional STM.
8.2 Mechanical Properties of Moulding Materi-als
Lots of information about moulding materials are lost by neglecting to keep trackof the properties of these materials. To draw attention to the fact that the prop-erties of various moulding materials used in the foundry today, need to be trackedand properly documented, a new strength testing machine (STM) was built tomeasure the mechanical properties of moulding materials and also to monitor thebehaviour of the moulding materials during loading [Supplement 4]. With tradi-tional methods, the loading history to ascertain the deformation of the material isnot available. This deficiency is the driving force for the development of the newSTM. The force and displacement of the STM were calibrated to ensure reliabilityof the measurements. When taking elasticity and other linear measurement errorsinto account the system shows excellent precision in measuring the position andforce, compared to the traditional STM as shown in Figure 8.3.The controlling software is made to acquire and present data as Force (N) vs.Time (s) during measurement. It automatically converts the data as Force (N) vs.Displacement (mm) during data saving [Supplement 4]. The measurements withthe new strength testing machine (New STM) was done at a constant loading rateof 0.5 mms−1, which is one of the advantages of the new STM. This is very clearlyshown in the figure above with the smoothness of the curves. In the measurementswith the traditional STM, the controlling software still assumes uniform loadingrate in the data acquisition during measurement, even at this situation, it is clearlyseen that the loading is not uniform because it is manually loaded. Furthermore,the old STM does not measure displacement, which is another limitation. In themeasurements presented in the figure above, three measurements were made for
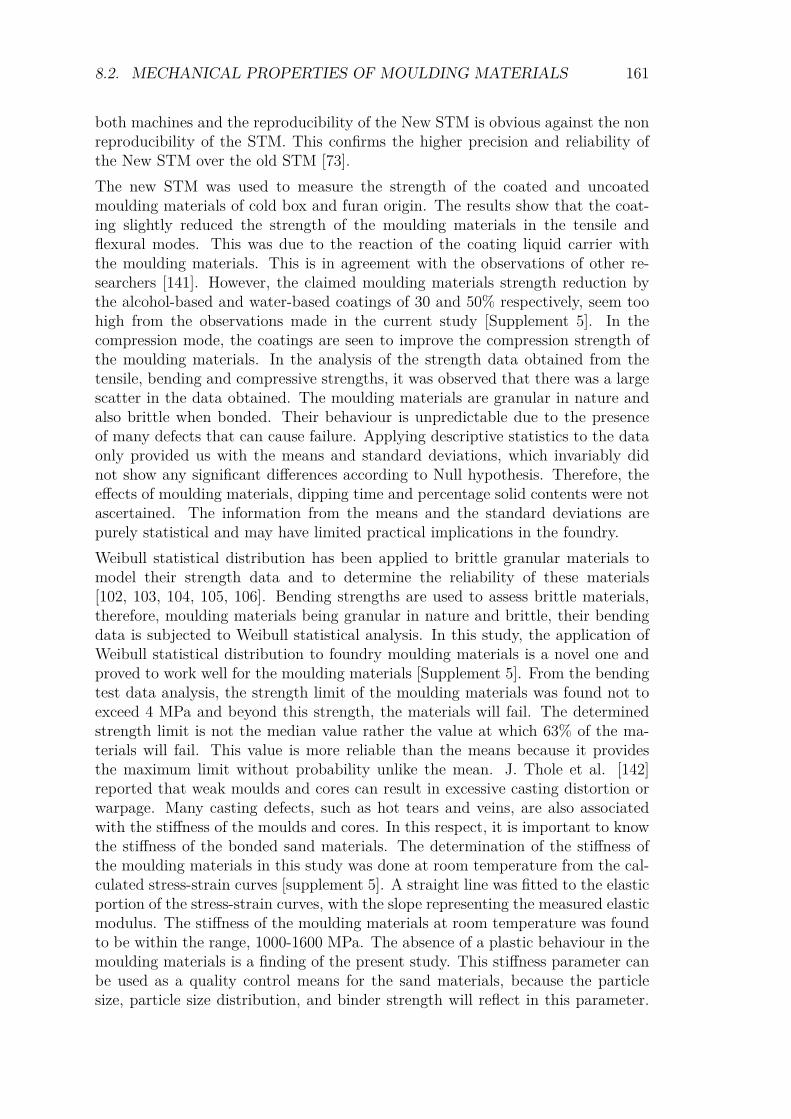
8.2. MECHANICAL PROPERTIES OF MOULDING MATERIALS 161
both machines and the reproducibility of the New STM is obvious against the nonreproducibility of the STM. This confirms the higher precision and reliability ofthe New STM over the old STM [73].The new STM was used to measure the strength of the coated and uncoatedmoulding materials of cold box and furan origin. The results show that the coat-ing slightly reduced the strength of the moulding materials in the tensile andflexural modes. This was due to the reaction of the coating liquid carrier withthe moulding materials. This is in agreement with the observations of other re-searchers [141]. However, the claimed moulding materials strength reduction bythe alcohol-based and water-based coatings of 30 and 50% respectively, seem toohigh from the observations made in the current study [Supplement 5]. In thecompression mode, the coatings are seen to improve the compression strength ofthe moulding materials. In the analysis of the strength data obtained from thetensile, bending and compressive strengths, it was observed that there was a largescatter in the data obtained. The moulding materials are granular in nature andalso brittle when bonded. Their behaviour is unpredictable due to the presenceof many defects that can cause failure. Applying descriptive statistics to the dataonly provided us with the means and standard deviations, which invariably didnot show any significant differences according to Null hypothesis. Therefore, theeffects of moulding materials, dipping time and percentage solid contents were notascertained. The information from the means and the standard deviations arepurely statistical and may have limited practical implications in the foundry.Weibull statistical distribution has been applied to brittle granular materials tomodel their strength data and to determine the reliability of these materials[102, 103, 104, 105, 106]. Bending strengths are used to assess brittle materials,therefore, moulding materials being granular in nature and brittle, their bendingdata is subjected to Weibull statistical analysis. In this study, the application ofWeibull statistical distribution to foundry moulding materials is a novel one andproved to work well for the moulding materials [Supplement 5]. From the bendingtest data analysis, the strength limit of the moulding materials was found not toexceed 4 MPa and beyond this strength, the materials will fail. The determinedstrength limit is not the median value rather the value at which 63% of the ma-terials will fail. This value is more reliable than the means because it providesthe maximum limit without probability unlike the mean. J. Thole et al. [142]reported that weak moulds and cores can result in excessive casting distortion orwarpage. Many casting defects, such as hot tears and veins, are also associatedwith the stiffness of the moulds and cores. In this respect, it is important to knowthe stiffness of the bonded sand materials. The determination of the stiffness ofthe moulding materials in this study was done at room temperature from the cal-culated stress-strain curves [supplement 5]. A straight line was fitted to the elasticportion of the stress-strain curves, with the slope representing the measured elasticmodulus. The stiffness of the moulding materials at room temperature was foundto be within the range, 1000-1600 MPa. The absence of a plastic behaviour in themoulding materials is a finding of the present study. This stiffness parameter canbe used as a quality control means for the sand materials, because the particlesize, particle size distribution, and binder strength will reflect in this parameter.
162 CHAPTER 8. DISCUSSION
In other words, when new sand is introduced into the system, this parameter isdetermined and at a later stage of using the sand it is again measured and com-pared. The result is expected to reveal the state of the sand, although, binderconsumption can also serve as an indicator for the state of the sand.In another development in the study of the mechanical properties of the mouldingmaterials, the fracture surfaces of the materials were subjected to microscopicexamination. The results proved that the coating refractory materials do notcontribute to the strength of the moulding materials. The microscopic studies alsorevealed that the strength of the moulding materials are determined by the bondingbridges between the sand grains and fracture mode is inter-granular through thebonding bridges. Therefore, the finer the sand grains, the more the bonding bridgesand the stronger the moulding materials. This also means that more binder willbe consumed due to larger surface area. The reverse will be the case with coarsergrains. To improve the mechanical properties of moulding materials, camphor andcastor oil can be added to the coating to promote film formation and improve itsplasticity and strength [143].
8.3 Mass and Heat Transport at Core-Metal In-terface
When the moulding materials come in contact with the liquid metal, lots of activ-ities take place because they are typically capillary-porous bodies. There are massand heat transports (diffusion), thermo-mechanical degradation of the mouldingmaterials and chemical reactions, etc. The diffusion of heat in a capillary-porousbody is complex. More especially, when the molten metal is put in contact withthe mould which is very much colder, a contact is formed between the moltenmetal and the substrate only at the asperities protruding from the surface due tothe effect of the surface tension of the molten metal [144, 145]. The quality of thecontact between the liquid metal and the mould is largely determined by the sur-face micro-topography of the mould/core surface. Therefore, the surface tensionof the liquid metal and the mould atmosphere play significant roles in determiningthe topographic contact. This non-perfect contact results in a thermal resistanceto heat transfer known as Thermal Contact Resistance (TCR). TCR is equivalentto the inverse of the interfacial thermal conductance or heat transfer coefficient (h)at the interface. The occurrence of TCR at the interface is associated with the factthat the heat flux from the liquid metal to the cold mould/core wall needs to beconstricted to pass through the micro-contact spots at the interface as illustratedin Figure 8.4. This may be modelled at a macroscopic scale by a temperaturedifference at the interface that characterizes the magnitude of the TCR accordingto Equation (8.1):
TCR = 4Tq
(8.1)
The significance of TCR in the mechanisms of heat transfer becomes more pro-nounced when the thermal properties of the contacting surfaces are high. If the
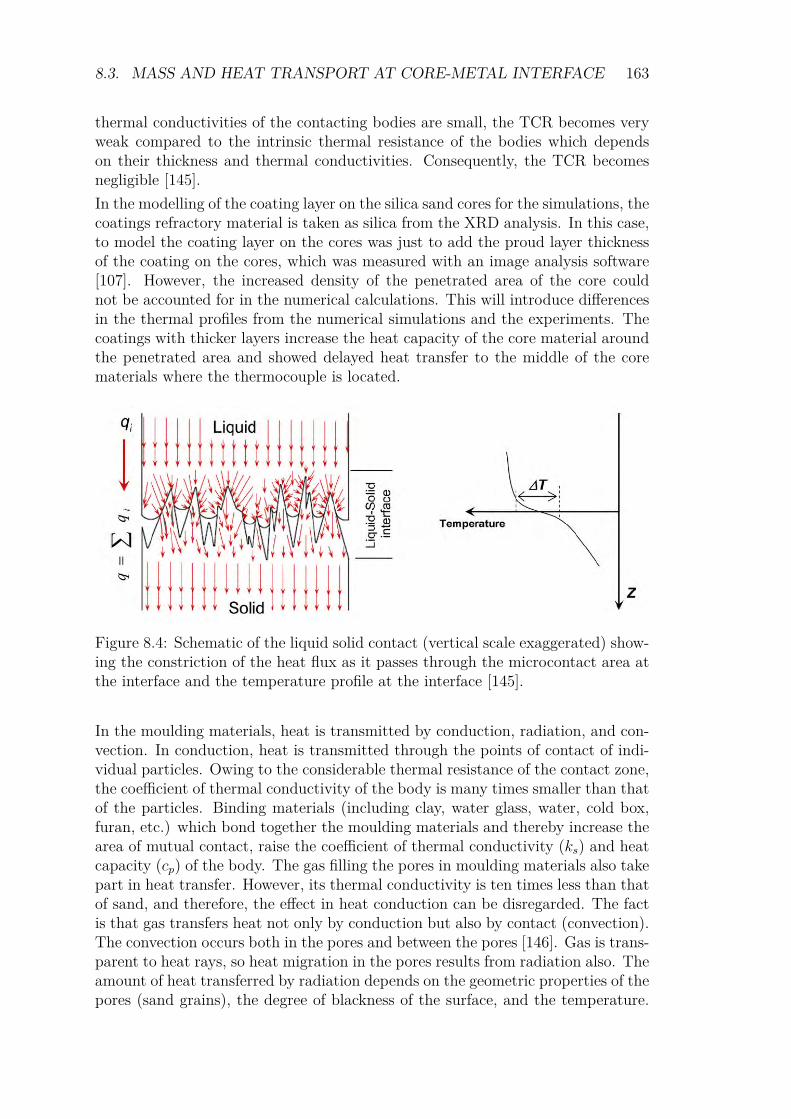
8.3. MASS AND HEAT TRANSPORT AT CORE-METAL INTERFACE 163
thermal conductivities of the contacting bodies are small, the TCR becomes veryweak compared to the intrinsic thermal resistance of the bodies which dependson their thickness and thermal conductivities. Consequently, the TCR becomesnegligible [145].In the modelling of the coating layer on the silica sand cores for the simulations, thecoatings refractory material is taken as silica from the XRD analysis. In this case,to model the coating layer on the cores was just to add the proud layer thicknessof the coating on the cores, which was measured with an image analysis software[107]. However, the increased density of the penetrated area of the core couldnot be accounted for in the numerical calculations. This will introduce differencesin the thermal profiles from the numerical simulations and the experiments. Thecoatings with thicker layers increase the heat capacity of the core material aroundthe penetrated area and showed delayed heat transfer to the middle of the corematerials where the thermocouple is located.
Figure 8.4: Schematic of the liquid solid contact (vertical scale exaggerated) show-ing the constriction of the heat flux as it passes through the microcontact area atthe interface and the temperature profile at the interface [145].
In the moulding materials, heat is transmitted by conduction, radiation, and con-vection. In conduction, heat is transmitted through the points of contact of indi-vidual particles. Owing to the considerable thermal resistance of the contact zone,the coefficient of thermal conductivity of the body is many times smaller than thatof the particles. Binding materials (including clay, water glass, water, cold box,furan, etc.) which bond together the moulding materials and thereby increase thearea of mutual contact, raise the coefficient of thermal conductivity (ks) and heatcapacity (cp) of the body. The gas filling the pores in moulding materials also takepart in heat transfer. However, its thermal conductivity is ten times less than thatof sand, and therefore, the effect in heat conduction can be disregarded. The factis that gas transfers heat not only by conduction but also by contact (convection).The convection occurs both in the pores and between the pores [146]. Gas is trans-parent to heat rays, so heat migration in the pores results from radiation also. Theamount of heat transferred by radiation depends on the geometric properties of thepores (sand grains), the degree of blackness of the surface, and the temperature.
164 CHAPTER 8. DISCUSSION
Radiation depends mainly on temperature [146]. According to Stefan-Boltzmannlaw, heat flux is proportional to the difference of the fourth powers of absolutetemperature [29, 31]. In this case, the primary concern is the temperature gra-dient on the surface of any given pore. This gradient results from the presenceof a temperature gradient in the cross-section of the body (mould or core). Thecoefficient of radiation is proportional to the degree of blackness of the body andmay vary from 0 (absolutely white body) to much higher for an absolutely blackbody. The general theory of radiation heat-exchange postulates that the amountof heat transmitted by radiation depends on both the shape and size of the pores.However, tracing the effect of the shape of the pores is difficult, but the effectof the size can be discussed on the basis of the theory of the action of screen forradiation heat-exchange. In this context, screens reduce heat exchange proportion-ally with the number of screens between two parallel surfaces. Bridges betweenpores may to some extent be regarded as a type of screen. Consequently, withincrease in the dimensions of the sand grains (decrease in the number of bridges),heat-transfer must increase, and decrease with the reduction of the particle size.Therefore, with application of coating, it means that the density around the pene-trated area is increased while introducing more bonding bridges which reduce theheat transfer thereby increasing the heat capacity accordingly. This, in effect, willincrease the cooling power of the mould/core material. This could be one of thepossible explanations to the delay observed in the thermal profiles during castingbecause the coating layer absorbs more energy before the temperature rises or thecoating is thermally insulating. However, considering the small coating layer theexplanation that the coating is thermally insulating becomes dominant.In moulding materials, there are at least three identified types of convection cur-rents of gas, resulting from different factors. The first type corresponds to normalconvection arising from the difference in the specific gravities of gas particles heatedto an uneven temperature. This type of convection occurs both in each individ-ual pore and in the body as a whole, owing to filtration of the gas through itscapillaries.The second type of convection takes the form of forced directional filtration of thegas, caused by the pressure difference which arises near the casting owing to gasevolution from the liquid metal, combustion of coating and binding additives inthe mould, evaporation of moisture, expansion of gas heated in the pores of themould, etc.The third type of convection is caused by thermodynamic factors, and alwaysoccurs when there is a gradient of temperature.In moulding materials, there is also convection of the water, which generally cir-culates as both steam and liquid. The water and organic solvents evaporatingin the heated parts of the capillary-porous body, is transferred as steam to thecolder parts and condenses there. Volatilization is accompanied by heat absorp-tion, therefore, the zone where evaporation takes place will thermally act as aheat sink, condensation is accompanied by heat evolution, because in the areawhere condensation takes place heat is generated. Migration of gas and liquid isaccompanied by migration of heat together with their masses.
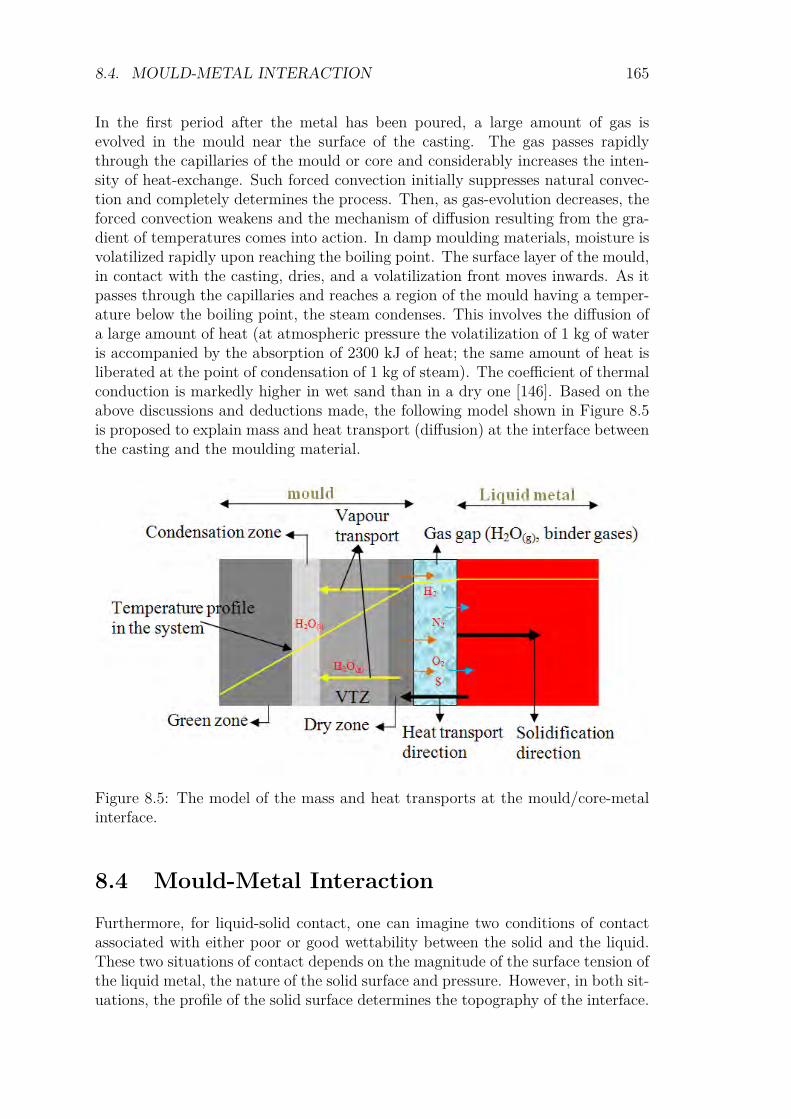
8.4. MOULD-METAL INTERACTION 165
In the first period after the metal has been poured, a large amount of gas isevolved in the mould near the surface of the casting. The gas passes rapidlythrough the capillaries of the mould or core and considerably increases the inten-sity of heat-exchange. Such forced convection initially suppresses natural convec-tion and completely determines the process. Then, as gas-evolution decreases, theforced convection weakens and the mechanism of diffusion resulting from the gra-dient of temperatures comes into action. In damp moulding materials, moisture isvolatilized rapidly upon reaching the boiling point. The surface layer of the mould,in contact with the casting, dries, and a volatilization front moves inwards. As itpasses through the capillaries and reaches a region of the mould having a temper-ature below the boiling point, the steam condenses. This involves the diffusion ofa large amount of heat (at atmospheric pressure the volatilization of 1 kg of wateris accompanied by the absorption of 2300 kJ of heat; the same amount of heat isliberated at the point of condensation of 1 kg of steam). The coefficient of thermalconduction is markedly higher in wet sand than in a dry one [146]. Based on theabove discussions and deductions made, the following model shown in Figure 8.5is proposed to explain mass and heat transport (diffusion) at the interface betweenthe casting and the moulding material.
Figure 8.5: The model of the mass and heat transports at the mould/core-metalinterface.
8.4 Mould-Metal InteractionFurthermore, for liquid-solid contact, one can imagine two conditions of contactassociated with either poor or good wettability between the solid and the liquid.These two situations of contact depends on the magnitude of the surface tension ofthe liquid metal, the nature of the solid surface and pressure. However, in both sit-uations, the profile of the solid surface determines the topography of the interface.
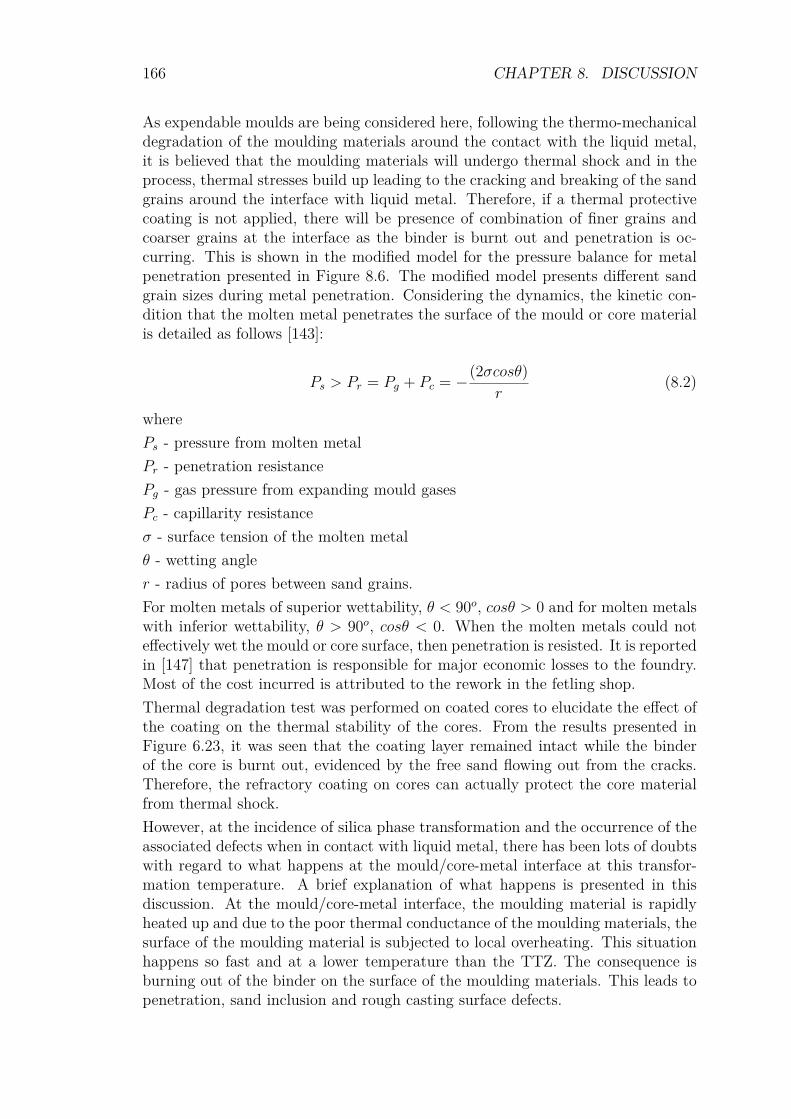
166 CHAPTER 8. DISCUSSION
As expendable moulds are being considered here, following the thermo-mechanicaldegradation of the moulding materials around the contact with the liquid metal,it is believed that the moulding materials will undergo thermal shock and in theprocess, thermal stresses build up leading to the cracking and breaking of the sandgrains around the interface with liquid metal. Therefore, if a thermal protectivecoating is not applied, there will be presence of combination of finer grains andcoarser grains at the interface as the binder is burnt out and penetration is oc-curring. This is shown in the modified model for the pressure balance for metalpenetration presented in Figure 8.6. The modified model presents different sandgrain sizes during metal penetration. Considering the dynamics, the kinetic con-dition that the molten metal penetrates the surface of the mould or core materialis detailed as follows [143]:
Ps > Pr = Pg + Pc = −(2σcosθ)r
(8.2)
wherePs - pressure from molten metalPr - penetration resistancePg - gas pressure from expanding mould gasesPc - capillarity resistanceσ - surface tension of the molten metalθ - wetting angler - radius of pores between sand grains.For molten metals of superior wettability, θ < 90o, cosθ > 0 and for molten metalswith inferior wettability, θ > 90o, cosθ < 0. When the molten metals could noteffectively wet the mould or core surface, then penetration is resisted. It is reportedin [147] that penetration is responsible for major economic losses to the foundry.Most of the cost incurred is attributed to the rework in the fetling shop.Thermal degradation test was performed on coated cores to elucidate the effect ofthe coating on the thermal stability of the cores. From the results presented inFigure 6.23, it was seen that the coating layer remained intact while the binderof the core is burnt out, evidenced by the free sand flowing out from the cracks.Therefore, the refractory coating on cores can actually protect the core materialfrom thermal shock.However, at the incidence of silica phase transformation and the occurrence of theassociated defects when in contact with liquid metal, there has been lots of doubtswith regard to what happens at the mould/core-metal interface at this transfor-mation temperature. A brief explanation of what happens is presented in thisdiscussion. At the mould/core-metal interface, the moulding material is rapidlyheated up and due to the poor thermal conductance of the moulding materials, thesurface of the moulding material is subjected to local overheating. This situationhappens so fast and at a lower temperature than the TTZ. The consequence isburning out of the binder on the surface of the moulding materials. This leads topenetration, sand inclusion and rough casting surface defects.
8.5. CASTING SURFACE QUALITY 167
Figure 8.6: Proposed model for the thermo-mechanical degradation of the mould-ing materials at the core-metal interface during metal penetration.
When the surface temperature reaches 573 C, α - β quartz phase transformationwill occur with its associated rapid expansion. This expansion is non-uniform andconsequently introduces thermo-mechanical stresses which lead to the crackingof the core/mould surface. If the metal temperature is still above the liquidustemperature, when the cracks occur, the melt will flow into these cracks formingveining or finning defects. However, with the application of refractory coatings, therapidity of the heating of the moulding materials surface is significantly reducedand the binder around the surface of the moulding materials is protected fromearly burn-out, allowing the metal to start solidifying before the coating-core-binder failure. This will eliminate the the incidence of the defects (such as sandinclusion, penetration, roughness of casting surfaces, etc.) associated with theearly burn-out of the binder. To a reasonable extent, the coatings also prevent theincidence of veining defects. This is particularly the case when the coating containssome additives that can enhance it thermal plasticity as mentioned earlier. Thecoating protective layer is clearly shown in Figure 6.23. From this figure, it canbe seen that the coating remained intact even when the binder has completelyburnt out. In the figure, what was observed is that the failure of the coating wasby cracking, in this case the only likely defects to occur are veining defects if thetemperature of the metal is above liquidus.
8.5 Casting Surface Quality
The quality of the surface as well as the dimensional accuracy of a casting dependson the extent of the reaction and interaction between the metal and the mouldmaterials. Some of the variables affecting the reaction are the compositions ofthe metal and sand, pouring temperature, cooling rate, metal pressure, and themould atmosphere. These reactions and interactions can lead to sand burn-on,
168 CHAPTER 8. DISCUSSION
metal penetration, surface roughness, veinings, casting porosity, and dimensionalinaccuracy [148]. In furtherance of the explanation of the interfacial interaction ofthe metal and the mould which determines the surface quality of the castings, castiron can be used as an example. Iron is oxidized at the mould surface, forming anoxide liquid which wets the silica sand in the mould. This liquid phase penetratesinto the pores of the mould. Silica is soluble in this oxide liquid to about of 50% byweight. The dissolution of silica enlarges the pores in the sand. This enlargementof the pores permits the molten iron to penetrate the mould/core at low pressuresalthough iron does not wet the silica sand. The depth of penetration into the sandby the iron depends on the length of time the melt remains above the liquidus andthe severity of the oxidation. At a very low CO2/CO ratio, no penetration occursbecause the atmosphere is reducing. This is why green sand contains carbon toavoid the risk of decaburization. At a higher CO2 content, the iron will be oxidized.Slag formation depends on the time, temperature, and the oxidizing level at themould-metal interface. The rate of oxidation and the amount of attack uponthe sand increase under oxidizing environments [148]. All these affect the surfacequality of castings produced under this situation. In the foundries, most of theseeffects are reduced by application of refractory coatings [149]. The activity at themould/core-metal interface also have negative effects on the sub-microstructuralevolution. If there is a change in the expected microstructure at the subsurface ofthe casting beyond machining allowance, the mechanical properties of the part willbe affected. Therefore, the composition of the moulding materials and the coatingsbecome very important to monitor. They should be inert to the molten metal. Inthis study, efforts were made to show some of the changes in the microstructureat the interface of castings with coated cores. This needs further investigation.Further work is necessary to show that the sol-gel additive has no negative effecton the casting microstructure.The good surface quality of the castings obtained by application of coatings on thecores is attributed to the fact that the coating offers a protective barrier conse-quently stopping the reactions and interactions. Furthermore, the refractory fillermaterials in the coatings are very much smaller than the sand grains in sizes andat the right amount, offers the right surface coverage to the cores. The fine detailsof the refractory materials will be reproduced on the surface of the castings. Someof the coating also contain anti-veining substance such as Fe2O3 which preventsthe occurrence of veining defects. This is the mechanism of surface improvementwith coating application. From the results presented in the case studies, the sol-geladdition showed strong potential in enhancing the surface quality of the castingsrelative to the reference coating (the same coating but without sol-gel component).The addition of sol-gel to foundry coatings needs optimization for various coatings.However, in this study, it was observed that the coatings improved the surfacequality of the castings more in areas away from the parting-lines of the core box inboth the cylindrical and flat cores. A closer observation shows that the parting-linearea of the cores seem to be the weakest part. This emanates from the productionprocess. These areas are mostly where penetration is largest especially in thecastings made with smaller flat cores (Figure 6.35). Therefore, a complete surfacequality of the castings can only be obtained by harnessing the synergy of the
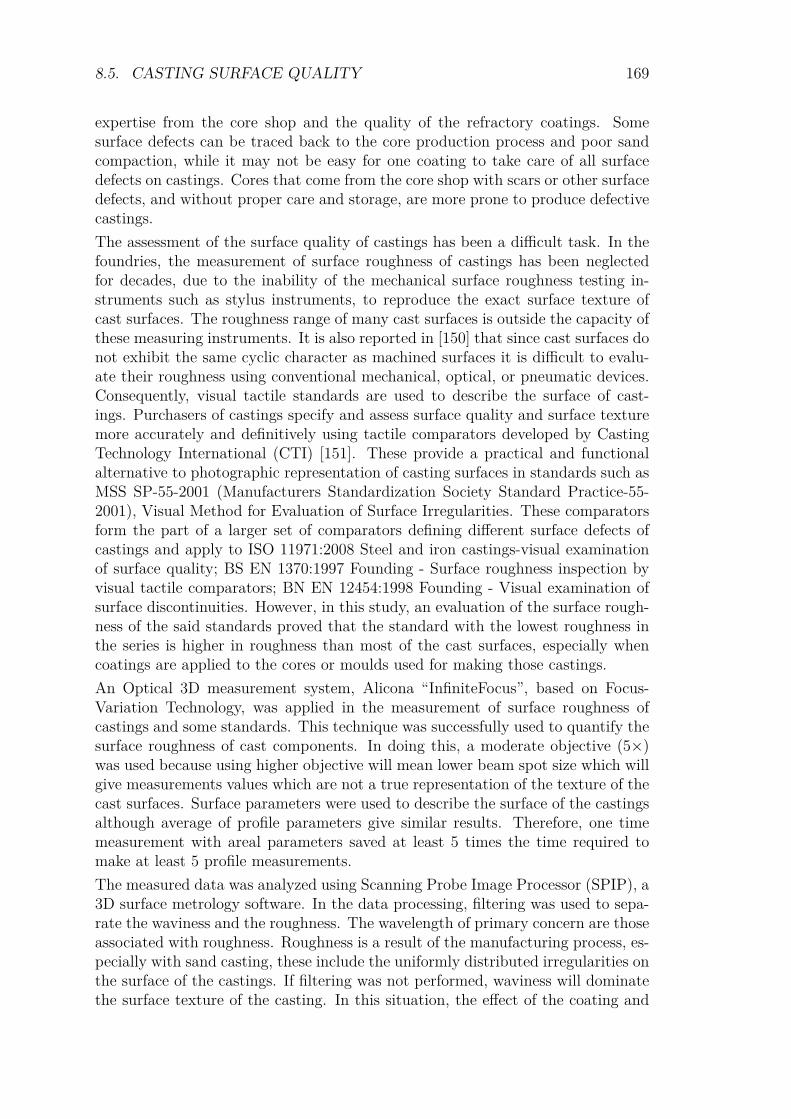
8.5. CASTING SURFACE QUALITY 169
expertise from the core shop and the quality of the refractory coatings. Somesurface defects can be traced back to the core production process and poor sandcompaction, while it may not be easy for one coating to take care of all surfacedefects on castings. Cores that come from the core shop with scars or other surfacedefects, and without proper care and storage, are more prone to produce defectivecastings.The assessment of the surface quality of castings has been a difficult task. In thefoundries, the measurement of surface roughness of castings has been neglectedfor decades, due to the inability of the mechanical surface roughness testing in-struments such as stylus instruments, to reproduce the exact surface texture ofcast surfaces. The roughness range of many cast surfaces is outside the capacity ofthese measuring instruments. It is also reported in [150] that since cast surfaces donot exhibit the same cyclic character as machined surfaces it is difficult to evalu-ate their roughness using conventional mechanical, optical, or pneumatic devices.Consequently, visual tactile standards are used to describe the surface of cast-ings. Purchasers of castings specify and assess surface quality and surface texturemore accurately and definitively using tactile comparators developed by CastingTechnology International (CTI) [151]. These provide a practical and functionalalternative to photographic representation of casting surfaces in standards such asMSS SP-55-2001 (Manufacturers Standardization Society Standard Practice-55-2001), Visual Method for Evaluation of Surface Irregularities. These comparatorsform the part of a larger set of comparators defining different surface defects ofcastings and apply to ISO 11971:2008 Steel and iron castings-visual examinationof surface quality; BS EN 1370:1997 Founding - Surface roughness inspection byvisual tactile comparators; BN EN 12454:1998 Founding - Visual examination ofsurface discontinuities. However, in this study, an evaluation of the surface rough-ness of the said standards proved that the standard with the lowest roughness inthe series is higher in roughness than most of the cast surfaces, especially whencoatings are applied to the cores or moulds used for making those castings.An Optical 3D measurement system, Alicona “InfiniteFocus”, based on Focus-Variation Technology, was applied in the measurement of surface roughness ofcastings and some standards. This technique was successfully used to quantify thesurface roughness of cast components. In doing this, a moderate objective (5×)was used because using higher objective will mean lower beam spot size which willgive measurements values which are not a true representation of the texture of thecast surfaces. Surface parameters were used to describe the surface of the castingsalthough average of profile parameters give similar results. Therefore, one timemeasurement with areal parameters saved at least 5 times the time required tomake at least 5 profile measurements.The measured data was analyzed using Scanning Probe Image Processor (SPIP), a3D surface metrology software. In the data processing, filtering was used to sepa-rate the waviness and the roughness. The wavelength of primary concern are thoseassociated with roughness. Roughness is a result of the manufacturing process, es-pecially with sand casting, these include the uniformly distributed irregularities onthe surface of the castings. If filtering was not performed, waviness will dominatethe surface texture of the casting. In this situation, the effect of the coating and
170 CHAPTER 8. DISCUSSION
moulding materials cannot be assessed. A typical effect of the filtering is shownin Figure 8.7. This figure emphasizes the need for filtering the surface in order tobe able to measure the real surface roughness.
(a) Waviness (b) Roughness
(c) Waviness profile (d) Roughness profile
Figure 8.7: The difference between waviness and roughness.
Chapter 9
Summary
9.1 ConclusionsThis PhD thesis addresses the development of a novel refractory foundry coat-ing using the Sol-Gel Technology. The coatings were developed and applied onmould/core materials in order to enhance the surface quality of castings by reduc-ing or eliminating the surface defects. From the detailed experiments performed,the following deductions are made.Sol-gel refractory coatings for foundry applications are possible. However, thesol-gel stock is selective of particle size and particle size distribution, types ofrefractory materials and suspension agents. This selectivity has to be reduced forfoundry coating development using sol-gel technology.In the characterization of the coatings, the particle size and the particle size distri-bution of the refractory materials have significant roles to play in the performanceof the coatings. Therefore, considering the sand grain sizes, nanoparticle refractorymaterials are not suitable for foundry coatings. The formulation of the sol-gel coat-ings with other refractory materials like zircon, olivine, china clay, and aluminiumsilicates did not prove workable as the refractory materials were flocculating in thesystems. The rheological properties of coating such as viscosity and density are de-pendent on the solid content of the coating. From various characterization results,it can be concluded that the percentage solid content in the coating is directlyproportional to the density, oBaumé, viscosity, coverage, and proud layer thick-ness, and inversely proportional to the penetration into the substrate, moisturecontent, and permeability. The characterization results of the coating emphasizesthat oBaumé parameter be performed with additional tests such as viscosity, den-sity, and surface tension, in controlling the consistency of foundry coatings. Thecoatings enhanced the thermal stability of the core materials in general, while withlittle amount of sol-gel additive, greater reinforcement to the stability of the corecan be achieved.Test casting of the coatings showed that the filter dust sol-gel coatings showedstrong positive potential to enhance the surface quality of the castings. However,the development of this coating was discontinued as a result of non availability ofthe filter dust materials. The next activity was to add the sol-gel component as
171
172 CHAPTER 9. SUMMARY
an additive to commercial foundry coatings. The surface quality of the castingsimproved significantly with addition of certain amount of sol-gel component tosome commercial coatings relative to the coating without sol-gel. Lower amountsof sol-gel components were observed to improve the thermal integrity/stability ofthe mould/core materials and consequently, enhance the surface quality and reduceveining defects.
During the application of the coating to the mould/core, the interaction of thecoatings with the moulding materials leads to the lowering of the strength of themoulding materials. The mechanical property measurements of mould/core ma-terials reveals that the strength of the moulding materials is determined by thebinder and the fracture mode under loading is inter-granular through the bondingbridges between the sand grains. Sand moulds/cores are not fully compact withsand due to irregular particle shapes and sizes of the sand grains. Consequently,the mould or core has large amount of voids of different sizes determined by thesand grains and grain size distribution. Therefore, the cause of brittle failure ofmoulding materials is as a result of these voids. Chemically-bonded sand core ma-terials have no specific strength but a range of strengths at ambient temperature.However, the knowledge of the mean strength is not much of technical use forthe foundry rather, the strength at which the moulding materials can be reliablyused. This is successfully determined by application of the Weibull Statistics onthe measured strength data. From the Weibull statistical analysis, the reliabilitystrength of the moulding materials is determined. The modulus of elasticity ofthe chemically-bonded sand core materials were determined in the range of 1000-1500 MPa for cold box and 1000-1600 MPa for furan core materials at ambienttemperature. The binder remains the determinant contributor.
From the predicted reactions at the mould/core-metal interface, the metals getoxidized at very low free energy change within the casting temperature and alsoat very low CO/CO2 ratio. The harder the oxide is to reduce, the greater theproportion of CO needed in the gases. This means that an oxidizing atmosphereshould be avoided.
In this research, it has been established that optical system can be reliably used tocharacterize the surface texture of castings contrary to previous views. An optical3D measurement system, Alicona “InfiniteFocus”, based on Focus-Variation Tech-nology, was applied successfully in the measurement of surface roughness of sandcastings and some standards. Average parameters are more sensitive to changesin surface features than the extreme (peak-to-value height) parameters both inprofile and surface measurements. Surface parameters are more precise and reli-able and saves measurement time compared to the profile parameters. Parameterrash should be avoided in the foundry. Sa parameter from 3D surface measure-ment suffices for casting surface characterization. Bearing area curve parametersnormalized to the core roughness can be used to determine the symmetry of thesurface features.

9.2. RECOMMENDATIONS FOR FURTHER WORK 173
9.2 Recommendations for Further WorkIn view of the fact that the filter dust used as a refractory material for the sol-gel coating showed positive results with improving the surface quality of castings,probably due to the fact that it has already undergone thermal shock and hashigh thermal integrity, processing it and finding use for it in refractory liningsfor furnaces or as refractory fillers for foundry coatings will be favourable to theenvironment. This means recycling of a foundry waste.Concerning the coating formulations where the sol-gel component was not com-patible with many other refractory materials, this is a big limitation for the sol-gelapplication in foundry coating development. Therefore, it will be worth trying toapply surface active agents to get the refractory materials properly dispersed inthe suspension and zeta potential measurements adopted to determine the stabil-ity of the coating suspensions. This approach will significantly reduce the numberof trial formulations to be made thereby saving time, resources, and energy.Having established that the sol-gel component shows positive results in enhancingthe performances of commercial coatings, optimization of the amount of sol-gelcomponent required for various commercial coatings and different moulding mate-rials is required to be done. This will involve determining the viscosity, oBaumé,and the amount of commercial coating at each of the sol-gel component amountthat shows good results. This will help in the formulation of a model for the ad-dition for the right consistency for a particular commercial coating and mouldingmaterial. This will be done with a more automated production process like coldbox core system to ensure reproducibility.A detailed study of the subsurface microstructure of the castings at the interfacewith coated moulds/cores are recommended, accordingly.Another area of interest that is worth developing further is to effectively utilize thecapabilities of the new 3D optical measurement technique and make replicates ofcasting surfaces of interest without destroying the component. This will provide anon destructive novel technique of quantifying the roughness of cast components.

174 CHAPTER 9. SUMMARY

Bibliography
[1] K. P. Harris, Silica-free foundry sand at silica prices, Shape casting:The John Campbell Symposium, M. Tiryakioglu and P. N. CrepeauEds. TMS, 2005.
[2] J. Thiel, M. Ziegler, P. D. Dziekonski, S. Joyce, Investigation of theTechnical Limitation of Silica Sand to Thermal Expansion, AFSTransactions paper 07-145(04) (2007).
[3] S. G. Baker, J. M. Werling, Expansion Control method for SandCores, AFS Transactions paper 03-023(04) (2003).
[4] N. Hodgkinson, T. Birch, Improving Foundry Profitability throughthe use of RHEOTEC*XL Coating, Foseco Foundry Practice, 240(2003)
[5] www.cjc.dk/profile
[6] www.dania-as.dk
[7] www.dti.dk
[8] www.disagroup.com
[9] www.fresemetal.dk
[10] www.johan-jensen-og-son.dk
[11] www.nord-metal.dk
[12] www.pvsand.dk
[13] www.birn.com
[14] Environmental statement 2005 – company site Vestas CastingsKristiansand AS, Norway.
[15] K.P. Panayiotopulos, Packing of Sands - A Review, Soil & TillageResearch 13 (1989) 101-121.
[16] The American Foundrymen’s Society, Moulding Methods and Ma-terials, 1st ed., Illinois, 1962.
175
176 BIBLIOGRAPHY
[17] A. Raihane, O. Bonnefoy, J. –M. Chaix, J. –L. Gelet, G. Thomas,Analysis of the densification of a vibrated sand packing, PowderTechnology (2010).
[18] Y. Peng, S. Hu, Q. Ding, Dense packing properties of mineral ad-mixtures in cemetitious material, Particuology 7 (2009) 399-402.
[19] S. Shen, H. Yu, Characterize packing of aggregate particles forpaving materials: Particle size impact, Construction and BuildingMaterials. 25 (2011) 1362-1368.
[20] M. M. Monkul, G. Ozden, Compressional behaviour of clayey sandand transition fines content, Engineering Geology 89 (2007) 195-205.
[21] S. P. E. Forso, J. P Vuori, The determination of porosity of ironore green pellets by packing in silica sand, Powder technology 159(2005) 71-77.
[22] M. D. Webb, I. L. Davis, Random particle parking with large par-ticle size variations using reduced-dimension algorithms, PowderTechnology 167 (2006) 10-19.
[23] J. Xiang, The effect of air on the packing structure of fine particles,Powder Technology 191 (2009) 280-293.
[24] W. B. Parkes, Clay-bonded Foundry Sand, Applied Science Pub-lishers, London, 1971.
[25] P. L. Jain, Principles of Foundry Technology, 4th ed. McGraw-Hill,New Delhi, 2006.
[26] T. S. Piwonka, Aggregate Moulding Materials, 15 (1988).
[27] Foseco, Ferrous Foundryman’s handbook, Butterworth-Heinemann, Oxford, 2000.
[28] P.D. Webster, Fundamentals of Foundry Technology, PorticullisPress, Surrey, 1980.
[29] H. F., U. Åkerlind, Materials Processing during Casting, John Wi-ley, West Sussex, 2006.
[30] J. Campbell, The New Metallurgy of Castings, 2nd Edition, Burt-terworth Heinemann, Oxford, 2003.
[31] J. Hattel Ed., Fundamentals of Numerical Modelling of Castingprocesses, Lyngby, 2005.
BIBLIOGRAPHY 177
[32] S. N. Kulkarn, K. Radhakrishna, Evaluation of metal-mould inter-facial heat transfer during the solidification of aluminium - 4.5%copper alloy castings cast in CO2-sand moulds, Materials Science-Poland, Vol. 23, No. 3 (2005) 821-838.
[33] B. E. Brooks, C. Beckermann, Prediction of Burn-on and MoldPenetration in steel Casting using Simulation, in Proceedings ofthe 60th SFSA Technical and Operating Conference, Paper No.5.3, Steel Founders’ Society of America, Chicago, IL, 2006.
[34] K. M. Pedersen, N. Tiedje, Temperature measurement during so-lidification of thin wall ductile cast iron. Part 1: Theory and ex-periment, Measurement 41 (2008) 551-560.
[35] ASM International, Metals Handbook, Casting, 9th Ed. Vol. 15,metals park, Ohio, (1988)
[36] L. Winardi, H. E. Littleton, R. D. Griffin and J. A. Griffin, Gasfrom Green Sand Molds and Vapor Transport Zone, AFS Transac-tion 2008, vol. 49, pp. 381-398.
[37] L. Winardi, and G. Wilkinson, Comparison of Gas evolution andPermeability of Green Sand Molds and Chemically Bonded Sands,AFS Transaction 2008, vol. 50, pp. 399-412.
[38] L. Winardi, P. Scarber,Jr. and R. D. Griffin, Comparison of Gasevolution results from Chemically Bonded Cores in contact withMagnesium and aluminium Melts, AFS Transaction 2008, vol. 48,pp. 769-783.
[39] N. Tiedje, R. Crepaz, T. Eggert, N. Bay, Emission of organic com-pounds from mould and core binders used for casting iron, alu-minium and bronze in sand moulds, Journal of Environmental Sci-ence and Health Part A, 45 (2010) 1866-1876.
[40] L. Winardi, H. Onda, S. Harada and A. Yoshida, Gas Evolutionand Permeability of Shell Cores in Contact with Aluminum, AFSTransaction 2008, vol. 107, pp. 445-461.
[41] U. C. Nwaogu, T. Poulsen, C. Bischoff, N.S. Tiedje, Influence ofNew sol-Gel Refractory coating on the Casting properties of ColdBox and Furan Cores for Grey Cast Iron, Proceedings of the 69thWorld Foundry Congress, China (2010).
[42] D. A. Porter, K. E. Easterling, M. Y. Sherif, Phase Transformationin Metals and Alloys, 3rd Ed., CRC Press, Florida (2009).
[43] R. E. Smallman, R. J. Bishop, Modern Physical Metallurgy &Materials Engineering, 6th Ed. Butterworth-Heinemann, Oxford(2002).
178 BIBLIOGRAPHY
[44] CliffsNotes, Chemistry: Gibbs Free Energy,www.cliffsnotes.com/study_guide/Gibbs-Free-Energy.
[45] Gibb’s Free Energy and the Nature of Chemical Reactions:www.tiem.utk.edu/bioed/Webmodules/GibbsEnergy.htm
[46] Bodner Research Web, Gibbs Free Energy:www.chemed.purdue.edu./genchem/topicreview/bp/ch21/gibbs.php
[47] C. Cingi, Mould-Metal Reactions in Magnesium Investment Cast-ings, PhD Thesis, Helsinki University of Technology Publicationsin Foundry Technology, 2006.
[48] R. W. Monroe, J. B. Andrews and J. Thiel, Iron Oxide in Moldsand Cores for the production of Iron and Steel Castings, Paper10-148.pdf, AFS Proceedings 2010.
[49] N. N. Greenwood, A. Earnshaw, Chemistry of the Elements, 2ndEd., Butterworth-Heinemann, Oxford (1997).
[50] H. J. Grabke, Asorption, Segregation and Reactions of Non-metalatoms on Iron Surfaces, Materials science and engineering, 42(1980) 91-99.
[51] H. G. Lee, Y. K. Rao, Rate of Decarburization of Iron-CarbonMelts: Part 1. Experimental Determination of the Effectof Sulphur, Metallurgical Transactions B, Vol. 13B (1982) 403-409.
[52] H. J. Grabke, W. Paulitschke, G. Tauber, H. Viefhau, EquilibriumSurface Segregation of Dissolved Nonmetal Atoms on Iron(100)Faces, Surface Science 63 (1977) 377-389.
[53] L. Riposan, M. Chisamera, S. Stan, T. Skaland, Surface GraphiteDegeneration in Ductile Iron Castings for Resin Moulds, TsinghuaScience and Technology, Vol. 13, No. 2 (2008) 157-163.
[54] K. P. Harris, Silica-free foundry sand at silica prices, Shape casting:The John Campbell Symposium, M. Tiryakioglu and P. N. CrepeauEds. TMS, 2005.
[55] F. Peters, R. Voigt, S. Z. Ou and C. Beckermann, Effect of mouldexpansion on pattern allowances in sand casting of steel, Interna-tional Journal of Cast Metals Research, Vol. 20 No. 5 (2007) 275 –287.
[56] R. B. Sosman, The phases of silica, 1965, New Brunswick, NJ,Rutgers University Press.
[57] F. M. Wahl, R. E. Grim and R. B. Graf, Phase transformations insilica as examined by continuous X-ray diffraction, The AmericanMineralogist, vol. 46 (1961)196 – 208.
BIBLIOGRAPHY 179
[58] G.W. Moss, Mathematical Models of the Alpha-Beta Phase Tran-sition of Quartz, PhD Dissertation, Blacksburg, Virginia, 1999
[59] S. G. Baker, J. M. Werling, Expansion Control method for SandCores, AFS Transactions paper 03-023(04) (2003).
[60] J. Thiel, M. Ziegler, P. D. Dziekonski, S. Joyce, Investigation of theTechnical Limitation of Silica Sand to Thermal Expansion, AFSTransactions paper 07-145(04) (2007).
[61] AFS, Analysis of Casting Defects, 4th Ed., American Foundry So-ciety, Illinois, 2007.
[62] T. Birch, D. Bell, Improved Iron Casting Quality through Appli-cation of Advanced Coating Technology, Foseco Foundry Practice,Vol. 243 (2005) 16-23.
[63] I. Dugic, A. Dioszegi, I. L. Svensson, The mechanism of metal ex-pansion penetration during solidification of grey cast iron, ResearchReport, 1404-0018, 2006.
[64] G. D. Sylvestro, Experiences in Defect Diagnosis: Metal Penetra-tion, Special Report AFS paper No. 89-07 (1989).
[65] J. O. Barlow, D. M. Stefanescu, A. M. Lane, W. C. Schreiber, M.Owens, T. S. Piwonka, Metal penetration in sand moulds for steelcastings, Annual report, DOE/ID/13324-1
[66] I. Dugic, The mechanisms of metal expansion penetration duringsolidification of grey cast iron, PhD Thesis, Linkoping University,2006.
[67] K. D. Hayes, M. Owens, J. Barlow, D. M. Stefanescu, A. M. Lane,T. S. Piwonka, Steel penetration in sand moulds, Final TechnicalReport, DOE/ID/13324-T1,1997.
[68] T. S. Piwonka, Understanding metal penetration in green sand:cast iron, Modern Casting (1996)
[69] B. L. Kruse, V. L. Richards, P. D. Jacksom, An Investigation ofthe Causes that Lead to Burn-in/Burn-on in Heavy Section SteelCastings, American Foundry Society, IL, 2006.
[70] www.ikominerals.com/upæoads/media/01_burn-on_sand.pdf
[71] T. L. Donohue, H. F. Frye, Characterization and correction of Cast-ing Defects, The Ganoksin Project. www.ganoksin.com.
[72] M. P.Groover, Fundamentals of Modern Manufacturing: Materials,Processes and Systems, 3rd Ed. John Wiley & Sons, USA, 2002.

180 BIBLIOGRAPHY
[73] S. Kalpakjian, S. R. Schmid, Manufacturing Engineering and Tech-nology, 5th ed., Pearson Prentice Hall, New Jersey, 2006.
[74] R. K. Leach, Fundamental Principles of Engineering Nanometrol-ogy, Elsevier, London, 2010.
[75] P. Demircioglu, M. N. Durakbasa, Investigation on machined metalsurfaces through the stylus type and optical 3D instruments andtheir mathematical modeling with the help of statistical techniques,Measurement 44 (2011) 611-619.
[76] D. J. Whitehouse, Handbook of Surface Metrology, IOP Publishing,London, 1994.
[77] Geometriske produckt-specifikationwe (GPS), DS-Håndbog114.5:2006, Danske standard 2006.
[78] L. D. Chiffre, Geometrical Metrology and Machine Testing, A com-pendium for Course 41731, DTU Mechanical Engineering.
[79] I. Asiltürk, M. Cunkas, Modelling and prediction of surface rough-ness in turning operations using artificial neural network and multi-ple regression method, Expert systems with applications 38 (2011)5826-5832.
[80] S. Derbyshire, Coating Compositions, United States Patent:4,279,946, 1981.
[81] A. Larena, F. Millan, M. Verdu, G. Pinto, Surface roughness char-acterisation of multilayer polymer films for graphitic arts applica-tions, Applied Surface Science 174 (2001) 217-224.
[82] J. Järnström, P. Ihalainen, K. Backfolk, J. Peltonen, Rougness ofpigment coatings and its influence on gloss, Applied Surface Science254 (2008) 5741-5749.
[83] B. Griffiths, Manufacturing Surface Technology, ButterworthHeinemann, 2001.
[84] Alicon Infintefocus, IFM Manual IFM 3.1.1.2 EN 26.02.2009.
[85] M. Jolly, Castings, University of Birmingham, UK.
[86] F. Bonollo, S. Odorizzi, Eds. Numerical Simulations of FoundryProcesses, SGE, Podova, 2001.
[87] MAGMA5 Online Help
[88] DISA 231 B (2013-B Compatible), Moulding System ApplicationManual, Reg. No. 9157 H8610, Ed. 06-08.
BIBLIOGRAPHY 181
[89] B. E. Brooks, C. Beckermann, Prediction of Burn-on and Moldpenetration in Steel Casting Using Simulation, in Proceedings ofthe 60th SFSA Technical and Operating Conference, Paper No. 5.3,Steel Founders’ Society of America, Chicago, IL, 2006.
[90] A. -M Siouffi, Silica gel-based monoliths prepared by the sol-gelmethod: facts and figures, Journal of Chromatography A, 1000(2003) 801-818.
[91] B. Topus, Gas permeation through sol-gel derived alumina andsilica based membranes, PhD Thesis, the Graduate School of En-gineering and Sciences of İzmir Institute of Technology, 2009.
[92] A.C. Pierre, Introduction to Sol-Gel Processing; Kluwer AcademicPublisher: Boston, 2002.
[93] J. D. Wright, N. A. J. M. Sommerdijk, Sol-Gel Materilas ChemistryApplications, CRC Press, Boca Raton, 2001.
[94] C. J. Brinker, G. C. Frye, A. J. Hurd, C. S. Ashley, Fundamentalsof Sol-gel dip coating, Thin Solid Films, 201 (1991) 97-108
[95] C. J. Brinker, A. J. Hurd, P. R. Schunk, G. C. Frye, C. S. Ashley,Review of Sol-Gel Thin Film Formation, Journal of Non-CrystallineSolids, 147-148 (1992) 424-436.
[96] C. J. Brinker, R. Sehgal, S. L. Hietala, R. Deshpande, D. M. Smith,D. Loy, C. S. Ashley, Sol-Gel Strategies for Controlled Porosity inInorganic Materials, Journal of Membrane Science 94 (1994) 85-102.
[97] E. P. Plueddemann, Silane Coupling Agents, 2nd Edition, PlenumPress, New York, 1990.
[98] D. C. Montgomery, Design and Analysis of Experiments, 3rd. JohnWiley & Sons, New York, 1991.
[99] BYK Additives and Instruments: http://www.byk.com/physical-properties/viscosity-cups.html
[100] Gardco/DIN 4 mm Viscosity Cup:http://www.gardco.com/din_cups.cfm
[101] WTIA Technical note 10, WRC Bulletin No. 430; BS7910; AS/NZS3788; API 579.
[102] M. H. Dirikolu, A. Aktas, B. Birgoren, Statistical Analysis of Frac-ture Strength of Composite Materials Using Weibull Distribution,Turkish J. Eng. Env. Sci., 26 (2002) 45-48.
182 BIBLIOGRAPHY
[103] B. Basu, D. Tiwari, D. Kundu, R. Prasad, Is weibull distrubtionthe most appropriate statistical strength distribution for brittlematerials?, Ceramics International 35 (2009) 237-246.
[104] Y. Xu, L. Cheng, L. Zhang, D. Yan, C. You, Optimization of samplenumber for Weibull function of brittle materials strength, CeramicsInternational 27 (2001) 239-241.
[105] R. Sakin, I. Ay, Statistical analysis of bending fatigue life data usingWeibull distribution in glass-fiber reinforced polyester composites,Materials and Design 29 (2008) 1170-1181.
[106] A. Saghafi, A. R. Mirhabibi, G. H. Yari, Improved linear regres-sion method for estimating Weibull Parameters, Theoretical andApplied Fracture Mechanics 52 (2009) 180-180.
[107] U. C. Nwaogu, T. Poulsen, R. K. Stage, C. Bischoff, N.S. Tiedje,New sol-gel refractory coatings on chemically-bonded sand coresfor foundry applications to improve casting surface quality, Surface& Coatings Technology 205 (2011) 4035-4044.
[108] U. C. Nwaogu, N. S. Tiedje, Foundry Coating Technology: A Re-view, Materials Science and Applications, 2 (2011) 1143-1160.
[109] Cast TIP, "Controlling refractory coatings," Modern Casting, 2010.http://www.thefreelibrary.com/Controlling+refractory+coatings.-a022.
[110] L. Winardi, R.D. Griffin, "Effects of Coating drying Methods onLOI, Gas Evolution and Core Permeability," AFS Transactions pa-per, Vol. 08-047, 2008.
[111] T. K. Tokunaga, K. R. Olsen, J. Wan, Moisture Characteristicsof Hanford Gravels: Bulk, Grain-surface, and Intra-granular Com-ponents, Vadose Zone Journal 2 Soil Science Society of America(2003) 322-329.
[112] S. N. Ramrattan, M. K. Joyce, “Final Report - refractory CoatingControl” http://amc.aticorp.org/reports/wmu2009.pdf
[113] Ellingham DiagramWeb Tool, http://www.engr.sjsu.edu/ellingham
[114] R. Elliot, Cast Iron technology, Butterworths & CoLtd, 1988.
[115] Metals Handbook, 19th Ed. Volume 15, Casting, ASM Interna-tional, Metals park, Ohio, 1988.
[116] N. S. Tiedje, 25 year Perspective: Solidification, processing andproperties of ductile iron, Materials Science and Technology, Vol.26 No. 5 (2010) 505-514.
BIBLIOGRAPHY 183
[117] K. -F. Nilsson, D. Blagoeva, P. Moretto, An experimental and nu-merical analysis to correlate variation in ductility to defects andmicrostructure in ductile cast iron components, Engineering Frac-ture Mechanics, 73 (2006) 1133-1157.
[118] D. E. Krause, Gray Iron-A Unique Engineering Ma-terial, http://www.ironcasting.org/Gray%20Iron%20-%20A%20Unique%20Material.htm
[119] http://www.foundry.elkem.com/dav/b0beff04cb.pdf
[120] http://www.foundry.elkem.com/dav/47ef3df359.pdf
[121] http://www.foundry.elkem.com/dav/9ba90240eb.pdf
[122] S. Boonmee and D. M. Stefanescu, On the Mechanism of Castingskin formation in compacted graphite cast iron, Int. J. of Metal-casting, 3, 4 (2009) 19-24.
[123] J. Baier, C. Grefhorst, W. kleimann, M. Köppe and O. Podobed,Manual of Casting Defects. Incidence and avoidance of defects at-tributable to moulding sands. 3rd ed., IKO Marl, 2011.
[124] S. Yamada, T. Konno, S. Goto, S. Aso and Y. Komatsu, Somebehaviors and Characteristics of Decarburized Layer in SpheroidalGraphite Cast Iron, Int. J. Soc. Eng. Resour.,Vol. 10, No. 1 (2002)88-92.
[125] D. Stefanescu, S. Giese, T. P.iwonka and A. Lane, Cast Iron Pen-etration in sand Molds, Part1: Physics of penetration defects andpenetration Model, AFS Transactions, Vol.104 (1996) 1233.
[126] M. K. Joyce, M. Rebros and S. N. Ramrattan, Comparing Al-ternate Foundry Refractory Coating Measurement Systems, AFStransactions Paper 08-126(04) (2008) 463-481.
[127] J. Campbell, The concept of net shape for castings, Materials andDesign 21 (2000) 373-380.
[128] P. -M Geffroy, M. Lakehal, J. Goñi, E. Beaugnon and J. -F. Sil-vain, Thermal and mechanical behaviour of grey cast iron and duc-tile iron castings using magnetic molding and lost foam processes,Journal of Materials Processing Technology 209 (2009) 4103-4111.
[129] T. Penko, Ultra-Performance Core Coating For Mass Iron Produc-tion: Specialized Methods for Developing & Evaluating New Coat-ing Technology, Foseco Metallurgy, Inc.
[130] P. Beeley, Foundry Technology, 2nd edition, Butterworth-Heinemann, Oxford, 2001.
184 BIBLIOGRAPHY
[131] M. A. Butt. A. Chughtai, J. Ahmed, R. Ahmed, U. Majeed andI. H. Khan, Theory of Adhesion and its Practical Implications: ACritical Review, Journal of faculty of Engineering & Technology,(2008) 21-45.
[132] Malvern Instruments, Zeta Potential: An introduction in 30 min-utes, Zetasizer nano series technical note MRK654-01.
[133] A. Sze, D. Erickson, L. Ren and D. Li, Zeta-potential measurementusing the Smoluchowski equation and the slope of the current-timerelationship in electro-osmotic flow, Journal of Colloid and Inter-face Science 261 (2003) 402-410.
[134] Zeta-Meter Inc, Zeta Potential: A Complete Course in 5 Minutes.
[135] M. Boström, D. R. M. Williams and B. W. Ninham, Specific Ioneffects: Why DLVO Theory Fails for Biology and Colloid Systems,Physical Review Letters, Vol. 87, No. 16 (2001) 168103.
[136] B. J. kirby and E. F. Hasselbrink, Review -Zeta potential of mi-cropfluidic substrates: 1. Theory, experimental techniques and ef-fects on separations, Electrophoresis 25 (2004) 187-202.
[137] T. Missana and A. Adell, On the Applicability of DLVO theory tothe Prediction of Clay Colloids Stability, Journal of Colloid andInterface Science, 230 (2000) 150-156.
[138] http://foseco.com/end-markets/foundry/products-services/coating-preparation-plant-1/
[139] Christoph Genzler, Coating application Consistency - The TotalCoating Management Concept, Proceedings of the 69th WorldFoundry Congress, China (2010).
[140] http://www.thefreelibrary.com
[141] Gietech BV ir Henderieckx, coatings for chemically Bounded Sand,2005.
[142] J. Thole, C. Beckermann, Measurement of Elastic Modulus ofPUNB Bonded Sand as a Function of Temperature, InternationalJournal of Metalcasting, 2010 AFS.
[143] D. Liao, Z. Fan, W. Jiang, E. Shen, D. Liu, Study on the sur-face roughness of ceramic shells and castings in the ceramic shellcasting process based on expandable pattern, Journal of MaterialsProcessing Technology 211 (2011) 1465-1470.
[144] G. -X. Wang, E. F. Matthys, Experimental determination of theinterfacial heat transfer during cooling and solidification of molten
BIBLIOGRAPHY 185
metal droplets impacting on a metallic substrate: effect of rough-ness and superheat, International Journal of Heat and Mass Trans-fer 45 (2002) 4967-4981.
[145] A. Hamsaiid, M. S. Dargusch, T. Loulou and G. Dour, A predictivemodel for the thermal contact resistance at liquid-solid interfaces:Analytical developments and validation, international Journal ofThermal sciences 50 (2011) 1445-1459.
[146] A. I. Veinik, Thermodynamics for the foundryman, Maclaren andsons, London, 1968.
[147] L. Tomek, K. Rusín, I. Stachovec, Influence of Cement MouldingSand on the Structure of Castings, Proceedings of the 69th WorldFoundry Congress, China (2010).
[148] G. A. Colligan, L. H. VanVlack and R. A. Flinn, The effect of tem-perature and atmosphere on iron-silica interface reaction, TRANS-ACTIONS of the American Foundrymen’s Society, Proceedings ofthe 62nd Annual Meeting May 19-23, 1958, Ohio.
[149] R. Stötzel, C. Koch, Z. Ze and H. Huang, High Performance Re-fractory Coatings - Markets and Requirements, Proceedings of the69th World Foundry Congress, China (2010).
[150] British Standard-Founding-Surface roughness inspec-tion by visual tactile comparators, BS EN 1370:1997.http://bbs.6jc.cn/pdf/o/EN%201370-1997.pdf
[151] http://www.castingstechnology.com/public/services


Supplements


SUPPLEMENT 1
U. C. Nwaogu, T. Poulsen, C. Bischoff, N.S. Tiedje, “Influence of New sol-Gel Refractory coating on the Casting properties of Cold Box and Furan Cores for
Grey Cast Iron”, Proceedings of the 69th World Foundry Congress, Hangzhou, China (2010).


Proceedings of 69th World Foundry CongressOctober 16 - 20,2010, Hangzhou China
•
Influence of New Sol-Gel Refractory Coating on the CastingProperties of Cold Box and Furan Cores for Grey Cast Iron
*u. C. Nwaogu' T. Poulsen' C. Bischoff N. S. Tiedje1
1. Technical University of Denmark, Department of Mechanical Engineering,Institute of Production and Process Technology, DK-2800 Kgs. Lyngby, Denmark
2. Danish Technological Institute, Centre for Material Testing, Kongsvang Alle 29, 8000 Arhus, Denmark*E-mail: [email protected]
Abstract New Sol-Gel coated sand cores made from coldbox and furan binder systems were investigated. The ideaof the coating was to improve the surface quality of castings. Grey iron was cast on the cores in a sand casting process. Theeffect of the high temperature of the melt on the cores was assessed by measuring the heating curves. The viscosity of thecoating, moisture content and the permeability of the cores were evaluated. The surface quality of the castings wasinvestigated using SEM and OM. The results show that the moisture content of the cores affected the permeability. In furancores the vapour transport zone (VTZ) when in contact with the melt is larger than it is in a coldbox which means the furancores have higher moisture content. The new sol-gel coating has the potential for improving the surface quality of castingswithout negative effects on the graphite distribution. The surface of castings made using the new sol-gel coated furan coresshow better surface quality than those made using the coldbox.
Keywords heating curves.permeabluty, moisture content; coldbox, furan, casting surface quality
1 Introduction
In high production iron foundries everywhere, silicasand is predominantly used for core making due to itsavailability and because it is cheaper than other refractorysand such as Olivine or Zircon sand. In many foundriesthe silica sand is bonded using a phenolic-urethanebinder system cured with a gaseous amine catalyst. Thistype of process is called the cold box process and it hasbecome a common core production technique in manyfoundries because of its low operational and productioncost compared to other processes such as hot box andshell processes [1J •
Another type of resin commonly used by foundries isthe so-called furan resin. This is a low productivity binderdesigned for manufacture of large moulds and cores [2J •
This type of resin exhibits a lower performance in terms of" throughcure" and cold strength development. Howeverdue to the reduced nitrogen content they are moreacceptable for reclamation purposes[3 J • The use ofsynthetic resins is regarded as a promising area ofdevelopment of the foundry process because it has a highdrying strength, provides an excellent surface quality incastings and permits advanced techniquesl/ ' .
Nevertheless, there are still some fundamentaldeficiencies in these technologies, notably; poorrefractoriness of silica sand, non -linear thermal expansionof the bonded core sand and inherent low hot strength ofthe binder systems. The poor refractoriness of the silicasand and non-linear thermal expansion of the bonded coresand can lead to some expansion defects on the surface of
0648-
the castings such as sand bum-in, metal penetration and!or veining or scab [1J •
Among the sand expansion defects mentioned above,veining or finning has been one of the most well-knownand well-recognized casting defects for many years. It is adefect caused when sand grains on the surface of a mouldor a core expand due to heat transfer from the moltenmetal [4J • Veining is associated with silica sand and resultsfrom the penetration of liquid metal into cracks formedduring differential expansion of the core during heating.The differential expansion is linked to the a - f3 phasetransition of quartz, which happens to be the mainconstituent of silica. The rapid expansion of silica sand upto 600 "C and especially at 573"C , where the a - f3 phasetransformation occurs, is the cause of stresses in thebinder structure. These stresses cause crack formation andliquid melt flows into the cracks causing firming orveining defects. The removal of these casting defects,called fettling, requires a lot of extra work, energy, timeand money[4J •
The use of refractory coatings on cores isfundamental to obtaining acceptable casting surfacequality and is used on resin bonded cores in ironproduction foundries. As the need for more complex,critical castings and higher quality standards grows, thefunction of the core coatings utilized in the processbecomes important[5J •
In this study new sol gel-coated sand cores madefrom cold box and furan binder systems were investigated.The approach used was to make castings on these coresand then to evaluate the surface quality of the castings.Several other characterizations of the coated and uncoatedcores were made such as temperature measurement,moisture and permeability tests and optical microscopy.
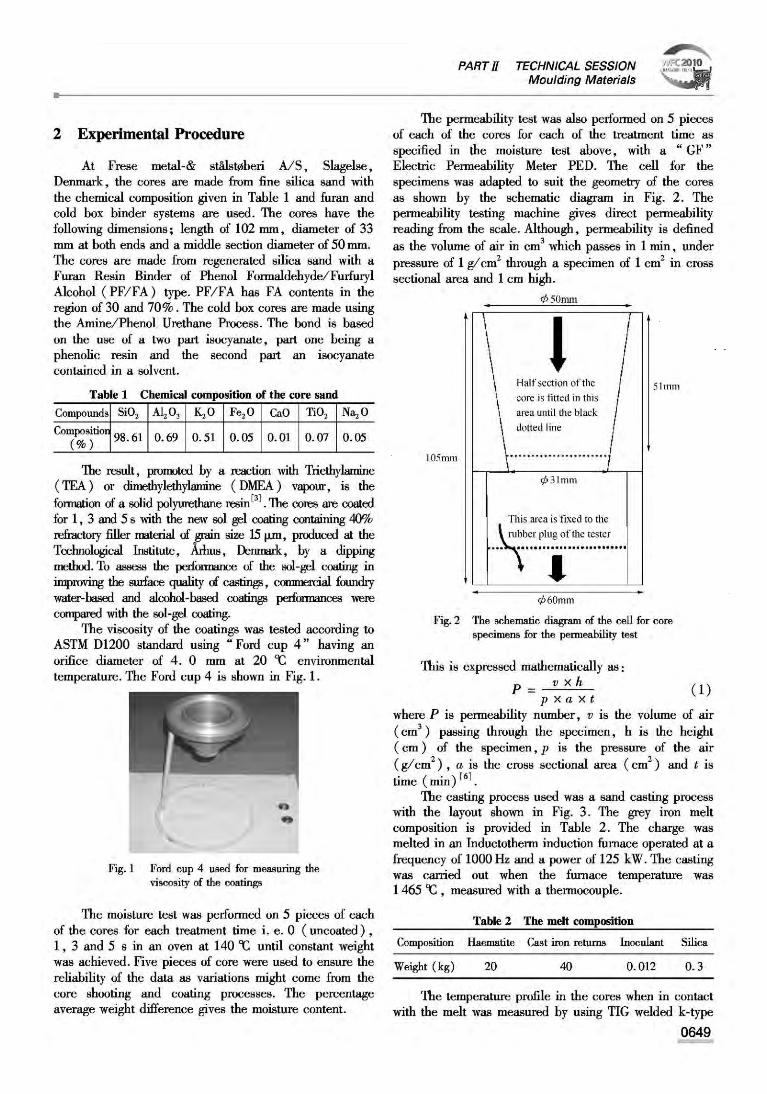
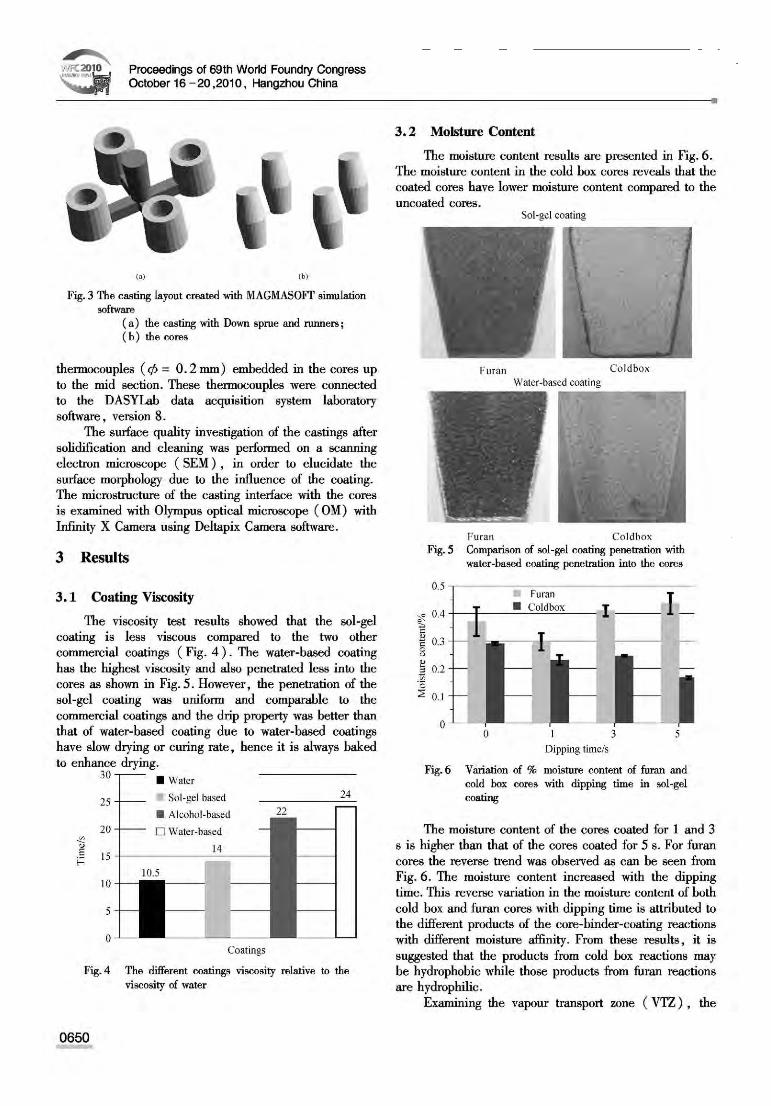
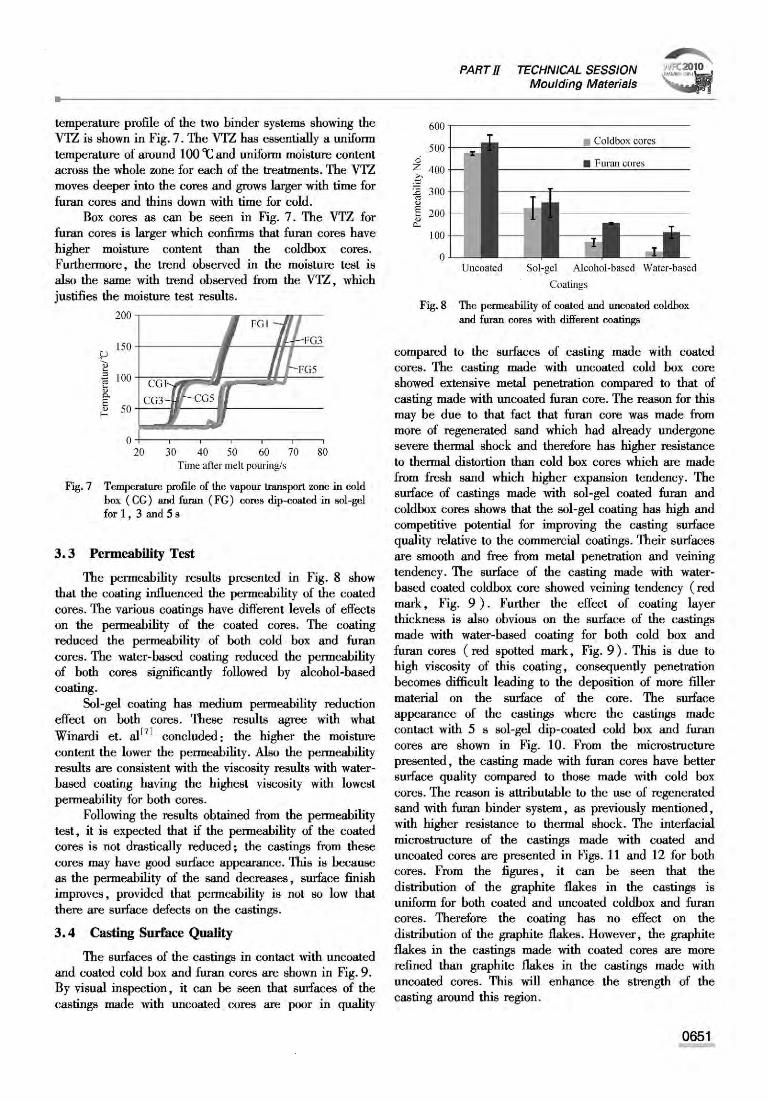
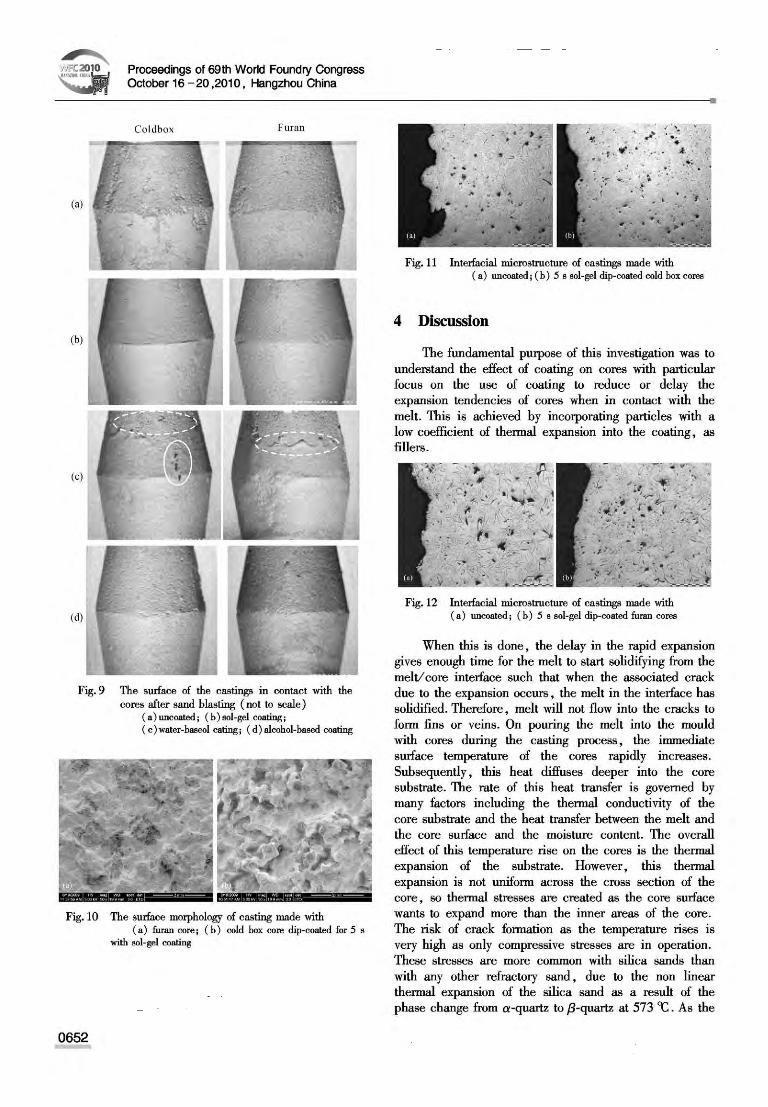

SUPPLEMENT 2
U. C. Nwaogu, T. Poulsen, R. K. Stage, C. Bischoff, N.S. Tiedje, “New sol-gel refractory coatings on
chemically-bonded sand cores for foundry applications to improve casting surface quality”,
Surface & Coatings Technology 205 (2011)
DOI 10.1016/j.surfcoat.2011.02.042


This article appeared in a journal published by Elsevier. The attachedcopy is furnished to the author for internal non-commercial researchand education use, including for instruction at the authors institution
and sharing with colleagues.
Other uses, including reproduction and distribution, or selling orlicensing copies, or posting to personal, institutional or third party
websites are prohibited.
In most cases authors are permitted to post their version of thearticle (e.g. in Word or Tex form) to their personal website orinstitutional repository. Authors requiring further information
regarding Elsevier’s archiving and manuscript policies areencouraged to visit:
http://www.elsevier.com/copyright

Author's personal copy
New sol–gel refractory coatings on chemically-bonded sand cores for foundryapplications to improve casting surface quality
U.C. Nwaogu a,⁎, T. Poulsen b, R.K. Stage b, C. Bischoff b, N.S. Tiedje a
a Technical University of Denmark, Department of Mechanical Engineering, Institute of Production and Process Technology, DK-2800 Kgs. Lyngby, Denmarkb Danish Technological Institute, Centre for Material Testing, Kongsvang Álle 29, Aarhus, Denmark
a b s t r a c ta r t i c l e i n f o
Article history:Received 10 December 2010Accepted in revised form 16 February 2011Available online 26 February 2011
Keywords:Sol–gel coatingCastingsRefractory fillerPUCB coresDip coatingSilica sand
Foundry refractory coatings protect bonded sand cores and moulds from producing defective castings duringthe casting process by providing a barrier between the core and the liquid metal. In this study, new sol–gelrefractory coating on phenolic urethane cold box (PUCB) core was examined. The coating density, viscosity,moisture content andwet and dry weight of the coating were evaluated on cores that had been coated at threedifferent dip-coating times. The coating coverage, surface appearance and depth of penetration into the coreswere examined with a Stereomicroscope. Gray iron castings were produced with sol-gel coated and uncoatedcores and the results were related to the coating properties. The casting results were also compared withcastings made with cores coated with commercial alcohol-based and water-based foundry coatings. Theanalyses show that castings produced with sol–gel coated cores have better surface quality than those fromuncoated cores and comparable surface quality with the commercial coatings. Therefore, the new sol–gelcoating has a potential application in the foundry industry for improving the surface finish of castings therebyreducing the cost of fettling in the foundry industry since the raw materials and technology are easilyaffordable.
© 2011 Elsevier B.V. All rights reserved.
1. Introduction
Sol-gel coating technology [1,2] has been applied to various areas ofcoating production for corrosion protection [3,4], wear resistance [5],thermal barrier [6], anti-soiling [7], anti reflective [8,9] etc. but has so farnot been applied to the foundry industry. In this regard, the coatingbeing investigated is a novel application for the sol–gel coatingtechnology. Owing to the intense developments in the field of sol–geltechnology the availability of affordable sol–gel silane precursorspresent the technology as a suitable alternative/compliment to foundryrefractory coatings. A number of advantages are affiliatedwith applyingthe technology. The inorganic ≡ Si-O-Si ≡ (siloxane) network that formthe foundation of silica based sol–gel coatings provides a strong glassceramic surface. By applying the coating to cores, cross binding of thesandgrainswith the sol–gel coatingwould induce a strengtheningof thesandmaterial resulting in a stronger protective barrier between the coreand liquid metal. This added strength would prove valuable to reducesurface defects during casting. The inorganic nature of the sol–gelcoating also has added environmental benefits by reducing undesiredgaseous by-products from pyrolysis during casting. Finally, because alarge number of precursors are available for manufacturing sol–gel
coatings the technology presents the opportunity to chemically modifythe coating to meet specific foundry demands.
Refractory coatings help foundries to protect chemically-bondedsand cores and moulds from producing castings with surface defects,such as metal penetration, veining, erosion etc. Metal penetration andveining defects are serious problems caused by the poor refractorinessof the silica sand and non-linear thermal expansion of the bonded sandcore when in contact with themoltenmetal. The differential expansionis linked to the α–β phase transition of quartz, which is the mainconstituent of silica. The rapid expansion of silica sand up to 600 °C andespecially at 573 °C, where the α–β phase transformation occurs, is thecause of thermal stresses in the core materials/binder structure. Thesestresses cause crack formation and liquid metal flows into these cracks,causing finning or veining defects. The removal of casting defects, calledfettling, requires a lot of extra work, energy, time and money [10,11].
The use of refractory coatings on cores is fundamental to obtainingacceptable casting surface quality and is used on resin bonded cores iniron production foundries. As the need for more complex, criticalcastings and higher quality standards grows, the function of the coreand mould coatings utilized in the process becomes important [12].However, the understanding of the coating/core material interactionhas been neglected for some decades. When applying a refractorycoating on cores ormoulds, it is important that a uniform coating layerfree from surface imperfections such as runs, drips or cracks, isobtained. Otherwise, these features will reflect on the surface of thecastings leading to defective castings.
Surface & Coatings Technology 205 (2011) 4035–4044
⁎ Corresponding author. Tel.: +45 45254737; fax: +45 45934570.E-mail address: [email protected] (U.C. Nwaogu).
0257-8972/$ – see front matter © 2011 Elsevier B.V. All rights reserved.doi:10.1016/j.surfcoat.2011.02.042
Contents lists available at ScienceDirect
Surface & Coatings Technology
j ourna l homepage: www.e lsev ie r.com/ locate /sur fcoat
Author's personal copy
A literature survey reveals that surprisingly little research iscarried out on a topic that is of great importance for the surface qualityof castings. This has led to foundries loosing focus as to whatparameters are to be considered in order to control foundry coatingsapplied on cores and sand moulds. In this study, it is our objective toredirect research into foundry coatings by developing a new sol–gelfoundry coating for sand cores and investigating the performance inimproving casting surface quality. It is also the objective of this studyto analyze the coating/core material interaction and relate this to thesurface quality of the castings obtained.
2. Material and methods
The refractory filler used in the preparing sol–gel coating is filterdust. The particle size and size distribution of the filter dust wasmeasured by Malvern Mastersizer 2000 using laser diffraction withwet analysis.
All refractory sol–gel coatings were prepared from a sol–gel stocksolution obtained by acid (0.1 N HCl) catalyzed hydrolysis with waterof 3-glycidyloxypropyltrimethoxysilane (GLYMO, Degussa) and alu-minium (III)-s-butoxide, 75% solution in s-butanol (AL, ABCR). Afterstirring the sol for 30 min., propyltrimethoxysilane (PTMO, Evonik/Degussa) was added and stirring continued for an additional 30 min.The molar composition of the stock sol–gel solution was GLYMO:AL:HCl:PTMO=385:3:1:95. The stock solution was mixed with a 3%bentonite suspension in demineralized water for 30 min. affording amixing ratio between sol–gel stock solution and bentonite suspensionof 1:6.67. Refractory filter dust of average particle size of 15 μm (fromanalysis) was added and the blend was stirred for approximately 2 huntil a homogeneous suspension was obtained. The coatings wereprepared with 40, 50 and 60% by mass of filter dust (coatings referredto as P40, P50 and P60 respectively). Low percentages of the solidcontent did not provide surface coverage from our preliminarystudies. The PUCB cores are produced from the Amine/phenolUrethane Process and silica sand of American Fineness Number(AFN) of 53 and mean grain size of 0.263 mm (information from thesupplier, Dansand A/S). The bond is based on the use of a two partisocyanate, part one being a phenolic resin, and the second part anisocyanate contained in a solvent. The result, promoted by a reactionwith triethylamine (TEA) or dimethylethylamine (DMEA) vapour isthe formation of a solid polyurethane resin holding the sand grains.The cores are coated with the sol–gel based coating, and water-basedand alcohol-based coatings by dipping method for 1, 3 and 5 s (D1, D3and D5 respectively). These timeswere chosen because they cover therange of dipping times used by the foundries.
The coating density was determined by weighing 200 ml ofcoating in a suitable beaker. The density, ρ (g/cm3) was calculatedfrom the expression given in Eq. (1).
ρ =mV
ð1Þ
Where m=mass (g) and V=volume (cm3).The coating viscosity was determined using the flow cup method.
The Ford Flow Cup with outlet orifice of 4 mm was filled with thecoating to the brim (100 ml). A stop watch was used to measure thetime it takes the coating to drain through the hole until the first dropappears. This time, called the efflux time is the viscosity in seconds.The Ford Flow Cup viscosity in seconds is converted into Stokesviscosity by interpolation using the Ford Flow Cup ViscosityConversion Chart which plots centistokes viscosity values againstefflux time for different Ford Flow Cup numbers (for this experimentFord Cup #4 was used).
The core material moisture content test was performed on fivecores for each treatment time i.e. uncoated (0 s), 1, 3 and 5 s in anoven at 140 °C until constant weight was achieved. The weight of each
core was measured before and after oven-drying. The percentageaverage of the sum of the mass differences before and after ovendrying for each time is taken as the moisture content. The use of fivecores ensures the reliability of the data since variations might comefrom the core making and coating processes.
The wet weight of coating on cores was obtained by measuring themass of five uncoated cores initially, then weighing the coresimmediately after coating with different coatings for 1, 3 and 5 s.The average mass differences before and after wet coating gives thewet weight of the coating on cores. The dry weight is determined bydrying the coated cores in an oven at 140 °C for 1 h, and finding theaverage mass differences between the dried coating and the uncoatedcores for the respective treatment times respectively.
The surface appearance of the coatings and the penetration depthinto the coreswere examinedwith Zeiss Stemi DV4 StereoMicroscopewith LED Illumination. The measurements of proud layer thickness(coating deposit on the surface of the core) and the sub-surface layer(penetration depth) were made with image analysis software —
Image-Pro® Plus version 6.0. Five measurements were made followingthe trace of the deposited and penetrated layers.
The casting process used was a sand casting process with thecasting layout and core geometry shown in Fig. 1. The chemicalcomposition of the grey iron melt is provided in Table 1. The chargewas melted in an Inductotherm induction furnace operated at afrequency of 1000 Hz and a power of 125 kW. The casting was carriedout when the furnace temperature was 1465 °C, measured with athermocouple. The moulds contained uncoated PUCB cores and PUCBcores coated with sol–gel coating and two commercial coatings(alcohol-based and water-based coatings) with similar densities andviscosities as the sol–gel coating. The surface quality of the castingswas elucidated by visual inspection, in which surface roughness andmelt penetration into the cores were examined. The surface finish/quality can also be characterized quantitatively by average roughness(Ra) parameter [13]. The surface profile roughness, Ra of the castingswas examined by using Alicona InfiniteFocus® G4 3D OpticalMeasuring Device (Germany). The operating principle is based on
Fig. 1. 3D-CAD-Model of casting layout (a) the casting with Down sprue and runners(b) the cores.
4036 U.C. Nwaogu et al. / Surface & Coatings Technology 205 (2011) 4035–4044
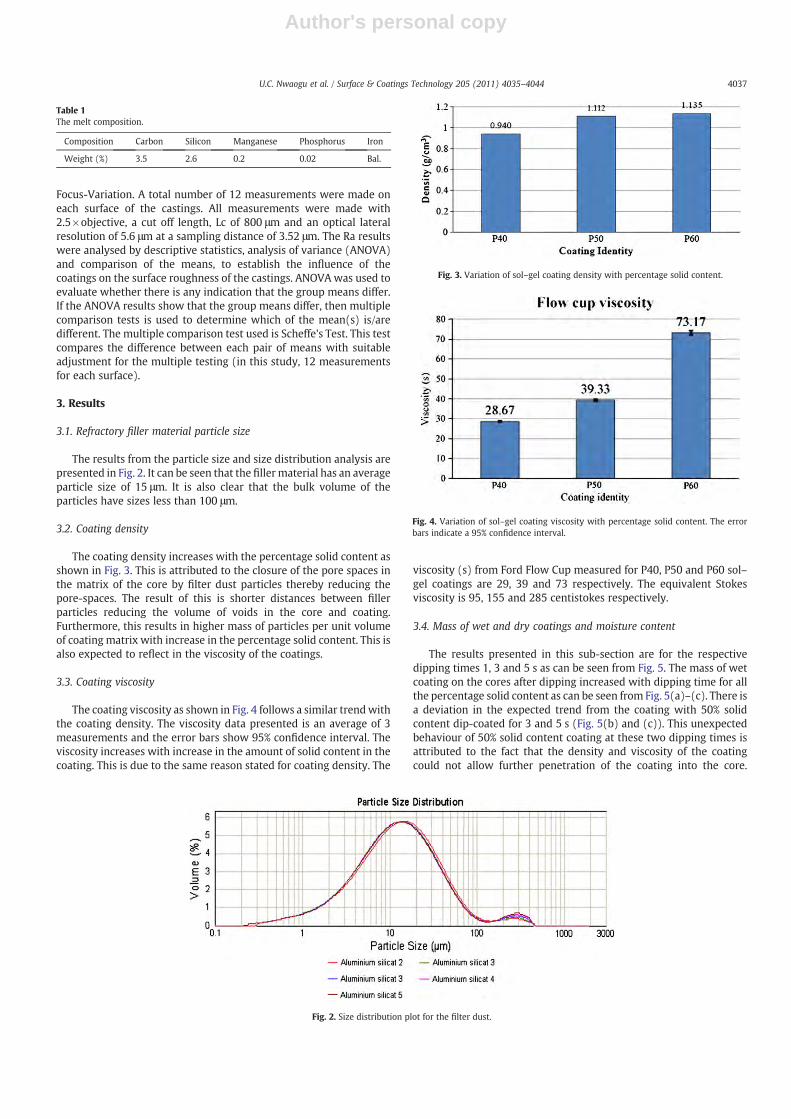
Author's personal copy
Focus-Variation. A total number of 12 measurements were made oneach surface of the castings. All measurements were made with2.5×objective, a cut off length, Lc of 800 μm and an optical lateralresolution of 5.6 μm at a sampling distance of 3.52 μm. The Ra resultswere analysed by descriptive statistics, analysis of variance (ANOVA)and comparison of the means, to establish the influence of thecoatings on the surface roughness of the castings. ANOVA was used toevaluate whether there is any indication that the group means differ.If the ANOVA results show that the group means differ, then multiplecomparison tests is used to determine which of the mean(s) is/aredifferent. The multiple comparison test used is Scheffe's Test. This testcompares the difference between each pair of means with suitableadjustment for the multiple testing (in this study, 12 measurementsfor each surface).
3. Results
3.1. Refractory filler material particle size
The results from the particle size and size distribution analysis arepresented in Fig. 2. It can be seen that the filler material has an averageparticle size of 15 μm. It is also clear that the bulk volume of theparticles have sizes less than 100 μm.
3.2. Coating density
The coating density increases with the percentage solid content asshown in Fig. 3. This is attributed to the closure of the pore spaces inthe matrix of the core by filter dust particles thereby reducing thepore-spaces. The result of this is shorter distances between fillerparticles reducing the volume of voids in the core and coating.Furthermore, this results in higher mass of particles per unit volumeof coating matrix with increase in the percentage solid content. This isalso expected to reflect in the viscosity of the coatings.
3.3. Coating viscosity
The coating viscosity as shown in Fig. 4 follows a similar trendwiththe coating density. The viscosity data presented is an average of 3measurements and the error bars show 95% confidence interval. Theviscosity increases with increase in the amount of solid content in thecoating. This is due to the same reason stated for coating density. The
viscosity (s) from Ford Flow Cup measured for P40, P50 and P60 sol–gel coatings are 29, 39 and 73 respectively. The equivalent Stokesviscosity is 95, 155 and 285 centistokes respectively.
3.4. Mass of wet and dry coatings and moisture content
The results presented in this sub-section are for the respectivedipping times 1, 3 and 5 s as can be seen from Fig. 5. The mass of wetcoating on the cores after dipping increased with dipping time for allthe percentage solid content as can be seen from Fig. 5(a)–(c). There isa deviation in the expected trend from the coating with 50% solidcontent dip-coated for 3 and 5 s (Fig. 5(b) and (c)). This unexpectedbehaviour of 50% solid content coating at these two dipping times isattributed to the fact that the density and viscosity of the coatingcould not allow further penetration of the coating into the core.
Table 1The melt composition.
Composition Carbon Silicon Manganese Phosphorus Iron
Weight (%) 3.5 2.6 0.2 0.02 Bal.
Fig. 2. Size distribution plot for the filter dust.
Fig. 3. Variation of sol–gel coating density with percentage solid content.
Fig. 4. Variation of sol–gel coating viscosity with percentage solid content. The errorbars indicate a 95% confidence interval.
4037U.C. Nwaogu et al. / Surface & Coatings Technology 205 (2011) 4035–4044
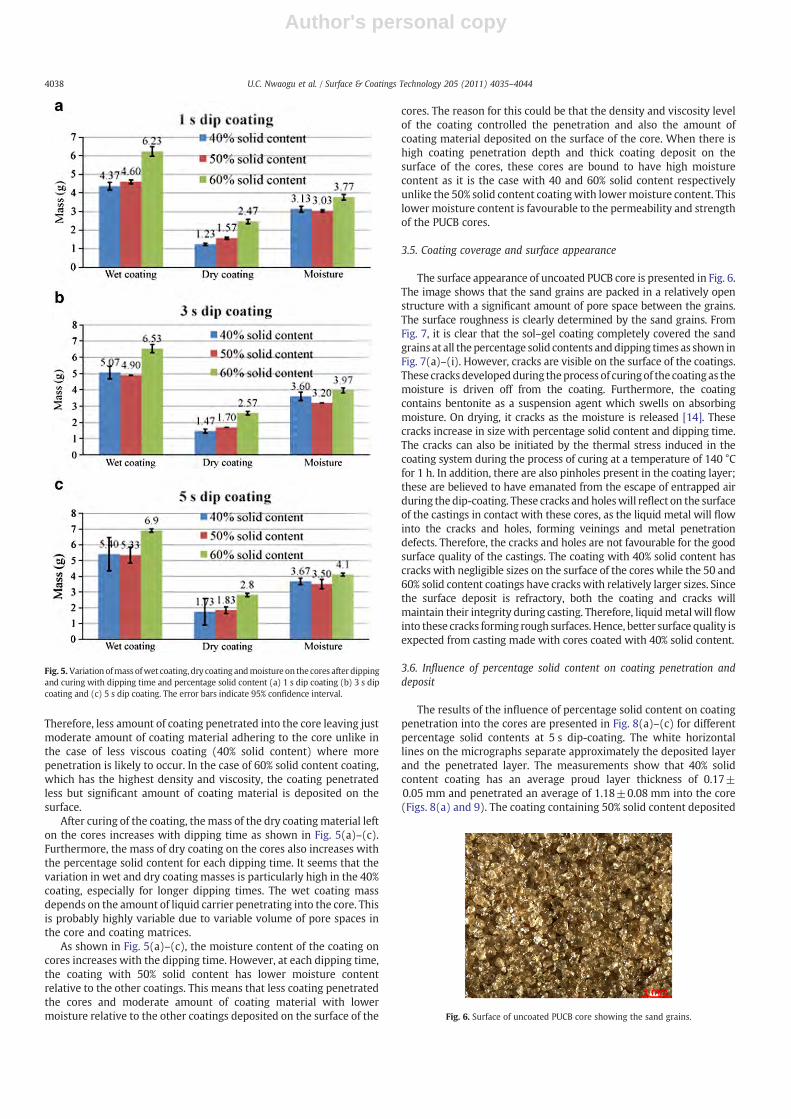
Author's personal copy
Therefore, less amount of coating penetrated into the core leaving justmoderate amount of coating material adhering to the core unlike inthe case of less viscous coating (40% solid content) where morepenetration is likely to occur. In the case of 60% solid content coating,which has the highest density and viscosity, the coating penetratedless but significant amount of coating material is deposited on thesurface.
After curing of the coating, themass of the dry coatingmaterial lefton the cores increases with dipping time as shown in Fig. 5(a)–(c).Furthermore, the mass of dry coating on the cores also increases withthe percentage solid content for each dipping time. It seems that thevariation in wet and dry coating masses is particularly high in the 40%coating, especially for longer dipping times. The wet coating massdepends on the amount of liquid carrier penetrating into the core. Thisis probably highly variable due to variable volume of pore spaces inthe core and coating matrices.
As shown in Fig. 5(a)–(c), the moisture content of the coating oncores increases with the dipping time. However, at each dipping time,the coating with 50% solid content has lower moisture contentrelative to the other coatings. This means that less coating penetratedthe cores and moderate amount of coating material with lowermoisture relative to the other coatings deposited on the surface of the
cores. The reason for this could be that the density and viscosity levelof the coating controlled the penetration and also the amount ofcoating material deposited on the surface of the core. When there ishigh coating penetration depth and thick coating deposit on thesurface of the cores, these cores are bound to have high moisturecontent as it is the case with 40 and 60% solid content respectivelyunlike the 50% solid content coatingwith lowermoisture content. Thislower moisture content is favourable to the permeability and strengthof the PUCB cores.
3.5. Coating coverage and surface appearance
The surface appearance of uncoated PUCB core is presented in Fig. 6.The image shows that the sand grains are packed in a relatively openstructure with a significant amount of pore space between the grains.The surface roughness is clearly determined by the sand grains. FromFig. 7, it is clear that the sol–gel coating completely covered the sandgrains at all the percentage solid contents anddipping times as shown inFig. 7(a)–(i). However, cracks are visible on the surface of the coatings.These cracksdevelopedduring theprocess of curingof the coating as themoisture is driven off from the coating. Furthermore, the coatingcontains bentonite as a suspension agent which swells on absorbingmoisture. On drying, it cracks as the moisture is released [14]. Thesecracks increase in size with percentage solid content and dipping time.The cracks can also be initiated by the thermal stress induced in thecoating system during the process of curing at a temperature of 140 °Cfor 1 h. In addition, there are also pinholes present in the coating layer;these are believed to have emanated from the escape of entrapped airduring the dip-coating. These cracks and holeswill reflect on the surfaceof the castings in contact with these cores, as the liquid metal will flowinto the cracks and holes, forming veinings and metal penetrationdefects. Therefore, the cracks and holes are not favourable for the goodsurface quality of the castings. The coating with 40% solid content hascracks with negligible sizes on the surface of the cores while the 50 and60% solid content coatings have crackswith relatively larger sizes. Sincethe surface deposit is refractory, both the coating and cracks willmaintain their integrity during casting. Therefore, liquidmetal will flowinto these cracks forming rough surfaces. Hence, better surface quality isexpected from casting made with cores coated with 40% solid content.
3.6. Influence of percentage solid content on coating penetration anddeposit
The results of the influence of percentage solid content on coatingpenetration into the cores are presented in Fig. 8(a)–(c) for differentpercentage solid contents at 5 s dip-coating. The white horizontallines on the micrographs separate approximately the deposited layerand the penetrated layer. The measurements show that 40% solidcontent coating has an average proud layer thickness of 0.17±0.05 mm and penetrated an average of 1.18±0.08 mm into the core(Figs. 8(a) and 9). The coating containing 50% solid content deposited
Fig. 5. Variationofmass ofwet coating, dry coating andmoisture on the cores after dippingand curing with dipping time and percentage solid content (a) 1 s dip coating (b) 3 s dipcoating and (c) 5 s dip coating. The error bars indicate 95% confidence interval.
Fig. 6. Surface of uncoated PUCB core showing the sand grains.
4038 U.C. Nwaogu et al. / Surface & Coatings Technology 205 (2011) 4035–4044
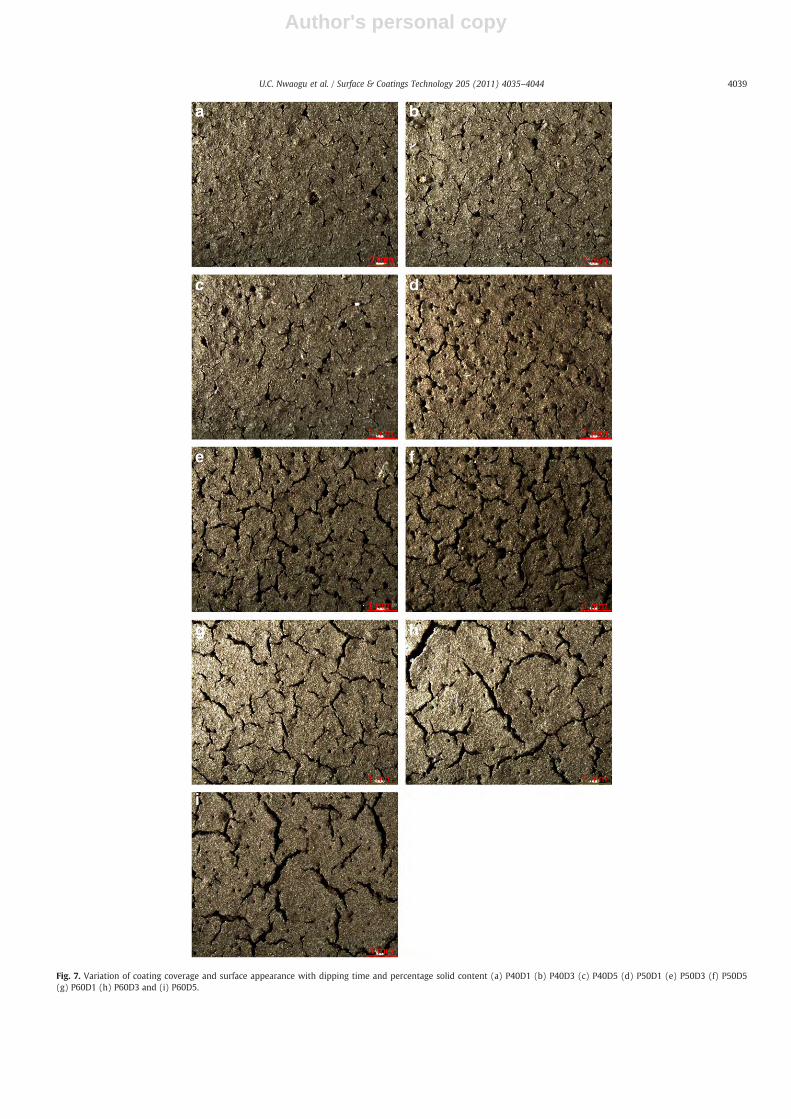
Author's personal copy
Fig. 7. Variation of coating coverage and surface appearance with dipping time and percentage solid content (a) P40D1 (b) P40D3 (c) P40D5 (d) P50D1 (e) P50D3 (f) P50D5(g) P60D1 (h) P60D3 and (i) P60D5.
4039U.C. Nwaogu et al. / Surface & Coatings Technology 205 (2011) 4035–4044
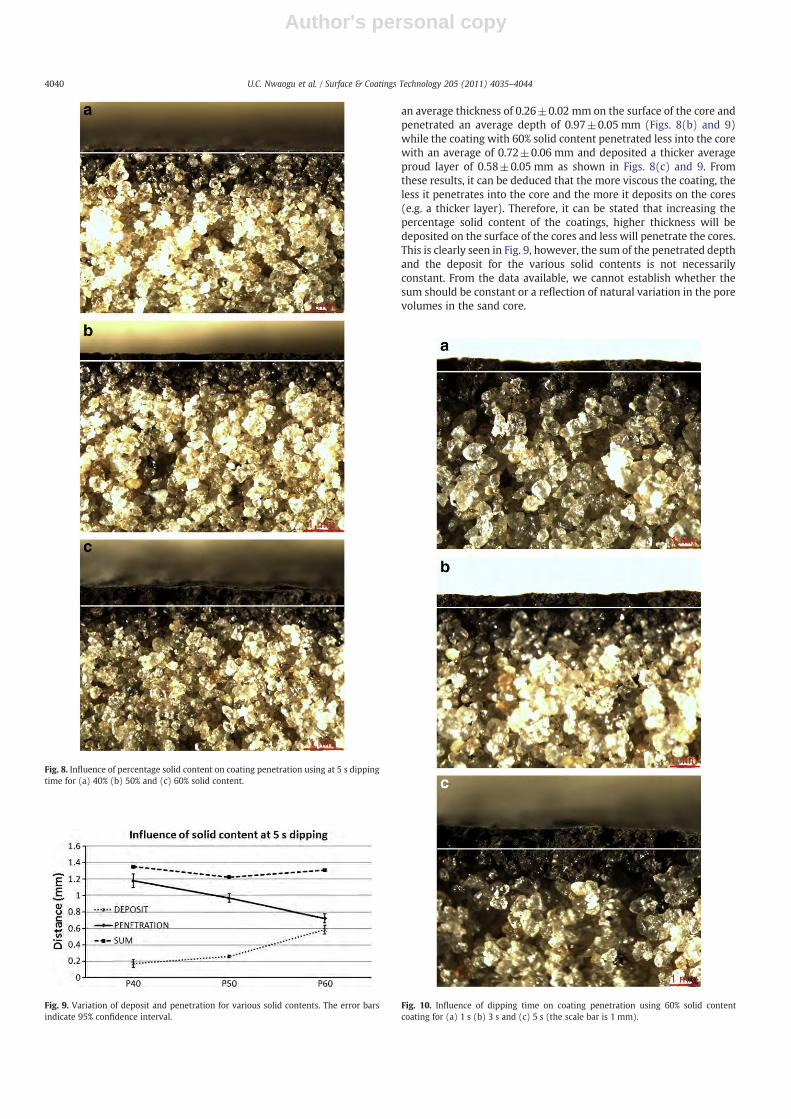
Author's personal copy
an average thickness of 0.26±0.02 mm on the surface of the core andpenetrated an average depth of 0.97±0.05 mm (Figs. 8(b) and 9)while the coating with 60% solid content penetrated less into the corewith an average of 0.72±0.06 mm and deposited a thicker averageproud layer of 0.58±0.05 mm as shown in Figs. 8(c) and 9. Fromthese results, it can be deduced that the more viscous the coating, theless it penetrates into the core and the more it deposits on the cores(e.g. a thicker layer). Therefore, it can be stated that increasing thepercentage solid content of the coatings, higher thickness will bedeposited on the surface of the cores and less will penetrate the cores.This is clearly seen in Fig. 9, however, the sum of the penetrated depthand the deposit for the various solid contents is not necessarilyconstant. From the data available, we cannot establish whether thesum should be constant or a reflection of natural variation in the porevolumes in the sand core.
Fig. 8. Influence of percentage solid content on coating penetration using at 5 s dippingtime for (a) 40% (b) 50% and (c) 60% solid content.
Fig. 9. Variation of deposit and penetration for various solid contents. The error barsindicate 95% confidence interval.
Fig. 10. Influence of dipping time on coating penetration using 60% solid contentcoating for (a) 1 s (b) 3 s and (c) 5 s (the scale bar is 1 mm).
4040 U.C. Nwaogu et al. / Surface & Coatings Technology 205 (2011) 4035–4044
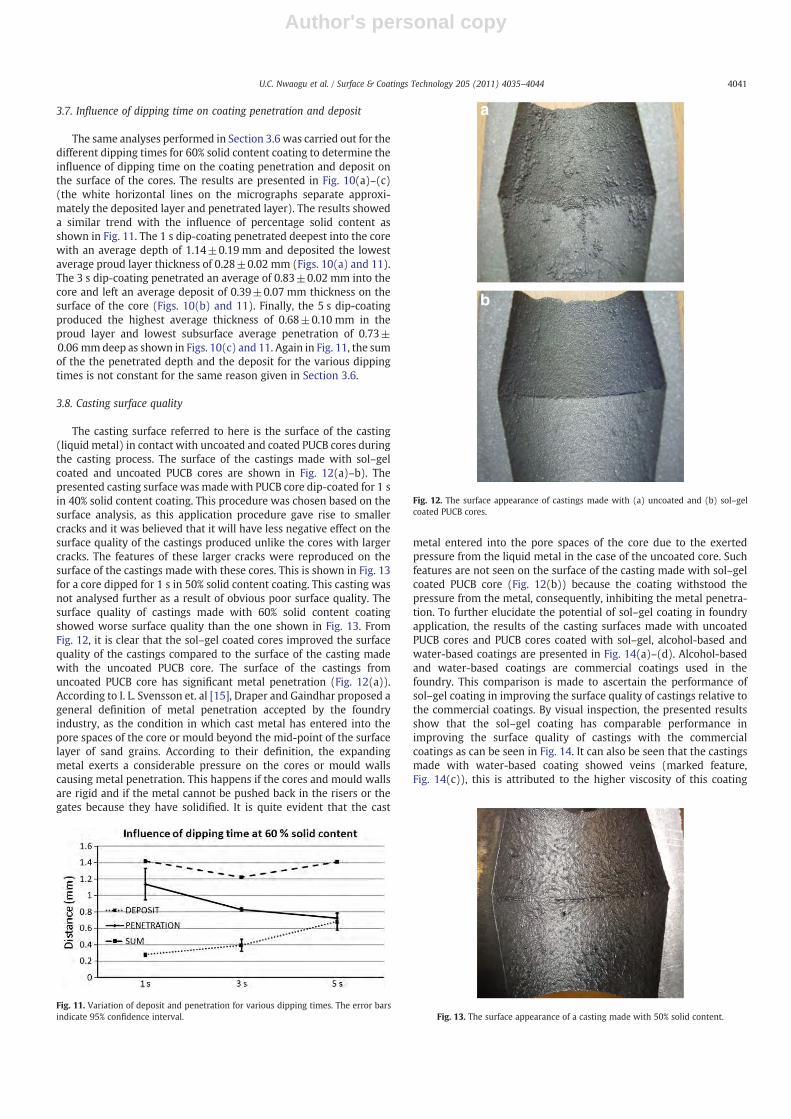
Author's personal copy
3.7. Influence of dipping time on coating penetration and deposit
The same analyses performed in Section 3.6 was carried out for thedifferent dipping times for 60% solid content coating to determine theinfluence of dipping time on the coating penetration and deposit onthe surface of the cores. The results are presented in Fig. 10(a)–(c)(the white horizontal lines on the micrographs separate approxi-mately the deposited layer and penetrated layer). The results showeda similar trend with the influence of percentage solid content asshown in Fig. 11. The 1 s dip-coating penetrated deepest into the corewith an average depth of 1.14±0.19 mm and deposited the lowestaverage proud layer thickness of 0.28±0.02 mm (Figs. 10(a) and 11).The 3 s dip-coating penetrated an average of 0.83±0.02 mm into thecore and left an average deposit of 0.39±0.07 mm thickness on thesurface of the core (Figs. 10(b) and 11). Finally, the 5 s dip-coatingproduced the highest average thickness of 0.68±0.10 mm in theproud layer and lowest subsurface average penetration of 0.73±0.06 mmdeep as shown in Figs. 10(c) and 11. Again in Fig. 11, the sumof the the penetrated depth and the deposit for the various dippingtimes is not constant for the same reason given in Section 3.6.
3.8. Casting surface quality
The casting surface referred to here is the surface of the casting(liquid metal) in contact with uncoated and coated PUCB cores duringthe casting process. The surface of the castings made with sol–gelcoated and uncoated PUCB cores are shown in Fig. 12(a)–b). Thepresented casting surface was made with PUCB core dip-coated for 1 sin 40% solid content coating. This procedure was chosen based on thesurface analysis, as this application procedure gave rise to smallercracks and it was believed that it will have less negative effect on thesurface quality of the castings produced unlike the cores with largercracks. The features of these larger cracks were reproduced on thesurface of the castings made with these cores. This is shown in Fig. 13for a core dipped for 1 s in 50% solid content coating. This casting wasnot analysed further as a result of obvious poor surface quality. Thesurface quality of castings made with 60% solid content coatingshowed worse surface quality than the one shown in Fig. 13. FromFig. 12, it is clear that the sol–gel coated cores improved the surfacequality of the castings compared to the surface of the casting madewith the uncoated PUCB core. The surface of the castings fromuncoated PUCB core has significant metal penetration (Fig. 12(a)).According to I. L. Svensson et. al [15], Draper and Gaindhar proposed ageneral definition of metal penetration accepted by the foundryindustry, as the condition in which cast metal has entered into thepore spaces of the core or mould beyond the mid-point of the surfacelayer of sand grains. According to their definition, the expandingmetal exerts a considerable pressure on the cores or mould wallscausing metal penetration. This happens if the cores and mould wallsare rigid and if the metal cannot be pushed back in the risers or thegates because they have solidified. It is quite evident that the cast
metal entered into the pore spaces of the core due to the exertedpressure from the liquid metal in the case of the uncoated core. Suchfeatures are not seen on the surface of the casting made with sol–gelcoated PUCB core (Fig. 12(b)) because the coating withstood thepressure from the metal, consequently, inhibiting the metal penetra-tion. To further elucidate the potential of sol–gel coating in foundryapplication, the results of the casting surfaces made with uncoatedPUCB cores and PUCB cores coated with sol–gel, alcohol-based andwater-based coatings are presented in Fig. 14(a)–(d). Alcohol-basedand water-based coatings are commercial coatings used in thefoundry. This comparison is made to ascertain the performance ofsol–gel coating in improving the surface quality of castings relative tothe commercial coatings. By visual inspection, the presented resultsshow that the sol–gel coating has comparable performance inimproving the surface quality of castings with the commercialcoatings as can be seen in Fig. 14. It can also be seen that the castingsmade with water-based coating showed veins (marked feature,Fig. 14(c)), this is attributed to the higher viscosity of this coating
Fig. 11. Variation of deposit and penetration for various dipping times. The error barsindicate 95% confidence interval.
Fig. 12. The surface appearance of castings made with (a) uncoated and (b) sol–gelcoated PUCB cores.
Fig. 13. The surface appearance of a casting made with 50% solid content.
4041U.C. Nwaogu et al. / Surface & Coatings Technology 205 (2011) 4035–4044
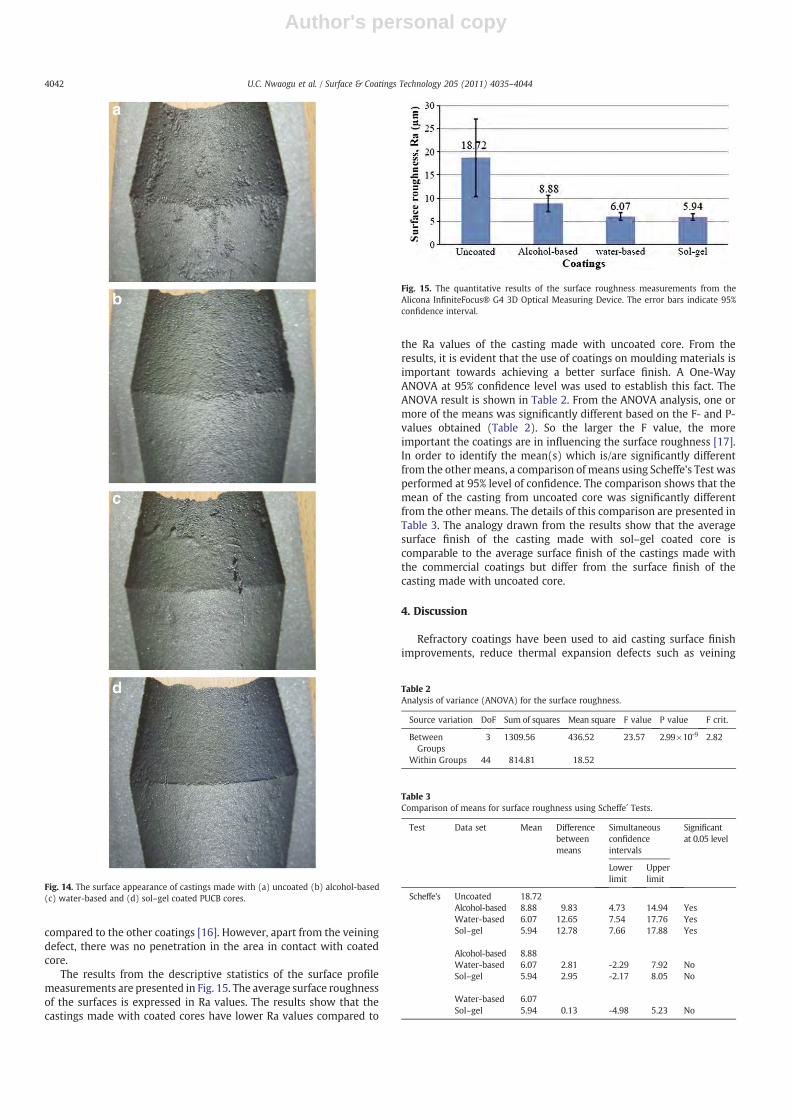
Author's personal copy
compared to the other coatings [16]. However, apart from the veiningdefect, there was no penetration in the area in contact with coatedcore.
The results from the descriptive statistics of the surface profilemeasurements are presented in Fig. 15. The average surface roughnessof the surfaces is expressed in Ra values. The results show that thecastings made with coated cores have lower Ra values compared to
the Ra values of the casting made with uncoated core. From theresults, it is evident that the use of coatings on moulding materials isimportant towards achieving a better surface finish. A One-WayANOVA at 95% confidence level was used to establish this fact. TheANOVA result is shown in Table 2. From the ANOVA analysis, one ormore of the means was significantly different based on the F- and P-values obtained (Table 2). So the larger the F value, the moreimportant the coatings are in influencing the surface roughness [17].In order to identify the mean(s) which is/are significantly differentfrom the other means, a comparison of means using Scheffe's Test wasperformed at 95% level of confidence. The comparison shows that themean of the casting from uncoated core was significantly differentfrom the other means. The details of this comparison are presented inTable 3. The analogy drawn from the results show that the averagesurface finish of the casting made with sol–gel coated core iscomparable to the average surface finish of the castings made withthe commercial coatings but differ from the surface finish of thecasting made with uncoated core.
4. Discussion
Refractory coatings have been used to aid casting surface finishimprovements, reduce thermal expansion defects such as veining
Fig. 14. The surface appearance of castings made with (a) uncoated (b) alcohol-based(c) water-based and (d) sol–gel coated PUCB cores.
Fig. 15. The quantitative results of the surface roughness measurements from theAlicona InfiniteFocus® G4 3D Optical Measuring Device. The error bars indicate 95%confidence interval.
Table 2Analysis of variance (ANOVA) for the surface roughness.
Source variation DoF Sum of squares Mean square F value P value F crit.
BetweenGroups
3 1309.56 436.52 23.57 2.99×10⁻⁹ 2.82
Within Groups 44 814.81 18.52
Table 3Comparison of means for surface roughness using Scheffe´ Tests.
Test Data set Mean Differencebetweenmeans
Simultaneousconfidenceintervals
Significantat 0.05 level
Lowerlimit
Upperlimit
Scheffe's Uncoated 18.72Alcohol-based 8.88 9.83 4.73 14.94 YesWater-based 6.07 12.65 7.54 17.76 YesSol–gel 5.94 12.78 7.66 17.88 Yes
Alcohol-based 8.88Water-based 6.07 2.81 -2.29 7.92 NoSol–gel 5.94 2.95 -2.17 8.05 No
Water-based 6.07Sol–gel 5.94 0.13 -4.98 5.23 No
4042 U.C. Nwaogu et al. / Surface & Coatings Technology 205 (2011) 4035–4044
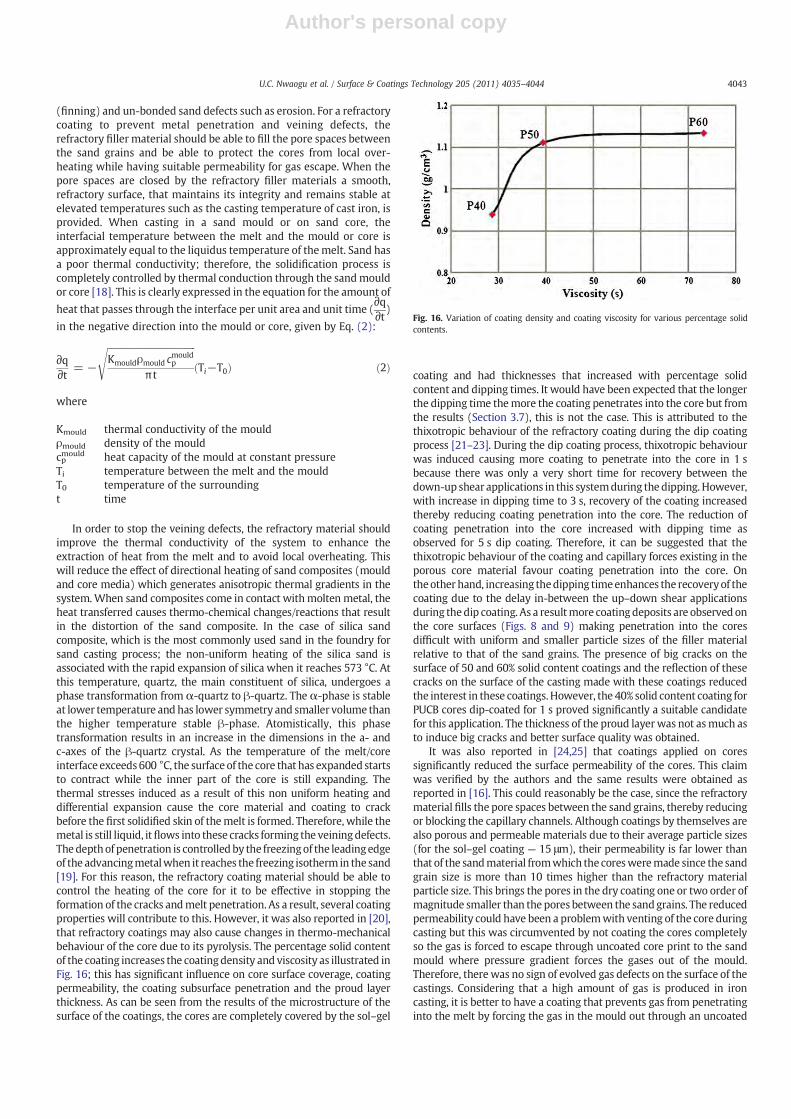
Author's personal copy
(finning) and un-bonded sand defects such as erosion. For a refractorycoating to prevent metal penetration and veining defects, therefractory filler material should be able to fill the pore spaces betweenthe sand grains and be able to protect the cores from local over-heating while having suitable permeability for gas escape. When thepore spaces are closed by the refractory filler materials a smooth,refractory surface, that maintains its integrity and remains stable atelevated temperatures such as the casting temperature of cast iron, isprovided. When casting in a sand mould or on sand core, theinterfacial temperature between the melt and the mould or core isapproximately equal to the liquidus temperature of themelt. Sand hasa poor thermal conductivity; therefore, the solidification process iscompletely controlled by thermal conduction through the sandmouldor core [18]. This is clearly expressed in the equation for the amount of
heat that passes through the interface per unit area and unit time (∂q∂t)
in the negative direction into the mould or core, given by Eq. (2):
∂q∂t = −
ffiffiffiffiffiffiffiffiffiffiffiffiffiffiffiffiffiffiffiffiffiffiffiffiffiffiffiffiffiffiffiffiffiffiffiffiffiffiffiffiKmouldρmould c
mouldp
π t
sTi−T0ð Þ ð2Þ
where
Kmould thermal conductivity of the mouldρmould density of the mouldcpmould heat capacity of the mould at constant pressureTi temperature between the melt and the mouldT0 temperature of the surroundingt time
In order to stop the veining defects, the refractory material shouldimprove the thermal conductivity of the system to enhance theextraction of heat from the melt and to avoid local overheating. Thiswill reduce the effect of directional heating of sand composites (mouldand core media) which generates anisotropic thermal gradients in thesystem.When sand composites come in contact withmolten metal, theheat transferred causes thermo-chemical changes/reactions that resultin the distortion of the sand composite. In the case of silica sandcomposite, which is the most commonly used sand in the foundry forsand casting process; the non-uniform heating of the silica sand isassociated with the rapid expansion of silica when it reaches 573 °C. Atthis temperature, quartz, the main constituent of silica, undergoes aphase transformation from α-quartz to β-quartz. The α-phase is stableat lower temperature andhas lower symmetry and smaller volume thanthe higher temperature stable β-phase. Atomistically, this phasetransformation results in an increase in the dimensions in the a- andc-axes of the β-quartz crystal. As the temperature of the melt/coreinterface exceeds600 °C, the surfaceof the core that has expanded startsto contract while the inner part of the core is still expanding. Thethermal stresses induced as a result of this non uniform heating anddifferential expansion cause the core material and coating to crackbefore the first solidified skin of themelt is formed. Therefore, while themetal is still liquid, itflows into these cracks forming the veiningdefects.Thedepthof penetration is controlledby the freezingof the leadingedgeof the advancingmetalwhen it reaches the freezing isotherm in the sand[19]. For this reason, the refractory coating material should be able tocontrol the heating of the core for it to be effective in stopping theformation of the cracks andmelt penetration. As a result, several coatingproperties will contribute to this. However, it was also reported in [20],that refractory coatings may also cause changes in thermo-mechanicalbehaviour of the core due to its pyrolysis. The percentage solid contentof the coating increases the coatingdensity and viscosity as illustrated inFig. 16; this has significant influence on core surface coverage, coatingpermeability, the coating subsurface penetration and the proud layerthickness. As can be seen from the results of the microstructure of thesurface of the coatings, the cores are completely covered by the sol–gel
coating and had thicknesses that increased with percentage solidcontent and dipping times. It would have been expected that the longerthe dipping time themore the coating penetrates into the core but fromthe results (Section 3.7), this is not the case. This is attributed to thethixotropic behaviour of the refractory coating during the dip coatingprocess [21–23]. During the dip coating process, thixotropic behaviourwas induced causing more coating to penetrate into the core in 1 sbecause there was only a very short time for recovery between thedown-up shear applications in this systemduring thedipping. However,with increase in dipping time to 3 s, recovery of the coating increasedthereby reducing coating penetration into the core. The reduction ofcoating penetration into the core increased with dipping time asobserved for 5 s dip coating. Therefore, it can be suggested that thethixotropic behaviour of the coating and capillary forces existing in theporous core material favour coating penetration into the core. Ontheother hand, increasing thedipping timeenhances the recoveryof thecoating due to the delay in-between the up–down shear applicationsduring thedip coating. As a resultmore coatingdeposits are observed onthe core surfaces (Figs. 8 and 9) making penetration into the coresdifficult with uniform and smaller particle sizes of the filler materialrelative to that of the sand grains. The presence of big cracks on thesurface of 50 and 60% solid content coatings and the reflection of thesecracks on the surface of the casting made with these coatings reducedthe interest in these coatings.However, the 40% solid content coating forPUCB cores dip-coated for 1 s proved significantly a suitable candidatefor this application. The thickness of the proud layerwas not asmuch asto induce big cracks and better surface quality was obtained.
It was also reported in [24,25] that coatings applied on coressignificantly reduced the surface permeability of the cores. This claimwas verified by the authors and the same results were obtained asreported in [16]. This could reasonably be the case, since the refractorymaterial fills the pore spaces between the sand grains, thereby reducingor blocking the capillary channels. Although coatings by themselves arealso porous and permeable materials due to their average particle sizes(for the sol–gel coating — 15 μm), their permeability is far lower thanthat of the sandmaterial fromwhich the coresweremade since the sandgrain size is more than 10 times higher than the refractory materialparticle size. This brings the pores in the dry coating one or two order ofmagnitude smaller than the pores between the sandgrains. The reducedpermeability could have been a problemwith venting of the core duringcasting but this was circumvented by not coating the cores completelyso the gas is forced to escape through uncoated core print to the sandmould where pressure gradient forces the gases out of the mould.Therefore, therewas no sign of evolved gas defects on the surface of thecastings. Considering that a high amount of gas is produced in ironcasting, it is better to have a coating that prevents gas from penetratinginto the melt by forcing the gas in the mould out through an uncoated
Fig. 16. Variation of coating density and coating viscosity for various percentage solidcontents.
4043U.C. Nwaogu et al. / Surface & Coatings Technology 205 (2011) 4035–4044
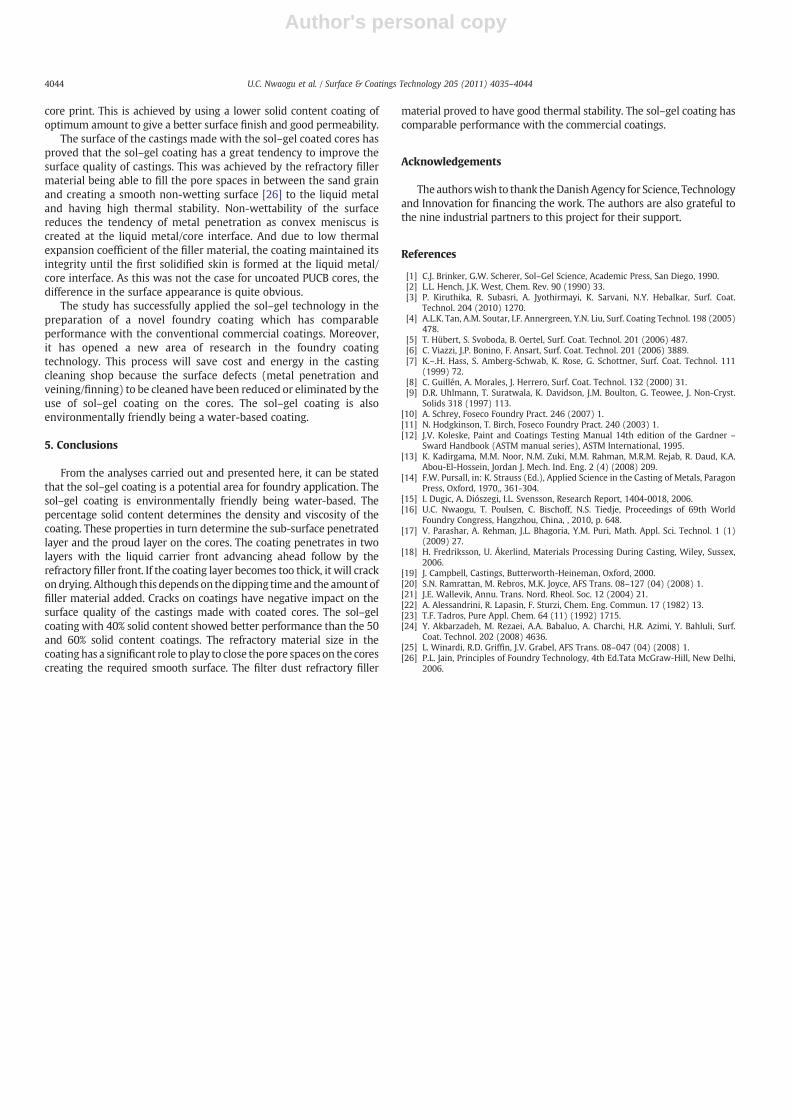
Author's personal copy
core print. This is achieved by using a lower solid content coating ofoptimum amount to give a better surface finish and good permeability.
The surface of the castings made with the sol–gel coated cores hasproved that the sol–gel coating has a great tendency to improve thesurface quality of castings. This was achieved by the refractory fillermaterial being able to fill the pore spaces in between the sand grainand creating a smooth non-wetting surface [26] to the liquid metaland having high thermal stability. Non-wettability of the surfacereduces the tendency of metal penetration as convex meniscus iscreated at the liquid metal/core interface. And due to low thermalexpansion coefficient of the filler material, the coating maintained itsintegrity until the first solidified skin is formed at the liquid metal/core interface. As this was not the case for uncoated PUCB cores, thedifference in the surface appearance is quite obvious.
The study has successfully applied the sol–gel technology in thepreparation of a novel foundry coating which has comparableperformance with the conventional commercial coatings. Moreover,it has opened a new area of research in the foundry coatingtechnology. This process will save cost and energy in the castingcleaning shop because the surface defects (metal penetration andveining/finning) to be cleaned have been reduced or eliminated by theuse of sol–gel coating on the cores. The sol–gel coating is alsoenvironmentally friendly being a water-based coating.
5. Conclusions
From the analyses carried out and presented here, it can be statedthat the sol–gel coating is a potential area for foundry application. Thesol–gel coating is environmentally friendly being water-based. Thepercentage solid content determines the density and viscosity of thecoating. These properties in turn determine the sub-surface penetratedlayer and the proud layer on the cores. The coating penetrates in twolayers with the liquid carrier front advancing ahead follow by therefractory filler front. If the coating layer becomes too thick, it will crackondrying. Although this depends on the dipping timeand the amount offiller material added. Cracks on coatings have negative impact on thesurface quality of the castings made with coated cores. The sol–gelcoating with 40% solid content showed better performance than the 50and 60% solid content coatings. The refractory material size in thecoating has a significant role to play to close the pore spaces on the corescreating the required smooth surface. The filter dust refractory filler
material proved to have good thermal stability. The sol–gel coating hascomparable performance with the commercial coatings.
Acknowledgements
Theauthorswish to thank theDanishAgency for Science, Technologyand Innovation for financing the work. The authors are also grateful tothe nine industrial partners to this project for their support.
References
[1] C.J. Brinker, G.W. Scherer, Sol–Gel Science, Academic Press, San Diego, 1990.[2] L.L. Hench, J.K. West, Chem. Rev. 90 (1990) 33.[3] P. Kiruthika, R. Subasri, A. Jyothirmayi, K. Sarvani, N.Y. Hebalkar, Surf. Coat.
Technol. 204 (2010) 1270.[4] A.L.K. Tan, A.M. Soutar, I.F. Annergreen, Y.N. Liu, Surf. Coating Technol. 198 (2005)
478.[5] T. Hübert, S. Svoboda, B. Oertel, Surf. Coat. Technol. 201 (2006) 487.[6] C. Viazzi, J.P. Bonino, F. Ansart, Surf. Coat. Technol. 201 (2006) 3889.[7] K.–.H. Hass, S. Amberg-Schwab, K. Rose, G. Schottner, Surf. Coat. Technol. 111
(1999) 72.[8] C. Guillén, A. Morales, J. Herrero, Surf. Coat. Technol. 132 (2000) 31.[9] D.R. Uhlmann, T. Suratwala, K. Davidson, J.M. Boulton, G. Teowee, J. Non-Cryst.
Solids 318 (1997) 113.[10] A. Schrey, Foseco Foundry Pract. 246 (2007) 1.[11] N. Hodgkinson, T. Birch, Foseco Foundry Pract. 240 (2003) 1.[12] J.V. Koleske, Paint and Coatings Testing Manual 14th edition of the Gardner –
Sward Handbook (ASTM manual series), ASTM International, 1995.[13] K. Kadirgama, M.M. Noor, N.M. Zuki, M.M. Rahman, M.R.M. Rejab, R. Daud, K.A.
Abou-El-Hossein, Jordan J. Mech. Ind. Eng. 2 (4) (2008) 209.[14] F.W. Pursall, in: K. Strauss (Ed.), Applied Science in the Casting of Metals, Paragon
Press, Oxford, 19708, 361-304.[15] I. Dugic, A. Diószegi, I.L. Svensson, Research Report, 1404-0018, 2006.[16] U.C. Nwaogu, T. Poulsen, C. Bischoff, N.S. Tiedje, Proceedings of 69th World
Foundry Congress, Hangzhou, China, , 2010, p. 648.[17] V. Parashar, A. Rehman, J.L. Bhagoria, Y.M. Puri, Math. Appl. Sci. Technol. 1 (1)
(2009) 27.[18] H. Fredriksson, U. Åkerlind, Materials Processing During Casting, Wiley, Sussex,
2006.[19] J. Campbell, Castings, Butterworth-Heineman, Oxford, 2000.[20] S.N. Ramrattan, M. Rebros, M.K. Joyce, AFS Trans. 08–127 (04) (2008) 1.[21] J.E. Wallevik, Annu. Trans. Nord. Rheol. Soc. 12 (2004) 21.[22] A. Alessandrini, R. Lapasin, F. Sturzi, Chem. Eng. Commun. 17 (1982) 13.[23] T.F. Tadros, Pure Appl. Chem. 64 (11) (1992) 1715.[24] Y. Akbarzadeh, M. Rezaei, A.A. Babaluo, A. Charchi, H.R. Azimi, Y. Bahluli, Surf.
Coat. Technol. 202 (2008) 4636.[25] L. Winardi, R.D. Griffin, J.V. Grabel, AFS Trans. 08–047 (04) (2008) 1.[26] P.L. Jain, Principles of Foundry Technology, 4th Ed.Tata McGraw-Hill, New Delhi,
2006.
4044 U.C. Nwaogu et al. / Surface & Coatings Technology 205 (2011) 4035–4044
SUPPLEMENT 3
U. C. Nwaogu, T. Poulsen, B. Gravesen, N.S. Tiedje,
“Using sol-gel component as additive to foundry coatings to improve casting quality”.
Published in International Journal of Cast Metals Research (2012)
DOI 10.1179/1743133611Y.0000000038

Using sol–gel component as additive tofoundry coatings to improve casting quality
U. Nwaogu*1, T. Poulsen2, B. Gravesen3 and N. Tiedje1
The improvement of foundry coatings to enhance performance is important. This paper
investigates the effect of using sol–gel component as an additive to foundry coatings applied
on chemically bonded sand cores. Three parameters at three levels each were investigated using
Taguchi experimental parameter design. The effects of the sol–gel component on viscosity,
density, uBaume, core coverage and permeability are shown. Numerical simulations were used to
predict defect areas. The thermal profiles of the core materials during casting were determined,
and the surface quality of the castings was evaluated. The results show that the surface quality of
castings obtained by adding the sol–gel component to the coatings for cold box cores has no
significant difference from castings produced with coatings without sol–gel component. On the
other hand, the addition of the sol–gel component in coatings for furan cores showed significant
improvement on the surface quality of the castings compared to that obtained without sol–gel
component.
Keywords: Foundry coatings, Dip coating, Surface roughness, Cast surface defects, Taguchi parametric design, Cold box cores, Furan cores, Numericalsimulations
IntroductionThe need for high surface quality castings is rising withthe high demand of cast components for variousapplications, such as hydraulic applications, water andoil valves, etc. The improvement of the surface quality ofcastings has been made possible by fettling.1 This isnot an easy task for foundries; it delays production,consumes much energy and time and constitutes noisepollution. Furthermore, due to the intricate designs ofsome complex castings, cleaning by fettling may not bepossible for example; it is not easy to use cleaningmachines in the internal channels of an autoengineblock. This limitation can be reduced using foundrycoatings of different types with different refractorymaterials on the cores used to create the channels.2
Therefore, it is important to direct research towardsfinding environmentally friendly ways of improving theexisting foundry coatings.
Foundry servicing companies are carrying outresearch to improve their foundry coating products tosatisfy their customers. This adoption of lean manu-facturing will help keep these companies competitive.Foundries are really pushing coating manufacturingcompanies to improve their refractory coating perfor-mance in enhancing the surface quality of castings.Most times, the same coatings are used for different
castings with different sizes and sections, while thecoatings prove successful in some casting components;in others, they produce very poor surface finish withveining defects, scabs, sand burn-on, metal penetrationor rough surfaces.2,3 Therefore, research on how toimprove foundry coatings is important, more especiallyin enhancing its thermal integrity to withstand the hightemperature of liquid metal much longer withoutcracking or degrading. The ability of a coated core ormould to produce defect free surface is dependent onthe thermal stability and integrity of the coating.4
However, some coatings crack at elevated tempera-tures, and this is not favourable for good surfacequality production.5 Stefanescu et al.6 classified thecasting skin of iron into two groups: surface andsubsurface. The surface feature is being described bysurface roughness. However, in the case of defectivecastings, other features like metal penetration and sandburn-on may be found along surface roughness on theskin of castings. The subsurface features includegraphite degradation, graphite depletion, pearlitic rimand ferritic rim.
This investigation will be limited to the study of theeffect of the sol–gel additive to the foundry coatings onthe surface features. The main surface feature of interestto elucidate the surface quality of the castings is thesurface roughness parameter Ra defined according toISO 4287/4288, as the arithmetic mean of the absolutevalues of the ordinate z(x), within the sampling lengthL.7,8 For discrete measurements, it is given by
Ra~1
N
XN
i~1
Zij j (1)
1Technical University of Denmark, Department of Mechanical Engineering,Institute of Process Technology, DK-2800 Kgs. Lyngby, Denmark2Centre for Material Testing, Danish Technological Institute, KongsvangAlle 29, Aarhus DK-8000, Denmark3Santrol Europe ApS, Agade 103, Pjedsted, Fredericia DK-7000, Denmark
*Corresponding author, email [email protected]
176
2012 W. S. Maney & Son Ltd.Received 1 November 2011; accepted 26 December 2011DOI 10.1179/1743133611Y.0000000038 International Journal of Cast Metals Research 2012 VOL 25 NO 3
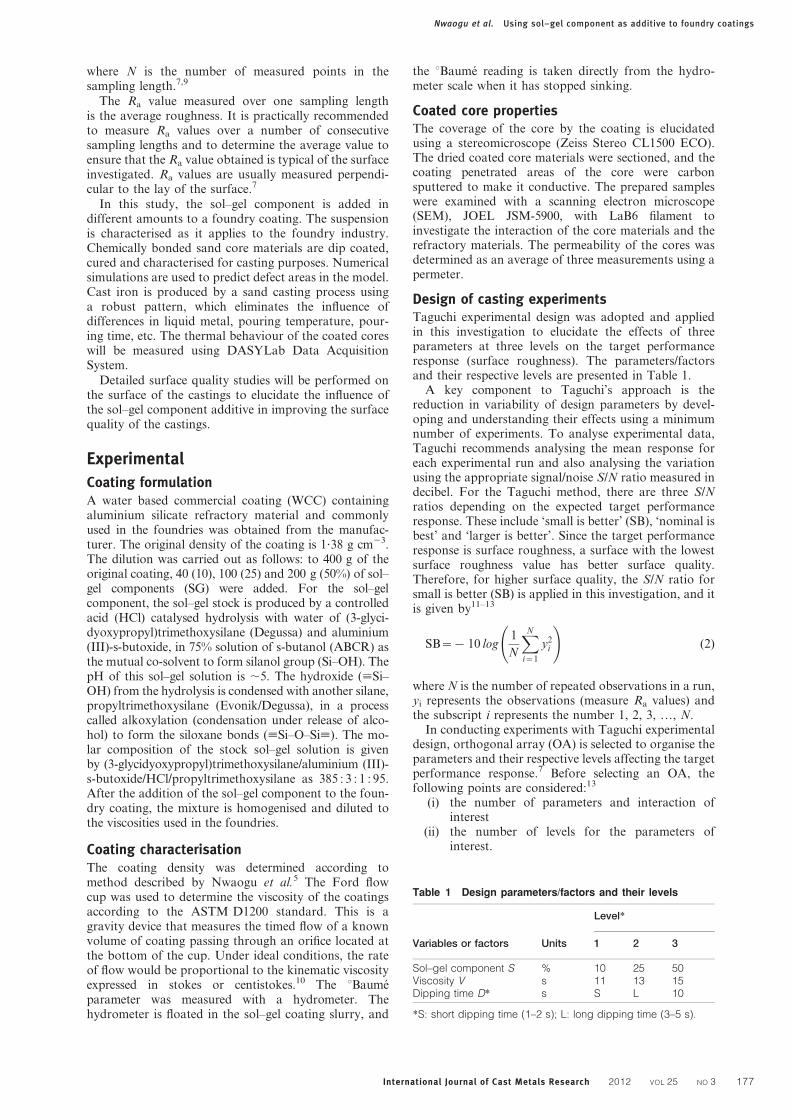
where N is the number of measured points in thesampling length.7,9
The Ra value measured over one sampling lengthis the average roughness. It is practically recommendedto measure Ra values over a number of consecutivesampling lengths and to determine the average value toensure that the Ra value obtained is typical of the surfaceinvestigated. Ra values are usually measured perpendi-cular to the lay of the surface.7
In this study, the sol–gel component is added indifferent amounts to a foundry coating. The suspensionis characterised as it applies to the foundry industry.Chemically bonded sand core materials are dip coated,cured and characterised for casting purposes. Numericalsimulations are used to predict defect areas in the model.Cast iron is produced by a sand casting process usinga robust pattern, which eliminates the influence ofdifferences in liquid metal, pouring temperature, pour-ing time, etc. The thermal behaviour of the coated coreswill be measured using DASYLab Data AcquisitionSystem.
Detailed surface quality studies will be performed onthe surface of the castings to elucidate the influence ofthe sol–gel component additive in improving the surfacequality of the castings.
Experimental
Coating formulationA water based commercial coating (WCC) containingaluminium silicate refractory material and commonlyused in the foundries was obtained from the manufac-turer. The original density of the coating is 1?38 g cm23.The dilution was carried out as follows: to 400 g of theoriginal coating, 40 (10), 100 (25) and 200 g (50%) of sol–gel components (SG) were added. For the sol–gelcomponent, the sol–gel stock is produced by a controlledacid (HCl) catalysed hydrolysis with water of (3-glyci-dyoxypropyl)trimethoxysilane (Degussa) and aluminium(III)-s-butoxide, in 75% solution of s-butanol (ABCR) asthe mutual co-solvent to form silanol group (Si–OH). ThepH of this sol–gel solution is ,5. The hydroxide (;Si–OH) from the hydrolysis is condensed with another silane,propyltrimethoxysilane (Evonik/Degussa), in a processcalled alkoxylation (condensation under release of alco-hol) to form the siloxane bonds (;Si–O–Si;). The mo-lar composition of the stock sol–gel solution is givenby (3-glycidyoxypropyl)trimethoxysilane/aluminium (III)-s-butoxide/HCl/propyltrimethoxysilane as 385 : 3 : 1 : 95.After the addition of the sol–gel component to the foun-dry coating, the mixture is homogenised and diluted tothe viscosities used in the foundries.
Coating characterisationThe coating density was determined according tomethod described by Nwaogu et al.5 The Ford flowcup was used to determine the viscosity of the coatingsaccording to the ASTM D1200 standard. This is agravity device that measures the timed flow of a knownvolume of coating passing through an orifice located atthe bottom of the cup. Under ideal conditions, the rateof flow would be proportional to the kinematic viscosityexpressed in stokes or centistokes.10 The uBaumeparameter was measured with a hydrometer. Thehydrometer is floated in the sol–gel coating slurry, and
the uBaume reading is taken directly from the hydro-meter scale when it has stopped sinking.
Coated core propertiesThe coverage of the core by the coating is elucidatedusing a stereomicroscope (Zeiss Stereo CL1500 ECO).The dried coated core materials were sectioned, and thecoating penetrated areas of the core were carbonsputtered to make it conductive. The prepared sampleswere examined with a scanning electron microscope(SEM), JOEL JSM-5900, with LaB6 filament toinvestigate the interaction of the core materials and therefractory materials. The permeability of the cores wasdetermined as an average of three measurements using apermeter.
Design of casting experimentsTaguchi experimental design was adopted and appliedin this investigation to elucidate the effects of threeparameters at three levels on the target performanceresponse (surface roughness). The parameters/factorsand their respective levels are presented in Table 1.
A key component to Taguchi’s approach is thereduction in variability of design parameters by devel-oping and understanding their effects using a minimumnumber of experiments. To analyse experimental data,Taguchi recommends analysing the mean response foreach experimental run and also analysing the variationusing the appropriate signal/noise S/N ratio measured indecibel. For the Taguchi method, there are three S/Nratios depending on the expected target performanceresponse. These include ‘small is better’ (SB), ‘nominal isbest’ and ‘larger is better’. Since the target performanceresponse is surface roughness, a surface with the lowestsurface roughness value has better surface quality.Therefore, for higher surface quality, the S/N ratio forsmall is better (SB) is applied in this investigation, and itis given by11–13
SB~ 10 log1
N
XN
i~1
y2i
!(2)
where N is the number of repeated observations in a run,yi represents the observations (measure Ra values) andthe subscript i represents the number 1, 2, 3, …, N.
In conducting experiments with Taguchi experimentaldesign, orthogonal array (OA) is selected to organise theparameters and their respective levels affecting the targetperformance response.7 Before selecting an OA, thefollowing points are considered:13
(i) the number of parameters and interaction ofinterest
(ii) the number of levels for the parameters ofinterest.
Table 1 Design parameters/factors and their levels
Level*
Variables or factors Units 1 2 3
Sol–gel component S % 10 25 50Viscosity V s 11 13 15Dipping time D* s S L 10
*S: short dipping time (1–2 s); L: long dipping time (3–5 s).
Nwaogu et al. Using sol–gel component as additive to foundry coatings
International Journal of Cast Metals Research 2012 VOL 25 NO 3 177
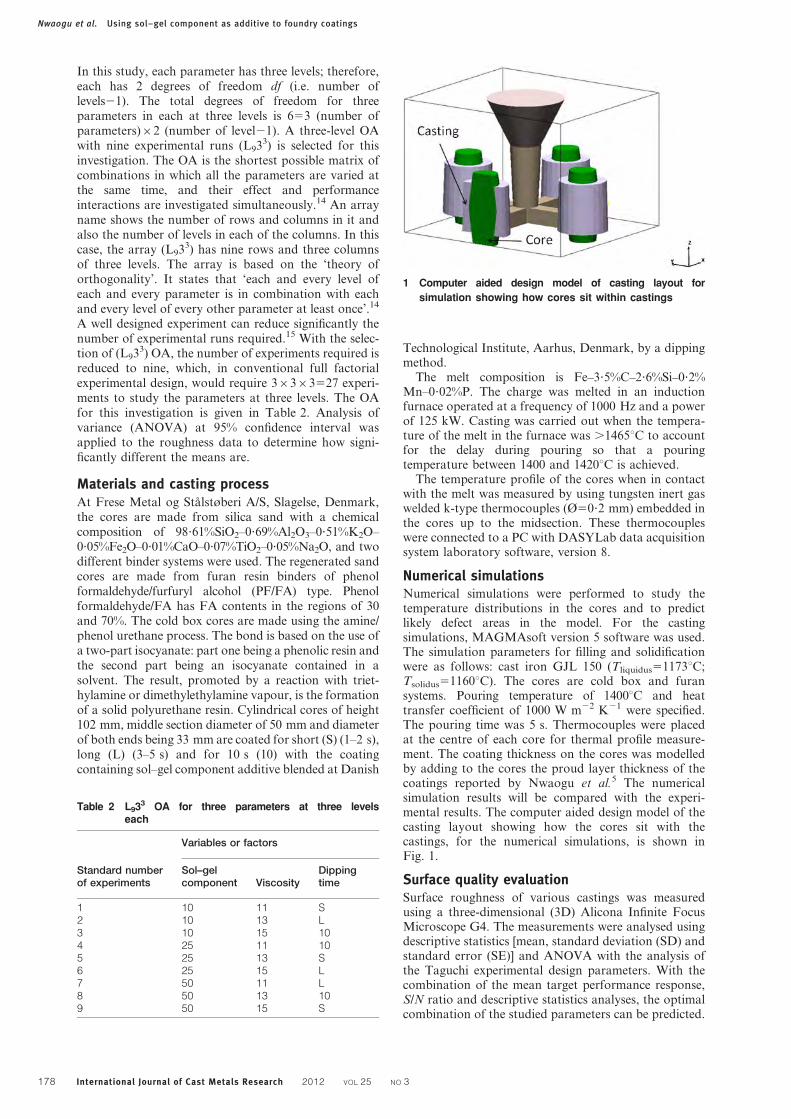
In this study, each parameter has three levels; therefore,each has 2 degrees of freedom df (i.e. number oflevels21). The total degrees of freedom for threeparameters in each at three levels is 653 (number ofparameters)62 (number of level21). A three-level OAwith nine experimental runs (L933) is selected for thisinvestigation. The OA is the shortest possible matrix ofcombinations in which all the parameters are varied atthe same time, and their effect and performanceinteractions are investigated simultaneously.14 An arrayname shows the number of rows and columns in it andalso the number of levels in each of the columns. In thiscase, the array (L933) has nine rows and three columnsof three levels. The array is based on the ‘theory oforthogonality’. It states that ‘each and every level ofeach and every parameter is in combination with eachand every level of every other parameter at least once’.14
A well designed experiment can reduce significantly thenumber of experimental runs required.15 With the selec-tion of (L933) OA, the number of experiments required isreduced to nine, which, in conventional full factorialexperimental design, would require 36363527 experi-ments to study the parameters at three levels. The OAfor this investigation is given in Table 2. Analysis ofvariance (ANOVA) at 95% confidence interval wasapplied to the roughness data to determine how signi-ficantly different the means are.
Materials and casting processAt Frese Metal og Stalstøberi A/S, Slagelse, Denmark,the cores are made from silica sand with a chemicalcomposition of 98?61%SiO2–0?69%Al2O3–0?51%K2O–0?05%Fe2O–0?01%CaO–0?07%TiO2–0?05%Na2O, and twodifferent binder systems were used. The regenerated sandcores are made from furan resin binders of phenolformaldehyde/furfuryl alcohol (PF/FA) type. Phenolformaldehyde/FA has FA contents in the regions of 30and 70%. The cold box cores are made using the amine/phenol urethane process. The bond is based on the use ofa two-part isocyanate: part one being a phenolic resin andthe second part being an isocyanate contained in asolvent. The result, promoted by a reaction with triet-hylamine or dimethylethylamine vapour, is the formationof a solid polyurethane resin. Cylindrical cores of height102 mm, middle section diameter of 50 mm and diameterof both ends being 33 mm are coated for short (S) (1–2 s),long (L) (3–5 s) and for 10 s (10) with the coatingcontaining sol–gel component additive blended at Danish
Technological Institute, Aarhus, Denmark, by a dippingmethod.
The melt composition is Fe–3?5%C–2?6%Si–0?2%Mn–0?02%P. The charge was melted in an inductionfurnace operated at a frequency of 1000 Hz and a powerof 125 kW. Casting was carried out when the tempera-ture of the melt in the furnace was .1465uC to accountfor the delay during pouring so that a pouringtemperature between 1400 and 1420uC is achieved.
The temperature profile of the cores when in contactwith the melt was measured by using tungsten inert gaswelded k-type thermocouples (Ø50?2 mm) embedded inthe cores up to the midsection. These thermocoupleswere connected to a PC with DASYLab data acquisitionsystem laboratory software, version 8.
Numerical simulationsNumerical simulations were performed to study thetemperature distributions in the cores and to predictlikely defect areas in the model. For the castingsimulations, MAGMAsoft version 5 software was used.The simulation parameters for filling and solidificationwere as follows: cast iron GJL 150 (Tliquidus51173uC;Tsolidus51160uC). The cores are cold box and furansystems. Pouring temperature of 1400uC and heattransfer coefficient of 1000 W m22 K21 were specified.The pouring time was 5 s. Thermocouples were placedat the centre of each core for thermal profile measure-ment. The coating thickness on the cores was modelledby adding to the cores the proud layer thickness of thecoatings reported by Nwaogu et al.5 The numericalsimulation results will be compared with the experi-mental results. The computer aided design model of thecasting layout showing how the cores sit with thecastings, for the numerical simulations, is shown inFig. 1.
Surface quality evaluationSurface roughness of various castings was measuredusing a three-dimensional (3D) Alicona Infinite FocusMicroscope G4. The measurements were analysed usingdescriptive statistics [mean, standard deviation (SD) andstandard error (SE)] and ANOVA with the analysis ofthe Taguchi experimental design parameters. With thecombination of the mean target performance response,S/N ratio and descriptive statistics analyses, the optimalcombination of the studied parameters can be predicted.
Table 2 L933 OA for three parameters at three levelseach
Variables or factors
Standard numberof experiments
Sol–gelcomponent Viscosity
Dippingtime
1 10 11 S2 10 13 L3 10 15 104 25 11 105 25 13 S6 25 15 L7 50 11 L8 50 13 109 50 15 S
1 Computer aided design model of casting layout for
simulation showing how cores sit within castings
Nwaogu et al. Using sol–gel component as additive to foundry coatings
178 International Journal of Cast Metals Research 2012 VOL 25 NO 3
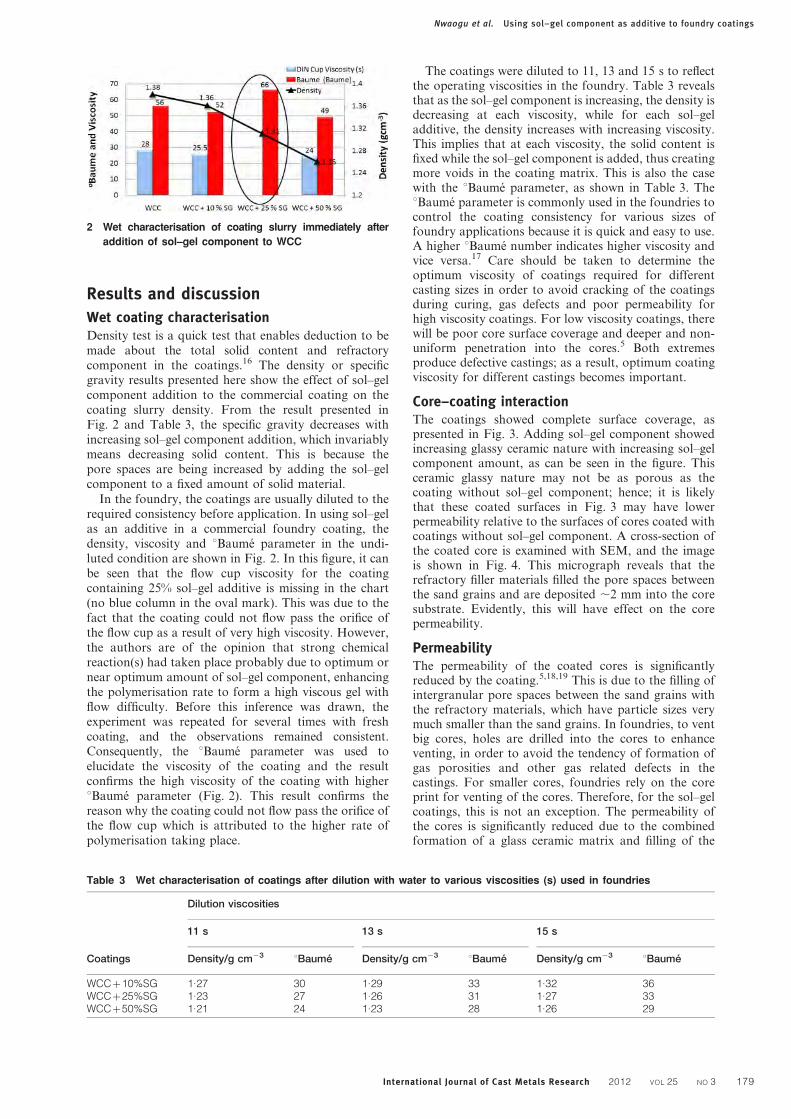
Results and discussion
Wet coating characterisationDensity test is a quick test that enables deduction to bemade about the total solid content and refractorycomponent in the coatings.16 The density or specificgravity results presented here show the effect of sol–gelcomponent addition to the commercial coating on thecoating slurry density. From the result presented inFig. 2 and Table 3, the specific gravity decreases withincreasing sol–gel component addition, which invariablymeans decreasing solid content. This is because thepore spaces are being increased by adding the sol–gelcomponent to a fixed amount of solid material.
In the foundry, the coatings are usually diluted to therequired consistency before application. In using sol–gelas an additive in a commercial foundry coating, thedensity, viscosity and uBaume parameter in the undi-luted condition are shown in Fig. 2. In this figure, it canbe seen that the flow cup viscosity for the coatingcontaining 25% sol–gel additive is missing in the chart(no blue column in the oval mark). This was due to thefact that the coating could not flow pass the orifice ofthe flow cup as a result of very high viscosity. However,the authors are of the opinion that strong chemicalreaction(s) had taken place probably due to optimum ornear optimum amount of sol–gel component, enhancingthe polymerisation rate to form a high viscous gel withflow difficulty. Before this inference was drawn, theexperiment was repeated for several times with freshcoating, and the observations remained consistent.Consequently, the uBaume parameter was used toelucidate the viscosity of the coating and the resultconfirms the high viscosity of the coating with higheruBaume parameter (Fig. 2). This result confirms thereason why the coating could not flow pass the orifice ofthe flow cup which is attributed to the higher rate ofpolymerisation taking place.
The coatings were diluted to 11, 13 and 15 s to reflectthe operating viscosities in the foundry. Table 3 revealsthat as the sol–gel component is increasing, the density isdecreasing at each viscosity, while for each sol–geladditive, the density increases with increasing viscosity.This implies that at each viscosity, the solid content isfixed while the sol–gel component is added, thus creatingmore voids in the coating matrix. This is also the casewith the uBaume parameter, as shown in Table 3. TheuBaume parameter is commonly used in the foundries tocontrol the coating consistency for various sizes offoundry applications because it is quick and easy to use.A higher uBaume number indicates higher viscosity andvice versa.17 Care should be taken to determine theoptimum viscosity of coatings required for differentcasting sizes in order to avoid cracking of the coatingsduring curing, gas defects and poor permeability forhigh viscosity coatings. For low viscosity coatings, therewill be poor core surface coverage and deeper and non-uniform penetration into the cores.5 Both extremesproduce defective castings; as a result, optimum coatingviscosity for different castings becomes important.
Core–coating interactionThe coatings showed complete surface coverage, aspresented in Fig. 3. Adding sol–gel component showedincreasing glassy ceramic nature with increasing sol–gelcomponent amount, as can be seen in the figure. Thisceramic glassy nature may not be as porous as thecoating without sol–gel component; hence; it is likelythat these coated surfaces in Fig. 3 may have lowerpermeability relative to the surfaces of cores coated withcoatings without sol–gel component. A cross-section ofthe coated core is examined with SEM, and the imageis shown in Fig. 4. This micrograph reveals that therefractory filler materials filled the pore spaces betweenthe sand grains and are deposited ,2 mm into the coresubstrate. Evidently, this will have effect on the corepermeability.
PermeabilityThe permeability of the coated cores is significantlyreduced by the coating.5,18,19 This is due to the filling ofintergranular pore spaces between the sand grains withthe refractory materials, which have particle sizes verymuch smaller than the sand grains. In foundries, to ventbig cores, holes are drilled into the cores to enhanceventing, in order to avoid the tendency of formation ofgas porosities and other gas related defects in thecastings. For smaller cores, foundries rely on the coreprint for venting of the cores. Therefore, for the sol–gelcoatings, this is not an exception. The permeability ofthe cores is significantly reduced due to the combinedformation of a glass ceramic matrix and filling of the
2 Wet characterisation of coating slurry immediately after
addition of sol–gel component to WCC
Table 3 Wet characterisation of coatings after dilution with water to various viscosities (s) used in foundries
Dilution viscosities
11 s 13 s 15 s
Coatings Density/g cm23 uBaume Density/g cm23 uBaume Density/g cm23 uBaume
WCCz10%SG 1.27 30 1.29 33 1.32 36WCCz25%SG 1.23 27 1.26 31 1.27 33WCCz50%SG 1.21 24 1.23 28 1.26 29
Nwaogu et al. Using sol–gel component as additive to foundry coatings
International Journal of Cast Metals Research 2012 VOL 25 NO 3 179
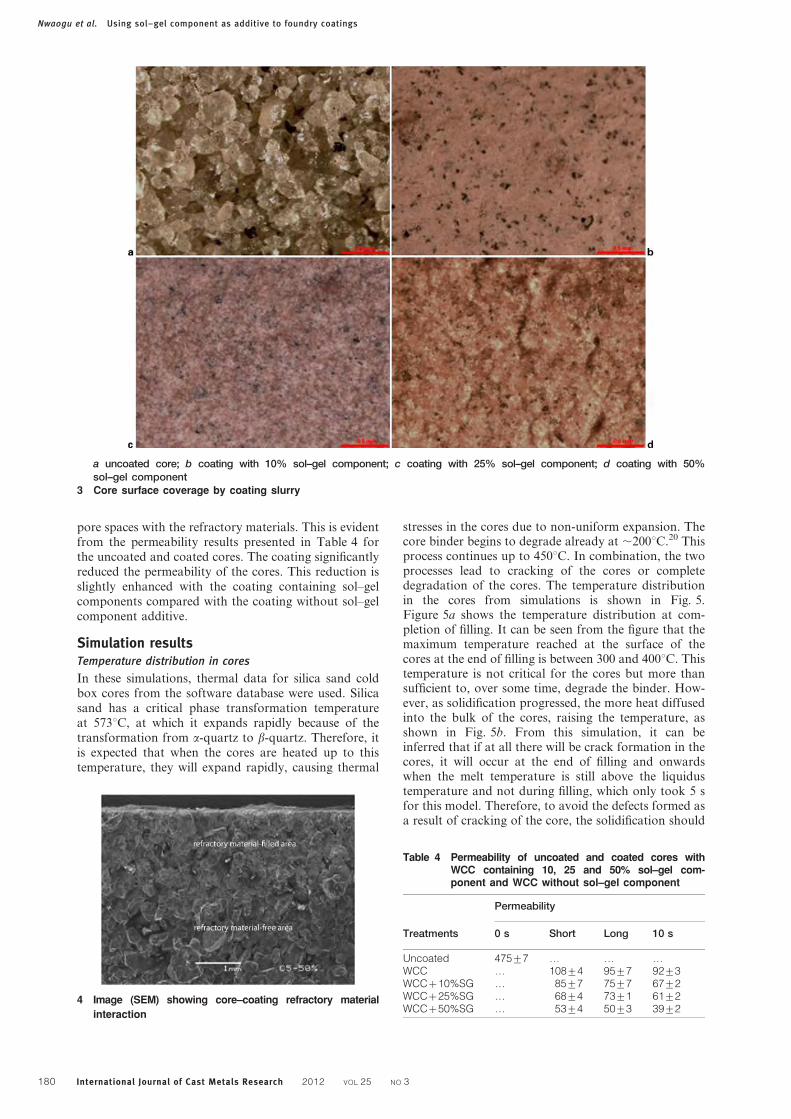
pore spaces with the refractory materials. This is evidentfrom the permeability results presented in Table 4 forthe uncoated and coated cores. The coating significantlyreduced the permeability of the cores. This reduction isslightly enhanced with the coating containing sol–gelcomponents compared with the coating without sol–gelcomponent additive.
Simulation resultsTemperature distribution in cores
In these simulations, thermal data for silica sand coldbox cores from the software database were used. Silicasand has a critical phase transformation temperatureat 573uC, at which it expands rapidly because of thetransformation from a-quartz to b-quartz. Therefore, itis expected that when the cores are heated up to thistemperature, they will expand rapidly, causing thermal
stresses in the cores due to non-uniform expansion. Thecore binder begins to degrade already at ,200uC.20 Thisprocess continues up to 450uC. In combination, the twoprocesses lead to cracking of the cores or completedegradation of the cores. The temperature distributionin the cores from simulations is shown in Fig. 5.Figure 5a shows the temperature distribution at com-pletion of filling. It can be seen from the figure that themaximum temperature reached at the surface of thecores at the end of filling is between 300 and 400uC. Thistemperature is not critical for the cores but more thansufficient to, over some time, degrade the binder. How-ever, as solidification progressed, the more heat diffusedinto the bulk of the cores, raising the temperature, asshown in Fig. 5b. From this simulation, it can beinferred that if at all there will be crack formation in thecores, it will occur at the end of filling and onwardswhen the melt temperature is still above the liquidustemperature and not during filling, which only took 5 sfor this model. Therefore, to avoid the defects formed asa result of cracking of the core, the solidification should
a uncoated core; b coating with 10% sol–gel component; c coating with 25% sol–gel component; d coating with 50%sol–gel component
3 Core surface coverage by coating slurry
4 Image (SEM) showing core–coating refractory material
interaction
Table 4 Permeability of uncoated and coated cores withWCC containing 10, 25 and 50% sol–gel com-ponent and WCC without sol–gel component
Permeability
Treatments 0 s Short Long 10 s
Uncoated 475¡7 … … …WCC … 108¡4 95¡7 92¡3WCCz10%SG … 85¡7 75¡7 67¡2WCCz25%SG … 68¡4 73¡1 61¡2WCCz50%SG … 53¡4 50¡3 39¡2
Nwaogu et al. Using sol–gel component as additive to foundry coatings
180 International Journal of Cast Metals Research 2012 VOL 25 NO 3
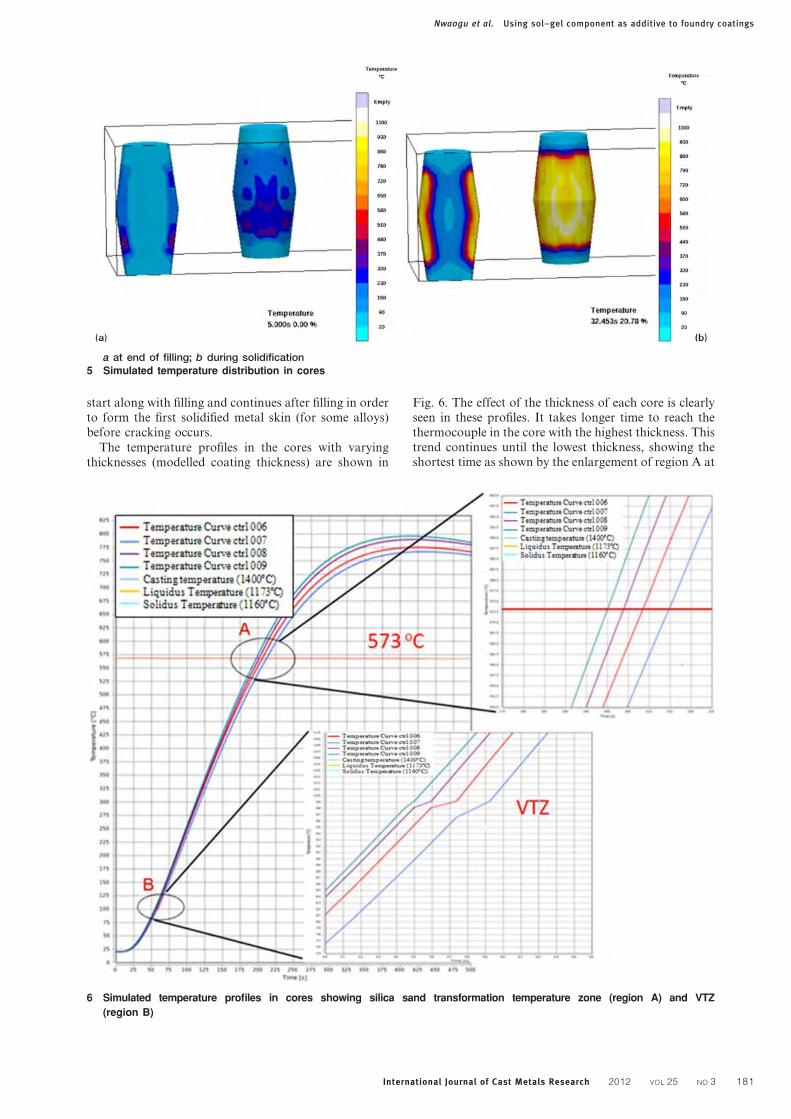
start along with filling and continues after filling in orderto form the first solidified metal skin (for some alloys)before cracking occurs.
The temperature profiles in the cores with varyingthicknesses (modelled coating thickness) are shown in
Fig. 6. The effect of the thickness of each core is clearlyseen in these profiles. It takes longer time to reach thethermocouple in the core with the highest thickness. Thistrend continues until the lowest thickness, showing theshortest time as shown by the enlargement of region A at
a at end of filling; b during solidification5 Simulated temperature distribution in cores
6 Simulated temperature profiles in cores showing silica sand transformation temperature zone (region A) and VTZ
(region B)
Nwaogu et al. Using sol–gel component as additive to foundry coatings
International Journal of Cast Metals Research 2012 VOL 25 NO 3 181
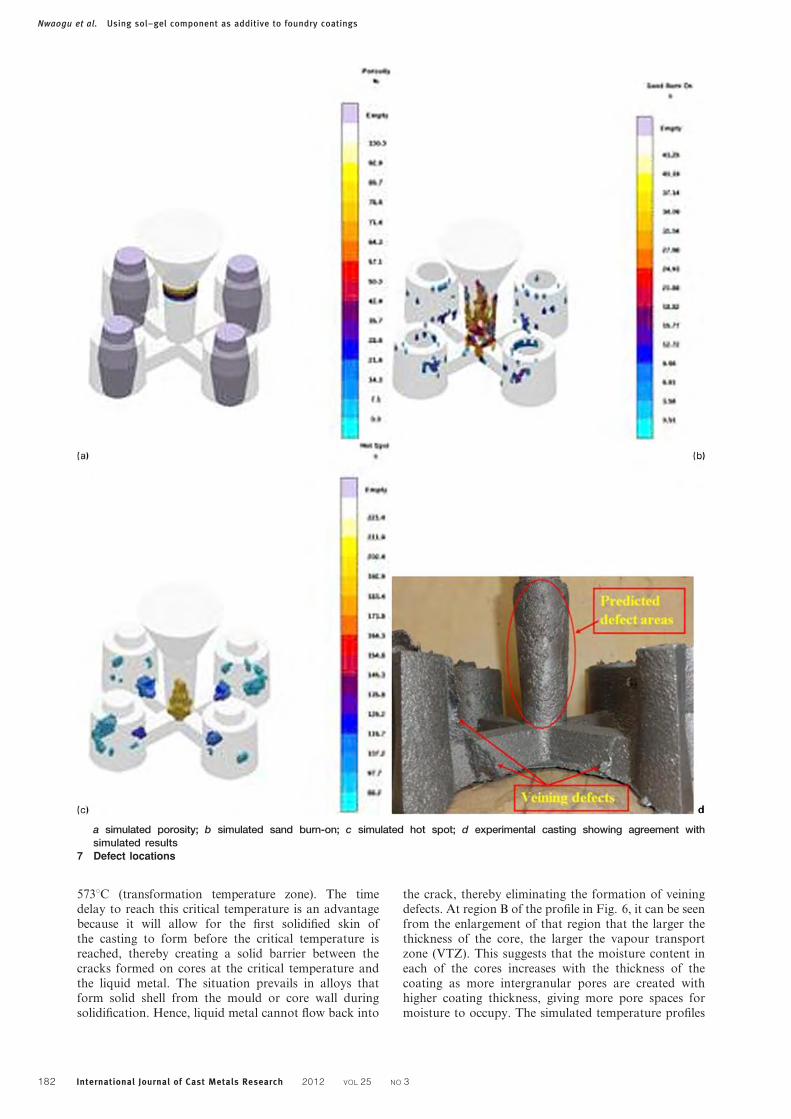
573uC (transformation temperature zone). The timedelay to reach this critical temperature is an advantagebecause it will allow for the first solidified skin ofthe casting to form before the critical temperature isreached, thereby creating a solid barrier between thecracks formed on cores at the critical temperature andthe liquid metal. The situation prevails in alloys thatform solid shell from the mould or core wall duringsolidification. Hence, liquid metal cannot flow back into
the crack, thereby eliminating the formation of veiningdefects. At region B of the profile in Fig. 6, it can be seenfrom the enlargement of that region that the larger thethickness of the core, the larger the vapour transportzone (VTZ). This suggests that the moisture content ineach of the cores increases with the thickness of thecoating as more intergranular pores are created withhigher coating thickness, giving more pore spaces formoisture to occupy. The simulated temperature profiles
a simulated porosity; b simulated sand burn-on; c simulated hot spot; d experimental casting showing agreement withsimulated results
7 Defect locations
Nwaogu et al. Using sol–gel component as additive to foundry coatings
182 International Journal of Cast Metals Research 2012 VOL 25 NO 3
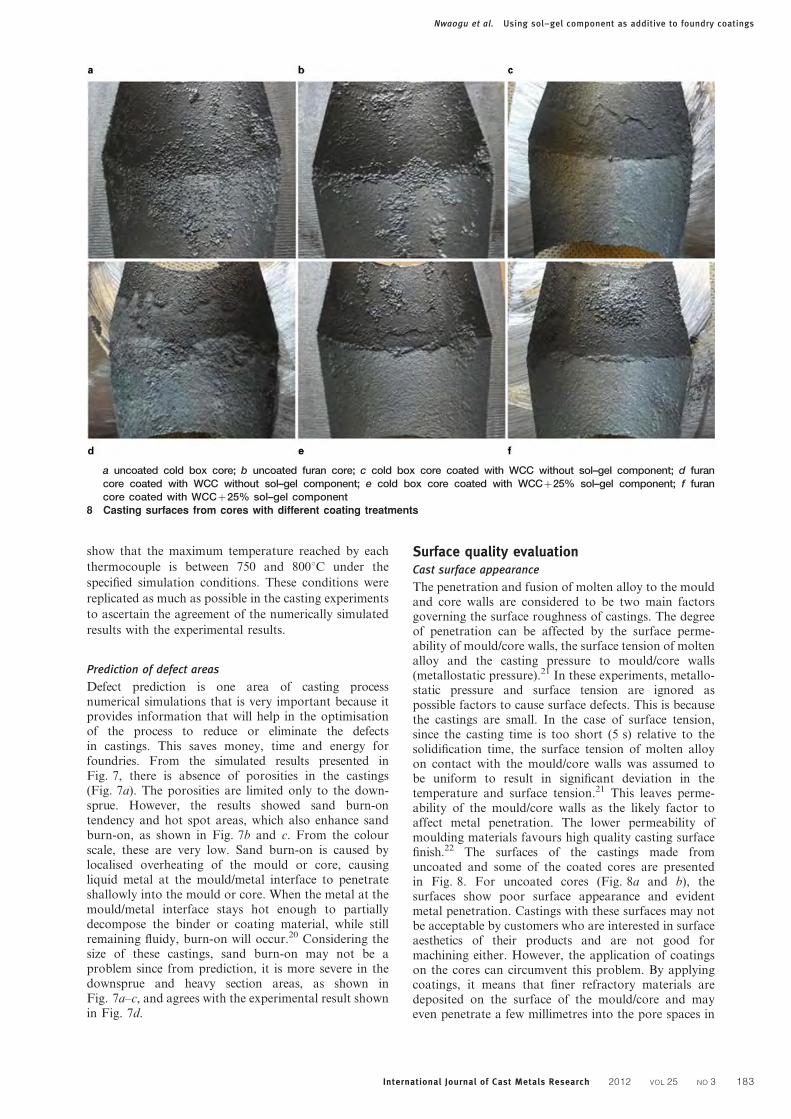
show that the maximum temperature reached by each
thermocouple is between 750 and 800uC under the
specified simulation conditions. These conditions were
replicated as much as possible in the casting experiments
to ascertain the agreement of the numerically simulated
results with the experimental results.
Prediction of defect areas
Defect prediction is one area of casting processnumerical simulations that is very important because itprovides information that will help in the optimisationof the process to reduce or eliminate the defectsin castings. This saves money, time and energy forfoundries. From the simulated results presented inFig. 7, there is absence of porosities in the castings(Fig. 7a). The porosities are limited only to the down-sprue. However, the results showed sand burn-ontendency and hot spot areas, which also enhance sandburn-on, as shown in Fig. 7b and c. From the colourscale, these are very low. Sand burn-on is caused bylocalised overheating of the mould or core, causingliquid metal at the mould/metal interface to penetrateshallowly into the mould or core. When the metal at themould/metal interface stays hot enough to partiallydecompose the binder or coating material, while stillremaining fluidy, burn-on will occur.20 Considering thesize of these castings, sand burn-on may not be aproblem since from prediction, it is more severe in thedownsprue and heavy section areas, as shown inFig. 7a–c, and agrees with the experimental result shownin Fig. 7d.
Surface quality evaluationCast surface appearance
The penetration and fusion of molten alloy to the mouldand core walls are considered to be two main factorsgoverning the surface roughness of castings. The degreeof penetration can be affected by the surface perme-ability of mould/core walls, the surface tension of moltenalloy and the casting pressure to mould/core walls(metallostatic pressure).21 In these experiments, metallo-static pressure and surface tension are ignored aspossible factors to cause surface defects. This is becausethe castings are small. In the case of surface tension,since the casting time is too short (5 s) relative to thesolidification time, the surface tension of molten alloyon contact with the mould/core walls was assumed tobe uniform to result in significant deviation in thetemperature and surface tension.21 This leaves perme-ability of the mould/core walls as the likely factor toaffect metal penetration. The lower permeability ofmoulding materials favours high quality casting surfacefinish.22 The surfaces of the castings made fromuncoated and some of the coated cores are presentedin Fig. 8. For uncoated cores (Fig. 8a and b), thesurfaces show poor surface appearance and evidentmetal penetration. Castings with these surfaces may notbe acceptable by customers who are interested in surfaceaesthetics of their products and are not good formachining either. However, the application of coatingson the cores can circumvent this problem. By applyingcoatings, it means that finer refractory materials aredeposited on the surface of the mould/core and mayeven penetrate a few millimetres into the pore spaces in
a uncoated cold box core; b uncoated furan core; c cold box core coated with WCC without sol–gel component; d furancore coated with WCC without sol–gel component; e cold box core coated with WCCz25% sol–gel component; f furancore coated with WCCz25% sol–gel component
8 Casting surfaces from cores with different coating treatments
Nwaogu et al. Using sol–gel component as additive to foundry coatings
International Journal of Cast Metals Research 2012 VOL 25 NO 3 183
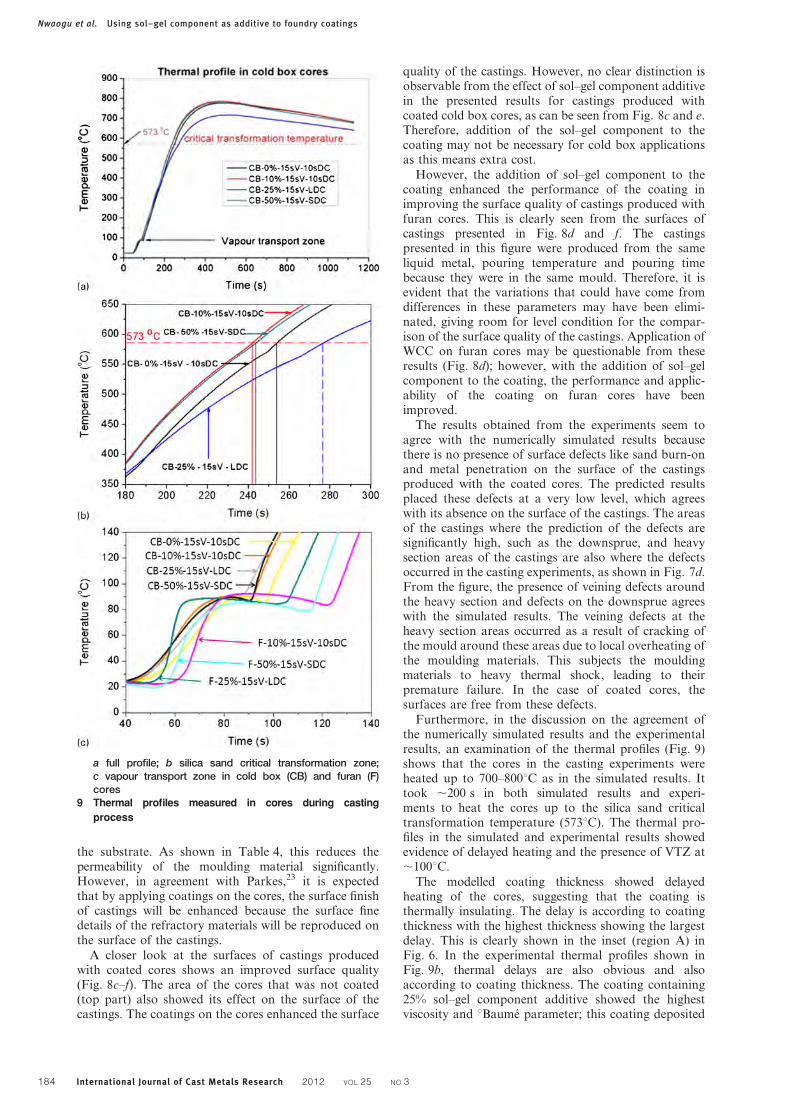
the substrate. As shown in Table 4, this reduces thepermeability of the moulding material significantly.However, in agreement with Parkes,23 it is expectedthat by applying coatings on the cores, the surface finishof castings will be enhanced because the surface finedetails of the refractory materials will be reproduced onthe surface of the castings.
A closer look at the surfaces of castings producedwith coated cores shows an improved surface quality(Fig. 8c–f). The area of the cores that was not coated(top part) also showed its effect on the surface of thecastings. The coatings on the cores enhanced the surface
quality of the castings. However, no clear distinction isobservable from the effect of sol–gel component additivein the presented results for castings produced withcoated cold box cores, as can be seen from Fig. 8c and e.Therefore, addition of the sol–gel component to thecoating may not be necessary for cold box applicationsas this means extra cost.
However, the addition of sol–gel component to thecoating enhanced the performance of the coating inimproving the surface quality of castings produced withfuran cores. This is clearly seen from the surfaces ofcastings presented in Fig. 8d and f. The castingspresented in this figure were produced from the sameliquid metal, pouring temperature and pouring timebecause they were in the same mould. Therefore, it isevident that the variations that could have come fromdifferences in these parameters may have been elimi-nated, giving room for level condition for the compar-ison of the surface quality of the castings. Application ofWCC on furan cores may be questionable from theseresults (Fig. 8d); however, with the addition of sol–gelcomponent to the coating, the performance and applic-ability of the coating on furan cores have beenimproved.
The results obtained from the experiments seem toagree with the numerically simulated results becausethere is no presence of surface defects like sand burn-onand metal penetration on the surface of the castingsproduced with the coated cores. The predicted resultsplaced these defects at a very low level, which agreeswith its absence on the surface of the castings. The areasof the castings where the prediction of the defects aresignificantly high, such as the downsprue, and heavysection areas of the castings are also where the defectsoccurred in the casting experiments, as shown in Fig. 7d.From the figure, the presence of veining defects aroundthe heavy section and defects on the downsprue agreeswith the simulated results. The veining defects at theheavy section areas occurred as a result of cracking ofthe mould around these areas due to local overheating ofthe moulding materials. This subjects the mouldingmaterials to heavy thermal shock, leading to theirpremature failure. In the case of coated cores, thesurfaces are free from these defects.
Furthermore, in the discussion on the agreement ofthe numerically simulated results and the experimentalresults, an examination of the thermal profiles (Fig. 9)shows that the cores in the casting experiments wereheated up to 700–800uC as in the simulated results. Ittook ,200 s in both simulated results and experi-ments to heat the cores up to the silica sand criticaltransformation temperature (573uC). The thermal pro-files in the simulated and experimental results showedevidence of delayed heating and the presence of VTZ at,100uC.
The modelled coating thickness showed delayedheating of the cores, suggesting that the coating isthermally insulating. The delay is according to coatingthickness with the highest thickness showing the largestdelay. This is clearly shown in the inset (region A) inFig. 6. In the experimental thermal profiles shown inFig. 9b, thermal delays are also obvious and alsoaccording to coating thickness. The coating containing25% sol–gel component additive showed the highestviscosity and uBaume parameter; this coating deposited
a full profile; b silica sand critical transformation zone;c vapour transport zone in cold box (CB) and furan (F)cores
9 Thermal profiles measured in cores during casting
process
Nwaogu et al. Using sol–gel component as additive to foundry coatings
184 International Journal of Cast Metals Research 2012 VOL 25 NO 3
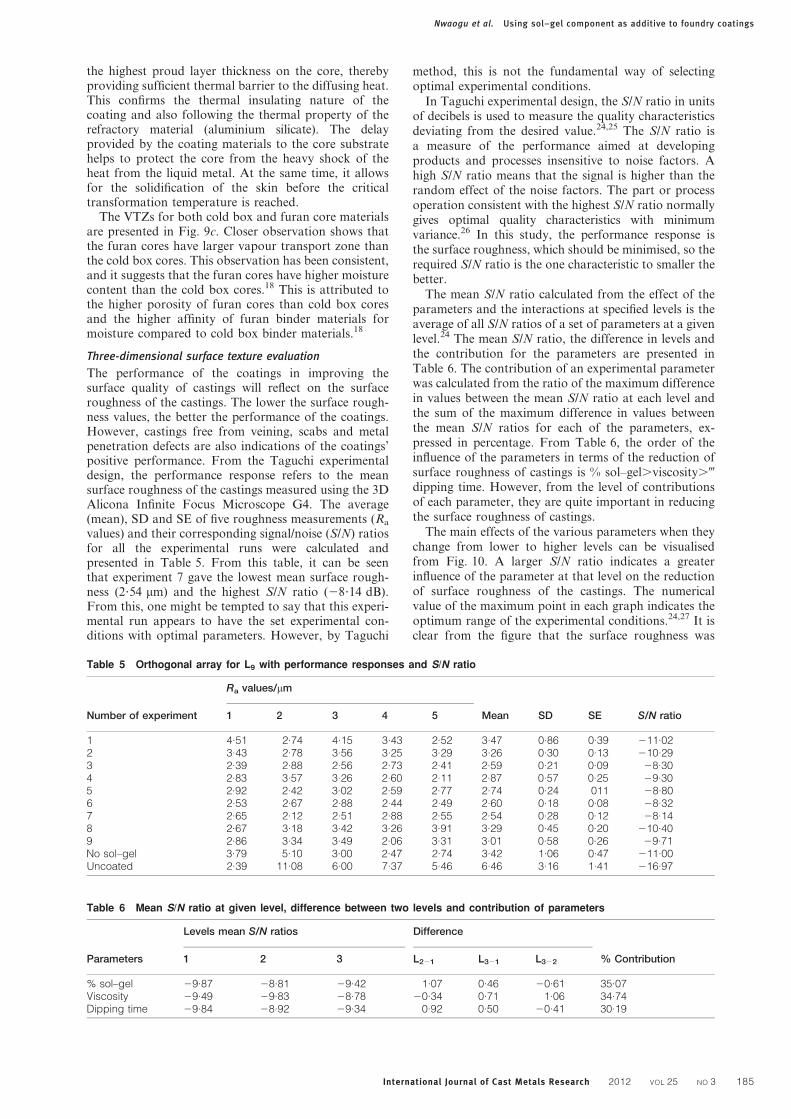
the highest proud layer thickness on the core, therebyproviding sufficient thermal barrier to the diffusing heat.This confirms the thermal insulating nature of thecoating and also following the thermal property of therefractory material (aluminium silicate). The delayprovided by the coating materials to the core substratehelps to protect the core from the heavy shock of theheat from the liquid metal. At the same time, it allowsfor the solidification of the skin before the criticaltransformation temperature is reached.
The VTZs for both cold box and furan core materialsare presented in Fig. 9c. Closer observation shows thatthe furan cores have larger vapour transport zone thanthe cold box cores. This observation has been consistent,and it suggests that the furan cores have higher moisturecontent than the cold box cores.18 This is attributed tothe higher porosity of furan cores than cold box coresand the higher affinity of furan binder materials formoisture compared to cold box binder materials.18
Three-dimensional surface texture evaluation
The performance of the coatings in improving thesurface quality of castings will reflect on the surfaceroughness of the castings. The lower the surface rough-ness values, the better the performance of the coatings.However, castings free from veining, scabs and metalpenetration defects are also indications of the coatings’positive performance. From the Taguchi experimentaldesign, the performance response refers to the meansurface roughness of the castings measured using the 3DAlicona Infinite Focus Microscope G4. The average(mean), SD and SE of five roughness measurements (Ra
values) and their corresponding signal/noise (S/N) ratiosfor all the experimental runs were calculated andpresented in Table 5. From this table, it can be seenthat experiment 7 gave the lowest mean surface rough-ness (2?54 mm) and the highest S/N ratio (28?14 dB).From this, one might be tempted to say that this experi-mental run appears to have the set experimental con-ditions with optimal parameters. However, by Taguchi
method, this is not the fundamental way of selectingoptimal experimental conditions.
In Taguchi experimental design, the S/N ratio in unitsof decibels is used to measure the quality characteristicsdeviating from the desired value.24,25 The S/N ratio isa measure of the performance aimed at developingproducts and processes insensitive to noise factors. Ahigh S/N ratio means that the signal is higher than therandom effect of the noise factors. The part or processoperation consistent with the highest S/N ratio normallygives optimal quality characteristics with minimumvariance.26 In this study, the performance response isthe surface roughness, which should be minimised, so therequired S/N ratio is the one characteristic to smaller thebetter.
The mean S/N ratio calculated from the effect of theparameters and the interactions at specified levels is theaverage of all S/N ratios of a set of parameters at a givenlevel.24 The mean S/N ratio, the difference in levels andthe contribution for the parameters are presented inTable 6. The contribution of an experimental parameterwas calculated from the ratio of the maximum differencein values between the mean S/N ratio at each level andthe sum of the maximum difference in values betweenthe mean S/N ratios for each of the parameters, ex-pressed in percentage. From Table 6, the order of theinfluence of the parameters in terms of the reduction ofsurface roughness of castings is % sol–gel.viscosity.-
dipping time. However, from the level of contributionsof each parameter, they are quite important in reducingthe surface roughness of castings.
The main effects of the various parameters when theychange from lower to higher levels can be visualisedfrom Fig. 10. A larger S/N ratio indicates a greaterinfluence of the parameter at that level on the reductionof surface roughness of the castings. The numericalvalue of the maximum point in each graph indicates theoptimum range of the experimental conditions.24,27 It isclear from the figure that the surface roughness was
Table 5 Orthogonal array for L9 with performance responses and S/N ratio
Number of experiment
Ra values/mm
Mean SD SE S/N ratio1 2 3 4 5
1 4.51 2.74 4.15 3.43 2.52 3.47 0.86 0.39 211.022 3.43 2.78 3.56 3.25 3.29 3.26 0.30 0.13 210.293 2.39 2.88 2.56 2.73 2.41 2.59 0.21 0.09 28.304 2.83 3.57 3.26 2.60 2.11 2.87 0.57 0.25 29.305 2.92 2.42 3.02 2.59 2.77 2.74 0.24 011 28.806 2.53 2.67 2.88 2.44 2.49 2.60 0.18 0.08 28.327 2.65 2.12 2.51 2.88 2.55 2.54 0.28 0.12 28.148 2.67 3.18 3.42 3.26 3.91 3.29 0.45 0.20 210.409 2.86 3.34 3.49 2.06 3.31 3.01 0.58 0.26 29.71No sol–gel 3.79 5.10 3.00 2.47 2.74 3.42 1.06 0.47 211.00Uncoated 2.39 11.08 6.00 7.37 5.46 6.46 3.16 1.41 216.97
Table 6 Mean S/N ratio at given level, difference between two levels and contribution of parameters
Parameters
Levels mean S/N ratios Difference
% Contribution1 2 3 L221 L321 L322
% sol–gel 29.87 28.81 29.42 1.07 0.46 20.61 35.07Viscosity 29.49 29.83 28.78 20.34 0.71 1.06 34.74Dipping time 29.84 28.92 29.34 0.92 0.50 20.41 30.19
Nwaogu et al. Using sol–gel component as additive to foundry coatings
International Journal of Cast Metals Research 2012 VOL 25 NO 3 185
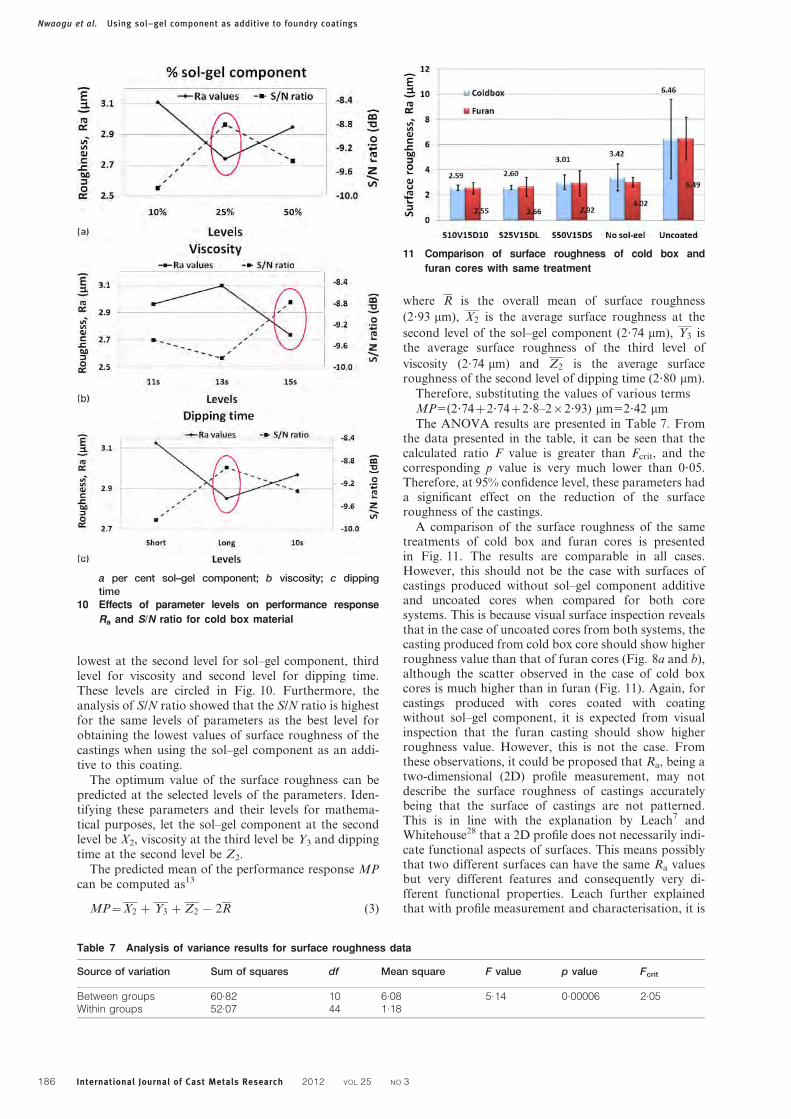
lowest at the second level for sol–gel component, thirdlevel for viscosity and second level for dipping time.These levels are circled in Fig. 10. Furthermore, theanalysis of S/N ratio showed that the S/N ratio is highestfor the same levels of parameters as the best level forobtaining the lowest values of surface roughness of thecastings when using the sol–gel component as an addi-tive to this coating.
The optimum value of the surface roughness can bepredicted at the selected levels of the parameters. Iden-tifying these parameters and their levels for mathema-tical purposes, let the sol–gel component at the secondlevel be X2, viscosity at the third level be Y3 and dippingtime at the second level be Z2.
The predicted mean of the performance response MPcan be computed as13
MP~X2 z Y3 z Z2 2R (3)
where R is the overall mean of surface roughness
(2?93 mm), X2 is the average surface roughness at the
second level of the sol–gel component (2?74 mm), Y3 isthe average surface roughness of the third level of
viscosity (2?74 mm) and Z2 is the average surfaceroughness of the second level of dipping time (2?80 mm).
Therefore, substituting the values of various terms
MP5(2?74z2?74z2?8–262?93) mm52?42 mm
The ANOVA results are presented in Table 7. Fromthe data presented in the table, it can be seen that thecalculated ratio F value is greater than Fcrit, and thecorresponding p value is very much lower than 0?05.Therefore, at 95% confidence level, these parameters hada significant effect on the reduction of the surfaceroughness of the castings.
A comparison of the surface roughness of the sametreatments of cold box and furan cores is presentedin Fig. 11. The results are comparable in all cases.However, this should not be the case with surfaces ofcastings produced without sol–gel component additiveand uncoated cores when compared for both coresystems. This is because visual surface inspection revealsthat in the case of uncoated cores from both systems, thecasting produced from cold box core should show higherroughness value than that of furan cores (Fig. 8a and b),although the scatter observed in the case of cold boxcores is much higher than in furan (Fig. 11). Again, forcastings produced with cores coated with coatingwithout sol–gel component, it is expected from visualinspection that the furan casting should show higherroughness value. However, this is not the case. Fromthese observations, it could be proposed that Ra, being atwo-dimensional (2D) profile measurement, may notdescribe the surface roughness of castings accuratelybeing that the surface of castings are not patterned.This is in line with the explanation by Leach7 andWhitehouse28 that a 2D profile does not necessarily indi-cate functional aspects of surfaces. This means possiblythat two different surfaces can have the same Ra valuesbut very different features and consequently very di-fferent functional properties. Leach further explainedthat with profile measurement and characterisation, it is
a per cent sol–gel component; b viscosity; c dippingtime
10 Effects of parameter levels on performance response
Ra and S/N ratio for cold box material
Table 7 Analysis of variance results for surface roughness data
Source of variation Sum of squares df Mean square F value p value Fcrit
Between groups 60.82 10 6.08 5.14 0.00006 2.05Within groups 52.07 44 1.18
11 Comparison of surface roughness of cold box and
furan cores with same treatment
Nwaogu et al. Using sol–gel component as additive to foundry coatings
186 International Journal of Cast Metals Research 2012 VOL 25 NO 3
difficult to determine the exact nature of topographicfeatures on surfaces. He suggested a more detailedsurface texture parameter measurement in 3D. This isknown as areal surface texture. This gives a morerealistic representation of the whole surface and hasmore statistical significance.7
Conclusions
1. At 25% sol–gel content, a reaction led to thethickening of the coating with significant increase inuBaume. This is attributed to increasing polymerisationrate, causing rapid gelation in the coating.
2. A glassy surface layer was observed to graduallybuild upon the cores with increasing sol–gel content.
3. The core permeability was reduced by the coatingsand decreasing with increasing sol–gel content.
4. The sol–gel component additive to WCC coatingapplied on cold box cores showed no significant difference,as the surface quality of the castings is comparable.
5. A significant enhancement effect was observed onthe surface of castings with the sol–gel componentadditive to WCC coating applied on furan cores.
6. The optimum coating performance can beobtained from 25%SG, 15 s DIN cup viscosity and 3–5 s dc for this case, and the expected mean surfaceroughness is 2?42 mm.
7. All the parameters (sol–gel component, viscosityand dipping time) contributed in the reduction of thesurface roughness of the castings.
8. There is a positive potential in adding sol–gelcomponent to foundry coatings; however, it requiresoptimum viscosity consideration as it changes therheology of the coatings.
9. Finally, 2D surface texture characterisation maynot be enough to describe the surface quality of castcomponents. A 3D areal surface texture measurement issuggested.
Acknowledgements
The authors wish to thank the Danish Agency forScience, Technology and Innovation for financing thework. They are also grateful to the two institutions andnine industrial partners to this project for their supportand expertise.
References1. in ‘Metals handbook’, 9th edn, Vol. 15, ‘Casting’; 1998, Materials
Park, OH, ASM International.
2. T. A. Burns (ed.): ‘The Foseco foundryman’s handbook’, 9th edn;
1989, Oxford, Pergamon Press.
3. AFS: ‘Analysis of casting defects’; 2007, Schaumburg, IL,
American Foundry Society.
4. J. Campbell: ‘Castings’; 1995, Oxford, Butterworth-Heinemann.
5. U. C. Nwaogu, T. Poulsen, R. K. Stage, C. Bischoff and N. S.
Tiedje: ‘New sol–gel refractory coatings on chemically-bonded
sand cores for foundry applications to improve casting surface
quality’, Surf. Coat. Technol., 2011, 205, 4035–4044.
6. D. Stefanescu, S. Wills, J. Massone and F. Duncan: ‘Quantification
of casting skin in ductile and compacted graphite irons and its
effect on tensile properties’, Int. J. Metalcast., 2008, 7–26.
7. R. K. Leach: ‘Fundamental principles of engineering nanometrol-
ogy’; 2010, London, Elsevier.
8. I. Asilturk and M. Cunkas: ‘Modelling and prediction of surface
roughness in turning operations using artificial neural network and
multiple regression method’, Expert Syst. Appl., 2011, 38, 5826–
5832.
9. A. Larena, F. Millan, M. Verdu and G. Pinto: ‘Surface roughness
characterisation of multilayer polymer films for graphitic arts
applications’, Appl. Surf. Sci., 2001, 174, 217–224.
10. ‘BYK additives and instruments’. http://www.byk.com/physical-
properties/viscosity-cups.html
11. D. C. Montgomery: ‘Design and analysis of experiments’, 3rd edn;
1991, New York, John Wiley & Sons.
12. O. Davas and R. Kayikci: ‘Application of Taguchi’s methods to
investigate some factors affecting microporosity formation in A360
aluminium alloy casting’, Mater. Des., 2007, 28, 2224–2228.
13. S. Kumar, P. Kumar and H. S. Shan: ‘Parametric optimization of
surface roughness of castings produced by evaporative pattern
casting process’, Mater. Lett., 2006, 60, 3048–3053.
14. P. Vijian and V. P. Arunacalam: ‘Optimization of squeeze cast
parameters of LM6 aluminium alloy for surface roughness using
Taguchi method’, J. Mater. Process. Technol., 2006, 180, 161–166.
15. M. Alauddin, M. A. El Baradie and M. S. J. Hashmi: ‘Computer
aided analysis of a surface roughness model for end milling’,
J. Mater. Process. Technol., 1995, 55, 123–127.
16. Cast TIP: ‘Controlling refractory coatings’, ‘Modern casting’, 2010.
http://www.docstoc.com/docs/56025950/Controlling-refractory-coatings
(CAST-TIP-Technical-Information-and-Practice).
17. L. Winardi and R. D. Griffin: ‘Effects of coating drying methods
on LOI, gas evolution and core permeability’, AFS Transactions
paper, AFS, Schaumburg, IL, USA, Vol. 08-047, 2008.
18. U. C. Nwaogu, T. Poulsen, C. Bischoff and N. S. Tiedje: ‘Influence
of new sol–gel refractory coating on the casting properties of cold
box and Furan cores for grey cast iron’, Proc. 69th World Foundry
Cong., Hangzhou, China, 648–653, October 2010, World
Foundrymen Organization.
19. S. N. Ramrattan and M. K. Joyce: ‘Final report – refractory
coating control’. http://amc.aticorp.org/reports/wmu2009.pdf
20. Y. Wang, F. S. Cannon, M. Salama, J. Goudzwaard and A. J.
Furness: ‘Characterization of hydrocarbon emissions from green
sand foundry core binders by analytical pyrolysis’, Environ. Sci.
Technol., 2007, 41, 7922–7927.
21. B. E. Brooks and C. Beckermann: ‘Prediction of burn-on and mold
penetration in steel casting using simulation’, Proc. 60th SFSA
Technical and Operating Conf., Chicago, IL, USA, December
2006, Steel Founders’ Society of America, Paper 5?3.
22. T. Fusayama and M. Yamane: ‘Surface roughness of castings made
by various casting techniques’, J. Prosthet. Dent., 1973, 29, (5),
529–535.
23. W. B. Parkes: ‘Clay-bonded foundry sand’; 1971, London, Applied
Science Publishers.
24. S. Kim, B. Yim, and Y. Park: ‘Application of Taguchi experimental
design for the optimization of effective parameters on the rapeseed
methyl ester production’, Environ. Eng. Res., 2010, 15, (3), 129–134.
25. K. Kandananond: ‘Characterization of FDB sleeves surface
roughness using the Taguchi approach’, Eur. J. Sci. Res., 2009,
33, (2), 330–337.
26. N. M. Mehat and S. Kamaruddin: ‘Optimization of mechanical
properties of recycled plastic products via optimal processing
parameters using Taguchi method’, J. Mater. Process. Technol.,
2011, 211, 1989–1994.
27. M. Altan: ‘Reducing shrinkage in injection moldings via Taguchi,
ANOVA and neural network methods’, Mater. Des., 2010, 31, 599–
604.
28. D. J. Whitehouse: ‘Handbook of surface metrology’; 1994,
London, IOP Publishing.
Nwaogu et al. Using sol–gel component as additive to foundry coatings
International Journal of Cast Metals Research 2012 VOL 25 NO 3 187
SUPPLEMENT 4
U. C. Nwaogu, K. S. Hansen, N.S. Tiedje,
“Design and production of a novel sand materials strength testing machine for foundry applications”.
Published in International Foundry Research 64 (2012) No. 2

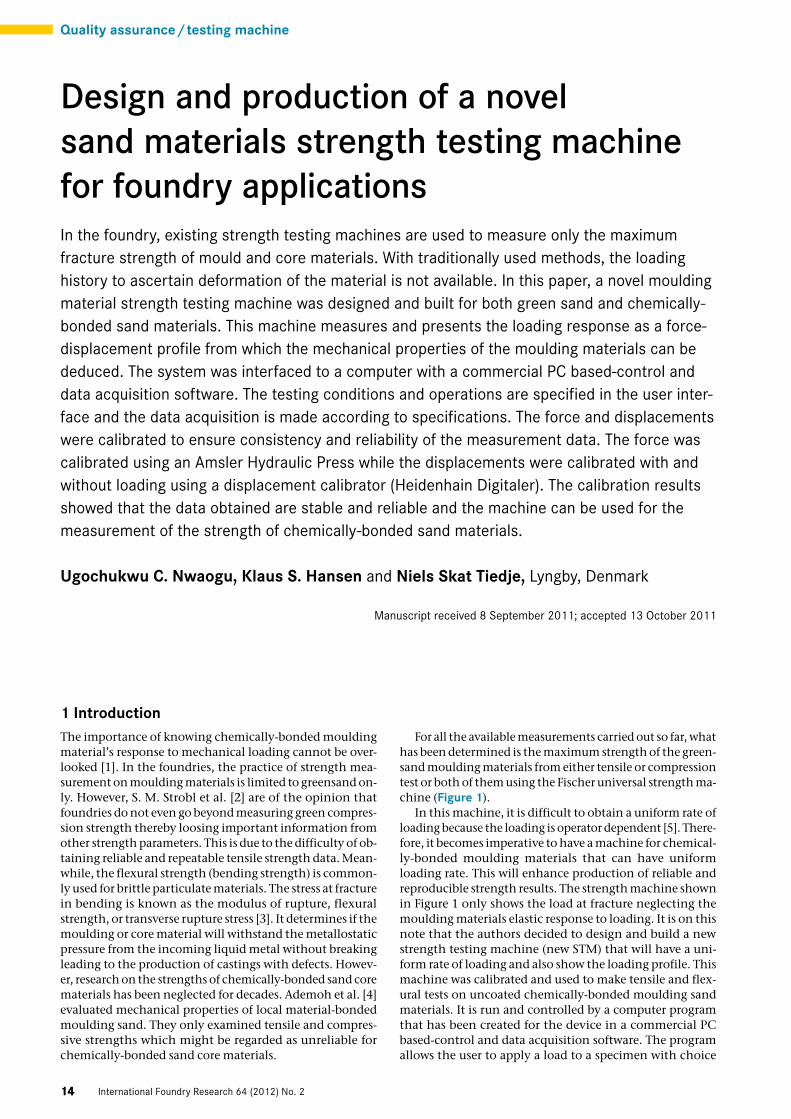
14
Quality assurance/testing machine
International Foundry Research 64 (2012) No. 214
For all the available measurements carried out so far, what has been determined is the maximum strength of the green-sand moulding materials from either tensile or compression test or both of them using the Fischer universal strength ma-chine (Figure 1).
In this machine, it is difficult to obtain a uniform rate of loading because the loading is operator dependent [5]. There-fore, it becomes imperative to have a machine for chemical-ly-bonded moulding materials that can have uniform loading rate. This will enhance production of reliable and reproducible strength results. The strength machine shown in Figure 1 only shows the load at fracture neglecting the moulding materials elastic response to loading. It is on this note that the authors decided to design and build a new strength testing machine (new STM) that will have a uni-form rate of loading and also show the loading profile. This machine was calibrated and used to make tensile and flex-ural tests on uncoated chemically-bonded moulding sand materials. It is run and controlled by a computer program that has been created for the device in a commercial PC based-control and data acquisition software. The program allows the user to apply a load to a specimen with choice
1 Introduction The importance of knowing chemically-bonded moulding material’s response to mechanical loading cannot be over-looked [1]. In the foundries, the practice of strength mea-surement on moulding materials is limited to greensand on-ly. However, S. M. Strobl et al. [2] are of the opinion that foundries do not even go beyond measuring green compres-sion strength thereby loosing important information from other strength parameters. This is due to the difficulty of ob-taining reliable and repeatable tensile strength data. Mean-while, the flexural strength (bending strength) is common-ly used for brittle particulate materials. The stress at fracture in bending is known as the modulus of rupture, flexural strength, or transverse rupture stress [3]. It determines if the moulding or core material will withstand the metallostatic pressure from the incoming liquid metal without breaking leading to the production of castings with defects. Howev-er, research on the strengths of chemically-bonded sand core materials has been neglected for decades. Ademoh et al. [4] evaluated mechanical properties of local material-bonded moulding sand. They only examined tensile and compres-sive strengths which might be regarded as unreliable for chemically-bonded sand core materials.
Design and production of a novel sand materials strength testing machine for foundry applicationsIn the foundry, existing strength testing machines are used to measure only the maximum fracture strength of mould and core materials. With traditionally used methods, the loading history to ascertain deformation of the material is not available. In this paper, a novel moulding material strength testing machine was designed and built for both green sand and chemically-bonded sand materials. This machine measures and presents the loading response as a force-displacement profile from which the mechanical properties of the moulding materials can be deduced. The system was interfaced to a computer with a commercial PC based-control and data acquisition software. The testing conditions and operations are specified in the user inter-face and the data acquisition is made according to specifications. The force and displacements were calibrated to ensure consistency and reliability of the measurement data. The force was calibrated using an Amsler Hydraulic Press while the displacements were calibrated with and without loading using a displacement calibrator (Heidenhain Digitaler). The calibration results showed that the data obtained are stable and reliable and the machine can be used for the measurement of the strength of chemically-bonded sand materials.
Ugochukwu C. Nwaogu, Klaus S. Hansen and Niels Skat Tiedje, Lyngby, Denmark
Manuscript received 8 September 2011; accepted 13 October 2011
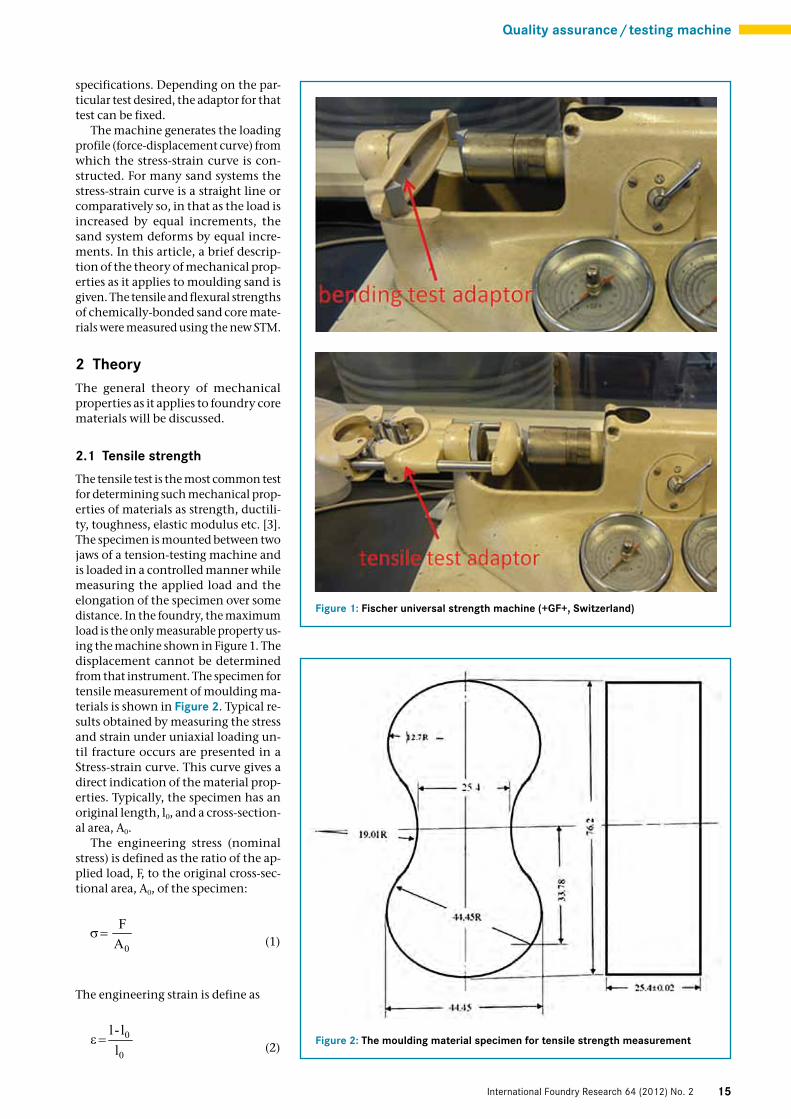
15
Quality assurance/testing machine
International Foundry Research 64 (2012) No. 2
specifications. Depending on the par-ticular test desired, the adaptor for that test can be fixed.
The machine generates the loading profile (force-displacement curve) from which the stress-strain curve is con-structed. For many sand systems the stress-strain curve is a straight line or comparatively so, in that as the load is increased by equal increments, the sand system deforms by equal incre-ments. In this article, a brief descrip-tion of the theory of mechanical prop-erties as it applies to moulding sand is given. The tensile and flexural strengths of chemically-bonded sand core mate-rials were measured using the new STM.
2 TheoryThe general theory of mechanical properties as it applies to foundry core materials will be discussed.
2.1 Tensile strength
The tensile test is the most common test for determining such mechanical prop-erties of materials as strength, ductili-ty, toughness, elastic modulus etc. [3]. The specimen is mounted between two jaws of a tension-testing machine and is loaded in a controlled manner while measuring the applied load and the elongation of the specimen over some distance. In the foundry, the maximum load is the only measurable property us-ing the machine shown in Figure 1. The displacement cannot be determined from that instrument. The specimen for tensile measurement of moulding ma-terials is shown in Figure 2. Typical re-sults obtained by measuring the stress and strain under uniaxial loading un-til fracture occurs are presented in a Stress-strain curve. This curve gives a direct indication of the material prop-erties. Typically, the specimen has an original length, l0, and a cross-section-al area, A0.
The engineering stress (nominal stress) is defined as the ratio of the ap-plied load, F, to the original cross-sec-tional area, A0, of the specimen:
(1)
The engineering strain is define as
(2)
Figure 1: Fischer universal strength machine (+GF+, Switzerland)
Figure 2: The moulding material specimen for tensile strength measurement
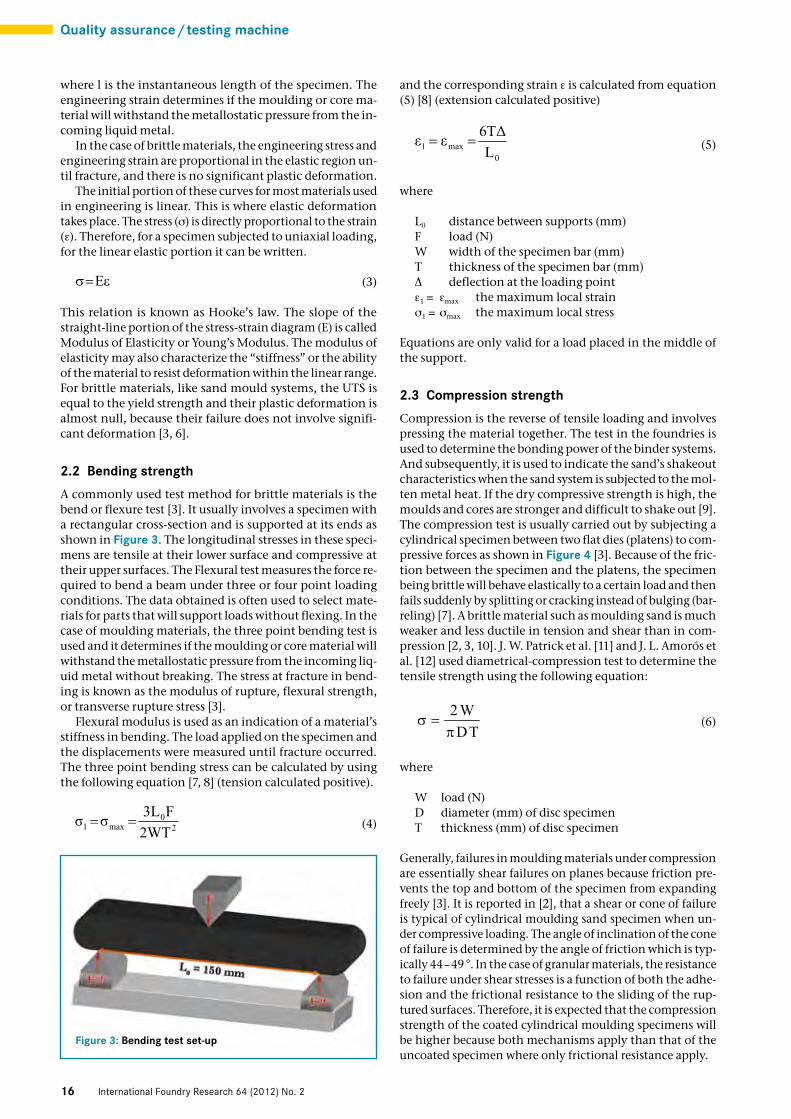
16
Quality assurance/testing machine
International Foundry Research 64 (2012) No. 2
and the corresponding strain ε is calculated from equation (5) [8] (extension calculated positive)
(5)
where
L0 distance between supports (mm) F load (N) W width of the specimen bar (mm) T thickness of the specimen bar (mm)Δ deflection at the loading pointε1 = εmax the maximum local strainσ1 = σmax the maximum local stress
Equations are only valid for a load placed in the middle of the support.
2.3 Compression strength
Compression is the reverse of tensile loading and involves pressing the material together. The test in the foundries is used to determine the bonding power of the binder systems. And subsequently, it is used to indicate the sand’s shakeout characteristics when the sand system is subjected to the mol-ten metal heat. If the dry compressive strength is high, the moulds and cores are stronger and difficult to shake out [9]. The compression test is usually carried out by subjecting a cylindrical specimen between two flat dies (platens) to com-pressive forces as shown in Figure 4 [3]. Because of the fric-tion between the specimen and the platens, the specimen being brittle will behave elastically to a certain load and then fails suddenly by splitting or cracking instead of bulging (bar-reling) [7]. A brittle material such as moulding sand is much weaker and less ductile in tension and shear than in com-pression [2, 3, 10]. J. W. Patrick et al. [11] and J. L. Amorós et al. [12] used diametrical-compression test to determine the tensile strength using the following equation:
(6)
where
W load (N)D diameter (mm) of disc specimenT thickness (mm) of disc specimen
Generally, failures in moulding materials under compression are essentially shear failures on planes because friction pre-vents the top and bottom of the specimen from expanding freely [3]. It is reported in [2], that a shear or cone of failure is typical of cylindrical moulding sand specimen when un-der compressive loading. The angle of inclination of the cone of failure is determined by the angle of friction which is typ-ically 44–49 °. In the case of granular materials, the resistance to failure under shear stresses is a function of both the adhe-sion and the frictional resistance to the sliding of the rup-tured surfaces. Therefore, it is expected that the compression strength of the coated cylindrical moulding specimens will be higher because both mechanisms apply than that of the uncoated specimen where only frictional resistance apply.
where l is the instantaneous length of the specimen. The engineering strain determines if the moulding or core ma-terial will withstand the metallostatic pressure from the in-coming liquid metal.
In the case of brittle materials, the engineering stress and engineering strain are proportional in the elastic region un-til fracture, and there is no significant plastic deformation.
The initial portion of these curves for most materials used in engineering is linear. This is where elastic deformation takes place. The stress (σ) is directly proportional to the strain (ε). Therefore, for a specimen subjected to uniaxial loading, for the linear elastic portion it can be written.
(3)
This relation is known as Hooke’s law. The slope of the straight-line portion of the stress-strain diagram (E) is called Modulus of Elasticity or Young’s Modulus. The modulus of elasticity may also characterize the “stiffness” or the ability of the material to resist deformation within the linear range. For brittle materials, like sand mould systems, the UTS is equal to the yield strength and their plastic deformation is almost null, because their failure does not involve signifi-cant deformation [3, 6].
2.2 Bending strength
A commonly used test method for brittle materials is the bend or flexure test [3]. It usually involves a specimen with a rectangular cross-section and is supported at its ends as shown in Figure 3. The longitudinal stresses in these speci-mens are tensile at their lower surface and compressive at their upper surfaces. The Flexural test measures the force re-quired to bend a beam under three or four point loading conditions. The data obtained is often used to select mate-rials for parts that will support loads without flexing. In the case of moulding materials, the three point bending test is used and it determines if the moulding or core material will withstand the metallostatic pressure from the incoming liq-uid metal without breaking. The stress at fracture in bend-ing is known as the modulus of rupture, flexural strength, or transverse rupture stress [3].
Flexural modulus is used as an indication of a material’s stiffness in bending. The load applied on the specimen and the displacements were measured until fracture occurred. The three point bending stress can be calculated by using the following equation [7, 8] (tension calculated positive).
(4)
Figure 3: Bending test set-up
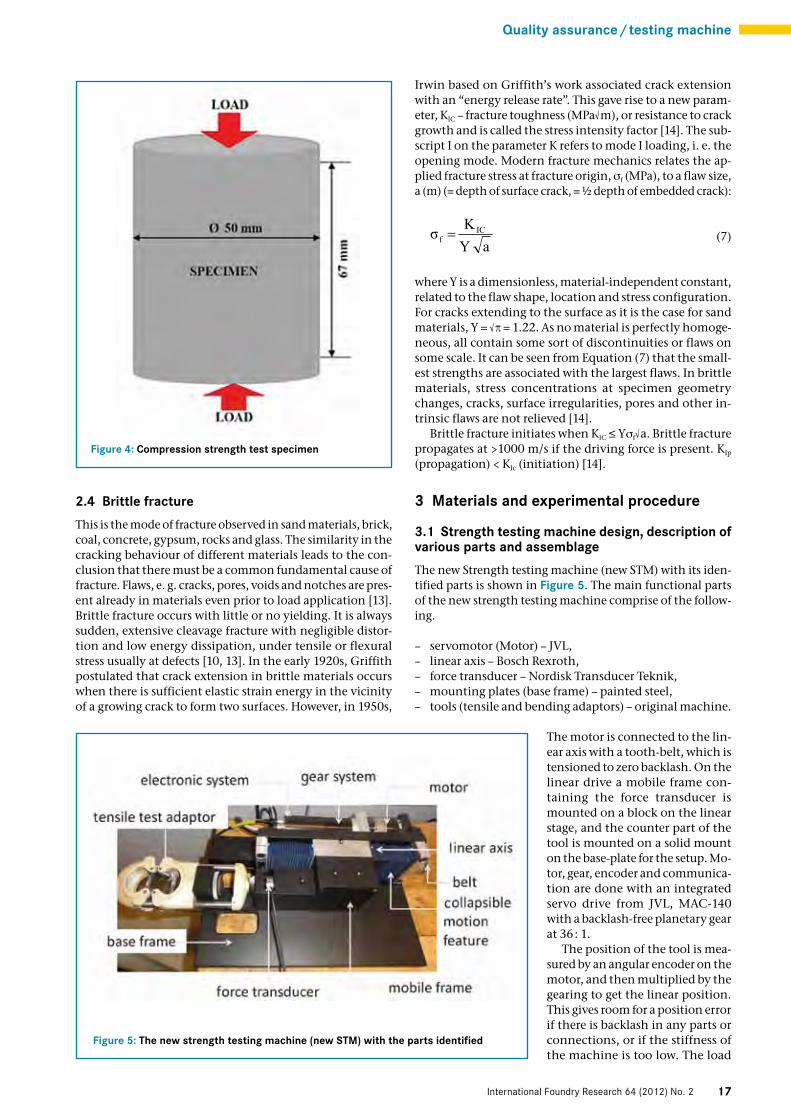
17
Quality assurance/testing machine
International Foundry Research 64 (2012) No. 2
Irwin based on Griffith’s work associated crack extension with an “energy release rate”. This gave rise to a new param-eter, KIC – fracture toughness (MPa√m), or resistance to crack growth and is called the stress intensity factor [14]. The sub-script I on the parameter K refers to mode I loading, i. e. the opening mode. Modern fracture mechanics relates the ap-plied fracture stress at fracture origin, σf (MPa), to a flaw size, a (m) (= depth of surface crack, = ½ depth of embedded crack):
(7)
where Y is a dimensionless, material-independent constant, related to the flaw shape, location and stress configuration. For cracks extending to the surface as it is the case for sand materials, Y = √π = 1.22. As no material is perfectly homoge-neous, all contain some sort of discontinuities or flaws on some scale. It can be seen from Equation (7) that the small-est strengths are associated with the largest flaws. In brittle materials, stress concentrations at specimen geometry changes, cracks, surface irregularities, pores and other in-trinsic flaws are not relieved [14].
Brittle fracture initiates when KIC ≤ Yσf√a. Brittle fracture propagates at >1000 m/s if the driving force is present. KIp (propagation) < KIc (initiation) [14].
3 Materials and experimental procedure
3.1 Strength testing machine design, description of various parts and assemblage
The new Strength testing machine (new STM) with its iden-tified parts is shown in Figure 5. The main functional parts of the new strength testing machine comprise of the follow-ing.
– servomotor (Motor) – JVL,– linear axis – Bosch Rexroth,– force transducer – Nordisk Transducer Teknik,– mounting plates (base frame) – painted steel,– tools (tensile and bending adaptors) – original machine.
The motor is connected to the lin-ear axis with a tooth-belt, which is tensioned to zero backlash. On the linear drive a mobile frame con-taining the force transducer is mounted on a block on the linear stage, and the counter part of the tool is mounted on a solid mount on the base-plate for the setup. Mo-tor, gear, encoder and communica-tion are done with an integrated servo drive from JVL, MAC-140 with a backlash-free planetary gear at 36 : 1.
The position of the tool is mea-sured by an angular encoder on the motor, and then multiplied by the gearing to get the linear position. This gives room for a position error if there is backlash in any parts or connections, or if the stiffness of the machine is too low. The load
2.4 Brittle fracture
This is the mode of fracture observed in sand materials, brick, coal, concrete, gypsum, rocks and glass. The similarity in the cracking behaviour of different materials leads to the con-clusion that there must be a common fundamental cause of fracture. Flaws, e. g. cracks, pores, voids and notches are pres-ent already in materials even prior to load application [13]. Brittle fracture occurs with little or no yielding. It is always sudden, extensive cleavage fracture with negligible distor-tion and low energy dissipation, under tensile or flexural stress usually at defects [10, 13]. In the early 1920s, Griffith postulated that crack extension in brittle materials occurs when there is sufficient elastic strain energy in the vicinity of a growing crack to form two surfaces. However, in 1950s,
Figure 4: Compression strength test specimen
Figure 5: The new strength testing machine (new STM) with the parts identified
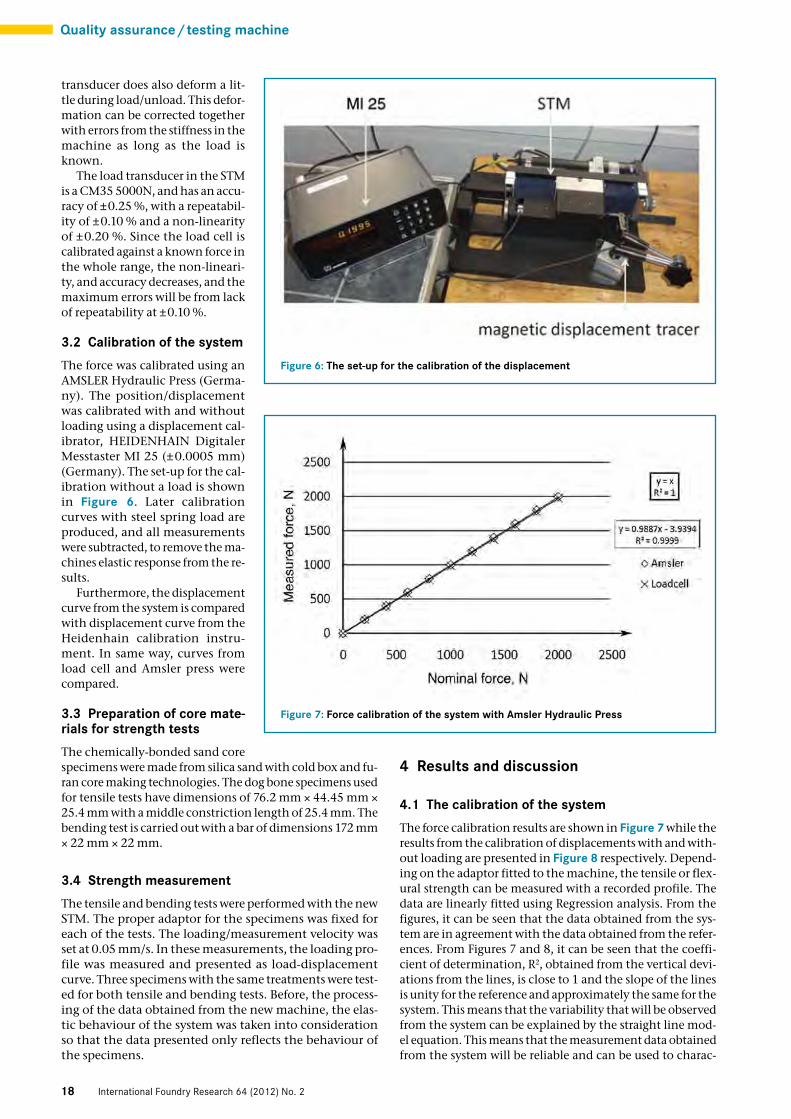
18
Quality assurance/testing machine
International Foundry Research 64 (2012) No. 2
transducer does also deform a lit-tle during load/unload. This defor-mation can be corrected together with errors from the stiffness in the machine as long as the load is known.
The load transducer in the STM is a CM35 5000N, and has an accu-racy of ±0.25 %, with a repeatabil-ity of ±0.10 % and a non-linearity of ±0.20 %. Since the load cell is calibrated against a known force in the whole range, the non-lineari-ty, and accuracy decreases, and the maximum errors will be from lack of repeatability at ±0.10 %.
3.2 Calibration of the system
The force was calibrated using an AMSLER Hydraulic Press (Germa-ny). The position/displacement was calibrated with and without loading using a displacement cal-ibrator, HEIDENHAIN Digitaler Messtaster MI 25 (±0.0005 mm) (Germany). The set-up for the cal-ibration without a load is shown in Figure 6. Later calibration curves with steel spring load are produced, and all measurements were subtracted, to remove the ma-chines elastic response from the re-sults.
Furthermore, the displacement curve from the system is compared with displacement curve from the Heidenhain calibration instru-ment. In same way, curves from load cell and Amsler press were compared.
3.3 Preparation of core mate-rials for strength tests
The chemically-bonded sand core specimens were made from silica sand with cold box and fu-ran core making technologies. The dog bone specimens used for tensile tests have dimensions of 76.2 mm × 44.45 mm × 25.4 mm with a middle constriction length of 25.4 mm. The bending test is carried out with a bar of dimensions 172 mm × 22 mm × 22 mm.
3.4 Strength measurement
The tensile and bending tests were performed with the new STM. The proper adaptor for the specimens was fixed for each of the tests. The loading/measurement velocity was set at 0.05 mm/s. In these measurements, the loading pro-file was measured and presented as load-displacement curve. Three specimens with the same treatments were test-ed for both tensile and bending tests. Before, the process-ing of the data obtained from the new machine, the elas-tic behaviour of the system was taken into consideration so that the data presented only reflects the behaviour of the specimens.
4 Results and discussion
4.1 The calibration of the system
The force calibration results are shown in Figure 7 while the results from the calibration of displacements with and with-out loading are presented in Figure 8 respectively. Depend-ing on the adaptor fitted to the machine, the tensile or flex-ural strength can be measured with a recorded profile. The data are linearly fitted using Regression analysis. From the figures, it can be seen that the data obtained from the sys-tem are in agreement with the data obtained from the refer-ences. From Figures 7 and 8, it can be seen that the coeffi-cient of determination, R2, obtained from the vertical devi-ations from the lines, is close to 1 and the slope of the lines is unity for the reference and approximately the same for the system. This means that the variability that will be observed from the system can be explained by the straight line mod-el equation. This means that the measurement data obtained from the system will be reliable and can be used to charac-
Figure 6: The set-up for the calibration of the displacement
Figure 7: Force calibration of the system with Amsler Hydraulic Press
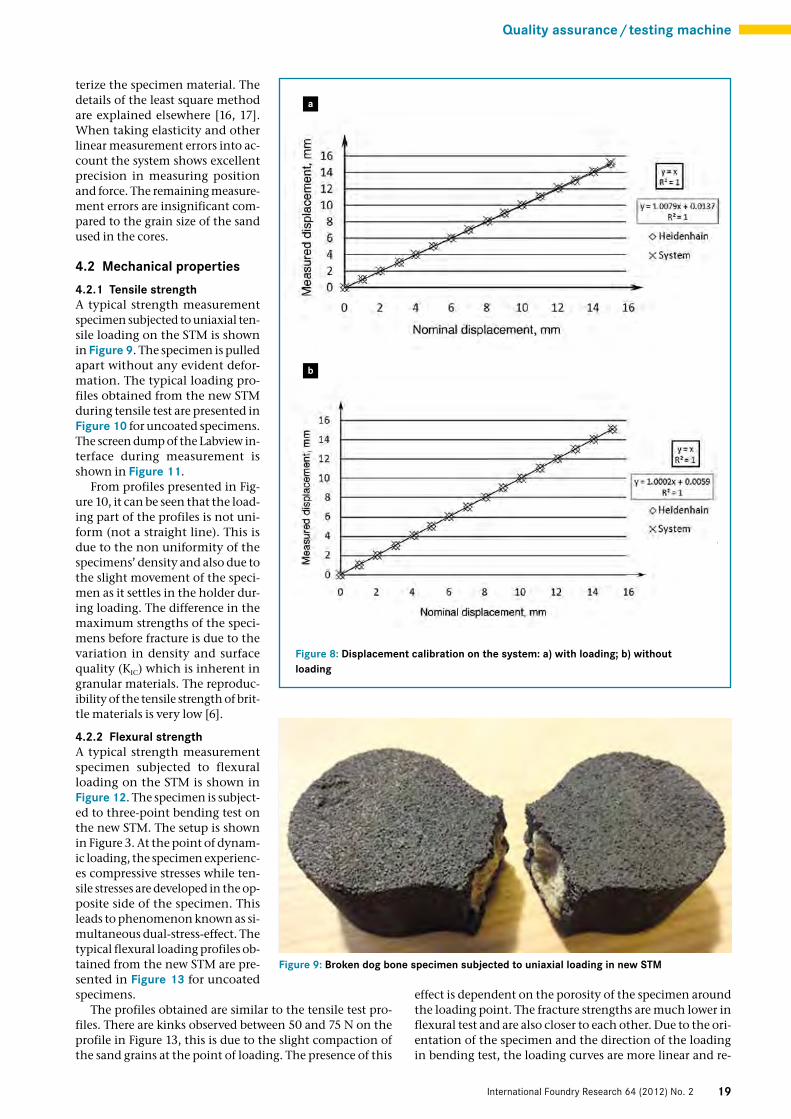
19
Quality assurance/testing machine
International Foundry Research 64 (2012) No. 2
terize the specimen material. The details of the least square method are explained elsewhere [16, 17]. When taking elasticity and other linear measurement errors into ac-count the system shows excellent precision in measuring position and force. The remaining measure-ment errors are insignificant com-pared to the grain size of the sand used in the cores.
4.2 Mechanical properties
4.2.1 Tensile strengthA typical strength measurement specimen subjected to uniaxial ten-sile loading on the STM is shown in Figure 9. The specimen is pulled apart without any evident defor-mation. The typical loading pro-files obtained from the new STM during tensile test are presented in Figure 10 for uncoated specimens. The screen dump of the Labview in-terface during measurement is shown in Figure 11.
From profiles presented in Fig-ure 10, it can be seen that the load-ing part of the profiles is not uni-form (not a straight line). This is due to the non uniformity of the specimens’ density and also due to the slight movement of the speci-men as it settles in the holder dur-ing loading. The difference in the maximum strengths of the speci-mens before fracture is due to the variation in density and surface quality (KIC) which is inherent in granular materials. The reproduc-ibility of the tensile strength of brit-tle materials is very low [6].
4.2.2 Flexural strengthA typical strength measurement specimen subjected to flexural loading on the STM is shown in Figure 12. The specimen is subject-ed to three-point bending test on the new STM. The setup is shown in Figure 3. At the point of dynam-ic loading, the specimen experienc-es compressive stresses while ten-sile stresses are developed in the op-posite side of the specimen. This leads to phenomenon known as si-multaneous dual-stress-effect. The typical flexural loading profiles ob-tained from the new STM are pre-sented in Figure 13 for uncoated specimens.
The profiles obtained are similar to the tensile test pro-files. There are kinks observed between 50 and 75 N on the profile in Figure 13, this is due to the slight compaction of the sand grains at the point of loading. The presence of this
effect is dependent on the porosity of the specimen around the loading point. The fracture strengths are much lower in flexural test and are also closer to each other. Due to the ori-entation of the specimen and the direction of the loading in bending test, the loading curves are more linear and re-
Figure 8: Displacement calibration on the system: a) with loading; b) without loading
a
b
Figure 9: Broken dog bone specimen subjected to uniaxial loading in new STM
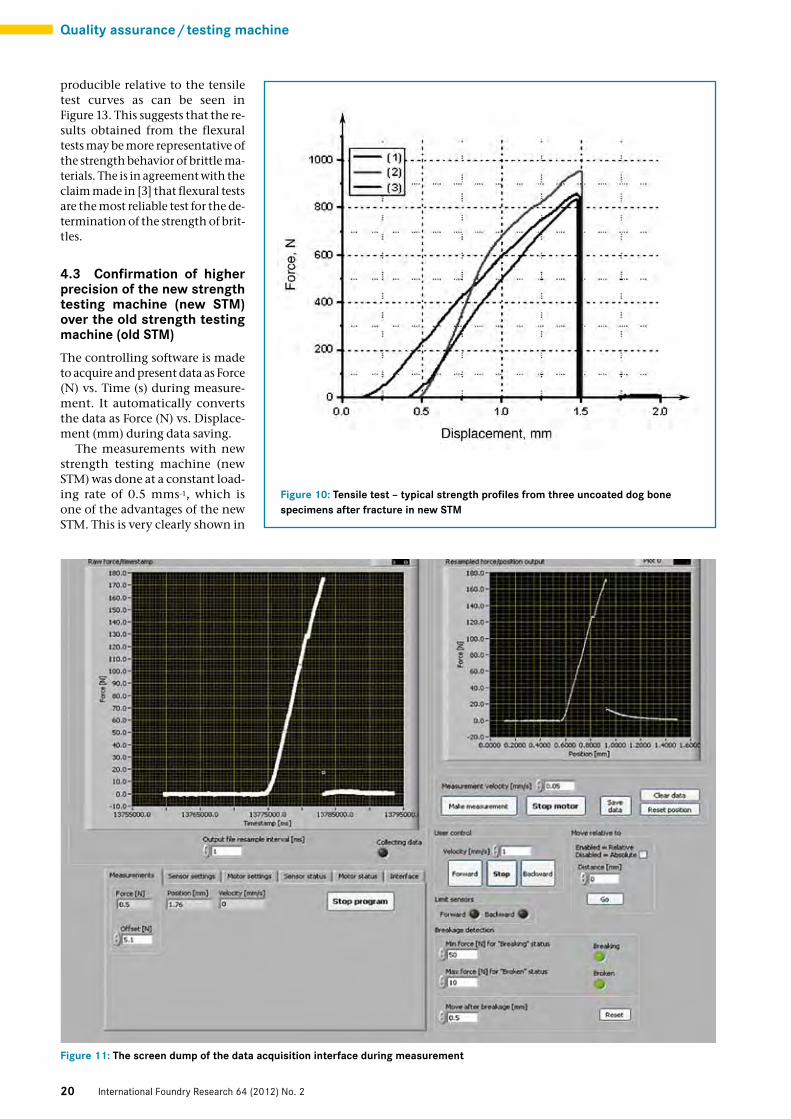
20
Quality assurance/testing machine
International Foundry Research 64 (2012) No. 2
producible relative to the tensile test curves as can be seen in Figure 13. This suggests that the re-sults obtained from the flexural tests may be more representative of the strength behavior of brittle ma-terials. The is in agreement with the claim made in [3] that flexural tests are the most reliable test for the de-termination of the strength of brit-tles.
4.3 Confirmation of higher precision of the new strength testing machine (new STM) over the old strength testing machine (old STM)
The controlling software is made to acquire and present data as Force (N) vs. Time (s) during measure-ment. It automatically converts the data as Force (N) vs. Displace-ment (mm) during data saving.
The measurements with new strength testing machine (new STM) was done at a constant load-ing rate of 0.5 mms-1, which is one of the advantages of the new STM. This is very clearly shown in
Figure 10: Tensile test – typical strength profiles from three uncoated dog bone specimens after fracture in new STM
Figure 11: The screen dump of the data acquisition interface during measurement
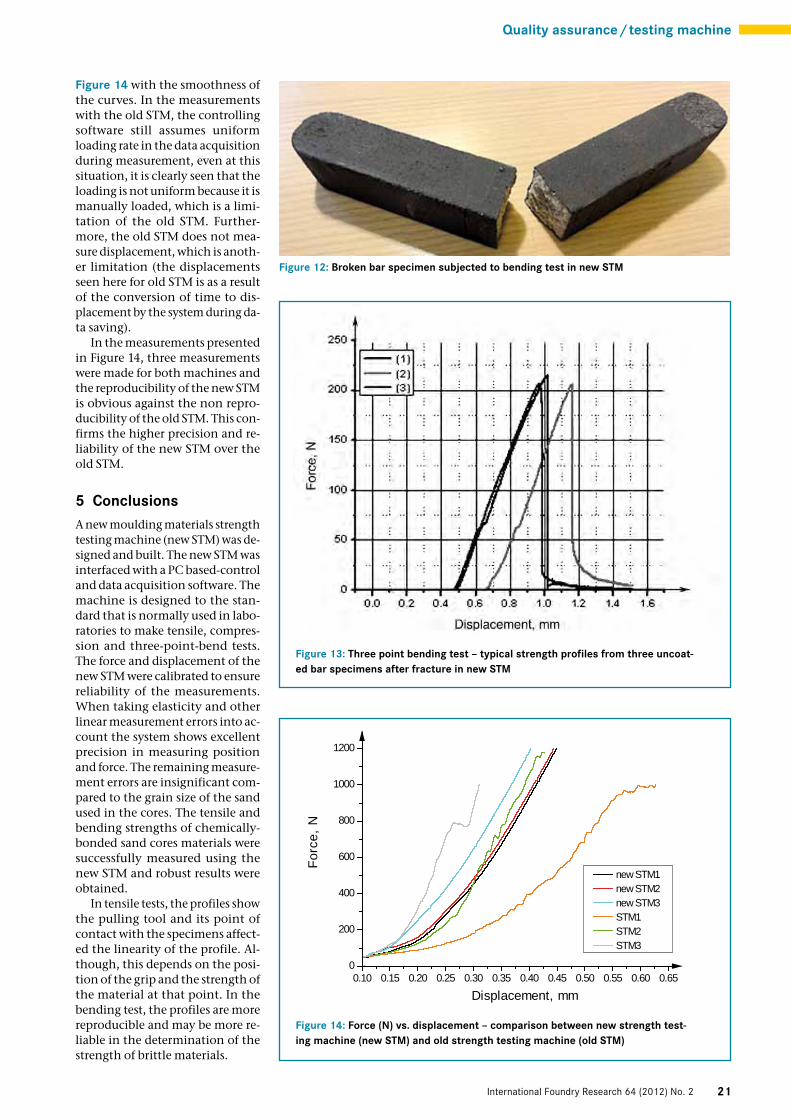
21
Quality assurance/testing machine
International Foundry Research 64 (2012) No. 2
Figure 14 with the smoothness of the curves. In the measurements with the old STM, the controlling software still assumes uniform loading rate in the data acquisition during measurement, even at this situation, it is clearly seen that the loading is not uniform because it is manually loaded, which is a limi-tation of the old STM. Further-more, the old STM does not mea-sure displacement, which is anoth-er limitation (the displacements seen here for old STM is as a result of the conversion of time to dis-placement by the system during da-ta saving).
In the measurements presented in Figure 14, three measurements were made for both machines and the reproducibility of the new STM is obvious against the non repro-ducibility of the old STM. This con-firms the higher precision and re-liability of the new STM over the old STM.
5 ConclusionsA new moulding materials strength testing machine (new STM) was de-signed and built. The new STM was interfaced with a PC based-control and data acquisition software. The machine is designed to the stan-dard that is normally used in labo-ratories to make tensile, compres-sion and three-point-bend tests. The force and displacement of the new STM were calibrated to ensure reliability of the measurements. When taking elasticity and other linear measurement errors into ac-count the system shows excellent precision in measuring position and force. The remaining measure-ment errors are insignificant com-pared to the grain size of the sand used in the cores. The tensile and bending strengths of chemically-bonded sand cores materials were successfully measured using the new STM and robust results were obtained.
In tensile tests, the profiles show the pulling tool and its point of contact with the specimens affect-ed the linearity of the profile. Al-though, this depends on the posi-tion of the grip and the strength of the material at that point. In the bending test, the profiles are more reproducible and may be more re-liable in the determination of the strength of brittle materials.
Figure 13: Three point bending test – typical strength profiles from three uncoat-ed bar specimens after fracture in new STM
0.10 0.15 0.20 0.25 0.30 0.35 0.40 0.45 0.50 0.55 0.60 0.650
200
400
600
800
1000
1200
Forc
e, N
Displacement, mm
new STM1new STM2new STM3STM1STM2STM3
Figure 14: Force (N) vs. displacement – comparison between new strength test-ing machine (new STM) and old strength testing machine (old STM)
Figure 12: Broken bar specimen subjected to bending test in new STM

22
Quality assurance/testing machine
International Foundry Research 64 (2012) No. 2
The authors wish to thank the Danish Agency for Science, Tech-nology and Innovation for financing the work. The authors are al-so grateful to the nine industrial partners to this project for their support and expertise.
U. C. Nwaogu, Technical University of Denmark, Department of Mechanical Engineering, Institute of Production and Process Tech-nology, DK2800 Kgs. Lyngby, Denmark, K. S. Hansen, IPU Tech-nology Development, DK-2800 Kgs. Lyngby, Denmark, N. S. Tied-je, Technical University of Denmark, Department of Mechanical Engineering, Institute of Production and Process Technology, DK2800 Kgs. Lyngby, Denmark
Literature
[1] Dietert, H. W.; Brewster, F. S.; Graham, A. L.: Load carrying power of moulding sand, moulding methods and materials. The American Foundrymen’s Society, 1st ed., Illinois, 1962.[2] Strobl, S. M.; Schuster, F. W.: Gauging green sand flowabili-ty helps predict mould quality. Modern Casting 87 (1997) no. 2, pp. 48-51.[3] Kalpakjian, S.; Schmid, S. R.: Manufacturing engineering and technology. Pearson Prentice Hall, New Jersey, 2006.[4] Ademoh, N. A.;. Abdullahi, A. T.: Evaluation of mechanical properties of expendable sand cores bonded with the Nigerian Gum Arabic Grade 4. American-Eurasian Journal of scientific Re-search 3 (2008) no. 2, pp. 199-204.[5] Parkes, W. B.: Clay-bonded foundry sand. Applied Science Publishers, London, 1971.[6] Van Vlack, L. H.: Materials science for engineers. Addison-Wesley, California, 1970.[7] Mencik, J.: Strength and fracture of glass and ceramics. Glass Science and Technology 12 (1992), pp. 164-168.[8] Ramrattan, S. N.; Paudel, A. M.; Makino, H.; Hirata, M.: De-sirable green sand properties via aeration sand filling. AFS Trans-actions (2008), paper 08-128 (04).
[9] Fu, R.; Zhang, T.-Y.: Influences of temperature and electric field on the bending strength of lead zirconate titanate ceram-ics. Acta. Mater. 48 (2000), pp. 1729-1740.[10] Ceriolo, L.; Tommaso, A. D.: Fracture mechanics of brittle materials: A historical point of view. 2nd Int. PhD Symposium in Civil Engineering, 1998, Budapest, Hungary.[11] Patrick, J. W.; Stacey, A. E.; Wilkinson, H. C.: The strength of industrial cokes: Part 2. Tensile strength of foundry cokes. Fuel 51 (1972), pp. 174-179.[12] Amorós, J. L.; Cantavella, V.; Jarque, J. C.; Felíu, C.: Green strength testing of pressed compacts: An analysis of the differ-ent methods. Journal of the European Ceramic Society 28 (2008), pp. 701-710.[13] Wang, E. Z.; Shrive, N. G.: Brittle fracture in compression: mechanisms, models and criteria. Engineering Fracture Mechan-ics 52 (1995) no. 6, pp. 1107-1126.[14] Quinn, J. B.; Quinn, G. D.: A practical and systematic review of Weibull statistics for reporting strengths of dental materials. Dental Materials 26 (2010), pp. 135-147.[15] WTIA Technical note 10, WRC Bulletin no. 430; BS7910; AS/NZS 3788; API 579.[16] Box, G. E. P.; Hunter, W. G.; Hunter, J. S.: Statistics for ex-perimenters: An Introduction to design, data analysis, and mod-el building. John Wiley & Sons, Canada, 1978.[17] Montgomery, D. C.: Design and analysis of experiments. 3rd edition, John Wiley & Sons, Canada, 1991.
Keywords: Strength testing machine; mechanical properties; load transducer; linear displacements; calibration; cold box; furan


SUPPLEMENT 5
U. C. Nwaogu and N.S. Tiedje,
“Mechanical properties of chemically bonded sand core materials dipped in sol–gel coating impregnated
with filter dust: novel approach to improve casting quality”.
Published in International Journal of Cast Metals Research (2012)
DOI 10.1179/1743133612Y.0000000013

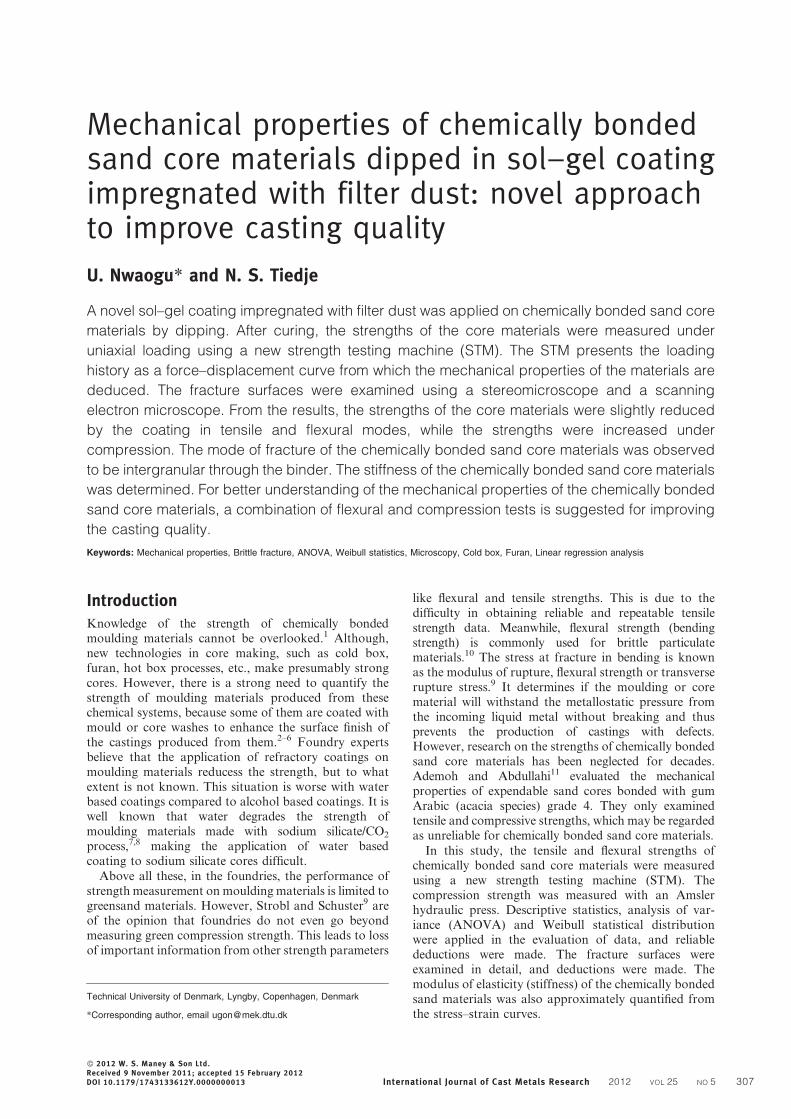
Mechanical properties of chemically bondedsand core materials dipped in sol–gel coatingimpregnated with filter dust: novel approachto improve casting quality
U. Nwaogu* and N. S. Tiedje
A novel sol–gel coating impregnated with filter dust was applied on chemically bonded sand core
materials by dipping. After curing, the strengths of the core materials were measured under
uniaxial loading using a new strength testing machine (STM). The STM presents the loading
history as a force–displacement curve from which the mechanical properties of the materials are
deduced. The fracture surfaces were examined using a stereomicroscope and a scanning
electron microscope. From the results, the strengths of the core materials were slightly reduced
by the coating in tensile and flexural modes, while the strengths were increased under
compression. The mode of fracture of the chemically bonded sand core materials was observed
to be intergranular through the binder. The stiffness of the chemically bonded sand core materials
was determined. For better understanding of the mechanical properties of the chemically bonded
sand core materials, a combination of flexural and compression tests is suggested for improving
the casting quality.
Keywords: Mechanical properties, Brittle fracture, ANOVA, Weibull statistics, Microscopy, Cold box, Furan, Linear regression analysis
IntroductionKnowledge of the strength of chemically bondedmoulding materials cannot be overlooked.1 Although,new technologies in core making, such as cold box,furan, hot box processes, etc., make presumably strongcores. However, there is a strong need to quantify thestrength of moulding materials produced from thesechemical systems, because some of them are coated withmould or core washes to enhance the surface finish ofthe castings produced from them.2–6 Foundry expertsbelieve that the application of refractory coatings onmoulding materials reducess the strength, but to whatextent is not known. This situation is worse with waterbased coatings compared to alcohol based coatings. It iswell known that water degrades the strength ofmoulding materials made with sodium silicate/CO2
process,7,8 making the application of water basedcoating to sodium silicate cores difficult.
Above all these, in the foundries, the performance ofstrength measurement on moulding materials is limited togreensand materials. However, Strobl and Schuster9 areof the opinion that foundries do not even go beyondmeasuring green compression strength. This leads to lossof important information from other strength parameters
like flexural and tensile strengths. This is due to thedifficulty in obtaining reliable and repeatable tensilestrength data. Meanwhile, flexural strength (bendingstrength) is commonly used for brittle particulatematerials.10 The stress at fracture in bending is knownas the modulus of rupture, flexural strength or transverserupture stress.9 It determines if the moulding or corematerial will withstand the metallostatic pressure fromthe incoming liquid metal without breaking and thusprevents the production of castings with defects.However, research on the strengths of chemically bondedsand core materials has been neglected for decades.Ademoh and Abdullahi11 evaluated the mechanicalproperties of expendable sand cores bonded with gumArabic (acacia species) grade 4. They only examinedtensile and compressive strengths, which may be regardedas unreliable for chemically bonded sand core materials.
In this study, the tensile and flexural strengths ofchemically bonded sand core materials were measuredusing a new strength testing machine (STM). Thecompression strength was measured with an Amslerhydraulic press. Descriptive statistics, analysis of var-iance (ANOVA) and Weibull statistical distributionwere applied in the evaluation of data, and reliabledeductions were made. The fracture surfaces wereexamined in detail, and deductions were made. Themodulus of elasticity (stiffness) of the chemically bondedsand materials was also approximately quantified fromthe stress–strain curves.
Technical University of Denmark, Lyngby, Copenhagen, Denmark
*Corresponding author, email [email protected]
2012 W. S. Maney & Son Ltd.Received 9 November 2011; accepted 15 February 2012DOI 10.1179/1743133612Y.0000000013 International Journal of Cast Metals Research 2012 VOL 25 NO 5 307
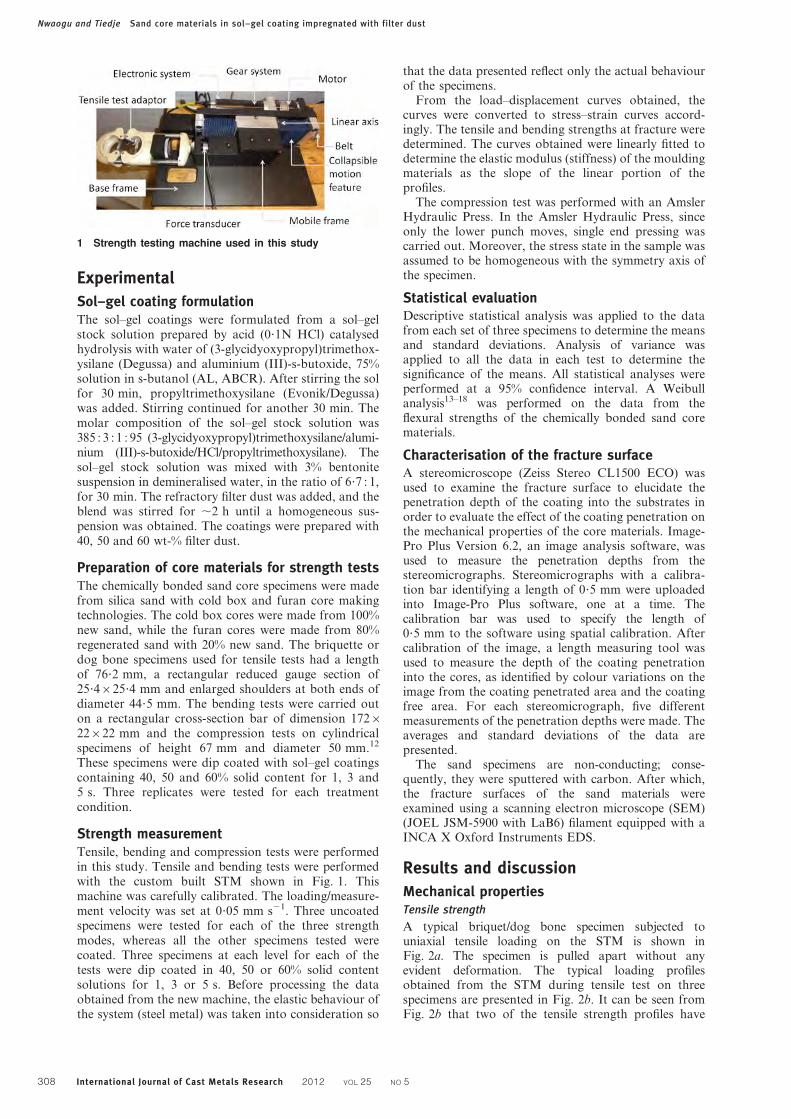
Experimental
Sol–gel coating formulationThe sol–gel coatings were formulated from a sol–gelstock solution prepared by acid (0?1N HCl) catalysedhydrolysis with water of (3-glycidyoxypropyl)trimethox-ysilane (Degussa) and aluminium (III)-s-butoxide, 75%solution in s-butanol (AL, ABCR). After stirring the solfor 30 min, propyltrimethoxysilane (Evonik/Degussa)was added. Stirring continued for another 30 min. Themolar composition of the sol–gel stock solution was385 : 3 : 1 : 95 (3-glycidyoxypropyl)trimethoxysilane/alumi-nium (III)-s-butoxide/HCl/propyltrimethoxysilane). Thesol–gel stock solution was mixed with 3% bentonitesuspension in demineralised water, in the ratio of 6?7 : 1,for 30 min. The refractory filter dust was added, and theblend was stirred for ,2 h until a homogeneous sus-pension was obtained. The coatings were prepared with40, 50 and 60 wt-% filter dust.
Preparation of core materials for strength testsThe chemically bonded sand core specimens were madefrom silica sand with cold box and furan core makingtechnologies. The cold box cores were made from 100%new sand, while the furan cores were made from 80%regenerated sand with 20% new sand. The briquette ordog bone specimens used for tensile tests had a lengthof 76?2 mm, a rectangular reduced gauge section of25?4625?4 mm and enlarged shoulders at both ends ofdiameter 44?5 mm. The bending tests were carried outon a rectangular cross-section bar of dimension 172622622 mm and the compression tests on cylindricalspecimens of height 67 mm and diameter 50 mm.12
These specimens were dip coated with sol–gel coatingscontaining 40, 50 and 60% solid content for 1, 3 and5 s. Three replicates were tested for each treatmentcondition.
Strength measurementTensile, bending and compression tests were performedin this study. Tensile and bending tests were performedwith the custom built STM shown in Fig. 1. Thismachine was carefully calibrated. The loading/measure-ment velocity was set at 0?05 mm s21. Three uncoatedspecimens were tested for each of the three strengthmodes, whereas all the other specimens tested werecoated. Three specimens at each level for each of thetests were dip coated in 40, 50 or 60% solid contentsolutions for 1, 3 or 5 s. Before processing the dataobtained from the new machine, the elastic behaviour ofthe system (steel metal) was taken into consideration so
that the data presented reflect only the actual behaviourof the specimens.
From the load–displacement curves obtained, thecurves were converted to stress–strain curves accord-ingly. The tensile and bending strengths at fracture weredetermined. The curves obtained were linearly fitted todetermine the elastic modulus (stiffness) of the mouldingmaterials as the slope of the linear portion of theprofiles.
The compression test was performed with an AmslerHydraulic Press. In the Amsler Hydraulic Press, sinceonly the lower punch moves, single end pressing wascarried out. Moreover, the stress state in the sample wasassumed to be homogeneous with the symmetry axis ofthe specimen.
Statistical evaluationDescriptive statistical analysis was applied to the datafrom each set of three specimens to determine the meansand standard deviations. Analysis of variance wasapplied to all the data in each test to determine thesignificance of the means. All statistical analyses wereperformed at a 95% confidence interval. A Weibullanalysis13–18 was performed on the data from theflexural strengths of the chemically bonded sand corematerials.
Characterisation of the fracture surfaceA stereomicroscope (Zeiss Stereo CL1500 ECO) wasused to examine the fracture surface to elucidate thepenetration depth of the coating into the substrates inorder to evaluate the effect of the coating penetration onthe mechanical properties of the core materials. Image-Pro Plus Version 6.2, an image analysis software, wasused to measure the penetration depths from thestereomicrographs. Stereomicrographs with a calibra-tion bar identifying a length of 0?5 mm were uploadedinto Image-Pro Plus software, one at a time. Thecalibration bar was used to specify the length of0?5 mm to the software using spatial calibration. Aftercalibration of the image, a length measuring tool wasused to measure the depth of the coating penetrationinto the cores, as identified by colour variations on theimage from the coating penetrated area and the coatingfree area. For each stereomicrograph, five differentmeasurements of the penetration depths were made. Theaverages and standard deviations of the data arepresented.
The sand specimens are non-conducting; conse-quently, they were sputtered with carbon. After which,the fracture surfaces of the sand materials wereexamined using a scanning electron microscope (SEM)(JOEL JSM-5900 with LaB6) filament equipped with aINCA X Oxford Instruments EDS.
Results and discussion
Mechanical propertiesTensile strength
A typical briquet/dog bone specimen subjected touniaxial tensile loading on the STM is shown inFig. 2a. The specimen is pulled apart without anyevident deformation. The typical loading profilesobtained from the STM during tensile test on threespecimens are presented in Fig. 2b. It can be seen fromFig. 2b that two of the tensile strength profiles have
1 Strength testing machine used in this study
Nwaogu and Tiedje Sand core materials in sol–gel coating impregnated with filter dust
308 International Journal of Cast Metals Research 2012 VOL 25 NO 5
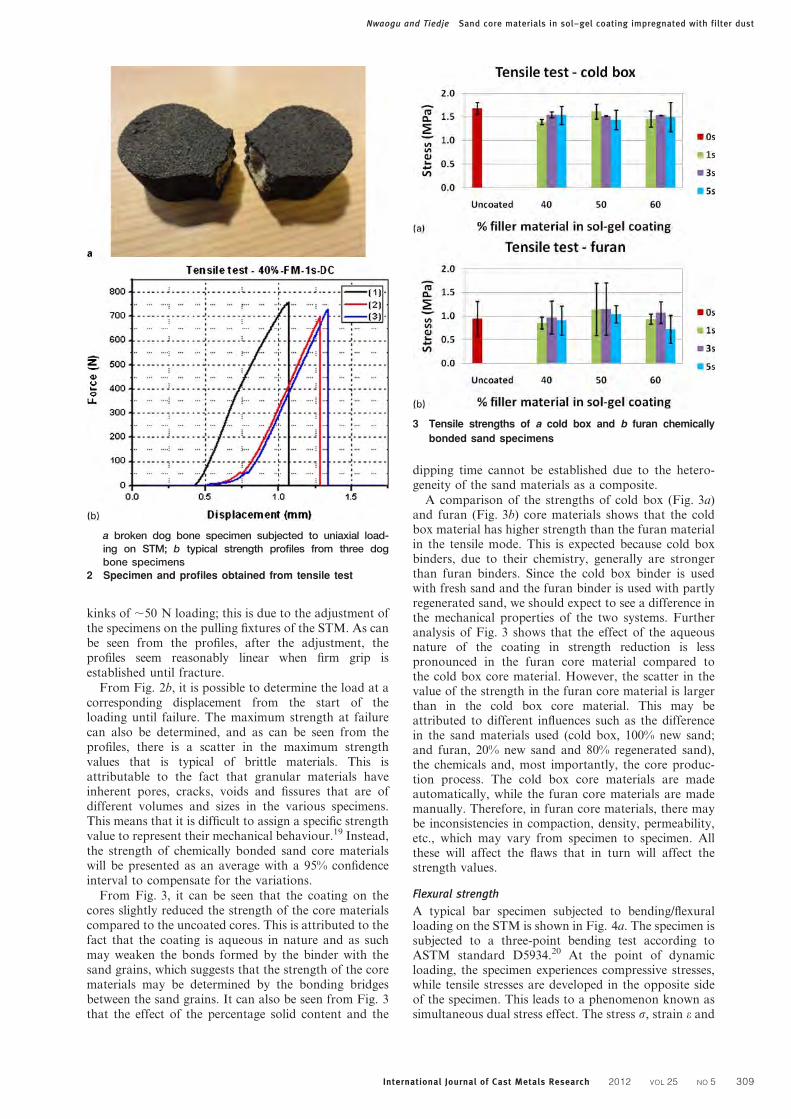
kinks of ,50 N loading; this is due to the adjustment ofthe specimens on the pulling fixtures of the STM. As canbe seen from the profiles, after the adjustment, theprofiles seem reasonably linear when firm grip isestablished until fracture.
From Fig. 2b, it is possible to determine the load at acorresponding displacement from the start of theloading until failure. The maximum strength at failurecan also be determined, and as can be seen from theprofiles, there is a scatter in the maximum strengthvalues that is typical of brittle materials. This isattributable to the fact that granular materials haveinherent pores, cracks, voids and fissures that are ofdifferent volumes and sizes in the various specimens.This means that it is difficult to assign a specific strengthvalue to represent their mechanical behaviour.19 Instead,the strength of chemically bonded sand core materialswill be presented as an average with a 95% confidenceinterval to compensate for the variations.
From Fig. 3, it can be seen that the coating on thecores slightly reduced the strength of the core materialscompared to the uncoated cores. This is attributed to thefact that the coating is aqueous in nature and as suchmay weaken the bonds formed by the binder with thesand grains, which suggests that the strength of the corematerials may be determined by the bonding bridgesbetween the sand grains. It can also be seen from Fig. 3that the effect of the percentage solid content and the
dipping time cannot be established due to the hetero-geneity of the sand materials as a composite.
A comparison of the strengths of cold box (Fig. 3a)and furan (Fig. 3b) core materials shows that the coldbox material has higher strength than the furan materialin the tensile mode. This is expected because cold boxbinders, due to their chemistry, generally are strongerthan furan binders. Since the cold box binder is usedwith fresh sand and the furan binder is used with partlyregenerated sand, we should expect to see a difference inthe mechanical properties of the two systems. Furtheranalysis of Fig. 3 shows that the effect of the aqueousnature of the coating in strength reduction is lesspronounced in the furan core material compared tothe cold box core material. However, the scatter in thevalue of the strength in the furan core material is largerthan in the cold box core material. This may beattributed to different influences such as the differencein the sand materials used (cold box, 100% new sand;and furan, 20% new sand and 80% regenerated sand),the chemicals and, most importantly, the core produc-tion process. The cold box core materials are madeautomatically, while the furan core materials are mademanually. Therefore, in furan core materials, there maybe inconsistencies in compaction, density, permeability,etc., which may vary from specimen to specimen. Allthese will affect the flaws that in turn will affect thestrength values.
Flexural strength
A typical bar specimen subjected to bending/flexuralloading on the STM is shown in Fig. 4a. The specimen issubjected to a three-point bending test according toASTM standard D5934.20 At the point of dynamicloading, the specimen experiences compressive stresses,while tensile stresses are developed in the opposite sideof the specimen. This leads to a phenomenon known assimultaneous dual stress effect. The stress s, strain e and
3 Tensile strengths of a cold box and b furan chemically
bonded sand specimens
a broken dog bone specimen subjected to uniaxial load-ing on STM; b typical strength profiles from three dogbone specimens
2 Specimen and profiles obtained from tensile test
Nwaogu and Tiedje Sand core materials in sol–gel coating impregnated with filter dust
International Journal of Cast Metals Research 2012 VOL 25 NO 5 309
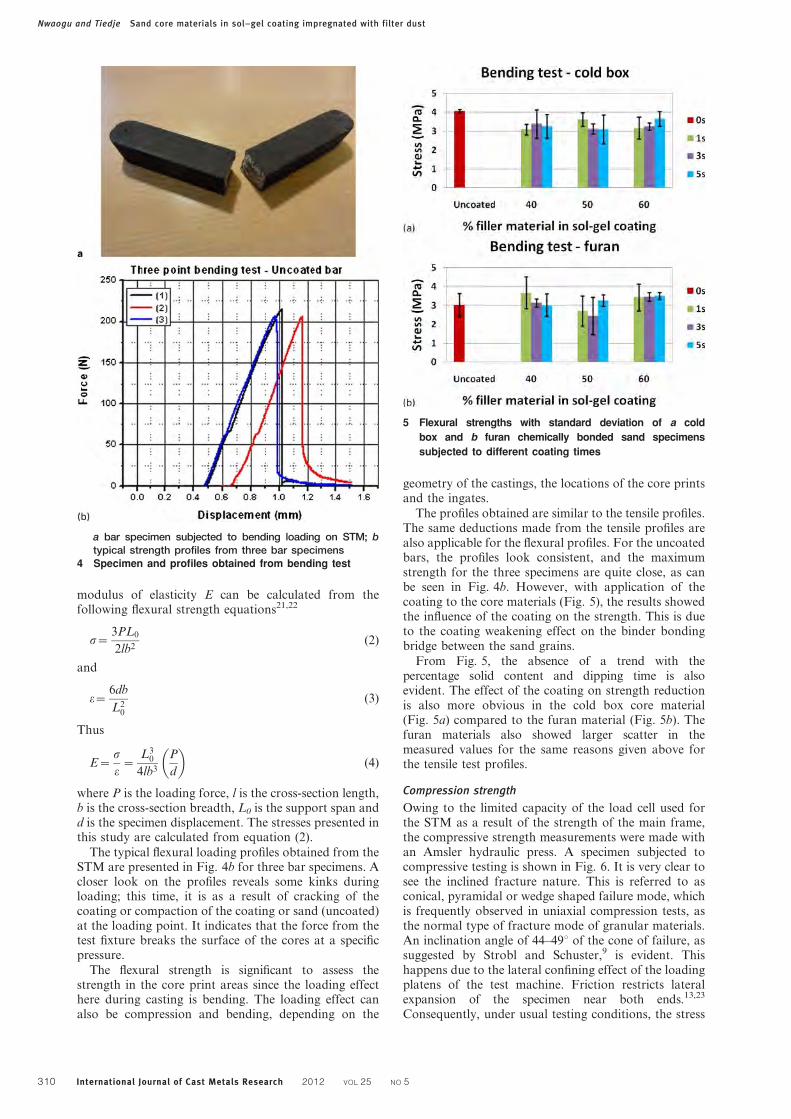
modulus of elasticity E can be calculated from thefollowing flexural strength equations21,22
s~3PL0
2lb2(2)
and
e~6db
L20
(3)
Thus
E~s
e~
L30
4lb3
P
d
(4)
where P is the loading force, l is the cross-section length,b is the cross-section breadth, L0 is the support span andd is the specimen displacement. The stresses presented inthis study are calculated from equation (2).
The typical flexural loading profiles obtained from theSTM are presented in Fig. 4b for three bar specimens. Acloser look on the profiles reveals some kinks duringloading; this time, it is as a result of cracking of thecoating or compaction of the coating or sand (uncoated)at the loading point. It indicates that the force from thetest fixture breaks the surface of the cores at a specificpressure.
The flexural strength is significant to assess thestrength in the core print areas since the loading effecthere during casting is bending. The loading effect canalso be compression and bending, depending on the
geometry of the castings, the locations of the core printsand the ingates.
The profiles obtained are similar to the tensile profiles.The same deductions made from the tensile profiles arealso applicable for the flexural profiles. For the uncoatedbars, the profiles look consistent, and the maximumstrength for the three specimens are quite close, as canbe seen in Fig. 4b. However, with application of thecoating to the core materials (Fig. 5), the results showedthe influence of the coating on the strength. This is dueto the coating weakening effect on the binder bondingbridge between the sand grains.
From Fig. 5, the absence of a trend with thepercentage solid content and dipping time is alsoevident. The effect of the coating on strength reductionis also more obvious in the cold box core material(Fig. 5a) compared to the furan material (Fig. 5b). Thefuran materials also showed larger scatter in themeasured values for the same reasons given above forthe tensile test profiles.
Compression strength
Owing to the limited capacity of the load cell used forthe STM as a result of the strength of the main frame,the compressive strength measurements were made withan Amsler hydraulic press. A specimen subjected tocompressive testing is shown in Fig. 6. It is very clear tosee the inclined fracture nature. This is referred to asconical, pyramidal or wedge shaped failure mode, whichis frequently observed in uniaxial compression tests, asthe normal type of fracture mode of granular materials.An inclination angle of 44–49u of the cone of failure, assuggested by Strobl and Schuster,9 is evident. Thishappens due to the lateral confining effect of the loadingplatens of the test machine. Friction restricts lateralexpansion of the specimen near both ends.13,23
Consequently, under usual testing conditions, the stress
5 Flexural strengths with standard deviation of a cold
box and b furan chemically bonded sand specimens
subjected to different coating times
a bar specimen subjected to bending loading on STM; btypical strength profiles from three bar specimens
4 Specimen and profiles obtained from bending test
Nwaogu and Tiedje Sand core materials in sol–gel coating impregnated with filter dust
310 International Journal of Cast Metals Research 2012 VOL 25 NO 5
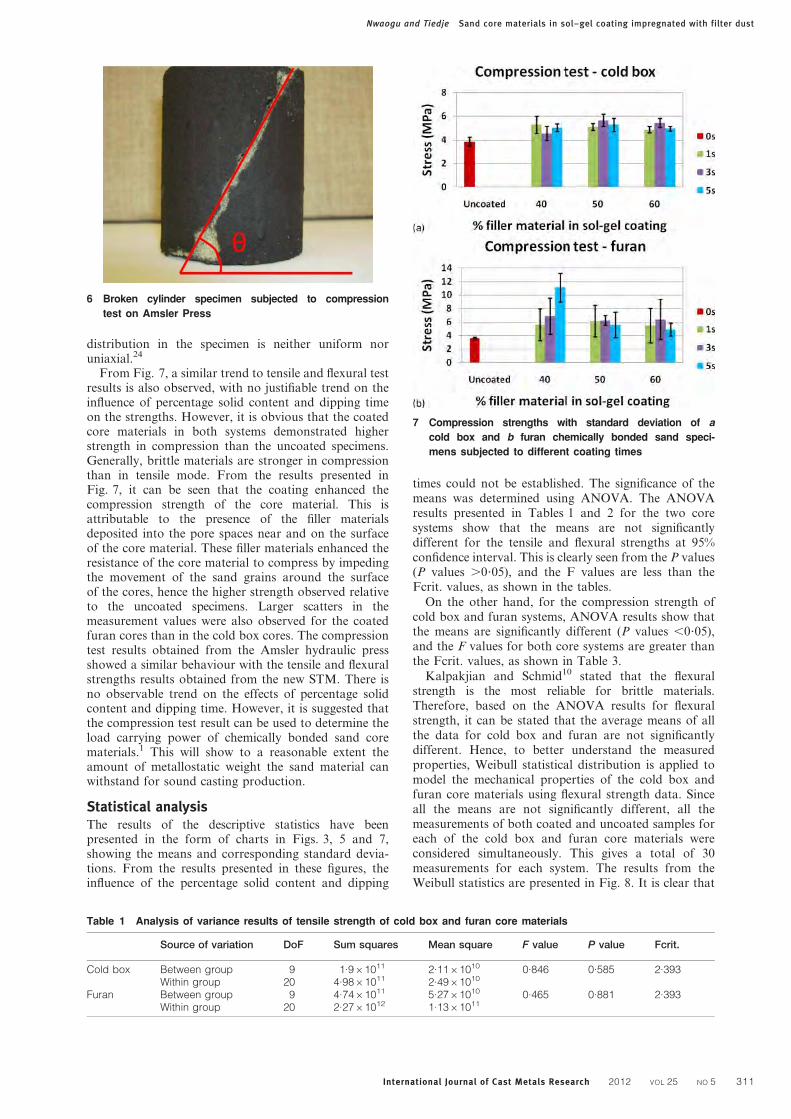
distribution in the specimen is neither uniform noruniaxial.24
From Fig. 7, a similar trend to tensile and flexural testresults is also observed, with no justifiable trend on theinfluence of percentage solid content and dipping timeon the strengths. However, it is obvious that the coatedcore materials in both systems demonstrated higherstrength in compression than the uncoated specimens.Generally, brittle materials are stronger in compressionthan in tensile mode. From the results presented inFig. 7, it can be seen that the coating enhanced thecompression strength of the core material. This isattributable to the presence of the filler materialsdeposited into the pore spaces near and on the surfaceof the core material. These filler materials enhanced theresistance of the core material to compress by impedingthe movement of the sand grains around the surfaceof the cores, hence the higher strength observed relativeto the uncoated specimens. Larger scatters in themeasurement values were also observed for the coatedfuran cores than in the cold box cores. The compressiontest results obtained from the Amsler hydraulic pressshowed a similar behaviour with the tensile and flexuralstrengths results obtained from the new STM. There isno observable trend on the effects of percentage solidcontent and dipping time. However, it is suggested thatthe compression test result can be used to determine theload carrying power of chemically bonded sand corematerials.1 This will show to a reasonable extent theamount of metallostatic weight the sand material canwithstand for sound casting production.
Statistical analysisThe results of the descriptive statistics have beenpresented in the form of charts in Figs. 3, 5 and 7,showing the means and corresponding standard devia-tions. From the results presented in these figures, theinfluence of the percentage solid content and dipping
times could not be established. The significance of themeans was determined using ANOVA. The ANOVAresults presented in Tables 1 and 2 for the two coresystems show that the means are not significantlydifferent for the tensile and flexural strengths at 95%confidence interval. This is clearly seen from the P values(P values .0?05), and the F values are less than theFcrit. values, as shown in the tables.
On the other hand, for the compression strength ofcold box and furan systems, ANOVA results show thatthe means are significantly different (P values ,0?05),and the F values for both core systems are greater thanthe Fcrit. values, as shown in Table 3.
Kalpakjian and Schmid10 stated that the flexuralstrength is the most reliable for brittle materials.Therefore, based on the ANOVA results for flexuralstrength, it can be stated that the average means of allthe data for cold box and furan are not significantlydifferent. Hence, to better understand the measuredproperties, Weibull statistical distribution is applied tomodel the mechanical properties of the cold box andfuran core materials using flexural strength data. Sinceall the means are not significantly different, all themeasurements of both coated and uncoated samples foreach of the cold box and furan core materials wereconsidered simultaneously. This gives a total of 30measurements for each system. The results from theWeibull statistics are presented in Fig. 8. It is clear that
7 Compression strengths with standard deviation of a
cold box and b furan chemically bonded sand speci-
mens subjected to different coating times
Table 1 Analysis of variance results of tensile strength of cold box and furan core materials
Source of variation DoF Sum squares Mean square F value P value Fcrit.
Cold box Between group 9 1.961011 2.1161010 0.846 0.585 2.393Within group 20 4.9861011 2.4961010
Furan Between group 9 4.7461011 5.2761010 0.465 0.881 2.393Within group 20 2.2761012 1.1361011
6 Broken cylinder specimen subjected to compression
test on Amsler Press
Nwaogu and Tiedje Sand core materials in sol–gel coating impregnated with filter dust
International Journal of Cast Metals Research 2012 VOL 25 NO 5 311
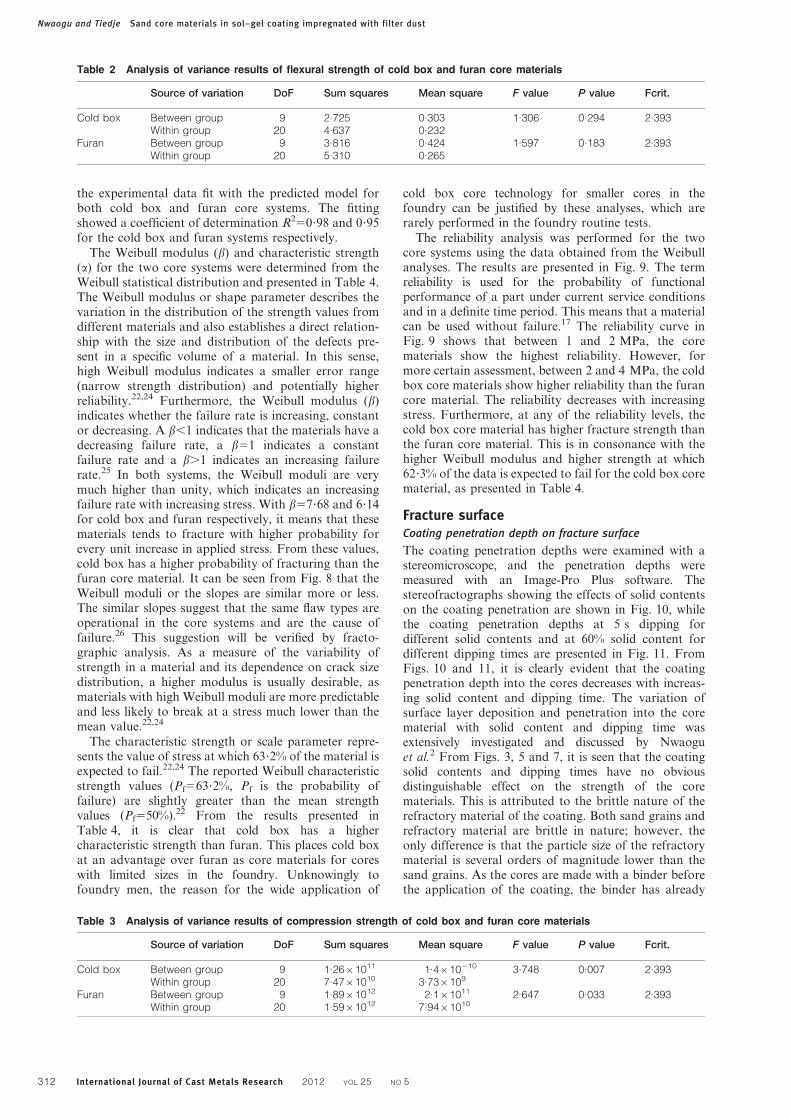
the experimental data fit with the predicted model forboth cold box and furan core systems. The fittingshowed a coefficient of determination R250?98 and 0?95for the cold box and furan systems respectively.
The Weibull modulus (b) and characteristic strength(a) for the two core systems were determined from theWeibull statistical distribution and presented in Table 4.The Weibull modulus or shape parameter describes thevariation in the distribution of the strength values fromdifferent materials and also establishes a direct relation-ship with the size and distribution of the defects pre-sent in a specific volume of a material. In this sense,high Weibull modulus indicates a smaller error range(narrow strength distribution) and potentially higherreliability.22,24 Furthermore, the Weibull modulus (b)indicates whether the failure rate is increasing, constantor decreasing. A b,1 indicates that the materials have adecreasing failure rate, a b51 indicates a constantfailure rate and a b.1 indicates an increasing failurerate.25 In both systems, the Weibull moduli are verymuch higher than unity, which indicates an increasingfailure rate with increasing stress. With b57?68 and 6?14for cold box and furan respectively, it means that thesematerials tends to fracture with higher probability forevery unit increase in applied stress. From these values,cold box has a higher probability of fracturing than thefuran core material. It can be seen from Fig. 8 that theWeibull moduli or the slopes are similar more or less.The similar slopes suggest that the same flaw types areoperational in the core systems and are the cause offailure.26 This suggestion will be verified by fracto-graphic analysis. As a measure of the variability ofstrength in a material and its dependence on crack sizedistribution, a higher modulus is usually desirable, asmaterials with high Weibull moduli are more predictableand less likely to break at a stress much lower than themean value.22,24
The characteristic strength or scale parameter repre-sents the value of stress at which 63?2% of the material isexpected to fail.22,24 The reported Weibull characteristicstrength values (Pf563?2%, Pf is the probability offailure) are slightly greater than the mean strengthvalues (Pf550%).22 From the results presented inTable 4, it is clear that cold box has a highercharacteristic strength than furan. This places cold boxat an advantage over furan as core materials for coreswith limited sizes in the foundry. Unknowingly tofoundry men, the reason for the wide application of
cold box core technology for smaller cores in thefoundry can be justified by these analyses, which arerarely performed in the foundry routine tests.
The reliability analysis was performed for the twocore systems using the data obtained from the Weibullanalyses. The results are presented in Fig. 9. The termreliability is used for the probability of functionalperformance of a part under current service conditionsand in a definite time period. This means that a materialcan be used without failure.17 The reliability curve inFig. 9 shows that between 1 and 2 MPa, the corematerials show the highest reliability. However, formore certain assessment, between 2 and 4 MPa, the coldbox core materials show higher reliability than the furancore material. The reliability decreases with increasingstress. Furthermore, at any of the reliability levels, thecold box core material has higher fracture strength thanthe furan core material. This is in consonance with thehigher Weibull modulus and higher strength at which62?3% of the data is expected to fail for the cold box corematerial, as presented in Table 4.
Fracture surfaceCoating penetration depth on fracture surface
The coating penetration depths were examined with astereomicroscope, and the penetration depths weremeasured with an Image-Pro Plus software. Thestereofractographs showing the effects of solid contentson the coating penetration are shown in Fig. 10, whilethe coating penetration depths at 5 s dipping fordifferent solid contents and at 60% solid content fordifferent dipping times are presented in Fig. 11. FromFigs. 10 and 11, it is clearly evident that the coatingpenetration depth into the cores decreases with increas-ing solid content and dipping time. The variation ofsurface layer deposition and penetration into the corematerial with solid content and dipping time wasextensively investigated and discussed by Nwaoguet al.2 From Figs. 3, 5 and 7, it is seen that the coatingsolid contents and dipping times have no obviousdistinguishable effect on the strength of the corematerials. This is attributed to the brittle nature of therefractory material of the coating. Both sand grains andrefractory material are brittle in nature; however, theonly difference is that the particle size of the refractorymaterial is several orders of magnitude lower than thesand grains. As the cores are made with a binder beforethe application of the coating, the binder has already
Table 2 Analysis of variance results of flexural strength of cold box and furan core materials
Source of variation DoF Sum squares Mean square F value P value Fcrit.
Cold box Between group 9 2.725 0.303 1.306 0.294 2.393Within group 20 4.637 0.232
Furan Between group 9 3.816 0.424 1.597 0.183 2.393Within group 20 5.310 0.265
Table 3 Analysis of variance results of compression strength of cold box and furan core materials
Source of variation DoF Sum squares Mean square F value P value Fcrit.
Cold box Between group 9 1.2661011 1.4610210 3.748 0.007 2.393Within group 20 7.4761010 3.736109
Furan Between group 9 1.8961012 2.161011 2.647 0.033 2.393Within group 20 1.5961012 7.9461010
Nwaogu and Tiedje Sand core materials in sol–gel coating impregnated with filter dust
312 International Journal of Cast Metals Research 2012 VOL 25 NO 5
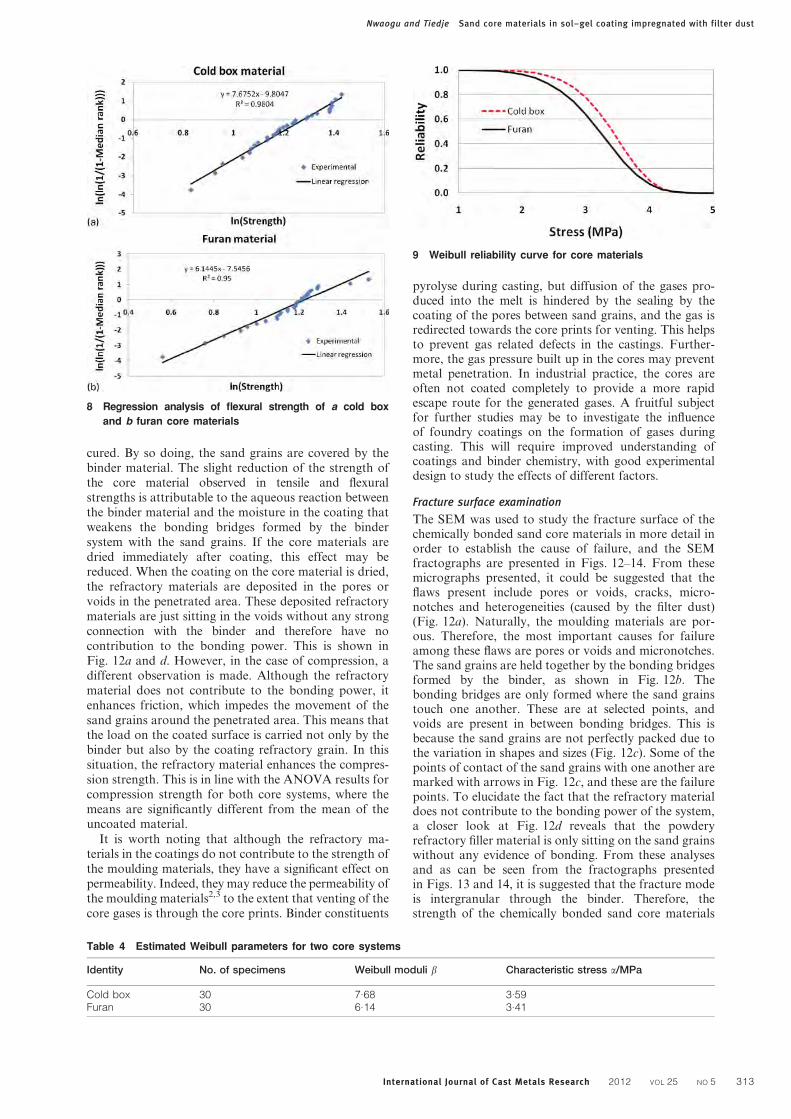
cured. By so doing, the sand grains are covered by thebinder material. The slight reduction of the strength ofthe core material observed in tensile and flexuralstrengths is attributable to the aqueous reaction betweenthe binder material and the moisture in the coating thatweakens the bonding bridges formed by the bindersystem with the sand grains. If the core materials aredried immediately after coating, this effect may bereduced. When the coating on the core material is dried,the refractory materials are deposited in the pores orvoids in the penetrated area. These deposited refractorymaterials are just sitting in the voids without any strongconnection with the binder and therefore have nocontribution to the bonding power. This is shown inFig. 12a and d. However, in the case of compression, adifferent observation is made. Although the refractorymaterial does not contribute to the bonding power, itenhances friction, which impedes the movement of thesand grains around the penetrated area. This means thatthe load on the coated surface is carried not only by thebinder but also by the coating refractory grain. In thissituation, the refractory material enhances the compres-sion strength. This is in line with the ANOVA results forcompression strength for both core systems, where themeans are significantly different from the mean of theuncoated material.
It is worth noting that although the refractory ma-terials in the coatings do not contribute to the strength ofthe moulding materials, they have a significant effect onpermeability. Indeed, they may reduce the permeability ofthe moulding materials2,3 to the extent that venting of thecore gases is through the core prints. Binder constituents
pyrolyse during casting, but diffusion of the gases pro-duced into the melt is hindered by the sealing by thecoating of the pores between sand grains, and the gas isredirected towards the core prints for venting. This helpsto prevent gas related defects in the castings. Further-more, the gas pressure built up in the cores may preventmetal penetration. In industrial practice, the cores areoften not coated completely to provide a more rapidescape route for the generated gases. A fruitful subjectfor further studies may be to investigate the influenceof foundry coatings on the formation of gases duringcasting. This will require improved understanding ofcoatings and binder chemistry, with good experimentaldesign to study the effects of different factors.
Fracture surface examination
The SEM was used to study the fracture surface of thechemically bonded sand core materials in more detail inorder to establish the cause of failure, and the SEMfractographs are presented in Figs. 12–14. From thesemicrographs presented, it could be suggested that theflaws present include pores or voids, cracks, micro-notches and heterogeneities (caused by the filter dust)(Fig. 12a). Naturally, the moulding materials are por-ous. Therefore, the most important causes for failureamong these flaws are pores or voids and micronotches.The sand grains are held together by the bonding bridgesformed by the binder, as shown in Fig. 12b. Thebonding bridges are only formed where the sand grainstouch one another. These are at selected points, andvoids are present in between bonding bridges. This isbecause the sand grains are not perfectly packed due tothe variation in shapes and sizes (Fig. 12c). Some of thepoints of contact of the sand grains with one another aremarked with arrows in Fig. 12c, and these are the failurepoints. To elucidate the fact that the refractory materialdoes not contribute to the bonding power of the system,a closer look at Fig. 12d reveals that the powderyrefractory filler material is only sitting on the sand grainswithout any evidence of bonding. From these analysesand as can be seen from the fractographs presentedin Figs. 13 and 14, it is suggested that the fracture modeis intergranular through the binder. Therefore, thestrength of the chemically bonded sand core materials
Table 4 Estimated Weibull parameters for two core systems
Identity No. of specimens Weibull moduli b Characteristic stress a/MPa
Cold box 30 7.68 3.59Furan 30 6.14 3.41
8 Regression analysis of flexural strength of a cold box
and b furan core materials
9 Weibull reliability curve for core materials
Nwaogu and Tiedje Sand core materials in sol–gel coating impregnated with filter dust
International Journal of Cast Metals Research 2012 VOL 25 NO 5 313
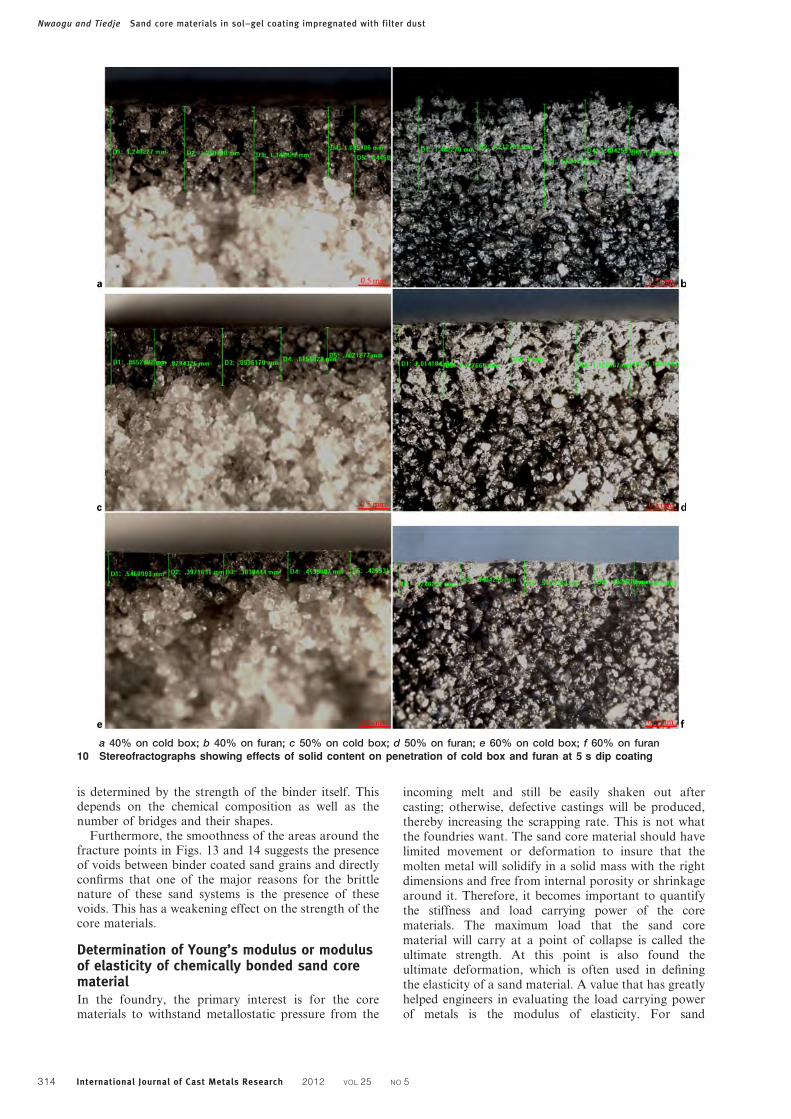
is determined by the strength of the binder itself. Thisdepends on the chemical composition as well as thenumber of bridges and their shapes.
Furthermore, the smoothness of the areas around thefracture points in Figs. 13 and 14 suggests the presenceof voids between binder coated sand grains and directlyconfirms that one of the major reasons for the brittlenature of these sand systems is the presence of thesevoids. This has a weakening effect on the strength of thecore materials.
Determination of Young’s modulus or modulusof elasticity of chemically bonded sand corematerialIn the foundry, the primary interest is for the corematerials to withstand metallostatic pressure from the
incoming melt and still be easily shaken out aftercasting; otherwise, defective castings will be produced,thereby increasing the scrapping rate. This is not whatthe foundries want. The sand core material should havelimited movement or deformation to insure that themolten metal will solidify in a solid mass with the rightdimensions and free from internal porosity or shrinkagearound it. Therefore, it becomes important to quantifythe stiffness and load carrying power of the corematerials. The maximum load that the sand corematerial will carry at a point of collapse is called theultimate strength. At this point is also found theultimate deformation, which is often used in definingthe elasticity of a sand material. A value that has greatlyhelped engineers in evaluating the load carrying powerof metals is the modulus of elasticity. For sand
a 40% on cold box; b 40% on furan; c 50% on cold box; d 50% on furan; e 60% on cold box; f 60% on furan10 Stereofractographs showing effects of solid content on penetration of cold box and furan at 5 s dip coating
Nwaogu and Tiedje Sand core materials in sol–gel coating impregnated with filter dust
314 International Journal of Cast Metals Research 2012 VOL 25 NO 5
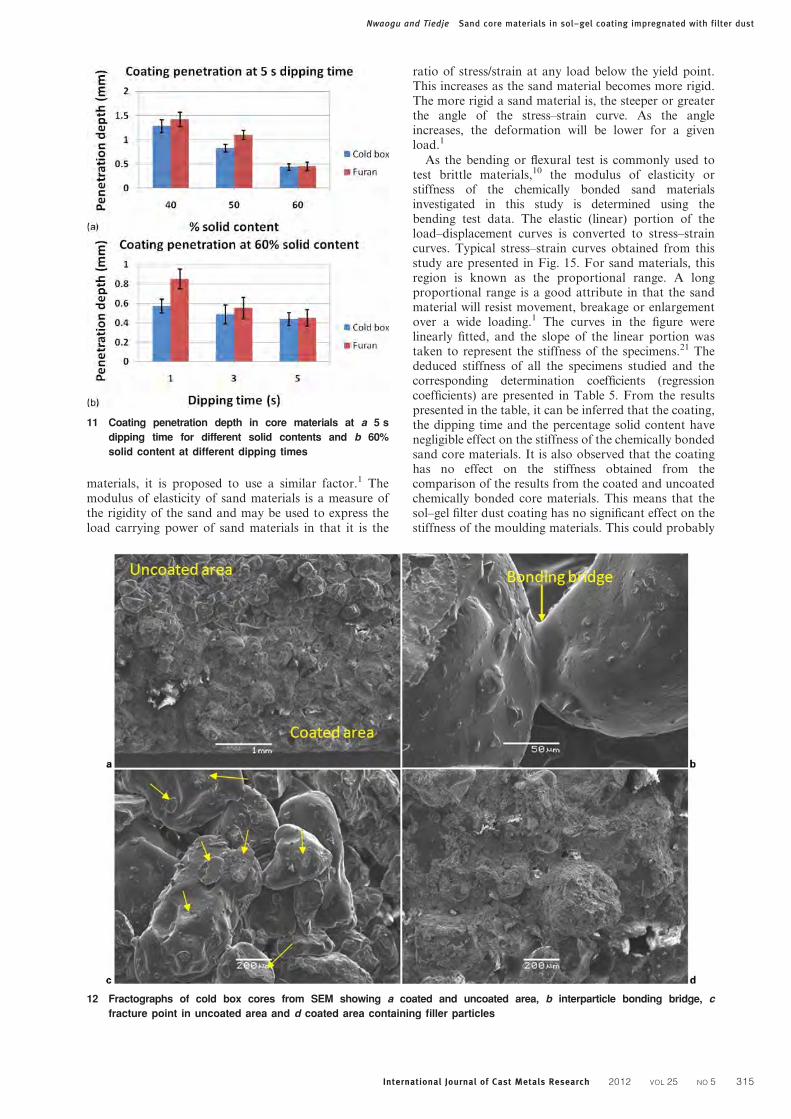
materials, it is proposed to use a similar factor.1 Themodulus of elasticity of sand materials is a measure ofthe rigidity of the sand and may be used to express theload carrying power of sand materials in that it is the
ratio of stress/strain at any load below the yield point.This increases as the sand material becomes more rigid.The more rigid a sand material is, the steeper or greaterthe angle of the stress–strain curve. As the angleincreases, the deformation will be lower for a givenload.1
As the bending or flexural test is commonly used totest brittle materials,10 the modulus of elasticity orstiffness of the chemically bonded sand materialsinvestigated in this study is determined using thebending test data. The elastic (linear) portion of theload–displacement curves is converted to stress–straincurves. Typical stress–strain curves obtained from thisstudy are presented in Fig. 15. For sand materials, thisregion is known as the proportional range. A longproportional range is a good attribute in that the sandmaterial will resist movement, breakage or enlargementover a wide loading.1 The curves in the figure werelinearly fitted, and the slope of the linear portion wastaken to represent the stiffness of the specimens.21 Thededuced stiffness of all the specimens studied and thecorresponding determination coefficients (regressioncoefficients) are presented in Table 5. From the resultspresented in the table, it can be inferred that the coating,the dipping time and the percentage solid content havenegligible effect on the stiffness of the chemically bondedsand core materials. It is also observed that the coatinghas no effect on the stiffness obtained from thecomparison of the results from the coated and uncoatedchemically bonded core materials. This means that thesol–gel filter dust coating has no significant effect on thestiffness of the moulding materials. This could probably
12 Fractographs of cold box cores from SEM showing a coated and uncoated area, b interparticle bonding bridge, c
fracture point in uncoated area and d coated area containing filler particles
11 Coating penetration depth in core materials at a 5 s
dipping time for different solid contents and b 60%
solid content at different dipping times
Nwaogu and Tiedje Sand core materials in sol–gel coating impregnated with filter dust
International Journal of Cast Metals Research 2012 VOL 25 NO 5 315
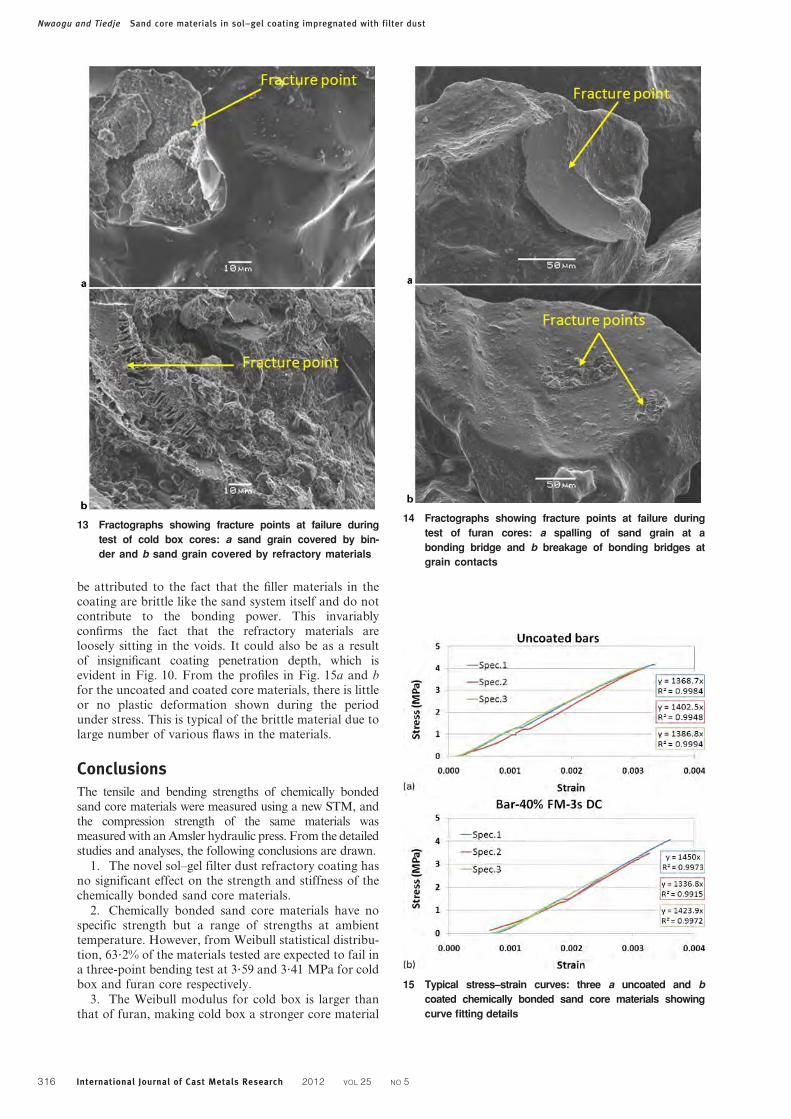
be attributed to the fact that the filler materials in thecoating are brittle like the sand system itself and do notcontribute to the bonding power. This invariablyconfirms the fact that the refractory materials areloosely sitting in the voids. It could also be as a resultof insignificant coating penetration depth, which isevident in Fig. 10. From the profiles in Fig. 15a and bfor the uncoated and coated core materials, there is littleor no plastic deformation shown during the periodunder stress. This is typical of the brittle material due tolarge number of various flaws in the materials.
ConclusionsThe tensile and bending strengths of chemically bondedsand core materials were measured using a new STM, andthe compression strength of the same materials wasmeasured with an Amsler hydraulic press. From the detailedstudies and analyses, the following conclusions are drawn.
1. The novel sol–gel filter dust refractory coating hasno significant effect on the strength and stiffness of thechemically bonded sand core materials.
2. Chemically bonded sand core materials have nospecific strength but a range of strengths at ambienttemperature. However, from Weibull statistical distribu-tion, 63?2% of the materials tested are expected to fail ina three-point bending test at 3?59 and 3?41 MPa for coldbox and furan core respectively.
3. The Weibull modulus for cold box is larger thanthat of furan, making cold box a stronger core material
15 Typical stress–strain curves: three a uncoated and b
coated chemically bonded sand core materials showing
curve fitting details
14 Fractographs showing fracture points at failure during
test of furan cores: a spalling of sand grain at a
bonding bridge and b breakage of bonding bridges at
grain contacts
13 Fractographs showing fracture points at failure during
test of cold box cores: a sand grain covered by bin-
der and b sand grain covered by refractory materials
Nwaogu and Tiedje Sand core materials in sol–gel coating impregnated with filter dust
316 International Journal of Cast Metals Research 2012 VOL 25 NO 5
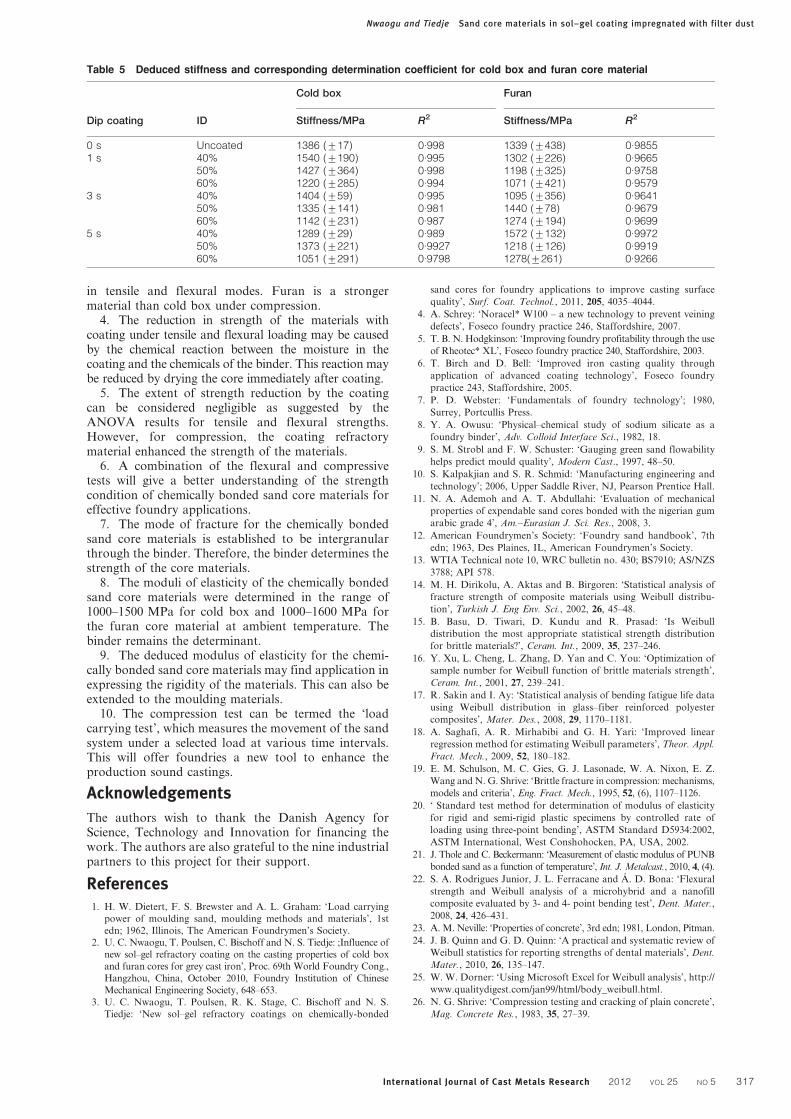
in tensile and flexural modes. Furan is a strongermaterial than cold box under compression.
4. The reduction in strength of the materials withcoating under tensile and flexural loading may be causedby the chemical reaction between the moisture in thecoating and the chemicals of the binder. This reaction maybe reduced by drying the core immediately after coating.
5. The extent of strength reduction by the coatingcan be considered negligible as suggested by theANOVA results for tensile and flexural strengths.However, for compression, the coating refractorymaterial enhanced the strength of the materials.
6. A combination of the flexural and compressivetests will give a better understanding of the strengthcondition of chemically bonded sand core materials foreffective foundry applications.
7. The mode of fracture for the chemically bondedsand core materials is established to be intergranularthrough the binder. Therefore, the binder determines thestrength of the core materials.
8. The moduli of elasticity of the chemically bondedsand core materials were determined in the range of1000–1500 MPa for cold box and 1000–1600 MPa forthe furan core material at ambient temperature. Thebinder remains the determinant.
9. The deduced modulus of elasticity for the chemi-cally bonded sand core materials may find application inexpressing the rigidity of the materials. This can also beextended to the moulding materials.
10. The compression test can be termed the ‘loadcarrying test’, which measures the movement of the sandsystem under a selected load at various time intervals.This will offer foundries a new tool to enhance theproduction sound castings.
Acknowledgements
The authors wish to thank the Danish Agency forScience, Technology and Innovation for financing thework. The authors are also grateful to the nine industrialpartners to this project for their support.
References1. H. W. Dietert, F. S. Brewster and A. L. Graham: ‘Load carrying
power of moulding sand, moulding methods and materials’, 1st
edn; 1962, Illinois, The American Foundrymen’s Society.
2. U. C. Nwaogu, T. Poulsen, C. Bischoff and N. S. Tiedje: ;Influence of
new sol–gel refractory coating on the casting properties of cold box
and furan cores for grey cast iron’, Proc. 69th World Foundry Cong.,
Hangzhou, China, October 2010, Foundry Institution of Chinese
Mechanical Engineering Society, 648–653.
3. U. C. Nwaogu, T. Poulsen, R. K. Stage, C. Bischoff and N. S.
Tiedje: ‘New sol–gel refractory coatings on chemically-bonded
sand cores for foundry applications to improve casting surface
quality’, Surf. Coat. Technol., 2011, 205, 4035–4044.
4. A. Schrey: ‘Noracel* W100 – a new technology to prevent veining
defects’, Foseco foundry practice 246, Staffordshire, 2007.
5. T. B. N. Hodgkinson: ‘Improving foundry profitability through the use
of Rheotec* XL’, Foseco foundry practice 240, Staffordshire, 2003.
6. T. Birch and D. Bell: ‘Improved iron casting quality through
application of advanced coating technology’, Foseco foundry
practice 243, Staffordshire, 2005.
7. P. D. Webster: ‘Fundamentals of foundry technology’; 1980,
Surrey, Portcullis Press.
8. Y. A. Owusu: ‘Physical–chemical study of sodium silicate as a
foundry binder’, Adv. Colloid Interface Sci., 1982, 18.
9. S. M. Strobl and F. W. Schuster: ‘Gauging green sand flowability
helps predict mould quality’, Modern Cast., 1997, 48–50.
10. S. Kalpakjian and S. R. Schmid: ‘Manufacturing engineering and
technology’; 2006, Upper Saddle River, NJ, Pearson Prentice Hall.
11. N. A. Ademoh and A. T. Abdullahi: ‘Evaluation of mechanical
properties of expendable sand cores bonded with the nigerian gum
arabic grade 4’, Am.–Eurasian J. Sci. Res., 2008, 3.
12. American Foundrymen’s Society: ‘Foundry sand handbook’, 7th
edn; 1963, Des Plaines, IL, American Foundrymen’s Society.
13. WTIA Technical note 10, WRC bulletin no. 430; BS7910; AS/NZS
3788; API 578.
14. M. H. Dirikolu, A. Aktas and B. Birgoren: ‘Statistical analysis of
fracture strength of composite materials using Weibull distribu-
tion’, Turkish J. Eng Env. Sci., 2002, 26, 45–48.
15. B. Basu, D. Tiwari, D. Kundu and R. Prasad: ‘Is Weibull
distribution the most appropriate statistical strength distribution
for brittle materials?’, Ceram. Int., 2009, 35, 237–246.
16. Y. Xu, L. Cheng, L. Zhang, D. Yan and C. You: ‘Optimization of
sample number for Weibull function of brittle materials strength’,
Ceram. Int., 2001, 27, 239–241.
17. R. Sakin and I. Ay: ‘Statistical analysis of bending fatigue life data
using Weibull distribution in glass–fiber reinforced polyester
composites’, Mater. Des., 2008, 29, 1170–1181.
18. A. Saghafi, A. R. Mirhabibi and G. H. Yari: ‘Improved linear
regression method for estimating Weibull parameters’, Theor. Appl.
Fract. Mech., 2009, 52, 180–182.
19. E. M. Schulson, M. C. Gies, G. J. Lasonade, W. A. Nixon, E. Z.
Wang and N. G. Shrive: ‘Brittle fracture in compression: mechanisms,
models and criteria’, Eng. Fract. Mech., 1995, 52, (6), 1107–1126.
20. ‘ Standard test method for determination of modulus of elasticity
for rigid and semi-rigid plastic specimens by controlled rate of
loading using three-point bending’, ASTM Standard D5934:2002,
ASTM International, West Conshohocken, PA, USA, 2002.
21. J. Thole and C. Beckermann: ‘Measurement of elastic modulus of PUNB
bonded sand as a function of temperature’, Int. J. Metalcast., 2010, 4, (4).
22. S. A. Rodrigues Junior, J. L. Ferracane and A. D. Bona: ‘Flexural
strength and Weibull analysis of a microhybrid and a nanofill
composite evaluated by 3- and 4- point bending test’, Dent. Mater.,
2008, 24, 426–431.
23. A. M. Neville: ‘Properties of concrete’, 3rd edn; 1981, London, Pitman.
24. J. B. Quinn and G. D. Quinn: ‘A practical and systematic review of
Weibull statistics for reporting strengths of dental materials’, Dent.
Mater., 2010, 26, 135–147.
25. W. W. Dorner: ‘Using Microsoft Excel for Weibull analysis’, http://
www.qualitydigest.com/jan99/html/body_weibull.html.
26. N. G. Shrive: ‘Compression testing and cracking of plain concrete’,
Mag. Concrete Res., 1983, 35, 27–39.
Table 5 Deduced stiffness and corresponding determination coefficient for cold box and furan core material
Dip coating ID
Cold box Furan
Stiffness/MPa R2 Stiffness/MPa R2
0 s Uncoated 1386 (¡17) 0.998 1339 (¡438) 0.98551 s 40% 1540 (¡190) 0.995 1302 (¡226) 0.9665
50% 1427 (¡364) 0.998 1198 (¡325) 0.975860% 1220 (¡285) 0.994 1071 (¡421) 0.9579
3 s 40% 1404 (¡59) 0.995 1095 (¡356) 0.964150% 1335 (¡141) 0.981 1440 (¡78) 0.967960% 1142 (¡231) 0.987 1274 (¡194) 0.9699
5 s 40% 1289 (¡29) 0.989 1572 (¡132) 0.997250% 1373 (¡221) 0.9927 1218 (¡126) 0.991960% 1051 (¡291) 0.9798 1278(¡261) 0.9266
Nwaogu and Tiedje Sand core materials in sol–gel coating impregnated with filter dust
International Journal of Cast Metals Research 2012 VOL 25 NO 5 317

SUPPLEMENT 6
U. C. Nwaogu and N.S. Tiedje,
“Foundry Coating Technology: A Review”
Published in Materials Sciences and Applications, 2 (2011).
DOI 10.4236/msa.2011.28155

Materials Sciences and Application, 2011, 2, 1143-1160 doi:10.4236/msa.2011.28155 Published Online August 2011 (http://www.SciRP.org/journal/msa)
Copyright © 2011 SciRes. MSA
1143
Foundry Coating Technology: A Review
U. C. Nwaogu*, N. S. Tiedje
Technical University of Denmark, Department of Mechanical Engineering, Institute of Production and Process Technology, Kgs. Lyngby, Denmark. Email: [email protected] Received April 27th, 2011; revised May 16th, 2011; accepted May 31st, 2011 ABSTRACT
The importance of foundry coating in improving the surface quality of castings cannot be over emphasized. The appli-cation of mould and core washes creates a high thermal integrity barrier between the metal and the mould resulting in the reduction of the thermal shock experienced by the sand system. These thermal shock leads to series of surface de-fects such as veining/finning, metal penetration, burn-on/in, scab, rat tail, erosion etc. The use of coatings reduces the tendency of occurrence of these defects. However, the understanding of the coating, its components, characteristics and mechanism of action is important. In this review, a detailed description of these topics and examples are provided where necessary. A potential area of research in foundry coating development, using sol-gel process is suggested. The application of sol-gel technology in the development of foundry coatings is a novel approach. Keywords: Coating, Refractory Materials, Application Methods, Characterization, Sol-Gel Technology
1. Introduction
Research in coatings for various applications such as aesthetics, corrosion protection, wear resistance, thermal barrier, self-cleaning, antifouling etc. have been very wide spread but not much is going on in the area of foundry coatings in recent times. The use of foundry coatings for moulds and cores during casting is very necessary as a means of achieving high quality surface finish of castings more especially in complex internal channels created by use of cores. This is despite the con-siderable advances that have taken place over the recent years in binder and sand technology giving the foundries greater opportunity to choose and control these basic foundry raw materials. Since casting surface finish de-pends largely on sand particle grading, it might be sup-posed that a proper selection of a particular grade of sand would be the only requirement to achieve the desired casting surface quality. However, there are other factors to be considered, such as the ability to vent off the gases produced during casting, economic use of a binder, non availability of sand with required grading, etc., these make the use of coatings the more practicable approach [1].
In filling a mould with liquid metal its surface is sub-jected to thermal, mechanical and physicochemical ac-tions. The oxidation products of the metal, reacting with the mould material, form low-melting materials such as
silicates, which lubricate the grains of the quartz sand well. This promotes penetration of the metal into the in-ter-granular spaces and the formation of mechanical pick-up which is difficult to remove from the casting surface. Considering that the sand moulds and cores are highly porous, the production of castings in these materi-als without pick-up and other surface defects is possible only with protection of the surfaces of moulds and cores with refractory coatings. The fundamental requirements for the refractory coatings are minimum porosity, high refractoriness and reduction of the physicochemical reac-tion at the metal-coating interface (lubrication, solution, penetration) [2]. These refractory coatings are used to make better castings and to reduce costs. Castings sur-face quality is improved because the coating produces smoother metal surfaces, either by filling the spaces be-tween the sand grains or by providing, to the metal, a surface smoother than the mould surface itself. Further improvement from the coatings is due to the cleaner and better peel of sand at shakeout and elimination of certain defects such as metal penetration, veining, erosion, sand burn-in etc [3,4].
Controlling casting quality and increasing productivity are top priorities for foundries to become more competi-tive in a global casting market and coatings can help to provide the required remedy. Addressing the issue of mould/core moisture can lead to improvements in pro-ductivity and help keep foundries competitive. Identify-
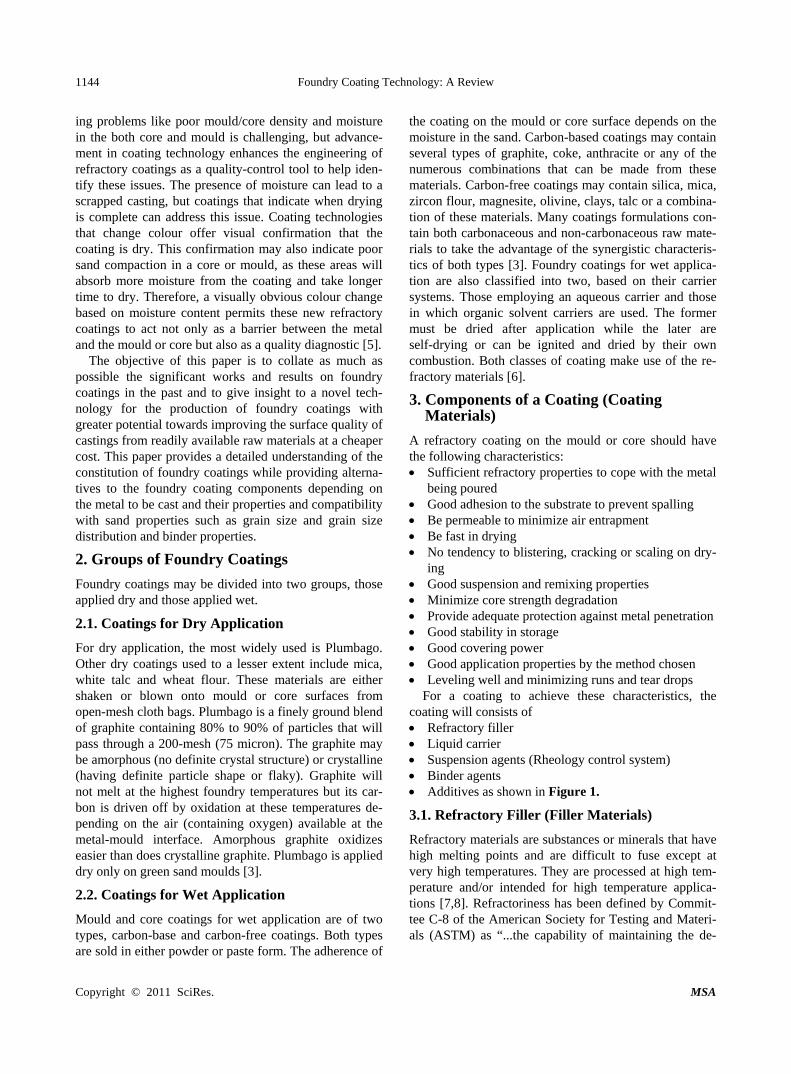
Foundry Coating Technology: A Review 1144
ing problems like poor mould/core density and moisture in the both core and mould is challenging, but advance-ment in coating technology enhances the engineering of refractory coatings as a quality-control tool to help iden-tify these issues. The presence of moisture can lead to a scrapped casting, but coatings that indicate when drying is complete can address this issue. Coating technologies that change colour offer visual confirmation that the coating is dry. This confirmation may also indicate poor sand compaction in a core or mould, as these areas will absorb more moisture from the coating and take longer time to dry. Therefore, a visually obvious colour change based on moisture content permits these new refractory coatings to act not only as a barrier between the metal and the mould or core but also as a quality diagnostic [5].
The objective of this paper is to collate as much as possible the significant works and results on foundry coatings in the past and to give insight to a novel tech-nology for the production of foundry coatings with greater potential towards improving the surface quality of castings from readily available raw materials at a cheaper cost. This paper provides a detailed understanding of the constitution of foundry coatings while providing alterna-tives to the foundry coating components depending on the metal to be cast and their properties and compatibility with sand properties such as grain size and grain size distribution and binder properties.
2. Groups of Foundry Coatings
Foundry coatings may be divided into two groups, those applied dry and those applied wet.
2.1. Coatings for Dry Application
For dry application, the most widely used is Plumbago. Other dry coatings used to a lesser extent include mica, white talc and wheat flour. These materials are either shaken or blown onto mould or core surfaces from open-mesh cloth bags. Plumbago is a finely ground blend of graphite containing 80% to 90% of particles that will pass through a 200-mesh (75 micron). The graphite may be amorphous (no definite crystal structure) or crystalline (having definite particle shape or flaky). Graphite will not melt at the highest foundry temperatures but its car-bon is driven off by oxidation at these temperatures de-pending on the air (containing oxygen) available at the metal-mould interface. Amorphous graphite oxidizes easier than does crystalline graphite. Plumbago is applied dry only on green sand moulds [3].
2.2. Coatings for Wet Application
Mould and core coatings for wet application are of two types, carbon-base and carbon-free coatings. Both types are sold in either powder or paste form. The adherence of
the coating on the mould or core surface depends on the moisture in the sand. Carbon-based coatings may contain several types of graphite, coke, anthracite or any of the numerous combinations that can be made from these materials. Carbon-free coatings may contain silica, mica, zircon flour, magnesite, olivine, clays, talc or a combina-tion of these materials. Many coatings formulations con-tain both carbonaceous and non-carbonaceous raw mate-rials to take the advantage of the synergistic characteris-tics of both types [3]. Foundry coatings for wet applica-tion are also classified into two, based on their carrier systems. Those employing an aqueous carrier and those in which organic solvent carriers are used. The former must be dried after application while the later are self-drying or can be ignited and dried by their own combustion. Both classes of coating make use of the re-fractory materials [6].
3. Components of a Coating (Coating Materials)
A refractory coating on the mould or core should have the following characteristics: Sufficient refractory properties to cope with the metal
being poured Good adhesion to the substrate to prevent spalling Be permeable to minimize air entrapment Be fast in drying No tendency to blistering, cracking or scaling on dry-
ing Good suspension and remixing properties Minimize core strength degradation Provide adequate protection against metal penetration Good stability in storage Good covering power Good application properties by the method chosen Leveling well and minimizing runs and tear drops
For a coating to achieve these characteristics, the coating will consists of Refractory filler Liquid carrier Suspension agents (Rheology control system) Binder agents Additives as shown in Figure 1.
3.1. Refractory Filler (Filler Materials)
Refractory materials are substances or minerals that have high melting points and are difficult to fuse except at very high temperatures. They are processed at high tem-perature and/or intended for high temperature applica-tions [7,8]. Refractoriness has been defined by Commit-tee C-8 of the American Society for Testing and Materi-als (ASTM) as “...the capability of maintaining the de-
Copyright © 2011 SciRes. MSA
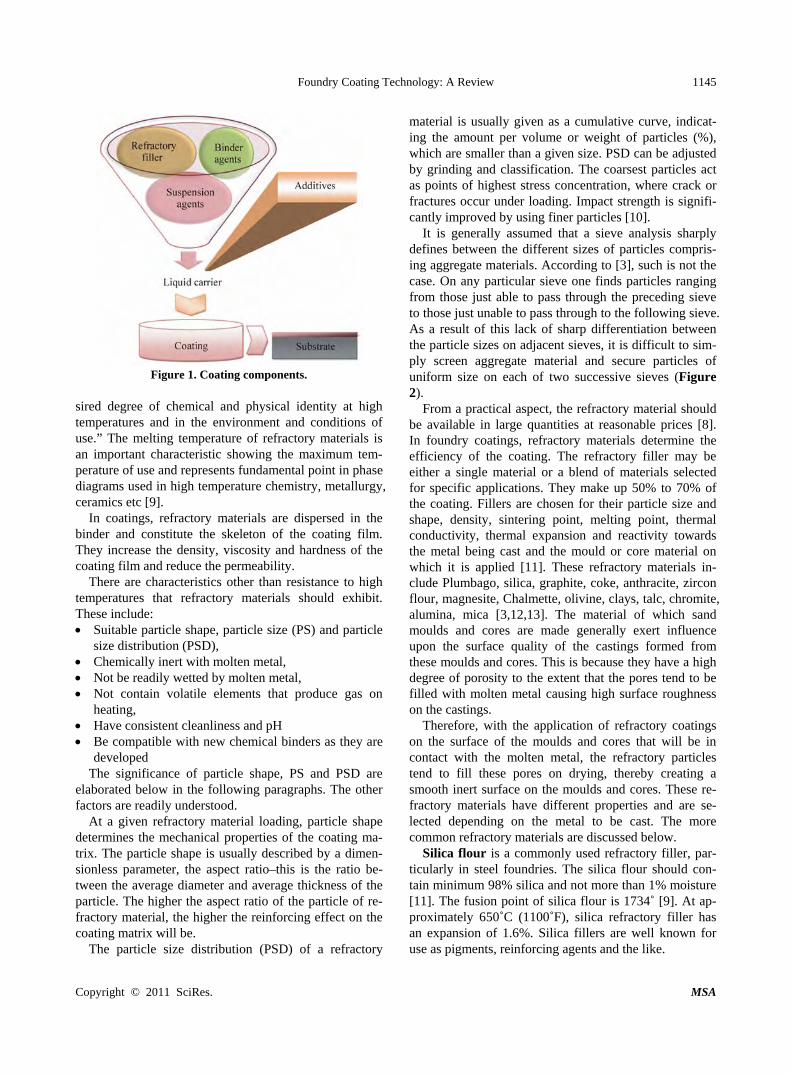
Foundry Coating Technology: A Review
Copyright © 2011 SciRes. MSA
1145
Figure 1. Coating components.
sired degree of chemical and physical identity at high temperatures and in the environment and conditions of use.” The melting temperature of refractory materials is an important characteristic showing the maximum tem-perature of use and represents fundamental point in phase diagrams used in high temperature chemistry, metallurgy, ceramics etc [9].
In coatings, refractory materials are dispersed in the binder and constitute the skeleton of the coating film. They increase the density, viscosity and hardness of the coating film and reduce the permeability.
There are characteristics other than resistance to high temperatures that refractory materials should exhibit. These include: Suitable particle shape, particle size (PS) and particle
size distribution (PSD), Chemically inert with molten metal, Not be readily wetted by molten metal, Not contain volatile elements that produce gas on
heating, Have consistent cleanliness and pH Be compatible with new chemical binders as they are
developed The significance of particle shape, PS and PSD are
elaborated below in the following paragraphs. The other factors are readily understood.
At a given refractory material loading, particle shape determines the mechanical properties of the coating ma-trix. The particle shape is usually described by a dimen-sionless parameter, the aspect ratio–this is the ratio be-tween the average diameter and average thickness of the particle. The higher the aspect ratio of the particle of re-fractory material, the higher the reinforcing effect on the coating matrix will be.
The particle size distribution (PSD) of a refractory
material is usually given as a cumulative curve, indicat-ing the amount per volume or weight of particles (%), which are smaller than a given size. PSD can be adjusted by grinding and classification. The coarsest particles act as points of highest stress concentration, where crack or fractures occur under loading. Impact strength is signifi-cantly improved by using finer particles [10].
It is generally assumed that a sieve analysis sharply defines between the different sizes of particles compris-ing aggregate materials. According to [3], such is not the case. On any particular sieve one finds particles ranging from those just able to pass through the preceding sieve to those just unable to pass through to the following sieve. As a result of this lack of sharp differentiation between the particle sizes on adjacent sieves, it is difficult to sim-ply screen aggregate material and secure particles of uniform size on each of two successive sieves (Figure 2).
From a practical aspect, the refractory material should be available in large quantities at reasonable prices [8]. In foundry coatings, refractory materials determine the efficiency of the coating. The refractory filler may be either a single material or a blend of materials selected for specific applications. They make up 50% to 70% of the coating. Fillers are chosen for their particle size and shape, density, sintering point, melting point, thermal conductivity, thermal expansion and reactivity towards the metal being cast and the mould or core material on which it is applied [11]. These refractory materials in-clude Plumbago, silica, graphite, coke, anthracite, zircon flour, magnesite, Chalmette, olivine, clays, talc, chromite, alumina, mica [3,12,13]. The material of which sand moulds and cores are made generally exert influence upon the surface quality of the castings formed from these moulds and cores. This is because they have a high degree of porosity to the extent that the pores tend to be filled with molten metal causing high surface roughness on the castings.
Therefore, with the application of refractory coatings on the surface of the moulds and cores that will be in contact with the molten metal, the refractory particles tend to fill these pores on drying, thereby creating a smooth inert surface on the moulds and cores. These re-fractory materials have different properties and are se-lected depending on the metal to be cast. The more common refractory materials are discussed below.
Silica flour is a commonly used refractory filler, par-ticularly in steel foundries. The silica flour should con-tain minimum 98% silica and not more than 1% moisture [11]. The fusion point of silica flour is 1734˚ [9]. At ap-proximately 650˚C (1100˚F), silica refractory filler has an expansion of 1.6%. Silica fillers are well known for use as pigments, reinforcing agents and the like.
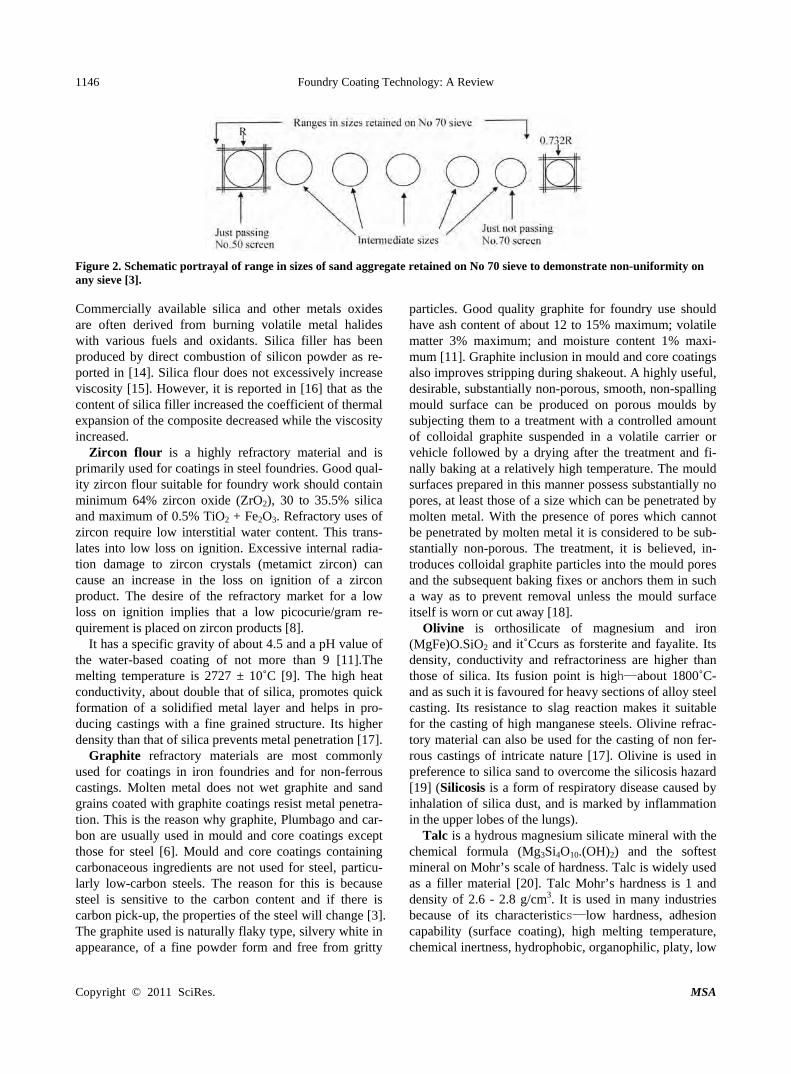
Foundry Coating Technology: A Review 1146
Figure 2. Schematic portrayal of range in sizes of sand aggregate retained on No 70 sieve to demonstrate non-uniformity on any sieve [3]. Commercially available silica and other metals oxides are often derived from burning volatile metal halides with various fuels and oxidants. Silica filler has been produced by direct combustion of silicon powder as re-ported in [14]. Silica flour does not excessively increase viscosity [15]. However, it is reported in [16] that as the content of silica filler increased the coefficient of thermal expansion of the composite decreased while the viscosity increased.
Zircon flour is a highly refractory material and is primarily used for coatings in steel foundries. Good qual-ity zircon flour suitable for foundry work should contain minimum 64% zircon oxide (ZrO2), 30 to 35.5% silica and maximum of 0.5% TiO2 + Fe2O3. Refractory uses of zircon require low interstitial water content. This trans-lates into low loss on ignition. Excessive internal radia-tion damage to zircon crystals (metamict zircon) can cause an increase in the loss on ignition of a zircon product. The desire of the refractory market for a low loss on ignition implies that a low picocurie/gram re-quirement is placed on zircon products [8].
It has a specific gravity of about 4.5 and a pH value of the water-based coating of not more than 9 [11].The melting temperature is 2727 ± 10˚C [9]. The high heat conductivity, about double that of silica, promotes quick formation of a solidified metal layer and helps in pro-ducing castings with a fine grained structure. Its higher density than that of silica prevents metal penetration [17].
Graphite refractory materials are most commonly used for coatings in iron foundries and for non-ferrous castings. Molten metal does not wet graphite and sand grains coated with graphite coatings resist metal penetra-tion. This is the reason why graphite, Plumbago and car-bon are usually used in mould and core coatings except those for steel [6]. Mould and core coatings containing carbonaceous ingredients are not used for steel, particu-larly low-carbon steels. The reason for this is because steel is sensitive to the carbon content and if there is carbon pick-up, the properties of the steel will change [3]. The graphite used is naturally flaky type, silvery white in appearance, of a fine powder form and free from gritty
particles. Good quality graphite for foundry use should have ash content of about 12 to 15% maximum; volatile matter 3% maximum; and moisture content 1% maxi-mum [11]. Graphite inclusion in mould and core coatings also improves stripping during shakeout. A highly useful, desirable, substantially non-porous, smooth, non-spalling mould surface can be produced on porous moulds by subjecting them to a treatment with a controlled amount of colloidal graphite suspended in a volatile carrier or vehicle followed by a drying after the treatment and fi-nally baking at a relatively high temperature. The mould surfaces prepared in this manner possess substantially no pores, at least those of a size which can be penetrated by molten metal. With the presence of pores which cannot be penetrated by molten metal it is considered to be sub-stantially non-porous. The treatment, it is believed, in-troduces colloidal graphite particles into the mould pores and the subsequent baking fixes or anchors them in such a way as to prevent removal unless the mould surface itself is worn or cut away [18].
Olivine is orthosilicate of magnesium and iron (MgFe)O.SiO2 and it˚Ccurs as forsterite and fayalite. Its density, conductivity and refractoriness are higher than those of silica. Its fusion point is high—about 1800˚C- and as such it is favoured for heavy sections of alloy steel casting. Its resistance to slag reaction makes it suitable for the casting of high manganese steels. Olivine refrac-tory material can also be used for the casting of non fer-rous castings of intricate nature [17]. Olivine is used in preference to silica sand to overcome the silicosis hazard [19] (Silicosis is a form of respiratory disease caused by inhalation of silica dust, and is marked by inflammation in the upper lobes of the lungs).
Talc is a hydrous magnesium silicate mineral with the chemical formula (Mg3Si4O10.(OH)2) and the softest mineral on Mohr’s scale of hardness. Talc is widely used as a filler material [20]. Talc Mohr’s hardness is 1 and density of 2.6 - 2.8 g/cm3. It is used in many industries because of its characteristics—low hardness, adhesion capability (surface coating), high melting temperature, chemical inertness, hydrophobic, organophilic, platy, low
Copyright © 2011 SciRes. MSA
Foundry Coating Technology: A Review 1147
electrical and high thermal conductivity [20,21]. The inert and lamellar platy natures of talc improve its crack-ing resistance, adhesion and barrier properties. Talc is practically insoluble in water and weak acids and alkalis. Above 900˚C, talc progressively loses its hydroxyl groups and above 1050˚C, it recrystallizes into different forms of enstatite (anhydrous magnesium silicate). Talc’s melting point is at 1500˚C [22].
Mica is a plate-like crystalline aluminosilicate and has been widely used as reinforcing filler in polymer matrix due to its excellent mechanical, electrical and thermal properties as well as lower cost than carbon or glass fi-bres [23]. Chemically they contain complex silicate of aluminium and alkalis with hydroxyl. They crystallize in monoclinic system. Some varieties may contain iron, magnesium, lithium. There are seven important mica minerals: Muscovite or potassium mica, H2KAl3(SiO4)3; Paragonite or sodium mica, H2NaAl3(SiO4)3; Lepidolite or lithium mica, K Li Al(OH, F)2Al(SiO4)3; Phlogopite or magnesium mica , H2KMg3Al(SiO4)3; Biotite or magne-sium iron mica , (H2K)(Mg, Fe)3Al(SiO4)3; Zinnwaldite or lithium iron mica, Li2K2Fe2Al4Si7O24; and Lepidome-lane or iron mica , (H, K)2(Fe, Al)4(SiO4)5. Muscovite is the commonest of all and whenever the word mica is used it is understood to mean muscovite. No other natu-ral substance has been found to possess the properties equal to those of mica. Of all the known varieties of mica only muscovite and phlogopite are of commercial im-portance. Muscovite finds the largest use while phlogopite has a limited application. On the other hand phlogopite is superior to muscovite in heat resistance. Muscovite can withstand temperatures up to 700˚C, and phlogopite up to about 1000˚C. Phlogopite is, therefore, preferred where a high temperature is required [24]. Mica can be used as refractory filler in foundry core and mould coatings to eliminate or reduce finning defect in castings because of its lamellar plate-like nature [8].
Clays used for the manufacture of refractory fillers are the kaolinites. In the kaolinites there are equal numbers of silica and alumina sheets and equal numbers of silicon and aluminium atoms. The basic composition is Al2O3.2SiO2.2H2O [25]. Kaolinite crystals are normally hexagonal disks which are built up by laying double sheets of alumina˚Ctahedral and silica tetrahedral on top of one another [26]. Kaolin clay is the most extensively used particulate mineral in the filling of coating of paper [27,28]. Since kaolin clay is fine and refractory and has found application in coating for papers, it also has poten-tial application in foundry coating technology.
Other filler materials and their properties are provided in Table 1.
Different filler materials and their functions in the ma-trix depending on their various particles sizes are pre-
sented in Figure 3.
3.2. Liquid Carrier
The liquid career is the medium containing the coating constituents and also serves as the vehicle to transport the filler materials onto the sand substrate [11]. Therefore, the coatings are typically suspensions of high melting point refractories in a liquid carrier. Liquid carrier con-stitutes about 20 to 40% of the coating. After application, it is necessary to dry the coating to prevent gas formation when the hot metal is poured into the mould. The forma-tion of gases may cause casting defects. After the liquid carrier is removed by evaporation or combustion, a pro-tective refractory layer is deposited on the surface of the mould or core [29,30]. This layer prevents or minimizes the penetration of molten metal into the sand, reduces or prevents "burn-on" and erosion of the sand, and generally improves the quality of a casting surface. However, there are many factors to consider with carrier selection, in-cluding: compatibility of carrier with sand binder and/or refractory, method of drying, flammability and “burning” characteristics; toxicity and odour; application; labour and floor space. The most commonly used carrier are water-based (aqueous) and spirit-based (organic solvent) [29]. Table 1. Other filler materials and their respective proper-ties [17].
Data Chamotte Chromite Magnesite Chrome- Magnesite
Availability abundant Good Good Good Refractoriness
(approx.) 1780 1850 1850 1850
Thermal expansion (×1000 mm/m) 0.0052 0.007 0.014 0.012
Thermal conductivity (WK-1m-1) 6-9.5 9-15 20-30 13-20
Wettability with molten metal No wetting No wetting No wetting No wetting
Figure 3. Classification of fillers according to average parti-cle size [31].
Copyright © 2011 SciRes. MSA
Foundry Coating Technology: A Review 1148
3.2.1. Aqueous-Based Carrier In this class, water is used as the carrier. Water is cheap and readily available but drying in an oven is usually necessary to remove it before casting [11,12,29]. Water is non flammable and non toxic. It has no flash point. Water is the safest of the carriers. From environmental view point, the use of water-based coatings is highly recommended. However, apart from requiring heat to dry water-coatings, complete drying of deep pockets in a reasonable time can be difficult. It has greater tendency for tears or runs compared to organic-based coatings. It reduces the tensile strength of urethane no-bakes, cold box and silicate sands. It increases the potential for core breakage. There is also possible degradation during core storage. Moreover, aqueous-based coatings can freeze [29].
3.2.2. Organic Solvent-Based Carrier Organic solvent-based or spirit-based coating usually contains isopropanol (isopropyl alcohol) as liquid carrier for coating constituents, and the coating is dried by ig-niting and burning off the isopropanol [12]. This is typi-cal of organic solvent-based carriers which also include methanol, ethanol, hydrocarbons and chlorinated hydro-carbons. They dry very fast. Isopropanol is recommended for use on large moulds and cores [11]. Isopropanol has good combustion characteristics with slow burning front and a moderate hot flame. This reduces the chance of over-heating the sand surface and subsequent problems of sand friability. Isopropanol is also technically accept-able because it is compatible with a wide range of sus-pension agents and resin binders also used in the formu-lation of these coatings. Most of the organic sol-vent-based carriers are referred to as air-drying carrier. These include carbon tetrachloride, methylenechloride, chloroethene and chloroform. They rely for efficiency on a rapid rate of evaporation which places them in a more hazardous category than isopropanol. They are also not versatile as isopropanol in the formation of foundry coatings. In many cases, they call for specialized forms of gelling media and resin binders [6]. The use of organic solvent-based coatings is threatened by environmental issues because they are toxic and flammable [30].
3.3. Suspension Agents (The Rheology Control System)
There is no difficulty in keeping solid particles in per-manent suspension in a liquid if both have the same spe-cific gravity. This is not the case with foundry sand coatings. The maintenance of solid particles in suspen-sion is achieved by addition of suspension agents. These agents provide the suspension system that prevents the filler particles from agglomerating and separating out during storage of the coating over extended periods. It
ensures that the coating is homogeneous and ready for application with the minimum of agitation. It also con-trols the flow properties of the coating and is designed to suit the application method that is used [11,12]. The sus-pension agent makes up 1 to 5% of the coating.
When water is used as the carrier liquid, bentonite clay is used as a suspension agent. Bentonite swells and forms a gel when mixed with water. Time must be allowed for gelling to proceed to completion. Two kinds of bentonite are in common use, one linked with calcium and the other with sodium ions. As a suspension agent bentonites ini-tially of the sodium type are preferred. Calcium bentonite is converted to sodium bentonite by treatment with so-dium carbonate. This treatment affects the swelling power of the clay and makes control of the viscosity of the coat-ing unpredictable. Apart from the difficulties with quality control of the bentonite, it has the disadvantage of tending to induce shrinkage cracks in the coating when dried. In view of the drawbacks associated with bentonite, substi-tutes are found in polysaccharide and certain forms of carboxymethyl cellulose. Polysaccharides require special mixers, which few foundries possess, to obtain optimum suspension [6]. The cellulose type does not require this special mixers and do not induce shrinkage cracks as does dried bentonite as shown in Figure 4 below.
(a)
(b)
Figure 4. Surfaces of coated cores (a) cracking of coating induced by bentonite and (b) cracking eliminated by using carboxymethyl cellulose [6]
Copyright © 2011 SciRes. MSA
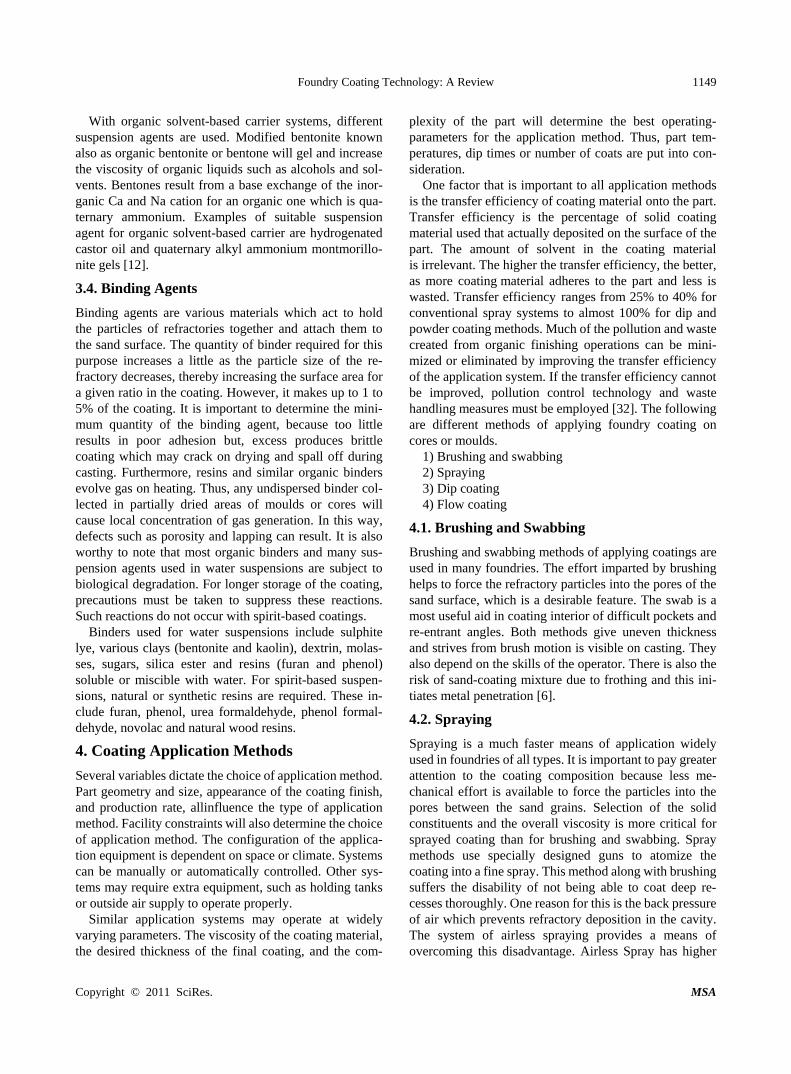
Foundry Coating Technology: A Review 1149
With organic solvent-based carrier systems, different suspension agents are used. Modified bentonite known also as organic bentonite or bentone will gel and increase the viscosity of organic liquids such as alcohols and sol-vents. Bentones result from a base exchange of the inor-ganic Ca and Na cation for an organic one which is qua-ternary ammonium. Examples of suitable suspension agent for organic solvent-based carrier are hydrogenated castor oil and quaternary alkyl ammonium montmorillo-nite gels [12].
3.4. Binding Agents
Binding agents are various materials which act to hold the particles of refractories together and attach them to the sand surface. The quantity of binder required for this purpose increases a little as the particle size of the re-fractory decreases, thereby increasing the surface area for a given ratio in the coating. However, it makes up to 1 to 5% of the coating. It is important to determine the mini-mum quantity of the binding agent, because too little results in poor adhesion but, excess produces brittle coating which may crack on drying and spall off during casting. Furthermore, resins and similar organic binders evolve gas on heating. Thus, any undispersed binder col-lected in partially dried areas of moulds or cores will cause local concentration of gas generation. In this way, defects such as porosity and lapping can result. It is also worthy to note that most organic binders and many sus-pension agents used in water suspensions are subject to biological degradation. For longer storage of the coating, precautions must be taken to suppress these reactions. Such reactions do not occur with spirit-based coatings.
Binders used for water suspensions include sulphite lye, various clays (bentonite and kaolin), dextrin, molas-ses, sugars, silica ester and resins (furan and phenol) soluble or miscible with water. For spirit-based suspen-sions, natural or synthetic resins are required. These in-clude furan, phenol, urea formaldehyde, phenol formal-dehyde, novolac and natural wood resins.
4. Coating Application Methods
Several variables dictate the choice of application method. Part geometry and size, appearance of the coating finish, and production rate, allinfluence the type of application method. Facility constraints will also determine the choice of application method. The configuration of the applica-tion equipment is dependent on space or climate. Systems can be manually or automatically controlled. Other sys-tems may require extra equipment, such as holding tanks or outside air supply to operate properly.
Similar application systems may operate at widely varying parameters. The viscosity of the coating material, the desired thickness of the final coating, and the com-
plexity of the part will determine the best operating-parameters for the application method. Thus, part tem-peratures, dip times or number of coats are put into con-sideration.
One factor that is important to all application methods is the transfer efficiency of coating material onto the part. Transfer efficiency is the percentage of solid coating material used that actually deposited on the surface of the part. The amount of solvent in the coating material is irrelevant. The higher the transfer efficiency, the better, as more coating material adheres to the part and less is wasted. Transfer efficiency ranges from 25% to 40% for conventional spray systems to almost 100% for dip and powder coating methods. Much of the pollution and waste created from organic finishing operations can be mini-mized or eliminated by improving the transfer efficiency of the application system. If the transfer efficiency cannot be improved, pollution control technology and waste handling measures must be employed [32]. The following are different methods of applying foundry coating on cores or moulds.
1) Brushing and swabbing 2) Spraying 3) Dip coating 4) Flow coating
4.1. Brushing and Swabbing
Brushing and swabbing methods of applying coatings are used in many foundries. The effort imparted by brushing helps to force the refractory particles into the pores of the sand surface, which is a desirable feature. The swab is a most useful aid in coating interior of difficult pockets and re-entrant angles. Both methods give uneven thickness and strives from brush motion is visible on casting. They also depend on the skills of the operator. There is also the risk of sand-coating mixture due to frothing and this ini-tiates metal penetration [6].
4.2. Spraying
Spraying is a much faster means of application widely used in foundries of all types. It is important to pay greater attention to the coating composition because less me-chanical effort is available to force the particles into the pores between the sand grains. Selection of the solid constituents and the overall viscosity is more critical for sprayed coating than for brushing and swabbing. Spray methods use specially designed guns to atomize the coating into a fine spray. This method along with brushing suffers the disability of not being able to coat deep re-cesses thoroughly. One reason for this is the back pressure of air which prevents refractory deposition in the cavity. The system of airless spraying provides a means of overcoming this disadvantage. Airless Spray has higher
Copyright © 2011 SciRes. MSA
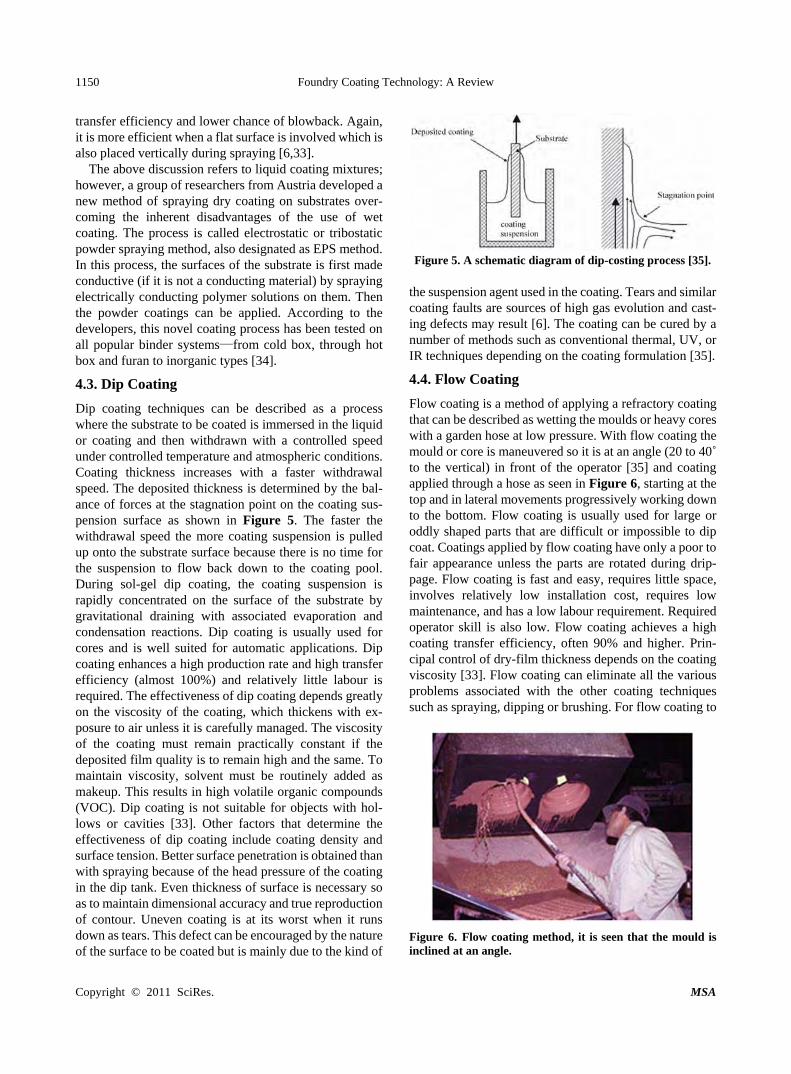
Foundry Coating Technology: A Review 1150
transfer efficiency and lower chance of blowback. Again, it is more efficient when a flat surface is involved which is also placed vertically during spraying [6,33].
The above discussion refers to liquid coating mixtures; however, a group of researchers from Austria developed a new method of spraying dry coating on substrates over-coming the inherent disadvantages of the use of wet coating. The process is called electrostatic or tribostatic powder spraying method, also designated as EPS method. In this process, the surfaces of the substrate is first made conductive (if it is not a conducting material) by spraying electrically conducting polymer solutions on them. Then the powder coatings can be applied. According to the developers, this novel coating process has been tested on all popular binder systems—from cold box, through hot box and furan to inorganic types [34].
4.3. Dip Coating
Dip coating techniques can be described as a process where the substrate to be coated is immersed in the liquid or coating and then withdrawn with a controlled speed under controlled temperature and atmospheric conditions. Coating thickness increases with a faster withdrawal speed. The deposited thickness is determined by the bal-ance of forces at the stagnation point on the coating sus-pension surface as shown in Figure 5. The faster the withdrawal speed the more coating suspension is pulled up onto the substrate surface because there is no time for the suspension to flow back down to the coating pool. During sol-gel dip coating, the coating suspension is rapidly concentrated on the surface of the substrate by gravitational draining with associated evaporation and condensation reactions. Dip coating is usually used for cores and is well suited for automatic applications. Dip coating enhances a high production rate and high transfer efficiency (almost 100%) and relatively little labour is required. The effectiveness of dip coating depends greatly on the viscosity of the coating, which thickens with ex-posure to air unless it is carefully managed. The viscosity of the coating must remain practically constant if the deposited film quality is to remain high and the same. To maintain viscosity, solvent must be routinely added as makeup. This results in high volatile organic compounds (VOC). Dip coating is not suitable for objects with hol-lows or cavities [33]. Other factors that determine the effectiveness of dip coating include coating density and surface tension. Better surface penetration is obtained than with spraying because of the head pressure of the coating in the dip tank. Even thickness of surface is necessary so as to maintain dimensional accuracy and true reproduction of contour. Uneven coating is at its worst when it runs down as tears. This defect can be encouraged by the nature of the surface to be coated but is mainly due to the kind of
Figure 5. A schematic diagram of dip-costing process [35].
the suspension agent used in the coating. Tears and similar coating faults are sources of high gas evolution and cast-ing defects may result [6]. The coating can be cured by a number of methods such as conventional thermal, UV, or IR techniques depending on the coating formulation [35].
4.4. Flow Coating
Flow coating is a method of applying a refractory coating that can be described as wetting the moulds or heavy cores with a garden hose at low pressure. With flow coating the mould or core is maneuvered so it is at an angle (20 to 40˚ to the vertical) in front of the operator [35] and coating applied through a hose as seen in Figure 6, starting at the top and in lateral movements progressively working down to the bottom. Flow coating is usually used for large or oddly shaped parts that are difficult or impossible to dip coat. Coatings applied by flow coating have only a poor to fair appearance unless the parts are rotated during drip-page. Flow coating is fast and easy, requires little space, involves relatively low installation cost, requires low maintenance, and has a low labour requirement. Required operator skill is also low. Flow coating achieves a high coating transfer efficiency, often 90% and higher. Prin-cipal control of dry-film thickness depends on the coating viscosity [33]. Flow coating can eliminate all the various problems associated with the other coating techniques such as spraying, dipping or brushing. For flow coating to
Figure 6. Flow coating method, it is seen that the mould is inclined at an angle.
Copyright © 2011 SciRes. MSA
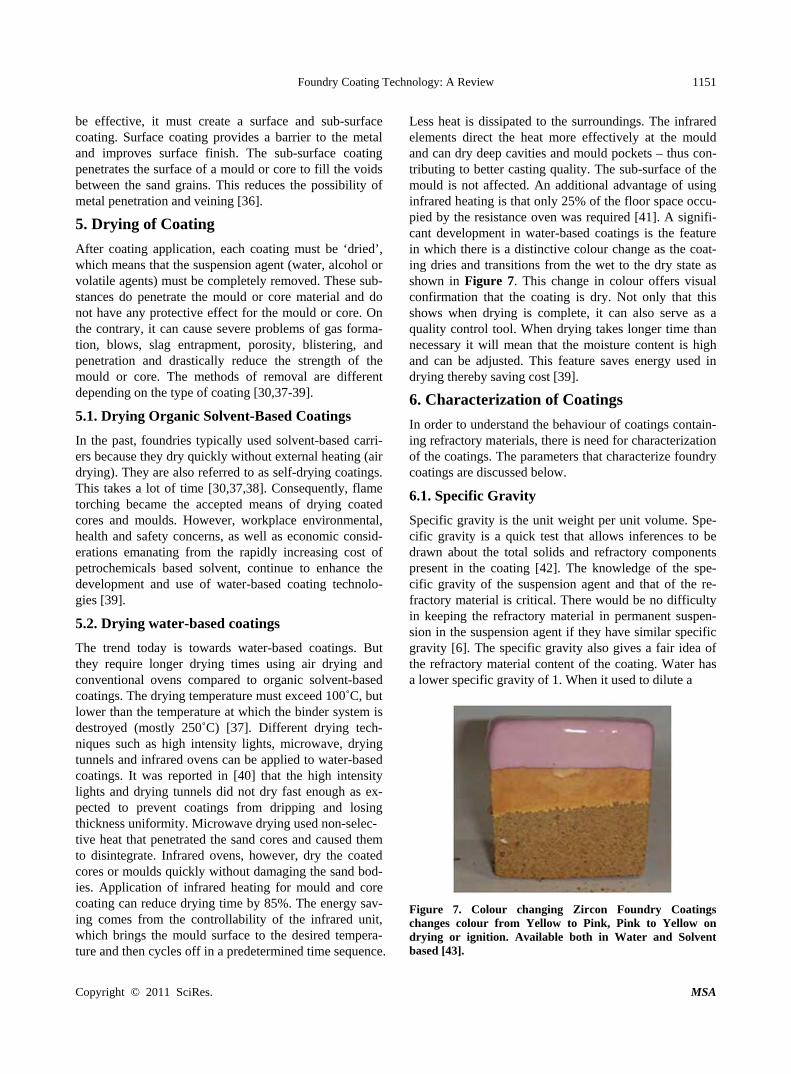
Foundry Coating Technology: A Review 1151
be effective, it must create a surface and sub-surface coating. Surface coating provides a barrier to the metal and improves surface finish. The sub-surface coating penetrates the surface of a mould or core to fill the voids between the sand grains. This reduces the possibility of metal penetration and veining [36].
5. Drying of Coating
After coating application, each coating must be ‘dried’, which means that the suspension agent (water, alcohol or volatile agents) must be completely removed. These sub-stances do penetrate the mould or core material and do not have any protective effect for the mould or core. On the contrary, it can cause severe problems of gas forma-tion, blows, slag entrapment, porosity, blistering, and penetration and drastically reduce the strength of the mould or core. The methods of removal are different depending on the type of coating [30,37-39].
5.1. Drying Organic Solvent-Based Coatings
In the past, foundries typically used solvent-based carri-ers because they dry quickly without external heating (air drying). They are also referred to as self-drying coatings. This takes a lot of time [30,37,38]. Consequently, flame torching became the accepted means of drying coated cores and moulds. However, workplace environmental, health and safety concerns, as well as economic consid-erations emanating from the rapidly increasing cost of petrochemicals based solvent, continue to enhance the development and use of water-based coating technolo-gies [39].
5.2. Drying water-based coatings
The trend today is towards water-based coatings. But they require longer drying times using air drying and conventional ovens compared to organic solvent-based coatings. The drying temperature must exceed 100˚C, but lower than the temperature at which the binder system is destroyed (mostly 250˚C) [37]. Different drying tech-niques such as high intensity lights, microwave, drying tunnels and infrared ovens can be applied to water-based coatings. It was reported in [40] that the high intensity lights and drying tunnels did not dry fast enough as ex-pected to prevent coatings from dripping and losing thickness uniformity. Microwave drying used non-selec- tive heat that penetrated the sand cores and caused them to disintegrate. Infrared ovens, however, dry the coated cores or moulds quickly without damaging the sand bod-ies. Application of infrared heating for mould and core coating can reduce drying time by 85%. The energy sav-ing comes from the controllability of the infrared unit, which brings the mould surface to the desired tempera-ture and then cycles off in a predetermined time sequence.
Less heat is dissipated to the surroundings. The infrared elements direct the heat more effectively at the mould and can dry deep cavities and mould pockets – thus con-tributing to better casting quality. The sub-surface of the mould is not affected. An additional advantage of using infrared heating is that only 25% of the floor space occu-pied by the resistance oven was required [41]. A signifi-cant development in water-based coatings is the feature in which there is a distinctive colour change as the coat-ing dries and transitions from the wet to the dry state as shown in Figure 7. This change in colour offers visual confirmation that the coating is dry. Not only that this shows when drying is complete, it can also serve as a quality control tool. When drying takes longer time than necessary it will mean that the moisture content is high and can be adjusted. This feature saves energy used in drying thereby saving cost [39].
6. Characterization of Coatings In order to understand the behaviour of coatings contain-ing refractory materials, there is need for characterization of the coatings. The parameters that characterize foundry coatings are discussed below.
6.1. Specific Gravity
Specific gravity is the unit weight per unit volume. Spe-cific gravity is a quick test that allows inferences to be drawn about the total solids and refractory components present in the coating [42]. The knowledge of the spe-cific gravity of the suspension agent and that of the re-fractory material is critical. There would be no difficulty in keeping the refractory material in permanent suspen-sion in the suspension agent if they have similar specific gravity [6]. The specific gravity also gives a fair idea of the refractory material content of the coating. Water has a lower specific gravity of 1. When it used to dilute a
Figure 7. Colour changing Zircon Foundry Coatings changes colour from Yellow to Pink, Pink to Yellow on drying or ignition. Available both in Water and Solvent based [43].
Copyright © 2011 SciRes. MSA
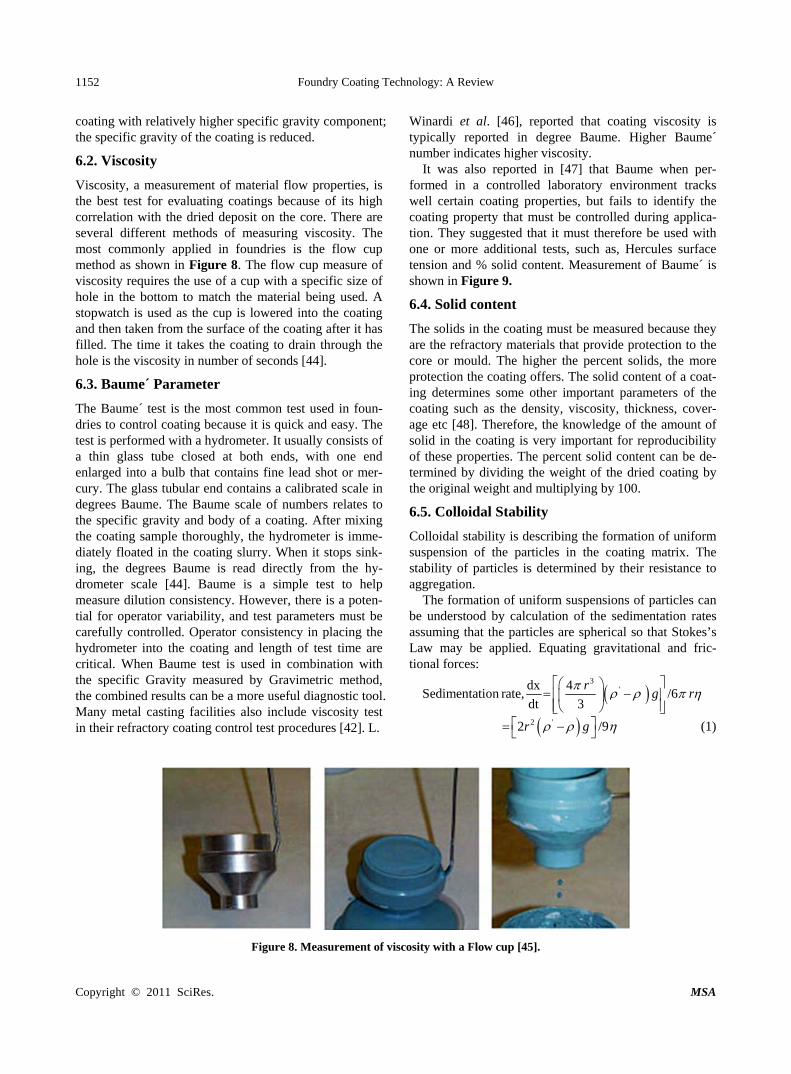
Foundry Coating Technology: A Review
Copyright © 2011 SciRes. MSA
1152
Winardi et al. [46], reported that coating viscosity is typically reported in degree Baume. Higher Baume´ number indicates higher viscosity.
coating with relatively higher specific gravity component; the specific gravity of the coating is reduced.
6.2. Viscosity It was also reported in [47] that Baume when per-formed in a controlled laboratory environment tracks well certain coating properties, but fails to identify the coating property that must be controlled during applica-tion. They suggested that it must therefore be used with one or more additional tests, such as, Hercules surface tension and % solid content. Measurement of Baume´ is shown in Figure 9.
Viscosity, a measurement of material flow properties, is the best test for evaluating coatings because of its high correlation with the dried deposit on the core. There are several different methods of measuring viscosity. The most commonly applied in foundries is the flow cup method as shown in Figure 8. The flow cup measure of viscosity requires the use of a cup with a specific size of hole in the bottom to match the material being used. A stopwatch is used as the cup is lowered into the coating and then taken from the surface of the coating after it has filled. The time it takes the coating to drain through the hole is the viscosity in number of seconds [44].
6.4. Solid content
The solids in the coating must be measured because they are the refractory materials that provide protection to the core or mould. The higher the percent solids, the more protection the coating offers. The solid content of a coat-ing determines some other important parameters of the coating such as the density, viscosity, thickness, cover-age etc [48]. Therefore, the knowledge of the amount of solid in the coating is very important for reproducibility of these properties. The percent solid content can be de-termined by dividing the weight of the dried coating by the original weight and multiplying by 100.
6.3. Baume´ Parameter
The Baume´ test is the most common test used in foun-dries to control coating because it is quick and easy. The test is performed with a hydrometer. It usually consists of a thin glass tube closed at both ends, with one end enlarged into a bulb that contains fine lead shot or mer-cury. The glass tubular end contains a calibrated scale in degrees Baume. The Baume scale of numbers relates to the specific gravity and body of a coating. After mixing the coating sample thoroughly, the hydrometer is imme-diately floated in the coating slurry. When it stops sink-ing, the degrees Baume is read directly from the hy-drometer scale [44]. Baume is a simple test to help measure dilution consistency. However, there is a poten-tial for operator variability, and test parameters must be carefully controlled. Operator consistency in placing the hydrometer into the coating and length of test time are critical. When Baume test is used in combination with the specific Gravity measured by Gravimetric method, the combined results can be a more useful diagnostic tool. Many metal casting facilities also include viscosity test in their refractory coating control test procedures [42]. L.
6.5. Colloidal Stability
Colloidal stability is describing the formation of uniform suspension of the particles in the coating matrix. The stability of particles is determined by their resistance to aggregation.
The formation of uniform suspensions of particles can be understood by calculation of the sedimentation rates assuming that the particles are spherical so that Stokes’s Law may be applied. Equating gravitational and fric-tional forces:
3
'dx 4Sedimentation rate, /6dt 3
rg r
2 '2r g /9 (1)
Figure 8. Measurement of viscosity with a Flow cup [45].
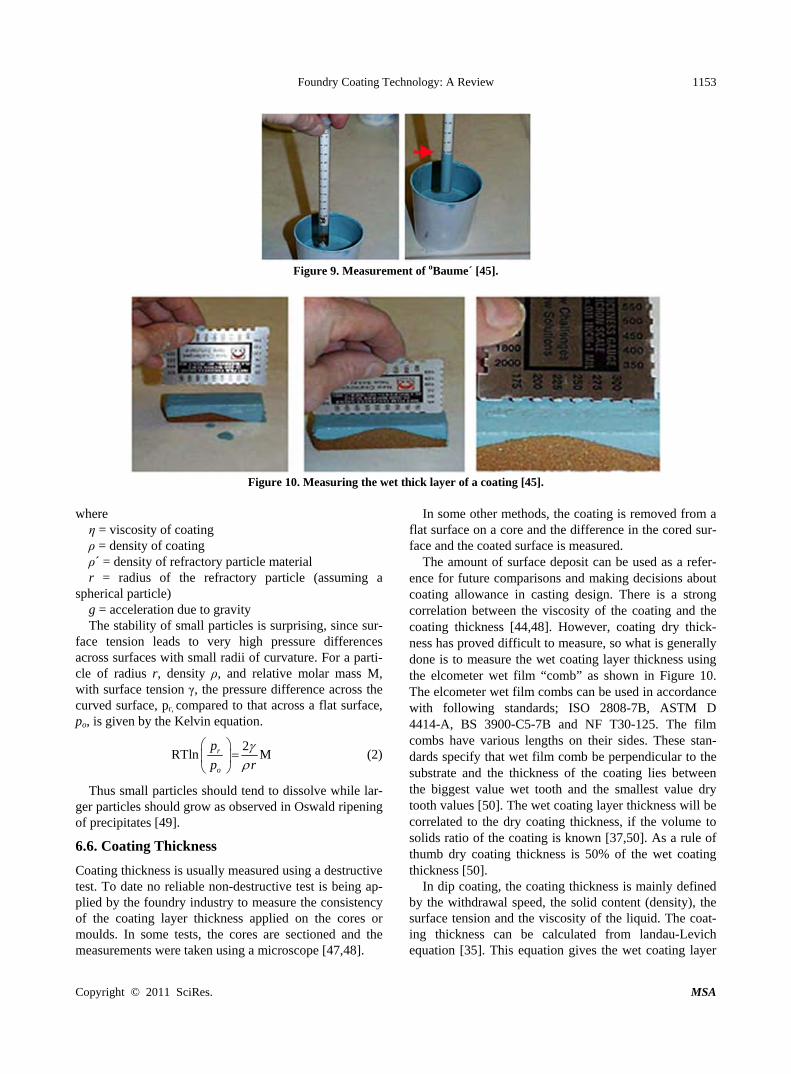
Foundry Coating Technology: A Review 1153
Figure 9. Measurement of oBaume´ [45].
Figure 10. Measuring the wet thick layer of a coating [45].
where η = viscosity of coating ρ = density of coating ρ´ = density of refractory particle material r = radius of the refractory particle (assuming a
spherical particle) g = acceleration due to gravity The stability of small particles is surprising, since sur-
face tension leads to very high pressure differences across surfaces with small radii of curvature. For a parti-cle of radius r, density ρ, and relative molar mass M, with surface tension γ, the pressure difference across the curved surface, pr, compared to that across a flat surface, po, is given by the Kelvin equation.
2RTln Mr
o
p
p r
(2)
Thus small particles should tend to dissolve while lar-ger particles should grow as observed in Oswald ripening of precipitates [49].
6.6. Coating Thickness
Coating thickness is usually measured using a destructive test. To date no reliable non-destructive test is being ap-plied by the foundry industry to measure the consistency of the coating layer thickness applied on the cores or moulds. In some tests, the cores are sectioned and the measurements were taken using a microscope [47,48].
In some other methods, the coating is removed from a flat surface on a core and the difference in the cored sur-face and the coated surface is measured.
The amount of surface deposit can be used as a refer-ence for future comparisons and making decisions about coating allowance in casting design. There is a strong correlation between the viscosity of the coating and the coating thickness [44,48]. However, coating dry thick-ness has proved difficult to measure, so what is generally done is to measure the wet coating layer thickness using the elcometer wet film “comb” as shown in Figure 10. The elcometer wet film combs can be used in accordance with following standards; ISO 2808-7B, ASTM D 4414-A, BS 3900-C5-7B and NF T30-125. The film combs have various lengths on their sides. These stan-dards specify that wet film comb be perpendicular to the substrate and the thickness of the coating lies between the biggest value wet tooth and the smallest value dry tooth values [50]. The wet coating layer thickness will be correlated to the dry coating thickness, if the volume to solids ratio of the coating is known [37,50]. As a rule of thumb dry coating thickness is 50% of the wet coating thickness [50].
In dip coating, the coating thickness is mainly defined by the withdrawal speed, the solid content (density), the surface tension and the viscosity of the liquid. The coat-ing thickness can be calculated from landau-Levich equation [35]. This equation gives the wet coating layer
Copyright © 2011 SciRes. MSA
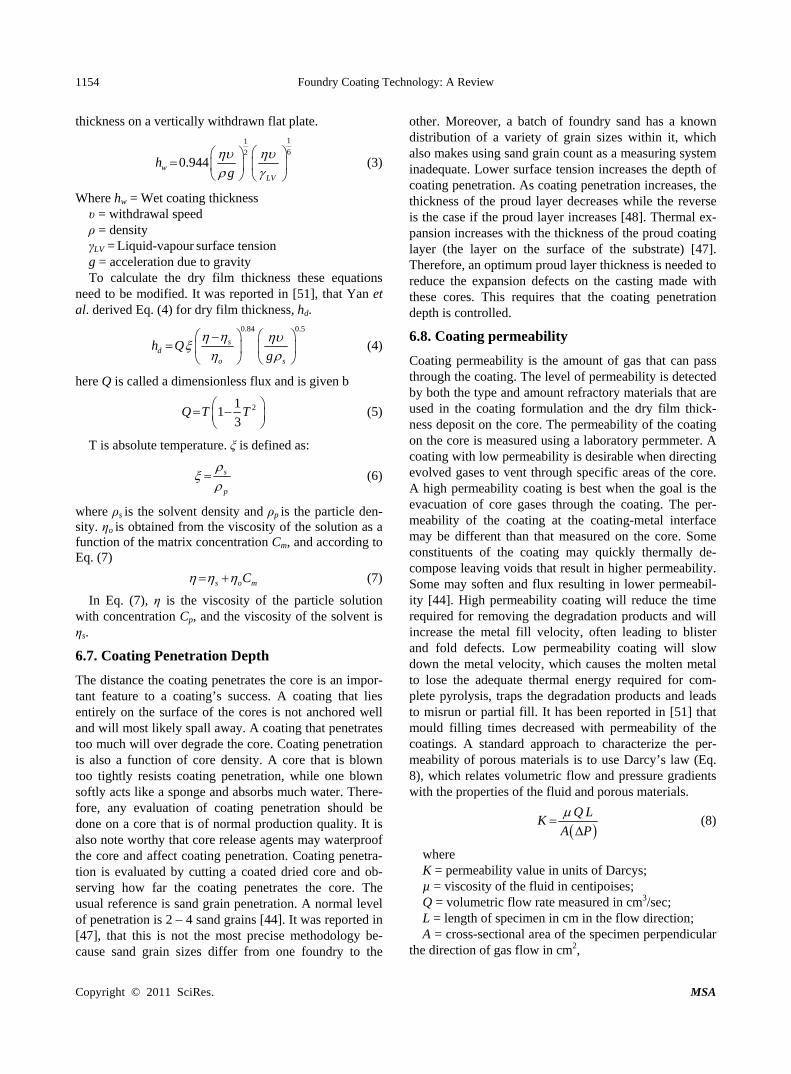
Foundry Coating Technology: A Review 1154
thickness on a vertically withdrawn flat plate. 1162
0.944wLV
hg
(3)
Where hw = Wet coating thickness υ = withdrawal speed ρ = density γLV = Liquid-vapour surface tension g = acceleration due to gravity To calculate the dry film thickness these equations
need to be modified. It was reported in [51], that Yan et al. derived Eq. (4) for dry film thickness, hd.
0.84 0.5s
do s
h Qg
(4)
here Q is called a dimensionless flux and is given b
2113
Q T T
(5)
T is absolute temperature. ξ is defined as:
s
p
(6)
where ρs is the solvent density and ρp is the particle den-sity. ηo is obtained from the viscosity of the solution as a function of the matrix concentration Cm, and according to Eq. (7)
s o mC (7)
In Eq. (7), η is the viscosity of the particle solution with concentration Cp, and the viscosity of the solvent is ηs.
6.7. Coating Penetration Depth
The distance the coating penetrates the core is an impor-tant feature to a coating’s success. A coating that lies entirely on the surface of the cores is not anchored well and will most likely spall away. A coating that penetrates too much will over degrade the core. Coating penetration is also a function of core density. A core that is blown too tightly resists coating penetration, while one blown softly acts like a sponge and absorbs much water. There-fore, any evaluation of coating penetration should be done on a core that is of normal production quality. It is also note worthy that core release agents may waterproof the core and affect coating penetration. Coating penetra-tion is evaluated by cutting a coated dried core and ob-serving how far the coating penetrates the core. The usual reference is sand grain penetration. A normal level of penetration is 2 – 4 sand grains [44]. It was reported in [47], that this is not the most precise methodology be-cause sand grain sizes differ from one foundry to the
other. Moreover, a batch of foundry sand has a known distribution of a variety of grain sizes within it, which also makes using sand grain count as a measuring system inadequate. Lower surface tension increases the depth of coating penetration. As coating penetration increases, the thickness of the proud layer decreases while the reverse is the case if the proud layer increases [48]. Thermal ex-pansion increases with the thickness of the proud coating layer (the layer on the surface of the substrate) [47]. Therefore, an optimum proud layer thickness is needed to reduce the expansion defects on the casting made with these cores. This requires that the coating penetration depth is controlled.
6.8. Coating permeability
Coating permeability is the amount of gas that can pass through the coating. The level of permeability is detected by both the type and amount refractory materials that are used in the coating formulation and the dry film thick-ness deposit on the core. The permeability of the coating on the core is measured using a laboratory permmeter. A coating with low permeability is desirable when directing evolved gases to vent through specific areas of the core. A high permeability coating is best when the goal is the evacuation of core gases through the coating. The per-meability of the coating at the coating-metal interface may be different than that measured on the core. Some constituents of the coating may quickly thermally de-compose leaving voids that result in higher permeability. Some may soften and flux resulting in lower permeabil-ity [44]. High permeability coating will reduce the time required for removing the degradation products and will increase the metal fill velocity, often leading to blister and fold defects. Low permeability coating will slow down the metal velocity, which causes the molten metal to lose the adequate thermal energy required for com-plete pyrolysis, traps the degradation products and leads to misrun or partial fill. It has been reported in [51] that mould filling times decreased with permeability of the coatings. A standard approach to characterize the per-meability of porous materials is to use Darcy’s law (Eq. 8), which relates volumetric flow and pressure gradients with the properties of the fluid and porous materials.
Q L
KA P
(8)
where K = permeability value in units of Darcys; µ = viscosity of the fluid in centipoises; Q = volumetric flow rate measured in cm3/sec; L = length of specimen in cm in the flow direction; A = cross-sectional area of the specimen perpendicular
the direction of gas flow in cm2,
Copyright © 2011 SciRes. MSA
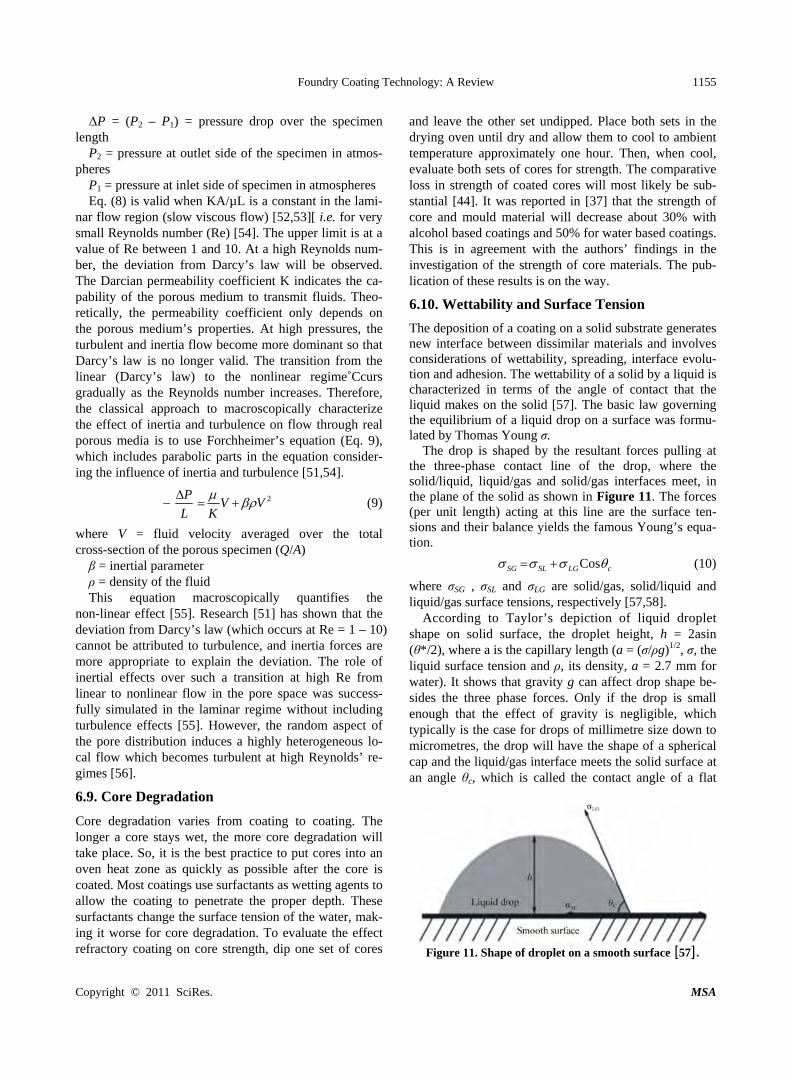
Foundry Coating Technology: A Review 1155
ΔP = (P2 – P1) = pressure drop over the specimen length
P2 = pressure at outlet side of the specimen in atmos-pheres
P1 = pressure at inlet side of specimen in atmospheres Eq. (8) is valid when KA/µL is a constant in the lami-
nar flow region (slow viscous flow) [52,53][ i.e. for very small Reynolds number (Re) [54]. The upper limit is at a value of Re between 1 and 10. At a high Reynolds num-ber, the deviation from Darcy’s law will be observed. The Darcian permeability coefficient K indicates the ca-pability of the porous medium to transmit fluids. Theo-retically, the permeability coefficient only depends on the porous medium’s properties. At high pressures, the turbulent and inertia flow become more dominant so that Darcy’s law is no longer valid. The transition from the linear (Darcy’s law) to the nonlinear regime˚Ccurs gradually as the Reynolds number increases. Therefore, the classical approach to macroscopically characterize the effect of inertia and turbulence on flow through real porous media is to use Forchheimer’s equation (Eq. 9), which includes parabolic parts in the equation consider-ing the influence of inertia and turbulence [51,54].
2PV V
L K
(9)
where V = fluid velocity averaged over the total cross-section of the porous specimen (Q/A) β = inertial parameter ρ = density of the fluid This equation macroscopically quantifies the
non-linear effect [55]. Research [51] has shown that the deviation from Darcy’s law (which occurs at Re = 1 – 10) cannot be attributed to turbulence, and inertia forces are more appropriate to explain the deviation. The role of inertial effects over such a transition at high Re from linear to nonlinear flow in the pore space was success-fully simulated in the laminar regime without including turbulence effects [55]. However, the random aspect of the pore distribution induces a highly heterogeneous lo-cal flow which becomes turbulent at high Reynolds’ re-gimes [56].
6.9. Core Degradation
Core degradation varies from coating to coating. The longer a core stays wet, the more core degradation will take place. So, it is the best practice to put cores into an oven heat zone as quickly as possible after the core is coated. Most coatings use surfactants as wetting agents to allow the coating to penetrate the proper depth. These surfactants change the surface tension of the water, mak-ing it worse for core degradation. To evaluate the effect refractory coating on core strength, dip one set of cores
and leave the other set undipped. Place both sets in the drying oven until dry and allow them to cool to ambient temperature approximately one hour. Then, when cool, evaluate both sets of cores for strength. The comparative loss in strength of coated cores will most likely be sub-stantial [44]. It was reported in [37] that the strength of core and mould material will decrease about 30% with alcohol based coatings and 50% for water based coatings. This is in agreement with the authors’ findings in the investigation of the strength of core materials. The pub-lication of these results is on the way.
6.10. Wettability and Surface Tension
The deposition of a coating on a solid substrate generates new interface between dissimilar materials and involves considerations of wettability, spreading, interface evolu-tion and adhesion. The wettability of a solid by a liquid is characterized in terms of the angle of contact that the liquid makes on the solid [57]. The basic law governing the equilibrium of a liquid drop on a surface was formu-lated by Thomas Young σ.
The drop is shaped by the resultant forces pulling at the three-phase contact line of the drop, where the solid/liquid, liquid/gas and solid/gas interfaces meet, in the plane of the solid as shown in Figure 11. The forces (per unit length) acting at this line are the surface ten-sions and their balance yields the famous Young’s equa-tion.
CosSG SL LG c (10)
where σSG , σSL and σLG are solid/gas, solid/liquid and liquid/gas surface tensions, respectively [57,58].
According to Taylor’s depiction of liquid droplet shape on solid surface, the droplet height, h = 2asin (θ*/2), where a is the capillary length (a = (σ/ρg)1/2, σ, the liquid surface tension and ρ, its density, a = 2.7 mm for water). It shows that gravity g can affect drop shape be-sides the three phase forces. Only if the drop is small enough that the effect of gravity is negligible, which typically is the case for drops of millimetre size down to micrometres, the drop will have the shape of a spherical cap and the liquid/gas interface meets the solid surface at an angle θc, which is called the contact angle of a flat
Figure 11. Shape of droplet on a smooth surface [57].
Copyright © 2011 SciRes. MSA
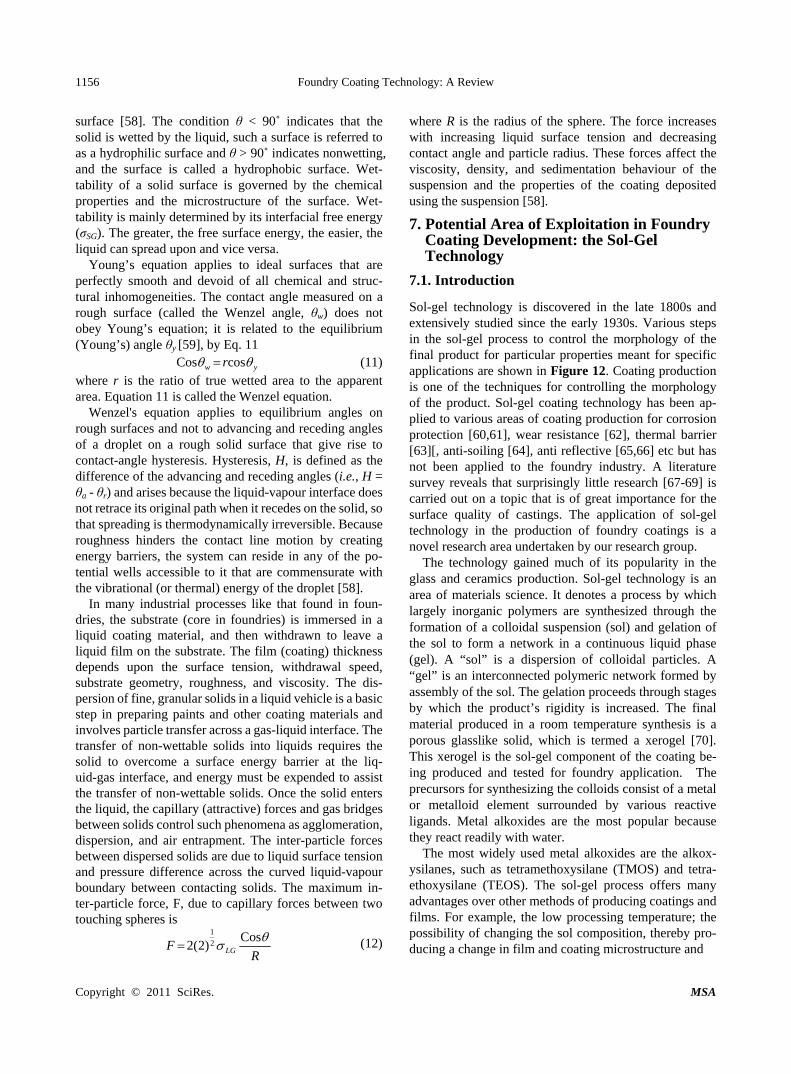
Foundry Coating Technology: A Review
Copyright © 2011 SciRes. MSA
1156
y
surface [58]. The condition θ < 90˚ indicates that the solid is wetted by the liquid, such a surface is referred to as a hydrophilic surface and θ > 90˚ indicates nonwetting, and the surface is called a hydrophobic surface. Wet-tability of a solid surface is governed by the chemical properties and the microstructure of the surface. Wet-tability is mainly determined by its interfacial free energy (σSG). The greater, the free surface energy, the easier, the liquid can spread upon and vice versa.
where R is the radius of the sphere. The force increases with increasing liquid surface tension and decreasing contact angle and particle radius. These forces affect the viscosity, density, and sedimentation behaviour of the suspension and the properties of the coating deposited using the suspension [58].
7. Potential Area of Exploitation in Foundry Coating Development: the Sol-Gel Technology Young’s equation applies to ideal surfaces that are
perfectly smooth and devoid of all chemical and struc-tural inhomogeneities. The contact angle measured on a rough surface (called the Wenzel angle, θw) does not obey Young’s equation; it is related to the equilibrium (Young’s) angle θy [59], by Eq. 11
7.1. Introduction
Sol-gel technology is discovered in the late 1800s and extensively studied since the early 1930s. Various steps in the sol-gel process to control the morphology of the final product for particular properties meant for specific applications are shown in Figure 12. Coating production is one of the techniques for controlling the morphology of the product. Sol-gel coating technology has been ap-plied to various areas of coating production for corrosion protection [60,61], wear resistance [62], thermal barrier [63][, anti-soiling [64], anti reflective [65,66] etc but has not been applied to the foundry industry. A literature survey reveals that surprisingly little research [67-69] is carried out on a topic that is of great importance for the surface quality of castings. The application of sol-gel technology in the production of foundry coatings is a novel research area undertaken by our research group.
Cos cosw r (11) where r is the ratio of true wetted area to the apparent area. Equation 11 is called the Wenzel equation.
Wenzel's equation applies to equilibrium angles on rough surfaces and not to advancing and receding angles of a droplet on a rough solid surface that give rise to contact-angle hysteresis. Hysteresis, H, is defined as the difference of the advancing and receding angles (i.e., H = θa - θr) and arises because the liquid-vapour interface does not retrace its original path when it recedes on the solid, so that spreading is thermodynamically irreversible. Because roughness hinders the contact line motion by creating energy barriers, the system can reside in any of the po-tential wells accessible to it that are commensurate with the vibrational (or thermal) energy of the droplet [58].
The technology gained much of its popularity in the glass and ceramics production. Sol-gel technology is an area of materials science. It denotes a process by which largely inorganic polymers are synthesized through the formation of a colloidal suspension (sol) and gelation of the sol to form a network in a continuous liquid phase (gel). A “sol” is a dispersion of colloidal particles. A “gel” is an interconnected polymeric network formed by assembly of the sol. The gelation proceeds through stages by which the product’s rigidity is increased. The final material produced in a room temperature synthesis is a porous glasslike solid, which is termed a xerogel [70]. This xerogel is the sol-gel component of the coating be-ing produced and tested for foundry application. The precursors for synthesizing the colloids consist of a metal or metalloid element surrounded by various reactive ligands. Metal alkoxides are the most popular because they react readily with water.
In many industrial processes like that found in foun-dries, the substrate (core in foundries) is immersed in a liquid coating material, and then withdrawn to leave a liquid film on the substrate. The film (coating) thickness depends upon the surface tension, withdrawal speed, substrate geometry, roughness, and viscosity. The dis-persion of fine, granular solids in a liquid vehicle is a basic step in preparing paints and other coating materials and involves particle transfer across a gas-liquid interface. The transfer of non-wettable solids into liquids requires the solid to overcome a surface energy barrier at the liq-uid-gas interface, and energy must be expended to assist the transfer of non-wettable solids. Once the solid enters the liquid, the capillary (attractive) forces and gas bridges between solids control such phenomena as agglomeration, dispersion, and air entrapment. The inter-particle forces between dispersed solids are due to liquid surface tension and pressure difference across the curved liquid-vapour boundary between contacting solids. The maximum in-ter-particle force, F, due to capillary forces between two touching spheres is
The most widely used metal alkoxides are the alkox-ysilanes, such as tetramethoxysilane (TMOS) and tetra-ethoxysilane (TEOS). The sol-gel process offers many advantages over other methods of producing coatings and films. For example, the low processing temperature; the possibility of changing the sol composition, thereby pro-ducing a change in film and coating microstructure and
12 Cos2(2) LGF
R
(12)
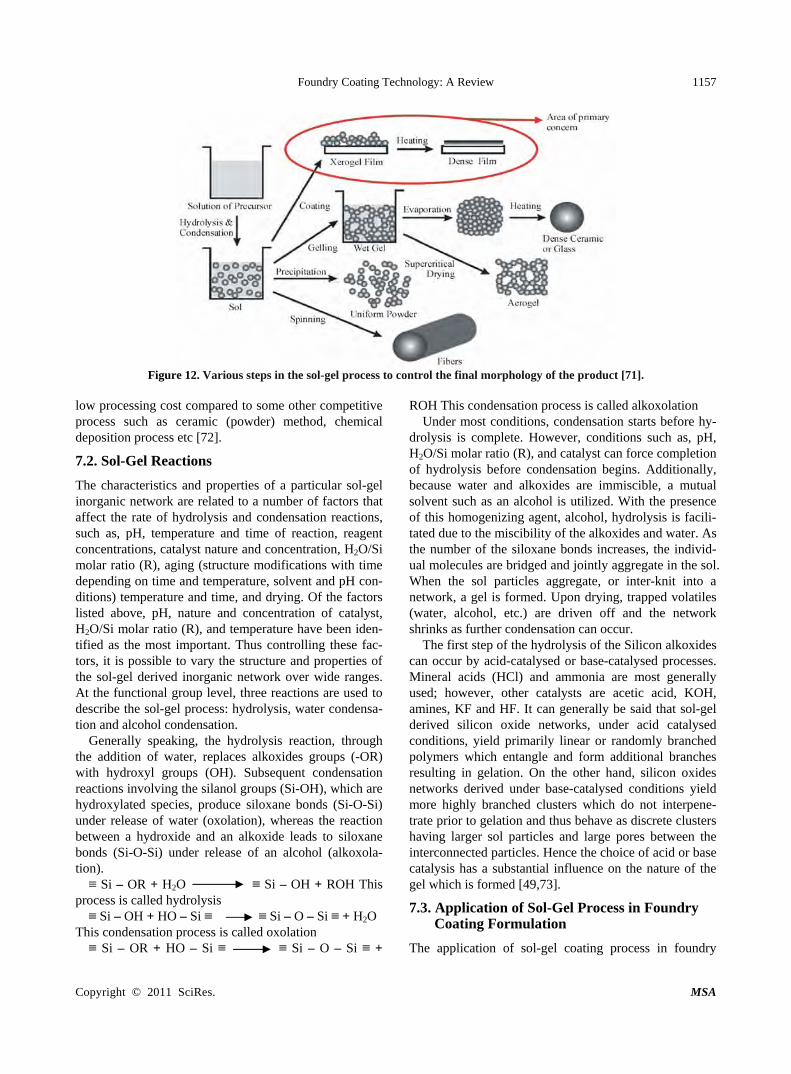
Foundry Coating Technology: A Review 1157
Figure 12. Various steps in the sol-gel process to control the final morphology of the product [71].
low processing cost compared to some other competitive process such as ceramic (powder) method, chemical deposition process etc [72].
7.2. Sol-Gel Reactions
The characteristics and properties of a particular sol-gel inorganic network are related to a number of factors that affect the rate of hydrolysis and condensation reactions, such as, pH, temperature and time of reaction, reagent concentrations, catalyst nature and concentration, H2O/Si molar ratio (R), aging (structure modifications with time depending on time and temperature, solvent and pH con-ditions) temperature and time, and drying. Of the factors listed above, pH, nature and concentration of catalyst, H2O/Si molar ratio (R), and temperature have been iden-tified as the most important. Thus controlling these fac-tors, it is possible to vary the structure and properties of the sol-gel derived inorganic network over wide ranges. At the functional group level, three reactions are used to describe the sol-gel process: hydrolysis, water condensa-tion and alcohol condensation.
Generally speaking, the hydrolysis reaction, through the addition of water, replaces alkoxides groups (-OR) with hydroxyl groups (OH). Subsequent condensation reactions involving the silanol groups (Si-OH), which are hydroxylated species, produce siloxane bonds (Si-O-Si) under release of water (oxolation), whereas the reaction between a hydroxide and an alkoxide leads to siloxane bonds (Si-O-Si) under release of an alcohol (alkoxola-tion). ≡ Si – OR + H2O ≡ Si – OH + ROH This
process is called hydrolysis ≡ Si – OH + HO – Si ≡ ≡ Si – O – Si ≡ + H2O
This condensation process is called oxolation ≡ Si – OR + HO – Si ≡ ≡ Si – O – Si ≡ +
ROH This condensation process is called alkoxolation Under most conditions, condensation starts before hy-
drolysis is complete. However, conditions such as, pH, H2O/Si molar ratio (R), and catalyst can force completion of hydrolysis before condensation begins. Additionally, because water and alkoxides are immiscible, a mutual solvent such as an alcohol is utilized. With the presence of this homogenizing agent, alcohol, hydrolysis is facili-tated due to the miscibility of the alkoxides and water. As the number of the siloxane bonds increases, the individ-ual molecules are bridged and jointly aggregate in the sol. When the sol particles aggregate, or inter-knit into a network, a gel is formed. Upon drying, trapped volatiles (water, alcohol, etc.) are driven off and the network shrinks as further condensation can occur.
The first step of the hydrolysis of the Silicon alkoxides can occur by acid-catalysed or base-catalysed processes. Mineral acids (HCl) and ammonia are most generally used; however, other catalysts are acetic acid, KOH, amines, KF and HF. It can generally be said that sol-gel derived silicon oxide networks, under acid catalysed conditions, yield primarily linear or randomly branched polymers which entangle and form additional branches resulting in gelation. On the other hand, silicon oxides networks derived under base-catalysed conditions yield more highly branched clusters which do not interpene-trate prior to gelation and thus behave as discrete clusters having larger sol particles and large pores between the interconnected particles. Hence the choice of acid or base catalysis has a substantial influence on the nature of the gel which is formed [49,73].
7.3. Application of Sol-Gel Process in Foundry Coating Formulation
The application of sol-gel coating process in foundry
Copyright © 2011 SciRes. MSA
Foundry Coating Technology: A Review 1158
coating production is a novel area of research undertaken by the authors at Technical University of Denmark, DTU and the coating producers at Danish Technological Insti-tute, DTI along with the expertise of the industrial part-ners [48,74]. Chemically bonded sand cores are dip coated with the sol-gel coatings containing different filler materials. The core-coating interactions are investigated using advanced microscopy and spectroscopy. During casting, the thermal behaviour of the coated cores is monitored using a data acquisition soft ware. The mod-eled results for commercial casting modeling and simu-lating soft ware are correlated to experimental results accordingly. After casting, the surface and subsurface quality of the castings are examined with a 3 D optical surface roughness measuring microscope and a scanning electron microscope respectively. The results so far ob-tained show a significant potential in the sol-gel process towards, improvement of the surface quality of casting.
8. Conclusions
This is a review about foundry coating technology. It includes but not limited to the coating components, methods of application and characterization parameters. New area of innovation for further development and im-provement of foundry coating technology was also in-troduced. Following the ongoing discussions, this review has thrown more light in the foundry coating technology. The information in this report will help foundries to identify the right parameters to enhance the performance of their coatings to produce castings with excellent sur-face finish. On the other hand foundry coating manufac-turers will find this report highly resourceful for the im-provement of their various existing products.
9. Acknowledgements
The authors wish to acknowledge the Danish Agency for Science, Technology and Innovation for their financial support for the ongoing project.
REFERENCES [1] T. A. Burns, “The Foseco Foundryman's Hanbook,” Per-
gamon Press, Staffordshire, 1986. [2] I. D. Kascheev, N. Yu. Novozhilov, E. V. Tsarevskii, V. A.
Perepelitsyn, V. A. Ryabin and N. F. Seliverstov, “Re-fractory Coatings for Foundry Moulds and Cores,” Journal of Refractories and Ceramics, Vol. 23, 1982, pp. 36-139.
[3] AFS, “Moulding Methods and Materials,” 1st Edition, The Ameriacan Foundrymen’s Society, Illonois, 1962.
[4] S. D. Chastain, “A Sand Casting Manual for the Small Foundry,” Jacksonvile Publishers, Florrida, Vol. 1, 2004.
[5] L. Horvath, “Coatings Go Beyond Appearance to Provide Quality Control,” 2010. Http://www.Foundrymag.com/Classes/Article/articledraw
.Aspx. [6] F. W. Pursall, “Coatings for Moulds and Cores,” K. Straus,
Ed., Applied Science in the Casting of Metals, Pergamon Press, Oxford, 1970.
[7] R. E. Moore, “Refractories, Structure and Properties,” Encyclopedia of Materials: Science and Technology, 2001, pp. 8079-8099.
[8] F. L. Pirkle, D. A. Podmeyer, “Zircon: Origin and Uses,” Society for Mining, Metallurgy and Exploration, Vol. 292. http://cam.usf.edu/CAM/exhibitions/1998_12_McCollum/supplemental_didactics/62.Zircon.pdf
[9] J. Hlavac, “Melting Temperatures of Refractory Oxides,” Pure and Applied Chemistry, Vol. 54, No. 3, 1982, pp. 681-688. doi:org/10.1351/pac198254030681
[10] C. E. Houssa, “Minerals in Plastics,” Bulletin de la Societe Royale des sciences de liege, Vol. 72, 2003, pp. 71-80.
[11] J. R. Brown, “The Foseco Foundryman’s Handbook”, Pergamon Press, Oxford, 2000.
[12] S. Derbyshire, “Coating Composition,” US patent, 4279, 946, 1981. http://www.freepatentsonline.com/4279946
[13] J. J. Horak, “Core and Mould Wash,” US patent 075, 1990. http://www.freepatentsonline.com/1990075
[14] G. D. Ulrich and D. W. Molesky, “Silica Fillers from Silicon Powder,” US patent 4, 755, 368, 1988. http://www.osti.gov/energycitations/product.biblio
[15] N. A. Waterman, R. Trubshaw and A. M. Pye, “Filled thermoplastic Materials Part 1: Fillers and Compounds,” International journal of Materials in Engineering Appli-cations, Vol. 1, No. 2, 1978, pp. 74-79. doi:org/10.1016/S0141-5530(78)90036-5
[16] K. W. Jang, W. S. Kwon, M. J. Yim and K. Paik, “Effects of Silica Filler and Diluent on Materials Properties of Non-Conductive Paste and thermal Cycling reliability of Flip Chip Assembly,” Microelectronics and packaging Society, Vol. 10, 2003, pp. 1-9.
[17] P. L. Jain, “Principle of Foundry Technology,” 4th Edition, McGraw-Hill, New Delhi, 2006.
[18] F.O. Traenkner, “Surface Treatments of Moulds,” US Patent 2,618,032, 1952. http://www.freepatentsonline.com/2618032
[19] J. W. G. Wells, “Olivine Uses and Beneficiation Meth-ods,” NCSU Minerals Laboratoty Bull, Vol. 2, 1959. http://www.p2pays.org/ref/49/48621
[20] M. Yekeler, U. Ulusoy and C. Hicyilmaz, “Effect of Par-ticle Shape and Roughness of Talc Mineral Around by Different Mills on the Wettability and Floatability,” Powder Technology, Vol. 140, No. 12, 2004, pp. 68-78. doi:org/10.1016/j.powtec.2003.12.012
[21] Z. S. Aćimović-Pavlović, A. K. Prstić and L. D. Andrić, “The Characterization of Talc-Based Coating for Appli-cation for Al-Si Alloy Casting,” Chemical Industry and Chemical Engineering Quarterly, Vol. 13, No. 1, 2007, pp. 38-40.
[22] K. S. Ariffin, “Talc and Pyrophylite Group–2:1 Phyl-losilicate,” EBS 425–Mineral Perindustria, pp. 1-21, 2000.
Copyright © 2011 SciRes. MSA
Foundry Coating Technology: A Review 1159
http://mineral.eng.usm.my/web%20halaman%20mineral/Talc%20and%20pyrohyllite
[23] D. Gan, S. Lu, C. Song and Z. Wang, “Physical Properties of Poly(ether ketone ketone)/Mica Composites: Effect of Filler Content,” Materials Letters, Vol. 48, No. 5, 2001, pp. 299-302. doi:org/10.1016/S0167-577X(00)00318-9
[24] M. Zone, “Mica,” 2010. Http://www.Mineralszone.com/minerals/mica.Html.
[25] W. B. Parkes, “Clay-Bonded Foundry Sand,” ASP, Eng-land, 1971.
[26] A. Astruc, E. Joliff, J. F. Chailan, E. Aragon, C. O. Petter and C. H. Sampaio, “Incorporation of Kaolin Fillers into an Epoxy/Polyamidoamine Matrix for Coatings ,” Pro-gress in Organic Coatings, Vol. 65, No. 1, 2009, pp. 158- 168. doi:org/10.1016/j.porgcoat.2008.11.003
[27] W. M. Bundy and J. N. Ishley, “Kaolin in paper filling and coating,” Scholars Portal Journals, Vol. 5, No. 1, 1991, pp. 397-420. doi: 10.1016/0169-1317(91)90015-2
[28] B. W. Rowland, “Modified Clay,” US patent 2,307,239, 2006. http://www.google.com/patents?
[29] M. Swartzlander, “Refractory Coating: Making the Right Choice,” Modern Casting, 1992. http://www.allbusiness.com/manufacturing/fabricated-metal-product-manufacturing/340970-1.html
[30] J. Koller and B. Schmitt, “The Challenge: Decrease the Drying Time for Wash Coatings on Sand Moulds and Cores,” The EPRI Center for Materials Production. CMP-091. http://www.p2pays.org/ref/09/08993
[31] J. L. Leblane, “Rubber-Filler Interactions and Rheological Properties in Filled Compounds,” Progress in Polymer Scence, Vol. 27, No. 4, 2002, pp. 627-687. doi:org/10.1016/S0079-6700(01)00040-5
[32] EPA “Self-Audit and Inspection Guide: Organic Finishing of Metals,” 2010. Http://www.Paintcenter.org/ctc/applimeth.Cfm.
[33] C. J. Brinker, G. C. Frye, A. J. Hurd and C. S. Ashley, “Ashley Fundamentals of Sol-Gel Dip Coating,” Thin Solid Films, Vol. 201, No. 5, 1991, pp. 97-108. doi:org/10.1016/0040-6090(91)90158-T
[34] A. C. Psimenos and G. Eder, “PCT-Pure Coating Tech-nology,” 2011. http://kongre.tudoksad.org.tr/assets/Uploads/31.GunterEder-word.pdf.
[35] YTCA's, “Anti-reflection coating technology,” 2010. http://www.ytca.com/dip_coating.
[36] S. Brannon, M. McElrath, R. Reddy and S. R. Counselor, “Navigating the Ripples of Flow Coating,” Modern Cast-ing, pp. 29-31, 2009.
[37] Gietech BV ir Henderieckx, “Coatings for Chemical Bounded Sand,” 2005. http://www.gietech.be/LinkClick.aspx?fileticket=l6MCLoftoMI%3D&tabid=111&mid=539
[38] Y. P. Yakunin, G. A. Ponomarevn and E. V. Shtyrenkov, “Experience in the Preparation of Self-Drying Sand-Bur- ning Resistant Coatings for Foundry Moulds and Cores,”
US Patent UDC 678.026.3. [39] J. Kroker, “Casting solutions,” 2010.
http://www.ductile.org/magazine/2003_3/nbriefs.htm [40] Case Study, “Aluminium Foundry replaces TCA with
Water-based Coatings,” 2010 http://www.p2pays.org/ref/05/04239.htm.
[41] Canadian Foundry Association, “Guide to Energy Effi-ciency Opportunities in Canadian Foundries,” 2003. http://oee.rncan.gc.ca/cipec/ieep/newscentre/foundry/2/2_3_5.cfm?attr=29.
[42] Cast TIP, “Controlling Refractory Coatings,” Modern Casting, 2010. http://www.thefreelibrary.com/Controlling+refractory+coatings.-a022
[43] Shamlax Meta-chem Private, “Colour Changing Zircon Foundry Coatings,” 2003. http://www.tradeindia.com/fp442828/Color-Changing-Zircon-Foundry-Coatings.html
[44] S. G. Baker, “Evaluating Refractory Coatings: a Practical Approach,” Modern Casting, Vol. 92, 2002, pp. 21-23.
[45] N. Hodgkinson, “Improved Ductile Iron Casting Quality Through Optimized Coating Technology,” The Ductile Iron News, 2004. http://www.ductile.org/magazine/2004_1/coating.htm
[46] L. Winardi and R. D. Griffin, “Effects of Coating Drying Methods on LOI, Gas Evolution and Core Permeabil-ity,”AFS Transactions Paper, Vol. 08-047, 2008.
[47] S. N. Ramrattan and M. K. Joyce, “Final Report-Refractory Coating Control,” http://amc.aticorp.org/reports/wmu2009.pdf.
[48] U. C. Nwaogu, T. Poulsen, R. Stage, C. Bischoff and N. S. Tiedje, “New sol-gel Refractory Coatings on Chemi-cally-Bonded Sand Cores for Foundry Applications to Improve Casting Surface Quality,” Science and Coatings Technology, Vol. 205, No. 16, 2011. doi:10.1016/j.surfcoat.2011.02.042
[49] J. D. Wright and N. A. J. M. Sommerdijk, “Sol-Gel Ma-terials Chemistry and Applications,” CRC Press, London, 2001.
[50] BAMR (Pty), “Elcometer Wet Film Combs,” 2011. http://www.bamr.co.za/elcometer%203238%20long%20edge%20wet%20film%20comb.shtml.
[51] X. Chen, “Permeability Measurement and Numerical Modelling for Refractory Porous Materials,” American Foundry Society Transactions Paper, Vol. 08-133, 2008.
[52] W. A. Anderson, “Permeability Relationships Using Darcy Permeability, Vacuum Decay, Pressure Decay, and Pore Size Distribution Methods on Graphitic Materials,” Carbon, Vol. 4, No. 1, 1966, pp. 107-114. doi:org/10.1016/0008-6223(66)90015-7
[53] T. Sogabe, M. Inagaki and T. Ibuki, “Coating of graphite by polyimide and its gas permeability,” Carbon, Vol. 30, No. 3, 1992, pp. 513-516. doi:org/10.1016/0008-6223(92)90051-W
[54] X. H. Wang and Z. Liu, “The Forchheimer Equation in Two-Dimensional Percolation Porous Media,” Physical A:
Copyright © 2011 SciRes. MSA
Foundry Coating Technology: A Review
Copyright © 2011 SciRes. MSA
1160
Statical and Theoretical Phycics, Vol. 337, No. 3-4, 2004, pp. 384-388. doi:org/10.1016/j.physa.2004.01.047
[55] U. M. S. Costa, J. S. Andrade Jr, H. A. Makse and H. E. Stanley, “The Role of Inertia on Fluid Flow through Dis-ordered Porous Media,” Physical A: Statistical Mechanics and Its Applications, Vol. 266, No. 1-4, 1999, pp. 420-424. doi:org/10.1016/S0378-4371(98)00624-4
[56] H. H. Macedo, U. M. S. Costa and M. P. Almeida, “Tur-bulent Effects on Fluid Flow through Disordered Porous Media,” Physical A: Statistical Mechanics and Its Appli-cations, Vol. 299, No. 1-4, 2001, pp. 371-377. doi:org/10.1016/S0378-4371(01)00257-6
[57] A. W. Neumann and R. J. Good, Surface and Colloid Science, Vol. 2, 1979.
[58] Z. Lijun, W. Xuedong, L. Zeng and W. Dan, “Superhy-drophobicity from Microstructured Surface,” Chinese science Bulletin, Vol. 49, No. 17, 2004, pp. 1779-1787. doi:10.1007/bf03183400
[59] R. Asthana and S. S. T. Mileiko, “Wettability and Inter-facial Considerations in Advanced Heat-Resistant Ni-base Composites,” Bulletin of the Polish Academy of Sciences, Technical Sciences, Vol. 54, 2006.
[60] P. Kiruthika, R. Subasri, A. Jyothirmayi, K. Sarvani and N. Y. Hebalkar, “Effect of Plasma Surface Treatment on Mechanical and Corrosion Protection Properties of UV-Curable sol-gel based GPTS-ZrO2 Coatings on Mild Steel,” Surface and Coatings Technology, Vol. 204, No. 6, 2010, pp. 1270-1276. doi:org/10.1016/j.surfcoat.2009.10.017
[61] A. L. K. Tan, A. M. Soutar, I. F. Annergreen and Y. N. Liu, “Multilayer sol-gel Coatings for Corrosion Protection of Magnesium,” Surface and Coatings Technology, Vol. 198, No. 1-3, 2005, pp. 478-482. doi:10.1016/j.surfcoat.2004.10.066
[62] T. Hübert, S. Svoboda and B. Oertel, “Wear Resistant Alumina Coatings Produced by a sol-gel Process,” Surface and Coatings Technology, Vol. 201, No. 1-2, 2006, pp. 487-491. doi:10.1016/j.surfcoat.2005.11.014
[63] C. Viazzi, J. P. Bonino and F. Ansart, “Synthesis by sol-gel Route and Characterization of Yttria Stabilized Zircinia Coatings for Thermal Barrier Applications,” Surface and Coatings Technology, Vol. 201, No. 7, 2006, pp. 3889-3893. doi:org/10.1016/j.surfcoat.2006.07.241
[64] K. H. Hass, S. Amberg-Schwab, K. Rose and G. Schottner, “Functionalized Coatings based on Inorganic-Organic
Polymers (ORMOCER ®s) and Their Combination with vapor Deposited Inorganic Thin Films,” Surface and Coatings Technology, Vol. 111, No. 1, 1999, pp. 72-79. doi:org/10.1016/S0257-8972(98)00711-7
[65] C. Guillén, A. Morales and J. Herrero, “Performance of sol-gel SiO2 Coatings onto Glass/SnO2 Superstrates,” Surface and Coating Technology, Vol. 132, No. 1, 2000, pp. 31-35. doi:org/10.1016/S0257-8972(00)00727-1
[66] D. R. Uhlmann, T. Suratwala, J. K. Davidson, M. Boulton and G. Teowee, “Sol-gel coatings on Glass,” Journal of Non-Crystalline Solids, Vol. 318, 1997, pp. 113-122. doi:org/10.1016/S0022-3093(97)00162-2
[67] T. B. N. Hodgkinson, “Improving Foundry Profitability through the Use of Rheotec* XL Coating,” Foseco Foun-dry Practice, Vol. 240, 2003.
[68] T. Birch and D. Bell, “Improved Iron Casting Quality through Application of Advanced Coating Technology,” Foseco Foundry Practice, Vol. 243, 2005.
[69] A. Schrey, “NORACEL* w100 - A New Technology to Prevent Veining Defects,” Foseco Foundry Practice, Vol. 246, 2007.
[70] J. B. Laughlin, J. L. Sarquis, V. M. Jones and J. A. Cox, “Using Sol-Gel Chemistry to Synthesize a Material with properties Suited for Chemical Sensing,” Journal of Chemical Education, Vol. 77, No. 1, 2000, pp. 77-79. doi:10.1021/ed077p77
[71] M. Niederberger and N. Pinna, “Metal Oxide Nanoparticles in Organic Synthesis,” Formation, Assembly and Appli-cation, Vol. XIII, No. 217, 2009.
[72] S. M. Tracey, S. N. B. Hodgson, A. K. Ray and Z. Ghas-semlooy, “The Role and Interactions of Process Parame-ters on the Nature of Alkoxides Derived sol-gel Films,” Journal of Materials Processing Technology, Vol. 77, No. 1-3, 1998, pp. 86-94. doi:org/10.1016/S0924-0136(97)00399-3
[73] K. Mauritz, “Sol-Gel Chemistry,” http://www.psrc.usm.edu/mauritz/solgel.html.
[74] U. C. Nwaogu, T. Poulsen, C. Bischoff and N. S. Tiedje, “Influence of New sol-Gel Refractory Coating on the Casting Properties of Cold Box and Furan Cores for Grey Cast Iron,” The Proceedings of 69th World Foundry Con-gress, Hangzhou, 16-20 October 2010, pp. 648-653.
SUPPLEMENT 7
A Technical Report
U. C. Nwaogu and N.S. Tiedje,
“A new approach to surface texture characterization of castings”, 2011.

A Technical Report
A new approach to surface texture characterization of castings
U. C. Nwaogu N.S. Tiedje
Casting Technology Group, Department of Mechanical Engineering,
Technical University of Denmark.
2011


i
Contents
1 Introduction . . . . . . . . . . . . . . . . . . . . . . . . . . . . . . . 12 Surface Characterization . . . . . . . . . . . . . . . . . . . . . . . . 32.1 Types of Surfaces . . . . . . . . . . . . . . . . . . . . . . . . . . . 32.2 Surface Texture . . . . . . . . . . . . . . . . . . . . . . . . . . . . . 52.3 Filtering . . . . . . . . . . . . . . . . . . . . . . . . . . . . . . . . . 63 Optical Systems . . . . . . . . . . . . . . . . . . . . . . . . . . . . . 73.1 Focus-Variation . . . . . . . . . . . . . . . . . . . . . . . . . . . . . 74 Definition of Parameters for Roughness Characterisation . . . . . . 104.1 Profile Parameters . . . . . . . . . . . . . . . . . . . . . . . . . . . 104.2 Surface Parameters . . . . . . . . . . . . . . . . . . . . . . . . . . . 114.3 Bearing Area Ratio Curve . . . . . . . . . . . . . . . . . . . . . . . 125 Approach used for the Measurements . . . . . . . . . . . . . . . . . 156 Results from Standard Roughness Comparators . . . . . . . . . . . 167 Roughness Description by Bearing Area Ratio Curve . . . . . . . . 258 Results from Castings . . . . . . . . . . . . . . . . . . . . . . . . . 299 Conclusions . . . . . . . . . . . . . . . . . . . . . . . . . . . . . . . 36
List of Figures
1 Fish-bone cause-effect diagram with the factors that affect surfaceroughness of cast components in expendable moulds. . . . . . . . . 2
2 SCRATA comparators for casting surface roughness (UK). . . . . . 43 Tactile comparators for casting surface roughness after shot blasting
(Sweden). . . . . . . . . . . . . . . . . . . . . . . . . . . . . . . . . 44 Schematic of focus-variation instrument [11]. . . . . . . . . . . . . . 95 IFM G4 laboratory system. . . . . . . . . . . . . . . . . . . . . . . 96 Number of measurements needed to keep parameter value within
±10% using T-Distribution with 95% Confidence Level [28]. . . . . 127 Profile and surface bearing area curve characterized by five profile
and corresponding surface parameters: Rk, Sk, Rpk, Spk, Rvk, Svk,Rmr1, Smr1 and Rmr2, Smr2 [29]. . . . . . . . . . . . . . . . . . . 13
8 Schematic diagram of the material volume and the void volume fromisometric plot of the surface [26]. . . . . . . . . . . . . . . . . . . . 13
9 Bearing area ratio and the height distribution of an EDM surface[26]. . . . . . . . . . . . . . . . . . . . . . . . . . . . . . . . . . . . 15
ii
10 Surface processing in Scanning Probe Image Processor (SPIP). . . 1511 The difference between waviness and roughness. The reason for
filtering. . . . . . . . . . . . . . . . . . . . . . . . . . . . . . . . . . 1612 A typical 3D surface texture of a processed casting surface for rough-
ness measurement in SPIP. . . . . . . . . . . . . . . . . . . . . . . . 1613 Surface structure of A1 and A2 comparators from measuring system. 1714 Profile roughness of A1 comparator showing various parameters. . 1815 Surface (Areal) roughness of A1 comparator showing various para-
meters. . . . . . . . . . . . . . . . . . . . . . . . . . . . . . . . . . 1916 Roughness of A2 comparator with selected parameters. . . . . . . . 2017 Surface texture of S25-S250 from the measuring system. . . . . . . . 2118 Profile roughness of S250 comparator showing various parameters. . 2219 Surface (Areal) roughness of S250 comparator showing various para-
meters. . . . . . . . . . . . . . . . . . . . . . . . . . . . . . . . . . . 2320 Comparison of the roughness (Sa) of A and S series standard com-
parators. . . . . . . . . . . . . . . . . . . . . . . . . . . . . . . . . 2521 Typical bearing area ratio curves from the same surface. . . . . . . 2522 Profile reduced peak height and valley depth to core roughness ratio. 2723 Surface reduced peak height and valley depth to core roughness ratio. 2824 Casting layout and descriptions. . . . . . . . . . . . . . . . . . . . 3025 Single point roughness of casting made with W230 + 20% sol-
additive with multilayer application. . . . . . . . . . . . . . . . . . 3226 Single point roughness of casting made with W226 with multilayer
application. . . . . . . . . . . . . . . . . . . . . . . . . . . . . . . . 3327 Comparison of roughness of castings made with W230 and rough-
ness of standards. . . . . . . . . . . . . . . . . . . . . . . . . . . . . 3428 Comparison of roughness of castings made with W230 + 20% sol-gel
additive + multilayer application and roughness of standards. . . . 35
List of Tables
1 Profile amplitude parameters [12]. . . . . . . . . . . . . . . . . . . . 102 Surface amplitude parameters [9]. . . . . . . . . . . . . . . . . . . . 113 Profile parameters for A1 and A2 standards of A series comparators. 204 Surface parameters for A1 and A2 standards of A series comparators. 205 Profile parameters for all the S series standards. . . . . . . . . . . . 246 Surface parameters for all the S series. . . . . . . . . . . . . . . . . 247 Surface roughness results of the castings. . . . . . . . . . . . . . . . 31
1 Introduction 1
1 Introduction
Surface characterization, the nature of surfaces, and the measurement of surfacescannot be separated from each other. A deeper understanding of the surfacegeometry produced by better instrumentation often produces a new approach tocharacterization. Surface characterization means the breakdown of the surfacegeometry into basic components based usually on some functional requirements.These components have various shapes, sizes, distribution in space, and can beconstrained by a multiplicity of boundaries in height and position [1]. Surfaceroughness is that part of the irregularities left on the surface after manufacture.In the study of roughness, the word lay is used to describe the direction of thepredominant surface pattern. Surface roughness is generally examined in planei.e., areal view with the aid of optical and electron microscopes, in cross-sectionsnormal to the surface with stylus instruments and, in oblique cross-section, byoptical interference methods [1].The surface topography or roughness is the most important parameter describingsurface integrity of a component. It has great importance in specifying the func-tion of a surface, as a significant proportion of component failure, starts at thesurface due to either discontinuity or deterioration of the surface quality. In themanufacturing industry, the surface must be within a certain limit of roughness.Consequently, measuring surface roughness is important for quality control. Sur-face finish has also important role in aesthetics and corrosion resistance and maytranslate to improved performance and reduced life cycle cost [2].The surface roughness of castings is influenced by the manufacturing process (ex-pendable mould process, permanent mould process, etc.), the moulding materialsused (sand, binder, coatings, etc.), the equipment available, and the alloy cast, etc.[3, 4, 5]. Figure 1 shows a detailed list of all the factors influencing the surfaceroughness of cast components. The controlling parameters are so many that theproblem becomes a complex situation. To control the surface roughness of cast-ings, these factors must be selected in a proper way most suitable. However, inmeasuring the cast surface roughness, the following issues are considered [6]:
1. Compliance with standards
2. Suitability for random pattern
3. Repeatability (or reproducibility)
4. Latitude to accommodate rough and smooth surface and a variety of shapes
5. Easy operation
6. Dependence on human judgement
In the foundries the measurement of surface roughness of castings have been neg-lected for decades, due to the inability of the mechanical surface roughness testinginstruments such as stylus instruments, to reproduce the exact surface texture ofcasting surfaces. Probably, the single factor causing the most difficulty in devisinga means of measuring surface roughness is that the surface characteristic has three
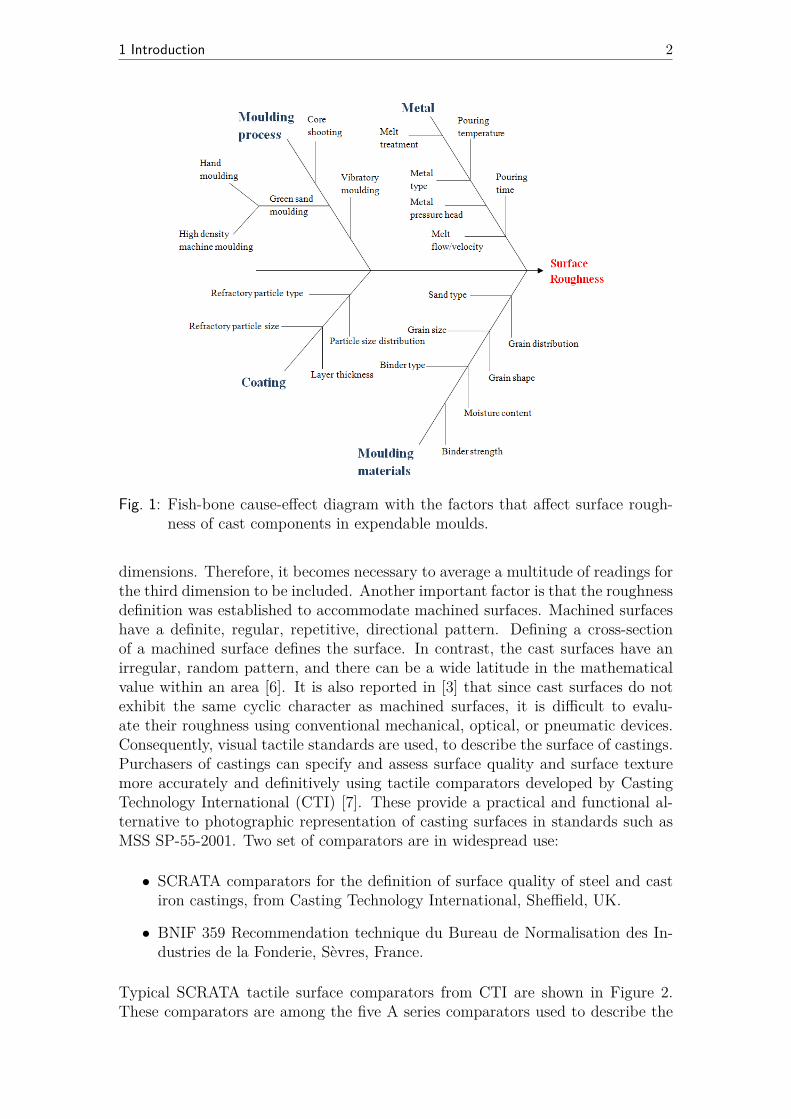
1 Introduction 2
Fig. 1: Fish-bone cause-effect diagram with the factors that affect surface rough-ness of cast components in expendable moulds.
dimensions. Therefore, it becomes necessary to average a multitude of readings forthe third dimension to be included. Another important factor is that the roughnessdefinition was established to accommodate machined surfaces. Machined surfaceshave a definite, regular, repetitive, directional pattern. Defining a cross-sectionof a machined surface defines the surface. In contrast, the cast surfaces have anirregular, random pattern, and there can be a wide latitude in the mathematicalvalue within an area [6]. It is also reported in [3] that since cast surfaces do notexhibit the same cyclic character as machined surfaces, it is difficult to evalu-ate their roughness using conventional mechanical, optical, or pneumatic devices.Consequently, visual tactile standards are used, to describe the surface of castings.Purchasers of castings can specify and assess surface quality and surface texturemore accurately and definitively using tactile comparators developed by CastingTechnology International (CTI) [7]. These provide a practical and functional al-ternative to photographic representation of casting surfaces in standards such asMSS SP-55-2001. Two set of comparators are in widespread use:
• SCRATA comparators for the definition of surface quality of steel and castiron castings, from Casting Technology International, Sheffield, UK.
• BNIF 359 Recommendation technique du Bureau de Normalisation des In-dustries de la Fonderie, Sèvres, France.
Typical SCRATA tactile surface comparators from CTI are shown in Figure 2.These comparators are among the five A series comparators used to describe the
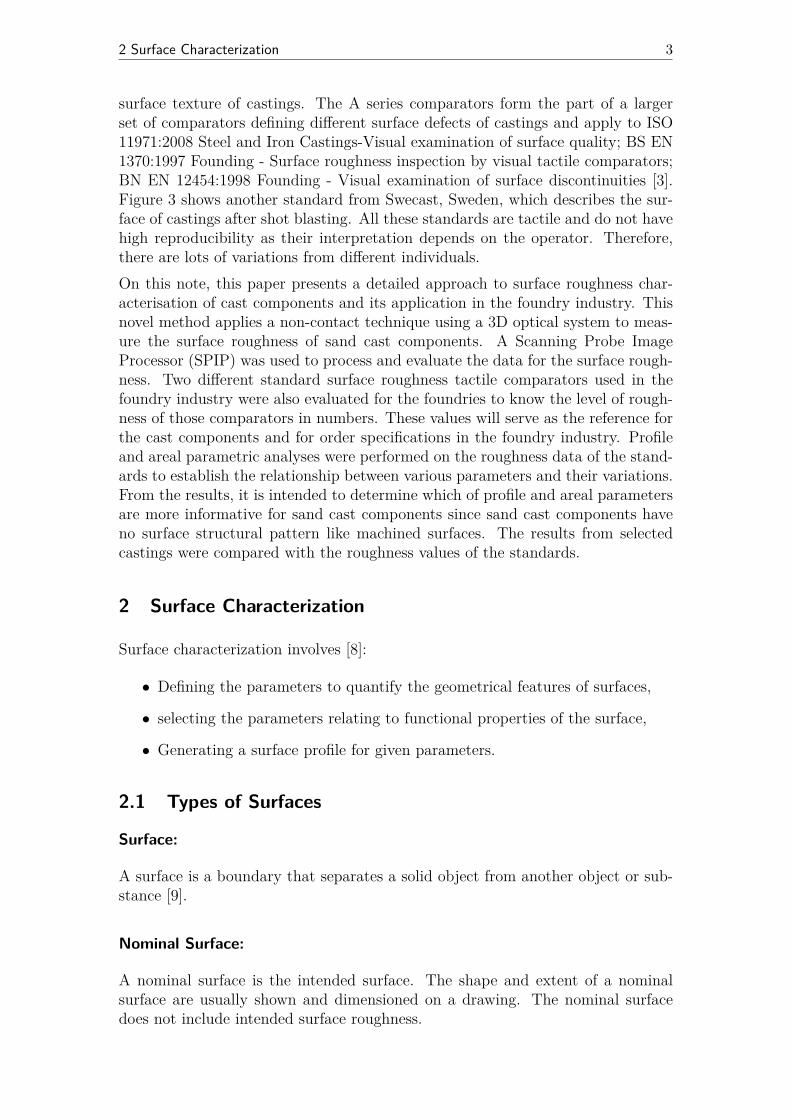
2 Surface Characterization 3
surface texture of castings. The A series comparators form the part of a largerset of comparators defining different surface defects of castings and apply to ISO11971:2008 Steel and Iron Castings-Visual examination of surface quality; BS EN1370:1997 Founding - Surface roughness inspection by visual tactile comparators;BN EN 12454:1998 Founding - Visual examination of surface discontinuities [3].Figure 3 shows another standard from Swecast, Sweden, which describes the sur-face of castings after shot blasting. All these standards are tactile and do not havehigh reproducibility as their interpretation depends on the operator. Therefore,there are lots of variations from different individuals.On this note, this paper presents a detailed approach to surface roughness char-acterisation of cast components and its application in the foundry industry. Thisnovel method applies a non-contact technique using a 3D optical system to meas-ure the surface roughness of sand cast components. A Scanning Probe ImageProcessor (SPIP) was used to process and evaluate the data for the surface rough-ness. Two different standard surface roughness tactile comparators used in thefoundry industry were also evaluated for the foundries to know the level of rough-ness of those comparators in numbers. These values will serve as the reference forthe cast components and for order specifications in the foundry industry. Profileand areal parametric analyses were performed on the roughness data of the stand-ards to establish the relationship between various parameters and their variations.From the results, it is intended to determine which of profile and areal parametersare more informative for sand cast components since sand cast components haveno surface structural pattern like machined surfaces. The results from selectedcastings were compared with the roughness values of the standards.
2 Surface Characterization
Surface characterization involves [8]:
• Defining the parameters to quantify the geometrical features of surfaces,
• selecting the parameters relating to functional properties of the surface,
• Generating a surface profile for given parameters.
2.1 Types of Surfaces
Surface:
A surface is a boundary that separates a solid object from another object or sub-stance [9].
Nominal Surface:
A nominal surface is the intended surface. The shape and extent of a nominalsurface are usually shown and dimensioned on a drawing. The nominal surfacedoes not include intended surface roughness.
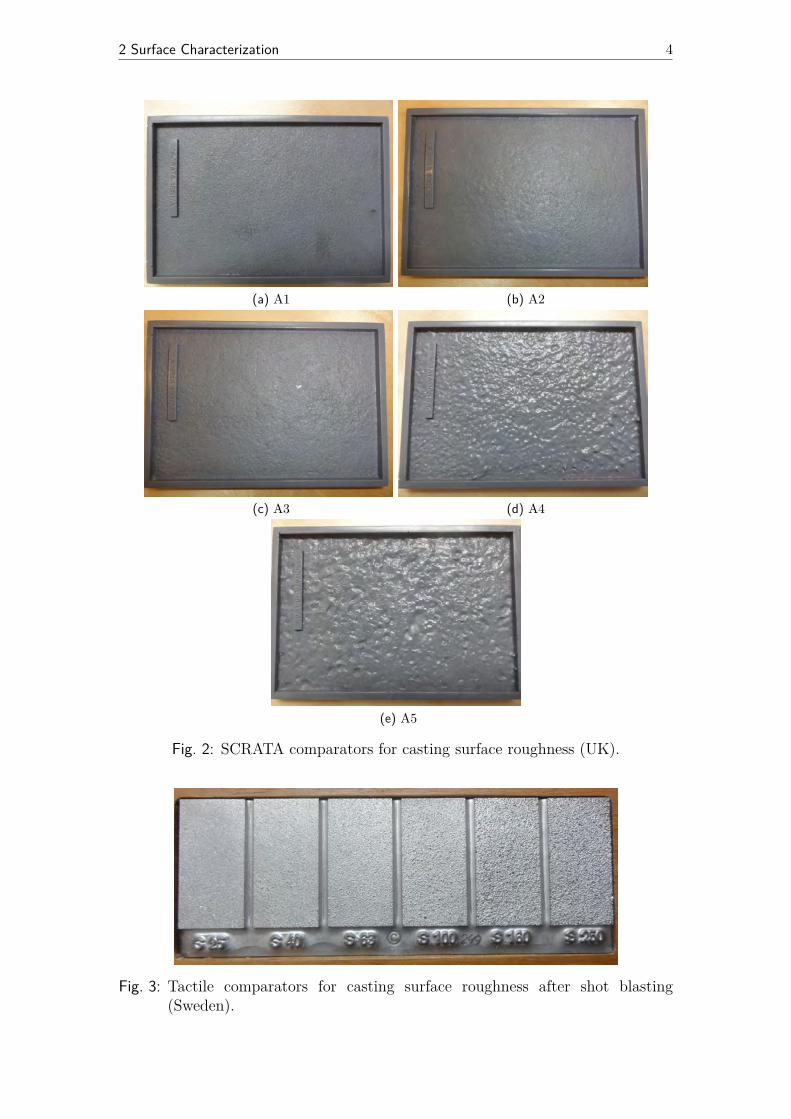
2 Surface Characterization 4
(a) A1 (b) A2
(c) A3 (d) A4
(e) A5
Fig. 2: SCRATA comparators for casting surface roughness (UK).
Fig. 3: Tactile comparators for casting surface roughness after shot blasting(Sweden).
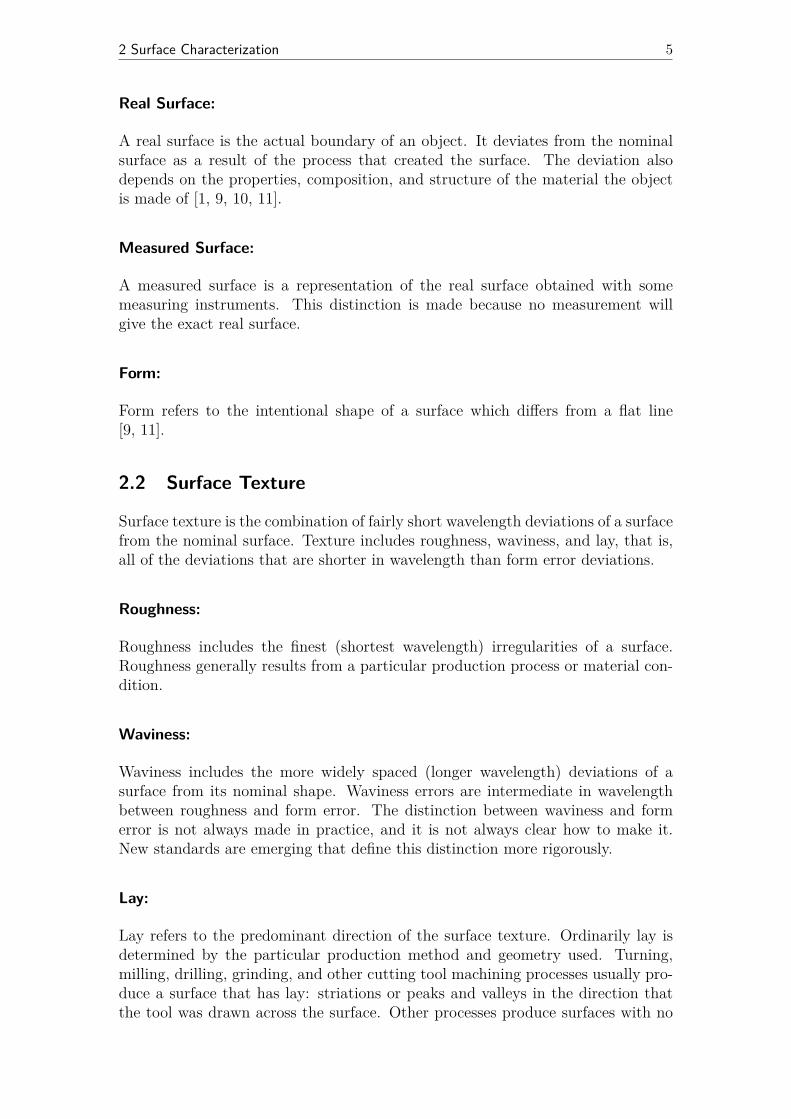
2 Surface Characterization 5
Real Surface:
A real surface is the actual boundary of an object. It deviates from the nominalsurface as a result of the process that created the surface. The deviation alsodepends on the properties, composition, and structure of the material the objectis made of [1, 9, 10, 11].
Measured Surface:
A measured surface is a representation of the real surface obtained with somemeasuring instruments. This distinction is made because no measurement willgive the exact real surface.
Form:
Form refers to the intentional shape of a surface which differs from a flat line[9, 11].
2.2 Surface Texture
Surface texture is the combination of fairly short wavelength deviations of a surfacefrom the nominal surface. Texture includes roughness, waviness, and lay, that is,all of the deviations that are shorter in wavelength than form error deviations.
Roughness:
Roughness includes the finest (shortest wavelength) irregularities of a surface.Roughness generally results from a particular production process or material con-dition.
Waviness:
Waviness includes the more widely spaced (longer wavelength) deviations of asurface from its nominal shape. Waviness errors are intermediate in wavelengthbetween roughness and form error. The distinction between waviness and formerror is not always made in practice, and it is not always clear how to make it.New standards are emerging that define this distinction more rigorously.
Lay:
Lay refers to the predominant direction of the surface texture. Ordinarily lay isdetermined by the particular production method and geometry used. Turning,milling, drilling, grinding, and other cutting tool machining processes usually pro-duce a surface that has lay: striations or peaks and valleys in the direction thatthe tool was drawn across the surface. Other processes produce surfaces with no
2 Surface Characterization 6
characteristic direction: sand casting, spark erosion and grit blasting. Sometimesthese surfaces are said to have a non-directional, particulate, or protuberant lay.Several different types of lay are possible depending on the manufacturing andmachining processes [1, 9, 11, 10, 12].
2.3 Filtering
Filter:
A filter (for purposes of surface finish measurement) is an electronic, mechan-ical, optical, or mathematical transformation of a profile to attenuate (remove)wavelength components of the surface outside the range of interest for a measure-ment. Filters select (or reject) the structure according to its scale in the x-axis,that is in terms of wavelengths or spatial frequencies. A filter that rejects shortwavelength while retaining longer ones is called a low-pass filter since it preserves(or lets pass) the low frequencies. A high-pass preserves the shorter wave-lengthfeatures while rejecting longer ones [9, 11].
Waviness Profile:
The waviness profile includes medium wavelength deviations of the measured pro-file from the nominal profile. The waviness is the modified profile obtained byfiltering a measured profile to attenuate the longest and shortest wavelength com-ponents of the measured profile (i.e. the filter removes form error and roughness).
Texture Profile:
The texture profile is the sum of the waviness profile and the roughness profile, i.e.the remaining medium and short wavelength deviations of the measured profilefrom the nominal profile after form error has been subtracted from the primaryprofile. Measurement of texture is the primary domain of traditional surface finishanalysis.
Roughness Profile:
The roughness profile includes only the shortest wavelength deviations of the meas-ured profile from the nominal profile. The roughness profile is the modified profileobtained by filtering a measured profile to attenuate the longer wavelengths asso-ciated with waviness and form error. Optionally, the roughness may also exclude(by filtering) the very shortest wavelengths of the measured profile which are con-sidered noise or features smaller than those of interest. Roughness is of significantinterest in manufacturing because it is the roughness of a surface (given reason-able waviness and form error) that determines its friction in contact with anothersurface. The roughness of a surface defines how that surface feels, how it looks,how it behaves in a contact with another surface, and how it behaves for coatingor sealing. For moving parts the roughness determines how the surface will wear,how well it will retain lubricant, and how well it will hold a load [9, 10, 11].
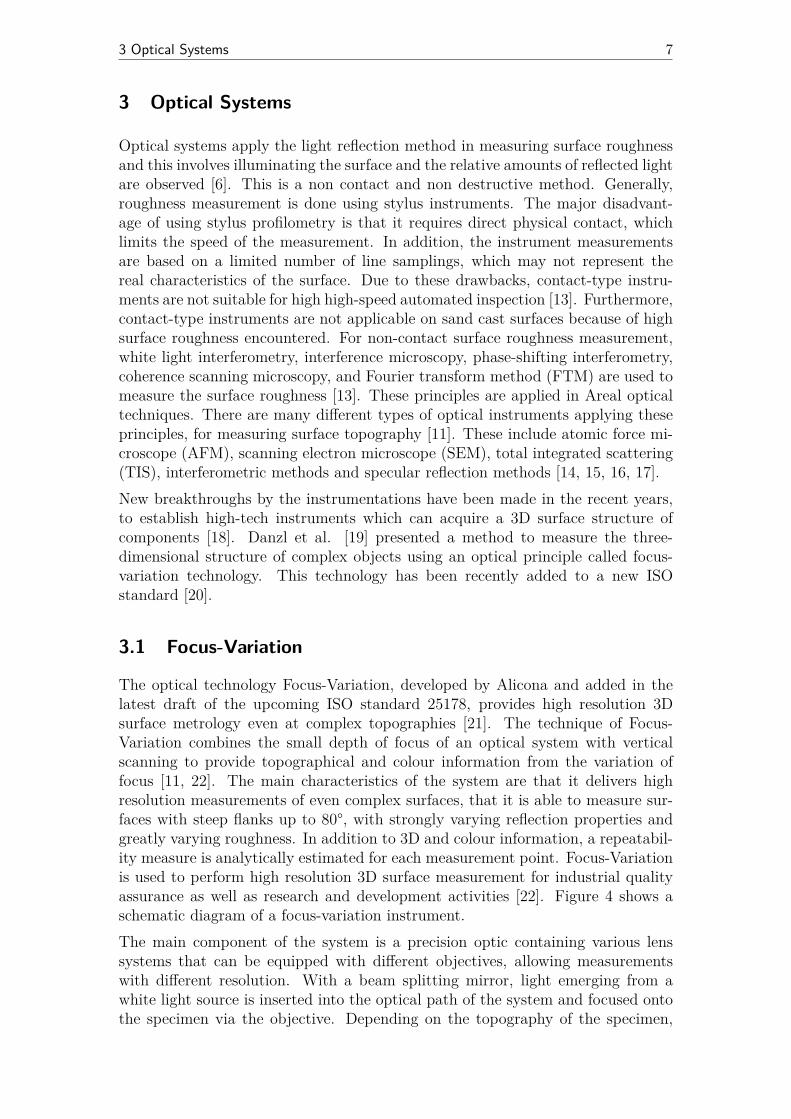
3 Optical Systems 7
3 Optical Systems
Optical systems apply the light reflection method in measuring surface roughnessand this involves illuminating the surface and the relative amounts of reflected lightare observed [6]. This is a non contact and non destructive method. Generally,roughness measurement is done using stylus instruments. The major disadvant-age of using stylus profilometry is that it requires direct physical contact, whichlimits the speed of the measurement. In addition, the instrument measurementsare based on a limited number of line samplings, which may not represent thereal characteristics of the surface. Due to these drawbacks, contact-type instru-ments are not suitable for high high-speed automated inspection [13]. Furthermore,contact-type instruments are not applicable on sand cast surfaces because of highsurface roughness encountered. For non-contact surface roughness measurement,white light interferometry, interference microscopy, phase-shifting interferometry,coherence scanning microscopy, and Fourier transform method (FTM) are used tomeasure the surface roughness [13]. These principles are applied in Areal opticaltechniques. There are many different types of optical instruments applying theseprinciples, for measuring surface topography [11]. These include atomic force mi-croscope (AFM), scanning electron microscope (SEM), total integrated scattering(TIS), interferometric methods and specular reflection methods [14, 15, 16, 17].New breakthroughs by the instrumentations have been made in the recent years,to establish high-tech instruments which can acquire a 3D surface structure ofcomponents [18]. Danzl et al. [19] presented a method to measure the three-dimensional structure of complex objects using an optical principle called focus-variation technology. This technology has been recently added to a new ISOstandard [20].
3.1 Focus-Variation
The optical technology Focus-Variation, developed by Alicona and added in thelatest draft of the upcoming ISO standard 25178, provides high resolution 3Dsurface metrology even at complex topographies [21]. The technique of Focus-Variation combines the small depth of focus of an optical system with verticalscanning to provide topographical and colour information from the variation offocus [11, 22]. The main characteristics of the system are that it delivers highresolution measurements of even complex surfaces, that it is able to measure sur-faces with steep flanks up to 80°, with strongly varying reflection properties andgreatly varying roughness. In addition to 3D and colour information, a repeatabil-ity measure is analytically estimated for each measurement point. Focus-Variationis used to perform high resolution 3D surface measurement for industrial qualityassurance as well as research and development activities [22]. Figure 4 shows aschematic diagram of a focus-variation instrument.The main component of the system is a precision optic containing various lenssystems that can be equipped with different objectives, allowing measurementswith different resolution. With a beam splitting mirror, light emerging from awhite light source is inserted into the optical path of the system and focused ontothe specimen via the objective. Depending on the topography of the specimen,
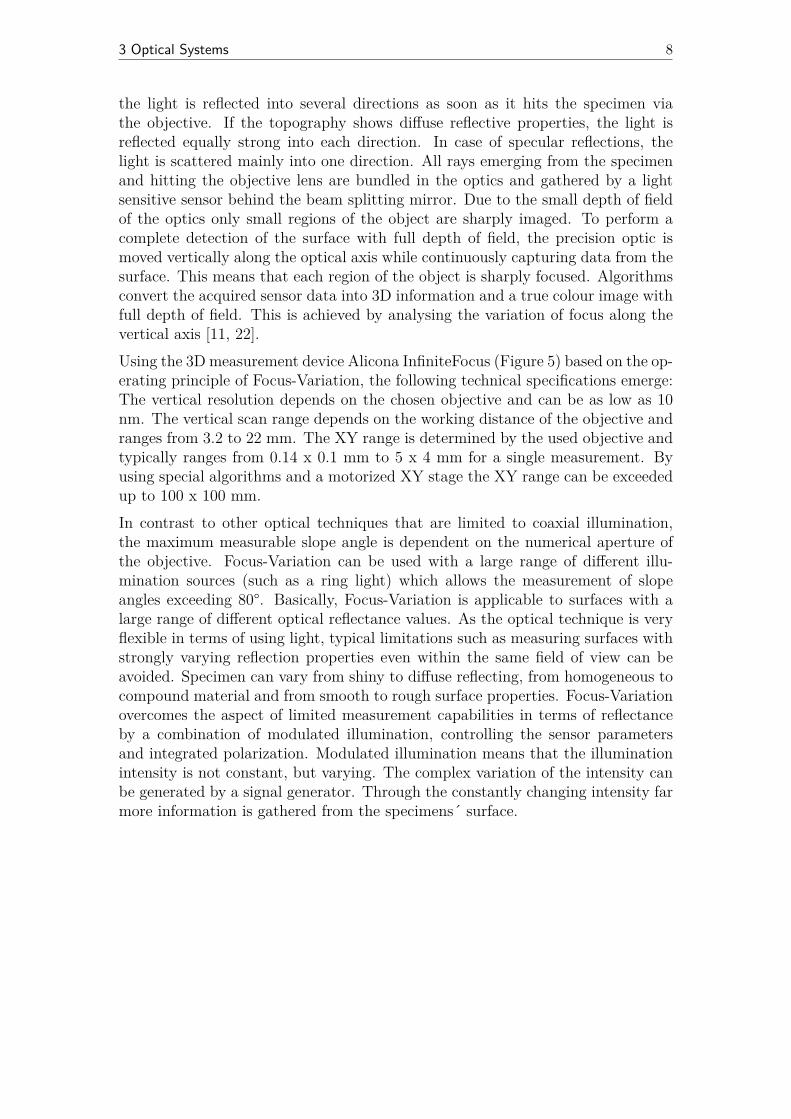
3 Optical Systems 8
the light is reflected into several directions as soon as it hits the specimen viathe objective. If the topography shows diffuse reflective properties, the light isreflected equally strong into each direction. In case of specular reflections, thelight is scattered mainly into one direction. All rays emerging from the specimenand hitting the objective lens are bundled in the optics and gathered by a lightsensitive sensor behind the beam splitting mirror. Due to the small depth of fieldof the optics only small regions of the object are sharply imaged. To perform acomplete detection of the surface with full depth of field, the precision optic ismoved vertically along the optical axis while continuously capturing data from thesurface. This means that each region of the object is sharply focused. Algorithmsconvert the acquired sensor data into 3D information and a true colour image withfull depth of field. This is achieved by analysing the variation of focus along thevertical axis [11, 22].Using the 3D measurement device Alicona InfiniteFocus (Figure 5) based on the op-erating principle of Focus-Variation, the following technical specifications emerge:The vertical resolution depends on the chosen objective and can be as low as 10nm. The vertical scan range depends on the working distance of the objective andranges from 3.2 to 22 mm. The XY range is determined by the used objective andtypically ranges from 0.14 x 0.1 mm to 5 x 4 mm for a single measurement. Byusing special algorithms and a motorized XY stage the XY range can be exceededup to 100 x 100 mm.In contrast to other optical techniques that are limited to coaxial illumination,the maximum measurable slope angle is dependent on the numerical aperture ofthe objective. Focus-Variation can be used with a large range of different illu-mination sources (such as a ring light) which allows the measurement of slopeangles exceeding 80°. Basically, Focus-Variation is applicable to surfaces with alarge range of different optical reflectance values. As the optical technique is veryflexible in terms of using light, typical limitations such as measuring surfaces withstrongly varying reflection properties even within the same field of view can beavoided. Specimen can vary from shiny to diffuse reflecting, from homogeneous tocompound material and from smooth to rough surface properties. Focus-Variationovercomes the aspect of limited measurement capabilities in terms of reflectanceby a combination of modulated illumination, controlling the sensor parametersand integrated polarization. Modulated illumination means that the illuminationintensity is not constant, but varying. The complex variation of the intensity canbe generated by a signal generator. Through the constantly changing intensity farmore information is gathered from the specimens´ surface.
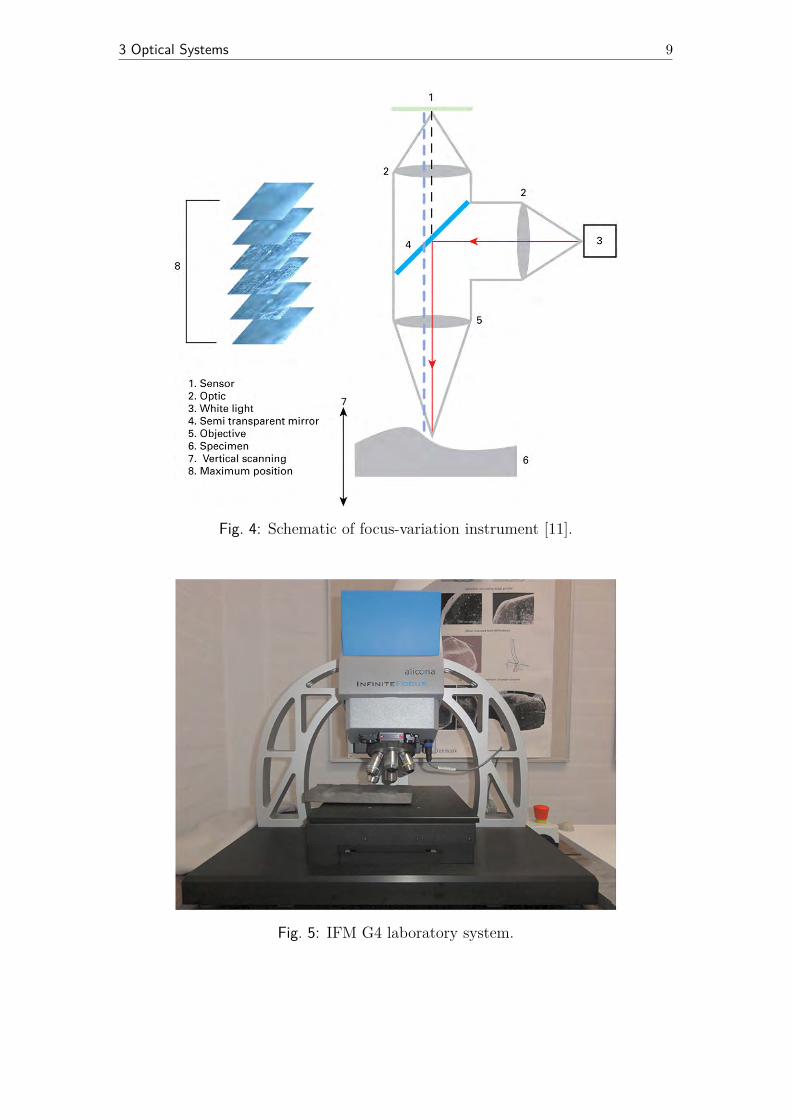
3 Optical Systems 9
Fig. 4: Schematic of focus-variation instrument [11].
Fig. 5: IFM G4 laboratory system.
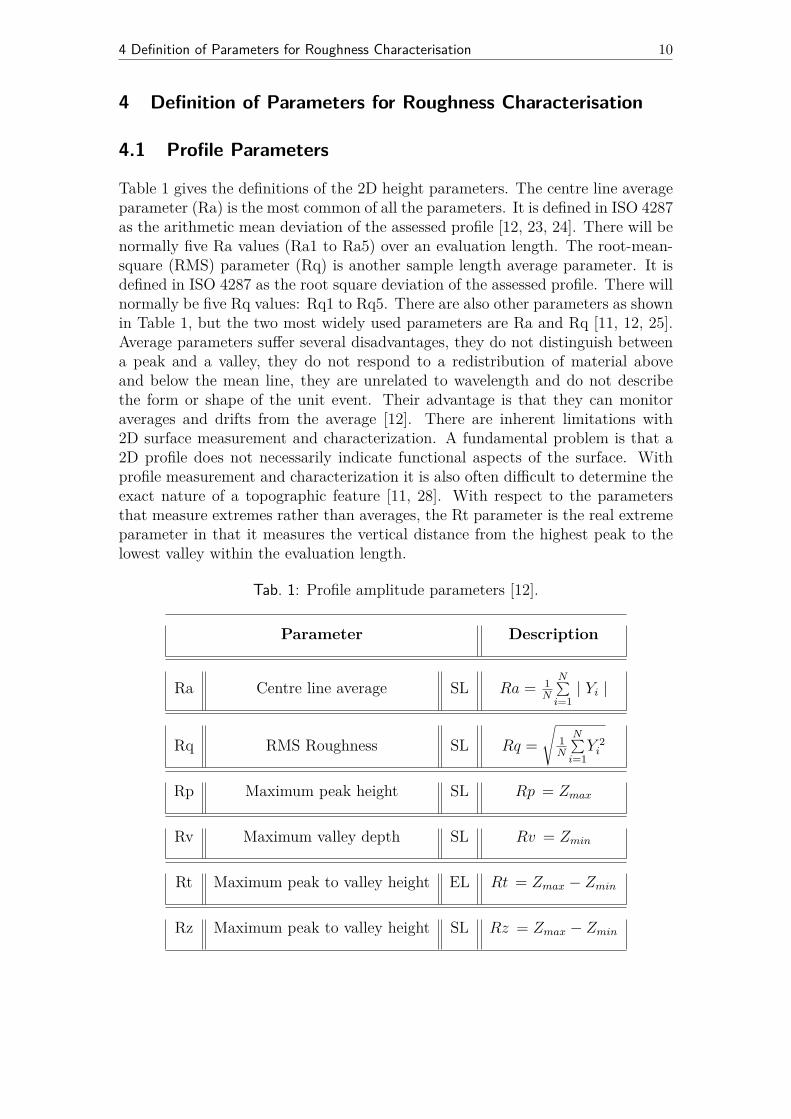
4 Definition of Parameters for Roughness Characterisation 10
4 Definition of Parameters for Roughness Characterisation
4.1 Profile Parameters
Table 1 gives the definitions of the 2D height parameters. The centre line averageparameter (Ra) is the most common of all the parameters. It is defined in ISO 4287as the arithmetic mean deviation of the assessed profile [12, 23, 24]. There will benormally five Ra values (Ra1 to Ra5) over an evaluation length. The root-mean-square (RMS) parameter (Rq) is another sample length average parameter. It isdefined in ISO 4287 as the root square deviation of the assessed profile. There willnormally be five Rq values: Rq1 to Rq5. There are also other parameters as shownin Table 1, but the two most widely used parameters are Ra and Rq [11, 12, 25].Average parameters suffer several disadvantages, they do not distinguish betweena peak and a valley, they do not respond to a redistribution of material aboveand below the mean line, they are unrelated to wavelength and do not describethe form or shape of the unit event. Their advantage is that they can monitoraverages and drifts from the average [12]. There are inherent limitations with2D surface measurement and characterization. A fundamental problem is that a2D profile does not necessarily indicate functional aspects of the surface. Withprofile measurement and characterization it is also often difficult to determine theexact nature of a topographic feature [11, 28]. With respect to the parametersthat measure extremes rather than averages, the Rt parameter is the real extremeparameter in that it measures the vertical distance from the highest peak to thelowest valley within the evaluation length.
Tab. 1: Profile amplitude parameters [12].
Parameter Description
Ra Centre line average SL Ra = 1N
N∑i=1| Yi |
Rq RMS Roughness SL Rq =√
1N
N∑i=1Y 2i
Rp Maximum peak height SL Rp = Zmax
Rv Maximum valley depth SL Rv = Zmin
Rt Maximum peak to valley height EL Rt = Zmax − Zmin
Rz Maximum peak to valley height SL Rz = Zmax − Zmin
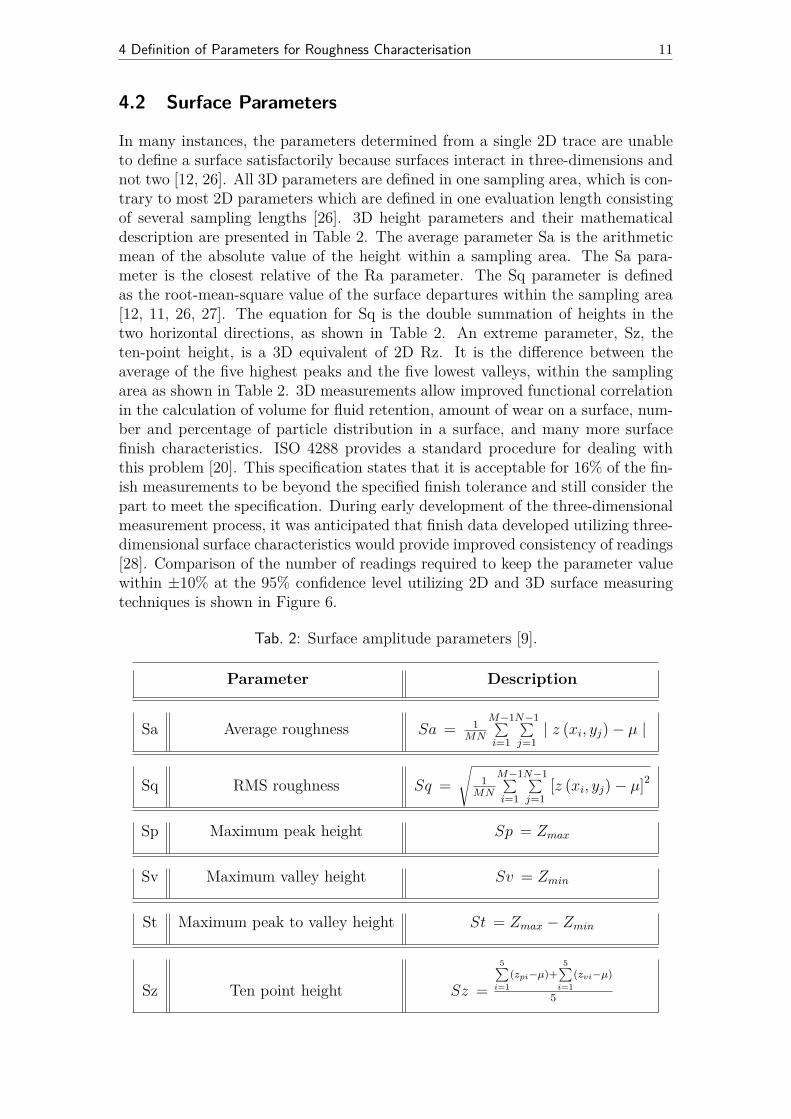
4 Definition of Parameters for Roughness Characterisation 11
4.2 Surface Parameters
In many instances, the parameters determined from a single 2D trace are unableto define a surface satisfactorily because surfaces interact in three-dimensions andnot two [12, 26]. All 3D parameters are defined in one sampling area, which is con-trary to most 2D parameters which are defined in one evaluation length consistingof several sampling lengths [26]. 3D height parameters and their mathematicaldescription are presented in Table 2. The average parameter Sa is the arithmeticmean of the absolute value of the height within a sampling area. The Sa para-meter is the closest relative of the Ra parameter. The Sq parameter is definedas the root-mean-square value of the surface departures within the sampling area[12, 11, 26, 27]. The equation for Sq is the double summation of heights in thetwo horizontal directions, as shown in Table 2. An extreme parameter, Sz, theten-point height, is a 3D equivalent of 2D Rz. It is the difference between theaverage of the five highest peaks and the five lowest valleys, within the samplingarea as shown in Table 2. 3D measurements allow improved functional correlationin the calculation of volume for fluid retention, amount of wear on a surface, num-ber and percentage of particle distribution in a surface, and many more surfacefinish characteristics. ISO 4288 provides a standard procedure for dealing withthis problem [20]. This specification states that it is acceptable for 16% of the fin-ish measurements to be beyond the specified finish tolerance and still consider thepart to meet the specification. During early development of the three-dimensionalmeasurement process, it was anticipated that finish data developed utilizing three-dimensional surface characteristics would provide improved consistency of readings[28]. Comparison of the number of readings required to keep the parameter valuewithin ±10% at the 95% confidence level utilizing 2D and 3D surface measuringtechniques is shown in Figure 6.
Tab. 2: Surface amplitude parameters [9].
Parameter Description
Sa Average roughness Sa = 1MN
M−1∑i=1
N−1∑j=1| z (xi, yj)− µ |
Sq RMS roughness Sq =√
1MN
M−1∑i=1
N−1∑j=1
[z (xi, yj)− µ]2
Sp Maximum peak height Sp = Zmax
Sv Maximum valley height Sv = Zmin
St Maximum peak to valley height St = Zmax − Zmin
Sz Ten point height Sz =
5∑i=1
(zpi−µ)+5∑
i=1(zvi−µ)
5
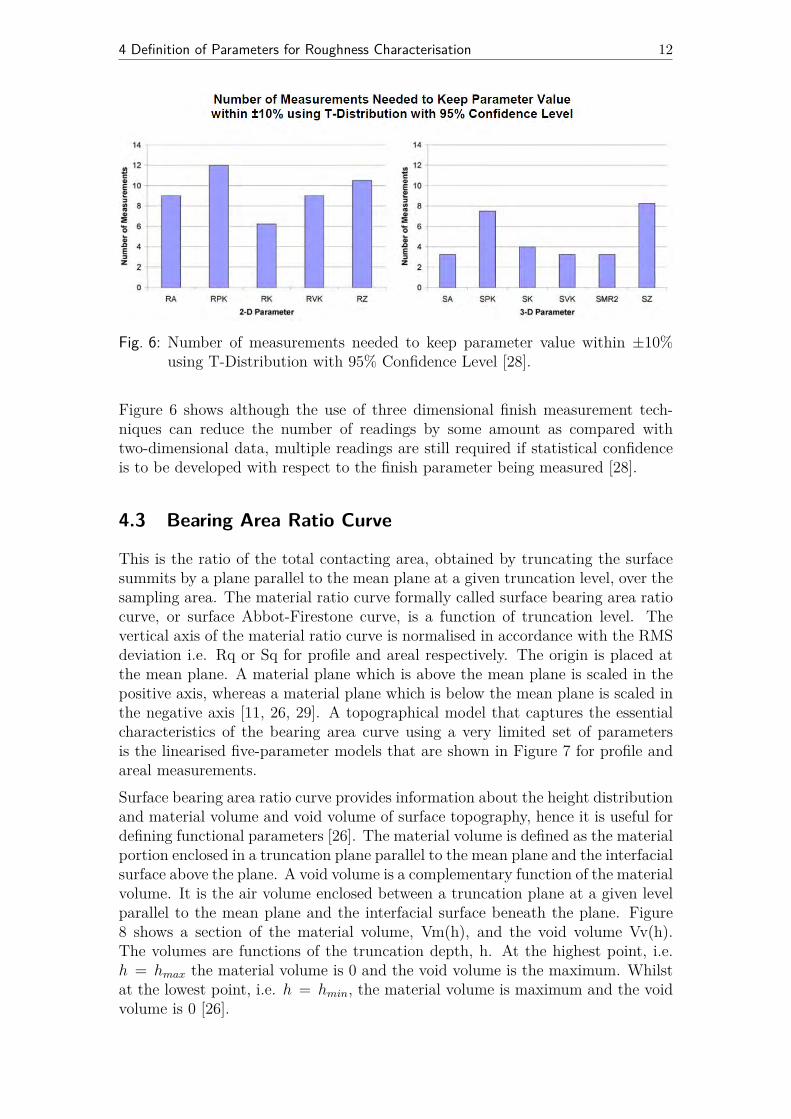
4 Definition of Parameters for Roughness Characterisation 12
Fig. 6: Number of measurements needed to keep parameter value within ±10%using T-Distribution with 95% Confidence Level [28].
Figure 6 shows although the use of three dimensional finish measurement tech-niques can reduce the number of readings by some amount as compared withtwo-dimensional data, multiple readings are still required if statistical confidenceis to be developed with respect to the finish parameter being measured [28].
4.3 Bearing Area Ratio Curve
This is the ratio of the total contacting area, obtained by truncating the surfacesummits by a plane parallel to the mean plane at a given truncation level, over thesampling area. The material ratio curve formally called surface bearing area ratiocurve, or surface Abbot-Firestone curve, is a function of truncation level. Thevertical axis of the material ratio curve is normalised in accordance with the RMSdeviation i.e. Rq or Sq for profile and areal respectively. The origin is placed atthe mean plane. A material plane which is above the mean plane is scaled in thepositive axis, whereas a material plane which is below the mean plane is scaled inthe negative axis [11, 26, 29]. A topographical model that captures the essentialcharacteristics of the bearing area curve using a very limited set of parametersis the linearised five-parameter models that are shown in Figure 7 for profile andareal measurements.Surface bearing area ratio curve provides information about the height distributionand material volume and void volume of surface topography, hence it is useful fordefining functional parameters [26]. The material volume is defined as the materialportion enclosed in a truncation plane parallel to the mean plane and the interfacialsurface above the plane. A void volume is a complementary function of the materialvolume. It is the air volume enclosed between a truncation plane at a given levelparallel to the mean plane and the interfacial surface beneath the plane. Figure8 shows a section of the material volume, Vm(h), and the void volume Vv(h).The volumes are functions of the truncation depth, h. At the highest point, i.e.h = hmax the material volume is 0 and the void volume is the maximum. Whilstat the lowest point, i.e. h = hmin, the material volume is maximum and the voidvolume is 0 [26].
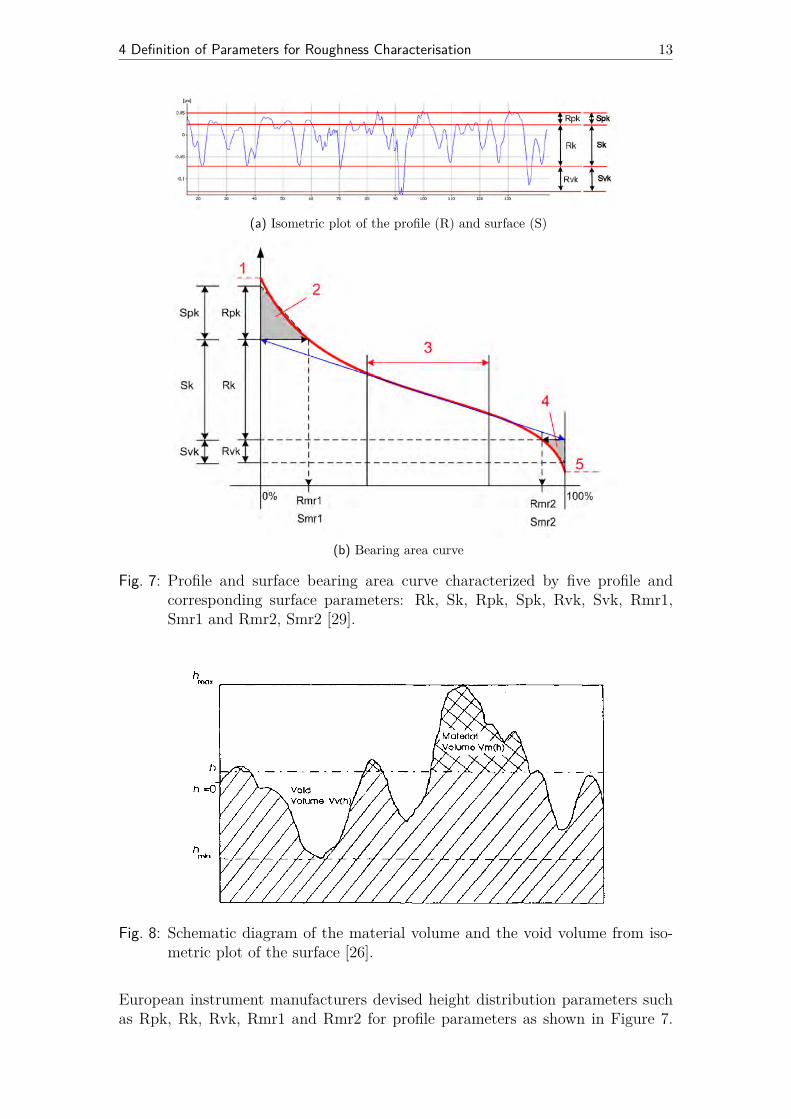
4 Definition of Parameters for Roughness Characterisation 13
(a) Isometric plot of the profile (R) and surface (S)
(b) Bearing area curve
Fig. 7: Profile and surface bearing area curve characterized by five profile andcorresponding surface parameters: Rk, Sk, Rpk, Spk, Rvk, Svk, Rmr1,Smr1 and Rmr2, Smr2 [29].
Fig. 8: Schematic diagram of the material volume and the void volume from iso-metric plot of the surface [26].
European instrument manufacturers devised height distribution parameters suchas Rpk, Rk, Rvk, Rmr1 and Rmr2 for profile parameters as shown in Figure 7.
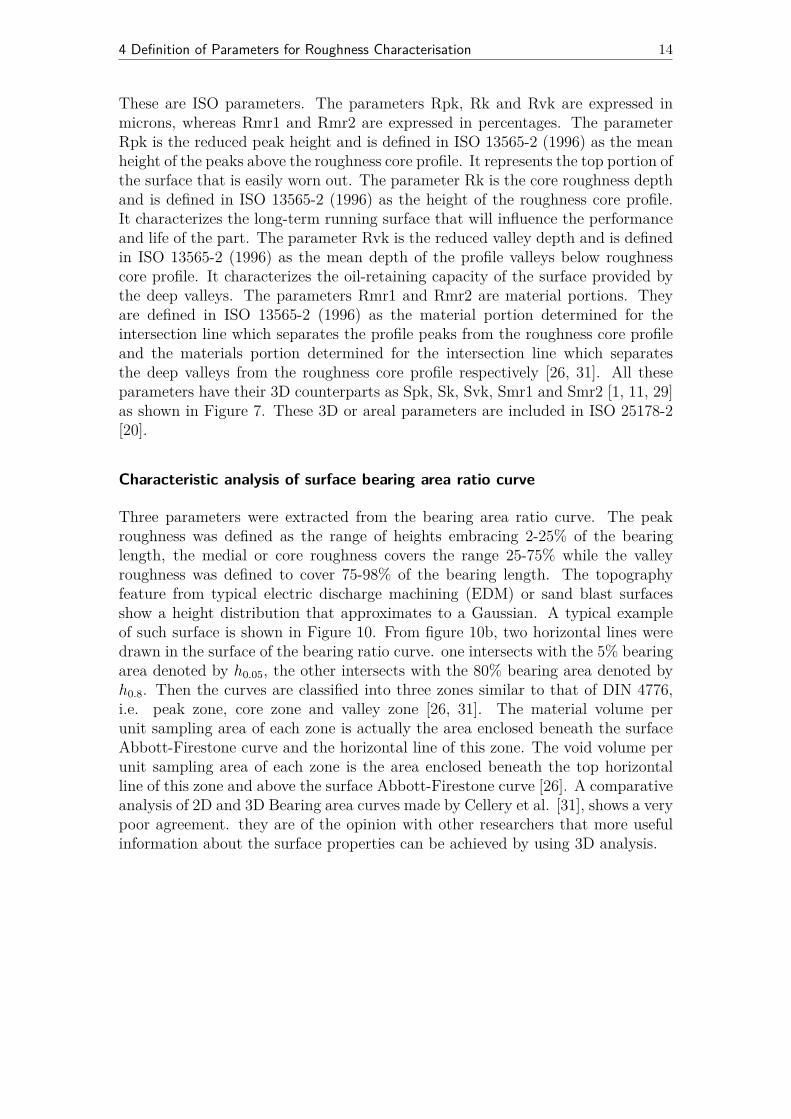
4 Definition of Parameters for Roughness Characterisation 14
These are ISO parameters. The parameters Rpk, Rk and Rvk are expressed inmicrons, whereas Rmr1 and Rmr2 are expressed in percentages. The parameterRpk is the reduced peak height and is defined in ISO 13565-2 (1996) as the meanheight of the peaks above the roughness core profile. It represents the top portion ofthe surface that is easily worn out. The parameter Rk is the core roughness depthand is defined in ISO 13565-2 (1996) as the height of the roughness core profile.It characterizes the long-term running surface that will influence the performanceand life of the part. The parameter Rvk is the reduced valley depth and is definedin ISO 13565-2 (1996) as the mean depth of the profile valleys below roughnesscore profile. It characterizes the oil-retaining capacity of the surface provided bythe deep valleys. The parameters Rmr1 and Rmr2 are material portions. Theyare defined in ISO 13565-2 (1996) as the material portion determined for theintersection line which separates the profile peaks from the roughness core profileand the materials portion determined for the intersection line which separatesthe deep valleys from the roughness core profile respectively [26, 31]. All theseparameters have their 3D counterparts as Spk, Sk, Svk, Smr1 and Smr2 [1, 11, 29]as shown in Figure 7. These 3D or areal parameters are included in ISO 25178-2[20].
Characteristic analysis of surface bearing area ratio curve
Three parameters were extracted from the bearing area ratio curve. The peakroughness was defined as the range of heights embracing 2-25% of the bearinglength, the medial or core roughness covers the range 25-75% while the valleyroughness was defined to cover 75-98% of the bearing length. The topographyfeature from typical electric discharge machining (EDM) or sand blast surfacesshow a height distribution that approximates to a Gaussian. A typical exampleof such surface is shown in Figure 10. From figure 10b, two horizontal lines weredrawn in the surface of the bearing ratio curve. one intersects with the 5% bearingarea denoted by h0.05, the other intersects with the 80% bearing area denoted byh0.8. Then the curves are classified into three zones similar to that of DIN 4776,i.e. peak zone, core zone and valley zone [26, 31]. The material volume perunit sampling area of each zone is actually the area enclosed beneath the surfaceAbbott-Firestone curve and the horizontal line of this zone. The void volume perunit sampling area of each zone is the area enclosed beneath the top horizontalline of this zone and above the surface Abbott-Firestone curve [26]. A comparativeanalysis of 2D and 3D Bearing area curves made by Cellery et al. [31], shows a verypoor agreement. they are of the opinion with other researchers that more usefulinformation about the surface properties can be achieved by using 3D analysis.
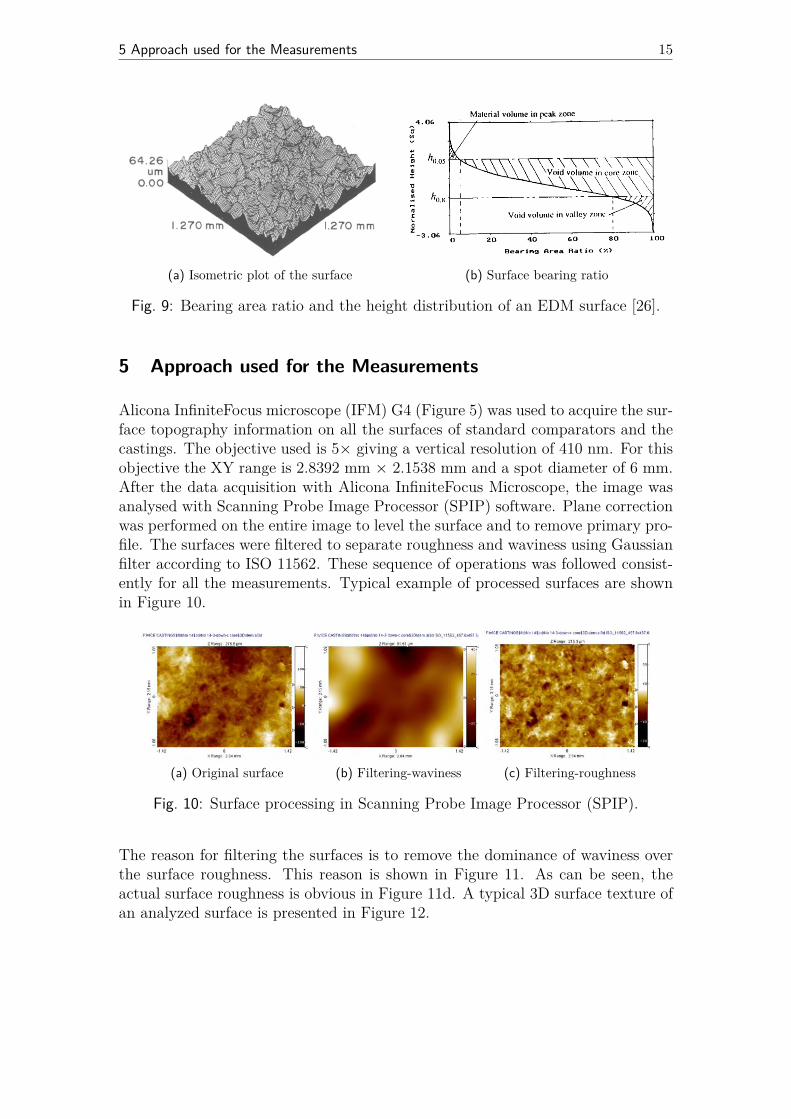
5 Approach used for the Measurements 15
(a) Isometric plot of the surface (b) Surface bearing ratio
Fig. 9: Bearing area ratio and the height distribution of an EDM surface [26].
5 Approach used for the Measurements
Alicona InfiniteFocus microscope (IFM) G4 (Figure 5) was used to acquire the sur-face topography information on all the surfaces of standard comparators and thecastings. The objective used is 5× giving a vertical resolution of 410 nm. For thisobjective the XY range is 2.8392 mm × 2.1538 mm and a spot diameter of 6 mm.After the data acquisition with Alicona InfiniteFocus Microscope, the image wasanalysed with Scanning Probe Image Processor (SPIP) software. Plane correctionwas performed on the entire image to level the surface and to remove primary pro-file. The surfaces were filtered to separate roughness and waviness using Gaussianfilter according to ISO 11562. These sequence of operations was followed consist-ently for all the measurements. Typical example of processed surfaces are shownin Figure 10.
(a) Original surface (b) Filtering-waviness (c) Filtering-roughness
Fig. 10: Surface processing in Scanning Probe Image Processor (SPIP).
The reason for filtering the surfaces is to remove the dominance of waviness overthe surface roughness. This reason is shown in Figure 11. As can be seen, theactual surface roughness is obvious in Figure 11d. A typical 3D surface texture ofan analyzed surface is presented in Figure 12.
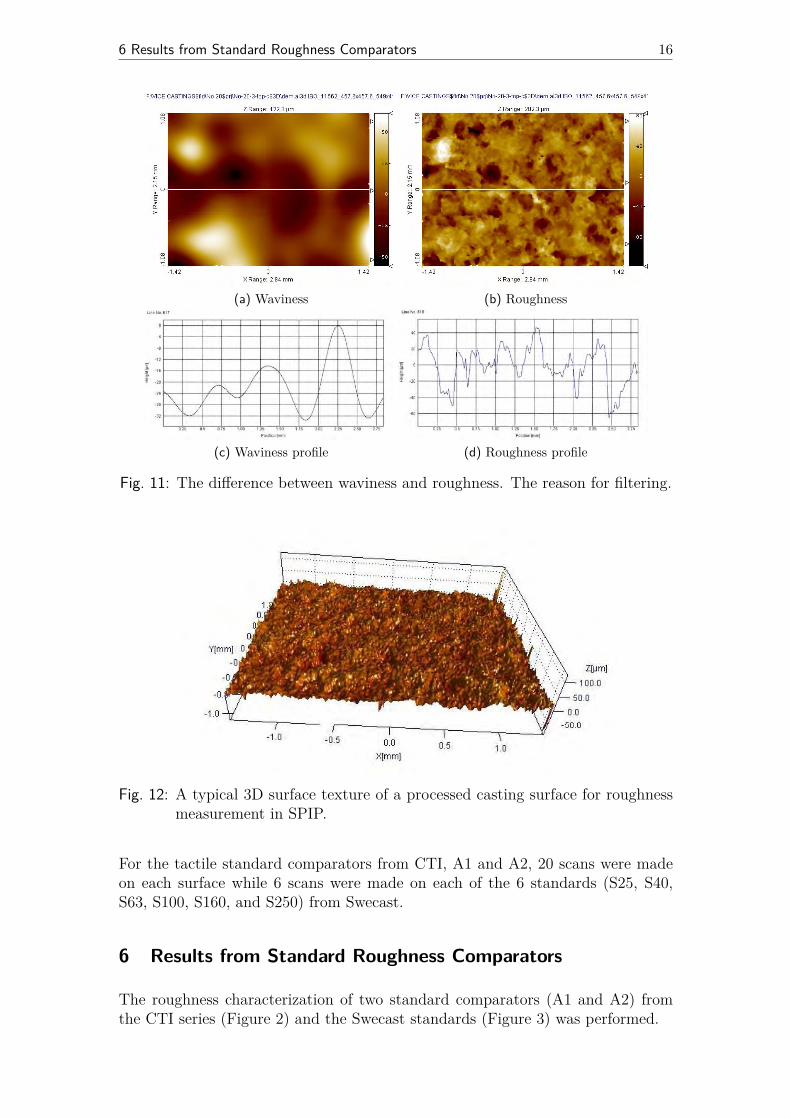
6 Results from Standard Roughness Comparators 16
(a) Waviness (b) Roughness
(c) Waviness profile (d) Roughness profile
Fig. 11: The difference between waviness and roughness. The reason for filtering.
Fig. 12: A typical 3D surface texture of a processed casting surface for roughnessmeasurement in SPIP.
For the tactile standard comparators from CTI, A1 and A2, 20 scans were madeon each surface while 6 scans were made on each of the 6 standards (S25, S40,S63, S100, S160, and S250) from Swecast.
6 Results from Standard Roughness Comparators
The roughness characterization of two standard comparators (A1 and A2) fromthe CTI series (Figure 2) and the Swecast standards (Figure 3) was performed.
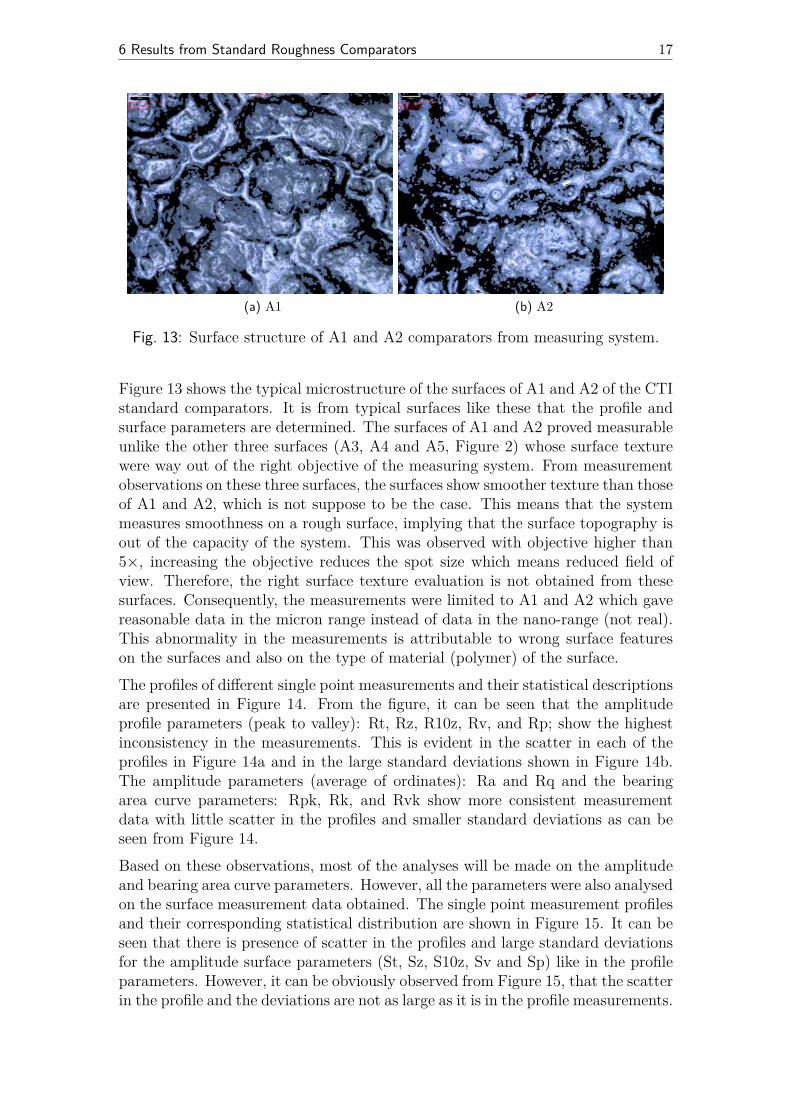
6 Results from Standard Roughness Comparators 17
(a) A1 (b) A2
Fig. 13: Surface structure of A1 and A2 comparators from measuring system.
Figure 13 shows the typical microstructure of the surfaces of A1 and A2 of the CTIstandard comparators. It is from typical surfaces like these that the profile andsurface parameters are determined. The surfaces of A1 and A2 proved measurableunlike the other three surfaces (A3, A4 and A5, Figure 2) whose surface texturewere way out of the right objective of the measuring system. From measurementobservations on these three surfaces, the surfaces show smoother texture than thoseof A1 and A2, which is not suppose to be the case. This means that the systemmeasures smoothness on a rough surface, implying that the surface topography isout of the capacity of the system. This was observed with objective higher than5×, increasing the objective reduces the spot size which means reduced field ofview. Therefore, the right surface texture evaluation is not obtained from thesesurfaces. Consequently, the measurements were limited to A1 and A2 which gavereasonable data in the micron range instead of data in the nano-range (not real).This abnormality in the measurements is attributable to wrong surface featureson the surfaces and also on the type of material (polymer) of the surface.The profiles of different single point measurements and their statistical descriptionsare presented in Figure 14. From the figure, it can be seen that the amplitudeprofile parameters (peak to valley): Rt, Rz, R10z, Rv, and Rp; show the highestinconsistency in the measurements. This is evident in the scatter in each of theprofiles in Figure 14a and in the large standard deviations shown in Figure 14b.The amplitude parameters (average of ordinates): Ra and Rq and the bearingarea curve parameters: Rpk, Rk, and Rvk show more consistent measurementdata with little scatter in the profiles and smaller standard deviations as can beseen from Figure 14.Based on these observations, most of the analyses will be made on the amplitudeand bearing area curve parameters. However, all the parameters were also analysedon the surface measurement data obtained. The single point measurement profilesand their corresponding statistical distribution are shown in Figure 15. It can beseen that there is presence of scatter in the profiles and large standard deviationsfor the amplitude surface parameters (St, Sz, S10z, Sv and Sp) like in the profileparameters. However, it can be obviously observed from Figure 15, that the scatterin the profile and the deviations are not as large as it is in the profile measurements.
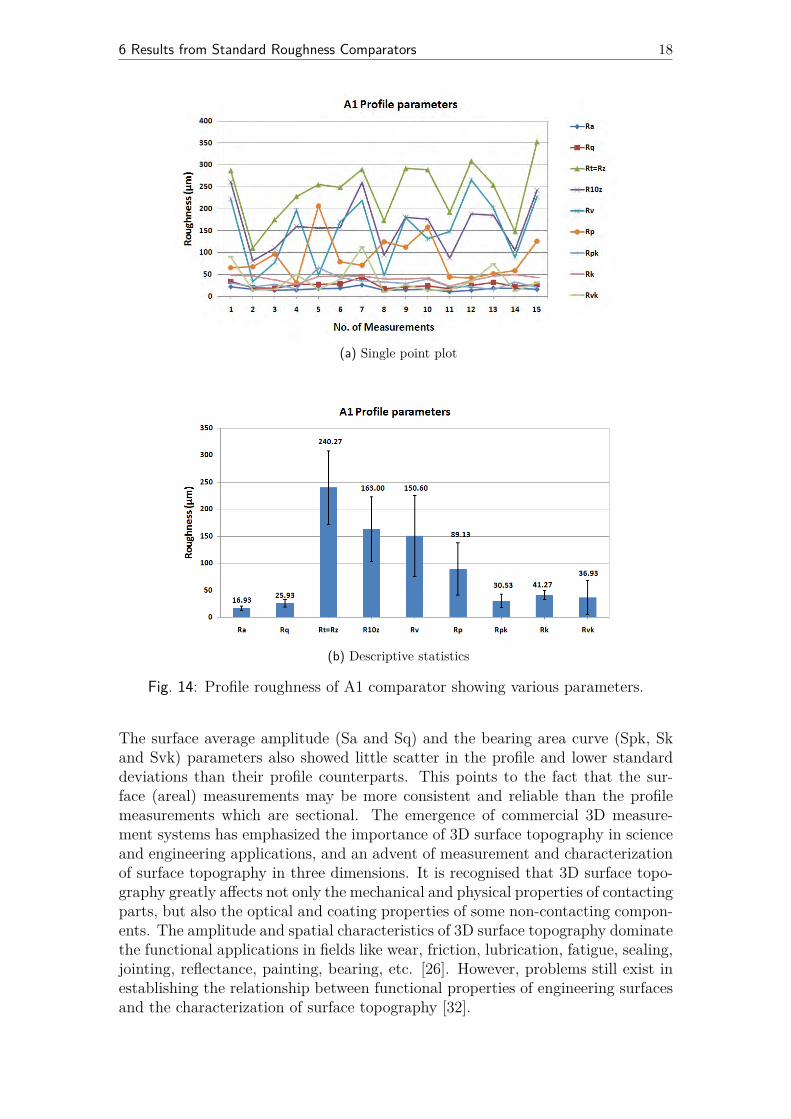
6 Results from Standard Roughness Comparators 18
(a) Single point plot
(b) Descriptive statistics
Fig. 14: Profile roughness of A1 comparator showing various parameters.
The surface average amplitude (Sa and Sq) and the bearing area curve (Spk, Skand Svk) parameters also showed little scatter in the profile and lower standarddeviations than their profile counterparts. This points to the fact that the sur-face (areal) measurements may be more consistent and reliable than the profilemeasurements which are sectional. The emergence of commercial 3D measure-ment systems has emphasized the importance of 3D surface topography in scienceand engineering applications, and an advent of measurement and characterizationof surface topography in three dimensions. It is recognised that 3D surface topo-graphy greatly affects not only the mechanical and physical properties of contactingparts, but also the optical and coating properties of some non-contacting compon-ents. The amplitude and spatial characteristics of 3D surface topography dominatethe functional applications in fields like wear, friction, lubrication, fatigue, sealing,jointing, reflectance, painting, bearing, etc. [26]. However, problems still exist inestablishing the relationship between functional properties of engineering surfacesand the characterization of surface topography [32].
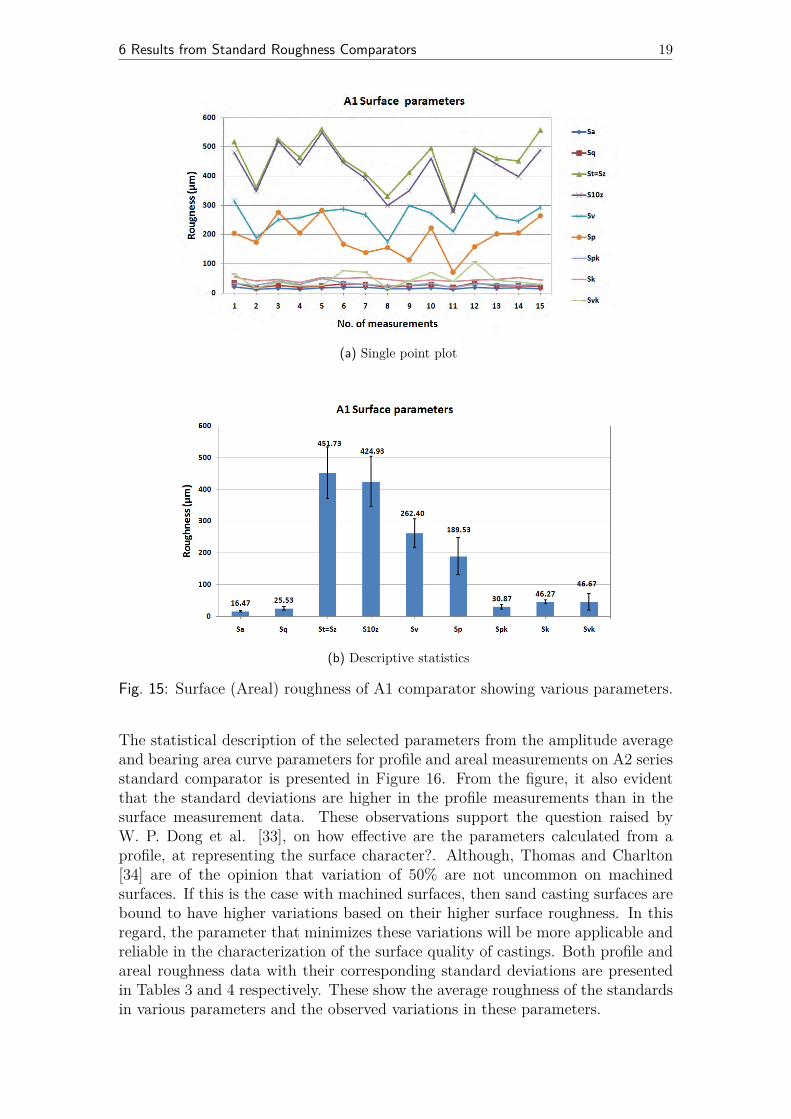
6 Results from Standard Roughness Comparators 19
(a) Single point plot
(b) Descriptive statistics
Fig. 15: Surface (Areal) roughness of A1 comparator showing various parameters.
The statistical description of the selected parameters from the amplitude averageand bearing area curve parameters for profile and areal measurements on A2 seriesstandard comparator is presented in Figure 16. From the figure, it also evidentthat the standard deviations are higher in the profile measurements than in thesurface measurement data. These observations support the question raised byW. P. Dong et al. [33], on how effective are the parameters calculated from aprofile, at representing the surface character?. Although, Thomas and Charlton[34] are of the opinion that variation of 50% are not uncommon on machinedsurfaces. If this is the case with machined surfaces, then sand casting surfaces arebound to have higher variations based on their higher surface roughness. In thisregard, the parameter that minimizes these variations will be more applicable andreliable in the characterization of the surface quality of castings. Both profile andareal roughness data with their corresponding standard deviations are presentedin Tables 3 and 4 respectively. These show the average roughness of the standardsin various parameters and the observed variations in these parameters.
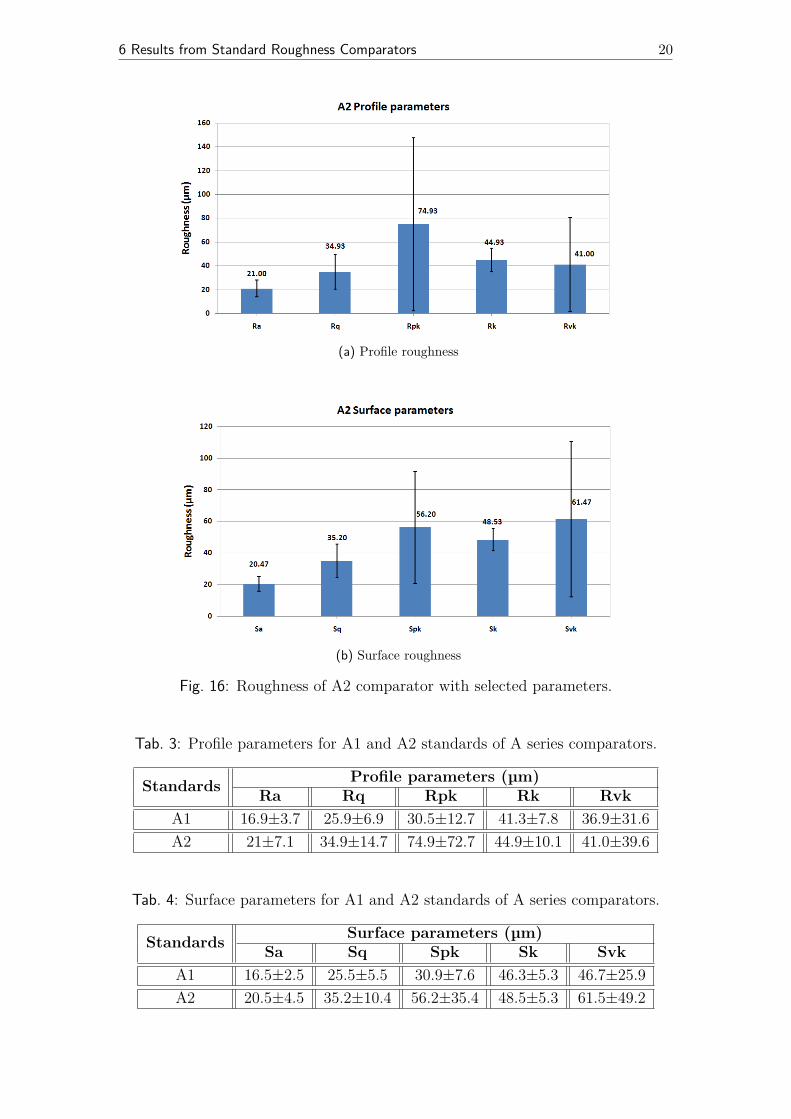
6 Results from Standard Roughness Comparators 20
(a) Profile roughness
(b) Surface roughness
Fig. 16: Roughness of A2 comparator with selected parameters.
Tab. 3: Profile parameters for A1 and A2 standards of A series comparators.
Standards Profile parameters (µm)Ra Rq Rpk Rk Rvk
A1 16.9±3.7 25.9±6.9 30.5±12.7 41.3±7.8 36.9±31.6A2 21±7.1 34.9±14.7 74.9±72.7 44.9±10.1 41.0±39.6
Tab. 4: Surface parameters for A1 and A2 standards of A series comparators.
Standards Surface parameters (µm)Sa Sq Spk Sk Svk
A1 16.5±2.5 25.5±5.5 30.9±7.6 46.3±5.3 46.7±25.9A2 20.5±4.5 35.2±10.4 56.2±35.4 48.5±5.3 61.5±49.2
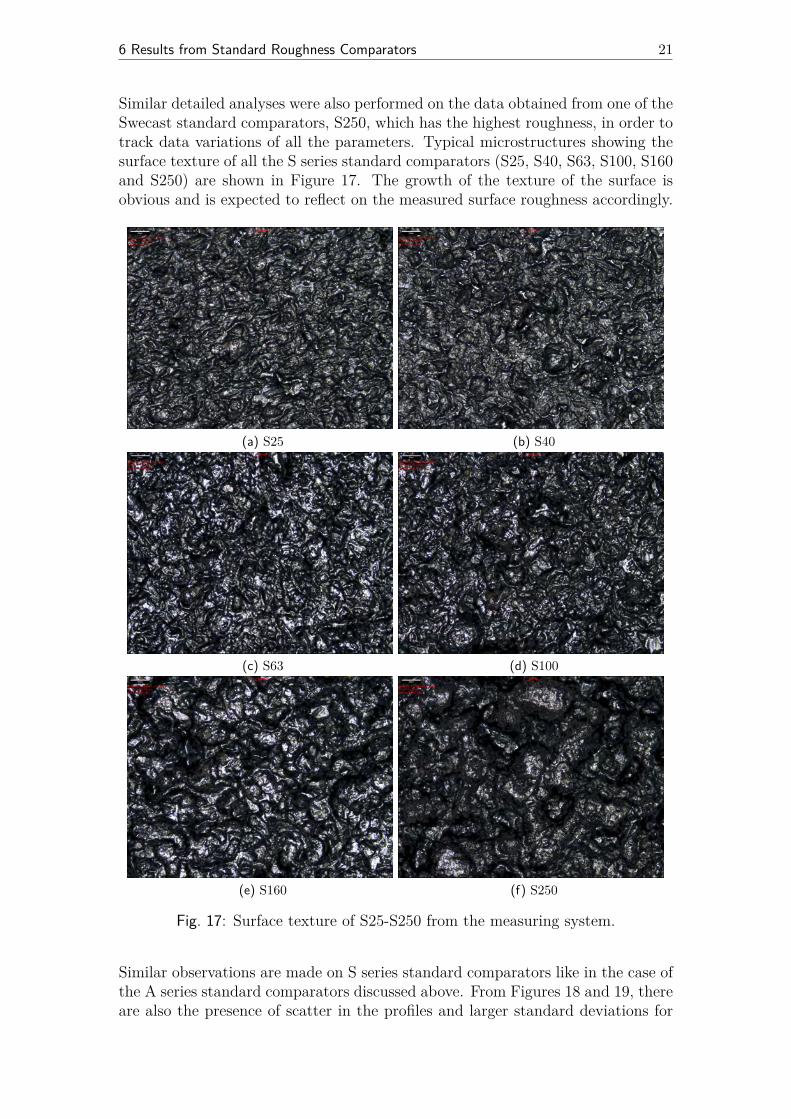
6 Results from Standard Roughness Comparators 21
Similar detailed analyses were also performed on the data obtained from one of theSwecast standard comparators, S250, which has the highest roughness, in order totrack data variations of all the parameters. Typical microstructures showing thesurface texture of all the S series standard comparators (S25, S40, S63, S100, S160and S250) are shown in Figure 17. The growth of the texture of the surface isobvious and is expected to reflect on the measured surface roughness accordingly.
(a) S25 (b) S40
(c) S63 (d) S100
(e) S160 (f) S250
Fig. 17: Surface texture of S25-S250 from the measuring system.
Similar observations are made on S series standard comparators like in the case ofthe A series standard comparators discussed above. From Figures 18 and 19, thereare also the presence of scatter in the profiles and larger standard deviations for
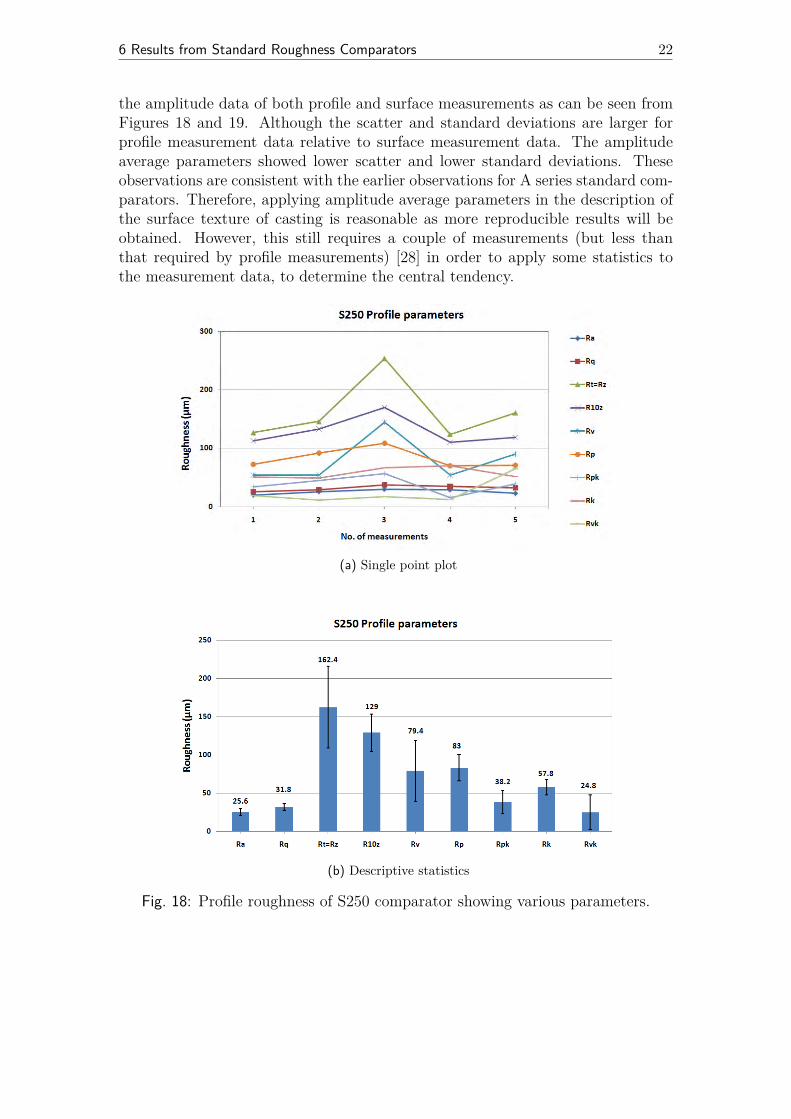
6 Results from Standard Roughness Comparators 22
the amplitude data of both profile and surface measurements as can be seen fromFigures 18 and 19. Although the scatter and standard deviations are larger forprofile measurement data relative to surface measurement data. The amplitudeaverage parameters showed lower scatter and lower standard deviations. Theseobservations are consistent with the earlier observations for A series standard com-parators. Therefore, applying amplitude average parameters in the description ofthe surface texture of casting is reasonable as more reproducible results will beobtained. However, this still requires a couple of measurements (but less thanthat required by profile measurements) [28] in order to apply some statistics tothe measurement data, to determine the central tendency.
(a) Single point plot
(b) Descriptive statistics
Fig. 18: Profile roughness of S250 comparator showing various parameters.
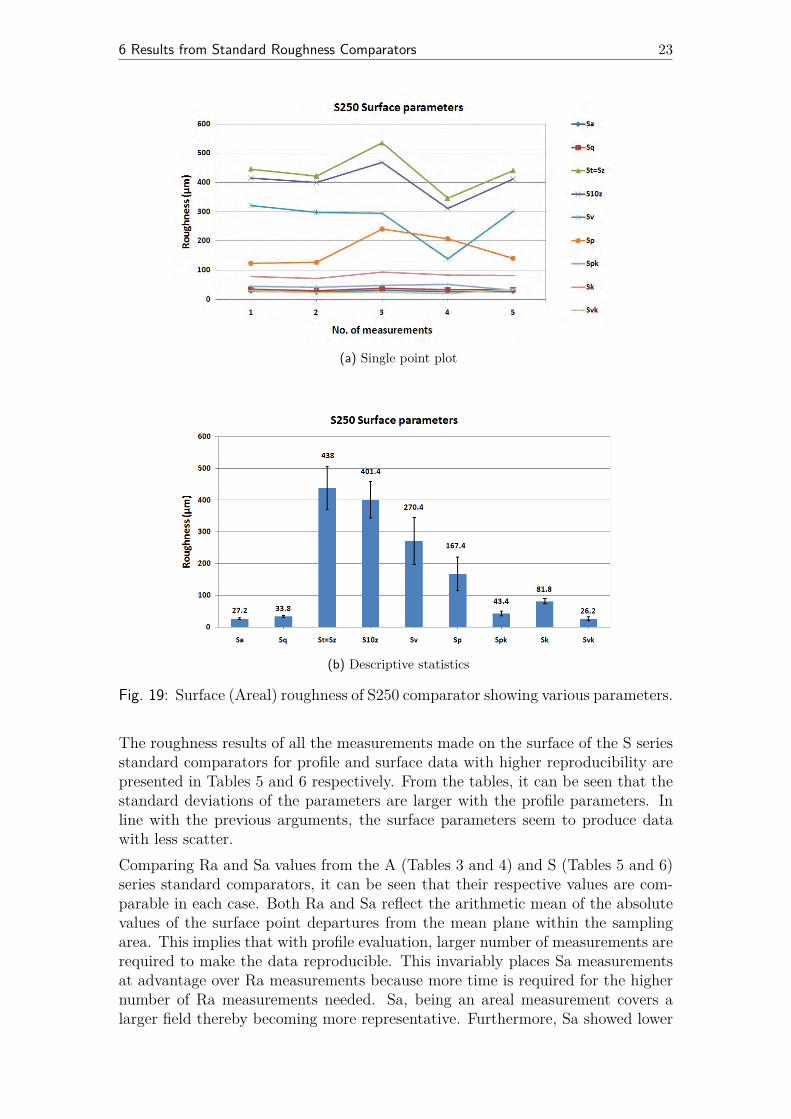
6 Results from Standard Roughness Comparators 23
(a) Single point plot
(b) Descriptive statistics
Fig. 19: Surface (Areal) roughness of S250 comparator showing various parameters.
The roughness results of all the measurements made on the surface of the S seriesstandard comparators for profile and surface data with higher reproducibility arepresented in Tables 5 and 6 respectively. From the tables, it can be seen that thestandard deviations of the parameters are larger with the profile parameters. Inline with the previous arguments, the surface parameters seem to produce datawith less scatter.Comparing Ra and Sa values from the A (Tables 3 and 4) and S (Tables 5 and 6)series standard comparators, it can be seen that their respective values are com-parable in each case. Both Ra and Sa reflect the arithmetic mean of the absolutevalues of the surface point departures from the mean plane within the samplingarea. This implies that with profile evaluation, larger number of measurements arerequired to make the data reproducible. This invariably places Sa measurementsat advantage over Ra measurements because more time is required for the highernumber of Ra measurements needed. Sa, being an areal measurement covers alarger field thereby becoming more representative. Furthermore, Sa showed lower
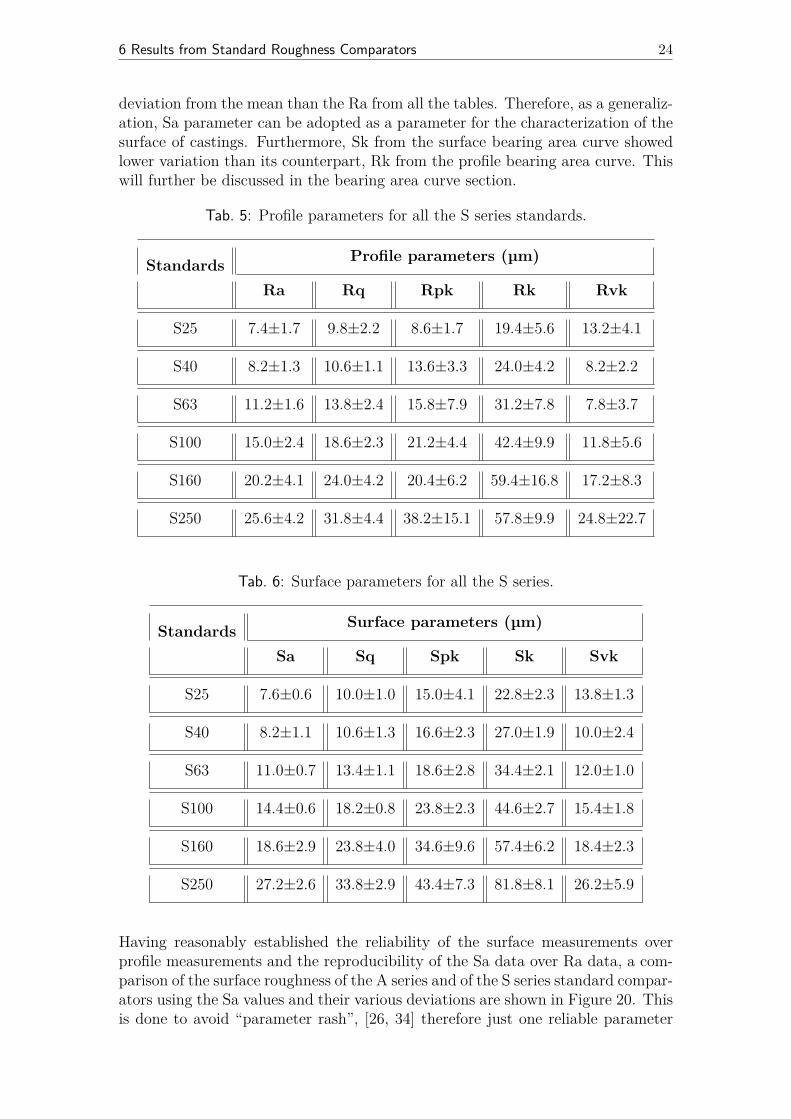
6 Results from Standard Roughness Comparators 24
deviation from the mean than the Ra from all the tables. Therefore, as a generaliz-ation, Sa parameter can be adopted as a parameter for the characterization of thesurface of castings. Furthermore, Sk from the surface bearing area curve showedlower variation than its counterpart, Rk from the profile bearing area curve. Thiswill further be discussed in the bearing area curve section.
Tab. 5: Profile parameters for all the S series standards.
Standards Profile parameters (µm)
Ra Rq Rpk Rk Rvk
S25 7.4±1.7 9.8±2.2 8.6±1.7 19.4±5.6 13.2±4.1
S40 8.2±1.3 10.6±1.1 13.6±3.3 24.0±4.2 8.2±2.2
S63 11.2±1.6 13.8±2.4 15.8±7.9 31.2±7.8 7.8±3.7
S100 15.0±2.4 18.6±2.3 21.2±4.4 42.4±9.9 11.8±5.6
S160 20.2±4.1 24.0±4.2 20.4±6.2 59.4±16.8 17.2±8.3
S250 25.6±4.2 31.8±4.4 38.2±15.1 57.8±9.9 24.8±22.7
Tab. 6: Surface parameters for all the S series.
Standards Surface parameters (µm)
Sa Sq Spk Sk Svk
S25 7.6±0.6 10.0±1.0 15.0±4.1 22.8±2.3 13.8±1.3
S40 8.2±1.1 10.6±1.3 16.6±2.3 27.0±1.9 10.0±2.4
S63 11.0±0.7 13.4±1.1 18.6±2.8 34.4±2.1 12.0±1.0
S100 14.4±0.6 18.2±0.8 23.8±2.3 44.6±2.7 15.4±1.8
S160 18.6±2.9 23.8±4.0 34.6±9.6 57.4±6.2 18.4±2.3
S250 27.2±2.6 33.8±2.9 43.4±7.3 81.8±8.1 26.2±5.9
Having reasonably established the reliability of the surface measurements overprofile measurements and the reproducibility of the Sa data over Ra data, a com-parison of the surface roughness of the A series and of the S series standard compar-ators using the Sa values and their various deviations are shown in Figure 20. Thisis done to avoid “parameter rash”, [26, 34] therefore just one reliable parameter
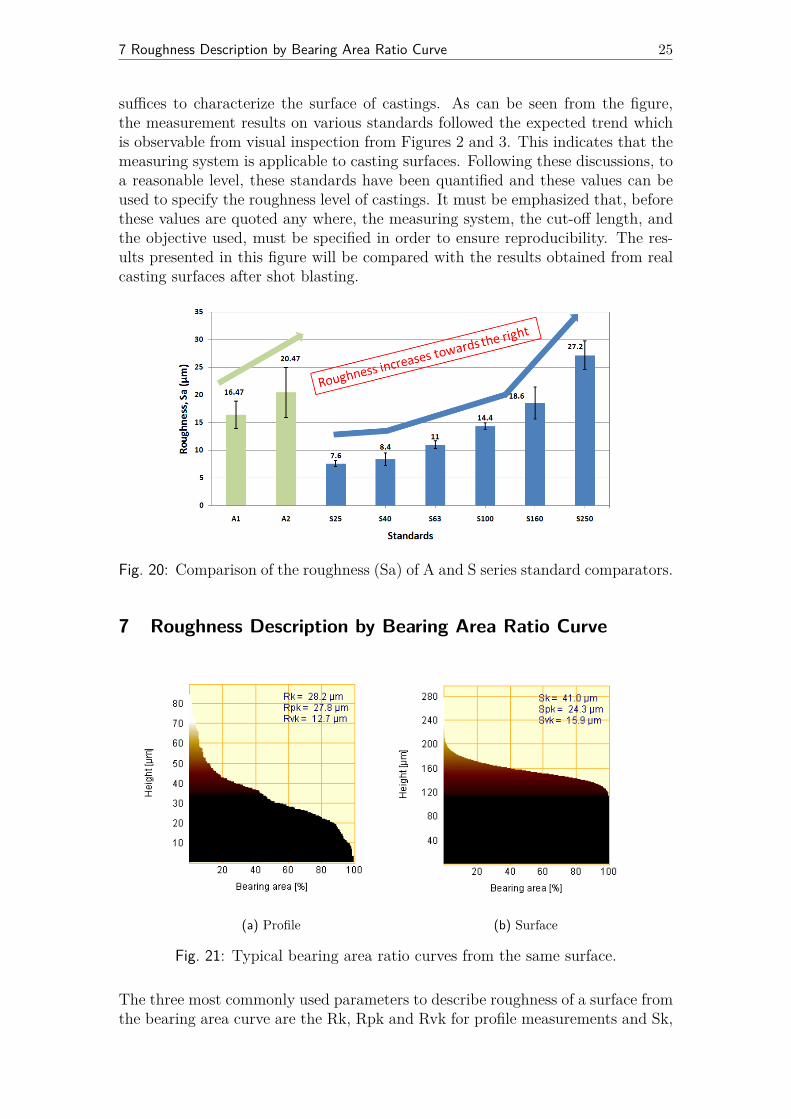
7 Roughness Description by Bearing Area Ratio Curve 25
suffices to characterize the surface of castings. As can be seen from the figure,the measurement results on various standards followed the expected trend whichis observable from visual inspection from Figures 2 and 3. This indicates that themeasuring system is applicable to casting surfaces. Following these discussions, toa reasonable level, these standards have been quantified and these values can beused to specify the roughness level of castings. It must be emphasized that, beforethese values are quoted any where, the measuring system, the cut-off length, andthe objective used, must be specified in order to ensure reproducibility. The res-ults presented in this figure will be compared with the results obtained from realcasting surfaces after shot blasting.
Fig. 20: Comparison of the roughness (Sa) of A and S series standard comparators.
7 Roughness Description by Bearing Area Ratio Curve
(a) Profile (b) Surface
Fig. 21: Typical bearing area ratio curves from the same surface.
The three most commonly used parameters to describe roughness of a surface fromthe bearing area curve are the Rk, Rpk and Rvk for profile measurements and Sk,
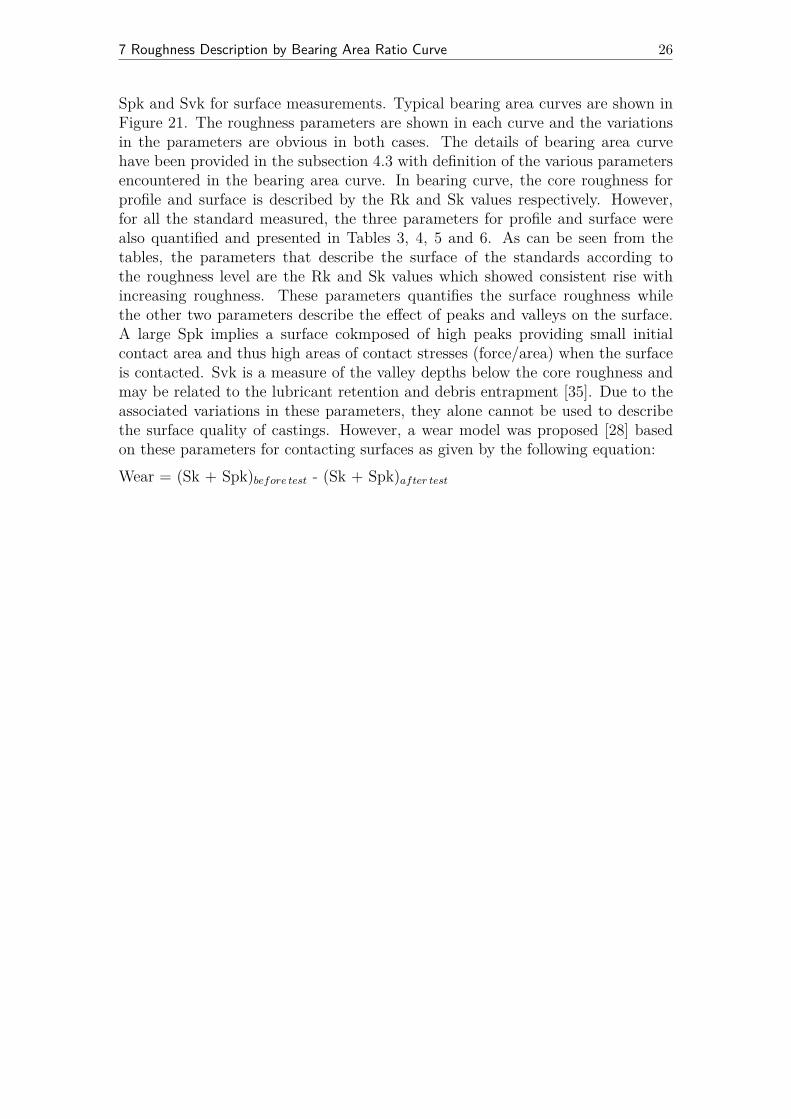
7 Roughness Description by Bearing Area Ratio Curve 26
Spk and Svk for surface measurements. Typical bearing area curves are shown inFigure 21. The roughness parameters are shown in each curve and the variationsin the parameters are obvious in both cases. The details of bearing area curvehave been provided in the subsection 4.3 with definition of the various parametersencountered in the bearing area curve. In bearing curve, the core roughness forprofile and surface is described by the Rk and Sk values respectively. However,for all the standard measured, the three parameters for profile and surface werealso quantified and presented in Tables 3, 4, 5 and 6. As can be seen from thetables, the parameters that describe the surface of the standards according tothe roughness level are the Rk and Sk values which showed consistent rise withincreasing roughness. These parameters quantifies the surface roughness whilethe other two parameters describe the effect of peaks and valleys on the surface.A large Spk implies a surface cokmposed of high peaks providing small initialcontact area and thus high areas of contact stresses (force/area) when the surfaceis contacted. Svk is a measure of the valley depths below the core roughness andmay be related to the lubricant retention and debris entrapment [35]. Due to theassociated variations in these parameters, they alone cannot be used to describethe surface quality of castings. However, a wear model was proposed [28] basedon these parameters for contacting surfaces as given by the following equation:Wear = (Sk + Spk)before test - (Sk + Spk)after test
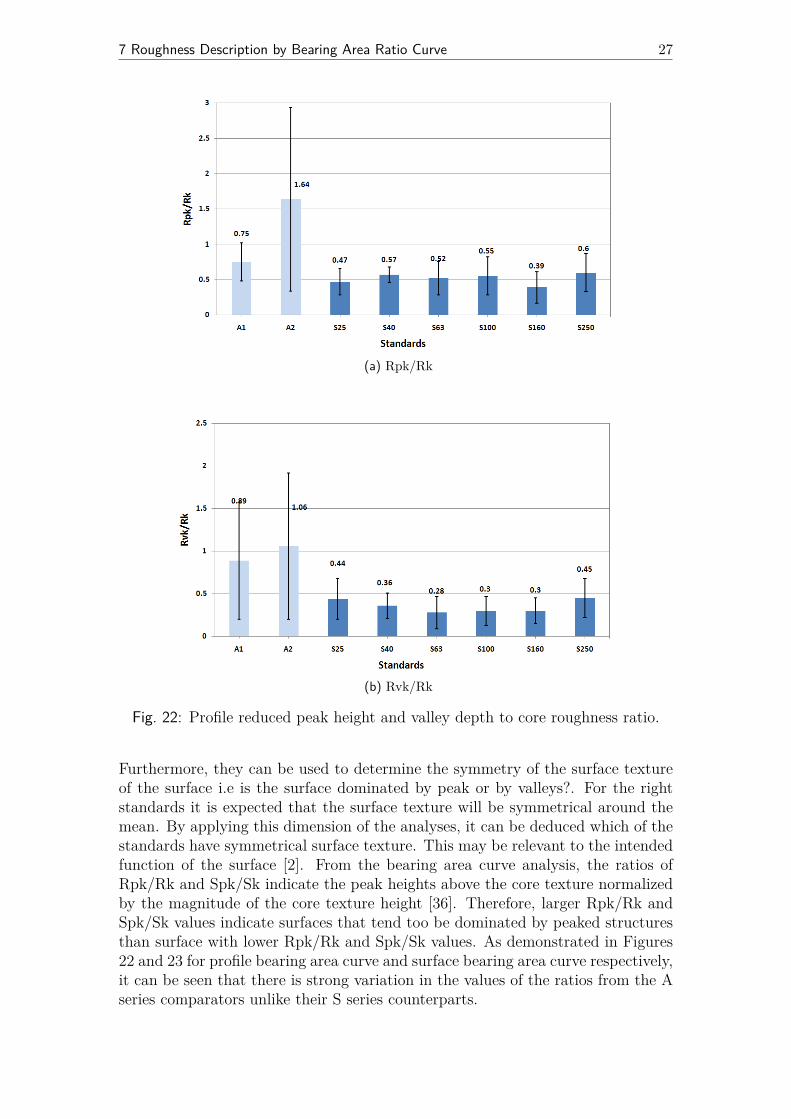
7 Roughness Description by Bearing Area Ratio Curve 27
(a) Rpk/Rk
(b) Rvk/Rk
Fig. 22: Profile reduced peak height and valley depth to core roughness ratio.
Furthermore, they can be used to determine the symmetry of the surface textureof the surface i.e is the surface dominated by peak or by valleys?. For the rightstandards it is expected that the surface texture will be symmetrical around themean. By applying this dimension of the analyses, it can be deduced which of thestandards have symmetrical surface texture. This may be relevant to the intendedfunction of the surface [2]. From the bearing area curve analysis, the ratios ofRpk/Rk and Spk/Sk indicate the peak heights above the core texture normalizedby the magnitude of the core texture height [36]. Therefore, larger Rpk/Rk andSpk/Sk values indicate surfaces that tend too be dominated by peaked structuresthan surface with lower Rpk/Rk and Spk/Sk values. As demonstrated in Figures22 and 23 for profile bearing area curve and surface bearing area curve respectively,it can be seen that there is strong variation in the values of the ratios from the Aseries comparators unlike their S series counterparts.
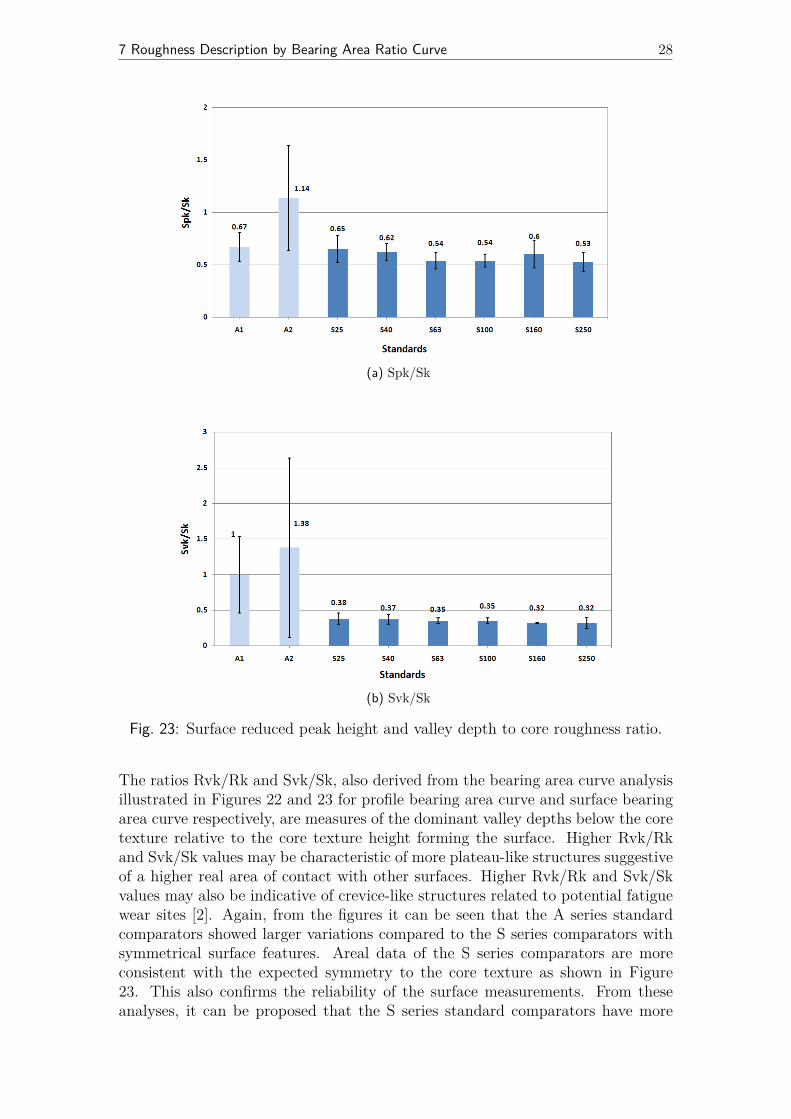
7 Roughness Description by Bearing Area Ratio Curve 28
(a) Spk/Sk
(b) Svk/Sk
Fig. 23: Surface reduced peak height and valley depth to core roughness ratio.
The ratios Rvk/Rk and Svk/Sk, also derived from the bearing area curve analysisillustrated in Figures 22 and 23 for profile bearing area curve and surface bearingarea curve respectively, are measures of the dominant valley depths below the coretexture relative to the core texture height forming the surface. Higher Rvk/Rkand Svk/Sk values may be characteristic of more plateau-like structures suggestiveof a higher real area of contact with other surfaces. Higher Rvk/Rk and Svk/Skvalues may also be indicative of crevice-like structures related to potential fatiguewear sites [2]. Again, from the figures it can be seen that the A series standardcomparators showed larger variations compared to the S series comparators withsymmetrical surface features. Areal data of the S series comparators are moreconsistent with the expected symmetry to the core texture as shown in Figure23. This also confirms the reliability of the surface measurements. From theseanalyses, it can be proposed that the S series standard comparators have more

8 Results from Castings 29
homogeneously distributed and symmetrical surface features than the A seriesstandard comparators. Hence, show a better description of the surfaces.
8 Results from Castings
A description of the casting geometry is provided in Figure 24 for the vertically-parted moulds. Prints 2 and 4 were spray-coated while prints 1 and 3 are leftuncoated. This pattern also helps in the investigation of the influence of metal-lostatic pressure on the surface finish of the vice castings. For each of the printsin a mould, the top and down of the front face (Figure 24c) and top and downof the reverse face (Figure 24d) were scanned for roughness measurement. Sixmeasurements were made on each face and then averaged.The castings are vice casting made by spraying foundry coatings containing sol-gelcomponent as an additive. The castings examined are castings identified with themould numbers as 10, 11, 14, 20, and 22. The description of the treatments givento the prints in the mould is as follows:
• Mould no.10: Print 1+3: No coating, Print 2+4: W230, dilution of W230:30% addition of water.
• Mould no. 11: Print 1+3: No coating, Print 2+4: W230 + 4% Sol-Gel,dilution of W230: 25% addition of water.
• Mould no. 14: Print 1+3: No coating, Print 2+4: W230 + 20% Sol-Gel,dilution of W230: 25% addition of water with Multilayer application. Mouldspoured after 1 hour extra waiting time
• Mould no. 20: Print 1+3: No coating, Print 2+4: W226 + 4% Sol-Gel,dilution of W226: 30% addition of water.
• Mould no. 22: Print 1+3: No coating, Print 2+4: W226, dilution of W226:30% addition of water with Multilayer application
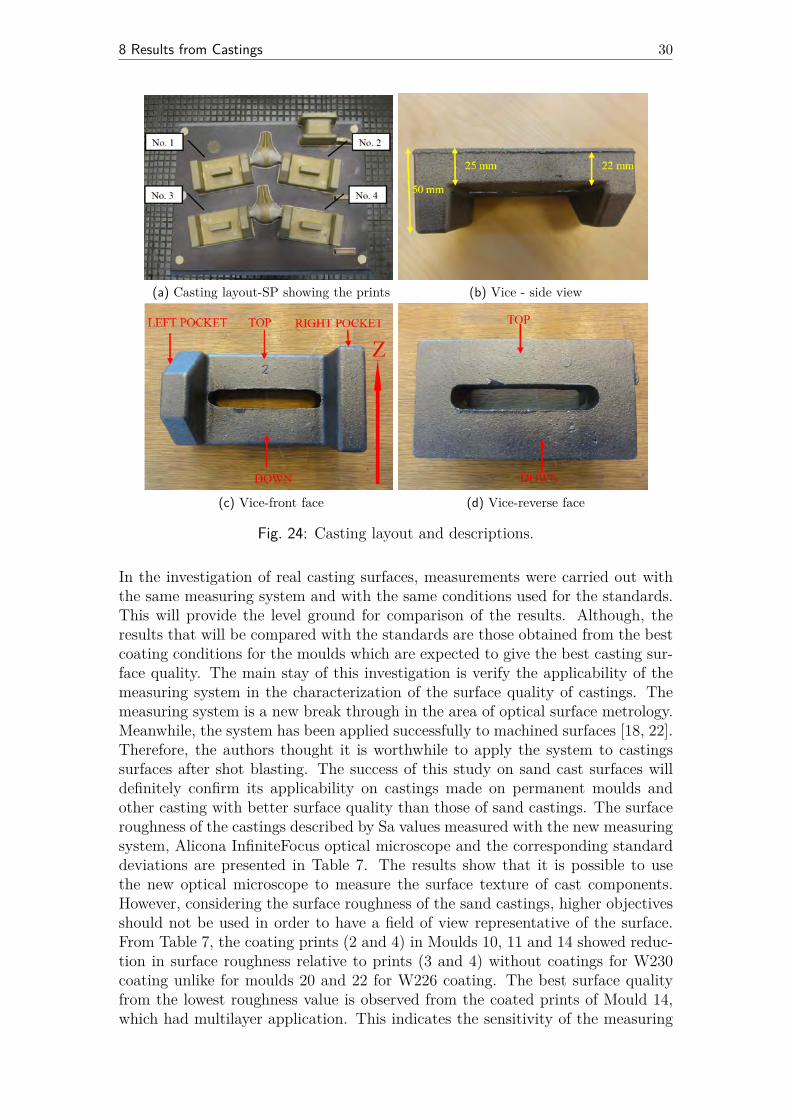
8 Results from Castings 30
(a) Casting layout-SP showing the prints (b) Vice - side view
(c) Vice-front face (d) Vice-reverse face
Fig. 24: Casting layout and descriptions.
In the investigation of real casting surfaces, measurements were carried out withthe same measuring system and with the same conditions used for the standards.This will provide the level ground for comparison of the results. Although, theresults that will be compared with the standards are those obtained from the bestcoating conditions for the moulds which are expected to give the best casting sur-face quality. The main stay of this investigation is verify the applicability of themeasuring system in the characterization of the surface quality of castings. Themeasuring system is a new break through in the area of optical surface metrology.Meanwhile, the system has been applied successfully to machined surfaces [18, 22].Therefore, the authors thought it is worthwhile to apply the system to castingssurfaces after shot blasting. The success of this study on sand cast surfaces willdefinitely confirm its applicability on castings made on permanent moulds andother casting with better surface quality than those of sand castings. The surfaceroughness of the castings described by Sa values measured with the new measuringsystem, Alicona InfiniteFocus optical microscope and the corresponding standarddeviations are presented in Table 7. The results show that it is possible to usethe new optical microscope to measure the surface texture of cast components.However, considering the surface roughness of the sand castings, higher objectivesshould not be used in order to have a field of view representative of the surface.From Table 7, the coating prints (2 and 4) in Moulds 10, 11 and 14 showed reduc-tion in surface roughness relative to prints (3 and 4) without coatings for W230coating unlike for moulds 20 and 22 for W226 coating. The best surface qualityfrom the lowest roughness value is observed from the coated prints of Mould 14,which had multilayer application. This indicates the sensitivity of the measuring

8 Results from Castings 31
system on the changes of the surface features.
Tab. 7: Surface roughness results of the castings.
Mould no. Prints Front face (µm) Reverse face (µm)
Top Down Top Down
10 1 14.3±1.0 15.9±1.7 15.0±3.8 16.0±1.2
2 9.8±1.1 13.2±1.8 13.2±1.3 9.8±1.1
3 17.3±1.1 18.6±3.1 17.1±1.1 20.4±4.3
4 11.6±2.3 15.1±1.4 14.7±2.1 9.7±1.6
11 1 13.2±1.6 15.3±1.3 11.2±1.7 13.3±0.8
2 9.6±2.3 14.0±2.5 9.9±3.2 13.9±1.0
3 18.3±3.1 18.8±2.0 17.3±1.7 18.7±0.6
4 15.2±4.3 17.4±1.6 13.3±2.4 9.6±2.7
14 1 13.5±1.6 12.1±1.9 12.1±1.0 15.3±1.4
2 7.5±0.9 12.9±1.3 5.6±0.9 5.6±0.3
3 13.8±1.3 17.6±1.4 17.1±2.5 19.2±2.1
4 8.4±1.8 7.5±0.8 5.8±0.2 7.7±2.2
20 1 16.1±1.9 16.3±1.5 15.4±0.6 16.4±0.9
2 11.9±1.5 16.3±1.0 15.2±1.4 17.8±1.2
3 15.9±2.0 20.0±2.2 17.8±1.0 19.7±2.4
4 17.0±2.9 20.8±1.8 12.4±0.6 11.7±0.5
22 1 11.1±1.1 16.7±1.3 11.8±1.7 15.3±0.8
2 11.4±1.2 13.8±1.8 12.5±1.0 16.2±2.1
3 14.6±2.1 16.5±2.1 14.5±1.0 17.8±1.6
4 16.4±1.6 19.8±1.9 16.6±1.4 17.2±1.2
In the analysis of the single measurement points and their variations from one an-other, Figure 25 shows the profiles and their variations with one another for prints
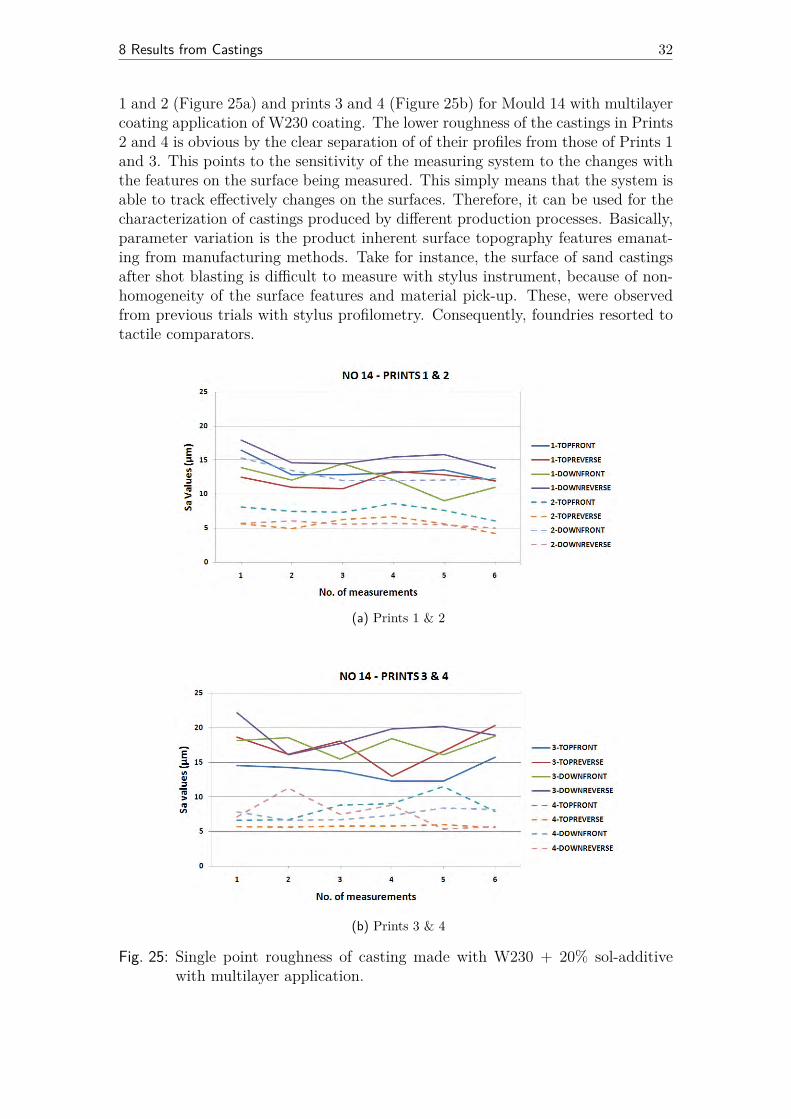
8 Results from Castings 32
1 and 2 (Figure 25a) and prints 3 and 4 (Figure 25b) for Mould 14 with multilayercoating application of W230 coating. The lower roughness of the castings in Prints2 and 4 is obvious by the clear separation of of their profiles from those of Prints 1and 3. This points to the sensitivity of the measuring system to the changes withthe features on the surface being measured. This simply means that the system isable to track effectively changes on the surfaces. Therefore, it can be used for thecharacterization of castings produced by different production processes. Basically,parameter variation is the product inherent surface topography features emanat-ing from manufacturing methods. Take for instance, the surface of sand castingsafter shot blasting is difficult to measure with stylus instrument, because of non-homogeneity of the surface features and material pick-up. These, were observedfrom previous trials with stylus profilometry. Consequently, foundries resorted totactile comparators.
(a) Prints 1 & 2
(b) Prints 3 & 4
Fig. 25: Single point roughness of casting made with W230 + 20% sol-additivewith multilayer application.
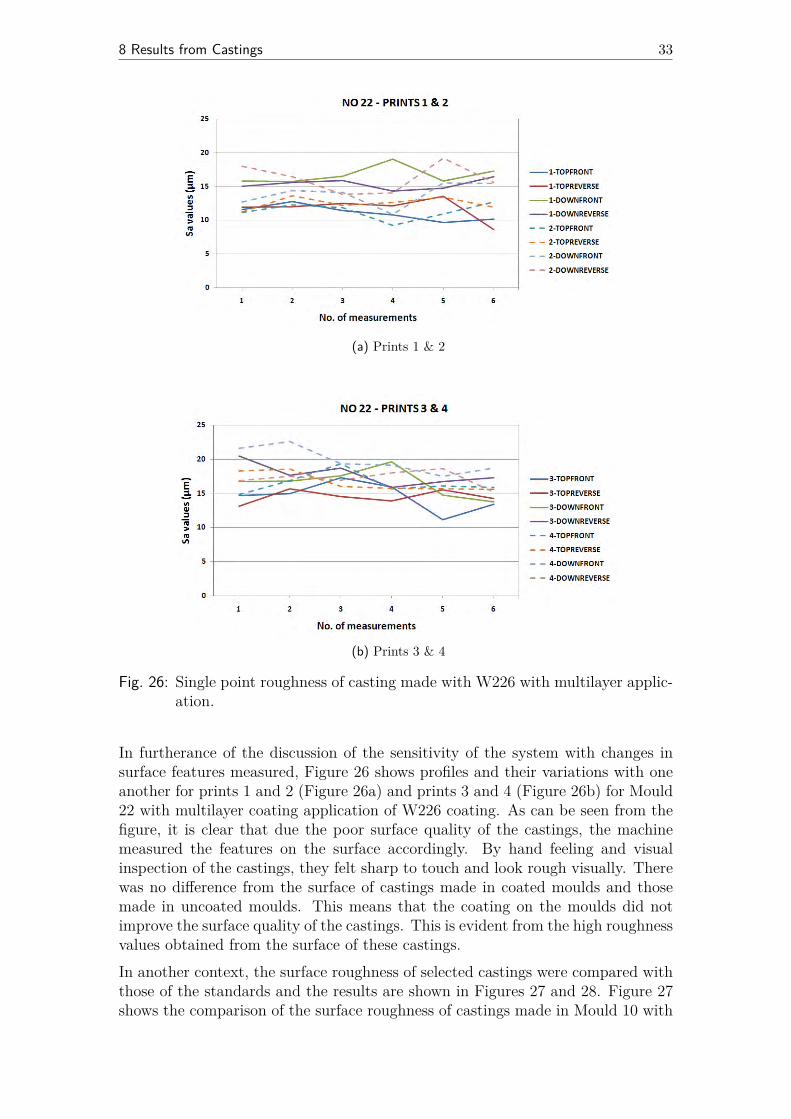
8 Results from Castings 33
(a) Prints 1 & 2
(b) Prints 3 & 4
Fig. 26: Single point roughness of casting made with W226 with multilayer applic-ation.
In furtherance of the discussion of the sensitivity of the system with changes insurface features measured, Figure 26 shows profiles and their variations with oneanother for prints 1 and 2 (Figure 26a) and prints 3 and 4 (Figure 26b) for Mould22 with multilayer coating application of W226 coating. As can be seen from thefigure, it is clear that due the poor surface quality of the castings, the machinemeasured the features on the surface accordingly. By hand feeling and visualinspection of the castings, they felt sharp to touch and look rough visually. Therewas no difference from the surface of castings made in coated moulds and thosemade in uncoated moulds. This means that the coating on the moulds did notimprove the surface quality of the castings. This is evident from the high roughnessvalues obtained from the surface of these castings.In another context, the surface roughness of selected castings were compared withthose of the standards and the results are shown in Figures 27 and 28. Figure 27shows the comparison of the surface roughness of castings made in Mould 10 with
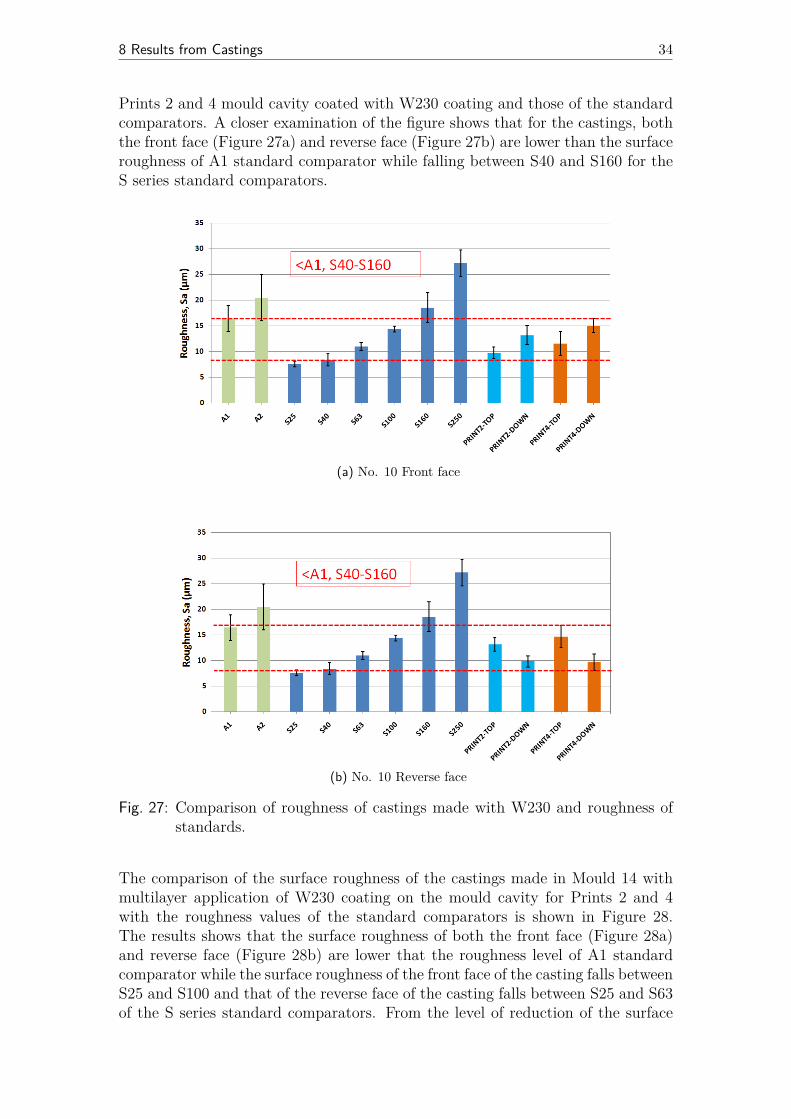
8 Results from Castings 34
Prints 2 and 4 mould cavity coated with W230 coating and those of the standardcomparators. A closer examination of the figure shows that for the castings, boththe front face (Figure 27a) and reverse face (Figure 27b) are lower than the surfaceroughness of A1 standard comparator while falling between S40 and S160 for theS series standard comparators.
(a) No. 10 Front face
(b) No. 10 Reverse face
Fig. 27: Comparison of roughness of castings made with W230 and roughness ofstandards.
The comparison of the surface roughness of the castings made in Mould 14 withmultilayer application of W230 coating on the mould cavity for Prints 2 and 4with the roughness values of the standard comparators is shown in Figure 28.The results shows that the surface roughness of both the front face (Figure 28a)and reverse face (Figure 28b) are lower that the roughness level of A1 standardcomparator while the surface roughness of the front face of the casting falls betweenS25 and S100 and that of the reverse face of the casting falls between S25 and S63of the S series standard comparators. From the level of reduction of the surface
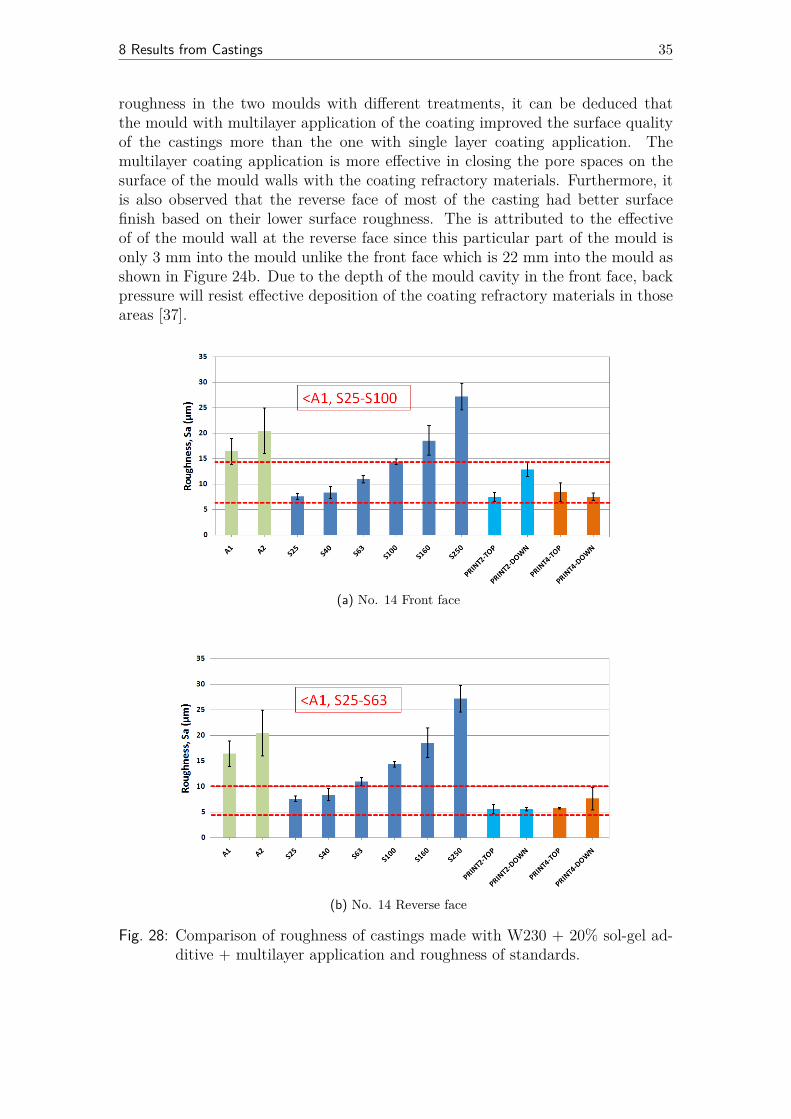
8 Results from Castings 35
roughness in the two moulds with different treatments, it can be deduced thatthe mould with multilayer application of the coating improved the surface qualityof the castings more than the one with single layer coating application. Themultilayer coating application is more effective in closing the pore spaces on thesurface of the mould walls with the coating refractory materials. Furthermore, itis also observed that the reverse face of most of the casting had better surfacefinish based on their lower surface roughness. The is attributed to the effectiveof of the mould wall at the reverse face since this particular part of the mould isonly 3 mm into the mould unlike the front face which is 22 mm into the mould asshown in Figure 24b. Due to the depth of the mould cavity in the front face, backpressure will resist effective deposition of the coating refractory materials in thoseareas [37].
(a) No. 14 Front face
(b) No. 14 Reverse face
Fig. 28: Comparison of roughness of castings made with W230 + 20% sol-gel ad-ditive + multilayer application and roughness of standards.

9 Conclusions 36
9 Conclusions
The surface texture characterization of cast components is an area of surface met-rology in manufacturing that has been neglected for ages due to the inability ofthe existing mechanical and optical roughness measuring systems to measure thesurface roughness of castings. This is due to the peculiar nature of the surfaceof castings with its associated higher roughness level, especially with sand castcomponents.In this study, considering the new breakthroughs by instrumentations in the recenttimes, to establish high-tech instruments which can acquire 3D surface structureof surfaces in Manufacturing Engineering, the authors thought it is time to trythese new technologies in the characterization of surface texture of castings. Oneof the new technologies adopted for this investigation is the InfiniteFocus opticalmetrology device produced by Alicona, which is based on Focus-Variation techno-logy. In this study, the authors have been able to make the following findings andassertions:
• The surface texture of castings can be characterized by using the new Infin-iteFocus Optical Metrology Microscope.
• The roughness of tactile standard surface comparators was evaluated.
• S series comparators described the surface texture of castings better thanthe A series comparators
• The measuring system is non-destructive.
• Higher objectives should be avoided, working with 5× is suggested for sandcastings but lower objective, 2.5× can still be used.
• Parameter rash should be avoided in the foundries to avoid complications indata interpretation.
• 3D surface parameters give more precise reflection of the surface and moreprecision than their 2D counterparts.
• Ra and Sa have close values. However, larger number of measurements arerequired for Ra, to get this closeness. Therefore, the measurement of Saparameter save time and energy.
• The surface average amplitude parameters, Sa and Sq and the bearing areacurve parameter, Sk can be used to characterize the surface texture of cast-ings. However, Sa suffices for the evaluation of casting surface texture.
• The variation in extreme parameters (Peak-Valley height) is larger than thevariation in the average parameters. As a result, average parameters aremore sensitive to the changes in surface topography features.
• The variations observed in the parameters is mainly due to the nature of thesurface feature resulting from the manufacturing processes.
9 Conclusions 37
• To understand the symmetry of the surface texture of standards and surfacesas a whole, the normalized surface bearing area curve parameters can be usedi.e. Spk/Sk and Svk/Sk.
References
[1] D. J. Whitehouse, Handbook of Surface and Nanometrology, 2nd ed.,CRC Press, Florida, 2011.
[2] O. Hatamleh, J. Smith, D. Cohen and R. Bradley, Surface roughnessand friction coefficient in peened friction stir welded 2195 aluminiumalloy, Applied Surface Science 255 (2009) 7414-7426.
[3] British Standard-Founding-Surface roughness inspec-tion by visual tactile comparators, BS EN 1370:1997.http://bbs.6jc.cn/pdf/o/EN%201370-1997.pdf
[4] U. C. Nwaogu, T. Poulsen, R. K. Stage, C. Bischoff, N.S. Tiedje,New sol-gel refractory coatings on chemically-bonded sand cores forfoundry applications to improve casting surface quality, Surface &Coatings Technology 205 (2011) 4035-4044.
[5] E. Konstantoulakis, H. Nakajima, R. D. Woody and A. W. Miller,Marginal fit and surface roughness of crowns made with an acceler-ated casting technique, The Journal of Prosthetic Dentistry, Vol. 80No. 3(1998)337-345
[6] E. Swing, Methods of Surface Roughness Measurement, Transactionsof the American Foundrymen’s Society, Proceedings of the Sixty-Seventh Annual Meeting, May 6-10, 1963, Volume 71, Illinois, 1964.
[7] http://www.castingstechnology.com/
[8] V. M. huynh and Y. Fan, Surface Texture Measurement and Char-acterisation with Applications to Machine-Tool Monitoring, Int. J.Adv. Manuf. Technol. 7 (1992) 2-10.
[9] U. Işleyici, Effect of Surface Roughness on Ultrasonic Testing, AThesis submitted to the Department of Mechanical Engineering,Middle east Technical University, 2005.
[10] L. D. Chiffre, Geometrical Metrology and Machine Testing Textbook,DTU Mekanik, CGM, 2011.
[11] R. Leach, Fundamental Principles of Engineering Nanometrology, El-sevier, Oxford, 2010.
[12] B. Griffiths, Manufacturing Surface Technology, Butterworth Heine-mann, 2001.
9 Conclusions 38
[13] C. -L. Tien, H. -M. Yang and M. -C. Liu, The measurement of surfaceroughness of optical thin films based on fast Fourier transform, ThinSolid Films, 517 (2009) 5110-5115.
[14] B. Dhanasekar, N. Mohan, B. Bhaduri and B. Ramamoorthy, Evalu-ation of surface roughness based on monochromatic speckle correla-tion using image processing, Precision engineering 32 (2008) 196-206.
[15] E. kayahan, H. Oktem, F. Hacizade, H. Nasibov and O. Gundogdu,Measurement of surface roughness of metals using binary speckle im-age analysis, Tribology International 43 (2010) 307-311.
[16] C. -C. Kuo, and C. -S. Chao, Rapid optical measurement of surfaceroughness of polycrystalline thin films, Optics and Lasers in Engin-eering 48 (2010) 1166-1169.
[17] C. -C. Kuo and Y. -R. Chen, A new method of characterizing surfaceroughness of TiO2 thin films, Optics and Laser Engineering 49 (2011)410-414.
[18] P. Demircioglu and M. N. Durakbasa, Investigations on machinedmetal surface through the stylus type and optical 3D instruments andtheir mathematical modelling with the help of statistical techniques,Measurements 44 (2011) 611-619.
[19] R. Danzl, F. Helmli and S. Scherer, 3D Measure-ment of complex structures using focus variation:http://www.focusonmicroscopy.org/2007/PDF/106_Danzl.pdf
[20] ISO 25178-6: Geometrical product specifications (GPS) – Surfacetexture: Areal – Part 6: Classification of methods for measuringsurface texture.
[21] O. Huber, Focus-Variation - A New Technology for High ResolutionOptical 3D Surface Metrology in the Micro- and Nano-meter Range,Geophysical Research Abstracts, Vol. 11 (2009) 8417.
[22] R. Danzl, F. Helmli and S. Scherer, Focus-Variation - A New Tech-nology for High Resolution Optical 3D Surface Metrology, The 10thInternational Conference of the Slovanian Society for Non-DestructiveTesting, Application of Contemporary Non-Destructive Testing inEngineering, September 1-3, 2009, Ljubljana, Slovenia.
[23] I. Asiltürk and M. Çunkaş, Modelling and prediction of surface rough-ness in turning operations using artificial neural network and multipleregression method, Expert Systems with Applications 38 (2011) 5826-5832.
[24] C. Y. Poon and B. Bhushan, Surface roughness analysis of glass-ceramic substrates and finished magnetic disks, and Ni-P coated Al-Mg and glass substrate, Wear 190 (2995) 89-109.
9 Conclusions 39
[25] S. Chandrasekaran and S. Sundararajan, Effect of micro-fabricationprocesses on surface roughness parameters of silicon surfaces, Surfaceand Coating Technology 188-189 (2004) 581-587.
[26] W. P. Dong, P. J. Sullivan and K. J. Stout, Comprehensive study ofparameters for characterizing three-dimensional surface topographyIII: Parameters for characterizing amplitude and some functionalproperties, Wear 178 (1994) 29-43.
[27] J. Järnström, P. Ihalainen and J. Peltonen, Roughness of pigmentcoatings and its influence on gloss, Applied Surface Science 254 (2008)5741-5749.
[28] H. McCormick and K. Duho, A brief History of the De-velopment of 2-D Surface Finish Characterization and MoreRecent Developments in 3-D Surface Finish characterization,C-K Engineering, Inc: http://www.c-kengineering.com/files/3-D%20Surface%20Measurement.pdf.
[29] Alicona InfiniteFocus, IFM Manual, IFM 3.1.1.2 EN 26.02.2009, Al-icona Imaging GmbH.
[30] U. Sellgren, S. Björklund and S. Andersson, A finite element-basedmodel of normal contact between rough surfaces, Wear (2003) 1180-1188.
[31] A. Cellary, M. Wieczorowski and K. F. Ehmann, A comparative ana-lysis of 2D and 3D Bearing area curves, S. M. Wu Symposium, Vol.II (1996)196-200.
[32] W. P. Dong, P. J. Sullivan and K. J. Stout, Comprehensive study ofparameters for characterizing three-dimensional surface topographyII: Statistical properties of parameter variation, Wear 167 (1993) 9-21.
[33] W. P. Dong, P. J. Sullivan and K. J. Stout, Comprehensive study ofparameters for characterizing three-dimensional surface topographyI: Some inherent properties of parameter variation. Wear, 159 (1992)161-171.
[34] T. R. Thomas and G. Charlton, Variation of roughness parameterson some typical manufactured surfaces, Precision Engineering (1981)91-96.
[35] 3D Functional Parameters - Michigan Metrologyhttp://www.michmet.com/3d_s_functional_parameters.htm
[36] ISO 13565-2:1996, Geometrical product specifications (GPS) - Sur-face texture: Profile method; surfaces having stratified functionalproperties - Part 2: Height characterization using the linear materialratio curve.

9 Conclusions 40
[37] U. C. Nwaogu, N. S. Tiedje, Foundry Coating Technology: A Review,Materials Science and Applications, 2 (2011) 1143-1160.