New Immigrant Destinations in a New Country of Immigration: Settlement Patterns of Non-natives in...
27
New Immigrant Destinations in a New Country of Immigration: Settlement Patterns of Non-natives in the Czech Republic Eva Janská 1 , Zdeněk Čermák 1 and Richard Wright 2 1 Department of Social Geography and Regional Development, Faculty of Science, Charles University, Prague 2, Czech Republic 2 Department of Geography, Dartmouth College, Hanover, NH, USA Pre-print version Published in: Population, Space and Place 20, 680–693 (2014) Introduction In a short timespan. the Czech Republic (CR) has evolved from a country of emigration to an intermediate transit country to a country of immigration: that is, it now ranks among the countries gaining population via international migration. While non-natives 1 constitute a little over 4 per cent of the total population (Cizinci 2010), their geographies are uneven. Non- natives concentrate in Prague and the capital is now home for over one third of that population. So just as in other countries of immigration, flows of the foreign born often involve major metropolitan centres and the largest cities function as what many call immigrant gateways. Such settlement patterns are never static. Over time, some immigrants and their offspring find opportunities elsewhere and a geographical diffusion of non-natives away from traditional gateway cities occurs (e.g., Wright and Ellis 2000). New patterns of direct settlement from abroad sometimes reinforce these internal movements. In the US, for example, a growing body of scholarship on “new immigrant gateways” has emerged. Such places have little or no prior history of immigration and receive immigrants directly from abroad or via secondary migration from other places within the country. In this context, Singer et al. (2008) document the extraordinary recent growth in immigrant populations in places such as Dallas, Atlanta, Phoenix, and Washington DC. Although the Czech Republic has been a country of immigration for a much shorter period than the US and many others, this research evaluates the role urban immigrant gateways play in the settlement process. This analysis assesses the degree to which Prague has maintained 1 For our purposes, “non-natives” are first- or second- or third-generation immigrants, and not Czech citizens.
Transcript of New Immigrant Destinations in a New Country of Immigration: Settlement Patterns of Non-natives in...
New Immigrant Destinations in a New Country of Immigration:
Settlement Patterns of Non-natives in the Czech Republic
Eva Janská1, Zdeněk Čermák1 and Richard Wright2
1Department of Social Geography and Regional Development, Faculty of Science, Charles
University, Prague 2, Czech Republic
2Department of Geography, Dartmouth College, Hanover, NH, USA
Pre-print version
Published in: Population, Space and Place 20, 680–693 (2014)
Introduction
In a short timespan. the Czech Republic (CR) has evolved from a country of emigration to an
intermediate transit country to a country of immigration: that is, it now ranks among the
countries gaining population via international migration. While non-natives1 constitute a little
over 4 per cent of the total population (Cizinci 2010), their geographies are uneven. Non-
natives concentrate in Prague and the capital is now home for over one third of that population.
So just as in other countries of immigration, flows of the foreign born often involve major
metropolitan centres and the largest cities function as what many call immigrant gateways.
Such settlement patterns are never static. Over time, some immigrants and their offspring find
opportunities elsewhere and a geographical diffusion of non-natives away from traditional
gateway cities occurs (e.g., Wright and Ellis 2000). New patterns of direct settlement from
abroad sometimes reinforce these internal movements. In the US, for example, a growing body
of scholarship on “new immigrant gateways” has emerged. Such places have little or no prior
history of immigration and receive immigrants directly from abroad or via secondary migration
from other places within the country. In this context, Singer et al. (2008) document the
extraordinary recent growth in immigrant populations in places such as Dallas, Atlanta,
Phoenix, and Washington DC.
Although the Czech Republic has been a country of immigration for a much shorter period than
the US and many others, this research evaluates the role urban immigrant gateways play in
the settlement process. This analysis assesses the degree to which Prague has maintained
1 For our purposes, “non-natives” are first- or second- or third-generation immigrants, and not Czech citizens.

1
its position as the primary gateway during this period and how the roles of secondary cities
and other places have changed. We also ask: How do patterns of settlement vary by
nationality? To what extent is the internal migration of non-natives in the Czech Republic
changing and becoming an important component in total population mobility? How are rates
of mobility tied to changing non-native geographies, over time and by nativity? And, because
of theories that link internal migration and economic opportunity and belonging, what does all
this imply for immigrant incorporation?
We focus on the 2001-2010 period because this is when the CR started registering significant
net gains of newcomers from abroad. While related studies have focused on the immigration
process and the geography of the immigrant stock, the patterns of the internal migration of
foreign nationals in the Czech context remains unexplored. These types of mobilities are
gaining significance, both in terms of rate and volume (Novotný, Janská, Čermáková 2007;
Drbohlav and Čermák 2005). They therefore increasingly influence non-native settlement
geographies. Thus, new “immigrant gateways” are emerging in Czechia, produced by both
direct settlement from abroad and by the internal movement of non-natives.
This article adds to scholarship on the internal migration and integration of non-natives in
immigrant receiving countries. A recent spurt of research has augmented findings in North
America and Europe (e.g., Hall 2009; Nogle 1994; King and Newbold 2007; Wright and Ellis
2000; Stillwell and Hussain 2008; Champion 2005). For example, in Spain, Silvestre and Reher
(2012; see also Maza et al. 2013; Reher and Silvestre 2009; 2011) distinguished between the
characteristics of one-time movers and multiple movers. More pertinent for our research, they
also compared patterns of movement, concluding that internal migration produced de-
concentration, generally in line with spatial assimilation perspectives on regional mobility. Zorlu
and Mulder (2008) obtained a similar result for the Netherlands. Recent research on internal
migration in Estonia centered on the rhythms of movement of mainly Russian-speaking ethnic
minorities associated with gateway cities; during communism, gateways acted as a magnet for
non-natives but in the post Soviet period, movement tends to be centrifugal (Tammaru and
Kontuly 2011). Outside of the European context, Ishikawa and Liaw (2009) found differences
foreign residents and native Japanese migration processes and that non-native migration
could be differentiated by nativity and education.
In the Czech Republic, as in other places, the geography of non-natives shaped mostly by
direct immigration from abroad. At this point, however, the similarities between Czechia and
other places begin to dissipate. The interregional migration rates of the non-natives are high

2
relative to those of Czechs, the trend in those rates is upwards, and direct immigration has
recently stagnated. Furthermore, patterns of settlement do not follow a simple hierarchy.
Prague indeed dominates but this overall settlement structure is differentiated by nativity with
certain secondary centres and smaller places gaining non-native populations from internal
migration and direct immigration. We use these geographies and spatial processes to
comment on immigrant incorporation and the links to labour markets and economic
opportunity. We caution that although the analysis reveals differential patterns of diffusion and
concentration by key immigrant group, scholars should take care not to infer any simple social
process of adaptation that can be easily read off from such maps (Wright and Ellis 2000).
The Czech Context
Between 1945 and 1989, the Czech lands lost population to emigration. The expulsion of
approximately 2.8 million Germans after World War 2 started this pattern of movement
dramatically. While the borders closed and formal international migration subsided following
the communist coup in 1948, politically motivated unauthorized emigration was steady. Most
Czechs became disaffected with totalitarian rule and some departed; between 1948 and 1989
approximately 500,000 people exited the country (Srb 2004). As a consequence, and despite
a trickle of workers from Vietnam and the USSR (see Alamgir 2013), rates of natural increase
meant that the ethnic homogeneity of the population actually increased over these 40 years.
With the democratic transformation and the Velvet Divorce from Slovakia after 1989, the Czech
Republic shifted from being a country of emigration, to a transit country, and then to a country
of immigration. It is now one of the few states in Central and Eastern Europe with net gains
from immigration (Drbohlav et al. 2010). Much of that growth is recent (Figure 1). More
precisely, there has been a substantial increase in the number of migrants from abroad since
2001 – from about 25,000 per year at the start of the period to approximately 100,000 in 2007.
The global economic crisis, however, dented that trend and produced a decrease in the
number of immigrants arriving after 2008. For example, only 28,000 immigrated and 12,500
emigrated in 2010 (Cizinci 2010).
Ukrainians, Vietnamese, Slovaks, Russians and Poles represent the largest groups of
newcomers. Together they accounted for 68% of all non-natives in the country as of December
2010. We can divide non-natives another way, differentiating a) those who take up qualified
employment positions as experts, managers, technicians and skilled professionals (mainly
from the EU), from b) labour migrants, many of whom fill low-ranking positions in the job market

3
(e.g., unskilled occupations are more typical for Ukrainians while Vietnamese are more likely
to work as shop keepers). Slovaks, who lived together with Czechs in common state between
1918-1993, occupy a specific position. After the 1993 split and when compared to other
immigrants, they received preferential treatment in labour markets and other areas of social
life. Their migration behaviour is very similar to the movement of Czechs and will not concern
us for the rest of this analysis.
Figure 1 about here
As in most other countries gaining population from abroad, large urban areas attract
newcomers. Being by far the biggest city in the Czech Republic, Prague stands out and is the
home to one-third of all non-natives, followed by Brno. Spa towns also prove attractive
destinations for some (e.g., Karlovy Vary, Poděbrady, Teplice) as are towns with substantial
economic, especially foreign, investment (e.g., Pilsen, Mladá Boleslav and Pardubice). Non-
natives also settle in the border regions (e.g., the districts of Karlovy Vary, Teplice). In general
terms, the non-native population in the Czech Republic forms a west-east gradient across the
country, with their share progressively decreasing from west to east. While populous places,
especially Prague, are key centres, the former occupies a dominant position not only in terms
of immigration but also as a destination for non-natives moving internally to the country. It
accounts for 38 per cent of the volume of internal migration of non-natives and is the
destination of 34 per cent of the total number of international immigrants (2006–08).
What explains these geographies? Immigrants concentrate in large cities for well-known
reasons. A gateway city is a large urban area with a legacy of hosting new arrivals. It is a place
that, for historical reasons and thanks to the opportunities it offers, traditionally takes in a large
number of immigrants (e.g. Singer 2004; Painter and Yu 2010; King and Newbold 2007; Hou
2006; Crowley et al. 2006). Such cities offer a wider range of employment options as well as
the chance for social interaction and convivial contact with co-ethnics. Initial settlers lay the
foundations for others to join them via networks associated with work or family or along the
lines of gender.
Over time, the hold that the gateway exerts on immigrant settlement can weaken. Why do non-
natives begin to disperse from initial points of concentration? Explanations of such diffusion
from gateways fall into three areas. The first is associated with tight labour and housing
markets in that often occur in gateway cities (Ley 2007; Card and Lewis 2005). Second, much
like the process of initial settlement in primary gateways, some “pioneers” move out from the
original place of settlement seeking better work or cheaper housing or lured by a job offer. A

4
process of cumulative causation kicks in, and produces growing non-native populations in
these new destinations as well as increased enclave economy vitality, which in turn attract
more co-ethnics, either from within the country or directly from abroad. Third, and related, is
the idea of spatial assimilation and immigrant incorporation. Over time, a maturing non-native
population obtains sufficient socioeconomic and cultural experience/capital for some to leave
gateway enclaves to seek opportunities elsewhere – a process that operates from the intra-
metropolitan scale to the interregional scale (Wright and Ellis 2000; Lichter and Johnson 2009;
Singer et al. 2008).
The progression down the settlement hierarchy can also be understood as related to the
process of counter-urbanisation (e.g., Champion 2005; Stillwell, Hussain 2008; Collantes et al.
2013). In the Czech case, such diffusion is also partly the product of political processes during
the post-socialist transformation, EU expansion, and the global economic restructuring of
agriculture. This means that migrants no longer migrate just to large towns because some take
up available low-status job opportunities, for example, in rural farm work. In Greece, for
instance, a large influx of agricultural workers from Albania reversed the process of rural
depopulation that had been going on for decades (Kasimis and Papadopoulos 2005). Similarly,
in the UK, since 2001, labour migration to provincial towns and rural areas has accelerated
(Green, Jones, and Owen 2007). Accordingly, the following sections consider the geography
of non-natives and their migration between 2001 and 2010, contrasting the non-natives with
the native born, and also comparing the patterns of the two largest immigrant groups
(Vietnamese and Ukrainians). We frame the analysis in terms of the Czech urban hierarchy,
allowing to see the migration relationships among gateway cities, their hinterlands, and other
locations for each of these groups.
Data and Methods
Our data derive from official statistics from the Czech Statistical Office or from the registries of
other institutions such as the Czech Interior Ministry and the Czech Ministry of Labour and
Social Affairs. Census data, which would traditionally assist in such a case as this, are
inappropriate. The relevant data from the last census in 2001 are incomplete – approximately
48 per cent of documented resident non-natives were not included in the census (Čermáková
2002). This article thus relies on data that indicate the number of non-native persons by region
by date (documented using valid residence permits) and their recorded movements (the
number who register and de-register as residents over a specific time period). “Non-native”
people are documented in a population register and are not Czech citizens.

5
We base our definitions of migration on those used by the Czech Statistical Office, which
considers migration as a formally documented change in address between municipalities in
the Czech Republic (internal migration) or the receipt of a residence permit (international
migration). The Czech statistical office changed the registration system for foreign nationals in
2001. It follows that internal migration data from earlier years are incompatible with those after
2001. Accordingly, our analysis focuses mainly on the period between 2001 and 2010 to
ensure data compatibility. The analysis does not take into account undocumented non-natives,
whose numbers can only be estimated,2 or individuals granted asylum status, who are few in
number compared to the total number of documented non-natives in the country.3 To create a
detailed portrait of some of the most recent trends (e.g., migration rates, hierarchical structure),
we refer specifically to the 2006-8 period, thereby avoiding the recessionary period of 2008-
2010.4
A milestone in statistical observation occurred when the Czech Republic joined the European
Union in 2004. From that point, two categories of immigrant were measured, each of which is
subject to a different residence system. EU citizens with a right to free movement across
borders, who are subject to a registration obligation, were distinguished from citizens of “third”
countries, who are required to apply for a residence permit (Cizinci 2010).5 The character of
registration of EU citizens on the one hand results in the underestimation of their numbers and
on the other, is skewed by cases of formal registration for utilitarian reasons.6 In the case of
citizens from third countries, they are required to register any change of address or any change
in their residence status if they are away from their registered place of residence for more than
30 days. Compliance, however, is not universal and, importantly, probably improved since the
first two years after its introduction in 2001. Given these data quality issues, we focus not just
on non-natives as a whole but also on the two largest, non-native groups – Ukrainians and
Vietnamese.
To assess the links between migration and settlement structure we divided Czech
municipalities into six classes, five of which are categorised on the basis of population size or
2 Estimates vary considerably – between 15,000 and 30,000 undocumented immigrants may be residing in the Czech Republic (Drbohlav, 2008). 3 For example, between 1993 and 2008, there were 83,000 applications for asylum, of which only 2,377 people or 2.9% were granted asylum. 4 Recessions perturb patterns and depress rates of migration and we leave analysis of the global economic
downturn on Czech migration to another paper. 5 Complicating things further, of course, is the fact that, as in most other countries, the number of emigrants from the Czech Republic (notably Czech citizens) is incomplete and therefore significantly underestimated. 6 Based on information from staff at the Czech Statistical Office (CSO) hundreds of German citizens registered formally to obtain cheaper Czech driver’s licenses.

6
its position in the settlement size hierarchy (Prague, regional centres – regional towns, large
towns – 10,000 or more inhabitants, small towns – 2,000 to 10,000 inhabitants, villages – up
to 2,000 inhabitants). Municipalities located in the hinterland of Prague and regional centres
that represent a type of suburban settlement formed a sixth group. The criterion with which
these municipalities were selected was that 30% or more of the inhabitants had to be
commuting daily to the relevant centre (see Ouředníček, Temelová, Pospíšilová 2011).
The analysis uses net migration and migration efficiency to gauge changes in the distribution
of Czechs compared to non-natives. While several measures of population concentration are
available, we applied the Gini coefficient to analyse the distribution of different groups in the
Czech Republic. To assess the relationship between individual processes connected with
spatial changes in the population we used a simple two-dimensional measure of dependence
using the Pearson correlation coefficient. Dependency measurements and a quantitative
analysis of spatial concentration were carried out on 77 territorial units (76 districts plus
Prague).
The geography of non-natives in the Czech Republic
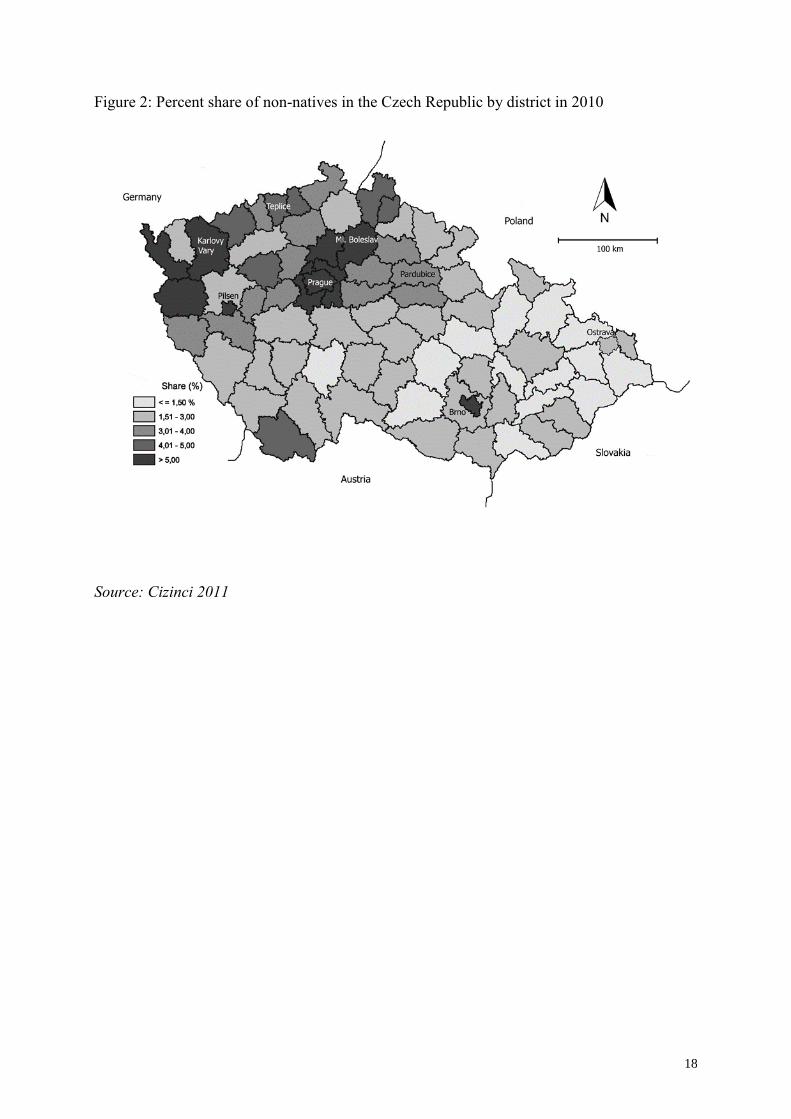
As already noted, the major cities, Prague, Brno, and Pilsen contain the largest non-native
concentrations, along with some border regions (mainly in the west and northwest), while rural
districts in the south-east (Moravia) had relatively few (Figure 2).
Figure 2 about here
Notable differences, however, occur by nativity. Vietnamese are heavily concentrated in the
border regions in Bohemia. Russians have a very different geography; most are concentrated
in two territorial units, 65 per cent of whom reside in Prague or the Karlovy Vary region. Citizens
from the Czech Republic’s neighbouring states (Poles, Germans, and Slovaks) were typically
more concentrated in the border regions. Citizens from countries of the global north tended to
concentrate in Prague (usually over 50% of the given community).
Prague dominates the geography of non-natives in both absolute and relative terms. This
pattern is evident both cartographically (Figure 2) and hierarchically (Table 1). Table 1 shows
the share of the resident non-natives by municipality size. Large towns also play an important
role as migration destinations for non-natives. This is most evident when examining the
location quotients by size category of municipality. Calculated by dividing the proportion in

7
column 5 by that in column 6, these quotients make plain that Prague dominates as an
immigrant gateway. Non-natives are 2.8 times more concentrated in Prague than the
population as a whole. In addition, regional cities also boast slight non-native concentrations,
with this population about 1.13 times more likely to be located in such places than are Czechs.
After these two types of place, there is a steady decline in overall immigrant concentration
further down the urban hierarchy. Fusing the information in both Figure 2 and Table 1 we see
that it is not always the case that the larger the town, the larger the concentration of non-
natives; it also depends on the location of the settlement, especially in relation to the country’s
western border (Uherek 2003).
Table 1 about here
Despite the recent sharp increase in their number, the spatial distribution of non-natives was
highly uneven over the last decade. Their distribution is more concentrated than that of Czechs
and this concentration has increased since 2001 (see Table 2).
Table 2 about here
Those with long-term residence visas are more unevenly distributed than those with permanent
resident status. This is not too surprising as the labour market activity of members of the former
group is more flexible, both in the sense of that they are able to perform various types of jobs
and in the sense that they can more easily move to where the jobs are.7 While several factors
influence the line of work and where a non-native lives (e.g., Grygar, Čaněk, Černík 2006),
many non-natives hold long-term residence visas living in districts where there is a large
demand for unskilled labour in response to foreign investment (e.g., the districts of Mladá
Boleslav, Pardubice, and Pilsen). The patterns of change in the geographies of Ukrainian and
Vietnamese nationals follow different paths. While the Vietnamese became less concentrated
over the 2000s, the opposite holds for the Ukrainian population. The increasing concentration
of Ukrainians in particular neighbourhoods in Prague and other large towns stems from the
location of low-cost accommodation in particular neighbourhoods, the type of work most of
them perform, and the need to live close to work (Leontieva 2010). In contrast, the Vietnamese,
whose initial concentrations were in the border regions of Bohemia, have an increasing
presence in other regions. This diffusion is connected with the spread of their business
activities, mostly retail trade. Ninety-one per cent of all Vietnamese hold visas for work mainly
in retail (which for small businesses is somewhat independent of the settlement hierarchy). In
7 Non-natives must report the change of their place of residence at relevant regional office of the Ministry of Interior if is longer than 30 days.

8
contrast, Ukrainians work mainly in construction industry and manufacturing, activities that are
far more connected with the structure of urban spaces and hierarchies. (Jíchová 2010,
Čermáková, Schovánková, Fiedlerová 2011).
The Internal Migration of Non-natives
What determines the geography of non-natives in the Czech Republic? Differential fertility and
mortality rates have thus far had a negligible influence. Accordingly, migration, both directly
from abroad and internal to the country, is key. Table 3 shows that, in contrast to the relatively
low and stable rates of internal migration of Czech nationals, the migration rate of non-natives
has increased in the 2000s. As the decade progressed, non-natives constituted an increasing
share of those people moving internally in the Czech Republic, such that by 2009, they
represented over one sixth of all such movers. The fact that the gender ratio has remained
relatively stable indicates that the increases in the migration propensity of non-natives are not
driven changes in the proportion of internal migrants who are male. To put this in some sort of
perspective, in the US, differences in the interstate migration rates of the native- and foreign-
born populations are negligible for every year since 1994 with native-born rates topping those
of the foreign born over half the time (Ellis et al. 2013).
Table 3 about here
Some of the characteristics of non-natives who migrate within the country differ from those of
internal migrants who are Czech. Not only is there a larger share of males among non-native
internal migrants, owing to the larger share of male in the foreign population overall, but
migration intensity in the early years of economic activity (age 20–29) is also higher. The
distribution of migration intensity by age conforms to very common patterns of migration
behaviour: i.e., a high rate of mobility at a young age (20–35 years), with a secondary increase
at ages 0–5 and after age 60 (Figure 3). The highest migration intensity among Czechs occurs
among those aged 25-29. In contrast, for non-natives, it occurs at a younger age (20-24 years).
Figure 3 about here
Prague dominates the regional patterns of internal migration, but this is changing. Between
2007–08, for instance, Prague’s migration turnover accounted for 38 per cent of the total
volume of internal migration. Earlier in the decade, this figure was 55 per cent. In terms of net
migration, in 2002–2003 Prague’s net gains of non-natives accounted for 88 per cent of the
total such net gains by district. In 2007–2008 that figure had more than halved to 40 per cent.
9
More generally, Prague and the majority of districts recorded net gains of non-natives in the
early 2000s, but by the end of the period this had changed in favour of Prague’s hinterland, so
that, for instance, the districts Prague-East and Prague-West currently have moderate non-
native migration gains from Prague. Alongside Prague, other attractive secondary migration
centres have emerged, most notably Pilsen and Pardubice, and in the past two years also
Brno.
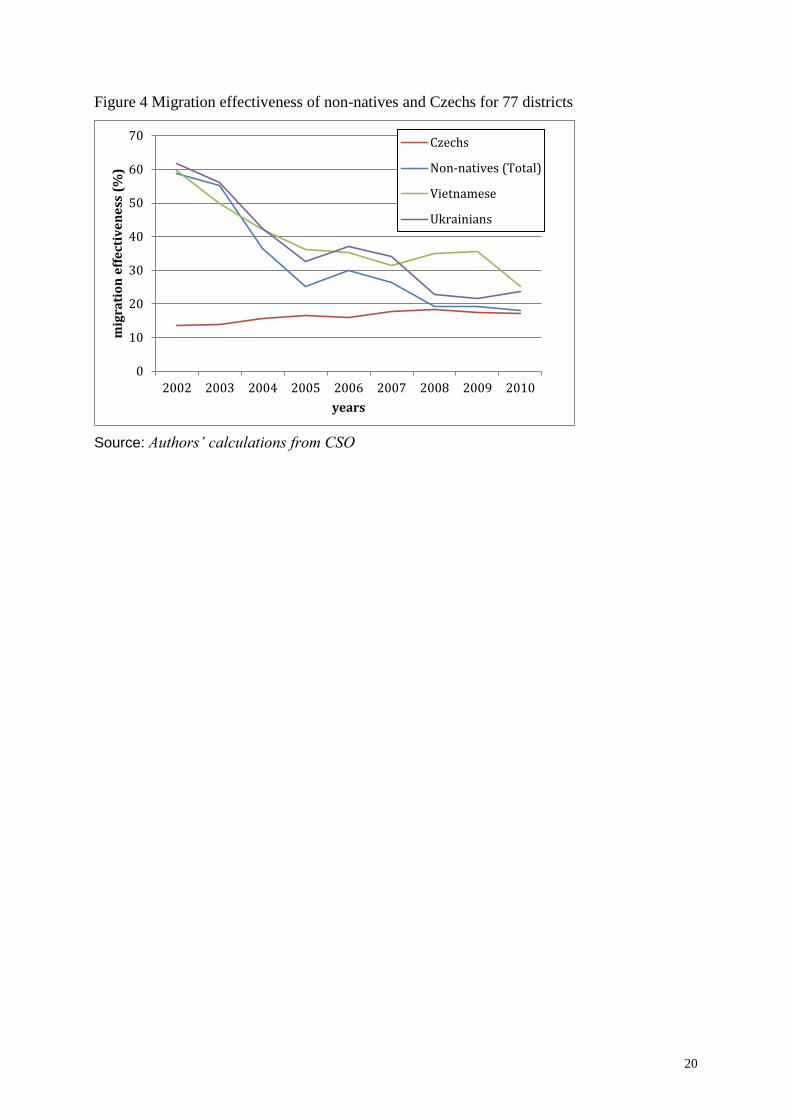
Assessments of migration effectiveness8 using 77 districts of the Czech Republic capture
these shifts from another aspect. Migration effectiveness measures the population relocated
within the country per 100 internal movers. In other words, migration effectiveness gauges the
ability of places to attract and retain people. For non-natives, the migration effectiveness at the
start of the observed period (2001-2) was 50.5% and by the end (2009-10) it had fallen to
16.3%. Among the Czech population migration effectiveness at the district level remained
much more steady, ranging between 12-18% during the observed period. Thus, internal
migration is producing a larger net shift in the redistribution of non-natives relative to that of
the native born. The trends converge but it is unclear if this is the result of the recession at the
end of the decade or something else. To summarise, migration rates and proportional
redistribution remained relatively stable among native-born Czechs during this decade.
Meanwhile, the propensity of non-natives to migrate internally tripled while migration
effectiveness dropped by two thirds to match that of Czech migrants.
Figure 4 about here
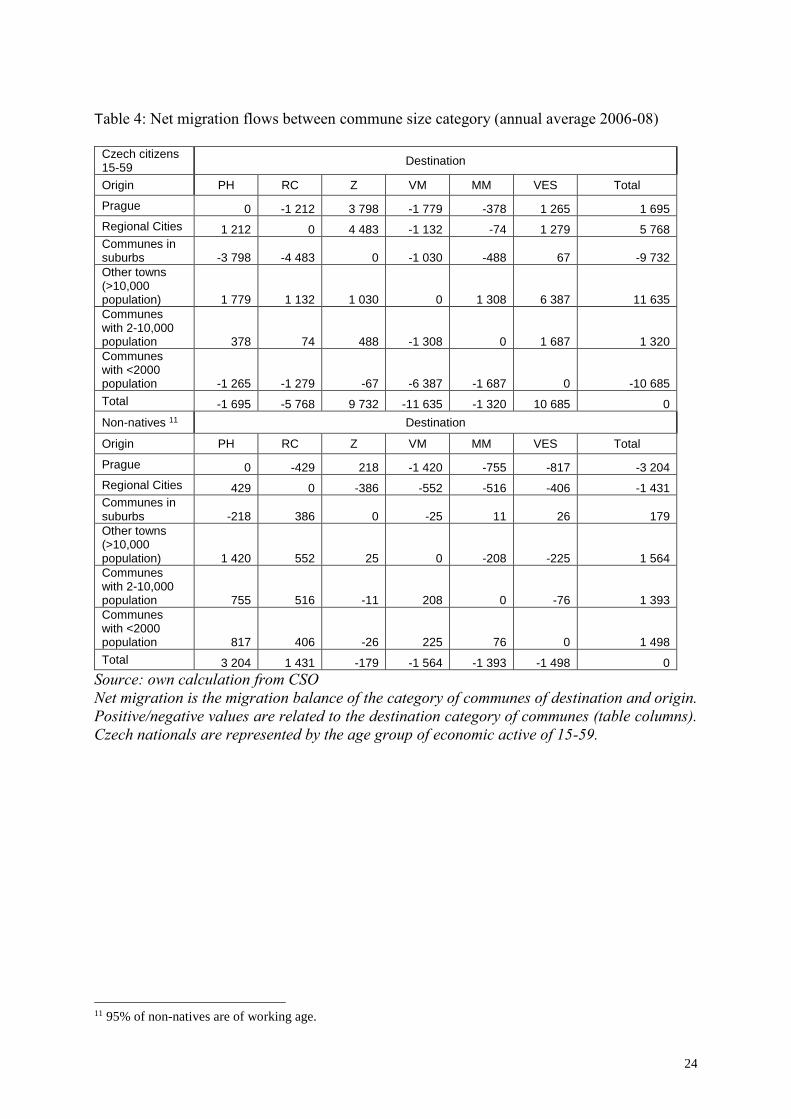
Switching the viewpoint to simple net migration, we find large differences between patterns of
internal migration for Czechs and non-natives. Table 4 shows that in many instances, the type
of places that gained working-age Czechs were losing non-natives.9 For non-natives, small
settlements experience migration losses to larger settlements. In contrast, suburbs and small
towns are gaining Czechs at the expense of other settlements. So Czechs are suburbanising
or moving to smaller settlements while Prague and regional cities gain non-natives as a whole
at the expense of other types of settlement.
Table 4 about here
8 Effectiveness is the ratio of net migration to gross migration expressed as a percent. 9 As we strongly suspect that most non-natives migrate internally for economic reasons (reflected, for example, in the age structure of these migrants), we restricted the population of internal Czech migrants to people of working age (15–59).

10
The clear associations between the internal migration of non-natives and the Czech urban
hierarchy vary by nativity (Table 5). The share of both Vietnamese international and internal
migrants moving to Prague is smaller and the share moving to large towns (10,000 or more
inhabitants) is much larger than Ukrainians and other non-natives. Thus, the Vietnamese are
de-concentrating because of direct immigration from abroad, and internal migration. In
contrast, Ukrainians are a driving force behind the net gains of non-natives experienced by
larger Czech cities.
Table 5 about here
We next examine non-native internal migration using paired correlation coefficients by
comparing patterns of net migration at the district level for seven different types of migrant for
the non-recession years of 2006-8. In addition, we assess the effect of economic factors on
this regional differentiation. Given the dominant position occupied by Prague, the absolute
figures of the correlations for characteristics were overly influenced by the extreme values for
Prague, so the correlation analysis uses net migration rates (i.e., standardized by population).
We again restrict the population of internal Czech migrants to people of working age (15–59).
Using the 77 districts as the basis for analysis, Table 6 shows a positive and significant
correlation between the net migration rates of non-natives (both international and internal
migration) compared to the net migration rates of Czechs (top row of Table 6, first two entries).
In the aggregate, the same places gained both working age Czechs and non-Czechs through
migration. While earlier analysis shows that differences do exist by position on the urban
hierarchy, Table 6 provides additional perspective by comparing net migration gains and
losses in other ways. Moving across the top row, we find no significant association between
the district-scale net migration of Czechs and that of Ukrainian internal migrants. The same
holds for both Vietnamese internal movers and those who moved directly to the Czech
Republic from abroad.
Reading the table in another way, we find that areas that were attractive internal-migration
destinations for Vietnamese and Ukrainians were not generally those attracting international
immigrants from these countries. The correlation between district level net migration for
international Ukrainian movers and internal Ukrainian migrants is -.35 and highly significant.
For Vietnamese, the correlation is stronger (-.56) and also highly significant. With the
Vietnamese community, this has to do with the existence of a gradual wave of migration out of
the west and northwest border regions to other parts of Bohemia, while these border regions
continue to be attractive for international immigrants from Vietnam.

11
The relationships between economic factors (expressed as the districts’ unemployment rates
and average wage levels) and net migration behave as we might expect. Economic effects
shape the net migration of both Czech citizens of productive age and non-natives (both
international and internal). For example, the correlation between district-level net migration and
wages is negative for all groups, with three of the correlations reaching the level of statistical
significance. The strongest correlation in this regard is between the net migration of Czechs
and district-level unemployment. The effect of economic factors on district-level net migration
is less pronounced for selected groups of non-natives. In the case of Vietnamese migration
the insignificant correlation coefficients stem from the fact that many Vietnamese migrate to
the west and northwest Bohemia (areas marked by a higher rate of unemployment and lower
average wages). Here the economic appeal of the region as a destination of immigration is not
connected so much to internal conditions; rather the dominant factor is its close proximity to
regions inhabited by populations in Germany with strong purchasing power just across the
international border.10
Discussion and Conclusions
Like many other countries with increasingly significant immigrant populations, newcomers to
the Czech Republic tend to settle in large cities. Between 2001 and 2010, the regional
concentration of non-natives increased. In terms of both the volume and the intensity of
immigration, Prague dominates, followed by some regional centres. Ukrainians, the largest
immigrant group, is a main force behind this trend. These large flows, however, mask more
subtle undercurrents. When we distinguish between the two main groups, we find that while
Ukrainians were increasingly concentrated, Vietnamese were becoming less so. Furthermore,
Prague’s “gateway” role is not so simple. For Ukrainians, it is not a gateway city in the sense
of receiving international migrants who then migrate on to other regions of the country. As
Prague is a less attractive migration destination for the Vietnamese community than it is for
Ukrainians, the majority of Vietnamese migrate to large towns (towns with more than 10,000
inhabitants, not including Prague) and regional towns.
These patterns derive in large part from the types of work the Vietnamese and Ukrainians
perform. The former are far more likely to be involved in small-scale retail employment while
10 We are aware of the shortcomings of using simple correlations in this manner and are cautious in
our interpretation of the results.

12
the latter tend to work construction or similar jobs involving unskilled manual labour. These
labour market attachments shape the patterns of settlement. The decrease in the
concentration of Vietnamese over the decade reflects the evolution of their penetration into the
retail sector and its more distributed geography. The increase in concentration of Ukrainians
concerns opportunities for work. Labour market attachment rather than other forces matter
most for these geographies.
The internal migration of non-natives has become an important component of overall migration
within the Czech Republic. In 2008 the rate of internal mobility of non-natives was five times
higher than that of Czechs. But while this share increased over the decade of the 2000s, we
also found that migration effectiveness rates for the two groups converged. Moreover, the
decline in migration effectiveness occurred while inter-regional migration rates increased for
non-natives. Non-natives are moving much more within the Czech Republic while their patterns
of migration become more restricted. The late 2000s recession surely played into this. The
broader lesson here is again that economic forces shape population geographies and, more
specifically, scholars need to be much more attentive to recessionary cycles in shifts in forms
of migration.
One important finding relates to the character of migration flows among municipalities. Non-
natives were increasingly concentrated in large cities. For Czech migrants the opposite holds;
migration streams flow from Prague and other regional centres into smaller municipalities and
municipalities located in agglomerations. Some of the results of our analysis point to some
possible new trends. It is apparent from the relationship between Prague and its hinterland that
non-natives are starting to become part of these suburbanisation processes putting the breaks
on the drift toward concentration.
There is also a link between international and internal migration and regional economic
development. Economic conditions, expressed as unemployment rates and average wages,
significantly influence regional net migration. The effect of economic factors, however, is
stronger for non-natives migrating to districts that are more attractive destinations. In the case
of districts with lower net migration, economic conditions are not always the decisive factor
determining net migration. In the case of non-natives, social and ethnic ties may be key, but
that specific question again remains for future research to unpack.
Our research also relates in part to the debate about the relationship between immigration and
internal migration. One theory is that immigrants migrate to particular places and their
concentration results in locals leaving for various reasons (including labour market competition:

13
Hatton and Tani 2005). The literature finds little support for this (see Wright et al. 1997; Card
1990). A different view suggests that under certain circumstances the native born migrate out
of a region (e.g., as part of suburbanisation and counter-urbanisation processes) and the
vacancies in housing and labour markets come to be filled by immigrants. Although our data
imperfectly address this issue, our results suggest that in many cases the situation in the Czech
Republic resembles the second scenario, where immigrants are not directly competing with
the native population. This question of integration processes connected with internal migration
is important. One of our next research steps is to ascertain, using surveys, the most significant
reasons (ethnic ties, economic prosperity, housing, labour market, etc.) that shape the
concentration/deconcentration processes of the two largest groups of non-natives.
14
REFERENCES
Alamgir, A.K., 2013. Race is elsewhere: state-socialist ideology and the racialisation of
Vietnamese workers in Czechoslovakia. Race & Class 54: 67–85.
Čermáková, D. 2002. Prostorové rozmístění cizinců v České republice a jeho
podmíněnosti. [magisterská práce] Praha, Přírodovědecká fakulta UK.
Čermáková, D, Schovánková,S.,Fiedlerová, K. 2011. Podnikání cizinců v Česku: vliv
struktury příležitostí. Geografie 116: 440-461.
Champion, A. G. 2005. The counterurbanisation cascade in England and Wales since
1991: the evidence of a new migration dataset. BELGEO, 1-2: 85-101.
Cizinci 2010. Cizinci v České republice 2010. Praha: Český statistický úřad.
Cizinci 2011. Cizinci v České republice 2011. Praha: Český statistický úřad.
Collantes, F., Pinilla, V., Sáez, L. A. and Silvestre, J. (2013), Reducing Depopulation in
Rural Spain: The Impact of Immigration. Population, Space, and Place,
doi: 10.1002/psp.1797
Drbohlav, D, et al. 2010. Migrace a (i)migranti v Česku.„Kdo jsme, odkud přicházíme,
kam jdeme“. Praha: Sociologické nakladatelství.
Drbohlav, D and Čermák, Z. 2005. Population Migration and Mobility in the Current
Czech Republic – Reflections on Some Conceptual Frameworks. AUC-geographica 37: 11-
26.
Ellis, M., Wright, R, and Townley M. 2013. The Allure of New Immigrant Destinations.
International Migration Review. Forthcoming.
Goodwin-White, J. 2007 Dispersion or Concentration for the 1.5 Generation? Destination
Choices of the Children of Immigrants. Population, Space and Place 13: 313–331.
Grygar J, Čaněk M, Černík J. 2006. Vliv kvalifikace na uplatnění a mobilitu na českém
trhu práce u migrantů ze třetích zemí. Závěrečná zpráva z výzkumu. MKC Praha.
www.migraceonline.cz/vyzkum.
Hall, M. 2009. Interstate migration, spatial assimilation, and the incorporation of US
immigrants. Population, Space and Place 15: 57–77. doi: 10.1002/psp.498
Hatton T, Tani, M. 2005. Immigration and Inter-regional Mobility in the UK, 1982-2000.
The Economic Journal 115: F342–F358.
Ishikawa Y, Liaw K. 2009. The 1995–2000 interprefectural migration of foreign residents
of Japan: salient features and multivariate explanation. Population, Space and Place 15: 401–
428.
Jíchová, Eva. 2010. Hodnocení působení zahraničních pracovníků na trhu práce České
republiky. MPSV.
King K, Newbold KB. 2007. Internal migration dynamics of Canadian immigrant
gateways: Toronto as an origin, way-station, and destination between 1991 and 2001.
Canadian Journal of Regional Science 30: 243-262.
15
Leontiyeva Y. 2010. Uplatnění a integrace migrantů z Ukrajiny na českém trhu práce. In
Trbola, Robert, Miroslava Rákoczyová 2010 (eds.). Vybrané aspekty života cizinců v České
republice. VÚPSV, Praha.
Ley, D. 2007. Countervailing immigration and domestic migration in gateway cities:
Australian and Canadian variations on an American theme. Economic Geography 83: 231–
254.
Lichter D, and Johnson K. 2009. Immigrant gateways and Hispanic migration to new
destinations. International Migration Review 43: 496–518.
Maza A, Villaverde J, and Hierro M. 2013. Explaining the settlement patterns of
foreigners in Spain. Applied Geography 40: 11–20.
Mollenkopf J, Castells M. (eds.). 1991. Dual City. Restructuring New York. New York:
Russell Sage Foundation.
Nogle J. 1994. The internal migration of recent immigrants to Canada. International
Migration Review 28: 31-48
Novotný J, Janská E, Čermáková D. 2007. “Rozmístění cizinců v Česku a jeho
podmiňující faktory: pokus o kvantitativní analýzu.“ Geografie 112: 204-220.
Ouředníček M, Temelová J, Pospíšilová L. (eds.) 2011. Atlas sociálně prostorové
diferenciace České republiky. Karolinum, Praha.
Painter G, Zhou Y. 2010. Immigrants and housing markets in mid-size metropolitan areas.
International Migration Review 44: 442-476.
Počty obyvatel v obcích. [online] Praha: Ministerstvo vnitra ČR 2010. [cit. 15. 3. 2012]
Dostupné z: http://www.mvcr.cz/clanek/pocty-obyvatel-v-obcich.aspx
Reher D, Silvestre J. 2009. Internal migration patterns of foreign-born immigrants in a
country of recent mass immigration: evidence from new micro data for Spain. International
Migration Review 43: 815–849.
Reher, David S. and Javier Silvestre (2011) Internal Migration Patterns of Foreign-Born
Immigrants in Spain. A study based on the National Immigrant Survey (ENI-2007). Revista
Internacional de Sociología 69(M1): 167-188.
Silvestre J, Reher D. 2012. The internal migration of immigrants: Differences between
one-time and multiple movers in Spain. Population, Space and Place DOI: 10.1002/psp.1755
Singer, A. 2004. The rise of new immigrant gateways. Washington: Brookings Institution.
Singer A. Hardwick S, Brettell C. eds. 2008. Twenty-first century gateways: Immigrant
incorporation in suburban America. Washington DC: Brookings Institution Press.
Srb, Vladimír. 2004. 1000 let obyvatelstva v českých zemích. Praha: Karolinum.
Statistiky nezaměstnanosti. 2010 [online] Praha: Ministerstvo práce a sociálních věcí ČR
2010. [cit. 14. 1. 2010] Dostupné z: http://portal.mpsv.cz/sz/stat/nz/mes
Simpson L, Finney N. 2009. Spatial patterns of internal migration: evidence for ethnic
groups in Britain. Population, Space and Place 15: 37-56.

16
Stillwell J, Hussain S. 2008. Internal migration of ethnic groups in England and Wales by
age and district type. Working Paper 08/2, School of Geography, University of Leeds.
Tammaru T, Kontuly T. 2011. Selectivity and destinations of ethnic minorities leaving the
main gateway cities of Estonia. Population, Space and Place 17: 674–688.
Uherek Z. 2003. Cizinecké komunity a městský prostor v České republice. Sociologický
časopis 39: 193-216.
Vnitřní stěhování cizinců v krajích ČR - v letech 2003-2007.2008. [online] Praha: Český
statistický úřad [cit. 13. 3. 2010] Dostupné z:
http://www.czso.cz/csu/cizinci.nsf/t/420044445C/$File/c02r04.pdf
Wright R, Ellis M, Reibel M. 1997. The linkage between immigration and internal labour
migration in large metropolitan areas in the United States. Economic Geography 73: 234-254.
Wright R, Ellis M. 2000 Race, region and the territorial politics of immigration in the
US. International Journal of Population Geography 6: 197–211.
Zorlu A, Mulder C. 2008. Initial and subsequent location choices of immigrants to the
Netherlands. Regional Studies 42: 245–264.
Život cizinců v ČR. 2010. [online]. [visited in 11.1.2011] Dostupné z:
http://notes2.czso.cz/csu/2010edicniplan.nsf/p/1118-10.

17
Figure 1: The size of the five main non-native groups in the Czech Republic, 2001-10
Source: Cizinci 2010
18
Figure 2: Percent share of non-natives in the Czech Republic by district in 2010
Source: Cizinci 2011

19
Figure 3. Migration rate by age – Czechs and non-natives (annual average 2006-08)
Source: Authors’ calculations from CSO Note: NN-Non-natives
0
5
10
15
20
25
300
-4
5-9
10
-14
15
-19
20
-24
25
-29
30
-34
35
-39
40
-44
45
-49
50
-54
55
-59
60
-64
65
-69
70
-74
75
-79
80
-84
85
-89
90
-94
mig
rati
on
rat
e (
%)
age groups
male NN
female NN
male
female
20
Figure 4 Migration effectiveness of non-natives and Czechs for 77 districts
Source: Authors’ calculations from CSO
0
10
20
30
40
50
60
70
2002 2003 2004 2005 2006 2007 2008 2009 2010
mig
rati
on
eff
ect
ive
ne
ss (
%)
years
Czechs
Non-natives (Total)
Vietnamese
Ukrainians

21
Table 1: The Share of non-natives by total population by commune category: 2010
Communes Total population
Non-natives
Non-native share by Commune (%)
Share of Non-natives in the CR (%)
Total population by size category (%)
Location Quotient
Prague 1 289 556 171 324 11,5 37,3 12,0 3,10
Regional Cities
1 656 833 80 227 4,8 17,5 15,5 1,13
Communes in suburbs
779 743 26 650 3,3 5,8 7,3 0,80
Other towns (>10,000 population)
2 699 918 89 416 3,5 19,5 25,2 0,77
Communes with 2-10,000 population
1 825 104 44 355 2,6 9,7 17,0 0,57
Communes with <2000 population
2 459 086 46 994 2,0 10,2 23,0 0,45
Total 10 710 240 458 966 4,3 100 100
Source: Počty obyvatel 2011, Ministry of Interior CR, authors’ calculations

22
Table 2: Gini Indexes recording the spatial concentration of the native and non-native
populations in the Czech Republic
2001 2002 2003 2004 2005 2006 2007 2008 2009 2010
Total Population 0,39 0,39 0,39 0,39 0,39 0,39 0,39 0,39 0,40 0,40
Total Non-native
Population
0,62 0,62 0,61 0,62 0,64 0,64 0,65 0,65 0,67 0,67
Vietnamese 0,70 0,70 0,70 0,70 0,69 0,69 0,67 0,66 0,66 0,65
Ukrainians 0,64 0,66 0,64 0,66 0,68 0,70 0,72 0,73 0,74 0,74

23
Table 3: Internal migration of non-natives in the Czech Republic, 2001-10
Year Total non-native (NN) population
Male NNs Male Czechs
(%)
Share of NN of total internal migration (%)
Migration rate of NNs (%)
Migration rate of Czechs (%)
2001 5 978 66,6 47,2 3,4 3,7 1,7
2002 9 868 66,7 47,4 5,0 5,5 1,9
2003 10 285 65,7 47,0 5,5 5,3 1,8
2004 11 722 62,3 46,8 6,1 6,1 1,8
2005 17 933 62,2 46,8 8,4 6,9 2,0
2006 22 973 61,5 46,8 10,2 7,8 2,0
2007 42 756 61,4 46,8 16,7 12,3 2,1
2008 42 743 62,6 46,7 17,1 10,5 2,1
2009 41 600 62,7 46,2 17,8 9,8 1,9
2010 37 107 63,2 46,4 15,4 8,7 1,9
Source: Cizinci 2010, Demografická 2010
Note: The migration rate is the share of the migrants from particular group to the total
population of that group.
24
Table 4: Net migration flows between commune size category (annual average 2006-08)
Czech citizens 15-59
Destination
Origin PH RC Z VM MM VES Total
Prague 0 -1 212 3 798 -1 779 -378 1 265 1 695
Regional Cities 1 212 0 4 483 -1 132 -74 1 279 5 768
Communes in suburbs -3 798 -4 483 0 -1 030 -488 67 -9 732
Other towns (>10,000 population) 1 779 1 132 1 030 0 1 308 6 387 11 635
Communes with 2-10,000 population 378 74 488 -1 308 0 1 687 1 320
Communes with <2000 population -1 265 -1 279 -67 -6 387 -1 687 0 -10 685
Total -1 695 -5 768 9 732 -11 635 -1 320 10 685 0
Non-natives 11 Destination
Origin PH RC Z VM MM VES Total
Prague 0 -429 218 -1 420 -755 -817 -3 204
Regional Cities 429 0 -386 -552 -516 -406 -1 431
Communes in suburbs -218 386 0 -25 11 26 179
Other towns (>10,000 population) 1 420 552 25 0 -208 -225 1 564
Communes with 2-10,000 population 755 516 -11 208 0 -76 1 393
Communes with <2000 population 817 406 -26 225 76 0 1 498
Total 3 204 1 431 -179 -1 564 -1 393 -1 498 0
Source: own calculation from CSO
Net migration is the migration balance of the category of communes of destination and origin.
Positive/negative values are related to the destination category of communes (table columns).
Czech nationals are represented by the age group of economic active of 15-59.
11 95% of non-natives are of working age.

25
Table 5: The share of the selected immigrant groups immigrated into the particular commune
categories (2006-08)
Direct International migration (%) Internal migration of immigrants (%)
Size category of communes
All Non-natives
Ukrainians Vietnamese Czechs (15 – 59)
All Non-natives
Ukrainians Vietnamese
Prague 34 33.8 16 8.3 26.8 30.6 19.3
Regional Cities
16.7 16 15.6 10.5 17.9 19 18.6
Communes in suburbs
5.6 7.5 4 14.1 9.4 9 5.1
Other towns
(>10,000 population)
20.7 17.5 32.1 17.6 18.4 16.3 26.2
Communes with 2-10,000
population
11.5 11.4 17.5 19.1 12.9 10.5 18.9
Communes with <2000 population
11.5 13.7 14.8 30.5 14.5 14.6 11.9
Total 100 100 100 100 100 100 100
Source: Authors’ calculations from CSO
Data for direct international migration means the share of group of immigrants into size
category of communes to total immigrants into this size category.
Data for Internal migration is the share of immigrants group into the size category of communes
to total internal migrants of the relevant group. Czech nationals are those of working age (15-
59).

26
Table 6: Paired correlation relations between net international and internal migration and
selected district variables (77 units, Pearson correlation coefficient)
Czechs
Non-native
(Internal) Non-native
(International) Ukrainian (Internal)
Ukrainian (International)
Vietamese (Internal)
Vietnamese (International) Unemp Wage
Czechs .225* .260* .062 .285* .173 -.006 -.468** .342**
Non-native (Internal)
-.120 .914** -.244* .442** -.098 -.197 .305**
Non-native (International)
-.113 .798** -.272* .645** -.297** .546**
Ukrainian (Internal)
-.349** .171 .061 -.120 .196
Ukrainian (International)
-.077 .225* -.237* .396**
Vietamese (Internal)
-.560** -.165 .233*
Vietnamese (International)
-.034 .153
Source: our own calculation from CSU
Notes: ** Correlation is significant at p< 0.01 * Correlation is significant at p< 0.05.
Unemp –unemployment rate at 31. 12. 2007; Wage – average wages of employees in 2005.
Nets migration are as annual average of 2007-08 and were relativized to population size of
district (as 31. 12. 2007)