Actual and ideal fertility differential among natives, immigrants ...
14
RESEARCH ARTICLE Actual and ideal fertility differential among natives, immigrants, and descendants of immigrants in a northeastern state of India Nandita Saikia 1,2 | Moradhvaj 2 | Apala Saha 2,3 | Utpal Chutia 4 1 World Population Program, International Institute for Applied Systems Analysis, Laxenburg, Austria 2 Centre for the Study of Regional Development, Jawaharlal Nehru University, Delhi, India 3 Department of Geography, Institute of Science, Banaras Hindu University, Varanasi, India 4 Department of Anthropology, Delhi University, Delhi, India Correspondence Dr. Nandita Saikia, Post Doc Scholar, International Institute for Applied Systems Analysis, Schlossplatz 1, 2361 Laxenburg, Austria. Email: [email protected] Funding information Indian Council of Social Science Research, Grant/Award Number: RESPRO/58/2013‐14/ ICSSR/RPS Abstract Little research has been conducted on the native‐immigrant fertility differential in low‐income settings. The objective of our paper is to examine the actual and ideal fer- tility differential of native and immigrant families in Assam. We used the data from a primary quantitative survey carried out in 52 villages in five districts of Assam during 2014–2015. We performed bivariate analysis and used a multilevel mixed‐effects lin- ear regression model to analyse the actual and ideal fertility differential by type of vil- lage. The average number of children ever‐born is the lowest in native villages in contrast to the highest average number of children ever‐born in immigrant villages. The likelihood of having more children is also the highest among women in immigrant villages. However, the effect of religion surpasses the effect of the type of village the women reside in. KEYWORDS Assam, fertility, immigrants, India, native, religion 1 | INTRODUCTION The importance of examining the native–immigrant fertility differen- tial across countries has been growing tremendously in recent years for several reasons. First, a high level of immigration is said to have permanently altered the ancestry of some national populations due to the domestic population's persistently low level of fertility and high level of emigration (Coleman, 2006). Indeed, a third demographic tran- sition is said to be under way in industrialised countries, given the rapid changes observed in the composition of the population due to immigration's direct and indirect effects, the potential reduction of countries' original populations to minority status in the future, and if such population transformations prove to be permanent and general (Coleman, 2006). Understanding immigration and the fertility behav- iour of immigrants is thus essential for understanding the future pop- ulation dynamics in migrant destination countries. Secondly, the fertility of immigrants and their descendants can be an important indi- cator of social integration over time (Dubuc, 2012). Immigrants often come from high‐fertility countries and have a higher level of fertility than the native‐born population (Dubuc, 2012). The native–immigrant fertility differential diminishes over time, the longer the migrants stay in the destination country (Andersson, 2004; Milewski, 2010; Sobotka, 2008). Thirdly, the native–immigrant fertility differential is of interest both to academics and policymakers, as it is closely linked to the over- all economic and social impacts of immigration. For instance, although immigration can make a positive contribution to the economic growth of a country, a higher level of fertility on the part of immigrants can also create a need for greater social provision and investment. For the reasons discussed above, there is a large body of literature on the native–immigrant fertility differential in the context of advanced and economically prosperous countries. It is found that, on average, immigrant women in the United States have more children -------------------------------------------------------------------------------------------------------------------------------- This is an open access article under the terms of the Creative Commons Attribution License, which permits use, distribution and reproduction in any medium, provided the original work is properly cited. © 2019 The Authors. Population, Space and Place published by John Wiley & Sons Ltd Accepted: 24 January 2019 DOI: 10.1002/psp.2238 Popul Space Place. 2019;e2238. https://doi.org/10.1002/psp.2238 wileyonlinelibrary.com/journal/psp 1 of 14
-
Upload
khangminh22 -
Category
Documents
-
view
3 -
download
0
Transcript of Actual and ideal fertility differential among natives, immigrants ...
Accepted: 24 January 2019
DOI: 10.1002/psp.2238
R E S E A R CH AR T I C L E
Actual and ideal fertility differential among natives, immigrants,and descendants of immigrants in a northeastern state of India
Nandita Saikia1,2 | Moradhvaj2 | Apala Saha2,3 | Utpal Chutia4
1World Population Program, International
Institute for Applied Systems Analysis,
Laxenburg, Austria
2Centre for the Study of Regional
Development, Jawaharlal Nehru University,
Delhi, India
3Department of Geography, Institute of
Science, Banaras Hindu University, Varanasi,
India
4Department of Anthropology, Delhi
University, Delhi, India
Correspondence
Dr. Nandita Saikia, Post Doc Scholar,
International Institute for Applied Systems
Analysis, Schlossplatz 1, 2361 Laxenburg,
Austria.
Email: [email protected]
Funding information
Indian Council of Social Science Research,
Grant/Award Number: RESPRO/58/2013‐14/ICSSR/RPS
- - - - - - - - - - - - - - - - - - - - - - - - - - - - - - - - - - - - - - -
This is an open access article under the terms of th
the original work is properly cited.
© 2019 The Authors. Population, Space and Place
Popul Space Place. 2019;e2238.https://doi.org/10.1002/psp.2238
Abstract
Little research has been conducted on the native‐immigrant fertility differential in
low‐income settings. The objective of our paper is to examine the actual and ideal fer-
tility differential of native and immigrant families in Assam. We used the data from a
primary quantitative survey carried out in 52 villages in five districts of Assam during
2014–2015. We performed bivariate analysis and used a multilevel mixed‐effects lin-
ear regression model to analyse the actual and ideal fertility differential by type of vil-
lage. The average number of children ever‐born is the lowest in native villages in
contrast to the highest average number of children ever‐born in immigrant villages.
The likelihood of having more children is also the highest among women in immigrant
villages. However, the effect of religion surpasses the effect of the type of village the
women reside in.
KEYWORDS
Assam, fertility, immigrants, India, native, religion
1 | INTRODUCTION
The importance of examining the native–immigrant fertility differen-
tial across countries has been growing tremendously in recent years
for several reasons. First, a high level of immigration is said to have
permanently altered the ancestry of some national populations due
to the domestic population's persistently low level of fertility and high
level of emigration (Coleman, 2006). Indeed, a third demographic tran-
sition is said to be under way in industrialised countries, given the
rapid changes observed in the composition of the population due to
immigration's direct and indirect effects, the potential reduction of
countries' original populations to minority status in the future, and if
such population transformations prove to be permanent and general
(Coleman, 2006). Understanding immigration and the fertility behav-
iour of immigrants is thus essential for understanding the future pop-
ulation dynamics in migrant destination countries. Secondly, the
- - - - - - - - - - - - - - - - - - - - - - - - - - -
e Creative Commons Attribution Li
published by John Wiley & Sons
fertility of immigrants and their descendants can be an important indi-
cator of social integration over time (Dubuc, 2012). Immigrants often
come from high‐fertility countries and have a higher level of fertility
than the native‐born population (Dubuc, 2012). The native–immigrant
fertility differential diminishes over time, the longer the migrants stay
in the destination country (Andersson, 2004; Milewski, 2010; Sobotka,
2008). Thirdly, the native–immigrant fertility differential is of interest
both to academics and policymakers, as it is closely linked to the over-
all economic and social impacts of immigration. For instance, although
immigration can make a positive contribution to the economic growth
of a country, a higher level of fertility on the part of immigrants can
also create a need for greater social provision and investment.
For the reasons discussed above, there is a large body of literature
on the native–immigrant fertility differential in the context of
advanced and economically prosperous countries. It is found that, on
average, immigrant women in the United States have more children
- - - - - - - - - - - - - - - - - - - - - - - - - - - - - - - - - - - - - - - - - - - - - - - - - - - - - - - - - - - - - -
cense, which permits use, distribution and reproduction in any medium, provided
Ltd
wileyonlinelibrary.com/journal/psp 1 of 14
2 of 14 SAIKIA ET AL.
than native‐born groups (Carter, 2000); foreign‐born women in the
United States have disproportionately more children than their
native‐born counterparts (Livingston & Cohn, 2012); immigrant Mus-
lims to Europe have a higher fertility rate than second‐generation
Muslims (Stonawski, Potančoková, & Skirbekk, 2016); immigrants to
Europe generally have a higher fertility rate than native Europeans
(Coleman, 1994; Dubuc & Haskey, 2010; Sobotka, 2008); recent immi-
grants to Canada currently have a higher fertility rate than second‐
generation immigrants (Woldemicael & Roderic, 2010), and so on. In
the United Kingdom, a few studies show that the fertility levels of
descendants of immigrants from high‐fertility countries are usually
lower in the second generation, but that, for some ethnic groups, for
example, Bangladeshis and Pakistanis, fertility remains relatively high
(Coleman & Dubuc, 2010; Sobotka, 2008).
But what do we know about the native–immigrant fertility differ-
ential in low‐ or middle‐income countries? The literature on the rela-
tionship between migration and fertility in developing countries
mainly focuses on migrant fertility within a country, rather than on
the fertility differential between immigrants and the native‐born. We
found limited evidence of differential fertility between the native‐born
and immigrant population in the developing country context. A study
conducted with respect to Afghan immigrants in Iran demonstrated
that the fertility behaviour of immigrants is very different from that
of native Iranians, at least initially (Abbasi‐Shavazi, Sadeghi,
Mahmoudian, & Jamshidiha, 2012). Immigrant fertility behaviours also
do not resemble those of nonmigrants back in the country of origin.
Immigrants' fertility behaviour eventually starts resembling that of
the native‐born population at the migration destination with, inter alia,
time and educational advancements (Abbasi‐Shavazi et al., 2012;
Abbasi‐Shavazi & Sadeghi, 2015). A study conducted in rural South
Africa found that Mozambican self‐settled refugees are adopting the
childbearing patterns of South African women. The decline in Mozam-
bican fertility has occurred alongside socioeconomic gains on their
part (Williams et al., 2013). The aim of the present study is to contrib-
ute knowledge on the native‐born and immigrant fertility differential
in the developing country of India.
1.1 | Theoretical background on linkages betweenfertility and migration
The literature summarises four main theoretical perspectives to
explain differentials in fertility behaviours and attitudes between
migrants and non‐migrants (Abbasi‐Shavazi & Sadeghi, 2015;
Majelantle & Navaneetham, 2013). The causes of the native–migrant
fertility differential can be condensed into four basic hypotheses,
namely, socialization or generational, selectivity, adaptation, and disrup-
tion (Abbasi‐Shavazi & Sadeghi, 2015; Kulu, 2005).
The socialisation hypothesis is based on the understanding that if
there is a difference in fertility behaviour between the immigrant and
the native‐born population, and assuming that immigrants' fertility
rates are higher than that of natives, it takes at least a generation for
the former to be able to imitate the fertility behaviour of the latter.
This perspective also suggests that even if immigrants start imitating
the behaviour of the native‐born population irrespective of their dura-
tion of stay, then the culture, norms, and values prevalent in the place
of origin nevertheless continue to impact the behaviour of the immi-
grants, even after migration to a relatively low‐fertility region
(Chattopadhyay, White, & Debpuur, 2006). Some studies in the United
States found that first‐generation immigrants maintain the fertility
behaviour of their sending country, whereas second‐generation immi-
grants have fertility behaviour that is similar to that of the receiving
country (Kahn, 1988; Stephen & Bean, 1992).
The selectivity perspective is based on the hypothesis that “immi-
grants are self‐selected and represent a non‐random sample.” Because
migrants typically constitute a selected group (in terms of age educa-
tion, marital status, etc.), they can be expected to possess different fer-
tility preferences from those of the overall population and more similar
to the fertility preferences in the destination country (Hervitz, 1985).
Under this hypothesis, however, it is important to consider who
migrates, how, and when (Genereux, 2007). For example, migrants with
a preference for smaller families are expected to migrate to low‐fertility
areas, where it is easier to raise small families, and high‐fertility areas
should attract migrants who prefer larger families (Hervitz, 1985).
The adaptation hypothesis explains that with the passage of time,
the fertility of the immigrants and natives will converge and that the
fertility rates of recent immigrants will be higher than that of older
immigrants. Adaptation theory identifies two major factors that impact
fertility behaviour: resources and cultural norms. Although resources
indicate the living and opportunity costs associated with the receiving
community, new cultural norms among immigrants, formed through
interaction with friends, peers, coworkers, and others in the new envi-
ronment, shape individual beliefs and desires that influence parent-
hood and the value placed on children (Kulu, 2005).
However, a similar stand is maintained by the disruptive hypothe-
sis, which states that although migration as a process may involve a
drop in fertility rates before and upon arrival in the receiving country,
because of the disruption to immigrants' life, these rates eventually
rise once the immigrants have settled down at their destination
(Abbasi‐Shavazi & Sadeghi, 2015).
1.2 | Immigration in Assam: A brief geographical andhistorical account
Assam, a state in Northeast India, shares an international border with
Bhutan in the north and Bangladesh in the south. It is connected to
the rest of India by the Siliguri Corridor in the state of West Bengal,
a narrow strip of land, 22 km long, known familiarly as the Chicken's
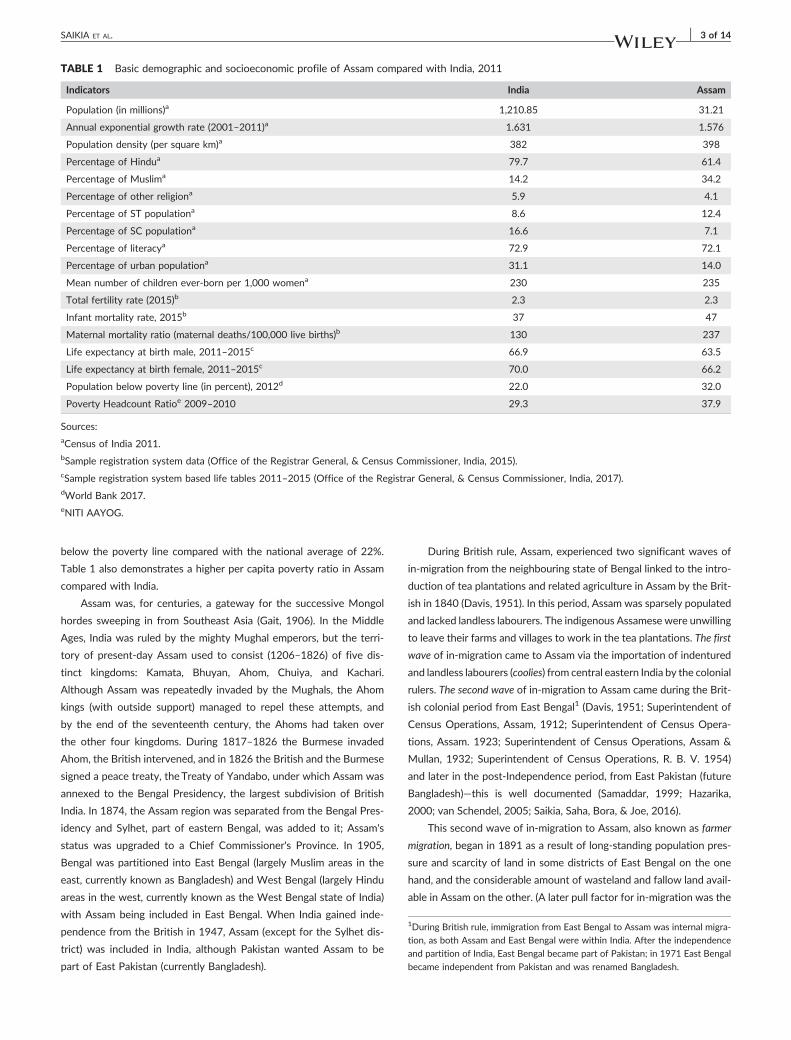
Neck. Table 1 presents the basic demographic and socioeconomic pro-
file of Assam compared with India. Assam constitutes about 2.6% of
India's total population (2011). The annual exponential decadal growth
rate of Assam is slightly lower than India's, but the population density
is higher. Assam has high mortality and low urbanisation compared
with the national Indian level, indicating the demographic backward-
ness of the state. About 32% of the total population of Assam lives
1During British rule, immigration from East Bengal to Assam was internal migra-
tion, as both Assam and East Bengal were within India. After the independence
and partition of India, East Bengal became part of Pakistan; in 1971 East Bengal
became independent from Pakistan and was renamed Bangladesh.
TABLE 1 Basic demographic and socioeconomic profile of Assam compared with India, 2011
Indicators India Assam
Population (in millions)a 1,210.85 31.21
Annual exponential growth rate (2001–2011)a 1.631 1.576
Population density (per square km)a 382 398
Percentage of Hindua 79.7 61.4
Percentage of Muslima 14.2 34.2
Percentage of other religiona 5.9 4.1
Percentage of ST populationa 8.6 12.4
Percentage of SC populationa 16.6 7.1
Percentage of literacya 72.9 72.1
Percentage of urban populationa 31.1 14.0
Mean number of children ever‐born per 1,000 womena 230 235
Total fertility rate (2015)b 2.3 2.3
Infant mortality rate, 2015b 37 47
Maternal mortality ratio (maternal deaths/100,000 live births)b 130 237
Life expectancy at birth male, 2011–2015c 66.9 63.5
Life expectancy at birth female, 2011–2015c 70.0 66.2
Population below poverty line (in percent), 2012d 22.0 32.0
Poverty Headcount Ratioe 2009–2010 29.3 37.9
Sources:aCensus of India 2011.bSample registration system data (Office of the Registrar General, & Census Commissioner, India, 2015).cSample registration system based life tables 2011–2015 (Office of the Registrar General, & Census Commissioner, India, 2017).dWorld Bank 2017.eNITI AAYOG.
SAIKIA ET AL. 3 of 14
below the poverty line compared with the national average of 22%.
Table 1 also demonstrates a higher per capita poverty ratio in Assam
compared with India.
Assam was, for centuries, a gateway for the successive Mongol
hordes sweeping in from Southeast Asia (Gait, 1906). In the Middle
Ages, India was ruled by the mighty Mughal emperors, but the terri-
tory of present‐day Assam used to consist (1206–1826) of five dis-
tinct kingdoms: Kamata, Bhuyan, Ahom, Chuiya, and Kachari.
Although Assam was repeatedly invaded by the Mughals, the Ahom
kings (with outside support) managed to repel these attempts, and
by the end of the seventeenth century, the Ahoms had taken over
the other four kingdoms. During 1817–1826 the Burmese invaded
Ahom, the British intervened, and in 1826 the British and the Burmese
signed a peace treaty, the Treaty of Yandabo, under which Assam was
annexed to the Bengal Presidency, the largest subdivision of British
India. In 1874, the Assam region was separated from the Bengal Pres-
idency and Sylhet, part of eastern Bengal, was added to it; Assam's
status was upgraded to a Chief Commissioner's Province. In 1905,
Bengal was partitioned into East Bengal (largely Muslim areas in the
east, currently known as Bangladesh) and West Bengal (largely Hindu
areas in the west, currently known as the West Bengal state of India)
with Assam being included in East Bengal. When India gained inde-
pendence from the British in 1947, Assam (except for the Sylhet dis-
trict) was included in India, although Pakistan wanted Assam to be
part of East Pakistan (currently Bangladesh).
During British rule, Assam, experienced two significant waves of
in‐migration from the neighbouring state of Bengal linked to the intro-
duction of tea plantations and related agriculture in Assam by the Brit-
ish in 1840 (Davis, 1951). In this period, Assam was sparsely populated
and lacked landless labourers. The indigenous Assamese were unwilling
to leave their farms and villages to work in the tea plantations. The first
wave of in‐migration came to Assam via the importation of indentured
and landless labourers (coolies) from central eastern India by the colonial
rulers. The second wave of in‐migration to Assam came during the Brit-
ish colonial period from East Bengal1 (Davis, 1951; Superintendent of
Census Operations, Assam, 1912; Superintendent of Census Opera-
tions, Assam. 1923; Superintendent of Census Operations, Assam &
Mullan, 1932; Superintendent of Census Operations, R. B. V. 1954)
and later in the post‐Independence period, from East Pakistan (future
Bangladesh)—this is well documented (Samaddar, 1999; Hazarika,
2000; van Schendel, 2005; Saikia, Saha, Bora, & Joe, 2016).
This second wave of in‐migration to Assam, also known as farmer
migration, began in 1891 as a result of long‐standing population pres-
sure and scarcity of land in some districts of East Bengal on the one
hand, and the considerable amount of wasteland and fallow land avail-
able in Assam on the other. (A later pull factor for in‐migration was the
4 of 14 SAIKIA ET AL.
“Grow More Food” program introduced in 1942–1943, encouraged by
the British and the then Muslim League governments to support the
workers in the tea plantations.) The mass migration of Bengali Muslim
peasants and cultivators from East Bengal districts to Assam was first
reported in the 1911 census, and thereafter, the number of Bengali‐
born people not living in tea plantation areas (resulting from farmer
migration) rose continuously in successive censuses. For instance, in
1911 and 1921, the number of people born in Bengal but living in
Assam was 159,000 and 348,000, respectively, excluding tea‐
plantation workers (Superintendent of Census Operations, Assam,
1912; Superintendent of Census Operations, Assam, 1923). A table
of Bengal‐born people in Assam is presented in Appendix A1. A higher
level of in‐migration from East Bengal to some selected districts of
Assam has significantly influenced the ethnic or religious composition
of those districts. The percentage of Muslim population in the erst-
while Nowgong (currently known as Morigaon and Nagaon) district,
for example, has risen from less than 4.8% to about 40.5% between
1901 and 1951 (Allen, 1905; Superintendent of Census Operations,
1954).
This stream of in‐migration from East Bengal to Assam continued
even after the separation of East Bengal from India in 1947 because of
similar push and pull factors in both the origin and destination coun-
tries (Superintendent of Census Operations, 1954; Weiner, 1983;
Nath & Nath, 2011; Nath, Nath, & Bhattachaya, 2012; Saikia, Joe, et
al., 2016). Immigration is being facilitated by the vast open porous bor-
der between India and Bangladesh. As Assam lacks robust vital
registration‐system data, and as census‐based information on immi-
gration data is highly underreported (Census commissioner of Assam,
1961; Saikia, Saha, et al., 2016), there have been several attempts to
estimate the number of immigrants and their descendants during the
post‐Independence era. Estimates as to the magnitude of immigrants
in Assam vary among independent studies, yet all studies agree on
the presence of a significant number of immigrants from East Pakistan
or current Bangladesh to Assam. A table of various estimates of immi-
grants and their descendants in Assam is presented in Appendix A2.
Historically, the migrants from East Bengal encroached the waste-
lands in Assam, which existed either in forest areas or near rivers (pop-
ularly known as Chars or sandbars) (Superintendent of Census
Operations, 1954). They also encroached the government wastelands
reserved for developmental schemes, known as khas land (Superinten-
dent of Census Operations, 1954). They always settled in groups with
families rather than singly (Superintendent of Census Operations,
1954). It has been documented that during 1930–1950, about
15,088 thousand acres of land were settled with migrants from East
Bengal (Superintendent of Census Operations, 1954). In the post inde-
pendent period, encroachment was extended to Village Grazing
Reserves, Professional Grazing reserves, underutilised land owned by
Vaishnava Monastries (known as Satra) and temples, land of the tribal
belt, etc. (Baruah, Bhattacharyya, Dutta, & Borpatragohain, 2017;
Sharma, 2012), where immigrants created their villages.
Large‐scale immigration, coupled with the faster growth of the
population of immigrant origin in most of the districts of Assam, trig-
gered confrontations in many areas—the most important issues being
linguistic (Assamese versus Bengali), religious (Hindu versus Muslims),
and ethnicity (indigenous or those who were in Assam in the pre‐
colonial era versus non‐indigenous). Conflict between the native‐born
population and immigrants was documented as early as 1951 (Davis,
1951). However, in 1979 following a sudden rise of registered voters
from 6.3 million in 1971 to 8.7 million on the electoral roll in 1979, a
student‐led anti‐immigrant movement began and continued until 1985
(Weiner, 1983). The movement, known as the Assam movement or
Assam agitation demanded that illegal Bengali immigrants to Assam
be identified and expelled (Saikia, Joe, Saha, & Chutia, 2016; Weiner,
1983). The movement continued for 6 years and ended in 1985 with
a memorandum of settlement called the Assam accord between the
government of India and the leaders of the Assam movement. The
two principal promises (or clauses) of the Assam accord were to detect
and expel the immigrants who entered after 1966 and to give consti-
tutional, legislative, and administrative safeguards to the Assamese
people (Government of Assam, 2019). This movement has had several
long‐term political, economic, and social consequences in the state,
but the main clauses of the Assam accord remains unaddressed and
is a highly debated issue to this day.
As noted earlier, there are a couple of studies estimating the mag-
nitude of immigrants in Assam. However, there has not, to our knowl-
edge, been any empirical research comparing demographic aspects
such as the fertility, mortality, or health of the native‐born and immi-
grant populations of Assam. The aim of this paper is thus to compare
the actual and ideal fertility differential by migration status.
2 | DATA AND METHODS
2.1 | Data
A primary quantitative survey was carried out in 52 villages in five dis-
tricts of Assam during 2015–2016 as part of the project “Cross Border
Migration in Assam during 1951–2011: Process, Magnitude, and
Socioeconomic Consequences,” funded by the Indian Council of Social
Science Research, New Delhi. We sampled only rural villages, given
that the percentage of the rural population in Assam is about 86% of
the total population. A three‐stage sampling was adopted to select eli-
gible women aged 15–49. In the first stage, we selected five districts,
namely, Barpeta, Dhubri, Kokrajhar, Morigaon, and Nagaon on the
basis of two criteria: first, the districts had to have experienced a very
high population growth rate in the postindependence period, and sec-
ondly, the districts had to have a record of high in‐migration in the
census data of East Bengal (current Bangladesh) prior to Indian inde-
pendence. In the second stage, we selected 52 villages, classified into
the following categories:
1. Villages consisting primarily of native‐born: The inhabitants of these
villages are indigenous to Assam; they consist of General Caste
Assamese Hindus and Assamese Muslims; Other Backward Caste
populations such as tea plantation workers, Ahoms, and Koch‐
Rajbanshis; and Scheduled Tribe (ST) populations including the
SAIKIA ET AL. 5 of 14
Bodo, Karbi, Rabha, and Tiwa people. Fifteen villages from this
group were surveyed. In our analysis, we refer to this group as
native.
2. Villages of old settlers/descendants of immigrants: Villages compris-
ing both Hindu and Muslim immigrants from East
Bengal/Bangladesh settled in Assam for more than 20 years. Thir-
teen villages from this group were surveyed. In our analysis, we
refer to this group as descendants of immigrants.
3. Villages with mixed population: Villages comprising natives,
descendants of immigrants, and immigrants (as defined below),
namely, villages with all population groups. Fourteen villages from
this group were surveyed.
4. Villages of immigrants: Villages comprising immigrants from Ban-
gladesh, settled in Assam for less than 20 years. Ten villages from
this group were surveyed. In our analysis, we refer to this group
as immigrants.
As the reporting of immigration status is a sensitive issue in
Assam, we carried out qualitative research (focus group discussions,
key informant interviews, and in‐depth interviews) to identify the vil-
lage types. We obtained a representative sample of villages by
selecting villages both near district headquarters and distant from it,
villages near the Assam–Bangladesh border, villages in tea plantations,
villages near the National Parks, and villages in the Bodoland Territo-
rial Council.
In the third stage, we selected an average of 32 households per
village through a systematic random sampling procedure. Thus, in 52
villages in five districts, we surveyed 1,693 households consisting of
8,209 members. The questionnaire for women was administered in
1,262 households lived in by eligible women (i.e., of reproductive
age) aged 15–49.
The exact questions regarding the fertility level were (a) How
many ever‐born children (boys and girls) do you have? (b) In your opin-
ion, what is the ideal number of children for a married couple to have?
Of this number, how many boys and how many girls are ideal?
2The detailed list of the variables included is shown in Appendix (B1). Principal
component analysis is a statistical technique used to reduce the number of var-
iables into a smaller data set. We used information regarding ownership of fur-
niture, electrical devices and appliances, vehicles, and land. We used factor
scoring, with each variable from first principle components as weights, to gener-
ate a socioeconomic indicator for each household (Vyas & Kumaranayake,
2006). The index was then coded into three terciles, namely, poor (bottom
33.33% of the households), middle (intermediate 33.33%), and rich (top
33.33%).
2.1.1 | Methods
Two outcome variables interested us: the actual number of children
ever‐born at the time of the survey and the ideal number of children,
as reported by women of reproductive age. By “actual number of chil-
dren ever‐born,” we indicate the total number of children born alive to
the respondent at the time of the survey. By ideal number of children,
we indicate the general family size ideals perceived by the respon-
dents. Our survey question (as mentioned in the data section) was
motivated by the findings of a detailed study in many European coun-
tries by Sobotka and Beaujouan (2014).
There are numerous studies addressing socioeconomic factors
affecting fertility in developing countries. In general, it is found that
there is an inverse relationship between women's education and child-
bearing (Basu, 2002; Kravdal, 2002). Social status expressed either
through religion (Bhat & Zavier, 2005) or castes (Murthi, Guio, & Dreze,
1995) is a significant determinant of the fertility of Indian women; and
in most of the models of fertility analysis—fromThomas Malthus in the
18th century to the more recent models of Gary S. Becker and John
Caldwell—economic status plays a central role in childbearing. Follow-
ing the literature review and depending on the availability of informa-
tion in our data, we chose the exposure variables at two levels: the
individual level and the village level. The individual level variables are
(a) age of mother at birth of the first child, (b) age of the respondent
at the time of survey, and the age square (c) education (illiterate, pri-
mary, middle school, high school, and above), (d) work status (not work-
ing outside the home/housewife only; working outside the home), (e)
source of water (unsafe and safe sources), (f) type of cooking fuel
(unclean and clean fuel), and (g) wealth tercile (poor, middle‐income,
and rich). The village‐level variables are listed as (a) percentage belong-
ing to deprived social groups such as Scheduled Caste/Scheduled Tribe
(SC/ST), (b) percentage of children that have died in the village, (c) per-
centage of Muslim women, and (d) type of village (native, old settlers,
mixed population, and immigrant population). All this information was
obtained from the survey administered to the respondents.
We generated an asset‐based index, wealth tercile2as a proxy of
the economic status of the household using a principal component
analysis of the household's various assets.
As native–migration status is a village‐level variable in our sam-
ple, the application of the ordinary least squares model to our data
was not appropriate due to the clustering of women within a certain
village type. We thus conducted two‐level mixed‐effects linear
modelling to examine the association between fertility outcome
(actual and ideal) and type of village. We categorised all the indepen-
dent variables into variables at the women's level and at the village
level (Tables 3 and 4).
A two‐level mixed‐effects model is
yij ¼ β0 þ ∑pp¼1βpxpij þ ∑q
q¼1γquqj þ uaj þ eij� �
; (1)
where
yij=number of children ever‐born/ideal number of children for ith
women of jth village
xpij is the pth independent variable at individual level
uqj is the qth independent variable at village level
β0 + βp + γq= the fixed part
μoj + eij=the random part
We carried out all analysis in STATA S.E. 15.0.
6 of 14 SAIKIA ET AL.
3 | RESULTS
3.1 | Basic demographic and socioeconomic profileof Assam and sample description
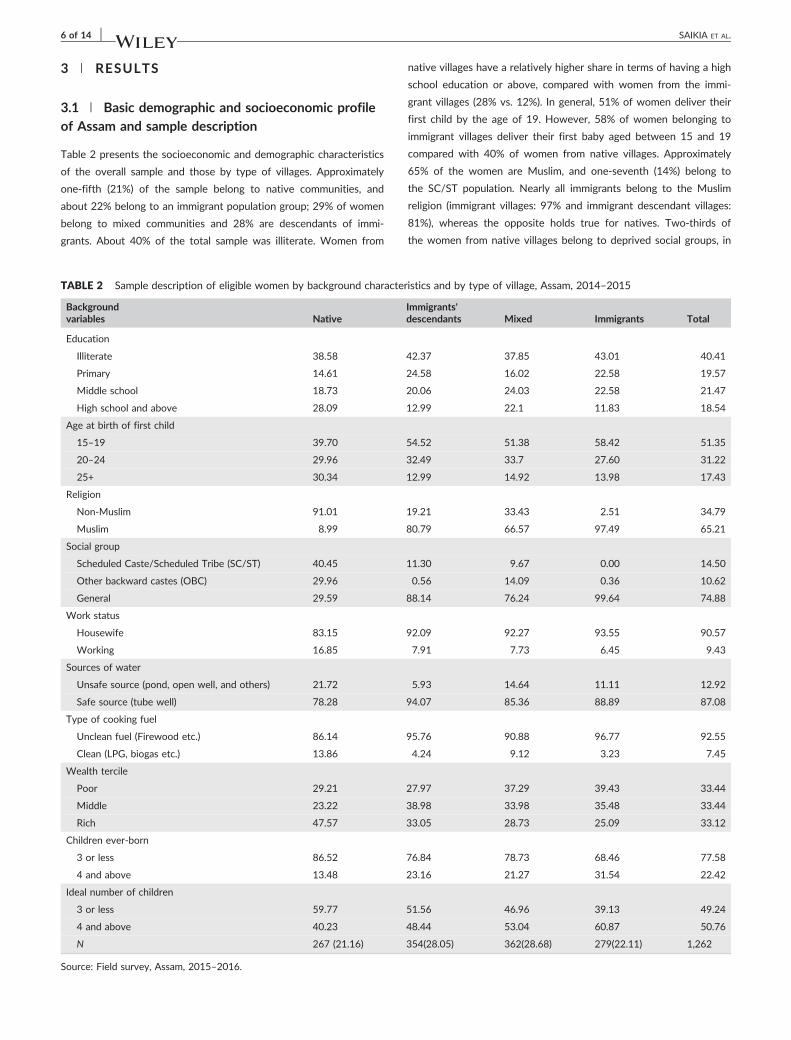
Table 2 presents the socioeconomic and demographic characteristics
of the overall sample and those by type of villages. Approximately
one‐fifth (21%) of the sample belong to native communities, and
about 22% belong to an immigrant population group; 29% of women
belong to mixed communities and 28% are descendants of immi-
grants. About 40% of the total sample was illiterate. Women from
TABLE 2 Sample description of eligible women by background character
Backgroundvariables Native
Education
Illiterate 38.58
Primary 14.61
Middle school 18.73
High school and above 28.09
Age at birth of first child
15–19 39.70
20–24 29.96
25+ 30.34
Religion
Non‐Muslim 91.01
Muslim 8.99
Social group
Scheduled Caste/Scheduled Tribe (SC/ST) 40.45
Other backward castes (OBC) 29.96
General 29.59
Work status
Housewife 83.15
Working 16.85
Sources of water
Unsafe source (pond, open well, and others) 21.72
Safe source (tube well) 78.28
Type of cooking fuel
Unclean fuel (Firewood etc.) 86.14
Clean (LPG, biogas etc.) 13.86
Wealth tercile
Poor 29.21
Middle 23.22
Rich 47.57
Children ever‐born
3 or less 86.52
4 and above 13.48
Ideal number of children
3 or less 59.77
4 and above 40.23
N 267 (21.16)
Source: Field survey, Assam, 2015–2016.
native villages have a relatively higher share in terms of having a high
school education or above, compared with women from the immi-
grant villages (28% vs. 12%). In general, 51% of women deliver their
first child by the age of 19. However, 58% of women belonging to
immigrant villages deliver their first baby aged between 15 and 19
compared with 40% of women from native villages. Approximately
65% of the women are Muslim, and one‐seventh (14%) belong to
the SC/ST population. Nearly all immigrants belong to the Muslim
religion (immigrant villages: 97% and immigrant descendant villages:
81%), whereas the opposite holds true for natives. Two‐thirds of
the women from native villages belong to deprived social groups, in
istics and by type of village, Assam, 2014–2015
Immigrants'descendants Mixed Immigrants Total
42.37 37.85 43.01 40.41
24.58 16.02 22.58 19.57
20.06 24.03 22.58 21.47
12.99 22.1 11.83 18.54
54.52 51.38 58.42 51.35
32.49 33.7 27.60 31.22
12.99 14.92 13.98 17.43
19.21 33.43 2.51 34.79
80.79 66.57 97.49 65.21
11.30 9.67 0.00 14.50
0.56 14.09 0.36 10.62
88.14 76.24 99.64 74.88
92.09 92.27 93.55 90.57
7.91 7.73 6.45 9.43
5.93 14.64 11.11 12.92
94.07 85.36 88.89 87.08
95.76 90.88 96.77 92.55
4.24 9.12 3.23 7.45
27.97 37.29 39.43 33.44
38.98 33.98 35.48 33.44
33.05 28.73 25.09 33.12
76.84 78.73 68.46 77.58
23.16 21.27 31.54 22.42
51.56 46.96 39.13 49.24
48.44 53.04 60.87 50.76
354(28.05) 362(28.68) 279(22.11) 1,262
SAIKIA ET AL. 7 of 14
other words, the Other Backward Caste/SC/ST population. An over-
whelming percentage of women report themselves as housewives
(90%) in our study sample and the variation in work status across vil-
lage type is nearly negligible.
Although most of the women from all villages have access to safe
water (87%), 92% of the sample uses unclean fuel such as firewood for
cooking. A higher percentage of women from immigrant villages have
access to safe water (89%) compared with those from native villages
(78%). As we categorised households' economic status per wealth
tercile, about one‐third of the sample belongs to one of the three cat-
egories of wealth status. The percentages of women belonging to poor
wealth terciles varies from 29 to 39% in all types of villages.
Table 2 also presents the percentage of women reporting the
number of children ever‐born and the ideal number of children. At
the time of the survey, 78% of the women had a family with three
or less children, and only 49% of the women perceived the ideal family
as comprising three children or less. This indicates that a substantial
percentage of women with three or less children perceive the ideal
size of the family as being more than three. This may be because many
of them have not reached the end of their reproductive life. Across
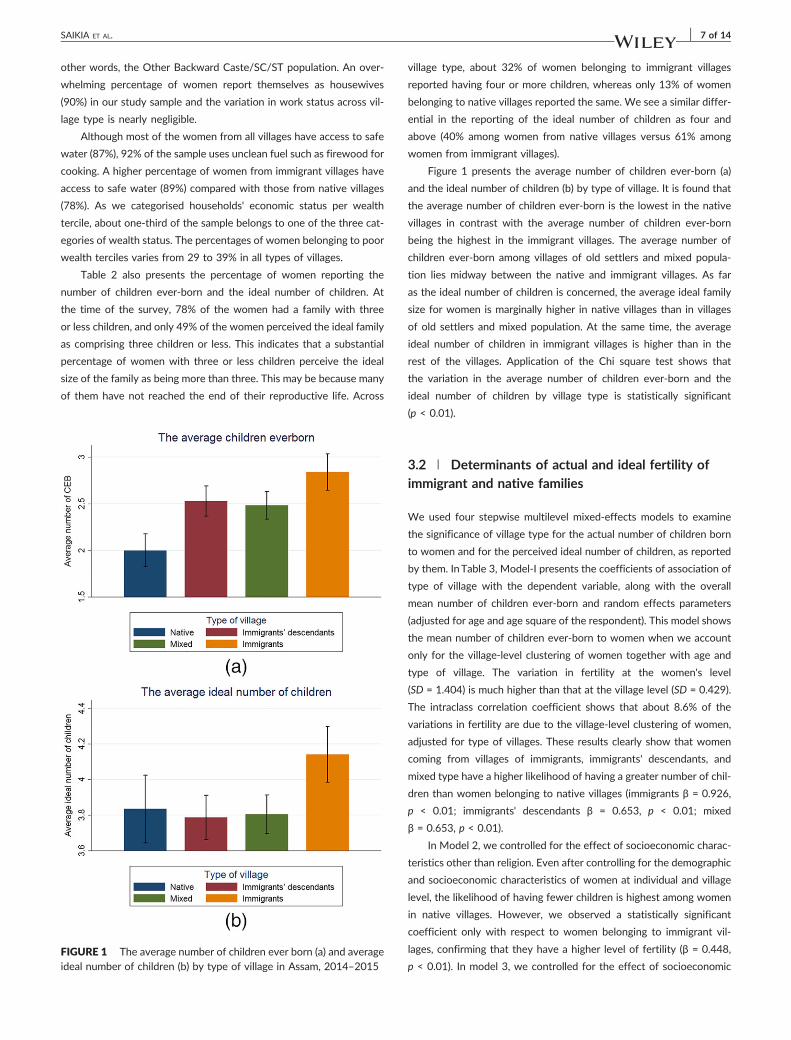
FIGURE 1 The average number of children ever born (a) and averageideal number of children (b) by type of village in Assam, 2014–2015
village type, about 32% of women belonging to immigrant villages
reported having four or more children, whereas only 13% of women
belonging to native villages reported the same. We see a similar differ-
ential in the reporting of the ideal number of children as four and
above (40% among women from native villages versus 61% among
women from immigrant villages).
Figure 1 presents the average number of children ever‐born (a)
and the ideal number of children (b) by type of village. It is found that
the average number of children ever‐born is the lowest in the native
villages in contrast with the average number of children ever‐born
being the highest in the immigrant villages. The average number of
children ever‐born among villages of old settlers and mixed popula-
tion lies midway between the native and immigrant villages. As far
as the ideal number of children is concerned, the average ideal family
size for women is marginally higher in native villages than in villages
of old settlers and mixed population. At the same time, the average
ideal number of children in immigrant villages is higher than in the
rest of the villages. Application of the Chi square test shows that
the variation in the average number of children ever‐born and the
ideal number of children by village type is statistically significant
(p < 0.01).
3.2 | Determinants of actual and ideal fertility ofimmigrant and native families
We used four stepwise multilevel mixed‐effects models to examine
the significance of village type for the actual number of children born
to women and for the perceived ideal number of children, as reported
by them. InTable 3, Model‐I presents the coefficients of association of
type of village with the dependent variable, along with the overall
mean number of children ever‐born and random effects parameters
(adjusted for age and age square of the respondent). This model shows
the mean number of children ever‐born to women when we account
only for the village‐level clustering of women together with age and
type of village. The variation in fertility at the women's level
(SD = 1.404) is much higher than that at the village level (SD = 0.429).
The intraclass correlation coefficient shows that about 8.6% of the
variations in fertility are due to the village‐level clustering of women,
adjusted for type of villages. These results clearly show that women
coming from villages of immigrants, immigrants' descendants, and
mixed type have a higher likelihood of having a greater number of chil-
dren than women belonging to native villages (immigrants β = 0.926,
p < 0.01; immigrants' descendants β = 0.653, p < 0.01; mixed
β = 0.653, p < 0.01).
In Model 2, we controlled for the effect of socioeconomic charac-
teristics other than religion. Even after controlling for the demographic
and socioeconomic characteristics of women at individual and village
level, the likelihood of having fewer children is highest among women
in native villages. However, we observed a statistically significant
coefficient only with respect to women belonging to immigrant vil-
lages, confirming that they have a higher level of fertility (β = 0.448,
p < 0.01). In model 3, we controlled for the effect of socioeconomic
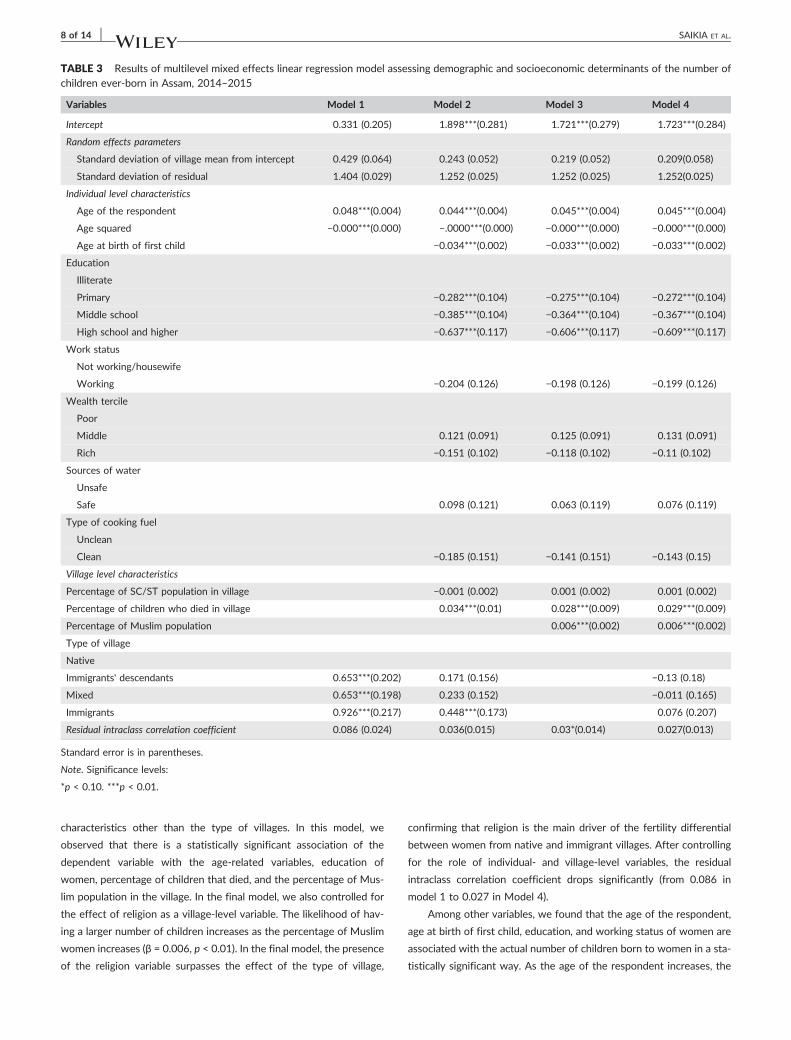
TABLE 3 Results of multilevel mixed effects linear regression model assessing demographic and socioeconomic determinants of the number ofchildren ever‐born in Assam, 2014–2015
Variables Model 1 Model 2 Model 3 Model 4
Intercept 0.331 (0.205) 1.898***(0.281) 1.721***(0.279) 1.723***(0.284)
Random effects parameters
Standard deviation of village mean from intercept 0.429 (0.064) 0.243 (0.052) 0.219 (0.052) 0.209(0.058)
Standard deviation of residual 1.404 (0.029) 1.252 (0.025) 1.252 (0.025) 1.252(0.025)
Individual level characteristics
Age of the respondent 0.048***(0.004) 0.044***(0.004) 0.045***(0.004) 0.045***(0.004)
Age squared −0.000***(0.000) −.0000***(0.000) −0.000***(0.000) −0.000***(0.000)
Age at birth of first child −0.034***(0.002) −0.033***(0.002) −0.033***(0.002)
Education
Illiterate
Primary −0.282***(0.104) −0.275***(0.104) −0.272***(0.104)
Middle school −0.385***(0.104) −0.364***(0.104) −0.367***(0.104)
High school and higher −0.637***(0.117) −0.606***(0.117) −0.609***(0.117)
Work status
Not working/housewife
Working −0.204 (0.126) −0.198 (0.126) −0.199 (0.126)
Wealth tercile
Poor
Middle 0.121 (0.091) 0.125 (0.091) 0.131 (0.091)
Rich −0.151 (0.102) −0.118 (0.102) −0.11 (0.102)
Sources of water
Unsafe
Safe 0.098 (0.121) 0.063 (0.119) 0.076 (0.119)
Type of cooking fuel
Unclean
Clean −0.185 (0.151) −0.141 (0.151) −0.143 (0.15)
Village level characteristics
Percentage of SC/ST population in village −0.001 (0.002) 0.001 (0.002) 0.001 (0.002)
Percentage of children who died in village 0.034***(0.01) 0.028***(0.009) 0.029***(0.009)
Percentage of Muslim population 0.006***(0.002) 0.006***(0.002)
Type of village
Native
Immigrants' descendants 0.653***(0.202) 0.171 (0.156) −0.13 (0.18)
Mixed 0.653***(0.198) 0.233 (0.152) −0.011 (0.165)
Immigrants 0.926***(0.217) 0.448***(0.173) 0.076 (0.207)
Residual intraclass correlation coefficient 0.086 (0.024) 0.036(0.015) 0.03*(0.014) 0.027(0.013)
Standard error is in parentheses.
Note. Significance levels:
*p < 0.10. ***p < 0.01.
8 of 14 SAIKIA ET AL.
characteristics other than the type of villages. In this model, we
observed that there is a statistically significant association of the
dependent variable with the age‐related variables, education of
women, percentage of children that died, and the percentage of Mus-
lim population in the village. In the final model, we also controlled for
the effect of religion as a village‐level variable. The likelihood of hav-
ing a larger number of children increases as the percentage of Muslim
women increases (β = 0.006, p < 0.01). In the final model, the presence
of the religion variable surpasses the effect of the type of village,
confirming that religion is the main driver of the fertility differential
between women from native and immigrant villages. After controlling
for the role of individual‐ and village‐level variables, the residual
intraclass correlation coefficient drops significantly (from 0.086 in
model 1 to 0.027 in Model 4).
Among other variables, we found that the age of the respondent,
age at birth of first child, education, and working status of women are
associated with the actual number of children born to women in a sta-
tistically significant way. As the age of the respondent increases, the
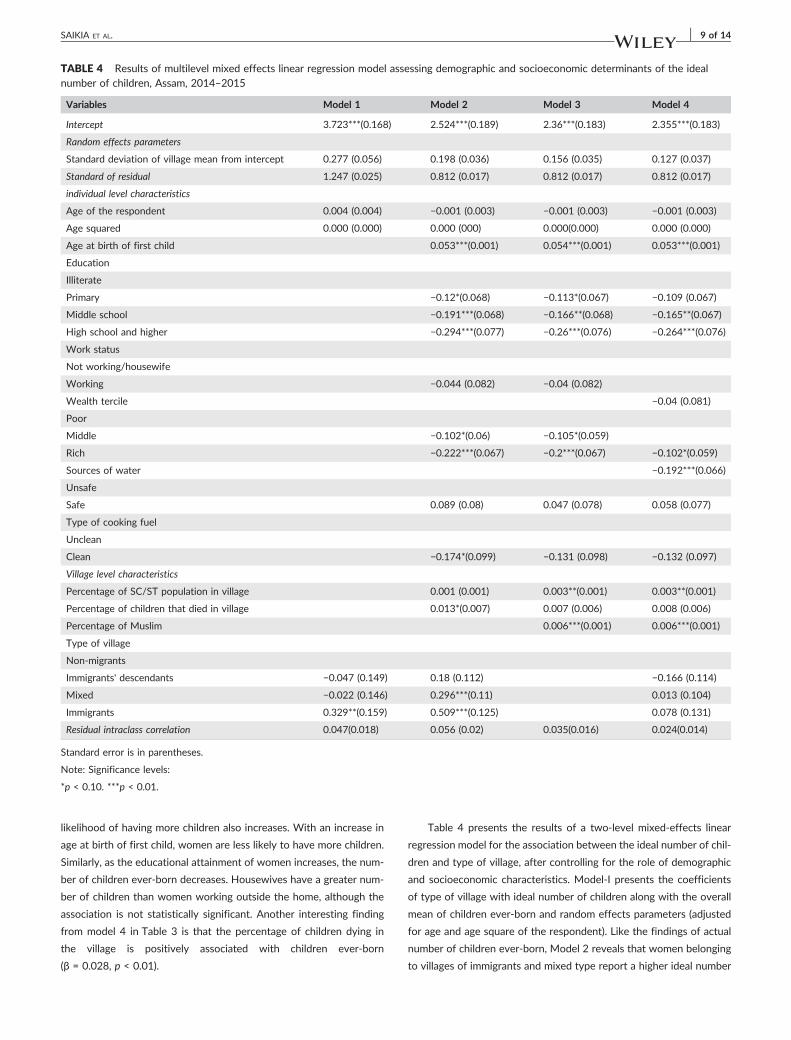
TABLE 4 Results of multilevel mixed effects linear regression model assessing demographic and socioeconomic determinants of the idealnumber of children, Assam, 2014–2015
Variables Model 1 Model 2 Model 3 Model 4
Intercept 3.723***(0.168) 2.524***(0.189) 2.36***(0.183) 2.355***(0.183)
Random effects parameters
Standard deviation of village mean from intercept 0.277 (0.056) 0.198 (0.036) 0.156 (0.035) 0.127 (0.037)
Standard of residual 1.247 (0.025) 0.812 (0.017) 0.812 (0.017) 0.812 (0.017)
individual level characteristics
Age of the respondent 0.004 (0.004) −0.001 (0.003) −0.001 (0.003) −0.001 (0.003)
Age squared 0.000 (0.000) 0.000 (000) 0.000(0.000) 0.000 (0.000)
Age at birth of first child 0.053***(0.001) 0.054***(0.001) 0.053***(0.001)
Education
Illiterate
Primary −0.12*(0.068) −0.113*(0.067) −0.109 (0.067)
Middle school −0.191***(0.068) −0.166**(0.068) −0.165**(0.067)
High school and higher −0.294***(0.077) −0.26***(0.076) −0.264***(0.076)
Work status
Not working/housewife
Working −0.044 (0.082) −0.04 (0.082)
Wealth tercile −0.04 (0.081)
Poor
Middle −0.102*(0.06) −0.105*(0.059)
Rich −0.222***(0.067) −0.2***(0.067) −0.102*(0.059)
Sources of water −0.192***(0.066)
Unsafe
Safe 0.089 (0.08) 0.047 (0.078) 0.058 (0.077)
Type of cooking fuel
Unclean
Clean −0.174*(0.099) −0.131 (0.098) −0.132 (0.097)
Village level characteristics
Percentage of SC/ST population in village 0.001 (0.001) 0.003**(0.001) 0.003**(0.001)
Percentage of children that died in village 0.013*(0.007) 0.007 (0.006) 0.008 (0.006)
Percentage of Muslim 0.006***(0.001) 0.006***(0.001)
Type of village
Non‐migrants
Immigrants' descendants −0.047 (0.149) 0.18 (0.112) −0.166 (0.114)
Mixed −0.022 (0.146) 0.296***(0.11) 0.013 (0.104)
Immigrants 0.329**(0.159) 0.509***(0.125) 0.078 (0.131)
Residual intraclass correlation 0.047(0.018) 0.056 (0.02) 0.035(0.016) 0.024(0.014)
Standard error is in parentheses.
Note: Significance levels:
*p < 0.10. ***p < 0.01.
SAIKIA ET AL. 9 of 14
likelihood of having more children also increases. With an increase in
age at birth of first child, women are less likely to have more children.
Similarly, as the educational attainment of women increases, the num-
ber of children ever‐born decreases. Housewives have a greater num-
ber of children than women working outside the home, although the
association is not statistically significant. Another interesting finding
from model 4 in Table 3 is that the percentage of children dying in
the village is positively associated with children ever‐born
(β = 0.028, p < 0.01).
Table 4 presents the results of a two‐level mixed‐effects linear
regression model for the association between the ideal number of chil-
dren and type of village, after controlling for the role of demographic
and socioeconomic characteristics. Model‐I presents the coefficients
of type of village with ideal number of children along with the overall
mean of children ever‐born and random effects parameters (adjusted
for age and age square of the respondent). Like the findings of actual
number of children ever‐born, Model 2 reveals that women belonging
to villages of immigrants and mixed type report a higher ideal number
10 of 14 SAIKIA ET AL.
of children than women belonging to native villages (immigrants
β = 0.509, p < 0.01; mixed β = 0.296, p < 0.01) and after controlling
for all socioeconomic characteristics other than religion. In Model 3,
we controlled for the effect of demographic and socioeconomic char-
acteristics except the type of villages. In this model, we observed a
statistically significant coefficient for women belonging to the villages
with a higher Muslim and SC/ST population (percentage of Muslims:
β = 0.006, p < 0.01; percentage SC/STs β = 0.003, p < 0.01) together
with the education and wealth tercile of the households. In the final
model, after controlling for the effect of all the socioeconomic vari-
ables together, the likelihood of having more children as ideal
increases as the percentage of Muslim women increases at village
level (β = 0.006, p < 0.01). Interestingly, religion again surpasses the
effect of the type of village in the final model.
4 | DISCUSSION AND CONCLUSION
It has become increasingly important to understand the patterns and
consequences of international migration. Despite the fact that south–
south migration (also termed as poor‐to‐poor‐country migration) is one
of international migration's most prominent trends (United Nations,
2016), the literature on immigration issues concentrates heavily on
northern countries. Moreover, within India, the northeastern states
are poorly represented in the demographic literature. Although there
are frequent debates on immigration and growth in the number of peo-
ple of immigrant origin in Northeast India, we found empirical evidence
to be limited in terms of helping to explain population dynamics in this
part of the country. The aim of the present study was thus to contrib-
ute knowledge on the fertility differential by migration status in areas
neglected by researchers that, nonetheless, are of substantial demo-
graphic and socioeconomic importance. A native–migrant comparison
of fertility differentials is particularly significant for Assam, the biggest
state in Northeast India, as it indicates the future population dynamics
of this region. Using the data from a recently conducted primary sample
survey, the present study investigated actual and ideal fertility behav-
iour among women from four distinct types of villages in Assam,
namely, native Assamese villages, immigrant villages, immigrant
descendants' villages, and villages of mixed population. To our knowl-
edge, no similar study has been conducted on the native–immigrant
fertility differential in any Indian state (namely, Assam or West Bengal)
or those widely documented as Bangladeshi migrant‐receiving states
(Samaddar, 1999; van Schendel, 2005).
Our study demonstrates that even in low‐income situations
where both natives and immigrants are relatively poor, the fertility dif-
ference between women from native and immigrant villages resembles
to a great extent what, in high‐income countries, is already an
established fact. Our results show that both the actual and ideal level
of fertility among women from immigrant villages is substantially
higher than those from native villages. At the same time, the differ-
ence in both actual and ideal fertility behaviour between the native‐
and descendants of immigrant villages is much smaller than that
between native and immigrant villages, indicating an assimilation of
demographic behaviours by the second‐generation immigrants. Thus,
the descendants of immigrants tend to have a higher fertility level
than natives but a lower one than immigrants. Our study reveals that
after controlling for the important variable, the socioeconomic status
of women, women belonging to immigrant or immigrant descendants'
villages have higher fertility than the rest. However, this effect van-
ishes once the role of religion at village level is controlled for. This
finding is different from those observed in high‐income countries
(Kulu et al., 2017; Kulu & Hannemann, 2016) where the effect of
migration status remains after controlling for the effect of religion.
In light of the immigration and fertility theories discussed earlier,
we may infer that the fertility differential by migration status in Assam
resembles the hypothesis of socialisation and adaptation. In common
with socialisation theory, which derived from the experiences of
Western countries, immigration has, in our study area too, been taking
place from a densely populated area (East Bengal or Bangladesh) as a
result of high fertility to a relatively less populated area (Das, 2016;
Davis, 1951). In the literature, it is argued that if immigrants from
high‐fertility countries are able to maintain the subculture of their
country of origin, their fertility remains higher than that of the
native‐born population. Together with cultural norms, education and
employment opportunities play an important role in the fertility
behaviour of immigrants and their descendants in high‐income coun-
tries (Kulu et al., 2017). In general, immigration to Assam is a
poverty‐induced phenomenon (Das, 2016; Siddiqui, 2003), indicating
that the immigrants belong to poorer socioeconomic strata compared
with old settlers or natives. Immigrants are often involved in agricul-
ture or allied activities in the unorganised sector, which demands man-
ual labour. Children supply labour by helping parents' economic
activities and contributing to family income. As a result, parents may
see having a higher number of children as an economic asset. How-
ever, the longer immigrants stay at their new destination, the more
they may try to imitate the behaviour of the native‐born population
through observation and through interaction with people in the new
environment. They may replicate the behaviour of the native‐born res-
idents by sending their children to school, which increases the cost of
raising children. This may lead to lower fertility among second‐
generation immigrants. At the same time, the fact that immigrants in
Assam belong to poorer socioeconomic strata is one among several
dimensions of the selectivity issue discussed in the introduction.
Our analysis shows that the effect of village type vanishes once
we control for the effect of religion. As the percentage of Muslim
women in a village increases, so too does the fertility after all back-
ground characteristics are controlled for. The final model thus shows
that religious traits are more important than the migration character-
istics of the study population. The findings of this study further con-
tribute to the ongoing debate on whether differences in
socioeconomic characteristics between Muslim and non‐Muslim pop-
ulations entirely explain the difference in fertility between these two
population subgroups. Although some literature demonstrates that a
higher level of fertility among the Muslim population is not entirely
due to religious affiliation (Westoff & Frejka, 2007), some others
resolved that socioeconomic factors does not entirely explain the
SAIKIA ET AL. 11 of 14
higher level of fertility among Muslims in India (Bhat, 2005; Bhat &
Zavier, 2005; Dharmalingam & Morgan, 2004; Kulkarni & Alagarajan,
2005; Mishra, 2004; Morgan, Stash, Smith, & Mason, 2002). Our
findings are consistent with previous studies conducted in India
(Balasubramanian, 1984; Bhat & Zavier, 2005; Dharmalingam & Mor-
gan, 2004; Pasupuleti, Pathak, & Jatrana, 2017), which repeatedly
found Muslim women in India to have higher fertility than Hindu
women, independent of socioeconomic condition. It has been said
that although both Islam and Hinduism are pro‐natalist religions, their
beliefs differ greatly with respect to marriage, reproductive behav-
iour, and fertility control, and this has different effects on the inter-
mediate variables of fertility (Balasubramanian, 1984). The role of
religion or pro‐natal religious leaders is crucial when the role of the
healthcare system is minimal. This is particularly true of our study
area. According to the National Family Health Survey (NFHS,
2015–2016), maternal and child healthcare service utilisation and
the quality of family planning services throughout Assam is very poor
(IIPS and ICF, 2017).3 Poor knowledge and access to family planning,
together with religious superstition, have aggravated the situation
relating to the reproductive choice of immigrant women with low
educational attainment.
Another reason for high fertility among women from immigrant
villages can be linked to the local political environment. Political
leaders of immigrant origin may promote higher fertility to increase
the numbers of their voters, which is crucial for negotiating welfare
benefits in a democratic system. A study found that local political
leaders in Assam depend on the immigrants to sustain their power
(Goswami, 2010; Saikia et al 2016). They may also encourage more
births to increase the political power of people of immigrant origin in
the future. Because of geographic proximity, the historical context
(Indian Partition), and over‐population in East Bengal, the former polit-
ical leaders of Pakistan always wanted Assam to be part of East Paki-
stan or East Bengal (current Bangladesh) (Bhutto, 1969; Jinnah, 1947).
The local political leaders of immigrant origin can be influenced by
expansionist political ideology (Hussain, 2004), which, in turn, encour-
ages a higher level of fertility.
The religious determinant of fertility and its consequences for
native–immigrant differentials emerging in our study agree with stud-
ies pertaining to European countries. For example, a recent study in
Europe (Stonawski et al., 2016) concluded that the fertility rates of
Muslims (both native and immigrant) are higher than those of non‐
Muslims. The authors also inferred that fertility rates are higher in
countries where most of the Muslims were immigrants. Our findings
are also consistent with the findings of previous studies conducted
in the United Kingdom and the rest of Europe (Coleman & Dubuc,
2010; Kulu et al., 2017; Kulu & Hannemann, 2016). The fertility level
of Bangladeshi or Pakistani immigrant women is also found to be sub-
stantially higher than that of native women in high‐income countries
like the United Kingdom, despite a declining trend over the years.
3According to NFHS‐4, the percentage of mothers who had full antenatal care
(at least four antenatal visits, at least one tetanus injection, and iron and folic
acid pills/syrup taken for 100 or more days) is as low as 18%; of nonusers, only
17.2% women were told about family planning methods by health workers.
Following the findings of this study, it is crucial to discuss the pos-
sible impact of the relatively higher level of fertility among immigrants
(and immigrants' descendants) on the size and composition of the host
population. In general, if the total size of the immigrant population is
found to be small, a small difference in fertility between natives and
immigrants can have a minor impact on the overall size of the popula-
tion. In the context of Assam, immigrants or their descendants consti-
tute nearly 16% of the population (Saikia, Saha, et al., 2016). The
existing size of the immigrant population together with differential fer-
tility might have been affecting the total size of the population in
Assam. In addition, it has a significant impact on the ethnic or religious
composition, particularly at district level as discussed previously (The
Governor of Assam, 1998).
The present study has a few limitations. First, our sample is not
representative of the entire state of Assam; it represents mainly the
central and western districts. On the basis of other studies using cen-
sus data (Singh, Kumar, Pathak, Chauhan, & Banerjee, 2017), the fertil-
ity rate is found to be much lower in the eastern districts of Assam
where the native population is dominant. We may thus speculate that
the native–immigrant differential will be even higher if the fertility
level of the districts where immigration is relatively less pronounced
had been taken into account. Secondly, we could not include the hus-
bands of the women in our analysis, as we did not collect any data
related to them. Particularly in the Indian context, husbands may influ-
ence the fertility decision. However, we did include the major socio-
economic characteristics of the household, which may be a
substitute for the husband's role in fertility decision making. Thirdly,
our study is based on cross‐sectional data despite much of the previ-
ous literature on the present topic being based on longitudinal data.
This is because of the paucity of longitudinal data in the study area.
Despite these limitations, the present study provides crucial scientific
evidence on the native‐immigrant fertility differential in low‐income
and high‐fertility settings.
To reduce fertility and improve the quality of life of women of
immigrant origin, the educational level, particularly of females, must
be increased. Knowledge of, and access to, modern family planning
methods should be increased in immigrant villages through an expan-
sion of healthcare facilities.
ACKNOWLEDGEMENTS
The authors thank Dr Abhishek Singh for his constructive comments in
an earlier version of this study. We sincerely thank the two anony-
mous reviewers for their comments and suggestions, which helped
to improve the manuscript. The first author is grateful to the Indian
Council of Social Science Research, New Delhi, for providing the grant
for the project “Cross border migration in Assam from 1951‐2011:
process, magnitude and demographic consequences,” which helped
to collect the data for this study.
ORCID
Nandita Saikia https://orcid.org/0000-0001-6735-6157
12 of 14 SAIKIA ET AL.
REFERENCES
Abbasi‐Shavazi, M. J., & Sadeghi, R. (2015). Socio‐cultural adaptation of
second‐generation Afghans in Iran. International Migration, 53(6),
89–110. https://doi.org/10.1111/imig.12148
Abbasi‐Shavazi, M. J., Sadeghi, R., Mahmoudian, H., & Jamshidiha, G.
(2012). Marriage and family formation of the second‐generationAfghans in Iran: Insights from a qualitative study. International Migra-
tion Review, 46(4), 828–860. https://doi.org/10.1111/imre.12002
Allen, B. C. (1905). Assam District Gazetteers. Volume VI Nowgong. Calcutta:
The City Press.
Andersson, G. (2004). Childbearing after migration: Fertility patterns of
foreign‐born women in Sweden. International Migration Review, 38(2),
747–774. https://doi.org/10.1111/j.1747‐7379.2004.tb00216.x
Balasubramanian, K. (1984). Hindu‐Muslim differentials in fertility and pop-
ulation growth in India: Role of proximate variables. Artha Vijnana, 26,
189–216. https://doi.org/10.21648/arthavij/1984/v26/i3/116369
Baruah, R.K., Bhattacharyya, A.K., Dutta, A.K. and Borpatragohain, R.
(2017). Final report submitted by Brahma Committee (M), Commitee
for protection of land rights of indigenous people of Assam 2017.
Basu, A. M. (2002). Why does education lead to lower fertility? A critical
review of some of the possibilities. World Development, 30(10),
1779–1790. https://doi.org/10.1016/S0305‐750X(02)00072‐4
Bhat, P. M. (2005). Trivialising religion: Causes of higher Muslim fertility.
Economic and Political Weekly, 40(13), 1376–1379.
Bhat, P. M., & Zavier, A. F. (2005). Role of religion in fertility decline: The
case of Indian Muslims. Economic and Political Weekly, 40(5), 385–402.
Bhutto, Z. A. (1969). The myth of independence (pp. 66–69). London: oxforduniversity press. Member Sindh Council, PPP
Carter, M. (2000). Fertility of Mexican immigrant women in the US: A
closer look. Social Science Quarterly, 81(4), 1073–1086.
Census commissioner (1961). Census of India 1961 ( ed., Vol. III) (pp.
123–124). Assam: Part I‐A General Report. 72
Chattopadhyay, A., White, M. J., & Debpuur, C. (2006). Migrant fertility in
Ghana: Selection versus adaptation and disruption as causal mecha-
nisms. Population Studies, 60(2), 189–203. https://doi.org/10.1080/
00324720600646287
Coleman, D. (2006). Immigration and ethnic change in low‐fertility countries:A third demographic transition. Population and Development Review,
32(3), 401–446. https://doi.org/10.1111/j.1728‐4457.2006.00131.x
Coleman, D. A. (1994). Trends in fertility and intermarriage among immi-
grant populations in Western Europe as measures of integration.
Journal of Biosocial Science, 26(1), 107–136.
Coleman, D. A., & Dubuc, S. (2010). The fertility of ethnic minorities in the
UK, 1960s–2006. Population Studies, 64(1), 19–41. https://doi.org/
10.1080/00324720903391201
Das, P. (2016). Illigal migration from Bangladesh. Deportation, border fences
and work permit. IDSA Monograph Series. No 56, December 2016. New
Delhi. Retrieved from https://idsa.in/monograph/illegal‐migration‐from‐bangladesh_pdas: Institute for Defence Studies and Analyses.
Accessed on 21st August 2018
Davis, K. (1951). The population of India and Pakistan Kingsley Davis.
Princeton, N. J: Princeton Univ. Press.
Dharmalingam, A., & Morgan, S. P. (2004). Pervasive Muslim‐Hindu fertility
differences in India. Demography, 41(3), 529–545. https://doi.org/
10.1353/dem.2004.0020
Dubuc, S. (2012). Immigration to the UK from high‐fertility countries:
Intergenerational adaptation and fertility convergence. Population and
Development Review, 38(2), 353–368. https://doi.org/10.1111/j.1728‐4457.2012.00496.x
Dubuc, S., & Haskey, J. (2010). Ethnicity and fertility in the United King-
dom. In Ethnicity and integration (pp. 63–81). Dordrecht: Springer.
Gait, A. (1906). A history of Assam. Calcutta: Thacker, Spink & co.
Genereux, A. (2007). A review of migration and fertility theory through the
lens of African immigrant fertility in France. Max Planck Institute for
Demographic Research, Working Paper 2007, 8.
Goswami, N. (2010). Bangladeshi illegal migration into Assam: Issues and
concerns from the Field Institute for Defence Studies and Analyses
issue brief. Retrieved from https://idsa.in/issuebrief/Bangladesh
iIllegalMigrationintoAssam_ngoswami_140110 Accessed on 19th
November 2018.
Government of Assam (2019). Assam accord and its clauses. Retrieved
from https://assamaccord.assam.gov.in/portlets/assam‐accord‐and‐its‐clauses Accessed on 11th January 2019.
Hazarika, S. (2000). Rites of passage: Border crossings, imagined homelands,
India's East and Bangladesh. New Delhi: Penguin Books.
Hervitz, H. M. (1985). Selectivity, adaptation, or disruption? A comparison
of alternative hypotheses on the effects of migration on fertility: The
case of Brazil. International Migration Review, 19, 293–292, 317.
Hussain W. (2004). Assam: Demographic jitters. Retrieved from https://
www.outlookindia.com/website/story/demographic‐jitters/225190Accessed on 19th November 2018.
IIPS (International Institute for Population Sciences) and ICF (2017).
National Family Health Survey (NFHS‐4), 2015–16: India.Mumbai: IIPS.
Jinnah A. (1947). Move to partition Punjab and Bengal. Retrieved from
http://www.nationalarchives.gov.uk/education/resources/the‐road‐to‐partition/jinnah‐partition/ Accessed on 19th November 2018.
Kahn, J. R. (1988). Immigrant selectivity and fertility adaptation in the
United States. Social Forces, 67(1), 108–128. https://doi.org/10.1093/sf/67.1.108
Kravdal, Ø. (2002). Education and fertility in sub‐Saharan Africa: Individual
and community effects. Demography, 39(2), 233–250.
Kulkarni, P. M., & Alagarajan, M. (2005). Population growth, fertility, and
religion in India. Economic and Political Weekly, 40(5), 403–410.
Kulu, H. (2005). Migration and fertility: Competing hypotheses re‐examined. European Journal of Population/Revue européenne de
Démographie, 21(1), 51–87. https://doi.org/10.1007/s10680‐005‐3581‐8
Kulu, H., & Hannemann, T. (2016). Why does fertility remain high among
certain UK‐born ethnic minority women? Demographic Research, 35,
1441–1488. https://doi.org/10.4054/DemRes.2016.35.49
Kulu, H., Hannemann, T., Pailhé, A., Neels, K., Krapf, S., González‐Ferrer, A.,& Andersson, G. (2017). Fertility by birth order among the descendants
of immigrants in selected European countries. Population and Develop-
ment Review, 43(1), 31–60. https://doi.org/10.1111/padr.12037
Livingston, G., & Cohn, D. (2012). US birth rate falls to a record low:
Decline is greatest among immigrants. Pew Research Center Social
and Demographic Trends.
Majelantle, R. G., & Navaneetham, K. (2013). Migration and fertility: A
review of theories and evidences. Journal of Global Economy, 1(101), 2.
Milewski, N. (2010). Immigrant fertility in West Germany: Is there a social-
ization effect in transitions to second and third births? European Journal
of Population/Revue européenne de Démographie, 26(3), 297–323.https://doi.org/10.1007/s10680‐010‐9211‐0
Mishra, V. K. (2004). Muslim/non‐Muslim differentials in fertility and family
planning in India. Avaialable at https://scholarspace.manoa.hawaii.edu/
handle/10125/3749
Morgan, S. P., Stash, S., Smith, H. L., & Mason, K. O. (2002). Muslim and
non‐Muslim differences in female autonomy and fertility: evidence
SAIKIA ET AL. 13 of 14
from four Asian countries. Population and Development Review, 28(3),
515–537. https://doi.org/10.1111/j.1728‐4457.2002.00515.x
Murthi, M., Guio, A. C., & Dreze, J. (1995). Mortality, fertility, and gender
bias in India: A district‐level analysis. Population and Development
Review, 21, 745–782. https://doi.org/10.2307/2137773
Nath, B. K., Nath, D. C., & Bhattachaya, B. (2012). Undocumented migra-
tion in the State of Assam in North East India: Estimates since 1971
to 2001. Asian Journal of Applied Sciences, 5(3), 164–173. https://doi.org/10.3923/ajaps.2012.164.173
Nath, H. K., & Nath, S. K. (2011). Illegal migration into Assam: Magnitude,
causes, and economic consequences.
Office of the Registrar General & Census Commissioner, India. (2015).
Sample registration system statistical report 2015 (Annual). New Delhi:
MINISTRY OF HOME AFFAIRS, Government of India. Retrieved from
http://www.censusindia.gov.in/vital_statistics/SRS_Reports_2015.
html Accessed on 19th November 2018.
Office of the Registrar General & Census Commissioner, India. (2017). SRS
based abridged life tables 2011–15. New Delhi. Retrieved from http://
www.censusindia.gov.in/Vital_Statistics/SRS_Life_Table/Srs_life_
Table_2011‐15.html Accessed on 19th November 2018.
Pasupuleti, S. S. R., Pathak, P., & Jatrana, S. (2017). Hindu–muslim fertility
differential in india: A cohort approach. Journal of Biosocial Science,
49(2), 147–172. https://doi.org/10.1017/S0021932016000262
Saikia N., Joe W., Saha, A. and Chutia, U. (2016). Cross border migration in
Assam during 1951–2011: Process, magnitude, and socio‐economic
consequences. Project report submitted to ICSSR: Delhi.
Saikia N., Saha, A., Bora, J.K. and Joe, W.. (2016). Trends in immigration
from Bangladesh to Assam, 1951‐2001 Evidence from direct and indi-
rect demographic estimation. International Migration and Diaspora
Studies (IMDS) Working paper series, Working paper no 91. ISSN
0976‐271X published by IMDS project, Zakir Husain Centre for Educa-
tional Studies, JNU, New Delhi
Samaddar, R. (1999). The marginal nation: Transborder migration from Ban-
gladesh to West Bengal. Delhi: Sage.
Sharma, C. K. (2012). The immigration issue in Assam and conflicts around
it. Asian Ethnicity, 13(3), 287–309. https://doi.org/10.1080/
14631369.2012.676235
Siddiqui, T. (2003). Migration as a livelihood strategy of the poor: The Bangla-
desh case. Bangladesh: Refugee and Migratory Movements Research
Unit, Dhaka University.
Singh, A., Kumar, K., Pathak, P. K., Chauhan, R. K., & Banerjee, A. (2017).
Spatial patterns and determinants of fertility in India. Population,
72(3), 505–526.
Sobotka, T. (2008). Overview Chapter 7: The rising importance of migrants
for childbearing in Europe. Demographic Research, 19(9), 225–248.https://doi.org/10.4054/DemRes.2008.19.9
Sobotka, T., & Beaujouan, É. (2014). Two Is best? The persistence of a two‐child family ideal in Europe. Population and Development Review, 40(3),
391–419. https://doi.org/10.1111/j.1728‐4457.2014.00691.x
Stephen, E. H., & Bean, F. D. (1992). Assimilation, disruption and the fertil-
ity of Mexican‐origin women in the United States. International
Migration Review, 26(1), 67–88. https://doi.org/10.1177/
019791839202600104
Stonawski, M., Potančoková, M., & Skirbekk, V. (2016). Fertility patterns of
native and migrant Muslims in Europe. Population, Space and Place,
22(6), 552–567. https://doi.org/10.1002/psp.1941
Superintendent of Census Operations, Assam. (1912). Census of India
1911 Volume III Assam Part I Report. The Government Press Assam,
Shillong.
Superintendent of Census Operations, Assam. (1923). Census of India
1921 Volume III Assam Part I Report. The Government Press Assam.
Superintendent of Census Operations, Assam and Mullan C. S. (1932).
Census of India 1931 Volume III Assam Part I Report. The Government
Press Assam, Shillong.
Superintendent of Census Operations, R. B. V. (1954). Census of India,
1951 Volume Xll Assam, Manipur and Tripura Part I‐A:Report (Vols. 1–XII). Shilong: The Municipal Printing Press, Bombay.
The Governor of Assam (Sinha, S.K) (1998). Report on illegal migration into
Assam, Submitted toThe President of India by The Governor of Assam.
Retrieved from http://www.satp.org/satporgtp/countries/india/
states/assam/documents/papers/illegal_migration_in_assam.htm
Accessed on 19th November 2018.
United Nations. (2016). International migration report 2015. Retrieved from
http://www.un.org/en/development/desa/population/migration/pub-
lications/migrationreport/docs/MigrationReport2015.pdf
van Schendel, W. (2005). The Bengal borderland: Beyond state and nation in
South Asia. London: Anthem Press.
Vyas, S., & Kumaranayake, L. (2006). Constructing socio‐economic status
indices: How to use principal components analysis. Health Policy and
Planning, 21(6), 459–468. https://doi.org/10.1093/heapol/czl029
Weiner, M. (1983). The political demography of Assam's anti‐immigrant
movement. Population and Development Review, 9, 279–292. https://doi.org/10.2307/1973053
Westoff, C. F., & Frejka, T. (2007). Religiousness and fertility among Euro-
pean Muslims. Population and Development Review, 33(4), 785–809.https://doi.org/10.1111/j.1728‐4457.2007.00197.x
Williams, J., Ibisomi, L., Sartorius, B., Kahn, K., Collinson, M., Tollman, S., &
Garenne, M. (2013). Convergence in fertility of South Africans and
Mozambicans in rural South Africa, 1993–2009. Global Health Action,
6(1), 19236. https://doi.org/10.3402/gha.v6i0.19236
Woldemicael, G., & Roderic, B. (2010). Fertility behavior of immigrants in
Canada: Converging trends. PSC Discussion Papers Series, 24(5), 1.
World Bank. 2017. Assam ‐ Poverty, growth, and inequality (English). India
state briefs. Washington, D.C.: World Bank Group. http://documents.
worldbank.org/curated/en/545361504000062662/Assam‐Poverty‐growth‐and‐inequality
How to cite this article: Saikia N, Moradhvaj, Saha A, Chutia
U. Actual and ideal fertility differential among natives, immi-
grants, and descendants of immigrants in a northeastern state
of India. Popul Space Place. 2019;e2238. https://doi.org/
10.1002/psp.2238
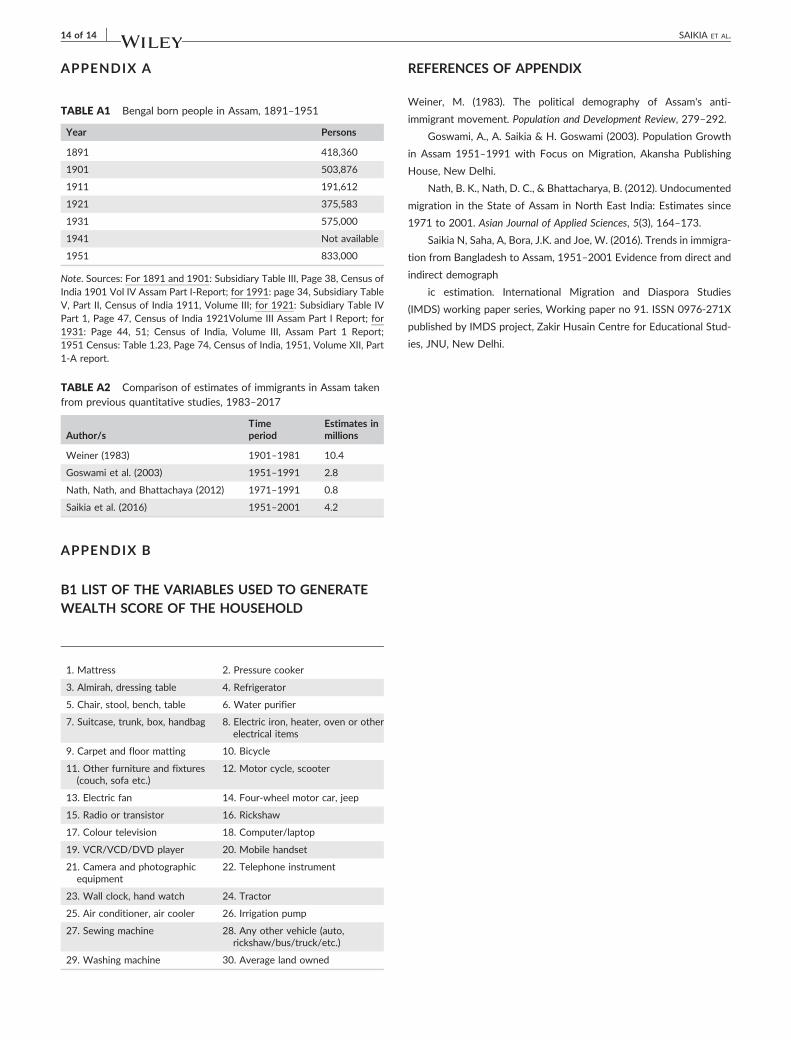
14 of 14 SAIKIA ET AL.
APPENDIX A
TABLE A2 Comparison of estimates of immigrants in Assam takenfrom previous quantitative studies, 1983–2017
Author/sTimeperiod
Estimates inmillions
Weiner (1983) 1901–1981 10.4
Goswami et al. (2003) 1951–1991 2.8
Nath, Nath, and Bhattachaya (2012) 1971–1991 0.8
Saikia et al. (2016) 1951–2001 4.2
TABLE A1 Bengal born people in Assam, 1891–1951
Year Persons
1891 418,360
1901 503,876
1911 191,612
1921 375,583
1931 575,000
1941 Not available
1951 833,000
Note. Sources: For 1891 and 1901: Subsidiary Table III, Page 38, Census ofIndia 1901 Vol IV Assam Part I‐Report; for 1991: page 34, Subsidiary TableV, Part II, Census of India 1911, Volume III; for 1921: Subsidiary Table IVPart 1, Page 47, Census of India 1921Volume III Assam Part I Report; for1931: Page 44, 51; Census of India, Volume III, Assam Part 1 Report;1951 Census: Table 1.23, Page 74, Census of India, 1951, Volume XII, Part1‐A report.
APPENDIX B
B1 LIST OF THE VARIABLES USED TO GENERATEWEALTH SCORE OF THE HOUSEHOLD
1. Mattress 2. Pressure cooker
3. Almirah, dressing table 4. Refrigerator
5. Chair, stool, bench, table 6. Water purifier
7. Suitcase, trunk, box, handbag 8. Electric iron, heater, oven or otherelectrical items
9. Carpet and floor matting 10. Bicycle
11. Other furniture and fixtures(couch, sofa etc.)
12. Motor cycle, scooter
13. Electric fan 14. Four‐wheel motor car, jeep
15. Radio or transistor 16. Rickshaw
17. Colour television 18. Computer/laptop
19. VCR/VCD/DVD player 20. Mobile handset
21. Camera and photographicequipment
22. Telephone instrument
23. Wall clock, hand watch 24. Tractor
25. Air conditioner, air cooler 26. Irrigation pump
27. Sewing machine 28. Any other vehicle (auto,rickshaw/bus/truck/etc.)
29. Washing machine 30. Average land owned
REFERENCES OF APPENDIX
Weiner, M. (1983). The political demography of Assam's anti‐
immigrant movement. Population and Development Review, 279–292.
Goswami, A., A. Saikia & H. Goswami (2003). Population Growth
in Assam 1951–1991 with Focus on Migration, Akansha Publishing
House, New Delhi.
Nath, B. K., Nath, D. C., & Bhattacharya, B. (2012). Undocumented
migration in the State of Assam in North East India: Estimates since
1971 to 2001. Asian Journal of Applied Sciences, 5(3), 164–173.
Saikia N, Saha, A, Bora, J.K. and Joe, W. (2016). Trends in immigra-
tion from Bangladesh to Assam, 1951–2001 Evidence from direct and
indirect demograph
ic estimation. International Migration and Diaspora Studies
(IMDS) working paper series, Working paper no 91. ISSN 0976‐271X
published by IMDS project, Zakir Husain Centre for Educational Stud-
ies, JNU, New Delhi.