Fertility, Living Arrangements, Care and Mobility - National ...
Upload
independentCategory
view
1download
0
The Pakistan Development ReviewVol. XXIII, Nos. 2 & 3 (Summer-Autumn 1984)
An Analysis of Fertility Change in Pakistan
M. NASEEM IQBAL F AROOQUI and GHULAM YASIN SOOMRO*
INTRODUCTION
In most of the developing countries, sustained population growth rates havebeen a dominant factor in decelerating socio-economicdevelopment. The continuingdecline in mortality rates has been a major contributor to the acceleration of growthof population in these countries which started in the period following the secondWorld War, and has not abated yet in most of the developing world. There is everylikelihood that the population of these developingcountries will double in the courseof the next generation or so, because of the demographic momentum that is builtinto their age structure. The rapidly increasingpopulation in low-incomecountries isnot keeping pace with the necessary cultural and technological changesthat may helpthem to raise the standard of living of their masses. Also, high rates of populationgrowth have become a barrier to a successful attainment of the desired socio-economic development, both quantitative and qualitative.
Like other developing countries, Pakistan also faces a population problem.The trends of population growth observed for the 50 years prior to 1951 (Le. the1901-1951 period) indicate that the growth rate in the area constituting Pakistanwas then closer to 1 percent per annum. During the next 30 years (1951-81) thepopulation growth rate was, however, closer to 3 percent per annum [6; 7; 8; 9;10]. This observed increase in population growth rates in the last 30 years(1951-1981) was largely attributed to the decline in mortality levels. The femalepopulation of reproductive ageshas been growingbecause of the fertility potential ofthe previous cohorts as well as the decline in maternalrnortality. The increase in thenumber of women in reproductive ages consequently means more births and addi-tional strain on the resourcesof the country. The proportion of population aged lessthan 15 years remains static at roughly 45 percent, creating multidimensional prob-lems of food and nutrition, health, education, employment, etc.
A little decline was, however, observed in fertility levels. This decline wascaused by changes in nuptiality patterns, the introduction of family planning during
*Reseaxch Demographers, Pakistan Institute of Development Economics, Islamabad(Pakistan)
226 Farooqui and SoomroAnA1Ii1/ysis of Fertility Change in Pakistan 227
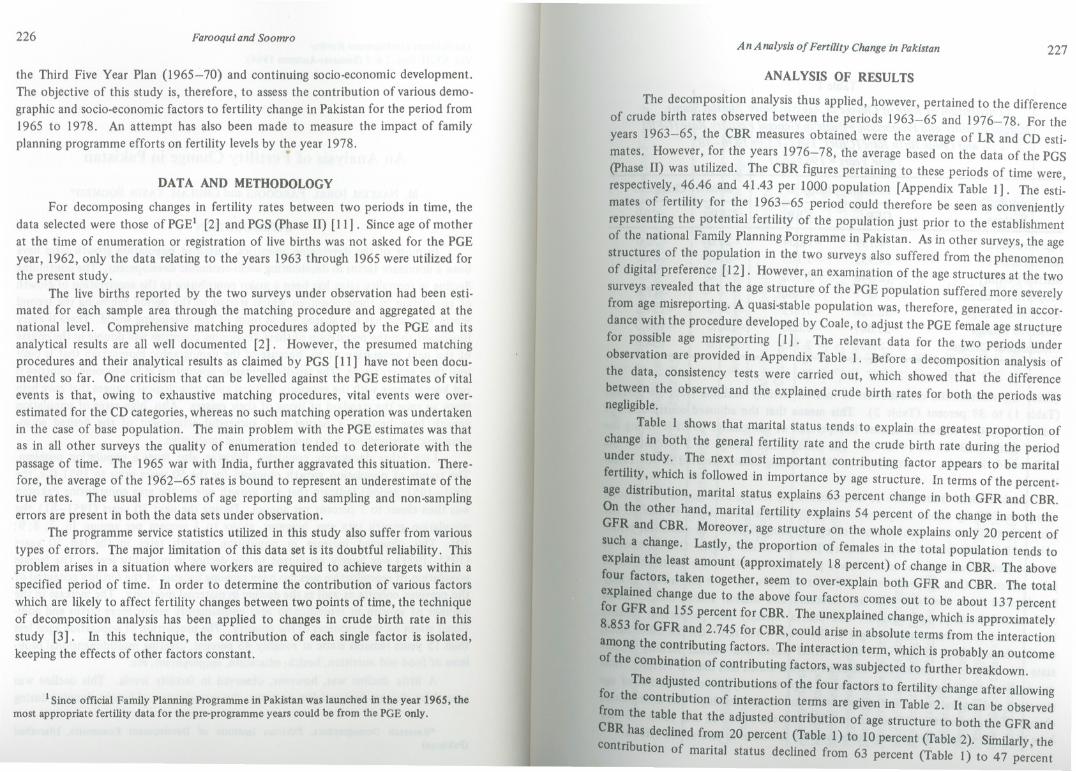
the Third Five Year Plan (1965-70) and continuing socio-economic development.The objective of this study is, therefore, to assess the contribution of various demo-graphic andsocio-economic factors to fertility change in Pakistan for the period from1965 to 1978. An attempt has also been made to measure the impact of familyplanning programme efforts on fertility levelsby the year 1978.
ANALYSIS OF RESULTS
DATA AND METHODOLOGY
For decomposing changes in fertility rates between two periods in time, thedata selected were those of PGE1 [2] and PGS (phase II) [11]. Since age of motherat the time of enumeration or registration of live births was not asked for the PGEyear, 1962, only the data relating to the years 1963 through 1965 were utilized forthe present study.
The live births reported by the two surveys under observation had been esti-mated for each sample area through the matching procedure and aggregated at thenational level. Comprehensive matching procedures adopted by the PGE and itsanalytical results are all well documented [2]. However, the presumed matchingprocedures and their analytical results as claimed by PGS [11] have not been docu-mented so far. One criticism that can be levelled against the PGE estimates of vitalevents is that, owing to exhaustive matching procedures, vital events were over-estimated for the CD categories,whereas no such matching operation was undertakenin the case of base population. The main problem with the PGE estimates was thatas in all other surveys the quality of enumeration tended to deteriorate with thepassage of time. The 1965 war with India, further aggravated this situation. There-fore, the average of the 1962-65 rates is bound to represent an underestimate of thetrue rates. The usual problems of age reporting and sampling and non-samplingerrors are present in both the data sets under observation.
. The programme service statistics utilized in this study also suffer from varioustypes of errors. The major limitation of this data set is its doubtful reliability. Thisproblem arises in a situation where workers are required to achieve targets within aspecified period of time. In order to determine the contribution of various factorswhich are likely to affect fertility changesbetween two points of time, the techniqueof decomposition analysis has been applied to changes in crude birth rate in thisstudy [3]. In this technique, the contribution of each single factor is isolated,keeping the effects of other factors constant.
.
The decomposition analysis thus applied, however, pertained to the differenceof crude birth rates observed between the periods 1963-65 and 1976-78. For theyears 1963-65, the CBR measures obtained were the average of LR and CD esti-mates. However, for the years 1976-78, the average based on the data of the PGS
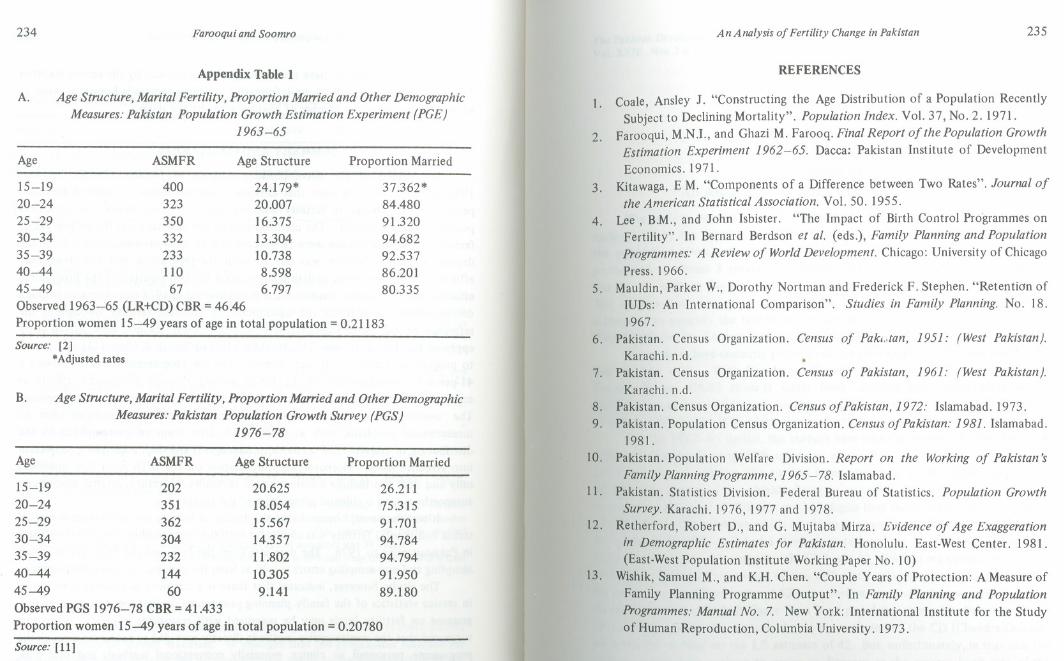
(phase II) was utilized. The CBR figures pertaining to these periods of time were,respectively, 46.46 and 41.43 per 1000 population [Appendix Table 1]. The esti-mates of fertility for the 1963-65 period could therefore be seen as convenientlyrepresenting the potential fertility of the population just prior to the establishment
of the national Family Planning Porgramme in Pakistan. As in other surveys, the agestructures of the population in the two surveys also suffered from the phenomenonof digital preference [12]. However, an examination of the age structures at the two
surveys revealed that the age structure of the PGE population suffered more severelyfr:omage misreporting. A quasi-stable population was, therefore, generated in accor-dance with the procedure developed by Coale, to adjust the PGE female age structurefor possible age misreporting [1]. The relevant data for the two periods underobservation are provided in Appendix Table 1. Before a decomposition analysis ofthe data, consistency tests were carried out, which showed that the differencebetween the observed and the explained crude birth rates for both the periods wasnegligible.
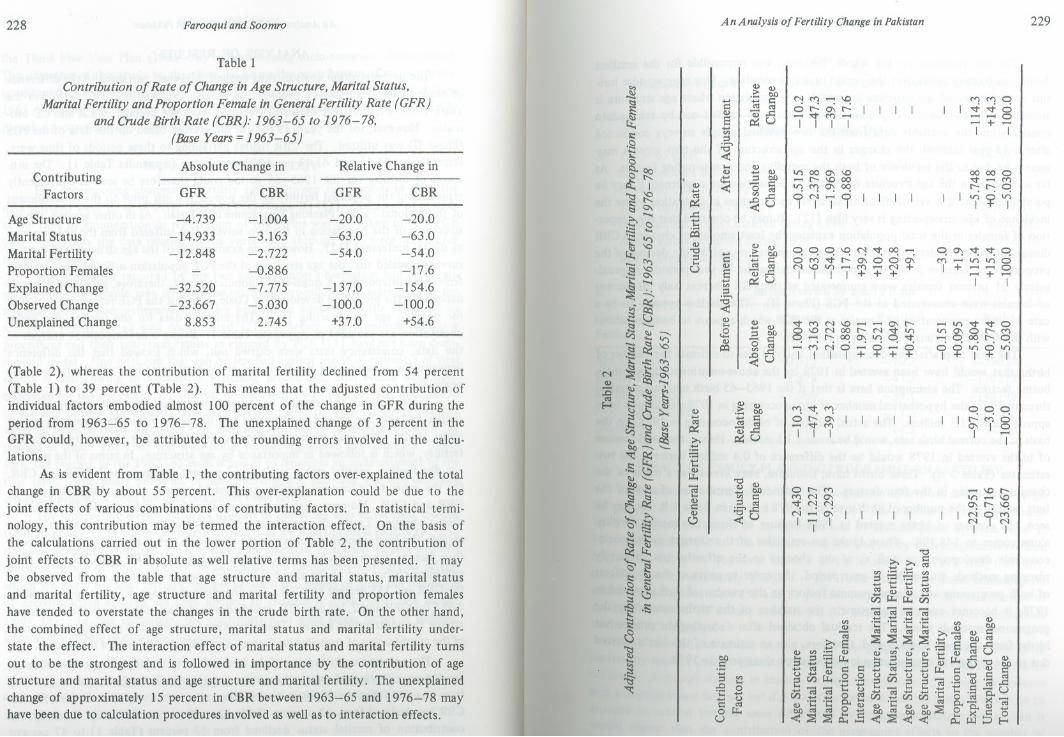
Table 1 shows that marital status tends to explain the greatest proportion ofchange in both the general fertility rate and the crude birth rate during the periodunder study. The next most important contributing factor appears to be maritalfertility, which is followed in importance by age structure. In terms of the percent-age distribution, marital status explains 63 percent change in both GFR and CBR.On the other hand, marital fertility explains 54 percent of the change in both theGFR and CBR. Moreover, age structure on the whole explains only 20 percent ofsuch a change. Lastly, the proportion of females in the total population tends toexplain the least amount (approximately 18 percent) of change in CBR. The abovefour factors, taken together, seem to over-explain both GFR and CBR. The total
explained change due to the above four factors comes out to be about 137 percentfor GFR and 155 percent for CBR. The unexplained change, which is approximately8.853 for GFR and 2.745 for CBR, could arise in absolute terms from the interactionamong the contributing factors. The interaction term, which is probably an outcomeof the combination of contributing factors, was subjected to further breakdown.
The adjusted contributions of the four factors to fertility change after allowingfor the contribution of interaction terms are given in Table 2. It can be observedfrom the table that the adjusted contribution of age structure to both the GFR andCBR has declined from 20 percent (Table 1) to 10 percent (Table 2). Similarly, thecontribution of marital status declined from 63 percent (Table 1) to 47 percent
1Since official Family Planning Programme in Pakistan waS launched in the year 1965, the
most appropriate fertility data for the pre-programme years could be from the PGE only.
228 Farooqui and Soomro
Table 1
Contribution of Rate of Changein Age Structure, MaritalStatus,MaritalFertility and Proportion Female in GeneralFertility Rate (GFR)
and CrudeBirth Rate (CBR): 1963-65 to 1976-78.(Base Years=1963-65)
(Table 2), whereas the contribution of marital fertility declined from 54 percent(Table 1) to 39 percent (Table 2). This means that the adjusted contribution ofindividual factors embodied almost 100 percent of the change in GFR during theperiod from 1963-65 to 1976-78. The unexplained change of 3 percent in theGFR could, however, be attributed to the rounding errors involved in the calcu-lations.
As is evident from Table 1, the contributing factors over-explained the totalchange in CBR by about 55 percent. This over-explanation could be due to thejoint effects of various combinations of contributing factors. In statistical termi-nology, this contribution may be termed the interaction effect. On the basis ofthe calculations carried out in the lower portion of Table 2, the contribution ofjoint effects to CBR in absolute as well relative terms has been presented. It maybe observed from the table that age structure and marital status, marital statusand marital fertility, age structure and marital fertility and proportion femaleshave tended to overstate the changes in the crude birth rate. On the other hand,the combined effect of age structure, marital status and marital fertility under-state the effect. The interaction effect of marital status and marital fertility turnsout to be the strongest and is followed in importance by the contribution of agestructure and marital status and age structure and marital fertility. The unexplainedchange of approximately 15 percent in CBR between 1963-65 and 1976-78 mayhave been due to calculation procedures involved as well as to interaction effects.
.
NQ)
~f-<
Ji
~I::.9...5§-~~I~~1::0-~ .......bo:.:::...'<:: V)
~'f-"".~ ~...........~~. i:t:
~et---;!;!.<u----~ ... V)- ~ '0~et: I';;: ..t: ""
~.~ ~. ~ '"';<~ <u I::::$ ~ '"
~6~g ~ ~~ I:: 1:::1<u ~ i:t\bo --- ---
~~'- '-'<u ---~~~ ~
Get:~b0 '-:;:::~ 1:::
~~'t-]I:: <u0 ~'§ '-'~ .S...I::a~..."".::$~~
An Analysis of Fertility Change in Pakistan
Q)
~r:t:..c:t:~Q)
"0
;::I....
U
Q)
~>,.......:3t:Q)u..e;;....Q)I::Q)
Co:)
.......I::Q)S~;::I:0-<:....Q)
ct::<:
Q) Q)
.~ gp'" '"'Q)..c:r:t:U
Q)Q)
;::I 01)- I::0 '""'..c:<u
dQ)S
.......'";::I
:0-<:Q)....
c£Q)
CQ
~ Q).- 01)I::
~l'!r:t:U
Q)Q)
;::I 01)- I::0 '""'..c:<u
~ Q).- 01)I::
~a
"0
Q) Q)
~ 01);::I I::..." l'!~u
.5.......;::I '"
.D .....- 0.......u
I:: '"ou..U
NM-I.Oor--:o\r--: I-",,"M-I I 1 I
10000\1.0-r-I.OOO10M 0\ 00ON"": 0 11 1 1 1
00 01.0 N",,"OO-or,)..,tr--:o\ooo\NI.OV)-M-N+1 I I 1 + + +
",,"MNI.O--O\r-01.0 NOOr-N """ V)o-r-ooO\V)o",,""':r,)NO"":O"':O1 I I 1++++
M",,"Mor--: 0\ 1-",,"M1 1 1
Or-MMNO\",,"NNN"':O\ 1
1'1 1
229
MMO
l..,t..,to--0-+-1 I
00000",,"-Mr-r-o
lviovi1 + 1
qO')oo:I;oo:I;qM-V)V)O
1+--0 -+-1 I
-10""",,,,"0V)o\Or-M-ooor-oooviovi1 + I + 1
000Ir--:r,)o
0\ I 01 -I
-1.Or-10-1.0O\r-I.O
1 NOr,)N 1 N1 1
"0
>.>,1::'"'" .- .- '";::I :::1:::1 ;::I
t:t:.......'" Q) Q) '"ti5u..u..ti5
]3]] Q)'" .~.~.~.~ '" 01)..2 "''''''''''>,..2Q)1::
>. S ::E::E::E ::E .1:: S gpl'!Q) '" .1:: Q) Q)" ",' Q)" a) :::It: Q) '" U"";::I:::Iu.. ;::1 u c:"OQ)B~t: I:: I::B~BB~ I::U Q) gpu Q)oou"""'uu 0"01::",2{Z)u ;:::..;::: 2{Z) 2 2]:= ~]..c:e;; e;; u e;; .- .- Po.U
(Z) :!:: .1:: 0 ~ (Z) ;<;:: (Z) (Z) ; 0 ~ >< e;;Q) Po.o Q) Q) !: Q) Q)."'" Po.o Po. Q) .......01)'" '" 01) W 01)01),0<; >< I:: 0<:::E::E~.$<:::E<:<: ~~;=Jf-<
ContributingAbsolute Change in Relative Change in
Factors GFR CBR GFR CBR
Age Structure -4.739 -1.004 -20.0 -20.0Marital Status -14.933 -3.163 -63.0 -63.0
Marital Fertility -12.848 -2.722 -54.0 -54.0
Proportion Females - -0.886 - -17.6
Explained Change -32.520 -7.775 -137.0 -]54.6
ObservedChange -23.667 -5.030 -100.0 -100.0
Unexplained Change 8.853 2.745 +37.0 +54.6

230 Farooqui and Soomro
The age structure on the whole, however, was responsible for the m1.allestdecline in fertility levels over the period under observation. One may wonder howthis contribution of age structure is possible in a population where age structure isalmost con$tant. Since the present analysis has been carried out by taking intoconsideration the available data from the two national sample surveys conductedafter a IS-year interval, the changes in the age structure of the two surveys maymerely be due to the incidence of both the sampling and non-sampling factors. Asfar as changes in the age structure of Pakistan's population are concerned, it may bepointed out that it is very difficult to ascertain such changes in a situation where theincidence of age misreporting is very high [12]. It may be observed that the propor-tion of females in the total population explains the least amount of change in CBRduring the period under observation. This change was caused by the decline of theproportion of females in the total population during the IS-year period. Approxi-mately 21 percent females were enumerated at the PGE whereas only 20 percentof females were enumerated at the PGS (phase II). This decline appears to be acase of under-enumeration of females at the PGS which appears to be inconsistentwith the decliningmaternal mortality in Pakistan.
The next step after the decomposition analysis was to estimate the number ofbirths that would have been averted in 1978 by the above-mentioned three contri-buting factors. The assumption here is that if the 1963-65 birth rate had prevailedthrough 1978, the hypothetical number of births occurring in 1978 would have beenapproximately 3.5 million. The actual number of births occurring in 1978, on thebasis of the current birth rate, would be around 3.1 million. Hence, the total numberof births averted in 1978 would be the difference of 0.4 million between the two
estimates (Table 3 A). These births have, therefore, been averted as a result of thechanges occurring in the four factors. The individual contribution of each of thefour factors to the number of birth averted in 1978 is givenin Table 3.B. As may beseen, the number of births averted in 1978 because of changes in marital fertilityalone comes to 148,198. These births are reflective of the changes in the socio-economic development as well as of the changes in the effective use of familyplanning methods during the IS-year period. In order to arrive at the net effectsof both programme and non-programme factors on the number of births averted in1978, it becomes essential to estimate the number of the births averted by theprogramme methods alone. The residual obtained after deducting the programmebirths from the total births would, therefore, give an estimate of the births averteddue to the changesin socio-economicdevelopment alone prior to 1978.
An Analysis of Fertility Change in Pakistan 231
Table 3
BasicDemographicData and Number of Births Averted in 1978 byeach Contributing Factor of Change
Basic Demographic Data
A. 1963-65 CBR
Hypothetical CBR 1976-78ObservedCBR 1976-78
Total Population in 1978
Hypothetical Birth~Occurred during 1978Actual Births Occurred during 1978Births Averted during 1978
IMPACTOF FAMILY PLANNINGPROGRAMMEON FERTILITY
.
The number of births averted by the programme efforts was estimated throughthe use of family planning service statistics [10]. The number of births averted in1978 was thus the result of an effective use of contraception between April 1,1977 and April I, 1978. The number of births averted by each programme methodis given in Table 4. The total number of births averted in 1978 was, therefore,estimated at approximately 253,099. The IUDs and conventional contraceptivemethods contributed more (55 and 33 percent respectively) to the total number ofthe births averted. The least contribution (of around 12 percent) was attributableto the use of oral pills.
The comparison of the births averted by programme methods with thoseaverted by marital fertility shows that the programme averted more births than wereobserved. Although changes in marital fertility were influenced by both programmeand non-programme factors, but if it could be assumed that the births averted due tochanges in marital fertility were influenced by programme factors alone, then itwould appear that the contribution of the programme efforts to the number ofbirths averted is overestimated by approximately 41 percent.
46.50= 46.50= 41.43= 75,757,673= 3,476,232= 3,097,210= 379,022
B. Births Averted by Each Factor
Contributing Adjusted Relative BirthsFactor Change Change Averted
Age Structure -0.515 -10.3 -39039Marital Status -2.378 -47.3 -179277
Marital Fertility -1.969 -39.1 -148198Proportion Females -0.886 -17.6 -66708Interaction 0.718 14.3 +54200

232 Farooqui and Soomro An Analysis of Fertility Change in Pakistan 233
Table 4
Number of Acceptors and Births Averted by eachMethod as of October 1,1977
in the context of Pakistan have not been taken into account by the servicestatistics
[5]. The non-availability of the information on these factors is bound to result inan overestimation of the number of births averted by the IUDs.
SUMMARY AND CONCLUSION
The results of the decomposition analysis of fertility changes between1963-65 and 1976-78 show that changes in marital status contributed about 47
percent of the change in fertility whereas marital fertility contributed about 38percent of such a change. The contributions of age structure and the proportion offemales to fertility change were 10 percent anti 18 percent respectively. Since thedecline in marital fertility was due to both the programme and non-programmeeffects, it was considered desirable to estimate the contribution of the programmeeffect as well. The total number of the births averted in 1978 was estimated through
decomposition analysis on the assumption of constant fertility throughout thereference period. The births averted by the programme method were arrived at byapplying the Lee & Isbister [4], Mauldin [5] and Wishik& Chen [13] techniquesto programme statistics. It was observed that the programme statistics showed a41-percent overestimation of the births averted through programme efforts ascompared to the observed number of births averted by changes in marital fertility.The overestimation of births by programme statistics is probably due tomeasurement problems, such as those which arise from an overemphasis on thedistribution of conventional methods to salesagents and their subsequent conversioninto effective users. Moreover, the information on the IUDs is for first insertionsonly and does not include information on fecundity, mortality, marital dissolution,amenorrhoea, and accidental pregnanciesof the acceptors.
It was, however, observed that the decline in fertility due to changesin maritalstatus and marital fertility was consistent with the demographic changestaking placein Pakistan prior to 1978. The data sets from the PGE and the PGS suffered fromsamplingand non-samplingerrors as well as from the incidence of age misreporting.
The study, however, indicates that there is a dire need of ensuring consistencyin service statistics of the family planning programme, so that the impact of the pro-gramme on fertility levels may be measured with reasonable accuracy. It may besuggested that the contraceptive methods directly provided to acceptors through theprogramme personnel or clinics, especially conventional methods and oral pills,should be recorded separately from those distributed in the market. The quality ofdata needs to be considerably improved before any pragmatic policy recommend-ations can be offered.
Note:(a) Number of acceptors wasarrivedat by the followingprogrammeformula:
One IUD insertion =One AcceptorThirteen cycles of pills =One AcceptorOne hundred conventional contraceptive units = One Acceptor
(b) Effective users were estimated by applying the continuation rate of 0.6 for oral pills and0.5 for conventional methods. The IUD acceptors were cumulated for the last fiveyears(1973-77) and continuation rate was calculatedthrough decay curve,R(t) = ae-;ot whereR =retention rate, a = constant for immediate termination, e = natural logarithm base,r = constant rate of annual decline and t =time. The retention rates applied here werederivedby life-tableapproach of Mauldin.
The rates applied were 0.72265 (4.5 months), 0.50152 (IS months), 0.33176 (27months), 0.21903 (39 months) and 0.14461 (51 months).
(c) The age shifting of the acceptors (Q) of ith age at time 't' from 1973 to 1977 wascalcu-lated by:Q =aq +b q +cq +d q +eq +~q . +
I,t 1,t-1. 1-1,t-1 l,t-2 1-1.t-2 I,t-s, J"-1,t-s.
gq"t-4 +hq,-1.t-4 +jqi,t-6 +kq,-1,t-6 +lq,-1,t-6 +mq'-2,t-6where
a=0.925, b=0.075, c=0.75, d=0.25, e=0.55, f=0.45, g=0.35, h=0.65, j=0.15,k=0.85, 1=0.95and m=0.05.
(d) The number of births averted was estimated by applying potential fertilityestimate of 0.332 for women of 30-34 years of age. This was selected underthe assumption of mean age of use of 34 years. The number of births avertedthrough sterilizationwasdiscardedas the mean age of acceptorswas 38 years.
The demographicimpact of sterilizationat this subfecund stageof reproductive spanwas considered to be negligible.
The overestimation of the births averted by programme efforts casts doubtson the reliability of service statistics. It emerges that the programme formula forestimating the acceptors from the service statistics seems to be inappropriate in thecontext of Pakistan. In the case of the IUDs, the programme statistics provideinformation on first insertions only. The estimates of an effective use of the IUDsare affected not only by retention rates but also by such factors as fecundity, mor-tality, marital dissolution, amenorrhoea"and accidental pregnancies. These factors
Methods Acceptors Births Averted in 1978
Conventional Contraceptives (1977) 360,000 119,520Oral Pills (1977) 126,964 42,152IUDs (1973- 77) 275,384 91,427Total 762,348 253,099
234 Farooqui and Soomro
A.
Appendix Table 1
Age Structure, Marital Fertility, Proportion Married and Other Demographic
Measures:Pakistan Population Growth Estimation Experiment (PGE)1963 -65
Age ASMFR Age Structure Proportion Married
15-19 40020-24 32325-29 35030-34 33235-39 23340-44 11045-49 67
Observed 1963-65 (LR+CD)CBR =46.46Proportion women 15-49 years of age in total population =0.21183
Source: [2)*Adjusted rates
24.179*20.007
16.375
13.30410.738
8.5986.797
37.362*
84.480
91.320
94.682
92.53786.201
80.335
B. Age Structure, Marital Fertility, Proportion Married and Other Demographic
Measures: Pakistan Population Growth Survey (PGS)1976-78
Age ASMFR Age Structure Proportion Married
15-19 20220-24 35125-29 36230-34 30435-39 23240-44 14445-49 60ObservedPGS1976-78 CBR=41.433Proportion women 15-49 years of age in total population =0.20780
Source: [11)
20.625
18.054
15.567
14.357
11.802
10.305
9.141
26.211
75.315
91.701
94.784
94.794
91.950
89.180
An Analysis of Fertility Change in Pakistan 235
REFERENCES
.
1. Coale, Ansley J. "Constructing the Age Distribution of a Population RecentlySubject to DecliningMortality". Population Index. Vo\. 37, No.2. 1971.
2. Farooqui, M.N.I., and Ghazi M. Farooq. Final Report of the Population GrowthEstimation Experiment 1962-65. Dacca: Pakistan Institute of DevelopmentEconomics. 1971.
3. Kitawaga, EM. "Components of a Difference between Two Rates". Journal ofthe American Statistical Association. Vol. 50.1955.
4. Lee, B.M., and John Isbister. "The Impact of Birth Control Programmes onFertility". In Bernard Berdson et al. (eds.), Family Planningand PopulationProgrammes:A Review of WorldDevelopment. Chicago: University of ChicagoPress. 1966.
5. Mauldin, Parker W., Dorothy Nortman and Frederick F. Stephen. "Retention ofIUDs: An International Comparison". Studies in Family Planning. No. 18.1967.
6. Pakistan. Census Organization. Census of Pakt..tan, 1951: (West Pakistan).Karachi. n.d. .
7. Pakistan. Census Organization. Census of Pakistan, 1961: (West Pakistan).Karachi. n.d.
8. Pakistan. Census Organization. Censusof Pakistan, 1972: Islamabad. 1973.9. Pakistan. Population Census Organization. Censusof Pakistan: 1981. Islamabad.
1981.10. Pakistan. Population Welfare Division. Report on the Working of Pakistan's
Family PlanningProgramme,1965 -78. Islamabad.II. Pakistan. Statistics Division. Federal Bureau of Statistics. Population Growth
Survey. Karachi. 1976, 1977 and 1978.12. Retherford, Robert D., and G. Mujtaba Mirza. Evidence of Age Exaggeration
in Demographic Estimates for Pakistan. Honolulu. East-West Center. 1981.(East-WestPopulation Institute WorkingPaper No. 10)
13. Wishik,Samuel M., and K.H. Chen. "Couple Years of Protection: A MeasureofFamily Planning Programme Output". In Family Planning and PopulationProgrammes:Manual No.7. New York: International Institute for the Studyof Human Reproduction, Columbia University. 1973.
The Pakistan Development ReviewVol. XXIII, Nos. 2 & 3 (Summer-Autumn 1984)
Comments on
"An Analysis of Fertility Change in Pakistan"
The authors have correctly highlighted the problems created in all walks ofnational life by the population explosion of the last three decades in Pakistan whenthe population growth rate increased from I percent to 2 percent in the pre-1951period and to almost 3 percent in the post-1951 period. This increase, as pointedout by the authors, has been brought about by a rapid decline in mortality rates.The upsurge has taken place despite some fall in fertility and the authors haveattempted to quantify the factors which have led to the decline in the Crude BirthRate (CBR) and the General Fertility Rate (GFR).
The authors have correctly pointed out the poor quality of the data which theyhad to deal with. Both Population Growth Estimation (PGE) and PopulationGrowth Survey (PGS) Phase-II suffer from sampling and non-sampling errors.Besides the endemic problem of age reporting, there was deterioration in the qualityof data in a survey like PGE which was conducted over a period of three years.
For the 1962-65 period, the authors have taken an averageof Cross-Sectional(CS) and Chandra-Deming (CD) estimates of the PGE. These were 39 and 53 res-pectively. In my opinion, the authors have created an artifact CBR figure of 46by taking an averageof these highly divergent estimates. If the authors really believein averagingestimates of different methodologies they should have taken the averageof LR, CS and CD estimates which would have given them a 10weraveragefigure of44 as the PGE (1962-65) had a third estimate based on Longitudinal Registration(LR). According to this estimate, the CBRwas 42, which in my opinion was closestto reality. Taking of an averageof two different methodologies of samplingshouldbe avoided as the CD estimate of 53 was a deviant one and in fact no serious demog-rapher can uphold this high figure for a large population group like Pakistan. There-fore, in my opinion the authors should have eliminated the CD (Chandra-Deming)estimate and worked on the LR estimate of 42. But, unfortunately, in that case theauthors would have nothing to prove or disprove as the average birth rate of thePGS-II is 41.4. Probably the fertility rate in Pakistan has fallen very little althoughit may not have fallen as little as indicated by these two figures. The authors couldhave done better if, instead of using the averagesof CD and LR estimates, they hadused only the average of the LR estimate for 1962-65 as benchmark. Also, theyshould have considered the fertility rates yielded by the recent Population, LabourForce and Migration Survey (PLM)in place of the 1976-78 PGS rates.
238 Akhtar Hasan Khan
The other comment on the quality of data concerns the effect of samplingvariation in the two sets of the data based on different types of samples. Forexample, in the PGE it was a cluster sample whereas in the PGS a systematicsamplingtechnique was used.
I have also compared the age structure and marital status data used in the paperwith those of the 1981 Census. Of course, there were problems with the age dataobtained in the 1981 Census,but these data are more recent and are based on a totalcount rather than on a sample. The difference between the PGS and the 1981Census in respect of the percentage of female population is more significant in theolder age groups of 30 - 34 and above. In respect of married females, the differencebetween the two sets of data (Census and PGS) is more significant in almost all agegroups, and it is particularly notable in the younger age groups of 15 - 19and 20 - 24.
The authors have explained the fall in fertility by quantifying the contributionof age structure, marital status and marital fertility. It would have been better ifthey had eliminated age structure altogether as age reporting is extremely poor inall surveys and its contribution, even according to their analysis, is marginal (explain-ing only 10 percent). They have correctly concluded that marital status (age atmarriage) has been a more important factor than marital fertility in the decline ofthe CBR and the GFR. The authors have correctly emphasized the very limitedimpact of the family planning programme and cast serious doubts on the reliabilityof the service statistics. They have also correctly pointed out that in the context ofPakistan, it is wrong to base estimates on the initial acceptance of a service. Forexample, in the case of the intra-uterine device(IUD) programme,the servicestatisticsprovide information on first insertions only, whereas the effective use of the IUDis influenced not only by the retention rate but also by factors like fecundity,marital status, marital dissolution, etc. They have correctly emphasized the need formore up-to-date and scientific servicestatistics for determining the role of the FamilyPlanning Programme in bringing down the birth rate.
However, I wish to congratulate both the authors, Mr. Farooqui and Mr.Soomro, on undertaking this valuable exercise. The authors have highlighted the gapin information on fertility trends in Pakistan and the need for more a reliable datacollection for assessingthe behaviour of the CBR and the GFR. They have correctlyconcluded that to date the impact of family planning has been insignificant and themajor contributor to a decline in fertility has been the increase in the age at marriage.The authors' message of adverse impact of high CBR in different walks of nationallife and the dire need of an effective population policy to bring about a sharp reduc-tion in that rate needs to be taken to every Pakistani home.
Additional Secretary,Ministry of Production,Islamabad
Akhtar Hasan Khan
Copyright © 2022 FDOKUMEN