Household borrowing constraints, fertility dynamics, and economic growth
The Politics of Fertilityand Economic Development
Yi Feng
Jacek Kugler
and
Paul J. Zak
Claremont Graduate University
This paper presents a formal model that characterizes the two faces ofdevelopment—persistent poverty, and industrialization and risingincomes—and establishes that the interaction between politics and eco-nomics determines which path a nation travels. We demonstrate thatpolitical factors affect fertility decisions so that a one-time disturbancecompounds across generations, impacting a country’s entire develop-ment trajectory. Modeling strategic multiobjective policy-setting by thegovernment, we derive a new concept of political capacity and provethat a sufficient amount of political capacity is necessary to escape apoverty trap and develop the economy. Empirical tests for a sample of100 countries from 1960 to 1990 provide strong support for the predic-tions of the formal model. In particular, we show that both politicalstability and political capacity significantly influence birth rates. Weconclude that politics can be either a stimulant or a barrier to economicdevelopment.
This paper presents a formal model that characterizes the two faces ofdevelopment—a poverty trap with persistent economic stagnation, and industri-alization and rising incomes—and establishes politics as a fundamental determi-nant of the trajectory taken by a nation. We demonstrate that policy choices at asingle point affect a country’s development path by impacting fertility decisionsacross generations. The primary policy implication of our analysis is that sus-tained economic development has political prerequisites.
The model in this paper formalizes and extends a number of alternateapproaches to demographic change and economic development. First, we cap-ture insights from the modernization literature that show that rising incomeslead to lower fertility rates ~Thompson, 1929; Notestein, 1945; with recent workby Bongaarts, Mauldin, and Phillips, 1990; Camp, 1993; Freedman, 1994; Sind-ing, Ross, and Rosenfield, 1994!. Additionally, our research is related to economictheories of development in which human capital is the engine of growth ~Lucas,
Authors’ note: This research is supported by a grant from the National Science Foundation ~SBR-9730474!. Wethank Doris Fuchs, Monika Gruter Morhenn, participants at the 1999 International Studies Association conference,and five anonymous ISQ reviewers for comments, and Brian Buford-Efird, Chi Choi, and Natalia Maric for expertresearch assistance.
International Studies Quarterly ~2000! 44, 667–693.
© 2000 International Studies Association.Published by Blackwell Publishers, 350 Main Street, Malden, MA 02148, USA, and 108 Cowley Road, Oxford OX4 1JF, UK.
1988; Galor and Zeira, 1993; Stokey, 1996!, though we extend these studies bymodeling the impact of fertility choices on the accumulation of human capital.As a result, our model is also related to the endogenous fertility literature~Becker and Tomes, 1976; Becker and Barro, 1988; Becker, Murphy, and Tamura,1990; Tamura, 1996; Azariadis, 1997; Galor and Tsiddon, 1997!. Furthermore,this research contributes to the literature examining the political economy ofeconomic growth ~e.g., Barro, 1997! by focusing on the effects that politicalinstitutions have on fertility decisions. For example, the model provides anexplanation for the baby booms that follow severe conflicts, a well-establishedempirical finding ~Organski et al., 1984!. Finally, we establish the mechanism ofaction through which increases in political capacity reduce fertility ~Arbetmanand Kugler, 1997! by using a measure of political capacity based on strategicmultiobjective policy-setting by the government.
In this paper, we present a formal equilibrium model that integrates politicaldecision-making with population dynamics and economic development, reveal-ing the interdependence of each on the other. This permits a derivation ofnecessary conditions for development, which include sufficient political capacityand adequate political stability. The formal model shows that the equilibriumlevel of births depends nonlinearly on political stability, political capacity, income,and education. Analyzing annual data for a sample of 100 countries over theperiod of 1960 through 1990 shows that the formal model’s predictions for theinteraction between fertility, politics, and economics are strongly supported.Economic factors, political capacity, and political stability all influence birthrates and therefore the prospects for economic development.
Equilibrium Dynamics and Predictions of the POFED Model
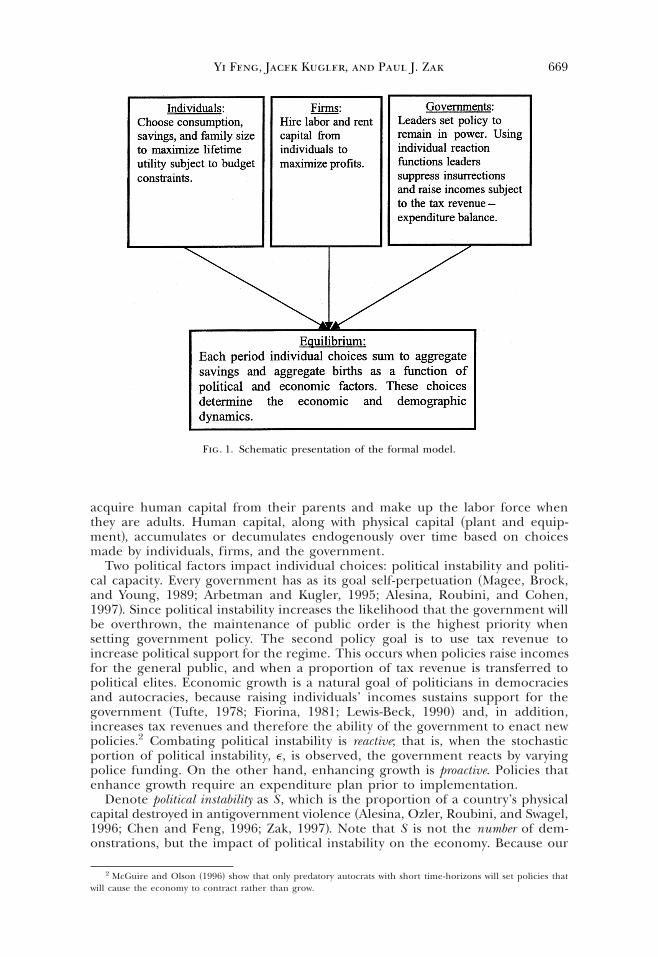
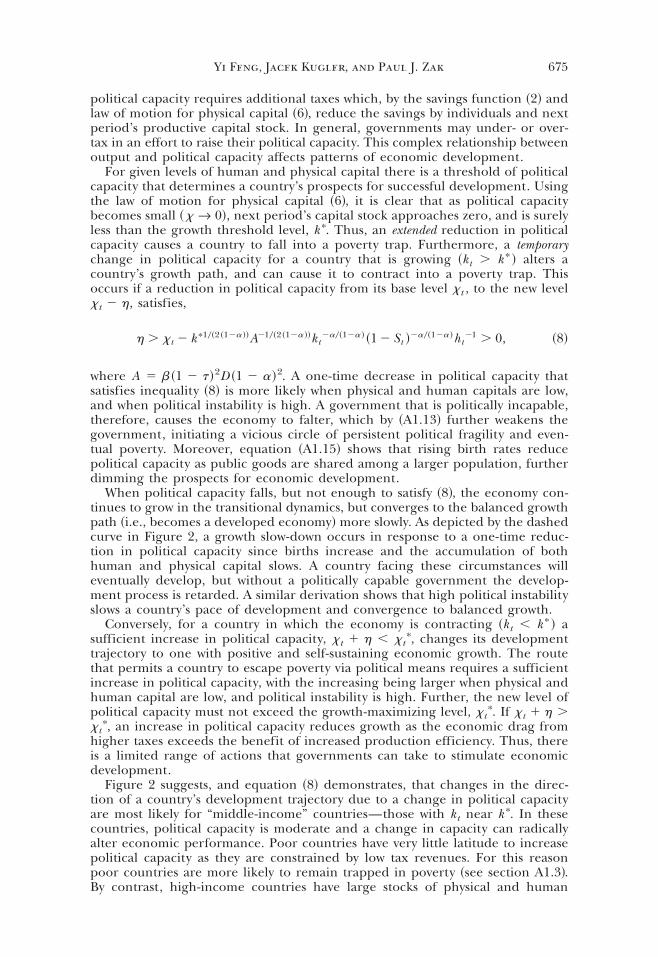
In this section, we present and analyze the equilibrium dynamics of a political-economic model in which decisions cumulate over generations. Figure 1 con-tains a schematic representation of the choices made by the three types of actorsin the model: individuals, firms, and the government. By modeling all threesectors, we present a self-contained ~general equilibrium! political economy inwhich population and income endogenously grow ~or contract!, and both dependon evolving political structures. Each aspect of the model is presented and solvedin Appendix 1, with all variables presented in Table A1. In this section wedescribe the model and characterize the derived equilibrium dynamics linkingpolitics, fertility, and economic development, which we call the POFED model.
Consider a country with a large number of individuals who live three periods inoverlapping generations. At each point in time, children, young adults, and olderadults are alive. Each generation has a different level of human capital, h , whileindividuals within a generation are, for simplicity, identical. The economy has asingle good that can be used for consumption or investment in physical capital, K .
Agents maximize lifetime utility during the two periods of adulthood, subjectto a budget constraint in each period. During young adulthood, individuals workfor firms paying a proportion of labor income t [ ~0,1! to the government astaxes, using the remaining income to fund their own and their children’s con-sumption, and to save for old age. During old age, agents are retired andconsume the principal and interest on their savings.
Besides choosing how much to consume and save during young adulthood,individuals also choose how many children to have.1 In this model, children
1 To keep this rather complicated model as simple as possible, children are produced by parthenogenesis~asexual reproduction!. This permits us to avoid the issue of marriage matching. For a model of the search for amarriage partner, see Burdett and Coles, 1997. We also ignore issues such as infertility and infant mortality, thoughthese are reflected in our empirics.
668 Politics of Fertility and Economic Development
acquire human capital from their parents and make up the labor force whenthey are adults. Human capital, along with physical capital ~plant and equip-ment!, accumulates or decumulates endogenously over time based on choicesmade by individuals, firms, and the government.
Two political factors impact individual choices: political instability and politi-cal capacity. Every government has as its goal self-perpetuation ~Magee, Brock,and Young, 1989; Arbetman and Kugler, 1995; Alesina, Roubini, and Cohen,1997!. Since political instability increases the likelihood that the government willbe overthrown, the maintenance of public order is the highest priority whensetting government policy. The second policy goal is to use tax revenue toincrease political support for the regime. This occurs when policies raise incomesfor the general public, and when a proportion of tax revenue is transferred topolitical elites. Economic growth is a natural goal of politicians in democraciesand autocracies, because raising individuals’ incomes sustains support for thegovernment ~Tufte, 1978; Fiorina, 1981; Lewis-Beck, 1990! and, in addition,increases tax revenues and therefore the ability of the government to enact newpolicies.2 Combating political instability is reactive; that is, when the stochasticportion of political instability, e, is observed, the government reacts by varyingpolice funding. On the other hand, enhancing growth is proactive. Policies thatenhance growth require an expenditure plan prior to implementation.
Denote political instability as S , which is the proportion of a country’s physicalcapital destroyed in antigovernment violence ~Alesina, Ozler, Roubini, and Swagel,1996; Chen and Feng, 1996; Zak, 1997!. Note that S is not the number of dem-onstrations, but the impact of political instability on the economy. Because our
2 McGuire and Olson ~1996! show that only predatory autocrats with short time-horizons will set policies thatwill cause the economy to contract rather than grow.
Fig. 1. Schematic presentation of the formal model.
Yi Feng, Jacek Kugler, and Paul J. Zak 669
purpose is to characterize how political instability affects fertility and economicdevelopment, we do not model the incentives for instability, but rather treat it asan aggregate phenomenon with two effects. First, political instability impactsindividual decisions by reducing the physical capital stock, which attenuatesequilibrium labor income ~as section A1.2 shows in Appendix 1!. Second, polit-ical instability impacts government policy-setting by pulling resources away fromother programs as the government seeks to maintain itself in power ~as sectionA1.3 demonstrates!. Resources spent to maintain the regime cannot be spent onproductive activities and constitute a deadweight economic loss.
The second political factor, political capacity x, is the effectiveness of the gov-ernment in implementing policy ~Arbetman and Kugler, 1997!. Capable govern-ments enhance the productivity of private firms by choosing policies that encourageeconomic efficiency. Arbetman and Kugler ~1997! show that politically capablegovernments improve a variety of economic activities such as attracting invest-ment, enhancing trade, and reducing inflation. Because our concern is withdevelopment, we restrict political capacity to have a single effect, raising laborproductivity.
In section A1.3 in Appendix 1, we derive a country’s maximal level of politicalcapacity that a government can attain at any point in time, xt
*, with t denotingtime, along with optimal spending on the police to maintain public order, pt
*,and the resulting tax rate, tt
*. The optimal policy set is a Nash equilibrium of therepeated game played by the government and citizens, after a proportion of taxrevenue, s [ ~0,1!, is paid to political elites. Payments to elites are necessary forthe government to remain in power and are therefore paid before other policiesare funded. Next, the police are funded to keep the regime in power, with theresidual tax revenue funding political capacity. In this way political capacitycaptures political constraints, and therefore policy discretion of the government.Once the government has chosen the optimal tax rate, police spending, andpolitical capacity, individuals execute their optimal choices for births and savings.
The derivation of optimal political capacity reveals its positive dependence ontax revenue, and negative dependence on payments to political elites and thevirulence of political instability. In practice, it is unlikely that governments canreach maximum political capacity because of additional political constraints thatwe have not modeled. When xt , xt
*, the specification of the production func-tion ~A1.6!, and of the law of motion for physical capital ~A1.12!, shows thatoutput net of taxes is increasing in political capacity. Moreover, the ratio xt 0xt
*
can be viewed as a measure of the political constraints on policy-setting, which isinversely related to a government’s discretion.3 That is, a government with polit-ical capacity xt
* has maximal discretion in setting policy.We show in Appendix 1 that political instability both reduces tax revenue and
changes the optimal mix of government expenditures toward police funding andaway from growth-enhancing policies ~by A1.14! and thus reduces political capac-ity. Governments can raise their capacity by increasing the tax rate t, but thiscauses a drag on the economy by reducing net-of-tax income, and thereforesavings and capital formation. Thus, governments face intertemporal trade-offsbetween funding policies that stabilize current political and economic environ-ments and policies that can shape the future of these environments.
To understand policy-makers’ dilemma when setting policies that affect theeconomy, reflect on the following thought experiment. Consider a country inwhich political instability is high. Because a government’s first priority is to stayin power and sufficient instability can threaten the ruling regime’s longevity~Feng and Zak, 1999!, the first use of tax revenue is police funding to maintain
3 The derivation of x0x* provides a formal basis for the relative political capacity measure of Arbetman andKugler ~1997!.
670 Politics of Fertility and Economic Development

public order. Secondarily, tax revenue is used to raise individual incomes, forexample, by expanding infrastructure expenditures that raise productivity. Ris-ing incomes increase support for the ruling regime. Thus, the government’sobjective when setting policy is to maintain itself in power by quelling rebellionsand by raising popular support. We demonstrate in section A1.3 that govern-ments faced with highly unstable political environments allocate a large portionof expenditures to security and have little remaining revenue for programs toboost private incomes since government spending is constrained by tax receipts~equation A1.10!. Thus, unstable governments produce less output than stable,capable governments. Because income is a fundamental determinant of birthrates ~by equation A1.5! political capacity and instability affect birth rates viatheir impacts on labor income. Furthermore, since in each period fertility deci-sions are made by those who were children in the prior period, political effectscompound over generations as family size alters per child parental investments~by equation ~4! below!. This changes a country’s development trajectory and thegovernment’s stream of tax revenue, producing a spillover effect on futuregenerations.
Next, we construct and analyze the sequence of equilibria of the POFEDmodel. In Appendix 1, we derive the following utility maximizing time t optimafor the desired number of children ~births!, bt
*, and for savings from middle toold age, at11
*,
bt* 5 Max HE
g
~1 1 g!~1 2 a!~1 2 t!Dkta ~1 2 St !a ~xt ht !12a
,1J ~1!
at11* 5 E $b~1 2 a!~1 2 tt !~Kt ~1 2 St !!a ~xt ht !12a % ~2!
Equation ~1! shows that births decrease as human capital, h , and physical capital,K , rise since an individual’s labor income is increasing in both types of capital~by equation A1.8!. Relation ~1! also shows that births increase when taxes, t, rise~which reduces net labor income!, when the preference for children, g, becomesstronger, and when the proportional cost of children, D, falls.4 Political factorsalso affect births in ~1!. An increase in political instability, S , raises births since itreduces labor incomes and thus reduces the opportunity cost of raising children~by equations A1.4 and A1.8, the opportunity cost of children is the incomeforegone while raising them!.5 Political capacity, x, decreases births in ~1! sincegovernment policy that raises economic efficiency increases individual incomes.Optimality condition ~1! is consistent with empirical evidence showing that asincomes rise, birth rates fall ~Birdsall, 1988!. To simplify the analysis, the mini-mum family size in relation ~1! is set to unity so that population is constant in thelimit. Relaxing this assumption does not change the results.
Optimal old-age savings, equation ~2!, shows that an increase in political capac-ity ~holding the tax rate constant! raises labor incomes and therefore savings,while an increase in political violence reduces income and therefore savings. Allthese implications find support in empirical studies of savings behavior ~Blinderand Deaton, 1985; Venieris and Gupta, 1986; Arbetman and Kugler, 1997!.
We now turn to the demographic structure. Let Nt denote the working pop-ulation of young adults at time t . Recall that only young adults reproduce andthat the old do not work. As a result, children in the current period make up the
4 The remaining parameter in ~1!, a [ ~0,1!, is the marginal productivity of physical capital ~see section A1.2!.Births are highly nonlinear in a.
5 Note that the expected value operator appears in ~1! and ~2! because political instability S has a stochasticelement to it which corresponds to the partially unpredictable nature of antigovernment violence.
Yi Feng, Jacek Kugler, and Paul J. Zak 671
labor force of young adults in the subsequent period. Thus, the evolution of theworking population is given by
Nt11 5 Nt bt*, ~3!
where bt* is given by equation ~1!. Equation ~3! simply shows that the number of
young adults at time t 1 1 is the aggregate births at time t , Nt bt*.
Next, we specify the dynamics of human capital. Using the generational struc-ture of the model, we allow parents to transmit some of their human capital totheir children. Since children’s inherited traits are more fully expressed whenparental nurturing is high, family structure influences the intergenerationaltransmission of human capital. Hanushek ~1992! and Downey ~1995! show that asthe number of siblings in a family increases, adult income and educationalattainment of children falls. Thus, when family size is small, parental nurturingper child is higher and their adult productivity is enhanced. Combining theeffects of household environment with the inheritability of human capital, achild’s human capital is, on average, increasing in his or her parent’s humancapital and decreasing in the number of children in a family.6 Equation ~4!captures this structure where the human capital ht11 of each child is relatedto the parental human capital, ht , and the number of siblings in his or herfamily, bt ,
ht11 5vht
btu
. ~4!
The parameter v in ~4! is the maximum rate of intergenerational human capitaltransmission, while u is the dilution effect resulting from multiple siblings ~b . 1!vying for their parent’s attention.7
The final component of the equilibrium dynamics maps the saving decisionsof individuals, equation ~2!, into the demand for investment by firms ~Appendix1, section A1.2!. Because only young adults save, aggregate savings from time t totime t 1 1 is Nt at11
*, which firms use to form the physical capital stock at timet 1 1. That is,
Kt11 5 Nt at11* 5 E $b~1 2 a!~1 2 tt !~Kt ~1 2 St !!a ~xt Nt ht !1 2 a %. ~5!
Observe in equation ~5! that next period’s physical capital stock, Kt11, is increas-ing in the current period’s physical and human capital stocks, is decreasing intaxes and political instability, and increases as political capacity rises. Thus,politics affects the rate of physical capital accumulation in equation ~5!, thenumber of births in equation ~1!, and the rate of human capital accumulation in
6 This argument is fully developed in Zak, 1999. Because Behrman and Taubman ~1989! show that 81% ofeducational attainment is attributable to one’s genetic endowment, we abstract from modeling the effect of formaleducation on human capital. Many studies have shown that IQ or “cognitive ability” predicts earnings ~Cawley et al.,1996; Ceci and Williams, 1997; Murray, 1997!. This is consistent with causation running from inherited ability, tohuman capital, to earnings. Note that only the transmission of workplace skills are modeled, not other personaltraits.
7 The law of motion for human capital ~4! accords well with that used by Lucas ~1988!, and collapses to matchLucas’s exactly when the chosen number of children is one. A more general human capital accumulation functionis contained in Bong, Wang, and Yip, 1996. Galor and Tsiddon ~1997! and Tamura ~1996! include nonconvexitiesin the accumulation of human capital, and several of the predictions that come from these models match those thatcome from ours, as the dilution effect in ~4! induces a nonconvexity. Zak ~1999! examines the stochastic transmis-sion of inherited human capital.
672 Politics of Fertility and Economic Development
equation ~4!. This demonstrates the interaction between politics, economics, andfertility in all parts of the model.
The equilibrium for the POFED model specifies a sequence of optima for allactors for each time t 5 1,2, . . . along with a number of technical conditions ~seeAppendix 1!. This equilibrium is completely specified by the dynamic sequenceof the working population, equation ~3!; of human capital, equation ~4!; and ofphysical capital ~5!, all of which are constructed from optimal behaviors byindividuals, firms, and the government. The three-dimensional dynamics can bereduced to two dimensions by writing the evolution of physical capital ~5! in perworker terms using the population evolution equation ~3! ~note the evolution ofhuman capital ~4! is an individual, rather than aggregate, relation!. Defining perworker physical capital as kt 5 Kt 0Nt , equation ~5! can be written in per workerterms,
kt11 5 E $b~1 2 a!~1 2 tt !~Kt ~1 2 St !!a ~xt ht !12a %0bt*. ~6!
Now, the equilibrium of this political-economic system is given by the evolu-tion of human capital equation ~3! and of per worker physical capital, equation~6!, along with government choices for political capacity, x, police expenditures,p , and taxes, t. In the next several sections we characterize how politics affectsfertility and economic development using the POFED model.
Development Trajectories
As indicated at the outset, the POFED model produces two types of developmentpaths, a poverty trap and a balanced growth path. When physical or humancapital is below threshold values derived below, the economy is caught in alow-income stationary equilibrium, a poverty trap. This occurs because a paucityof physical or human capital results in low labor incomes and birth rates are sohigh that human capital decumulates over generations due to large family sizeand low parental investments in children. Formally, using the law of motion forhuman capital ~4!, if bt . v 10u, then ht11 , ht and human capital decumulatesover time. As a result, output contracts, rather than growing as a reduction inhuman capital, causes time t 1 1 physical capital and output to fall ~by produc-tion process ~A1.10! and the law of motion for physical capital ~6!!. A reductionin time t 1 1 labor income further raises births by ~1!, causing human capital toshrink at time t 1 2, initiating a self-reinforcing feedback loop. In the limit, asboth types of capital and output decline, society is pushed toward a poverty trap.
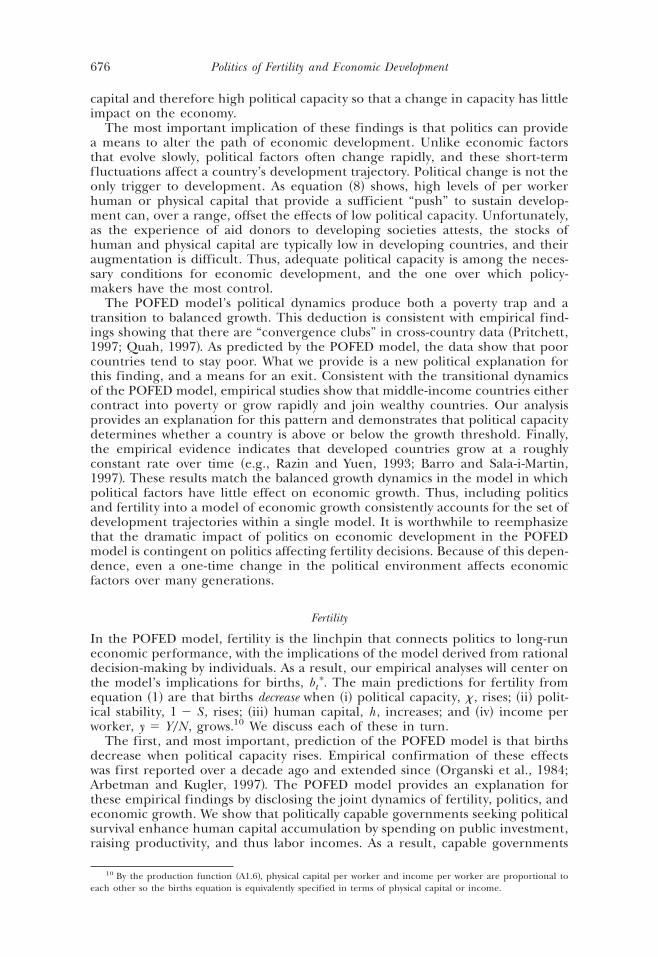
Figure 2 plots the equilibrium dynamical equation for physical capital ~6! inkt 2 kt11 space.8 It shows that if a country has little physical capital, then invest-ment is insufficient to sustain positive economic growth and the economy con-tracts into a poverty trap. Solving the equilibrium dynamical system ~3! and ~6!for the stationary point shown in Figure 2, the threshold for physical capital thatdetermines whether the economy grows or contracts is
k * 5 bgv220u0D ~1 1 g!2. ~7!
The growth threshold for human capital can be derived using the same method.When a country’s physical capital is below k * labor income falls over time,
birth rates rise, and the economy falls into a poverty trap. When physical capital
8 For simplicity, human capital is not shown in Figure 2. The full dynamics of this model can be found in Zak,1999.
Yi Feng, Jacek Kugler, and Paul J. Zak 673

exceeds k *, the economy grows endogenously, expanding rapidly during a periodof transitional dynamics when birth rates fall and income and investment surge.
A second equilibrium trajectory, a balanced growth path, emerges when physicaland human capitals are above thresholds that lead to a poverty trap. On thistrajectory, portrayed in the far right of Figure 2, economic growth is endogenous—that is, it continues indefinitely without reaching a stationary equilibrium. Thelong-run rate of output growth is v, the maximum rate of transmission of humancapital.9 On a balanced growth path, output is driven by new ideas that followfrom the continuing accumulation of human capital.
The dynamics of the POFED model reveal that politics fundamentally impactsa country’s development trajectory. As depicted in Figure 2, low political capacitycountries that are below the growth threshold contract rapidly into poverty;while those above this threshold grow more slowly in the transitional dynamics,taking longer to become fully developed ~i.e., to reach the balanced growthpath!. Conversely, high political capacity countries exhibit surging growth in thetransitional dynamics, rapidly becoming developed economies. Expectations ofhigh instability have similar effects on economic growth by decreasing physicalcapital in production, which reduces incomes, causing births to rise, by equation~1!, and reducing next period’s capital stock, by equation ~6!.
Political Capacity
A noteworthy implication of the POFED model is that the relationship betweenoutput growth and political capacity is nonmonotone. Recall that increasing
9 This long-run growth rate is derived by assuming the political capacity and political instability are constant inthe long run, consistent with the evidence in Arbetman and Kugler, 1997.
Fig. 2. Growth paths with high and low political capacity.
674 Politics of Fertility and Economic Development
political capacity requires additional taxes which, by the savings function ~2! andlaw of motion for physical capital ~6!, reduce the savings by individuals and nextperiod’s productive capital stock. In general, governments may under- or over-tax in an effort to raise their political capacity. This complex relationship betweenoutput and political capacity affects patterns of economic development.
For given levels of human and physical capital there is a threshold of politicalcapacity that determines a country’s prospects for successful development. Usingthe law of motion for physical capital ~6!, it is clear that as political capacitybecomes small ~x r 0!, next period’s capital stock approaches zero, and is surelyless than the growth threshold level, k *. Thus, an extended reduction in politicalcapacity causes a country to fall into a poverty trap. Furthermore, a temporarychange in political capacity for a country that is growing ~kt . k * ! alters acountry’s growth path, and can cause it to contract into a poverty trap. Thisoccurs if a reduction in political capacity from its base level xt , to the new levelxt 2 h, satisfies,
h . xt 2 k *10~2~12a!!A210~2~12a!!kt2a0~12a! ~1 2 St !2a0~12a!ht
21 . 0, ~8!
where A 5 b~1 2 t!2D ~1 2 a!2. A one-time decrease in political capacity thatsatisfies inequality ~8! is more likely when physical and human capitals are low,and when political instability is high. A government that is politically incapable,therefore, causes the economy to falter, which by ~A1.13! further weakens thegovernment, initiating a vicious circle of persistent political fragility and even-tual poverty. Moreover, equation ~A1.15! shows that rising birth rates reducepolitical capacity as public goods are shared among a larger population, furtherdimming the prospects for economic development.
When political capacity falls, but not enough to satisfy ~8!, the economy con-tinues to grow in the transitional dynamics, but converges to the balanced growthpath ~i.e., becomes a developed economy! more slowly. As depicted by the dashedcurve in Figure 2, a growth slow-down occurs in response to a one-time reduc-tion in political capacity since births increase and the accumulation of bothhuman and physical capital slows. A country facing these circumstances willeventually develop, but without a politically capable government the develop-ment process is retarded. A similar derivation shows that high political instabilityslows a country’s pace of development and convergence to balanced growth.
Conversely, for a country in which the economy is contracting ~kt , k * ! asufficient increase in political capacity, xt 1 h , xt
*, changes its developmenttrajectory to one with positive and self-sustaining economic growth. The routethat permits a country to escape poverty via political means requires a sufficientincrease in political capacity, with the increasing being larger when physical andhuman capital are low, and political instability is high. Further, the new level ofpolitical capacity must not exceed the growth-maximizing level, xt
*. If xt 1 h .xt*, an increase in political capacity reduces growth as the economic drag from
higher taxes exceeds the benefit of increased production efficiency. Thus, thereis a limited range of actions that governments can take to stimulate economicdevelopment.
Figure 2 suggests, and equation ~8! demonstrates, that changes in the direc-tion of a country’s development trajectory due to a change in political capacityare most likely for “middle-income” countries—those with kt near k *. In thesecountries, political capacity is moderate and a change in capacity can radicallyalter economic performance. Poor countries have very little latitude to increasepolitical capacity as they are constrained by low tax revenues. For this reasonpoor countries are more likely to remain trapped in poverty ~see section A1.3!.By contrast, high-income countries have large stocks of physical and human
Yi Feng, Jacek Kugler, and Paul J. Zak 675
capital and therefore high political capacity so that a change in capacity has littleimpact on the economy.
The most important implication of these findings is that politics can providea means to alter the path of economic development. Unlike economic factorsthat evolve slowly, political factors often change rapidly, and these short-termfluctuations affect a country’s development trajectory. Political change is not theonly trigger to development. As equation ~8! shows, high levels of per workerhuman or physical capital that provide a sufficient “push” to sustain develop-ment can, over a range, offset the effects of low political capacity. Unfortunately,as the experience of aid donors to developing societies attests, the stocks ofhuman and physical capital are typically low in developing countries, and theiraugmentation is difficult. Thus, adequate political capacity is among the neces-sary conditions for economic development, and the one over which policy-makers have the most control.
The POFED model’s political dynamics produce both a poverty trap and atransition to balanced growth. This deduction is consistent with empirical find-ings showing that there are “convergence clubs” in cross-country data ~Pritchett,1997; Quah, 1997!. As predicted by the POFED model, the data show that poorcountries tend to stay poor. What we provide is a new political explanation forthis finding, and a means for an exit. Consistent with the transitional dynamicsof the POFED model, empirical studies show that middle-income countries eithercontract into poverty or grow rapidly and join wealthy countries. Our analysisprovides an explanation for this pattern and demonstrates that political capacitydetermines whether a country is above or below the growth threshold. Finally,the empirical evidence indicates that developed countries grow at a roughlyconstant rate over time ~e.g., Razin and Yuen, 1993; Barro and Sala-i-Martin,1997!. These results match the balanced growth dynamics in the model in whichpolitical factors have little effect on economic growth. Thus, including politicsand fertility into a model of economic growth consistently accounts for the set ofdevelopment trajectories within a single model. It is worthwhile to reemphasizethat the dramatic impact of politics on economic development in the POFEDmodel is contingent on politics affecting fertility decisions. Because of this depen-dence, even a one-time change in the political environment affects economicfactors over many generations.
Fertility
In the POFED model, fertility is the linchpin that connects politics to long-runeconomic performance, with the implications of the model derived from rationaldecision-making by individuals. As a result, our empirical analyses will center onthe model’s implications for births, bt
*. The main predictions for fertility fromequation ~1! are that births decrease when ~i! political capacity, x, rises; ~ii! polit-ical stability, 1 2 S , rises; ~iii! human capital, h , increases; and ~iv! income perworker, y 5 Y0N , grows.10 We discuss each of these in turn.
The first, and most important, prediction of the POFED model is that birthsdecrease when political capacity rises. Empirical confirmation of these effectswas first reported over a decade ago and extended since ~Organski et al., 1984;Arbetman and Kugler, 1997!. The POFED model provides an explanation forthese empirical findings by disclosing the joint dynamics of fertility, politics, andeconomic growth. We show that politically capable governments seeking politicalsurvival enhance human capital accumulation by spending on public investment,raising productivity, and thus labor incomes. As a result, capable governments
10 By the production function ~A1.6!, physical capital per worker and income per worker are proportional toeach other so the births equation is equivalently specified in terms of physical capital or income.
676 Politics of Fertility and Economic Development
unwittingly initiate demographic transitions, leading to low birth rates, a stablepopulation, and rapid economic development.11
The second implication of the model is that political instability has a positiveimpact on birth rates. Demographers have documented the baby booms thatfollow conflicts, causing population to rebound after even great wars ~Coale,1975; Organski and Kugler, 1980!. The formal explanation we provide for thisphenomenon is new. The POFED model shows that as political instability rises,labor income falls, reducing the opportunity cost of children. Since childrenprovide utility, a parents’ best response when incomes fall is to increase thedesired number of children. Aggregating such responses results in the babybooms that have echoes across generations.
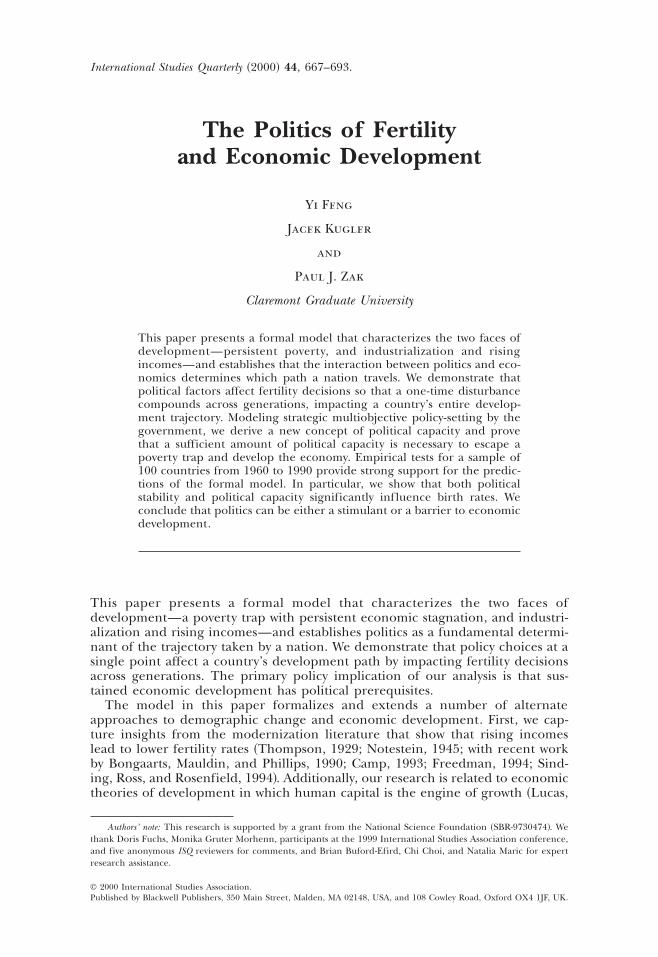
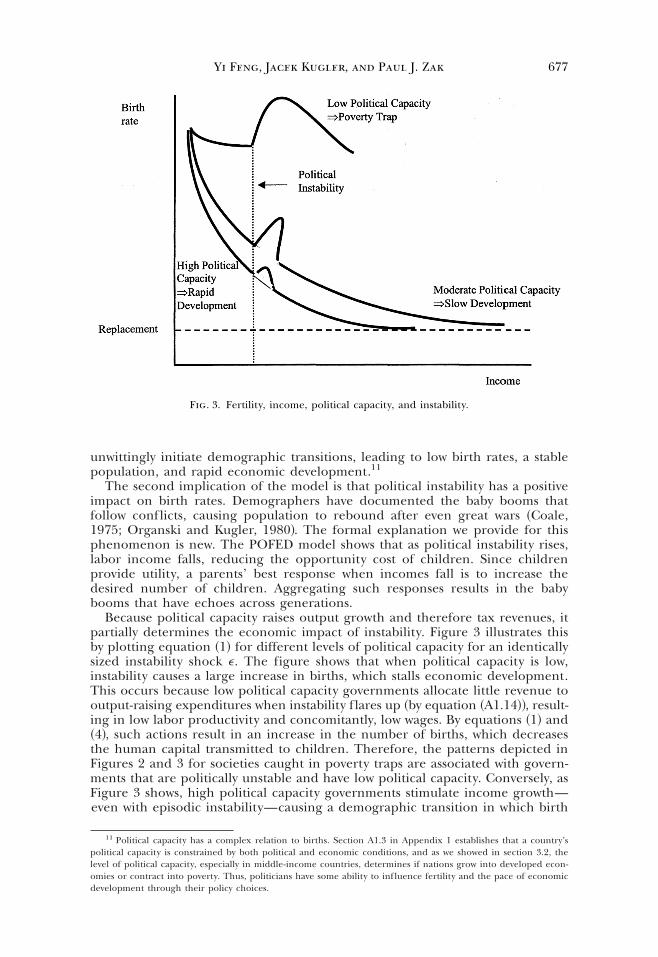
Because political capacity raises output growth and therefore tax revenues, itpartially determines the economic impact of instability. Figure 3 illustrates thisby plotting equation ~1! for different levels of political capacity for an identicallysized instability shock e. The figure shows that when political capacity is low,instability causes a large increase in births, which stalls economic development.This occurs because low political capacity governments allocate little revenue tooutput-raising expenditures when instability flares up ~by equation ~A1.14!!, result-ing in low labor productivity and concomitantly, low wages. By equations ~1! and~4!, such actions result in an increase in the number of births, which decreasesthe human capital transmitted to children. Therefore, the patterns depicted inFigures 2 and 3 for societies caught in poverty traps are associated with govern-ments that are politically unstable and have low political capacity. Conversely, asFigure 3 shows, high political capacity governments stimulate income growth—even with episodic instability—causing a demographic transition in which birth
11 Political capacity has a complex relation to births. Section A1.3 in Appendix 1 establishes that a country’spolitical capacity is constrained by both political and economic conditions, and as we showed in section 3.2, thelevel of political capacity, especially in middle-income countries, determines if nations grow into developed econ-omies or contract into poverty. Thus, politicians have some ability to influence fertility and the pace of economicdevelopment through their policy choices.
Fig. 3. Fertility, income, political capacity, and instability.
Yi Feng, Jacek Kugler, and Paul J. Zak 677
rates fall, stimulating rapid economic development. Therefore, the effect ofpolitical instability on fertility is countervailed in a high political capacity coun-try. The third implication is that high parental human capital reduces birth rates.With smaller families, each child receives greater parental investment, and as aresult, has more human capital when he or she becomes an adult. The dynamiclink to growth is that high human capital workers are more productive, receivehigher wages, and themselves have fewer children, each of whom will, on aver-age, have high human capital.12
The final implication of the POFED model is that births decrease when incomegrows. This deduction provides formal support for a now standard finding in themodernization literature. Scores of empirical studies support this general rela-tionship ~e.g., Coale, 1975; Demeny, 1989!. The POFED model discloses themechanism through which this result obtains. As incomes rise, the opportunitycost of time spent raising children increases so those parents optimally choose tohave fewer children and invest more in each child. This is the primary reason forsmall families in developed economies, and, as the model shows, leads to a rapidaccumulation of human capital across generations. On a balanced growth path,countries are fully developed “information economies” where low birth ratesmaximize the accumulation of human capital which is the engine of continuedgrowth.
Statistical Specification and Measurement
Taking natural logs of the equilibrium births equation ~1! produces the followingequation, which is used to test the propositions derived from the POFED model:
ln~bit ! 5 b0 1 b1 ln~xit ! 1 b2 ln~1 2 Sit ! 1 b3 ln~ yit ! 1 b4 ln~hit ! 1 ei , ~9!
where subscript i indicates country, and t indicates year. Recall that the depen-dent variable, b , is birth rates, and the independent variables are political capac-ity, x; political stability, 1 2 S ; per worker output, y ; and human capital, h .Because of well-known measurement problems with physical capital k whichappears in ~1!, we proxy physical capital with per worker output, y . This preservesthe model’s structure since the production function ~A1.6! shows that physicalcapital and output are directly proportional to each other. Lastly, the parameterb0 is a constant that comprises the preference, cost, and production parametersfrom the model, and e is a white noise error term. Below we discuss the opera-tionalization of the variables in equation ~9!.
Births
A commonly used measure for births is the crude birth rate, defined as thenumber of children born per thousand of the population. The use of birth ratesas the dependent variable helps to alleviate reverse causation. The source ofthese data is the United Nations.
Political Capacity
Government political capacity reflects the ability of political elites to tap intohuman and material resources. Government elites mobilize this pool of resourcesto promote their objectives within the limits imposed by competing domesticpolitical actors and by competitive pressures from the external environment~Organski and Kugler, 1980:69!. Political capacity is proxied by a government’s
12 On the trade-off of child quality vs. quantity see Becker and Tomes, 1976 and Hanushek, 1992.
678 Politics of Fertility and Economic Development
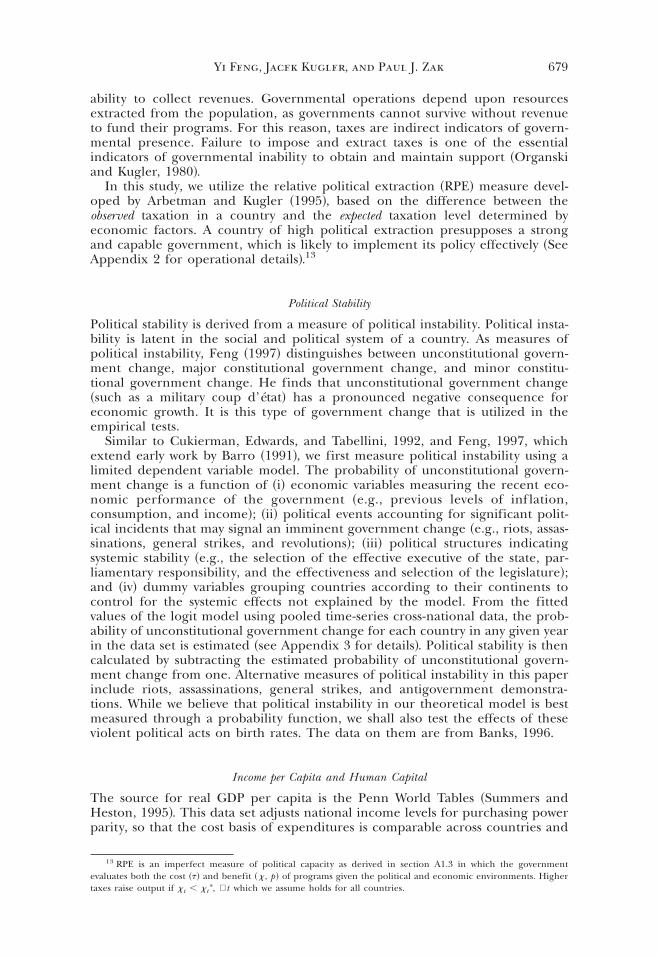
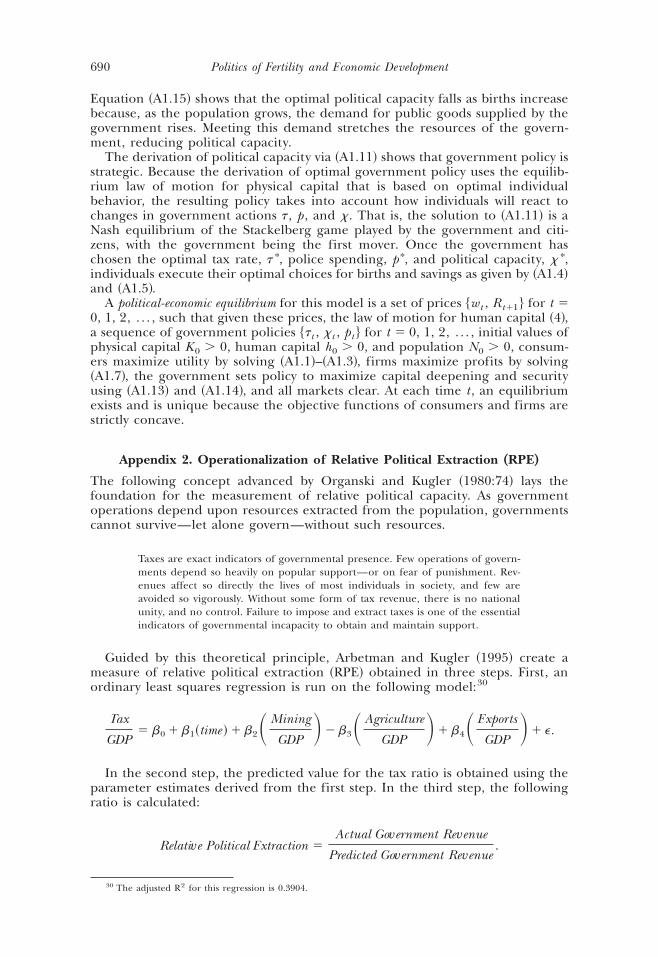
ability to collect revenues. Governmental operations depend upon resourcesextracted from the population, as governments cannot survive without revenueto fund their programs. For this reason, taxes are indirect indicators of govern-mental presence. Failure to impose and extract taxes is one of the essentialindicators of governmental inability to obtain and maintain support ~Organskiand Kugler, 1980!.
In this study, we utilize the relative political extraction ~RPE! measure devel-oped by Arbetman and Kugler ~1995!, based on the difference between theobserved taxation in a country and the expected taxation level determined byeconomic factors. A country of high political extraction presupposes a strongand capable government, which is likely to implement its policy effectively ~SeeAppendix 2 for operational details!.13
Political Stability
Political stability is derived from a measure of political instability. Political insta-bility is latent in the social and political system of a country. As measures ofpolitical instability, Feng ~1997! distinguishes between unconstitutional govern-ment change, major constitutional government change, and minor constitu-tional government change. He finds that unconstitutional government change~such as a military coup d’état! has a pronounced negative consequence foreconomic growth. It is this type of government change that is utilized in theempirical tests.
Similar to Cukierman, Edwards, and Tabellini, 1992, and Feng, 1997, whichextend early work by Barro ~1991!, we first measure political instability using alimited dependent variable model. The probability of unconstitutional govern-ment change is a function of ~i! economic variables measuring the recent eco-nomic performance of the government ~e.g., previous levels of inf lation,consumption, and income!; ~ii! political events accounting for significant polit-ical incidents that may signal an imminent government change ~e.g., riots, assas-sinations, general strikes, and revolutions!; ~iii! political structures indicatingsystemic stability ~e.g., the selection of the effective executive of the state, par-liamentary responsibility, and the effectiveness and selection of the legislature!;and ~iv! dummy variables grouping countries according to their continents tocontrol for the systemic effects not explained by the model. From the fittedvalues of the logit model using pooled time-series cross-national data, the prob-ability of unconstitutional government change for each country in any given yearin the data set is estimated ~see Appendix 3 for details!. Political stability is thencalculated by subtracting the estimated probability of unconstitutional govern-ment change from one. Alternative measures of political instability in this paperinclude riots, assassinations, general strikes, and antigovernment demonstra-tions. While we believe that political instability in our theoretical model is bestmeasured through a probability function, we shall also test the effects of theseviolent political acts on birth rates. The data on them are from Banks, 1996.
Income per Capita and Human Capital
The source for real GDP per capita is the Penn World Tables ~Summers andHeston, 1995!. This data set adjusts national income levels for purchasing powerparity, so that the cost basis of expenditures is comparable across countries and
13 RPE is an imperfect measure of political capacity as derived in section A1.3 in which the governmentevaluates both the cost ~t! and benefit ~x, p! of programs given the political and economic environments. Highertaxes raise output if xt , xt
*, ∀t which we assume holds for all countries.
Yi Feng, Jacek Kugler, and Paul J. Zak 679

over years. The level of real GDP per capita is obtained from an equation basedupon a country’s real domestic consumption relative to that of the United States.
Human capital is proxied by data on literacy. Literacy provides a measure ofthe quality of education, as opposed to, for example, years in school. The sourceof the literacy data is the Cross-National Time-Series Archive ~Banks, 1996!.
Empirical Evidence
Table 1 reports the result of a cross-country time-series regression analysis ofequation ~9!.14 The data span from 1960 through 1990 for 100 countries. Thetheoretical model identifies variations that are examined in subsequent estima-tions. In the base statistical model, we use real GDP per capita as a controlvariable for the level of income, though it is also a policy variable in our theo-retical model. In Table 2 and Table 3, we use dummy variables to isolate differ-ential effects of politics on fertility regarding high-, middle-, and low-incomecountries. While Table 1 provides a general statistical framework to examine ourtheoretical position, Table 2 and Table 3 uncover additional nuances about andinsights into our theory.
In Table 1, all independent variables are lagged to instrument the variablesthe theory identifies as jointly endogenous with births, as well as to capturedynamic changes in the underlying structure. The variation of the lag structureis provided in the first row of the table. While the first column tests the “con-temporaneous” effect of political institutions on birth rates, the remaining col-umns use the first through fifth order lags of the independent variables.15
The unit of lags is annual. As all variables are simultaneously determined ~i.e.,
14 Beck and Katz ~1995! show that some specially designed time-series methods ~e.g., the Parks method! can leadto a serious over-fitting problem in panel data, making it more likely to obtain a “statistically significant” parameterestimate. They also demonstrate that the statistical results from ordinary least squares ~OLS! estimation is robust,and therefore recommend the use of OLS estimation for time-series cross-section data.
15 Contemporaneous political variables may capture two consequences. The first is that parents may foresee thechanges in the political environment in the near future and react by varying family size as the POFED model shows.This is the ex ante effect. The second possibility is that political institutions are semi-permanent and path-dependent ~Cukierman, Edwards, and Tabellini, 1992!. Therefore, the contemporaneous effect may reflect acontinuation of past effects of political institutions on fertility decisions. We are grateful to a referee for this insight.
Table 1. Politics, Economics, and Births: A Regression Analysis, 1960–90
Lag 5 0 Lag 5 1 Lag 5 2 Lag 5 3 Lag 5 4 Lag 5 5
Constant 6.446*** 6.435*** 6.420*** 6.406*** 6.384*** 6.366***~0.056! ~0.057! ~0.058! ~0.058! ~0.057! ~0.059!
Political stability 20.219*** 20.224*** 20.276*** 20.294*** 20.330*** 20.341***~0.093! ~0.094! ~0.094! ~0.094! ~0.094! ~0.095!
Political capacity 20.028* 20.030* 20.035** 20.036** 20.040*** 20.048***~0.016! ~0.016! ~0.016! ~0.017! ~0.017! ~0.018!
Real GDP per capita 20.280*** 20.279*** 20.278*** 20.277*** 20.276*** 20.276***~0.010! ~0.010! ~0.010! ~0.010! ~0.010! ~0.010!
Literacy rate 20.221*** 20.223*** 20.223*** 20.223*** 20.222*** 20.222***~0.014! ~0.014! ~0.014! ~0.013! ~0.013! ~0.013!
OR2 0.774 0.771 0.770 0.768 0.766 0.765s 0.223 0.225 0.225 0.226 0.227 0.228
Numbers in parentheses are standard errors.***significant at the 1% error level, one-tail; ** significant at the 2.5% error level, one-tail; *significant at the 5%error level, one-tail
680 Politics of Fertility and Economic Development
the formal derivations are part of a general equilibrium model!, we use laggedvalues of the variables identified in the model as instruments. We also vary thelags to demonstrate the robustness of the instrumental variables estimation. Thejoint simultaneity of variables in general equilibrium models always results in
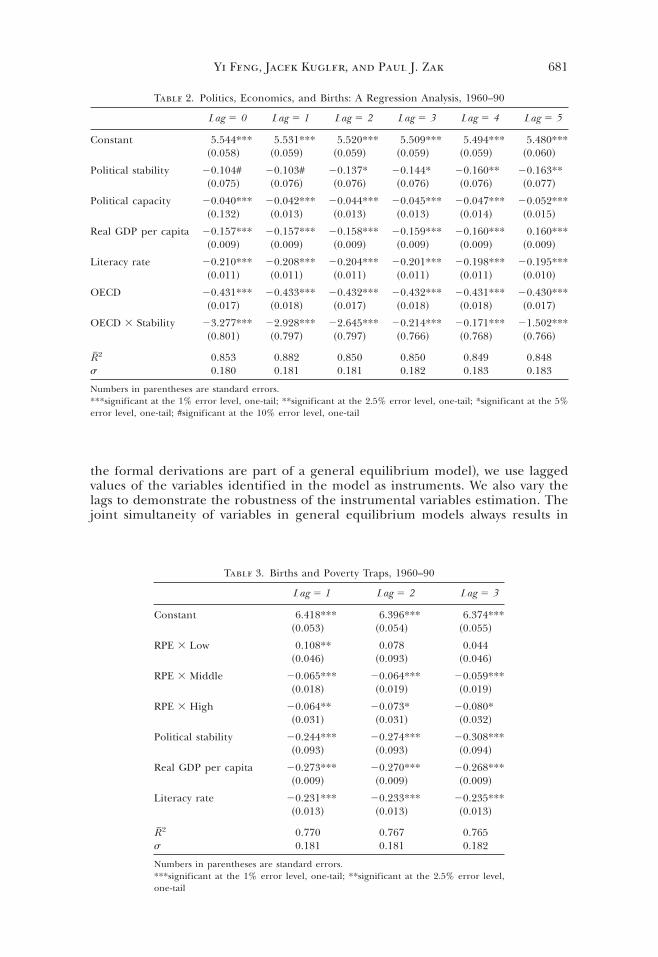
Table 2. Politics, Economics, and Births: A Regression Analysis, 1960–90
Lag 5 0 Lag 5 1 Lag 5 2 Lag 5 3 Lag 5 4 Lag 5 5
Constant 5.544*** 5.531*** 5.520*** 5.509*** 5.494*** 5.480***~0.058! ~0.059! ~0.059! ~0.059! ~0.059! ~0.060!
Political stability 20.104# 20.103# 20.137* 20.144* 20.160** 20.163**~0.075! ~0.076! ~0.076! ~0.076! ~0.076! ~0.077!
Political capacity 20.040*** 20.042*** 20.044*** 20.045*** 20.047*** 20.052***~0.132! ~0.013! ~0.013! ~0.013! ~0.014! ~0.015!
Real GDP per capita 20.157*** 20.157*** 20.158*** 20.159*** 20.160*** 0.160***~0.009! ~0.009! ~0.009! ~0.009! ~0.009! ~0.009!
Literacy rate 20.210*** 20.208*** 20.204*** 20.201*** 20.198*** 20.195***~0.011! ~0.011! ~0.011! ~0.011! ~0.011! ~0.010!
OECD 20.431*** 20.433*** 20.432*** 20.432*** 20.431*** 20.430***~0.017! ~0.018! ~0.017! ~0.018! ~0.018! ~0.017!
OECD 3 Stability 23.277*** 22.928*** 22.645*** 20.214*** 20.171*** 21.502***~0.801! ~0.797! ~0.797! ~0.766! ~0.768! ~0.766!
OR2 0.853 0.882 0.850 0.850 0.849 0.848s 0.180 0.181 0.181 0.182 0.183 0.183
Numbers in parentheses are standard errors.***significant at the 1% error level, one-tail; **significant at the 2.5% error level, one-tail; *significant at the 5%error level, one-tail; #significant at the 10% error level, one-tail
Table 3. Births and Poverty Traps, 1960–90
Lag 5 1 Lag 5 2 Lag 5 3
Constant 6.418*** 6.396*** 6.374***~0.053! ~0.054! ~0.055!
RPE 3 Low 0.108** 0.078 0.044~0.046! ~0.093! ~0.046!
RPE 3 Middle 20.065*** 20.064*** 20.059***~0.018! ~0.019! ~0.019!
RPE 3 High 20.064** 20.073* 20.080*~0.031! ~0.031! ~0.032!
Political stability 20.244*** 20.274*** 20.308***~0.093! ~0.093! ~0.094!
Real GDP per capita 20.273*** 20.270*** 20.268***~0.009! ~0.009! ~0.009!
Literacy rate 20.231*** 20.233*** 20.235***~0.013! ~0.013! ~0.013!
OR2 0.770 0.767 0.765s 0.181 0.181 0.182
Numbers in parentheses are standard errors.***significant at the 1% error level, one-tail; **significant at the 2.5% error level,one-tail
Yi Feng, Jacek Kugler, and Paul J. Zak 681
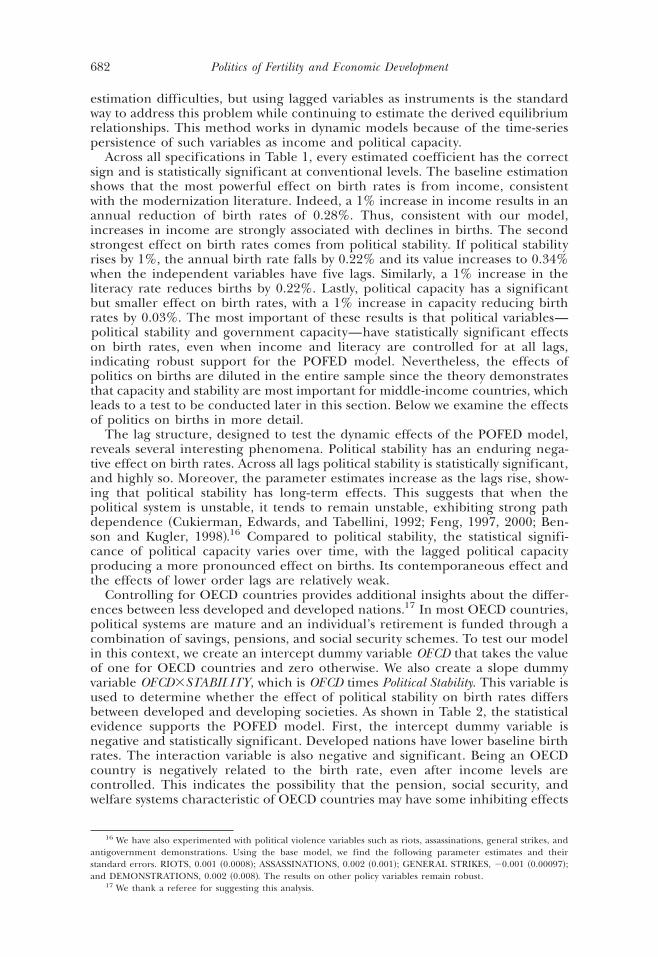
estimation difficulties, but using lagged variables as instruments is the standardway to address this problem while continuing to estimate the derived equilibriumrelationships. This method works in dynamic models because of the time-seriespersistence of such variables as income and political capacity.
Across all specifications in Table 1, every estimated coefficient has the correctsign and is statistically significant at conventional levels. The baseline estimationshows that the most powerful effect on birth rates is from income, consistentwith the modernization literature. Indeed, a 1% increase in income results in anannual reduction of birth rates of 0.28%. Thus, consistent with our model,increases in income are strongly associated with declines in births. The secondstrongest effect on birth rates comes from political stability. If political stabilityrises by 1%, the annual birth rate falls by 0.22% and its value increases to 0.34%when the independent variables have five lags. Similarly, a 1% increase in theliteracy rate reduces births by 0.22%. Lastly, political capacity has a significantbut smaller effect on birth rates, with a 1% increase in capacity reducing birthrates by 0.03%. The most important of these results is that political variables—political stability and government capacity—have statistically significant effectson birth rates, even when income and literacy are controlled for at all lags,indicating robust support for the POFED model. Nevertheless, the effects ofpolitics on births are diluted in the entire sample since the theory demonstratesthat capacity and stability are most important for middle-income countries, whichleads to a test to be conducted later in this section. Below we examine the effectsof politics on births in more detail.
The lag structure, designed to test the dynamic effects of the POFED model,reveals several interesting phenomena. Political stability has an enduring nega-tive effect on birth rates. Across all lags political stability is statistically significant,and highly so. Moreover, the parameter estimates increase as the lags rise, show-ing that political stability has long-term effects. This suggests that when thepolitical system is unstable, it tends to remain unstable, exhibiting strong pathdependence ~Cukierman, Edwards, and Tabellini, 1992; Feng, 1997, 2000; Ben-son and Kugler, 1998!.16 Compared to political stability, the statistical signifi-cance of political capacity varies over time, with the lagged political capacityproducing a more pronounced effect on births. Its contemporaneous effect andthe effects of lower order lags are relatively weak.
Controlling for OECD countries provides additional insights about the differ-ences between less developed and developed nations.17 In most OECD countries,political systems are mature and an individual’s retirement is funded through acombination of savings, pensions, and social security schemes. To test our modelin this context, we create an intercept dummy variable OECD that takes the valueof one for OECD countries and zero otherwise. We also create a slope dummyvariable OECD3STABILITY, which is OECD times Political Stability. This variable isused to determine whether the effect of political stability on birth rates differsbetween developed and developing societies. As shown in Table 2, the statisticalevidence supports the POFED model. First, the intercept dummy variable isnegative and statistically significant. Developed nations have lower baseline birthrates. The interaction variable is also negative and significant. Being an OECDcountry is negatively related to the birth rate, even after income levels arecontrolled. This indicates the possibility that the pension, social security, andwelfare systems characteristic of OECD countries may have some inhibiting effects
16 We have also experimented with political violence variables such as riots, assassinations, general strikes, andantigovernment demonstrations. Using the base model, we find the following parameter estimates and theirstandard errors. RIOTS, 0.001 ~0.0008!; ASSASSINATIONS, 0.002 ~0.001!; GENERAL STRIKES, 20.001 ~0.00097!;and DEMONSTRATIONS, 0.002 ~0.008!. The results on other policy variables remain robust.
17 We thank a referee for suggesting this analysis.
682 Politics of Fertility and Economic Development
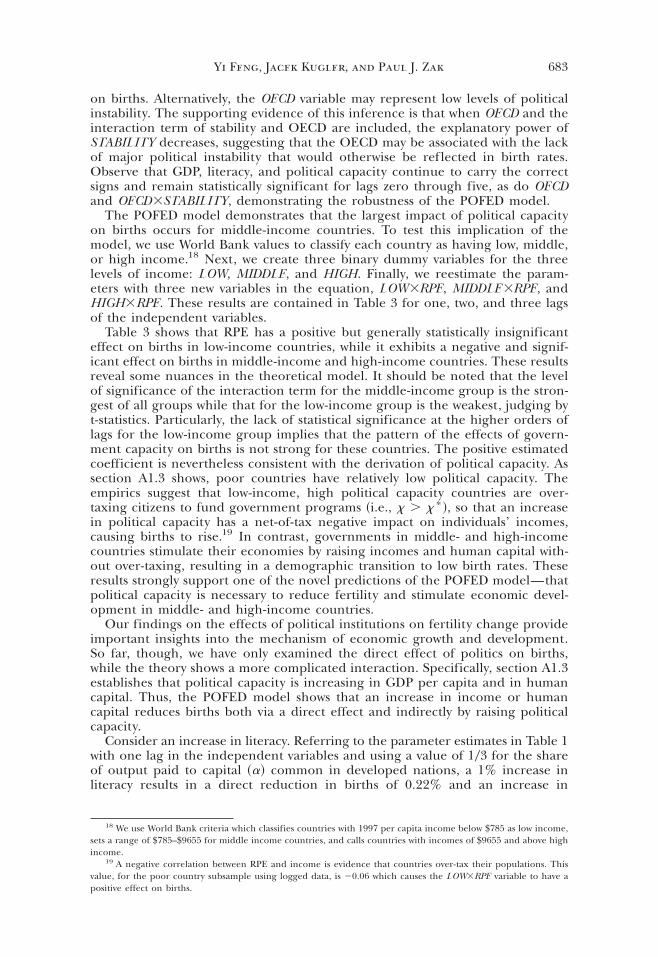
on births. Alternatively, the OECD variable may represent low levels of politicalinstability. The supporting evidence of this inference is that when OECD and theinteraction term of stability and OECD are included, the explanatory power ofSTABILITY decreases, suggesting that the OECD may be associated with the lackof major political instability that would otherwise be reflected in birth rates.Observe that GDP, literacy, and political capacity continue to carry the correctsigns and remain statistically significant for lags zero through five, as do OECDand OECD3STABILITY, demonstrating the robustness of the POFED model.
The POFED model demonstrates that the largest impact of political capacityon births occurs for middle-income countries. To test this implication of themodel, we use World Bank values to classify each country as having low, middle,or high income.18 Next, we create three binary dummy variables for the threelevels of income: LOW, MIDDLE, and HIGH. Finally, we reestimate the param-eters with three new variables in the equation, LOW3RPE, MIDDLE3RPE, andHIGH3RPE. These results are contained in Table 3 for one, two, and three lagsof the independent variables.
Table 3 shows that RPE has a positive but generally statistically insignificanteffect on births in low-income countries, while it exhibits a negative and signif-icant effect on births in middle-income and high-income countries. These resultsreveal some nuances in the theoretical model. It should be noted that the levelof significance of the interaction term for the middle-income group is the stron-gest of all groups while that for the low-income group is the weakest, judging byt-statistics. Particularly, the lack of statistical significance at the higher orders oflags for the low-income group implies that the pattern of the effects of govern-ment capacity on births is not strong for these countries. The positive estimatedcoefficient is nevertheless consistent with the derivation of political capacity. Assection A1.3 shows, poor countries have relatively low political capacity. Theempirics suggest that low-income, high political capacity countries are over-taxing citizens to fund government programs ~i.e., x . x * !, so that an increasein political capacity has a net-of-tax negative impact on individuals’ incomes,causing births to rise.19 In contrast, governments in middle- and high-incomecountries stimulate their economies by raising incomes and human capital with-out over-taxing, resulting in a demographic transition to low birth rates. Theseresults strongly support one of the novel predictions of the POFED model—thatpolitical capacity is necessary to reduce fertility and stimulate economic devel-opment in middle- and high-income countries.
Our findings on the effects of political institutions on fertility change provideimportant insights into the mechanism of economic growth and development.So far, though, we have only examined the direct effect of politics on births,while the theory shows a more complicated interaction. Specifically, section A1.3establishes that political capacity is increasing in GDP per capita and in humancapital. Thus, the POFED model shows that an increase in income or humancapital reduces births both via a direct effect and indirectly by raising politicalcapacity.
Consider an increase in literacy. Referring to the parameter estimates in Table 1with one lag in the independent variables and using a value of 103 for the shareof output paid to capital ~a! common in developed nations, a 1% increase inliteracy results in a direct reduction in births of 0.22% and an increase in
18 We use World Bank criteria which classifies countries with 1997 per capita income below $785 as low income,sets a range of $785–$9655 for middle income countries, and calls countries with incomes of $9655 and above highincome.
19 A negative correlation between RPE and income is evidence that countries over-tax their populations. Thisvalue, for the poor country subsample using logged data, is 20.06 which causes the LOW3RPE variable to have apositive effect on births.
Yi Feng, Jacek Kugler, and Paul J. Zak 683
political capacity of 2% which causes births to fall by 0.06%.20 The sum of thedirect and indirect effects of a 1% increase in literacy is an annual decline inbirths of 0.28%. As the POFED model shows, this decrease compounds acrossgenerations leading to a significant reduction in fertility over time. By a similarcalculation, a 1% increase in income has a direct effect of a 0.28% reduction inbirth rates and also raises political capacity by 1%. The sum of the direct andindirect effects of increasing income by 1% is therefore an annual reduction inbirth rates of 0.31%. If both income and education increase by 1%, the directand indirect effects lead to a reduction in birth rates of over one-half percentper year ~0.59%!.
Conclusions
The POFED model links political structures to long-run economic performance,showing how both politics and economics affect fertility choices and thereforehuman capital accumulation over generations. A unique feature of the model isthat we derive growth trajectories as a function of the underlying politics. Indoing this, we demonstrate why nations fall into poverty traps, and why theydevelop into advanced economies. The formal structure shows that a demo-graphic transition prompted by political factors provides a means to escapepoverty.
The POFED model also reveals that the period of rapid transitional growth isfragile. Politically weak governments engender relatively high rates of populationgrowth, which reduces productivity and incomes, and diverts resources fromproduction to child rearing. Such increases in births reduce the human capitalof future generations, imperiling prospects for economic growth and causingpolitical capacity to decline. In this situation, we show that a vicious circle ofeconomic contraction and political impotence emerges. Conversely, developingnations, particularly those in the middle-income group, that are able to improvetheir political structures can jump-start their economies by inducing a demo-graphic transition, which lays the foundation for rapid transitional growth.
The barrier to development in the least developed societies is politics. As it isdifficult to build political structures when participation and resources are lim-ited, poor nations face the daunting challenge to improve their political capacityand escape from the poverty trap at the same time. External forces such asinternational aid may help lead societies out of a poverty trap, but the funda-mental resources required to erase poverty primarily reside within the nation,particularly with the government leadership, in whose hands rest the means toelevate the society from poverty.
Appendix 1. POFED Model Formal Theory
This appendix presents and solves the individual’s utility maximization problem,the firm’s profit maximization problem, and the government’s optimal policyproblem which are the components of the POFED model. Thereafter, a political-economic equilibrium is defined. POFED is a dynamical general equilibriummodel, which means that given a utility function, a specified production process,and initial conditions, all aspects of the model evolve endogenously and arejointly dependent on each other. For example, we show that political capacityaffects production decisions by firms, the utility maximization problem for indi-viduals, and thus the process of economic development. The model itself has an
20 Using the derivation of political capacity ~A1.13!, and the production function ~A1.6!, one can show thatln~xt ! 5 ln@~1 2 s! ~1 2 a!2 # 1 ln~Yt !, so that d ln~xt !0d ln~Yt ! 5 1. Similarly, d ln~xt !0d ln~ht ! 5 ~1 2 a!0a 5 2 whena 5 103.
684 Politics of Fertility and Economic Development
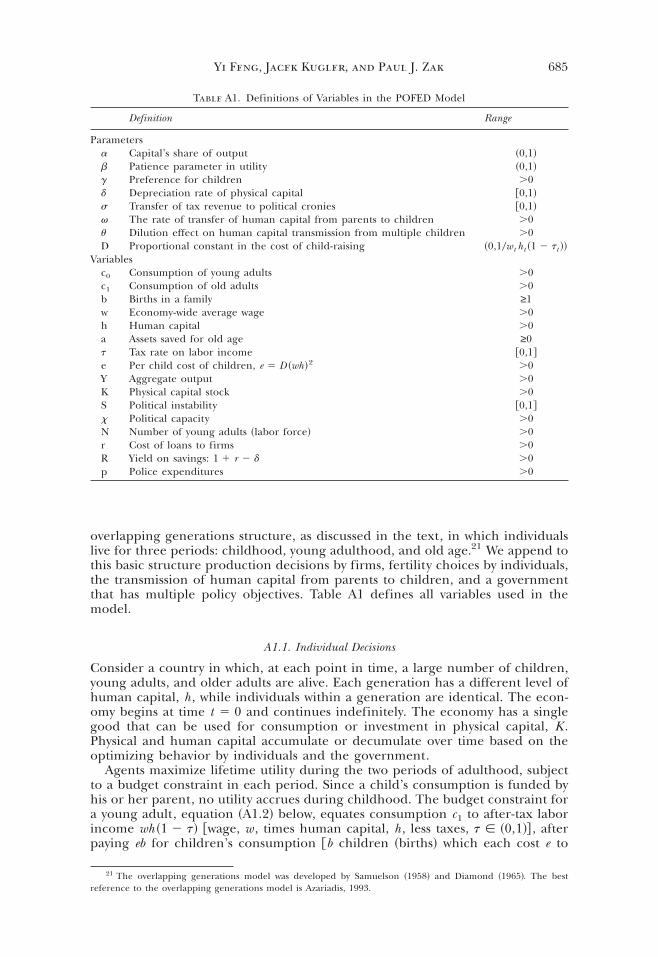
overlapping generations structure, as discussed in the text, in which individualslive for three periods: childhood, young adulthood, and old age.21 We append tothis basic structure production decisions by firms, fertility choices by individuals,the transmission of human capital from parents to children, and a governmentthat has multiple policy objectives. Table A1 defines all variables used in themodel.
A1.1. Individual Decisions
Consider a country in which, at each point in time, a large number of children,young adults, and older adults are alive. Each generation has a different level ofhuman capital, h , while individuals within a generation are identical. The econ-omy begins at time t 5 0 and continues indefinitely. The economy has a singlegood that can be used for consumption or investment in physical capital, K .Physical and human capital accumulate or decumulate over time based on theoptimizing behavior by individuals and the government.
Agents maximize lifetime utility during the two periods of adulthood, subjectto a budget constraint in each period. Since a child’s consumption is funded byhis or her parent, no utility accrues during childhood. The budget constraint fora young adult, equation ~A1.2! below, equates consumption c1 to after-tax laborincome wh ~1 2 t! @wage, w , times human capital, h , less taxes, t [ ~0,1!# , afterpaying eb for children’s consumption @b children ~births! which each cost e to
21 The overlapping generations model was developed by Samuelson ~1958! and Diamond ~1965!. The bestreference to the overlapping generations model is Azariadis, 1993.
Table A1. Definitions of Variables in the POFED Model
Definition Range
Parametersa Capital’s share of output ~0,1!b Patience parameter in utility ~0,1!g Preference for children .0d Depreciation rate of physical capital @0,1!s Transfer of tax revenue to political cronies @0,1!v The rate of transfer of human capital from parents to children .0u Dilution effect on human capital transmission from multiple children .0D Proportional constant in the cost of child-raising ~0,10wt ht ~1 2 tt !!
Variablesc0 Consumption of young adults .0c1 Consumption of old adults .0b Births in a family ≥1w Economy-wide average wage .0h Human capital .0a Assets saved for old age ≥0t Tax rate on labor income @0,1#e Per child cost of children, e 5 D ~wh!2 .0Y Aggregate output .0K Physical capital stock .0S Political instability @0,1#x Political capacity .0N Number of young adults ~labor force! .0r Cost of loans to firms .0R Yield on savings: 1 1 r 2 d .0p Police expenditures .0
Yi Feng, Jacek Kugler, and Paul J. Zak 685
raise# , and save a for old age. The budget constraint for an old agent, equation~A1.3!, shows that consumption c2 is funded by the principal and interest onsavings from young adulthood R a , where R is one plus the net interest rate. Allagents have identical logarithmic and temporally separable utility functions.
Combining the elements above, the expected lifetime utility maximizationproblem for an individual born at time t 2 1 is
Maxc1, t ; c2, t11; bt E $~1 2 b! ln~c1, t ! 1 b ln~c2, t11! 1 g ln~bt !% ~A1.1!
s.t.
c1, t 5 wt ht ~1 2 tt ! 2 et bt 2 at11 ~A1.2!
c2, t11 5 Rt11 at11 ~A1.3!
where b [ ~0,1! denotes the preference for consuming when middle-agedversus old-aged, g . 0 is the preference for children, and E is the expectationsoperator.22 Agents maximize expected utility because, due to political effects describedbelow, income and the return on savings are stochastic. Further, because there isa large number of atomistic agents in the model, the actions of a single individ-ual have no effect on aggregates. As a result, individuals take political instability,S , and political capacity, x, as given in solving their utility maximization problem~A1.1!–~A1.3!.
We choose a parameterization of the cost of children, e , that reflects theincome foregone for the time spent with children, which is the primary cost ofchild-rearing ~Birdsall, 1988!. To wit, let the cost of children be quadratic in netlabor income, et 5 D ~wt ht ~1 2 tt !!
2, with the constant 0 , D , 10wt ht ~1 2 tt !.In addition, we impose the condition that the minimum number of children ina family is one so that in the limit population is constant at its replacement rate.Note that with logarithmic preferences, individual optima from problem ~A1.1!–~A1.3! are unique and strictly positive. As a result, the Largrange multipliermethod is not necessary, and the optimization problem is solved by substitutingout middle-age and old-age consumption using each period’s budget constraintand maximizing over at11 and bt .
Solving for the optima from the utility maximization problem ~A1.1!–~A1.3!under these conditions, the solutions for the number of children bt
*, and sav-ings, at11
*, are
bt* 5 Max HE
g
~1 1 g!Dwt ht ~1 2 tt !, 1J ~A1.4!
and
a1, t11* 5 E
bwt ht ~1 2 tt !
~1 1 g!. ~A1.5!
Equation ~A1.4! shows that an individual’s optimal number of children ispositively related to the preference for children, g, and negatively related tonet-of-tax labor income wh ~1 2 t!. Optimal old-age savings ~A1.5! is a constantproportion of net-of-tax labor income, with this proportion increasing as agents
22 Note that as is standard, we ignore the integer constraint on children. In addition, problem ~A1!–~A3! iswritten in per effective worker terms, i.e., economic variables are written relative to working agents’ human capital, h .For this reason, labor income is given by wh , that is, the wage times human capital, h , rather than simply w .
686 Politics of Fertility and Economic Development

become more patient ~b increases!, and falling as the preference for children ~g!becomes stronger since children have a cost. Observe that government policyaffects individual decisions. As the tax rate t increases in ~A1.4!, births increaseas net-of-tax labor income, and therefore the opportunity cost of children, falls.Similarly, taxes reduce income and therefore savings in ~A1.5!.
A1.2 Politics and Production
As discussed in the text, political instability is a mapping St 5 S ~Yt21, pt ,et !: R3 r@0,1# which is the proportion of the physical capital stock that is destroyed duringantigovernment uprisings, where Y is aggregate income, p is government fund-ing for the police which reduces the ability of demonstrators to destroy capital,and e;G is a random variable that denotes the level of discontent with thepolitical milieu, where G is a CDF with finite mean and variance. Following theevidence in Feng, 1997, and Zak, 1997, we assume that S is decreasing in laggedoutput, Y, is decreasing police spending, p , and increasing in e.23 If instability isso large the entire physical capital stock is destroyed ~S 5 1!, then the govern-ment is considered overthrown. Note that S is not the number of demonstrations,but the impact of demonstrations on the economy.
Firms produce output, Y, with a modified Cobb-Douglas production function,
E $Yt % 5 E $~Kt ~1 2 St !!a ~xt Nt ht !12a %, ~A1.6!
with the marginal productivity parameter a [ ~0,1!. Equation ~A1.6! shows thatpolitical instability reduces stock of productive capital and therefore the outputthat is produced. Net capital in production is Kt ~1 2 St ! since proportion S ofthe capital stock is destroyed in antigovernment demonstrations. Note that theexpected value operator appears because St has a random element to it at time t .The second political factor in the model is that political capacity, x, affects theproductivity of private firms by implementing policies that enhance economicefficiency. Political capacity, x, enters in the production function ~A1.6! byraising the productivity of labor.
A representative firm chooses physical capital per effective worker, uKt [Kt ~1 2 St !0Lt , to maximize profits, where effective labor supply is Lt [ Nt ht xt , bysolving
Max uKt , E $Yt % 2 rt uKt , ~A1.7!
where rt is the cost of financing capital investments which is taken as given byfirms and markets are perfectly competitive. Solving ~A1.7! after substituting inthe production function ~A1.6! produces the firm’s demand function for pereffective worker physical capital, uK . Noting that the production function is homo-geneous of degree one, permits one to solve for the demand for effective laborL . Given these demand schedules and supply decisions made by consumers, themarket clearing wage for labor, w , and return on savings, R 5 1 1 r 2 d, arefound. The return to savings takes into account the rate of depreciation of
23 Gupta, Singh, and Sprague ~1993! show that the number of demonstrations and demonstrators follows aninverted U pattern relative to police coercion in a cross-country sample, and Francisco ~1996! finds some evidenceof backlash against the police in German demonstration data. If such a backlash occurred in the economic impactof demonstrations, S , a rational policy-setter, who we model choosing optimal police expenditures, would nevergenerate such an outcome. As a result, our assumption of a ~locally! monotone relation between S and policespending is justified. We thank a referee for pointing this out. See Zak and Feng, 1998, for a model in which theequilibrium dynamics include optimal government policy to maintain public order, and Feng and Zak, 1999, for adynamic model of regime change.
Yi Feng, Jacek Kugler, and Paul J. Zak 687
physical capital in production, d [ @0,1# , with r 2 d the net interest rate. Using~A1.6! and ~A1.7!, factor prices wt and Rt11 are the marginal product of effectivelabor and the marginal product of capital plus one minus depreciation,
wt 5 ~1 2 a!E $~Kt ~1 2 St !!axt12a ~Nt ht !2a %, ~A1.8!
Rt11 5 1 1 aE $~Kt11~1 2 St11!!a21 ~xt11 Nt11 ht11!12a % 2 d. ~A1.9!
Conditions ~A1.8! and ~A1.9! show that political instability, S , reduces both wagesand the return to savings, while political capacity raises both w and R . Note that~A1.6! and ~A1.8! indicate that the aggregate wages paid to labor are a fixedproportion of output, wt ht Nt 5 ~1 2 a!E $Yt %.
Substituting wage ~A1.8! into the first order condition for births ~A1.4! pro-duces the equilibrium births equation ~1! in the text. Similarly, putting ~A1.8!into the savings relation ~A1.5!, we obtain the equilibrium savings function ~2!.
A1.3. The Politics of Policy-Setting
Aggregating the taxes paid by working agents shows that the government receivestax revenue, twhN . Using the production function ~A6! and equilibrium wage~A8!, tax revenue can be written as t~1 2 a!Y, which shows it is a proportion ofaggregate output. The reactive portion of government policy, police expendi-tures, is a fixed proportion s [ @0,1! of tax revenue. The remaining tax revenueis spent on proactive policies that enhance income growth. Tax revenues andexpenditures balance at each time t , producing the government budget constraint24
~1 2 s!~1 2 a!tt Yt 5 xt , ~A1.10!
where Yt is given by ~A1.6!.Since output is increasing in physical capital, politicians choose the tax rate t
and spending x to maximize expected capital deepening,25
Maxt EKt11
Kt. ~A1.11!
This maximization is subject to two constraints, the government budget balancerelation ~A1.10! and the equilibrium law of motion for physical capital which isfound by summing the savings of working agents, ~A1.5!, using the equilibriumwage ~A1.8!. The capital market clearing condition shows that aggregate savings attime t funds the capital stock at time t11,
Kt11 5 E $b~1 2 a!~1 2 tt !~Kt ~1 2 St !!a ~xt Nt ht !12a %. ~A1.12!
The solution to ~A1.11!, which holds in expected value, generates a spendingplan for political capacity, Ext
*,
Ext* 5 @E ~1 2 s!~1 2 a!2Kt
a ~1 2 St !a ~Nt ht !12a #10a. ~A1.13!
After this plan and the tax rate are determined, the stochastic portion of politicalinstability e is observed, establishing the potential impact of antigovernment
24 For simplicity, government borrowing is ignored.25 A full discussion of this method of setting government policy can be found in Zak, 1997, and Ghate and Zak,
1999.
688 Politics of Fertility and Economic Development
demonstrations on the economy as well as tax revenue. Spending on the police,which is nonstochastic, is given implicitly by
pt* 5 s~1 2 s!~12a!0a ~1 2 a!20aKt ~1 2 S ~Yt21 , pt
*,et !!~Nt ht !~12a!0. ~A1.14!
Police expenditures—the highest priority spending—follow rule ~A1.14!, whilespending on growth-enhancing policies is the residual of actual tax revenue afterfunding the police, which, on average, follows proactive spending rule ~A1.13!.Under a technical condition, ~A1.14! indicates that governments optimally increasespending on the police when political discontent e increases, and decrease policespending when the economy grows such that physical and0or human capitalincrease.26
Because maintenance of public order is the government’s top priority, theproactive spending plan ~A1.13! holds on average, but will not hold at everypoint in time. The actual amount of political capacity is xt
* 5 Ext* 1 Dt , where
the difference between actual and expected tax revenues is Dt 5 ~1 2 s!10a
~1 2 a!20aKt ~Nt ht !~12a!0a @1 2 St 2 $E ~1 2 St !
a %10a # .27 Loosely speaking, the termD is positive or negative if the effect of political instability on the economyexceeds or falls below its expected value.28
Equation ~A1.13! is the maximal value of government programs that stimulatecapital accumulation, which takes into account both the increase in output andthe impact on the future level of the capital stock from the taxes that fundgovernment programs. The derivation shows that political capacity is increasingin physical capital, K , and in aggregate human capital, Nh . Observe that whenthe production function parameter a is less than half, political capacity increasesfaster than linearity in aggregate human capital.29 Thus, the accumulation ofhuman capital, typically measured by education or literacy, is an importantcontributor to a nation’s political strength. Relation ~A1.13! also reveals twoeffects through which political instability, S , affects political capacity, x *. First,political instability directly reduces a country’s productive capacity by destroyingpart of the physical capital stock. By this income effect, an increase in politicalinstability reduces output and thus tax revenue by ~A1.10! which reduces thegovernment’s ability to fund productivity-enhancing projects. Second, by thesubstitution effect, when political instability rises the government’s first priority isto raise expenditures on the police by ~A1.14!. For a given tax rate t, suchpreemptive reallocation decreases policy discretion of the government. Thus,unstable governments are less politically capable because of the combined impactof the income and substitution effects.
We now relate political capacity to demography. Using the condition for thedesired number of children ~A1.4! ~assuming bt
* . 1! and equilibrium wages~A1.8!, we can write political capacity as a function of births,
Ext* 5 @Eg0~11g! ~1 2 a!2D ~1 2 St !aKt
a ~Nt ht !12abt* # ~10~12a!!. ~A1.15!
26 The technical condition is 2dS0dP . 10 @s~1 2 s!~12a!0a~1 2 a!20aKt ~Nt ht !~12a!0a # which we assume holds
throughout the analysis.27 Because the government budget constraint holds with certainty, the tax rate can be shown to be a constant,
t* 5 1 2 a. This follows from the timing of the game: choose the expected value for proactive policy Ex *, thenobserve the shock e as the period begins and allocate police spending p * to combat instability S , collect taxrevenue, and then use the tax revenue less police spending for political capacity.
28 Due to the nonlinearity of the expression for D, the condition for D . 0 requires that 1 2 St . @E ~1 2St !
a #10a. Interestingly, this derivation shows that the variance of government spending is proportional to thevariance in political violence.
29 The parameter a is the share of output paid to physical capital which is typically measured at one third; seeCooley, 1995: ch. 1.
Yi Feng, Jacek Kugler, and Paul J. Zak 689
Equation ~A1.15! shows that the optimal political capacity falls as births increasebecause, as the population grows, the demand for public goods supplied by thegovernment rises. Meeting this demand stretches the resources of the govern-ment, reducing political capacity.
The derivation of political capacity via ~A1.11! shows that government policy isstrategic. Because the derivation of optimal government policy uses the equilib-rium law of motion for physical capital that is based on optimal individualbehavior, the resulting policy takes into account how individuals will react tochanges in government actions t, p , and x. That is, the solution to ~A1.11! is aNash equilibrium of the Stackelberg game played by the government and citi-zens, with the government being the first mover. Once the government haschosen the optimal tax rate, t*, police spending, p *, and political capacity, x *,individuals execute their optimal choices for births and savings as given by ~A1.4!and ~A1.5!.
A political-economic equilibrium for this model is a set of prices $wt , Rt11% for t 50, 1, 2, . . . , such that given these prices, the law of motion for human capital ~4!,a sequence of government policies $tt , xt , pt % for t 5 0, 1, 2, . . . , initial values ofphysical capital K0 . 0, human capital h0 . 0, and population N0 . 0, consum-ers maximize utility by solving ~A1.1!–~A1.3!, firms maximize profits by solving~A1.7!, the government sets policy to maximize capital deepening and securityusing ~A1.13! and ~A1.14!, and all markets clear. At each time t , an equilibriumexists and is unique because the objective functions of consumers and firms arestrictly concave.
Appendix 2. Operationalization of Relative Political Extraction ~RPE!
The following concept advanced by Organski and Kugler ~1980:74! lays thefoundation for the measurement of relative political capacity. As governmentoperations depend upon resources extracted from the population, governmentscannot survive—let alone govern—without such resources.
Taxes are exact indicators of governmental presence. Few operations of govern-ments depend so heavily on popular support—or on fear of punishment. Rev-enues affect so directly the lives of most individuals in society, and few areavoided so vigorously. Without some form of tax revenue, there is no nationalunity, and no control. Failure to impose and extract taxes is one of the essentialindicators of governmental incapacity to obtain and maintain support.
Guided by this theoretical principle, Arbetman and Kugler ~1995! create ameasure of relative political extraction ~RPE! obtained in three steps. First, anordinary least squares regression is run on the following model:30
Tax
GDP5 b0 1 b1~time ! 1 b2SMining
GDP D2 b3S Agriculture
GDP D1 b4S Exports
GDP D1 e.
In the second step, the predicted value for the tax ratio is obtained using theparameter estimates derived from the first step. In the third step, the followingratio is calculated:
Relative Political Extraction 5Actual Government Revenue
Predicted Government Revenue.
30 The adjusted R2 for this regression is 0.3904.
690 Politics of Fertility and Economic Development
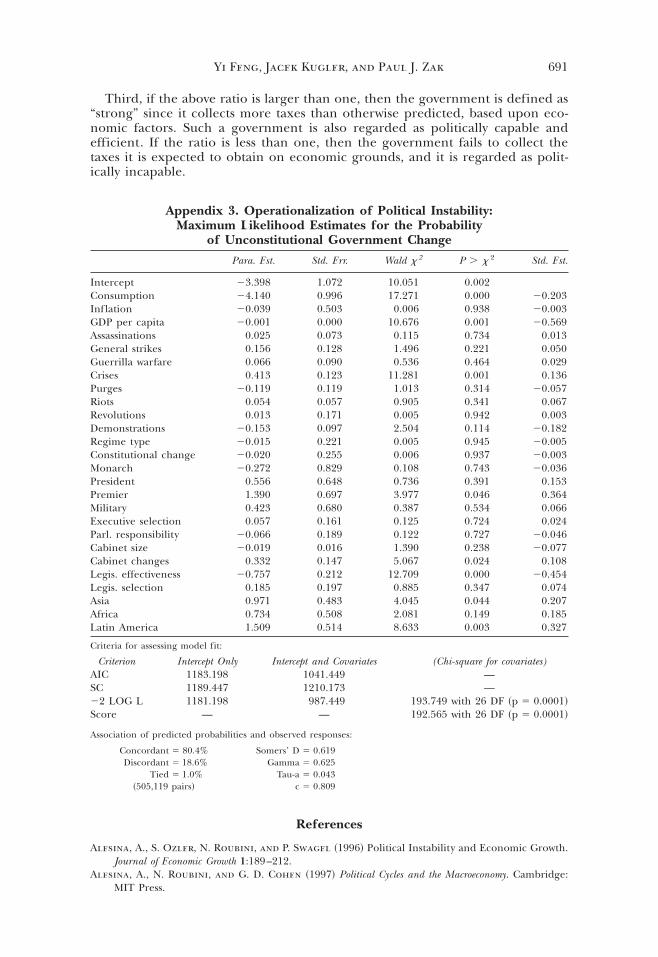
Third, if the above ratio is larger than one, then the government is defined as“strong” since it collects more taxes than otherwise predicted, based upon eco-nomic factors. Such a government is also regarded as politically capable andefficient. If the ratio is less than one, then the government fails to collect thetaxes it is expected to obtain on economic grounds, and it is regarded as polit-ically incapable.
Appendix 3. Operationalization of Political Instability:Maximum Likelihood Estimates for the Probability
of Unconstitutional Government Change
Para. Est. Std. Err. Wald x2 P . x 2 Std. Est.
Intercept 23.398 1.072 10.051 0.002Consumption 24.140 0.996 17.271 0.000 20.203Inflation 20.039 0.503 0.006 0.938 20.003GDP per capita 20.001 0.000 10.676 0.001 20.569Assassinations 0.025 0.073 0.115 0.734 0.013General strikes 0.156 0.128 1.496 0.221 0.050Guerrilla warfare 0.066 0.090 0.536 0.464 0.029Crises 0.413 0.123 11.281 0.001 0.136Purges 20.119 0.119 1.013 0.314 20.057Riots 0.054 0.057 0.905 0.341 0.067Revolutions 0.013 0.171 0.005 0.942 0.003Demonstrations 20.153 0.097 2.504 0.114 20.182Regime type 20.015 0.221 0.005 0.945 20.005Constitutional change 20.020 0.255 0.006 0.937 20.003Monarch 20.272 0.829 0.108 0.743 20.036President 0.556 0.648 0.736 0.391 0.153Premier 1.390 0.697 3.977 0.046 0.364Military 0.423 0.680 0.387 0.534 0.066Executive selection 0.057 0.161 0.125 0.724 0.024Parl. responsibility 20.066 0.189 0.122 0.727 20.046Cabinet size 20.019 0.016 1.390 0.238 20.077Cabinet changes 0.332 0.147 5.067 0.024 0.108Legis. effectiveness 20.757 0.212 12.709 0.000 20.454Legis. selection 0.185 0.197 0.885 0.347 0.074Asia 0.971 0.483 4.045 0.044 0.207Africa 0.734 0.508 2.081 0.149 0.185Latin America 1.509 0.514 8.633 0.003 0.327
Criteria for assessing model fit:
Criterion Intercept Only Intercept and Covariates (Chi-square for covariates)AIC 1183.198 1041.449 —SC 1189.447 1210.173 —22 LOG L 1181.198 987.449 193.749 with 26 DF ~p 5 0.0001!Score — — 192.565 with 26 DF ~p 5 0.0001!
Association of predicted probabilities and observed responses:
Concordant 5 80.4% Somers’ D 5 0.619Discordant 5 18.6% Gamma 5 0.625
Tied 5 1.0% Tau-a 5 0.043~505,119 pairs! c 5 0.809
References
Alesina, A., S. Ozler, N. Roubini, and P. Swagel ~1996! Political Instability and Economic Growth.Journal of Economic Growth 1:189–212.
Alesina, A., N. Roubini, and G. D. Cohen ~1997! Political Cycles and the Macroeconomy. Cambridge:MIT Press.
Yi Feng, Jacek Kugler, and Paul J. Zak 691
Arbetman, M., and J. Kugler ~1995! “The Politics of Inflation: An Empirical Assessment of theEmerging Market Economies.” In Establishing Monetary Stability in Emerging Market Economies,edited by T. D. Willett, R. C. K. Burdekin, R. J. Sweeney, and C. Whilborg. Boulder, CO:Westview Press.
Arbetman, M., and J. Kugler, eds. ~1997! Political Capacity and Economic Behavior. Boulder, CO:Westview Press.
Azariadis, C. ~1993! Intertemporal Macroeconomics. New York: Basil Blackwell.Azariadis, C. ~1997! The Economics of Poverty Traps, Part One: Complete Markets. Journal of
Economic Growth 1:449–486.Banks, A. S. ~1996! Cross-National Time-Series Data. Binghamton, NY: SUNY Binghamton.Barro, R. J. ~1991! Economic Growth in a Cross-Section of Countries. Quarterly Journal of Economics
106:407–444.Barro, R. J. ~1997! Determinants of Economic Growth. Cambridge: MIT Press.Barro, R. J., and X. Sala-i-Martin ~1997! Technological Diffusion, Convergence and Growth. Jour-
nal of Economic Growth 2:1–26.Beck, N., and J. N. Katz ~1995! What to Do ~And Not to Do! with Time-Series and Cross-Section
Data. American Political Science Review 89:634–647.Becker, G. S., and R. J. Barro ~1988! A Reformulation of the Economic Theory of Fertility. Quarterly
Journal of Economics 53:1–25.Becker, Gary S., K. M. Murphy, and R. Tamura ~1990! Human Capital, Fertility, and Economic
Growth. Journal of Political Economy 98:S12–S37.Becker, G. S., and N. Tomes ~1976! Child Endowments and the Quantity and Quality of Children.
Journal of Political Economy 84:S143–S162.Behrman, J., and P. Taubman ~1989! Is Schooling “Mostly in the Genes”? Nature-Nurture, Decom-
position Using Data on Relatives. Journal of Political Economy 97:1425–1446.Benson, M., and J. Kugler ~1998! Power Parity, Democracy, and the Severity of Internal Violence.
Journal of Conflict Resolution 42:196–209.Birdsall, N. ~1988! “Economic Approaches to Population Growth.” In Handbook of Development
Economics, Vol. 1, edited by H. Chenery and T. N. Srivivasan. New York: Elsevier Science.Blinder, A., and A. Deaton ~1985! “The Time-Series Consumption Function Revisited.” In Brookings
Papers on Economic Activity 2, edited by W. C. Brainard and G. L. Perry. Washington, DC:Brookings Institution.
Bong, E. W., P. Wang, and C. K. Yip ~1996! A General Two-Sector Model of Endogenous Growth withHuman Capital: Balanced Growth and Transitional Dynamics. Journal of Economic Theory32:1667–1717.
Bongaarts, J., W. P. Mauldin, and J. F. Phillips ~1990! The Demographic Impact of Family PlanningPrograms. Studies in Family Planning 21:299–310.
Burdett, K., and M. G. Coles ~1997! Marriage and Class. Quarterly Journal of Economics 112:141–168.Camp, S. L. ~1993! Population: The Critical Debate. Foreign Policy 90:126–144.Cawley, J., K. Conneely, J. Heckman, and E. Vytlacil ~1996! Measuring the Effects of Cognitive
Ability. NBER Working Paper No. 5645.Ceci, S. J., and W. M. Williams ~1997! Schooling, Intelligence and Income. American Psychologist
52:1051–1058.Chen, B., and Y. Feng ~1996! Some Political Determinants of Economic Growth: Theory and Empir-
ical Implications. European Journal of Political Economy 12:609–627.Coale, A. J. ~1975! “The Demographic Transition.” In The Population Debate: Dimensions and Perspec-
tives, Vol. 1. New York: The United Nations.Cooley, T. F., ed. ~1995! Frontiers of Business Cycle Research. Princeton, NJ: Princeton University Press.Cukierman, A., S. Edwards, and G. Tabellini ~1992! Seigniorage and Political Instability. American
Economic Review 82:537–555.Demeny, P. ~1989! World Population Growth and Prospects. Working Paper No. 4, The Research
Division of the Population Council.Diamond, P. A. ~1965! National Debt in a Neoclassical Growth Model. American Economic Review
55:1026–1050.Downey, D. B. ~1995! When Bigger Is Not Better: Family Size, Parental Resources, and Children’s
Educational Performance. American Sociological Review 60:746–761.Feng, Y. ~1997! Democracy, Political Stability and Economic Growth. British Journal of Political Science
27:391–418.Feng, Y. ~2000! Democracy, Governance and Economic Performance: Theory, Statistical Analysis and
Case Studies. Manuscript. Claremont Graduate University.
692 Politics of Fertility and Economic Development
Feng, Y., and P. J. Zak ~1999! The Determinants of Democratic Transitions. Journal of Conflict Resolu-tion 43:162–177.
Fiorina, M. P. ~1981! Retrospective Voting in American National Elections. New Haven, CT: Yale UniversityPress.
Francisco, R. A. ~1996! Coercion and Protest: An Empirical Test in Two Democratic States. AmericanJournal of Political Science 40:1179–1204.
Freedman, L. P. ~1994! Family Planning as an Instrument of Empowerment. International FamilyPlanning Perspectives 20:31–33.
Galor, O., and D. Tsiddon ~1997! The Distribution of Human Capital and Economic Growth. Journalof Economic Growth 2:93–124.
Galor, O., and J. Zeira ~1993! Income Distribution and Macroeconomics. Review of Economic Studies60:35–52.
Ghate, C., and P. J. Zak ~1999! Cycles, Thresholds and Growth: The Politics of Fiscal Policy. WorkingPaper. Claremont Graduate University.
Gupta, D. K., H. Singh, and T. Sprague ~1993! Government Coercion of Dissidents: Deterrence orProvocation? Journal of Conflict Resolution 37:301–339.
Hanushek, E. A. ~1992! The Trade-off between Child Quantity and Quality. Journal of Political Econ-omy 100:84–117.
Lewis-Beck, M. S. ~1990! Economics and Elections: The Major Western Democracies. Ann Arbor: Universityof Michigan Press.
Lucas, R. E., Jr. ~1988! On the Mechanics of Economic Development. Journal of Monetary Economics22:1–42.
Magee, S., W. A. Brock, and L. Young ~1989! Black Hole Tariffs and Endogenous Policy Theory. Cam-bridge: Cambridge University Press.
McGuire, M. C., and M. Olson ~1996! The Economics of Autocracy and Majority Rule: The InvisibleHand and the Use of Force. Journal of Economic Literature 34:72–96.
Murray, C. ~1997! IQ and Economic Success. The Public Interest 128:21–35.Notestein, F. ~1945! “Population, The Long View.” In Food for the World, edited by T. W. Schultz.
Chicago: University of Chicago Press.Organski, A. F. K., and J. Kugler ~1980! The War Ledger. Ann Arbor: University of Michigan Press.Organski, A. F. K., J. Kugler, T. Johnson, and Y. Cohen ~1984! Birth, Death and Taxes: Political and
Economic Transition. Chicago: University of Chicago Press.Pritchett, L. ~1997! Divergence, Big Time. Journal of Economic Perspectives 11:3–17.Quah, D. T. ~1997! Empirics for Growth and Distribution: Stratification, Polarization and Conver-
gence Clubs. Journal of Economic Growth 2:27–60.Razin, A., and C. W. Yuen ~1993! Convergence in Growth Rates: A Quantitative Assessment of the
Role of Capital Mobility and International Taxation. NBER Working Paper No. 4336.Samuelson, P. ~1958! An Exact Consumption-Loan Model of Interest with or without the Social
Contrivance of Money. Journal of Political Economy 66:467–482.Sinding, S., J. Ross, and A. Rosenfeld ~1994! Seeking Common Ground: Unmet Need and the
Demographic Goals. International Family Planning Perspectives 20:23–28.Stokey, N. L. ~1996! Free Trade, Factor Returns, and Factor Accumulation. Journal of Economic Growth
1:421–447.Summers, R., and A. Heston ~1995! The Penn World Table (Mark 5.6). National Bureau of Economic
Research.Tamura, R. ~1996! From Decay to Growth: A Demographic Transition to Economic Growth. Journal
of Economic Dynamics and Control 20:1237–1261.Thompson, W. S. ~1929! Population. American Journal of Sociology 34:959–975.Tufte, E. ~1978! Political Control of the Economy. Princeton, NJ: Princeton University Press.Venieris, Y., and D. Gupta ~1986! Income Distribution and Socio-Political Instability as Determinants
of Savings: A Cross-Sectional Model. Journal of Political Economy 94:873–883.Zak, P. J. ~1997! Institutions, Property Rights and Growth. Working Paper. Claremont Graduate
University.Zak, P. J. ~1999! Genetics, Family Structure and Economic Growth. Working Paper. Claremont Grad-
uate University.Zak, P. J., and Y. Feng ~1998! A Dynamic Theory of the Transition to Democracy. Working Paper.
Claremont Graduate University.
Yi Feng, Jacek Kugler, and Paul J. Zak 693
Copyright © 2022 FDOKUMEN