Availability of Coal Resources in Illinois: Mt. Carmel Quadrangle, Southeastern Illinois

This article was downloaded by: [University of Illinois at Urbana-Champaign]On: 27 November 2012, At: 06:31Publisher: Taylor & FrancisInforma Ltd Registered in England and Wales Registered Number: 1072954 Registeredoffice: Mortimer House, 37-41 Mortimer Street, London W1T 3JH, UK
Communications in Soil Science andPlant AnalysisPublication details, including instructions for authors andsubscription information:http://www.tandfonline.com/loi/lcss20
Soil Fertility Status of Soils in IllinoisFabián G. Fernández a , Bhupinder S. Farmaha a & Emerson D.Nafziger aa Department of Crop Sciences, University of Illinois, Urbana,Illinois, USAAccepted author version posted online: 20 Sep 2012.Version ofrecord first published: 26 Nov 2012.
To cite this article: Fabián G. Fernández , Bhupinder S. Farmaha & Emerson D. Nafziger (2012): SoilFertility Status of Soils in Illinois, Communications in Soil Science and Plant Analysis, 43:22, 2897-2914
To link to this article: http://dx.doi.org/10.1080/00103624.2012.728268
PLEASE SCROLL DOWN FOR ARTICLE
Full terms and conditions of use: http://www.tandfonline.com/page/terms-and-conditions
This article may be used for research, teaching, and private study purposes. Anysubstantial or systematic reproduction, redistribution, reselling, loan, sub-licensing,systematic supply, or distribution in any form to anyone is expressly forbidden.
The publisher does not give any warranty express or implied or make any representationthat the contents will be complete or accurate or up to date. The accuracy of anyinstructions, formulae, and drug doses should be independently verified with primarysources. The publisher shall not be liable for any loss, actions, claims, proceedings,demand, or costs or damages whatsoever or howsoever caused arising directly orindirectly in connection with or arising out of the use of this material.

Communications in Soil Science and Plant Analysis, 43:2897–2914, 2012Copyright © Taylor & Francis Group, LLCISSN: 0010-3624 print / 1532-2416 onlineDOI: 10.1080/00103624.2012.728268
Soil Fertility Status of Soils in Illinois
FABIÁN G. FERNÁNDEZ, BHUPINDER S. FARMAHA,AND EMERSON D. NAFZIGER
Department of Crop Sciences, University of Illinois, Urbana, Illinois, USA
Our objective was to survey the phosphorus (P), potassium (K), pH, calcium (Ca),magnesium (Mg), and organic-matter (OM) levels of soils in Illinois, including thedegree of nutrient vertical stratification. Soil samples were collected from depths of0–8 and 8–18 cm in 547 randomly chosen fields throughout Illinois and analyzed fornutrients, pH, and OM. Forty-six percent of samples were below the critical range forK (130 to 150 mg K kg−1), and 59% of samples were above the soil P levels, requiringno additional fertilization. Soil pH ranged from 4.7 to 8.1. Mean Ca and Mg levels werenonlimiting for crop production, and OM was correlated (R2 = 0.690) with corn grainyield. Vertical stratification (surface/subsurface ratio) was 2.4:1 for P and 1.5:1 forK. Many fields with greater than needed P levels and less than suggested levels for Kpresent opportunities for improvement in fertilizer management.
Keywords Fertilizer rates, nutrient stratification, soil fertility
Introduction
Illinois has more than 10 million ha of cropland, producing an estimated $8.6 billion forthe state (2000–2009 mean) (USDA-NASS Quick Stats 2010). A substantial portion ofthis area has some of the most productive soils in the world, most of which are used toproduce corn (Zea mays L.) and soybean [Glycine max (L.) Merr.]. Even though manysoils in Illinois are highly productive, phosphorus (P) and potassium (K) fertilization andpH correction with limestone applications are often needed to maintain high productivity.Like most land-grant universities, the University of Illinois has a set of recommendationsfor P, K, and limestone applications to help guide producers on the fertilizer and limeinputs needed to maximize productivity while minimizing potential negative impacts tothe environment (Fernández and Hoeft 2009).
Fertilizer recommendations for the application of P and K fertilizers in Illinois weredeveloped by relating soil-test levels and yield-response curves generated from fertilizerrate studies. The yield-response curve can be divided into three major segments: (1) aresponsive segment where increasing soil-test levels increases yield; (2) a segment at whichadditional application of P and K will not produce an increase in yields; and (3) a main-tenance segment that falls between the previous two segments. The point between theresponsive and maintenance segments is defined as the critical level (CL) where near max-imum yields can be achieved. Producers are encouraged to maintain test levels within themaintenance segment by applying amounts of P and K equal to removal by the harvested
Received 29 April 2011; accepted 18 July 2011.Address correspondence to Fabián G. Fernández, Department of Crop Sciences, N-315 Turner
Hall, MC-046, 1102 South Goodwin Avenue, Urbana, IL 61801, USA. E-mail: [email protected]
2897
Dow
nloa
ded
by [
Uni
vers
ity o
f Il
linoi
s at
Urb
ana-
Cha
mpa
ign]
at 0
6:31
27
Nov
embe
r 20
12

2898 F. G. Fernández, B. S. Farmaha, and E. D. Nafziger
portion of the crop. When soil-test levels are above the maintenance segment of theresponse curve, it is recommended to stop additional application of fertilizers to drawdownsoil-test levels. This strategy is designed to improve the return on the fertilizer investmentand to prevent excessive soil-test levels that can pose environmental risks or adverselyaffect other nutrients in the system.
Parent material and degree of weathering were the most important factors consideredin delineating three major soil P-supplying power regions in the state (Fernández and Hoeft2009). The CLs for the high-, medium-, and low-P supplying region are 15, 20, and 23 mgP kg−1, respectively. Applying additional P fertilizer when soil-test levels are more than 30,33, and 35 mg P kg−1 for the high-, medium-, and low-P-supplying regions, respectively,is not recommended. The state is also divided into two major K-supplying power regionsassociated with the cation exchange capacity (CEC) of the soil. The low-K-supplyingregion (CEC <12 meq 100 g−1) is located in the southern one-third portion of thestate where soils are more highly weathered than the high-K-supplying region (≥12 meq100 g−1) soils in the northern two thirds of the state. Within the high-K-supplying region,some soils are categorized as low K supplying because they are high in sand content (lowCEC). The critical soil K levels are 130 and 150 mg kg−1 for the low- and high-K-supplyingregions, respectively. It is not recommended to apply additional K when soil-test levels aremore than 180 and 200 mg kg−1, for the low- and high-K-supplying regions, respectively.Maintaining soil pH for corn and soybean production between 6.0 and 6.5 is recommended.
Although having accurate information for a specific field is critical to guide fertilizerapplications in that particular field, knowing the fertility status of soils across Illinois can beimportant to help target statewide efforts to enhance nutrient management both in terms ofagricultural production and environmental considerations. This approach has been used inIllinois in the past. More than 100 years ago, Hopkins and Pettit (1908) published a surveyentitled “The fertility in Illinois soils.” Another similar survey was conducted between1967 and 1969 (Walker et al. 1968, 1969, 1970). These surveys provide benchmarks of thenutrient status of soils in Illinois, allowing us to track overall changes in soil fertility andeffectively address concerns and improve nutrient management.
Finally, since the earlier surveys by Hopkins and Pettit (1908) and Walker et al. (1968,1969, 1970) conservation or reduced-tillage practices have been more widely adopted byIllinois farmers (Illinois Department of Agriculture 2006). The adoption of these practicescan result in vertical stratification of some nutrients in the soil profile (Crozier et al. 1999;Holanda et al. 1998; Howard et al. 1999). Stratification can reduce nutrient availability ifthe soil surface dries out and can create challenges in obtaining accurate soil-test informa-tion if soil samples are not collected from the appropriate depth (Bordoli and Mallarino1998; Fernández et al. 2008; James and Wells 1990; Kaspar, Zahler, and Timmons 1989;Koenig, Barnhill, and Hurst 2000; Yin and Vyn 2002). Despite all these important issues,there is no current statewide information on the degree of nutrient stratification or on thefertility status of soils [including P, the cations K, calcium (Ca), and magnesium (Mg), andpH] to help direct research to improve nutrient management.
The objective of this study was to determine through survey the P, K, pH, Ca, Mg,and organic matter (OM) levels of soils in Illinois, including the degree of nutrient verticalstratification.
Materials and Methods
Soil samples were collected from randomly selected fields in 2007 and 2008, primarily bypersonnel conducting the long-running European Corn Borer Survey. Soil samples were
Dow
nloa
ded
by [
Uni
vers
ity o
f Il
linoi
s at
Urb
ana-
Cha
mpa
ign]
at 0
6:31
27
Nov
embe
r 20
12

Soil Fertility Status of Soils in Illinois 2899
Figure 1. Illinois county map with sample locations surveyed in 2007 and 2008 and the corre-sponding P-supplying regions broadly defined by parent material and degree of weathering (A) andK-supplying regions broadly defined in function of soil cation exchange capacity (CEC) (B).
taken from a total of 547 randomly selected fields in 51 of the 102 counties in Illinois.Sample locations are overlaid in a map of the P- and K-supplying regions of Illinois inFigures 1A and B. The sampling density ranged from 1 to 25 samples per county withmedian and mean values of 10.0 and 10.7 samples per county, respectively. Samples werecollected prior to harvest of the corn crop during September and October. This approachprevented sampling fields with very recent fertilizer applications.
A six-core (2-cm diameter) composite sample was taken from each field within a 3-m-diameter area that was georeferenced at the time of sampling. Most samples were dividedinto soil depth increments of 0–8 and 8–18 cm; those few left undivided were used forgeneral fertility levels only. Samples were air dried and ground to pass through a 1-mmsieve. Samples were analyzed for Bray P1 (Bray and Kurtz 1945); ammonium acetate–extractable K, Ca, and Mg (Warncke and Brown 1998); pH water (1:1v/v) (Thomas1996); and OM by loss of weight on ignition (LOI) at 360 ◦C (Schulte and Hopkins1996).
Soil classification information for each sample location was obtained from the USDA-NRCS Web Soil Survey database (2011b). Historic information on number of cattle andswine production by county, crop area harvested, and crop yield information were obtainedfrom USDA-NASS Quick Stats (2010).
Fertilizer applications needed to build up soil P and K levels were estimated usingthe following information: fertilizer rate needed to increase P and K test levels [20 kgP2O5 ha−1 and 9 kg K2O ha−1 to increase P and K test levels by 1 mg kg−1, respectively(Fernández and Hoeft 2009)]; percentage of samples and mean soil-test level of samplestesting below CL; and the mean number of hectares (8,667,000) under corn and soybeanproduction in the state in 2007 and 2008.
Amounts of P and K fertilizer that can be withheld to draw down test levels to the upperlimit of the maintenance range were estimated using the following information: percentage
Dow
nloa
ded
by [
Uni
vers
ity o
f Il
linoi
s at
Urb
ana-
Cha
mpa
ign]
at 0
6:31
27
Nov
embe
r 20
12

2900 F. G. Fernández, B. S. Farmaha, and E. D. Nafziger
of samples in the survey testing above the maintenance range; the mean number of hectares(8,667,000) and mean corn (11.1 Mg ha−1) and soybean (3.0 Mg ha−1) yield produced inthe state in 2007 and 2008; and the amount of nutrient removal in seed [7.68 g P2O5 kg−1
seed−1 and 5.00 g K2O kg−1 seed−1 for corn, and 14.17 g P2O5 kg−1 seed−1 and 21.67 gK2O kg−1 seed−1 for soybean (Fernández and Hoeft 2009)].
Descriptive analysis of the data was conducted using the MEANS procedure andcomparison of soil-test values between soil depth samples was performed using the t-testprocedure of SAS (SAS Institute 2000). Regression analysis was used to determine variousrelationships.
Results and Discussion
Soil fertility surveys typically gather information from soil samples submitted to testinglaboratories. This approach has the benefit of generating a large database at relativelylow cost because it does not require sample collection from the field or chemical analy-sis by the investigator. This approach has been used over the years by the InternationalPlant Nutrition Institute (IPNI). One such report was released recently (International PlantNutrition Institute 2010). One of the potential drawbacks of this approach is the bias thatcan be introduced by the fact that the person submitting the samples is likely interestedin maintaining adequate fertility in the field and understands the importance of regularassessment of soil fertility. One of the unique aspects of the survey presented here is that,because the soil survey was done in random fields selected for a purpose other than theevaluation of soil fertility (the main focus was the European Corn Borer Survey) the surveyshould provide an excellent source of unbiased information that should closely representsthe actual soil fertility status of Illinois. One possible bias of this survey is that sampleswere collected only from fields with corn growing during the years of the survey and farm-ers applying P and K fertilizers in a biennial basis in a corn–soybean rotation would haveapplied sufficient levels for two successive crops only a year prior to the sampling.
Our survey represents a sampling density of 15,678 ha per sample for the state(547 samples over an average corn and soybean harvested area of 8,667,000 ha during2007–2008 [USDA-NASS Quick Stats 2010]). Approximately 45% of the soils in Illinoisare Mollisols, 45% are Alfisols, 7% are Entisols, and 2% are Inceptisols (USDA-NRCS2011a). In our soil survey 67, 28, 3, and 2% of the samples were Mollisols, Alfisols,Entisols, and Inceptisols, respectively. The survey represented 165 soil series out of themore than 600 series that have been recognized in Illinois (USDA-NRCS 2011a). The10 most extensive soil series in Illinois were represented in our survey (Table 1). Drummer,the most extensive soil series in Illinois, was also the most extensively sampled soil series inour survey. The Hickory soil series is the third most extensive in Illinois. Although this soilseries was not well represented in our survey (only one sample), this soil series is mostlyused for forest or pastures in Illinois (USDA-NRCS 2011a). Other soil series, besides thosein Table 1, for which there were more than 10 samples (number of samples in parenthe-ses) collected in our survey included Osco (22), Elliott (15), Fayette (12), Virden (12),Hoyleton (11), and Rozetta (11). In ideal natural conditions (no erosion to slightly erodedsoils with 0 to 2% slopes), productivity of Illinois soils under average management rangesfrom 43 to 130 (Olson et al. 2000). Soils in our survey (adjusted for erosion and slope con-ditions below ideal natural conditions) had a productivity index ranging from 67 to 130.All of these data indicate that overall our survey was representative of the different soils inIllinois.
Dow
nloa
ded
by [
Uni
vers
ity o
f Il
linoi
s at
Urb
ana-
Cha
mpa
ign]
at 0
6:31
27
Nov
embe
r 20
12

Soil Fertility Status of Soils in Illinois 2901
Table 1Ten most extensive soil series in Illinois and their respective land coverage (andpercentage of total land), and number of samples collected during the soil survey
(and percentage of total number of samples)
Soil seriesLand area
(ha ×1000)Percentage
of landaNumber of
samplesPercentageof samples
Drummer 648.0 4.5 32 5.9Tama 567.0 3.9 2 0.4Hickory 526.5 3.7 1 0.2Fayette 374.6 2.6 12 2.2Sable 374.6 2.6 13 2.4Flanagan 340.2 2.4 22 4.1Bluford 315.9 2.2 8 1.5Cisne 295.7 2.1 11 2.0Ipava 291.6 2.0 24 4.4Muscatine 279.5 1.9 6 1.1Total 4, 013.6 27.9 131 24.1
aBased on the approximate land area of Illinois of 14.4 million ha.
Table 2Descriptive statistics of various soil parameters for the top 18 cm of soil
across 547 fields in Illinois
Variable Minimum Maximum Median Mean
Phosphorus (mg kg−1) 1 576 39 51Potassium (mg kg−1) 31 794 152 172Calcium (mg kg−1) 404 6485 2047 2226Magnesium (mg kg−1) 37 1107 329 366OM (%) 0.9 8.9 3.2 3.3pH 4.7 8.1 6.7 6.7
Soil Phosphorus
Overall, in Illinois it is recommended to maintain soil P values between 15 and 35 mg kg−1
depending on the P-supplying region to maximize crop production (Fernández and Hoeft2009). Across the state, there was a wide range of P values (1 to 576 mg kg−1) with mean(51 mg kg−1) and median (39 mg kg−1) P values above the recommended maintenancerange of all three P-supplying regions (Table 2). A recent report of samples submitted tosoil-testing laboratories showed median P levels of 26 mg kg−1 for Illinois (InternationalPlant Nutrition Institute 2010) and a previous report showed a median test value of 36 mgkg−1 in 2001 and 2005 (Potash and Phosphate Institute 2005). These values are lower thanour survey and could reflect the fact that soil samples submitted to a commercial laboratoryare normally collected from fields where a fertilizer application may be suspected. We alsoobserved 78% (40 counties) and 57% (29 counties) of the 51 surveyed counties had mean Pand median P levels above the recommended maintenance range, respectively (Figure 2A).
Dow
nloa
ded
by [
Uni
vers
ity o
f Il
linoi
s at
Urb
ana-
Cha
mpa
ign]
at 0
6:31
27
Nov
embe
r 20
12

2902 F. G. Fernández, B. S. Farmaha, and E. D. Nafziger
Figure 2. Mean and median phosphorus (A) and potassium (B) soil test levels at the 0- to 18-cmdepth increment for 51 counties surveyed during 2007–2008. Numbers following the county nameindicate number of samples used to calculate nutrient concentrations for the county. Dark gray bandsrepresent the range of critical levels across the different P-supplying regions of Illinois (based onparent material and weathering) (A) and K-supplying regions of Illinois (based on cation exchangecapacity [CEC]) (B). Similarly, light gray bands represent the range of levels at which additionalapplication of P and K are not recommended because they are above the maintenance range for thevarious regions.
The number of samples testing below the CL within the different P-supplying regionsincreased from the high- to the low-P-supplying region, while the number of samples thattested above the upper limit of the maintenance range increased from the low- to high-P-supplying region (Table 3). Also, mean P values for each of the P-supplying regions weremore than the recommended upper limit of the maintenance range and maximum, median,and mean values increased from low- to high-P-supplying regions (Table 4). It is possiblethat relatively greater P availability present at depths below the 18-cm sampling depth inthe high-P-supplying region, compared to the low-P-supplying region, induced greater Puptake deeper in the soil and greater deposition on the soil surface in the form of cropresidue. We found no evidence of differential P management on the basis of potential cropyield since there was no correlation between soil productivity index (defined by Olson et al.2000) and P-test levels (Figure 3).
Wide adoption of conservation tillage systems across Illinois in which minimal soildisturbance occur can induce vertical stratification with greater levels in the surfacelayer when P is broadcast applied. This stratification in conservation tillage systems wasobserved by others (Crozier et al. 1999; Holanda et al. 1998; Howard, Essington, and Tyler1999). In our survey soil P analysis showed a surface (0–8 cm) to subsurface (8–18 cm)
Dow
nloa
ded
by [
Uni
vers
ity o
f Il
linoi
s at
Urb
ana-
Cha
mpa
ign]
at 0
6:31
27
Nov
embe
r 20
12

Soil Fertility Status of Soils in Illinois 2903
Table 3Number of samples and percentage of total number of samples below the University ofIllinois recommended critical test level (CL), above the maintenance range (AM), or at
maintenance soil test levels (between CL and AM) for the different phosphorus-supplyingpower regions (broadly defined based on parent material and weathering) and
potassium-supplying power regions (broadly defined basedon cation exchange capacity [CEC])
Below CL Maintenance AM
Region n CL (mg kg−1) AM (mg kg−1) Samples % Samples % Samples %
PhosphorusHigh 202 15 30 14 7 40 20 148 73Medium 168 20 33 26 16 41 24 101 60Low 177 23 35 60 34 41 23 76 43PotassiumHigh CEC 447 150 200 195 44 126 28 126 28Low CEC 78 130 180 47 60 20 26 11 14Low CEC
(sands)22 130 180 7 32 4 18 11 50
stratification ratio of 2.4:1 (Table 5). Measurements of P stratification ratios [surface(0–10 cm) to subsurface (10–20 cm)] measured by Holanda et al. (1998) showed littleor no P stratification with moldboard plow (1.3:1 or lower), but chisel plow had ratiosof 1.9:1 or greater and no-till had ratios of 2.2:1 or greater. The high ratio of stratifica-tion in our survey is likely an indication that most soils in Illinois are not being mixedextensively by tillage operations. Regression analysis of surface and subsurface P levelsshowed a positive linear relation (R2 = 0.782) (Figure 4A), which indicates a concomitantincrease in the subsurface layer as the P levels increase in the surface. Also, the regressionline was always below the 1:1 correlation line, indicating that there was greater P con-centration in the surface than the subsurface across all soil P levels. We observed that theratio of stratification was greater in the low-P-supplying region (2.8:1) than in the high-P-supplying region (2.1:1) (Table 5). This lends support to the idea that greater inherentP availability in the subsurface may be responsible for lowering P stratification. Further,changes in P stratification for the different P-supplying regions are not the result of changesin tillage practices across the regions because there were consistent stratification ratios forK (another nutrient with low mobility in the soil) across the P-supplying regions. Finally,it was observed that P levels were not affected by the different K-supplying power regionsbecause this delineation is not related to soil conditions affecting P supply.
A soil fertility survey similar to ours was done between 1967 and 1969 in Illinois(Walker et al. 1968, 1969, 1970). While the sampling depth may be slightly different(15 cm in the earlier survey and 18 cm in our survey) and the time of collection (in-seasonin the earlier survey and in fall in our survey) and locations may not match our survey,we observed that P levels have increased over time (Figure 5A). The mean P level in the1967–1969 survey was 31 mg P kg−1, which is 20 mg P kg−1 less than in the current sur-vey. In the earlier survey, 30% of the samples were less than the CL (15 mg kg−1) for P,whereas we found only 11% in this category. The earlier survey had a greater percentage ofsamples testing slightly below to slightly above the CL than the current survey. Conversely,
Dow
nloa
ded
by [
Uni
vers
ity o
f Il
linoi
s at
Urb
ana-
Cha
mpa
ign]
at 0
6:31
27
Nov
embe
r 20
12

Tabl
e4
Des
crip
tive
stat
istic
sof
vari
ous
soil
para
met
ers
for
the
top
18cm
ofso
ilat
the
diff
eren
tpho
spho
rus-
supp
lyin
gpo
wer
regi
ons
ofIl
linoi
s(b
road
lyde
fined
base
don
pare
ntm
ater
iala
ndw
eath
erin
g)an
ddi
ffer
entp
otas
sium
-sup
plyi
ngpo
wer
regi
ons
ofIl
linoi
s(b
road
lyde
fined
base
don
catio
nex
chan
geca
paci
ty[C
EC
])
Hig
h-P
regi
on(n
=20
2)M
ediu
m-P
regi
on(n
=16
8)L
ow-P
regi
on(n
=17
7)
Var
iabl
eM
inM
axM
edia
nM
ean
Min
Max
Med
ian
Mea
nM
inM
axM
edia
nM
ean
Phos
phor
us(m
gkg
−1)
657
643
601
407
3952
119
732
40Po
tass
ium
(mg
kg−1
)43
639
152
179
4970
116
517
831
794
146
158
Cal
cium
(mg
kg−1
)40
446
5319
1120
5671
158
1220
7422
7074
364
8522
4823
80M
agne
sium
(mg
kg−1
)37
857
273
298
5910
3130
034
292
1107
471
467
OM
(%)
0.9
6.6
2.7
2.8
1.2
6.2
3.4
3.4
1.7
8.9
3.6
3.8
pH4.
78.
06.
86.
85.
28.
06.
56.
65.
18.
16.
86.
8
Hig
h-C
EC
regi
on(n
=44
7)L
ow-C
EC
regi
on(n
=78
)L
ow-C
EC
(san
ds)
regi
on(n
=22
)
Phos
phor
us(m
gkg
−1)
157
638
513
150
4448
316
852
63Po
tass
ium
(mg
kg−1
)43
794
158
179
3131
011
912
771
377
173
188
Cal
cium
(mg
kg−1
)71
164
8521
4123
4474
344
9815
6316
5840
439
4117
5618
59M
agne
sium
(mg
kg−1
)37
1107
376
400
5952
415
217
552
857
334
362
OM
(%)
1.2
8.9
3.3
3.5
1.3
5.2
2.4
2.5
0.9
6.1
3.4
3.2
pH4.
78.
16.
76.
75.
28.
06.
76.
65.
08.
06.
66.
6
2904
Dow
nloa
ded
by [
Uni
vers
ity o
f Il
linoi
s at
Urb
ana-
Cha
mpa
ign]
at 0
6:31
27
Nov
embe
r 20
12

Soil Fertility Status of Soils in Illinois 2905
Figure 3. Relationship between soil productivity index and mean soil-test P levels at the 0- to 18-cmdepth increment for 51 counties measured during the 2007–2008 Illinois soil survey.
compared to the earlier survey, the new survey had 2.2 times greater relative frequency ofsamples testing in the very high (>50 mg kg−1) soil P level category.
It is not clear what factor or factors contributed to the large number of samples testingvery high (>50 mg P kg−1) in our survey (Figure 5A). It is possible that P levels haveincreased as crops are continually removing nutrients from subsurface layers below thestandard soil sampling depth and depositing nutrients in the form of crop residue on thesoil surface. While frequent manure applications are often associated with high soil-testP and K levels, we found no correlation between the number of animals produced percounty (for the time period elapsed between the survey conducted in the late 1960s andour survey) and soil-test P levels (Figure 6). Finally, another possibility is that less thanexpected P removal rates during marginal-yielding years or greater rates of applicationthan those needed to maximize production have over time built up test levels.
Soil Potassium
Current recommendations across Illinois indicate maximum crop production can beobtained when soil K levels are maintained between 130 and 200 mg kg−1 (Fernándezand Hoeft 2009). The survey showed a wide range of K values across the state (31 to794 mg kg−1) with mean (172 mg kg−1) and median (152 mg kg−1) values within therecommended maintenance range (Table 2). A recent report of samples submitted to soil-testing laboratories showed median K levels of 179 mg kg−1 for Illinois (InternationalPlant Nutrition Institute 2010) and a previous report showed a median test value of 178 mgkg−1 in 2005 (Potash and Phosphate Institute 2005). These median values are also withinthe recommended maintenance range for Illinois. For individual counties we also observedthat most (36 counties) were within the maintenance range; only 8 counties (16%) hadmean K levels of more than the maintenance range and 7 counties (14%) had less than theCL (Figure 2B).
Across the three K-supplying regions there was a large number of samples (249 outof 547) testing below CL, but the low-K-supplying region had the most with 60% ofthe surveyed fields testing below CL (Table 3). Mean and median soil K levels wereabove the CL for the high- and low- (sand) K-supplying power regions of the state, butmean and median values were below the CL for the low-K-supplying region (Table 4).
Dow
nloa
ded
by [
Uni
vers
ity o
f Il
linoi
s at
Urb
ana-
Cha
mpa
ign]
at 0
6:31
27
Nov
embe
r 20
12
2906 F. G. Fernández, B. S. Farmaha, and E. D. Nafziger
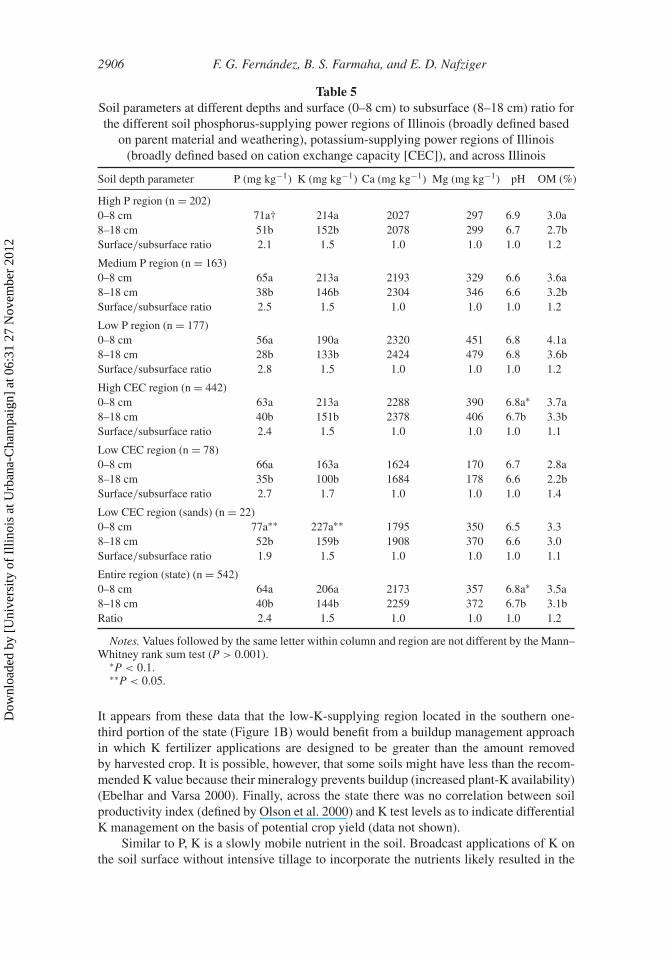
Table 5Soil parameters at different depths and surface (0–8 cm) to subsurface (8–18 cm) ratio forthe different soil phosphorus-supplying power regions of Illinois (broadly defined based
on parent material and weathering), potassium-supplying power regions of Illinois(broadly defined based on cation exchange capacity [CEC]), and across Illinois
Soil depth parameter P (mg kg−1) K (mg kg−1) Ca (mg kg−1) Mg (mg kg−1) pH OM (%)
High P region (n = 202)0–8 cm 71a† 214a 2027 297 6.9 3.0a8–18 cm 51b 152b 2078 299 6.7 2.7bSurface/subsurface ratio 2.1 1.5 1.0 1.0 1.0 1.2
Medium P region (n = 163)0–8 cm 65a 213a 2193 329 6.6 3.6a8–18 cm 38b 146b 2304 346 6.6 3.2bSurface/subsurface ratio 2.5 1.5 1.0 1.0 1.0 1.2
Low P region (n = 177)0–8 cm 56a 190a 2320 451 6.8 4.1a8–18 cm 28b 133b 2424 479 6.8 3.6bSurface/subsurface ratio 2.8 1.5 1.0 1.0 1.0 1.2
High CEC region (n = 442)0–8 cm 63a 213a 2288 390 6.8a∗ 3.7a8–18 cm 40b 151b 2378 406 6.7b 3.3bSurface/subsurface ratio 2.4 1.5 1.0 1.0 1.0 1.1
Low CEC region (n = 78)0–8 cm 66a 163a 1624 170 6.7 2.8a8–18 cm 35b 100b 1684 178 6.6 2.2bSurface/subsurface ratio 2.7 1.7 1.0 1.0 1.0 1.4
Low CEC region (sands) (n = 22)0–8 cm 77a∗∗ 227a∗∗ 1795 350 6.5 3.38–18 cm 52b 159b 1908 370 6.6 3.0Surface/subsurface ratio 1.9 1.5 1.0 1.0 1.0 1.1
Entire region (state) (n = 542)0–8 cm 64a 206a 2173 357 6.8a∗ 3.5a8–18 cm 40b 144b 2259 372 6.7b 3.1bRatio 2.4 1.5 1.0 1.0 1.0 1.2
Notes. Values followed by the same letter within column and region are not different by the Mann–Whitney rank sum test (P > 0.001).
∗P < 0.1.∗∗P < 0.05.
It appears from these data that the low-K-supplying region located in the southern one-third portion of the state (Figure 1B) would benefit from a buildup management approachin which K fertilizer applications are designed to be greater than the amount removedby harvested crop. It is possible, however, that some soils might have less than the recom-mended K value because their mineralogy prevents buildup (increased plant-K availability)(Ebelhar and Varsa 2000). Finally, across the state there was no correlation between soilproductivity index (defined by Olson et al. 2000) and K test levels as to indicate differentialK management on the basis of potential crop yield (data not shown).
Similar to P, K is a slowly mobile nutrient in the soil. Broadcast applications of K onthe soil surface without intensive tillage to incorporate the nutrients likely resulted in the
Dow
nloa
ded
by [
Uni
vers
ity o
f Il
linoi
s at
Urb
ana-
Cha
mpa
ign]
at 0
6:31
27
Nov
embe
r 20
12

Soil Fertility Status of Soils in Illinois 2907
Figure 4. Relationship between soil-test level in the 0- to 8-cm depth and the 8- to 18-cm depthfor various parameters measured during the 2007–2008 Illinois soil survey; n = 542 for each plot.∗∗∗Significant F value for a regression at P < 0.01. Dotted line represents 1:1 correlation.
measured 1.5:1 surface (0–8 cm) to subsurface (8–18 cm) ratio (Table 5). This ratio wassmaller than for P, likely because K is more mobile in soil relative to P (Barber 1995).Greater mobility of K than P was also observed in a study by Holanda et al. (1998)where they measured greater stratification ratios for P than K for soils under no-till andchisel plow relative to conventional tillage. In our study, stratification ratios for K were notaffected by the different K-supplying regions because the regions are delineated by CECand not by soils’ native K reserves as is the case for P in Illinois. Regression analysis ofsurface and subsurface K levels showed a positive linear relation (R2 = 0.804) and illus-trated the fact that surface K concentrations were greater than subsurface concentrationsacross all soil K test levels (Figure 4B).
The distribution of values for K in this survey was similar to the values in the ear-lier survey (Walker et al. 1968, 1969, 1970). While the mean K level found in the earliersurvey (175 mg kg−1) was 3 mg kg−1 greater than we found, our survey showed more sam-ples within the recommended maintenance range or slightly above it (151–250 mg kg−1)(Figure 5B). The 1967–1969 survey had 56% of the samples testing at or below the CLcompared to 48% of samples for the 2007–2008 survey and 14% of samples testing very
Dow
nloa
ded
by [
Uni
vers
ity o
f Il
linoi
s at
Urb
ana-
Cha
mpa
ign]
at 0
6:31
27
Nov
embe
r 20
12

2908 F. G. Fernández, B. S. Farmaha, and E. D. Nafziger
Figure 5. Relative frequency distribution of soil phosphorus (A), potassium (B), and pH (C) levelsin Illinois as reported by two surveys conducted by the University of Illinois in 1967–1969 andin 2007–2008. The 1967–1969 survey had 1,701 samples collected from corn and soybean fieldsduring the growing season from the 0- to 15-cm soil depth increment. The 2007–2008 survey had547 samples collected from corn fields in the fall prior to harvest from the 0- to 18-cm soil depthincrement.
high (above 250 mg kg−1) in the earlier survey compared to 12% of samples in our sur-vey. These data may indicate that overall there has been improvement overtime in soil Kfertility by the fact that the frequency of samples testing either too low or too high relativeto recommended levels for crop production has decreased and the frequency of samples
Dow
nloa
ded
by [
Uni
vers
ity o
f Il
linoi
s at
Urb
ana-
Cha
mpa
ign]
at 0
6:31
27
Nov
embe
r 20
12

Soil Fertility Status of Soils in Illinois 2909
Figure 6. Relationship between total animal produced (swine and cattle) between 1970 and 2006(USDA-NASS Quick Stats 2010) and mean soil-test P levels at the 0- to 18-cm depth increment for51 counties measured during the 2007–2008 Illinois soil survey.
testing within the recommended values has increased. Still, our survey indicates that thereare many fields in the state at which crop production could be potentially improved byincreasing soil K test levels.
Soil pH
Soil pH median and mean values for the state were 6.7 (Table 2). In soils where limestoneapplications are required, it is recommended to maintain soil pH between 6 and 6.5 for cornand soybean production (Fernández and Hoeft 2009). Increasing the pH above 6.5 is notrecommended purely from an economic standpoint as the potential for crop grain increaseis very unlikely. A mean and median pH of 6.7 and only 11% of samples testing below pHof 6.0 across the state indicates that, in general, producers understand the importance ofmaintaining adequate soil pH and are managing it correctly.
Soil pH was not stratified within the top 18 cm of the soil as were P and K concentra-tions (Table 5). Surface and subsurface pH levels were well correlated (R2 = 0.653), andregression analysis showed that below pH 6.5 the subsurface had slightly greater pH thanthe surface and for pH above 6.5 the surface layer had slightly greater pH than the subsur-face (Figure 4E). It is possible that slightly greater pH in the surface than the subsurface atgreater soil pH was related to recent lime applications on the soil surface. Further, soil pHlevels were not influenced by P- or K-supplying regions (Table 4). This likely indicates thatsoil acidity is being controlled by management rather than natural soil conditions. Whensoil acidity is being managed, it is possible to maintain adequate pH at depth even if limeapplications are done on the soil surface in fields were little soil mixing by tillage occurs.Woodard and Bly (2010) observed that surface-applied limestone in conservation tillagesystems over time reduces acidity in deeper layers of the soil.
In comparison to the earlier survey conducted in the late 1960s (Walker et al. 1968,1969, 1970) our survey shows overall greater frequency of samples testing above pH 6.0(Figure 5C). Earlier, 35% of the sites were at or less than pH 6.0, whereas now only 15%of the sites were in that category. Currently 61% of the samples collected are testing abovepH 6.5 compared to only 35% during the former survey. This would indicate that producersare more actively managing soil acidity now than in the past.
Dow
nloa
ded
by [
Uni
vers
ity o
f Il
linoi
s at
Urb
ana-
Cha
mpa
ign]
at 0
6:31
27
Nov
embe
r 20
12

2910 F. G. Fernández, B. S. Farmaha, and E. D. Nafziger
Soil Calcium, Magnesium, and Organic Matter
Current recommendations indicate that Ca values of 200 to 400 mg kg−1 and Mg valuesof 30 to 100 mg kg−1 are sufficient for crop production in Illinois (Fernández and Hoeft2009). The survey data indicate that there is an abundant supply of both Ca and Mg andthe application of these nutrients will not be needed in the foreseeable future (Tables 2 and4). Calcium, Mg, and OM had lower levels in the high-P region than in the low-P regions(Table 4). This was expected because P-supplying regions were primarily determined byparent material and degree of weathering, which also influences these parameters. Soilsin the high-P-supplying region tend to be deeper and calcium and magnesium carbonatealso tend to occur deeper (below 100 cm) than the other P-supplying regions (Fernándezand Hoeft 2009). We also observed lower Ca, Mg, and OM mean values in the low- com-pared to the high-K-supplying regions (Table 4). As with the P-supplying regions, this isindicative of parent material influencing these parameters. The soils of southern Illinois areolder, have lower OM and CEC, and are generally less productive than soils in central andnorthern Illinois.
Calcium and Mg concentrations were not stratified within the top 18 cm of soil(Table 5). This is likely because these soils have an ample native supply of plant-availableCa and Mg. Unlike for applications of P and K that normally increase plant-available Pand K test levels in the soil, applications of Ca and Mg in liming materials representa relative minuscule amount relative to plant-available Ca and Mg from the native soilsupply. Regression analysis of surface and subsurface concentrations showed a high pos-itive linear relation for Ca (R2 = 0.913) (Figure 4C) and Mg (R2 = 0.946) (Figure 4D).Regression analysis also showed Ca and Mg levels were consistently above but very closeto the 1:1 correlation line.
Across the state, there was a large range of OM from 0.9% to 8.9% with median andmean values slightly above 3%. We observed that OM was slightly greater in the depths of0–8 cm than 8–18 cm (Table 5) and regression analysis showed this stratification across therange of OM levels measured (Figure 4F). This stratification is likely the result of greaterOM inputs from roots and aboveground crop residues being deposited on the top layer ofthe soil relative to the subsurface. Soil OM is an important indicator of soil productivity.Our OM data explained 69% of the variability in county mean corn yield for the combined2007 and 2008 growing seasons (Figure 7). We determined that yield was maximized at11.9 Mg ha−1 when OM was 3.8%. Other soil parameters measured in this study werenot as well correlated with county mean yield (data not shown). These data agree withKravchenko and Bullock (2000), who indicated OM was the most influential soil propertyto help explain yield variability.
Possible Implications for P and K Fertilization in Illinois
Because soil P and K levels are largely influenced by management, the fact that, generallyspeaking across the state, 59% of samples were above the maintenance range for P and46% of samples were below CL for K seems to indicate there is greater emphasis in Pfertilization relative to K. This imbalance with more samples testing high in P and lowin K can be readily observed when individual soil samples were partitioned based on thethree categorical segments (below maintenance, maintenance, and above maintenance) ofthe yield response curve used for P and K recommendations in Illinois (Fernández andHoeft 2009) (Table 6). For example, for P 19% and 12.6% of samples were testing abovethe maintenance range and within the maintenance range, respectively, at the same time
Dow
nloa
ded
by [
Uni
vers
ity o
f Il
linoi
s at
Urb
ana-
Cha
mpa
ign]
at 0
6:31
27
Nov
embe
r 20
12

Soil Fertility Status of Soils in Illinois 2911
Figure 7. Relationship between mean soil organic matter at the 0- to 18-cm depth increment mea-sured during the 2007–2008 Illinois soil survey and mean 2007–2008 corn grain yield (USDA-NASSQuick Stats 2010) for the 51 counties surveyed.
Table 6Distribution of soil samples, percentage of total number of samples, and number of
hectares in Illinois that could be represented by the survey samples testing at the differentcombinations of categorical segments (below maintenance, maintenance, and above
maintenance) of the yield response curve used for phosphorus and potassiumrecommendations in Illinois
Phosphorus level Potassium levelNumber of
samplesPercentageof samples
Hectaresin ILa
Above maintenance Above maintenance 134 24.5 2,100,854Above maintenance Maintenance 87 15.9 1,363,987Above maintenance Below maintenance 104 19.0 1,630,514Maintenance Above maintenance 12 2.2 188,136Maintenance Maintenance 41 7.5 642,799Maintenance Below maintenance 69 12.6 1,081,783Below maintenance Above maintenance 2 0.4 31,356Below maintenance Maintenance 22 4.0 344,916Below maintenance Below maintenance 76 13.9 1,191,529
aBased on average number of hectares (8,667,000) under corn and soybean production in the statein 2007 and 2008 (USDA-NASS Quick Stats 2010).
that K levels were below the maintenance range. On the other hand, only 4.4% of sampleshad P levels below the maintenance range when K levels were at or above the maintenancerange. Across the state, the mean recommended maintenance value for soil K is 165 mgkg−1 (130 to 200 mg kg−1 range) while the mean recommended maintenance value forsoil P is 26 mg kg−1 (15 to 35 mg kg−1 range). It follows that the mean recommendedmaintenance K/P ratio is 6.3:1. Phosphorus and K values in our soil survey were stronglycorrelated (R2 = 0.512) and the regression indicates a K/P ratio of 3.4:1 (Figure 8). Thisrepresents a 46% reduction compared to the recommended mean ratio and also illustratesthat there is greater emphasis in P fertilization relative to K.
Dow
nloa
ded
by [
Uni
vers
ity o
f Il
linoi
s at
Urb
ana-
Cha
mpa
ign]
at 0
6:31
27
Nov
embe
r 20
12

2912 F. G. Fernández, B. S. Farmaha, and E. D. Nafziger
Figure 8. Relationship between soil K and P levels at the 0- to 18-cm depth increment measuredduring the 2007–2008 Illinois soil survey, n = 547. ∗∗∗Significant F value for a regression at P < 0.01.
We determined that it would be necessary to apply 248,981 tons of P2O5 and1,349,741 tons of K2O in Illinois to build up soils to the CL. The application for P wouldbe on 248,981 ha and the application range would be 7 to 433 kg P2O5 ha−1 (mean of151 kg P2O5 ha−1). The application for K would be on 3,900,150 ha and the applicationrange would be 15 to 959 kg K2O ha−1 (mean of 346 kg K2O ha−1). These estimates donot account for the maintenance (crop removal) rates that would be needed in addition tothe buildup rates. Using the mean soil-test level below CL (13 mg P kg−1 and 107 mg Kkg−1) from our survey and the yield response curve to soil P and K test level for Illinois(Fernández and Hoeft 2009), we estimated that it would be possible to increase corn andsoybean yields by approximately 5% by increasing soil-test levels to the CL.
Conversely, the soil survey indicated that some soils are testing very high and couldproduce maximum yields without P and K application for several years. Using data fromMallarino and Borges (2006) and Fernández and Hoeft (2009), we determined that it wouldtake approximately 6 years of crop removal without P fertilization to reduce the current(71 mg P ha−1) mean testing level above the maintenance range to the upper limit of themaintenance range. Assuming fields testing above the maintenance range currently receivemaintenance rates equal to the amount of nutrient removal in seed, we estimated that Papplications could be reduced by 1,968,490 tons of P2O5 on 5,113,530 ha over a 6-yearperiod. For K, drawdown values are not as readily available due in part to the large vari-ability observed for such measurements (Randall, Iragavarapu, and Evans 1997). However,Fernández and Hoeft (2009) indicated that it is very unlikely for a high-testing soil to dropby more than 50 mg K kg−1 over a 4-year period when no K is applied in a corn–soybeanrotation. Using this conservative approach, it would be safe to say that crop removal with-out K fertilization to reduce the current mean testing level (257 mg K ha−1) above themaintenance range to the upper limit of the maintenance level would take approximately6 years. We estimated that K applications could be reduced by 978,434 tons of K2O on2,686,770 hectares over a 6-year period.
Conclsions
The soil survey represents the fertility status of agricultural land in Illinois. In general,across the state soil P levels are high and K levels are low relative to the recommended formaximum corn and soybean production. Although P levels have increased since the late1960s, K levels have remained approximately constant. Soils in Illinois are not being tilled
Dow
nloa
ded
by [
Uni
vers
ity o
f Il
linoi
s at
Urb
ana-
Cha
mpa
ign]
at 0
6:31
27
Nov
embe
r 20
12

Soil Fertility Status of Soils in Illinois 2913
extensively, judging by the amount of vertical stratification of P and K. Both nutrients arestratified, with P being more highly stratified than K. Soil pH levels are adequate for cornand soybean production and showed no vertical stratification within the top 18-cm layer.Similarly, Ca and Mg levels in the soil are at adequate concentrations for crop productionand the survey indicates there is an ample supply of these nutrients present in the soil. Thesoil survey indicates that in general terms P is being overapplied and K is underapplied.Many fields with greater-than-needed P levels and below suggested levels for K indicatean opportunity for improvement in fertilizer management.
References
Barber, S. A. 1995. Soil nutrient bioavailability: A mechanistic approach, 2nd ed. New York: JohnWiley & Sons.
Bordoli, J. M., and A. P. Mallarino. 1998. Deep and shallow banding of phosphorus and potassiumas alternatives to broadcast fertilization for no-till corn. Agronomy Journal 90:27–33.
Bray, R. H., and L. T. Kurtz. 1945. Determination of total, organic, and available form of phosphorusin soil. Soil Science 59:39–45.
Crozier, C. R., G. C. Naderman, M. R. Tucker, and R. E. Sugg. 1999. Nutrient and pH stratificationwith conventional and no-till management. Communications in Soil Science and Plant Analysis30:65–74.
Ebelhar, S. A., and E. C. Varsa. 2000. Tillage and potassium placement effects on potassium utiliza-tion by corn and soybean. Communications in Soil Science and Plant Analysis 31:2367–2377.
Fernández, F. G., S. M. Brouder, C. A. Beyrouty, J. J. Volenec, and R. Hoyum. 2008. Assessmentof plant available potassium for no-till, rainfed soybean. Soil Science Society America Journal72:1085–1095.
Fernández, F. G., and R. G. Hoeft. 2009. Managing soil pH and crop nutrients. In Illinois agronomyhandbook, 24th ed., 91–112. Urbana: University of Illinois.
Holanda, F. S. R., D. B. Mengel, M. B. Paula, J. G. Carvaho, and J. C. Bertoni. 1998. Influence of croprotations and tillage systems on phosphorus and potassium stratification and root distribution insoil profile. Communications in Soil Science and Plant Analysis 29:2383–2394.
Hopkins, C. G., and J. H. Pettit. 1908. The fertility in Illinois soils (Bulletin 123). Champaign:University of Illinois Agricultural Experiment Station.
Howard, D. D., M. E. Essington, and D. D. Tyler. 1999. Vertical phosphorus and potassiumstratification in no-till cotton soils. Agronomy Journal 91:266–269.
Illinois Department of Agriculture. 2006. Illinois soil conservation transect survey summary.Available at http://www.agr.state.il.us/darts/References/transect/transect06.pdf
International Plant Nutrition Institute. 2010. Soil test levels in North America (Publication No. 30-3110). Norcross, Ga.: IPNI.
James, D. W., and K. L. Wells. 1990. Soil sample collection and handling: Techniques based onsource and degree of field variability. In Soil testing and plant analysis, ed. R. L. Westerman,25–44. Madison, Wisc.: SSSA.
Kaspar, T. C., J. B. Zahler, and D. R. Timmons. 1989. Soybean response to phosphorus and potassiumfertilizers as affected by soil drying. Soil Science Society America Journal 53:1448–1454.
Koenig, R. T., J. V. Barnhill, and C. J. Hurst. 2000. Sampling depth effects on sodium bicar-bonate (NaHCO3)–extractable phosphorus and potassium and fertilizer recommendations.Communications in Soil Science and Plant Analysis 31:375–386.
Kravchenko, A. N., and D. G. Bullock. 2000. Correlation of corn and soybean grain yield withtopography and soil properties. Agronomy Journal 92:75–83.
Mallarino, A. P., and R. Borges. 2006. Phosphorus and potassium distribution in soil following long-term deep-band fertilization in different tillage systems. Soil Science Society America Journal70:702–707.
Dow
nloa
ded
by [
Uni
vers
ity o
f Il
linoi
s at
Urb
ana-
Cha
mpa
ign]
at 0
6:31
27
Nov
embe
r 20
12

2914 F. G. Fernández, B. S. Farmaha, and E. D. Nafziger
Olson, K. R., J. M. Lang, J. D. Garcia-Paredes, R. N. Majchrzak, C. I. Hadley, M. E. Woolery,and R. M. Rejesus. 2000. Average crop, pasture, and forestry productivity ratings for Illinoissoils (Bulletin 810, revised 26 January 2010). Champaign: University of Illinois AgriculturalExperiment Station.
Potash and Phosphate Institute. 2005. Soil test levels in North America (PPI/PPIC/FAR TechnicalBulletin 2005-1). Norcross, Ga.: PPI.
Randall, G. W., T. K. Iragavarapu, and S. D. Evans. 1997. Long-term P and K applications, I:Effect on soil test incline and decline rates and critical soil test levels. Journal of ProductionAgriculture 10:565–571.
SAS Institute, Inc. 2000. SAS user’s guide: Statistics. Cary, N.C.: SAS.Schulte, E. E., and B. G. Hopkins. 1996. Estimation of soil organic matter by weight loss-on-ignition.
In Soil organic matter: Analysis and interpretation (Special Publication No. 46), ed. F. R.Magdoff, M. A. Tabatasbai, and E. A. Hanlon Jr., 21–31. Madison, Wisc.: SSSA.
Thomas, G. W. 1996. Soil pH and soil acidity. In Methods of soil analysis, part 3, ed. D. L. Sparks,475–490. Madison, Wisc.: SSSA.
USDA-NASS. Quick stats. 2010. Available at http://www.nass.usda.gov/Data_and_Statistics/Quick_Stats/index.asp.
USDA-NRCS. 2011a. Soils of Illinois. Available at http://www.il.nrcs.usda.gov/technical/soils/soilsofil.html.
USDA-NRCS. 2011b. Web soil survey database. Available at http://websoilsurvey.nrcs.usda.gov/app/HomePage.htm.
Walker, W. M., T. R. Peck, S. R. Aldrich, and W. R. Oschwald. 1968. Nutrient levels in Illinois soils.Illinois Research, University of Illinois Agricultural Experiment Station 10:12–13.
Walker, W. M., T. R. Peck, S. R. Aldrich, and W. R. Oschwald. 1969. Illinois soils remain high innutrients according to 1968 plant and soil analyses. Illinois Research, University of IllinoisAgricultural Experiment Station 11:6–7.
Walker, W. M., T. R. Peck, S. R. Aldrich, and W. R. Oschwald. 1970. Nutrient levels of corn andsoybean fields remain high. Illinois Research, University of Illinois Agricultural ExperimentStation 12:16–17.
Warncke, D., and J. R. Brown. 1998. Potassium and other basic cations. In Recommended chemi-cal soil test procedures for the North Central Region (North Central Region Publication 221,revised), ed. J. R. Brown, 31–33. Columbia: University of Missouri.
Woodard, H., and A. Bly. 2010. Soil pH change and crop responses with long-term liming appli-cations in tilled and untilled systems. Communications in Soil Science and Plant Analysis41:1723–1739.
Yin, X., and T. J. Vyn. 2002. Residual effect of potassium placement and tillage systems for corn onsubsequent no-till soybean. Agronomy Journal 94:1112–1119.
Dow
nloa
ded
by [
Uni
vers
ity o
f Il
linoi
s at
Urb
ana-
Cha
mpa
ign]
at 0
6:31
27
Nov
embe
r 20
12
Copyright © 2022 FDOKUMEN