Do socio-economic conditions influence dynastic politics? - Loc
38
WORKING PAPER Do Socio-Economic Conditions Influence Dynastic Politics? Initial Evidence from the 16th Lok Sabha of India Ronald U. Mendoza AIM Rizalino S. Navarro Policy Center for Competitiveness Jan Fredrick P. Cruz AIM Rizalino S. Navarro Policy Center for Competitiveness Unnikrishnan Alungal MDM Batch 2014 AIM Stephen Zuellig Graduate School of Development Management RSN-PCC WORKING PAPER 15-011
-
Upload
khangminh22 -
Category
Documents
-
view
0 -
download
0
Transcript of Do socio-economic conditions influence dynastic politics? - Loc

WORKING PAPER
Do Socio-Economic Conditions Influence
Dynastic Politics? Initial Evidence from the 16th
Lok Sabha of India
Ronald U. Mendoza
AIM Rizalino S. Navarro Policy Center for Competitiveness
Jan Fredrick P. Cruz AIM Rizalino S. Navarro Policy Center for Competitiveness
Unnikrishnan Alungal
MDM Batch 2014
AIM Stephen Zuellig Graduate School of Development Management
RSN-PCC WORKING PAPER 15-011

RSNPCC WORKING PAPER 15-011
ASIAN INSTITUTE OF MANAGEMENT
RIZALINO S. NAVARRO POLICY CENTER FOR COMPETITIVENESS
WORKING PAPER
Do Socio-Economic Conditions
Influence Dynastic Politics? Initial Evidence from the 16th
Lok Sabha of India
Ronald U. Mendoza
AIM Rizalino S. Navarro Policy Center for Competitiveness
Jan Fredrick P. Cruz AIM Rizalino S. Navarro Policy Center for Competitiveness
Unnikrishna Alungal
MDM Batch 2014
AIM Stephen Zuellig Graduate School of Development Management
AUGUST 2015
The authors would like to thank Dr. Sounil Choudhary of the University of Delhi; Dr. Kripa Ananthpur of the Madras Institute of
Development Studies; Ms. Chandrika Bahadur of the Sustainable Development Solutions Network; Mr. Appu Lenin of the
Jawaharlal Nehru University; and Mr. Siddharth Singh of the Centre for Research on Energy Security for helpful comments on an
earlier draft.
This working paper is a discussion draft in progress that is posted to stimulate discussion and critical comment. The views
expressed herein are those of the authors and do not necessarily reflect the views of Asian Institute of Management.
Corresponding authors:
Ronald U. Mendoza, AIM Rizalino S. Navarro Policy Center for Competitiveness
Tel: +632-892-4011. Fax: +632-465-2863. E-mail: [email protected]
Jan Fredrick P. Cruz, AIM Rizalino S. Navarro Policy Center for Competitiveness
Tel: +632-892-4011. Fax: +632-465-2863. E-mail: [email protected]

1 RSNPCC WORKING PAPER 15-011
1. Introduction
At a campaign rally in Kishtwar in November 2014, Prime Minister Narendra Modi of India
asked: "Will only two families rule in Jammu and Kashmir, cannot other families produce
leaders? You are repenting for the last 50 years” (The Economic Times 2014). Months earlier, in
May 2014, when Modi’s Bharatiya Janata Party (BJP) ended the nearly seven-decade reign of
the Nehru-Gandhi-led1Indian National Congress (Congress), many wondered whether it would
signal the end of dynastic politics in India.
There is a rich literature examining Indian politics and its relationship with public policy.
Some studies on Indian political economy revolve around the issue of party politics. One strand
focuses on the effects of religion, ethnicity, language, caste, socio-economic classes, and
politicians' personal motivations on party affiliation and the development of party platforms (see
Banerjee and Somanathan 2007; Chhibber and Petrocik 1989; and Varshney 1999). Another
strand examines the possible effects of competition of political parties on the delivery of public
services (see Besley, Pande, and Rao 2005). For example, Indian states with electoral
competition solely between two parties deliver public goods more efficiently than the states with
robust multi-party electoral systems (Chhibber and Nooruddin 2004). It is possible that a two-
party system forces the two rival candidates to appeal to a broader section of the populace, in
contrast to a multi-party system where simply focusing on the delivery of benefits to one
constituency can guarantee seats in public office.
However, in the case of some developing countries, some analysts contend that the
primary political unit is not the political party but the family (McCoy 2010). For instance, recent
literature on political economy emphasizes the role of political dynasties, i.e., politicians and
their relatives serve in public office simultaneously or in succession. The allocation and
distribution of State resources, the trajectory of development policies adopted by the
bureaucracy, and the norm in government-constituent relations could be influenced by privileged
families in the political arena (De Dios 2007). Therefore, this growing area of research
contributes to our understanding of the political economy of reforms, notably in cases where
democratic institutions are in the early stages of development.
1 The political family is not related to Mohandas K. Gandhi, one of the leaders of Indian national independence.

2 RSNPCC WORKING PAPER 15-011
This study contributes to the literature by focusing on the case of India, in particular the
members of the parliament (MPs) of sixteenth Lok Sabha (i.e., the lower house of the Indian
parliament). It is notable for it marked a decline in the dominance of the Indian National
Congress in the country's political scene. The Congress party, once led by India's founding
fathers Mohandas Gandhi and Jawaharlal Nehru, has long been dominated by the political family
started by Nehru’s daughter Indira Gandhi. The situation of India mirrors the politics of other
countries in South Asia, where the national governments are--or were--led by entrenched ruling
families: the Bhuttos of Pakistan; the Bandernaikes of Sri Lanka; the Koirala family of Nepal;
and the Sheikh Mujib dynasty of Bangladesh (Amundsen 2013).
The Indian National Congress was the force to be reckoned with in Asia's largest
democracy until its defeat in the 2014 general elections by the Bharatiya Janata Party (BJP) of
Narendra Modi, a former tea-seller who served three consecutive terms as chief minister of
Gujarat before assuming the premiership of the 16th Lok Sabha. Given his humble origins and
his party's challenger status, Modi styles himself and his political party as the new face of Indian
politics. The findings of the study, however, question the idealized picture of the new national
government. The present Modi-led parliament registers one out of four Members of the
Parliament as dynastic. Even Modi's own BJP includes dynastic legislators among its ranks, as
the succeeding sections further elaborate.
This study builds on earlier studies that examine the possible links across political
dynasties and socio-economic outcomes at the sub-national level (e.g., Balisacan and Fuwa
2003; Mendoza et al. 2012; Monsod et al. 2004 for the Philippines; Patrikios and
Chatzikonstantinou 2015 for Greece; Camp 1982 for Mexico; Asako et al. 2015 for Japan; Dal
Bo et al. 2009 for the United States). In the case of India, local magazines and newspapers have
analyzed the existence of dynasties in either the national or state governments (The Hindu 2014;
Merchant 2014; Wyatt 2014), but as one reviewer of the study comments, a gap exists in the
formal academic literature.
In the present case, the research hypothesizes that state-level socio-economic indicators influence
dynastic representation to the Lok Sabha. The results of the study do not claim causation but
suggest the existence of patterns and relationships worth exploring in future studies. These
patterns are then compared to the Philippine case, the latter being the subject of a series of
3 RSNPCC WORKING PAPER 15-011
extensive research (see Mendoza et al., 2012; Mendoza et al., 2014; Mendoza et al., 2015).
The remaining sections are divided as follows. Section 2 reviews the related literature on
political dynasties. Section 3 discusses the data sources. Section 4 elaborates the findings of the
analysis. Section 5 concludes.
2. Review of Related Literature
Recent literature highlights the role of elites in a country’s economic development. Several
studies focus on the way the elites influence the allocation and distribution of the resources of the
State, ensure that market regulations will be advantageous to them, and include or exclude non-
elite interests in their decision-making processes (see Acemoglu and Robinson 2012; and
Amsden, DiCaprio, and Robinson 2012). Studies discussing the inclusivity of political
institutions contend that the entrenchment of elites in the political arena inhibit development by
creating an incentive structure that rewards rent-seeking behavior and personal gain over
execution of public service that is sensitive to the needs of society (Acemoglu 2008; and Bull
2014).
The elite are generally understood to be the group that occupies the top position in the
political and/or economic hierarchy. There are different channels that exist for recruitment to
elite membership. There is a strand of literature, however, that specifically underscores the elites
as bonded by kinship. For example, family ties characterize the selection of politicians in Peru,
legislators in Guatemala, and elected local officials in Brazil (Camp 1982). Elites tied by blood
or by marriage are termed “political dynasties,” and their relevance on democratization and
economic development has been studied in Argentina (Rossi 2014), Brazil (Frank 2001), Japan
(Asako et al. 2015), Mexico (Camp 1982), the United States (Dal Bo, Dal Bo, and Snyder 2009),
and the Philippines (Balisacan and Fuwa 2003; Mendoza et al. 2012; Monsod et al. 2004).
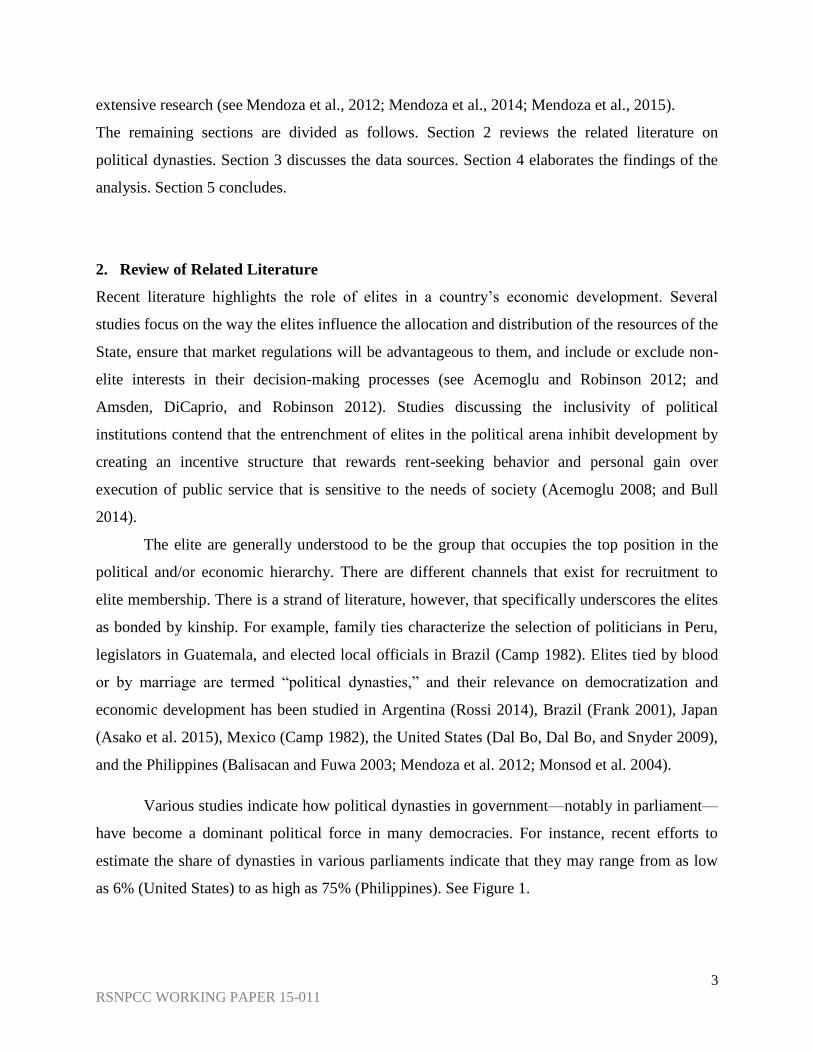
Various studies indicate how political dynasties in government—notably in parliament—
have become a dominant political force in many democracies. For instance, recent efforts to
estimate the share of dynasties in various parliaments indicate that they may range from as low
as 6% (United States) to as high as 75% (Philippines). See Figure 1.

4 RSNPCC WORKING PAPER 15-011
Figure 1.
Share of Dynastic Legislators in Parliaments for Selected Countries
Notes: Data from Dal Bo et al. 2009 (United States); Rossi 2009 (Argentina); Asako et al. 2015 (Japan and Mexico);
The Hindu 2014 (India); Thananithichote 2013 (Thailand); Patrikios and Chatzikonstantinou 2015 (Greece and
Ireland); and AIM Policy Center 2013 (Philippines). For India and the Philippines, dynastic relationship included the
legislator’s relatives who were also incumbent officials. For Greece, dynastic relationship was determined by family
ties to a previous or incumbent legislator. For the rest, dynastic legislators are identified by their kinship to previous
legislators.
What factors explain this dynastic prevalence? There are empirical studies that argue how
the existence of political dynasties is related to legacy-building behavior of politicians. In an
analysis of congressional elections in Argentina from 1983 to 2008, Rossi (2014) for example
finds evidence that a legislator’s tenure length could be linked to the probability that he or she
will be succeeded by someone from his or her family. In the said study, five more years in a
typical Argentinian’s legislator’s term increases the likelihood of him/her having a relative in
future congresses by eight percentage-points.
Dynastic persistence can also be seen among some industrialized countries, albeit in
much earlier stages of their democracy. For example, Dal Bo, Dal Bo, and Snyder (2009)
analyzed officials that composed the United States Congress from 1789 to 1996, comparing the
percentage of representatives who barely won a re-election and would have a relative elected into
future congresses vis-à-vis the percentage of representatives who barely lost a re-election
campaign but would have a relative elected as legislator in the future. Among congressmen who
won by less than 2.5% margin of votes, they found that 8.2% would have relatives elected into
6%
10%
22%
33%
40%
42%
10%
24%
75%
0% 10% 20% 30% 40% 50% 60% 70% 80%
United States
Argentina
Ireland
Japan
Mexico
Thailand
Greece
India
Philippines

5 RSNPCC WORKING PAPER 15-011
future legislatures. This is in contrast to the 3.6% of congressmen who lost by less than 2.5%
margin of votes but had relatives elected into office after.
These aforementioned studies contend how name recall among voters (obtained after a
long tenure of a politician) makes it easier for future family members to aspire for and win
elected public office.
Additional research also link the existence of political dynasties to a country’s socio-
economic structures. In the case of the Philippines, the historical literature pioneered by
Anderson (2004) traces most of the existing political dynasties in Congress to land-owning
families that accumulated their agrarian properties during the Spanish and American colonial
periods. The primacy of land ownership in sustaining these dynasties has led to the use of terms
such as “oligarchy,” “cacique democracy,” "landed gentry," and “feudal elite” to describe the
privileged few that dominate the Philippine political landscape. As such, De Dios (2012)
attributes the existence of political dynasties to “historical conditions” that facilitated the
prevalence of clan-based politics of stable party systems and platform-based governance.
As regards empirical analyses, Mendoza et al. (2012), for example, analyze the district
representatives in the 15th Philippine Congress and they examine if dynastic jurisdiction could be
linked to a province’s socio-economic conditions. The study concludes that dynastic jurisdictions
are positively correlated with various indicators of deprivation (i.e., poverty incidence, poverty
gap, and poverty severity) and negatively correlated with the provincial Human Development
Index score and real per capita income. This gives credence to the idea that socio-economic
conditions are inextricably linked to the existence and persistence of political dynasties.
However, the above-cited study does not establish causality. It is plausible that the
political dynasties are the roots of under-development in the provinces, or that underdevelopment
and dynastic concentration mutually reinforces one another. The former is the argument adopted
by Monsod et al. (2004) in their study on the status of Millennium Development Goals (MDGs)
in the provincial-level for the year 2000. Dynastic concentration per province is measured by the
share of governor, vice-government, and district representatives related to one another by blood
or by marriage in 1998. Highly dynastic provinces lag in MDG targets relative to provinces with
lower dynastic share. Specifically, a high dynastic share is positively correlated with poverty
incidence while negatively correlated with average income and primary education completion
rates. Monsod et al. (2004) interpret these results as evidence of the damaging effects of dynastic

6 RSNPCC WORKING PAPER 15-011
politics to the quality and provision of public services, as well as the proper functioning of
markets in the locality.
Furthermore, Balisacan and Fuwa (2003) explore the linkage between dynastic
concentration and standard of living in their study of average annual growth rates in per capita
income of Philippine provinces between 1988 and 1997. They used as explanatory variable the
share of governors, vice-governors, and district representatives within a province that are related
to one another by blood or marriage. The share of dynastic elected officials is interpreted as a
proxy for "political competitiveness," i.e., the less dynastic a province is, the more competitive is
the local political arena. This then links the said study to the dominant literature that highlights
the positive effects of democracy to income per capita (see Acemoglu, Johnson, Robinson, and
Yared 2008). The results of Balisacan's and Fuwa's analysis indicate that dynastic concentration
negatively and significantly affect the growth of local standards of living, and they conclude that
this stems from the "sub-optimal policy choices" within an uncompetitive political environment.
Political dynasties as determinant of local economic development is also the framework
adopted by Asako et al. (2015) in their analysis of Japanese legislators from 1997 to 2007. They
develop a model where legislators who inherited political advantages alter policy choices, and a
corresponding empirical analysis is made to test their model. The results show that districts
which elected dynastic politicians to the Japanese parliament exhibited lower economic
performance, as measured by district-level GDP growth, relative to districts with non-dynastic
representatives.
On the other hand, Patrikios and Chatzikonstantinou (2015) analyze the persistence of
dynastic legislators, defined as incumbents related by blood or by marriage to a previous or co-
incumbent legislator, in the Greek parliament from 2000 to 2012. The study finds that dynastic
concentration in the parliament hovers around 14 to 16 percent during non-crisis election years,
while the share declines to around 9 to 10 percent during election years marked by social and
economic instability. However, if one distinguishes between 'single dynastic' MPs (related to one
other MP) and 'multiple dynastic' MPs (related to more than one MP), data suggest that
economic shock only adversely affects the single dynastic legislators. As a case in point, around
the time of the global financial crisis, 93% of the multiple dynastic legislators got re-elected in
the 2012 elections, vis-a-vis the 19% among the single dynastic MPs. The findings hint that

7 RSNPCC WORKING PAPER 15-011
expanding a political family's control over a number of elected government positions tend to
exclude them from being voted out of office due to poor economic performance.
Finally, in India, literature on political dynasties appears nascent. French (2011) explores
the members of the 15th Lok Sabha who succeeded relatives in office, or have members of their
families elected into positions simultaneous with their terms. However, his work resembles
McCoy's (2010) seminal study on clan politics in the Philippines. Both treat political dynasties as
a historical investigation rather than an empirical question. French puts greater emphasis on the
family background of individual politicians over establishing whether and to what extent
dynastic patterns are related to socio-economic variables.
Other studies on Indian politics are focused on the role of political elites (see Chhibber
and Eldersveld 2000; and Chandra 2000). Yet, as already clarified earlier, political dynasties and
political elites are not exactly the same. There are avenues for elite recruitment that are not
mediated by bloodlines or marriages. As such, there is a gap in the literature—that which focuses
on political dynasties—which this study seeks to augment.
3. Data and Methodology
The primary dataset for this paper is culled from the collected data of The Hindu, which the
Indian Readership Survey (2013) considers as one of the most widely-read English-language
newspapers in India. Citing "ground-level sources," the said publication in 2014 listed down
"hereditary politicians" among the newly elected members of Lok Sabha and identified former
and incumbent elected officials related to the said MPs up to the fourth degree of consanguinity
and third degree of affinity2.
Thus, information from The Hindu includes name of the legislator, party affiliation, and
relatives in elected public office before or simultaneous with the MP's term. We review the
dynastic linkage by searching for online news reports that can confirm the family relationship
(i.e., by marriage or bloodline) of a given MP to a certain politician. Data on gender, age,
number of terms in office, and occupation draw from official profiles of the parliamentarians in
the Lok Sabha website.
2 This is different from the analysis made by French (2011), wherein he also considers dynastic the MPs who are
related to the leaders of political parties.

8 RSNPCC WORKING PAPER 15-011
The analysis of the Lok Sabha only covers the MPs that won in the elections from 7 April
to 12 May 2014. It must be underscored that a couple of by-elections occurred in India after the
16th Lok Sabha general elections due to death or resignation of certain MPs. However, there
might be factors influencing the outcomes of these by-elections (e.g., "sympathy votes" arising
from the death of the MP, public sentiment on the first few months of the Modi government) that
were not present during the general elections, thus introducing comparability issues in the
empirical analysis. Thus they were excluded from the present study.
The measures of economic growth, per capita income, and poverty incidence are
computed based from the data tables of the Indian Planning Commission (2014). The real gross
state domestic products (GSDP) are expressed in constant 2004-2005 Indian rupees. Economic
growth is the percentage growth of the real GSDP. Per capita income is the real GSDP divided
by the population reported in the national census. Poverty incidence refers to the percentage of
people living below poverty line.
Furthermore, the state-wide urban population and share of urban to state population are
derived from the data tables of the Indian Rural Development Report (Ministry of Rural
Development 2014). Land inequality is measured by Rawal (2008) as the Gini coefficient of the
distribution of state-level ownership of all lands except homesteads. The average monthly crime
rate is computed as the number of crime reported in the state per 100,000 people. Crime here is
understood as the sum of reported incidents of riots, murder, arson, and banditry. Raw data are
attained from the Crime in India database by the Center for Systemic Peace (2008).
Data on the Philippines and the Philippine legislature is also analyzed herein in order to
facilitate a rough comparison. For the Philippines, real economic growth, per capita income, and
poverty incidence are derived from the data tables provided by the Philippine Statistics Authority
to the authors. Economic growth is measured as the percentage growth in real gross regional
domestic product (GRDP). In turn, the real GRDP and real per capita income are expressed in
constant 2000 Philippine pesos. Poverty incidence refers to the number of poor people in a
region as a percentage of the total regional population.
Similar to the case of Indian statistics, urbanization and crime rate indicators for the
Philippines are culled from various sources. The shares of urban population to regional
population come from the data tables of the Philippine Statistics Authority. The average monthly
crime rate is obtained from the crime statistics provided by the Senate Economic Planning Office
9 RSNPCC WORKING PAPER 15-011
(2013). Crime is defined as any violation of the law which prohibits it and where a penalty or
punishment is handed down after a conviction. Crime statistics are measured at the regional
level.
All socio-economic variables precede the dynastic indicator in time period. In India, an
annual indicator corresponds to the beginning and end of the Indian government's fiscal year
(e.g., real per capita income is labeled as 2011-2012). As such, Indian socio-economic indicators
are labeled by the calendar year when a fiscal year ends (e.g., real per capita income measured in
fiscal year 2011-2012 is labeled as 2012). In the Philippines, an annual indicator covers the
calendar year (January to December of the same year). Further details on the measurement and
time coverage of the indicators are given on Table 1.
4. Analysis of Dynastic Leadership Patterns
4.1. India's 16th Lok Sabha
In the literature, political dynasties are defined as those elected politicians with relatives
in elected office in the past or present3. Data from The Hindu shows that 130 dynastic legislators
(out of a total of 5404), or 24%, comprise the 16th Lok Sabha (see Figure 2). In terms of
numbers, the five political parties with the most dynastic MPs are the Bharatiya Janata Party
(BJP), Indian National Congress, All India Trinamool Congress, Biju Janata Dal, and Telugu
Desam Party. The first two are relatively larger political parties with a national presence. The last
three are considered state-wide and regional political parties.
Two observations can be gleamed from this. Firstly, clan politics persists even under the
new administration. While BJP asserts that its landslide win is a rejection of political dynasties in
India (The Hindu 2014), data suggests that a significant number of dynastic MPs constitute the
new ruling party. Nevertheless, dynastic presence in BJP is admittedly less than in the other
major political parties. Most parties that won between six to 40 seats have share of dynastic MPs
ranging from 22 to 44 percent, while BJP has 16%. Secondly, the inclusion of the other three
3 As stated earlier, family relationship is covered up to the fourth degree of consanguinity and affinity. An MP is
flagged as dynastic when he or she has a relative that is holding an elected national or local position from May 2014
to present, or if he or she has a relative that held an elected national or local position within May 2009 to May 2014
(the term of the 15th Lok Sabha). 4 Excluded from the list are constituencies whose elected MP chose another constituency to represent. An example is
Vadodara. Prime Minister Modi ran to represent both Varanasi and Vadodara in the general elections. He won in
both but chose the former to represent in the Lok Sabha.

10 RSNPCC WORKING PAPER 15-011
parties in the ranking hints that political parties which are more attuned to answering the needs of
specific constituencies than expanding a national presence appear to be more prone to including
more political dynasties among its MPs.
Figure 3 corroborates the latter point. All of the political parties that garnered more than
50% of dynastic parliamentarians have won six seats or fewer. Most of these political parties that
registered significant dynastic concentration are parties that cater to sectarian, ethnic, and/or
local communities. One possible explanation is the diverse interests that a national party should
consider for it to gain a wider following. The plurality of competing perspectives could make it
difficult for certain families to entrench themselves in the party hierarchy.
Contrast this to state and regional parties that arguably are more homogenous in terms of
members and where the organizational structure is simpler. Through this, it could perhaps be
easier for a political family to cultivate good relations with party cadres and sustain a mass
following. Another plausible explanation is the need of minor political parties to counter the
advantage in popularity of major parties during elections by asking its charismatic members to
run for office. This can translate to the candidacies of the founders of the political party, and
eventually their relatives. In effect, this highlights the influence of party organization in the
dynastic orientation of parties. Allocation and distribution of tickets on the basis of kith and clan
is plausibly determined by the party’s organizational structure: the interaction between the
national party leadership and the local branches and grassroots, the groups and communities that
form its voter base, and so on.
Dynastic concentration can simply be related to the size of the political parties. Small
political parties that have few elected seats in the government can be prone to dynastic capture
relative to the large political parties where competition and factions are expected.
Lastly, dynastic concentration in political parties may represent a penalty on poor
governance. Under the assumption that dynastic MPs have a higher likelihood of re-election than
non-dynastic ones, a previously large political party may have lost a substantial number of seats
in the recent parliamentary elections except in the “safe” constituencies held by dynastic MPs.
The high dynastic concentration of this political party thus stems from the defeat of its non-
dynastic candidates in several “unsafe”/contested constituencies, indicating voter dissatisfaction
with the performance of the said party while it was in office.

11 RSNPCC WORKING PAPER 15-011
On the state level, the following do not have any dynastic politician among their
representation to the current Lok Sabha: Andaman and Nicobar Islands, Chandigarh, Dadra and
Nagar Haveli, Daman and Diu, Goa, Lakshadweep, Manipur, Mizoram, Nagaland, and Sikkim.
At the extreme end of the spectrum, the five states with the most number of dynastic MPs
include Uttar Pradesh, Andhra Pradesh, Maharashtra, West Bengal, and Bihar. (See Figure 4.)
In terms of concentration, Figure 5 shows the states with half or more than half of their
MPs tagged as dynastic are Puducherry, Arunachal Pradesh, Tripura, and Meghalaya. These
states all have small constituencies that are represented by one or two MPs. It appears that states
with smaller legislative territories display a tendency towards having more dynastic
parliamentarians. From here it can be argued that constituencies from larger states tend to be
more competitive and dynamic given the complex web of interests aiming for political
representation and the heterogeneity of voter background associated with large voting
populations.
4.2. Gender, Term in Office, Age, and Occupation
The following mirrors the analysis done by French (2011) in his study of the 15th Lok Sabha. In
terms of gender, the number of non-dynastic female MPs (36) is higher than the number of
dynastic MPs (24). In terms of ratios, however, a different picture emerges. One out of five
dynastic MPs is a female. Among non-dynastic legislators, it is one out of ten. Both numbers and
percentages suggest that females constitute a minority whether one looks at the dynastic or the
non-dynastic groupings of parliamentarians. This is indicative of gender disparity in political
representation. Yet, a higher concentration of females in the dynastic group of MPs relative to
the non-dynastic group hints at the significance of political capital that dynastic affiliation
provides to a female aspirant for elected public office. This is consistent with the findings of Dal
Bo et al. (2009) in the United States Congress. Figures 6 and 7 display the relevant charts.
Looking at the terms in office, there are 314 first-time officeholders elected in the 16th
Indian parliament. They are roughly 60% of the current Lok Sabha. Among the newcomers, the
non-dynastic MPs outnumber the dynastic ones. Some 79.94% of the first-time officeholders are
non-dynastic, while the dynastic legislators form the remaining 20.06%. For those who have
served for two terms or more (inclusive of their incumbent term in office), seven out of ten MPs
are non-dynastic, while three out of ten are dynastic. Figure 8 displays the relevant chart.
12 RSNPCC WORKING PAPER 15-011
In terms of age, the typical dynastic legislator is younger than the typical non-dynastic
MP. The average age of dynastic parliamentarians is 49 years old, while the average age of non-
dynastic parliamentarians is 55 years old. Looking at the dynastic concentration across different
age groups, a pattern emerges. The younger the MP is, the more likely he is affiliated to a
political dynasty. To illustrate, roughly 11% of MPs who are 56 to 65 years old are flagged as
dynastic. The percentage of dynastic MPs increases to 38% for the 36-to-45-years-old age
bracket. It becomes 61% when looking at the youngest cohort, or those MPs who are 25 to 35
years old. Figure 9 displays the relevant chart. It appears that recruitment for the next generation
of political leaders is skewed in favor of dynasty-affiliated politicians. For some analysts, this
could signal the continuity of the status quo rather than a change in regime. In Mendoza et al.
(2012), for example, seven out of 10 district representatives aged 26-40 belong to political
families.
According to profession, a majority of the dynastic MPs lists political and social
advocacy (34%), agriculture (24%), and business (21%) as their line of work. The same fields of
occupation dominate the professional background of the non-dynastic MPs. These observations
are supported by Figures 10 and 11.

13 RSNPCC WORKING PAPER 15-011
Figure 2.
Dynastic MPs in the 16th Lok Sabha, by Party Affiliation
Notes: Data from The Hindu (2014). The following parties do not have dynastic MPs in the current Lok Sabha: Apna Dal, Indian Union Muslim League, Janata
Dal (Secular), Janata Dal (United), Naga People's Front, Pattali Makkal Katchi, Rashtriya Lok Samta Party, Revolutionary Socialist Party, Sikkim Democratic
Front, Swabhimani Paksha, and Community Party of India. Likewise, independents MPs are not dynastic.

14 RSNPCC WORKING PAPER 15-011
Figure 3.
Dynastic Concentration in Political Parties
Notes: Data from The Hindu (2014). The following parties do not have dynastic MPs in the current Lok Sabha: Apna Dal, Indian Union Muslim League, Janata
Dal (Secular), Janata Dal (United), Naga People's Front, Pattali Makkal Katchi, Rashtriya Lok Samta Party, Revolutionary Socialist Party, Sikkim Democratic
Front, Swabhimani Paksha, and Communist Party of India. Likewise, independents MPs are not dynastic.

15 RSNPCC WORKING PAPER 15-011
Figure 4.
Dynastic MPs in the 16th Lok Sabha, by State
Source: The Hindu (2014). The following states do not have dynastic MPs: Andaman and Nicobar Islands, Chandigarh, Dadra and Nagar Haveli, Daman and
Diu, Goa, Lakshadweep, Manipur, Mizoram, Nagaland, and Sikkim.

16 RSNPCC WORKING PAPER 15-011
Figure 5.
Dynastic Concentration per State
Source: The Hindu (2014). The following states do not have dynastic MPs: Andaman and Nicobar Islands, Chandigarh, Dadra and Nagar Haveli, Daman and
Diu, Goa, Lakshadweep, Manipur, Mizoram, Nagaland, and Sikkim.

17 RSNPCC WORKING PAPER 15-011
Figure 6.
Concentration of Female MPs among Dynastic Legislators, 16th Lok Sabha
Source: Official profiles of MPs in the Lok Sabha website (2014); data on political dynasties from The Hindu
(2014).
Figure 7.
Concentration of Female MPs among Non-Dynastic Legislators, 16th Lok Sabha
Source: Official profiles of MPs in the Lok Sabha website (2014); data on political dynasties from The Hindu
(2014).

18 RSNPCC WORKING PAPER 15-011
Figure 8.
Dynastic and Non-Dynastic MPs Grouped by Terms in Office
Source: Official profiles of MPs in the Lok Sabha website (2014); data on political dynasties from The Hindu
(2014). Data labels pertain to the number of legislators.
Figure 9.
Dynastic and Non-Dynastic MPs Grouped by Age Bracket
Source: Official profiles of MPs in the Lok Sabha website (2014); data on political dynasties from The Hindu
(2014). Data labels pertain to the number of legislators.

19 RSNPCC WORKING PAPER 15-011
Figure 10.
Dynastic MPs by Profession
Source: Official profiles of MPs in the Lok Sabha website (2014); data on political dynasties from The Hindu
(2014).
Figure 11.
Non-Dynastic MPs by Profession
Source: Official profiles of MPs in the Lok Sabha website (2014); data on political dynasties from The Hindu
(2014).

20 RSNPCC WORKING PAPER 15-011
4.3. Scatter Plots and Correlates with Socio-Economic Indicators
Without inferring causality, we then proceed to examine the links across dynastic patterns on the
one hand and socio-economic indicators on the other, at the Indian state level. Factors of interest
include economic performance, standards of living, urbanization, land inequality, and incidence
of crime. Pair-wise correlation suggests the following.
First, the dynastic share at the state level is found to be negatively correlated with
annualized state-level economic growth (from 2009 to 2013). The correlation value between the
two variables is -0.1708. This hints at smaller prevalence of dynastic legislators in better
performing state economies. Meanwhile, the correlation value between dynastic share and
average economic growth (from 2010 to 2013) is -0.2139. The correlate suggests that dynastic
MPs are less concentrated in states where the economy grows faster on average. Figures 12 and
13 provide the relevant scatter plots.
There are several possible preliminary interpretations for these results. On one hand,
better economic performance could be predicated on a more competitive environment.
Businesses and entrepreneurs thrive in such a climate, and thus have incentives to counter any
political activity (e.g., entrenchment of dynastic legislators) creating rent-seeking opportunities
that hinder competition. On the other hand, the stronger and more stable performance of the local
economy can embolden voters to "experiment" with their choice of political leaders, giving
opportunities for new entrants (non-dynastic politicians) to participate successfully in the
electoral arena. It is possible that there is confidence among key stakeholders that changes in
local government administration will not adversely affect economic conditions.
Both the levels (real per capita income, for year 2012) and growth in standards of living
(growth of real per capita income, from 2002 to 2012) are negatively associated with dynastic
share of Indian MPs, with correlation values of -0.2097 and -0.3392 respectively. See Figures 14
and 15 for the relevant graphs. That is, dynastic concentration is smaller in states where citizens
are relatively better-off and where the socio-economic standing of the average person is rising.
These preliminary findings complement the earlier link explored between economic performance
and political dynasties. These also cohere with studies in other developing democracies, such as
the Philippines (Mendoza et al. 2012).
It can be argued that rising living standards weaken patron-client relations that tend to
sustain political dynasties. The more economically independent the typical voter is, the less

21 RSNPCC WORKING PAPER 15-011
reliant he or she is to patronage politics that political families peddle during elections. One can
also explain the negative correlation between living standard and political inequality by the
lowering of barriers to entry in elective positions: Relatives of established politicians enjoy built-
in access to networks, election funds, etc., which makes it easier for them to run for office while
outsiders have high entry barriers. Rising incomes however denote economic empowerment, or
the creation of resources that can be tapped for political campaigns.
The same reasoning can apply when it comes to the dynasty-poverty linkage, given that
analysis shows how dynastic share is positively correlated with a rising poor population (from
1994 to 2000). The correlation value between the two variables is 0.1546. In other words,
dynastic legislators persist in states where there is low living standards and rising poor
population. It must be noted though that the relationship between the levels of poverty and
political dynasties is weak; the correlation value between the two variables is 0.0475. See
Figures 16 and 17.
Historical literature in the Philippines, traces the origin of political dynasties to the feudal
elite (see Anderson 2004). It is of interest then to see if the same association between
landlordism and political dynasties can be seen in India. Figure 18 provides very preliminary and
partial evidence supporting this view. It appears that dynastic share of MPs increases as land
Gini (for year 2004) increases. The correlation value between proportion of dynastic
parliamentarians and inequality in land ownership is 0.1203. This is suggestive of a historical
link between the feudal structure of the local economy and the political conditions of a state. It is
possibly reflective of the way the distribution of factors of production affects the distribution of
political resources. Inequality of factors of production results to inequality of incomes from the
use of these factors. In turn, income inequality relates to political inequality by the way
economic elites monopolize control over political institutions to reinforce their position in
society (Acemoglu and Robinson 2012).
Furthermore, Figure 19 also appears to hint at a negative relationship between
urbanization and dynastic politics. The correlation value between share of dynastic legislators
and share of urban population (for year 2011) is -0.3211. Perhaps this is due to the fact that more
urbanized constituencies do not form a homogenous electorate and stakeholders often
aggressively compete with other groups for access to political power. Public office is hence more

22 RSNPCC WORKING PAPER 15-011
competitive and it is more difficult for families who want to entrench themselves in elected
positions.
Finally, the incidence of dynastic parliamentarians is positively correlated with high
crime rates and rising criminality. The correlation value for the dynastic share and crime rate (for
year 2006) is 0.1515 while the one for dynastic share and growth of crime rate (from 2004 to
2006) is 0.1017. One way to make sense of this is to perceive dynastic politicians as guarantors
of stability and order from the eyes of constituencies with high crime incidence. As such, states
that see a greater incidence of violence and crime could tend to elect leaders from political
dynasties in public office. Nonetheless this interpretation might seem tenuous to some analysts,
and the correlation merits more in-depth investigation.

23 RSNPCC WORKING PAPER 15-011
Figure 12.
Dynastic share and annualized economic growth
Note: APC staff computations given data from The Hindu (2014) and the Indian Planning Commission (2014).
Annualized economic growth is obtained from the difference of the natural log of 2009 GSDP and natural log of
2013 GSDP divided by four, then multiplied to 100 to express in percentage. Graph does not include Dadra and
Nagar Haveli; Daman and Diu; and Odisha for lack of data.
Figure 13.
Dynastic share and average economic growth
Note: APC staff computations given data from The Hindu (2014) and the Indian Planning Commission (2014).
Graph does not include Dadra and Nagar Haveli; Daman and Diu; and Lakshadweep for lack of data.

24 RSNPCC WORKING PAPER 15-011
Figure 14.
Dynastic share and standard of living
Note: APC staff computations given data from The Hindu (2014) and the Indian Planning Commission (2014). Graph
does not include Dadra and Nagar Haveli; Daman and Diu; and Lakshadweep for lack of data.
Figure 15.
Dynastic share and rise in standard of living
Note: APC staff computations given data from The Hindu (2014) and the Indian Planning Commission (2014).
Graph does not include Dadra and Nagar Haveli; Daman and Diu; and Lakshadweep for lack of data.

25 RSNPCC WORKING PAPER 15-011
Figure 16.
Dynastic share and poverty incidence
Note: APC staff computations given data from The Hindu (2014) and the Indian Planning Commission (2014).
Graph does not include Chhattisgarh; Jharkhand; Telangana; and Uttarakhand for lack of data.
Figure 17.
Dynastic share and growth in poverty incidence
Note: APC staff computations given data from The Hindu (2014) and the Indian Planning Commission (2014).
Graph does not include Chhattisgarh; Jharkhand; Telangana; and Uttarakhand of lack of data.

26 RSNPCC WORKING PAPER 15-011
Figure 18.
Dynastic share and land inequality
Note: APC staff computations given data from The Hindu (2014) and Rawal (2008). Graph not include Andaman,
Chandigarh, Dadra and Nagar Haveli, Daman and Diu, Delhi, Goa, Lakshadweep, and Puducherry for lack of data.
Figure 19.
Dynastic share and urbanization
Note: APC staff computations given data from The Hindu (2014) and Indian Ministry of Rural Development (2014).
Graph does not include Andaman and Nicobar Islands; Chandigarh; Dadra and Nagar Haveli; Daman and Diu;
Lakshadweep; and Puducherry for lack of data.

27 RSNPCC WORKING PAPER 15-011
Figure 20.
Dynastic share and crime rate
Note: APC staff computations given data from The Hindu (2014) and Center for Systemic Peace (2008).
Figure 21.
Dynastic share and rise in crime rate
Note: APC staff computations given data from The Hindu (2014) and Center for Systemic Peace (2008).

28 RSNPCC WORKING PAPER 15-011
Still, it is also possible that political dynasties contribute to the factors behind the
conflict. It is also possible that the more entrenched a political family is in office, the greater
probability that its members will resort to violence to secure elected positions. See Figures 20
and 21 for the relevant scatter plots.
4.4. The case of the Philippines
In order to further appreciate the patterns observed in India, we discuss briefly here some of the
same patterns present in the Philippine case5. Table 1 presents the results.
Economic growth (both annualized, for years 2009 to 2013, and averaged, for years 2010
to 2013) appears to be uncorrelated with dynastic concentration. Although the growth of living
standards (from 2009 to 2013) seems to be also uncorrelated with the share of dynastic
legislators, there is a strong and negative relationship existing between real per capita income
(for year 2013) and the share of dynastic representatives of a given region. Regions with higher
living standards (real per capita income, for year 2013) tend to have a lower share of political
dynasties in their representation to Congress. In terms of poverty, both the poverty incidence
(2012) and growth of poor population (from 2006 to 2012) are positively associated with
regional dynastic concentration. That is, dynastic district representatives usually come from
regions with high poverty incidence or a rising poor population.
The aforementioned observations so far are consistent with earlier studies that show how
political dynasties in the Philippines persist in more underdeveloped areas. For example,
Mendoza et al. (2015) pinpoint how income poverty at the provincial level fuels the expansion of
the largest political dynasty in that area. After applying the instrumental variable approach to
provincial-level variables, the study shows that per capita income and poverty incidence are
strong determinants of DYNLAR (the number of positions occupied by members of the largest
political dynasty in the province) and DYNHERF (a measure of concentration of political power,
equal to the sum of squared shares of the total positions of each political dynasty in each
province).
5 The ideal case would be to find the correlates of concerned indicators at the provincial-level. However, unlike
India where a state is represented by several MPs, a Philippine province is commonly represented by one or two
district representatives only. The outcome of this is that the dynastic shares of legislators in the Philippines would
assume extreme values, i.e., 0%, 50%, or 100%. As such, the correlation analysis here makes use of regional share
of dynastic legislators instead.

29 RSNPCC WORKING PAPER 15-011
Dynastic concentration is negatively correlated with the share of regional urban
population (for year 2010). In other words, urbanized regions tend to elect relatively more
parliamentarians (as a share of the total) among non-dynastic leaders. Aside from the
explanations on dynasty-urbanization linkage as mentioned in the earlier subsection, the
Philippine case can be seen as proof of the continued dominance of landed political dynasties in
the local politics of rural (i.e., largely agrarian) areas.
So far, the signs of correlates of dynastic concentration and socio-economic indicators
have been the same for India and the Philippines. For example, in both countries, the share of
dynastic legislators is negatively associated with the levels of standards of living and
urbanization while it is positively correlated with poverty incidence. Hence, India like the
Philippines produces the main pattern that there are more dynastic legislators and
parliamentarians from places with higher poverty and less human development.
In contrast to the Indian case, however, both the levels (for year 2012) and rise (from
2010 to 2012) in crime rates in the Philippines are negatively associated with dynastic
concentration. That is, regions with high or rising crime rates tend to elect fewer dynastic district
representatives in the Philippines. A plausible interpretation is that areas with high or rising
crime rates are prone to election-related or politically-motivated violence that creates
disincentives for future generations of a political dynasty to involve themselves in public office.

30 RSNPCC WORKING PAPER 15-011
Table 1.
Dynastic Share and Correlates with Socio-Economic Indicators for India and the
Philippines
INDIA PHILIPPINES
Economic growth (%),
annualized, 2009-2013 -0.1708
Economic growth (%),
annualized, 2009-2013 -0.0073
Economic growth (%),
average, 2010-2013 -0.2139
Economic growth (%),
average, 2010-2013 -0.0035
Real per capita income,
in Indian rupees, 2012 -0.2097
Real per capita income,
in Philippine peso, 2013 -0.7526
Growth of real per
capita income (%),
annualized, 2002-2012
-0.3392
Growth of real per
capita income (%),
annualized, 2009-2013
0.0179
Poverty incidence (%),
2005 0.0475
Poverty incidence (%),
2012 0.3481
Growth of poor
population (%),
annualized, 1994-2000
0.1546
Growth of poor
population (%),
annualized, 2006-2012
0.1690
Land inequality, Gini,
2004 0.1203 Land inequality, Gini NA
Share of urban to state
population (%), 2011 -0.3211
Share of urban to
regional population (%),
2010
-0.5821
Average monthly crime
rate, per 100,000
people, 2006
0.1515
Average monthly crime
rate, per 100,000
people, 2012
-0.6121
Growth in average
monthly crime rate (%),
annualized, 2004-2006
0.1017
Growth in average
monthly crime rate (%),
annualized, 2010-2012
-0.3650
Note: APC staff computations based on data from Center for Systemic Peace (2008); Indian Planning Commission
(2014); Indian Ministry of Rural Development (2014); Philippine Statistics Authority; Rawal (2008); Senate
Economic Planning Office (2013); and The Hindu (2014). Annualized growth of Variable X for years t to t+x is
computed as log 𝑋t+x− log 𝑋𝑡
𝑥. Average growth of Variable X for years t to t+x is computed as the average of the
annual growth rates of the said variable for the specified years.

31 RSNPCC WORKING PAPER 15-011
5. Conclusion
The link between socio-economic conditions and the existence of political dynasties is an
empirical question worth exploring in many developing democracies exhibiting dynastic
leadership patterns. Previous studies pinpoint either underdevelopment as originators of dynastic
persistence or dynastic politics as a potential contributor to lower economic performance. Our
study contributes to the literature by focusing on the relationship between dynastic concentration
and state-level socio-economic variables in the present parliament of India.
We find evidence of a higher concentration of dynastic MPs in small political parties and
rising dynastic concentration in younger age brackets.
Furthermore, the empirical analysis suggests that a higher share of dynastic
representation in the legislature is associated with lower economic performance, a poorer
standard of living, and a lower level of urbanization. Meanwhile, greater dynastic concentration
among state MPs is associated with higher poverty incidence, inequality in land ownership, and
higher crime rates.
All these results appear to largely cohere with the findings of existing empirical literature.
Certainly, similar patterns are, for the most part, present in another large developing democracy
in Asia, the Philippines. Furthermore, the findings are suggestive of the influence of poor socio-
economic conditions on the creation of political dynasties, or a possible deleterious effect of
dynasties on local economies.
The study is limited to correlation analysis and does not make categorical claims on the
direction of causality. Moreover, the scope of the study is circumscribed to the Members of the
Indian Parliament as of 2015. One needs to keep in mind that the election results were after two
consecutive terms for the Congress-led coalition and thus reflect the anti-incumbency sentiments
of the voters. It is suggested that future studies extend the analysis to earlier Lok Sabhas,
possible up to two previous legislative terms.
The share of dynastic representation to Lok Sabha has served as a rough proxy for
political inequality in this study, following Mendoza et al. (2012). While the relationship
between the composition of the national parliament and state-level economic conditions may be
stronger for the Union Territories (e.g., Andaman and Nicobar, Chandigarh, and Lakshadweep),
where the national government has more influence in state affairs, the same cannot be said for
the other states. Succeeding studies hence should extend up to the dynastic composition of state

32 RSNPCC WORKING PAPER 15-011
governments, i.e., determine the dynastic affiliation of officials in local elective positions,
preferably up to the panchayats (rural village councils) and municipal governments. This will
further the conclusiveness of the interpretation of empirical results. Moreover, the inclusion of
other officials in succeeding studies expands the data under scrutiny and allows the discussion to
go beyond correlate analysis.
Lastly, future research can explore questions of causality, associating dynastic patterns
with economic development and poverty reduction in India. These are critical areas for
monitoring and study, given the importance of these leadership patterns on Indian development.

33 RSNPCC WORKING PAPER 15-011
BIBLIOGRAPHY
‘BJP: People have rejected dynastic rule,’ The Hindu, 16 May 2014,
<http://www.thehindubusinessline.com/news/bjp-people-have-rejected-dynastic-
rule/article6015742.ece>, accessed 15 March 2015.
‘Indian Readership Survey 2013 Topline Findings,’ Official Website of the Media Research
Users Council, < http://mruc.net/sites/default/files/irs_2013_topline_findings.pdf>,
accessed 15 March 2015.
‘It’s all in the family,’ The Hindu, 12 June 2014, <http://www.thehindu.com/news/national/its-
all-in-the-family/article6095545.ece>, accessed 28 August 2014.
‘Key Data on Rural Development from IDFC Indian Rural Development Report,’ Official
Website of the Ministry of Rural Development,
<http://rural.nic.in/netrural/rural/sites/IDFC.aspx>, accessed 20 August 2014.
‘Sixteenth Lok Sabha: Brief Bio-Profiles of Members,’ Official Website of the Lok Sabha,
<http://164.100.47.132/LssNew/Members/breif_alphalist.aspx>, accessed 15 March
2015.
‘State-wise Indicators of Poverty and Per Capita Expenditure,’ Official Website of the Indian
Planning Commission,
<http://planningcommission.nic.in/data/datatable/index.php?data=datatab>, accessed 20
August 2014.
Acemoglu, Daron and James Robinson, Why nations fail: the origins of power, prosperity, and
poverty (London: Profile Books, 2012).
Acemoglu, Daron, 'Oligarchic versus democratic societies,' Journal of European Economic
Association 6 (2008), 1-44.
Amsden, Alice, Alisa DiCaprio, and James Robinson (eds.), The Role of Elites in Economic
Development (Oxford: Oxford University Press, 2012).
Amundsen, Inge, 'Dynasty or democracy? Party politics in Bangladesh,' CMI Brief Volume 12
No. 6 (Chr. Michelsen Institute, 2013).
Anderson, Benedict, Spectre of comparisons: Nationalism, Southeast Asia, and the world
(Quezon City: Ateneo de Manila University Press, 2004).
Asako, Yasushi, Takeshi Iida, Tetsuya Matsubayashi, and Michiko Ueda, 'Dynastic politicians:
theory and evidence from Japan,' Japanese Journal of Political Science, 16/1 (2015): 5-
32.
Banerjee, Abhijit, and Rohini Somanathan, 'The political economy of public goods: Some
evidence from India,' Journal of Development Economics, 82/2 (2007), 287-314.
Besley, Timothy, Rohini Pande, and Vijayendra Rao, 'Political selection and the quality of
government: Evidence from South India,' Economic Growth Center Discussion Paper
Series No. 921 (Yale University, 2005).
Bull, Benedicte, 'Towards a political economy of weak institutions and strong elites in Central
America,' European Review of Latin America and Carribbean Studies, 97 (2014), 117-
128.
Camp, Roderic, 'Family relationships in Mexican politics: a preliminary view,' The Journal of
Politics, 44/3 (1982), 848-862.
Chandra, Kanchan, ‘Elite incorporation in multi-ethnic societies,’ Asian Survey, 40/5 (2000),
836-855.

34 RSNPCC WORKING PAPER 15-011
Chhibber, Pradeep, and Irfan Nooruddin, 'Do party systems count? The number of parties and
government performance in the Indian states,' Comparative Political Studies, 37/2
(2004), 152-187.
Chhibber, Pradeep, and John Petrocik, 'The puzzle of Indian politics: Social cleavages and the
Indian party system,' British Journal of Political Science, 19/2 (1989), 191-210.
Chhibber, Pradeep, and Samuel Eldersveld, ‘Local elites and popular support for economic
reforms in China and India,’ Comparative Political Studies, 33/3 (2000), 350-373.
Dal Bo, Ernesto, Pedro Dal Bo, and Jason Snyder, 'Political dynasties,' Review of Economic
Studies, 76 (2009), 115-142.
De Dios, Emmanuel, 'Local politics and local economy,' in Arsenio Balisacan and Hal Hill
(eds.), The dynamics of regional development: The Philippines in East Asia, (Quezon
City: Ateneo de Manila University Press, 2007).
De Dios, Emmanuel, 'Political dynasties: cause or consequence,' BusinessWorld, 'Opinion,' 10
October 2012.
'End dynastic rule: PM Narendra Modi in Jammu and Kashmir,' The Economic Times, 22
November 2014, < http://articles.economictimes.indiatimes.com/2014-11-
22/news/56362186_1_jammu-and-kashmir-chief-minister-omar-abdullah-pm-narendra-
modi >, accessed 18 May 2015.
Frank, Zephyr Lake, 'Elite families and oligarchic politics on the Brazilian Frontier: Mato
Grosso, 1889-1937,' Latin American Research Review, 36/1 (2001), 49-74.
French, Patrick, India: A Portrait (New York: Knopf Doubleday Publishing Group, 2011).
Marshall, Monty and Donna Ramsay Marshall, Crime in India: Riots, Murders, and Dacoit,
1954-2006, (Vienna, Virginia: Center for Systemic Peace, 2008), accessed 20 August
2014.
McCoy, Alfred, 'An anarchy of families: the historiography of State and family in the
Philippines,' in Alfred McCoy (ed.), An anarchy of families: State and family in the
Philippines (6th edn., Quezon City: Ateneo de Manila University, 2010).
Mendoza, Ronald, Edsel Beja, Jr., Victor Venida, and David Yap II, 'An empirical analysis of
political dynasties in the 15th Philippine Congress,' Philippine Political Science Journal,
33/2 (2012), 132-145.
Mendoza, Ronald, Edsel Beja, Jr., Victor Venida, and David Yap II, ‘Empirics on the Impact of
Political Dynasties on Poverty: Initial Evidence for the Philippines,’ Working Paper
forthcoming (AIM-RSN Policy Center for Competitiveness, 2015).
Mendoza, Ronald, Tristan Canare, Mario Antonio Lopez, and David Yap II, 'The 2013
Philippine Mid-Term Election: An Empirical Analysis of Dynasties, Vote Buying, and
the Correlates of Senate Votes,' Working Paper No. 2 (AIM-RSN Policy Center for
Competitiveness, 2014).
Merchant, Minhaz, 'Why Political Dynasties Beget Poverty,' The Economic Times, 22 March
2014, < http://blogs.economictimes.indiatimes.com/headon/why-political-dynasties-
beget-poverty/ >, accessed 18 May 2015.
Monsod, Solita, Toby Monsod, and Geoffrey Ducanes, 'Philippines' progress towards the
Millenium Development Goals: geographical and political correlates of subnational
outcomes,' Journal of Human Development, 5/1 (2004), 121-149.
Patrikios, Stratos and Michalis Chatzikonstantinou, 'Dynastic politics: Family ties in Greek
parliament, 2000-12,' South European Society and Politics, 20/1 (2015), 93-111.

35 RSNPCC WORKING PAPER 15-011
Rawal, Vikas, ‘Ownership holdings of land in rural India: Putting the record straight,’ Economic
and political weekly, (2008), 43-47.
Rossi, Martin, 'Family business: causes and consequences of political dynasties,' Working Paper
No. 114 (Universidad de San Andres, 2014).
Senate Economic Planning Office, At A Glance: Crime Statistics (Pasay City: Senate of the
Philippines, 2013). Thananithichote, Satithorn, 'Family Politics: Democracy in Thailand,' Working Paper Series
(King Prajadhipok's Institute 2013).
Varshney, Ashutosh, 'Democracy and poverty,' paper given at the Conference on World
Development Report 2000, Sussex, 15-16 August 1999,
<http://siteresources.worldbank.org/INTPOVERTY/Resources/WDR/DfiD-Project-
Papers/varshney.pdf>, accessed 20 August 2014.
Wyatt, Andrew, 'Family ties,' The Indian Express, 1 April 2014,
<http://indianexpress.com/article/opinion/columns/family-ties-5/>, accessed 18 May
2015. +AMDG

This policy research is in collaboration with Konrad-Adenauer-Stiftung and AIM Stephen
Zuellig Graduate School of Development Management.


![Complexitat i fenomen (socio)lingüístic [Complexity and (socio)linguistic phenomenon]](https://static.fdokumen.com/doc/165x107/63130623c32ab5e46f0c3b37/complexitat-i-fenomen-sociolingueistic-complexity-and-sociolinguistic-phenomenon.jpg)