
Widespread plant species: natives versus aliens in our changing world
Open Research OnlineThe Open University’s repository of research publicationsand other research outputs
Net generation or Digital Natives: Is there a distinctnew generation entering university?
Journal ArticleHow to cite:
Jones, Chris; Ramanau, Ruslan; Cross, Simon and Healing, Graham (2010). Net generation or DigitalNatives: Is there a distinct new generation entering university? Computers and Education, 54(3), pp. 722–732.
For guidance on citations see FAQs.
c© 2010 Elsevier Ltd
Version: Accepted Manuscript
Link(s) to article on publisher’s website:http://dx.doi.org/doi:10.1016/j.compedu.2009.09.022
Copyright and Moral Rights for the articles on this site are retained by the individual authors and/or other copy-right owners. For more information on Open Research Online’s data policy on reuse of materials please consultthe policies page.
oro.open.ac.uk
Net generation or digital natives: Is there a distinct new generation entering university? Chris Jones, Ruslan Ramanau, Simon Cross and Graham Healing
*[email protected]; [email protected] ; [email protected] ;
*corresponding author Tel +44 (0)1908 652530 Fax +44 (0) 1908 654173
The Institute of Educational Technology, The Open University, Walton Hall, Milton
Keynes MK7 6AA, United Kingdom.
Abstract
This article reports key findings from the first phase of a research project investigating Net
generation age students as they encounter e-learning at five universities in England. We take a
critical view of the idea of a distinct generation which has been described using various terms including Net generation and Digital Natives and explore age related differences amongst first year
university students. The article draws on evidence from a survey of first year undergraduates
studying a range of pure and applied subjects. Overall we found a complex picture amongst first year students with the sample population appearing to be a collection of minorities. These included
a small minority that made little use of some technologies and larger minorities that made extensive
use of new technologies. Often the use of new technology was in ways that did not fully correspond
with the expectations that arise from the Net generation and Digital Natives theses. The article concludes that whilst there are strong age related variations amongst the sample it is far too
simplistic to describe young first year students born after 1983 as a single generation. The authors
find that the generation is not homogenous in its use and appreciation of new technologies and that there are significant variations amongst students that lie within the Net generation age band.
Keywords: computer-mediated communication; cooperative/collaborative learning; distributed
learning environments; pedagogical issues; post-secondary education
1. Introduction
We are told that there is a new population emerging from young people born after the
time when digital technologies began to be embedded in social life sometime in the 1980s
(Palfrey & Gasser 2008, Tapscott 2008). These young people having grown up with
computers and the Internet are said to have a natural aptitude and high skill levels when
using new technologies. Older people are characterized as being at least one step behind
and unable to reach the kinds of natural fluency that comes with having grown up with
new digital technologies. Furthermore we are told that this generational shift has
consequences for approaches to learning because the new generation requires rapid
access and quick rewards, is impatient with linear thinking and displays a novel capacity
for multi-tasking. This argument is not new but it continues to have a contemporary
significance despite having received a recent critical response from a variety of
empirically (e.g. Kennedy, Judd, Churchward, Kay & Krause 2008) and theoretically
(e.g. Bayne & Ross 2007, Bennett, Maton & Kervin 2008) based arguments. The
argument persists even after some of the originators of the idea have begun to distance
themselves from it (Prensky 2009). This article considers these arguments in the context

of a new generation of learners entering university in England and is based on research
conducted in 5 universities.
This issue has added importance because it suggests that teachers and educational
institutions have a responsibility to change in response to the assumed demands of this
new generation of learners. The Vice Chancellor of the Open University (UK) had this to
say to the university council:
“Most of our students, moreover, are part of what we now describe as the Net
Generation. This is a generation who think IM, text and Google are verbs not
applications! “They expect to be engaged by their environment, with
participatory, sensory-rich, experiential activities (either physical or virtual) and
opportunities for input. They are more oriented to visual media than previous
generations – and prefer to learn by doing rather than by telling or reading.” They
prefer to discover rather than be told. (Becta Research Report 2008, page 13) So,
as John Thompson frames the question: “Is education 1.0 ready for Web 2.0
students?” (Brenda Gourley VC Open University (UK), Council and Staff
Address 26th September 2008)
What is striking about this source is that the Open University (UK) has a largely mature
intake of students with only about 20% of first level students being under 25 years of age.
The importance of the comment by Brenda Gourley is that it relies on a consistent image
of the Net generation and Digital Natives that has become commonplace and is regularly
reproduced in keynote addresses, policy discourse and the literature relevant to
practitioners (e.g. Oblinger 2006, Barnes, Marateo & Pixy Ferris 2007, Thompson 2007).
For example in this keynote speech:
“One student walks across campus listening to an iPod; another is engrossed in
text messaging on her cell phone. During class, they're Googling, Instant
Messaging and playing games - often at the same time. More likely to use the
library as a gathering place than a resource, this is the Net Generation. (Oblinger
2006)
Bayne and Ross (2007) have argued that the persistence of this image of the Net
generation or Digital Native student has a strong relationship to the logic of the market
and a culture of enterprise and it is evident in advertising that these ideas are clearly
reinforced by marketing aimed at the education sector. Research Machines for example
has this account on its web site:
“It's become a stereotypical statement, but children today really are digital
natives. Much, much more than most of us realise. Even more so than most
readers of this article, who are probably reasonably ICT literate.”
http://www.rm.com/Secondary/InTheNews/Article.asp?cref=MNEWS1122876
This article critically reviews the available literature and appraises the main theses that
arise from this drawing on recent research conducted in English universities, aspects of
which have already been partially reported in a series of conference papers (Jones and
Ramanau 2009a, Jones and Ramanau 2009b and Jones and Cross 2009).
2. The Net generation and Digital Natives
There are a number of competing terms that claim to identify a generation of young
people who are now entering universities across the world. Three of the most common
terms in circulation are the Net generation (Tapscott 1998, 2008), Digital Natives
(Prensky 2001a and b and 2009) and Millenials (Oblinger & Oblinger 2005). Each way
of describing this new generation carries with it some distinct features but in general the
terms are used interchangeably. One of the differences is in terms of the dates that
bracket the new generation. Tapscott starts the new generation with extreme precision in
January 1977 and ends it with a further generational shift into Generation Next in
December 1997 (Tapscott 2008 p16). He clearly views the Net generation as part of a
succession of generational types in the post-World War 2 era. Prensky is not specific
about dates that define this new generation which is somewhat odd given that he suggests
that there is a radical break between the generation he describes and previous generations.
However other authors that make use of the idea of the Digital Native suggest that Digital
Natives appear after 1980 (Palfrey & Gasser 2008 p1). Oblinger & Oblinger put a precise
date on the Millenials suggesting that they were born ‘in or after 1982’ (Oblinger 2003
p38) and that this generation ends in 1991 (Oblinger & Oblinger 2005 2.9). They suggest
that the generational boundary is sharp and that just a few years makes a significant
difference in young people’s attitudes. Oblinger takes her view of the Millenial student
from Howe and Strauss who have a strong focus on the USA in contrast to other authors
who advance a more general thesis. Howe and Strauss (2000) also extend the thesis into
the years after the millennium unlike Oblinger who adds a clear end date in 1991.
Given the almost universal claim that this Net generation of Digital Natives is marked out
by clear boundaries in terms of their attitudes, in the form of a ‘discontinutity’ or
‘singularity’ (Prensky 2001a), the lack of clarity in terms of the years that define the
population is striking. For the purposes of our research we have designated all students
born after 1983, who were 25 or younger at the time of the research, as part of the Net
generation or Digital Natives.
Recently the idea of a Net generation and the term Digital native has come under some
critical scrutiny. Bennett et al. (2008) have argued that there are still significant
questions surrounding the main claims made about a new generation of learners and that
for the most part the debate has been neither empirically nor theoretically informed. They
go on to maintain that the debate can be likened to an academic form of ‘moral panic’ in
which arguments and assertions are couched in overly dramatic language which then
lead to appeals for urgent action and fundamental change. They also note that this
academic moral panic is associated with polarized and determinist arguments in which
descriptions rely on oppositions between digital natives and digital immigrants, a new
Net generation and all previous generations and in which change is portrayed as
inevitable with those who resist these characterizations being represented as simply being
resistant to change, out of touch with reality and as not having legitimate concerns
(Bennett et al. 2008 pp782-783). Bennett et al.’s critique of the language of moral panic
is that it closes down debate and allows unsupported claims to circulate and gain
credibility. Bayne and Ross (2007) are equally sceptical about the nature of the claims
made about the pressures arising in education from a new generation of Digital Natives.
They suggest that the arguments lead to a one way determinism forcing institutions and
teachers to change. They also note a paradox lying at the centre of this debate because
each person is fixed by their generational position, you either are or you are not a ‘native’
but this sits alongside a requirement to change to become more like the natives, a digital
immigrant at least. In turn this leads to a deficit model for professional development in
which however hard older academic staff try they will never be able to bridge the gap
arising from their generational position (Bayne and Ross 2007).
Empirical work that examines the nature of young university students finds that the
generation entering university is more complex than the literature would lead an observer
to expect. Kennedy et al. (2008) found that amongst first year Australian students use of
technologies there was significant diversity when looking beyond the basic and
entrenched technologies. They found that the patterns of access to, use of and preference
for a range of other technologies varied considerably. They argued that their findings ran
counter to many of the assumptions that underpin both the idea of the Digital Native
found in Prensky (2001a) and the similar set of ideas advanced by Tapscott using the
term Net generation (Tapscott 1998 and 2008). They went on to suggest that the
fundamental changes that have been proposed to accommodate the claims made about the
characteristics of this new generation of learners didn’t not seem to be warranted by the
evidence they had gathered. They also note that it would necessarily be difficult because
the generational grouping showed a high degree of technological diversity. Overall they
characterized first year students as possessing a core set of technology based skills whilst
beyond this core there were a diverse range of skills across the student population
(Kennedy et al. 2008 p117).
In the UK Margaryan and Littlejohn (2009) found that students used a limited range of
established technologies for learning and another limited range for recreational and social
use. They found that there were low levels of use and degrees of familiarity with some
more advanced technologies and services such as virtual worlds and personal web
publishing. Also their research provided no evidence to support the claims that students
were adopting radically different study patterns indeed they argued that students’
attitudes to learning appeared to conform to fairly traditional pedagogies, dependant on
the lecturing staff even though there were some minor uses of technology and tools to
deliver course content. Selwyn (2008), basing his argument on survey evidence from UK
students, has suggested that the new generation of learners are no more homogenous than
were previous generations. In particular Selwyn points to the existence of gender
differences and he notes that the gender divide he finds in the survey data does not
necessarily follow the lines of division that might be expected from earlier research.
In the USA, Kvavik (2005) found that undergraduate students had basic office computing
skills, were frequent users of email and instant messaging and surfed the Internet (Kvavik
2005 7.7), but that these high levels of use and skill did not lead on either to a preference
for increased use of technology in the classroom or adequate skills in using these skills
for academic activities (Kvavik 2005 7.17). In a following study, Caruso and Kvavik
(2005) found that students were comfortable with a core set of technologies but they were
less comfortable with specialised technologies. Further ECAR studies of US students
show that in terms of skills with core applications used for studying that there were few
gender differences with males and females reporting similar skill levels for most
applications (Salaway, Caruso & Nelson 2008 p11). Salaway et al. also found that age
was a significant factor in terms of the usage of what they describe as communication and
collaboration technologies such as text, IM and social networking (ibid p 49). The 2008
survey continued to report that students were not looking for extensive use of ICT on
their courses and that the use of information and communication technologies (ICT)
needed to be balanced with other activities, in particular face to face activity. (Salaway et
al. p 16). The 2008 survey had a particular focus on Social Networking and reported that
up to 82% of US university students were registered with one or more social networking
sites, with Facebook and MySpace being the most frequently cited. The survey also
reported that the students spent up to five hours per week on these sites with the majority
of students logging in on a daily basis (Salaway et al. 2008 pp, 81-100)
Work exploring new generation learners and their relationship to technology has also
been undertaken outside of the advanced industrial countries and in South Africa it
showed that ICTs formed some part of teaching and learning for a diverse group of
students (Brown & Czerniewicz 2008). However whilst almost all South African students
were exposed to ICTs the use of these technologies was rarely frequent and despite the
hype associated with Web2.0 technologies, there was low use of these for teaching and
learning. Use of digital and networked technologies for learning were not found to be
entrenched in courses, nor were these technologies found to be ubiquitous in students’
everyday lives. Use by South African students was found to be linked to a requirement to
use technologies on the students’ course and use of technology tended to focus on course
content. These findings about Web 2.0 technologies and course content were noted by
Brown & Czerniewicz (2008) to be similar to findings in the UK and US.
Overall there is growing theoretical and empirical evidence that casts doubt on the idea
that there is a defined new generation of young people with common characteristics
related to their exposure to digital technologies and networked communication
throughout their lives. Despite the growth of this evidence base the arguments about a
new Net generation of Digital Natives persists in a popular discourse which is replicated
in policy and practitioner literatures. For these reasons we argue that further work needs
to be done to examine the characteristics of students entering university in order to
identify those changes that are taking place and to provide a fuller and more complex
picture of the new generation of learners.
3. Research and methods
This article is based on the first phase of a two year study which took place in the spring
of 2008 in five universities in England. The universities were selected to represent the
main ‘types’ of university found in the English system and access was gained to 14
courses across a range of pure and applied subject and disciplinary areas (see Table 1 for
a more detailed description of universities and courses under study). A questionnaire
exploring the experiences of first year students as they encountered university e-learning
provision was developed by the research team and administered in all five participating
institutions. The survey instrument was developed with reference to the prior surveys
conducted by Kennedy, Kraus, Judd, Churchward & Gray (2006) and the Educause
ECAR studies (Salaway et al. 2008 Appendix B). The instrument collected baseline data
about key aspects of the students’ use of technology in their social life and for study
purposes and it consisted of four sections: demographic characteristics of the
respondents, access to technology, use of technology in university study and finally
course-specific uses of technology.
The access to technology section sought to collect information on levels and nature of
student access to computer software, hardware, mobile devices, games consoles and
networks. The use of technology section was comprised of 16 self-report questions aimed
at finding out more about the importance and frequency of student access to the Internet
for social life and study, locations of online access, use of Web 2.0 tools, virtual worlds
and games as well their confidence levels in performing most common ICT tasks. Three
of these questions were on a 5-point Likert-scale. The course-specific technology usage
section was mainly concerned with exploring the frequency and nature of technology use
in the context of specific courses, the usefulness of various types of online
communication between the students and their institution and student attitudes to using
ICT on the courses under study.
The instrument was piloted on an individual basis in electronic and paper formats with a
small number of students (n=5) for timing and understanding of the individual items and
the overall structure of the questionnaire. The pilot tests resulted in the rewording of
several items and the removal of others, either because they were unclear to the students
answering the pilot questions and an acceptable revised wording could not be found or to
reduce the overall time taken answering the survey. The research team had agreed with
participating course teams to place a time limit for completion of the questionnaire at 20
minutes, a duration that was at the margin of acceptability for some of the courses. A gap
in piloting emerged when the survey was issued because no pilot testing had been
undertaken with non-native English speaking students and the time taken by students who
did not have English as their first language was significantly longer than for native
English speakers. The survey was also submitted to a Student Research Project Panel
which provided feedback on the questionnaire. The sample was purposive and relied for
its validity and generalisability on the selection of representative university types and a
broad range of subject and disciplinary types (Table 1). The survey developed in this first
phase of research was intended to be a single ‘snapshot’ of student activity gathered
towards the end of the first year of university studies. It was also used to pilot test some
of the items to be used in the questionnaires for the second phase of the study.
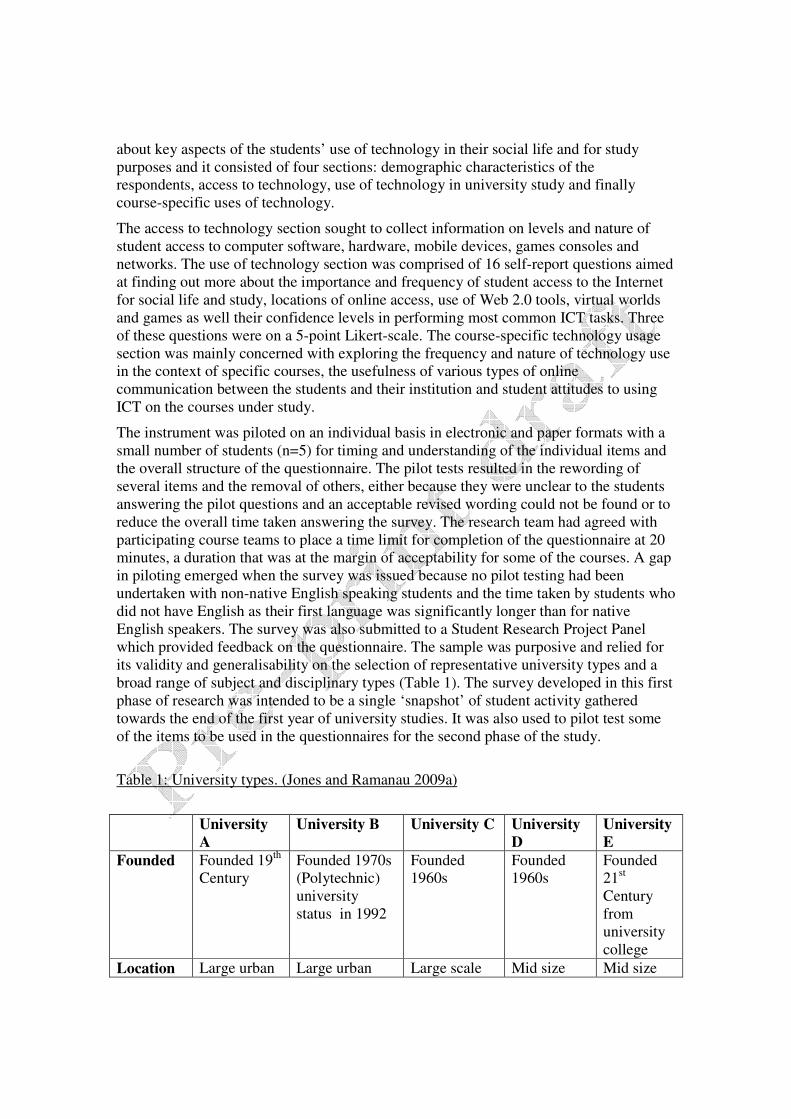
Table 1: University types. (Jones and Ramanau 2009a)
University
A
University B University C University
D
University
E
Founded Founded 19th
Century
Founded 1970s
(Polytechnic)
university
status in 1992
Founded
1960s
Founded
1960s
Founded
21st
Century
from
university
college
Location Large urban Large urban Large scale Mid size Mid size
metropolitan metropolitan distance campus
outside
small city
with multi-
site
campuses
in small
towns
Course
units
English Sociology Science Modern
Languages
(2)
Journalism
Bio-science Information
and
Communication
Health and
Social Care
Computing Psychology
Veterinary
science
The Arts Accounting
and Finance
Social
Work
Course registration at the time of the survey was a maximum of 1809 students and a total
of 596 first-year students completed the survey yielding a response rate of approximately
33%. A further 62 responses were excluded because students had either failed to finish
the survey form or had not signed the consent sheet. The method of delivery used for
each course varied between electronic and paper format and was determined on a case by
case basis. When it was possible surveys were issued either using an online link or on
paper during class sessions. In all place based universities students were invited to
participate during a short presentation by a member of the project team or university
teaching staff and in the case of distance students an email and letter were sent in place of
the introductory presentation. Following this initial contact, follow-up emails, including a
link to the online survey, were sent to all students on each course. Some verbal reminders
were also given by teaching staff in subsequent lectures. Three versions of the survey
were produced, an online version accessible via the Internet, a paper version for
distribution and collection within a teaching session and for distance learners a paper
version that could be mailed to their home and returned in a prepaid envelope. Of the
fifteen courses surveyed (14 subject areas with 2 language courses at university D) nine
courses used only online surveys, five offered a combination of online and paper and one
used paper only.
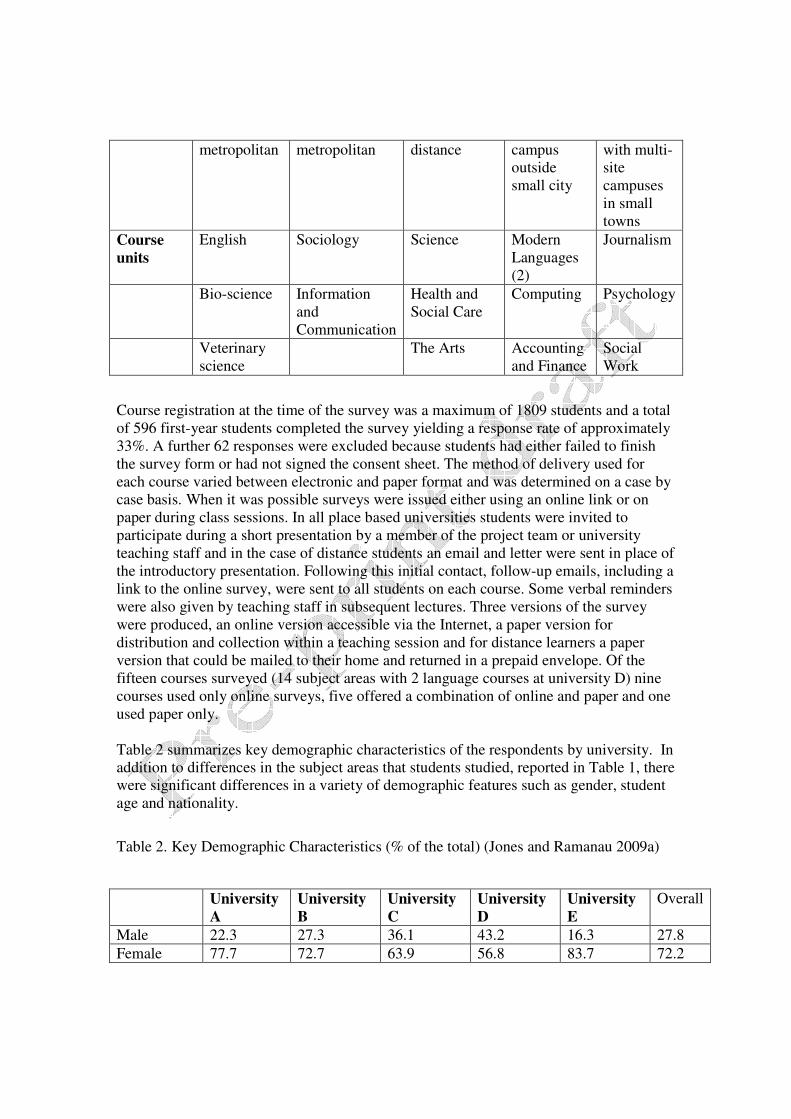
Table 2 summarizes key demographic characteristics of the respondents by university. In
addition to differences in the subject areas that students studied, reported in Table 1, there
were significant differences in a variety of demographic features such as gender, student
age and nationality.
Table 2. Key Demographic Characteristics (% of the total) (Jones and Ramanau 2009a)
University
A
University
B
University
C
University
D
University
E
Overall
Male 22.3 27.3 36.1 43.2 16.3 27.8
Female 77.7 72.7 63.9 56.8 83.7 72.2
UK
Students
96.6 95.3 93.3 80.8 98.0 93.9
International
Students
3.4 4.6 6.7 19.2 2.0 6.1
18-25 years
of age
96.0 89.1 12.6 95.9 84.4 75.8
Older than
25
4.0 10.9 87.4 4.1 15.6 24.2
Full-time
student
99.4 96.9 5.1 100.00 99.0 80.3
Part-time
student
0.6 3.1 94.9 0 1.0 19.7
Total
number
176 128 119 74 99 596
To clarify the nature of age differences the data which had been collected in the form of
the year of birth was firstly divided into two categories representing the Net generation
students and those older (26 years of age and above and 25 years of age and under). The
sample was then organised into four age bands – 20 years of age and under, 21 to 25
years of age, 26 to 35 years of age and older than 35 years of age. Further variables
relevant to student experiences were examined including gender, institutional affiliation
and type of university i.e. place based or distance mode.
The results of the survey should be treated with some caution because the sample was
purposive rather than representative of all first year students in English universities. Also
the fact that that the participants were volunteers (which led to limited response rates for
both paper and online versions of the questionnaire) places further constraints on the
generalisability of the study’s results. Another limitation is that some of the questionnaire
items relied on student self-reporting of the frequency and nature of their technology use
and describing their own skill levels. Previous research has shown (e.g. Douwes, de
Krakera, H. & Blattera 2007) that self-reported data on computer use is not always a
reliable source of evidence.
4. Results
In terms of general characteristics just over three quarters (77.4%) of the respondents
owned a laptop and over a third (38.1%) owned a desktop computer. Very few (0.4%
n=2) had no access to a desktop computer with only slightly more (1.4% n=8) no access
to a laptop and over half (55.4%) reporting use of a desktop computer in a public place.
These findings mirror surveys conducted in the USA (Salaway et al. 2008) and Australia
(Kennedy et al. 2008) in terms of the ownership and access to computers and they
confirm the findings of other UK studies (Margarayan and Littlejohn 2009). Over two
thirds (70.1%) of those asked, felt that their access to computers was sufficient to meet
their computing needs whilst a further 26.4% said it mostly met their needs. Over half of
the respondents had a broadband connection (55.6%) and 39.5% had access via a
broadband wireless hub /router. We were surprised at the number of students (13.4%)
who reported that had a wireless mobile connection but this was supported by cross
referencing other items and in open text answers. In a second item we had asked students
where they accessed the Internet and included the option of ‘anywhere, mobile Internet’.
Whilst this isn’t directly comparable with a question specifically identifying mobile
broadband access it gives confirmation of the approximate size of the minority of
students because 11.1% of respondents reported using mobile Internet and cross-
tabulation reveals that 9% of students responded positively to both questions, however
this would also suggest that we need to be cautious in interpreting these results.
Almost all students owned a mobile phone (97.8%) and these phones were often
equipped with a camera (91.9%), music player (77.25) and Internet access (75.7%).
Memory sticks were the second most commonly reported device (87.9%) but as with
many other devices there was a small minority who did not own or have access to one
(7.9%). An Mp3 device or other digital music player was commonly owned (82.4%) but
a games console (38.4%) was less commonly owned although there was a significant
amount of shared use (21.5%) and there was a large minority who reported no access at
all (39.5%). When we asked which of these devices they would miss the most if they did
not have access to it most chose their mobile phone (83.2%) and in open text answers it
was clear that this was because the phones had several functions (i.e. the phone function
was not the only, or indeed the primary, benefit). Fuller details of these results can be
found in Jones and Cross (2009)
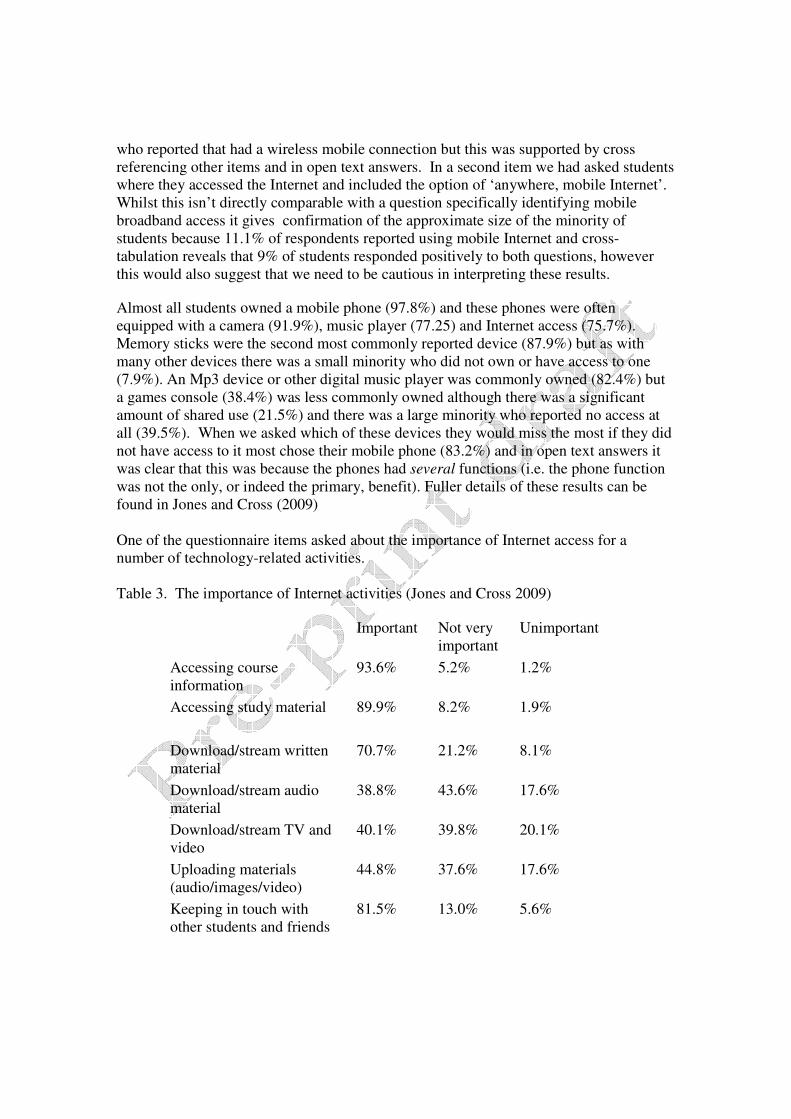
One of the questionnaire items asked about the importance of Internet access for a
number of technology-related activities.
Table 3. The importance of Internet activities (Jones and Cross 2009)
Important Not very
important
Unimportant
Accessing course
information
93.6% 5.2% 1.2%
Accessing study material
89.9% 8.2% 1.9%
Download/stream written
material
70.7% 21.2% 8.1%
Download/stream audio
material
38.8% 43.6% 17.6%
Download/stream TV and
video
40.1% 39.8% 20.1%
Uploading materials
(audio/images/video)
44.8% 37.6% 17.6%
Keeping in touch with
other students and friends
81.5% 13.0% 5.6%
Students were asked how important Internet access was for a variety of activities and the
activities that they rated as the most important were accessing materials and
communicating. Examining the item concerned with accessing course information and
study materials there appeared to be differences between Net generation age and older
students (χ² =36.82, d.f.=2, p < .001 and χ² =57.97, d.f.=2, p < .001) and between gender
groups (χ² =20.56, d.f.=2, p < .001 and χ ² =12.07, d.f.=2, p = .002). Younger students
and men regarded the Internet as more important for these activities than older students
and women. There were also differences between universities in how important Internet
access was thought to be (χ² =59.64, d.f. = 8, p< .001) and in particular differences
between university's modes, i.e. between distance and place based universities (χ² =56.68,
d.f. = 2, p < .001). Students in place based universities saw the Internet as being more
important than students in the distance university. The other differences between
universities were consistent across a number of items but it was difficult to analyse or
describe these differences in a meaningful way with so many potentially contributing factors.
For example some universities in our sample had most students co-located on campus, whilst
other university students were quite dispersed and access to the Internet was another factor
that varied widely in each university setting.
Some arguments about Web 2.0 and Net generation age students suggest a greater
inclination amongst younger students towards participatory digital technologies including
the uploading and downloading of multi-media (Jones 2002, Clark, Logan, Lukin, Mee &
Oliver 2009). The importance of activities based on accessing materials and
communicating in our data might suggest that these arguments are somewhat
exaggerated. However there was a minority in our sample that reported that uploading
and downloading audio and video was important to them. In a similar way to items
concerning access to course information there were differences for items relating to the
importance of the Internet for downloading and uploading materials. In terms of age
group (χ² =72.60, d.f. = 6, p < .001) younger students and Net generation age students (χ²
=57.97, d.f. = 2, p < .001) were the more likely to upload and download materials than
older students. There were difference between the modes of university study (χ² =1.19,
d.f. = 2, p < .001) with students in place based universities more likely to view the
Internet as important for uploading and downloading materials. Then again a more in-
depth examination of age showed that even within the Net generation age students there
were differences in their views regarding the importance of the Internet. For example,
students aged 20 years of age and younger were more likely to regard the Web as being
important for downloading or streaming TV and video (χ² =8.06, d.f. = 2, p = .02).
The analysis of other questionnaire items suggested a very similar tendency. For
example, when asked about the frequency of performing some of the most common
technology tasks the sub-set of younger Net generation students (i.e. those aged 20 years
of age and younger) reported being more frequently engaged in instant messaging,
sending text by a mobile phone, participating in social networks, downloading or
streaming TV or video and uploading images, audio and video onto social networking
sites and (see Table 4 below for descriptive statistics and ANOVA test results).
Table 4. Item Means and F values on Self-Reported Frequency of Technology Tasks
among Net generation Students (5-Point Scale, d.f. = 1).
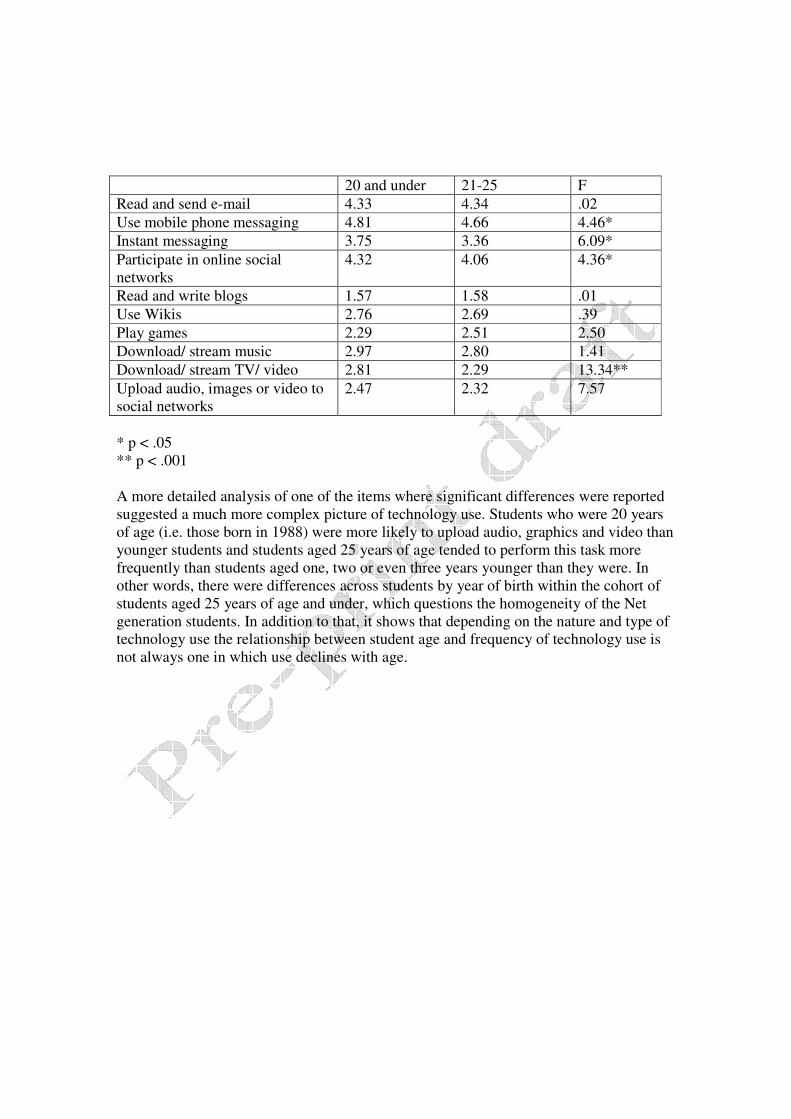
20 and under 21-25 F
Read and send e-mail 4.33 4.34 .02
Use mobile phone messaging 4.81 4.66 4.46*
Instant messaging 3.75 3.36 6.09*
Participate in online social
networks
4.32 4.06 4.36*
Read and write blogs 1.57 1.58 .01
Use Wikis 2.76 2.69 .39
Play games 2.29 2.51 2.50
Download/ stream music 2.97 2.80 1.41
Download/ stream TV/ video 2.81 2.29 13.34**
Upload audio, images or video to
social networks
2.47 2.32 7.57
* p < .05
** p < .001
A more detailed analysis of one of the items where significant differences were reported
suggested a much more complex picture of technology use. Students who were 20 years
of age (i.e. those born in 1988) were more likely to upload audio, graphics and video than
younger students and students aged 25 years of age tended to perform this task more
frequently than students aged one, two or even three years younger than they were. In
other words, there were differences across students by year of birth within the cohort of
students aged 25 years of age and under, which questions the homogeneity of the Net
generation students. In addition to that, it shows that depending on the nature and type of
technology use the relationship between student age and frequency of technology use is
not always one in which use declines with age.
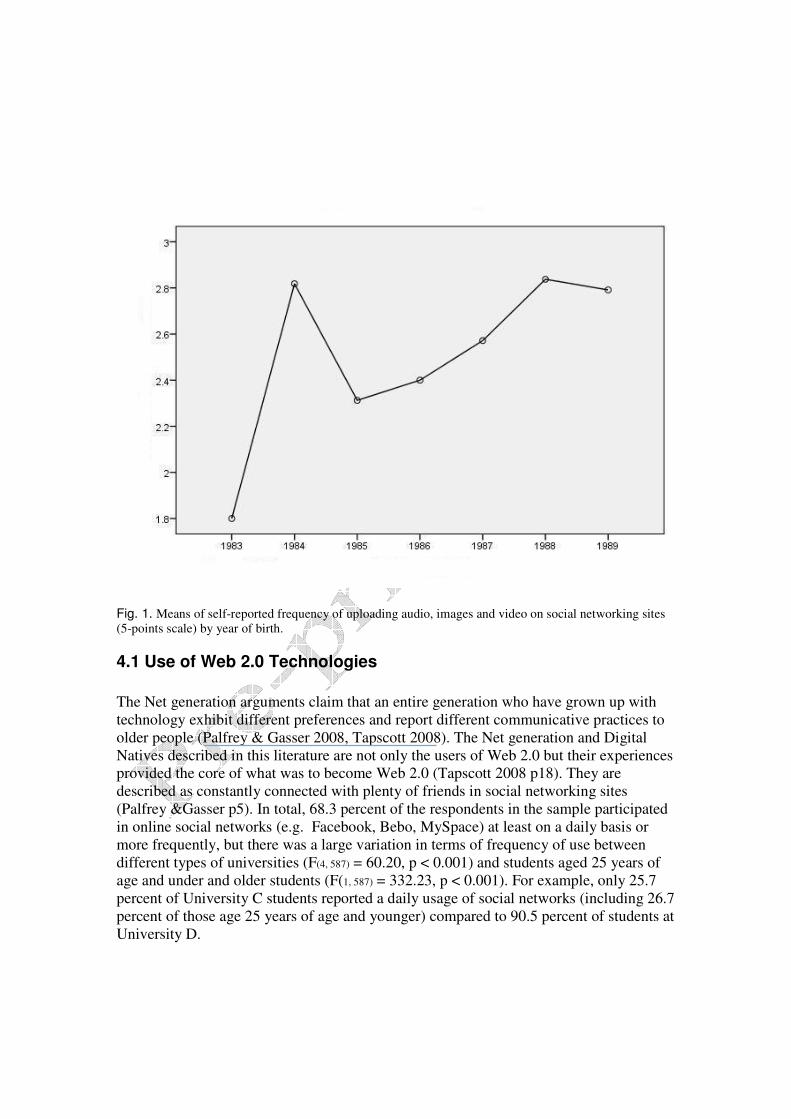
Fig. 1. Means of self-reported frequency of uploading audio, images and video on social networking sites
(5-points scale) by year of birth.
4.1 Use of Web 2.0 Technologies
The Net generation arguments claim that an entire generation who have grown up with
technology exhibit different preferences and report different communicative practices to
older people (Palfrey & Gasser 2008, Tapscott 2008). The Net generation and Digital
Natives described in this literature are not only the users of Web 2.0 but their experiences
provided the core of what was to become Web 2.0 (Tapscott 2008 p18). They are
described as constantly connected with plenty of friends in social networking sites
(Palfrey &Gasser p5). In total, 68.3 percent of the respondents in the sample participated
in online social networks (e.g. Facebook, Bebo, MySpace) at least on a daily basis or
more frequently, but there was a large variation in terms of frequency of use between
different types of universities (F(4, 587) = 60.20, p < 0.001) and students aged 25 years of
age and under and older students (F(1, 587) = 332.23, p < 0.001). For example, only 25.7
percent of University C students reported a daily usage of social networks (including 26.7
percent of those age 25 years of age and younger) compared to 90.5 percent of students at
University D.
Interestingly, although a majority of University C’s (mainly older) students had never
used a social networking site, there were also considerable minority groups of students in
other universities who also reported not participating in social networking, e.g. 11.0 and
11.2 percent of students studying with universities A and B. Whilst at University A the
majority of those who never used a social networking website were mature students, at
University B it was students aged 25 years and younger who were less likely to have used
social networking sites (8.8 percent of students in this group reportedly never used these
websites). When asked whether their use of social networking sites had increased since
beginning university 74.8 to 87.7 percent of the Net generation aged students in place
based universities agreed with the statement compared with only 26.7 percent of students
(or 18.8 percent of older students) at the distance mode University C. This low reported
increase compares to more than 53.3 percent of the older students at University A who
reported an increase in their use of social networking sites. The data on social networking
site use suggests further work is necessary to investigate institutional contexts and modes
of teaching and learning as influences that may affect student use of social networking
sites.
When the differences across two rather than four age groups were explored younger
respondents reported more frequent use of social networking websites (F(3, 584) =
554.20, p < 0.001), e.g. only 4.3 percent of those aged 20 and younger never used this
technology compared to 78.5 percent of those aged 35 years of age and older. Amongst
Net generation age students (25 and under) 81.7 percent used social networking on at
least a daily basis, whilst only 5.1 percent ‘never’ participated in online social networks.
In comparison 55.7 percent of students aged 26 years of age and older reported they had
never participated in social networking sites and only 24.3 percent of them reported the
frequency of usage reported by most younger students. Younger respondents tended to
have more experience of using social networking sites than older students. However, the
differences between place based and distance institutions also appeared to be highly
significant. For example, the Net generation age students at the distance mode university
tended to both use social networking sites less frequently than students in other
universities and to report a lower increase in the frequency of use during their first year of
study. Moreover, when looking at both the experiences of younger and more mature
first-year students in place based universities different patterns of use emerge, which
suggests that further investigation is required into the ways in which student technology
use is mediated by institutional and possibly even individual course and departmental
contexts.
Gender differences did not appear to be quite as pronounced and there were no
statistically significant differences in terms of the frequency of participation in social
networks (F(1, 587) = 2.93, p = 0.09). However though not statistically significant, female
students tended to report using social networking sites more frequently (sample mean of
3.83 compared to 3.60 for men) and fewer women had never used a social networking
website compared to men: 15.5 percent compared to 21.3 percent. There were no
significant differences in terms of the previous experience prior to university of using
social networking sites between the two gender groups (Cramer’s V = 0.30, d.f. = 1, p –
n.s.), but when asked whether their frequency of use had increased while at university
women were more likely to agree with this statement than men (Cramer’s V = 1.50, d.f.
= 1, p < 0.001).
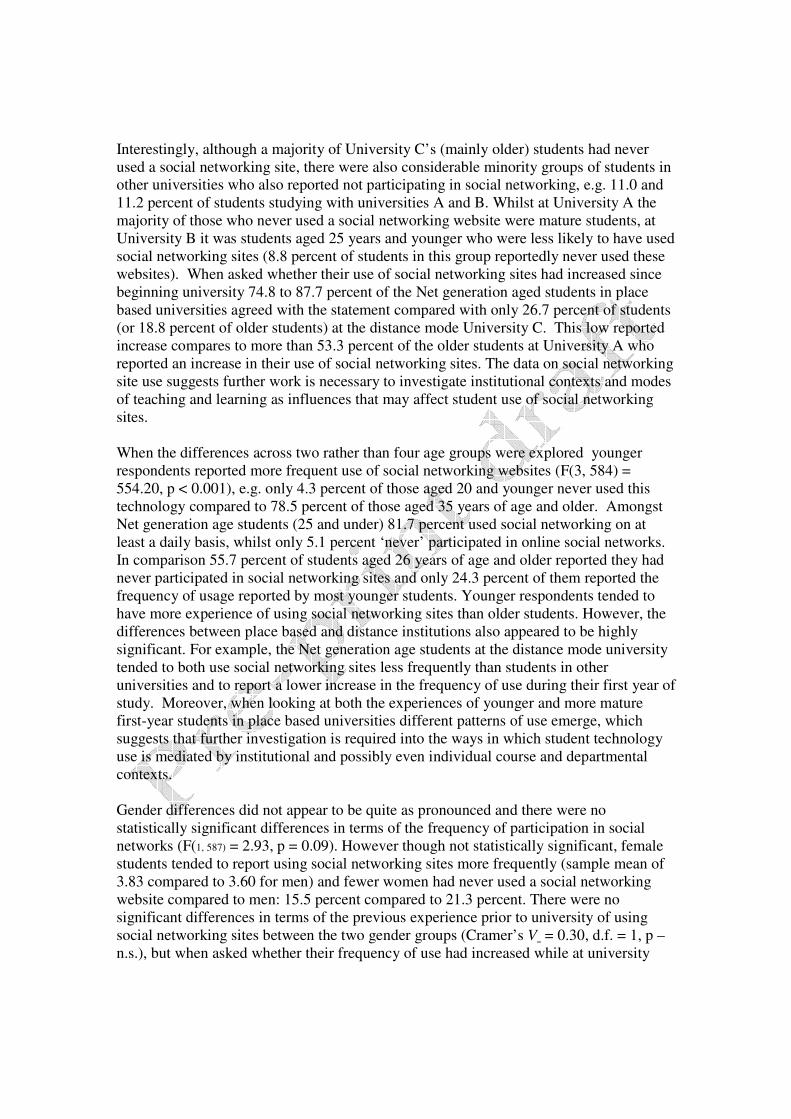
The picture is more complex than this however as we can see significant variations in the
use of technologies for social life and leisure and for study purposes.
Fig. 2. Study purposes (left) social life and leisure (right).
Patterns in student use of various technologies for social life and leisure were correlated
with the use of the same technologies for study at statistically significant levels (p <
0.001). However, the relationships between the use of these technologies for study and
for leisure were not equally strong. Cohen (1988) classified the strength of correlations
into three groups – weak, moderate and strong. Using his typology the associations
between the use of instant messaging (r = 0.54) and Internet telephony (r = 0.52) for
study and for social purposes and leisure can be described as strong. The correlations
between the use of text messaging (r=0.42) and social networking sites (r=0.41), chat
rooms (r=0.36) and virtual worlds (r=0.46) were at a moderate level and it was weak for
the use of e-mail (r = 0.29). This suggests that although students were more likely to use
some of the newer tools and services that foster interpersonal communication for both
study and for social purposes, the relationships between social and educational uses of
some of the more established technologies (e.g. email) were not as strong. This
relationship, strong in terms of the newer technologies and weakening as they become
more established, requires further investigation.
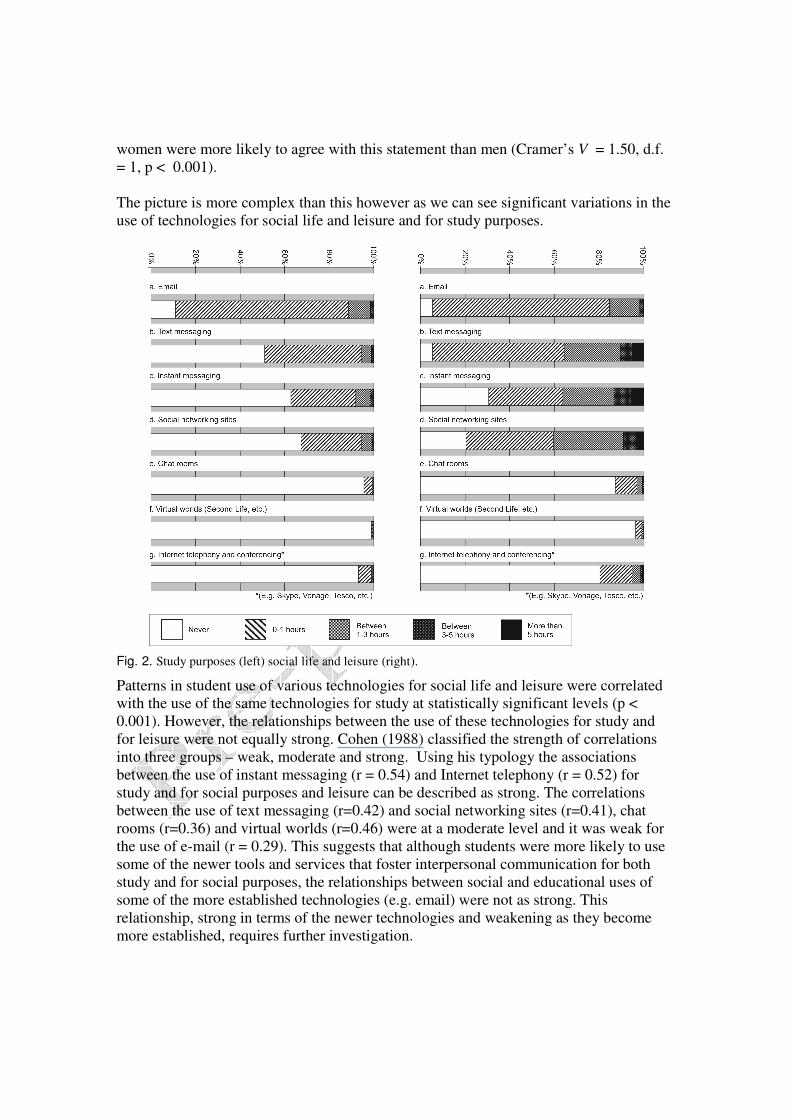
Students were asked specifically about their use of particular technologies that have
received significant attention in recent educational technology literature, blogs, wikis and
virtual worlds (See for example Williams & Jacobs 2004, Ferris & Wilder 2006). Perhaps
surprisingly there is not a significant uptake of any of these technologies amongst the first
year students and virtual worlds in particular (although Second Life for example doesn’t
allow access to their full site under 18). These figures were also consistent across a
number of items.
Table 5. The use of new technology forms (Blogs, wikis and virtual worlds) (Jones and
Cross 2009)
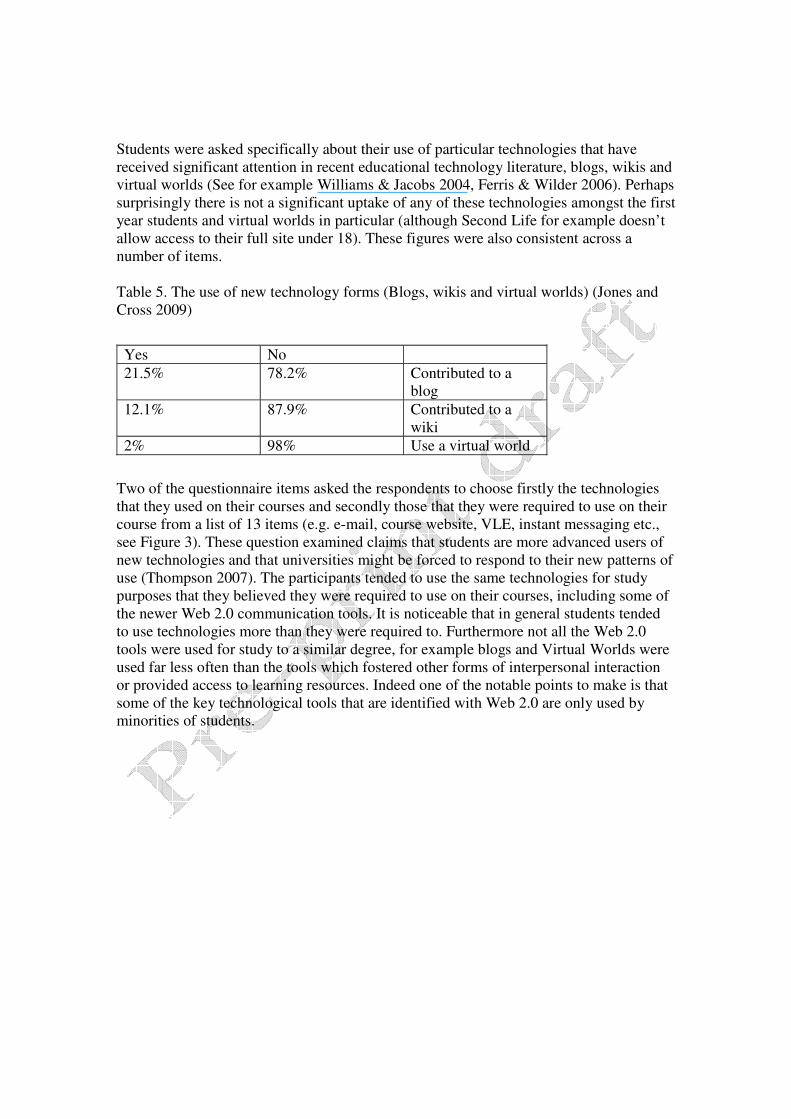
Two of the questionnaire items asked the respondents to choose firstly the technologies
that they used on their courses and secondly those that they were required to use on their
course from a list of 13 items (e.g. e-mail, course website, VLE, instant messaging etc.,
see Figure 3). These question examined claims that students are more advanced users of
new technologies and that universities might be forced to respond to their new patterns of
use (Thompson 2007). The participants tended to use the same technologies for study
purposes that they believed they were required to use on their courses, including some of
the newer Web 2.0 communication tools. It is noticeable that in general students tended
to use technologies more than they were required to. Furthermore not all the Web 2.0
tools were used for study to a similar degree, for example blogs and Virtual Worlds were
used far less often than the tools which fostered other forms of interpersonal interaction
or provided access to learning resources. Indeed one of the notable points to make is that
some of the key technological tools that are identified with Web 2.0 are only used by
minorities of students.
Yes No
21.5% 78.2% Contributed to a
blog
12.1% 87.9% Contributed to a
wiki
2% 98% Use a virtual world
0
100
200
300
400
500
Cou
rse W
eb s
iteVLE
E-jour
nals/
e-boo
ks
Inst
ant m
essa
ging
Onlin
e qu
izze
s or
test
s
E-por
tfolio
Simul
ations
/ co
mpu
ter m
odels
Blogs
Wikis (i
nc W
ikipe
dia)
Socia
l net
wor
king
site
s
Virtua
l wor
lds
Disciplin
e sp
ecific
tech
nolo
gies
*
Oth
er (p
leas
e sp
ecify)
Fre
qu
en
cy
Technologies Used
Technologies belived to be
course requirement
Fig. 3. Technologies used and believed to be required to use (Q4.8: On your current course which of the
following technologies have you used? Q4.9: On your current course which of the following are you
required to use?).
Nevertheless the differences in percentage of students who chose to use certain
technology tools were quite considerable. For example, 26.2 percent of students in the
sample chose to use instant messaging in their studies, but 3.2 percent of them were
required to use this technology in their studies (Cramer’s V = 0.22, d.f. = 1, p < 0.001). In
the case of Wikis 44.7 percent of the respondents used them (including Wikipedia), while
only 10.7 percent were required to use this technology (Cramer’s V = 0.,31 d.f. = 1, p <
.001). In terms of social networking sites 30.4 percent reported using them and only 4.0
percent were required to do so (Cramer’s V = 0.22, d.f. = 1, p < 0.001). Interestingly, the
usages of blogs were at similar levels as 7.7 percent of students used blogs for study
purposes and 5.0 were required to use this technology (Cramer’s V = 0.34, d.f. = 1, p <
0.001). Students generally chose to use new technologies in their studies even more than
they were required to, but this was most marked with some of the newer social and
communicative technologies. Overall further work is required to identify how these
technologies are used and the motivations that support their use.
4.2 Confidence and Skills
Students were asked to report on their confidence (defined in relation to skill level) in
using various computer technologies and applications on the scale from 1 (Not
confident/minimal skill) to 5 (Very confident/excellent skill level) (see Table 6 for item

means). Over 80% of students reported slight confidence and basic skills or better in
using presentation software (87.5%), online library resources (86.5%) spreadsheets
(84.9%), and in computer maintenance (82.3%). However, over a third reported not
confident/minimal skills (not known or not confident) using VLEs (37.7%), writing and
commenting on blogs and wikis (40.6%), and graphics software (36.4%); with almost
two thirds (60.3%) reporting not confident/minimal skills in video/audio editing software.
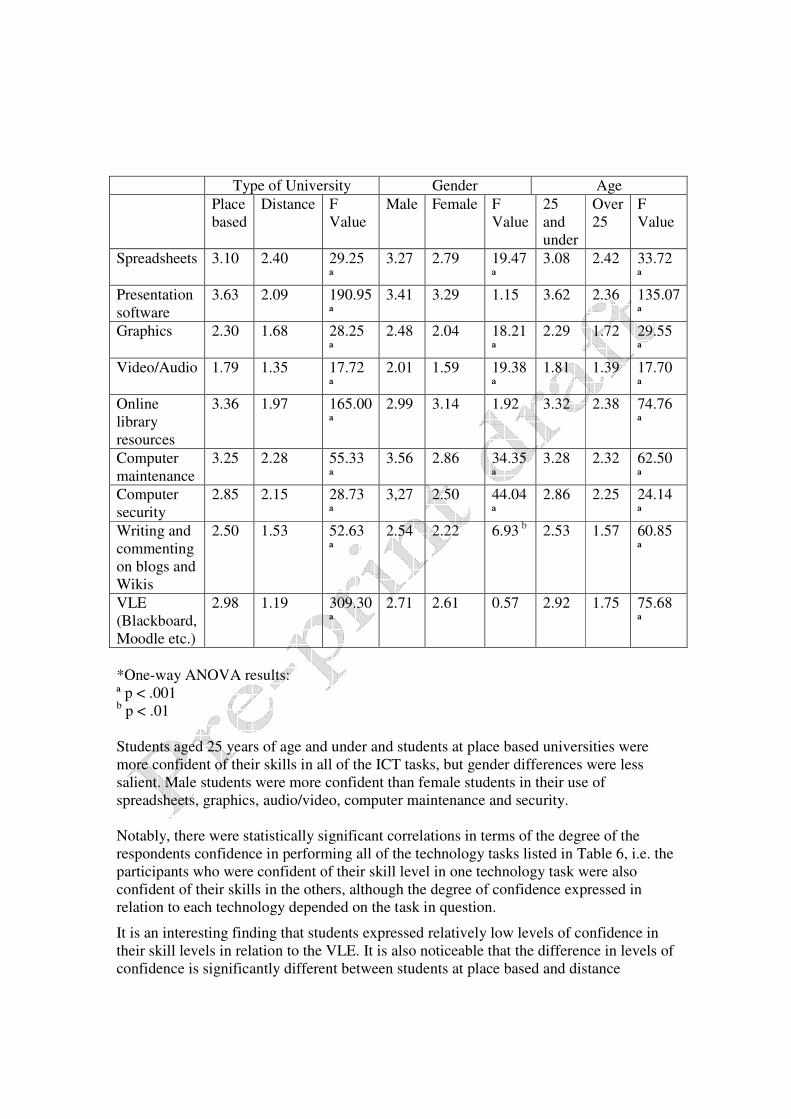
Students aged 25 years of age and under were more confident of their skills in all of the
ICT tasks, but gender and differences between place-based and distance universities were
less salient. Male students were more confident than female students in their use of
spreadsheets, graphics, audio/video, computer maintenance and security.
Table 6. Self-Reported Skill Levels in Key ICT Tasks (Item Means, 5-point scale)*.
*One-way ANOVA results:
ª p < .001 b p < .01
Students aged 25 years of age and under and students at place based universities were
more confident of their skills in all of the ICT tasks, but gender differences were less
salient. Male students were more confident than female students in their use of
spreadsheets, graphics, audio/video, computer maintenance and security.
Notably, there were statistically significant correlations in terms of the degree of the
respondents confidence in performing all of the technology tasks listed in Table 6, i.e. the
participants who were confident of their skill level in one technology task were also
confident of their skills in the others, although the degree of confidence expressed in
relation to each technology depended on the task in question.
It is an interesting finding that students expressed relatively low levels of confidence in
their skill levels in relation to the VLE. It is also noticeable that the difference in levels of
confidence is significantly different between students at place based and distance
Type of University Gender Age
Place
based
Distance F
Value
Male Female F
Value
25
and
under
Over
25
F
Value
Spreadsheets 3.10 2.40 29.25
ª
3.27 2.79 19.47
ª
3.08 2.42 33.72
ª
Presentation
software
3.63 2.09 190.95
ª
3.41 3.29 1.15 3.62 2.36 135.07
ª
Graphics 2.30 1.68 28.25
ª
2.48 2.04 18.21
ª
2.29 1.72 29.55
ª
Video/Audio 1.79 1.35 17.72
ª
2.01 1.59 19.38
ª
1.81 1.39 17.70
ª
Online
library
resources
3.36 1.97 165.00
ª
2.99 3.14 1.92 3.32 2.38 74.76
ª
Computer
maintenance
3.25 2.28 55.33
ª
3.56 2.86 34.35
ª
3.28 2.32 62.50
ª
Computer
security
2.85 2.15 28.73
ª
3,27 2.50 44.04
ª
2.86 2.25 24.14
ª
Writing and
commenting
on blogs and
Wikis
2.50 1.53 52.63
ª
2.54 2.22 6.93 b 2.53 1.57 60.85
ª
VLE
(Blackboard,
Moodle etc.)
2.98 1.19 309.30
ª
2.71 2.61 0.57 2.92 1.75 75.68
ª
universities, although two factors may affect these findings. Firstly 94.9 percent of the
students at University C, the distance university, were studying part-time, while at other
universities it was from 0 to 3.1 percent and secondly 87.4 percent of University C
students were older than 25 compared to, for example, only 4.0 percent of students in
University A. Both mode of study (whole time/part-time) and student age seem to have
an impact on confidence levels but further investigation is needed to clarify which of
these influences is most important.
5. Discussion and Conclusions
This research confirms many of the general points found in studies outside of the United
Kingdom in relation to the level of technology access and use. The laptop and the mobile
phone are not yet universal but the vast majority of students make extensive use of
mobile technologies and computing facilities for communication and for access to course
materials and resources. In this way this study helps to confirm the research that has
shown that the conditions in terms of the availability and use of technologies required for
a Net generation and the development of Digital Natives exists within the population
entering university. However we would counsel caution to all those tempted to see a
confirmation of the Net generation thesis. Firstly there exist a number of minorities
within the student population and secondly there is a wide variation within as well as
between age groups. The use of the term Millenial has been more sophisticated in its
approach to students’ age than either the Net generation or Digital Natives theses.
Authors using the term Millenials have recognized the complexity of the context facing
students entering university, with mature students facing family commitments combining
with young students, a university environment encouraging the use of digital technologies
and an increasing ethnic and cultural diversity in the student body (Oblinger & Oblinger
2005 and Howe & Strauss 2000). The Millenial approach also recognizes that age is not
the sole determinant : “Although these trends are described in generational terms, age
may be less important than exposure to technology.” (Oblinger & Oblinger 2005, 2.9).
This difference in understanding breaks down the simple generational binary opposition
and allows older students to develop different approaches based on their exposure to new
technologies. We would endorse this more complex picture but add to it in a number of
ways.
The findings of our survey show that students are active users of technology and that in
general they use technologies more than they believe that they are required to. Students
seem to respond to the requirements of their courses, programmes and universities as
suggested by Brown & Czerniewicz (2008). However we should also note that students in
our sample differed in their reports about which technologies they believed they were
required to use on all the courses we surveyed. Some courses showed a wider
discrepancy than others but in general we should not assume that students fully
understand course requirements in terms of technology use, no matter how clearly these
requirements are expressed and no matter how often they are reinforced. However despite
variations in understanding of course requirements it is likely that students are responding
to aspects of the local course, programme and university context.
Our survey also shows the persistence of minorities. In our sample we found a small
minority of students who report make very little use of email (Jones and Cross 2009). The
numbers who didn’t use email for both study and for social life and leisure were small
(n=3) but a larger group (n=42) didn’t use email for either study or their social life and
then only in a very limited way for the alternative use. This low use of email does not
necessarily imply a resistance to technology because email may have been replaced by
other means of communication but it does imply that universities cannot expect email to
be a universal system for communication with students. We also identified a large
minority who make use of the Internet to download or upload materials and a smaller
minority who contribute to blogs and wikis or engage with virtual worlds. Far from our
research revealing a single generation of students we find a complex picture of
minorities, most of whom engage in a wide range of technology uses with a high
frequency but who do not show a strong impulse towards the kind of participation and
generational homogeneity predicted by Net generation or Digital Native inspired
literature.
Further work is required to clarify some of the areas identified in the results from this
survey. This survey was a single snapshot taken at the end of the students first year of
study. In the second phase of the research we have issued two linked survey instruments,
one at the start of the first year in the autumn of 2008 and a second at the end of the first
year in the spring of 2009 to look for changes taking place during the first year of study.
We also know little about the motivations that lie behind the patterns of technology use
revealed by the survey. In the first phase of research we conducted a small number of
interviews with students (n=10) and we have increased the number and spread of the
student interviews in the second phase (n=58) and accompanied this with cultural probes
based on the Day Experience Method (n=18) (Riddle and Arnold 2007). Taken together
the interviews and cultural probes will provide a more detailed and richer picture of the
activities of first year students linked to the survey sample. Through these methods we
hope to shed more light on why students use particular technologies and what their
motivations are.
If we had to sum up the outcome of our work in a single message it would be to advocate
caution to all those arguing that universities and academic staff have to change to
accommodate a new Net generation of Digital Native students. The new generation of
students show significant age related differences but the generation is not homogenous
nor is it articulating a single clear set of demands. It seems to us that universities and
academics are, as always, faced with choices about how to change and these choices need
to be better informed about the kinds of students that are entering their institutions.
Acknowledgements
The research reported in this paper was funded by the UK Economic and Social Science
Research Council (Grant RES-062-23-0971). We would also like to acknowledge the
assistance of our collaborators at the five participating universities, in particular Susan
Armitage, Martin Jenkins, Sheila French, Ann Qualter and Tunde Varga-Atkins.
References
Barnes, K, Marateo, R, Pixy Ferris, S (2007) Teaching and learning with the net generation,
Innovate:Journal of Online Education, vol 3, issue 4, April/May 2007. Retrieved 28th
April 2009
from: http://innovateonline.info/index.php?view=article&id=382&action=article.
Bayne, S. and Ross, J. (2007) The ‘digital native’ and ‘digital immigrant’: a dangerous opposition. paper is
presented at the Annual Conference of the Society for Research into Higher Education (SRHE)
December 2007. Retrieved 28th April 2009 from:
http://www.malts.ed.ac.uk/staff/sian/natives_final.pdf Becta (2008) Research Report: Emerging Technologies for Learning, Volume 3.
Bennett, S., Maton, K. & Kervin, L. (2008) The ‘digital natives’ debate: A critical review of the evidence,
British Journal of Educational Technology. Vol 39 No 5 2008 775–786
Brown, C. and Czerniewicz, L. (2008) in student use of ICTs in higher education in South Africa. In: van
Brakel, P.A. (Ed.), Proceedings of the 10th annual conference of world wide web applications,
Cape Peninsula University of Technology, Cape Town, South Africa.
Caruso, J. B. and Kvavik, R. (2005). ECAR study of students and information technology 2005:
Convenience, connection, control, and learning. EDUCAUSE. Retrieved 29th April 2009 from:
http://connect.educause.edu/Library/ECAR/ECARStudyofStudentsandInf/41159
Clark, W., Logan, K., Lukin, R., Mee, A., and Olver, M. (2009) Beyond Web 2.0 : mapping the technology
landscapes of young learners. Journal of Computer Assisted Learning. Vol 25, 56 -69.
Cohen, J. (1988). Statistical Power Analysis for the Behavioral Sciences. 2nd ed. Hillsdale, New Jersey:
Erlbaum.
Douwes, M., de Krakera, H. and Blattera, B. M. (2007). Validity of two methods to assess computer use:
Self-report by questionnaire and computer use software. International Journal of Industrial
Ergonomics. Vol 37, Issue5, 425-431
Ferris, S., and Wilder, H. (2006). Uses and Potentials of Wikis in the Classroom. Innovate 2 (5). Retrieved
17 June, 2009 from: http://www.innovateonline.info/index.php?view=article&id=258
Gourley, B. (2008) Scholarship in the digital age. Address to Council and Staff Members 26th
September
2008. Retrieved 29th
April 2009 from:
http://www.open.ac.uk/vice-chancellor/Speeches_3A00_Publications.html
Howe, N. and Strauss,W. (2000) Millennials Rising: The Next Greatest Generation. New York: Vintage
Books.
Jones,C., and Ramanau, R. (2009a) Collaboration and the Net generation: The changing characteristics of
first year university students. Proceedings of the 8th International Conference on Computer
Supported Collaborative Learning: CSCL2009: CSCL Practices.
Jones, C., and Ramanau, R. (2009b) The Net Generation enters university: What are the implications for
Technology Enhanced Learning? M-2009: Proceedings of the 23rd ICDE World Conference on
Open Learning and Distance Education including the 2009 EADTU Annual Conference, 7-10
June 2009, Maastricht NL.
Jones, C., and Cross, S.J. (2009) Is there a Net generation coming to university? Association for Learning
Technology Conference, Manchester 2009.
Jones, S. (Principal author) (2002). The Internet Goes to College: How students are living in the future with
todays technology. Retrieved 11th
September 2009 from:
http://www.pewinternet.org/Reports/2002/The-Internet-Goes-to-College.aspx
Kennedy, G., Judd, T.S., Churchward, A., Gray, K. and Krause, K. (2008), First year students' experiences
with technology: Are they really digital natives? ‘Questioning the net generation: A collaborative
project in Australian higher education’, Australasian Journal of Educational Technology, 24(1),
108-122, Retrieved 20th April 2009 from: http://www.ascilite.org.au/ajet/ajet24/kennedy.html
Kennedy, G., Krause, K., Judd, T.S., Churchward, A., and Gray, K. (2006) First Year students’
Experiences with technology: Are they really Digital Natives? Internal Report: The University of
Melbourne. Retrieved 29th
June 2009 from:
http://www.bmu.unimelb.edu.au/research/munatives/index.html
Kvavik, R. (2005). Convenience, communications, and control: How students use technology. In Oblinger,
D.G. and Oblinger, J.L. (2005), Educating the net generation, An Educause e-book publication,
http://www.educause.edu/ir/library/pdf/pub7101.pdf [20/04/09]
Margaryan, A., and Littlejohn, A. (2009) Are digital natives a myth or reality?: Students’ use of
technologies for learning. Retrieved 29th June 2009 from:
http://www.academy.gcal.ac.uk/anoush/documents/DigitalNativesMythOrReality-
MargaryanAndLittlejohn-draft-111208.pdf
Oblinger, D. (2003) Boomers, Gen-Xers & Millenials: Understanding the new students. Educause Review
July/August 2003 pp37 - 47.
Oblinger, D. (2006). Listening To What We're Seeing. Key note presentation To ALT-C 2006, Heriot-Watt
University. 5-7th
September 2006. Retrieved 28th
April 2009 from:
http://www.alt.ac.uk/docs/diana_oblinger_20060905.pdf
Oblinger, D.G. and Oblinger, J.L. (2005), Educating the net generation, An Educause e-book publication,
http://www.educause.edu/ir/library/pdf/pub7101.pdf [20/04/09]
Palfrey, J. and Gasser, U. (2008) Born Digital: Understanding the First Generation of Digital Natives.
New York: Basic Books.
Prensky, M. (2001) Digital natives, digital immigrants. On the Horizon. NCB University Press, Vol 9(5).
Prensky, M (2001a) Digital Natives, Digital Immigrants Part II: Do they really think differently? On the
Horizon. NCB University Press, Vol 9 (6).
Prensky, M. (2009) H. sapiens digital: From digital immigrants and digital natives to digital wisdom.
Innovate 5 (3). Retrieved 1st February 2009 from:
http://www.innovateonline.info/index.php?view=article&id=705
Riddle, M.D. and Arnold, M.V. (2007) The Day Experience Method: A Resource Kit. Retrieved 25th April
2009 from: http://dtl.unimelb.edu.au/dtl_publish/12/67585.html
Salaway, G. and Caruso, J. B., with Nelson, M.R.. The ECAR Study of Undergraduate Students and
Information Technology, 2008 (Research Study, Vol. 8). Boulder, CO: EDUCAUSE Center for
Applied Research, 2008, available from http://www.educause.edu/ecar.
Selwyn, N. (2008) An investigation of differences in undergraduates' academic use of the internet. Active
Learning in Higher Education 2008; 9; 11 pp11-22.
Tapscott, D. (2008) Grown up digital: How the Net generation is changing your world. New York:
McGraw-Hill.
Tapscott, D. (1998). Growing up digital: the rise of the Net generation. New York: McGraw-Hill.
Thompson, J. (2007) Is education 1.0 ready for web 2.0 students? Innovate: Journal of Online Education,
vol 3, issue 4, April/May 2007. Retrieved 28th April 2009 from:
http://innovateonline.info/index.php?view=article&id=393&action=article Williams, J. and Jacobs, J. (2004), Exploring the use of blogs as learning spaces in the higher education
sector, Australasian Journal of Educational Technology, 20 (2), 232-247.
Copyright © 2022 FDOKUMEN