The Measurement and Reduction of Urban Litter Entering ...
207
Water Research Commission TT 211/03 The Measurement and Reduction of Urban Litter Entering Stormwater Drainage Systems Mark Marais and Neil Armitage The Measurement and Reduction of Urban Litter Entering Stormwater Drainage Systems Mark Marais and Neil Armitage
-
Upload
khangminh22 -
Category
Documents
-
view
1 -
download
0
Transcript of The Measurement and Reduction of Urban Litter Entering ...
Water ResearchCommission
TT 211/03
The Measurement and Reduction of Urban Litter Entering Stormwater Drainage Systems
Mark Marais and Neil Armitage
The Measurement and Reduction of Urban Litter Entering Stormwater Drainage Systems
Mark Marais and Neil Armitage

THE MEASUREMENT AND REDUCTION
OF URBAN LITTER ENTERING STORMWATER DRAINAGE SYSTEMS
Report to the Water Research Commission
by
Mark Marais and Neil Armitage
University of Cape Town
WRC TT 211/03
June 2003
Obtainable from: Water Research Commission Private Bag X03 Gezina 0031
The publication of this report emanates from a project entitled: Reduction of urban litter in drainage systems through integrated catchment management
(Project No 1051)
DISCLAIMER
This report has been reviewed by the Water Research Commission (WRC) and
approved for publication. Approval does not signify that the contents necessarily reflect the views and policies of the WRC, nor does mention of trade names or
commercial products constitute endorsement or recommendation for use.
ISBN 1-77005-041-8 Printed in the Republic of South Africa
i
Marais & Armitage (2003). The measurement and reduction of urban litter entering stormwater drainage
systems. Contents.
Contents List of Figures vii List of Tables xi List of Abbreviations xiii Executive Summary xiv Acknowledgements xx
Part 1 : Introduction 1 Introduction 1-1
1.1 Background 1-1 1.2 The format of this report 1-3
2 The urban litter problem 2-1
2.1 Introduction 2-1 2.2 Sources of litter 2-2 2.3 Types of litter 2-3 2.4 Factors influencing litter composition and quantity 2-4 2.5 Litter and neighbourhood decline 2-5 2.6 Case studies from the developed world 2-6
2.6.1 The Merri Creek Study, Melbourne 2-6 2.6.2 The Coburg Study 2-7 2.6.3 The Auckland Study 2-8 2.6.4 American experience 2-9
2.7 Case studies from developing countries 2-10 2.7.1 Vingulgati and Mtambini, Dar es Salaam,
Tanzania 2-10
2.7.2 Bamako, Mali 2-12 2.8 Previous South African studies and initiatives 2-14
2.8.1 The Springs Study 2-14 2.8.2 Marine litter originating from Sea Point, Paarden
Eiland and Milnerton (Cape Town) 2-15
2.9 Conclusions 2-16
Part 2 : The Source, Type and Amount of Urban Litter
3 The pilot catchments 3-1
3.1 Introduction 3-1 3.2 Objectives of the data collection programme 3-1 3.3 Selection criteria 3-2 3.4 Physical descriptions 3-5

ii
Marais & Armitage (2003). The measurement and reduction of urban litter entering stormwater drainage
systems. Contents.
3.4.1 A : Imizamo Yethu 3-6 3.4.2 B : Ocean View 3-7 3.4.3 C, D and E : Cape Town Central Business District 3-8 3.4.4 F : Fresnaye 3-9 3.4.5 G : Summer Greens 3-11 3.4.6 H : Montague Gardens 3-11 3.4.7 I : Welgemoed 3-12
3.5 Demographic profiles 3-13 3.6 Service levels 3-19 3.7 Conclusions 3-21
4 Social attitudes in Imizamo Yethu and Ocean View 4-1
4.1 Introduction 4-1 4.2 Case Study 1 – Imizamo Yethu 4-2
4.2.1 The application of the Rapid Rural Appraisal Methodology
4-2
4.2.2 Respondents’ perceptions of their environment and waste
4-2
4.2.3 Perception of the Municipality and other community structures associated with the environment
4-3
4.2.4 The Imizamo Yethu Community in the context of historical politico-economic structures
4-4
4.2.5 Sources of littering 4-4 4.2.6 A sense of home 4-5 4.2.7 Community perceptions of environment and
health 4-6
4.2.8 The ‘us and them’ syndrome 4-7 4.2.9 The role and agency of the individual 4-8 4.2.10 Specific problems identified with this Research
Project as a means of reducing littering 4-8
4.2.11 Issues of infrastructural improvement 4-9 4.2.12 Recommendations 4-10
4.3 Case Study 2 – Ocean View 4-10 4.3.1 Study methodology 4-11 4.3.2 The activities of the data collection team 4-11 4.3.3 Engaging with the community 4-11 4.3.4 The objectives of the research 4-12 4.3.5 The community’s perception of littering and the
service provided by the Municipality 4-12
4.3.6 Attitudes to community initiatives 4-14 4.3.7 Awareness of littering and the environment 4-14 4.3.8 Problems encountered with the research 4-15 4.3.9 Concluding remarks 4-15
5 Data collection 5-1
5.1 Introduction 5-1 5.2 Traps and nets 5-1 5.3 Implementation of the data collection process 5-2

iii
Marais & Armitage (2003). The measurement and reduction of urban litter entering stormwater drainage
systems. Contents.
5.4 The monitoring procedure 5-5 5.4.1 Responsibilities of the Local Authorities 5-5 5.4.2 Role of the Waste Auditor 5-5 5.4.3 Classification of the litter 5-7 5.4.4 Adjustments to the monitoring procedure 5-8
5.5 Constraints and lessons learned 5-9 5.5.1 Implementation 5-9 5.5.2 Effectiveness of traps 5-9 5.5.3 The role of the local authorities 5-10 5.5.4 Assessing the fullness of the traps in the field 5-10 5.5.5 Frequency of collection 5-10 5.5.6 Absence of traps and nets 5-11 5.5.7 Litter categories 5-11 5.5.8 Establishing baseline data 5-11 5.5.9 Measuring the effectiveness of catchment litter
management strategies 5-12
5.6 Conclusions 5-12 6 Analysis of collected data 6-1
6.1 Introduction 6-1 6.2 A : Imizamo Yethu 6-2 6.3 B : Ocean View 6-3 6.4 C, D and E : Cape Town Central Business District 6-4 6.5 F : Fresnaye 6-5 6.6 G : Summer Greens 6-6 6.7 H : Montague Gardens 6-6 6.8 I : Welgemoed 6-7 6.9 Summary of findings for the pilot catchments 6-8
6.9.1 Introduction 6-8 6.9.2 Annual litter loads excluding sand 6-8 6.9.3 Annual litter loads excluding sand, stone,
vegetation and rubble 6-11
6.9.4 Annual litter loads for vegetation only 6-13 6.9.5 Composition of litter for each catchment 6-14 6.9.6 Principal findings 6-15
6.10 Comparison of findings with other similar studies 6-17 6.11 Conclusions 6-19
Part 3 : Litter Management Strategies
7 Towards a litter management strategy 7-1
7.1 Introduction 7-1 7.2 Review of litter management techniques 7-1
7.2.1 Planning controls 7-2 7.2.2 Source controls 7-2 7.2.3 Structural controls 7-5
7.3 Applicable litter management techniques and their achievability in the pilot catchments
7-5
7.3.1 Cleansing options 7-6
iv
Marais & Armitage (2003). The measurement and reduction of urban litter entering stormwater drainage
systems. Contents.
7.3.2 Options related to construction activity 7-6 7.3.3 Options involving businesses 7-7 7.3.4 Educational options 7-7 7.3.5 Enforcement options 7-8
7.4 Current South African initiatives 7-9 7.4.1 Legislative context 7-9 7.4.2 The Dense Settlements Project 7-11 7.4.3 The Mess Action Campaign 7-14 7.4.4 Fairest Cape Association Initiatives 7-15 7.4.5 Waste Minimisation Clubs 7-16
7.5 Conclusions 7-16 8 A litter removal strategy for the Salt and Lotus Rivers
– a case study 8-1
8.1 Introduction 8-1 8.2 Characteristics of the study area 8-1 8.3 The methodology 8-3
8.3.1 Catchment data collection and capture 8-4 8.3.2 Identification of potential trap locations 8-4 8.3.3 Litter generation modelling 8-6 8.3.4 Litter generation modelling results 8-10 8.3.5 Hydraulic and hydrological analyses 8-13 8.3.6 Trap selection 8-13 8.3.7 Litter removal strategy 8-13
8.3.7.1 Proposed trap locations : Salt River Catchment
8-13
8.3.7.2 Proposed trap locations : Lotus River Catchment
8-14
8.3.7.3 Proposed phasing 8-15 8.4 Conclusions 8-17
9 Economic evaluation of alternative litter management
options 9-1
9.1 Introduction 9-1 9.2 Costing of alternative options 9-1
9.2.1 More frequent collections of litter (residential areas)
9-2
9.2.2 Street sweeping 9-2 9.2.3 Installation of grids at the entrance to catchpit
inlets 9-3
9.2.4 Community education programmes 9-3 9.3 Discussion 9-4 9.4 Conclusions 9-6
v
Marais & Armitage (2003). The measurement and reduction of urban litter entering stormwater drainage
systems. Contents.
Part 4 : Conclusions and Recommendations 10 Preliminary guidelines for the reduction of urban litter
loads 10-1
10.1 Introduction 10-1 10.2 Factors to be considered 10-1
10.2.1 The composition of the litter 10-2 10.2.2 The volume of the litter 10-3 10.2.3 The presence of a street sweeping service 10-3 10.2.4 The nature of the refuse removal service 10-3 10.2.5 The nature of the land tenure 10-3 10.2.6 The composition of the community 10-3 10.2.7 The pedestrian volumes 10-4 10.2.8 Community awareness of litter and the
environment 10-4
10.2.9 The layout 10-4 10.3 The appropriateness of particular litter management
options 10-4
10.3.1 More frequent collections of litter 10-5 10.3.2 Street sweeping 10-6 10.3.3 Cleaning of catchpits 10-6 10.3.4 Installation of street grids 10-7 10.3.5 Community education programmes 10-7 10.3.6 Additional litter bins 10-7 10.3.7 Grassing or hardening of verges 10-7 10.3.8 Swales 10-7 10.3.9 Recycling and composting 10-8 10.3.10 Waste minimisation 10-8
10.4 The recommended selection procedure 10-8 10.5 Conclusions 10-10
11 Conclusions 11-1 12 Proposals for research opportunities 12-1 References R-1 Appendices: A Standard forms A-1
A.1 Standard field recording sheet for litter clearouts A-1 A.2 Original version of table used in recording litter analysis
data A-2
A.3 Improved version of table used in recording litter analysis data
A-3

vi
Marais & Armitage (2003). The measurement and reduction of urban litter entering stormwater drainage
systems. Contents.
B Tables of annual litter loads for the pilot catchments B-1
B.1 Introduction B-1 B.2 Tables of annual litter loads B-2
C Requirements for Waste Auditor C-1 D Plan views of study catchments showing the drainage
systems D-1
D.1 Imizamo Yethu (A) D-1 D.2 Ocean View (B) D-2 D.3 Cape Town CBD (C,D & E) D-3 D.4 Fresnaye (F) D-4 D.5 Summer Greens (G) D-5 D.6 Montague Gardens (H) D-6 D.7 Welgemoed (I) D-7
E Charts of litter profiles E-1
vii
Marais & Armitage (2003). The measurement and reduction of urban litter entering stormwater drainage
systems. List of Figures.
List of Figures Figure E-1 : Components of an integrated catchment management
strategy xiv Figure E-2 Annual litter loads for the pilot catchments : February 2000
to January 2002 xvii Figure E-3 Litter compositions for the pilot catchments : February
2000 to January 2002 xvii Figure 2-1 : Composition by count of litter items collected from all
sites on Merri Creek (after Senior, 1992) 2-6 Figure 2-2 : Litter composition by dry mass from different catchments
in Coburg (after Allison & Chiew, 1995) 2-8 Figure 2-3 : Litter composition by count from different land use types
in Auckland (after Cornelius et al., 1994) 2-9 Figure 2-4 : Litter composition by dry mass for Ningulgati and
Mtambani (after Kivaisi and Rubindamayugi, 2000) 2-11 Figure 2-5 Litter composition by volume trapped in Springs (after
Armitage et al, 1998) 2-14 Figure 2-6 Litter composition by mass from three urban land use types
in Cape Town (after Arnold and Ryan, 1999) 2-16 Figure 3-1 : Map showing the CMA and the locations of the selected
catchments 3-4 Figure 3-2 : Socio-economic and land use characteristics of selected
drainage catchments 3-5 Figure 3-3 : A typical view of Imizamo Yethu 3-6 Figure 3-4 : Hostels and a section of the canal draining Ocean View 3-7 Figure 3-5 : A typical trash bin in the vicinity of the Grand Parade,
Central Business District, Cape Town 3-8 Figure 3-6 : Cape Town CBD : Kiosk shops on the Grand Parade 3-9 Figure 3-7 : A tree-lined street in Fresnaye 3-10 Figure 3-8 : Blocks of flats lining Kloof Road, Fresnaye 3-10 Figure 3-9 : A neighbourhood park in Summer Greens 3-11
viii
Marais & Armitage (2003). The measurement and reduction of urban litter entering stormwater drainage
systems. List of Figures.
Figure 3-10 : The light industrial area of Montague Gardens 3-12 Figure 3-11 : The verdant suburb of Welgemoed 3-12 Figure 3-12 : Population group distribution for the residential study
catchments 3-14 Figure 3-13 : Population by age distribution for the residential study
catchments 3-15 Figure 3-14 : Households by dwelling type for the residential study
catchments 3-16 Figure 3-15 : Households by dwelling ownership for the residential
catchments 3-16 Figure 3-16 : Population by employment status for the residential
catchments 3-17 Figure 3-17 : Population by individual monthly income for the
residential catchments 3-18 Figure 3-18 : Household water supply for the residential catchments 3-19 Figure 3-19 : Household toilet facilities for the residential catchments 3-20 Figure 3-20 : Household refuse removal for the residential catchments 3-20 Figure 5-1 : Cross-section through a typical side-entry catchpit 5-2 Figure 5-2 : Detail of a typical net (as tendered) 5-3 Figure 5-3 : Database entry screens for detailed analysis 5-6 Figure 6-1 : Record of litter collections 6-1 Figure 6-2 : Plot of estimated street sweeping efficiency against
dimensionless street sweeping frequency (after Armitage, 2001) 6-5
Figure 6-3 : Bagging and recording of trap contents in progress in
Welgemoed 6-7 Figure 6-4 : Street sweeping in progress in the tourist area of Cape
Town’s Grand Parade 6-10 Figure 6-5 Annual litter loads for the pilot catchments : February 2000
to January 2002 6-16

ix
Marais & Armitage (2003). The measurement and reduction of urban litter entering stormwater drainage
systems. List of Figures.
Figure 6-6 Litter compositions for the pilot catchments : February
2000 to January 2002 6-16 Figure 7-1 : Components of an integrated catchment management
strategy 7-1 Figure 8-1 : Study area showing the major drainage routes 8-2 Figure 8-2 : Sub-catchment divisions showing potential trap locations 8-5 Figure 8-3 : Datasheet for trap location V1 8-6 Figure 8-4 : Litter generation distribution and characterisation 8-11 Figure 8-5 : Proposed phasing 8-16 Figure 10–1 : Selection matrix for litter management options 10-9 Figure 11-1 Annual litter loads for the pilot catchments : February 2000
to January 2002 11-3 Figure 11-2 Litter compositions for the pilot catchments : February
2000 to January 2002 11-4 Figure D-1 : A plan view of the study catchment in Imizamo Yethu
showing the drainage system and the litter trap and net positions D-1
Figure D-2 : A plan view of the study catchment in Ocean View
showing the drainage system and the litter trap and net positions D-2
Figure D-3 : A plan view of the study catchments in the Central
Business District of Cape Town showing the drainage system and the litter trap and net positions D-3
Figure D-4 : A plan view of the study catchment in Fresnaye showing
the drainage system and the litter trap and net positions D-4 Figure D-5 : A plan view of the study catchment in Summer Greens
showing the drainage system and the litter trap and net positions
D-5
Figure D-6 : A plan view of the study catchment in Montague Gardens
showing the drainage system and the litter trap and net positions
D-6
x
Marais & Armitage (2003). The measurement and reduction of urban litter entering stormwater drainage
systems. List of Figures.
Figure D-7 : A plan view of the study catchment in Welgemoed
showing the drainage system and the litter trap and net positions
D-7
Figure E-1 Summary of Clearouts – Imizamo Yethu (A) E-1 Figure E-2 Summary of Clearouts – Ocean View (B) E-2 Figure E-3 Summary of Clearouts – Cape Town CBD (C) E-3 Figure E-4 Summary of Clearouts – Cape Town CBD (D) E-4 Figure E-5 Summary of Clearouts – Cape Town CBD (E) E-5 Figure E-6 Summary of Clearouts – Fresnaye (F) E-6 Figure E-7 Summary of Clearouts – Summer Greens (G) E-7 Figure E-8 Summary of Clearouts – Montague Gardens (H) E-8 Figure E-9 Summary of Clearouts – Welgemoed (I) E-9

xi
Marais & Armitage (2003). The measurement and reduction of urban litter entering stormwater drainage
systems. List of Tables.
List of Tables Table 2-1 : Results obtained for four sectors in Bamako District (after
Ouedraogo et al., 2000) 2-13 Table 5-1 : Distribution of catchpits and outlets for selected
catchments 5-4 Table 5-2 : Litter classification system 5-7 Table 6-1 : Annual litter loads excluding sand 6-8 Table 6-2 : Annual litter loads for street sweeping and bin collection
for the Cape Town CBD 6-10 Table 6-3 : Annual litter loads excluding sand, stone, vegetation and
rubble 6-11 Table 6-4 : Ranking of catchments in terms of increasing litter load :
February 2001 to January 2002 6-12 Table 6-5 : Annual litter loads for vegetation only 6-13 Table 6-6 : Composition of litter in terms of percentage by mass
excluding sand 6-14 Table 6-7 : Composition of litter in terms of percentage by mass
excluding sand, stone, vegetation and rubble 6-14 Table 6-8 : Annual litter loads for plastic and paper items 6-17 Table 8-1 : Land use distribution in study area (* indicates land uses
that were not considered to contribute a significant amount of litter) 8-3
Table 8-2 : Litter loading figures guided by the preliminary results
from this study (excl. vegetation loads) 8-9 Table 8-3 : Litter loading figures as used in this study 8-10 Table 8-4 : Distribution of litter generation in the Salt River 8-12 Table 8-5 : Distribution of litter generation in the Lotus River 8-12 Table 8-6 : Estimated litter generation per year for the proposed trap
locations in the Salt River Catchment 8-13 Table 8-7 : Estimated litter generation per year for the proposed trap
locations in the Salt River Catchment 8-14

xii
Marais & Armitage (2003). The measurement and reduction of urban litter entering stormwater drainage
systems. List of Tables.
Table 8-8 Phase 1 (Combined catchments) 8-15 Table 8-9 Phase 2 (Combined catchments) 8-15 Table 8-10 Phase 3 (Combined catchments) 8-16 Table 8-11 Phase 4 (Combined catchments) 8-16 Table 9-1 The cost per kg reduction in the litter load for four
alternative litter management options 9-4 Table 11-1 Findings relating to the effectiveness of the litter
management strategies 11-5 Table A-1 : Standard field recording sheet for litter clearouts A-1 Table A-2 : Original version of table used in recording litter analysis
data A-2 Table A-3 : Improved version of table used in recording litter analysis
data A-3 Table B-1 (a) : Annual litter loads excluding sand : February to September
2000 B-1 Table B-1 (b) : Annual litter loads excluding sand : February 2001 to
January 2002 B-2 Table B-1 (c) : Annual litter loads excluding sand : February to September
2000 and February 2001 to January 2002 combined B-2 Table B-2 (a) : Annual litter loads excluding sand, stone, vegetation and
rubble : February to September 2000 B-3 Table B-2 (b) : Annual litter loads excluding sand, stone, vegetation and
rubble : February 2001 to January 2002 B-3 Table B-2 (c) : Annual litter loads excluding sand, stone, vegetation and
rubble : February to September 2000 and February 2001 to January 2002 combined B-4
Table B-3 (a) : Annual litter loads for vegetation only : February to
September 2000 B-4 Table B-3 (b) : Annual litter loads for vegetation only : February 2001 to
January 2002 B-5 Table B-3 (c) : Annual litter loads for vegetation only : February to
September 2000 and February 2001 to January 2002 combined B-5
xiii
Marais & Armitage (2003). The measurement and reduction of urban litter entering stormwater drainage
systems. List of Abbreviations.
List of Abbreviations ATM = Automatic Telling Machine CA = Civic Association CBD = Central Business District CMA = Cape Metropolitan Area CMC = Cape Metropolitan Council CTM = Cape Town Municipality CWP = Community Waste Programme CSIR = Council for Scientific and Industrial Research, South Africa DEAT = Department of Environmental Affairs and Tourism DANCED = Danish Cooperation for Environment and Development DWAF = Department of Water Affairs and Forestry GEAR = The South African Government’s Macro-Economic Strategy
for Growth, Employment and Redistribution GIS = Geographical Information System HIV = Human Immunodeficiency Virus IMEP = Integrated Metropolitan Environmental Policy MA = Master of Arts MAC = Mess Action Campaign MLC = Municipal Local Council NGO = Non-Governmental Organisation RDP = Reconstruction and Development Programme SPA = South Peninsula Administration UCT = University of Cape Town
xiv
Marais & Armitage (2003). The measurement and reduction of urban litter entering stormwater drainage
systems. Executive Summary.
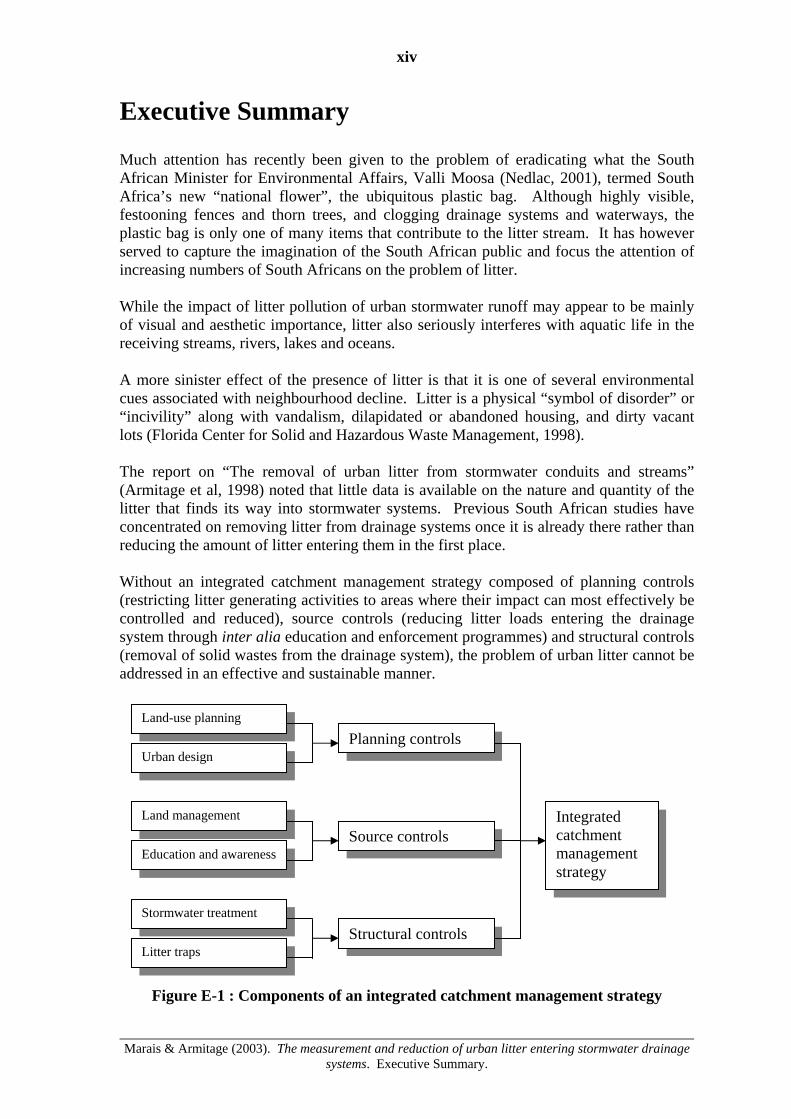
Executive Summary Much attention has recently been given to the problem of eradicating what the South African Minister for Environmental Affairs, Valli Moosa (Nedlac, 2001), termed South Africa’s new “national flower”, the ubiquitous plastic bag. Although highly visible, festooning fences and thorn trees, and clogging drainage systems and waterways, the plastic bag is only one of many items that contribute to the litter stream. It has however served to capture the imagination of the South African public and focus the attention of increasing numbers of South Africans on the problem of litter. While the impact of litter pollution of urban stormwater runoff may appear to be mainly of visual and aesthetic importance, litter also seriously interferes with aquatic life in the receiving streams, rivers, lakes and oceans. A more sinister effect of the presence of litter is that it is one of several environmental cues associated with neighbourhood decline. Litter is a physical “symbol of disorder” or “incivility” along with vandalism, dilapidated or abandoned housing, and dirty vacant lots (Florida Center for Solid and Hazardous Waste Management, 1998). The report on “The removal of urban litter from stormwater conduits and streams” (Armitage et al, 1998) noted that little data is available on the nature and quantity of the litter that finds its way into stormwater systems. Previous South African studies have concentrated on removing litter from drainage systems once it is already there rather than reducing the amount of litter entering them in the first place. Without an integrated catchment management strategy composed of planning controls (restricting litter generating activities to areas where their impact can most effectively be controlled and reduced), source controls (reducing litter loads entering the drainage system through inter alia education and enforcement programmes) and structural controls (removal of solid wastes from the drainage system), the problem of urban litter cannot be addressed in an effective and sustainable manner.
Figure E-1 : Components of an integrated catchment management strategy
Land-use planning
Urban design
Stormwater treatment
Education and awareness
Land management
Litter traps Structural controls
Source controls
Planning controls
Integrated catchment management strategy
xv
Marais & Armitage (2003). The measurement and reduction of urban litter entering stormwater drainage
systems. Executive Summary.
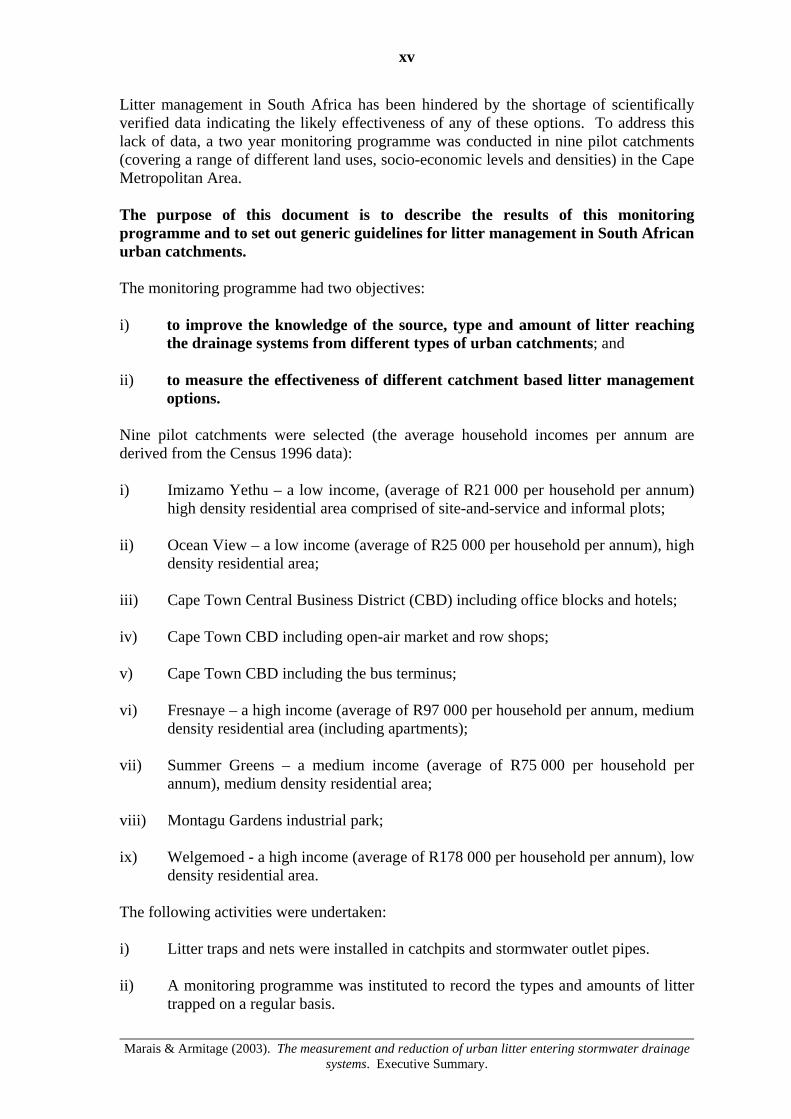
Litter management in South Africa has been hindered by the shortage of scientifically verified data indicating the likely effectiveness of any of these options. To address this lack of data, a two year monitoring programme was conducted in nine pilot catchments (covering a range of different land uses, socio-economic levels and densities) in the Cape Metropolitan Area. The purpose of this document is to describe the results of this monitoring programme and to set out generic guidelines for litter management in South African urban catchments. The monitoring programme had two objectives: i) to improve the knowledge of the source, type and amount of litter reaching
the drainage systems from different types of urban catchments; and ii) to measure the effectiveness of different catchment based litter management
options. Nine pilot catchments were selected (the average household incomes per annum are derived from the Census 1996 data): i) Imizamo Yethu – a low income, (average of R21 000 per household per annum)
high density residential area comprised of site-and-service and informal plots; ii) Ocean View – a low income (average of R25 000 per household per annum), high
density residential area; iii) Cape Town Central Business District (CBD) including office blocks and hotels; iv) Cape Town CBD including open-air market and row shops; v) Cape Town CBD including the bus terminus; vi) Fresnaye – a high income (average of R97 000 per household per annum, medium
density residential area (including apartments); vii) Summer Greens – a medium income (average of R75 000 per household per
annum), medium density residential area; viii) Montagu Gardens industrial park; ix) Welgemoed - a high income (average of R178 000 per household per annum), low
density residential area. The following activities were undertaken: i) Litter traps and nets were installed in catchpits and stormwater outlet pipes. ii) A monitoring programme was instituted to record the types and amounts of litter
trapped on a regular basis.

xvi
Marais & Armitage (2003). The measurement and reduction of urban litter entering stormwater drainage
systems. Executive Summary.
iii) The data obtained from the monitoring was analysed to arrive at a litter profile for
each of the pilot catchments. The litter profile was then considered in tandem with the socio-economic characteristics for each catchment. In this way:
• a litter profile was established in terms of the source, type and amount of
urban litter for each of the different types of urban catchments; • understanding was gained of how land-use, population densities, level of
servicing and socio-economic levels affect these litter profiles using data obtained from the 1996 census database compiled by Statistics S.A. The unequal access to services in the CMA was illustrated using data relating to water supply, toilet facilities and refuse disposal;
• reasons were identified for any changes in the behaviour of the
communities with respect to their littering patterns during the monitoring period; and
• possible litter management techniques to reduce litter loadings in the pilot
catchments were identified.
iv) Studies were carried out into attitudes towards littering amongst the communities living in two of the catchments, Imizamo Yethu and Ocean View by researchers from the Department of Social Anthropology at the University of Cape Town.
Three major problems were encountered in the monitoring process. i) The catchment litter situation in the Cape Town Municipal Area (CMA) was
rapidly evolving as National Government, Local Authorities, NGOs and Ratepayers attempted to address the problem. This made it impossible to establish baseline data, implement a litter management strategy and then compare the new data with the baseline data in isolation from other initiatives as had been hoped at the commencement of the monitoring programme.
ii) The local administrations helped greatly with the physical removal of the litter
from the traps, bagging the contents and transporting them to the UCT laboratory for analysis, but could not be relied upon to record the litter data consistently. This was overcome through the appointment of a Waste Auditor to record the litter and carry out the in-depth analyses of the contents of the litter traps and nets. This ensured that the contents were recorded and analysed in an accurate and consistent way across all nine catchments.
iii) To avoid flooding problems it was found that the frequency of collections and
emptying litter traps and nets had to be reassessed and adjusted during the monitoring process on a catchment by catchment basis as more information about the rate at which the traps and nets fill was obtained.

xvii
Marais & Armitage (2003). The measurement and reduction of urban litter entering stormwater drainage
systems. Executive Summary.
Figures E-2 and E-3 summarise the annual litter loads and litter compositions obtained for the pilot catchments for the period February 2000 to January 2002.
0
20
40
60
80
100
120
140
160
18020
00
2001
2000
/200
1
2000
2001
2000
/200
1
2000
2001
2000
/200
1
2000
2001
2000
/200
1
2000
2001
2000
/200
1
2000
2001
2000
/200
1
2000
2001
2000
/200
1
Imizamo Yethu Ocean View Summer Greens Fresnaye Welgemoed Cape TownCBD
MontagueGardensCatchment
Ann
ual l
itter
load
(kg/
ha.y
r) o
r H
ouse
hold
inco
me
(R'0
00 p
er a
nnum
)
0
50
100
150
200
250
300
350
400
450
Popu
latio
n de
nsity
(per
ha)
Excl sand, stone, vegetation & rubble Vegetation onlyStone & rubble Mean household income 1996Population density
Residential Commercial Industrial
Figure E-2 : Annual litter loads for the pilot catchments : February 2000 to January
2002
0%
20%
40%
60%
80%
100%
2000
2001
2000
/200
1
2000
2001
2000
/200
1
2000
2001
2000
/200
1
2000
2001
2000
/200
1
2000
2001
2000
/200
1
2000
2001
2000
/200
1
2000
2001
2000
/200
1
ImizamoYethu
Ocean View SummerGreens
Fresnaye Welgemoed Cape TownCBD
MontagueGardens
Catchment
Perc
enta
ge C
ompo
sitio
n
Plastic Paper Metal Glass Vegetation Stone & rubble Miscellaneous
Residential Commercial Industrial
Figure E-3 : Litter compositions for the pilot catchments : February 2000 to January 2002
xviii
Marais & Armitage (2003). The measurement and reduction of urban litter entering stormwater drainage
systems. Executive Summary.
A case study included in the report shows how this litter profile information was used to develop a litter removal strategy for the Salt and Lotus Rivers in Cape Town. The impacts of several catchment litter management options implemented during the course of the monitoring programme were determined by comparing the litter loads and profiles obtained for the periods February to September of 2000 and February 2001 to January 2002 for each of the nine pilot catchments. The principal findings were: i) There appears to be an inverse relationship between income and litter loadings in
residential areas when garden refuse is excluded. This is largely due to the more effective and reliable household refuse removal service enjoyed by affluent areas.
ii) The installation of grids over catchpit openings resulted in a significant decrease
in the amount of litter trapped in catchpits in Summer Greens and Montague Gardens.
iii) There was a significant reduction in litter loads in Ocean View during the
monitoring period. The sensitizing of the community to littering issues from the end of 2000 and a more frequent and comprehensive litter removal service by the local authority are plausible reasons for this improvement.
iv) Sand entering the catchpits is a major problem in many catchments as it tends to
become entrained in other litter such as plastic bags resulting in blockages and flooding of the stormwater system. This problem is particularly acute in informal areas such as Imizamo Yethu which have very little ground cover to stabilise the soil.
v) Street sweeping is an extremely effective method of reducing the quantity of litter
reaching the stormwater system as was demonstrated in the Cape Town Central Business District.
vi) Construction rubble is a significant contributor to the waste stream. Catchpit
grids are an effective way of reducing the amount of rubble entering the stormwater drainage system.
vii) Plastic items contributed between 19% and 50% of the litter stream by mass when
sand, stones, vegetation and rubble were excluded. Plastic was the largest major litter category in all the catchments except for the formal residential areas of Summer Greens and Welgemoed.
The strategies implemented in the pilot catchments are costed in the report to give them an economic context. Based on previous research and the results of the monitoring programme the report derives preliminary generic guidelines for the reduction of urban litter loads. These are intended to assist in the selection of appropriate strategies for reducing litter loads entering the drainage system by dealing with litter pollution at source.

xix
Marais & Armitage (2003). The measurement and reduction of urban litter entering stormwater drainage
systems. Executive Summary.
It should be emphasized that the findings and the guidelines are based on a study carried out in the City of Cape Town and that their applicability to the country as a whole has not been established. The challenges facing other urban areas are however similar and it is likely that many of the findings will be equally applicable to the other urban areas of South Africa. The report concludes by identifying several allied research needs. In particular there is a need for research into: i) Dealing with the problems of sand, silt and builder’s rubble in urban stormwater
drainage systems. ii) The impact of heavy metals and bacteriological pollutants on stormwater runoff. iii) The cost effectiveness of street sweeping as a litter management option. iv) To investigate if there is a difference in the way men and women view the
importance of keeping litter out of the drainage systems and whether this impacts on litter reduction strategies.
v) The effectiveness of litter bin collections. vi) The litter patterns and loads in the pilot catchments in two to three year’s time to
determine whether the implemented catchment management strategies continue to be effective.

xx
Marais & Armitage (2003). The measurement and reduction of urban litter entering stormwater drainage
systems. Acknowledgements.
Acknowledgements This report emanates from a project co-funded by the Water Research Commission of South Africa and the Cape Metropolitan Council entitled: The Removal of Urban Litter in Drainage Systems through Integrated Catchment Management (WRC Project No. K5/1051). A multi-faceted report of this scope and size requires input from many people from several disciplines. Thanks are due to the following people and organisations who have made major contributions: i) The Water Research Commission for supporting and co-funding the project.
Particular thanks are due to Mr Dawid van der Merwe, recently retired Deputy Executive Director of the WRC, and Mr Jay Bhagwan, Executive Director (Water Use and Waste Management), for their encouragement and leadership.
ii) The Cape Metropolitan Administration of the City of Cape Town for co-funding
the project. A special word of thanks are due to Ms Sonja Pithey of the Catchment Management Department for her invaluable assistance in enlisting the cooperation of the various local administrations falling within the Cape Metroplitan Area and facilitating the process leading to the funding and installation of the litter traps and nets.
iii) The Project Steering Committee who provided constructive assistance throughout:
Mr DS van der Merwe - Water Research Commission (Former Chairperson) Mr J Bhagwan - Water Research Commission (Chairperson –
Successor to Mr van der Merwe) Ms SG Matthews - Water Research Commission (Committee Secretary) Mrs CM Smit - Water Research Commission (Coordinator :
Committee Services) Dr NP Armitage - University of Cape Town (Project Manager) Mr MJ Marais - University of Cape Town (Researcher) Prof G Ekama - University of Cape Town Prof A Rooseboom - University of Stellenbosch Ms S Pithey - City of Cape Town: Catchment Management Ms C McKinnon - City of Cape Town: Cleansing Mr RW Arnold - City of Cape Town: Stormwater
xxi
Marais & Armitage (2003). The measurement and reduction of urban litter entering stormwater drainage
systems. Acknowledgements.
Ms G Nosilela-Twala - Department of Water Affairs and Forestry, Pretoria Mr KA Barnett - Ethekwini Municipality Mr AA Mather - Ethekwini Municipality Mr R Leak - Fairest Cape Association Mr M Braune - SRK Consulting Engineers
iv) My fellow author, Dr Neil Armitage, who managed the project and the several researchers while providing invaluable advice borne of his extensive experience in the field of litter reduction.
v) The University of Cape Town which made laboratory resources and students from
several disciplines available and allowed Dr Armitage and myself to devote considerable time to the project.
vi) Dr Owen Sichone, from the Department of Social Anthropology at the University
of Cape Town, who contributed and supervised the MA (Social Anthropology) students.
vii) Dr Kevin Winter, from the Environmental and Geographical Science Department
at the University of Cape Town, who supervised and contributed the BSc Hons (Environmental and Geographical Science) student.
viii) Special thanks are due to Messrs Leloko Puling and Khayakhulu Lubanga, the
two Waste Auditors, for their crucial role in recording and ensuring the integrity of the collected data. This often entailed accompanying municipal cleaning teams into the early hours of the morning.
ix) The students from the University of Cape Town who contributed social
anthropological and socio-economic research findings from several pilot catchments:
Ms O Ainslie - MA (Social Anthropology) project in Imizamo Yethu Ms R Chamberlain - MA (Social Anthropology) project in Imizamo Yethu Mr R Croke - MA (Social Anthropolgy) project in Imizamo Yethu Ms CB Horsten - MA (Social Anthropology) project in Ocean View Ms A Matzener - BSc (Hons) thesis in Imizamo Yethu, Ocean View
and Fresnaye

xxii
Marais & Armitage (2003). The measurement and reduction of urban litter entering stormwater drainage
systems. Acknowledgements.
x) The Blaauwberg, Cape Town Central, South Peninsula and Tygerberg
Administrations of the City of Cape Town for permitting the project team to install litter traps and nets in their areas of jurisdiction. Without the assistance of their cleansing teams in clearing the traps and nets, carrying out field recordings and transporting the collected litter to the UCT laboratory for analysis in close cooperation with the Waste Auditors, this project would not have been possible. Special mention should be made of Mr Talcott Persent from the South Peninsula Administration whose enthusiasm never flagged despite having to contend with the two most difficult catchments.
xi) My colleagues at Liebenberg & Stander Western Cape Consulting Engineers for
allowing me to spend considerable time and resources on the project. In particular I am grateful to Mr Trenton Williams for assisting with the contract to install the litter traps and nets and setting up the project database.
xii) Dr Armitage and Mr Chris Wise for contributing a case study, written by Mr
Chris Wise, describing work carried out by Jeffares & Green Incorporated and Neil Armitage Consulting in 2001. Thanks are also due to Mr Rod Arnold of the Stormwater Department of the Central Administration of the City of Cape Town, which initiated and funded this work, for permitting its inclusion.
Mark Marais PrEng Principal Author, University of Cape Town, March 2003

Marais & Armitage (2003). The measurement and reduction of urban litter entering stormwater drainage
systems. Part 1 : Introduction.
Part 1 : Introduction
1-1
Marais & Armitage (2003). The measurement and reduction of urban litter entering stormwater
drainage systems. Chapter 1 : Introduction.
1. Introduction 1.1 Background Much attention has recently been given to the problem of eradicating what the South African Minister for Environmental Affairs, Valli Moosa (Nedlac, 2001), termed South Africa’s new “national flower”, the ubiquitous plastic bag. Although highly visible, festooning fences and thorn trees, and clogging drainage systems and waterways, the plastic bag is only one of many items that contribute to the litter stream. It has however served to capture the imagination of the South African public and focus the attention of increasing numbers of South Africans on the problem of litter. South Africa is of course not alone in having to contend with this problem. The local authorities’ objectives for controlling littering activity include (National Center for Environmental Decision-making Research, 1999): • aesthetic improvement; • public health and safety protection; • economic development; • preservation of neighbourhood integrity; and • conservation of financial resources. Keep America Beautiful has stated that litter is a serious concern to urban communities throughout the United States because it indicates that citizens do not take pride in the places where they live, work and play (Florida Center for Solid and Hazardous Waste Management, 1998). Conversely, litter studies conducted in Australia found that there is a high level of social concern and involvement in Australia surrounding the issues of litter and waste reduction (Australian Bureau of Statistics, 1999). The report on “The removal of urban litter from stormwater conduits and streams” (Armitage et al, 1998) notes that little data is available on the nature and quantity of the litter that finds its way into stormwater systems. This is despite the Council for Scientific and Industrial Research (CSIR, 1991) estimating in 1991 that 780 000 tonnes of waste a year was entering the drainage systems of South Africa. This represents a potential removal cost in excess of two billion rand (Armitage et al, 1998). Waste managers in SA have been guilty of addressing the symptoms of the waste problem – namely the growing mountains of waste – and not the cause of the problem – the production of waste (Lukey, 1991). As a consequence, previous South African studies have concentrated on removing litter from drainage systems once it is already there rather than reducing the amount of litter entering them in the first place. This is despite the contention that trapping litter should only be viewed as an interim measure or as part of an overall solution; and that by itself it is almost an admission of failure (Senior, 1992).
1-2
Marais & Armitage (2003). The measurement and reduction of urban litter entering stormwater
drainage systems. Chapter 1 : Introduction.
A further explanation for the lack of available data has been the reluctance of researchers and municipal officials involved with litter and stormwater management, most of whom are from engineering or scientific backgrounds, to tackle the non-technical aspects of the litter problem. Since the 1970s, litter has been considered a social behavioural problem and an educational problem that needs to be solved (Andres, 1993). The litter problem cannot be addressed in an effective and sustainable manner without an effective integrated catchment and litter management strategy. This could include planning controls (adopting land use policies which restrict the situation of litter-producing activities to areas where it is possible to contain and control litter accumulation), source controls (reducing litter loads entering the drainage system by dealing with pollution at source) and structural controls (removal of solid waste from the drainage system), supported by education and enforcement programmes. As Senior (1992) comments “it is not just the nature of the items themselves, nor the demands of retailers and manufacturers which are to blame, it is the community, whose behaviour, attitude and awareness are fundamental to the problem.” Litter management in South Africa has been hindered by the shortage of scientifically verified data indicating the likely effectiveness of any of the proposals. Therefore, to address this lack of data, a two year monitoring programme was conducted in nine catchments (covering a range of different land uses, socio-economic levels and densities) in the Cape Metropolitan Area. This monitoring programme had two aims: i) To improve the knowledge of the source, type and amount of urban litter
coming from different types of urban catchments; and ii) To identify appropriate litter management techniques in the reduction of urban
litter reaching the drainage systems. The purpose of this document is to describe the results of this monitoring programme and thereby to arrive at a set of generic guidelines for litter management in South African urban catchments. Over the course of this programme the greater Cape Town area underwent a series of profound administrative changes. The six local municipalities and the metropolitan authority providing joint and bulk services to these local municipalities, in existence at the commencement of the monitoring programme at the end of 1999, were merged into one unicity at the end of 2000. However the former local municipalities continued to operate as administrations within the unicity as a transitional measure. The data obtained from the programme needs to be seen against the background of these changes. It should be emphasized that the findings are based on a study carried out in the City of Cape Town and that their applicability to the country as a whole has not been established. The challenges facing other urban areas are however similar and it is likely that many of the findings will be equally applicable to the other urban areas of South Africa.
1-3
Marais & Armitage (2003). The measurement and reduction of urban litter entering stormwater
drainage systems. Chapter 1 : Introduction.
1.2 The format of this report This report has been divided into four parts: Part 1 introduces the urban litter problem in general terms borrowing from the experience gained in various developed and developing countries including South Africa. Part 2 focuses on the information about the source, type and amount of urban litter obtained from the two year monitoring programme carried out in the nine pilot catchments in the Cape Metropolitan Area (CMA). Social attitudes amongst members of the community living in two of theses catchments are examined. In working towards a litter management strategy Part 3 reviews litter management options generally and than focuses on current South African initiatives. The achievability of these options in the pilot catchments is discussed. A case study carried out by Jeffares & Green Incorporated and Neil Armitage Consulting in 2001 into the removal of litter from the Salt and Lotus River Catchments is described. This part concludes with an economic evaluation of alternative litter management techniques based on costs obtained from the Central Administration of the City of Cape Town. Part 4 presents a set of generic guidelines for litter management, proposes a method for selecting appropriate litter reduction options and summarises the outcome of the research. Recommendations for future research are also made.
2-1
Marais & Armitage (2003). The measurement and reduction of urban litter entering stormwater
drainage systems. Chapter 2 : The urban litter problem.
2. The urban litter problem 2.1 Introduction Urban stormwater runoff may be polluted by, inter alia, nutrients, low pH (acidity), micro-organisms, toxic organics, heavy metals, litter/debris, oils, surfactants and increased water temperature. While the impact of litter may appear mainly visual and of aesthetic importance only, litter also seriously interferes with aquatic life (Victoria Stormwater Committee, 1999). The focus of this report is on the removal of the larger pollution elements from urban drainage systems and waterways. For the purposes of the report litter is defined as visible solid waste (Amitage et al, 1998). Litter has been considered a social behavioural problem since the 1970’s. Keep America Beautiful, a national litter education and prevention organization in the United States, found that people litter for three reasons: • they lack a sense of ownership; • they believe that someone else picks up their litter; or • the area is already littered. The fundamental reason underlying all of the above reasons is that people are too lazy to dispose of trash properly (Florida Center for Solid and Hazardous Waste Management, 1998-9). The existence, proliferation and accumulation of litter is intensified by rapid growth, increasing mobility, and improper disposal habits (National Center for Environmental Decision-making Research, 1999). All these factors are characteristic of the developing world which includes South Africa. In Australia, much research effort has been directed toward understanding and reforming the attitudes and behaviours of litterers (Australian Bureau of Statistics, 1999). The Australians found that • The presence or absence of trash bins was not a major factor in littering. • There were large differences between the way people described their behaviour
and their actual behaviour in that many of the people interviewed denied having littered immediately after having been observed littering.
2-2
Marais & Armitage (2003). The measurement and reduction of urban litter entering stormwater
drainage systems. Chapter 2 : The urban litter problem.
Whether the presence or absence of trash bins is a major factor in littering is disputed by Pressend (1998) and Hall (1996). Nevertheless there is general agreement that littering is more likely to occur in areas where litter is already present than in areas that are clean. People litter in places where litter is present because of the perceived acceptability of littering where others have already done so. The presence of only two pieces of litter can lead a person to conclude that “everyone litters here” (Cialdini et al., 1990). In South Africa and other developing countries where litter collections are infrequent except in central business districts, the manifestation of this perception is all too plainly apparent. The general inadequacy of litter refuse services leads to a rapid and sustained accumulation of litter. The temptation to litter is also increased where there is a general failure by authorities to enforce effective penalties as a deterrent to offenders and where littering is not as yet countered by a strong environmental ethic amongst the population at large. This exacerbates the problem of litter in South Africa and most of the developing world where the public seems to be less environmentally aware than in, say, Australia, New Zealand and the United States. 2.2 Sources of litter American researchers have identified seven typical sources of litter (National Center for Environmental Decision-making Research 1999): • Household trash sites for kerbside collection; • Commercial waste dumpsters; • Loading docks; • Building construction and demolition activities; • Vehicles travelling with uncovered loads; • Pedestrians; and • People in motor vehicles. Examples of high litter or illegal dump generating events or enterprises they have identified include: • Community events; • Parades;

2-3
Marais & Armitage (2003). The measurement and reduction of urban litter entering stormwater
drainage systems. Chapter 2 : The urban litter problem.
• Street fairs; • Concerts; • Sports events; • Loads lost off the back of vehicles; • Unloading bags of garbage at remote locations; • Lack of litter bins; • Convenience stores; • Fast food establishments. 2.3 Types of litter The consumer culture, to which most South Africans belong, creates demand for the supply of products and packaging which have the potential to become major contributors to the litter stream. The same types of products and packaging and hence the same major categories of litter prevail as in the developed world, although the proportions and amounts may vary. A common finding in studies in Springs (Armitage et al., 1998) , Coburg (Australia) (Allison and Chiew, 1995) and Auckland (New Zealand) (Cornelius et al., 1994) was that plastics are a major problem. The same finding has been made in the various studies undertaken in the Cape Metropolitan Area. Ryan (1996) has found that some of the pelagic seabirds that visit SA waters have among the highest levels of plastic ingestion recorded, with almost every Great Shearwater or Blue Petrel containing plastic in its stomach. Coastal cleanups in the Western Cape indicate that the major component of coastal pollution is plastic waste. It was also noted that the debris does not originate from the sea but mainly from the land (Kieser, 1999). By way of comparison, in a study carried out into littering patterns in the informal urban settlements of Vingunguti and Mtambani in Dar es Salaam (Tanzania), paper predominated once sand, stones and vegetable and organic matter (including food remains) were excluded (Kivaisi and Rubindamayugi, 2000). Research conducted in a range of settlement types in the city of Bamako (Mali) (Quedraogo et al, 2000) showed that plastics formed a small percentage of the total litter load but this picture changed once sand, stones and vegetable and organic matter (including food remains) were excluded. The exception was in the urban centre of Bamako where the contribution of paper was of the same order.
2-4
Marais & Armitage (2003). The measurement and reduction of urban litter entering stormwater
drainage systems. Chapter 2 : The urban litter problem.
For the purposes of this study a simplified classification system was adopted based on research experience elsewhere (Armitage et al, 1998): • Plastics (packaging and containers); • Paper (packaging, newspapers and cardboard); • Metal (cans); • Glass (bottles); • Vegetation (leaves, branches and food); • Sediment (sand and clay); • Miscellaneous (animal remains, construction material, cloth and fibre-glass). This hierarchical classification system allowed considerable flexibility as it could be further subdivided as the study progressed if it was thought that it was important to record the incidence of a specific item. For example a can containing a particular brand of cool drink may have been found to predominate. Implementing a strategy that targeted this one item might significantly reduce the amount of litter emanating from the catchment. This would only be apparent if the incidence of the specific item was monitored and recorded. 2.4 Factors influencing litter composition and quantity Research carried out in Australia and New Zealand has shown that the rate at which litter is deposited on a catchment and the composition of that litter is highly variable and depends on a large number of independent factors including (Armitage et al, 1998): • the type of development, i.e. commercial, industrial, residential – generally
commercial and industrial areas produce higher litter loading rates than residential areas;
• the density of development; • the income level of the community – it has been hypothesised that very poor
people don’t have access to many products, hence are not in a position to waste them or their containers;
• the type of industry - some industries tend to produce more pollutants than
others;

2-5
Marais & Armitage (2003). The measurement and reduction of urban litter entering stormwater
drainage systems. Chapter 2 : The urban litter problem.
• the rainfall patterns, i.e. does the rain come in one season only or year-round?
Litter will build up in the catchment until it is either picked up by refuse removal, or is swept into the drains by a downpour. Long dry spells give greater opportunity to the local authority to pick up the litter, but also tend to result in heavy concentrations of accumulated rubbish being brought down the channels with the first rains of the season - the so-called “first flush”;
• the type of vegetation in the catchment - in Australia for example, leaves form
the major proportion of “litter” collected in traps with the highest proportions recorded in residential areas;
• the efficiency and effectiveness of refuse removal by the local authority - it is
important that the local authority not only clean the streets and bins regularly, but also that cleansing staff do not sweep or flush the street litter into the stormwater drains;
• the level of environmental concern in the community - leading to, for example,
the reduction in the use of certain products, and the recycling of others; and • the extent of legislation prohibiting or reducing waste, with which is associated
the effectiveness of the policing of the legislation, and the level of the fines. 2.5 Litter and neighbourhood decline A more sinister effect of the presence of litter is that it is one of several environmental cues associated with neighbourhood decline. Litter is a physical “symbol of disorder” or “incivility” along with vandalism, dilapidated or abandoned housing, and dirty vacant lots (Florida Center for Solid and Hazardous Waste Management, 1998). Skogan (1990) found that people identify the incidence of crime with environmental cues. His research indicates that physical and social disorder correlate very strongly. The “broken windows” theory suggests that if an element of disorder, such as a broken window, is not quickly repaired, a contagion effect will occur (Wilson & Kelling, 1982). This theory may be applied to other elements of disorder such as litter, graffiti, vandalism and abandonment. Concurring research indicated that “litter begets littering”. In the CMA many environmentally degraded areas are subject to gangsterism and rampant crime. It would be too simplistic to blame this on excessive littering, but it certainly may be a factor in perpetuating an atmosphere of lawlessness. American researchers have even gone so far as to hypothesise that crime may be reduced by improving a neighbourhood’s environment (DeFrances & Titus, 1994).
2-6
Marais & Armitage (2003). The measurement and reduction of urban litter entering stormwater
drainage systems. Chapter 2 : The urban litter problem.
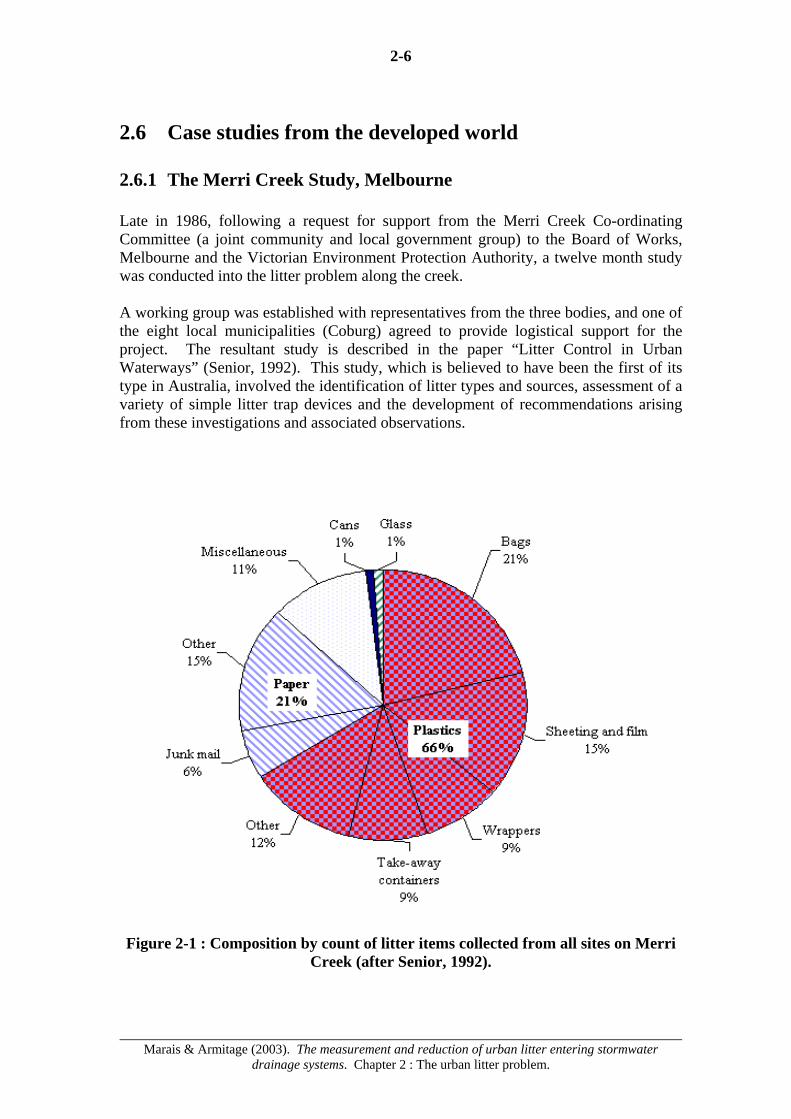
2.6 Case studies from the developed world 2.6.1 The Merri Creek Study, Melbourne Late in 1986, following a request for support from the Merri Creek Co-ordinating Committee (a joint community and local government group) to the Board of Works, Melbourne and the Victorian Environment Protection Authority, a twelve month study was conducted into the litter problem along the creek. A working group was established with representatives from the three bodies, and one of the eight local municipalities (Coburg) agreed to provide logistical support for the project. The resultant study is described in the paper “Litter Control in Urban Waterways” (Senior, 1992). This study, which is believed to have been the first of its type in Australia, involved the identification of litter types and sources, assessment of a variety of simple litter trap devices and the development of recommendations arising from these investigations and associated observations.
Figure 2-1 : Composition by count of litter items collected from all sites on Merri
Creek (after Senior, 1992).
2-7
Marais & Armitage (2003). The measurement and reduction of urban litter entering stormwater
drainage systems. Chapter 2 : The urban litter problem.
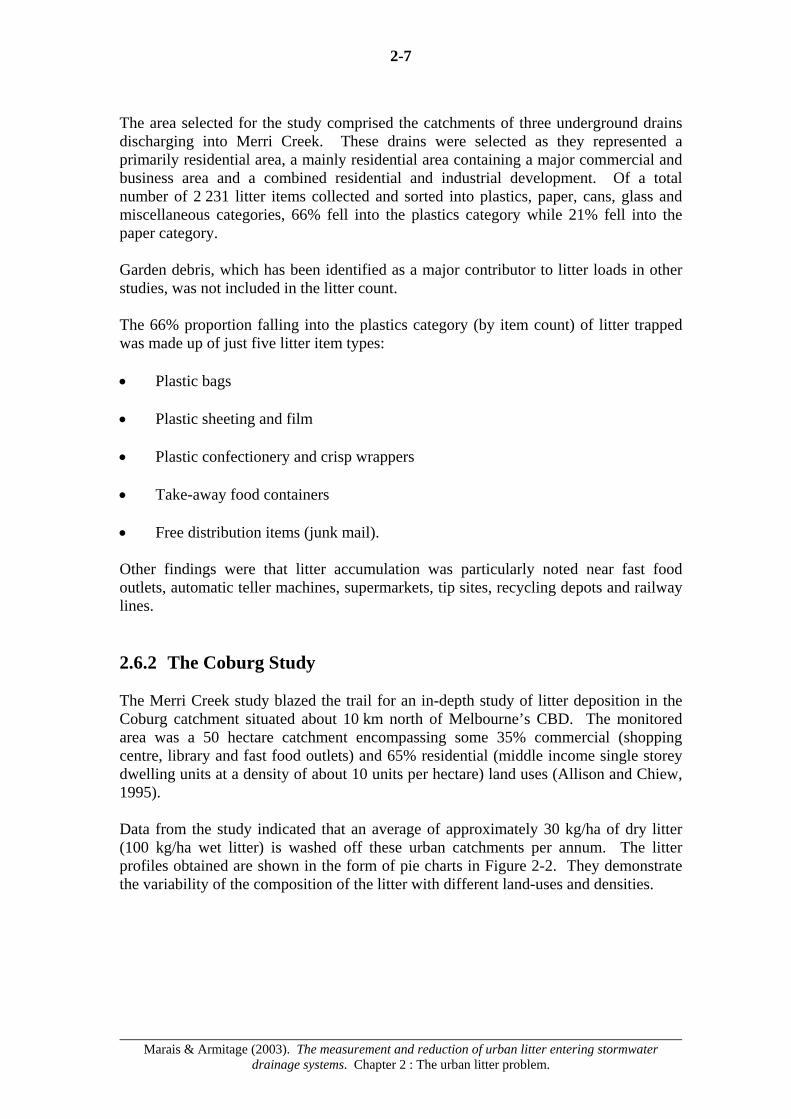
The area selected for the study comprised the catchments of three underground drains discharging into Merri Creek. These drains were selected as they represented a primarily residential area, a mainly residential area containing a major commercial and business area and a combined residential and industrial development. Of a total number of 2 231 litter items collected and sorted into plastics, paper, cans, glass and miscellaneous categories, 66% fell into the plastics category while 21% fell into the paper category. Garden debris, which has been identified as a major contributor to litter loads in other studies, was not included in the litter count. The 66% proportion falling into the plastics category (by item count) of litter trapped was made up of just five litter item types: • Plastic bags • Plastic sheeting and film • Plastic confectionery and crisp wrappers • Take-away food containers • Free distribution items (junk mail). Other findings were that litter accumulation was particularly noted near fast food outlets, automatic teller machines, supermarkets, tip sites, recycling depots and railway lines. 2.6.2 The Coburg Study The Merri Creek study blazed the trail for an in-depth study of litter deposition in the Coburg catchment situated about 10 km north of Melbourne’s CBD. The monitored area was a 50 hectare catchment encompassing some 35% commercial (shopping centre, library and fast food outlets) and 65% residential (middle income single storey dwelling units at a density of about 10 units per hectare) land uses (Allison and Chiew, 1995). Data from the study indicated that an average of approximately 30 kg/ha of dry litter (100 kg/ha wet litter) is washed off these urban catchments per annum. The litter profiles obtained are shown in the form of pie charts in Figure 2-2. They demonstrate the variability of the composition of the litter with different land-uses and densities.
2-8
Marais & Armitage (2003). The measurement and reduction of urban litter entering stormwater
drainage systems. Chapter 2 : The urban litter problem.
Figure 2-2 : Litter composition by dry mass from different catchments in Coburg (after Allison & Chiew, 1995)
2.6.3 The Auckland Study Similar profiles to the Coburg Study were also obtained for Auckland (Cornelius et al., 1994). Nine stormwater outfalls discharging from Auckland City into the Hauraki Gulf, representing three basic land use types (commercial, industrial and residential), were sampled from November 1992 to October 1993 to determine if the quantity and composition of stormwater debris discharges varied with catchment land use. It was found that the commercial catchments were the most significant sources of litter by mass. The estimated daily contributions originating from the three land use types, commercial, industrial and residential, yielded litter loading rates of 1.3, 0.9 and 0.5 kg per ha per annum respectively when converted to annual rates. Although these loading rates are considerably lower than for the Coburg study, garden debris, which was a significant component of the Coburg litter profiles, was not recorded in this study.

2-9
Marais & Armitage (2003). The measurement and reduction of urban litter entering stormwater
drainage systems. Chapter 2 : The urban litter problem.
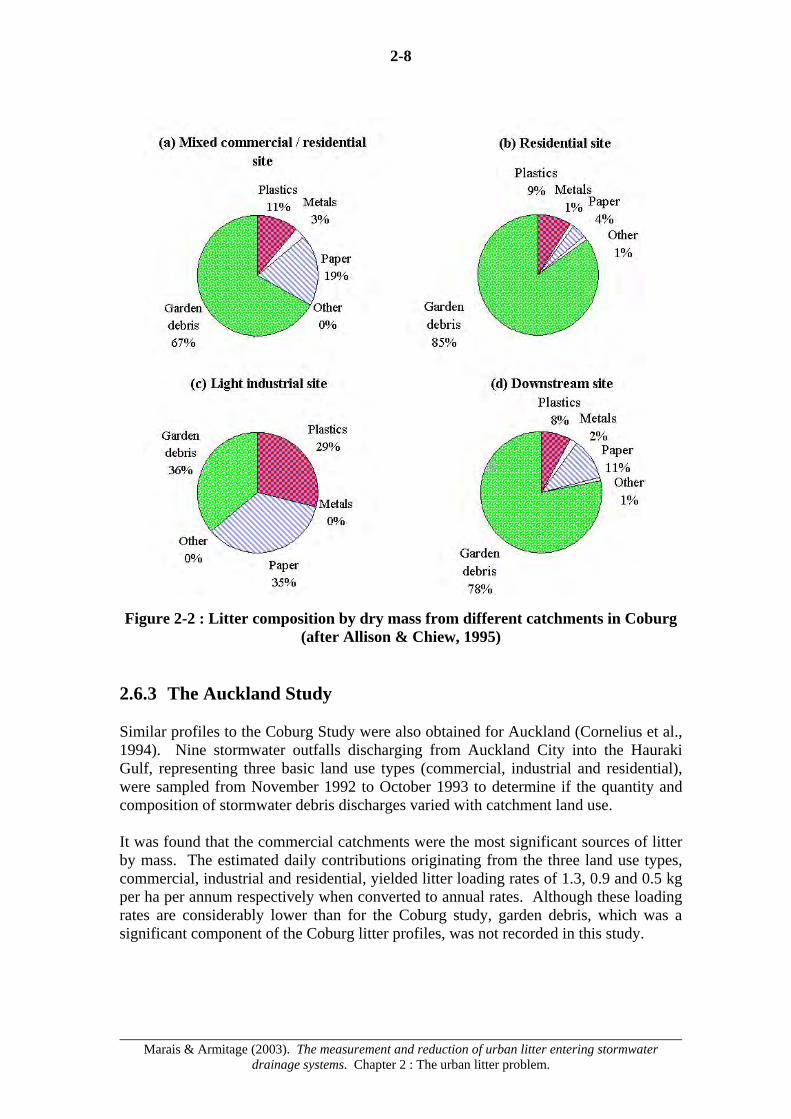
The litter profiles obtained are illustrated in the form of a bar chart in Figure 2-3.
Figure 2-3 : Litter composition by count from different land use types in Auckland
(after Cornelius et al., 1994) It is interesting to note that plastic products predominate in the litter emanating from the industrial areas (80% by count) while paper products are the most significant contributor in the commercial and residential areas (64 and 43% by count respectively). 2.6.4 American experience In the United States of America, published litter surveys have generally focused on litter along roads rather than litter in drainage systems and waterways. There has been an emphasis on the behavioural and attitudinal aspects connected with littering. Research has also concentrated on how to reduce litter and its effects on the economy and quality of life. After noting a significant increase in the amount of litter found on Florida’s roadsides in 1997 compared with previous years (Florida Center for Solid and Hazardous Waste Management, 1998), the Florida Department of Environmental Protection commissioned a multi-pronged research project to examine: • The costs of managing litter;
2-10
Marais & Armitage (2003). The measurement and reduction of urban litter entering stormwater
drainage systems. Chapter 2 : The urban litter problem.
• The economic and social benefits associated with preventing litter; • The importance of tourism and ecotourism to Florida’s economy; and • Successful litter prevention programmes in other American states. The project concluded that: i) The presence of litter in a neighbourhood can have a significant economic and
social impact on the quality of life of the neighbourhood’s residents. ii) Additional data was needed to determine the economic impact of litter on
Florida’s tourism industry. iii) At the corporate level (restaurant industry, shopping malls, convenience stores)
there was no knowledge of the costs associated with the cleaning up of litter. iv) Grass roots efforts to prevent litter in Florida were increasing. v) Several states had found that statewide media campaigns were effective in
raising awareness about litter and reducing roadside litter. vi) Additional research was needed to determine the cost of managing litter at
county and local authority levels. 2.7 Case studies from developing countries 2.7.1 Vingulgati and Mtambani, Dar es Salaam, Tanzania Tanzania’s urban population has been growing at a rate of 7 to 10% in recent years. 60 to 70% of the urban population live in informal settlements (Kivaisi and Rubindamayugi, 2000). Vingulgati and Mtambani are unplanned urban settlements in Dar es Salaam, the commercial centre of Tanzania. The Dar es Salaam City Commission provides limited social services, but does not undertake solid waste collection in any of the settlements due to a lack of financial resources. Both the settlements are densely populated (6 317 person/km²) and generate about 22 kg/ha of household waste and 345 kg of market waste per day. It was estimated that between 80 and 90% of the waste ends up as litter accumulating on the streets where it is either burnt on site, buried, wasted to drains or left to rot. The main purpose of the survey carried out in the settlements was to determine the proportions of the waste that were organic (suitable for composting) and recyclable (capable of providing a source of income).
2-11
Marais & Armitage (2003). The measurement and reduction of urban litter entering stormwater
drainage systems. Chapter 2 : The urban litter problem.
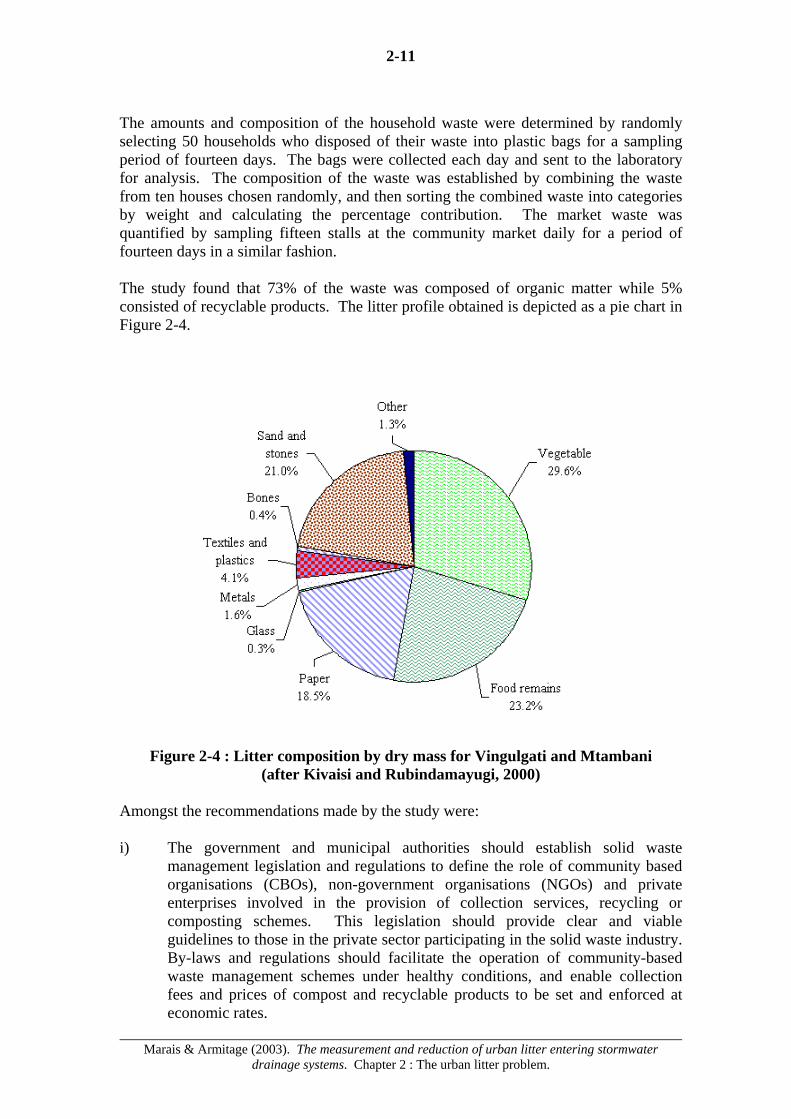
The amounts and composition of the household waste were determined by randomly selecting 50 households who disposed of their waste into plastic bags for a sampling period of fourteen days. The bags were collected each day and sent to the laboratory for analysis. The composition of the waste was established by combining the waste from ten houses chosen randomly, and then sorting the combined waste into categories by weight and calculating the percentage contribution. The market waste was quantified by sampling fifteen stalls at the community market daily for a period of fourteen days in a similar fashion. The study found that 73% of the waste was composed of organic matter while 5% consisted of recyclable products. The litter profile obtained is depicted as a pie chart in Figure 2-4.
Figure 2-4 : Litter composition by dry mass for Vingulgati and Mtambani (after Kivaisi and Rubindamayugi, 2000)
Amongst the recommendations made by the study were: i) The government and municipal authorities should establish solid waste
management legislation and regulations to define the role of community based organisations (CBOs), non-government organisations (NGOs) and private enterprises involved in the provision of collection services, recycling or composting schemes. This legislation should provide clear and viable guidelines to those in the private sector participating in the solid waste industry. By-laws and regulations should facilitate the operation of community-based waste management schemes under healthy conditions, and enable collection fees and prices of compost and recyclable products to be set and enforced at economic rates.
2-12
Marais & Armitage (2003). The measurement and reduction of urban litter entering stormwater
drainage systems. Chapter 2 : The urban litter problem.
ii) The lack of available capital for financing waste collection and composting
enterprises must be addressed. At the same time the government should provide financial support to potential entrepreneurs for acquiring the technological, financial and managerial skills to run these enterprises. The city authorities should set aside land for the operation of these enterprises.
iii) The government and municipal authorities should foster the participation of the
private sector and CBOs through the creation of environmental awareness, training in efficient and environmentally sound waste management techniques, and by expanding existing municipal structures dealing with waste management to include private sector, CBO and NGO representatives.
iv) A campaign to educate the public about the advantages of composting and
sorting litter and waste at source should be conducted using the public media and existing NGOs and CBOs as bridges between municipal officials and households. The income generating potential of community-based waste management practices should be demonstrated.
v) Markets for recyclable goods and compost should be promoted. A demand for
compost should be created through designating areas where urban agriculture using organic fertilisers could be practised.
vi) Women should be involved in all aspects and particularly in demonstration
schemes as they represent the most effective way of promoting community based waste management.
2.7.2 Bamako, Mali Bamako district is an expanding city with more than one million inhabitants which experiences severe and increasing environmental pollution by municipal solid waste because of the lack of an efficient waste management service (Oudraogao et al., 2000). The aims of an in-depth scientific study of the solid waste problem in Bamako district were to obtain reliable data on the nature and quantity of the solid waste generated, to propose a management strategy and develop a sustainable composting technology for the organic fraction of the waste. Field investigations were carried out from December 1993 to December 1994. Six sectors with different social and economic characteristics were selected. The results for two of these, the Gabriel Touré Hospital and the Hôtel de l’Amitié are not discussed here as they relate to specialised land-uses. Hamdallaye is a largely unpaved, high density (with many families per household and a significant number of livestock), low income residential area while Falaje-SEMA is a medium density (one family per household), middle income residential area with fewer livestock and less pastoral activity. The River Quarter is a well-wooded, medium to low density, high income, primarily residential area with some schools and offices. The Urban Centre is where intense commercial and public service activities take place.
2-13
Marais & Armitage (2003). The measurement and reduction of urban litter entering stormwater
drainage systems. Chapter 2 : The urban litter problem.
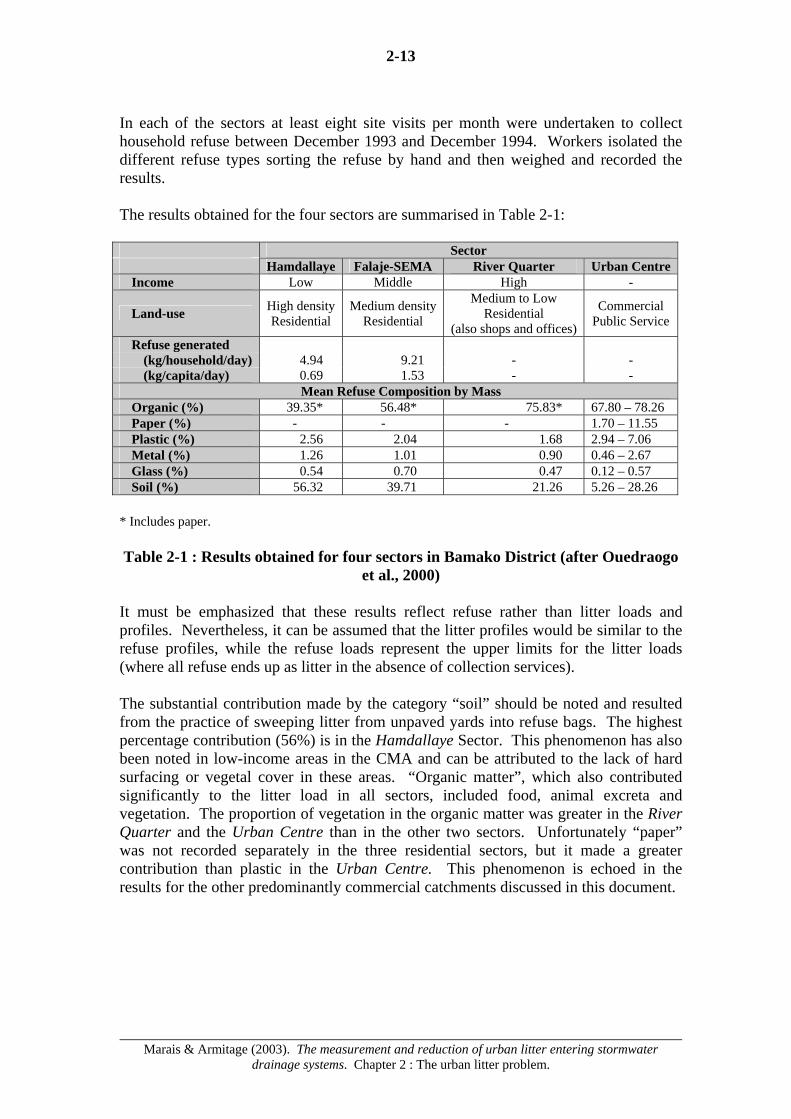
In each of the sectors at least eight site visits per month were undertaken to collect household refuse between December 1993 and December 1994. Workers isolated the different refuse types sorting the refuse by hand and then weighed and recorded the results. The results obtained for the four sectors are summarised in Table 2-1:
Sector Hamdallaye Falaje-SEMA River Quarter Urban Centre Income Low Middle High -
Land-use High density Residential
Medium density Residential
Medium to Low Residential
(also shops and offices)
Commercial Public Service
Refuse generated (kg/household/day) 4.94 9.21 - - (kg/capita/day) 0.69 1.53 - -
Mean Refuse Composition by Mass Organic (%) 39.35* 56.48* 75.83* 67.80 – 78.26 Paper (%) - - - 1.70 – 11.55 Plastic (%) 2.56 2.04 1.68 2.94 – 7.06 Metal (%) 1.26 1.01 0.90 0.46 – 2.67 Glass (%) 0.54 0.70 0.47 0.12 – 0.57 Soil (%) 56.32 39.71 21.26 5.26 – 28.26
* Includes paper. Table 2-1 : Results obtained for four sectors in Bamako District (after Ouedraogo
et al., 2000) It must be emphasized that these results reflect refuse rather than litter loads and profiles. Nevertheless, it can be assumed that the litter profiles would be similar to the refuse profiles, while the refuse loads represent the upper limits for the litter loads (where all refuse ends up as litter in the absence of collection services). The substantial contribution made by the category “soil” should be noted and resulted from the practice of sweeping litter from unpaved yards into refuse bags. The highest percentage contribution (56%) is in the Hamdallaye Sector. This phenomenon has also been noted in low-income areas in the CMA and can be attributed to the lack of hard surfacing or vegetal cover in these areas. “Organic matter”, which also contributed significantly to the litter load in all sectors, included food, animal excreta and vegetation. The proportion of vegetation in the organic matter was greater in the River Quarter and the Urban Centre than in the other two sectors. Unfortunately “paper” was not recorded separately in the three residential sectors, but it made a greater contribution than plastic in the Urban Centre. This phenomenon is echoed in the results for the other predominantly commercial catchments discussed in this document.
2-14
Marais & Armitage (2003). The measurement and reduction of urban litter entering stormwater
drainage systems. Chapter 2 : The urban litter problem.
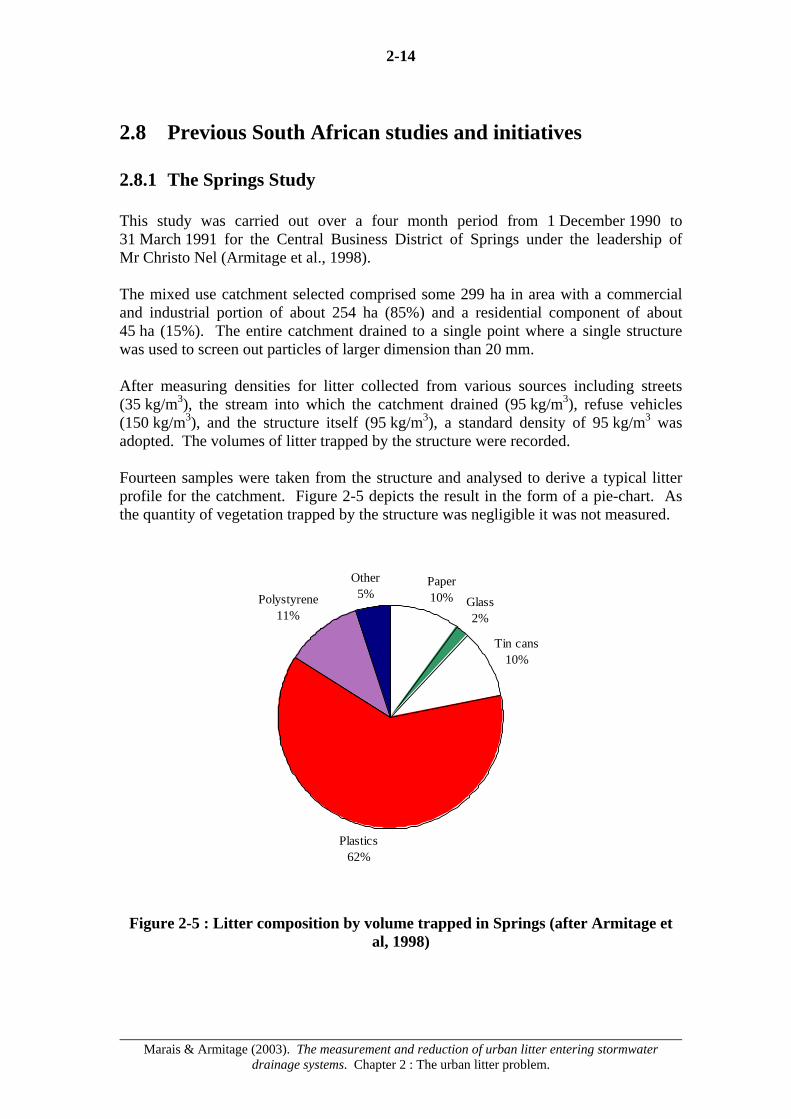
2.8 Previous South African studies and initiatives 2.8.1 The Springs Study This study was carried out over a four month period from 1 December 1990 to 31 March 1991 for the Central Business District of Springs under the leadership of Mr Christo Nel (Armitage et al., 1998). The mixed use catchment selected comprised some 299 ha in area with a commercial and industrial portion of about 254 ha (85%) and a residential component of about 45 ha (15%). The entire catchment drained to a single point where a single structure was used to screen out particles of larger dimension than 20 mm. After measuring densities for litter collected from various sources including streets (35 kg/m3), the stream into which the catchment drained (95 kg/m3), refuse vehicles (150 kg/m3), and the structure itself (95 kg/m3), a standard density of 95 kg/m3 was adopted. The volumes of litter trapped by the structure were recorded. Fourteen samples were taken from the structure and analysed to derive a typical litter profile for the catchment. Figure 2-5 depicts the result in the form of a pie-chart. As the quantity of vegetation trapped by the structure was negligible it was not measured.
Figure 2-5 : Litter composition by volume trapped in Springs (after Armitage et
al, 1998)
Paper10% Glass
2%
Tin cans10%
Plastics62%
Polystyrene11%
Other5%

2-15
Marais & Armitage (2003). The measurement and reduction of urban litter entering stormwater
drainage systems. Chapter 2 : The urban litter problem.
The litter deposition rate for the commercial / industrial area was estimated at about 550 kg/ha.yr using the standard density to convert the measured volumes into masses. Of the amount deposited, about 18% was estimated to enter the stormwater drainage system yielding an average annual litter load of about 82 kg/ha.yr for the entire catchment. 2.8.2 Marine litter originating from Sea Point, Paarden Eiland and
Milnerton (Cape Town) The aims of this study, carried out under the auspices of the Percy Fitzpatrick Institute at the University of Cape Town, were threefold (Arnold & Ryan, 1999): i) To estimate the amount of litter entering the sea from stormwater runoff. ii) To identify key sources of solid waste entering waste water systems. iii) To target these specific sources with an education / involvement campaign to
reduce stormwater litter and thus reduce the amount of litter entering the sea. The stormwater drain outlets from three small urban catchments in Cape Town were equipped with litter traps in the form of polypropylene netting. The three catchments chosen were Sea Point (a high income, mixed commercial-residential area of 6.24 ha), Paarden Eiland (an industrial area of 2.5 ha) and Milnerton (an upper middle-class residential area of 4.7 ha). All these areas had regular refuse collection (once to twice a week) and the commercial area of Sea Point also enjoyed regular street sweeping. The drains were netted for five to twenty-two days during the winter of 1996. Litter collected from the nets was dried, weighed, counted and sorted to identify probable litter sources. The litter profiles obtained for the three catchments are depicted in Figure 2-6 in the form of a bar chart. Extrapolating the mass of litter collected, the annual litter loadings obtained were 4 kg/ha.yr, 9 kg/ha.yr and 138 kg/ha.yr for the residential (Milnerton), commercial (Sea Point) and industrial (Paarden Eiland) areas respectively. Plastics made up 15 % of the litter by mass in the residential area of Milnerton and more than 50% in both the industrial and commercial areas. Vehicle debris (metal parts and seat upholstery) contributed a large proportion of the litter (by mass) in the residential area of Milnerton. The findings of the study were taken to the local communities through a series of facilitated meetings where participants were asked to suggest solutions to the litter problem. The researchers concluded their study with a range of recommendations. Key points included targeting adults for educational campaigns, rethinking the role of street cleaners and promoting waste reduction policies at a national level
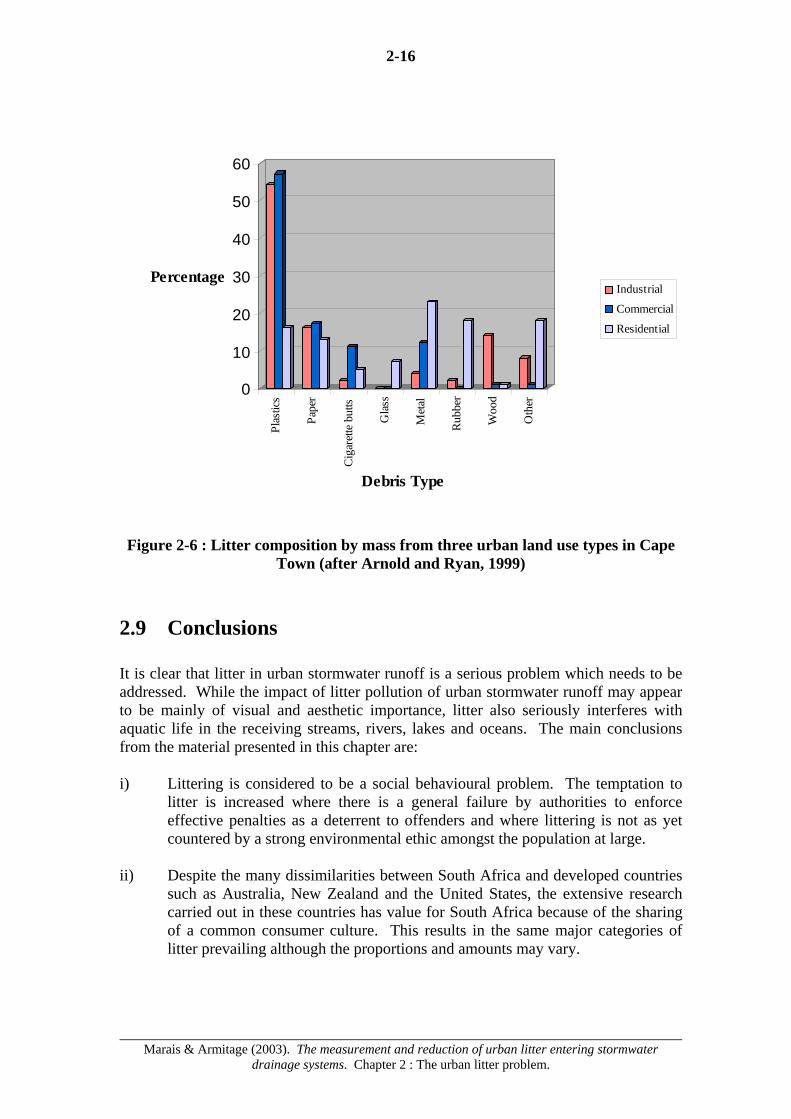
2-16
Marais & Armitage (2003). The measurement and reduction of urban litter entering stormwater
drainage systems. Chapter 2 : The urban litter problem.
Figure 2-6 : Litter composition by mass from three urban land use types in Cape
Town (after Arnold and Ryan, 1999) 2.9 Conclusions It is clear that litter in urban stormwater runoff is a serious problem which needs to be addressed. While the impact of litter pollution of urban stormwater runoff may appear to be mainly of visual and aesthetic importance, litter also seriously interferes with aquatic life in the receiving streams, rivers, lakes and oceans. The main conclusions from the material presented in this chapter are: i) Littering is considered to be a social behavioural problem. The temptation to
litter is increased where there is a general failure by authorities to enforce effective penalties as a deterrent to offenders and where littering is not as yet countered by a strong environmental ethic amongst the population at large.
ii) Despite the many dissimilarities between South Africa and developed countries
such as Australia, New Zealand and the United States, the extensive research carried out in these countries has value for South Africa because of the sharing of a common consumer culture. This results in the same major categories of litter prevailing although the proportions and amounts may vary.
0
10
20
30
40
50
60
PercentagePl
astic
s
Pape
r
Cig
aret
te b
utts
Gla
ss
Met
al
Rub
ber
Woo
d
Oth
er
Debris Type
Industrial
Commercial
Residential

2-17
Marais & Armitage (2003). The measurement and reduction of urban litter entering stormwater
drainage systems. Chapter 2 : The urban litter problem.
iii) The general inadequacy of litter refuse services leads to a rapid and sustained
accumulation of litter. This is particularly evident in South Africa and other developing countries where litter collections are often infrequent except in business districts.
iv) The temptation to litter is increased where there is a general failure by
authorities to enforce effective penalties as a deterrent to offenders and where littering is not as yet countered by a strong environmental ethic amongst the population at large.
v) The composition of the litter varies with different land-uses, income and service
levels and population densities:
• Plastics make up a significant proportion of the litter in all types of land-uses and densities surveyed where sand, stones, vegetable and organic matter are excluded.
• Paper products are often the most significant contributor in commercial
and high income residential areas. • A notable phenomenon in low-income areas is the substantial
contribution from soil. This can be attributed to the lack of hard surfacing or vegetal cover in these areas.
vi) Recycling and composting of refuse at source should be promoted to reduce the
potential litter load finding its way into stormwater drainage systems.
Marais & Armitage (2003). The measurement and reduction of urban litter entering stormwater drainage
systems. Part 2 : The Source, Type and Amount of Urban Litter.
Part 2 : The Source, Type and Amount of Urban Litter

3-1
Marais & Armitage (2003). The measurement and reduction of urban litter entering stormwater drainage
systems. Chapter 3 : The pilot catchments.
3. The pilot catchments 3.1 Introduction In common with other South African urban areas, the basic infrastructure of the Cape Metropolitan Area is unequally distributed. Rapid urbanisation and urban growth have placed enormous pressure on the existing basic infrastructure and resulted in backlogs in the provision of basic services such as waste removal thereby exacerbating the litter problem. 19% of the dwellings in which the metro region’s 3 million people reside are classed as informal (Van Deventer, 2000). In 1990, almost 1 million tons of waste was received at landfill sites a year, which amounted to about 1 kg of waste per person per day (Cape Metropolitan Council, 1998). Estimates for the amount of litter entering the stormwater systems differ wildly. The Cape Metropolitan Council’s State of the Environment Report for 1998 estimated that about 87 tons of litter enters the stormwater system per year and that up to 239 kg of plastic bags enters per day. This is an order of magnitude less than the Ryan (1996) estimate of 4 million litter items weighing more than 2.5 tons entering storm drains daily equating to more than 900 tons per year. Ryan’s estimate was based on extrapolating actual average litter loads obtained from monitoring the outfalls from three small urban catchments in Cape Town. This leads to the conclusion that the Cape Metropolitan Council’s figures are a gross underestimate. There is clearly a lack of knowledge of the source, type and amount of litter reaching the stormwater drainage systems from different types of urban catchments. To remedy this lack of knowledge a data collection programme was instituted in a range of pilot catchments in the Cape Metropolitan Council. 3.2 Objectives of the data collection programme The twin objectives of the data collection programme were • to improve the knowledge of the source, type and amount of litter reaching the drainage
systems from the different types of urban catchments; and • to measure the effectiveness of different catchment based litter management strategies. To achieve these objectives the following activities were undertaken: i) A number of urban catchments representing a spread of land uses, income levels,
densities and service levels were selected. ii) Litter traps and nets were installed in catchpits and stormwater outlet pipes. iii) A monitoring programme was instituted to record the types and amounts of litter
trapped on a regular basis.
3-2
Marais & Armitage (2003). The measurement and reduction of urban litter entering stormwater drainage
systems. Chapter 3 : The pilot catchments.
iv) The data obtained from the monitoring was analysed to arrive at a litter profile for
each of the study catchments. The litter profile was then considered in tandem with the socio-economic characteristics for each catchment. In this way it was hoped:
• to establish a litter profile in terms of the source, type and amount of urban
litter for each of the different types of urban catchments; • to gain some understanding of how land-use, population densities, level of
servicing and socio-economic levels affect these litter profiles;. • to identify the reasons for any change in the behaviour of the communities
with respect to their littering patterns during the monitoring period; and • to determine possible litter management strategies to reduce litter loadings
in the study catchments. As an adjunct to the monitoring programme, studies were carried out into the attitudes towards littering amongst the communities living in two of the catchments, namely Imizamo Yethu and Ocean View.
3.3 Selection criteria As a key starting point of this study is that littering patterns are to some extent linked to the socio economic profile and level of service in a catchment, it was essential that drainage catchments covering a range of different land-uses, income levels, population densities and service levels be selected. Each of the then Municipal Local Councils (now all part of the Cape Town unicity) were requested to identify candidate catchments within their area for inclusion in the study. The criteria for the selection of the catchments were: i) The catchment should ideally be between 10 and 30 hectares (ha) in area with a
maximum of 100 catchpits. This was to keep the monitoring process manageable and limit the cost of installing catchpit traps. On the other hand the catchment should not be too small otherwise the data might be distorted by a single litter source such as a fast-food outlet, an ATM, a supermarket, or a fresh produce market.
ii) The catchment must not receive flow from other areas, i.e. it should be at the head
of a drainage system. iii) Ideally all the catchpits within a catchment should drain to a single outlet where any
litter bypassing the catchpit traps could be caught in a net.
3-3
Marais & Armitage (2003). The measurement and reduction of urban litter entering stormwater drainage
systems. Chapter 3 : The pilot catchments.
iv) The catchment should have a distinctive land-use and socio-economic profile.
v) Catchments should cover a range of different land-uses, income levels, population densities and service levels.
vi) A catchment occupied by an informal or site and service area should be included. There is a particular lack of research on litter loadings from such catchments despite the acuteness of the litter problem in these areas.
An additional criterion in making the final selection from the candidate catchments was that, as far as possible, the study catchments should be distributed throughout the Cape Metropolitan Area to include all six of the then Municipal Local Councils within the CMA.
Nine catchments were selected (the average household incomes per annum given below are 1996 figures derived from the Census 1996 data):
i) Imizamo Yethu – a low income, (average of R21 000 per household per annum)
high density residential area comprised of site-and-service and informal plots; ii) Ocean View – a low income (average of R25 000 per household per annum), high
density residential area; iii) Cape Town Central Business District (CBD) including office blocks and hotels; iv) Cape Town CBD including open-air market and row shops; v) Cape Town CBD including the bus terminus; vi) Fresnaye – a high income (average of R97 000 per household per annum, medium
density residential area (including apartments); vii) Summer Greens – a medium income (average of R75 000 per household per
annum), medium density residential area; viii) Montagu Gardens industrial park; ix) Welgemoed - a high income (average of R178 000 per household per annum), low
density residential area.

3-4
Marais & Armitage (2003). The measurement and reduction of urban litter entering stormwater drainage
systems. Chapter 3 : The pilot catchments.
The approximate location of the drainage catchments is indicated in Figure 3-1 while the socio-economic and land-use characteristics are summarized in Figure 3-2:
Figure 3-1 : Map showing the CMA and the locations of the
selected catchments
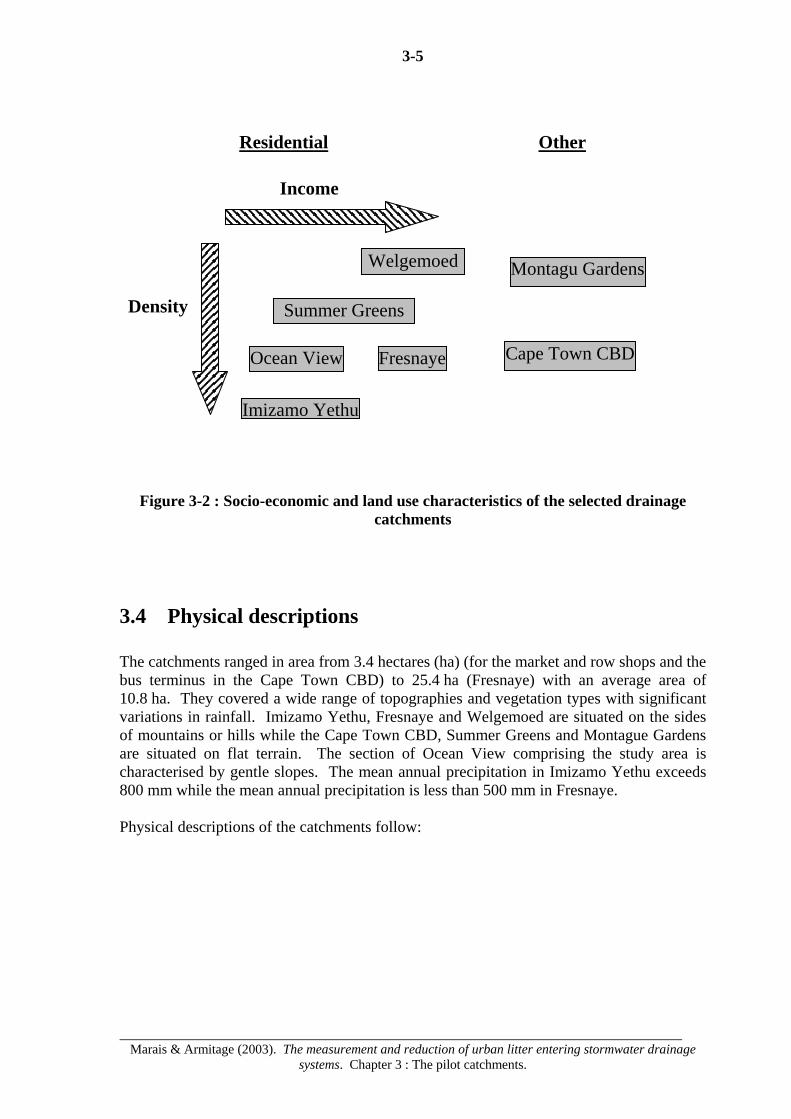
3-5
Marais & Armitage (2003). The measurement and reduction of urban litter entering stormwater drainage
systems. Chapter 3 : The pilot catchments.
Figure 3-2 : Socio-economic and land use characteristics of the selected drainage catchments
3.4 Physical descriptions The catchments ranged in area from 3.4 hectares (ha) (for the market and row shops and the bus terminus in the Cape Town CBD) to 25.4 ha (Fresnaye) with an average area of 10.8 ha. They covered a wide range of topographies and vegetation types with significant variations in rainfall. Imizamo Yethu, Fresnaye and Welgemoed are situated on the sides of mountains or hills while the Cape Town CBD, Summer Greens and Montague Gardens are situated on flat terrain. The section of Ocean View comprising the study area is characterised by gentle slopes. The mean annual precipitation in Imizamo Yethu exceeds 800 mm while the mean annual precipitation is less than 500 mm in Fresnaye. Physical descriptions of the catchments follow:
Density
Income
Imizamo Yethu
Welgemoed
Ocean View
Summer Greens
Fresnaye
Montagu Gardens
Cape Town CBD
Residential Other

3-6
Marais & Armitage (2003). The measurement and reduction of urban litter entering stormwater drainage
systems. Chapter 3 : The pilot catchments.
3.4.1 A : Imizamo Yethu This is a high-density low-income site-and-service residential settlement. There are almost no permanent structures and the vast majority of the residents live in shacks. About 70% of the settlement is fully serviced with each erf having an individual water connection, a toilet with waterborne sanitation and frontage onto a surfaced road or walkway. These erven average 125 m² in area.
Figure 3-3 : A typical view of Imizamo Yethu
The remainder of the settlement is provided with communal taps and toilets or bucket latrines. The study area of 53 150 m² falls into the fully serviced area which is however downstream of areas with rudimentary services. In the absence of proper services, many households on the periphery of the settlement use the stormwater catchpits as disposal points for nightsoil and refuse. The site is also extremely dusty and and a considerable quantity of sand finds its way into the drainage system exacerbated by erosion of the steep slopes (ranging from 8% in the study area to more than 20% on the periphery of the settlement) and the relatively high rainfall (in excess of 800 mm per annum). There is little vegetal cover other than the remains of a pinus pinea (stone pine) plantation and the topsoil is largely composed of clay. Very few of the residents have gardens and there is also a considerable amount of silt that washes off the mountain slopes above the settlement in addition to the silt generated locally. These slopes have been destabilised by mountain fires and the growth of the settlement beyond its formal boundaries.
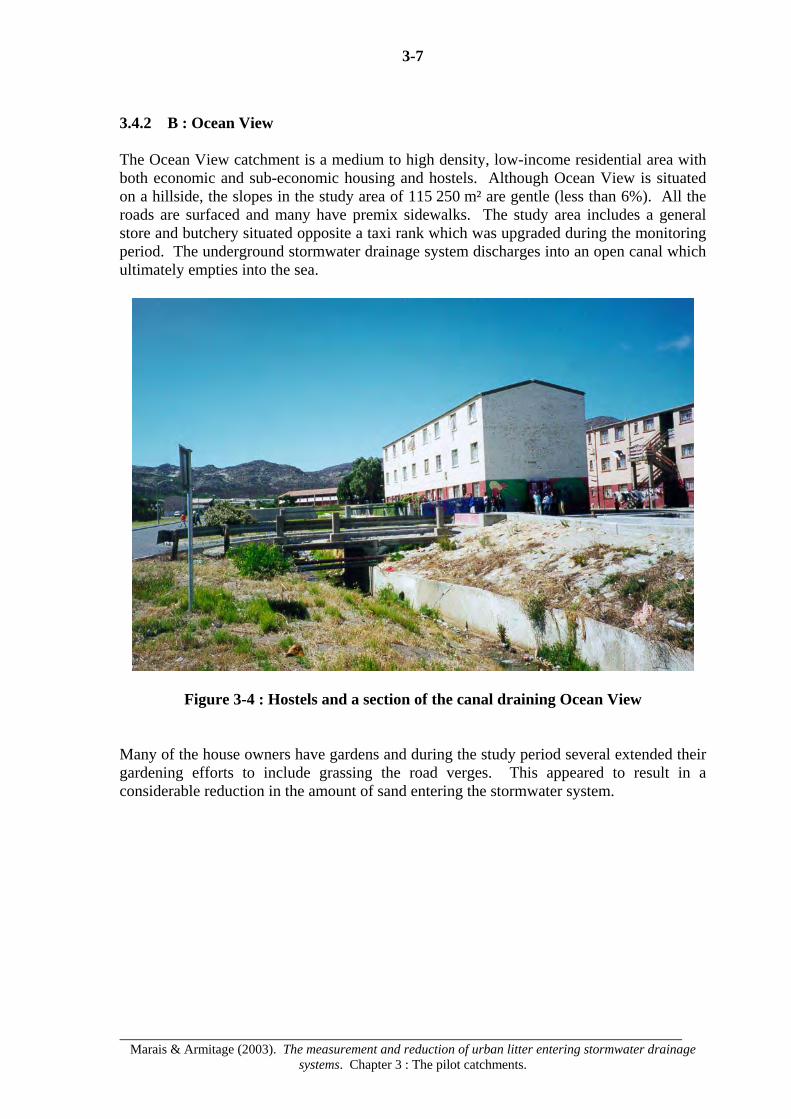
3-7
Marais & Armitage (2003). The measurement and reduction of urban litter entering stormwater drainage
systems. Chapter 3 : The pilot catchments.
3.4.2 B : Ocean View The Ocean View catchment is a medium to high density, low-income residential area with both economic and sub-economic housing and hostels. Although Ocean View is situated on a hillside, the slopes in the study area of 115 250 m² are gentle (less than 6%). All the roads are surfaced and many have premix sidewalks. The study area includes a general store and butchery situated opposite a taxi rank which was upgraded during the monitoring period. The underground stormwater drainage system discharges into an open canal which ultimately empties into the sea.
Figure 3-4 : Hostels and a section of the canal draining Ocean View
Many of the house owners have gardens and during the study period several extended their gardening efforts to include grassing the road verges. This appeared to result in a considerable reduction in the amount of sand entering the stormwater system.

3-8
Marais & Armitage (2003). The measurement and reduction of urban litter entering stormwater drainage
systems. Chapter 3 : The pilot catchments.
3.4.3 C, D and E : Cape Town Central Business District This is an amalgamation of three small catchments and includes a wide range of land uses inter alia; a bus depot, informal traders, parking areas, row shops, hotels, offices, the Receiver of Revenue and even a corner of the Parliamentary complex. Catchment C (with an area of 66 000 m²) slopes gently downwards from south to north and is lined with office buildings, hotels and a mix of shops including coffee shops and fast food establishments. The streets are lined with trees but other than this, the vegetal cover is limited to isolated flowerbeds. All the sidewalks and streets are fully paved and equipped with small plastic rubbish bins mounted on lamp posts. There is a significant amount of both vehicular and pedestrian traffic between the Grand Parade at the northern end of the catchment and the government offices, including the Receiver of Revenue, at the southern end.
Figure 3-5 : A typical trash bin in the vicinity of the Grand Parade, Central Business
District, Cape Town
Catchments D and E which are essentially level have a combined area of 34 000 m². Both catchments have considerable numbers of informal traders and Catchment D also includes an open air market with kiosk shops and adjacent public parking situated on the western side of the Grand Parade. The periphery of the Grand Parade is treed but both catchments are otherwise unvegetated and completely paved - mostly with asphalt.
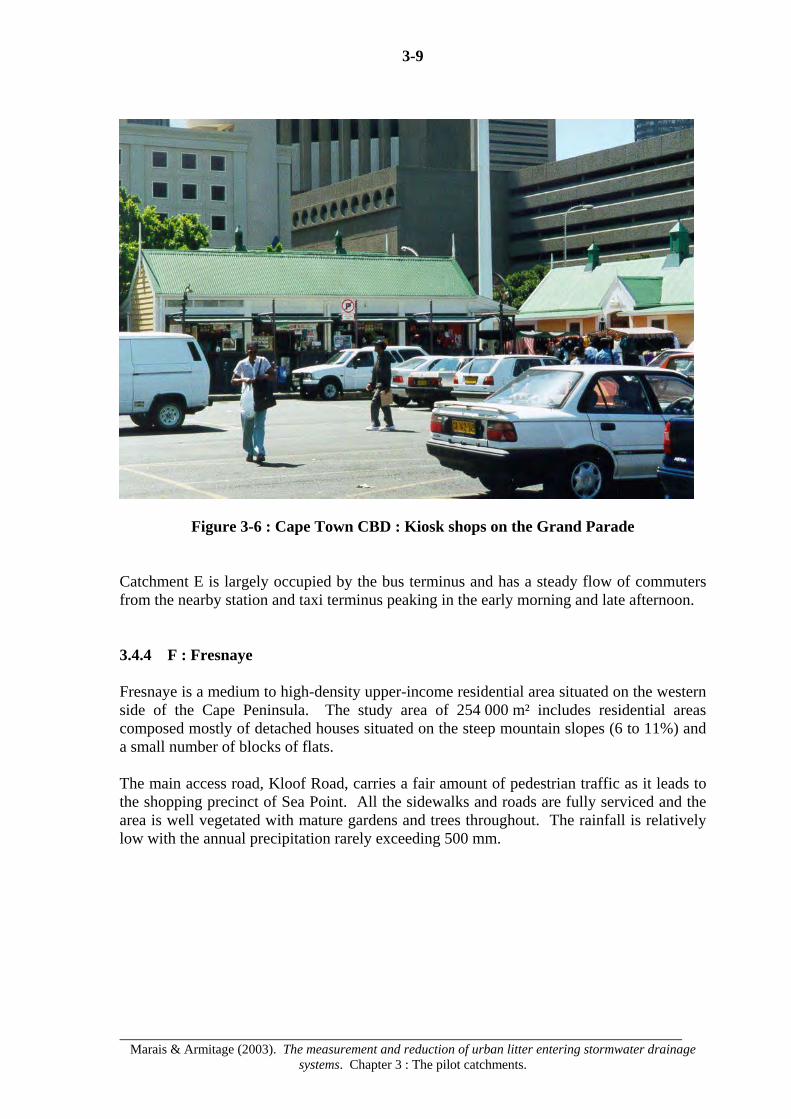
3-9
Marais & Armitage (2003). The measurement and reduction of urban litter entering stormwater drainage
systems. Chapter 3 : The pilot catchments.
Figure 3-6 : Cape Town CBD : Kiosk shops on the Grand Parade
Catchment E is largely occupied by the bus terminus and has a steady flow of commuters from the nearby station and taxi terminus peaking in the early morning and late afternoon. 3.4.4 F : Fresnaye Fresnaye is a medium to high-density upper-income residential area situated on the western side of the Cape Peninsula. The study area of 254 000 m² includes residential areas composed mostly of detached houses situated on the steep mountain slopes (6 to 11%) and a small number of blocks of flats. The main access road, Kloof Road, carries a fair amount of pedestrian traffic as it leads to the shopping precinct of Sea Point. All the sidewalks and roads are fully serviced and the area is well vegetated with mature gardens and trees throughout. The rainfall is relatively low with the annual precipitation rarely exceeding 500 mm.
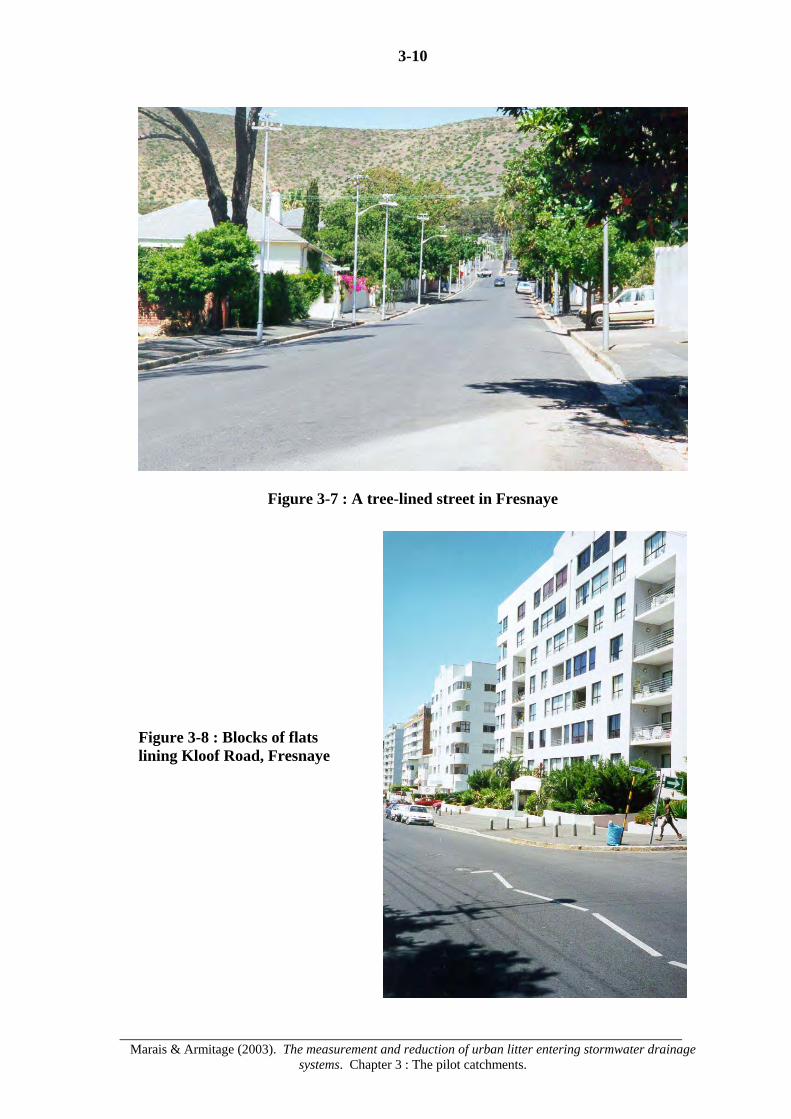
3-10
Marais & Armitage (2003). The measurement and reduction of urban litter entering stormwater drainage
systems. Chapter 3 : The pilot catchments.
Figure 3-7 : A tree-lined street in Fresnaye
Figure 3-8 : Blocks of flats lining Kloof Road, Fresnaye

3-11
Marais & Armitage (2003). The measurement and reduction of urban litter entering stormwater drainage
systems. Chapter 3 : The pilot catchments.
3.4.5 G : Summer Greens Summer Greens is a medium-density middle income residential area. Plot sizes are generally of the order of 250 to 300 m² and nearly all the houses in the study area of 53 200 m² are single-storied and free standing. Despite the area being recently developed, it is well-grassed and most of the residents have modest gardens. Although road reserves are narrow they are fully paved and there is a small neighbourhood park of about 500 m² which doubles as a stormwater detention area. The soils of the area are sandy and the topography is flat. In the study area the road layout does not permit through traffic with the result that nearly all the pedestrian and vehicular traffic is generated by the residents themselves. The mean annual precipitation is about 530 mm for the area.
Figure 3-9 : A neighbourhood park in Summer Greens
3.4.6 H : Montague Gardens Montague Gardens is a light industrial catchment. The study area covers an area of 140 685 m² and is almost fully paved. Together with adjacent Marconi Beam it is the fastest growing industrial area in the CMA and there is a constant stream of heavy and light traffic through the area during work hours. A substantial workforce inhabits the area during the day and there are several fast food outlets catering for their needs. There is little vegetation to speak of, although the owners of some businesses have made an effort to plant flowers or grass outside their premises and there are a few scraggly trees. As with nearby Summer Greens the soils of the area are sandy and the topography is flat. The mean annual precipitation is also of the order of 530 mm.

3-12
Marais & Armitage (2003). The measurement and reduction of urban litter entering stormwater drainage
systems. Chapter 3 : The pilot catchments.
Figure 3-10 : The light industrial area of Montague Gardens
3.4.7 I : Welgemoed Welgemoed is a high-income, low-density residential area situated on the slopes of the Tygerberg Hills in the northern suburbs of Cape Town.
Figure 3-11 : The verdant suburb of Welgemoed

3-13
Marais & Armitage (2003). The measurement and reduction of urban litter entering stormwater drainage
systems. Chapter 3 : The pilot catchments.
The property sizes (more than 1 000 m²) and dwellings are large with mature and often elaborate gardens. All the houses in the study area of 144 000 m² are freestanding and many are multi-level to take advantage of the sloping topography. Slopes are estimated to be between 8 and 10%. Although the roads and sidewalks are surfaced, treatment of road verges varies. A few verges displayed erosion problems mostly as a result of excessive watering of adjacent gardens rather than as a result of runoff from heavy rainfall. Both gardens and road reserves are well-wooded 3.5 Demographic profiles Attitude surveys carried out amongst 1 000 respondents in the State of Florida in the United States indicated that those thought most likely to litter are between 13 and 24 years of age (Florida Centre for Solid and Hazardous Waste Management, 1999). These surveys are supported by research conducted in 1968 for Keep America Beautiful Inc. which identified specific demographic variables related to littering. Among the findings was that twice as many males litter as females, and that adults under the age of 35 are twice as likely to litter as people aged 35-49, and three times more likely to litter than people over 50 (Florida Centre for Solid and Hazardous Waste Management, 1998). Similar demographic trends have been noted in Australia. From these results it can be construed that littering patterns are strongly linked to demographic profiles. To investigate this link, data from the 1996 census database compiled by Statistics S.A. was used to compile the demographic and socio-economic profiles of the selected residential study areas. Although a more recent census took place in 2001 the results were not available at the time of writing. The motivation behind utilising such census data is to gain a broader understanding of the influence of socio-economic circumstances on the nature and amount of litter in these areas. The commercial study areas falling in the Cape Town Central Business District and the light industrial study area of Montague Gardens have not been included for two reasons: i) The census data related to households and places of residence. The Cape Town
CBD and Montague Gardens have few residents and their impact on littering is insignificant compared to that of the workers and passing vehicles in the area. Neither the people who commute to work in these areas nor traffic volumes are reflected in the census data.
ii) The set of characteristics should be comparable using a common reference system
for all the catchments to derive a meaningful comparison. This holds true for all the residential catchments where the characteristics are referenced per resident or household.
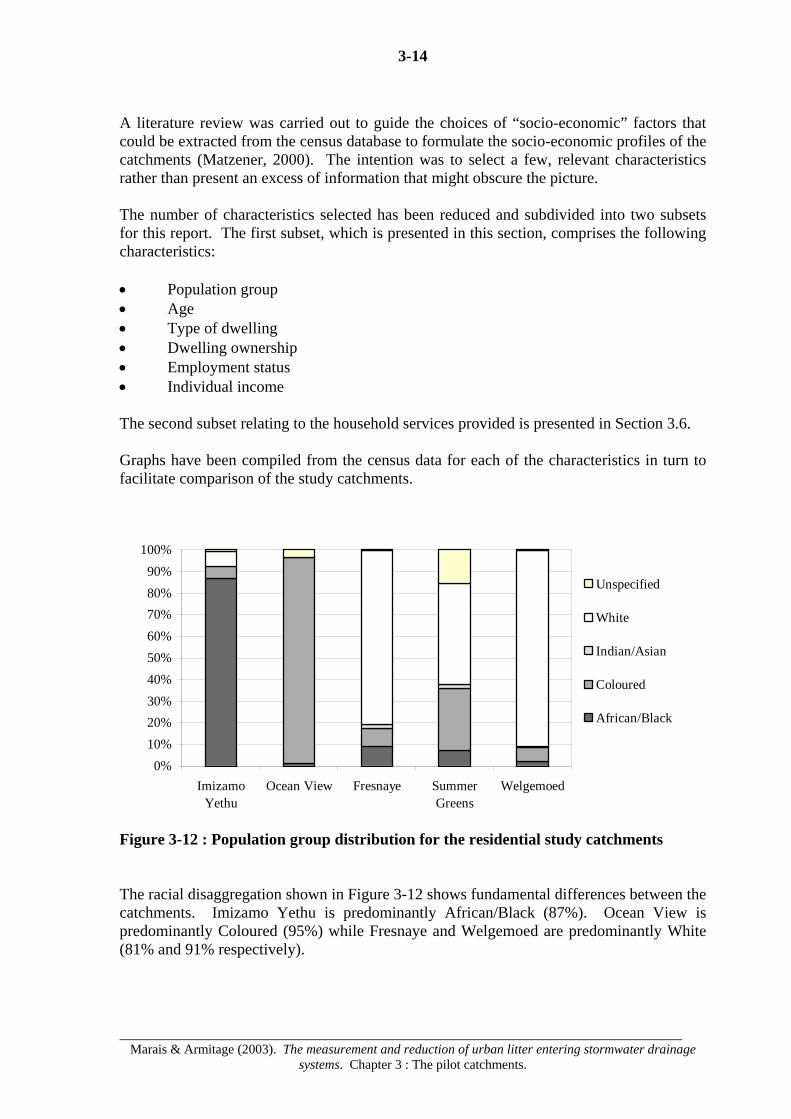
3-14
Marais & Armitage (2003). The measurement and reduction of urban litter entering stormwater drainage
systems. Chapter 3 : The pilot catchments.
A literature review was carried out to guide the choices of “socio-economic” factors that could be extracted from the census database to formulate the socio-economic profiles of the catchments (Matzener, 2000). The intention was to select a few, relevant characteristics rather than present an excess of information that might obscure the picture. The number of characteristics selected has been reduced and subdivided into two subsets for this report. The first subset, which is presented in this section, comprises the following characteristics: • Population group • Age • Type of dwelling • Dwelling ownership • Employment status • Individual income The second subset relating to the household services provided is presented in Section 3.6. Graphs have been compiled from the census data for each of the characteristics in turn to facilitate comparison of the study catchments.
0%10%20%30%40%50%60%70%80%90%
100%
ImizamoYethu
Ocean View Fresnaye SummerGreens
Welgemoed
Unspecified
White
Indian/Asian
Coloured
African/Black
Figure 3-12 : Population group distribution for the residential study catchments The racial disaggregation shown in Figure 3-12 shows fundamental differences between the catchments. Imizamo Yethu is predominantly African/Black (87%). Ocean View is predominantly Coloured (95%) while Fresnaye and Welgemoed are predominantly White (81% and 91% respectively).
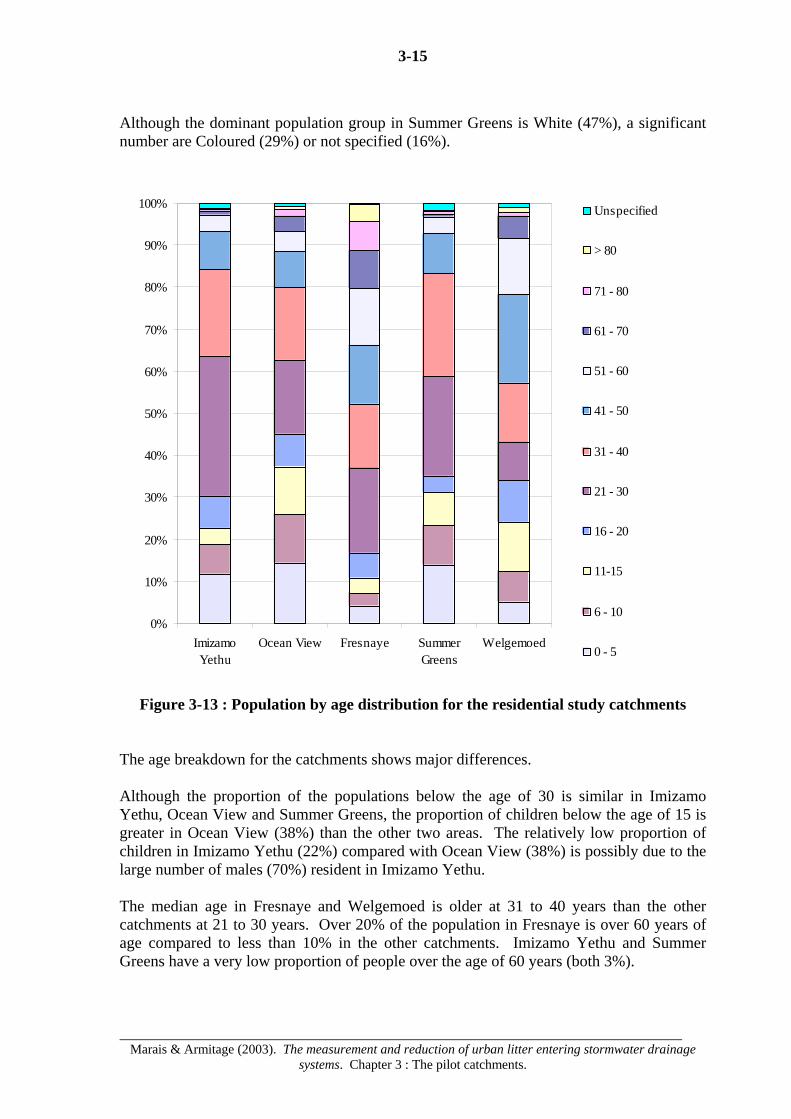
3-15
Marais & Armitage (2003). The measurement and reduction of urban litter entering stormwater drainage
systems. Chapter 3 : The pilot catchments.
Although the dominant population group in Summer Greens is White (47%), a significant number are Coloured (29%) or not specified (16%).
0%
10%
20%
30%
40%
50%
60%
70%
80%
90%
100%
ImizamoYethu
Ocean View Fresnaye SummerGreens
Welgemoed
Unspecified
> 80
71 - 80
61 - 70
51 - 60
41 - 50
31 - 40
21 - 30
16 - 20
11-15
6 - 10
0 - 5
Figure 3-13 : Population by age distribution for the residential study catchments
The age breakdown for the catchments shows major differences. Although the proportion of the populations below the age of 30 is similar in Imizamo Yethu, Ocean View and Summer Greens, the proportion of children below the age of 15 is greater in Ocean View (38%) than the other two areas. The relatively low proportion of children in Imizamo Yethu (22%) compared with Ocean View (38%) is possibly due to the large number of males (70%) resident in Imizamo Yethu. The median age in Fresnaye and Welgemoed is older at 31 to 40 years than the other catchments at 21 to 30 years. Over 20% of the population in Fresnaye is over 60 years of age compared to less than 10% in the other catchments. Imizamo Yethu and Summer Greens have a very low proportion of people over the age of 60 years (both 3%).
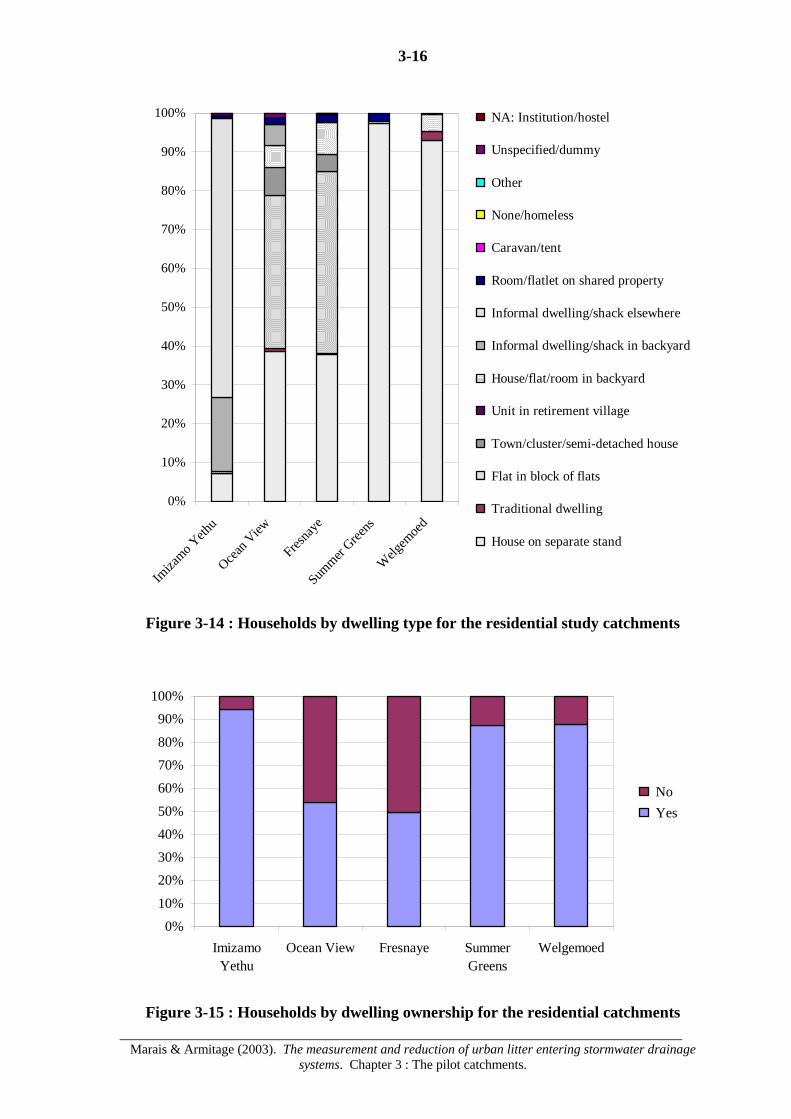
3-16
Marais & Armitage (2003). The measurement and reduction of urban litter entering stormwater drainage
systems. Chapter 3 : The pilot catchments.
0%
10%
20%
30%
40%
50%
60%
70%
80%
90%
100%
Imiza
mo Yeth
u
Ocean V
iew
Fresna
ye
Summer
Greens
Welg
emoe
d
NA: Institution/hostel
Unspecified/dummy
Other
None/homeless
Caravan/tent
Room/flatlet on shared property
Informal dwelling/shack elsewhere
Informal dwelling/shack in backyard
House/flat/room in backyard
Unit in retirement village
Town/cluster/semi-detached house
Flat in block of flats
Traditional dwelling
House on separate stand
Figure 3-14 : Households by dwelling type for the residential study catchments
0%10%
20%30%40%50%
60%70%80%
90%100%
ImizamoYethu
Ocean View Fresnaye SummerGreens
Welgemoed
No Yes
Figure 3-15 : Households by dwelling ownership for the residential catchments

3-17
Marais & Armitage (2003). The measurement and reduction of urban litter entering stormwater drainage
systems. Chapter 3 : The pilot catchments.
Dwelling type and ownership are facets of a person’s socio-economic status. Figures3-14 and 3-15 respectively illustrate the dwelling types and ownership patterns. Fresnaye and Ocean View are fairly evenly divided between ownership and non-ownership while the other catchments show a predominance of ownership. However in Imizamo Yethu this probably reflects the fact that the occupiers built their dwellings themselves rather than a legal right of ownership. An examination of the dwelling type shows that 91% of Imizamo Yethu’s residents live in informal shacks whereas more than 90% of the inhabitants in the other catchments live in houses or flats. In Summer Greens (97%) and Welgemoed (93%) inhabitants reside overwhelmingly in freestanding houses. In both Ocean View (39%) and Fresnaye (47%) significant proportions of the residents live in blocks of flats.
0%
10%
20%
30%
40%
50%
60%
70%
80%
90%
100%
Imiza
mo Yeth
u
Ocean V
iew
Fresna
ye
Summer
Greens
Welg
emoe
d
NA: Institution
NA: Aged <15
Unspecified
Not working - none of the above
Not working - not wishing to work
Not working - disabled person
Not working - pensioner/retired person
Not working - scholar/full-time student
Not working - housewife/home-maker
Not working - not looking for work
Unemployed - looking for work
Employed
Figure 3-16 : Population by employment status for the residential catchments Figure 3-16 portrays the employment status of the inhabitants of the residential catchments. Imizamo Yethu (15%) and Ocean View (6%) have the greatest proportions of unemployed job seekers. Ocean View (35%) has the lowest proportion of employed people while Summer Greens (57%) has the highest.
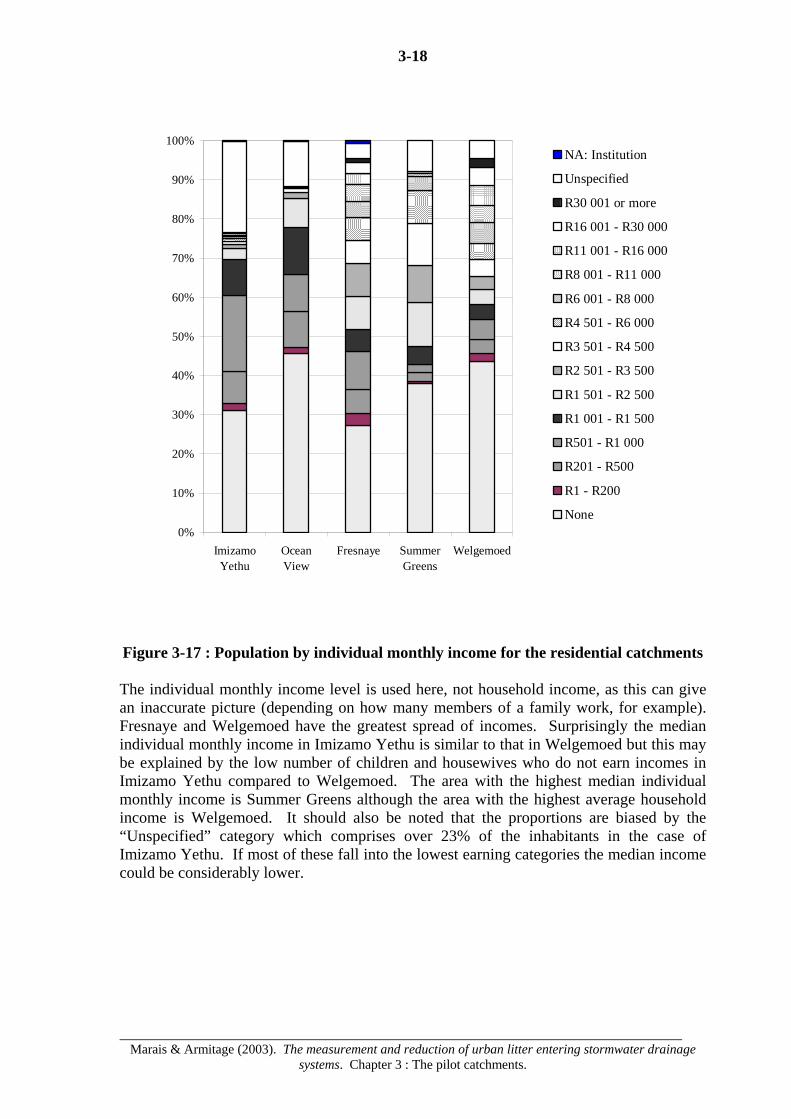
3-18
Marais & Armitage (2003). The measurement and reduction of urban litter entering stormwater drainage
systems. Chapter 3 : The pilot catchments.
0%
10%
20%
30%
40%
50%
60%
70%
80%
90%
100%
ImizamoYethu
OceanView
Fresnaye SummerGreens
Welgemoed
NA: Institution
Unspecified
R30 001 or more
R16 001 - R30 000
R11 001 - R16 000
R8 001 - R11 000
R6 001 - R8 000
R4 501 - R6 000
R3 501 - R4 500
R2 501 - R3 500
R1 501 - R2 500
R1 001 - R1 500
R501 - R1 000
R201 - R500
R1 - R200
None
Figure 3-17 : Population by individual monthly income for the residential catchments The individual monthly income level is used here, not household income, as this can give an inaccurate picture (depending on how many members of a family work, for example). Fresnaye and Welgemoed have the greatest spread of incomes. Surprisingly the median individual monthly income in Imizamo Yethu is similar to that in Welgemoed but this may be explained by the low number of children and housewives who do not earn incomes in Imizamo Yethu compared to Welgemoed. The area with the highest median individual monthly income is Summer Greens although the area with the highest average household income is Welgemoed. It should also be noted that the proportions are biased by the “Unspecified” category which comprises over 23% of the inhabitants in the case of Imizamo Yethu. If most of these fall into the lowest earning categories the median income could be considerably lower.
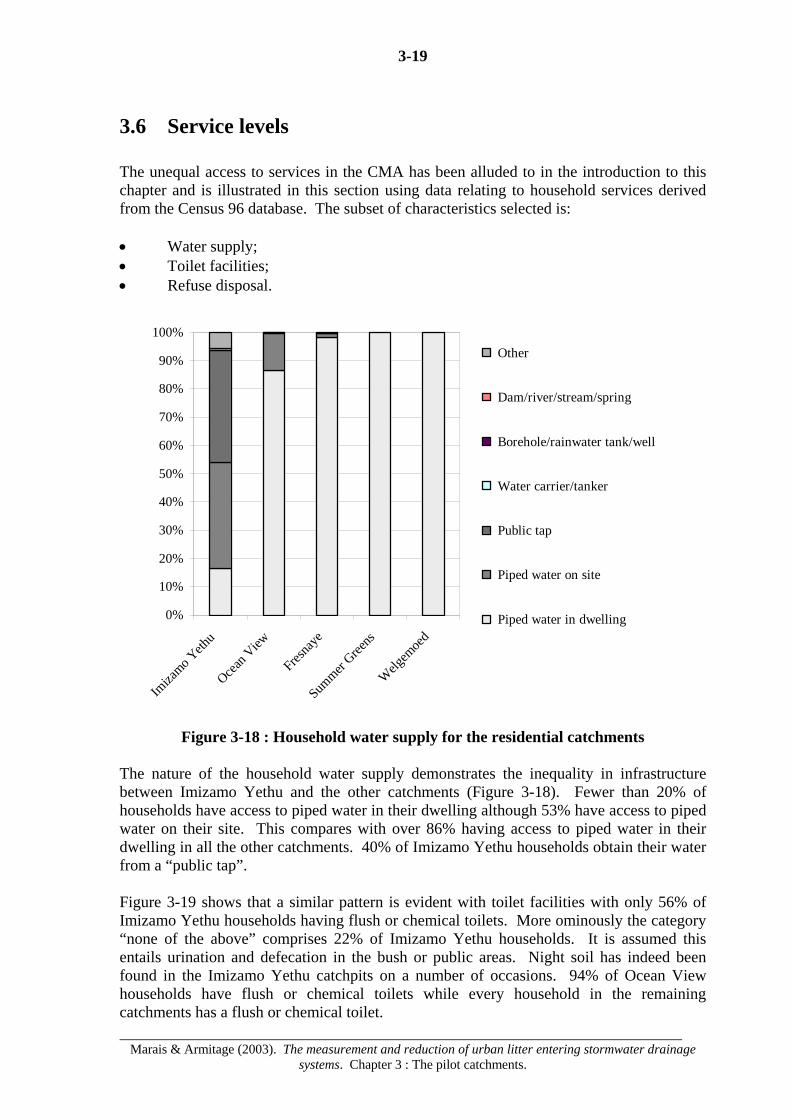
3-19
Marais & Armitage (2003). The measurement and reduction of urban litter entering stormwater drainage
systems. Chapter 3 : The pilot catchments.
3.6 Service levels The unequal access to services in the CMA has been alluded to in the introduction to this chapter and is illustrated in this section using data relating to household services derived from the Census 96 database. The subset of characteristics selected is: • Water supply; • Toilet facilities; • Refuse disposal.
0%
10%
20%
30%
40%
50%
60%
70%
80%
90%
100%
Imiza
mo Yeth
u
Ocean V
iew
Fresna
ye
Summer
Greens
Welg
emoe
d
Other
Dam/river/stream/spring
Borehole/rainwater tank/well
Water carrier/tanker
Public tap
Piped water on site
Piped water in dwelling
Figure 3-18 : Household water supply for the residential catchments The nature of the household water supply demonstrates the inequality in infrastructure between Imizamo Yethu and the other catchments (Figure 3-18). Fewer than 20% of households have access to piped water in their dwelling although 53% have access to piped water on their site. This compares with over 86% having access to piped water in their dwelling in all the other catchments. 40% of Imizamo Yethu households obtain their water from a “public tap”. Figure 3-19 shows that a similar pattern is evident with toilet facilities with only 56% of Imizamo Yethu households having flush or chemical toilets. More ominously the category “none of the above” comprises 22% of Imizamo Yethu households. It is assumed this entails urination and defecation in the bush or public areas. Night soil has indeed been found in the Imizamo Yethu catchpits on a number of occasions. 94% of Ocean View households have flush or chemical toilets while every household in the remaining catchments has a flush or chemical toilet.
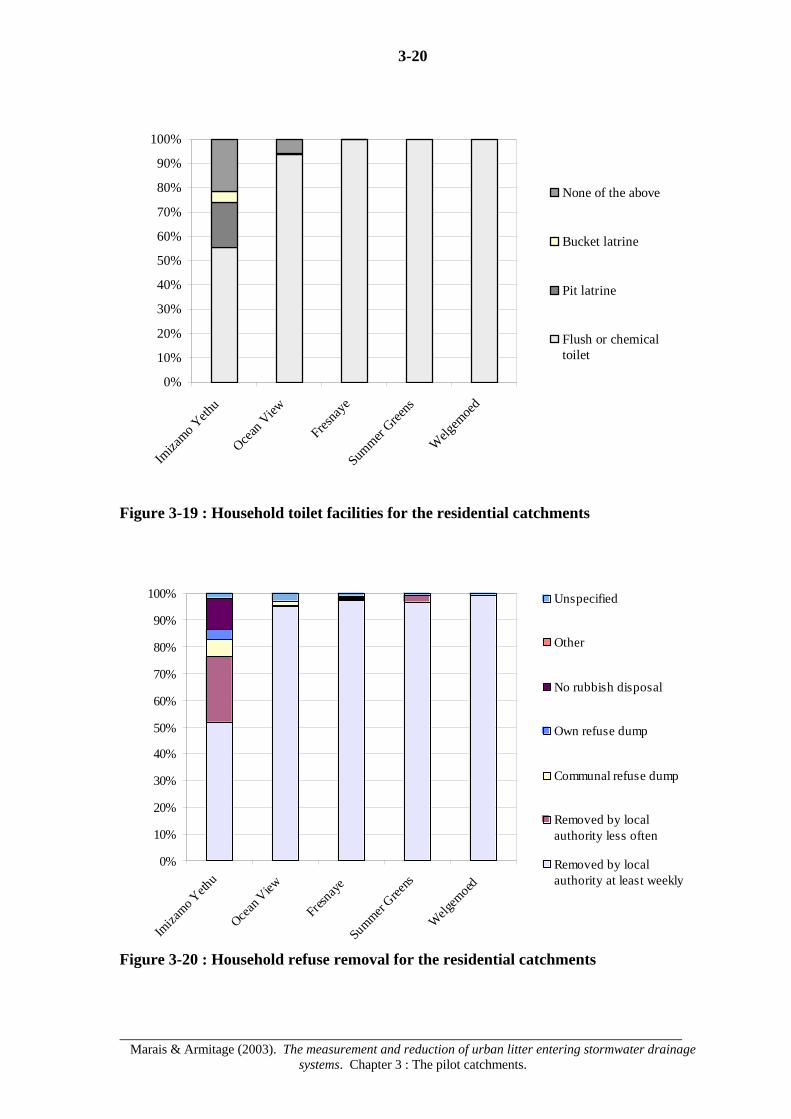
3-20
Marais & Armitage (2003). The measurement and reduction of urban litter entering stormwater drainage
systems. Chapter 3 : The pilot catchments.
0%
10%
20%
30%
40%
50%
60%
70%
80%
90%
100%
Imiza
mo Yeth
u
Ocean V
iew
Fresna
ye
Summer
Greens
Welg
emoe
d
None of the above
Bucket latrine
Pit latrine
Flush or chemicaltoilet
Figure 3-19 : Household toilet facilities for the residential catchments
0%
10%
20%
30%
40%
50%
60%
70%
80%
90%
100%
Imiza
mo Yeth
u
Ocean V
iew
Fresnaye
Summer Gree
ns
Welgem
oed
Unspecified
Other
No rubbish disposal
Own refuse dump
Communal refuse dump
Removed by localauthority less often
Removed by localauthority at least weekly
Figure 3-20 : Household refuse removal for the residential catchments

3-21
Marais & Armitage (2003). The measurement and reduction of urban litter entering stormwater drainage
systems. Chapter 3 : The pilot catchments.
The most critical household service relating to the problem of litter in the stormwater drainage systems is that of household refuse removal. Figure 3-20 illustrates that only 52% of Imizamo Yethu households have their refuse removed at least once weekly and that 24% have no refuse removal at all. In contrast at least 97% of the households in the other catchments have their refuse removed at least once weekly. This must significantly increase the potential for household refuse to become part of the litter stream in the case of Imizamo Yethu. 3.7 Conclusions i) There is a considerable need to improve the knowledge of the source, type and
amount of litter reaching the drainage systems from different types of urban catchments. This can be achieved through instituting a programme to collect and analyse litter data from a range of catchments.
ii) In common with other South African urban areas the basic infrastructure of the
Cape Metropolitan Area is unequally distributed. iii) The nine pilot catchments arrived at through the selection process cover a wide
range of different land-uses, socio-economic levels, population densities and service levels. The problems they experience with respect to litter in their stormwater drainage systems are probably representative of similar urban catchments elsewhere in South Africa.
iv) In the absence of proper services, it appears that some households in informal areas,
such as Imizamo Yethu, use the stormwater catchpits as disposal points for nightsoil and refuse.
4-1
Marais & Armitage (2003). The measurement and reduction of urban litter entering stormwater drainage
systems. Chapter 4 : Social attitudes in Imizamo Yethu and Ocean View.
4. Social attitudes in Imizamo Yethu and Ocean View
4.1 Introduction This chapter, which discusses attitudes to littering in two case study communities; those of Imizamo Yethu and Ocean View, was contributed by researchers from the Department of Social Anthropology at the University of Cape Town. The aims of the studies were to observe and examine the behaviour, attitude and awareness of the two communities with respect to littering. An essential aspect of this was to understand; i) what the residents of each catchment regard as being litter and what shapes the
community’s response to handling their waste, ii) how residents relate to their environment and living space, and iii) what residents’ perceptions are of their community’s needs and how these needs
fit into the current macro politico-economic climate of the Western Cape. It is important to note that the study communities were deliberately not informed of the real purpose of the litter project as this might have influenced their behaviour with respect to littering. The White Paper on Integrated Pollution and Waste Management for South Africa (Department of Environmental Affairs and Tourism, 2000) contextualises the litter problem in the Cape Metropolitan Area by stating that “in the past, waste management was not afforded the priority it warrants as an essential function required to prevent pollution and protect the environment and public health. Consequently, insufficient funds and human resources were allocated to this function. In many instances this neglect has resulted in a lack of long-term planning, information, appropriate legislation and capacity to manage the waste stream.” The question addressed here is whether littering can be attributed to social behaviour or level of education, ignorance or indifference. This is against a background of several social variables such as level of income and education, housing conditions and availability of public services.
4-2
Marais & Armitage (2003). The measurement and reduction of urban litter entering stormwater drainage
systems. Chapter 4 : Social attitudes in Imizamo Yethu and Ocean View.
4.2 Case Study 1 – Imizamo Yethu This case study was contributed by Rhian Croke and Ross Chamberlain, MA students in the UCT Social Anthropology Department, and edited for the purposes of this report. As described in Chapter 3, Imizamo Yethu is a low-income settlement situated on the slope of the mountains above Hout Bay. Although there are no formal dwellings, roughly 70% of the area is serviced with surfaced streets and each erf is provided with an individual toilet connected to a waterborne foul sewer system, a water connection and an electricity connection. This part of Imizamo Yethu is referred to in the case study as the formal part. The reminder of the settlement, which is provided with rudimentary emergency services only, consisting of communal toilets and water taps, is referred to as the informal part. 4.2.1 The application of the Rapid Rural Appraisal Methodology The rapid rural appraisal methodology (Chambers, 1983) has been adapted for use in an urban township environment. The following sections comprise a discussion of the findings from a participant observation exercise, a focus group interview with the Imizamo Yethu Environmental Group and ten random semi-structured interviews. The information was gathered during three separate visits to the Imizamo Yethu community in August 2001. 4.2.2 Respondents’ perception of their environment and waste A female informal resident said that she felt Imizamo Yethu was very dirty. She told the researchers that people mainly dispose of food scraps, vegetable peelings, paper, glass bottles and plastic. Some people, she said, put rubbish in plastic bags that get removed by the South Peninsula Administration (SPA), some take it down to the municipal depot and others throw it in the streets. A female home-based care coordinator was of the opinion that Imizamo Yethu was very dirty because of drainage problems. She said the main things they see going into black bags are food peelings, leftovers and plastic bottles. She also said that they couldn’t put heavy things in the black bags because the SPA would not take the bags away. All informants were aware that that there were many sick people living in Imizamo Yethu and felt that a dirty environment contributed greatly to their state of health. The home-based care coordinators also stated that dirty living conditions were a major contributing factor to the high levels of illness in the township. They told the researchers that the main illnesses people suffer from are tuberculosis, human immunodeficiency virus (HIV), asthma and diarrhoea. Diarrhoea is a particular problem in young children and is connected with children playing around rubbish. “Young children don’t know better, they pick up anything and put it in their mouths.” A younger lady claimed that people were getting sick because so many individuals have to share one toilet, particularly in the informal part of the settlement.

4-3
Marais & Armitage (2003). The measurement and reduction of urban litter entering stormwater drainage
systems. Chapter 4 : Social attitudes in Imizamo Yethu and Ocean View.
4.2.3 Perception of the Municipality and other community structures associated with the environment
There is a Health Forum in Imizamo Yethu consisting of Imizamo Yethu residents and people from the Hout Bay community. Some of the residents felt that the forum is “worried but do nothing”. Some residents spoke highly of the Imizamo Yethu Environmental Group. Respondents were impressed with progress regarding township crime reduction and with the recent clean up campaigns. Respondents felt it wrong to expect local volunteers to carry out unremunerated clean ups. They emphasised that the sick especially should be remunerated so that they could look after themselves more effectively. Residents also pointed out that they wouldn’t want to volunteer if they see paid SPA workers carrying out clean-ups. Residents agreed that four SPA workers are not sufficient to clean up Imizamo Yethu effectively. They argued that the Municipality should employ more residents to assist. Many people said that the SPA workers are not given enough time to clean up the settlement. They explained that the SPA workers were frequently reassigned to clean up Hout Bay harbour for tourists’ benefit. The residents were very critical of the low priority the Municipality assigned to the environment in Imizamo Yethu. They argued that Imizamo Yethu should be allocated more clean ups which they perceived to be more frequent in other areas. Two SPA workers unblocking storm water drains confirmed what residents had expressed. They stated that it takes four people two weeks to clean Imizamo Yethu properly. They have to work all over Hout Bay and they only get allocated two days every three to four months in Imizamo Yethu. It was also obvious that the clean up team had not succeeded in unblocking the storm drain but had only cleared up around it and removed standing water. They explained that the drain was blocked “all the way down with sand” and that they needed to come back. Due to the lack of attention the Municipality pays to Imizamo Yethu it was likely that it would be a long time before the SPA workers returned. When people were asked whether the Civic Association (CA) was assisting them most people said that they did little to help. They didn’t feel that the CA was representing their interests. In the light of these comments it is interesting to note that previous research (Ainslie, 2000) referred to the lack of cooperation from residents for a cleanup campaign organised by a local non-government organisation and endorsed by the CA. The majority of the respondents argued that the environment in Imizamo Yethu would only improve if the infrastructure and services were upgraded, and only then would people begin to respect their environment. Residents from both the formal and informal parts of the settlement confirmed that the most pressing needs were for housing and improved sanitation. One respondent stated “everybody needs houses”. Even respondents from the formal part of Imizamo Yethu were of the opinion that their homes were unlikely to weather another Cape Town winter. Another man said “I don’t feel any pride in my community”.

4-4
Marais & Armitage (2003). The measurement and reduction of urban litter entering stormwater drainage
systems. Chapter 4 : Social attitudes in Imizamo Yethu and Ocean View.
4.2.4 The Imizamo Yethu Community in the context of historical
politico-economic structures The social experience of the residents of Imizamo Yethu must be seen to take place in a continuum that is traversed by economic, political and historical relations of inequality (Marcus & Fischer, 1986). A prerequisite of environmental sustainability is that harsh and distinctive disparities in social, economic and political development are ended (Ramphele and McDowell, 1991). Imizamo Yethu is one of many South African townships that are suffering as a result of social, political and economic disparities, fiscal austerity and a lack of social spending inherent in the GEAR approach (the South African Government’s macro-economic strategy for Growth, Employment and Redistribution) (Bardill, 2000, Said, 2001, Coleman et al, 2001, Ramphele & McDowell, 1991). Environmental conservation may not be a paramount consideration for a community which is both historically and currently disempowered (Ramphele & McDowell 1991). A common identity has been created by the residents seeing themselves as united in opposition to the “other”, the “other” being the white Hout Bay community. The Imizamo Yethu residents employ oppositional images that politicise the township: “There is still apartheid in this place – if you are out there you are in a good environment, if you are in Imizamo Yethu, you are in a bad environment”. Activities such as a recent Unicity project to rehabilitate a pond in the nearby Silvermine River at a cost of approximately R1.5 million may reflect entrenched ‘white’ conservatism in Western Cape politics. Perhaps there is the financial capacity to upgrade and expand the Imizamo Yethu infrastructure but political unwillingness prevents change. 4.2.5 Sources of littering The members of the Imizamo Yethu community who appear to have the most concern for environmental issues are the Environmental Group. They feel that older members of the community are more to blame for the littering problems. It also appears that there are many recently arrived residents who have migrated from predominantly rural areas. Living in poor rural areas implies that rubbish is mostly biodegradable. Perhaps older migrants maintain their rural identity and behaviour to a much greater extent than the young. It may be more difficult for both new residents and the elderly to change the entrenched modes of behaviour learned and internalised over a long period of time. The older generation is not identified as the only source of littering. There are problems with the present rubbish collection service. Ainslie (2000) revealed that community members and a local non-government organisation (NGO) initiated a Community Waste Programme (CWP) to improve cooperation between residents and SPA workers and to improve collection services. However some of the residents do not put rubbish out for collection at the right time and others leave rubbish in the street in protest at their current lack of services (Ainslie, 2000). Further research is required to pinpoint the problems with the CWP and to design a suitable campaign to address these issues.
4-5
Marais & Armitage (2003). The measurement and reduction of urban litter entering stormwater drainage
systems. Chapter 4 : Social attitudes in Imizamo Yethu and Ocean View.
Residents also commented that Imizamo Yethu is dirty because there are no litter-bins and they could not understand why this was so. The researchers suggested that the bins might be stolen. People generally seemed offended by the suggestion and said that if the Municipality was concerned that people would steal them then they should attach the bins firmly to poles. The Municipality, however, refuses to accept responsibility for providing bins even though rates are levied from the community. A municipal employee commented that the residents “think everybody owes them for something – but people have to put things in to get things back. Any effort we make is for nothing.” The possibility that the residents of Imizamo Yethu may use bins for purposes other than for which they were intended is as much the fault of the Municipality as the residents. The Municipality must open a dialogue with the community to find a solution to the misuse of litter bins. There are two points of concern regarding the litter monitoring programme that was the focus of this investigation. Firstly the litter project is implemented by the Municipality. If it wishes to address the litter problem then it is its responsibility to make sure there is open communication with the community. Secondly the community have been proactive in requesting litter bins and been refused, calling into question whether the Municipality is serious about addressing Imizamo Yethu’s litter issues. It should be noted that the municipal research team used in this study, which empties the litter traps and might easily be mistaken for SPA employees, are perceived by the community to be guilty of littering. If it is perceived that the municipal department charged with the responsibility for ensuring cleanliness contributes to the littering, this will reinforce the residents’ lack of consideration for the environment and litter volumes will continue to increase. 4.2.6 A sense of home Many of the residents are migrant workers who see their home as rural South Africa. People might care less for their surroundings in a place that they do not consider to be their home. An unquantified but increasing proportion of the community do not regard Imizamo Yethu as home and this is the single most influential cause of littering. One man said “I don’t feel any pride in my community”. Another resident stated that “people here look at their dignity at a lower level, the place needs to be upgraded – if it’s at a higher level, people won’t keep it dirty”. Previous research, where informants expressed a strong desire for infrastructure and facilities to be upgraded (Ainslie, 2000), showed that the provision of formal housing was the most commonly expressed aspiration amongst respondents. It may be said that many residents live in a “generalised condition of homelessness”. If these residents do not express pride in or gain a sense of dignity from where they live, how can they be expected to call their place of residency home or to invest personal time and effort in its upkeep.

4-6
Marais & Armitage (2003). The measurement and reduction of urban litter entering stormwater drainage
systems. Chapter 4 : Social attitudes in Imizamo Yethu and Ocean View.
Ainslie (2000) suggests that the Imizamo Yethu community may be fragmented along ethnic, political, residency status, gender, age, criminality, leadership status or religious lines. Many residents may have a sense of community from a common history or shared experience of the homelands which they have been forced to leave for one reason or another. This unifying sense may be stronger than many divisory factors. This research has shown that the most fundamental split in the social fabric of Imizamo Yethu is between those who see the township as their home and those who do not. Evidence gathered by Ainslie suggests that residents of longer standing view newcomers as not caring about the settlement. According to some informants it is the newcomers who do not cooperate with litter management programmes. An example quoted is that of “people putting their rubbish in black bags and leaving them outside their homes at the wrong time.” The bags remain there until the SPA workers come back the next time. A man stated that bags left in the street are a problem because dogs eat the refuse and spread it on the street. On asking him why he thought people owned dogs, he replied that people don’t keep the dogs as guard dogs but as friends. 4.2.7 Community perceptions of environment and health The residents of Imizamo Yethu are aware that the environment impacts on their lives in terms of health and wellbeing. They expressed the importance of caring for their environment in terms of community primary health care but little concern was expressed for the aesthetic quality of their surroundings. The Silvermine River project is a reflection of the different values accorded to the environment by the residents of Imizamo Yethu and their neighbours. The affluent neighbours in Silvermine appear to have a conservation based awareness of the environment. However, it may be that environmental education in Imizamo Yethu would be better suited to residents’ needs if it were health rather than conservation based. Imizamo Yethu residents have noted that their children are contracting diarrhoeal diseases from the unclean environment. The home-based care coordinators were quick to point out that because unemployment rates are very high in the township people do not have money to buy enough food. There are feeding schemes for the elderly, infirm and disabled but there is no feeding scheme for younger and otherwise healthy adults and children. The low levels of nutrition, they argued, cause people to have weak immune systems making them more vulnerable to opportunistic illnesses. Diarrhoeal illnesses are especially exacerbated amongst infants and young children who are not well nourished (Sanders, 1985). Poor nutrition and diarrhoea can lead to increased infant and child mortality rates (Doyal, 1987, Howson et al, 1996, Sanders, 1985).
4-7
Marais & Armitage (2003). The measurement and reduction of urban litter entering stormwater drainage
systems. Chapter 4 : Social attitudes in Imizamo Yethu and Ocean View.
Diarrhoea is the only form of sickness mentioned by residents that can be readily traced to the litter problem in Imizamo Yethu. As such it can be considered as the most important community perceived health issue related to littering. In the light of the resultant increased infant and child mortality the responsibility of the relevant authorities to take action regarding the litter issue becomes a profound moral obligation. Ainslie (2000) states that people’s main concern was for the cleanliness of their living environment. She was surprised to discover that NGO’s active in the community felt the need to inform residents of the importance of environmental cleanliness. She states that the interiors of people’s houses were clean and tidy and that her informants fully understood the health benefits of good hygiene. As such, hygiene education may not be effective in persuading the community to cooperate with the municipal litter project unless directed towards the pertinent social groups. 4.2.8 The ‘us and them’ syndrome There is a perception amongst municipal employees that the clean-up process has no purpose. As soon as Imizamo Yethu is cleaned up it becomes dirty again! What then is the difference between Imizamo Yethu and other areas of Cape Town? Any interruption to street cleaning in Claremont results in enormous quantities of litter gathering in the streets overnight. Can anyone imagine a successful one time clean-up programme in Hout Bay Harbour? The Municipality and the residents of Imizamo Yethu are equally responsible for creating the ‘us and them’ syndrome that must be broken down before an atmosphere of co-operation can develop. Joint responsibility for this attitude is demonstrated in the following statements: • “The Municipality plant trees to hide us from the tourists”. • “The Municipality doesn’t call Imizamo Yethu Hout Bay, they show the tourists a
different side”. • “They don’t want us to be here”. The municipal informant felt helpless, powerless and unable to make a difference within his workplace. This is but an aspect of the compelling evidence which constitutes miscommunication, barriers to communication and an ‘us and them’ attitude within and between the levels of the municipal bureaucracy, (Mcewan, 2001). A municipal informant said that “Whites still feel that they have authority” but in “such a way that it doesn’t look so to the naked eye”. The predominantly Black and Coloured poor in the Western Cape have consistently been separated from the policies that shape their lives first by an Apartheid Government that set out to oppress them and now by a Provincial Government that they have elected to represent them. For South Africa to transform effectively, and for this transformation to take cognisance of environmental sustainability, it is crucial that the majority of the population, including the poor who are overwhelmingly from the Black and Coloured groups, is encouraged to participate in the transformation process (Chambers, 1983).
4-8
Marais & Armitage (2003). The measurement and reduction of urban litter entering stormwater drainage
systems. Chapter 4 : Social attitudes in Imizamo Yethu and Ocean View.
4.2.9 The role and agency of the individual The discussion so far has highlighted a number of the more obvious social issues pertinent to Imizamo Yethu. There are several political, social and cultural dynamics that remain hidden (Chambers, 1983, Skalnik, 1989). The single common thread expressed in one form or another by all stakeholders is the feeling of powerlessness. The lack of cooperation and communication between stakeholders has resulted in a stalemate and the many barriers to progress remain unsurmounted. Skalnik (1989) shows how people who are powerless vis-à-vis the centre of power and who are unable to confront it directly, nevertheless manage to outwit it. A typical example of ‘outwitting’ is the residents’ removal of several catchpit litter trap baskets used on the study for braai grills. Removing the baskets is a symbol of the community’s disregard for the Project, it is a form of resistance to the Project. If residents have no understanding or respect for the Litter Project why should they cooperate with it? Numerous researchers have shown that the ordinary citizen is far from powerless and may rebel against the objectives of what he or she perceives as the centre of power (Havel 1985). The residents of Imizamo Yethu have so far been overlooked as active stakeholders in the outcome of the litter project. If dialogue is encouraged between stakeholders they are less likely to ‘outwit’ each other since they understand and support the aims and objectives of stakeholder activities. The lack of cooperation between the numerous stakeholders involved in the implementation of the Litter Project in Imizamo Yethu has resulted in a number of opposing centres of power all with the ability to either consciously or unconsciously manipulate the outcome of the Litter Project. Ferguson (1990) refers to these multiple sources of influence as ‘constellations of control’. There has been little cooperation fostered between the main centres of power, i.e. the Municipality, the University Research Team (over the period of the research), the Imizamo Yethu community as a whole, and various existing community bodies such as the Environmental Group, the Civic Association and the home-based care coordinators. This results in a multiple and chaotic ‘push-pull’ effect on the outcome of the project. It is this concept of constellations of control that causes uncontrollable and unexpected outcomes. Future interaction between stakeholders must account for the agency all parties have in influencing the outcome of the Litter Project. Stakeholders must encourage a spirit of cooperation that will guide the project implementation process to a mutually beneficial conclusion. 4.2.10 Specific problems identified with this Research Project as a
means of reducing littering As noted at the beginning of this chapter the study communities were deliberately not informed of the real purpose of the litter project as this might have influenced their behaviour with respect to littering and the aim was to measure the existing situation. Hence the points raised in the following section are only relevant as part of a strategy to reduce littering rather than as a means of measuring the existing situation.
4-9
Marais & Armitage (2003). The measurement and reduction of urban litter entering stormwater drainage
systems. Chapter 4 : Social attitudes in Imizamo Yethu and Ocean View.
A major problem with the Litter Project, if the reduction of littering had been intended, were breakdowns between the stakeholders. This was exacerbated by the lack of education in the community at large regarding littering and how this impacted them. Some proposals that would have facilitated communication between stakeholders include: • It would have been better if the Waste Auditor and the rest of the Research Team
had been local residents. • An individual should have been employed as a full time facilitator to encourage
dialogue between the Municipality, the Research Team, the Civic Association, community organisations such as the Environmental Group, the Health Forum and the local community. This individual should be patient, dynamic, articulate, have an understanding of the theory of ‘constellations of control’, and not be bound solely to the service of his or her remunerating body.
• A social scientist on a short-term contract could have acted as facilitator and
continued to research the challenges the Imizamo Yethu community provide for environmental sustainability.
• This social scientist could train a local resident in basic research and facilitation
skills. The local resident would then take over the social scientist’s role at the end of the social scientist’s contract. This creates employment and encourages dialogue between stakeholders.
• The facilitator can assist the aims and objectives of the Litter Project through:
- Fostering a dialogue between all stakeholders which encourages them to identify and address their needs and work together to formulate practical solutions.
- Advertising him/herself as an information resource and informing and
training residents how to approach the Municipality on issues of concern. 4.2.11 Issues of infrastructural improvement Residents in Imizamo Yethu are more likely to show respect for their environment if: • Security of legal tenure is granted to all current inhabitants and further illegal
squatting is prevented thus encouraging residential equality. • The settlement is upgraded through access to better housing, sanitary facilities and
other service. Political pressure needs to be placed on the authorities to carry out these objectives.
4-10
Marais & Armitage (2003). The measurement and reduction of urban litter entering stormwater drainage
systems. Chapter 4 : Social attitudes in Imizamo Yethu and Ocean View.
4.2.12 Recommendations • To be most effective, environmental education in the community would link the
importance of protecting the local environment with the health and wellbeing of residents. However, evidence suggests that a great number of residents are already fully aware of the benefits to health that come with living in a clean environment. As such it is important that the help of local action groups is enlisted to target the hygiene messages to the right sectors of the community.
• Environmental education would have a longer lasting and more effective impact
if it is carried out by a respected action group such as the Environmental Group and/or other respected community members such as the home-based care coordinators.
• The Environmental Group is a dedicated and respected local organisation who
have had much practical success. The group should be rewarded with environmental and health education training and acceptably remunerated for their efforts.
• All educational messages should be disseminated in the local languages. • Artistic or visual aids perhaps in the form of a poster campaign would be useful
in explaining the complexities of the storm water drainage system and the links between rubbish and disease.
• Strong messages that state it is not acceptable to pollute the environment need to
be transmitted sensitively to the older population and to the newcomers in the community.
• A campaign is needed to inform residents on which day and at what time they
should put their black bags outside their homes for the SPA workers to collect. 4.3 Case Study 2 – Ocean View This case study was contributed by Cecilia Horsten, an MA student in the UCT Social Anthropology Department and edited for the purposes of this report. The focus of this study is to observe and examine the behaviour, attitude and awareness related to littering in Ocean View, a low-income medium-density residential area with a primarily Coloured population (91%, National Census 1996), situated in the Cape Metropolitan Area.
4-11
Marais & Armitage (2003). The measurement and reduction of urban litter entering stormwater drainage
systems. Chapter 4 : Social attitudes in Imizamo Yethu and Ocean View.
4.3.1 Study methodology The Ocean View community was visited on three occasions during a three week period in September 2001. Around twenty-five people, chosen at random in public spaces, such as on the street and outside shops or outside their dwellings, were interviewed. Although twenty-five people is not statistically significant, given that the total population of Ocean View is about 7 500 persons (National Census of 1996), time constraints precluded more residents from being interviewed. 4.3.2 The activities of the data collection team On the first visit, the catchpits in the study area were being emptied by South Peninsula Administration (SPA) workers, under the supervision of a research assistant from the Civil Engineering Department at the University of Cape Town (UCT), Mr Khaya Lubanga. This team carried out the collection of the waste caught in the litter traps installed in the catchpits on a fortnightly basis. The researchers accompanied the team to obtain a general feel of the area before proceeding with interviewing residents. Clearing of catchpits began in Castor Way where twenty of the 34 litter traps are located, then proceeded to Gemini Way, past the shops, around the park and back to Gemini Way. The researchers helped estimate the percentage of fullness of baskets placed inside gulleys. The council workers asked them how full they thought the baskets were “from a ladies’ point of view”. They contained everything from soil and leaves to plastic bottles and condoms! Potato chip bags seemed to be the most numerous litter item. Some catchpits were clogged and full of water and some of the gulley covers were broken. In other catchpits the baskets were missing and the amount of litter in those catchpits was left unrecorded. The litter collected in the catchments was later weighed and analysed in the Civil Engineering department at UCT and the data entered into a detailed database. Ironically one of the SPA workers threw a candy wrapper on the ground right next to one of the gulley thus perpetuating the problem under examination. 4.3.3 Engaging with the community Two of the three occasions on which Ocean View was visited were particularly rainy days. People were not generally on the streets and, if they were, they were proceeding directly to a specific destination (shops, school, home, etc.) with their heads down. On one sunny morning more people were passing the time of day on the streets. Residents were more willing to talk and the weather was more conducive to this, partly due to not having to stand in the rain or wind. No one was observed littering except for one of the municipal workers disposing of his candy wrapper next to a gulley! In contrast several residents of Ocean View, in several locations and at different times, were observed sweeping and cleaning up streets and street corners.
4-12
Marais & Armitage (2003). The measurement and reduction of urban litter entering stormwater drainage
systems. Chapter 4 : Social attitudes in Imizamo Yethu and Ocean View.
The intention was to investigate residents’ awareness of the environment and the issue of littering, their relationship to the environment, their recycling practices and their attitudes to local cleaning services and campaigns. In chatting to people about the issue of littering, questions such as “Do people litter a lot in Ocean View and why?” and “Which parts of Ocean View are most dirty and why?” were asked. There was not a set of structured questions as the conversation depended on the setting. For example, if people were seen sweeping the street, they were asked for whom they worked and how often. Sometimes people approached the researchers and asked them what they were doing or whether they were looking for someone and so conversation was initiated. In the pursuit of accuracy the use of a dictaphone was attempted but people felt intimidated by this electronic device. Conversations were therefore recorded in writing. It would have been much easier to communicate with the residents of Ocean View had at least one of the researchers been fluent in Afrikaans. In carrying out the research the background and purpose of the research was made clear. 4.3.4 The objectives of the research The objectives of the research were to allow people from Ocean View to voice their views and opinions about litter and littering in Ocean View, and also to observe the littering behaviour of residents. Due to the lack of time and the limited nature of the research, an understanding of the political functioning of the ‘community’ could not be derived. This would include establishing the homogeneity of the ‘community’, as well as ascertaining the effectiveness of the Ocean View groupings and civic associations. A more extensive and in-depth study would have allowed more time for the interviewing of a larger number of residents. 4.3.5 The community’s perception of littering and the service provided
by the Municipality On the first day in Ocean View, outside the Pop In Moslem Butchery, a man approached the SPA workers as they were emptying a gulley. He said “Oh it must be clean! People don’t care, maybe? … you need more people at the top, man, you musn’t blame the guys [the municipal workers], they do their job. It’s the government; they don’t want to employ people. R500 in a week is nothing. They must pay them more and they’ll do their job better.” The owner of the Pop In Moslem Butchery gave an opposing view. He thought that all the facilities were already available and that the problem was that people do not make proper use of them. One of the researchers went into the neighbouring shop (which shares an entrance with the butchery) to buy something to eat and struck up a conversation with him. Talking to this man was a reminder that communities are not homogeneous and do not necessarily share the same view. Ocean View does not appear to be a self-contained and homogeneous community. Residents would perhaps know their neighbours but would not have any contact or relationship with people living a few houses down the same street.
4-13
Marais & Armitage (2003). The measurement and reduction of urban litter entering stormwater drainage
systems. Chapter 4 : Social attitudes in Imizamo Yethu and Ocean View.
This made it clear that it is also essential to recognise power differentials between participants in negotiations – between ‘community’ representatives and authorities, and between ‘community’ participants. No matter how well-intentioned, comprehensive or democratic the consultative process, ultimately decision-making and implementation powers are vested in the authorities, as was strongly sensed to be the case in Ocean View. A retired man who had worked for the municipality for twenty-eight years said: “Litter is not nice at all. I don’t like [it]. We try our best to keep our place clean in this street [Castor Way]. If my neighbour litters I’ll go over and tell him and he’ll do the same. That is the reason why our street is like this. But not everybody cares. The council is doing the best they can. As far as drainage is concerned it’s quite poor. The roads are not nice. People and litter can’t live together. Ocean View is not that bad, but some places are quite bad. Council told us they can’t maintain grass and pavements, so people must do it.” Opposite his house there was previously an empty lot used as a dumping ground. He said that before a house was built on this lot he used to tell people not to dump garbage there. Similarly, other people said that if they saw someone throwing something on the ground they would tell them to pick it up. A young man, seemingly frustrated said: “It’s very bad-very bad in Ocean View. We’ve got a hell of a problem with rubbish in this place. We’re living in a dump! Some people they don’t have the decency to push the rubbish down with something else. You see this place here? It’s filthy as I would say. They won’t throw the rubbish if the grass is cut and clean. Why do they want to save money?” [the Municipality] This young man was of rebellious mien and warned the researchers against walking around Ocean View, saying that young men would ‘hit on” them and even rob them. His friends nodded constantly as he spoke, approving of his comments and complaints about the Municipality. Several people said that they paid rent to the Municipality, and that the Municipality was responsible for maintaining the buildings and its surroundings. They said that on occasion they had wanted to replace a vandalised door or paint their flat but that the lease with the Municipality did not allow them to make any changes to the flats privately. One of our informants related that one afternoon he and his friends bought white paint and spray cans. They painted a big dirty wall in their building and had just started spraying grafitti, or, as he put it: “It wasn’t graffiti, it was art”, when the police approached them and splashed the rest of the paint on the wall, telling them they were making the place look dirty. “We wanted to keep it beautiful. It’s our place, they don’t live here.” In an environment where initiatives such as these are devalued or simply not respected at all, how can people be expected to take responsibility for littering? One of the most forthcoming interviewee’s response when photographs were being taken of the littered surroundings was: “Take a picture of me, I’m a mess myself!” The conclusion was that living in an area which has long been devalued by the government, with little attention given to the establishment of a healthy environment, affects the way people perceive themselves and their surroundings.
4-14
Marais & Armitage (2003). The measurement and reduction of urban litter entering stormwater drainage
systems. Chapter 4 : Social attitudes in Imizamo Yethu and Ocean View.
A young man explained that people in Ocean View do not like to spend time in the parks because they do not find them enticing at all. He said that if the council kept the parks clean and cut the grass regularly, people would want to sit on the grass. Pointing at a park he said: “Look at that! Who would want to sit on that grass? If it is clean and the grass is cut you would see people sitting there”. Another man said: “They must put playgrounds for the children, otherwise in the afternoons the children get naughty, they do nothing”. Most times, when talking to young men, a level of frustration was sensed because of too much neglect by the council. 4.3.6 Attitudes to community initiatives When asked about community initiatives one man said that at the time of our research there was a project against shebeens. He said that the Police Forum works with them and that they also go to churches and ask church leaders to assist. He said: “I don’t want shebeens because they are not a good environment for my children to grow up in”. He added that the establishment of such shebeens would create even more litter in the area. However, unlike this man, people were generally not particularly concerned about litter in Ocean View and referred to areas previously classified as ‘black townships’ (Khayelitsha and Langa were mentioned) as being far worse with respect to littering. Residents were more concerned about alcohol abuse, gangsterism, drugs and crime. The same man said that there were currently no clean up campaigns, but that every six months school children from the three schools in the area (two primary and one secondary) collect litter with black bags supplied by the municipality. He felt that the clean up campaigns were successful. 4.3.7 Awareness of littering and the environment On the second visit a man was observed sweeping outside the Welcome Supermarket. On being approached and asked who he was working for and how often he cleaned, he replied that he was the manager of the supermarket. He added: “I like it to look nice. When I’m done I’ll go inside and help.” Another man said he cleaned the park every day except Sundays for which he received R50 a month. On asking him which places were most dirty, he replied that by the mountain roadside “people buy chips and just throw it on the ground.” Another interviewee who lives in a house said: “I’ll tell people to pick up litter if I see someone littering. Some would say, ‘why don’t you pick it up yourself?’. They clean today, tomorrow it’s the same again. You can’t tell them, ‘cause they own the place. People litters. I’m happy here. I have my wife, my children, my grandchildren”. After being approached as he was gardening, he invited the researchers into his house which was immaculate. He told them that he enjoyed gardening, especially on sunny days. Inside his house he had many more plants, which he proudly showed the researchers.

4-15
Marais & Armitage (2003). The measurement and reduction of urban litter entering stormwater drainage
systems. Chapter 4 : Social attitudes in Imizamo Yethu and Ocean View.
As with this house, a sense was obtained that people cared about the immediate environment around their homes. Most houses and their ‘gardens’ were very clean with no discernible litter. 4.3.8 Problems encountered with the research In general people in Ocean View were very friendly and approachable, especially the men, both young and old. The researchers were greeted with such sentences as: “Good morning you beautiful sunshine! I’ve had a bad day, no pretty face to look into, but then you come making the day. Your are the sun!” The researchers felt welcome and trusted; people even invited them inside their homes and started showing them family-pictures and diplomas. People, especially the children, seemed very curious about what was going on. At times linguistic barriers were encountered as the vast majority (71%, National Census 1996) of the people speak Afrikaans and the researchers had no working knowledge of that language. However, on their last visit an Afrikaans-speaking friend accompanied them as an interpreter. It was generally more difficult to talk to the women than to the men. On several occasions women who were approached walked away. They were either too shy, intimidated or simply did not speak English. They also seemed to be in a hurry while the men seemed to have more time to pass the time of day. Due to time constraints the difference in the way men and women used public spaces could not be investigated further. This would be a relevant area for further research. 4.3.9 Concluding remarks A resident said that the Reconstruction and Development Programme (RDP) needs to consult with the people before they make decisions which will have an impact on their immediate environment and not after the decisions have already begun to be implemented. At this stage any input from the community is put on paper for the sake of political correctness and headlines in the media. It is wishful thinking to believe that the average Ocean View resident can have any influence once implementation of a project is under way. Another lesson to be learned is that anthropologists should be brought into the scene at the project planning stage, and not after the project has commenced. Generally the impression gained was that people in Ocean View care about their surroundings. On every visit people were seen sweeping or picking up litter, without them knowing what the researchers’ role was. Opposite the store, the man responsible for the toilets at the newly-built taxi rank asked the researchers as they were exiting the public toilets: “Was there any toilet paper in there? I’m just checking to see if my cleaners are doing their job.”

5-1
Marais & Armitage (2003). The measurement and reduction of urban litter entering stormwater
drainage systems. Chapter 5 : Data collection.
5. Data collection 5.1 Introduction As noted in the introductory chapter, previous South African studies have concentrated on removing litter from drainage systems once it is already there rather than reducing the amount of litter entering the drainage systems. This has led to a paucity of available data on the nature and quantity of litter that finds its way into the stormwater drainage systems (Armitage et al, 1998).
This chapter relates how a data collection process was instituted in the nine study catchments to remedy this deficiency. The simple devices used to trap the litter, the steps taken to implement the process, including the installation of the trapping devices, and the monitoring procedure are described. The constraints experienced both in setting up the catchments to enable the collection of the data and in recording the data are discussed. It is hoped that the lessons learned will prove useful to researchers tackling similar undertakings.
5.2 Traps and nets The litter traps were fabricated of galvanised weld mesh with 25 x 13.4 mm openings. The mesh was folded on site to suit the catchpit dimensions. A minimum horizontal clearance of 200 mm between the short sides of the trap and the short walls of the catchpit was generally provided to allow for overflow in the event of the trap becoming blocked. The traps rested on two horizontal lengths of angle iron bolted to opposing catchpit walls where the configuration of the catchpit allowed, otherwise they hung from the lip of the catchpit opening below the grid. Ease of fabrication and cheapness were paramount considerations in the design as it was thought the traps might be prone to theft (Figure 5-1). Nets made of diamond mesh nylon netting were originally provided at all catchment outlets. Their intended function was to intercept all the litter which had bypassed the litter traps upstream of the outlet. The end of the net was fastened onto a circular galvanised mild steel hoop fixed to the headwall. A horizontal gap of at least 20 mm was left between the end of the emerging pipe and the hoop to allow for the passage of water in the event of the net filling with litter (Figure 5-2). Each catchpit and outlet net was uniquely identified by a reference number with the format X N N N where X = catchment code (see Table 5-1) NNN = catchpit or outlet net number.
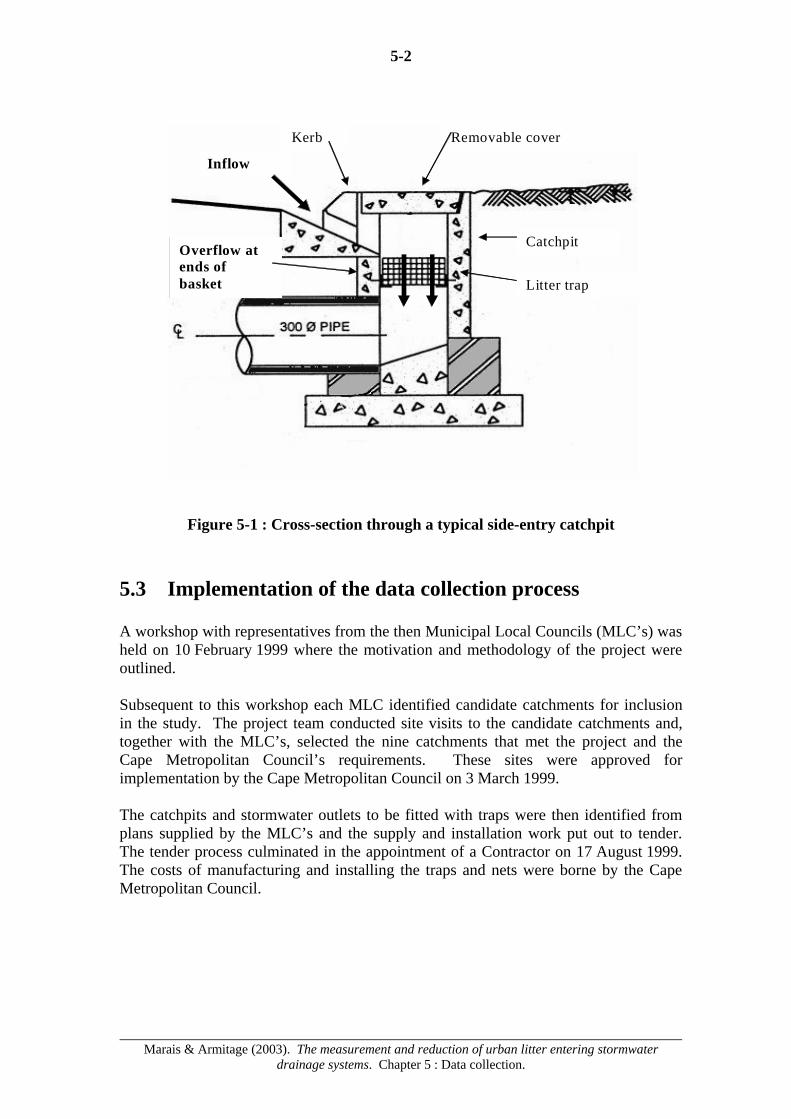
5-2
Marais & Armitage (2003). The measurement and reduction of urban litter entering stormwater
drainage systems. Chapter 5 : Data collection.
Figure 5-1 : Cross-section through a typical side-entry catchpit 5.3 Implementation of the data collection process A workshop with representatives from the then Municipal Local Councils (MLC’s) was held on 10 February 1999 where the motivation and methodology of the project were outlined. Subsequent to this workshop each MLC identified candidate catchments for inclusion in the study. The project team conducted site visits to the candidate catchments and, together with the MLC’s, selected the nine catchments that met the project and the Cape Metropolitan Council’s requirements. These sites were approved for implementation by the Cape Metropolitan Council on 3 March 1999. The catchpits and stormwater outlets to be fitted with traps were then identified from plans supplied by the MLC’s and the supply and installation work put out to tender. The tender process culminated in the appointment of a Contractor on 17 August 1999. The costs of manufacturing and installing the traps and nets were borne by the Cape Metropolitan Council.
Inflow
Kerb Removable cover
Litter trap
Catchpit Overflow at ends of basket
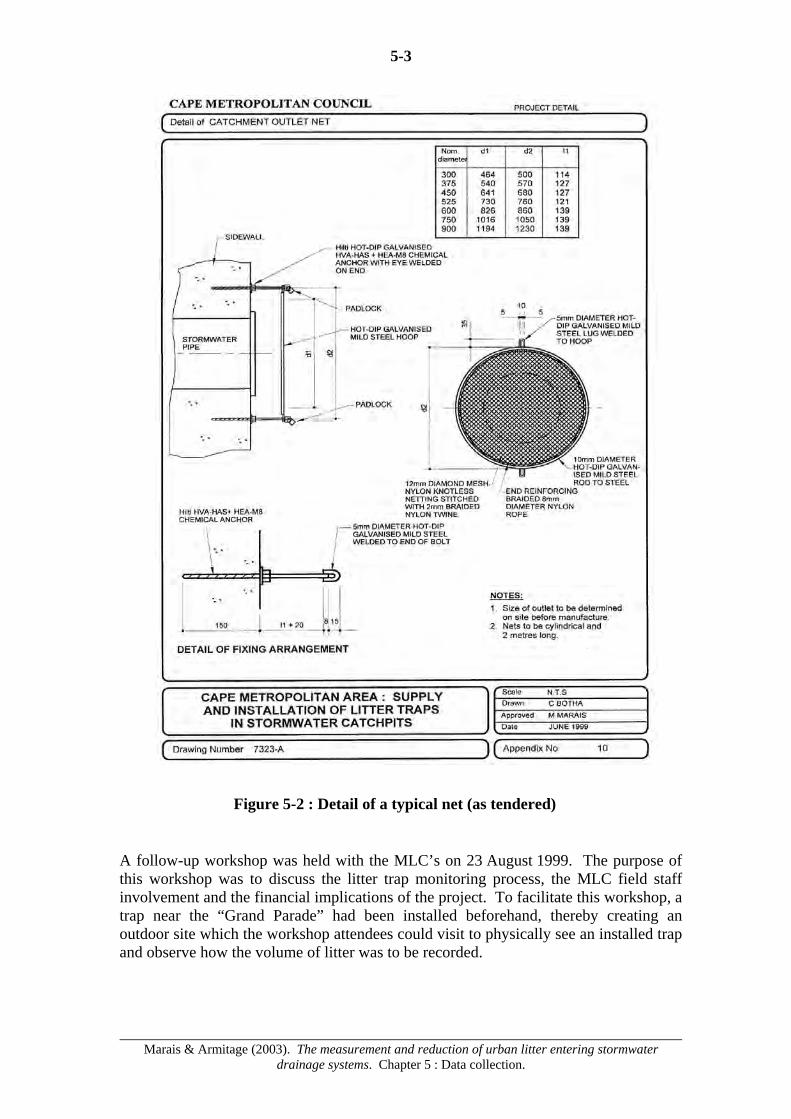
5-3
Marais & Armitage (2003). The measurement and reduction of urban litter entering stormwater
drainage systems. Chapter 5 : Data collection.
A follow-up workshop was held with the MLC’s on 23 August 1999. The purpose of this workshop was to discuss the litter trap monitoring process, the MLC field staff involvement and the financial implications of the project. To facilitate this workshop, a trap near the “Grand Parade” had been installed beforehand, thereby creating an outdoor site which the workshop attendees could visit to physically see an installed trap and observe how the volume of litter was to be recorded.
Figure 5-2 : Detail of a typical net (as tendered)
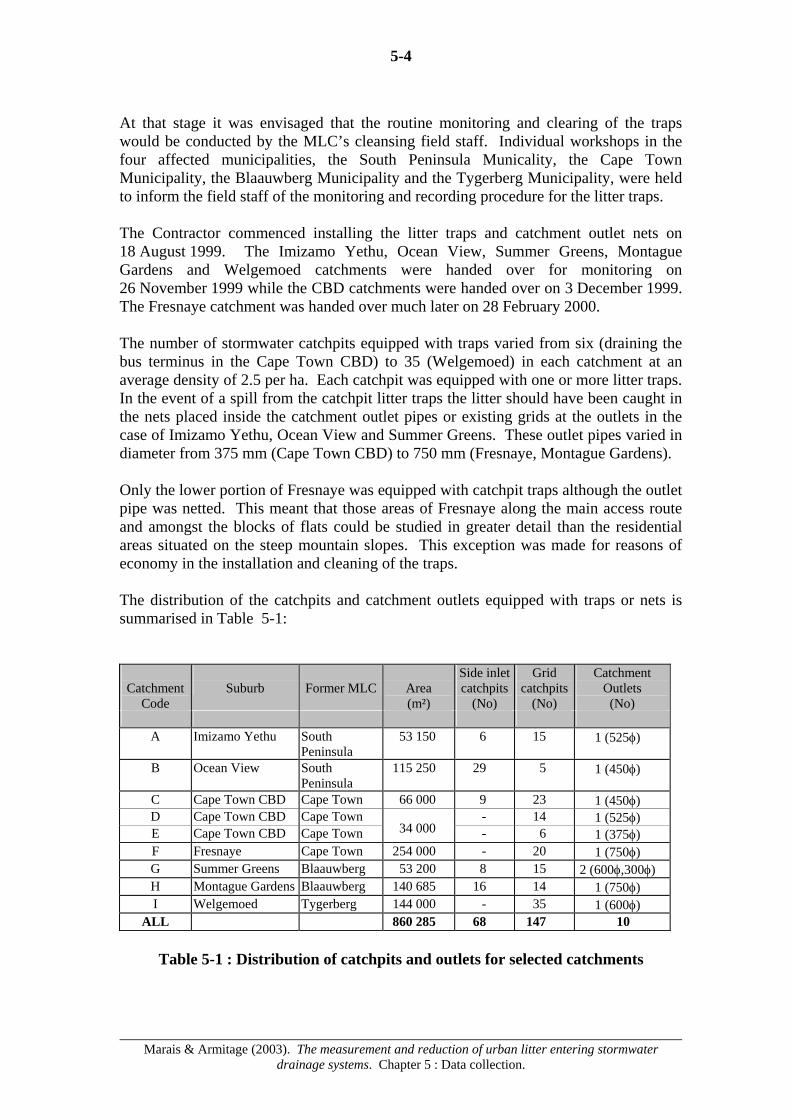
5-4
Marais & Armitage (2003). The measurement and reduction of urban litter entering stormwater
drainage systems. Chapter 5 : Data collection.
At that stage it was envisaged that the routine monitoring and clearing of the traps would be conducted by the MLC’s cleansing field staff. Individual workshops in the four affected municipalities, the South Peninsula Municality, the Cape Town Municipality, the Blaauwberg Municipality and the Tygerberg Municipality, were held to inform the field staff of the monitoring and recording procedure for the litter traps. The Contractor commenced installing the litter traps and catchment outlet nets on 18 August 1999. The Imizamo Yethu, Ocean View, Summer Greens, Montague Gardens and Welgemoed catchments were handed over for monitoring on 26 November 1999 while the CBD catchments were handed over on 3 December 1999. The Fresnaye catchment was handed over much later on 28 February 2000. The number of stormwater catchpits equipped with traps varied from six (draining the bus terminus in the Cape Town CBD) to 35 (Welgemoed) in each catchment at an average density of 2.5 per ha. Each catchpit was equipped with one or more litter traps. In the event of a spill from the catchpit litter traps the litter should have been caught in the nets placed inside the catchment outlet pipes or existing grids at the outlets in the case of Imizamo Yethu, Ocean View and Summer Greens. These outlet pipes varied in diameter from 375 mm (Cape Town CBD) to 750 mm (Fresnaye, Montague Gardens). Only the lower portion of Fresnaye was equipped with catchpit traps although the outlet pipe was netted. This meant that those areas of Fresnaye along the main access route and amongst the blocks of flats could be studied in greater detail than the residential areas situated on the steep mountain slopes. This exception was made for reasons of economy in the installation and cleaning of the traps. The distribution of the catchpits and catchment outlets equipped with traps or nets is summarised in Table 5-1:
Catchment
Code
Suburb
Former MLC
Area (m²)
Side inlet catchpits
(No)
Grid catchpits
(No)
Catchment Outlets (No)
A Imizamo Yethu South
Peninsula 53 150 6 15 1 (525φ)
B Ocean View South Peninsula
115 250 29 5 1 (450φ)
C Cape Town CBD Cape Town 66 000 9 23 1 (450φ) D Cape Town CBD Cape Town - 14 1 (525φ) E Cape Town CBD Cape Town 34 000 - 6 1 (375φ) F Fresnaye Cape Town 254 000 - 20 1 (750φ) G Summer Greens Blaauwberg 53 200 8 15 2 (600φ,300φ) H Montague Gardens Blaauwberg 140 685 16 14 1 (750φ) I Welgemoed Tygerberg 144 000 - 35 1 (600φ)
ALL 860 285 68 147 10
Table 5-1 : Distribution of catchpits and outlets for selected catchments

5-5
Marais & Armitage (2003). The measurement and reduction of urban litter entering stormwater
drainage systems. Chapter 5 : Data collection.
5.4 The monitoring procedure Monitoring of the installed litter traps and nets began during January 2000 and ended in January 2002. 5.4.1 Responsibilities of the Local Authorities It was anticipated that the traps and nets in each catchment would undergo a routine clearout by the local authorities at least once a month. The following data was to be recorded on a standard recording sheet supplied to them: • the date of the clearout; • the duration of the rainfall and precipitation (if any) during the period preceding
the clearout; • the total volume of litter removed from the streets and from the dustbins in the
catchment between clearouts; • the degree of fullness of each uniquely numbered trap and outlet net. A detailed analysis was to be undertaken once a month in each catchment during the rainy season (April to September). In addition to recording the above data the contents of each trap and net were to be emptied into large bags clearly labelled with the trap/net reference number for sorting and detailed analysis in the UCT Laboratory. 5.4.2 Role of the Waste Auditor To carry out the sorting and detailed analysis of the litter an independent Waste Auditor was appointed for six months full-time over the winter period April to September of 2000 with the intention to repeat the six month appointment in 2001. In the course of the six months the Waste Auditor should have been able to carry out about six full analyses of each catchment at a rate of about two per week. For each trap or net the following additional data was recorded by the Waste Auditor: • the exact mass and volume trapped; • the trap contents by type, number, volume and mass; and • the likely sources of litter.
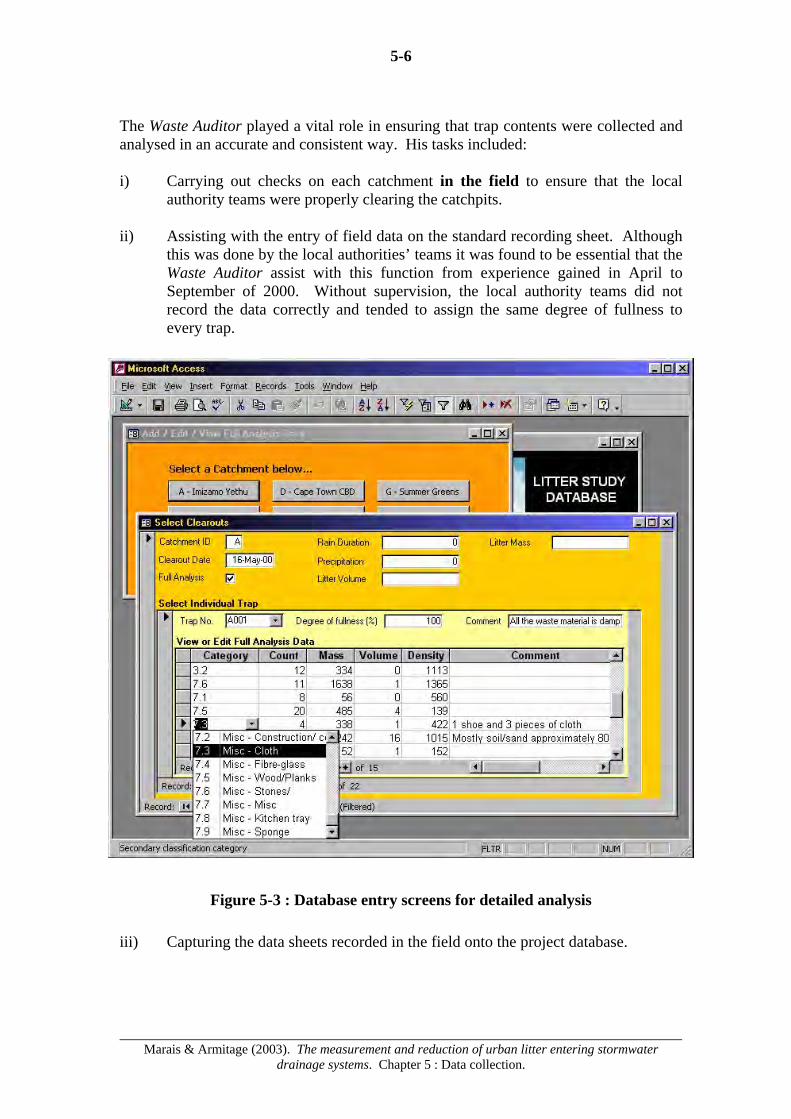
5-6
Marais & Armitage (2003). The measurement and reduction of urban litter entering stormwater
drainage systems. Chapter 5 : Data collection.
The Waste Auditor played a vital role in ensuring that trap contents were collected and analysed in an accurate and consistent way. His tasks included: i) Carrying out checks on each catchment in the field to ensure that the local
authority teams were properly clearing the catchpits. ii) Assisting with the entry of field data on the standard recording sheet. Although
this was done by the local authorities’ teams it was found to be essential that the Waste Auditor assist with this function from experience gained in April to September of 2000. Without supervision, the local authority teams did not record the data correctly and tended to assign the same degree of fullness to every trap.
iii) Capturing the data sheets recorded in the field onto the project database.
Figure 5-3 : Database entry screens for detailed analysis
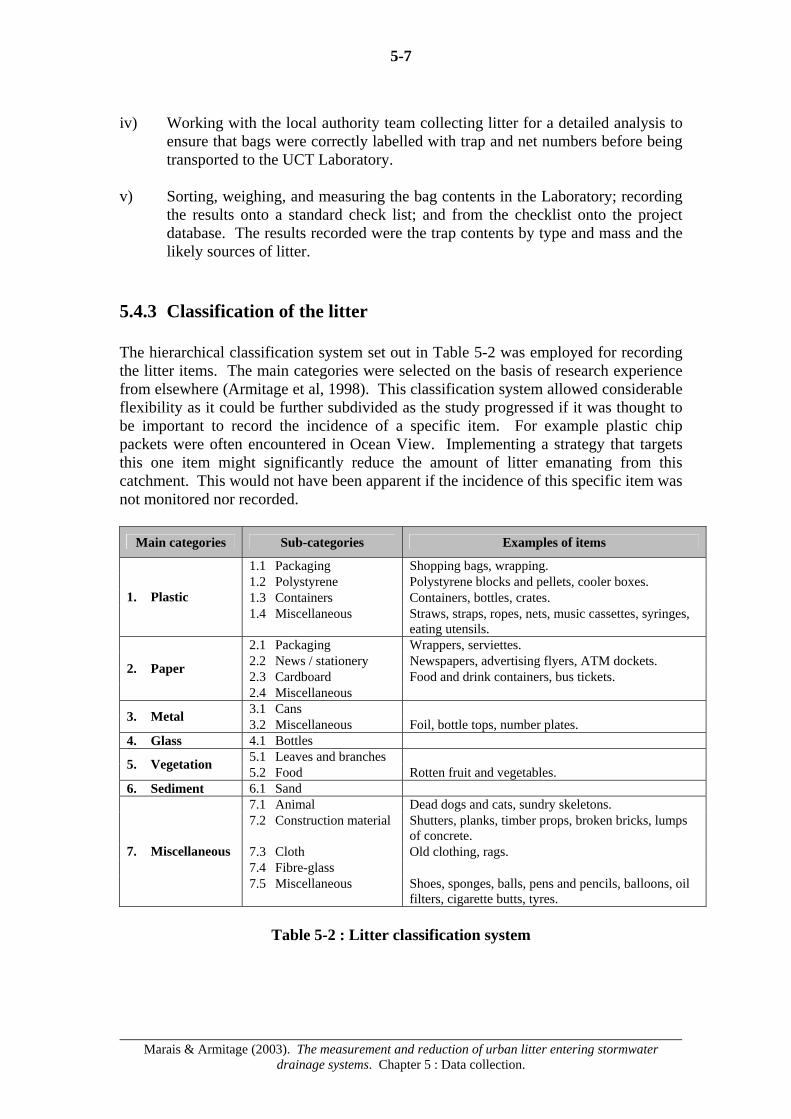
5-7
Marais & Armitage (2003). The measurement and reduction of urban litter entering stormwater
drainage systems. Chapter 5 : Data collection.
iv) Working with the local authority team collecting litter for a detailed analysis to
ensure that bags were correctly labelled with trap and net numbers before being transported to the UCT Laboratory.
v) Sorting, weighing, and measuring the bag contents in the Laboratory; recording
the results onto a standard check list; and from the checklist onto the project database. The results recorded were the trap contents by type and mass and the likely sources of litter.
5.4.3 Classification of the litter The hierarchical classification system set out in Table 5-2 was employed for recording the litter items. The main categories were selected on the basis of research experience from elsewhere (Armitage et al, 1998). This classification system allowed considerable flexibility as it could be further subdivided as the study progressed if it was thought to be important to record the incidence of a specific item. For example plastic chip packets were often encountered in Ocean View. Implementing a strategy that targets this one item might significantly reduce the amount of litter emanating from this catchment. This would not have been apparent if the incidence of this specific item was not monitored nor recorded.
Main categories Sub-categories Examples of items
1.1 Packaging Shopping bags, wrapping. 1.2 Polystyrene Polystyrene blocks and pellets, cooler boxes. 1.3 Containers Containers, bottles, crates. 1. Plastic 1.4 Miscellaneous Straws, straps, ropes, nets, music cassettes, syringes,
eating utensils. 2.1 Packaging Wrappers, serviettes. 2.2 News / stationery Newspapers, advertising flyers, ATM dockets. 2.3 Cardboard Food and drink containers, bus tickets. 2. Paper
2.4 Miscellaneous 3.1 Cans 3. Metal 3.2 Miscellaneous Foil, bottle tops, number plates.
4. Glass 4.1 Bottles 5.1 Leaves and branches 5. Vegetation 5.2 Food Rotten fruit and vegetables.
6. Sediment 6.1 Sand 7.1 Animal Dead dogs and cats, sundry skeletons. 7.2 Construction material Shutters, planks, timber props, broken bricks, lumps
of concrete. 7.3 Cloth Old clothing, rags. 7.4 Fibre-glass
7. Miscellaneous
7.5 Miscellaneous Shoes, sponges, balls, pens and pencils, balloons, oil filters, cigarette butts, tyres.
Table 5-2 : Litter classification system

5-8
Marais & Armitage (2003). The measurement and reduction of urban litter entering stormwater
drainage systems. Chapter 5 : Data collection.
5.4.4 Adjustments to the monitoring procedure Experience gained on site over the first monitoring period (January to September 2000) led to a number of changes to the monitoring procedure: • With notable exceptions it was found that without independent supervision it
could not be guaranteed that the data was collected by the local authorities in such a way that its integrity was assured. In particular the degree of fullness recorded was found in many cases to be almost completely arbitrary.
As a consequence it was decided to employ the Waste Auditor for the entire twelve month monitoring period commencing in February 2001 and ending in January 2002 so that he could accompany all collections.
• From October 2000 on the local authorities were asked to deliver the litter
collected from their routine clearouts in clearly labelled bags to the laboratory as for the detailed clearouts so that the total mass of each bag could be determined and recorded for routine clearouts.
This was requested because the degree of fullness of traps had been found to be inconsistently recorded by the local authorities. The volume derived from the degree of fullness of the trap was also found to be an unreliable indicator of mass as the densities of the litter varied so widely. Sorting into different litter categories was not however carried out for these routine clearouts.
• It was also decided to dispense with the counting of litter items in 2001 as this
had proved extremely time consuming and once the litter profile had been established there was little need to continue with this. Litter counts do however give a better indication of the aesthetic impact of lighter materials such as plastic bags and packaging which can appear to be negligible in terms of mass. The litter counts obtained in 2000 are included in the Appendices.
• Due to the large mass of silt accumulating in the Imizamo Yethu traps, the
clearing on a monthly basis conducted in 2000 had proven to be extremely onerous. Blockage of catchpits had occurred with consequent limited flooding. The frequency of clearing was increased to once a week from mid May of 2001 to lessen the chances of the traps filling to capacity and causing flooding between clearouts and to ease the task of removing the baskets by reducing the weight of the litter and sediment trapped in them. Following the same reasoning the frequency of clearouts in Ocean View was increased with clearouts taking place on a fortnightly basis from mid May 2001. The frequency of clearouts for the other catchments was maintained at roughly once a month.
5-9
Marais & Armitage (2003). The measurement and reduction of urban litter entering stormwater
drainage systems. Chapter 5 : Data collection.
5.5 Constraints and lessons learned 5.5.1 Implementation It took two months from the selection of the pilot catchments to obtain all the stormwater drainage data. It rapidly became evident that much of this drainage data was inaccurate and out of date. In some cases the plans had been drawn up 50 or more years ago and had not been amended when changes had been made. Sometimes two plans of the same area showed different drainage routes. Scales also varied from plan to plan, some maps still being in imperial units. Some of the plans were difficult to read. Although all of the MLCs cooperated with the project team in locating accurate information, it was some time before the Project Team could be confident that they had reliable information. As the installation of the traps and nets was being funded by the Cape Metropolitan Council the appointment of a Contractor had to pass through their approval process which took a further two months. The Contractor optimistically tendered a three week contract period. The actual contract period was close to six months. This extraordinary difference can be attributed to the Contractor underestimating the practical difficulties associated with retrofitting catchpits of differing dimension, scattered over a wide area, and often filled with sand and other debris. This was exacerbated in the case of Imizamo Yethu where night soil was routinely dumped into the stormwater drainage system. 5.5.2 Effectiveness of traps The catchpits equipped with litter traps (wire baskets) were of three basic types; those with side inlets only, those with horizontal grid covered inlets and those with both side inlets and horizontal grid covered inlets. In the case of the latter type the litter baskets were found to trap only a portion of the litter. The items found in the baskets were mostly those that could easily pass through the concrete grid covers (e.g. small paper and plastic wrappings) while the larger items tended to escape the basket. These items were sometimes trapped between the basket and the back of the catchpit underneath the side inlet. This was because the baskets did not extend underneath the side inlet opening but were positioned directly below the grid covering. All the litter trapped in the catchpits, both inside and outside the baskets, was however collected and recorded. Based on the quantities trapped in the catchpit types not manifesting this shortcoming the data loss was less than 10%. The incidence of this situation was also noted when encountered.

5-10
Marais & Armitage (2003). The measurement and reduction of urban litter entering stormwater
drainage systems. Chapter 5 : Data collection.
5.5.3 The role of the local authorities Initially it had been hoped that the four participating local authorities (the former Metropolitan Local Councils) would assist with the collection and volumetric assessment of trap contents. In practice, it was soon realised that this was naïve. Whenever the Waste Auditor did not appear to be watching, the clearing teams rushed through the clearing operation with little regard for the integrity of the data. One local authority team reported every trap to be 50% full irrespective of how full it actually was. It became clear that without independent supervision and some form of reward, the team was unlikely to work carefully. In the case of the street cleaning teams working within the Central Business District, special care had to be taken to ensure that the teams did not think the Waste Auditor was a “spy” evaluating how much of their work could be outsourced. A further problem was interference in the project by other departments of the local authorities concerned. Despite several attempts to keep all interested and affected parties informed of the research project, information seldom seemed to be passed down from the officials to the supervisors and litter was removed, nets tampered with, and various litter management options were adopted without prior approval of the Project Team. 5.5.4 Assessing the fullness of the traps in the field In estimating the volume of collected litter in the baskets and nets it was initially proposed that degrees of fullness 0, 1, 2, 3, 4 corresponding to 0%, 25%, 50%, 75% and 100% full would be employed for recording in the field. However this resulted in error and confusion on the part of the local authority teams emptying the baskets. The percentage of fullness (preferably to the closest ten percent) was therefore adopted for recording the volume of collected litter in the baskets and nets.
5.5.5 Frequency of collection To begin with the process of litter collection and analysis was generally undertaken following a monthly clearance schedule or immediately after a (major) storm. This had been the case in all the monitored catchments except Imizamo Yethu and the Cape Town CBD. Unauthorised and premature clearing of litter in these two areas (as a result of flooding in the former) had led to the loss of important data and disruption of the schedules for clearing. To mitigate this, estimates of mass and volume based on previous collections were made. These estimates were more reliable in Imizamo Yethu where the degree of fullness of the baskets had been noted before the litter had been cleared. More frequent contact with the local authority officials proved necessary to avoid further unauthorised removal of litter and consequent loss of data.

5-11
Marais & Armitage (2003). The measurement and reduction of urban litter entering stormwater
drainage systems. Chapter 5 : Data collection.
Experience gained over a period of time indicated that the frequency of clearing the catchpits could be adjusted from catchment to catchment. Clearing in Imizamo Yethu and Ocean View, where the baskets were likely to fill within a short period of time, needed to be more frequent. In contrast, in Summer Greens and Welgemoed, the monthly frequency initially adopted had proved to be unnecessarily high. Baskets in these areas were on average found to be less than 10% full. Regular checking of traps was carried out in order to refine the frequency of collection on an individual basis for each of the pilot catchments.
5.5.6 Absence of traps and nets The absence of baskets and nets and difficulty in opening catchpits complicated data collection. This was due to a number of reasons which included traps being stolen or not yet being installed, and removal of nets due to flooding. During the course of 2001 the missing traps and nets were replaced with the most severely affected areas of Imizamo Yethu and Ocean View enjoying precedence. 5.5.7 Litter categories Another problem was inherent in the classification and recording of the litter items. Certain litter items have an impact on the environment (even if aesthetic only) which is disproportionate to their mass or volume. Statistically, litter items contributing a small percentage to the litter loading in terms of mass should not be assigned a subcategory. However if there is a high incidence of the items they may merit a separate sub-category. Litter items such as plastic bags have a noticeable and persistent negative impact on the environment even if their contribution by mass is low and have therefore been assigned separate subcategories.
5.5.8 Establishing baseline data The litter environment within South Africa is rapidly changing. An example of this was the declaration by the Minister of Environmental Affairs that the minimum specification for polyethylene shopping bags was about to be substantially increased. which will have an impact on the litter finding its way into the catchpits. The former Cape Town Municipality (CTM) recently introduced a minimum street sweeping service in all the areas under its jurisdiction. Increasingly local authorities, NGOs and ratepayers are becoming more pro-active in reducing the quantity of litter in the environment. This made it impossible to determine baseline litter data.

5-12
Marais & Armitage (2003). The measurement and reduction of urban litter entering stormwater
drainage systems. Chapter 5 : Data collection.
5.5.9 Measuring the effectiveness of catchment litter management
strategies Measuring the effectiveness of different catchment based litter management strategies was one of the twin objectives of the data collection programme. Originally it was proposed that after a year of monitoring to establish “baseline data” in 2000, a first round of catchment strategies would be implemented by the Project Team. The impacts of these strategies would then be determined from a second year of monitoring in 2001. Based on an analysis of these impacts the strategies would then be refined and the impacts of the refined strategies assessed from a third year of monitoring in 2002. However during the first year of monitoring it became clear that interventions, outside the control of the Project Team from National Government, Local Authorities, NGOs and ratepayers, were taking place to address the litter situation. These interventions impacted on the litter loads. It was concluded that it could not be hoped to simply implement a catchment litter management strategy and compare it with previous data in isolation from other initiatives. The implementation of educational catchment litter management strategies in particular would have required a major community participation exercise. The Project Team did not have the budget or adequately trained staff to handle such an undertaking. However in two catchments, Imizamo Yethu and Ocean View, Fairest Cape and SRK Consulting had taken over this responsibility. In Summer Greens and Montague Gardens, Blaauwberg Municipality installed grids over the catchpit entrances whilst in the Cape Town CBD street sweeping was already in place as a litter control strategy. The research strategy was accordingly amended with two years of data collection terminating in January 2002. It should be emphasised that this amendment did not change the project objectives, in particular the provision of scientific data on the efficacy of various catchment management strategies in the reduction of urban litter reaching the drainage systems, as the effects of the litter management strategies implemented by the various outside parties were monitored. 5.6 Conclusions The following conclusions may be drawn from the experience gained in the data collection process: i) The catchment litter situation in the Cape Town Municipal Area (CMA) is
rapidly evolving as National Government, Local Authorities, NGOs and Ratepayers attempt to address the problem. This made nonsense of the idea of “baseline data” prior to intervention. Litter loads were changing in response to interventions outside the control of the Project Team. It could not be hoped to
5-13
Marais & Armitage (2003). The measurement and reduction of urban litter entering stormwater
drainage systems. Chapter 5 : Data collection.
simply implement a catchment litter management strategy and compare it with previous data in isolation from other initiatives.
ii) The data collection process relied on the activities of other authorities, which
did not have the same objectives or urgency as the Project Team. The local administrations helped greatly with the physical removal of the litter from the traps, bagging the contents and transporting them to the UCT laboratory for analysis, but could not be relied upon to record the litter data.
iii) The appointment of a Waste Auditor to carry out the in-depth analyses of the
contents of the litter traps and nets ensured that the contents were analysed in an accurate and consistent way across all nine catchments.
iv) Monitoring of the clearing of the litter traps needed to be carried out
continuously under the direct supervision of an appropriately trained Waste Auditor to ensure proper collection of the litter.
v) The frequency of collections and emptying litter traps and nets should be
determined on a catchment by catchment basis as each is unique. This should be reassessed and adjusted during the monitoring process as more information about the rate at which the traps and nets fill is obtained.
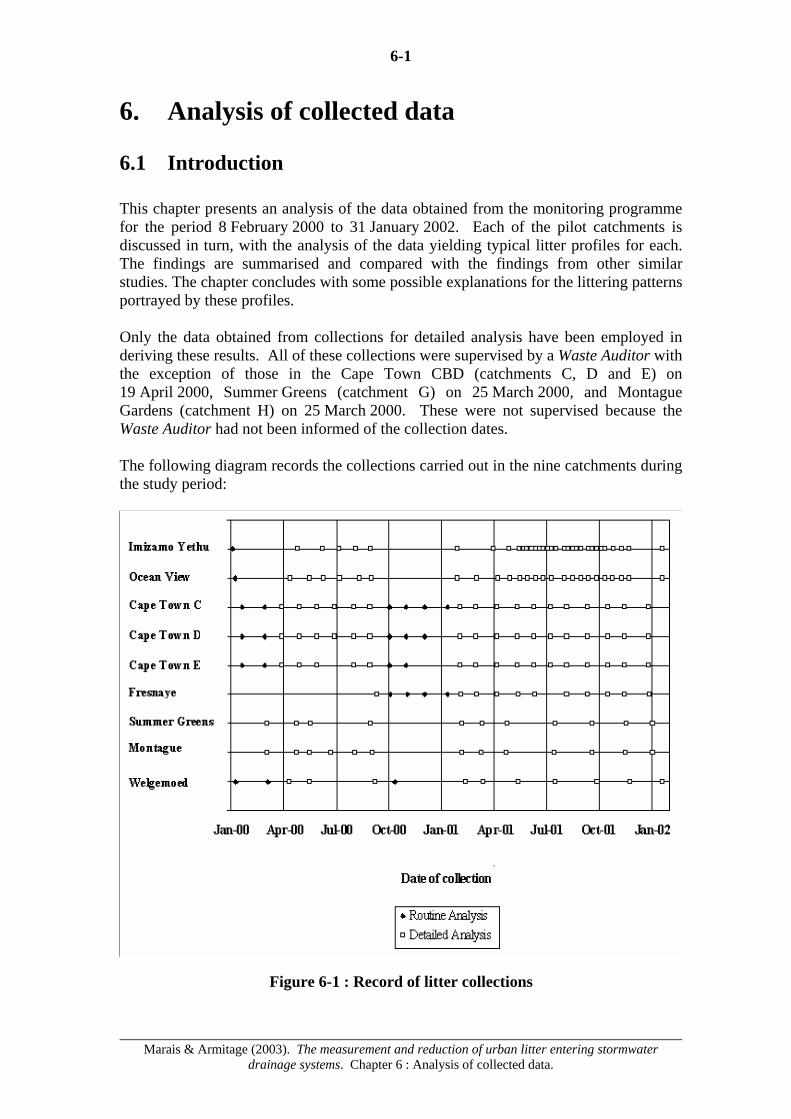
6-1
Marais & Armitage (2003). The measurement and reduction of urban litter entering stormwater
drainage systems. Chapter 6 : Analysis of collected data.
6. Analysis of collected data 6.1 Introduction This chapter presents an analysis of the data obtained from the monitoring programme for the period 8 February 2000 to 31 January 2002. Each of the pilot catchments is discussed in turn, with the analysis of the data yielding typical litter profiles for each. The findings are summarised and compared with the findings from other similar studies. The chapter concludes with some possible explanations for the littering patterns portrayed by these profiles. Only the data obtained from collections for detailed analysis have been employed in deriving these results. All of these collections were supervised by a Waste Auditor with the exception of those in the Cape Town CBD (catchments C, D and E) on 19 April 2000, Summer Greens (catchment G) on 25 March 2000, and Montague Gardens (catchment H) on 25 March 2000. These were not supervised because the Waste Auditor had not been informed of the collection dates. The following diagram records the collections carried out in the nine catchments during the study period:
Figure 6-1 : Record of litter collections
6-2
Marais & Armitage (2003). The measurement and reduction of urban litter entering stormwater
drainage systems. Chapter 6 : Analysis of collected data.
The data show that an analysis by mass would have been distorted by the large volumes of sand that were washed into the catchments. This was particularly so in the case of Imizamo Yethu (95% sand by mass) and Ocean View (69% sand by mass) and, to a lesser extent, Summer Greens (30%) and Montague Gardens (37%). In the Cape Town CBD catchments C, D and E, very little sand was recorded in 2000 but a large increase was noted in catchment D in 2001. Strictly sand cannot be quantified as litter although it is a problem that needs to be addressed. Construction materials, such as rubble and stone, or vegetation likewise tended to dominate the data and reduce the impact of the conventional litter items which were the focus of the study. Because of this results for each catchment are presented for the following cases: i) Excluding sand. ii) Excluding sand, stone, vegetation and rubble. iii) Vegetation only. 6.2 A : Imizamo Yethu This was one of the most difficult catchments to work in. It is a high-density low-income site-and-service residential settlement. The situation is complicated by the fact that the number of shacks is much larger than the number of serviced sites. In the absence of proper services, many households on the periphery of the settlement use the stormwater catchpits as disposal points for nightsoil and refuse. The site is also extremely dusty and a considerable quantity of sand finds its way into the drainage system. Monitoring of Imizamo Yethu officially commenced on 14 November 1999 and ended on 31 January 2002, although the first supervised clearout only took place on 16 May 2000. Considerable help was received from the drainage department of the South Peninsula Administration (SPA) throughout the monitoring period. Litter measurement in 2000 was severely affected by: i) Interference by other departments of the SPA who removed litter on at least one
occasion without permission. The quantity of litter was unrecorded. ii) Removal of traps and nets on a number of occasions. iii) Implementation of a Community Litter Management Project by the Fairest Cape
Association. Four paid educators were selected from the Community and trained by a Coordinator from the Fairest Cape Association for a six month period. A steering committee composed of the Coordinator, the four educators, representatives from the South Peninsula Administration and the Hout Bay Health Forum met on a monthly basis.

6-3
Marais & Armitage (2003). The measurement and reduction of urban litter entering stormwater
drainage systems. Chapter 6 : Analysis of collected data.
The first phase (training and awareness) involved the educators joining the SPA’s weekly cleaning rounds, clearing accumulated piles of rubbish away and educating the residents about the collection system. The second phase of the Community Project tackled recycling with prizes awarded to residents who recycled the most items (SRK Consulting, 2000).
As a result of these interventions the Project Team was unable to determine proper base-line data for Imizamo Yethu in 2000. On the other hand, the impact of the community based catchment litter management strategy facilitated by the Fairest Cape was monitored. In 2001, the baskets and net were replaced, and weekly clearouts were implemented. Particularly high quality data was obtained over the period from May 2001 to January 2002. A plan view of the study catchment in Imizamo Yethu showing the drainage system and the litter trap and net positions can be found on page D-1 of Appendix D. 6.3 B : Ocean View The Ocean View catchment is a high-density, low-income residential area with sub-economic housing and hostels. Monitoring officially commenced on 14 December 1999 and ended on 31 January 2002, although the first supervised clearout only took place on 4 May 2000. Once again, some data was lost in 2000 owing to outside interference. In 2001, the baskets and net were replaced, and bi-weekly clearouts were implemented. Particularly high quality data was obtained over the period from June 2001 to January 2002. On 11 October 2000, SRK Consulting Engineers facilitated a workshop for “Litter Management Strategy for Masiphumelele, Ocean View, Kommetjie and Imhoff’s Gift” (Report No. 279987/1) on behalf of the Cape Metropolitan Council. The Project Team attended this workshop. Subsequent to this the public in Ocean View was sensitised to the litter problem through community meetings and clean up campaigns involving the school children (see Chapter 4). The level of service provided by the local administration was extended to include the clearing of street verges which encouraged several residents to extend their gardening activities to these verges by planting and maintaining grass. There was a 37 % decrease in the amount of litter excluding sand and a 52 % decrease in the amount of sand in Ocean View in 2001 which can be attributed to these strategies. A plan view of the study catchment in Ocean View showing the drainage system and the litter trap and net positions can be found on page D-2 of Appendix D.

6-4
Marais & Armitage (2003). The measurement and reduction of urban litter entering stormwater
drainage systems. Chapter 6 : Analysis of collected data.
6.4 C, D, E : Cape Town Central Business District This is an amalgamation of three small catchments and includes a wide range of land uses inter alia; a bus depot, informal traders, parking areas, row shops, hotels, offices, the Receiver of Revenue and even a corner of the Parliamentary complex. Monitoring commenced on 15 December 1999 and ended on 17 January 2002 although the first supervised clearout only took place on 19 April 2000. A plan view of the study catchments in the Central Business District of Cape Town showing the drainage system and the litter trap and net positions can be found on page D-3 of Appendix D. In 2000 remarkably little litter found its way from this combined catchment into the catchpits considering the high density of people and the large quantities of visible litter on the ground. Further investigation showed that this was due to an extremely efficient street sweeping service. All areas within the catchment are swept twice a day during the week with targeted areas around night clubs swept a third time in the early hours of the morning after the patrons have gone home. Street sweeping removes well in excess of 95% of the litter falling on the ground within the public areas of the catchment. In the absence of data, the maximum probable efficiency of litter removal through street sweeping can be estimated with the aid of Figure 6-2 where
Fsw = average number of days between street sweeping (d) and Fs = average number of days between storms (d).
The efficiency is the total fraction of the litter load that is removed through sweeping (Armitage, 2001). In view of the extremely diverse users within the CBD catchment and the extremely efficient street sweeping service, the team recommended in 2000 that there be no intervention in this catchment. Although only a limited amount of data on street sweeping service could be obtained, it was possible to investigate the cost-effectiveness of street sweeping as a litter management option.

6-5
Marais & Armitage (2003). The measurement and reduction of urban litter entering stormwater
drainage systems. Chapter 6 : Analysis of collected data.
Figure 6-2 : Plot of estimated street sweeping efficiency against dimensionless street sweeping frequency (after Armitage, 2001)
6.5 F : Fresnaye Fresnaye is a medium to high-density upper-income residential area with both free-standing houses and blocks of flats. It was only finally equipped with traps and nets on 21 July 2000. The first supervised clearout only took place on 29 September 2000 with the last clearout on 9 January 2002. Litter was collected on a monthly basis. No catchment management strategies were implemented during the monitoring period. A plan view of the study catchments in Fresnaye showing the drainage system and the litter trap and net positions can be found on page D-4 of Appendix D.
0
0.1
0.2
0.3
0.4
0.5
0.6
0.7
0.8
0.9
1
0 0.5 1 1.5 2 2.5 3 3.5 4 4.5 5
Average number of days between street sweeping / average number of days between significant storms (Fsw/Fs)
Effic
ienc
y (f
ract
ion)
6-6
Marais & Armitage (2003). The measurement and reduction of urban litter entering stormwater
drainage systems. Chapter 6 : Analysis of collected data.
6.6 G : Summer Greens Summer Greens is a medium-density middle income residential area. Monitoring of Summer Greens officially commenced on 29 November 1999 and ended on 15 January 2002 although the first supervised clearout only took place on 15 May 2000. Some data was lost owing to the removal of the net and the odd trap. On the other hand, very little litter was ever captured. No catchment litter management strategy was implemented in 2001 in view of the very low litter volumes measured in 2000. However the local authority installed grids across the catchpit openings in the spring of 2000 which led to an 83 % reduction in the mass of stone and rubble trapped. A plan view of the study catchment in Summer Greens showing the drainage system and the litter trap and net positions can be found on page D-5 of Appendix D. 6.7 H : Montague Gardens Montague Gardens is a light industrial catchment. Monitoring of this catchment officially commenced on 29 November 1999 and ended on 14 January 2002 although the first supervised clearout only took place on 15 May 2000. In spring of 2000, the Blaauwberg Administration, without prior consultation or warning, installed grids over all catchpit entrances thus severely restricting the flow of litter into the catchpits. The Project Team thus recommended in 2000 that the monitoring of the catchpits in Montague Gardens continue and the use of grids as a litter management strategy be evaluated in 2001. This evalution was carried out during 2001. A significant reduction in litter loadings (excluding sand) from 86 kg/ha.yr in 2000 to 22 kg/ha.yr in 2001 was recorded. A plan view of the study catchment in Montague Gardens showing the drainage system and the litter trap and net positions can be found on page D-6 of Appendix D.
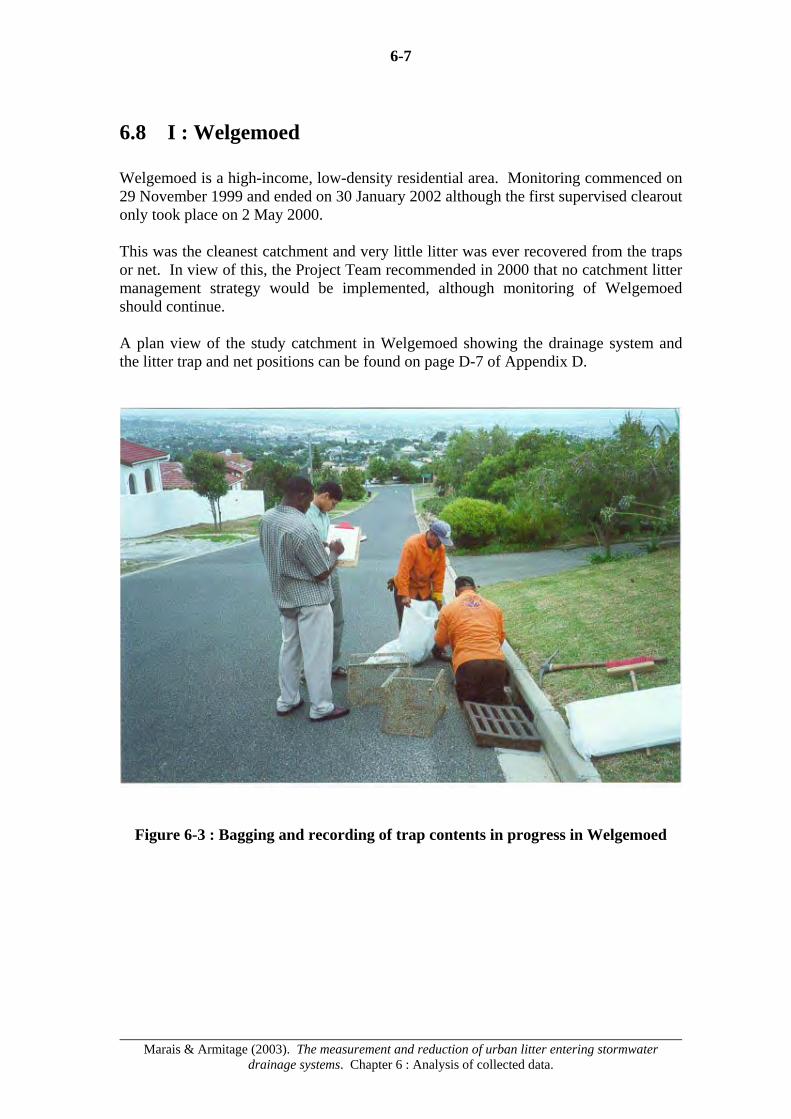
6-7
Marais & Armitage (2003). The measurement and reduction of urban litter entering stormwater
drainage systems. Chapter 6 : Analysis of collected data.
6.8 I : Welgemoed Welgemoed is a high-income, low-density residential area. Monitoring commenced on 29 November 1999 and ended on 30 January 2002 although the first supervised clearout only took place on 2 May 2000. This was the cleanest catchment and very little litter was ever recovered from the traps or net. In view of this, the Project Team recommended in 2000 that no catchment litter management strategy would be implemented, although monitoring of Welgemoed should continue. A plan view of the study catchment in Welgemoed showing the drainage system and the litter trap and net positions can be found on page D-7 of Appendix D.
Figure 6-3 : Bagging and recording of trap contents in progress in Welgemoed

6-8
Marais & Armitage (2003). The measurement and reduction of urban litter entering stormwater
drainage systems. Chapter 6 : Analysis of collected data.
6.9 Summary of findings for the pilot catchments 6.9.1 Introduction Annual litter loads are extrapolated from the data for each catchment and summarised in tabular form for each of the following cases in turn: i) Excluding sand (Table 6-1). ii) Excluding sand, stone, vegetation and rubble (Table 6-3). iii) Vegetation only (Table 6-5). The fourth, fifth and sixth columns of the above tables present the calculated annual loads for the data collection periods February to September of 2000, February 2001 to January 2002 and both data collection periods combined respectively. 6.9.2 Annual litter loads excluding sand
Catchment Name Description
Area
(ha)
Annual load 2000
(kg/ha.yr)
Annual load 2001
(kg/ha.yr)
Annual load 2000/2001 (kg/ha.yr)
Imizamo Yethu
Informal “site and service” residential area for very poor people – no street sweeping
5.3 67 55 58
Ocean View
Sub-economic residential area for poor people including both freestanding dwellings and 3-storey high-density apartment blocks – no street sweeping
11.5 130 84 102
Cape Town CBD ( C ) 6.6 69 66 67
Cape Town CBD (D) 2.0 87 56 65
Cape Town CBD (E)
Central Business District including office blocks, hotels, line shops, informal traders and a bus terminus, extensive street cleaning (up to 3 times daily) with a removal efficiency of approximately 99%
1.4 155 94 113
Fresnaye High income, medium density residential area which includes some apartments
25.4 - 62 62
Summer Greens
Medium density, medium income residential area – no street sweeping
5.3 20 11 14
Montague Gardens
Light industrial park - no street sweeping 14.1 86 22 45
Welgemoed Low density, high income residential area - no street sweeping
14.4 27 30 29
Table 6-1 : Annual litter loads excluding sand
6-9
Marais & Armitage (2003). The measurement and reduction of urban litter entering stormwater
drainage systems. Chapter 6 : Analysis of collected data.
Table 6-1 summarises the annual litter loads, where sand is excluded, for the data collection periods February to September of 2000, February 2001 to January 2002 and both data collection periods combined. Further details are provided in Appendix B : Tables B-1(a) to (c). In calculating the loads, the masses measured during the first detailed clearout of each period for each catchment were not included as the cumulative masses for the routine clearouts preceding each block of detailed clearouts were not available. Hence the calculated annual loads are extrapolated annual values based on the data monitoring periods February to September of 2000, February 2001 to January 2002 and both periods together. An interesting trend was that annual loads in three of the catchments, Ocean View, Summer Greens and Montague Gardens were considerably less in 2001 than in 2000. From Table 6-1 it can be seen that: i) The annual litter loads for most of the catchments in 2000 and 2001 fell in a
range between 20 and 87 kg/ha.yr. The exceptions were Ocean View (2000 only), Cape Town CBD (E) (the bus terminus) and Summer Greens (2001 only).
ii) There were significant decreases in litter loads in Ocean View (35%), Summer
Greens (45%) and Montague Gardens (74%) from 2000 to 2001. In Summer Greens and Montague Gardens grids were installed in the spring of 2000. SRK Consulting Engineers were involved in the initial phase of formulating a litter management strategy for the Ocean View area from late 2000.
iii) The Cape Town CBD (E) catchment, the bus terminus, had a litter load of
113 kg/ha.yr for the combined monitoring periods. This is an adjusted figure to allow for the abandoning of a number of catchpits between 2000 and 2001. This resulted from the enclosure of a portion of the roadway into a new building development. The litter loads for 2000 and 2001 were 155 kg/ha.yr and 94 kg/ha.yr respectively. The Cape Town CBD (D) catchment, which includes the Grand Parade and Lower Plein Street areas frequented by informal traders, and the Cape Town CBD (C) catchment, which consists mostly of office blocks and line shops, had litter loads which were 30% to 40% lower than those for the bus terminus. All three catchments received regular street cleaning (up to three times daily).
The litter loads for street sweeping and bins for catchment C and catchments D & E combined in Table 6-2 were extrapolated from six collections. Although the litter loads were derived from a small number of collections and there was uncertainty as to whether they were correctly allocated, they did give an indication of how much litter was generated in the CBD catchments. The masses trapped in the catchpits represented between 1 and 3% of the total and the litter loads could have been up to 100 times as great were it not for the efficiency of the street sweeping and bin collection services.

6-10
Marais & Armitage (2003). The measurement and reduction of urban litter entering stormwater
drainage systems. Chapter 6 : Analysis of collected data.
Catchment Street sweeping (kg/ha.yr)
Bins (kg/ha.yr)
Total (kg/ha.yr)
C 1 852 437 2 289 D & E 4 836 8 527 13 363
Table 6-2 : Annual litter loads for street sweeping and bin collection for the Cape
Town CBD
Figure 6-4 : Street sweeping in progress in the tourist area of Cape Town’s Grand Parade

6-11
Marais & Armitage (2003). The measurement and reduction of urban litter entering stormwater
drainage systems. Chapter 6 : Analysis of collected data.
6.9.3 Annual litter loads excluding sand, stone, vegetation and rubble Table 6-3 summarises the annual litter loads, where sand, stone, vegetation and rubble are excluded, for the data collection periods February to September of 2000, February 2001 to January 2002 and both data collection periods combined. More details are given in Appendix B :Tables B-2(a) to (c).
Catchment Name Description
Area
(ha)
Annual load 2000
(kg/ha.yr)
Annual load 2001
(kg/ha.yr)
Annual load 2000/2001 (kg/ha.yr)
Imizamo Yethu
Informal “site and service” residential area for very poor people – no street sweeping
5.3 59 40 45
Ocean View
Sub-economic residential area for poor people including both freestanding dwellings and 3-storey high-density apartment blocks – no street sweeping
11.5 72 19 41
Cape Town CBD ( C ) 6.6 42 14 23
Cape Town CBD (D) 2.0 46 10 22
Cape Town CBD (E)
Central Business District including office blocks, hotels, line shops, informal traders and a bus terminus, extensive street sweeping (up to 3 times daily) with a removal efficiency of approximately 99%
1.4 111 35 59
Fresnaye High income, medium density residential area which includes some apartments
25.4 - 0 0
Summer Greens
Medium density, medium income residential area - no street sweeping
5.3 6 6 6
Montague Gardens
Light industrial park - no street sweeping 14.1 51 14 28
Welgemoed Low density, high income residential area - no street sweeping
14.4 0 0 0
Table 6-3 : Annual litter loads excluding sand, stone, vegetation and rubble
A comparison of Tables 6-1 and 6-3 shows that: i) The ranking of the catchments with respect to litter loads changes when stone,
rubble and vegetation are omitted in addition to sand. This is illustrated for the monitoring period February 2001 to January 2002 in Table 6-4:

6-12
Marais & Armitage (2003). The measurement and reduction of urban litter entering stormwater
drainage systems. Chapter 6 : Analysis of collected data.
Annual load (kg/ha.yr)
Ranking (from lowest to highest)
Catchment Name Description Excluding
sand
Excluding sand, stone,
vegetation and rubble
Excluding Sand
Excluding sand, stone,
vegetation and rubble
Imizamo Yethu
Informal “site and service” residential area for very poor people – no street sweeping
55 40 4 9
Ocean View
Sub-economic residential area for poor people including both freestanding dwellings and 3-storey high-density apartment blocks – no street sweeping
84 19 8 7
Cape Town CBD ( C ) 66 14 7 5
Cape Town CBD (D) 56 10 4 4
Cape Town CBD (E)
Central Business District including office blocks, hotels, line shops, informal traders and a bus terminus, extensive street sweeping (up to 3 times daily) with a removal efficiency of approximately 99%
94 35 9 8
Fresnaye High income, medium density residential area which includes some apartments
62 0 6 1
Summer Greens
Medium density, medium income residential area - no street sweeping
11 6 1 3
Montague Gardens
Light industrial park - no street sweeping 22 14 2 6
Welgemoed Low density, high income residential area - no street sweeping
30 0 3 1
Table 6-4 : Ranking of catchments in terms of increasing litter load : February
2001 to January 2002 ii) With the exception of Ocean View in 2000 an increase in income level was
generally matched by a decrease in litter load in the residential areas when sand, stone rubble and vegetation were omitted (Table 6-3). This trend was particularly marked between low (Imizamo Yethu) and medium income catchments (Summer Greens) where litter loads were 45 and 6 kg/ha.yr respectively for the combined period. An explanation for this is that formal residential areas generally receive a reliable and effective household refuse removal service while informal areas do not. Also, as income rises, population density decreases resulting in fewer people to litter. The litter load in Imizamo Yethu is over seven times that in Summer Greens when measured per unit area whereas it is only double when measured per person (0.10 and 0.05 kg/person.yr in Imizamo Yethu and Summer Greens respectively).
iii) The effect of omitting vegetation, stone and rubble in addition to sand is
particularly marked in Ocean View where the litter load drops by 54% and in Fresnaye and Welgemoed where it effectively drops to zero.
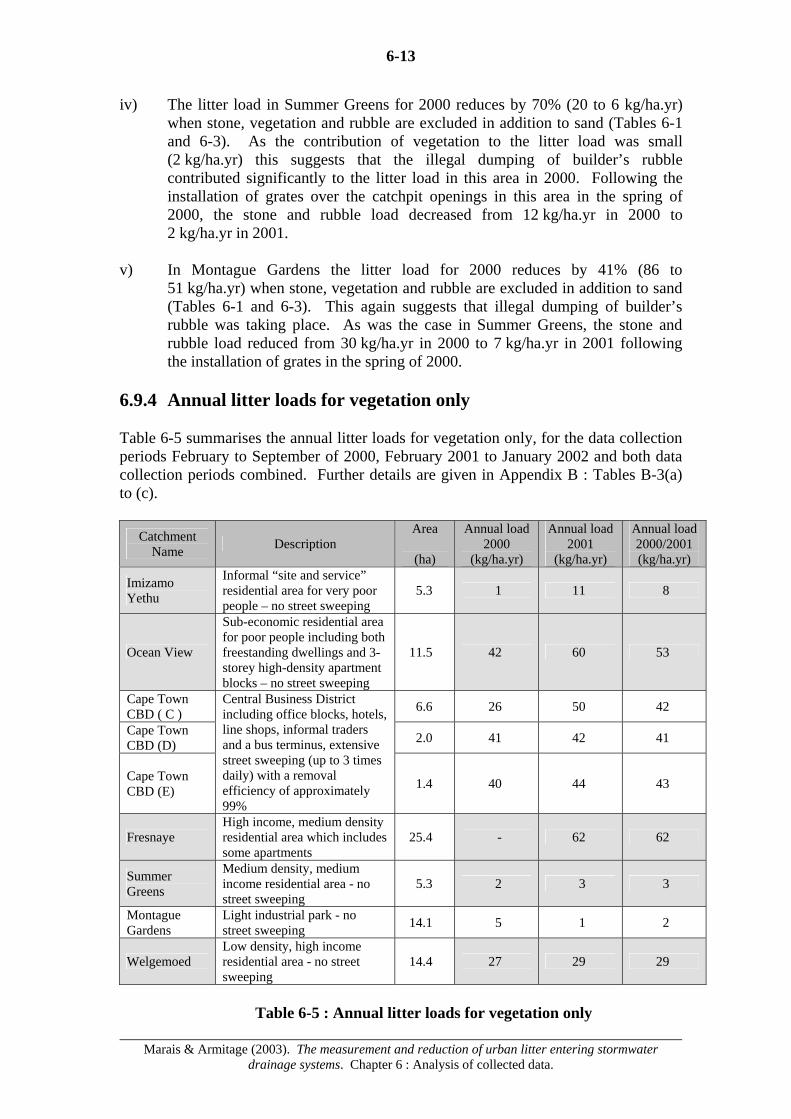
6-13
Marais & Armitage (2003). The measurement and reduction of urban litter entering stormwater
drainage systems. Chapter 6 : Analysis of collected data.
iv) The litter load in Summer Greens for 2000 reduces by 70% (20 to 6 kg/ha.yr) when stone, vegetation and rubble are excluded in addition to sand (Tables 6-1 and 6-3). As the contribution of vegetation to the litter load was small (2 kg/ha.yr) this suggests that the illegal dumping of builder’s rubble contributed significantly to the litter load in this area in 2000. Following the installation of grates over the catchpit openings in this area in the spring of 2000, the stone and rubble load decreased from 12 kg/ha.yr in 2000 to 2 kg/ha.yr in 2001.
v) In Montague Gardens the litter load for 2000 reduces by 41% (86 to
51 kg/ha.yr) when stone, vegetation and rubble are excluded in addition to sand (Tables 6-1 and 6-3). This again suggests that illegal dumping of builder’s rubble was taking place. As was the case in Summer Greens, the stone and rubble load reduced from 30 kg/ha.yr in 2000 to 7 kg/ha.yr in 2001 following the installation of grates in the spring of 2000.
6.9.4 Annual litter loads for vegetation only Table 6-5 summarises the annual litter loads for vegetation only, for the data collection periods February to September of 2000, February 2001 to January 2002 and both data collection periods combined. Further details are given in Appendix B : Tables B-3(a) to (c).
Catchment Name Description
Area
(ha)
Annual load 2000
(kg/ha.yr)
Annual load 2001
(kg/ha.yr)
Annual load 2000/2001 (kg/ha.yr)
Imizamo Yethu
Informal “site and service” residential area for very poor people – no street sweeping
5.3 1 11 8
Ocean View
Sub-economic residential area for poor people including both freestanding dwellings and 3-storey high-density apartment blocks – no street sweeping
11.5 42 60 53
Cape Town CBD ( C ) 6.6 26 50 42
Cape Town CBD (D) 2.0 41 42 41
Cape Town CBD (E)
Central Business District including office blocks, hotels, line shops, informal traders and a bus terminus, extensive street sweeping (up to 3 times daily) with a removal efficiency of approximately 99%
1.4 40 44 43
Fresnaye High income, medium density residential area which includes some apartments
25.4 - 62 62
Summer Greens
Medium density, medium income residential area - no street sweeping
5.3 2 3 3
Montague Gardens
Light industrial park - no street sweeping 14.1 5 1 2
Welgemoed Low density, high income residential area - no street sweeping
14.4 27 29 29
Table 6-5 : Annual litter loads for vegetation only

6-14
Marais & Armitage (2003). The measurement and reduction of urban litter entering stormwater
drainage systems. Chapter 6 : Analysis of collected data.
From Table 6-5 it can be seen that Summer Greens had a surprisingly low vegetation load for a residential area. This may have been due to the lack of deciduous trees and well-developed gardens in this comparatively recently developed suburb. 6.9.5 Composition of litter for each catchment Tables 6-6 and 6-7 summarise the percentage contributions in terms of mass for the main litter categories for all analysed collections in each of the nine catchments for the following two cases: i) Excluding sand. ii) Excluding sand, stone, vegetation and rubble. The “miscellaneous” category in Table 6-6 includes rubble and stone.
Main Category (% by mass) Catchment
Name Plastic Paper Metal Glass Vegetation Miscellaneous Imizamo Yethu 40 7 6 1 11 35 Ocean View 16 5 2 0 51 26 Cape Town CBD ( C) 13 5 3 1 65 13 Cape Town CBD (D) 10 4 2 1 66 17 Cape Town CBD (E) 11 5 4 2 40 38 Fresnaye 0 0 0 0 99 1 Summer Greens 8 9 3 3 20 57 Montague Gardens 14 6 2 2 5 71 Welgemoed 0 0 0 0 99 1
Table 6-6 : Composition of litter in terms of percentage by mass excluding sand
Main Category (% by mass) Catchment
Name Plastic Paper Metal Glass Miscellaneous Imizamo Yethu 50 9 8 2 31 Ocean View 40 12 6 1 41 Cape Town CBD ( C) 40 15 10 3 32 Cape Town CBD (D) 35 13 6 3 43 Cape Town CBD (E) 20 8 6 3 63 Fresnaye 42 23 10 10 15 Summer Greens 19 21 7 6 47 Montague Gardens 23 10 3 3 61 Welgemoed 38 53 7 0 2
Table 6-7 : Composition of litter in terms of percentage by mass excluding sand,
stone, vegetation and rubble
6-15
Marais & Armitage (2003). The measurement and reduction of urban litter entering stormwater
drainage systems. Chapter 6 : Analysis of collected data.
A general trend is that the percentage contribution of plastic to the litter load rose in all catchments from 2000 to 2001. If the “miscellaneous” category is excluded from Table 6-7, the main category responsible for the largest contribution to the litter load in all the catchments, except Summer Greens and Welgemoed, is plastic. In those catchments the category responsible for the largest contribution is paper. From Table 6-6 it can be seen that in Welgemoed and Fresnaye, vegetation accounted for 99% of the total litter load where sand was excluded. 6.9.6 Principal findings The principal findings from the analysis of the data are: i) Comparison of the data from 2000 and 2001 shows that the contribution of
plastic to the litter load increased across all the catchments. ii) There appears to be an inverse relationship between income and litter loadings
in residential areas when garden refuse is excluded. This is largely due to the more effective and reliable household refuse removal service received by affluent areas. However when litter loadings are measured and compared per unit area rather than per person, this relationship is exaggerated as a result of the tendency for population density to decrease with increasing income.
iii) The installation of grids over catchpit openings resulted in a significant decrease
in the amount of litter trapped in catchpits in Summer Greens and Montague Gardens.
iv) There was a significant reduction in litter loads in Ocean View during the
monitoring period. The sensitizing of the community to littering issues from the end of 2000 and a more frequent and comprehensive litter removal service by the local authority are plausible reasons for this improvement.
v) Sand entering the catchpits is a major problem in many catchments as it tends to
become entrained in other litter such as plastic bags resulting in blockages and flooding of the stormwater system. The problem is particularly acute in informal areas such as Imizamo Yethu which have very little ground cover to stabilise the soil.
vi) Street sweeping is an extremely effective method of reducing the quantity of
litter reaching the stormwater system as has been demonstrated in the Cape Town Central Business District.
vii) Construction rubble is a significant contributor to the waste stream. Catchpit
grids are an effective way of reducing the amount of rubble entering the stormwater drainage system.
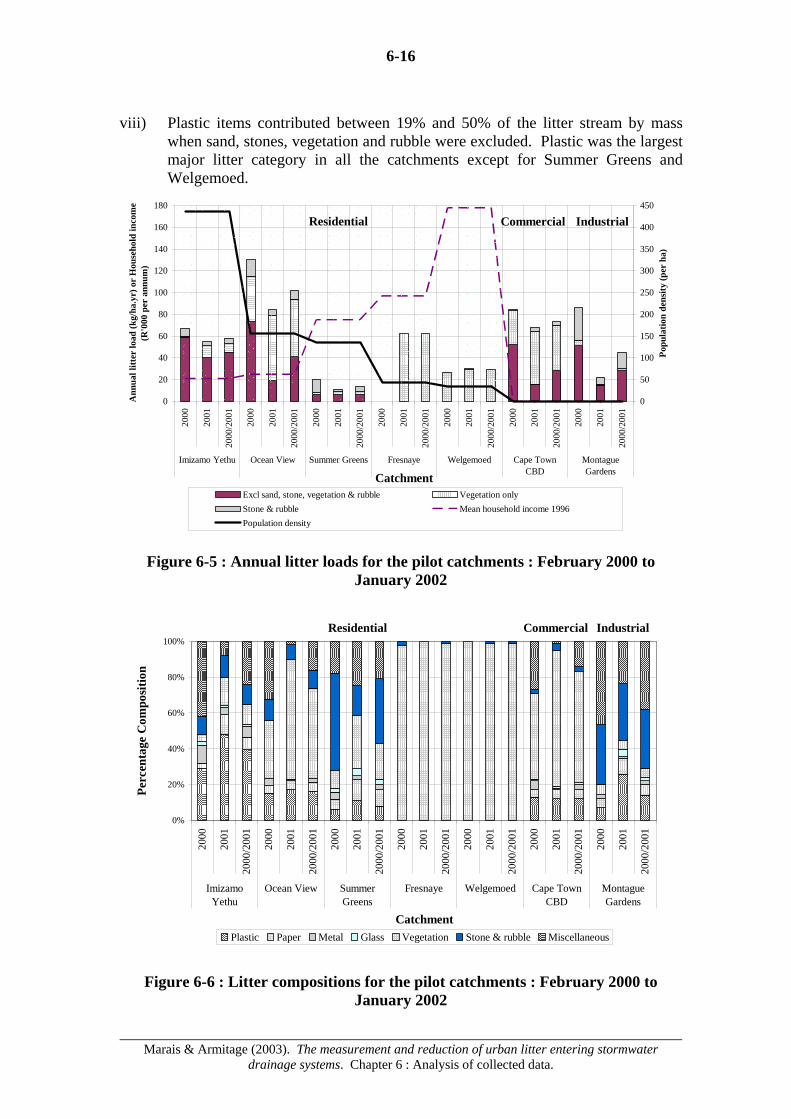
6-16
Marais & Armitage (2003). The measurement and reduction of urban litter entering stormwater
drainage systems. Chapter 6 : Analysis of collected data.
viii) Plastic items contributed between 19% and 50% of the litter stream by mass
when sand, stones, vegetation and rubble were excluded. Plastic was the largest major litter category in all the catchments except for Summer Greens and Welgemoed.
0
20
40
60
80
100
120
140
160
180
2000
2001
2000
/200
1
2000
2001
2000
/200
1
2000
2001
2000
/200
1
2000
2001
2000
/200
1
2000
2001
2000
/200
1
2000
2001
2000
/200
1
2000
2001
2000
/200
1
Imizamo Yethu Ocean View Summer Greens Fresnaye Welgemoed Cape TownCBD
MontagueGardensCatchment
Ann
ual l
itter
load
(kg/
ha.y
r) o
r H
ouse
hold
inco
me
(R'0
00 p
er a
nnum
)
0
50
100
150
200
250
300
350
400
450
Popu
latio
n de
nsity
(per
ha)
Excl sand, stone, vegetation & rubble Vegetation onlyStone & rubble Mean household income 1996Population density
Residential Commercial Industrial
Figure 6-5 : Annual litter loads for the pilot catchments : February 2000 to January 2002
0%
20%
40%
60%
80%
100%
2000
2001
2000
/200
1
2000
2001
2000
/200
1
2000
2001
2000
/200
1
2000
2001
2000
/200
1
2000
2001
2000
/200
1
2000
2001
2000
/200
1
2000
2001
2000
/200
1
ImizamoYethu
Ocean View SummerGreens
Fresnaye Welgemoed Cape TownCBD
MontagueGardens
Catchment
Perc
enta
ge C
ompo
sitio
n
Plastic Paper Metal Glass Vegetation Stone & rubble Miscellaneous
Residential Commercial Industrial
Figure 6-6 : Litter compositions for the pilot catchments : February 2000 to January 2002
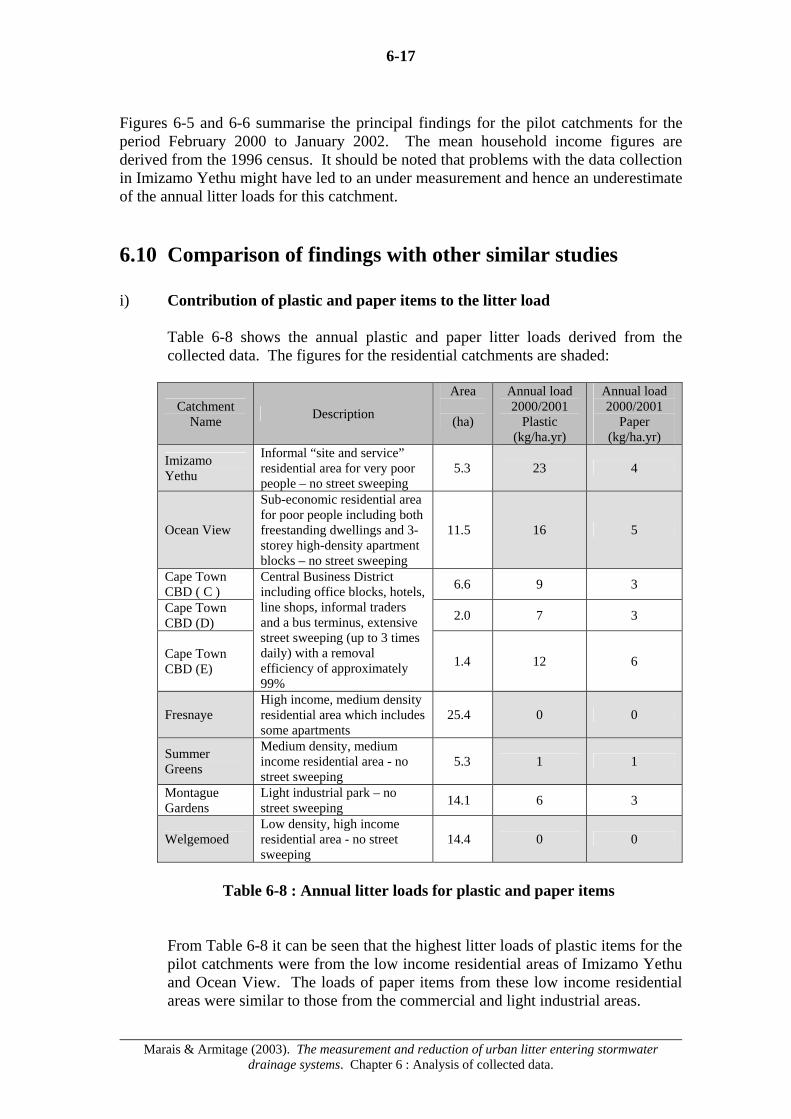
6-17
Marais & Armitage (2003). The measurement and reduction of urban litter entering stormwater
drainage systems. Chapter 6 : Analysis of collected data.
Figures 6-5 and 6-6 summarise the principal findings for the pilot catchments for the period February 2000 to January 2002. The mean household income figures are derived from the 1996 census. It should be noted that problems with the data collection in Imizamo Yethu might have led to an under measurement and hence an underestimate of the annual litter loads for this catchment. 6.10 Comparison of findings with other similar studies i) Contribution of plastic and paper items to the litter load
Table 6-8 shows the annual plastic and paper litter loads derived from the collected data. The figures for the residential catchments are shaded:
Catchment Name Description
Area
(ha)
Annual load 2000/2001
Plastic (kg/ha.yr)
Annual load 2000/2001
Paper (kg/ha.yr)
Imizamo Yethu
Informal “site and service” residential area for very poor people – no street sweeping
5.3 23 4
Ocean View
Sub-economic residential area for poor people including both freestanding dwellings and 3-storey high-density apartment blocks – no street sweeping
11.5 16 5
Cape Town CBD ( C ) 6.6 9 3
Cape Town CBD (D) 2.0 7 3
Cape Town CBD (E)
Central Business District including office blocks, hotels, line shops, informal traders and a bus terminus, extensive street sweeping (up to 3 times daily) with a removal efficiency of approximately 99%
1.4 12 6
Fresnaye High income, medium density residential area which includes some apartments
25.4 0 0
Summer Greens
Medium density, medium income residential area - no street sweeping
5.3 1 1
Montague Gardens
Light industrial park – no street sweeping 14.1 6 3
Welgemoed Low density, high income residential area - no street sweeping
14.4 0 0
Table 6-8 : Annual litter loads for plastic and paper items
From Table 6-8 it can be seen that the highest litter loads of plastic items for the pilot catchments were from the low income residential areas of Imizamo Yethu and Ocean View. The loads of paper items from these low income residential areas were similar to those from the commercial and light industrial areas.
6-18
Marais & Armitage (2003). The measurement and reduction of urban litter entering stormwater
drainage systems. Chapter 6 : Analysis of collected data.
If these low income residential areas are excluded it can be seen that higher loads of plastic and paper items were transported to drainage systems from commercial than residential or light industrial areas. This trend was also suggested by the Coburg Study, Australia (see section 2.6.2) which however did not include low income residential areas. The Marine Litter Study carried out in Cape Town (see section 2.8.2) found that the lowest annual load of plastic items was from the upper income residential area of Milnerton (approximately 1 kg/ha.yr) while both the industrial area of Paarden Eiland (74 kg/ha.yr) and the mixed commercial and residential area of Sea Point (5 kg/ha.yr) had higher annual loads. When sand, stones, vegetation and rubble were excluded the percentage contribution by mass of plastic items ranged from 19 to 50% for the pilot catchments (Table 6-7). The comparative figures were 33 to 60% for the Coburg Study and 34 to 57% for the Marine Litter Study.
ii) Annual litter loads and land-use
The annual litter loads for the residential pilot catchments, excluding sand, stones, vegetation and rubble, ranged from 0 to 72 kg/ha.yr (Table 6-3). However the range reduces to 0 to 6 kg/ha.yr if the low income residential areas of Imizamo Yethu and Ocean View are excluded. This compares with 0.5 kg/ha.yr obtained for the residential catchments in Auckland (see section 2.6.3) and 4 kg/ha.yr for the residential area of Milnerton under the Marine Litter Study (see section 2.8.2). The annual litter loads for the light industrial area of Montague Gardens were 51 kg/ha.yr in 2000, 14 kg/ha.yr in 2001 and 28 kg/ha.yr for the combined period 2000/2001. The latter figure compares with the annual litter load for the entire Coburg catchment of 30 kg/ha.yr but is orders of magnitude greater than the figure of 0.9 kg/ha.yr for the industrial areas in Auckland. On the other hand the comparative figure for the industrial area of Paarden Eiland under the Marine Litter Study was 138 kg/ha.yr (see section 2.8.2), which is more than double that for Montague Gardens in 2000. For the Springs Study (see section 2.8.1), where the catchment was 85% commercial and industrial, the comparative figure was 82 kg/ha.yr. The annual litter loads for the commercial areas in the Cape Town CBD ranged from 42 to 111 kg/ha.yr in 2000 and 23 to 59 kg/ha.yr in 2001. This compares with the figure for the Springs Study catchment of 82 kg/ha.yr but is again an order of magnitude greater than the figure for the Auckland commercial catchments of 1.3 kg/ha.yr. A general observation is that litter loads in Auckland (New Zealand) appear to be an order of magnitude lower than in the equivalent pilot catchments in the Cape Metropolitan Area.
6-19
Marais & Armitage (2003). The measurement and reduction of urban litter entering stormwater
drainage systems. Chapter 6 : Analysis of collected data.
iii) Sand and sediment in the stormwater system
In the pilot catchments, sand contributed as much as 96% and 71% of the litter loads in Imizamo Yethu and Ocean View respectively in 2000. Although the study in Bamako (see section 2.7.2) measured household and market refuse quantities rather than the litter quantities entering the stormwater system, it does attest to the problem of sand and sediment in low income informal areas. In Bamako the percentage contribution from soil in the lowest income areas was 56%.
iv) Garden refuse
Garden refuse contributed 99% of the litter load, where sand was excluded, in the high income residential areas of Fresnaye and Welgemoed. A similar finding was made in Coburg (see section 2.6.2) where garden refuse contributed 85% of the litter load.
6.11 Conclusions The principal findings from the analysis of the data are set out in detail in section 6.9.6. The following are conclusions relating to the analysis process and comparisons of the results with other similar studies: i) An analysis of litter by mass can be distorted by large volumes of sand that may
wash into sampling traps. Construction materials, such as rubble and stone, or vegetation can likewise dominate the data and reduce the impact of the conventional litter items. Because of this results should be analysed at least for the following cases:
• Excluding sand.
• Excluding sand, stone, vegetation and rubble.
• Vegetation only.
ii) The installation of litter traps and the monitoring and analysis of the quantities
and composition of the litter trapped on a regular and consistent basis, is a practical way of determining the impacts of catchment litter strategies implemented during the course of the monitoring. It is important that there is ongoing communication between all role players involved in litter strategies and programmes so that all possible factors contributing to a change in littering patterns are taken into account in the analysis.

6-20
Marais & Armitage (2003). The measurement and reduction of urban litter entering stormwater
drainage systems. Chapter 6 : Analysis of collected data.
iii) Plastic items are a major and increasing contributor to the litter load. Moreover
their detrimental aesthetic impact and effect on aquatic wildlife far outweigh their contribution by mass. Special attention should therefore be paid to measuring plastic items and developing strategies to reduce their contribution to litter loads.
iv) Litter loads in low income informal residential areas are likely to be
considerably higher than those in formal residential areas largely as a result of inferior and irregular refuse collection services. A high priority therefore should be given to improving refuse collection services in low income areas. Inhabitants should be informed of the workings of the refuse collection service and the dangers to health and the environment of littering. They should also be encouraged to reduce their quantities of refuse through recycling or composting.
v) Litter loads in middle and high income formal residential areas are likely to be
considerably lower than in informal low income residential, commercial or industrial areas. And this is despite street sweeping only rarely taking place in the residential areas. The low litter loads are probably due to the efficient and regular refuse collection services in these areas, although community awareness of the environmental consequences of littering is also likely to be strong. This leads to the conclusion that further interventions in middle and high income residential areas to achieve reductions in litter loads should be given a low priority provided current standards of refuse collection services are maintained. Nevertheless encouraging recycling of plastic items and composting of garden refuse may effect further reductions.
vi) Garden refuse can be expected to be a major contributor to litter loads in South
African high income residential areas (more than 90% by mass). It is important that a separate collection service for garden refuse in high income residential areas be retained and residents encouraged to compost organic materials.

Marais & Armitage (2003). The measurement and reduction of urban litter entering stormwater drainage
systems. Part 3 : Litter Management Strategies.
Part 3 : Litter Management Strategies

7-1
Marais & Armitage (2003). The measurement and reduction of urban litter entering stormwater
drainage systems. Chapter 7 : Review of available litter management strategies.
7. Towards a litter management strategy 7.1 Introduction Without an integrated catchment management strategy composed of planning controls (restricting litter generating activities to areas where their impact can most effectively be controlled and reduced), source controls (reducing litter loads deposited in the catchment or entering the drainage system through inter alia education and enforcement programmes) and structural controls (removal of solid wastes from the drainage system), the problem of urban litter cannot be addressed in an effective and sustainable manner. As Senior (1992) comments “it is not just the nature of the items themselves, nor the demands of retailers and manufacturers which are to blame, it is us, the community, whose behaviour, attitude and awareness are fundamental to the problem.” 7.2 Review of litter management techniques The integrated catchment management strategies and litter management techniques should be evaluated on the basis of cost-effectiveness (cost of measures in relation to reducing risk), capability (capacity of the local authority or community in terms of sufficent resources, expertise or powers to implement them) and opportunity (there may be practical restraints preventing a trap from being installed at a particular location for example) (Victoria Stormwater Committee, 1999).
Figure 7-1 : Components of an integrated catchment management strategy
Land-use planning
Urban design
Stormwater treatment
Education and awareness
Land management
Litter traps Structural controls
Source controls
Planning controls
Integrated catchment management strategy
7-2
Marais & Armitage (2003). The measurement and reduction of urban litter entering stormwater
drainage systems. Chapter 7 : Review of available litter management strategies.
7.2.1 Planning controls Planning controls are aimed at adopting land-use policies which: • preserve existing valuable elements of the stormwater system, such as natural
channels, wetlands and riparian vegetation by restricting the use of such areas; and
• minimise the risk of litter reaching the drainage system by situating litter
producing activities in areas where it is possible to contain and control litter accumulation more easily.
Requiring pollution control measures as part of any development application is an example of such a planning control (Canterbury Urban Runoff Taskforce, 1990). 7.2.2 Source controls Source controls are aimed at reducing the litter loads entering the drainage system by dealing with pollution at source. These are the focus of this particular study and can be grouped into the following broad categories: i) Cleansing operations. Source control measures for local government activities
that may effect stormwater quality. These include:
• better placement and design of litter bins, • more frequent collections of litter, • monitoring of street sweeping methods to ensure that litter is not swept
into catchpits, and • placing of communal collection depots to concentrate litter – this may
also be a possible way of creating jobs.
ii) Construction activity. Developing site management plans to avoid contaminant spills and rubble reaching the drainage system and best practices to implement them. Such plans should include a description of measures to mitigate pollution threats to stormwater.
iii) Business surveys. Carrying out surveys to determine the nature and extent of
business activities likely to generate litter that reaches the stormwater system. This can lead to encouraging manufacturers:
• to move to more environmentally friendly packaging and • to pay deposits on returned containers thus providing an incentive for
recycling.

7-3
Marais & Armitage (2003). The measurement and reduction of urban litter entering stormwater
drainage systems. Chapter 7 : Review of available litter management strategies.
An example of a successful South African recycling campaign is Collect-a Can. In 1999, by enlisting the help of the community, some 40 000 collectors recovered 63% of all used beverage cans, selling them to Collect-a-Can’s depots and making the can the most recycled packaging in Africa (Institution of Municipal Engineering in Southern Africa, 2000).
iv) Education. Campaigns targeted at businesses and households to reduce litter by informing them how the streets, stormwater drainage system, rivers and oceans are interconnected and how daily activities affect stormwater quality (Victoria Stormwater Committee, 1999). The rationale behind these campaigns is that it is “a better investment to educate litterers out of their habit than to go around just picking up after them” (Florida Centre For Solid And Hazardous Waste Management, 1998). Such campaigns include: • educational programmes aimed at changing people’s behaviour, • cleanup campaigns which serve the dual purpose of creating awareness
and reducing the amount of litter, • direct contact with community groups eg. Chambers of Commerce,
service organisations, • “adopt-a-block” programmes, and • encouraging separation of litter into different types so homeless people
can collect the recyclable material (Pressend, 1998). Examples of education campaigns and programmes are (Florida Center for Solid and Hazardous Waste Management, 1998, Canterbury Urban Runoff Taskforce, 1990 and Cape Metropolitan Council, 1999): • Storm drain stencilling involves volunteer efforts to stencil anti-litter
messages on storm drains. The focus is to educate citizens about the direct connections between storm drains and waterways (Florida).
• Xeriscape/Beautification is a programme that addresses litter prevention
through beautification. The programme encourages beautification through landscaping practices that benefit the environment (Florida).
• “Bag it on buses” is a programme that can be instituted on school buses
and public transportation vehicles. Litter receptacles with plastic liners are located on the buses and maintained by volunteers or clubs. The program educates the public about proper waste disposal (Florida).
• Highway billboards with anti-littering messages seemed to reach the
highest number of people (Evansville, Indiana). • Logo’s painted on catchpits encouraging residents not to litter
(Canterbury, NSW, Australia).

7-4
Marais & Armitage (2003). The measurement and reduction of urban litter entering stormwater
drainage systems. Chapter 7 : Review of available litter management strategies.
• Educational material included with rates notices (Canterbury, NSW,
Australia). • Distribution of posters with an environmental theme to interest groups
(Canterbury, NSW, Australia). • International Coastal Cleanup: 3 644 volunteers took part in the ’98
cleanup in the Western Cape and filled 10 624 bags from 374 kilometres of beaches with an estimated weight of 30 726 kilograms (Western Cape).
v) Enforcement. Measures that can be taken to complement the education and
other management programmes. These include:
• pollution “hot-lines” to permit the general public to report cases of littering,
• increasing the number of personnel enforcing anti-litter legislation, and
• taxes on types of items that are considered likely to be major
contributors to the litter stream. Examples are (Florida Center for Solid and Hazardous Waste Management, 1998): • “Trash troopers” which is a programme that coordinates volunteer litter
patrol officers (Florida). • “Don’t Be A Litterbug” : Public service announcements explaining how
litter affects the environment and listing a toll-free hotline that anyone can call to report the sighting of someone littering. (Started in March 1997). A letter is sent to the litterer explaining the effects of litter on Pennsylvania’s economy with a litter bag for the car (Pennsylvania).
• Clean Communities Act (1986) funded by a tax on items determined to
be most likely to become litter. Manufacturers pay 1% of sales within New Jersey. Retailers with annual in-state sales of more than $250 000 pay 0.000225%; retailers whose annual sales of these items is under $250 000 are exempt (New Jersey).
• Returnable Container Law (1982). Enforces a deposit of at least 5c on
beer, soft drink, wine cooler, mineral and soda water containers. A 1.5% handling fee is paid by the distributor to the dealer or operator. The redemption rate was about 76% in 1996 (New York).
7-5
Marais & Armitage (2003). The measurement and reduction of urban litter entering stormwater
drainage systems. Chapter 7 : Review of available litter management strategies.
7.2.3 Structural controls These are aimed at intercepting or removing solid wastes after they have enter the drainage system by installing structures such as traps, nets or diversion systems in the stormwater system. WRC Report TT 95/98 “The removal of urban litter from stormwater conduits and streams” focuses on the use of these litter removal structures (Armitage et al, 1998). 7.3 Applicable litter management techniques and their
achievability in the pilot catchments Although there has been considerable research in several countries into the problems of pollution in urban drainage systems much of this has been concentrated on the more technically rewarding aspects of sedimentology, water chemistry and design of litter removal devices. Many studies in Western Europe and much of North America have dealt with combined sewer systems and are therefore of little significance to South Africa. In common with South Africa, Australia, New Zealand and parts of the United States have separate stormwater and foul sewer systems. California and the South Eastern and South Western states of Australia also have similar weather patterns to the Western Cape with warm, dry summers and cool, wet winters. However the extreme non-homogeneity of the population in terms of income, culture and levels of education sets South Africa and, to a lesser degree, California apart. South African cities are probably closer in character to many American urban areas than to Australian or New Zealand urban areas which are characterised by homogeneous living standards. Average literacy levels are much lower in South Africa which may render ineffective information and education campaigns which have proved successful elsewhere. Litter problems peculiar to very low income areas where people are housed in informal structures are not generally encountered in the comparatively affluent societies of Australia, New Zealand and the United States of America. Bags and bins emptied by vagrants, children, dogs etc. are identified as sources of litter in Cape Town (Pressend, 1998) but not in Melbourne, Auckland or Cincinatti. Many South African neighbourhoods, excepting central business districts, suffer from rudimentary or minimal levels of municipal servicing not experienced in Australia, New Zealand or the United States. Despite these dissimilarities South Africa shares a common “throw away” culture with these first world societies. Local aesthetic sensibilities are to a lesser or greater extent influenced by American trends which have become global through the evangelising power of cinema and television. The local packaging industry is as sophisticated as in Australia and America. South Africans enjoy all the conveniences of modern packaging, automated banking and fast food establishments with their potential to add significantly to the litter stream as their counterparts. Consequently the extensive research carried out in Australia, New Zealand and America has some value for South Africa. Likewise many of the litter management techniques listed in the previous section are likely to be of application to South African urban drainage systems.
7-6
Marais & Armitage (2003). The measurement and reduction of urban litter entering stormwater
drainage systems. Chapter 7 : Review of available litter management strategies.
7.3.1 Cleansing options i) Better placement and design of litter bins. There is agreement that a poor
litter bin design which is susceptible to vandalism or allows the wind or scavenging animals to remove litter from the bin should be avoided. The City of Cape Town is currently testing a litter bin prototype in an attempt to overcome these problems. However Australian studies have shown that providing additional litter bins does not necessarily reduce the amount of litter reaching the stormwater system (Australian Bureau of Statistics, 1999). The rationale is that littering is an anti-social behaviour which is not influenced by the presence of litter bins. The corollary is that people who don’t generally litter will carry litter with them, even if it is a fairly long distance, until they find a litter bin in which to deposit it. Observed in Melbourne, these hypotheses need to be tested for their universal validity in all the catchments with high levels of pedestrian traffic.
ii) More frequent collections of litter. There is universal agreement that the most
effective way to reduce litter is effective refuse removal. Unfortunately most South African local authorities do not have the resources to increase the frequency of their litter collections. There may be a possibility of redistributing the collection effort based on an analysis of where the greatest needs are without increasing the resources needed to do so. Imposing recycling levies on businesses could finance additional litter collections.
iii) Monitoring of street sweeping methods. The scope of this option is limited to
those areas, generally commercial districts in South Africa, where street sweeping is carried out on a regular basis such as the Cape Town Central Business District. For example it could be ascertained whether litter was being swept into catchpits rather than picked up and carted away.
iv) Placing of communal collection depots to concentrate litter. The
establishment of community based litter collection to communal depots is an option which could create jobs in areas with high unemployment such as Imizamo Yethu and possibly Ocean View. The local authority would in turn collect from these depots. Savings in collection and transport costs from the depots to the municipal waste dump sites could be achieved through reducing litter volumes by removing recyclable materials. This would provide a further source of income to the local community.
7.3.2 Options related to construction activity Informal areas such as Imizamo Yethu are characterised by ongoing informal construction activities which often destabilise areas leading to erosion, silting of catchpits and also generate rubble. In such areas it is difficult to insist on site management plans from the builders and even more difficult to police them. Existing bylaws do provide some control and protection where construction follows a formal route. There are insufficient municipal staff to police construction sites, however, and whatever action is taken must of necessity be reactive since the pollution has already occurred.

7-7
Marais & Armitage (2003). The measurement and reduction of urban litter entering stormwater
drainage systems. Chapter 7 : Review of available litter management strategies.
7.3.3 Options involving businesses i) Moving to more environmentally friendly packaging. If it can be shown that
the packaging of a particular product adds significantly to the litter stream it may be possible to persuade businesses to change their packaging to more environmentally friendly options or reduce its bulk by taxing them for packaging that is not biodegradable or recyclable. This strategy is applicable to all the catchments but particularly to those where there are fast-food outlets and high levels of pedestrian traffic such as the Cape Town CBD and Montague Gardens.
ii) Deposits on returned containers. If it can be shown that a particular type of
container is a major component of the litter stream, businesses can be pressured into using recyclable containers by imposing levies for containers that are not recyclable and by offering incentives such as deposits for the return of recyclable containers. This strategy is applicable to all the catchments but particularly to those where there are fast-food outlets and high levels of pedestrian traffic such as the CBD and Montague Gardens.
7.3.4 Educational options Education is an essential component of the litter prevention partnership. Its purpose is to motivate the participants, including people in the judicial system, law enforcement, local authority departments, private industry, and the public. Educational programmes will have to be tailored to the particular target group in each catchment. Some examples of educational strategies include: i) Cleanup programmes and storm drain stencilling which may be appropriate
for school children in residential catchments such as Imizamo Yethu, Ocean View, Fresnaye, Summer Greens and Welgemoed where the cooperation of local schools can be obtained. If those involved are paid, it may also be useful in reaching adults in areas with high unemployment such as Imizamo Yethu. Attempting to involve adults who work in the CBD or Montague Gardens in these kinds of programmes is impractical.
ii) “Adopt-a-block” programmes are good candidates for the Central Business
District and Montagu Gardens where businesses can be co-opted by virtue of garnering favourable publicity and increasing their customer base by improving their surroundings.
iii) Providing litter receptacles on buses and taxis reaches commuters who use
public transport only. Such a campaign could be successful in the CBD, Montagu Gardens and the medium and low income residential areas of Summer Greens, Imizamo Yethu and Ocean View. It is not likely to reach many residents in Fresnaye or Welgemoed who do not generally make use of public transport.
7-8
Marais & Armitage (2003). The measurement and reduction of urban litter entering stormwater
drainage systems. Chapter 7 : Review of available litter management strategies.
iv) Highway billboards are an option for all the catchments although there may be
objections to them in residential catchments as it is essential that they enjoy maximum visibility and are next to commuter routes. The main entrance roads to residential catchments may be acceptable locations.
v) Educational material with rates notices could be supplied to most of the
catchments. However in the CBD and Montagu Gardens they would be read by a very small number of the people who actually spend time in these areas every work day. In Imizamo Yethu many residents are not rate-payers and there may be problems with literacy levels.
vi) Painting logo’s on catchpits encouraging residents not to litter and informing
them where the litter ends up may be a successful strategy in areas where much of the littering is from pedestrians eg. low-income areas, the CBD and Montagu Gardens. Whether people read messages that are at ground level or underfoot needs to be investigated.
vii) Separation of litter into different types so recyclable material can be
collected is a measure that requires a fair degree of commitment from the general public to work successfully. The extent to which separation is required must not be too ambitious. Most consumers have great difficulty, for instance, in deciding which plastics are recyclable. Schemes which require the separation of easily differentiable items only, such as tins and glass bottles, have been far more successful and are certainly worthy of general implementation. “Collect-a-can” is an example of such a scheme where it is claimed the recycling rate is 63% (Institution of Municipal Engineering in Southern Africa, 2000). This measure has particular potential where separation of litter can provide an income to jobless people provided that the portion of the litter for which they cannot gain any income is not discarded but properly disposed of. A relatively compact, high-density residential area with high rates of unemployment such as Imizamo Yethu is a candidate for such a measure.
7.3.5 Enforcement options i) Pollution “hot-lines”. For the success of this strategy a high degree of civic
reponsibility and environmental concern is required. Reasonably rapid access to a telephone is also necessary if offenders are to be successfully apprehended. This strategy may work in the CBD, Montagu Gardens or a high income, high density residential area such as Fresnaye which are frequented by sufficient numbers of environmentally conscious individuals.
ii) Increasing the number of personnel enforcing anti-litter legislation. This
strategy would have to rely on volunteer litter patrol officers, preferably drawn from the local community, as local authorities do not have the resources to increase their own staff. It would be of application in the residential areas of Imizamo Yethu, Ocean View, Fresnaye and Summer Greens and could be integrated with Neighbourhood Watch programmes.

7-9
Marais & Armitage (2003). The measurement and reduction of urban litter entering stormwater
drainage systems. Chapter 7 : Review of available litter management strategies.
iii) Taxes on type of items that are considered likely to be major contributors
to the litter stream. The potential effectiveness of this strategy would have to be determined from the litter analyses in all the catchments. The advantage is that the taxes would be relatively easy to administer, serve as incentives to manufacturers and retailers to change to recyclable containers or packaging which are not taxed, and provide revenue to pay for its administration.
7.4 Current South African initiatives 7.4.1 Legislative context Spearheaded by the promulgation of South Africa’s new Constitution at the end of 1996, numerous environmental management related policy and law reform programmes have been introduced. The Constitution stipulates fundamental environmental rights and requirements with regard to co-operative governance. Consequently approaches to water quality management must promote integrated management and be conducive to sustainable development (van Wyk et al, 2002). South African water quality management is governed by a hierarchical suite of environmental legislation and associated policies under the National Water Quality Management Framework Policy. A description of the relevant sections of the South African legislation promulgated to date follows: • Constitution of the Republic of South Africa, 1996 (Act No. 108 of 1996)
Section 24 of the Constitution guarantees every citizen the right to “an environment that is not harmful to human health or well-being, and to have the environment protected, for the benefit of present and future generations, through reasonable legislative and other measures that prevent pollution and ecological degradation; promote conservation; and secure ecologically sustainable development and use of natural resources while promoting justifiable economic and social development”. Statutory requirements have been promulgated to give effect to this right.
• National Environmental Management Act, 1998 (Act No. 107 of 1998)
This Act sets out the overall framework for environmental management in South Africa. It gives legal effect to the internationally agreed principles of sustainable development in South Africa, and makes it a legal requirement that these principles must be taken into consideration in all decisions that may affect the environment. The Act also provides for co-operative environmental governance by establishing • principles for decision-making on matters affecting the environment; • institutions that will promote environmental governance; and • procedures for coordinating environmental functions.

7-10
Marais & Armitage (2003). The measurement and reduction of urban litter entering stormwater
drainage systems. Chapter 7 : Review of available litter management strategies.
• National Water Act, 1998 (Act No. 36 of 1998)
The National Water Act gives effect to Section 24 of the Constitution with regard to the water resources component of the environment. It is the primary statute providing the legal basis for realising South Africa’s water quality management policy. In terms of this Act, South Africa’s water quality management policy must inter alia • give priority to the satisfaction of basic human needs and the
safeguarding of aquatic ecosystems and their biological diversity; • facilitate socially, economically and ecologically sustainable
development; • promote the efficient and beneficial use of water in the public interest; • balance the protection of the water resources with the use and
development of the particular resource; • reduce and prevent pollution and degradation of water resources; and • recognise the need for the integrated management of all aspects of water
resources.
• Environmental Conservation Act, 1989 (Act No. 73 of 1998) Although predating the promulgation of the Constitution and the introduction of the National Water Quality Management Framework Policy, this Act is integral to the carrying out of this Policy. The objectives of the Act are to reduce potential negative environmental impacts of activites related to development and to promote sustainable development. Procedures for Environmental Impact Assessment that must be complied with for certain activities, including water and waste, are set out in this Act.
The National White Paper on Integrated Pollution and Waste Management for South Africa, completed in 2000, complements the National Water Quality Management Framework Policy. This document includes an outline of the government’s strategic goals and supporting objectives for addressing the major issues regarding pollution and waste, as well as for measuring the success of policy implementation. Integrated pollution and waste management is defined as a holistic and integrated system and process of management aimed at (City of Cape Town, 2000): i) pollution prevention and minimisation at source, ii) managing the impact of pollution and waste on the receiving environment, and iii) remediating damaged environments.

7-11
Marais & Armitage (2003). The measurement and reduction of urban litter entering stormwater
drainage systems. Chapter 7 : Review of available litter management strategies.
Section 152 of the Constitution requires local government to provide services in a sustainable manner, provide a safe and healthy environment for all communities, promote social and economic development and ensure transparent governance. Moreover the Local Government : Municipal Systems Act (MSA), 2000 (Act No. 32 of 2000), has certain implications and obligations for environmental management by local government which must be accommodated and reflected in the institutional framework and policies of the local government authority. The local authority is obliged to strive to ensure that municipal services are provided in a financially and environmentally sustainable manner and to promote a safe and healthy environment. Therefore the development of an integrated environmental policy by local government is not only imperative for sustainable development but also a legal obligation (City of Cape Town, 2001). At local level the Cape Town Unicity has approved the Integrated Metropolitan Environmental Policy (IMEP) as the first environmental policy for the City of Cape Town. The IMEP is a set of principles and ethics that sets the framework for environmental management in the City. “Litter” is one of the six sectoral approaches that have been identified as priorities under the IMEP. One of the key priorities for the first implementation of this policy is a programme to eliminate litter and illegal dumping (Fairest Cape Association, 2002). 7.4.2 The Dense Settlements Project The Department of Water Affairs and Forestry (DWAF) developed a National Strategy for Managing the Water Quality Effects of Densely Populated Settlements in cooperation with the Danish Cooperation for Environment and Development (DANCED) which culminated in the production of a series of five documents in June 1999. The implementation guidelines, included in these documents, emphasised that effective solid waste management was critical to the implementation of the Strategy both in terms of controlling the contamination of local water resources with litter, and to ensure the effective functioning of stormwater drainage systems (DWAF, 1999). The National Strategy for Managing the Water Quality Effects of Densely Populated Settlements was tested through implementation in nine communities. The nine urban and rural communities ranging in size from about 50 to 5 000 households were spread throughout South Africa. In most cases only rudimentary services, often in a state of disrepair, were present. The settlements impacted on water quality through the waste generated as part of their normal day to day activities reaching the water resource. This might be sewage waste from failing or non-existent sanitation systems, household refuse and litter carried by storm water flows or dirty wash water (sullage water).
7-12
Marais & Armitage (2003). The measurement and reduction of urban litter entering stormwater
drainage systems. Chapter 7 : Review of available litter management strategies.
The physical failure of the services was often caused by underlying social problems, such as the improper use or vandalism of the services, or institutional problems where the services provided were inappropriate to the community’s needs or not properly maintained. Lack of the financial or technical capacity required for operation and maintenance of the services was identified as the major cause of ongoing pollution (Hinsch, 2000). A “structure facilitated” approach was employed to find the root cause of the problem. This approach aimed at facilitating interaction between the Department of Water Affairs or its agencies, the local authority or its service providers and the community. The required interventions and their respective roles and responsibilities were then agreed by all stakeholders leading to the drafting of an intervention plan. This plan was then incorporated into the normal planning and funding processes of the local government and the Water Services Development Plan. The main pollution problems were found to be: • Bush toileting by those sections of the communities without toilets. • Blockages of toilets and sewers for those sections of the communities with flush
toilets. • Flooding and overflowing of pit latrines during wet periods. • Blockages of small-bore sewers and pump failures due to inappropriate cleaning
materials. • Stormwater pipes and canals clogged with solid waste. • Sullage water runoff from standpipe areas. • Sullage water thrown into the streets where no drains were provided. • The ripping of refuse bags and spreading of their contents by animals. • Informal, poorly located solid waste sites dotted around the communities. • Uncollected refuse bags due to refuse removal vehicles not being able to reach
all parts of the settlement. • Uncollected refuse bags left next to skips which were too tall for children to
reach. • Refuse overflowing from solid waste skips. • Solid waste blown off the back of tractor drawn trailers.
7-13
Marais & Armitage (2003). The measurement and reduction of urban litter entering stormwater
drainage systems. Chapter 7 : Review of available litter management strategies.
• Refuse bags not left out for collection at the correct times. • No recycling of garden refuse. • The dumping of building rubble because the removal costs were too expensive. The interventions carried out to remedy the identified pollution problems included: • repairing and extending toilets and sewers, • educating communities about the link between pollution and health and the
proper use of toilets, latrines and refuse collection systems, • organising communal refuse collection services and relocating skips, • employing toilet block supervisors to look after communal toilets, and • providing sullage drainage points. Most test cases had remarkable success in reducing pollution loads and the impacts on the communities involved (Hinsch, 2000). A key observation was that the costs of waste management should not be considered in isolation as the pilot studies revealed a strong link between filthy, unhygienic conditions and epidemiology or environmental health issues. To further address the solid waste issue, the Department of Water Affairs and Forestry (DWAF) together with the Department of Environmental Affairs and Tourism (DEAT), supported by the Danish Cooperation for Environment and Development (DANCED), has been developing a National Waste Management Strategy. The aim is to deal with the whole waste stream from generation to final disposal with an overall goal to “reduce the generation of waste and its impact on health and the environment so that they do not limit socio-economic development” (DWAF, 1999). The National Waste Management Strategy focuses on four strategic areas: i) Waste minimisation. ii) General waste. iii) Hazardous waste. iv) The setting up of a waste information system. The key departure points of this Strategy are preventing and reducing the generation of waste and providing and improving service delivery in un-serviced areas (City of Cape Town, 2000).

7-14
Marais & Armitage (2003). The measurement and reduction of urban litter entering stormwater
drainage systems. Chapter 7 : Review of available litter management strategies.
7.4.3 The Mess Action Campaign The Mess Action Campaign (MAC) which commenced in 2000 is an initiative of the City of Cape Town to address the unacceptable amount of litter and illegal dumping within the Unicity. The MAC recognises that the causes of the littering and illegal dumping need to be addressed and is implementing a wide range of programmes encompassing awareness and education in schools and communities, in business and institutions, to support the operational aspect and enforcement of littering and illegal dumping (Fairest Cape, 2002). These programmes have included • an arts festival and drama competition in schools; • the greening of schools; • the linking of a primary school to a wetland; • tackling the problem of getting refuse from informal settlements in Khayelitsha to
collection points accessible by refuse removal vehicles; and • the installation of bins along main routes in Khayelitsha. As a result of a concerted effort under the MAC umbrella to increase awareness in the community, the tonnage of illegal dumping cleared in the Cape Town Administration area increased from 5 000 tons in 1999 to approximately 60 000 tons in 2000 (City of Cape Town, 2000). This was due to both enhanced public awareness, leading to increased reporting of illegal dumping, and greater clearing efficiencies achieved by municipal crews. Amongst other initiatives the MAC has commissioned a metro-wide publicity and education campaign. This campaign is intended to target all stakeholders in waste production and control. The stakeholders include communities, schools, commerce, industry, hawkers, hospitals, institutions, tourists and the staff and councillors of the City of Cape Town. The campaign seeks to change attitudes to littering and illegal dumping in particular that are found across the entire socio-economic spectrum of Cape Town. The first phase of this campaign, the “Waste Wise” mass community education campaign which commenced in April 2002, comprises advertisements on local radio stations, in community newspapers and on billboards and bins on the topics of littering and illegal dumping in English, Afrikaans and Xhosa (Liebenberg & Stander, 2002).

7-15
Marais & Armitage (2003). The measurement and reduction of urban litter entering stormwater
drainage systems. Chapter 7 : Review of available litter management strategies.
7.4.4 Fairest Cape Association Initiatives The mission of the Fairest Cape Association is “to promote a cleaner, healthier environment by enabling people to take responsibility for waste”. The five aims of the organisation are: i) To increase awareness that waste is a resource. ii) To facilitate the development of systems to recover and add value to this
resource. iii) To make people aware of the volumes and nature of waste generated and their
impact on the environment. iv) To enable groups to develop appropriate waste management options in
partnership with local authorities. v) To influence the development of policy and legislation on waste. The Association works closely with the Waste Departments of the City of Cape Town and regularly presents the “Principles of Solid Waste Management Planning Training Course” to participants from the City and the Department of Water Affairs. This course is designed primarily to assist those local government officials, who are responsible for solid waste management, to plan and implement more holistic solid waste management programmes in their communities or cities. During 1999 the Fairest Cape Association held workshops at 27 schools in the City of Cape Town as part of the “Wise up on Waste!” programme. The number of schools participating in litter projects increased to 134 in 2000 with an additional 20 crèches and community organisations also involved. Other educational and training activities carried out by the Fairest Cape Association in 2000 included (City of Cape Town, 2000): • The hosting of the Dentyne High Schools’ Environmental Quiz. • The holding of a number of teacher training workshops. • The successful launching of the Engen “Wise up on Waste!” Teacher Training
Project. • The Millennium Mural Competition which depicted the impact of water and
waste on catchments. • The Imizamo Yethu Community Programme in Hout Bay which is described in
detail in Section 6.2 of Chapter 6.
7-16
Marais & Armitage (2003). The measurement and reduction of urban litter entering stormwater
drainage systems. Chapter 7 : Review of available litter management strategies.
7.4.5 Waste Minimisation Clubs The Water Research Commission sponsored a project from 1998 to 2000, under the auspices of the Pollution Research Group at the University of Natal, to establish pilot Waste Minimisation Clubs in South Africa and determine the feasibility of this approach in promoting waste minimisation to industry. A waste minimisation club is a group of companies working together to reduce waste and save money and may be from the same or different industrial sectors. The club members meet regularly to exchange information and ideas on waste minimisation and to receive training in aspects of waste minimisation. Two pilot Clubs, the Metal Finishing Waste Minimisation Club in the Durban region and a cross-sectional club in the Hammarsdale area were initially established. Both these areas are situated in the KwaZulu Natal Province. The project is described in detail in the WRC Report No. K5/973 (Barclay, 2002). Waste minimisation can be defined as the application of a systematic approach to reducing waste at source. It relates to all inputs and outputs from an industry, business site or process including water, energy, chemicals, raw materials, effluent, air emissions and solid waste. The aim is to maximise the conversion of the inputs to the product by minimising the discharge of waste to water, air and land. This results in improved process efficiency and reduced emissions to the environment which translate into financial savings. As much as 50% of solid waste disposal can be saved through implementing waste minimisation (Barclay, 2002). As of March 2002 there were 17 Waste Minimisation Clubs running in South Africa with a further six in the planning stage (Barclay, 2002). 7.5 Conclusions In this Chapter several litter management techniques have been reviewed. The applicability of the litter management techniques classed as source controls (aimed at reducing litter loads entering the drainage system) have been discussed with particular reference to the pilot catchments. Several current South African initiatives, which seek to address problems related to urban litter entering stormwater drainage systems, including the legislative framework behind these initiatives, have been described. The following conclusions may be drawn: i) The litter problem can only be addressed in an effective and sustainable manner
with integrated catchment management strategies composed of planning controls, source controls (reducing litter loads entering the drainage system) and structural controls (removal of solid wastes from the drainage system), supported by education and enforcement programmes.
ii) South Africa and the first world share a common “throw away” culture which
means that many of the litter management techniques adopted in first world countries with separate stormwater and foul sewer systems could be of application to South African urban drainage systems.
7-17
Marais & Armitage (2003). The measurement and reduction of urban litter entering stormwater
drainage systems. Chapter 7 : Review of available litter management strategies.
iii) Litter problems peculiar to very low income areas, where people are housed in
informal structures and suffer from rudimentary or minimal levels of municipal servicing, are not encountered in the comparatively affluent societies of the first world but are commonly found in Brazil, Mexico, India and other parts of the developing world. Examples of these problems are dealing with the contents of bags and bins emptied by vagrants, children and dogs etc. and night soil in the stormwater drainage systems. However comparatively little research is available into litter in drainage systems situated in the developing world. This has lead to a dearth of research into the litter problems peculiar to very low income areas. In South Africa, where a large proportion of the populace live in informal dwellings, there is an urgent need to remedy this through focused research in these areas.
iv) The particular physical attributes of a catchment, the socio-economic
characteristics of its community and the level of services provided determine which source control options are most likely to be effective in reducing the volume of litter entering the stormwater drainage systems.
v) The fundamental environmental rights and requirements guaranteed by the
South African Constitution (Act No. 108 of 1996) have given rise to a hierarchical suite of environmental legislation and associated policies at national and local level. As a result of this underpinning by the Constitution, which stipulates fundamental environmental rights and requirements with regard to cop-operative governance, any approach to water quality management must promote integrated management and be conducive to sustainable development (van Wyk et al, 2002).
vi) Current South African initiatives, such as the Dense Settlements Project, the
City of Cape Town’s Mass Action Programme, the education and training programmes run by the Fairest Cape Association and the promotion of Waste Minimisation Clubs, backed by the promulgation of enabling legislation and associated policies, are contributing valuable information on the effectiveness of various litter management strategies in reducing the volumes of litter entering South African stormwater drainage systems.
8-1
Marais & Armitage (2003). The measurement and reduction of urban litter entering stormwater drainage
systems. Chapter 8 : A litter removal strategy for the Salt and Lotus Rivers.
8. A litter removal strategy for the Salt and Lotus Rivers – a case study
This section describes work carried out by Jeffares & Green Incorporated in consortium with Neil Armitage Consulting in 2001. It was written by Mr Chris Wise of Jeffares & Green and commissioned and funded by Cape Town Administration. The reason for including it in this report is to show how the litter generation information can be used to develop a litter removal strategy. 8.1 Introduction Litter in Cape Town’s waterways has been a constant problem for the City and has negatively impacted on the natural ecosystems and aesthetic value of the previously pristine waterways. Although there are a number of programs in place to prevent litter from entering the stormwater system, these will never prove to be 100% effective. A second level of defence is thus required and the project team was appointed to develop a strategy for the removal of this litter from the waterways. The consortium used a methodology based on WRC Report No. TT 95/98 (Armitage et al, 1998) utilising the litter loading data obtained from this project. The methodology is detailed in Section 8-3. A GIS was used to link all the various aspects together.
The study was limited to removing litter that is in the open channels and rivers and was restricted to the boundaries of the Cape Town Administration, i.e. it did not cover all of the Salt and Lotus River catchments. Although the upper reaches of the Lotus River catchment were largely contained within the study area, the upper reaches of a number of tributaries of the Salt River catchment were not. There are many potential litter sources on these upper reaches, but since these originate from outside the study area, they unfortunately had to be disregarded in the calculations. For the purpose of the study, litter was defined as human generated solid waste and excluded silt and vegetation. For the design of the traps, however, the vegetation load was taken into consideration. 8.2 Characteristics of the study area The study area comprises those parts of the Salt River and Lotus river catchments that fall within the Cape Town Administration boundaries and is shown on Figure 8-1. It is located roughly in the centre of the Cape Metropolitan Area and has a total gross area of approximately 147 km2. The two river systems are separated by a watershed which runs roughly east-west.
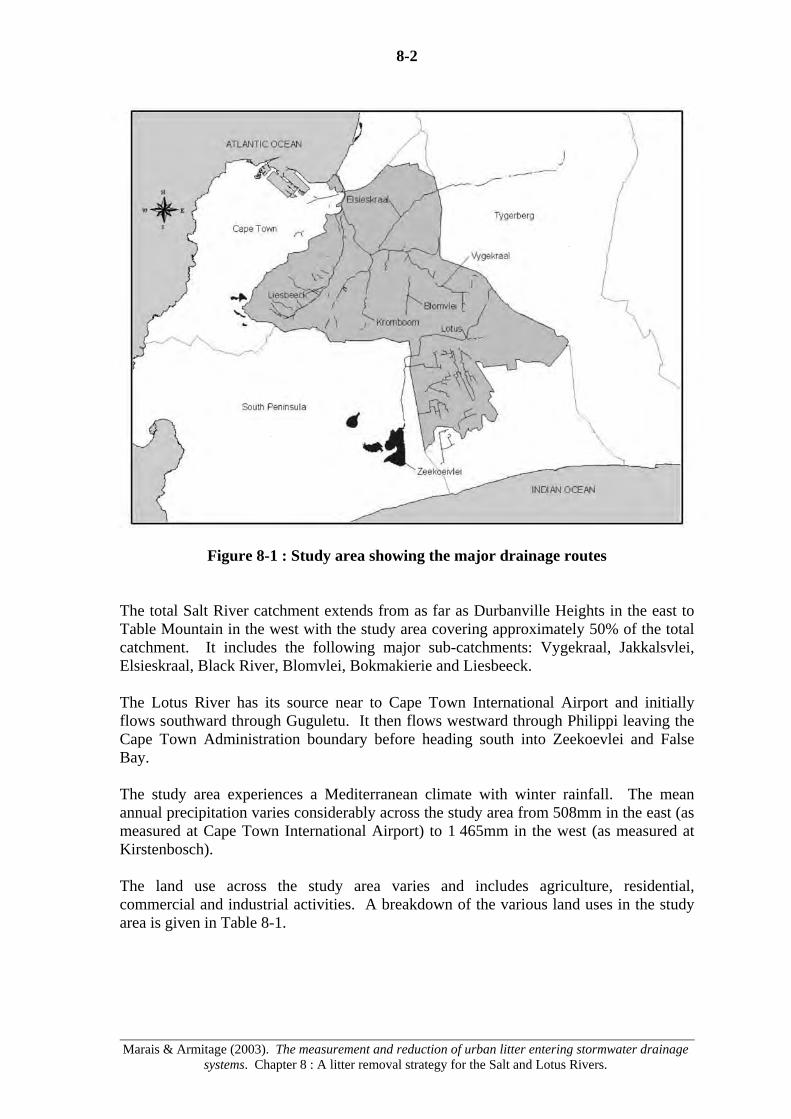
8-2
Marais & Armitage (2003). The measurement and reduction of urban litter entering stormwater drainage
systems. Chapter 8 : A litter removal strategy for the Salt and Lotus Rivers.
Figure 8-1 : Study area showing the major drainage routes
The total Salt River catchment extends from as far as Durbanville Heights in the east to Table Mountain in the west with the study area covering approximately 50% of the total catchment. It includes the following major sub-catchments: Vygekraal, Jakkalsvlei, Elsieskraal, Black River, Blomvlei, Bokmakierie and Liesbeeck. The Lotus River has its source near to Cape Town International Airport and initially flows southward through Guguletu. It then flows westward through Philippi leaving the Cape Town Administration boundary before heading south into Zeekoevlei and False Bay. The study area experiences a Mediterranean climate with winter rainfall. The mean annual precipitation varies considerably across the study area from 508mm in the east (as measured at Cape Town International Airport) to 1 465mm in the west (as measured at Kirstenbosch). The land use across the study area varies and includes agriculture, residential, commercial and industrial activities. A breakdown of the various land uses in the study area is given in Table 8-1.

8-3
Marais & Armitage (2003). The measurement and reduction of urban litter entering stormwater drainage
systems. Chapter 8 : A litter removal strategy for the Salt and Lotus Rivers.
Landuse Area (ha) %
Residential 9 937 67.5% Manufacture 638 4.3% Retail 474 3.2% Offices 169 1.1% Halls, Stadiums & Entertainment Fac. 109 0.7% Taxi Ranks etc. 59 0.4% POS, green belts and open land * 540 3.7% Farms * 2 046 13.9% Other * 757 5.1%
Total 14 729 Table 8-1 : Land use distribution in study area (* indicates land uses that were not
considered to contribute a significant amount of litter) The land uses marked with an asterisk are those that do not generate significant volumes of litter and were thus not included in the calculations. Of these land uses approximately 20 km2 (13.9% of the total area) comprises agricultural land, all of which is located to the south of the Lotus River in the Philippi area. 8.3 The methodology The study area was sub-divided into the hydrological sub-catchments applicable to each potential trap location. Each sub-catchment was split into its main land uses. The area of each land use was then multiplied by the applicable loading rate to obtain the litter generation quantity for each sub-catchment per year. Early on during the study it became evident that there were a number of important variables that will significantly affect the litter load generation figures. These include public education campaigns, new regulations regarding plastic bags, the street cleaning frequency and efficiency, as well as changing urban environments. Consequently, the litter generation model will have to be regularly refined to suit the changing environment. It was thus recommended that litter traps be implemented in a phased approach where one or two traps are installed per phase and the data collected from these traps used to refine the model. The design and sizing of the remaining traps would then be checked using the updated litter collection data and “as-built” efficiency of the traps. It was also proposed that the initial traps be placed as far upstream as possible because, in this way, future traps can be designed with the knowledge gained from the upstream trap. These downstream traps can also then act as a second line of defence to improve the overall efficiency of the litter removal for the catchment.
8-4
Marais & Armitage (2003). The measurement and reduction of urban litter entering stormwater drainage
systems. Chapter 8 : A litter removal strategy for the Salt and Lotus Rivers.
The methodology may be summarised as follows: i) The catchment data was collected and captured onto the GIS. ii) Potential trap locations were identified. iii) The GIS was used to predict the litter loadings at the preliminary trap locations
using data from this present study. iv) Hydraulic and hydrological analyses were carried out for each trap location. v) Trap selection, design and costing were carried out for each trap location. vi) A litter removal strategy was developed. 8.3.1 Catchment data collection and capture GIS datasets that were relevant to this study (for example topography, drainage and land use) were obtained from the Cape Metropolitan Council Administration: Catchment Management Department. These datasets were used to develop a map of the two catchments. Discussions were held with the river cleaning teams from the Stormwater Department of the Cape Town Administration who were able to help in assessing the major sources of litter entering the rivers in the study as well as the distribution of the litter across the catchment. Interviews were also held with the Cleansing Department district managers to determine the street sweeping and refuse collection regimes. Particular litter generation hotspots were identified. 8.3.2 Identification of potential trap locations Ideal locations for litter traps are those where a step exists in the canal or river floor which will provide hydraulic head for a trap. Locations in the study area where such conditions exist were identified with the help of the Stormwater Branch of the Cape Town Administration and are shown on Figure 8-2: Each location was investigated to determine its technical suitability based on the following criteria: • Canalised?: Yes/No. • Width of Channel. • Approximate change in head. • Vehicular access. • Space for structure.

8-5
Marais & Armitage (2003). The measurement and reduction of urban litter entering stormwater drainage
systems. Chapter 8 : A litter removal strategy for the Salt and Lotus Rivers.
The potential sites were then ranked from poor to very good from a technical perspective.
Figure 8-2 : Sub-catchment divisions showing potential trap locations
Having assessed each location according to its technical feasibility, their environmental benefits were examined. The Environmental Planning Department of the Cape Town Administration and CMCA : Catchment Management Department identified the reaches that were of environmental and aesthetic importance. Some of these reaches are earmarked as future urban parks, while others currently have aesthetic importance. It was possible to identify which of the technically preferred sites would be most effective in preventing litter pollution of these sensitive reaches. In selecting the final trap locations preference was given to those that met the above criteria. By taking the technical and environmental considerations into account, the feasible trap locations on each tributary were identified. A datasheet was produce for each feasible trap location, an example of which is given for the Vygekraal canal as Figure 8-3:
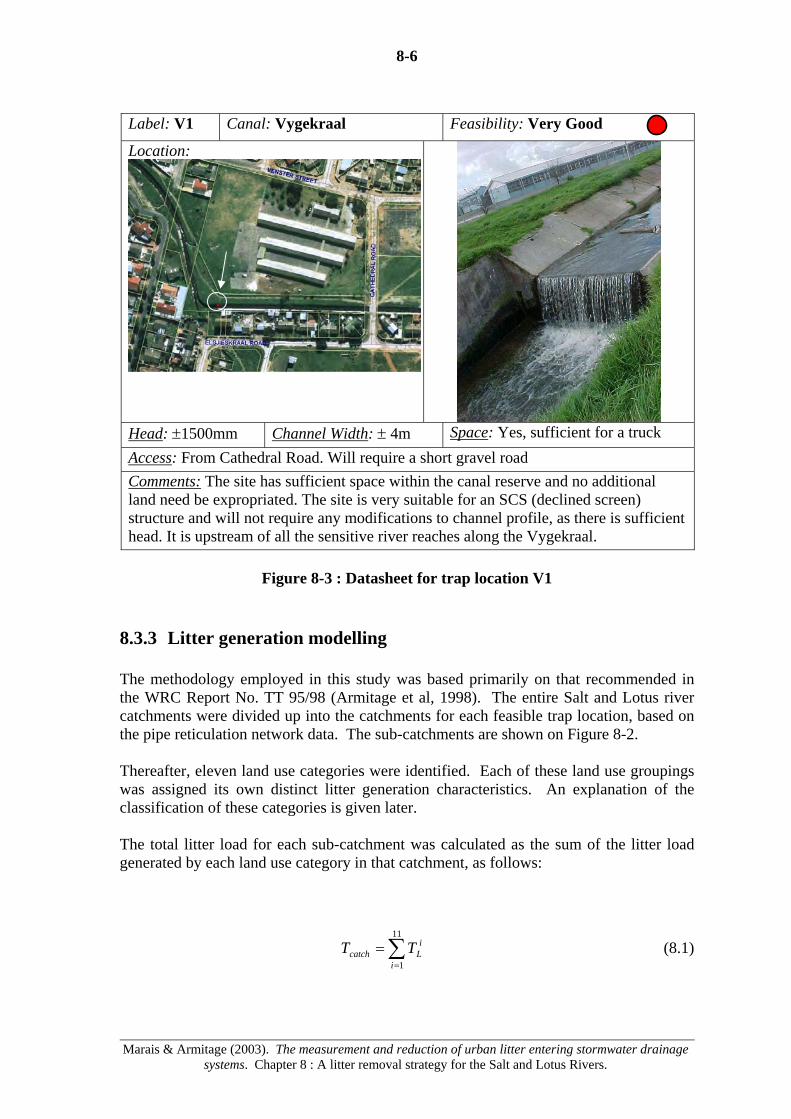
8-6
Marais & Armitage (2003). The measurement and reduction of urban litter entering stormwater drainage
systems. Chapter 8 : A litter removal strategy for the Salt and Lotus Rivers.
Label: V1 Canal: Vygekraal Feasibility: Very Good
Location:
Head: ±1500mm Channel Width: ± 4m Space: Yes, sufficient for a truck Access: From Cathedral Road. Will require a short gravel road Comments: The site has sufficient space within the canal reserve and no additional land need be expropriated. The site is very suitable for an SCS (declined screen) structure and will not require any modifications to channel profile, as there is sufficient head. It is upstream of all the sensitive river reaches along the Vygekraal.
Figure 8-3 : Datasheet for trap location V1
8.3.3 Litter generation modelling The methodology employed in this study was based primarily on that recommended in the WRC Report No. TT 95/98 (Armitage et al, 1998). The entire Salt and Lotus river catchments were divided up into the catchments for each feasible trap location, based on the pipe reticulation network data. The sub-catchments are shown on Figure 8-2. Thereafter, eleven land use categories were identified. Each of these land use groupings was assigned its own distinct litter generation characteristics. An explanation of the classification of these categories is given later. The total litter load for each sub-catchment was calculated as the sum of the litter load generated by each land use category in that catchment, as follows:
∑=
=11
1i
iLcatch TT (8.1)
8-7
Marais & Armitage (2003). The measurement and reduction of urban litter entering stormwater drainage
systems. Chapter 8 : A litter removal strategy for the Salt and Lotus Rivers.
where
Tcatch = Total litter load for the catchment (kg/year) TL
i = Total litter load in the waterways for each specific landuse (kg/year)
The total litter load in the waterways (TL) for each landuse in a catchment is a product of the area, the litter generation for that landuse and the street sweeping efficiency for the area, i.e. GGremovalL ALT ⋅⋅−= )1( η (8.2)
where
TL = total litter load in the waterways for a specific land use(kg/yr) removalη = Litter removal efficiency by street sweeping
LG = Litter generation per gross area for the specific land use (kg/ha.yr)
AG = Gross area (ha) The litter removal efficiency by street sweeping value, removalη , is discussed later in this section. For the purpose of the analysis it was necessary to work with net areas (i.e. erven only) since the GIS land use data was received in that format. However, the loading data (kg/ha.yr) is based on gross areas (i.e. erven plus roads). The net areas calculated in the GIS were converted to gross areas using a factor ( EGf ), which was calculated by comparing the net and gross areas on a random sampling of cadastral plans. The litter entering the stormwater system from any specific land use within a sub-catchment, is given by:
EG
EGremovalL f
ALT ⋅⋅−= )1( η (8.3)
where
removalη = Litter removal efficiency by street sweeping LG = Litter generation per gross area for the specific landuse
(kg/ha.year) EA = Total net area of the specific landuse (ha)
EGf = Fraction of the gross area that is erven only Substituting this into Equation 8.3 and subsequently into Equation 8.1 will then give the total litter load for the sub-catchment in kilograms per year.
8-8
Marais & Armitage (2003). The measurement and reduction of urban litter entering stormwater drainage
systems. Chapter 8 : A litter removal strategy for the Salt and Lotus Rivers.
The results were converted into m3/year using an average litter density of 95kg/m3, determined from a study undertaken in Springs (Armitage et al, 1998). Eleven broad-based land uses, which generate significant quantities of litter, were identified in this study. It was felt that the litter generated from other land uses was negligible and these land uses were therefore ignored in the calculations. The eleven land uses are as follows: i) Manufacturing. ii) Retail. iii) Offices. iv) Halls, Stadiums and Entertainment facilities. v) Taxi Ranks and transport interchange facilities. vi) Education facilities. vii) Hospital and clinics. viii) Low Density Residential. ix) Medium Density Residential. x) High Density Residential. xi) Informal Settlements. In defining low, medium and high density for residential areas, the following criteria were used: • Low Density: 0.5 to 50 persons/ha. • Medium Density: 50 to 175 persons/ha. • High Density: > 175 persons/ha. These criteria are based on recognised town planning guideline documents such as “Guidelines for the provision of engineering services and amenities in residential township development” (Department of Housing in collaboration with the National Housing Board, 1995).
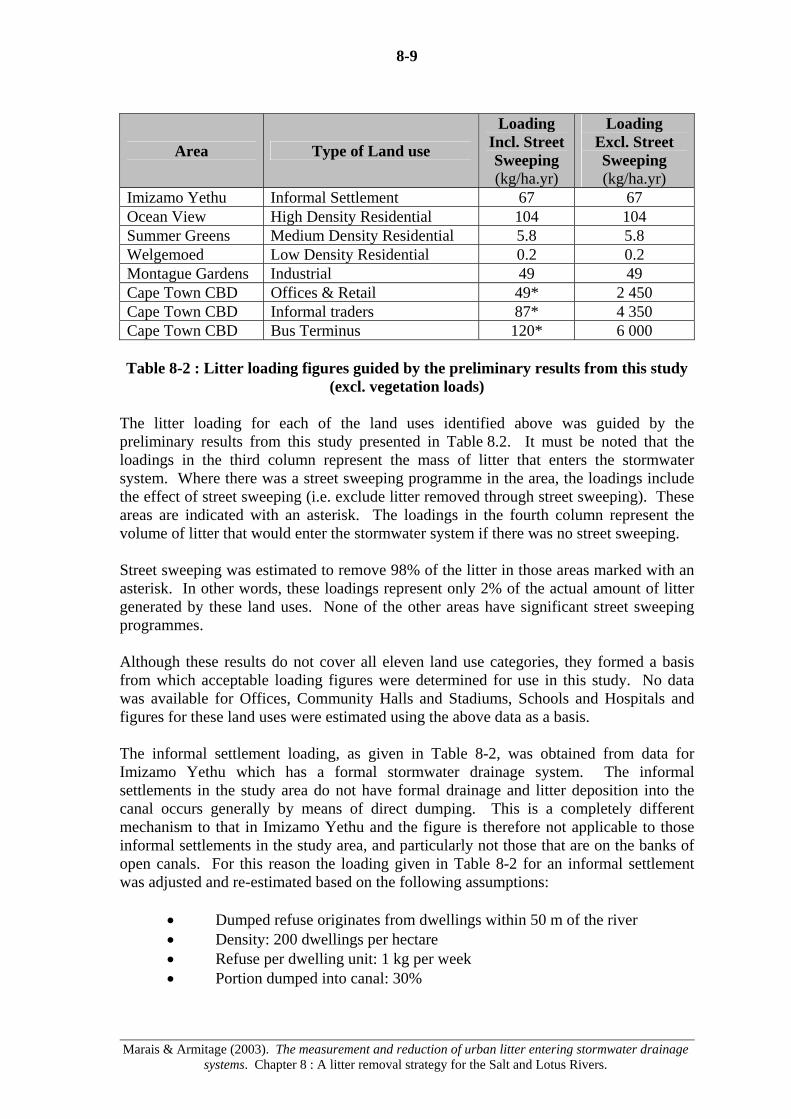
8-9
Marais & Armitage (2003). The measurement and reduction of urban litter entering stormwater drainage
systems. Chapter 8 : A litter removal strategy for the Salt and Lotus Rivers.
Area Type of Land use
Loading Incl. Street Sweeping (kg/ha.yr)
Loading Excl. Street Sweeping (kg/ha.yr)
Imizamo Yethu Informal Settlement 67 67 Ocean View High Density Residential 104 104 Summer Greens Medium Density Residential 5.8 5.8 Welgemoed Low Density Residential 0.2 0.2 Montague Gardens Industrial 49 49 Cape Town CBD Offices & Retail 49* 2 450 Cape Town CBD Informal traders 87* 4 350 Cape Town CBD Bus Terminus 120* 6 000
Table 8-2 : Litter loading figures guided by the preliminary results from this study
(excl. vegetation loads) The litter loading for each of the land uses identified above was guided by the preliminary results from this study presented in Table 8.2. It must be noted that the loadings in the third column represent the mass of litter that enters the stormwater system. Where there was a street sweeping programme in the area, the loadings include the effect of street sweeping (i.e. exclude litter removed through street sweeping). These areas are indicated with an asterisk. The loadings in the fourth column represent the volume of litter that would enter the stormwater system if there was no street sweeping. Street sweeping was estimated to remove 98% of the litter in those areas marked with an asterisk. In other words, these loadings represent only 2% of the actual amount of litter generated by these land uses. None of the other areas have significant street sweeping programmes. Although these results do not cover all eleven land use categories, they formed a basis from which acceptable loading figures were determined for use in this study. No data was available for Offices, Community Halls and Stadiums, Schools and Hospitals and figures for these land uses were estimated using the above data as a basis. The informal settlement loading, as given in Table 8-2, was obtained from data for Imizamo Yethu which has a formal stormwater drainage system. The informal settlements in the study area do not have formal drainage and litter deposition into the canal occurs generally by means of direct dumping. This is a completely different mechanism to that in Imizamo Yethu and the figure is therefore not applicable to those informal settlements in the study area, and particularly not those that are on the banks of open canals. For this reason the loading given in Table 8-2 for an informal settlement was adjusted and re-estimated based on the following assumptions:
• Dumped refuse originates from dwellings within 50 m of the river • Density: 200 dwellings per hectare • Refuse per dwelling unit: 1 kg per week • Portion dumped into canal: 30%
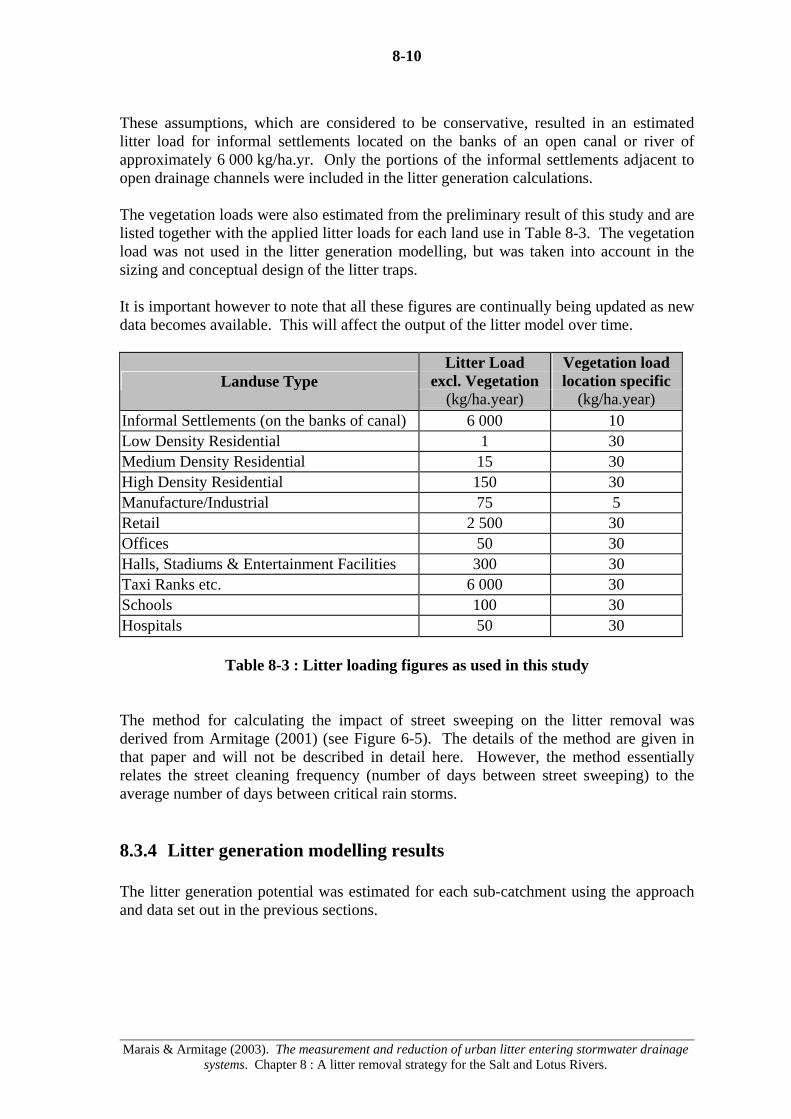
8-10
Marais & Armitage (2003). The measurement and reduction of urban litter entering stormwater drainage
systems. Chapter 8 : A litter removal strategy for the Salt and Lotus Rivers.
These assumptions, which are considered to be conservative, resulted in an estimated litter load for informal settlements located on the banks of an open canal or river of approximately 6 000 kg/ha.yr. Only the portions of the informal settlements adjacent to open drainage channels were included in the litter generation calculations. The vegetation loads were also estimated from the preliminary result of this study and are listed together with the applied litter loads for each land use in Table 8-3. The vegetation load was not used in the litter generation modelling, but was taken into account in the sizing and conceptual design of the litter traps. It is important however to note that all these figures are continually being updated as new data becomes available. This will affect the output of the litter model over time.
Litter Load excl. Vegetation
Vegetation load location specific Landuse Type
(kg/ha.year) (kg/ha.year) Informal Settlements (on the banks of canal) 6 000 10 Low Density Residential 1 30 Medium Density Residential 15 30 High Density Residential 150 30 Manufacture/Industrial 75 5 Retail 2 500 30 Offices 50 30 Halls, Stadiums & Entertainment Facilities 300 30 Taxi Ranks etc. 6 000 30 Schools 100 30 Hospitals 50 30
Table 8-3 : Litter loading figures as used in this study The method for calculating the impact of street sweeping on the litter removal was derived from Armitage (2001) (see Figure 6-5). The details of the method are given in that paper and will not be described in detail here. However, the method essentially relates the street cleaning frequency (number of days between street sweeping) to the average number of days between critical rain storms. 8.3.4 Litter generation modelling results The litter generation potential was estimated for each sub-catchment using the approach and data set out in the previous sections.
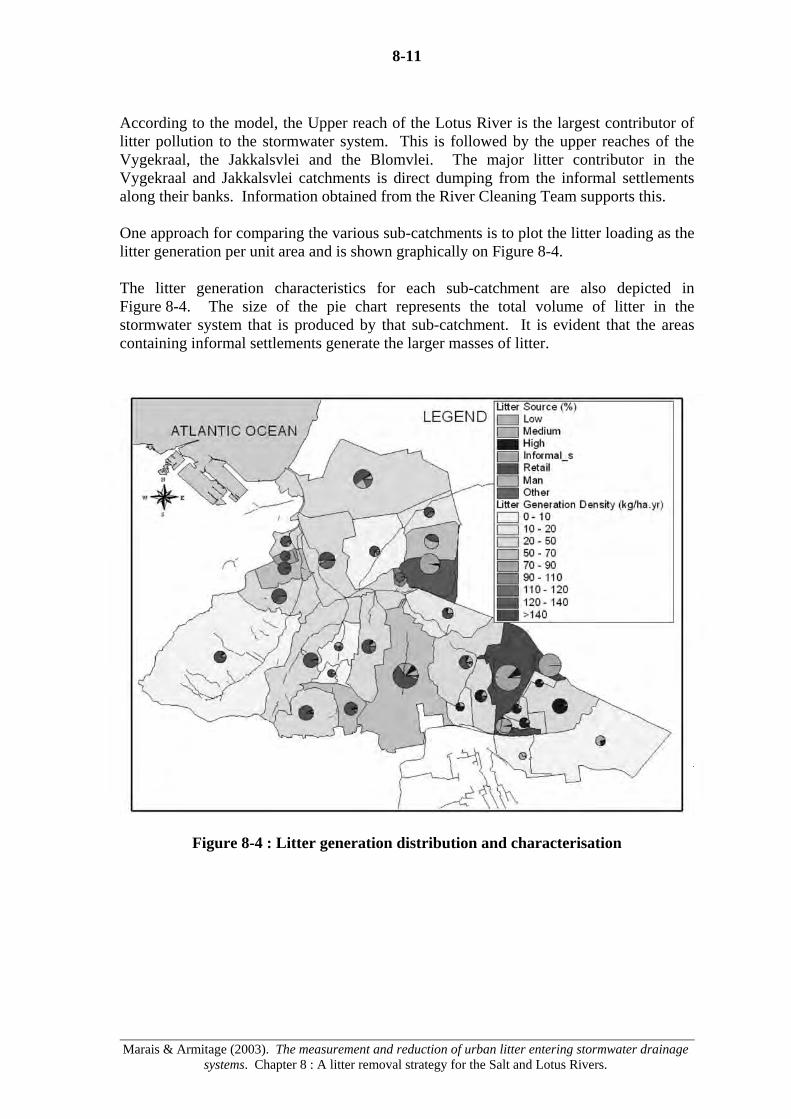
8-11
Marais & Armitage (2003). The measurement and reduction of urban litter entering stormwater drainage
systems. Chapter 8 : A litter removal strategy for the Salt and Lotus Rivers.
According to the model, the Upper reach of the Lotus River is the largest contributor of litter pollution to the stormwater system. This is followed by the upper reaches of the Vygekraal, the Jakkalsvlei and the Blomvlei. The major litter contributor in the Vygekraal and Jakkalsvlei catchments is direct dumping from the informal settlements along their banks. Information obtained from the River Cleaning Team supports this. One approach for comparing the various sub-catchments is to plot the litter loading as the litter generation per unit area and is shown graphically on Figure 8-4. The litter generation characteristics for each sub-catchment are also depicted in Figure 8-4. The size of the pie chart represents the total volume of litter in the stormwater system that is produced by that sub-catchment. It is evident that the areas containing informal settlements generate the larger masses of litter.
Figure 8-4 : Litter generation distribution and characterisation
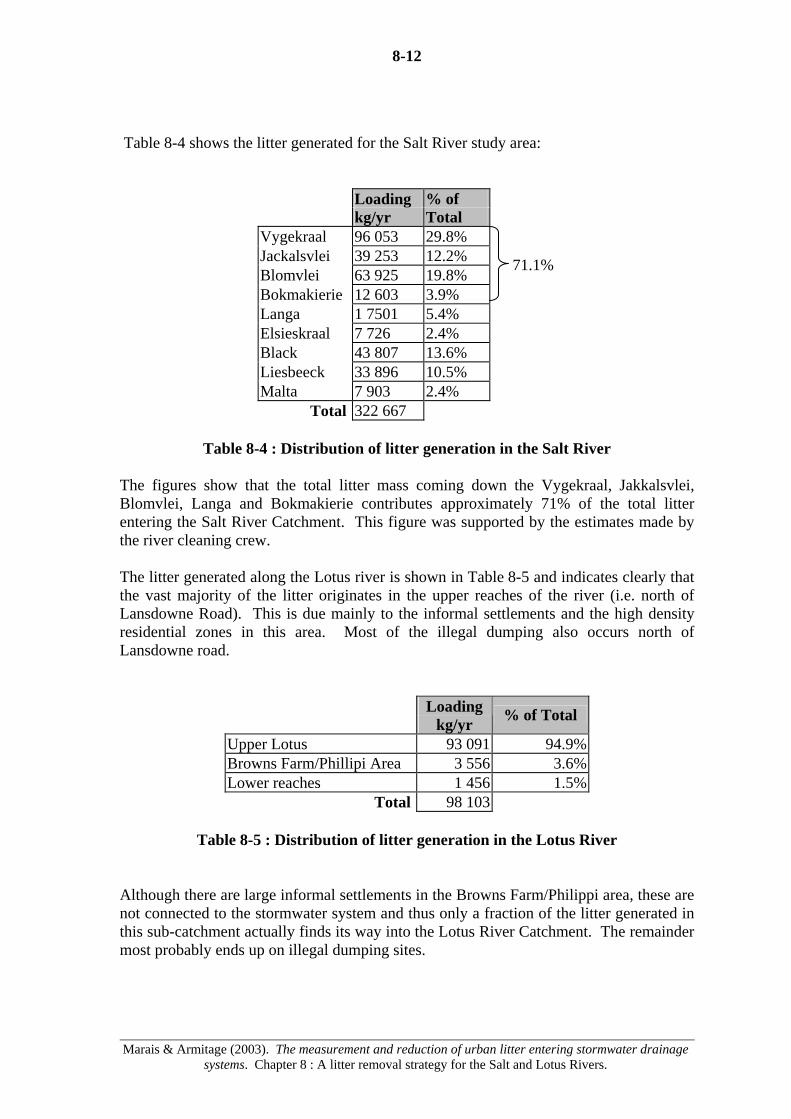
8-12
Marais & Armitage (2003). The measurement and reduction of urban litter entering stormwater drainage
systems. Chapter 8 : A litter removal strategy for the Salt and Lotus Rivers.
Table 8-4 shows the litter generated for the Salt River study area:
Loading % of kg/yr Total Vygekraal 96 053 29.8% Jackalsvlei 39 253 12.2% Blomvlei 63 925 19.8% 71.1%
Bokmakierie 12 603 3.9% Langa 1 7501 5.4% Elsieskraal 7 726 2.4% Black 43 807 13.6% Liesbeeck 33 896 10.5% Malta 7 903 2.4%
Total 322 667
Table 8-4 : Distribution of litter generation in the Salt River The figures show that the total litter mass coming down the Vygekraal, Jakkalsvlei, Blomvlei, Langa and Bokmakierie contributes approximately 71% of the total litter entering the Salt River Catchment. This figure was supported by the estimates made by the river cleaning crew. The litter generated along the Lotus river is shown in Table 8-5 and indicates clearly that the vast majority of the litter originates in the upper reaches of the river (i.e. north of Lansdowne Road). This is due mainly to the informal settlements and the high density residential zones in this area. Most of the illegal dumping also occurs north of Lansdowne road.
Loading kg/yr % of Total
Upper Lotus 93 091 94.9% Browns Farm/Phillipi Area 3 556 3.6% Lower reaches 1 456 1.5%
Total 98 103
Table 8-5 : Distribution of litter generation in the Lotus River Although there are large informal settlements in the Browns Farm/Philippi area, these are not connected to the stormwater system and thus only a fraction of the litter generated in this sub-catchment actually finds its way into the Lotus River Catchment. The remainder most probably ends up on illegal dumping sites.
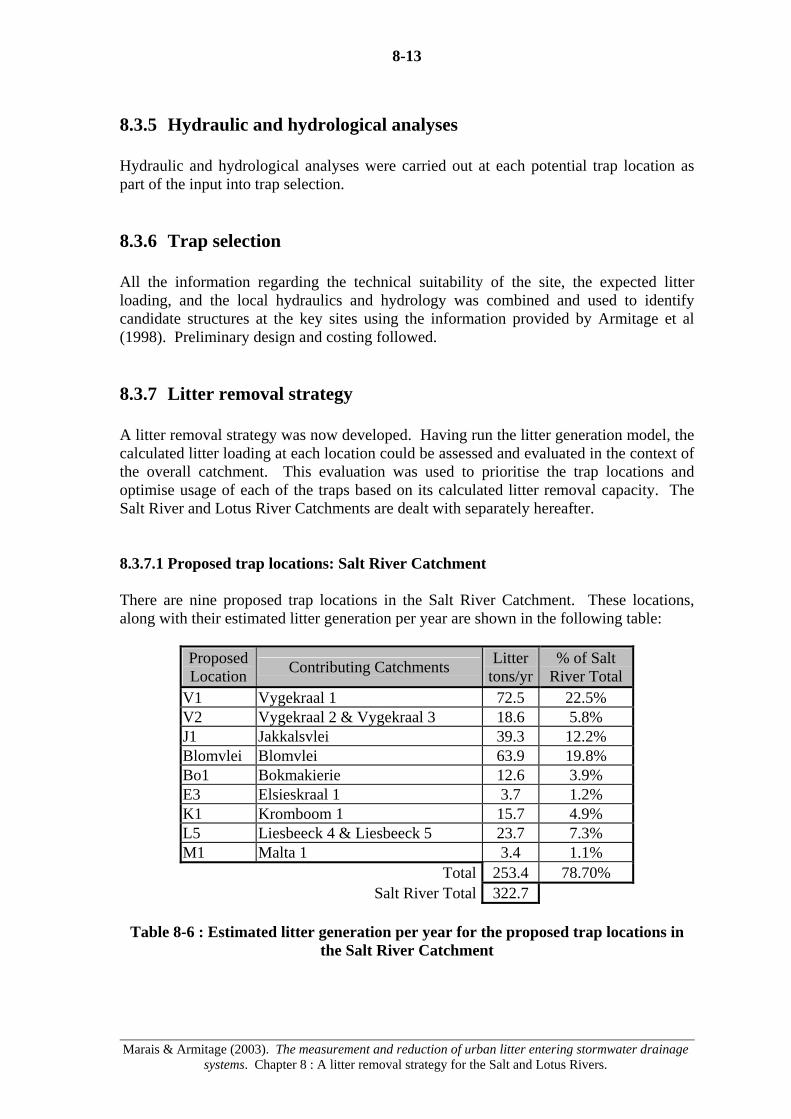
8-13
Marais & Armitage (2003). The measurement and reduction of urban litter entering stormwater drainage
systems. Chapter 8 : A litter removal strategy for the Salt and Lotus Rivers.
8.3.5 Hydraulic and hydrological analyses Hydraulic and hydrological analyses were carried out at each potential trap location as part of the input into trap selection. 8.3.6 Trap selection All the information regarding the technical suitability of the site, the expected litter loading, and the local hydraulics and hydrology was combined and used to identify candidate structures at the key sites using the information provided by Armitage et al (1998). Preliminary design and costing followed. 8.3.7 Litter removal strategy A litter removal strategy was now developed. Having run the litter generation model, the calculated litter loading at each location could be assessed and evaluated in the context of the overall catchment. This evaluation was used to prioritise the trap locations and optimise usage of each of the traps based on its calculated litter removal capacity. The Salt River and Lotus River Catchments are dealt with separately hereafter. 8.3.7.1 Proposed trap locations: Salt River Catchment There are nine proposed trap locations in the Salt River Catchment. These locations, along with their estimated litter generation per year are shown in the following table:
Proposed Location Contributing Catchments Litter
tons/yr% of Salt
River Total V1 Vygekraal 1 72.5 22.5% V2 Vygekraal 2 & Vygekraal 3 18.6 5.8% J1 Jakkalsvlei 39.3 12.2% Blomvlei Blomvlei 63.9 19.8% Bo1 Bokmakierie 12.6 3.9% E3 Elsieskraal 1 3.7 1.2% K1 Kromboom 1 15.7 4.9% L5 Liesbeeck 4 & Liesbeeck 5 23.7 7.3% M1 Malta 1 3.4 1.1%
Total 253.4 78.70% Salt River Total 322.7
Table 8-6 : Estimated litter generation per year for the proposed trap locations in
the Salt River Catchment
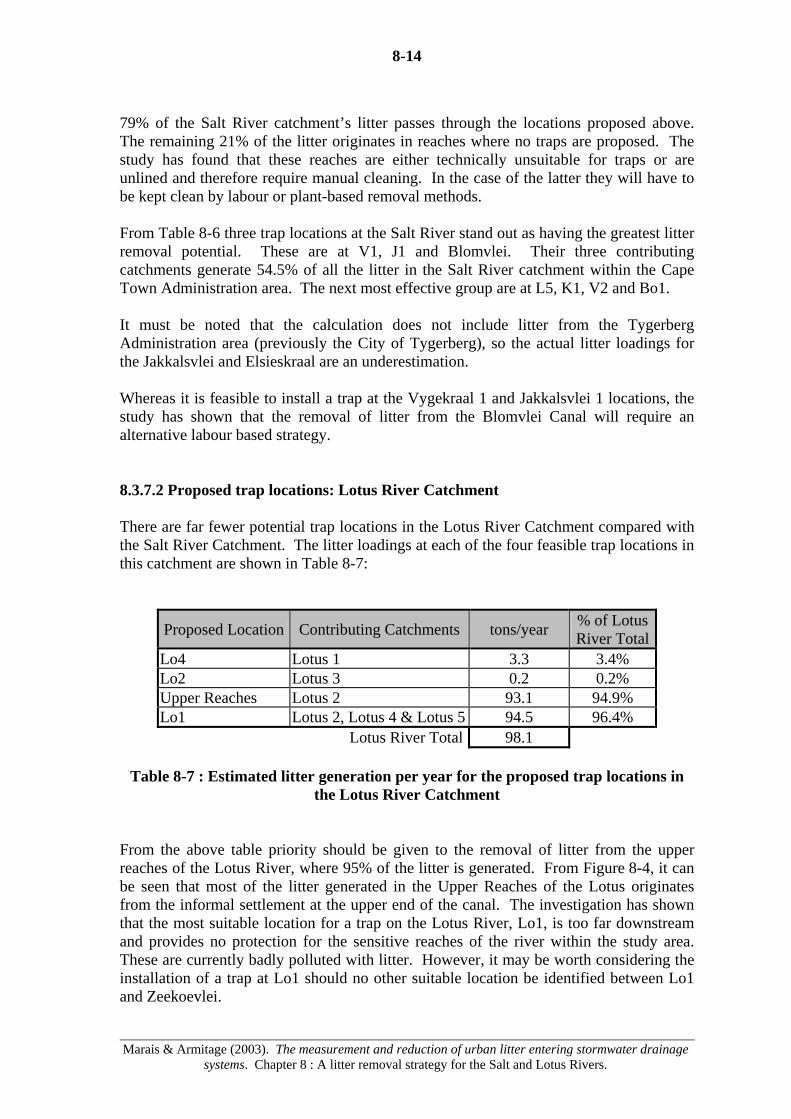
8-14
Marais & Armitage (2003). The measurement and reduction of urban litter entering stormwater drainage
systems. Chapter 8 : A litter removal strategy for the Salt and Lotus Rivers.
79% of the Salt River catchment’s litter passes through the locations proposed above. The remaining 21% of the litter originates in reaches where no traps are proposed. The study has found that these reaches are either technically unsuitable for traps or are unlined and therefore require manual cleaning. In the case of the latter they will have to be kept clean by labour or plant-based removal methods. From Table 8-6 three trap locations at the Salt River stand out as having the greatest litter removal potential. These are at V1, J1 and Blomvlei. Their three contributing catchments generate 54.5% of all the litter in the Salt River catchment within the Cape Town Administration area. The next most effective group are at L5, K1, V2 and Bo1. It must be noted that the calculation does not include litter from the Tygerberg Administration area (previously the City of Tygerberg), so the actual litter loadings for the Jakkalsvlei and Elsieskraal are an underestimation. Whereas it is feasible to install a trap at the Vygekraal 1 and Jakkalsvlei 1 locations, the study has shown that the removal of litter from the Blomvlei Canal will require an alternative labour based strategy. 8.3.7.2 Proposed trap locations: Lotus River Catchment There are far fewer potential trap locations in the Lotus River Catchment compared with the Salt River Catchment. The litter loadings at each of the four feasible trap locations in this catchment are shown in Table 8-7:
Proposed Location Contributing Catchments tons/year % of Lotus River Total
Lo4 Lotus 1 3.3 3.4% Lo2 Lotus 3 0.2 0.2% Upper Reaches Lotus 2 93.1 94.9% Lo1 Lotus 2, Lotus 4 & Lotus 5 94.5 96.4%
Lotus River Total 98.1
Table 8-7 : Estimated litter generation per year for the proposed trap locations in the Lotus River Catchment
From the above table priority should be given to the removal of litter from the upper reaches of the Lotus River, where 95% of the litter is generated. From Figure 8-4, it can be seen that most of the litter generated in the Upper Reaches of the Lotus originates from the informal settlement at the upper end of the canal. The investigation has shown that the most suitable location for a trap on the Lotus River, Lo1, is too far downstream and provides no protection for the sensitive reaches of the river within the study area. These are currently badly polluted with litter. However, it may be worth considering the installation of a trap at Lo1 should no other suitable location be identified between Lo1 and Zeekoevlei.

8-15
Marais & Armitage (2003). The measurement and reduction of urban litter entering stormwater drainage
systems. Chapter 8 : A litter removal strategy for the Salt and Lotus Rivers.
The removal of litter from the Lotus River can thus best be done by implementing an alternative labour based strategy in the upper reaches of the Lotus River (Catchment Lotus2). 8.3.7.3 Proposed phasing Based on the preceding discussion the phasing set out in Tables 8-8 to 8-11 is proposed for the Salt River and Lotus River Catchments. This phasing is depicted graphically on Figure 8-5:
Location tons/yr % of Salt River Total
% of Lotus River Total % of Total
V1 72.5 22.5% N/A 17.2% Blomvlei* 63.9 19.8% N/A 15.1% J1 39.3 12.2% N/A 9.3%
175.7 54.5% N/A 41.6% * No suitable trap location
Table 8-8 : Phase 1 (Combined catchments)
Location tons/yr % of Salt River Total
% of Lotus River Total % of Total
Lotus Upper* 93.1 N/A 94.9% 22.1% L5 23.7 7.3% N/A 5.6% K1 15.7 4.9% N/A 3.7% Bo1 12.6 3.9% N/A 3.0%
145.1 16.1% 94.9% 34.4% * No suitable trap location
Table 8-9 : Phase 2 (Combined catchments)

8-16
Marais & Armitage (2003). The measurement and reduction of urban litter entering stormwater drainage
systems. Chapter 8 : A litter removal strategy for the Salt and Lotus Rivers.
Location tons/yr % of Salt River Total
% of Lotus River Total % of Total
Lo1 ? N/A ? ? V2 18.6 5.8% N/A 4.4% E3 3.7 1.2% N/A 0.9%
? The litter mass reaching Lotus 1 is unknown for Phase 3 as it depends on the litter mass that will be collected along the upper reaches of the Lotus River in Phase 2.
Table 8-10 : Phase 3 (Combined catchments)
Location tons/yr % of Salt River Total
% of Lotus River Total % of Total
Lo4 3.3 N/A 3.4% 0.8% Lo2 0.2 N/A 0.2% <0.1% M1 3.4 1.1% N/A 0.8%
6.9 1.1% 3.6% 1.6%
Table 8-11 : Phase 4 (Combined catchments)
Figure 8-5 : Proposed phasing
8-17
Marais & Armitage (2003). The measurement and reduction of urban litter entering stormwater drainage
systems. Chapter 8 : A litter removal strategy for the Salt and Lotus Rivers.
8.4 Conclusions This study provided an ideal opportunity to apply the research documented in WRC Report No TT 95/98 and the data collected for this present report to develop an optimal litter removal strategy for the catchments falling within the Cape Town Administration boundaries. Applying site-specific landuse, topographical and drainage data to the research, a litter generation model of the catchment was developed and analysed using GIS. Results obtained from the model provide the engineers and catchment managers with an excellent decision support system for selection and prioritization of locations for litter traps. Whilst the study has addressed the distribution of litter within the Salt and Lotus rivers, it is recognised that the parameters used in the litter generation model are approximate at this stage and require verification and refinement. However, the results obtained provide a sound basis for the prioritisation of locations and the phasing of an implementation strategy. Phase 1 offers an ideal opportunity to act as a pilot project because it includes the installation of traps in close proximity to informal settlements and labour-based alternative strategies. All three litter trap locations proposed for Phase 1 will provide valuable data that can be used to refine the strategy and the theoretical model for use in the following phases. Evaluating the performance and efficiency of the installed traps may lead to modifying the designs or rethinking the litter removal strategy. Success in the use of the alternative labour-based strategy may result in the expansion of this programme to include manual cleaning in other reaches which at present are not under consideration (shown on Figure 8-5). It is envisaged that the entire catchment will ultimately benefit from the findings of this study and will receive some form of litter removal which may be either a trap or a labour-based cleaning programme.

9-1
Marais & Armitage (2003). The measurement and reduction of urban litter entering stormwater
drainage systems. Chapter 9 : Economic evaluation of alternative strategies.
9. Economic evaluation of alternative strategies
9.1 Introduction From Chapter 7 it can be seen that there are a number of available litter management techniques which can be used to address the litter problem. Costing all these techniques is an exhaustive study in itself which falls beyond the scope of this report. As a consequence only a selected number of options are costed here to give some economic context. Some of these options were implemented in the pilot catchments during the monitoring period, ie.: i) More frequent collection of litter. ii) Street sweeping. iii) Cleaning of catchpits and leadings. iv) Installation of grids at the entrance to catchpit inlets. Several difficulties were experienced in costing these options: i) An economic evaluation demands that the effectiveness of the options is also
determined. To measure this it is necessary to quantify each option’s effect in terms of the reduction in litter. With educational programmes it is often difficult to define the extent of the area which is influenced and should therefore be considered in measuring their effectiveness.
ii) As cleansing operations are in the main carried out by local authorities using
their own staff and plant, unit costs for removing litter are generally not available and have to be deduced. Fortunately these operations were outsourced in the Cape Town CBD and Fresnaye catchments and the cleaning contract rates have been used to derive unit costs.
iii) Many interventions are undertaken by NGOs operating with grant money and
often using unpaid volunteers. Generally task based accounting practices are not applied by the NGOs which makes it difficult to establish the true costs of the interventions.
9.2 Costing of alternative options To permit comparison each option is costed in rands per kg reduction in litter reaching the stormwater system. All costs are based on or have been adjusted to 2001 figures and are expressed without VAT.
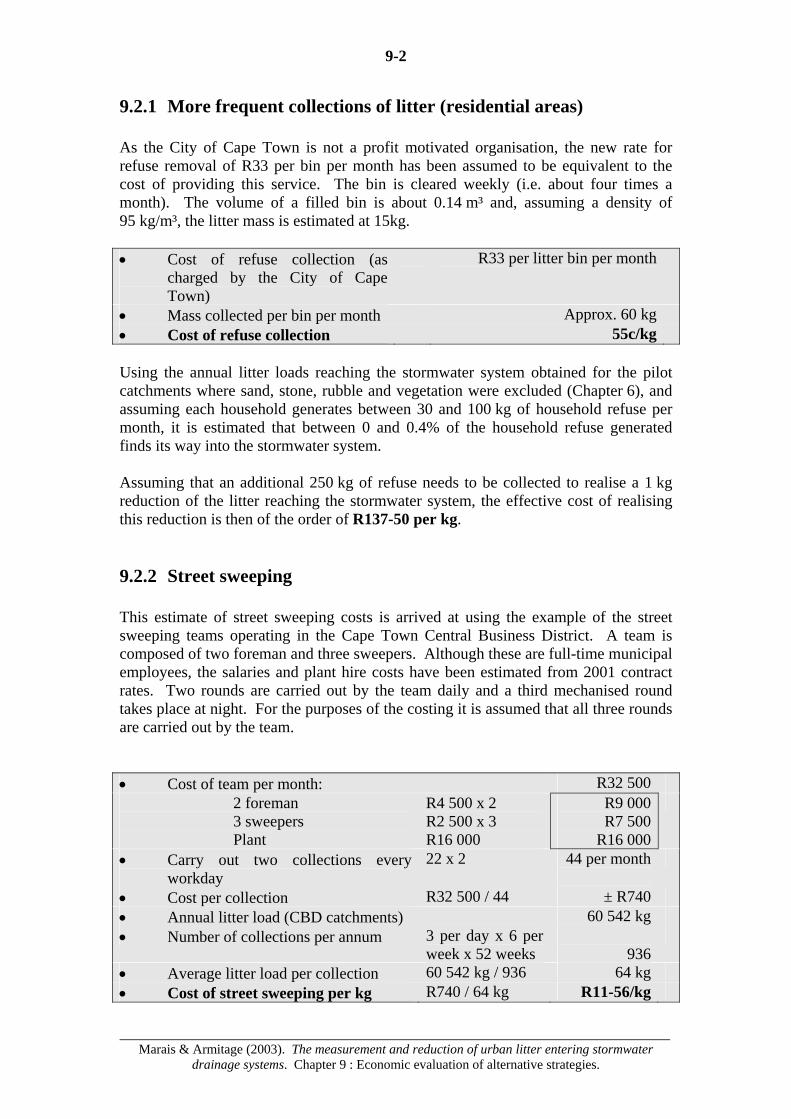
9-2
Marais & Armitage (2003). The measurement and reduction of urban litter entering stormwater
drainage systems. Chapter 9 : Economic evaluation of alternative strategies.
9.2.1 More frequent collections of litter (residential areas) As the City of Cape Town is not a profit motivated organisation, the new rate for refuse removal of R33 per bin per month has been assumed to be equivalent to the cost of providing this service. The bin is cleared weekly (i.e. about four times a month). The volume of a filled bin is about 0.14 m³ and, assuming a density of 95 kg/m³, the litter mass is estimated at 15kg. • Cost of refuse collection (as
charged by the City of Cape Town)
R33 per litter bin per month
• Mass collected per bin per month Approx. 60 kg • Cost of refuse collection 55c/kg Using the annual litter loads reaching the stormwater system obtained for the pilot catchments where sand, stone, rubble and vegetation were excluded (Chapter 6), and assuming each household generates between 30 and 100 kg of household refuse per month, it is estimated that between 0 and 0.4% of the household refuse generated finds its way into the stormwater system. Assuming that an additional 250 kg of refuse needs to be collected to realise a 1 kg reduction of the litter reaching the stormwater system, the effective cost of realising this reduction is then of the order of R137-50 per kg. 9.2.2 Street sweeping This estimate of street sweeping costs is arrived at using the example of the street sweeping teams operating in the Cape Town Central Business District. A team is composed of two foreman and three sweepers. Although these are full-time municipal employees, the salaries and plant hire costs have been estimated from 2001 contract rates. Two rounds are carried out by the team daily and a third mechanised round takes place at night. For the purposes of the costing it is assumed that all three rounds are carried out by the team. • Cost of team per month: R32 500 2 foreman 3 sweepers Plant
R4 500 x 2 R2 500 x 3 R16 000
R9 000 R7 500
R16 000
• Carry out two collections every workday
22 x 2 44 per month
• Cost per collection R32 500 / 44 ± R740 • Annual litter load (CBD catchments) 60 542 kg • Number of collections per annum 3 per day x 6 per
week x 52 weeks
936
• Average litter load per collection 60 542 kg / 936 64 kg • Cost of street sweeping per kg R740 / 64 kg R11-56/kg
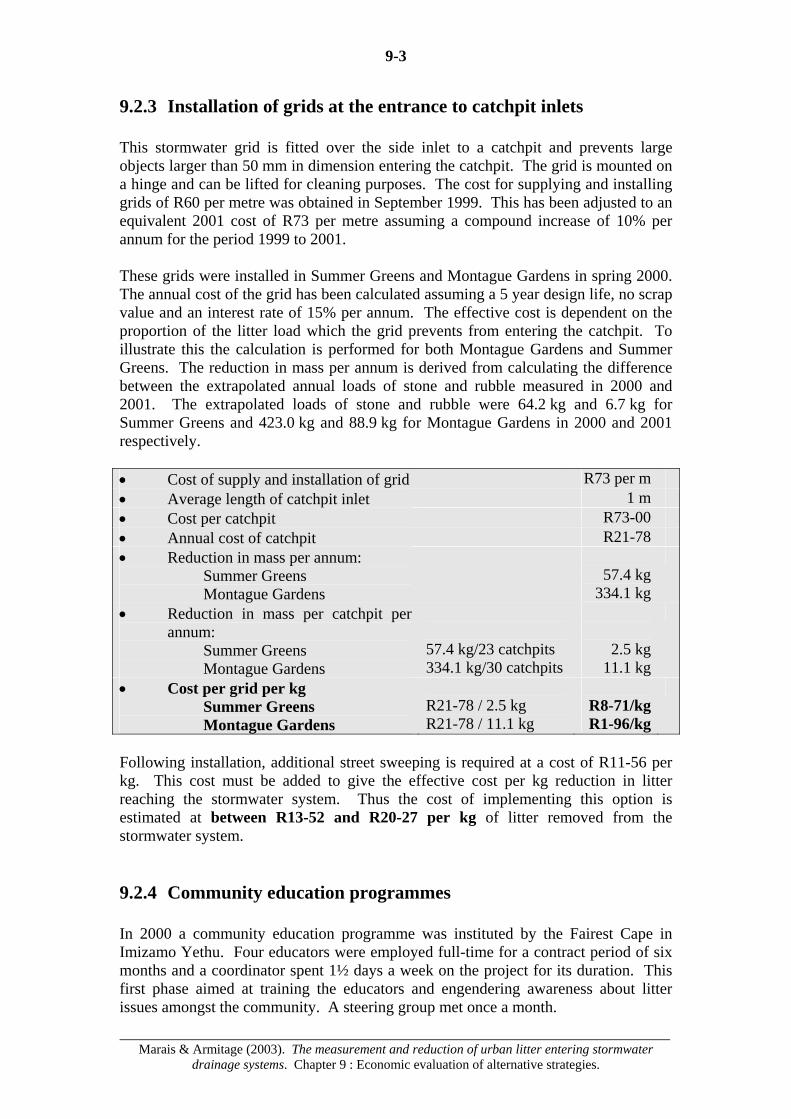
9-3
Marais & Armitage (2003). The measurement and reduction of urban litter entering stormwater
drainage systems. Chapter 9 : Economic evaluation of alternative strategies.
9.2.3 Installation of grids at the entrance to catchpit inlets This stormwater grid is fitted over the side inlet to a catchpit and prevents large objects larger than 50 mm in dimension entering the catchpit. The grid is mounted on a hinge and can be lifted for cleaning purposes. The cost for supplying and installing grids of R60 per metre was obtained in September 1999. This has been adjusted to an equivalent 2001 cost of R73 per metre assuming a compound increase of 10% per annum for the period 1999 to 2001. These grids were installed in Summer Greens and Montague Gardens in spring 2000. The annual cost of the grid has been calculated assuming a 5 year design life, no scrap value and an interest rate of 15% per annum. The effective cost is dependent on the proportion of the litter load which the grid prevents from entering the catchpit. To illustrate this the calculation is performed for both Montague Gardens and Summer Greens. The reduction in mass per annum is derived from calculating the difference between the extrapolated annual loads of stone and rubble measured in 2000 and 2001. The extrapolated loads of stone and rubble were 64.2 kg and 6.7 kg for Summer Greens and 423.0 kg and 88.9 kg for Montague Gardens in 2000 and 2001 respectively. • Cost of supply and installation of grid R73 per m • Average length of catchpit inlet 1 m • Cost per catchpit R73-00 • Annual cost of catchpit R21-78 • Reduction in mass per annum:
Summer Greens Montague Gardens
57.4 kg
334.1 kg
• Reduction in mass per catchpit per annum:
Summer Greens Montague Gardens
57.4 kg/23 catchpits 334.1 kg/30 catchpits
2.5 kg 11.1 kg
• Cost per grid per kg Summer Greens Montague Gardens
R21-78 / 2.5 kg R21-78 / 11.1 kg
R8-71/kg R1-96/kg
Following installation, additional street sweeping is required at a cost of R11-56 per kg. This cost must be added to give the effective cost per kg reduction in litter reaching the stormwater system. Thus the cost of implementing this option is estimated at between R13-52 and R20-27 per kg of litter removed from the stormwater system. 9.2.4 Community education programmes In 2000 a community education programme was instituted by the Fairest Cape in Imizamo Yethu. Four educators were employed full-time for a contract period of six months and a coordinator spent 1½ days a week on the project for its duration. This first phase aimed at training the educators and engendering awareness about litter issues amongst the community. A steering group met once a month.
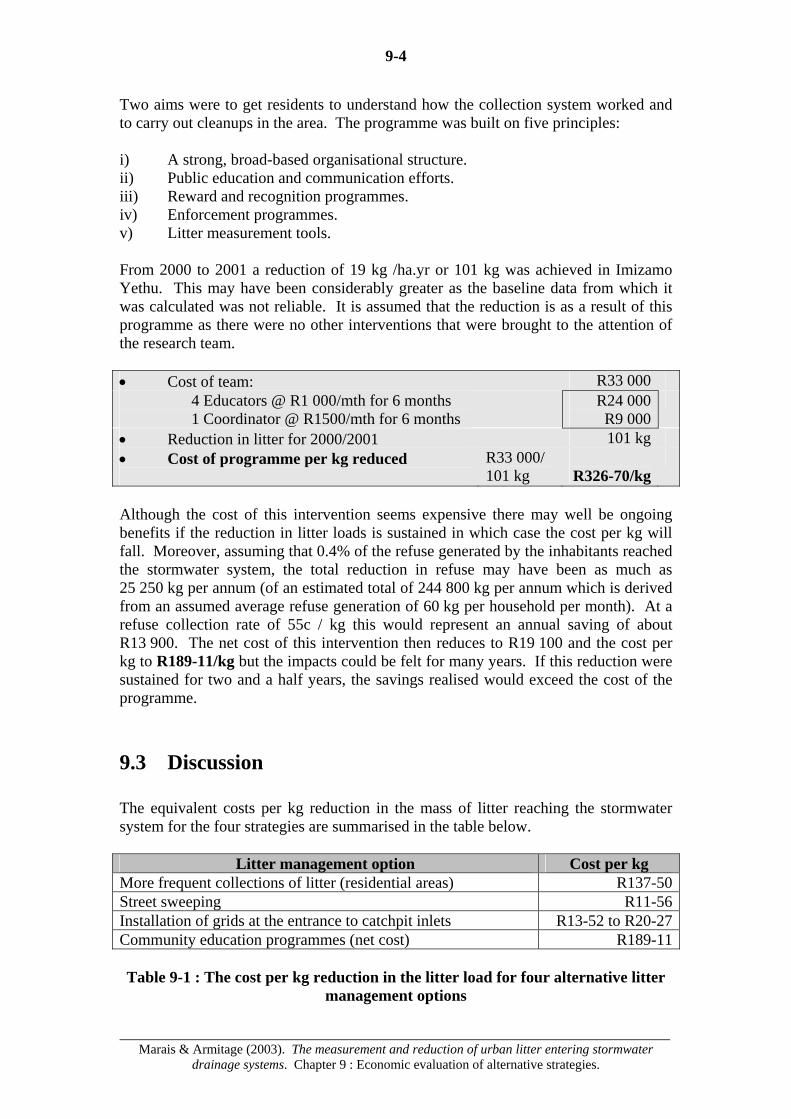
9-4
Marais & Armitage (2003). The measurement and reduction of urban litter entering stormwater
drainage systems. Chapter 9 : Economic evaluation of alternative strategies.
Two aims were to get residents to understand how the collection system worked and to carry out cleanups in the area. The programme was built on five principles: i) A strong, broad-based organisational structure. ii) Public education and communication efforts. iii) Reward and recognition programmes. iv) Enforcement programmes. v) Litter measurement tools. From 2000 to 2001 a reduction of 19 kg /ha.yr or 101 kg was achieved in Imizamo Yethu. This may have been considerably greater as the baseline data from which it was calculated was not reliable. It is assumed that the reduction is as a result of this programme as there were no other interventions that were brought to the attention of the research team. • Cost of team: R33 000
4 Educators @ R1 000/mth for 6 months 1 Coordinator @ R1500/mth for 6 months
R24 000 R9 000
• Reduction in litter for 2000/2001 101 kg • Cost of programme per kg reduced
R33 000/ 101 kg
R326-70/kg
Although the cost of this intervention seems expensive there may well be ongoing benefits if the reduction in litter loads is sustained in which case the cost per kg will fall. Moreover, assuming that 0.4% of the refuse generated by the inhabitants reached the stormwater system, the total reduction in refuse may have been as much as 25 250 kg per annum (of an estimated total of 244 800 kg per annum which is derived from an assumed average refuse generation of 60 kg per household per month). At a refuse collection rate of 55c / kg this would represent an annual saving of about R13 900. The net cost of this intervention then reduces to R19 100 and the cost per kg to R189-11/kg but the impacts could be felt for many years. If this reduction were sustained for two and a half years, the savings realised would exceed the cost of the programme. 9.3 Discussion The equivalent costs per kg reduction in the mass of litter reaching the stormwater system for the four strategies are summarised in the table below.
Litter management option Cost per kg More frequent collections of litter (residential areas) R137-50Street sweeping R11-56Installation of grids at the entrance to catchpit inlets R13-52 to R20-27Community education programmes (net cost) R189-11 Table 9-1 : The cost per kg reduction in the litter load for four alternative litter
management options
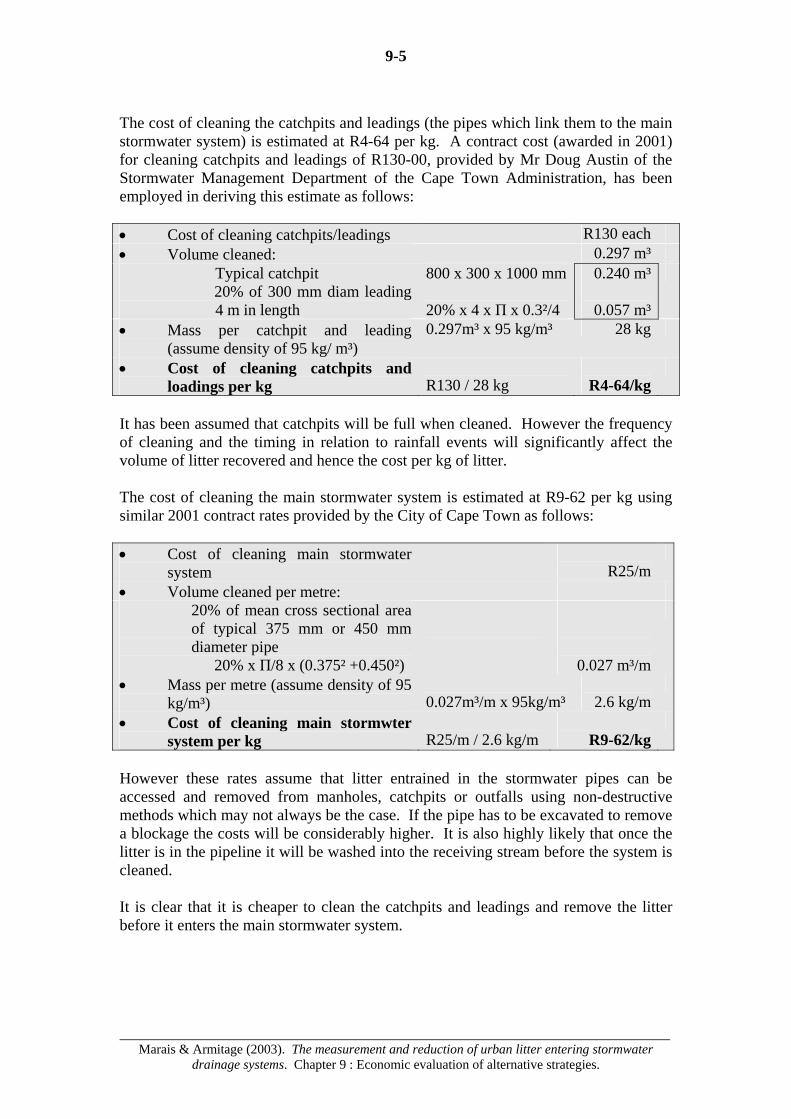
9-5
Marais & Armitage (2003). The measurement and reduction of urban litter entering stormwater
drainage systems. Chapter 9 : Economic evaluation of alternative strategies.
The cost of cleaning the catchpits and leadings (the pipes which link them to the main stormwater system) is estimated at R4-64 per kg. A contract cost (awarded in 2001) for cleaning catchpits and leadings of R130-00, provided by Mr Doug Austin of the Stormwater Management Department of the Cape Town Administration, has been employed in deriving this estimate as follows: • Cost of cleaning catchpits/leadings R130 each • Volume cleaned: 0.297 m³ Typical catchpit 20% of 300 mm diam leading
4 m in length
800 x 300 x 1000 mm 20% x 4 x Π x 0.3²/4
0.240 m³
0.057 m³
• Mass per catchpit and leading (assume density of 95 kg/ m³)
0.297m³ x 95 kg/m³ 28 kg
• Cost of cleaning catchpits and loadings per kg
R130 / 28 kg
R4-64/kg
It has been assumed that catchpits will be full when cleaned. However the frequency of cleaning and the timing in relation to rainfall events will significantly affect the volume of litter recovered and hence the cost per kg of litter. The cost of cleaning the main stormwater system is estimated at R9-62 per kg using similar 2001 contract rates provided by the City of Cape Town as follows: • Cost of cleaning main stormwater
system
R25/m
• Volume cleaned per metre: 20% of mean cross sectional area
of typical 375 mm or 450 mm diameter pipe
20% x Π/8 x (0.375² +0.450²)
0.027 m³/m
• Mass per metre (assume density of 95 kg/m³)
0.027m³/m x 95kg/m³
2.6 kg/m
• Cost of cleaning main stormwter system per kg
R25/m / 2.6 kg/m
R9-62/kg
However these rates assume that litter entrained in the stormwater pipes can be accessed and removed from manholes, catchpits or outfalls using non-destructive methods which may not always be the case. If the pipe has to be excavated to remove a blockage the costs will be considerably higher. It is also highly likely that once the litter is in the pipeline it will be washed into the receiving stream before the system is cleaned. It is clear that it is cheaper to clean the catchpits and leadings and remove the litter before it enters the main stormwater system.
9-6
Marais & Armitage (2003). The measurement and reduction of urban litter entering stormwater
drainage systems. Chapter 9 : Economic evaluation of alternative strategies.
None of the strategies costed are cheaper than the costs of cleaning the litter from the catchpits and leadings or the main stormwater system, however, apart from street sweeping, their efficacy is not as dependent on programming with respect to rainfall events. The strategy of installing grids is effective in catchments where there is a high proportion of items such as stones and rubble. Street sweeping only becomes effective when the litter loads are extremely high. Although the community education programme option appears expensive, this is because only a small part of the area where the littering behaviour of the public may have been modified as a result of the programme has been taken into account. It has also been assumed that this change in behaviour will be maintained for a year only. 9.4 Conclusions Several litter management options have been costed in terms of the reduction in the mass of litter achieved following their implementation. This gives some economic context to a comparison of litter management strategies. At best these costs should be treated as indicative only for the following reasons: i) Many assumptions have had to be made to arrive at the calculated costs.
These assumptions will vary from region to region. ii) The costs are based upon rates applicable in Cape Town in 2001 and will vary
both regionally and temporally. iii) Besides the implemented options there may be other factors which contribute
to a change in littering behaviour. iv) Only the mass of litter entering the catchpits was monitored and measured.
Generally this represents a small percentage of the refuse generated. To assume the percentage reduction achieved in the litter load in the stormwater system is the same or similar to that achieved in refuse generation may be invalid. This makes it difficult to quantify all the savings achieved by implementing a particular litter management option.
v) With educational programmes it is particularly difficult to quantify their
efficacy as the area and time period of influence cannot be easily defined. vi) More and better data is required, particularly on costs and efficiencies, to
arrive at a meaningful economic evaluation of alternative litter mangement options.
10-1
Marais & Armitage (2003). The measurement and reduction of urban litter entering stormwater
drainage systems. Chapter 10 : Preliminary guidelines for the reduction of urban litter loads.
10. Preliminary guidelines for the reduction of
urban litter loads 10.1 Introduction The focus of this report is on the litter management options which fall within the category of source controls. Source controls are aimed at reducing the litter loads entering the drainage system by dealing with the pollution at source. A whole range of such interventions has been identified in Chapter 7. Accepting that some litter will always escape into the stormwater system, structural controls, such as litter traps or pollution basins, will always be required. The location and selection of these litter removal structures is the subject of WRC Report No TT 95/98 entitled “The removal of urban litter from stormwater conduits and streams” (Armitage et al, 1998), which is available on the web at: - http:\\www.wrc.org.za\reports\tt95_98.htm. Alternatively this document has been summarised in Armitage & Rooseboom (2000a,b,c). This is also available online at: - http:\\www.wrc.org.za\wrcpublications\wrcwatersa\wsa-apr00.htm #quantities
#studies #selecting.
These guidelines are intended to assist in the selection of appropriate techniques for reducing litter loads entering the drainage system by dealing with litter pollution at source. When using them it must be remembered that these were derived under the conditions encountered in the pilot catchments situated in the Cape Metropolitan Area during 2000 and 2001. 10.2 Factors to be considered There are a whole host of factors that need to be considered before selecting an appropriate litter management option to reduce litter loads. Most of these factors are associated with the land use of the urban catchment. In previous chapters of this report it has been shown that the litter loads and profiles for residential, commercial and industrial areas are significantly different from one another. Vegetation loads are generally insignificant while rubble and large items are significant contributors in industrial areas. Informal residential areas are characterised by ongoing informal construction activities that generate rubble and destabilise areas leading to erosion and the silting of catchpits.

10-2
Marais & Armitage (2003). The measurement and reduction of urban litter entering stormwater
drainage systems. Chapter 10 : Preliminary guidelines for the reduction of urban litter loads.
Litter loads in middle and high income residential areas, which are dominated by the contribution made by garden refuse, are lower than in low income residential, commercial or industrial areas. Plastics are a significant contributor to litter loads for all urban land use types where vegetation and sediments are excluded. While these should not be regarded as a comprehensive list, nine factors influencing the selection of a particular option are dealt with in greater detail below: i) The composition of the litter. ii) The volume of the litter. iii) The presence of a street sweeping service. iv) The nature of the refuse removal service. v) The nature of the land tenure. vi) The composition of the community. vii) The pedestrian volumes. viii) Community awareness of litter and the environment. ix) The layout. 10.2.1 The composition of the litter Important considerations relating to the composition of the litter are: • Is the litter dominated by stone or rubble? • Does packaging constitute a significant proportion of the litter and does it
come from a particular business? • How much of the litter is composed of recyclable materials (such as glass
bottles, cans and plastic containers)? • Is there a significant proportion of garden refuse? • Do entrained sediments add appreciably to the mass of the litter? • Is there evidence of contamination by heavy metals? • Are oil and grease spills evident?

10-3
Marais & Armitage (2003). The measurement and reduction of urban litter entering stormwater
drainage systems. Chapter 10 : Preliminary guidelines for the reduction of urban litter loads.
10.2.2 The volume of litter The volume of litter generated has a direct bearing on selecting the most appropriate litter management option. If only small volumes find their way into the stormwater system it is difficult to justify street sweeping, while installing well situated and designed litter bins may prove cost effective. 10.2.3 The presence of a street sweeping service Where street sweeping is infrequent or non-existent it may be inappropriate to introduce methods, such as installing grates across catchpit entrances, which result in an increase in the amount of litter that accumulates in the roadway. There may be potential to improve an existing street sweeping service by ensuring that litter is not merely swept into the nearest convenient catchpit; or a study could be undertaken to identify areas with high rates of litter accumulation and sweeping times and resources reallocated accordingly, to name two examples. 10.2.4 The nature of the refuse removal service The nature of the refuse removal service that is in place is important because there is a clear link between service levels and litter loadings. Generally low income areas receive inferior refuse removal services which result in higher litter loadings in the stormwater system. If skips are provided, aspects such as appropriate maximum distances to walk to deposit refuse and skip heights, which allow children to toss rubbish into the skip, are critical to their effectiveness. 10.2.5 The nature of the land tenure In residential areas, the nature of the land tenure is an important determinant of the community’s sense of ownership and responsibility for their surroundings. Where this sense of ownership is lacking it is extremely difficult to motivate the community to change their littering behaviour for example through educational programmes. 10.2.6 The composition of the community The size of the community that it is intended to reach will determine whether mass media such as newspapers, radio and television will need to be employed or whether it is feasible to train educators to engage directly with the community. If there are large numbers of children, programmes to promote environmental awareness, discourage littering and encourage recycling etc. can be effectively propagated through the schools. Where there are large numbers of unemployed in the community, community based litter collection to communal depots or recycling initiatives can provide employment and income.
10-4
Marais & Armitage (2003). The measurement and reduction of urban litter entering stormwater
drainage systems. Chapter 10 : Preliminary guidelines for the reduction of urban litter loads.
10.2.7 The pedestrian volumes Routes which carry large pedestrian volumes generally have higher litter loads than less trafficked routes. The provision of frequently cleared litter bins along these busy routes can be an effective way to reduce the quantity of litter reaching the stormwater drainage system. Billboards erected along these routes with messages encouraging proper disposal of litter or recycling can be expected to reach a large number of people whereas they would clearly have a marginal impact on the community if erected in areas with low pedestrian traffic. 10.2.8 Community awareness of litter and the environment Where there is already a good understanding of the environmental problems caused by littering and the need to reduce the quantities, recycling programmes can be effectively implemented. If this understanding does not exist, an awareness programme would first have to be undertaken before recycling programmes could be considered. 10.2.9 The layout The layout often dictates which particular options are possible. Important considerations are: • Are there generous road reserves which permit the creation of swales to trap
litter and contaminants such as heavy metals, oil and grease before they reach the stormwater system?
• Is there access to every dwelling for refuse removal trucks or is it necessary
for litter to be brought to central collection areas? • Are road verges surfaced or not (unsurfaced verges can suffer erosion
resulting in high silt loads)? • Are the dwellings informal or formal (informal areas often generate more
rubble because of ongoing building activity)? 10.3 The appropriateness of particular litter management
options The appropriateness of particular options and the applicability of the concomitant litter management techniques have been discussed in some detail in Section 7.3 with particular reference to the pilot catchments. Some of these options have been costed in Chapter 9. These costings are used to derive broad “rules of thumb” for implementing these options.
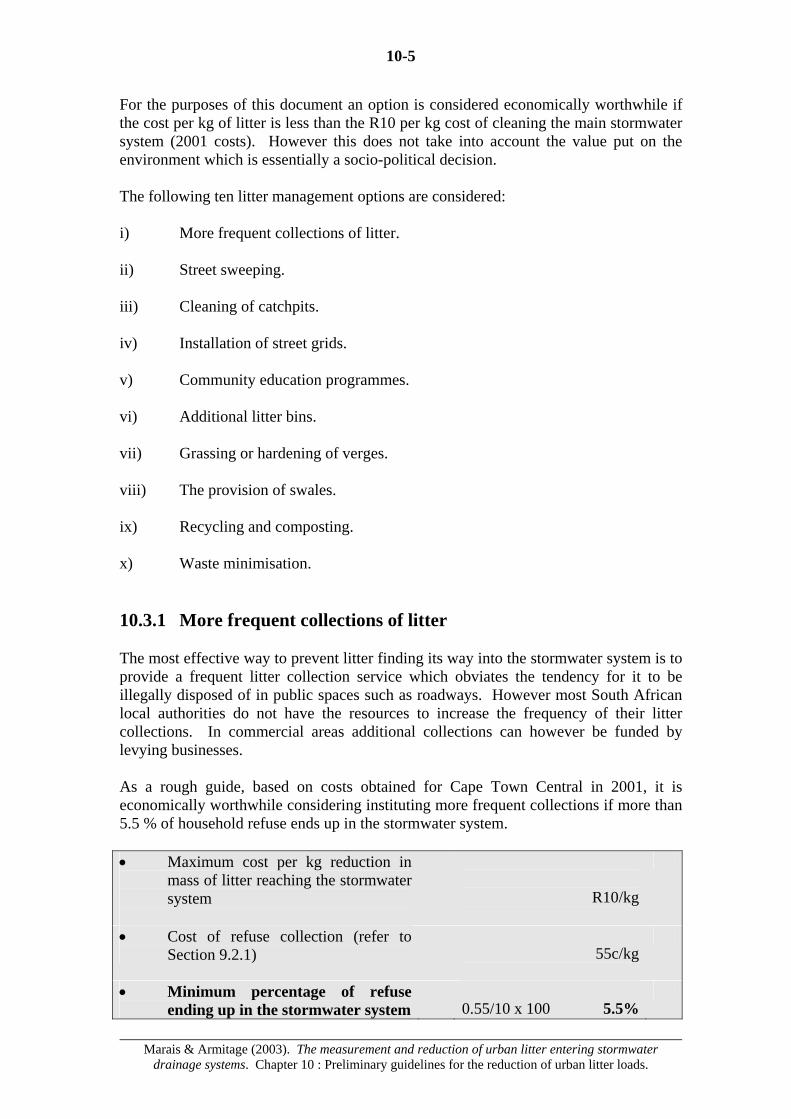
10-5
Marais & Armitage (2003). The measurement and reduction of urban litter entering stormwater
drainage systems. Chapter 10 : Preliminary guidelines for the reduction of urban litter loads.
For the purposes of this document an option is considered economically worthwhile if the cost per kg of litter is less than the R10 per kg cost of cleaning the main stormwater system (2001 costs). However this does not take into account the value put on the environment which is essentially a socio-political decision. The following ten litter management options are considered: i) More frequent collections of litter. ii) Street sweeping. iii) Cleaning of catchpits. iv) Installation of street grids. v) Community education programmes. vi) Additional litter bins. vii) Grassing or hardening of verges. viii) The provision of swales. ix) Recycling and composting. x) Waste minimisation. 10.3.1 More frequent collections of litter The most effective way to prevent litter finding its way into the stormwater system is to provide a frequent litter collection service which obviates the tendency for it to be illegally disposed of in public spaces such as roadways. However most South African local authorities do not have the resources to increase the frequency of their litter collections. In commercial areas additional collections can however be funded by levying businesses. As a rough guide, based on costs obtained for Cape Town Central in 2001, it is economically worthwhile considering instituting more frequent collections if more than 5.5 % of household refuse ends up in the stormwater system. • Maximum cost per kg reduction in
mass of litter reaching the stormwater system
R10/kg
• Cost of refuse collection (refer to Section 9.2.1)
55c/kg
• Minimum percentage of refuse ending up in the stormwater system
0.55/10 x 100 5.5%
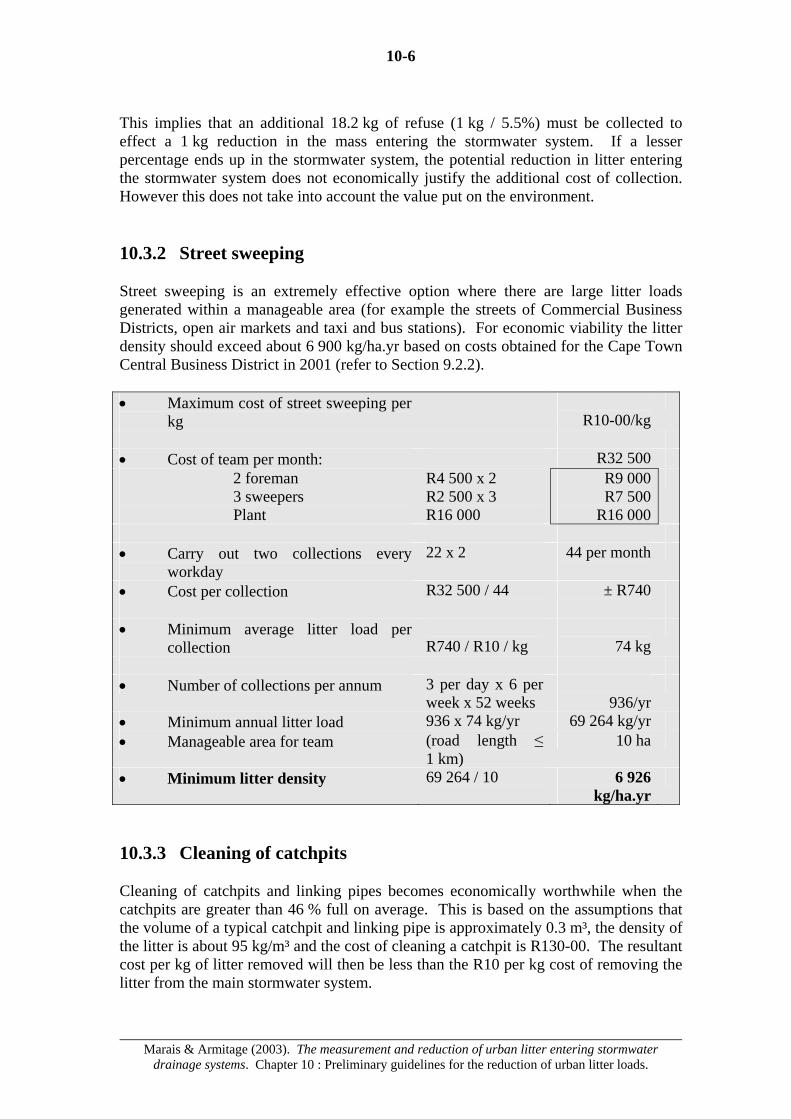
10-6
Marais & Armitage (2003). The measurement and reduction of urban litter entering stormwater
drainage systems. Chapter 10 : Preliminary guidelines for the reduction of urban litter loads.
This implies that an additional 18.2 kg of refuse (1 kg / 5.5%) must be collected to effect a 1 kg reduction in the mass entering the stormwater system. If a lesser percentage ends up in the stormwater system, the potential reduction in litter entering the stormwater system does not economically justify the additional cost of collection. However this does not take into account the value put on the environment. 10.3.2 Street sweeping Street sweeping is an extremely effective option where there are large litter loads generated within a manageable area (for example the streets of Commercial Business Districts, open air markets and taxi and bus stations). For economic viability the litter density should exceed about 6 900 kg/ha.yr based on costs obtained for the Cape Town Central Business District in 2001 (refer to Section 9.2.2). • Maximum cost of street sweeping per
kg
R10-00/kg
• Cost of team per month: R32 500 2 foreman 3 sweepers Plant
R4 500 x 2 R2 500 x 3 R16 000
R9 000 R7 500
R16 000
• Carry out two collections every
workday 22 x 2 44 per month
• Cost per collection R32 500 / 44 ± R740 • Minimum average litter load per
collection R740 / R10 / kg
74 kg
• Number of collections per annum 3 per day x 6 per
week x 52 weeks
936/yr
• Minimum annual litter load 936 x 74 kg/yr 69 264 kg/yr • Manageable area for team (road length ≤
1 km) 10 ha
• Minimum litter density 69 264 / 10 6 926 kg/ha.yr
10.3.3 Cleaning of catchpits Cleaning of catchpits and linking pipes becomes economically worthwhile when the catchpits are greater than 46 % full on average. This is based on the assumptions that the volume of a typical catchpit and linking pipe is approximately 0.3 m³, the density of the litter is about 95 kg/m³ and the cost of cleaning a catchpit is R130-00. The resultant cost per kg of litter removed will then be less than the R10 per kg cost of removing the litter from the main stormwater system.

10-7
Marais & Armitage (2003). The measurement and reduction of urban litter entering stormwater
drainage systems. Chapter 10 : Preliminary guidelines for the reduction of urban litter loads.
10.3.4 Installation of street grids For the installation of street grids over stormwater catchpit inlets to be considered, stone and rubble must constitute a large proportion of the litter load. This is often the case in industrial areas and informal residential areas. Installation must be followed up with a regular sweeping programme, if it is not already in place, to remove the stone and rubble that will accumulate at the grids. Grids may also delay the entry of plastic bags or large leaves into the stormwater system although ultimately these items tend to pass through or under the grid. 10.3.5 Community education programmes Community education programmes are appropriate where there is a lack of environmental awareness and a high prevalence of littering behaviour. The programmes should be tailored to the particular target group. 10.3.6 Additional litter bins Areas where there are high concentrations of pedestrians should be targeted for the placing of additional litter bins. Examples of such areas are adjacent to markets, fast food places or bus and taxi ranks and along major pedestrian routes. The bins should be easily accessible and emptied regularly. The design of the bin should permit ease of emptying while preventing wind or scavengers from removing the contents. 10.3.7 Grassing or hardening of verges Areas with unsurfaced road verges commonly have high sediment loads as a result of erosion of the road verge. Grassing these verges or surfacing them considerably reduces erosion and sediment loads originating from the road verges. However surfacing also increases flood peaks and facilitates the movement of pollutants. Grassing should only be considered for verges which have low pedestrian traffic and can be maintained and watered during the dry season. 10.3.8 Swales Swales are commonly used along rural highways and residential streets to convey runoff. Like ditches they collect stormwater from roads, driveways, parking lots and other hard surfaces. Unlike ditches they have gently sloping sides and are vegetated to prevent the slopes from eroding and to help filter pollutants during and after rain. Because they are wider than they are deep, stormwater flows are spread over a broader area and slowed. The vegetation can then filter the stormwater flow and remove sediments, heavy metals, oil and grease. Temporary ponding in the swale allows time for water to soak into the ground which assists in reducing the volume of runoff and the amount of pollutants.

10-8
Marais & Armitage (2003). The measurement and reduction of urban litter entering stormwater
drainage systems. Chapter 10 : Preliminary guidelines for the reduction of urban litter loads.
Swales are easy and relatively cheap to construct. Drawbacks are that they require generous road servitudes and must be regularly mowed and cleared of litter. 10.3.9 Recycling and composting Where there is a high percentage of recyclable materials present in the refuse generated by households and businesses, recycling can significantly reduce the quantity of the refuse and hence the potential litter load that reaches the stormwater system. This also holds for the composting of organic material where this is a large component of domestic refuse. Separation of litter into organic, recyclable and non-recyclable components can provide an income to jobless people if businesses are prepared to pay for the recycled items. Organic waste can be converted into compost and sold. Relatively compact, high-density residential areas with high unemployment rates are candidates for such a measure. 10.3.10 Waste minimisation Waste minimisation can be defined as the systematic approach to reducing waste at source. It relates to all inputs and outputs from an industry, business site or process and aims to maximise the conversion of the inputs such as water, energy, chemicals and raw materials to the product while minimising the production of effluent, air emissions and solid waste. The application of waste minimisation techniques is most suited to industrial and commercial areas. 10.4 The recommended selection procedure The above factors and litter management options are combined below in matrix form to simplify the selection of the most appropriate options. The process which should be followed is: 1. Identify the factors which are relevant to the particular situation. 2. Select the appropriate options by determining which options are associated
with the largest number of the identified factors.
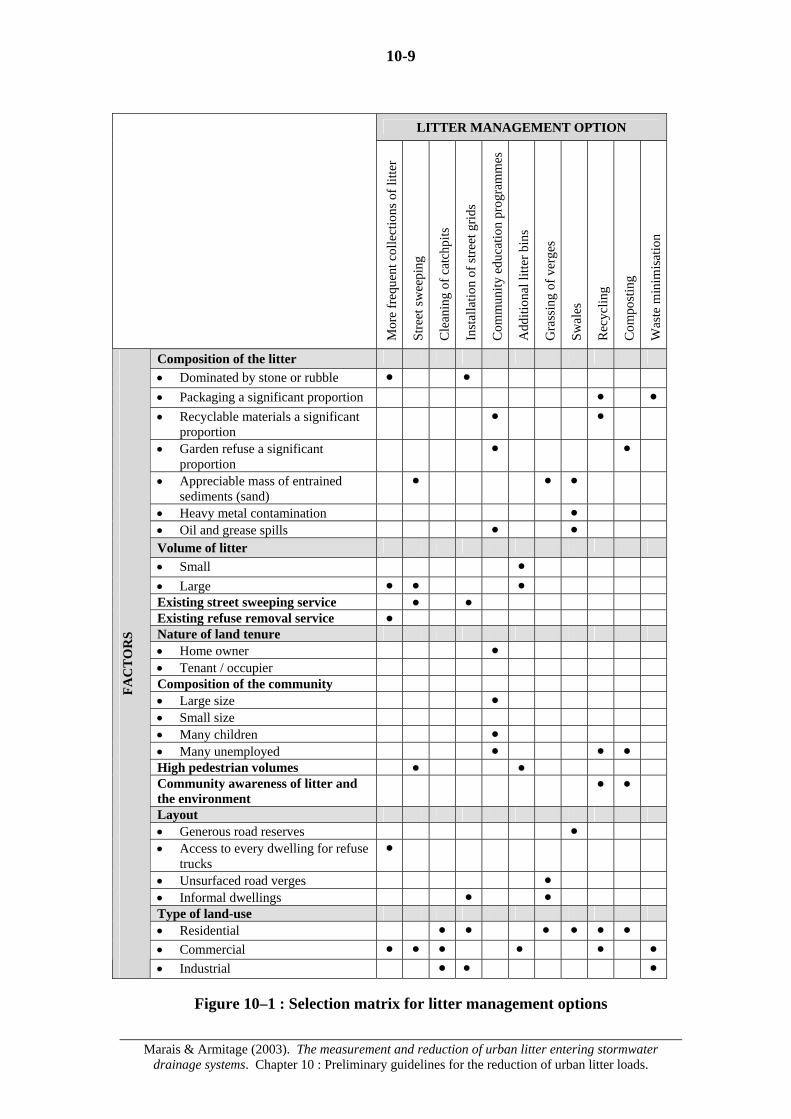
10-9
Marais & Armitage (2003). The measurement and reduction of urban litter entering stormwater
drainage systems. Chapter 10 : Preliminary guidelines for the reduction of urban litter loads.
LITTER MANAGEMENT OPTION
Mor
e fr
eque
nt c
olle
ctio
ns o
f litt
er
Stre
et sw
eepi
ng
Cle
anin
g of
cat
chpi
ts
Inst
alla
tion
of st
reet
grid
s
Com
mun
ity e
duca
tion
prog
ram
mes
Add
ition
al li
tter b
ins
Gra
ssin
g of
ver
ges
Swal
es
Rec
yclin
g
Com
post
ing
Was
te m
inim
isat
ion
Composition of the litter • Dominated by stone or rubble ● ● • Packaging a significant proportion ● ● • Recyclable materials a significant
proportion ● ●
• Garden refuse a significant proportion
● ●
• Appreciable mass of entrained sediments (sand)
● ● ●
• Heavy metal contamination ● • Oil and grease spills ● ● Volume of litter • Small ● • Large ● ● ● Existing street sweeping service ● ● Existing refuse removal service ● Nature of land tenure • Home owner ● • Tenant / occupier Composition of the community • Large size ● • Small size • Many children ● • Many unemployed ● ● ● High pedestrian volumes ● ● Community awareness of litter and the environment
● ●
Layout • Generous road reserves ● • Access to every dwelling for refuse
trucks ●
• Unsurfaced road verges ● • Informal dwellings ● ● Type of land-use • Residential ● ● ● ● ● ● • Commercial ● ● ● ● ● ●
FAC
TO
RS
• Industrial ● ● ●
Figure 10–1 : Selection matrix for litter management options

10-10
Marais & Armitage (2003). The measurement and reduction of urban litter entering stormwater
drainage systems. Chapter 10 : Preliminary guidelines for the reduction of urban litter loads.
10.5 Conclusions These guidelines do not provide a comprehensive list of all the available options for reducing litter loads entering the drainage system. However they do provide a quick method of making a preliminary selection of appropriate litter management options for a given set of factors. The selected options should be investigated further and preferably implemented on a pilot basis in the area under consideration to determine their likely efficacy before proceeding with full implementation.

11-1
Marais & Armitage (2003). The measurement and reduction of urban litter entering stormwater
drainage systems. Chapter 11 : Conclusions.
11. Conclusions It is clear that litter in urban stormwater runoff is a serious problem which needs to be addressed. While the impact of litter pollution of urban stormwater runoff may appear to be mainly of visual and aesthetic importance, litter also seriously interferes with aquatic life in the receiving streams, rivers, lakes and oceans. Littering is considered to be a social behavioural problem. The temptation to litter is increased where there is a general failure by authorities to enforce effective penalties as a deterrent to offenders and where littering is not countered by a strong environmental ethic amongst the population at large. The general inadequacy of litter refuse services leads to a rapid and sustained accumulation of litter. This is particularly evident in South Africa and other developing countries where litter collections are often infrequent. In attempting to understand and address the litter problem this study built on the following two premises: i) The composition of the litter varies with different land-uses, income and service
levels and population densities. ii) The particular physical attributes of a catchment, the socio-economic
characteristics of its community and the level of services provided determine which litter management strategies are most likely to be effective in reducing the volume of litter entering the stormwater drainage systems.
As a result of the historical inequalities in public spending on the different population groups, the basic infrastructure of South African urban areas, including the Cape Metropolitan Area, is unequally distributed. Litter problems peculiar to very low income areas, where people are housed in informal structures with rudimentary or minimal levels of municipal servicing, are not generally encountered in the comparatively affluent societies of the first world. Examples of these problems are dealing with the contents of bags and bins emptied by vagrants, children and dogs etc. and night soil in the stormwater drainage systems. These and other litter problems cannot be addressed in an effective and sustainable manner without an appropriate integrated catchment and litter management strategy. Litter management in South Africa has been hindered by the shortage of scientifically verified data indicating the likely effectiveness of different options in the reduction of urban litter. Current South African initiatives, such as the Dense Settlements Project, the City of Cape Town’s Mess Action Programme, the education and training programmes run by the Fairest Cape Association and the promotion of Waste Minimisation Clubs, backed by the promulgation of enabling legislation and associated policies, are, however, contributing valuable information on the effectiveness of various litter management strategies.
11-2
Marais & Armitage (2003). The measurement and reduction of urban litter entering stormwater
drainage systems. Chapter 11 : Conclusions.
The twin aims of this study were to complement these initiatives by i) Improving the knowledge of the source, type and amount of urban litter ending
up in the stormwater drainage systems from different types of urban catchments; and
ii) Determining the effectiveness of different litter management options in the
reduction of urban litter reaching the stormwater drainage systems. The first aim was largely achieved with the institution of a two year monitoring programme in nine pilot catchments in the Cape Metropolitan Area. These catchments were selected to cover a wide range of different land uses, socio-economic levels, population densities and service levels. The problems they experience with respect to litter in their stormwater drainage systems are probably representative of similar urban catchments elsewhere in South Africa. Litter traps and nets were installed and a data collection process, whereby the litter trap contents were regularly measured and analysed, was instituted. Although some problems were experienced much useful data was obtained. The second aim was not achieved as originally intended. It proved impractical for the Project Team to implement litter management options and measure their effectiveness in isolation from other litter management initiatives that were taking place. However the effects of the litter management initiatives implemented by various parties were monitored and their effectiveness assessed where possible. The data collection process relied on the assistance of the local administrations, which did not always have the same objectives as the Project Team. They helped greatly with the physical removal of the litter from the traps, bagging the contents and transporting them to the UCT laboratory for analysis, but could not be relied upon to record the litter data. To ensure proper collection of the litter and consistent and reliable recording of the litter data in the field, detailed monitoring of the clearing of the litter traps needed to be carried out continuously under the direct supervision of an appropriately trained Waste Auditor. The carrying out of the in-depth analyses of the contents of the litter traps and nets by the Waste Auditor ensured that the contents were analysed in an accurate and consistent way across all nine catchments.
It was found that the frequency of collections and emptying litter traps and nets was best determined on a catchment by catchment basis as each was unique. This collection frequency had to be regularly reassessed and adjusted during the monitoring process as more information about the rate at which the traps and nets fill was obtained. The analysis of the data obtained from the monitoring programme yielded annual litter loads and typical litter profiles for each of the nine pilot catchments for the periods February to September of 2000, February 2001 to January 2002 and both data collection periods combined.
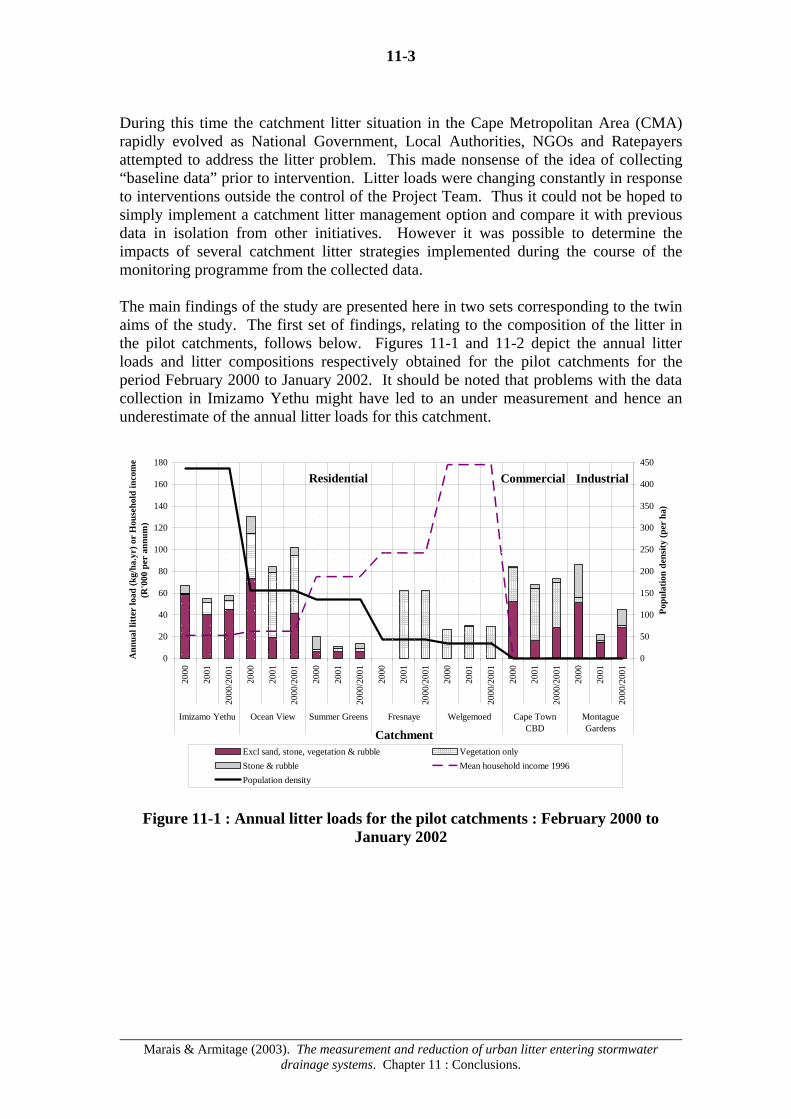
11-3
Marais & Armitage (2003). The measurement and reduction of urban litter entering stormwater
drainage systems. Chapter 11 : Conclusions.
During this time the catchment litter situation in the Cape Metropolitan Area (CMA) rapidly evolved as National Government, Local Authorities, NGOs and Ratepayers attempted to address the litter problem. This made nonsense of the idea of collecting “baseline data” prior to intervention. Litter loads were changing constantly in response to interventions outside the control of the Project Team. Thus it could not be hoped to simply implement a catchment litter management option and compare it with previous data in isolation from other initiatives. However it was possible to determine the impacts of several catchment litter strategies implemented during the course of the monitoring programme from the collected data. The main findings of the study are presented here in two sets corresponding to the twin aims of the study. The first set of findings, relating to the composition of the litter in the pilot catchments, follows below. Figures 11-1 and 11-2 depict the annual litter loads and litter compositions respectively obtained for the pilot catchments for the period February 2000 to January 2002. It should be noted that problems with the data collection in Imizamo Yethu might have led to an under measurement and hence an underestimate of the annual litter loads for this catchment.
0
20
40
60
80
100
120
140
160
180
2000
2001
2000
/200
1
2000
2001
2000
/200
1
2000
2001
2000
/200
1
2000
2001
2000
/200
1
2000
2001
2000
/200
1
2000
2001
2000
/200
1
2000
2001
2000
/200
1
Imizamo Yethu Ocean View Summer Greens Fresnaye Welgemoed Cape TownCBD
MontagueGardensCatchment
Ann
ual l
itter
load
(kg/
ha.y
r) o
r H
ouse
hold
inco
me
(R'0
00 p
er a
nnum
)
0
50
100
150
200
250
300
350
400
450
Popu
latio
n de
nsity
(per
ha)
Excl sand, stone, vegetation & rubble Vegetation onlyStone & rubble Mean household income 1996Population density
Residential Commercial Industrial
Figure 11-1 : Annual litter loads for the pilot catchments : February 2000 to January 2002
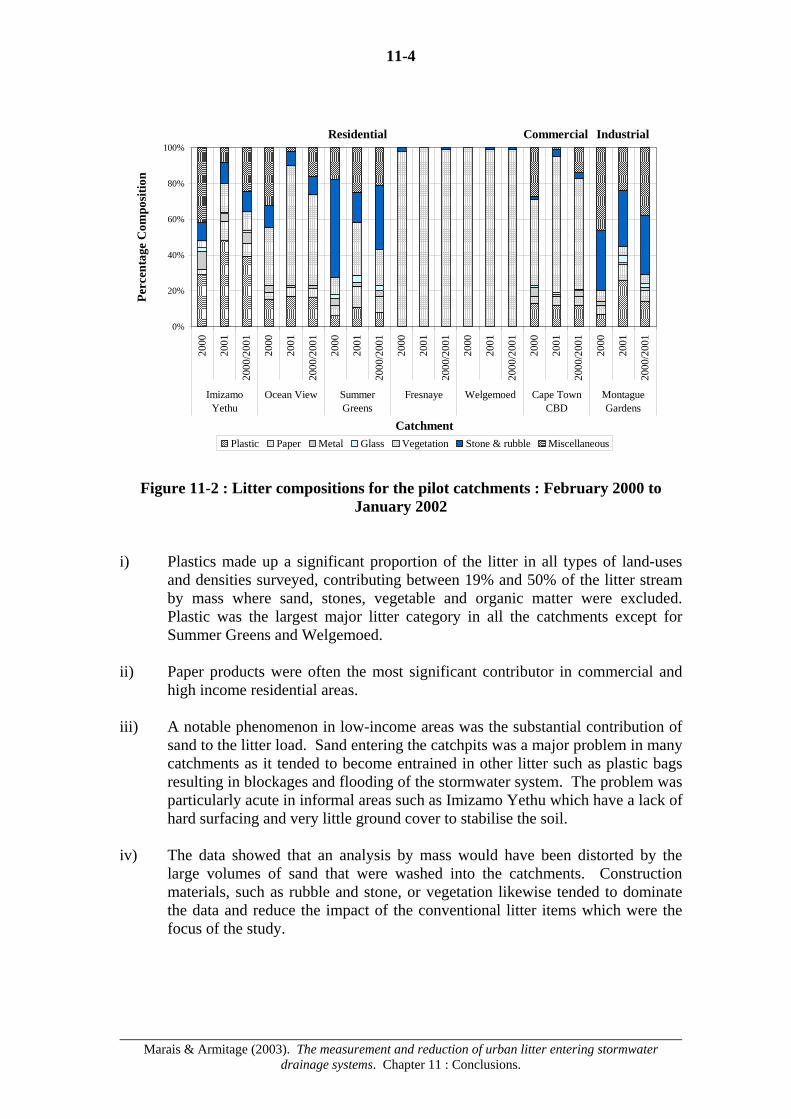
11-4
Marais & Armitage (2003). The measurement and reduction of urban litter entering stormwater
drainage systems. Chapter 11 : Conclusions.
0%
20%
40%
60%
80%
100%
2000
2001
2000
/200
1
2000
2001
2000
/200
1
2000
2001
2000
/200
1
2000
2001
2000
/200
1
2000
2001
2000
/200
1
2000
2001
2000
/200
1
2000
2001
2000
/200
1
ImizamoYethu
Ocean View SummerGreens
Fresnaye Welgemoed Cape TownCBD
MontagueGardens
Catchment
Perc
enta
ge C
ompo
sitio
n
Plastic Paper Metal Glass Vegetation Stone & rubble Miscellaneous
Residential Commercial Industrial
Figure 11-2 : Litter compositions for the pilot catchments : February 2000 to January 2002
i) Plastics made up a significant proportion of the litter in all types of land-uses
and densities surveyed, contributing between 19% and 50% of the litter stream by mass where sand, stones, vegetable and organic matter were excluded. Plastic was the largest major litter category in all the catchments except for Summer Greens and Welgemoed.
ii) Paper products were often the most significant contributor in commercial and
high income residential areas. iii) A notable phenomenon in low-income areas was the substantial contribution of
sand to the litter load. Sand entering the catchpits was a major problem in many catchments as it tended to become entrained in other litter such as plastic bags resulting in blockages and flooding of the stormwater system. The problem was particularly acute in informal areas such as Imizamo Yethu which have a lack of hard surfacing and very little ground cover to stabilise the soil.
iv) The data showed that an analysis by mass would have been distorted by the
large volumes of sand that were washed into the catchments. Construction materials, such as rubble and stone, or vegetation likewise tended to dominate the data and reduce the impact of the conventional litter items which were the focus of the study.
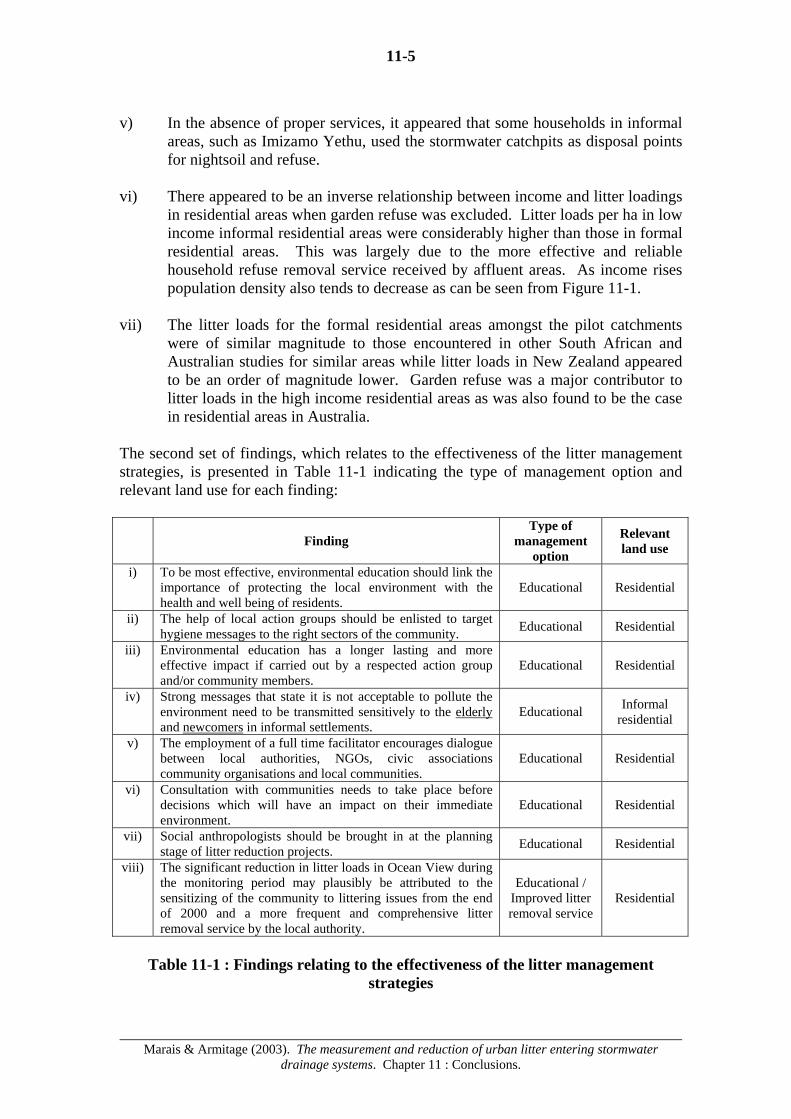
11-5
Marais & Armitage (2003). The measurement and reduction of urban litter entering stormwater
drainage systems. Chapter 11 : Conclusions.
v) In the absence of proper services, it appeared that some households in informal
areas, such as Imizamo Yethu, used the stormwater catchpits as disposal points for nightsoil and refuse.
vi) There appeared to be an inverse relationship between income and litter loadings
in residential areas when garden refuse was excluded. Litter loads per ha in low income informal residential areas were considerably higher than those in formal residential areas. This was largely due to the more effective and reliable household refuse removal service received by affluent areas. As income rises population density also tends to decrease as can be seen from Figure 11-1.
vii) The litter loads for the formal residential areas amongst the pilot catchments
were of similar magnitude to those encountered in other South African and Australian studies for similar areas while litter loads in New Zealand appeared to be an order of magnitude lower. Garden refuse was a major contributor to litter loads in the high income residential areas as was also found to be the case in residential areas in Australia.
The second set of findings, which relates to the effectiveness of the litter management strategies, is presented in Table 11-1 indicating the type of management option and relevant land use for each finding:
Finding
Type of management
option
Relevant land use
i) To be most effective, environmental education should link the importance of protecting the local environment with the health and well being of residents.
Educational Residential
ii) The help of local action groups should be enlisted to target hygiene messages to the right sectors of the community. Educational Residential
iii) Environmental education has a longer lasting and more effective impact if carried out by a respected action group and/or community members.
Educational Residential
iv) Strong messages that state it is not acceptable to pollute the environment need to be transmitted sensitively to the elderly and newcomers in informal settlements.
Educational Informal residential
v) The employment of a full time facilitator encourages dialogue between local authorities, NGOs, civic associations community organisations and local communities.
Educational Residential
vi) Consultation with communities needs to take place before decisions which will have an impact on their immediate environment.
Educational Residential
vii) Social anthropologists should be brought in at the planning stage of litter reduction projects. Educational Residential
viii) The significant reduction in litter loads in Ocean View during the monitoring period may plausibly be attributed to the sensitizing of the community to littering issues from the end of 2000 and a more frequent and comprehensive litter removal service by the local authority.
Educational / Improved litter removal service
Residential
Table 11-1 : Findings relating to the effectiveness of the litter management
strategies

11-6
Marais & Armitage (2003). The measurement and reduction of urban litter entering stormwater
drainage systems. Chapter 11 : Conclusions.
Finding
Type of management
option
Relevant land use
ix) Residents in informal settlements are more likely to show respect for their environment if: • Security of legal tenure is granted to all inhabitants
and illegal further squatting is prevented thus encouraging residential equality.
• The settlements are upgraded through access to better housing, sanitation, refuse removal and other services.
Institutional / Service
provision
Informal residential
x) The Municipality and the residents of Imizamo Yethu were equally responsible for creating the ‘us and them’ syndrome that needs to be broken down before an atmosphere of co-operation can develop.
Institutional Informal residential
xi) For South Africa to transform effectively, and for this transformation to take cognisance of environmental sustainability, it is crucial that the majority of the population, including the poor who are overwhelmingly from the black and coloured groups, is encouraged to participate in the transformation process (Chambers, 1983).
Institutional General
xii) All educational messages should be disseminated in the local languages. Educational General
xiii) Artistic or visual aids, such as posters, are useful in explaining the complexities of the storm water drainage system and the links between rubbish and disease.
Educational General
xiv) The promotion of recycling and composting of refuse at source will reduce the potential litter load finding its way into stormwater drainage systems
Recycling Composting Residential
xv) Catchpit grids are an effective way of reducing the amount of construction rubble entering the stormwater drainage system. The installation of grids over catchpit openings resulted in a significant decrease in the amount of rubble trapped in catchpits in Summer Greens and Montague Gardens.
Structural Residential
Industrial
xvi) Street sweeping is an extremely effective method of reducing the quantity of litter reaching the stormwater system in areas where litter generation rates are high. This was demonstrated in the Cape Town Central Business District.
Service provision Commercial
Table 11-1 : Findings relating to the effectiveness of the litter management
strategies (continued) While both sets of findings are based on a study carried out in the City of Cape Town and their applicability to the country as a whole has not been established, the challenges facing other urban areas are similar. It is likely, therefore, that many of the findings and the following broad conclusions emanating from them, will be equally applicable to the other urban areas of South Africa:

11-7
Marais & Armitage (2003). The measurement and reduction of urban litter entering stormwater
drainage systems. Chapter 11 : Conclusions.
i) The litter problem is a mix of technical and social issues which requires a multi-
disciplinary approach and not merely a purely technical approach. The establishment of partnerships between local government, NGO’s and consultants can bring different skills and competencies to addressing the litter problem.
ii) The costs of waste management should not be considered in isolation as there is
a strong link between filthy, unhygienic conditions and epidemiology or environmental health issues.
iii) It is crucial that local authorities render a regular and efficient refuse removal
service to all communities as this has a major impact on the amount of urban litter entering the stormwater drainage systems.
iv) Street sweeping is the most effective way to reduce litter entering the
stormwater drainage system in areas with high rates of litter accumulation (such as commercial areas, markets, taxi ranks and bus termini.
v) Sustained education and awareness programmes are important for changing
people’s behaviour in the medium term but have limited immediate impact on litter.
vi) Even with improved public awareness of litter and illegal dumping, structural
controls to intercept litter such as traps and booms in streams will remain necessary.
vii) Reducing the amount of packaging or encouraging the use of recyclable
packaging is a litter strategy that can be implemented relatively easily by targeting manufacturers and businesses while having an immediate effect in reducing litter.
The fundamental environmental rights and requirements guaranteed by the South African Constitution (Act No. 108 of 1996) have given rise to a hierarchical suite of environmental legislation and associated policies at national and local level under the National Water Quality Management Framework Policy which governs South African water quality management. The National White Paper on Integrated Pollution and Waste Management for South Africa, completed in 2000, complements the National Water Quality Management Framework Policy in addressing the major issues regarding pollution and waste. Both these policies provide the framework within which the problem of litter in urban stormwater runoff can be tackled. Clearly this problem can only be addressed in an effective and sustainable manner with an integrated catchment management strategy composed of planning controls, source controls (reducing litter loads entering the drainage system) and structural controls (removal of solid wastes from the drainage system), supported by education and enforcement programmes. This management strategy will require constant refinement based on information collected from ongoing monitoring.

12-1
Marais & Armitage (2003). The measurement and reduction of urban litter entering stormwater
drainage systems. Chapter 12 : Proposals for research opportunities.
12. Proposals for research opportunities During the course of this study several allied research needs have been identified. In particular there is a need for research into: i) Dealing with the problems of sand, silt and builder’s rubble in urban
stormwater drainage systems. These gross pollutants were found to be significant contributors to the litter loadings in many of the pilot catchments. Sand entering the catchpits is of particular concern as it tends to become entrained in other litter such as plastic bags resulting in blockages and flooding of the stormwater system. The problem is particularly acute in informal areas which have very little ground cover to stabilise the soil.
ii) Heavy metals and bacteriological pollutants in stormwater runoff. Toxic
pollutants from vehicles and other sources wash off roads into the stormwater system and are taken up by the stream and river sediments where they may have serious effects on the aquatic ecology. Similarly bacterial contamination of sediments occurs from practices such as the disposing of night soil into the stormwater drainage system in many informal areas. Very little information is available about the seriousness of this problem in South Africa.
iii) The cost effectiveness of street sweeping as a litter management option. It
is clear that street sweeping is only cost effective in areas with a high rate of litter deposition such as commercial districts, markets, taxi ranks or bus termini. However there is little information available for South African conditions about how this deposition rate should be determined and the frequency of the street sweeping that should be applied This knowledge is critical to local authorities in deciding where to allocate their often limited street sweeping resources.
iv) The way men and women view pollution in the drainage system. American
research has shown that there are differences in littering behaviour between men and women and between people of different ages but little similar research has been undertaken in South Africa. This knowledge is vitally important in optimising the effectiveness of education and awareness programmes.
v) Litter bin collections. There are conflicting opinions as to the effectiveness of
litter bin collections. This needs to be tested in catchments with high levels of pedestrian traffic. Little guidance is available on the number and size of the bins, their spacing (a function of how far people are prepared to walk to deposit litter items) and the frequency of emptying.
vi) The litter patterns and loads in the pilot catchments in two to three year’s time. This is important to establish any trends if any. The study could be widened to include other types of land use.

R-1
Marais & Armitage (2003). The measurement and reduction of urban litter entering stormwater
drainage systems. References.
References Ainslie, O. (2000). Behaviour Patterns Related to Solid Urban Waste Disposal, UCT,
MA Social Anthropology project, Unpublished. Allison, R.A. & F.H.S. Chiew (1995). Monitoring of stormwater pollution from
various land uses in an urban catchment. Proceedings, 2nd Internat. Symp. on Urban Stormwater Management, Melbourne, 551-516.
Andres, D. (1993). Synthesis of Highway Practice 184: Disposal of Roadside Litter
Mixtures, National Cooperative Highway Research Program, Transportation Research Board, Washington, D.C.
Armitage, N., A. Rooseboom, C. Nel & P. Townshend (1998). The Removal of
Urban Litter from Stormwater Conduits and Streams. WRC Report No. TT 95/98, Pretoria, ISBN 1 86845 367 7.
Armitage, N.P. & A. Rooseboom (2000). The removal of urban litter from
stormwater conduits and streams: Paper 1 – The quantities involved and catchment litter management options. Water SA, Vol. 26, No. 2, pp. 181-187, Pretoria, South Africa.
Armitage, N.P. (2001). The removal of Urban Litter from Stormwater Drainage
Systems. Ch. 19. Stormwater Collection Systems Design Handbook, L. W. Mays, Ed., McGraw-Hill Companies, Inc., New York.
Arnold, G. & P. Ryan (1999). Marine Litter from Cape Town's residential,
commercial and industrial areas. The Connection Between Street Litter And Storm-Water Debris, Auckland, New Zealand.
Australian Bureau of Statistics (1999). Environmental Issues – People’s Views and
Practices in Australia, Canberra, Australia. Barclay, S. (2002). Waste Minimisation Clubs : Facilitator’s Manual : Summary and
Outline Document, Pollution Research Group, University of Natal, Durban. Bardill, J. (2000). Towards a Culture of Good Governance: The Presidential Review
Commission and Public Service Reform in South Africa. Public Administration and Development, 20.
Canterbury Urban Runoff Taskforce (1990). Catchment Management Study : Orissa
St Stormwater Channel, Canterbury NSW. Cape Metropolitan Council (1999). Cape Metropolitan Coastal Water Quality
Committee Annual Report 1999, Cape Town. Cape Metropolitan Council (1998). Summary: State of the Environment for the Cape
Metropolitan Area: Year One 1998, Cape Town.

R-2
Marais & Armitage (2003). The measurement and reduction of urban litter entering stormwater
drainage systems. References.
Chambers, R. (1983). Rural Development: Putting the Last First, Essex: Longman. Cialdini, R.B., R.R. Reno & C.A. Kallgren (1990). A focus theory of normative
conduct: Recycling the concept of norms to reduce littering in public places. Journal of Personality and Social Psychology, 58, 1015-1026
City of Cape Town (2000). State of the Environment Report (SOE) for the City of
Cape Town: Year 3(2000), Cape Town. City of Cape Town (2001). An Integrated Metropolitan Environmental Strategy for
the City of Cape Town, Cape Town. Coleman, N., Davies, R., Ehrenreich, T., Makgetle, N., Moloto, A., Pillay, P.,
Samson, M., Marias, H., Stetten, J. & Turok, B. (2001). State of the SA Economy: Report by a study group. New Agenda, Iss 3, Autumn 2001, pp64-78.
Cornelius, M., Clayton, T., Lewis, G., Arnold, G. and Craig, J. (1994). Litter
Associated with Stormwater Discharge in Auckland City New Zealand, Auckland: Island Care New Zealand Trust.
CSIR (1991). The Situation of Waste Management and Pollution Control in South
Africa, Report CPE 1/91 to the Department of Environment Affairs by the CSIR Programme for the Environment, Pretoria.
DeFrances, C.J. & R.M. Titus (1994). The environment and residential burglary
outcomes. Proceedings of the International Seminar on Environmental Criminology and Crime Analysis, Coral Gables, Florida., 46-56.
Department of Environmental Affairs and Tourism (2000). White Paper on
Integrated Pollution and Waste Management for South Africa. Department of Housing in collaboration with the National Housing Board (1995).
Guidelines for the provision of engineering services and amenities in residential township development - Revised edition, CSIR Division of Building Technology, Pretoria.
DWAF (1999). Managing the Water Quality Effects of Settlements : Volume 2 :
Guidelines for Implementation, First Edition, Pretoria. Doyal, L. (1987). The Political Economy of Health, London: Pluto Press. Fairest Cape Association (2002). Clean City Awards, Information Pamphlet and
Entry/Nomination Form , Cape Town. Ferguson, J. (1990). The Anti Politics Machine, Cambridge: Cambridge University
Press.

R-3
Marais & Armitage (2003). The measurement and reduction of urban litter entering stormwater
drainage systems. References.
Florida Centre For Solid And Hazardous Waste Management (1998). The Florida
Litter Study: 1998, Gainesville, Florida: Florida Centre for Solid and Hazardous Waste Management.
Florida Centre For Solid And Hazardous Waste Management (1999). The Florida
Litter Study Interim Report, January 31, 1999, Gainesville, Florida: Florida Centre for Solid and Hazardous Waste Management.
Hall, M. (1996). Litter Traps in the Stormwater Drainage System, Unpublished
M.Eng. paper, Swinburne University of Technology, Melbourne. Havel, V. (1985). The Power of the Powerless: Citizens against the State in Central-
eastern Europe, London: Hutchinson. Hinsch, M. (2000). Overcoming the Pessimism that Water Quality Impacts from
Urban Areas cannot be Solved – A Light at the End of the Tunnel. Proceedings, The Water Institute of Southern Africa Biennial Conference and Exhibition, Sun City.
Howson et al (eds) (1996). In Her Lifetime: Female Morbidity and Mortality in Sub
Saharan Africa, Washington: National Academic Press. Institution of Municipal Engineering in Southern Africa (2000). Collect-a-Can
advertisement. IMIESA The Official Journal of the Institution of Municipal Engineering of Southern Africa, Vol. 25, No. 1, January 2000, p. 60, Norwood, South Africa.
Island Care New Zealand Trust (1996). Reducing the Incidence of Stormwater Debris
and Street Litter in the Marine Environment - A co-operative Community Approach, Auckland.
Kivaisi, A.K. & Rubindamayugi, M.S.T. (2000). Community based Small Scale
Composting for Treatment of Organic Fraction of Municipal Solid Waste: The Tanzania Experience. Proceedings, Managing Water and Waste in the New Millennium, Midrand / Johannesburg, Paper 1A-3.
Liebenberg & Stander (2002). Proposal to the City of Cape Town : A Communication
Strategy for the MAC Campaign, Cape Town. Lukey, P., Albertyn, C. and Coetzee, H. (1991). Wasting away : South Africa and the
global waste problem, Going Green: People, politics and the environment in South Africa, Cock, J & Koch, E. (eds), Oxford University Press, Cape Town, 284 – 302.
Mcewan, C. (2001). Gender and citizenship: learning from South Africa. Agenda 47. Marcus & Fischer (1986). Anthropology as Cultural Critique: An Experimental
Movement in the Human Sciences, Chicago : University of Chicago Press.
R-4
Marais & Armitage (2003). The measurement and reduction of urban litter entering stormwater
drainage systems. References.
Matzener, A. (2000). Urban Litter in Stormwater Conduits: A Socio-economic
Analysis on Three Areas of Cape Town. B.Sc Hons (Environmental and Geographical Science) thesis, University of Cape Town.
Melbourne Water And Melbourne Parks & Waterways (1993). Backyard to Bay
Program, Melbourne. National Center For Environmental Decision-Making Research (1999). Decision
Maker’s Guide to Controlling Litter and Illegal Dumping, Washington. Nedlac Executive Council (2001). The Plastic Bag Dilemma, Dialogue, Volume 5,
Issue 1, March, Pretoria. Oudraogao, A., Diallo, S.B., Sylla, S., Maiga, M.F. & Berthe, S.F. (2000).
Sustainable Municipal Solid Waste Management Strategy for the District of Bamako. Proceedings, Managing Water and Waste in the New Millennium, Midrand / Johannesburg, Paper 1A-4.
Podolefsky, A. & Brown, P. (1994). Profile of an anthropologist: From Tikal to
Tuscon: Today’s’ Garbage is Tomorrow’s Artefact, Applying Anthropology, Mayfield, California.
Pressend, M. (1998). Strategies to reduce marine litter through land-based sources:
An assessment of public attitude and awareness, M.Sc (Conservation Biology) thesis, University of Cape Town.
Ramphele & McDowell (1991). Restoring the Land – Environment and Change in
Post Apartheid South Africa, London: Panos Rural Development Task Team (RDP) & Land Reform Policy Branch (1997). Rural
Development Framework, Department of Land Affairs, South Africa. Ryan, P. (1996). Plastic litter in marine systems: Impacts, sources and solutions,
Plastics Southern Africa, November: 20-28. Said, E. (2001). Neo-Liberalism’s Free-for-all Approach. New Agenda, Iss 3,
Autumn 2001, pp55-58. Sanders, D. (1985). The Struggle for Health, London: Macmillan Press Senior, J.C. (1992). Litter control in urban waterways. Proceedings, Internat. Symp.
on Urban Stormwater Management, Sydney, 234 - 239. Skalnik, P. (1989). Outwitting the State, Transaction Publishers, New Jersey. Skogan, W. (1990). Decline and Disorder: Crime and the Spiral of Decay in
American Neighbourhoods, Free Press, New York.

R-5
Marais & Armitage (2003). The measurement and reduction of urban litter entering stormwater
drainage systems. References.
SRK Consulting (2000). South Peninsula Municipality : Litter Management Strategy
for Masiphumelele, Ocean View, Kommetjie and Imhoff’s Gift. Report No. 279987/1, Cape Town.
Van Deventer, K. (2000). Co-operative Urban Catchment Management in the CMA:
Goals and Background Concepts: Social and Economic Considerations. Proceedings, 3rd Bi-annual Symp on Urban Catchment Management, Cape Town.
Van Wyk, J.J., Moodley, P., S.A.P. Brown, S.A.P., and Viljoen, P. (2002). Water
Quality Management in the New Millennium: Towards a National Water Quality Management Framework Policy for South Africa. Proceedings, The Water Institute of Southern Africa Biennial Conference and Exhibition, Durban.
Victoria Stormwater Committee (1999). Urban Stormwater : Best Practice
Environmental Management Guidelines, Collingwood VIC, Australia: CSIRO Publishing.
Wilson, J.Q. & G.L. Kelling (1982). Broken windows: The police and neighbourhood
safety. The Atlantic Monthly (March), Vol. 249, pp. 29-38.

Marais & Armitage (2003). The measurement and reduction of urban litter entering stormwater drainage
systems. Appendices.
Appendices

Appendix A : Standard forms
Marais & Armitage (2003). The measurement and reduction of urban litter entering stormwater drainage systems.
Appendix A : Standard Forms.
Appendix A.1 : Standard field recording sheet for litter clearouts
Water Research Commission Project No. K5/1051
“The reduction of urban litter in drainage systems through integrated catchment management”
Standard Recording Sheet for Litter Clearout Sheet Number of Muncipal Local Council : Suburb : Number of litter traps : Number of outlet nets : Date of clearout (YYMMDD) : Duration of rainfall (HH:MM) : : Precipitation (mm) : Volume of litter removed from streets and litter bins (m³) : Degree of fullness : 0 - empty Full analysis : Yes No
1 - 25% full 2 - 50% full 3 - 75% full 4 - full
Litter trap/ Outlet net number
Degree of fullness
Comments
Litter trap/ Outlet net number
Degree of fullness
Comments
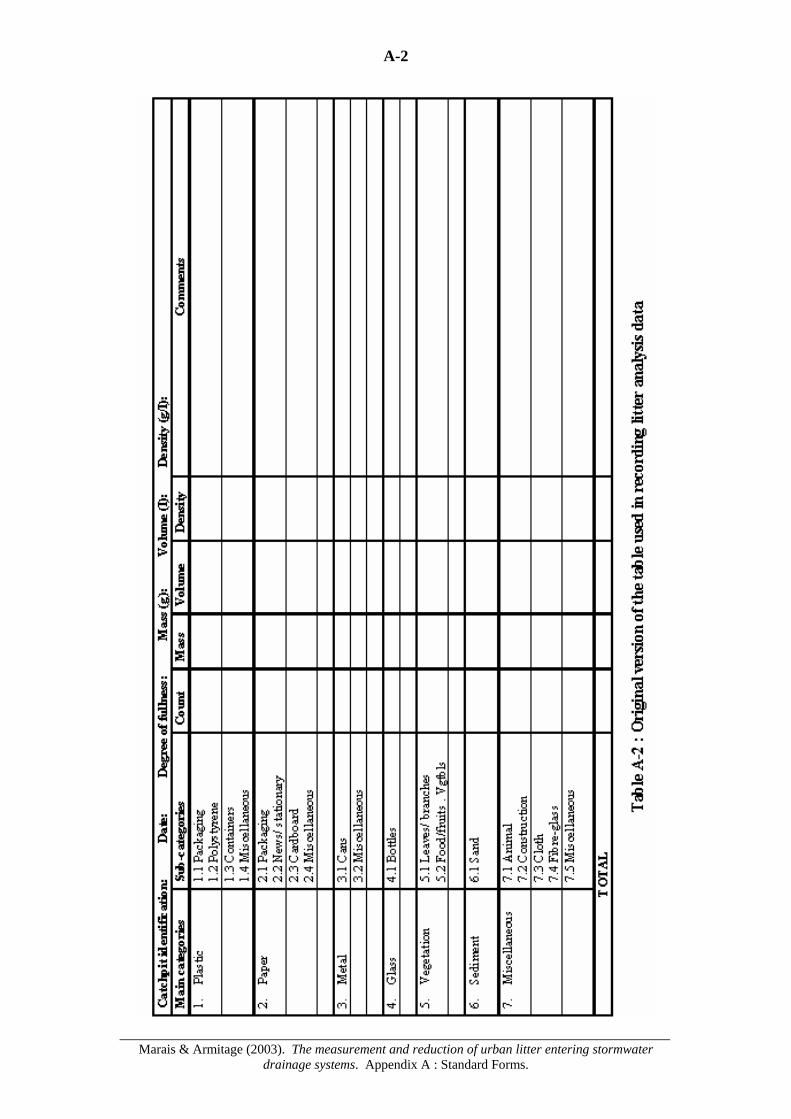
A-2
Marais & Armitage (2003). The measurement and reduction of urban litter entering stormwater
drainage systems. Appendix A : Standard Forms.
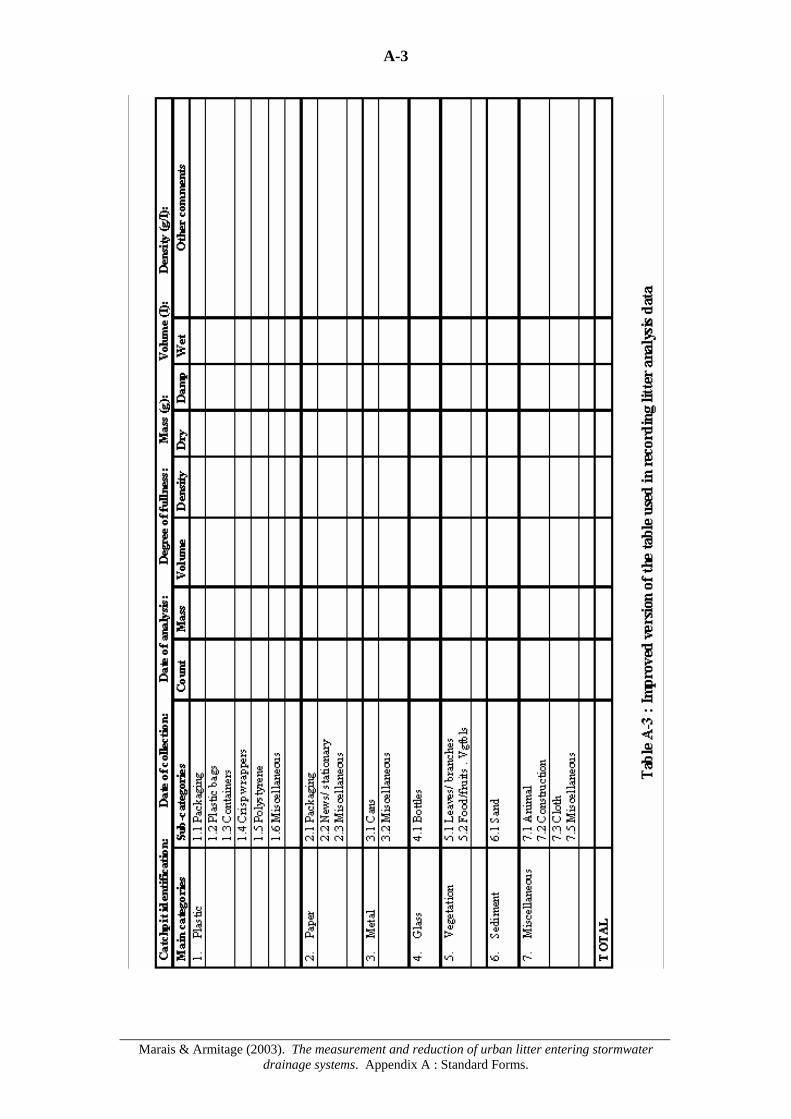
A-3
Marais & Armitage (2003). The measurement and reduction of urban litter entering stormwater
drainage systems. Appendix A : Standard Forms.
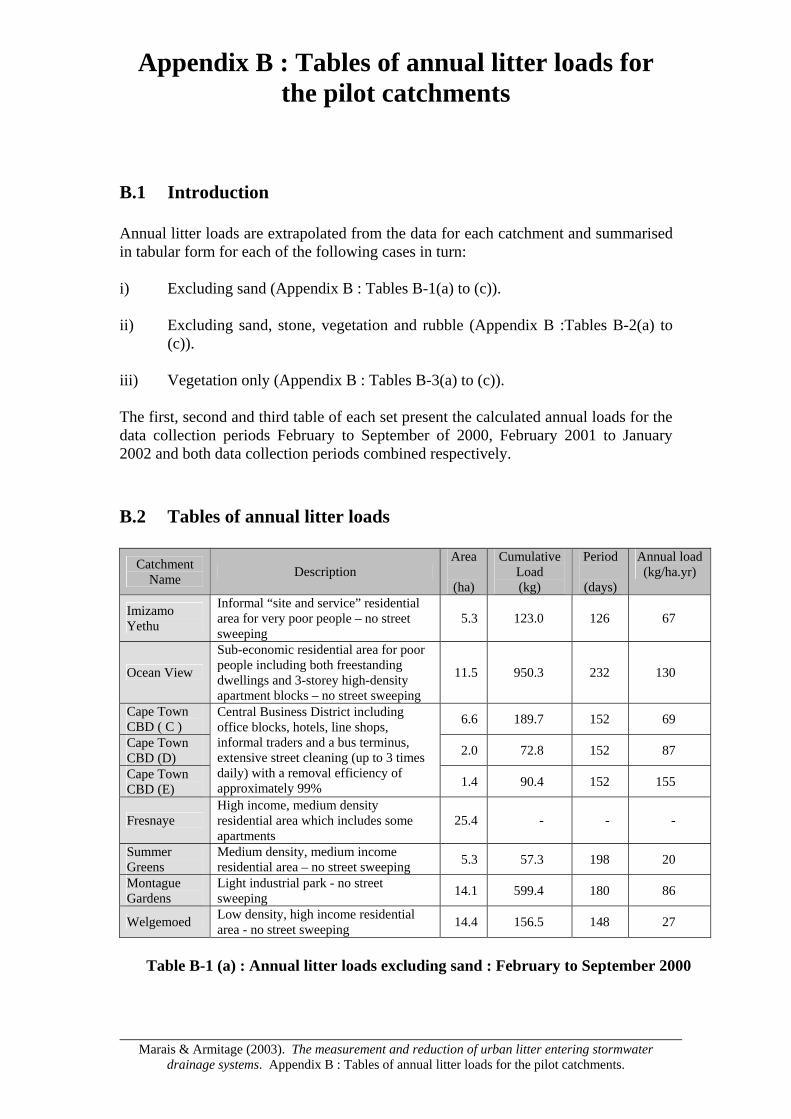
Appendix B : Tables of annual litter loads for the pilot catchments
Marais & Armitage (2003). The measurement and reduction of urban litter entering stormwater
drainage systems. Appendix B : Tables of annual litter loads for the pilot catchments.
B.1 Introduction Annual litter loads are extrapolated from the data for each catchment and summarised in tabular form for each of the following cases in turn: i) Excluding sand (Appendix B : Tables B-1(a) to (c)). ii) Excluding sand, stone, vegetation and rubble (Appendix B :Tables B-2(a) to
(c)). iii) Vegetation only (Appendix B : Tables B-3(a) to (c)). The first, second and third table of each set present the calculated annual loads for the data collection periods February to September of 2000, February 2001 to January 2002 and both data collection periods combined respectively. B.2 Tables of annual litter loads
Catchment Name Description
Area
(ha)
Cumulative Load (kg)
Period
(days)
Annual load (kg/ha.yr)
Imizamo Yethu
Informal “site and service” residential area for very poor people – no street sweeping
5.3 123.0 126 67
Ocean View
Sub-economic residential area for poor people including both freestanding dwellings and 3-storey high-density apartment blocks – no street sweeping
11.5 950.3 232 130
Cape Town CBD ( C ) 6.6 189.7 152 69
Cape Town CBD (D) 2.0 72.8 152 87
Cape Town CBD (E)
Central Business District including office blocks, hotels, line shops, informal traders and a bus terminus, extensive street cleaning (up to 3 times daily) with a removal efficiency of approximately 99% 1.4 90.4 152 155
Fresnaye High income, medium density residential area which includes some apartments
25.4 - - -
Summer Greens
Medium density, medium income residential area – no street sweeping 5.3 57.3 198 20
Montague Gardens
Light industrial park - no street sweeping 14.1 599.4 180 86
Welgemoed Low density, high income residential area - no street sweeping 14.4 156.5 148 27
Table B-1 (a) : Annual litter loads excluding sand : February to September 2000

B-2
Marais & Armitage (2003). The measurement and reduction of urban litter entering stormwater
drainage systems. Appendix B : Tables of annual litter loads for the pilot catchments.
Catchment
Name Description Area
(ha)
Cumulative Load (kg)
Period
(days)
Annual load (kg/ha.yr)
Imizamo Yethu
Informal “site and service” residential area for very poor people – no street sweeping
5.3 281.1 350 55
Ocean View
Sub-economic residential area for poor people including both freestanding dwellings and 3-storey high-density apartment blocks – no street sweeping
11.5 930.1 351 84
Cape Town CBD ( C ) 6.6 384.8 323 66
Cape Town CBD (D) 2.0 98.7 323 56
Cape Town CBD (E)
Central Business District including office blocks, hotels, line shops, informal traders and a bus terminus, extensive street cleaning (up to 3 times daily) with a removal efficiency of approximately 99% 1.4 116.3 323 94
Fresnaye High income, medium density residential area which includes some apartments
25.4 1 398.8 323 62
Summer Greens
Medium density, medium income residential area – no street sweeping 5.3 49.8 326 11
Montague Gardens
Light industrial park - no street sweeping 14.1 271.8 326 22
Welgemoed Low density, high income residential area - no street sweeping 14.4 396.0 336 30
Table B-1 (b) : Annual litter loads excluding sand : February 2001 to January 2002
Catchment Name Description
Area
(ha)
Cumulative Load (kg)
Period
(days)
Annual load (kg/ha.yr)
Imizamo Yethu
Informal “site and service” residential area for very poor people – no street sweeping
5.3 404.2 476 58
Ocean View
Sub-economic residential area for poor people including both freestanding dwellings and 3-storey high-density apartment blocks – no street sweeping
11.5 1 880.4 583 102
Cape Town CBD ( C ) 6.6 574.5 475 67
Cape Town CBD (D) 2.0 171.5 475 66
Cape Town CBD (E)
Central Business District including office blocks, hotels, line shops, informal traders and a bus terminus, extensive street sweeping (up to 3 times daily) with a removal efficiency of approximately 99% 1.4 206.7 475 113
Fresnaye High income, medium density residential area which includes some apartments
25.4 1 398.8 323 62
Summer Greens
Medium density, medium income residential area – no street sweeping 5.3 107.1 524 14
Montague Gardens
Light industrial park - no street sweeping 14.1 871.2 506 45
Welgemoed Low density, high income residential area - no street sweeping 14.4 552.5 484 29
Table B-1 (c) : Annual litter loads excluding sand : February to September 2000 and
February 2001 to January 2002 combined
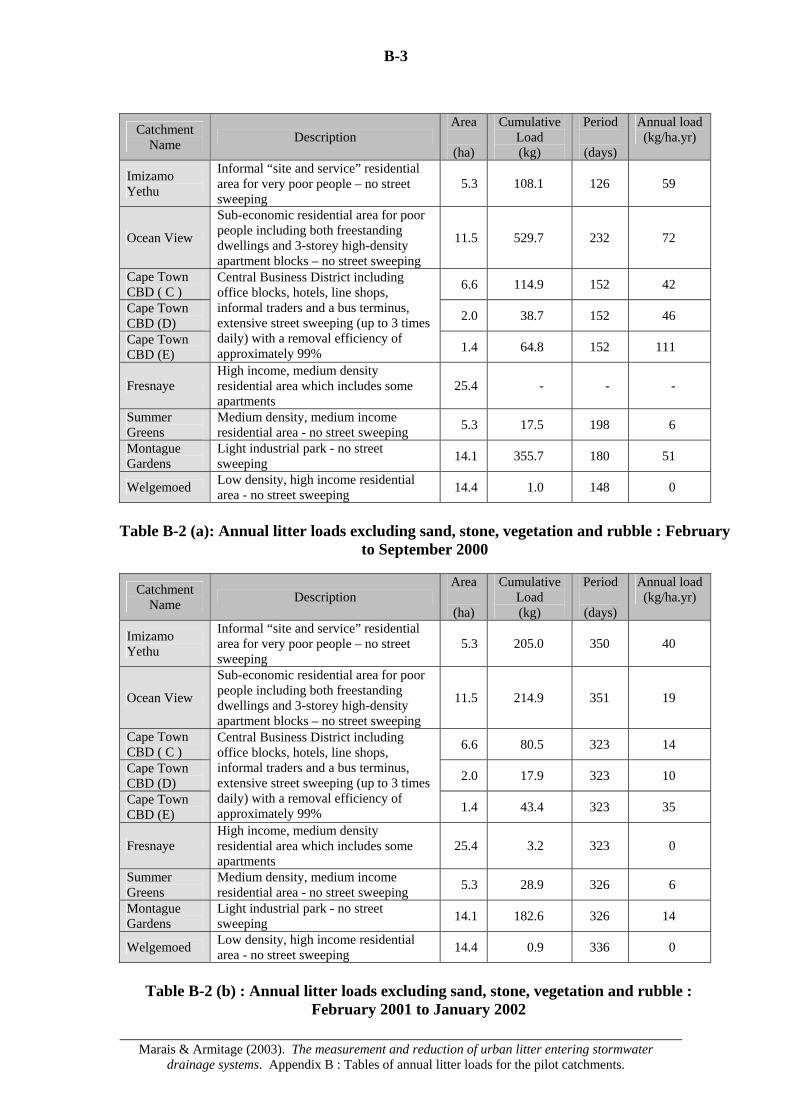
B-3
Marais & Armitage (2003). The measurement and reduction of urban litter entering stormwater
drainage systems. Appendix B : Tables of annual litter loads for the pilot catchments.
Catchment
Name Description Area
(ha)
Cumulative Load (kg)
Period
(days)
Annual load (kg/ha.yr)
Imizamo Yethu
Informal “site and service” residential area for very poor people – no street sweeping
5.3 108.1 126 59
Ocean View
Sub-economic residential area for poor people including both freestanding dwellings and 3-storey high-density apartment blocks – no street sweeping
11.5 529.7 232 72
Cape Town CBD ( C ) 6.6 114.9 152 42
Cape Town CBD (D) 2.0 38.7 152 46
Cape Town CBD (E)
Central Business District including office blocks, hotels, line shops, informal traders and a bus terminus, extensive street sweeping (up to 3 times daily) with a removal efficiency of approximately 99% 1.4 64.8 152 111
Fresnaye High income, medium density residential area which includes some apartments
25.4 - - -
Summer Greens
Medium density, medium income residential area - no street sweeping 5.3 17.5 198 6
Montague Gardens
Light industrial park - no street sweeping 14.1 355.7 180 51
Welgemoed Low density, high income residential area - no street sweeping 14.4 1.0 148 0
Table B-2 (a): Annual litter loads excluding sand, stone, vegetation and rubble : February
to September 2000
Catchment Name Description
Area
(ha)
Cumulative Load (kg)
Period
(days)
Annual load (kg/ha.yr)
Imizamo Yethu
Informal “site and service” residential area for very poor people – no street sweeping
5.3 205.0 350 40
Ocean View
Sub-economic residential area for poor people including both freestanding dwellings and 3-storey high-density apartment blocks – no street sweeping
11.5 214.9 351 19
Cape Town CBD ( C ) 6.6 80.5 323 14
Cape Town CBD (D) 2.0 17.9 323 10
Cape Town CBD (E)
Central Business District including office blocks, hotels, line shops, informal traders and a bus terminus, extensive street sweeping (up to 3 times daily) with a removal efficiency of approximately 99% 1.4 43.4 323 35
Fresnaye High income, medium density residential area which includes some apartments
25.4 3.2 323 0
Summer Greens
Medium density, medium income residential area - no street sweeping 5.3 28.9 326 6
Montague Gardens
Light industrial park - no street sweeping 14.1 182.6 326 14
Welgemoed Low density, high income residential area - no street sweeping 14.4 0.9 336 0
Table B-2 (b) : Annual litter loads excluding sand, stone, vegetation and rubble :
February 2001 to January 2002
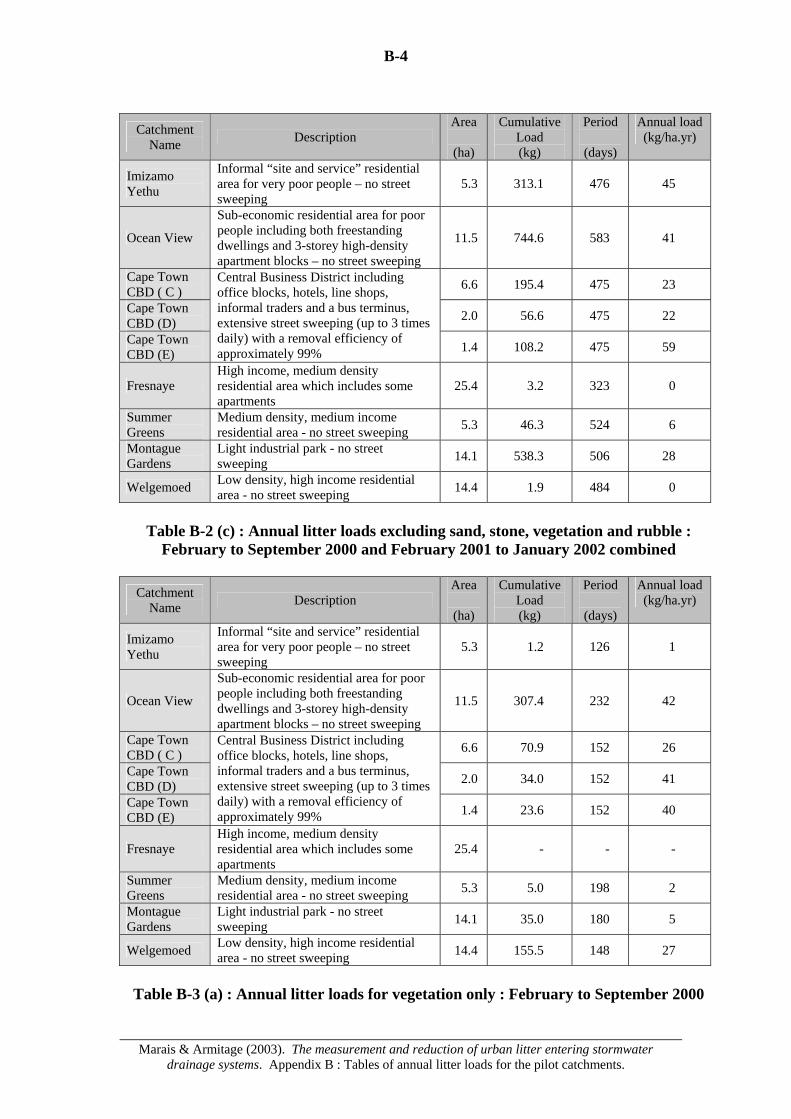
B-4
Marais & Armitage (2003). The measurement and reduction of urban litter entering stormwater
drainage systems. Appendix B : Tables of annual litter loads for the pilot catchments.
Catchment
Name Description Area
(ha)
Cumulative Load (kg)
Period
(days)
Annual load (kg/ha.yr)
Imizamo Yethu
Informal “site and service” residential area for very poor people – no street sweeping
5.3 313.1 476 45
Ocean View
Sub-economic residential area for poor people including both freestanding dwellings and 3-storey high-density apartment blocks – no street sweeping
11.5 744.6 583 41
Cape Town CBD ( C ) 6.6 195.4 475 23
Cape Town CBD (D) 2.0 56.6 475 22
Cape Town CBD (E)
Central Business District including office blocks, hotels, line shops, informal traders and a bus terminus, extensive street sweeping (up to 3 times daily) with a removal efficiency of approximately 99% 1.4 108.2 475 59
Fresnaye High income, medium density residential area which includes some apartments
25.4 3.2 323 0
Summer Greens
Medium density, medium income residential area - no street sweeping 5.3 46.3 524 6
Montague Gardens
Light industrial park - no street sweeping 14.1 538.3 506 28
Welgemoed Low density, high income residential area - no street sweeping 14.4 1.9 484 0
Table B-2 (c) : Annual litter loads excluding sand, stone, vegetation and rubble :
February to September 2000 and February 2001 to January 2002 combined
Catchment Name Description
Area
(ha)
Cumulative Load (kg)
Period
(days)
Annual load (kg/ha.yr)
Imizamo Yethu
Informal “site and service” residential area for very poor people – no street sweeping
5.3 1.2 126 1
Ocean View
Sub-economic residential area for poor people including both freestanding dwellings and 3-storey high-density apartment blocks – no street sweeping
11.5 307.4 232 42
Cape Town CBD ( C ) 6.6 70.9 152 26
Cape Town CBD (D) 2.0 34.0 152 41
Cape Town CBD (E)
Central Business District including office blocks, hotels, line shops, informal traders and a bus terminus, extensive street sweeping (up to 3 times daily) with a removal efficiency of approximately 99% 1.4 23.6 152 40
Fresnaye High income, medium density residential area which includes some apartments
25.4 - - -
Summer Greens
Medium density, medium income residential area - no street sweeping 5.3 5.0 198 2
Montague Gardens
Light industrial park - no street sweeping 14.1 35.0 180 5
Welgemoed Low density, high income residential area - no street sweeping 14.4 155.5 148 27
Table B-3 (a) : Annual litter loads for vegetation only : February to September 2000
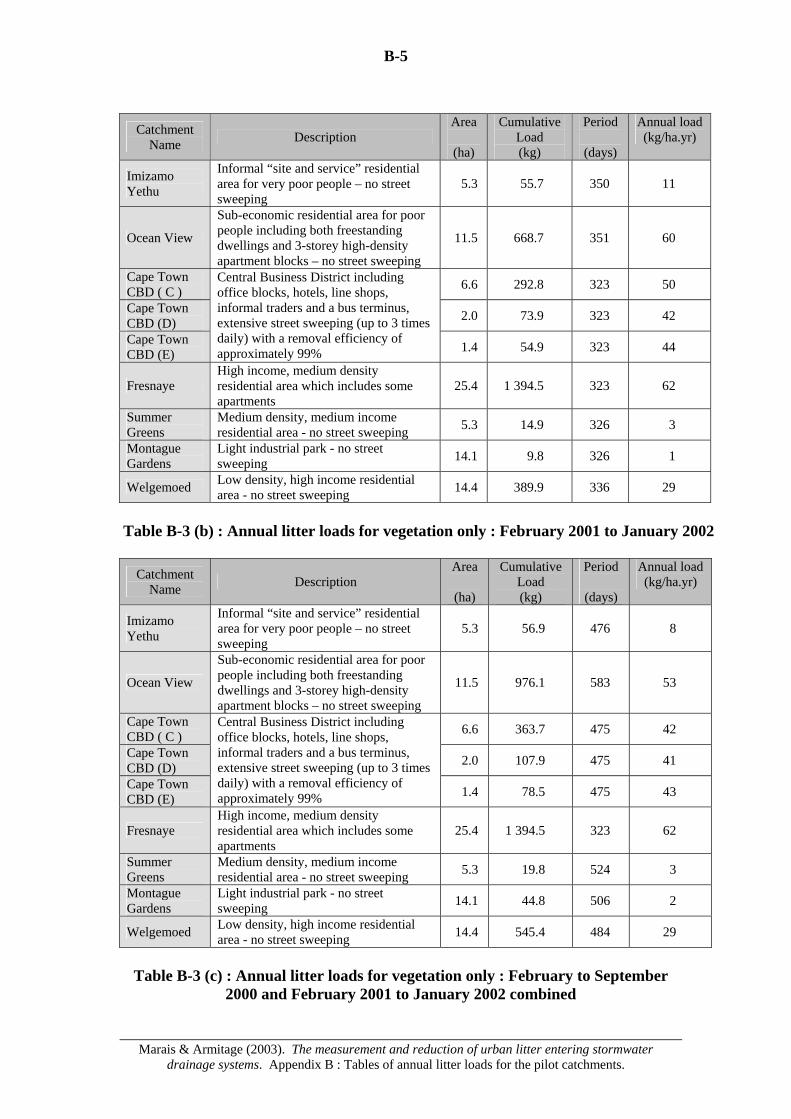
B-5
Marais & Armitage (2003). The measurement and reduction of urban litter entering stormwater
drainage systems. Appendix B : Tables of annual litter loads for the pilot catchments.
Catchment
Name Description Area
(ha)
Cumulative Load (kg)
Period
(days)
Annual load (kg/ha.yr)
Imizamo Yethu
Informal “site and service” residential area for very poor people – no street sweeping
5.3 55.7 350 11
Ocean View
Sub-economic residential area for poor people including both freestanding dwellings and 3-storey high-density apartment blocks – no street sweeping
11.5 668.7 351 60
Cape Town CBD ( C ) 6.6 292.8 323 50
Cape Town CBD (D) 2.0 73.9 323 42
Cape Town CBD (E)
Central Business District including office blocks, hotels, line shops, informal traders and a bus terminus, extensive street sweeping (up to 3 times daily) with a removal efficiency of approximately 99% 1.4 54.9 323 44
Fresnaye High income, medium density residential area which includes some apartments
25.4 1 394.5 323 62
Summer Greens
Medium density, medium income residential area - no street sweeping 5.3 14.9 326 3
Montague Gardens
Light industrial park - no street sweeping 14.1 9.8 326 1
Welgemoed Low density, high income residential area - no street sweeping 14.4 389.9 336 29
Table B-3 (b) : Annual litter loads for vegetation only : February 2001 to January 2002
Catchment Name Description
Area
(ha)
Cumulative Load (kg)
Period
(days)
Annual load (kg/ha.yr)
Imizamo Yethu
Informal “site and service” residential area for very poor people – no street sweeping
5.3 56.9 476 8
Ocean View
Sub-economic residential area for poor people including both freestanding dwellings and 3-storey high-density apartment blocks – no street sweeping
11.5 976.1 583 53
Cape Town CBD ( C ) 6.6 363.7 475 42
Cape Town CBD (D) 2.0 107.9 475 41
Cape Town CBD (E)
Central Business District including office blocks, hotels, line shops, informal traders and a bus terminus, extensive street sweeping (up to 3 times daily) with a removal efficiency of approximately 99% 1.4 78.5 475 43
Fresnaye High income, medium density residential area which includes some apartments
25.4 1 394.5 323 62
Summer Greens
Medium density, medium income residential area - no street sweeping 5.3 19.8 524 3
Montague Gardens
Light industrial park - no street sweeping 14.1 44.8 506 2
Welgemoed Low density, high income residential area - no street sweeping 14.4 545.4 484 29
Table B-3 (c) : Annual litter loads for vegetation only : February to September
2000 and February 2001 to January 2002 combined

Appendix C
Marais & Armitage (2003). The measurement and reduction of urban litter entering stormwater drainage systems.
Appendix C : Requirements for Waste Auditor.
UNIVERSITY OF CAPE TOWN Department of Civil Engineering Your Ref University of Cape Town . Rondebosch 7701 Our Ref 7323A/MJM/mjm Telephone: 650-2584 Enquiries to M J Marais Fax No: (021) 689-7471 Date 29 February 2000 E-mail: [email protected]
Water Research Commission Project No. K5/1051 “The reduction of urban litter in drainage systems through integrated catchment management”
Requirements for Waste Auditor Job Title : Waste Auditor Relations with : Project Team, Municipal Local Council Officials and Employees. Responsible to : Project Leader (Mr Neil Armitage) and Researcher (Mr Mark Marais). Task Summary : 1. Carrying out of spot checks on each catchment in the field to
ensure that the MLC teams are properly cleaning the catchpits and recording the volumes of litter.
2. Capturing of the data sheets filled in by the MLC teams recording the volumes and contents of the litter traps onto an ACCESS database.
3. Marking of litter bags to be filled by the MLC teams for purposes of a complete analysis after return to the UCT Laboratory (two catchments per week).
4. Working with MLC team carrying out complete analysis to ensure that bags are correctly labelled and transported to the UCT Laboratory.
5. Sorting, weighing, counting, measuring of litter in the Laboratory; recording of results on check list; and data entry from checklists to ACCESS database (two catchments per week).
6. Disposal of litter to WASTETECH container at UCT. 7. Liaison with Project Team. 8. Liaison with MLC Officials to inform them which catchment
requires a complete analysis. 9. Attendance at workshops with Project Team and/or MLC’s.

C-2
Marais & Armitage (2003). The measurement and reduction of urban litter entering stormwater drainage systems.
Appendix C : Requirements for Waste Auditor.
Job Specification : 1. Ability to work in a team.
2. Good interpersonal skills. 3. Good communication skills – ability to speak Xhosa a
recommendation. 4. Literate. 5. Basic computer literacy (basic knowledge of computers and data
entry). 6. Matric or equivalent experience. 7. Light vehicle driver’s licence – transport provided. 8. 26 years or older.
Employment Details : 1. Salary of R per month.
2. Transport provided. 3. Period of employment – to full-time. 4. Employed by
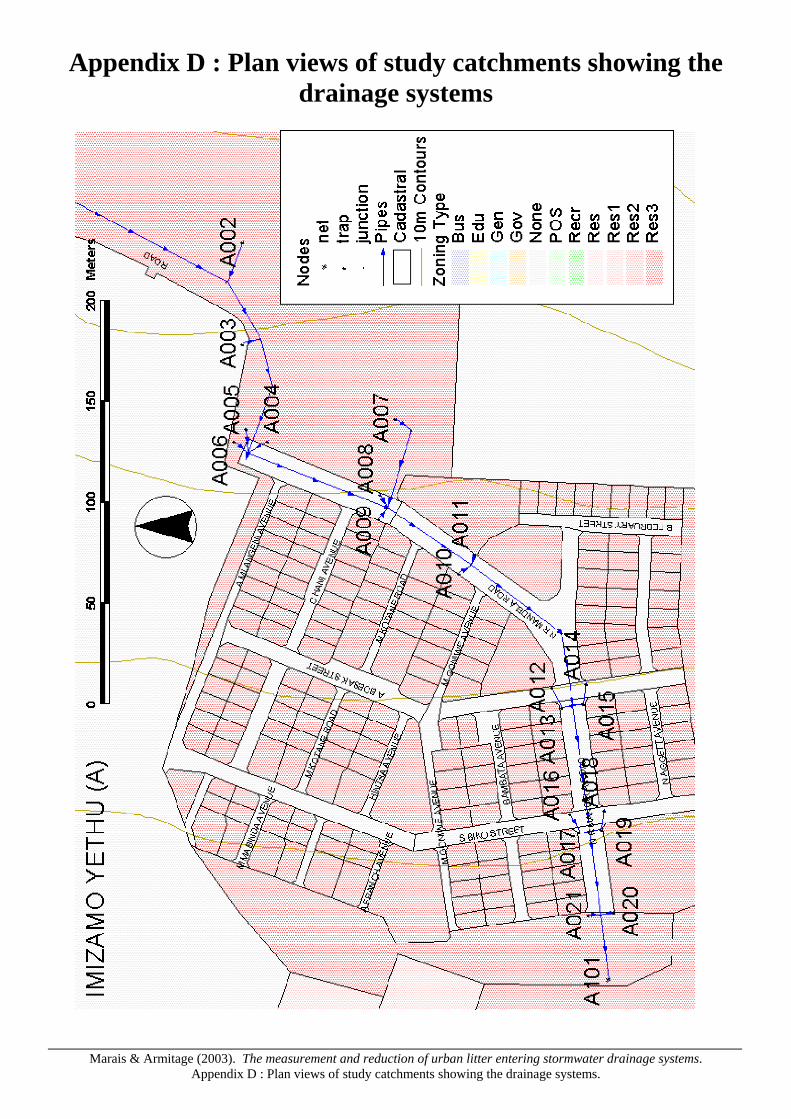
Appendix D : Plan views of study catchments showing the drainage systems
Marais & Armitage (2003). The measurement and reduction of urban litter entering stormwater drainage systems.
Appendix D : Plan views of study catchments showing the drainage systems.

D-2
Marais & Armitage (2003). The measurement and reduction of urban litter entering stormwater drainage systems.
Appendix D : Plan views of study catchments showing the drainage systems.

D-3
Marais & Armitage (2003). The measurement and reduction of urban litter entering stormwater drainage systems.
Appendix D : Plan views of study catchments showing the drainage systems.

D-4
Marais & Armitage (2003). The measurement and reduction of urban litter entering stormwater drainage systems.
Appendix D : Plan views of study catchments showing the drainage systems.
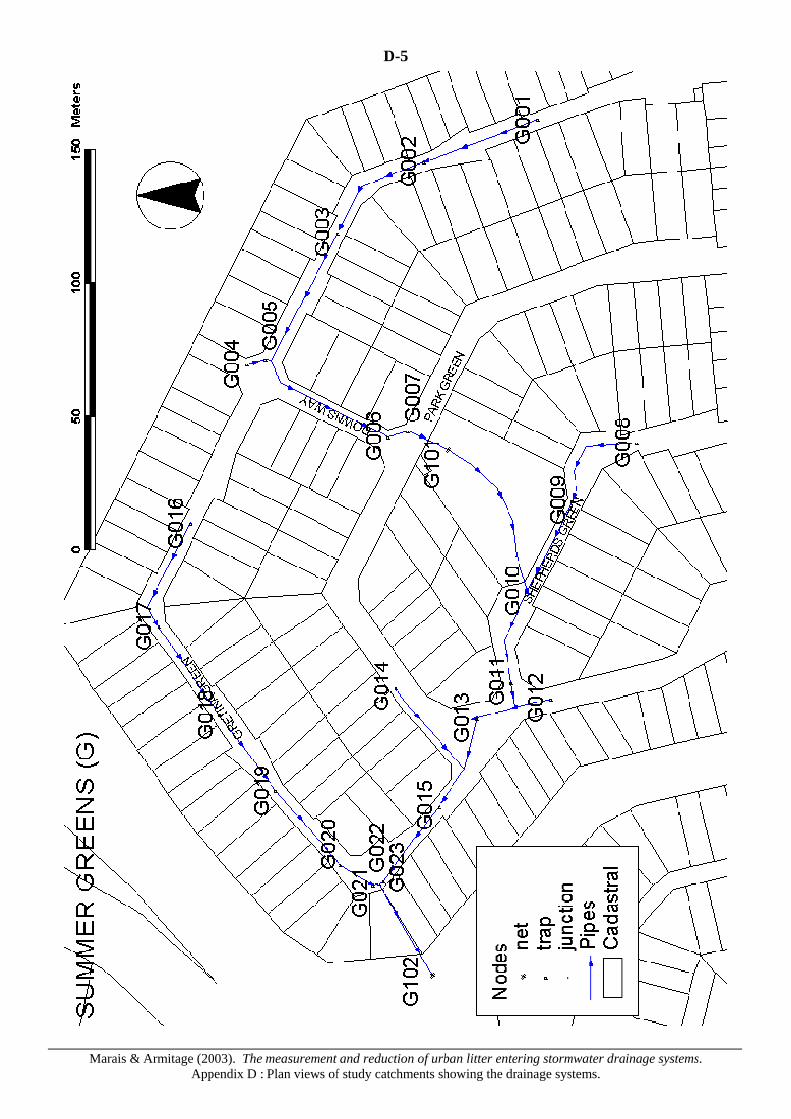
D-5
Marais & Armitage (2003). The measurement and reduction of urban litter entering stormwater drainage systems.
Appendix D : Plan views of study catchments showing the drainage systems.

D-6
Marais & Armitage (2003). The measurement and reduction of urban litter entering stormwater drainage systems.
Appendix D : Plan views of study catchments showing the drainage systems.

D-7
Marais & Armitage (2003). The measurement and reduction of urban litter entering stormwater drainage systems.
Appendix D : Plan views of study catchments showing the drainage systems.
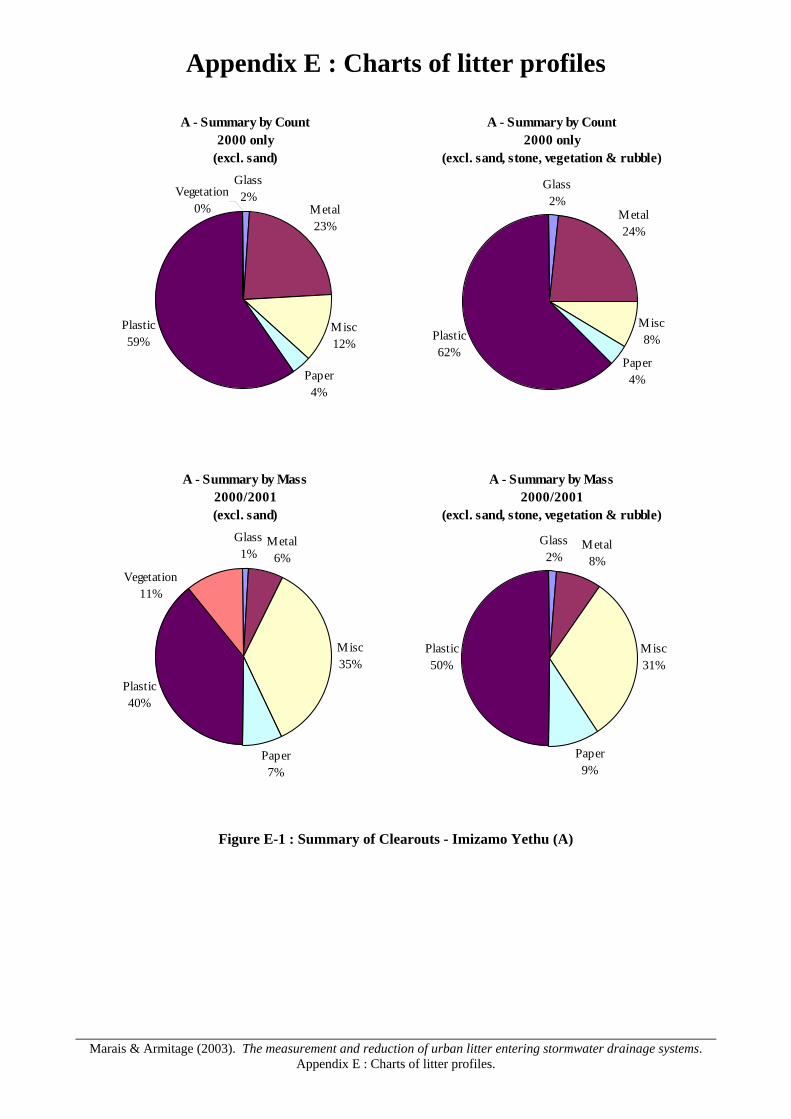
Appendix E : Charts of litter profiles
Marais & Armitage (2003). The measurement and reduction of urban litter entering stormwater drainage systems.
Appendix E : Charts of litter profiles.
Figure E-1 : Summary of Clearouts - Imizamo Yethu (A)
A - Summary by Count2000 only
(excl. sand)Glass
2%Metal23%
Misc12%
Paper4%
Plastic59%
Vegetation0%
A - Summary by Count2000 only
(excl. sand, stone, vegetation & rubble)
Glass2%
Metal24%
Misc8%
Paper4%
Plastic62%
A - Summary by Mass2000/2001(excl. sand)
Glass1%
Metal6%
Misc35%
Paper7%
Plastic40%
Vegetation11%
A - Summary by Mass2000/2001
(excl. sand, stone, vegetation & rubble)
Glass2%
Metal8%
Misc31%
Paper9%
Plastic50%
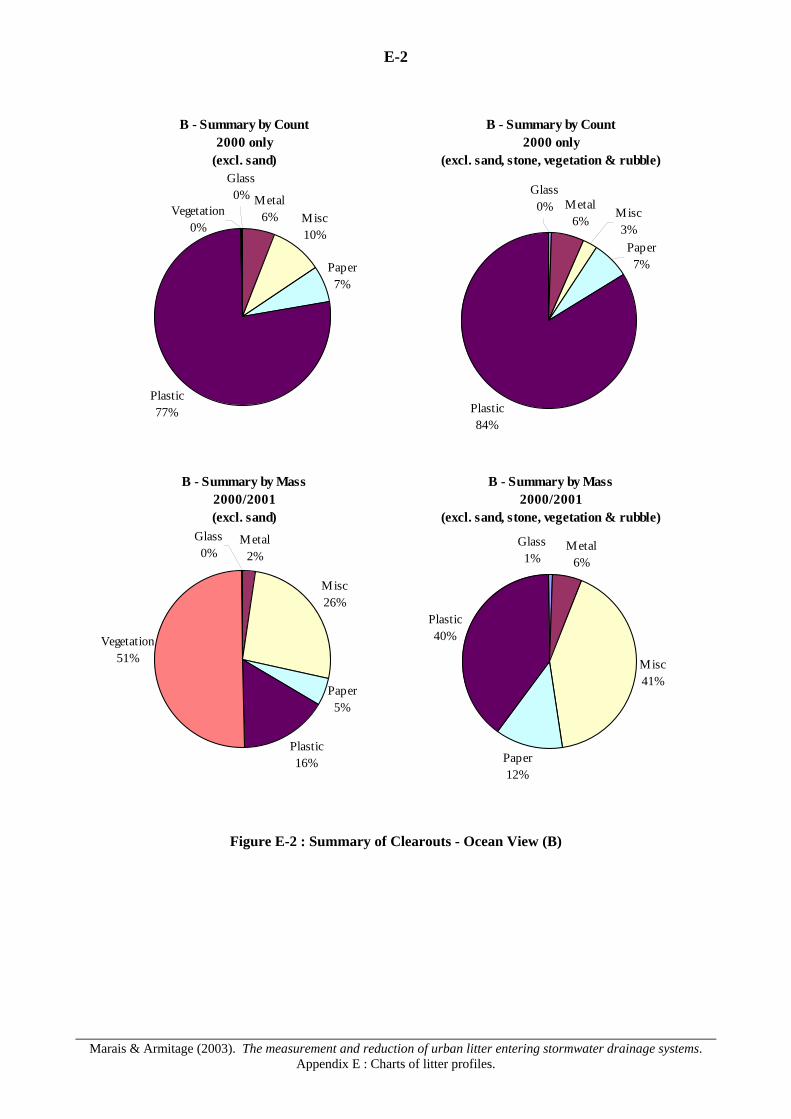
E-2
Marais & Armitage (2003). The measurement and reduction of urban litter entering stormwater drainage systems.
Appendix E : Charts of litter profiles.
Figure E-2 : Summary of Clearouts - Ocean View (B)
B - Summary by Count2000 only
(excl. sand)
Metal6% Misc
10%
Paper7%
Plastic77%
Vegetation0%
Glass0%
B - Summary by Count2000 only
(excl. sand, stone, vegetation & rubble)
Metal6%
Plastic84%
Misc3%
Glass0%
Paper7%
B - Summary by Mass2000/2001(excl. sand)
Metal2%
Misc26%
Paper5%
Plastic16%
Glass0%
Vegetation51%
B - Summary by Mass2000/2001
(excl. sand, stone, vegetation & rubble)
Metal6%
Misc41%
Paper12%
Plastic40%
Glass1%
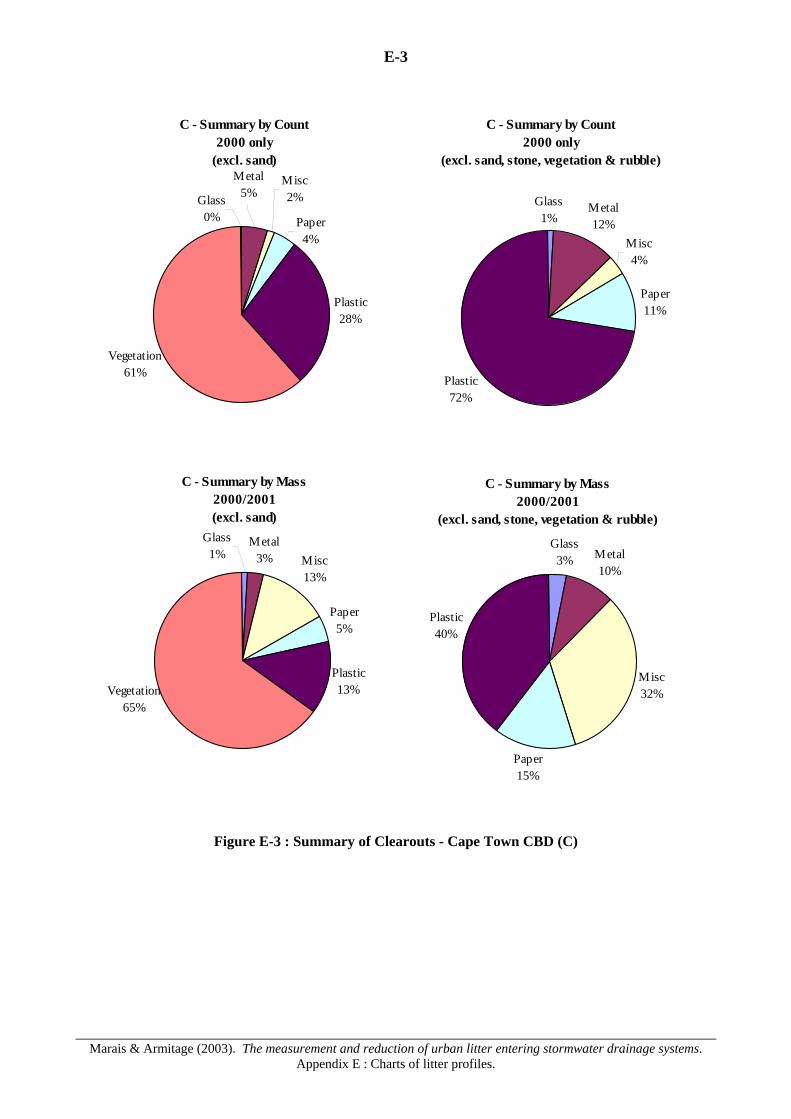
E-3
Marais & Armitage (2003). The measurement and reduction of urban litter entering stormwater drainage systems.
Appendix E : Charts of litter profiles.
Figure E-3 : Summary of Clearouts - Cape Town CBD (C)
C - Summary by Count2000 only
(excl. sand)Misc2%
Paper4%
Plastic28%
Metal5%Glass
0%
Vegetation61%
C - Summary by Count2000 only
(excl. sand, stone, vegetation & rubble)
Metal12%
Plastic72%
Misc4%
Glass1%
Paper11%
C - Summary by Mass2000/2001(excl. sand)
Metal3% Misc
13%
Paper5%
Plastic13%Vegetation
65%
Glass1%
C - Summary by Mass2000/2001
(excl. sand, stone, vegetation & rubble)
Glass3% Metal
10%
Misc32%
Paper15%
Plastic40%
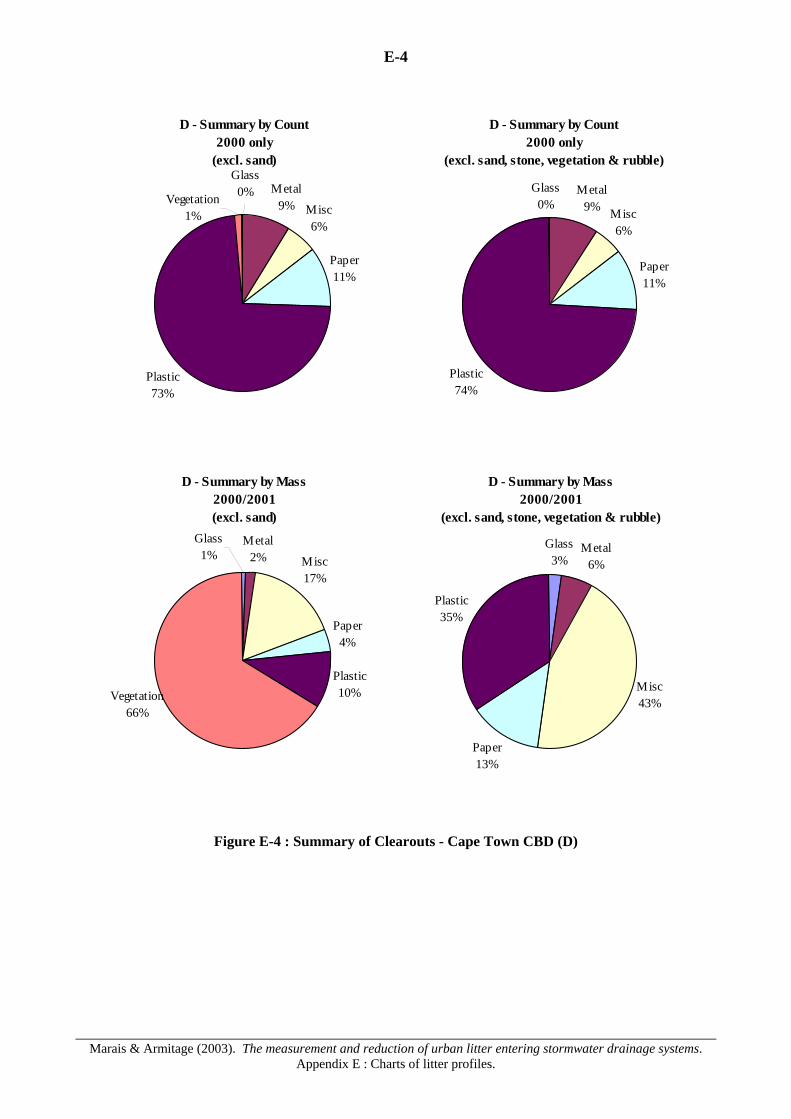
E-4
Marais & Armitage (2003). The measurement and reduction of urban litter entering stormwater drainage systems.
Appendix E : Charts of litter profiles.
Figure E-4 : Summary of Clearouts - Cape Town CBD (D)
D - Summary by Count2000 only
(excl. sand)
Metal9% Misc
6%
Paper11%
Plastic73%
Glass0%Vegetation
1%
D - Summary by Count2000 only
(excl. sand, stone, vegetation & rubble)
Metal9%
Plastic74%
Misc6%
Glass0%
Paper11%
D - Summary by Mass2000/2001(excl. sand)
Metal2% Misc
17%
Paper4%
Plastic10%
Glass1%
Vegetation66%
D - Summary by Mass2000/2001
(excl. sand, stone, vegetation & rubble)
Glass3%
Metal6%
Misc43%
Paper13%
Plastic35%
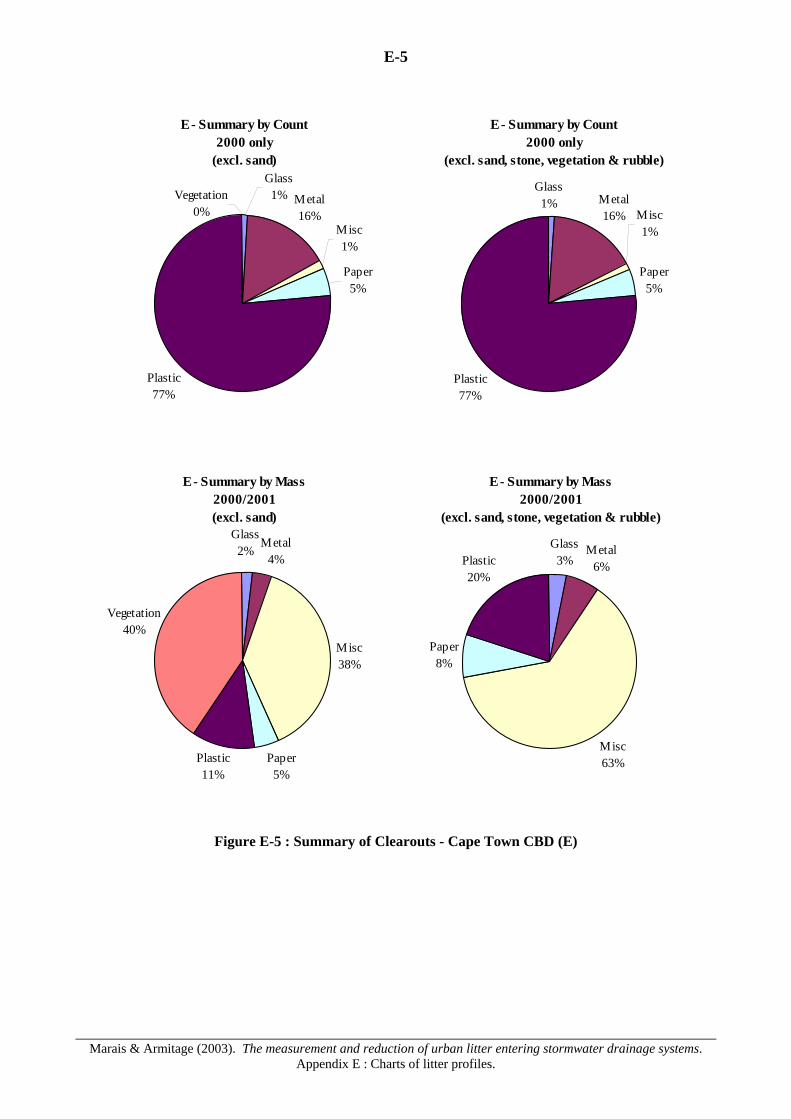
E-5
Marais & Armitage (2003). The measurement and reduction of urban litter entering stormwater drainage systems.
Appendix E : Charts of litter profiles.
Figure E-5 : Summary of Clearouts - Cape Town CBD (E)
E - Summary by Count2000 only
(excl. sand)
Metal16%
Misc1%
Paper5%
Plastic77%
Glass1%Vegetation
0%
E - Summary by Count2000 only
(excl. sand, stone, vegetation & rubble)
Metal16%
Plastic77%
Misc1%
Glass1%
Paper5%
E - Summary by Mass2000/2001(excl. sand)
Metal4%
Misc38%
Paper5%
Plastic11%
Glass2%
Vegetation40%
E - Summary by Mass2000/2001
(excl. sand, stone, vegetation & rubble)
Glass3%
Metal6%
Misc63%
Paper8%
Plastic20%
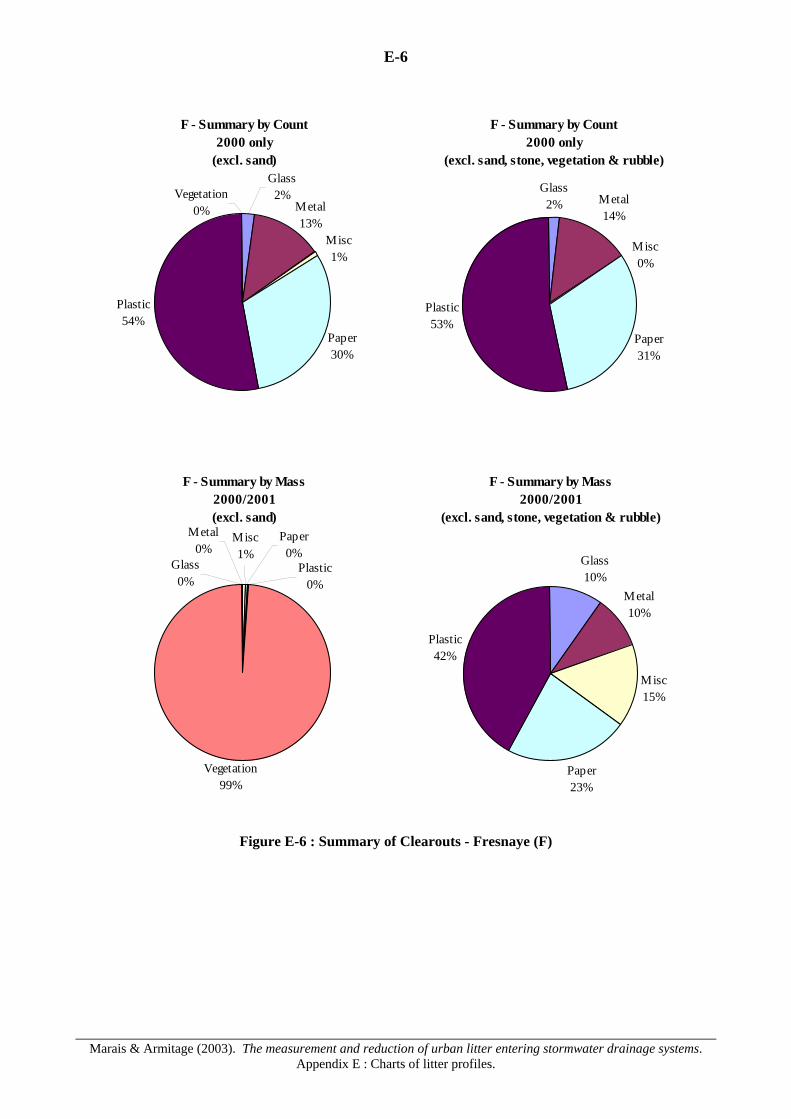
E-6
Marais & Armitage (2003). The measurement and reduction of urban litter entering stormwater drainage systems.
Appendix E : Charts of litter profiles.
Figure E-6 : Summary of Clearouts - Fresnaye (F)
F - Summary by Count2000 only
(excl. sand)
Paper30%
Plastic54%
Misc1%
Metal13%
Glass2%Vegetation
0%
F - Summary by Count2000 only
(excl. sand, stone, vegetation & rubble)
Metal14%
Plastic53%
Misc0%
Glass2%
Paper31%
F - Summary by Mass2000/2001(excl. sand)
Vegetation99%
Glass0%
Plastic0%
Metal0%
Paper0%
Misc1%
F - Summary by Mass2000/2001
(excl. sand, stone, vegetation & rubble)
Glass10%
Metal10%
Misc15%
Paper23%
Plastic42%
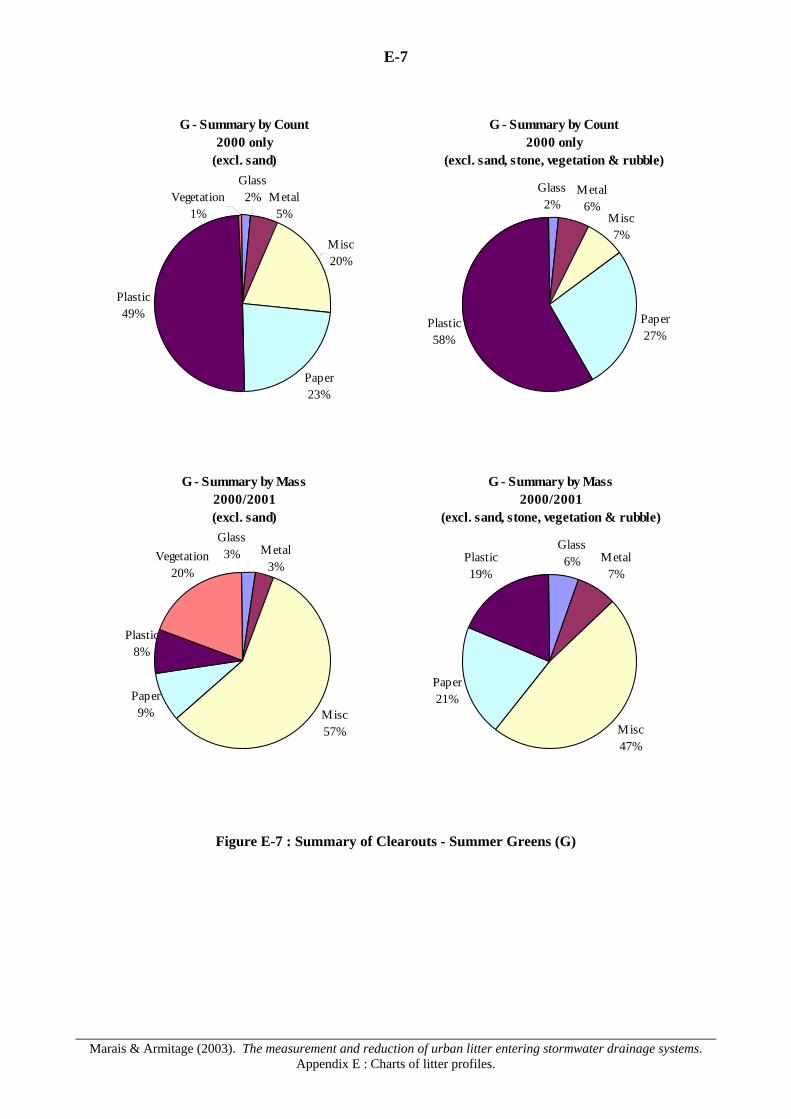
E-7
Marais & Armitage (2003). The measurement and reduction of urban litter entering stormwater drainage systems.
Appendix E : Charts of litter profiles.
Figure E-7 : Summary of Clearouts - Summer Greens (G)
G - Summary by Count2000 only
(excl. sand)
Paper23%
Plastic49%
Misc20%
Metal5%
Glass2%Vegetation
1%
G - Summary by Count2000 only
(excl. sand, stone, vegetation & rubble)
Metal6%
Plastic58%
Misc7%
Glass2%
Paper27%
G - Summary by Mass2000/2001(excl. sand)
Misc57%
Paper9%
Metal3%
Plastic8%
Glass3%Vegetation
20%
G - Summary by Mass2000/2001
(excl. sand, stone, vegetation & rubble)
Glass6% Metal
7%
Misc47%
Paper21%
Plastic19%

E-8
Marais & Armitage (2003). The measurement and reduction of urban litter entering stormwater drainage systems.
Appendix E : Charts of litter profiles.
Figure E-8 : Summary of Clearouts - Montague Gardens (H)
H - Summary by Count2000 only
(excl. sand)
Paper21%
Plastic58%
Misc13%
Metal8%
Glass0%Vegetation
0%
H - Summary by Count2000 only
(excl. sand, stone, vegetation & rubble)
Metal8%
Plastic61%
Misc9%
Glass0%
Paper22%
H - Summary by Mass2000/2001(excl. sand)
Misc71%
Paper6%
Metal2%Plastic
14%
Glass2%
Vegetation5%
H - Summary by Mass2000/2001
(excl. sand, stone, vegetation & rubble)
Glass3%
Misc61%
Paper10%
Plastic23%
Metal3%
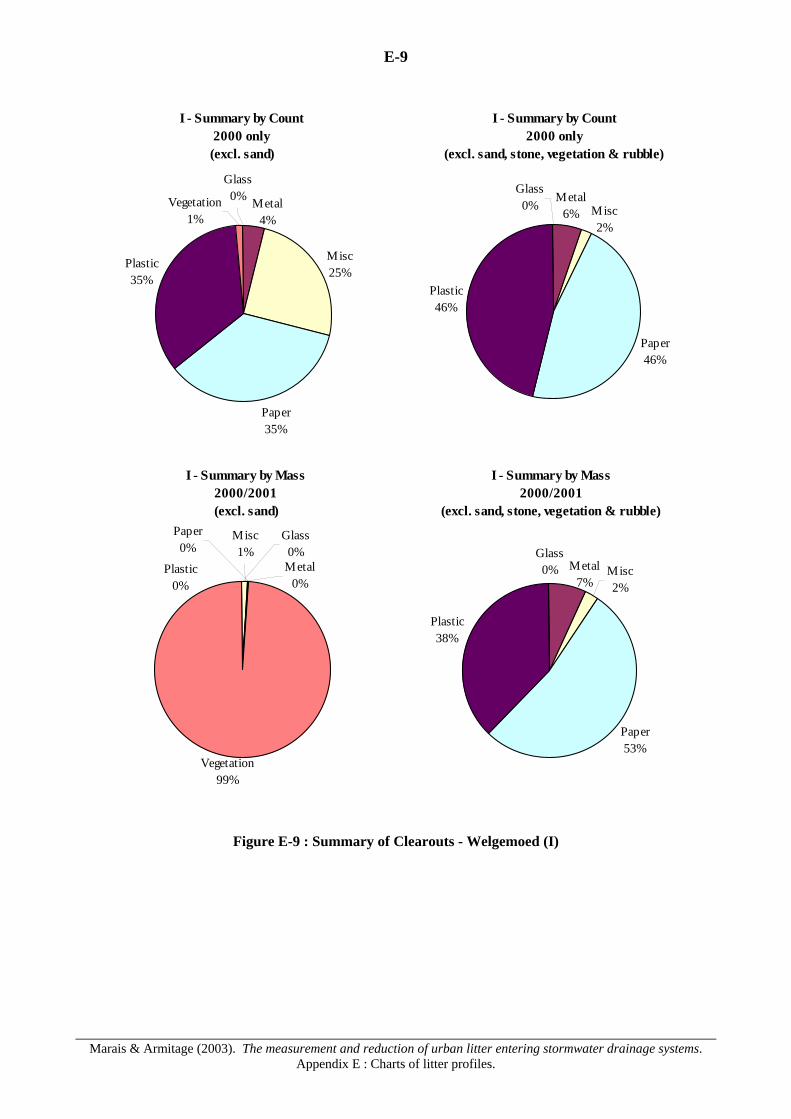
E-9
Marais & Armitage (2003). The measurement and reduction of urban litter entering stormwater drainage systems.
Appendix E : Charts of litter profiles.
Figure E-9 : Summary of Clearouts - Welgemoed (I)
I - Summary by Count2000 only(excl. sand)
Paper35%
Plastic35%
Misc25%
Metal4%
Glass0%Vegetation
1%
I - Summary by Count2000 only
(excl. sand, stone, vegetation & rubble)
Plastic46%
Metal6% Misc
2%
Glass0%
Paper46%
I - Summary by Mass2000/2001(excl. sand)
Vegetation99%
Glass0%
Plastic0%
Metal0%
Paper0%
Misc1%
I - Summary by Mass2000/2001
(excl. sand, stone, vegetation & rubble)
Glass0%
Paper53%
Plastic38%
Misc2%
Metal7%