New human-specific brain landmark: The depth asymmetry of superior temporal sulcus
11
New human-specific brain landmark: The depth asymmetry of superior temporal sulcus François Leroy a,1 , Qing Cai b , Stephanie L. Bogart c , Jessica Dubois a , Olivier Coulon d , Karla Monzalvo a , Clara Fischer e , Hervé Glasel a , Lise Van der Haegen f , Audrey Bénézit a , Ching-Po Lin g , David N. Kennedy h , Aya S. Ihara i , Lucie Hertz-Pannier j , Marie-Laure Moutard k , Cyril Poupon l , Marc Brysbaert e , Neil Roberts m , William D. Hopkins c , Jean-François Mangin e , and Ghislaine Dehaene-Lambertz a a Cognitive Neuroimaging Unit, U992, e Analysis and Processing of Information Unit, j Clinical and Translational Applications Research Unit, U663, and l Nuclear Magnetic Resonance Imaging and Spectroscopy Unit, Office of Atomic Energy and Alternative Energies (CEA), INSERM, NeuroSpin, Gif-sur-Yvette 91191, France; b Shanghai Key Laboratory of Brain Functional Genomics, East China Normal University, Shanghai 200241, China; c Division of Developmental and Cognitive Neuroscience, Yerkes National Primate Research Center, Atlanta, GA 30322; d Laboratory for Systems and Information Science, UMR CNRS 7296, Aix-Marseille University, Marseille 13284, France; f Department of Experimental Psychology, Ghent University, Ghent B-9000, Belgium; g Institute of Neuroscience, National Yang-Ming University, Taipei City 112, Taiwan; h Center for Morphometric Analysis, Neuroscience Center, Massachusetts General Hospital, Boston, MA 02114; i Center for Information and Neural Networks, National Institute of Information and Communications Technology, Osaka 565-0871 Japan; k Neuropediatrics Department, Trousseau Hospital, Assistance Publique Hôpitaux de Paris, Paris 75012, France; and m Clinical Research Imaging Centre, College of Medicine and Veterinary Medicine, University of Edinburgh, Edinburgh EH8 9YL, United Kingdom Edited by Jon H. Kaas, Vanderbilt University, Nashville, TN, and approved December 9, 2014 (received for review July 1, 2014) Identifying potentially unique features of the human cerebral cortex is a first step to understanding how evolution has shaped the brain in our species. By analyzing MR images obtained from 177 humans and 73 chimpanzees, we observed a human-specific asymmetry in the superior temporal sulcus at the heart of the communication regions and which we have named the “superior temporal asymmetrical pit” (STAP). This 45-mm-long segment ven- tral to Heschl’s gyrus is deeper in the right hemisphere than in the left in 95% of typical human subjects, from infanthood till adult- hood, and is present, irrespective of handedness, language later- alization, and sex although it is greater in males than in females. The STAP also is seen in several groups of atypical subjects includ- ing persons with situs inversus, autistic spectrum disorder, Turner syndrome, and corpus callosum agenesis. It is explained in part by the larger number of sulcal interruptions in the left than in the right hemisphere. Its early presence in the infants of this study as well as in fetuses and premature infants suggests a strong genetic influence. Because this asymmetry is barely visible in chimpanzees, we recommend the STAP region during midgestation as an impor- tant phenotype to investigate asymmetrical variations of gene expression among the primate lineage. This genetic target may provide important insights regarding the evolution of the crucial cognitive abilities sustained by this sulcus in our species, namely communication and social cognition. brain | anatomy | asymmetry | human-specific | STS S ince Geschwind and Levitsky’s (1) first attempt to identify a specifically human cortical landmark, the identification of unique features of the human brain that might explain the cog- nitive success of the human species has remained elusive so that anatomical targets still do not exist to inform the search for genetic mutations contributing to the human cognitive pheno- type. Because hemispheric asymmetry and language processing are fundamental human traits, the perisylvian language areas have been especially scrutinized for such markers, but until now none has been forthcoming. In particular, the reported asym- metries in the planum temporale and the inferior frontal region are not as robust as initially thought (1–3) and also are observed, albeit often less marked, in other primates (4). However, we show here that asymmetry of the superior temporal sulcus (STS), at the core of the human communication system, represents a species-specific perisylvian anatomical marker. This finding is consistent with functional brain imaging studies that have em- phasized the importance of STS not only for language processing in the left hemisphere but also for social communication in the right hemisphere (5, 6). Notably, in the left hemisphere a hierarchy of areas sensitive to increased levels of acoustical complexity is observed along superior temporal regions and become specifically linguistic along the STS (7, 8), whereas in the right hemisphere the presence of areas involved in voice and face recognition, gaze perception, and theory of mind confirms the importance of the right superior temporal cortex in social cognition (6). As is the case for many cortical sulci, the STS appears 1 or 2 wk earlier in the right hemisphere than in the left during ges- tation (9–11), but unlike other sulci, in which the left hemisphere catches up, a depth asymmetry in the STS also is reported later in life (12–14) with a reproducible location in the posterior STS, at least in young adults and adolescents (10, 14, and 24 y) (15). The principal objectives of the present study were first to define the location and extent of STS asymmetry accurately; second to ex- amine whether the STS asymmetry has the same characteristics from infanthood, when sulcation is on-going, to adulthood; and finally to compare the measurements in humans with the mea- surements obtained in chimpanzees. We assessed how widespread STS asymmetry was across the human species by investigating several factors known to affect brain asymmetry. First, because of the critical role of the STS Significance In the human brain, from early in development through to adulthood, the superior temporal sulcus is deeper in the right than the left cerebral hemisphere in the area ventral of Heschl’s gyrus. Irrespective of gender, handedness, and language lat- eralization, and present in several pathologies, this asymmetry is widely shared among the human population. Its appearance early in life suggests strong genetic control over this part of the brain. In contrast, the asymmetry is barely visible in chim- panzees. Thus this asymmetry probably is a key locus to look for variations in gene expression among the primate lineage that have favored the evolution of crucial cognitive abilities sustained by this sulcus in our species, namely communication and social cognition. Author contributions: F.L., J.-F.M., and G.D.-L. designed research; F.L., Q.C., S.L.B., J.D., K.M., H.G., L.V.d.H., A.B., C.-P.L., D.N.K., A.S.I., L.H.-P., M.-L.M., C.P., J.-F.M., and G.D.-L. performed research; O.C. and C.F. contributed new reagents/analytic tools; F.L., Q.C., S.L.B., L.V.d.H., A.B., and G.D.-L. analyzed data; and F.L., J.D., M.B., N.R., W.D.H., J.-F.M., and G.D.-L. wrote the paper. The authors declare no conflict of interest. This article is a PNAS Direct Submission. 1 To whom correspondence should be addressed. Email: [email protected]. This article contains supporting information online at www.pnas.org/lookup/suppl/doi:10. 1073/pnas.1412389112/-/DCSupplemental. www.pnas.org/cgi/doi/10.1073/pnas.1412389112 PNAS Early Edition | 1 of 6 NEUROSCIENCE
-
Upload
independent -
Category
Documents
-
view
0 -
download
0
Transcript of New human-specific brain landmark: The depth asymmetry of superior temporal sulcus

New human-specific brain landmark: The depthasymmetry of superior temporal sulcusFrançois Leroya,1, Qing Caib, Stephanie L. Bogartc, Jessica Duboisa, Olivier Coulond, Karla Monzalvoa, Clara Fischere,Hervé Glasela, Lise Van der Haegenf, Audrey Bénézita, Ching-Po Ling, David N. Kennedyh, Aya S. Iharai,Lucie Hertz-Pannierj, Marie-Laure Moutardk, Cyril Pouponl, Marc Brysbaerte, Neil Robertsm, William D. Hopkinsc,Jean-François Mangine, and Ghislaine Dehaene-Lambertza
aCognitive Neuroimaging Unit, U992, eAnalysis and Processing of Information Unit, jClinical and Translational Applications Research Unit, U663, and lNuclearMagnetic Resonance Imaging and Spectroscopy Unit, Office of Atomic Energy and Alternative Energies (CEA), INSERM, NeuroSpin, Gif-sur-Yvette 91191,France; bShanghai Key Laboratory of Brain Functional Genomics, East China Normal University, Shanghai 200241, China; cDivision of Developmental andCognitive Neuroscience, Yerkes National Primate Research Center, Atlanta, GA 30322; dLaboratory for Systems and Information Science, UMR CNRS 7296,Aix-Marseille University, Marseille 13284, France; fDepartment of Experimental Psychology, Ghent University, Ghent B-9000, Belgium; gInstitute ofNeuroscience, National Yang-Ming University, Taipei City 112, Taiwan; hCenter for Morphometric Analysis, Neuroscience Center, Massachusetts GeneralHospital, Boston, MA 02114; iCenter for Information and Neural Networks, National Institute of Information and Communications Technology, Osaka565-0871 Japan; kNeuropediatrics Department, Trousseau Hospital, Assistance Publique Hôpitaux de Paris, Paris 75012, France; and mClinical Research ImagingCentre, College of Medicine and Veterinary Medicine, University of Edinburgh, Edinburgh EH8 9YL, United Kingdom
Edited by Jon H. Kaas, Vanderbilt University, Nashville, TN, and approved December 9, 2014 (received for review July 1, 2014)
Identifying potentially unique features of the human cerebralcortex is a first step to understanding how evolution has shapedthe brain in our species. By analyzing MR images obtained from177 humans and 73 chimpanzees, we observed a human-specificasymmetry in the superior temporal sulcus at the heart of thecommunication regions and which we have named the “superiortemporal asymmetrical pit” (STAP). This 45-mm-long segment ven-tral to Heschl’s gyrus is deeper in the right hemisphere than in theleft in 95% of typical human subjects, from infanthood till adult-hood, and is present, irrespective of handedness, language later-alization, and sex although it is greater in males than in females.The STAP also is seen in several groups of atypical subjects includ-ing persons with situs inversus, autistic spectrum disorder, Turnersyndrome, and corpus callosum agenesis. It is explained in part bythe larger number of sulcal interruptions in the left than in theright hemisphere. Its early presence in the infants of this study aswell as in fetuses and premature infants suggests a strong geneticinfluence. Because this asymmetry is barely visible in chimpanzees,we recommend the STAP region during midgestation as an impor-tant phenotype to investigate asymmetrical variations of geneexpression among the primate lineage. This genetic target mayprovide important insights regarding the evolution of the crucialcognitive abilities sustained by this sulcus in our species, namelycommunication and social cognition.
brain | anatomy | asymmetry | human-specific | STS
Since Geschwind and Levitsky’s (1) first attempt to identifya specifically human cortical landmark, the identification of
unique features of the human brain that might explain the cog-nitive success of the human species has remained elusive so thatanatomical targets still do not exist to inform the search forgenetic mutations contributing to the human cognitive pheno-type. Because hemispheric asymmetry and language processingare fundamental human traits, the perisylvian language areashave been especially scrutinized for such markers, but until nownone has been forthcoming. In particular, the reported asym-metries in the planum temporale and the inferior frontal regionare not as robust as initially thought (1–3) and also are observed,albeit often less marked, in other primates (4). However, weshow here that asymmetry of the superior temporal sulcus (STS),at the core of the human communication system, represents aspecies-specific perisylvian anatomical marker. This finding isconsistent with functional brain imaging studies that have em-phasized the importance of STS not only for language processingin the left hemisphere but also for social communication in theright hemisphere (5, 6). Notably, in the left hemisphere a hierarchy
of areas sensitive to increased levels of acoustical complexity isobserved along superior temporal regions and become specificallylinguistic along the STS (7, 8), whereas in the right hemisphere thepresence of areas involved in voice and face recognition, gazeperception, and theory of mind confirms the importance of theright superior temporal cortex in social cognition (6).As is the case for many cortical sulci, the STS appears 1 or
2 wk earlier in the right hemisphere than in the left during ges-tation (9–11), but unlike other sulci, in which the left hemispherecatches up, a depth asymmetry in the STS also is reported later inlife (12–14) with a reproducible location in the posterior STS, atleast in young adults and adolescents (10, 14, and 24 y) (15). Theprincipal objectives of the present study were first to define thelocation and extent of STS asymmetry accurately; second to ex-amine whether the STS asymmetry has the same characteristicsfrom infanthood, when sulcation is on-going, to adulthood; andfinally to compare the measurements in humans with the mea-surements obtained in chimpanzees.We assessed how widespread STS asymmetry was across the
human species by investigating several factors known to affectbrain asymmetry. First, because of the critical role of the STS
Significance
In the human brain, from early in development through toadulthood, the superior temporal sulcus is deeper in the rightthan the left cerebral hemisphere in the area ventral of Heschl’sgyrus. Irrespective of gender, handedness, and language lat-eralization, and present in several pathologies, this asymmetryis widely shared among the human population. Its appearanceearly in life suggests strong genetic control over this part ofthe brain. In contrast, the asymmetry is barely visible in chim-panzees. Thus this asymmetry probably is a key locus to lookfor variations in gene expression among the primate lineagethat have favored the evolution of crucial cognitive abilitiessustained by this sulcus in our species, namely communicationand social cognition.
Author contributions: F.L., J.-F.M., and G.D.-L. designed research; F.L., Q.C., S.L.B., J.D.,K.M., H.G., L.V.d.H., A.B., C.-P.L., D.N.K., A.S.I., L.H.-P., M.-L.M., C.P., J.-F.M., and G.D.-L.performed research; O.C. and C.F. contributed new reagents/analytic tools; F.L., Q.C.,S.L.B., L.V.d.H., A.B., and G.D.-L. analyzed data; and F.L., J.D., M.B., N.R., W.D.H., J.-F.M.,and G.D.-L. wrote the paper.
The authors declare no conflict of interest.
This article is a PNAS Direct Submission.1To whom correspondence should be addressed. Email: [email protected].
This article contains supporting information online at www.pnas.org/lookup/suppl/doi:10.1073/pnas.1412389112/-/DCSupplemental.
www.pnas.org/cgi/doi/10.1073/pnas.1412389112 PNAS Early Edition | 1 of 6
NEU
ROSC
IENCE

in verbal and nonverbal human communication, analyses wereextended to cohorts with atypical communication profiles,namely adults with right hemispheric dominance for languageand autistic children who previously have been reported to showanatomical and functional abnormalities in the STS (16). Sec-ond, the effects of handedness and sex, which have been shownto modulate asymmetries of both the planum temporale andHeschl’s gyrus in nearby temporal regions (17, 18), were in-vestigated by including patients with Turner syndrome (XO).Third, two general mechanisms have been proposed to explainbrain asymmetries, namely a left–right reversed pattern of body-axis orientation and a competition between homotopic regionsacross hemispheres through the corpus callosum (19), and thesepotential mechanisms were investigated by studying cohorts ofsubjects with situs inversus and patients with corpus callosumagenesis (AgCC). In situs inversus, the main organs of the body areflipped relative to their usual position (i.e., the heart is on the rightside), and the brain is reported to exhibit reversed petalia (20).Finally, a detailed characterization of STS asymmetry was
attempted via the measurement of the shape of individual sulcalprofiles and the assessment of how anatomical interruptions ofthe sulcus might influence overall STS asymmetry. Because sul-cal interruption, also referred to as a “pli de passage,” has beenreported to be more frequent in the left hemisphere than in theright (21), we investigated whether sulcal interruption is theunderlying cause of STS asymmetry.
ResultsFor each subject the brain and sulci were segmented on individualT1-weighted (T1w) 3D MR images using the BrainVISA Mor-phologist pipeline,* normalized to Talairach space, and a meshrepresenting the STS in each cerebral hemisphere was constructed.When the sulcus was disconnected, sulcal parts were concatenated;and with regard to potential extension of STS into parietal lobe onlythe caudal rami within the angular gyrus were considered. Sub-sequently, a new coordinate system was defined along and acrossthe STS (22), with an origin referenced to the location where theplanum temporale has the greatest depth (12). Subsequently, depthprofiles were computed along the long axis of the sulcus and alignedacross hemispheres and subjects (Fig. 1). A depth asymmetry index[AI = 2*(R − L)/(R + L)] was computed, e.g., AI = +20% for right(R) depth = +26 mm, and left (L) depth = +21 mm.
Location and Extent of Sulcal Asymmetry in Typical Groups. STSasymmetry was measured in 14 infants, 28 right-handed children,and 47 right-handed adults. On average, the right STS was deeperthan the left in each age group (Ps ≤ 0.004) (Table 1). By usingpermutation tests for 5-mm-long intervals along the length of theSTS, an asymmetrical sulcal segment was detected in each group.A large region of overlap of these asymmetrical sulcal segmentsacross the three age groups was termed the “superior temporalasymmetrical pit) (STAP) (Figs. 1 and 2). The STAP is a 45-mm-long sulcal segment located at the base of Heschl’s gyrus (mid-STS) with its center slightly forward of the planum landmark.Specifically, the STAP has the following position within Talairachspace: left anterior border: x = −59, y = −12, z = −9; right an-terior border: +54, −8, −14; left center: −55, −28, −3; rightcenter: +50, −26, −4; left posterior border: −52, −45, +5; rightposterior border: +51, −42, +7. Based on criteria previously de-veloped for studies of the planum temporale (23), 96% of sub-jects had an AI >0, and 74% had an AI >10%. The left–rightdifference in magnitude was around 29%, 19%, and 28% in infants,children, and adults, respectively, but these potential differences
across the lifespan were not significant (F2,86 = 1.5; P = 0.2; one-way ANOVA).
Effects of Handedness and Sex.The effect of handedness and sex onSTS asymmetry was investigated in 95 adults (Fig. 3 and Table 1).The sulcus was found to be asymmetrical in both male andfemale left-handers (Ps ≤ 0.001) (Table 1). Using permutationstatistics, an asymmetrical segment was found in each group,which largely overlapped with the STAP region (≥89%). TheSTAP was present in 96% of left-handers (AI >0) with a meanamplitude of 19%. When the asymmetry magnitude was com-pared between group-specific asymmetrical segments with sexand handedness as between-subject factors, a trend for a sex ef-fect, but no significant handedness effect, was observed (sex:F1,92 = 3.3, P = 0.07; handedness: F1,92 <1; handedness × sex:F1,92 <1; two-way ANOVA). When the analysis was restricted tothe STAP region, the handedness factor remained not signifi-cant, but the sex effect was strengthened, with males havinga larger AI than females (sex: F1,92 = 8.3; P = 0.001; handedness:F1,92 = 1; P = 0.3; two-way ANOVA) (Fig. 3B).Because of this sexual dimorphism, we analyzed 14 females with
Turner syndrome i.e., who have only one X chromosome (Table 1).The STAP was present in every subject, and, unexpectedly, itsmagnitude was as large as in typical male adults (Turner AI = 33 ±9%, typical males: AI = 35 ± 7%; P = 0.9; Welch t test).
Species-Specific Asymmetry. In comparison with the complex,twisted shape of human STS, chimpanzee STS is nearly linear.No significant STS asymmetry was observed in chimpanzees wheneither the whole sulcus or the STAP was considered (STS AI = 1 ±9%; P = 0.3; STAP AI = 1 ± 8%; P = 0.2) (Table 1). A smallasymmetrical segment within the STAP was barely deeper on theright side than the left in 56% of chimpanzees (AI >0) (Fig. 2). Itwas 10 mm long in normalized space i.e., 6 mm in the native space.However, this right–left difference was smaller than in every hu-man typical group (AI = 4 ± 10%; Ps < 0.002; Tukey’s test). No-tably, the asymmetrical segment was present in male but not in
Fig. 1. (A) Location of the STAP (yellow) relative to Heschl’s gyrus (blue) andthe ventral tip of the central sulcus (green) on both left and right innercortical surfaces of an individual adult brain. The STAP center is shown bya cross. The black dot with a white contour line shows the planum temporalelandmark. (B, Upper) Sulcal depth shown by color coding of the sulcal mesh(seen from above). (Lower) Sulcal depth profile in the right hemisphere of anindividual subject. (C) Adult sulcal depth profile; STAP anterior and posteriorends as well as the planum landmark are drawn in dotted lines. The lightorange overlay illustrates the STAP (deeper on the right), defined as thecommon asymmetrical segment in the three typical groups (infant, right-handed children, and adults).
*Fischer C, The 18th Annual Meeting of the Organization for Human Brain Mapping, June10–14, 2012, Beijing, China.
2 of 6 | www.pnas.org/cgi/doi/10.1073/pnas.1412389112 Leroy et al.
female chimpanzees (47 females: AI = 1% ± 7%; P = 0.1; 26males: AI = 7 ± 11%; P = 0.001); The asymmetry magnitude wasnot correlated with brain volume (Pearson’s P = 0.9) although malebrains were larger than female brains (female brains: 280 ± 30 cm3;male brains: 304 ± 36 cm3; males > females: P < 0.01; Welch t test).
Atypical Communication Systems: Right Lateralization for Languageand Autism. Because the STS is at the heart of the human com-munication system, we first investigated whether the STAP isaffected by language dominance. In particular, two groups of 17young adults with either left or right cerebral hemisphere dom-inance for language, matched in age and handedness (24), werestudied. In each group, permutation tests revealed asymmetricalsegments along the sulcus which overlapped with the STAP region.In particular, in subjects with right lateralization for language one30-mm-long segment fully included in the STAP was recognized,whereas in left-lateralized subjects two segments (one 15-mm-longanterior segment with 66% overlap and one 45-mm-long posteriorsegment with 56% overlap) were recognized. When restricted tothe STAP, asymmetry was present (AI > 0) in 94% of subjects withright lateralization for language and was not significantly differentbetween groups (left language dominance: AI = 17 ± 21%; rightlanguage dominance: AI = 14 ± 16%; left lateral vs. right lateraldominance: P = 0.6; Welch t test) (Fig. 2C and Table 1).Next 15 autistic boys, matched with the group of typical right-
handed boys for age, handedness, and developmental quotients,were studied. Rightward asymmetry of the STAP region wassimilar in autistic children and their matched controls (autisticchildren: AI = 17 ± 15%; controls: AI = 16 ± 26%; autistic boysvs. controls: P = 0.9; Welch t test).
General Structural Factors: Hemispheric Asymmetry, Body-AxisOrientation, and Interhemispheric Interaction. Because sulcalasymmetry potentially may be explained by a more generalbrain asymmetry, the volume asymmetry of the hemisphereswas computed. Right-handed children and adults hada slightly bigger right than left hemisphere, on average (Ps ≤0.01), but left-handed adults did not (Ps ≥ 0.7). However, nocorrelation was found between brain asymmetry and anyasymmetrical STS segment in these groups (Ps ≥ 0.15).Six subjects (five men) with situs inversus for whom a reverse
pattern of brain petalia had been shown were studied also. De-spite the small sample size, the right STS again was deeper thanthe left in the STAP (AI = 30 ± 21%; P = 0.008), with a mag-nitude similar to that in the right-handed adult male group usedas controls (controls: AI = 28 ± 2 8%; situs inversus vs. controls;P = 0.7; Welch t test).Finally, five girls with complete or partial AgCC were studied.
The STAP was present (AI >0) in four of the five patients, al-though it was smaller than in the right-handed girls used ascontrols (AgCC: AI = 4 ± 8%; P = 0.2; controls: AI = 24 ± 23%;AgCC vs. controls: P = 0.03; Welch t test).
Sulcal Interruptions. Because it has been shown previously inadults that sulcal interruptions (plis de passage) occur more fre-quently on the left than on the right STS (21), a post hoc analysiswas run over all human subjects to assess the effect of theseinterruptions on depth asymmetry. An interruption can either befull (when the sulcus is made of several disconnected parts) orpartial (when a transverse gyrus is buried in the depth of thesulcus) (Fig. S1). We computed the occurrence and size of plisde passage in each hemisphere in each group over the STAP.By using Fisher’s exact test, more sulcal interruptions were
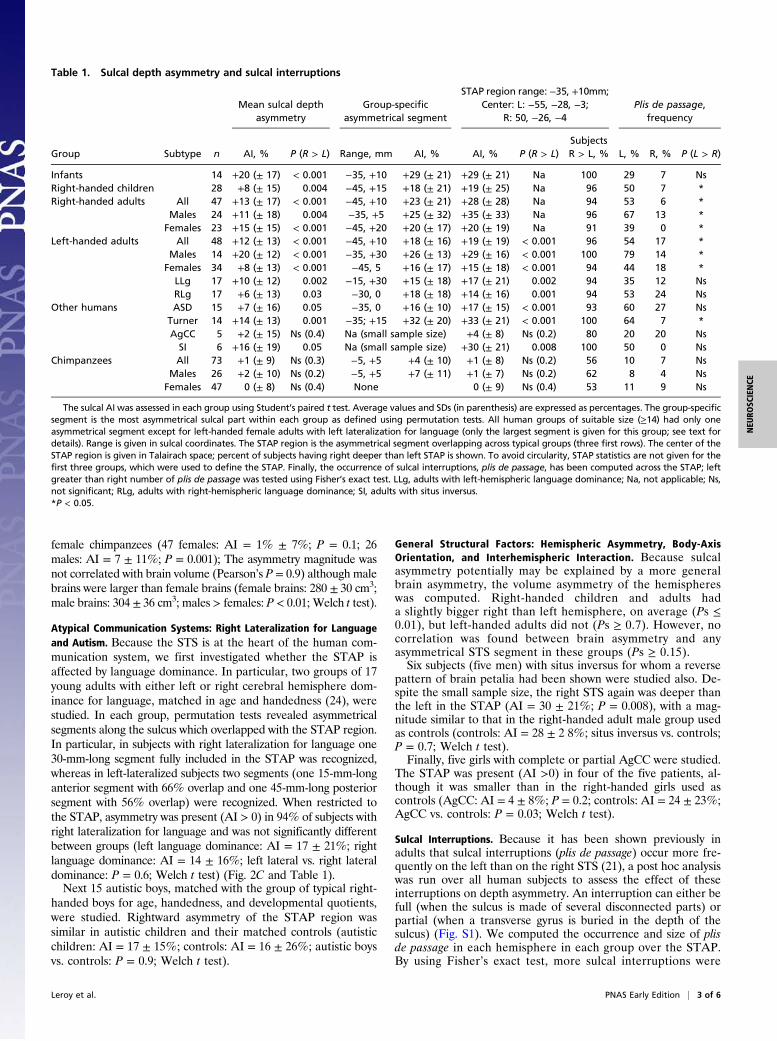
Table 1. Sulcal depth asymmetry and sulcal interruptions
Group Subtype n
Mean sulcal depthasymmetry
Group-specificasymmetrical segment
STAP region range: −35, +10mm;Center: L: −55, −28, −3;
R: 50, −26, −4Plis de passage,
frequency
AI, % P (R > L) Range, mm AI, % AI, % P (R > L)SubjectsR > L, % L, % R, % P (L > R)
Infants 14 +20 (± 17) < 0.001 −35, +10 +29 (± 21) +29 (± 21) Na 100 29 7 NsRight-handed children 28 +8 (± 15) 0.004 −45, +15 +18 (± 21) +19 (± 25) Na 96 50 7 *Right-handed adults All 47 +13 (± 17) < 0.001 −45, +10 +23 (± 21) +28 (± 28) Na 94 53 6 *
Males 24 +11 (± 18) 0.004 −35, +5 +25 (± 32) +35 (± 33) Na 96 67 13 *Females 23 +15 (± 15) < 0.001 −45, +20 +20 (± 17) +20 (± 19) Na 91 39 0 *
Left-handed adults All 48 +12 (± 13) < 0.001 −45, +10 +18 (± 16) +19 (± 19) < 0.001 96 54 17 *Males 14 +20 (± 12) < 0.001 −35, +30 +26 (± 13) +29 (± 16) < 0.001 100 79 14 *
Females 34 +8 (± 13) < 0.001 −45, 5 +16 (± 17) +15 (± 18) < 0.001 94 44 18 *LLg 17 +10 (± 12) 0.002 −15, +30 +15 (± 18) +17 (± 21) 0.002 94 35 12 NsRLg 17 +6 (± 13) 0.03 −30, 0 +18 (± 18) +14 (± 16) 0.001 94 53 24 Ns
Other humans ASD 15 +7 (± 16) 0.05 −35, 0 +16 (± 10) +17 (± 15) < 0.001 93 60 27 NsTurner 14 +14 (± 13) 0.001 −35; +15 +32 (± 20) +33 (± 21) < 0.001 100 64 7 *AgCC 5 +2 (± 15) Ns (0.4) Na (small sample size) +4 (± 8) Ns (0.2) 80 20 20 NsSI 6 +16 (± 19) 0.05 Na (small sample size) +30 (± 21) 0.008 100 50 0 Ns
Chimpanzees All 73 +1 (± 9) Ns (0.3) −5, +5 +4 (± 10) +1 (± 8) Ns (0.2) 56 10 7 NsMales 26 +2 (± 10) Ns (0.2) −5, +5 +7 (± 11) +1 (± 7) Ns (0.2) 62 8 4 Ns
Females 47 0 (± 8) Ns (0.4) None 0 (± 9) Ns (0.4) 53 11 9 Ns
The sulcal AI was assessed in each group using Student’s paired t test. Average values and SDs (in parenthesis) are expressed as percentages. The group-specificsegment is the most asymmetrical sulcal part within each group as defined using permutation tests. All human groups of suitable size (≥14) had only oneasymmetrical segment except for left-handed female adults with left lateralization for language (only the largest segment is given for this group; see text fordetails). Range is given in sulcal coordinates. The STAP region is the asymmetrical segment overlapping across typical groups (three first rows). The center of theSTAP region is given in Talairach space; percent of subjects having right deeper than left STAP is shown. To avoid circularity, STAP statistics are not given for thefirst three groups, which were used to define the STAP. Finally, the occurrence of sulcal interruptions, plis de passage, has been computed across the STAP; leftgreater than right number of plis de passage was tested using Fisher’s exact test. LLg, adults with left-hemispheric language dominance; Na, not applicable; Ns,not significant; RLg, adults with right-hemispheric language dominance; SI, adults with situs inversus.*P < 0.05.
Leroy et al. PNAS Early Edition | 3 of 6
NEU
ROSC
IENCE

identified in the left than the right hemisphere in typical childrenand in adult groups irrespective of sex or handedness (far rightcolumn of Table 1). Notably, patients with AgCC had few sulcalinterruptions on the left (20%). In chimpanzees, there were fewsulcal interruptions, and the number of interruptions was notsignificantly different in the left and right STS.An assessment was made to determine whether an asymmetry
of sulcal interruptions might explain STS depth asymmetry.Accordingly, all human subjects were divided into two groups:one group of 100 subjects who had an interruption in one orother hemisphere within the STAP and another group withcontinuous sulci in both hemispheres (77 subjects). As expected,in the former group the left–right difference in interruption sizewas correlated with the STAP (R2 = 0.45, P < 0.001) (Fig. S2A).The larger the plis de passage in the left hemisphere, the largerthe STAP. However, the STAP remained significant in 97% ofsubjects without plis de passage (Fig. S2B). Thus, the STAP isexplained only in part by a greater number of interruptions in theleft than right cerebral hemisphere.Finally, because a larger STAP had been observed in males than
in females, sulcal interruptions were compared across sex in theadult groups. There were more interruptions in the left hemispherein males than in females (females: 42%; males: 71%; P = 0.004;Fisher exact test), whereas no sex effect on AI was found in adultswithout any interruption (30 females and 9 males; females: AI =12 ± 10%; males: AI = 12 ± 5%; P = 1; Welch t test). Because this
sexual dimorphism might be explained by differences in brain size(brain volume in females: 978 ± 94 cm3; in males: 1,094 ± 106 cm3;males > females: P < 0.001; Welch t test), we computed the fre-quency of interruptions as a function of brain size intervals. Wefound a linear relationship between the number of interruptionsand brain size (R2 = 0.76, P = 0.001) using 60-cm3-wide intervalsin the range of 800–1,340 cm3 (Fig. 3C).
DiscussionA significant depth asymmetry in STS ventral to the Heschl’sgyrus is identified as a feature widely shared among the humanpopulation but scarcely visible in chimpanzees. To a large extentthis STAP region overlaps with other asymmetrical areas pre-viously reported in the STS (figure 5 in ref. 9, figure 6 in ref. 25,figure 2 in ref. 14, figure 13 in ref. 13, and both middle andposterior segments in figure 3 in ref. 15). In many respects theSTAP is as important as the widely studied asymmetry of theplanum temporale. First, results obtained in infants, children,and adults, together with studies at other age periods, e.g., infetuses (10), toddlers (14), and adolescents (15), suggest that theSTAP has its origin during midgestation and is presentthroughout the human lifespan. Second, the STAP, like planumtemporale asymmetry, is present irrespective of sex (26), hand-edness (17), and language lateralization (27). Third, the preva-lence of STAP in adults (72% using the criterion defined in ref.23) is similar to that of planum temporale asymmetry (28). Fi-nally, because both planum temporale asymmetry and the STAPare preserved in subjects with situs inversus (20, 29), thesetemporal asymmetries may have an origin distinctly differentfrom visceral and petalia asymmetries. Despite these commonfeatures, however, notable differences suggest that the STAPmight be a more species-distinctive feature than the planum.Atypical asymmetry (i.e., to the other side) is larger for theplanum temporale [AI >10% in 15% of subjects (28)] than for
Fig. 2. (A) Left (red line) and right (blue line) STS depth profiles from thetemporal pole to its parietal caudal end. Depth profiles are shown forinfants, right-handed children, adults, and chimpanzees. The asymmetricalpart of the STS is computed for each group by permutation tests over 5-mm-long intervals along the sulcus. Two statistical thresholds (Pcorr = 0.05; Pcorr =0.01) are shown by horizontal dashed-and-dotted lines. The extent of theasymmetrical segment is given by the range of the Student t variable (blackline) above the lower threshold and is identified by a black bar (see alsoTable 1). The extent of the common region across the three typical humangroups (STAP) is shown in light orange overlay. (B) STAP per cent in in-dividual typical humans and chimpanzees. Mean group values are shown bya short red line. (C) STAP in atypical human groups, i.e., adults with rightlateralization for language, adults with situs inversus (reversed petalia),children with autism spectrum disorders, and children with AgCC. *P < 0.05.n.s., not significant.
Fig. 3. The STAP in relation to sex and handedness in adults. (A) Left (redline) and right (blue line) STS depth profiles. The extent of the asymmetricalsegment is given by the range of the Student t variable (black line) above thelower threshold and is identified by a black bar (see also Table 1). The extentof the STAP region is shown in light orange overlay. (B) STAP statistics (meanand SE) in healthy right-handers and left-handers and in patients with Turnersyndrome. (C) Frequency of left sulcal interruptions in relation to brain vol-ume. LH, left-handed; n.s., not significant; RH, right-handed. **P < 0.01.
4 of 6 | www.pnas.org/cgi/doi/10.1073/pnas.1412389112 Leroy et al.
the STS (AI ≤10% in 2% of typical subjects in our study). Mostimportantly, the small spatial extent and weak magnitude of STSasymmetry in chimpanzees might constitute a major differencewith the planum temporale, for which asymmetry also has beenreported in chimpanzees (4, 30).The sexual dimorphism of the STS asymmetry found in both
chimpanzees and humans encourages a search for a relationshipwith the sex chromosomes, which also have diverged rapidlybetween the two species (31). Furthermore, XY aneuploidiesoften are associated with verbal or social cognition deficits andanomalies of the temporal regions (32). As a first approach, weexamined females with Turner syndrome (XO). The STAP inthis group was similar to that in typical males. Studies of othertypes of XY aneuploidies are required to understand better howthese chromosomes affect the STAP, but we emphasize that mostof the sexual dimorphism observed in humans might be relatedsimply to differences in brain size in the human species. Indeed,we found a close relationship between the STAP, the number ofsulcal interruptions, and the brain size, consistent with a previousreport of an increase of gyrification patterns in larger cortices(33). Males’ larger brain size increases the number of sulcalinterruptions in the left hemisphere and subsequently the STAPmagnitude. Thus, a human universal STAP, present in adults withno pli de passage or in small brains (infants), might be enhanced inbigger brains (usually males) by a left pli de passage (15, 21).The relationship between the STAP and sulcal interruptions
may shed light on the biological mechanisms responsible for thisasymmetry. A recent study has shown that the number of pits, andsubsequently interruptions, increases in the left STS between birthand 2 y of age (34). This increase of sulcal interruptions mightcorrespond to the growth of a transverse gyrus in the depth of theleft sulcus. According to models of cortical folding, gyral growthcan be explained by variations of mechanical properties of thecortex and/or constraints of the underlying white matter (35, 36).Several findings suggest a large connectivity in this brain region: Adense local connectivity between the many areas useful for thecorrect encoding of phonemes (37) intermingles with many long-range tracts (38)—the arcuate fasciculus, the middle longitudinalfasciculus, the inferior occipito-frontal fasciculus, and transcallosalfibers. These last fibers might be an important factor, because bothreduced STAP magnitude and fewer plis de passage were observedin patients with AgCC. The arcuate fasciculus might participatealso, because it shares several features with the STAP: It is muchlarger in humans than in chimpanzees; it expands near the STAPregion to a larger extent on the left hemisphere than on the right(39); and it is asymmetric from early in life (40) and irrespective oflanguage lateralization (41). These observations suggest that theSTAP might be related to a dense and asymmetrical developmentof the underlying white matter in the superior temporal region.To understand the functional significance of the STAP, a hu-
man distinctive anatomical marker, two groups of subjects withatypical communication systems were investigated, namely, autis-tic children and adults with right-hemispheric language domi-nance. Dysfunction of the STS region, including decreased graymatter density, hypoperfusion at rest, and decreased activations intasks involving voice and face recognition, gaze perception, andsocial cognition in general, has been reported in autism (16).However, in the present study no alteration in STS asymmetry wasobserved in this group. Similarly, the present study has revealedthat STS asymmetry is not related to language lateralization.However, the STAP region is at a key location along the linguisticventral pathway mapping sounds to meaning (7, 42, 43). Theclassical criteria of hemispheric language dominance based onfunctional lateralization in Broca’s area during a word-productiontask (44) may not reflect the functional role of the STAP regioncloser to the language-receptive areas. Indeed independent anal-ysis by Greve et al. (27) of the database investigated in the presentstudy found no difference in the asymmetry of the planum
temporale between groups of subjects with opposite hemisphericdominance for language. Apart from communication systems, theSTS is involved in several other processes, including audiovisualintegration and biological motion related to social cognition (6),which should be investigated also. The search for the STAPfunction would be greatly facilitated by a more detailed de-scription of the cytoarchitectonic organization in this brain region.In conclusion, a robust asymmetry in the depth of the STS is
present at the base of Heschl’s gyrus in the great majority ofhuman subjects. Because STS asymmetry is barely visible inchimpanzees and likely is absent in macaques (45), the presenceof the STAP is interpreted as a recent evolutionary change.Furthermore, that this asymmetry is present in infants and evenfetuses (10) suggests an early genetically driven mechanism andstimulates the search for genes of recent evolution expresseddifferently in the superior temporal region during midgestation(46). Although observed in all human groups, the magnitude ofthe STAP asymmetry is modulated by sex, perhaps because malebrains are larger than female brains. Because children with cor-pus callosum dysgenesis were the least asymmetric human groupin our study, further studies should examine how the dense un-derlying fiber pathways (38) act upon this region. Understandinghow evolution shaped this cortical area differently in eachhemisphere most likely would highlight a critical feature of one ofthe several cognitive networks involved in this region (5, 38, 47).
Material and MethodsSee SI Materials and Methods for further details on subjects, scanning param-eters, brain segmentation, sulcal identification, measurement of interruptions,and landmarks. Informed consent was obtained in each experiment and theseexperiments were approved by the local ethical committee. MRI acquisitionparameters are given in Table S1.
Subjects. Three typical subject groups were defined, namely, infants, right-handed children, and right-handed adults: 14 healthy full-term infants (meanage = 11.1 ± 3.9 wk; nine males, five females), whose data have already beenpublished (12); 18 right-handedboys (meanage=10.6±1.3 y) from theKennedyKrieger Institute, as part of the Autism Brain Imaging Data Exchange (ABIDE)project; 10 right-handed girls (mean age = 9.6 ± 0.4 y) imaged at the NeuroSpincenter [Office of Atomic Energy and Alternative Energies (CEA), Gif sur Yvette,France]; and 47 young right-handed adults (mean age = 21 ± 1.2 y; 23 females,24 males) imaged at the NeuroSpin center (CEA, Gif sur Yvette, France).
The following atypical human groups were studied also: 48 young left-handed adults from a study by Van der Haegen et al. (24), consisting of 14males (mean age = 22 ± 4 y), 17 females with left hemisphere lateralizationfor language (mean age = 20 ± 1.6 y), and 17 females with right hemispherelateralization for language (mean age = 20.2 ± 1.5 y); 15 autistic right-handed boys (mean age = 10.0 ± 1.5 y) from the Kennedy Krieger Instituterecruited as part of the ABIDE project matched with the typically developingchild group defined above; five right-handed girls with prenatal diagnosis ofisolated AgCC (mean age = 11.4 ± 1.5 y) imaged at the NeuroSpin center(CEA, Gif sur Yvette, France) (48); six adults with situs inversus from the SitusInversus Project managed by N.R.; and 14 patients with Turner syndrome(mean age 24.5 ± 6 y) from a study by Molko et al. (49).
Finally, 73 adult chimpanzees (47 females, 26males; mean age = 23 y ± 12 y)from the Division of Developmental and Cognitive Neuroscience at the YerkesNational Primate Research Center, Atlanta, GA (45) were studied.
Computing and Aligning Sulcal Depth Profiles. A model-driven parameteri-zation (22) was used to define a coordinate system along the length anddepth of the sulcus. Once parameterized, local sulcal depth may be computedas the geodesic distance between the most and least superficial sulcal loca-tions at each length coordinate. A depth profile is the curve made of all theselocal depth measurements along the sulcus. A common landmark was appliedto define the origin of the depth profile in all subjects. As in Glasel et al. (12),the landmark was provided by the deepest location of the planum temporale,which is located in the posterior part of the insula posterior to the medial tipof Heschl’s gyrus. This location has been shown to be relatively stable acrosssubjects (12). When Heschl’s gyrus was duplicated, the anterior border ofthe planum temporale was set posterior to the most anterior transversegyrus (23). Finally, the planum landmark was projected onto the STSalong the dorso–ventral axis to set the profile origin. Depth profiles both
Leroy et al. PNAS Early Edition | 5 of 6
NEU
ROSC
IENCE

within and across groups of subjects were aligned according to thiscommon origin.
Location and Extent of Asymmetry Using Permutation Tests. As in Glasel et al.(12), the asymmetrical part of the STS was identified by applying permutationtests to groups of suitable size (≥14), i.e., infants, normally developing andautistic children, all adult groups except for subjects with situs inversus, andchimpanzees. Paired t tests were applied between right and left depth profilesat each sulcal location using a sliding window, and the most asymmetricalsegment that provided the maximum tmax score was determined. Next, 5,000random inversions of right and left profiles across subjects were performedto estimate the random distribution of t-score maximal values. Finally, themeasured tmax was compared with this distribution to obtain the P value.This procedure was performed in Talairach space with a 5-mm-wide slidingwindow and enabled 5-mm-long segments with significant asymmetry to beidentified along the sulcus. Adjacent segments were concatenated to define
the extent of asymmetry in each group (Table 1). We applied Bonferonnicorrection to take into account the number of sulcal locations. Despite thisrestrictive criterion, we confirmed that one asymmetrical segment could stillbe found in all groups but LLg left-handed females and that typical groupshad one asymmetrical segment in common within the STAP region.
ACKNOWLEDGMENTS. We thank the ABIDE initiative, the Laboratory forNeurocognitive and Imaging Research (Kennedy Krieger Institute, Baltimore,MD), and Roberto Toro for the dataset related to normally developing andautistic children; specifically, from the Laboratory for Neurocognitive andImaging Research, we thank Anita Barber, Rebecca Buhlman, Brian Caffo,Deana Crocetti, Suresh Joel, John Muschelli, Carrie Nettles, James Pekar,Kristie Sweeney, Michelle Talley, Mary Beth Nebel, and Stewart Mostofsky.We also thank Nicolas Molko and Stanislas Dehaene for the dataset relatedto Turner syndrome. Finally, we are grateful to the NeuroSpin teams fortheir help in the acquisition of infants and children data. This work wassupported by the McDonnell and Bettencourt–Schueller Foundations.
1. Geschwind N, Levitsky W (1968) Human brain: Left-right asymmetries in temporalspeech region. Science 161(3837):186–187.
2. Dorsaint-Pierre R, et al. (2006) Asymmetries of the planum temporale and Heschl’sgyrus: Relationship to language lateralization. Brain 129(Pt 5):1164–1176.
3. Keller SS, Crow T, Foundas A, Amunts K, Roberts N (2009) Broca’s area: Nomenclature,anatomy, typology and asymmetry. Brain Lang 109(1):29–48.
4. Hopkins WD, Nir TM (2010) Planum temporale surface area and grey matter asym-metries in chimpanzees (Pan troglodytes): The effect of handedness and comparisonwith findings in humans. Behav Brain Res 208(2):436–443.
5. Pelphrey KA, Viola RJ, McCarthy G (2004) When strangers pass: Processing of mutualand averted social gaze in the superior temporal sulcus. Psychol Sci 15(9):598–603.
6. Hein G, Knight RT (2008) Superior temporal sulcus—It’s my area: Or is it? J CognNeurosci 20(12):2125–2136.
7. DeWitt I, Rauschecker JP (2012) Phoneme and word recognition in the auditoryventral stream. Proc Natl Acad Sci USA 109(8):E505–E514.
8. Dehaene-Lambertz G, et al. (2006) Functional organization of perisylvian activationduring presentation of sentences in preverbal infants. Proc Natl Acad Sci USA 103(38):14240–14245.
9. Dubois J, et al. (2010) Structural asymmetries of perisylvian regions in the pretermnewborn. Neuroimage 52(1):32–42.
10. Habas PA, et al. (2012) Early folding patterns and asymmetries of the normal humanbrain detected from in utero MRI. Cereb Cortex 22(1):13–25.
11. Chi JG, Dooling EC, Gilles FH (1977) Gyral development of the human brain. AnnNeurol 1(1):86–93.
12. Glasel H, et al. (2011) A robust cerebral asymmetry in the infant brain: The rightwardsuperior temporal sulcus. Neuroimage 58(3):716–723.
13. Van Essen DC (2005) A Population-Average, Landmark- and Surface-based (PALS)atlas of human cerebral cortex. Neuroimage 28(3):635–662.
14. Li G, et al. (2014) Mapping longitudinal hemispheric structural asymmetries of thehuman cerebral cortex from birth to 2 years of age. Cereb Cortex 24(5):1289–1300.
15. Bonte M, et al. (2013) Development from childhood to adulthood increases mor-phological and functional inter-individual variability in the right superior temporalcortex. Neuroimage 83:739–750.
16. Zilbovicius M, et al. (2013) Autism, social cognition and superior temporal sulcus.Open J Psychiatr 3(2A):46–55.
17. Steinmetz H, Volkmann J, Jäncke L, Freund HJ (1991) Anatomical left-right asymmetryof language-related temporal cortex is different in left- and right-handers. AnnNeurol 29(3):315–319.
18. Good CD, et al. (2001) Cerebral asymmetry and the effects of sex and handedness onbrain structure: A voxel-based morphometric analysis of 465 normal adult humanbrains. Neuroimage 14(3):685–700.
19. Cook ND (1984) Callosal inhibition: The key to the brain code. Behav Sci 29(2):98–110.20. Kennedy DN, et al. (1999) Structural and functional brain asymmetries in human situs
inversus totalis. Neurology 53(6):1260–1265.21. Ochiai T, et al. (2004) Sulcal pattern and morphology of the superior temporal sulcus.
Neuroimage 22(2):706–719.22. Coulon O, et al. (2006) Cortical localization via surface parameterization: a sulcus-
based approach. Neuroimage 31(Suppl 1):29–185.23. Galaburda AM, Corsiglia J, Rosen GD, Sherman GF (1987) Planum Temporale Asym-
metry, Reappraisal since Geschwind and Levitsky. Neuropsychologia 25(6):853–868.24. Van der Haegen L, Cai Q, Brysbaert M (2012) Colateralization of Broca’s area and the
visual word form area in left-handers: fMRI evidence. Brain Lang 122(3):171–178.25. Hill J, et al. (2010) A surface-based analysis of hemispheric asymmetries and folding of
cerebral cortex in term-born human infants. J Neurosci 30(6):2268–2276.
26. Sommer IE, Aleman A, Somers M, Boks MP, Kahn RS (2008) Sex differences in hand-edness, asymmetry of the planum temporale and functional language lateralization.Brain Res 1206:76–88.
27. Greve DN, et al. (2013) A surface-based analysis of language lateralization and cor-tical asymmetry. J Cogn Neurosci 25(9):1477–1492.
28. Shapleske J, Rossell SL, Woodruff PW, David AS (1999) The planum temporale:Asystematic, quantitative review of its structural, functional and clinical significance.Brain Res Brain Res Rev 29(1):26–49.
29. Ihara A, et al. (2010) Neuroimaging study on brain asymmetries in situs inversus to-talis. J Neurol Sci 288(1-2):72–78.
30. Gannon PJ, Holloway RL, Broadfield DC, Braun AR (1998) Asymmetry of chimpanzeeplanum temporale: Humanlike pattern of Wernicke’s brain language area homolog.Science 279(9 January):220–222.
31. Hughes JF, et al. (2010) Chimpanzee and human Y chromosomes are remarkably di-vergent in structure and gene content. Nature 463(7280):536–539.
32. Raznahan A, et al. (2014) Globally divergent but locally Convergent X- and Y-chro-mosome influences on cortical development. Cereb Cortex, in press.
33. Germanaud D, et al. (2012) Larger is twistier: Spectral analysis of gyrification(SPANGY) applied to adult brain size polymorphism. Neuroimage 63(3):1257–1272.
34. Meng Y, Li G, Lin W, Gilmore JH, Shen D (2014) Spatial distribution and longitudinaldevelopment of deep cortical sulcal landmarks in infants. Neuroimage 100:206–218.
35. Xu G, et al. (2010) Axons pull on the brain, but tension does not drive cortical folding.J Biomech Eng 132(7):071013.
36. Toro R, Burnod Y (2005) A morphogenetic model for the development of corticalconvolutions. Cereb Cortex 15(12):1900–1913.
37. Mesgarani N, Cheung C, Johnson K, Chang EF (2014) Phonetic feature encoding inhuman superior temporal gyrus. Science 343(6174):1006–1010.
38. Turken AU, Dronkers NF (2011) The neural architecture of the language comprehensionnetwork: Converging evidence from lesion and connectivity analyses. Front Syst Neurosci 5:1.
39. Fernández-Miranda JC, et al. (2014) Asymmetry, connectivity, and segmentation ofthe arcuate fascicle in the human brain. Brain Struct Funct, in press.
40. Dubois J, et al. (2009) Structural asymmetries in the infant language and sensori-motor networks. Cereb Cortex 19(2):414–423.
41. Vernooij MW, et al. (2007) Fiber density asymmetry of the arcuate fasciculus in relationto functional hemispheric language lateralization in both right- and left-handedhealthy subjects: A combined fMRI and DTI study. Neuroimage 35(3):1064–1076.
42. Liebenthal E, et al. (2010) Specialization along the left superior temporal sulcus forauditory categorization. Cereb Cortex 20(12):2958–2970.
43. Striem-Amit E, Hertz U, Amedi A (2011) Extensive cochleotopic mapping of humanauditory cortical fields obtained with phase-encoding FMRI. PLoS ONE 6(3):e17832.
44. Van der Haegen L, Cai Q, Seurinck R, Brysbaert M (2011) Further fMRI validation ofthe visual half field technique as an indicator of language laterality: A large-groupanalysis. Neuropsychologia 49(10):2879–2888.
45. Bogart SL, et al. (2012) Cortical sulci asymmetries in chimpanzees and macaques: Anew look at an old idea. Neuroimage 61(3):533–541.
46. Johnson MB, et al. (2009) Functional and evolutionary insights into human braindevelopment through global transcriptome analysis. Neuron 62(4):494–509.
47. Yovel G, Belin P (2013) A unified coding strategy for processing faces and voices.Trends Cogn Sci 17(6):263–271.
48. Bénézit A, et al. (2015) Organising white matter in a brain without corpus callosumfibres. Cortex 63:155–171.
49. Molko N, et al. (2004) Brain anatomy in Turner syndrome: Evidence for impaired socialand spatial-numerical networks. Cereb Cortex 14(8):840–850.
6 of 6 | www.pnas.org/cgi/doi/10.1073/pnas.1412389112 Leroy et al.

Supporting InformationLeroy et al. 10.1073/pnas.1412389112SI Materials and MethodsSubjects.We studied the following typical groups of infants, right-handed children, and adults:
• 14 healthy full-term infants (mean age = 11.1 ± 3.9 wk; ninemales, five females) imaged in Necker Hospital (Assistance-Publique Hôpitaux de Paris, France). These data have beenpublished already (1).
• 18 right-handed boys (mean age = 10.6 ± 1.3 y) from theKennedy Krieger Institute selected as control subjects in theABIDE project (2). Note that one subject appeared as anoutlier in our analyses. He had a strong asymmetry in theSTAP but in the opposite direction (see the orange dot inthe lower left quadrant in Fig. S2A). We checked the MRIdata carefully and found that this subject also had a reversepattern of petalia, suggesting that the MR image might havebeen flipped accidentally. However, because we could notprove the MRI flipping, this subject was included in all anal-yses. When this subject is excluded, boys have a STAP ampli-tude similar to that of girls (boys: AI = 21 ± 14%; girls: AI =24 ± 23%; P = 0.7; Welch t test), and the STAP amplitude is+22% in children, not +19% as shown in Table 1.
• 10 right-handed girls (mean age = 9.6 ± 0.4 y) imaged at theNeuroSpin center (CEA, Gif sur Yvette, France). Writteninformed consent was obtained from their parents. The pro-tocol was approved by the ethical committee. We used thesesubjects as controls for studying the effect of AgCC on STSasymmetry.
• 47 young right-handed adults (mean age = 21 ± 1.2 y; 23females, 24 males) imaged at the NeuroSpin center (CEA,Gif sur Yvette, France). The protocol was approved by theethical committee.
We studied the following atypical human groups of left-handedadults with left- and right-hemispheric language dominance (LLgand RLg, respectively), children with autism spectrum disorders(ASD), children with AgCC, adults with situs inversus, and adultswith Turner syndrome. We also included a group of chimpanzees:
• 48 young left-handed adults from Van der Haegen’s study (3),consisting of 14 males (mean age = 22 ± 4 y), 17 LLg adultfemales (mean age = 20 ± 1.6 y) and 17 RLg adult females(mean age = 20.2 ± 1.5 y). Only female subjects with a stronghemispheric dominance (lateralization index smaller than −0.6or greater than 0.6) were included in this study. See Van derHaegen et al. (4) for further details on subject recruitment andprotocol approval.
• 15 autistic right-handed boys (mean age = 10.0 ± 1.5 y) fromthe Kennedy Krieger Institute through the ABIDE project.Handedness, intelligence assessment tests, and psychiatric di-agnoses can be found on the ABIDE Website (2). The ABIDEdatabase is open for data sharing in the scientific community.
• 5 right-handed girls with a prenatal diagnosis of isolated cor-pus callosum dysgenesis (mean age = 11.4 ± 1.5 y) imaged atthe NeuroSpin center (CEA, Gif sur Yvette, France). Threechildren presented with complete AgCC; two children hada partial corpus callosum agenesis restricted to the genu.Thus, the amount of callosal fibers along the STS is assumedto be strongly reduced in every child (5). All had normalpsychomotor development, clinical evaluation, and Intellec-tual Quotient. Written informed consent was obtained fromtheir parents. The protocol was approved by the ethical com-mittee (CCP Kremlin Bicêtre) (6).
• 6 adults with situs inversus from the Situs Inversus Projectmanaged by N.R. Three of these subjects—one 49-y-oldright-handed woman and two 33-y-old right-handed men—have been studied by Kennedy et al. (7). All three had re-versed petalia and left hemispheric language dominance. Twoother subjects, a 46-y-old right-handed man and an 81-y-oldleft-handed man, have been studied by Ihara et al. (8). Bothhad reversed petalia and RLg. The last subject was a 43-y-oldright-handed Taiwanese man with a score of 100 on theEdinburgh Handedness Inventory (9). MR images were ac-quired at the National Yang-Ming University, Taipei City,Taiwan. He had normal general health with no history of de-velopmental defects of the cardiopulmonary system, learningdisorders, neurologic disorders, or psychiatric disease. We man-ually assessed the reverse pattern of petalia: The left frontallobe was shifted anteriorly with respect to the right, and theright occipital lobe was shifted posteriorly with respect to theleft. His hemispheric language dominance was not investigated.
• 14 patients with Turner syndrome (mean age = 24.5 ± 6 y)from Molko’s study (10) imaged at the Frederic Joliot Hospi-tal (CEA, Orsay, France). All had the main features of theTurner syndrome phenotype. Ten were of the 45,X karyotype,and four showed a mosaic. See Molko et al. (10) for furtherdetails on subject recruitment and protocol approval.
• 73 adult chimpanzees (47 females, 26 males; mean age =23 y ± 12 y) from the Division of Developmental and Cog-nitive Neuroscience at the Yerkes National Primate Re-search Center, Atlanta, GA. See ref. 11 for further detailson subjects and study approval.
MRI Acquisition Parameters. Parameters are given in Table S1.
Data Processing. Brain segmentation and sulci detection. We appliedthe BrainVISA Morphologist pipeline procedure* (12, 13) on alldatasets except infants. The pipeline process consists of seg-menting the brain and extracting the sulci from the gray–white-matter interface. It includes the following steps: correction forspatial inhomogeneities in the T1w signal intensity, splitting of thehemispheres, tissue statistics estimation, white–gray matter classifi-cation, cortical reconstruction, normalization toward the Talairachspace, and sulcal detection and recognition. It runs automatically assoon as both anterior and posterior brain commissures have beenspecified manually on the MRI. A quality check was performed oneach subject.In patients with Turner syndrome, the same procedure was fol-
lowed, but the normalization step based on the Statistical ParametricMapping software (SPM99); only the normalized data were acces-sible; the raw images were not (14). Distance errors of anatomicallandmarks across subjects have been shown to be slightly reducedwith SPM-type normalization compared with the linear trans-formation that we used in this study (15). Furthermore, the MNIcoordinates provided with SPM can be converted easily to theTalairach coordinates of our study with errors less than 5 mm(imaging.mrc-cbu.cam.ac.uk/imaging/MniTalairach). Thus, we be-lieve that this normalization process has only a minor impact onboth the magnitude and spatial extent of the STS asymmetry.To account for the differences in chimpanzee brains, a number
of adjustments were necessary to take into account the different
*Fischer C, The 18th Annual Meeting of the Organization for Human Brain Mapping, June10–14, 2012, Beijing, China.
Leroy et al. www.pnas.org/cgi/content/short/1412389112 1 of 5

structural characteristics of the two species (11). ChimpanzeeMRI scans first were skull-stripped, cropped, and reformatted at0.7-mm cubic isotropic resolution using Analyze 8.1 (BIR, MayoClinic) software. Adjustments sometimes were needed in esti-mating tissue statistics to distinguish gray and white matter betterin chimpanzee brain scans. Manual correction of the split-brainmask sometimes was needed to label hemispheres and cerebel-lum properly. Finally, the size of the morphological closing of thehemispheric segmentation was set to 5 mm as opposed to 10 mmin human children and adults.In infants, brain was segmented on T2w MR images, which
provide better white–gray matter contrast than T1w images atthis age using a dedicated approach (16). Normalization wasa two-steps process. Brains first were normalized toward a com-mon infant template by using the left and right brain surfaceenvelope (1). Then, the infant template was linearly normalizedto the Talairach space using a common scaling factor of 1.4 in allthree dimensions [see supplementary materials in Dehaene-Lambertz et al. (17)].STS identification. We identified the STS in each subject. Inchimpanzees, it is a long and linear sulcus with very few branches,which runs below the sylvian fissure from the temporal pole to theinferior parietal lobule. In infants, the sulcation also was ratherstraightforward: We found only two full sulcal interruptions (on twoleft hemispheres), and there was only one caudal branch connectedto the main sulcal part. Because automatic sulcus delineationremains an open issue during the first postnatal months (1), thesulcus was drawn manually in the MR images using the Anatomistsoftware (18). The drawing was blinded both to infant age and tothe side convention of the acquisitions. It was managed slice byslice, starting from the outer section of the brain and moving in-ward until a wall of gray matter was met (1).In children and adults, the STS shape often is segmented and
bent in places. In the temporal pole, there is a small sulcus belowthe superior temporal plane, which most often is disconnectedfrom the STS, usually being shallow and either running inwardlytoward medial regions or having a different orientation from theSTS. This sulcus was not included in our definition of the STS. SeeSulcal interruptions for our handling of other sulcal interruptions.Of note, a few sulci (7% in children; 17 % in right-handed adults)had an unusual connection to the sylvian fissure, all of whichoccurred in the left hemispheres. In these cases, definition of theSTS stopped where the sulcus connected to the sylvian fissure.In most human brains, the identification of STS caudal branches
presents a major issue. Across all human subjects in this study(except infants), only one STS (in a subject with situs inversus) hadonly a single caudal branch. In themajority of hemispheres we foundthree caudal branches, i.e., anterior, central, and posterior (19); inthe remaining hemispheres, we found only anterior and posteriorbranches. In all cases we excluded the posterior branch, whichoften is horizontal and more ventral than the other branches and isunlikely to be part of the angular gyrus. We selected the anteriorbranch in subjects having only two caudal branches in a givenhemisphere (children: 61%; children with ASD: 40%; right-handedfemales: 48%; right-handed males: 58%; LLg females: 41%; RLgfemales: 71%; left-handed males: 62%). In the contralateralhemisphere, we selected the caudal branch (the anterior branch orthe central branch) whose location was the most symmetrical inrelation to the interhemispheric plane. In a few cases, thesebranches were equidistant from the contralateral branch, so weadded another criterion: Because left caudal branches usually aremore posterior than right ones (19), we selected the anterior(central) branch for right (left) hemispheres, respectively.For the remaining human subjects, who had three caudal
branches in both hemispheres, the location of the angular gyruswas not easily determined because most modern atlases consideronly two caudal branches (20, 21). Furthermore, there are dis-crepancies between atlases, which locate the angular gyrus at the
termination of either the anterior branch or the central branch(19). Therefore we used a developmental approach and selectedthe branch that most deeply joined with the main temporal partof the STS, i.e., a true connection as described in Ono’s atlas(20). Indeed, the posterior part of the STS often is continuous upto the angular gyrus in infant brains (1), and the deepest parts ofsulci form early and retain their identity during development inseveral species (22, 23). Using this approach, we selected eithera pair of left–right anterior branches or a pair of left–right centralbranches for each subject (percent of central branches in nor-mally developing children: 64%; in children with ASD: 44%; inright-handed females: 73%; in right-handed males: 70%; in LLgfemales: 40%; in RLg females: 60%; in left-handed males: 67%).Note that caudal branches were posterior to the asymmetrical
segment that we describe here. As reported in this paper, theSTAP region terminates 10mm posterior to the planum landmarkin typical subjects. We measured the distance (dcaudal) betweenthe planum landmark and the most anterior part of caudalbranches along the coronal axis. Most branches started posteri-orly to the STAP region (dcaudal >10 mm). The percentage ofsubjects with dcaudal >10 mm in infants was 100% on the left,57% on the right; in children: 93% on the left, 86% on the right;in right-handed adults: 91% on the left, 77% on the right. Thus,our choice of caudal branches had little effect, if any, on theSTAP magnitude in these groups.The planum temporale as sulcal landmark. To set the origin of sulcaldepth profile, we defined a common landmark in all subjects. Asin Glasel et al. (1), we chose the deepest location of the planumtemporale, which is located in the posterior part of the insulaposterior to the medial tip of Heschl’s gyrus. This location hasbeen shown to be relatively stable across subjects (1). In caseswhere Heschl’s gyrus was duplicated, the landmark was setposterior to the most anterior transverse gyrus according toa common definition of the anterior border of the planumtemporale (24). We then projected the planum landmark ontothe STS along the dorso–ventral axis to set the profile origin(Fig. S1 C–E). Depth profiles both within and across groups ofsubjects were aligned according to the sulcal coordinates origin.Note that the left landmark is slightly more posterior than the
right along the coronal axis in all groups (with Δ = jyleft – yrightj inTalairach space, infants: Δ = 4.2 ± 8 mm, P = 0.06; children: Δ =3.1 ± 3 mm, P < 0.001; children with ASD: Δ = 5.0 ± 4 mm, P <0.001; right-handed adults: Δ = 3.7 ± 3 mm, P < 0.001; left-handedadults: Δ = 1.2 ± 3 mm, P = 0.006; chimpanzees: Δ = 1.2 ± 2 mm,P < 0.001). However, this right–left landmark difference based onan anatomical landmark provides an overall better alignment ofthe left and right depth profiles than the choice of homologousimage coordinates in both hemispheres.Location and extent of the STAP.We computed the overlap of group-specific asymmetrical segments in the sulcal coordinate systemsacross typically developing groups, i.e., infants, right-handed chil-dren, and adults (anterior border: x = −35 mm; center: x = −12 mm;posterior border: x = +10 mm along the sulcus). This overlapconstituted the STAP. The location of the STAP then was com-puted in the Talairach referential for each hemisphere and av-eraged across subjects. Profiles from both children and adultswere used for computing mean Talairach coordinates; infants’profiles were omitted because of the sulcal parameterization used(1) and because the normalization process (see Data Processing)might be less accurate in infants than in children and adults.Sulcal interruptions. We assessed how anatomical interruptions ofthe sulcus might influence overall STS asymmetry. Sulcal inter-ruptions (plis de passage) might signal enhanced connectivitybetween adjacent gyri and have been used by anatomists tocharacterize primate brains (25).We detected sulcal interruptions in every subject. Interruptions
can either be full or partial. A full interruption occurs when thesulcus is broken into two pieces, e.g., when a transverse gyrus
Leroy et al. www.pnas.org/cgi/content/short/1412389112 2 of 5

connects the superior temporal gyrus with the middle temporalone. In most cases, contiguous sulcal parts simply were concat-enated to get one continuous morphological structure. In the caseof parallel parts, however, we kept only the sulcal part closest tothe superior temporal gyrus. For example, in Fig. S1 the sulcal tip“s2” is closer to the gyrus than the sulcal tip “s3,” so that sulcalparts are concatenated by projecting tip “s2” on the other part ofthe sulcus. In contrast, a sulcal interruption is partial when thetransverse gyrus is buried in the depth of the sulcus, causing onlya local elevation of the sulcus floor, a pli de passage (26). (Wehave used “pli de passage” as generic name for sulcal inter-ruptions, because a full interruption can be seen as a superficialpli de passage.)Because sulcal interruptions could affect the depth of the
sulcus, we ran a post hoc analysis to assess their effect on depthasymmetry. We computed the occurrence and size of plis depassage in each group over the STAP. Interruptions were char-acterized by local minima along the depth profile. They weredetected if they were at least 5 mm lower than neighboring localmaxima. This threshold was chosen empirically to minimize thefalse detection rate caused by several sources of noise, e.g.,partial volume effects close to the cortical–pial interface in theMR image and inaccuracies in brain segmentation and in sulcalparameterization. Furthermore, because the spatial extent ofinterruptions is a few millimeters wide, interruptions were con-sidered when they were less than 5 mm away from the STAP, i.e.,in the sulcal range of −40, +15 mm. Because it has been shown inadults that plis de passage occur more often on the left STS than
on the right (27), we tested this hypothesis in each group usingFisher’s exact test (Table 1). Eventually we estimated the in-terruption size over the depth profiles as the depth gap betweenthe local minimum that defined the pli de passage and nearbylocal maxima on both sides of this minimum (Fig. S1).We assessed whether asymmetrical sulcal interruptions might
explain STS depth asymmetry. Accordingly, all human subjectswere divided into two groups: the pli de passage (PP) group,which included 100 subjects having an interruption in one or theother hemisphere within the STAP, and the no pli de passage(noPP) group containing 77 subjects with continuous sulci inboth hemispheres.As expected in the PP group, the left–right difference in in-
terruption size is correlated with the STAP (R2 = 0.45; P < 0.001)(Fig. S2A). The increase of the STAP in the PP group comparedwith the noPP group also was seen when analysis was restricted tothe typical groups (PP AI = 33% ± 33% > noPP AI = 16% ±11%; PP–noPP factor: F1,85 = 11.5; P = 0.001; infant–child–adultfactor: F2,85 = 2.1; P = 0.1; two-way ANOVA).In the noPP group, the STAP remained significant in 97% of
subjects without plis de passage (Fig. S2B): infants: P < 0.001;children: P < 0.001; children with ASD: P = 0.004; children withAgCC: P = 0.2; left-handed adult LLg females: P = 0.002; left-handed adult RLg females: P = 0.002; left-handed male adults: P =0.06; right-handed female adults: P < 0.001; right-handed maleadults: P < 0.001; adults with situs inversus: P = 0.004; adults withTurner syndrome: P = 0.03.
1. Glasel H, et al. (2011) A robust cerebral asymmetry in the infant brain: The rightwardsuperior temporal sulcus. Neuroimage 58(3):716–723.
2. Autism Brain Imaging Data Exchange (ABIDE) project (2010) Available at fcon_1000.projects.nitrc.org/indi/abide. Accessed October 2012.
3. Van der Haegen L, Cai Q, Brysbaert M (2012) Colateralization of Broca’s area and thevisual word form area in left-handers: fMRI evidence. Brain Lang 122(3):171–178.
4. Van der Haegen L, Cai Q, Seurinck R, Brysbaert M (2011) Further fMRI validation ofthe visual half field technique as an indicator of language laterality: A large-groupanalysis. Neuropsychologia 49(10):2879–2888.
5. Witelson SF (1989) Hand and sex differences in the isthmus and genu of the humancorpus callosum. A postmortem morphological study. Brain 112(Pt 3):799–835.
6. Bénézit A, et al. (2015) Organising white matter in a brain without corpus callosumfibres. Cortex 63:155–171.
7. Kennedy DN, et al. (1999) Structural and functional brain asymmetries in human situsinversus totalis. Neurology 53(6):1260–1265.
8. Ihara A, et al. (2010) Neuroimaging study on brain asymmetries in situs inversus to-talis. J Neurol Sci 288(1-2):72–78.
9. Oldfield RC (1971) The assessment and analysis of handedness: The Edinburgh in-ventory. Neuropsychologia 9(1):97–113.
10. Molko N, et al. (2004) Brain anatomy in Turner syndrome: Evidence for impaired socialand spatial-numerical networks. Cereb Cortex 14(8):840–850.
11. Bogart SL, et al. (2012) Cortical sulci asymmetries in chimpanzees and macaques: Anew look at an old idea. Neuroimage 61(3):533–541.
12. Perrot M, Rivière D, Mangin JF (2011) Cortical sulci recognition and spatial normali-zation. Med Image Anal 15(4):529–550.
13. Mangin JF, et al. (2004) Object-based morphometry of the cerebral cortex. IEEE TransMed Imaging 23(8):968–982.
14. Ashburner J, Friston KJ (2000) Voxel-based morphometry—the methods. Neuroimage11(6 Pt 1):805–821.
15. Klein A, et al. (2009) Evaluation of 14 nonlinear deformation algorithms applied tohuman brain MRI registration. Neuroimage 46(3):786–802.
16. Leroy F, et al. (2011) Atlas-free surface reconstruction of the cortical grey-white in-terface in infants. PLoS ONE 6(11):e27128.
17. Dehaene-Lambertz G, Dehaene S, Hertz-Pannier L (2002) Functional neuroimaging ofspeech perception in infants. Science 298(5600):2013–2015.
18. Cointepas Y, Mangin JF, Garnero L, Poline JB, Benali H (2001) BrainVISA: Softwareplatform for analysis of multi-modality brain data. Neuroimage 13(6):S98.
19. Segal E, Petrides M (2012) The morphology and variability of the caudal rami of thesuperior temporal sulcus. Eur J Neurosci 36(1):2035–2053.
20. Ono M, Kubik S, Abernathey C (1990) Atlas of the Cerebral Sulci (Thieme MedicalPublishers, Inc., New York).
21. Duvernoy H (1999) The Human Brain: Surface, Blood Supply and Three-DimensionalSectional Anatomy (Springer Wien, New York).
22. Welker W (1990)Why does cerebral cortex fissure and fold? Cerebral Cortex 8(B):3–136.23. Smart IH, McSherry GM (1986) Gyrus formation in the cerebral cortex in the ferret.
I. Description of the external changes. J Anat 146:141–152.24. Galaburda AM, Corsiglia J, Rosen GD, Sherman GF (1987) Planum temporale asym-
metry, reappraisal since Geschwind and Levitsky. Neuropsychologia 25(6):853–868.25. Gratiolet P (1854) Mémoires sur les Plis Cérébraux de l’Homme et des Primates
(Bertrand Arthus, Paris).26. Régis J, et al. (2005) “Sulcal root” generic model: A hypothesis to overcome the
variability of the human cortex folding patterns. Neurol Med Chir (Tokyo) 45(1):1–17.27. Ochiai T, et al. (2004) Sulcal pattern and morphology of the superior temporal sulcus.
Neuroimage 22(2):706–719.
Leroy et al. www.pnas.org/cgi/content/short/1412389112 3 of 5

Fig. S1. Computation of the STS depth profile in a left sulcus with two plis de passage: one superficial pli de passage (i.e., a full interruption) at the STAP anda buried pli de passage posterior to the planum landmark (partial interruption). (A) MRI of an adult subject with left STS in three parts: from s1 to s2, from s3 tos4, and from s4 to s5. (B) The planum temporale landmark is located at the most internal tip of the planum (orange), immediately posterior to Heschl’s gyrus.The STS is shown in red, and the other sulci are shown in blue. (C) Sagittal view of the STS (red) with sulcal landmarks (from s1 to s5); note that landmark s3 hasbeen defined arbitrarily so that the delineated STS excludes the transverse gyrus from the superior temporal gyrus. The ventral projection of the planumlandmark onto the STS defines the origin of the coordinate system. (D) Sulcal parameterization. Two coordinate systems have been defined along and acrossthe sulcus to define sulcal coordinates and depth at every location. Each color longitudinal to the sulcus indicates locations of equal depth; each colortransverse to the sulcus indicates locations of equal coordinates. (E) Left and right depth profiles in Talairach space. The right profile is deeper than the left onenear the STAP. Landmarks s2 and s3 overlap because sulcal parts have been concatenated. The two sulcal interruptions make two notches on the left profile.The size of the pli de passage over the STAP is computed as the height of the anterior notch (light red). See text for details.
Fig. S2. Relationship between STAP and plis de passage in humans. (A) Subjects with pli de passage over the STAP region (PP group, approximately half of thewhole human population). Correlation of the depth asymmetry and the height difference between left and right plis de passage. (B) Subjects without a pli depassage on any hemisphere (noPP group). Despite the lack of sulcal interruption, asymmetrical sulcal depth over the STAP region is present in all groups exceptchildren with AgCC and left-handed male adults (small sample sizes). ns, not significant. *P < 0.05; **P < 0.01; ***P < 0.001.
Leroy et al. www.pnas.org/cgi/content/short/1412389112 4 of 5

Table S1. MRI acquisition parameters
Population Group
Sex
MRI scanner Sequence name TE/TR, ms
No. ofsignals
averaged Matrix size
Imageresolution,
mm Ref.F M
Infants 5 9 1.5T Signa GE Axial, sagittal, andcoronal fastspin echo
120/5,500 1 192 x 192 0.8 x 0.8 x 2(in each direction)
(1)
Children Males 18 3T Achieva Philips 3D MP-RAGE N.a. 1 256 x 256 1 x 1 x 1 (2)ASD males 15Females 10 3T Trio Siemens 3D MP-RAGE 4.18/2,300 1 256 x 256 1 x 1 x 1 (6)
AgCC females 5Right-handed
adults23 24 3T Trio Siemens 3D MP-RAGE 2.98/2,300 1 256 x 240 1 x 1 x 1.1
Left-handedadults
Males 14 3T Trio Siemens 3D MP-RAGE 2.39/1,550 N.a 256 x 256 0.9 x 0.9 x 0.9 (3)LLg females 17RLg females 17
Situs inversusadults
First set 1 2 1.5 T Signa GE Coronal inversionrecovery SPGR
5/12 1 256 x 192 0.9 x 3 x 0.9 (7)
Second set 0 2 3T Signa GE N.a. N.a. N.a. N.a. 1 x 1 x 1 (8)Third set 0 1 3T Siemens 3D MP-RAGE 3.5/2,530 1 256 x 256 1 x 1 x 1
Turnersyndrome
14 0 1.5 Signa GE Axial gradient echo 2.1/10.3 N.a 128 x 128 0.9 x 0.9 x 1.2 (10)
Chimpanzees 47 26 3T Trio Siemens 3D gradient echo 4.4/2,300 3 320 x 320 0.6 x 0.6 x 0.6 (11)
MP-RAGE, magnetization-prepared rapid gradient-echo; n.a., not available; SPGR, spoiled gradient echo.
Leroy et al. www.pnas.org/cgi/content/short/1412389112 5 of 5