Primary Authors - Landmark College
491
Contributing Authors Bruce Abedon Kimberly D. Coleman Thomas R. Hinckley Judy Rubin Cynthia Tolman Susan Whittemore Primary Authors Richard A. Grumbine Linda Hecker Abigail P. Littlefield I The National Institute at landmark ege AANCING KNLEDGE IN LEARNING DISABILITIES AND AD/HD Research • EducaUon & Training · Advocacy • Public Aw•reness
-
Upload
khangminh22 -
Category
Documents
-
view
0 -
download
0
Transcript of Primary Authors - Landmark College

Contributing Authors
Bruce Abedon
Kimberly D. Coleman
Thomas R. Hinckley
Judy Rubin
Cynthia Tolman
Susan Whittemore
Primary Authors
Richard A. Grumbine
Linda Hecker
Abigail P. Littlefield
I The National Institute at landmark College ADVANCING KNOWLEDGE IN LEARNING DISABILITIES AND AD/HD
Research • EducaUon & Training · Advocacy • Public Aw•reness

The National Institute at Landmark College
Putney, VT 05346 802-387-4767 www.landmark.edu
© 2005 by National Institute at Landmark College
All rights reserved Printed in the United States of America
This material is based on work supported by the National Science Foundation under Grant No. HRD-0004264. Any
opinions, findings, conclusions, or recommendations expressed in this publication are those of the authors and do not necessarily reflect the views of the granting agency.
ACKNOWLEDGEMENTS
The Biology Success! project originated as a three-year
grant from the National Science Foundation's Program for Persons with Disabilities (NSF No. HRD-0004264). Based at Landmark College in Putney, Vermont, from 2001 through 2004, the three-person Biology Success! project team, working with biology faculty collaborators from three cooperating institutions and with several other Landmark College science faculty, conceived, developed, wrote, fieldtested, and revised all aspects of the book in your hands.
Biology Success! Project Team
Richard A. Grumbine, Principal Investigator and Associate Professor of Biology, Landmark College
Linda Hecker, Co-Principal Investigator and Director of Educational Services, National Institute at Landmark College
Abigail P. Littlefield, Co-Principal Investigator and Associate Professor of Biology, Landmark College
Biology Success! Faculty Collaborators
Bruce Abedon, PhD, Assistant Professor of Biology, Marlboro College, VT; Keene State College, NH
Judy Rubin, Biology Faculty, Keene High School, NH Susan Whittemore, PhD, Professor of Biology, Keene State
College, NH
Landmark College Science Faculty
Kimberly D. Coleman Thomas R. Hinckley J. Bruce Lord Cynthia Tolman, PhD
Project Support
Arne Andersen Brent Betit Kathy Bilton Joy Birdsey Marie Breheny Geoffrey Gaddis
Annesa Hartman Barbara Hochberg Betsy Judson Steve Muller Lynne Shea Julie Strothman
Other product and company names herein may be the trademarks of their respective owners.
No part of this work covered by the copyright hereon may be reproduced in any form or by any means-graphic, electronic, or mechanical, including photocopying, recording, taping, Web distribution, or information storage and retrieval systems-without the written permission of the publisher.
ISBN: 0-9764499-0-0
Project Intern
Peter Dumont, Keene State College, NH
Materials Field Testing
Lisa Holderness, Community High School of Vermont Macy Holmquist, Community High School of Vermont
Biology Success! Advisory Board Claudia Burdett Lerner, Special Education Specialist, Keene
High School, NH Dr. Libby Cohen, Executive Director, ALL TECH, New
Gloucester, ME Kimberly D. Coleman, Assistant Professor of Biology,
Landmark College, Putney, VT Tracey Devlin, Personal ADD Coach, Dummerston, VT Jurij Homziak, Sea Grant Extension Specialist, University
of Vermont School of Natural Resources Katrina Maloney, Director of Learning Skills Program, Dublin
School, NH
Eric Rhomberg, Biology Faculty, Compass School, Westminster, VT
Sallie Sheldon, Professor of Biology, Middlebury College, VT
Stuart Strothman, Associate Professor of English, Landmark College, Putney, VT
Copyediting: Judith Bellamy Editorial Services Book Design: Dede Cummings Designs Photographs: Abigail P. Littlefield
Printing: Excelsior Printing Co. Videography: Vermont Digital Productions

OVERVIEW OF BIOLOGY SUCCESS!
Section 1: SIX GUIDING EDUCATIONAL PRINCIPLES
Section 2: WIDELY BENEFICIAL PRACTICES
Section 3: GENERAL TEACHING METHODS
Starting a Course
Teaching Study Skills
Using Varied Instructional Techniques
Assessing Student Performance
The Blolo y Laboratorv
, Section 4: USING THE INTERNET AND CD-ROMS IN THE BIOLOGY CURRICULUM
Section 5: INTRODUCTION TO ACTIVITIES
Section 6: ACTIVITIES: SCIENTIFIC INQUIRY
Section 7: ACTIVITIES: ECOLOGY
Section 8: ACTIVITIES: EVOLUTION
• Section 9: ACTIVITIES: CELL BIOLOGY
Section 10: ACTIVITIES: GENETICS
Appendix A: Identifying and Using Learning Styles to Facilitate Instruction by Nannette Smith
Appendix B: Biology Success! and the National Science Education Standards
Appendix C: Student Handouts
IA
..... ; . ...>
.., .. ' ' -�
\ ., � '
..
I NTENTS •.
- -
\ I l
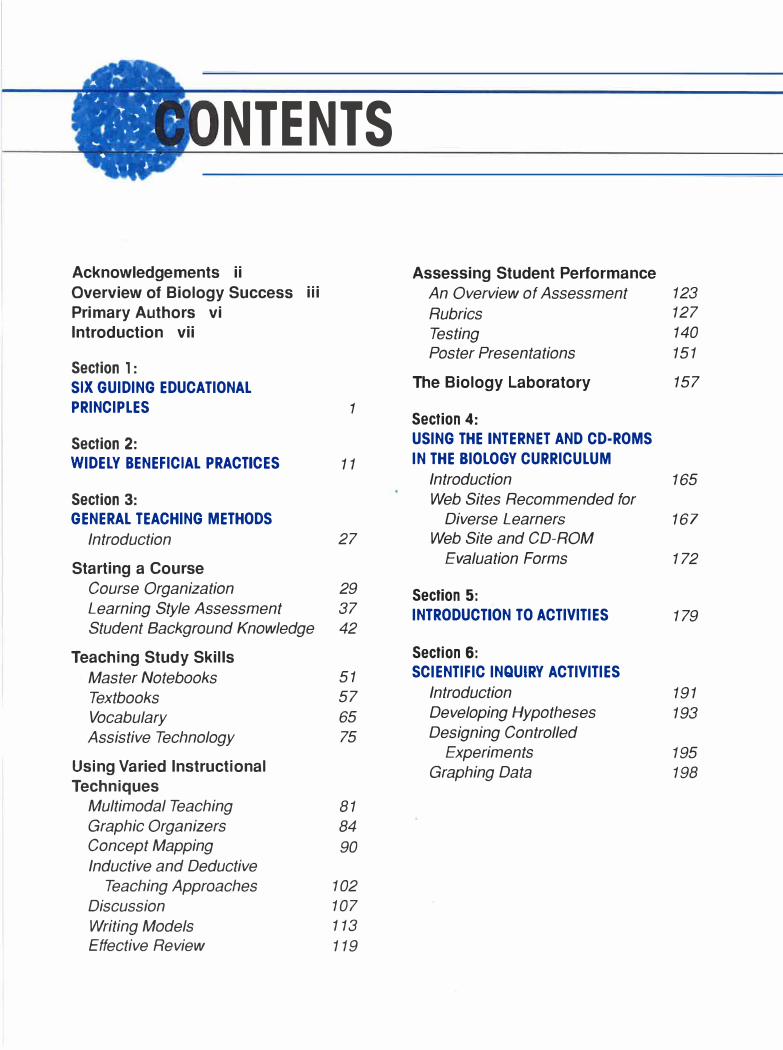
Acknowledgements ii
Overview of Biology Success iii
Primary Authors vi
Introduction vii
Section 1:
SIX GUIDING EDUCATIONAL
PRINCIPLES
Section 2:
WIDELY BENEFICIAL PRACTICES
Section 3: GENERAL TEACHING METHODS
1
11
Introduction 27
Starting a Course
Course Organization 29
Learning Style Assessment 37
Student Background Knowledge 42
Teaching Study Skills
Master Notebooks 51
Textbooks 57
Vocabulary 65
Assistive Technology 75
Using Varied Instructional
Techniques
Multimodal Teaching 81 Graphic Organizers 84 Concept Mapping 90 Inductive and Deductive
Teaching Approaches 102
Discussion 107
Writing Models 113
Effective Review 119
Assessing Student Performance
An Overview of Assessment 123
Rubrics 127
Testing 140
Poster Presentations 151
The Biology Laboratory 157
Section 4:
USING THE INTERNET AND CD-ROMS
IN THE BIOLOGY CURRICULUM
Introduction
Web Sites Recommended for
Diverse Learners Web Site and CD-ROM
Evaluation Forms
Section 5:
INTRODUCTION TO ACTIVITIES
Section 6:
SCIENTIFIC INQUIRY ACTIVITIES
Introduction
Developing Hypotheses
Designing Controlled
Experiments
Graphing Data
165
167
172
179
191
193
195
198

Section 7: Section 10:
ACTIVITIES: ECOLOGY ACTIVITIES: GENETICS
Introduction 203 Introduction 297
Web of Life 205 Mendelian Genetics 299
Analyzing Food Webs 209 Genetics on the
Biogeochemical Cycles 212 World Wide Web 307
Fast Plants 217 Human Monogenic Traits 312
Pond Investigation I 225
Pond Investigation II 229 Appendix A:
Identifying and Using Learning
Section 8: Styles to Facilitate lnstrcrction
ACTIVITIES: EVOLUTION by Nannette Smith 325
Introduction 235
Science and Religion 237 Appendix B:
Mussel Beach Simulation 240 Biology Success! and
Phylogenetic Trees 256 The National Science
Education Standards 327
Section 9:
ACTIVITIES: CELL BIOLOGY Appendix C:
Introduction 267 Student Handouts 329
Cell Cycle Role-Play 269
The Cell Tour 278
Environmental Factors and Index 477
Enzyme Activity 281
Egg Osmosis 286

PRIMARY AUTHORS
SINCE COMING to Landmark College in
1990, Rich Grumbine, associate professor
of natural sciences, has tutored; taught
biology, environmental science, and yoga; chaired
the Natural Science Department; and served as the
principal investigator for Biology Success!, a three
year project funded by the National Science
Foundation's Research in
Disabilities Education pro- �.
gram. He received a mas
ter's degree from Antioch
New England Graduate
School in Keene, New
Hampshire. He lives in Put
ney with his wife and
3-year-old son.
Linda Hecker has taught at Landmark College
since its founding in 1985. She has overseen tuto
rial and teacher training programs; taught English,
study skills, and music classes; and served as an
academic advisor and academic dean. She re
ceived a BA from Brandeis University and an MEd
from the University of Hartford. Appointed director
of educational services in 2001, she frequently
presents workshops and
teacher training programs
and has published several
articles. As a member
of the Biology Success!
team, she ensures that
the concepts described in
the manual reflect re-
search and best practices in the field of learning
differences. Hecker lives in the woods in Guilford,
Vermont, with her husband, Zeke, and doubles as
a freelance violinist.
Abigail Littlefield is an associate professor in the
Natural Science Department. Since joining Land
mark in 1988, she has taught a variety of science
courses as well as Web site design. She is also
an adjunct faculty member at the Marlboro College
Graduate Center in Brattleboro, Vermont, and has
taught graduate courses at Cambridge College in
Cambridge, Massachusetts. She holds a master
of environmental studies degree from Antioch
New England Graduate School as well as a mas
ter's degree in teaching with Internet technologies
from the Marlboro College Graduate Center. She
has presented workshops on teaching biology to
diverse learners at national conventions of both
the National Science
Teachers Association
and the National Associa
tion of Biology Teachers.
When not working, Little
field spends much of her
time tending the bees in
her apiary.
INTRODUCTION
H E A u T H o R s of Biology Success! Teach
ing Diverse Learners accept the challenge,
so clearly articulated by Shaw and Scott, to
go beyond accommodating students with learning
disabilities by providing real opportunities for aca
demic success. The specific purpose of Biology
Success! is to give introductory biology instructors
at both the high school and college levels the ideas,
tools, and inspiration for teaching to the great diver
sity of learners that walk into our collective class
rooms each semester. While our perspective is
mostly drawn from our work with students with
learning disabilities, we believe that the practices
and ideas presented in this book are widely appli
cable to all learners, with or without learning dis
abilities. This introduction presents the rationale
and history of the project and an overview of the
manual's contents.
Increasing Incidence of Students
with Learning Disabilities in
Higher Education
Over the last twenty-five years, the numbers of stu
dents with diagnosed disabilities participating in
higher education has increased dramatically, from
2.3 percent in 1978 to 9.8 percent in 1998 (Hen
derson 1999). Two of the fastest growing cate
gories of reported disabilities in recent years are
students with learning disabilities and those with
Attention Deficit Hyperactivity Disorder (ADHD). By
2000, 40 percent of freshmen with disabilities were
classified with learning disabilities, compared to
16 percent in 1988 (Henderson 2001 ).
Why this rapid increase? Several factors are at
play, but two major ones are most influential. The
first is the trend toward higher levels of academic
achievement for the majority of Americans. Well
paying factory jobs are increasingly scarce, and the
disparity in earnings between those who complete
just high school and those who graduate from col
lege has continued to widen. In 1999 students who
graduated from college earned between 58 percent
and 92 percent more than those who graduated
from high school. In 2000 more than fifteen million
students enrolled in postsecondary education
approximately two out of three high school gradu
ates (U.S. Department of Education 2000).
A second contributing factor in increased num
bers of students with disabilities in higher educa
tion is legislation such as the Rehabilitation Act of
1973 and the Americans with Disabilities Act of
VIII BIOLOGY SUCCESS!
1990 which prohibit discrimination as a matter of
civil rights. While these laws guarantee equal
access to public institutions such as colleges and
universities, students with disabilities still "face sig
nificant barriers to achieving their goals" (U.S.
Department of Education 2002). College participa
tion and graduation for students with disabilities still
does not match that of their nondisabled peers. For
example, students with disabilities "who enroll in a
two-year program with the intention of transferring
to a four-year school do not, and students with dis
abilities are less likely to persist in earning a post
secondary degree or credential than peers without
disabilities." (U.S. Department of Education 2000).
Universal Design
Until recently, services for students with disabili
ties at the postsecondary level have focused on
accommodations, usually provided through a cam
pus office for students with disabilities (OSD). In
this model, students with disabilities disclose their
condition and provide documentation to support it,
while the OSD determines appropriate accommo
dations, such as extended time on tests or priority
registration, and negotiates with faculty to ensure
these are provided. Under this approach, students
with disabilities are somewhat stigmatized by virtue
of being singled out for "alternative treatment."
However, recently there has been a growing
interest in more systemic approaches to serving
students with disabilities, one that also takes into
account the growing numbers of students in other
categories at risk for academic struggle: minority
students, older students, first-generation college
students, students whose first language isn't Eng
lish. Foremost among these approaches is the
movement toward Universal Design.
The Universal Design movement had its origins
in providing physical access for individuals with
mobility and sensory impairments, not by retro-
fitting with ramps and out-of-the-way elevators, but
by integrating improved access into the overall
design, enhancing both the aesthetic and practical
aspects of the environment. Educators at the Uni
versities of Massachusetts, Connecticut, and else
where have adapted this approach for academic
environments: instead of providing accommoda
tions that equalize access for a few specifically des
ignated individuals with "invisible" handicaps such
as learning disabilities, they advocate approach
ing curriculum design and instructional delivery
with the needs of diverse kinds of learners in mind.
Shaw & Scott's article for the Fall 2003 issue of
the Journal of Postsecondary Education and Dis
ability summarizes the Universal Design movement
and their University of Connecticut version of the
nine principles. An approach like this promotes sys
temic change rather than focusing on individual
accommodation and brings a welcome emphasis
on good pedagogy to the realm of postsecondary
academics. Furthermore, it empowers faculty to be
the engines of change, recognizing their unique
role in direct educational reform. It is fair to say that
the Biology Success! manual grows out of the Uni
versal Design approach to education, yet Land
mark College's instructional practices, which form
the basis of the manual, antedate this approach
and also make some unique contributions.
Landmark College
Landmark College was founded in 1985 as the
nation's and, to the best of our knowledge, the
world's first postsecondary institution exclusively
designed to meet the academic needs of high
achieving students with learning disabilities and
ADHD. The college grew out of a successful pro
gram for similar high school students, the Landmark
Schools in Beverly, Massachusetts. Both institu
tions were the brainchild of a brilliant-and ex
tremely dyslexic-visionary educator, Dr. Charles
Drake, who developed many of the effective educa
tional approaches practiced at the schools and
college.
Dr. Drake believed in direct instruction rather
than bypass techniques: his programs focused on
improving students' ability to read, write, take
notes, and stay organized instead of using books
on tape, scribes, or note takers as in other pro
grams. He held the highest expectations for stu
dents but realized that specialized techniques,
often multisensory, were key to teaching students
who "learned differently." These techniques often
capitalized on students' strengths and talents and
fostered "metacognition"-the ability to under
stand one's unique learning profile and to develop
and practice strategies appropriate to it. Teachers
also need to be well versed in understanding stu
dent profiles so they can design courses that are
diagnostic and prescriptive, responding to where
students are in their academic knowledge and
skills when they arrive in class. The six educational
principles and four widely beneficial practices that
are described beginning on page 2 have been the
foundation of the academic program at both the
Landmark Schools and Landmark College, and
thus they form the basis for this Biology Success!
manual.
A Brief Overview of
Learning Disabilities
What do we mean when we use the terms learn
ing disabilities and ADHD? The term "learning dis
ability" goes back only to 1962, when psychologist
Samuel Kirk and a group of parents coined it to
describe students who seemed bright and capable
in most regards but who failed to make expected
academic gains in specific areas such as reading
or math (Kirk 1963). Their definition evolved over
the years in response to research and changes in
educational policy, to the most recent definition
Introduction IX
from the United States Department of Education's
2002 Common Ground Round Table:
The term "learning disability" refers to a class
of specific disorders. They are due to cogni
tive deficits intrinsic to the individual and are
often unexpected in relation to other cogni
tive abilities. Such disorders result in perform
ance deficits in spite of quality instruction and
predict anomalies in the development of
adaptive functions having consequences
across the lifespan. (Dickman 2003)
In current practice, only students who show a
significant discrepancy between their potential (as
measured by IQ-type tests) and their academic
performance meet definitional standards to qualify
for special education services in most states; how
ever, a great weight of evidence from research, and
a realization that waiting for that discrepancy to
appear often means enduring three to four years
of school failure, has led to the questioning of that
discrepancy formula, and we expect it to be
replaced by other means of (earlier) identification
over the next few years (Dickman 2002).
The most common form of learning disability is
reading disability. Sometimes this is called dyslexia;
unfortunately, terminology, like diagnostic criteria,
can vary from state to state or region to region.
Students with reading disability obviously face a
struggle in learning to read accurately and fluently.
Generally, this begins as difficulty with decoding
(recognizing and pronouncing words), but trouble
with comprehension often follows because the
decoding is slow and laborious, and students'
vocabulary becomes impoverished because of
their reluctance to read. Most dyslexic students
also show poor spelling and struggle with aca
demic writing. Sometimes oral language is also
affected; it may take extra time to process what
they are hearing and to formulate a coherent,
elaborated response. On the other hand, many

X B I O L O G Y S U C C E S S !
dyslexic students are fluent and articulate with oral
language, and the disparity between their verbal
gifts and their reading and writing skill becomes a
cause for great frustration, or for skepticism on the
part of teachers and parents that the students are
"applying themselves" to their work.
A growing diagnostic category that is not, strictly
speaking, a learning disability but nevertheless
adversely affects academic performance is that of
the attention disorders, variously called ADD
(Attention Deficit Disorder), ADHD, or AD/HD
(Attention Deficit-Hyperactivity Disorder). Unlike
dyslexia, which is diagnosed by educational spe
cialists through a series of performance tests and
by looking at academic achievement, ADHD is
actually a medical condition, diagnosed most often
by a psychiatrist or pediatrician through a series of
focused interviews and behavioral checklists.
The core symptoms of ADHD are considered
to be distractibility, impulsivity, and hyperactivity.
However, this is a little misleading, as a significant
percentage of individuals with the disorder don't
exhibit hyperactivity at all, but are more prone to
inattentiveness. The secondary characteristics
include mental effort depletion, performance incon
sistency, and difficulty with executive functions,
which involves the ability to set and hold goals,
plan strategies for meeting goals, and monitor
behavior. Students with executive function difficulty
typically have trouble keeping appointments,
meeting deadlines, and balancing personal and
academic demands, and they often fail to complete
assignments despite obvious command of nec
essary skills. They appear to be disorganized
in keeping track of materials as well as in manag
ing time.
As with dyslexic students, when students with
ADHD are undiagnosed, those around them tend
to attribute their difficulties to laziness or lack of
motivation, rather than to recognize the origins of
these difficulties as an organic condition that is not
completely under voluntary control. Often, medica-
tion (originally stimulants and now also alternative
forms) is part of the treatment program for individ
uals with ADHD. Medication helps regulate the
faulty levels of neurotransmitter activity that are
associated with this diagnosis. One important note:
dyslexia and ADHD often seem to co-occur. At
Landmark College approximately 60 percent of stu
dents have this dual diagnosis.
Smaller numbers of students may fall into some
lesser-known categories of learning disability;
dyscalculia, nonverbal LD, and Asperger's syn
drome share some characteristics. Students with
dyscalculia experience their major difficulties in the
area of math, in their ability both to understand and
apply number concepts and to remember basic
math facts (like the multiplication table) and accu
rately perform arithmetical calculations. Sometimes
these issues stem primarily from problems under
standing the specialized, often sequential, sym
bolic language of math. In other cases, the main
difficulty seems to be related to difficulty under
standing and interpreting visual-spatial information,
a key component of geometry, graphing, and other
aspects of math.
The relatively new categories of nonverbal LD
and Asperger's syndrome are still developing, and
experts disagree somewhat on the precise defini
tions and cluster of characteristics. They share a
difficulty in processing visual-spatial information,
such as described in dyscalculia, and often stu
dents with these diagnoses struggle with math.
However, in addition, a defining characteristic
relates to great difficulty in interpreting the nonver
bal components of everyday communication,
sometimes referred to as "body language." Indi
viduals with these diagnoses fail to notice or mis
interpret aspects of language such as tone of
voice, facial expression, and stance. As a result,
they struggle with the social aspects of school and
experience difficulty sustaining relationships with
peers. They are uncomfortable with "small talk" and
tend to limit their conversations to a narrow choice
of favorite topics, and they misread nonverbal
cues, failing to notice how people are responding
to them.
Some experts distinguish nonverbal LO from
Asperger's syndrome (sometimes called "high
functioning autism") by looking at the quality of
emotional response. According to this classifica
tion, Asperger's syndrome also entails great diffi
culty in understanding and relating to the emotional
component of human interaction. Like Mr. Spock
on the spaceship Enterprise, individuals with
Asperger's syndrome can learn to analyze human
emotional response but don't spontaneously expe
rience it for themselves. This may seem unrelated
to academic success or failure-indeed, often indi
viduals with Asperger's syndrome seem to be bril
liant in their chosen areas of intellectual
pursuit-but when we consider how much of
school-based learning involves the "social con
struction of meaning," the fact that these individu
als don't easily fit in and appear socially inept tends
to have a negative impact on their overall academic
functioning.
Some experts in the field of learning disabili
ties-notably Dr. Mel Levine, founder of All Kinds of
Minds and the "Schools Attuned" programs-dis
credit the pigeon-holing of individuals under rigid
diagnostic taxonomies, and argue instead for a
phenomenological approach which evaluates indi
viduals in terms of their strengths and specific chal
lenges in the neurodevelopmental areas that form
the basis for learning. Levine's "Interactive Neuro
developmental Paradigm" takes a dynamic view of
how biology and environment interact over time to
create individual patterns of functioning (Levine et
al. 1993). It analyzes individual student profiles in
the areas of attention, memory, language, neuro
motor skills, social function, sequencing temporal
and spatial information, and higher-order cognition;
helps individuals to understand the unique ways
their brains function; and offers hope as well as spe
cific recommendations for support and strategy use
Introduct ion X I
to overcome difficulties by capitalizing on areas of
strength and competence. This approach has been
critical in shaping Landmark College's academic
programs and approaches since the early 1990s,
when Dr. Levine made several visits to the Land
mark campus.
A Note on Terminology
The Biology Success! project falls under NSF's
Research in Disabilities Education (ROE) program,
so we have been using the term "learning disabili
ties" to identify the kinds of students for whom this
manual was created. There is, however, a growing
movement in the disabilities field to replace the
term "learning disability" with "learning difference."
There is also controversy among teachers, stu
dents, and researchers about what to call the well
documented phenomenon of students who seem
generally bright and capable but who struggle with
specific aspects of academic performance such as
reading, writing, or mathematics.
There are strong arguments for both terms. First
of all, "disability" is actually a legal term that defines
who is eligible for services and accommodations
under the several federal laws that govern treat
ment of individuals with disabilities. So anyone who
currently plans to take advantage of these legal
rights must be willing to accept the label of "learn
ing disability." Those who favor the term "learning
disability" also argue that the kinds of difficulties
experienced by these designated individuals go
well beyond the ordinary differences among learn
ers, and that to use the term "learning difference"
belittles the grave obstacles they face, especially in
academic settings.
On the other hand, proponents of the term
"learning difference" point out that the term "dis
ability" carries a real stigma and seems to imply
that those affected are incapable of learning, when
in fact, with appropriate teaching methods, they

X I I B I O L O G Y S U C C E S S !
can become very successful students and lifelong
learners. Most students at Landmark College
prefer to refer to themselves as persons who learn
differently, rather than as individuals with a learn
ing disability. It fosters self-esteem and increases
their confidence as learners. There's growing sup
port for the term among professionals, too. Charles
Schwab, the well-known "dyslexic CEO," who not
only advises people on how to manage their
money but also sponsors two excellent Web-based
resources (www.ldonline.org and www.schwab
learning.org), is a strong advocate for the term
"learning difference," and venerable institutions
such as the International Dyslexia Association are
moving toward adopting this term.
We are likely to see both terms persist over the
next three to five years, and perhaps a new term
altogether will emerge; eventually those who carry
the label will have enough political savvy and
power to decide what that label should be.
An Overview of the Structure of
Biology Success! Teaching
Diverse Learners
The Biology Success! manual has two primary sub
divisions: a primer on the key pedagogical prac
tices that should inform the teaching and learning
of biology, and a sampling of introductory biology
activities that exemplify the principles and practices
described in the first section.
In the first subdivision, we begin by elucidating
the six educational principles and subprinciples
that form the backbone of Landmark College's
teaching philosophy. This is followed by a descrip
tion of what we call "widely beneficial practices"
for structuring lessons to meet the needs of diverse
learners. We continue with short pieces that illus
trate ideas and techniques for starting courses,
teaching study skills that support the learning
of biology, varying how instruction can be deliv-
ered, assessing the progress of students, facilitat
ing learning through the laboratory experience, and
using online biology learning resources effectively.
The second subdivision consists of nineteen
sample activities in the core introductory biology
topic areas of cell biology, evolution , genetics, and
ecology. The intention of presenting these activi
ties is not to show an ideal introductory biology
curriculum per se, but rather to demonstrate the
application of the educational principles and widely
beneficial practices described earlier in the book.
Many of the activities have a student handout that
is ready to copy and distribute, designed to make
the activity easy to use with students.
We have also included a CD on the inside front
cover that offers three additional resources: video
clips of two sample activities ("Cell Cycle Role
Play" and "Mendelian Genetics") from a Biology
Success! teacher workshop; an interactive Web
based activity called "The Cell Tour"; and student
handouts in both Microsoft Word and rich text
format.
How to Get the Most
Out of This Book
Our professional lives are busy, and although we
would love to think that all readers will examine this
resource carefully from cover to cover, we recog
nize that this is not likely. Depending on your learn
ing and teaching temperament and needs, you
may be attracted to the activities in the last section,
where you can consider concrete ways to teach the
content of introductory biology. Or you may be
attracted to the pedagogical presentation of the
first section of this book and immediately begin by
exploring the educational principles that underpin
the entire book. Or perhaps you have a specific
need or interest to learn about a specific technique,
such as rubrics, and decide to begin your explo
ration by turning to the pages on assessment. All of

these approaches are valid, and we hope the
design and content of this book can readily facili
tate your productive engagement no matter where
you start. We view Biology Success! Teaching
Diverse Learners as a vast toolkit for best teach
ing practices; use the tool that best fits your pro
fessional needs.
That said, we do believe that grounding our biol
ogy teaching in some conscious pedagogy has a
high value. So please afford yourself the time to
read the introductory section on the educational
principles so you can understand more deeply all
that follows.
We hope you consider this book a long-term
investment and resource to come back to again
and again. And while it is overwhelming to consider
a wholesale transformation of your teaching prac
tices, making incremental change is a more realis
tic expectation. We can't change our practices (or
our students) overnight. Key in on one particular
area for your development (assessment, study
skills, multimodal teaching, etc.) and start from
there. Over time, you will slowly modify your teach
ing practices to better suit the needs of all students
in your biology classroom and provide real and
lasting opportunities for success.
References
Dickman, G. E. 2002. Dyslexia and the aptitude
achievement discrepancy controversy. Perspec
tives Journal of the International Dyslexia
Association 27 (1): 23-27.
Dickman, G. E. 2003. The nature of learning dis
abilities through the lens of reading research.
Perspectives Journal of the International Dys
lexia Association 29 (2): 1-5.
Introduction X 1 1 1
Henderson, C. 1999. College freshmen with dis
abilities: Statistical year 1998. Washington, DC:
American Council on Education.
Henderson, C. 2001. College freshmen with dis
abilities: A biennial statistical profile. Washing
ton, DC: American Council on Education.
Kirk, S. A. 1963. Behavioral diagnosis and remedi
ation of learning disabilities. In Proceedings of
the Conference on the Exploration into the Prob
lems of the Perceptually Handicapped Child.
Evanston, IL: Fund for the Perceptually Handi
capped Child.
Levine, M., S. Hooper, J. Montgomery, M. Reed,
A. Sandler, and C. Swartz. 1993. Learning dis
abilities: An interactive developmental paradigm.
In Better understanding of learning disabilities,
ed. G. R. Lyon, D. Gray, J. Kavanagh, and N.
Krasnegor, 1 99-228. Baltimore: Paul Brookes.
Shaw, F., and S. Scott. 2003. New directions in fac
ulty development. Journal of Postsecondary
Education and Disability 17 (1 ): 3-9.
U.S. Department of Education. National Center for
Educational Statistics. T he Condition of Educa
tion 2000 (NCES 2000-602). Washington, DC:
U.S. Government Printing Office. 2000.
U.S. Department of Education. 2002. A New Era:
Revitalizing Special Education for Children and
T heir Families. Washington, DC: U.S. Depart
ment of Education.

.I ........... _
1 SIX GUIDING
EDUCATIONAL
PRINCIPLES
TH Is Boo K demonstrates how to adapt the curriculum of
introductory biology courses to serve both traditional stu
dents and those with learning disabilities in the kinds of het
erogeneous classes typical of high schools and colleges. Landmark
College's Six Guiding Educational Principles are the cornerstone of
the college's successful academic programs and the foundation for
the ideas, techniques, and activities presented in Biology Success!
Teaching Diverse Learners. While these principles were not invented
by nor are they exclusive to Landmark College, the way Landmark
faculty consciously and systematically incorporate these principles
into curriculum design and classroom practice may be unique.
Throughout nearly twenty years of effective classroom practice,
Landmark College faculty have been guided by a set of educational
principles that predate the founding of the college in 1985, and recall
the college's origins as an offshoot of the Landmark Schools in Bev
erly, Massachusetts. Both the college and the schools were founded
by Dr. Charles Drake, a brilliant educational visionary and profoundly
dyslexic individual, who developed many of the teaching techniques
that are practiced every day in Landmark College classrooms.
These principles, which are founded on a deep understanding of
the learning process, can improve instruction for any student. Still, it is
important to remember that while these principles may be beneficial
to all students, they are essential for students with learning disabilities.

processes. Teachers observe students' progress by
evaluating and recording their performance in
everyday class activities such as homework com
pletion, contributions to discussions and small
group work, in-class exercises, and lab activities.
When individual students fail to master important
ideas, teachers can refer them to office hours, peer
tutors, or support centers for extra help; but when
groups of students fail to grasp concepts, teachers
will need to rethink lesson plans and devise alter
native ways to present information, rather than just
forging ahead to the next topic.
More on using a diagnostic-prescriptive approach
can be found on the following pages:
• Learning Style Assessment, page 37
• Student Background Knowledge, page 42
• Multimodal Teaching, page 81
• Graphic Organizers, page 84
• Effective Review, page 119
• An Overview of Assessment, page 123
Principle 2: Provide explicit
instruction in skills and strategies
2a. Teach strategies and procedures explicitly
One of the most distinctive features of a Landmark
education is its emphasis on direct teaching of
skills that students are often assumed to possess,
such as note taking, text reading, and report writ
ing. At Landmark College, students actually learn
how to learn; the program specializes in uncovering
what is sometimes referred to as "the hidden cur
riculum" of language and study skills that underpins
success in academic settings at the secondary and
postsecondary levels (Oliver et al. 2000).
In addition to explicit teaching of language-
Six Guiding Educational Principles 3
based skills that involve classroom listening,
speaking, reading, and writing at appropriate
levels, Landmark faculty have discovered the
importance of directly teaching executive-function
skills that are critical to academic success: setting
goals, selecting effective strategies, monitoring
progress, and critical self-reflection. These skills
are introduced in a course called Reading and
Study Skills that all students take in their first
semester at the college, and they are continually
retaught, refined, and monitored in all classrooms.
Thus, in a science class, teachers incorporate the
following kinds of skills instruction and expectations
into their content-based curriculum:
• Reading science text books • Maintaining a course-specific master notebook • Learning and retaining vocabulary
• Writing lab reports • Concept mapping
• Taking tests
2b. Break tasks and skills into subskills, staged procedures, and other processes
This approach is sometimes called "micro-uniting."
Although it may seem obvious to teachers how to
break down a research project into the stages of
(1) determining a topic; (2) gathering information;
(3) constructing an outline; (4) writing a draft; and
(5) revising to produce a final draft, many students
with learning disabilities lack the executive-function
or language skills to divide the project into discrete
steps that can be tackled individually without get
ting overwhelmed by its immensity or lost in the
welter of details.
Therefore, effective teachers will guide students
through the process of breaking a task into its com
ponent stages, and will support them by collecting
work at each stage and returning it with feedback
and suggestions about the effectiveness of the
process as well as the quality of the product. This

instance) that are being tested but their competen
cies as well. (See also Principle 4)
3c. Set clear expectations and support students in meeting them
All students benefit from clear expectations, but
students with learning disabilities in particular may
need to have expectations spelled out in ways that
teachers take for granted, and repeated many
times in different formats. For instance, if you
expect lab reports to be typed and of a certain
length, state those expectations explicitly in writing
and remind students often. Ask students with learn
ing disabilities to reverbalize assignments and state
what materials they will need to complete them; or
ask them to check their assignment books to make
sure they have written down the assignments accu
rately. Give students firm assignment and project
deadlines, visually represented on a calendar, and
review these deadlines in class frequently. Provide
templates and models for projects, so that students
know what a lab report should look like, as well as
rubrics that clarify exactly what the differences are
between an A-worthy project and one that earns a
Bor a C.
More on providing a student-centered classroom
can be found on the following pages:
• Course Organization, page 29
• Learning Style Assessment, page 37
• Student Background Knowledge, page 42
• Inductive and Deductive Teaching
Approaches, page 1 02
• Discussion, page 1 07
• Writing Models, page 113
• Rubrics, page 1 27
• Testing, page 140
• The Biology Laboratory, page 157
Six Guiding Educational Principles 5
Principle 4: Address diversity of
learning styles
4a. Create a strength-based context
Howard Gardner's Frames of Mind (1983) delin
eates a view of intelligence that asserts there is not
just one way to be "smart," and that cultivation of a
variety of intelligences is critical to the continued
well-being of the human species. In addition to the
kinds of intelligence that are traditionally valued and
nurtured in schools (mathematical-logical and lin
guistic), Gardner also argues for the importance of
visual-spatial, tactile-kinesthetic, musical, interper
sonal, intrapersonal, and naturalist intelligences.
This view of variable forms of intelligence pro
vides a framework for regarding students with learn
ing disabilities in a new light. It allows us to see
a dyslexic individual not just as someone who is
disabled in regard to reading, but as someone who
may possess high levels of visual-spatial or musical
intelligence but relatively lower levels of linguistic
intelligence. Acknowledging that all individuals vary
in their relative strengths and weaknesses across
the spectrum of multiple intelligences lets us dis
card the notion of students with learning disabilities
as individuals who are "broken" and therefore need
to be "fixed" so they can be like everyone else. It also
encourages us to seek out students' areas of
strengths and use them as leverage in addressing
areas of weakness (Levine 1994).
4b. Incorporate visual-spatial, kinesthetic, and tactile modalities
Landmark College instructors, as well as others in
the field of learning disabilities, have observed that
"students with learning disabilities often have pro
nounced strengths in processing information using
alternative pathways, such as a visual, tactile, or
kinesthetic approach, rather than relying on strictly
auditory processing, which is often their weakest

4e. Value alternative modes of intelligence
We recommend that diversity of learning styles be
addressed openly and in a friendly context from the
first day of class. Teachers who assess students'
learning styles and prior knowledge, engage stu
dents in discussing how the students learn best,
and explicitly talk about how they shape their
courses to the individual needs of students are
modeling that they value diversity in learning. Look
ing at exemplary scientists who apparently had
learning disabilities, such as Einstein, Edison,
Maxwell, and Faraday, helps students understand
that thinking differently can lead to excellence and
innovation, not just to academic failure (West
1991 ). T his in turn encourages students to value
their own approach to learning and to develop
strategies that capitalize on their strengths.
More on addressing a diversity of learning styles
can be found on the following pages:
• Learning Style Assessment, page 37
• Assistive Technology, page 75
• Multimodal Teaching, page 81
• Graphic Organizers, page 84
• Concept Mapping, page 90
• Effective Review, page 11 9
• Testing, page 140
• Poster Presentations, page 151
Principle 5: Base instruction and
assessment on clear objectives
Sa. Identify agendas, learning goals, means, and standards for assessment
It's self-evident that teachers should supply stu
dents with a course syllabus that lists texts, read
ings, and important assignment due dates. But
students with learning disabilities sometimes have
Six Guiding Educational Principles 7
difficulties relating the minutiae of a course to its
overarching themes and goals. They might also
have trouble breaking down the big picture of
what's expected into manageable parts. We find
that these students benefit from an augmented syl
labus that clearly defines goals and activities along
a semester timeline or calendar, and that explains
in detail the criteria by which their work and con
tent mastery will be assessed. This more detailed
approach should be applied at the start of a se
mester, when introducing new units, and at the be
ginning of each class when a preview of the daily
agenda will help students focus on upcoming ac
tivities. It's not enough just to hand out the agen
das, syllabi, or rubrics to students and assume
they will accurately interpret the information on
their own. Teachers need to discuss the content,
invite questions from students, and cue them to re
verbalize some of the information in their own
words.
Sb. Link agendas and goals to learning objectives
Students perform better when they have a clear
purpose in mind. When teachers explain the "why"
of daily, weekly, or semester-long readings and
activities, explicitly linking them to the course
objectives stated at the start of the course, stu
dents are more motivated to invest effort in their
work. For example, when previewing a daily
agenda or weekly plan, ask students to pull out
their syllabus and refer to the course objectives.
Explicitly discuss which objectives will be ad
dressed by the activities they are about to under
take. We recommend that teachers introduce most
activities with a brief discussion of both "Why
are we doing this?"-linking to learning objec
tives-and "Why are we doing it this way?"-link
i ng to learning styles and encouraging students
to think reflectively and be strategic. (See also
Principle 6)
demic failure, these students stop expecting things
to make sense, fall back on ineffective learning
techniques such as rote memorization, and lose
their confidence and ability to be self-reliant in
learning situations. One of Landmark College's key
principles entails fostering students' active learning
and independence through developing metacogni
tion. Literally, this means "thinking about thinking."
In practice, it means helping students understand
how their learning profiles (the sum of their aca
demic strengths and challenges) relate to the
learning process. Ideally, students with highly
developed metacognitive skills can understand and
articulate their learning profiles, and select and
implement effective strategies.
Metacognition rarely develops spontaneously.
Rather, teachers need to support its development
by building reflective activities throughout the cur
riculum, from initial discussions about learning
styles in the opening days of a course to compo
nents of final projects or exams that ask students to
think about what they learned and how they
learned it. Students may be asked to keep weekly
"learning journals" where they record their obser
vations and questions about their learnir:ig
processes in an unstructured format. On long
range projects, teachers will want to assign pre
planning worksheets, midprocess reflections, and
summary reflections, where students respond to
questions such as these:
• "What do I think will be the hardest part of this
project?" • "Where can I go for assistance if I get stuck?" • "What strategies have I learned that can assist
me with this project?" • "How would I grade myself on this project for
(a) mastery of content, (b) efficient completion
of the process?" • "What have I learned from this project that may
be useful next time?"
Six Guiding Educational Principles 9
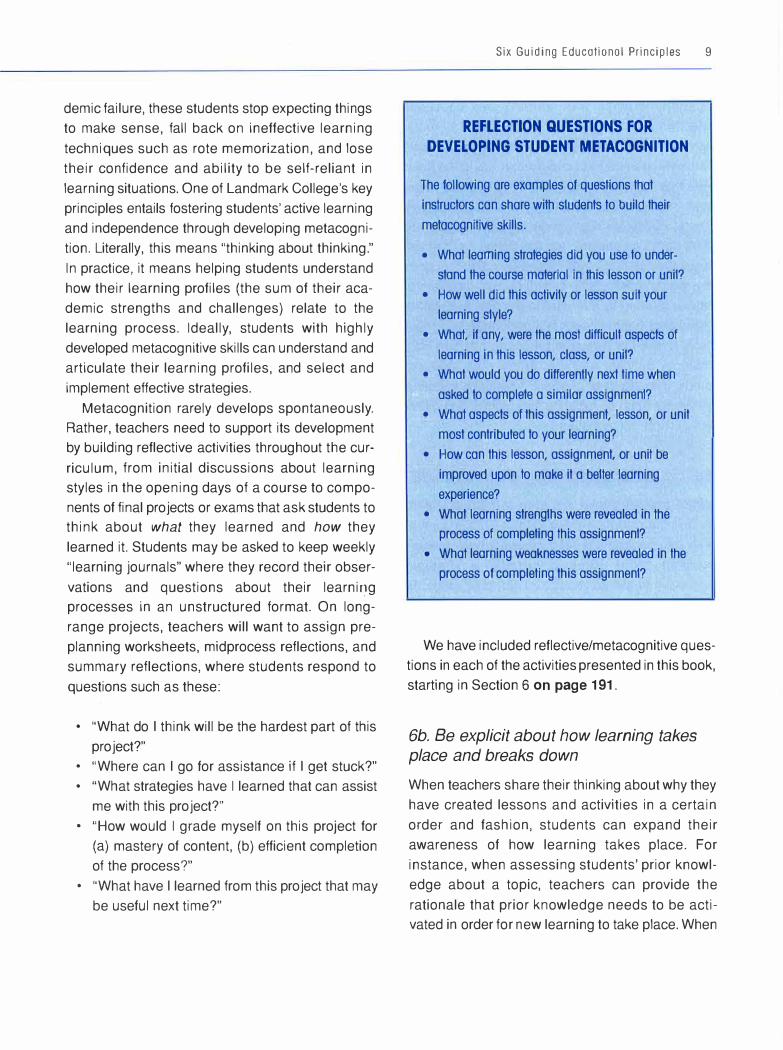
REFLECTION QUESTIONS FOR
DEVELOPING STUDENT METACOGNITION
The following are examples of questions that
instructors can share with students to build their
metacognilive skills.
• What learning strategies did you use to under
stand the course material in this lesson or unit?
• How well did this activity or lesson suit your
learning style?
• What, if any, were the most difficult aspects of
learning in this lesson, class, or unit?
• What would you do differently next time when
asked to complete a similar assignment?
• What aspects of this assignment, lesson, or unit
most contributed to your learning?
• How can this lesson, assignment, or unit be
improved upon to make it a better learning
experience?
• What learning strengths were revealed in the
process of completing this assignment?
'
.
I
What learning weaknesses were revealed in the
process of completing this assignment?
We have included reflective/metacognitive ques
tions in each of the activities presented in this book,
starting in Section 6 on page 191.
6b. Be explicit about how learning takes place and breaks down
When teachers share their thinking about why they
have created lessons and activities in a certain
order and fashion, students can expand their
awareness of how learning takes place. For
instance, when assessing students' prior knowl
edge about a topic, teachers can provide the
rationale that prior knowledge needs to be acti
vated in order for new learning to take place. When

2 WIDELY
BENEFICIAL
PRACTICES
I N Ao o IT Io N to the Six Guiding Educational Principles, there are a number of classroom practices for structuring lessons that will greatly support students with learning disabilities while benefiting
all students. These are sometimes referred to as Universal Design practices, using an analogy to an architectural concept: when environmental modifications for individuals with disabilities (such as ramps for individuals with mobility impairments) are part of a building's intrinsic design, they can benefit everyone, and are less expensive and more attractive than when they are added on as an afterthought. The concept of Universal Design applied to educational practices currently enjoys widespread popularity, and a number of institutions employ different versions of Universal Design principles (University of Massachusetts, University of Connecticut, Center for Applied Special Technology [CAST], and University of South Dakota). We'll refer to our version as Widely Beneficial Practices.
Most of the material in this section comes from "Making College Classrooms Accessible to Students with (and without) Learning Disabilities," by Christina Herbert, in the Landmark College guide Pro
moting Academic Success for Students with Learning Disabilities
(Strothman 2001 ).
12 BIOLOGY SUCCESS!
Advance Organizers
The term advance organizer was coined by cogni
tive psychologist David Ausubel in the 1950s, and
the concept has been widely practiced and stud
ied since then (Newell 1984). According to
Ausubel, Novak, and Hanesian (1978), advance
organizers may be defined as "material presented
at a higher level of abstraction, generality, and
inclusiveness than the material to be learned."
Some claim that an advance organizer is "not an
overview . . . but an 'umbrella' for new material to be
learned" (Douglas, Maineville, and Smith 1997).
Good teachers use advance organizers to help
students connect what they already know to new
information they are about to learn. Advance
organizers have been used in many settings, from
elementary school through university, and they can
take many forms.
At Landmark College, they have the form of spe
cific, concrete steps taken to organize and motivate
students in advance. Usually, they give students a
"map" of an upcoming unit, lesson, or activity and
a sense of direction. They focus on both the content
to be learned and the process by which it will be
learned.
Several distinct kinds of tools-agendas, course
maps, and activators-are used to improve stu
dents' thematic awareness and to clarify instruc
tional objectives, which are often an unintentionally
hidden part of the curriculum.
Agendas and Course Maps
The agenda is a calendar of the steps the class
will take and the assignments the students will
receive. Agendas need to be presented both visu
ally and verbally. They help students prepare to
focus on the upcoming material and to pace them
selves through the activities for the day or the unit.
At the unit level, agendas function as course
"maps" and include the following:
• Unit title
• Approximate unit length
• Key learning objectives
• Due dates and rationales for important
assignments
• Test dates and test formats
• Vocabulary list
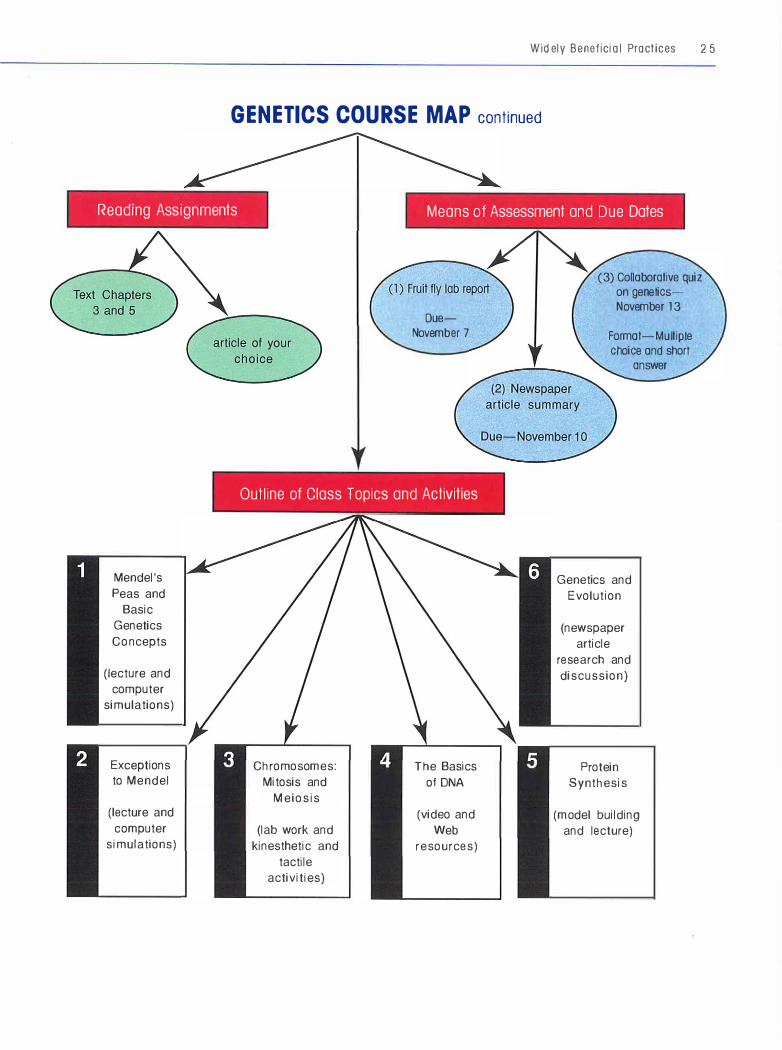
This information should be conveyed in a simple,
visually accessible format. See pages 18-25 for
four examples of course maps in the areas of ecol
ogy, evolution, cell biology, and genetics.
At the level of the daily lesson, Landmark Col
lege's use of agendas entails discussing the day's
activities and goals with support from a visual rep
resentation (in words or graphics) on the board or
on a transparency. See Figure 3.1 on page 31 for
an example of a daily agenda.
Activators
Activators are a kind of advance organizer
designed to activate a personal connection to the
lesson and to motivate students to want to learn
more. Activators also check what students already
know about a topic. We know from research into
schema theory (Lazear 1993) that the brain
processes new information by associating and link
ing it with what is already known. For students with
learning disabilities, there may be significant back
ground knowledge deficits caused by their difficul
ties with reading or processing information. The
use of activities designed to consciously activate a
connection to the new material helps these stu
dents make connections in a way that they might
not do independently. Activators are also good
diagnostic tools for teachers to use in assessing
what students already know or understand about
a given topic. And they provide a reference point for
progress, revealing how much more students
understand at the end of the unit of study. See "Stu
dent Background Knowledge" on page 42 for more

information on basing instruction on student pre
conceptions.
Some options for activators are the following:
• A poster that shows a variety of life forms or
cycles before students are introduced to a par
ticular example
• A quotation that gets at the essence of content
• Photographs or paintings of a historic event
related to a scientific concept or invention
A teacher may ask students to respond in a variety
of ways, such as brainstorming or freewriting their
ideas. Alternatively, teachers may ask students to
draw a picture or diagram of what they understand
about the given topic. It is important for the teacher
to allow time in class for students to explore their
connections to a topic in advance of a lesson.
Connectors
Connectors refer to those activities designed by
faculty to help students identify connections be
tween previously introduced course concepts and
new ones. Research on characteristics of expert
learners (National Research Council 1999) points
to experts' superior ability to make connections with
old material, and their flexibility in seeing how the
new relates to the old. Students with learning dis
abilities may be characterized by difficulties in mak
ing these connections. Saphier and Gower (1997)
liken this process to presenting students with a
metaphor of the course as a chain of concepts, and
developing their ability to see how the new links fit
onto the whole of the chain. Connectors are closely
related to activators; the chief distinction is that con
nectors are used throughout the lesson to link new
to old knowledge, while activators are used before
introducing new information to stimulate students'
access to what they already know.
Connectors are especially useful in helping stu-
Widely Beneficial Practices l 3
dents grasp abstract theories or processes by help
ing them connect these theories to something they
already know. There are several relatively direct
and simple ways that teachers can use connectors
in the classroom. Graphic organizers such as Venn
diagrams, matrices, and flow charts help students
see how concepts are connected. Analogies help
students understand a process by comparing it to
something already familiar (How is learning like
growing a garden? How is this approach to an
experiment similar to the previous one we used in
class?). Each of the nineteen activities beginning
on page 193 in Section 6 contains an activator or
connector idea that is typically the starting point
for the lesson.
Summarizers
Summarizers are activities that allow frequent
opportunities for students to summarize, review,
and synthesize class material. When teachers
break lessons into smaller chunks and allow for
incremental review, students are more likely to
retain information. Summarizers also serve teach
ers with ongoing feedback about the quality of stu
dent synthesis of information. They thus provide
an opportunity to address misconceptions far in
advance of exams, when it's too late for students
to benefit in any way. Summarizers serve as the
"glue" for cementing concepts, and they help stu
dents determine what is salient-specifically, how
their conceptualization of key information does or
doesn't coincide with the teacher's intent.
One way for teachers to integrate summarizers
into the classroom is to develop a vocabulary that
cues students to the importance of main ideas or
key concepts. Throughout a lesson, a teacher can
return to this key phrase, asking questions like "So,
what's the point of all this?" "What do you take
away from the discussion?" "How does this relate
to the main idea we're studying today?" Allowing

14 BIOLOGY SUCCESS!
students time to identify and sum up their under
standing is critical. In addition, teachers need to
ensure that their summarizers do not rely just on
discussion, but that they allow students to write or
draw their understandings or to discuss them with
peers.
Some options for summarizers include the
following:
• Brainstorm the key points from the day's les
son; write them on the board • Have students identify the one question or con
cept they are taking away from the day's lesson • Identify the main point they think was made in
the lesson (or the three main points, two ques
tions, and one way the lesson relates to a pre
vious lesson in the course)
• Write a five-minute summary of the most
important points of today's class • Create a concept map that shows the relation
ship among the points of the day's lesson • Generate three types of questions around the
day's lesson: clarification, critical thinking, and
test questions
Another helpful way to integrate summarizers is to
have students use a two-column note-taking
approach and revise their notes in class. It enhances
salient memory storage when teachers allow time
at the end of any given class for students to process
what they've learned. Summarizers are incorporated
into all of the activities presented in Sections 6
through 10, usually in the Follow-up Discussion
Questions section of the activity.
Giving Clear Directions
Students with learning disabilities are often at a dis
advantage when it comes to following procedures
and directions in the classroom. Their difficulties
with language processing or distractibility may
mean that they miss oral cues or directions and are
therefore feeling lost as the students around them
proceed with assurance into a new part of the les
son. Those students with executive-functioning dif
ficulties, i.e., difficulty planning, prioritizing, and
following through on work, may struggle in particu
lar with longer-term assignments that are unclear.
The guiding principles for creating good directions
in class are to make them concise, visual, and
organized.
Teachers are likely to communicate information
well if they follow the essential concepts that good
directions are clearly stated and written in a clear
and meaningful way, using a step-by-step list and
avoiding too much abbreviation, assumed lan
guage, or excessive description. See page 252 for
an example of a student assignment packet de
signed to convey clear directions.
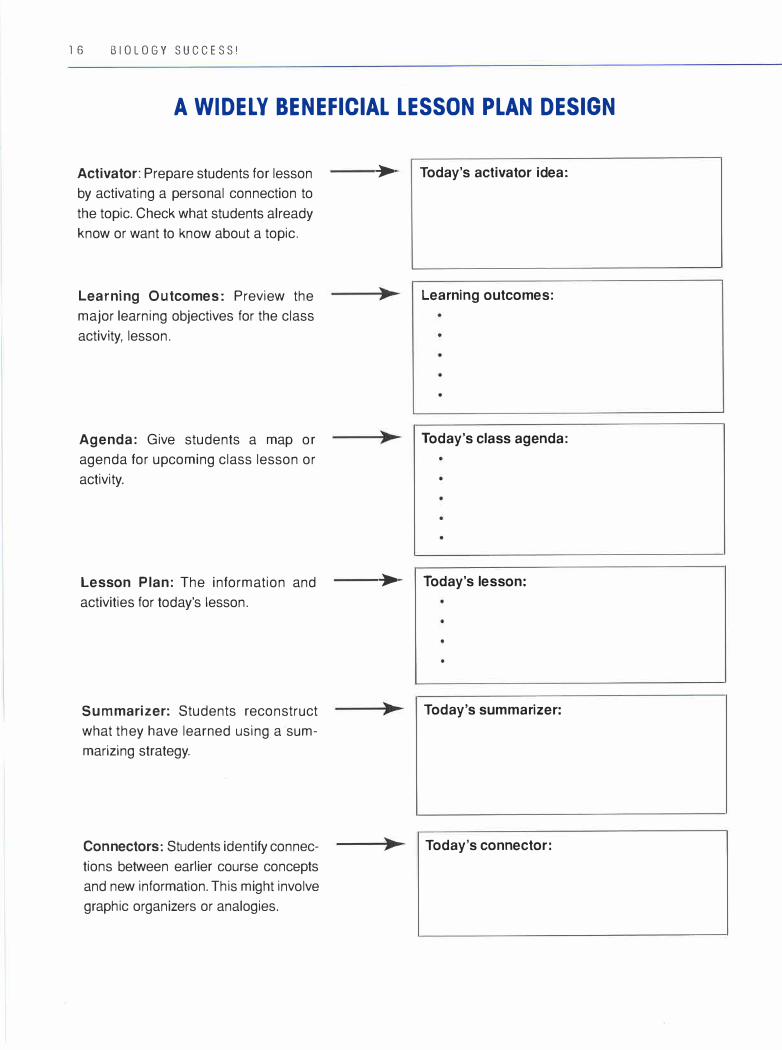
On page 16, we have also provided a Widely
Beneficial Lesson Plan Design template. It is meant
to be used as a tool to prepare a lesson that incor
porates many of the Widely Beneficial Practices
described in this section.
References
Ausubel, D., J. Novak, and H. Hanesian. 1978. Edu
cational psychology: A cognitive view. 2nd ed.
New York: Holt, Rinehart and Winston.
Lazear, D. 1993. Seven ways of knowing. New York:
Skylight Press.
National Research Council. 1999. How people
learn: Brain, mind, experience, and school.
Washington, DC: National Academies Press.
Newell, J. 1984. Advance organizers: Their con
struction and use in instructional development.
Vol. 2 of Instructional development: The state of
the art, ed. R. K. Bass and C. R. Dills. Dubuque,
IA: Kendall/Hunt Publishing.
Douglas, R., D. Maineville, and B. Smith. 1997.
Salmon River-Great Lakes Collaborative Eisen
hower Project. www.potsdam.edu/EDUC/GLC/
ike/organ.html.
Widely Beneficial Practices 1 5
Saphier, J., and R. Gower. 1997. The skillful
teacher. 5th ed. Acton, MA: Research for Better
Teaching.
Strothman, S., ed. 2001. Promoting academic suc
cess for students with learning disabilities. Put
ney, VT: Landmark College.
()sVVtoSl6
E F P r oz 3
.. p I: D 4
:CCFJ> 5
Dr OS l' 6
ra1..o• • • 7 .. ,. .. ,. e
.. t •• • •
10 11
16 BIOLOGY SUCCESS!
A WIDELY BENEFICIAL LESSON PLAN DESIGN
Activator: Prepare students for lesson
by activating a personal connection to
the topic. Check what students already
know or want to know about a topic.
Learning Outcomes: Preview the
major learning objectives for the class
activity, lesson.
Agenda: Give students a map or
agenda for upcoming class lesson or
activity.
Lesson Plan: The information and
activities for today's lesson.
Summarizer: Students reconstruct
what they have learned using a sum
marizing strategy.
Connectors: Students identify connec
tions between earlier course concepts
and new information. This might involve
graphic organizers or analogies.
>
>
Today's activator idea:
Learning outcomes:
Today's class agenda:
Today's lesson:
Today's summarizer:
Today's connector:
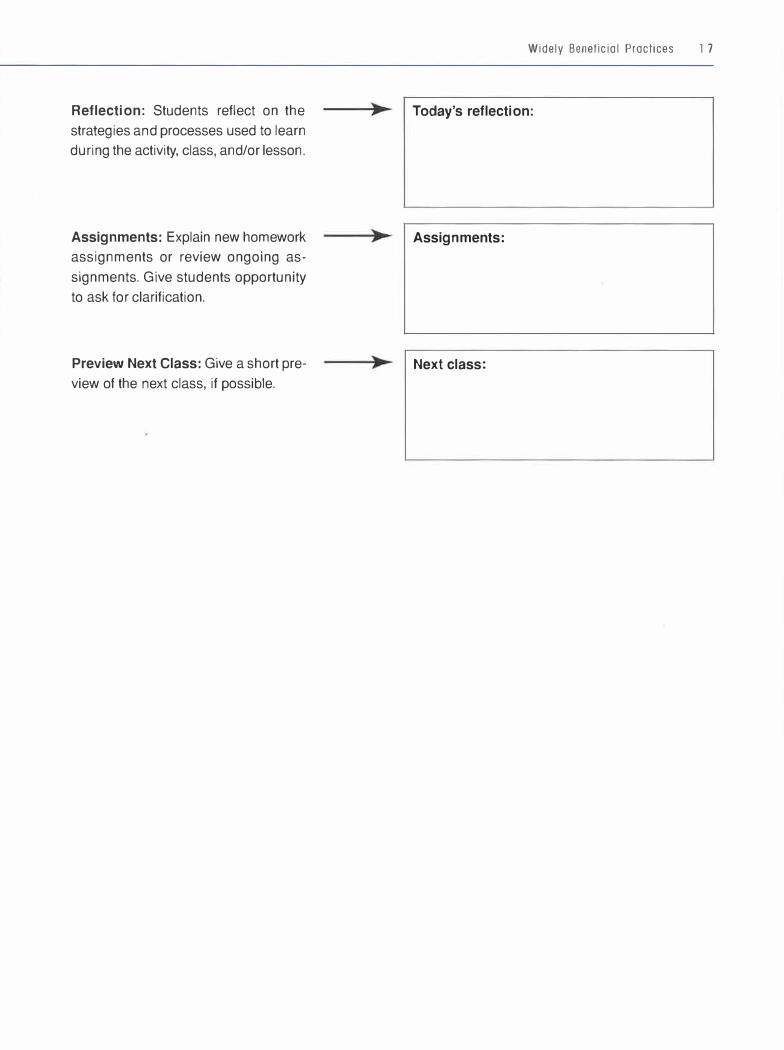
Reflection: Students reflect on the
strategies and processes used to learn
during the activity, class, and/or lesson.
Assignments: Explain new homework
assignments or review ongoing as
signments. Give students opportunity
to ask for clarification.
Preview Next Class: Give a short pre
view of the next class, if possible.
Widely Beneficial Practices l 7
Today's reflection:
Assignments:
Next class:

18 BIOLOGY SUCCESS!
Ecology
is the science
of studying the
relationships
between organisms
and their
environment.
organisms and
their physical
environments,
including energy
flow and the
ECOLOGY COURSE MAP
Overarching Unit Concept Ecological concepts help explain the principles that govern the interactions
between organisms and the physical environment they live in.
role of humans
in affecting the
ecological
systems of the
earth.
Population
ecology
studies the growth
patterns of
populations and
the factors that
affect those
patterns.
many
associations
between

(diagrams
and field trip)
Widely Ben eficial Practices 1 9
ECOLOGY COURSE MAP continued
Understanding
Population
Dynamics
(lecture notes,
graphs, Web
research, and
video)
Quiz on population and
community ecology
September 30
Ways That
Species Interact
(field trip,
lecture notes,
Web research,
and red-bock
salamander
investigation )
Due-October 7
Describing
Ecosystems
(field trip, lecture
notes, graphs,
diagrams of
cycles,
application
activity, and
concept mops)

20 BIOLOGY SUCCESS!
theory of evolution
by noturol selection hos hod a large
social, cultural, and historical influence
on the Western world.
selection is based on
observations
and deductions.
EVOLUTION COURSE MAP
Overarching Unit Concept The concepts of evolution and natural selection help explain the
unity and diversity of life on Earth.
of new species
involves reproductive
isolation.
ollopotric
adoptive
radiation
differential survival
History of
Evolutionary
Thought and
Charles Darwin
(lecture notes
and CD-ROM)
The Central
Proposition of
Evolution
(diagram and
lecture notes)
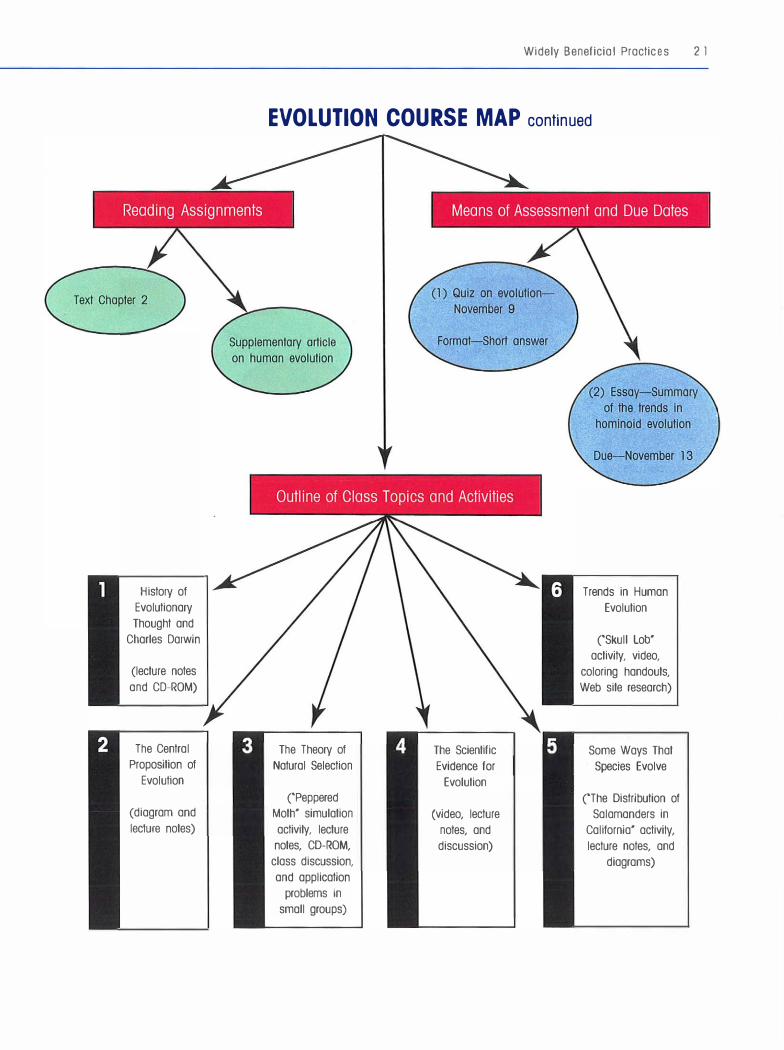
Widely Beneficial Practices 2 1
EVOLUTION COURSE MAP continued
The Theory of The Scientific
Natural Selection Evidence for
Evolution
('Peppered
Moth' simulation (video, lecture
activity, lecture notes, and
notes, CD-ROM, discussion)
class discussion,
and application
problems in
small groups)
Trends in Human
Evolution
('Skull Lob'
activity, video,
coloring handouts,
Web site research)
Some Ways That
Species Evolve
('The Distribution of
Salamanders in
California' activity,
lecture notes, and
diagrams)

22 BIOLOGY SUCCESS!
CELL BIOLOGY COURSE MAP
Overall Unit Objective To understand the major classes, basic anatomy, and functions of cells
and occur both as single-cell
organisms and in multicellular
distinct classes based on the presence or
absence of a nucleus and
contain a cell wall, a central vacuole, and chloroplasts in addition to the
protein synthesis
in both organelle
y ribosome
carbohydrate lipid
nucleic acid protein
t nucleus
mitochondria chloroplast
endoplasmic reticulum Golgi body lysosome vacuole
I
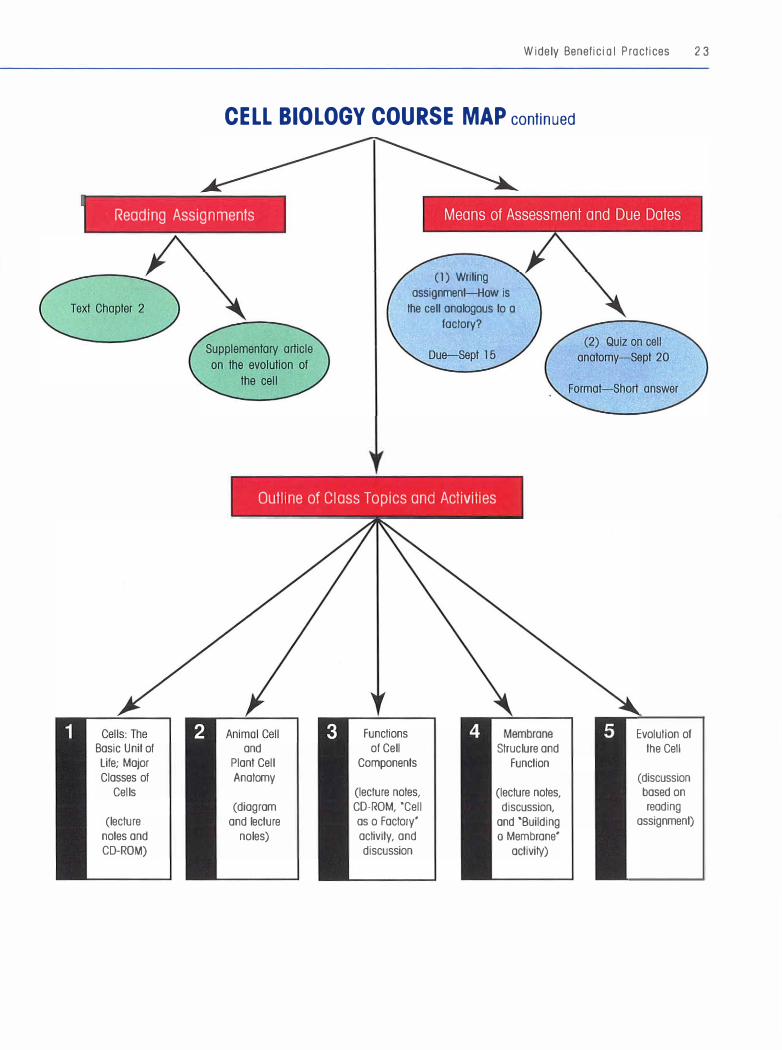
Widely Beneficial Practices 2 3
CELL BIOLOGY COURSE MAP continued
Reading Assignments
Basic Unit of Life; Major Classes of
Cells
(lecture notes and CD-ROM)
(l) Writing assignment-Haw is
the cell analogous to a factory?
Outline of Class Topics and Activities
Functions and of Cell Struclure and
Plant Cell Components Function Anatomy
(leclure notes, (lecture notes, (diagram CD-ROM, ·cell discussion,
and lecture as o Factory' and 'Building noles) activity, and a Membrane·
discussion activity)
Evolution of the Cell
(discussion based on reading
assignment)

2 4 B I O L O G Y S U C C E S S !
genetics,
developed some
of the basic
tenets of
inheritance using
pea plants in the
mid-1 9th
GENETICS COURSE MAP
Overarching Unit Concept The field of genetics details the ways in which biological information
is passed along from generation to generation.
was born when
the structure of
DNA was
uncovered in the
1 950s by
Walson and
of genetics have
validated and
enhanced our
understanding
of evolution
and natural
Key Vocabulary
e
of life, has
become a key
unifying
metaphor in
the field of
biology.
r
Widely Beneficial Pract ices 2 5
GENETICS COURSE MAP continued
Reading Assignments
Mendel's Peas and
Basic Genetics C o ncepts
(lecture and computer
simulations)
Exceptions to Mendel
(lecture and computer
simulations)
Means of Assessment and Due Dates
DueNovember 7
Outline of Class Topics and Activities
Chromosomes: The Basics Mitosis and of DNA
M e ios is (video and
(lab work and Web kinesthetic and resources)
tactile activities)
(3) Collaborative quiz on geneticsNovember 13
Format - Multiple choice and short
answer
Genetics and Evolution
(newspaper article
research and discuss ion)
Protein Synthesis
(model building and lecture)


CI\.Lt,I,\._. IA):)r�k
&t,Jt we.& �
Mo.croffle l-"clt I Carbohyd•
'P
3 GENERAL
TEACHING
METHODS
Introduction
The General Teaching Methods section illustrates and expands upon
the Six Guiding Educational Principles and Widely Beneficial Prac
tices outlined in Sections 1 and 2. It is divided into five subsections
that are meant to provide a succinct overview of various teaching
methods and techniques that can enhance the success of students
with diverse learning needs. A short description of each subsection
follows.
Starting a Course (page 29). The three subjects addressed are
intended to help a biology instructor organize and begin a course in
such a way that the diverse learning needs of students are taken into
account.
Teaching Study Skills (page 51 ). Four articles with accompanying
examples provide an overview of teaching some of the study skills
necessary for student success in a typical biology course.
Using Varied Instructional Techniques (page 81 ). Seven teaching
and learning techniques that serve the diverse learners in a biology
classroom are described.

28 BIOLOGY SUCCESS!
Assessing Student Performance (page 123). An
overview of assessment is offered along with three
specific areas of ideas and techniques for assess
ing student learning in the biology classroom.
The Biology Laboratory (page 157). This subsec
tion presents the value of engaging students in bio
logical inquiry, as well as some common struggles
encountered by students with learning disabilities in
laboratory settings. It ends with some suggestions
for teaching and learning scientific inquiry.

Starting a Course:
Course Organization
PR o v Io ING M AP s and itineraries of
course work can help students understand
the expectations of their instructors and
help them preview the learning they will engage in.
This can be helpful to all students but particularly to
students with learning disabilities. It should hap
pen at three levels: the semester or course level,
the weekly or unit level, and the daily level.
Semester or Course Level
The most effective way to prepare students for the
course journey they are embarking on is to provide
and explicitly "uncover" the course syllabus. Spend
time during the first day(s) of class discussing the
academic expectations, learning objectives, course
policies and procedures, key assignments, etc. that
frame your course.
Most syllabi proceed in a linear, text-based form.
Consider providing your syllabus in a more visu
ally engaging format. See page 32 for a graphically
formatted example of an introductory biology syl
labus made with Inspiration software. In addition,
a course Web site can be a useful and appealing
29
way for students to interact with the syllabus and its
information.
Also, consider printing your syllabus on colored
paper that will stand out from the rest of the paper
work flowing from your hands to the students'. This
will heighten the awareness and importance of this
document in the students' minds. To take this idea
further, consider printing other key course docu
ments on colored copier paper. Handouts such as
specific assignment guidelines, advance organiz
ers, or vocabulary lists would be good candidates
for color-coding. Or an instructor could go all the
way and distribute to students a// documents on col
ored paper. For instance, genetics handouts could
be blue, evolution handouts could be orange, and
so on. This comprehensive system would make
students' efforts to maintain course organization
easier. Keep in mind, however, that this requires sig
nificant copier preparation by the instructor.
Another idea for making a course document like
a syllabus less daunting is to break it up into sev
eral smaller documents, such as goals and objec
tives, grading, attendance policy, etc. For some
students this may make access and use of these
important items easier.
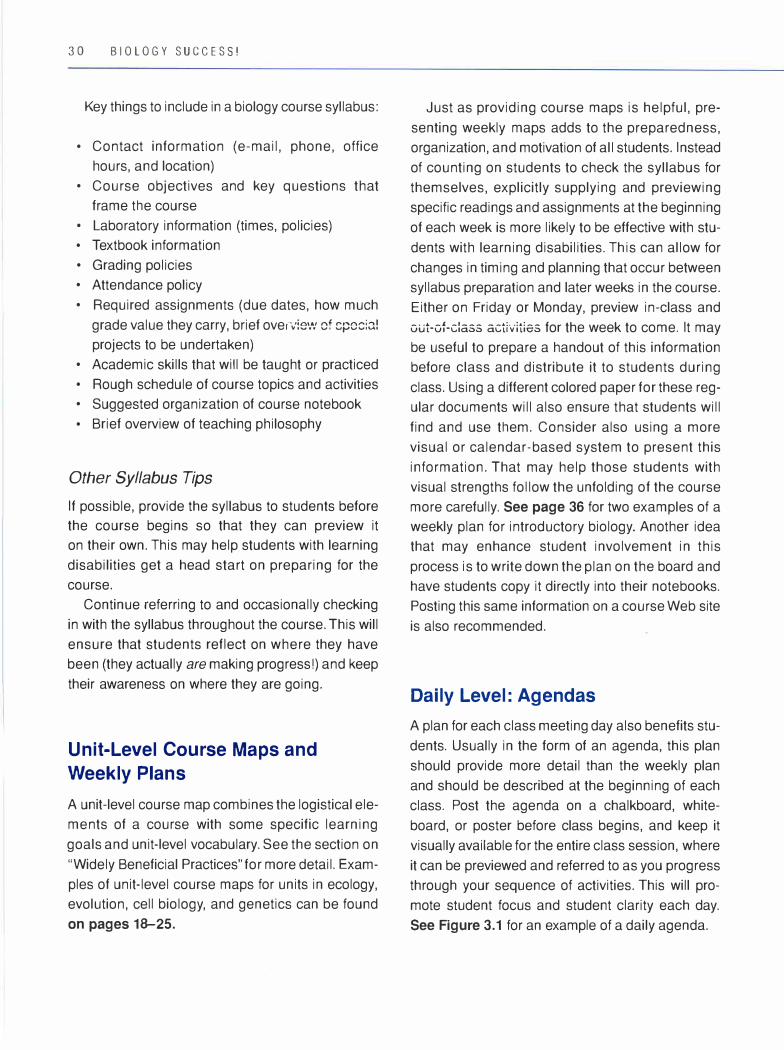
30 BIOLOGY SUCCESS!
Key things to include in a biology course syllabus:
• Contact information (e-mail, phone, office
hours, and location) • Course objectives and key questions that
frame the course • Laboratory information (times, policies) • Textbook information • Grading policies • Attendance policy • Required assignments (due dates, how much
grade value they carry, brief ove.--v·:e�·: cf spcc:a!
projects to be undertaken) • Academic skills that will be taught or practiced • Rough schedule of course topics and activities • Suggested organization of course notebook • Brief overview of teaching philosophy
Other Syllabus Tips
If possible, provide the syllabus to students before
the course begins so that they can preview it
on their own. This may help students with learning
disabilities get a head start on preparing for the
course.
Continue referring to and occasionally checking
in with the syllabus throughout the course. This will
ensure that students reflect on where they have
been (they actually are making progress!) and keep
their awareness on where they are going.
Unit-Level Course Maps and
Weekly Plans
A unit-level course map combines the logistical ele
ments of a course with some specific learning
goals and unit-level vocabulary. See the section on
"Widely Beneficial Practices" for more detail. Exam
ples of unit-level course maps for units in ecology,
evolution, cell biology, and genetics can be found
on pages 18-25.
Just as providing course maps is helpful, pre
senting weekly maps adds to the preparedness,
organization, and motivation of all students. Instead
of counting on students to check the syllabus for
themselves, explicitly supplying and previewing
specific readings and assignments at the beginning
of each week is more likely to be effective with stu
dents with learning disabilities. This can allow for
changes in timing and planning that occur between
syllabus preparation and later weeks in the course.
Either on Friday or Monday, preview in-class and
out-of-c:ass acti'v·itias for the week to come. It may
be useful to prepare a handout of this information
before class and distribute it to students during
class. Using a different colored paper for these reg
ular documents will also ensure that students will
find and use them. Consider also using a more
visual or calendar-based system to present this
information. That may help those students with
visual strengths follow the unfolding of the course
more carefully. See page 36 for two examples of a
weekly plan for introductory biology. Another idea
that may enhance student involvement in this
process is to write down the plan on the board and
have students copy it directly into their notebooks.
Posting this same information on a course Web site
is also recommended.
Daily Level: Agendas
A plan for each class meeting day also benefits stu
dents. Usually in the form of an agenda, this plan
should provide more detail than the weekly plan
and should be described at the beginning of each
class. Post the agenda on a chalkboard, white
board, or poster before class begins, and keep it
visually available for the entire class session, where
it can be previewed and referred to as you progress
through your sequence of activities. This will pro
mote student focus and student clarity each day.
See Figure 3.1 for an example of a daily agenda.
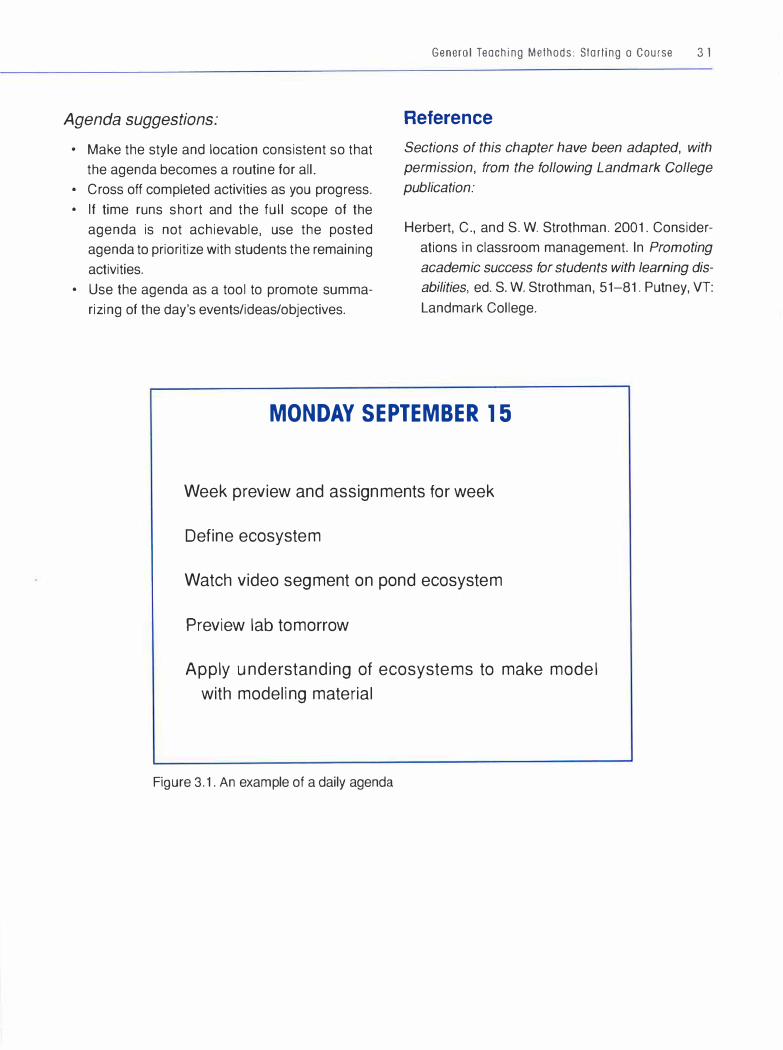
Agenda suggestions:
• Make the style and location consistent so that
the agenda becomes a routine for all. • Cross off completed activities as you progress. • If time runs short and the full scope of the
agenda is not achievable, use the posted
agenda to prioritize with students the remaining
activities. • Use the agenda as a tool to promote summa
rizing of the day's events/ideas/objectives.
General Teaching Methods: Starling a Course 3 1
Reference
Sections of this chapter have been adapted, with
permission, from the following Landmark College
publication:
Herbert, C., and S. W. Strothman. 2001. Consider
ations in classroom management. In Promoting
academic success for students with learning dis
abilities, ed. S. W. Strothman, 51-81. Putney, VT:
Landmark College.
MONDAY SEPTEMBER 15
Week preview and assignments for week
Define ecosystem
Watch video segment on pond ecosystem
Preview lab tomorrow
Apply understanding of ecosystems to make model with modeling material
Figure 3.1. An example of a daily agenda
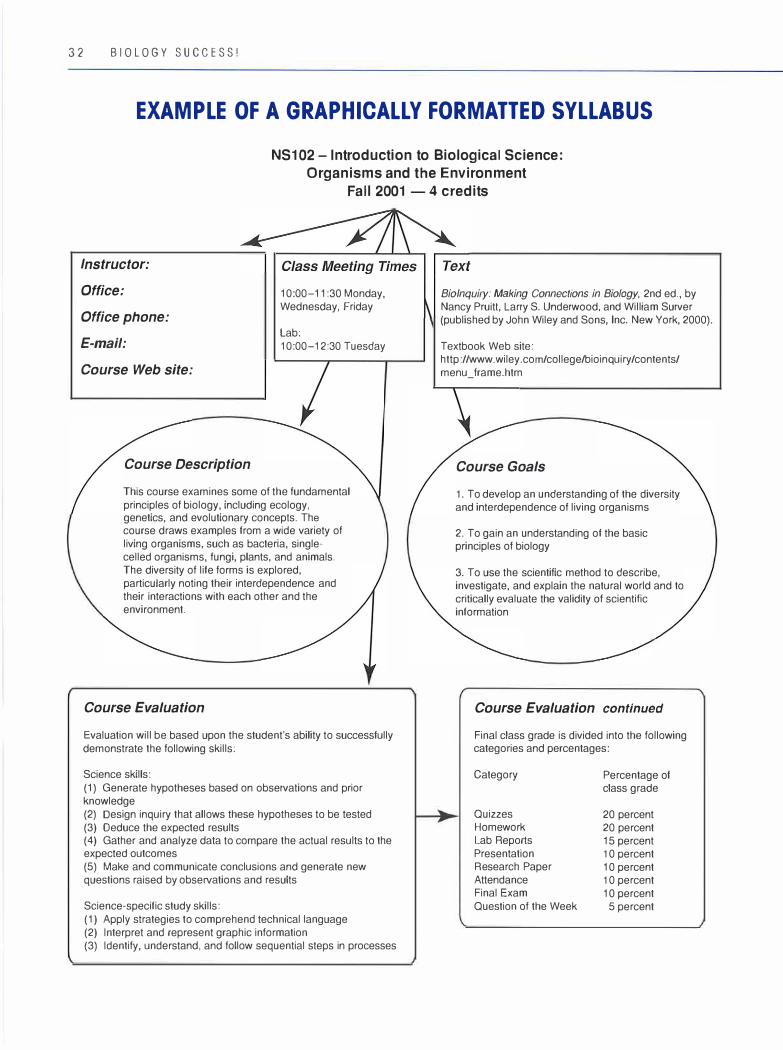
32 BIOLOGY SUCCESS!
EXAMPLE OF A GRAPHICALLY FORMATTED SYLLABUS
NS102- Introduction to Biological Science: Organisms and the Environment
Fall 2001 - 4 credits
Instructor:
Office:
Office phone:
E-mail:
Course Web site:
Course Description
10:00-11 :30 Monday, Wednesday, Friday
Lab: 10:00-12:30 Tuesday
This course examines some of the fundamental principles of biology, including ecology, genetics, and evolutionary concepts. The course draws examples from a wide variety of living organisms, such as bacteria, single-celled organisms, fungi, plants, and animals. The diversity of life forms is explored, particularly noting their interdependence and their interactions with each other and the environment.
Course Evaluation
Evaluation will be based upon the student's ability to successfully demonstrate the following skills:
Science skills: (1) Generate hypotheses based on observations and prior knowledge (2) Design inquiry that allows these hypotheses to be tested (3) Deduce the expected results (4) Gather and analyze data to compare the actual results to the expected outcomes (5) Make and communicate conclusions and generate new questions raised by observations and results
Science-specific study skills: (1) Apply strategies to comprehend technical language (2) Interpret and represent graphic information (3) Identify, understand, and follow sequential steps in processes
Biolnquiry: Making Connections in Biology, 2nd ed., by Nancy Pruitt, Larry S. Underwood, and William Surver (published by John Wiley and Sons, Inc. New York, 2000).
Textbook Web site: http://www.wiley.com/college/bioinquiry/contents/ menu_frame.htm
Course Goals
1. To develop an understanding of the diversity and interdependence of living organisms
2. To gain an understanding of the basic principles of biology
3. To use the scientific method to describe, investigate, and explain the natural world and to critically evaluate the validity of scientific information
Course Evaluation continued
Final class grade is divided into the following categories and percentages:
Category
Quizzes Homework Lab R eports Presentation R esearch Paper Attendance Final Exam Question of the Week
Percentage of class grade
20 percent 20 percent 15 percent 10 percent 10 percent 10 percent 10 percent
5 percent

Reading
Readings will be assigned regularly from the text and supplemental sources.
Students are expected to actively read assignments-tiighlight
pertinent material, look up unknown vocabulary terms. take notes for review, generate questions/comments. etc. It is essential that all readings be completed
on time so that you are fully prepared for discussions on the
material.
General Teaching Methods: Starting a Course 3 3
Course Structure
Writing Assignments
Writing assignments are given
to help reinforce class discussions and textbook reading. Formal lab reports will be expected for each of the laboratory exercises performed. All written work must be typed, spell checked,
and proofread for errors. Unless arrangements have been made with the instructor
prior to the due date, late papers will be marked off 20 points and will not be
accepted more than two
weeks after the original due date. Writing assignments are
often handed back with suggestions; they must be corrected and returned within
a week for full credit. Unless prior arrangements have been made, written assignments must be turned in on their due
date, even if the student is abserit from class that day.
D -
-
Research Paper
Each student will be
required to research and write about a current biological "hot topic."
Laboratories
Labs will be held weekly for
approximately 2-1/2 hours each time. Students are expected to attend every lab. Labs are an opportunity for students to apply and witness principles covered in class. Because of their nature, labs are often one
time-only events; therefore,
it is imperative that students attend each lab. Formal lab reports will be expected after each lab.

34 BIOLOGY SUCCESS!
Class Presentation
Working with a partner, each student will present a 30-minute class on a biological topic of the student's choosing. These presentations will take place toward the middle of the semester, and several class periods will be devoted to preparation.
Attendance
Course Structure continued
Examinations
Quizzes will be given every two to three weeks. A cumulative final exam will be given.
P lease make an attempt to attend every class. Certain activities are impossible to duplicate, such as labs, group projects, presentations, and lectures. The entire week of class often revolves around what is covered in that week's lab; it is imperative that you attend lab every week. Attendance makes up 1 o percent of your final class grade.
Tardies are defined as arrivals more than 5 minutes late to class.
Once a student has accumulated more than three class absences, one lab absence, or five tardies, or if it appears that a pattern of attendance problems is developing early in the semester, a meeting will be called between the student, the instructor, and the advisor to address the issue.
P referably, a student should inform the instructor-via e-mail, phone, or in person-prior to an absence. If this is not possible, it is the student's responsibility to approach the instructor as soon as possible after the absence. If a student accumulates more than eight absences, he or she may be asked to withdraw from the class.
It is very important that you attend class-if you are not there, you will not get the information.
Question of the Week
Each week a new question will be posted on the class Web site. The question will be related to that week's lecture, reading, or lab. Fill out the Internet form with your name and answer by the beginning of class on Friday every week.

r
Course Web Site
Class Schedule
DATES
August 28 - 31
September 4 - 7
September 10 - 14
September 17 - 21
September 24 - 28
October 1 - 5
October 8 - 12
October 22 - 26
October 29 - November 2
November 5 - 9
November 12 - 16
November 19 - 23
November 26 - 30
December 3 - 7
TOPICS
General Teaching Methods: Starting a Course 3 5
I'
\ta
--·'' � ';.,''&, .}:.-."
• . ., ·• · .. ,., . ,
•
The class Web site is an integral component of the class. All of the information in this syllabus can be found there, as well as other vital information.
Web resources for learning specific topics are located there, weekly assignments are listed, and the PowerPoint slides are uploaded following each lecture. Material will be added to the site often. and students are expected to visit the Web site regularly to take advantage of the resources that it has to offer.
You must visit the course Web site at least once a week to answer the Question of the Week.
Course Expectations & Study of Life
Scientific Method & B1od1versity
Biodiversity
Ecology
Ecology
Ecology
Evolution
Evolution
Evolution
DNA
G enetics
G enetics
G enetics: Biotechnology
R eview and Wrap-up

36 BIOLOGY SUCCESS!
Weekly Plan for Introductory Biology
Day In Class For Homework
Mon. 3/17 Intro to Genetics unit: Text Chapter 3, pages 55-65 Journey into Life animation; See vocabulary sheet for key terms begin Biologica computer software work
Wed. 3/19 Continue with Biologica Text Chapter 3, pages 62-70 work; discussion and notes See vocabulary sheet for key terms, on basic genetics concepts and answer review Question #6 on
page 82
Fri. 3/21 Final day on Biologica work Complete concept map assignment and continued discussion and (see handout for details) notes on basic genetics concepts
Weekly Plan for
Introductory Biology
Mon.
9/17
Intro to Ecosystems
H
Read pages 115-120 in text
Bring 3 possible quiz questions to class
Tues.
9/18
Lab:
Pond Ecosystems
' t
Use the World Wide Web to rese arch deformed frogs
See handout for details
Wed.
9/19
Lab:
Pond Ecosystems
' f
Read Pages 120-125 in text
Bring 3 possible quiz questions to class
Thurs.
9/20
Comparing Ecosystems:
Forests, Ponds.and
Oce ans
' f
Create study guide to unit on e cology
Fri.
9/21
Review of Ecology Unit
H
Prepare for quiz on Monday
Starti ng a Course :
Learn i ng Style
Assessment
Introduction
Biology students do not all learn in the same way.
Some have visual strengths; some have visual
weaknesses. Some learn best through their hands;
others learn best by listening. Learning happens
through different modalities. Generally, a "learning
style" is a learner's preferred method/mode/way of
processing information. Bernice McCarthy (1 987),
David Kolb (1984), and other researchers have
articulated some of the best insights into learning
style. Howard Gardner's (1 983) work on the theory
of multiple intelligences offers yet another perspec
tive on individual learners possessing different
combinations of strengths and weaknesses.
Christina Herbert (2001 ) , a professor at Land
mark· College, says that "students with learning
disabilities often have pronounced strengths in
processing information using alternative pathways,
such as a visual, tactile, or kinesthetic approach,
rather than relying on strictly auditory processing,
which is often their weakest channel."
3 7
Why Designing Instruction with
Learning Styles in Mind Is Important
If an instructor provides a learning environment
that acknowledges varying learning styles,
• instruction will reach all of the students some of
the time; • student self-confidence and awareness will be
enhanced;
• students are more likely to be motivated and
engaged; • students will also recognize a diversity of
approaches to learning and the varieties of
intelligence; • students will learn to convert information that
is less compatible with their learning styles to
more compatible formats.
How to Understand and Address
Learning Styles
Provide a survey at the beginning of the course to
informally assess students' perceived strengths
and difficulties.
3 8 B I O L O G Y S U C C E S S !
This survey might include four parts : ( 1 ) a
learning style inventory, (2) a study and academic
ski l ls self-assessment, (3) a survey of preferred
classroom instructional activities, and (4) an
open-ended written question.
(1) Learning Style Inventory
Web site addresses and descriptions for three dif
ferent learning style inventories are provided below.
Al l sites provide an immediate printable analysis
of learning style preferences following completion
of a series of questions.
http://WWY-f.metamath.com/lsweb/dvclearn.htm
This site offers a learning style survey developed
for college students by Catherine Jester at Diablo
Valley College in California. It consists of thirty-two
questions, allows for graded responses, and pro
vides an immediate analysis of learning style
preferences. In addition , a detailed list of numerous
learning strategies that match the user's learn
ing style is provided. This site is h ighly recom
mended because it's easy to use and offers
valuable feedback.
http ://www.eng r.ncsu .ed u/learn i ngstyles/
ilsweb.html The learning styles questionnaire
found at this site was developed by Barbara Solo
man and Richard Felder at North Carolina State
University. The user must answer forty-four ques
tions, choosing between two alternative answers
even if both answers apply. A somewhat confusing
graphical representation of learning style prefer
ences along with a brief interpretation is generated
upon completion of the questionnaire. Users have to
go to other l inks to read descriptions of the various
learning styles.
http ://webster.com m net.ed u/f ac ulty /-si monds/
styles/styles.htm The learning style question
naire at this site was developed by the Learning
Assistance Center staff at Capital Commu nity
Col lege i n Hartford, Connecticut. Users must
complete a five-part survey (a total of th i rty-five
questions) to determine whether as learners they
are auditory or visual, applied or conceptual, spa
tial or verbal, social or independent, and creative
or pragmatic. Because users are required to keep
track of their scores for each part (a mechanism
is provided for this purpose), this survey is more
complicated to use than the previous two. How
ever, l i nks and i nstruct ions are provided for
obta in ing both the i nterpretation of the results
and suggested learning strategies.
Because these onl ine surveys have a built-in
analysis component, students and teachers can
get immediate feedback on the inventory. With the
results in hand, instructors will have a better sense
of their students' strengths and weaknesses. For
example, instructors might discover that the major
ity of their students are visually oriented; this knowl
edge could be immensely he lpful in p lanning
appropriate instructional strategies.
Nannette Smith (2001 ) , of Bennett College in
North Carolina, uses a learning style inventory as
an exercise in developing hypotheses, collecting
data, and drawing conclusions as part of a written
lab report. See Appendix A for the ful l text of her
article.
(2) Study and Academic Skills Self-Assessment
Teachers can also create and administer a study
and academic skills self-assessment that will help
them better understand their students. See the
Learning Questionnaire on page 40 for an
example.
Suggested Analysis: One could simply tally up the
number of "strength," "needs some improvement,"
and "needs much improvement" responses for each
category across the class and convert each to a
percentage. For example, an instructor might dis
cover that 50 percent of the class reports that their
test taking "needs much improvement." Or an
instructor may find that 90 percent of the students
perceive their abstract comprehension skills to be a
strength. Al l of this information would be helpful in
identifying the specific skill i nstruction area that may
or may not be necessary to include in the course.
(3) Survey of Preferred Classroom Instructional Activities
A third component could be a survey of the kinds of
classroom activities that students think support
their optimal learn ing. See the Learning Ques
tionnaire on page 40 for an example.
Suggested Analysis: One could simply tally up
the number of "preferred," "not preferred," and "neu
tral" responses for each category across the class
and convert to a percentage. For example, an
instructor might discover that 1 5 percent of the stu
dents in a class claim that small-group activities are
not preferred or 90 percent claim that hands-on
activities/labs are a preferred activity. Again, this
information would be helpful in designing day-to
day activities in the class.
(4) Open-Ended Question
It is also helpful to give students a chance to tell you
something in their own words that they feel is impor
tant for you to know. This may be done orally or in
writing, and may reveal some valuable information
about students that the grids and surveys missed.
See the Learning Questionnaire on page 40 for
an example of an open-ended question.
Possible discoveries include finding that one stu
dent has failed h is last three biology classes. Or
you may discover that another student is a mathe
matical wizard and wants to apply that to her bio
logical studies.
General Teach ing Methods: Start ing a Course 3 9
Further Ideas
Once students have their results from the learning
questionnaire and/or learning style inventory, hold a
class discussion to validate the diverse learning
styles and needs of members of the class. Make
them aware of the design of your course and how it
will attempt to serve the diversity of learners
enrolled.
References
Gardner, H. 1 983. Frames of mind: The theory of
multiple intelligences. New York: Basic Books.
Kolb, D. A. 1 984. Experiential learning: Experience
as the source of learning and development.
Englewood Cliffs, NJ: Prentice-Hall.
McCarthy, B. 1 987. The 4MAT system: Teaching to
learning styles with right/left mode techniques.
Barrington, IL : About Learning.
Smith, N. 200 1 . Identifying and using learning
styles to facilitate instruction. In College path
ways to the science education standards, ed.
E. D. Siebert and W. J. McIntosh, 6 - 7. Arlington,
VA: NSTA Press.
Herbert, C. 2001 . Making col lege classrooms
accessible to students with and without learning
disabilities. In Promoting academic success for
students with learning disabilities, ed. S. Stroth
man, 1 -26. Putney, VT: Landmark College.
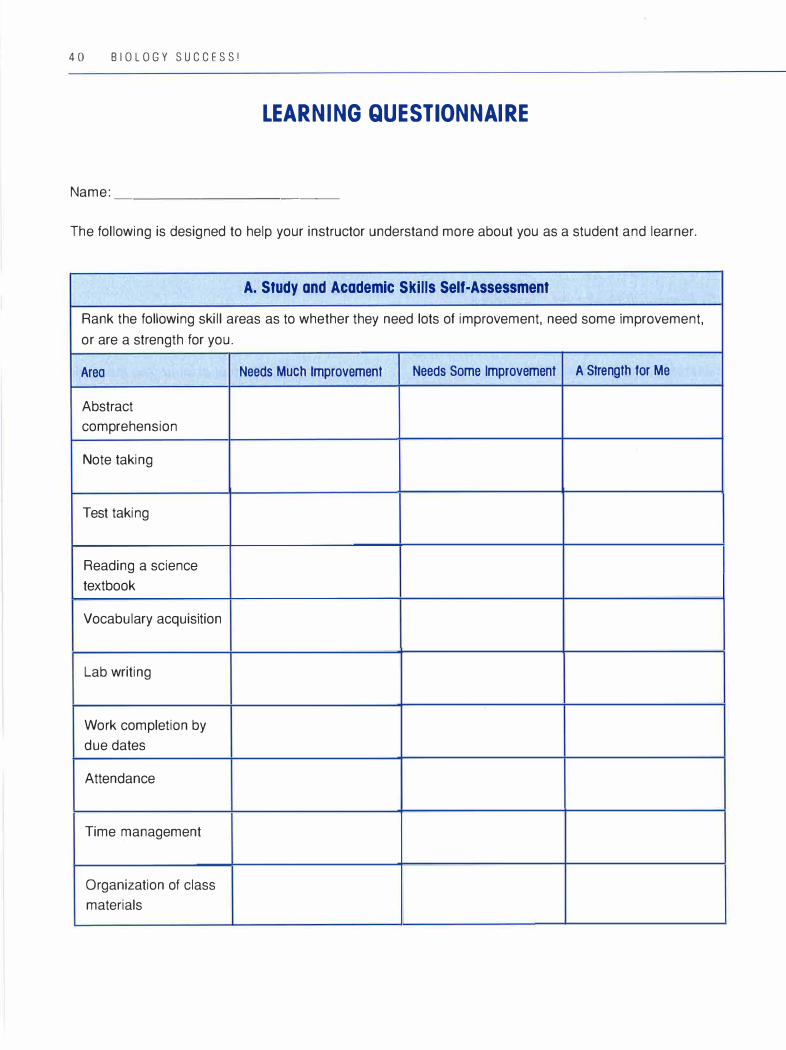
4 0 B I O L O G Y S U C C E S S !
LEARNING QUESTIONNAIRE
Name: _ __ _ _ _ _ _ ___ _
The following is designed to help your instructor understand more about you as a student and learner.
A. Study and Academic Skills Seit-Assessment
Rank the following skill areas as to whether they need lots of improvement, need some improvement,
or are a strength for you.
Area Needs Much Improvement Needs Some Improvement A Strength tor Me
Abstract
comprehension
Note taking
Test taking
Reading a science
textbook
Vocabulary acquisition
Lab writing
Work completion by
due dates
Attendance
Time management
Organization of class
materials
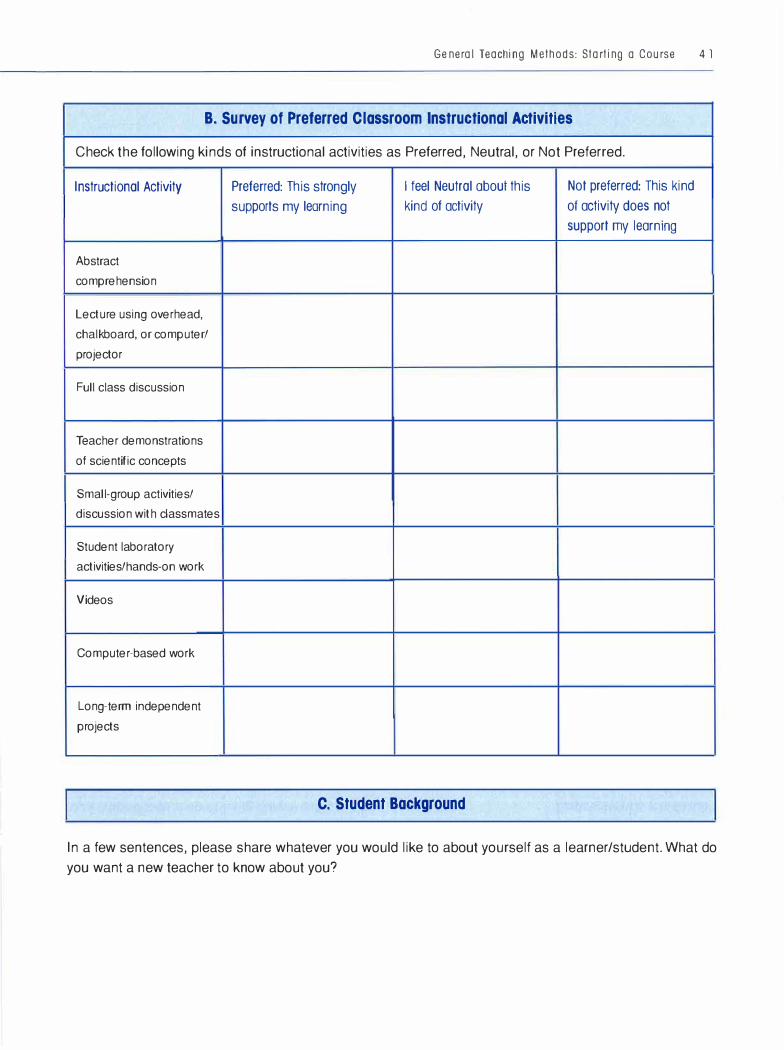
General Teaching Methods: Starting a Course 4 1
B. Survey of Preferred Classroom Instructional Activities
Check the following kinds of instructional activities as Preferred, Neutral, or Not Preferred.
Instructional Activity Preferred: This strongly I feel Neutral about this Not preferred: This kind
supports my learning kind of activity of activity does not
support my learning
Abstract
comprehension
Lecture using overhead,
chalkboard, or computer/
projector
Full class discussion
Teacher demonstrations
of scientific concepts
Small-group activities/
discussion with classmates
Student laboratory
activities/hands-on work
Videos
Computer-based work
Long-term independent
projects
C. Student Background
In a few sentences, please share whatever you would like to about yourself as a learner/student. What do
you want a new teacher to know about you?

Starti ng a Course :
Student Background
Knowledge
LE ARN I N G s T Y L E surveys and assess
ments provide information on general stu
dent learning across the curriculum. In
addition to gathering this data, administering an
informal assessment of students' preexisting
knowledge of biological concepts and of the scien
tific method is also recommended. Both contem
porary science education theory and Landmark
teaching principles agree that effective teaching
and learning begin with an understanding of stu
dents' prior knowledge and skill levels. According to
the American Association for the Advancement of
Science's educational reform initiative Project 2061
(AAAS 200 1 ) , many science concepts are incon
sistent with students' preexisting beliefs about the
biological and physical world. It is therefore the
teacher's role to understand the preconceptions or
prior knowledge students brings with them to class,
and to guide them to a new and superior level of
conceptual understanding.
It is suggested that instructors informally assess
student background both at the beginning of a
course and at the beginning of each new unit of
study. The assessment at the beginning of a
4 2
course should be more general and should include
a component on student understanding of the sci
entific method. The assessment at the beginning of
each unit should be more specific to that unit. The
diagnostic information gained through these as
sessments offers a teacher some insightful guid
ance in designing the instructional sequence for
the particular group of students. These assess
ments also activate student thinking and focus on
the new subject by forging a connection between
what students already think and believe and what
they're about to be taught. Carefully attending to
preconceptions is therefore as important to stu
dents' learning as it is to a teacher's diagnostic un
derstanding.
It is important to be explicit with students about
the purpose of any technique or activity intended to
check their preconceptions. Let them know not only
what you are asking them to do, but also the rea
son you are asking them to do it: recognizing prior
conceptions is an important academic skill. Also, it
is essential to impress upon students that their
responses to background assessments will in no
way affect their grades.
Biology Background Assessment
at Beginning of Course
Carry out an informal assessment that allows stu
dents to express their preexisting knowledge in dif
ferent ways: individual written responses, group
discussion, and a small-group task.
Written Responses
Choose one or a few different formats for gather
ing written responses on core biological concepts
and background. See page 47 for a reproducible
example of a background assessment based on
written responses. Use a format and content that is
specific to your course objectives.
Group Discussion
Take twenty to thirty minutes to hold a class dis
cussion.
1 . Brainstorm some of the current controversial
issues i n the field of b iology. The teacher
records responses on poster paper, chalk
board, or computer (with projection device) in a
location visible for the entire class to see.
2. Have the class choose two of the controversies
to discuss in more detail. Lead the students in
discussion to ascertain what they know and
don't know about the issues chosen, what their
viewpoints are, and how they articulate their
positions.
The purpose is to assess background knowl
edge, observe discussion/oral expression skil ls,
and get a sense of group dynamics. This can be
helpful in planning future activities and can inspire
those students who like to talk about ideas.
General Teach ing Methods: Start ing a Course 4 3
Small-Group Task
Ask students to work in teams (two-person teams
are ideal) to complete the following tasks:
Option A: Create/draw a visual model of a cel l .
I l lustrate, color, and identify parts.
Provide markers, large sheets of paper, and
whatever may assist students in this task.
Option B: Use the materials provided to bu i ld an
ecosystem.
Provide some form of modeling materials: clay,
colored paper clips, Tinkertoys, paper. Whi le this
may seem like a stretch for students to connect
abstract tactile materials to biology, it can be sur
prising and i l luminating to see what students can
express when they think through a hands-on activity.
For both of these activities, build in a short, infor
mal presentation by the students, so they can show
their work and l ink language to visuals and models.
The purpose of th is activity is to see student
conceptions of key biological phenomena, and to
see how students express their u nderstanding
through a medium that is not language based. The
idea is not to spend hours doing this; rather, give
the students a twenty-minute opportunity to
demonstrate what they already know.
Biology Background Assessment
at Beginning of New Units
Use some of the following techniques for drawing
out prior knowledge at the beginning of new units of
study. The techniques that follow start with the sim
plest to i mplement and progress to the more
involved.
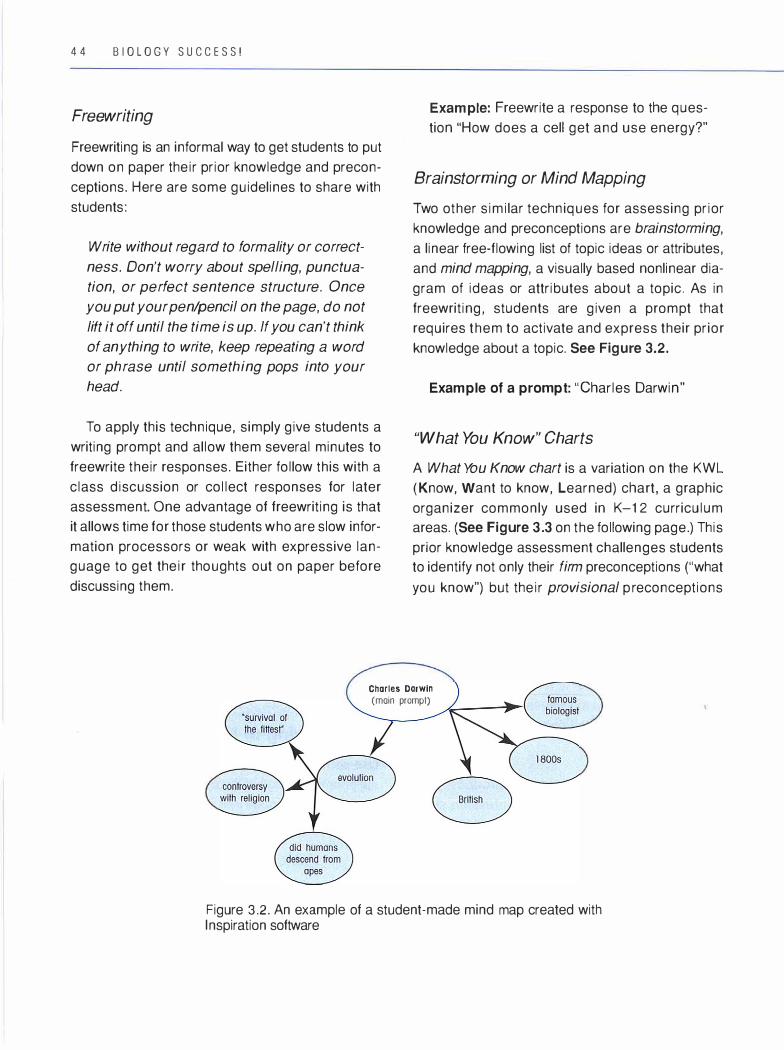
4 4 BIOLO GY SUCCE SS !
Freewriting
Freewriting is an informal way to get students to put
down on paper their prior knowledge and precon
ceptions. Here are some guidelines to share with
students:
Write without regard to formality or correct
ness. Don't worry about spelling, punctua
tion, or perfect sentence structure. Once
you put your pen/pencil on the page, do not
lift it off until the time is up. If you can't think
of anything to write, keep repeating a word
or phrase until something pops into your
head.
To apply this technique, simply give students a
writing prompt and allow them several minutes to
freewrite their responses. Either follow this with a
class discussion or collect responses for later
assessment. One advantage of freewriting is that
it allows time for those students who are slow infor
mation processors or weak with expressive lan
guage to get their thoughts out on paper before
discussing them.
Example: Freewrite a response to the ques
tion "How does a cell get and use energy?"
Brainstorming or Mind Mapping
Two other similar techniques for assessing prior
knowledge and preconceptions are brainstorming,
a linear free-flowing list of topic ideas or attributes,
and mind mapping, a visually based nonlinear dia
gram of ideas or attributes about a topic. As in
freewriting, students are given a prompt that
requires them to activate and express their prior
knowledge about a topic. See Figure 3.2.
Example of a prompt: "Charles Darwin"
"What You Know" Charts A What You Know chart is a variation on the KWL
(Know, Want to know, Learned) chart, a graphic
organizer commonly used in K -12 curriculum
areas. (See Figure 3.3 on the following page.) This
prior knowledge assessment challenges students
to identify not only their firm preconceptions ("what
you know") but their provisional preconceptions
Charles Darwin
(main prompt)
Figure 3.2. An example of a student-made mind map created with Inspiration software
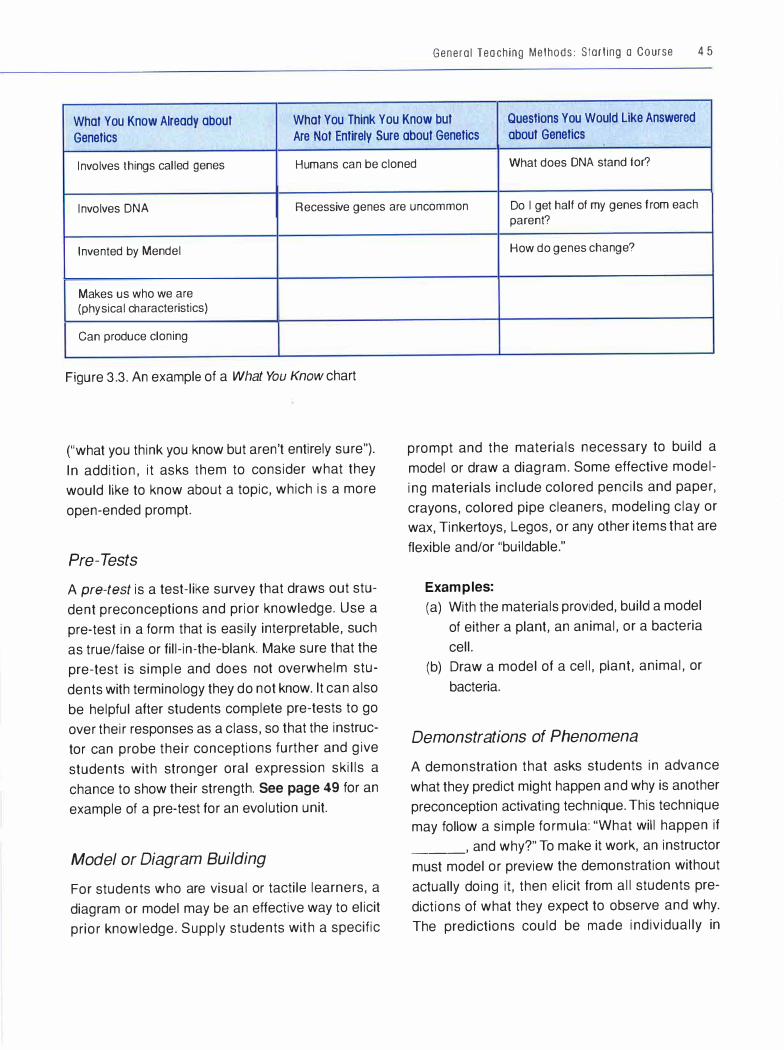
General Teaching Methods : Starling o Course 4 5
What You Know Already about What You Think You Know but Questions You Would Like Answered Genetics Are Not Entirely Sure about Genetics about Genetics
Involves things called genes Humans can be cloned What does DNA stand for?
Involves DNA Recessive genes are uncommon Do I get half of my genes from each
Invented by Mendel
Makes us who we are (physical characteristics)
Can produce cloning
Figure 3.3. An example of a What You Know chart
("what you think you know but aren't entirely sure").
In addition, it asks them to consider what they
would like to know about a topic, which is a more
open-ended prompt.
Pre-Tests
A pre-test is a test-like survey that draws out stu
dent preconceptions and prior knowledge. Use a
pre-test in a form that is easily interpretable, such
as true/false or fill-in-the-blank. Make sure that the
pre-test is simple and does not overwhelm stu
dents with terminology they do not know. It can also
be helpful after students complete pre-tests to go
over their responses as a class, so that the instruc
tor can probe their conceptions further and give
students with stronger oral expression skills a
chance to show their strength. See page 49 for an
example of a pre-test for an evolution unit.
Model or Diagram Building
For students who are visual or tactile learners, a
diagram or model may be an effective way to elicit
prior knowledge. Supply students with a specific
parent?
How do genes change?
prompt and the materials necessary to build a
model or draw a diagram. Some effective model
ing materials include colored pencils and paper,
crayons, colored pipe cleaners, modeling clay or
wax, Tinkertoys, Legos, or any other items that are
flexible and/or "buildable."
Examples:
(a) With the materials provided, build a model
of either a plant, an animal, or a bacteria
cell.
(b) Draw a model of a cell, plant, animal, or
bacteria.
Demonstrations of Phenomena
A demonstration that asks students in advance
what they predict might happen and why is another
preconception activating technique. This technique
may follow a simple formula: "What will happen if
___ , and why?" To make it work, an instructor
must model or preview the demonstration without
actually doing it, then elicit from all students pre
dictions of what they expect to observe and why.
The predictions could be made individually in
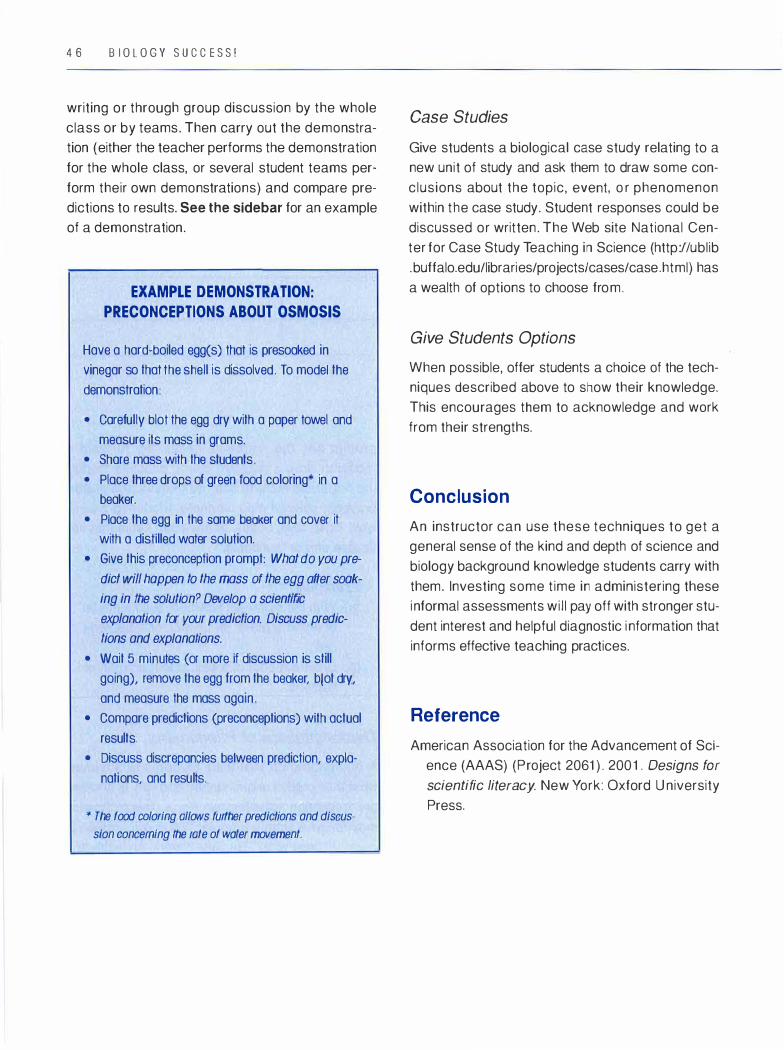
4 6 BIO L O G Y SUCC E SS !
writing or through group discussion by the whole
class or by teams. Then carry out the demonstra
tion ( either the teacher performs the demonstration
for the whole class, or several student teams per
form their own demonstrations) and compare pre
dictions to results. See the sidebar for an example
of a demonstration.
EXAMPLE DEMONSTRATION:
PRECONCEPTIONS ABOUT OSMOSIS
Have a hard-boiled egg(s) that is presoaked in
vinegar so that the shell is dissolved. To model the
demonstration:
• Carefully blot the egg dry with a paper towel and
measure its mass in grams.
• Share mass with the students.
• Place three drops of green food coloring* in a
beaker.
• Place the egg in the same beaker and cover it
with a distilled water solution.
• Give this preconception prompt: What do you pre
dict will happen to the mass of the egg offer soak
ing in the solution? Develop a scientific
explanation tor your prediction. Discuss predic
tions and explanations.
• Wait 5 minutes (or more if discussion is still
going), remove the egg from the beaker, blot dry,
and measure the mass again.
• Compare predictions (preconceptions) with actual
results.
• Discuss discrepancies between prediction, expla
nations, and results.
* The food coloring allows further predictions and discus
sion concerning the rate of water movement.
Case Studies
Give students a biological case study relating to a
new unit of study and ask them to draw some con
clusions about the topic, event, o r phenomenon
within the case study. Student responses could be
discussed or written. The Web site National Cen
ter for Case Study Teaching in Science (http://ublib
.buffalo.edu/libraries/projects/cases/case.html) has
a wealth of options to choose from.
Give Students Options
When possible, offer students a choice of the tech
niques described above to show their knowledge.
This encourages them to acknowledge and work
from their strengths.
Conclusion
An instructor can use these techniques to get a
general sense of the kind and depth of science and
biology background knowledge students carry with
them. Investing some time in administering these
informal assessments wil l pay off with stronger stu
dent interest and helpful diagnostic information that
informs effective teaching practices.
Reference
American Association for the Advancement of Sci
ence (AAAS) (Project 2061 ) . 2001 . Designs for
scientific literacy. New York: Oxford U niversity
Press.

General Teaching Methods: Start ing a Course 4 7
BIOLOGY BACKGROUND SURVEY
(Beginning of Course)
Name: __________ _ _
Please complete the following:
Multiple Choice: (circle a, b, c, or d)
1 . Charles Darwin is best known for his work:
a. with cells in the 1 9th century
b. inventing modern microscopes
c. suggesting a theory of evolution
d. discovering the structure of DNA
2. A species can be defined as:
a. a group of related organisms
b. a group of organisms that can interbreed successfully and produce fertile offspring
c. a group of organisms that have the same genes
d. a group of organisms that share similar physical characteristics
3 . Viruses are:
a. the simplest living organisms
b. infectious particles
c. thought to be nonliving entities
d. a and b
e. b and c
4. Ecology is best described as the study of:
a. species diversity
b. the interactions of species and the environment
c. natural environment
d. ecosystems
5. Cells have many membrane-bound substructures called:
a. organelles
b. molecules
c. DNA
d. proteins
(over)
4 8 BIOLOGY SUCCESS!
Short Answer
1 . Describe how scientists study the natural world using the scientific method.
2. You are setting up an experiment to study the effects on tomato seedlings of adding varying concentra
tions of salt in the watering solution. Your teacher suggests you set up a "control" as part of your experiment.
What does this mean?
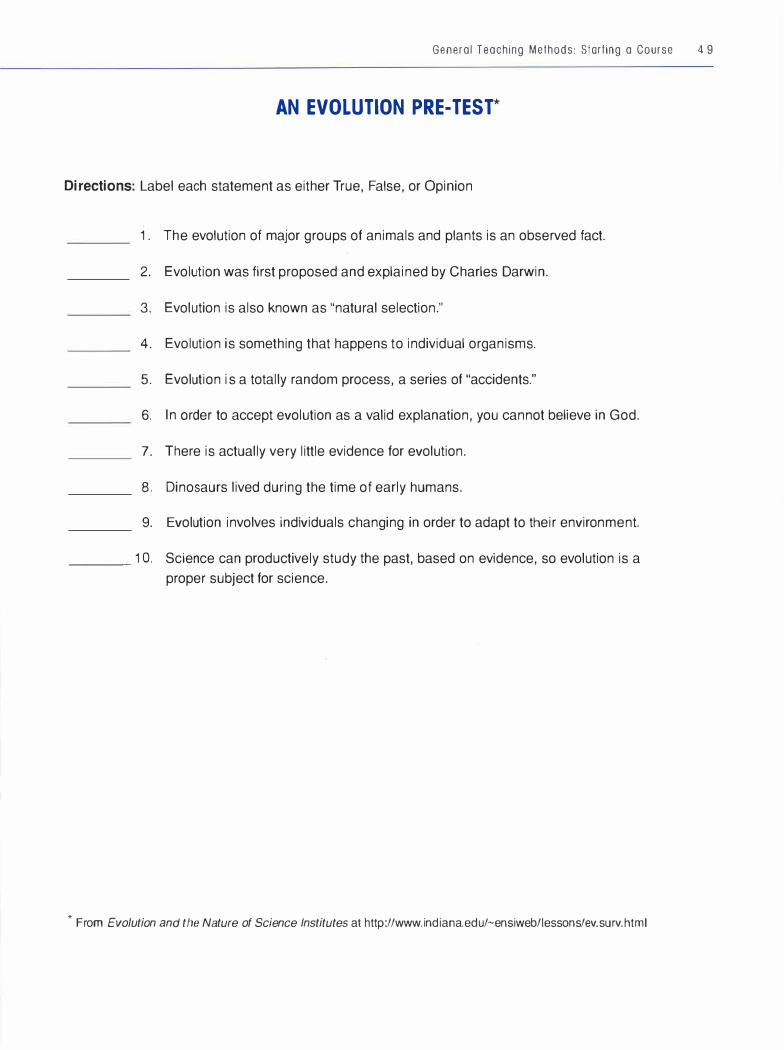
General Teaching Methods: Slorting a Course 4 9
AN EVOLUTION PRE-TEST*
Directions: Label each statement as either True, False, or Opinion
1 . The evolution of major groups of animals and plants is an observed fact.
2. Evolution was first proposed and explained by Charles Darwin.
3. Evolution is also known as "natural selection."
4. Evolution is something that happens to individual organisms.
5 . Evolution is a totally random process, a series of "accidents."
6. In order to accept evolution as a valid explanation, you cannot believe in God.
7. There is actually very little evidence for evolution.
8. Dinosaurs lived during the time of early humans.
9. Evolution involves individuals changing in order to adapt to their environment.
____ 1 O. Science can productively study the past, based on evidence, so evolution is a
proper subject for science.
* From Evolution and the Nature of Science Institutes at http://www.indiana.edu/-ensiweb/lessons/ev.surv.html


Teaching Study Skills:
Master Notebooks
Overview and Rationale
A master notebook is an organizational system
used to maintain and study all course-related mate
rials. It can be a useful course management tool for
introductory biology students. Figure 3.4 shows
some of the features of the system.
The master notebook is
• a portable filing system and reference source
for class materials;
Test
• a step-by-step study process that builds in suc
cessful study techniques;
• a strategy for increasing comprehension and
retention in preparation for tests or other
assessments; • a system for organizing all aspects of a course; • a technique that demands an active learning
approach; and • a helpful tool for developing time management
skills.
Master Notebook
Study
Process
Active
Learning
Figure 3.4. The purposes of a master notebook system
51
52 BIOLOGY SUCCESS!
Implementing a master notebook system in a
biology course can benefit all students' course
management. The system requires that students
be active participants in the organizing of their
course materials. Consequently, maintaining a
master notebook enhances students' metacogni
tive skills. Explaining the rationale behind this sys
tem helps motivate students to use this approach.
As students become more experienced learners,
they often adapt the system to meet their particu
lar learning styles. In order to stay organized, stu
dents are advised to maintain a separate master
notebook for every course they take.
Organization of the
Master Notebook
There are several ways to organize the physical
layout of the master notebook. We offer two ex
amples below, but teacher preferences and stu
dent needs may make other layouts more practical
and appropriate.
Layout One
Figure 3.5 shows one possible layout for a master
notebook. The left side contains
• the course syllabus or outline, • assignments (provided weekly by instructor),
and • the semester calendar (optional).
The right side contains
• 2-column note paper, • tab dividers/pocket keeper, • class notes in chronological order by date, • handouts: dated and hole-punched (cross
referenced to notes),
• tests, quizzes: for review, to analyze test-taking
skills,
• written assignments, and
• completed homework due today.
Layout Two
An alternative to the system described above
would be to organize the right side of the notebook
by topic. For instance, a biology course might pur
sue five topics over the course of a semester: cell
biology, genetics, evolution, botany, and zoology.
Each topic would get a unique section, and all
materials (notes, handouts, labs, etc.) related to
that topic would be filed chronologically within that
section. See Figure 3.6 for an example of this
layout.
Note Taking and the
Master Notebook
Utilizing a note-taking system is just as important
as the physical layout of the master notebook and
is key to maximizing its effectiveness. The following
system is based on the Cornell Method of note tak
ing, developed by Walter Pauk (2000) at Cornell
University.
Step 1-Taking Notes in Class
Here are some basic guidelines for taking notes:
• Give the lecture a title and date, and number
the page • Use two-column note paper, or create two
column note paper by drawing a vertical line
approximately one-third over from the left edge
of plain note paper (see Figure 3.7, the "unre
vised" example)
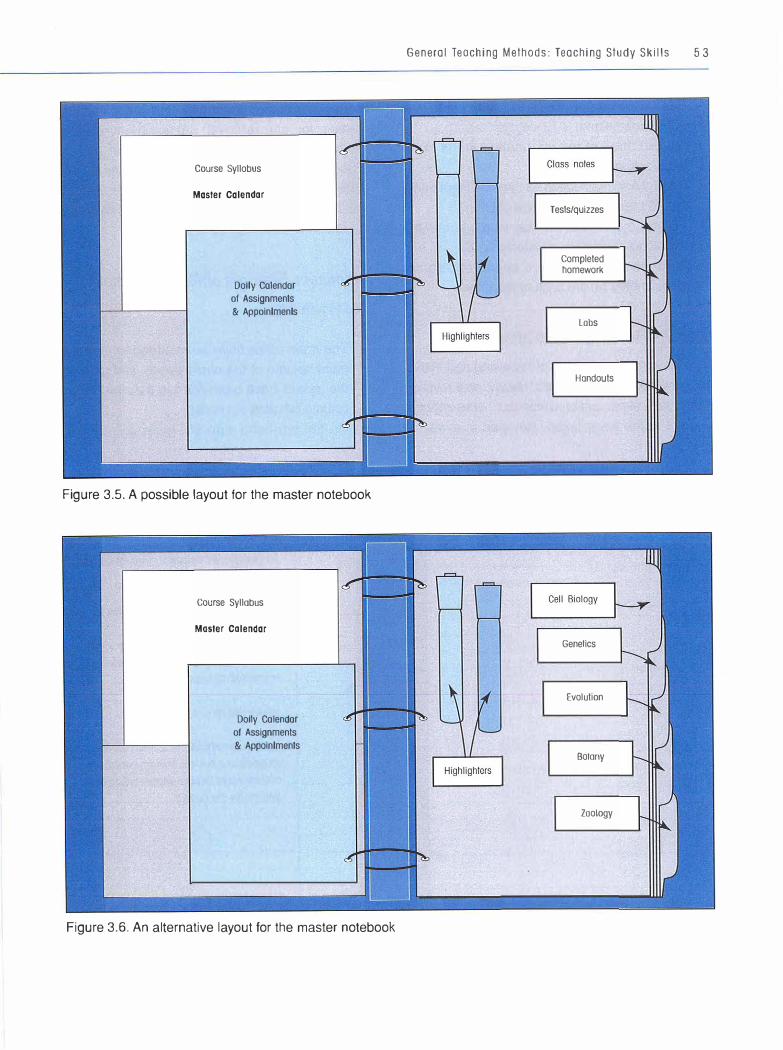
Course Syllobus
Master Calendar
Doily Calendar of Assignments & Appoinlmenls
Figure 3.5. A possible layout for the master notebook
Course Syllabus
Master Calendar
Doily Calendar of Assignments & Appoinlments
Figure 3.6. An alternative layout for the master notebook
General Teaching Methods: Teaching Study Skills 5 3
Tesls/quizzes
Completed homework
Lobs
Handouts
Genelics
Evolution
Botany
Zoology
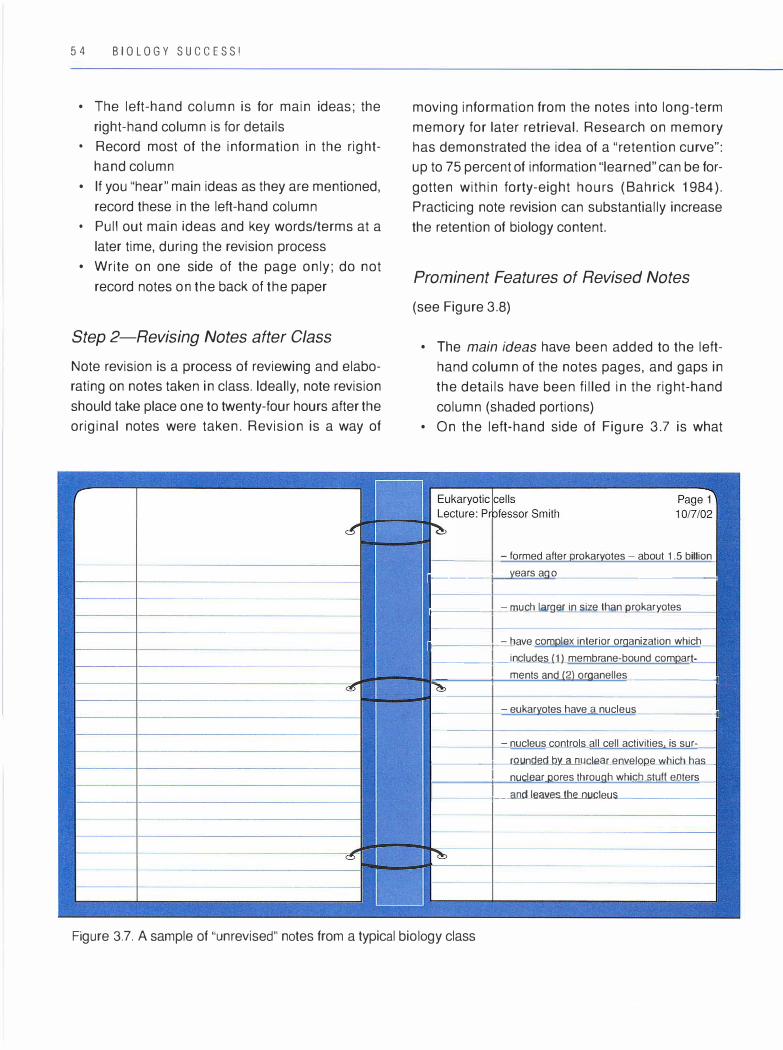
54 BIOLOGY SUCCESS!
• The left-hand column is for main ideas; the
right-hand column is for details
• Record most of the information in the right
hand column • If you "hear" main ideas as they are mentioned,
record these in the left-hand column • Pull out main ideas and key words/terms at a
later time, during the revision process • Write on one side of the page only; do not
record notes on the back of the paper
Step 2-Revising Notes after Class
Note revision is a process of reviewing and elabo
rating on notes taken in class. Ideally, note revision
should take place one to twenty-four hours after the
original notes were taken. Revision is a way of
moving information from the notes into long-term
memory for later retrieval. Research on memory
has demonstrated the idea of a "retention curve":
up to 75 percent of information "learned" can be for
gotten within forty-eight hours (Bahrick 1984).
Practicing note revision can substantially increase
the retention of biology content.
Prominent Features of Revised Notes
(see Figure 3.8)
• The main ideas have been added to the left
hand column of the notes pages, and gaps in
the details have been filled in the right-hand
column (shaded portions) • On the left-hand side of Figure 3.7 is what
- formed after rokar oles - about 1.5 billion
1 _ _ __ 1__Jtears ag,=o _ _ _ _ _____ _
,-- ----.---�m�u=ch�l=arger in size than rokaryotes
1 ____ 1_-_h_a_v_e _co�mQlex interior organization which ----,--i�nc�lu�d=es_(,1) membrane-bound comQar
�- --,- �m=e�nt=s=an=de....,
(�...m:ganelles _____ ,
- eukaryotes have a nucleus __ _ __ ,
- nucleus controls all cell activities. is sur-
___ __, __ ro_u-nd_e-d�by_a_mJclear enveloQe which has ----,-�n�uc=le-a�r. pores through which stuff enters
_ _ __ 1.__an_d_J_e_alle_:i..lb.e..nu_cJeu..s'--------
Figure 3.7. A sample of "unrevised" notes from a typical biology class
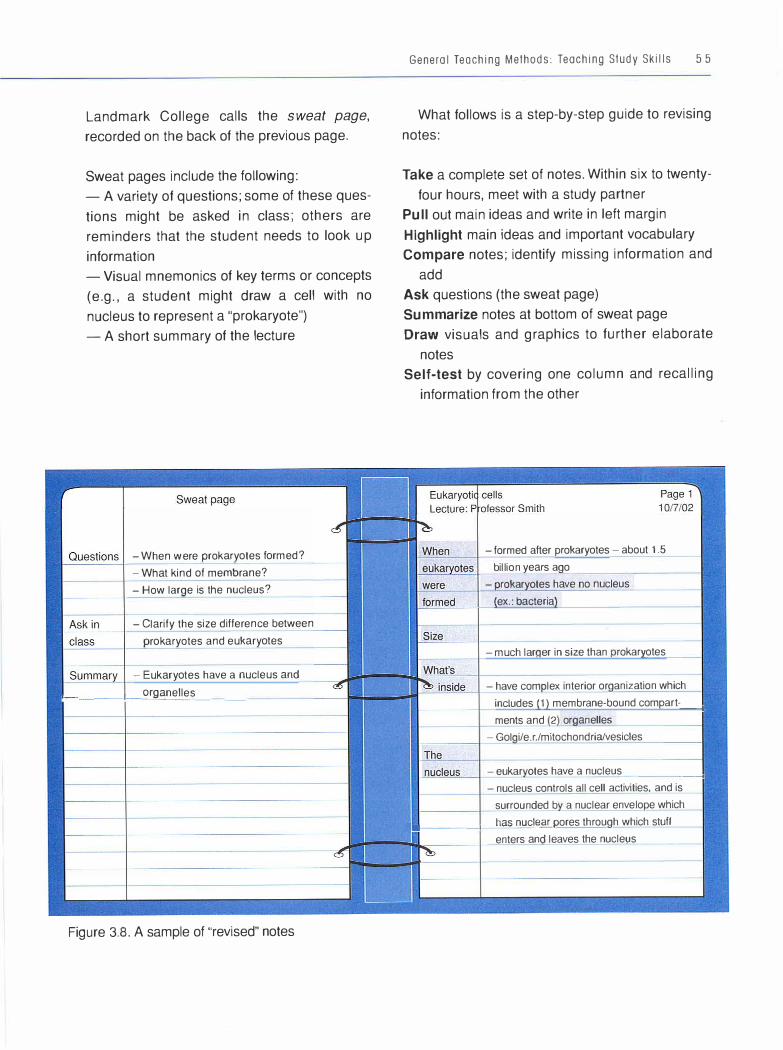
Landmark College calls the sweat page,
recorded on the back of the previous page.
Sweat pages include the following:
- A variety of questions; some of these ques
tions might be asked in class; others are
reminders that the student needs to look up
information
- Visual mnemonics of key terms or concepts
(e.g., a student might draw a cell with no
nucleus to represent a "prokaryote")
- A short summary of the lecture
- When were prokaryotes formed?
- What kind of membrane?
- How large is the nucleus?
- Clarify the size difference between
prokaryotes and eukaryotes
- Eukaryotes have a nucleus and
1-----i--=-or_,,g..::an:..:.ce::.:cll-=-es __ _
Figure 3.8. A sample of "revised" notes
General Teaching Methods: Teaching Study Skills 5 5
What follows is a step-by-step guide to revising
notes:
Take a complete set of notes. Within six to twenty-
four hours, meet with a study partner
Pull out main ideas and write in left margin
Highlight main ideas and important vocabulary
Compare notes; identify missing information and
add
Ask questions (the sweat page)
Summarize notes at bottom of sweat page
Draw visuals and graphics to further elaborate
notes
Self-test by covering one column and recalling
information from the other
- formed after prokaryotes - about 1.5
billion years ago
- rokar ates have no nucleus
(ex.: bacteria)
- much lar er in size than rokary�o_te_s _ _
- have com lex interior organization which
includes (1) membrane-bound comi:>art-_ ments and 2 or anelles
- Gol i/e.r./mitochondria/vesicles
- eukar ates have a nucleus _ __ _ _
- nucleus controls all cell activities, and is
surrounded b a nuclear enve lope which
ri•----l--'h=a=s-'-n=u =cl=ea=-r, r:iores through which stuff
enters and leaves the nucleus
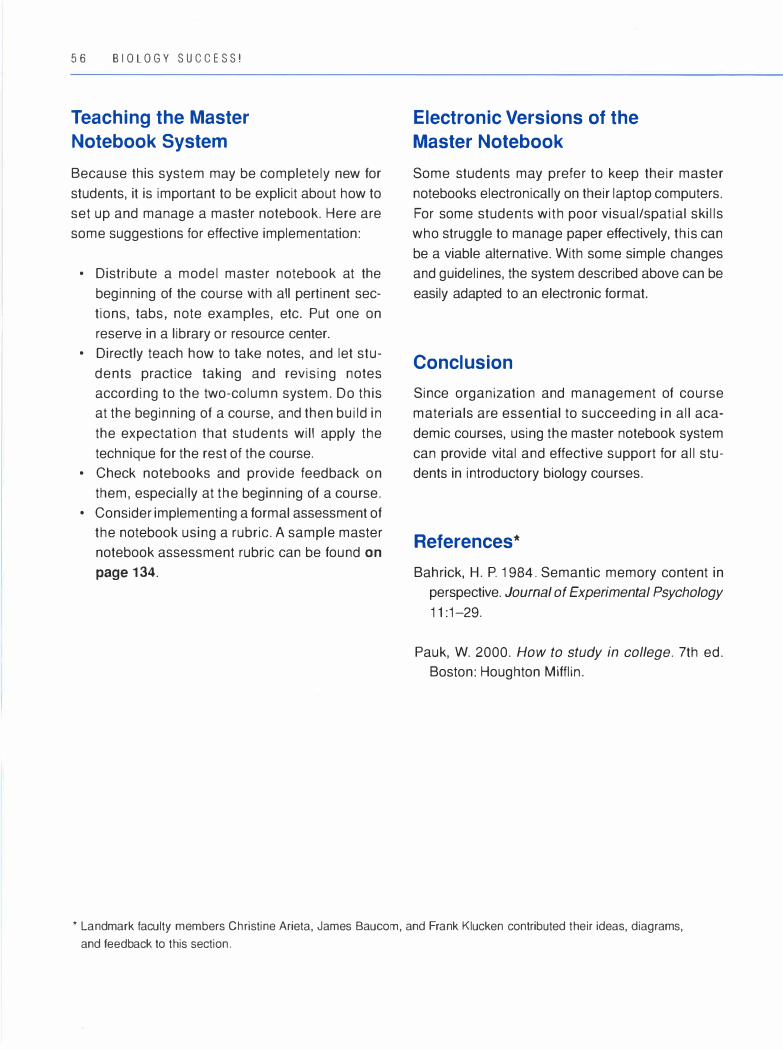
56 BIOLOGY SUCCESS!
Teaching the Master
Notebook System
Because this system may be completely new for
students, it is important to be explicit about how to
set up and manage a master notebook. Here are
some suggestions for effective implementation:
• Distribute a model master notebook at the
beginning of the course with all pertinent sec
tions, tabs, note examples, etc. Put one on
reserve in a library or resource center. • Directly teach how to take notes, and let stu
dents practice taking and revising notes
according to the two-column system. Do this
at the beginning of a course, and then build in
the expectation that students will apply the
technique for the rest of the course. • Check notebooks and provide feedback on
them, especially at the beginning of a course. • Consider implementing a formal assessment of
the notebook using a rubric. A sample master
notebook assessment rubric can be found on
page 134.
Electronic Versions of the
Master Notebook
Some students may prefer to keep their master
notebooks electronically on their laptop computers.
For some students with poor visual/spatial skills
who struggle to manage paper effectively, this can
be a viable alternative. With some simple changes
and guidelines, the system described above can be
easily adapted to an electronic format.
Conclusion
Since organization and management of course
materials are essential to succeeding in all aca
demic courses, using the master notebook system
can provide vital and effective support for all stu
dents in introductory biology courses.
References*
Bahrick, H. P. 1984. Semantic memory content in
perspective. Journal of Experimental Psychology
11 :1-29.
Pauk, W. 2000. How to study in college. 7th ed.
Boston: Houghton Mifflin.
* Landmark faculty members Christine Ariela, James Baucom, and Frank Klucken contributed their ideas, diagrams, and feedback to this section.
Teaching Study Skills:
Textbooks
Background
Biology textbooks typically pose a great challenge
to all students, but especially to students with
learning disabilities. These dictionary-sized tomes
hold a vast reservoir of descriptions of biological
phenomena that can at first glance be quite over
whelming and off-putting. To a student with little
background knowledge, the organization is
obscure; most of the facts and descriptions of phe
nomena seem disconnected. It is hard to find the
big picture or the unity of biology when so many
details seem to be emphasized.
The vocabulary demands of a biology textbook
can be viewed as another intimidating factor.
Learning biological terminology is like learning a
foreign language. Not only are there lots of Latin
based words, but these words are often introduced
at a rapid-fire pace.
That biology textbooks lack user-friendliness
has not gone unnoticed. The American Association
for the Advancement of Science, through its Project
2061 initiative (AAAS 2000), has released a
scathing assessment of science textbook quality.
Its criticism includes some of the most popular
texts of biology at the high school level. The goal
57
of Project 2061 is to improve science literacy
through research-based reforms. According to
AAAS's assessment, the texts neither aligned
well with the National Research Council's (1996)
National Science Education Standards, nor did
they promote meaningful scientific literacy.
The Project 2061 guidelines advocate science
textbook reform that follows these principles:
• Explicit inclusion of common student miscon
ceptions about science • Structured exercises that promote thinking
about scientific phenomena
• Lots of opportunities for students to practice
and apply what they are learning
While we wait for these reforms to become
reality, textbooks will continue to be a key compo
nent of our science teaching culture. Biology teach
ers must recognize the inherent challenges these
texts offer students, and provide direct support and
structures that make managing and learning from a
biology textbook easier (Roseman, Kulm, and
Shuttleworth 2001 ).
58 BIOLOGY SUCCESS!
Strategies and Ideas
Choose the Right Book
There are myriad choices for biology textbooks at
both the high school and the college level. Besides
the criteria put forward under Project 2061, con
sider using a text that has these features, which are
beneficial to students with learning disabilities:
• Is concise, not a compendium
• Is driven by concepts, not terms and details • Provides a sense of the big picture and often
refers to it • Offers a visually appealing but not overwhelm
ing or overstimulating layout • Contains effective learning aids, such as
chapter outlines and headings in the form of
questions • Has a CD-ROM supplement for the computer
oriented learner • Contains quality visual aids to help visual
learners • Provides a user-friendly glossary with easy-to
understand definitions
Host a Textbook Orientation Session
Because some students have difficulty sensing and
interpreting textbook structure independently,
spend some time in class before assigning read
ing from the book to preview the features and lay
out of the text. Choose a sample chapter and
uncover the structure and learning aids explicitly
with students. This can be more informal with a
savvy group of students, or more structured with a
less sophisticated group. See page 61 for an
example of a biology textbook orientation guide.
Provide Clear and Explicit Expectations for Student Use of Text
Present to students a written set of instructions on
your text-reading expectations. For example, you
may decide that the S03R reading technique (see
page 59) is the approach that will work best. Or you
may come up with some variation on that. The
important thing is to offer guidance to students and
set a standard for their efforts.
Make Individual Suggestions to Students
Although tailoring your teaching may be hard as a
course begins, use what you know about your stu
dents' learning profiles to make suggestions to indi
vidual students. For example, an instructor might
suggest to a strong visual learner that he or she
focus learning on the diagrams and other visual
aids contained in the text and use the reading as a
backup. As another example, an instructor might
recommend that a student take class notes directly
in the textbook next to the relevant section. This
may help that student interact more effectively with
the text, noting its structure and relevance to the
course.
Use the Text During Class
The more you emphasize and make reference to
the text, the more value (and therefore use) your
students will place on it. This can be done in two
ways. First, use the anecdotes, examples, and
visual diagrams from the text during your in-class
lessons; doing so may help to bring the book alive
for students. Second, have open-ended discus
sions about students' experiences with the text. Ask
students to reflect on and share their comprehen
sion and study strategies, and encourage them to
offer criticisms of the text.
Provide Instruction on a Reading Technique
Instruction and guidance on specific reading tech
niques may assist students in using biology text
books more effectively. One common and effective
example is called S03R, developed by psycholo
gist Francis P. Robinson (1946). In a nutshell, it
combines reading with active note taking and
review, and is an example of what is called a multi
pass strategy. The following provides an overview
of SQ3R:
S = Survey
a= Question
R = Read
R = Recite
R = Review
Survey - A survey entails a before-reading pre
view of an assignment that focuses on looking over
headings, introductory outlines, visual aids, and
chapter summaries. This helps readers anticipate
upcoming content and helps make a connection to
their prior knowledge.
Question - For texts whose headings are not in
the form of questions, the reader creates and writes
questions next to the major chapter headings. This
helps to foster purpose and a sense of actively
searching for the answers within the reading.
Read - Reading is driven by the need to search
out answers to the questions the reader has writ
ten. Answers are highlighted, as are other ideas
that seem key. A color-coded highlight system is
used that is consistent from reading to reading: one
color for main ideas, one color for important details,
and one color for vocabulary. The 20 percent rule is
used: no more than 20 percent of text should be
highlighted. Another way to express this is: high
light only two lines out of every ten lines of text.
General Teaching Methods: Teaching Study Skills 5 9
Recite - Highlighting is reviewed, and notes that
paraphrase main ideas and vocabulary are written
in the margin. Symbols and abbreviations are used
to note things such as questions (?), most impor
tant concepts (*), and connections between con
cepts (arrows).
Review - The completed reading is looked over,
learning is verbally reviewed, comprehension level
is assessed, and some self-quizzing techniques
are carried out.
For a fuller explanation of this technique, exam
ine the following online resource:
http://www.ucc.vt.edu/lynch/TextbookReading.htm
Give Out a Set of Study Questions for Each Text Chapter
The teacher can develop study questions or can
use the ones commonly provided at the end of
each chapter in the text. If using the questions pro
vided by the text, photocopy them so students have
a handy reference guide while reading that does
not require them to turn pages to the end of the
chapter. Identify the questions that are most rele
vant and those which are unimportant in your
course. For students who need extra support, pro
vide the page number reference for each study
question. This technique gives students a clear
sense of what knowledge they are accountable for
in each reading assignment. The following are
examples of study questions for a textbook chap
ter on evolution:
a. Explain the central tenet for the theory of evo
lution.
b. Distinguish between Darwin's theory of natural
selection and a broader theory of evolution.
c. Paraphrase the observations and inferences
that form Darwin's theory of natural selection.
6 0 B I O L O G Y S U C C E S S !
Provide a Graphic Organizer for Text
Note Taking for Each Chapter
A graphic organizer should show a visual outline
that is partially filled in with headings or ideas. The
rest is left blank for the students to fill in while they
are reading. See page 64 for a sample graphic
organizer for a biology textbook chapter. The
instructor may need to model how to best incorpo
rate this tool, after which students can practice
designing their own graphic organizers for reading
notes. The Inspiration software program is an
excellent tool for creating graphic organizers. Con
sider teaching it to students and letting them apply
it to their reading. This kind of task is also a good
introduction to more formalized concept maps.
Assign a Reading after a Class Session Has Introduced the Concepts
Some students may make stronger connections to
the reading if their first exposure to ideas and con
cepts is in class with concrete phenomena or
examples. Suggest using the text as a review or
elaboration of class notes and activities. This tech
nique supports the idea that an initial hands-on and
direct experience with concepts can provide a foun
dation for more effective reading-based learning
later.
Build Metacognition into the Textbook Reading Experience
After students have been working in the course
for a while, ask them to reflect on their effective-
ness using the textbook. What reading strategies
and techniques have they been using? Are they
working? What might they change in their ap
proach to get more out of the textbook? Encour
age them to share their experiences and develop
a personalized process for interacting with their
textbook.
Conclusion
It is important to guide students through effective
textbook usage. Instructors can choose from the
strategies described above to make biology text
books more meaningful to all students.
References
American Association for the Advancement of Sci
ence (AAAS). 2000. Big biology books fail to
convey big ideas, reports AAAS's Project 2061 .
News release, June 27, 2000. http://www
.project2061 .org/press/pr000627. htm
National Research Council. 1996. National science
education standards. Washington, DC: National
Academies Press.
Robinson, F. P. 1 946. Effective study. New York:
Harper and Bros.
Roseman, J. E., G. Kulm, and S. Shuttleworth.
2001 . Putting textbooks to the test. Eisenhower
National Clearinghouse Focus 8 (3): 56-59.

General Teaching Methods: Teaching Study Sk i l ls 6 1
BIOLOGY TEXTBOOK ORIENTATION GUIDE
Directions: Analyze the course textbook, looking for the features listed below.
1 . The Textbook as a Whole
Check if present:
Brief table of contents
Detailed table of contents
Introduction
_ Glossary
Index
Are there any appendices? If so, what are they?
2. A Sample Chapter
Choose any chapter, ideally in the middle of the book, and look for the following features. Write your answer
in the space below each question.
Chapter Beginning
Does the chapter start with an outline?
Does the chapter start with a key concept list?
Does the chapter start with questions to focus reading?
6 2 BIOLOGY SUCCE S S !
Does the chapter start with a story to grab interest?
Describe any other learning aid or feature evident at the beginning of the chapter.
Within the Chapter
How many different-size headings are there?
Are there different-size headings in different colors?
Are the headings in question form or statement form?
Are there number codes for each heading or section?
Is vocabulary in bold or italics?
Is some text in color? If so, how is color used to mark different kinds of text?
Are there summaries after each major topic or heading?
Are visual aids varied, simple, and clear?

General Teaching Methods: Teaching Study Skills 6 3
Are there boxed sidebars? If so, what is their purpose?
Are other learning aids or features evident? If so, what are they?
Chapter Ending
Is there a chapter summary or outline of key concepts?
Is there a vocabulary list? With page references?
Are there review questions? If so, what form do they take? (multiple choice, short answer, etc.)
Are there any other learning aids or features evident? If so, what are they?
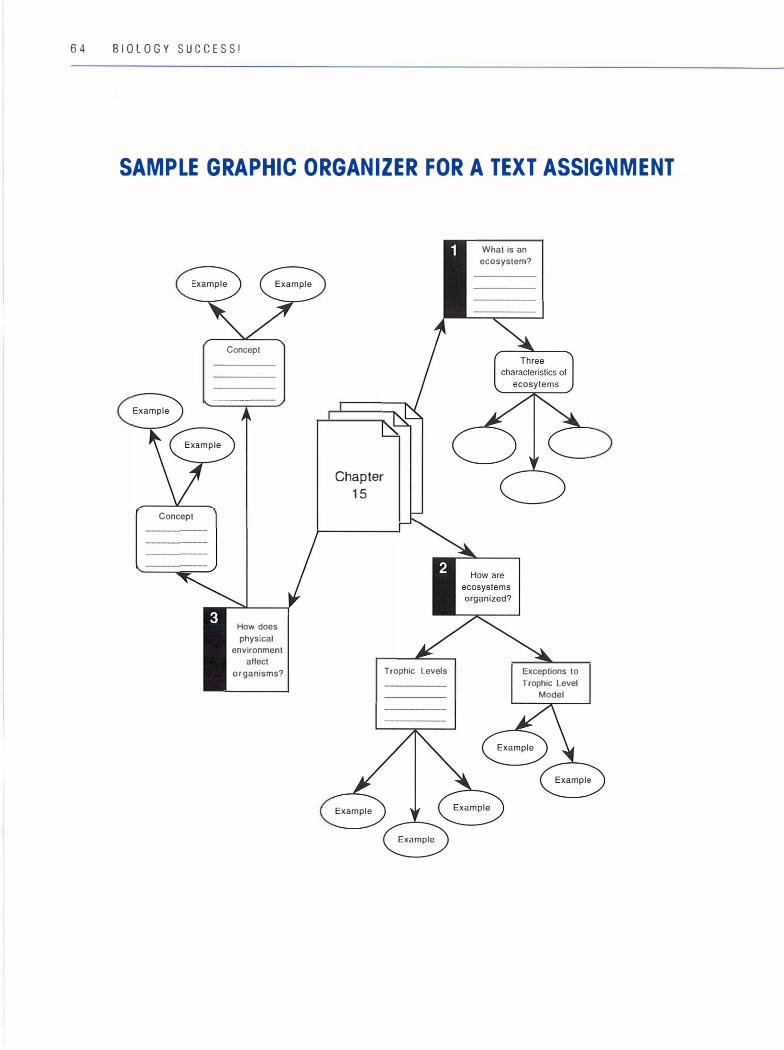
6 4 B I O L O G Y S U C C E S S !
SAMPLE GRAPHIC ORGANIZER FOR A TEXT ASSIGNMENT
Concepl
Concepl
How does
physical
environmenl
affecl
organisms?
Chapter
1 5
Trophic Levels
Whal is an
ecosyslem?
Exceplions lo
Trophic Level
Model
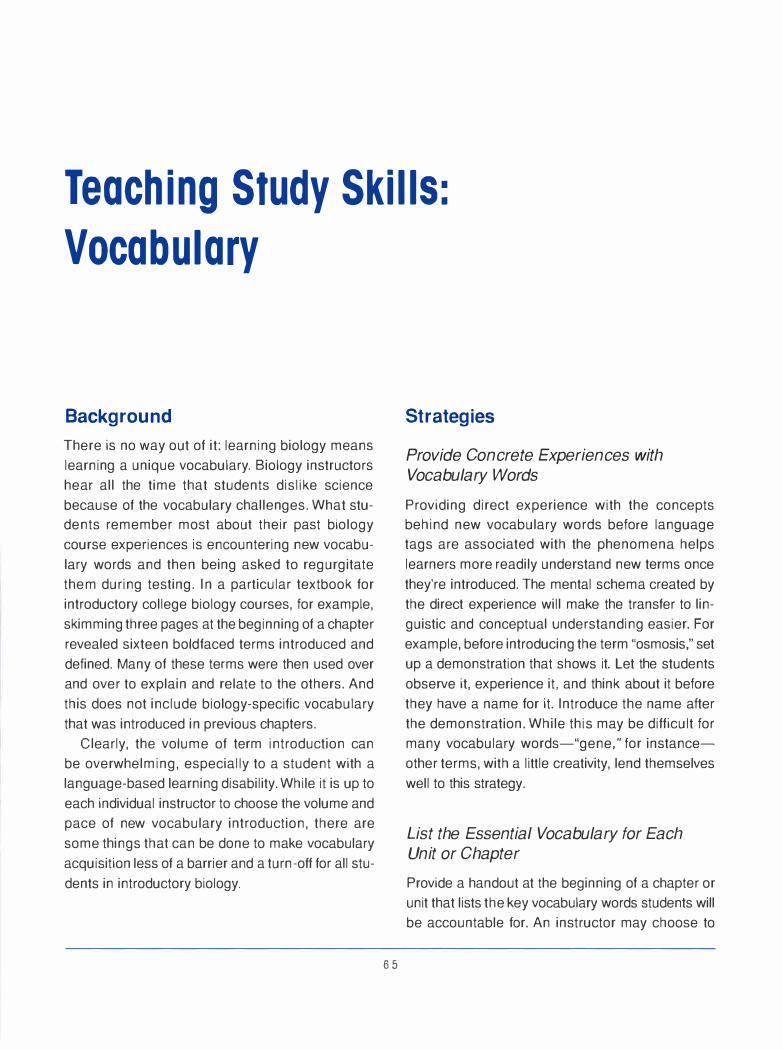
Teach ing Study Ski l ls :
Vocabu lary
Background
There is no way out of it: learning biology means
learning a unique vocabulary. Biology instructors
hear all the time that students dislike science
because of the vocabulary challenges. What stu
dents remember most about their past biology
course experiences is encountering new vocabu
lary words and then being asked to regurgitate
them during testing. In a particular textbook for
introductory college biology courses, for example,
skimming three pages at the beginning of a chapter
revealed sixteen boldfaced terms introduced and
defined. Many of these terms were then used over
and over to explain and relate to the others. And
this does not include biology-specific vocabulary
that was introduced in previous chapters.
Clearly, the volume of term introduction can
be overwhelming, especially to a student with a
language-based learning disability. While it is up to
each individual instructor to choose the volume and
pace of new vocabulary introduction, there are
some things that can be done to make vocabulary
acquisition less of a barrier and a turn-off for all stu
dents in introductory biology.
6 5
Strategies
Provide Concrete Experiences with Vocabulary Words
Providing direct experience with the concepts
behind new vocabulary words before language
tags are associated with the phenomena helps
learners more readily understand new terms once
they're introduced. The mental schema created by
the direct experience will make the transfer to lin
guistic and conceptual understanding easier. For
example, before introducing the term "osmosis," set
up a demonstration that shows it. Let the students
observe it, experience it, and think about it before
they have a name for it. Introduce the name after
the demonstration. While this may be difficult for
many vocabulary words-"gene," for instance
other terms, with a little creativity, lend themselves
well to this strategy.
List the Essential Vocabulary for Each Unit or Chapter
Provide a handout at the beginning of a chapter or
unit that lists the key vocabulary words students will
be accountable for. An instructor may choose to
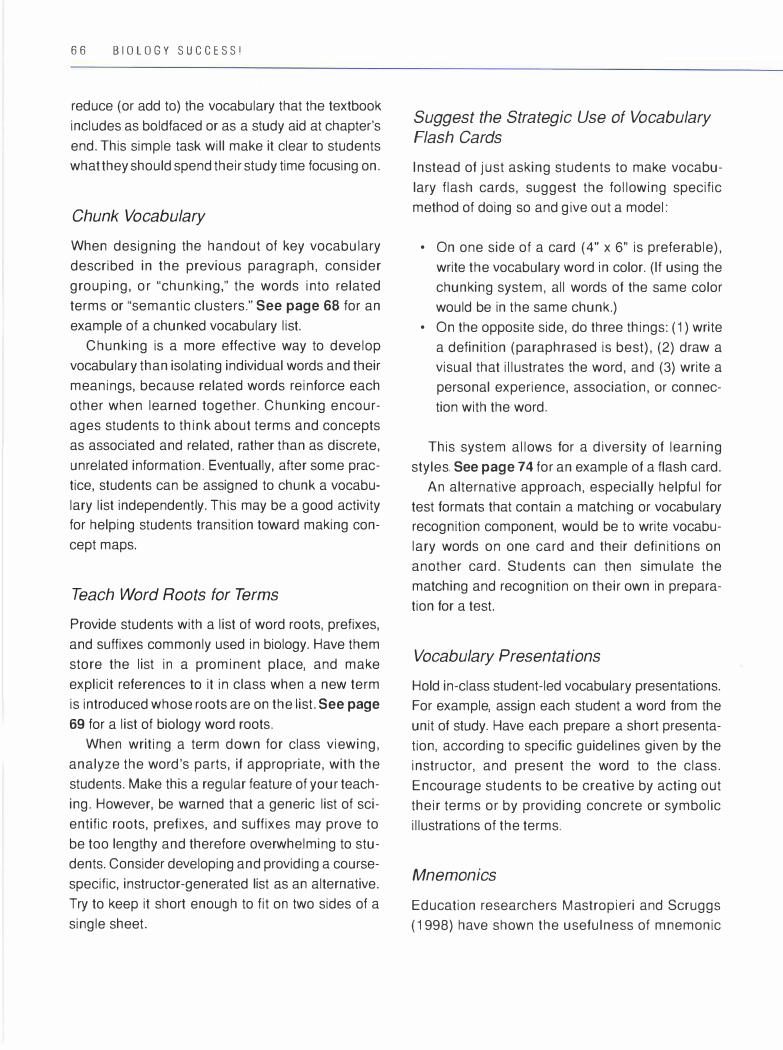
6 6 B I O L O G Y S U C C E S S !
reduce (or add to) the vocabulary that the textbook
includes as boldfaced or as a study aid at chapter's
end. This simple task will make it clear to students
what they should spend their study time focusing on.
Chunk Vocabulary
When designing the handout of key vocabulary
described in the previous paragraph, consider
grouping, or "chunking," the words into related
terms or "semantic clusters." See page 68 for an
example of a chunked vocabulary list.
Chunking is a more effective way to develop
vocabulary than isolating individual words and their
meanings, because related words reinforce each
other when learned together. Chunking encour
ages students to think about terms and concepts
as associated and related, rather than as discrete,
unrelated information. Eventually, after some prac
tice, students can be assigned to chunk a vocabu
lary list independently. This may be a good activity
for helping students transition toward making con
cept maps.
Teach Word Roots for Terms
Provide students with a list of word roots, prefixes,
and suffixes commonly used in biology. Have them
store the list in a prominent place, and make
explicit references to it in class when a new term
is introduced whose roots are on the list. See page
69 for a list of biology word roots.
When writing a term down for class viewing,
analyze the word's parts, if appropriate, with the
students. Make this a regular feature of your teach
ing. However, be warned that a generic list of sci
entific roots, prefixes, and suffixes may prove to
be too lengthy and therefore overwhelming to stu
dents. Consider developing and providing a course
specific, instructor-generated list as an alternative.
Try to keep it short enough to fit on two sides of a
single sheet.
Suggest the Strategic Use of Vocabulary Flash Cards
Instead of just asking students to make vocabu
lary flash cards, suggest the following specific
method of doing so and give out a model:
• On one side of a card (4" x 6" is preferable),
write the vocabulary word in color. (If using the
chunking system, all words of the same color
would be in the same chunk.) • On the opposite side, do three things: (1) write
a definition (paraphrased is best), (2) draw a
visual that illustrates the word, and (3) write a
personal experience, association, or connec
tion with the word.
This system allows for a diversity of learning
styles. See page 74 for an example of a flash card.
An alternative approach, especially helpful for
test formats that contain a matching or vocabulary
recognition component, would be to write vocabu
lary words on one card and their definitions on
another card. Students can then simulate the
matching and recognition on their own in prepara
tion for a test.
Vocabulary Presentations
Hold in-class student-led vocabulary presentations.
For example, assign each student a word from the
unit of study. Have each prepare a short presenta
tion, according to specific guidelines given by the
instructor, and present the word to the class.
Encourage students to be creative by acting out
their terms or by providing concrete or symbolic
illustrations of the terms.
Mnemonics
Education researchers Mastropieri and Scruggs
(1998) have shown the usefulness of mnemonic
memory strategies for vocabulary acquisition
with a diversity of learners. Using a mnemonic
strategy provides a student with some form of
mental cuing structure that facilitates recall of
detailed, long, or complex information. Mastropieri
and Scruggs's research has shown that student
created mnemonics are more effective than
teacher-made mnemonics.
If student recall of vocabulary is an important
part of an instructor's assessment of science learn
ing, then teaching students some basic mnemonic
strategies is suggested. Below are three basic
kinds of mnemonic devices: the acronym tech
nique, the keyword technique, and the "Pictionary"
technique, with some biology-related examples.
Acronym technique. A student or instructor uses
the terms to be memorized to create a word or
sentence in a precise sequence. If a student had
to recall the phases of mitosis in sequence, for
example, the acronym "PMAT" might help. Since
that acronym is not a word itself and therefore
may be hard to remember, the sentence "Prunes
Make Apples Tart" may work better.
Keyword technique. Term recall is facilitated by
identifying words or phrases that are acousti
cally similar to the term to be remembered. For
example, if the term "mitochondria" needs to be
recalled, then the mnemonic "the mighty have
lots of energy" may assist in summoning that
term and its function from a student's memory.
"Pictionary" technique. Term recall is facilitated
by the creation of a concrete or a metaphorical
image. For example, if the term "endoplasmic
General Teaching Methods: Teaching Study Skills 6 7
reticulum" needs to be recalled, then the drawn
or imagined image of an ambulance traveling on
a road to the Emergency Room may assist a stu
dent in remembering the desired term and its
function.
It can be both fun and valuable for students to
share their mnemonic creations with the rest of the
class.
Build Metacognition into Vocabulary Development
After students have been working in the course for
a while, ask them to reflect on their success with
learning course vocabulary. What vocabulary learn
ing strategies and techniques have they been
using? Are these strategies working? Are there
other techniques they could use that might be more
effective given their learning styles? Encourage
them to share their experience and develop a per
sonalized process for building course-specific biol
ogy vocabulary.
Reference
Mastropieri, M. A., and T. E. Scruggs. 1998.
Enhancing school success with mnemonic
strategies. Inter vention in School and Clinic 33
(4): 201-208.
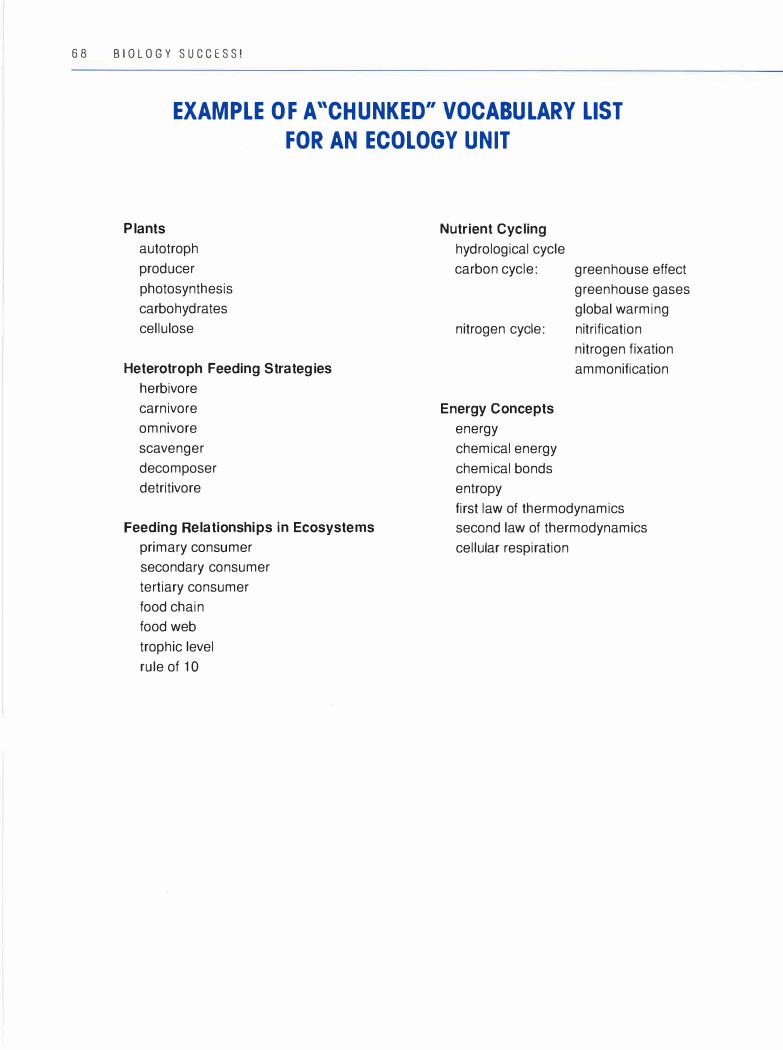
6 8 B I O L O G Y S U C C E S S !
EXAMPLE OF A "CHUNKED" VOCABULARY LIST
FOR AN ECOLOGY UNIT
Plants
autotroph
producer
photosynthesis
carbohydrates
cellulose
Heterotroph Feeding Strategies
herbivore
carnivore
omnivore
scavenger
decomposer
detritivore
Feeding Relationships in Ecosystems
primary consumer
secondary consumer
tertiary consumer
food chain
food web
trophic level
rule of 1 O
Nutrient Cycling
hydrological cycle
carbon cycle:
nitrogen cycle:
Energy Concepts
energy
chemical energy
chemical bonds
entropy
greenhouse effect
greenhouse gases
global warming
nitrification
nitrogen fixation
ammonification
first law of thermodynamics
second law of thermodynamics
cellular respiration

General Teaching Methods: Teaching Study Ski l ls 6 9
BIOLOGY VOCABULARY: WORD ROOTS
Knowing the common roots, prefixes, and suffixes involved in forming many words
will help students understand and retain terms we often use in biology. Many compo
nents are derived from Latin (L) or Greek (G), but other languages also contribute.
(Students already know a fair number of roots, whether they realize it or not, as the
same roots form many ordinary words in the English language.) This brief list is com
piled mainly from the Dictionary of Word Roots and Combining Forms by Donald J .
Borror (Mountain View, CA: Mayfield Publishing Co., 1 960) , The New Cold Latin and
English Dictionary (New York: Bantam Books, 1 966), and Websters Ninth New Colle
giate Dictionary (Springfield, MA: Merriam-Webster, 1 989). (Note: Variations of given
roots are preceded by -; for example, a/bi and a/bid are variations of the given root alb.)
Root Meaning
ab (L) off, from, away
ad (L) to, toward
alb, -i, -id (L) white
allelo (G) one another; parallel
ameb, -a, -o (G) change
amph, -i, -o (G) around, on both sides; double
ampulla (L) a flask
an (G) without, not
ang, -ea, -i, -io (G) a vessel, box, case
annel, -us (L) a ring, a little ring
ante (L) before
archae, -o (G) ancient
arthr, -o, -um (G) a joint; speech
aur, -ar, -at, -e, -i (L) gold, golden
aur, -i, -icul, -is, -it (L) an ear
aut, -o (G) self
bi (L) two, twice, double
blast, -em, -o, -us (G) a bud, sprout
botan, -a (G) pasture, grass, fodder
branch, -i, -o, -ium (G) a gill; a fin; hoarse
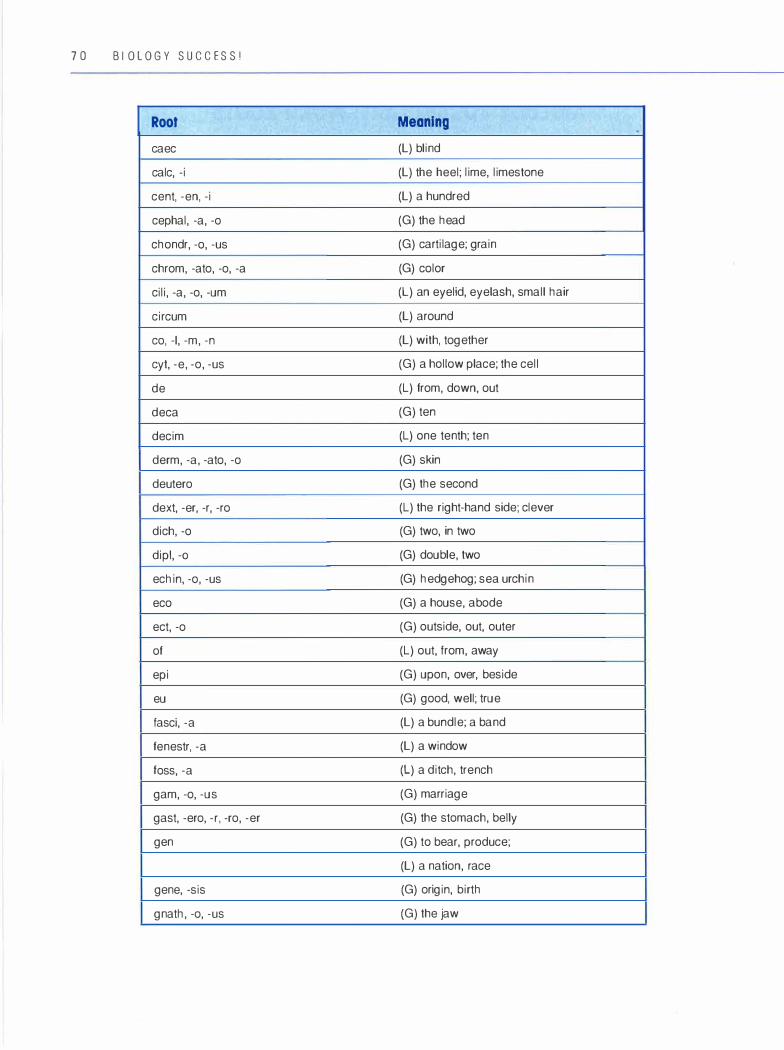
7 0 BIOLOGY SUCCESS!
Root
caec
calc, -i
cent, -en, -i
cephal, -a, -o
chondr, -o, -us
chrom, -ato, -o, -a
cili, -a, -o, -um
circum
co, -1, -m, -n
cyt, -e, -o, -us
de
deca
decim
derm, -a, -ato, -o
deutero
dext, -er, -r, -ro
dich, -o
dipl, -0
echin, -o, -us
eco
ect, -o
of
epi
eu
fasci, -a
fenestr, -a
toss, -a
gam, -o, -us
gast, -ero, -r. -ro, -er
gen
gene, -sis
gnath, -o, -us
Meaning
(L) blind
(L) the heel; lime, limestone
(L) a hundred
(G) the head
(G) cartilage; grain
(G) color
(L) an eyelid, eyelash, small hair
(L) around
(L) with, together
(G) a hollow place; the cell
(L) from, down, out
(G) ten
(L) one tenth; ten
(G) skin
(G) the second
(L) the right-hand side; clever
(G) two, in two
(G) double, two
(G) hedgehog; sea urchin
(G) a house, abode
(G) outside, out, outer
(L) out, from, away
(G) upon, over, beside
(G) good, well; true
(L) a bundle; a band
(L) a window
(L) a ditch, trench
(G) marriage
(G) the stomach, belly
(G) to bear, produce;
(L) a nation, race
(G) origin, birth
(G) the jaw

Root
gymn, -o
haem, -ato, -o, -a
heli, -a, -o
helmin, -s, -th
heter, -o
horn, -in, -o
horn, -eo, -o, -oeo, -oio
homin, -i
hormon
hydr, -a, -i, -o
hyp, -0
hyper
ichthy, -o, -s
id
in
infra
is, -o
kary, -o
kera, -to
kilo
lact, -e, -i, -o
lamin, -a, -i
leuk, -o
lys, -i, -is, -io
mar, -i
mei, -o
melan, -o
mes, -o
micr, -o
mit, -o, -us
morph, -o, -a
morul, -a
muta
General Teaching Methods: Teaching Study Skills 7 l
Meaning
(G) naked, bare
(G) blood
(G) the sun
(G) a worm
(G) other, different
(L) man
(G) like, same, alike
(L) man
(G) excite
(G) water
(G) under, beneath
(G) over, above, excessive
(G) a fish
(L) a condition of
(L) in, into; not, without; on
(L) below, beneath
(G) equal
(G) nut; the nucleus
(G) horn
(G) a thousand
(L) milk
(L) a thin plate, sheet, layer
(G) white
(G) loose; a loosening
(L) the sea
(G) less; to diminish
(G) black
(G) the middle
(G) small
(G) a thread
(G) form
(L) a little mulberry
(L) change
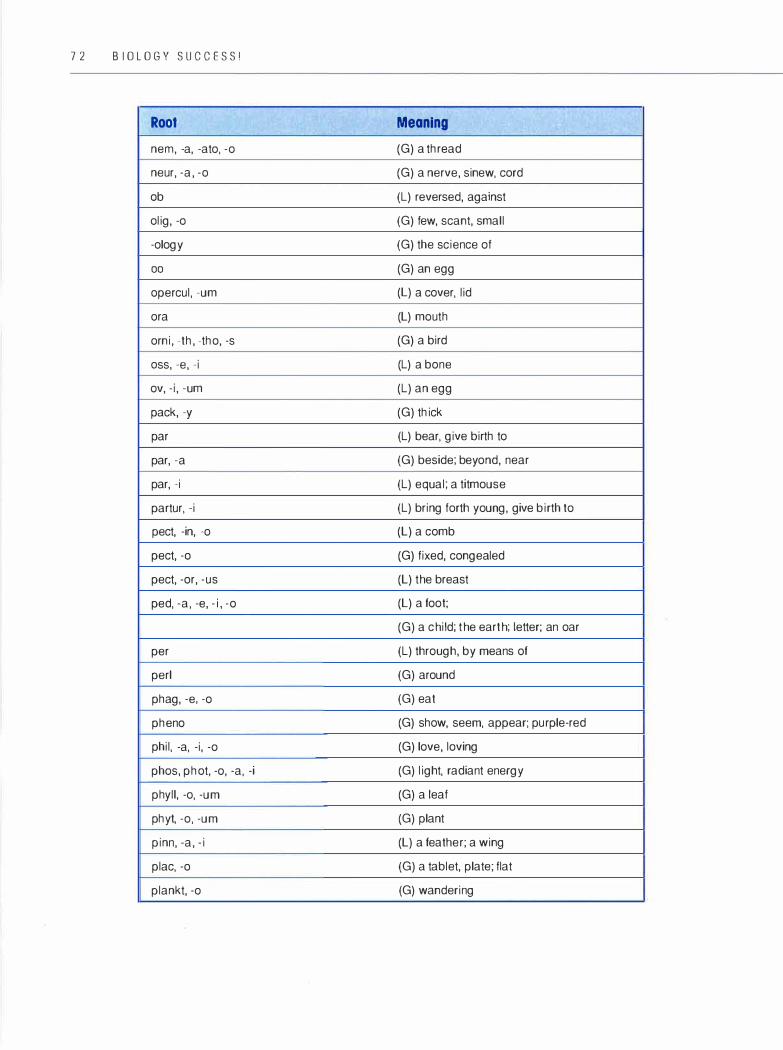
7 2 B I O L O G Y SUCCESS!
Root
nem, -a, -ato, -o
neur, -a, -o
ob
olig, -o
-ology
00
opercul, -um
ora
orni, -th, -tho, -s
ass, -e, -i
ov, -i, -um
pack, -y
par
par, -a
par, -i
partur, -i
pect, -in, -o
pect, -o
pect, -or, -us
ped, -a, -e, -i , -o
per
perl
phag, -e, -o
pheno
phil, -a, -i, -o
phos, phot, -o, -a, -i
phyll, -o, -um
phyt, -o, -um
pinn, -a, -i
plac, -o
plankt, -o
Meaning
(G) a thread
(G) a nerve, sinew, cord
(L) reversed, against
(G) few, scant, small
(G) the science of
(G) an egg
(L) a cover, lid
(L) mouth
(G) a bird
(L) a bone
(L) an egg
(G) thick
(L) bear, give birth to
(G) beside; beyond, near
(L) equal; a titmouse
(L) bring forth young, give birth to
(L) a comb
(G) fixed, congealed
(L) the breast
(L) a foot;
(G) a child; the earth; letter; an oar
(L) through, by means of
(G) around
(G) eat
(G) show, seem, appear; purple-red
(G) love, loving
(G) light, radiant energy
(G) a leaf
(G) plant
(L) a feather; a wing
(G) a tablet, plate; flat
(G) wandering
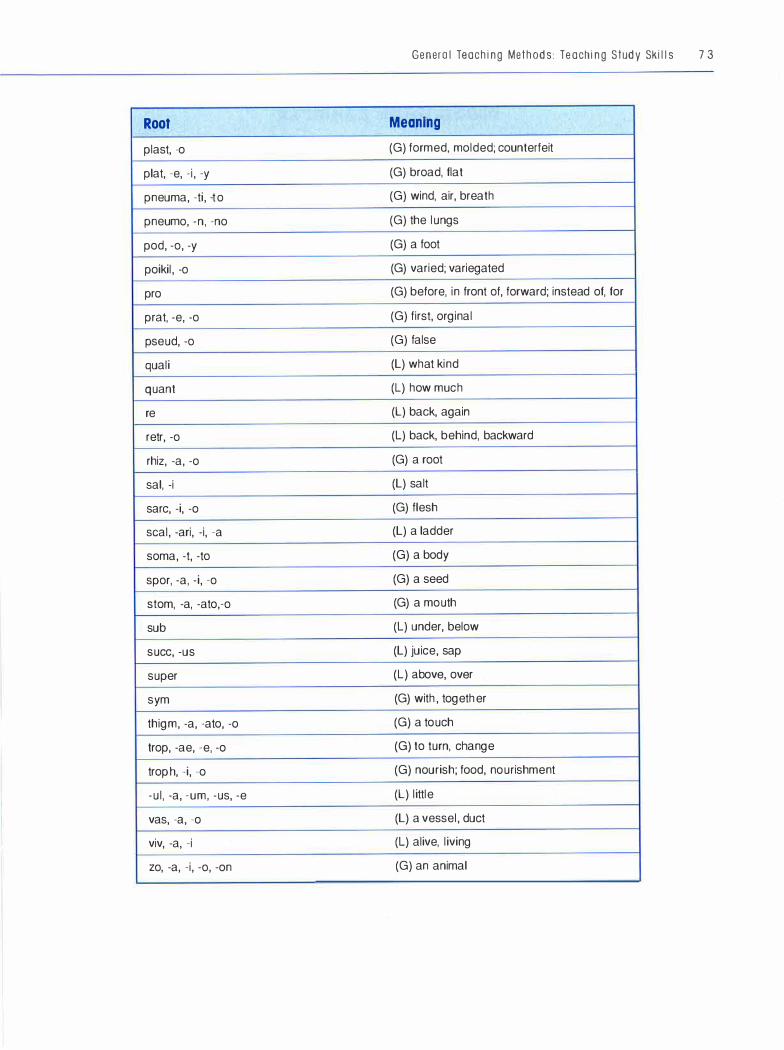
Root
plast, -o
plat, -e, -i, -y
pneuma, -ti, - t o
pneumo, -n, -no
pod, -o, -y
poikil, -o
pro
prat, -e, -o
pseud, -o
quali
quant
re
retr, -o
rhiz, -a, -o
sal, -i
sarc, -i, -o
seal, -ari, -i, -a
soma, -t, -to
spor, -a, -i, -o
stom, -a, -ato,-o
sub
succ, -us
super
sym
thigm, -a, -ato, -o
trop, -ae, -e, -o
troph, -i, -o
-ul, -a, -um, -us, -e
vas, -a, -o
viv, -a, -i
zo, -a, -i, -o, -on
General Teaching Methods: Teaching Study Skills 7 3
Meaning
(G) formed, molded; counterfeit
(G) broad, flat
(G) wind, air, breath
(G) the lungs
(G) a foot
(G) varied; variegated
(G) before, in front of, forward; instead of, for
(G) first, orginal
(G) false
(L) what kind
(L) how much
(L) back, again
(L) back, behind, backward
(G) a root
(L) salt
(G) flesh
(L) a ladder
(G) a body
(G) a seed
(G) a mouth
(L) under, below
(L) juice, sap
(L) above, over
(G) with, together
(G) a touch
(G) to turn, change
(G) nourish; food, nourishment
(L) little
(L) a vessel, duct
(L) alive, living
(G) an animal
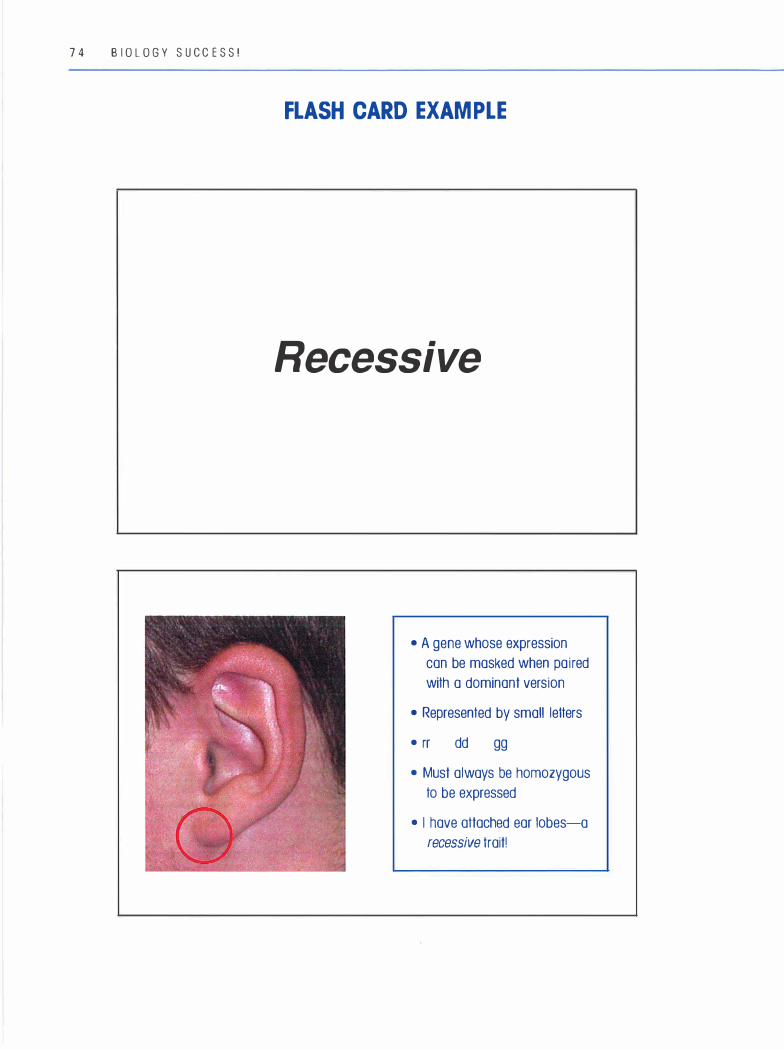
7 4 BIO L O GY SUC C ESS!
FLASH CARD EXAMPLE
Recessive
• A gene whose expression
can be masked when paired
with a dominant version
• Represented by small letters
• rr dd gg
• Must always be homozygous
to be expressed
• I have attached ear lobes-a
recessive trait!

Teach ing Study Ski l ls :
Assistive Technology
Co M P R E H E N S I O N A N D generation of
written language are necessary for stu
dent success in academically rigorous
courses such as biology. This can be problematic
for students with learning differences who may be
weak in basic reading, writing, and communication
skills. Assistive technology offers these students
access to books, writing, and critical thinking about
a world of concepts that are otherwise inaccessible
to them, and thereby helps them achieve their edu
cational goals. This technology includes tools such
as word processors, screen readers, voice recog
nition software, visual mapping software, and pres
entation software. Successful integration of this
technology into introductory biology courses is
dependent upon matching students with appropri
ate hardware and software based on individual
needs, coupled with explicit instruction on how to
use the assisstive technology.
What Keeps Students from
Succeeding?
In the past thirty years, research has emerged that
describes the most common difficulties that stu
dents face in school. They are the following:
7 5
• Difficulty decoding text • Slow processing of text • Poor comprehension of written text • Difficulty encoding (spelling) • Poor handwriting • Difficulty organizing ideas • Difficulty paying attention • Difficulty completing assigned work
While this list is by no means comprehensive, it
covers the most common reasons why students fail
in school. Although remedial strategies can be
highly effective for many of these difficulties, stu
dents often continue to struggle with them. Such
students are severely handicapped in their ability
to achieve the goals of a secondary and post
secondary curriculum.
Landmark College, along with other leading edu
cational institutions, such as the University of Ore
gon's Center for Computer-Based Study Skills
(Anderson-Inman, Knox-Quinn, and Szymanski
1999), has developed technology strategies that
address the learning issues that commonly prevent
students from achieving their learning potential.
With these strategies available as tools to our stu
dents, instructors and students are able to choose
software strategies that will reduce or eliminate the
7 6 B I O L O G Y S U C C E S S !
barriers to learning. These tools not only are effec
tive for students with learning difficulties but are
sound pedagogical practices for the entire range
of diverse learners.
What Technology Applications
Are Useful?
The technology applications to assist students in
learning academic skills are numerous, but they fall
into some basic categories:
Word Processors
Word processors are not typically thought of as
assistive technology, but at their most basic level,
they assist students with graphomotor difficulties to
write without relying on handwriting. They also pro
vide students with assistance in spel l ing (spell
checker) and grammar (grammar check). Word
processors commonly have tools for editing and
revising written drafts, which are of great assis
tance to students who struggle with proofreading
and paper revision.
Screen Readers
A text-to-speech screen reader converts computer
based text into spoken words. It also al lows slow
or inaccurate readers to efficiently process text
based information aurally and visually. Screen
readers vary widely, from the most bare-bones,
which do nothing more than read the text, to the
highly sophisticated, which include features for
h igh l ighting, note taking, and customizing the
entire reading experience. Text-to-speech screen
readers assist students with difficulties decoding
written text, those who have difficulty reading flu
ently, and those who have trouble paying attention
to what they read (Hecker et al . 2002; Fein 2002).
Typically, a biology textbook or handouts from
teachers will have to be scanned and converted
into digital format before the screen reader can
assist the student. Since biology texts are often
dense with visual aids such as pictures, charts, and
maps, it's important to have a scanning system with
an Optical Character Recognition (OCR) system
that can handle pages of mixed text and graphics.
Ideally, teachers or a school-based resource center
would help students with this preparatory stage,
so students can utilize their study time for actually
reading and understanding their texts.
Voice Recognition
Voice recognition software is good for students who
have difficulty converting their thoughts into writ
ten words. Students must train the software to rec
ognize their voices; accuracy rates run around
95%. Whi le these software programs are greatly
improved over their early versions, students with
thick accents or speech impediments still find them
difficult to use. I n addition, students must still rely
on a good writing process in order to edit, revise,
and proofread their essays.
Visual Mapping
Visual mapping software provides a l ink between
teaching content and supporting thinking pro
cesses. Talking and writing out ideas are only one
way of representing thinking. Students who have
difficulty expressing thoughts in writing may find
that visual mapping of concepts frees them from
the l imitations of their working memory, as well as
from the limitations of syntax and spelling (Ander
son-Inman and Ditson 1 999).
Presentation Software
Presentation software such as PowerPoint is widely
accepted as an effective means of communicating
information because of its ability to combine graph-
ics and text. It reduces the need for text, and it
allows for ideas to be organized in outline form.
How Do You Decide What
Technology Will Suit Which
Student?
Assistive technology is effective only if the device
or software builds on the strengths of the students
who use it. There are a number of approaches,
both formal-such as the Functional Evaluation
for Assistive Technology, or FEAT (Raskind and
Bryant 2002)-and informal, to assessing students
for assistive technology tools; but any assessment
must fit the assistive technology to the student and
not vice versa. The key to a successful match
between students and technology is to establish
specific goals that hardware and software will
enable a student to realistically achieve. Here are
the key considerations for matching a student with
an assistive technology tool:
• What is the student's diagnosis?
- How severe is the disability? • What are the student's learning strengths? • What is the student's preferred learning style? • How does the student's disability affect aca
demic performance (reading, written language,
math, study skills, memory, organization)? • What are the requirements of the student's
academic program? • Where will the student need to use the assis
tive technology device (lecture, seminar, labo
ratory)? • How comfortable is the student with using
technology?
The best accommodation for a student is not
necessarily the most high-tech one. The best assis
tive technology plans are those that take into
account students' abilities, preferences, and the
General Teaching Methods: Teaching Study Sk i l l s 7 7
academic tasks that are required in their course
work (Bisagna and Haven 2002).
Setting the Stage for Success
Before students get the benefits of assistive tech
nology, they must learn to interact with their com
puters. Some attention to how students touch and
perceive their computers may make the difference
between their acceptance or rejection of technol
ogy. Simple adjustments, such as reducing visual
clutter on the desktop and placing shortcuts on the
desktop to reduce the steps required to access
programs and files, can greatly reduce confusion
for students.
Teaching a system of file management is
another crucial step for students with poor organi
zational skills, attention issues, or limited experi
ence with technology. These students do well with
a predesigned file/folder organizational structure,
guidelines for accessing and housing their elec
tronic files, and a regular weekly time in which to
clean up their files.
Use Technology to Support an
Established Learning Process
The key to successful teaching and learning is
to break each skill into its component parts so
that students understand the cognitive processes
behind it. An example is writing, a skill that proves
difficult for many students with learning disabili
ties. Learning to write successful essays, lab
reports, and research papers requires that stu
dents approach the task as a process that
includes generating and organizing ideas, draft
ing, editing, and revising. Despite the success
that educators have had with teaching writing as
a process, some students continue to have diffi
culty because of their language, attention, or

7 8 BIO LOGY S U C CESS !
executive function difficulties (Gander and Stroth
man 2001 ).
For students with writing difficulties, strategic
use of software programs can bridge the gap
between their writing needs and their writing abili
ties. Technology offers the chance for students
whose potential was overlooked in the past to
become successful writers. Following is a list of
common barriers to writing success and the soft
ware that addresses them. Also see page 79 for
online assistive technology resources.
Poor spelling • Spell checker, word prediction, voice recogni
tion software
Difficulty expressing concepts in writing
• Voice recognition software
Difficulty with working memory • Visual mapping software to reduce cognitive
load • Voice recognition software
Difficulty identifying relationships between con
cepts and time order
• Visual mapping software templates • Word processor's templates
Poor planning strategies • Visual mapping software for brainstorming and
sorting
• Word processor's outline mode
Difficulty with reading
• Screen-reading software
Poor sentence structure • Screen-reading software to find sentence
errors or omissions
Poor attention to detail • Word processor's "reviewing" toolbar for track
ing errors and making changes
When assistive technology is used strategically
throughout the writing process, it is not a bypass
accommodation. Instead, it is an integral part of the
process, allowing access to students who might
otherwise be blocked from applying this important
cognitive tool to achieve success in essay writing.
Conclusion
Assistive technology offers powerful tools to the
many students with learning differences who would
otherwise struggle with the academic demands of
a biology course. Used strategically, and integrated
into established pedagogical processes, assistive
technology can lower the traditional barriers that
have prevented so many students from achieving
their educational goals and potential.
References*
Anderson-Inman, L., and L. Ditson. 1999. Com
puter -based concept mapping: A tool for negoti
ating meaning. Learning and Leading with
Technology26 (8): 6-13.
• This chapter is adapted, with permission, from "The Use of Assistive Technology for College Students with ADHD," an article by Ellen Engstrom, M.A., Associate Professor at Landmark College, for the Children and Adults with Attention Deficit Hyperactivity Disorder (CHADD) newsletter, ADHD Challenge 1 7, no. 3 (2003): 5-6, 1 1 .

Anderson-Inman, L., C. Knox-Quinn, and M. Szy
manski. 1 999. Computer supported studying:
Stories of successful transition to postsecondary
education. Career Development for Exceptional
Individuals 22 (2): 185-212.
Bisagna, J., and R. Haven. 2002. Customizing tech
nology solutions for college students with learn
ing disabilities. Perspectives 28 (2): 21-26.
Fein, A. 2002. Educator's review: Text, books, and
Kurzweil 3000. Syllabus: Technology for Higher
Education 15 (12). http://www.campus-technology
.com/article.asp?id=6995.
Gander, M. , and S. W. Strothman. 200 1 . Teaching
writing to students with learning disabilities: A
Landmark College guide. Putney, VT: Landmark
College.
Hecker, L., L. Burns, J. Elkind, K. Elkind, and
L. Katz. 2002. Benefits of assistive reading soft
ware for students with attention disorders.
Annals of Dyslexia 52: 243-72.
Raskind, M. H., and B. R. Bryant. 2002. Functional
evaluation for assistive technology. Austin, TX:
Psycho-Educational Services.
General Teaching Methods: Teaching Study Skills 7 9
Assistive Technology Resources
Following is a list of Web sites for assistive tech
nology information. Related products are shown in
parentheses.
Text-to-Speech Resources
www.kurzweiledu.com (Kurzweil)
www.arkenstone.org (WYNN)
www.texthelp.com (Read & Write)
www.cast.org (eReader)
www.pixi.com/-reader1 (HELPread freeware)
Voice Recognition Resources
www.scansoft.com/naturallyspeaking (Dragon)
www.ibm.com/software/speech (IBM ViaVoice)
www.lhsl.com/voicexpress/ (Voice Express)
www.edc.org (general information)
General Information
www.cast.org
www.closingthegap.org
www.ldonline.org
www.ldresources.com
www.ala.org/roads (public libraries)
www.hood.edu/seri/serihome
www.snow.utoronto.ca/index/html
www.landmarkcollege.org/links.html
www.donjohnston.com (commercial link)
www.nextup.com/
www.freedomscientific.com (WYNN)
www.promo.neVpg (Project Gutenburg, a library of
digital texts)


Using Varied
Instructional Techniques:
Multimodal Teaching
AMUL TIMODAL TECHNIQUE is defined
as a learning activity that includes the use
of movement, tactile manipulation of mate
rials, or a strong emphasis on color, drawing, or
other graphic depictions of ideas. Most lab-based
activities in biology are multimodal by nature. This
chapter encourages teachers to use other kinds of
hands-on techniques to support student learning.
Using an assortment of multimodal techniques
makes a biology class fun and interactive and
acknowledges the diversity of learning preferences
present in any class. Multimodal instruction can be
an extremely effective technique to teach students
key biological concepts.
Using Kinesthetic Role-Playing
In kinesthetic role-playing, students use their bod
ies, movement, and props to demonstrate how a
biological concept works. One important applica
tion of kinesthetic role-playing is teaching biological
81
processes, such as photosynthesis or cell respira
tion. But other concepts as well, such as exponen
tial growth, can be taught or demonstrated through
kinesthetic techniques. For a fully developed ex
ample of a kinesthetic role-play, see the "Cell Cycle
Role-Play" activity on page 269.
Not only does using kinesthetic techniques rec
ognize the value of the body as a tool to enhance
conceptual learning; it also helps translate informa
tion that is linguistic and logical in nature to another
medium that may be more effective for certain
learners. (Howard Gardner has proposed the idea
of multiple intelligences, including kinesthetic intel
ligence, in his book Frames of Mind (1993].) They
are also particularly useful as a way to turn abstract
information into a concrete form, thereby assisting
students who are challenged by abstract thinking.
In addition, students with attentional difficulties may
stay more focused when engaged in kinesthetic
activities. These techniques can provide an enjoy
able break from the routine "seated" learning that
characterizes many learning environments.

82 BIOLOGY SUCCESS!
Using Tactile Manipulatives
"Manipulable" objects or materials can be used as tools to create or demonstrate biological content. For instance, students could be instructed to model the eukaryotic cell membrane by using styrofoam balls, pipe cleaners, marshmallows, and tape. The balls would represent the phospholipid heads, the pipe cleaners would represent the phospholipid tails, the marshmallows would represent the embedded proteins, and the tape would hold the model intact.
As another example, an instructor might ask students to construct a section of DNA using multicolored mini marshmallows and colored toothpicks. A suggestion might be to use four different-colored marshmallows for the bases, white for the deoxyribose, and a colored toothpick to represent the phosphate groups. Uncolored toothpicks could be used to represent hydrogen bonds between the bases. (It's also possible to give the students all
1 / /. )\
( �
Figure 3.9. An example of a manipulative: Fiddle Discs
• Figure 3.10. An example of a manipulative: Cuisenaire Rods
Figure 3.11. An example of a manipulative: Klondike rs
General Teaching Methods: Using Varied Instructional Techniques 8 3
the materials and let them decide how to use them.)
This produces a model that is flexible and that can
then be used to simulate replication.
See page 299 for a fully developed example of a
tactile/manipulative-based activity called "Mendelian
Genetics."
Similarly to kinesthetic role-playing, using tac
tile techniques engages the body in order to
engage the mind. Abstract details about structures
become concrete and colorful. See the sidebar for a list of useful materials that offer a range of
manipulative applications.
, USEFUL MANIPULATIVES FOR
BIOLOGICAL CONCEPTS
• Legos
• Tinkertoys
• Klondikers
• Clay or Fimo
• Connex
• FiddleDiscs
• Bandies
• Atomic model kits
• Colored pipe cleaners
• Modeling clay
, • stockmar Brand Modeling Wax (less messy
than modeling clay)
Using Large-Scale Drawing
This technique allows students to use large-motor
activity to create drawings and diagrams. For
example, the use of colored chalk on a large, rough
surface, such as a sidewalk or parking lot, provides
a tactile and kinesthetic experience. It also capital
izes on the use of color to distinguish structures or
processes. This technique works best as a rein
forcement or review exercise after some biological
content has already been introduced. It requires
that the class have reasonable access to a usable
sidewalk area or parking lot that is safe and spa
cious. For those classes without easy access to a
public sidewalk, another variation is to use large
sheets of butcher paper and magic markers to cre
ate the drawings or diagrams. When adapting this
technique, however, it's important to note that the
large scale of this activity is key to its effectiveness.
This technique is best suited for kinesthetic and
visual learners.
For instance, students could be asked to con
struct a Venn diagram that shows the similarities
and differences between meiosis and mitosis. Spe
cific guidelines such as size, labeling, and time
frame would be supplied by the instructor. Individ
ual students or student teams could work on the
same task or on different tasks, and could be asked
to share and compare their work as part of the
exercise. To add to the activity, students could also
be asked to entertain questions from nonclass
members passing by the chalking area.
Conclusion
The incorporation of kinesthetic techniques, manip
ulatives, and large-scale drawing into the biology
classroom is relatively easy to accomplish and will
improve the understanding of conceptual material.
These multimodal strategies may also help those stu
dents with attention deficits to maintain their focus.
Reference
Gardner, H. 1993. Frames of mind. New York: Basic
Books.

Using Varied
Instructional Techniques:
Graphic Organizers
What Are Graphic Organizers?
A graphic organizer is a teaching and learning tool that integrates both text and visual symbols (Hutcheson 2002). Graphic ogranizers can be used within any discipline and have many applications in the teaching of science. Jamie McKenzie (1997), writing in the educational journal From Now On, says that "graphical [graphic] organizers convert complex and messy information collections into meaningful displays."
Some common graphic organizer forms are Venn diagrams, concept maps, flow charts, graphs, tables, matrices, and brainstorming maps. (See
Figures 3.12-3.16 beginning on page 88 for examples of graphic organizers.) Once the basic idea of a graphic organizer is understood by a learner, the forms and applications are limited only by the learner's needs and imagination.
Researcher and educator David Hyerle (1996) prefers a broader and more inclusive name for the concept: "visual tools." Hyerle argues that "graphic organizer" is too limiting a label, because such tools can do much more than just organize infor-
84
mation. They can support brainstorming, support the development of metacognition, and actually assist in the formation of knowledge.
Although we agree that "visual tools" is a more descriptive and pedagogically appropriate name for the idea of graphic organizers, we will use the latter term because it has become more common in the education field.
Why Use Graphic Organizers?
V iewing, using, and creating graphic organizers can enhance the learning of biology content as well as improve the thinking skills of students, especially those with learning disabilities (Begerid, Horton, and Lovitt 1990). Tracey Hall and Nicole Strangman (2004), of the Center for Applied Special Technology (CAST), conducted a literature review of graphic organizer research and found that ten of the twelve studies investigating the effects on learning of using graphic organizers showed some

General Teaching Methods: Using Varied Instructional Techniques 8 5
positive learning outcome. They also discovered
that the most pronounced gains identified from
using graphic organizers have been reported for
postsecondary student populations.
Before the term "graphic organizer" was in
vogue, the famous Russian psychologist L. S.
V ygotsky (1962) said that "a visual graphic con
taining key ideas and information is easier to
remember than extended text, whether the text is
visual (writing) or verbal (speech)." One of the key
benefits of using graphic organizers, therefore, is
their memory-enhancing value; they help learners
in setting up thinking/knowledge templates that can
more effectively store and retrieve information.
They can reveal the key structure and meaning of
information more efficiently for students, which in
turn reduces the volume of information that needs
detailed processing (Ellis 1999).
A recent study conducted for Inspiration Corpo
ration by Dr. Kimberly Hambrick and Dr. Kim Good
of the Institute for the Advancement of Research
in Education at AEL (Hambrick and Good 2003)
revealed an additional benefit. Not only do graphic
organizers aid in the retention and recall of infor
mation, they can help build students' critical think
ing skills, especially when students create their
own graphic organizers.
Using and making graphic organizers also sup
ports the principles of schema theory: Based on
prior experiences and knowledge, learners con
struct new knowledge in a multidirectional, nonlin
ear, and nonhierarchical way. A graphic organizer
accommodates and encourages this kind of
schema-based learning.
Effective Use of Graphic
Organizers
Graphic organizers are particularly well suited for
students with visual strengths, yet all learners can
benefit from them. Careful and effective implemen-
tation of graphic organizers is key to maximizing
student success. It is essential that any new
graphic organizer form be adequately introduced
and modeled, and that students be given multiple
opportunities to practice using it in order to develop
proficiency. Ongoing formative assessment through
regular teacher-student interactions is also a criti
cal component of using graphic organizers effec
tively (Hall and Strangman 2004).
The computer software Inspiration 7.5 (see Ref
erences for company contact information) offers a
whole suite of graphic organizer templates-some
of which are specifically designed for scientific con
tent-that make electronic construction easy. For
some students, this software can be a valuable and
motivating tool for making all kinds of graphic
organizers.
It might be helpful to classify student use of
graphic organizers into three categories: passive,
active, and constructive. In passive use, students
might view and interpret a graphic organizer from
a textbook or one generated by the instructor. This
could be as simple as assigning students to ana
lyze a graph, a table, or a visual outline of a unit of
study. Although this kind of use is sometimes
appropriate and necessary, the overall learning
value for students is likely to be minimal.
In active use, students might fill out a blank or
partially completed graphic organizer presented in
a textbook or made by the instructor. An example
would be a Venn diagram comparing photosynthe
sis with cellular respiration where only some of the
diagram is completed. Students would typically be
assigned to add more information to the partially
completed diagram.
Finally, with constructive use, students decide
the type of organizer to use and/or the content it
should contain. For example, students might be
assigned to make a concept-map graphic organizer
of a text chapter on Mendelian genetics.
Hyerle (1996) suggests that using graphic
organizers only as simple fill-in-the-blank forms

86 BIOLOGY SUCCESS!
(active use) without encouraging student construction of graphic organizers has a limited pedagogical and _intellectual value. For the best learning value, he believes the emphasis should be on constructive use. However, other researchers assert that a combination of student-generated (constructive) and teacher-generated (passive or active) graphic organizers seems to be the most effective strategy for students with learning disabilities (Crank and Bulgren 1993).
We believe that for best results, teaching students to use graphic organizers must be done incrementally and explicitly. An instructor designs and presents a graphic organizer and carefully models the process for using or constructing it. Eventually, for some graphic organizer applications, this approach can lead to successful studentconstructed graphic organizers.
Developed Examples of Graphic
Organizers within the Biology
Success! Manual
In this manual are several examples of welldeveloped graphic organizers:
• A more detailed presentation, including several examples, on using concept maps to teach and learn introductory biology begins on page 90.
• There are two writing templates: a Lab Reporting Template (page 163) and a Writing Model for a Biological Process (page 115).
• We also include an experiment planning template (Appendix C, "Student• Designing Con
trolled Experiments 9").
In addition, there are
• graphic organizers in the form of weekly course plans (see page 36),
• a course syllabus (page 32),
• assessment rubrics (beginning on page 130),
and • a textbook note-taking form (see page 64).
These are meant to provide just a sampling of ways to integrate graphic organizers into an introductory biology course. The possibilities are limitless and can all enhance the learning of biology content and skills for all students.
References
Begerid, D., S. V. Horton, and T. C. Lovitt. 1990. The effectiveness of graphic organizers for three classifications of secondary students in content area classes. Journal of Learning Disabilities 23 (1): 12-22.
Crank, J. N., and J. A. Bulgren. 1993. Visual depictions as information organizers for enhancing achievement of students with learning disabilities. Learning Disabilities Research & Practice 8 (3): 140-47.
Ellis, E. 1999. Using graphic organizers to make sense of the curriculum. Tuscaloosa, AL: Masterminds Publishing. www.pcboe.net/.
Hall, T., and N. Strangman. 2004. Graphic organizers. Center for Applied Special Technology (CAST). http://www.cast.org/ncac/index.cfm?i=3015.
Hambrick, K., and K. Good. 2003. Graphic organizers: A review of the scientifically based research. http ://www. inspiration .com/research.
Hutcheson, M. R. 2002. Teaching history and humanities. In Teaching in the disciplines: Classroom instruction for students with learn-

General Teaching Methods: Using Varied Instructional Techniques 8 7
ing disabilities, 175-77. Putney, VT: Landmark
College.
Hyerle, D. 1996. Visual tools for constructing knowledge. Alexandria, VA: Association for
Supervision & Curriculum.
Inspiration Software, Inc., 7412 SW Beaverton
Hillsdale Hwy., Portland, OR 97225. 1-800-877-
4292. http:// www.inspiration.com.
McKenzie, J. 1997. Graphical organizers as think
ing technology. From Now On: The Educational Technology Journal 7 (2). http://www.fno.org/
oct97/picture.html.
Vygotsky, L. S. 1962. Thought and language. Cam
bridge, MA: MIT Press.
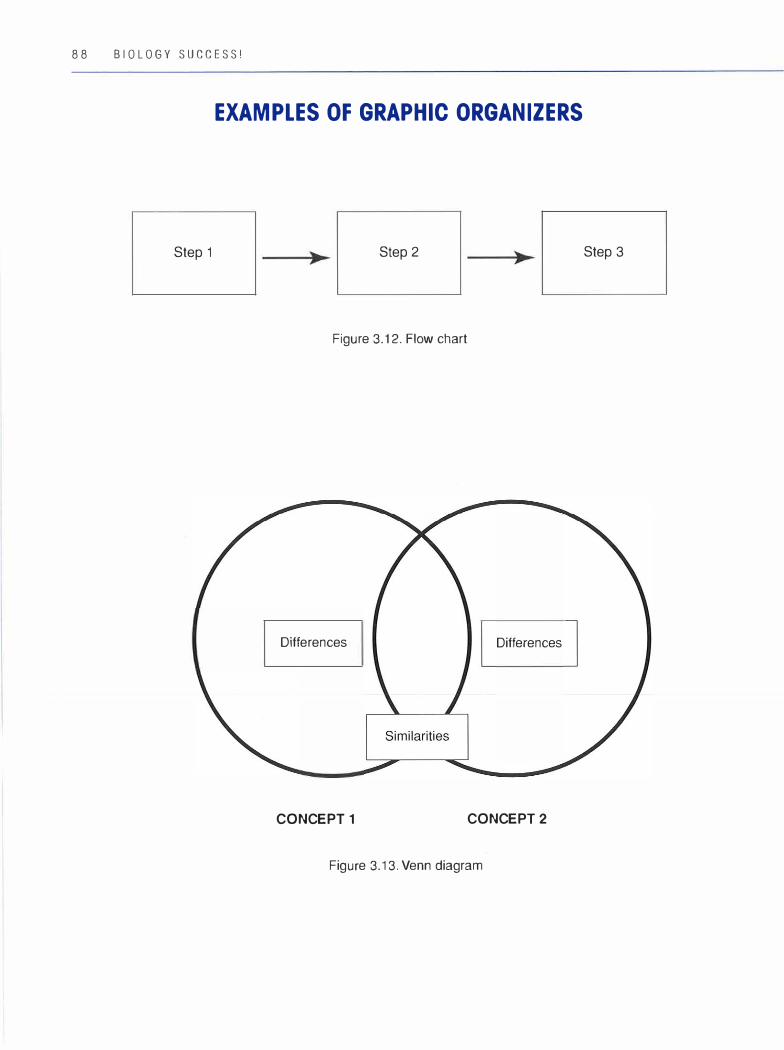
88 BIOLOGY SUCCESS!
EXAMPLES OF GRAPHIC ORGANIZERS
Step 1 Step 2
Figure 3.12. Flow chart
Differences Differences
CONCEPT 1 CONCEPT 2
Figure 3.13. Venn diagram
Step 3
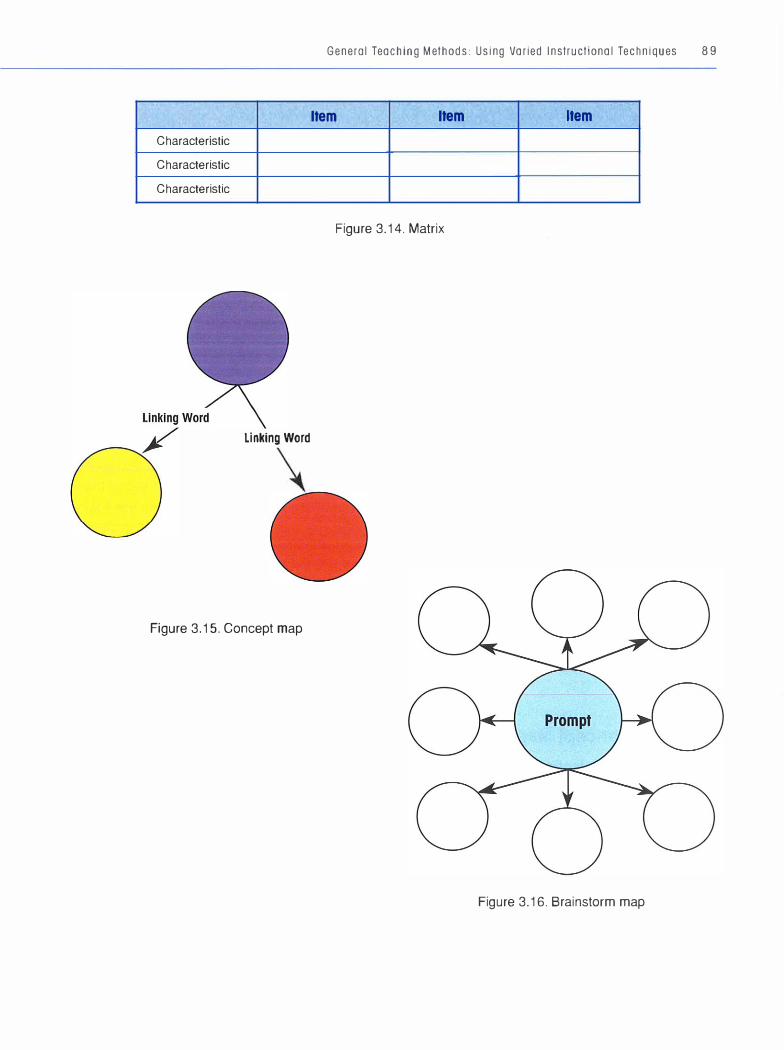
Characteristic
Characteristic
Characteristic
Linking Word
Figure 3.15. Concept map
General Teaching Methods: Using Varied Instructional Techniques 8 9
Item Item Item
Figure 3.14. Matrix
Figure 3.16. Brainstorm map
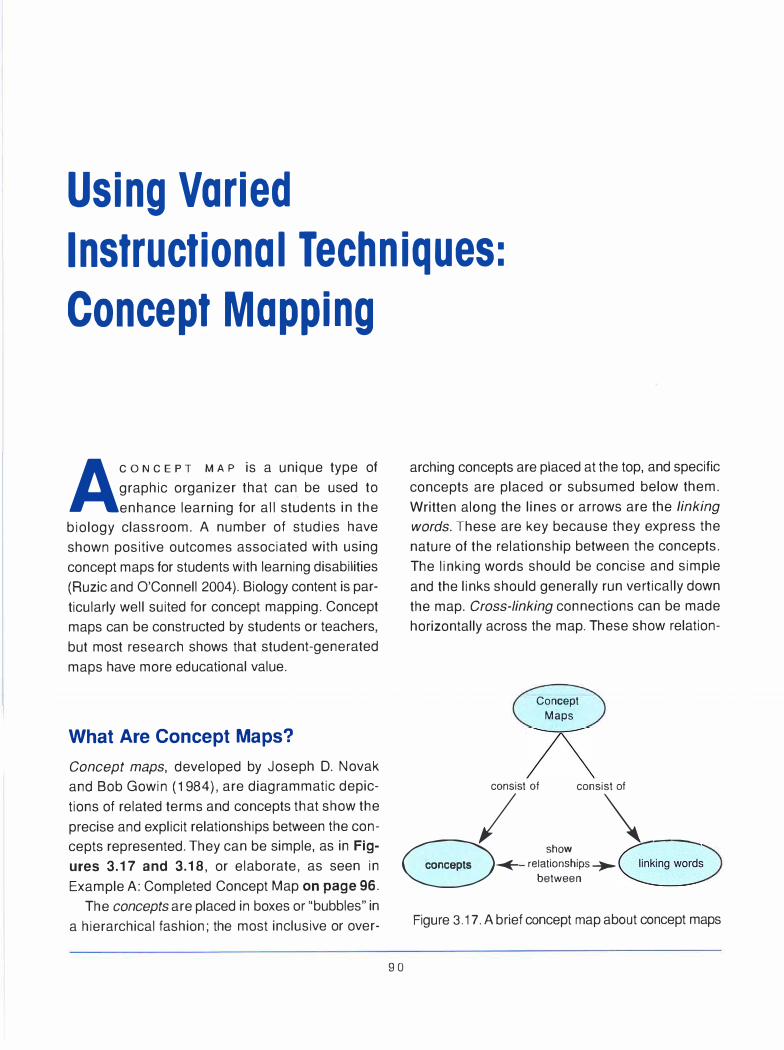
Using Varied
Instructional Techniques:
Concept Mapping
Ac o N c E PT MAP is a unique type of graphic organizer that can be used to enhance learning for all students in the
biology classroom. A number of studies have shown positive outcomes associated with using concept maps for students with learning disabilities (Ruzic and O'Connell 2004). Biology content is particularly well suited for concept mapping. Concept maps can be constructed by students or teachers, but most research shows that student-generated maps have more educational value.
What Are Concept Maps?
Concept maps, developed by Joseph D. Novak and Bob Gowin (1984), are diagrammatic depictions of related terms and concepts that show the precise and explicit relationships between the concepts represented. They can be simple, as in Fig
ures 3.17 and 3.18, or elaborate, as seen in Example A: Completed Concept Map on page 96.
The concepts are placed in boxes or "bubbles" in a hierarchical fashion; the most inclusive or over-
arching concepts are placed at the top, and specific concepts are placed or subsumed below them. Written along the lines or arrows are the linking words. These are key because they express the nature of the relationship between the concepts. The linking words should be concise and simple and the links should generally run vertically down the map. Cross-linking connections can be made horizontally across the map. These show relation-
Concept Maps
consist of consist of
d. cela:��;hlps_\'-__ _ � between
Figure 3.17. A brief concept map about concept maps
90
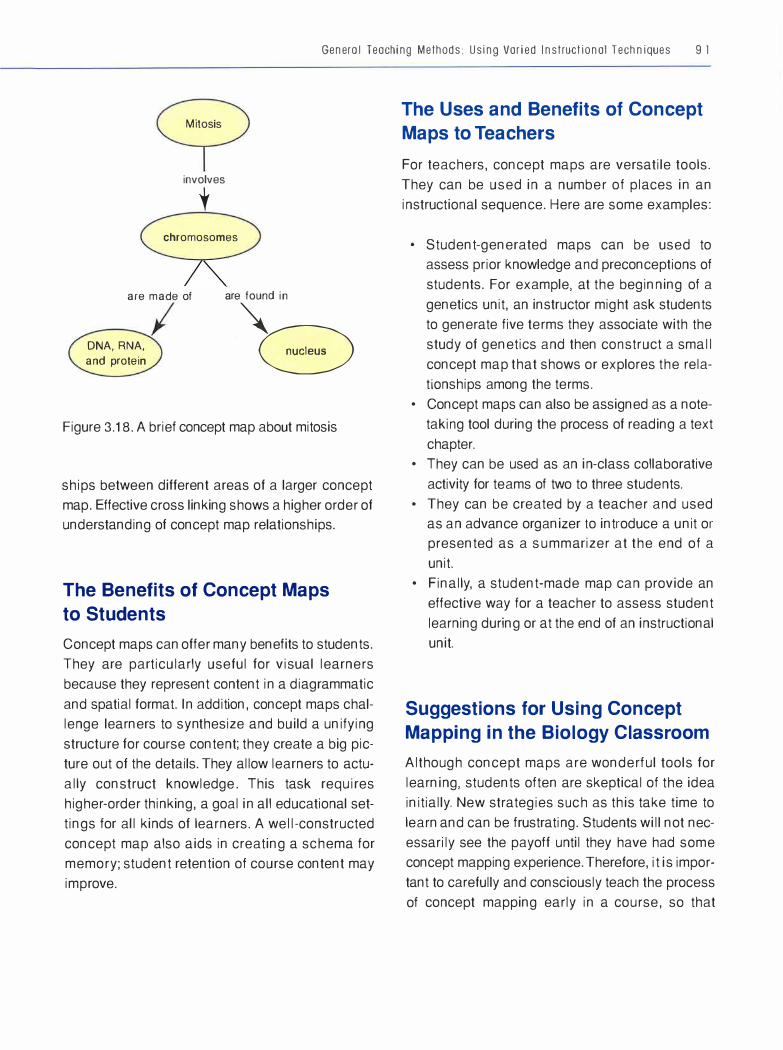
General Teaching Methods : Using Varied Instructional Techniques 9 1
Mitosis
involves
t
chromosomes
are made of are found in
DNA, RNA,
and protein
�
8 Figure 3.18. A brief concept map about mitosis
ships between different areas of a larger concept
map. Effective cross linking shows a higher order of
understanding of concept map relationships.
T he Benefits of Concept Maps
to Students
Concept maps can offer many benefits to students.
They are particularly useful for visual learners
because they represent content in a diagrammatic
and spatial format. In addition, concept maps chal
lenge learners to synthesize and build a unifying
structure for course content; they create a big pic
ture out of the details. They allow learners to actu
ally construct knowledge. This task requires
higher-order thinking, a goal in all educational set
tings for all kinds of learners. A well-constructed
concept map also aids in creating a schema for
memory; student retention of course content may
improve.
The Uses and Benefits of Concept
Maps to Teachers
For teachers, concept maps are versatile tools.
They can be used in a number of places in an
instructional sequence. Here are some examples:
• Student-generated maps can be used to
assess prior knowledge and preconceptions of
students. For example, at the beginning of a
genetics unit, an instructor might ask students
to generate five terms they associate with the
study of genetics and then construct a small
concept map that shows or explores the rela
t ionships among the terms.
• Concept maps can also be assigned as a note
taking tool during the process of reading a text
chapter.
• They can be used as an in-class collaborative
activity for teams of two to three students.
• They can be created by a teacher and used
as an advance organizer to introduce a unit or
presented as a summarizer at the end of a
unit.
• Finally, a student-made map can provide an
effective way for a teacher to assess student
learning during or at the end of an instructional
unit.
Suggestions for Using Concept
Mapping in the Biology Classroom
Although concept maps are wonderful tools for
learning, students often are skeptical of the idea
initially. New strategies such as this take time to
learn and can be frustrating. Students will not nec
essarily see the payoff until they have had some
concept mapping experience. Therefore, it is impor
tant to carefully and consciously teach the process
of concept mapping early in a course, so that

9 2 B IO L O G Y SUCCESS!
students have sufficient time and multiple opportunities to practice the skill.
When introducing concept maps, start small and start with the familiar. Cover the basic idea and model the construction of a simple map, for instance using fruit, as in Figure 3.19. List the concepts to be included and collectively make the map on the chalkboard or with a projection device.
Fruit-related concepts: fruit (overarching concept), nutrition, apples, vitamin C, bananas, yellow, snack
can be
Now let the students practice, alone or in teams, with another group of familiar concepts, such as those related to cars. Here is a sample list of carrelated concepts:
Cars (overarching), roads, tires, engine, carburetor, speed limit, radiator, antifreeze, radials
After this activity, it is important for students to see the variety of maps that were made by the class. This demonstrates that there is no map that
such as
snacks bananas apples
provide good are
nutrition yellow
with
vitamin C
Figure 3.19. A practice concept map about fruit
General Teaching Methods: Using Varied Instructional Techniques 9 3
is "right." Structure and linking language can vary and still represent the relationships well.
With the familiar under their belts, students will be ready to move on to biology-specific concept maps. If the goal is for students to ultimately create their own concept maps from course material, then it is important to continue building their confidence and facility with the technique. To achieve this goal, give students partially created maps that they must complete independently or collaboratively.
There are three kinds of partially completed concept maps: concept-focused, link-focused, and a combination of the two.
1. A partially completed concept-focused map has some concepts filled in while others are blank. All linking word language is included for the students. (See Example B on page 97.)
An instructor can choose whether to include a concept "bank" (a list of concepts for students to select from) or to have the students find the appropriate concepts using their course resources.
2. A partially completed link-focused map has all the concepts included but lacks the linking word language. (See Example C on page 98.)
3. A combination map has some links and some concepts provided while others are not. (See
Example D on page 99.)
Eventually, an instructor could give students just a list of concepts to map; the students provide the design and the linking language themselves. Ultimately, with students who are capable and concept map savvy, an instructor could leave the entire process up to them by giving assignments to map a textbook chapter or a unit of study. Using this incremental approach to building concept map proficiency will enhance student attitudes and confidence toward this teaching and learning strategy.
Construction Tools and Ideas
The computer software Inspiration 7.5 offers a concept map template option that makes electronic construction easy. All examples included here were made using this software. (See _References on
page 94 for company contact information.) Paper-and-pencil versions can work well too,
allowing for easy revisions. Concept maps are works in progress. Clearly, multiple drafts are common, and to some extent necessary, as students solidify the depth of their conceptual understanding. But working on paper, erasing and overwriting, can sometimes result in a messy product. One way to avoid the messiness of the drafting process is to suggest that students write their concepts on sticky notes. This provides a flexible, tactile way to create a map that allows for trial and error without mess.
Using poster paper increases the size available for the map and may thus make the process easier for some students. If a map like the one in Example D on page 99 is assigned in an 8 1/2 x 1 1 inch format, the size, scope, and detail can be intimidating to some students. In addition to handing out the entire partially completed map, give students enlarged sections (as shown in Example
E on pages 100), so that working with the map will be less overwhelming. When they are done completing the sections, students can then transfer the work to the entire map so they have a comprehensive copy as well.
The use of different colors or the inclusion of clip art and other visuals can also enhance the usefulness of the map for some visual learners. The idea is that these maps can become quite personalized.
Provide a list of common linking words or a linking word "bank." This may help students who struggle with generating specific language that describes kinds of relationships. A list of common or typical linking words is found on page 95. Hand this out to students separately so they may file it away for future applications.
9 4 BIOLOGY SUC CESS!
Assessment
Robert K. Noyd, in his article "A Primer on Concept Mapping" (2000), offers some simple assessment guidelines for student-generated maps. The following questions could easily be transferred to a rubric format (see page 1 27 for a discussion of using rubrics as an assessment tool):
Overall Map Organization (40 percent of assessment)
• Is the map organized from most general to more specific?
• Are all terms/concepts included and placed in appropriate locations within the map?
Linking Words (40 percent of assessment)
• Are the linking words precise and accurate in identifying the relationships between the concepts?
Cross Linking (20 percent of assessment)
• How many cross links are included? Do they accurately integrate the map?
References
Inspiration Software, Inc. 7 412 SW Beaverton Hillsdale Hwy., Portland, OR 97225. 1-800-877-4292. http://www.inspiration.com.
Novak, J. D., and B. Gowin. 1984. Learning how to learn. New York: Cambridge University Press.
Noyd, R. K. 2000. A primer on concept maps. Journal of Cooperation and Collaboration in College Teaching 10 (1): 9-11.
Ruzic, R., and K. O'Connell. 2004. Concept maps. Center for Applied Special Technology (CAST). http://www.cast.org/ncac/index.cfm?i=1669.

General Tea ching Met hods: Using Varied l nslruclionol Techniq u es 9 5
CONCEPT MAPS:
Commonly Used Linking Words and Phrases
composed of lives in includes occurs in depends on may indicate is influenced by have causes are is affected by is involved in contains limits is made by uses can be produces such as consists of determine(s) influence(s) is an example of shows provides helps to functions as

96 BIO L O G Y SUCCE SS!
EXAMPLE A: COMPLETED CONCEPT MAP
Genes are found on
pairs
such as such as
y
come in versions
called
can be
can be
determine
can be
can be
determines
such as
such as
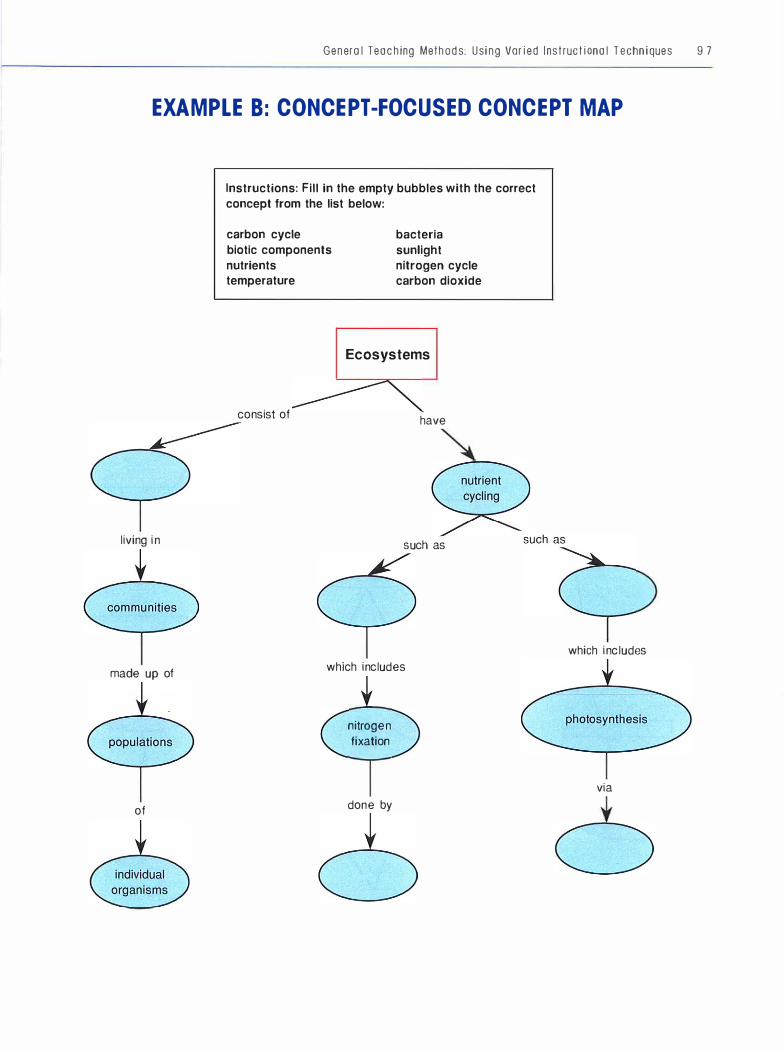
General Teaching Methods: Using Varied Instructional Techniques 9 7
EXAMPLE B: CONCEPT-FOCUSED CONCEPT MAP
living in
made up of
of
Instructions: Fill in the empty bubbles with the correct
concept from the list below:
carbon cycle
biotic components
nutrients
temperature
consist of
bacteria
sunlight
nitrogen cycle
carbon dioxide
Ecosystems
have
such as
which includes
nitrogen
fixation
done by
which includes
via

9 8 B I O L O G Y S U C C E S S !
EXAMPLE C : LINKED-FOCUSED CONCEPT MAP
temperature
Instructions: For each link, f i l l in concise language that expresses the relationship between the "bubbled" concepts.
Ecosystems
light
limiting factors

General Teaching Methods: Using Varied Instructional Techniques 9 9
EXAMPLE D: COMBINATION CONCEPT MAP
Concept-Focused and Link-Focused
Instructions: Part A : Instructions: Part B :
For each link that is not labeled, provide a
concise word or phrase that expresses the
relationship between the "bubbled" concepts.
For each bubble or box that is empty, choose
one of the following concepts to fill it in with:
chromosomes, proteins and lipids, diffusion,
ribosomes, organelles, cell respiration
Cells I
which includes
t
contain
which contain
\
are used for
which which consumes
produces
� can be can be
which have a
is used for
without a nucleus contain
which have a
d NA
made up of
t C)
such as
� contain
which make
�
ATP
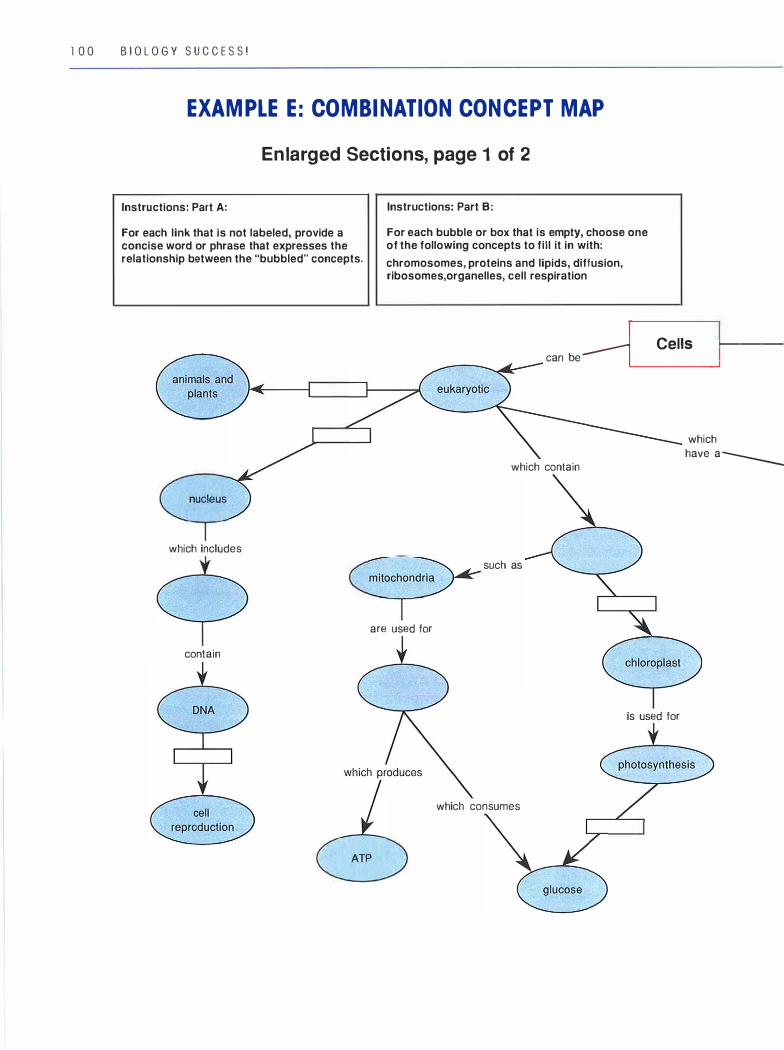
1 0 0 B I O L O G Y S U C C E S S !
EXAMPLE E: COMBINATION CONCEPT MAP
Enlarged Sections, page 1 of 2
Instructions: Part A:
For each link that is not labeled, provide a concise word or phrase that expresses the relationship between the "bubbled" concepts.
Instructions: Part B:
For each bubble or box that is empty, choose one of the following concepts to fill it in with: chromosomes, proteins and lipids, diffusion, ribosomes,organelles, cell respiration
I Cells ---can be----J
L _____ _,
which
which contain have a----
nucleus
which includes such as
are used for
contain
is used for
which consumes
ATP

General Teaching Methods: U sing Varied Instruct ional Tech niques 1 0 1
EXAMPLE E : COMBINATION CONCEPT MAP
Enlarged Sections, page 2 of 2
Instructions: Part A:
For each link that is not labeled, provide a concise word or phrase that expresses the relationship between the "bubbled" concepts.
Cells can be
nucleus
Crthmogh
through
Instructions: Part B:
For each bubble or box that is empty, choose one of the following concepts to fill it in with: chromosomes, proteins and lipids, diffusion, ribosomes,organelles, cell respiration
coiled DNA
soch as �
contain
which make
G
ATP

Using Varied
Instructiona l Techn iques:
Inductive and Deductive
Teach i ng Approaches
I N o R o E R to meet the needs of diverse learners in a biology classroom, it is important to vary the approach to teaching the content. One
basic dichotomy related to approaches is that of inductive-deductive teaching.
What Are Inductive and
Deductive Teaching?
Inductive teaching (also called discovery teaching or inquiry teaching) is based on the claim that knowledge is built primarily from a learner's experiences and interactions with phenomena. An instructor using an inductive approach begins by exposing students to a concrete instance, or instances, of a concept. Then learners are encouraged to observe patterns, raise questions, or make generalizations from their observations. The teacher's role is to create the opportunities and the context in which students can successfully
l O 2
make the appropriate generalizations, and to guide students as necessary.
Inductive teaching has close ties with the instructional method called the "learning cycle," where phenomena are explored before concepts are named. Inquiry-based teaching, in which students are asked to continually develop and test hypotheses in order to generalize a principle, is another member of the inductive "family."
Deductive teaching (also called direct instruction) is much less "constructivist" and is based on the idea that a highly structured presentation of content creates optimal learning for students. The instructor using a deductive approach typically presents a general concept by first defining it and then providing examples or illustrations that demonstrate the idea. Examples that do not fit the idea are helpful in confirming the idea. Students are given opportunities to practice, with instructor gu idance and feedback, applying and finding examples of the concept at hand, until they achieve concept mastery.

General Teaching Methods: Usi ng Varied Instructional Techniqu es l O 3
Most "demonstration" or "cookbook" labs are deductive in nature. Students have already been introduced to the idea in their text or in lecture, and the lab serves to show them directly and concretely something that they already know or have been taught conceptually. They know the outcome of the procedure before it is completed. The three osmosis labs starting on page 286 present a deductive version (demonstration), a transitional deductive/ inductive version (structured inquiry), and an inductive version (guided inquiry). all based on the same materials.
Examples of Inductive and
Deductive Ecology Lessons
The following two examples are meant to illustrate the two approaches.
Deductive
During an ecology unit, the instructor presents the concept of resource partitioning. It is defined: Resource partitioning is the dividing up of a key resource (habitat, food) in order to reduce direct competition between species. Examples of the phenomenon (such as a visual depiction of the famous warbler/spruce tree spatial partitioning example) are then shared with students and explained. Then the instructor asks students to apply their understanding by evaluating a new example (such as a wading birds/feeding depths visual depiction) and deciding whether it fits the concept of resource partitioning. The example is discussed, and students are given feedback on their choices and justifications. The teacher decides if additional examples are necessary in order for students to achieve concept mastery.
Inductive
During an ecology unit, the instructor provides students with a few visual depictions of ecological scenarios where resource partitioning is shown (the warblers/spruce trees and the wading birds/feeding depths examples, for instance). Students are instructed to observe and describe the examples and to look for any patterns they share. The instructor may ask a guiding question, such as What are some ways that competition can be minimized? Students then share their observations and interpretations of the phenomena, hopefully describing the unnamed concept of resource partitioning. After the discussion, the instructor provides the name of the concept for the students.
The Advantages and
Disadvantages of These
Approaches
Neither of these approaches is perfect for all students all of the time; each has advantages, disadvantages, and trade-offs.
Richard Felder (1993) characterizes inductive and deductive preferences as a learning style issue. Some students learn best through an inductive approach; some learn best through a deductive approach. Inductive learners like making observations and poring over data looking for patterns so they can infer larger principles. Deductive learners like to have the general principles identified and prefer to deduce the consequences and examples from them. These are often the same learners who prefer more structure in general.
From the example about resource partitioning described previously, one can see that the inductive approach could potentially make for a "messier" lesson. Students may draw other meanings from the examples and data provided than what was intended by the instructor. The inductive approach

1 0 4 B I O L O G Y S U C C E S S !
may also take more time and be less "efficient" than a deductive approach. In addition, certain ideas do not lend themselves easily to an inductive technique-teaching about DNA base pairs or photosynthesis, for instance.
Some educators have suggested that deductive teaching can be critically important for students with learning disabilities (Brigham and Matins 1999). This method has a clear and readily apparent structure, is easily paced to accommodate student needs, and is very familiar to students. But deductive teaching has trade-offs; it can be too rigid a form that does not allow for divergent student thinking nor emphasize student reasoning and problem solving.
Mary Bay et al. (1990) found that in a controlled study of science achievement by students with mild handicaps, including learning disabilities, those students taught by an inductive approach showed better long-term retention of concepts than those taught with a deductive approach. The hypothesis is that inductive thinking demands deeper processing.
At the same time, open-ended inductive exercises may pose severe challenges for students with learning disabilities. Such students may have difficulty getting started, understanding their role in the exercise, and staying focused on the activity. In order for these students to succeed when engaged in inductive activities, it is essential that the instructor create clear guidelines for behavior, provide explicit directions from the outset of the activity, and be prepared to offer extra guidance as necessary. Mastropieri, Scruggs, and Butcher (1997 ) concur and suggest that inductive-based activities for students with learning disabilities, without the supporting structures described here, will result in less effective concept development.
T hese pros and cons, however, should not steer an instructor away from using one approach or the other; both are important teaching models.
Ways to Integrate Inductive
Teaching
Since inductive teaching is a less familiar approach to many biology teachers, two additional examples of inductive teaching are offered below.
1. Give students a basic data set in the form of a table or graph that shows a key concept, such as exponential growth. Ask them to observe the data, describe the data, and make some interpretations about the data. After the observations and interpretations have been discussed, introduce the name for the concept (exponential growth) and give them any other additional information deemed appropriate.
2. Play what is called the "inductive game." Provide a prompt in the form of a question or challenge, such as "List as many basic foods that humans consume as you can." Provide one or two examples so students catch on quickly (e.g. , eggs, carrots). As the group names foods, record the responses for all to see in a simple table with three columns, leaving the heading for each column blank. T he students will see that each response is placed in one of three different columns. (See
Figure 3.20.)
After several examples have filled all three columns, ask students to propose a classification system for the three-column table; in other words, what concept is the basis for the groupings? Collect and record the suggestions as the class discusses the merits of the various classification schemes proposed. Then write the appropriate name or definition for the groupings in the empty headings of the columns.
In this case, the concept intended to be drawn out of the students was macromolecules: fats, proteins, and carbohydrates. Students will not typically identify the proper name of the con-
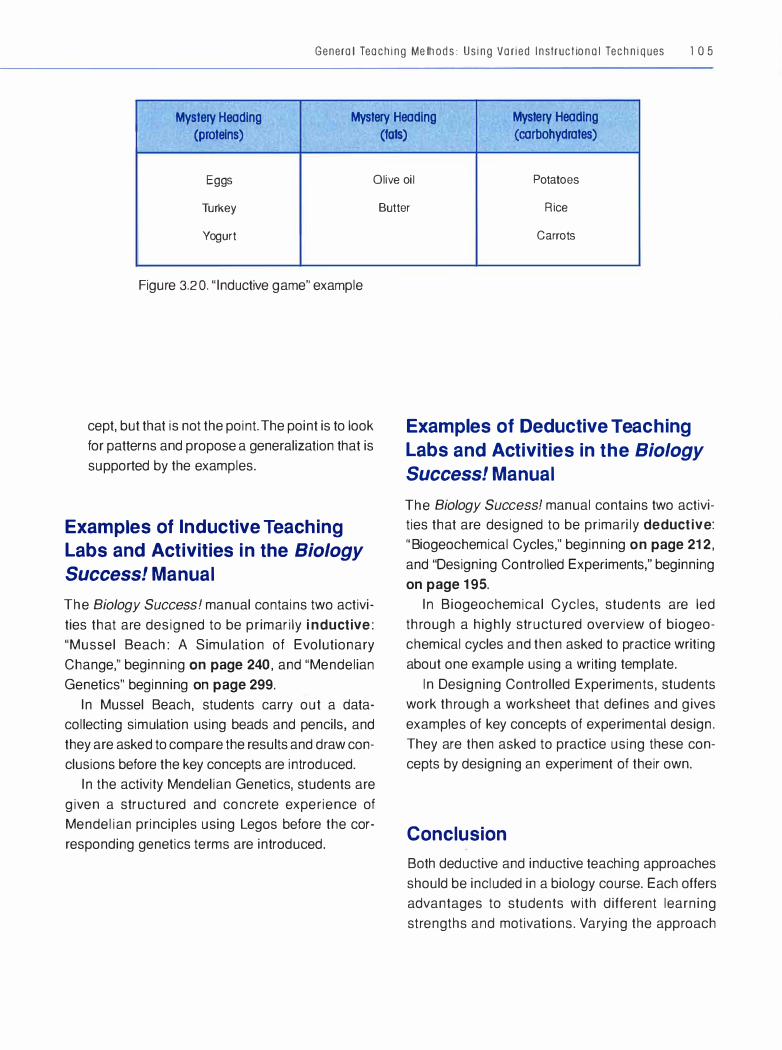
General Teaching Methods: U sing Varied Instructional Techniques 1 O 5
Mystery Heading Mystery Heading Mystery Heading
(proteins) (fats) (carbohydrates)
Eggs Olive oil Potatoes
Turkey
Yogurt
Figure 3.20. "Inductive game" example
cept, but that is not the point. The point is to look for patterns and propose a generalization that is supported by the examples.
Examples of Inductive Teaching
Labs and Activities in the Biology
Success! Manual
The Biology Success! manual contains two activities that are designed to be primarily inductive:
"Mussel Beach: A Simulation of Evolutionary Change," beginning on page 240, and "Mendelian Genetics" beginning on page 299.
In Mussel Beach, students carry out a datacollecting simulation using beads and pencils, and they are asked to compare the results and draw conclusions before the key concepts are introduced.
In the activity Mendelian Genetics, students are given a structured and concrete experience of Mendelian principles using Legos before the corresponding genetics terms are introduced.
Butter Rice
Carrots
Examples of Deductive Teaching
Labs and Activities in the Biology
Success! Manual
The Biology Success! manual contains two activities that are designed to be primarily deductive:
"Biogeochemical Cycles," beginning on page 212,
and "Designing Controlled Experiments," beginning on page 195.
In Biogeochemical Cycles, students are led through a highly structured overview of biogeochemical cycles and then asked to practice writing about one example using a writing template.
In Designing Controlled Experiments, students work through a worksheet that defines and gives examples of key concepts of experimental design. They are then asked to practice using these concepts by designing an experiment of their own.
Conclusion
Both deductive and inductive teaching approaches should be included in a biology course. Each offers advantages to students with different learning strengths and motivations. Varying the approach

l 06 BIOLOGY SUCCE SS!
to teaching content can help reach a broader number of students with diverse learning needs.
References
Bay, M., J. R. Staver, T. Bryan, and J. B. Hale. 1990. Science instruction for the mildly handicapped: Direct instruction versus discovery teaching. Journal of Research in Science Teaching 29 (6): 555-70.
Brigham, F. , and J. J. Matins. 1999. A synthesis of empirically supported best practices for sci-
ence students with learning disabilities. 1999 Annual International Conference of the Association for the Education of Teachers in Science, Austin, TX.
Felder, R. 1993. Reaching the second tier: Learning and teaching styles in college science education. Journal of College Science Teaching 23 (5): 286-90.
Mastropieri, M. A., T. E. Scruggs, and K. Butcher. 1997. How effective is inquiry learning for students with mild disabilities? Journal of Special
Education 29 (2): 199-211.
Using Varied
Instructional Techniques:
Discussion
AT F I R s T G L A N C E ' a biology teacher who knows something about learning disabilities might assume that classroom dis
cussions offer an academic environment in which students with learning disabilities will flourish. After all, discussions don't entail burdensome reading and writing demands, and they do offer the interactivity often lacking in lecture formats. In many cases, this assumption will turn out to be true. But discussions also present their own obstacles for many students with learning disabilities because of students' difficulties in receiving or expressing information orally. T his section spells out some of the challenges students with learning disabilities encounter in discussion-based classroom environments, as well as some ideas for structuring and managing a class discussion so all students can participate effectively.
Challenges to Effective
Participation in Class Discussions
Some of the key characteristics students with learning disabilities may exhibit in a discussion-
1 0 7
based environment are slow oral processing speed, difficulties with oral comprehension, attention issues, difficulties with expressing ideas, discussion anxiety, impulsive and/or dominating styles of participation, and difficulties with discussion decorum and pragmatics.
Students who cannot process oral language quickly or accurately find the meandering quality of discussions a special challenge-far more so than lectures, in which information is generally better organized and may be accompanied by visual referents. While a lecturer may pause to take or encourage questions and to ask students to summarize and reflect, class discussions may bounce from topic to topic in a seemingly random or contradictory fashion and never settle into a neatly condensed core of main ideas and secondary supports. T he free-flowing nature of discussions also challenges students who are distractible, who tune in and out of the discussion while missing large chunks of information, or those who have difficulty with saliency, the ability to distinguish key points from less relevant context.
Class discussions also pressure students to be actively engaged in posing or answering questions and responding to statements. Many students with
1 0 8 B IOLOGY SUCCESS!
learning disabilities form part of the "silent majority "
of the classroom-those who don't volunteer infor
mation for a variety of diagnostic reasons, "not the
least of which is fear" (Herbert 2001 ). Students
with learning disabil ities often trade horror stories
about having been humiliated or ridiculed by
teachers or other students in earlier school settings
for their "stupid" or inappropriate responses.
Another impediment to active participation for
some students with language-based disabilities is
verbal dysfluency: they struggle to formulate ideas
into syntactically correct, clearly expressed sen
tences, or they experience word-retrieval difficulty
and are unable to summon the terms for ideas they
carry in their heads. Under the pressure of being
called on to answer a question, they may fall silent
or stammer an inarticulate response, making it
seem as if they are uninformed or unmotivated. At
the opposite end of this scale are students who
dominate discussions or who interrupt othe rs,
sometimes to offer comments that seem off the
topic. Frequently, problems with inattention or
impulsivity are at the root of these behaviors.
Another group of students has problems under
standing or participating appropriately in the non
verbal aspects of communication . Sometimes
these students carry a diagnosis of nonverbal
learning disability, but often they simply will be
viewed as rude or clueless by their teachers and
peers. These students may not have inte rnalized
some conversational basics, such as maintaining
eye contact or taking turns. They may fail to grasp
or convey tone of voice and body language, and
thus miss irony, sarcasm, and many forms of
humor, completely misunderstanding the intention
of a remark or gesture.
Enhancing Student Participation in
Class Discussions
Despite the problems that class discussions may
pose, they are a vital component of most biology
courses. With an understanding of the difficulties
some students face, teachers can plan discussions
so that all students benefit from the practice of the
critical thinking and communication skills they
embed.
Creating Class Rules
One of the best ways to address the hesitancy of
some students to participate actively is to develop
a set of classroom rules on the opening days of
class. This goes along well with assessment of
learning style (see page 37-41 ), because it sup
ports the notion that class members must respect a
diversity of learning styles and that all students
must feel safe to express their ideas. Rules also
provide explicit instruction in classroom expecta
tions for the students who struggle with nonverbal
communication. Students and i nstructors should
coope ratively create rules for communicating with
each other (Meehl 2002).
Some of the guidelines that have been consis
tently generated in communications classes at
Landmark College include the following (E. Wood,
personal communication, in Meehl 2002, p. 138):
• Respect each other
• Be open to others' thoughts and ideas • Come prepared for class
• Offer constructive criticism
• Have fun
"These agreements between class members
create a foundation that is conducive to meaningful
learning" (Meehl 2002, 138) and are posted on
classroom walls as a reminder of the "social con
tract" everyone has agreed on.

General Teaching Methods: Using Varied I nstructional Techniques l O 9
Providing "Wait Time"
Teachers and students are often uncomfortable with silent pauses in the classroom discussion and rush to fill in the silences. However, allowing fifteen seconds or so after posing a question to the class before you choose a respondent allows for slower processors to gather their thoughts and formulate more thoughtful responses. During this wait time, it can be beneficial to ask students to jot down some words or ideas that may help them articulate a clear and coherent response to the question. Also consider waiting a few seconds when responding to students, so that you model thoughtfulness to them.
Seating That Promotes Discussion
Arranging class seating so that students face each other is another simple way to promote good discussion. "When students sit in rows, they see many people's backs instead of their faces, which may in itself suggest negative implications for their meaningful working relationships." Organizing chairs into a circle or horseshoe promotes good eye contact and conversational flow. When the teacher sits among the students, instead of standing at the front of the room, "the locus of control shifts and a more egalitarian climate emerges" (Meehl 2002, 1 35). Chairs and tables can also be rearranged to facilitate working in pairs or small groups, giving students even more opportunities to learn by talking. Unfortunately, many biology classes are held in labs with seating determined by lab stations bolted to the floor. In these cases, discussion can be enhanced by moving the stools to a central area of the room or, if that isn't feasible, having the teacher sit among the students.
Setting Purpose
The first requirement of a successful discussion is to have a clear purpose. Is the central purpose
to assess students' command of text material?to probe students' abilities to apply previously learned information to a problem in the field?-to prepare students for a video they will be watching? All are legitimate goals, but all will require different types of questions. One of the built-in tensions of discussion-based teaching is that having a purpose is sometimes confused with arriving at a predetermined conclusion. T his pitfall should be avoided, because students may feel manipulated rather than included if their questions and answers are bent to serve an instructor's hidden agenda.
Asking the Right Questions
The purpose of the discussion combined with the profile of the students should determine how the discussion begins. Often this is where the discussion goes awry. Instructors "preface" the discussion with a twenty-minute introduction, or ask a question that is too global for their narrow purpose or too restrictive for their expansive purpose. Two of the quickest ways to kill a discussion are for the instructor either to force students to complete his or her sentences, or to ask an open-ended question that assumes not only full command of all necessary information but also the ability to draw conclusions and make inferences based on it.
For example, a biology instructor may want students to think comparatively about Lamarckian and Darwinian evolutionary theories and at the end of the discussion be able to consider the characteristics of a good scientific theory. If the teacher feels the class has a firm grasp of the principles delineated by Lamarck and Darwin, the questioning could begin by asking the students to compare the two theories. On the other hand, if the teacher has reason to believe that most of the students still need to solidify their literal understanding, it would be better to begin by asking students to summarize the key points of each theory, and then create a visual on the board (such as a Venn diagram or a

1 1 0 BIOLOGY SUCCE S S !
double-bubble chart) that lets students examine points of comparison. When the teacher feels the students are secure in understanding the ways in which Darwin's theory differs from Lamarck's, the next question would ask students "Which theory better accounts for the data?" Then the discussion can proceed to the more general issue by asking "What are the characteristics of a good scientific theory?"
Just as important as having an opening question suited to the purpose of the discussion is assuring that questions serve to keep students focused on the main purpose of the discussion. Following the comparison question in the previous paragraph with "Why do religious fundamentalists oppose teaching evolutionary theory in public schools?" will lurch the discussion in a very different direction than that established by the opening questions, and it may be hard to draw students back to the central issue of the scientific basis for evolutionary theory.
Assuring Equitable Participation
To be truly inclusive, discussion-based teaching must also find a means for involving the uninvolved. One approach that gets everyone involved in an equitable fashion uses the cooperative learning technique called random group check. To accomplish this, each class member is assigned a number, which is written on a slip of paper and deposited in a receptacle of some sort. To initiate answer-sharing and discussion, the instructor randomly chooses a number, and the student with the corresponding number is then accountable to respond to the first question. Informal, studentdriven discussion can follow this initial structure, as other students may have different interpretations. For each new question discussed, however, employ the random group check to begin the discussion. The rationale for this technique is that it
embeds in the activity the expectation of personal accountability for the work completed. Students know that they may be asked (in a random, nonpersonalized way) to participate, and they therefore take the activity more seriously.
Another specialized technique for helping reluctant or unfocused students overcome their hesitancy to participate is for teachers to let these students know in advance when they will be called on. A teacher generally knows what he or she is going to cover and can discreetly let students know they will be asked about a certain topic. This strategy has a number of excellent benefits: It brings reluctant students and their insights into the discussion, improving their confidence and facilitating acceptance by the larger group. It also gives students the necessary time to prepare their answers, while providing a point of focus to improve comprehension of other points of information.
A simple tactic, especially when distractibility seems to be the issue, is to begin a question with the student's name. This allows distracted students to focus on the question and avoid the feeling that they have been caught not paying attention. Teachers should also require students to speak in complete thoughts. If they offer one- or two-word answers, draw out more explanation with an encouraging phrase such as "tell me more."
Teachers can help reluctant or domineering participants improve their class participation by talking privately outside of class (after class or during office hours) to help them set goals for participation. A silent student might be encouraged to increase his or her participation to a minimum of two or three comments per class, while an overenthusiastic participant can be asked to reduce the number of comments, especially if there's a tendency to interrupt other students. Teachers can help students monitor their progress by encouraging them to keep a daily tally of how many times they participate or interrupt, and by providing an agreed-upon, discreet cue

General Teaching Methods: Using Varied I n struct ional Techniques l l l
(such as scratching their left ear, or taking off their eyeglasses) for the targeted behavior.
Keeping Students Focused
There are several techniques for keeping students focused and productive during a discussion. First and foremost is for the instructor (and the students) to have a clear idea of the purpose of the discussion. Writing out the purpose or the overarching discussion questions on paper or chalkboard for all participants to see as a visual reference can help make this clear. It is also recommended that the length of discussions be limited: the longer the discussion, the more possibility there is of losing the attention of students. Gauge student "discussion span" early in a course and honor it.
Students often raise off-topic comments and questions during a class discussion, and these can be both annoying and amusing. T he instructor's role as a facilitator is to contain and forward the discussion. This at times means verbally redirecting students back toward the topic. It is constructive to honor interesting but off-topic questions by recording them and raising them later at a more appropriate time.
Small-Group Work
Another way to promote equitable and focused discussion is by using small groups. Small-group discussions and tasks can provide an opportunity for students to rehearse the presentation of their ideas in a smaller, less anxiety-producing setting. See the "Science and Religion" activity on page 237 for a detailed example. Assigning students specific roles can work well to promote equitable participation, and it is tremendously helpful in ensuring that all students have ample opportunities to practice their oral expression and critical thinking skills.
Common roles within small groups include
• facilitator : makes sure everyone participates and stays on topic;
• time keeper: moves the discussion along; • recorder: takes notes; and • reporter: presents the group's work to the rest
of the class,
as well as some creative roles, such as illustrator or "devil's advocate." Teachers who use this form of small-group organization will need to spend time instructing students in the roles and supervising their practice. If they arrange the groups so that students play different roles from class to class, everyone will have a broad range of learning experiences by the end of the course.
Discussing Controversy
Discussing controversial topics can be an exciting part of an introductory biology course. The many relevant and interesting controversial topics can act as strong student motivators and promote discussion skills, biological literacy, and critical thinking. The same challenges and principles of effective participation in discussions described earlier pertain to controversies as well-perhaps even more so. One additional principle should be emphasized when facilitating discussions on controversial topics: maintaining instructor neutrality. This may be particularly important for students with learning disabilities, who, because of their already weak participation skills and background knowledge deficits, can be disproportionately influenced by an instructor's viewpoint. A biased instructor can interfere with the development of essential reasoning and argumentative skills in these students. The National Institutes of Health Curriculum Supplement Series on Infectious Diseases (1999) provides additional tips on leading students though controversial discussions in science.
1 1 2 B I O L O G Y S U C C E S S !
Conclusion
Discussions may be more participatory than lectures, but they still involve processing a lot of talk, and they can be difficult for some students with attention or language-processing difficulties to follow. Therefore, discussions should be broken into smaller units, with opportunities for other multimodal activities: individual or group brainstorming, constructing a diagram, watching a video clip, or writing summary notes. Used this way, discussions can be not just an occasional respite from lectures, but also a means of teaching the critical thinking skills necessary to study biology.
References
National Institutes of Health, Biological Sciences Curriculum Study, and V ideo Discovery. 1999. Emerging and reemerging infectious diseases. NIH Publication 99-4645. Rockville, MD: National Institutes of Health.
Sections of this chapter have been adapted, with permission, from the following Landmark College publications:
Herbert, C., and S. W. Strothman. 2001. Considerations in classroom management. In Promoting academic success for students with learning disabilities, ed. S. W. Strothman, 51-81 . Putney, VT: Landmark College.
Hutcheson, M . R. 2002. Teaching history and humanities. In Teaching in the disciplines: Classroom instruction for students with learning disabilities, ed. L. C. Shea and S. W. Strothman, 167 -85. Putney, VT: Landmark College.
Meehl, J. J. 2002. Oral expression in the college classroom: Creating communication climates for collaborative learning. In Teaching in the disciplines: Classroom instruction for students with learning disabilities, ed. L. C. Shea and S. W. Strothman, 121- 50. Putney, VT: Landmark College.
Using Varied
Instructional Techniques:
Writing Models
ST u D E N T s B E N E F I T from having explicit guidelines for assignments, particularly those involving writing. Providing models or
graphic templates is a useful method for improving students' writing. Such templates can be used for laboratory reports (see page 1 63), article summaries, critiques, and "process" writing-writing that explains or describes a particular biological process, such as photosynthesis, cellular respiration, mitosis, meiosis, protein synthesis, or biogeochemical cycles.
The "Writing Model for a Biological Process" template found on page 1 1 5 could be of great value to students whose teachers ask them to know the details of these biological processes. An example of a filled-out template using the biological process of cell division is also provided on page 1 1 7.
Suggestions for Using the "Writing
Model for a Biological Process"
In order to get students proficient with writing about biological processes using the model, or template,
l 1 3
an instructor could facilitate the following activities to provide explicit instruction and practice:
Activity 1
Before assigning to students the task of wr iting about a biological process, introduce the writing model by having students write about a familiar everyday process using the template as their guide. Examples might be making breakfast or getting to class or pumping gas at a gas station. This could be done collectively with the entire class. The instructor could display the template for all to see and record student responses in the blank boxes. When the model is complete, discuss how it could be used to describe a biological process.
Activity 2
1. Before class, take a recently introduced biological process, such as cellular respiration, and write a sample explanation using the Writing Model for a Biological Process as a guide.
2. Write the specific and discrete parts of the explanation (purpose, essential features,
1 1 4 B I O L O G Y S U C C E S S !
Step A, etc.) on strips of colored paper. Do not label or identify the components on the stripsjust include the text.
3. Mix up the strips and place them in envelopes, making as many envelopes and strips as needed for the class or group size.
4. Distribute one set of strips in an envelope per group of students.
5. Give them the task of sequencing the strips according to the Writing Model for a Biological Process and their understanding of the process.
6. Compare and discuss the results with students when they complete their work. Be sure to include some metacognitive components in the discussion: What aspects of this task were challenging? How did you approach the task?
Activity 3
Use a procedure similar to that in Activity 1, but this time write about a biological process that has recently been discussed.
Activity 4
After students have gained some familiarity with the model and its use through the suggestions described above, give them the following task:
1. Assign students to use the Writing Model for a Biological Process to write their own summary of a different process, such as photosynthesis, that has already been discussed in class.
2. When students are finished drafting their individual summaries, pair them up in class for a peer review and feedback session. Suggest that student pairs use the template's guidelines as a checklist for assessing the completeness of each other's work.
3. Discuss with the entire class their experience with this assignment, paying attention not only to the content but to their metacognitive reflections on using the model, and to the benefits and challenges of peer review.

General Teaching Methods: Us i ng Varied Instruct ional Techn i ques 1 1 5
WRITING MODEL FOR A BIOLOGICAL PROCESS
Follow these steps when describing a biological process
Name of Process:
1 . State the purpose and/or
importance of the process
(1-2 sentences)
2. Summarize the process by
answering this question: What
are its essential features?
(1-2 sentences)
3. Start at the beginning of the
process (if a cycle, start at a
logical starting point)
A. Elaborate on Step A.
For example, provide details on:
• Components
• Relationships between
components
• Specific outcomes or products
of the step
B. Elaborate on Step B.
For example, provide details on:
• Components
• Relationships between
components
• Specific outcomes or products
of the step
..
..
Purpose/Importance
Essential Features
Step A
Step B
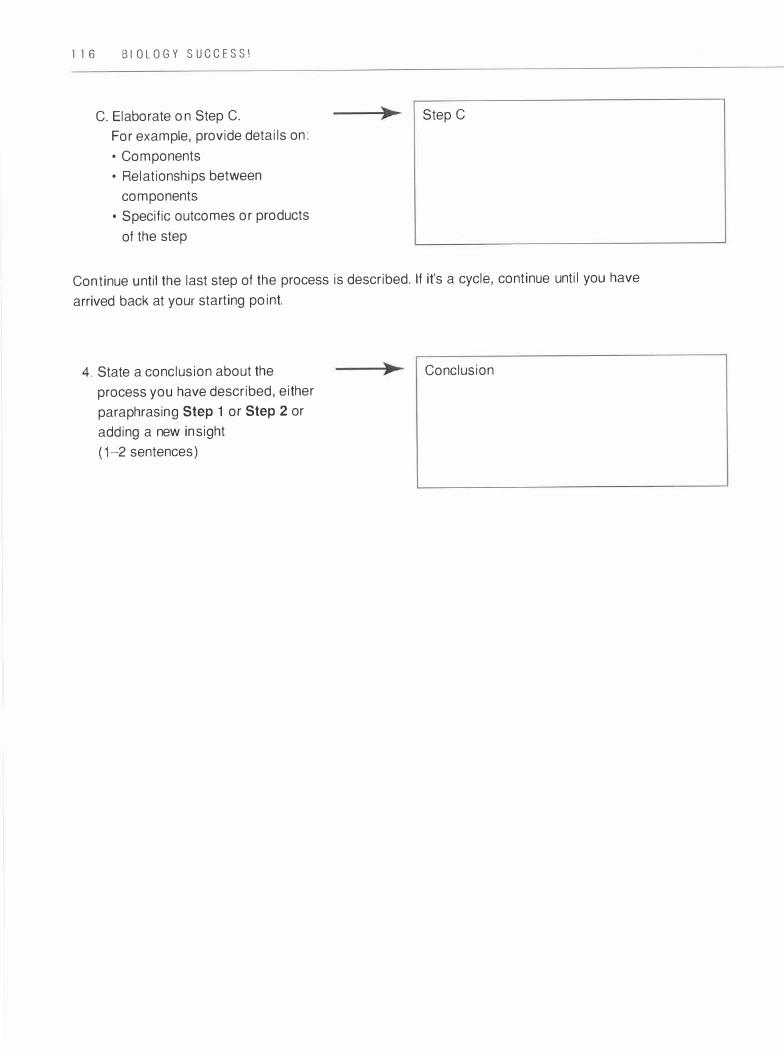
1 1 6 BIOLOGY SUC C E SS!
C. Elaborate on Step C.
For example, provide details on :
• Components
• Relationships between
components
• Specific outcomes or products
of the step
Step C
Continue until the last step of the process is described. If it's a cycle, continue until you have
arrived back at your starting point.
4. State a conclusion about the
process you have described, either
paraphrasing Step 1 or Step 2 or
adding a new insight
( 1-2 sentences)
Conclusion
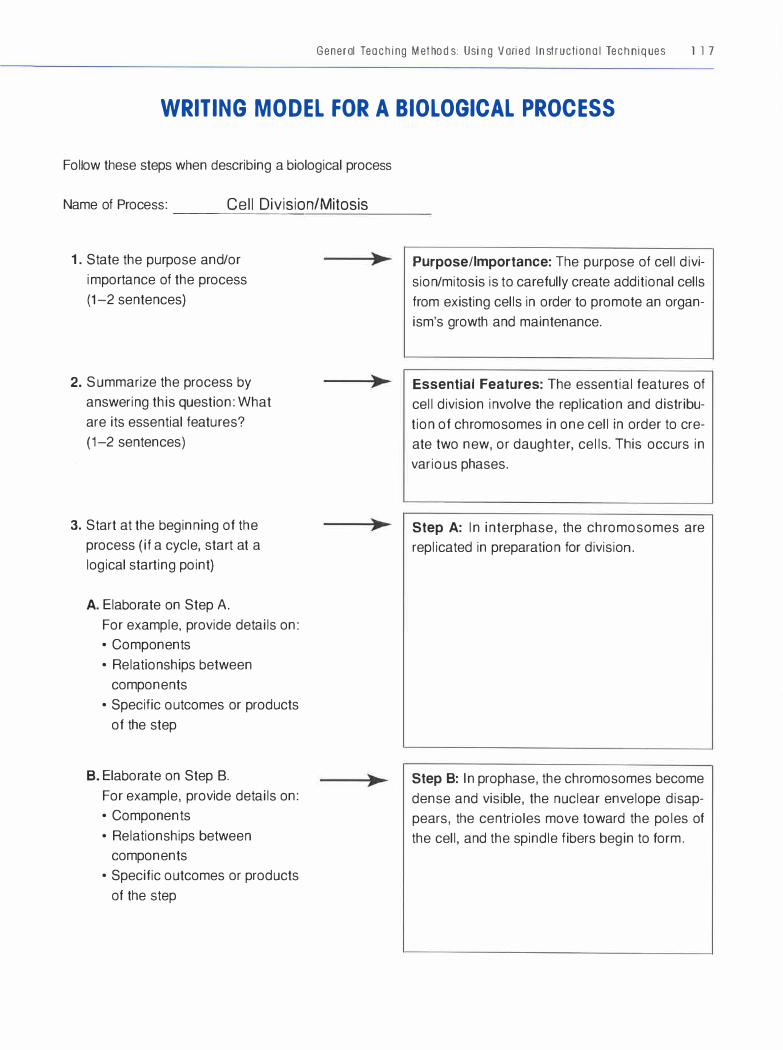
General Teaching Methods: Using Varied Instructional Techn iq u es l l 7
WRITING MODEL FOR A BIOLOGICAL PROCESS
Follow these steps when describing a biological process
Name of Process: Cell Division/Mitosis ------ -- -- - - -- --
1 . State the purpose and/or
importance of the process
(1-2 sentences)
2. Summarize the process by
answering this question: What
are its essential features?
(1-2 sentences)
3. Start at the beginning of the
process (if a cycle, start at a
logical starting point)
A. Elaborate on Step A.
For example, provide details on:
• Components
• Relationships between
components
• Specific outcomes or products
of the step
B. Elaborate on Step B.
For example, provide details on:
• Components
• Relationships between
components
• Specific outcomes or products
of the step
Purpose/Importance: The purpose of cell divi
sion/mitosis is to carefully create additional cells
from existing cells in order to promote an organ
ism's growth and maintenance.
Essential Features: The essential features of
cell division involve the replication and distribu
tion of chromosomes in one cell in order to cre
ate two new, or daughter, cells. This occurs in
various phases.
Step A: In interphase, the chromosomes are
replicated in preparation for division.
Step B: In prophase, the chromosomes become
dense and visible, the nuclear envelope disap
pears, the centrioles move toward the poles of
the cell, and the spindle fibers begin to form.
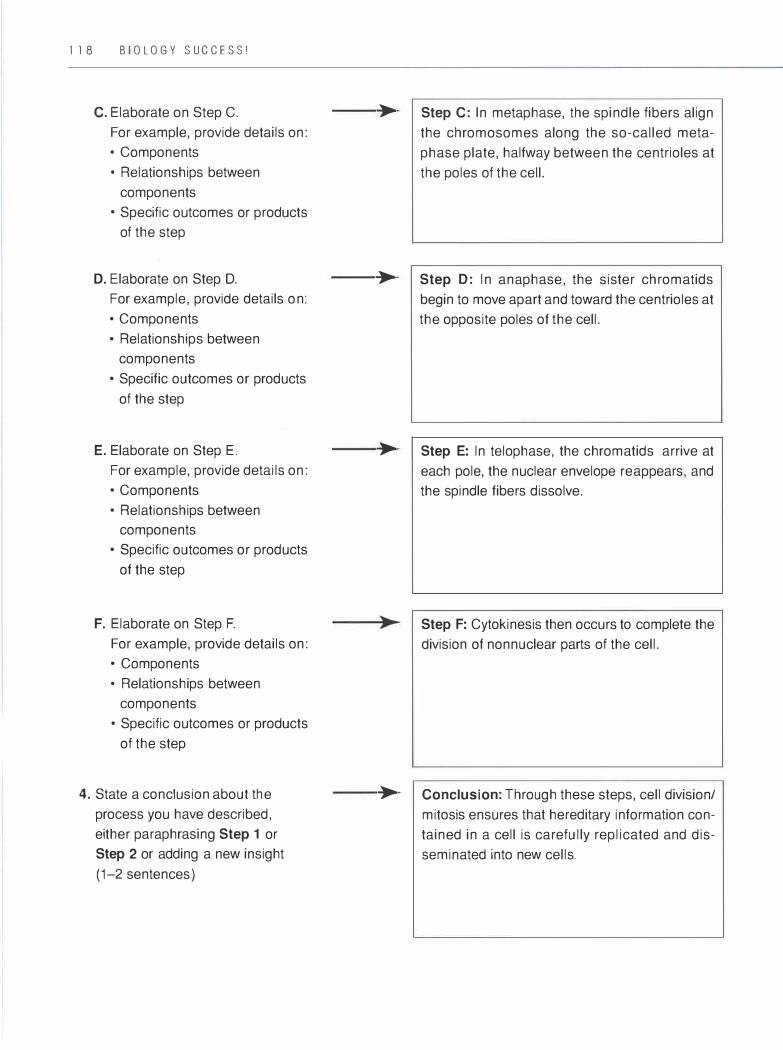
1 1 8 B IO LOGY SUC C E SS!
C. Elaborate on Step C. For example, provide details on: • Components • Relationships between
components • Specific outcomes or products
of the step
D. Elaborate on Step D. For example, provide details on: • Components • Relationships between
components • Specific outcomes or products
of the step
E. Elaborate on Step E. For example, provide details on: • Components • Relationships between
components • Specific outcomes or products
of the step
F. Elaborate on Step F. For example, provide details on: • Components • Relationships between
components • Specific outcomes or products
of the step
4. State a conclusion about the process you have described, either paraphrasing Step 1 or Step 2 or adding a new insight (1-2 sentences)
>
>
>
>
Step C: In metaphase, the spindle fibers align the chromosomes along the so-called metaphase plate, halfway between the centrioles at the poles of the cell.
Step D : In anaphase, the sister chromatids begin to move apart and toward the centrioles at the opposite poles of the cell.
Step E: In telophase, the chromatids arrive at each pole, the nuclear envelope reappears, and the spindle fibers dissolve.
Step F: Cytokinesis then occurs to complete the division of nonnuclear parts of the cell.
Conclusion: Through these steps, cell division/ mitosis ensures that hereditary information contained in a cell is carefully replicated and disseminated into new cells.
Using Varied Instructiona l
Techn iques:
Effective Review
AL L L E A R N E R s benefit from reviewing course material on a regular basis. Reviewing helps to consolidate or recode
information in long-term memory for later retrieval. Furthermore, the ways in which we review new ideas and concepts can affect our long-term retention. For example, a student who reviews notes on cell respiration by silently reading the notes taken weeks ago tends to have less retention than a student who paraphrases the notes, then writes the paraphrases next to the original set of notes.
In addition, students who learn to review by applying their strengths to the reviewing process will retain and utilize that information more effectively. For example, a student who learns and remembers best by discussing ideas with another learner would do well to apply this technique in reviewing course information. Or a visual learner could make a flow chart or a mind map of the concepts. Students who are more aware of their learning style strengths and weaknesses can better develop and apply specific, effective reviewing strategies.
Listed and explained in this section are several strategies that teachers and students can use when reviewing course material. It is important for the instructor to explicitly introduce and model
l l 9
these strategies in class in order to help students fully understand how they could be used, and also suggest that students choose the most appropriate strategies for their learning style. Encouraging students to use these strategies develops their selfunderstanding while reinforcing biology content, and gives them practice with techniques that could be applied elsewhere in their academic work or profession.
Some of the review activities described may work best when done individually. Others might be more useful if performed in collaboration with other students. When appropriate, working with partners to brainstorm or generate ideas may be more effective than working alone. A combination approach in which students develop ideas independently but then share them with another student afterwards is another possibility.
Samples of Review Strategies
Use of Study Guide
During review sessions early in a course, the instructor should supply students with a set of

1 2 0 B I O L O G Y S U C C E S S !
review questions or a study guide. A sample study
guide is found on page 148. As the course pro
ceeds, ask students to take on more responsibil
ity to develop their own review questions from
course material . Encourage students to employ a
strategy that best fits their learning style when
responding to the study guide questions. Some
examples follow:
• Visual Responses to the Questions. Encour
age visually strong learners to choose a
graphic or pictorial method of expressing their
answers. For instance, they could use colors,
pictures, arrows, or words to enhance a draw
ing, or they might use a Venn diagram or some
other form of graphic organizer.
• Use of a Comp uter. Some students may best
express their answers using a computer. The
method could be as simple as word process
ing instead of hand writing answers, or more
complex, such as constructing a graphic orga
nizer using the Inspiration software program, or
a table or spreadsheet using Microsoft Excel
software or a Web page.
• Model Building and Manipulatives. For
learners who like to work with their hands and
can link concepts in three dimensions, suggest
that they build a model for some review ques
tions. The instructor would need to make avail
able some basic materials-for example, some
of those listed in the sidebar on page 83.
Student Lessons
As teaching is great way to test knowledge and
demonstrate understanding, give students the
option of preparing a brief lesson for the rest of the
class on one of the concepts to be reviewed.
Review Games
Following is a list of games that can be used effec
tively for review:
• Bingo. The teacher provides students with a
blank template for a bingo board and lists
twenty-four terms or concepts to be reviewed.
(Alternatively, the teacher may ask the class to
generate the list.) These twenty-four terms get
entered randomly on the bingo boards. (Don't
forget the FREE space!) The teacher then
reads out the definitions, provides examples, or
uses visual cues for the terms. For example,
the teacher might show a diagram of a com
pleted Punnet square and ask the question
"What type of inheritance is being demon
strated?" The students might then guess the
answer to be "sex-linked inheritance" and cover
that square. This continues until someone gets
B I NGO. After a few runs, students might want
to volunteer to lead the activity.
• Round Robin or Round Table. Have students
form groups of three to five, and provide a
question that would generally require a list of
answers, such as "Name eight parts of the cell
and their functions." In a round robin, students
talk among their group (as robins chirp), and
one student records the answers. If the round table option is chosen, students circulate a
paper and generate the list silently in writing
(tables don't talk). Students who can't add
something may pass the paper along. Groups
signal when they have completed the task. This
particular strategy is excellent for a class wrap
up, or as a way to begin a class by reviewing
information from a previous class.
• Cue Cards. If students have been keeping
index cards with terms on one side and a pie-
General Teaching Methods : Us ing Varied lnstruct ionol Techn i ques 1 2 1
ture on the other, they can place their cards on the table. As the teacher provides a definition or example of a term, students hold up the appropriate card in front of them. ( Individual white boards work well too.) This is a quick way for teachers to check on the progress of individuals and of the group.
• Pictionary or Charades. Give the group a prompt-for example, "Describe a function of one of the four major macromolecules." Students present their ideas as pictures or charades. The class could call out their guesses or list them on a piece of paper to check with answers later. Alternatively, the teacher could assign each student a specific concept or term, such as divergent evolution, to draw or act out.
• Biojeopardy. The teacher generates major categories within the unit that is being reviewed and designs questions within each category (or assigns these tasks to the students as homework or class work.) Groups are formed and
then take turns choosing questions that they answer as a group. (Assigning a group spokesperson is usually a good idea.) At the end, a "final jeopardy" question is given to all groups, and the winners are declared.
Conclusion
Spending class time teaching students how to review may seem like a task that takes time away from introducing and covering more content. However, the authors of this manual believe that the time invested in teaching effective review will result in better and more motivated student learning. Encouraging students to find and practice effective methods that express their understanding of course material affirms the idea that we are diverse learners with many ways to approach solving a problem or answering a question. Appropriate review strategies engage students with the content more fully and creatively, and help to further develop their understanding of how they learn best.

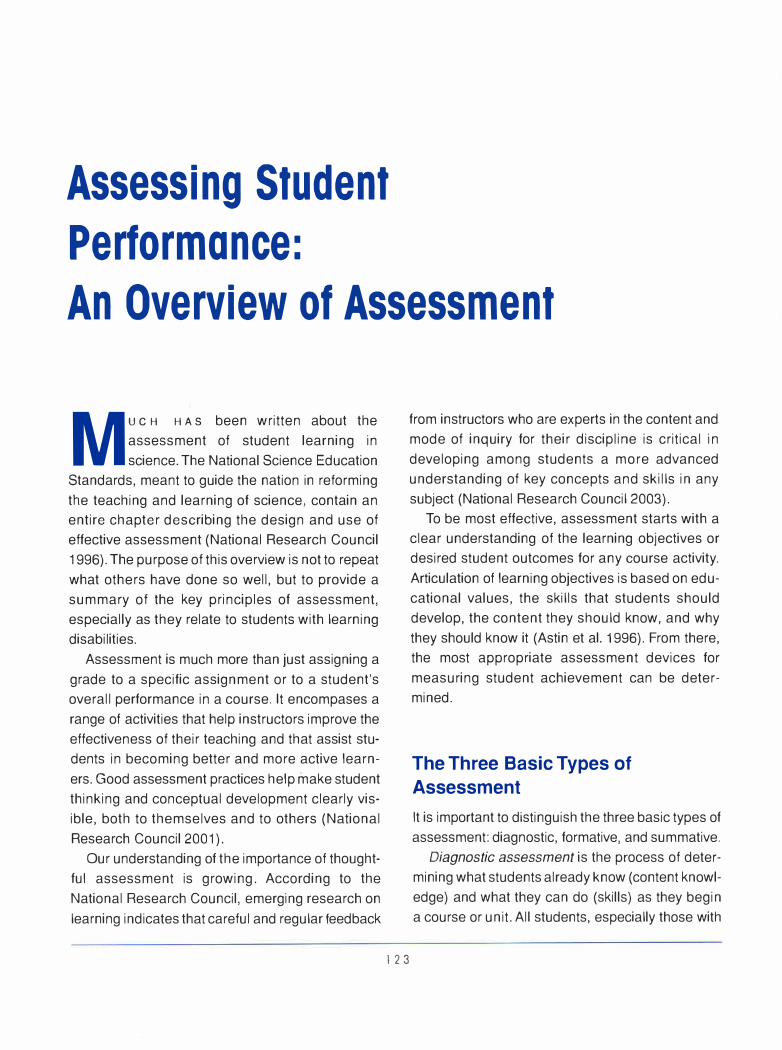
Assessing Student
Performance:
An Overview of Assessment
Mu c H HA s been written about the
assessment of student learning in
science. The National Science Education
Standards, meant to guide the nation in reforming
the teaching and learning of science, contain an
entire chapter describing the design and use of
effective assessment (National Research Council
1996). The purpose of this overview is not to repeat
what others have done so well, but to provide a
summary of the key principles of assessment,
especially as they relate to students with learning
disabilities.
Assessment is much more than just assigning a
grade to a specific assignment or to a student's
overall performance in a course. It encompases a
range of activities that help instructors improve the
effectiveness of their teaching and that assist stu
dents in becoming better and more active learn
ers. Good assessment practices help make student
thinking and conceptual development clearly vis
ible, both to themselves and to others (National
Research Council 2001 ).
Our understanding of the importance of thought
fu I assessment is growing. According to the
National Research Council, emerging research on
learning indicates that careful and regular feedback
from instructors who are experts in the content and
mode of inquiry for their discipline is critical in
developing among students a more advanced
understanding of key concepts and skills in any
subject (National Research Council 2003).
To be most effective, assessment starts with a
clear understanding of the learning objectives or
desired student outcomes for any course activity.
Articulation of learning objectives is based on edu
cational values, the skills that students should
develop, the content they should know, and why
they should know it (Astin et al. 1996). From there,
the most appropriate assessment devices for
measuring student achievement can be deter
mined.
The Three Basic Types of
Assessment
l 2 3
It is important to distinguish the three basic types of
assessment: diagnostic, formative, and summative.
Diagnostic assessment is the process of deter
mining what students already know (content knowl
edge) and what they can do (skills) as they begin
a course or unit. All students, especially those with

124 BIOLOGY SUCCESS!
learning disabilities, can show a broad range of
biology/science background knowledge as well as
skill strengths and weaknesses. As described in
"Six Guiding Educational Principles" and "Student
Background Knowledge" earlier in this manual,
using techniques for collecting diagnostic informa
tion is helpful for instructors as they plan their
instruction to meet their learning objectives. Gath
ering diagnostic information through various and
ongoing assessment techniques is also essential
for establishing an effective teacher/student rela
tionship. A simple example of diagnostic assess
ment in biology would be to give students the task
of making a mind map that shows their under
standing of natural selection before beginning
instruction on this key biological concept.
Formative assessments are the informal and
ongoing ways in which we gather and share
feedback with students as they progress toward
meeting the stated course objectives. Formative
assessment is critical in establishing a learning and
teaching "feedback loop": that is, determining what
students are learning and adjusting teaching
strategies accordingly. It is important to note that
formative assessment is meant to support learn
ing and should not result in the assignment of
grades.
Most instructors use some type of formative
assessment every day in their courses. The most
common is interactive classroom discussion
hearing students formulate their understanding
of the skills and content that guide the course.
Other common methods of formative assessment
are practice quizzes, observing small-group prob
lem solving activities, and assigning multiple drafts
of writing assignments in which students can
continually revise their writing based on instructor
feedback.
Summative assessment is the certification of
learning or mastering the stated course objectives.
Grades are assigned and credits are given based
on this kind of assessment data. Often, summative
assessment occurs at the end of a course unit,
and several of these assessments may constitute
the official determination of whether a student has
met the course objectives. Large-scale examina
tions, final drafts of written reports, and oral pre
sentations are the most common examples of this
kind of assessment.
Key Principles of Assessment
as Applied to Students with
Learning Disabilities
Make Clear All Assessment Criteria
It is essential to provide students who have learning
disabilities with an explicit accounting of the criteria
that will be used to assess their work. These criteria
should carefully match the course learning objec
tives. The sharing of criteria with students can take
many forms, from a bulleted checklist to an elabo
rate scoring rubric (see "Rubrics," page 127).
Make Assessments Frequent
Students with learning disabilities benefit im
mensely from regular formative assessment prac
tices. Establishing a routine of assessment and
feedback helps students stay focused on their
learning and gives them a realistic appraisal of their
academic progress. Encourage them to meet with
you outside of class during office hours, so that
they take some responsibility for their role in the
assessment feedback loop.
Allow for Ongoing Revision of Student Work
Make it common practice for students to gather
formative feedback on their work and revise their

General Teaching Methods: Assessing Student Performance 125
learning products accordingly. In writing classes,
students often develop multiple drafts of their
essays, gathering instructor feedback along the
way. Apply this same practice to lab reports or
graphic organizers that are assigned.
Use Varied and Alternative Assessments
Both formative and summative assessments
should be varied to allow for diverse learners to
express their progress toward meeting course objectives. Using only one type of assessment,
such as a written test, is not a reliable way
to measure learning in all students (National
Research Council 2001; Doran et al. 2002). Give
students a chance to provide evidence of their
learning through so-called "alternative assess
ments." For "formative assessments," include in
formal writing, discussion, graphic organizers,
construction of simple models, and your observa
tions of students working in class. For "summative assessments," use oral presentations, poster presentations, more involved models or graphic orga
nizers (such as concept maps), formal writing
assignments, experimental designs, and portfolios.
(See "Testing" on page 140 for more on alterna
tive assessments.)
Self-Assessment
Incorporating some form of student self-assess
ment into the overall assessment process can help
students in many ways. Most importantly, it helps
students become reflective or metacognitive learn
ers, adept at observing and analyzing their own
work (National Research Council 2001 ). Self
assessment takes the learning objectives out of the
hands of instructors and puts them in the hands of
learners, so learners can appraise their own
progress. A simple method of self-assessment
would be for students to write and submit a list of
their strengths and weaknesses related to each
assignment. A more involved and useful technique
would be to assign scoring rubrics as the selfassessment tool. Give students the specific learn
ing objectives and grading criteria for their
assignments and have them submit a self-scored
rubric along with their work.
More on Assessment
We have included three additional essays on par
ticular aspects of assessment. "Rubrics" (page
127) describes the value of using scoring rubrics to assess student work and provides several
example rubrics. "Poster Presentations" (page
151) describes the value and how-to's of organiz
ing a student poster presentation assignment.
Finally, "Testing" (page 140) describes how to
make traditional testing a better teaching and
assessment tool.
References
Astin, A. W., T. W. Banta, K. P. Cross, E. EI-Khawas,
P. T. Ewell, P. Hutchings, T. J. Marchese, K. M. McClenney, M. Mentkowski, M.A. Miller, E.T.
Moran, B. D. Wright. 1996. ASSESSMENT
FORUM: 9 principles of good practice for
assessing student learning. Washington, DC: American Association for Higher Education.
Doran, R., F. Chem, P. Tamir, and C. Lenhardt.
2002. Science educator's guide to laboratory
assessment. Washington, DC: National Science Teacher's Association Press.
National Research Council. 1996. National science education standards. Washington, DC: National
Academies Press.
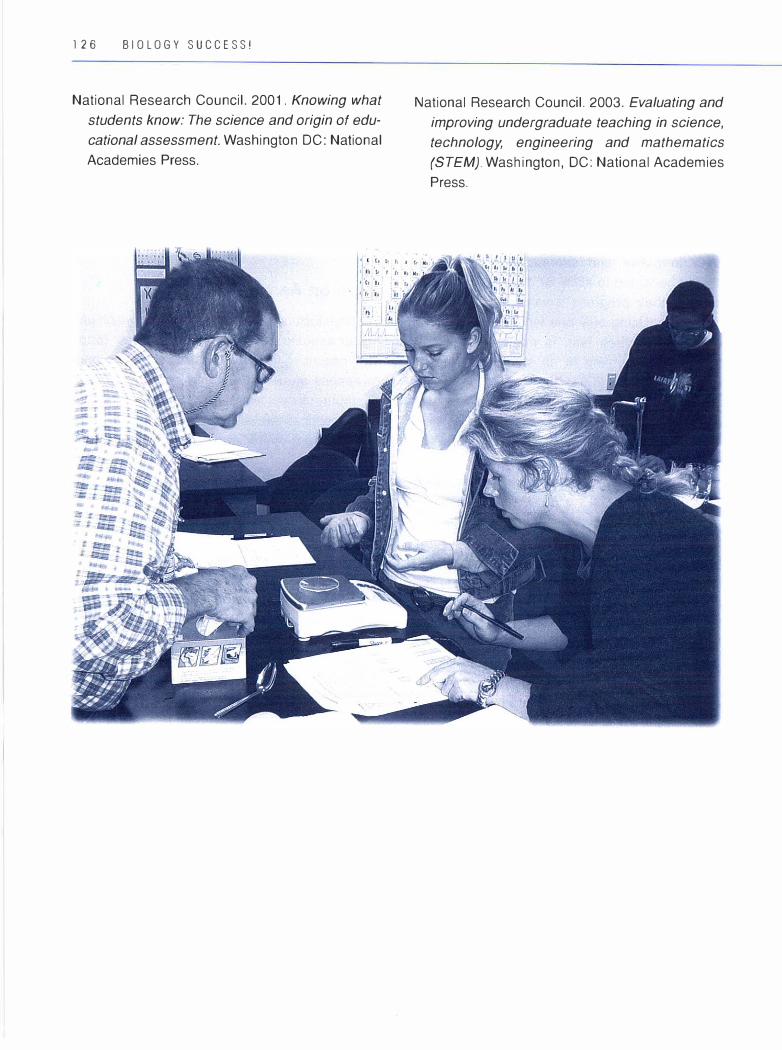
126 BIOLOGY SUCCESS!
National Research Council. 2001. Knowing what
students know: The science and origin of edu
cational assessment. Washington DC: National
Academies Press.
National Research Council. 2003. Evaluating and
improving undergraduate teaching in science,
technology, engineering and mathematics
(STEM). Washington, DC: National Academies
Press.

Assessing Student
Performance:
Rubrics
R u BR I cs-or scoring rubrics or matri
ces, as they are sometimes called-are
grid-formatted assessment devices. The row headings list specific areas of assessment.
The columns describe the characteristics of student work in each assessment area needed to meet specific levels of quality. Rubrics also include
specific point allocations for each area of assessment (see Figure 3.21 ). Rubrics can be an effec
tive tool in the biology classroom for assessing
performance-based tasks, including assignments
such as laboratory reports, oral presentations,
poster displays, portfolios, concept maps, or any form of writing.
Why Use Rubrics?
While rubrics may take some time to design and lay out, especially for the first-time designer, they
have particular advantages that make them well
worth the effort. Rubrics illustrate the value of bas
ing instruction and assessment on clear objectives and of fostering self-understanding and self-efficacy
in students (guiding educational principles 5 and 6).
Constructing a rubric requires that instructors be
l 2 7
clear about the learning objectives they have for a
particular assignment. Explicit descriptions of high
quality and low-quality work are developed by the
teacher and shared with students via the rubric
before an assignment begins. If used effectively, through emphasis and review, the rubric's descriptions of mastery can guide a student successfully
through an assignment. Both teachers and stu
dents know what is expected and strive for it. And
if students are given multiple opportunities during a course to work on a particular kind of assignment,
such as laboratory reports, they will get to know the
rubric well and be able to chart their progress in each specific area of assessment.
Over time, it becomes easier for students to
monitor and reflect on their own progress toward meeting the learning objectives for assignments
and courses. They will discover which aspects of
assignments are most difficult for them to perform
well, and in which aspects they excel. The rubric
thereby encourages self-assessment and meta
cognition. Students begin to use the rubrics to plan
how to complete assignments and can therefore
assess their own work before they pass it along to
their teacher. For students with learning disabilities
who may need as many concrete tools as possible

128 BIOLOGY SUCCESS!
for guiding their work, rubrics can anchor them effectively as they work through a performance
based task.
How to Use Rubrics Effectively
To use rubrics effectively, it is important to keep
several principles in mind. First, a rubric is effec
tive only if the language used in it is unambiguous. This applies particularly to the characteristics of
work required to meet the various levels of quality. Vague descriptions will neither guide student work
nor make it easy for the instructor to assess that
work. It is best to avoid overly general descriptors
like "creative" or "complete" and instead focus on
defining what is meant by creative (includes an
original idea, integrates two related ideas, etc.) or complete (includes title, statement of purpose,
graphs, etc.). If possible, use quantitative language
in the descriptions (exceptional-includes five
sources of information; developing-includes 2-3
sources of information, etc.). Similarly, it is best to
avoid excessive detail so as not to overwhelm stu
dents with text-based information. Strike a balance
between precision of descriptions and their con
ciseness. As a rule of thumb, rubrics should be no more than one to two pages in length.
For best results, introduce students to rubrics early in a course and spend some time uncovering
their structure and purpose. It is quite possible that
students may never have encountered rubrics in
their previous courses. Also, it is advisable to use the same general rubric for assessing similar kinds
of assignments. For example, when assessing lab
reports, descriptions of the qualities that constitute an "exceptional" hypothesis should not vary from
lab task to lab task. Those qualities remain the
same no matter the application. Finally, it is also
essential to distribute rubrics for performancebased assignments when an assignment is given,
or very soon thereafter. Otherwise, they have little
Description of Levels of Quality
Areas of Exceptional Work Developing Work Incomplete Work Comments/Points
Assessment (full credit) (partial credit) (no credit)
Area of As specific as possible As specific as possible As specific as possible A place for com-Assessment #1 a description of what a description of what a description of what ments that justify (1 O points) constitutes exceptional constitutes developing constitutes incomplete instructor's assess-
work in this area work in this area work in this area ment in this area
Area of Assessment #2
(5 points)
Area of
Assessment #3 (15 points)
Figure 3.21. A generalized rubric
General Teaching Methods: Assessing Student Performance l 2 9
value to the students in planning and completing the assignment.
It may be helpful for students to get some prac
tice using a rubric before they turn in their work.
Consider distributing a mock student-written lab
report and assigning students to assess it accord
ing to your lab reporting rubric. Have students com
pare their assessment results. This can be a
valuable discussion, and can provide some diag
nostic information about students as well.
For some students, a complete rubric may be
overwhelming upon first encounter. To prevent this,
pass out the rubric in pieces over some period of
time and allow students to get familiar with its parts
incrementally. Consider initially using a rubric to
assess only one section of a lab report, such as the
introduction. Eventually, add other sections until
an entire lab report rubric is included in student
assessment.
Scoring Rubrics
While rubrics can add much-needed clarity and objectivity to assessment practices, instructor sub
jectivity is still present. The biggest challenge is allocating points to "developing" areas of a rubric.
For example, take an assessment area with a
maximum possible allocation of ten points. Partial
credit in this area could range from one to nine
points. This leaves a lot of room for subjectivity. The use of the "Comments" column can be important
in outlining the reasons for partial credit.
Examples of Rubrics
We have provided the following examples of spe
cific rubrics for readers to investigate:
• A "Rubric for an Inquiry-Based Biology Labo
ratory Report" ("Comments/Points" column
blank) that demonstrates how a rubric could
be applied to standard lab writing assignments
that are based on inquiry or experimental work.
See page 130.
• A "Scored Rubric for an Inquiry-Based Biology
Laboratory Report" ("Comments/Points" col
umn filled in) that shows how an instructor
might use the lab report rubric to score student
work. See page 132.
• A "Master Notebook Assessment Rubric"
that could be used by an instructor to monitor
and assess student progress with organizing
course materials and taking class notes. See
page 134.
• A "Course-Wide Learning Objectives and
Assessment Rubric." This example shows how a rubric can be used to summarize student per
formance for an entire course. See page 135. • A "Poster Presentation Assessment Rubric"
that could be used to evaluate student poster
presentations. See page 154.
• A "Mussel Beach Simulation Assignment Packet" that includes an assignment overview, writing
guidelines, and an assessment rubric specific
to that assignment. The purpose is to show how a rubric can be integrated with other assignment
documents. See page 252.
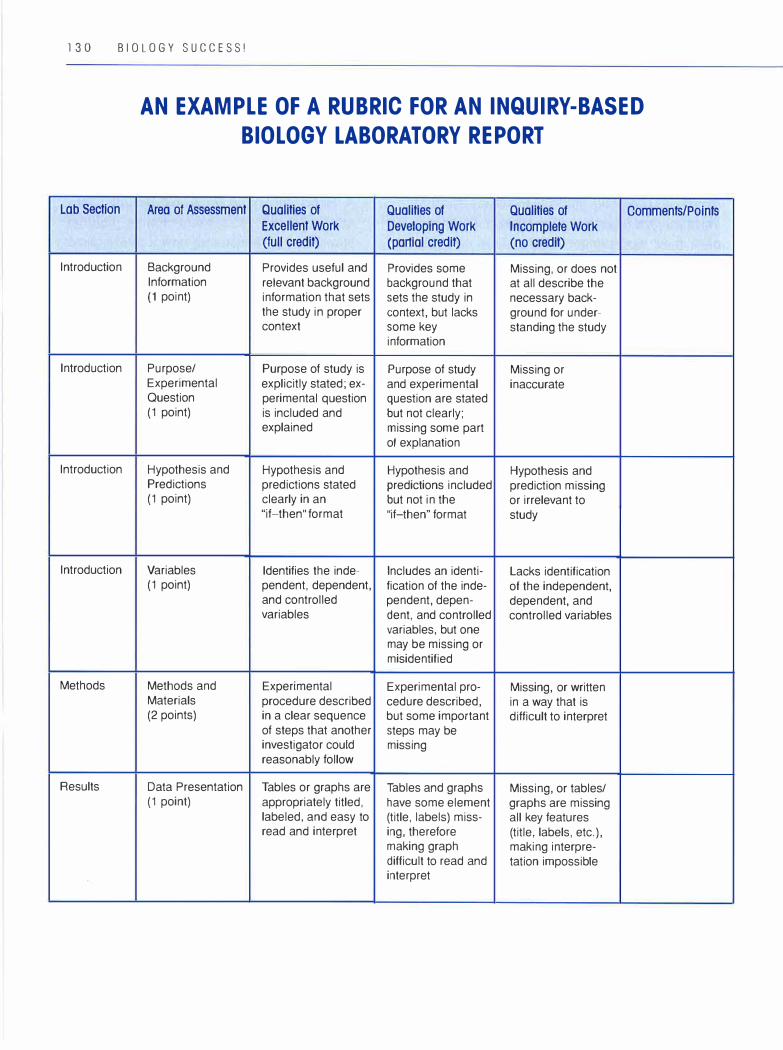
1 3 0 BIOLOGY SUCCESS!
AN EXAMPLE OF A RUBRIC FOR AN INQUIRY-BASED
BIOLOGY LABORATORY REPORT
Lab Section Area of Assessment Qualities of Qualities of Qualities of Comments/Points Excellent Work Developing Work Incomplete Work (full credit) (partial credit) (no credit)
Introduction Background Provides useful and Provides some Missing, or does not Information relevant background background that at all describe the (1 point) information that sets sets the study in necessary back-
the study in proper context, but lacks ground for under-context some key standing the study
information
Introduction Purpose/ Purpose of study is Purpose of study Missing or Experimental explicitly stated; ex- and experimental inaccurate Question perimental question question are stated (1 point) is included and but not clearly;
explained missing some part of explanation
Introduction Hypothesis and Hypothesis and Hypothesis and Hypothesis and Predictions predictions stated predictions included prediction missing (1 point) clearly in an but not in the or irrelevant to
"if-then" format "if-then" format study
Introduction Variables Identifies the inde- Includes an identi- Lacks identification (1 point) pendent, dependent, fication of the inde- of the independent,
and controlled pendent, depen- dependent, and variables dent, and controlled controlled variables
variables, but one may be missing or misidentified
Methods Methods and Experimental Experimental pro- Missing, or written Materials procedure described cedure described, in a way that is (2 points) in a clear sequence but some important difficult to interpret
of steps that another steps may be investigator could missing reasonably follow
Results Data Presentation Tables or graphs are Tables and graphs Missing, or tables/ (1 point) appropriately titled, have some element graphs are missing
labeled, and easy to (title, labels) miss- all key features read and interpret ing, therefore (title, labels, etc.),
making graph making interpre-difficult to read and talion impossible interpret
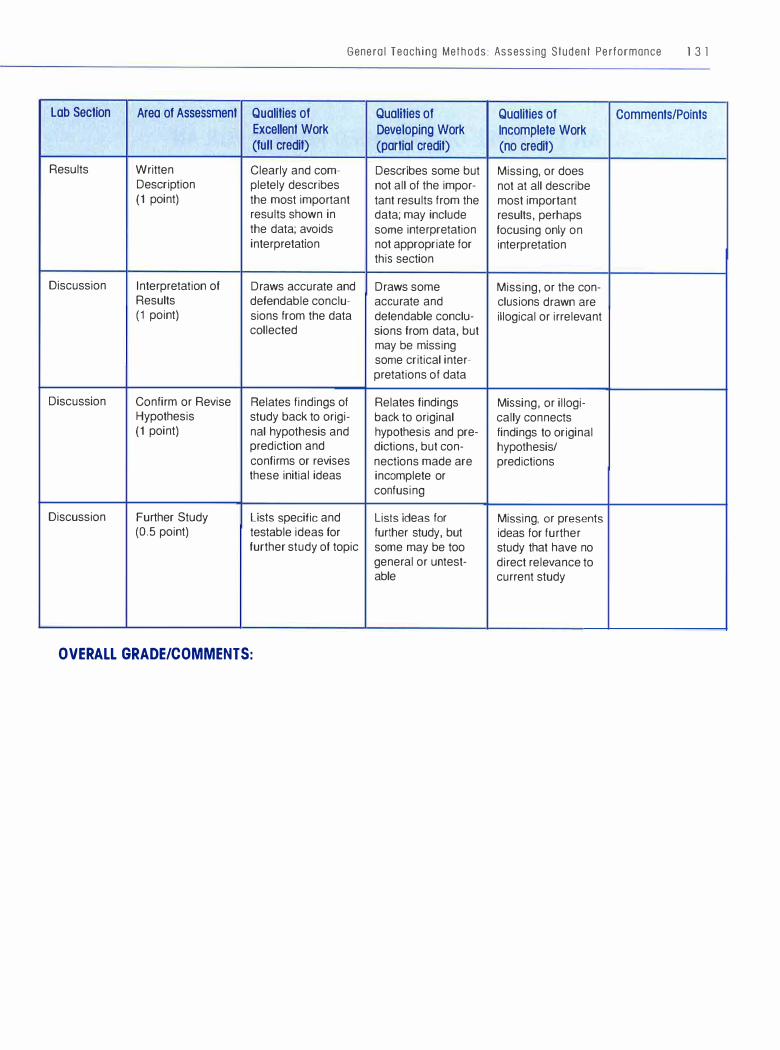
Lab Section Area of Assessment
Results Written Description (1 point)
Discussion Interpretation of Results (1 point)
Discussion Confirm or Revise Hypothesis (1 point)
Discussion Further Study (0.5 point)
General Teaching Methods: Assessing Student Performance l 3 l
Qualities of Qualities of Qualities of Comments/Points Excellent Work Developing Work Incomplete Work (full credit) (partial credit) (no credit)
Clearly and com- Describes some but Missing, or does pletely describes not all of the impor- not at all describe the most important tant results from the most important results shown in data; may include results, perhaps the data; avoids some interpretation focusing only on interpretation not appropriate for interpretation
this section
Draws accurate and Draws some Missing, or the con-defendable conclu- accurate and clusions drawn are sions from the data defendable conclu- illogical or irrelevant collected sions from data, but
may be missing some critical inter-pretations of data
Relates findings of Relates findings Missing, or illogi-study back to origi- back to original cally connects nal hypothesis and hypothesis and pre- findings to original prediction and dictions, but con- hypothesis/ confirms or revises nections made are predictions these initial ideas incomplete or
confusing
Lists specific and Lists ideas for Missing, or presents testable ideas for further study, but ideas for further further study of topic some may be too study that have no
general or untest- direct relevance to able current study
OVERALL GRADE/COMMENTS:

1 32 BIOLOGY SUCCESS!
AN EXAMPLE OF A SCORED RUBRIC FOR AN
INQUIRY-BASED BIOLOGY LABORATORY REPORT
Lab Section Area of Assessment Qualities of Qualities of Qualities of
Excellent Work Developing Work Incomplete Work
(full credit) (partial credit) (no credit)
Introduction Background Provides useful and Provides some Missing, or does not
Information relevant background background that at all describe the
(1 point) information that sets sets the study in necessary back-
the study in proper context, but lacks ground for under-
context some key standing the study
information
Introduction Purpose/ Purpose of study is Purpose of study Is missing or
Experimental explicitly stated; and experimental inaccurate
Question experimental ques- question are stated
(1 point) tion is included and but not clearly; miss-
explained ing some part of explanation
Introduction Hypothesis and Hypothesis and Hypothesis and Hypothesis and
Predictions predictions stated predictions included predictions missing
(1 point) clearly in an but not in the or irrelevant to study
"i f -then" format "if-then" format
Introduction Variables Identifies the inde- Includes an identifi- Lacks identification
(1 point) pendent, dependent, cation of the inde- of the independent,
and controlled pendent, dependent, dependent, and con-
variables and controlled vari- trolled variables
ables, but one may be missing or misidentified
Methods Methods and Experimental proce- Experimental pro- Missing, or written in
Materials dure described in a cedure described, a way that is difficult
(2 points) clear sequence of but some important to interpret
steps that another steps may be investigator could missing reasonably follow
Results Data Presentation Tables or graphs are Tables and graphs Missing, or
(1 point) appropriately titled, have some element tables/graphs are
labeled, and easy to (title, labels) mis- missing all key tea-
read and interpret sing, therefore mak- lures (title, labels,
ing graph difficult to etc.), making inter-
read and interpret pretation impossible
Comments/Points
Background does not include: - citations - reference to
key source 0. 75 points
1 point
1 point
1 point
Missing explana-tion of how data was analyzed and with what instruments 1.5 points
One graph lacks title and axis labels 0. 75 points
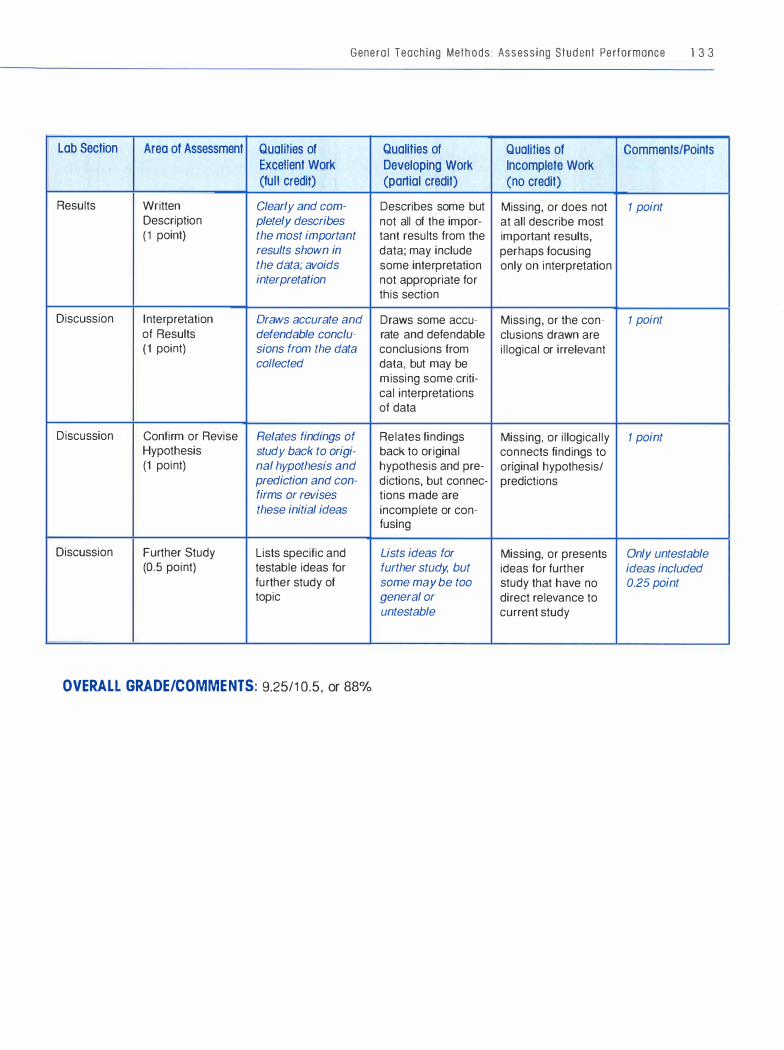
Lab Section
Results
Discussion
Discussion
Discussion
Area of Assessment
Written Description (1 point)
Interpretation of Results (1 point)
Confirm or Revise Hypothesis (1 point)
Further Study (0.5 point)
General Teaching Methods: Assessing Student Performance 1 3 3
Qualities of Qualities of Excellent Work Developing Work (full credit) (partial credit)
Clearly and com- Describes some but pletely describes not all of the impor-the most important tant results from the results shown in data; may include the data; avoids some interpretation interpretation not appropriate for
this section
Draws accurate and Draws some accu-defendable conclu- rate and defendable sions from the data conclusions from collected data, but may be
missing some criti-cal interpretations of data
Relates findings of Relates findings study back to origi- back to original nal hypothesis and hypothesis and pre-prediction and con- dictions, but connec-firms or revises lions made are these initial ideas incomplete or con-
fusing
Lists specific and Lists ideas for testable ideas for further study, but
further study of some may be too topic general or
untestable
Qualities of Incomplete Work (no credit)
Missing, or does not at all describe most important results, perhaps focusing only on interpretation
Missing, or the con-clusions drawn are illogical or irrelevant
Missing, or illogically connects findings to original hypothesis/ predictions
Missing, or presents ideas for further study that have no direct relevance to current study
Comments/Points
1 point
1 point
1 point
Only untestable
ideas included 0.25 point
OVERALL GRADE/COMMENTS: 9.25/1 0.5, or 88%
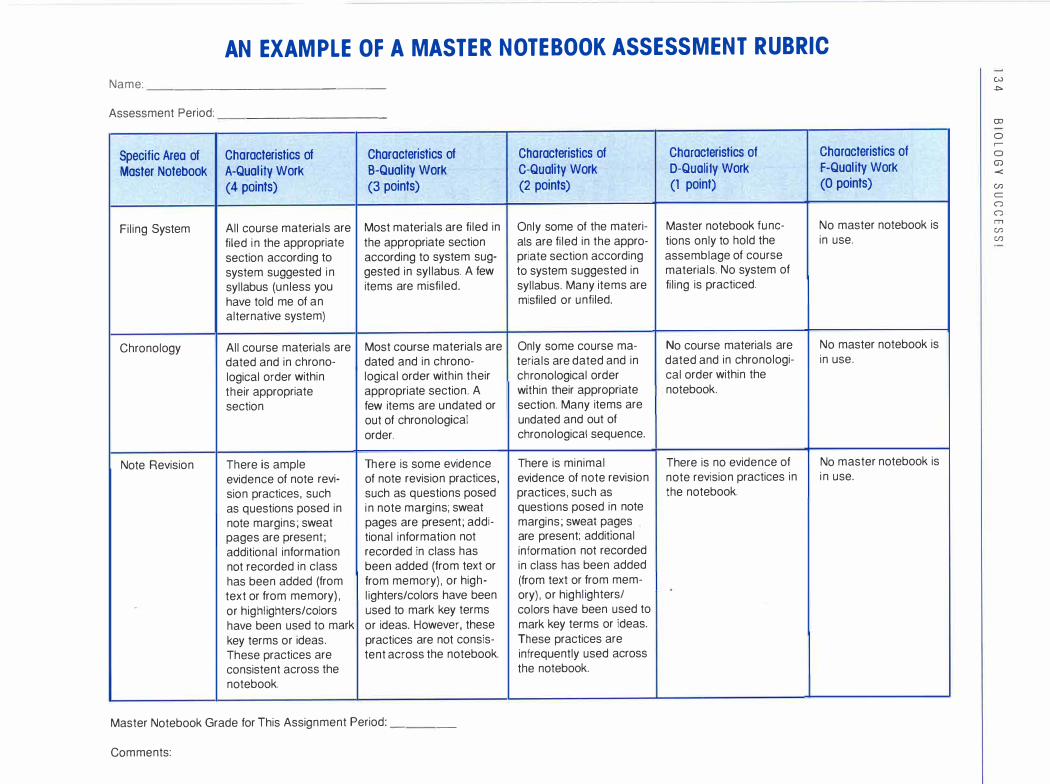
AN EXAMPLE OF A MASTER NOTEBOOK ASSESSMENT RUBRIC
Name: - ------------- -
Assessment Period: - -----------
Specific Area of Characteristics of Characteristics of Master Notebook A-Quality Work B-Quality Work
(4 points) (3 points)
Filing System All course materials are Most materials are filed in filed in the appropriate the appropriate section section according to according to system sug-system suggested in gested in syllabus. A few syllabus (unless you items are misfiled. have told me of an alternative system)
Chronology All course materials are Most course materials are dated and in chrono- dated and in chrono-logical order within logical order within their their appropriate appropriate section. A section few items are undated or
out of chronological order.
Note Revision T here is ample There is some evidence evidence of note revi- of note revision practices, sion practices, such such as questions posed as questions posed in in note margins; sweat note margins; sweat pages are present; addi-pages are present; tional information not additional information recorded in class has not recorded in class been added (from text or has been added (from from memory), or high-text or from memory), lighters/colors have been
-or highl ighters/colors used to mark key terms have been used to mark or ideas. However, these key terms or ideas. practices are not consis-T hese practices are tent across the notebook. consistent across the notebook.
Master Notebook Grade for This Assignment Period: _ __ _
Comments:
Characteristics of Characteristics of Characteristics of C-Quality Work D-Quality Work F-Quality Work (2 points) (l point) (0 points)
Only some of the materi- Master notebook tune- No master notebook is als are filed in the appro- tions only to hold the in use. priate section according assemblage of course to system suggested in materials. No system of syllabus. Many items are filing is practiced. misfiled or untiled.
Only some course ma- No course materials are No master notebook is terials are dated and in dated and in chronologi- in use. chronological order cal order within the within their appropriate notebook. section. Many items are undated and out of chronological sequence.
There is minimal T here is no evidence of No master notebook is evidence of note revision note revision practices in in use. practices, such as the notebook. questions posed in note margins; sweat pages are present; additional information not recorded in class has been added (from text or from mem-ory), or highlighters/ colors have been used to mark key terms or ideas.
These practices are infrequently used across the notebook.
w
J:,.
OJ
0 r-
0
G)
-<
C/)
C
0
0
rn
C/)
C/)
General Teaching Methods: Assessing Student Performance l 3 5
EXAMPLE OF A COURSE-WIDE LEARNING
OBJECTIVES AND ASSESSMENT RUBRIC
Explanation of Rubric:
The rubric beginning on the next page is meant to
show students how well they met the stated course
objectives for an entire course. It lists the various
course objectives in the left-most column and then
attempts to carefully describe three possible levels
of mastery for each of those objectives in the
remaining columns. Each objective has been
assigned a relative percentage weight of the
course grade, summarized at the end of the rubric
under "Grading," so that students can know the
importance of any particular objective.
Also, each mastery level has been assigned a
relative percentage range, so that specific grades
can be assigned for each objective. For example,
a student who scores 82 percent on course ob
jective number 6 ( the Packing-Peanut Lab) has
demonstrated a moderate level of mastery for that
objective. This way, objective mastery is explicitly
linked with grades. It is also important to note that
each written or performance-based objective (num
bers 6 through 14) has a more detailed rubric that
guides the assessment for that objective. This
course-wide rubric essentially shows a summary of
each of those more-elaborated rubrics.
This rubric should be distributed to students and
previewed near the beginning of the course. I t can
then serve as a midterm progress report and/or a
final progress report.

Course Learning Objectives Level of Mastery-High (87-1 00%)
1 . Demonstrate understanding of Student scored 87-1 00 %
key biological overview and scientific inquiry concepts through
a variable format quiz (Quiz 1 )
2. Demonstrate understanding of Student scored 87-1 00 %
key evolutionary concepts through a variable format quiz (Quiz 2)
3. Demonstrate understanding of Student scored 87-100 %
key genetics concepts through a variable format quiz (Quiz 3)
4. Demonstrate understanding of Student scored 87-100 %
key ecological concepts through a variable format quiz (Quiz 4)
5. Demonstrate understanding of Student scored 87-100 %
key cell biology concepts through a variable format quiz (Quiz 5)
6. Understand and apply the scien- Student fully demonstrates the ability
tific method of inquiry through labo- to use and apply scientific method
ratory report writing through report writing. Shows strong
(Packing-Peanuts Assignment) skill in being able to:
See specific rubric for this - articulate investigative questions
assignment for more detail - describe testable hypotheses and
predictions - design and communicate clear
procedures that test hypothesis - represent data graphically
- summarize results - draw appropriate conclusions
Level of Mastery-Moderate (74-86%)
Student scored 7 4-86 %
Student scored 7 4-86 %
Student scored 74-86 %
Student scored 74-86 %
Student scored 74-86 %
Student inconsistently demon-strates the ability to use and apply scientific method through report writ-
ing. Shows some gaps in being able to: - articulate investigative questions - describe testable hypotheses and
predictions - design and communicate clear
procedures that test hypothesis - represent data graphically - summarize results - draw appropriate conclusions
Level of Mastery-Low (less than 74%)
Student scored less than 74%
Student scored less than 74%
Student scored less than 74%
Student scored less than 74%
Student scored less than 74%
Student rarely demonstrates the ability to use and apply scientific method through report writing. Shows notable gaps in being
able to: - articulate investigative questions - describe testable hypotheses
and predictions - design and communicate clear
procedures that test hypothesis - represent data graphically
- summarize results - draw appropriate conclusions
w
a,
CD
0 r-
0
(j)
-<
C/)
<=
(')
(')
n,
C/)
C/)

Course Learning Objectives Level of Mastery-
High (87-1 00%)
7. Understand and apply the scien- Student fully demonstrates the ability tific method of inquiry through labo- to use and apply scientific method ratory report writing (Mussel through report writing (See bulleted Beach Simulation Assignment) list in Objective 6) See specific rubric for this assignment for more detail
8. Understand and apply the scien- Student fully demonstrates the ability tific method of inquiry through labo- to use and apply scientific method ratory report writing (Osmosis through report writing (See bulleted Assignment) See specific rubric list in Objective 6) for this assignment for more detail
9. Understand and apply the scien- Student fully demonstrates the ability tific method of inquiry through labo- to use and apply scientific method ratory report writing (Monogenics through report writing (See bulleted Traits Assignment) See specific list in Objective 6) rubric for this assignment for more detail
1 0. Understand and apply the sci- Student fully demonstrates the ability entific method of inquiry through to use and apply scientific method laboratory report writing (Pond through report writing (See bulleted Investigation Assignment) See list in Objective 6) specific rubric for this assign-ment for more detail
1 1 . Demonstrate key learning about Student progress report fully project research through a written describes learning objectives for midterm progress report project, clearly summarizes key See specific rubric for this biology learned, describes prelimi-assignment for more detail nary results, and suggests next
steps for research
12. Demonstrate key learning about Student poster shows an in-depth project research through a poster application of scientific method and/or presentation (DOUBLE WEIGHTED) presents project content comprehen-See specific rubric for this sively and displays elements of effec-assignment for more detail tive, visually appealing poster design
Level of Mastery-
Moderate (74-86%)
Student inconsistently demon-strates the ability to use and apply scientific method through report writ-ing (See bulleted list in Objective 6)
Student inconsistently demon-strates the ability to use and apply scientific method through report writ-ing (See bulleted list in Objective 6)
Student inconsistently demon-strates the ability to use and apply scientific method through report writ-ing (See bulleted list in Objective 6)
Student inconsistently demon-strates the ability to use and apply scientific method through report writ-ing (See bulleted list in Objective 6)
Student progress report partially describes learning objectives for project, or may not clearly summa-rize key biology learned; description of preliminary results may be inaccu-rate, suggestions for next research steps may be poorly conceived
Student poster shows some aspects of an in-depth application of scientific method and elements of effective, visually appealing poster design
Level of Mastery-
Low (less than 74%)
Student rarely demonstrates the ability to use and apply scientific method through report writing (See bulleted list in Objective 6)
Student rarely demonstrates the ability to use and apply scientific method through report writing (See bulleted list in Objective 6)
Student rarely demonstrates the ability to use and apply scientific method through report writing (See bulleted list in Objective 6)
Student rarely demonstrates the ability to use and apply scientific method through report writing (See bulleted list in Objective 6)
Student progress report may be missing some key components, such as learning objectives, sum-marizing learning, description of preliminary results, and next research steps
Student poster shows minimal aspects of an in-depth application of scientific method and elements of effective, visually appealing poster design
(j) CD ::, CD
0 -i CD a c-, ::::T
::, co
s: CD
::::T 0 a. CJ)
):> CJ) CJ) CD CJ) CJ)
::, co
� C a. CD ::,
" CD
0
3 a ::, c-, CD
w
-.J

Course Learning Objectives Level of Mastery-High (87-100%)
1 3. Demonstrate the application of Assessments show that textbook is
actively reading the course text- highlighted and margin-noted thor-
book. oughly and appropriately. Highlight-
See specific rubric for this ing roughly follows the 20 percent
assignment for more detail rule: Only two lines out of ten lines are highlighted. If appropriate, differ-ent highlighting colors are employed. Margin notes include paraphrases, comments, questions, and various symbols (e.g., numbers, ?, •• etc.)
1 4. Demonstrate the application of Assessments show that the filing sys-
organizing and managing the tern, chronological order, and note
course master notebook revision practices in the master note-
See specific rubric for this book meet instructor guidelines
assignment for more detail
1 5. Demonstrate active in-class Student regularly offers appropriate
participation comments and questions about text readings and course topics, and attentively listens to classmates dur-ing small- and full-group discussions
16 . Demonstrate regular class Student missed 0 -3 classes over the
attendance entire semester
1 7. Demonstrate understanding of Student scored 87-1 00 %
key concepts from course through take-home exam (TRIPLE WEIGHT)
Level of Mastery-Moderate (74-86%)
Assessments show that textbook highlighting is used, but is too mini-mal or too much. Margin notes are used, but could be more extensive/ complete and could show better use of paraphrases, comments, questions, and various symbols
Assessments show that the filing sys-tern, chronological order, and note revision practices in the master note-book partially meet instructor guidelines
Student occasionally offers appro-priate comments and questions about text readings and course topics, and attentively listens to classmates during small- and full-group discussions
Student missed 4-6 classes over the entire semester
Student scored 7 4-86 %
Level of Mastery-
Low (less than 74%)
Assessments show that there is only minimal evidence of active reading in the textbook
Assessments show that the filing system, chronological order, and note revision practices in the mas-ter notebook do not meet instruc-tor guidelines
Student seldom offers appropriate comments and questions about text readings and course topics, and attentively listens to class-mates during small- and full-group discussions
Student missed 7 or more classes over the entire semester
Student scored less than 74%
w
CX>
co
0 ,--
0 G)
-<
u,
C
(")
(")
m
u,
u,

COURSE GRADE:
General Teach ing Methods : Assess ing Student Performance 1 3 9
Grading: Each objective is worth 5 percent of the course grade, except Objective 1 2 which is worth
1 O percent of the course grade, and Objective 1 7 which is worth 1 5 percent of the course grade.
Overall Midterm or Final Grade:
Learning Objectives Breakdown: High Levels of Mastery
Moderate Levels of Mastery
Low Levels of Mastery
Assessing Student
Performance:
Testing
As s E s s I N G s T u D E N T learning in biol
ogy through paper-and-pencil tests is common practice. Unfortunately, many
students learn to dread th e test-taking process
through their past experiences in biology class. Students are often bombarded with multiple-choice questions that not only stress the factual recall of
course-specific vocabulary, but demand that they
decipher the sophisticated wording of questions. It is no surprise, then, that students, especially those
with learning differences, are often subject to severe testing anxiety that can impinge on their
expression of course-specific knowledge (Kovach,
Wilgosh, and Stewin 1998).
This section takes a careful look at testing as an assessment tool. We will discuss ways that
teachers can construct tests and the test-taking
experience so that students can better demonstrate their biology knowledge, be more metacog
nitive about their approach to tests as a form of
assessment, and relieve their test anxiety.
Although tests can sometimes be diagnostic and formative assessment tools, most tests are used as
summative assessment tools. Therefore, we will
assume for this discussion that tests are being used summatively.
1 4 0
There are four sections that follow:
• Providing Test-Taking Accommodations
• Teaching Test Taking • Designing and Making Better Tests • Alternatives to Tests
Providing Test-Taking
Accommodations
In order to comply with federal laws, including the
Americans with Disabilities Act of 1 990 and Section
504 of the Rehabilitation Act of 1973, educational
institutions have offered various testing accommo
dations for students with learning disabilities. The
idea behind accommodations is that they attempt
to "level the playing field" and to provide a fairer, more accurate assessment of student learning of
the material tested. Since most of these accom
modation techniques are widely known, we will
only briefly mention and discuss them here. All
of them require at least some additional logistical
planning and support to carry out; however, these
efforts should yield more accurate and fair testing
results.
General Teaching Methods: Assessing Student Performance 1 4 1
Extra Time for Tests
We all process and express written and oral
language at different rates. Some students with
learning differences process information at a
slower-than-average rate. Providing opportuni
ties for extra time to complete tests is therefore
helpful for these students. A study completed by
S. M. Weaver (2000) compared extended-time test
scores of students with learning disabilities with
extended-time test scores of students without
learning disabilities. The results revealed that
students with learning disabilities showed signifi
cant gains in test scores over students without
learning disabilities under extended-time or un
timed testing conditions.
If the purpose of a test is for students to demon
strate their understanding of course concepts, not
their speed of information processing, then this is a
perfectly appropriate accommodation to offer any
student, regardless of whether or not he or she has a
documented learning disability. However, legally
speaking, this accommodation is required only for
students whose documentation supports their specific
need for extended time on tests. Often a particular
amount of extra time is specified, such as time and a
half or two times the regular time allotment.
Alternative Testing Locations
Some students can get distracted or anxious when
placed in a large room with other test takers. Pro
viding a quiet, private location may help them per
form better in testing situations.
Use of Computers
Sometimes student test performance can be
enhanced by providing the opportunity to write an
swers using a word processing program on a com
puter. Students with a written-language disability
can particularly benefit from this accommodation,
although many learners can think more clearly and
concisely when composing on a computer.
Test Readers
Difficulty reading test questions is another prob
lem encountered by some students when taking
tests. This can be remedied by providing a test
reader or proctor who reads the questions aloud.
The student can then record his or her responses
independently.
Paraphrasing
When requested, teachers can offer paraphrases
of particular test questions with complicated word
ing. An instructor needs to feel comfortable with the
amount of information he or she provides students
when offering this accommodation.
Oral Test Taking
Some students show weaknesses in expressing
their knowledge in writing, whether handwritten or
word processed. Offering these students the ac
commodation of conveying their understanding
orally can improve their test performance. This can
take place in at least two ways. Students can tape
record their answers under a proctor's monitoring,
or they can make an appointment directly with the
instructor, who can record their responses. This ob
viously would not be appropriate for an essay exam
in which writing organization is being assessed, but
could work well for a short-answer format where as
sessing content knowledge is the goal.
Teaching Test Taking
Since effective test taking is a skill that can be
learned, teaching useful test-taking techniques
and strategies is another approach to enhancing

1 4 2 BIOLOGY SUCCE S S !
student performance on tests. There are many re
sources available on test-taking skills; we recom
mend Kathleen McWhorter's College Reading and
Study Skills (2000). It contains chapters on test
taking and test preparation. While we do not rec
ommend reorienting a biology class toward com
prehensive coverage of test-taking techniques at
the expense of biology content and the practice of
science, spending some time offering students
test-taking tips can have a big pay-off: better stu
dent performance on tests. What follows is a sam
pling of techniques we feel are particularly useful
in a biology setting.
Previewing Tests
Suggest to students that before diving in at the be
ginning and completing a test as fast as possible,
they preview the entire test first. Encourage them to
look at the different sections of the test and the
point allocations, and to skim the questions. This
can lessen some of the students' initial feelings
of anxiety and help them develop a strategic
approach to allocating their time and energy. An
instructor should consider previewing the first test
of the course with the class to model this strategy.
Start with Strength
Suggest that students first complete a section of
the test that they feel the most confident with. For
example, if essay writing is a student's strength,
then he or she should consider starting there, even
though it might be the last section of the test. If the
entire test is multiple choice, students could jump
around the test, answering the easier questions
before attempting the harder ones. Starting with
strength builds confidence and can reduce testing
anxiety.
Actively Read Test Questions
Active reading means highlighting, circling, or
u nderlining key parts of test questions. Actively
reading test questions enables students to break
down the task presented to them and keep track
of the requested information. Consider the follow
ing test question : "Compare Darwin's theory of
natural selection with Lamarck's theory of acquired
characteristics." In this question, comparing is the
action, so it is important to highlight it. Additionally,
natural selection and acquired characteristics are
items of content that need addressing, so they
could be underlined. In another example, "List three
features of a prokaryotic cel l ," circling the word
three would help a student stay focused on offer
ing the requested number of features.
Proofread When Done
Suggest that students look over the entire test
when they think they are done. The purpose is not
so much to revisit each question and revise the
answers, but to see if all parts of a question have
been answered and to determine if directions have
been followed carefully.
Build Metacognition into the Test-Taking Experience
After students have finished taking a test, ask them
to fill out a test reflection form. An example of a
reflection form is shown in Figure 3.22.
Provide a Post-Test Analysis Form
A post-test analysis form enables students to ana
lyze a recent test and determine the causes of their
errors. An example of such a form is provided in
Figure 3.23. The form asks students to categorize
their test errors in terms of comprehension gaps,
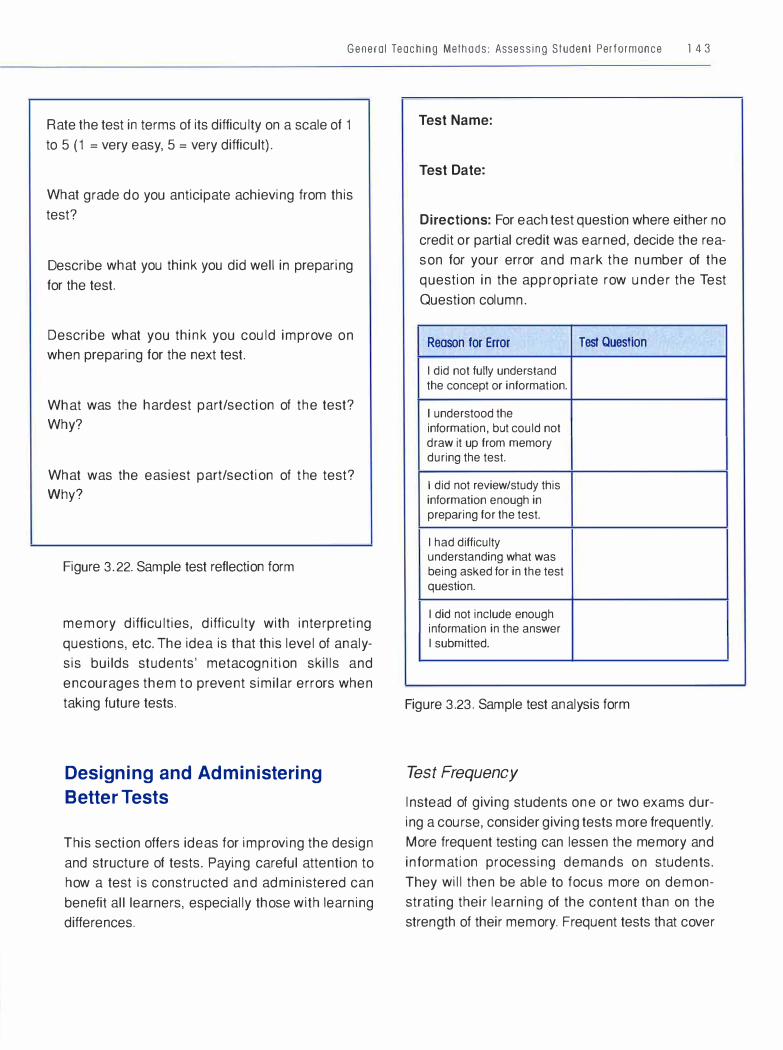
General Teach ing Methods : Assess ing Student Performonce 1 4 3
Rate the test in terms of its difficulty on a scale of 1
to 5 (1 = very easy, 5 = very difficult).
What grade do you anticipate achieving from this test?
Describe what you think you did well in preparing
for the test.
Describe what you think you could improve on when preparing for the next test.
What was the hardest part/section of the test? Why?
What was the easiest part/section of the test? Why?
Figure 3.22. Sample test reflection form
memory difficulties, difficulty with interpreting
questions, etc. The idea is that this level of analysis builds students' metacognition skills and
encourages them to prevent similar errors when
taking future tests.
Designing and Administering
Better Tests
This section offers ideas for improving the design
and structure of tests. Paying careful attention to how a test is constructed and administered can
benefit all learners, especially those with learning differences.
Test Name:
Test Date:
Directions: For each test question where either no
credit or partial credit was earned, decide the reason for your error and mark the number of the
question in the appropriate row under the Test
Question column.
Reason for Error Test Question
I did not fully understand the concept or information.
I understood the information, but could not draw it up from memory during the test.
I did not review/study this information enough in preparing for the test.
I had difficulty understanding what was being asked for in the test question.
I did not include enough information in the answer I submitted.
Figure 3.23. Sample test analysis form
Test Frequency
Instead of giving students one or two exams dur
ing a course, consider giving tests more frequently.
More frequent testing can lessen the memory and
information processing demands on students.
They will then be able to focus more on demon
strating their learning of the content than on the
strength of their memory. Frequent tests that cover

1 4 4 BIOL O G Y S U C C E SS!
less content can also reduce the anxiety common
with tests of huge magnitude.
Link Learning Objectives to the Test
I t may seem obvious that testing should relate to
learning objectives, but it is a consideration that
can be overlooked. W hat do you want your stu
dents to demonstrate to you through the test: Their
understanding of the biological content (e.g. , the
difference between evol ution and natural selec
tion)? Are you testing their language skills? their
math skills? their scientific thinking skills? their
memory for vocabulary? the depth and quality of
their reading and note taking? Your responses to
these questions should guide the kind of test you
design. It is quite possible that a number of these
areas comprise your testing objectives. The key is
to be sure that the test students take links to the
learning objectives you are trying to assess.
Communicate the Learning Objectives Clearly to Students before the Test
Students have a right to know what they are ac
countable for learning. If you plan to have them dem
onstrate their skill at drawing conclusions from a data
set, it is best for them to know this ahead of time.
The easiest way to let students know what they
will be accountable for is to give them a list of the
learning objectives, or a study guide, at the begin
ning of a unit or at some other convenient time before
a test. We have provided a study guide template
(see page 1 47) as well as a sample study guide for
a unit test in basic genetics (see page 148).
I t is also a good practice to let students develop
their own study guides based on the reading and
activities they have been engaged in. Do not expect
students to know how to construct a useful study
guide; this technique works best after it has been
modeled by the instructor. (Also see "Effective
Review" on page 1 1 9.)
Vary Formats within a Test
The standard test formats are multiple choice,
true/false, matching, short answer, and essay.
Some students will test better on the same content
within a multiple choice format; others will test
better within an essay format. In order to meet the
needs of diverse learners who express their un
derstanding best through different formats, it is
important to vary the formats within a test. Include
small sections using each of the major format
types, and do not structure a test around only one
specific format.
Test Practice
Before giving a test, be sure that students have a
chance to practice answering the kinds or styles of
questions included on the test. It is not effective to
design a test entirely of essay questions when
matching and multiple choice have been used as
the format for review. For example, in advance of a
test, provide students with the three essay ques
tions they will be expected to answer. This allows
them to organize and rehearse their responses as
they prepare for the test.
Students should also be able to practice the kind
of thinking required for a test question. For ex
ample, if students will be asked on the test to evalu
ate an experimental design, then give them a
review exercise in class that requires them to evalu
ate experimental designs. If the focus is on recall
and basic comprehension of concepts, then allow
them time to practice answering questions that
demand recall and comprehension.
Student Input
Offer students themselves the chance to construct
and submit some or all of the test questions. This
can be an effective way to motivate or engage
them. It also encourages metacognition as stu-
General Teaching Methods: Assessing Student Performance l 4 5
dents turn their knowledge into questions. As with a
study guide, do not expect students to know how to
make good questions. This is a skill that needs
modeling, practice, and feedback.
Collaborative Test Taking
Consider offering students the opportunity to col
laborate in some way during a test. This collabora
tion can be as simple as allowing a set, limited time
for students to compare and discuss answers with each other. Give them the opportunity to revise their
original answers, if they choose to, and submit the revised test. Both an individual and a collaborative
component of their grade can be designed if de
sired. This technique also promotes metacognition and critical thinking as students evaluate the vary
ing answers they encounter in the collaboration.
Provide a Term "Bank"
Consider providing students with a list of all key terms relevant to the test. (This, of course, is most
appropriate when term recall is not an assessment goal.) For some students with recall deficits, this
technique may help them match a forgotten term
name with their accurate conceptual understanding of that term, and thus may offer a fairer assess
ment of their content knowledge.
Incorporate Multiple Modalities within a Test
T he language used by the Center for Applied Spe
cial Technology (CAST) for the idea of incorporating multiple modalities in testing is "multiple
means of recognition" and "multiple means of
expression" (Dolan and Hall 2001 ). In essence, this means designing and administering tests that
allow diverse learners to interpret the test ques
tions and demonstrate their knowledge through
their preferred and/or strongest modality.
For example, students with a strong visual preference could be given the option to combine draw
ing and writing to express an answer instead of just
writing it. Similarly, test questions could be created
that involve interpreting illustrations. Tactile learners could be offered the use of manipulatives or
demonstrations during the testing process, espe
cially the same manipulatives used by the teacher
in the instructional process leading up to the test.
For example, if pipe cleaners were used to teach about chromosome behavior during mitosis, then
have pipe cleaners available for students to handle
during the testing process.
Alternatives to Tests
In addition to offering accommodations, teaching
test-taking techniques, and designing better, more
flexible tests, instructors should consider including
alternatives to testing in their assessment of student learning. These alternatives fall primarily under the heading of performance assessments.
Some students will never accurately show their
mastery of learning objectives through test taking.
Therefore, offering these poor testers a chance
to show their learning through other means is a
viable alternative. The key is finding an alternative
that can just as adequately address the learning
objectives under study. What follows are some ex
amples of these alternatives.
Model Building
Have students build models that demonstrate the
key concepts, terms, and relationships studied in
a particular unit. Some appropriate applications
would be an ecosystem or a cell. Giving students adequate time and careful, explicit guidelines is
critical for the success of this unique means of
assessment.

1 4 6 BIOLOGY SUCCESS!
Posters or Other Forms of Presentations
Have students design posters that include the key
concepts, terms, and relationships studied in a par
ticular unit. The posters could be combined with an
oral presentation. A poster articulating the theory of
natural selection could combine Darwin's ideas
with photos, text, and colorful graphics that show
the thinking and applications behind this central
biological topic. Alternatively, ask students to make
a PowerPoint presentation to the class. For more
on poster presentations, see "Assessing Student
Performance: Poster Presentations" on page 1 5 1 .
Formal Debates
Have students prepare for and engage in a debate
that synthesizes their learning in a topic area. Pos
sible topics that require students to synthesize
essential biological content are genetic engineer
ing, evolution vs. creationist science, and habitat
preservation controversies (Everglades, tropical
rainforests).
Concept Maps
Concept maps can be an excellent alternative to a
paper-and-pencil test. A unit-level concept map
assignment would require strong synthesizing skills
that would clearly show the depth of a student's
content understanding. For this alternative to be
successful, students would have to be familiar with
making concept maps. It is important not to test
them on their understanding of concept mapping,
but on their mastery of the content learning objec
tives. See the section on concept maps beginning
on page 90 for more information.
Miscellaneous Alternative Forms of Assessment
Letters to members of Congress or town officials,
poems, dances, skits, pamphlets, or student-made
videos or Web sites can also be useful alternatives
to tests.
References
Dolan, R. P., and T. E. Hall. 2001 . Universal design
for learning: Implications for large-scale assess
ment. /DA Perspectives 27 (4): 22-25.
Kovach , K., L. R. Wilgosh, and L. L. Stewin. 1 998.
Dealing with test anxiety and underachievement
in postsecondary students with learning disabili
ties. Developmental Disabilities Bulletin 26:2.
McWhorter, K. 2000. College reading and study
skills, 8th ed. New York: Harper Collins.
Weaver, S. M. 2000. The efficacy of extended time
on tests for postsecondary students with learn
ing disabilities. Learning Disabilities 1 0:47-56.
Test Date:
Scope of Test:
General Teaching Methods: Assessing Student Performance 1 4 7
STUDY GUIDE TEMPLATE
What the test (or quiz, or other assessment) covers in terms of chapters in the text, lecture dates,
and other resources (such as worksheets, videos, Web pages, CD-ROMS, etc.) that students
might find helpful as they prepare for the test.
Course Grade Weight:
What percentage of the course grade is this test or assessment worth?
What to Bring to the Test:
Note here any aids students may bring to the test (such as a calculator and any notes which may
be allowed) and specify particular things they may not bring (for example, "This is a closed-book
test").
Format:
Include types of questions and approximate number and point value of each type.
Vocabulary and Concepts:
List vocabulary terms and concepts to be tested.
Test Expectations:
Include here what students are expected to be able to do.
Take-Home Component:
A take-home component is optional. It may include essays which students may prepare and turn in separately, or essays which will be on the test and are given to students in advance for study
purposes, but which they are not to write outside of the test period.
Getting Help:
Include here any extra office hours, T.A. hours, review sessions, etc.
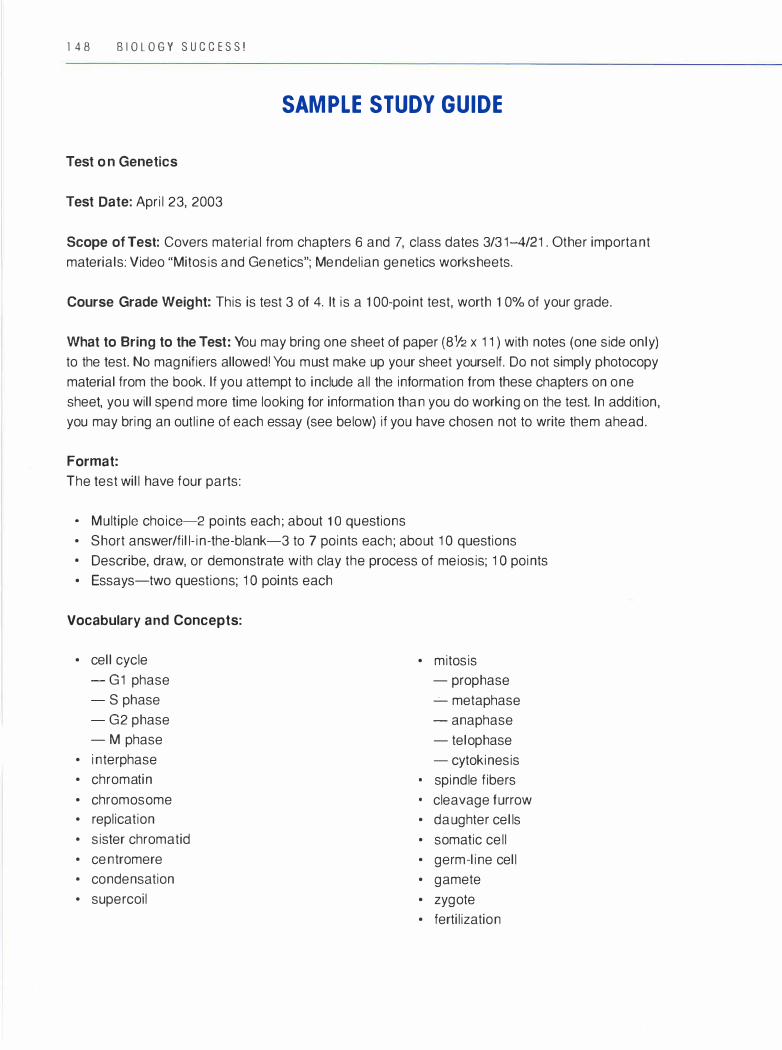
1 4 8 B I O L O G Y S U C C E S S !
SAMPLE STUDY GUIDE
Test o n Genetics
Test Date: April 23, 2003
Scope of Test: Covers material from chapters 6 and 7, class dates 3/31-4/21 . Other important
materials: Video "Mitosis and Genetics"; Mendelian genetics worksheets.
Course Grade Weight: This is test 3 of 4. It is a 100-point test, worth 10% of your grade.
What to Bring to the Test: You may bring one sheet of paper (81/2 x 1 1 ) with notes (one side only)
to the test. No magnifiers allowed! You must make up your sheet yourself. Do not simply photocopy
material from the book. If you attempt to include all the information from these chapters on one
sheet, you will spend more time looking for information than you do working on the test. In addition,
you may bring an outline of each essay (see below) if you have chosen not to write them ahead.
Format:
The test will have four parts:
• Multiple choice- 2 points each ; about 1 O questions
• Short answer/fill-in-the-blank-3 to 7 points each; about 1 O questions
• Describe, draw, or demonstrate with clay the process of meiosis; 1 O points
• Essays-two questions; 1 O points each
Vocabulary and Concepts:
• cell cycle
- G1 phase
- S phase
- G2 phase
- M phase
• interphase
• chromatin
• chromosome
• replication
• sister chromatid
• centromere
• condensation
• supercoil
• mitosis
- prophase
-'- metaphase
- anaphase
- telophase
- cytokinesis
• spindle fibers • cleavage furrow
• daughter cells
• somatic cell
• germ-line cell
• gamete
• zygote
• fertilization
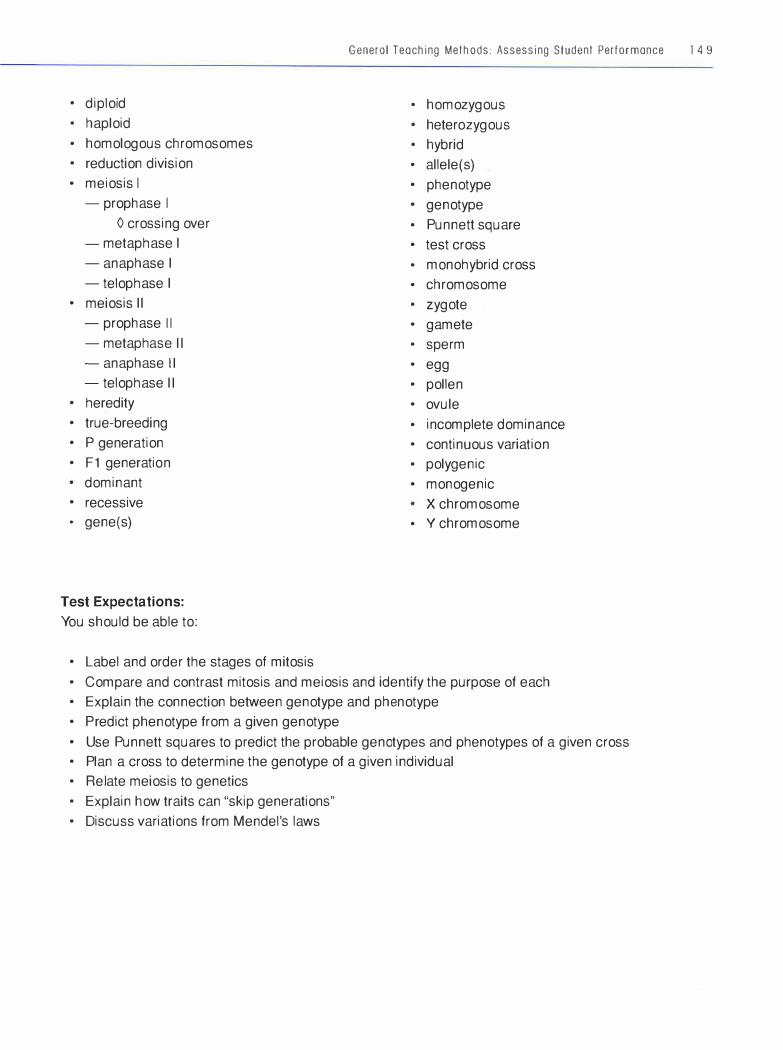
• diploid • haploid • homologous chromosomes • reduction division • meiosis I
- prophase I
0 crossing over
- metaphase I
- anaphase I
- telophase I • meiosis II
- prophase 1 1
- metaphase 1 1
- anaphase 1 1 - telophase 1 1
• heredity • true-breeding • P generation • F 1 generation
dominant • recessive • gene(s)
Test Expectations:
You should be able to:
• Label and order the stages of mitosis
General Teaching Methods: Assessing Student Performance l 4 9
• homozygous • heterozygous • hybrid • allele(s) • phenotype • genotype • Punnett square • test cross • monohybrid cross • chromosome • zygote • gamete • sperm • egg • pollen • ovule • incomplete dominance • continuous variation • polygenic • monogenic
X chromosome • Y chromosome
• Compare and contrast mitosis and meiosis and identify the purpose of each • Explain the connection between genotype and phenotype • Predict phenotype from a given genotype • Use Punnett squares to predict the probable genotypes and phenotypes of a given cross • Plan a cross to determine the genotype of a given individual • Relate meiosis to genetics • Explain how traits can "skip generations" • Discuss variations from Mendel's laws
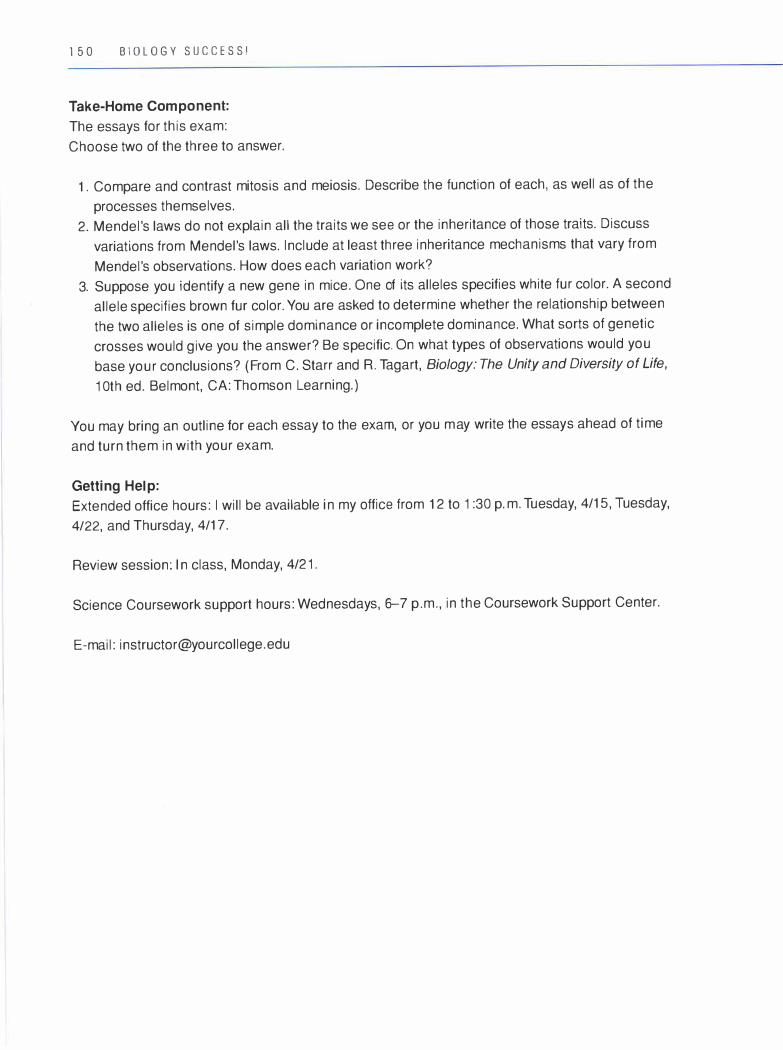
1 5 0 B I O L O G Y S U C C E S S !
Take-Home Component:
The essays for this exam:
Choose two of the three to answer.
1 . Compare and contrast mitosis and meiosis. Describe the function of each, as well as of the processes themselves.
2. Mendel's laws do not explain all the traits we see or the inheritance of those traits. Discuss
variations from Mendel's laws. Include at least three inheritance mechanisms that vary from
Mendel's observations. How does each variation work?
3. Suppose you identify a new gene in mice. One of its alleles specifies white fur color. A second
allele specifies brown fur color. You are asked to determine whether the relationship between
the two alleles is one of simple dominance or incomplete dominance. What sorts of genetic
crosses would give you the answer? Be specific. On what types of observations would you
base your conclusions? (From C. Starr and R. Tagart, Biology: The Unity and Diversity of Life,
10th ed. Belmont, CA: Thomson Learning.)
You may bring an outline for each essay to the exam, or you may write the essays ahead of time and turn them in with your exam.
Getting Help:
Extended office hours: I will be available in my office from 1 2 to 1 :30 p.m. Tuesday, 4/1 5, Tuesday, 4/22, and Thursday, 4/1 7.
Review session: In class, Monday, 4/21.
Science Coursework support hours: Wednesdays, 6-7 p.m. , in the Coursework Support Center.
E-mail: [email protected]
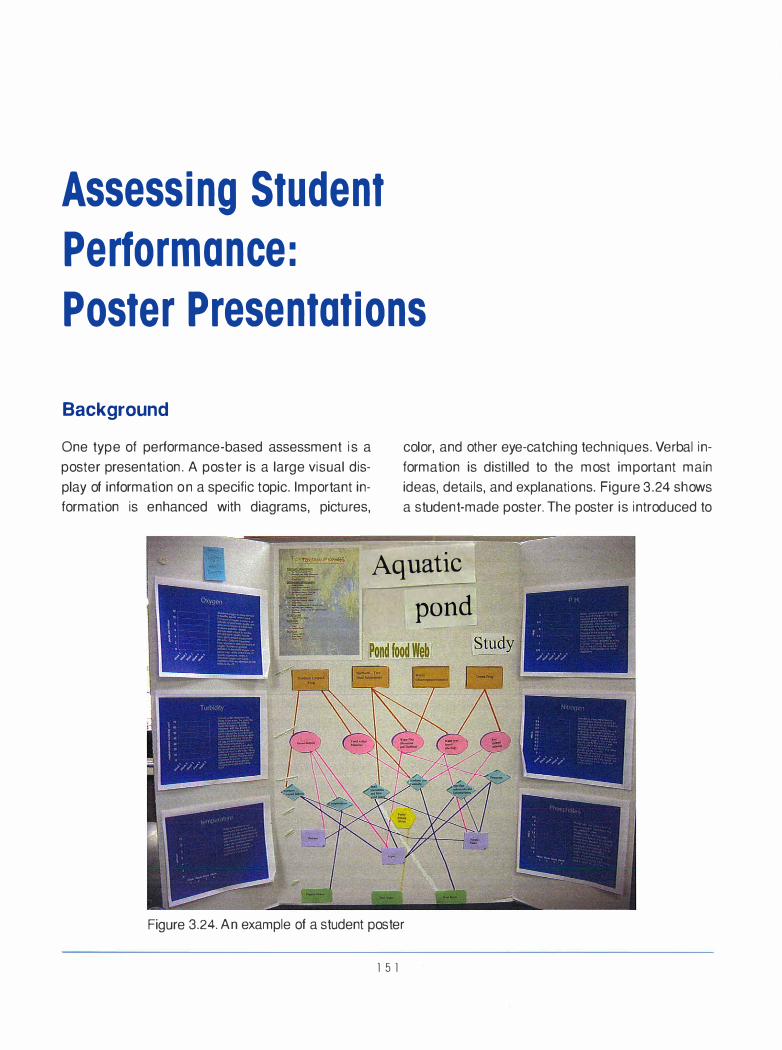
Assessing Student
Performance:
Poster Presentations
Background
One type of performance-based assessment is a
poster presentation. A poster is a large visual dis
play of information on a specific topic. Important information is enhanced with diagrams, pictures,
color, and other eye-catching techniques. Verbal in
formation is distilled to the most important main
ideas, details, and explanations. Figure 3 .24 shows
a student-made poster. The poster is introduced to
Aquatic I pond
Figure 3.24. An example of a student poster
l 5 1
1 5 2 BIOLOGY SUCC ESS!
the students as a vehicle designed specifically to
convey information in a visually efficient manner. Its
goal is to provide as much information as possible to
many individuals in a relatively short time period
(minutes). Poster sessions are regularly held as part
of scientific conferences to provide an efficient venue
for sharing information rapidly with colleagues.
Student posters can be displayed at an informal
poster session. For example, several science
classes might host a poster session to share the
results of individual student projects with members
of several classes. Poster sessions may be open
to the public; consequently, more people are
exposed to the information, and students have the
opportunity to discuss their work with larger, often
lay, audiences. Also, the poster session can be
useful in highlighting activities and achievements of
the biology department.
Rationale
There are several advantages to creating a poster
session with students.
• A poster session allows students to present a
topic of personal interest to a larger community.
They experience both the public display of their
work and a demonstration of their mastery of
the material by explaining their topics to others. • Additionally, these modes of visual and oral
presentation underscore the importance of com
munication in the sciences. Poster projects can
be used as a tool to explicitly teach the skills
necessary for completion of long-term inde
pendent projects; students can be assessed on
process skills such as developing a thesis state
ment or hypothesis, creating a working outline,
conducting background research, and complet
ing work by specific deadlines. • Posters also aid students' learning by encourag
ing them to research areas of their personal inter-
est and by providing a different format for them to
display their knowledge. Having students choose
their own topics allows them to delve more
deeply (in a structured manner) into a concept
that has been mentioned briefly in class or that
falls outside the scope of course material.
• Most importantly, poster projects give students
practice in approaching a project from their
specific strengths.
Process
Student posters may be approached from two dif
ferent starting points. In one type of poster, the in
formation synthesis poster, the students present
topics on which they have done background re
search. This form of poster can be used to help stu
dents develop skill in gathering and assembling
information from a variety of sources. From the
teacher's perspective, this type of poster can pro
vide a means of encouraging higher level, analyti
cal thought. For example, students researching
controversial topics, such as stem-cell research or
genetically modified crops, can be asked to synthe
size information on both sides of the issue and sup
port their conclusions about the safety or ethics
involved.
The other type of poster, the original research
poster, provides an opportunity for students to
communicate the results of one or more experi
ments they conducted using the scientific method.
These posters more closely resemble those at sci
entific conferences.
Poster sessions may also be used to enhance oral
presentation skills or to improve the sharing of infor
mation with peers in a large classroom setting. Stu
dents can be asked to provide a two- to five-minute
orientation to their poster before allowing the class
to freely circulate. The use of large self-adhesive
(Post-It-style) poster paper or an easel allows for
easy movement of posters from the front of the class-
General Teach ing Methods: Assessing Student Performance l 5 3
room for the oral portion of the presentation to a dif
ferent site for individual viewing.
Instructors can introduce various strategies to
promote peer review of posters. Critique forms can
be developed and provided which require all stu
dents to view each others' posters. Alternatively,
students may be provided with the same rubric that
the instructor will use to evaluate the posters.
These forms can be graded, reinforcing the value of constructive peer review in the sharing of scien
tific information.
Useful Strategies for Assigning
Poster Projects
• Determine exactly what your goals for the proj
ect are. Examples: Are you specifically inter
ested in having students complete original
research? Do you have a general topic in mind
that you'd like students to explore further? • When the project is first assigned, give stu
dents a worksheet that explicitly states the
learning objectives and expectations for the
project. Include process deadlines, such as
due dates for thesis/hypothesis statements,
working outlines, and draft models of the poster. Also include expectations for source
materials (what types and how many). • Give students a grading rubric for the poster
early in the process; it is essential that students
be aware of exactly how they are being evalu
ated while they develop their posters. See page
154 for an example of a rubric for a poster pres
entation. • Provide qualitative feedback at several stages
in the poster-making process. • Involve other faculty in the poster session by
having them visit student posters and ask
relevant questions, so the students have the
opportunity to explain their understanding to
someone other than the classroom teacher. • Allow students time to visit classmates' posters. • Plan a wrap-up discussion after the poster ses
sion, so students can reflect on the entire process and on the poster session itself, or dis
tribute a written reflection form for students to complete.

1 5 4 BIOLOGY SUCCESS!
AN EXAMPLE OF A POSTER
PRESENTATION ASSESSMENT RUBRIC
Broad Area Specific Area of Qualities of Qualities of Qualities of
of Assessment Assessment Excellent Work Developing Work Incomplete Work
(full credit) (partial credit) (no credit)
Content Abstract (5 points) Provides a concise Is missing some Missing, or so brief
(65 points) summary of the essential informa- as to be irrelevant
entire project in one lion about the
paragraph scope of the project
Experimental Clearly articulated Present, but is Missing or com-
Question somewhat confus- pletely misleading
(5 points) ing or misleading
Background Info Shows strong evi- Shows little Missing, or
(1 0 points) dence of completion evidence of com- extremely brief
and understanding pletion and under-
of background standing of
research on the background
topic research on the topic
Hypothesis/ Clearly articulated; Present, but Missing, or
Predictions shows what you confusing, mislead- irrelevant to
(5 points) expected and why ing, or lacking some research
you expected it depth
Procedure Described in enough Missing some Missing or
( 10 points) detail to show clear detail that is impor- extremely brief
idea of experimental tant to understand-
design; explicitly lists ing experimental dependent and inde- design; misidenti-
pendent variables fies dependent and independent variables
Data (tables and Appropriately titled, Some data missing, Missing or
graphs) labeled, and easy to or titles lacking or undecipherable
(10 points) read and interpret confusing to interpret
Written Results Clearly and com- Describes some but Missing or
(5 points) pletely describes the not all of the impor- extremely brief
most important tant results from the results shown in the data, may include
data; avoids inter- some interpretation
pretation; contains not appropriate for
just the facts this section
Comments/Points
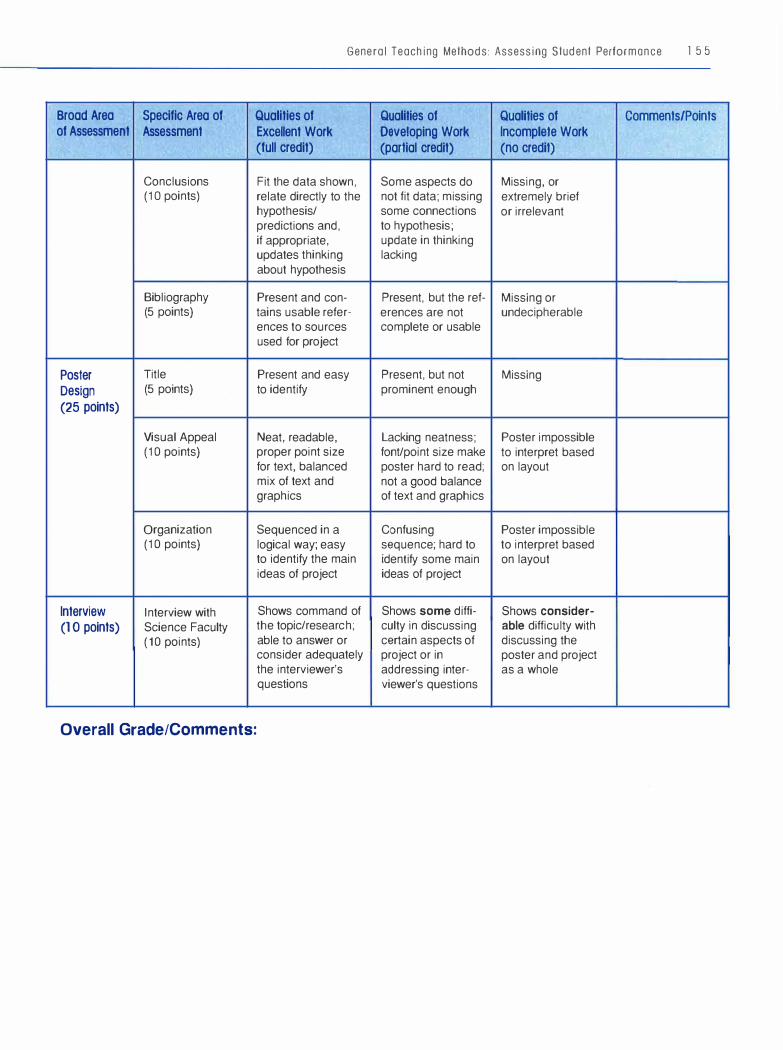
Broad Area Specific Area of of Assessment Assessment
Conclusions (1 O points)
Bibliography (5 points)
Poster T itle
Design (5 points)
(25 points)
Visual Appeal (1 0 points)
Organization (1 0 points)
Interview Interview with
(1 O points) Science Faculty ( 10 points)
General Teaching Methods: Assessing Student Performance l 5 5
Qualities of Qualities of Qualities of Comments/Points Excellent Work Developing Work Incomplete Work (full credit) (partial credit) (no credit)
Fit the data shown, Some aspects do Missing, or relate directly to the not fit data; missing extremely brief hypothesis/ some connections or irrelevant predictions and, to hypothesis; if appropriate, update in thinking updates thinking lacking about hypothesis
Present and con- Present, but the ref- Missing or tains usable refer- erences are not undecipherable ences to sources complete or usable used for project
Present and easy Present, but not Missing to identify prominent enough
Neat, readable, Lacking neatness; Poster impossible proper point size font/point size make to interpret based for text, balanced poster hard to read; on layout mix of text and not a good balance graphics of text and graphics
Sequenced in a Confusing Poster impossible logical way; easy sequence; hard to to interpret based to identify the main identify some main on layout ideas of project ideas of project
Shows command of Shows some diffi- Shows consider-the topic/research; culty in discussing able difficulty with able to answer or certain aspects of discussing the consider adequately project or in poster and project the interviewer's addressing inter- as a whole questions viewer's questions
Overall Grade/Comments:

The Biology Laboratory
Why Biology Laboratories
Are Important
Most introductory biology courses in high school
and college contain a laboratory component, a time
when students characteristically engage in activi
ties that are "hands on" in nature. Labs may take
many forms, but their presence in a biology course
is considered essential to the learning of biology.
There are a number of pedagogical reasons for
requiring that students get some form of labora
tory experience in biology.
Most biology instructors would say that labs pro
vide an opportunity for students to see a concrete
demonstration of various biological phenomena
that would be difficult to replicate in a "lecture" con
text. In addition , laboratory experiences teach the
use of equipment and techniques that are key to
further biological studies. Labs also provide a
glimpse into how real-world scientists conduct their
work, with the intention of inspiring an apprecia
tion for the work of a professional scientist. Many
would claim that the lab offers an excellent oppor
tunity for students to practice the gamut of scientific
thinking skills, from observation to hypothesis gen
eration to drawing conclusions based on data. And,
of course, there are the basic claims that doing
l 5 7
laboratory science is simply fun and engaging for
students of all backgrounds and interests, and that
it draws out the innate scientific curiosity in all of
us (Sundberg et al. 2000). For all of these reasons,
the biology laboratory is an indispensable element
of any student's educational experience.
Types of Biology Laboratories
For this manual's purposes, two basic types of biol
ogy laboratories will be examined: demonstration
laboratories and inquiry-based laboratories.
Demonstration Labs
Demonstration labs, often referred to as "cookbook"
labs, typically involve a highly structured laboratory
setting in which students follow a set of instructions
that lead them to some predetermined outcome,
usually to show a biological phenomenon.
For example, students may obtain and view a set
of animal cells (such as human cheek cells) , and
obtain and view a set of plant cells (such as Elodea
cells) , then draw and compare what they observe.
They may be instructed how to obtain the cells and

1 5 8 BIOLOGY SUCCESS!
what to look for under the microscope. The result of
this activity is a confirmation of what they (and their
instructor) already know from their biology lecture,
textbook reading, or previous experience: plant
cells and animal cells are different in some funda
mental ways.
Another example might be asking students to
follow a series of steps in which they add chemicals to a substance to show the breakdown of starch
by the amylase enzyme. The students get to wit
ness the activity of a key biological agent. Usually a
demonstration lab ends after the teacher gives the
students some directed questions about what they
observed.
Inquiry-Based Labs
Inquiry-based labs ask that students take a more
active role in practicing the thinking processes sci
entists use to investigate the natural world. This means that students are expected to do some or all
of the following: ask questions; develop and test hypotheses; design careful scientific procedures; record and represent data; and draw, communi
cate, and defend conclusions. For example, an
instructor might ask students how they would determine if the cells of plants, animals, protists,
bacteria, and fungi are of similar size and structure.
In order to answer this question, students would
have to design and follow a procedure, gather
materials, and make careful observations to draw
their conclusions. This would require much more
student responsibility and thinking than a typical
demonstration lab.
Inquiry-based biology laboratories can be placed along an inquiry continuum, as shown in
F igure 3.25, from structured inquiry to guided
inquiry to open-ended student inquiry (NREL 1999).
Structured inquiry describes an activity in which the
instructor offers explicit instructions and proce
dures, yet students are pressed to draw their own
conclusions. Guided inquiry describes an activity in
which the instructor supplies the investigative
question and perhaps the materials to use, while
the students follow a procedure of their own design and draw the subsequent conclusions. F inally,
open-ended student inquiry requires the most inde
pendence, because students generate their own
questions, procedures, etc. from a topic chosen by
the instructor or by themselves. It is important to
note that the categories on the continuum are gen
eralized; most biology labs cannot be rigidly placed in any one category and may fall in between the categories.
Demonstration vs. Inquiry
Based Labs-Advantages
and Disadvantages
Most scientific and scientific education organizations strongly advocate the inquiry-based teaching
Structured Inquiry Guided Inquiry Open-Ended Inquiry
Figure 3.25. The inquiry continuum
approach to the biology laboratory (NSF 1996; NRC
1 996). The claim is that inquiry-based approaches are more student-centered, inspire more active and
creative learning, and cultivate stronger problem
solving abilities in students; and that demonstration
labs encourage passive learning and do not chal
lenge students to think scientifically or engage stu
dents' higher-order thinking skills.
There are situations, however, where a demon
stration lab is an essential instructional technique
in a biology course. Demonstrations may show or
reinforce a phenomenon effectively and efficiently.
Demonstrations can also teach students laboratory
skills and techniques, such as microscopy or pipet
ting, that will serve them as they pursue their study
of biology. Time or materials limitations may also
require that an instructor employ demonstrations instead of inquiries.
There are critics of inquiry-based approaches as well. They claim that this approach takes
longer, demands much more from the instructor (as well as the student), and places too much emphasis on process, with the consequence that
students either do not learn the appropriate con
tent or misunderstand the content's relevance to the inquiry.
The authors of this manual submit that there are
situations in which a demonstration lab may be
appropriate and others in which an inquiry-based lab may be appropriate. However, edging the stu
dent's biological laboratory experience toward the
right end of the inquiry continuum is a worthy and
pedagogically sound goal.
While less-structured inquiry labs may be a
desirable goal, research and Landmark College
faculty experience have indicated that structured
or guided inquiry labs are the most effective tor
students with learning disabilities-as they are tor many students without learning disabilities
(NREL 1 999). Students with learning disabilities tend not to possess the skills necessary to deal
General Teaching Methods: The Biology Laboratory 1 5 9
with the cognitive and procedural demands of open-ended inquiry experiences. Thus, the lab
materials contained in this manual are primarily
for structured or guided inquiry. Over the course
of a semester, instructors may be able to move
students toward the right side of the inquiry con
tinuum, to less-structured experiences. For any
particular lab, the instructor can also be flexible in
determining how much structure the class as a
whole or individual students need, and can make
appropriate accommodations.
Common Biology Lab Difficulties
for Students with Learning
Disabilities
Any biology laboratory approach may be problematic tor students with learning disabilities. Such students tend to have difficulties comprehending,
making predictions, sequencing, prioritizing information, creating quantitative visual displays (such as graphs or charts), and drawing conclusions
(NREL 1 999). The following list elaborates on each of these areas of difficulty.
Comprehension:
• Understanding the wording o f a procedural
step • Knowing what variables are or how they fit into
an experiment • Processing oral instructions • Selecting the proper equipment needed • Knowing the precise meaning of hypothesis,
conclusion, etc.
Making Predictions:
• Creating a relevant hypothesis • Making a prediction that is a testable hypothesis

1 6 0 BIOLOGY SUCCESS!
Sequencing:
• Following the sequence of steps in a procedure
without skipping steps • Creating and organizing a logical progression
of steps when designing a procedure
Prioritizing Information:
• Organizing data • Identifying key data needed to draw appropri
ate conclusions • Identifying the key information needed to evalu
ate or revise a hypothesis
Making and Understanding Visual Displays:
• Putting data into graphic form • Interpreting visual organization • Writing descriptions of the data from graphical
forms • Identifying similarities or differences when
comparing graphs
Drawing Conclusions:
• Drawing appropriate conclusions that follow
from the results • Identifying sources of error • Identifying underlying assumptions that gov
ern the lab • Relating the results to new situations
Given that students may struggle with the
various areas of scientific inquiry just outlined,
instructors must recognize that individual steps
of the scientific inquiry process may need to be taught separately and explicitly. Doing so will
help lay the groundwork for success as students are presented with laboratory tasks that tend
more toward the "open-ended" side of the inquiry continuum.
Adapting Labs to Make Inquiry
Based Learning Work for Students
with Learning Disabil ities
The following set of ideas may be helpful in promot
ing student success with inquiry-based activities.
Start with the Familiar
To introduce students to the process of inquiry, take
them through an engaging activity that shows that
inquiry thinking is natural and normal. For example,
pose the question or challenge "What is the fastest
way to make packing-peanuts dissolve?" (assuming the use of cellulose-based biodegradable pack
ing-peanuts). Provide students with the materials
(various solutions, such as vinegar, hot water, ice water, soap, salt, heat sources, etc.) and some boundaries (e.g., time and safety), and let them
loose. After the experience, share results and intro
duce some of the terms related to scientific method or inquiry thinking embedded within the task.
Isolate and Teach the Steps of Inquiry
It may help students if an instructor breaks down the inquiry process into its components and teaches each in isolation before expecting stu
dents to put all the steps together. For example,
teachers should model how to generate testable
questions and should provide students the opportunity to practice developing their own. Likewise,
spending some class time modeling and dis
cussing hypothesis making, followed by creating
and comparing student-generated hypotheses ,
would foster greater student competence with this
skill. Teach other inquiry skills, such as the char
acteristics of a good experimental procedure

(replication, avoiding bias, controlling variables,
etc.). Three activities contained in this manual are
designed to teach students the skills necessary to
engage in scientific inquiry: "Developing Hypothe
ses" beginning on page 193, "Designing Con
trolled Experiments" beginning on page 195, and
"Graphing Data" beginning on page 198.
Provide and Use Templates
A template shows a pattern or blueprint for follow
ing a process. It can be made in three different for
mats: a text-only format, a graphics-only format, or
an integrated text and graphics format. Templates
help make abstract thinking or writing structures
concrete and visual. They also aid students in dis
cerning and applying the steps of a complex procedure such as the scientific method. With re
peated use and practice, students can internalize a template and eventually work without it. We
have included two examples of templates applicable to inquiry-based lab activities in biology : a Worksheet for Designing Controlled Experiments in Appendix C and a Lab Report Template on
page 163.
Start with Small Changes to Existing Labs
If it feels overwhelming for an instructor (and stu
dents ) to modify existing demonstration labs to
involve more inquiry, take an incremental approach.
Choose an existing lab and consider where it might be possible to change one aspect of the lab toward
greater inquiry. Emphasize only that one particular
inquiry skill for that lab.
For instance, a lab could be adapted so that
students are asked to come up with their own
hypotheses, yet still follow a strict procedure guided by the instructor for carrying out experiments. For
another lab, allow students to design their own data table instead of using a preexisting table. In another
lab's conclusion/discussion section, assign stu-
General Teaching Methods: The Biology Laboratory l 6 l
dents to find previously published research that
supports their conclusion.
The set of osmosis activities starting on page
286 provides one example of how a lab can be modified to allow for more student inquiry. We have
included a demonstration osmosis activity, a struc
tured inquiry osmosis activity, and a guided inquiry activity. While each activity uses the same phe
nomena and materials, the students' role and level
of inquiry differs.
Consult with Other Professionals and Professional Resources
• Ask other colleagues if they have versions of
labs that reinforce the same content and concepts but are more inquiry-based.
• The following periodicals all offer ideas for
adapting the biology curriculum toward greater inquiry:
-The American Biology Teacher (published by the National Association of Biology Teachers, 12030 Sunrise Valley Drive, Suite 11 O, Reston,
VA 201 91 . 800-406-0775. www.nabt.org) -The Journal of College Science Teaching
and The Science Teacher (both published by the National Science Teachers Association,
1 840 Wilson Boulevard, Arlington, VA 22201 -
3000. www.nsta.org) • Web sites such as Access Excellence
(www.accessexcellence.org/) can offer an
abundance of teaching ideas, many of them
inquiry-based.
Long-Term Labs
Many science teachers value the idea of having stu
dents learn science through a long-term inquiry
based research project. Long-term projects, such
as the "Fast Plants" activity on page 217, offer additional benefits and challenges to students with
1 6 2 B I O L O G Y S U C C E S S !
learning disabilities that may not be found in one
day or short-term labs. A long-term project gives
students who have difficulty mastering lab skills
time to practice and become proficient in those
skills. Spending short periods of time on the project
within longer class periods breaks up each class
into more digestible units, which is helpful for students with attention deficit issues. Long-term proj
ects also allow the instructor to take time
periodically throughout the project to explicitly teach
the inquiry and lab skills necessary to complete each component of the lab. This provides tremen
dous support and insures success for all students.
The challenges long-term labs present must also be considered. Students can feel over
whelmed with such a large task looming, so it
is imperative for the instructor to set manageable
timelines and provide organizational tools to help. For example, a graphic organizer that allows stu
dents to plan short-term and long-term tasks can
be an essential aid. (See page 222 for an example
of a long-term project planner.) As many different skills are required to complete a long-term project,
the skills necessary for each project should be taught explicitly. (For an example of teaching graph
ing skills explicitly, see the "Graphing Data" activity on page 1 98.)
Often, long-term projects count quite a bit
toward a final course grade. Consequently, it is
important to assess student progress carefully.
Ongoing formative assessment practices during
the project are essential for students who may have
difficulty pulling a project together at the end, or
who have attendance issues that cause them to
miss some pieces along the way. We've included
examples of both formative and summative as
sessments that value process as well as the final
product in the "Fast Plants" activity starting on
page 217.
Because long-term projects offer benefits to stu
dents that are not easily achieved in one-day or
short-term labs, instructors should address paten-
tial challenges in a proactive manner to allow
incorporation of this useful pedagogical tool in the
classroom.
Conclusion
There is no denying that modifying biology labs
toward greater inquiry takes time for the instructor.
Students, especially those with learning disabilities,
may find the inquiry process frustrating and difficult
at first. However, if the proper structures and strate
gies are built into a course, an inquiry-based labo
ratory approach can produce improved learning of
biology content and better scientific thinking skills.
References
National Research Council (NRC). 1 996. From
analysis to action: Undergraduate education in science, mathematics, engineering, and tech
nology. Washington, DC: National Academies Press.
National Science Foundation (NSF). 1996. Shap
ing the future: New expectations for undergraduate education in science, math, engineering
and technology. Report 96- 1 39 . Arlington, VA:
National Science Foundation.
Northwest Regional Educational Laboratory
(NREL). 1999. The inclusive classroom: Math
and science instruction for students with LO.
www.nwrel.org.msec.book7.pdf.
Sundberg, M. D., J. E. Armstrong, M. L. Dini, and W.
E. Wischusen. 2000. Some practical tips for insti
tuting investigative biology laboratories. Journal of College Science Teaching, March-April:
353-59.
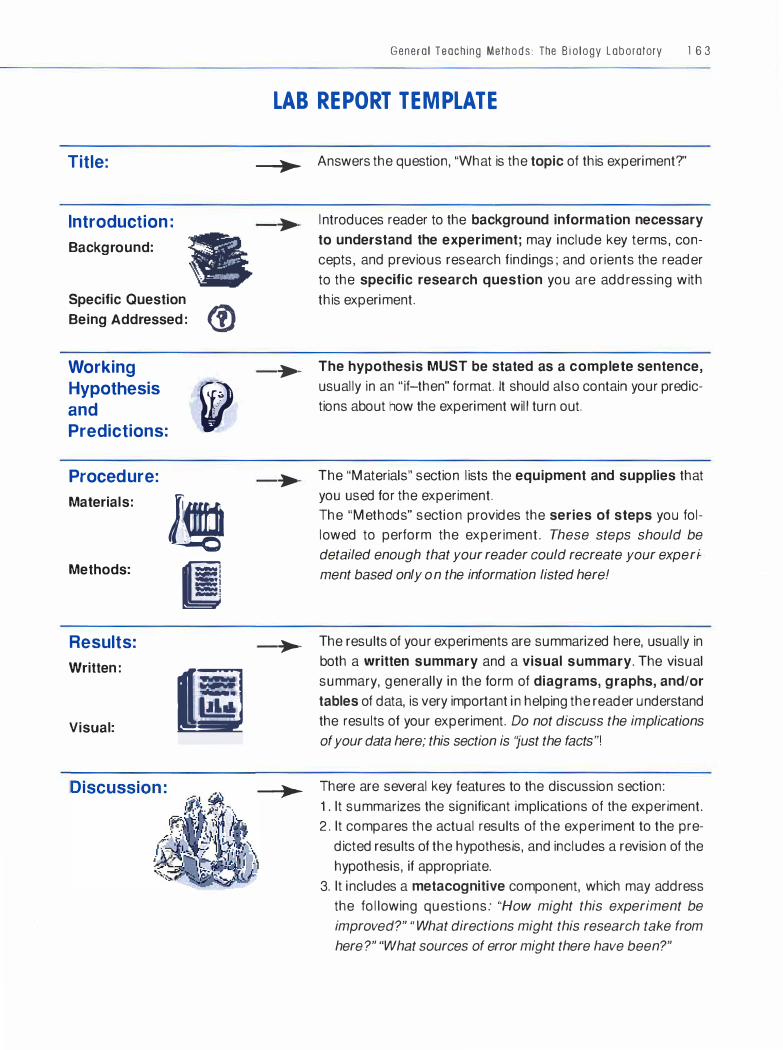
Title:
Introduction :
Background:
• Specific Question
® Being Addressed :
Working
Hypothesis
·(W and Predictions:
Procedure:
Materials:
Im Methods:
((! Results:
Written :
n� Visual:
General Teaching Methods : The B i ology Laboratory 1 6 3
LAB REPORT TEMPLATE
-�>� Answers the question, "What is the topic of this experiment?"
> Introduces reader to the background information necessary
to understand the experiment; may include key terms, con-
cepts, and previous research findings; and orients the reader
to the specific research question you are addressing with
this experiment.
> The hypothesis MUST be stated as a complete sentence,
usually in an "if-then" format. It should also contain your predic-
tions about how the experiment will turn out.
> The "Materials" section lists the equipment and supplies that
you used for the experiment. The "Methods" section provides the series of steps you fol-lowed to perform the experiment. These steps should be
detailed enough that your reader could recreate your experi-
ment based only on the information listed here!
� The results of your experiments are summarized here, usually in
both a written summary and a visual summary. The visual
summary, generally in the form of diagrams, graphs, and/or
tables of data, is very important in helping the reader understand
the results of your experiment. Do not discuss the implications
of your data here; this section is 'yust the facts"!
--�� There are several key features to the discussion section:
1 . It summarizes the significant implications of the experiment. 2. It compares the actual results of the experiment to the pre
dicted results of the hypothesis, and includes a revision of the
hypothesis, if appropriate.
3. It includes a metacognitive component, which may address
the following questions: "How might this experiment be
improved?" "What directions might this research take from
here?" "What sources of error might there have been?"

4 USING THE
INTERNET AND
CD-ROMS IN
THE BIOLOGY
CURRICULUM
Introduction
The powerful learning potential of the Internet, CD-ROMs, and other
digital media has led to a gradual shift in how biology is taught and
learned in the contemporary high school or college classroom. Yet
these potentially significant learning tools can present unique teach
ing and learning challenges, especially for students who learn differ
ently. In this section we present an annotated list of Web sites that
the authors believe are effective at meeting the needs of diverse
learners while offering high-quality science content.
All Web sites were examined for their accessibility for students with
specific issues in four primary categories: (1) reading, decoding, and
vision; (2) considerations when using a screen reader (see page 76 for
more on screen readers); (3) distractibility, short-term memory, and
attention; and (4) content comprehension. Each site described in the
annotated list scored consistently high in each of these categories. The
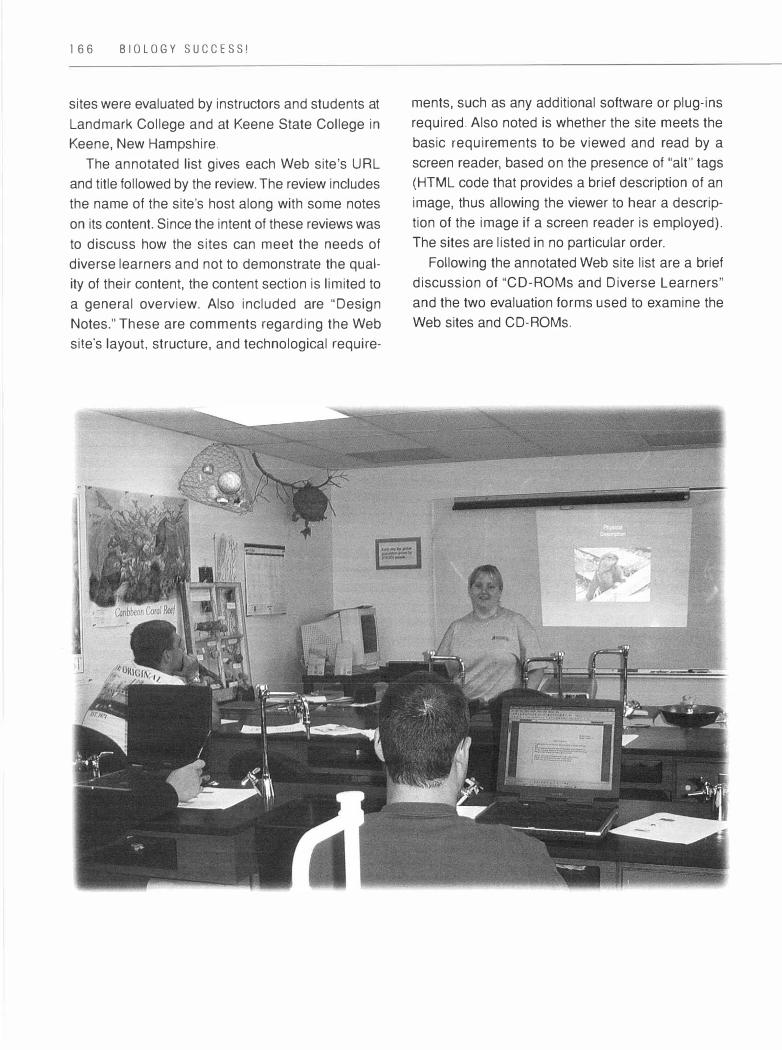
166 BIOLOGY SUCCESS!
sites were evaluated by instructors and students at
Landmark College and at Keene State College in
Keene, New Hampshire.
The annotated list gives each Web site's URL
and title followed by the review. The review includes
the name of the site's host along with some notes
on its content. Since the intent of these reviews was
to discuss how the sites can meet the needs of
diverse learners and not to demonstrate the qual
ity of their content, the content section is limited to
a general overview. Also included are "Design
Notes." These are comments regarding the Web
site's layout, structure, and technological require-
ments, such as any additional software or plug-ins
required. Also noted is whether the site meets the
basic requirements to be viewed and read by a
screen reader, based on the presence of "alt" tags
(HTML code that provides a brief description of an
image, thus allowing the viewer to hear a descrip
tion of the image if a screen reader is employed).
The sites are listed in no particular order.
Following the annotated Web site list are a brief
discussion of "CD-ROMs and Diverse Learners"
and the two evaluation forms used to examine the
Web sites and CD-ROMs.
Web Sites Recommended
for Diverse Learners
http://www.cellsalive.com
(Cells Alive!)
Site Content: The Cells Alive! site contains com
puter-enhanced images and animations of living
cells and organisms that can be studied and used by
teachers and students in the classroom. Some of the
animations are available for free, and others for a
fee. Several interactive activities are available on the
site, which is hosted and created by an individual,
James A. Sullivan, with no organizational affiliation.
Design Notes: The site employs Flash animation
to depict various concepts, so the Flash plug-in is
needed to take advantage of these animations.
Some of the images on the site contain "alt" tags;
however, the "alt" text does not adequately inform
the viewer of what the image is.
167
http://www.ornl.gov/TechResources/Human
_ Genome/home.html
(Human Genome Project)
Site Content: This is a comprehensive site about
the Human Genome Project funded by the U.S.
Department of Energy. The site includes topics
ranging from current news about the project to re
search updates to ethical, legal, and social issues
to chromosome images, and much more.
Design Notes: This site employs Flash, Media
Player, and Real Player for some of its multimedia
elements; however, much of the site requires no
additional software. The site is actually a suite of
sites related to the human genome, so there is no
consistency in either design look or navigation
throughout all the pages within the suite. This has
the potential to cause difficulty with navigation.
Since the number of linked sites included is so
large and comprehensive, instructors are advised
to preview the site and send students to a particu
lar linked page rather than to the home page.
168 BIOLOGY SUCCESS!
http://www.life.umd.edu/CBMG/faculty/wolniak/
wolniakmitosis.html
(Life Sciences: Introduction to Mitosis)
Site Content: This site provides descriptions and
photographs of mitosis occurring in a stamen hair
cell of the spiderwort plant. Each photograph has
a time stamp on it; thus, the viewer can get a sense
of how long each step actually takes. The site is
hosted at the University of Maryland by Professor
Stephen Wolniak, Department of Cell Biology &
Molecular Genetics.
Design Notes: The site images are photographs
that can be viewed with a browser only; the site
contains no animation, nor does it require addi
tional software to view. The navigation is straight
forward and easy to use. The mitosis images do not
contain "alt" tags.
http://www.pbs.org/wgbh/aso/tryit/evolution/
(A Science Odyssey: You Try It:
Human Evolution)
Site Content: This Web site is hosted by WGBH
TV, a public television station in Boston. It shows
the major hominid species that have been discov
ered thus far, when they lived, and how they may
have been related to each other.
Design Notes: This site is available in two ver
sions, one that requires Shockwave and one that
is text based. Both sites contain the same content;
the only difference is in the presentation. "Alt" tags
are consistently used in the text-based version.
Navigation is clear and straightforward.
http://www.pbs.org/wgbh/nova/photo51 /
(Secret of Photo 51)
Site Content: This site is a companion to a PBS
documentary, The Secret of Photo 51, about the
work of Rosalyn Franklin. It is not necessary to
watch the video to reap the benefits of the Web site.
There are several articles as well as three interac
tive pieces available. The first interactive section is a
slide show of the "molecules of life"; the second is
an in-depth examination titled "Anatomy of Photo
51 "; and the third section, "Journey into DNA," is an
animation that allows viewers to progress into a
cell's DNA down to the molecular level.
Design Notes: "Journey into DNA" comes in both
a Flash and a non-Flash version. "Anatomy of
Photo 51" is available only in a Flash version. "Alt"
tags are used consistently throughout the site, and
the text included in them is informative.
http://tolweb.org/tree/phylogeny.html
(Tree of Life Web Project)
Site Content: This gigantic site contains informa
tion on the phylogeny, taxonomy, and biodiversity of
organisms. Each page contains information about
one group of organisms. Because the site is so
large, it is recommended that students be given a
specific page or section to visit, rather than being
assigned open-ended browsing. The site repre
sents a collaboration among over 200 authors; the
material on the site has gone through a peer review
process before being included.
Design Notes: Navigation on this site follows a
hierarchical pattern, allowing a visitor to progress
down a specific path about a species. This makes it
difficult to change direction in the middle without
returning to pages already visited. Although the site
Using the Internet and CD-RO Ms in the Biology Curriculum 169
uses "alt" tags throughout, the text does not ade
quately describe the intended images.
http ://www.ucsusa.org/
(Union of Concerned Scientists)
Site Content: This site has information on the
issues of concern to the Union of Concerned Sci
entists. A small sampling of topics includes global
warming, antibiotic resistance, invasive species, and
biotechnology. Also included are curricular materi
als available to teachers. A note of caution: The site
is a venue for the UCS to showcase its philosophies,
which may be interpreted as biased. There are also
several places where a visitor can "take action" and
send a prewritten letter (which can be changed) to
various organizations and individuals.
Design Notes: Some pop-up windows are used on
the site for more information about a particular
topic. Use of "alt" tags is inconsistent throughout
the site. RealOne Player is required to view some
animations.
http://www.lbl.gov/Education/ELSI/ELSl.html
(ELSI-Ethical, Legal and Social Issues
in Science)
Site Content: This site is hosted by the Lawrence
Berkeley National Laboratory and primarily pro
vides information on the ethical, legal, and social
implications of selected areas of scientific
research. Six specific areas (Basic and Applied
Research; Breast Cancer Screening; Science,
Ethics and Democracy; Indoor and Outdoor Air Pol
lution; Genetic Patents and Intellectual Property;
Personal Privacy and Medical Databases; and Sus
tainable Development) can be investigated, each
one launching its own Web site.
Design Notes: Each individual topic launches a
new Web site. Most use frames, yet one (Science,
Ethics and Democracy) goes to a New York Times
article on the topic. There are no "alt" tags used on
any of the sites except the first page.
http://ublib.buffalo.edu/libraries/projects/cases/
ubcase.htm
(Case Studies in Science)
Site Content: This site is hosted by the State Uni
versity of New York at Buffalo and provides a col
lection of case studies that can be incorporated
into the biology curriculum. Case studies included
are arranged in the following topic areas: Anatomy
& Physiology; Anthropology; Astronomy; Chem
istry/Biochemistry; Computer Science; Ecology/
Environment; Evolutionary Biology; Food Science;
General Cases; Geology; Mathematics/Statistics;
Medicine/Health; Microbiology; Molecular Biol
ogy/Genetics; Nutrition; Pharmacy; Physics/Engi
neering; Plant Science; Psychology; and Teaching
Cases.
Design Notes: "Alt" tag use is intermittent on the
site, with some case studies using tags consis
tently and others not at all. The navigation of all
sites is fairly consistent throughout, with few links
from each page.
http://gslc.genetics.utah.edu/
(Genetic Science Learning Center)
Site Content: The University of Utah Genetic Sci
ence Learning Center at the Eccles Institute of
Human Genetics hosts this site as a way to distrib
ute its genetics curriulum materials. The content on
the site is extensive, ranging from the basics of
DNA to genetic disorders to cloning to genetic engi
neering, with many additional topics in between.
170 BIOLOGY SUCCESS!
The site includes activities and exercises for stu
dents, as well as materials for teachers and sug
gestions on how to use the site.
Design Notes: The site is cleanly designed, with
clear and consistent navigation throughout. Some
of the animations require Flash software to run.
There is inconsistent use of "alt" tags on the site.
http://www.dnaftb.org/
{DNA from the Beginning)
Site Content: Hosted by Cold Spring Harbor Labo
ratory, this site contains a plethora of information
on genetics. The site is divided into three main sec
tions: Classical Genetics; Molecules of Genetics;
and Genetic Organization and Control. Each page
provides links to multimedia that support the con
cepts on that page.
Design Notes: Flash animation, RealPlayer, and
JavaScript are employed for various aspects of the
site. Some "alt" tags are present, but many of the
images are in Flash format.
http://www.biology.arizona.edu/
{The Biology Project)
Site Content: The Biology Project is run by the
University of Arizona and is home to a great num
ber of problem sets and tutorials on the following
subjects: cellular biology; biochemistry; chemicals
and human health; developmental biology; human
biology; immunology; Mendelian genetics; and
molecular biology.
Design Notes: The site map is a good place to
start, as all the pages and sections of this vast site
are outlined there. The use of "alt" tags is intermit
tent throughout the site.
http://www.pbs.org/wgbh/evolution/
{PBS Evolution)
Site Content: PBS hosts this site, which is a com
panion to its video series Evolution, originally
broadcast in 2001. Although the site is supplemen
tal to the video series, it is also an excellent stand
alone resource. There are seven videos ("Darwin's
Dangerous Idea"; "Great Transformations"; "Extinc
tion!"; "The Evolutionary Arms Race"; "Why Sex?";
"The Mind's Big Bang"; "What About God?") and
seven corresponding sections of the Web site.
Each section includes specific hands-on activities,
Web activities, teacher resources, and informa
tional text.
Design Notes: QuickTime, RealPlayer, Shock
wave, and Flash are all incorporated at various
parts of the site. Throughout the site, informative
"alt" tags are used consistently for images.
http://www.pbs.org/wgbh/nova/genome/
{Cracking the Code of Life)
Site Content: This is the companion Web site to
the PBS show Cracking the Code of Life, originally
broadcast in 2001. The comprehensive site con
tains interviews with genetic scientists, a Quick
Time version of the PBS show, information on
understanding genetics, interactive animations,
and more-all about genetics. Instructor resources
for integrating the site in a course are also
included.
Design Notes: Any section of this site that
employs Shockwave is duplicated in a text-based
version. "Alt" tags are included with all images.

Using the Internet ond CD-ROMs in the Biology Curriculum 17 1
CD-ROMs and Diverse Learners
After vetting ten subject-specific CD-ROMs through
a process similar to the one we used for the Web
site reviews, we do not recommend any for use
with students who learn differently. (The CD-ROM
evaluation form is included with the Web site evalu
ation form at the end of this section.) Unlike the rec
ommended Web sites, CD-ROMs generally do not
meet many of the basic requirements for use with
diverse learners, specifically:
• Since CD-ROMs can hold vast amounts of infor
mation, clear navigation is a paramount need. Of
the CD-ROMS we reviewed, navigation was
often confusing; once the user started down one
topic track, it was very difficult to change to
another or to go back to the beginning.
• There is little or no flexibility in adjusting text or
window size. • Many CD-ROMs include clickable vocabulary
words that, once clicked, jump the user to a
new page. However, the user was not always
taken directly to the definition for the word
clicked, but to the top of the glossary, leaving
users to find the word themselves.
• The ability to search the CD-ROM was variable
and inconsistent.
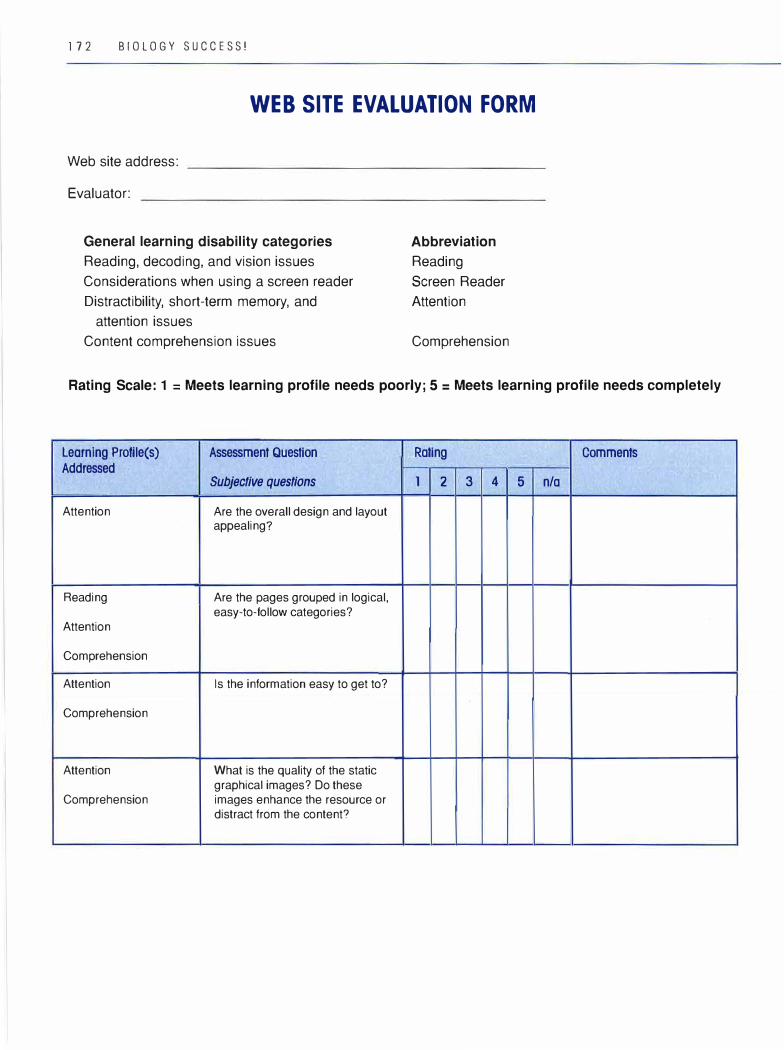
172 BIOLOGY SUCCESS!
WEB SITE EVALUATION FORM
Web site address:
Evaluator:
General learning disability categories
Reading, decoding, and vision issues
Considerations when using a screen reader
Distractibility, short-term memory, and
attention issues
Content comprehension issues
Abbreviation
Reading
Screen Reader
Attention
Comprehension
Rating Scale: 1 = Meets learning profile needs poorly; 5 = Meets learning profile needs completely
Learning Proflle(s) Assessment Question Rating Comments Addressed
Subjective questions l 2 3 4 5 n/a
Attention Are the overall design and layout appealing?
Reading Are the pages grouped in logical, easy-to-follow categories?
Attention
Comprehension
Attention Is the information easy to get to?
Comprehension
Attention What is the quality of the static
graphical images? Do these Comprehension images enhance the resource or
distract from the content?
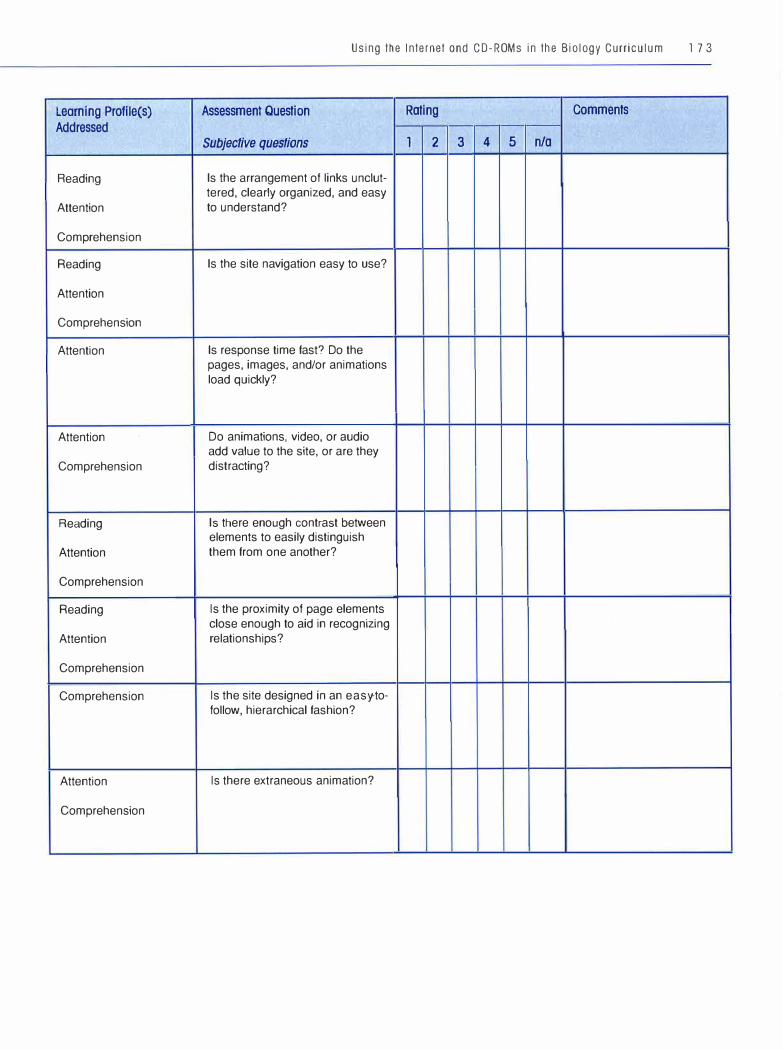
Learning Profile(s) Addressed
Reading
Attention
Comprehension
Reading
Attention
Comprehension
Attention
Attention
Comprehension
Reading
Attention
Comprehension
Reading
Attention
Comprehension
Comprehension
Attention
Comprehension
Using the Internet and CD-ROMs in the Biology Curriculum l 7 3
Assessment Question Rating Comments
Subjective questions 1 2 3 4 5 n/a
Is the arrangement of links unclut-tered, clearly organized, and easy
to understand?
Is the site navigation easy to use?
Is response time fast? Do the pages, images, and/or animations
load quickly?
Do animations, video, or audio add value to the site, or are they
distracting?
Is there enough contrast between elements to easily distinguish
them from one another?
Is the proximity of page elements
close enough to aid in recognizing
relationships?
Is the site designed in an easy-to-follow, hierarchical fashion?
Is there extraneous animation?
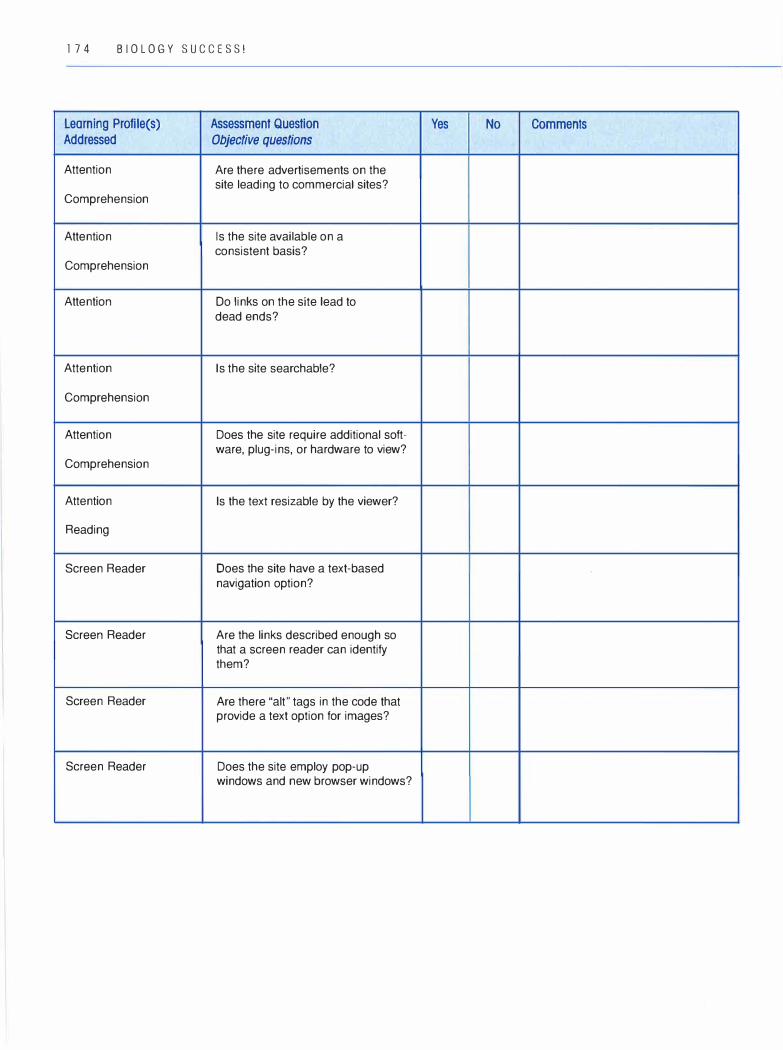
174 BIOLOGY SUCCESS!
Learning Profile(s) Assessment Question Addressed Objective questions
Attention Are there advertisements on the site leading to commercial sites?
Comprehension
Attention Is the site available on a consistent basis?
Comprehension
Attention Do links on the site lead to
dead ends?
Attention Is the site searchable?
Comprehension
Attention Does the site require additional soft-ware, plug-ins, or hardware to view?
Comprehension
Attention Is the text resizable by the viewer?
Reading
Screen Reader Does the site have a text-based
navigation option?
Screen Reader Are the links described enough so that a screen reader can identify them?
Screen Reader Are there "alt" tags in the code that provide a text option for images?
Screen Reader Does the site employ pop-up windows and new browser windows?
Yes No Comments
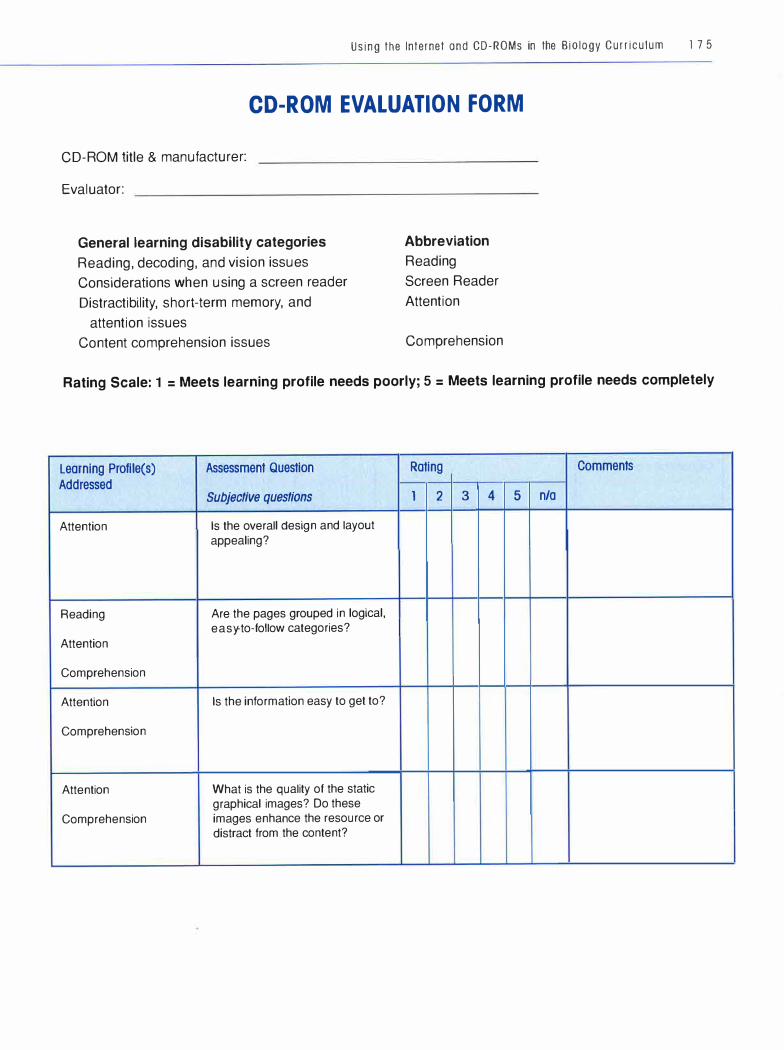
Us ing the Internet and CD-ROMs in the Biology Curr icu lum l 7 5
CD-ROM EVALUATION FORM
CD-ROM title & manufacturer:
Evaluator:
General learning disability categories
Reading, decoding, and vision issues
Considerations when using a screen reader
Distractibility, short-term memory, and
attention issues
Content comprehension issues
Abbreviation
Reading
Screen Reader
Attention
Comprehension
Rating Scale: 1 = Meets learning profile needs poorly; 5 = Meets learning profile needs completely
Learning Profile(s) Assessment Question Rating Comments Addressed
Subjective questions 1 2 3 4 5 n/a
Attention Is the overall design and layout appealing?
Reading Are the pages grouped in logical, easy-to-follow categories?
Attention
Comprehension
Attention Is the information easy to get to?
Comprehension
Attention What is the quality of the static graphical images? Do these
Comprehension images enhance the resource or distract from the content?

1 7 6 BIO LOGY SUCCESS!
Learning Profile(s) Assessment Question Addressed
Subjective questions
Reading Is the CD-ROM navigation easy to use?
Attention
Comprehension
Attention Do animations, video, or audio add value to the CD-ROM, or are
Comprehension they distracting?
Reading Is there enough contrast between elements to easily distinguish
Attention them from one another?
Comprehension
Attention Is there extraneous animation?
Comprehension
Learning Profile(s) Assessment Question Addressed Objective questions
Attention Is the CD-ROM searchable?
Comprehension
Attention Does the CD-ROM require additional
software, plug-ins, or hardware to Comprehension view?
Attention Is the text resizable by the viewer?
Reading
Screen Reader Does the CD-ROM have a text-based navigation option?
Screen Reader Are the links described enough so that a screen reader can identify them?
Rating Comments
l 2 3 4 5 n/a
Yes No Comments

Learning Profile(s) Addressed
Screen Reader
Screen Reader
COMMENTS:
Using the Internet and CD-ROMs in the Biology Curr icu lum l 7 7
Assessment Question Yes No Comments Objective questions
Are there "alt" tags in the code that provide a text option for images?
Does the CD-ROM employ pop-up windows and new browser windows?


5 INTRODUCTION
TO ACTIVITIES
IN SE c TI o N s 6 through 10, we present a sampling of introductory biology classroom activities that fall within the broad curricular categories of teaching scientific inquiry, cell biology, genetics, evolu-
tion, and ecology. We chose to create activities in these content areas because they represent the core content of most introductory biology courses.
The nineteen activities in these sections are not meant as a prescribed curriculum to be carried out in some lock-step sequence. Instead, they are intended to show how the educational principles, widely beneficial practices, and instructional techniques presented in Sections 1 through 3 of this book can be applied to specific contentbased lessons. Instructors can use them in any order that suits their particular curriculum. The activities are described briefly in the introductions to the five sections following this one.
Each activity includes an instructor guide designed to orient instructors to the purpose and scope of the activity as well as to support them in facilitating and assessing student learning. Each instructor guide follows a uniform sequence of sections based on the educational principles and widely beneficial practices. An explanation of the organization and rationale for the instructor guides can be found on page 181. Then, on page 186, we show explicitly how one of the activities,"Web of Life," applies the educational principles and
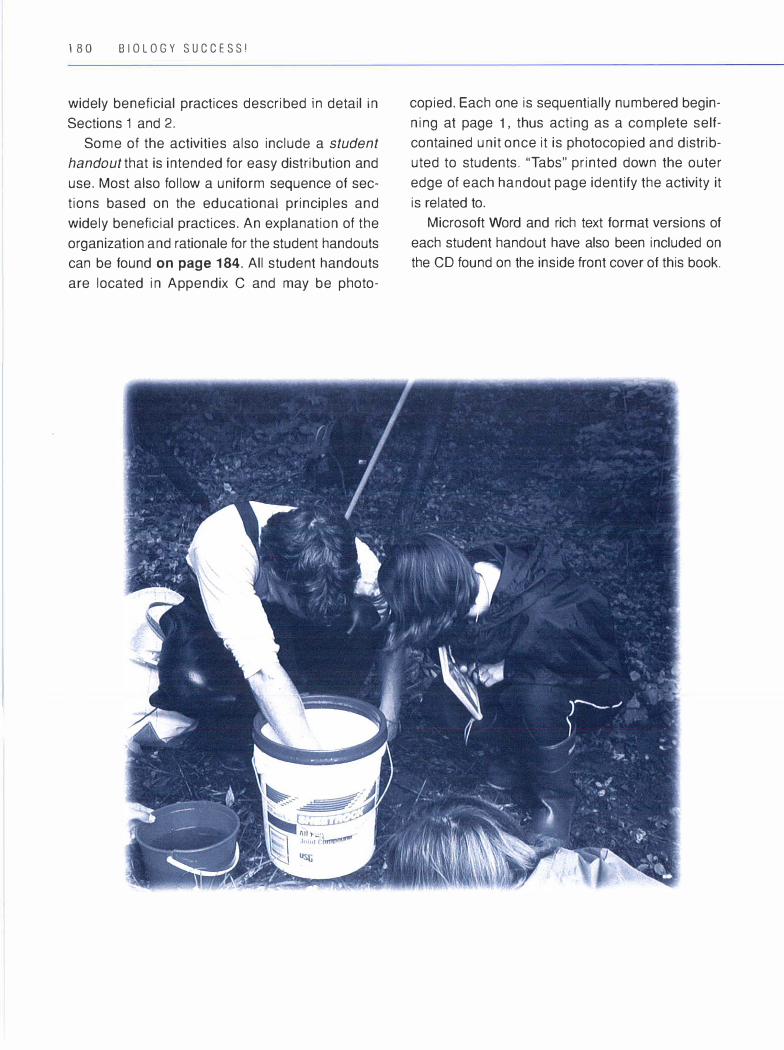
180 BIOLOGY SUCCESS!
widely beneficial practices described in detail in
Sections 1 and 2.
Some of the activities also include a student handout that is intended for easy distribution and
use. Most also follow a uniform sequence of sec
tions based on the educational principles and
widely beneficial practices. An explanation of the
organization and rationale for the student handouts
can be found on page 184. All student handouts
are located in Appendix C and may be photo-
copied. Each one is sequentially numbered begin
ning at page 1, thus acting as a complete self
contained unit once it is photocopied and distrib
uted to students. "Tabs" printed down the outer
edge of each handout page identify the activity it
is related to.
Microsoft Word and rich text format versions of
each student handout have also been included on
the CD found on the inside front cover of this book.
Instructor Guide to Activities:
Organization and Rationale
Name of Activity
Time Required
Summary
Learning Outcomes
-->--- Each activity has been named to reflect the concept(s) taught.
-->--- It is helpful for an instructor to have a sense of the time necessary to complete an activity. Estimates are based on the collective teaching experiences of the authors. Some activities can be completed within a sixty-minute class period. Other lab-based activities may take parts of several class periods to complete; others
can be completed within a typical two- to three-hour block.
-...;>..... A concise summary of the activity is meant to help an instructor see quickly what the activity involves, what content it teaches, and what learning techniques are employed.
-->--- One key educational principle for teaching students with diverse
learning profiles is to explicity identify learning outcomes. Therefore, this section carefully elaborates what students should be able to do as a result of engaging in the activity. The outcomes are broken down into four types: content outcomes, inquiry outcomes, communication outcomes, and lab or computer skill outcomes. Each outcome is directly linked to the assessment suggestions at the end of the lab or activity. Instructors are encouraged to add their own outcomes. It is helpful for students to know the expected learning outcomes prior to beginning a lab or activity.
1 81
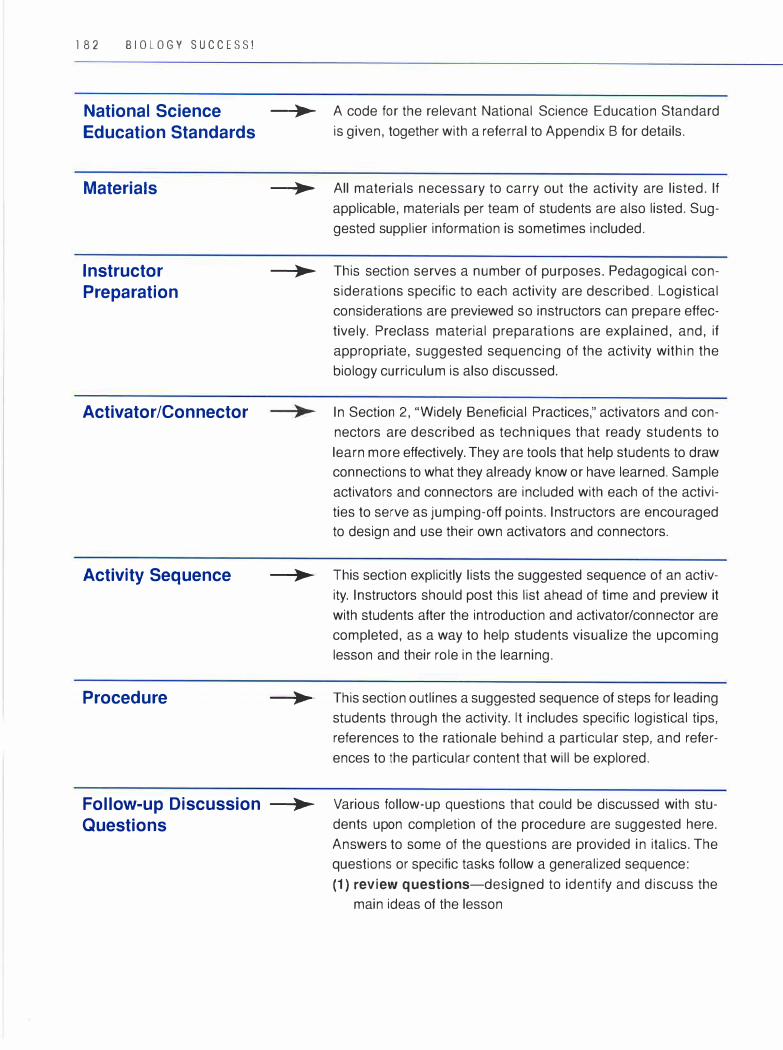
182 BIOLOGY SUCCESS!
National Science
Education Standards
Materials
Instructor
Preparation
Activator/Connector
Activity Sequence
Procedure
Follow-up Discussion
Questions
-�>� A code for the relevant National Science Education Standard is given, together with a referral to Appendix B for details.
--)ii,..... All materials necessary to carry out the activity are listed. If applicable, materials per team of students are also listed. Suggested supplier information is sometimes included.
--)ii,..... This section serves a number of purposes. Pedagogical considerations specific to each activity are described. Logistical considerations are previewed so instructors can prepare effectively. Preclass material preparations are explained, and, if appropriate, suggested sequencing of the activity within the biology curriculum is also discussed.
In Section 2, "Widely Beneficial Practices," activators and connectors are described as techniques that ready students to
learn more effectively. They are tools that help students to draw connections to what they already know or have learned. Sample activators and connectors are included with each of the activities to serve as jumping-off points. Instructors are encouraged to design and use their own activators and connectors.
--)ii,..... This section explicitly lists the suggested sequence of an activity. Instructors should post this list ahead of time and preview it with students after the introduction and activator/connector are completed, as a way to help students visualize the upcoming lesson and their role in the learning.
--)ii,..... This section outlines a suggested sequence of steps for leading students through the activity. It includes specific logistical tips, references to the rationale behind a particular step, and references to the particular content that will be explored.
--)ii,� Various follow-up questions that could be discussed with students upon completion of the procedure are suggested here. Answers to some of the questions are provided in italics. The questions or specific tasks follow a generalized sequence:
(1) review questions-designed to identify and discuss the main ideas of the lesson
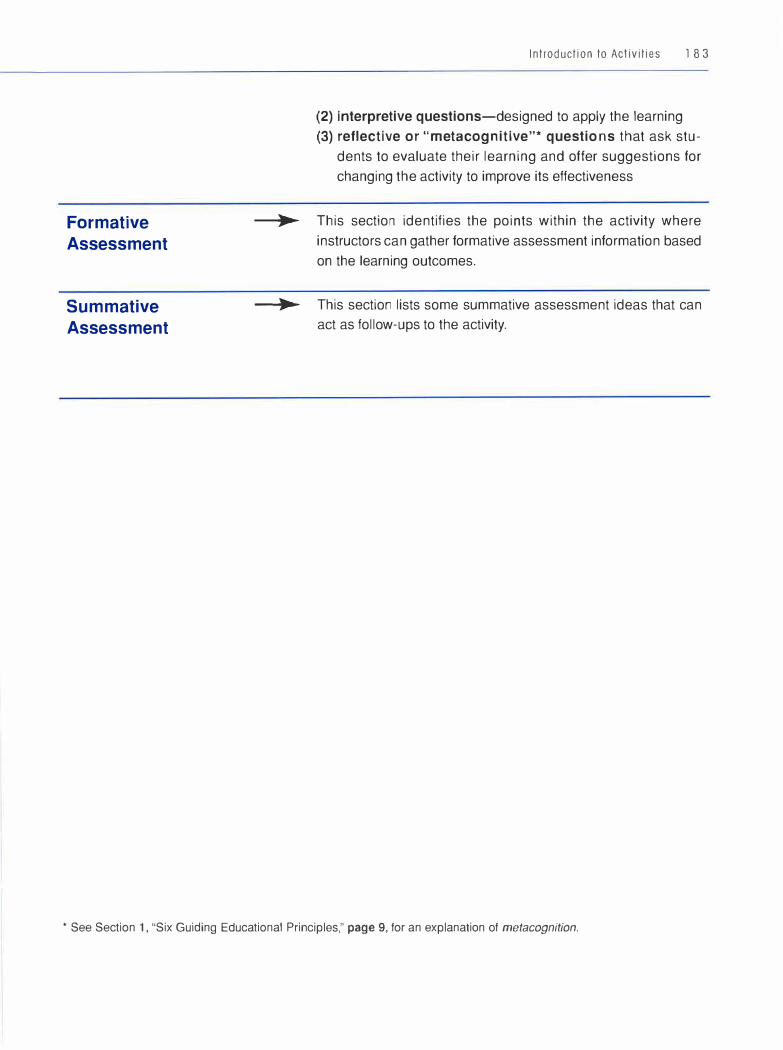
Formative
Assessment
Summative
Assessment
Introduction to Activities l 8 3
(2) interpretive questions-designed to apply the learning (3) reflective or "metacognitive"* questions that ask stu
dents to evaluate their learning and offer suggestions for changing the activity to improve its effectiveness
-�>� This section identifies the points within the activity where instructors can gather formative assessment information based on the learning outcomes.
-...:>� This section lists some summative assessment ideas that can act as follow-ups to the activity.
• See Section 1, "Six Guiding Educational Principles," page 9, for an explanation of metacognition.
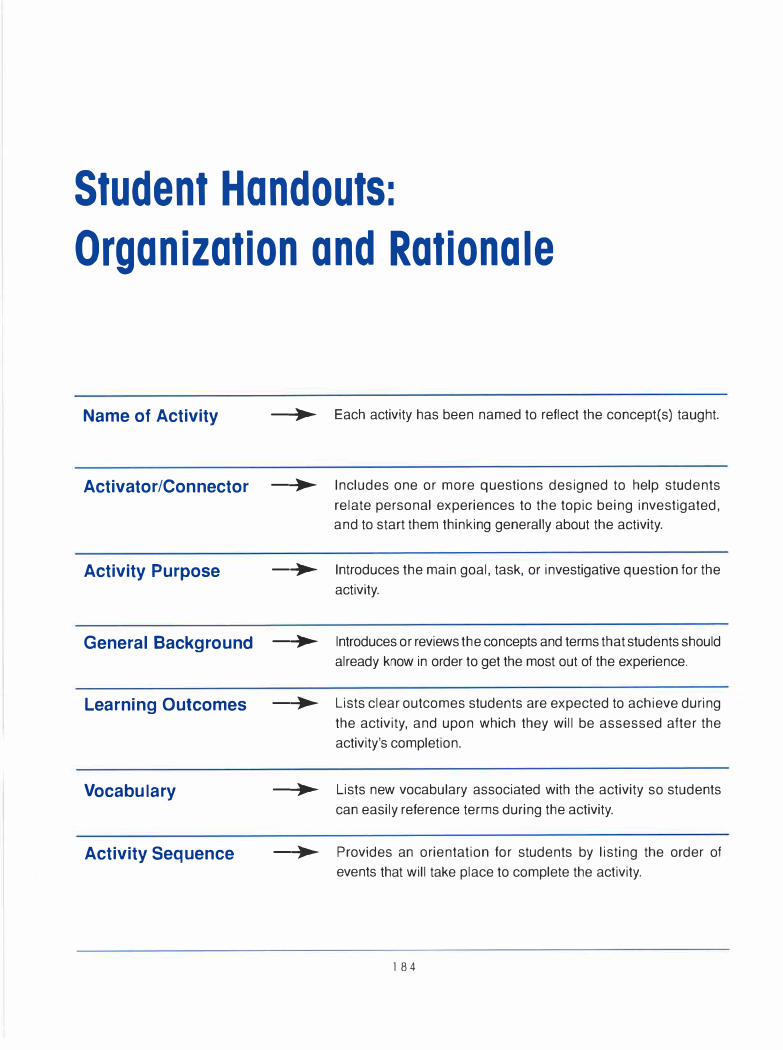
Student Handouts:
Organization and Rationale
Name of Activity
Activator/Connector
Activity Purpose
General Background
Learning Outcomes
Vocabulary
Activity Sequence
-.....l>� Each activity has been named to reflect the concept(s) taught.
-.....l>� Includes one or more questions designed to help students relate personal experiences to the topic being investigated, and to start them thinking generally about the activity.
-.....i>� Introduces the main goal, task, or investigative question for the activity.
-.....l>� Introduces or reviews the concepts and terms that students should already know in order to get the most out of the experience.
-.....l>� Lists clear outcomes students are expected to achieve during the activity, and upon which they will be assessed after the activity's completion.
-.....l>� Lists new vocabulary associated with the activity so students can easily reference terms during the activity.
-.....i>� Provides an orientation for students by listing the order of events that will take place to complete the activity.
184
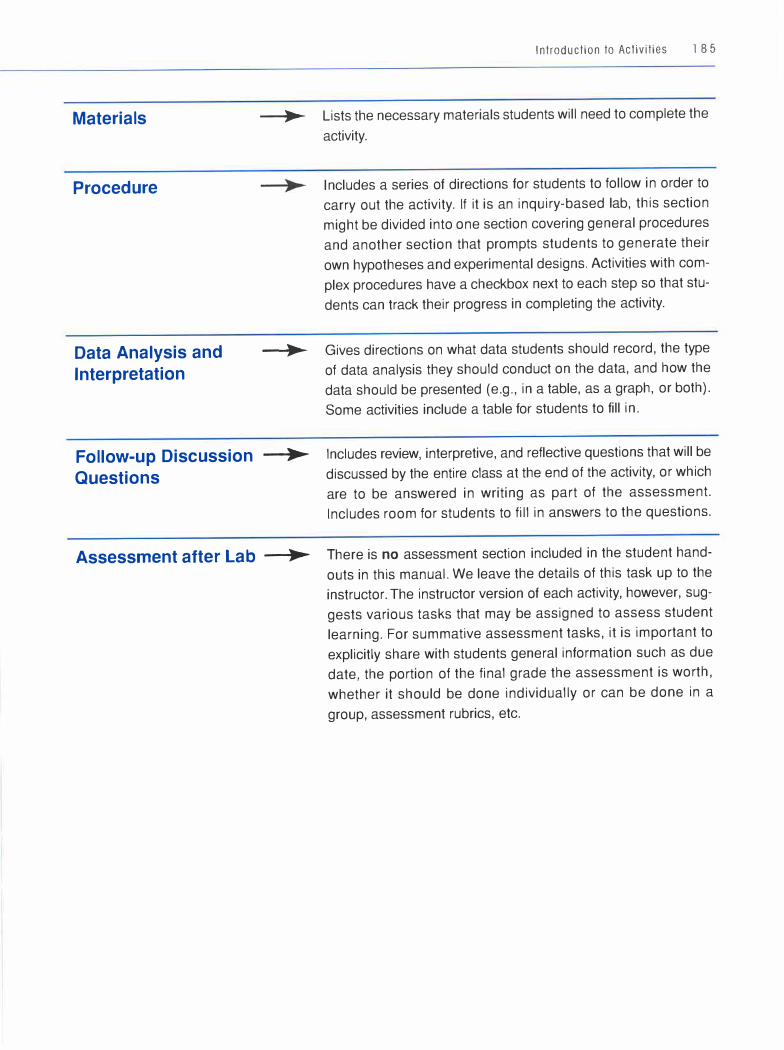
Materials
Procedure
Data Analysis and
Interpretation
Follow-up Discussion
Questions
Introduction to Activities l 8 5
-...;)ir...... Lists the necessary materials students will need to complete the activity.
Includes a series of directions for students to follow in order to carry out the activity. If it is an inquiry-based lab, this section might be divided into one section covering general procedures and another section that prompts students to generate their own hypotheses and experimental designs. Activities with complex procedures have a checkbox next to each step so that students can track their progress in completing the activity.
-->...... Gives directions on what data students should record, the type of data analysis they should conduct on the data, and how the data should be presented (e.g., in a table, as a graph, or both). Some activities include a table for students to fill in.
_ .... ,........ Includes review, interpretive, and reflective questions that will be discussed by the entire class at the end of the activity, or which are to be answered in writing as part of the assessment. Includes room for students to fill in answers to the questions.
Assessment after Lab -...;>...... There is no assessment section included in the student handouts in this manual. We leave the details of this task up to the instructor. The instructor version of each activity, however, suggests various tasks that may be assigned to assess student learning. For summative assessment tasks, it is important to explicitly share with students general information such as due date, the portion of the final grade the assessment is worth, whether it should be done individually or can be done in a group, assessment rubrics, etc.
186 BIOLOGY SUCCESS!
Web of Life*
Time Required: 11/2-2 hours
Summary
This activity can be used as an introduction to the concepts surrounding food chains and food webs, and could occur anytime during an ecology unit of study. The activity can also aid student understanding of some of the interrelationships among organisms on earth (the "web of life") by bringing these concepts to a more personal level. In addition, this activity can set the stage for follow-up discussion on energy relationships, such as biomass and trophic levels. The activity is experiential. It may be helpful for students to discuss the process in small groups of three or four; however, they should prepare their food webs individually.
SUMMARY SECTION DEMONSTRATES:
• Subprinciple lb: Start instruction at students' point of readiness
• Subprinciple l c: Base instruction on informal dynamic assessment of students' progress and mastery
• Subprinciple 3a: Incorporate and integrate different language domains and processing modes
Learning Outcomes
After completing this activity, students will be able to:
Content
• Construct a food web diagram that correctly links humans to other living organisms
• Define the following terms: producer, primary consumer, secondary consumer, tertiary consumer, herbivore, omnivore, carnivore, autotroph, heterotroph
• Apply these terms to a food web diagram
LEARNING OUTCOMES DEMONSTRATE:
• Subprinciple 5a: Identify agendas, learning goals, means, and standards for assessment
National Science Education
Standards: Content Standard C:4:2
(see Appendix B)
Materials
• Newsprint (one sheet for each student) • Markers (five different colors per student) • Notebook paper
* This activity was adapted from Biological Science Curriculum Study (BSCS), Biological Science: An Ecological Approach
(Dubuque, IA: Kendall Hunt Publishing, 1992).
Instructor Preparation
• Assign students to record all the foods and drinks they consumed for dinner (or the equivalent amount of food) the night before the activity
• Gather materials • Make copies of student handout (see Appen
dix C, "Student• Web of Life")
Activator/Connector
Prompt students with the following question: Where do you fit in the web of life? Discuss responses.
ACTIVATOR/CONNECTOR DEMONSTRATES:
• Subprinciple l c: Base instruction on informal dynamic assessment of students' progress and mastery
• 'Activator' -one of the Widely Beneficial Practices
Activity Sequence
1. Preview the activity, its purpose, background, and learning outcomes
2. Students construct a food web based on a recent dinner
3. Introduce food web terms and add to food webs
4. Follow-up discussion questions
SEQUENCE DEMONSTRATES:
• Subprinciple 3c: Set clear expectations and support students in meeting them
• Subprinciple 5a: Identify agendas, learning goals, means, and standards for assessment
Procedure
Introduction to Activities l 8 7
THE ENTIRE PROCEDURE SECTION
DEMONSTRATES:
• Widely Beneficial Practices 'Clear Directions· • Subprinciple 2a: Teach strategies and procedures
explicitly • Subprinciple 2b: Break tasks and skills into sub
skills, staged procedures, and other processes
1 . Ask students to break down the food they ate for dinner last night into any known components. For example, if the food was pepperoni pizza, the components could be as follows: For the crust, dough in the form of wheat flour, egg, and water; for the topping, tomatoes, milk in the form of cheese, and beef and pork in the pepperoni. This step can be done on notebook paper rather than on the newsprint. (Remind students that there are checkboxes in the procedure section of their handouts to track their progress in completing the lab.)
2. Ask students to identify whether the ingredients came from a plant or an animal. Cue them to mark plant ingredients with a "P" and animal ingredients with an "A."
3. If the food came from an animal, ask students to list several foods that the animal eats. For instance, the beef and pork can be broken down further into the foods that were consumed by the beef or the pig-corn or wheat. Continue this dissection of each food item until a plant is reached.
4. At this point in the lesson, it may be helpful for clarity to have the instructor show a prepared sample food web on newsprint or the on blackboard.
5. Once students have generated a list of foods and identified the origin of each food down the chain to
188 BIOLOGY SUCCESS!
plants, have them then create a food web on the newsprint:
a. Begin the web at the bottom of the page with a drawing* of any plants that were consumed (wheat, tomatoes, corn).
b. Next, draw the animals that eat those particular
plants (chickens, cattle, pigs). c. Follow the first-level animals by drawing any
animals that may eat them. d. Lastly, on the top of the food web, students
should draw a picture of themselves.
PROCEDURE (STEP 5) DEMONSTRATES:
• Subprinciple 4a: Create a strength-based context • Subprinciple 4b: Incorporate visual-spatial, kines
thetic, and tactile modalities
6. Once the students have completed their webs, introduce the following terms:
• Producer • Autotroph • Primary consumer • Heterotroph • Secondary consumer • Tertiary consumer
PROCEDURE (STEP 6) DEMONSTRATES:
• Subprinciple 3a: Incorporate and integrate diffe r ent language domains and processing modes
7. Have students label their webs with the correct terms, using a black marker.
8. From each producer, draw a colored line to the primary consumer that eats it. Students should choose one color for these lines.
9. From each primary consumer, draw a line of a different color to any secondary consumers that may eat the primary consumer.
10. If any secondary consumers eat a producer, connect them with yet another color.
11 . Display the food webs around the room and allow students a few minutes to view them.
Follow-up Discussion Questions
Follow-up discussion should take place with the entire class at once.
Review:
1. Give students the opportunity to summarize their learning up to this point.
FOLLOW-UP DISCUSSION QUESTIONS
(REVIEW) DEMONSTRATE:
• 'Summarizers· -one of the Widely Beneficial Practices
Interpretive:
The following questions can be used to introduce the terms herbivore, omnivore, carnivore, and decomposer.
* The overall effect of the web will have more impact if the components are drawn rather than listed; however, if necessary,
the names can be written.

2. Which of the animals eat only plants? (herbivore) Examples include cows, chickens, etc.
3. Which of the foods consumed by animals are also foods that you eat? (omnivore) Examples include grains, fruits, etc.
4. Are there any animals that eat only other animals? (carnivore) Examples include some fish species, such as swordfish and tuna.
5. The webs you made appear to be unidirectional; what happens to the waste produced by the animals, and/or what happens when the animals die?
Organisms called decomposers "eat" or "recycle" the matter and get the energy from the waste and the dead organisms.
Reflective:
6. Have students discuss the aspect of the activity that most contributed to their understanding: Was it the visuals? the teacher questions? the group discussion? or the hands-on creating?
FOLLOW-UP DISCUSSION QUESTIONS
(REFLECTIVE) DEMONSTRATE:
• Subprinciple 6a: Build reflection into the process
of learning
Formative Assessment
Students will demonstrate their knowledge of the human role in food webs through their creation of a personal food web graphic. They will show their
understanding of key food web terms through their food web graphic, as well as through the discussion that follows the development of the graphic.
Introduction to Activities 1 8 9
FORMATIVE ASSESSMENT
DEMONSTRATES:
• Subprinciple 5c: Link assessment to specific
learning goals
Summative Assessment
Have students draw a sample food web of a person who is a vegetarian (or interview a vegetarian to gather data for the web on his or her diet). Ask students to label the appropriate trophic levels. Provide additional thought or analysis questions such as the following:
• How many trophic levels exist in a vegetarian food web vs. a meat eater's food web?
• Are humans who are vegetarians still considered omnivores?
SUMMATIVE ASSESSMENT
DEMONSTRATES:
• Subprinciple 5c: Link assessment to specific
learning goals
Suggestions for Extended
Learning
• Have students complete the "Analyzing Food Webs" activity on page 209.
• Have students research examples of humans as tertiary consumers. Challenge them to come up with as many animals as they can that are eaten by humans and that are also secondary consumers in their own food webs.

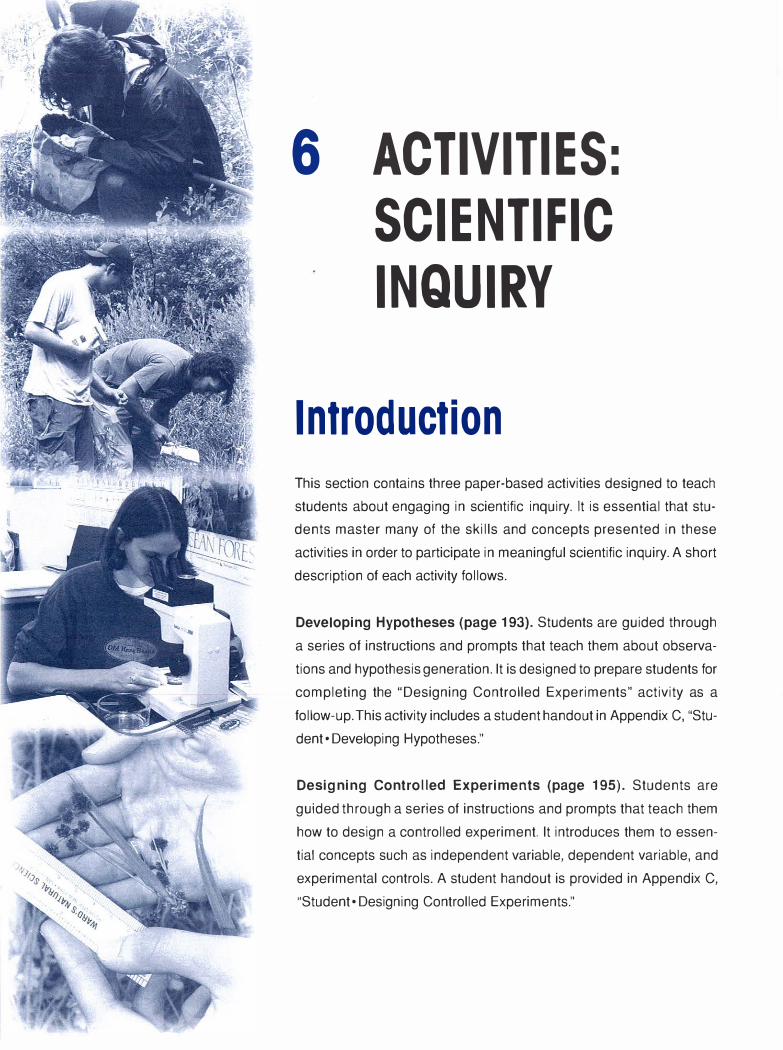
6 ACTIVITIES:
SCIENTIFIC
INQUIRY
Introduction
This section contains three paper-based activities designed to teach
students about engaging in scientific inquiry. It is essential that stu
dents master many of the skills and concepts presented in these
activities in order to participate in meaningful scientific inquiry. A short
description of each activity follows.
Developing Hypotheses (page 193). Students are guided through
a series of instructions and prompts that teach them about observa
tions and hypothesis generation. It is designed to prepare students for
completing the "Designing Controlled Experiments" activity as a
follow-up. This activity includes a student handout in Appendix C, "Stu
dent• Developing Hypotheses."
Designing Controlled Experiments (page 195). Students are
guided through a series of instructions and prompts that teach them
how to design a controlled experiment. It introduces them to essen
tial concepts such as independent variable, dependent variable, and
experimental controls. A student handout is provided in Appendix C,
"Student• Designing Controlled Experiments."
192 BIOLOGY SUCCESS!
Graphing Data (page 198). Students are guided
through a series of instructions and prompts that
teach them about graph design and interpretation.
This activity can easily be carried out in smaller
chunks throughout a course. A student handout is
provided in Appendix C, "Student• Graphing Data."
Activities: Scientific Inquiry 193
Developing Hypotheses
Time Required: 45-60 minutes
Summary
This activity employs a three-step process for
learning how to develop testable hypotheses. In
Part A, students are asked to develop alternative
hypotheses to explain observations provided to
them. In Part B (potential outdoor activity), students
supply their own observations about the natural
world for which they develop hypotheses. Finally,
in Part C, students share hypotheses and catego
rize them into those that can and can't be tested via
controlled experimentation.
Learning Outcomes
After completing this activity, students will be able to:
Inquiry Skills
• Distinguish between questions that can and
can't be addressed scientifically • Develop alternative testable hypotheses to
explain an observation
• Apply key scientific inquiry vocabulary: scien
tific method, observation, hypothesis
National Science Education
Standards: Content Standards A:1 :1, A:1 :5,
and A:2 (see Appendix B)
Materials
Student handout (see Appendix C, "Student•
Developing Hypotheses")
Instructor Preparation
• This activity is best completed as an in-class
experience. It may be beneficial to pair up stu
dents to work on the activity.
• Since the second set of exercises requires stu
dents to make observations, the instructor may
want to move students outdoors or to a new
environment to facilitate this process.
Activator/Connector
Can all questions be addressed using the scien
tific method? What types of questions can be and
what types can't be?
Activity Sequence
1 . Pass out the student handout
2. Preview the activity, its purpose, background,
and learning outcomes
3. Complete the procedure and discussion, includ
ing discussion questions
194 BIOLOGY SUCCESS
Procedure
1. Have students complete Part A exercises. Initiate
classroom discussion and encourage students to
share their answers with the class. Address exam
ples of hypotheses that were not scientific in nature
or were not in correct format.
2. Consider moving to an outdoor environment.
Have students complete Part B exercises requir
ing them to make their own observations and alter
native hypotheses.
3. For Part C, ask student groups to share their
results, and allow time for class discussion about
hypotheses that are testable under controlled
conditions.
Follow-up Discussion Questions
Review:
1. What are the main concepts you have learned
from this activity?
Student responses will vary.
Interpretive:
2. After sharing your answers with peers, did you find
that any of your hypotheses could not be tested sci
entifically? Were there any that could not be tested
under controlled conditions? How did you decide?
Student responses will vary, but the instructor
should emphasize that not all hypotheses can be
tested under controlled conditions.
Reflective:
3. Do you feel better able to identify and formulate
a testable hypothesis?
4. What aspect of this activity most contributed to
your learning?
Formative Assessment
• Students will demonstrate their ability to distin
guish between questions that can and can't be
answered during the follow-up discussion part
of the activity.
• Students will demonstrate their ability to
develop alternative hypotheses and apply key
scientific inquiry vocabulary during completion
of the handout, and during informal sharing of
student work at the end of the procedure.
Summative Assessment
• Develop a short quiz on the main concepts and
terms in this activity.
• Ask students to generate and submit for
assessment one additional observation and
hypothesis that applies all terms and concepts
from this activity.
Suggestions for Extended Learning
• Have students design a controlled experiment
to test one of the hypotheses they developed
by completing the activity called "Designing
Controlled Experiments" on page 195.
• Ask students to provide rationales (explana
tions) for their hypotheses based on their prior
knowledge of the topic.
• Ask students to research whether scientists are
currently investigating any of the hypotheses
they developed.

Activities: Scientific Inquiry 1 9 5
Designing Controlled
Experiments
Time Required: 45-60 minutes
Summary
This activity employs a developmental approach
to teaching the application of the scientific method.
Students are provided a step-wise procedure for
designing a controlled experiment to test a hypoth
esis. This activity can be used as a stand-alone tool
for introducing the scientific method or as a
preparatory step for initiating inquiry-based labo
ratory projects.
Learning Outcomes
After completing this activity, students will be able to:
Inquiry Skills
• Design controlled experiments to test hy
potheses
• Apply key scientific inquiry vocabulary (see list
on student handout)
National Science Education Standards: Content Standards A:1 :1 , A:1 :2,
and A:2 (see Appendix B)
Materials
Student handout and student worksheet (See
Appendix C, "Student• Designing Controlled Ex
periments")
Instructor Preparation
Develop a student worksheet for the activity or copy
the one provided. The worksheet requires students
to provide a hypothesis that is suitable for testing
under controlled conditions. The instructor has the
option of either providing students with a suitable
hypothesis or using the "Developing Hypotheses"
activity on page 193 to ensure that all students have
selected appropriate hypotheses for the activity. The
activator that follows can serve to start a discussion
on the nature of controlled experimentation.
Activator/Connector
Not all fields of science arrive at conclusions
through the process of controlled experimentation.
Ask students whether they can think of some
examples of fields that do and fields that do not.
Activity Sequence
1 . Pass out the student handouts (instructions and
student worksheet in Appendix C, "Student•
Designing Controlled Experiments")
196 BIOLOGY SUCCESS!
2. Preview the activity, its purpose, background,
and learning outcomes
3. Complete the procedure and initiate discussion,
including discussion questions
Procedure
1 . Give students an overview of the scientific
method.
2. Either provide students with a suitable hypothe
sis for the activity (one that can be tested under
controlled conditions) or ask them to choose one
they generated in the "Developing Hypotheses"
activity on page 193.
3. Ask students to design an experiment to test their
hypothesis. Ask them to consider and decide upon
the following aspects as they sequentially work on
their experimental design: the particular treatment
and levels of treatment to be used, how to meas
ure the effect of the treatment, the experimental
control, and other variables to hold constant.
4. Note: Students may design experiments for
which there is no immediately identifiable experi
mental control. For example, if a student decides
to test the effect of temperature on bread mold
growth, the typical experimental control would be to
conduct the experiment in the absence of the inde
pendent variable, temperature. Class discussion
around these "exceptions to the rule" and how to
develop alternative controls can provide valuable
critical thinking experiences for students.
5. Ask students to make a prediction as to the out
come of their experiment, in both written and
graphic form. If, for example, they have predicted
that plant growth will increase with increased levels
of potassium, what would that predicted growth
look like on a graph?
6. Initiate class sharing and discussion. Student
groups can present their experimental designs to
the class for feedback using posters or write-on
transparencies.
7. Complete the follow-up discussion questions.
Follow-up Discussion Questions
Review:
1. In an experiment, distinguish between an inde
pendent variable, a dependent variable, and a vari
able that must be held constant.
The independent variable is the one variable
that, when changed or manipulated within an
experiment, best helps to answer an experimental
question and test a hypothesis. A dependent vari
able is the one variable monitored and measured
during an experiment to see how it changes in
response to the independent variable. All other
variables in an experiment must be held at con
stant levels so as not to influence the course of the
experiment as the relationship between the inde
pendent and the dependent variable is isolated.
Interpretive:
2. In the spaces below, give an example of a sci
entific hypothesis that can be tested under con
trolled conditions and one that can't.
Hypothesis that can be tested under con
trolled conditions: Sunflowers grow best
when in a clay soil.

Hypothesis that can't be tested under
controlled conditions: The forests of
Canada would have different trees had it
not been for the last Ice Age.
3. Sarah designed an experiment to test whether
the length of time spent washing hands reduces
the frequency of colds. She asked some students
to wash their hands for 30 seconds, some for 60
seconds, and a third group for 90 seconds. What
is the independent variable for this experiment? the
dependent variable? Provide a minimum of two
variables that should be held constant. Provide an
experimental control for the experiment.
Variable: Time spent washing hands
Dependent variable: Frequency of colds
Two examples of other variables to hold
constant: Type of soap used, tempera
ture of water used, etc.
Experimental control: No-hand-washing
group
4. Design another experiment based on a different
hypothesis. Or, using the same hypothesis, develop
an alternative experiment to test it.
Student responses will vary according to their
choice of hypothesis.
Reflective
5. In the space below, describe the aspect of this
activity that most contributed to your understanding
of the scientific method. In addition, describe those
aspects of the scientific method you found to be
most challenging.
Formative Assessment
Students will demonstrate their ability to design
controlled experiments and apply key scientific
Activities: Scientific Inquiry 197
inquiry vocabulary through their completion of the
activity handout, their informal presentation of their
work to the whole class, and their responses to the
follow-up discussion questions.
Summative Assessment
• Develop a short quiz on the main concepts and
terms in this activity.
• Ask students to generate and submit for as
sessment one additional observation, hypothe
sis, and experimental design that applies all
terms and concepts from this activity.
Suggestions for Extended
Learning
• Have students actually carry out their experi
mental designs to test their hypotheses.
• This activity can be readily linked to two other
activities provided in this manual:
1 . The "Developing Hypotheses" activity guides
students in the process of converting observa
tions about the natural world into hypotheses. It
also asks students to distinguish between
hypotheses that can and can't be tested under
controlled conditions. (See page 193.)
2. The "Graphing Data" activity begins by ask
ing students to correctly orient independent
and dependent variables to the appropriate
axis on a graph, and then offers other exercises
to further develop their graphing skills. (See
page 198.)

198 BIOLOGY SUCCESS!
Graphing Data
Time Required: This activity is intended to
be spread out over several class periods.
Summary
This activity is planned to help students who lack
basic graphing skills develop enough proficiency to
construct simple bar and line graphs. Students will
learn how to determine the independent and depend
ent variables for an experiment, and how to correctly
orient them to the axes of a graph. They will receive
guidance on deciding whether to construct a bar or
a line graph, how to choose the scale for each axis,
how to develop descriptive titles for graphs, and how
to state observed trends in written form.
Note: It is highly recommended that these graph
ing activities be slowly integrated into the curricu
lum. It's important that students master each part
before moving on to the next. There is a checklist
(Part F) at the end of the student handout that stu
dents may find useful for self-assessment of graphs.
Learning Outcomes
After completing this activity, students will be able to:
Inquiry Skills
• Orient the independent and dependent vari
ables to their respective axes
• Choose an appropriate format for a graph (line
or bar) • Choose appropriate scales for the X and Y axes • Plot data points on a graph
• Write descriptive titles for a graph • State observed trends in written form
National Science Education Standards: Content Standards A:1 :3, A:1 :4,
and A:1 :6 (see Appendix B)
Materials
The following materials are found in Appendix C,
"Student• Graphing Data":
• Copies of the Graphing Data student handout
(one per student)
• Copies of the Graphing Data Worksheets (one
set per student)
• Copies of blank uniform graph paper (multiple
copies per student)
Instructor Preparation
• The specific exercises included in this activity
are very basic in nature. Students may already
possess sufficient skills to construct a simple
graph of their experimental data. The instruc
tor may want to assign a graphing exercise to
assess student proficiency.
• The instructor will need to decide whether to
assign the parts of this activity for completion
during or outside of class.
• The Graphing Data student handout is divided
into six parts, which can be copied and pro
vided to students either individually or all
together in one packet, depending on instructor
preference.

• In addition to the Graphing Data student hand
out, separate worksheets for Parts A through
E have been provided for students to record
their answers.
• The use of a separate worksheet and stan
dardized graph paper will facilitate rapid
assessment of student progress in developing
basic graphing skills. A sample graph paper
form, which can also be reproduced, has been
provided in this manual in Appendix C, "Stu
dent• Graphing Data 22."
Alternatively, the instructor can readily con
struct a similar form using the "table" feature of
Microsoft Word. After creating a place for stu
dents to write their name and graph title, the
instructor can insert a table that is roughly 30
columns by 40 rows. Extra graph paper can
then be quickly printed as needed.
Activator/Connector
Ask students if they have heard the expression "A
picture is worth a thousand words" and whether, from
their perspective, that statement is true. Ask them to
identify some of the advantages of depicting infor
mation, including scientific data, in graphic form.
Activity Sequence
This activity is divided into six separate parts:
Part A: Identifying the independent and dependent
variables
Part B: Graphing the independent and dependent
variables
Part C: Choosing between the bar and the line graph
Part D: Choosing scales for the axes
Part E: Writing figure titles and stating trends
Part F: Checking the graph with a checklist
Procedure
Activities: Scientific Inquiry 199
1. Preview the activity, its purpose, background,
and learning outcomes.
2. Introduce each part (see preceding Activity
Sequence) as a separate activity.
3. Ask students to complete corresponding work
sheets. (Note: To successfully complete Part D,
some students may require individual instruction
on how to plot data points once they have devel
oped the scales for both axes of their graph.)
4. Provide frequent opportunities for practice (see
Formative Assessment that follows) before mov
ing to the next part.
Follow-up Discussion Questions
Review:
1 . Using the graph paper provided by your instruc
tor, construct a complete graph for the following two
studies.
a. Tara designed a study to investigate the rela
tionship between tree trunk diameter and
canopy height on a nearby forest plot. Here are
her findings:
Canopy Height Average Trunk Diameter in cm
Above 15 meters 158
10-15 m 121
5-10 m 73
0-5 m 32
b. Drew hypothesized that male peacocks with
longer tail feathers would spend more time
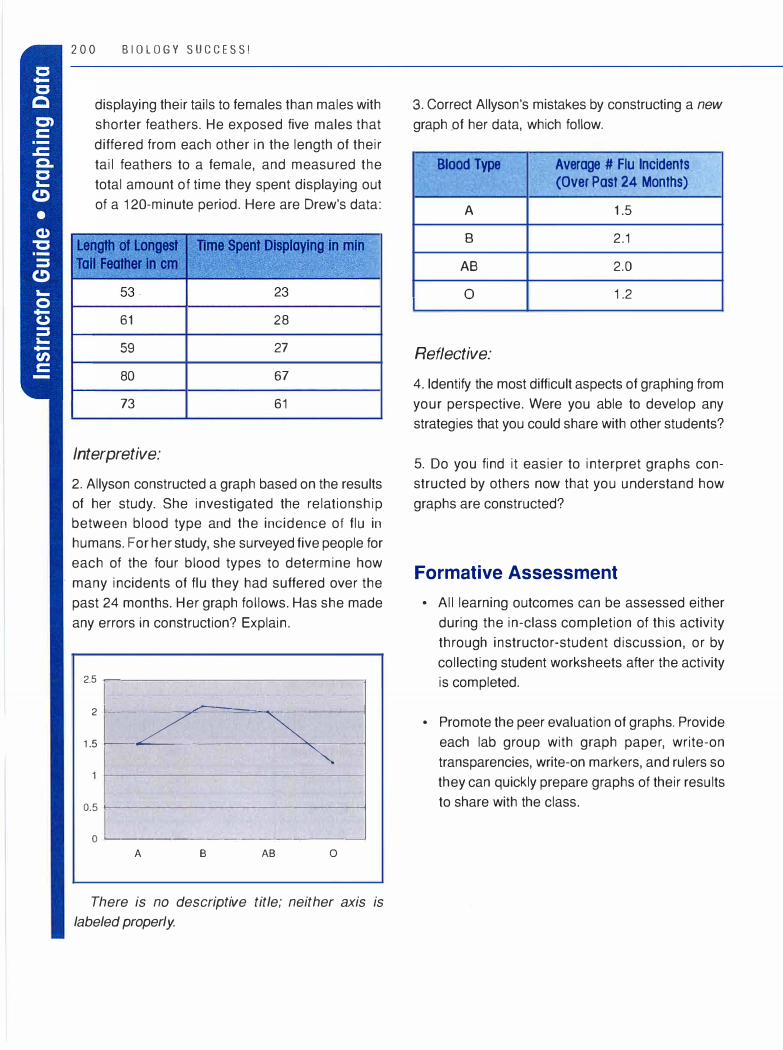
B I O L O G Y S U C C E S S !
displaying their tails to females than males with
shorter feathers. He exposed five males that
differed from each other in the length of their
tail feathers to a female, and measured the
total amount of time they spent displaying out
of a 120-minute period. Here are Drew's data:
61 28
59 27
80 67
73 61
Interpretive:
2. Allyson constructed a graph based on the results
of her study. She investigated the relationship
between blood type and the incidence of flu in
humans. For her study, she surveyed five people for
each of the four blood types to determine how
· many incidents of flu they had suffered over the
past 24 months. Her graph follows. Has she made
any errors in construction? Explain.
2.5 - -- - - - - - - - - - - - �
2 1--- -- -�.L.-:::::::==---- ----1
/ � 1 .5 --- - ---------�
- ----,
0.5 1--------------- --------l
0 '-------------- -�
A B AB 0
T here is no descriptive title; neither axis is
labeled properly.
3. Correct Allyson's mistakes by constructing a new
graph .of her data, which follow.
Blood Type Average # Flu Incidents (Over Past 24 Months)
A 1 .5
B 2.1
AB 2.0
0 1 .2
Reflective:
4. Identify the most difficult aspects of graphing from
your perspective. Were you able to develop any
strategies that you could share with other students?
5. Do you find it easier to interpret graphs con
structed by others now that you understand how
graphs are constructed?
Formative Assessment
• All learning outcomes can be assessed either
during the in-class completion of this activity
through instructor-student discussion, or by
collecting student worksheets after the activity
is completed.
• Promote the peer evaluation of graphs. Provide
each lab group with graph paper, write-on
transparencies, write-on markers, and rulers so
they can quickly prepare graphs of their results
to share with the class.
Summative Assessment
Require students to include graphs in each of their
lab reports. Integrate the characteristics of a com
plete graph into the grading rubric for the report.
Suggestions for Extended
Learning
• For any lab activity (whether demonstration or
inquiry-based), ask students to predict the out
come of the experiment in graphic form.
• Ask students to bring in examples of graphs
from newspapers, magazines, or Web sites
that represent examples of how the choice of
scale for the axes may distort the data and mis
lead the viewer.
Activities: Scientific Inquiry 2 0 l
• Assign graphs at every opportunity to reinforce
the skills. Include graphic interpretation as a
regular part of your objective assessment
instruments for the course.
• Once students have gained mastery over these
basic graphing skills, you may want to intro
duce skills and data sets that are more
complex. Teaching students to use Microsoft
Excel to create graphs will require additional
instruction. The National Science Foundation
sponsored Web site, LabWrite, created at
North Carolina State University (http://www
.ncsu.edu/labwrite/lwr-home.html), provides a
tutorial for students on the fine points of graph
ing as well as the construction of graphs using
Excel. It also provides instruction in the prepa
ration of scientific lab reports.


7 ACTIVITIES:
ECOLOGY
Introduction
The six activities that follow fall under the content area of ecology.
They are not intended to be used in the particular sequence in which
they are presented; rather, instructors are encouraged to use them in
any sequence that fits their curriculum. A short description of each
activity follows.
Web of Life (page 205). In this activity, students make a food web that
includes themselves and is based on their recent food choices. They
are introduced to terms relevant to food webs. A complete student
handout is provided in Appendix C, "Student• Web of Life."
Analyzing Food Webs (page 209). After viewing a depiction of a
forest edge food web, students determine and discuss the trophic
roles of each food web member. This activity is a good follow-up to
Web of Life. A student handout is provided in Appendix C, "Student•
Analyzing Food Webs."
Biogeochemical Cycles (page 212). Using the content of the carbon
cycle as the example, students are taught to use a widely applicable
writing model to describe a biological process. Besides a writing
model template (page 115) and a biogeochemical model (page 216),
no student handouts are provided for this activity.
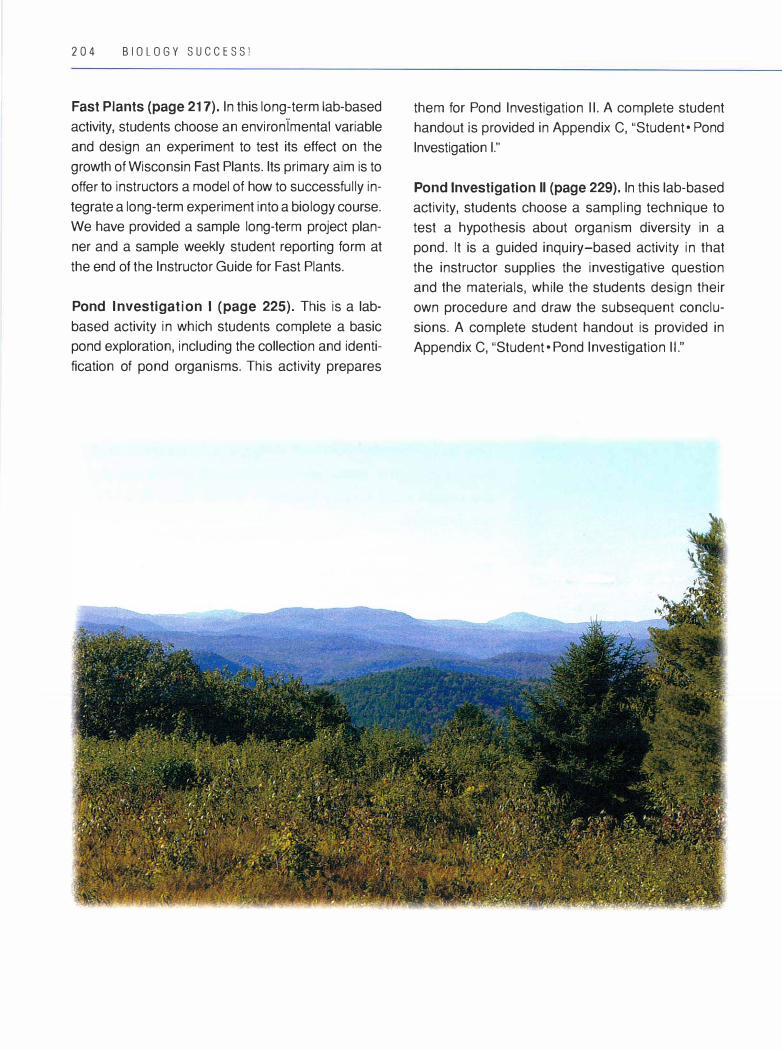
204 BIOLOGY SUCCESS!
Fast Plants {page 217). In this long-term lab-based activity, students choose an environ"imental variable and design an experiment to test its effect on the growth of Wisconsin Fast Plants. Its primary aim is to offer to instructors a model of how to successfully integrate a long-term experiment into a biology course. We have provided a sample long-term project planner and a sample weekly student reporting form at the end of the Instructor Guide for Fast Plants.
Pond Investigation I (page 225). This is a labbased activity in which students complete a basic pond exploration, including the collection and identification of pond organisms. This activity prepares
them for Pond Investigation II. A complete student handout is provided in Appendix C, "Student• Pond Investigation I."
Pond Investigation II {page 229). In this lab-based activity, students choose a sampling technique to test a hypothesis about organism diversity in a pond. It is a guided inquiry-based activity in that the instructor supplies the investigative question and the materials, while the students design their own procedure and draw the subsequent conclusions. A complete student handout is provided in Appendix C, "Student• Pond Investigation 11."
Web of Life
Time Required: 11/2-2 hours
Summary
This activity can be used as an introduction to the concepts surrounding food chains and food webs, and could occur anytime during an ecology unit of study. The activity can also aid student understanding of some of the interrelationships among organisms on earth (the "web of life") by bringing these concepts to a more personal level. In addition, this activity can set the stage for follow-up discussion on energy relationships, such as biomass and trophic levels. The activity is experiential. It may be helpful for students to discuss the process in small groups of three or four; however, they should prepare their food webs individually.
Learning Outcomes
After completing this activity, students will be able to:
Content
• Construct a food web diagram that correctly links humans to other living organisms
• Define the following terms: producer, primary consumer, secondary consumer, tertiary consumer, herbivore, omnivore, carnivore, autotroph, heterotroph
• Apply these terms to a food web diagram
Activities: Ecology 2 0 5
National Science Education
Standards: Content Standard C:4:2 (see
Appendix B)
Materials
• Newsprint (one sheet for each student) • Markers (five different colors per student) • Notebook paper
Instructor Preparation
• Assign students to record all the foods and drinks they consumed for dinner (or the equivalent amount of food) the night before the activity
• Gather materials • Make copies of student handout (see Appen
dix C, "Student•Web of Life")
Activator/Connector
Prompt students with the following question: Where do you fit in the web of life? Discuss responses.
Activity Sequence
1. Preview the activity, its purpose, background, and learning outcomes
This activity was adapted from Biological Science Curriculum Study (BSCS), Biological science: An ecological approach
(Dubuque, IA: Kendall Hunt Publishing, 1992).
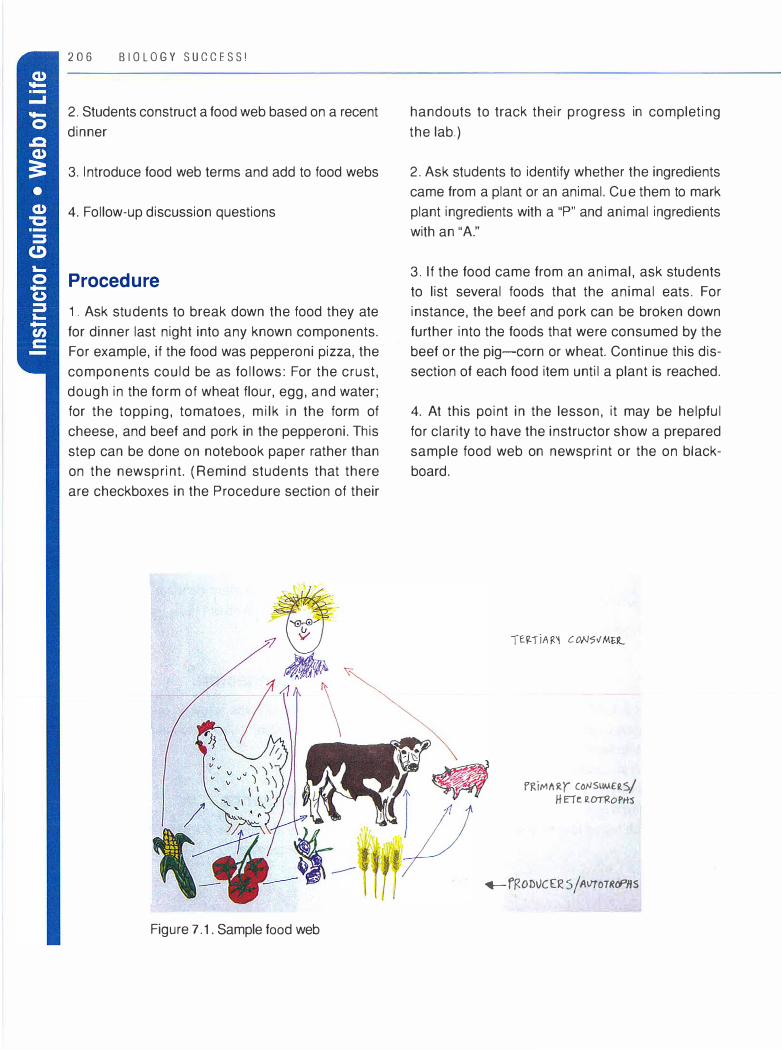
206 BIOLOGY SUCCESS!
2. Students construct a food web based on a recent dinner
3. Introduce food web terms and add to food webs
4. Follow-up discussion questions
Procedure
1 . Ask students to break down the food they ate for dinner last night into any known components. For example, if the food was pepperoni pizza, the components could be as follows: For the crust, dough in the form of wheat flour, egg, and water; for the topping, tomatoes, milk in the form of cheese, and beef and pork in the pepperoni. This step can be done on notebook paper rather than on the newsprint. (Remind students that there are checkboxes in the Procedure section of their
Figure 7.1. Sample food web
handouts to track their progress in completing the lab.)
2. Ask students to identify whether the ingredients came from a plant or an animal. Cue them to mark plant ingredients with a "P" and animal ingredients with an "A."
3. If the food came from an animal, ask students to list several foods that the animal eats. For instance, the beef and pork can be broken down further into the foods that were consumed by the beef or the pig-corn or wheat. Continue this dissection of each food item until a plant is reached.
4. At this point in the lesson, it may be helpful for clarity to have the instructor show a prepared sample food web on newsprint or the on blackboard.
f'RiMIIRY Co/JSUM£f.S/ If ETc e.�ortts
._ f� onvc ER s / AvtOTR<:F'HS

5. Once students have generated a list of foods and identified the origin of each food down the chain to plants, have them then create a food web on the newsprint:
a. Begin the web at the bottom of the page with a drawing* of any plants that were consumed (wheat, tomatoes, corn).
b. Next, draw the animals that eat those particular plants (chickens, cattle, pigs).
c. Follow the first-level animals by drawing any animals that may eat them.
d. Lastly, on the top of the food web, students should draw a picture of themselves.
6. Once the students have completed their webs, introduce the following terms:
• Producer • Autotroph • Primary consumer • Heterotroph • Secondary consumer • Tertiary consumer
7. Have students label their webs with the correct terms, using a black marker.
8. From each producer, draw a colored line to the primary consumer that eats it. Students should choose one color for these lines.
9. From each primary consumer, draw a line of a different color to any secondary consumers that may eat the primary consumer.
10. If any secondary consumers eat a producer, connect them with yet another color.
Activities: Ecology 2 0 7
11. Display the food webs around the room and allow students a few minutes to view them.
Follow-up Discussion Questions Follow-up discussion should take place with the entire class at once.
Review:
1. Give students the opportunity to summarize their learning up to this point.
Interpretive:
The following questions can be used to introduce the terms herbivore, omnivore, carnivore, and decomposer.
2. Which of the animals eat only plants? {herbivore) Examples include cows, chickens, etc.
3. Which of the foods consumed by animals are also foods that you eat? (omnivore)
Examples include grains, fruits, etc.
4. Are there any animals that eat only other animals? (carnivore)
Examples include some fish species, such as
swordfish and tuna.
5. The webs you made appear to be unidirectional; what happens to the waste produced by the animals, and/or what happens when the animals die?
Organisms called decomposers "eat" or "re
cycle" the matter and get the energy from the
waste and the dead organisms.
·rhe overall effect of the web will have more impact if the components are drawn rather than listed; however, if necessary,
the names can be written.
208 BIOLOGY SUCCESS!
Reflective:
6. Have students discuss the aspect of the activity that most contributed to their understanding: Was it the visuals? the teacher questions? the group discussion? or the hands-on creating?
Formative Assessment
Students will demonstrate their knowledge of the human role in food webs through their creation of a personal food web graphic. They will show their understanding of key food web terms through their food web graphic, as well as through the discussion that follows the development of the graphic.
Summative Assessment
Have students draw a sample food web of a person who is a vegetarian (or interview a vegetarian to
gather data for the web on his or her diet). Ask students to label the appropriate trophic levels. Provide additional thought or analysis questions such as the following:
• How many trophic levels exist in a vegetarian food web vs. a meat eater's food web?
• Are humans who are vegetarians still considered omnivores?
Suggestions for Extended
Learning
• Have students complete the "Analyzing Food Webs" activity on page 209
• Have students research examples of humans as tertiary consumers. Challenge them to come up with as many animals as they can that are eaten by humans and that are also secondary consumers in their own food webs.
Activities: Ecology 2 0 9
Analyzing Food Webs
Time Required: 25 minutes
Summary
This activity applies students' understanding of trophic-level food web relationships by having them analyze diagrammatic depictions of food webs. The activity could be completed in class or outside of class.
Learning Outcomes
After completing this activity, students will be able to:
Content
• Define the following terms as they relate to trophic levels: producer, primary consumer,
secondary consumer, tertiary consumer, detri
tivore, omnivore
• Apply these terms by accurately describing a food web diagram
• .Recognize that organisms can occupy more than one trophic level
• Determine the trophic level of organisms by analyzing a food web diagram
National Science Education
Standards: Content Standard C:4:2 (see
Appendix B)
Materials
• Student handout that includes a worksheet with analysis questions and a model of a forest edge food web (see Appendix C, "Student· Analyzing Food Webs")
• Colored markers (optional)
Instructor Preparation
• Decide whether students will carry out this activity in teams or as individuals.
• Copy the student handout ahead of time. • The activity would fit best after food webs and
energy flow have already been introduced in some fashion.
Activator/Connector
Have students quickly draw some depiction of a "web" in their notes. Then ask why ecologists may have chosen the term "food web" to show feeding relationships.
Activity Sequence
1. Preview the activity, its purpose, and learning outcomes
2. Students work individually or in pairs to analyze the Model Food Web using the analysis questions on the Analyzing Food Webs Worksheet to guide them
3. Compare answers and discuss
21 0 BIOLOGY SUCCESS!
Procedure
1. Pass out the student handout that includes the food web model and analysis questions.
2. Give students the option of working individually or in a team of two.
3. Explain that the task is to use the food web model to answer the analysis questions.
4. Give the students approximately 1 O minutes to analyze the food web model.
5. Options: a. Distribute to students colored markers or high
lighters so they can color code the trophic levels on the food webs as they work through the activity.
b. Distribute to students a list of all organisms in the food web to use as a note-taking guide as they work through the task of identifying which organism is in each trophic level.
Follow-up Discussion Questions
Review and Interpretive:
1 . When all students have finished the questions on their own or in their teams, lead a class discussion that shares student answers to the analysis questions.* Let students resolve differences of interpretation by asking them to justify their answers.
How many producer species? List. Four-Goldenrod; Grass; Oak Acorn;
Blackberry
How many primary consumers? List. Four-Mouse; Rabbit; Deer; Squirrel
How many secondary consumers? List.
Four-Mink; Snake; Hawk; Coyote
How many tertiary consumers? List. One-Hawk
List the members of the longest food chain. Grass - Mice - Snake - Hawk
Do any organisms belong to two trophic levels? Which ones and why?
Coyote, because it eats both producers
and primary consumers; and hawk, because it
eats both primary consumers and secondary
consumers.
What essential food web role has been left out of the web?
Detritivores or decomposers
Which species is at the highest possible trophic level in this web? Why?
The hawk, because it is at the end of the
longest food chain in the web.
2. Ask students to summarize their key learning from this activity.
Reflective:
3. Ask students if this activity played to their learning strengths or weaknesses.
*If appropriate for the group, use the discussion technique called "random group check." See page 110 for further elabora
tion on this technique.
Formative Assessment
Students will demonstrate their knowledge of trophic levels and accurate use of trophic-level terminology orally when completing the food web analysis in their small groups, as well as in the discussion period that follows.
Summative Assessment
• Assign an additional food web model for students to analyze for further practice, using the
Activities: Ecology 2 1 1
same or similar analysis questions. Collect and assess accuracy of students' work based on the learning outcomes.
• Include a similar analysis task as part of a quiz or test on ecology.
• Assign to students the task of building a 3-D food web model that includes all the key food web terminology.
212 BIOLOGY SUCCESS!
Biogeochemical Cycles
Time Required: 60 minutes
Summary
Nutrient or biogeochemical cycles are key concepts for understanding the interactions between organisms and the environment. Students of biology often encounter difficulty in differentiating the main ideas and ecological relevance of these cycles from their intricate details. This activity sequence is designed to introduce students to the big picture before they are presented with a model for examining the details. It also includes introducing students to a template for writing about biological processes.
Learning Outcomes
After completing this activity, students will be able to:
Content
• Define the term biogeochemical cycle
• Give examples of how both the water and the carbon cycle include biotic and abiotic (geological and chemical) components of the biosphere
• Describe the importance of carbon to plants and animals
Communication Skills
• Write a well-organized and coherent summary of a biological process
National Science Education
Standards: Content Standard C:4:1, C:5:6,
and D:2:1 (see Appendix B)
Materials
• Depictions of both the water and the carbon cycles from texts, overhead transparencies, CD-ROMs, the World Wide Web, etc., preferably in color
• A diagram that depicts a general biogeochemical cycle. See page 216
• Student handouts of a writing model for summarizing biological processes (two copies for each student). See page 115
• Overhead projector or digital projector/computer (optional)
Instructor Preparation
• This activity requires that students have an understanding of the abiotic and biotic components of an ecosystem.
• Choose ahead of time which graphic depictions of the water and carbon cycles to use.
• Copy all student handouts.
Activator/Connector
Most students have a basic understanding of the water cycle from their backgrounds, so use the following question to get them to recognize and explain their conceptions of this basic biogeo-
chemical cycle: How does water move from living to nonliving components of the earth? Discuss their conceptions briefly and categorize this phenomenon as an example of a biogeochemical cycle.
Activity Sequence
1 . Preview the activity and its learning outcomes
2. Procedure, Part A: Instructor introduction to biogeochemical cycles
3. Procedure, Part B: Instructor-led explanation of the water cycle, with student input
4. Procedure, Part C: Instructor-led demonstration of how to use the writing model to describe the events in the water cycle, with student input
5. Procedure, Part D: Instructor-led explanation of the carbon cycle
6. Follow-up discussion questions
7. Assignment: Students write a summary of the carbon cycle using the writing model
Procedure
Part A: Instructor Introduction to Biogeochemical Cycles
1. Pass out the General Model of a Biogeochemical Cycle to students. Have students look at it on their own briefly. Then provide this prompt:
From this diagram, what can you tell about bio
geochemical cycles?
Continue prompting until the basics are uncovered:
Activities: Ecology 2 l 3
• they involve living and nonliving components • something is moving or cycling between living
and nonliving things • they occur only within the biosphere
2. Break down the word biogeochemical into its component parts-"bio"-"geo"-"chemical"-and use this analysis to define the concept. A biogeochemical cycle is the movement of particular essential substances through the biosphere, alternating between biological (biotic), geological (abiotic), and chemical (abiotic) forms.
3. List for students some examples of biogeochemical cycles: water, phosphorus, carbon, and nitrogen. These substances are essential for proper functioning and balance in ecological systems and in individual organisms.
Part B: Instructor-Led Explanation of the Water Cycle
1. Show a version of the water cycle, or construct one with input from the students.
2. Lead a discussion about the water cycle. Students should take notes. Highlight the following:
a. The importance of the cycle: Water is essential for all organisms because of its unique characteristics.
b. General features of the cycle: The water cycle carries water through the atmosphere, living systems, and nonliving systems on land and soil.
c. Specific components of the cycle: Examine one "loop" of the cycle in more detail. Minimally, this should include condensation, precipitation, and transpiration.
3. When finished with the instructor-led explanation, ask students to review the cycle orally in pairs or teams.
2 1 4 BIOLO G Y S U CCESS!
Part C. Instructor- Led Demonstration of How to Use the Writing Model to Describe the Water Cycle
1 . Using an overhead projection device, display the
blank template for the Writing Model for a Biological
Process. Distribute two copies on paper to each
student. Introduce the model as a tool to organize
certain kinds of scientific writing. Using the water
cycle information just presented, fi l l in the writing
model with input from students.
2. Assign students to convert the fi l led-in writing
model to paragraph form. This could be assigned to
groups of two.
Part D. Instructor-Led Explanation of the Carbon Cycle
Use a clear visual depiction of the carbon cycle to
highl ight its purpose, general features, and spe
cific components. Distribute the depiction to stu
dents. Students should take notes in some form.
Follow-up Discussion Questions
Review:
1 . Provide an opportunity for students to summa
rize their learning about biogeochemical cycles,
perhaps in small groups.
2. What do all b iogeochem ical cycles have in
common?
They cycle matter/nutrients through ecosystems and the biosphere. They are all closed loops; no matter/nutrients escape the biosphere. The matter/nutrients go back and forth between biotic and abiotic parts of the ecosystem and biosphere.
3. What are two abiotic phases and two biotic
phases within the carbon cycle?
Abiotic phases: carbon dioxide in atmosphere; fossil fuels; marine sediments; etc. Biotic phases: plants; animals; bacteria; etc.
4. How is the carbon cycle essential to plants and
animals?
Carbon is involved in the formation of essential organic compounds, such as carbohydrates and DNA. Plants must get carbon from the biosphere through photosynthesis. Animals must get carbon through eating plants or other organisms.
Interpretive:
5. What would happen within the carbon cycle if
there were a notable increase in the burning of fos
si l fuels?
This is a topic of considerable interest and debate among scientists. Obviously, more carbon dioxide would be released into the atmosphere. Some of this extra carbon dioxide would create significant greenhouse warming in the atmosphere. Some might be absorbed in significant amounts by various producers in ecosystems. The idea is that the overall rate of carbon cycling within the earth's system might change, perhaps with some negative ramifications for humans.
Reflective:
6. Was the Writing Model for a Biological Process a
useful tool for organizing information?
7. Which aspect of this activity was most congruent
with your learning style? least congruent with your
learning style?

Formative Assessment
• Students will demonstrate their knowledge of biogeochemical cycles orally during the discussion section of the activity.
• Students will begin to demonstrate their ability to write a summary of a biological process when they produce a draft summary of the water cycle.
Summative Assessment
Assign students the task of using the Writing Model for a Biological Process to describe the carbon cycle in writing. The cycle must start and end at the same point and include a minimum of four
Act iv i t ies : Ecology 2 1 5
steps. The product should be in paragraph form. It is highly recommended that the instructor develop a rubric for this writing activity (see page 1 27 on Rubrics). The rubric could be given to students as a guide for completing this assignment.
Suggestions for Extended
Learning
1 . Assign students to apply the Writing Model for a Biological Process template to another cycle (such as the nitrogen or the phosphorus cycle).
2. Assign students to construct three-dimensional models of any biogeochemical cycle discussed in the class.
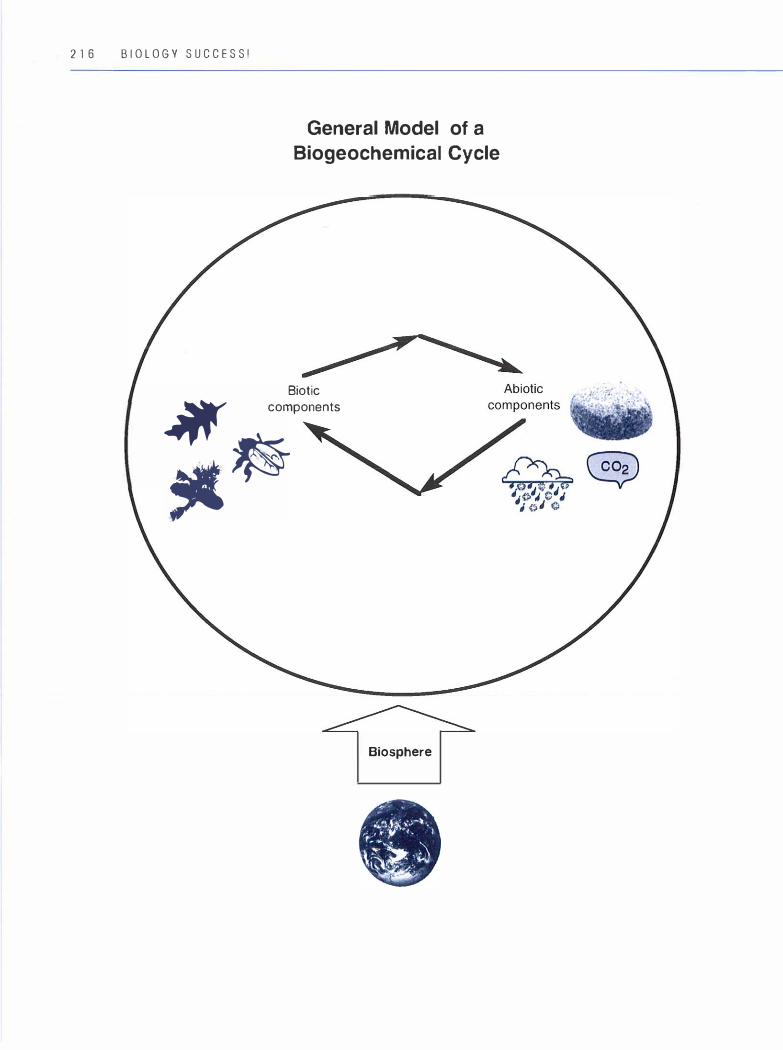
21 6 B I OLOGY S UCCESS!
General Model of a
Biogeochemical Cycle
Biotic ,,;ff' components
,c�
Biosphere
Fast Plants
Ti me Req U ired: Part of class on various days over a 40-day period. (Specific activities require different amounts of time ranging from 15 minutes to a full lab period.)
Summary
Students will conduct a long-term experiment testing the effects of environmental variables on growth and seed production of Wisconsin Fast Plants. This experiment could occur at any time during an ecology unit of study, but would be most effective after the concept of abiotic variables has been discussed.
Learning Outcomes
After completing this activity, students will be able to:
Content
• Describe the major stages of plant development • Describe how certain environmental factors
affect plant growth
Inquiry Skills
• Collect relevant scientific background on research topics from reliable sources
• Design an experiment to test a hypothesis • Independently collect and record data over an
extended period • Display data in both tabular and graphic forms • Calculate averages • Decide whether data support hypotheses
Communication Skills
Activities: Ecology 2 l 7
• Provide oral weekly progress reports to class • Write a scientific lab report that accurately
summarizes the experiment
National Science Education
Standards: Content Standards A:1 :1, A:1 :2,
A:1 :3, A:1 :4, A:1 :5, A:1 :6, and A:2 (see
Appendix B)
Materials
• All materials for growing Wisconsin Fast Plants are available from most biological supply companies. These include - seed, - containers, growth media, and fertilizer, and - supplemental lighting
• Additional materials will be necessary for individual group experiments (e.g., chemicals, etc. )
• Lab notebook/journal
Instructor Preparation
• Make copies of the Worksheet for Designing Controlled Experiments in Appendix C, "Student • Designing Controlled Experiments 9" to aid students in designing their long-term fast plants project.
2 1 8 BIOLOGY SUCCESS!
• Order growth media and other materials that students may want to use in their experiments (e.g. , acids and bases to test effects of pH, black cloth to test effects of light, etc.). Additional materials may be required if students design unique experiments that the instructor has not prepared for.
• Prepare a long-term project planner for students (see sample on page 222) that contains the following: - A section for student groups to exchange names and contact information (to aid in team communication) - A calendar that indicates the important dates when various aspects of the project will occur (to aid students in time management) - Any other pertinent information
• Optional: Create a report form for students to submit periodically, containing written updates of their experiments. This would be an organizational tool for students, and would allow instructors to more carefully assess and document the progress of the experiment.
• Set up equipment.
Activator/Connector
Have you ever conducted a long-term project? What are some benefits of doing a long-term vs. a short-term project? some challenges?
Have you ever watched a plant grow? What are the growth stages of a plant? Based on your experience, how do levels of water or heat affect the growth rate of plants? How can growth rate be measured? What are some interesting and/or important questions that could be asked about factors that affect plant growth?
Activity Sequence
1 . Pass out student lab handouts
2. Preview activity, purpose, and learning outcomes using long-term project planner
3. Procedure
4. Follow-up discussion questions
5. Assessment
Procedure
1. Assign students to groups of two to four and have them fill out the team member portion of their long-term project planner.
2. Present background information necessary for conducting the project, including information on Wisconsin Fast Plants and their normal growth requirements. There is a lot of supportive material available through Carolina Biological (manuals, videos, teacher guides, etc.).
3. Instruct students in how to properly design an experiment (see "Developing Hypotheses," page 193, and "Designing Controlled Experiments," page 195). Guide each student group in the following:
a. Formulating a clear question b. Developing a hypothesis to test c. Brainstorming independent environmental vari
ables that might be tested to determine their effects on plant growth (e.g., amount of water or fertilizer, temperature, quantity and quality [color] of light, pH, presence of a pollutant such as a heavy metal or bleach)
d. Brainstorming dependent variables that best
measure plant growth (e.g. , plant height, days to flowering, number of seeds produced)
e. Developing a procedure, including appropriate levels of the independent variable, an experimental control, and other variables that should be held constant. (Note: To minimize effects of genetic and environmental variability on results, it is recommended that each treatment level consist of a minimum of 1 2 plants.) Some groups may be able to develop their procedures independently, while others may need different degrees of teacher input. Some data may need to be collected only once every three days (e.g., plant height), while other data (e.g., flowering date) may need to be assessed daily.
f. Predicting the outcome of the experiment
4. Each procedure should be reviewed by the instructor and possibly a peer group. Alternatively, each research group could be asked to prepare a brief overview of its research proposal, including relevant background information, hypothesis, experimental design, and prediction. Allow other groups the opportunity to provide feedback and make suggestions for improvement.
5. Instruct students in any lab skills that might be needed for their particular procedure, such as using a balance (including taring), making solutions, making a table to record data (see Figure 7.2), and keeping an organized lab journal in which to record data.
6. Have each group set up its experiment and begin to carry out its experimental procedure.
7. Sometime during the several weeks that data is being collected by students, instruct them in how to analyze the results (e.g., take the average height for each treatment group for each day of the experiment) and make graphical representations of the data. If students require instruction in graph construction and
Activities: Ecology 2 1 9
interpretation, consider using the "Graphing Data" activity on page 1 98 to teach these skills.
8. As data is collected, each group should interpret results and orally present them to the class to allow for comparisons. It is recommended that this be done weekly, and also at the end of the project. See the sample of a Fast Plants weekly student report form on page 224.
Follow-up Discussion Questions
Ask students the following questions:
Review:
1. Based on the class's data, what environmental conditions are best and worst for growing Wisconsin Fast Plants?
Interpretive:
2. How might the results of this lab be used to advise farmers on how to grow their crops, or advise politicians on environmental policy?
Reflective:
3. How could each group have improved upon the organization or procedure of the long-term project?
4. What are sources of error in the lab?
5. What aspect of the activity most contributed to students' understanding? Was it the small-group interaction or the larger class discussions? Was it the hands-on manipulation?
6. Which part of the lab was most challenging?
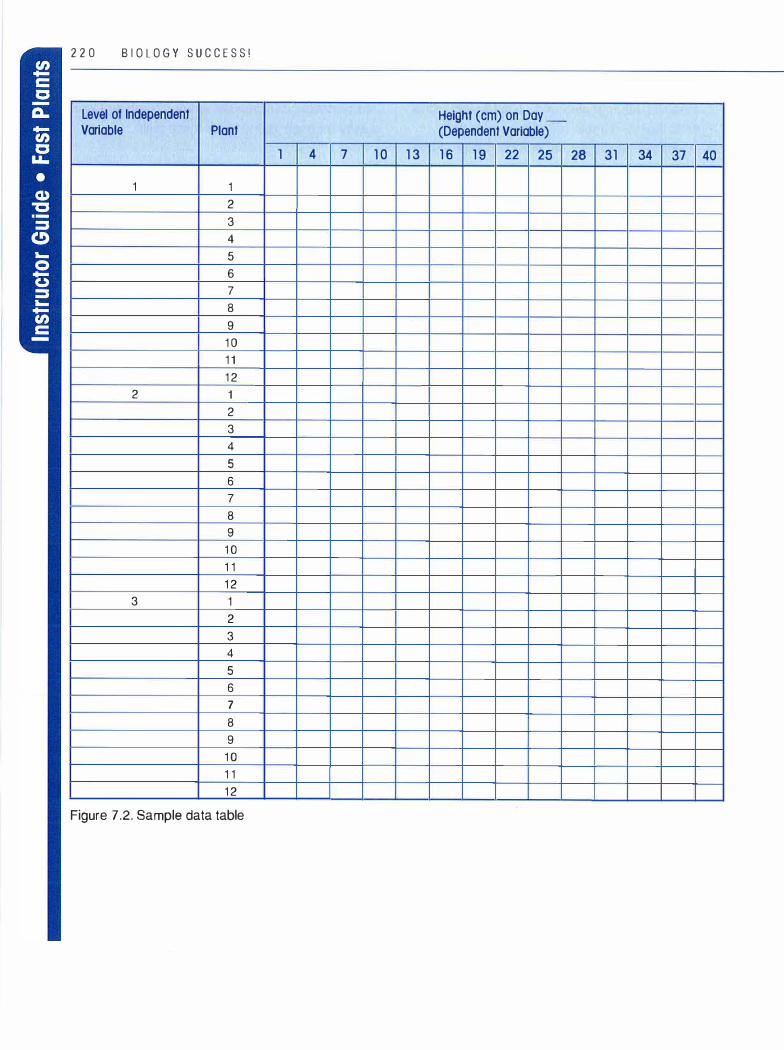
2 2 0 B I O L O G Y S U C C E S S !
Level of Independent Variable Plant
1 1
2
3
4
5
6
7
8
9
1 0
1 1
1 2
2 1
2
3
4
5
6
7
8
9
10
1 1
1 2
3 1
2
3
4
5
6
7
8
9
1 0
1 1
1 2
Figure 7.2. Sample data table
1
Height (cm) on Day _ (Dependent Variable)
4 7 1 0 1 3 1 6 1 9 22 25 28 31 34 37 40
Formative Assessment
All interactions with students as they design and carry out their experiments can provide assessment information for each learning outcome. Most important, the weekly oral reports are key for collecting assessment data on the content learning outcomes as well as on inquiry skills learning outcomes such as displaying data, calculating averages, and deciding whether data support hypotheses.
Summative Assessment
The following are suggestions for assessment after the lab work is completed:
• Ask students to write a lab report using the Lab Report Template on page 163.
Activit ies: Ecology 2 2 l
• Alternatively, ask students to develop a research poster and communicate findings during a poster session. See "Poster Presentations" on page 151.
Suggestions for Extended
Learning
Have students use their experimental results to refine their initial hypothesis and create a new experimental design that could yield additional data on their chosen topic.
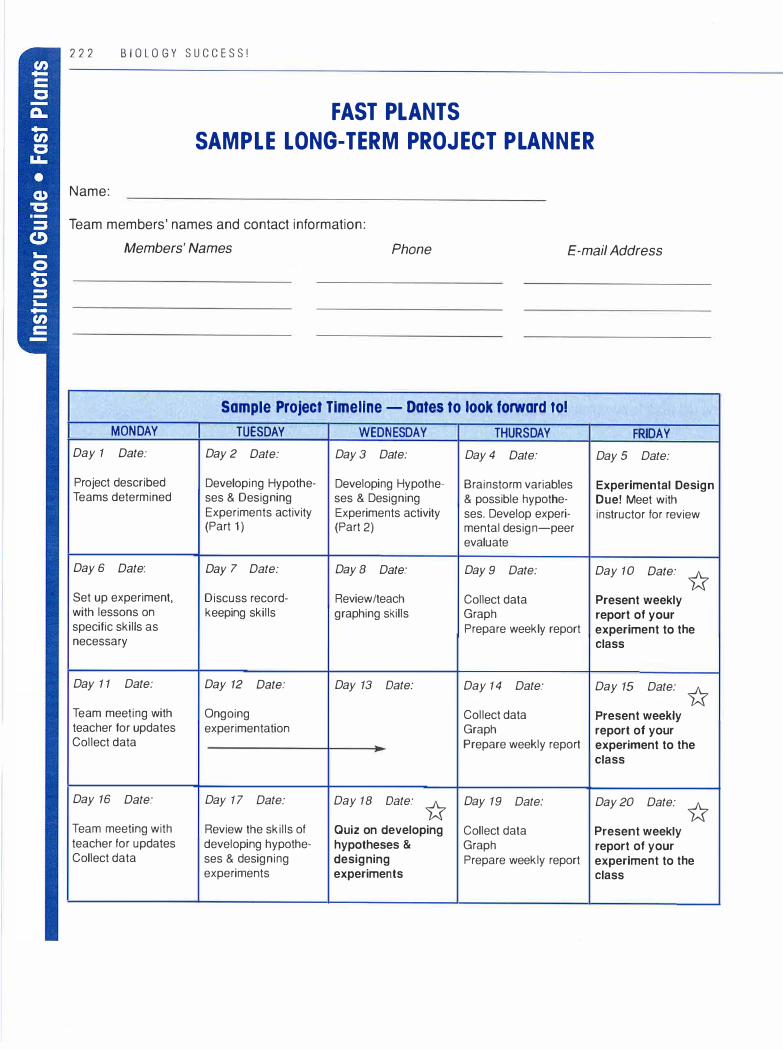
222 B I OLOGY SU CCESS!
FAST PLANTS
SAMPLE LONG-TERM PROJECT PLANNER
Name:
Team members' names and contact information:
Members' Names Phone E-mail Address
Sample Project Timeline - Dates to look forward to!
MONDAY TUESDAY WEDNESDAY THURSDAY FRIDAY
Day 1 Date: Day 2 Date: Day 3 Date: Day 4 Date: Day 5 Date:
Project described Developing Hypothe- Developing Hypothe- Brainstorm variables Experimental Design Teams determined ses & Designing ses & Designing & possible hypothe- Due! Meet with
Experiments activity Experiments activity ses. Develop experi- instructor for review (Part 1 ) (Part 2) mental design-peer
evaluate
Day 6 Date: Day 7 Date: Day B Date: Day 9 Date: Day 10 Date:
* Set up experiment, Discuss record- Review/teach Collect data Present weekly with lessons on keeping skills graphing skills Graph report of your specific skills as Prepare weekly report experiment to the necessary class
Day 1 1 Date: Day 12 Date: Day 13 Date: Day 14 Date: Day 15 Date:
* Team meeting with Ongoing Collect data Present weekly teacher for updates experimentation Graph report of your Collect data Prepare weekly report experiment to the
class
Day 16 Date: Day 17 Date: Day 18 Date:
* Day 19 Date: Day 20 Date:
* Team meeting with Review the skills of Quiz on developing Collect data Present weekly teacher for updates developing hypothe- hypotheses & Graph report of your Collect data ses & designing designing Prepare weekly report experiment to the
experiments experiments class

MONDAY TUESDAY WEDNESDAY
Day 21 Date: Day 22 Date: Day 23 Date:
* Team meeting with Review the skills for Quiz on graphing teacher for updates graphing Collect data
Day 26 Date: Day 27 Date: Day28 Date:
Team meeting with Ongoing teacher for updates experimentation
Day 31 Date: Day 32 Date: Day 33 Date:
Team meeting with Ongoing teacher for updates experimentation
-
Day 36 Date: Day 37 Date: Day 38 Date:
Teacher presents Organize information poster session project and materials for description & rubric poster
-
Activities: Ecology 2 2 3
THURSDAY FRIDAY
Day 24 Date: Day 25 Date:
* Ongoing Present weekly experimentation report of your
experiment to the class (optional)
Day 29 Date: Day 30 Date:
* Present weekly report of your experiment to the class (optional)
Day 34 Date: Day 35 Date:
* Collect seed data Final weekly report Graph of your experiment Prepare weekly report to the class-
students compare results
Day 39 Date: Day 40 Date:
* Students present Poster Session for posters to each public display other-peer evaluate
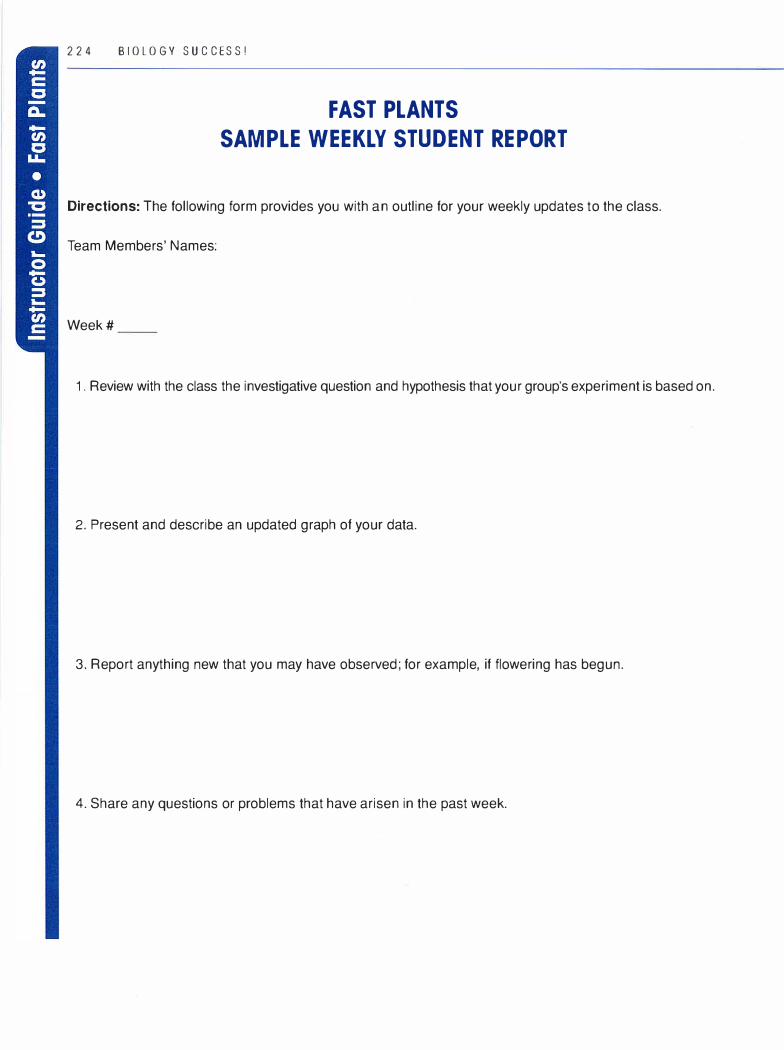
22 4 B IOLOGY SUCCESS!
FAST PLANTS
SAMPLE WEEKLY STUDENT REPORT
Directions: The following form provides you with an outline for your weekly updates to the class.
Team Members' Names:
Week #
1. Review with the class the investigative question and hypothesis that your group's experiment is based on.
2. Present and describe an updated graph of your data.
3. Report anything new that you may have observed; for example, if flowering has begun.
4. Share any questions or problems that have arisen in the past week.
Activities: Ecology 2 2 5
Pond Investigation I
Time Required: 3-31/2 hours (spread over
two class meetings, and depending on
transportation distances)
Summary
This activity introduces students to proper field skills required for an examination of macroinvertebrates that dwell in a pond. The investigation could occur at any time during an ecology unit of study. It is meant to serve as a discovery lab that sets the stage for an inquiry-based problem to be addressed in "Pond Investigation II" (see page 229).
Learning Outcomes
After completing this activity, students will be able to:
Content
• Identify a variety of different macroinvertebrates inhabiting a local pond
Inquiry Skills
• Determine the relative abundance of the various macroinvertebrates inhabiting the pond
• Develop alternative hypotheses that explain why certain inhabitants are less abundant than others
Lab Skills
• Collect aquatic invertebrates using nets and other collecting tools
• Use a dissecting microscope • Use identification guides
National Science Education
Standards: Content Standard A:2 and C:4:3
(see Appendix B)
Materials
Field
• Collecting nets-several (Ward's D-Frame Aquatic Net #1 O W 0620 recommended)
• Buckets for holding organisms and pond water • Enamel or plastic pans for sorting and viewing
aquatic invertebrates • Meter sticks-several • Hip waders-a pair per sampling team • Rubber boots-for use by nonsampling students • Tweezers for moving organisms within the
containers • Plastic pipettes or eyedroppers for moving
organisms • Clipboards
Materials
In Lab
• Dissecting microscopes • Tweezers • Probes • Plastic petri dishes for holding organisms

2 2 6 B I OLOG Y SUCCESS!
• Identification guides (see bibliography at end of this Instructor Guide for suggestions)
• Plastic pipettes/eyedroppers • Drawing materials
Instructor Preparation
Before the lab, the instructor will have to identify a nearby pond that is accessible. A landowner may need to be contacted for permission to use the pond. The main accessibility concerns include proximity to campus or school, parking of vehicles, a pond shoreline that accommodates the group size, and varying water depths to accommodate the experimental design if "Pond Investigation II" will be used as a follow-up.
As this lab requires that students identify macroinvertebrate pond organisms using identification guides, it is recommended that instructors decide ahead of time which taxonomic level of identification would be most appropriate for their students. In general, it is recommended that introductory biology students identify to the taxonomic level of order. However, some advanced groups may be capable of identifying to the taxonomic level of family.
Activator/Connector
• Ask students to brainstorm what kinds of animals they might expect to find in the pond.
• Ask students to describe insect life cycles; at this time, a review of complete and incomplete metamorphosis may be appropriate.
Activity Sequence
1. Preview with students the lab's purpose, background, and learning outcomes
2. Gather equipment and travel to pond
3. Learn how to use equipment and gather specimens from pond
4. Return to lab and use microscopes and field guides to identify organisms collected
5. Follow-up discussion questions
Procedure
Part A (in the field)
Remind students that there are checkboxes in the Procedure sections of their handouts to track their progress in completing the lab.
1 . Collect all relevant field equipment and materials and take students to the pond under study.
2. Have students observe the pond and the surrounding area. Discuss their observations.
3. Instruct students on the proper equipment handling technique as well ·as proper use of the collecting tools. A review of general field lab etiquette and/or rules may be appropriate as well.
4. Have students collect samples as instructed.
5. Have students observe and record the relative abundance of each type of organism. A general observation is all that is necessary; an accurate count is not required.
6. Have students choose a representative sample of each type of organism to place in buckets (with water) to take back to the lab.
Part B (in the lab)
1. Introduce students to identification resources. Using microscopes and identification books, students should identify as many organisms as possible.
2. Have students create a master list of organisms identified for the entire class.
3. Have students sketch at least three of the organisms that they observed, using the sheets provided at the end of their handout.
Follow-up Discussion Questions
These questions are intended to get students to think ecologically about what they have discovered, and perhaps make some trophic-level connections.
Review:
1. How many different species were identified? Student responses will vary from class to class.
2. What species were the most abundant? Student responses will vary, but ideally will show
that species numbers at the lower trophic levels are more abundant.
3. What organisms had low numbers? Student responses will vary, but ideally will show
that species numbers at the higher trophic levels are less abundant.
4. What did you learn about macroinvertebrates that you did not know before?
Student responses will vary.
Interpretive:
Activities: Ecology 2 2 7
5. Give two possible hypotheses as to why the pond would have so many of the most abundant species.
Some possible hypotheses include trophic level/biomass principles; ease of collection; recent hatching of some species; etc.
6. Give some hypotheses as to why the numbers of other organisms were low.
Some possible hypotheses include trophic level/biomass principles; difficulty with collection; rare or endangered for some reason.
Reflective:
7. What more would you like to know about macroinvertebrates?
8. What did you like and dislike about this lab?
9. What aspect of this lab was most difficult for you and why?
10. What did it teach you about how you learn best?
Formative Assessment
• Students will demonstrate their use of proper field techniques during the field trip component of the lab.
• Students will show their skills with identifying aquatic macroinvertebrates in the microscope component of this lab.
• Students will show their understanding of the diversity of organisms found in a local pond and their relative abundance through oral participation in the discussion that follows the lab.
2 2 8 B IOLOGY S U C C E SS!
• Students will also demonstrate their ability to develop hypotheses about the abundance of pond life during the discussion that follows the lab.
Summative Assessment
• Assign students to make a "field guide" for all or some of the pond organisms found during the investigation. The field guide would include name, key identifying features, and a sketch of each organism.
• Assign students to complete some form of comprehensive lab report that documents their achievement of the learning outcomes.
Suggestions for Extended
Learning
• Assign each student an organism that was found in the pond. They must use the Internet or some other reference to figure out what their organism eats and/or other pertinent information about it.
• Using all organisms discovered in the pond, students can be assigned to construct a pond food web.
• Continue to study this pond ecosystem by undertaking the inquiry-based Pond Investigation II on page 229.
Suggested Identification Books
and Web Resources
Chu, H. How to Know the Immature Insects.
Dubuque, IA: Wm. C. Brown Company Publishers, 1949.
Lehmkuhl, D. How to Know the Aquatic Insects.
Dubuque, IA: Wm. C. Brown Company Publishers, 1979.
McCafferty, P. Aquatic Entomology: The Fisher
man's and Ecologists ' Illustrated Guide to
Insects and Their Relatives. Sudbury, MA: Jones and Bartlett Publishers, 1981.
Needham, J. A Guide to the Study of Fresh-Water
Biology. San Francisco: Holden-Day, 1962. Peckarsky, B., P. Fraissinet, M. Penton, and D. Con
klin Jr. Freshwater Macroinvertebrates of North
eastern North America. Ithaca, NY: Comstock Publishing Associates, 1990.
Reid, G. Pond Life. Golden Guide series. New York: St. Martin's Press, 2001.
Voshell, R. A Guide to Common Freshwater Inver
tebrates of North America. Blacksburg, VA: McDonald & Woodward Publishing Company, 2002.
http://www.microscopy-uk.org.uk/pond/. Online information and identification resource for pond organisms, with great photos.

Activities: Ecology 2 2 9
Pond Investigation I I
Time Required: 3-5 hours (depending on
transportation and level of student support
required)
Summary
This investigation is the inquiry-based follow-up to
the exploratory Pond Investigation I (see page 225). In this activity, the instructor provides students
with an investigative question concerning pond
depth and aquatic invertebrate diversity. Students
then develop testable hypotheses and sample the
pond accordingly to evaluate their hypotheses.
Learning Outcomes
After completing this activity, students will be able to:
Content
• Identify a variety of different macroinverte
brates inhabiting a local pond • Describe the effect of depth on aquatic bio
diversity
Inquiry Skills
• Develop working hypotheses and predictions
for a given investigative question • Design an experiment to test hypotheses • Determine and compare the abundance of
macroinvertebrates inhabiting different depth
zones in the pond • Decide whether data support hypotheses
Lab Skills
• Collect aquatic invertebrates using nets and
other collecting tools • Use a dissecting microscope • Use identification guides
Communication Skills
• Write a scientific lab report that accurately
summarizes the experiment
National Science Education
Standards: Content Standards A:1 : 1 , A:1 :2,
A:1 :3, A:1 :4, A:1 :5, A:1 :6, A:2, and C:4:3 (see
Appendix B)
Materials
Field
• Collecting materials such as nets (Ward's D
Frame Aquatic Net #1 O W 0620 recom
mended), closable jars, etc. • Buckets for holding organisms and pond water • Enamel or plastic pans for sorting and viewing
aquatic invertebrates • Thermometers (optional) • Meter sticks-several • Hip waders-a pair per sampling team • Rubber boots-for use by nonsampling students • Tweezers for moving organisms within the
containers
2 3 0 B I O L O G Y S U C C E S S !
Materials
In Lab
• Dissecting microscopes • Tweezers • Probes • Plastic petri dishes for holding organisms • Identification guides (see attached bibl iogra-
phy for suggestions) • Plastic pipettes/eyedroppers • Calculator • Graph paper (see the graph paper form in
Appendix C, "Student · Graphing Data 22")
Instructor Preparation
Before the lab, the instructor will have to identify a nearby pond that is accessible. A landowner may need to be contacted for permission to use the pond. The main accessibility concerns include proximity to campus or school, parking of vehicles, a pond shoreline that accommodates the group size, and varying water depths to accommodate the experimental design (see Procedure Part A).
The other concern to resolve is the time allotted for the activity. Ideally, the field and lab components of this investigation (Procedure Parts B and C) would occur on the same day. It is possible to do the field component on one day and the lab component the next day if there are time constraints. The in-lab and field materials listed will need to be collected and readied before the investigation begins.
As this lab requires that students identify macroinvertebrate pond organisms using identification guides, it is recommended that instructors decide ahead of time which taxonomic level of identification would be most appropriate for their students. In general, it is recommended that introductory biology students identify to the level of order. However, some
advanced groups may be capable of identifying to the taxonomic level of family.
Activator/Connector
Recall the steps in the scientific process. What parts of this process were used in Pond Investigation I?
Recall your observations of the pond in Pond Investigation I. In what parts of the pond were the aquatic invertebrates collected?
If the pond is an ecosystem, brainstorm some of the "mini" ecosystems or habitats within a pond.
Activity Sequence
1. Preview the investigation, its purpose, background, and learning outcomes
2. Present and discuss the investigative question (Procedure Part A)
3. Lead students in making a hypothesis and predictions (Procedure Part A)
4. Lead students in developing an experimental procedure (Procedure Part A)
5. Carry out the experimental procedure at the pond (Procedure Part B)
6. Identify organisms in the lab (Procedure Part C)
7. Data analysis (Procedure Part D)
8. Follow-up discussion questions
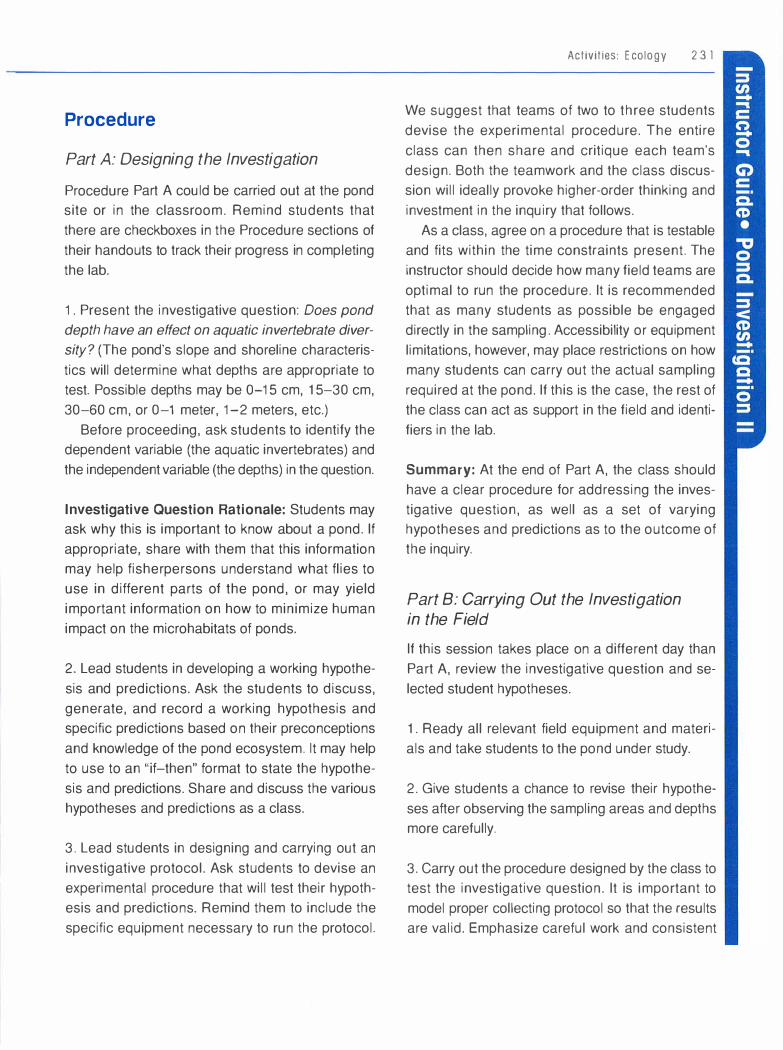
Procedure
Part A: Designing the Investigation
Procedure Part A could be carried out at the pond site or in the classroom. Remind students that there are checkboxes in the Procedure sections of their handouts to track their progress in completing the lab.
1 . Present the investigative question: Does pond
depth have an effect on aquatic invertebrate diver
sity? (The pond's slope and shoreline characteristics will determine what depths are appropriate to test. Possible depths may be 0-15 cm, 15-30 cm, 30-60 cm, or 0-1 meter, 1-2 meters, etc.)
Before proceeding, ask students to identify the dependent variable (the aquatic invertebrates) and the independent variable (the depths) in the question.
Investigative Question Rationale: Students may ask why this is important to know about a pond. If appropriate, share with them that this information may help fisherpersons understand what flies to use in different parts of the pond, or may yield important information on how to minimize human impact on the microhabitats of ponds.
2. Lead students in developing a working hypothesis and predictions. Ask the students to discuss, generate, and record a working hypothesis and specific predictions based on their preconceptions and knowledge of the pond ecosystem. It may help to use to an "if-then" format to state the hypothesis and predictions. Share and discuss the various hypotheses and predictions as a class.
3. Lead students in designing and carrying out an investigative protocol. Ask students to devise an experimental procedure that will test their hypothesis and predictions. Remind them to include the specific equipment necessary to run the protocol.
Activities: E cology 2 3 1
We suggest that teams of two to three students devise the experimental procedure. The entire class can then share and critique each team's design. Both the teamwork and the class discussion will ideally provoke higher-order thinking and investment in the inquiry that follows.
As a class, agree on a procedure that is testable and fits within the time constraints present. The instructor should decide how many field teams are optimal to run the procedure. It is recommended that as many students as possible be engaged directly in the sampling. Accessibility or equipment limitations, however, may place restrictions on how many students can carry out the actual sampling required at the pond. If this is the case, the rest of the class can act as support in the field and identifiers in the lab.
Summary: At the end of Part A, the class should have a clear procedure for addressing the investigative question, as well as a set of varying hypotheses and predictions as to the outcome of the inquiry.
Part B: Carrying Out the Investigation in the Field
If this session takes place on a different day than Part A, review the investigative question and selected student hypotheses.
1. Ready all relevant field equipment and materials and take students to the pond under study.
2. Give students a chance to revise their hypotheses after observing the sampling areas and depths more carefully.
3. Carry out the procedure designed by the class to test the investigative question. It is important to model proper collecting protocol so that the results are valid. Emphasize careful work and consistent
2 3 2 BI OLO G Y S U C CESS!
collection methods. Clearly label all containers holding aquatic invertebrates with the depth where the sample was found.
Part C: Lab Work
1. It may be useful to split up the class into groups based on sampling depths. The students begin to identify the aquatic invertebrates found at each depth. Create a running list of organisms identified for each sampling depth on a poster or chalkboard so all students may add to the list.
Discuss issues like identification reliability (can the identification skills of the class be trusted?), total numbers of organisms vs. diversity (there may be more overall numbers of organisms in one sample but more diversity in another-what does this mean?), complete analysis of sample (are students seeing and identifying all organisms present in each sample?), and other procedural issues as they arise.
2. Ask students to record organisms with high overall numbers and low overall numbers.
3. At the end of the identification period, each student will need to record all species identified for each sampling depth.
Part D: Data Analysis
Lead students in analyzing the data:
1. List taxa found at all depths.
2 . List taxa found only at a single depth and the depth at which they were found.
3. For each depth, calculate the percentage of the total number of different taxa which were unique to that depth.
4. For each depth, calculate the percentage of the total number of different taxa which were the same in all depths.
5. Graph the class data to show numbers of organisms unique to a depth and numbers of organisms overlapping depths.
Follow-up Discussion Questions
Review:
Compare and discuss results from the data analysis.
1. Which organisms overlapped at each depth?
2. Which organisms were unique to each depth?
It is recommended that these questions be explored visually through a Venn diagram or by color coding the list of organisms found.
Interpretive:
3. What conclusions can students draw from their data? Did the data support their hypotheses and predictions?
4. Based on the data and observations, ask students to develop one or more new hypotheses as to why the different depths had the diversities observed.
5. Based on the data and observations, ask students to develop one or more new hypotheses as to why there were different numbers of individuals for the different taxa.
6. What are the possible sources of error in the data?

Reflective:
7. What did you learn about pond ecology?
8. What did you learn about the nature of scientific inquiry?
9. What aspects of this investigation were most suited to your learning style?
10. What aspects of the lab were most challenging?
Formative Assessment
• Students will demonstrate their abilities to develop and test hypotheses through developing and discussing with each other the lab protocol. They will demonstrate their abilities to compare the abundance of macroinvertebrates and evaluate hypotheses orally during the discussion that follows the lab procedure.
• Students will demonstrate their use of proper lab and field techniques during the Procedure components of the lab.
• Students will show their skills with observing and identifying aquatic invertebrates during the laboratory-based component of the investigation.
• Students will show their abilities to reflect on the ecological conditions that affect a pond's biological community through their oral participation in the discussion that follows the investigation.
Summative Assessment
• Assign students to write a report using the Lab Report Template on page 1 63. Consider using
Activities: Ecology 2 3 3
a rubric, such as An Example of a Rubric for an Inquiry-Based Biology Laboratory Report on
page 1 30, to assess overall student mastery of the learning outcomes.
• Choose one component of the investigation for students to write about. For example, ask them to write an explanation of the working hypothesis and revision of that hypothesis based on the results of the investigation. Use components of the inquiry-based lab report rubric to assess mastery of the relevant learning outcomes.
Suggestions for Extended
Learning
Ask students to generate additional investigative questions, hypotheses, and experimental procedures concerning the ecology of the pond.
Suggested ldentif ication Books
and Web Resources
Chu, H. How to Know the Immature Insects. Dubuque, IA: Wm. C. Brown Company Publishers, 1949.
Lehmkuhl, D. How to Know the Aquatic Insects. Dubuque, IA: Wm. C. Brown Company Publishers, 1 979.
Mccafferty, P. Aquatic Entomology: The Fisherman's and Ecologists' Illustrated Guide to Insects and Their Relatives. Sudbury, MA: Jones and Bartlett Publishers, 1981 .
Needham, J. A Guide to the Study of Fresh-Water Biology. San Francisco: Holden-Day, 1 962.
Peckarsky, B., P. Fraissinet, M. Penton, and D. Conklin Jr. Freshwater Macroinvertebrates of Northeastern North America. Ithaca, NY: Comstock Publishing Associates, 1 990.

2 3 4 BIOLO G Y SUCCESS!
Reid, G. Pond Life. Golden Guide series. New York:
St. Martin's Press, 2001 .
Voshell, R. A Guide to Common Freshwater Inver
tebrates of North America. Blacksburg, VA:
McDonald & Woodward Publ ish ing Company,
2002.
http://www. microscopy-uk.org.uk/pond/. Onl ine
information and identification resource for pond
organisms, with great photos.
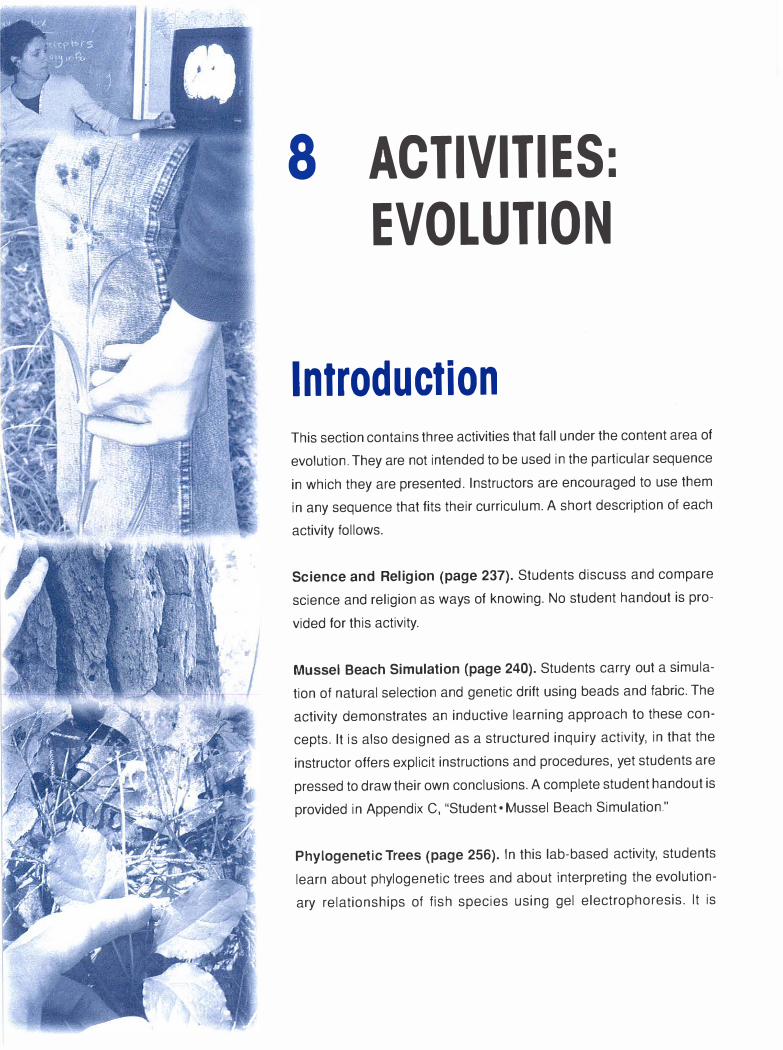
8 ACTIVITIES:
EVOLUTION
Introduction
This section contains three activities that fall under the content area of evolution. They are not intended to be used in the particular sequence in which they are presented. Instructors are encouraged to use them in any sequence that fits their curriculum. A short description of each activity follows.
Science and Religion (page 237). Students discuss and compare science and religion as ways of knowing. No student handout is provided for this activity.
Mussel Beach Simulation (page 240). Students carry out a simulation of natural selection and genetic drift using beads and fabric. The activity demonstrates an inductive learning approach to these concepts. It is also designed as a structured inquiry activity, in that the instructor offers explicit instructions and procedures, yet students are pressed to draw their own conclusions. A complete student handout is provided in Appendix C, "Student• Mussel Beach Simulation."
Phylogenetic Trees (page 256). In this lab-based activity, students learn about phylogenetic trees and about interpreting the evolutionary relationships of fish species using gel electrophoresis. It is
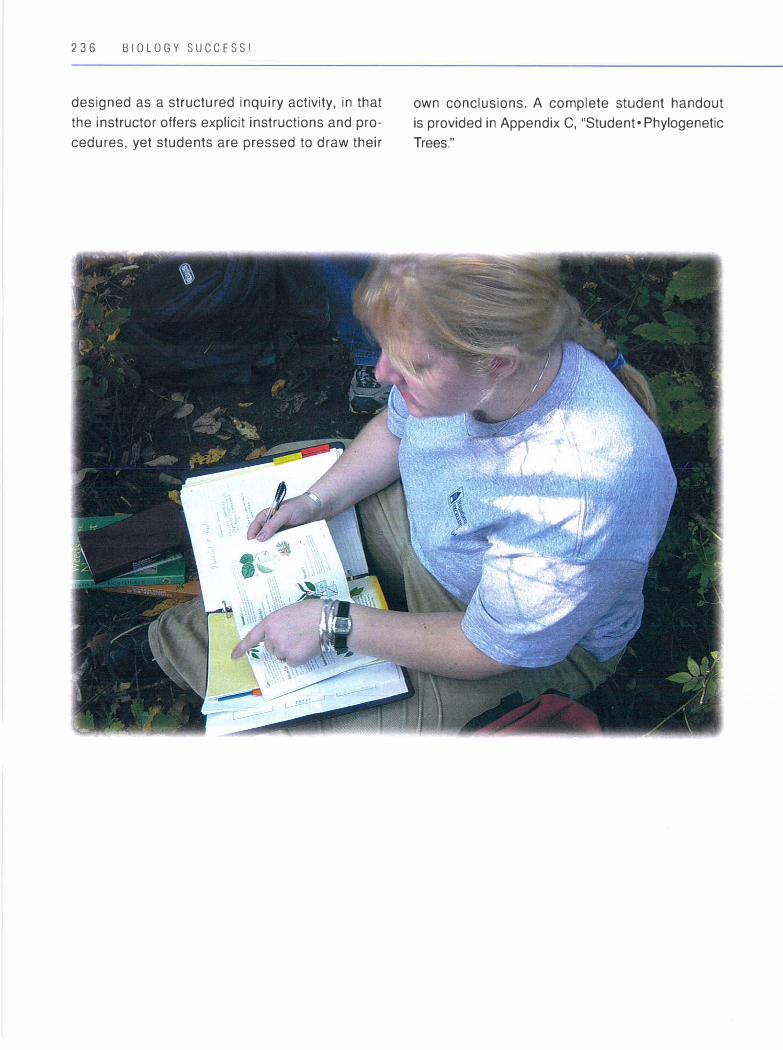
236 BIOLOGY SUCCESS!
designed as a structured inquiry activity, in that the instructor offers explicit instructions and procedures, yet students are pressed to draw their
own conclusions. A complete student handout is provided in Appendix C, "Student• Phylogenetic Trees."
Activities: Evolution 2 3 7
Science and Religion
Time Required: 60 minutes
Summary
In this activity, students will discuss and write about their thoughts on the relationship between science and religion. It is assumed that instructors have previously discussed the nature of science with students and are using this activity as an introduction to a unit on evolution. Students first discuss their ideas in small groups, then share them with the whole class.
Learning Outcomes
After completing this activity, students will be able to:
Content
• Describe the nature of science and scientific inquiry
• Distinguish between fact and theory • Identify key differences between science and
religion
Communication Skills
• Respectfully contribute to small- and largegroup discussions on the nature of science and religion
• Write about the differences between science and religion
National Science Education
Standards: Content Standards G:2:1, G:2:2, and G:2:3 (see Appendix B)
Materials
• Pencil • Writing paper • Poster paper • Colored markers
Instructor Preparation
This activity is meant to be an activator for a unit on evolution in order to motivate student interest in that subject. It is written based on the assumption that an instructor has previously discussed the nature of science and has already defined terms such as fact, theory, and scientific method. If these broader aspects of science have already been discussed, instructors may wish to conduct a brief review first. This activity may also help the instructor to see where students are in their thinking and to identify anyone who is uncomfortable with the subject of science and religion.
The controversy between science and religion need not be presented as a conflict at all. When the two types of knowledge are examined closely, one may discover that they are two different modes of perceiving the world and are not necessarily in competition with one another, as often presented in creationist arguments, and even by scientists.
This is not intended as a graded assignment, because the main purpose of the activity is to get
238 BIOLOGY SUCCESS!
students thinking and talking, not to evaluate
what they have to say. Each student may be given
the option to "pass" on the large-group participa
tion, but not on the small-group sharing. It is
important for the instructor to lay some ground
rules for discussion that ensure a nonthreaten
ing and respectful environment. For more on
structuring and leading discussions, see "Discus
sion" on page 107.
The teacher should develop a set of questions
for use in this activity. For example:
• Do science and religion offer similar or different
kinds of knowledge? Explain. • Where does scientific knowledge come from? • Where does religious knowledge come from? • How does each kind of knowledge change?
Instructors may also wish to do some back
ground reading (see Resources at the end of this
activity) to get a sense of where the scientific com
munity stands on this topic, or to gain some per
spective on their own thoughts or feelings.
Activator /Connector
Probe students' background knowledge of evolu
tion and religion. Ask if the students have ever
been involved in or listened to a discussion on
their relationship.
Activity Sequence
1. Preview the activity, its purpose, and learning
outcomes
2. Individual written responses to questions
3. Small-group discussion
4. Large-group discussion
5. Suggestions for extended learning
Procedure
1. Discuss ground rules for conducting a respect
ful discussion.
2. Present questions to the students and allow sev
eral minutes for them to write individual responses.
3. Arrange small groups of two to three students
each to share and discuss the responses. The
instructor may or may not wish to participate in the
discussions at this point, depending upon the level
of support students need and whether misconcep
tions arise.
4. Have each group write its individual or group
responses to the questions on poster paper. Some
students may prefer to put their ideas into graphic
form with cartoons or drawings, or similar displays.
5. Open the discussion up at the class level. Again,
at this point the instructor may or may not wish to
participate, depending upon the needs of the class
and the level of student comfort. For example, dis
cussion may lead to a debate on the subject, which
may cause some students to feel uncomfortable. If
students do not suggest the following ideas, the
instructor should bring them into the discussion:
• Science is based on evidence; religion is based
on revelation or tradition. • Science is open to revision; religion generally
is not. • Studying science and evolution does not mean
changing one's religious beliefs. • Science and religion are compatible.
6. Display each group's responses in a prominent location (e.g., a wall) and give students time to read them.
Follow-up Discussion Questions
Review:
1. Ask students to share their key learning from the activity.
Reflective:
2. Students can discuss what they liked and/or disliked about the activity.
3. Student can consider how well they were able to communicate their thoughts on science and religion: in small-group discussions? in large groups? in writing?
Formative Assessment
• Students will demonstrate their understanding of the nature of science and the differences between science and religion during both the small-group and large-group discussions.
• Students will demonstrate their ability to distinguish between fact and theory during the largegroup discussion.
• Students will show their facility in contributing their ideas respectfully during small-group and large-group discussions.
Activities: Evolution 2 3 9
Summative Assessment
This activity is not designed to be graded, but after the discussion, some instructors may wish to assign a summative "reflection" paper, based on the learning outcomes, in order to reinforce the activity.
Suggestions for Extended
Learning
If the instructor wishes to extend the activity to include specific questions about evolution, here are some suggested questions:
• Define evolution. • What is your understanding of evolution as a
process? • What are your thoughts and/or feelings on evo
lution? • Are evolution and religion compatible or incom
patible? Explain.
Here are some keys ideas regarding evolution that instructors may wish to present:
• Evolution is a cornerstone of biology, not a "belief."
• Evidence is the key factor in evolution. • Understanding evolution is important for sci
ence literacy.
Resources
Alters, B. 1998. Stephen J. Gould: An interview. The
American Biology Teacher(April): 272-75.
Meadows, L., E. Doster, and D. Jackson. 2000. Managing the conflict between science and religion. The American Biology Teacher (February): 102-7.
240 BIOLOGY SUCCESS!
Mussel Beach: A Simulation
of Evolutionary Change·
Time Required: 21/2-3 hours
Summary
In this lab, two types of evolutionary change-natural selection and genetic drift-will be investigated with simulations involving two different populations of mussels. In one population, the oystercatchers are predatory birds that simulate the natural selection mechanism as they visually "hunt" for mussels in the "habitat." In the other population, the driftwood logs simulate genetic drift in the random manner by which they "kill" mussels upon the shore. The class is divided into teams that carry out one or the other simulation.
This activity is designed to introduce the concepts of natural selection and genetic drift in an inductive manner: students explore the concepts experientially through the simulation, and then are introduced to the key vocabulary after they have run the simulation. For more on inductive teaching, see page 102. Individual instructors may revise the activity to be deductive if they wish. This lab simulation is best used after students have had a solid foundation in genetics.
Learning Outcomes
After completing this activity, students will be able to:
Content
• Define the concepts of natural selection and genetic drift
• Differentiate between natural selection and genetic drift with respect to how they influence evolutionary change in small populations
Inquiry Skills
• Display data in both tabular and graphic form • Compare and contrast related sets of data and
draw conclusions • Identify sources of experimental error
Communication Skills
• Write a scientific lab report that summarizes the experimental simulation
National Science Education
Standards: Content Standards A:1 :1, A:1 :3, A:1 :4, A:1 :6, A:2, and C:3:1 (See Appendix B)
* The basic premise and some aspects of the procedure for this lab were adapted, with permission, from T. Marat and S.
Rissing, "Exploring Genetic Drift and Natural Selection through a Simulation Activity," in The American Biology Teacher
(Nov/Dec 1998), 681-83.
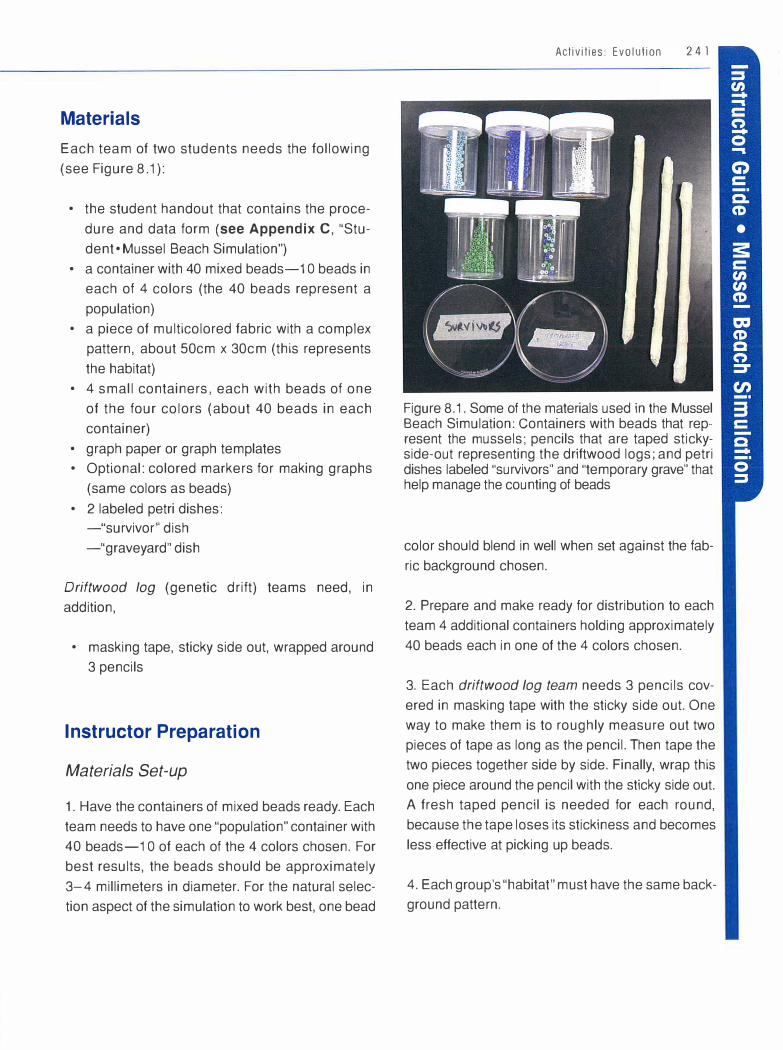
Materials
Each team of two students needs the following (see Figure 8.1 ):
• the student handout that contains the procedure and data form (see Appendix C, "Student • Mussel Beach Simulation")
• a container with 40 mixed beads-1 O beads in each of 4 colors (the 40 beads represent a population)
• a piece of multicolored fabric with a complex pattern, about 50cm x 30cm (this represents the habitat)
• 4 small containers, each with beads of one of the four colors (about 40 beads in each container)
• graph paper or graph templates • Optional: colored markers for making graphs
(same colors as beads) • 2 labeled petri dishes:
-"survivor" dish -"graveyard" dish
Driftwood log (genetic drift) teams need, in addition,
• masking tape, sticky side out, wrapped around 3 pencils
Instructor Preparation
Materials Set-up
1. Have the containers of mixed beads ready. Each team needs to have one "population" container with 40 beads-1 O of each of the 4 colors chosen. For best results, the beads should be approximately 3-4 millimeters in diameter. For the natural selection aspect of the simulation to work best, one bead
Activities: Evolution
Figure 8.1. Some of the materials used in the Mussel Beach Simulation: Containers with beads that represent the mussels; pencils that are taped stickyside-out representing the driftwood logs; and petri dishes labeled "survivors" and "temporary grave" that help manage the counting of beads
color should blend in well when set against the fabric background chosen.
2. Prepare and make ready for distribution to each team 4 additional containers holding approximately 40 beads each in one of the 4 colors chosen.
3. Each driftwood log team needs 3 pencils covered in masking tape with the sticky side out. One way to make them is to roughly measure out two pieces of tape as long as the pencil. Then tape the two pieces together side by side. Finally, wrap this one piece around the pencil with the sticky side out. A fresh taped pencil is needed for each round, because the tape loses its stickiness and becomes less effective at picking up beads.
4. Each group's "habitat" must have the same background pattern.

242 BIOLOGY SUCCESS!
5. Have the 2 petri dishes for each group labeled ("graveyard," "survivors") to keep track of beads in the various stages of the simulation.
6. Prepare and copy the student handout for this activity, found in Appendix C, "Student• Mussel Beach Simulation." It includes learning outcomes, investigative question, hypothesis/predictions, procedure, data table, etc.
7. Prepare and copy graph template(s) to distribute to students for recording data trends.
8. Prepare a brief written agenda that gives an overview of the lab.
Activator/Connector
Ask students: Pretend that you are a mussel living on the shoreline. List some ways that you might be killed.
Discuss the responses. If appropriate, connect to population ecology concepts like densitydependent and density-independent population limiting factors.
Activity Sequence
1. Instructor previews lab purpose, general background, and learning outcomes
2. Instructor models both simulations
3. Students run simulations in teams and record data
4. Students graph their own data in teams
5. Students share and copy all data collected
6. Follow-up discussion questions, including naming the types of evolutionary change
Procedure
1. Organize student teams. Have students work in pairs, each pair assigned to either "oystercatcher" or "driftwood log." In order to have meaningful results to analyze, at least two student teams should be assigned to each simulation (four teams total); ideally, an equal number of teams will perform each simulation. Have students collect the materials and spread out the "habitat" in their working areas.
2. Model the procedure. It is essential to show students a thorough and careful run-through of the simulation in order for this activity to be successfully completed.
Have students gather around an area where you have laid out the lab materials. Run through enough of the simulation for both oystercatchers and driftwood logs that students understand the procedure and how to enter the data on the data table properly. Ask that they follow along with the procedure as described in their student handouts as they observe the simulation.
3. Present the investigative question: What is going to happen to each of the four mussel/bead subpopulations after running the oystercatcher and driftwood log simulations?
4. Have students record their predictions and
hypotheses. Ask students to make predictions and hypotheses based on the following prompts. Get them to consider what will happen to each of the four colors when they run the simulation, and why. Discuss responses before proceeding.
Oystercatcher prompt: What do you think will happen to each of the four colors of beads

when the oystercatcher simulation is performed? (prediction)
What is the basis for the prediction? (hypothesis)
Driftwood Log prompt: What do you think will happen to each of the four colors of beads when the driftwood log simulation is performed? (prediction)
What is the basis for your prediction? (hypothesis)
5. Have student teams run the simulation and col
lect data. Students should run the simulations and collect data according to the following procedures described for each simulation. They should use the data table for recording data. They can refer to their own handouts and to the instructor for support. Suggest to students that they use the checkboxes in their handouts to keep track of their progress.
PROCEDURE FOR OYSTERCATCHER SIMULATION
(1) Working in pairs, students collect the materials and spread out the fabric.
(2) Identify students' roles in the team: The oystercatcher hunts the mussels; the habitat
manager manages the fabric and bead counts.
(3) The habitat manager sprinkles the 40 beads onto the fabric and spreads them evenly.
(4) The oystercatcher picks out 30 beads in a predatory manner (one at a time) by looking at the fabric and taking the first bead that stands out, then looking away between each "hunt" (see Figure 8.2).
(5) The oystercatcher puts the bead victims in the "graveyard" dish. The habitat manager
Activities: Evolution 2 4 3
counts them carefully as they are hunted, until 30 are removed from the fabric and placed in the dish.
(6) Hunting stops when 10 survivors are left on the fabric.
(7) The remaining 1 O bead survivors are removed from the fabric and placed in the "survivor'' dish. The number of each color is counted and recorded in the data sheet provided.
(8) The number of each survivor color is multiplied by 3 and the results are put in the data sheet. The total of the four colors should add up to 30.
(9) The number of survivors of each color is added to the corresponding total from step 8 and recorded in the Totals column of the data sheet. The total number of all four colors should add up to 40.
(10) Then, the numbers of beads of each color shown in the Totals column are taken from the four single-color bead containers,
Figure 8.2. A depiction of Oystercatcher Procedure step 4: A student hand (the oystercatcher) "hunting" beads (the mussels) spread out over the fabric (the rocky coastline habitat)
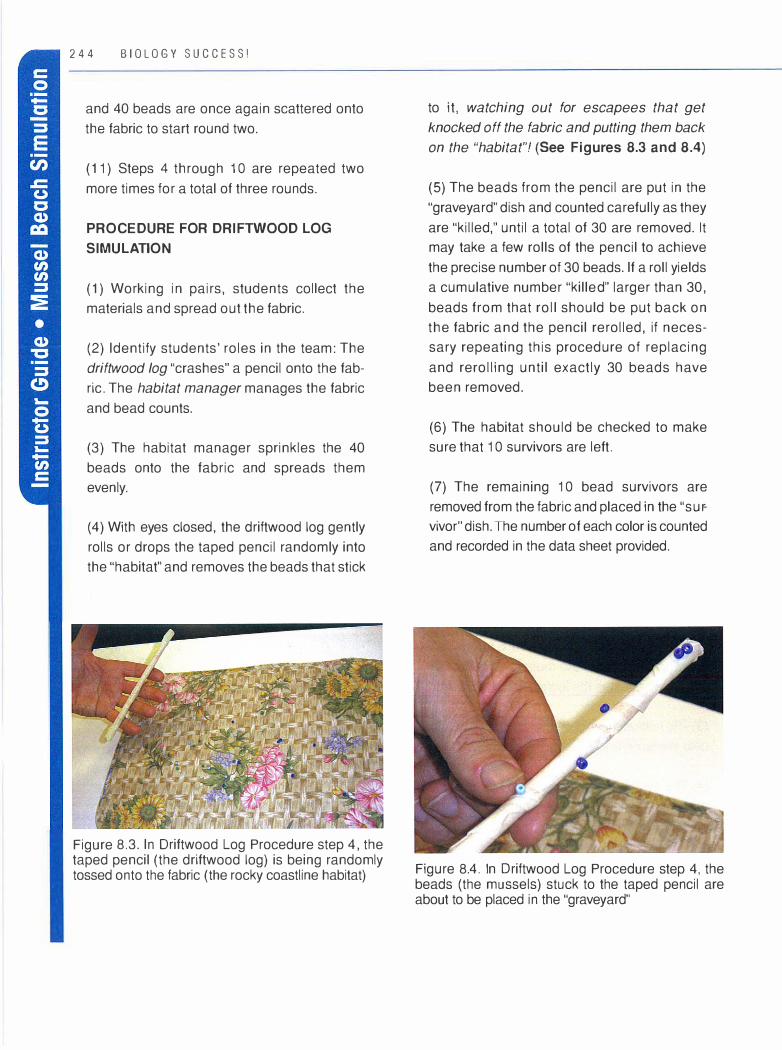
2 4 4 B I O L O G Y S U C C E S S !
and 40 beads are once again scattered onto the fabric to start round two.
(11) Steps 4 through 1 O are repeated two more times for a total of three rounds.
PROCEDURE FOR DRIFTWOOD LOG SIMULATION
(1) Working in pairs, students collect the materials and spread out the fabric.
( 2) Identify students' roles in the team: The driftwood log "crashes" a pencil onto the fabric. The habitat manager manages the fabric and bead counts.
(3) The habitat manager sprinkles the 40 beads onto the fabric and spreads them evenly.
(4) With eyes closed, the driftwood log gently rolls or drops the taped pencil randomly into the "habitat" and removes the beads that stick
Figure 8. 3. In Driftwood Log Procedure step 4, the taped pencil (the driftwood log) is being randomly tossed onto the fabric (the rocky coastline habitat)
to it, watching out for escapees that get knocked off the fabric and putting them back on the "habitat"! (See Figures 8.3 and 8.4)
(5) The beads from the pencil are put in the "graveyard" dish and counted carefully as they are "killed," until a total of 30 are removed. It may take a few rolls of the pencil to achieve the precise number of 30 beads. If a roll yields a cumulative number "killed" larger than 30, beads from that roll should be put back on the fabric and the pencil rerolled, if necessary repeating this procedure of replacing and rerolling until exactly 30 beads have been removed.
(6) The habitat should be checked to make sure that 1 O survivors are left.
(7) The remaining 1 O bead survivors are removed from the fabric and placed in the "survivor'' dish. The number of each color is counted and recorded in the data sheet provided.
Figure 8.4. In Driftwood Log Procedure step 4, the beads (the mussels) stuck to the taped pencil are about to be placed in the "graveyard"

(8) The number of each survivor color is mul
tiplied by 3 and the results are put in the data
sheet. The total of the four colors should add
up to 30.
(9) The number of survivors of each color is
added to the corresponding total from step 8
and recorded in the Totals column of the data
sheet. The total number of all four colors
should add up to 40.
(1 0) Then, the numbers of beads of each color
shown in the Totals column are taken from the
First, count the number of survivors of each color and enter that number in the Survivors column below (Procedure step 7).
Survivors
3 Green
3 Blue
3 White
1 Purple
Second, multiply the number of survivors by 3 (Procedure step 8).
Survivors x 3 = 9
Survivors x 3 = 9
Survivors x 3 = 9
Survivors x 3 = 3
Activities: Evolution 2 4 5
four single-color bead containers, and 40
beads are once again scattered onto the fab
ric to start round two.
( 1 1) A new taped pencil is obtained, and
steps 4-1 O are repeated two more times for
a total of three rounds.
Data Tables
Sample Data. This sample data uses the following
four bead/mussel colors: green, blue, white, and
purple.
Third, add the number of survivors to the total from the previous column.
9 + 3 (Survivors) =
9 + 3 (Survivors) =
9 + 3 (Survivors) =
3 + 1 (Survivors) =
The total is the number of beads that get placed on the fabric for the next round (should be a total of 40) (Procedure step 9).
Totals
12
1 2
1 2
4
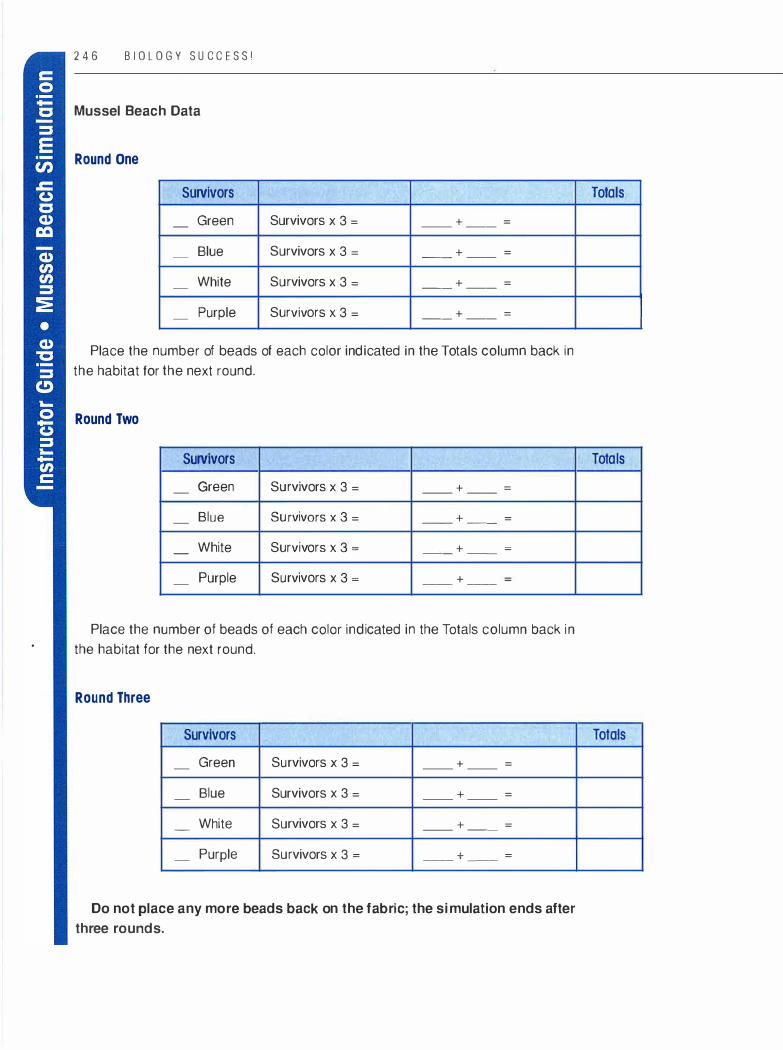
2 46 B IO L OGY S U CCES S!
Mussel Beach Data
Round One
Survivors
Green -
Blue -
White -
- Purple
Survivors x 3 = + = -- --
Survivors x 3 = + = -- --
Survivors x 3 = + = -- --
Survivors x 3 = + = -- --
Place the number of beads of each color indicated in the Totals column back in the habitat tor the next round.
Round Two
Survivors
Green Survivors x 3 = + = - -- --
Blue Survivors x 3 = + = - - - --
White Survivors x 3 = + = - -- --
Purple Survivors x 3 = + - -- --
Place the number of beads of each color indicated in the Totals column back in the habitat tor the next round.
Round Three
Survivors
Green Survivors x 3 = + = - -- --
Blue Survivors x 3 = + = - -- --
White Survivors x 3 = + = - -- --
Purple Survivors x 3 = + = - -- --
Do not place any more beads back on the fabric; the simulation ends after
three rounds.
Totals
Totals
Totals

6. Instruct students on graphing results. Show students an example of how to display the results (after three rounds) in a bar graph, with the vertical (Y) axis being the total number of beads/mussels after each round for each of the four colors (include also the starting populations, 1 O of each color), and the horizontal (X) axis being the three
Act iv i t ies : Evolut ion
rounds plus "round zero," the starting point. See
Figures 8.5 and 8.6 for examples of a graph for each simulation. Ask students to make a graph for their own team's simulation, using the blank graph templates in Appendix C, "Student • Mussel Beach Simulation."
Driftwood Log Simulation
1 8
1 6
1 4
1 2 w
1 0 (/)
8 (/)
6 -0 .... 4 -
2 -
0 -Start Round 1 Round 2 Round 3
• Purple 1 0 8 1 2 1 2
• Blue 1 0 8 0 0
• Green 1 0 8 1 6 1 2
O White 1 0 1 6 1 2 1 6
Rounds
Figure 8.5. Sample Driftwood Log graph
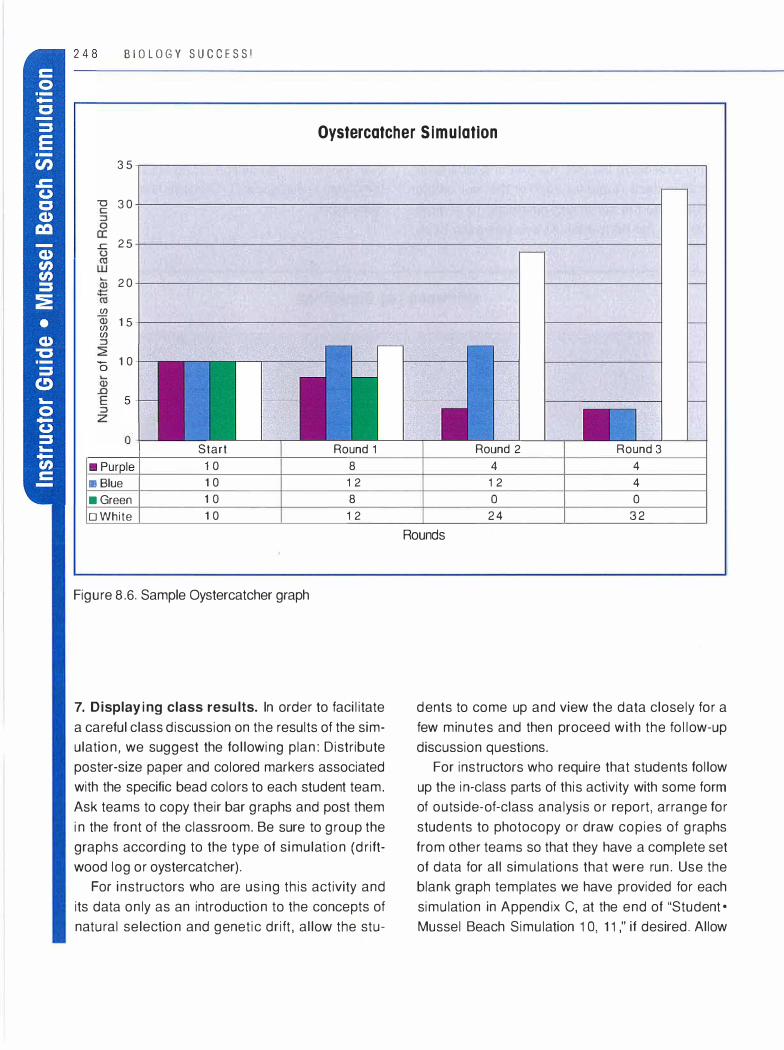
B I O L O G Y S U C C E S S !
Oystercatcher Simulation
3 5
'O 3 0
..c 2 5
..... 2 0
(/)
1 5 (/) (/)
0 1 0
Start Round 1
1 0 8
o Blue 1 0 1 2
a Green 1 0 8
O White 1 0 1 2
Figure 8.6. Sample Oystercatcher graph
7. Displaying class results. In order to facilitate
a careful class discussion on the results of the sim
ulation, we suggest the following plan: Distribute
poster-size paper and colored markers associated
with the specific bead colors to each student team.
Ask teams to copy their bar graphs and post them
in the front of the classroom. Be sure to group the
graphs according to the type of simulation (drift
wood log or oystercatcher).
For instructors who are using this activity and
its data only as an introduction to the concepts of
natural selection and genetic drift, allow the stu-
Round 2 Round 3
4 4
1 2 4
0 0
24 32
Rounds
dents to come up and view the data closely for a
few minutes and then proceed with the follow-up
discussion questions.
For instructors who require that students follow
up the in-class parts of this activity with some form
of outside-of-class analysis or report, arrange for
students to photocopy or draw copies of graphs
from other teams so that they have a complete set
of data for all simulations that were run. Use.the
blank graph templates we have provided for each
simulation in Appendix C, at the end of "Student •
Mussel Beach Simulation 1 O, 11 ," if desired. Allow
adequate time and support for this to take place smoothly and efficiently. When students have a complete set of data, proceed with the follow-up discussion.
Follow-up Discussion Questions
Review:
1 . Compare and contrast the oystercatcher graphs for the whole class.
Student responses will vary, but ideally there will
be some noticeable similarities between the oys
tercatcher groups. A pattern will be discernible;
beads of the same color will have thrived while
others will have diminished or been eliminated.
2. Compare and contrast the driftwood log graphs for the whole class.
Student responses will vary, but ideally there
will be significant differences in the driftwood log
graphs. No pattern should be discernible. The
graphs should show the random nature of the
simulation.
3. Compare and contrast the data for the driftwood logs vs. the oystercatchers.
Student responses will vary, but ideally they
should show different trends when compared.
4. Compare the results to your original predictions and hypotheses for both the oystercatcher and the driftwood log simulations: Do the results support your original hypotheses and predictions? Explain.
Student responses will vary, but some students
will have accurately predicted that one particular
color would thrive in the oystercatcher simulation,
and that the colors which thrive or decrease would
be totally random in the driftwood log simulation.
Activit ies: Evo lut ion 2 4 9
5. The simulation: What does each of the simulation components represent in nature?
The beads: mussels
The pencil: driftwood log
The step of increasing the 1 O survivors to 40: reproduction
The fabric: coastline habitat
The bead colors: natural variation in mussels
or subpopulations
The elimination of bead colors: extirpation of
subpopulations
The different rounds: time or generations
6. What are at least two other variables that affected how the simulation played out? Do these same variables exist in nature?
Student responses will vary. Some common
responses will be the following: Oystercatcher
teams: visual acuity of individual students. In nature
there is variation in visual acuity among individual
oystercatchers too. Driftwood log teams: the
method of rolling the pencil. This exists in nature
too, as logs crash in various ways onto the shore
line.
Interpretive:
7. Introduce and explain the concepts of natural selection and genetic drift. Define these terms and discuss how they apply to the simulation.
Natural selection- a mechanism for evolution
ary change involving the differential survival and
reproduction of certain individuals in a population
based on their favorable adaptations or character
istics.
Genetic drift-a mechanism for evolutionary
change involving the effects of random or chance
events, usually environmental. Differential survival
and reproduction is irrelevant to genetic drift.
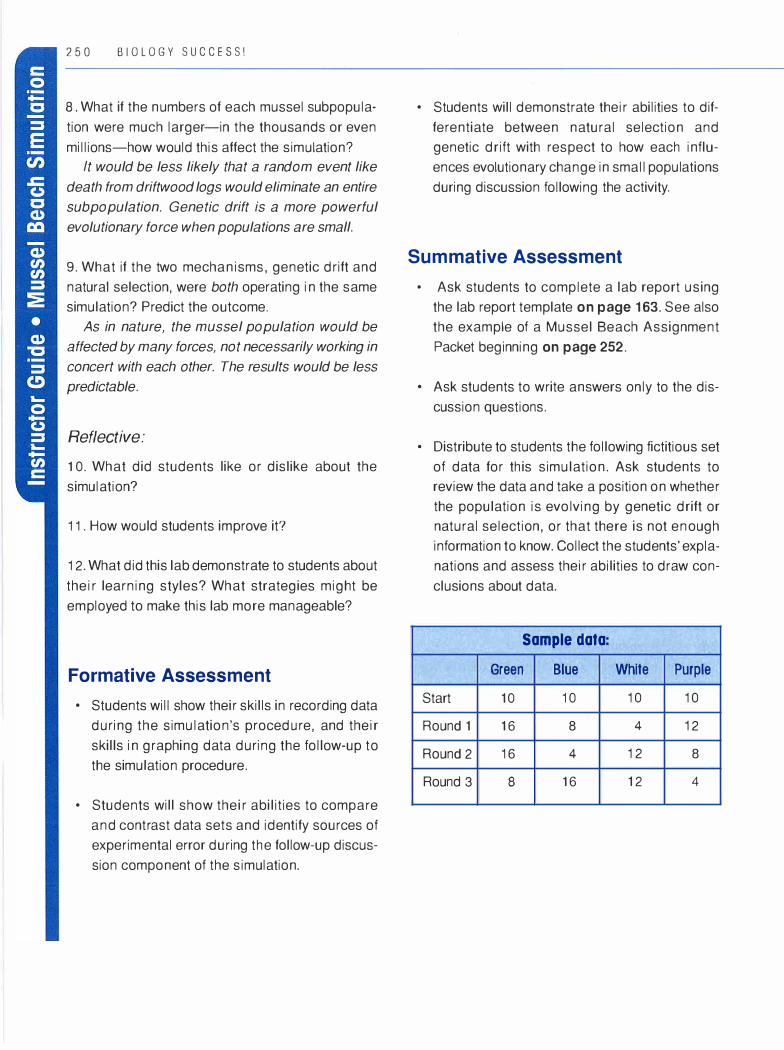
2 5 0 B I O L O G Y S U C C E S S !
8 . What if the numbers of each mussel subpopula
tion were much larger- in the thousands or even
millions-how would this affect the simulation?
It would be less likely that a random event like death from driftwood logs would eliminate an entire subpopulation. Genetic drift is a more powerful evolutionary force when populations are small.
9. What if the two mechanisms, genetic drift and
natural selection, were both operating in the same
simulation? Predict the outcome.
As in nature, the mussel population would be affected by many forces, not necessarily working in concert with each other. The results would be less predictable.
Reflective:
10. What did students like or dislike about the
simulation?
1 1 . How would students improve it?
1 2. What did this lab demonstrate to students about
their learning styles? What strategies might be
employed to make this lab more manageable?
Formative Assessment
• Students will show their skills in recording data
during the simulation's procedure, and their
skills in graphing data during the follow-up to
the simulation procedure.
• Students will show their abilities to compare
and contrast data sets and identify sources of
experimental error during the follow-up discus
sion component of the simulation.
• Students will demonstrate their abilities to dif
ferentiate between natural selection and
genetic drift with respect to how each influ
ences evolutionary change in small populations
during discussion following the activity.
Summative Assessment
• Ask students to complete a lab report using
the lab report template on page 1 63. See also
the example of a Mussel Beach Assignment
Packet beginning on page 252.
• Ask students to write answers only to the dis
cussion questions.
• Distribute to students the following fictitious set
of data for this simulation. Ask students to
review the data and take a position on whether
the population is evolving by genetic drift or
natural selection, or that there is not enough
information to know. Collect the students' expla
nations and assess their abilities to draw con
clusions about data.
Sample data:
Green Blue White Purple
Start 10 1 0 1 0 1 0
Round 1 16 8 4 1 2
Round 2 1 6 4 1 2 8
Round 3 8 16 12 4

Suggestions for Extended
Learning
1. Students could develop a plan for a new simulation that builds on the current one. For example, include another variable besides color (e.g., size) for the bead population.
2. Research a real-life example of how natural selection or genetic drift is affecting some species (e.g., the work of Peter and Rosemary Grant on the medium ground-finch of the Galapagos Islands).
Activities: Evolution 2 5 1

2 5 2 BIOLOGY SUCCESS!
MUSSEL BEACH SIMULATION
ASSIGNMENT PACKET
Due Date: This assignment is due on Wed 2/19
Grade Value: It is worth 5% of your course grade, and the late policy applies
Assignment Overview: A laboratory report describing the purpose, methods, and findings of the Mussel Beach Simulation
Purpose: Practice with applying the scientific method of inquiry and writing a lab report
Structure: The report should have five sections, plus a title. Use the Lab Report Template on the next page for specific guidelines for writing the report.
Resources: 1. The Mussel Beach Simulation handout and notes 2. All graphs produced from class
Assessment: 1. You will be assessed according to the assessment rubric that follows. 2. Along with the lab report, please turn in a self-assessment of your work using the rubric.
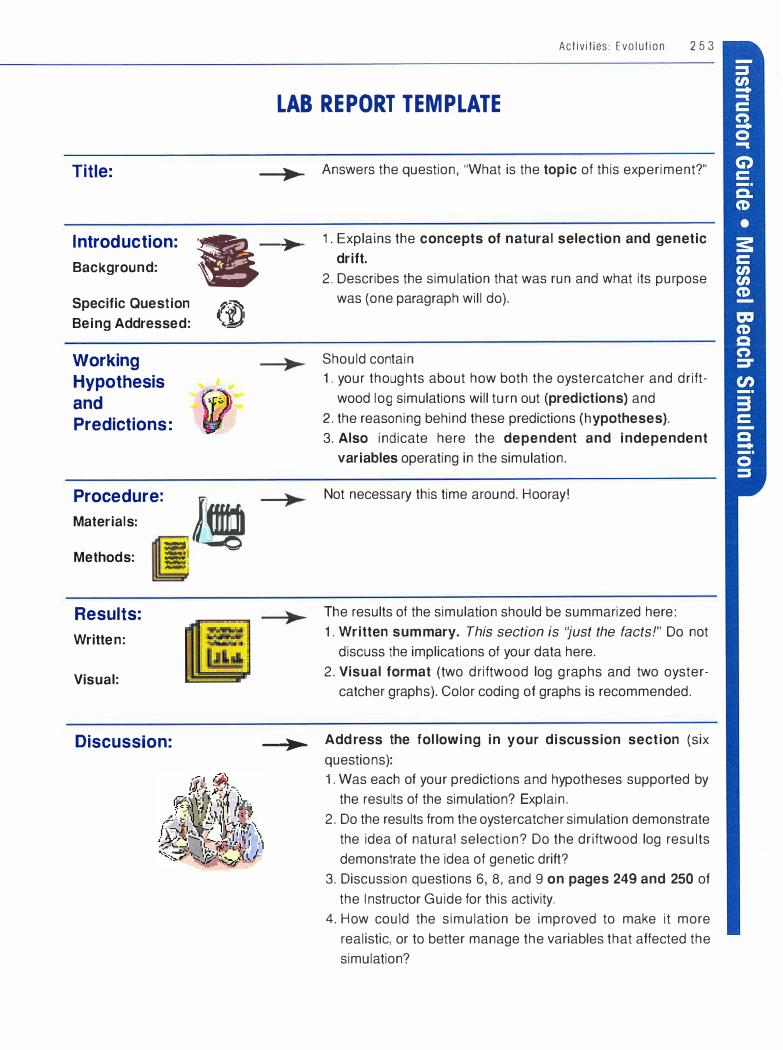
Title:
Introduction:
Background:
Specific Question
Being Addressed:
Working
Hypothesis
and
Predictions :
• (�
Procedure:
--=J
Materials:
Methods: _, =::n
Results:
Written:
Visual:
Discussion:
Activities: E volution 2 5 3
LAB REPORT TEMPLATE
-�)ii,� Answers the question, "What is the topic of this experiment?"
)ii, 1. Explains the concepts of natural selection and genetic
drift.
2. Describes the simulation that was run and what its purpose was (one paragraph will do).
Should contain 1. your thoughts about how both the oystercatcher and drift
wood log simulations will turn out (predictions) and 2. the reasoning behind these predictions (hypotheses).
3. Also indicate here the dependent and independent
variables operating in the simulation.
Not necessary this time around. Hooray !
The results of the simulation should be summarized here: 1. Written summary. This section is "lust the facts!" Do not
discuss the implications of your data here. 2. Visual format (two driftwood log graphs and two oyster
catcher graphs). Color coding of graphs is recommended.
_...;,......_ Address the fol lowing in your discussion section (six questions): 1 . Was each of your predictions and hypotheses supported by
the results of the simulation? Explain. 2. Do the results from the oystercatcher simulation demonstrate
the idea of natural selection? Do the driftwood log results demonstrate the idea of genetic drift?
3. Discussion questions 6, 8, and 9 on pages 249 and 250 of the Instructor Guide for this activity.
4. How could the simulation be improved to make it more realistic, or to better manage the variables that affected the simulation?
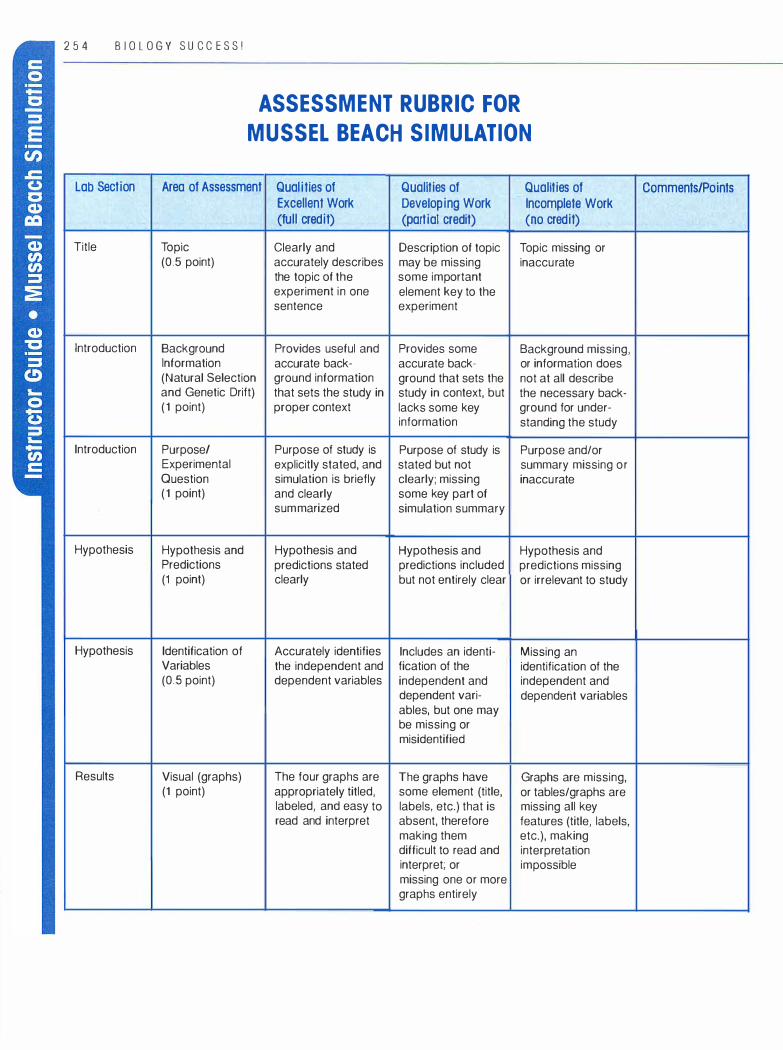
2 5 4 B IOLOG Y SUCC E S S!
ASSESSMENT RUBRIC FOR
MUSSEL BEACH SIMULATION
Lab Section Area of Assessment Qualities of Qualities of Qualities of Excellent Work Developing Work Incomplete Work (full credit) (partial credit) (no credit)
Title Topic Clearly and Description of topic Topic missing or (0.5 point) accurately describes may be missing inaccurate
the topic of the some important experiment in one element key to the sentence experiment
Introduction Background Provides useful and Provides some Background missing, Information accurate back- accurate back- or information does (Natural Selection ground information ground that sets the not at all describe and Genetic Drift) that sets the study in study in context, but the necessary back-(1 point) proper context lacks some key ground for under-
information standing the study
Introduction Purpose/ Purpose of study is Purpose of study is Purpose and/or Experimental explicitly stated, and stated but not summary missing or Question simulation is briefly clearly; missing inaccurate ( 1 point) and clearly some key part of
summarized simulation summary
Hypothesis Hypothesis and Hypothesis and Hypothesis and Hypothesis and Predictions predictions stated predictions included predictions missing (1 point) clearly but not entirely clear or irrelevant to study
Hypothesis Identification of Accurately identifies Includes an identi- Missing an Variables the independent and fication of the identification of the (0.5 point) dependent variables independent and independent and
dependent vari- dependent variables ables, but one may be missing or misidentified
Results Visual (graphs) The four graphs are The graphs have Graphs are missing, (1 point) appropriately titled, some element (title, or tables/graphs are
labeled, and easy to labels, etc.) that is missing all key read and interpret absent, therefore features (title, labels,
making them etc.), making difficult to read and interpretation interpret; or impossible missing one or more graphs entirely
Comments/Points
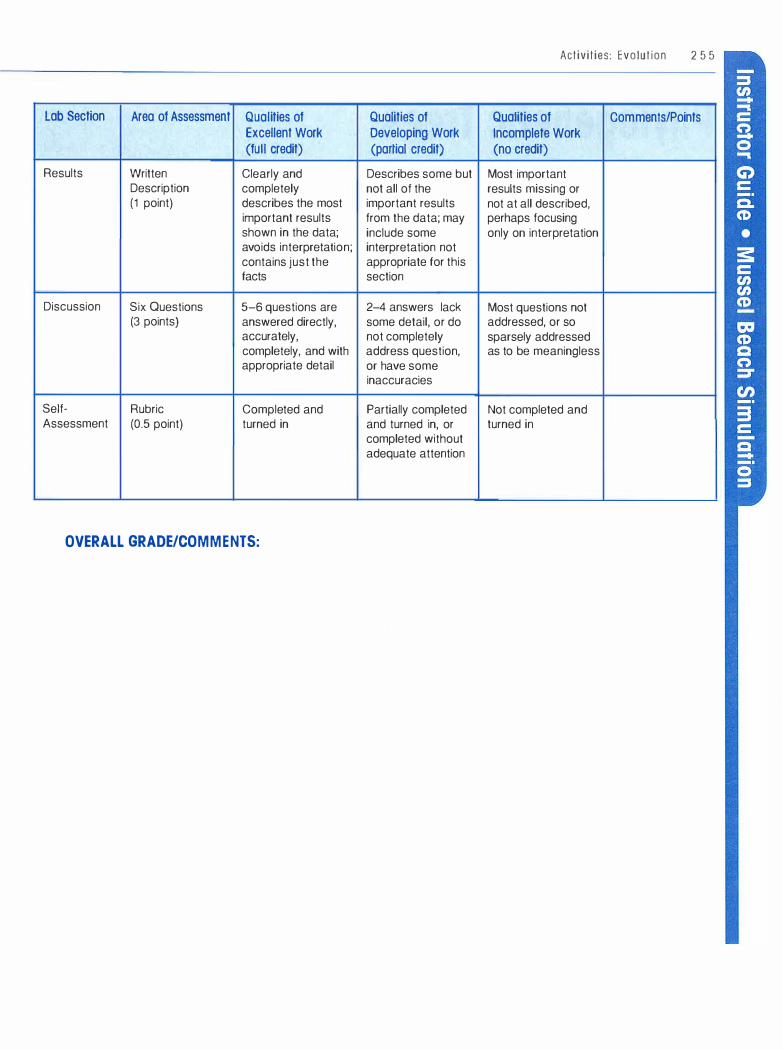
Lab Section Area of Assessment Qualities of Excellent Work (tu II credit)
Results Written Clearly and Description completely (1 point) describes the most
important results shown in the data; avoids interpretation; contains just the facts
Discussion Six Questions 5-6 questions are (3 points) answered directly,
accurately, completely, and with appropriate detail
Self- Rubric Completed and Assessment (0.5 point) turned in
OVERALL GRADE/COMMENTS:
Qualities of Developing Work (partial credit)
Describes some but not all of the important results from the data; may include some interpretation not appropriate for this section
2-4 answers lack some detail, or do not completely address question, or have some inaccuracies
Partially completed and turned in, or completed without adequate attention
Activities: Evolut ion 2 5 5
Qualities of Comments/Points Incomplete Work (no credit)
Most important results missing or not at all described, perhaps focusing only on interpretation
Most questions not addressed, or so sparsely addressed as to be meaningless
Not completed and turned in
2 5 6 B I O L O G Y S U C C E S S !
Phylogenetic Trees
Time Required :
Day 1: • Instructor prelab preparation-1 hour • Class time-2 hours • Postlab follow-up-1 to 2 hours
Day 2: • Class time-45 minutes
Summary
Evolutionary relationships between organisms can be determined based on how similar they are in morphology, behavior, biochemistry, and molecular and other characteristics. The greater the number of characteristics that are shared, the greater the likelihood that two organisms have a common ancestor. In this lab, students will compare habitat, anatomy, and diet of seven fish species to develop hypotheses of their evolutionary relationships. Then students will compare protein banding patterns in these species, using gel electrophoresis, to test their hypotheses and develop a new phylogenetic tree they can compare to the hypothesized tree. This lab is best used at the end of an evolution unit and after the genetics unit has been covered, so that students will already be familiar with concepts such as descent with modification and evidence for evolution, and with vocabulary such as protein, mutation, etc.
Learning Outcomes
After completing this activity, students will be able to:
Content
• Describe the structure and purpose of phylogenetic trees
• Construct a phylogenetic tree (or trees) that hypothesizes the evolutionary relationships among seven fish species based on several criteria, including habitat, anatomy, diet, and protein electrophoretic banding patterns
Inquiry Skills
• Interpret elecrophoretic banding patterns • Decide whether data support hypotheses
Lab Skills
• Load samples into a gel • Prepare solutions for protein electrophoresis
(optional)
Communication Skills
• Write a scientific lab report that accurately summarizes the experiment
National Science Education
Standards: Content Standards A:1 :1 , A: 1 :4, A:1 :5, A:1 :6, A:2, C:3:3, C:3:4, and G:2:3 (see Appendix B)
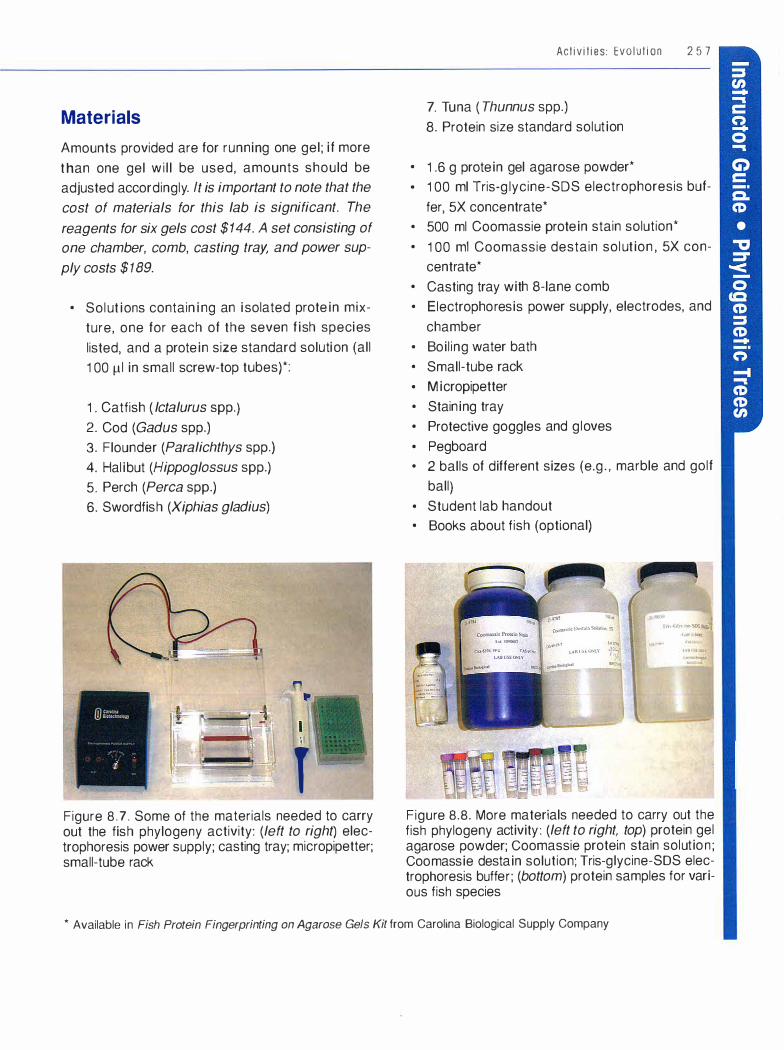
Materials
Amounts provided are for running one gel; if more than one gel wi l l be used, amounts should be adjusted accordingly. It is important to note that the cost of materials for this lab is significant. The reagents for six gels cost $144. A set consisting of one chamber, comb, casting tray, and power supply costs $189.
• Solutions containing an isolated protein mixture, one for each of the seven fish species listed, and a protein size standard solution (all 1 00 µI in small screw-top tubes)*:
1 . Catfish ( lctalurus spp.) 2. Cod (Gadus spp.} 3. Flounder (Paralichthys spp.} 4. Halibut (Hippoglossus spp.) 5. Perch (Perea spp.) 6. Swordfish (Xiphias gladius)
t Figure 8 . 7 . Some of the materials needed to carry out the fish phylogeny activity: (left to right} electrophoresis power supply; casting tray; micropipetter; small-tube rack
Activities: Evolution 2 5 7
7. Tuna ( Thunnus spp.} 8. Protein size standard solution
• 1 .6 g protein gel agarose powder* • 1 00 ml Tris-g lycine-SOS electrophoresis buf
fer, 5X concentrate* • 500 ml Coomassie protein stain solution* • 1 00 ml Coomassie destain solution , 5X con
centrate* • Casting tray with 8-lane comb • Electrophoresis power supply, electrodes, and
chamber • Boil ing water bath • Small-tube rack • Micropipetter • Staining tray • Protective goggles and gloves • Pegboard • 2 balls of different sizes (e.g . , marble and golf
ball) • Student lab handout • Books about fish (optional)
11.i,o}') lri�-<,I�.: ,...sos; ...
Figure 8.8. More materials needed to carry out the fish phylogeny activity : (left to right, top) protein gel agarose powder; Coomassie protein stain solution ; Coomassie destain solution; Tris-glycine-SOS electrophoresis buffer; (bottom) protein samples for various fish species
* Available in Fish Protein Fingerprinting on Agarose Gels Kit from Carolina Biological Supply Company
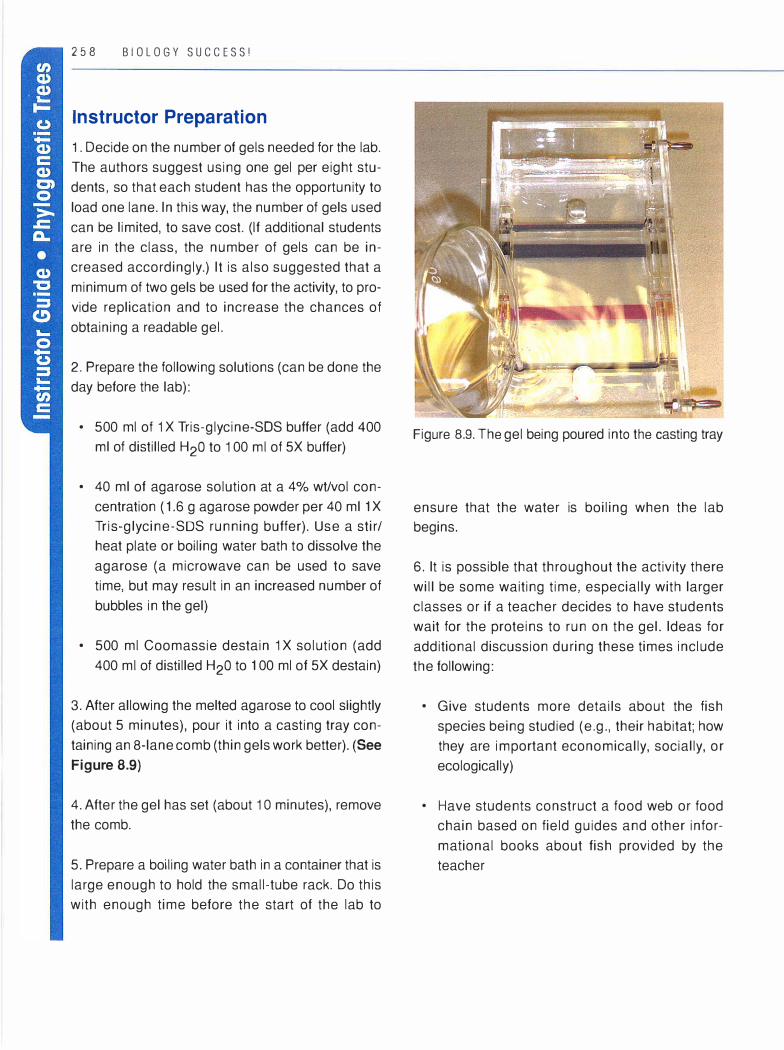
2 5 8 B I O L OGY S U CC E S S!
Instructor Preparation
1 . Decide on the number of gels needed for the lab. The authors suggest using one gel per eight students, so that each student has the opportunity to load one lane. In this way, the number of gels used can be limited, to save cost. (If additional students are in the class, the number of gels can be increased accordingly.) It is also suggested that a minimum of two gels be used for the activity, to provide replication and to increase the chances of obtaining a readable gel.
2. Prepare the following solutions (can be done the day before the lab):
• 500 ml of 1 X Tris-glycine-SOS buffer (add 400 ml of distilled H2o to 100 ml of 5X buffer)
• 40 ml of agarose solution at a 4% wt/vol concentration ( 1 .6 g agarose powder per 40 ml 1 X Tris-glycine-SOS running buffer). Use a stir/ heat plate or boiling water bath to dissolve the agarose (a microwave can be used to save time, but may result in an increased number of bubbles in the gel)
• 500 ml Coomassie destain 1 X solution (add 400 ml of distilled H2o to 1 00 ml of 5X destain)
3. After allowing the melted agarose to cool slightly (about 5 minutes), pour it into a casting tray containing an 8-lane comb (thin gels work better). (See
Figure 8.9)
4. After the gel has set (about 1 O minutes), remove the comb.
5. Prepare a boiling water bath in a container that is large enough to hold the small-tube rack. Do this with enough time before the start of the lab to
Figure 8.9. The gel being poured into the casting tray
ensure that the water is boiling when the lab begins.
6. It is possible that throughout the activity there will be some waiting time, especially with larger classes or if a teacher decides to have students wait for the proteins to run on the gel. Ideas for additional discussion during these times include the following:
• Give students more details about the fish species being studied (e.g., their habitat; how they are important economically, socially, or ecologically)
• Have students construct a food web or food chain based on field guides and other informational books about fish provided by the teacher
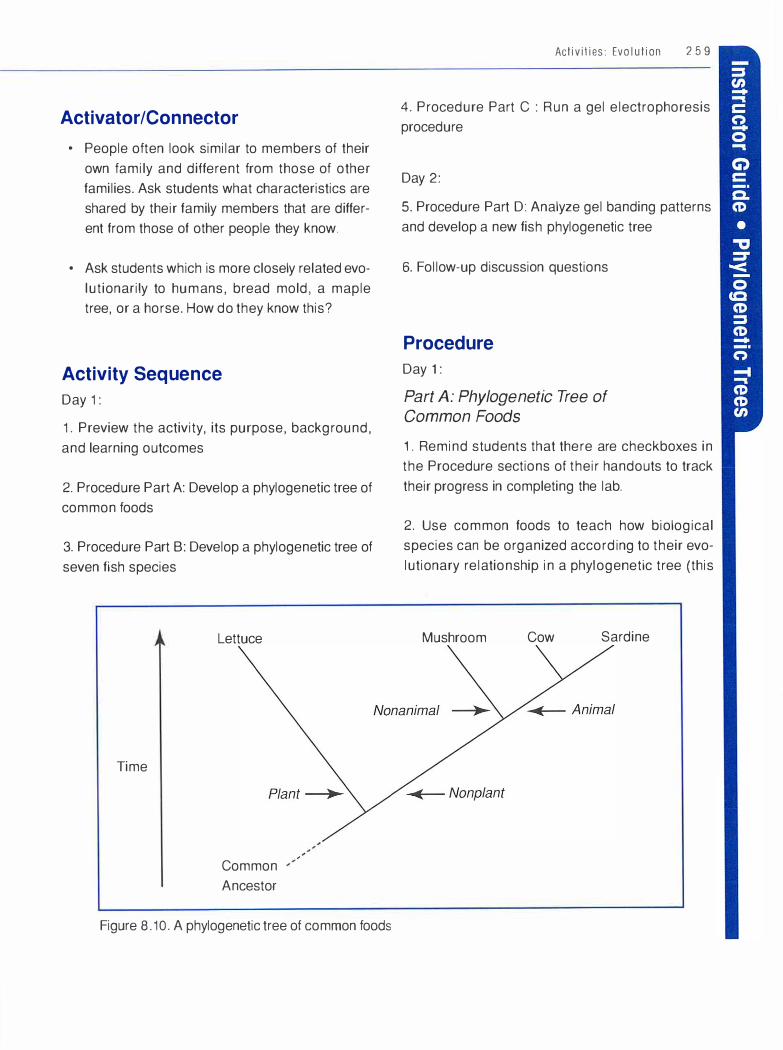
Activator/Connector
• People often look similar to members of their
own family and different from those of other
families. Ask students what characteristics are
shared by their family members that are differ
ent from those of other people they know.
• Ask students which is more closely related evo
lutionarily to humans, bread mold, a maple
tree, or a horse. How do they know this?
Activity Sequence
Day 1 :
1 . Preview the activity, its purpose, background,
and learning outcomes
2. Procedure Part A: Develop a phylogenetic tree of
common foods
3. Procedure Part B: Develop a phylogenetic tree of
seven fish species
Lettuce
Time
Common
Ancestor
, ,
Figure 8 . 10 . A phylogenetic tree of common foods
Activities: Evolution 2 5 9
4. Procedure Part C : Run a gel electrophoresis
procedure
Day 2:
5. Procedure Part D: Analyze gel banding patterns
and develop a new fish phylogenetic tree
6. Follow-up discussion questions
Procedure
Day 1:
Part A: Phylogenetic Tree of Common Foods
1 . Remind students that there are checkboxes in
the Procedure sections of their handouts to track
their progress in completing the lab.
2. Use common foods to teach how biological
species can be organized according to their evo
lutionary relationship in a phylogenetic tree (this
Mushroom Cow Sardine
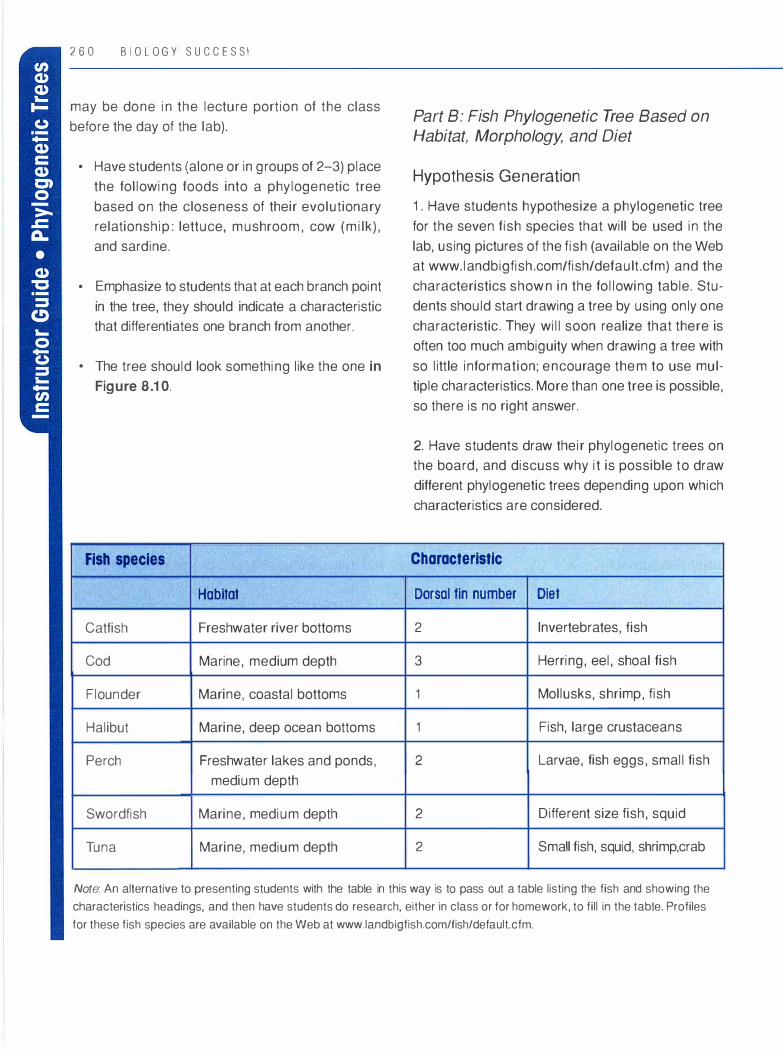
2 6 0 B IOL O GY SUCCESS!
may be done in the lecture portion of the class
before the day of the lab).
• Have students (alone or in groups of 2-3) place
the following foods into a phylogenetic tree
based on the closeness of their evolutionary
relationship: lettuce, mushroom, cow (milk),
and sardine.
• Emphasize to students that at each branch point
in the tree, they should indicate a characteristic
that differentiates one branch from another.
• The tree should look something like the one in
Figure 8.10.
Fish species
Habitat
Catfish Freshwater river bottoms
Cod Marine, medium depth
Flounder Marine, coastal bottoms
Halibut Marine, deep ocean bottoms
Perch Freshwater lakes and ponds,
medium depth
Swordfish Marine, medium depth
Tuna Marine, medium depth
Part B: Fish Phylogenetic Tree Based on Habitat, Morphology, and Diet
Hypothesis Generation
1 . Have students hypothesize a phylogenetic tree
for the seven fish species that will be used in the
lab, using pictures of the fish (available on the Web
at www.landbigfish.com/fish/default.cfm) and the
characteristics shown in the following table. Stu
dents should start drawing a tree by using only one
characteristic. They will soon realize that there is
often too much ambiguity when drawing a tree with
so little information; encourage them to use mul
tiple characteristics. More than one tree is possible,
so there is no right answer.
2. Have students draw their phylogenetic trees on
the board, and discuss why it is possible to draw
different phylogenetic trees depending upon which
characteristics are considered.
Characteristic
Dorsal fin number Diet
2 Invertebrates, fish
3 Herring, eel, shoal fish
1 Mollusks, shrimp, fish
1 Fish, large crustaceans
2 Larvae, fish eggs, small fish
2 Different size fish, squid
2 Small fish, squid, shrimp.crab
Note: An alternative to presenting students with the table in this way is to pass out a table listing the fish and showing the
characteristics headings, and then have students do research, either in class or for homework, to fill in the table. Profiles
for these fish species are available on the Web at www.landbigfish.com/fish/default.cfm.
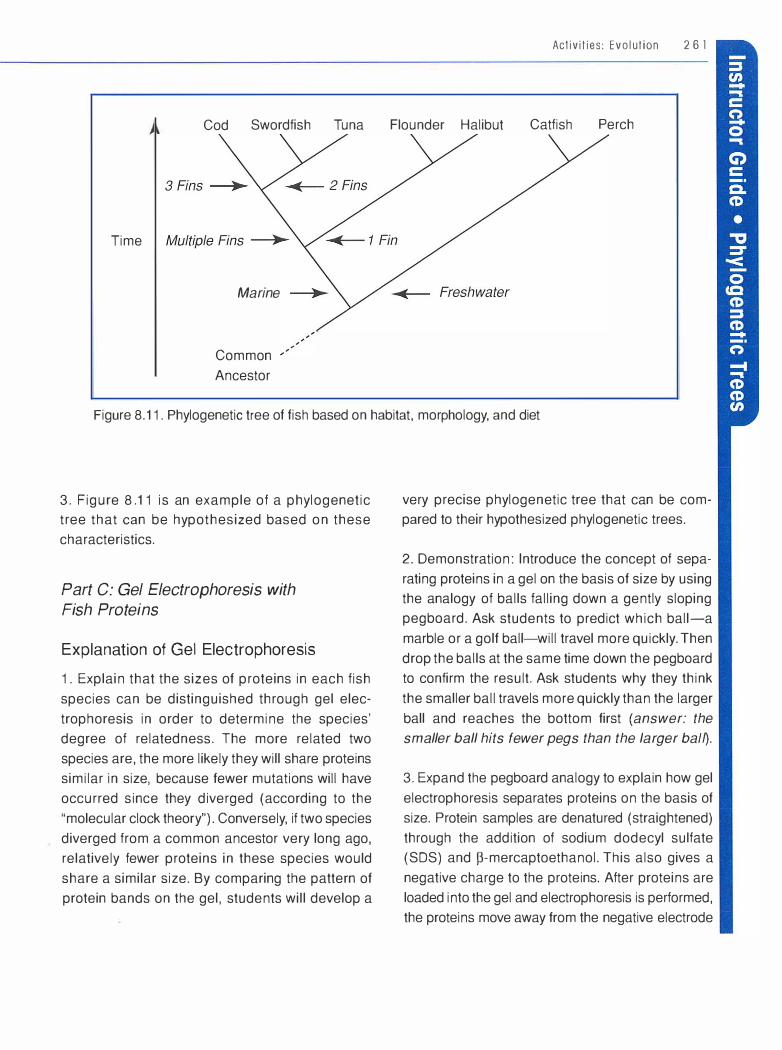
Time
Cod Swordfish Tuna
Marine
Common Ancestor
Flounder Halibut
Act iv i t ies : Evo l ution 2 6 1
Catfish Perch
Figure 8. 11. Phylogenetic tree of fish based on habitat, morphology, and diet
3. Figure 8 . 11 is an example of a phylogenetic tree that can be hypothesized based on these characteristics.
Part C: Gel Electrophoresis with
Fish Proteins
Explanation of Gel Electrophoresis
1. Explain that the sizes of proteins in each fish species can be distinguished through gel electrophoresis in order to determine the species' degree of relatedness. The more related two species are, the more likely they will share proteins similar in size, because fewer mutations will have occurred since they diverged (according to the "molecular clock theory"). Conversely, if two species diverged from a common ancestor very long ago, relatively fewer proteins in these species would share a similar size. By comparing the pattern of protein bands on the gel, students will develop a
very precise phylogenetic tree that can be compared to their hypothesized phylogenetic trees.
2. Demonstration: Introduce the concept of separating proteins in a gel on the basis of size by using the analogy of balls falling down a gently sloping pegboard. Ask students to predict which ball-a marble or a golf ball-will travel more quickly. Then drop the balls at the same time down the pegboard to confirm the result. Ask students why they think the smaller ball travels more quickly than the larger ball and reaches the bottom first (answer: the
smaller ball hits fewer pegs than the larger ba/0.
3. Expand the pegboard analogy to explain how gel electrophoresis separates proteins on the basis of size. Protein samples are denatured (straightened) through the addition of sodium dodecyl sulfate (SOS) and �-mercaptoethanol. This also gives a negative charge to the proteins. After proteins are loaded into the gel and electrophoresis is performed, the proteins move away from the negative electrode

B I O L O G Y S U C C E S S !
and toward the positive electrode. The rate of movement through the gel is dependent upon the length of the protein. Longer molecules interact with the gel meshwork more than shorter molecules, so longer molecules don't travel as far in the same amount of time.
Lab Protocol
Sample preparation
1. Put the screw-top tubes containing the fish protein samples and the protein size standard solution in a rack and place it in the boiling water bath for 3-5 minutes. DO NOT IMMERSE LIDS. (See Figure 8.1 2)
, "",. � .. -.. ,.: ••":vo,,tt- ,.-•) /i\. . ,, "-. � -
, .. I
\"--" ,� Figure 8.12. The protein samples immersed in a boiling water bath
Protein separation by gel electrophoresis
1. Place the gel in the chamber with the wells on the black, or negative, side.
2. Cover the gel with electrophoresis buffer.
3. Load 1 O µI of each sample and the size standard into the gel, one per lane (make note of the lane each solution is loaded into). One student should load one lane. It may be helpful to have the students practice pipetting with water beforehand. (See Figure 8.13)
4. Fasten the top of the electrophoresis chamber in place; be sure to keep the black and red sides together!
Figure 8.13. The protein samples being loaded into the gel of the casting tray

5. Attach electrodes to the power supply and run
the gel at 1 00 -1 35 volts.
6. The student portion of the lab can be stopped
after completing steps a-d below, since 1-2 hours
are needed for the electrophoresis to be com
pleted. Before ending the lab, the instructor should:
a. Review what students did.
b. Describe how the gel will be developed.
c. Preview how students will use the gel to com
plete the lab during the following class period (see Part D).
d. Have students observe the initial movement of
the bromophenol blue dye (a component of
each protein solution) on the gel, so they can
see the electrophoresis occurring.
Postlab follow-up and gel staining (does not have to involve students ; use gloves)
1 . After 1 -2 hours, when the dye in the samples is
close to the positive side of the gel, turn off the
power supply and remove the gel from the chamber.
2. Transfer the gel to a staining tray.
3. Cover the gel with Coomassie stain for 1 0-20
minutes. Gently oscillate the tray every couple of
minutes.
4. Remove the stain and cover the gel with
Coomassie destain; leave overnight or until bands
are visible (changing the destaining solution will
speed the process) .
Day 2:
Part D: Analyzing Gel Banding Patterns
1 . During the next class period, the entire class can
observe the gel if it is placed on a piece of plastic
wrap and then on an overhead projector. The gel
will not melt.
Activit ies: Evo lut ion 2 6 3
2. Have students draw a sketch of the gel and
include the banding pattern for each fish species.
3. As a class activity, guide students in how to inter
pret the gel in order to determine the degree of
relatedness between fish species.
4. Some useful strategies for interpreting gel band
ing patterns are as follows:
• Number the lanes 1, 2, 3, etc., and label the
bands a, b, c, etc., in order to better organize
group discussion of the gel.
• Initially, identify lanes with the most unique band
ing patterns. These would include, for example,
the one with the fewest bands, the one with the
most bands, or one with a pattern of bands that
makes it stand out from the other lanes.
• Look at the number of bands that different
lanes have in common. This can be made eas
ier by redrawing the gel on a piece of scrap
paper and cutting out the lanes so they can be
moved next to each other for comparison.
5. Have students draw a phylogenetic tree that
illustrates the evolutionary relationships shown
from the banding patterns. A possible phyloge
netic tree for the seven fish species appears on
page 265 in Figure 8.1 4.
Follow-up Discussion Questions
Review:
1. What are the main concepts students have
learned from this lab activity?
Student responses will vary.
26 4 B IOLOGY SU CCESS!
2. Why is a protein size standard solution included in this experiment?
The proteins in the protein size standard solution are of known sizes, so by comparing the fish bands to the protein size standard bands, one can get an idea of the size (in kilodaltons) of the fish proteins. Protein size standard solutions are traditionally included in gel electrophoresis.
3. Why was electricity used during the electrophoresis procedure?
Proteins are negatively charged. By running an electric current through the gel, the negatively charged proteins will move toward the positive charge. The gel itself sorts the proteins by size, so the smallest proteins will move the furthest through the gel to end up closest to the positive pole.
4. Why do scientists use phylogenetic trees? Scientists use phylogenetic trees to communi
cate in graphic or visual form the known and/or hypothesized evolutionary relationships between specific groups of organisms.
Interpretive:
5. Does the gel banding pattern support only one type of phylogenetic tree, or are multiple trees possible based on the same data? Why?
Student responses will vary based on the banding pattern, but in general, multiple trees are possible. This shows that scientists put forward their hypothesis based on evidence, but that evidence is not always clear-cut and is open to interpretation.
6. Does the phylogenetic tree based on biochemical data correlate with the hypothesized tree based on habitat, morphology, and diet? Why or why not?
There should be some correlations here, but it is not meant to be perfect. Data and evidence based on anatomy, habitat, and diet are not as reliable as data from biochemical analysis.
7. If fish DNA instead of protein were used for gel electrophoresis,do you think the banding pattern and the phylogenetic tree based on it would be similar to or different from those in this experiment? Why?
They should be reasonably similar, because the DNA in the fish codes for the specific amino acids in the proteins.
Reflective:
8. Are there sources of error in this experiment? How might they have affected the results?
9. Did the lab help your understanding of how phylogenetic trees are developed?
1 O. What did you like or dislike about this lab?
11 . How can this lab be improved to make it a better learning experience?
Formative Assessment
• Students will demonstrate their understanding of phylogenetic trees through the construction of their own phylogenetic trees in Procedure Part A and Part B, and through their participation during the follow-up discussion at the end of the activity.
• Students will demonstrate their abilities to load samples in a gel through their participation in Procedure Part C.
• Students will demonstrate their abilities to interpret electrophoretic banding patterns and decide if data supports a hypothesis during Procedure Part D and the follow-up discussion.
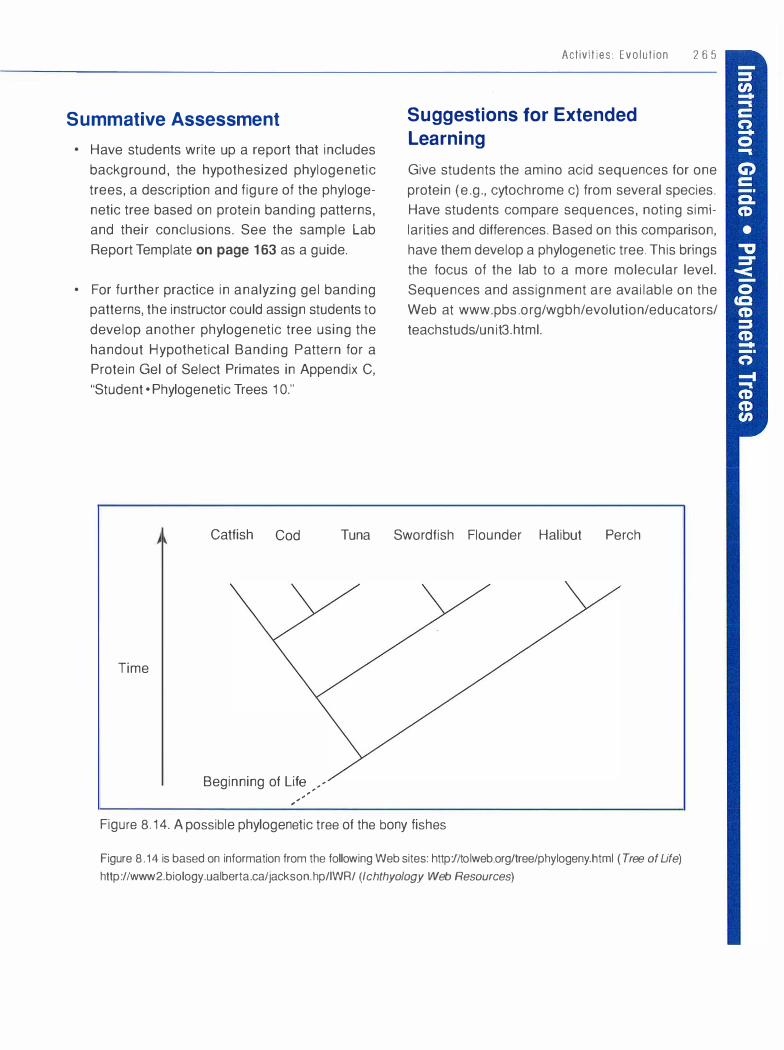
Summative Assessment
• Have students write up a report that includes background, the hypothesized phylogenetic trees, a description and figure of the phylogenetic tree based on protein banding patterns, and their conclusions. See the sample Lab Report Template on page 1 63 as a guide.
• For further practice in analyzing gel banding patterns, the instructor could assign students to develop another phylogenetic tree using the handout Hypothetical Banding Pattern for a Protein Gel of Select Primates in Appendix C, "Student• Phylogenetic Trees 1 O."
Activit i es : Evo lut ion 2 6 5
Suggestions for Extended
Learning
Give students the amino acid sequences for one protein (e.g., cytochrome c) from several species. Have students compare sequences, noting similarities and differences. Based on this comparison, have them develop a phylogenetic tree. This brings the focus of the lab to a more molecular level. Sequences and assignment are available on the Web at www.pbs.org/wgbh/evolution/educators/ teachstuds/unit3. html.
Catfish Cod Tuna Swordfish Flounder Halibut Perch
Time
Beginning of L��:,/
Figure 8.14. A possible phylogenetic tree of the bony fishes
Figure 8 . 14 is based on information from the following Web sites: http://tolweb.org/tree/phylogeny.html ( Tree of Life)
http://www2.biology.ualberta.ca/jackson.hp/lWR/ (Ichthyology Web Resources)

9 ACTIVITIES:
CELL BIOLOGY
Introduction
This section contains four activities that fall under the content area of
cell biology. They are not intended to be used in the particular
sequence in which they are presented. Instructors are encouraged to
use them in any sequence that fits their curriculum. A short descrip
tion of each activity follows.
Cell Cycle Role-Play (page 269). Students act out cell division. The
activity is intended to demonstrate in detail an example of a kines
thetic-based learning technique. A supporting student handout to the
activity can be found in Appendix C, "Student• Cell Cycle-Role Play."
The Cell Tour (page 278). In this interactive Web-based activity, stu
dents learn or review the basics of plant and animal cells as they
take a virtual tour of a cell. This activity requires computer access for
each student or student team. Student handouts are downloadable
at www.landmark.edu/biosuccess. This activity is also contained on
the CD found on the inside front cover of the book.

268 BIOLOGY SUCCESS!
Environmental Factors and Enzyme Activity
(page 281 ). Students test variables that may affect
yeast enzyme activity. The activity is designed
as a guided inquiry; the instructor supplies the
investigative question and the materials, while the
students design their own procedure and draw
the subsequent conclusions. A complete student
handout is provided in Appendix C, "Student• Envi
ronmental Factors and Enzyme Activity."
Egg Osmosis (page 286). In this lab-based activ
ity, students use eggs to chart osmotic rates in dif
ferent solutions. There are three versions of this
activity: demonstration, structured inquiry, and
guided inquiry. Each version is based on the level
of structure and guidance provided to students as
they carry out the activity. A complete student
handout for each version appears in Appendix C,
"Student· Egg Osmosis."

Activities: Cell Biology 2 6 9
Cell Cycle Role-Play
Time Required: 60 minutes
Summary
The instructor leads students through a kinesthetic
role-play to teach the cell cycle. See page 81 for
background on using multimodal teaching tech
niques. Students act out the behavior of chromo
somes and centrioles and use props to represent
other components of this process. This activity
would take place at the end of a cell biology unit,
when students are familiar with the basics of cell
structure. As presented here, the activity works
best as a technique to introduce the cell cycle, but
it could easily be adapted to reinforce or review this
process. A short video clip showing the activity is
included on the CD found on the inside front cover
of this manual.
Learning Outcomes
After completing this activity, students will be able to:
Content
• Define the purpose of cell division
• List the following stages of the cell cycle in their
correct sequence: G1 phase, S-phase, G2 phase, interphase, prophase, metaphase,
anaphase, telophase, and cytokinesis
• Identify the major cellular events associated
with each of the stages just listed
• Associate key organelles and structures
involved in cell division with their functions
• Differentiate between a chromosome and a
chromatid
National Science Education
Standards: Content Standards C:1 :1 and
C:1 :6 (see Appendix B)
Materials
(a prop's analogous cellular component appears
in parentheses)
• 2 heavy-duty extension cords, each 20 feet
long, of the same color (cell membrane)
• 8 pieces of twine, cut into approximately 1 a
foot lengths; two pieces for each of four chro
mosomes (spindle fibers)
• 10-foot length of ribbon or flagging tape
(metaphase plate)
• 2 bedsheets, blankets, or tarps, each large
enough when laid out for eight students to
stand on (nuclear membrane)
• Labels for props:
- 2 pieces each of blue, green, yellow, and
red paper (for chromosomes)
- 14 pieces of white paper (for other cell
cycle components)
• Poster, plaque, or free-standing model of the
cell cycle
• Beaker filled with baking soda
• Vinegar
• Magic markers
• Tape

BIOLOGY SUCCESS!
Centromere
Yellow
Chromatid
Figure 9.1. Cell Cycle Role-Play materials: (left to right) colored paper for chromosome/chromatid labels, blue flagging tape, 8 pieces of green twine, 2 extension cords, 2 tarps
Instructor Preparation
• Space requirements: A room large enough to
accommodate a 15-foot-diameter circle (as
well as additional space for an audience, if
present) should be adequate.
• Ten students are required to be players in the
role-play procedure, which is based on 4 chro
mosomes (2n = 4).
- Two students are needed to play the role
of each chromosome (8 students total). The
instructor may modify the number of chromo
somes based on class size, space demands,
etc. If this is done, the number of players and
amount of materials will also have to be
modified.
- Two students are needed to play the role of
centrioles.
• If the class size is too large to accommodate all
students acting as players concurrently, the
role-play can be performed by one set of stu
dents while the rest act as an audience, and
then the roles of players and audience can be
reversed. Ideally, the audience should stand
on tables or in a balcony to get a bird's-eye
view of the role-play.
• Prepare a poster of each stage of the cell
cycle, or have available a commercial poster,
plaque, or free-standing model to refer to as
the activity proceeds.
• Copy the student handout (see Appendix C,
"Student• Cell Cycle Role-Play"), one for each
student.
• Write the following "playbill" for the role-play on
the board or a poster, so that each act or scene
can be checked off as the activity proceeds.
Act 1: Prelude Scene 1 - A Day in the Life
Scene 2 - Copycats I Scene 3 - Copycats 11
Act 2: Sorting Out the Pieces Scene 1 - Getting Some Breathing Room
Scene 2 - Line Dancing
Scene 3 - Homeward Bound
Scene 4 - There's No Place Like Home
Act 3: Finale
Scene 1 - Coming Apart at the Seams
• Prelabel the paper for the players:
Colored paper
- These are labels for chromosomes/chro
matids. The instructor may want to cut the
paper into the shape of contracted chromo
somes to help students make a connection
with how chromosomes are drawn in their
textbook.
- On each blue piece, write "blue sister
chromatid" on one side and "blue chromo
some" on the other side.
Activities: Cell Biology 2 7 l
- Repeat for each remaining color of
paper.
White paper
- Write "centriole" on two pieces of white
paper.
• Prelabel the paper for the props: Write each of the following terms on the
number of pieces of white paper indicated
in parentheses:
- centromere (4)
- cleavage furrow (1)
- metaphase plate (1)
- spindle fiber (2)
• Keep four pieces of white paper blank.
• If any additional vocabulary words are intro
duced, visual references need to be made for
them as well.
Activator/Connector
• Probe students' knowledge of human develop
ment and repair mechanisms. Humans start
out as single-celled zygotes and develop into
multicelled organisms. After an injury, damaged
tissue is replaced by new tissue. How does one
cell turn into many?
• In small groups, have students list the basic
parts of an animal cell. Call on each group until
a complete list is on the board. Then ask them
the following question: If you were an animal
cell and needed to divide to make two identi
cal new cells, which parts would you need to
incorporate into each new cell in a precise
manner to ensure survival? Lead the discus
sion toward the conclusion that primarily DNA
must be partitioned into each new cell in a

272 BIOLOGY SUCCESS!
nonrandom manner. Random partitioning of
other cell parts is tolerated because their num
bers can be adjusted to normal levels based
on information contained in the DNA.
Activity Sequence
1 . Preview the activity, its learning outcomes, and
the rationale for doing it kinesthetically
2. Role-Play A: Walk-through with players labeled
by role; clarification as necessary
3. Role-Play B: Walk-through with players and
props labeled; clarification as necessary
4. Role-Play C: Student narration and role switching
5. Follow-up discussion questions
Procedure
Role-Play A:
Role-Play A is a walk-through activity. Use terms for
parts of the cell that students are already familiar
with and label only the players involved. These terms
appear in bold below. It is recommended that terms
associated with the stages of the cell cycle (e.g.,
metaphase plate) not be introduced until Role-Play
B. These terms are included in directions for RolePlay A for the instructor's benefit only. Emphasize
that this activity models the cell cycle in animal cells,
which differs slightly from that in plant cells.
Note: Steps 1-3 could take place before the
class assembles to save class time.
1 . Connect two extension cords (cell membrane)
at both ends and lay them out to form a large circle
(the cell). The connected ends should be situated
midway between the poles of the cell as desig
nated by the instructor.
2. Lay out the sheet (nuclear membrane) on the
ground somewhere within the cell.
3. Lay out the ribbon (metaphase plate) along the
plane midway between the cell poles, and attach it
to the floor with tape.
4. Divide students participating in the role-play into
five pairs, four to represent chromosomes and one to represent centrioles.
Chromosome pairs:
a. Each pair should choose a unique color label.
b. One member of each pair should attach both labels of their chosen color ( one on top of the other) to himself or herself, with the word
"chromosome" facing outward, and stand on
the sheet in a random location.
c. The other member of each pair should
remain outside the cell.
Centriole pair:
a. One member of the pair should attach both
pieces of white paper labeled "centriole"
(one on top of the other) to himself or her
self, and then stand outside the nucleus but
inside the cell.
b. The other member should remain outside
the cell.
5. Have students make a mental note of the initial
configuration (colors and number) of chromosomes
in the cell.
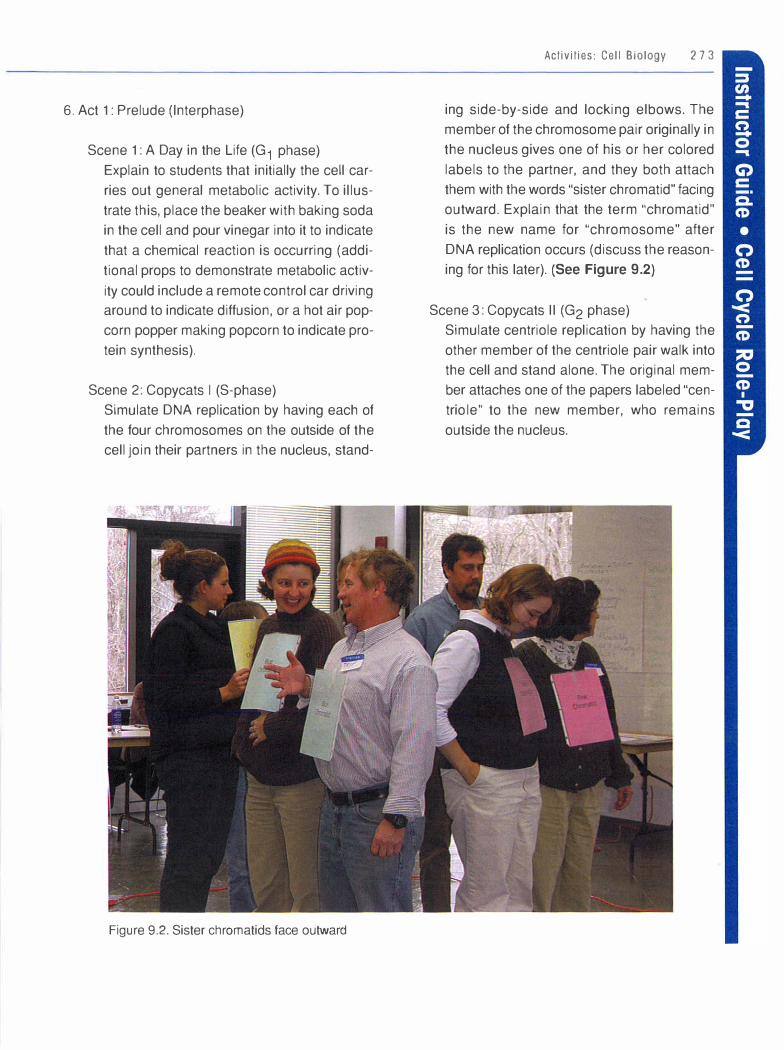
6. Act 1: Prelude (lnterphase)
Scene 1: A Day in the Life (G1 phase)
Explain to students that initially the cell car
ries out general metabolic activity. To illus
trate this, place the beaker with baking soda
in the cell and pour vinegar into it to indicate
that a chemical reaction is occurring (addi
tional props to demonstrate metabolic activ
ity could include a remote control car driving around to indicate diffusion, or a hot air pop
corn popper making popcorn to indicate pro
tein synthesis).
Scene 2: Copycats I (S-phase)
Simulate DNA replication by having each of
the four chromosomes on the outside of the
cell join their partners in the nucleus, stand-
Figure 9.2. Sister chromatids face outward
Activities: Cell Biology 2 7 3
ing side-by-side and locking elbows. The
member of the chromosome pair originally in
the nucleus gives one of his or her colored
labels to the partner, and they both attach
them with the words "sister chromatid" facing
outward. Explain that the term "chromatid"
is the new name for "chromosome" after
DNA replication occurs (discuss the reason
ing for this later). (See Figure 9.2)
Scene 3: Copycats II (G2 phase)
Simulate centriole replication by having the
other member of the centriole pair walk into
the cell and stand alone. The original mem
ber attaches one of the papers labeled "cen
trio le" to the new member, who remains
outside the nucleus.
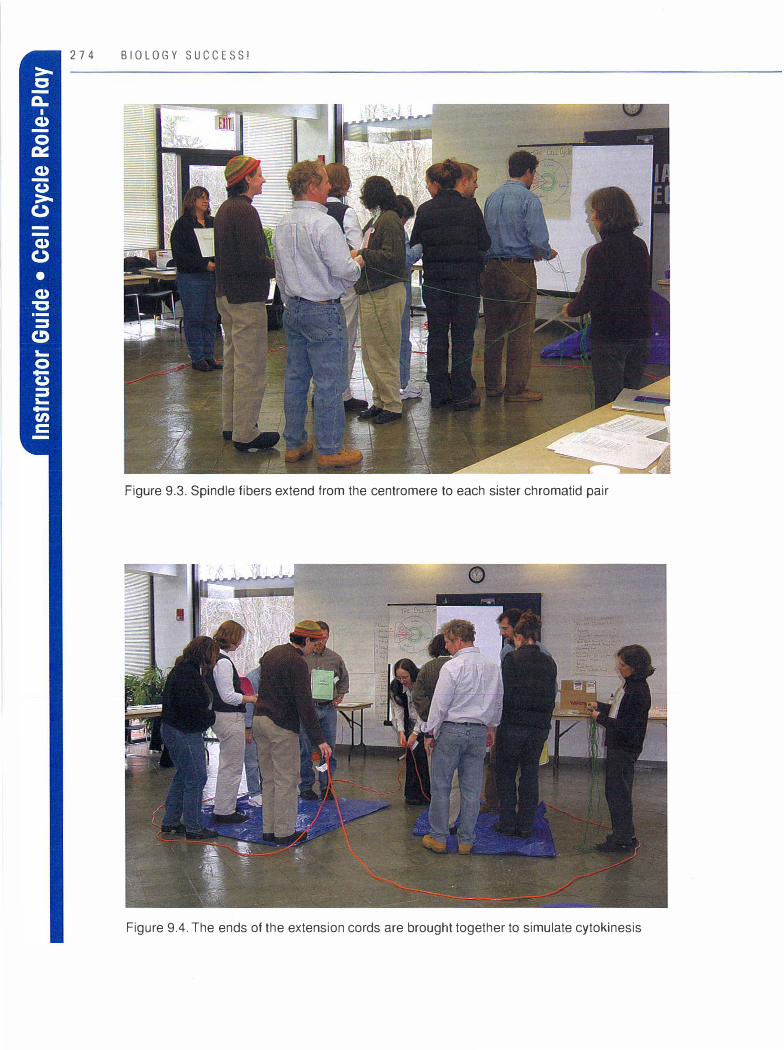
274 BIOLOGY SUCCESS!
Figure 9.3. Spindle fibers extend from the centromere to each sister chromatid pair
Figure 9.4. The ends of the extension cords are brought together to simulate cytokinesis
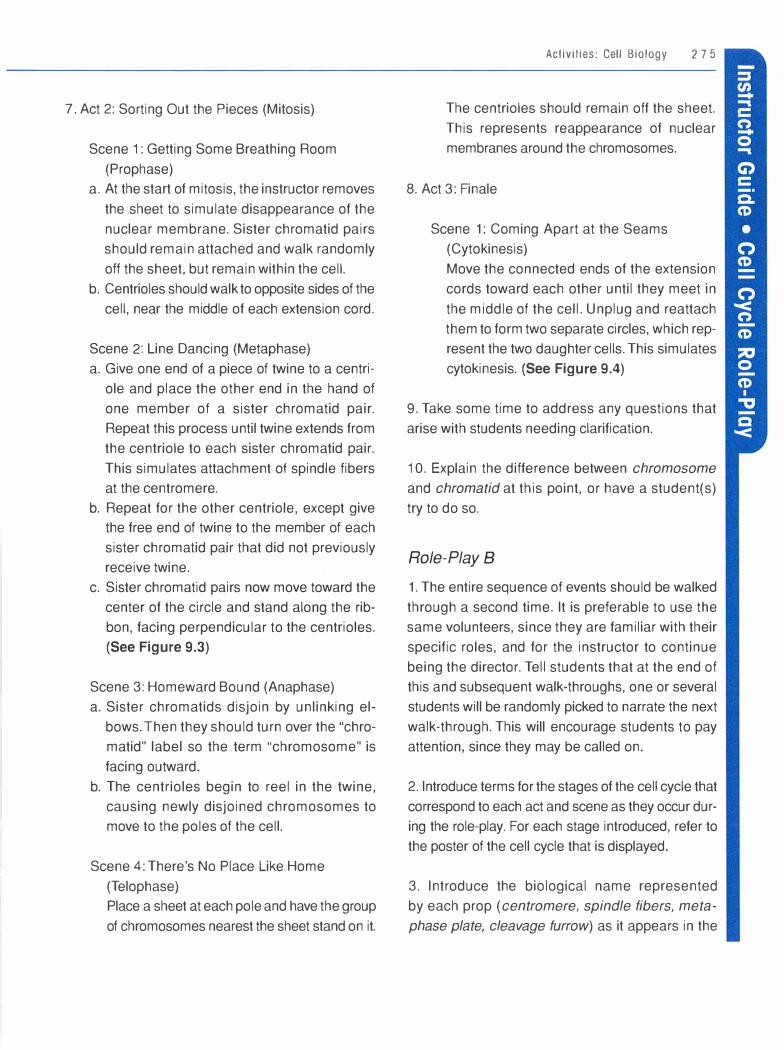
7. Act 2: Sorting Out the Pieces (Mitosis)
Scene 1 : Getting Some Breathing Room
(Prophase) a. At the start of mitosis, the instructor removes
the sheet to simulate disappearance of the
nuclear membrane. Sister chromatid pairs
should remain attached and walk randomly
off the sheet, but remain within the cell.
b. Centrioles should walk to opposite sides of the
cell, near the middle of each extension cord.
Scene 2: Line Dancing (Metaphase)
a. Give one end of a piece of twine to a centri
ole and place the other end in the hand of
one member of a sister chromatid pair.
Repeat this process until twine extends from
the centriole to each sister chromatid pair.
This simulates attachment of spindle fibers
at the centromere.
b. Repeat for the other centriole, except give the free end of twine to the member of each
sister chromatid pair that did not previously
receive twine.
c. Sister chromatid pairs now move toward the
center of the circle and stand along the rib
bon, facing perpendicular to the centrioles.
(See Figure 9.3)
Scene 3: Homeward Bound (Anaphase)
a. Sister chromatids disjoin by unlinking el
bows. Then they should turn over the "chro
matid" label so the term "chromosome" is
facing outward.
b. The centrioles begin to reel in the twine,
causing newly disjoined chromosomes to
move to the poles of the cell.
Scene 4: There's No Place Like Home
(Telophase) Place a sheet at each pole and have the group
of chromosomes nearest the sheet stand on it.
Activities: Cell Biology 2 7 5
The centrioles should remain off the sheet.
This represents reappearance of nuclear
membranes around the chromosomes.
8. Act 3: Finale
Scene 1: Coming Apart at the Seams
(Cytokinesis)
Move the connected ends of the extension
cords toward each other until they meet in
the middle of the cell. Unplug and reattach
them to form two separate circles, which rep
resent the two daughter cells. This simulates
cytokinesis. (See Figure 9.4)
9. Take some time to address any questions that
arise with students needing clarification.
1 0. Explain the difference between chromosome
and chromatid at this point, or have a student(s)
try to do so.
Role-Play B
1. The entire sequence of events should be walked
through a second time. It is preferable to use the
same volunteers, since they are familiar with their
specific roles, and for the instructor to continue
being the director. Tell students that at the end of
this and subsequent walk-throughs, one or several
students will be randomly picked to narrate the next
walk-through. This will encourage students to pay
attention, since they may be called on.
2. Introduce terms for the stages of the cell cycle that
correspond to each act and scene as they occur dur
ing the role-play. For each stage introduced, refer to
the poster of the cell cycle that is displayed.
3. Introduce the biological name represented
by each prop ( centromere, spindle fibers, meta
phase plate, cleavage furrow) as it appears in the
276 BIOLOGY SUCCESS!
role-play and use a visual reference to reinforce the
term. For example, after DNA replication, label the
centromere, represented by the locked elbows of
sister chromatids, by taping the piece of paper
labeled "centromere" over the elbows. Attach the paper labeled "spindle fiber" to one piece of twine
on each side of the cell so the term is visible from
both sides of the room, and so on.
4. Take time to address any additional questions
that arise with students needing clarification.
Role-Play C
1 . We recommend allowing a student to take on the
narrator/director role and explain the process. This
may be a student who has not yet been directly involved or one who has taken on a role. Audience
members and active role-players also have the opportunity to switch roles at this point. This
increases the investment of students in the audience and allows the original actors to witness the
role-play from a new perspective.
2. Repeat as necessary, with different students tak
ing the narrator/director and other roles.
Follow-up Discussion Questions
Review:
1 . What biological stages and what cellular events
take place in each of the acts and scenes?
See Role-Play A procedure beginning on
page 272.
2. How do the daughter cells compare to each other and to the original cell in terms of the num
ber and identity (colors) of their chromosomes? They are the same.
3. What mechanism or mechanisms ensure that chromosomes similar in quantity and identity are
partitioned into each daughter cell?
The attachment of sister chromatids at the centromere until anaphase assures that when the
chromosomes separate, one of each kind goes to
each new cell.
4. How do chromosomes differ from chromatids?
A chromosome is a single long strand of DNA
supercoiled into a tight "package." A chromatid is
one of a pair of replicated chromosomes-exact
copies of each other-which are connected at the
centromere.
Interpretive:
5. How would the role-play need to be modified to
represent the cell cycle in plant cells?
Plant cells have asters rather than centromeres,
but they perform the same role, so only the signs would need to be changed. Plant cells have a cell
wall, so something to represent the cell wall would
need to be added, in a form that could demonstrate the formation of a new wall between the two
daughter cells after cytokinesis.
6. If a mistake occurred during mitosis and the
spindle fibers failed to attach to the chromosomes,
what do you think would be the consequence in
terms of the number of cells formed and the num
ber of chromosomes in each cell after cytokinesis
took place?
If the spindle fibers did not attach at all, there
would be no movement of the chromosomes at all.
Presumably, there would be no cytokinesis, as
none of the steps of mitosis would occur. The cell
would now have four copies of each chromosome
rather than two, but they would still be attached as
sister chromatids. If cytokinesis did occur, the chro
mosomes-still as sister chromatids-would divide
randomly into the two new cells, with each new
cell having two copies of some chromosomes (as
sister chromatids), four copies of some, and no
copies of others.
Reflective:
1. Which part of the model is still unclear to students?
2. Did students find the role-play to be an effective
learning instrument? How could it be improved as
an activity?
3. Does the kinesthetic approach complement indi
vidual learning styles of students in the class?
4. Do students have other ideas on how best to
learn this material?
Formative Assessment
Students will demonstrate their understanding of all
learning outcomes through their active participation in the role-play scenarios, their ability to ask clari
fying questions during the role-play, and their oral
Activities: Cell Biology 2 7 7
and written participation during the follow-up dis
cussion component of the activity.
Summative Assessment
• Assign students to write a summary of cell divi
sion using the Writing Model for a Biological
Process on page 115.
• Students should fill in the rest of their "playbill"
student handout. Have them: - Write the name of each stage of the cell
cycle next to the act or scene it appears in
- Make a drawing of each stage as it
appears in a textbook
- In their own words, write a description of
events that take place in each stage
Suggestions for Extended
Learning
Assign students to develop a role-play for meiosis,
using similar props and adapting them as necessary.
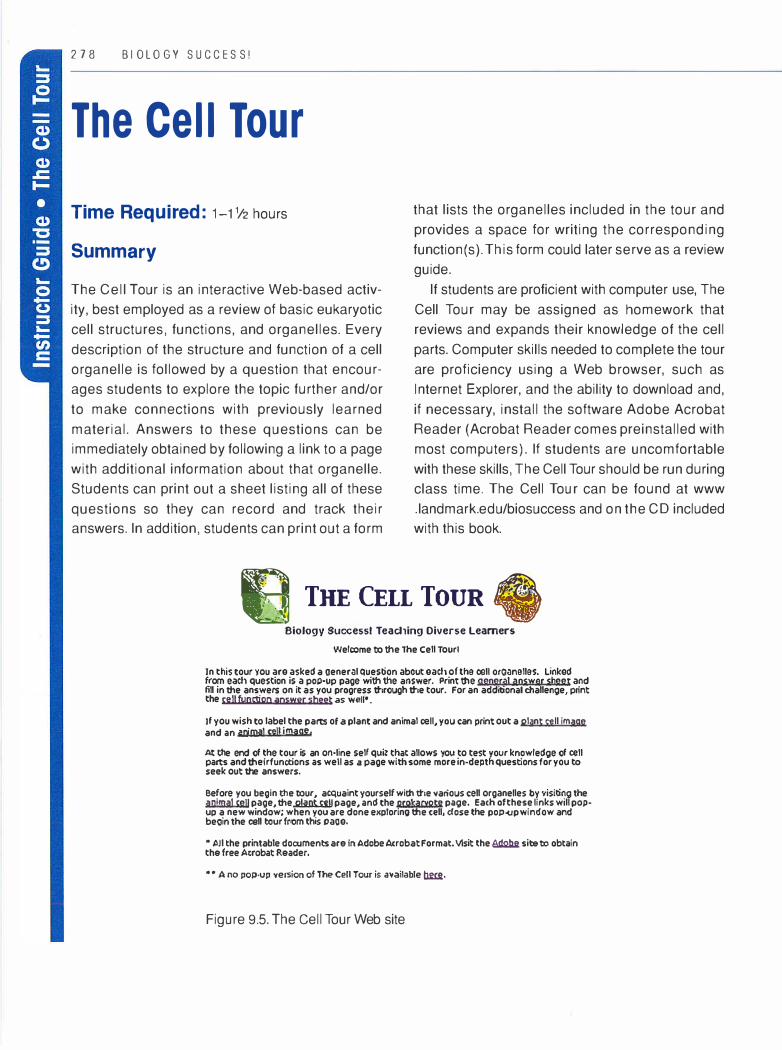
2 7 8 BIOLOGY SUCCESS!
The Cell Tour
Time Required : 1 -11/2 hours
Summary
The Cell Tour is an interactive Web-based activ
ity, best employed as a review of basic eukaryotic
cell structures, functions, and organelles. Every
description of the structure and function of a cell
organelle is followed by a question that encour
ages students to explore the topic further and/or
to make connections with previously learned
material. Answers to these questions can be immediately obtained by following a link to a page
with additional information about that organelle.
Students can print out a sheet listing all of these
questions so they can record and track their answers. In addition, students can print out a form
that lists the organelles included in the tour and
provides a space for writing the corresponding
function(s). This form could later serve as a review
guide.
If students are proficient with computer use, The
Cell Tour may be assigned as homework that
reviews and expands their knowledge of the cell
parts. Computer skills needed to complete the tour
are proficiency using a Web browser, such as
Internet Explorer, and the ability to download and,
if necessary, install the software Adobe Acrobat
Reader (Acrobat Reader comes preinstalled with
most computers). If students are uncomfortable
with these skills, The Cell Tour should be run during
class time. The Cell Tour can be found at www
. landmark.edu/biosuccess and on the CD included with this book.
E THE CELL TouR a � w
Biology Success! Teaching Diverse Learners
Welcome tx> the lhe Cell Tourl
Jn this tour you are asked a oeneral Question about each of tho cell oroanollos. Linked from each question is a pop-up page with the answer. Print ttie general answer sheet and fill in the answers on it as you progress ttlrough ttle tour. For an additional challenge, print the cell tvoctioo answer sheet as wen•.
Jf you wish to label the parts of a plant and animal cell, you can print out a plant cell image and an animal cen image.
At the end of the tour is an on-line self qui: that allows you to test your knowledge of cell parts and their functions as well as a page with some more in-depth questions for you to seek out the answers.
Before you begin the tour, acquaint yourself with ttle various cell organelles by visiting the animal ceH page, the� page, and the grol;aryote page. Each of these links will popup a new window; when you are done exploring tt,e cell, dose the pop-up window and beoin the cell tour from this oaae.
• All the printable documents are in Adobe Acrobat Format. Vlsit the � site tx> obtain the free Acrobat Reader.
• • A no pop-up version of The Cell Tour is available �.
Figure 9.5. The Cell Tour Web site
Learning Outcomes
After completing this activity, students will be able to:
Content
• Associate cell organelles and structures with
their functions • Identify those organelles/structures common to
both animal and plant cells, as well as those
that are unique to each cell type
Computer Skills
• Use a Web browser • Download and install Adobe Acrobat Reader • Print pages from a Web-based activity
National Science Education
Standards: Content Standard C:1 : 1 (see
Appendix B)
Materials
Computer equipped with
• CD-ROM drive or Internet connection • Internet browser, such as Internet Explorer • Printer
Instructor Preparation
Before introducing The Cell Tour to students,
instructors should be comfortable with using a
computer and an Internet browser. The Cell Tour is meant to serve as a review of eukaryotic cell
structures, to be completed after students have
already been introduced to them. It is recom-
Activities: Cell B iology 2 7 9
mended that the instructor print out an unlabeled
cell diagram (plant cell and animal cell images are
linked to the first page of the tour) so that students
can add labels as they progress through the tour.
Activator/Connector
Tell students that "organelle" means "little organ."
Ask students to describe the basic functions of a
few well-known organs of the human body (heart,
liver, etc.). Then make the analogy between a cell
and a whole organism, like the human, and be
tween organelles and organs. A human has a liver
which detoxifies harmful chemicals; does a cell
have a comparable organelle that is involved in
detoxification? Humans have a bony skeleton
which provides internal structural support. Do cells
have an internal support structure?
Activity Sequence
1. Preview the activity and its learning outcomes
2. Guide students to The Cell Tour home page
3. Have students print out the following forms as
needed: • List of all organelles included on The Cell Tour,
with blanks provided for writing in correspon
ding functions • Animal and plant cell diagrams for labeling • List of questions asked during The Cell Tour,
with spaces for writing answers
4. Have students complete The Cell Tour and any
assigned forms (answers to questions are found
within The Cell Tour itself)
5. Ask students to take the interactive self-quiz and
review cell organelles as needed

2 8 0 BIOLOGY SUCC E S S!
Procedure
Use of The Cell Tour is self-explanatory beginning
on the first page.
Follow-up Discussion Questions
Review:
1 . Ask students to complete the self-quiz following
completion of The Cell Tour.
Interpretive:
2 . Ask students to complete the questions that
appear at the end of The Cell Tour.
3. Ask students to think of the cell as a factory and assign roles to certain organelles. For ex
ample, if the cell were a factory, the mitochondria would be the boilers and the lysosomes
would be the janitors.
Reflective:
4. Ask students to reflect upon the best way to
learn about cell organelles and their functions.
5. Ask students whether a visual, self-paced tour of
the cell aided their learning.
Formative Assessment
• Students will demonstrate their ability to asso
ciate cell structures with their functions, and to
identify those organelles and structures com
mon to both animal and plant cells and those
that are unique to each cell type, during their
work using The Cell Tour and taking the fol
low-up self-quiz.
• Students will demonstrate their abilities to use a Web browser, download and install Adobe
Acrobat Reader (if necessary), and print pages
from a Web-based activity as they carry out
The Cell Tour on a computer.
Summative Assessment
• Ask students to construct a three-dimensional
model of a plant or animal cell. • Give students a short quiz based on the learn
ing outcomes. • Ask students to complete a concept map on
cell structure and function.
Suggestions for Extended
Learning
Have students compare and contrast this Cell Tour
with other online cell Web sites, such as
• The Virtual Cell Tour, http://personal.tm1p
.com/Jimr57/ • Eukaryotic Cell Home Page, http://www-class
.unl.edu/bios201 a/spring97/group6/
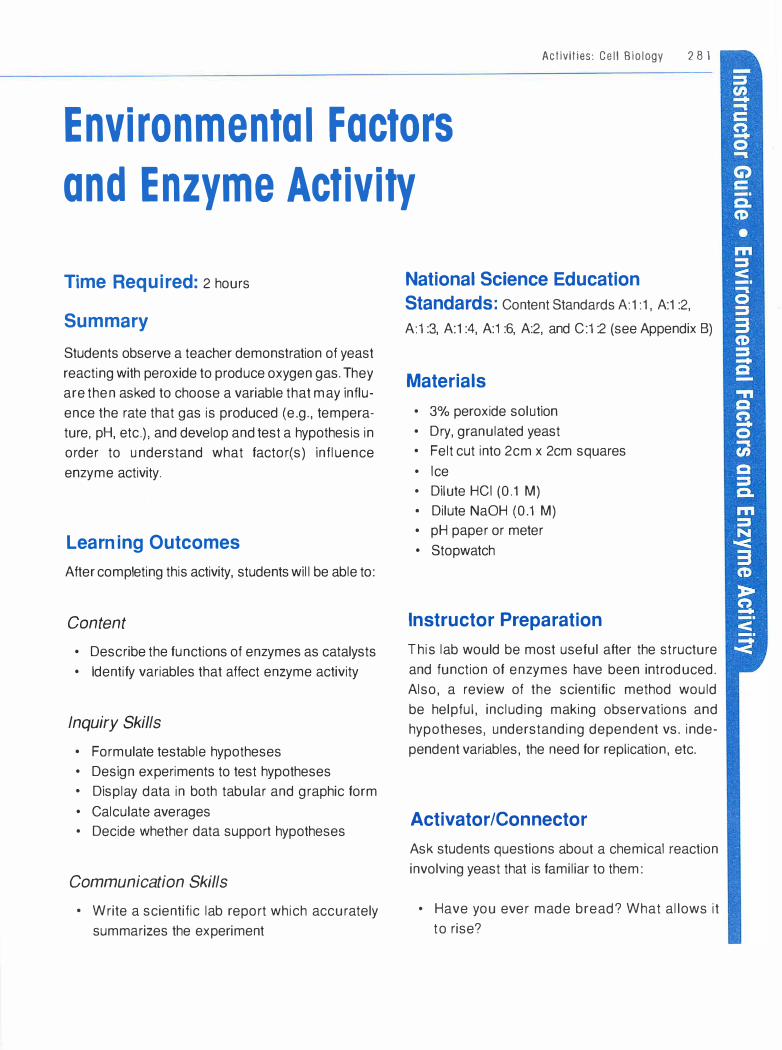
Activities: Ce l l B io logy 2 8 1
Envi ronmenta l Factors
and Enzyme Activity
Time Required: 2 hours
Summary
Students observe a teacher demonstration of yeast
reacting with peroxide to produce oxygen gas. They
are then asked to choose a variable that may influ
ence the rate that gas is produced (e.g., tempera
ture, pH, etc.), and develop and test a hypothesis in
order to understand what factor(s) influence
enzyme activity.
Learning Outcomes
After completing this activity, students will be able to:
Content
• Describe the functions of enzymes as catalysts • Identify variables that affect enzyme activity
Inquiry Skills
• Formulate testable hypotheses • Design experiments to test hypotheses • Display data in both tabular and graphic form
• Calculate averages • Decide whether data support hypotheses
Communication Skills
• Write a scientific lab report which accurately
summarizes the experiment
National Science Education
Standards: Content Standards A:1 :1 , A:1 :2,
A:1 :3, A:1 :4, A:1 :6, A:2, and C:1 :2 (see Appendix B)
Materials
• 3% peroxide solution • Dry, granulated yeast • Felt cut into 2cm x 2cm squares
• Ice • Dilute HCI (0.1 M) • Dilute NaOH (0.1 M) • pH paper or meter • Stopwatch
Instructor Preparation
T his lab would be most useful after the structure
and function of enzymes have been introduced.
Also, a review of the scientific method would
be helpful, including making observations and
hypotheses, understanding dependent vs. inde
pendent variables, the need for replication, etc.
Activator/Connector
Ask students questions about a chemical reaction
involving yeast that is familiar to them:
• Have you ever made bread? What allows it
to rise?

2 8 2 B I O L O G Y S U C C E S S !
• Where do the bubbles in beer or champagne
come from?
Activity Sequence
1. Preview the activity, its purpose, general back
ground, and learning outcomes
2. Teacher demonstration of enzyme reaction (Pro
cedure Part A)
3. Discussion of reaction and possible variables
affecting reaction (Procedure Part B)
4. Student generation of hypotheses and experi
mental procedures (Procedure Part C)
5. Data analysis and presentation (Procedure
Part D)
6. Follow-up discussion questions
Procedure
Part A: Teacher Demonstration
Remind students that there are checkboxes in the
Procedure sections of their handouts to track their
progress in completing the lab.
1 . Dissolve 10-15 grains of yeast in 300 ml H20.
(Note: Yeast may vary in viability. It's advisable to
test your solution prior to use.)
2 . Dilute 1 O ml of 3% peroxide solution in 90 ml
H20 (100 ml total).
3. Using forceps, dip the felt square into the yeast
solution until it's saturated.
4. Drop the yeast-saturated felt square into the
diluted peroxide solution (it may take as long as
30 seconds to sink).
5. Record the total amount of time the felt takes to
sink and rise back to the surface (this can range
from 1 to 2 minutes).
6. As a control, dip the felt square into a 1 00%
water solution and then drop it into the peroxide
solution.
7. Record the result of the control and compare it to
the behavior of the yeast-saturated felt square (the
water-soaked felt square will not rise, indicating
that no chemical reaction has occurred and that the
enzyme is in the yeast).
Part B: Teacher-Led Discussion
1 . Write the chemical equation for the reaction on the board and identify the reactants, products, and
enzyme involved. Specify to the students that cata
lase is a chemical within yeast; yeast itself is not
the enzyme.
catalase H202 (peroxide) > H20 + 1/202 (g)
2. Ask students why the felt initially sinks to the bot
tom of the beaker and later rises to the surface.
The yeast solution makes the felt initially heav
ier than the peroxide solution; the reaction then pro
duces oxygen gas in the felt, making it buoyant.
3. Ask students what variables might affect the time it takes for the felt to sink and then rise again (e.g.,
concentration of yeast or peroxide solutions, tem
perature or pH of the peroxide solution, etc.) and
what treatment levels for these variables could be
investigated:
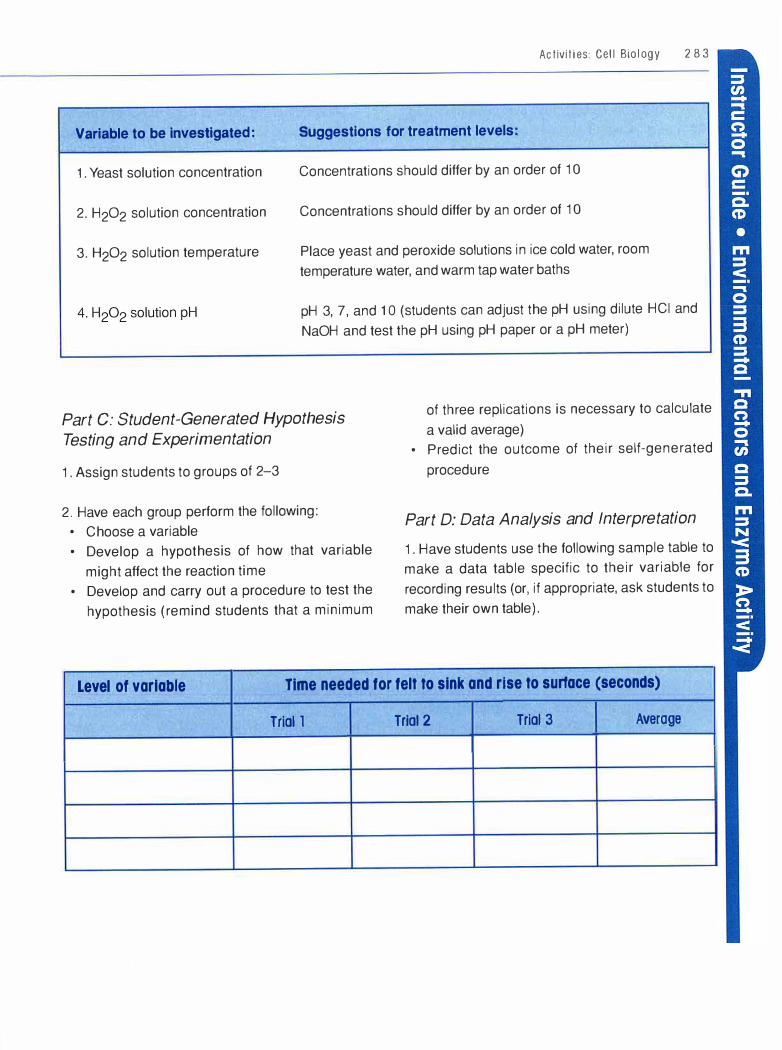
Activities: Cell Biology 2 8 3
Variable to be investigated: Suggestions for treatment levels:
1 . Yeast solution concentration Concentrations should differ by an order of 1 O
2. H202 solution concentration Concentrations should differ by an order of 1 O
3. H202 solution temperature Place yeast and peroxide solutions in ice cold water, room
temperature water, and warm tap water baths
pH 3, 7, and 1 O (students can adjust the pH using dilute HCI and
NaOH and test the pH using pH paper or a pH meter)
Part C: Student-Generated Hypothesis Testing and Experimentation
1 . Assign students to groups of 2-3
2. Have each group perform the following: • Choose a variable • Develop a hypothesis of how that variable
might affect the reaction time • Develop and carry out a procedure to test the
hypothesis (remind students that a minimum
of three replications is necessary to calculate
a valid average) • Predict the outcome of their self-generated
procedure
Part D: Data Analysis and Interpretation
1 . Have students use the following sample table to make a data table specific to their variable for
recording results (or, if appropriate, ask students to
make their own table).
Level of variable Time needed for felt to sink and rise to surface (seconds)
Trial 1 Trial 2 Trial 3 Average

2 8 4 B I O L O G Y S U C C E S S !
2. Ask students to calculate averages and graph
them (e.g., level of variable vs. time to sink and
rise), or show them how using an example.
3. Have students compare averages and develop
an explanation of why their hypothesis was or was not supported.
4. When all students have finished their experi
ments, have each group share with the class their hypothesis, prediction, experimental procedure,
and results.
Follow-up Discussion Questions
Review:
1 . What are the main concepts students have
learned from this lab activity?
2 . What is the general role of enzymes for all
organisms?
Enzymes in organisms act to speed and facili
tate metabolic reactions that might otherwise be
very slow or nonexistent.
3. Based on the class data, what variables affect
enzyme reaction rates and in what way?
• Increasing the yeast concentration should
increase the rate. This is equivalent to increas
ing the enzyme concentration. The rate should go up with enzyme concentration, unless the
substrate concentration is very low.
• Increasing the H2o2 concentration should
increase the rate; decreasing it should
decrease the rate. The rate will level off with
increased concentration when the substrate
concentration is high enough to saturate the
enzyme.
• Increasing the temperature should increase
the rate, up to a point. If the temperature gets
too high, the enzyme will stop working. De
creasing the temperature should decrease
the rate.
• Changing the pH too far in either direction
should reduce the rate. Enzymes have ideal
pH levels at which they work.
Interpretive:
4. If other levels of the variable were used, what
results might be predicted for the experiment?
Student responses will vary, but the idea is that
the treatment levels chosen for the independent
variable have an important role in how the experi
ment plays out. Identifying the treatment level that
has the most pronounced effect can take several
rounds of experimentation.
Reflective:
5. Are there sources of error in this experiment?
How might they have affected the results?
6. What aspects of the activity most contributed to
students' understanding or were most challenging?
How might this understanding be applied to the next lab experiment run?
7. How could the lab be improved?
Formative Assessment
• Students will demonstrate their abilities to
describe the function of enzymes through their
participation in the follow-up discussion to the
activity.
• Students will demonstrate their abilities to
develop a hypothesis, choose a variable, and
perform an experimental procedure during Pro
cedure Part C of the lab.
• Students will demonstrate their understanding
of the effects of environmental conditions on
enzyme activity through their active participa
tion in running their experiments and sharing
their findings and conclusions orally in the fol
low-up discussion section of the lab.
• Students will demonstrate their skills with con
structing data tables and calculating averages, as well as deciding whether data supports a
hypothesis, during Procedure Part D of the lab,
and during the discussion component of the lab
when they present their findings.
Activit ies: Cel l Biology 2 8 5
Summative Assessment
Ask students to use the Lab Report Template on
page 1 63 to summarize the experiment in writing.
In addition, supply an assessment rubric, such as
the one found on page 1 30. Students should pre
sent their data in both tabular and graphic forms.
Suggestions for Extended
Learning
• Ask students to research why factors such as
temperature or pH can affect enzyme activity.
Ask them to bring this information to the next
class session for presentation.
• Ask students to devise an additional hypothesis
and experimental design related to enzyme
activity.

2 8 6 B IO L OGY SUCC E S S !
Egg Osmosis
Special Introduction: This lab activity provides a model for how instructors can convert
demonstration laboratory exercises into structured inquiry and guided inquiry versions.
See page 1 58 for an explanation of the inquiry continuum. The demonstration version of
this lab has students follow a set of instructions to a predetermined outcome in order to
demonstrate the concept of osmosis. The inquiry-based labs allow for more student par
ticipation with respect to developing alternative procedures or experiments to study this
concept. Based on student ability, the instructor has the choice of conducting the demon
stration lab first to allow students the opportunity to practice the basic procedures they'll
need for completing one of the inquiry-based osmosis labs at a later date. Alternatively,
the demonstration version could be skipped altogether, and students can complete one
of the inquiry-based labs.
OSMOSIS LAB:
DEMONSTRATION VERSION
Time Required: 2-21/2 hours
Summary
The Demonstration version of this lab has students
follow a set of instructions to a predetermined out
come in order to demonstrate the concept of osmo
sis. Deshelled eggs are submerged in hypotonic,
isotonic, and hypertonic sugar solutions, and
changes in their weights are recorded.
Learning Outcomes
After completing this activity, students will be able to:
Content
• Define the process of osmosis • Differentiate among the terms hypertonic,
hypotonic, and isotonic • Identify variables that affect osmosis (Guided
Inquiry only)
Inquiry Skills
• Formu late testable hypotheses (Guided Inquiry
only) • Design experiment to test hypotheses (Guided
Inquiry only) • Display data in both tabular and graphic form • Calculate averages
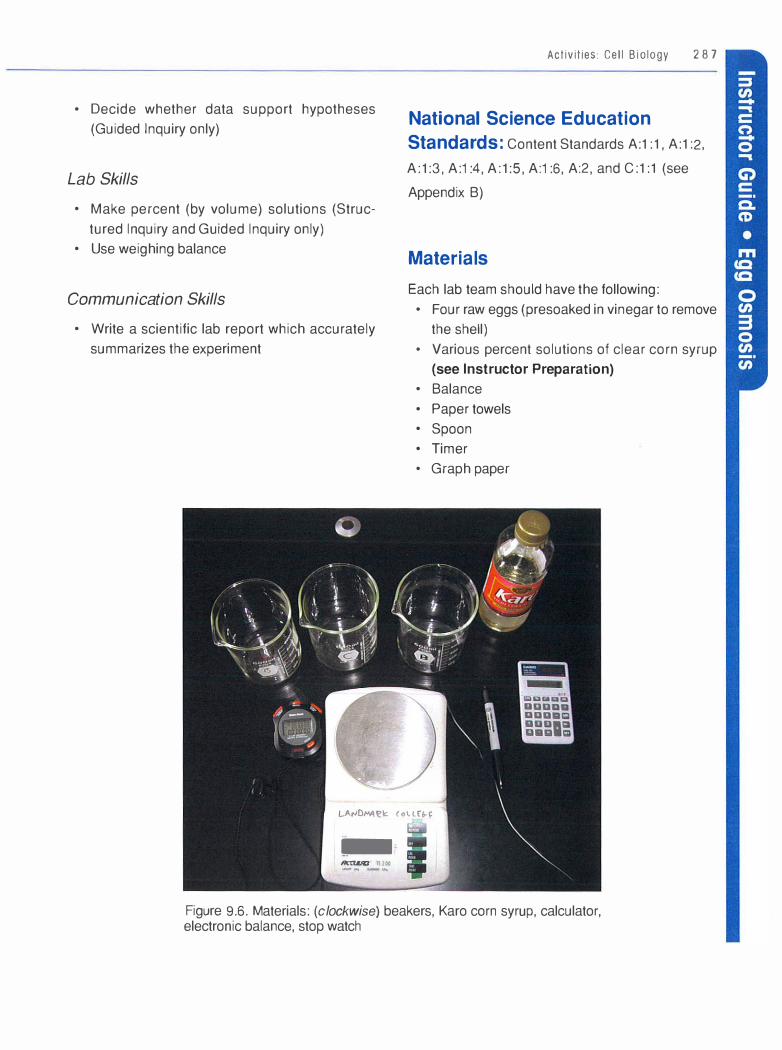
• Decide whether data support hypotheses
(Guided Inquiry only)
Lab Skills
• Make percent (by volume) solutions (Struc
tured Inquiry and Guided Inquiry only) • Use weighing balance
Communication Skills
• Write a scientific lab report which accurately
summarizes the experiment
-IIC:U..:J I 111 - -. -...
Activit ies: Cel l B iology 2 8 7
National Science Education
Standards: Content Standards A:1 :1, A:1 :2,
A:1 :3, A:1 :4, A:1 :5, A:1 :6, A:2, and C:1 :1 (see
Appendix B)
Materials
Each lab team should have the following: • Four raw eggs (presoaked in vinegar to remove
the shell) • Various percent solutions of clear corn syrup
(see Instructor Preparation)
• Balance • Paper towels • Spoon • Timer • Graph paper
Figure 9.6. Materials: (clockwise) beakers, Karo corn syrup, calculator, electronic balance, stop watch
2 8 8 BIOLOGY SUCC E SS!
Instructor Preparation
• Presoak eggs in vinegar for 48 hours to remove
the shell.
1 . White eggs are better to use than brown
eggs, as their shells come off more easily. 2. For best results, soak eggs for 24 hours,
drain the vinegar, add fresh vinegar, and
soak for another 24 hours.
3. Remove any remaining shell by rubbing
eggs gently under running water.
4. Prepare four eggs per lab team, as well as
several extra in case of breakage.
• For each lab team, prepare four solutions dif
fering in solute concentration. Use 600-ml
beakers labeled A, B, C, and D. The solutions
should be prepared in the following manner:
A: 0% solution - 500 ml water only B: 5% solution - add 25 ml clear corn syrup
to 475 ml water
C : 30% solution - add 1 50 ml clear corn
syrup to 350 ml water
D: 50% solution - add 250 ml clear corn
syrup to 250 ml water
• This lab would typically occur after the concept
of osmosis and the terms hypertonic, hypo
tonic, and isotonic have been introduced in the
lecture portion of the class.
Activator/Connector
• Ask students whether they have ever used salt
to draw out water (and some bitter-tasting
solutes) from eggplant slices?
• Ask students whether they have ever prepared
fruit salad. Ask if they've noticed that adding
sugar to the cut pieces of fruit increases the
volume of juice that forms.
Activity Sequence
1 . Preview the activity, its purpose, background,
and learning outcomes
2. Procedure: Measuring weight changes in the eggs
3. Data display and analysis
4. Follow-up discussion questions
Procedure
Lab Preview
• Assign students to groups of 2-4.
• Remind students that there are checkboxes in
the Procedure sections of their handouts to
track their progress in completing the lab.
• Review the entire lab procedure with students
before beginning the lab.
• Explain how each solution was prepared, so
students have a sense of the range of sugar
concentrations provided. The instructor may
need to teach students about the concept of
concentration and percent solutions.
• Teach students how to use a balance, including
taring.
Lab Protocol
1 . Inform students about which of the solutions is probably closest to being isotonic to the egg fluids

(typically, the 5% solution for fresh eggs). Ask stu
dents which solutions they predict will be hyper
tonic and which will be hypotonic relative to the egg
fluids. Based on their knowledge of osmosis, have
students predict what will happen to the weight of
an egg when placed into each solution. Tell them
to record their predictions in the table provided in
the student handout.
2 . Have students record the initial weight (g) of
each egg in the table in the student handout (or
provide students with a table).
3. Instruct students on how to stagger their meas
urements (e.g., placing an egg into a solution every
two minutes) to improve timing efficiency. (An alter
native is to let the eggs soak for an entire day
Figure 9.7. Egg in solution
Activities: Cell Biology 2 8 9
between each weighing in order to achieve more
dramatic results.)
4. Place one egg into the 0% solution, start the
timer, and soak the egg for 15 minutes. Repeat for
the 5%, 30%, and 50% solutions.
5. After each egg soaks for 15 minutes, remove it
with a spoon and carefully dry it with a paper towel.
6. Record the weight of each dried egg in the table
in the student handout.
7. Return each egg to its solution and repeat step 6
after 30 minutes.
8. Return each egg to its solution and repeat step 6
after 45 minutes.
Data Display and Analysis
1. Have students calculate and record in the table
the overall gain or loss in weight for each egg by
giving an example of how the calculation should
be performed (final weight minus initial weight
equals overall weight gain or loss).
2. Instruct students on constructing a graph that
illustrates the change in weight over time for the
various solutions. Have them put the results for
all four solutions on the same graph for easier
comparison.
3. Have students estimate the percent solution that
is isotonic to the fluid inside the egg and write down
their answer in the space provided on the student
handout.
2 9 0 B I O L O G Y S U C C E S S !
Follow-up Discussion Questions
Review:
1 . Give students the opportunity to summarize their
observations and data up to this point.
2. Have groups share and compare results.
3. Ask students whether their results matched their
predictions.
4. Review the terms hypotonic, hypertonic, and iso
tonic, and guide students in the correct application
of these terms to their results.
Hypotonic = fluid with lower solute concentration
relative to another fluid
Hypertonic = fluid with greater solute concen
tration relative to another fluid
Isotonic = fluids with the same solute con
centration
Interpretive:
5. Ask students to relate the results of the lab exer
cise to osmosis within a cell or organism. Give
them some scenarios where organisms or cells are
exposed to changes in osmolarity. For example,
salmon migrate from seawater to freshwater to
spawn. Ask students to predict what will happen to
the salmon's cell volumes.
One of the problems with drinking seawater is
that it is three times as salty as blood or tissue
fluid or cytoplasm. The natural tendency is for the
fluid in the cells of the stomach and intestine to lose water to the saltier seawater, thus shrinking
the cells and possibly killing them and others. Salt
water fish normally drink seawater, but they have
specialized gills that pump salt ions back into the
seawater, allowing the fish to keep just the water.
Since the gills are thin and filled with capillaries,
they are a natural gateway for water flux. If a salt
water fish swims into freshwater, the outflow of
water reverses, and the fish may be in danger of
gaining too much water. Anadromous fish (salmon,
eels, etc.) can alter the capabilities of their gills,
compensating for the reversal of water flux,
whereas other fish cannot.
6. Ask students to predict how the results of this
experiment would differ if older, more dehydrated
eggs had been used instead of fresh eggs.
When something dehydrates, water is lost. The
ratio of water to dissolved substances-ions for
example-changes to a higher proportion of dis
solved substances, even though their number has
not changed. When this happens, the osmotic
potential of the solution is also changed. For ex
ample, when eggs dehydrate in storage, they are
more likely than fresh eggs to absorb more water
if placed into distilled water, and the isotonic point
would shift toward a higher osmolarity than the normal isotonic point.
Reflective:
7. Ask students to determine sources of error for
the lab.
8. Ask students to freewrite a paragraph on those
aspects of the activity that most contributed to their
understanding of osmosis.
9. Ask students to freewrite on those aspects of the
lab they found most challenging.
10. Ask students to develop and share mnemonic
devices for memorizing the terms associated with
the process of osmosis.

Formative Assessment
• Students will demonstrate their knowledge of
osmosis and of the terms hypertonic, hypo
tonic, and isotonic in the discussion during the
preview section before the lab.
• Students will demonstrate their abilities to iden
tify variables that affect osmosis, formulate
testable hypotheses, and design experiments
to test those hypotheses during the procedure
part of the lab (Guided Inquiry only).
• Students will demonstrate their abilities to
decide if data supports a hypothesis during the
follow-up discussion part of the lab (Guided
Inquiry only).
• Students will show their facility with displaying
data and calculating percentages during the
procedure part of the lab.
• Students will demonstrate their abilities to make
percent (by volume) solutions and use the weigh
ing balance during the procedure part of the lab
(Structured Inquiry and Guided Inquiry only).
Activities: Cell Biology 2 9 l
Summative Assessment
• Ask students to use the Lab Report Template
on page 1 63 to summarize the experiment in
writing. In addition, supply an assessment
rubric such as the one found on page 1 30.
• Have students convert the data into a graph
that indicates time vs. weight gain or loss,
describe the results, and draw some con
clusions.
Suggestions for Extended
Learning
• Ask students to develop new questions about
the process of osmosis and design further
experiments that might answer those ques
tions. For example, students could be asked to
design experiments with dialysis tubing as the model system. Using dialysis tubing, they have
the ability to alter both the internal and exter
nal solute concentrations.
• As the terms hypotonic, hypertonic, and iso
tonic are quite similar, ask students to create mnemonic devices for remembering the differ
ences between the terms. Have them share
their mnemonics with the class.
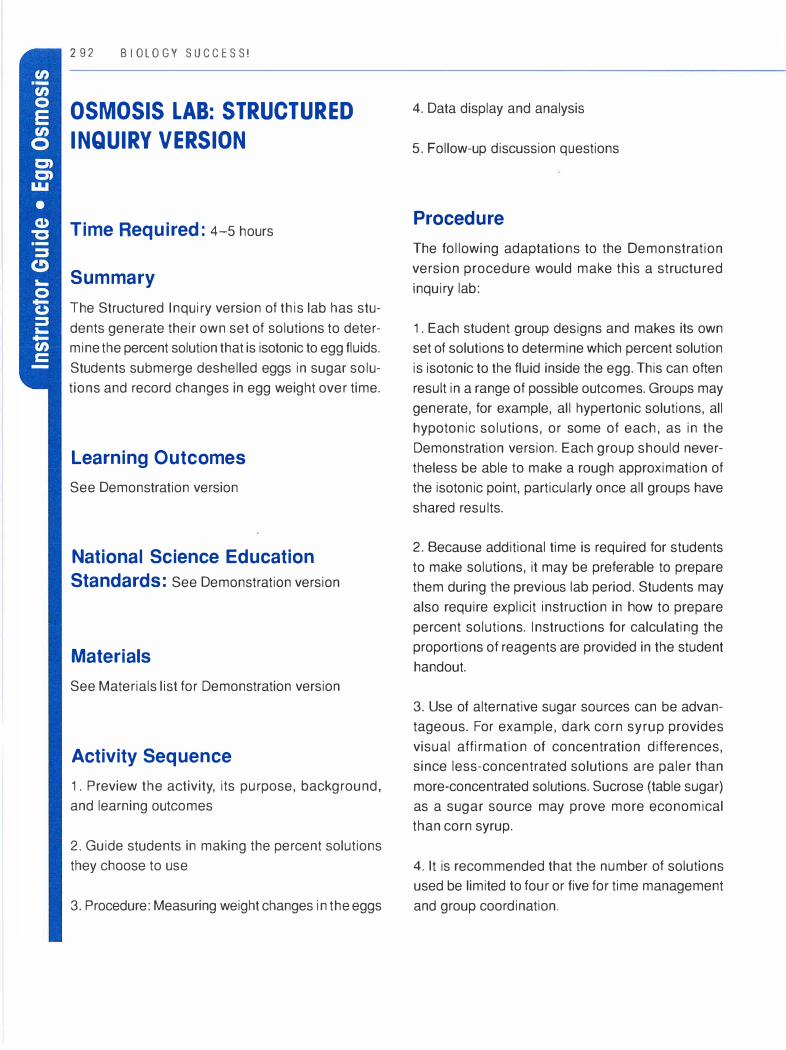
2 9 2 BIOLOGY SUCC ESS!
OSMOSIS LAB: STRUCTURED
INQUIRY VERSION
Time Required : 4-5 hours
Summary
T he Structured Inquiry version of this lab has stu
dents generate their own set of solutions to determine the percent solution that is isotonic to egg fluids.
Students submerge deshelled eggs in sugar solu
tions and record changes in egg weight over time.
Learning Outcomes
See Demonstration version
National Science Education
Standards: See Demonstration version
Materials
See Materials list for Demonstration version
Activity Sequence
1 . Preview the activity, its purpose, background,
and learning outcomes
2. Guide students in making the percent solutions
they choose to use
3. Procedure: Measuring weight changes in the eggs
4. Data display and analysis
5. Follow-up discussion questions
Procedure
The following adaptations to the Demonstration
version procedure would make this a structured
inquiry lab:
1 . Each student group designs and makes its own
set of solutions to determine which percent solution
is isotonic to the fluid inside the egg. This can often
result in a range of possible outcomes. Groups may
generate, for example, all hypertonic solutions, all
hypotonic solutions, or some of each, as in the
Demonstration version. Each group should never
theless be able to make a rough approximation of
the isotonic point, particularly once all groups have
shared results.
2 . Because additional time is required for students
to make solutions, it may be preferable to prepare
them during the previous lab period. Students may
also require explicit instruction in how to prepare
percent solutions. Instructions for calculating the
proportions of reagents are provided in the student
handout.
3. Use of alternative sugar sources can be advan
tageous. For example, dark corn syrup provides
visual affirmation of concentration differences, since less-concentrated solutions are paler than
more-concentrated solutions. Sucrose (table sugar)
as a sugar source may prove more economical than corn syrup.
4. It is recommended that the number of solutions used be limited to four or five for time management
and group coordination.

5. Remind students that there are checkboxes in
the Procedure section of their handouts to track
their progress in completing the lab.
6. See the student handout "Student· Egg Osmo
sis-Structured Inquiry" in Appendix C for detailed
procedure and data analysis.
Follow-up Discussion Questions
These questions are the same as those in the
Demonstration version
Activities: Cell B i ology 2 9 3
Formative Assessment
See Demonstration version
Summative Assessment
See Demonstration version
Suggestions for Extended
Learning
See Demonstration version
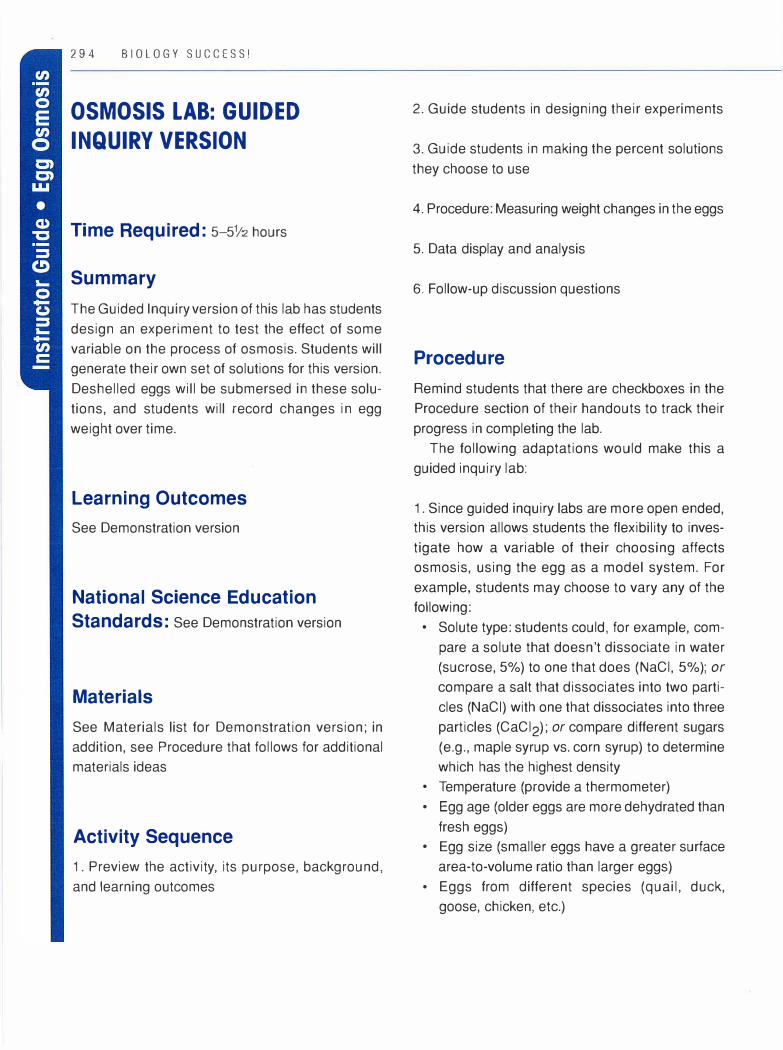
2 9 4 B I O L O G Y S U C C E S S !
OSMOSIS LAB: GUIDED
INQUIRY VERSION
Time Required: 5-5112 hours
Summary
The Guided Inquiry version of this lab has students
design an experiment to test the effect of some
variable on the process of osmosis. Students will
generate their own set of solutions for this version.
Deshelled eggs will be submersed in these solu
tions, and students will record changes in egg
weight over time.
Learning Outcomes
See Demonstration version
National Science Education
Standards: See Demonstration version
Materials
See Materials list for Demonstration version; in
addition, see Procedure that follows for additional
materials ideas
Activity Sequence
1 . Preview the activity, its purpose, background,
and learning outcomes
2. Guide students in designing their experiments
3. Guide students in making the percent solutions
they choose to use
4. Procedure: Measuring weight changes in the eggs
5. Data display and analysis
6. Follow-up discussion questions
Procedure
Remind students that there are checkboxes in the
Procedure section of their handouts to track their
progress in completing the lab.
The following adaptations would make this a
guided inquiry lab:
1 . Since guided inquiry labs are more open ended, this version allows students the flexibility to inves
tigate how a variable of their choosing affects osmosis, using the egg as a model system. For
example, students may choose to vary any of the following:
• Solute type: students could, for example, com
pare a solute that doesn't dissociate in water
(sucrose, 5%) to one that does (NaCl, 5%); or
compare a salt that dissociates into two parti
cles (NaCl) with one that dissociates into three
particles (CaCl2); or compare different sugars
(e.g., maple syrup vs. corn syrup) to determine
which has the highest density • Temperature (provide a thermometer) • Egg age (older eggs are more dehydrated than
fresh eggs) • Egg size (smaller eggs have a greater surface
area-to-volume ratio than larger eggs) • Eggs from different species (quail, duck,
goose, chicken, etc.)

2. Limit students to studying one variable at no
more than three levels to facilitate completion of
each group's project in the allotted time.
3. Students may require instruction on controlling
all possible variables except the independent vari
able being studied. If this is the case, provide a
sample experiment and ask students to develop a
list of variables that should be controlled to achieve
optimal results.
4. Student groups should be required to write the
protocols for their experiments prior to starting the
experiment. This activity ensures that the group
f,orts out procedures prior to initiating work.
5. Additional prelab prep is required to make this
version more manageable for the instructor; for
example: • If the Demonstration version is done first, ask
students to design and submit a mini-proposal for their self-designed version prior to leaving
that lab. In this way, the instructor can provide some on-the-spot guidance and have required
materials available for the next lab period.
• If only the inquiry-based lab is done, provide a
restricted list of available materials that can be
used to design an experiment.
6. See the student handout "Student• Egg Osmo
sis-Guided Inquiry" in Appendix C for detailed
procedure and data analysis.
Follow-up Discussion Questions
These Review and Interpretive questions can be substituted for questions 1-5 in the Demonstration
version.
Activities: Cell Biology 2 9 5
1 . Give students the opportunity to summarize their observations and data up to this point.
2. Review the terms hypotonic, hypertonic, and iso
tonic and guide students in the correct application of these terms to their results.
3. Ask students to estimate the percent solution
that is isotonic to the fluid in the egg in each case.
Did their results change or remain the same as a
result of their treatment protocol?
4. Ask students to compare their results with those
of other groups. What general conclusions can they
draw about the process of osmosis and the factors
that affect it?
5. Ask students whether their results matched their
predictions.
For interpretive and reflective questions 6-9, see the Demonstration version of this activity.
Formative Assessment
See Demonstration version
Summative Assessment
See Demonstration version
Suggestions for Extended
Learning
See Demonstration version

10 ACTIVITIES:
GENETICS
Introduction
This section contains three activities that fall under the content area of
genetics. They are not intended to be used in the particular sequence
in which they are presented. Instructors are encouraged to use them
in any sequence that fits their curriculum. A short description of each
activity follows.
Mendelian Genetics {page 299). In this activity, students learn the
basic patterns of Mendelian inheritance using Punnett squares and
Legos to represent genes. The activity is designed to demonstrate
both an inductive and a tactile approach to learning these concepts. A
supporting student handout and concept map are provided for this
activity in Appendix C, "Student• Mendelian Genetics."
Genetics on the World Wide Web {page 307). Students explore vari
ous Web sites that teach about genetics through animations and inter
active features. No student handout is provided for this activity.
Human Monogenic Traits {page 312). In this activity, students carry
out a survey to sample the frequency of human monogenic traits in

298 BIOLOGY SUCCESS!
their school or community. It is designed as a struc
tured inquiry activity in that the instructor offers
explicit instructions and procedures, yet students
are pressed to draw their own conclusions. It also
includes an optional component in which students
use an explicitly taught statistical test to determine
the significance of their results. A complete stu
dent handout is provided in Appendix C, "Stu
dent• Human Monogenic Traits."

Activities: Genetics 2 9 9
Mendelian Genetics
Time Required: 60 minutes
Summary
This activity provides a concrete experience and
analogy for students in building their understanding
of key introductory genetics principles. It is inductive
by design. See page 102 for an overview of "Induc
tive and Deductive Teaching Approaches." The
activity should be carried out after some prior
knowledge assessment for a genetics unit has been
done, and after students have been given a basic
introduction to genes and chromosomes. A short
video clip that shows this activity is included on the
CD found on the inside front cover of this manual.
Learning Outcomes
After completing this activity, students will be able to:
Content
• Associate genes and genotype with traits and
phenotype
• Use Punnett square analysis to predict the
genotype and phenotype of offspring
• Define and correctly apply the following genetic
terms: allele, genotype, phenotype, heterozy
gous/heterozygote, homozygouslhomozygote,
dominant allele/dominance, recessive allele!
recessiveness
National Science Education
Standards: Content Standard C:2:2 (see
Appendix B)
Materials
• Two small, distinct shapes representing alleles:
- Examples: Legos or wooden blocks; any
materials that fit into containers ,described
under next bullet
- 14 pieces of one shape and 14 pieces of
another shape are needed per team
- The exercise as described here uses black
2cm x 2cm Lego square bricks and Lego steep
slope roof tiles (see the source note at the
end of this activity)
.
I ! I
r,
Figure 10.1. Materials (A): two distinct Lego shapes representing alleles
Note:This activity was inspired by one authored by Anne Buchanan and found at the Access Excellence Web site:
http://www.accessexcellence.org/ (AE/ATG/data/released/0256-AnneBuchanan/index.html; link now discontinued) (permis
sion granted to cite)
Source Note for Materials: Lego, P.O. Box 1310, Enfield, CT 06083; www.lego.com; 2x2 brick, Item #3495; 2x2 steep slope
roof tile, Item #3453
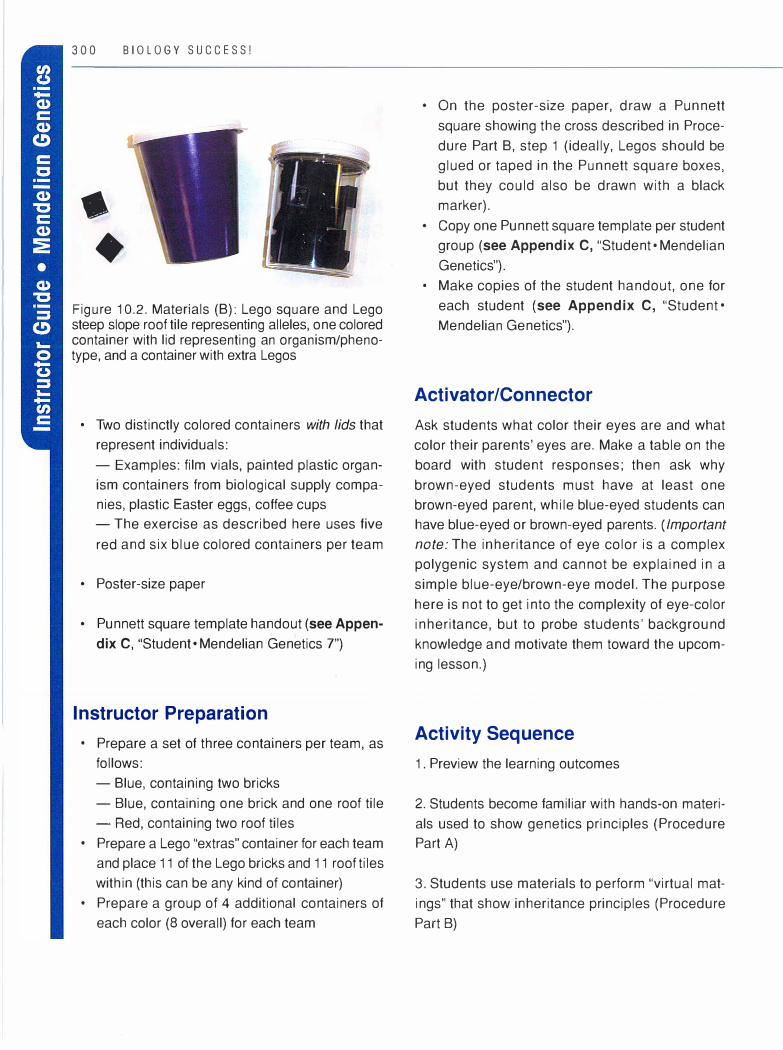
300 BIOLOGY SUCCESS!
•
•
Figure 10.2. Materials (B): Lego square and Lego steep slope roof tile representing alleles, one colored container with lid representing an organism/phenotype, and a container with extra Legos
• Two distinctly colored containers with lids that
represent individuals:
- Examples: film vials, painted plastic organ
ism containers from biological supply compa
nies, plastic Easter eggs, coffee cups
- The exercise as described here uses five
red and six blue colored containers per team
• Poster-size paper
• Pun nett square template handout (see Appen
dix C, "Student• Mendelian Genetics 7")
Instructor Preparation
• Prepare a set of three containers per team, as
follows:
- Blue, containing two bricks
- Blue, containing one brick and one roof tile
- Red, containing two roof tiles • Prepare a Lego "extras" container for each team
and place 11 of the Lego bricks and 11 roof tiles
within (this can be any kind of container) • Prepare a group of 4 additional containers of
each color (8 overall) for each team
• On the poster-size paper, draw a Punnett
square showing the cross described in Proce
dure Part B, step 1 (ideally, Legos should be
glued or taped in the Punnett square boxes,
but they could also be drawn with a black
marker).
• Copy one Punnett square template per student
group (see Appendix C, "Student•Mendelian
Genetics"). • Make copies of the student handout, one for
each student (see Appendix C, "Student•
Mendelian Genetics").
Activator/Connector
Ask students what color their eyes are and what
color their parents' eyes are. Make a table on the
board with student responses; then ask why
brown-eyed students must have at least one
brown-eyed parent, while blue-eyed students can
have blue-eyed or brown-eyed parents. (Important
note: The inheritance of eye color is a complex
polygenic system and cannot be explained in a
simple blue-eye/brown-eye model. The purpose
here is not to get into the complexity of eye-color
inheritance, but to probe students' background
knowledge and motivate them toward the upcom
ing lesson.)
Activity Sequence
1. Preview the learning outcomes
2. Students become familiar with hands-on materi
als used to show genetics principles (Procedure
Part A)
3. Students use materials to perform "virtual mat
ings" that show inheritance principles (Procedure
Part B)
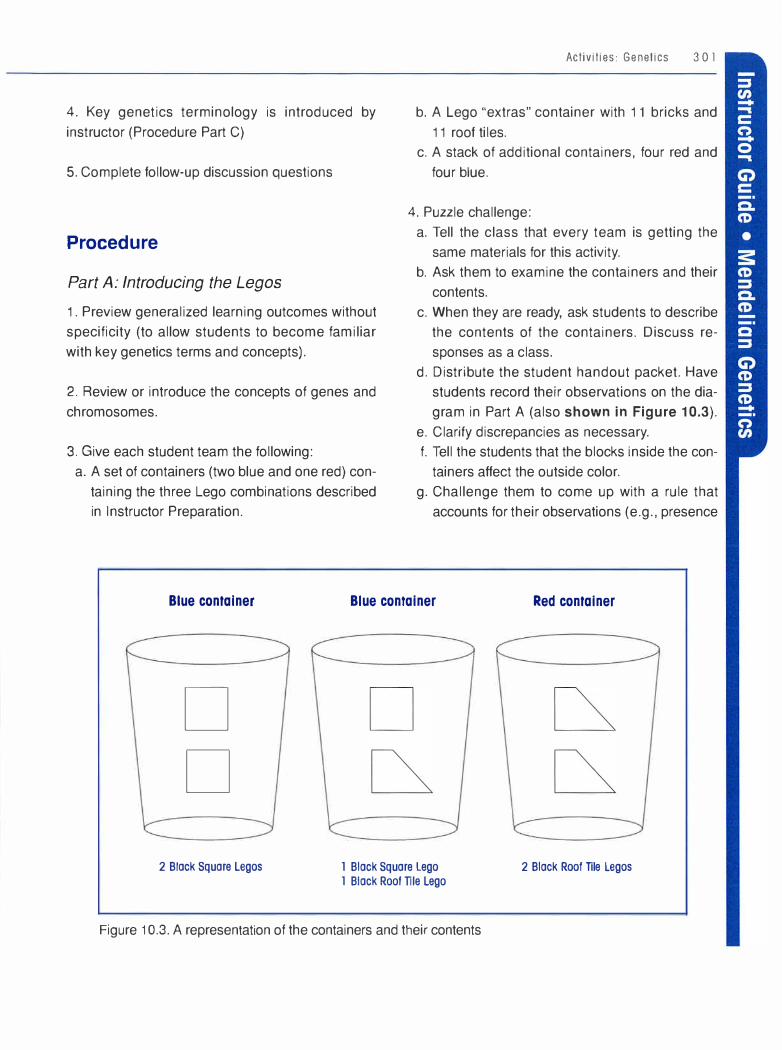
4. Key genetics terminology is introduced by
instructor (Procedure Part C)
5. Complete follow-up discussion questions
Procedure
Part A: Introducing the Legos
1 . Preview generalized learning outcomes without
specificity (to allow students to become familiar
with key genetics terms and concepts).
2. Review or introduce the concepts of genes and
chromosomes.
3. Give each student team the following:
a. A set of containers (two blue and one red) con
taining the three Lego combinations described
in Instructor Preparation.
Activities: Genetics 3 0 1
b. A Lego "extras" container with 11 bricks and
11 roof tiles.
c. A stack of additional containers, four red and
four blue.
4. Puzzle challenge:
a. Tell the class that every team is getting the
same materials for this activity.
b. Ask them to examine the containers and their
contents.
c. When they are ready, ask students to describe
the contents of the containers. Discuss re
sponses as a class.
d. Distribute the student handout packet. Have
students record their observations on the dia
gram in Part A (also shown in Figure 10.3).
e. Clarify discrepancies as necessary.
f. Tell the students that the blocks inside the con
tainers affect the outside color.
g. Challenge them to come up with a rule that
accounts for their observations (e.g., presence
Blue container Blue container Red container
D
D
2 Black Square Lagos 1 Black Square Lego 1 Black Roof Tile Lego
Figure 10.3. A representation of the containers and their contents
2 Black Roof Tile Lagos
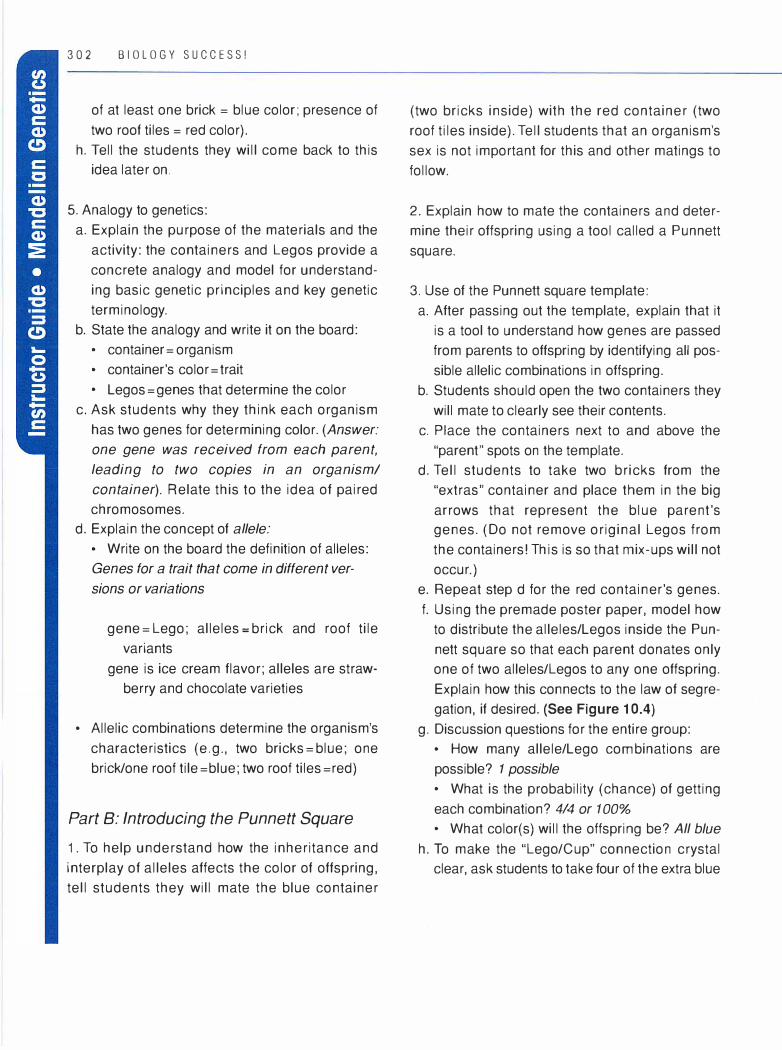
302 BIOLOGY SUCCESS!
of at least one brick = blue color; presence of
two roof tiles = red color).
h. Tell the students they will come back to this
idea later on.
5. Analogy to genetics:
a. Explain the purpose of the materials and the
activity: the containers and Legos provide a
concrete analogy and model for understand
ing basic genetic principles and key genetic
terminology.
b. State the analogy and write it on the board:
• container= organism
• container's color= trait
• Legos=genes that determine the color
c. Ask students why they think each organism
has two genes for determining color. (Answer:
one gene was received from each parent,
leading to two copies in an organism/
container). Relate this to the idea of paired
chromosomes.
d. Explain the concept of allele:
• Write on the board the definition of alleles:
Genes for a trait that come in different ver
sions or variations
gene= Lego; alleles= brick and roof tile
variants
gene is ice cream flavor; alleles are straw
berry and chocolate varieties
• Allelic combinations determine the organism's
characteristics (e.g., two bricks=blue; one
brick/one roof tile= blue; two roof tiles= red)
Part B: Introducing the Punnett Square
1. To help understand how the inheritance and
interplay of alleles affects the color of offspring,
tell students they will mate the blue container
(two bricks inside) with the red container (two
roof tiles inside). Tell students that an organism's
sex is not important for this and other matings to
follow.
2. Explain how to mate the containers and deter
mine their offspring using a tool called a Punnett
square.
3. Use of the Punnett square template:
a. After passing out the template, explain that it
is a tool to understand how genes are passed
from parents to offspring by identifying all pos
sible allelic combinations in offspring.
b. Students should open the two containers they
will mate to clearly see their contents.
c. Place the containers next to and above the
"parent" spots on the template.
d. Tell students to take two bricks from the
"extras" container and place them in the big
arrows that represent the blue parent's
genes. (Do not remove original Legos from
the containers! This is so that mix-ups will not
occur.)
e. Repeat step d for the red container's genes.
f. Using the premade poster paper, model how
to distribute the alleles/Legos inside the Pun
nett square so that each parent donates only
one of two alleles/Legos to any one offspring.
Explain how this connects to the law of segre
gation, if desired. (See Figure 10.4) g. Discussion questions for the entire group:
• How many allele/Lego combinations are
possible? 1 possible
• What is the probability (chance) of getting
each combination? 4/4 or 100%
• What color(s) will the offspring be? All blue
h. To make the "Lego/Cup" connection crystal
clear, ask students to take four of the extra blue
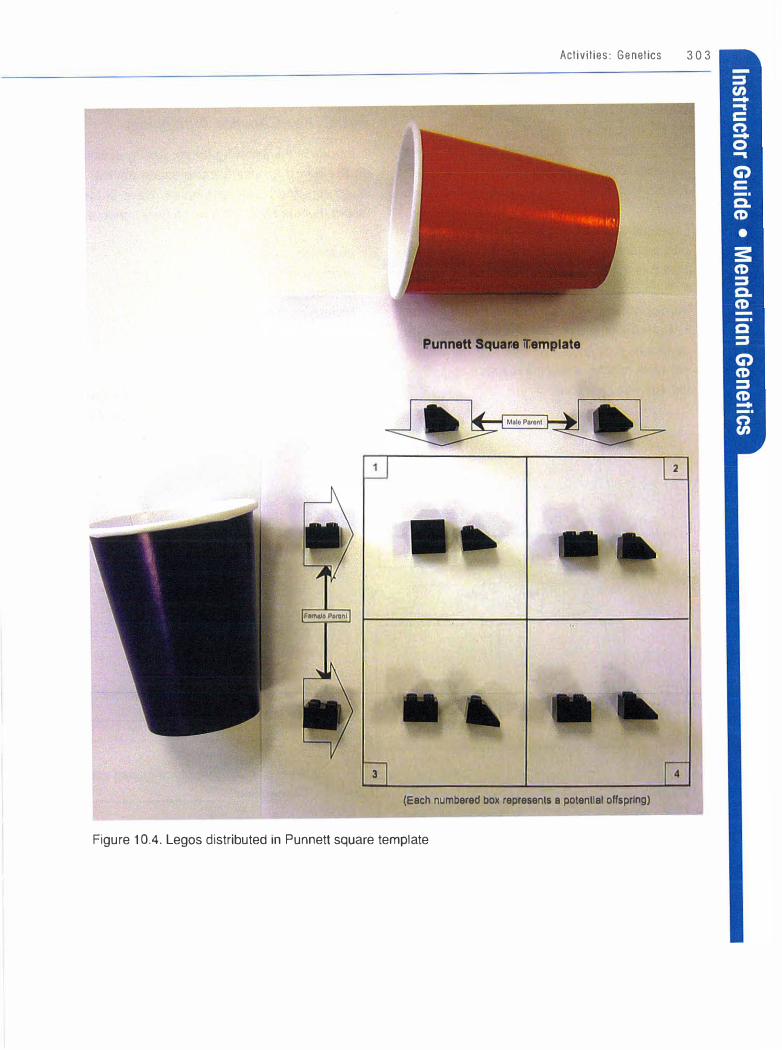
Fema!o Pan,nl
3
Activities: Genetics 3 0 3
Punnett Square Template
2
(Each numbered box represents a potential offspring)
Figure 10.4. Legos distributed in Punnett square template
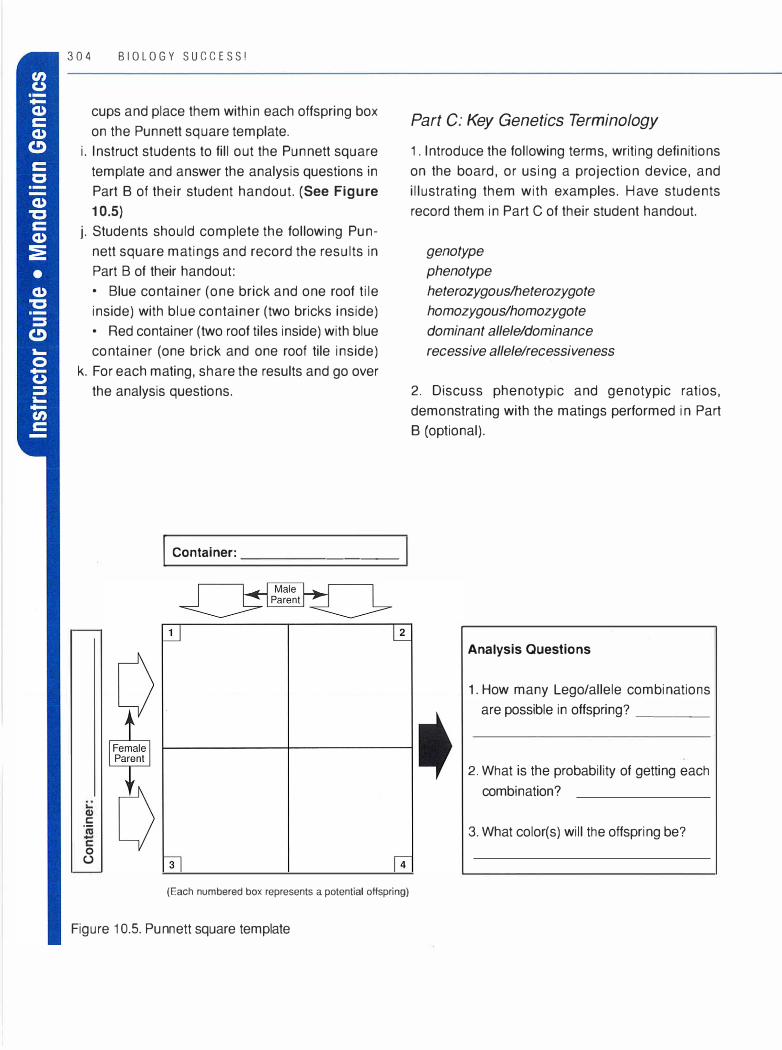
304 BIOLOGY SUCCESS!
cups and place them within each offspring box
on the Punnett square template.
i. Instruct students to fill out the Punnett square
template and answer the analysis questions in
Part B of their student handout. (See Figure 10.5)
j. Students should complete the following Pun
nett square matings and record the results in
Part B of their handout:
• Blue container (one brick and one roof tile
inside) with blue container (two bricks inside)
• Red container (two roof tiles inside) with blue
container (one brick and one roof tile inside)
k. For each mating, share the results and go over
the analysis questions.
·=
0 (.)
I Container: _ _ _ _ ____ _
(Each numbered box represents a potential offspring)
Figure 10.5. Pun nett square template
Part C: Key Genetics Terminology
1. Introduce the following terms, writing definitions
on the board, or using a projection device, and
illustrating them with examples. Have students
record them in Part C of their student handout.
genotype
phenotype
heterozygous/heterozygote
homozygous/homozygote
dominant allele/dominance
recessive allele/recessiveness
2. Discuss phenotypic and genotypic ratios,
demonstrating with the matings performed in Part
B {optional).
Analysis Questions
1. How many Lego/allele combinations
are possible in offspring? ___ _
2. What is the probability of getting each
combination?
3. What color(s) will the offspring be?
Follow-Up Discussion Questions
Review:
Note: In the following tasks, students demonstrate
their understanding with actions, not words. The
easiest way to do this is to have all students hold
up and use the appropriate materials to show their
answers to the prompts listed below. This is a quick
way to assess student understanding and to iden
tify and correct discrepancies. It also recognizes
those students who understand through their
hands but have difficulty using language to share
their understanding.
1. Post these tasks for all to see, so students can
have a visual reference. Ask students to demon
strate the following:
a. Show two possible phenotypes.
Students will hold up the two colored
containers.
b. Show the heterozygous genotype.
Students will hold up the roof tile/brick
combination.
c. Show a recessive allele.
Students will hold up the roof tile.
d. Show three possible genotypes.
Students will hold up the two bricks, the two
roof tiles, and the roof tile/brick combination.
e. Show a dominant allele.
Students will hold up the brick.
f. Show the homozygous genotypes.
Students will hold up the two bricks and the
two roof tiles.
2. To apply their learning, ask students, using the
Pun nett square template, to determine potential off
spring genotypes, phenotypes, and their ratios for
all possible matings that have not been discussed:
a. Homozygous blue container x homozygous
blue container
Activities: Genetics 3 0 5
b. Homozygous red container x homozygous red
container
c. Heterozygous container x heterozygous con
tainer
Have them record their work in Part D of the stu
dent handout.
Interpretive:
3. Analyze the Lego/colored container analogy
used in this exercise for its genetic accuracy.
a. What is accurate?
Genes do affect an organism's color. Genes
come in different forms (alleles) that at a
molecular level have different shapes, just like
the Legos.
b. What is oversimplified?
Color tends to be affected by more than one
set of genes.
Note: It is important to fend off larger miscon
ceptions whenever possible.
Reflective:
4. Ask students to reflect on how well this analogy
helped them learn the genetics terms and princi
ples introduced.
Formative Assessment
• Students will demonstrate their understanding
of the relationship between genotype and phe
notype in class by completing question 1 of the
follow-up discussion part of the activity.
• Students will demonstrate their understanding
of the genetic terms homozygous, heterozy
gous, recessive, and dominant in class by com
pleting question 1 of the follow-up discussion
part of the activity.
306 BIOLOGY SUCCESS!
• Students will demonstrate their abilities to use
Punnett square analysis to predict genotypes
and phenotypes during Procedure Part B and
question 2 of the follow-up discussion part of
the activity.
Summative Assessment
• If students are familiar with concept maps, ask
them to generate a concept map that includes
the following concepts: genes, alleles, homozy
gous, heterozygous, dominant, recessive,
genotype, phenotypes, chromosomes.
• Alternatively, assign a fill-in-the-blank concept
map such as the example found in Appen
dix C, "Student • Mendelian Genetics 8."
Suggestions for Extended
Learning
• Once students have mastered the terms and
their tactile representations, introduce more
traditional representations of Punnett squares
using letter codes (i.e., AA or aa) and classic
genetics problems.
• Use this same Lego/container set-up and
enhance it to teach additional concepts such as
incomplete dominance, codominance, and
dihybrid crosses.
Incomplete Dominance: This could be done by
adding a new cup color, such as purple, to
the activity's materials.
Codominance: The classic A-B-0 blood-type
example of codominance could be modeled
by adding another Lego shape to the mix,
as well as two more container colors (for
instance, Blue=A type; Red=B type; Pur
ple=O type; and Blue-and-Red Striped=AB
type)
Dihybrid Crosses: A dihybrid cross would be a
lot more complex than the monohybrid
cross, but possible. It would require
- a 16-box Punnett square template
- an additional phenotypic trait besides
container color (such as two different lid
styles)
- four different Lego shapes (two new
ones for the lid styles, for instance, plus the
originals)

Activit ies: Genetics 3 O 7
Genet ics on f he World Wide Web
Time Required: variable
Summary
Using Web sites selected by the instructor, stu
dents utilize the graphic advantages of the World
Wide Web to explore key genetics concepts, such
as the structure of DNA, protein synthesis, chro
mosomes, and genes. See "Using the Internet and
CD-ROMs in the Biology Curriculum" beginning on page 165 for ideas on evaluating and choosing
Web sites for students with learning differences.
Learning Outcomes
After completing this activity, students will be able to:
Content
• Define terms (as determined by instructor)
associated with some or all of the following
areas of genetics: general DNA and chromo
some structure and function, the processes of
transcription and translation, mutations, gene
structure, and sequence analysis • Demonstrate knowledge of key genetic con
cepts through class presentation (optional)
Computer Skills
• Locate and navigate Web sites on concepts in
genetics
National Science Education
Standards: C:2:1, C:2:2, and C:2:3 (see
Appendix B)
Materials
• Computers with Internet access, as well as
Flash and Shockwave plug-ins • Question guides for each site to focus student
explorations • Digital projection device
Instructor Preparation
Before the activity, instructors will need to do the
following:
• Preview the Web sites described below to
determine if they are still active • Decide which active sites best suit their teach
ing objectives. For instance, an instructor could
use these sites to introduce some new genetics
concepts or to review and enhance student
understanding of concepts previously encoun
tered during the course • Decide whether to have students work in pairs
or alone • Decide how many sites an individual or team
will explore • Decide whether or not to modify the "sample
guiding questions" in Procedure Part A to suit
their teaching objectives • Reserve a computer lab where the activity can
take place and load, if necessary, the plug-ins
needed to run some of the Web activities

3 0 8 B I O L O G Y S U C C E S S !
• Devise a quick and efficient method for stu
dents to access the URLs described in Proce
dure Part A, such as a Web page that contains
the links
Activator/Connector
What does a gene look like? Ask students to draw
their depictions of a gene and share them with the
class. Use this as a segue to suggest that the
graphic powers of the World Wide Web can make
the abstract nature of genetics more concrete and
easier to understand.
Activity Sequence
1. Preview the activity, its purpose, background,
and learning outcomes
2. Student exploration of Web sites assigned by
instructor (Procedure Part A)
3. Student presentations on Web sites (Procedure
Part B-optional)
4. Follow-up discussion questions
Procedure
Part A: Web Site Descriptions
The Web sites described in this section offer activi
ties and animations to help students explore and
understand key genetics concepts. We have sup
plied a description of the main features of each site
and a list of focusing questions to guide students
in using the sites effectively. Teachers may assign
one or more sites or Web explorations for each stu-
dent or student team. The sites are arranged from
most basic to most advanced.
1. Journey into DNA
http://www.pbs.org/wgbh/nova/genome/dna. html
(needs Flash plug-in)
From NOVA: Cracking the Code of Life
http://www.pbs. org/wgbh/nova/genome/
This activity is a 15-slide animation that allows the
user to view smaller and smaller levels of genetic
detail, starting with the human body and ending with
the atomic structure of DNA bases. It even includes
a rhyming verse that accompanies the animation. It
provides a meaningful sense of scale for under
standing the relationship of cells and DNA.
Sample Guiding Questions
• How many cells are there in the human
body? • What is the range of gene length in terms of
bases? • What is the role of histones? • Rank the following structures from largest
to smallest: nucleosome, cell, gene, chromo
somes, nucleotide, bases, DNA, chromatid,
nitrogen, atom, nucleus
2. Build a DNA Molecule
http://gslc.genetics.utah.edu/basic/builddna.html
From Genetics Science Learning Center at
http://gslc.genetics.utah.edu/index.html
This short activity allows students to see and
manipulate the base pair combinations in a DNA
strand. This would be most appropriate for groups
with little background knowledge about the struc
ture of DNA.
Sample Guiding Questions
• Describe the pairing of DNA bases in the
DNA strand. • What do you think the "crunching" sound

represents biologically when the nucleotides
are dragged into their locations?
3. Tour of the Basics
http://gslc.genetics. utah. edu/basic/basics.html
(requires a Flash plug-in)
From Genetics Science Learning Center at
http://gslc.genetics. utah.edu/index.html
This primer activity contains six different mod
ules: What Is DNA? What Is a Gene? What Is a
Chromosome? What Is Inheritance? What Is a Pro
tein? What Is Meiosis/Mitosis? A teacher could
assign any single module or a combination of the
modules in any order. This would be most appro
priate for groups just encountering these ideas for
the first time, or as a method of review.
Sample Guiding Questions for the What Is a
Chromosome ? module
• Describe the role of chromosomes for an
organism. • Describe the sex chromosomes. • Compare chromosome numbers across
species.
4. Transcribe and Translate a Gene
http ://gslc .genetics. utah .edu/basic/transcribe. htm I
From Genetics Science Learning Center at
http://gslc.genetics.utah.edu/index.html
This activity introduces the process of protein
synthesis. It takes students through the transcrip
tion and translation phases and simulates the pro
duction of an amino acid sequence. It demands a
working knowledge of DNA structure and the func
tion of genes; therefore, it is more advanced.
Sample Guiding Questions • Describe the following:
a. transcription
b. translation
c. central dogma of biology
d. messenger RNA
e. codon
f. amino acid
Activities : Genetics 3 O 9
• Why do you think there is a "stop" codon? • Name an imaginary function for the protein
you made.
5. What is a Mutation?
http://gslc.genetics.utah.edu/thematic/nf1 /
proteinrole/sentence.asp
From Genetics Science Learning Center at
http://gslc.genetics.utah.edu/index.html
This activity is a primer on mutations. The main
goal is to reinforce the codon/amino acid relation
ship and demonstrate four different kinds of muta
tions: silent, frameshift, nonsense, and missense. It
supplies background information and tasks that
apply the information presented. It requires a good
working knowledge of DNA structure and function
and basic protein synthesis.
Sample Guiding Questions • How is a sentence like a gene? How is a
word like a codon? How is a misspelling like
a mutation? • What codon and amino acid do all genes
start with?
• What is the amino acid sequence encoded by
the DNA sequence presented in the activity?
• What does a missense mutation look like?
How does it change the amino acid se
quence?
• What does a nonsense mutation look like?
How does it change the amino acid se
quence?
• You can make more than one frameshift
mutation. What do they look like? How do
they change the amino acid sequence?
• Notice how a single amino acid can be
encoded by a number of different codons.
What are some examples of silent mutations
in the DNA sequence?

3 1 0 B I O L O G Y S U C C E S S !
6. Explore a Stretch of Code
http://www.pbs.org/wgbh/nova/genome/explore
.html (requires Shockwave)
From NOVA: Cracking the Code of Life
http://www.pbs.org/wgbh/nova/genome/
This activity shows a section of human chromo
some #1 and its specific sequence of bases. I t
demonstrates the terms gene, intrans, exons, gene
promoters, and others. It also demands a basic
working knowledge of DNA structure and function.
Sample Guiding Questions • Briefly describe the following:
a. hitchhiker code
b. start codon
c. stop codon
d. intron
e. extron
f. site of variation
7. Sequence for Yourself
http://www.pbs.org/wgbh/nova/genome/sequencer
.html (Flash plug-in required)
From NOVA: Cracking the Code of Life
http://www.pbs.org/wgbh/nova/genome/
This activity is a self-paced tutorial animation
that shows how the Human Genome Project uses
restriction enzymes and bacterial culturing to iden
tify the precise sequences of DNA bases on each
of our 23 chromosomes. It is appropriate for stu
dents with a good background in molecular biology.
Sample Guiding Questions • What is the role of restriction enzymes? • What is the role of the vector? • What is the purpose of cloning the DNA
fragments? • What is the role of the special nucleotides? • What is the role of the electrophoresis
process? • How is the computer used?
Part B: Web Site Presentations {optional)
Have students give brief oral presentations on
the site they explored . This would require a digital
projection device for the whole class to see the
Web sites.
Suggested Guidelines
• Be brief-five-minute maximum per team or
individual • Use the graphics of the Web site to show 2-3
key ideas learned, using the teacher-provided
guiding questions
Follow-up Discussion Questions
Review:
1. Write down one important and interesting con
cept or idea you have encountered from each Web
site visited.
2. If someone asked you to explain DNA in one
sentence, what would you say?
Interpretive:
3. Why do you think problems can arise if an indi
vidual human has more than 4 6 chromosomes in
each of his or her cells, or fewer than 46?
More or fewer than 46 chromosomes create
problems in cell division and gene expression,
leading to dysfunctional genes.
Reflective:
4. Freewrite for a few minutes on the advantages
and disadvantages of using the Web, as compared
to a text, to access this kind of information.

5. Was this kind of activity a good match for your
learning style?
Formative Assessment
Students will demonstrate their abilities to define
and describe selected key terms in genetics and
navigate the Web sites during Procedure Part A
(Web site exploration), Procedure Part B (optional
student presentations), and the follow-up discus
sion parts of this activity.
Summative Assessment
Provide students with a list of the key terms and
concepts that they need to understand. Also supply
Act iv i t ies : Genetics 3 l l
them with the links to the Web sites used in the
activity, so that they can review and enhance their
understanding of the concepts. Give a quiz based
on the key terms and concepts and include varied
ways for students to show their understanding of
the terms and concepts.
Suggestions for Extended
Learning
Assign or have students locate one more Web site
that deals with some aspect of genetics and submit
a list of questions to be answered based on the
information on that site. Have them switch "sites"
with another student and complete the accom
panying questions.
3 1 2 BIOLOGY SUC CESS!
Human Monogen ic Tra its
Time Required
Day 1 : Introduction/Set-up: 45 minutes
Day 2: In-class Follow-up: 60- 75 minutes
Statistical Option: 45- 60 minutes
Summary
This activity uses a classic set of simple monogenic
human traits (tongue rolling, etc. ) as a springboard
for students to design an experimental protocol and
collect and analyze data to determine the allele fre
quencies for these traits in the local population
(school, community). It also attempts to address the
widely held misconception that dominant alleles are
more common or abundant than recessive alleles in
a population. It includes an optional section that
applies a statistical test to the data collected.
It is most appropriate to introduce this activity
after students are already familiar with the basic
Mendelian genetics concepts of genotype, pheno
type, heterozygous, homozygous, recessive, domi
nance, sex-linked traits, alleles, and monogenic
trait. In addition, familiarity with population genetics
concepts such as allele frequencies and gene pool
would be helpful but are not necessary.
Learning Outcomes
After this lab activity, students will be able to :
Content
• Define a monogenic trait • Distinguish the phenotypes for several human
monogenic traits
• Differentiate between allele dominance and
allele frequency • Distinguish between sex-influenced traits and
sex-linked traits (optional)
Inquiry Skills
• Identify some basic principles of survey design
• Calculate percentages • Use clear language to accurately describe
results from a data table
• Following data analysis, decide if a set of data
supports a hypothesis • Following statistical analysis, decide if a set of
data supports a hypothesis (optional)
National Science Education
Standards: Content Standards A:1 :1, A:1 :2,
A:1 :3, A:1 :4, A:1 :6, A:2, and C:2:2 (see Appendix B)
Materials
• Student handout (see Appendix C, "Student•
Human Monogenic Traits")
• PTC paper and control paper (available
through biological supply companies)
• Calculators for data analysis
Instructor Preparation
• Decide which monogenic traits to include in the
survey. See Instructor Background Sheet for
Monogenic Traits on page 3 1 7 for some
choices • Copy the student handout for this activity • Decide whether to include the statistics com
ponent of the lab • Gather the items on the Materials list
• Instructors may wish to make additional
copies of the survey data collection sheet
from the student handout in case they are
needed
Activator/Connector
Use the following activator to get students inter
ested in the survey to follow:
How many students have known someone with
polydactyly?
How many students can roll their tongue?
How many of you have urine that smells "sulfury"
after you eat asparagus?
Activity Sequence
Day 1 :
1. Preview the activity, its purpose, background,
and learning outcomes
2. Part A-Introduce easily detected human mono
genie traits
3. Part B-Design a survey to answer the inves
tigative question
4. Part C-Perform the survey and collect data
(homework)
Day 2:
Act iv i t ies : Genetics 3 l 3
5. Part D-Share results of the survey and calcu
late percentages
6. Part E-Optional statistical analysis (z-test)
7. Follow-up discussion questions
Procedure
Part A: Introduction to Monogenic Traits
Remind students that there are checkboxes in the
Procedure sections of their handouts to track their
progress in completing the lab.
1. Review the concept of monogenic traits vs. poly
genie traits.
2. Introduce the investigative question: Are pheno
types associated with the dominant allele generally
found more frequently in a population than pheno
types associated with the recessive allele ? Discuss
the question as a group. Have students record their
answers and reasoning on this question.
3. Introduce each of the monogenic traits selected for
the survey, and have students record the phenotypes
for each trait in the table provided in their student
handouts. Be sure to instruct them on the proper use
of the index finger length " T " grid (see page 321 ),
and model the proper use of the PTC paper and its
control.
4. Make sure that each phenotype is represented
in the class for all to see, or provide students with
pictures of the phenotypes not present among the
students.
3 1 4 BIOLOGY SUCCESS!
5. Share initial results by tallying the number of stu
dents with each specific phenotype for each trait
under study.
6. Share with students the genotype information for
each of the traits to be included in the survey. For
example, explain that tongue rolling is controlled by
a dominant allele, while the inability to roll the
tongue is controlled by a recessive allele. Have
them record genotype information in their trait
table. See Instructor Background Sheet for Mono
genie Traits on page 317 for specific genotype
information.
7. Discuss the possible biological advantages and
disadvantages of any of the traits included.
Part 8: Survey Design
1. Explain to students that they will be designing a
survey that they will administer in the school or
local community that attempts to answer the inves
tigative question introduced and discussed in Part
A, step 2:
Are phenotypes associated with the dominant
allele generally found more frequently in a popu
lation than phenotypes associated with the reces
sive allele ?
2. Give students time, and other parameters
deemed necessary, to design a survey that will
provide data to answer the investigative question.
Consider using teams to design a study protocol.
If choosing to include polydactyly in the survey,
be sure to model an appropriate interview ques
tion that takes into account the sensitive nature of
this trait.
3. Discuss and compare survey designs and ideas
across the class, and decide collectively which
ideas and protocols to include. Have students
record key features of the survey protocol decided
upon. Key issues to resolve include sample size,
consistent data collection, and interview protocols
across the class, and consistent student tabula
tion of the raw data.
4. Preview with students the Survey Data Collec
tion Sheet from the student handout (see Appen
dix C, "Student• Human Monogenic Traits 1 O"}.
5. Run a sample survey interview within the class
to model and clarify appropriate survey procedures.
Part C: Data Collection
Assign students to collect their data as homework.
Part D: Data Analysis
1. When all data are collected, ask students to
summarize their individual data in Table A: Sum
mary of Individual Data, page 12 in the student
handout.
2. Lead students in recording all class data that
was collected in the first three blank columns of
Table B: Composite Class Data for All Individuals
Surveyed, page 12 in the student handout. Using
an overhead projection device will allow all students
to record data with a visual reference available.
3. Assign students the task of turning the raw
numbers from the second and third blank
columns of Table B into percentages. These
should then be recorded in the last two columns
of Table B. For instance, what percentage of
people surveyed could roll their tongue? As some
students in introductory biology may have weak
math skills, it may be necessary to provide
instruction on how to calculate percentages. Be
sure to compare the percentages calculated
across the class for accuracy.
Part E: Statistical Analysis (optional)
1. Introduce Investigative Question B: Is there any
reason to believe that the frequency with which
dominant traits are expressed differs between the
genders? For example, do women express more
dominant traits than men, or vice-versa ? Have stu
dents discuss and record thoughts on the student
handout.
2. Preview the purpose (determining significance)
and steps involved in performing the z-score. See student handout (Appendix C , "Student • Human
Monogenic Traits 5") for the procedural steps for
calculating the z-score.
3. Help students to share their individual data on
the number of dominant traits for each male and
each female they surveyed. Assist them in carry
ing out the calculations necessary to arrive at a
z-score, which are contained in the student hand
out. It is advisable to match students in pairs,
ideally with one strong math student per team.
4. Discuss and compare z-scores across the class.
Follow-up Discussion Questions
Review:
1. Have students make general statements that
describe the results, orally or in writing.
2. Have students analyze the data to answer this
question: In this school or local community, which
of the two phenotypes for each of the monogenic
traits surveyed is more common ?
3. Have students analyze the data to answer this
question: Are any of the phenotypes more common
in women than they are in men?
Interpretive:
Acti v i t i es : Genet ics 3 1 5
4. Have students relate the data collected to Inves
tigative Question A: Are phenotypes associated
with the dominant allele generally found more fre
quently in a population than phenotypes associ
ated with the recessive allele? What are their
conclusions? Does the data support their original
prediction/hypothesis? Why or why not? If not, how
would they revise their hypothesis?
Student data may vary, but some traits {poly
dactyly) that are controlled by the dominant allele
are much less frequent in the human population.
Most of the traits suggested in this activity show
that phenotypes associated with the dominant
allele are found more frequently in a population.
5. Have students relate their findings to Investiga
tive Question B posed in procedure Part E: Is there
any reason to think that the frequency of the traits
under study will be different between the genders?
Does the data support your original prediction and
hypothesis? Why or why not? If not, how would you
revise your hypothesis?
The data on the short index finger trait will ideally
reveal a difference between the genders; see
instructor background sheet. Otherwise, the fre
quencies should not differ between the genders.
Reflective:
6. Ask students what was the most difficult part of
this activity for them?
7. What did they like?
8. What would they change?

3 1 6 BIOLOGY SUC C E SS!
Formative Assessment
• Students will demonstrate their knowledge of
the phenotypes of a set of human monogenic
traits through their oral participation in Proce
dure Parts A, B, and C as well as the follow-up
discussion section of the lab.
• Students will demonstrate their understanding
of some basic principles of survey design
through the discussion of how to design and
run the survey in Procedure Part B of the lab.
• Students will demonstrate their abilities to accu
rately describe the survey findings and decide
if a set of data supports a hypothesis orally dur
ing the follow-up discussion part of the lab.
• Students will demonstrate their understanding
of the difference between allele dominance and
allele frequency and the difference between
sex-influenced and sex-linked traits orally dur
ing the follow-up discussion part of the lab.
• Students will demonstrate their abilities to cal
culate percentages during the data analysis
part of the lab.
• Students will demonstrate their abilities to
decide if a set of data supports a hypothesis in
the follow-up discussion part of the lab.
Summative Assessment
• Ask students to use the Lab Report Template
on page 1 63 to summarize the survey in writ
ing. In addition, supply an assessment rubric,
such as the one found on page 1 30.
• Assign the following question as an out-of
class assignment or for inclusion on the next
quiz: Can a recessive allele be more common
in a population than a dominant allele? Explain
with a real or fictional example.
Suggestions for Extended
Learning
• Assign studen.ts to research some "famous"
monogenic disease traits, such as cystic fibro
sis, albinism, Huntington's disease, or progeria.
Are these diseases associated with dominant
or recessive alleles?
• Assign the following question for students to
address in writing:
Assuming we could cross humans in our
genetics laboratory, how would you determine
if the earlobe attachment allele (or any other
alleles for a certain trait studied) is dominant
or recessive? Lay out your research plans
carefully and in detail.

INSTRUCTOR BACKGROUND SHEET
FOR MONOGENIC TRAITS
The following are descriptions of several human monogenic traits.
Activit ies: Genetics 3 l 7
A. Tongue rolling(T/t)-the ability to curl the sides of the tongue upward to form a tube. The dominant allele
produces tongue rolling.
Figure 10.6. Tongue rolling example
B. Handedness (H/h)-the primary use of the right vs. the left hand in writing, throwing, etc. A dominant
allele produces right-handedness.
C. Mid-digital hair (D/d)-the presence or absence of hairs on the middle section of fingers. The dominant
allele produces hair on at least one finger.
Figure 1 0. 7. An example of mid-digital hair
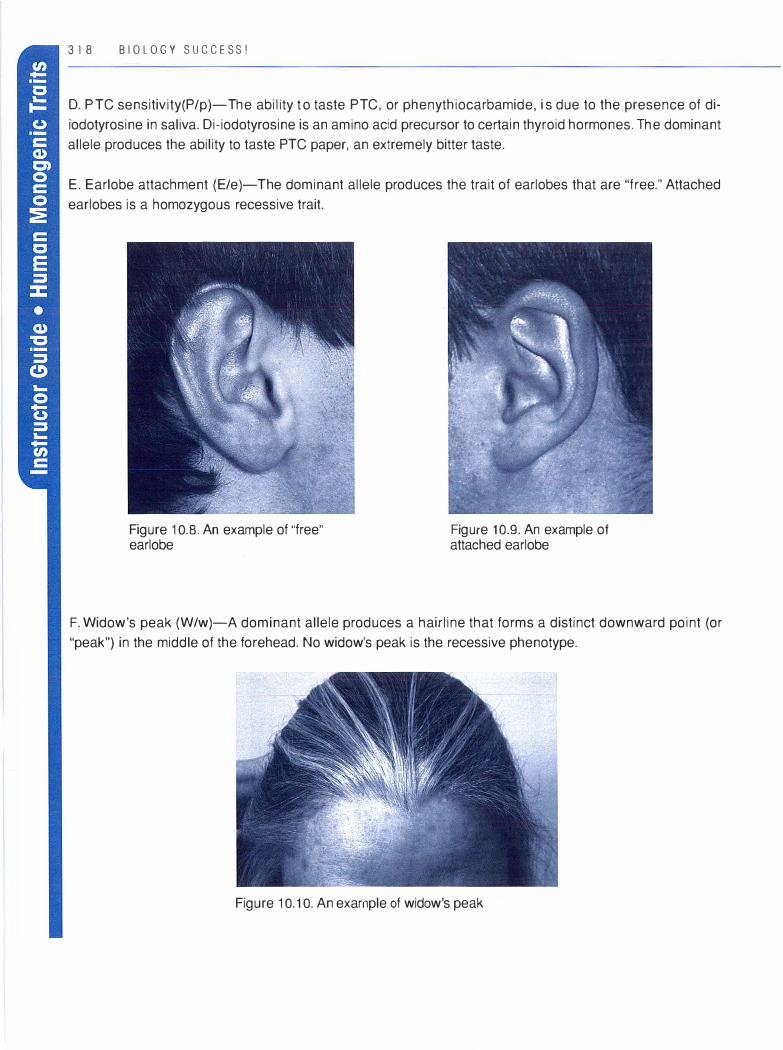
3 1 8 B I O LOG Y S U C C E S S !
D. PTC sensitivity(P/p)-The ability t o taste PTC, or phenythiocarbamide, i s due to the presence of di
iodotyrosine in saliva. Di-iodotyrosine is an amino acid precursor to certain thyroid hormones. The dominant
allele produces the ability to taste PTC paper, an extremely bitter taste.
E. Earlobe attachment (E/e)- The dominant allele produces the trait of earlobes that are "free." Attached
earlobes is a homozygous recessive trait.
Figure 10. 8. An example of "free" earlobe
Figure 1 0.9. An example of attached earlobe
F. Widow's peak (W/w)-A dominant allele produces a hairline that forms a distinct downward point (or
"peak") in the middle of the forehead. No widow's peak is the recessive phenotype.
Figure 10. 1 0. An example of widow's peak
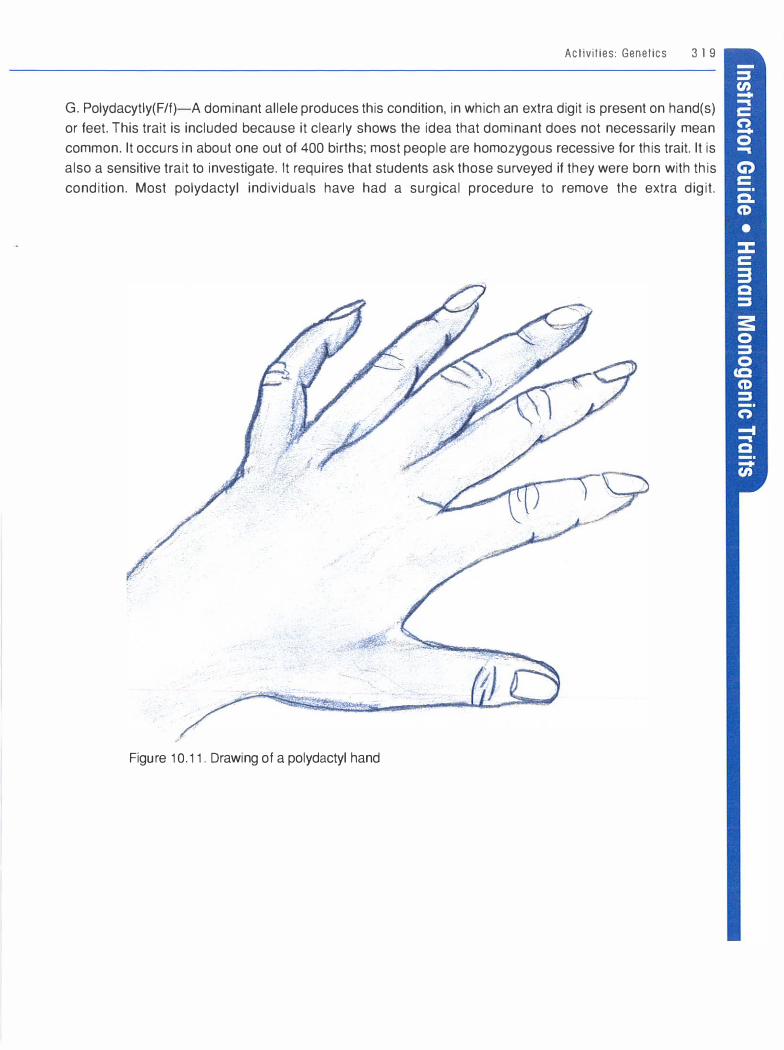
Activities: Genetics 3 l 9
G. Polydacytly(F/f)- A dominant allele produces this condition, in which an extra digit is present on hand(s)
or feet. This trait is included because it clearly shows the idea that dominant does not necessarily mean
common. It occurs in about one out of 400 births; most people are homozygous recessive for this trait. It is
also a sensitive trait to investigate. It requires that students ask those surveyed if they were born with this
condition. Most polydactyl individuals have had a surgical procedure to remove the extra digit.
Figure 1 0. 1 1 . Drawing of a polydactyl hand

B IOLOGY SUCC E SS!
H. Index finger length (S/s)-measures the relative length of the index finger to the ring finger. This is con
sidered a sex-influenced trait. The dominant allele in men produces a short index finger relative to the ring
finger; in women, the dominant allele produces an index finger that is equal to or greater than the ring fin
ger in length. Women need two short-finger alleles to produce the short-finger effect; men need just one
short-finger allele to produce the effect. This gene is not likely to be found on the X chromosome ; sex
influenced traits can be autosomal. This trait requires a simple "T" grid to determine the phenotype. (See
Figure 1 0.14, Template for Measuring Index Finger Length Phenotype.) Pattern baldness is another exam
ple of a sex-influenced trait.
Figure 1 0. 1 2. Index finger greater in length than ring finger
Figure 10. 13. Index finger lesser in length than ring finger
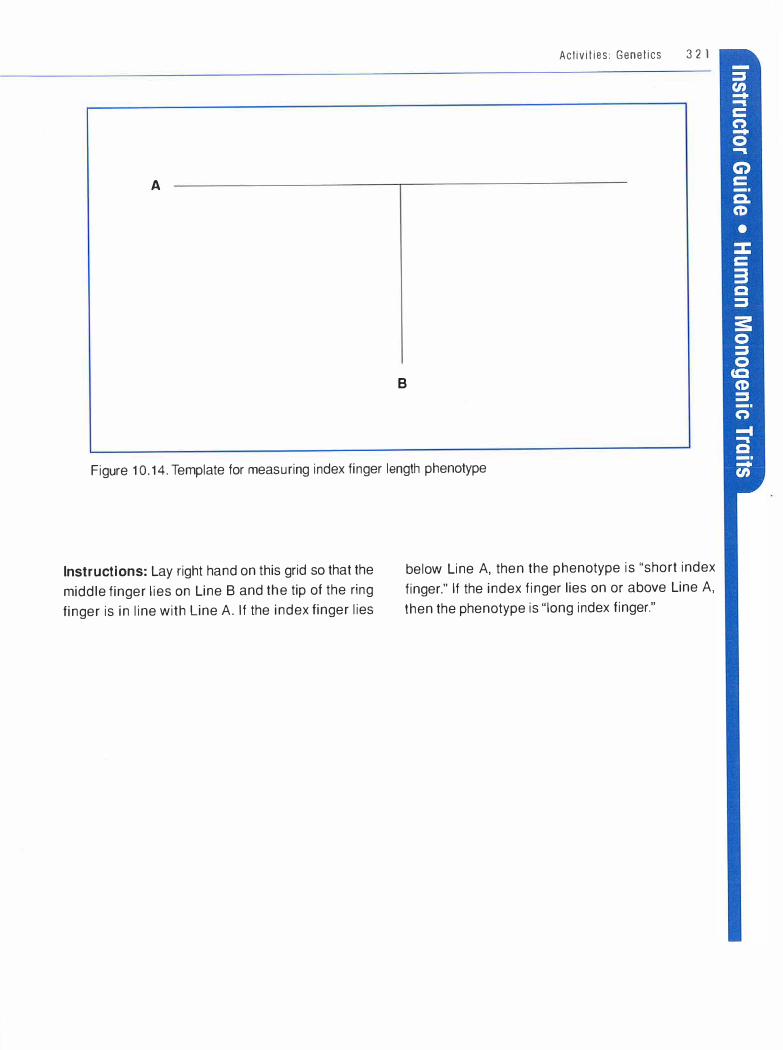
A
B
Activ i t i es : Genet ics 3 2 1
Figure 1 0. 14. Template for measuring index finger length phenotype
Instructions: Lay right hand on this grid so that the
middle finger lies on Line B and the tip of the ring
finger is in line with Line A. If the index finger lies
below Line A, then the phenotype is "short index
finger." If the index finger lies on or above Line A,
then the phenotype is "long index finger."

APPENDIX
Appendix A:
Identifying and Using Learning
Styles to Facilitate Instruction
by Nannette Smith 325
Appendix B:
Biology Success! and
The National Science
Education Standards 327
Appendix C:
Student Handouts 329

Appendix A Identifying and Using Learning
Styles to Facilitate Instruction by Nannette Smith,
DIVISION OF NATURAL, BEHAVIORAL, AND
SOCIAL SCIENCE S, BENNETT COLLEGE
AT THE BEGIN N ING of the 2000 fall
semester, faculty members at our college
who taught introductory biology gathered
to plan for coming classes. One professor who had
attended a Project Kaleidoscope summer work
shop boldly announced what many of us had come
to suspect: "The emperor has no clothes," she said.
"We are teaching but our students are not learning.
We must change." And change we did.
The introductory biology professors decided that
knowledge of how each student learned would help
us as instructors and empower our students to
direct changes in our pedagogical techniques. In
pursuit of those goals, I designed the following
cooperative venture. I began the process by telling
my students about the conversation and events
that had led to the need for change in the course
structure. To teach them more effectively, I said, I
needed their help. I went on to explain that each of
them was a unique learner: They each had their
own style of learning and their own learning expe
riences. To help them understand introductory biol
ogy, I would need to know about these learning
styles and experiences. I challenged my students
to accept and share responsibility for their own
learning and "do science" at the same time. They
accepted the challenge.
My first step was to educate both my students and
myself about learning style theory. I used my course
Web site at Blackboard.com to link to a site where
each student would take the NC State Index of Learn
ing Styles Questionnaire, www2.ncsu.edu/unity/
lockers/users/f/felder/public/lLSdir/ilsweb.html,* online
and free-of-charge. The site also provided us with two
(Reprinted, with permission, from College Pathways to the Science Education Standards, E. D. Siebert and W. J. McIntosh,
eds. Arlington, VA: National Science Teacher's Association, 2001.)
• (The updated URL is http://www.engr.ncsu.edu/learningstyles/ilsweb.html-Ed.]
325

326 BIOLOGY SUCCESS'
articles that contained in-depth explanations of theo
ries of learning styles and their practical applications.
As the professor, I was responsible for providing
copies of the articles. After reading the articles, each
student formed a hypothesis as to what the inventory
would show her or his learning style to be. Students
then took the inventory and printed out two copies of
their results. One copy was placed in each student's
file; the other was kept by the student. When all stu
dents had completed the assignment, they brought
the results to class. Each student presented her or
his results to the class and compared the inventory
results to her or his hypothesis. Much discussion
ensued. Some agreed with the inventory results and
some did not. The students drew up conclusions as
to how they would alter note taking, classroom ques
tioning, and study habits as a result of the inventory.
Each student's hypothesis, process, results, and dis
cussion were combined in a written report that was
turned in to me. We also discussed the changes that
I would have to make in my classroom presentation
in order to support the learning styles of all students.
In the true spirit of scientific research we quan
tified our results. We compiled total class results
using Microsoft Excel to create tables and graphs
of our data. Students unfamiliar with Excel were
responsible for arranging tutorials with me or with
classmates. Numerous e-mails followed as stu
dents explored how to graph and what graphs were
most illustrative of the data gathered. The resulting
graphs were included in their written reports.
The introduction of learning style theory, the
cooperative investigation, and the inventory results
significantly altered the nature of student-profes
sor interaction in my class. Whereas students had
formerly asked me simply to repeat material or to
provide further explanation when they were con
fused, now their requests became much more spe
cific and helpful to me. Students now asked if they
could be provided with graphics, models, or
sequential explanations to help them understand
a concept. Oftentimes they cited their learning
styles as justifications for their requests. Addition
ally, students began to help their peers. More
important to me were their suggestions as to how
I might alter a learning experience in order to
address the styles of classmates.
I was thrilled when non-biology majors and stu
dents from other colleges began to access my site
to take the inventory. However, my greatest
reward came when several of my students com
mented, "Why haven't we been told this before?
Everyone needs to know this!" Now, one hopes,
everyone will.
Appendix B Biology Success! and
The National Science Education
Standards* (9-12)
National Research Council. 1996. National Science Education Standards. Washington, DC: National Academies Press.
327

� u;- _.. ff 3 O
en .. ;,::: -· � ::, C.11 II
0 ()
-l
I � � CC S:: CD CD Ql =
§= rv _..... () m i\, ::, II CD -l ..... ::;
� CD
Ql s:: ::, 0 a. m 0 g (,Q ii5" Ql ..... ='· CJJ N Ql Ql en =· ui' g S, 5· I r CD <. ro -· Q. ::, -· cc -
'< (f) - .
'< (,.) � () CD ••
3 Yi' -� CJJ
0) 5·
0 0 .. cc I\J -· II o G) � CD m
0 < () 0 ::; -CD 5, 3 5· r5· ::, � .;.. () () '< .. Q. t rn -i - . ::;
--J CD
G) :, i\, co II -. -l Q. ::; CD CD -g z ::, Ql Q. - CD C ::, ..... () CD CD S, S, �o a5· (,Q ::, Ql ' =?
STANDARDS
CONTENT STANDARD A: SCIENCE AS INQUIRY
A:1 :1 Identify questions and concepts that guide scientific investigations. A:1 :2 Design and conduct scientific investigations. A:1 :3 Use technology and mathematics to improve investigations and
communication. A:1 :4 Formulate and revise scientific explanation and models using logic
and evidence. A:1 :5 Recognize and analyze alternative explanations and models. A:1 :6 Communicate and defend a scientific argument. A:2 Understandings about scientific inouirv.
CONTENT STANDARD C: LIFE SCIENCE
C:1 :1 Cells have particular structures that underlie their functions.1
C:1 :2 Most cell functions involve chemical reactions.1
C:1 :6 Cells can differentiate.1
C:2:1 The instructions for specifying the characteristics of the organism are carried in DNA.2
C:2:2 Most cells in a human contain two copies of each of 22 different chromosomes, and two copies of each gene.2
C:2:3 Changes in DNA (mutations) occur spontaneously at low rates.2
C:3:1 Species evolve over time.3
C:3:3 Natural selection and its evolutionary consequences provide a scientific explanation for the striking molecular similarities observed among the diverse species of living organisms.3
C:3:4 The millions of different species of plants, animals, and microorganisms that live on earth today are related by descent from common ancestors.3
C:4:1 The atoms and molecules on the earth cycle among the living and nonliving components of the biosphere.4
C:4:2 Energy flows through ecosystems in one direction from photosynthetic organisms to herbivores to carnivores and decomposers.4
C:4:3 Organisms both cooperate and compete in ecosystems.4
C:5:6 As matter and energy flow through different levels of organization of living svstems, chemical elements are combined in different wavs.5
CONTENT STANDARD D: EARTH AND SPACE SCIENCE
D:2:1 Each element on earth moves among reservoirs in the solid earth, oceans atmosohere, and oroanisms as oart of oeochemical cvcles.6
CONTENT STANDARD G: HISTORY AND NATURE OF SCIENCE
G:2:1 Science distinguishes itself from other ways of knowing.7
G:2:2 Scientific explanations must meet certain criteria.7
G:2:3 All scientific knowledge is, in principle, subject to change as new
Inquiry
CJ CD )> < CJ ::, CD CD
:;E 0 0 "' <
co· CD "C c:r N ::i' ::, (j) ::i' cc 5· 0 cc a -
:::c: mcc "C r- "T'I -< X C) ::r 0
16 0 co "C ::i' 0 0 ==· ::, cc )> 0. � 3� £l. :;E CD CD Q. CJ "' ::, - 0 <' CD CD - CD
c � c:r "' "' 0. "'
X X
X
X
X
X
X
X X
X X
Ecology Evolution Cell Biology Genetics
s: :::c: OJ C (j)
C:
5· "' m 3 en "'
§ �-CD
cc "'C "'C (") CD C) ::, 0 CD 0 - CD s: ::,
0 0 ::, ar
OJ "'C = 0. 0 CD s ::, ::, ::r s: (") 0. 0. (") CD -< C) m=> ::, c=:;·
::r :, CD 0 0 -< ::, 3
0. "' 0 CD :, (") (")
CD 0 ::, 3 < 0 ::r cc -l N CD m 0 < CD ::, CD CD ::r -< ::, cc 5· ::,
cc <',' "T'I CD !:!?. 0. en ::, CD 3- cc ::, � CD 0 "'
3· s ;;o CD £ £ !:!?. co· co· ;;o 0 C) 0 (j) CD ::,
0 CD C: c=:;· CD � )> "T'I "' CD c=:;· C) "'C 0 o
(") 0 3 ::,
I -<
o 5· 5· co· -l -b 6 �u s :::;t (") ::, 5· 5·
co o
0 0 CD ::, CD
s --0 "' c=:;· � "' vi - = ::, ::, "' -< -< cil in' "'
X X X X X X X
X X X X X
X X X X X X
X X X X X X X
X X X X
X X X X X X X
X X X X X X X X
X X X
X
X
X
X X X
X
X
X
X X
X
X X
X
X
X
X
X X X

Appendix C Student Handouts
329


Developing Hypotheses
Activator/Connector
Can all questions be addressed using the scientific method? What types of questions can be
and what types can't be?
Activity Purpose
This activity is designed to help you to practice making observations about the natural world
and to convert scientific questions based on those observations into hypotheses. You will
also learn to differentiate between hypotheses that can and can't be tested using controlled
experimentation.
General Background
The scientific method represents a systematic approach to formulating and answering
questions about the natural world. The first steps of the scientific method include making an
observation and developing a reasonable explanation for that observation in the form of a
testable hypothesis.
Vocabulary
scientific method, observation, hypothesis
Learning Outcomes
After completing this activity, you will be able to:
Inquiry Skills
• Distinguish between questions that can and can't be addressed scientifically • Develop alternative testable hypotheses to explain observations • Apply key scientific inquiry vocabulary: scientific method, observation, hypothesis
Activity Sequence
1. Complete Part A on how to develop and state a hypothesis.
2. Complete Part B on how to develop alternative hypotheses based on observations you
have made.
3. Determine which of the hypotheses in Parts A and B could be tested under controlled
conditions, and justify your decisions (Part C).
4. Follow-up discussion questions
Procedure
Hypotheses are based on observations. A scientist observes or notices something about
our natural world and wonders why it happens or how it works. The first step, then, in the
scientific method is to clearly write down the observation about which you have questions
(see the following examples). A hypothesis is a reasonable, scientifically testable explanation
for an observation. Scientists formulate hypotheses in the form of statements rather than
questions.
Complete the following exercises to practice developing hypotheses. The first set of
exercises (Part A) asks you to develop hypotheses for observations provided to you. The
second set of exercises (Part B) asks you to make your own observations and then formulate
hypotheses. Remember that a hypothesis must be in statement form and must be able to be
tested by an experiment. Finally, Part C asks you to decide which of the hypotheses you
developed could be tested under controlled conditions.
Part A
For each of the following observations, list two alternative hypotheses (reasonable
explanations for an observation-see examples) in the spaces provided.
Observation 1: Sunflowers growing in Judy's front yard are shorter than the sunflowers
growing in her backyard.
Hypothesis: Salt from the road has washed into the front garden and stunted the growth
of those sunflowers.
Hypothesis:
Hypothesis:
Observation 2: Cigarette smokers have more colds.
Hypothesis: Cigarette smokers touch their fingers to their mouths more frequently,
increasing their contact with the cold virus.
Hypothesis:
Hypothesis:
Part B
In the spaces below, write your own observations and provide two alternative hypotheses
for each.
Observation 1 :
Hypothesis:
Hypothesis:
Observation 2:
Hypothesis:
Hypothesis:
Part C
A controlled experiment is one in which a control group is compared in some way to an
experimental group to determine the presence of cause and effect. For example, if an
investigator wanted to conduct a controlled experiment to test whether road salt inhibited
plant growth, he or she might compare the growth rates of salt-treated plants to the growth
rates of untreated ( control) plants.
Not all scientific hypotheses can be tested under controlled conditions. Certain
hypotheses concerning the origin or age of the universe, for example, cannot be tested by
direct comparison of our universe with another "control" universe. (This doesn't mean,
however, that there isn't a great deal of valid scientific research resulting in testable
hypotheses addressing questions about the universe.)
Put an asterisk (*) next to those hypotheses you developed in Parts A and B that could be
tested using controlled experiments. Be prepared to justify your choices.
Follow-up Discussion Questions
Review:
1. What are the main concepts you have learned from this activity?
Interpretive:
2. After sharing your answers with peers, did you find that any of your hypotheses could not
be tested scientifically? Were there any that could not be tested under controlled conditions?
How did you decide?
Reflective:
3. Do you feel better able to formulate and identify a testable hypothesis?
4. What aspect of this activity most contributed to your learning?

Designing Controlled Experiments
Activator/Connector
Not all fields of science arrive at conclusions through the process of controlled
experimentation. Can you think of some examples of fields that do and fields that do not?
Activity Purpose
This activity is designed to help you to practice some of the basic steps of the scientific method
by designing a controlled experiment to test a hypothesis.
General Background
The scientific method represents a systematic approach to formulating and answering
questions about the natural world. Experiments are designed to answer questions by
investigating cause and effect relationships in nature. Many, but certainly not all, scientific
investigations are carried out under controlled conditions.
Vocabulary
scientific method, hypothesis, experiment, experimental procedure, independent variable,
treatment, dependent variable, experimental control, prediction
Learning Outcomes
After completing this activity, you will be able to:
Inquiry Skills
• Design controlled experiments to test hypotheses • Apply key scientific inquiry vocabulary: independent variable, experimental control, etc.
(see Vocabulary list)
Activity Sequence
1 . For each part (A through G), read the example provided and record your answers to the
questions on the handout Worksheet for Designing Controlled Experiments.
2. Complete each part before moving to the next.
3. Follow-up discussion questions
Procedure
Designing an experiment involves writing a step-by-step list, called an experimental proce
dure, to test the hypothesis. You will need to consider all of the following when designing your
procedure:
• Treatment-the variable you want to test the effect of • Treatment levels • How you will measure the effect of the treatment
• Experimental control • Other variables that must be held constant to test the effect of the treatment
As you progress through the descriptions of these important design components of a
scientific experiment, you can begin to construct your own experiment based on a
hypothesis.
Part A: Choosing the Treatment (the Independent Variable)
One of the most important considerations in designing an experiment is choosing the treat
ment (also called the independent variable). This is the one variable or factor that, when
changed by a scientist, best helps to answer an experimental question and test a hypothesis.
Follow the example below to learn how to identify the treatment or independent variable.
EXAMPLE:
Hypothesis: Road salt stunts the growth of sunflowers.
Put another way, we want to test the effect of road salt on sunflower growth. In order
to test this hypothesis, we will probably change the amount of road salt and determine
the effect on sunflower growth. Since we will be testing the effect of road salt and
changing its levels, then the independent variable in this case is road salt.
Independent variable: Amount of road salt
Scientists also provide a rationale for why their hypothesis is valid and worth testing,
based on prior knowledge.
Rationale: Pine trees located near salted road surfaces tend to have more brown needles
than trees located farther away. If salt damages pine trees. it is logical to assume that it
may damage another plant. like the sunflower. as well.
In the spaces provided on your worksheet.
• write out the hypothesis you will be testing. • identify the independent variable (treatment) to be changed. and • provide a rationale for your hypothesis.
Part B: Choosing the Treatment Levels
You will often need to do some further literature review to determine the specific range of
treatment levels for your experiment. For example, you don't want to expose the sunflowers to
huge amounts of road salt-levels well beyond those ever found at roadsides. This may result
in ALL of the plants dying, and you'll never get a chance to see whether growth is stunted.
Typically. two or three levels of a treatment represent a good starting point for an experiment.
EXAMPLE:
After researching the amount of salt typically found at roadsides. the following treatment
levels were decided upon:
Treatment levels: 0.5 grams, 1.0 grams, and 1.5 grams of road salt
In the space on your worksheet, list the treatment levels you will use in your experiment.
Part C: Identifying the Dependent Variable
The variable that is measured in an experiment is called the dependent variable. The typical
experiment is designed to test the effect of the independent variable on the dependent vari
able. After identifying the dependent variable in an experiment, you will then have to decide
how to measure it.
EXAMPLE:
To test the effect of road salt (our independent variable) on sunflower growth. we will have to
measure sunflower growth.
Dependent variable: Sunflower growth
Now we have to decide how to measure sunflower growth. There is more than one
way to measure growth. We could. for example. measure the heights of the sunflower
plants. Or, we could measure the biomass of each plant by cutting the plants at soil
level and weighing them.
Units of measurement for dependent variable: Height in centimeters
In the spaces provided on your worksheet, list
• the dependent variable for your experiment, and • the units of measurement for your dependent variable.
Part D: Identifying the Experimental Control
Experiments should also include what is called an experimental control. The experimental
control provides a reference point for comparison and indicates that all other aspects of the
experiment are working. The typical experimental control is to eliminate the treatment (the
independent variable) you are testing altogether.
EXAMPLE:
Experimental control: No road salt (or O grams of road salt)
In the space provided on your worksheet, identify the experimental control.
Part E: Identifying Other Variables to Hold Constant
In experiments, there are other variables that must be held constant so that we can isolate
the effect of the independent variable.
EXAMPLE:
Other variables to hold constant: Variety of sunflower studied, amount of light,
amount of water, temperature, type of road salt, etc.
In the space provided on your worksheet, list other variables that you will have to hold con
stant in order to isolate the effect of your independent variable.
Part F: Designing the Experimental Procedure
The experimental procedure is the step-by-step outline of how you will carry out your
experiment.
EXAMPLE:
Experimental procedure
1. Plant sunflower seeds. Water and keep warm.
2. Once seeds have germinated, place seedlings under grow-light and water daily.

3. Divide 7-day-old seedlings into 4 groups of 1 O plants each, all of equal starting
height. The groups are O salt (experimental control), 0.5 g salt, 1.0 g salt, and 1.5 g salt.
4. Sprinkle soil surface with salt treatments.
5. Record plant heights in centimeters at 14 days.
6. Determine average plant heights for each group.
In the space provided in your handout, list the step-by-step experimental procedure you will follow.
Part G: Predicting the Outcome of the Experiment
Once the experimental procedure has been developed, a prediction of the outcome of the
experiment can be made. The prediction can be more general in nature or more specific.
EXAMPLE:
General Prediction: As salt levels increase, sunflower plant heights will decrease.
Specific Prediction: After 14 days, the 1 .5 g salt group will be shortest in height, the
control group will be tallest, and the 0.5 g and 1 .0 g groups will have intermediate heights.
You may also find it helpful to depict your prediction in the form of a graph. The dependent
variable goes on the Y, or vertical, axis, while the independent variable is typically placed on
the X, or horizontal, axis.
EXAMPLE:
4) :0 m ·;:
"C C: Q) a. Q)
(/)
>< m
>
X axis (Independent Variable)

60
50
Cl)
40 E
30
-� 20 Cl)
10
0
Prediction of the Effect of Road Salt
on Sunflower Height
Og 0.5 g 1 0 g
Amount of Road Salt
In the spaces provided on your worksheet.
1.5 g
• write your prediction for the outcome of your experiment in the form of a statement; and • sketch a graphic representation of the predicted outcome and label the axes.
Follow-up Discussion Questions
Review:
1. In an experiment, distinguish between an independent variable. a dependent variable, and
a variable that must be held constant.
Interpretive:
2. In the spaces below, give an example of a scientific hypothesis that can be tested under
controlled conditions and an example of one that can't.
Hypothesis that can be tested under controlled conditions:
Hypothesis that can't be tested under controlled conditions:
3. Sarah designed an experiment to test whether the length of time spent washing hands
reduces the frequency of colds. She asked some students to wash their hands for 30
seconds, some for 60 seconds, and a third group for 90 seconds. What is the independent
variable for this experiment? the dependent variable? Provide a minimum of two variables
that should be held constant. Provide an experimental control for the experiment.
Independent variable:
Dependent variable:
Two examples of other variables to hold constant:
Experimental control:

4. Design another experiment based on a different hypothesis. Or, using the same
hypothesis, develop an alternative experiment to test it.
Reflective:
5. Describe the aspect of this activity that most contributed to your understanding of the
scientific method. In addition, describe those aspects of the scientific method you found to be
most challenging.

Name:
WORKSHEET FOR
DESIGNING CONTROLLED EXPERIMENTS
---------
Hypothesis
Independent Variable
(Treatment)
Rationale for Hypothesis
Treatment Levels
Dependent Variable
Units of Measurement for
Dependent Variable
Experimental Control
Variables That Must Be
Held Constant
Experimental Procedure

Predicted Outcome
(Written Form)
Predicted Outcome
(Graphic Form)


Graphing Data
Activator/Connector
Have you heard the expression "A picture is worth a thousand words"? From your perspec
tive, is that statement true? Discuss some of the advantages of depicting information, includ
ing scientific data, in graphic form.
Activity Purpose
This activity is designed to help you practice some of the basic steps for converting data
obtained from an experiment to graphic form.
General Background
Graphs often provide the most efficient way to observe and communicate any major trends
in the data collected during a scientific experiment. Knowing how to construct graphs also
makes it easier to interpret information presented to you in graphic form.
Vocabulary
graph, figure, independent variable, dependent variable, axis, X and Y axes, scale, caption
Learning Outcomes
After completing this activity, you will be able to:
Inquiry Skills
• Orient the independent and dependent variables to their respective axes • Choose an appropriate format for a graph (line or bar) • Choose appropriate scales for the X and Y axes • Plot data points on a graph • Write descriptive titles for a graph • State observed trends in written form

Activity Sequence
This activity is divided into six main parts (A through F), plus follow-up discussion questions
and applications:
Part A: Identifying the independent and dependent variables
Part B: Graphing the independent and dependent variables
Part C: Choosing between the bar and the line graph
Part D: Choosing scales for the axes
Part E: Writing figure titles and stating trends
Part F: Checking the graph with a checklist
Procedure
Part A: Identifying the Independent and Dependent Variables
In order to place the variables from an experiment on their proper axes when constructing a
graph, you must first be able to distinguish the independent from the dependent variable.
The independent variable in an experiment is the variable that you manipulate. It repre
sents the treatment that you've chosen to investigate. The dependent variable is the variable
that you measure. Therefore, in the typical experiment, you are trying to determine the effect
that the independent variable has on the dependent variable.
In the following exercises, experiments are described and you are asked to identify the inde
pendent and dependent variables. Write your answers on the Graphing Data Worksheets,
Part A. An example follows.
EXAMPLE:
David designed an experiment to determine whether the number of offspring produced
by bobcats in the spring was affected by winter rodent density.
Independent variable: rodent density in winter
Dependent variable: number of bobcat offspring
1. A group of researchers at the National Cancer Institute conducted a study to determine
whether the incidence of liver cancer was affected by the level of alcohol consumption.
2. A high school teacher decides to investigate whether students who study prior to an exam
get better grades on the exam.
3. That same high school teacher decides to investigate whether students who study prior to
an exam take less time to finish the exam.
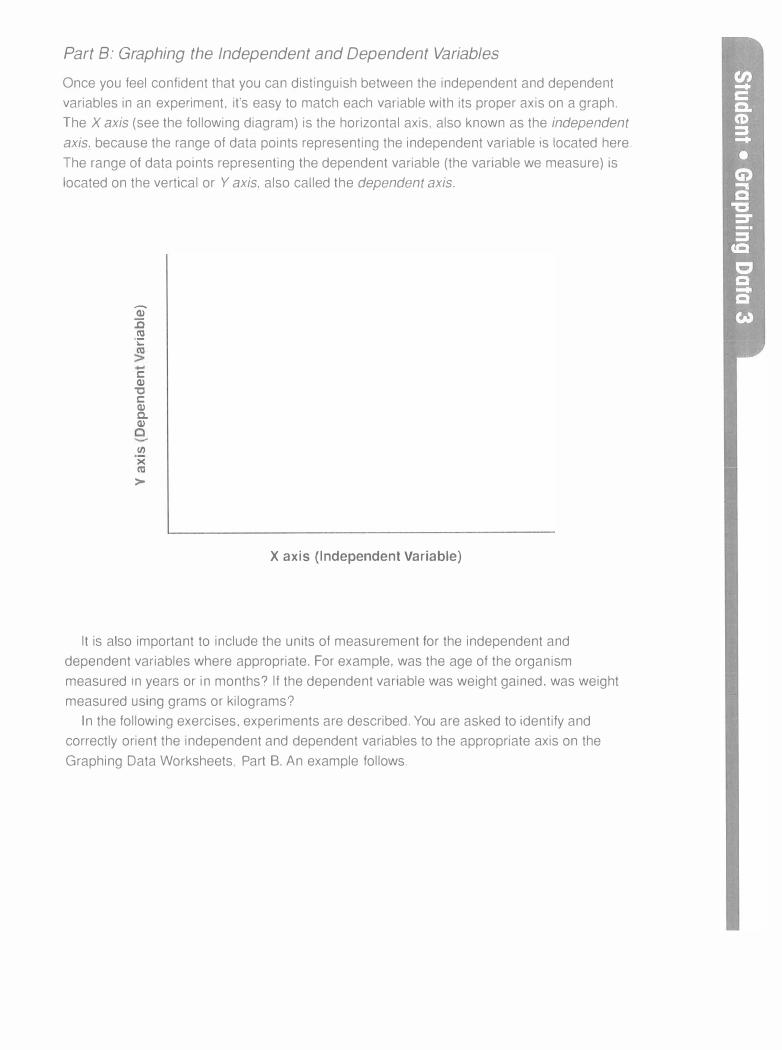
Part B: Graphing the Independent and Dependent Variables
Once you feel confident that you can distinguish between the independent and dependent
variables in an experiment, it's easy to match each variable with its proper axis on a graph.
The X axis (see the following diagram) is the horizontal axis. also known as the independent
axis. because the range of data points representing the independent variable is located here.
The range of data points representing the dependent variable (the variable we measure) is
located on the vertical or Y axis. also called the dependent axis.
a>' :0 ro ·;:
C: Cl)
"C C: Cl) a. Cl)
(/)
>< ro
>
X axis (Independent Variable)
It is also important to include the units of measurement for the independent and
dependent variables where appropriate. For example, was the age of the organism
measured in years or in months? If the dependent variable was weight gained. was weight
measured using grams or kilograms?
In the following exercises, experiments are described. You are asked to identify and
correctly orient the independent and dependent variables to the appropriate axis on the
Graphing Data Worksheets. Part B. An example follows.
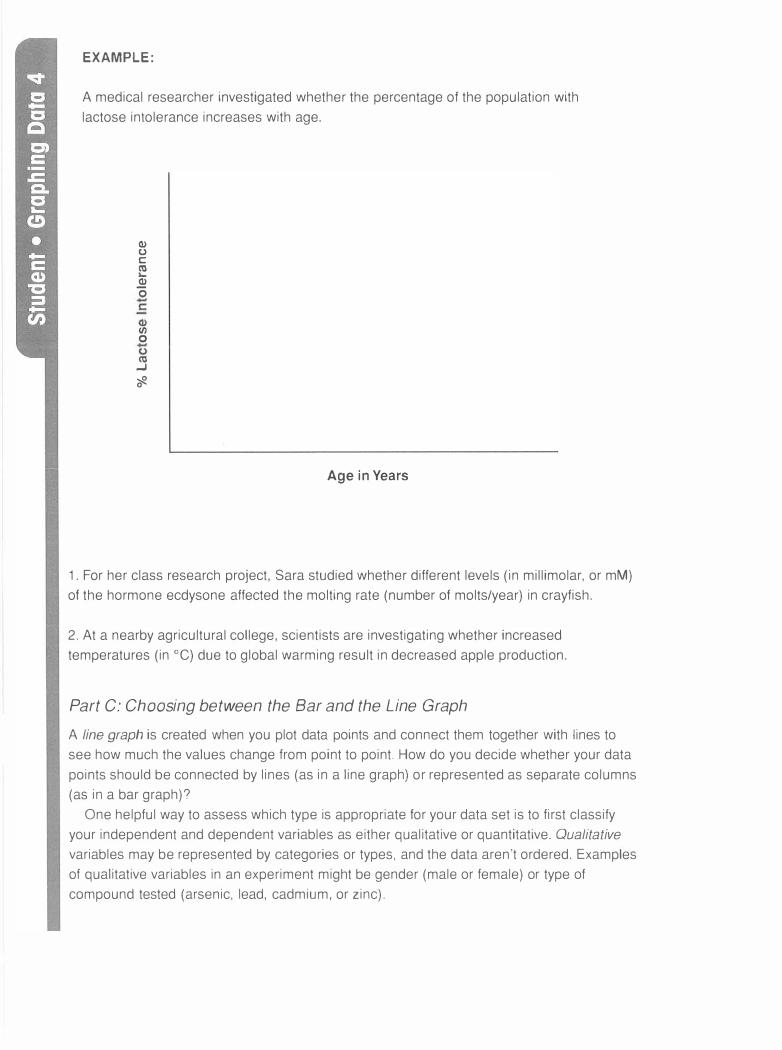
EXAMPLE:
A medical researcher investigated whether the percentage of the population with lactose intolerance increases with age.
(I) (.) C m
� 0
"' 0
m ...J 'cf-
Age in Years
1. For her class research project, Sara studied whether different levels (in millimolar, or mM) of the hormone ecdysone affected the molting rate (number of molts/year) in crayfish.
2. At a nearby agricultural college, scientists are investigating whether increased temperatures (in °C) due to global warming result in decreased apple production.
Part C: Choosing between the Bar and the Line Graph
A line graph is created when you plot data points and connect them together with lines to see how much the values change from point to point. How do you decide whether your data points should be connected by lines (as in a line graph) or represented as separate columns (as in a bar graph)?
One helpful way to assess which type is appropriate for your data set is to first classify your independent and dependent variables as either qualitative or quantitative. Qualitative variables may be represented by categories or types, and the data aren't ordered. Examples of qualitative variables in an experiment might be gender (male or female) or type of compound tested (arsenic, lead, cadmium, or zinc).
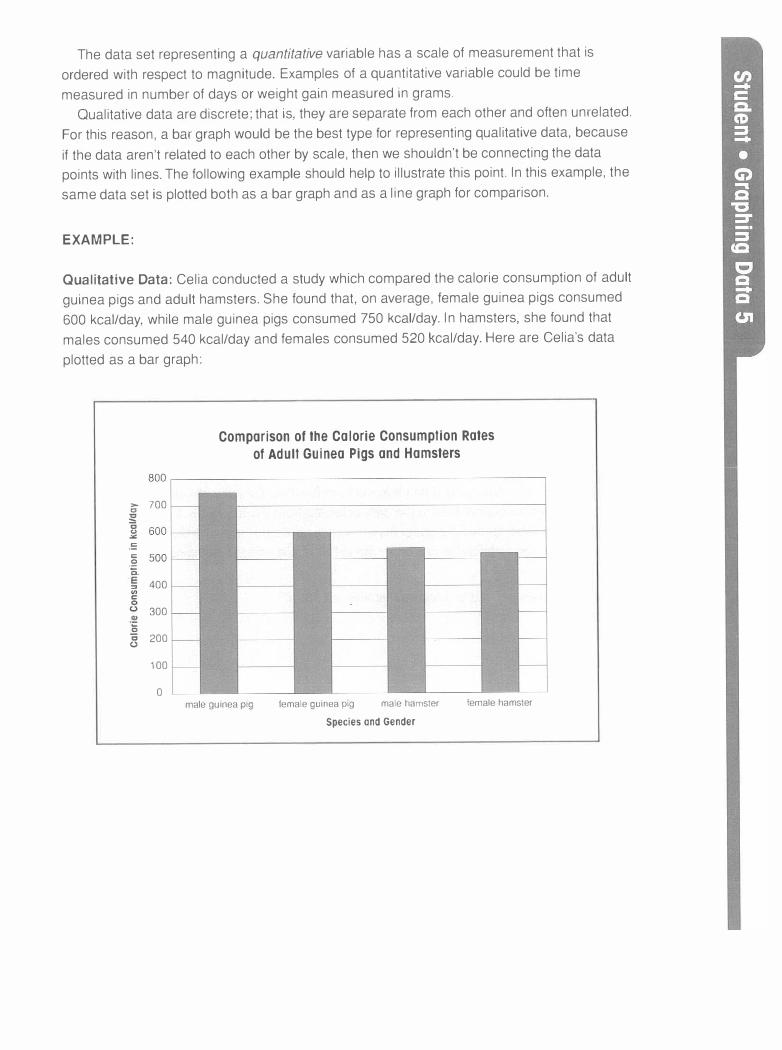
The data set representing a quantitative variable has a scale of measurement that is ordered with respect to magnitude. Examples of a quantitative variable could be time measured in number of days or weight gain measured in grams.
Qualitative data are discrete; that is, they are separate from each other and often unrelated. For this reason, a bar graph would be the best type for representing qualitative data, because if the data aren't related to each other by scale, then we shouldn't be connecting the data points with lines. The following example should help to illustrate this point. In this example, the same data set is plotted both as a bar graph and as a line graph for comparison.
EXAMPLE:
Qualitative Data: Celia conducted a study which compared the calorie consumption of adult guinea pigs and adult hamsters. She found that, on average, female guinea pigs consumed 600 kcal/day, while male guinea pigs consumed 750 kcal/day. In hamsters, she found that males consumed 540 kcal/day and females consumed 520 kcal/day. Here are Celia's data plotted as a bar graph:
i:';" 700
� 0 <> .,. .!:
.� 500 0. ::, en C
0 (.J
-� ;; (.J
400
300
200
100
0
Comparison of the Calorie Consumption Rates
of Adult Guinea Pigs and Hamsters
male guinea pig female guinea pig male hamster female hamster
Species and Gender

Here are Celia's data plotted as a line graph:
> C
700
C 600 u .:.: C:
c: 500 0
i 400 :::, V, C:
8 300
·:s 200 0
100
Comparison of the Calorie Consumption Rate
of Adult Guinea Pigs and Hamsters
-�-� �-----
------ -
- ---. I I
o�--male guinea pig female guinea pig male hamster female hamster
Species and Gender
As you can see, using lines to connect the data points doesn't make sense. because the data obtained from males is unrelated to the data obtained from females. Similarly, the data collected from the guinea pigs is unconnected to the data collected from the hamsters. In addition, the independent variable for this particular experiment is qualitative and unordered; that is, the data could have been arranged in any order along the X axis without changing the ability to see the differences.
Following is a graph of a data set that is more quantitative in nature.
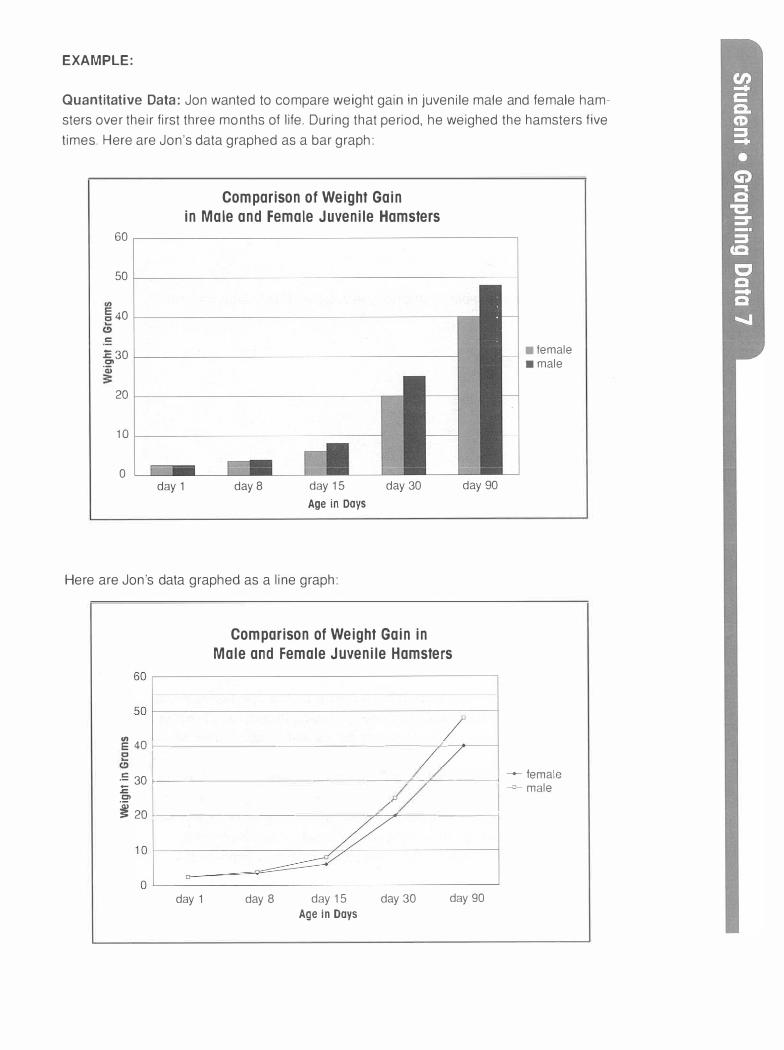
EXAMPLE:
Quantitative Data: Jon wanted to compare weight gain in juvenile male and female ham
sters over their first three months of life. During that period, he weighed the hamsters five
times. Here are Jon's data graphed as a bar graph:
Comparison of Weight Gain
in Male and Female Juvenile Hamsters
60
50
�40
C
.E 30 -� •female •male
20
10
0 day 1 day 8 day 15 day 30 day 90
Age in Days
Here are Jon's data graphed as a line graph:
Comparison of Weight Gain in
Male and Female Juvenile Hamsters
E 4o 1-- -- - - - -------- ----,"'-
·= 30 1----- - - - - --- ---�-/-------1 -+- female ..c: ---0--- male -� C1> :::201---------- -----,,<--;-- -------l
day 1 day 8 day 15 day 30 Age in Days
day 90

While it is possible to see the differences in weights between males and females in both
graphs, it is much easier to observe the overall shape and trends in the growth curve over
the 90-day period by viewing the line graph. It shows us immediately that the rate of growth
was quite rapid for both male and female hamsters during the first 20 days of life, and that
after 20 days, the growth rate tapered off somewhat. In this case, the line graph makes the
information more accessible.
In the following exercises, name the independent variable, determine whether it is qualitative
or quantitative, and decide whether the line graph or the bar graph is more appropriate. Record
your answers on the Graphing Data Worksheets, Part C. An example follows.
EXAMPLE:
Amy counted and compared the number of offspring produced by Daphnia raised under
light and dark conditions.
Independent variable? light or dark
Qualitative or quantitative? qualitative
Bar or line graph? bar
1. Mike counted the number of bacterial colonies on agar plates containing 1, 2, 5, 10, and
100 mM of the antibiotic tetracycline.
2. Amos studied whether differences in the population density of bobcats among several areas
in northern Vermont had an impact on the snowshoe hare population numbers in those areas.
3. Allison wanted to determine whether the population density of robins was greater in urban,
suburban, or rural areas of southern New Hampshire.
Part D: Choosing Scales for the Axes
A graph is a pictorial representation of a data set. If that picture is distorted, it may be difficult
to make an accurate interpretation of the relationships we are hoping to uncover. Choosing
the appropriate scale for the X and Y axes makes it easier for you and others to interpret any
trends in the data.
You'll need to develop a scale for any of the variables that are quantitative. This could be
both the independent and dependent variables if you are constructing a line graph or just the
dependent variable in a bar graph. How do you determine the appropriate scale for your data
set? The first step is to assess the overall range of the values a given data set contains.
What is the lowest value? What is the highest value? What is the difference between the
lowest and the highest value?
If the scale representing the data range for your variable is too small in scope, it may
exaggerate minor differences. On the other hand, if the scale is too large for your data set,

any differences will be hard to see. Moreover, it's aesthetically appealing to other observers when the overall scale of your graph uses the majority of the space provided. If you have been given a page-size piece of graph paper for constructing your graph, use the entire page so your graph is easy to view.
When constructing a line graph, if the independent variable covers a greater range of values than the dependent variable, then you will want to orient the graph paper so that the X axis is placed on the longer side of the paper. Next, you will want to determine how many squares you have available to use for each of your variables by counting the squares on your graph paper.
Divide the data range for each variable by the number of squares, as a rough estimate of what each square might represent numerically. Then you can make adjustments so that your squares represent units that are easy to interpret. Now you are ready to plot your data points. The examples below should to help illustrate this process.
EXAMPLE:
Teresa measured the heights of several bean plants that had been grown under different conditions. Her data set is shown in the following table:
Condition Average plant height in cm
10° C, high light 12 10° C, low light 5 20° C, high light 38 20° C, low light 29
Teresa's data range from 5 to 38 cm, a difference of 33 cm. She decides to orient "plant height in cm" on the shorter side of the graph paper. There are about 20 squares available on this axis (the Y axis in this case, since plant height is the dependent variable). But 33 cm divided by 20 squares is 1.65 cm/square. It would be very frustrating to try to construct or interpret a graph using such a scale. However, Teresa could have each square represent 2 cm and still be using much of the available space.
Teresa decides to have each square on the Y axis represent 2 cm. She doesn't label every square; instead she indicates where 10, 20, 30, and 40 cm occur on the Y axis. This provides enough information for anyone viewing the graph without making the axis too cluttered. Her final product follows.
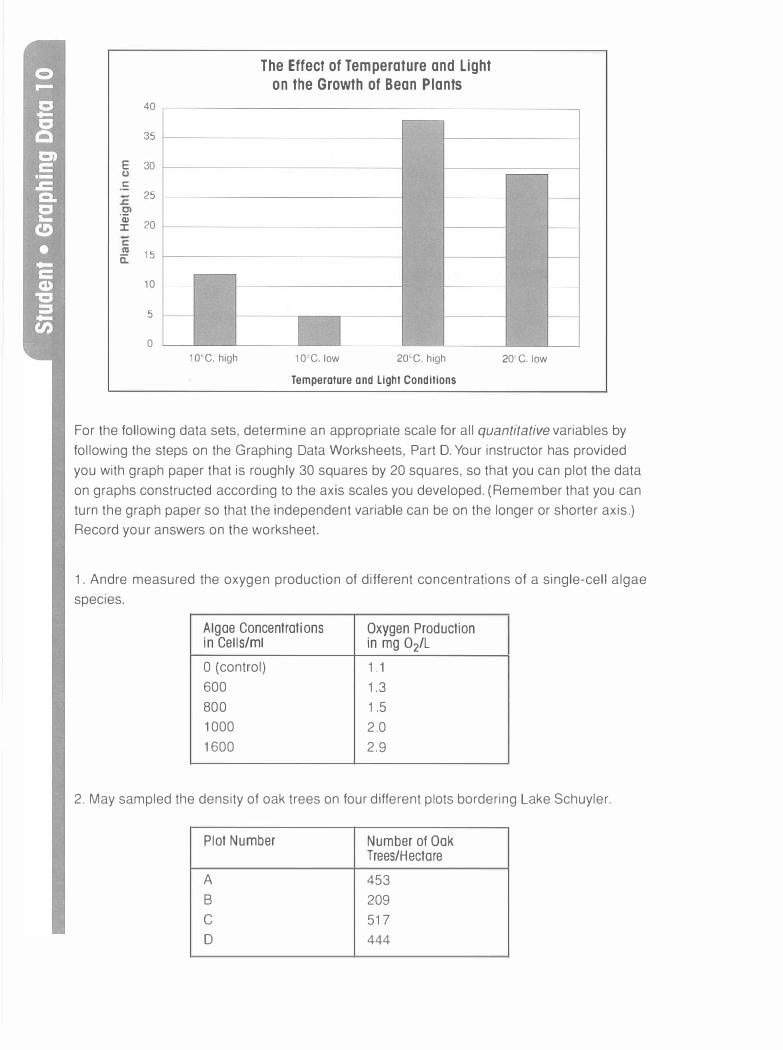
40
35
E 30
C:
- 25
'iii 20 J:
15 a: 10
5
0
1o·c. high
The Effect of Temperature and Light
on the Growth of Bean Plants
10-C, low 2o·c. high
Temperature and Light Conditions
20"C, low
For the following data sets, determine an appropriate scale for all quantitative variables by following the steps on the Graphing Data Worksheets, Part D. Your instructor has provided you with graph paper that is roughly 30 squares by 20 squares, so that you can plot the data on graphs constructed according to the axis scales you developed. (Remember that you can turn the graph paper so that the independent variable can be on the longer or shorter axis.) Record your answers on the worksheet.
1. Andre measured the oxygen production of different concentrations of a single-cell algae species.
Algae Concentrations Oxygen Production in Cells/ml in mg 02/L O (control) 1 . 1 600 1.3 800 1.5 1000 2.0 1600 2.9
2. May sampled the density of oak trees on four different plots bordering Lake Schuyler.
Plot Number Number of Oak Trees/Hectare
A 453 B 209 C 517 D 444
Part E: Writing Figure Titles and Stating Trends
Now that you have chosen the proper graph type to illustrate your data, used appropriate scales for the axes. plotted your data, and labeled your axes with both the names of the variables and their units of measurement, there are a few more additions to make to the final product before incorporating your graph into a report.
Writing Figure Titles. In a report. a graph is often referred to as a figure. The graph will need a descriptive title, sometimes referred to as a caption. Let's take another look at our example study from Part D.
EXAMPLE:
If you recall, Teresa measured the heights of several bean plants that had been grown under different light and temperature conditions. She chose the title "The Effect of Temperature and Light on the Growth of Bean Plants," a title that really gives you an idea of the nature of her study. Titles such as "The Heights of Bean Plants," "Temperature and Light Effects," or even "Height vs. Temperature and Light" are less informative about the purpose of the study. The title does NOT have to be a complete sentence, but it should help orient the viewer to the displayed data.
Write descriptive figure titles in the spaces provided for the two figures on the Graphing Data Worksheets, Part E.
Stating Trends. Rarely do we present a graph without some sort of accompanying text. For instance, in the typical scientific lab report, graphic representations of the experimental data would be included under the Results section. Any general trends observed by examining the graphs would also be noted within the text of the Results section. (Remember, interpretation
of data-explanations of observed trends-is NOT included in the Results section of a scientific report. Instead, we state in written format any general or major trends observed in graphs.) Stating trends can help readers notice important aspects of your graph that they may have overlooked at first glance. It is also important for scientists to be fluent at converting visual information to written form and vice versa.
Let's go back once again to Teresa's study on the effect of temperature and light on bean plant growth.

EXAMPLE:
The graph of Teresa's data follows.
40
35
30
C
25
·� 20 ::c
C
1 5
1 0
5
0
1 0°c, high
The Effect of Temperature and Light
on the Growth of Bean Plants
10°c, low 20°c, high
Temperature and Light Conditions
20°C, low
There a couple of trends we could state for this data set. For instance, we could point
out the conditions for the lowest and highest observed heights. "The shortest heights
were observed in bean plants kept under low light levels at 10°C, while the tallest
heights were observed in bean plants kept under high light conditions at 20°C."
We could also state the separate effects of temperature and light on bean plant
height. "Bean plants grown under high light conditions were taller than bean plants
grown under low light levels. Similarly, bean plants grown under the higher temperature
were taller than those grown under the lower temperature." As you see, none of these
statements provide any explanation for why Teresa observed what she did; they simply
restate the trends evident from viewing the graph.
In the spaces provided on the Graphing Data Worksheets, Part E , state any major trends you
observe after viewing the two graphs on the worksheet.

Part F: A Final Checklist
Before submitting your graph for assessment, take the time to check it over to make sure it
addresses the following aspects of graph making:
1 . Are the independent and dependent variables oriented to the proper axes?
2. Are the axes labeled with the names of the variable and the units of measurement?
3. Does the graph occupy a majority of the available space?
4. Is the scale of each axis noted?
5. Is the scale labeled at major intervals only (and not every square)?
6. Does the graph have a descriptive title?
If you answered yes to all of the above, then you have acquired the basic skills needed to
construct a simple line or bar graph for your next lab report. Congratulations!
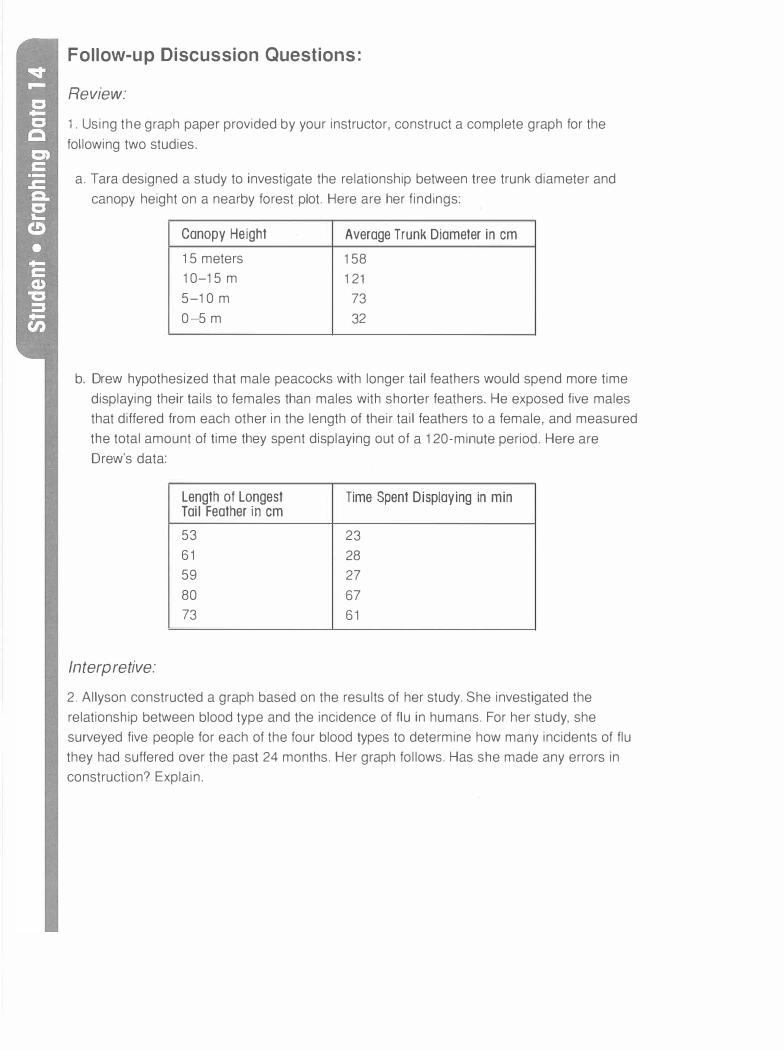
Follow-up Discussion Questions :
Review:
1 . Using the graph paper provided by your instructor, construct a complete graph for the following two studies.
a. Tara designed a study to investigate the relationship between tree trunk diameter and canopy height on a nearby forest plot. Here are her findings:
Canopy Height Average Trunk Diameter in cm
15 meters 158 10-15 m 121 5-10 m 73 0-5 m 32
b. Drew hypothesized that male peacocks with longer tail feathers would spend more time displaying their tails to females than males with shorter feathers. He exposed five males that differed from each other in the length of their tail feathers to a female, and measured the total amount of time they spent displaying out of a 120-minute period. Here are Drew's data:
Length of Longest Time Spent Displaying in min Tail Feather in cm
53 23 61 28 59 27 80 67 73 61
Interpretive:
2. Allyson constructed a graph based on the results of her study. She investigated the relationship between blood type and the incidence of flu in humans. For her study, she surveyed five people for each of the four blood types to determine how many incidents of flu they had suffered over the past 24 months. Her graph follows. Has she made any errors in construction? Explain.
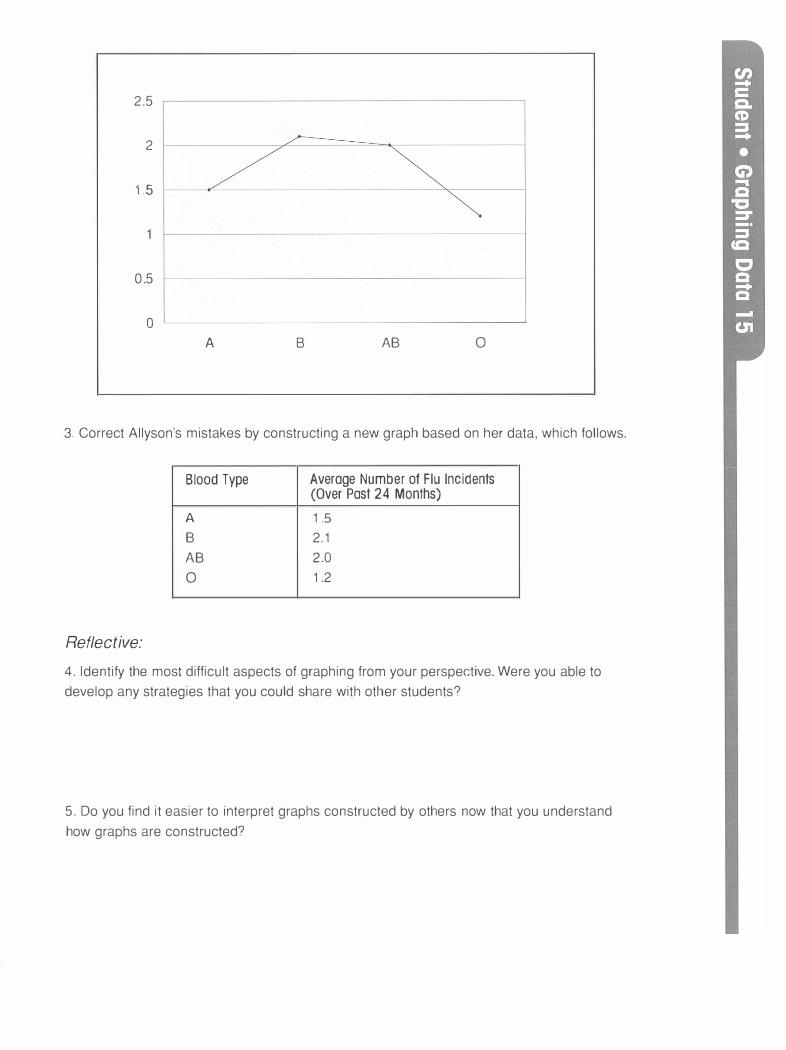
2.5
2
1 .5
0.5
0 A B AB 0
3. Correct Allyson's mistakes by constructing a new graph based on her data, which follows.
Blood Type Average Number of Flu Incidents (Over Past 24 Months)
A 1.5 B 2. 1
AB 2.0
0 1.2
Reflective:
4. Identify the most difficult aspects of graphing from your perspective. Were you able to develop any strategies that you could share with other students?
5. Do you find it easier to interpret graphs constructed by others now that you understand how graphs are constructed?
GRAPHING DATA WORKSHEETS
Part A: Identifying the Independent and Dependent Variables
1. Independent variable:
Dependent variable:
2. Independent variable:
Dependent variable:
3. Independent variable:
Dependent variable:
GRAPHING DATA WORKSHEETS
Part 8: Graphing the Independent and Dependent Variables
1 .
2.
GRAPHING DATA WORKSHEETS
Part C: Choosing between Bar and Line Graphs
1 . Independent Variable
Circle Answers: Qualitative or Quantitative
2. Independent Variable
Circle Answers: Qualitative or Quantitative
3. Independent Variable
Circle Answers: Qualitative or Quantitative
Bar Graph or Line Graph
Bar Graph or Line Graph
Bar Graph or Line Graph

GRAPHING DATA WORKSHEETS
Part D: Choosing Scales for the Axes
1 . Independent variable _ __ _ _ _ _ _ _ _ _ _ _ _ _ _ _ Quantitative? ----
Data range__________________ Circle one: 20 or 30 squares
Scale: Each square = _ _ _ _ _ __ _______ _ (include units)
Dependent variable _______ __ __ ____ __ _ Quantitative? - - - -
Data range__________________ Circle one: 20 or 30 squares
Scale: Each square = _ _ _ _ _ _ _ _ _ _ __ _ __ (include units)
2. Independent variable ___ __ __ _ _ _ _ _ _ _ _ _ _ Quantitative? __ _ _
Data range ___ _ _ _ _ _ _ ________ _ Circle one: 20 or 30 squares
Scale: Each square = _______________ (include units)
Dependent variable_ _ _ _ _ _ _ _ _ _ _ _ _ _ _ _ _ __ Quantitative? _ _ _ _
Data range_ __ _ _______ __ _ __ __ Circle one: 20 or 30 squares
Scale: each square = _______________ (include units)
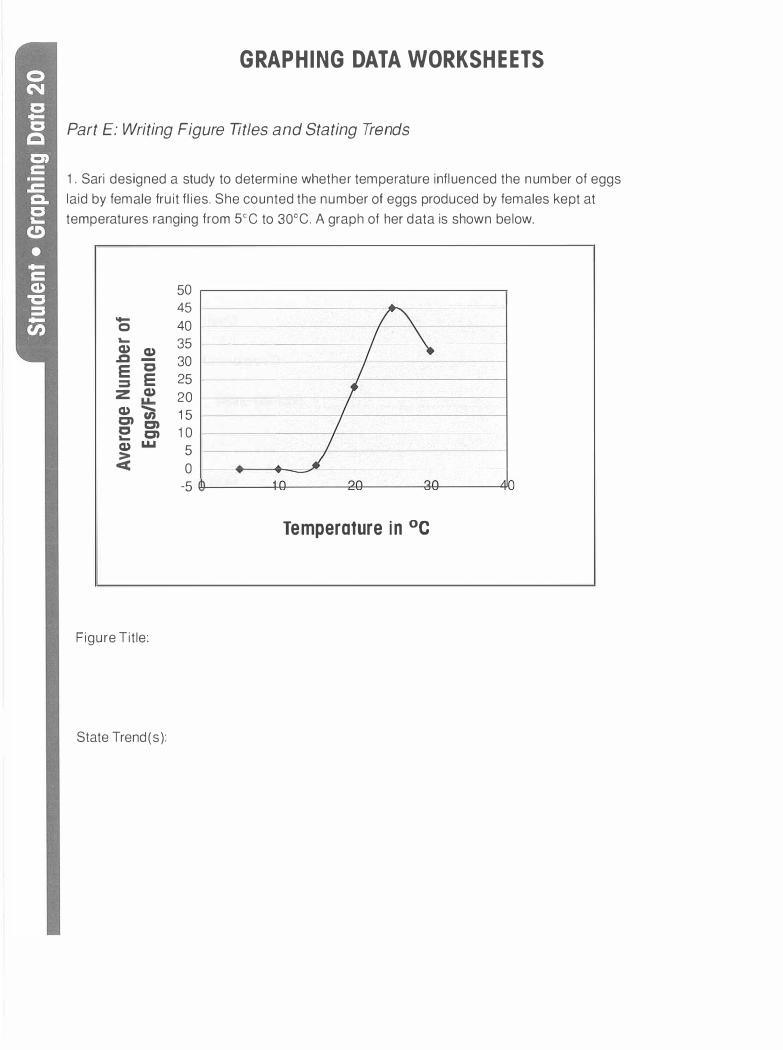
GRAPHING DATA WORKSHEETS
Part E: Writing Figure Titles and Stating Trends
1 . Sari designed a study to determine whether temperature influenced the number of eggs
laid by female fruit flies. She counted the number of eggs produced by females kept at
temperatures ranging from 5°C to 30°C. A graph of her data is shown below.
50
45 -40 0
.... 35 ------ -
Q) Q) .Q - 30 E C
::::s E 25
z Q) 20
Q) en 1 5 c:n c:n E c:n 1 0 Q) LLI
5
� 0
-5
Temperature in °c
Figure Title:
State Trend(s):
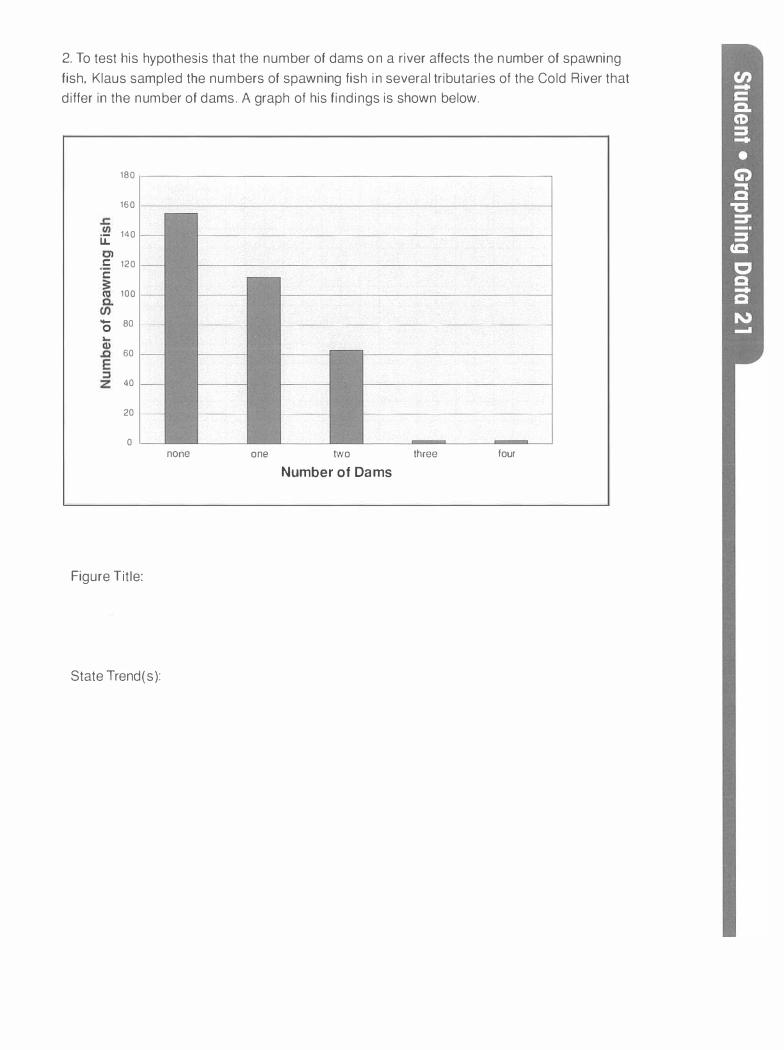
2. To test his hypothesis that the number of dams on a river affects the number of spawning
fish, Klaus sampled the numbers of spawning fish in several tributaries of the Cold River that
differ in the number of dams. A graph of his findings is shown below.
180
160
140 u:: C: 120
C:
100
- 80 0
60
40
20
0
Figure Title:
State Trend(s):
none one two Number of Dams
three four

Name: _ _ _____ _
Title: ______ _ _
I I I I I I I I I I I I I
I I I I I I I I I I I I I I I
I I I I I I I I I I I I I I I I I I I I
I I I
I I
I I I I
I I I I I I I
I I I I I I I I I I I I I I I
I I I I I I I I I I I I I I I I I
I I I I I
I I I I I I
I i I I I •
I I I I I I I I I I I I I
I I I I I I I I I I I I I I I I I I I I I I I I I I I
I I I I I I I I I I I I I
I I I I
I I I i I
I
I I I I I I I I I I I I I I I I I I I I I I I I I I I
I I I I I I I I I I I I I I I I I I I I I I
I I I I I I I I I I I I I
I I I I I I I I I I I
' I I I I I I I I I
I I I I I I I I I
I I I I I I I I I I I I
I I I I I I I I I I I I I
I I I I I I I
I I I I I I I I I I i I I I I I I I I I
I I I I i I I I I I I
I :

Web of Life
Activator/Connector
Where do you fit in the web of life?
Activity Purpose
In this activity, your goal is to create a personal food web, based on a recent meal , in order to
understand some basic food web concepts.
General Background
In order to survive, an organism must have a source of energy. Many organisms, including
ourselves, obtain energy through eating. The web of life is the idea that all forms of life,
including humans, are connected in a way that allows energy to flow through ecosystems.
Vocabulary
producer, primary consumer, secondary consumer, tertiary consumer, herbivore, omnivore,
carnivore, decomposer, autotroph, heterotroph
Learning Outcomes
After completing this activity, you will be able to:
Content
• Construct a food web diagram that correctly links humans to other living organisms • Define the terms listed under Vocabulary • Apply these terms to a food web diagram

Materials
• Newsprint (1 sheet)
• Notebook paper • Markers (5 different colors)
Activity Sequence
1 . Record what you had for dinner last night, or a comparable amount of food.
2. Break down to the level of plants the components of the foods and drinks you had
for dinner.
3. Asssemble your food web.
4. Label the food web with food web terminology.
5 . Follow-up discussion questions
Procedure
D 1 . From the list of foods that you ate for dinner last night, on a sheet of notebook paper,
break each food down into any known components. For example, if the food was pep
peroni pizza, the components could be as follows: For the crust, dough in the form of
wheat flour, egg, and water; for the topping, tomatoes, milk in the form of cheese, and
beef and pork in the pepperoni.
D 2. Now identify whether the ingredients came from a plant or an animal. Mark the plant
ingredients with a "P" and the animal ingredients with an "A."
D 3. If the food came from an animal, list several foods that the animal eats. For instance,
the beef and pork can be broken down further into the foods that were consumed by
the beef or the pig-corn or wheat. Continue this dissection of each food item until a
plant is reached.
D 4. At this point, you should begin drawing your food webs. To start, at the bottom of the
newsprint, draw any plants that you may have consumed, either directly or as a food
of any animals you ate (for example, wheat, tomatoes, corn).
D 5. Next, above the plants on the newsprint, draw the animals that eat those particular
plants (chickens, cattle, pigs).
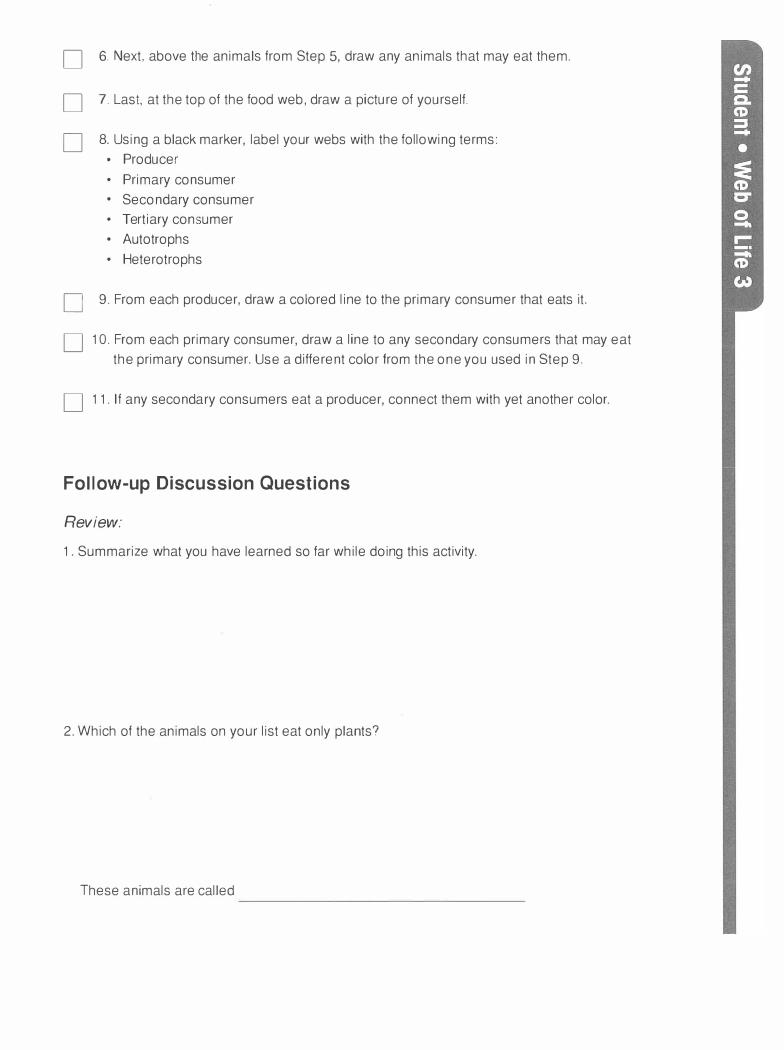
D 6. Next, above the animals from Step 5, draw any animals that may eat them.
D 7. Last, at the top of the food web, draw a picture of yourself.
D 8. Using a black marker, label your webs with the following terms:
• Producer
• Primary consumer
• Secondary consumer
• Tertiary consumer
• Autotrophs
• Heterotrophs
D 9. From each producer, draw a colored line to the primary consumer that eats it.
D 1 0. From each primary consumer, draw a line to any secondary consumers that may eat
the primary consumer. Use a different color from the one you used in Step 9.
D 1 1 . If any secondary consumers eat a producer, connect them with yet another color.
Fol low-up Discussion Questions
Review:
1 . Summarize what you have learned so far while doing this activity.
2. Which of the animals on your list eat only plants?
These animals are called
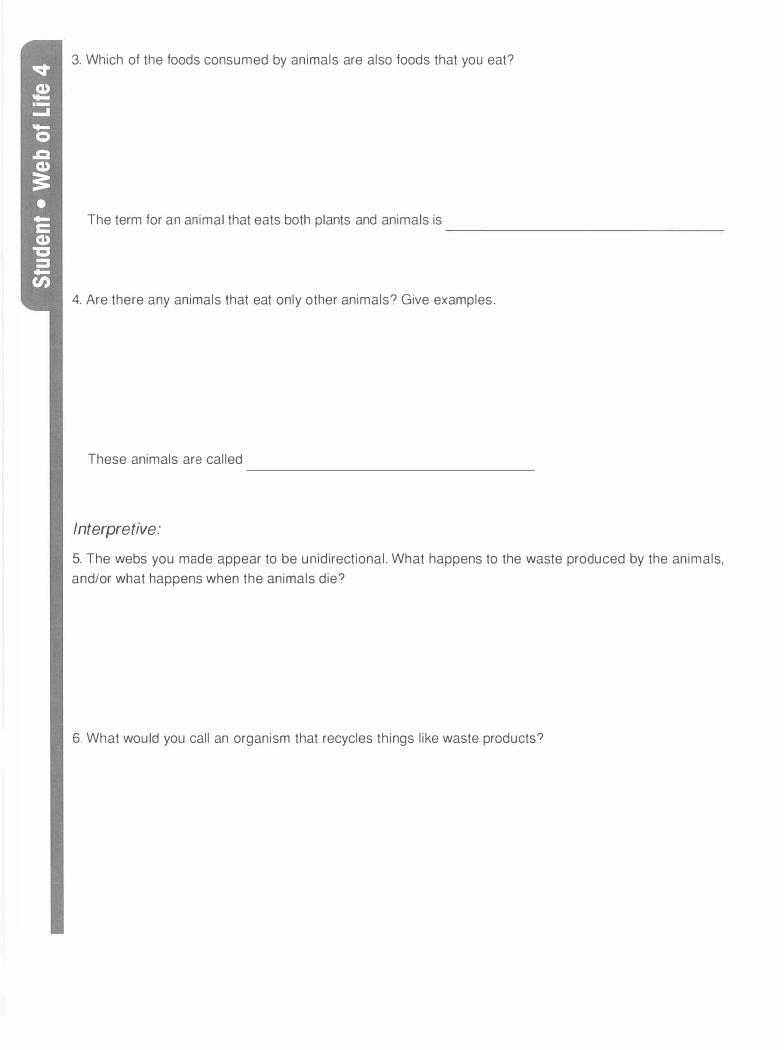
3. Which of the foods consumed by animals are also foods that you eat?
The term for an animal that eats both plants and animals is
4. Are there any animals that eat only other animals? Give examples.
These animals are called
Interpretive:
5. The webs you made appear to be unidirectional. What happens to the waste produced by the animals,
and/or what happens when the animals die?
6. What would you call an organism that recycles things like waste products?

Reflective:
7. What did you like best about the activity?
8. What would you change and why?

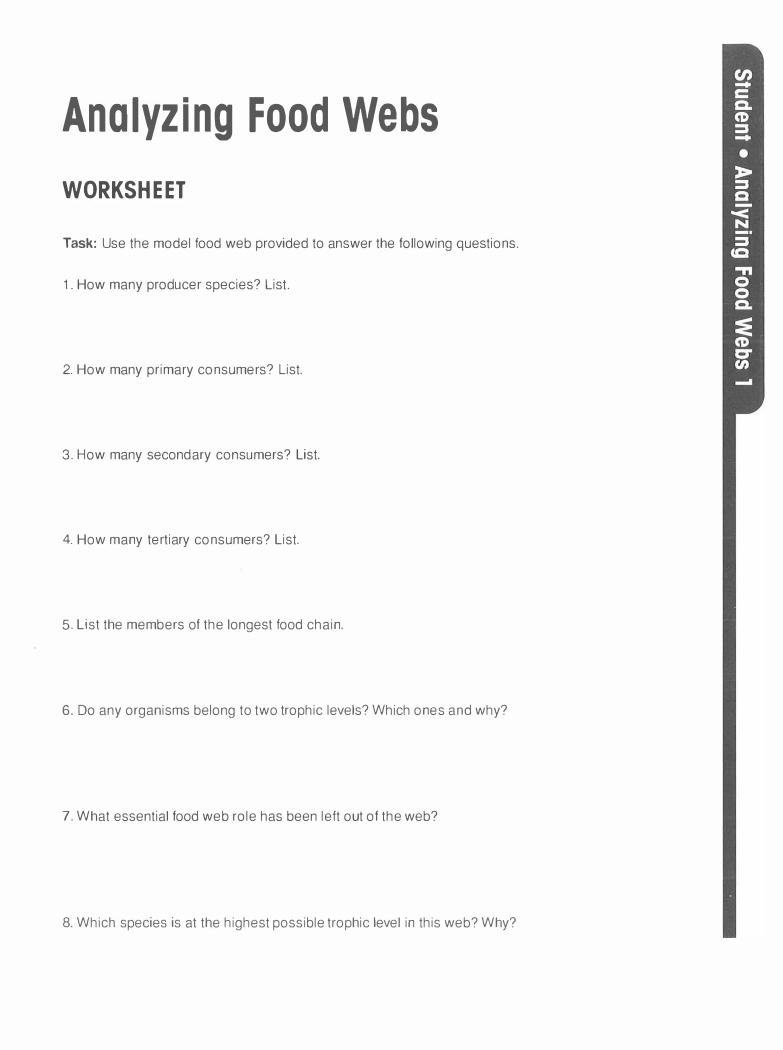
Ana lyz i ng Food Webs
WORKSHEET
Task: Use the model food web provided to answer the following questions.
1. How many producer species? List.
2. How many primary consumers? List.
3. How many secondary consumers? List.
4. How many tertiary consumers? List.
5. List the members of the longest food chain.
6. Do any organisms belong to two trophic levels? Which ones and why?
7. What essential food web role has been left out of the web?
8. Which species is at the highest possible trophic level in this web? Why?
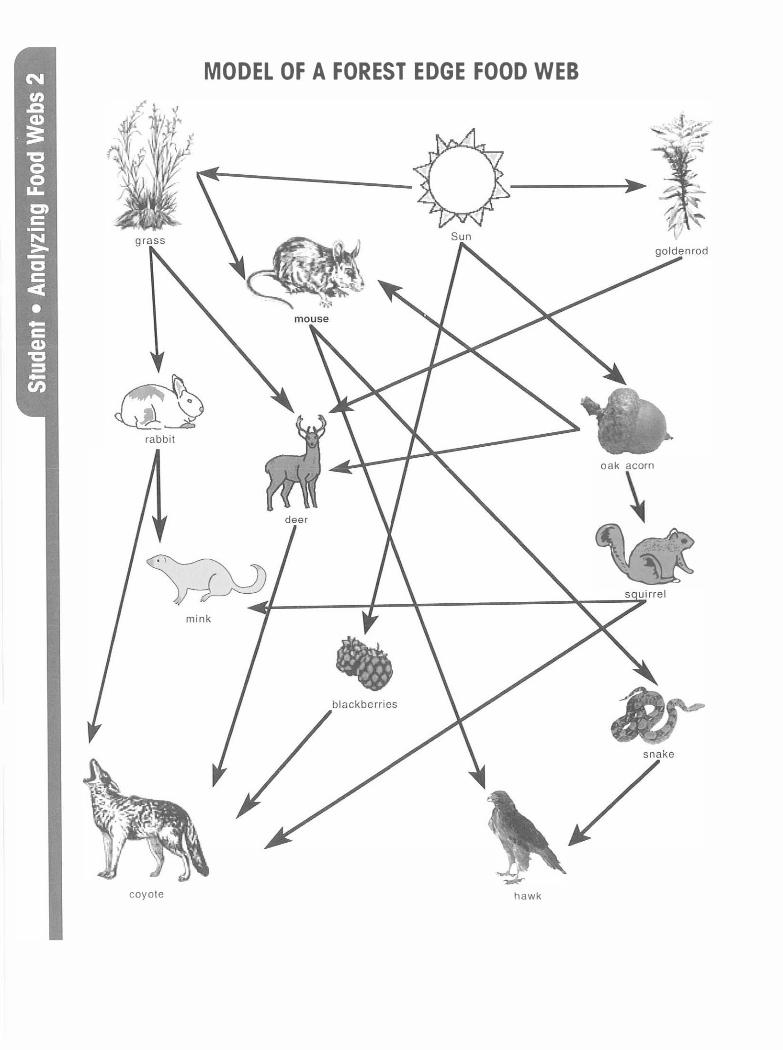
MODEL OF A FOREST EDGE FOOD WEB
coyote hawk
oak acorn
� �
�
Pond Investigation I
Activator/Connector
What kinds of animals might you expect to find in a pond?
Describe insect life cycles. What are the differences and similarities between complete and
incomplete metamorphosis?
Activity Purpose
In this activity, in order to begin exploring some of the organisms and relationships in an
ecosystem, you will use collecting nets to retrieve organisms from a nearby pond. Back in
the lab, you will use microscopes and field guides to identify those organisms.
General Background
Ponds are useful sites for field studies because of the diversity, or number of different kinds,
of collectible and identifiable species. In general, most of the organisms collected in a pond
are macroinvertebrates, visible with the naked eye and having no internal skeletons. These
include adult insects and immature stages, or larvae. The instructor will demonstrate the
proper use of the collecting nets and other equipment before collecting begins. You will be
gathering specimens from both the water and the pond bottom, or substrate.
The pond is on private property Please show respect for the pond and the surrounding
area. Leave behind no trash, including cigarette butts, and do not pick flowers or dig up or
destroy plants.
Vocabulary
diversity, substrate, macroinvertebrate, larvae, complete metamorphosis, incomplete
metamorphosis
Learning Outcomes
After completing this activity, you will be able to:
Content
• Identify a variety of different macroinvertebrates inhabiting a local pond
Inquiry Skills
• Determine the relative abundance of the various macroinvertebrates inhabiting the pond
• Develop various hypotheses that explain why certain inhabitants are less abundant
than others
Lab Skills
• Collect aquatic macroinvertebrates using nets and other collecting tools • Use a dissecting microscope • Use identification guides
Activity Sequence
1. Gather equipment and travel to pond
2. Learn how to use equipment and gather specimens from pond
3. Return to lab and use microscopes and field guides to identify organisms collected
Materials
Field
• Collecting nets • Buckets for holding organisms and pond water • Enamel or plastic pans for sorting and viewing aquatic invertebrates • Meter sticks • Hip waders-a pair per sampling team • Rubber boots-for use by nonsampling students • Tweezers for moving organisms within the containers • Pipettes for moving organisms
• Clipboard, paper, and pen or pencil for recording observations
Materials
In Lab
• Dissecting microscopes
• Tweezers
• Pipettes
• Probes
• Plastic petri dishes for holding organisms
• Identification guides
• Plastic pipettes/eyedroppers
• Drawing materials
Procedure
Part A (in the field)
D 1. Collect all the field equipment and materials to bring to the pond.
D 2. Observe the pond and surrounding area. Discuss your observations with the class.
D 3. Observe the instructor's demonstration of the proper equipment handling techniques
and proper use of the collecting tools.
D 4. Collect samples in the manner demonstrated.
D 5. Observe and record the relative abundance of each type of organism. A general
observation is all that is necessary; an accurate count is not required.
D 6. Choose a representative sample of each type of organism to place in buckets (with
water) to bring back to the lab.
Part 8 (in the lab)
D 1. Using microscopes and identification books, identify as many organisms as possible.

D 2. Record your organisms on a class list of organisms.
D 3. Sketch at least three of the organisms that you observed, using the sheets provided
at the end of this handout.
Follow-up Discussion Questions
Review:
1. How many different species were identified?
2. What species were the most abundant?
3. What organisms had low numbers?
4. What did you learn about macroinvertebrates that you did not know before?
Interpretive:
5. Give two possible hypotheses as to why you think the pond would have so many of the
most abundant organisms.

6. Give some hypotheses as to why you think numbers of other organisms were low.
Reflective:
7. What more would you like to know about macroinvertebrates?
8. What did you like and dislike about this lab?
9. What aspect of this lab was most difficult for you and why?
10. What did it teach you about how you learn best?

POND ORGANISM SKETCH
Name:
Date:
Organism:
Observations:
Sketch:

POND ORGANISM SKETCH
Name:
Date:
Organism:
Observations:
Sketch:

POND ORGANISM SKETCH
Name:
Date:
Organism:
Observations:
Sketch:

Pond Investigation II
Activator/Connector
Recall the steps in the scientific process. What parts of this process were used in Pond
Investigation I?
Recall your observations of the pond in Pond Investigation I. In what parts of the pond
were the aquatic invertebrates collected?
If the pond is an ecosystem, brainstorm some of the "mini" ecosystems or habitats
within a pond.
Activity Purpose
In this lab-based activity, you will develop hypotheses regarding the effect of depth on
various organisms living in a pond, then design an experiment, perform the experiment, and
analyze the results in the lab.
General Background
Ponds are useful sites for field studies because of the diversity, or number of different kinds,
of collectible and identifiable species. In general, most of the organisms collected in a pond
are macroinvertebrates, visible with the naked eye and having no internal skeletons. These
include adult insects and immature stages, or larvae. The instructor will demonstrate the
proper use of the collecting nets and other equipment before collecting begins. You will be
gathering specimens to test your hypothesis.
Remember that this pond is on private property and treat the area with respect.
Vocabulary
diversity, substrate, macroinvertebrate, larvae, complete metamorphosis, incomplete
metamorphosis
Learning Outcomes
After completing this activity, you will be able to:
Content
• Identify a variety of different macroinvertebrates inhabiting a local pond
• Describe the effect of depth on aquatic biodiversity
Inquiry Skills
• Develop working hypotheses and predictions for a given investigative question
• Design experiments to test hypotheses • Determine and compare the abundance of macroinvertebrates inhabiting different
depth zones in a pond
• Decide whether data support hypotheses
Lab Skills
• Collect aquatic invertebrates using nets and other collecting tools
• Use a dissecting microscope
• Use identification guides
Activity Sequence
1. Discuss the investigative question
2. Develop hypotheses and predictions
3. Develop experimental procedures
4. Gather equipment and travel to pond
5. Carry out designed procedure
6. Identify and quantify collected organisms
7. Analyze data
8. Follow-up discussion questions
Materials
Field:
• Collecting materials such as nets, closable jars, etc. • Buckets for holding organisms and pond water
• Enamel or plastic pans for sorting and viewing aquatic invertebrates
• Thermometers (optional) • Meter sticks-several • Hip waders-a pair per sampling team
• Rubber boots-for use by nonsampling students
• Tweezers for moving organisms within the containers
Materials
In Lab:
• Dissecting microscopes • Tweezers • Probes • Plastic petri dishes for holding organisms • Identification guides • Plastic pipettes/eyedroppers • Calculators
• Graph paper
Procedure
Part A (in the lab)
1. In your lab groups, discuss the following investigative question: Does pond depth have
an effect on aquatic invertebrate diversity?
D a. Identify the dependent and independent variables in the question.
Dependent variable:
Independent variable:
D b. Develop and record a hypothesis which answers the investigative question.
Hypothesis:
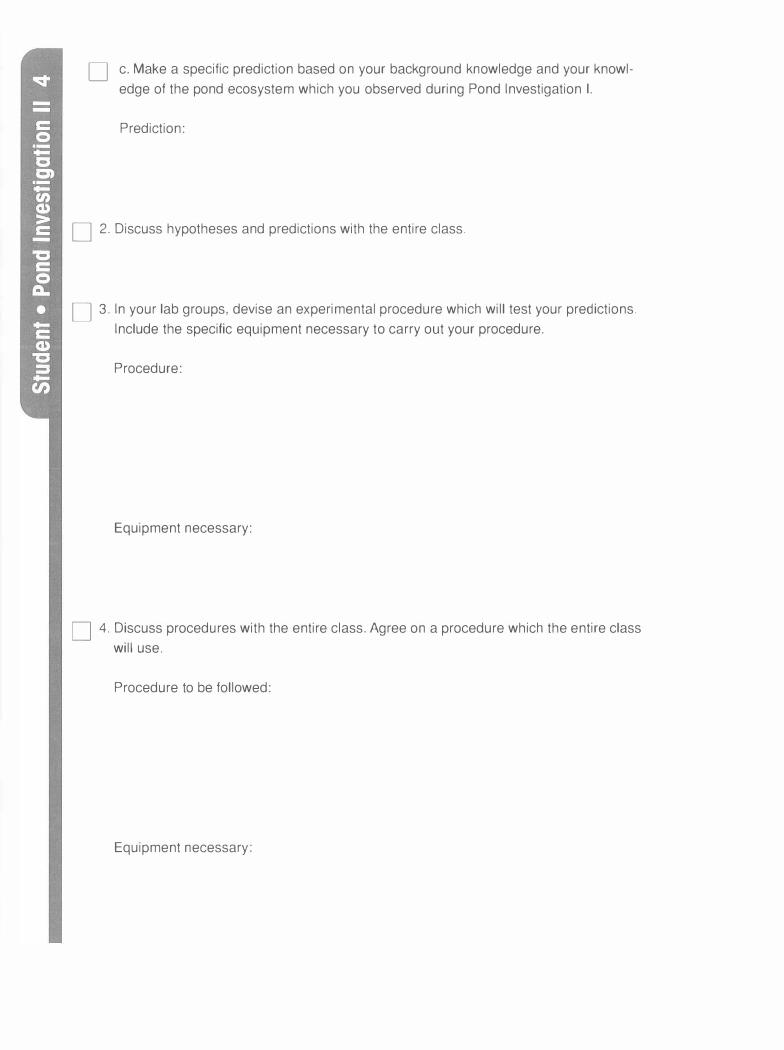
D c. Make a specific prediction based on your background knowledge and your knowl
edge of the pond ecosystem which you observed during Pond Investigation I.
Prediction:
D 2. Discuss hypotheses and predictions with the entire class.
D 3. In your lab groups, devise an experimental procedure which will test your predictions.
Include the specific equipment necessary to carry out your procedure.
Procedure:
Equipment necessary:
D 4. Discuss procedures with the entire class. Agree on a procedure which the entire class
will use.
Procedure to be followed:
Equipment necessary:
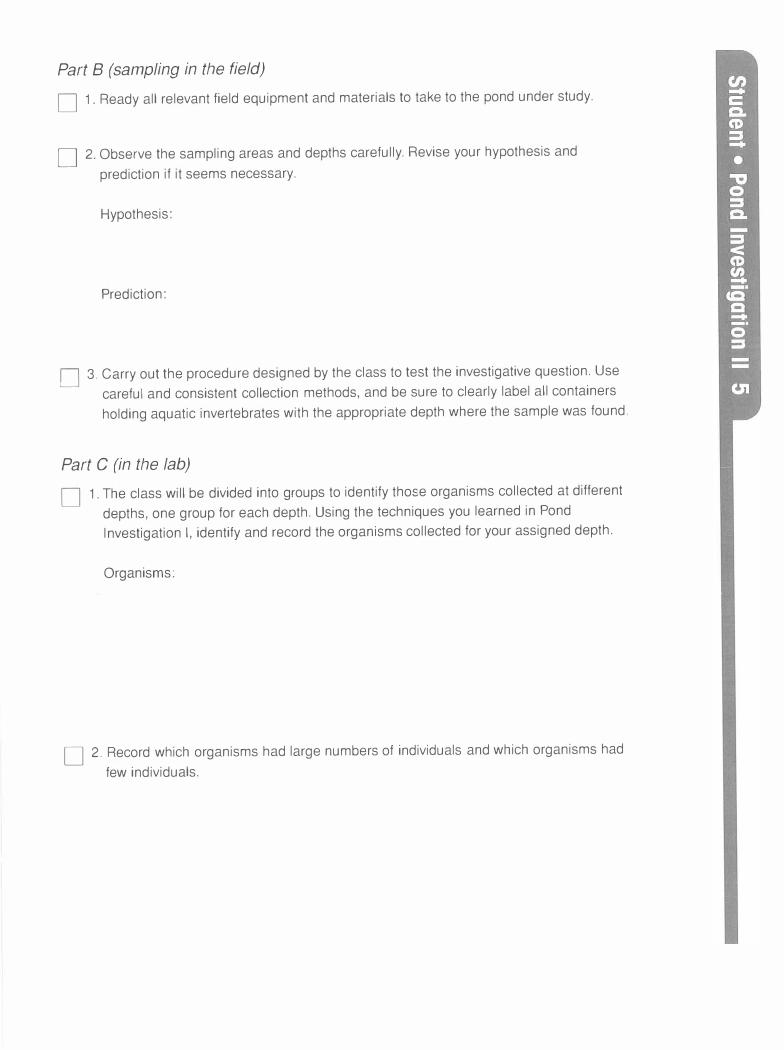
Part B (sampling in the field)
D 1. Ready all relevant field equipment and materials to take to the pond under study.
D 2. Observe the sampling areas and depths carefully. Revise your hypothesis and
prediction if it seems necessary.
Hypothesis:
Prediction:
D 3. Carry out the procedure designed by the class to test the investigative question. Use
careful and consistent collection methods, and be sure to clearly label all containers
holding aquatic invertebrates with the appropriate depth where the sample was found.
Part C (in the lab)
D 1. The class will be divided into groups to identify those organisms collected at different
depths, one group for each depth. Using the techniques you learned in Pond
Investigation I, identify and record the organisms collected for your assigned depth.
Organisms:
D 2. Record which organisms had large numbers of individuals and which organisms had
few individuals.
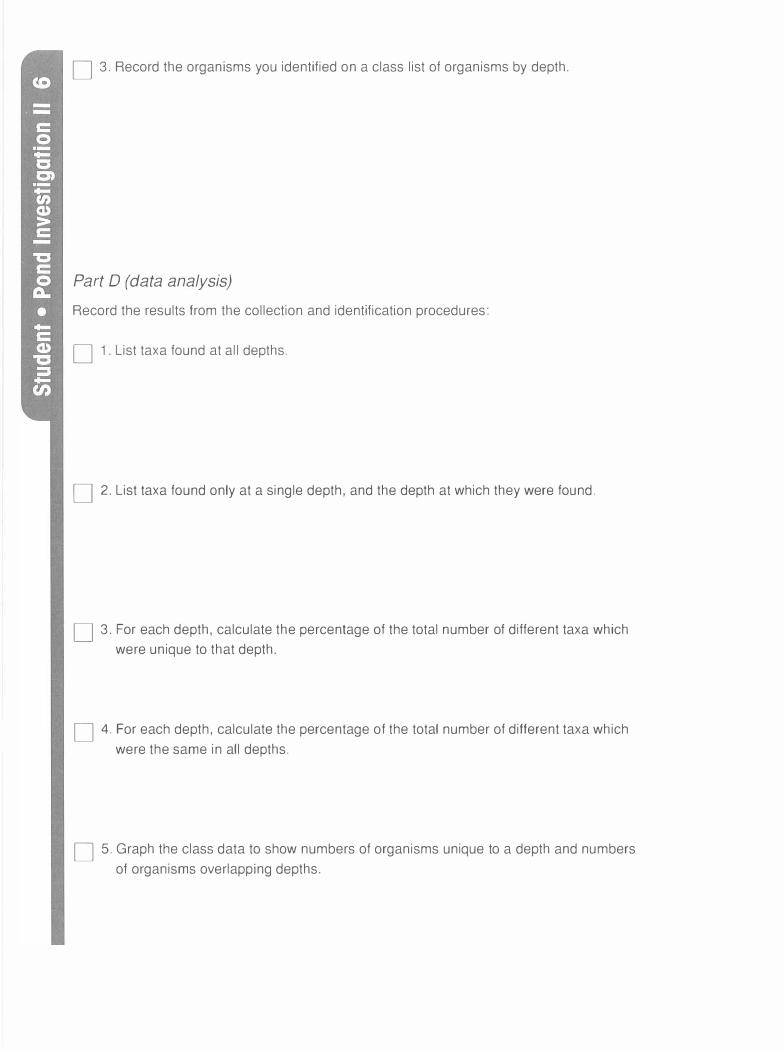
D 3. Record the organisms you identified on a class list of organisms by depth.
Part D (data analysis)
Record the results from the collection and identification procedures:
D 1. List taxa found at all depths.
D 2. List taxa found only at a single depth, and the depth at which they were found.
D 3. For each depth, calculate the percentage of the total number of different taxa which
were unique to that depth.
D 4. For each depth, calculate the percentage of the total number of different taxa which
were the same in all depths.
D 5. Graph the class data to show numbers of organisms unique to a depth and numbers
of organisms overlapping depths.
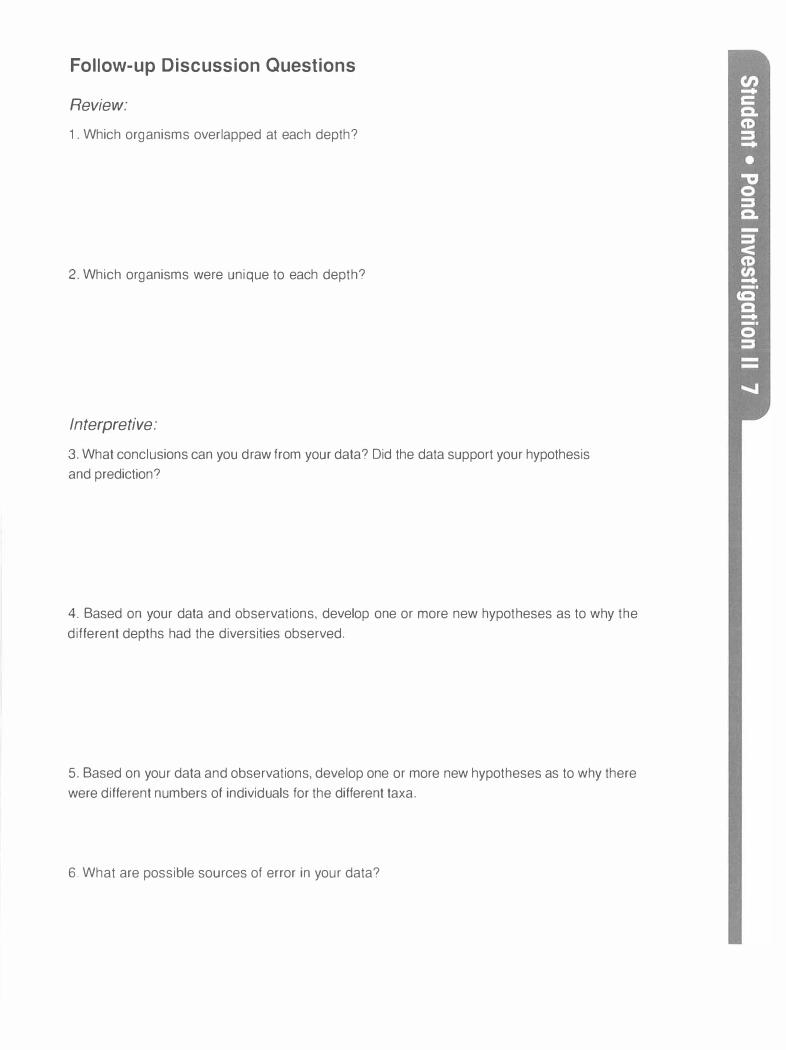
Follow-up Discussion Questions
Review:
1. Which organisms overlapped at each depth?
2. Which organisms were unique to each depth?
Interpretive:
3. What conclusions can you draw from your data? Did the data support your hypothesis
and prediction?
4. Based on your data and observations, develop one or more new hypotheses as to why the
different depths had the diversities observed.
5. Based on your data and observations, develop one or more new hypotheses as to why there
were different numbers of individuals for the different taxa.
6. What are possible sources of error in your data?
Reflective:
7. What did you learn about pond ecology?
8. What did you learn about the nature of scientific inquiry?
9. What aspects of this investigation were most suited to your learning style?
10. What aspects of the lab were most challenging?
Mussel Beach: A Simulation
of Evolutionary Change Activator/Connector
Pretend that you are a mussel living on the shoreline. List some ways that you might
be killed.
Activity Purpose
In this activity, you will be a carrying out a simulation that shows how evolutionary change
might occur.
General Background
Evolution can be a difficult subject to study in real time. Evolutionary change generally
occurs at extremely slow rates. This simulation is designed to speed up the process, so we
can get a glimpse of the process in a shorter time frame. Set in a rocky coastline habitat, this
evolution simulation has two variations: the oystercatcher and the driftwood log. In the
oystercatcher simulation, a predator (the oystercatcher bird) will visually "hunt" and "kill" its
prey (mussels) in the coastline habitat. In the driftwood log simulation, mussels will be "killed"
by a driftwood log smashing into the coastline habitat. After performing the simulations, you
will graph your data, and then all data will be grouped together in large class graphs. You will
then compare the two simulations and discuss types of evolutionary change.
Learning Outcomes
After completing this activity, you will be able to:
Content
• Define the concepts of natural selection and genetic drift • Differentiate between natural selection and genetic drift with respect to how they influence
evolutionary change in small populations

Inquiry Skills
• Display data in both tabular and graphic form • Compare and contrast related sets of data and draw conclusions • Identify sources of experimental error
Communication Skills
• Write a scientific lab report that summarizes the experimental simulation
Activity Sequence
1. Instructor demonstrates the two simulations
2. Students run simulations in teams and record data
3. Graph data in teams
4. Share and graph all class data generated
5. Discuss results
6. Name types of evolutionary change and discuss simulations
Materials
Each student simulation team needs:
• A container with 40 mixed beads-1 O beads in each of four colors • A piece of multicolored fabric with a complex pattern, about 50cm x 30cm • Four small containers, each with beads of one of the four colors (about 40 beads in
each container) • Graph paper or graph templates • Colored markers in the same colors as the beads
• Two labeled petri dishes:
-"Survivor" dish
-"Graveyard" dish
Driftwood Log teams need, in addition,
• Masking tape, sticky side out, wrapped around three pencils

Investigative Question
What is going to happen to each of the four mussel/bead subpopulations after the
oystercatcher and driftwood log simulations are run?
What do you think will happen to each of the four colors of beads when the oystercatcher
simulation is performed ?
What is the basis for your prediction? (hypothesis)
What do you think will happen to each of the four colors of beads when the driftwood log
simulation is performed?
What is the basis for your prediction? (hypothesis)
Procedure-Oystercatcher Teams
D 1 . Working in pairs, collect the materials and spread out the fabric.
D 2. Identify your roles in the team: the oystercatcher hunts the mussels; the habitat
manager manages the fabric and bead counts.
D 3. The habitat manager sprinkles the 40 beads onto the fabric and spreads them
evenly.
D 4. The oystercatcher picks out 30 beads in a predatory manner (one at a time). Do this
by looking at the fabric and taking the first bead that stands out. Look away between
each "hunt."
D 5. Put the bead victims in the "graveyard" dish. The habitat manager counts them care
fully as they are hunted, until 30 are removed from the fabric and placed in the dish.
D 6. Stop hunting when 1 O survivors are left on the fabric.

D 7. Remove the remaining 1 O bead survivors from the fabric and place them in the "sur
vivor'' dish. Count the number of each color and record it in the data sheet provided.
D 8. Multiply the number of each survivor color by 3 and put the results in the data sheet.
The four totals should add up to 30.
D 9. Add the number of survivors of each color to the corresponding total from step 8 and
record the results in the Totals column of the data sheet. Make sure the total number
of all four colors is 40.
D 1 0. Then, take the numbers of beads of each color shown in the Totals column from the
four single-color bead containers, and once again scatter 40 beads onto the fabric to
start round two.
D 1 1 . Repeat steps 4 through 1 O two more times for a total of three rounds.
Procedure-Driftwood Log Teams
D 1 . Working in pairs, collect the materials and spread out the fabric.
D 2. Identify your roles in the team: the driftwood log "crashes" a pencil onto the fabric.
The habitat manager manages the fabric and bead counts.
D 3. The habitat manager sprinkles the 40 beads onto the fabric and spreads them
evenly.
D 4. With eyes closed, the driftwood log gently rolls or drops the taped pencil randomly
into the "habitat" and removes the beads that stick to it. Be sure to watch out for
escapees that get knocked off of the fabric!! Put them back on the fabric!
D 5. Put the beads from the pencil in the "graveyard" dish, counting them carefully as they
are hunted, until a total of 30 are removed. It may take a few rolls of the pencil to
achieve the precise number of 30 beads. If a roll yields a cumulative number "killed"
larger than 30, beads from that roll should be put back on the fabric and the pencil
rerolled, if necessary repeating this procedure of replacing and rerolling until exactly
30 beads have been removed.
D 6. Check to make sure 1 0 survivors are left in the habitat.
D 7. Remove the remaining 1 0 bead survivors from the fabric and place them in the
"survivor" dish. Count the number of each color and record it in the data sheet
provided.
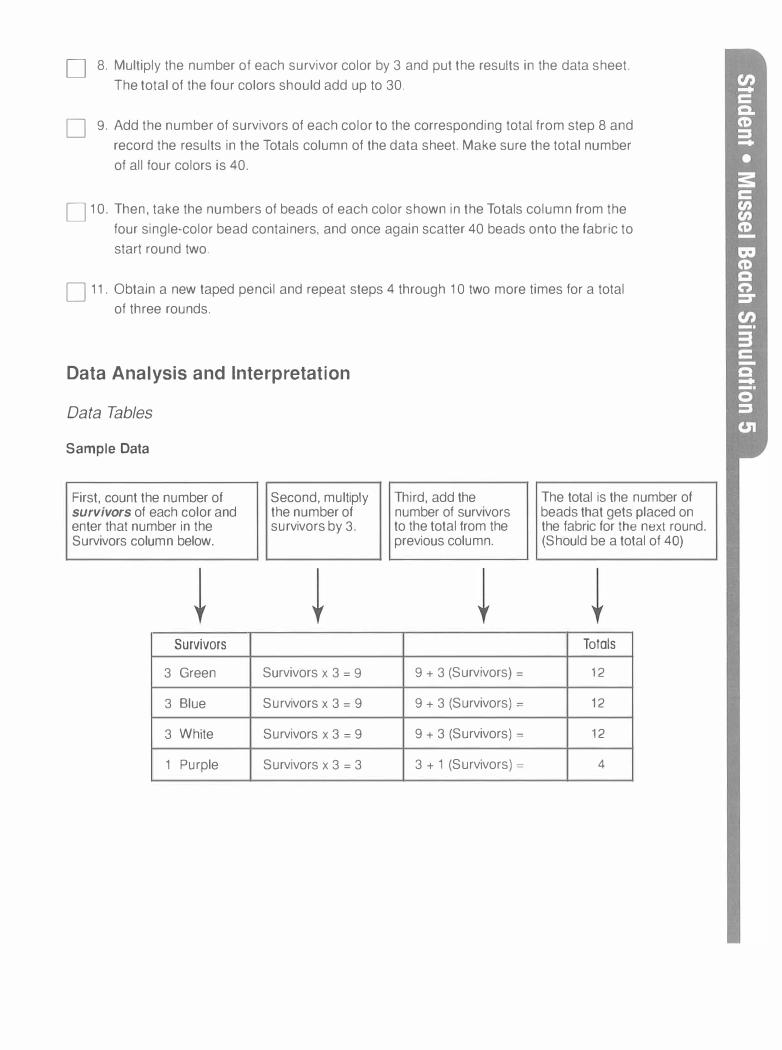
D 8. Multiply the number of each survivor color by 3 and put the results in the data sheet.
The total of the four colors should add up to 30.
D 9. Add the number of survivors of each color to the corresponding total from step 8 and
record the results in the Totals column of the data sheet. Make sure the total number
of all four colors is 40.
D 10. Then, take the numbers of beads of each color shown in the Totals column from the
four single-color bead containers, and once again scatter 40 beads onto the fabric to
start round two.
D 11. Obtain a new taped pencil and repeat steps 4 through 1 O two more times for a total
of three rounds.
Data Analysis and Interpretation
Data Tables
Sample Data
First, count the number of survivors of each color and enter that number in the Survivors column below.
Survivors
3 Green
3 Blue
3 White
1 Purple
Second, multiply the number of survivors by 3.
Survivors x 3 = 9
Survivors x 3 = 9
Survivors x 3 = 9
Survivors x 3 = 3
Third, add the number of survivors to the total from the previous column.
9 + 3 (Survivors) =
9 + 3 (Survivors) =
9 + 3 (Survivors) =
3 + 1 (Survivors) =
The total is the number of beads that gets placed on the fabric for the next round. (Should be a total of 40)
Totals
1 2
1 2
1 2
4
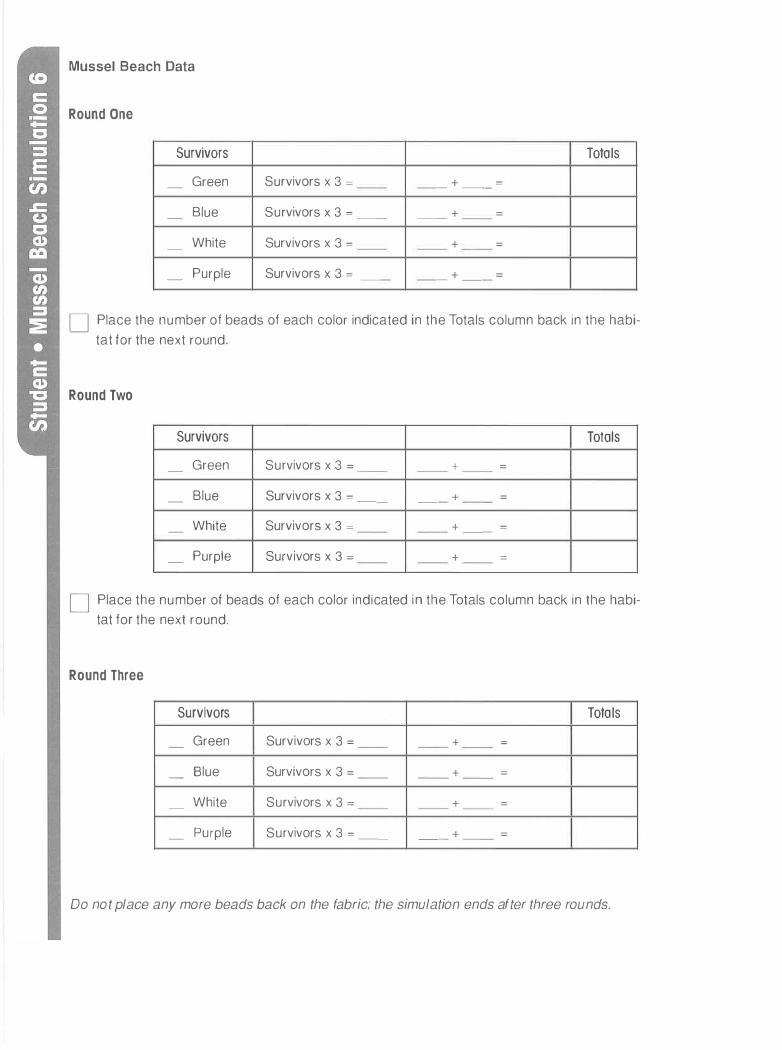
Mussel Beach Data
Round One
Survivors Totals
Green Survivors x 3 = + = - - - - - --
Blue Survivors x 3 = + = - -- -- - -
White Survivors x 3 = + = - - - - - - -
- Purple Survivors x 3 = + = - - - - - -
D Place the number of beads of each color indicated in the Totals column back in the habi
tat for the next round.
Round Two
Survivors Totals
Green Survivors x 3 = + = - - - - - - -
Blue Survivors x 3 = + = - -- - - - -
White Survivors x 3 = + = - - - - - --
- Purple Survivors x 3 = - - + = - - - -
D Place the number of beads of each color indicated in the Totals column back in the habi
tat for the next round.
Round Three
Survivors Totals
Green Survivors x 3 = + = - - - - - - -
Blue Survivors x 3 = + = - - - - - - -
White Survivors x 3 = + = - - - - - - -
Purple Survivors x 3 = + = - -- - - - -
Do not place any more beads back on the fabric; the simulation ends after three rounds.
Graphing
D 1 . Display your team's results (after three rounds) in a graph with the vertical (Y ) axis
being the total number of beads/mussels after each round for each of the four colors
(include also the starting populations, 1 O of each color), and the horizontal (X) axis
being the three rounds plus "round zero," the starting point. Use the blank graph tem
plate or poster paper provided. Use colored markers for the beads/mussels.
D 2. Post your team's data for all to see, or copy or photocopy the graphs so that each
team has access to all data collected.
Follow-up Discussion Questions
Review:
1 . Compare and contrast the oystercatcher graphs of the whole class:
a. List some ways that the oystercatcher graphs are similar.
b. List some ways that the oystercatcher graphs are different.
2. Compare and contrast the driftwood log graphs of the whole class:
a. List some ways that the driftwood log graphs are similar.
b. List some ways that the driftwood log graphs are different.
3. Compare and contrast the graphs of the driftwood logs vs. the oystercatchers:
a. List some ways that the driftwood log graphs and oystercatcher graphs are similar.
b. List some ways that they are different.

4. Compare the results to your original predictions and hypotheses for both the oystercatcher
and the driftwood log simulations: Do the results support your original hypothesis and
predictions? Explain.
a. Oystercatcher:
b. Driftwood Log:
5. The Simulation: What does each of the simulation components represent in nature?
• The beads _ _ __ __ _ _ _ _ _ __ _________ __ __ _ _ _ ___ _
• The pencil ______ ___ __ _ _ _ _ __ _______ __ __ __ _ _ _ _
• The step of increasing the 10 survivors to 40 _ _ _ _ _ _ __ ______ __ __ __ _
• The fabric _ _ _ __________ ____ _ _ _ _ __ _______ _ _ _ _
• The bead colors _ _ _ ________ _ _ __ __ __ _ _ __ ______ _
• The elimination of bead colors _ _ _______ __ ____ _ __ _ _ _____ _
• The different rounds - -- - - - - - --------- -- -- - - - - -----
6. What are at least two other variables that affected how the simulation played out? Do
these same variables exist in nature?
Interpretive:
7. The oystercatcher simulation was designed to represent the process in nature called
_____ __ _ __ . The driftwood log simulation was designed to represent the
process in nature called _ _ _ _ __ ___ _
8. If the numbers of each mussel subpopulation were much larger- in the thousands or even
millions-how would this affect the simulation?
9. What if the two mechanisms, driftwood logs and oystercatchers, were both operating
in the same simulation? Predict the outcome.
Reflective:
1 O. What did you like or dislike about the simulation?
1 1. How would you improve it?
12. What did this lab demonstrate to you about your learning style? What strategies might
you employ to make this lab more manageable?
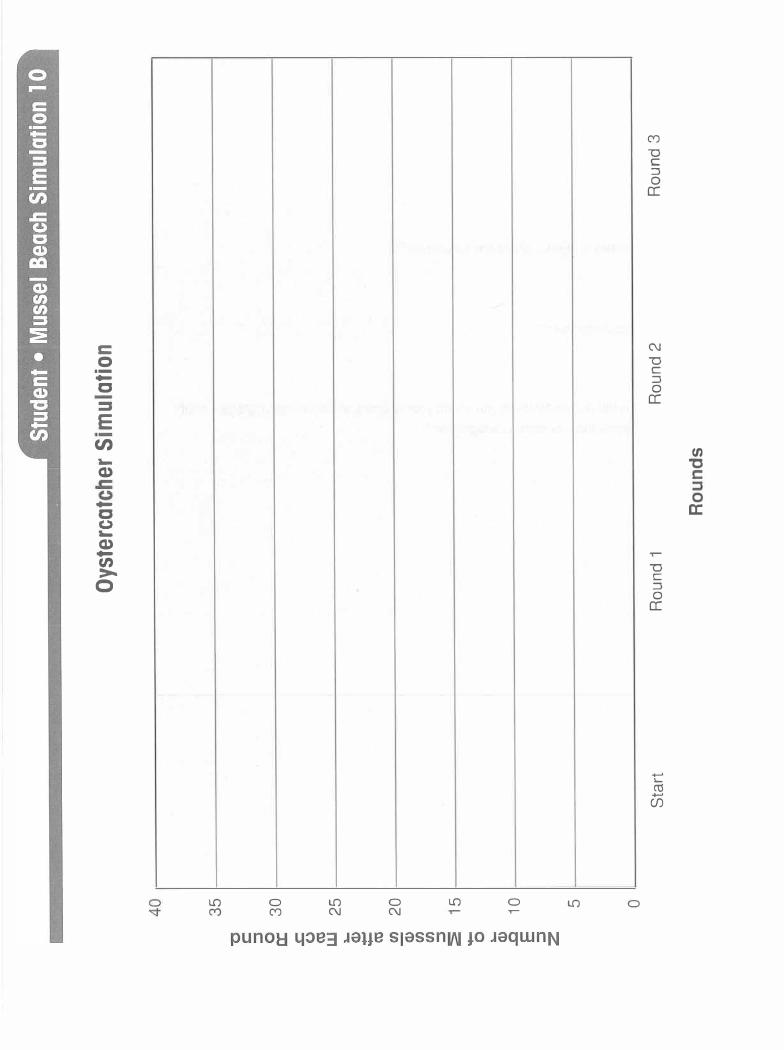
C: 0 ·-
...
C
::::::s
E
U) ...
C1)
...
C (.) ...
C1) ...
U) >
0
LO C")
0 C")
LO (\J
0 (\J
LO 0 T"""
LO 0
C")
""O C :::J 0
a:
(\J
""O C
:::J 0
a:
T"""
""O C
:::J 0
a:
...... ,._ C1:l ......
Cf)
Cl)
"C
0 a:

C 0 ·-
...
C -
:::,
E
U)
C, 0
"C 0 0
3: ·-
...
C
U") Cf)
0 Cf)
U") C\J
0 C\J
0
puno1::1 4:>e3 Jaue s1assnw JO JaqwnN
U") 0
Cf)
"'O C ::::J 0
a:
C\J
"'O C
::::J 0
a:
"'O C
::::J 0
a:
"'
"C C:
0
a:

Phylogenetic Trees
Activator/Connector
People often look similar to members of their own family and different from those of other
families. What characteristics are shared by your family that are different from other people
you know?
Which is more closely related evolutionarily to humans, bread mold, a maple tree, or a
horse? How do you know this?
Activity Purpose
In this lab-based activity, you will study evolutionary relationships among seven fish species
and arrange them in a phylogenetic tree that illustrates these relationships.
General Background
Evolutionary relationships between organisms can be determined based on how similar they
are in morphology (e.g., coloration), behavior (e.g. , mating pattern), biochemistry (e.g., protein
amino acid sequence), and other characteristics. The greater the number of characteristics
that are shared, the greater the likelihood that two organisms have a common ancestor.
Scientists illustrate the degree of relatedness between organisms graphically using a
phylogenetic tree. In the example on the next page, the relationship between organisms in
the five classic kingdoms is illustrated. Branch points on the tree indicate a points of
divergence where organisms from each branch differ in at least one characteristic. For
example, the first branch point is drawn to differentiate the one kingdom (Monera = bacteria)
that is composed of prokaryotes from the other kingdoms that are composed of eukaryotes.
Vocabulary
phylogenetic tree, gel electrophoresis, protein
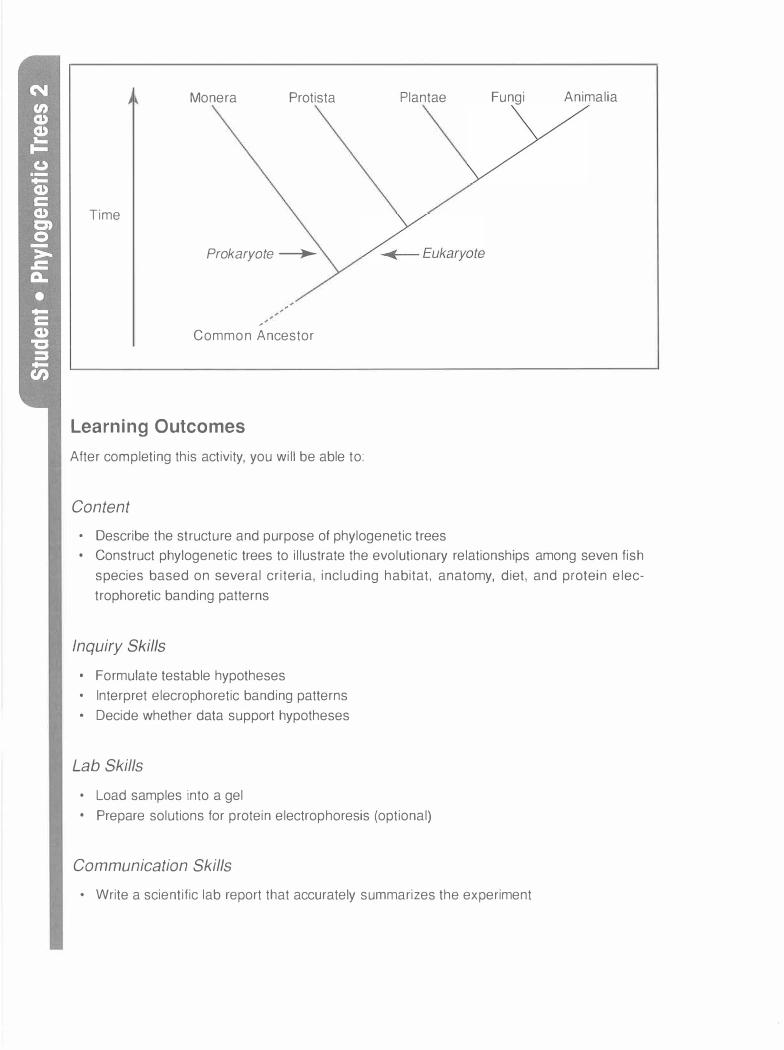
Time
Monera Protista
Prokaryote �
,
,
Common Ancestor
Learning Outcomes
After completing this activity, you will be able to:
Content
Plantae
• Describe the structure and purpose of phylogenetic trees
Fungi Animalia
• Construct phylogenetic trees to illustrate the evolutionary relationships among seven fish
species based on several criteria, including habitat, anatomy, diet, and protein elec
trophoretic banding patterns
Inquiry Skills
• Formulate testable hypotheses • Interpret elecrophoretic banding patterns • Decide whether data support hypotheses
Lab Skills
• Load samples into a gel • Prepare solutions for protein electrophoresis (optional)
Communication Skills
• Write a scientific lab report that accurately summarizes the experiment
Activity Sequence
Day One:
1. Small groups practice constructing a phylogenetic tree by arranging common foods
into levels of evolutionary relatedness (Procedure Part A)
2. Small groups develop a hypothesized phylogenetic tree for seven fish species based
on their habitats, anatomy, and diets (Procedure Part B)
3. Carry out gel electrophoresis procedure with proteins for seven fish species (Procedure
Part C)
Day Two:
4. Analyze the protein gel results for the fish and develop a new phylogenetic tree
(Procedure Part D)
5. Follow-up discussion questions
Materials
• 8 small tubes containing isolated fish protein (7) and protein standard (1) • Gel in casting tray (fragile ; handle with care!)
• Electrophoresis power supply, electrodes, and chamber
• 100 ml Tris-glycine-SDS (buffer)
• Boiling water bath
• Small-tube rack
• Micropipetter
• Protective goggles and gloves
• Student handout
Procedure
Part A: Phylogenetic Tree of Common Foods
Check off each step as you proceed through the lab.
D 1. Form groups of 2 - 3 students.
D 2. In the space provided, place the following foods into a phylogenetic tree based on
the closeness of their evolutionary relationship: lettuce, mushroom, cow (milk), and
sardines. Indicate a characteristic that differentiates one branch from another at each
branch point.

Draw your tree here:

Part B: Fish Phylogenetic Tree Based on Habitat, Morphology, and Diet
D Using the following table, hypothesize a phylogenetic tree for these fish species:
cod, swordfish, tuna, catfish, flounder, perch, and halibut:
Fish species Characteristic
Habitat Dorsal fin number Diet
Catfish Freshwater river bottoms 2 Invertebrates, fish lctalurus spp.
Cod Marine, medium depth 3 Herring, eel, shoal fish Gadus spp.
Flounder Marine, coastal bottoms 1 Mollusks, shrimp, fish Paralichthys spp.
Halibut Marine, deep ocean bottoms 1 Fish, large crustaceans Hippoglossus spp.
Perch Freshwater lakes and ponds, 2 Larvae, fish eggs, small fish Perea spp. medium depth
Swordfish Marine, medium depth 2 Different size fish, squid Xiphias gladus
Tuna Marine, medium depth 2 Small fish, squid, shrimp, crab Thunnus spp.
Draw your tree here:

Part C: Gel Electrophoresis with Fish Proteins
Gel electrophoresis
1. Prepare fish protein samples.
D Put the screw-top tubes containing the fish protein samples AND the protein
standard into a rack.
D Place the rack into a boiling water bath for 3-5 minutes. DO NOT IMMERSE LIDS!
2. Load the samples into the gel.
D Using a micropipetter, load 10 �ti of each sample into separate wells. Each student
will load one sample into one well. Be sure to keep track of which sample is placed in
each well!
3. Run the gel.
D Fasten the top of the electrophoresis chamber in place; be sure to keep the black
and red sides together!
D Attach the electrodes to the power supply, and run the gel at 100-135 volts.
D Double-check that the electrophoresis is working.
Are the tiny bubbles moving from the black end toward the red end?
Can you see the blue dye of the samples moving into the gel itself?
4. The gel will need to run for 1-2 hours.
Part D: Analyzing the Gel Banding Patterns
D 1. Accurately sketch the banding pattern of your gel in the space that follows.
2. To determine the degree of relatedness between species as indicated by the bands,
interpret the gel using some of the following techniques:
D Number the lanes 1 , 2, 3, etc., and label the bands a, b, c, etc. , in order to better
organize your group discussion of the gel.
D b. Initially, identify lanes with the most unique banding patterns. These would include,
for example, the one with the fewest bands, the one with the most bands, or one with
a pattern of bands that makes it stand out from the other lanes.
D c. Look at the number of bands that different lanes have in common. This may be
easier if you redraw the gel on a piece of scrap paper and cut out the lanes so they
can be moved next to each other for comparison.
D 3. Use your gel interpretation to draw a new phylogenetic tree for the fish species in the
space that follows.

Follow-up Discussion Questions
Review:
1 . What are the main concepts you have learned from this lab activity?
2. Why are protein standards included in this experiment?
3. Why was electricity used during the electrophoresis procedure?
4. Why do scientists use phylogenetic trees?
Interpretive:
5. Does the gel banding pattern support only one type of phylogenetic tree, or are multiple
trees possible based on the same data? Why?
6. Does the phylogenetic tree based on biochemical data correlate with the hypothesized
tree based on habitat, morphology, and diet? Why or why not?
7. If fish DNA instead of protein were used for gel electrophoresis, do you think the banding
pattern and the phylogenetic tree based on it would be similar to or different from those in
this experiment? Why?
Reflective:
8. Are there sources of error in this experiment? How might they have affected the results?
9. Did the lab help your understanding of how phylogenetic trees are developed?
10. What did you like or dislike about this lab?
11. How can this lab be improved to make it a better learning experience?
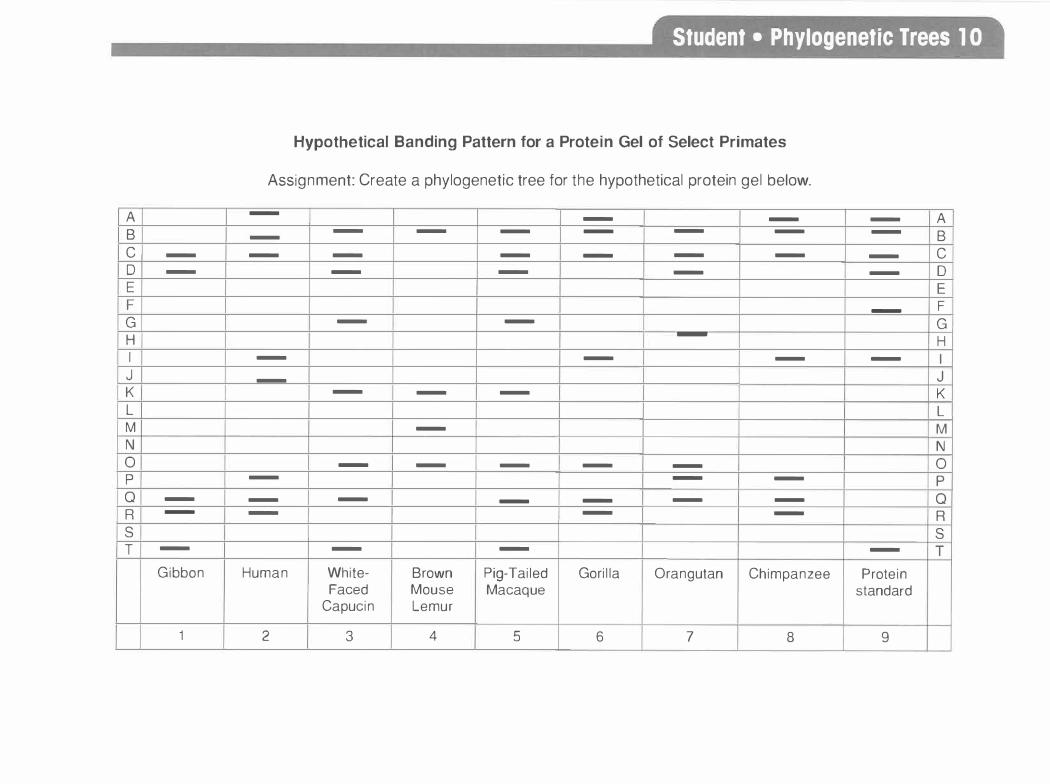
A B
C -
D -
E F G H I
J K L M N 0
p
Q -
R -
s
T -
Gibbon
1
Student • Phylogenetic Trees 1 o
Hypothetical Banding Pattern for a Protein Gel of Select Primates
Assignment: Create a phylogenetic tree for the hypothetical protein gel below.
-- -
- - - - - --
- - - - - -
- - -
- -
-
- - -
-
- - -
-
- - - - -
- - -
- - - - - -
- - -
- -
Human White- Brown Pig-Tailed Gorilla Orangutan Chimpanzee Faced Mouse Macaque
Capucin Lemur
2 3 4 5 6 7 8
- A -
B - C - D
E
- F
G H
- I J K L M N 0
p
Q R s
- T
Protein standard
9
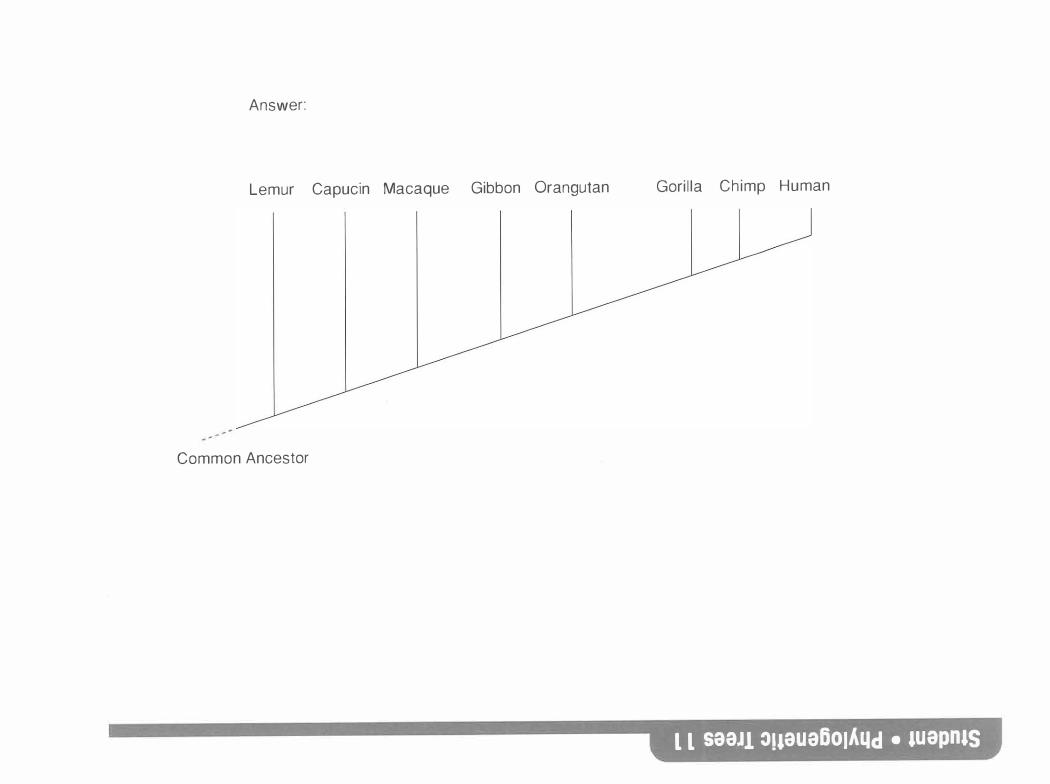
Answer:
Lemur Capucin Macaque Gibbon Orangutan
Common Ancestor
Gori l la Chimp Human
L L saaJ1 :>11aua601A1.1d • 1uapn1s

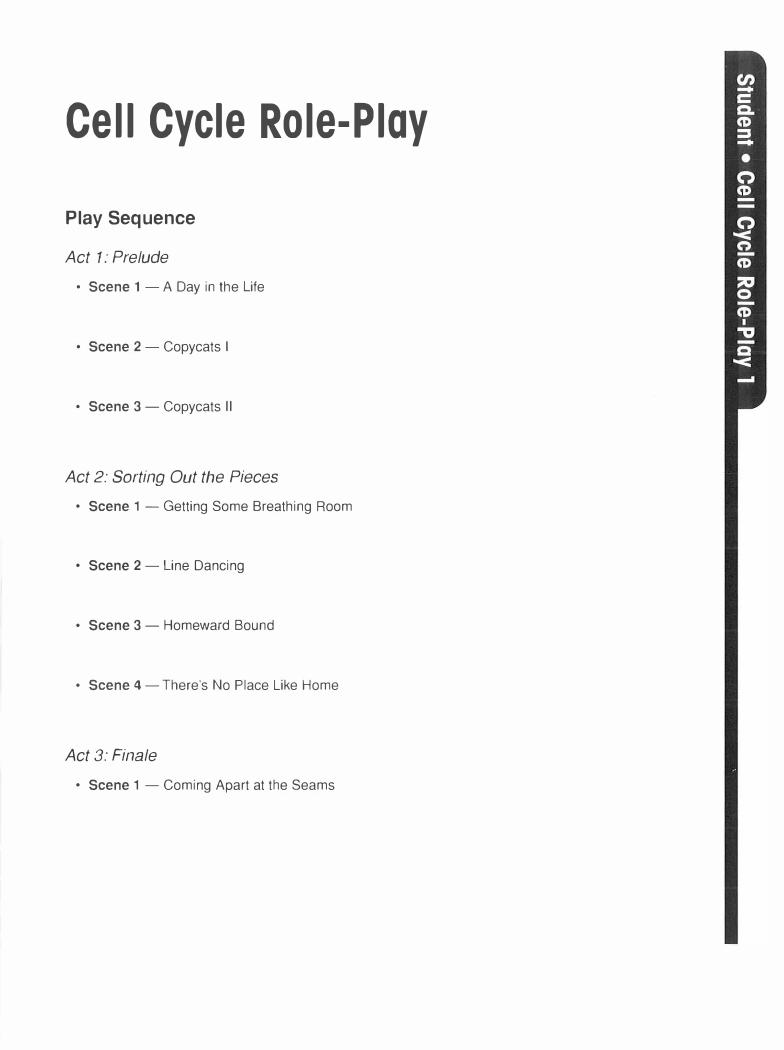
Cell Cycle Role-Play
Play Sequence
Act 1: Prelude
• Scene 1 - A Day in the Life
• Scene 2 - Copycats I
• Scene 3 - Copycats 11
Act 2: Sorting Out the Pieces
• Scene 1 - Getting Some Breathing Room
• Scene 2 - Line Dancing
• Scene 3 - Homeward Bound
• Scene 4 - There's No Place Like Home
Act 3: Finale
• Scene 1 - Coming Apart at the Seams

Follow-up Discussion Questions
Review:
1. What biological stages and what cellular events take place in each of the acts and
scenes? Fill in terms from the list below next to each act or scene in the play sequence on
the previous page. Some terms may be used more than once or appear together with other
terms in one stage.
Stages:
Mitosis
Anaphase
G1
G2 Telophase
S-Phase
Cytokinesis
Metaphase
Prophase
lnterphase
Cellular events:
Cell membrane divides
DNA replicates
Spindle fibers form
Spindle fibers disappear
Sister chromatids align in one plane at center of cell
Chromosomes shorten and thicken
Chromosomes lengthen and become thin
Centrioles move to opposite poles
Cellular metabolism occurs
Daughter cells form
Centrioles replicate
Sister chromatids separate and move to opposite poles
Nuclear membrane forms
Nuclear membrane disappears
2. How do the daughter cells compare to each other and to the original cell in terms of
the number and identity (colors) of their chromosomes?
3. What mechanism or mechanisms ensure that chromosomes similar in quantity and iden
tity are partitioned into each daughter cell?
4. How do chromosomes differ from chromatids?
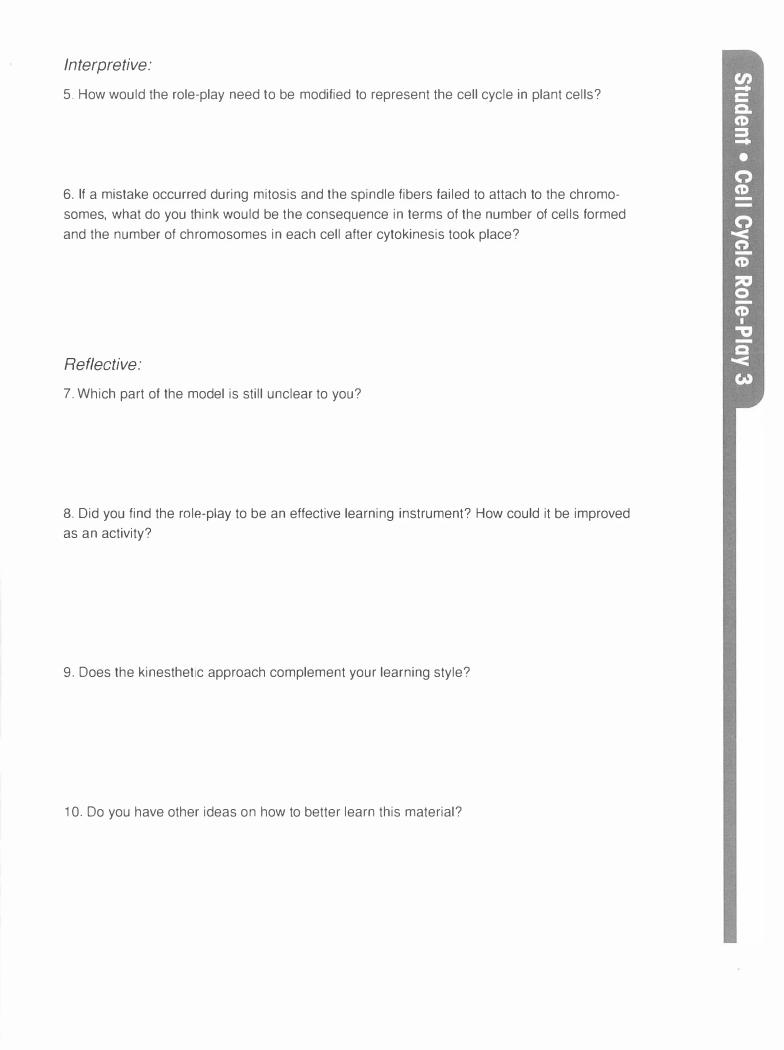
Interpretive:
5. How would the role-play need to be modified to represent the cell cycle in plant cells?
6. If a mistake occurred during mitosis and the spindle fibers failed to attach to the chromo
somes, what do you think would be the consequence in terms of the number of cells formed
and the number of chromosomes in each cell after cytokinesis took place?
Reflective:
7. Which part of the model is still unclear to you?
8. Did you find the role-play to be an effective learning instrument? How could it be improved
as an activity?
9. Does the kinesthetic approach complement your learning style?
10. Do you have other ideas on how to better learn this material?

Environmental Factors
and Enzyme Activity
Activator/Connector
What allows bread to rise?
Where do the bubbles in beer or champagne come from?
Activity Purpose
In this lab-based activity, you will design an experiment to test the effect of a particular
environmental factor on the activity of catalase, an enzyme found in yeast.
General Background
Enzymes are organic catalysts that increase rates of biochemical reactions necessary to
support life. Essentially, enzymes allow one or several reactants to be converted chemically
into one or several products. In today's lab, you will investigate the behavior and function of
an enzyme in yeast. This enzyme, catalase, catalyzes the following reaction:
catalase
reactant products
Vocabulary
enzyme, reactant, product, reaction rate, solution
Learning Outcomes
After completing this activity, you will be able to:
Content
• Describe the functions of enzymes as catalysts • Identify variables that affect enzyme activity
Inquiry Skills
• Formulate testable hypotheses • Design experiments to test hypotheses • Display data in both tabular and graphic form • Calculate averages • Decide whether data support hypotheses
Communication Skills
• Write a scientific lab report which accurately summarizes an experiment
Activity Sequence
1 . Observe teacher demonstration of an enzyme reaction
2. Small groups choose an environmental variable and develop a hypothesis
3. Small groups design an experiment to test their hypothesis
4. Small groups collect and interpret data
5. Follow-up discussion questions
Materials
• 3% peroxide solution • Dry, granulated yeast • Felt cut into 2cm x 2cm squares • Ice • Dilute HCL (0.1 M) • Dilute NaOH (0.1 M) • pH paper or meter • Stopwatch
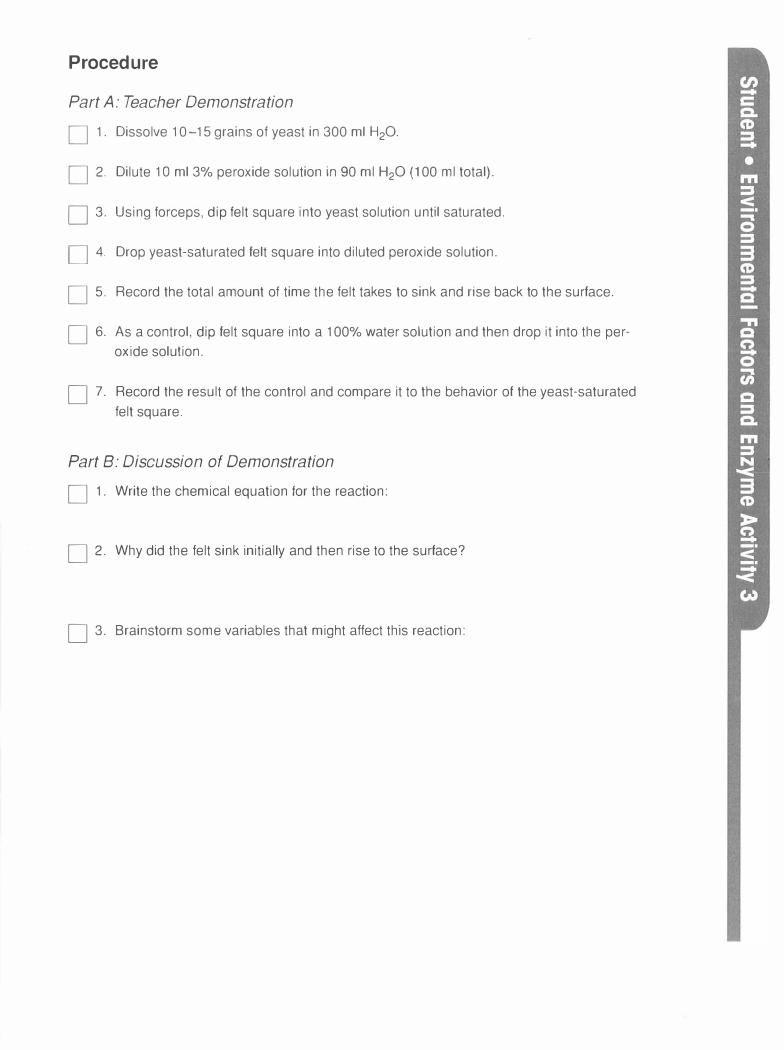
Procedure
Part A: Teacher Demonstration
D 1. Dissolve 10-15 grains of yeast in 300 ml H20.
D 2. Dilute 1 O ml 3% peroxide solution in 90 ml H20 (100 ml total).
D 3. Using forceps, dip felt square into yeast solution until saturated.
D 4. Drop yeast-saturated felt square into diluted peroxide solution.
D 5. Record the total amount of time the felt takes to sink and rise back to the surface.
D 6. As a control, dip felt square into a 100% water solution and then drop it into the per-
oxide solution.
D 7. Record the result of the control and compare it to the behavior of the yeast-saturated
felt square.
Part B: Discussion of Demonstration
D 1. Write the chemical equation for the reaction:
D 2. Why did the felt sink initially and then rise to the surface?
D 3. Brainstorm some variables that might affect this reaction:
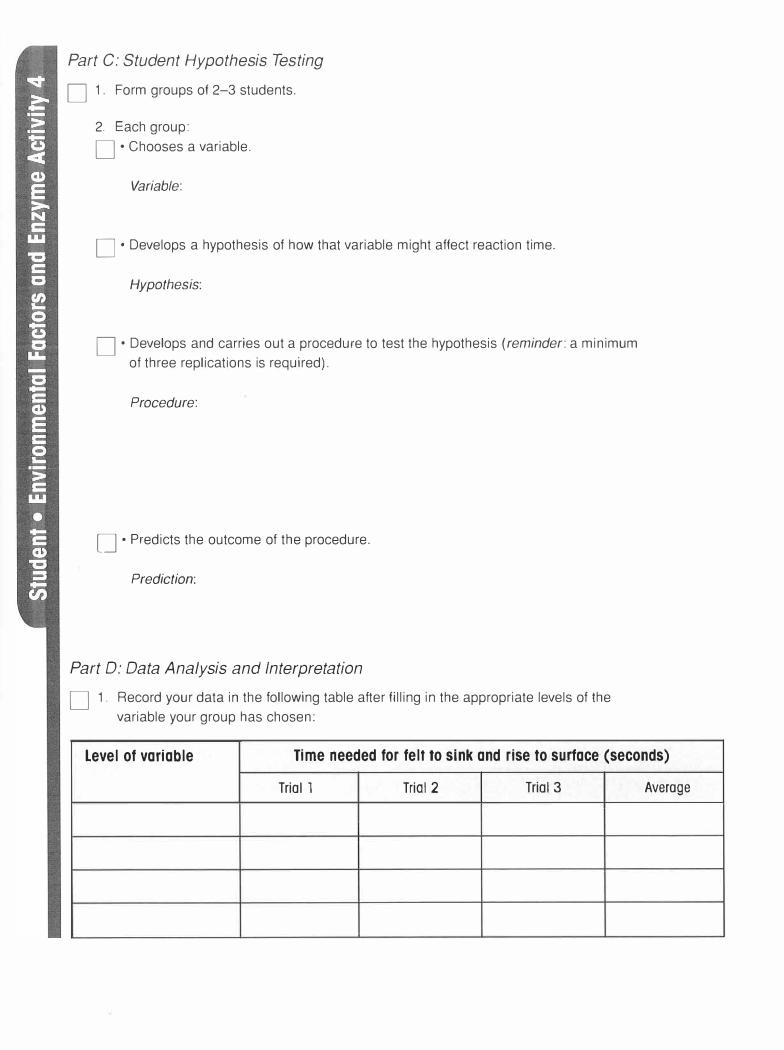
Part C: Student Hypothesis Testing
D 1 . Form groups of 2-3 students.
2. Each group:
D · Chooses a variable.
Variable:
D · Develops a hypothesis of how that variable might affect reaction time.
Hypothesis:
D · Develops and carries out a procedure to test the hypothesis (reminder: a minimum
of three replications is required).
Procedure:
D · Predicts the outcome of the procedure.
Prediction:
Part D: Data Analysis and Interpretation
D 1 . Record your data in the following table after filling in the appropriate levels of the
variable your group has chosen:
Level of variable Time needed for felt to sink and rise to surface (seconds)
Trial l Trial 2 Trial 3 Average
D 2. Calculate averages and graph them (level of variable vs. time to sink and rise).
D 3. Compare averages.
D 4. Did the data support the hypothesis?
D 5. Develop an explanation of why the hypothesis was or was not supported by the data.
Follow-up Discussion Questions
Review:
1 . What are the main concepts you have learned from this lab activity?
2. What is the general role of enzymes for all organisms?
3. Based on the class data, what variables affect enzyme reaction rates and in what ways?
Interpretive:
4. If other levels of the variable were used, what results might be predicted for the
experiment?
Reflective:
5. Are there sources of error in this experiment? How might they have affected the results?
6. What aspects of the activity most contributed to your understanding or were most
challenging?
7. How might you apply this understanding to the next lab experiment you run?
8. How could this lab be improved?

Egg Osmosis-Demonstration
Activator/Connector
Have you ever noticed that sugar can "draw out" the juice from fruit pieces, creating a
syrup? Have you ever used salt to draw out water (and some bitter-tasting solutes) from
eggplant slices?
Activity Purpose
In this lab-based activty, you will place deshelled eggs in solutions that vary in osmolarity
and then measure changes in egg weight over time. By observing whether there was a net
gain or loss of water from the egg, you will be able to determine the isotonic point, or the
percent solution that is isotonic to the internal egg fluid.
General Background
Diffusion is the passive movement of small dissolved particles, like ions and other molecules,
from a region of higher concentration to a region of lower concentration. This process relies
on thermal kinetic energy and not ATP. Cells use diffusion to exchange gases, nutrients, and
waste products with their environment.
Cells also exchange water molecules with their environment, using a special form
of diffusion called osmosis. Like diffusion, osmosis is a passive, thermally dependent
process. Water moves from a region of lower solute concentration to one of higher solute
concentration. Osmolarity is a measure of the concentration of dissolved particles in
a solution.
The terms hypertonic, hypotonic, and isotonic are relative terms used to compare the
osmolarities of different solutions. In the diagram that follows, two fluids that differ in
osmolarity are separated by a membrane that is permeable to water but not to solutes. Fluid
A, with the higher solute concentration (or osmolarity), is hypertonic relative to Fluid B, which
has a lower osmolarity. Fluid B is hypotonic relative to Fluid A. If enough time is allowed for
osmosis to occur, eventually the osmolarities of the two fluids will be the same, or isotonic. In
the example, water moves via osmosis from B into A until the fluids are isotonic. As a result,
the volume of B will get smaller while that of A will become greater.
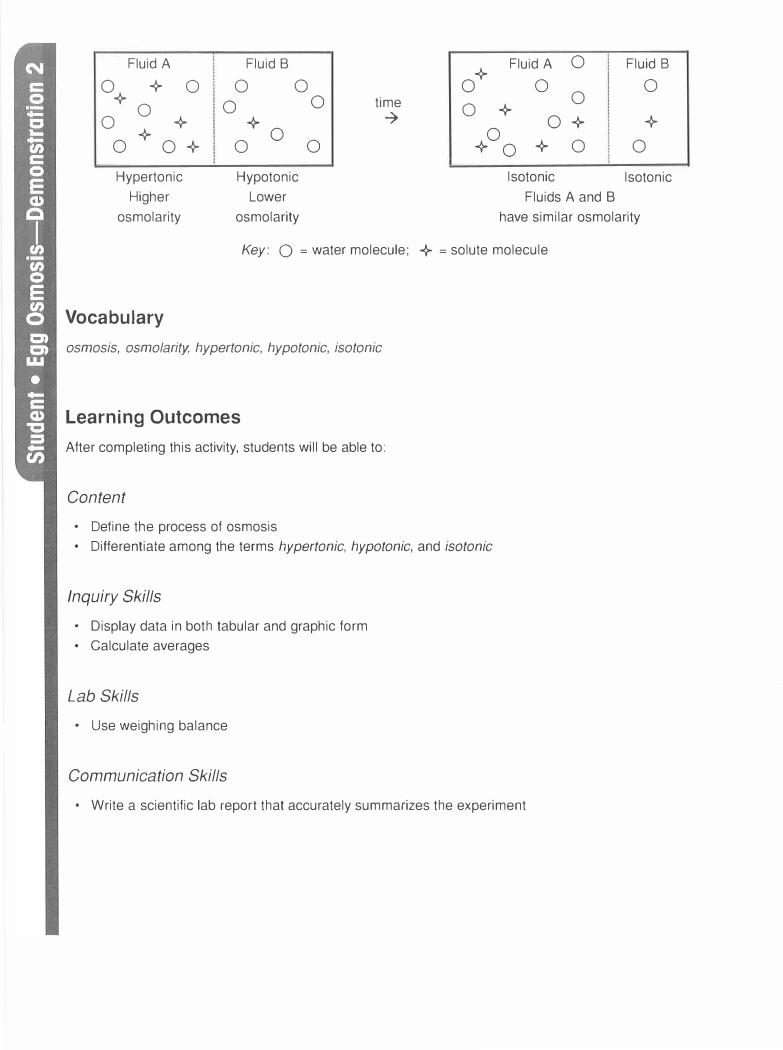
Fluid A Fluid B
o+
+ 0 0 0
0 0 0 0
+ +o
o+
0 o+ 0
o+
Fluid A 0 Fluid B
0 0
0 time
0 + � o + +
+o
o + 0 0
Hypertonic
Higher
osmolarity
Hypotonic
Lower
osmolarity
Isotonic Isotonic
Fluids A and B
have similar osmolarity
Key: O = water molecule; + = solute molecule
Vocabulary
osmosis, osmolarity, hypertonic, hypotonic, isotonic
Learning Outcomes
After completing this activity, students will be able to:
Content
• Define the process of osmosis
• Differentiate among the terms hypertonic, hypotonic, and isotonic
Inquiry Skills
• Display data in both tabular and graphic form
• Calculate averages
Lab Skills
• Use weighing balance
Communication Skills
• Write a scientific lab report that accurately summarizes the experiment

Activity Sequence
1. Obtain initial weights of deshelled eggs
2. Submerge eggs in 0%, 5%, 30%, and 50% solutions and weigh at 15-, 30-, and 45-minute
intervals
3. Display data in both tabular and graphic form
4. Analyze data
5. Follow-up discussion questions
Materials
• Deshelled raw eggs
• Various percent solutions
• Beakers
• Spoon
• Weighing balance
• Timer
• Paper towels
• Graph paper
Procedure
D 1. There are four solutions for submerging eggs. The 0% solution is hypotonic relative
to egg fluid, the 5% solution is probably the closest to being isotonic, and the 30%
and 50% solutions are hypertonic relative to egg fluid. Knowing this information,
predict whether an egg placed in each solution will lose weight (and water), gain
weight, or stay the same.
Record your predictions:
Percent Solution 0% 5% 30%
Weight: Gain, Lose, or Stay the Same?
D 2. Record the initial weight of each egg in the table at the end of this section.
50%
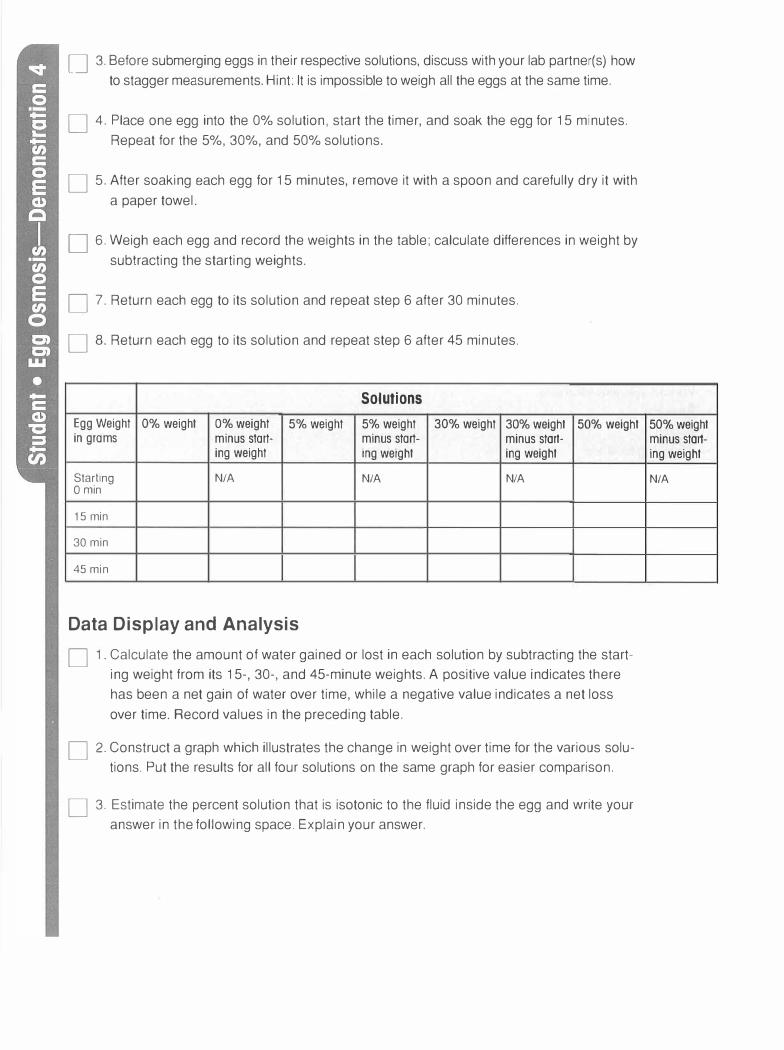
D 3. Before submerging eggs in their respective solutions, discuss with your lab partner(s) how to stagger measurements. Hint: It is impossible to weigh all the eggs at the same time.
D 4. Place one egg into the 0% solution, start the timer, and soak the egg for 15 minutes. Repeat for the 5%, 30%, and 50% solutions.
D 5. After soaking each egg for 15 minutes, remove it with a spoon and carefully dry it with a paper towel.
D 6. Weigh each egg and record the weights in the table; calculate differences in weight by subtracting the starting weights.
D 7. Return each egg to its solution and repeat step 6 after 30 minutes.
D 8. Return each egg to its solution and repeat step 6 after 45 minutes.
Solutions
Egg Weight 0% weight 0% weight 5% weight 5% weight 30% weight 30% weight in grams minus start- minus start- minus start-
ing weight ing weight ing weight
Starting N/A N/A NIA
Omin
15 min
30 min
45 min
Data Display and Analysis
50% weight
D 1. Calculate the amount of water gained or lost in each solution by subtracting the starting weight from its 15-, 30-, and 45-minute weights. A positive value indicates there has been a net gain of water over time, while a negative value indicates a net loss over time. Record values in the preceding table.
D 2. Construct a graph which illustrates the change in weight over time for the various solutions. Put the results for all four solutions on the same graph for easier comparison.
D 3. Estimate the percent solution that is isotonic to the fluid inside the egg and write your answer in the following space. Explain your answer.
50% weight minus start-ing weight
N/A

Follow-up Discussion Questions
Review:
1 . Summarize your observations and data.
2. Share and compare your results with those of other groups. Was there much variability
in the results of different groups?
3. Did your results match your predictions? Explain.
4. Review the concepts of hypotonic, hypertonic, and isotonic and determine which term
applied to the solutions used. Was the 0% solution hypertonic, isotonic, or hypotonic relative
to the fluids inside the eggs?
Interpretive:
5. Relate the results of the lab exercise to osmosis within a cell or organism. Think of some
scenarios where cells or organisms are exposed to changes in the osmolarity of their
environment. For example, salmon migrate from seawater to freshwater to spawn. Predict
what will happen to their cell volumes.
6. Suppose this experiment had been performed using older, not fresh, eggs. Eggs lose
water by evaporation through pores in the shell. Thus, older eggs will be more dehydrated
than fresher eggs. How might this affect the results of the experiment? Will the isotonic point
change? In which direction?

Reflective:
7. List some sources of error for this lab.
8. Which aspect of the activity contributed most to your understanding of osmosis: group discussion? the hands-on manipulation?
9. Which aspects of the lab did you find most challenging? Explain.
10. Develop and share mnemonic devices for memorizing the terms associated with the process of osmosis.
Egg Osmosis-Structured Inqu i ry
Activator/Connector
Have you ever noticed that sugar can "draw out" the juice from fruit pieces, creating a
syrup? Have you ever used salt to draw out water (and some bitter-tasting solutes) from
eggplant slices?
Activity Purpose
In this lab-based activity, you will place deshelled eggs in solutions that vary in osmolarity
and then measure changes in egg weight over time. By observing whether there was a net
gain or loss of water from the egg, you will be able to determine the isotonic point, or the
percent solution that is isotonic to the internal egg fluid.
General Background
Diffusion is the passive movement of small dissolved particles, like ions and other molecules,
from a region of higher concentration to a region of lower concentration. This process relies
on thermal kinetic energy, not ATP. Cells use diffusion to exchange gases, nutrients, and
waste products with their environment.
Cells also exchange water molecules with their environment using a special form of diffusion
called osmosis. Like diffusion, osmosis is a passive, thermally dependent process. Water
moves from a region of lower solute concentration to one of higher solute concentration.
Osmolarity is a measure of the concentration of dissolved particles in a solution.
The terms hypertonic, hypotonic, and isotonic are relative terms used to compare the
osmolarities of different solutions. In the diagram that follows, two fluids that differ in
osmolarity are separated by a membrane that is permeable to water but not to solutes. Fluid
A, with the higher solute concentration (or osmolarity), is hypertonic relative to Fluid B, which
has a lower osmolarity. Fluid B is hypotonic relative to Fluid A. If enough time is allowed for
osmosis to occur, eventually the osmolarities of the two fluids will be the same, or isotonic. In
the example, water moves via osmosis from B into A until the fluids are isotonic. As a result,
the volume of B will get smaller while that of A will become greater.

Fluid A Fluid B
o+
+ 0 0 0
0 0 o
+ Fluid A 0 Fluid B
0 0
0 time
0 + "'? + 0
0 + +
o o
+ o + 0 0
o +
+o
o + 0 0
Hypertonic Higher
osmolarity
Hypotonic Lower
osmolarity
Isotonic Isotonic Fluids A and B
have similar osmolarity
Key: O = water molecule; + = solute molecule
Vocabulary
osmosis, osmolarity, hypertonic, hypotonic, isotonic
Learning Outcomes
After completing this activity, students will be able to:
Content
• Define the process of osmosis • Differentiate among the terms hypertonic, hypotonic, and isotonic
Inquiry Skills
• Display data in both tabular and graphic form • Calculate averages
L ab Skills
• Use a weighing balance • Make percent solutions
Communication Skills
• Write a scientific lab report which accurately summarizes the experiment
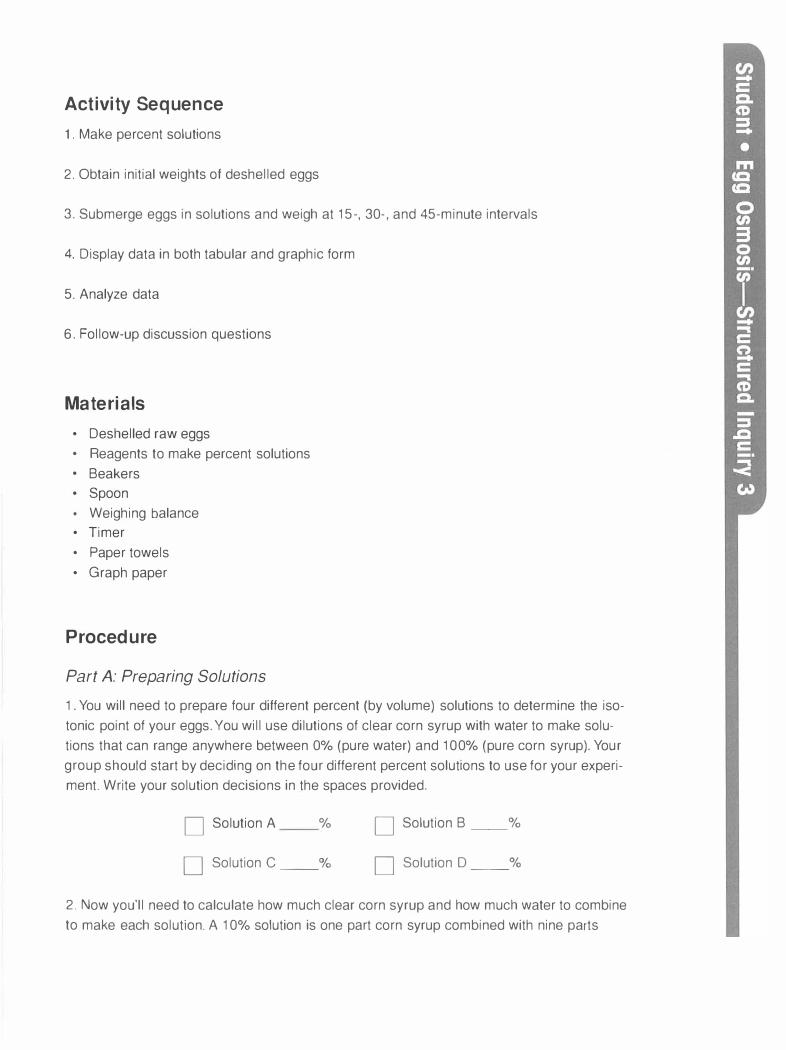
Activity Sequence
1 . Make percent solutions
2. Obtain initial weights of deshelled eggs
3. Submerge eggs in solutions and weigh at 15-, 30-, and 45-minute intervals
4. Display data in both tabular and graphic form
5. Analyze data
6. Follow-up discussion questions
Materials
• Deshelled raw eggs
• Reagents to make percent solutions
• Beakers
• Spoon
• Weighing balance
• Timer
• P aper towels
• Graph paper
Procedure
Part A: Preparing Solutions
1 . You will need to prepare four different percent (by volume) solutions to determine the iso
tonic point of your eggs. You will use dilutions of clear corn syrup with water to make solu
tions that can range anywhere between 0% (pure water) and 100% (pure corn syrup). Your
group should start by deciding on the four different percent solutions to use for your experi
ment. Write your solution decisions in the spaces provided.
D Solution A %
D Solution C __ 0/o
D Solution B __ 0/o
D Solution D __ 0/o
2. Now you'll need to calculate how much clear corn syrup and how much water to combine
to make each solution. A 10% solution is one part corn syrup combined with nine parts
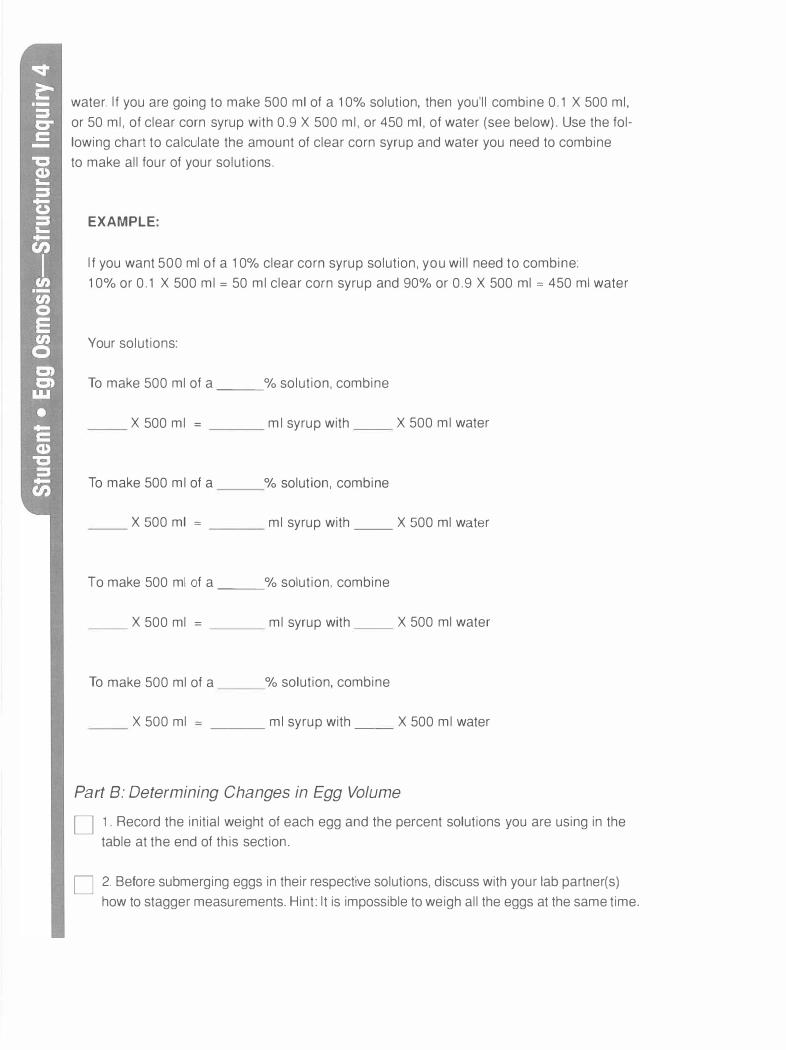
water. If you are going to make 500 ml of a 10% solution, then you'll combine 0.1 X 500 ml,
or 50 ml, of clear corn syrup with 0.9 X 500 ml, or 450 ml, of water (see below). Use the fol
lowing chart to calculate the amount of clear corn syrup and water you need to combine
to make all four of your solutions.
EXAMPLE:
If you want 500 ml of a 1 0% clear corn syrup solution, you will need to combine:
10% or 0.1 X 500 ml = 50 ml clear corn syrup and 90% or 0.9 X 500 ml = 450 ml water
Your solutions:
To make 500 ml of a ___ % solution, combine
X 500 ml = _ _ _ ml syrup with _ _ X 500 ml water
To make 500 ml of a _ __ % solution, combine
X 500 ml = _ _ _ ml syrup with __ X 500 ml water
To make 500 ml of a ___ % solution, combine
X 500 ml = _ _ _ ml syrup with _ _ X 500 ml water
To make 500 ml of a _ __ % solution, combine
X 500 ml ___ ml syrup with _ _ X 500 ml water
Part B: Determining Changes in Egg Volume
O 1 . Record the initial weight of each egg and the percent solutions you are using in the
table at the end of this section.
O 2. Before submerging eggs in their respective solutions, discuss with your lab partner(s)
how to stagger measurements. Hint: It is impossible to weigh all the eggs at the same time.
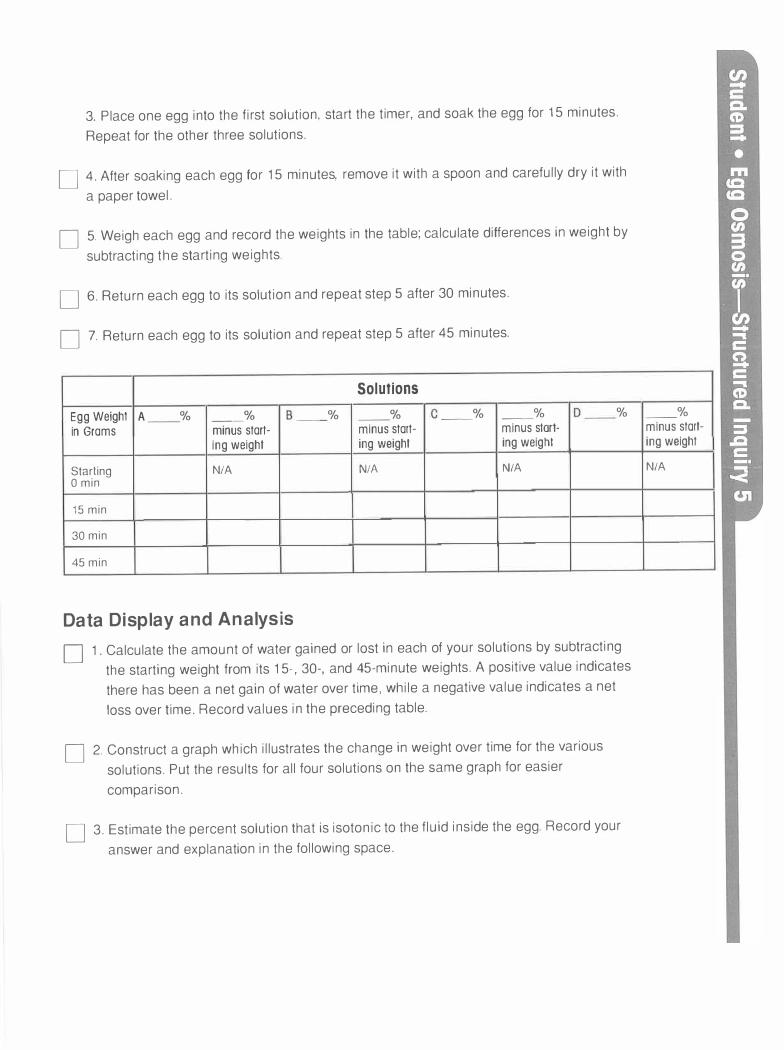
3. Place one egg into the first solution, start the timer, and soak the egg for 1 5 minutes.
Repeat for the other three solutions.
D 4. After soaking each egg for 1 5 minutes, remove it with a spoon and carefully dry it with
a paper towel.
D 5. Weigh each egg and record the weights in the table; calculate differences in weight by
subtracting the starting weights.
D 6. Return each egg to its solution and repeat step 5 after 30 minutes.
D 7. Return each egg to its solution and repeat step 5 after 45 minutes.
Solutions
Egg Weight A _ _ % --
% --
% - -
% --
% --%
in Grams minus start- minus start- minus start-ing weight ing weight ing weight
Starting N/A N/A N/A
0 min
15 min
30 min
45 min
Data Display and Analysis
% - -
D 1 . Calculate the amount of water gained or lost in each of your solutions by subtracting
the starting weight from its 1 5-, 30-, and 45-minute weights. A positive value indicates
there has been a net gain of water over time, while a negative value indicates a net
loss over time. Record values in the preceding table.
D 2. Construct a graph which illustrates the change in weight over time for the various
solutions. Put the results for all four solutions on the same graph for easier
comparison.
D 3. Estimate the percent solution that is isotonic to the fluid inside the egg. Record your
answer and explanation in the following space.
% --minus start-ing weight
N/A

Follow-up Discussion Questions
Review:
1 . Summarize your observations and data.
2. Share and compare your results with those of other groups. Was there much variability in
the results of different groups?
3. Did your results match your predictions? Explain.
4. Review the concepts of hypotonic, hypertonic, and isotonic and determine which term
applied to the solutions used. Was the 0% solution hypertonic, isotonic, or hypotonic relative
to the fluid inside the eggs?
Interpretive:
5. Relate the results of the lab exercise to osmosis within a cell or organism. Think of some
scenarios where cells or organisms are exposed to changes in the osmolarity of their envi
ronment. For example, salmon migrate from seawater to freshwater to spawn. Predict what
will happen to their cell volumes.

6. Suppose this experiment had been performed using older, not fresh, eggs. Eggs lose
water by evaporation through pores in the shell. Thus, older eggs will be more dehydrated
than fresher eggs. How might this affect the results of the experiment? Will the isotonic point
change? In which direction?
Reflective:
7. List some sources of error for this lab.
8. Which aspect of the activity contributed most to your understanding of osmosis: group dis
cussion? the hands-on manipulation?
9. Which aspects of the lab did you find most challenging? Explain.
1 0. Develop and share mnemonic devices for memorizing the terms associated with the
process of osmosis.

Egg Osmosis-Gu ided Inqu i ry
Activator/Connector
Have you ever noticed that sugar can "draw out" the juice from fruit pieces, creating a syrup? Have you ever used salt to draw out water (and some bitter-tasting solutes) from eggplant slices?
Activity Purpose
In this lab-based activity, you will place deshelled eggs in solutions that vary in osmolarity and then measure changes in egg weight over time. By observing whether there was a net gain or loss of water from the egg, you will be able to determine the isotonic point, or the percent solution that ,s isotonic to the internal egg fluid. In addition , you will be designing an experiment to examine how a variable of your choosing affects the process of osmosis.
General Background
Diffusion is the passive movement of small dissolved particles, like ions and other molecules, from a region of higher concentration to a region of lower concentration. This process relies on thermal kinetic energy and not ATP. Cells use diffusion to exchange gases, nutrients, and waste products with their environment.
Cells also exchange water molecules with their environment using a special form of diffusion called osmosis. Like diffusion, osmosis is a passive, thermally dependent process. Water moves from a region of lower solute concentration to one of higher solute concentration. Osmolarity is a measure of the concentration of dissolved particles in a solution.
The terms hypertonic, hypotonic, and isotonic are relative terms used to compare the osmolarities of different solutions. In the diagram that follows, two fluids that differ in osmolarity are separated by a membrane that is permeable to water but not to solutes. Fluid A, with the higher solute concentration or osmolarity, is hypertonic relative to Fluid B. which has a lower osmolarity. Fluid B is hypotonic relative to Fluid A. If enough time is allowed for osmosis to occur, eventually the osmolarities of the two fluids will be the same, or isotonic. In the example, water moves via osmosis from B into A until the fluids are isotonic. As a result, the volume of B will get smaller while that of A will become greater.

Fluid A Fluid B
o+
+ 0 0 0
0 0
+ 0 0
+o
o+
o + 0 0
o+
Fluid A 0 Fluid B
0 0
0 time
0 + � o + +
+o
o + 0 0
Hypertonic
Higher
osmolarity
Hypotonic
Lower
osmolarity
Isotonic Isotonic
Fluids A and B
have similar osmolarity
Key: O = water molecule; + = solute molecule
Vocabulary
osmosis, osmolarity, hypertonic, hypotonic, isotonic
Learning Outcomes
After completing this activity, students will be able to:
Content
• Define the process of osmosis • Differentiate among the terms hypertonic, hypotonic, and isotonic • Identify variables that affect osmosis
Inquiry Skills
• Formulate testable hypotheses • Design experiments to test hypotheses • Display data in both tabular and graphic form • Calculate averages • Decide whether data support hypotheses
L ab Skills
• Make percent (by volume) solutions • Use weighing balance
Communication Skills
• Write a scientific lab report which accurately summarizes the experiment
Activity Sequence
1 . Develop a hypothesis, design an experiment to test it, and predict the outcome
2. Make percent solutions according to calculations
3 . Obtain initial weights of deshelled eggs
4. Submerge eggs in solutions and weigh at 1 5-, 30-, and 45-minute intervals
5. Display data in both tabular and graphic form
6. Analyze data
7. Follow-up discussion questions
Materials
• Deshelled raw eggs • Reagents to make percent solutions
• Beakers
• Spoon
• Weighing balance
• Timer
• P aper towels
• Graph paper
• Additional materials for student-designed component of activity
Procedure
Part A: Investigating Osmosis
1 . You will be submerging eggs in clear corn syrup solutions that differ in osmolarity to observe
changes in egg volume. In addition, you will design an experiment to investigate how a variable
of your choosing affects the process of osmosis. You may use the following list of questions to
help you choose a variable to investigate, or you may generate an idea on your own.
• Is osmosis a temperature-dependent process?
• Do osmolarity and osmosis depend on the type of dissolved particle? For example, does
it make a difference whether we use salt solutions or sugar solutions to test volume
changes in the eggs?
• Does the age of the egg matter? Eggs lose water over time. Will this affect the isotonic point?
• Like cells, eggs exchange water with their environment at their surface. Is osmosis affected
by egg size (surface area to volume relationships)?
2. In the spaces below, write your hypothesis, a brief rationale for your hypothesis, your experimental design, and your predictions for the outcome of your experiment.
D Hypothesis:
D Rationale:
D Experimental Design:
D Prediction:
Part B: Preparing Solutions
1. You will need to prepare at least four different percent (by volume) solutions to determine the isotonic point of your eggs. You will use dilutions of clear corn syrup with water to make solutions that can range anywhere between 0% (pure water) and 1 00% (pure corn syrup). Your group should start by deciding on the four different percent solutions to use for your experiment. Write your solution decisions in the spaces provided.
D Solution A %
D Solution C _ _ 0/o
D Solution B __ 0/o
D Solution D _ _ 0/o

2. Now you'll need to calculate how much clear corn syrup and how much water to combine
to make each solution. A 1 0% solution is one part corn syrup combined with nine parts
water. If you are going to make 500 ml of a 1 0% solution, then you'll combine 0. 1 X 500 ml,
or 50 ml, of clear corn syrup with 0.9 X 500 ml, or 450, ml of water (see below). Use the
following chart to calculate the amount of clear corn syrup and water you need to combine to
make all four of your solutions.
EXAMPLE:
If you want 500 ml of a 1 0% clear corn syrup solution, you will need to combine:
1 0% or 0. 1 X 500 ml = 50 ml clear corn syrup and 90% or 0.9 X 500 ml = 450 ml water
Your solutions:
To make 500 ml of a % solution, combine ---
X 500 ml = _ _ _ ml syrup with _ _ X 500 ml water
To make 500 ml of a ___ % solution, combine
X 500 ml = ___ ml syrup with _ _ X 500 ml water
To make 500 ml of a % solution, combine ---
X 500 ml = _ _ _ ml syrup with _ _ X 500 ml water
To make 500 ml of a ___ % solution, combine
X 500 ml = ___ ml syrup with _ _ X 500 ml water
Note: If your experimental procedure requires you to make solutions using other reagents. your instructor will provide
instructions. You can make percent solutions using dry reagents. For example, to make 500 ml of a 10% NaCl solution,
you would combine 50 g NaCl with water until you have a final volume of 500 ml.
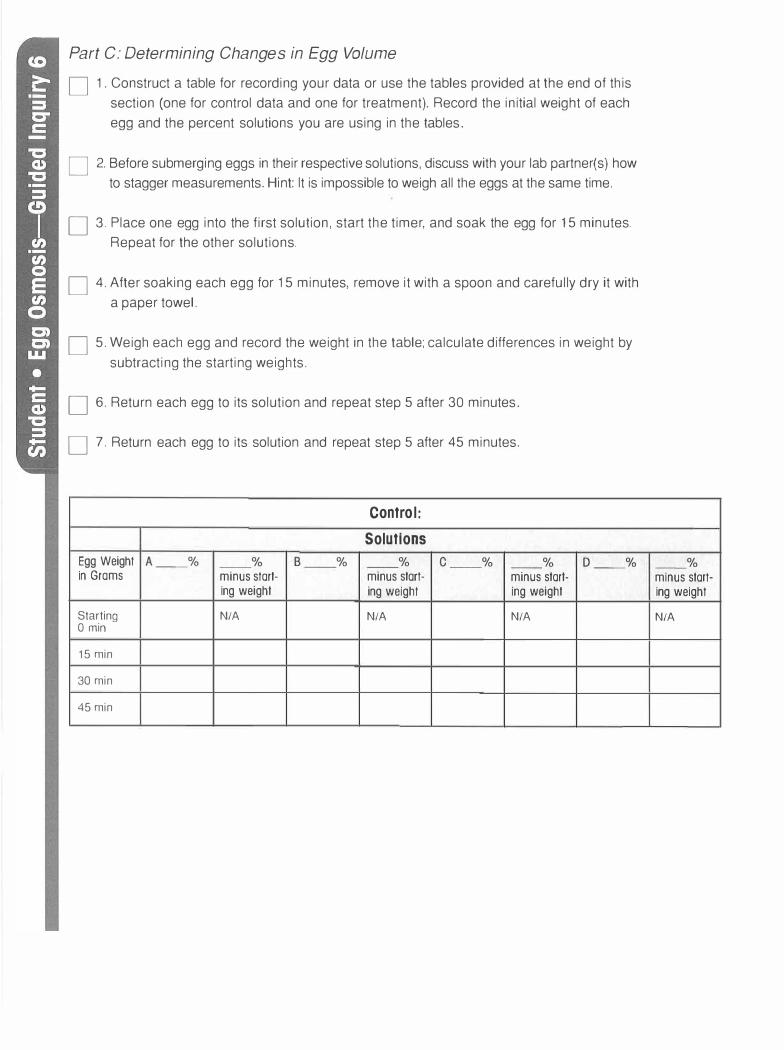
Part C: Determining Changes in Egg Volume
D 1 . Construct a table for recording your data or use the tables provided at the end of this
section (one for control data and one for treatment). Record the initial weight of each
egg and the percent solutions you are using in the tables.
D 2. Before submerging eggs in their respective solutions, discuss with your lab partner(s) how
to stagger measurements. Hint: It is impossible to weigh all the eggs at the same time.
D 3. Place one egg into the first solution, start the timer, and soak the egg for 1 5 minutes.
Repeat for the other solutions.
D 4. After soaking each egg for 1 5 minutes, remove it with a spoon and carefully dry it with
a paper towel.
D 5. Weigh each egg and record the weight in the table; calculate differences in weight by
subtracting the starting weights.
D 6. Return each egg to its solution and repeat step 5 after 30 minutes.
D 7. Return each egg to its solution and repeat step 5 after 45 minutes.
Egg Weight in Grams
Starting 0 min
1 5 min
30 min
45 min
% -- --% - -%
minus start-ing weight
N/A
Control :
Solutions
- -% --% --%
minus start- minus start-ing weight ing weight
N/A N/A
% -- % --
minus start-ing weight
N/A
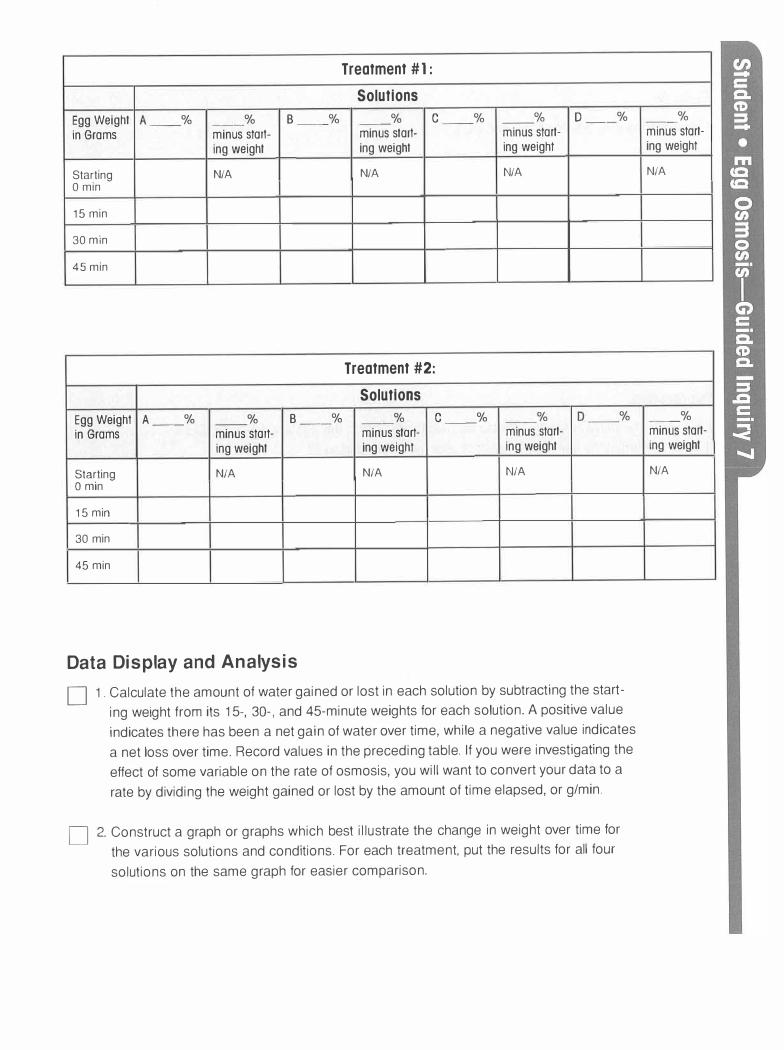
Treatment #1 :
Solutions
Egg Weight --% - -% B __ % - -% C --% - -% D - -%
in Grams minus start- minus start- minus start-ing weight ing weight ing weight
Starting NIA NIA NIA
0 min
1 5 min
30 min
45 min
Treatment #2:
Solutions
Egg Weight A - -% - - % B - -% - -% C - -% --% - - %
in Grams minus start- minus start- minus start-
ing weight ing weight ing weight
Starting NIA NIA NIA
O min
1 5 min
30 min
45 min
Data Display and Analysis
D 1. Calculate the amount of water gained or lost in each solution by subtracting the starting weight from its 15-, 30-, and 45-minute weights for each solution. A positive value indicates there has been a net gain of water over time, while a negative value indicates a net loss over time. Record values in the preceding table. If you were investigating the effect of some variable on the rate of osmosis, you will want to convert your data to a rate by dividing the weight gained or lost by the amount of time elapsed, or g/min.
D 2. Construct a graph or graphs which best illustrate the change in weight over time for the various solutions and conditions. For each treatment, put the results for all four solutions on the same graph for easier comparison.
% - -minus start-ing weight
NIA
--%
minus start-ing weight
NIA

Follow-up Discussion Questions
Review:
1. Summarize your observations and data.
2. Review the concepts of hypotonic, hypertonic, and isotonic and determine which term applied to the solutions used. Which solutions were hypertonic and which were isotonic or hypotonic relative to the fluid inside the eggs?
Interpretive:
3. Estimate the percent solution that is isotonic to the fluid in the egg in each case. Did it change or remain the same as a result of your treatment protocol?
4. Compare your results with those of other groups. What conclusions can be drawn about the process of osmosis and the factors that affect it?
5. How did your results compare to your predictions?
6. Relate the results of the lab exercise to osmosis within a cell or organism. Think of some scenarios in which cells or organisms might be exposed to changes in the osmolarity of their environment. For example, salmon migrate from seawater to f reshwater to spawn. Predict what will happen to their cell volumes.

Reflective:
7. Determine sources of error for this lab.
8. Which aspect of the activity contributed most to your understanding of osmosis: group discussion? the hands-on manipulation?
9. Which aspects of the lab did you find most challenging? Explain.

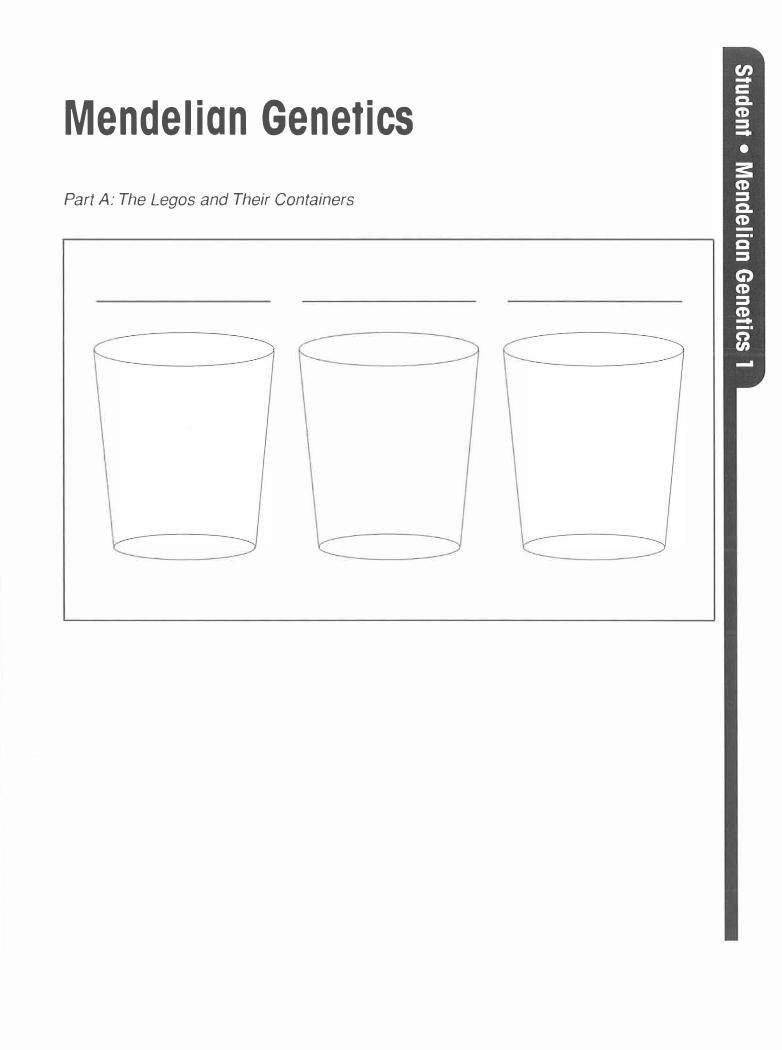
Mendelian Genetics
Part A: The Legos and Their Containers

Part B: Punnett Square Matings
Q)
co
Q) C: co -0
(.)
2 Femalt.
3
[)
Container:
�Parent, ���
1 � ----'
3 14 (Each numbered box represents a potential offspring)
Container: ------- ---
�� �l�nt
�
2 '---
4
1 Eacr numbered box represents a potential offspring
Analysis Questions
1. How many Lego/allele combinations are possible in offspring?
2. What is the probability of getting each combination?
3. What color(s) will the offspring be?
Analysis Questions
1. How many Lego/allele combinations are possible in offspring? _ ___ _
2. What is the probability of getting each combination?
3. What color(s) will the offspring be?
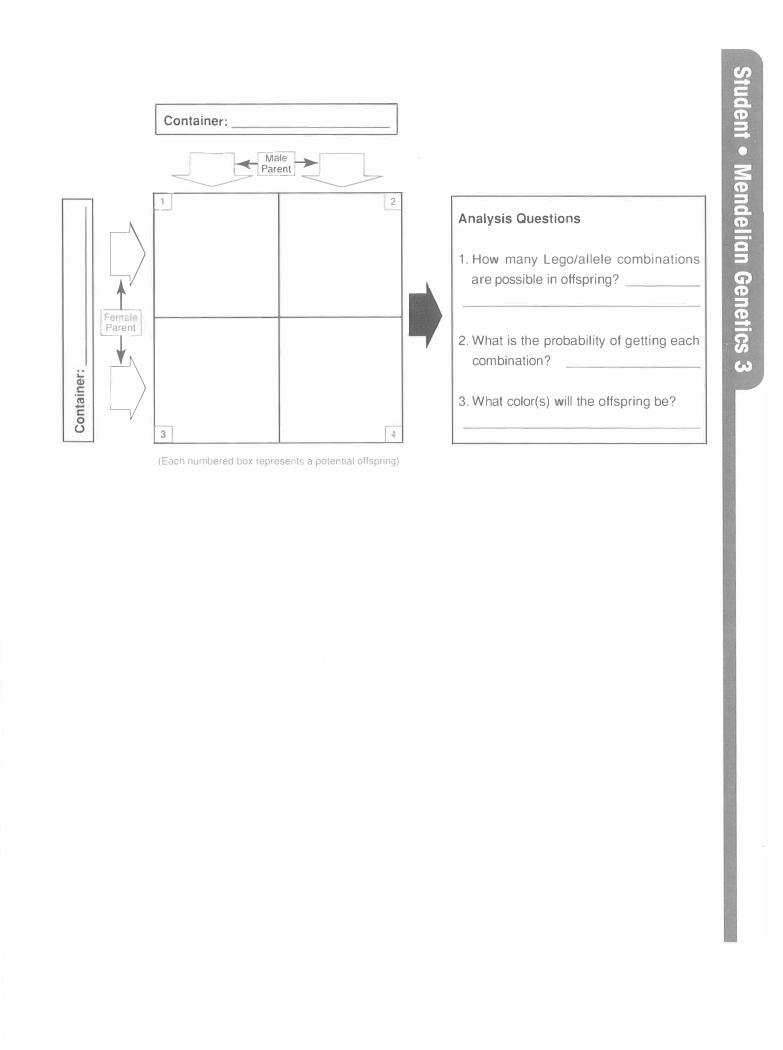
Container:
�- '"tvfale [ �Parent� ���
. 1_ J 2
Q Analysis Questions
1. How many Lego/allele combinations are possible in offspring?
Fe1.,, Parer t
b 2. What is the probability of getting each
combination?
(1l 3. What color(s) will the offspring be?
3] r 4
(Eacl-J numbered box rep1·e.;ents a potential offspring)
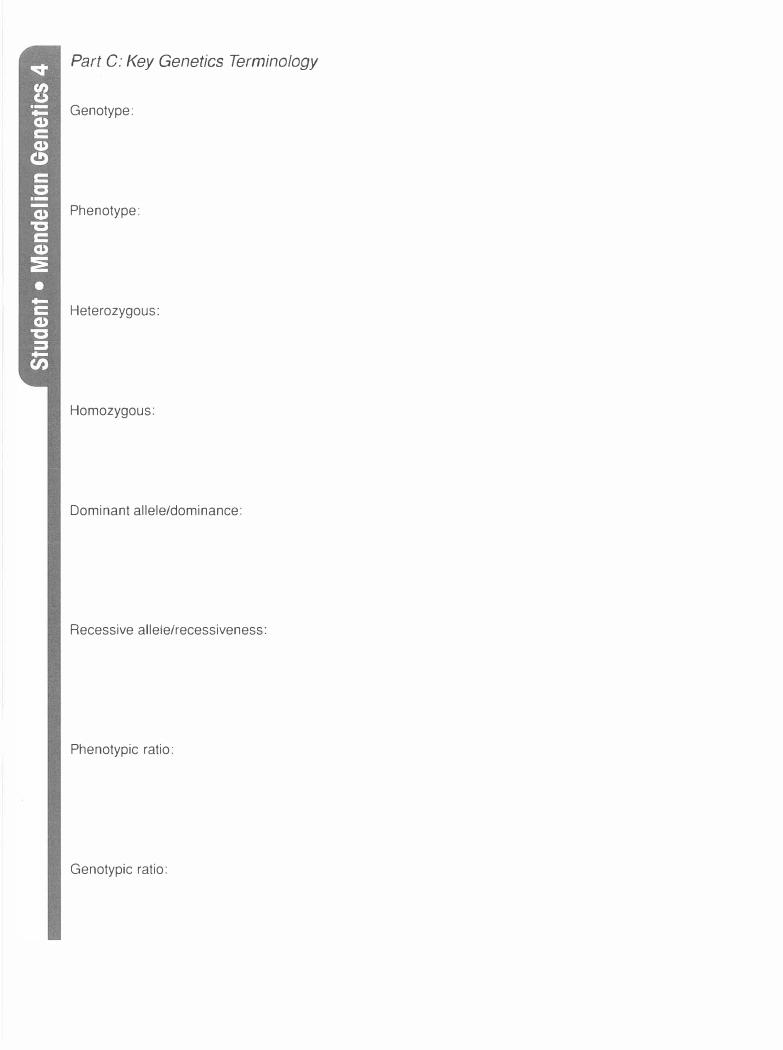
Part C: Key Genetics Terminology
Genotype:
Phenotype:
Heterozygous:
Homozygous:
Dominant allele/dominance:
Recessive allele/recessiveness:
Phenotypic ratio:
Genotypic ratio:
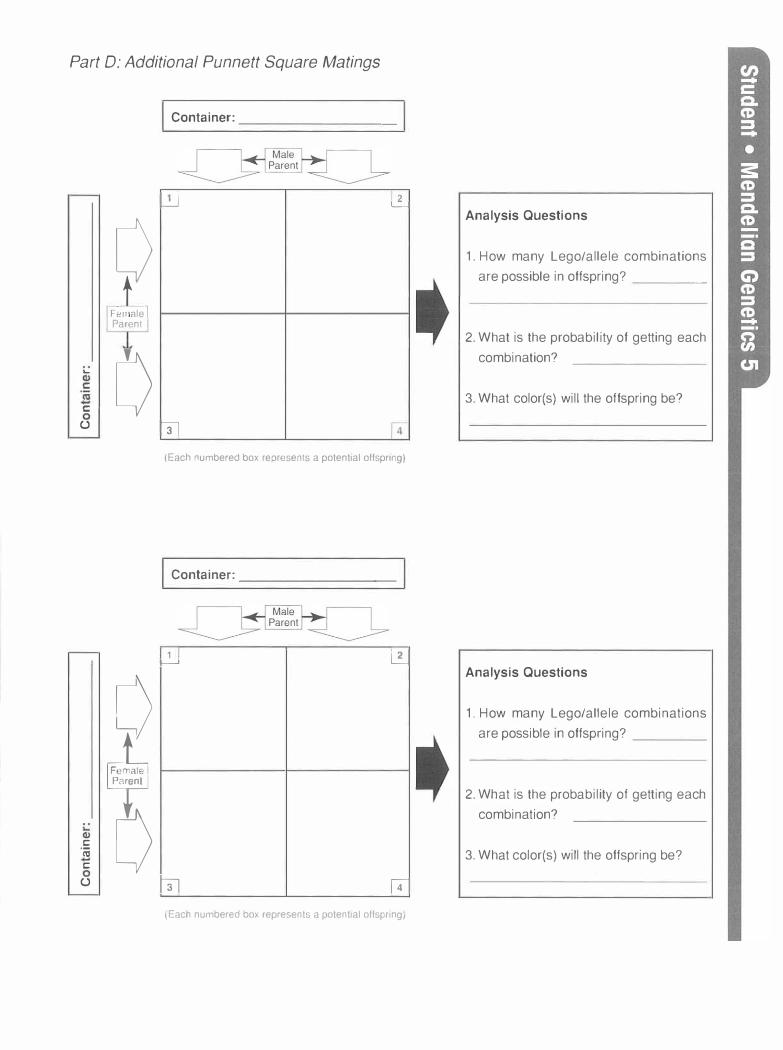
Part D: Additional Punnett Square Matings
Container: ----------
� 2 '--
0 ,,!,,,I Parent
...
0 C:
C:
u 3'
(Each numbered box represents a potential offspring)
Container: _________ _
1 � -
2 �r
�
[) C
-� C
u Gl "'
,Each numbered box represents a potential offspr·ng,
Analysis Questions
1. How many Lego/allele combinations are possible in offspring? _ _ _ _ _
2. What is the probability of getting each combination?
3. What color(s) will the offspring be?
Analysis Questions
1. How many Lego/allele combinations are possible in offspring?
2. What is the probability of getting each combination?
3. What color(s) will the offspring be?
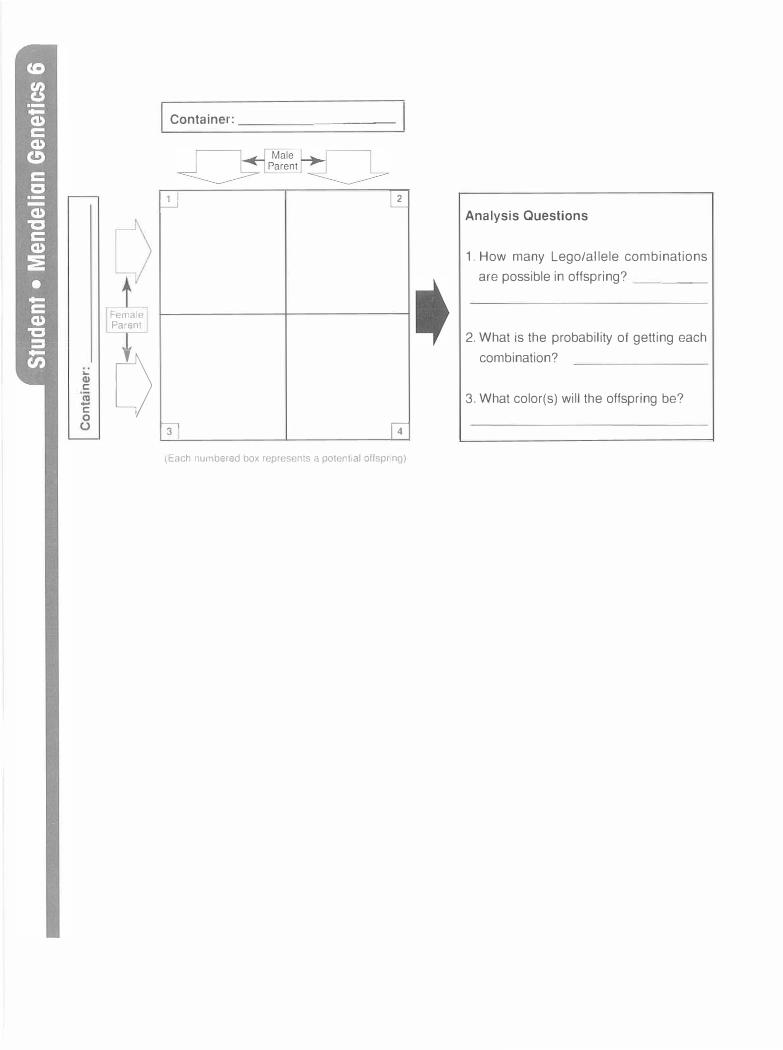
Female Parent
...
j C
C
Container: _ _ _ _ _____ _
1 � I-----'
----, 14 3
,Each numbered box represents a potential offspr ng)
Analysis Questions
1. How many Lego/allele combinations are possible in offspring? _ ___ _
2. What is the probability of getting each combination?
3. What color(s) will the offspring be?

Female Parent
Punnett Square Template
1 i 12
31 14
(Each numbered box represents a potential offspring)
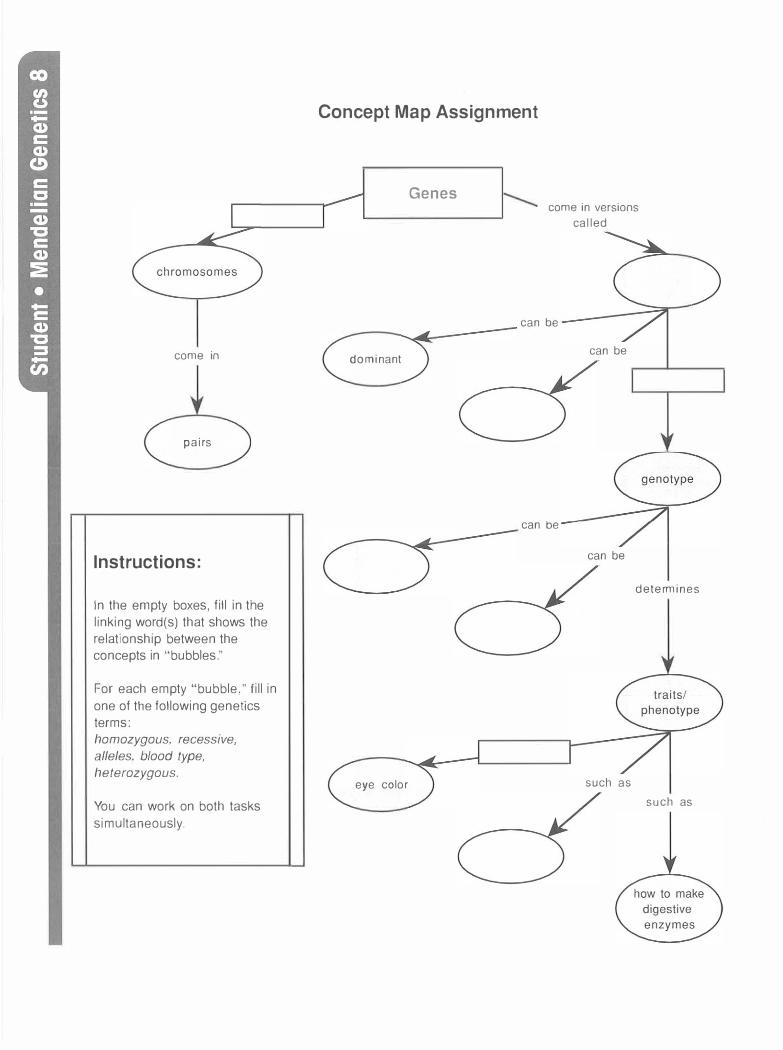
come in
pairs
Instructions:
In the empty boxes, fill in the linking word(s) that shows the relationship between the concepts in "bubbles."
For each empty "bubble," fill in one of the following genetics terms: homozygous, recessive,
alleles. blood type,
heterozygous.
You can work on both tasks simultaneously.
Concept Map Assignment
Genes
dominant
eye color
come in versions
called
can be
can be
can be
can be
determines
such as
such as
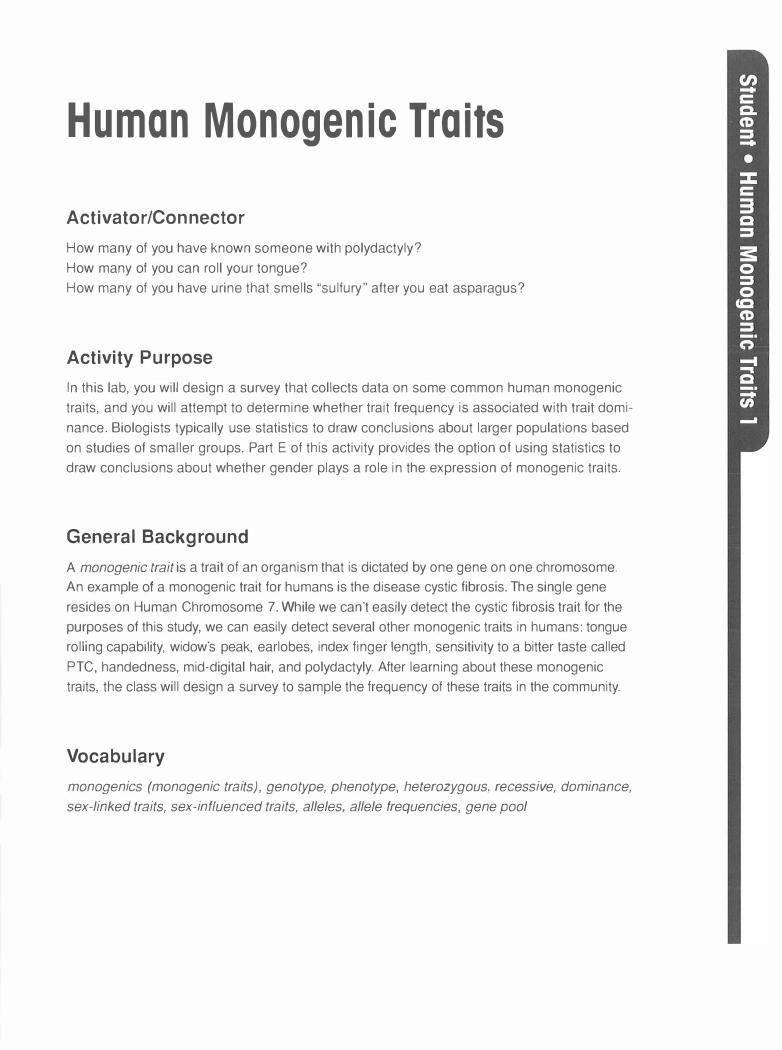
Human Monogenic Traits
Activator/Connector
How many of you have known someone with polydactyly? How many of you can roll your tongue? How many of you have urine that smells "sulfury" after you eat asparagus?
Activity Purpose
In this lab, you will design a survey that collects data on some common human monogenic traits, and you will attempt to determine whether trait frequency is associated with trait dominance. Biologists typically use statistics to draw conclusions about larger populations based on studies of smaller groups. Part E of this activity provides the option of using statistics to draw conclusions about whether gender plays a role in the expression of monogenic traits.
General Background
A monogenic trait is a trait of an organism that is dictated by one gene on one chromosome. An example of a monogenic trait for humans is the disease cystic fibrosis. The single gene resides on Human Chromosome 7. While we can't easily detect the cystic fibrosis trait for the purposes of this study, we can easily detect several other monogenic traits in humans: tongue rolling capability, widow's peak, earlobes, index finger length, sensitivity to a bitter taste called PTC, handedness, mid-digital hair, and polydactyly. After learning about these monogenic traits, the class will design a survey to sample the frequency of these traits in the community.
Vocabulary
monogenics (monogenic traits), genotype, phenotype, heterozygous, recessive, dominance,
sex-linked traits, sex-influenced traits, alleles, allele frequencies, gene pool
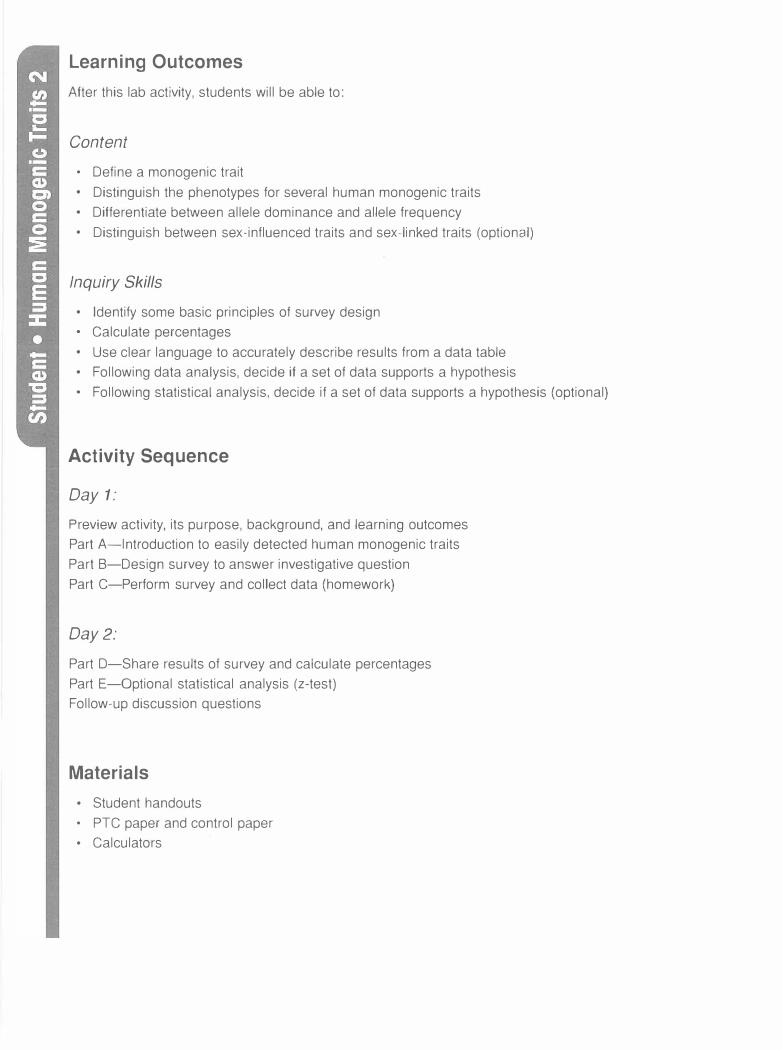
Learning Outcomes
After this lab activity, students will be able to:
Content
• Define a monogenic trait • Distinguish the phenotypes for several human monogenic traits • Differentiate between allele dominance and allele frequency • Distinguish between sex-influenced traits and sex-linked traits (optional)
Inquiry Skills
• Identify some basic principles of survey design • Calculate percentages • Use clear language to accurately describe results from a data table • Following data analysis, decide if a set of data supports a hypothesis • Following statistical analysis, decide if a set of data supports a hypothesis (optional)
Activity Sequence
Day 1:
Preview activity, its purpose, background, and learning outcomes Part A-Introduction to easily detected human monogenic traits Part 8-Design survey to answer investigative question Part C-Perform survey and collect data (homework)
Day 2:
Part D-Share results of survey and calculate percentages Part E-Optional statistical analysis (z-test) Follow-up discussion questions
Materials
• Student handouts • PTC paper and control paper • Calculators
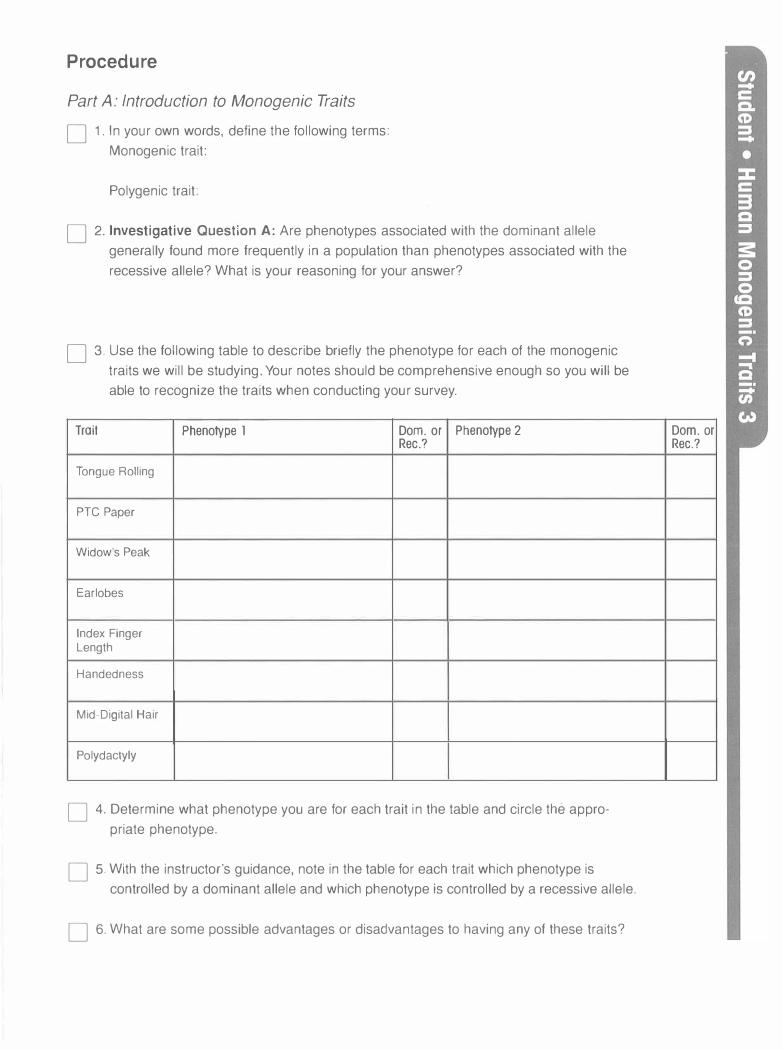
Procedure
Part A: Introduction to Monogenic Traits
D 1. In your own words, define the following terms:
Monogenic trait:
Polygenic trait:
D 2. Investigative Question A: Are phenotypes associated with the dominant allele
generally found more frequently in a population than phenotypes associated with the
recessive allele? What is your reasoning for your answer?
D 3. Use the following table to describe briefly the phenotype for each of the monogenic
traits we will be studying. Your notes should be comprehensive enough so you will be
able to recognize the traits when conducting your survey.
Trait Phenotype l Dom. or Phenotype 2 Rec.?
Tongue Rolling
PTC Paper
Widow's Peak
Earlobes
Index Finger Length
Handedness
Mid-Digital Hair
Polydactyly
D 4. Determine what phenotype you are for each trait in the table and circle the appro
priate phenotype.
D 5. With the instructor's guidance, note in the table for each trait which phenotype is
controlled by a dominant allele and which phenotype is controlled by a recessive allele.
D 6. What are some possible advantages or disadvantages to having any of these traits?
Dom. or Rec.?
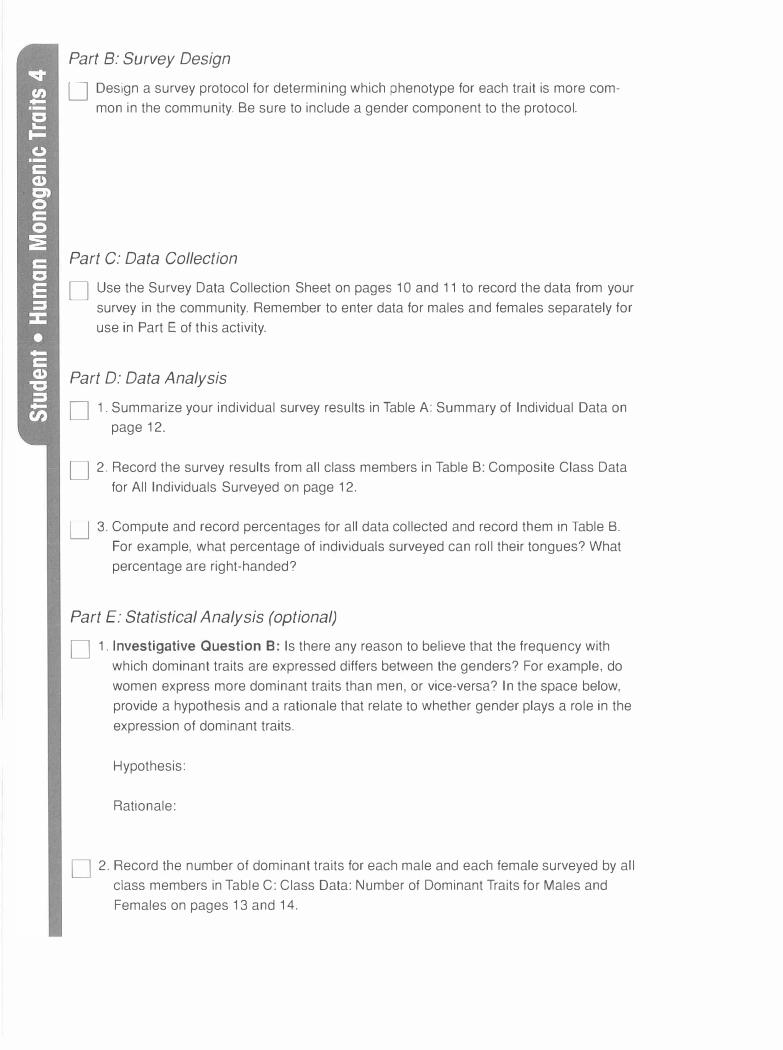
Part B: Survey Design
D Design a survey protocol for determining which phenotype for each trait is more com
mon in the community. Be sure to include a gender component to the protocol.
Part C: Data Collection
D Use the Survey Data Collection Sheet on pages 1 O and 11 to record the data from your
survey in the community. Remember to enter data for males and females separately for
use in Part E of this activity.
Part D: Data Analysis
D 1. Summarize your individual survey results in Table A: Summary of Individual Data on
page 12.
D 2. Record the survey results from all class members in Table B: Composite Class Data
for All Individuals Surveyed on page 12.
LJ 3. Compute and record percentages tor all data collected and record them in Table B.
For example, what percentage of individuals surveyed can roll their tongues? What
percentage are right-handed?
Part E: Statistical Analysis (optional)
D 1. Investigative Question B: Is there any reason to believe that the frequency with
which dominant traits are expressed differs between the genders? For example, do
women express more dominant traits than men, or vice-versa? In the space below,
provide a hypothesis and a rationale that relate to whether gender plays a role in the
expression of dominant traits.
Hypothesis:
Rationale:
D 2. Record the number of dominant traits for each male and each female surveyed by all
class members in Table C: Class Data: Number of Dominant Traits for Males and
Females on pages 13 and 14.
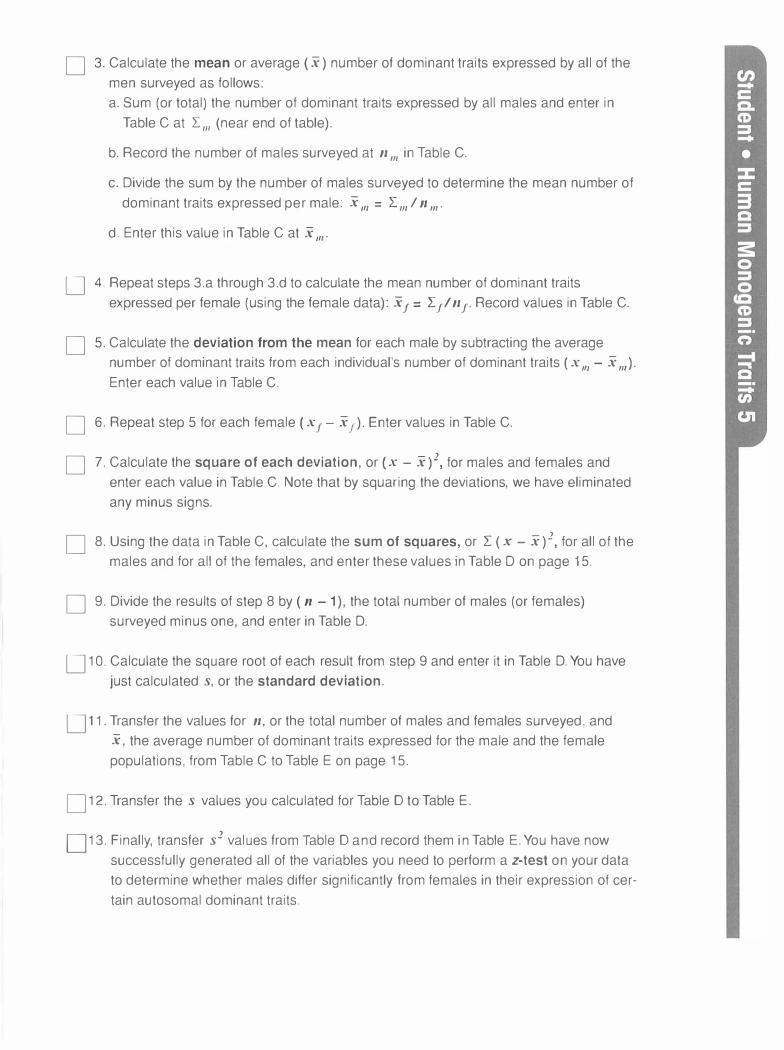
D 3. Calculate the mean or average ( x) number of dominant traits expressed by all of the men surveyed as follows: a. Sum (or total) the number of dominant traits expressed by all males and enter in
Table C at r. 111 (near end of table).
b. Record the number of males surveyed at 11 111 in Table C.
c. Divide the sum by the number of males surveyed to determine the mean number of dominant traits expressed per male: x 111 = I III I 11
111.
d. Enter this value in Table C at x 111•
D 4. Repeat steps 3.a through 3.d to calculate the mean number of dominant traits expressed per female (using the female data): x f = 'I 1; 11 f· Record values in Table C.
D 5. Calculate the deviation from the mean for each male by subtracting the average number of dominant traits from each individual's number of dominant traits ( x 111 - x 1
11).
Enter each value in Table C.
D 6. Repeat step 5 for each female ( x J - x f ). Enter values in Table C.
D 7. Calculate the square of each deviation, or (x - x)2, for males and females and enter each value in Table C. Note that by squaring the deviations, we have eliminated any minus signs.
D 8. Using the data in Table C, calculate the sum of squares, or I ( x - x)2, for all of the males and for all of the females, and enter these values in Table D on page 15.
D 9. Divide the results of step 8 by ( 11 - 1 ), the total number of males (or females) surveyed minus one, and enter in Table D.
D 10. Calculate the square root of each result from step 9 and enter it in Table D. You have just calculated s, or the standard deviation.
D 11. Transfer the values for 11, or the total number of males and females surveyed. and x, the average number of dominant traits expressed for the male and the female populations, from Table C to Table E on page 15.
D 12. Transfer the s values you calculated for Table D to Table E.
013. Finally, transfer s2 values from Table D and record them in Table E. You have now
successfully generated all of the variables you need to perform a z-test on your data to determine whether males differ significantly from females in their expression of certain autosomal dominant traits.

D 14. The formula for determining z is as follows:
z score= ( xm - x 1)
S1 S1
_!!.!_ - _f_ Jim II f
Note: If you're unsure of how to start using this formula, follow the next steps:
Calculate:
Subtract:
1 S1
Sm and __f_ /Im II f
S1 S
1
_!!L minus __f_ /Im II f
Now take the square root of that number, and you will have the value of the denominator of the previous formula.
• To determine the numerator, subtract the average number of dominant traits expressed by females ( x f) from the average number expressed by males ( x 111).
Finally, divide the numerator by the denominator to obtain the z-score for your data. Write it in the space that follows.
z-score =
If the z-score is greater than 1.96, then we can state with 95% certainty that the males and females surveyed differed in the number of dominant traits they expressed. However, it's also important to convey how these two populations differed. In this case, if the mean number of dominant traits for males was greater than the mean for females (or x 111 > x 1), then we can state, "Males in our survey expressed a signifi
cantly greater number of dominant traits than did females." If the mean number of dominant traits for females is greater than that for males (or x f > x 111), then we can state, "Females in our survey expressed a significantly greater number of dominant traits than did males."
If the z-score is less than 1.96, then we can state with 95% certainty that "the number of dominant traits expressed by males and females in our survey did not differ significantly."
15. State the results of your statistical analysis of the data.
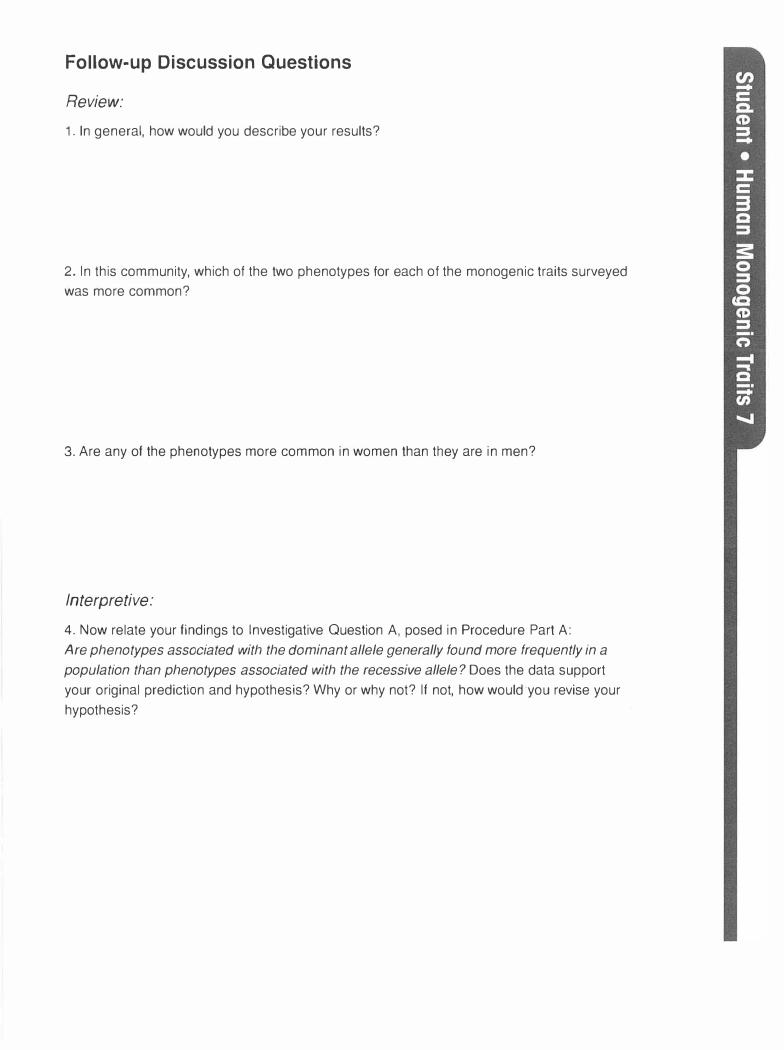
Follow-up Discussion Questions
Review:
1. In general, how would you describe your results?
2. In this community, which of the two phenotypes for each of the monogenic traits surveyed
was more common?
3. Are any of the phenotypes more common in women than they are in men?
Interpretive:
4. Now relate your findings to Investigative Question A, posed in Procedure Part A:
Are phenotypes associated with the dominant allele generally found more frequently in a population than phenotypes associated with the recessive allele? Does the data support
your original prediction and hypothesis? Why or why not? If not, how would·you revise your
hypothesis?
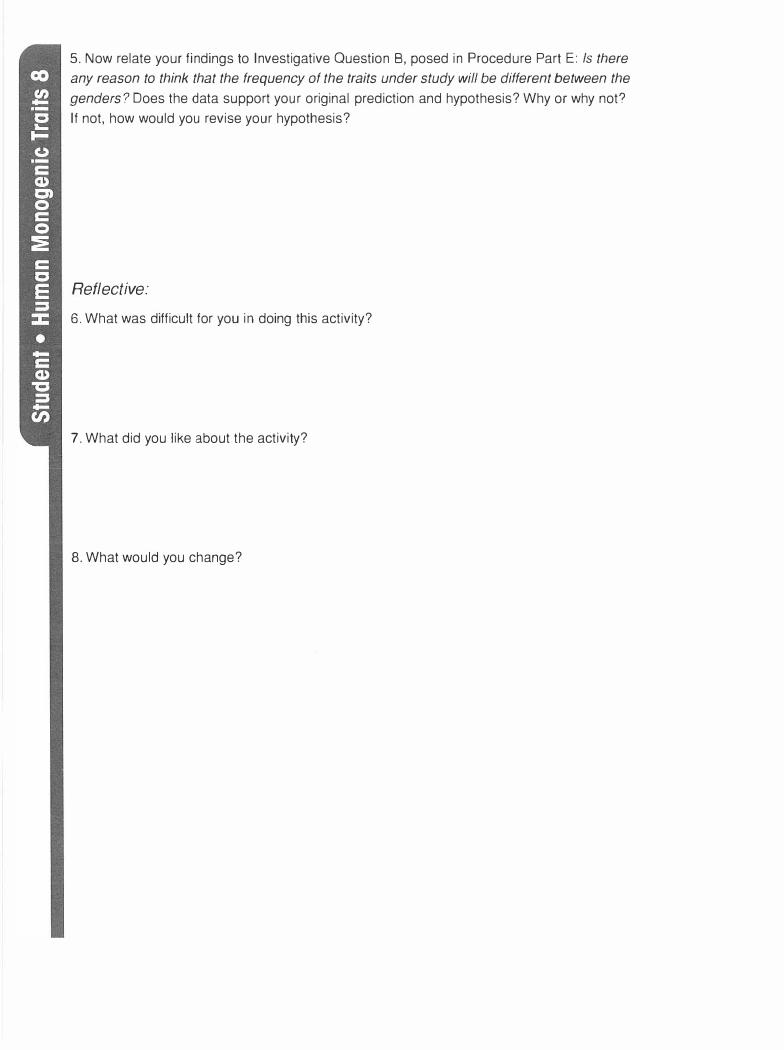
5. Now relate your findings to Investigative Question B, posed in Procedure Part E: /s there any reason to think that the frequency of the traits under study will be different between the genders? Does the data support your original prediction and hypothesis? Why or why not? If not, how would you revise your hypothesis?
Reflective:
6. What was difficult for you in doing this activity?
7. What did you like about the activity?
8. What would you change?

A
TEMPLATE FOR MEASURING
INDEX FINGER LENGTH PHENOTYPE
B
Instructions: Lay right hand on this grid so that the middle finger lies on Line B and
the tip of the ring finger is in line with Line A. If the index finger lies below Line A, then
the phenotype is "short index finger." If the index finger lies on or above Line A, then the
phenotype is "long index finger."

SURVEY DATA COLLECTION SHEET
Name: __________ _ _
Record whether each individual surveyed expressed the dominant or recessive trait for the
eight traits listed below. Keep male and female data separate.
Male #1 :
Trait: Tongue PTC Widow's Index Finger Handed- Mid- Poly-Rolling Paper Peak Earlobes Length ness Digital Hair dactyly
Dominant
Recessive
Male #2:
Trait: Tongue PTC Widow's Index Finger Handed- Mid- Poly-Rolling Paper Peak Earlobes Length ness Digital Hair dactyly
Dominant
Recessive
Male #3:
Trait: Tongue PTC Widow's Index Finger Handed- Mid- Poly-Rolling Paper Peak Earlobes Length ness Digital Hair dactyly
Dominant
Recessive
Male #4:.
Trait: Tongue PTC Widow's Index Finger Handed- Mid- Poly-Rolling Paper Peak Earlobes Length ness Digital Hair dactyly
Dominant
Recessive
Male #5:
Trail: Tongue PTC Widow's Index Finger Handed- Mid- Poly-Rolling Paper Peak Earlobes Length ness Digital Hair dactyly
Dominant
Recessive
Total #
N/A
Total #
N/A
Total #
N/A
Total #
N/A
Total #
N/A

Female #1 :
Trait: Tongue PTC Widow's Index Finger Handed- Mid- Poly- Total # Rolling Paper Peak Earlobes Length ness Digital Hair dactyly
Dominant
Recessive N/A
Female #2:
Trait: Tongue PTC Widow's Index Finger Handed- Mid- Poly- Total # Rolling Paper Peak Earlobes Length ness Digital Hair dactyly
Dominant
Recessive N/A
Female #3:
Trait: Tongue PTC Widow's Index Finger Handed- Mid- Poly- Total # Rolling Paper Peak Earlobes Length ness Digital Hair dactyly
Dominant
Recessive NIA
Female #4:
Trait: Tongue PTC Widow's Index Finger Handed- Mid- Poly- Total # Rolling Paper Peak Earlobes Length ness Digital Hair dactyly
Dominant
Recessive N/A
Female #5:
Trail: Tongue PTC Widow's Index Finger Handed- Mid- Poly- Total # Rolling Paper Peak Earlobes Length ness Digital Hair dactyly
Dominant
Recessive N/A
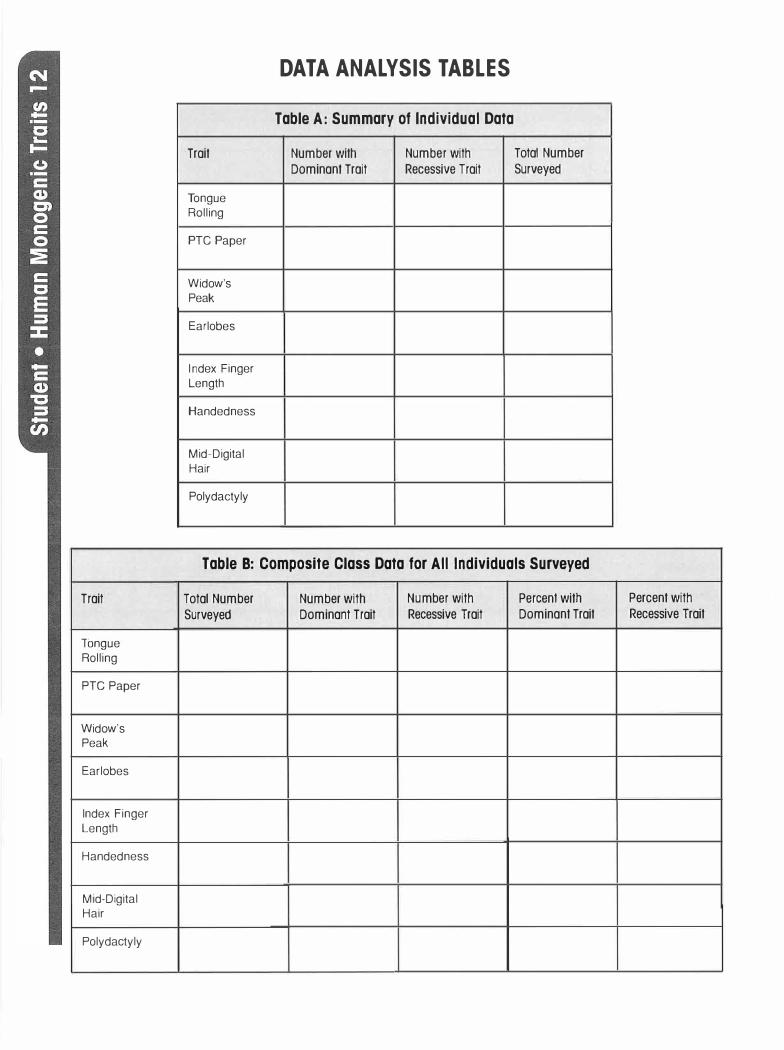
DATA ANALYSIS TABLES
Table A : Summary of Individual Data
Trait Number with Number with Total Number
Dominant Trait Recessive Trait Surveyed
Tongue Rolling
PTC Paper
Widow's Peak
Earlobes
I ndex Finger
Length
Handedness
Mid-Digital Hair
Polydactyly
Table B: Composite Class Data for All Individuals Surveyed
Trait Total Number Number with Number with Percent with Percent with
Surveyed Dominant Trait Recessive Trait Dominant Trait Recessive Trait
Tongue
Rolling
PTC Paper
Widow's Peak
Earlobes
Index Finger
Length
Handedness
Mid-Digital Hair
Polydactyly
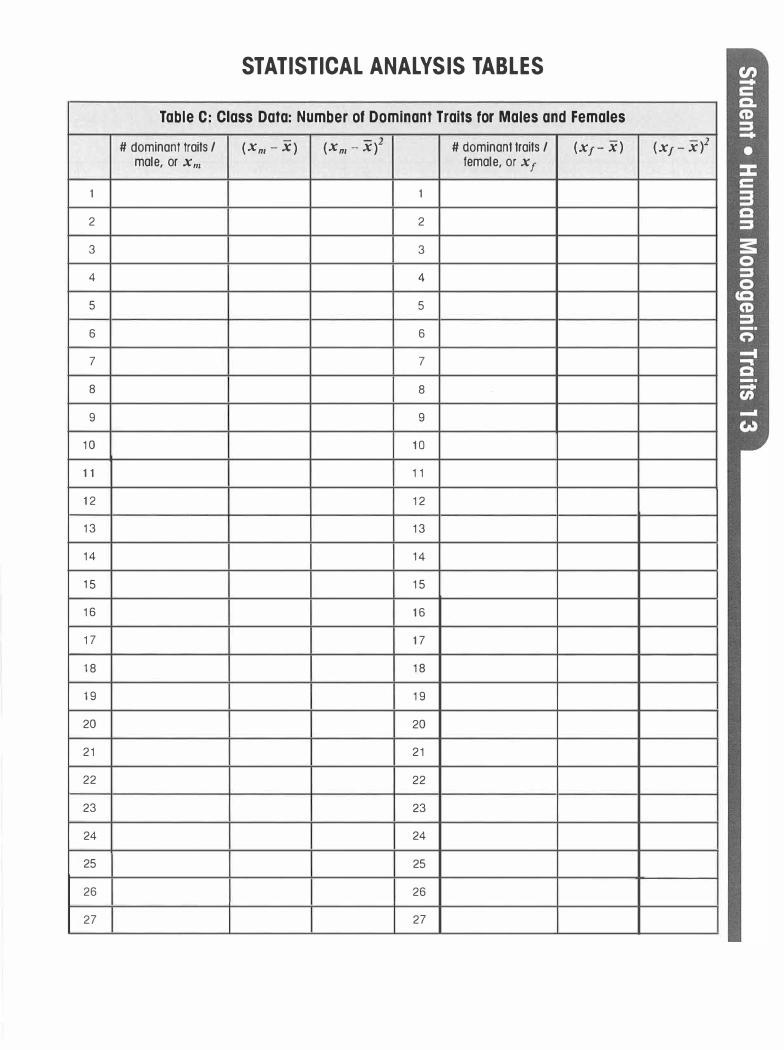
STATISTICAL ANALYSIS TABLES
Table C: Class Data: Number of Dominant Traits for Males and Females
# dominant traits / (x,,, - x) - 2
(x,,, - x) male, or Xm
# dominant traits / female, or x 1
(Xj - X) - 2 (Xj - X)
1 1
2 2
3 3
4 4
5 5
6 6
7 7
8 8
9 9
1 0 1 0
1 1 1 1
1 2 1 2
1 3 1 3
1 4 1 4
1 5 1 5
1 6 1 6
1 7 1 7
1 8 1 8
1 9 1 9
20 20
21 21
22 22
23 23
24 24
25 25
26 26
27 27

Table C: Class Data: Number of Dominant Traits for Males and Females (continued)
# dominant traits / (X111 - X} - 2 (X111 - X } # dominant traits / (XJ - X}
- 2 (Xj - X }
male, or x 111 female, or x f
28 28
29 29
30 30
31 31
32 32
33 33
34 34
35 35
36 36
37 37
38 38
39 39
40 40
41 41
42 42
43 43
44 44
45 45
I m NIA NIA I1 NIA NIA
II m NIA NIA II I NIA NIA
x,,, NIA NIA XI NIA NIA
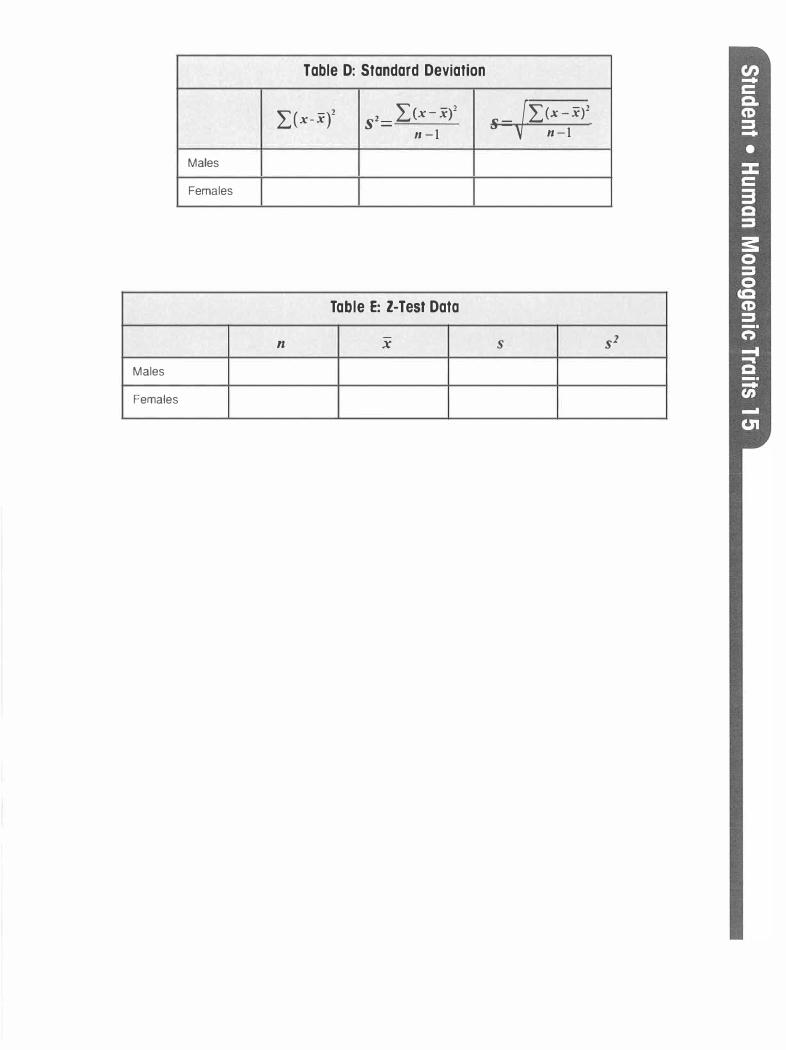
Table D: Standard Deviation
I(x-x)2 i I<x-x)2 s=)I<x-x)2
S = ,, -1 ,, - 1
Males
Females
Table E: Z-Test Data
-s
2 1l X s
Males
Females

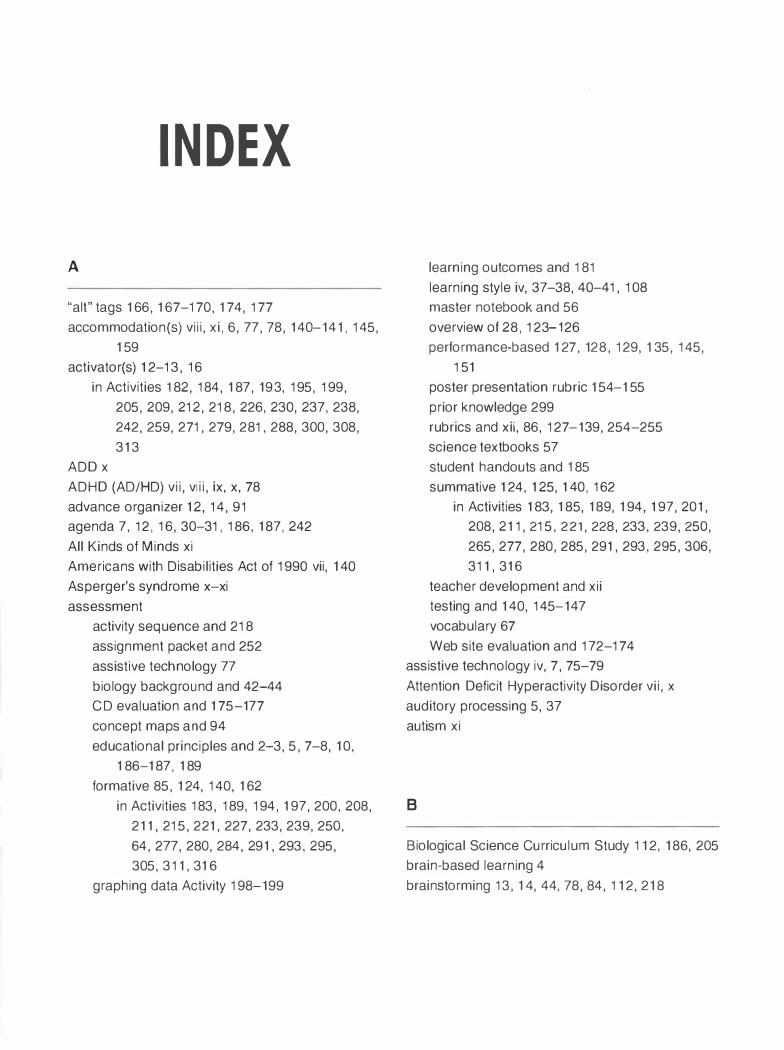
I NDEX
A
"alt" tags 1 66, 1 67-170, 1 74, 177
accommodation(s) viii, xi, 6, 77, 78, 1 40-141 , 145,
1 59
activator(s) 1 2-13, 16
in Activities 1 82, 184, 1 87, 193, 195, 199,
205, 209, 212, 218, 226, 230, 237, 238,
242, 259, 271, 279, 281, 288, 300, 308,
31 3
ADD x
ADHD (AD/HD) vii, viii, ix, x, 78
advance organizer 1 2, 14, 91
agenda 7, 12, 16, 30-31, 186, 1 87, 242
All Kinds of Minds xi
Americans with Disabilities Act of 1990 vii, 1 40
Asperger's syndrome x-xi
assessment
activity sequence and 218
assignment packet and 252
assistive technology 77
biology background and 42-44
CD evaluation and 1 75-177
concept maps and 94
educational principles and 2-3, 5, 7-8, 1 0,
1 86-1 87, 1 89
formative 85, 1 24, 140, 1 62
in Activities 183, 189, 194, 1 97, 200, 208,
21 1 , 215, 221 , 227, 233, 239, 250,
64, 277, 280, 284, 291 , 293, 295,
305, 311 , 31 6
graphing data Activity 198-199
learning outcomes and 181
learning style iv, 37-38, 40-41, 108
master notebook and 56
overview of 28, 123-126
performance-based 1 27, 128, 129, 1 35, 145,
151
poster presentation rubric 1 54-1 55
prior knowledge 299
rubrics and xii, 86, 127-139, 254-255
science textbooks 57
student handouts and 1 85
summative 1 24, 1 25, 1 40, 162
in Activities 1 83, 1 85, 1 89, 1 94, 1 97, 201 ,
208, 21 1, 215, 221, 228, 233, 239, 250,
265, 277, 280, 285, 291 , 293, 295, 306,
311 , 31 6
teacher development and xii
testing and 1 40, 145-147
vocabulary 67
Web site evaluation and 172-174
assistive technology iv, 7, 75-79
Attention Deficit Hyperactivity Disorder vii, x
auditory processing 5, 37
autism xi
B
Biological Science Curriculum Study 1 1 2, 1 86, 205
brain-based learning 4
brainstorming 13, 1 4, 44, 78, 84, 1 1 2, 21 8

4 7 8 Index
C
cell biology iii, v, xii, 1 2 , 30, 52, 1 36, 1 68, 1 79, 267, 269
chunked vocabulary 66 chunking 66 Common Ground Round Table ix comprehension ix, 39, 40-4 1 , 5 1 , 58-59, 75, 1 07,
1 1 0, 1 42, 1 44, 1 59 , 1 65, 1 72-1 76 concept map(s)(ing) 3, 4, 6, 7, 1 0, 1 4, 36, 85, 89,
90-94, 95-1 0 1 , 1 25, 1 27, 1 46, 280, 297, 306
connector(s) 1 3, 1 6 in Activities 1 82, 1 84, 1 87, 1 93, 1 95, 1 99, 205,
209, 2 1 2, 2 1 8, 226, 230, 238, 242, 259, 271 , 279, 281, 288, 300, 308, 31 3
course map(s) 8, 1 2 , 30
D
decoding ix, 75, 76, 1 65, 1 72 , 1 75 deductive learner(s) 1 03-104 deductive teaching iv, 4, 5 , 1 02-103, 1 04, 1 05,
240 , 299 demonstration lab 1 58-159, 201 , 286 diagnostic-prescriptive approach 2, 3 direct instruction ix, 1 02 , 1 06 distractibility x, 1 4, 1 1 0, 1 65, 1 72 , 1 75 Drake, Dr. Charles ix, 1 dyscalculia x dyslexia ix, x, xii, xiii
E
ecology iii, v, xii, 1 2, 30, 36, 47, 68, 1 03, 1 69, 1 79 in Activities 1 86, 203, 205, 2 1 1 , 2 1 7, 225, 233,
242 educational principles iii, iv, ix, xii, xiii, 1 -2, 1 1 , 27,
1 24, 1 27, 1 79, 1 80, 1 8 1 , 1 83 evolution iii, v, xii, 1 2 , 29, 30, 45, 47, 49, 52, 59,
1 2 1 , 1 44, 1 46, 1 68, 1 70, 1 79
in Activities 235, 237, 238, 239, 256, 265 executive function x, 3, 8, 1 4, 78 experiential learning 4, 39 explicit instruction 2 , 3 - 4, 75, 1 08, 1 1 3, 235, 236,
292 , 298
F
formative assessment (see assessment)
Frames of Mind 5 , 1 0, 39, 81 , 83
G
Gardner, Dr. Howard 5, 1 0, 37, 39, 8 1 , 83 genetics iii, v, xii, 6, 1 2 , 29, 30, 36, 45, 52, 83,
85, 9 1 , 1 05, 1 36, 1 44, 1 48, 1 49, 1 68-170, 1 79
in Activities 240, 256, 297, 299, 300-306, 307-31 1 , 312 , 3 1 6
graphic organizer(s) 2 , 3 , 7, 1 3, 1 6 , 44, 60, 64, 84-87, 90, 1 20, 1 62
guided inquiry 1 03, 1 58-1 59, 1 61 , 204, 268, 286, 287, 291 , 294-295
H
higher-order thinking 9 1 , 1 59, 231 Hyerle, Dr. David 84, 85, 87
inductive learner 1 03 inductive teaching 5, 1 02-105, 240, 299 inquiry continuum 1 58-160, 286 inquiry-based learning 4, 1 60 inquiry-based teaching 1 02, 1 58 Inspiration (software) 29, 44, 60, 85, 87, 93, 94,
1 20 International Dyslexia Association xii, xiii Internet iii, iv, vi, 6, 1 65 , 228, 278-280, 307

K
kinesthetic
learner(ing) 5, 10, 267
role-playing 81, 83, 269-277
Kirk, Dr. Samuel ix, xiii
L
lab report template 1 61, 1 63, 221 , 233, 250,
252-253, 265, 285, 291, 316
Landmark College
assistive technology and 75, 78, 79
authors and vi
background on viii-xii
communications classes and 1 08
educational principles and 1-3, 5, 9, 1 0
inquiry-based labs and 1 59
learning style 37
National Institute at ii
publications from 31, 39, 87, 1 1 2
Web site evaluations and 166
widely beneficial practices and 1 1-12, 15
Landmark Schools viii, ix, 1
learning cycle 102
learning difference(s) vi, xi, xii, 75, 78, 1 40, 1 41 ,
1 43, 307
learning disability (disabilities)
assessment and 1 23-1 24
assessment rubrics and 1 27
assistive technology and 79
biology labs and 28, 159-160, 162
biology textbooks and 57-58
biology vocabulary and 65
CD evaluation 1 75
classroom discussions and 1 07-108, 1 11-11 2
concept mapping and 90
course organization and 29-31
deductive teaching and 104, 1 06
diagnostic categories and x
Index 4 7 9
educational principles and 1, 3-8, 1 0
graphic organizers and 84, 86
incidence of vii
Landmark College and viii
learning style assessment and 37, 39
overview of ix
references xiii
test taking accommodations and 140- 1 41, 146
versus learning difference xi-xii
Web site evaluation and 1 72
widely beneficial practices and 1 1-15
writing and 77
learning journal(s) 9
learning outcomes 1 6
in Activities 1 8 1 , 183, 1 84, 1 86, 187, 193,
195-196, 198-200, 205, 209, 21 1 , 213,
21 7-218, 221 , 225-226, 228, 229-230,
233, 237-239, 240, 242, 256, 259, 269,
272, 277, 279-280, 281-282, 286, 288,
292, 294, 299-301 , 307- 308, 31 2-31 3
learning profile(s) ix, 8, 9, 10, 58, 172-1 77, 181
learning style(s) ii i , iv, v, 2, 3, 5, 7, 8, 9 , 1 0, 37-39,
42, 52, 66, 67, 77, 103, 108, 1 19, 1 20,
2 1 4, 233, 250, 277, 3 1 1
Levine, Dr. Mel xi, xiii, 5 , 1 0
M
manipulatives 82, 83, 120, 1 45
metacognition ix, 9, 60, 67, 84, 1 27 , 142, 143,
144-145, 1 83
metacognitive 2, 9, 52, 1 14, 1 25, 140, 163, 183
micro-uniting 3
mind map(s)(ping) 44, 1 1 9, 124
mnemonic device(s) 55, 66-67, 290, 291
multimodal teaching iv, xiii, 3, 7, 8 1-83, 269
multimodal techniques 8 1 , 83, 1 12
multiple intelligences 5, 37, 39, 81
multisensory ix
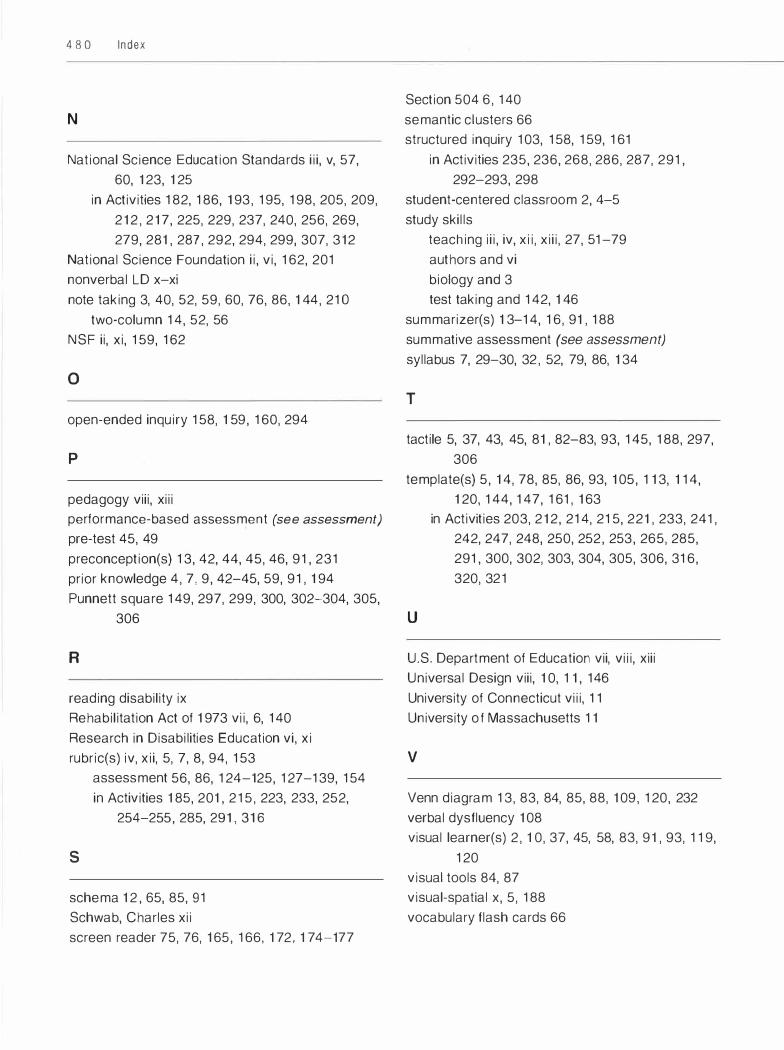
4 8 0 Index
N
National Science Education Standards iii, v, 57, 60, 1 23, 1 25
in Activities 182, 186, 1 93 , 195, 198, 205, 209, 2 1 2 , 2 1 7, 225, 229, 237, 240, 256, 269, 279, 281 , 287 , 292, 294, 299, 307, 3 1 2
National Science Foundation ii, vi, 162, 201 nonverbal LD x-xi note taking 3, 40, 52, 59, 60, 76, 86, 1 44, 21 O
two-column 14, 52, 56 NSF ii, xi, 159, 162
0
open-ended inquiry 158, 1 59, 160, 294
p
pedagogy viii, xiii performance-based assessment (see assessment)
pre-test 45, 49 preconception(s) 13, 42, 44, 45, 46, 91 , 231 prior knowledge 4 , 7 , 9 , 42-45, 59, 91 , 1 94 Punnett square 149, 297, 299, 300, 302-304, 305,
306
R
reading disability ix Rehabilitation Act of 1 973 vii, 6, 140 Research in Disabilities Education vi, xi rubric(s) iv, xii, 5, 7, 8, 94, 153
s
assessment 56, 86, 124-125, 127-139, 154 in Activities 1 85, 201 , 2 15 , 223, 233, 252,
254-255, 285, 291 , 31 6
schema 1 2 , 65, 85, 91 Schwab, Charles xii screen reader 75, 76, 1 65, 166, 1 72 , 1 74-177
Section 504 6 , 140 semantic clusters 66 structured inquiry 103, 158, 159, 161
in Activities 235, 236, 268, 286, 287, 291 , 292-293, 298
student-centered classroom 2, 4-5 study skills
teaching iii, iv, xii, xiii, 27, 51-79 authors and vi biology and 3 test taking and 142, 1 46
summarizer(s) 1 3-14, 16, 91 , 188 summative assessment (see assessment)
syllabus 7, 29-30, 32 , 52, 79, 86, 1 34
T
tactile 5, 37, 43, 45, 81 , 82-83, 93, 145, 188, 297, 306
template(s) 5, 1 4, 78, 85, 86, 93, 1 05, 1 1 3, 1 14, 1 20, 144, 147, 161, 1 63
u
in Activities 203, 2 1 2 , 214, 215, 22 1 , 233, 241, 242, 247, 248, 250, 252 , 253, 265, 285, 291, 300, 302, 303, 304, 305, 306, 316, 320, 32 1
U.S. Department of Education vii, viii, xiii Universal Design viii, 1 0, 1 1 , 146 University of Connecticut viii, 1 1 University o f Massachusetts 1 1
V
Venn diagram 13, 83, 84, 85, 88, 1 09, 120, 232 verbal dysfluency 1 08 visual learner(s) 2 , 1 0, 37, 45, 58, 83, 9 1 , 93, 1 19,
120 visual tools 84, 87 visual-spatial x, 5, 188 vocabulary flash cards 66

w
weekly plan 7, 30, 36
"What You Know" chart 44-45
widely beneficial practices i i i , iv, ix, xii , 8, 1 1 , 1 4,
27, 30, 1 79, 1 80, 1 82, 1 87, 1 88
I ndex 4 8 l
Wisconsin Fast Plants 204, 217, 2 1 8, 2 1 9
World Wide Web v, 36, 2 1 2, 297, 307-31 1
writing model(s) iv, 4, 5, 86, 1 1 3-1 1 8, 203, 2 1 2,
2 1 3, 2 1 4, 2 1 5, 277