Neuropsychological assessment of driving safety risk in older adults with and without neurologic...
12
This article was downloaded by: [University of Iowa Libraries] On: 20 September 2012, At: 12:27 Publisher: Psychology Press Informa Ltd Registered in England and Wales Registered Number: 1072954 Registered office: Mortimer House, 37-41 Mortimer Street, London W1T 3JH, UK Journal of Clinical and Experimental Neuropsychology Publication details, including instructions for authors and subscription information: http://www.tandfonline.com/loi/ncen20 Neuropsychological assessment of driving safety risk in older adults with and without neurologic disease Steven W. Anderson a , Nazan Aksan a , Jeffrey D. Dawson a b , Ergun Y. Uc a c , Amy M. Johnson a b & Matthew Rizzo a d a Division of Neuroergonomics, Department of Neurology, University of Iowa, Iowa City, IA, USA b Department of Biostatistics, University of Iowa, Iowa City, IA, USA c Veterans Affairs Medical Center, University of Iowa, Iowa City, IA, USA d Department of Mechanical and Industrial Engineering, University of Iowa, Iowa City, IA, USA Version of record first published: 03 Sep 2012. To cite this article: Steven W. Anderson, Nazan Aksan, Jeffrey D. Dawson, Ergun Y. Uc, Amy M. Johnson & Matthew Rizzo (2012): Neuropsychological assessment of driving safety risk in older adults with and without neurologic disease, Journal of Clinical and Experimental Neuropsychology, DOI:10.1080/13803395.2011.630654 To link to this article: http://dx.doi.org/10.1080/13803395.2011.630654 PLEASE SCROLL DOWN FOR ARTICLE Full terms and conditions of use: http://www.tandfonline.com/page/terms-and-conditions This article may be used for research, teaching, and private study purposes. Any substantial or systematic reproduction, redistribution, reselling, loan, sub-licensing, systematic supply, or distribution in any form to anyone is expressly forbidden. The publisher does not give any warranty express or implied or make any representation that the contents will be complete or accurate or up to date. The accuracy of any instructions, formulae, and drug doses should be independently verified with primary sources. The publisher shall not be liable for any loss, actions, claims, proceedings, demand, or costs or damages whatsoever or howsoever caused arising directly or indirectly in connection with or arising out of the use of this material.
Transcript of Neuropsychological assessment of driving safety risk in older adults with and without neurologic...

This article was downloaded by: [University of Iowa Libraries]On: 20 September 2012, At: 12:27Publisher: Psychology PressInforma Ltd Registered in England and Wales Registered Number: 1072954 Registered office: MortimerHouse, 37-41 Mortimer Street, London W1T 3JH, UK
Journal of Clinical and ExperimentalNeuropsychologyPublication details, including instructions for authors and subscription information:http://www.tandfonline.com/loi/ncen20
Neuropsychological assessment of driving safetyrisk in older adults with and without neurologicdiseaseSteven W. Anderson a , Nazan Aksan a , Jeffrey D. Dawson a b , Ergun Y. Uc a c , AmyM. Johnson a b & Matthew Rizzo a da Division of Neuroergonomics, Department of Neurology, University of Iowa, IowaCity, IA, USAb Department of Biostatistics, University of Iowa, Iowa City, IA, USAc Veterans Affairs Medical Center, University of Iowa, Iowa City, IA, USAd Department of Mechanical and Industrial Engineering, University of Iowa, IowaCity, IA, USA
Version of record first published: 03 Sep 2012.
To cite this article: Steven W. Anderson, Nazan Aksan, Jeffrey D. Dawson, Ergun Y. Uc, Amy M. Johnson & MatthewRizzo (2012): Neuropsychological assessment of driving safety risk in older adults with and without neurologicdisease, Journal of Clinical and Experimental Neuropsychology, DOI:10.1080/13803395.2011.630654
To link to this article: http://dx.doi.org/10.1080/13803395.2011.630654
PLEASE SCROLL DOWN FOR ARTICLE
Full terms and conditions of use: http://www.tandfonline.com/page/terms-and-conditions
This article may be used for research, teaching, and private study purposes. Any substantial orsystematic reproduction, redistribution, reselling, loan, sub-licensing, systematic supply, or distributionin any form to anyone is expressly forbidden.
The publisher does not give any warranty express or implied or make any representation that thecontents will be complete or accurate or up to date. The accuracy of any instructions, formulae, anddrug doses should be independently verified with primary sources. The publisher shall not be liable forany loss, actions, claims, proceedings, demand, or costs or damages whatsoever or howsoever causedarising directly or indirectly in connection with or arising out of the use of this material.

JOURNAL OF CLINICAL AND EXPERIMENTAL NEUROPSYCHOLOGY2012, iFirst, 1–11
Neuropsychological assessment of driving safety risk inolder adults with and without neurologic disease
Steven W. Anderson1, Nazan Aksan1, Jeffrey D. Dawson1,2, Ergun Y. Uc1,3,Amy M. Johnson1,2, and Matthew Rizzo1,4
1Division of Neuroergonomics, Department of Neurology, University of Iowa, Iowa City, IA, USA2Department of Biostatistics, University of Iowa, Iowa City, IA, USA3Veterans Affairs Medical Center, University of Iowa, Iowa City, IA, USA4Department of Mechanical and Industrial Engineering, University of Iowa, Iowa City, IA, USA
Decline in cognitive abilities can be an important contributor to the driving problems encountered by older adults,and neuropsychological assessment may provide a practical approach to evaluating this aspect of driving safetyrisk. The purpose of the present study was to evaluate several commonly used neuropsychological tests in theassessment of driving safety risk in older adults with and without neurological disease. A further goal of this studywas to identify brief combinations of neuropsychological tests that sample performances in key functional domainsand thus could be used to efficiently assess driving safety risk. A total of 345 legally licensed and active drivers overthe age of 50, with no neurologic disease (N = 185), probable Alzheimer’s disease (N = 40), Parkinson’s disease(N = 91), or stroke (N = 29), completed vision testing, a battery of 10 neuropsychological tests, and an 18-miledrive on urban and rural roads in an instrumented vehicle. Performances on all neuropsychological tests weresignificantly correlated with driving safety errors. Confirmatory factor analysis was used to identify 3 key cognitivedomains assessed by the tests (speed of processing, visuospatial abilities, and memory), and several brief batteriesconsisting of one test from each domain showed moderate corrected correlations with driving performance. Thesefindings are consistent with the notion that driving places demands on multiple cognitive abilities that can beaffected by aging and age-related neurological disease, and that neuropsychological assessment may provide apractical off-road window into the functional status of these cognitive systems.
Keywords: Automobile; Aging; Driving; Assessment; Neuropsychology.
INTRODUCTION
Driving an automobile places demands on per-ceptual, motor, and cognitive systems that can beaffected by normal aging and age-related neuro-logic disease. The population of legally licensedolder drivers continues to increase, resulting in agrowing number of drivers with varying degreesand profiles of safety-relevant functional limita-tions. Individual rights and the benefits of mobilityprovided by driving must be balanced against thepotential public safety risk posed by the aging
This study was supported by awards AG 17717 and AG 15071 from the National Institute on Aging (NIA) and NS 44930 from theNational Institute of Neurological Disorders and Stroke (NINDS), which provided salary support to the authors. The authors wouldlike to thank the entire neuroergonomics research team and all participants in the study.
Address correspondence to Steven W. Anderson, Department of Neurology, University of Iowa Carver College of Medicine, IowaCity, IA 52242, USA (E-mail: [email protected]).
population of drivers. Ideally, decisions regardingcessation or limitation of driving will be guided bya rational approach informed by empirical stud-ies. There is sufficient variability in driving perfor-mance within age groups and diagnoses to renderage- or diagnosis-based restrictions unfair for someand unsafe for others. Driving history, includingviolations and crashes, can provide a good predic-tor of future unsafe driving, but intervention afterthe fact is not ideal. On-road driving evaluationscan be informative and are considered by someto be the “gold standard” for determining driving
© 2012 Psychology Press, an imprint of the Taylor & Francis Group, an Informa business
http://www.psypress.com/jcen http://dx.doi.org/10.1080/13803395.2011.630654
Dow
nloa
ded
by [
Uni
vers
ity o
f Io
wa
Lib
rari
es]
at 1
2:27
20
Sept
embe
r 20
12
2 ANDERSON ET AL.
competency in older adults (e.g., Dobbs, Carr, &Morris, 2002). However, driving during these eval-uations may not provide a representative sample ofa person’s typical driving behavior, and there arelimitations, including practicality and expense, par-ticularly if repeated assessment is needed to moni-tor possible changes in driving safety status (Brown& Ott, 2004). Performances on tests of driverknowledge, such as State licensing exams, may notreflect the person’s application of that knowledgewhile driving and also may be preserved even inthe face of substantial acquired cognitive deficits,such as dense amnesia (e.g., Anderson et al.,2007).
Although there is evidence that declining cogni-tive abilities can be an important contributor tothe driving problems encountered by older adults,there has been limited study of the relationshipsbetween neuropsychological test performances andon-road driving ability (for reviews, see Carr &Ott, 2010; Iverson et al., 2010; O’Neill, Rizzo,Reger, & Iverson, 2010; Reger et al., 2004). Somestudies have failed to find relationships betweenneuropsychological test performances and driving(e.g., Trobe, Waller, Cook-Flannagan, Teshima, &Beiliauskas, 1996), and the evidence to date remainsinsufficient to make strong practice recommenda-tions. However, several studies have found individ-ual neuropsychological tests and composite indicesof cognitive status to be significantly correlated withmeasures of driving safety in a number of settings,including simulator scenarios, performance in stan-dard on-the-road driving tests, and final drivingoutcomes such as driving cessation (e.g., Dawson,Anderson, Uc, Dastrup, & Rizzo, 2009; Dawson,Uc, Anderson, Johnson, & Rizzo, 2010; De Raedt& Ponjaert-Kristoffersen, 2000; Ott et al., 2008; Uc,Rizzo, Anderson, Shi, & Dawson, 2005; Uc et al.,2010).
Studies to date of neuropsychological predictorsof driving safety in older drivers have focused pri-marily on normal elderly drivers or drivers withspecific diseases such as early Alzheimer’s disease,Parkinson’s disease, or mild cognitive impairment(MCI). Such studies are important for the iden-tification of cognitive, perceptual, or behavioralimpairments that may lead to unsafe driving in agiven patient group and to guide targeted interven-tions for specific populations. However, relativelylittle attention has been directed toward the broaderissue of relationships between neuropsychologicaltest performances and driving safety more gener-ally, across a broad spectrum of age-related condi-tions. The limited research to date that has takenthis approach suggests that evaluation of cognitive
abilities can provide valuable information regardingdriving safety risk, across diagnostic categories(e.g., Grace et al., 2005; Whelihan, DiCarlo, & Paul,2005).
Driving poses an equal-opportunity safety risk—in other words, the hazards inherent in the roadand traffic do not make concessions or accom-modations for being older or for having acquiredcognitive, perceptual, or motor deficits. In this vein,Barrash et al. (2010) showed that “pure” or rawneuropsychological test scores, not adjusted forage or other demographic factors, provided moreaccurate prediction of driving performance thandid demographically adjusted scores. Once on theroad, all drivers face essentially the same challenges,notwithstanding age or diagnosis. Their level ofperformance in key functional domains (cognitive,perceptual, motor) is the predominant factor indriver safety, not the etiology of that performance,which, in many cases, is undiagnosed (Johanssonet al., 1996) or has not been studied with respectto driving (Rizzo, 2011).
Furthermore, in many instances, an older driver’sneurological status may be unknown or uncertain.Conditions such as Alzheimer’s disease developgradually over a period of many years before clin-ical diagnosis can be made. Also, it is becomingincreasingly apparent that a large percentage ofolder individuals with cognitive impairments havemore than one neurodegenerative condition. Forexample, an autopsy study of 80 people with clin-ically diagnosed probable AD found that morethan half of the tissue samples showed evidencenot only of AD, but also other brain disease, pri-marily infarcts and Lewy body disease (Schneider,Arvanitakis, Bang, & Bennett, 2007). Similarly,many patients with a clinical diagnosis of vasculardementia are found to also have Alzheimer’s diseasepathology at autopsy.
With these considerations in mind, the broadgoal in this study was to examine the relationshipsbetween performances on several commonly usedneuropsychological tests and driving safety risk inolder adults, irrespective of diagnostic status. Morespecifically, we wanted to determine whether oneor more brief batteries of cognitive tests could pro-vide efficient assessment of driving safety in olderadults across a large and heterogeneous sample oflegally licensed older drivers. The first step was tobetter specify the functional domains tapped byseveral commonly used neuropsychological tests inthe assessment of driving safety with confirmatoryfactor analytic techniques (Bollen, 1989). Guidedby the structure of the cognitive functions, the sec-ond step was to identify brief combinations of
Dow
nloa
ded
by [
Uni
vers
ity o
f Io
wa
Lib
rari
es]
at 1
2:27
20
Sept
embe
r 20
12
NEUROPSYCHOLOGICAL ASSESSMENT OF DRIVING SAFETY 3
neuropsychological tests that sample performanceacross key functional domains, and which mightbe used to efficiently assess driving safety risk inclinical and research settings.
METHOD
Participants
The participants were 345 (230 male, 115 female)active drivers between the ages of 50 and 85 years(mean age = 68 years), including 185 with noneurologic disease, 40 with probable Alzheimer’sdisease (AD), 91 with Parkinson’s disease (PD),and 29 with stroke. Diagnosis of AD was basedon the NINCDS-ADRDA (National Institute ofNeurological and Communicative Disorders andStroke–Alzheimer’s Disease and Related DisordersAssociation) criteria (McKhann et al., 1984).Diagnosis of PD was based on UK Parkinson’sDisease Society Brain Bank clinical diagnostic cri-teria (Gibb & Lees, 1988; Hughes, Daniel, Kilford,& Lees, 1992). Participants in the stroke grouphad a history of a single cerebrovascular event atleast 3 months prior to the study, documented withcomputed tomography (CT) or magnetic resonance(MR) imaging. All participants held a valid statedriver’s license and were still driving. They wererecruited from the general community by meansof advertisements and from outpatient clinics. Thedata included in the current analyses were obtainedfrom participants in our prior and ongoing stud-ies who: (a) had a diagnosis of AD, PD, stroke, orno neurologic disease, (b) were age 50 or older, (c)had completed a standardized neuropsychologicalbattery described below, and (d) had subsequentlycompleted a standard on-road driving evaluation inan instrumented vehicle. Exclusion criteria includedalcohol or substance abuse, major psychiatric dis-ease, use of sedating medication, and correctedvisual acuity less than 20/50. The methods forthe neuropsychological assessment, on-road drivingevaluation, and video review of driving errors werethe same for all subjects across studies (Dawsonet al., 2009; Dawson et al., 2010; Uc et al.,2010). For some analyses, two random subsampleswere formed in which the distributions of diseased(Parkinson, stroke, or Alzheimer’s) and nondis-eased participants were similar. These two sampleswere compared for similarity in means on safetyerrors during the drive and neuropsychologicalfunctioning, and none of those independent-samplet tests were significant at the conventional level. Allparticipants provided informed consent according
to the policies of the Institutional Review Board atthe University of Iowa.
Neuropsychological tests
A battery of standardized neuropsychological testswas administered by a trained technician duringa single session lasting less than 2 hours. Thetests were selected on the basis of their concep-tual relevance to driving and demonstrated sensi-tivity to brain dysfunction (for test descriptions,see Lezak, Howieson, & Loring, 2004; Strauss,Sherman, & Spreen, 2006). The tests included: TrailMaking Test Part A (TMT-A), Judgment of LineOrientation (JLO), Complex Figure Test–Copy(CFT-Copy), Complex Figure Test–30-MinuteDelayed Recall (CFT-Recall), Wechsler AdultIntelligence Scale–Third Edition (WAIS–III) BlockDesign, Benton Visual Retention Test (BVRT),Controlled Oral Word Association (COWA), ReyAuditory Verbal Learning Test (AVLT), GroovedPegboard (average of left and right hands), andUseful Field of View (UFOV—total loss from allfour subtests; Ball, Owsley, Sloane, Roenker &Bruni, 1993; Ball & Rebok, 1994).
The raw scores on the individual tests werereversed when necessary so that high scores rep-resented better functioning on each test and sub-sequently transformed to t-scores based on thesample mean and standard deviation of 185 normalparticipants with no documented neurological con-dition. Hence, high scores on neurocognitive testsreflected better functioning.
Visual sensory functioning
Contrast sensitivity was assessed with the Pelli–Robson chart (Pelli, Robson, & Wilkins, 1988).Visual acuity was measured as logarithm of min-imum angle resolution on the Early TreatmentDiabetic Retinopathy Study chart for far visual acu-ity and reduced Snellen chart for near visual acuity(high scores are worse; Ferris, Kassoff, Bresnick, &Bailey, 1982).
Road test
On a separate day following the neuropsychologicaltesting, the participants took an 18-mile on-the-road-driving test around Iowa City in an instru-mented vehicle. The test included both urban andrural routes and was conducted on days whenweather did not lead to poor visibility or road
Dow
nloa
ded
by [
Uni
vers
ity o
f Io
wa
Lib
rari
es]
at 1
2:27
20
Sept
embe
r 20
12

4 ANDERSON ET AL.
conditions. The test began after a brief acclimationperiod to the vehicle, and a trained experimentersat in the front passenger seat to give instruc-tions and operate the dual controls, if needed. Thevehicle was a midsized car with an automatic trans-mission and hidden instrumentation and sensors.Electronic data (steering wheel position, acceleratorand brake pedal position, lateral and longitudinalacceleration, and vehicle speed) were recorded at10 Hz. Four miniature lipstick-size cameras cap-tured driver behavior (two views) and anteriorenvironment (two views).
Safety errors
A certified driving instructor reviewed the video-tapes of the drive to score safety errors accord-ing to the standards of the Iowa Department ofTransportation (September 7, 2005, version). Thescoring generated information on frequency andtypes of safety error that the participants commit-ted. The taxonomy of 76 error types (e.g., incom-plete stop, straddles lane line) are organized into15 categories (e.g., stop signs, lane observance).A total of 30 of these errors were classified ascritical errors (e.g., entering an intersection on ared light), meaning that under a different set ofcircumstances such errors would lead to crashes.The remaining errors were classified as noncriticalerrors. In all analyses, the sum of critical and non-critical errors was used as the outcome measure.A single reviewer evaluated all drives in this study.To evaluate the reliability of this scoring system, asample of 30 drives were re-reviewed by this instruc-tor and were independently reviewed by a seconddriving instructor. For total number of errors perdrive, the primary reviewer’s intrarater correlationwas .95, and the interrater correlation was .73.
Overview of data analyses
As a preliminary step, the intercorrelations amongthe individual predictors and the outcomes wereexamined. Then the primary analyses proceededin two steps. First, the structure and dimension-ality of the neuropsychological and visual sen-sory functioning measures were examined withconfirmatory factor analysis (CFA). All model-fitting analyses were conducted with LISREL8.72 on variance–covariances (Joreskog & Sorbom,2001) using robust maximum likelihood (ML)estimation (Sattora & Bentler, 2001). Both nor-mal ML and robust ML theory, Satorra–Bentler(SB) rescaled chi-squares are provided in tables.
However, inferences were based on SB rescaling(Satorra & Bentler, 2001).1 All comparisonsinvolved nested models, constituting exact tests ofthe specific implied constraints in the target modelrelative to the comparison model.
In addition, we relied on several fit indices.Goodness-of-fit indices in particular allow us toevaluate whether assumptions of the substantivemodels provide an adequate explanation of theobserved phenomena, for each model in isolation.There are several ways to classify goodness-of-fitindices. Here, we relied on Kaplan’s framework(Kaplan, 2000) and chose the following three stand-alone fit indices: (a) root mean square error ofapproximation (RMSEA), with a 90% confidenceinterval (CI), (b) expected cross-validation index(ECVI), with a 90% CI, and (c) standardized rootmean square residual (sRMR). Among incrementalfit indices, we examined the comparative fit index(CFI) and normed fit index (NFI). When the modelis acceptable in the population of interest, we expectRMSEA to range from .05 to .08 or less, CFI totake on values .95 and higher, NFI to take on val-ues .90 and higher, and sRMR to take on valuesclose to .05 (Hu & Bentler, 1999). The values for theECVI are evaluated relative to the value this indextakes for the saturated model, which necessarily hasa perfect fit. When the value of the ECVI in the tar-get model is lower than its value for the saturatedmodel, we have greater confidence that the resultswould hold in an independent sample of the samesize.
For all confirmatory factor models, the scalesof the latent factors were defined by fixing theirvariances to unity. Every indicator was forced toload on only one factor, and all error correlationswere constrained to be zero, with the exceptionof the error correlation between CFT-Copy andCFT-Recall scores, which was freely estimated.
In the second step of the analyses, the fac-tor structure that provided the best fit to thedata was used to inform the formation of smallneuropsychological composite scores that could beused as part of a brief assessment of fitness todrive in clinical and research settings. One reason-able approach to forming brief assessment batterieswould be to administer one test from among theindicators of each latent factor to briefly sample a
1Because full information maximum likelihood output fromLISREL is severely limited in providing goodness-of-fit indices,with the exception of root mean square error of approxima-tion (RMSEA), the tables and figures are based on robustmaximum likelihood estimates using 231 cases with listwise dele-tion. However, model-fitting analyses relying on full informationmaximum likelihood on 345 subjects led to similar inferencesregarding factor structure.
Dow
nloa
ded
by [
Uni
vers
ity o
f Io
wa
Lib
rari
es]
at 1
2:27
20
Sept
embe
r 20
12
NEUROPSYCHOLOGICAL ASSESSMENT OF DRIVING SAFETY 5
cognitive domain. We evaluated all possible suchsmall composites for their relative utility in pre-diction of driving performance. To that end, thecorrected (for age and visual sensory function-ing) and uncorrected correlations of the compositeswith driving errors were obtained in two randomsubsamples. Those correlations were z-transformedand were used as outcome measures in two-waymixed-design analyses of variance (ANOVAs).
RESULTS
Confirmatory factor analysis
Table 1 presents the intercorrelations among theobserved predictors and outcomes. As can be seenfrom Table 1, all correlations were in the expecteddirection. Out of a total of 91 correlations, allbut 2 were significant at the .05 level or bet-ter. Absolute value of the correlations betweeneach of the 10 individual neuropsychological testsand total driving errors ranged from .18 to .42(all p < .01).
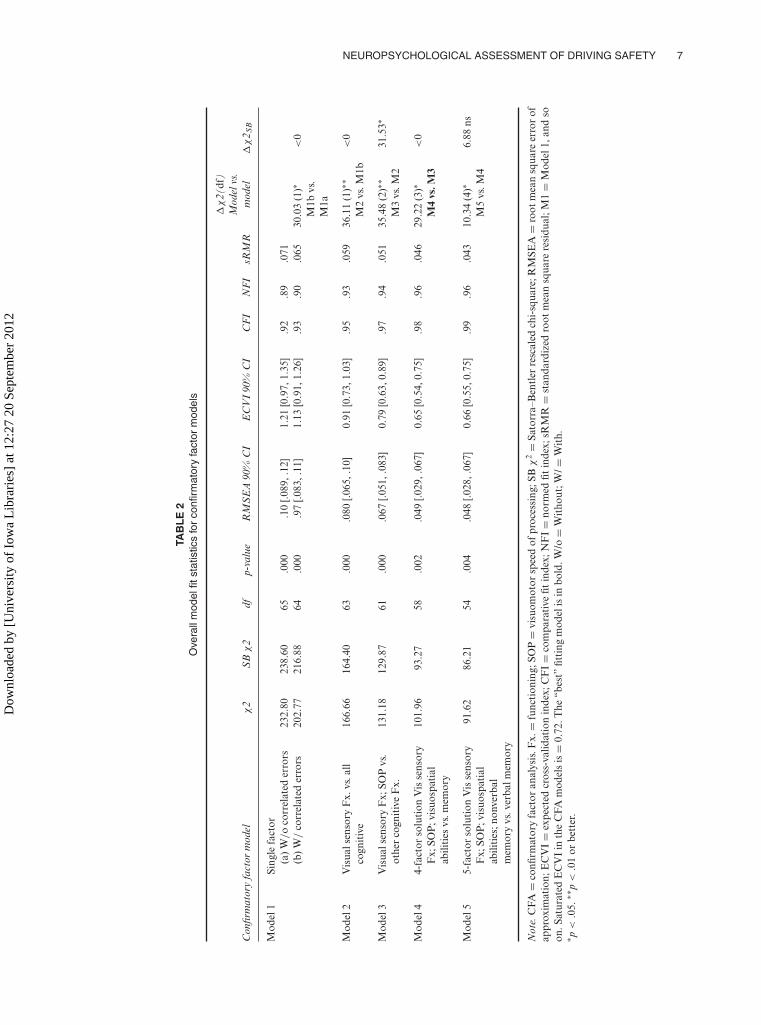
Table 2 presents the fit statistics for confirmatoryfactor models that examined the dimensionality ofthe battery of tests. As can be seen from Table 2,a single-factor model (Model 1a) was highly inad-equate. The two-factor model examined whether itwould be adequate to separate visual sensory func-tioning (contrast sensitivity and acuity measures)from cognitive functioning to achieve acceptable fit.Despite providing significant improvement over thesingle-factor model, the overall fit of this model washighly inadequate as well, indicating that a moredifferentiated view of cognitive functioning is war-ranted. The three-factor model evaluated the plau-sibility of differentiating between cognitive func-tioning tests so that speeded tests (both motor andcognitive processing), such as TMT-A, GroovedPegboard (GP), and UFOV–Total Loss, were dis-tinguished from those that minimized the role ofspeed in overall scoring, such as those tappingmemory and visuospatial abilities. Again, while thefit of this model was significantly better than that ofthe two-factor model, the overall fit was inadequategiven the RMSEA and NFI criteria, and eleva-tions in standardized residuals indicated significantdegrees of local misfit. The four-factor model fur-ther differentiated among cognitive tests so thatthose tapping memory (Benton Visual RetentionTest–Errors, BVRT-E; COWA; AVLT-Recall; CFT-Recall) were distinguished from those that mini-mize memory demands during visuospatial tasks(JLO, CFT-Copy, and Block Design). As can beseen from Table 2, the four-factor model showed
significantly better fit than the three-factor model,and the fit of the four-factor model was adequategiven RMSEA, CFI, and NFI criteria. We alsoconsidered the utility of differentiating among ver-bal versus nonverbal memory tests in a five-factormodel. While the nested likelihood ratio chi-squaretest using normal ML theory indicated significantimprovement in fit over the four-factor model, therescaled SB chi-square difference was not signif-icant. Given that previous factor-analytic studieshave not supported the separation of AVLT andCOWA tests into latent factors that reflect primar-ily verbal functioning (Greenway, Smith, Tangalos,Geda, & Ivnik, 2009; Siedlecki, Honig, & Stern,2008), we believe that relying on the SB chi-squarein our sample is the sounder choice here.
Collectively, the tests indicate that a four factor-model that distinguishes visual sensory function-ing from cognitive functioning and further distin-guishes cognitive functioning into memory, visu-ospatial abilities, and speed of processing (SOP)components provides the best fit to the data.The factor loadings and estimated latent factorintercorrelations for this model are presented inFigure 1.
Relative utility of subsets of tests inevaluating driver fitness
Next, CFA analyses were used to inform possi-ble approaches to identifying specific smaller setsof tests from the full battery that might providemore efficient assessment of driver fitness in agingpopulations. When only one test from each of thethree identified cognitive domains is selected to bepart of a brief assessment, there are 36 possiblethree-test batteries, referred to as minicompositeshereafter. We evaluated which of the 36 minicom-posites would yield the best prediction to driv-ing performance by examining both the corrected(for age and visual sensory functioning) and theuncorrected correlations between each minicom-posite and errors from the on-road driving test.The four panels of Figure 2 present corrected cor-relations between the 36 minicomposites and driv-ing errors in two random subsamples, as well astheir average (after r-to-z transforms and back-transforms), for each of four tests from the mem-ory domain. The y-axis shows the magnitude ofthe corrected correlation, and the x-axis showswhich of the tests from the visuospatial abili-ties and SOP domains were selected for a givenminicomposite.
As can be seen from Figure 2, some minicom-posites consistently showed larger absolute value
Dow
nloa
ded
by [
Uni
vers
ity o
f Io
wa
Lib
rari
es]
at 1
2:27
20
Sept
embe
r 20
12

6 ANDERSON ET AL.
TABLE 1Intercorrelations among neuropsychological measures and driving errors
Measures (1) (2) (3) (4) (5) (6) (7) (8) (9) (10) (11) (12) (13)
Predictors(1) Contrast
sensitivity(2) Near visual
acuity.25∗∗
(3) Far visualacuity
.58∗∗ .24∗∗
(4) GroovedPegboard
.53∗∗ .26∗∗ .46∗∗
(5) TMT-A .40∗∗ .16∗∗ .35∗∗ .50∗∗(6) UFOV .53∗∗ .22∗∗ .44∗∗ .56∗∗ .56∗∗(7) JLO .28∗∗ .24∗∗ .27∗∗ .31∗∗ .24∗∗ .37∗∗(8) CFT-Copy .39∗∗ .22∗∗ .31∗∗ .52∗∗ .46∗∗ .58∗∗ .47∗∗(9) Block Design .31∗∗ .21∗∗ .25∗∗ .29∗∗ .36∗∗ .39∗∗ .39∗∗ .44∗∗(10) BVRT-Errors .31∗∗ .12∗ .28∗∗ .37∗∗ .48∗∗ .61∗∗ .38∗∗ .55∗∗ .44∗∗(11) CFT-Recall .23∗∗ .10 .21∗∗ .24∗∗ .29∗∗ .43∗∗ .28∗∗ .44∗∗ .47∗∗ .47∗∗(12) COWA .19∗∗ .04 .14∗∗ .27∗∗ .31∗∗ .31∗∗ .26∗∗ .37∗∗ .29∗∗ .32∗∗ .24∗∗(13) AVLT-Recall .38∗∗ .13∗ .29∗∗ .34∗∗ .39∗∗ .49∗∗ .20∗∗ .43∗∗ .22∗∗ .46∗∗ .43∗∗ .34∗∗
Outcome(14) Total errors −.29∗∗ −.21∗∗ −.20∗∗ −.40∗∗ −.30∗∗ −.42∗∗ −.23∗∗ −.29∗∗ −.31∗∗ −.28∗∗ −.27∗∗ −.18∗∗ −.22∗∗
Note. TMT-A = Trail Making Test–Part A; UFOV = Useful Field of View Total Loss; JLO = Judgment of Line Orientation; CFT =Complex Figure Test; BVRT-E = Benton Visual Retention Test–Errors; COWA = Controlled Oral Word Association; AVLT = AuditoryVerbal Learning Test. N ranges from 264 to 345.∗p < .05. ∗∗p < .01 or better.
correlations with errors on the road and lessvariability in correlations across the two randomsamples. For example, when BVRT-E served as thememory test (Panel A), using UFOV to measureSOP and CFT-C to measure visuospatial abilityproduced higher correlations with errors on theroad in both subject samples and less variabil-ity across samples (i.e., greater replicability) thanchoosing TMT-A and CFT-C.
To enable more formal inferences on differencesin the relative utility of the various possible mini-composites in predicting driving performance, thecorrelations were z-transformed in each randomsample and used as outcome measures in two-wayANOVAs. For example, there are 9 minicompos-ites for each of the four memory tests and hence9 correlations with errors for each of these fourtests. Given that we evaluated replicability of thosecorrelations in two random samples, there were18 correlations per memory test as outcomes in theANOVA. A total of 6 two-way ANOVAs were con-ducted on z-transformed corrected (3 two-way) anduncorrected (3 two-way) correlations. The two ran-dom samples served as the between-subject factorin these ANOVAs, and the tests (indicators) fromeach of the three cognitive domains (latent factors)formed the levels of the within-subject factor.
A 4 × 2 mixed-design ANOVA for memory testsindicated that there were significant differences in
the size of the correlations of four memory testswith driving performance, F(3, 48) = 63.80, p <
.001. CFT-Recall produced larger correlations withdriving performance than did BVRT-E, F(1, 16) =55.41, p < .001; BVRT-E produced larger corre-lations with driving performance than did AVLT-Recall, F(1, 16) = 52.63, p < .001, and COWA,F(1, 16) = 16.67, p < .005. There were no differ-ences in the size of the correlations with drivingperformance when COWA or AVLT-Recall wasselected to tap memory, F(1, 16) = 1.47, ns.
The 3 × 2 ANOVA for the three tests from theSOP domain also indicated differences in the rela-tive size of correlations with driving performance,F(2, 44) = 17.47, p < .001. Follow-up comparisonsindicated that UFOV total loss produced highercorrelations than GP, F(1, 22) = 12.01, p < .005,and GP produced higher correlations than TMT-A with driving performance, F(1, 22) = 13.35, p <
.001.The 3 × 2 ANOVA for the three tests from
the visuospatial domain also indicated differencesin the relative size of correlations with drivingperformance, F(2, 44) = 35.71, p < .001. Follow-up comparisons within the visuospatial abilitiesdomain indicated that CFT-C produced higher cor-relations with driving performance than did Blocks,F(1, 22) = 72.36, p < .001. Although Blocks andJLO produced similar-magnitude correlations with
Dow
nloa
ded
by [
Uni
vers
ity o
f Io
wa
Lib
rari
es]
at 1
2:27
20
Sept
embe
r 20
12
NEUROPSYCHOLOGICAL ASSESSMENT OF DRIVING SAFETY 7
TAB
LE
2O
vera
llm
odel
fitst
atis
tics
for
confi
rmat
ory
fact
orm
odel
s
Con
firm
ator
yfa
ctor
mod
elχ
2S
Bχ
2df
p-va
lue
RM
SE
A90
%C
IE
CV
I90
%C
IC
FI
NF
IsR
MR
�χ
2(df
)M
odel
vs.
mod
el�
χ2 S
B
Mod
el1
Sing
lefa
ctor
(a)
W/o
corr
elat
eder
rors
232.
8023
8.60
65.0
00.1
0[.0
89,.
12]
1.21
[0.9
7,1.
35]
.92
.89
.071
(b)
W/
corr
elat
eder
rors
202.
7721
6.88
64.0
00.9
7[.0
83,.
11]
1.13
[0.9
1,1.
26]
.93
.90
.065
30.0
3(1
)∗M
1bvs
.M
1a
<0
Mod
el2
Vis
uals
enso
ryF
x.vs
.all
cogn
itiv
e16
6.66
164.
4063
.000
.080
[.065
,.10
]0.
91[0
.73,
1.03
].9
5.9
3.0
5936
.11
(1)∗
∗M
2vs
.M1b
<0
Mod
el3
Vis
uals
enso
ryF
x;SO
Pvs
.ot
her
cogn
itiv
eF
x.13
1.18
129.
8761
.000
.067
[.051
,.08
3]0.
79[0
.63,
0.89
].9
7.9
4.0
5135
.48
(2)∗
∗M
3vs
.M2
31.5
3∗
Mod
el4
4-fa
ctor
solu
tion
Vis
sens
ory
Fx;
SOP
;vis
uosp
atia
lab
iliti
esvs
.mem
ory
101.
9693
.27
58.0
02.0
49[.0
29,.
067]
0.65
[0.5
4,0.
75]
.98
.96
.046
29.2
2(3
)∗M
4vs
.M3
<0
Mod
el5
5-fa
ctor
solu
tion
Vis
sens
ory
Fx;
SOP
;vis
uosp
atia
lab
iliti
es;n
onve
rbal
mem
ory
vs.v
erba
lmem
ory
91.6
286
.21
54.0
04.0
48[.0
28,.
067]
0.66
[0.5
5,0.
75]
.99
.96
.043
10.3
4(4
)∗M
5vs
.M4
6.88
ns
Not
e.C
FA=
confi
rmat
ory
fact
oran
alys
is.F
x.=
func
tion
ing;
SOP
=vi
suom
otor
spee
dof
proc
essi
ng;S
Bχ
2=
Sato
rra–
Ben
tler
resc
aled
chi-
squa
re;R
MSE
A=
root
mea
nsq
uare
erro
rof
appr
oxim
atio
n;E
CV
I=
expe
cted
cros
s-va
lidat
ion
inde
x;C
FI=
com
para
tive
fitin
dex;
NF
I=
norm
edfit
inde
x;sR
MR
=st
anda
rdiz
edro
otm
ean
squa
rere
sidu
al;M
1=
Mod
el1,
and
soon
.Sat
urat
edE
CV
Iin
the
CFA
mod
els
is=
0.72
.The
“bes
t”fit
ting
mod
elis
inbo
ld.W
/o=
Wit
hout
;W/=
Wit
h.∗ p
<.0
5.∗∗
p<
.01
orbe
tter
.
Dow
nloa
ded
by [
Uni
vers
ity o
f Io
wa
Lib
rari
es]
at 1
2:27
20
Sept
embe
r 20
12

8 ANDERSON ET AL.
1
1
r = .76
r = .80
r = .81
r = .58
1
r = .79
r = .44
ContrastSensitivity
Near Acuity
Far Acuity
Visual SensoryFunctioning
1
GroovedPeg board
TMT-A
UFOV-total loss
Speed ofProcessing(motor&
cognitive)
JLO
CFT-Copy
BlockDesign
VisuospatialConstruction
Memory
CFT-Recall
AVLT-Recall
COWA
BVRT-Errors
.79
.64
.34
.73
.82
.66
.47.46
.89
.58
.58
.41
.73
r2 = .62
r2 = .11
r2 = .41
r2 = .54
r2 = .43
r2 = .67
r2 = .22
r2 = .21
r2 = .79
r2 = .34
r2 = .33
r2 = .17
r2 = .53
Figure 1. The best fitting confirmatory factor model, standardized maximum likelihood (ML) estimates, and indicator varianceexplained by the common factors. TMT-A = Trail Making Test–Part A; UFOV = Useful Field of View; JLO = Judgment of LineOrientation; CFT = Complex Figure Test; AVLT = Auditory Verbal Learning Test; COWA = Controlled Oral Word Association;BVRT = Benton Visual Retention Test.
driving performance on average (i.e., across randomsamples), F(1, 22) < 1, ns, correlations of JLO withdriving performance fluctuated to a greater extent(less replicability) than did those of Blocks, F(1, 22)= 59.12, p < .001.
In summary, the findings showed that UFOVfollowed by GP from the SOP domain, CFT-Copyfollowed by Block Design from the visuospatialabilities domain, and CFT-Recall followed by theBVRT-E from the memory domain yielded the
Dow
nloa
ded
by [
Uni
vers
ity o
f Io
wa
Lib
rari
es]
at 1
2:27
20
Sept
embe
r 20
12

NEUROPSYCHOLOGICAL ASSESSMENT OF DRIVING SAFETY 9
Panel A: BVRTE tapping memory
0
0.05
0.1
0.15
0.2
0.25
0.3
0.35
0.4
0.45
JLO BLOCK CFTC JLO BLOCK CFTC JLO BLOCK CFTC
Pegs TMTA UFOV
JLO BLOCK CFTC JLO BLOCK CFTC JLO BLOCK CFTC
Pegs TMTA UFOV
Pa
rtia
l C
orr
ela
tio
ns w
ith
Drivin
gP
erf
orm
an
ce
0
0.05
0.1
0.15
0.2
0.25
0.3
0.35
0.4
0.45
Pa
rtia
l C
orr
ela
tio
ns w
ith
Drivin
gP
erf
orm
an
ce
Samp_A
Average
Samp_B
Samp_A
Average
Samp_B
Panel B: COWA tapping memory
Panel C: AVLT-Recall tapping memory
0
0.05
0.1
0.15
0.2
0.25
0.3
0.35
0.4
0.45
JLO BLOCK CFTC JLO BLOCK CFTC JLO BLOCK CFTC
Part
ial co
rre
latio
ns w
ith
drivin
gp
erf
orm
an
ce
Samp_A
Average
Samp_B
Panel D: CFT-Recall tapping memory
0
0.05
0.1
0.15
0.2
0.25
0.3
0.35
0.4
0.45
PEGS TMTA UFOV
JLO BLOCK CFTC JLO BLOCK CFTC JLO BLOCK CFTC
PEGS TMTA UFOV
Part
ial C
orr
ela
tio
ns w
ith
drivin
g
pe
rfo
rma
nce
Samp_A
Average
Samp_B
Figure 2. Partial correlations of 36 minineurocognitive batterieswith driving performance, controlling for age and visual sensoryfunctioning, in two random samples, A and B, and their aver-age. Panel A: Benton Visual Retention Test–Errors (BVRT-E).Panel B: Controlled Oral Word Association (COWA). Panel C:Auditory Verbal Learning Test–Recall (AVLT-Recall). Panel D:Complex Figure Test–Recall (CFT-Recall). PEGS = GroovedPegboard; TMTA = Trail Making Test–Part A; UFOV = UsefulField of View.
highest correlations with on-the-road performance.Inferences were the same when uncorrected corre-lations were examined.
DISCUSSION
Along with perceptual and motor abilities, cogni-tive status is a key determinant of driving safetyrisk in older adults (Anstey, Wood, Lord, &Walker, 2005). Neuropsychological assessment ofrelevant cognitive abilities can play an importantrole in screening and more comprehensive evalua-tion of driving fitness. The findings of the currentstudy showed logical and significant relationshipsbetween performances on standardized tests tap-ping key cognitive domains and safety errors com-mitted while driving an automobile. Noninvasiveand practical tests of vision, speed of process-ing, visuospatial abilities, and memory were foundto provide prediction of older drivers’ safety risk.In clinical settings that require recommendationsregarding driving fitness, such test data can be com-bined with other relevant medical information, thedriver’s history of crashes or traffic violations, cur-rent driving activity and transportation needs, andconcerns of the patient or family who have observedthe patient’s driving.
In this analysis of relationships betweenneuropsychological test performances on driv-ing ability, we attempted to first differentiate andspecify domains of cognitive functioning rele-vant to driving performance and then to identifypossible sets of tests that might be used in briefscreening or assessments of driver fitness in clinicalor research settings. Consistent with the multidi-mensional demands of driving, our findings suggestthere is value in evaluating multiple key cognitivedomains. Specifically, in addition to standardvision screening (near and far acuity and contrastsensitivity), key domains identified for assessmentin older drivers included speed of processing,visuospatial processing, and memory. Within eachof these domains, two or more standardized testsshowed reasonably strong correlations with thedriving outcome measures (e.g., speed of pro-cessing: UFOV and GP; visuospatial abilities:CFT-copy and Block Design; memory: CFT-Recalland BVRT-E). Choice of tests in a given situationinvolving evaluation of driving safety risk couldconsider the statistical relationships illustrated hereand practical concerns such as time and cost.
This study provides the largest analysis ofrelationships between neuropsychological test
Dow
nloa
ded
by [
Uni
vers
ity o
f Io
wa
Lib
rari
es]
at 1
2:27
20
Sept
embe
r 20
12

10 ANDERSON ET AL.
performances and on-road driving to date, butit has limitations. The inclusion of only legallylicensed and actively driving participants pre-cludes the establishment of firm cutoff scores forpredicting driver failure. However, this subjectgroup reflects both the challenge clinicians facein identifying at-risk drivers and the realities ofrecruiting research participants who may perceivetheir driving privileges to be at risk. Another limi-tation is that all drives in this study were completedin good weather conditions, daylight hours, andduring non-rush-hour times of day, in order tominimize safety risks to participants. Although theroute included a variety of rural and urban drivingchallenges (e.g., controlled and uncontrolled inter-sections, left turns, and lane changes on interstateand multilane city roads), the investigators’ choiceof driving conditions necessarily reduced thechallenges that may characterize typical driving.This design also does not allow consideration ofdrivers’ strategic approach to driving, which mayor may not include self-restriction to good drivingconditions.
Another limitation is our choice of neuro-psychological tests. We chose as a starting point abrief battery of commonly used and readily avail-able tests with logical and/or empirical links todriving, but these tests clearly do not representall possible choices. We anticipate that ongoingresearch will help to identify even more useful testsof cognition for the prediction of driving safety.One domain that may not be adequately repre-sented in the current battery is executive functions,which have theoretical and demonstrated empiricalrelevance to driving (e.g., Whelihan et al., 2005).
This study shows that neuropsychological abil-ities in specific cognitive domains are importantfactors in driving. Previous studies have relatedcognitive test scores to driver behavior, but oftenonly as univariate predictors (Reger et al., 2004),and, in the absence of clear cutoff scores, the find-ings have not translated to clinical recommenda-tions (Iverson et al., 2010). Continued study ofthe predictive value of established tests and newexperimental approaches and theory are essen-tial. While aging and age-related medical disordersmay increase the risk of driver errors that lead tovehicle crashes, the relationship between diagno-sis and safety risk in many diagnoses is unstudiedor unclear. The findings in this study provide sup-port for a general evidence-based framework forevaluating driver fitness based upon a functionalevaluation of multiple domains that are importantfor safe driving. Cognitive tests from these domainscan complement evidence from other sources (suchas driving simulation and road tests) in assessments
of older driver safety, even in the absence of aknown diagnosis. Diagnostic status, when known,can help guide recommendations regarding time tofollow-up evaluation.
The neuropsychological tests and test batteriesidentified here may provide a cost-effective com-ponent of a set of evidence-based criteria for eval-uating older drivers’ safety risk. Changing popu-lation demographics point to a pressing need forcontinued research aimed at effectively preservingmobility while reducing safety risk in older citizens.
Original manuscript received 25 February 2011Revised manuscript accepted 28 June 2011
First published online 4 September 2012
REFERENCES
Anderson, S. W., Rizzo, M., Skaar, N., Stierman,L., Cavaco, S., Dawson, J., et al. (2007). Amnesiaand driving. Journal of Clinical and ExperimentalNeuropsychology, 29, 1–12.
Anstey, K. J., Wood, J., Lord, S., & Walker, J. G. (2005).Cognitive, sensory and physical factors enabling driv-ing safety in older adults. Clinical Psychology Review,25, 45–65.
Ball, K., Owsley, C., Sloane, M. E., Roenker, D. L. &Bruni, J. R. (1993). Visual attention problems as a pre-dictor of vehicle crashes in older drivers. InvestigativeOphthalmology & Visual Science, 34, 3110–3123.
Ball, K., & Rebok, G. (1994). Evaluating the driving abil-ity of older adults. Journal of Applied Gerontology, 13,20–38.
Barrash, J., Stillman, A., Anderson, S. W., Uc, E.Y., Dawson, J., & Rizzo, M. R. (2010). Predictionof driving ability with neuropsychological tests:Demographic adjustments diminish accuracy. Journalof International Neuropsychological Society, 16,679–686.
Bollen, K. A. (1989). Structural equations with latentvariables. New York, NY: Wiley.
Brown, L. B., & Ott, B. R. (2004). Driving and demen-tia: A review of the literature. Journal of GeriatricPsychiatry and Neurology, 17, 232–240.
Carr, D. B., & Ott, B. R. (2010). The older driving withcognitive impairment. Journal of American MedicalAssociation, 303, 1632–1641.
Dawson, J. D., Anderson, S. W., Uc, E. Y., Dastrup, E., &Rizzo, M. (2009). Predictors of driving safety in earlyAlzheimer’s disease. Neurology, 72, 521–527.
Dawson, J. D., Uc, E. Y., Anderson, S. W., Johnson, A.M., & Rizzo, M. (2010). Neuropsychological predic-tors of driving errors in older adults. Journal of theAmerican Geriatrics Society, 58, 1090–1096.
De Raedt, R., & Ponjaert-Kristoffersen, I. (2000). Therelationship between cognitive/neuropsychologicalfactors and car driving performance in older drivers.Journal of the American Geriatrics Society, 48,1664–1668.
Dobbs, B. M., Carr, D. B., & Morris, J. C. (2002).Evaluation and management of the driver withdementia. The Neurologist, 8, 61–70.
Dow
nloa
ded
by [
Uni
vers
ity o
f Io
wa
Lib
rari
es]
at 1
2:27
20
Sept
embe
r 20
12

NEUROPSYCHOLOGICAL ASSESSMENT OF DRIVING SAFETY 11
Ferris, F. L., III, Kassoff, A., Bresnick, G. H., &Bailey, I. (1982). New visual acuity charts for clini-cal research. American Journal of Ophthalmology, 94,91–96.
Gibb, W. R., & Lees, A. J. (1988) The relevanceof the Lewy body to the pathogenesis of idio-pathic Parkinson’s disease. Journal of Neurology,Neurosurgery, and Psychiatry, 51, 745–752.
Grace, J., Amick, M. M., D’Abreu, A., Festa,E. K., Heindel, W. C., & Ott, B. R. (2005).Neuropsychological deficits associated with drivingperformance in Parkinson’s and Alzheimer’s dis-ease. Journal of the International NeuropsychologicalSociety, 11, 766–775.
Greenway, M. C., Smith, G. G., Tangalos, E. G., Geda,Y., & Ivnik, R. J. (2009). Mayo older Americansnormative studies: Factor analysis of an expandedneuropsychological battery. Clinical Neuropsychology,23, 7–20.
Hu, L. T., & Bentler, P. M. (1999). Cutoff criteria for fitindexes in covariance structure analysis: Conventionalcriteria versus new alternatives. Structural EquationModeling, 6(1), 1–55.
Hughes, A. J., Daniel, S. E., Kilford, L., & Lees, A. J.(1992). Accuracy of clinical diagnosis of idiopathicParkinson’s disease: A clinico-pathological study of100 cases. Journal of Neurology, Neurosurgery, andPsychiatry, 55, 181–184.
Iverson, D. J., Gronseth, G., Reger, M. A., Claassen,S., Dubinsky, R. M., & Rizzo, M. (2010). Practiceparameter update: Evaluation and managementof driving risk in aging and in dementia (anevidence-based review): Report of the QualityStandards Subcommittee of the American Academyof Neurology. Neurology, 74, 1–10.
Johansson, K., Bronge, L., Lundberg, C., Persson, A.,Seideman, M., & Viitanen, M. (1996). Can a physicianrecognize an older driver with increased crash riskpotential? Journal of the American Geriatrics Society,44, 1198–1204.
Joreskog, K. G., & Sorbom, D. (2001). LISREL 8: User’sreference guide. Lincolnwood, IL: Scientific SoftwareInternational.
Kaplan, D. (2000). Advanced quantitative techniques insocial sciences: Vol. 10. Structural equation modeling:Foundations and extensions. Thousand Oaks, CA:Sage.
Lezak, M. D., Howieson, D. B., & Loring, D. W. (2004).Neuropsychological assessment (4th ed.). New York,NY: Oxford University Press.
McKhann, G., Drachman, D., Folstein, M., Katzman,R., Price, D., & Stadlan, E. M. (1984). Clinicaldiagnosis of Alzheimer’s disease: Report of theNINCDS-ADRDA Work Group under the aus-pices of Department of Health and Human ServicesTask Force on Alzheimer’s Disease. Neurology, 34,939–944.
O’Neill, D., Rizzo, M., Reger, M. A., & Iverson, D. J.(2010). Practice parameter update: Evaluation andmanagement of driving risk in dementia: Reportof the Quality Standards Subcommittee of theAmerican Academy of Neurology. Neurology, 75,1659.
Ott, B. R., Heindel, W. C., Papandonatos, G. D., Festa,E. K., Davis, J. D., Daiello, L. A., et al. (2008). Alongitudinal study of drivers with Alzheimer disease.Neurology, 70, 1171–1178.
Pelli, D. G., Robson, J. G., & Wilkins, A. J. (1988).The design of a new letter chart for measur-ing contrast sensitivity. Clinical Visual Sciences, 2,187–199.
Reger, M. A., Welsh, R. K., Watson, G. S., Cholerton,B., Baker, L. D., & Craft, S. (2004). The rela-tionship between neuropsychological functioningand driving ability in dementia: A meta-analysis.Neuropsychology, 18, 85–93.
Rizzo, M. (2011). Impaired driving from medical condi-tions: A 70 year-old man trying to decide if he shouldcontinue driving. Journal of the American MedicalAssociation, 305, 1018–1026.
Satorra, A., & Bentler, P. M. (2001). A scaled differencechi-square test statistic for moment structure analysis.Psychometrika, 66, 507–514.
Schneider, J. A., Arvanitakis, Z., Bang, W., & Bennett, D.A. (2007). Mixed brain pathologies account for mostdementia cases in community-dwelling older persons.Neurology, 69, 2197–2204.
Siedlecki, K. L., Honig, L. S., & Stern, Y. (2008).Exploring the structure of a neuropsychological bat-tery across healthy elders and those with questionabledementia and Alzheimer’s disease. Neuropsychology,22, 400–411.
Strauss, E., Sherman, E. M. S., & Spreen, O.(2006). A compendium of neuropsychological tests:Administration, norms, and commentary (3rd ed.). NewYork, NY: Oxford University Press.
Trobe, J. D., Waller, P. F., Cook-Flannagan, C. A.,Teshima, S. M., & Beiliauskas, L. A. (1996). Crashesand violations among drivers with Alzheimer disease.Archives of Neurology, 53, 411–416.
Uc, E. Y., Rizzo, M., Anderson, S. W., Shi, Q., &Dawson, J. D. (2005). Driver landmark and trafficsign identification in early Alzheimer’s disease. Journalof Neurology, Neurosurgery, and Psychiatry, 76,764–768.
Uc, E. Y., Rizzo, M., Johnson, A. M., Dastrup, E.,Anderson, S. W., & Dawson, J. D. (2010). Roadsafety in drivers with Parkinson disease. Neurology,73, 2112–2119.
Whelihan, W. M., DiCarlo, M. A., & Paul, R. H. (2005).The relationship of neuropsychological functioning todriving competence in older persons with early cogni-tive decline. Archives of Clinical Neuropsychology, 20,217–228.
Dow
nloa
ded
by [
Uni
vers
ity o
f Io
wa
Lib
rari
es]
at 1
2:27
20
Sept
embe
r 20
12