Neuroanatomical correlates of aging, cardiopulmonary fitness level, and education
15
Neuroanatomical correlates of aging, cardiopulmonary fitness level, and education BRIAN A. GORDON, a,b ELENA I. RYKHLEVSKAIA, a,b CARRIE R. BRUMBACK, a,b YUKYUNG LEE, b STERIANI ELAVSKY, c JAMES F. KONOPACK, c EDWARD MCAULEY, a,c ARTHUR F. KRAMER, a,b STANLEY COLCOMBE, b GABRIELE GRATTON, a,b and MONICA FABIANI a,b a Department of Psychology, University of Illinois at Urbana–Champaign, Champaign, Illinois 61820, USA b Beckman Institute, University of Illinois at Urbana–Champaign, Urbana, Illinois 61801, USA c Department of Kinesiology, University of Illinois at Urbana–Champaign, Urbana, Illinois 61801, USA Abstract Fitness and education may protect against cognitive impairments in aging. They may also counteract age-related structural changes within the brain. Here we analyzed volumetric differences in cerebrospinal fluid and gray and white matter, along with neuropsychological data, in adults differing in age, fitness, and education. Cognitive performance was correlated with fitness and education. Voxel-based morphometry was used for a whole-brain analysis of structural magnetic resonance images. We found age-related losses in gray and white matter in medial-temporal, parietal, and frontal areas. As in previous work, fitness within the old correlated with preserved gray matter in the same areas. In contrast, higher education predicted preserved white matter in inferior frontal areas. These data suggest that fitness and education may both be predictive of preserved cognitive function in aging through separable effects on brain structure. Descriptors: Aging, Fitness, Education, Voxel-based morphometry (VBM), Grey matter, Cerebrospinal fluid (CSF), White matter, Structural magnetic resonance imaging (MRI) Normal aging is often accompanied by a reduction in cognitive function. Over the life span, speed of processing, working mem- ory, and short- and long-term memory appear to decline (Park et al., 2002; Sliwinski & Buschke, 1999) along with correspond- ing changes in brain function. These age-related changes are not limited to functional outcomes, as physical degradation of gray and white matter also occurs (Davatzikos & Resnick, 2002; Raz, 2002). Although some age-related loss of mental abilities may be inevitable, the decline is not uniform for all individuals, as vari- ability in cognitive function also increases with age (Fleischman, Wilson, Gabrieli, Bienias, & Bennett, 2004; Morse, 1993). This suggests that it is possible to undergo successful aging with many of one’s cognitive faculties intact. Proposed mediators of this differential decline include physical fitness (Colcombe & Kramer, 2003; Spirduso, 1975) and education (Richards & Deary, 2005; Stern, 2002), as well as other factors. Only in the last decade have studies begun to investigate these relationships by examining the links between volumetric changes in brain anatomy and physical fitness (Colcombe et. al., 2003, 2006), whereas fewer studies have investigated the relationship between education and brain anatomy (e.g., relationship between educa- tion and white matter hyperintensities; Dufouil, Alperovitch, & Tzourio, 2003; Nebes et al., 2006). In addition, it may be very important to examine the effects of fitness and education within the same sample, because these two variables are likely to be correlated. Thus, in this study, we sought to explore the inter- relationship between these factors, by examining the effects of age, fitness, and education on brain anatomy and cognitive function. Research in the late 1970s and early 1980s laid the ground- work for the study of the relationship between fitness and aging (Dustman et al., 1984; Spirduso, 1975; Spirduso & Clifford, 1978). Although there is a vast literature on the cognitive and emotional correlates of exercise and fitness, there is a dearth of knowledge of how exercise affects the biological properties of the human brain. Much of this knowledge is gained through work with animal models. These studies have shown that exercise may lead to both angiogenesis (Cotman & Berchtold, 2002) and ne- urogenesis (van Pragg, Kemperman, & Gage, 1999; see also Kramer, Bherer, Colcombe, Dong, & Greenough, 2004). Inter- estingly, exercise also leads to increases in a number of nerve growth factors, such as brain-derived neurotrophic factor (Nee- per, Gomez-Pinilla, Choi, & Cotman, 1995) and insulin-like Our thanks to the Image Analysis Group, FMRIB, Oxford, UK, and their programmers and scientists who created the tools we used to do the analysis. Thanks to Kirk Erickson for helpful suggestions on data an- alyses. Finally we wish to show appreciation to Brad Sutton and Andrew Webb, who answered numerous questions of a technical nature related to MRI acquisition and protocol setup. This research was supported by NIA grant #AG21887 to Monica Fabiani. Address reprint requests to: Monica Fabiani, Department of Psy- chology, University of Illinois, 603 E. Daniel, Champaign, IL 61820, USA. E-mail: [email protected] Psychophysiology, 45 (2008), 825–838. Wiley Periodicals, Inc. Printed in the USA. Copyright r 2008 Society for Psychophysiological Research DOI: 10.1111/j.1469-8986.2008.00676.x 825
Transcript of Neuroanatomical correlates of aging, cardiopulmonary fitness level, and education

Neuroanatomical correlates of aging, cardiopulmonary
fitness level, and education
BRIAN A. GORDON,a,b ELENA I. RYKHLEVSKAIA,a,b CARRIE R. BRUMBACK,a,b
YUKYUNG LEE,b STERIANI ELAVSKY,c JAMES F. KONOPACK,c EDWARD MCAULEY,a,c
ARTHUR F. KRAMER,a,b STANLEY COLCOMBE,b GABRIELE GRATTON,a,b
and MONICA FABIANIa,b
aDepartment of Psychology, University of Illinois at Urbana–Champaign, Champaign, Illinois 61820, USAbBeckman Institute, University of Illinois at Urbana–Champaign, Urbana, Illinois 61801, USAcDepartment of Kinesiology, University of Illinois at Urbana–Champaign, Urbana, Illinois 61801, USA
Abstract
Fitness and education may protect against cognitive impairments in aging. They may also counteract age-related
structural changes within the brain. Here we analyzed volumetric differences in cerebrospinal fluid and gray and white
matter, along with neuropsychological data, in adults differing in age, fitness, and education. Cognitive performance
was correlated with fitness and education. Voxel-based morphometry was used for a whole-brain analysis of structural
magnetic resonance images. We found age-related losses in gray and white matter in medial-temporal, parietal, and
frontal areas. As in previous work, fitness within the old correlated with preserved gray matter in the same areas. In
contrast, higher education predicted preservedwhitematter in inferior frontal areas. These data suggest that fitness and
educationmay both be predictive of preserved cognitive function in aging through separable effects on brain structure.
Descriptors: Aging, Fitness, Education, Voxel-based morphometry (VBM), Grey matter, Cerebrospinal fluid (CSF),
White matter, Structural magnetic resonance imaging (MRI)
Normal aging is often accompanied by a reduction in cognitive
function. Over the life span, speed of processing, working mem-
ory, and short- and long-term memory appear to decline (Park
et al., 2002; Sliwinski & Buschke, 1999) along with correspond-
ing changes in brain function. These age-related changes are not
limited to functional outcomes, as physical degradation of gray
and white matter also occurs (Davatzikos & Resnick, 2002; Raz,
2002).
Although some age-related loss of mental abilities may be
inevitable, the decline is not uniform for all individuals, as vari-
ability in cognitive function also increases with age (Fleischman,
Wilson, Gabrieli, Bienias, & Bennett, 2004; Morse, 1993). This
suggests that it is possible to undergo successful aging with many
of one’s cognitive faculties intact. Proposed mediators of this
differential decline include physical fitness (Colcombe &
Kramer, 2003; Spirduso, 1975) and education (Richards &
Deary, 2005; Stern, 2002), as well as other factors. Only in the
last decade have studies begun to investigate these relationships
by examining the links between volumetric changes in brain
anatomy and physical fitness (Colcombe et. al., 2003, 2006),
whereas fewer studies have investigated the relationship between
education and brain anatomy (e.g., relationship between educa-
tion and white matter hyperintensities; Dufouil, Alperovitch, &
Tzourio, 2003; Nebes et al., 2006). In addition, it may be very
important to examine the effects of fitness and education within
the same sample, because these two variables are likely to be
correlated. Thus, in this study, we sought to explore the inter-
relationship between these factors, by examining the effects of
age, fitness, and education on brain anatomy and cognitive
function.
Research in the late 1970s and early 1980s laid the ground-
work for the study of the relationship between fitness and aging
(Dustman et al., 1984; Spirduso, 1975; Spirduso & Clifford,
1978). Although there is a vast literature on the cognitive and
emotional correlates of exercise and fitness, there is a dearth of
knowledge of how exercise affects the biological properties of the
human brain. Much of this knowledge is gained through work
with animal models. These studies have shown that exercise may
lead to both angiogenesis (Cotman & Berchtold, 2002) and ne-
urogenesis (van Pragg, Kemperman, & Gage, 1999; see also
Kramer, Bherer, Colcombe, Dong, & Greenough, 2004). Inter-
estingly, exercise also leads to increases in a number of nerve
growth factors, such as brain-derived neurotrophic factor (Nee-
per, Gomez-Pinilla, Choi, & Cotman, 1995) and insulin-like
Our thanks to the Image Analysis Group, FMRIB, Oxford, UK, and
their programmers and scientists who created the tools we used to do the
analysis. Thanks to Kirk Erickson for helpful suggestions on data an-
alyses. Finally we wish to show appreciation to Brad Sutton and Andrew
Webb, who answered numerous questions of a technical nature related to
MRI acquisition and protocol setup. This research was supported by
NIA grant #AG21887 to Monica Fabiani.Address reprint requests to: Monica Fabiani, Department of Psy-
chology, University of Illinois, 603 E. Daniel, Champaign, IL 61820,USA. E-mail: [email protected]
Psychophysiology, 45 (2008), 825–838. Wiley Periodicals, Inc. Printed in the USA.Copyright r 2008 Society for Psychophysiological ResearchDOI: 10.1111/j.1469-8986.2008.00676.x
825
growth factor I (Carro, Trejo, Busiguina, & Torres-Aleman,
2001), which may in some way contribute to its effects on brain
structures. These and other alterations due to exercise are
thought to contribute to improved learning and memory (An-
derson et al., 2000; Greenough,Madden, & Fleischmann, 1972),
as tested with enriched environment manipulations.
Structural changes in animals, such as increases in dendritic
length and branching (Greenough & Volkmar, 1973) and hip-
pocampal neurogenesis (Brown et al., 2003; Rossi et al., 2006)
have also resulted from environmental enrichment. This manip-
ulation typically includes an exercise component, although itmay
potentially be considered in some way an analog to increased
education in humans, due to the greater cognitive demand on the
animals.
From these animal studies, it is plausible to expect that car-
diovascular exercise will also have an impact on human brain
structure. In humans, age-related graymatter atrophy appears to
reflect primarily cell shrinkage rather than cell death (Terry,
DeTeresa&Hansen, 1987). Longitudinal interventions involving
aerobic training in humans have led to increases not only in gray
matter, but also in frontal white matter (Colcombe et al., 2006).
Because changes in gray matter are more extensive, they may be
more likely to be detected with noninvasive imaging methods
than those in white matter tracts.
In recent years, a number of experiments have provided fur-
ther support for the role of physical fitness in human aging by
showing that structural changes are also associated with im-
proved cognitive function (Colcombe & Kramer, 2003, 2006;
Hillman, Belopolsky, Snook, Kramer, & McAuley, 2004;
Kramer et al., 1999; McAuley, Kramer, & Colcombe, 2004).
For example, Colcombe and colleagues (2004) examined brain
activations during an Eriksen flanker task (Botvinick, Nystrom,
Fissel, Carter, & Cohen, 1999; Eriksen & Eriksen, 1974). In both
cross-sectional and clinical studies, higher levels of fitness were
implicated in improved attentional control.
Similarly to physical fitness, education has been suggested as a
possible factor in successful aging (Vaillant & Mukamal, 2001).
For example, higher levels of education may contribute to pre-
served memory performance through increased brain activity at
frontal sites in old age (Czernochowski et al., in press). Education
serves to improve cognitive function and may also delay mental
decline in later years by creating a reserve capacity (Stern, 2002).
The ‘‘cognitive reserve’’ hypothesis suggests that individuals can
cope with advancing brain pathology through either a set of
acquired skills or inherent abilities. This theoretical standpoint
has been operationally translated into an examination of specific
lifestyle factors, including level of education, IQ, and occupa-
tional status (Habeck et al., 2003; Richards & Deary, 2005;
Scarmeas et al., 2003). In fact, the concept of cognitive reserve
was initially invoked to account for the imperfect coupling be-
tween the degree of brain pathology and loss of cognitive ca-
pacity. For example, one study reported that a substantial
number of individuals without behavioral symptoms of Alzhei-
mer’s disease during life were found to have histological signs of
the disease upon postmortem examination (Ince, 2001). This
behavioral sparing may be mediated by high levels of education
or IQ (Snowdon, Greiner, & Markesbery, 2000). Several neuro-
imaging studies have recently been conducted to examine the
brain substrates supporting cognitive reserve (Habeck et al.,
2003; Scarmeas et al., 2003). However the possible role played by
education is still not determined. Due to its suggested role in
creating a cognitive reserve, it is possible that years of education
may affect the brain structurally. However, as mentioned, the
examination of structural effects of education concurrently with
those due to aerobic fitness has not yet been carried out. Edu-
cation could have a direct effect due to ‘‘use,’’ as seen with other
factors such as psychomotor activity (Draganski et al., 2004), or
an indirect effect through its influence on life habits such as nu-
trition, exercise, and health. Although we predict potential struc-
tural changes in older adults to be moderated by both aerobic
fitness and years of education, these effects could manifest in
different ways and affect different brain structures.
In contrast to the effect of aerobic fitness, it is not yet estab-
lished how an increased brain use due to education may lead to
structural effects. However, there is some evidence that education
may influence white matter integrity (Dufouil et al., 2003; Nebes
et al., 2006; however, see alsoChristensen et al., 2007). A possible
mechanism is that axonal function (through use) may influence
myelination (Colello, Devey, Imperato, & Pot, 1995), but other
mechanisms are also possible. Coffey, Saxton, Ratcliff, Bryan,
and Lucke (1999) found reduced cortical atrophy (indexed by
sulcal CSF volume) to be correlated with education in a large
sample of older adults. However, these data were not replicated
by Christensen et al. (2007), who, however, used a younger and
more restricted group of subjects (60–64 years of age).
In summary, although this latter group of studies suggests
effects of education onwhite and possibly gray matter, two issues
remain unresolved. First, all of these studies used global volu-
metric assessments, whereas it is well known that aging affects
frontal and temporal areasmore than sensory ormotor areas (for
reviews, see Colcombe et al., 2003; Kemper, 1994; see also Esiri,
1994). Second, none of these studies controlled for physical fit-
ness, and, as we have alreadymentioned, it is likely that these two
variables could be confounded.
Within the field of human aging research, there are compar-
atively few studies that have assessed the presence of systematic
volumetric changes in the whole brain. Until recently, quantita-
tive measurements of the brain in vivo would have been impos-
sible. However, the advent of high-resolution structural magnetic
resonance imaging (MRI) has made in vivo brain volumetric
assessment possible. Volumetric measures have been used, for
example, in studies of Alzheimer’s disease (Jack, Petersen,
O’Brien, & Tangalos, 1992; Kohler et al., 1998) and schizophre-
nia (Sachdev, Brodaty, Cheang, & Cathcart, 2000; Wright et al.,
1995) as well as in aging (Gunning-Dixon & Raz, 2003; Raz,
Gunning-Dixon, Head, Dupuis, & Acker, 1998). The gold stan-
dard used in volumetric studies is the manual tracing of specific
areas on high-resolution images by trained neuroanatomists.
However, with manual tracing, the number of subjects and/or
brain regions investigated is limited, because the work is time
intensive and requires extensive neuroanatomical knowledge.
Furthermore, although interrater reliability within a laboratory
can be quite high, reproducibility is not guaranteed, which may
limit the generalizability of results.
It is possible to avoid these problems through the use of voxel-
based morphometry (VBM; Ashburner & Friston, 2000, 2001).
VBManalysis is based on the computation of the probability that
each voxel in a subject’s structural image is classified as a par-
ticular tissue type: cerebrospinal fluid, gray matter, or white
matter. These classifications can then be statistically compared
between groups of subjects or regressed on a continuous variable
within a group. VBM allows for a whole-brain analysis in a semi-
automated fashion. Thus, it is easily reproducible and does not
require expert-level anatomical knowledge.
826 B.A. Gordon et al.

The use of VBM as a tool for studying structural differences
between groups presents some controversial issues. In particular,
there is concern that potential misalignment during the registra-
tion step could negatively impact results (Bookstein, 2001).
However, when used appropriately, VBM is a robust and accu-
rate tool (Ashburner & Friston, 2000). The method has proved
to be reliable in the study of a variety of populations, including,
but not limited to, schizophrenic patients (Wright et al., 1995),
gender differences (Good et al., 2001a), obsessive-compulsive
disorder (Pujol et al., 2004), diabetes (Musen et al., 2006), and
aging (Colcombe et al., 2003).
In the present study, we used VBM to test a series of hy-
potheses on a sample of younger and older adults. VBM allows
for a whole-brain comparison between younger and older adults
as well as for analyses of fitness and education effects within the
older adults. The initial comparison based on age should lead to
robust differences between the two groups as previously reported
(Good et al., 2001a; Raz, 2002). We predicted that, in older
adults, fitness and education may result in somewhat different
profiles of tissue sparing (with possible overlap). The mitigating
effects of aerobic fitness have shown their greatest effects on
frontal andmedio-temporal gray matter as well as anterior white
matter (Colcombe et al., 2006). Although there is no previous
work indicating where the effects of education should manifest,
studies of general aging have indicated greater anterior decline in
white matter while showing relative preservation in other areas
(for a review, see Kemper, 1994). To measure potential func-
tional correlates of structural changes, a battery of neuropsy-
chological tests was administered to all subjects. Analyses
examining the effects of age, education, and fitness were per-
formed on these data. These behavioral measures provide a par-
allel to the structural data.
In summary, although these analyses draw upon previous
research, they provide a new and important examination of the
differential contributions of age, cardiovascular fitness, and
years of formal education on brain structure. In particular, be-
cause both fitness and education have been suggested to serve as
protective factors against cognitive aging, it is important to
compare their relative contributions within the same sample with
a method that allows for the independent and parallel evaluation
of gray and white matter effects.
Methods
Participants
Participantswere drawn froma study that investigated the effects
of differences in physical fitness on neurovascular coupling
(Fabiani et al., 2004).1 The final sample comprised 20 younger
adults (age 20–28, 10 women, recruited from the University
of Illinois student population through postings in university
buildings and by word of mouth) and 40 older adults (age 65–81,
23 women, recruited through ads in the local newspaper, cam-
pus-wide e-mailings, and postings at area gyms, retirement
homes, and community centers). Participants were all right-
handed and fluent in English. Prior to graded maximal exercise
testing, all participants completed a personal health history form
and obtained medical clearance from their personal physician.
The demographic characteristics of the participants are
summarized in Table 1.
Screening Procedures
Potential participants were screened with a phone interview prior
to their entering the study. During this phone assessment, po-
tential participants were excluded if they regularly took medica-
tions known to directly affect the central nervous system or the
cardiovascular system (e.g., beta blockers, CNS stimulants, an-
tidepressants, anti-psychotics, sedating antihistamines, or mi-
graine medication) or had other serious or chronic medical
conditions. Screenings for these medications would eliminate
participants being treated for common health problems such as
hypertension. Participants who passed the phone screening then
underwent a session of screening and neuropsychological testing.
To continue in the experiment, individuals had to score at least 51
on the modified Mini-Mental Status exam (mMMS; Mayeux,
Stern, Rosen, & Leventhal, 1981) and show no signs of depres-
sion on Beck’s Depression Scale (Beck, Steer, & Brown, 1996; a
score of 12 or greater was exclusionary).
Neuropsychological Assessment
Participants who were within the limits of our screening proce-
dures also received an extensive battery of neuropsychological
tests, designed to assess the integrity of their cognitive functions.
In addition to themMMS test, which was used to examine global
cognitive competency, and the forward and backward digit span,
used to assess short-term memory, participants were adminis-
tered the Vocabulary subtest of the Wechsler Adult Intelligence
Scale–Revised (WAIS-R; Wechsler, 1981) to assess verbal skills,
the full version of the Wisconsin Card Sorting Test (WCST;
Heaton, 1981), the verbal fluency (CFL version) of the Con-
trolled Oral Word Association Test (Benton & Hamsher, 1976),
and the Alternate Category Test (Benton & Hamsher, 1976) to
assess flexibility and frontal lobe function, the short version of
the Raven’s Progressive Matrices (Engle, Tuholski, Laughlin, &
Conway, 1999; Raven, Court, & Raven, 1977) to evaluate fluid
intelligence, the operation word span task (OSPAN; Engle et al.,
1999) to evaluate working memory and attention control, the
digit copying test (Kendrick &Watts, 1999), the timed box com-
pletion of the WAIS-R (Wechsler, 1981), and the Trail Making
Tests A and B (Corrigan & Hinkeldey, 1987) to assess motor
speed, the digit-symbol copying test, and the three-, six-, and
nine-letter comparison tests (Salthouse, 1992) to assess process-
ing speed.
Fitness Assessment
Cardiovascular fitness for the older adults was assessed by a
maximal graded exercise test on a motor-driven treadmill using a
modified Balke protocol (American College of Sports Medicine,
1991). The goal of the test is to find a participant’s maximal rate
of oxygen uptake (VO2max). This measure is accepted as the cri-
terion measure of cardiorespiratory fitness (American College of
SportsMedicine, 1991). The protocol involves walking at a speed
of 3mphwith increasing grade increments of 2% every 2min and
was supervised by a physician, exercise test technologist, and a
registered nurse certified in Advanced Cardiac Life Support.
Expired gases were sampled at 30-s intervals and analyzed using
a Parvomedics Inc. TrueMax2400 metabolic system. The test
termination criteria included any of the following: (a) objective
evidence that VO2max had been attained, (b) volitional
exhaustion on the part of the participant, or (c) cardiovascular
Anatomical correlates of aging, fitness, and education 827
1Note that this sample was newly assessed and independent fromthose previously reported by Kramer and colleagues.

abnormalities or other symptoms indicating ischemia or abnor-
mal test responses. Individuals with abnormal responses were
excluded from the study. Heart rate was assessed at each work
stage via continuous 12-lead electrocardiographic monitoring.
Blood pressure was monitored by auscultation and sphygmo-
manometer. As is common practice within fitness literature,
when serving as controls, young participants were considered as
being relatively high fit as compared to the older adults.
Structural Imaging
All participants included in this study underwent a high-resolu-
tion structuralMRI scan in a Siemens 3-TeslaMagnetomAllegra
MR Headscanner. Using an MPRAGE sequence, a 144-slice
scan with a 1.2-mm slice thickness was obtained either in the
sagittal or axial plane.2 The pulse parameters used in MR re-
cording included a repetition time of 1800 ms, an echo time of
4.38 ms, and a flip angle of 81. The field of view was 240 � 240 �172.8 mmwith matrix dimensions of 192 � 256 � 144 and voxel
size of 1.25 � 0.938 � 1.2 mm.
Data Analyses
MR data were processed using tools in the FMRIB Software
Library (Image Analysis Group, FMRIB, Oxford, UK; Smith
et al., 2004). AVBMmethodwas used to determine the impact of
age, fitness level, and education on brain tissues. Before applying
this technique, the MR images underwent a series of automated
preprocessing steps. The purposes of these steps were to (1) re-
move all nonbrainmatter from theMR images (Smith, 2002); (2)
align different individuals to a common template in MNI space,
which is achieved through a series of affine transformations
(Jenkinson, Bannister, Brady, & Smith, 2002; Jenkinson &
Smith, 2001); (3) for each participant, assign to each voxel partial
volume estimates describing the probabilities that that voxel
contains cerebrospinal fluid, white matter, or gray matter (‘‘seg-
mentation’’; Zhang, Brady, & Smith, 2001)Fseparate maps for
each participant and tissue type are thus derived; and (4) smooth
the tissue maps with an 8-mm full-width at half-maximum
Gaussian kernel. (For further descriptions of VBM methodol-
ogies and template see Ashburner & Firston, 2000; Good et al.,
2001b; Pujol et al., 2004).
In all the analyses presented here we used a template (20
young, 10 female, 20 old, 10 female), selected from a pool of
participants acquired from other studies in our laboratory. The
template was composed of an equal numbers of older and
younger participants and gender balanced to make it as repre-
sentative as possible of the participants examined. By balancing
the template on both age and gender, we removed any potential
systematic registration bias that could have occurred.
Within the segmentation processes, the tissue maps were
multiplied by their Jacobian determinants obtained from the
registration step to account for the changes in voxel size due to
the spatial normalization. This partial volume correction proce-
dure makes it possible to describe the results of the analysis in
terms of actual volumes rather than tissue densities. Within the
tissue segmentation step of preprocessing, there was also a B1
inhomogeneity correction.
The final outputs of the processing were three parametric
maps representing partial volume estimates for each of the tissue
typesFgray matter, white matter, and CSFFfor each partic-
ipant. For the comparison between younger and older adults, a
group comparison was then carried out on each of the three sets
of parametric maps. The effect of age within the older population
was estimated by means of linear regression analyses in a voxel-
wise fashion for each map type. The regression analyses using
log-transformed VO2max scores as predictors were conducted
solely on the parametric maps of partial volume estimates of the
older adults. A third set of regressionswas run on the older adults
to examine if there were structural changes associated solely with
education. Within each of these analyses, the statistics were ad-
justed formultiple comparisons. Each comparison generated two
t-statistic maps, corresponding to the opposite directional con-
trastsFa possible increase or decrease for each tissue type with
age, fitness, or education. Because education and fitness were
correlated, we used each of them as a covariate in the analysis of
the other. Thus, the results presented here indicate only their
independent contributions. Similarly, gender was used as a
828 B.A. Gordon et al.
Table 1. Mean (SD) Demographic Characteristics of the Younger and Older Adults, and Separately for High- and Low-Fit Older Adults
Measure Young (n5 20) Old (n5 40) Old low-fit (n5 20) Old high-fit (n5 20) Old-low vs.old-high:t(38), p
Age (years) 22.5 (2.1) 71.5 (4.7) 72.7 (4.9) 70.4 (4.4) 1.53, n.s.Range 20–28 65–81 65–81 65–79
Education (years) 16.5 (1.4) 16.7 (2.8) 15.1 (2.4) 18.3 (2.2) 4.31,o.001Range 15–20 12–20 12–20 13–20
VO2max (mL kg� 1 min) F 25.1 (7.8) 18.7 (2.4) 31.4 (5.9) 8.87,o.001Range 10.3–44.7 10.3–21.3 24.3–44.7
BP systolic F 141.2 (16.2) 143.5 (21.4) 139.8 (12.5) 0.59, n.s.Range 120–190 124–190 120–172
BP diastolic F 83.2 (7.6) 86.9 (9.3) 80.9 (5.5) 2.20,o.05Range 70–104 78–104 70–92
HR resting F 68.4 (15.0) 68.8 (12.3) 68.2 (16.7) 0.11, n.s.Range 42–109 55–95 42–109
HR peak F 158.4 (14.9) 152.6 (19.2) 162.0 (10.6) 1.70, n.s.Range 104–180 104–179 136–180
BDI score 1.3 (1.2) 2.0 (2.4) 2.3 (2.4) 1.6 (2.3) 0.94, n.s.Range 0–3 0–9 0–7 0–9
Notes. Ranges are also provided, as well as the results of a comparison of high- and low-fir older adults. The blood pressure measurements (BP) weretaken at the time of VO2 max assessment. BDI: Beck’s Depression Inventory; HR: heart rate.
2A small number of scans (o4) were acquired in the axial rather thanthe saggital plane. This was due to wrapping issues on the scans. Therewas no effect of this difference.
covariate in all analyses to avoid possible biases and eliminate its
effects. Finally, age was also used as a covariate to evaluate its
effects within the older adult group.
Results
Neuropsychological Tests
The results of the neuropsychological tests are summarized in
Tables 2 through 5. Tables 2 and 3 report mean data separately
for the younger and older adults, whereas Tables 4 and 5 report
results on these same tests for the older adults only, grouped by
fitness level using a median split. The majority of neuropsycho-
logical measures showed significant differences as a function of
age. A similar patternwas present when older adults were divided
into high- and low-fit groups (Tables 4 and 5).
Correlations between the neuropsychological test scores and
either aerobic fitness or education within the older adult group
also yielded multiple significant effects (see Table 6, first two
columns). Both years of education and aerobic fitness were cor-
related with higher performance on a range of neuropsycholog-
ical tests. However, some of these effects may be correlated or
confounded with other factors, such as age and gender. There-
fore, to evaluate their independent contributions we ran a mul-
tiple regression analysis for each neuropsychological variables
using education, VO2max, age, and gender as predictors. The
results of this analysis (beta weights and multiple correlations)
are also reported in Table 6.
A number of significant beta weights were present for edu-
cation and a smaller number for VO2max. To avoid redundancy
and improve our understanding of the relationships between ed-
ucation, VO2max, and neuropsychological variables, we also ran
a factor analysis (based on a principal component analysis fol-
lowed by a varimax rotation) to group the latter. Both the
Kaiser’s criterion (eigenvalue 41) and a scree test converged
into selecting eight factors (accounting for 83.9%of the variance)
for the rotation. The factor analysis grouped the variables in a
way that was consistent with our expectations: most factors
(seven out of eight) appeared to correspond to the constructs we
expected to be assessed by the neuropsychological tests. Another
multiple regression was then run for each of these factors, using
age, gender, VO2max, and education as predictors and the factor
scores as dependent variables. The factor loadings and the results
of this multiple regression analysis are reported in Table 7. They
indicate that education was a significant predictor of Factor 1
(mainly related to several of the WCST scales, which could be
tentatively interpreted as representing cognitive flexibility) and
that VO2max was a significant predictor of Factor 7 (mainly
Anatomical correlates of aging, fitness, and education 829
Table 2. Mean (SD) Scores for Each Neuropsychological Test for Participants Grouped by Age
Test Young Old p value Directiona
mMMS 55.8 (1.5) 54.8 (1.7) n 1WAIS-R Vocabulary scaled 13.4 (1.8) 13.4 (2.7) 1Forward Digit Span 7.2 (1.4) 6.9 (1.1) 1Backwards Digit Span 6.0 (1.4) 5.1 (1.6) n 1Boxes 52.4 (11.5) 43.7 (12.7) n 1
Trail Making A 12.7 (4.2) 20.8 (11.0) n �Trail Making B 20.0 (6.5) 35.5 (18.3) nn �Digit Copying 79.5 (5.9) 65.7 (13.3) nn 1Digit Symbol 49.3 (5.3) 34.4 (5.8) nn 1Letter Completion 3 23.6 (2.7) 15.6 (3.1) nn 1Letter Completion 6 11.1 (2.9) 8.4 (1.9) nn 1
Letter Completion 9 7.3 (1.6) 6.2 (1.5) n 1Raven’s Prog. Matrices 11.1 (2.5) 5.3 (2.6) nn 1OSPAN 21.6 (0.8) 12.7 (6.5) n 1Verbal Fluency (CFL)% 80.5 (20.4) 60.2 (29.6) n 1Alternate Category 10.4 (2.0) 7.7 (2.4) n 1
aA plus sign means a higher score indicates higher performance on the test; a minus sign means a lower score indicates higher performance on the test.no.05; nno.001.
Table 3. Mean (SD) for the Wisconsin Card Sorting Test Subscores for Participants Grouped by Age
Young Old p value Directiona
Categories completed 5.7 (0.8) 4.3 (1.90) n 1Number of trials 76.9 (7.0) 101.3 (22.3) nn �Correct 64.6 (4.9) 68.1 (14.4) 1Errors 12.3 (5.8) 33.2 (20.9) nn �Perseverative responses 7.2 (4.3) 18.0 (13.6) nn �Perseverative errors 6.8 (3.5) 16.2 (11.7) nn �Nonperseverative errors 5.6 (3.3) 16.9 (12.4) nn �% perseverative errors 8.7 (4.2) 15.0 (8.6) n �Completion first category 17.4 (22.8) 16.6 (11.1) �% conceptual level resp. 81.6 (8.5) 61.1 (21.2) nn 1Failure to maintain set 0.3 (0.6) 1.1 (1.2) n �Learning to learn � 1.5 (5.2) � 6.7 (9.9) n 1
aA plus sign means a higher score indicates higher performance on the test; a minus sign means a lower score indicates higher performance on the test.no.05; nno.001.
related tomMMS andWAIS-R vocabulary score and tentatively
interpreted as an index of global cognitive competence). These
data suggest that the effects of VO2max and education, although
largely overlapping, also have some unique contributions.
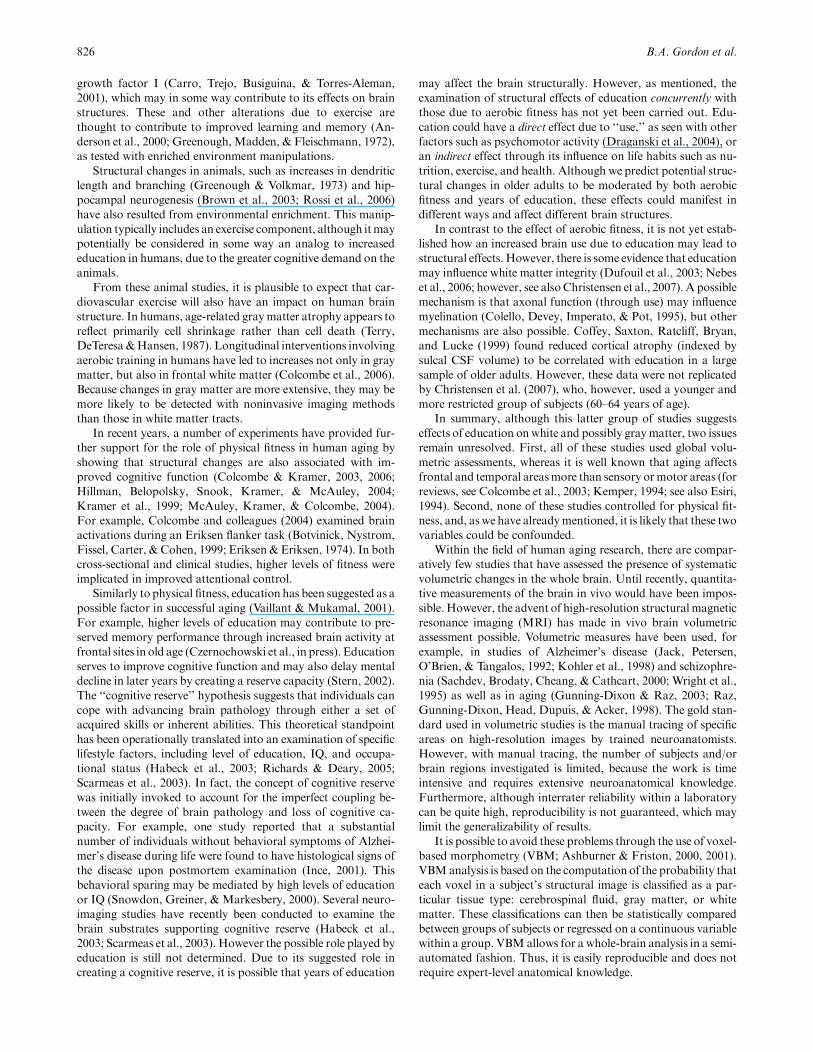
Age Effects on Brain Volumes
The tissue density maps for the young and old adults are pre-
sented in Figure 1A (with Figure 1B showing 3D renderings of
the same effects). Statistical comparisons showed a number of
significant areas of change for all three tissue types (Z41.96,
po.05). The analysis of cerebrospinal fluid showed an increase
with age along the midline and in tissue bordering the lateral
ventricles and cerebral aqueduct (first row). There were signifi-
cant decreases in gray matter density in extensive temporal, pa-
rietal, and prefrontal regions as a function of age (second row). A
significant age-related decline inwhitematter volumewas evident
in anteriormedial areas near the lateral and third ventricles (third
row). The white matter showed relative preservation in posterior
regions, especially parietal and occipital areas. These results are
in line with previous findings of age-related volumetric declines
(Colcombe et al., 2003; Raz et al., 1998). No areas showed a
reduction of CSF or an increase in gray matter as a function of
age. However, older adults showed increases in white matter in
one section posterior and one superior to the corpus callosum
(fourth row). This suggests that some of the apparent reduction
of periventricular white matter may not be due solely to atrophy,
but also to white matter tissue displacement in older adults into
regions normally occupied by gray matter in younger adults.
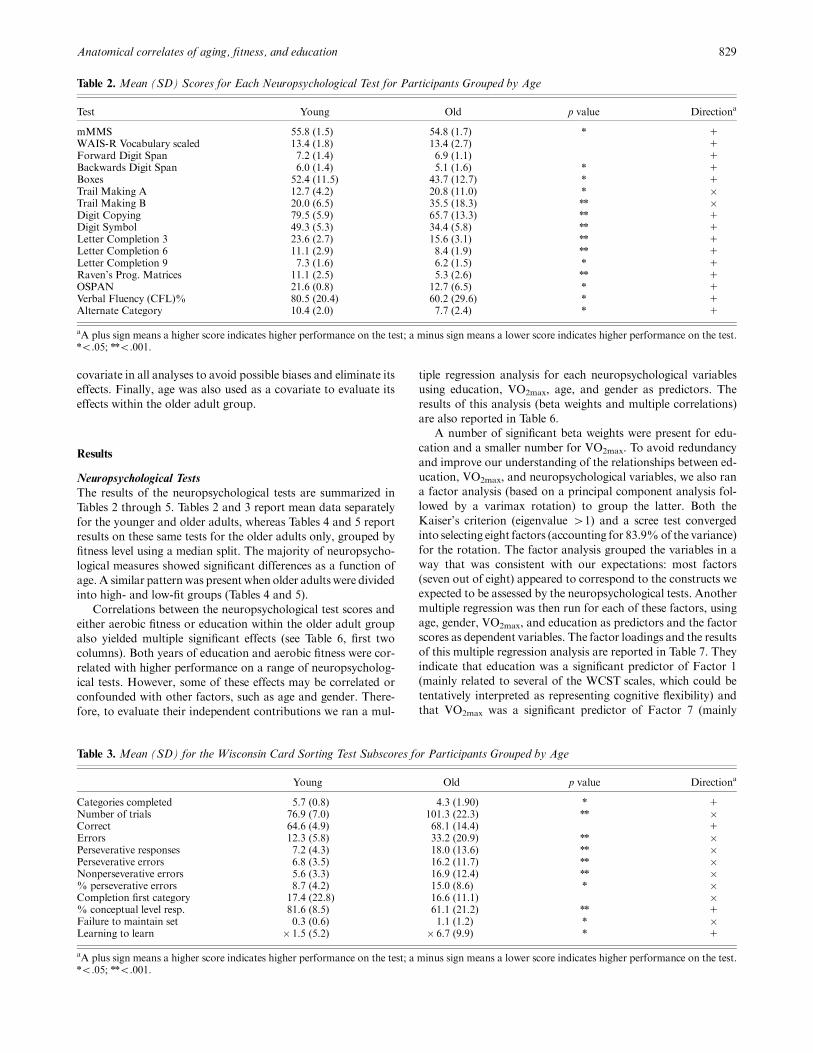
A second analysis, based on a regression with age, was per-
formed within the older adult group. The rationale for this ap-
proach was that, although the range of ages within the old group
was somewhat limited (65–81 years), if tissue deterioration con-
tinues over time, then differences may become detectable even
within this age group. This prediction was confirmed by the re-
sults presented in Figure 2A (with 3D renderings of the same
effects in Figure 2B). Smaller clusters of voxels showed signifi-
cant effects in midline cerebrospinal fluid (first row) and poste-
rior whitematter (third row) (Z41.96, po.05). Significant tissue
loss with increasing age was found for gray matter in the medial
temporal lobe (Z41.96, po.05) (second row). This type of effect
has been previously found along with effects in frontal cortex
(Colcombe et al., 2003).
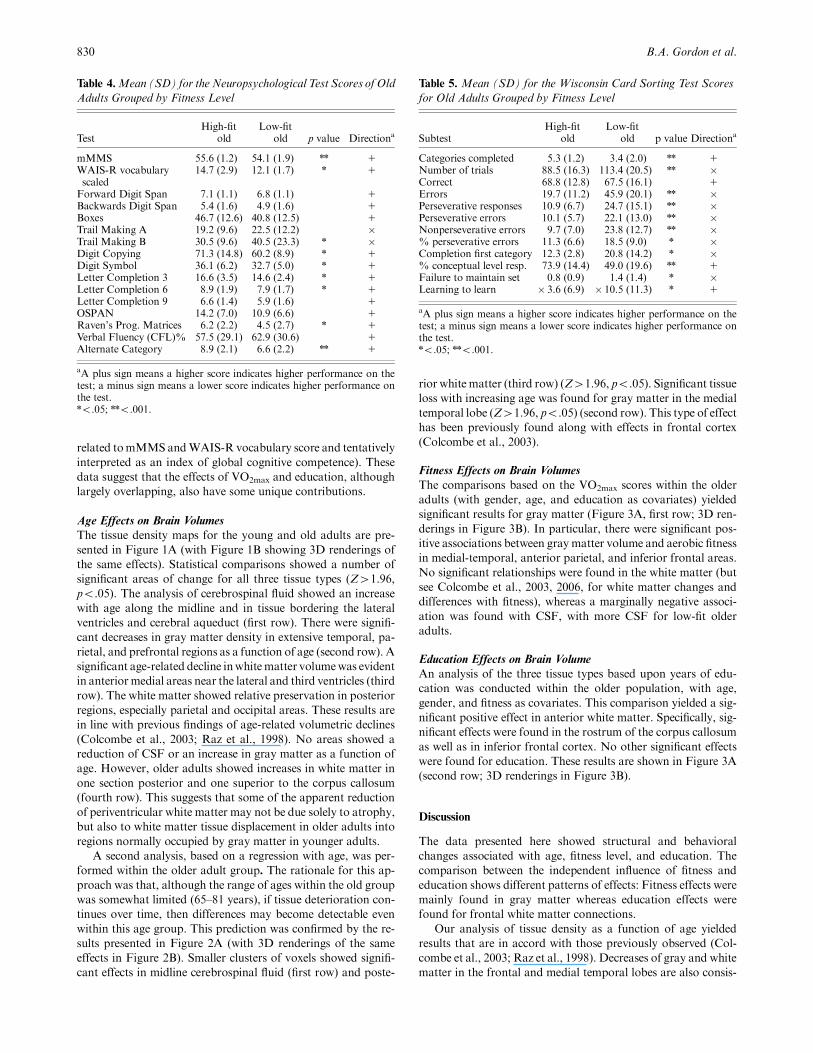
Fitness Effects on Brain Volumes
The comparisons based on the VO2max scores within the older
adults (with gender, age, and education as covariates) yielded
significant results for gray matter (Figure 3A, first row; 3D ren-
derings in Figure 3B). In particular, there were significant pos-
itive associations between gray matter volume and aerobic fitness
in medial-temporal, anterior parietal, and inferior frontal areas.
No significant relationships were found in the white matter (but
see Colcombe et al., 2003, 2006, for white matter changes and
differences with fitness), whereas a marginally negative associ-
ation was found with CSF, with more CSF for low-fit older
adults.
Education Effects on Brain Volume
An analysis of the three tissue types based upon years of edu-
cation was conducted within the older population, with age,
gender, and fitness as covariates. This comparison yielded a sig-
nificant positive effect in anterior white matter. Specifically, sig-
nificant effects were found in the rostrum of the corpus callosum
as well as in inferior frontal cortex. No other significant effects
were found for education. These results are shown in Figure 3A
(second row; 3D renderings in Figure 3B).
Discussion
The data presented here showed structural and behavioral
changes associated with age, fitness level, and education. The
comparison between the independent influence of fitness and
education shows different patterns of effects: Fitness effects were
mainly found in gray matter whereas education effects were
found for frontal white matter connections.
Our analysis of tissue density as a function of age yielded
results that are in accord with those previously observed (Col-
combe et al., 2003; Raz et al., 1998). Decreases of gray and white
matter in the frontal and medial temporal lobes are also consis-
830 B.A. Gordon et al.
Table 4.Mean (SD) for the Neuropsychological Test Scores of Old
Adults Grouped by Fitness Level
TestHigh-fit
oldLow-fit
old p value Directiona
mMMS 55.6 (1.2) 54.1 (1.9) nn 1WAIS-R vocabularyscaled
14.7 (2.9) 12.1 (1.7) n 1
Forward Digit Span 7.1 (1.1) 6.8 (1.1) 1Backwards Digit Span 5.4 (1.6) 4.9 (1.6) 1Boxes 46.7 (12.6) 40.8 (12.5) 1Trail Making A 19.2 (9.6) 22.5 (12.2) �Trail Making B 30.5 (9.6) 40.5 (23.3) n �Digit Copying 71.3 (14.8) 60.2 (8.9) n 1Digit Symbol 36.1 (6.2) 32.7 (5.0) n 1Letter Completion 3 16.6 (3.5) 14.6 (2.4) n 1Letter Completion 6 8.9 (1.9) 7.9 (1.7) n 1Letter Completion 9 6.6 (1.4) 5.9 (1.6) 1OSPAN 14.2 (7.0) 10.9 (6.6) 1Raven’s Prog. Matrices 6.2 (2.2) 4.5 (2.7) n 1
Verbal Fluency (CFL)% 57.5 (29.1) 62.9 (30.6) 1Alternate Category 8.9 (2.1) 6.6 (2.2) nn 1
aA plus sign means a higher score indicates higher performance on thetest; a minus sign means a lower score indicates higher performance onthe test.no.05; nno.001.
Table 5. Mean (SD) for the Wisconsin Card Sorting Test Scores
for Old Adults Grouped by Fitness Level
SubtestHigh-fit
oldLow-fit
old p value Directiona
Categories completed 5.3 (1.2) 3.4 (2.0) nn 1Number of trials 88.5 (16.3) 113.4 (20.5) nn �Correct 68.8 (12.8) 67.5 (16.1) 1Errors 19.7 (11.2) 45.9 (20.1) nn �Perseverative responses 10.9 (6.7) 24.7 (15.1) nn �Perseverative errors 10.1 (5.7) 22.1 (13.0) nn �Nonperseverative errors 9.7 (7.0) 23.8 (12.7) nn �% perseverative errors 11.3 (6.6) 18.5 (9.0) n �Completion first category 12.3 (2.8) 20.8 (14.2) n �% conceptual level resp. 73.9 (14.4) 49.0 (19.6) nn 1Failure to maintain set 0.8 (0.9) 1.4 (1.4) n �Learning to learn � 3.6 (6.9) � 10.5 (11.3) n 1
aA plus sign means a higher score indicates higher performance on thetest; a minus sign means a lower score indicates higher performance onthe test.no.05; nno.001.
tent with extensive behavioral evidence showing impairments in
tasks of executive control and memory for which these areas are
considered to be important (Park et al., 2002; West, 1996).
Cerebrospinal fluid increase in the parietal lobe is probably due
to decrease in the density or volume of the white matter sur-
rounding the ventricles, whereas increased amounts of cerebro-
spinal fluid in the longitudinal fissure and around the outer brain
surface can be attributed to a general reduction of the brain
volume.
The fitness data presented here support the idea that the be-
havioral effects observed in both the exercise and aging literature
may have a counterpart in brain anatomy. We also showed that,
within the older adults, higher fitness levels are associated with
relative sparing of tissue in brain areas typically vulnerable to the
effects of aging. This suggests that higher levels of fitness may
stave off some of the deleterious effects of aging on the brain and
possibly prevent or delay ensuing brain pathologies. This is con-
sistent with research in animal models as well as in humans
(Colcombe et al., 2003, 2004; Neeper et al., 1995; van Pragg
et al., 1999).
According to the cognitive reserve hypothesis, higher educa-
tion could potentially lead to, or be associated with, a surplus of
tissue. Specifically, our results are consistent with those indicat-
ing decreased occurrence of white matter hyperintensities in peo-
ple with higher education (Dufouil et al., 2003; Nebes et al.,
2006) and do suggest preferential sparing of white matter in this
group. The spatial localization of the education effect is very
similar to that observed in previous work after exercise inter-
vention (Colcombe et al., 2006). It is known that anterior white
matter is selectively sensitive to age-related declines, so any effect
of education on white matter was expected to show the greatest
effect in this area. Previous work on exercise interventions in-
dicates that it is possible to partially reverse this decline, whereas
the current study shows that education may be related to the
preservation of this area.
Due to the fact that the formal education used here as a pre-
dictor is completed long before adults reach an old age, longi-
tudinal studies are difficult to perform. Therefore, it is not easy to
determine whether education may be responsible for the pre-
served white matter integrity we reported or whether the pro-
pensity for more established frontal connections provides for
greater scholastic aptitude. Current work on cognitive interven-
tion on at-risk, low-socioeconomic status older adults (Carlson
et al., in press) suggests that improvements in neuropsychological
performance can be gained longitudinally. It would be useful to
expand this work to include structural brain measures to assess
whether white matter sparing and/or recovery accompanies these
functional changes.
It is also important to consider that higher levels of education
could be a proxy for a host of other influences that may affect
Anatomical correlates of aging, fitness, and education 831
Table 6. Correlations and Beta Weights of Neuropsychological Measures with Fitness and Years of Education for the Older Adults
Variable
Raw correlations
VO2max Education VO2max b Weight Education b Weight Multiple Correl.
Age � .25 � .16 F F FGender � .32n .02 F F FVO2 1.00 .56n F F FEducation .56n 1.00 F F FmMMS .42n .04 .58n � .31+ .50n
WAIS-R Vocab. .44n .52n .21 .38n .55n
Forward Digit .10 � .01 .13 � .08 .13Backward Digit .06 .18 � .04 .23 .24Boxes .15 .29+ .02 .29 .31Trail-A � .13 � .05 � .13 .01 .15Trail-B � .28 � .32+ � .07 � .29 .37Digit Copying .30+ .29+ .26 .10 .43Digit Symbol .26 .28 .33 .08 .48+
Letter Comp. (3, 6, 9) .28+ .29+ .18 .16 .36OSPAN .19 .19 .28 .01 .36Raven’s .32n .18 .19 .11 .49n
Verbal Fluency (CFL) % � .11 .12 � .14 .21 .32Alternate .39n .33+ .29 .17 .41WCSTCategories completed .34n .23 .15 .13 .44Number of trials � .40n � .46n � .20 � .34+ .50n
Correct .02 � .06 � .16 .00 .48+
Errors � .44n � .45n � .10 � .37n .61n
Perseverative resp. � .32n � .40n � .01 � .39n .48+
Perseverative errors � .33n � .43n .03 � .44n .53n
Nonpers. errors � .43n � .36n � .19 � .21 .56n
% perseverative errors � .25 � .37n .12 � .44n .50n
Completion first category � .30+ � .29+ � .18 � .19 .34% conceptual level resp. .40n .38n .07 .30+ .58n
Failure to maintain set � .22 .00 � .46n .24 .38Learning to learn .20 .06 � .13 � .02 .20
Notes. Age and gender are included in the model as predictors. Alternate: Alternate Category test. Letter Comp (3, 6, 9): Letter completion (combinedscore for 3,6,9). WCST: Wisconsin Card Sorting Test.npo.05; +po.10 (note that these correlations would all be significant if one-tailed tests were used, whichwould be justified here given that all our a priorihypotheses were unidirectional).
brain function and structure, such as improved access to health
care, better diet, and less stressful living environments. Irrespec-
tive of the possible origins of these effects, the identification of
structural correlates of higher education is an intriguing result.
The neuropsychological tests provide a behavioral parallel to
the structural analyses. Our data indicate that high fitness scores
predicted improved performance on a wide range of cognitive
tasks (Tables 4–6, raw correlations). This evidence supports pre-
viously published human behavioral data indicating that higher
cognitive performance is associated with higher aerobic fitness
(Churchill et al., 2002; Colcombe & Kramer, 2003; Hall, Smith,
& Keele, 2001). These data are also consistent with work done
within the animal literature providing evidence for improved
learning and memory with enriched environments, which lead
animals to engage in increased motor and exploratory behaviors
(Anderson et al., 2000; Churchill et al., 2002; Greenough et al.,
1972). In a manner similar to aerobic fitness, higher levels of
education were associated with better performance on several
neuropsychological tests (Tables 4–6).
Even though fitness and years of education were significantly
correlated, the volumetric analyses controlled for the other vari-
able, as well as for age and gender. Therefore, it was possible to
investigate the independent structural contributions of the two
factors. In the same way, the neuropsychological test results also
supported the existence of dissociations between the effects of
fitness and education, when the other factors were controlled for
(Tables 6 and 7, regression analyses). Specifically, the behavioral
data indicate that the independent effects of education are most
evident in tests highlighting flexibility (the WCST scales) and
semantic knowledge (WAIS-R vocabulary). These scales may be
closely related to the concept of cognitive reserve, which is
thought to be increased as a function of education (Stern, 2002).
In contrast, the greatest influence of fitness appears to be on the
mMMS scale, a measure of overall cognitive performance in
older adults. This suggests that, whereas education may boost
potential resources, fitness may in fact influence the way in which
these cognitive resources are actually deployed in everyday tasks.
This would suggest that these two factors may exert a comple-
mentary role in the preservation of cognitive function with ag-
ingFand that intervention strategies emphasizing both may be
particularly beneficial.
This study does have a number of potential limitations that
should be taken into account when interpreting and/or general-
izing our findings. For example, the cross-sectional nature of this
study may help to explain differences in results between this and
previous reports (Colcombe et al., 2006) that have shown aerobic
effects on both white and gray matter. The within-subject design
used by Colcombe and colleagues provides greater power to
832 B.A. Gordon et al.
Table 7. Summary of the Factor Analysis of the Neuropsychological Tests and of the Related Multiple Regression Analyses
Loadings 4.50Factor
Variable 1 2 3 4 5 6 7 8
mMMS 0.87WAIS-R Vocab. 0.56Forward Digit 0.80Backward Digit 0.83Boxes 0.82Trail-A � 0.63Trail-B 0.63 0.55Digit Copying 0.83Digit Symbol 0.81Letter Comp 3 0.67Letter Comp 6 0.75Letter Comp 9 0.73OSPAN 0.68Raven’s � 0.87Verbal Fluency (CFL) %AlternateWCSTCategories completed 0.84Number of trials � 0.63Correct 0.77Errors � 0.91Perverative resp. � 0.93Perseverative errors � 0.94Nonperseverative errors � 0.68 � 0.51% perseverative errors � 0.94Completion first category � 0.53% conceptual level resp. 0.89Failure to maintain set 0.78Learning to learn 0.89
Beta weightsAge � 0.12 � 0.19 0.10 0.10 � 0.32 � 0.04 � 0.10 � 0.24Gender � 0.30 0.20 0.14 � 0.02 � 0.44 0.20 0.12 0.43
VO2 � 0.16 0.22 � 0.03 � 0.17 � 0.32 0.19 0.58 0.02Education 0.48 � 0.01 0.01 0.23 � 0.03 � 0.02 � 0.22 � 0.32
Multiple R 0.52 0.33 0.20 0.20 0.54 0.23 0.48 0.52
Notes. Beta weights in bold indicate po.05, and in italics po.10.

detect relatively small anatomical changes. Thus a longitudinal
study would be able to detect relatively localized but small
changes in white matter whereas a cross-sectional study would
have more difficulty.
In the examination of the effects of fitness, secondary medical
conditions such as mild hypertension could influence the results.
However, our stringent screening process and the medical release
requirements should have limited some of these potential
Anatomical correlates of aging, fitness, and education 833
A
8.4Z-score
Z-score
Z-score
CSF: O>Y
e 2.3 7.5Grey: Y>O
White: Y>O - 2.3 7.0
2.3 5.1Z-scoreWhite: O>Y
B
Grey: Y>O
CSF: O>Y
White: Y>O
White: O>Y
2.3
Figure 1.A: Partial-volumemaps depicting the comparisons between younger and older adults. Row 1: CSF; colors identify regions
in which CSF partial volume increases as a function of age. Row 2: Grey matter; colors identify regions in which gray matter partial
volume decreases as a function of age. Rows 3 and 4: White matter; colors identify regions in which white matter partial volume
decreases (row 3) or increases (row 4) as a function of age. All images are presented in radiological convention. Y: young; O: old.
Saggital slices: MNI coordinates x: 20 (right), 0 (medial), � 20 (left); Coronal slices: y: � 38 (posterior), � 18 (middle), 2 (anterior);
Horizontal slices: z: 2 (inferior), 18 (middle), 38 (superior). B: Three-dimensional renderings of the effects in A, also shown in
radiological convention.
confounds. In fact, these screening and recruiting procedures
are likely to reduce the sizes of possible fitness or education
effects, as both variables have reduced ranges in our samples
compared to the overall population. Notwithstanding these
reduced ranges, however, significant contributions of both fac-
tors were found.
The relatively small sample size in this study also poses an-
other limitation, weakening the power of statistical inference.
834 B.A. Gordon et al.
Age Effects Within the Old Adults
A
Z-score 1.96CSF
Age Effects Within the Old Adults
B
CSF
Grey
White
4.90
Z-score 1.96Grey 4.30
Z-score 1.96White 4.10
Figure 2. A: Partial-volume maps depicting the analysis of age-effects within the older population. Row 1: CSF; colors identify
regions in which CSF partial volume increases as a function of age. Row 2: Grey matter; colors identify regions in which gray matter
partial volume decreases as a function of age. Row 3: White matter;: colors identify regions in which white matter partial volume
decreases as a function of age. All images are presented in radiological convention. Saggital slices: MNI coordinates x: 20 (right), 0
(medial), � 20 (left); Coronal slices: y: � 38 (posterior), � 18 (middle), 2 (anterior); Horizontal slices: z: 2 (inferior), 18 (middle), 38
(superior). B: Three-dimensaional renderings of the effects in A, also shown in radiological convention.

The number of individuals included is not as large as other stud-
ies (Good et al., 2001b). However, a sample size smaller than 40
subjects is not uncommon in the literature (Buskova, Vaneckova,
Sonka, Seidl, & Nevsimalova, 2006; Holzapfel, Barnea-Goraly,
Eckert, Kesler, & Reiss, 2006). Although the current sample size
is more than sufficient to detect robust differences, it may lead to
a small reduction in statistical power compared to some previous
work (Colcombe et al., 2003, 2006). In the current study, the
Anatomical correlates of aging, fitness, and education 835
Unique Effects of Fitness and Education Within the Old AdultsA
Fitness with age, education and gender removed
Education with age, fitness and gender removed
2.3 4.5Z-score
2.3 4.5Z-score
Unique Effects of Fitness and Education Within the Old Adults B
Fitness with age, education and gender removed
Grey
Education with age, fitness and gender removed
White
Figure 3.A:Graymatter partial-volumemaps depicting the unique contributions of fitness (row 1)Fcolors identify regions inwhich
gray matter increases as a function of fitness across all older adults, with education, gender, and age as variables in the modelFand
education (row 2)Fcolors identify regions in which white matter increases as a function of education across the older adults, with
fitness, gender, and age as variables in the model. All images are presented in radiological convention. Saggital slices: MNI
coordinates x: 20 (right), 0 (medial), � 20 (left); Coronal slices: y: � 38 (posterior), � 18 (middle), 2 (anterior); Horizontal slices: z:
2 (inferior), 18 (middle), 38 (superior). B: Three-dimensional renderings of the effects in A, also shown in radiological convention.

effect of fitness on gray matter found by Colcombe and col-
leagues (2003, 2006) was replicated, but the fitness effects on
white matter may have remained subthreshold. Further investi-
gation and generalization of the effects of fitness and education
will benefit from a larger sample size. Notwithstanding these
possible limitations, the results presented in this article advance
our understanding of the aging brain. This work reaffirms the
behavioral and volumetric effects associated with aerobic fitness.
It expands upon this work to also show that education impacts
not only cognitive measures, but also white matter integrity.
Although it has much support in the literature (Habeck et al.,
2003; Richards & Deary, 2005; Scarmeas et al., 2003) the ‘‘cog-
nitive reserve’’ hypothesis is still debated (Christensen et al., 2007).
These results add support to this idea that higher educationmay be
predictive of preserved brain tissue. In the future we hope to di-
rectly examine the interaction of such factors as socioeconomic
status, verbal IQ, as well as years of education. A composite score
based upon these three would potentially allow us to directly ex-
amine the cognitive reserve hypothesis in a volumetric manner.
This work goes beyond purely structural implications. For
example, it may be possible to directly correlate age-related
structural changes to changes in patterns of blood flow in fMRI
and other functional imaging studies (Buckner et al., 2004). The
anatomical differences between the higher- and lower-fit older
adults, as well as the effects of education, suggest that the changes
in functional activation observed in older adults may be related,
at least in part, to specific structural changes in the brain. Re-
search has shown that, compared to less fit older adults, aero-
bically fit older adults exhibit greater activation in brain areas
related to attention and reduced activation in brain areas related
to conflict (Colcombe et al., 2004). Similarly, Czernochowski
and colleagues (in press) showed that increased brain activity in
highly educated older adults, compared to older adults with
lower education, was associated with preserved memory perfor-
mance.
In conclusion, this article takes a novel approach to exam-
ining the effects of both education and fitness in aging. Simul-
taneous comparison of the effects of these two factors allowed us
to differentiate their influence on brain anatomy and cognitive
performance. Further research efforts may be directed toward
establishing cause–effect relationships between cardiovascular
fitness, brain anatomy, and function through fitness intervention
studies and to further clarify the potential effects of education
through cognitive intervention studies.
REFERENCES
American College of Sports Medicine. (1991). Guidelines for ExerciseTesting and Prescription. Philadelphia: Lea & Febiger.
Anderson, B. J., Rapp, D. N., Baek, D. H., McCloskey, D. P., Coburn-Litvak, P. S., & Robinson, J. K. (2000). Exercise influences spatiallearning in the radial armmaze.Physiology and Behavior, 70, 425–429.
Ashburner, J., & Friston, K. J. (2000). Voxel-based morphometry: Themethods. NeuroImage, 11, 805–821.
Ashburner, J., & Friston, K. J. (2001). Why voxel-based morphometryshould be used. NeuroImage, 14, 1454–1462.
Beck, A. T., Steer, R. A., & Brown, G. K. (1996). Manual for the BeckDepression Inventory (2nd ed). San Antonio: The Psychological Cor-poration.
Benton, A., & Hamsher, K. (1976). Multilingual aphasia exam. IowaCity: University of Iowa Press.
Bookstein, F. L. (2001). Voxel-based morphometry should not be usedwith imperfectly registered images. NeuroImage, 14, 1238–1243.
Botvinick, M. M., Nystrom, L. E., Fissel, K., Carter, C., & Cohen, J. D.(1999). Conflict monitoring versus selection-for-action in anteriorcingulate cortex. Nature, 402, 179–181.
Brown, J., Cooper-Kuhn, C. M., Kempermann, G., Van Praag, H.,Winkler, J., Gage, F. M., et al. (2003). Enriched environmentand physical activity stimulate hippocampal but not olfactorybulb neurogenesis. European Journal of Neuroscience, 17, 2042–2046.
Buckner, R. L., Head, D., Parker, J., Fotenos, A. F., Marcus, D., Mor-ris, J. C., et al. (2004). A unified approach for morphometric andfunctional data analysis in young, old, and demented adults usingautomated atlas-based head size normalization: Reliability and val-idation against manual measurement of total intracranial volume.NeuroImage, 23, 724–738.
Buskova, J., Vaneckova, M., Sonka, K., Seidl, Z., & Nevsimalova, S.(2006). Reduced hypothalamic gray matter in narcolepsy with cat-aplexy. Neuro Endocrinology Letters, 27, 769–772.
Carlson, M. C., Saczynski, J. S., Rebok, G. W., McGill, S., Tielsch, J.,Seeman, T., et al. (in press) Experience corps: Effects of a pilot trial ofa senior service program on executive and memory functions in olderadults. Journal of Gerontology.
Carro, E., Trejo, J. L., Busiguina, S., & Torres-Aleman, I. (2001). Cir-culating insulin-like growth factor I mediates the protective effects ofphysical exercise against brain insults of different etiology and anat-omy. Journal of Neuroscience, 21, 5678–5684.
Christensen, H., Anstey, K. J., Parslow, R. A., Maller, J., Mackinnon,A., & Sachdev, P. (2007). The brain reserve hypothesis, brain atrophyand aging. Gerontology, 53, 82–95.
Churchill, J. D., Galvez, R., Colcombe, S., Swain, R. A., Kramer, A. F.,&Greenough,W. T. (2002). Exercise, experience and the aging brain.Neurobiology of Aging, 23, 941–955.
Coffey, C. E., Saxton, J. A., Ratcliff, G., Bryan, R. N., & Lucke,J. F. (1999). Relation of education to brain size in normalaging: Implications for the reserve hypothesis. Neurology, 53,189.
Colcombe, S. J., Erickson, K. I., Raz, N., Webb, A. G., Cohen, N. J.,McAuley, E., et al. (2003). Aerobic fitness reduces brain tissue loss inaging humans. Journal of Gerontology: Biological Sciences, MedicalSciences, 58A, 176–180.
Colcombe, S. J., Erickson, K. I., Scalf, P. E., Kim, J. S., Prakash, R.,McAuley, E., et al. (2006). Aerobic exercise training increases brainvolume in aging humans. Journal of Gerontology: Medical Sciences,61, 1166–1170.
Colcombe, S., & Kramer, A. F. (2003). Fitness effects on the cognitivefunction of older adults: A meta-analytic study. Psychological Sci-ence, 14, 125–130.
Colcombe, S. J., Kramer, A. F., Erickson, K. I., Scalf, P., McAuley, E.,Cohen, N. J., et al. (2004). Cardiovascular fitness, cortical plasticity,and aging. Proceedings of the National Academy of Sciences, USA,101, 3316–3321.
Colello, R. J., Devey, L. R., Imperato, E., & Pott, U. (1995). The chro-nology of oligodendrocyte differentiation in the rat optic nerve: Ev-idence for a signaling step initiating myelination in the CNS. Journalof Neuroscience, 15, 7665–7672.
Corrigan, J. D., & Hinkeldey, N. S. (1987). Relationships between partsA and B of the Trail Making Test. Journal of Clinical Psychology, 43,402–409.
Cotman, C. W., & Berchtold, N. C. (2002). Exercise: A behavioral in-tervention to enhance brain health and plasticity. Trends inNeuroscience, 25, 295–301.
Czernochowski, D., Fabiani,M., & Friedman, D. (in press) Use it or loseit? SES mitigates age-related decline in a recency/recognition task.Neurobiology of Aging.
Davatzikos, C., & Resnick, S. M. (2002). Degenerative age changes inwhite matter connectivity visualized in vivo using magnetic resonanceimaging. Cerebral Cortex, 12, 767–771.
Draganski, B., Gaser, P., Busch, V., Schuierer, G., Bogdahn,U., &May,A. (2004). Neuroplasticity: Changes in grey matter induced by train-ing. Nature, 427, 311–312.
Dufouil, C., Alperovitch, A., & Tzourio, C. (2003). Influence of educa-tion on the relationship between white matter lesions and cognition.Neurology, 60, 831–836.
836 B.A. Gordon et al.
Dustman, R. E., Ruhling, R. O., Russell, E.M., Shearer, D. E., Bonekat,H. W., Shigeoka, J. W., et al. (1984). Aerobic exercise training andimproved neuropsychological function of older individuals. Neurobi-ology of Aging, 5, 35–42.
Engle, R. W., Tuholski, S. W., Laughlin, J. E., & Conway, A. R. A.(1999). Working memory, short-term memory, and general fluid in-telligence: A latent-variable approach. Journal of Experimental Psy-chology: General, 128, 309–331.
Eriksen, B. A., & Eriksen, C. W. (1974). Effects of noise letters upon theidentification of target letter in a non-search task. Perception andPsychophysics, 16, 143–149.
Esiri, M. (1994). Dementia and normal aging: Neuropathology. In F. A.Huppert, C. Brayne, &D.W. O’Connor (Eds.),Dementia and normalaging (pp. 385–436). Cambridge, England: Cambridge UniversityPress.
Fabiani, M., Brumback, C., Gordon, B., Pearson, M., Lee, Y., Kramer,A., et al. (2004). Effects of cardiopulmonary fitness on neurovascularcoupling in visual cortex in younger and older adults. Psychophys-iology, 41, S19.
Fleischman, D. A., Wilson, R. S., Gabrieli, J. D. E., Bienias, J. L., &Bennett, D. A. (2004). A longitudinal study of implicit and explicitmemory in old persons. Psychology and Aging, 19, 617–625.
Good, C. D., Johnsrude, I., Ashburner, J., Henson, R. N. A., Friston,K., & Frackowiak, R. S. J. (2001a). Cerebral asymmetry and theeffects of sex and handedness on brain structure: A voxel-based mo-rphometric analysis of 465 normal adult human brains. NeuroImage,14, 685–700.
Good, C. D., Johnsrude, I. S., Ashburner, J., Henson, R. N. A., Friston, K.J., &Frackowiak,R. S. J. (2001b). A voxel-basedmorphometric study ofageing in 465 normal adult human brains. NeuroImage, 14, 21–36.
Greenough, W. T., Madden, T. C., & Fleischmann, T. B. (1972). Effectsof isolation, daily handling, and enriched rearing on maze learning.Psychonomic Sciences, 1, 279–280.
Greenough, W. T., & Volkmar, F. R. (1973). Pattern of dendriticbranching in occipital cortex of rats reared in complex environments.Experimental Neurology, 40, 491–504.
Gunning-Dixon, F. M., & Raz, N. (2003). Neuroanatomical correlatesof selected executive function in middle-aged and older adults: Aprospective MRI study. Neuropsychologia, 41, 1929–1941.
Habeck, C., Hilton, H. J., Zarahn, E., Flynn, J., Moeller, J., & Stern, Y.(2003). Relation of cognitive reserve and task performance to ex-pression of regional covariance networks in an event-related study ofnon-verbal memory. NeuroImage, 20, 1723–1733.
Hall, C. D., Smith, A. L., & Keele, S. W. (2001). The impact of aerobicactivity on cognitive function in older adults: A new synthesis basedon the concept of executive control. European Journal of CognitivePsychology, 13, 279–300.
Heaton, R. K. (1981). Wisconsin card sorting test manual. Odessa, FL:Psychological Assessment Resources.
Hillman, C. H., Belopolsky, A. V., Snook, E. M., Kramer, A. F., &McAuley, E. (2004). Physical activity and executive control: Impli-cations for increased cognitive health during older adulthood. Re-search Quarterly of Exercise and Sport, 75, 176–185.
Holzapfel, M., Barnea-Goraly, N., Eckert,M. A., Kesler, S. R., & Reiss,A. L. (2006). Selective alterations of white matter associated withvisuospatial and sensorimotor dysfunction in Turner syndrome. TheJournal of Neuroscience, 26, 7007–7013.
Ince, P. (2001). Pathological correlates of late-onset dementia in a multi-center community-based population in England and Wales. Lancet,357, 169–175.
Jack, C. R. Jr., Petersen, R. C., O’Brien, P. C., & Tangalos, E. G. (1992).MR-based hippocampal volumetry in the diagnosis of Alzheimer’sdisease. Neurology, 42, 183–188.
Jenkinson, M., Bannister, P. R., Brady, J. M., & Smith, S. M. (2002).Improved optimization for the robust and accurate linear registrationand motion correction of brain images. NeuroImage, 17, 825–841.
Jenkinson, M., & Smith, S. (2001). A global optimization method forrobust affine registration of brain images.Medical Image Analysis, 5,143–156.
Kemper, T. L. (1994). Neuroanatomial and neuropathological changesduring aging and in dementia. In M. L. Albert & E. J. E. Knoepfel(Eds.), Clinical neurology of aging (2nd ed., pp. 3–67). New York:Oxford University Press.
Kendrick, D. C., &Watts, G. D. (1999). The Kendrick Assessment Scalesof Cognitive Ageing. Windsor: NFER-Nelson.
Kohler, S., Black, S. E., Sinden, M., Szekely, C., Kidron, D., Parker, J.L., et al. (1998). Memory impairments associated with hippocampalversus parahippocampal-gyrus atrophy: An MR volumetry study inAlzheimer’s disease. Neuropsychologia, 36, 901–914.
Kramer, A. F., Bherer, L., Colcombe, S., Dong, W., & Greenough, W.T. (2004). Environmental influences on cognitive and brain plasticityduring aging. Journal of Gerontology: Medical Sciences, 59A, 940–957.
Kramer, A. F., Hahn, S., Cohen, N. J., Banich, M. T., McAuley, E.,Harrison, C. R., et al. (1999). Aging, fitness, and neurocognitivefunction. Nature, 400, 418–419.
Mayeux, R., Stern, Y., Rosen, J., & Leventhal, J. (1981). Depression,intellectual impairment and Parkinson’s disease. Neurology, 31, 645–650.
McAuley, E., Kramer, A. F., & Colcombe, S. J. (2004). Cardiovascularfitness and neurocognitive function in older adults: A brief review.Brain Behavioral Immunology, 18, 214–220.
Morse, C. K. (1993). Does variability increase with age? An archivalstudy of cognitive measures. Psychology and Aging, 8, 156–164.
Musen, G., Lyoo, I. K., Sparks, C. R., Weinger, K., Hwang, J., Ryan, C.M., et al. (2006). Effects of type 1 diabetes on gray matter density asmeasured by voxel-based morphometry. Diabetes, 55, 326–333.
Nebes, R. D., Meltzer, C. C., Whyte, E. M., Scanlon, J. M., Halligan, E.M., Saxton, J. A., et al. (2006). The relation of white matter hyper-intensities to cognitive performance in the normal old: Educationmatters. Aging, Neuropsychology, and Cognition, 13, 326–340.
Neeper, S. A., Gomez-Pinilla, F., Choi, J., & Cotman, C. (1995). Ex-ercise and brain neurotrophins. Nature, 373, 109.
Park, D. C., Davidson, N., Lautenschlager, G., Smith, A. D., Smith, P.,& Hedden, T. (2002). Models of visuospatial and verbalmemory across the adult life span. Psychology and Aging, 17, 299–320.
Pujol, J., Soriano-Mas, C., Alonso, P., Cardoner, N., Menchon, J. M.,Deus, J., et al. (2004). Mapping structural brain alterations in ob-sessive-compulsive disorder. Archives of General Psychiatry, 61, 720–730.
Raven, J. C., Court, J. H., & Raven, J. (1977). Standard progressivematrices. London: HK Lewis.
Raz, N. (2002). Aging of the brain and its impact on cognitive perfor-mance. In F. I. M. Craik & T. A. Salthouse (Eds.), The handbook ofaging and cognition (pp. 1–90). Mahwah, NJ: Erlbaum.
Raz, N., Gunning-Dixon, F.M., Head, D., Dupuis, J. H., &Acker, J. D.(1998). Neuroanatomical correlates of cognitive aging: Evidence fromstructural magnetic resonance imaging.Neuropsychology, 12, 95–114.
Richards, M., & Deary, I. J. (2005). A life course approach to cognitivereserve: A model for cognitive aging and development? Annals ofNeurology, 58, 617–622.
Rossi, C., Angelucci, A., Costantin, L., Braschi, C., Mazzantini, M.,Babbini, F., et al. (2006). Brain-derived neurotrophic factor (BDNF)is required for the enhancement of hippocampal neurogenesis fol-lowing environmental enrichment. European Journal of Neuroscience,24, 1850–1856.
Sachdev, P., Brodaty, H., Cheang, D., & Cathcart, S. (2000). Hippo-campus and amygdala volumes in elderly schizophrenic patients asassessed by magnetic resonance imaging. Psychiatry and ClinicalNeurosciences, 54, 105.
Salthouse, T. A. (1992). Influence of processing speed on adult agedifferences in working memory. Acta Psychologica, 79, 155–170.
Scarmeas, N., Zarahn, E., Anderson, K. E., Hilton, J., Flynn, J., VanHeertum, R. L., et al. (2003). Cognitive reserve modulates functionalbrain responses during memory tasks: A PET study in health youngand elderly subjects. NeuroImage, 19, 1215–1227.
Sliwinski, M., & Buschke, H. (1999). Cross-sectional and longitudinalrelationships among age, cognition and processing speed. Psychologyand Aging, 14, 18–33.
Smith, S. (2002). Fast robust automated brain extraction. Human BrainMapping, 17, 143–155.
Smith, S. M., Jenkinson, M., Woolrich, M. W., Beckmann, C. F., Be-hrens, T. E. J., Johansen-Berg, H., et al. (2004). Advances in func-tional and structural MR image analysis and implementation as FSL.NeuroImage, 23, 208–219.
Snowdon, D. A., Greiner, L. H., &Markesbery,W. R. (2000). Linguisticability in early life and the neuropathology of Alzheimer’s disease andcerebrovascular disease: Findings from the nun study. Annals of theNew York Academy of Sciences, 903, 34–38.
Anatomical correlates of aging, fitness, and education 837

Spirduso, W. W. (1975). Reaction and movement time as a function ofage and physical activity level. Journal of Gerontology, 30, 18–23.
Spirduso, W. W., & Clifford, P. (1978). Replication of age and physicalactivity effects on reaction and movement time. Journal of Gerontol-ogy, 1, 26–30.
Stern, Y. (2002). What is cognitive reserve? Theory and research appli-cation of the reserve concept. Journal of the International Neuropsy-chological Society, 8, 448–460.
Terry, R. D., DeTeresa, R., & Hansen, L. A. (1987). Neocortical cellcounts in normal human adult aging. Annals of Neurology, 21, 530–539.
Vaillant, G. E., & Mukamal, K. (2001). Successful aging. AmericanJournal of Psychiatry, 158, 839–847.
van Pragg, H., Kempermann, G., & Gage, F. H. (1999). Running in-creases cell proliferation and neurogenesis in the adult mouse dentategyrus. Nature Neuroscience, 2, 266–270.
Wechsler, D. (1981). Wechsler Adult Intelligence Scale-Revised. San An-tonio: The Psychological Corporation.
West, R. L. (1996). An application of prefrontal cortex function theory tocognitive aging. Psychological Bulletin, 120, 272–292.
Wright, I.C, McGuire, P. K., Poline, J. B., Travere, J. M., Murray, R.M., Frith, C. D., et al. (1995). A voxel-basedmethod for the statisticalanalysis of gray and white matter density applied to schizophrenia.NeuroImage, 170, 406–410.
Zhang, Y., Brady, M., & Smith, S. (2001). Segmentation of brain MRimages through a hidden Markov random field model and the ex-pectation maximization algorithm. IEEE Transactions on MedicalImaging, 20, 45–57.
(Received May 4, 2007; Accepted October 22, 2007)
838 B.A. Gordon et al.