Neonatal Behavioral Assessment Scale Performance in ...
15
J. Great Lakes Res. 22(2): 198-212 Internal. Assoc. Great Lakes Res.. 1996 Neonatal Behavioral Assessment Scale Performance in Humans Influenced by Maternal Consumption of Environmentally Contaminated Lake Ontario Fish Edward Lonky, Jacqueline Reihman,Thomas DarviH, Joseph Mather Sr n ' and Helen Daly Center for Neurobehavioral Effects of Environmental Toxics and Department of Psychology State University of New York at Oswego Oswego. New York 13126 'Oswego County OB-CYN Practice ABSTRACT. Behavioral effects in neonates of their mothers' consumption of Lake Ontario fish were examined using the Neonatal Behavioral Assessment Scale (NBAS). Newboms of women who had con- sumed > 40 equivalent pounds offish were placed in a high-exposure group (n * I52\ those of women who had consumed < 40 equivalent pounds offish were placed in a low-exposure group (n * 243\ and offspring of women who reported having never eaten Lake Ontario fish comprised the control group (n » I64\ Assessments were given at 12-24 hours after birth, and again at 25-49 hours after birth. Despite relatively low levels offish consumption, newborns in the high-exposure group scored more poorly than those in both the low-exposure and control groups on the Reflex. Autonomies and Habituation clusters of the NBAS. No significant group differences wert found on the Orientation, Range of State. Regulation of Staff, or Motor clusters of the NBAS, nor did birth weight or head circumference differ between groups. These results represent the first replication and extension of the neonatal results of the Lake Michigan Maternal Infant Cohort study (Jacobson el aL 1994\ ( . INDEX WORDS: Behavioral teratogens. Great Lakes fish, human development. Neonatal Behavioral Assessment Scale. INTRODUCTION The Oswego Newborn and Infant Development Project was begun to examine the behavioral effects in human newboms, infants, and children of mater* nal consumption of Lake Ontario fish that were contaminated with a wide range of persistent toxic chemicals such as polychlorinated biphenyls (PCBs), hexachlorobenzene (HCBK polychlorinated dibenzo-p-dioxins, dieldrin, lindane, chlordane, cadmium, mercury, and mirex. Located on the southeastern shore of Lake Ontario, Oswego County is a mecca for sport fishing. Data collected by Dawson and Brown (1989) and Vena (1992) in- dicated that the decade of the 1980s witnessed a dramatic increase in sport fishing in the area, with various surveys indicating upwards of 50% of an- glers eating some or all of the fish they caught. New York State Department of Health has pub- lished advisories that women of childbearing age should not consume Lake Ontario fish. Despite these advisories, a survey of 655 pregnant women in the Oswego area, conducted by the authors prior to the start of this study, indicated that 8.2% of the pregnant women reported eating large quantities of fish (over 26 Ibs in die past 6 years), with a total of 46% saying that they had eaten at least some fish from Lake Ontario. Since there exists a ban on commercial fishing, sport fishing accounts for all fish eaten from Lake Ontariot With very little known about the behavioral ef- fects in humans of the combination of chemicals found in Lake Ontario fish, and with our knowledge that women of childbearing age were being exposed to these chemicals through consumption of sport fish, the researchers of the Oswego Newborn and Infant Development Project began a prospective longitudinal study, based on babies born between 1991 and 1994, whose mothers had or had not eaten 198
-
Upload
khangminh22 -
Category
Documents
-
view
8 -
download
0
Transcript of Neonatal Behavioral Assessment Scale Performance in ...
J. Great Lakes Res. 22(2): 198-212Internal. Assoc. Great Lakes Res.. 1996
Neonatal Behavioral Assessment Scale Performance in HumansInfluenced by Maternal Consumption of Environmentally
Contaminated Lake Ontario Fish
Edward Lonky, Jacqueline Reihman, Thomas DarviH, Joseph Mather Srn' and Helen DalyCenter for Neurobehavioral Effects of Environmental Toxics and Department of Psychology
State University of New York at OswegoOswego. New York 13126
'Oswego County OB-CYN Practice
ABSTRACT. Behavioral effects in neonates of their mothers' consumption of Lake Ontario fish wereexamined using the Neonatal Behavioral Assessment Scale (NBAS). Newboms of women who had con-sumed > 40 equivalent pounds offish were placed in a high-exposure group (n * I52\ those of womenwho had consumed < 40 equivalent pounds offish were placed in a low-exposure group (n * 243\ andoffspring of women who reported having never eaten Lake Ontario fish comprised the control group(n » I64\ Assessments were given at 12-24 hours after birth, and again at 25-49 hours after birth.
Despite relatively low levels offish consumption, newborns in the high-exposure group scored morepoorly than those in both the low-exposure and control groups on the Reflex. Autonomies and Habituationclusters of the NBAS. No significant group differences wert found on the Orientation, Range of State.Regulation of Staff, or Motor clusters of the NBAS, nor did birth weight or head circumference differbetween groups. These results represent the first replication and extension of the neonatal results of theLake Michigan Maternal Infant Cohort study (Jacobson el aL 1994\ (.INDEX WORDS: Behavioral teratogens. Great Lakes fish, human development. Neonatal BehavioralAssessment Scale.
INTRODUCTIONThe Oswego Newborn and Infant Development
Project was begun to examine the behavioral effectsin human newboms, infants, and children of mater*nal consumption of Lake Ontario fish that werecontaminated with a wide range of persistent toxicchemicals such as polychlorinated biphenyls(PCBs), hexachlorobenzene (HCBK polychlorinateddibenzo-p-dioxins, dieldrin, lindane, chlordane,cadmium, mercury, and mirex. Located on thesoutheastern shore of Lake Ontario, OswegoCounty is a mecca for sport fishing. Data collectedby Dawson and Brown (1989) and Vena (1992) in-dicated that the decade of the 1980s witnessed adramatic increase in sport fishing in the area, withvarious surveys indicating upwards of 50% of an-glers eating some or all of the fish they caught.New York State Department of Health has pub-lished advisories that women of childbearing age
should not consume Lake Ontario fish. Despitethese advisories, a survey of 655 pregnant womenin the Oswego area, conducted by the authors priorto the start of this study, indicated that 8.2% of thepregnant women reported eating large quantities offish (over 26 Ibs in die past 6 years), with a total of46% saying that they had eaten at least some fishfrom Lake Ontario. Since there exists a ban oncommercial fishing, sport fishing accounts for allfish eaten from Lake Ontariot
With very little known about the behavioral ef-fects in humans of the combination of chemicalsfound in Lake Ontario fish, and with our knowledgethat women of childbearing age were being exposedto these chemicals through consumption of sportfish, the researchers of the Oswego Newborn andInfant Development Project began a prospectivelongitudinal study, based on babies born between1991 and 1994, whose mothers had or had not eaten
198
Lakt Ontario Fish Ditt Influtncts in Ntwborn Human* 199
Lake Ontario fish. Fish consumption, analytical re-sults, and a large number of behaviors measured atbirth. 3. 6. 12. 24. 36. and 48 months, comprise theentire study. This paper reports Neonatal Behav-ioral Assessment Scale (NBAS) (Brazelton 1984)results for the sample of newborns. Tronick (1987)has argued that the NBAS is the most standardized,valid, and reliable assessment of the newborn, onethat assesses a wide range of interactive behaviorsand reflexes, and is the preferred tool for examiningthe effects of environmental agents on the newborn.This is especially true, Tronick notes, given that be-havioral environmental teratogens tend to have non-specific subtle effects on many areas of newbornfunctioning.
This study represents the first large scale replica-tion and extension of the only previous study de-signed to assess in humans the neurobehavioraleffects of consuming environmentally contaminatedfish. The Jacobsons and their colleagues (Jacobsonet al. 1984) found associations between amounts ofLake Michigan fish consumed by mothers and be-havioral changes on the NBAS in newborns. Infantsborn to mothers consuming the greatest amounts ofcontaminated fish showed: 1) more abnormallyweak reflexes; 2) greater motor immaturity andmore startles; and 3) less responsiveness to stimula-tion. Additionally, Rogan tt al. (1986), employing amaternal body burden estimate of prenatal PCB ex-posure, found more highly exposed infants to havemore abnormal reflexes and to be less responsive tostimulation on the NBAS, patterns similar to the Ja-cobson tt al. (1984) results. The present study wasdesigned to determine whether similar resultswould occur in babies bom between 1991 and 1994to mothers who had consumed Lake Ontario fish.
METHODS
Pregnant women were recruited during the physi-cian's required 20 week sonogram visit to the officeof the county's single obstetric practice. Thesewomen were initially interviewed between June.1991, and June, 1994. The sample represents low toMiddle socioeconomic status (SES), and almost allof the babies are Caucasian. While a total of 1.337out of 2,587 pregnant women volunteered (52%) tobe interviewed, only 602 women represent the pool°f participants for this study (only a random subsetof mothers who had not eaten Lake Ontario fish
included in the control group to be described
later, n » 584 were not included). By the time ofhospital delivery, attrition had reduced this numberto 559. An analysis of dropouts indicated that a vastmajority of the lost participants were due to namechanges not reported before the birth of the baby,participants who had moved from the area or whoreported that their schedules were too busy to con-tinue. Few babies in the sample exhibited risksymptoms at birth (e.g.. low Apgar scores (Apgar1953), low birthweight, premature birth, etc.), andthose who did were distributed evenly across thehigh, low. and no fish groups.
All pregnant women over 18 years of age andseeking prenatal care were given, during their firstprenatal visit, a brief description of the study by thenurse practitioner and a brochure providing addi-tional information. Two minors (17 yean of age)were also included in the sample, and parental con-sent was obtained in both instances. At the 20-weeksonogram visit, volunteers were interviewed by amember of the study Interview Team as to LakeOntario fish consumption, demographic and healthinformation, and a large number of potential con-founding variables (e.g.. other toxic exposure). In-formed consent was also obtained at this time. Fishconsumption interviews included data on species offish eaten. A chart of photographs was shown to aididentification. For each species, number of mealseaten, serving size (plastic samples of fish portionstogether with a baked potato and corn cob wereprovided on a plate), and method of preparationwere obtained, for the time period prior to and dur-ing pregnancy. Contaminant values vary as a func-tion of species of fish eaten, portion size, andmethod preparation, so data on these variables werecollected during the interviews. Because it wouldbe improper to equate a one pound salmon mealwith a one pound perch meal, relative PCB-equiva-tent weights were determined according to the fol-lowing algorithm:
Exposure * £ species (Z yean x f meals/yr xserving size x PCB load x preparation method)
species * fish species eatenyean » number of yean Lake On-
tario fish eaten from earlychildhood to index preg-nancy
4* meals/yr a estimated number of mealsconsumed each year
serving size * usual serving size (i.e., .25.50,or l.OOlbs)
200 Lanky et «L
PCS load s NYS Department of Envi-ronmental Conservationlevels
preparation method « calculated by consideringtrimming belly fat, skin re-moval, whole fish (chow-der) consumed.
For example, for a species given a value of 1.0 if itwas trimmed and the belly fat was removed, conta-minant loading was increased by .33 if the belly fatwas never trimmed, and by .33 if the skin was neverremoved, and by .25, .15, .05. and 0.0. respectively,if it was trimmed or belly fat removed rarely, some-times, usually, or always, respectively.
Using this algorithm, a one pound salmon or troutmeal, cooked with the belly fat and skin, was givena value of 1.66, and a one pound yellow perch mealfilleted with belly fat and skin removed was given avalue of 0.1. Group assignments were made basedon PCB-equivalent values derived by this method.PCBs were used as an indicator of toxic exposuredue to fish consumption, because the largest data-base the New York State Department of Environ-mental Conservation was able to provide us withwas for PCBs. Three groups were formed: high,low and a no fish eating control. Women assignedto the high fish group reported having eaten at least40 PCB-equivalent pounds in their lifetime(n 3 152). This cutoff was suggested, prior to datacollection, by J. Jacobson (personal communica-tion). Women assigned to the low fish group re-ported having eaten less than 40 PCB-equivalentpounds in their lifetime (n * 243). To have rela-tively equal numbers of women in the no fish con-trol and high fish eating groups, the followingstrategy for control group assignment was estab-lished. From the pool of women reporting no LakeOntario fish consumption, women were randomlyselected in numbers equal to the high fish group.This selection and assignment process occurredmonthly such that selected control group womenhad expected delivery dates in the same month a*their high fish group counterparts (control groupn » 164). At birth all participants were reinter-viewed updating information obtained at the sono-gram and covering the last portion of thepregnancy.
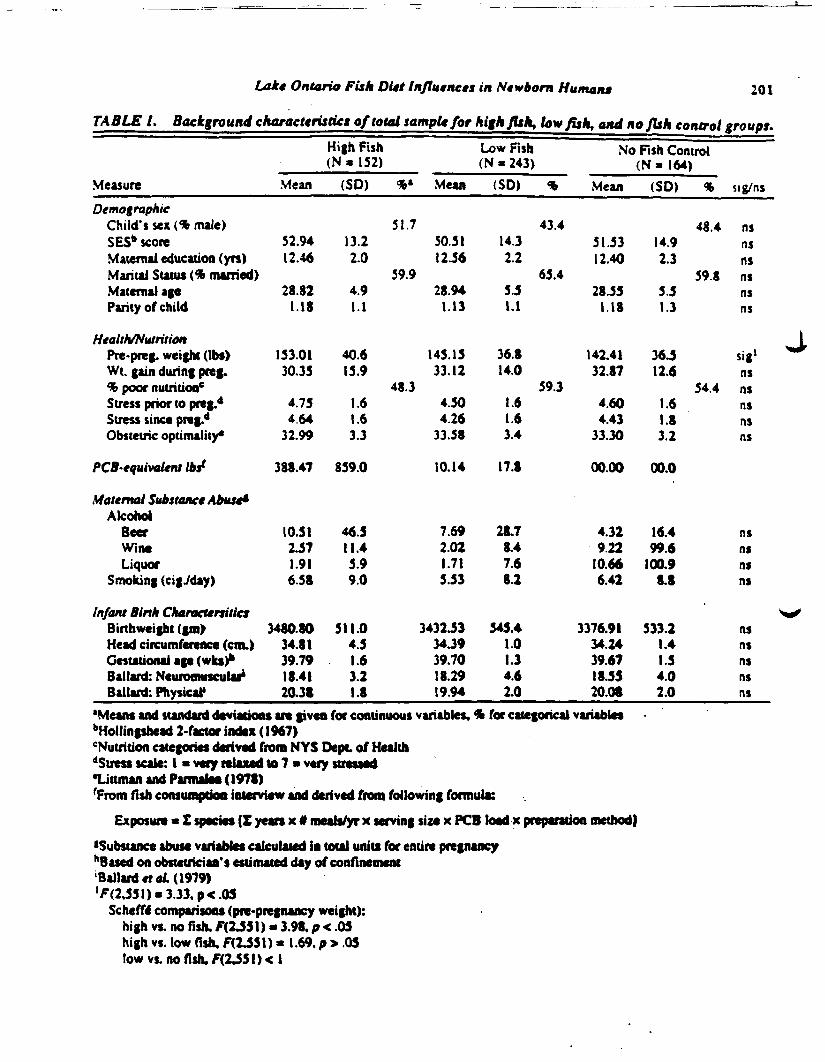
Subject characteristics are presented by groupmembership in Table 1. In comparing groups oncharacteristic variables, interval data were analyzedwith ANOVA and post hoc Scheffe* comparisons.
and categorical data were analyzed with X2 tests ofindependence.
As expected. Table I. reveals PCB-equivalentbody burden from Lake Ontario fish consumption.as estimated by a retrospective food frequency di-etary assessment, differed among groups. Results ofScheffe* tests (see Table 1) showed that Lake On-tario fish consumption was significantly higher inthe high fish group than the low and no fish groups.which did not differ significantly. Women in thehigh fish group report eating on average 388 PCB-equivalent pounds of Lake Ontario fish, which is amean of 2.3 salmon or trout meals per month (bellyfat trimmed and skin removed), for a mean of 1 6years. One 'other difference is revealed in compar-ing these groups. The pre-prcgnancy weight for thehigh fish group was significantly greater (on aver-age 10.6 Ibs more) than the no fish control group(no other groups differed). While statistically sig-nificant and controlled for in the analysis, it is notclinically significant All three groups were judgedto be slightly overweight as determined by NewYork State Department of Health guidelines. Thefact that there were no differences revealed either inweight gain during pregnancy or in nutritional vari-ables across the sample mitigates against the clini-cal significance of this statistical finding.
The Neonatal Behavioral Assessment Scale(NBAS) was administered 12-24 hn (Time 1) and25-48 hn (Time 2) after birth by • member of thestudy's Behavioral Assessment Team who wasblind to the babies' group assignment. They weretested in a separate quiet room, with controlledlighting and temperature. Sick babies (e.g., requir-ing incubation) were tested as soon as possible. Thesix behavioral and one reflex cluster scores definedby Lester ft at. (1982) were employed as the pre-ferred model of data redoctioB for the 28 behavioraland 20 reflex items on the NBAS. These sevenclusters are: 1> Reflex, which reflects the number ofabnormal elicited reflexes; 2) Range of State, whichincludes items relating to level of arousal; 3) Auto-nomies which includes items assessing physiologicresponses to stress: 4) Motor, which measures thequality of muscle tone and movement; 5) Orienta-tion, which includes attention to visual and auditorystimuli during alert states; 6) Regulation of State.which reflects the quality of the infants' responseswhen aroused and ability to control arousal in re-sponse to environmental stimulation; and 7) Habitu-
Lake Ontario Fish Diet Influences in Newborn Humans 201
TABLE I. Background characteristics of total sample for high fish, low fish, and nojlsh control groups.High Fish( N » I 5 2 )
MeasureDemographic
Child's sex (% male)SES» scoreMaternal education (yrs)Marital Status (* married)Maternal ageParity of child
Health/NutritionPre-pref. weight (lbs>Wt. gain during pref.% poor nutrition6
Stress prior to pref.4Stress since pref.4Obstetric optimally*
Mean
52.9412.46
28.821.18
153.0130.35
4.754.64
32.99
(SO)
13.22.0
4.91.1
40.615.9
1.61.63.3
%• Mean
51.750.5112.56
59.928.94
1.13
145.1533.12
48.34.504.26
33.58
Low Fish(N « 243)
(SO) %
43.414.32.2
65.45.51.1
36.814.0
59.31.61.63.4
No Fish Control(N- 164)
Mean
51.5312.40
28.551.18
142.4132.87
4.604.43
33.30
(SO)
14.92.3
5.51.3
36.512.6
1.61.83.2
% sig/ns
48.4 nsns(IS
59.8 nsnsns
sit'ns
54.4 nsnsnsns
PCB'tquivalent Ibs* 388.47 859.0 10.14 17.8 00.00 00.0
Maternal Substance Abuse*Alcohol
BeerWineLiquor
Smoking (cigJday)
Infant Birth ChanctersiticsBirth weight (gm>Head circumference (cm.)Gestational age (wits)*Ballard: Neuromusculai*Ballard: Physical1
10.512.571.916.58
3480.8034.8139.7918.4120.3S
46.511.45.99.0
511.04.51.63.21.8
7.692.021.715J3
3432.5334.3939.7018.2919.94
28.78.47.68.2
545.41.01.34.62.0
4.329.22
10.666.42
3376.9134.2439.6718.5520.08
16.499.6
100.98.8
•
533.21.41.54.02.0
nsnsnsns
nsnsnsnsns
•Means and standard deviations are given for continuous variables, * for categorical variables'Hollinfshead 2-factor index (1967)'Nutrition categories derived from NYS Dept, of HealthdStress scale: 1 * very relaxed to 7 * very stressed*Linman and Parmalee (1978)rFrom fish consumption interview and derived from following formula:
Exposure * £ species (Z yean x * meals/yr x serving size x PCB load x preparation method)(Substance abuse variables calculated in total units for entire pregnancy"Based on obstetrician's estimated day of confinement'Ballard etaL( 1979)lf(2,55l)«3.33.p<.OS
Scheffe* comparisons (pre-pregnancy weight):high vs. no fish, f(2J5l) - 3.98. p < .05high vs. low fish. fO55l)« 1.69, p > .05towvs.nofish.f(2J51)<l
202 Lanky et ai.
ation or Response Decrement, which includes itemsassessing the infants' reactivity to stimulation froma rattle, bell, light, and mild pin prick, followed byresponse decrement while in a light sleep state. Dueto the sleep-state dependent nature of many NBASitems, it is difficult to obtain complete data for aJIclusters. For example, Habituation items must be ad-ministered while the infant is in a light sleep, and
> Orientation can be assessed only when the infant isin a quiet alert state. Additionally, two items in theRegulation of State cluster (consolability and selfquieting behavior) require the newborn to be in cry*ing and active alert states, respectively. As a result,the NBAS was administered to 148 high fish groupnewboms at Time I. and 144 high fish group new-borns at Time 2; 230 low fish group newborns atTime I. and 228 low fish group newborns at Time 2;and 157 no fish control group newborns at Time I.and 158 no fish control group newboms at Time 2.
ReliabilityAuthor E.L. was certified to administer the
NBAS by members of the Boston Children's Hospi-tal NBAS training staff. He in turn trained three re-search scientists hired as part of the behavioralassessment team. Interobserver agreement was cal-culated prior to the beginning of data collection,and was defined in terms of agreements/(agree-ments + disagreements).
Reliabilities were calculated both allowing forthe 1-point discrepancy permitted in NBAS train-ing, and not allowing for said discrepancy. Allow-ing for the I-point discrepancy yielded aninterobserver agreement of 98%. Disallowing suchdiscrepancies yielded an interobserver agreement of92%. Six month and 1 year follow-up reliabilitieswere also conducted. Permitting the 1-point dis-crepancy yielded interobserver agreements of 95%and 98% for the 6 month and 1 year assessments re-spectively. Disallowing such discrepancies yielded6 month and I year reliabilities of 90% and 88% re-spectively.
Intra-subject reliability for fish consumption wascalculated for those women in the high and low fishgroups who gave birth to two babies included in thestudy population (N * 20 pairs), and were thusgiven the life-time fish-consumption interviewtwice. While interview data regarding fish con-sumption generated interval data and continuousmeasurement, data considered for this reliabilitycomponent were rank ordered. To argue that inorder to be regarded as reliable over time that
women be required to report exactly the sameamount of fish consumption before the birth of bothbabies appears overly restrictive. Rather, it is muchmore realistic to argue that women's relative order-ing of fish consumption at both interviews shouldremain relatively consistent. Therefore, a Spearmanrank order correlation was calculated on the ranksof lifetime fish consumption at both interviews forthe 20 pairs of data points. The resulting value, c, =.88. reveals substantial agreement in fish consump-tion estimated at the two interviews.
RESULTS AND DISCUSSIONRepresentativeness of Sample
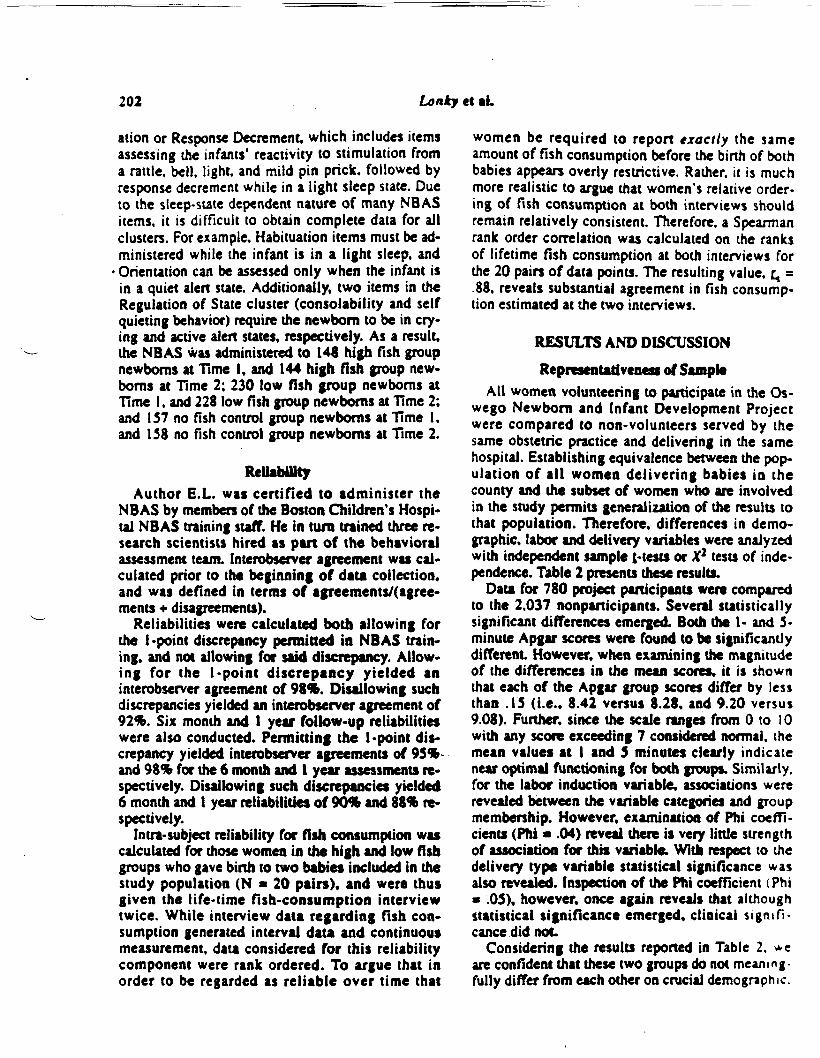
All women volunteering to participate in the Os-wego Newborn and Infant Development Projectwere compared to non-volunteers served by thesame obstetric practice and delivering in the samehospital. Establishing equivalence between the pop-ulation of all women delivering babies in thecounty and the subset of women who are involvedin the study permits generalization of the results tothat population. Therefore, differences in demo-graphic, labor and delivery variables were analyzedwith independent sample l-tests or X2 tests of inde-pendence. Table 2 presents these results.
Data for 780 project participants were comparedto the 2,037 nonparticipants. Several statisticallysignificant differences emerged. Both the I- and 5-minute Apgar scores were found to be significantlydifferent However, when examining the magnitudeof the differences in the mean scores, it is shownthat each of the Apgar group scores differ by lessthan .15 (i.e.. 8.42 versus 8.28. and 9.20 versus9.08). Further, since the scale ranges from 0 to 10with any score exceeding 7 considered normal, themean values at 1 and 5 minutes clearly indicatenear optimal functioning for both groups. Similarly,for the labor induction variable, associations wererevealed between the variable categories and groupmembership. However, examination of Phi coeffi-cients (Phi * .04) reveal there is very little strengthof association for this variable: With respect to thedelivery type variable statistical significance wasalso revealed. Inspection of the Phi coefficient (Phia .05), however, once again reveals that althoughstatistical significance emerged, clinical s ignif i -cance did not.
Considering the results reported in Table 2. *eare confident that these two groups do not meaning-fully differ from each other on crucial demographic.
..II___
Lake Ontario Fish Diet Influences in Newborn Human* 203
TABLE 2. Demographic, labor, and deliveryscorn for study tamplt and hospital population.
AgeParityGravidaApgar-l minApgar-5 min
Marital Status% single% married% other
StudySample1
(n » 780)Mean(SD)
25.39(5.19)U190.2I)2.59(1.49)8.42 ( .81)9.20 ( .56)
33.4%60.1%6.5%
HospitalPopulation2
(n » 2.037)Mean(SD)
24.99 (5.56)1.10(1.21)2.48(1.49)8.28(1.20)9.08 (0.94)
35.8%58.3%
5.9%
sig/nsnsnsns
sig"sig**
ns
Labor Induction%yes 8.1% 10.9%%no 91.9% 89.1% sig*
Complications% yes 27.6% 28.9%%no 72.4% 71.1% ns
Mtconium Staining% yes 14.7% 15.9%%no 85.3% 84.1% ns
Delivery Type% vaginal 717% 74.2%«cesarean 21.3% 25.8% sig*
Delivery Complications«yes 41.0% 42.8%%oo_________39.0% • 57.2% M•p < .05••/»<.01'The study sample subjects include extra no-fish eatenfor the first 2 years.2The hospital population was larger than the number ofsubjects we had access to at the 20 week sonograra.
labor or delivery variables. Therefore, the resultsmay be generalized to the entire population ofwomen delivering babies in this county.
Treatment ef Confoundlnf VariablesIn considering potential confounding variables, a
model was conceptualized where only those van-ables that represented influences temporally prior to
the birth of the child were considered as confoundsfor physical birth measures and neonatal behavioraltesting. Potential confounding variables were sub-mitted to principal components analyses. Compo-nent scores were then used to extract variance insubsequent analyses.
In total 58 variables were constructed from re-sponses to 139 separate items and were submittedto principal components analyses. The goal was toreduce this set of variables to a smaller number ofcomponents which would be linear functions of theoriginal variables. The components then, and notthe original variables were used to evaluate poten-tial confounds in subsequent analyses. This strategy Iallows, in fact encourages, the combinations ofvariables to be accounted for, and is considered to.be a rigorous, conservative method for the treat-ment of a large number of potentially confoundingvariables.
Data for all subjects were used to construct thecomponent scores. Both eigenvalues (Kaiser I960)and scree plots (Cattell 1966, Hakstian tt at. 1982)were used as guides in determining final componentstructure. Standard varimax rotations were employed.
A strategy was devised where three separatecomponents analyses were conducted. Decisionrules were constructed to include like variables ineach analysis. In general, the variables eligible forinclusion in the initial set of components were Urn-ited to demographic concerns (e.g., age, height.weight. SES. education, nutrition, stress, etc.).second components analysis focused on substancesconsumed during pregnancy (e.g., caffeine, alcohol,tobacco products, medications, etc.). chronic med-ical conditions (e.g. asthma, heart disease, diabetes,rashes, etc.). and other toxic exposure (e.g.. pesti-cides, herbicides, dry cleaning solvent, etc.). Thefinal components analysis concentrated on labor/de-livery complications and birth characteristics.
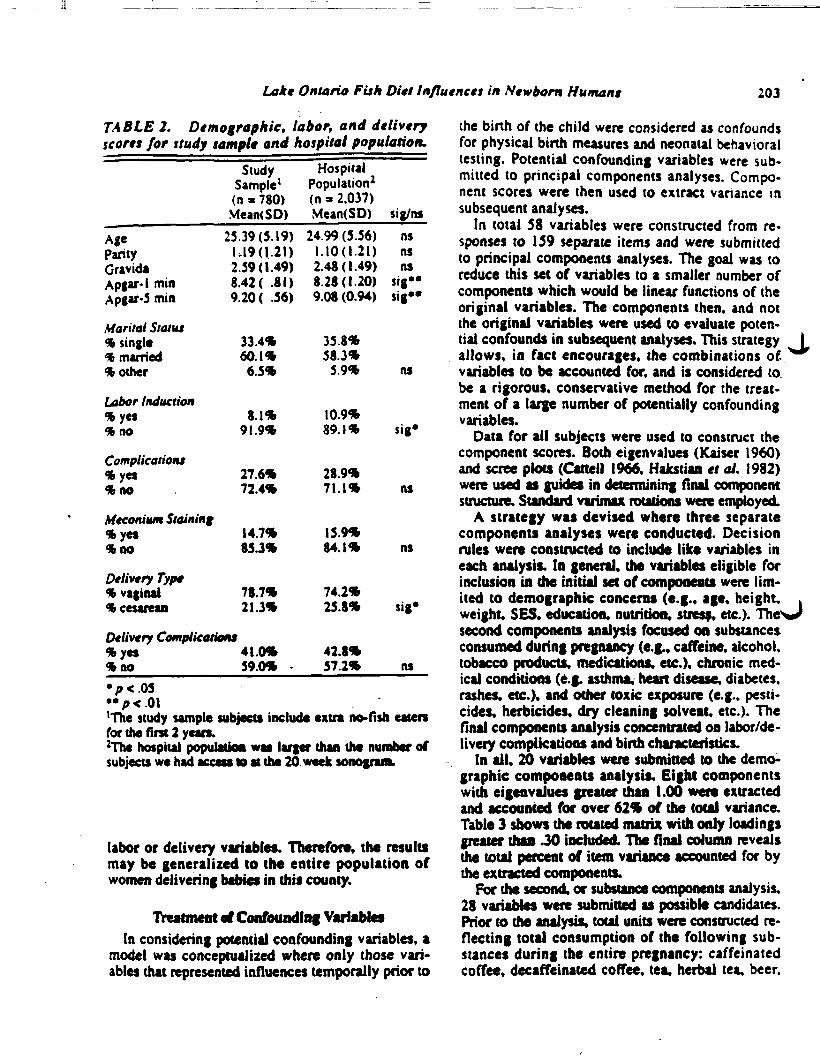
In all. 20 variables were submitted to the demo-graphic components analysis. Eight componentswith eigenvalues greater than 1.00 were extractedand accounted for over 62% of the total variance.Table 3 shows the rotated matrix with only loadingsgreater than JO included. The final column revealsthe total percent of item variance accounted for bythe extracted components.
For the second, or substance components analysis.28 variables were submitted as possible candidates.Prior to the analysis, total units were constructed re-flecting total consumption of the following sub-stances during the entire pregnancy: caffeinatedcoffee, decaffeinated coffee, tea. herbal tea. beer.
204 Lanky et al.
TABLE 3. Varimajc rotated component loadings from a principal components analysisbased on 20 demographic variables.
Vanable 1SES -88Maternal
Education .83Income .73
MaritalStatus -38
Maternal Age .32Paternal Age
ParityMiscarriages
Stress'Stress2
S tress J
Paternal HeightPaternal Weight
Weight GainPregnancy
Pre-PregnancyWeight
Maternal Height
StillbirthsPrenatal
Nutrition
RaceHistory of
DifficultPregnancies
Components ^ Q{
2 3 4 5 6 7 8 Variance80
.70
.61
-.33 .3980 .76
.74 .65
65 -.32 69.45 .33 .44 -.31 68
.78 .62
.70 .5269 .50
.85 .7580 .70
.73 .61
-.73 .40 .70.82 .70
.77 .64
-.42 -.43 .46
.33 .16
.91 .841 Stress Since Learning of Pregnancy2Stress Prior Year3Stress between Sonogram and Delivery
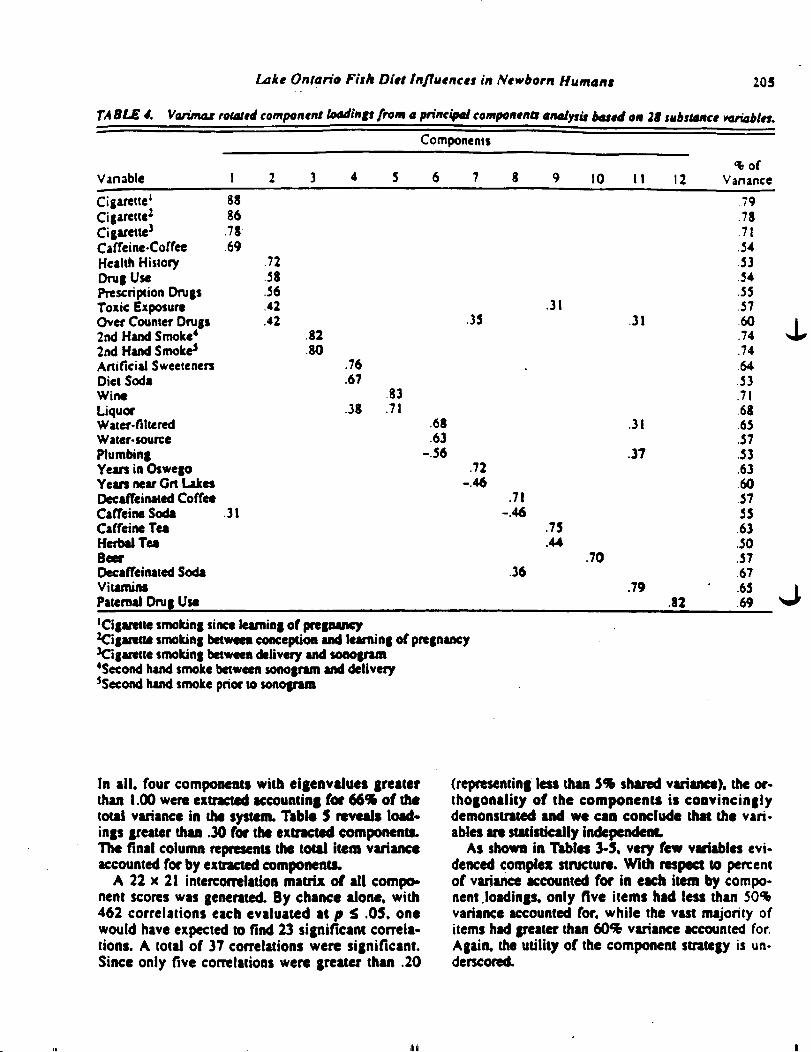
wine, liquor, vitamins, prescription and over thecounter medications. cafTeinated soda, diet soda, andartificial sweeteners. A "total other toxic exposure"variable was created by summing responses to a se-ries of 35 dichotomous variables. Similarly, a "totalchronic medical condition** variable was generatedby summing responses to 41 medical conditions.TWelve components, accounting for 63% of the totalvariance were extracted. Tabk 4 reveals the loadings(> .30) of the rotated matrix. The final column of the
table represents the amount of item variance ac-counted for by the retained components.
The third set of component analyses focused ondelivery/labor complications as well as birth char-acteristics. For this analysis, the OCS variable re-flects the score obtained from the ObstetricsComplications Scale (Parmalee 1974, Liuman andParmalee 1978). The neuromuscular and physicalvariables reflect subscale scores of the Ballard Ex-amination for Fetal Maturity. (Ballard et al. 1979).
Lakt Ontario Fith Ditt Influtncts in Ntwborn Human* 205
TA BLE 4. Varimat rotattd compcntnt loading* from a principal compontnts anatytit based on 29 tubttantt veriabltt.Components
Variable 1 2 3 4 5 6 7 8 9 10 1 1 12Cigarette' 88Cigarette2 86Cigarette1 .78Caffeine-Coffee 69Health History .72Drug Use 58Prescription Drugs 56Toxic Exposure 42 .31Over Counter Drugs .42 33 .312nd Hand Smoke4 822nd Hand Smoke3 80Artificial Sweeteners .76Diet Soda 67Wine 83Liquor 38 .71Water-filtered 68 .31Water- source 63Plumbing -56 .37Yean in Oswego .72Yean near Get Lakes -.46Decaffeinated Coffee .71Caffeine Soda .31 -.46Caffeine Tea .73Herbal Tea .44Beer .70Decaffeinated Soda .36Vitamins .79Paternal Drug Use .82'Cigarette smoking since learning of pregnancyCigarette smoking between conception and learning of pregnancy^Cigarette smoking between delivery and sooognm'Second hand smoke between sonogram and deliverySecond hand smoke prior to sonogram
%ofVariance
.79
.78
.71545354555760.74.746453.7168.65.57.53.6360.575363.505767.6569
In all. four components with eigenvalues greaterthan 1.00 were extracted accounting for 66% of thetotal variance in the system. Table 5 reveals load-ings greater than .30 for the extracted components.The final column represents the total item varianceaccounted for by extracted components.
A 22 x 21 intercorrelation matrix of all compo-nent scores was generated. By chance alone, with462 correlations each evaluated at p £ .05. onewould have expected to find 23 significant correla-tions. A total of 37 correlations were significant.Since only five correlations were greater than .20
(representing less than 3% shared variance), the or-thogonality of the components is convincinglydemonstrated and we can conclude that the vari-ables are statistically independent.
As shown in Tables 3-5, very few variables evi-denced complex structure. With respect to percentof variance accounted for in each item by compo-nent .loadings, only five items had less than 30%variance accounted for. while the vast majority ofitems had greater than 60% variance accounted for.Again, the utility of the component strategy is un-derscored.

206 Lanky et al.
TABLE 5. Varimajc rotated component loadingsfrom a principal components analysis based on 10delivery/labor variables.
ComponentsVariable 2 3 4 Variance
PhysicalNeuromuscularOCSWeightHead CircumferenceResuscitationMeconiumGestational AgeAnesthesiaSex
97.96.92
.79
.77
.32.7860
.52-.75
.52
.48
.94
.9385.6560.63.48.64.57.32
Neonatal Behavioral Assessment Scale FindingsTable 6 presents Time I and Time 2 means and
standard deviations for the NBAS tester clusters bygroup for all babies tested (Lester et al. 1982,Lester 1984). Analyses, however, were performedon change scores. From its inception, the NBASwas designed to reflect the changing nature of theneonate's physical, physiological, and behavioralsystems (Brazelton 1990. Lester 1984). As such, ithas never been deemed appropriate that a singleNBAS examination score be used in data analysis.As an instrument designed to measure the dynamicaspects of newborn coping and behavior, scoresrepresenting change from day to day resulting from
multiple NBAS administrations more accurately re-flect the purpose of the NBAS in a research context.Further. NBAS scores reflecting change in infantand newborn behavior appear to be more predictiveof cognitive, motor, and personality outcomes(Brazelton 1990). With this in mind, change scoreswere used in the present analyses rather than indi-vidual 12-25 hr (Time I) and 25-48 hr (Time 2)scores.
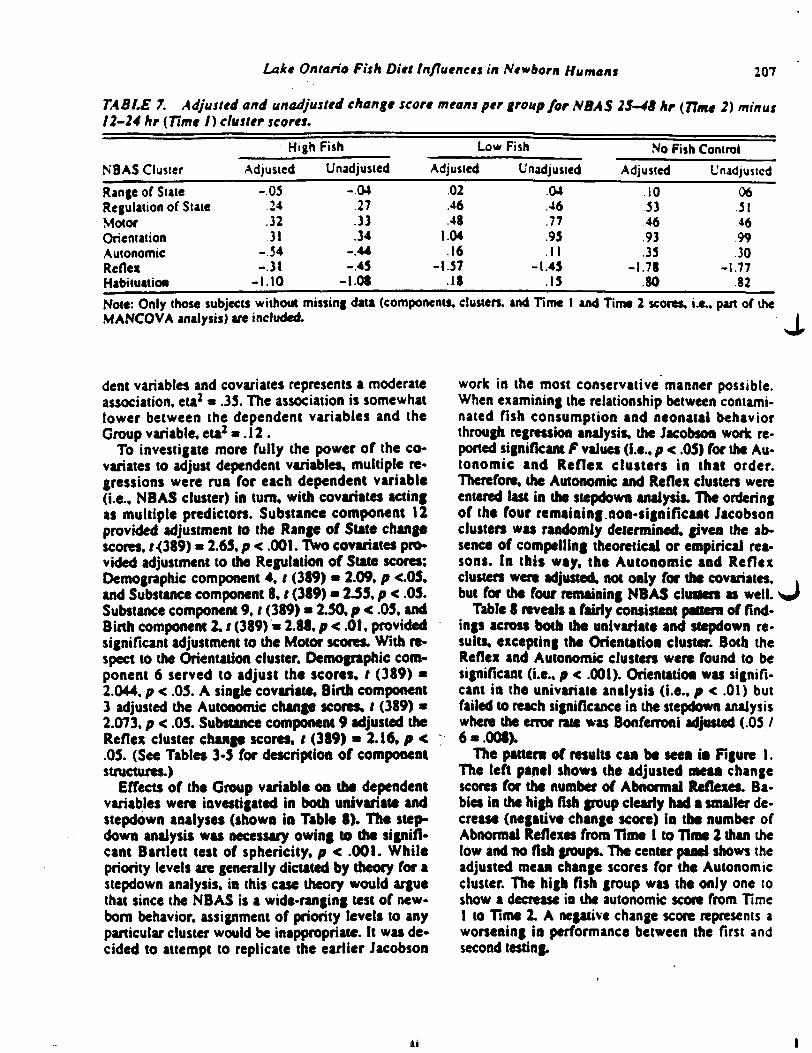
A multivariate analysis of covariance (MAN-CO VA) was performed on change scores (i.e.. Time2 - Time I) for all NBAS clusters excepting the Ha-bituation cluster (which was treated separately dueto a smaller sample size). The single independentvariable was Group membership (i.e.. high, low orno fish) and all derived component scores weretreated as covariates. A total of 416 cases were in-cluded in this analysis (111 high fish. 181 low fishand 124 no fish). Since both Time I and Time 2scores are required to calculate change scores, thechange score sample sizes differ somewhat from ei-ther the Time 1 or Time 2 sample sizes. Table 7 pre-sents unadjusted and adjusted NBAS cluster changescore means for each group. Apparent differencesbetween adjusted and unadjusted means are notgreat Results of evaluation of assumptions of nor-mality, homogeneity of variance-covariance matri-ces, linearity, and multicoltnearity weresatisfactory.
Under Wilks' criterion, the combined dependentvariables were significantly related to the combinedset of covariates, approximate F (144,2252) » 1.22.p * .046. and to the Group variable. F (12,768) »3.90. p < .001. The association between the depen-
TABLE 6. Group* meant and standard deviations (in parentheses) for NBAS 12-24 hr (Tl) and 25-49Ar (77) cluster scorn for all babies testeeL
High FisJlNBAS Clusteit Abnormal ReflexesOrientationMotorRange of StateRegulation of StateAutonomicHabiluation
Tl4.09(2.39)6.02(1.62)4.88< .98)3.86< .63)6.66(1.32)5.90(1.27)7.41(1.02)
T2
3.34(2.20)6.30(1.30)S.I8< .96)3.8* .66)6.30(1.33)5.49(1.19)6.42(1.34)
Low FishTl
3.50(2.22)5.74(1.74)4.9K .81)3.78< .69)5.840.21)6.14(1.19)7.26(1.17)
T22.10(185)6.53(1.24)5.44< .74)3.83( .69)6.28(1.11)6.26(1.12)7.43< .94)
No Fish ControlTl
3.62(1.92)6.00(1.70)5D8C .81)3.7S< .78)5.98(1.27)5.96(1.36)7.441 .95)
T21.92(1.77)6.86(1.28)5.52( .70)3.84( .70)6.32(1.24)6.32(1.18)8.03( .92)
Note: For number of abnormal reflexes higher scores reflect poorer performance. For ail other clusters higher scoresreflect better performance.
Lakt Ontario Fish Ditt Influences in Newborn Human* 207
TABLE 7. Adjusted and unadjusted change score means per group for NBAS 25-48 hr (Time 2) minus12-24 hr (Time /) cluster scores.
NBAS ClusterHigh Fish Low Fish No Fish Control
Adjusted Unadjusted Adjusted Unadjusted Adjusted UnadjustedRange of StateRegulation of StateMotorOrientationAutonomicReflexHabitation
-05.24.3231
-.54-.31
-1 10
-.04.27.33.34
-.44-.45
-1.08
0246.48
1.04.16
-1.57.18
.04
.46
.77
.95
.11-1.45
.15
.10534693.35
-1.78.80
0651469930
-1.7782
Note: Only those subjects without missing data (components, clusters, and Time I and Time 2 scores, i.e., pan of theMANCOVA analysis) are included. I
dent variables and covariates represents a moderateassociation, eta2 * .35. The association is somewhatlower between the dependent variables and theCroup variable, eta2 ».12 .
To investigate more fully the power of the co-variates to adjust dependent variables, multiple re-gressions were run for each dependent variable(i.e., NBAS cluster) in turn, with covariates actingas multiple predictors. Substance component 12provided adjustment to the Range of SUM changescores, r<389)» 2.6S, p < .001. Two covariates pro-vided adjustment to the Regulation of State scores;Demographic component 4. / (389) • 2.09, p <.05.and Substance component 8, f (389) * 2.55, p < .05.Substance component 9, t (389) • 2.50, p < .05, andBirth component 2. / (389) * 2.88. p < .01. providedsignificant adjustment to the Motor scores. With re-spect to the Orientation cluster. Demographic com-ponent 6 served to adjust the scores, r (389) *2.044. p < .05. A single covariate. Birth component3 adjusted the Autonomic change scores, t (389) *2.073, p < .05. Substance component 9 adjusted theReflex cluster change scores, r (389) * 2.16. p <.05. (See Tables 3-5 for description of componentstructures.)
Effects of the Group variable on the dependentvariables were investigated in both univariate andstepdown analyses (shown in Table 8). The step-down analysis was necessary owing to the signifi-cant Bartlett test of sphericity, p < .001. Whilepriority levels are generally dictated by theory for astepdown analysis, in this case theory would arguethat since the NBAS is a wide-ranging test of new-born behavior, assignment of priority levels to anyparticular cluster would be inappropriate. It was de-cided to attempt to replicate the earlier Jacobson
work in the most conservative manner possible.When examining the relationship between contami-nated fish consumption and neonatal behaviorthrough regression analysis, the Jacobson work re-ported significant F values (i.e.. p < .05) for the Au-tonomic and Reflex clusters in that order.Therefore, the Autonomic and Reflex clusters wereentered last in the stepdown analysis. The orderingof the four remaining.non-significant Jacobsonclusters was randomly determined, given the ab-sence of compelling theoretical or empirical rea-sons. In this way. the Autonomic and Reflexclusters were adjusted, not only for the covariates,but for the four remaining NBAS clusters as well.
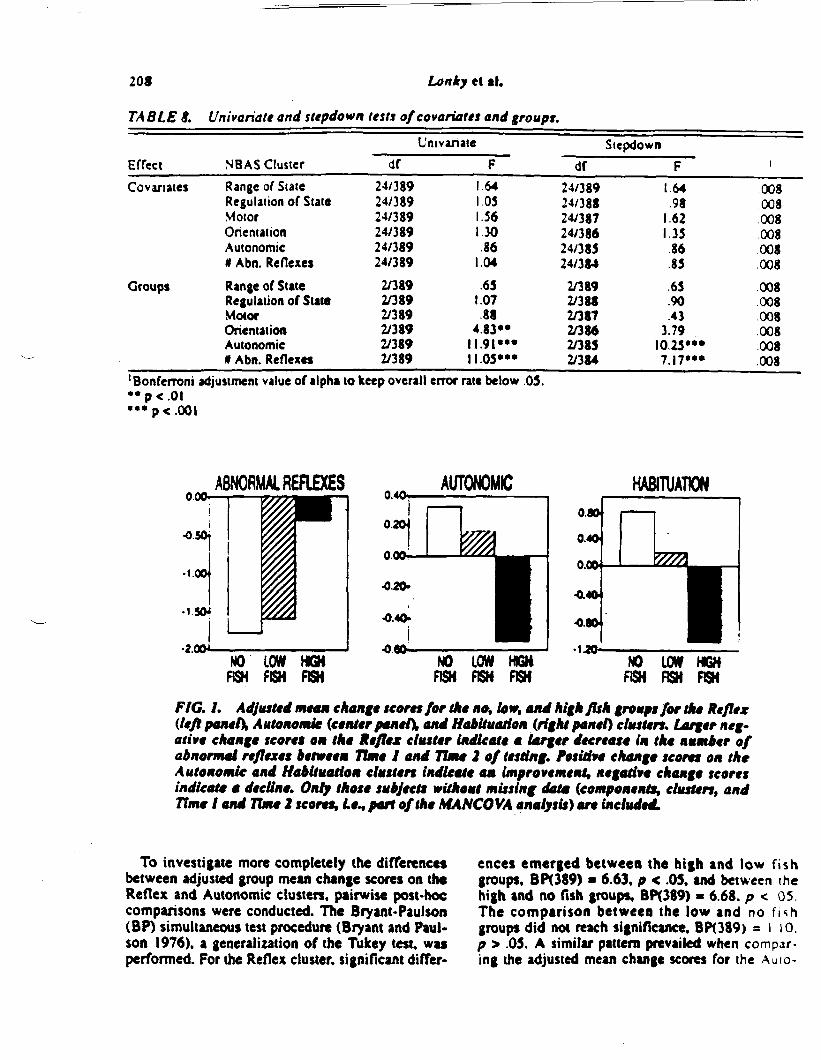
Table 8 reveals a fairly consistent pattern of find-ings across both the univariate and stepdown re-sults, excepting the Orientation cluster. Both theReflex and Autonomic clusters were found to besignificant (i.e., p < .001). Orientation was signifi-cant in the univariate analysis (i.e., p < .01) butfailed to reach significance in the stepdown analysiswhere the error rate was Bonferroni adjusted (.05 /6».008X
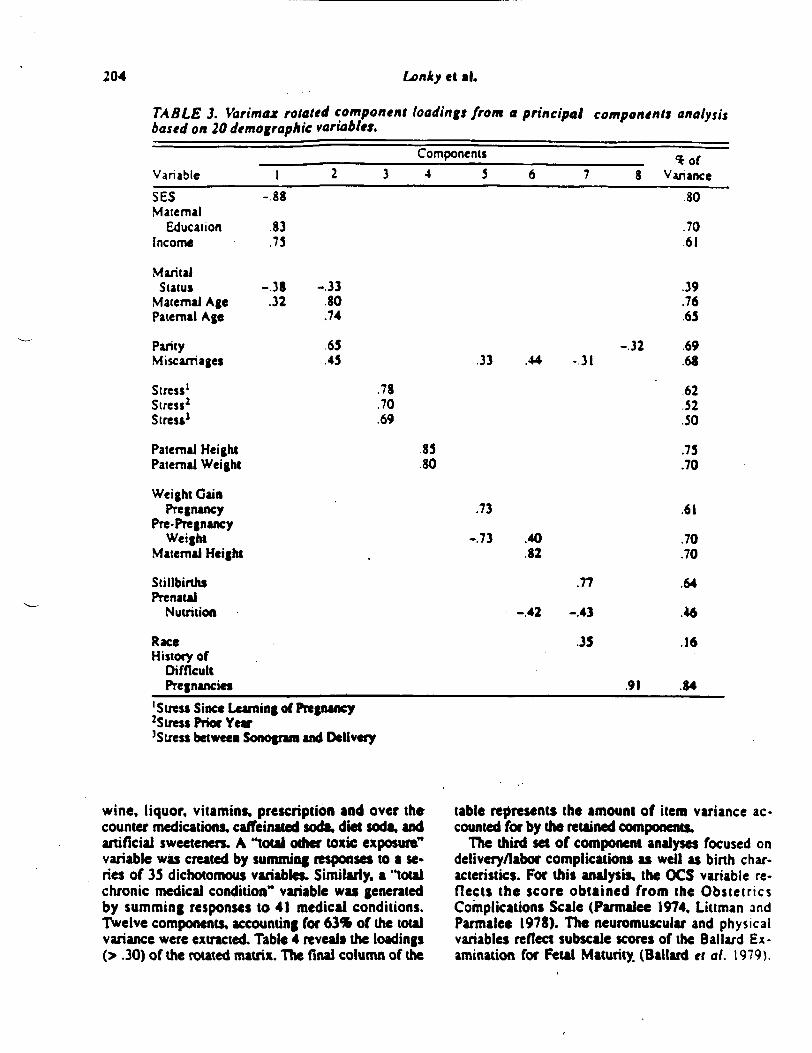
The pattern of results can be seen in Figure 1.The left panel shows the adjusted mean changescores for the number of Abnormal Reflexes. Ba-bies in the high fish group clearly had a smaller de-crease (negative change score) in the number ofAbnormal Reflexes from Time 1 to Time 2 than thetow and no fish groups. The center pand shows theadjusted mean change scores for the Autonomiccluster. The high fish group was the only one toshow a decrease in the autonomtc score from TimeI to Time 2. A negative change score represents aworsening in performance between the first andsecond testing.
it
208
TABLES.
Lanky et al.
Univariate and stepdown tests ofcovariates and groups.Univariate
EffectCovamtes
Groups
NBAS OusterRange of StateRegulation of StaleMotorOrientationAutonomic* Abn. ReflexesRange of StateRegulation of StateMotorOrientationAutonomic• Abn. Reflexes
df24/38924/38924/38924/38924/38924/3892/3892/3892/3892/3892/3892/389
F1.641 051.561.30
861.04.65
1.0788
4.83**1 1.9I***ll.05«'«
Stepdowndf
24/38924/38824/38724/38624/38524/3842/3892/3882/3872/3862/3852/384
F1 64.98
1.621.35
8685.65.90.43
3.79I0.25"*7.I7"*
i
008.008.008.008.008.008.008.008.008.008.008.008
'Bonferroni adjustment value of alpha to keep overall error rate below .05.
p<.OOI
ABNORMAL REFLEXES AUTONOMIC
NO LOW UGHFISH PISH FISH
HABITATION
NO LOW HIGH.FISH FISH FISH
NO LOW UGHFISH FISH FISH
FIG. /. Adjusted HUM change team for the no, low, and highflsh groups for the Reflex(left panel), Autonomic (center panel), and Habituation (right panel) clusters. Larger neg-ative change scores om Ike Reflex clutter indicate a larger decrease in the number ofabnormal reflexes between Time I andl Time 2 of testing. Positive change scores on theAutonomic and Habituation clusters indicate am improvement negative change scoresindicate a decline. Only those subjects without missing data (components, clusters, andTime I and Time 2 scores, &*, part of the MANCOVA analysis) are included.
To investigate more completely the differencesbetween adjusted group mean change scores on (heReflex and Autonomic clusters, pairwise post-hoccomparisons were conducted. The Bryant-Paulson(BP) simultaneous test procedure (Bryant and Paul-son 1976). a generalization of the Tukey test, wasperformed. For the Reflex cluster, significant differ-
ences emerged between the high and low fishgroups. BP(389) » 6.63. p < .05, and between thehigh and no fish groups, BP089) » 6.68. p < 05.The comparison between the low and no f i s hgroups did not reach significance. BPO89) = MO.p > .05. A similar pattern prevailed when compar-ing the adjusted mean change scores for the Auto-

Lake Ontario Fish Ditt Influtnctt in Newborn Human* 209
nomic cluster. Significant differences were foundwhen comparing the high and low fish groups.BP(389)=» 5.92. p < 05. and between the high andno fish groups, BP(389) » 8.09. p < .05. No differ-ences emerged between the low and no fish groups.BP(389)s |.64./» 05.
Scheffe* tests comparing each adjusted changescore with 0 were done to determine if there weresignificant changes between Time I and Time 2scores. For the Reflex cluster there was a nonsignif-icant change for the high fish group, F(2.413) < I.but significant changes for the low and no fishgroups, «2.4I3) » 49.40. p < .001. and F(2,413) »22.43. p < .001. respectively. For the Autonomiccluster there was a significant change for the highfish group. f(2.4!3)» 5.80, p < .01. but nonsignifi-cant changes for the low and no fish groups,FC2.4I3) « 1.88, p > .05. and F(2.413) » 2.60, p >.05. respectively.
Change scores for the Habituation cluster wereanalyzed in a separate analysis due to missing data.Only 274 subjects had complete habitation databoth at Time 1 and Time 2 administrations, andboth scores are required to calculate change scores(i.e.. Time 2 • Time I). Missing data are not unusualfor this cluster since it requires the newborn to be ina State 2 (light sleep) throughout the administra-tion.
Figure I (right panel) shows the adjusted meanchange scores for the Habituation cluster. Only thehigh fish group had a negative change score, whichindicates a worsening in performance from the firstto die second testing. The no-fish group had a post-live change score, indicating an improvement inperformance. The low-fish group showed essen-tially no change.
Group differences (i.e., high, tow and no fish) forchange scores were analyzed with an analysis of co-variance where components from die previously re-ported principal components analysis were used ascovariates. The results snow that the covariates failto explain significant variation, 1124.247) < I. TheGroup membership variable is, however, signifi-cant, F (2.247) » 27.26. p < .001. Following thesignificant omnibus test. Scheffe1 pairwisc compar-isons were performed on adjusted means. The com-parison between the high and low fish groups wassignificant. 5(2.271) « 29.29. p < .001. Similarly.the comparison between the high and no fish groupswas statistically significant. F(2,27I) * 60.17. p <.001. The comparison between the no fish and lowfish groups was also significant, F(2,271) * 6.79. p
Scheffe" tests comparing each change score with 0indicated a significant negative change for the highfish group. F(2.271) a 20.02. p < .001. a nonsignifi-cant change for the low fish group. F(2.27I) < I.and a significant positive change for the no fishgroup. F(2,271)» 10.67. p< .001.
DISCUSSIONThe Oswego Newborn and Infant Development
Project is a prospective longitudinal study the pur-pose of which is to examine the behavioral effectsin children of maternal consumption of Lake On-tario fish: fish contaminated with a wide range ofpersistent toxic chemicals. A significant strength ofthe study can be found in the areas of design and -methodology. Essential equivalence between thestudy sample and population of women deliveringbabies in Oswego County was established on cru-cial demographic, labor, and delivery variables.Such equivalence strengthens the ability to general-ize beyond the study sample to that population.
A potential threat to the integrity of all behav-ioral teratology research lies in sampling bias.Givea that random assignment to groups in researchof this kind is impossible and unethical, establish-ing equivalence between groups on behavioral non-teratogenk variables is crucial to the interpretationof findings. For example, it is well known that re-search on the effects of maternal cocaine consump-tion is heavily biased in that low income women,typically enrolled in drug treatment and recoveryprograms, constitute the "exposed" samples of moststudies (Myers «t at. 1992), and the nonexposedsample is quite different As Hawley and Disney(1992) note, the most difficult methodological issuecomplicating studies of the behavioral teratogeniceffects of illicit drugs is the selection of comparisongroups. All too often significant differences otherthan prenatal exposure exist between study groups.Naturally if differences exist between these groupswith respect to demography, health, nutrition, gesta-tional age, or prenatal care, it becomes extremelydifficult to determine the direct effect of prenatalexposure.
The comparisons reported in Table 1 establish theessential equivalence between the high, tow and nofish control groups on key demographic, health, nu-trition, substance use. and infant variables. Sam-pling bias does not appear to be a threat to thisstudy. We have a good deal of confidence that dif-ferences that have emerged in NBAS performanceare due to the fish consumption level.

210 Lanky et tl.
This confidence is strengthened by the principalcomponents strategy in treating potentially con-founding variables. A reliable and independent setof component scores for potentially confoundingvariables was created, and these component scoreswere assessed and statistically controlled in analyz-ing NBAS scores. This strategy differs dramaticallyfrom and, we believe, is a more conservative andrigorous method for treating large numbers of po-tentially confounding variables than those which, insome a priori fashion, eliminate variables from con-sideration that do not show statistical significancebetween exposure groups, or outcomes, and/or failto statistically control for the possible combinationsof variables. Were we to use such an approach, onlyone variable (see Table 1), prepregnancy weight, re-veals statistical differences among groups. In pointof fact in the multivariate analysis of covariance.component scores explained a significant amount ofvariance.
Both Reflex and Autonomic cluster changescores were found to be significant after controllingfor demographic, substance and birth factors viaMANCOVA. High fish group babies demonstrateda greater number of abnormal reflexes and less ma-ture autonomic response (e.g., more startles andtremors) at Time 2 than Time 1 than babies bom tomothers from the other groups. There is also someevidence of less developed attention to visual andauditory stimuli (Orientation) in high fish group ba-bies (p < .02). but this finding is mitigated by nothaving reached the Bonferroni adjusted alpha levelof .008. Differences were not found on the Motor.Range of State, or Regulation of State clusters, withT2 scores on these latter two clusters identical be-tween the high and no fish groups (see Table 6).and Tl scores slightly better in the high fish group.
The findings of poorer reflex functioning andgreater autonomic immaturity in the high fish groupbabies are similar to the Jacobson tt al. (1984) find-ings. In that study, contaminated fish consumptionpredicted both number of abnormal reflexes and au-tonomic maturity although it is important to notethat the Jacobson tt al. Autonomic cluster differsfrom the tester defined cluster (tester tt al. 1982.tester 1984) by including a motor maturity item,and excluding lability of skin color.
Separate analyses of Habituation cluster scoresshowed that babies born to high fisheaters had sig-nificantly poorer habituation recoveries than babiesborn to mothers in the other groups, and in contrastto low and control group babies the high group ba-
bies actually demonstrated poorer habituation re-sponses at Time 2 than Time I (negative changescore). This is to say that babies bom to motherswho have consumed high amounts of Lake Onianofish appear to be over-reactive to stimulation, as re-vealed by a delayed habituation or decrement of re-sponse to stimulation. This result is in contrast todevelopmental expectations and the performance oflow fish and no fish control group babies. These ef-fects were demonstrated even after controlling po-tential confounds via a covariate analysis. It is alsointeresting to note that Scheffe" post hoc compar-isons reveal a dose-response type relat ionshipamong fish consumption and habituation perfor-mance. The decrease in ability to habituate tomildly aversive stimuli by babies whose mothershad eaten high amounts of take Ontario fish is sim-ilar to results found in laboratory rats fed take On-tario salmon. These rats, and their offspring testedin adulthood, are hyper-reactive to negative eventssuch as mild electric shocks and frustrative reduc-tions in amount of a food reward (Daly 1992).
While significant and to a large extent confirma-tory of the NBAS findings of Jacobson tt al. (1984)and Rogan tt al. (1986), the importance of thesefindings is mitigated by several unknowns at thistime. First, while the NBAS has demonstrated util-ity in studies of high risk infants and in studies ofeffects of obstetric medication and effects of mater-nal substance abuse (Brazelton tt al. 1987), evi-dence for the predictive validity for later behaviorof NBAS scores in non at-risk population is limited.There is evidence that a focus on patterns of changein neonatal behavior as revealed in repeated admin-istrations of the NBAS is predictive of later cogni-tive development Both tester (1984) and Nugent etal. (1984) have demonstrated relationships betweenNBAS change over time and 18 month and 3 yearmeasures of intelligence. The take Michigan Ma-ternal Infant Cohort Study has continued to showcognitive effects beyond their initial NBAS find-ings. These findings include, at 7 months of ageless preference for a novel stimulus on the PaganTest of Infant Intelligence (Jacobson tt al. 198S).and, at 4 yean of age poorer short term memory asmeasured by the McCarthy Scales (Jacobson et al.1992). Nevertheless, future cognitive, and even so-cial and emotional development may be differen-t ial ly related to patterns of change in N B A Sclusters, and we are at this time not well prepared tohypothesize what the long-term significance of thepresent NBAS findings might be.

Lakt Ontario Fish Diet Influences in Newborn Humant 111
Secondly, while fish consumption is the indicatorvariable for toxic exposure in this report, and equiv-alent PCB pounds were used to estimate potentialtoxicity among species of fish, we simply do notknow what the specific nature of its behavioral ter-atogenic influence might be. Relationships betweenNBAS scores and total PCBs. PCB congener pat-terns. DDE. HCB. lead, and mercury in the cordblood of babies and hair of the mother in the highfish and no fish control groups await analysis. Inaddition, a piece of placenta! tissue has been tissue*banked for future analysis.
In addition to finding behavioral differences, theJacobson study revealed two statistically significantphysical differences in newborns of mothers whoconsumed Lake Michigan fish. Exposed babies werelighter at birth, and had a smaller head circumference(Fein «t al. 1984). A more recent study of newbomswhose mothers had consumed Lake Michigan fishfound the opposite results: babies whose mothers ateLake Michigan fish had a higher birth weight, butonly if the weight gain of the mother was less than34 IDS (Dar «t al, 1992). The authors of this studypoint out that the fish consumption levels of theirsubjects were lower than in the Jacobson study. Asno behavioral data were collected by Dar «r a/., acomparison on this dimension was not possible. Thepresent study found no significant physical differ-ences, yet did find behavioral differences in new-borns as measured by the NBAS. It would appearthat behavioral measures may be more sensitivemeasures of the effects of the pollutants in GreatLakes fish than physical measures.
ACKNOWLEDGMENTSThis research was supported by grants from the
Agency for Toxic Substances and Disease Registry(Great Lakes Program), the Great Lakes ProtectionFund, the New York State Great Lakes ResearchConsortium, and the State University of New York atOswego. We wish to thank the members of the Inter-view Team (Andrea Abbott, Barbara Bartholomew.Ruth Sabatint. Julie VandeVelde), the BehavioralAssessment Team (Mary Brown, Gloria Gunther.Penny Schrader. Dent Vbget and Abbey Weus), thedata manager (Dr. Jon Casey). and the secretary anddata-entry person (Patricia West), for their dedicationto the project We also wish to thank the doctors andnurses at the OB/GYN office and the maternity staffat the Oswego Hospital. Without their help this studycould never have been done.
REFERENCESApgar. V. 1933. A proposal for a new method of evalua-
tion of the newborn infant. Current Researches inAnesthesia and Analgesia 32:260-267.
Ballard. J. L. Novak. K. K.. and Driver. M. 1979. Asimplified score for assessment of fetal maturation ofnewborn infants. Journal of Pediatrics 93:769-774.
Brazelton, T. B. 1984. Neonatal Behavioral AssessmentScale. Philadelphia. PA: Uppincott.
____. 1990. Saving the bathwater. Child Develop-ment. 61:1661-1671.
____, Nugent, J. K., and Lester. B. M. 1917. Neona-tal Behavioral Assessment Scale. In Handbook ofInfant Development, ed. I. D. Osofsky. pp. 780-817.New York. NY: Wiley.
Bryant J. L.. and Paulson. A. S. 1976. An extension ofTukey's method of multiple comparisons to experi-mental design with random concomitant variables.fffoffwrrife 63:631-631
Cattell, R. B. 1966. The scree test for the number of fac-tors. Sociological Methods and Research 1:243-276.
Daly. H. B. 1992. The evaluation of behavioral changesproduced by consumption of environmentally contam-inated fish. In 7\t vulnerobi* brain and environmen-tal risks. Vol. I: MalnmtrMon and hazard assessment,ed. R.L Isaacson and K.P. Jensen. pp. 131-171. NewYork, NY: Plenum Pms.
Dar. B., Kanarck. M. S.. Andenon. H. A., and Soiuogni.W. C 1991. Fish comiuaptioei and reproductive out-comes in Greet Bay. Wisconsin. EnvironmentalResearch 59:119-201.
Dawson, C. P.. and Brown, T. L. 19S9. Characteristicsof 1987-48 OfMVfo Comntyflsnint Ikens* purchasersand snafltn on tkt Salmon Kivtr. New York SeaGrant Program. Cornell Cooperative Extension andSUMY Oswego, NY.
Fein, G. G.. Jacobson. J. L.. Jacobson, S. W.. Schwaru.P. M, and Dowler. I. K. 1994. Prenatal exposure topolycnlorinated bipnenyls: Effects on birth size andgestational age. Jawntl of Ptdtoric* 105:315-320.
Haksdan. A. R~> Rogers. W. D, and Cattell. R. B. 1982.The behavior of aumbcrs factors ruk* with simulateddata. MHltivariate ttktvtoral Research 17:193-219.
Hawley. T. L, and Dwaey. E. R. 1992. Crack's children:The consequences of maternal cocaine abuse. SocialPolity Report: Society Joe Res*artk in Child Develop*ment 6:1-22.
Jacobson, J.U Jacobson, S. W.. Fein. O. G. Schwaru.P. M, and Dowler. 1. K. 19*4. Prenatal exposure toan environmental toxin: A test of the multiple effectsmodel Development* Ptycnobfy 20:523-332.
____, Fein. 0. G., Jacobson. S. W.. Schwaru. P. M.,and Dowler. J. K. 1915. The effect of tntrauterinePCB exposure on viscal recognition memory. ChildDe\-tlopmeni 56:153-160.
Jacobson, S. W.. Jacobson. J. L.. Padgen. R. J., Brumitt.

212 Lanky et a I.
G. A., and Billings. R. L. 1992. Effects of prenatalPCB exposure on cognitive processing efficiency andsustained attention. Developmental Psychology28:297-306.
Kaiser. H. F. 1960. Directional statistical decisions. Psy-chological Review 67:160-167.
tester. B. M. 1984. Data analysis and prediction. InNeonatal Behavioral Assessment Scale {2nd ed.). ed.T. B. Brazelton. pp. 85-96. Spasiics InternationalMedical Publications. Philadelphia. PA: Lippincotl.
____, All, H., and Brazelton. B. T. 1982. Regionalobstetric anaesthesia and newborn behavior: Areanalysis towards syncrgistic effects. Child Develop-ment 53:687-692.
Littman. G.. and Parmalee, A. H. 1978. Medical corre-lates of infant development. Pediatrict 61:470-474.
Myers. B. J . Olson. H. C. and Kaltenback. K. 1992.Cocaine- exposed infants. Myths and misunderstand-ings. Zero to Three 13:1-5.
Nugent, J. K.. Greene. S.. and Brazelton. T. B. 1984.Predicting 3 year IQ scores from patterns of change in
newborn behavior. Presented at the third InternationalConference in Infant Studies, New York.
Parmalee. A. H. 1974. The Obstetric ComplicationsScales and the Postnatal Complications Scale. Unpub-lished manuscript.
Rogan, W. J., Gladen. B. C, McKinney. J. D.. Cameras. N .Hardy. P.. Thullen. H.. Tinglestad. J.. and Tully. M.1986. Polychlorinated biphenyls (PCBs) anddichlorodipheny! dichloroetnene (DDE) in human milk:Effects of maternal factors and previouslactation. American Journal of Public Health 76:172-177.
Tronick. E. Z. 1987. The neonatal behavioral assessmentscale as a biomarker of the effects of environmentalagents on the newborn. Environmental Health Per-jp*cf<V«74:l8M89.
Vena. J. 1992. Preliminary findings from the New YorkState angler cohort study. Perspectives: Great LakesProgram 6:1-5.
Submitted: 2 January 1996Accepted: 26 January 1996