National And Organizational Culture As An Attractor For Foreign Direct Investments
12
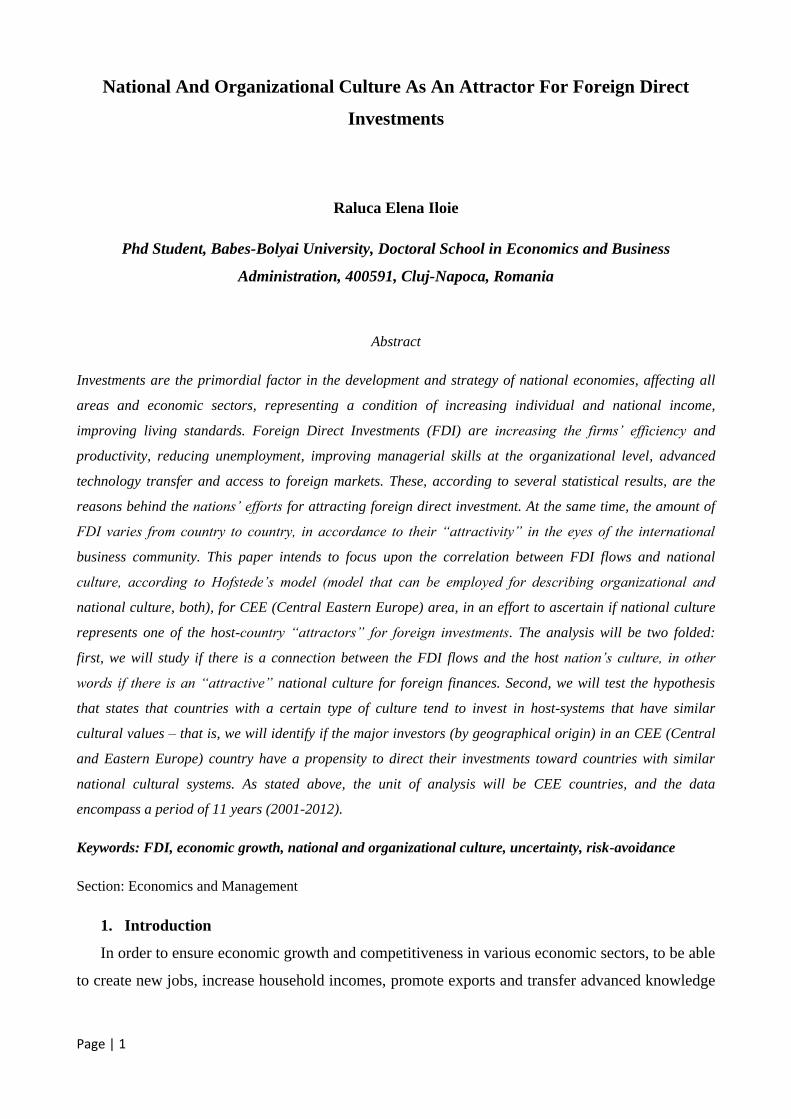
Page | 1 National And Organizational Culture As An Attractor For Foreign Direct Investments Raluca Elena Iloie Phd Student, Babes-Bolyai University, Doctoral School in Economics and Business Administration, 400591, Cluj-Napoca, Romania Abstract Investments are the primordial factor in the development and strategy of national economies, affecting all areas and economic sectors, representing a condition of increasing individual and national income, improving living standards. Foreign Direct Investments (FDI) are increasing the firms’ efficiency and productivity, reducing unemployment, improving managerial skills at the organizational level, advanced technology transfer and access to foreign markets. These, according to several statistical results, are the reasons behind the nations’ efforts for attracting foreign direct investment. At the same time, the amount of FDI varies from country to country, in accordance to their “attractivity” in the eyes of the international business community. This paper intends to focus upon the correlation between FDI flows and national culture, according to Hofstede’s model (model that can be employed for describing organizational and national culture, both), for CEE (Central Eastern Europe) area, in an effort to ascertain if national culture represents one of the host-country “attractors” for foreign investments. The analysis will be two folded: first, we will study if there is a connection between the FDI flows and the host nation’s culture, in other words if there is an “attractive” national culture for foreign finances. Second, we will test the hypothesis that states that countries with a certain type of culture tend to invest in host-systems that have similar cultural values – that is, we will identify if the major investors (by geographical origin) in an CEE (Central and Eastern Europe) country have a propensity to direct their investments toward countries with similar national cultural systems. As stated above, the unit of analysis will be CEE countries, and the data encompass a period of 11 years (2001-2012). Keywords: FDI, economic growth, national and organizational culture, uncertainty, risk-avoidance Section: Economics and Management 1. Introduction In order to ensure economic growth and competitiveness in various economic sectors, to be able to create new jobs, increase household incomes, promote exports and transfer advanced knowledge
Transcript of National And Organizational Culture As An Attractor For Foreign Direct Investments
Page | 1
National And Organizational Culture As An Attractor For Foreign Direct
Investments
Raluca Elena Iloie
Phd Student, Babes-Bolyai University, Doctoral School in Economics and Business
Administration, 400591, Cluj-Napoca, Romania
Abstract
Investments are the primordial factor in the development and strategy of national economies, affecting all
areas and economic sectors, representing a condition of increasing individual and national income,
improving living standards. Foreign Direct Investments (FDI) are increasing the firms’ efficiency and
productivity, reducing unemployment, improving managerial skills at the organizational level, advanced
technology transfer and access to foreign markets. These, according to several statistical results, are the
reasons behind the nations’ efforts for attracting foreign direct investment. At the same time, the amount of
FDI varies from country to country, in accordance to their “attractivity” in the eyes of the international
business community. This paper intends to focus upon the correlation between FDI flows and national
culture, according to Hofstede’s model (model that can be employed for describing organizational and
national culture, both), for CEE (Central Eastern Europe) area, in an effort to ascertain if national culture
represents one of the host-country “attractors” for foreign investments. The analysis will be two folded:
first, we will study if there is a connection between the FDI flows and the host nation’s culture, in other
words if there is an “attractive” national culture for foreign finances. Second, we will test the hypothesis
that states that countries with a certain type of culture tend to invest in host-systems that have similar
cultural values – that is, we will identify if the major investors (by geographical origin) in an CEE (Central
and Eastern Europe) country have a propensity to direct their investments toward countries with similar
national cultural systems. As stated above, the unit of analysis will be CEE countries, and the data
encompass a period of 11 years (2001-2012).
Keywords: FDI, economic growth, national and organizational culture, uncertainty, risk-avoidance
Section: Economics and Management
1. Introduction
In order to ensure economic growth and competitiveness in various economic sectors, to be able
to create new jobs, increase household incomes, promote exports and transfer advanced knowledge
Page | 2
and technology countries, mainly, need FDI, which is the purpose of integration into the European
economic system.
The decision to invest in a certain organization, institution or country is taken by individuals
like managers and leaders or by a group of people. These managers, leaders, as well as the people
they work with – at the level of organizations - are part of national societies (national cultures). “If
we want to understand their behavior, we have to understand their societies. In culture there is no
shortcut to the business world.” (Geert Hofstede, Gert Jan Hofstede, 2005, Cultures and
Organizations: Software of the Mind, p.20)
Many researchers, sociologists, anthropologists, population biologists and even economists
(Stiglitz, Joseph E. 2006) tried to explain why Globalization isn`t working in the same way for
every nation. Globalization, as a general concept, involves the international circulation of ideas,
information, shared cultural experiences, a global civil society and global environmental
movement.
Strictly economic, Globalization involves intensified circulation of goods, services, capital and
labor, contributing to raising living standards throughout the countries and foreign investors’ access
to new markets, open borders for people who want to travel, to train and even to work.
But, as observed in the late 80s, this process meets with fierce local resistance because
economic systems are not culture free. “We cannot change the way people in a country think, feel
and act by simply importing foreign institutions” (Hofstede, 2005, p.20), because there is a ”general
spirit of a nation” and institutions/ organizations that function in a geographical area follow mental
programs by adapting to local/ national culture (Montesquieu, C.-L., 1979 [1742], p.310).
“One point anthropologists have always made is that aspects of life which do not seem to be
related to another, actually are related (Marvin Harris, 1981, p. 8)”. The norms, values and patterns
of behavior exhibited by the employees of a certain organization are the product of a merging
process between the values and norms of the host-culture (national culture = the culture of the
society within which that organization functions) and those created by the rules, regulations and
structure of that particular organization.
Organizational culture improves stability and provides its members the understanding they need
to discover the meaning of events and activities taking place in the organization (within daily
activities). Thus, Hofstede, Neuijen, Ohayo and Sanders (1990) have shown that the essence of
organizational culture seems to be more in daily practice than shared values. This conclusion was
derived from a study of twenty organizations in Denmark and the Netherlands, which revealed that
the employee values differ more according to demographic characteristics such as nationality, age
or education, rather than organizational characteristics.
Page | 3
After many conceptual reasoning and statistical studies, the emphasis was placed more and
more on national cultures and its` dimensions. Researchers believed that all societies (modern and
traditional) face the same basic problems (Benedict, R. 1934,Mead, M. 1962). Also, in 1954 was
published a broad survey of the English-language literature on national culture, where psychologist
Daniel Levinson and sociologist Alex Inkeles suggested that issues like relation to authority,
conception of self (in particular, the relationship between individual and society and the
individuals` concept of masculinity/ femininity) and ways of dealing with conflicts were the basic
problems worldwide.
The most important statistical study was developed by Geert Hofstede (1960 - 1970) on values
of people in more than fifty countries around the world (IBM study). In this study he discovered
that different countries confront themselves with common problems in areas like social inequality
(power distance – first dimension of national culture), the control of aggression and the
expression of emotions (uncertainty avoidance – second dimension of national culture), the
relationship between individual and the group (individualism versus collectivism – third
dimension of national culture), and the social and emotional implications of having been born as a
boy or a girl (masculinity vs. femininity – the fourth dimension of national culture). Meanwhile,
his study continued and there were added another two dimensions:long- versus short-term
orientation (the fifth dimension-stability, perseverance, oriented toward future vs. oriented toward
present, thinking for oneself) and indulgence versus restraint (the sixth dimension-enjoying life
and having fun vs. strict social norms).
This paper will focus mainly on the dimensions of national cultures mentioned above because,
as scientists agree, organizations and their people, along with organizational cultures, are part of the
national culture of the host – country they function in. The Central Eastern European (CEE)
countries analyzed will be: Germany, Switzerland, Poland, Austria, Czech Republic, Romania,
Hungary, Ukraine, Bulgaria, Slovakia, Croatia, Serbia, Slovenia and Moldova.
1.1 Foreign Direct Investments
Foreign direct investment is the name given to the process where a firm / company from one
country invests capital in a business / company existing or newly created in another country.
“Broadly, foreign direct investment includes mergers and acquisitions, building new facilities,
reinvesting profits earned from overseas operations and intra company loans.” (Wikipedia)
However, the Organization for Economic Cooperation and Development (OECD) calls direct
investment (FDI) as more than just movement of capital - investment that adds to, deducts from or
by which you can have a long-term interest and profit in a firm / company operating in the
economy, capital - direct investment coming from a country other than the firms` / company
Page | 4
receiving the investment and implies that the investor exerts a significant influence on the
management of the investee company.( OECD 1996, pg. 7)
Types of FDI
• Greenfield refers to the establishment of companies - Greenfield investment;
• Mergers and acquisitions: full or partial takeover of companies by foreign investors;
• Business development: increasing FDI holdings in companies - foreign direct investment.
FDI Flows:
Data on FDI flows are on a net basis (capital transactions´ credits less debits between direct
investors and their foreign affiliates). FDI flows with a negative sign indicate that at least one of the
three components of FDI (equity capital, reinvested earnings or intra-company loans) is negative
and not offset by positive amounts of the remaining components. These are instances of reverse
investment or disinvestment. (United Nations Conference on Trade and Development – UNCTAD,
World Investment Report 2014, www.unctad.org)
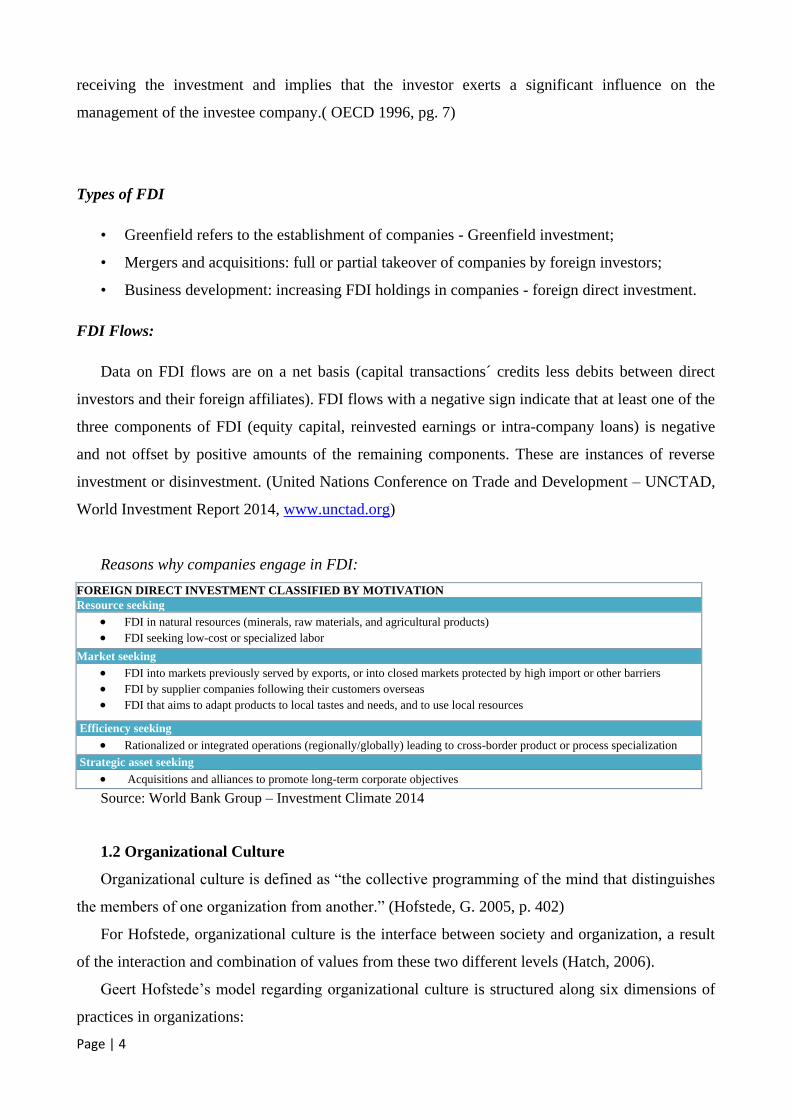
Reasons why companies engage in FDI:
FOREIGN DIRECT INVESTMENT CLASSIFIED BY MOTIVATION
Resource seeking
FDI in natural resources (minerals, raw materials, and agricultural products)
FDI seeking low-cost or specialized labor
Market seeking
FDI into markets previously served by exports, or into closed markets protected by high import or other barriers
FDI by supplier companies following their customers overseas
FDI that aims to adapt products to local tastes and needs, and to use local resources
Efficiency seeking
Rationalized or integrated operations (regionally/globally) leading to cross-border product or process specialization
Strategic asset seeking
Acquisitions and alliances to promote long-term corporate objectives
Source: World Bank Group – Investment Climate 2014
1.2 Organizational Culture
Organizational culture is defined as “the collective programming of the mind that distinguishes
the members of one organization from another.” (Hofstede, G. 2005, p. 402)
For Hofstede, organizational culture is the interface between society and organization, a result
of the interaction and combination of values from these two different levels (Hatch, 2006).
Geert Hofstede’s model regarding organizational culture is structured along six dimensions of
practices in organizations:
Page | 5
process-oriented versus results-oriented,
job-oriented versus employee-oriented,
professional versus parochial,
open systems versus closed systems,
tightly versus loosely controlled,
pragmatic versus normative.
The dimensions of organizational culture are about organizational units. Also, these dimensions
show us how to manage different types of organizational culture. Organizations place themselves
on dimensions depending on the business or industry they are part of.
1.3 National Culture
National culture is “the programming of the mind acquired by growing up in a particular
country.” (Hofstede, G. 2005, p.402)
The relative position of a country on a scale from 0 (low) to 100 (highest) on each of the six
cultural dimensions is a good predictor of human behavior and social norms in family and
education, workplace behavior, organization of state institutions, politics, national and
organizational decision making.As researchers claim, we may say that people`s way of thinking are
culturally determined.
The 6 dimensions of national culture:
Power distance (PDI),
Uncertainty avoidance (UAI),
Individualism versus collectivism (IDV),
Masculinity vs. femininity (MAS),
Long- versus short-term orientation (LTO),
Indulgence versus restraint (IVR).
These dimensions will not directly predict any future events or nation`s dynamics, but only the
understanding of what is likely to happen. Also, these dimensions have to be correlated with
national history, national wealth, personalities and coincidences.They are very useful when we
want to see and study cases of trends, averages or expectations.
2. Data and Empirical Methodology
In the present article we will analyze two hypotheses: first, we will study if there is a
connection between the FDI flows and the host nation’s culture (if there is an “attractive” national
Page | 6
culture for foreign investors), and second, we will identify if the major investors (by geographical origin) in an Eastern or Central European country
tend to invest in host-systems that have similar national cultures. Data gathered about FDI flows (foreign direct investments flows) and national culture
for Central Eastern Europe (CEE countries) will cover a period of 11 years from 2001 to 2012.
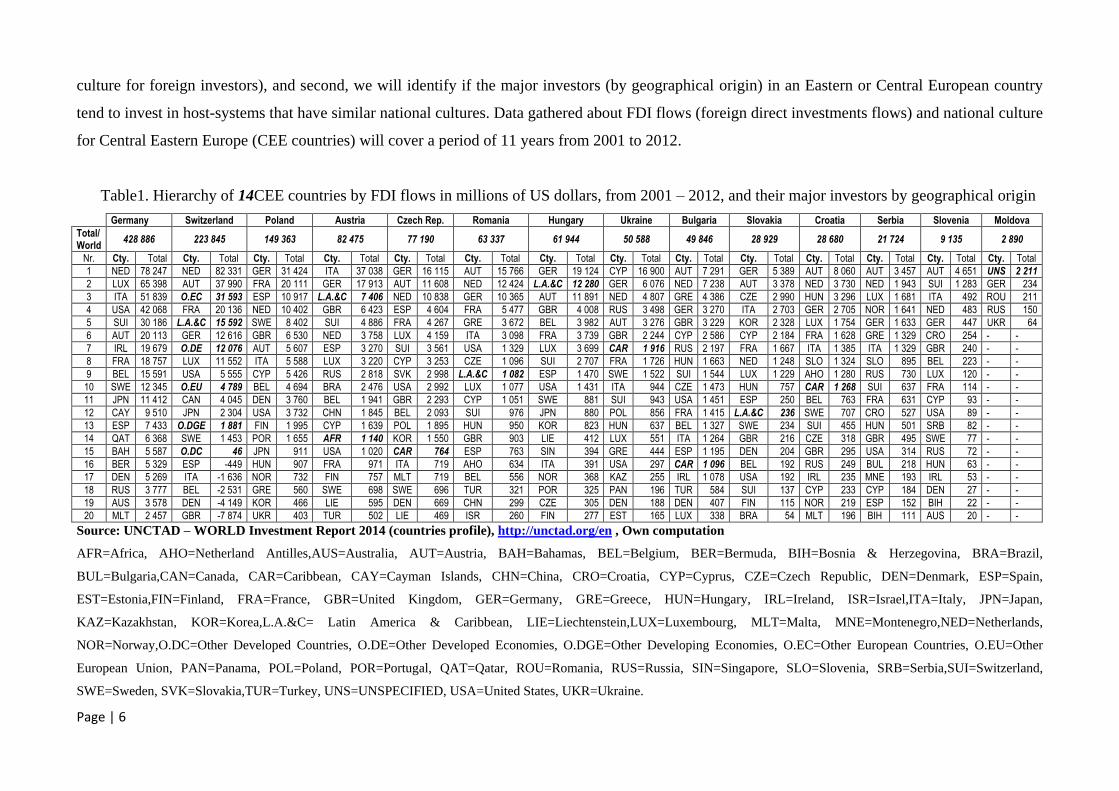
Table1. Hierarchy of 14CEE countries by FDI flows in millions of US dollars, from 2001 – 2012, and their major investors by geographical origin
Germany Switzerland Poland Austria Czech Rep. Romania Hungary Ukraine Bulgaria Slovakia Croatia Serbia Slovenia Moldova
Total/ World
428 886 223 845 149 363 82 475 77 190 63 337 61 944 50 588 49 846 28 929 28 680 21 724 9 135 2 890
Nr. Cty. Total Cty. Total Cty. Total Cty. Total Cty. Total Cty. Total Cty. Total Cty. Total Cty. Total Cty. Total Cty. Total Cty. Total Cty. Total Cty. Total
1 NED 78 247 NED 82 331 GER 31 424 ITA 37 038 GER 16 115 AUT 15 766 GER 19 124 CYP 16 900 AUT 7 291 GER 5 389 AUT 8 060 AUT 3 457 AUT 4 651 UNS 2 211
2 LUX 65 398 AUT 37 990 FRA 20 111 GER 17 913 AUT 11 608 NED 12 424 L.A.&C 12 280 GER 6 076 NED 7 238 AUT 3 378 NED 3 730 NED 1 943 SUI 1 283 GER 234
3 ITA 51 839 O.EC 31 593 ESP 10 917 L.A.&C 7 406 NED 10 838 GER 10 365 AUT 11 891 NED 4 807 GRE 4 386 CZE 2 990 HUN 3 296 LUX 1 681 ITA 492 ROU 211
4 USA 42 068 FRA 20 136 NED 10 402 GBR 6 423 ESP 4 604 FRA 5 477 GBR 4 008 RUS 3 498 GER 3 270 ITA 2 703 GER 2 705 NOR 1 641 NED 483 RUS 150
5 SUI 30 186 L.A.&C 15 592 SWE 8 402 SUI 4 886 FRA 4 267 GRE 3 672 BEL 3 982 AUT 3 276 GBR 3 229 KOR 2 328 LUX 1 754 GER 1 633 GER 447 UKR 64
6 AUT 20 113 GER 12 616 GBR 6 530 NED 3 758 LUX 4 159 ITA 3 098 FRA 3 739 GBR 2 244 CYP 2 586 CYP 2 184 FRA 1 628 GRE 1 329 CRO 254 - - 7 IRL 19 679 O.DE 12 076 AUT 5 607 ESP 3 270 SUI 3 561 USA 1 329 LUX 3 699 CAR 1 916 RUS 2 197 FRA 1 667 ITA 1 385 ITA 1 329 GBR 240 - - 8 FRA 18 757 LUX 11 552 ITA 5 588 LUX 3 220 CYP 3 253 CZE 1 096 SUI 2 707 FRA 1 726 HUN 1 663 NED 1 248 SLO 1 324 SLO 895 BEL 223 - - 9 BEL 15 591 USA 5 555 CYP 5 426 RUS 2 818 SVK 2 998 L.A.&C 1 082 ESP 1 470 SWE 1 522 SUI 1 544 LUX 1 229 AHO 1 280 RUS 730 LUX 120 - - 10 SWE 12 345 O.EU 4 789 BEL 4 694 BRA 2 476 USA 2 992 LUX 1 077 USA 1 431 ITA 944 CZE 1 473 HUN 757 CAR 1 268 SUI 637 FRA 114 - - 11 JPN 11 412 CAN 4 045 DEN 3 760 BEL 1 941 GBR 2 293 CYP 1 051 SWE 881 SUI 943 USA 1 451 ESP 250 BEL 763 FRA 631 CYP 93 - - 12 CAY 9 510 JPN 2 304 USA 3 732 CHN 1 845 BEL 2 093 SUI 976 JPN 880 POL 856 FRA 1 415 L.A.&C 236 SWE 707 CRO 527 USA 89 - - 13 ESP 7 433 O.DGE 1 881 FIN 1 995 CYP 1 639 POL 1 895 HUN 950 KOR 823 HUN 637 BEL 1 327 SWE 234 SUI 455 HUN 501 SRB 82 - - 14 QAT 6 368 SWE 1 453 POR 1 655 AFR 1 140 KOR 1 550 GBR 903 LIE 412 LUX 551 ITA 1 264 GBR 216 CZE 318 GBR 495 SWE 77 - - 15 BAH 5 587 O.DC 46 JPN 911 USA 1 020 CAR 764 ESP 763 SIN 394 GRE 444 ESP 1 195 DEN 204 GBR 295 USA 314 RUS 72 - - 16 BER 5 329 ESP -449 HUN 907 FRA 971 ITA 719 AHO 634 ITA 391 USA 297 CAR 1 096 BEL 192 RUS 249 BUL 218 HUN 63 - - 17 DEN 5 269 ITA -1 636 NOR 732 FIN 757 MLT 719 BEL 556 NOR 368 KAZ 255 IRL 1 078 USA 192 IRL 235 MNE 193 IRL 53 - - 18 RUS 3 777 BEL -2 531 GRE 560 SWE 698 SWE 696 TUR 321 POR 325 PAN 196 TUR 584 SUI 137 CYP 233 CYP 184 DEN 27 - - 19 AUS 3 578 DEN -4 149 KOR 466 LIE 595 DEN 669 CHN 299 CZE 305 DEN 188 DEN 407 FIN 115 NOR 219 ESP 152 BIH 22 - - 20 MLT 2 457 GBR -7 874 UKR 403 TUR 502 LIE 469 ISR 260 FIN 277 EST 165 LUX 338 BRA 54 MLT 196 BIH 111 AUS 20 - -
Source: UNCTAD – WORLD Investment Report 2014 (countries profile), http://unctad.org/en , Own computation
AFR=Africa, AHO=Netherland Antilles,AUS=Australia, AUT=Austria, BAH=Bahamas, BEL=Belgium, BER=Bermuda, BIH=Bosnia & Herzegovina, BRA=Brazil,
BUL=Bulgaria,CAN=Canada, CAR=Caribbean, CAY=Cayman Islands, CHN=China, CRO=Croatia, CYP=Cyprus, CZE=Czech Republic, DEN=Denmark, ESP=Spain,
EST=Estonia,FIN=Finland, FRA=France, GBR=United Kingdom, GER=Germany, GRE=Greece, HUN=Hungary, IRL=Ireland, ISR=Israel,ITA=Italy, JPN=Japan,
KAZ=Kazakhstan, KOR=Korea,L.A.&C= Latin America & Caribbean, LIE=Liechtenstein,LUX=Luxembourg, MLT=Malta, MNE=Montenegro,NED=Netherlands,
NOR=Norway,O.DC=Other Developed Countries, O.DE=Other Developed Economies, O.DGE=Other Developing Economies, O.EC=Other European Countries, O.EU=Other
European Union, PAN=Panama, POL=Poland, POR=Portugal, QAT=Qatar, ROU=Romania, RUS=Russia, SIN=Singapore, SLO=Slovenia, SRB=Serbia,SUI=Switzerland,
SWE=Sweden, SVK=Slovakia,TUR=Turkey, UNS=UNSPECIFIED, USA=United States, UKR=Ukraine.
Page | 7
From Table 1. we can see that the CEE countries that benefit from a large flow of investments
from 2001 – 2012 are Germany (428 886 millions of US dollars), Switzerland (223 845 millions of
US dollars) and Poland (149 363 mill. of US dollars), being the first 3 countries, in this order, from
the 14 countries we analyzed. Next in line are Austria, Czech Republic, Romania, Hungary,
Ukraine and Bulgaria. The countries which benefit less from FDI flows in the 11 years studied are:
Slovenia (9 135 mill. of US dollars) and Moldova (2 890 mill. of US dollars). Some data in Table
1. were available only for regions like Africa, Caribbean, Latin America & Caribbean, Other
Developed Economies, Other Developing Economies, Other European Countries, or Other
European Union, not for individual countries. “FDI flows with a negative sign indicate that at least
one of the three components of FDI (equity capital, reinvested earnings or intra-company loans) is
negative and not offset by positive amounts of the remaining components. These are instances of
reverse investment or disinvestment.”
(UNCTAD – FDI flows, http://unctad.org/en/Pages/DIAE/Investment%20and%20Enterprise/FDI_Flows.aspx)
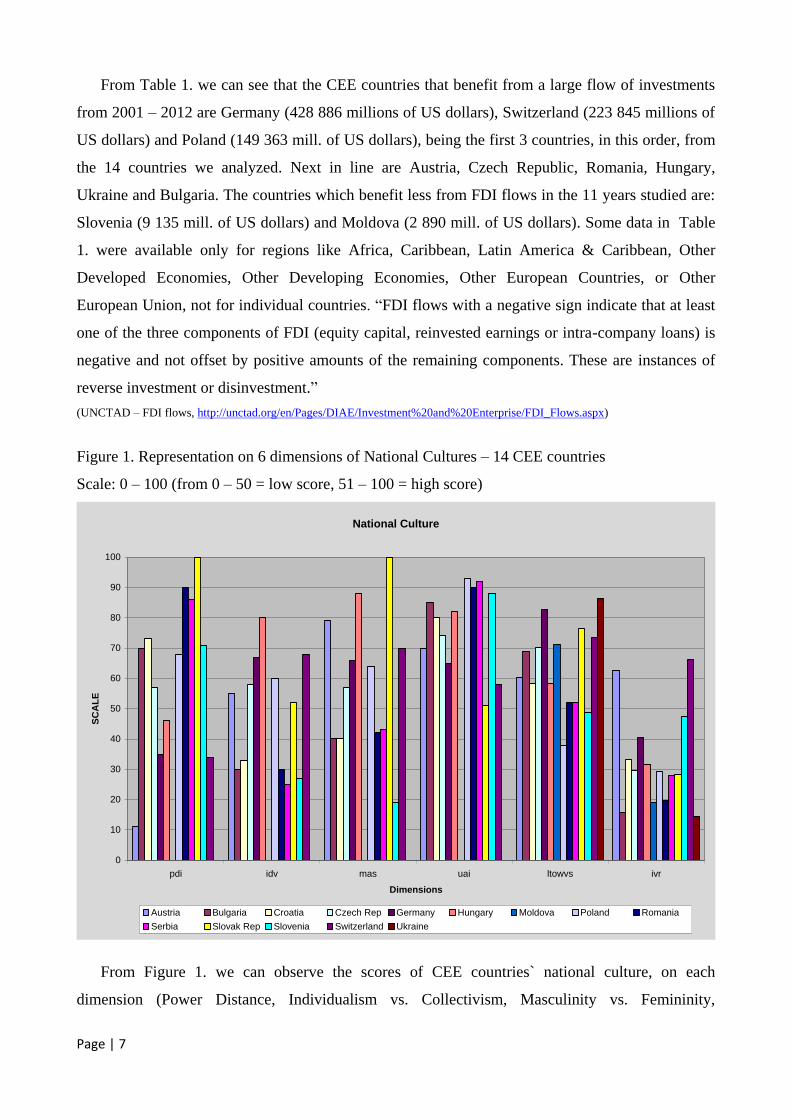
Figure 1. Representation on 6 dimensions of National Cultures – 14 CEE countries
Scale: 0 – 100 (from 0 – 50 = low score, 51 – 100 = high score)
From Figure 1. we can observe the scores of CEE countries` national culture, on each
dimension (Power Distance, Individualism vs. Collectivism, Masculinity vs. Femininity,
National Culture
0
10
20
30
40
50
60
70
80
90
100
pdi idv mas uai ltowvs ivr
Dimensions
SC
AL
E
Austria Bulgaria Croatia Czech Rep Germany Hungary Moldova Poland Romania
Serbia Slovak Rep Slovenia Switzerland Ukraine
Page | 8
Uncertainty Avoidance, Long-term Orientation vs. Short-term Orientation and Indulgence versus
Restraint).
We can see that Germany, Switzerland, Poland, Austria, Czech Republic, Hungary and
Slovakia have high scores on Individualism (IDV) and Masculinity (MAS) dimensions. The same
countries plus Romania, Bulgaria, Croatia, Serbia and Slovenia, have high scores on Uncertainty
Avoidance (UAI). Romania, Bulgaria, Croatia, Serbia and Slovenia have low scores on
Individualism and Masculinity dimensions. Power Distance (PDI) dimension scores low for
Germany, Switzerland, Austria and Hungary and high for Poland, Czech Republic, Romania,
Bulgaria, Slovakia, Serbia and Slovenia. Data about these dimensions are not available for Ukraine
and Moldova. We have only 2 countries that “manifest” Short-term Orientation namely Poland and
Slovenia, and also only 2 countries that score high on Indulgence versus Restraint dimension
(IVR), like Switzerland and Austria.
3. Findings based on the first set of gathered data
If we correlate Table 1. with Figure 1 we can observe that countries with very high levels of
foreign direct investment flows have in common high scores on IDV, MAS and UAI dimensions
(Germany, Switzerland, Poland, Austria, Czech Republic). Also, the countries with lower or very
low level of FDI flows have high scores on Power Distance (PDI) dimension (Bulgaria, Slovakia,
Croatia, Serbia, Slovenia). There are two exceptions from these “rules”: Romania and Hungary.
Even though Romania scores high on PDI dimension and low on IDV and MAS dimensions (with
high score on UAI dimension), and Hungary scores low on PDI and high on IDV, MAS, UAI
dimensions, Romania got more foreign investments over the period of 11 years (2001-2012) than
Hungary. Slovakia`s national culture scores high on IDV, MAS, UAI, but also has the highest score
on PDI, which can explain its` 10th place in the hierarchy of FDI flows from the 14 CEE countries
analyzed. Again, there is no data available on these dimensions for Ukraine and Moldova.
Based on gathered data and correlations between them we can say that the national culture that
“attracts” the most FDI flows is a culture that values more individualism, masculinity, avoidance of
uncertainty and has a democratic national/ institutional system (low score PDI).
Page | 9
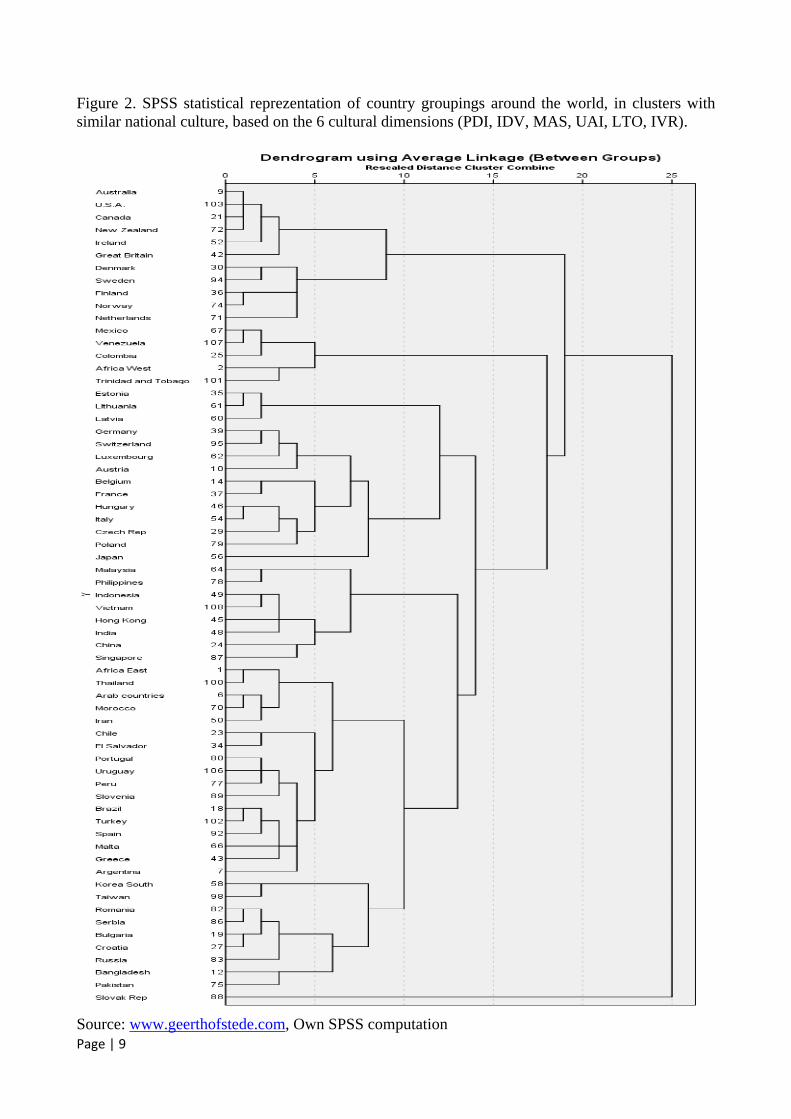
Figure 2. SPSS statistical reprezentation of country groupings around the world, in clusters with
similar national culture, based on the 6 cultural dimensions (PDI, IDV, MAS, UAI, LTO, IVR).
Source: www.geerthofstede.com, Own SPSS computation
Page | 10
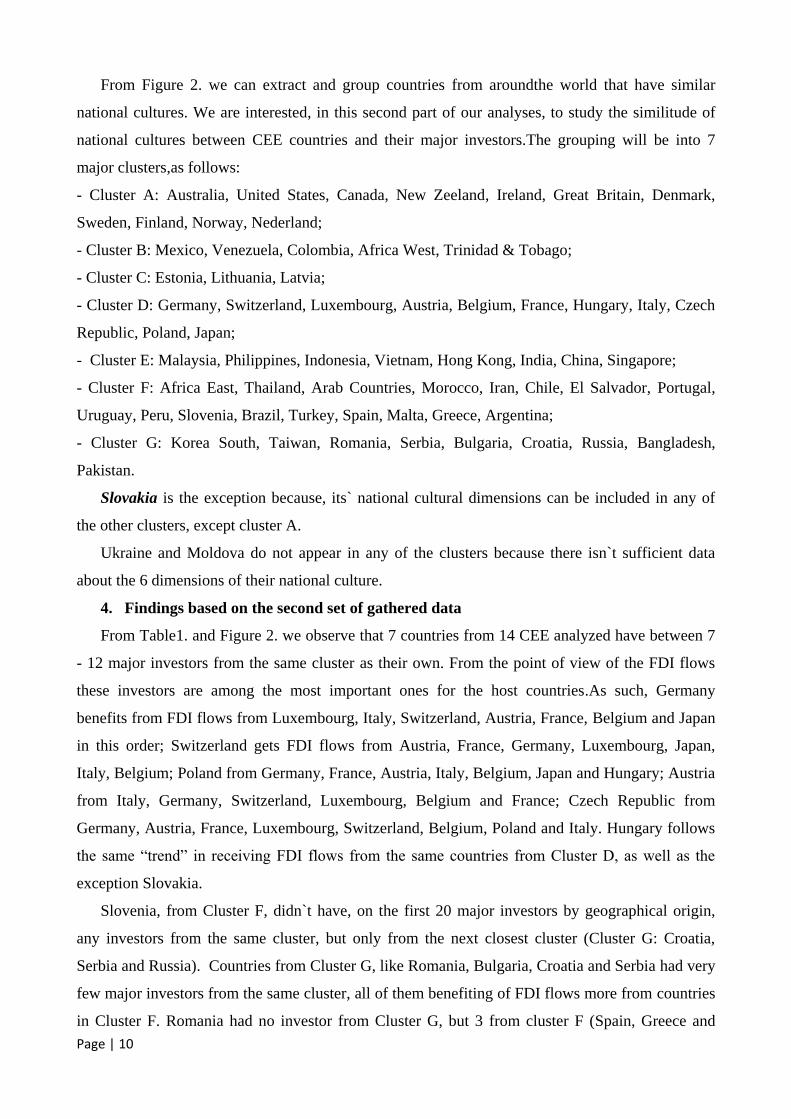
From Figure 2. we can extract and group countries from aroundthe world that have similar
national cultures. We are interested, in this second part of our analyses, to study the similitude of
national cultures between CEE countries and their major investors.The grouping will be into 7
major clusters,as follows:
- Cluster A: Australia, United States, Canada, New Zeeland, Ireland, Great Britain, Denmark,
Sweden, Finland, Norway, Nederland;
- Cluster B: Mexico, Venezuela, Colombia, Africa West, Trinidad & Tobago;
- Cluster C: Estonia, Lithuania, Latvia;
- Cluster D: Germany, Switzerland, Luxembourg, Austria, Belgium, France, Hungary, Italy, Czech
Republic, Poland, Japan;
- Cluster E: Malaysia, Philippines, Indonesia, Vietnam, Hong Kong, India, China, Singapore;
- Cluster F: Africa East, Thailand, Arab Countries, Morocco, Iran, Chile, El Salvador, Portugal,
Uruguay, Peru, Slovenia, Brazil, Turkey, Spain, Malta, Greece, Argentina;
- Cluster G: Korea South, Taiwan, Romania, Serbia, Bulgaria, Croatia, Russia, Bangladesh,
Pakistan.
Slovakia is the exception because, its` national cultural dimensions can be included in any of
the other clusters, except cluster A.
Ukraine and Moldova do not appear in any of the clusters because there isn`t sufficient data
about the 6 dimensions of their national culture.
4. Findings based on the second set of gathered data
From Table1. and Figure 2. we observe that 7 countries from 14 CEE analyzed have between 7
- 12 major investors from the same cluster as their own. From the point of view of the FDI flows
these investors are among the most important ones for the host countries.As such, Germany
benefits from FDI flows from Luxembourg, Italy, Switzerland, Austria, France, Belgium and Japan
in this order; Switzerland gets FDI flows from Austria, France, Germany, Luxembourg, Japan,
Italy, Belgium; Poland from Germany, France, Austria, Italy, Belgium, Japan and Hungary; Austria
from Italy, Germany, Switzerland, Luxembourg, Belgium and France; Czech Republic from
Germany, Austria, France, Luxembourg, Switzerland, Belgium, Poland and Italy. Hungary follows
the same “trend” in receiving FDI flows from the same countries from Cluster D, as well as the
exception Slovakia.
Slovenia, from Cluster F, didn`t have, on the first 20 major investors by geographical origin,
any investors from the same cluster, but only from the next closest cluster (Cluster G: Croatia,
Serbia and Russia). Countries from Cluster G, like Romania, Bulgaria, Croatia and Serbia had very
few major investors from the same cluster, all of them benefiting of FDI flows more from countries
in Cluster F. Romania had no investor from Cluster G, but 3 from cluster F (Spain, Greece and
Page | 11
Turkey), Bulgaria had only one investor from Cluster G (Russia), and the same investors from
Cluster F, Croatia also got FDI flows from Russia and Cluster F (Spain, Slovenia, Malta).
And so, 7 from 14 CEE countries have major foreign investors from countries with similar
national culture, 5 CEE countries analyzed have very few investors from the same cultural cluster
and 2 countries couldn`t be analyzed in this context (Ukraine and Moldova), because of lack of
data.
As a result, we can state that the second hypothesis (that postulated that countries with a certain
type of culture tend to invest in host-systems that have similar national culture) is uncertain, the
information available only partially supporting it.
5. Conclusions
The confirmation of our first hypothesis is backed up by studies that demonstrate correlations
between high scores in IDV, MAS, UAI and low scores for PDI cultural dimension. Nearly all
wealthy countries score high in Individualism or Masculinity and score low in PDI (power distance
dimension).
For example, high scores in PDI are related to bribery and scandals that are usually covered up
in corrupt countries.
Individualism is usually correlated to small power distance were the role of state in the
economic system is restrained, joint stock companies are owned by individuals and Per Capita
GNP tend to be higher, indicating the level of wealth forthosecountries.
In countries that manifest Masculine culture there is a preference for large organizations, more
status product are sold, people live in order to work, you find more opportunities for high earnings,
competitive manufacturing and economic growth at the national level.
Also, high scored UAI countries like law and order, dislike ambiguity and chaos, have more
specialists in organizations that show an inner urge to work hard and like precision and
formalization.
For the first and second hypothesis, the small difference in FDI flows between Romania and
Hungary (even though Hungary has more similar cultural dimensions and comes from the same
Cluster D as Germany, Switzerland, Poland and Austria) can be explained by Romania’s sea access
to international trade. In the case of Slovakia weobserve an extremely high score on the PDI
cultural dimension. Multinational companies avoid countries like this because they want to invest
in democratic systems, where decentralization is popular and there is fewer supervisory personnel,
qualities much needed for companies` long-distance management; this country also has an
extremely high score of MAS dimension which indicates that their national culture shows
disrespect for cooperation and employment security.

Page | 12
National culture represents only one of many factors that can explain the FDI flows within host
economies and there is need of further research to completely explore this relationship to its full
extent.
References:
Harris, M. 1981, America now: The anthropology of a changing culture, New York: Simon &
Schuster;
Hofstede, G., Hofstede, G.J., 2005, Cultures and Organizations: Software of the Mind, ed.
McGraw Hill;
Hofstede, G., Neuijen, B., Ohayv, D., & Sanders, G. (1990). Measuring organizational cultures:
A qualitative and quantitative study across twenty cases. Administrative ScienceQuarterly, 35, 286-
316;
Mead, M. 1962, Male and Female, London: Penguin Books [Original work published 1950];
Montesquieu, C.-L. de. 1979, De l'esprit des lois, vol. I, Paris: GF – Flammarion. [Original
work published 1742];
Porter, Michael, 2008, DespreConcurență, Ed. Meteor Business;
Rainelli, Michel, 2004ComerțulInternațional, Perspective generale/ NouaTeorie a
ComerțuluiInternațional, Ed. Arc;
Stiglitz, Joseph E.,2008,MecanismeleGlobalizării, Ed. Polirom, Bucuresti
http://www.bnr.ro/Investitiile-straine-directe-%28ISD%29-in-Romania-3174.aspx – StatisticaAnuala
BNR asuprafluxului net de ISD-uri;
http://geert-hofstede.com/national-culture.html - National culture dimensions;
http://geerthofstede.com/dimension-data-matrix - Statistical data base on countries cultural dimensions;
http://unctad.org/SearchCenter/Pages/Results.aspx?k=investment%20report – World Investment Report
2014, country profiles;
http://unctad.org/en/Pages/DIAE/Investment%20and%20Enterprise/FDI_Flows.aspx - UNCTAD – FDI
flows.
Acknowledgement: This work was cofinanced from the European Social Fund through Sectoral Operational
Programme Human Resources Development 2007-2013, project number POSDRU/159/1.5/S/134197 „Performance
and excellence in doctoral and postdoctoral research in Romanian economics science domain”./ Această lucrare a fost
cofinanțată din Fondul Social European, prin Programul Operațional Sectorial Dezvoltarea Resurselor Umane 2007-
2013, proiect numărul POSDRU/159/1.5/S/134197 „Performanață şi excelență în cercetarea doctorală și
postdoctorală în domeniul ştiințelor economice din România”