Nanoparticle Modified Smart Oil Well Cement for Monitoring Cementing Applications
16
Copyright 2015, AADE This paper was prepared for presentation at the 2015 AADE National Technical Conference and Exhibition held at the Henry B. Gonzalez Convention Center, San Antonio, Texas, April 8-9, 2015. This conference was sponsored by the American Association of Drilling Engineers. The information presented in this paper does not reflect any position, claim or endorsement made or implied by the American Association of Drilling Engineers, their officers or members. Questions concerning the content of this paper should be directed to the individual(s) listed as author(s) of this work. Abstract During cementing operation, it is critical to determine the location of cement slurry between the casing and formation, depth of the circulation losses and fluid loss, setting of cement in place and performance of the cement after hardening. Recent case studies on oil well failures have clearly identified some of the cementing issues that resulted in various types of delays in the cementing operations. At present there is no technology available to monitor cementing operations in real time from the time of placement through the borehole service life. Also, there is no reliable method to determine the length of the competent cement supporting the casing. In this study, smart cement with 0.38 and 0.54 water-to- cement ratio (w/c) was modified with iron nanoparticles (NanoFe) to have better sensing properties, so that its behavior can be monitored at various stages of construction and during the service life of wells. A series of experiments evaluated well smart cement behavior with and without NanoFe in order to identify the most reliable sensing properties that can also be relatively easily monitored. Tests were performed on the smart cement from the time of mixing to hardened state behavior. During the initial setting the electrical resistivity changed with time based on the w/c and the amount of NanoFe used to modify smart oil well cement. The shear thinning behavior of the smart cement slurries with and without NanoFe at different w/c ratio and temperatures have been quantified using the hyperbolic model and compared with three material parameters, Vocadlo model. The results showed that the hyperbolic model predicated the shear thinning relationship between the shear stress and shear strain rate of the NanoFe modified smart cement slurries very well. Also the hyperbolic model has a maximum shear stress limit were as the other model did not have a limit on the maximum shear stress. Based on the hyperbolic model the maximum shear stresses with w/c ratio of 0.34 and 0.54 modified with 1% NanoFe at temperature of 25 o C were 236 Pa and 74 Pa respectively. A new quantification concept has been developed to characterize cement curing based on electrical resistivity changes in the first 24 hours and 7 days of curing. When cement was modified with 0.1% of conductive filer (CF), the piezoresistive behavior of the hardened smart cement was improved without affecting the rheological and setting properties of the cement based on the w/c ratio and the NanoFe content. The test results showed that NanoFe reduced the electrical resistivity of the smart cement slurries. The 1% of NanoFe also affected the rheological properties and the piezoresistive behavior of the smart cement. . The RI 24hr for the smart cement with NanoFe decreased with the amount of NanoFe. Addition of 1% NanoFe increased the compressive strength of the smart cement with w/c ratio of 0.38 and 0.54 by 3% and 15% after 1 day of curing respectively. For the smart cement (w/c=0.38) modified with NanoFe, the resistivity change at peak stress was over 2500 times higher than the change in the compressive strain. A linear correlation was obtained between the RI 24hr and the compressive strength of the modified smart cement based on the w/c and curing time. Introduction As Deepwater exploration and production of oil and gas expands around the world, there are unique challenges in well construction beginning at the seafloor. Recent case studies on cementing failures have clearly identified several issues that resulted in various types of delays in the cementing operations. Also preventing the loss of fluids to the formations and proper well cementing have become critical issues in well construction to ensure wellbore integrity because of varying down hole conditions (Eoff et al. 2009; Labibzadeh et al. 2010). Moreover, the environmental friendliness of the cements is a critical issue that is becoming increasingly important (Thaemlitz et al. 1999; Dom et al. 2007). Lack of cement returns may compromise the casing support, and excess cement returns can cause problems with flow and control lines (Fuller et al. 2002; Gill et al. 2005). Hence there is a need for monitoring the cementing operation in real time. Free ions in the cement slurry have significant effect on electrical resistivity of samples. According to the literature conductivity of cement is mostly related to the three main parameters which are ion concentration, the number of charges per ion and the equivalent ionic conductivity it should be noted according to current experimental results other parameters that has significant effect on resistivity of cement during hydration are curing temperature, curing condition, weight loss during curing and method of resistivity measurement, two probe of four probe testing and frequency of measurement. AADE-15-NTCE-06 Nanoparticle Modified Smart Oil Well Cement for Monitoring Cementing Applications Cumaraswamy Vipulanandan and Ahmed Mohammed CIGMAT- University of Houston
Transcript of Nanoparticle Modified Smart Oil Well Cement for Monitoring Cementing Applications

Copyright 2015, AADE
This paper was prepared for presentation at the 2015 AADE National Technical Conference and Exhibition held at the Henry B. Gonzalez Convention Center, San Antonio, Texas, April 8-9, 2015. This conference was sponsored by the American Association of Drilling Engineers. The information presented in this paper does not reflect any position, claim or endorsement made or implied by the American Association of Drilling Engineers, their officers or members. Questions concerning the content of this paper should be directed to the individual(s) listed as author(s) of this work.
Abstract
During cementing operation, it is critical to determine
the location of cement slurry between the casing and
formation, depth of the circulation losses and fluid loss, setting
of cement in place and performance of the cement after
hardening. Recent case studies on oil well failures have clearly
identified some of the cementing issues that resulted in various
types of delays in the cementing operations. At present there is
no technology available to monitor cementing operations in
real time from the time of placement through the borehole
service life. Also, there is no reliable method to determine the
length of the competent cement supporting the casing.
In this study, smart cement with 0.38 and 0.54 water-to-
cement ratio (w/c) was modified with iron nanoparticles
(NanoFe) to have better sensing properties, so that its behavior
can be monitored at various stages of construction and during
the service life of wells. A series of experiments evaluated
well smart cement behavior with and without NanoFe in order
to identify the most reliable sensing properties that can also be
relatively easily monitored. Tests were performed on the smart
cement from the time of mixing to hardened state behavior.
During the initial setting the electrical resistivity changed with
time based on the w/c and the amount of NanoFe used to
modify smart oil well cement. The shear thinning behavior of
the smart cement slurries with and without NanoFe at different
w/c ratio and temperatures have been quantified using the
hyperbolic model and compared with three material
parameters, Vocadlo model. The results showed that the
hyperbolic model predicated the shear thinning relationship
between the shear stress and shear strain rate of the NanoFe
modified smart cement slurries very well. Also the hyperbolic
model has a maximum shear stress limit were as the other
model did not have a limit on the maximum shear stress.
Based on the hyperbolic model the maximum shear stresses
with w/c ratio of 0.34 and 0.54 modified with 1% NanoFe at
temperature of 25oC were 236 Pa and 74 Pa respectively. A
new quantification concept has been developed to characterize
cement curing based on electrical resistivity changes in the
first 24 hours and 7 days of curing. When cement was
modified with 0.1% of conductive filer (CF), the
piezoresistive behavior of the hardened smart cement was
improved without affecting the rheological and setting
properties of the cement based on the w/c ratio and the
NanoFe content. The test results showed that NanoFe reduced
the electrical resistivity of the smart cement slurries. The 1%
of NanoFe also affected the rheological properties and the
piezoresistive behavior of the smart cement. . The RI24hr for
the smart cement with NanoFe decreased with the amount of
NanoFe. Addition of 1% NanoFe increased the compressive
strength of the smart cement with w/c ratio of 0.38 and 0.54
by 3% and 15% after 1 day of curing respectively. For the
smart cement (w/c=0.38) modified with NanoFe, the
resistivity change at peak stress was over 2500 times higher
than the change in the compressive strain. A linear correlation
was obtained between the RI24hr and the compressive strength
of the modified smart cement based on the w/c and curing
time. Introduction
As Deepwater exploration and production of oil and gas
expands around the world, there are unique challenges in well
construction beginning at the seafloor. Recent case studies on
cementing failures have clearly identified several issues that
resulted in various types of delays in the cementing
operations. Also preventing the loss of fluids to the formations
and proper well cementing have become critical issues in well
construction to ensure wellbore integrity because of varying
down hole conditions (Eoff et al. 2009; Labibzadeh et al.
2010). Moreover, the environmental friendliness of the
cements is a critical issue that is becoming increasingly
important (Thaemlitz et al. 1999; Dom et al. 2007). Lack of
cement returns may compromise the casing support, and
excess cement returns can cause problems with flow and
control lines (Fuller et al. 2002; Gill et al. 2005). Hence there
is a need for monitoring the cementing operation in real time.
Free ions in the cement slurry have significant effect on
electrical resistivity of samples. According to the literature
conductivity of cement is mostly related to the three main
parameters which are ion concentration, the number of charges
per ion and the equivalent ionic conductivity it should be
noted according to current experimental results other
parameters that has significant effect on resistivity of cement
during hydration are curing temperature, curing condition,
weight loss during curing and method of resistivity
measurement, two probe of four probe testing and frequency
of measurement.
AADE-15-NTCE-06
Nanoparticle Modified Smart Oil Well Cement for Monitoring Cementing Applications
Cumaraswamy Vipulanandan and Ahmed Mohammed CIGMAT- University of Houston

2 C. Vipulanandan and A. Mohammed AADE-15-NTCE-06
Two studies done during the period of 1971 to 1991
and 1992 to 2006 clearly identified cement failures as the
major cause for blowouts (McCarter 1996). Cementing
failures increased significantly during the second period of
study when 18 of the 39 blowouts were due to cementing
problem (McCarter 1996).
Electrical resistivity measurement has been applied by
many researches on concrete and other cementing applications
(McCarter 2006), but there are no reports in the literature of
electrical resistivity measurements for characterizing oil well
cement. Electrical response characteristics measurement has
appropriate sensitivity in monitoring the characteristics of
cementitious materials (Mc Carter et al. 1991). The
advantages in using this technique include its accuracy, ease
of testing and procedures, and nondestructive characteristics
(Li et al. 2003). Additionally, this method can be used for
monitoring the long term behavior of cement in practice.
Electrical resistivity of cement is affected by a number of
factors, such as pore structure (continuity and tortuosity), pore
solution composition, cementitious content, water-to-cement
ratio (w/c), moisture content, and temperature (Polder et al.
2001). Moreover, electrical resistivity of cement is
dramatically affected by admixtures, due to the resistivity
contrast between cement and the admixture substances.
Vipulanandan et al. (2006-2014) have studied the change in
electrical resistivity with applied stress, referred to as
piezoresistive behavior of modified cementitious and polymer
composites.
Objectives
The overall objective of the study was to determine the
effect of NanoFe on the behavior of smart oil well cement.
The specific objectives are as follows:
(i) Investigate the effect of w/c and NanoFe on the rheological
and electrical properties of smart oil well cement.
(ii) Quantify the effect of NanoFe on the piezoresistive
behavior of smart cement.
Materials and Methods Smart Cement
Commercially available oil well cement (Class H
cement) was modified with additives to make it a
piezoresistive material.
Iron Nanoparticles (NanoFe) Commercially available nano iron was used in this study.
Based on the manufactures data sheet the particle size was 30
nm, bulk density of 0.25 gm/cc and surface area of 38 m2/gm.
Methods Cement Mixture
The samples were prepared according to the API
standards. Smart cement with a w/c ratio of 0.38 and 0.54
were used in this study. Four series of cement slurries without
and with 1% of NanoFe were prepared.
Cement Specimen Preparation After mixing, specimens were prepared using
cylindrical molds with a diameter of 2 inches and a height of 4
inches. Two conductive wires were placed in all of the molds
which were 5 cm apart. All specimens were capped to
minimize moisture loss and were cured up to the 28 days for
the piezoresistivity test under compressive loading.
Rheological Tests Rheological properties determine the ability of cement to
be pumped. The rheology tests were performed by utilizing a
rotational viscometer at room pressure and temperature at
rpms ranging from 3 to 600 rpm, and related shear stresses
were recorded. The viscometers were calibrated using several
standard solutions.
Electrical Resistivity Two different instruments were used to measure the
electrical resistivity of the smart cement.
(i) Conductivity Probe
Commercially available conductivity probe was used to
measure the conductivity (inverse of electrical resistivity) of
the fluids. In the case of cement, this meter was used during
the initial curing of the cement. The conductivity measuring
range was from 0.1μS/cm to 1000 mS/cm representing a
resistivity of 10,000 Ω.m to 0.1 Ω.m.
(ii) Digital Resistivity Meter
Digital resistivity meter measured the resistivity of
fluids, slurries and semi-solids with resistivities in the range of
0.01 Ω-m to 400 Ω-m. Both of the electrical resistivity devices
were calibrated using standard solution. Based on past studies,
electrical resistivity was selected the monitoring parameter to
quantify the performance of modified cement during curing
and hardening process (Vipulanandan et al. 2014). Further,
Electrical resistance was measured using LCR meter during
the curing time. To minimize the contact resistances, the
resistance was measured at 300 kHz using two-wire method.
Each specimen was calibrated to obtain the electrical
resistivity (ρ) from the measured electrical resistance (R)
based on the Eqn.1.
R = ρ ∗ (L
A) = ρK (1)
where L is the distance between the wires, A is the cross-
sectional area through which the current is flowing, and L/A is
called the geometry factor. In addition to geometry, other
interfacial factors are important in obtaining electrical
resistivity from electrical resistance. Due to the voltage
present during electrical resistance measurement, electric
polarization occurs as the resistance measurement is made
continuously. The polarization results in an increase in the
measured resistance (Chung et al 2001). Hence, L/A in Eqn.1
is replaced by an experimentally found calibration factor (K).
Normalized change in resistivity with the changing conditions
can be represented as follows:

AADE-15-NTCE-06 Nanoparticle Modified Smart Oil Well Cement for Monitoring Cementing Applications 3
Δρ
ρ=
ΔR
R (2)
In general total represent resistivity () is used to the
composition and curing characteristics. The incremental
resistivity (∆ is used as a monitoring tool.
Compressive Strength Tests
Compressive strength of cement determines the ability
of cement to stabilize casing in the wellbore. The cylindrical
specimen was capped and tested at a predetermined controlled
displacement rate. Compression tests were performed on
cement samples after 1 and 28 days of curing using a
hydraulic compression machine.
Piezoresistivity Tests
Piezoresistivity describes the change in electrical
resistivity of a material under pressure. Since oil well cement
serves as a pressure-bearing part of wells in real applications,
the piezoresistivity of smart cement with and without NanoFe
was investigated under compressive loading. During each
compression test, electrical resistance was measured in the
stress axis. To eliminate the polarization effect, alternating
current (AC) resistance measurements were made using a
LCR meter at a frequency of 300 kHz. Furthermore, changes
in resistivity were related to the applied stress.
Results and Discussions Modelling (i) Vocadlo model
Due to the shear-thinning behavior of the cement
slurries Bingham plastic model was not an accurate model to
estimate the shear stress - shear strain rate relationship. The
advantage of the proposed model is its higher accuracy
especially at higher strain shear strain rates. A comparison of
the proposed model with the Vocadlo model (Eqn. 3) which is
being used in industry is summarized in Fig. 3.
τ = [τo1
1
n + k1
n ∗ γ0.5]1/n (3)
when max. =
(ii) Hyperbolic model
To predict the shear strain rate - shear stress
relationship a hyperbolic model was proposed and fitted with
the experimental data (Vipulanandan and Mohammed 2014).
The developed hyperbolic model is presented in Eqn. 4 as
follows:
τ = τ02 +γ
A+γB (4)
where τ02 is the yield stress at zero shear strain rate (Pa), γ is the shear strain rate (s
-1) and A and B are the hyperbolic model
parameters. Experimental data and hyperbolic prediction for
smart cement slurries are shown in Fig. 2.
when
max =o
B
1 (5)
Rheological properties
Smart cement slurries with w/c ratio of 0.38 and 0.54 at
two different temperatures showed significantly different
rheological properties. However, regardless of the NanoFe
percentage and temperature, all slurries exhibited non-
Newtonian and shear-thinning behavior as shown in Fig. 1.
Rheological Models
Shear stress – shear strain rate relationships were
predicated using the hyperbolic model and compared with
Vocadlo model as shown in Fig. 1 and Fig. 2.
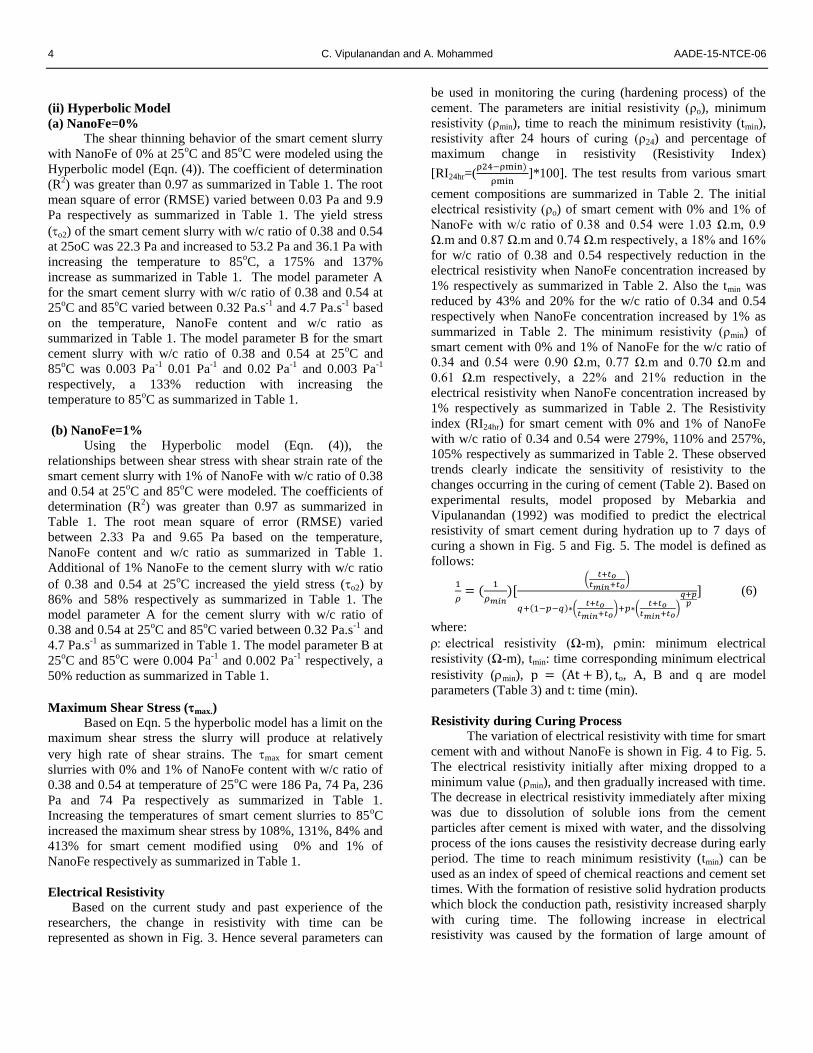
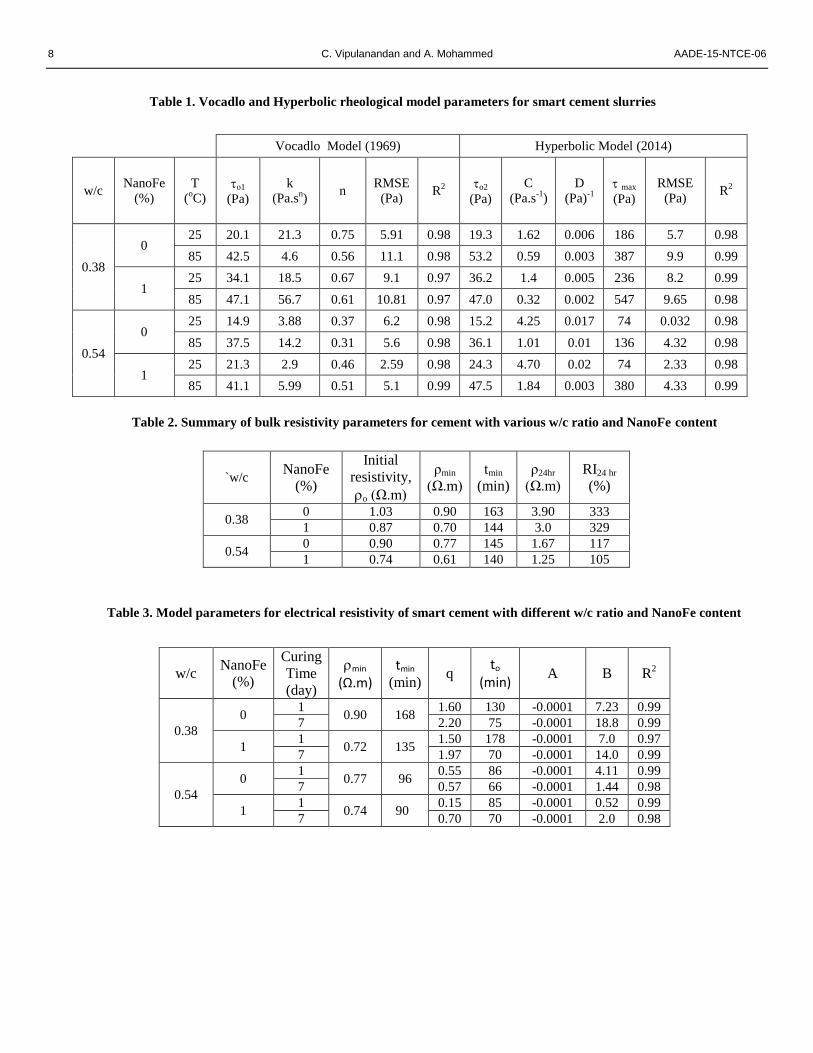
(i) Vocadlo Model
(a) NanoFe=0%
The shear thinning behavior of smart cement slurry with
w/c ratio of 0.38 and 0.54 and NanoFe of 0% at two different
temperatures 25oC and 85
oC were modeled using the Vocadlo
model (Eqn. (3)) up to a shear strain rate of 1024 s-1
(600
rpm). The coefficient of determination (R2) was greater than
0.97 as summarized in Table 1. The root mean square of error
(RMSE) varied between 5.6 Pa and 11.1 Pa based on the
temperature, NanoFe content and w/c ratio as summarized in
Table 1. The yield stress (o1) for the cement slurry with w/c
ratio of 0.38 and 0.54 at temperature of 25oC were 21.3 Pa and
18.5 Pa respectively, with increasing the temperature of the
slurry to 85oC, the yield stress increased to 42.5 Pa and 37.5
Pa respectively, a 97% and 150% increase respectively. The
model parameter k for the cement slurry with w/c ratio of 0.38
and 0.54 at temperatures of 25oC and 85
oC varied between
3.88 Pa.sn and 21.3 Pa.s
n based on the temperature, NanoFe
content and w/c ratio as summarized in Table 1. The model
parameter n for the cement slurry varied between 0.31 and
0.75 based on the temperature, NanoFe content and w/c ratio
as summarized in Table 1.
(b) NanoFe=1%
Using the Vocadlo model (Eqn. (3)), the relationships
between shear stress with shear strain rate of for smart cement
slurry mud with NanoFe of 1% at 25oC and 85
oC of
temperature and with w/c ratio of 0.38 and 0.54 were modeled.
The coefficient of determination (R2) was varied between 0.97
and 0.99 as summarized in Table 1. The root mean square of
error (RMSE) varied from 2.59 Pa to 11.1 Pa as summarized
in Table 1. The yield stress (o1) of the cement slurry with w/c
ratio of 0.38 and 0.54 at 25oC were 34.1 Pa 21.3 Pa and
increased to 47.1 Pa and 41.1 Pa with increasing the
temperature to 85oC, a 38% and 92% increase as summarized
in Table 1. The model parameter k for the cement slurry with
w/c ratio of 0.38 and 0.54 at 25oC and 85
oC varied between
2.9 Pa.sn and 56.7 Pa.s
n based on the temperature, NanoFe
content and w/c ratio. The model parameter n for cement
slurry decreased with increasing the temperature to 85oC as
summarized in Table 1.
4 C. Vipulanandan and A. Mohammed AADE-15-NTCE-06
(ii) Hyperbolic Model
(a) NanoFe=0%
The shear thinning behavior of the smart cement slurry
with NanoFe of 0% at 25oC and 85
oC were modeled using the
Hyperbolic model (Eqn. (4)). The coefficient of determination
(R2) was greater than 0.97 as summarized in Table 1. The root
mean square of error (RMSE) varied between 0.03 Pa and 9.9
Pa respectively as summarized in Table 1. The yield stress
(o2) of the smart cement slurry with w/c ratio of 0.38 and 0.54
at 25oC was 22.3 Pa and increased to 53.2 Pa and 36.1 Pa with
increasing the temperature to 85oC, a 175% and 137%
increase as summarized in Table 1. The model parameter A
for the smart cement slurry with w/c ratio of 0.38 and 0.54 at
25oC and 85
oC varied between 0.32 Pa.s
-1 and 4.7 Pa.s
-1 based
on the temperature, NanoFe content and w/c ratio as
summarized in Table 1. The model parameter B for the smart
cement slurry with w/c ratio of 0.38 and 0.54 at 25oC and
85oC was 0.003 Pa
-1 0.01 Pa
-1 and 0.02 Pa
-1 and 0.003 Pa
-1
respectively, a 133% reduction with increasing the
temperature to 85oC as summarized in Table 1.
(b) NanoFe=1%
Using the Hyperbolic model (Eqn. (4)), the
relationships between shear stress with shear strain rate of the
smart cement slurry with 1% of NanoFe with w/c ratio of 0.38
and 0.54 at 25oC and 85
oC were modeled. The coefficients of
determination (R2) was greater than 0.97 as summarized in
Table 1. The root mean square of error (RMSE) varied
between 2.33 Pa and 9.65 Pa based on the temperature,
NanoFe content and w/c ratio as summarized in Table 1.
Additional of 1% NanoFe to the cement slurry with w/c ratio
of 0.38 and 0.54 at 25oC increased the yield stress (o2) by
86% and 58% respectively as summarized in Table 1. The
model parameter A for the cement slurry with w/c ratio of
0.38 and 0.54 at 25oC and 85
oC varied between 0.32 Pa.s
-1 and
4.7 Pa.s-1
as summarized in Table 1. The model parameter B at
25oC and 85
oC were 0.004 Pa
-1 and 0.002 Pa
-1 respectively, a
50% reduction as summarized in Table 1.
Maximum Shear Stress (max.)
Based on Eqn. 5 the hyperbolic model has a limit on the
maximum shear stress the slurry will produce at relatively
very high rate of shear strains. The max for smart cement
slurries with 0% and 1% of NanoFe content with w/c ratio of
0.38 and 0.54 at temperature of 25oC were 186 Pa, 74 Pa, 236
Pa and 74 Pa respectively as summarized in Table 1.
Increasing the temperatures of smart cement slurries to 85oC
increased the maximum shear stress by 108%, 131%, 84% and
413% for smart cement modified using 0% and 1% of
NanoFe respectively as summarized in Table 1.
Electrical Resistivity
Based on the current study and past experience of the
researchers, the change in resistivity with time can be
represented as shown in Fig. 3. Hence several parameters can
be used in monitoring the curing (hardening process) of the
cement. The parameters are initial resistivity (ρo), minimum
resistivity (ρmin), time to reach the minimum resistivity (tmin),
resistivity after 24 hours of curing (ρ24) and percentage of
maximum change in resistivity (Resistivity Index)
[RI24hr=(ρ24−ρmin)
ρmin]*100]. The test results from various smart
cement compositions are summarized in Table 2. The initial
electrical resistivity (ρo) of smart cement with 0% and 1% of
NanoFe with w/c ratio of 0.38 and 0.54 were 1.03 Ω.m, 0.9
Ω.m and 0.87 Ω.m and 0.74 Ω.m respectively, a 18% and 16%
for w/c ratio of 0.38 and 0.54 respectively reduction in the
electrical resistivity when NanoFe concentration increased by
1% respectively as summarized in Table 2. Also the tmin was
reduced by 43% and 20% for the w/c ratio of 0.34 and 0.54
respectively when NanoFe concentration increased by 1% as
summarized in Table 2. The minimum resistivity (ρmin) of
smart cement with 0% and 1% of NanoFe for the w/c ratio of
0.34 and 0.54 were 0.90 Ω.m, 0.77 Ω.m and 0.70 Ω.m and
0.61 Ω.m respectively, a 22% and 21% reduction in the
electrical resistivity when NanoFe concentration increased by
1% respectively as summarized in Table 2. The Resistivity
index (RI24hr) for smart cement with 0% and 1% of NanoFe
with w/c ratio of 0.34 and 0.54 were 279%, 110% and 257%,
105% respectively as summarized in Table 2. These observed
trends clearly indicate the sensitivity of resistivity to the
changes occurring in the curing of cement (Table 2). Based on
experimental results, model proposed by Mebarkia and
Vipulanandan (1992) was modified to predict the electrical
resistivity of smart cement during hydration up to 7 days of
curing a shown in Fig. 5 and Fig. 5. The model is defined as
follows:
1
𝜌= (
1
𝜌𝑚𝑖𝑛)[
(𝑡+𝑡𝑜
𝑡𝑚𝑖𝑛+𝑡𝑜)
𝑞+(1−𝑝−𝑞)∗(𝑡+𝑡𝑜
𝑡𝑚𝑖𝑛+𝑡𝑜)+𝑝∗(
𝑡+𝑡𝑜𝑡𝑚𝑖𝑛+𝑡𝑜
)
𝑞+𝑝𝑝
] (6)
where:
electrical resistivity (Ω-m), min: minimum electrical
resistivity (Ω-m), tmin: time corresponding minimum electrical
resistivity (min), p = (At + B), to, A, B and q are model
parameters (Table 3) and t: time (min).
Resistivity during Curing Process
The variation of electrical resistivity with time for smart
cement with and without NanoFe is shown in Fig. 4 to Fig. 5.
The electrical resistivity initially after mixing dropped to a
minimum value (ρmin), and then gradually increased with time.
The decrease in electrical resistivity immediately after mixing
was due to dissolution of soluble ions from the cement
particles after cement is mixed with water, and the dissolving
process of the ions causes the resistivity decrease during early
period. The time to reach minimum resistivity (tmin) can be
used as an index of speed of chemical reactions and cement set
times. With the formation of resistive solid hydration products
which block the conduction path, resistivity increased sharply
with curing time. The following increase in electrical
resistivity was caused by the formation of large amount of

AADE-15-NTCE-06 Nanoparticle Modified Smart Oil Well Cement for Monitoring Cementing Applications 5
hydration products in the cement matrix. Finally, a relative
stable increase trend is reached by the ions diffusion control of
hydration process and resistivity increased steadily up to 24
hours, and reached a value of ρ24hr. Change in electrical
resistivity with respect to minimum resistivity, quantifies the
formation of solid hydration products which leads to decrease
in porosity and hence the strength development. Therefore by
tracking the change in resistivity of well cement, a clear
understanding of hydration process and strength development
can be obtained, which would be valuable in determining the
wait on cement times. Variations of electrical resistivity with
time for samples with different NanoFe content are
summarized in Table 2. Additional of 1% NanoFe had minmal
effect on the RI24hr.
Compressive Strength
Effect of NanoFe
1 day of curing
The compressive strength (f) of the cement with w/c
ratio of 0.38 and 0.54 modified with 0% and 1% of NanoFe
after 1 day of curing were 1583 psi, 763 psi and 1995 psi and
823 psi, a 26% and 9% increase as summarized in Table 4.
28 days of curing
The compressive strength (f) of the cement with w/c
ratio of 0.38 and 0.54 modified with 0% and 1% of NanoFe
after 28 days of curing were 2810 psi, 1829 psi and 4000 psi
and 2159 psi, a 42% and 18% increase as summarized in
Table 4.
Piezoresistivity Behavior of Smart Cement
Additional of NanoFe substantially improved
piezoresistive behavior of the smart cement.
1 day of curing
The piezoresistive behavior of cement as shown in Fig.
6. After 1 day of curing the piezoresistivity of the smart
cement with w/c ratio of 0.38 and 0.54 at failure were 0.72%
and 0.48% respectively as summarized in Table 4. Additional
of 0.1% CF to the cement increased the change in electrical
resistivity of oil well cement at failure (∆ρ
ρo)
f with w/c ratio of
0.38 and 0.54 were 583% and 296% respectively as
summarized in Table 4. Additional of 1% of NanoFe to the
smart cement after 1 day of curing increased the electrical
resistivity at failure (∆ρ
ρo)
f with different to 700% and 368%
respectively as summarized in Table 4. The Piezoresistivity at
failure for 1% NanoFe was about 3500 times higher than the
compressive strain at failure.
28 days of curing
Additional of 0.1% CF to the cement with w/c ratio of
0.38 and 0.54 increased the change in electrical resistivity of
oil well cement at failure (∆ρ
ρo)
f as summarized in Table 4.
Additional of 1% of NanoFe to the smart cement after 28 days
of curing increased the electrical resistivity at failure (∆ρ
ρo)
f to
574 % and 328% respectively as summarized in Table 4.
Compressive Strength – Resistivity Relationship.
During the entire cement hydration process both the
electrical resistivity and compressive strength of the cement
increased gradually with the curing time. For cement pastes
with various NanoFe content, the change in resistivity was
varied during the hardening. The cement paste without
NanoFe had the lowest electrical resistivity change (RI24hr), as
shown in Table 4.
The relationships between (RI 24hr) and the 1 day and 28 day
compressive strengths (psi) (Fig. 9) were:
1 day of curing
NanoFe=0%
31924
8.31
hr
RIday
(9)
NanoFe=1%
27324
2.51 hr
RIday (10)
28 day of curing
NanoFe=0%
129924
5.428
hr
RIday
(11)
NanoFe=1%
129524
81 hr
RIday (12)
Conclusions
Based on this experimental and analytical study on smart
cement with the addition of NanoFe, the following
conclusions are advanced:
1. The electrical resistivity responses during curing for
various samples followed the same trend. Resistivity
reduced to a minimum point, increased sharply and
then increased gradually with a lower rate. Therefore,
electrical resistivity was a sensitive parameter to
monitor the changes during curing of cement
2. Cement with various w/c ratio had different
resistivity responses. The change in resistivity was
higher for cement with lower water-to-cement ratios.
3. The resistivity index (RI24hr) of the cement with lower
w/c ratio was higher than that of the cement with
higher w/c ratio. A linear correlation was found
between resistivity index and compressive strength at
different curing ages.
4. The rheological test showed that class H cement had
shear-thinning behavior and a hyperbolic model was
proposed to predict shear stress- strain relationship.

6 C. Vipulanandan and A. Mohammed AADE-15-NTCE-06
The model was fitted with the experimental data for
cement with several compositions.
5. The smart cement showed piezoresistive behavior.
The change in resistivity increased with increasing
the compressive stress. Increasing the w/c ratio
reduced the piezoresistivity of smart cement at all
curing ages.
6. For the smart cement (w/c=0.38) modified with 1%
NanoFe, the resistivity change at peak stress was over
2500 times higher than the change in compressive
strain.
Acknowledgements This study was supported by the Center for Innovative
Grouting Materials and Technology (CIGMAT) at the
University of Houston, Texas. Funding for the project
(Project No. 10121-4501-01) is provided through the “Ultra-
Deepwater and Unconventional Natural Gas and Other
Petroleum Resources Research and Development Program”
authorized by the Energy Policy Act of 2005. This
program—funded from lease bonuses and royalties paid by
industry to produce oil and gas on federal lands—is designed
to assess and mitigate risk enhancing the environmental
sustainability of oil and gas exploration and production
activities. RPSEA is under contract with the U.S. Department
of Energy’s National Energy Technology Laboratory to
administer three areas of research. RPSEA is a 501(c) (3)
nonprofit consortium with more than 180 members, including
24 of the nation's premier research universities, five national
laboratories, other major research institutions, large and small
energy producers and energy consumers. The mission of
RPSEA, headquartered in Sugar Land, Texas, is to provide a
stewardship role in ensuring the focused research,
development and deployment of safe and environmentally
responsible technology that can effectively deliver
hydrocarbons from domestic resources to the citizens of the
United States. Additional information can be found
at www.rpsea.org.
References 1. API Recommended Practice 10B (1997),
Recommended Practice for Testing Well Cements
Exploration and Production Department, 22nd
Edition.
2. API Recommended Practice 65 (2002) Cementing
Shallow Water Flow Zones in Deepwater Wells.
3. Chung, D. D. L (1995), "Strain Sensors Based on
Electrical Resistance Change,” Smart Materials
Structures, No. 4, pp. 59-61.
4. Chung, D.D.L (2001), “Functional Properties of
cement-Matrix Composites,” Journal of Material
Science, Vol. 36, pp. 1315-1324.
5. Dom, P. B., S. Rabke, et al. (2007). "Development,
verification, and improvement of a sediment-toxicity
test for regulatory compliance." SPE Drilling &
Completion, Vol. 22(2), 90-97.
6. Eoff, L. and Waltman, B. (2009) "Polymer Treatment
Controls Fluid Loss While Maintaining Hydrocarbon
Flow,” Journal of Petroleum Technology, pp. 28-30.
7. Fuller, G., Souza, P., Ferreira, L., and Rouat, D.
(2002). "High-Strength Lightweight Blend Improves
Deepwater Cementing," Oil & Gas Journal, Vol. 100,
No.8, pp. 86-95.
8. Gill, C., Fuller, G. A., and Faul, R. (2005)
"Deepwater Cementing Best Practices for the
Riserless Section,” AADE-05-NTCE-70, pp. 1-14.
9. Labibzadeh, M., Zhhabizadeh, B., and Khajehdezfuly,
A. (2010) "Early Age Compressive Strength
Assessment of Oil Well Class G Cement Due to
Borehole Pressure and Temperature Changes,” Journal
of American Science, Vol. 6, No.7, pp.38-47.
10. McCarter, W. J. (1996) “Monitoring the influence of
water and ionic ingress on cover-zone concrete
subjected to repeated absorption”, Cement Concrete
and Aggregates, 18, pp. 55-63.
11. McCarter, W. J.and Ezirim H. C. (1998) “Monitoring
the Early Hydration of Pozzolan-Ca (OH)2 Mixtures
Using Electrical Methods” [J]. Advances in Cement
Research, 10 (4), pp. 161-168.
12. McCarter, W. J. (2006) “Monitoring the Influence
of Water and Ionic Ingress on Cover-Zone Concrete
Subjected to Repeated Absorption,” Cement,
Concrete and Aggregates 18.
13. Mebarkia, S., C., Vipulanandan, (1992)
“Compressive behavior of glass-fiber-reinforced
polymer concrete, Mater. Civil Engineering, 4, pp.
91–105.
14. Ravi, K. et al. (2007) "Comparative Study of
mechanical Properties of Density-reduced Cement
Compositions,” SPE Drilling & Completion, Vol. 22,
No. 2, pp. 119-126.
15. Thaemlitz, J., A. D. Patel, et al. (1999). "New
environmentally safe high-temperature water-based
drilling-fluid system." SPE Drilling & Completion
Vol. 14(3), pp. 185-189.
16. Vipulanandan, C. and Sett, K. (2004) "Development
and Characterization of Piezoresistive Smart
Structural Materials," Proceedings, Engineering,
Construction and Operations in Challenging
Environments, Earth & Space 2004, ASCE Aerospace
Division, League City, TX, pp. 656-663.
17. Vipulanandan, C. and Liu, J. (2005) "Polyurethane
Based Grouts for Deep Off-Shore Pipe-in-Pipe
Application", Proceedings, Pipelines 2005, ASCE,
Houston, TX, pp. 216-227.
18. Vipulanandan, C.,and Garas, V. (2006),
"Piezoresistivity of Carbon Fiber Reinforced Cement
Mortar", Proceedings, Engineering, Construction and
Operations in Challenging Environments,” Earth &
Space 2006, Proceedings ASCE Aerospace Division,
League City, TX, CD-ROM.
19. Vipulanandan, C. and Garas, V. (2008) "Electrical
Resistivity, Pulse Velocity and Compressive

AADE-15-NTCE-06 Nanoparticle Modified Smart Oil Well Cement for Monitoring Cementing Applications 7
Properties of Carbon Fiber Reinforced Cement
Mortar,” Journal of Materials in Civil Engineering,
Vol. 20, No. 2 , pp. 93-101.
20. Vipulanandan, C. and Prashanth, P. (2013)
"Impedance Spectroscopy Characterization of a
Piezoresistive Structural Polymer Composite Bulk
Sensor,” Journal of Testing and Evaluation, ASTM,
Vol. 41, No. 6, pp. 898-904. 21. Vipulanandan, C., A. Mohammed, (2014)
“Hyperbolic rheological model with shear stress limit
for acrylamide polymer modified bentonite drilling
muds”, Petroleum Science and Engineering, 122, pp.
38–47.
22. Vipulanandan, C., Heidari, M., Qu, Q., Farzam, H.
and Pappas, M. (2014). "Behavior of Piezoresistive
Smart Cement Contaminated with Oil Based Drilling
Mud.” OTC 25200-MS, pp. 1-14.
23. Vipulanandan, C., Krishnamoorti, R., Saravanan, R.,
Qu, Q. and Narvaez, G. (2014). "Development and
Characterization of Smart Cement for Real Time
Monitoring of Ultra-Deepwater Oil Well Cementing
Applications.” OTC 25099-MS, pp. 1-12.
8 C. Vipulanandan and A. Mohammed AADE-15-NTCE-06
Vocadlo Model (1969) Hyperbolic Model (2014)
w/c NanoFe
(%)
T
(oC)
o1
(Pa)
k
(Pa.sn)
n RMSE
(Pa) R
2
o2
(Pa)
C
(Pa.s-1
)
D
(Pa)-1
max
(Pa)
RMSE
(Pa) R
2
0.38
0 25 20.1 21.3 0.75 5.91 0.98 19.3 1.62 0.006 186 5.7 0.98
85 42.5 4.6 0.56 11.1 0.98 53.2 0.59 0.003 387 9.9 0.99
1 25 34.1 18.5 0.67 9.1 0.97 36.2 1.4 0.005 236 8.2 0.99
85 47.1 56.7 0.61 10.81 0.97 47.0 0.32 0.002 547 9.65 0.98
0.54
0 25 14.9 3.88 0.37 6.2 0.98 15.2 4.25 0.017 74 0.032 0.98
85 37.5 14.2 0.31 5.6 0.98 36.1 1.01 0.01 136 4.32 0.98
1 25 21.3 2.9 0.46 2.59 0.98 24.3 4.70 0.02 74 2.33 0.98
85 41.1 5.99 0.51 5.1 0.99 47.5 1.84 0.003 380 4.33 0.99
Table 1. Vocadlo and Hyperbolic rheological model parameters for smart cement slurries
w/c NanoFe
(%)
Curing
Time
(day)
min
(Ω.m) tmin
(min) q
to (min)
A B R2
0.38
0 1
0.90 168 1.60 130 -0.0001 7.23 0.99
7 2.20 75 -0.0001 18.8 0.99
1 1
0.72 135 1.50 178 -0.0001 7.0 0.97
7 1.97 70 -0.0001 14.0 0.99
0.54
0 1
0.77 96 0.55 86 -0.0001 4.11 0.99
7 0.57 66 -0.0001 1.44 0.98
1 1
0.74 90 0.15 85 -0.0001 0.52 0.99
7 0.70 70 -0.0001 2.0 0.98
`w/c NanoFe
(%)
Initial
resistivity,
o (Ω.m)
ρmin
(Ω.m)
tmin
(min)
ρ24hr
(Ω.m)
RI24 hr
(%)
0.38 0 1.03 0.90 163 3.90 333
1 0.87 0.70 144 3.0 329
0.54 0 0.90 0.77 145 1.67 117
1 0.74 0.61 140 1.25 105
Table 2. Summary of bulk resistivity parameters for cement with various w/c ratio and NanoFe content
Table 3. Model parameters for electrical resistivity of smart cement with different w/c ratio and NanoFe content

AADE-15-NTCE-06 Nanoparticle Modified Smart Oil Well Cement for Monitoring Cementing Applications 9
Table 4. Variation of piezoresistive behavior for cement with different w/c and NanoFe content
Material w/c NanoFe
(%)
Curing
Time
(day)
(∆/o) f (%)
f (psi)
Cement only 0.38 0
1 0.72 1544
28 0.55 2504
0.54 0 1 0.48 666
28 0.33 1635
Smart cement
0.38
0 1 583 1583
28 401 2810
1 1 700 1995
28 574 4000
0.54
0 1 296 763
28 271 1829
1 1 368 823
28 328 2159
0
50
100
150
200
250
300
350
400
0 250 500 750 1000 1250
Sh
ear
Str
ess,
(Pa
)
Shear Strain Rate (s-1)
NanoFe=0%
T=25 C
T=85 C
Vocadlo Model
Hyperbolic Model
0
50
100
150
200
250
300
350
400
450
500
0 250 500 750 1000 1250
Sh
ea
r S
tres
s,
(Pa
)
Shear Strain Rate (s-1)
NanoFe=1%
T=25 C
T=85 C
Vocadlo Model
Hyperbolic Model
Figure 1: Predicted and measured shear stress - shear strain rate relationship for smart cement
slurries with w/c ratio of 0.38 and different temperature (a) NanoFe=0% and (b) NanoFe=1%
-a-
-b-

10 C. Vipulanandan and A. Mohammed AADE-15-NTCE-06
0
50
100
150
200
250
300
0 250 500 750 1000 1250
Sh
ear
Str
ess,
(Pa
)
Shear Strain Rate (s-1)
NanoFe=1%
T=25C
T=85C
Vocadlo Model
Hyperbolic Model
0
20
40
60
80
100
120
140
160
0 250 500 750 1000 1250
Sh
ear
Str
ess,
(Pa
)
Shear Strain Rate (s-1)
NanoFe=0%
T=25 C
T=85 C
Vocadlo Model
Hyperbolic Model
Figure 2: Predicted and measured shear stress - shear strain rate relationship for smart cement
slurries with w/c ratio of 0.54 and different temperature (a) NanoFe=0% and (b) NanoFe=1%
-a-
-b-

AADE-15-NTCE-06 Nanoparticle Modified Smart Oil Well Cement for Monitoring Cementing Applications 11
-a-
Figure 3. Typical bulk resistivity development with curing time
0
0.5
1
1.5
2
2.5
3
3.5
4
4.5
0 200 400 600 800 1000 1200 1400 1600
Ele
ctri
cal R
esi
stiv
ity,
ρ(Ω
-m)
Time (min)
w/c=0.38
NanoFe=0%
NanoFe=1%
Model
0
0.2
0.4
0.6
0.8
1
1.2
1.4
1.6
1.8
0 200 400 600 800 1000 1200 1400 1600
Ele
ctri
cal R
esi
stiv
ity,
ρ(Ω
-m)
Time (min)
w/c=0.54
NanoFe=0%
NanoFe=1%
Model
Figure 4: Bulk electrical resistivity development of smart cement for 1 day of curing with various
NanoFe content (a) w/c=0.38 (b) w/c=0.54
-b-

12 C. Vipulanandan and A. Mohammed AADE-15-NTCE-06
0
1
2
3
4
5
6
7
0 2000 4000 6000 8000 10000 12000
Ele
ctri
cal R
esi
stiv
ity,
ρ(Ω
-m)
Time (min)
w/c=0.38
NanoFe=0%
NanoFe=1%
Model
0
0.5
1
1.5
2
2.5
0 2000 4000 6000 8000 10000 12000
Ele
ctri
cal R
esi
stiv
ity,
ρ(Ω
-m)
Time (min)
w/c=0.54
NanoFe=0%
NanoFe=1%
Model
-b-
-a-
Figure 4: Bulk electrical resistivity development of smart cement for 7 days of curing with various
NanoFe content (a) w/c=0.38 (b) w/c=0.54

AADE-15-NTCE-06 Nanoparticle Modified Smart Oil Well Cement for Monitoring Cementing Applications 13
0
200
400
600
800
1000
1200
1400
1600
1800
0.0 0.1 0.2 0.3 0.4 0.5 0.6 0.7 0.8
Co
mp
ress
ive
Str
ess
, (
psi
)
Change in Resistivity (∆/o )
Cement Only
W/C=0.38, (1 day)
W/C=0.54, (1day)
0
500
1000
1500
2000
2500
3000
0.0 0.1 0.2 0.3 0.4 0.5 0.6
Co
mp
ress
ive
Str
ess
, (
psi
)
Change in Resistivity (∆/o )(%)
Cement Only
W/C=0.38,(28 days)
W/C=0.54,(28 days)
Figure 6: Piezoresistive behaviour of oil well cement with different w/c ratio and curing
time (a) 1 day (b) 28 days
-b-
-a-

14 C. Vipulanandan and A. Mohammed AADE-15-NTCE-06
-b-
0
500
1000
1500
2000
2500
3000
3500
4000
4500
0 100 200 300 400 500 600 700
Co
mp
ress
ive
Str
ess
, (
psi
)
Change in Resistivity (∆/o )(%)
Curing Time=28 days
NanoFe=0%
NanoFe=1%
Figure 7: Piezoresistive behaviour of smart cement with different w/c ratio and curing
time (a) 1 day (b) 28 days
-a-
-b-
W/c=0.38
0
500
1000
1500
2000
2500
0 100 200 300 400 500 600 700 800
Co
mp
ress
ive
Str
en
gth
, (
psi
)
Change in Resistivity (∆/o )(%)
1 day of Curing
NanoFe=0%
NanoFe=1%
W/c=0.38
-a-

AADE-15-NTCE-06 Nanoparticle Modified Smart Oil Well Cement for Monitoring Cementing Applications 15
0
500
1000
1500
2000
2500
0 50 100 150 200 250 300 350
Co
mp
ress
ive
Str
en
gth
, (
psi
)
Change in Resistivity (∆/o )(%)
Curing Time =28 day
NanoFe=0%
NanoFe=1%
W/c=0.54
0
100
200
300
400
500
600
700
800
900
0 50 100 150 200 250 300 350 400
Co
mp
ress
ive
Str
en
gth
, (
psi
)
Change in Resistivity (∆/o )(%)
Curing Time =1 day
NanoFe=0%
NanoFe=1%
-a-
Figure 8: Piezoresistive behaviour of smart cement with different w/c ratio and curing
time (a) 1 day (b) 28 days
W/c=0.54
-b-

16 C. Vipulanandan and A. Mohammed AADE-15-NTCE-06
Figure 9. Relationship between resistivity index (RI24 hr) and compressive strength of smart cement modified
with NanoFe
0
500
1000
1500
2000
2500
3000
3500
4000
4500
0 50 100 150 200 250 300 350
Co
mp
ress
ive
Str
en
gth
, (
psi
)
Change in Electrical Resistivity, RI 24hr (%)
(NanoFe=0%) 1 day
(NanoFe=1%) 1 day
(NanoFe=0%) 28 days
(NanoFe=1%) 28 days