
Analysis and performance of oil well cement with 30 years of CO 2 exposure from the SACROC Unit,...
11
Analysis and performance of oil well cement with 30 years of CO 2 exposure from the SACROC Unit, West Texas, USA J.William Carey a, *, Marcus Wigand a , Steve J. Chipera a , Giday WoldeGabriel a , Rajesh Pawar a , Peter C. Lichtner a , Scott C. Wehner b,1 , Michael A. Raines b,2 , George D. Guthrie Jr. a a Earth and Environmental Sciences, Los Alamos National Laboratory, Los Alamos, NM, USA b Kinder Morgan CO 2 Company, L.P., Midland, TX, USA 1. Introduction Developing confidence in methods of sequestering CO 2 in geological formations requires an improved understanding of the long-term sealing capacity of both the new and historical wellbore systems designed to prevent fluids from escaping the sequestration reservoir. The primary concern is that the Portland cements used to seal wellbores react readily with CO 2 . This has led to the recognition that the long-term integrity of the wellbore seal is a primary performance issue in the geological sequestration of CO 2 . The potential effects of CO 2 on cement are varied and depend strongly on the extent of carbonation (Taylor, 1990). Moderate degrees of carbonation can be beneficial to cement porosity, permeability, and strength; extensive carbonation can result in the loss of cement structural integrity. The precise effects in the wellbore environment are difficult to predict because of uncertainties about the nature and extent international journal of greenhouse gas control 1 (2007) 75–85 article info Article history: Received 31 July 2006 Accepted 17 August 2006 Published on line 28 December 2006 Keywords: Sequestration CO 2 enhanced oil recovery Carbonation Wellbore Carbon storage abstract A core sample including casing, cement, and shale caprock was obtained from a 30-year old CO 2 -flooding operation at the SACROC Unit, located in West Texas. The core was investi- gated as part of a program to evaluate the integrity of Portland-cement based wellbore systems in CO 2 -sequestration environments. The recovered cement had air permeabilities in the tenth of a milliDarcy range and thus retained its capacity to prevent significant flow of CO 2 . There was evidence, however, for CO 2 migration along both the casing–cement and cement–shale interfaces. A 0.1–0.3 cm thick carbonate precipitate occurs adjacent to the casing. The CO 2 producing this deposit may have traveled up the casing wall or may have infiltrated through the casing threads or points of corrosion. The cement in contact with the shale (0.1–1 cm thick) was heavily carbonated to an assemblage of calcite, aragonite, vaterite, and amorphous alumino-silica residue and was transformed to a distinctive orange color. The CO 2 causing this reaction originated by migration along the cement–shale interface where the presence of shale fragments (filter cake) may have provided a fluid pathway. The integrity of the casing–cement and cement–shale interfaces appears to be the most important issue in the performance of wellbore systems in a CO 2 sequestration reservoir. # 2006 Elsevier Ltd. All rights reserved. * Corresponding author. Tel.: +1 505 667 5540; fax: +1 505 665 3285. E-mail address: [email protected] (J.W. Carey). 1 Current address: Whiting Petroleum Corporation, Midland, TX, USA. 2 Current address: PetroSource Energy Company, Midland, TX, USA. available at www.sciencedirect.com journal homepage: www.elsevier.com/locate/ijggc 1750-5836/$ – see front matter # 2006 Elsevier Ltd. All rights reserved. doi:10.1016/S1750-5836(06)00004-1
-
Upload
independent -
Category
Documents
-
view
1 -
download
0
Transcript of Analysis and performance of oil well cement with 30 years of CO 2 exposure from the SACROC Unit,...
i n t e r n a t i o n a l j o u r n a l o f g r e e n h o u s e g a s c o n t r o l 1 ( 2 0 0 7 ) 7 5 – 8 5
Analysis and performance of oil well cement with 30 yearsof CO2 exposure from the SACROC Unit, West Texas, USA
J.William Carey a,*, Marcus Wigand a, Steve J. Chipera a, Giday WoldeGabriel a,Rajesh Pawar a, Peter C. Lichtner a, Scott C. Wehner b,1, Michael A. Raines b,2,George D. Guthrie Jr.a
aEarth and Environmental Sciences, Los Alamos National Laboratory, Los Alamos, NM, USAbKinder Morgan CO2 Company, L.P., Midland, TX, USA
a r t i c l e i n f o
Article history:
Received 31 July 2006
Accepted 17 August 2006
Published on line 28 December 2006
Keywords:
Sequestration
CO2 enhanced oil recovery
Carbonation
Wellbore
Carbon storage
a b s t r a c t
A core sample including casing, cement, and shale caprock was obtained from a 30-year old
CO2-flooding operation at the SACROC Unit, located in West Texas. The core was investi-
gated as part of a program to evaluate the integrity of Portland-cement based wellbore
systems in CO2-sequestration environments. The recovered cement had air permeabilities
in the tenth of a milliDarcy range and thus retained its capacity to prevent significant flow of
CO2. There was evidence, however, for CO2 migration along both the casing–cement and
cement–shale interfaces. A 0.1–0.3 cm thick carbonate precipitate occurs adjacent to the
casing. The CO2 producing this deposit may have traveled up the casing wall or may have
infiltrated through the casing threads or points of corrosion. The cement in contact with the
shale (0.1–1 cm thick) was heavily carbonated to an assemblage of calcite, aragonite,
vaterite, and amorphous alumino-silica residue and was transformed to a distinctive orange
color. The CO2 causing this reaction originated by migration along the cement–shale
interface where the presence of shale fragments (filter cake) may have provided a fluid
pathway. The integrity of the casing–cement and cement–shale interfaces appears to be the
most important issue in the performance of wellbore systems in a CO2 sequestration
reservoir.
# 2006 Elsevier Ltd. All rights reserved.
avai lab le at www.sc iencedi rec t .com
journal homepage: www.e lsev ier .com/ locate / i jggc
1. Introduction
Developing confidence in methods of sequestering CO2 in
geological formations requires an improved understanding of
the long-term sealing capacity of both the new and historical
wellbore systems designed to prevent fluids from escaping the
sequestration reservoir. The primary concern is that the
Portland cements used to seal wellbores react readily with
CO2. This has led to the recognition that the long-term
* Corresponding author. Tel.: +1 505 667 5540; fax: +1 505 665 3285.E-mail address: [email protected] (J.W. Carey).
1 Current address: Whiting Petroleum Corporation, Midland, TX, US2 Current address: PetroSource Energy Company, Midland, TX, USA
1750-5836/$ – see front matter # 2006 Elsevier Ltd. All rights reserveddoi:10.1016/S1750-5836(06)00004-1
integrity of the wellbore seal is a primary performance issue in
the geological sequestration of CO2.
The potential effects of CO2 on cement are varied and
depend strongly on the extent of carbonation (Taylor, 1990).
Moderate degrees of carbonation can be beneficial to cement
porosity, permeability, and strength; extensive carbonation
can result in the loss of cement structural integrity. The
precise effects in the wellbore environment are difficult to
predict because of uncertainties about the nature and extent
A.
..
i n t e r n a t i o n a l j o u r n a l o f g r e e n h o u s e g a s c o n t r o l 1 ( 2 0 0 7 ) 7 5 – 8 576
of CO2-saturated fluid interaction with the cement. Moreover,
there is significant experimental variability in the interpreta-
tion of cement durability in the wellbore environment.
Experiments of Duguid et al. (2005) and Barlet-Gouedard
et al. (2006) suggest rapid carbonation, while those of Kutchko
et al. (2006b) and our own unpublished experimental studies
suggest more limited rates of CO2 penetration and reaction.
CO2-flooding operations in enhanced oil recovery provide a
superb opportunity to investigate the medium-term (decades
in length) performance of natural and engineered barriers to
CO2 migration. In this study, we investigated the impact of
CO2–cement interactions on cement performance by collect-
ing wellbore samples from the world’s second oldest con-
tinuous CO2-flooding operation, the SACROC Unit, located in
the Permian Basin of West Texas (Vest, 1970; Raines et al.,
2001). CO2 flooding operations at SACROC began in 1972. Since
that time, 68 million metric tonnes of CO2 have been
effectively sequestered during an operation that recovers
38% of injected CO2 for re-injection. Thirty million tonnes of
the sequestered CO2 is anthropogenic, derived by separation
from the Val Verde natural gas field, making SACROC the
largest demonstration of CO2 sequestration in the world.
The SACROC Unit reservoir is located in a Pennsylvanian-
age limestone reef (the Cisco and Canyon formations) with
the Wolfcamp shale forming the caprock. The reservoir is
located at about 2100 m depth; averages 240 m in thickness;
and has a temperature and pressure of 54 �C and 18 MPa.
Producing zones within the limestone reservoir have perme-
abilities in the 10–100 mD range and porosities near 10%,
although these alternate with non-producing zones with
permeabilities in the < 0:1 mD range and porosities <2%
(Raines and Helms, 2005).
The study location was well 49-6, located in the northern
region of the reservoir. The well was drilled in 1950 to a total
depth of 2131 m with the shale–limestone reservoir contact at
2000 m. Drilling mud additives varied with depth and included
Aquagel (Na-montmorillonite), but from 1967–2000 m
included only Tannex (tannin) and caustic soda (NaOH).
Two sections of casing were run to total depth and separately
cemented with a cement described only as Portland. It is
probably a typical type 1, equivalent to API type A cement. The
first stage circulated to surface from a depth of 534 m and
included 6% addition of gel (presumably bentonite) with a
density of 1678 kg/m3. The second stage of cementing was to
total depth and appears to be neat Portland cement (no
additives given) with a density of 1857 kg/m3. Following
cementing, the producing zone was perforated at 15 intervals
(the top-most was located from 2004 to 2009 m) and was acid
stimulated with 477,000 L of HCl. The well was first exposed to
CO2 in 1975 and in subsequent years was a producer (relatively
low pressure environment) for 10 years and an injector
(relatively high pressure environment) for 7 years (a total of
110,000 tonnes CO2 passed through the well).
2. Methodology
As part of Kinder Morgan’s redevelopment of SACROC, a side-
track core was obtained from well 49-6. The 5-cm diameter
core was collected by re-entering the well and using a
whipstock to guide the diamond core barrel out of the well,
through the casing and cement and into the caprock. The
sampled material extended from a depth of 1994 m to the
shale–limestone reservoir contact at 2000.1 m. In addition, a
cement bond log was collected for the depth interval between
1622 and 2075 m.
The core sample mineralogy and chemistry were char-
acterized by quantitative X-ray diffraction (Chipera and Bish,
2002), X-ray fluorescence, and scanning electron microscopy.
X-ray tomographic data were collected with a 125 kV, 66 mm
beam with a 127 mm voxel resolution. Carbon and oxygen
stable isotope data were obtained by phosphoric acid
dissolution of solids with results reported in standard d
notation in parts per thousand relative to PDB. Air permea-
meter data were collected at atmospheric pressure on
untreated and oven-dried samples (120 �C) as well as under
confining pressure on oven-dried samples (65 �C) from 6.9 to
27.6 MPa. Porosity data were collected on solvent-cleaned
(80% toluene and 20% methanol) and oven-dried (65 �C)
samples. Computer modeling of cement degradation was
conducted with the reactive transport code FLOTRAN (Licht-
ner, 2001) using the methods described by Carey and Lichtner
(in press).
3. Results
The coring operation recovered samples of casing and cement
from 6 to 4 m above the caprock–reservoir contact with the
largest pieces about 10 cm in length. Shale was collected from
4 m above the contact down to the contact with the reservoir.
Unfortunately, coring stopped just short of the limestone. As a
proxy, we obtained a sample of limestone at the shale–
reservoir contact from well 49-5, located about 0.6 km from
well 49-6. A reconstructed cross-section of the wellbore
environment is shown in Fig. 1 that includes the casing,
cement, and shale caprock. The casing was in excellent
condition and showed little evidence of corrosion. The cement
was recovered in large pieces, although intact interfaces with
the casing and caprock were not preserved as a result of coring
operations. An additional 4 m of shale with abundant bed-
ding-plane partings were recovered.
The recovered gray cement (>5 cm thickness) contains
typical cement phases such as portlandite, ettringite, and
katoite (hydrogarnet), a minor amount of calcite, and a
substantial amount of amorphous material (Table 1). Halite is
present in all samples and may be a residue of the brine. Two
distinct alteration zones of the cement were observed: a dark
rind (0.1–0.3 cm thickness) occurs between the casing and the
cement and an orange-colored alteration zone of the cement
(0.1–1 cm) occurs adjacent to the shale. The dark rind is a
mixture of calcite, aragonite, and halite without a significant
amorphous component. The orange zone is heavily carbonated
cement and contains three polymorphs of CaCO3(calcite,
aragonite, and vaterite), halite, and a substantial amorphous
component. Between the shale and the cement is a texturally
complex region we have informally named the shale-fragment-
zone (SFZ). This consists of a mixture of shale fragments,
carbonated cement, and pure carbonates. Some analyses (not
shown in Table 1) contain substantial dolomite.
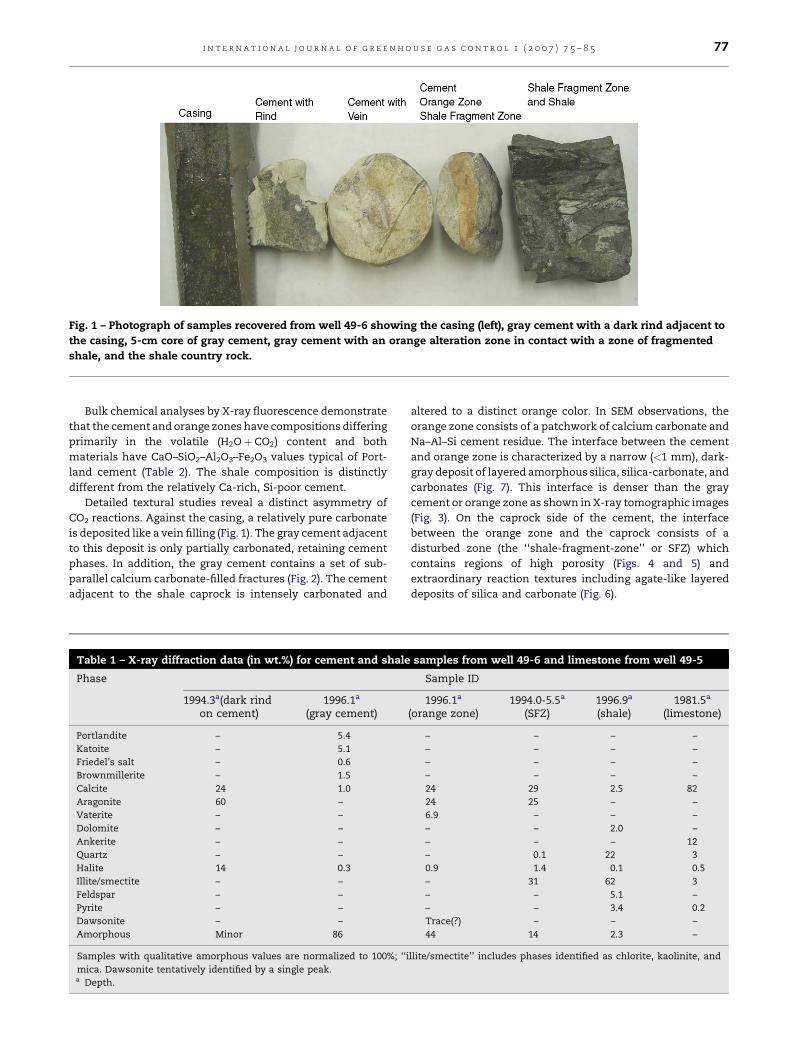
Fig. 1 – Photograph of samples recovered from well 49-6 showing the casing (left), gray cement with a dark rind adjacent to
the casing, 5-cm core of gray cement, gray cement with an orange alteration zone in contact with a zone of fragmented
shale, and the shale country rock.
i n t e r n a t i o n a l j o u r n a l o f g r e e n h o u s e g a s c o n t r o l 1 ( 2 0 0 7 ) 7 5 – 8 5 77
Bulk chemical analyses by X-ray fluorescence demonstrate
that the cement and orange zones have compositions differing
primarily in the volatile (H2Oþ CO2) content and both
materials have CaO–SiO2–Al2O3–Fe2O3 values typical of Port-
land cement (Table 2). The shale composition is distinctly
different from the relatively Ca-rich, Si-poor cement.
Detailed textural studies reveal a distinct asymmetry of
CO2 reactions. Against the casing, a relatively pure carbonate
is deposited like a vein filling (Fig. 1). The gray cement adjacent
to this deposit is only partially carbonated, retaining cement
phases. In addition, the gray cement contains a set of sub-
parallel calcium carbonate-filled fractures (Fig. 2). The cement
adjacent to the shale caprock is intensely carbonated and
Table 1 – X-ray diffraction data (in wt.%) for cement and shale
Phase
1994.3a(dark rindon cement)
1996.1a
(gray cement)
Portlandite – 5.4
Katoite – 5.1
Friedel’s salt – 0.6
Brownmillerite – 1.5
Calcite 24 1.0
Aragonite 60 –
Vaterite – –
Dolomite – –
Ankerite – –
Quartz – –
Halite 14 0.3
Illite/smectite – –
Feldspar – –
Pyrite – –
Dawsonite – –
Amorphous Minor 86
Samples with qualitative amorphous values are normalized to 100%; ‘‘i
mica. Dawsonite tentatively identified by a single peak.a Depth.
altered to a distinct orange color. In SEM observations, the
orange zone consists of a patchwork of calcium carbonate and
Na–Al–Si cement residue. The interface between the cement
and orange zone is characterized by a narrow (<1 mm), dark-
gray deposit of layered amorphous silica, silica-carbonate, and
carbonates (Fig. 7). This interface is denser than the gray
cement or orange zone as shown in X-ray tomographic images
(Fig. 3). On the caprock side of the cement, the interface
between the orange zone and the caprock consists of a
disturbed zone (the ‘‘shale-fragment-zone’’ or SFZ) which
contains regions of high porosity (Figs. 4 and 5) and
extraordinary reaction textures including agate-like layered
deposits of silica and carbonate (Fig. 6).
samples from well 49-6 and limestone from well 49-5
Sample ID
1996.1a
(orange zone)1994.0-5.5a
(SFZ)1996.9a
(shale)1981.5a
(limestone)
– – – –
– – – –
– – – –
– – – –
24 29 2.5 82
24 25 – –
6.9 – – –
– – 2.0 –
– – – 12
– 0.1 22 3
0.9 1.4 0.1 0.5
– 31 62 3
– – 5.1 –
– – 3.4 0.2
Trace(?) – – –
44 14 2.3 –
llite/smectite’’ includes phases identified as chlorite, kaolinite, and
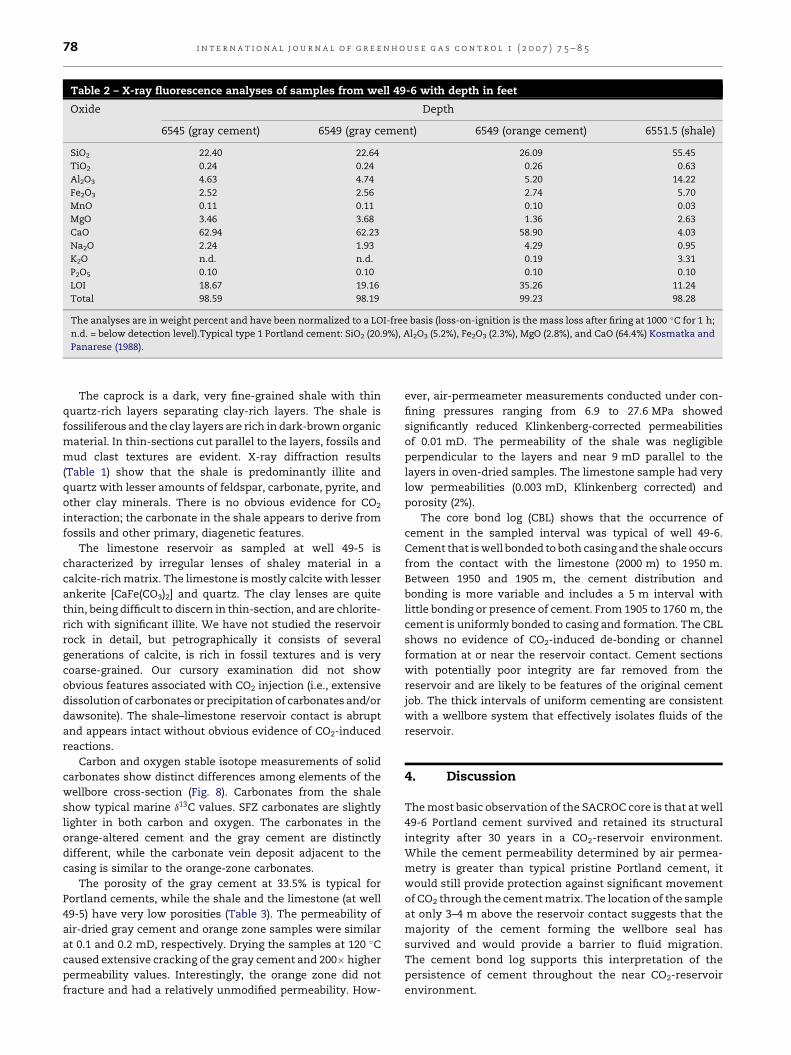
Table 2 – X-ray fluorescence analyses of samples from well 49-6 with depth in feet
Oxide Depth
6545 (gray cement) 6549 (gray cement) 6549 (orange cement) 6551.5 (shale)
SiO2 22.40 22.64 26.09 55.45
TiO2 0.24 0.24 0.26 0.63
Al2O3 4.63 4.74 5.20 14.22
Fe2O3 2.52 2.56 2.74 5.70
MnO 0.11 0.11 0.10 0.03
MgO 3.46 3.68 1.36 2.63
CaO 62.94 62.23 58.90 4.03
Na2O 2.24 1.93 4.29 0.95
K2O n.d. n.d. 0.19 3.31
P2O5 0.10 0.10 0.10 0.10
LOI 18.67 19.16 35.26 11.24
Total 98.59 98.19 99.23 98.28
The analyses are in weight percent and have been normalized to a LOI-free basis (loss-on-ignition is the mass loss after firing at 1000 �C for 1 h;
n.d. = below detection level).Typical type 1 Portland cement: SiO2 (20.9%), Al2O3 (5.2%), Fe2O3 (2.3%), MgO (2.8%), and CaO (64.4%) Kosmatka and
Panarese (1988).
i n t e r n a t i o n a l j o u r n a l o f g r e e n h o u s e g a s c o n t r o l 1 ( 2 0 0 7 ) 7 5 – 8 578
The caprock is a dark, very fine-grained shale with thin
quartz-rich layers separating clay-rich layers. The shale is
fossiliferous and the clay layers are rich in dark-brown organic
material. In thin-sections cut parallel to the layers, fossils and
mud clast textures are evident. X-ray diffraction results
(Table 1) show that the shale is predominantly illite and
quartz with lesser amounts of feldspar, carbonate, pyrite, and
other clay minerals. There is no obvious evidence for CO2
interaction; the carbonate in the shale appears to derive from
fossils and other primary, diagenetic features.
The limestone reservoir as sampled at well 49-5 is
characterized by irregular lenses of shaley material in a
calcite-rich matrix. The limestone is mostly calcite with lesser
ankerite [CaFe(CO3)2] and quartz. The clay lenses are quite
thin, being difficult to discern in thin-section, and are chlorite-
rich with significant illite. We have not studied the reservoir
rock in detail, but petrographically it consists of several
generations of calcite, is rich in fossil textures and is very
coarse-grained. Our cursory examination did not show
obvious features associated with CO2 injection (i.e., extensive
dissolution of carbonates or precipitation of carbonates and/or
dawsonite). The shale–limestone reservoir contact is abrupt
and appears intact without obvious evidence of CO2-induced
reactions.
Carbon and oxygen stable isotope measurements of solid
carbonates show distinct differences among elements of the
wellbore cross-section (Fig. 8). Carbonates from the shale
show typical marine d13C values. SFZ carbonates are slightly
lighter in both carbon and oxygen. The carbonates in the
orange-altered cement and the gray cement are distinctly
different, while the carbonate vein deposit adjacent to the
casing is similar to the orange-zone carbonates.
The porosity of the gray cement at 33.5% is typical for
Portland cements, while the shale and the limestone (at well
49-5) have very low porosities (Table 3). The permeability of
air-dried gray cement and orange zone samples were similar
at 0.1 and 0.2 mD, respectively. Drying the samples at 120 �C
caused extensive cracking of the gray cement and 200� higher
permeability values. Interestingly, the orange zone did not
fracture and had a relatively unmodified permeability. How-
ever, air-permeameter measurements conducted under con-
fining pressures ranging from 6.9 to 27.6 MPa showed
significantly reduced Klinkenberg-corrected permeabilities
of 0.01 mD. The permeability of the shale was negligible
perpendicular to the layers and near 9 mD parallel to the
layers in oven-dried samples. The limestone sample had very
low permeabilities (0.003 mD, Klinkenberg corrected) and
porosity (2%).
The core bond log (CBL) shows that the occurrence of
cement in the sampled interval was typical of well 49-6.
Cement that is well bonded to both casing and the shale occurs
from the contact with the limestone (2000 m) to 1950 m.
Between 1950 and 1905 m, the cement distribution and
bonding is more variable and includes a 5 m interval with
little bonding or presence of cement. From 1905 to 1760 m, the
cement is uniformly bonded to casing and formation. The CBL
shows no evidence of CO2-induced de-bonding or channel
formation at or near the reservoir contact. Cement sections
with potentially poor integrity are far removed from the
reservoir and are likely to be features of the original cement
job. The thick intervals of uniform cementing are consistent
with a wellbore system that effectively isolates fluids of the
reservoir.
4. Discussion
The most basic observation of the SACROC core is that at well
49-6 Portland cement survived and retained its structural
integrity after 30 years in a CO2-reservoir environment.
While the cement permeability determined by air permea-
metry is greater than typical pristine Portland cement, it
would still provide protection against significant movement
of CO2 through the cement matrix. The location of the sample
at only 3–4 m above the reservoir contact suggests that the
majority of the cement forming the wellbore seal has
survived and would provide a barrier to fluid migration.
The cement bond log supports this interpretation of the
persistence of cement throughout the near CO2-reservoir
environment.
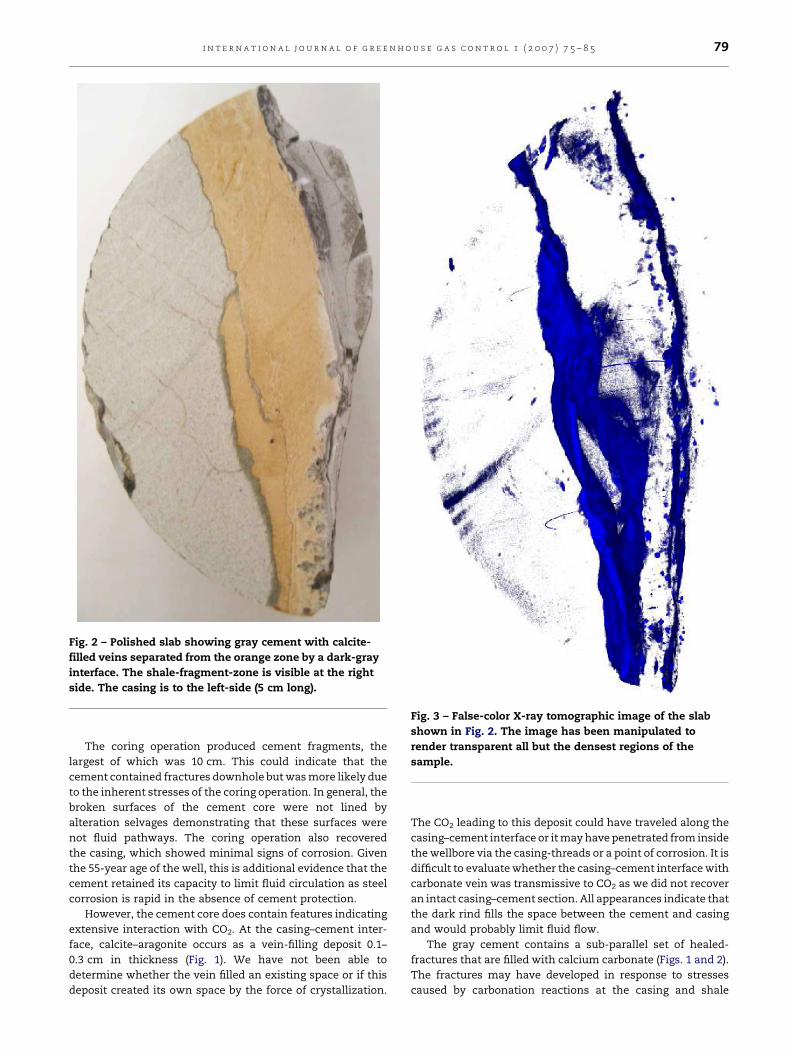
Fig. 2 – Polished slab showing gray cement with calcite-
filled veins separated from the orange zone by a dark-gray
interface. The shale-fragment-zone is visible at the right
side. The casing is to the left-side (5 cm long).
Fig. 3 – False-color X-ray tomographic image of the slab
shown in Fig. 2. The image has been manipulated to
render transparent all but the densest regions of the
sample.
i n t e r n a t i o n a l j o u r n a l o f g r e e n h o u s e g a s c o n t r o l 1 ( 2 0 0 7 ) 7 5 – 8 5 79
The coring operation produced cement fragments, the
largest of which was 10 cm. This could indicate that the
cement contained fractures downhole but was more likely due
to the inherent stresses of the coring operation. In general, the
broken surfaces of the cement core were not lined by
alteration selvages demonstrating that these surfaces were
not fluid pathways. The coring operation also recovered
the casing, which showed minimal signs of corrosion. Given
the 55-year age of the well, this is additional evidence that the
cement retained its capacity to limit fluid circulation as steel
corrosion is rapid in the absence of cement protection.
However, the cement core does contain features indicating
extensive interaction with CO2. At the casing–cement inter-
face, calcite–aragonite occurs as a vein-filling deposit 0.1–
0.3 cm in thickness (Fig. 1). We have not been able to
determine whether the vein filled an existing space or if this
deposit created its own space by the force of crystallization.
The CO2 leading to this deposit could have traveled along the
casing–cement interface or it may have penetrated from inside
the wellbore via the casing-threads or a point of corrosion. It is
difficult to evaluate whether the casing–cement interface with
carbonate vein was transmissive to CO2 as we did not recover
an intact casing–cement section. All appearances indicate that
the dark rind fills the space between the cement and casing
and would probably limit fluid flow.
The gray cement contains a sub-parallel set of healed-
fractures that are filled with calcium carbonate (Figs. 1 and 2).
The fractures may have developed in response to stresses
caused by carbonation reactions at the casing and shale
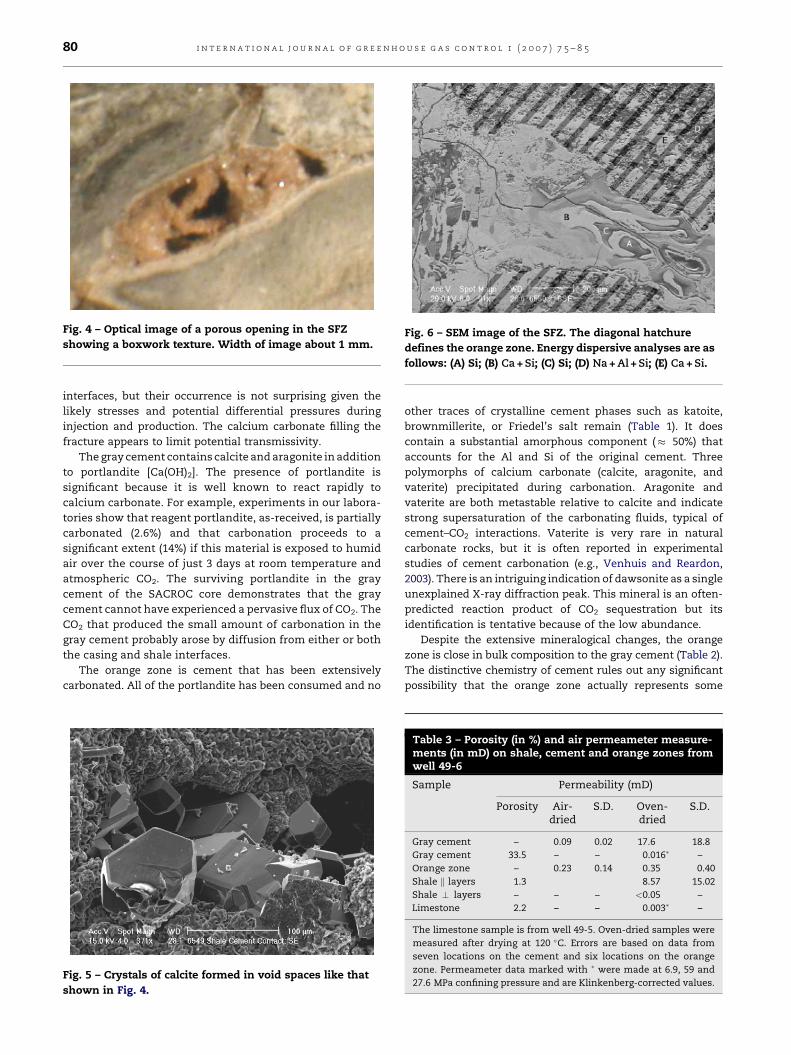
Fig. 4 – Optical image of a porous opening in the SFZ
showing a boxwork texture. Width of image about 1 mm.Fig. 6 – SEM image of the SFZ. The diagonal hatchure
defines the orange zone. Energy dispersive analyses are as
follows: (A) Si; (B) Ca + Si; (C) Si; (D) Na + Al + Si; (E) Ca + Si.
i n t e r n a t i o n a l j o u r n a l o f g r e e n h o u s e g a s c o n t r o l 1 ( 2 0 0 7 ) 7 5 – 8 580
interfaces, but their occurrence is not surprising given the
likely stresses and potential differential pressures during
injection and production. The calcium carbonate filling the
fracture appears to limit potential transmissivity.
The gray cement contains calcite and aragonite in addition
to portlandite [Ca(OH)2]. The presence of portlandite is
significant because it is well known to react rapidly to
calcium carbonate. For example, experiments in our labora-
tories show that reagent portlandite, as-received, is partially
carbonated (2.6%) and that carbonation proceeds to a
significant extent (14%) if this material is exposed to humid
air over the course of just 3 days at room temperature and
atmospheric CO2. The surviving portlandite in the gray
cement of the SACROC core demonstrates that the gray
cement cannot have experienced a pervasive flux of CO2. The
CO2 that produced the small amount of carbonation in the
gray cement probably arose by diffusion from either or both
the casing and shale interfaces.
The orange zone is cement that has been extensively
carbonated. All of the portlandite has been consumed and no
Fig. 5 – Crystals of calcite formed in void spaces like that
shown in Fig. 4.
other traces of crystalline cement phases such as katoite,
brownmillerite, or Friedel’s salt remain (Table 1). It does
contain a substantial amorphous component (� 50%) that
accounts for the Al and Si of the original cement. Three
polymorphs of calcium carbonate (calcite, aragonite, and
vaterite) precipitated during carbonation. Aragonite and
vaterite are both metastable relative to calcite and indicate
strong supersaturation of the carbonating fluids, typical of
cement–CO2 interactions. Vaterite is very rare in natural
carbonate rocks, but it is often reported in experimental
studies of cement carbonation (e.g., Venhuis and Reardon,
2003). There is an intriguing indication of dawsonite as a single
unexplained X-ray diffraction peak. This mineral is an often-
predicted reaction product of CO2 sequestration but its
identification is tentative because of the low abundance.
Despite the extensive mineralogical changes, the orange
zone is close in bulk composition to the gray cement (Table 2).
The distinctive chemistry of cement rules out any significant
possibility that the orange zone actually represents some
Table 3 – Porosity (in %) and air permeameter measure-ments (in mD) on shale, cement and orange zones fromwell 49-6
Sample Permeability (mD)
Porosity Air-dried
S.D. Oven-dried
S.D.
Gray cement – 0.09 0.02 17.6 18.8
Gray cement 33.5 – – 0.016� –
Orange zone – 0.23 0.14 0.35 0.40
Shale k layers 1.3 8.57 15.02
Shale ? layers – – – <0.05 –
Limestone 2.2 – – 0.003� –
The limestone sample is from well 49-5. Oven-dried samples were
measured after drying at 120 �C. Errors are based on data from
seven locations on the cement and six locations on the orange
zone. Permeameter data marked with � were made at 6.9, 59 and
27.6 MPa confining pressure and are Klinkenberg-corrected values.
i n t e r n a t i o n a l j o u r n a l o f g r e e n h o u s e g a s c o n t r o l 1 ( 2 0 0 7 ) 7 5 – 8 5 81
other wellbore feature (e.g., filter cake). There are some notable
minor variations in chemistry including a relative enrichment
in SiO2 and Na2O and depletion in CaO and MgO. The alkali
enrichment suggests that the carbonation process was asso-
ciated with infiltration by brine. The alkaline-earth depletion
and silica enrichment must reflect mass transport processes
occurring with the CO2 infiltration.
We have not made an extensive investigation of why the
carbonated cement is orange in color. The iron content is
similar in the gray cement and orange zone (Table 2); and,
since the iron in the original Portland cement is completely
oxidized, the orange zone is unlikely to reflect an oxidation of
the gray zone. We and others have also observed a similar
orange color in experimental brine–CO2 reactions with cement
(e.g., Duguid et al., 2005). We hypothesize that the carbonation
process releases Fe3+ from complex hydrated Ca-bearing
cement phases and reacts to form amorphous iron hydroxides
(e.g., Taylor, 1990). This amorphous material may provide the
orange color.
The orange zone is variable in thickness and ranges from
1 cm to a few mm. We have not been able to obtain conclusive
evidence on whether this alteration zone is continuous within
the wellbore environment. The orange zone samples extend
for 30–40 cm of the recovered core. By considering the
geometry of the whipstock coring operation, the extent of
the recovered orange zone samples is about as expected for a
continuous reaction zone. It is also apparent that the orange
zone could not be significantly thicker elsewhere as a greater
extent of altered cement would have been recovered.
The gray cement and orange zones are separated by a dark
translucent interface (Figs. 2 and 7). The interface is variable
in thickness and splits along its length to form other
interfaces within the orange zone. These internal interfaces
may reflect a succession of carbonation fronts moving into
the gray cement. The interface is dense in appearance and X-
ray tomographic studies demonstrate that the layer is denser
than either the gray cement or orange zone and that it appears
to form a continuous barrier (Fig. 3). We hypothesize that this
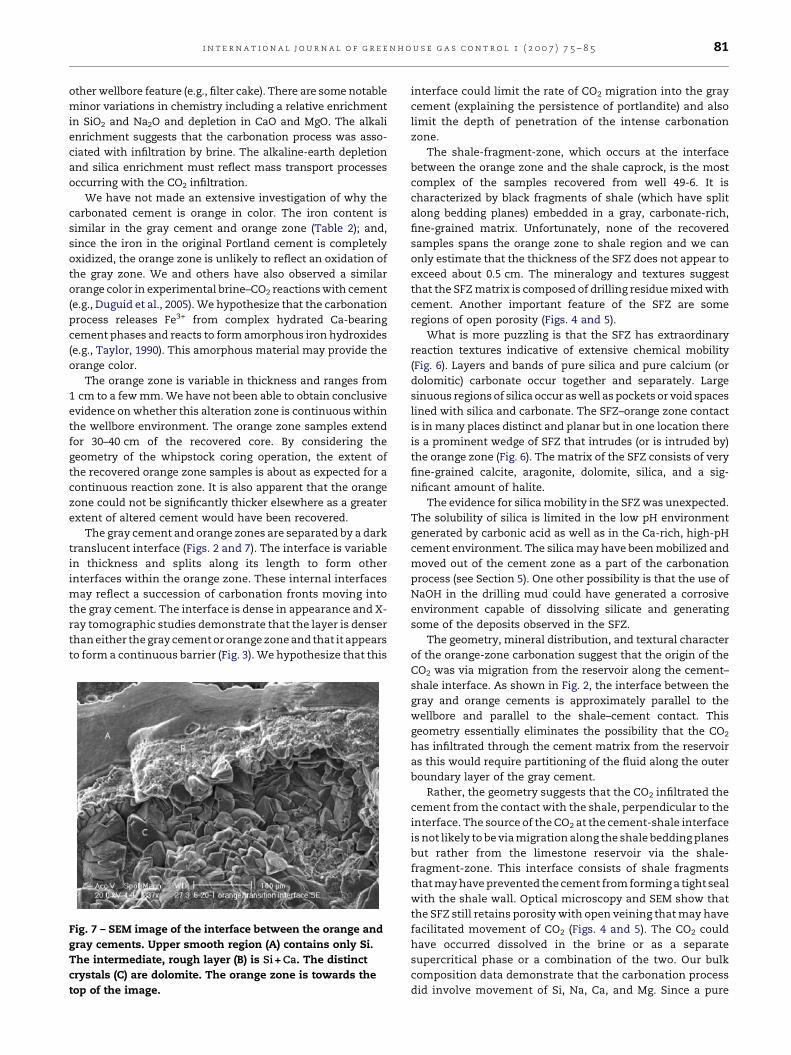
Fig. 7 – SEM image of the interface between the orange and
gray cements. Upper smooth region (A) contains only Si.
The intermediate, rough layer (B) is Si + Ca. The distinct
crystals (C) are dolomite. The orange zone is towards the
top of the image.
interface could limit the rate of CO2 migration into the gray
cement (explaining the persistence of portlandite) and also
limit the depth of penetration of the intense carbonation
zone.
The shale-fragment-zone, which occurs at the interface
between the orange zone and the shale caprock, is the most
complex of the samples recovered from well 49-6. It is
characterized by black fragments of shale (which have split
along bedding planes) embedded in a gray, carbonate-rich,
fine-grained matrix. Unfortunately, none of the recovered
samples spans the orange zone to shale region and we can
only estimate that the thickness of the SFZ does not appear to
exceed about 0.5 cm. The mineralogy and textures suggest
that the SFZ matrix is composed of drilling residue mixed with
cement. Another important feature of the SFZ are some
regions of open porosity (Figs. 4 and 5).
What is more puzzling is that the SFZ has extraordinary
reaction textures indicative of extensive chemical mobility
(Fig. 6). Layers and bands of pure silica and pure calcium (or
dolomitic) carbonate occur together and separately. Large
sinuous regions of silica occur as well as pockets or void spaces
lined with silica and carbonate. The SFZ–orange zone contact
is in many places distinct and planar but in one location there
is a prominent wedge of SFZ that intrudes (or is intruded by)
the orange zone (Fig. 6). The matrix of the SFZ consists of very
fine-grained calcite, aragonite, dolomite, silica, and a sig-
nificant amount of halite.
The evidence for silica mobility in the SFZ was unexpected.
The solubility of silica is limited in the low pH environment
generated by carbonic acid as well as in the Ca-rich, high-pH
cement environment. The silica may have been mobilized and
moved out of the cement zone as a part of the carbonation
process (see Section 5). One other possibility is that the use of
NaOH in the drilling mud could have generated a corrosive
environment capable of dissolving silicate and generating
some of the deposits observed in the SFZ.
The geometry, mineral distribution, and textural character
of the orange-zone carbonation suggest that the origin of the
CO2 was via migration from the reservoir along the cement–
shale interface. As shown in Fig. 2, the interface between the
gray and orange cements is approximately parallel to the
wellbore and parallel to the shale–cement contact. This
geometry essentially eliminates the possibility that the CO2
has infiltrated through the cement matrix from the reservoir
as this would require partitioning of the fluid along the outer
boundary layer of the gray cement.
Rather, the geometry suggests that the CO2 infiltrated the
cement from the contact with the shale, perpendicular to the
interface. The source of the CO2 at the cement-shale interface
is not likely to be via migration along the shale bedding planes
but rather from the limestone reservoir via the shale-
fragment-zone. This interface consists of shale fragments
that may have prevented the cement from forming a tight seal
with the shale wall. Optical microscopy and SEM show that
the SFZ still retains porosity with open veining that may have
facilitated movement of CO2 (Figs. 4 and 5). The CO2 could
have occurred dissolved in the brine or as a separate
supercritical phase or a combination of the two. Our bulk
composition data demonstrate that the carbonation process
did involve movement of Si, Na, Ca, and Mg. Since a pure

Fig. 8 – Carbon and oxygen isotope measurements of solid
carbonates in samples illustrated in Fig. 1.
i n t e r n a t i o n a l j o u r n a l o f g r e e n h o u s e g a s c o n t r o l 1 ( 2 0 0 7 ) 7 5 – 8 582
supercritical CO2 phase is unlikely to move these elements, an
aqueous diffusion process appears to be involved.
With a model of CO2 carbonation proceeding from the SFZ,
the interface between the gray and orange cement represents
the carbonation front as it progresses inwards from the
contact with the shale. As discussed previously, the dense,
silica-rich character of the interface may have helped to slow
the advance of the front and may have helped to prevent
significant carbonation of the interior gray cement.
The CO2 that migrated along the SFZ was most likely
derived from the injected and produced CO2 associated with
enhanced oil recovery (EOR) activities. A second possible,
limited-term, limited-volume source is the acid stimulation of
the limestone reservoir conducted during well completion (see
Section 1). The amount of CO2 generated by acid stimulation is
likely to have been relatively small (477,000 L of 15% HCl could
produce a maximum of 47 metric tonnes of CO2), but it would
have occurred early in the life of the wellbore, perhaps prior to
complete curing of the cement. At this point, we cannot
demonstrate that all of the CO2 producing the orange zone was
derived from CO2-EOR.
The isotopic data show distinct differences in the carbon
values for weakly carbonated gray cement compared to the
orange altered cement and casing-interface deposit (Fig. 8).
There is some cement literature on the isotopic behavior of
cement carbonation that suggests, unfortunately, that kinetic
factors are very important in determining isotopic fractionation
(Rafai et al., 1991). The kinetic studies show that carbon and
oxygenisotopescontinuously evolve overa period of months. In
view of these complexities, a more thorough analysis will be
presented in the future following a more complete study of fluid
and gas isotope chemistry. The existing dataare consistent with
the interpretation of the gray cement experiencing a different
type of CO2 exposure from either the orange zone or the casing-
interface. We suggest that this difference may reflect the extent
of CO2 exposure: the gray cement was in a CO2-poor environ-
ment and perhaps relatively unequilibrated with the infiltrating
CO2, while the orange alteration zone and the casing–cement
interface were in a CO2-rich environment and relatively more
equilibrated.
5. Numerical modeling
In order to improve our understanding of the carbonation
process and as a step in the development of a predictive model
for cement degradation, we conducted numerical simulations
of CO2–cement interactions using the reactive transport code
FLOTRAN (Lichtner, 2001). Our conceptual model, following
the previous discussion, is that CO2-saturated brine percolated
up the cement–shale interface and in so-doing equilibrated
with the shale mineralogy while maintaining a high effective
CO2 pressure. As the fluid migrates upward, CO2-saturated
brine diffuses into the cement matrix. This two-dimensional
problem was simplified to a one-dimensional representation
which consisted of a column of shale and CO2-saturated brine
in contact with a fully cured, CO2-free cement paste (for more
details see Carey and Lichtner, in press).
The initial conditions were a fully hydrated, CO2-free
cement (0.05 m in length with porosity = 30%) adjacent to a
porous, carbonate-bearing shale-fragment zone (0.2 m in
length with porosity = 70%). The choice of a large, high
porosity shale volume was designed to simulate a steady
source of CO2-saturated brine from the reservoir through the
high porosity SFZ. The brine in the SFZ was saturated with
18 MPa CO2 and the calculations were conducted at 25 �C
rather than 50 �C because of thermodynamic database
limitations. The initial cement mineralogy was 38% calcium
silicate hydrate (with Ca=Si ¼ 1:78), 15.4% portlandite, 13.5%
monosulfate, 3.3% hydrogarnet, and 30% porosity. The initial
SFZ mineralogy was taken as 19.8% illite, 6.6% quartz, 1.3%
albite, 1.0% kaolinite, 0.7% calcite, 0.7% dolomite, and 70%
porosity. The calcium silicate hydrate phase was modeled as a
kinetically controlled solid solution between Ca(OH)2 and SiO2
using the methods of Lichtner and Carey (2006).
In the simulations, the key variables controlling reaction
characteristics were the tortuosity and porosity of the cement
and reaction rates of the minerals. These were adjusted in an
effort to reproduce the primary mineralogical and composi-
tional features of the orange alteration zone after 30 years of
CO2 exposure.
The simulation captures several key features of the
observed reactions at SACROC such as the width of the
carbonation zone, carbonate deposition, cement alteration,
interface formation, and compositional variation (Figs. 9–12 ).
The simulation reproduces the loss of all primary cement
phases in a 0.005 m region adjacent to the shale interface
(Fig. 9) and their replacement by a mixture of calcium
carbonate (Fig. 10; we did not attempt to model the kinetics
of aragonite and vaterite), amorphous silica (Fig. 10), and
amorphous aluminum hydroxides (Fig. 11; represented by
gibbsite in the model). The constraints of the diffusion-based
model showed that it was necessary to have the effective
porosity of the SFZ greater than the shale to reproduce the
penetration of the reaction front (if the porosity of the SFZ was
less than the cement, the reaction front moved to the original
interface and into the SFZ; see Carey and Lichtner (in press) for
additional details).
The depth of the reaction front penetration was a sensitive
function of the cement tortuosity. A value of 0.0004 (implying a
very convoluted diffusion path) was necessary to limit the
reaction front to the observed 0.005 m. The sharpness of the
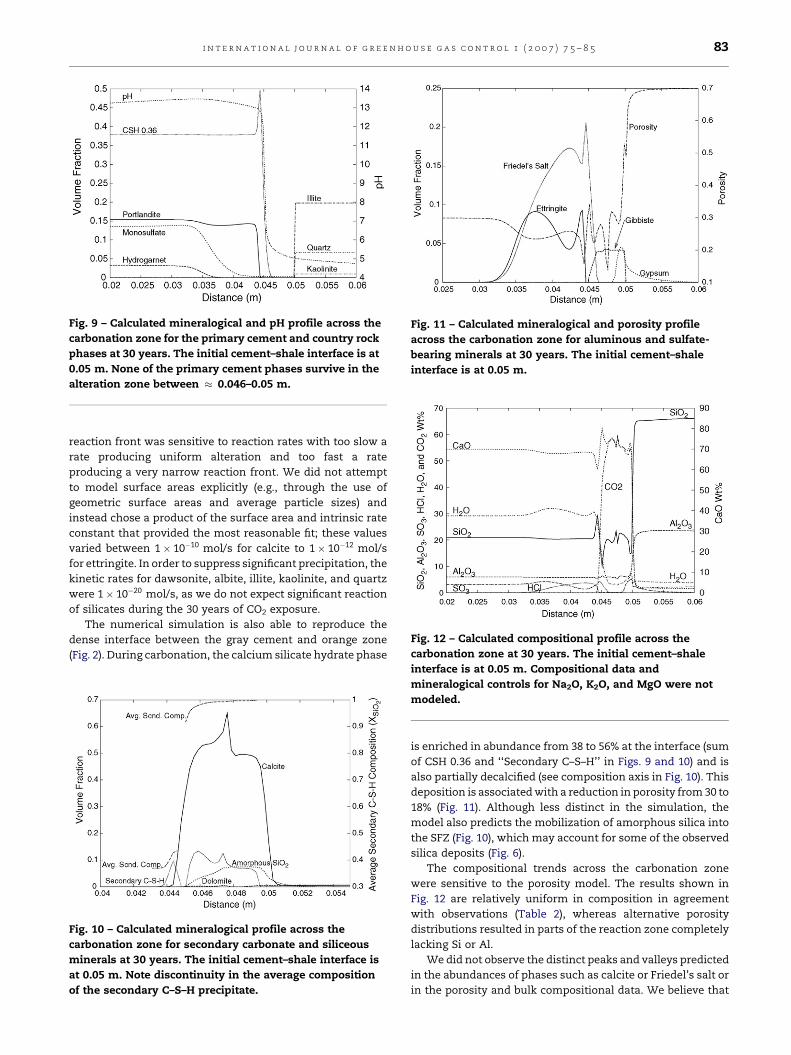
Fig. 9 – Calculated mineralogical and pH profile across the
carbonation zone for the primary cement and country rock
phases at 30 years. The initial cement–shale interface is at
0.05 m. None of the primary cement phases survive in the
alteration zone between � 0.046–0.05 m.
Fig. 11 – Calculated mineralogical and porosity profile
across the carbonation zone for aluminous and sulfate-
bearing minerals at 30 years. The initial cement–shale
interface is at 0.05 m.
Fig. 12 – Calculated compositional profile across the
carbonation zone at 30 years. The initial cement–shale
i n t e r n a t i o n a l j o u r n a l o f g r e e n h o u s e g a s c o n t r o l 1 ( 2 0 0 7 ) 7 5 – 8 5 83
reaction front was sensitive to reaction rates with too slow a
rate producing uniform alteration and too fast a rate
producing a very narrow reaction front. We did not attempt
to model surface areas explicitly (e.g., through the use of
geometric surface areas and average particle sizes) and
instead chose a product of the surface area and intrinsic rate
constant that provided the most reasonable fit; these values
varied between 1� 10�10 mol/s for calcite to 1� 10�12 mol/s
for ettringite. In order to suppress significant precipitation, the
kinetic rates for dawsonite, albite, illite, kaolinite, and quartz
were 1� 10�20 mol/s, as we do not expect significant reaction
of silicates during the 30 years of CO2 exposure.
The numerical simulation is also able to reproduce the
dense interface between the gray cement and orange zone
(Fig. 2). During carbonation, the calcium silicate hydrate phase
Fig. 10 – Calculated mineralogical profile across the
carbonation zone for secondary carbonate and siliceous
minerals at 30 years. The initial cement–shale interface is
at 0.05 m. Note discontinuity in the average composition
of the secondary C–S–H precipitate.
interface is at 0.05 m. Compositional data and
mineralogical controls for Na2O, K2O, and MgO were not
modeled.
is enriched in abundance from 38 to 56% at the interface (sum
of CSH 0.36 and ‘‘Secondary C–S–H’’ in Figs. 9 and 10) and is
also partially decalcified (see composition axis in Fig. 10). This
deposition is associated with a reduction in porosity from 30 to
18% (Fig. 11). Although less distinct in the simulation, the
model also predicts the mobilization of amorphous silica into
the SFZ (Fig. 10), which may account for some of the observed
silica deposits (Fig. 6).
The compositional trends across the carbonation zone
were sensitive to the porosity model. The results shown in
Fig. 12 are relatively uniform in composition in agreement
with observations (Table 2), whereas alternative porosity
distributions resulted in parts of the reaction zone completely
lacking Si or Al.
We did not observe the distinct peaks and valleys predicted
in the abundances of phases such as calcite or Friedel’s salt or
in the porosity and bulk compositional data. We believe that
i n t e r n a t i o n a l j o u r n a l o f g r e e n h o u s e g a s c o n t r o l 1 ( 2 0 0 7 ) 7 5 – 8 584
the detail predicted in the 1D model would probably be
smoothed out in a 3D model which had an initial hetero-
geneous mineralogical and compositional distribution as is
likely in real cement. Other shortcomings of the model include
the prediction of gypsum (Fig. 11) which was not observed and
the prediction that the cement interior is completely unaltered
contrary to the observation of calcium carbonate in the gray
cement. However, the gray cement may also have had CO2
infiltration from the casing interface.
Finally, we should note that some of the derived model
parameters, such as tortuosity and reaction rates, are
dependent on the nature of the model. For example, a more
complete 2D model could allow a more limited or episodic
exposure of the cement to CO2 via the SFZ. In these conditions,
the tortuosity required to limit the depth of CO2 penetration
could have been substantially reduced.
6. Conclusions
The Portland cement recovered from a 55-year old well with 30
years of CO2 exposure showed evidence of exposure to CO2 in
the form of carbonate precipitate adjacent to the casing and
heavily carbonated, orange-colored cement adjacent to the
shale caprock. However, the structural integrity of the
recovered cement core, petrographic observations, air per-
meameter data, and cement bond log indicate that the cement
retained its capacity to prevent significant transport of fluid
through the cement matrix. Observations and numerical
calculations suggest that the CO2 producing the orange
alteration originated by movement from the reservoir along
the shale–cement interface. The CO2 producing a carbonate
precipitate at the casing–cement interface may have origi-
nated by migration along the casing interface from the
reservoir or from the interior of the well at casing joints or
regions of casing corrosion.
Numerical modeling shows that carbonation induced by
diffusion of CO2-saturated brine reproduces key features of
the SACROC cement core. We used observations of the core to
constrain the porosity, tortuosity, and reaction rates used in
the modeling to values appropriate to well 49-6 at SACROC.
Additional samples would be necessary to construct a more
generally applicable model of CO2-induced cement degrada-
tion.
The observations demonstrate that Portland cement can
retain its integrity at least over decades in a CO2 reservoir with
conditions similar to SACROC. Numerical calculations are
consistent with a slow rate of degradation by diffusive attack
of CO2 that would allow a thick column of cement to survive
for long periods of time. However, the observations also show
that CO2 migrated along the casing–cement and shale–cement
interfaces for some period of time. We were unable to quantify
the amount of CO2 migration that may have occurred along
these interfaces. The integrity of these interfaces appears to be
the most critical issue in wellbore performance for CO2
sequestration.
The cement core recovered at SACROC provides some help
in understanding the experimental variability in studies of
cement carbonation at reservoir conditions. The laboratory
experiments of Duguid et al. (2005) investigated cement
deterioration under conditions of flowing CO2-saturated brine
and they observed rapid degradation and loss of structural
integrity within weeks of exposure. The SACROC sample
clearly did not experience a similar flux of acidic brine. This
indicates that for properly completed wells, the cement–
caprock interface does not experience flowing CO2-saturated
brine and the rapid cement decomposition observed by
Duguid et al. (2005) is unlikely to occur.
In contrast, the experiments of Barlet-Gouedard et al. (2006)
and Kutchko et al. (2006b) were conducted with a static volume
of brine subject to high CO2 pressure. Barlet-Gouedard et al.’s
experiments were conducted at 90 �C and 28 MPa, and they
observed rapid penetration of CO2 and complete carbonation
within 6 weeks. Their porosity and mechanical strength
studies showed that the cement appears to retain significant
hydrologic integrity but had clearly been substantially altered.
Kutchko et al.’s experiments were conducted at 50 �C and
30 MPa and showed very limited (slow) penetration of CO2
after 9 days (and after 3 months as presented in Kutchko et al.,
2006a). The SACROC cement samples (exposed to CO2 at 54 �C
and 18 MPa) showed rates of carbonation more compatible
with the experiments of Kutchko et al., which may reflect the
more similar temperatures of CO2 exposure. However, it also
possible that the amount of CO2 exposure for the SACROC
samples at 3 m above the reservoir contact was more limited.
The time and conditions for cement curing times prior to CO2
exposure is another important variable: SACROC at 35 years
(54 �C) compared to Kutchko et al. at 28 days (22 and 50 �C) and
Barlet-Gouedard et al. at 2 days (90 �C). In any case, both the
Barlet-Gouedard et al. and Kutchko et al. studies are consistent
with cement retaining hydrologic integrity in a CO2-rich
environment, although the results of Barlet-Gouedard et al.
indicate that CO2-induced cement degradation in higher
temperature reservoirs may be of greater concern.
The SACROC core in combination with the available
experimental data allow some preliminary conclusions
regarding wellbore integrity and CO2 storage. These studies
indicate that Portland cement based wellbore systems, if
properly completed, can prevent significant migration of CO2
from reservoirs for long periods of time (at least decades). A
properly completed well need not be completely free of
defects, but should not have continuous openings along either
the cement–casing or cement–caprock interfaces that might
permit a CO2–brine mixture to flow that could dissolve cement
and further widen the interface. The key variables appear to be
the initial width and connectivity of the interfaces in addition
to the pressure gradient driving flow from the reservoir.
Future work to develop and strengthen these conclusions
should include collecting additional core to understand
whether the observations at well 49-6 are unique or typical
at SACROC and to explore the significance of differing caprock
and reservoir chemistries as well as differing operational
histories. These studies could improve on our work by
obtaining fluid samples to better constrain the geochemistry
and collecting samples at multiple intervals to determine the
maximum extent of carbonation. In addition, more experi-
mental studies are needed to help interpret the field observa-
tions. These should focus on the evolution of cement-casing
and cement–caprock interfaces as a function of initial inter-
face width/quality and the CO2–brine flux. Observations at

i n t e r n a t i o n a l j o u r n a l o f g r e e n h o u s e g a s c o n t r o l 1 ( 2 0 0 7 ) 7 5 – 8 5 85
SACROC suggest that under limited flux the interfaces may be
self-sealing. Determining the conditions under which these
interfaces become more transmissive with time remains a key
unknown in evaluating the longevity of the Portland cement
seal in wellbore systems.
Acknowledgements
We are grateful to Melissa Fittipaldo for electron microscopy,
Toti Larson for stable isotope analyses, and Tim Ickes for X-ray
tomography (all at Los Alamos National Laboratory); to Bob
Svec for air permeameter measurements (at New Mexico
Tech); and Chandra Rai for porosity and air permeameter
measurements (at University of Oklahoma). Kinder Morgan
CO2 Company is gratefully acknowledged for providing the
core samples used in this study. This work was supported by
LDRD-DR 2004042DR and the U.S. Department of Energy–NETL
Contract #04FE04.
r e f e r e n c e s
Barlet-Gouedard, V., Rimmele, G., Goffe, B., Porcherie, O., 2006.Mitigation strategies for the risk of CO2 migration throughwellbores. In: Proceedings of the IADC/SPE DrillingConference, February 21–23, Miami, Florida, SPE 98924-MS.
Carey, J.W., Lichtner, P.C., in press. Calcium silicate hydratesolid solution model applied to cement degradation usingthe continuum reactive transport model FLOTRAN. Am.Ceram. Soc., Mater. Sci. Concrete.
Chipera, S.J., Bish, D.L., 2002. FULLPAT: a full-patternquantitative analysis program for X-ray powder diffractionusing measured and calculated patterns. J. Appl.Crystallogr. 35, 744–749.
Duguid, A., Radonjic, M., Scherer, G., 2005. Degradation of wellcements exposed to carbonated brine. In: Fourth Annual
Conference on Carbon Capture & Sequestration, May 2005,Alexandria, VA.
Kosmatka, S.H., Panarese, W.C., 1988. Design and Control ofConcrete Mixtures, 13th ed. Portland Cement Association.
Kutchko, B.G., Strazisar, B.R., Dzombak, D.A., Lowry, G.V., 2006a.Degradation of well cement under geologic sequestrationconditions. In: 2nd Wellbore Integrity Network Meeting,Princeton, New Jersey, March 2006. http://www.co2captureandstorage.info/networks/wellbore.htm.
Kutchko, B.G., Strazisar, B.R., Dzombak, D.A., Lowry, G.V.,Thaulow, N., 2006b. Degradation of wellbore cement by CO2
under geologic sequestration conditions. Environ. Sci.Technol., submitted for publication.
Lichtner, P.C., 2001. FLOTRAN User Manual. Tech. Re LA-UR-01–2349, Los Alamos National Laboratory.
Lichtner, P.C., Carey, J.W., 2006. Incorporating solid solutions ingeochemical reactive transport equations using a kineticdiscrete-composition approach. Geochim. Cosmochim.Acta 70, 1356–1378.
Rafai, N., Letolle, R., Blanc, P., Person, A., Gegout, P., 1991.Isotope geochemistry (13C, 18O) of carbonation processes inconcretes. Cement Concrete Res. 21, 368–377.
Raines, M.A., Dobitz, J.K., Wehner, S.C., 2001. A review of thePennsylvanian SACROC Unit. In: Fall Symposium WestTexas Geological Society, October 24–25.
Raines, M.A., Helms, W., 2005. Non-standard core analysisapplied to geologic model generation for fluid flowsimulation. In: Lufholm, P., Cox, D.M. (Eds.), UnconventionalReservoir, Technology, and Stratgies: AlternativePerspectives for the Permian Basin, No. 05–115. West TexasGeological Society, Midland, Texas, pp. 123–136, 2005 WTGSFall Symposium.
Taylor, H.F.W., 1990. Cement Chemistry. Academic Press,London.
Venhuis, M.A., Reardon, E.J., 2003. Carbonation of cementitiouswasteforms under supercritical and high pressuresubcritical conditions. Environ. Technol. 24, 877–887.
Vest, Jr., E.L., 1970. Oil fields of Pennsylvanian–PermianHorseshoe Atoll, West Texas. In: Halbouty, M.T. (Ed.),Geology of Giant Petroleum Fields, vol. 14 of Memoir—American Association of Petroleum Geologists, 185–203.