Namasaka current Thesis
209
EFFECTS OF SEQUENTIAL TEACHING METHODS ON ACHIEVEMENT, RETENTION AND TRANSFER OF KNOWLEDGE IN BIOLOGY BY SECONDARY SCHOOL STUDENTS IN KENYA BY FRED W. NAMASAKA E83/PUC/2042/11 A Thesis Submitted in Fulfillment of the Requirements for the Award of the Degree of Doctor of Philosophy, in the Department of Curriculum Instruction and Educational Technology, Pwani University August, 2015
-
Upload
khangminh22 -
Category
Documents
-
view
3 -
download
0
Transcript of Namasaka current Thesis
EFFECTS OF SEQUENTIAL TEACHING METHODS ON ACHIEVEME NT,
RETENTION AND TRANSFER OF KNOWLEDGE IN BIOLOGY BY
SECONDARY SCHOOL STUDENTS IN KENYA
BY
FRED W. NAMASAKA
E83/PUC/2042/11
A Thesis Submitted in Fulfillment of the Requirements for the Award of the Degree
of Doctor of Philosophy, in the Department of Curriculum Instruction and
Educational Technology, Pwani University
August, 2015
ii
DECLARATION
Declaration by the Candidate
This thesis is my original work and has not been presented for a degree in any other
university. No part of this research thesis may be reproduced without prior permission of
the author and/or Pwani University.
………………………………. ……………………………
Namasaka, Fred Wafula
E83/PUC/2042/11
Declaration by Supervisor
This thesis has been submitted for examination with our approval as University
Supervisors.
……………………………….. …………………………….. Prof. Helen Omondi Mondoh (Ph D)
Professor Department of Curriculum, Instruction and Educational Technology(Pwani University)
………………………………… …………………………. Dr. Chrilukovian B. Wasike (Dr. rer. agr.)
Lecturer Department of Animal Science (Maseno University)

iii
DEDICATION
To my family.
iv
ACKNOWLEDGEMENTS
I would like to thank all individuals who contributed and sacrificed their time towards the
writing and completion of this thesis. To my supervisors, Prof. Helen Mondoh and
Dr.Chrilukovian Bwire Wasike for their guidance and support in the development of this
research thesis; their advice and criticism made this thesis what it is.
I also thank all the Biology teachers and students in the schools where the research was
conducted. Additionally, I give my gratitude to Mr. Stephen Amukune and Mr Ezekiel
Some who helped in data analysis as well as Ms. Jane Rukwaro and Winnie Namasaka for
typing and editing the manuscript. Sincere thanks to my family and colleagues for their
support and encouragement.
v
ABSTRACT
Despite the importance of knowledge in Biology, candidates’ performance at the national examination; The Kenya Certificate of Secondary Education (KCSE) is poor. This could be attributed to the teaching methods. The purpose of this study was to compare differential effectiveness of Sequential Teaching Methods (STM) on the achievement, retention and transfer of knowledge in Biology by secondary school students. The study was Quasi- experimental using the Non-equivalent control- group 16 study design. There were four groups divided into eight (8) sub-groups: four Boys only schools and four Girls only schools to allow for investigation of gender. All the four groups took a pre-test, post-test, knowledge retention test and a transfer 0f knowledge test to make a total of 16 observations. The target population comprised students in the 18 old category National Schools in Kenya that were in existence before 2012. Purposive sampling was used to obtain a sample of eight (8) schools and 402 Students. The students in the eight (8) sub-groups were taught the same Biology topic: “General Characteristics of Enzymes”, using different sequences of three teaching methods namely: lecture, slide demonstration and laboratory (student experiment). Group I (ELD) began with experiments, followed by lecture method and was lastly shown, animated slides. The sequence of the three different methods used in the first group was altered in both the second and third groups as follows: The lecture method, slide demonstration and laboratory experiment (LDE) for Group II, and slide demonstration, experiment and lecture method (DEL) for group III. Students in group IV (control group) were taught using (oral-only) lecture method. The teachers gave lectures and performed slide demonstration while the students carried out laboratory experiments. In order to quantitatively measure achievement based on the various sequences of teaching the researcher used the Biology Achievement Test (BAT). The test was used as a pre-test and also post-test. In addition, it was also used as a retention test that was administered 40 days after the Post-test BAT. This test had 25 objective questions testing knowledge of facts, application of knowledge and problem solving ability. To measure Transfer of Knowledge, the researcher used Concept Maps as an assessment tool. The four research hypotheses were tested using ANOVA at significant level of 0.05. The results and findings of the study show that STM, when efficiently used in instruction, could enhance immediate post achievement test scores, retention and transfer of knowledge in Biology more effectively than the oratory lecture method predominantly used in Kenyan Secondary schools. Furthermore, DEL sequence was identified as the most effective in comparison to LDE and ELD. The findings of the study will help curriculum developers and teachers to choose the most appropriate sequence to use in Biology.
vi
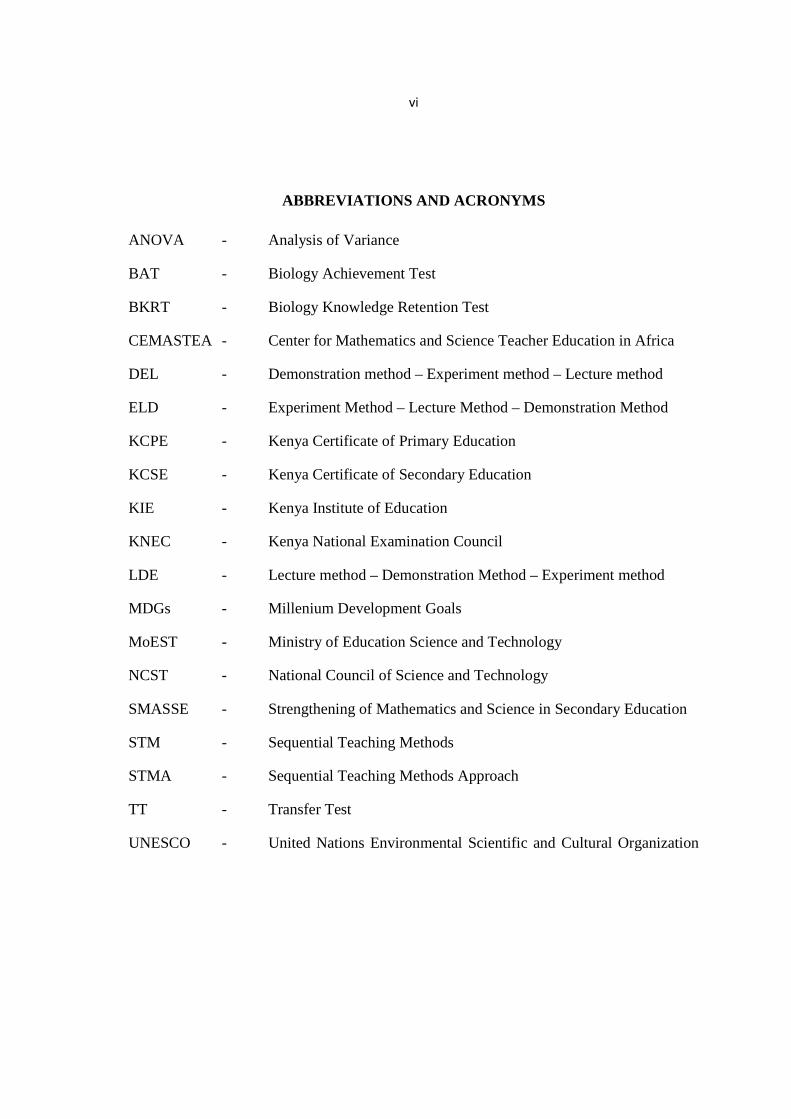
ABBREVIATIONS AND ACRONYMS
ANOVA - Analysis of Variance
BAT - Biology Achievement Test
BKRT - Biology Knowledge Retention Test
CEMASTEA - Center for Mathematics and Science Teacher Education in Africa
DEL - Demonstration method – Experiment method – Lecture method
ELD - Experiment Method – Lecture Method – Demonstration Method
KCPE - Kenya Certificate of Primary Education
KCSE - Kenya Certificate of Secondary Education
KIE - Kenya Institute of Education
KNEC - Kenya National Examination Council
LDE - Lecture method – Demonstration Method – Experiment method
MDGs - Millenium Development Goals
MoEST - Ministry of Education Science and Technology
NCST - National Council of Science and Technology
SMASSE - Strengthening of Mathematics and Science in Secondary Education
STM - Sequential Teaching Methods
STMA - Sequential Teaching Methods Approach
TT - Transfer Test
UNESCO - United Nations Environmental Scientific and Cultural Organization
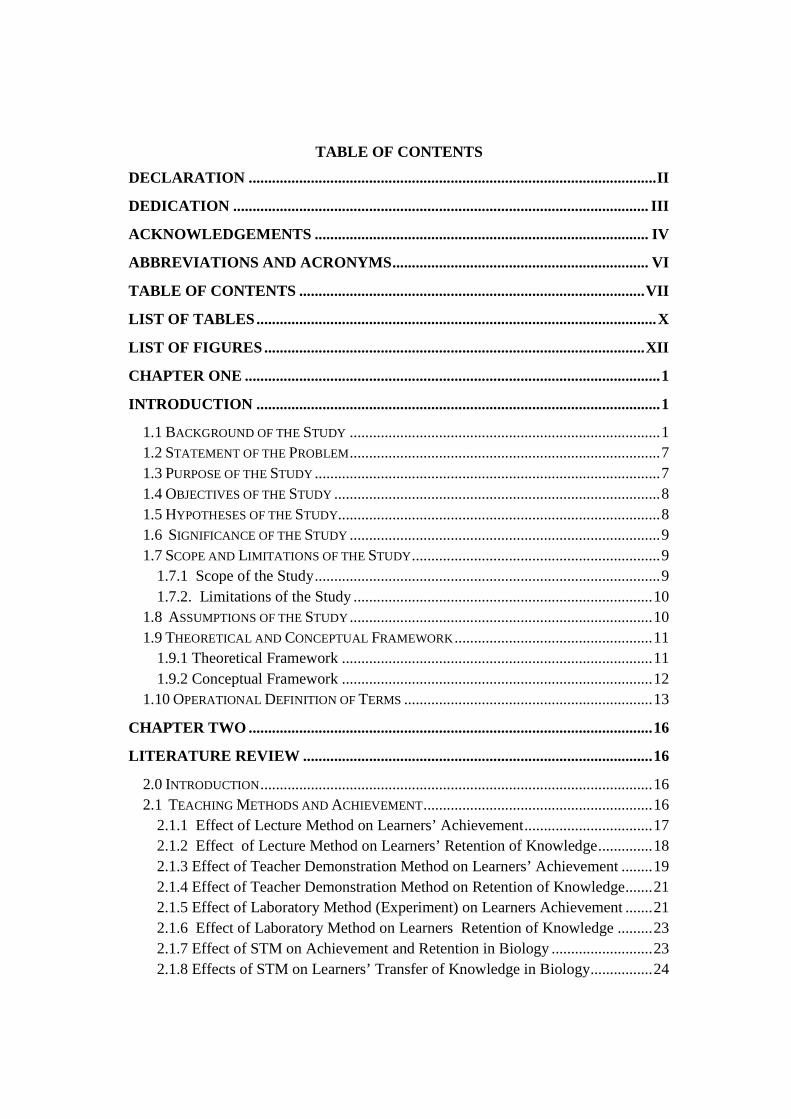
TABLE OF CONTENTS
DECLARATION ......................................................................................................... II
DEDICATION ........................................................................................................... III
ACKNOWLEDGEMENTS ...................................................................................... IV
ABBREVIATIONS AND ACRONYMS .................................................................. VI
TABLE OF CONTENTS ......................................................................................... VII
LIST OF TABLES ....................................................................................................... X
LIST OF FIGURES .................................................................................................. XII
CHAPTER ONE ........................................................................................................... 1
INTRODUCTION ........................................................................................................ 1
1.1 BACKGROUND OF THE STUDY ................................................................................ 1 1.2 STATEMENT OF THE PROBLEM ................................................................................ 7 1.3 PURPOSE OF THE STUDY ......................................................................................... 7 1.4 OBJECTIVES OF THE STUDY .................................................................................... 8 1.5 HYPOTHESES OF THE STUDY................................................................................... 8 1.6 SIGNIFICANCE OF THE STUDY ................................................................................ 9 1.7 SCOPE AND LIMITATIONS OF THE STUDY ................................................................ 9
1.7.1 Scope of the Study ......................................................................................... 9 1.7.2. Limitations of the Study ............................................................................. 10
1.8 ASSUMPTIONS OF THE STUDY .............................................................................. 10 1.9 THEORETICAL AND CONCEPTUAL FRAMEWORK ................................................... 11
1.9.1 Theoretical Framework ................................................................................ 11 1.9.2 Conceptual Framework ................................................................................ 12
1.10 OPERATIONAL DEFINITION OF TERMS ................................................................ 13
CHAPTER TWO ........................................................................................................ 16
LITERATURE REVIEW .......................................................................................... 16
2.0 INTRODUCTION ..................................................................................................... 16 2.1 TEACHING METHODS AND ACHIEVEMENT ........................................................... 16
2.1.1 Effect of Lecture Method on Learners’ Achievement ................................. 17 2.1.2 Effect of Lecture Method on Learners’ Retention of Knowledge .............. 18 2.1.3 Effect of Teacher Demonstration Method on Learners’ Achievement ........ 19 2.1.4 Effect of Teacher Demonstration Method on Retention of Knowledge ....... 21 2.1.5 Effect of Laboratory Method (Experiment) on Learners Achievement ....... 21 2.1.6 Effect of Laboratory Method on Learners Retention of Knowledge ......... 23 2.1.7 Effect of STM on Achievement and Retention in Biology .......................... 23 2.1.8 Effects of STM on Learners’ Transfer of Knowledge in Biology ................ 24
viii
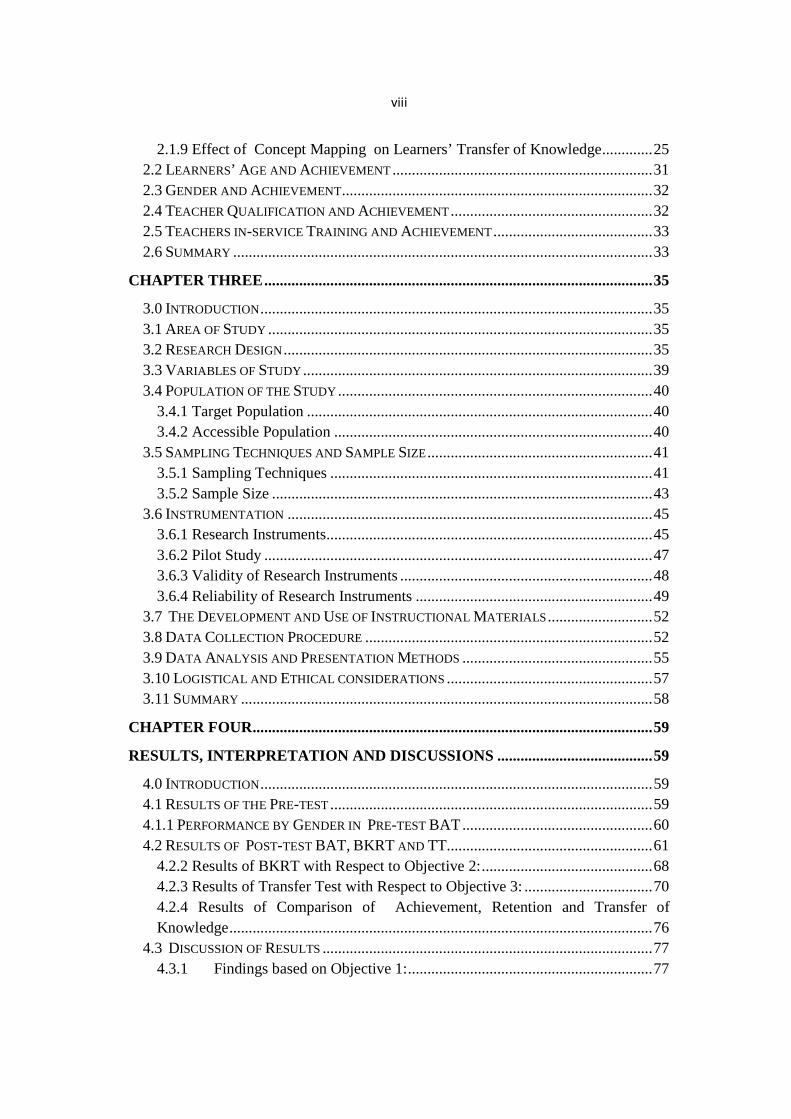
2.1.9 Effect of Concept Mapping on Learners’ Transfer of Knowledge ............. 25 2.2 LEARNERS’ AGE AND ACHIEVEMENT ................................................................... 31 2.3 GENDER AND ACHIEVEMENT ................................................................................ 32 2.4 TEACHER QUALIFICATION AND ACHIEVEMENT .................................................... 32 2.5 TEACHERS IN-SERVICE TRAINING AND ACHIEVEMENT ......................................... 33 2.6 SUMMARY ............................................................................................................ 33
CHAPTER THREE .................................................................................................... 35
3.0 INTRODUCTION ..................................................................................................... 35 3.1 AREA OF STUDY ................................................................................................... 35 3.2 RESEARCH DESIGN ............................................................................................... 35 3.3 VARIABLES OF STUDY .......................................................................................... 39 3.4 POPULATION OF THE STUDY ................................................................................. 40
3.4.1 Target Population ......................................................................................... 40 3.4.2 Accessible Population .................................................................................. 40
3.5 SAMPLING TECHNIQUES AND SAMPLE SIZE .......................................................... 41 3.5.1 Sampling Techniques ................................................................................... 41 3.5.2 Sample Size .................................................................................................. 43
3.6 INSTRUMENTATION .............................................................................................. 45 3.6.1 Research Instruments .................................................................................... 45 3.6.2 Pilot Study .................................................................................................... 47 3.6.3 Validity of Research Instruments ................................................................. 48 3.6.4 Reliability of Research Instruments ............................................................. 49
3.7 THE DEVELOPMENT AND USE OF INSTRUCTIONAL MATERIALS ........................... 52 3.8 DATA COLLECTION PROCEDURE .......................................................................... 52 3.9 DATA ANALYSIS AND PRESENTATION METHODS ................................................. 55 3.10 LOGISTICAL AND ETHICAL CONSIDERATIONS ..................................................... 57 3.11 SUMMARY .......................................................................................................... 58
CHAPTER FOUR ....................................................................................................... 59
RESULTS, INTERPRETATION AND DISCUSSIONS ........................................ 59
4.0 INTRODUCTION ..................................................................................................... 59 4.1 RESULTS OF THE PRE-TEST ................................................................................... 59 4.1.1 PERFORMANCE BY GENDER IN PRE-TEST BAT ................................................. 60 4.2 RESULTS OF POST-TEST BAT, BKRT AND TT ..................................................... 61
4.2.2 Results of BKRT with Respect to Objective 2: ............................................ 68 4.2.3 Results of Transfer Test with Respect to Objective 3: ................................. 70 4.2.4 Results of Comparison of Achievement, Retention and Transfer of Knowledge ............................................................................................................. 76
4.3 DISCUSSION OF RESULTS ..................................................................................... 77 4.3.1 Findings based on Objective 1: ............................................................... 77

ix
4.3.2 Findings based on Objective 2: ................................................................. 80 4.3.3 Findings based on Objective 3: .................................................................... 86 4.3.4 Discussion of Findings based on objective 4 .......................................... 89
4.4 SUMMARY ........................................................................................................... 89
CHAPTER FIVE ........................................................................................................ 91
SUMMARY, CONCLUSIONS AND RECOMMENDATIONS .......... .................. 91
5.0 INTRODUCTION ..................................................................................................... 91 5.1 SUMMARY OF MAIN FINDINGS AND CONTRIBUTIONS TO KNOWLEDGE ................ 91 5.3 CONCLUSION ........................................................................................................ 92 5.4 RECOMMENDATIONS ............................................................................................ 93
5.4.1 Recommendations at the pedagogical level ................................................. 93 5.4.2 Recommendations for Further Research. ..................................................... 94
REFERENCE .............................................................................................................. 96
APPENDICES ........................................................................................................... 112
APPENDIX I: BIOLOGY ACHIEVEMENT TEST (BAT) – PRE- T EST ........ 112
APPENDIX II: BIOLOGY ACHIEVEMENT TEST (BAT) POST- TEST ...... 120
APPENDIX III: BIOLOGY KNOWLEDGE RETENTION TEST(BKRT ) ...... 128
APPENDIX IV: STM TRAINING MANUAL .................. ..................................... 137
APPENDIX V: THE ENZYME ACTION DISCUSSION .......... .......................... 161
APPENDIX VI: DATA ON RAW SCORES .......................................................... 176
APPENDIX VIII: DISTRIBUTION OF OLD CATEGORY NATIONA L SCHOOLS ................................................................................................................. 189
APPENDIX IX: MARKING SCHEME FOR POST-TEST BIOLOGY ACHIEVEMENT TEST (BAT) .............................................................................. 190
APPENDIX X: MARKING SCHEME FOR BIOLOGY KNOWLEDGE RETENTION TEST (BKRT) .................................................................................. 191
APPENDIX XII: CONCEPTS FOR SCORING CONCEPT MAPS ................... 193
APPENDIX XIII: SAMPLE LETTER TO REQUEST PERMISION F OR DATA COLLECTION ......................................................................................................... 194
x
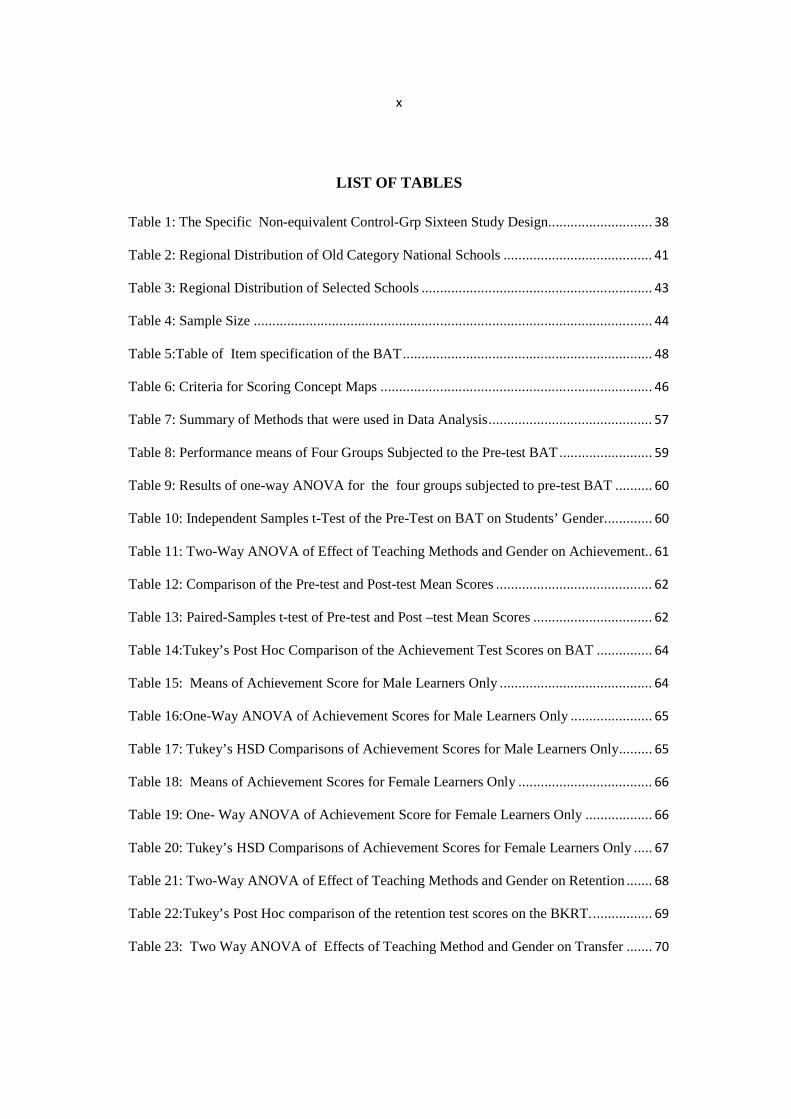
LIST OF TABLES
Table 1: The Specific Non-equivalent Control-Grp Sixteen Study Design............................ 38
Table 2: Regional Distribution of Old Category National Schools ........................................ 41
Table 3: Regional Distribution of Selected Schools .............................................................. 43
Table 4: Sample Size ........................................................................................................... 44
Table 5:Table of Item specification of the BAT ................................................................... 48
Table 6: Criteria for Scoring Concept Maps ......................................................................... 46
Table 7: Summary of Methods that were used in Data Analysis ............................................ 57
Table 8: Performance means of Four Groups Subjected to the Pre-test BAT ......................... 59
Table 9: Results of one-way ANOVA for the four groups subjected to pre-test BAT .......... 60
Table 10: Independent Samples t-Test of the Pre-Test on BAT on Students’ Gender............. 60
Table 11: Two-Way ANOVA of Effect of Teaching Methods and Gender on Achievement.. 61
Table 12: Comparison of the Pre-test and Post-test Mean Scores .......................................... 62
Table 13: Paired-Samples t-test of Pre-test and Post –test Mean Scores ................................ 62
Table 14:Tukey’s Post Hoc Comparison of the Achievement Test Scores on BAT ............... 64
Table 15: Means of Achievement Score for Male Learners Only ......................................... 64
Table 16:One-Way ANOVA of Achievement Scores for Male Learners Only ...................... 65
Table 17: Tukey’s HSD Comparisons of Achievement Scores for Male Learners Only ......... 65
Table 18: Means of Achievement Scores for Female Learners Only .................................... 66
Table 19: One- Way ANOVA of Achievement Score for Female Learners Only .................. 66
Table 20: Tukey’s HSD Comparisons of Achievement Scores for Female Learners Only ..... 67
Table 21: Two-Way ANOVA of Effect of Teaching Methods and Gender on Retention ....... 68
Table 22:Tukey’s Post Hoc comparison of the retention test scores on the BKRT. ................ 69
Table 23: Two Way ANOVA of Effects of Teaching Method and Gender on Transfer ....... 70
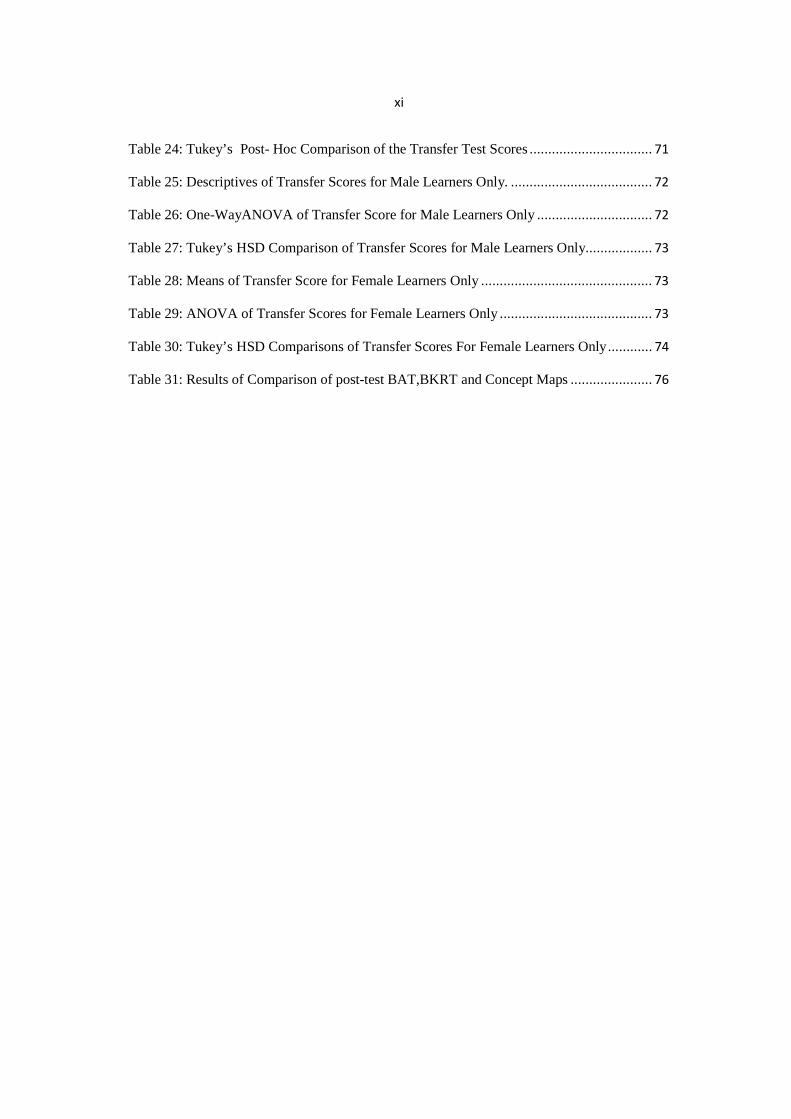
xi
Table 24: Tukey’s Post- Hoc Comparison of the Transfer Test Scores ................................. 71
Table 25: Descriptives of Transfer Scores for Male Learners Only. ...................................... 72
Table 26: One-WayANOVA of Transfer Score for Male Learners Only ............................... 72
Table 27: Tukey’s HSD Comparison of Transfer Scores for Male Learners Only.................. 73
Table 28: Means of Transfer Score for Female Learners Only .............................................. 73
Table 29: ANOVA of Transfer Scores for Female Learners Only ......................................... 73
Table 30: Tukey’s HSD Comparisons of Transfer Scores For Female Learners Only ............ 74
Table 31: Results of Comparison of post-test BAT,BKRT and Concept Maps ...................... 76
xii
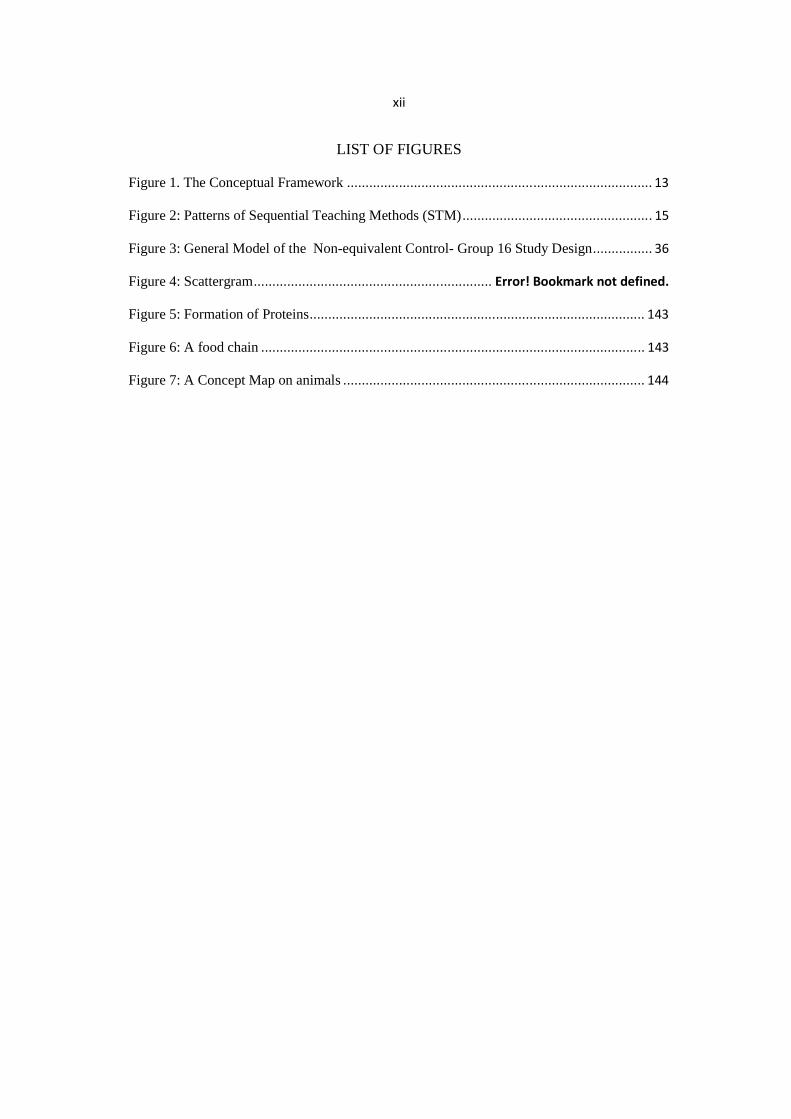
LIST OF FIGURES
Figure 1. The Conceptual Framework .................................................................................. 13
Figure 2: Patterns of Sequential Teaching Methods (STM) ................................................... 15
Figure 3: General Model of the Non-equivalent Control- Group 16 Study Design ................ 36
Figure 4: Scattergram ................................................................ Error! Bookmark not defined.
Figure 5: Formation of Proteins .......................................................................................... 143
Figure 6: A food chain ....................................................................................................... 143
Figure 7: A Concept Map on animals ................................................................................. 144
1
CHAPTER ONE
INTRODUCTION
1.1 Background of the Study
Biology education has both intrinsic and extrinsic justifications (Brown, 1995). The former
relates to advancement in Biology for its own sake as a discipline while the latter is
concerned with the promotion of societal welfare. Inferably, the teaching and learning in
Biology play both academic and social roles. Killermann (1998), explains that the academic
role concerns the acquisition of scientific knowledge, skills and attitudes for application in
the fields of medicine and agriculture among others. The social role pertains to the
empowerment of individuals in economic and technology related areas.
The overall goal of teaching Biology in Kenya is to make learners to fully understand
themselves and the environment (Maundu, Sambili & Muthwii, 1998). In addition, it enables
students to appreciate mankind as part of the broader community of living things. Biology is
also a precursor of Biotechnology, which is a vital tool for technological and industrial
development. The teaching in Biology therefore, aims at the production of a scientific
community whose major role is to promote the welfare of humankind through application of
knowledge in Biology. In addition, Biology fosters the advancement of science through
research and publications (Lawson, 2001).
Since independence, efforts have been made to improve standards of teaching Biology in
Kenya through educational reforms. Maundu, Sambili & Muthwii, (1998) report that, the
African Curriculum Development Centre (ACDC) established in 1963; later KIE (1974-
2013) and now KICD (2013), made the first attempt at improving the teaching in Biology.
The center produced Biology schemes of work and lesson plans for use by secondary
schools teachers. The argument then was that teachers in Biology were not qualified to
2
prepare schemes of work and lesson plans on their own. However, according to Maundu,
Sambili & Muthwii (1998), the ACDC project failed due to [1] teachers’ incompetence
[2] lack of teaching resources in schools. The United Nations Educational, Scientific and
Cultural Organisation (UNESCO) lauched the UNESCO pilot project as the second
intervention in 1967. The projecct aimed at improving teaching of Biology, and laid emphasis
on investigation, observation and discovery rather than rote learning and memorisation of
facts. In addition, teaching was based on students interests and experience. The project led
to the production of students’ laboratory manuals and teachers’ guides. Maundu, Sambili and
Muthwii (1998) pointed out that the UNESCO pilot project made wrong asssumptions
concerning the availabililty of ordinary standard equipment in the pilot schools. Upon the
project lauch it became apparent that most schools lacked the standard labarory equipment.
This became one of the constrains that led to the project failure.
Another effort to improve teaching in Biology was the Nuffield Science Project launched in
1969. This succeded the UNESCO pilot project. The project was introduced through the
Technical Assistance Programme whereby books, apparatus and equipment were shipped to
Kenya from England. Only a few schools were selected to participate. This project was
found to be ambitious and required sophisticated apparatus and too much of the students
time, hence its abandonment in 1972.
Thereafter, the School Science Project (SSP) was launched in 1974 as an indigenous
programme involving the then East African States (Kenya, Uganda and Tanzania). However,
the SSP Biology was modelled on the Nuffield Science Project but excluded the sophisticated
apparatus. The SSP project focused on answering of questions based on students’
experiments. Students were therefore expected to keep a detailed laboratory notebook record.
At the launch of this project only 15 schools were selected. However, the number increased
to 25 and by 1982, the number had risen to slightly over 50 schools, that were spread in
3
various parts of Kenya. Like the previous projects the SSP faced a number of challenges that
necessitated it to be offered alongside the traditional Biology Syllabus.
The traditional Biology syllabus was based on the conventional methods in which the
teaching is expository. Although students perform experiments they merely serve to verify
known information. The syllabus persisted for many years because it did not require too
much equipment and materials. Traditional Biology was later modified to suit the current
8-4-4 Biology Syllabus that commenced in the mid-1980s.
Since its introduction in 1986, the 8-4-4 Biology syllabus has undergone four reviews: 1992,
1997, 2002, 2006. The aim of these reviews was to align, scale-down an re-arrange the
content taught at various levels. The review of 2006 was accompanied by a change in the
examination format whose details are outside the scope of the current study.
In an attempt to achieve objectives of the Secondary School Biology syllabus, KIE (2006)
suggested several methods of teaching. The methods include: practical work, class
discussions, demonstrations, excursion/field trips and project work. However, the baseline
survey done by the project,‘Strengthening of Mathematics and Science in Secondary
Education’ (SMASSE, 2007), shows that the predominantly used teaching methods for
Biology include: lecture method, teacher demonstration and practical/laboratory work
(student experiment). The Biology syllabus in Kenya is organised in such a way that for
most theory lessons, mainly taught through the lecture method, there is corresponding
practical work. The recommendation by KIE (2006) is that practical or laboratory work
should be done through either teacher demonstration or student experiments; allowance is
made for practical lessons to be done before or after theory lessons. This in effect constitutes
Sequential Teaching Methods Approach (STMA). However, in actual fact, Biology teachers
in Kenya often use only lecture method (without demonstrations and experiments) in their
4
lessons (Njuguna, 1998). Any attempt of STMA in teaching Biology in Kenya mainly
follows the sequence:lecture method, teacher demonstration and student experiments (LDE).
It is however, important that these methods be used in an appropriate sequence (pattern). In
an effort to help the teachers implement the Biology syllabus effectively, emphasis is laid on
the teachers’ use of a combination of methods for a single topic (KIE, 2006). However, this
may not be practically possible due to constraints such as lack of material resources and even
space that curtail use of variety of teaching methods.
Biology teachers usually resort to use of lecture method owing to the aforementioned
constraints. Consequently, learners miss the hands–on experiences, which enhance learning.
The result is rote memorisation of information as opposed to meaningful learning. Mondoh
(2005) observes that, in most lessons the whole difference lies in the fact that the student is
asked to accept from outside an already organised intellectual discipline which he/she may or
may not understand.
Biology provides a foundation for careers in the related fields and is a precursor for
technological advancement. In Kenya, it is also one of the stepping stones to industrial
transformation and Kenya’s Vision 2030. Biology is part of our daily lives, and good
Biology education could help give learners a great foundation for success in life. It could
also help learners develop into more responsible citizens who will help to build a strong
economy, contribute to a healthier environment and bring about a brighter future in the
society.
Teaching method has been singled out as an important factor that determines learning
outcomes (Trumper, 2006). It fosters or hinders learning. The teaching method used therefore
affects achievement, retention and transfer of knowledge.
5
In Kenya, the secondary school Biology curriculum provides for the use of Sequential
Teaching Methods. High achievement, retention and transfer of knowledge in Biology
provides concrete evidence of meaningful learning. This is consistent with the goal in
Biology Education which is to promote the welfare of humankind through application of
knowledge in Biology. The knowledge can be applied only if it is retained and transferred to
different contexts of life. Transfer occurs when a concept learned at one time and place is
applied to another setting. This application goes on in every day life. Transfer is investigated
in this study because it is dependent on the student’s ability to access, connect and retrieve
information retained in the long term memory. The retention of knowledge in turn depends
on its meaningfulness.
Research conducted by Wachanga & Mwangi, (2004) in Kenya to find out effects of various
teaching methods on achievement in science subjects shows that cooperative class
experiment as a teaching method enhances learners’ achievement and motivation in
Chemistry and Agriculture respectively. The findings of another study by Kibett and Kathuri
(2005) involving secondary school students in Nakuru County, showed that learners who
were taught Agriculture using the project method performed better than their counterparts
who were taught using the regular approach, mainly by lecture. In a related study, Orora,
Wachanga and Keraro (2005) found that the cooperative Concept Mapping teaching method
enhanced achievement and motivation in secondary school Biology in Gucha County, Kenya.
Other studies (Johnson, 1991; Odubunmi & Balogun, 1991; Killermann, 1998; Esra, Ijlal and
Ocak, 2009) have been carried out to determine the effectiveness of different methods of
teaching Biology. The findings of these studies show that the methods of laboratory and slide
demonstration are very effective in teaching Biology.
Research done by Esra, Ijilal and Ocak (2009), conducted in Turkey at Arturk University
sought to determine the effect of Sequential Teaching Methods in Biology, on students’
6
achievement and retention. The study aimed at determining the effects of Sequential
Teaching Methods under three teaching modes; lecture, slide demonstration and laboratory
(student experiment) on academic achievement, retention and transfer of knowledge in
Biology by learners.
However, all the aforementioned studies involved a single teaching method except the study
by Esra, Ijilal and Ocak (2009) who used a combination of methods. Their study is in line
with KICD’s suggestion on effective methods of teaching Biology; hence the interest of the
researcher in this study.
A study such as that by Esra, Ijilal and Ocak (2009) had not been done in Kenya. The current
study is a replication of the aforesaid study but with some adjustments. Esra’s study was
quasi- experiment that used only three non-equivalent groups. The present study used four
groups with eight sub-groups as described in section 3.2. In addition, a control group that
was taught using oral-only lecture method was also included. Furthermore, Concept Mapping
was included as a tool to measure transfer of knowledge; this was absent in Esra’s study. The
present study also included transfer of knowledge in Biology as a third variable in addition
to achievement and retention. This study therefore, aimed at finding out the effects of
Sequential Teaching Methods (STM) on secondary school students Biology achievement,
retention and transfer of knowledge in Kenyan National schools.
According to the reports by the Kenya National Examination Council (KNEC 2007-2012) ,
the KCSE mean scores in Biology for the period 2007 to 2010 were as follows: 2007- 44% ;
2008- 30% ; 2009- 27%; 2010- 29%; 2011- 32% and 2012-26%). Accordingly, performance
was influenced by many factors but the magnitude of each factor was not known. This
research sought to put things in perspective instead of speculation.
7
1.2 Statement of the Problem
Despite the government’s effort to review curriculum as well as change the examination
format, students’ performance in the KCSE Biology National examination continues to
decline. Low achievement in Biology at KCSE examinations may imply that the information
given is not sufficiently retained in future years of study and not consequently transferred for
general use in life. Studies by (Wachanga & Mwangi, 2004;Kibet and Kathuri 2005; Orora,
Wachanga and Keraro 2005: Esra, Ijlal and Ocak 2009) have been carried out in Kenya and
elsewhere to compare effects of teaching methods on academic performance. These studies
observed that teaching methodology is a crucial factor in determining academic performance
of students. Mills (1991), observes that the teaching methodology is a crucial factor that
affects academic achievement of students. Esra, Ijlal and Ocak (2009) suggested that the
sequence of teaching methods affected performance. The Kenya 8-4-4 Biolgy syllabus
recommends use of STM; this has six possible combinations of sequences-
LDE,LED,ELD,DLE and DEL. Information based on empirical studies on whether the STM
was effective, and which sequence had greatest effect on academic perfomance in Biology in
the Kenyn context was lacking. The determination of the best sequence was also important.
However, a study on STM based on Kenyan conditions had not been conducted. The study
therefore sought to address the problem of determining whether STM was an effective
method of teaching Biology, and identifying the best sequence on achievement retention and
transfer of knowledge.
1.3 Purpose of the Study
The purpose of the study was to determine which sequence (pattern) of the three Sequential
Teaching Methods (lecture, demonstration and experiment) must take precedence in order to
increase learners’ academic achievement, knowledge retention (remembrance) and
8
knowledge transfer to Concept Maps. As such, the study sought to evaluate differential
effectiveness of three versions of Sequential Teaching Methods namely; ELD, DEL and
LDE.
1.4 Objectives of the Study
The study sought to:
1. Compare the effect of Sequential Teaching Methods on Academic Achievement of
learners taught Biology using different sequences.
2. Compare the retention of Knowledge of learners taught Biology using different
sequences of Sequential Teaching Methods.
3. Compare the transfer of knowledge to Concept Map among learners taught Biology
using different sequences of Sequential Teaching Methods.
4. To establish which sequence among the sequential teaching methods had greatest effect
on achievement retention and transfer of knowledge in Biology
1.5 Hypotheses of the Study
The following null hypotheses were tested:
Ho1 There is no difference in learners achievement in Biology when they are exposed to
different sequences of teaching methods.
Ho2 There is no difference in retention of knowledge in Biology when learners are
exposed to different sequences of teaching methods.
Ho3 There is no difference in transfer of knowledge in Biology when learners are taught
using different sequences of teaching methods.

9
Ho4 There is no difference in effect of sequence used on learners’ achievement, retention
and transfer of knowledge in Biology
1.6 Significance of the Study
Kenya’s Biology syllabus suggests use of STM in all the four broad areas of Biology:-
Anatomy, Physiology Morphology and Histology. The findings of this study should inform
Curriculum developers and teachers in choosing the most appropriate teaching sequence for
Biology. In addition, the findings should also inform teachers to arrange lessons such that
sequences that yield highest achievement are followed. Policy makers and Quality Assurance
personnel could use the findings to enforce policy on Sequential Teaching Methods.
Furthermore, literature on transfer of knowledge in Biology is very scanty. The findings of
this study, besides contributing to existing knowledge should contribute immensely to
literature.
1.7 Scope and Limitations of the Study
1.7.1 Scope of the Study
The study involved eight National schools selected across the country, out of the 18 Old
Category National schools established in the pre and post colonial era, and upgraded to
national status between 1960s and 1980s. The scientific scope of the study was confined to
the secondary school Biology curriculum implementation. Focus was on the effectiveness of
methodology. The main idea was to find out the most appropriate sequence of teaching
methods that could help learners to improve in achievement, retention and transfer of
knowledge in Biology.
10
1.7.2. Limitations of the Study
The schools that were involved in the study were those endowed with resources that could
support STMA. As such the results obtained are only generalisable to schools of similar
status. Only three sequences out of the six possible options of STM were used since the
current study was a replication of Esra, Ijilal and Ocak (2009) study that focussed on ELD,
LDE and DEL. The study was also limited to the area of Physiology and excluded other
broad areas of Biology namely:- Anatomy, Morphology and Histology.
1.8 Assumptions of the Study
The study was based on the following assumptions:-
The non-scientific assumptions were:
(1) That the main cause of poor academic results (failure) was the quality of instruction as
opposed to students inability to learn.
(2) That since National schools were subjected to a common admission criterion, all the
four groups and eight (8) sub-groups of students from the eight different schools were of
similar learning ability.
(3) That the gender of the teacher did not affect achievement.
While the Scientific assumptions were:
(4) Each sample was drawn from a normal population.
(5) Each population had same variance
(6) All variables other than those tested were effectively controlled hence absence of other
factors that could affect the conclusion.
11
1.9 Theoretical and Conceptual Framework
The theoretical framework provided the foundation on which the study was based, while the
conceptual framework presented an elaborate network of associations among the relevant
variables of the study.
1.9.1 Theoretical Framework
The study was guided by two theories: [1] the General Systems Theory proposed by
Bertalanfty (1968). Noting that a system is an interrelationship of various elements which
work in unison to achieve a designated goal, each element or variable in the system has its
own specific roles to perform. In addition to the elements and goals, a system also has to
work in harmony so as to give the expected feedback at the end of the process. This is
applicable in the teaching- learning situation. Based on the General Systems Theory , the
teaching in Biology involves elements that include the teacher, learners, teaching-learning
process, teaching- learning resources and physical facilities such as the classroom. The
current study involves independent, dependent and extrenous variables. All these variables
must interact with each other in order to move the system from an input condition of original
or entry behaviour to an output condition of modified behaviour. The expected modified
behaviour, for instance higher achievement, retention and transfer of knowledge serve as the
goal of the system whereas actual achievement serve as feedback of the teaching process.
The desired goals have to be achieved however, feed back could be positive or negative
performance. The quality of feedback is therefore determined by the quality of interaction
among the elements or variables hence the need for harmony. The General Systems Theory
guided the conceptual framework.
[2] The Cognitive Load Theory of learning proposed by Sweller (1994). According to this
theory the working memory is finite and has limited capacity. The information recieved

12
through the auditory channel gets direct access to the working memory thus clogging it. This
affects information processing.
The treatment given to the learners in the study was based on this theory, the human working
memory has a threshold of 4 to 10 elements making some material difficult to learn. Sweller
(1994), provided evidence that the cognitive load of some learning material can be greatly
reduced if the information is presented pictorially or otherwise as in the case of lecture and
slide demonstration.
1.9.2 Conceptual Framework
Several factors or variables interact and affect learning. The variables could be categorised
as extraneous, independent and dependent. These variables and their interactions constitute
the conceptual model of this study.The conceptual framework that guided this study is based
on the General Systems Theory. Accordingly, the teaching and learning process has inputs
and outputs. Therefore, in order to achieve good academic results, the input should have
appropriate instructional methods. Damico and Roth (1994) noted that quality education is
defined in terms of output such as the number of students passing an important national
examination. Thus a school of students with low achievement scores is said to be of low
quality or non-performing. However, Fowler (1995) observed that “a diagnosis of school
quality problem that focuses on outputs such as student performance fails to inform about the
antecedent causes such as teaching methods.
Arguably, learning outcomes are influenced by several factors. In the sudy, these included
both learner and teacher characteristics which, and constituted extraneous variables that had
to be controlled. As explication, the learners’ age determines what they are to be taught.
Teacher’s qualifications and training on the other hand determine the instructional approach
that a teacher would prefer to use more often and how effective the teacher would use the
13
approach. Gender of learners was an extraneous variable which could not be controlled but
whose effect could also not be ignored.
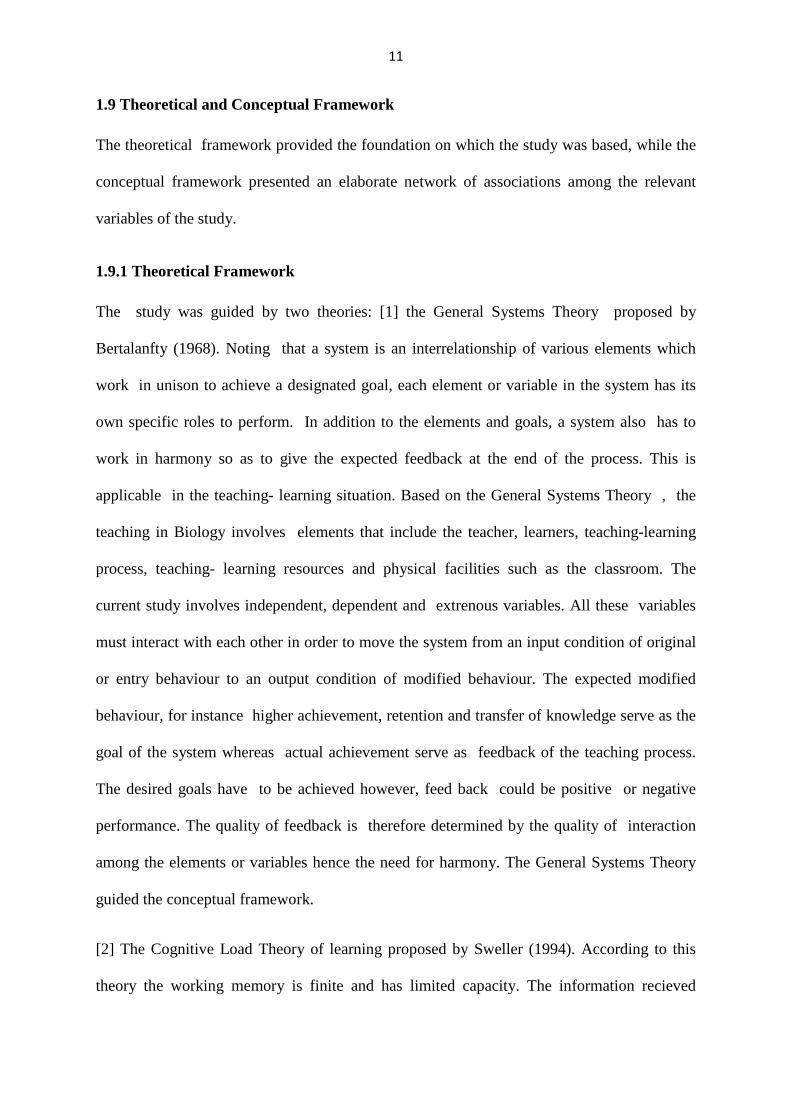
The conceptual framework shows the relationship of variables for determining the effects of
using sequential teaching methods on secondary school students’ achievement, retention and
transfer in Biology knowledge.The framework is represented diagrammatically in Figure 1.
Figure 1: The Conceptual Framework
1.10 Operational Definition of Terms
Achievement in Biology means the score (marks) that learners obtained on Biology
Achievement Test (BAT) Post-Test (refer to Appendix II).
Concept Map: Is a graphical representation of the relationship between various concepts as
contained in the mental structure of the learner. For purposes of this study, Concept Map
means the research instrument that was used as an assessment tool. It was used to assess
transfer of knowledge originally learned via Sequential Teaching Methods to the new context
of Concept Mapping (see Appendix IV).
Extraneous variables
• Age of learners • Gender of learners • Teacher Qualifications • In service Training of
teachers (SMASSE)
Dependent variable s
• Achievement in Biology (score on BAT)
• Retention in
Biology (Score on BKRT).
• Transfer of Knowledge In Biology (score on Concept Maps)
Independent variables
• Sequential Teaching Methods
o ELD
o LDE
o DEL
Variables
Variables
Variables

14
Laboratory work , also referred to as students’ experiment, is the method whereby the
teacher provided learners with resource materials so that they could manipulate to observe
enzyme activity. Learners performed experiments to examine catalytic features of enzymes,
factors and relation between substrate and enzymes.
Lecture Method means an oral presentation that was given to a class by the teacher and did
not involve manipulative work. This was used to teach the relevant theory of enzyme action.
National Schools refer to those government funded schools that admit students with highest
scores at Kenya Certificate of Primary Education (KCPE) examination. The schools are
equipped with adequate and standard physical facilities for teaching, learning and boarding.
Selection of students to such schools is done on merit by the Form One Selection Committee
of the Ministry of Education Science and Technology (MoEST). They accommondate
students from all districts of the Republic of Kenya. The School performance index at the
Kenya Certificate of Secondary Education (KCSE) examination must always be greater than
six on a scale whose maximum is twelve.
Old category of National Schools refer to the oldest, historic and prestigious schools that
were established in the pre and post colonial era and were given national status between
1960s and 1980s . Some of these schools were owned by independent churches but not
adequately funded yet, demand for them was high. The teachers were well trained, qualified,
competent and held in high esteem.They were eighteen in number and all are endowed with
adequate teaching and learning resources (refer to Appendix VII).They admitted good
performers in the KCPE examinations, from all the districts of the Republic of Kenya. They
have a small teacher: student ratio and are usually headed by a Chief Principal or Senior
Principal. Their class size ranges from 35 to 45 students.
15
New category National schools refer to those which were upgraded from provincial status
to national status in 2012.This category comprises of 72 schools.
Retention in Biology means the score obtained on the Biology Knowledge Retention Test
(BKRT) see Appendix III.
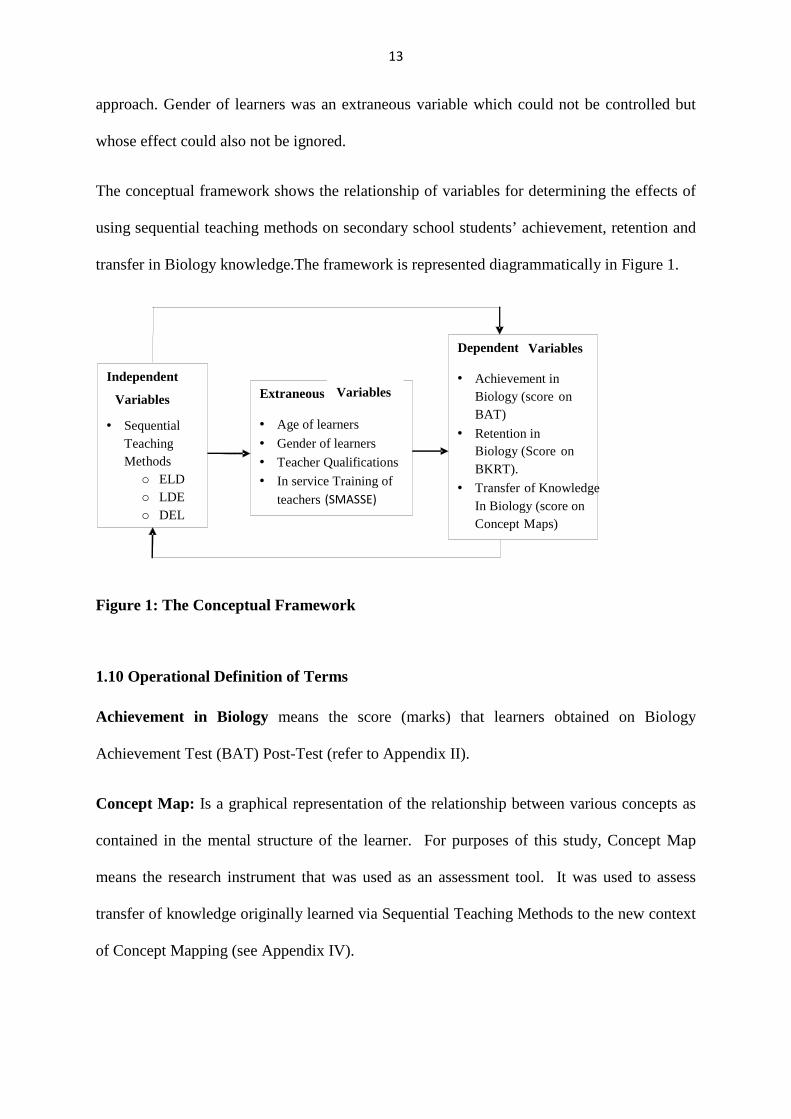
Sequential Teaching Methods refers to an umbrella term that embodies a specific pattern of
different methods that were used one after another in teaching the specified topic. In this
study, sequential teaching methods meant the following three patterns:
Figure 2: Patterns of Sequential Teaching Methods (STM)
Slide demonstration method is where the teacher showed slides and explained to the class
about the structure and function of enzymes using a prepared Power-Point teaching tool in
Microsoft Office software or via overhead projection.
Transfer in this study means the score obtained on the Concept Map constructed by each
learner (see Appendix IV).
Transfer Test: Means the assessment of learner’s knowledge that involved drawing of
Concept Maps using the concepts that had been learned through the Sequential Teaching
Methods (STM).
Transfer of Knowledge: Means utilising the concepts previously learned via Sequential
Teaching Methods to a new context namely Concept Mapping. Whereby, Concept Maps
were constructed by the learners.
Experiment Lecture Demonstration (ELD)
Lecture Demonstration Experiment (LDE)
Demonstration Experiment Lecture (DEL)
16
CHAPTER TWO
LITERATURE REVIEW
2.0 Introduction
This chapter reviews literature on methods of teaching Biology, focusing on pedagogical
parameters based on selected theories of teaching and learning. It also analyses literature on
Sequential Teaching Methods in relation to achievement, retention and transfer of
knowledge. It finally presents findings of previous empirical studies on Concept Mapping in
Biology and ends with a brief summary.
2.1 Teaching Methods and Achievement
Educationists all over the world are struggling to develop effective teaching and learning
approaches (Borich, 2004). According to Blisset and Atkins (1993), decisions should be
made when choosing teaching strategies that are appropriate to the learning styles. In order to
enhance teaching and learning, teachers in Biology are encouraged to use a variety of
methods and strategies (KIE, 2006). In addition, these methods and strategies should be used
effectively so as to optimise the attainment of instructional objectives (Kithaka, 2003).
However, a study by the SMASSE Biology team in Kenya, aimed at identifying the needs in
Biology Education at Secondary school revealed that teaching was largely expository, using
the lecture method (Njuguna,1998). It was therefore a worthwhile effort to extend the search
for more effective combinations of teaching methods for Biology through this current study.
The researcher sought to know, understand and prescribe Biology teaching methods that
would be effective so as to inform the pedagogical practices in secondary schools.
The teaching methods commonly used in secondary schools in Kenya are: lecture method,
Teacher demonstration and laboratory work (student experiments). Despite limited
17
documentation , the effect of teacher demonstration on achievement, retention and transfer of
knowledge are discussed in the subsequent sections.
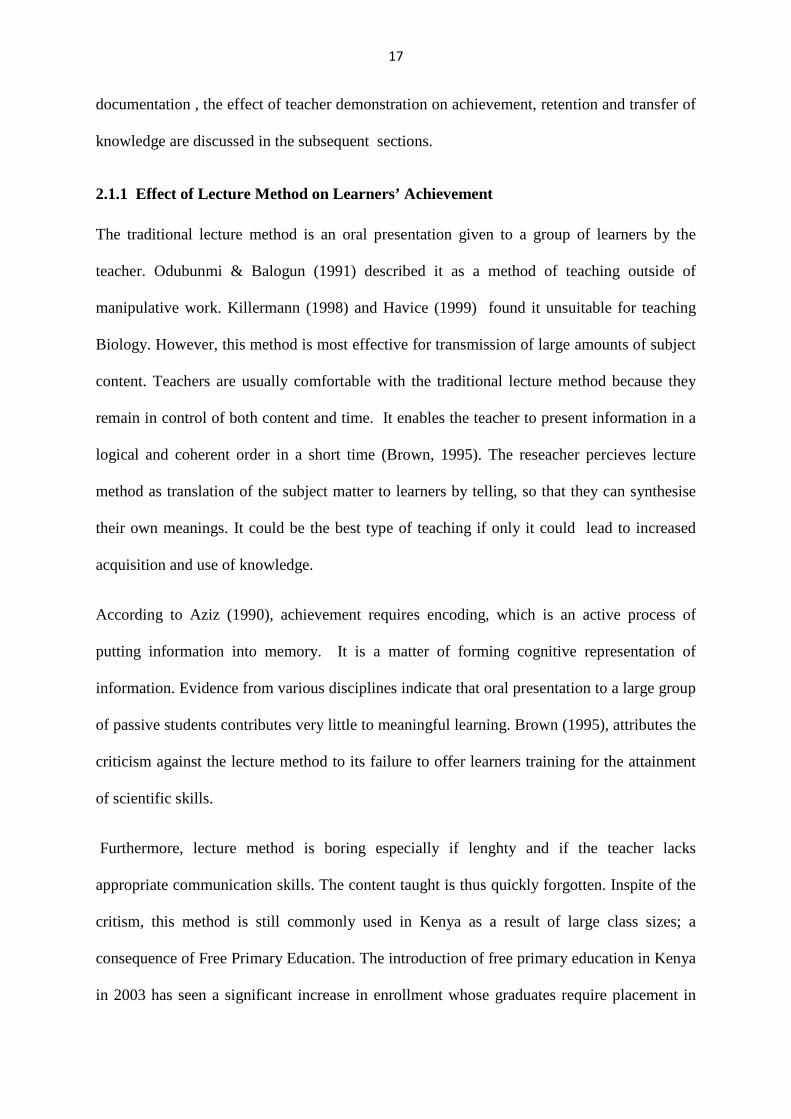
2.1.1 Effect of Lecture Method on Learners’ Achievement
The traditional lecture method is an oral presentation given to a group of learners by the
teacher. Odubunmi & Balogun (1991) described it as a method of teaching outside of
manipulative work. Killermann (1998) and Havice (1999) found it unsuitable for teaching
Biology. However, this method is most effective for transmission of large amounts of subject
content. Teachers are usually comfortable with the traditional lecture method because they
remain in control of both content and time. It enables the teacher to present information in a
logical and coherent order in a short time (Brown, 1995). The reseacher percieves lecture
method as translation of the subject matter to learners by telling, so that they can synthesise
their own meanings. It could be the best type of teaching if only it could lead to increased
acquisition and use of knowledge.
According to Aziz (1990), achievement requires encoding, which is an active process of
putting information into memory. It is a matter of forming cognitive representation of
information. Evidence from various disciplines indicate that oral presentation to a large group
of passive students contributes very little to meaningful learning. Brown (1995), attributes the
criticism against the lecture method to its failure to offer learners training for the attainment
of scientific skills.
Furthermore, lecture method is boring especially if lenghty and if the teacher lacks
appropriate communication skills. The content taught is thus quickly forgotten. Inspite of the
critism, this method is still commonly used in Kenya as a result of large class sizes; a
consequence of Free Primary Education. The introduction of free primary education in Kenya
in 2003 has seen a significant increase in enrollment whose graduates require placement in

18
secondary schools. For instance in National schools where the demand for Form One
vacancies is very high, large class sizes have become a reality. Enrollment in some schools
ranges between 50 and 60 students per class. Large class size could affect the teaching of
science which, should be practical and visual in nature.
In physics, for example Horn ( 1995 ) observed that standard oral-lecture method seldom
helps learners to develop conceptual understanding of fundamental processes in mechanics
and electricity. Similarly, learner’s performance in Chemistry taught only by lecture method
does not correlate with the lecturing skills and experience of the teacher. Despite the
limitations of traditional oral – lecture method, Biology teachers are forced to use it due to
high enrolment rates (Committee on Undergraduate Science Education, 1997). Most teachers
who teach large classes feel that lecturing is the only option. The researcher contends that this
method should not be considered outmoded. It is still a very useful instructional method and
has a specific role in the instructional process. This study sought to shed light on the paradox
of teaching Biology. For example, Havice (1999 ) observed that a lecture is vital for
introducing a lesson, explaining relationships between concepts, giving instructions during
practical work as well as summarising the results of laboratory work. He Further argued that
it was an economic way of transmitting information to a large number of students because it
did not require a lot of facililities.
2.1.2 Effect of Lecture Method on Learners’ Retention of Knowledge
The concept of retention of formally acquired knowledge is just about three decades old and
thus very few empirical studies have been done on it. Bahrick (1984), made the first attempt
and found a positive correlation with the depth of original learning. His study therefore
provided the basis upon which other studies could be carried out.
19
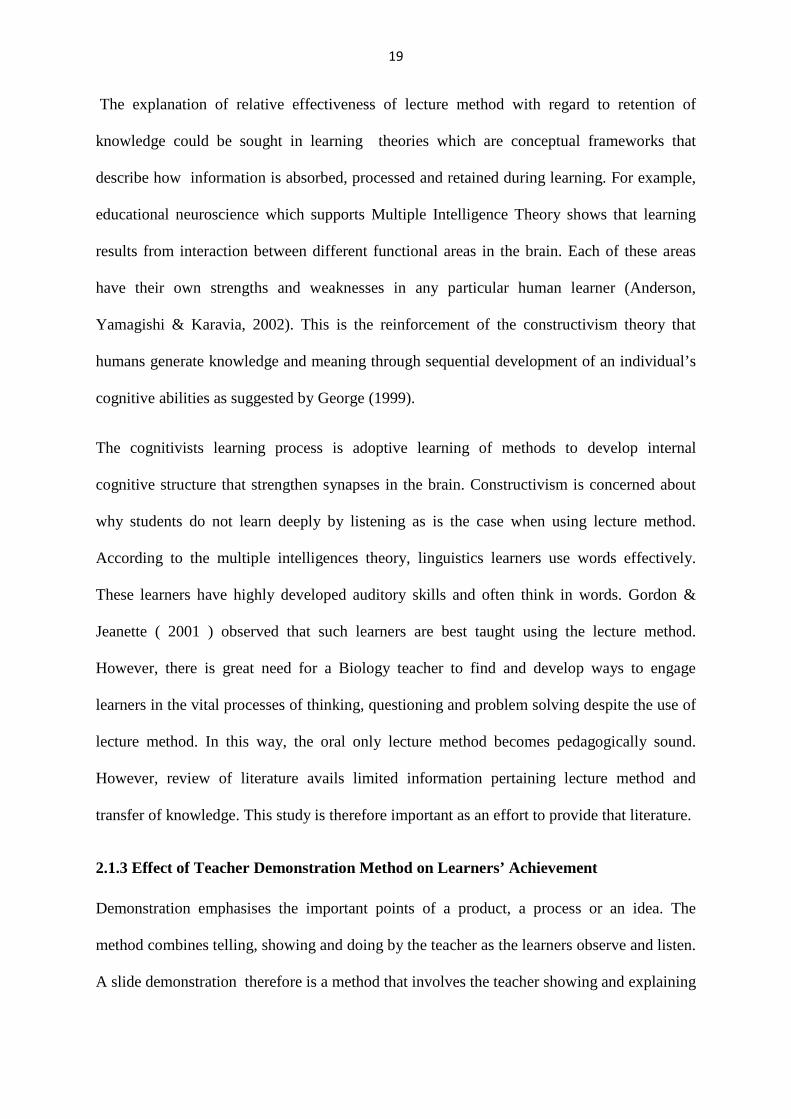
The explanation of relative effectiveness of lecture method with regard to retention of
knowledge could be sought in learning theories which are conceptual frameworks that
describe how information is absorbed, processed and retained during learning. For example,
educational neuroscience which supports Multiple Intelligence Theory shows that learning
results from interaction between different functional areas in the brain. Each of these areas
have their own strengths and weaknesses in any particular human learner (Anderson,
Yamagishi & Karavia, 2002). This is the reinforcement of the constructivism theory that
humans generate knowledge and meaning through sequential development of an individual’s
cognitive abilities as suggested by George (1999).
The cognitivists learning process is adoptive learning of methods to develop internal
cognitive structure that strengthen synapses in the brain. Constructivism is concerned about
why students do not learn deeply by listening as is the case when using lecture method.
According to the multiple intelligences theory, linguistics learners use words effectively.
These learners have highly developed auditory skills and often think in words. Gordon &
Jeanette ( 2001 ) observed that such learners are best taught using the lecture method.
However, there is great need for a Biology teacher to find and develop ways to engage
learners in the vital processes of thinking, questioning and problem solving despite the use of
lecture method. In this way, the oral only lecture method becomes pedagogically sound.
However, review of literature avails limited information pertaining lecture method and
transfer of knowledge. This study is therefore important as an effort to provide that literature.
2.1.3 Effect of Teacher Demonstration Method on Learners’ Achievement
Demonstration emphasises the important points of a product, a process or an idea. The
method combines telling, showing and doing by the teacher as the learners observe and listen.
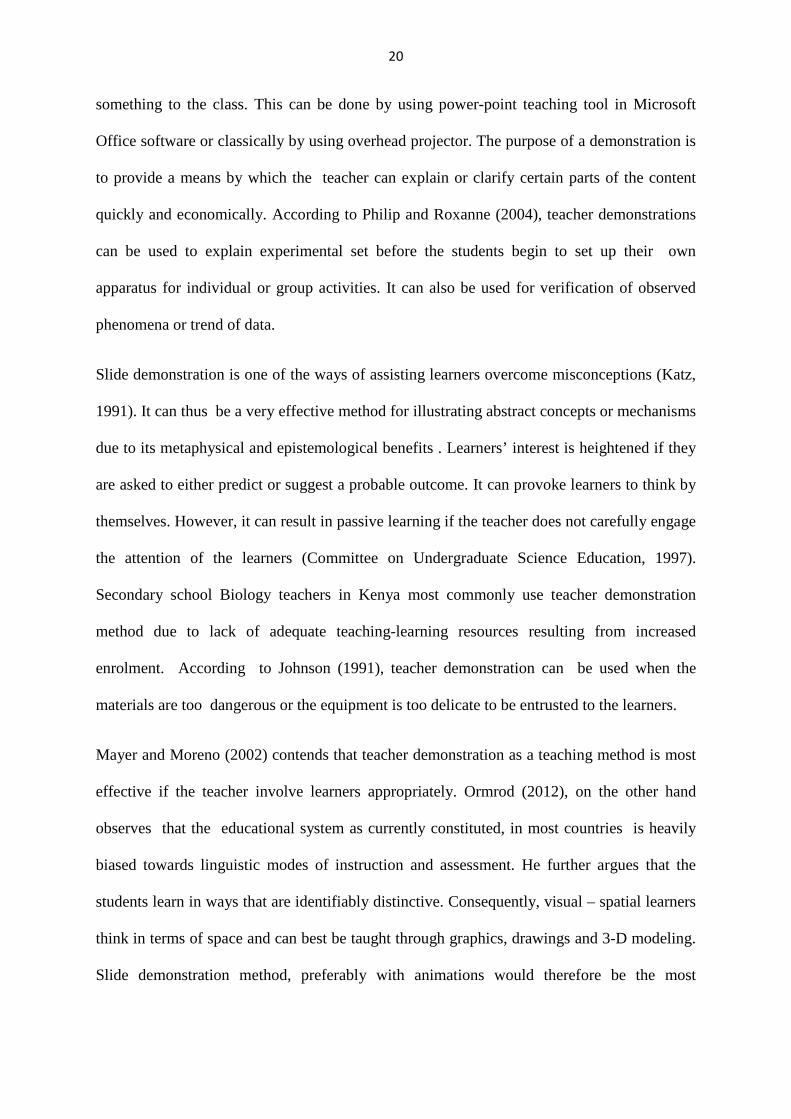
A slide demonstration therefore is a method that involves the teacher showing and explaining
20
something to the class. This can be done by using power-point teaching tool in Microsoft
Office software or classically by using overhead projector. The purpose of a demonstration is
to provide a means by which the teacher can explain or clarify certain parts of the content
quickly and economically. According to Philip and Roxanne (2004), teacher demonstrations
can be used to explain experimental set before the students begin to set up their own
apparatus for individual or group activities. It can also be used for verification of observed
phenomena or trend of data.
Slide demonstration is one of the ways of assisting learners overcome misconceptions (Katz,
1991). It can thus be a very effective method for illustrating abstract concepts or mechanisms
due to its metaphysical and epistemological benefits . Learners’ interest is heightened if they
are asked to either predict or suggest a probable outcome. It can provoke learners to think by
themselves. However, it can result in passive learning if the teacher does not carefully engage
the attention of the learners (Committee on Undergraduate Science Education, 1997).
Secondary school Biology teachers in Kenya most commonly use teacher demonstration
method due to lack of adequate teaching-learning resources resulting from increased
enrolment. According to Johnson (1991), teacher demonstration can be used when the
materials are too dangerous or the equipment is too delicate to be entrusted to the learners.
Mayer and Moreno (2002) contends that teacher demonstration as a teaching method is most
effective if the teacher involve learners appropriately. Ormrod (2012), on the other hand
observes that the educational system as currently constituted, in most countries is heavily
biased towards linguistic modes of instruction and assessment. He further argues that the
students learn in ways that are identifiably distinctive. Consequently, visual – spatial learners
think in terms of space and can best be taught through graphics, drawings and 3-D modeling.
Slide demonstration method, preferably with animations would therefore be the most
21
appropriate teaching method. This view is equally supported by the multiple intelligence
theory of learning and the Philosophical or Meutic theory of teaching.
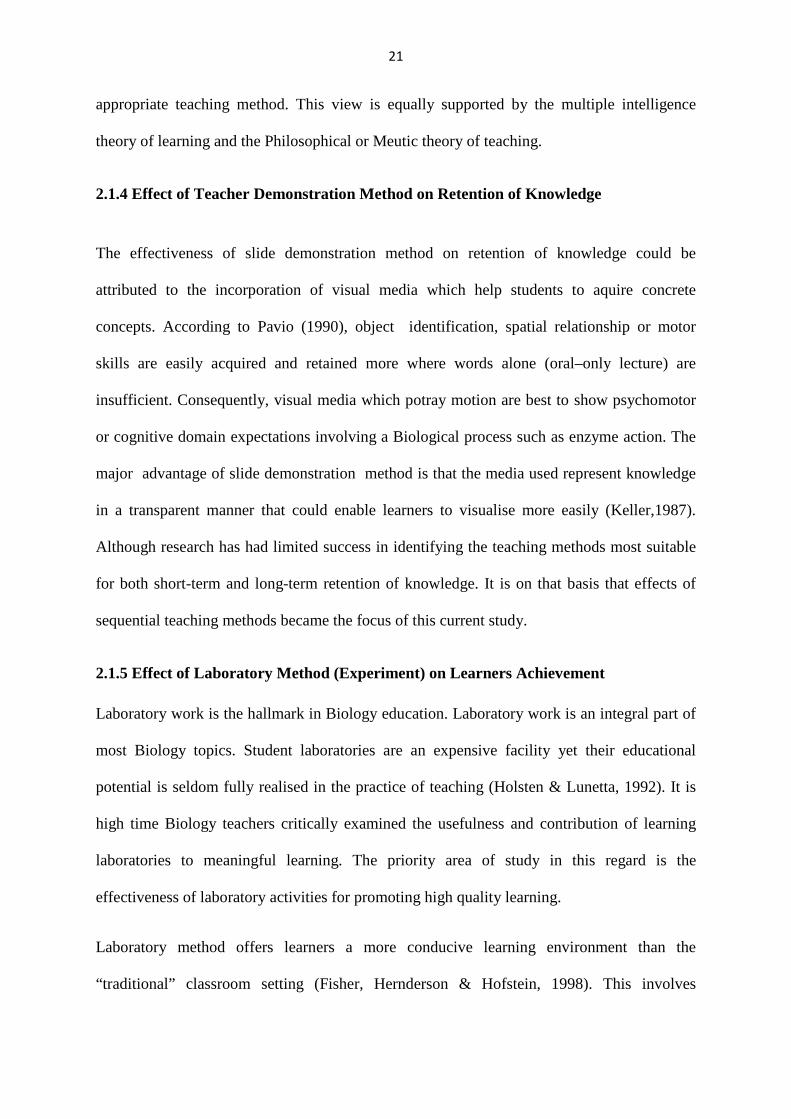
2.1.4 Effect of Teacher Demonstration Method on Retention of Knowledge
The effectiveness of slide demonstration method on retention of knowledge could be
attributed to the incorporation of visual media which help students to aquire concrete
concepts. According to Pavio (1990), object identification, spatial relationship or motor
skills are easily acquired and retained more where words alone (oral–only lecture) are
insufficient. Consequently, visual media which potray motion are best to show psychomotor
or cognitive domain expectations involving a Biological process such as enzyme action. The
major advantage of slide demonstration method is that the media used represent knowledge
in a transparent manner that could enable learners to visualise more easily (Keller,1987).
Although research has had limited success in identifying the teaching methods most suitable
for both short-term and long-term retention of knowledge. It is on that basis that effects of
sequential teaching methods became the focus of this current study.
2.1.5 Effect of Laboratory Method (Experiment) on Learners Achievement
Laboratory work is the hallmark in Biology education. Laboratory work is an integral part of
most Biology topics. Student laboratories are an expensive facility yet their educational
potential is seldom fully realised in the practice of teaching (Holsten & Lunetta, 1992). It is
high time Biology teachers critically examined the usefulness and contribution of learning
laboratories to meaningful learning. The priority area of study in this regard is the
effectiveness of laboratory activities for promoting high quality learning.
Laboratory method offers learners a more conducive learning environment than the
“traditional” classroom setting (Fisher, Hernderson & Hofstein, 1998). This involves
22
teaching/ learning activities conducted by the student under the guidance or supervision of
the teacher (Bennet & Higgins,1996). The teacher provides the students with the materials
and apparatus as well as the instructions to be followed in perfoming the activities. Students
work either singly or in groups. According to Hohn (1995), two basic skills are required in
order for students to carry out practical work safely and successfully. They include ability to
make accurate observations and correct use of equipment and apparatus. He further suggested
that meaningful practical work requires the following : preparation before the practical lesson
commence, rehearsal with materials to ensure they will yield expected results, clarity of
instructions by employing simple and clear language. Other requirements include effective
guidance and supervision by the teacher and cautioning learners on any precautionary
measures to ensure safety.
Finally, the teacher is expected to establish a link between the practical exercise and the
theoretical concepts in focus. A study by Opara (2011), showed that laboratory method has a
significant effect on learners’ achievement in Biology. In addition, the study also revealed
that learners who are taught using laboratory teaching method in well equiped schools had
higher rates of achievement in Biology compared to those schooling in less equipped
schools. This finding agrees with that of Njogu (2004) that schools record low achievement
due to lack of science laboratories. However, even when labaratories are available in schools,
teachers still find challenges in using them due to inadequacy of equipment, which limits
practical work (Holstein & Lunetta,1982; Johnson,1991; Fisher, Harrison, Hernderson and
Hofstein, 1998). Nonetheless the challenges of lack of learning resources could be overcome
by improvisation, and should not be used as an excuse.
23
2.1.6 Effect of Laboratory Method on Learners Retention of Knowledge
It is difficult to imagine learning Biology without doing laboratory or fieldwork. Student
experimentation underlies all scientific knowledge and understanding (Fisher, Harrison,
Hernderson & Hofstaein; 1998). This method provides learners with opportunities to think
about, exchange ideas and solve real life problems. Thus, this provides enough evidence that
knowledge was retained. Designing a laboratory experiment requires much skill, creativity
and hard work. Learners acquire such scientific attitude when teachers use this method. In
fact no Biology can be properly taught without use of student experiments. This method
should therefore be the central part in Biology teaching since it helps learners to find
relationships among concepts and to verify hypotheses.
However, the Kenya secondary school Biology syllabus emphasises use of a variety of
teaching methods. A combination of several methods for a particular topic is thus
recommended hence need for sequential teaching methods. As in other disciplines, the
effectiveness of a Biology lesson is dependent on the teaching method used. A combination
of teaching methods may be used together for offering a topic. It is on that premise that the
current study was carried out. Findings of previous research on effects of sequential teaching
methods on achievement and retention in Biology are discussed in the subsequent
subsections.
2.1.7 Effect of STM on Achievement and Retention in Biology
Previous research by Semb and Ellis (1994), Esra, Ijlal and Ocak (2009) defined a number of
variables which affect achievement and retention of knowledge as described in subsequent
text. According to Semb and Ellis (1994), these include the amount of original learning and
the instructional strategies used. Results of a study done by Esra, Ijlal and Ocak (2009) in

24
Turkey showed that academic achievement for the groups that began with experiment or slide
demonstration was higher than group beginning with lecture method. The effectiveness of
laboratory (student) experiment or slide demonstration at the commencement of the lesson
supports the idea that the lesson attracts the attention and thus increases the motivation of the
learners. On the other hand, using oral-only lecture increases boredom in learners and makes
them lose attention during the lesson. This sentiment agrees with the findings of Odubunmi
and Balogun (1991) and Gentry (1994). A possible explanation for the scenario is that a
visual material supplies comprehension that words alone cannot express and thus makes
learners to remember the contents of learning easily. The learners also have more time and
opportunities for hands-on-experience and development of teamwork spirit.
The findings of the study by Esra, Ijlal and Ocak (2009) revealed that retention
(remembrance) level for groups that began lessons with experiment or slide demonstration
was higher than that of the group which began with lecture. This result also agrees with the
findings of previous researches ( Chandler & Sweller, 1991; Bransford, Brown &Cocking,
1999) which show that; people remember 10% of what they read, 20% of what they hear,
30% of what they see and 90% of what they have hands-on experience. Likewise, the study
conducted by Esra, Ijal and Ocak (2009) also revealed that learners’ comprehension is
enhanced when lessons begin with experiment since practical activities increase learners
interest in the topic. These results could be adapted to any other teaching cases elsewhere in
the world.
2.1.8 Effects of STM on Learners’ Transfer of Knowledge in Biology
Transfer of knowledge means the influence of prior learning (retained until the present) upon
the learning of, or response to new material (Mc George, 1942). Transfer, therefore, has
enormous practical implications for education in schools. Despite its importance, it is
25
disappointing that the progress made towards understanding of knowledge transfer is not
commensurate with the amount of research that has been done on the phenomenon for a good
recent review (Barwett & Ceci, 2002). One factor that hinders progress in this aspect of
transfer of knowledge is the traditional approach to the study. Studies on transfer of
knowledge (Barwett & Ceci, 2002), focus mainly on the similarities and differences between
the contexts of initial learning and subsequent transfer. This was an indication for need of not
only further studies in the area, but also a more non -traditional approach to studies.
Furthermore, a related previous study by Esra, Ijilal and Ocak (2009), focused on university
students, and on achievement and retention based on recall and recognition of knowledge.
The study did not consider the structure of knowledge, depth of understanding and conceptual
relationships . This suggested need to conduct a smilar study but focusing on a lower tier of
education and consideration of other aspects of learning, hence adaptation of the earlier
related study. Esra, Ijilal and Ocak (2009) did not investigate transfer of knowledge, hence
the need to use Concept Maps in addressing the issue of transfer of knowledge.
2.1.9 Effect of Concept Mapping on Learners’ Transfer of Knowledge
As a result of too much emphasis on the transfer context as a limiting factor, relatively few
studies take the alternative approach of exploring how the conditions of initial learning can be
arranged to better promote transfer to many different possible contexts. If initial learning
produces better retention of information and numerous retrieval routes to access that
information, it should increase the possibility of a match between the cues given in the
transfer task and the store memory trace. Studies on Concept Mapping indicate that it is one
of the suitable strategies that can be used to break away from traditional approach of studying
transfer of knowledge as it provides many retrieval routes. Transfer of knowledge is based
26
on the finding that Concept Mapping is an appropriate knowledge evaluation tool (Rice, Ryan
& Samson, 1998).
Concept Maps have been used successfully to promote meaningful learning and effective
teaching and are helpful in representing qualitative aspects of students’ learning
(Derbentseva, Safayeni & Canas, 2006). The whole idea of Concept Mapping is based on the
assertion that human beings are meaning makers and thus the human brain endeavors to
construct order from apparent chaos (Edwards & Fraser, 1983).
Canas and Novak (2006), described a Concept Map as a visual, structured representation of
concepts and their interrelationships. They further described Concept Mapping as the process
that involves identification of concepts contained in study materials and the organization of
those concepts into hierarchical arrangements from the most general, most inclusive to the
least general, most specific. Edmonson (2000), noted that the key concepts in a Concept Map
are linked with lines bearing propositions (logical connectives).
Briggs, Shamma, Canas, Carf, Scarge and Novak (2004) proposed that the concepts be
represented using colour coding and various shapes of concept boxes for different concept
types.Concept Maps provide teachers with an avenue for developing insight into students’
understanding. The researcher contends that this is evidenced by well-organised and richly
elaborated knowledge structures, valid propositional relationships and interrelationships. The
Concept Maps also help to identify errors, omissions or misconceptions.
Briggs et al. (2004) showed that simple Concept Maps consists of two or three concepts
linked by propositions. Cana and Novak. (2005), further proposed the following pedagogical
aspects could benefit from application of Concept Mapping: advanced organising of learners’
thoughts at the start of a subject topic, planning and consequent delivery of the lesson,
27
summarising contents of the topic so as to help learners revise and lastly, assessment of
students achievement.
Semra, Caren and Omer (2001) acknowledge that the way the course content in Biology
subject taught in schools is presented, gives the impression that each topic consists of a series
of separate chunks of information. This impression clutters the content or the subject matter.
Students fail to make clear links between related or associated concepts. The researcher
alludes to the idea that among the many concerns teachers in Biology are left to grapple with
are the following: First, the best way to convey the many concepts that are taught in Biology
so that all learners can retain and use the information. Second, presentation in Biology
content so that concepts are interconnected to build upon each other. And lastly, making
Biology content to be meaningful and relevant to the learners.
Laver and Wenger (1990) formulated the Situated Learning Theory in which they urgued
that learning as it naturally occurs is a function of activity, context and culture in which it
takes place. Supported by the contextual learning theory, learning occurs only when learners
process new information using their own frame of reference, experiences, and responses in a
way that makes sense to them. Accordingly, teachers should prepare learning experiences that
relate subject matter content to real-world situations. They should aim to motivate learners to
make connections between knowledge and its applications to the learners’ lives. Biology
should therefore be taught and learned in the context of daily life, technology, community, or
society. Concepts could be easily internalised through the use of Concept Mapping technique.
The researcher asserts that the burden then rests on the teachers to highlight links in the
development of their work, so students can appreciate, Biology as an interconnected body of
knowledge. This approach adopts the belief that true knowledge and understanding can be
developed in the learner and by the learner, through the transformation of fragmented,

28
compartmentalised bits of knowledge into knowledge of personalized meaning (Bransford,
Brown & Cocking, 1999). They further suggest that the student is required to make conscious
effort to identify the key concepts in new knowledge and relate these key concept to concepts
in his/her existing knowledge structure.
It can be deduced from the aforementioned literature that Concept Mapping as a learning
strategy requires learners to organise a set of related concepts that make up the content of a
lesson. A Concept Map shows the relationships between concepts including bi-directional
ones. Usually, a Concept Map is divided into nodes and links. Nodes (often circles or boxes)
represent key concepts; links (lines) represent relationships (propositions) between concepts
(Vitale and Romance 2000). The link is represented by an arrow, which indicates the
direction of the relationships. Words are used to label the links in order to depict more
explicitly the relationships. The relationship is written on the line.
Concept Mapping is therefore a highly flexible tool that can be adopted for use by almost any
group of learners. Where possible, the concepts are anchored with specific examples. While
each concept can only appear in one place on the map, it may be linked to any number of
others. Briggs et al (2004) observed changes in students’ maps which showed that cognitive
structures are in a continual state of flux in an active learner. A Concept Map therefore has a
‘limited shelf life’, after which it is simply an historical record. The active use of Concept
Maps could be applied to any of four stages of the teaching/learning process: Planning and
preparation; Formative learning; Revision/summarising; Assessment. They are all discussed
in the section that follow with an exception of the first one.
Edmodson (2000) suggested adoption of the following steps in the construction of Concept
Maps:
1) Select about 12 concepts from the biology content material being considered.

29
2) Write each concept on a separate note card. Lay these cards down on a large sheet of
paper.
3) Select a super ordinate (most general) concept to be placed at the top of the map.
4) Arrange the other concepts in a distinct hierarchy under the super ordinate concept
5) Once the concepts have been arranged, draw lines between related concepts and label
each linking line with words that characterise the relationship between those concepts.
6) If you wish to cross-link two concepts in different branches of your map, use a dashed
line and label their relationship by writing on the linking line.
7) Examples, if they are to be given, should be connected to their source concepts by an
e.g. labeled linking line.
It was therefore a worthwhile idea for students to master the skill of Concept Mapping so that
they could use it as described in the text that follow.
2.1.9.1 Concept Mapping and Formative Learning
A Study by Namasaka, Mondoh and Keraro (2013) showed that Concept Mapping helps
students to gain more unified understanding of a topic and organise their knowledge
evidenced by enhanced achievement and motivation in Biology. For ‘holists’, who have a
global approach, Concept Mapping helps the learners to focus on critical details, whereas,
‘serialists’ can be stimulated to take a wider perspective of the subject matter. However, Rice,
and Samson, (1998) reported that students who gain most from Concept Mapping are those
identified as ‘visual-spatial learners’, who excel when provided with visual representations.
Such students reject rote memorisation and have need to see how the parts relate to the whole
before they can make sense of the isolated ideas typically presented in Biology lessons. This
suggests that for teachers to optimise the benefits of Concept Mapping for their students, they
first need to be familiar with the students’ prior knowledge and current learning strategies and
30
styles (Bareholz & Tamir, 1992). This was implicit in the use of the concept map as a tool to
measure transfer of knowledge; an indication of meaningful learning.
2.1.9.2 Concept Mapping and Revision
Anderson and Huang (1989) affirmed that Concept Maps are excellent summary/revision
tools in which large amounts of information are condensed. The creation of such a map
stretches the students’ mind thus deepening and broadening their understanding of the subject
matter. Students are enabled to revise actively. Anderson and Huang (1989), further argue
that revision by reading through the notes leaves no evidence of the effort that has been made
by the learners. With students producing a revision Concept Map to be handed in, the teacher
gets much more information about each of his/her students’ performance than would be
gained from a test mark alone (Rice & Samson, 1998). Like all teaching and learning tools,
Concept Mapping is not a panacea; it will not suit all learners or all learning situations. The
researcher therefore, agrees that there are some challenges and /or short comings teachers and
learners face while using Concept Mapping. However, concept mapping was not used as a
learning tool for treatment in this study.
2.1.9.3 Concept Mapping for Assessment
According to Rice, Ryan and Samson, (1998), once completed, the Concept Map is a visual
representation of a learner’s cognitive structure. It shows the hierarchies and the
interconnections of concepts learned in a particular lesson. Edmondson (2000), supports the
idea that a more practical way of generating a Concept Map is to write each term on a piece
of paper. The pieces of paper can be rearranged so that when links are drawn the terms are
beautifully laid out. When satisfied with the arrangement, the pieces of paper can be pasted
on a big sheet and the relationship linking the terms are written on the lines connecting them.
31
This means that the map may vary from person to person. More revealing is the nature of the
relationships or links between the concepts defined by each person (Preszler, 2004).
As earlier mentioned, there is no wrong or correct map. There is often more than one
appropriate link between a pair of concepts; the layout can vary considerably. However there
are some criteria and scoring procedures in evaluating Concept Maps.
A number of studies(Leake, Magnitman, Carvalho, & Arguedas 2004) have supported the
use of Concept Maps for summative assessment. They also have suggested evaluating student
maps by reference to a teacher-produced or ‘expert map’. Student maps could then be marked
according to how many of the propositions in his/her are incorporated. This informed the
choice of concept map as a tool for assessment in the current study.
2.2 Learners’ Age and Achievement
Age is also an important variable in pedagogy since it determines the school level as well as
the content that the learner is taught. According to the National research Council (2014)
report, learners age affect teacher-student interactions for example a study of 643 students in
37 secondary school classrooms indicated that the age of the learner is a predictor of teacher-
student conflicts, which in turn affect achievement. The researcher found a direct link
between the academic achievement of adolescent students and their sensitivity to student
needs. The researcher acknowledged the effect of age on acievement and therefore put in
place mechanisms for minimising its effect on the findings. Hence its classification as an
intervening variable.
32
2.3 Gender and Achievement
Wasanga (1997) reported that male students normally show more confidence in learning
science. However, the same study revealed that female students in single sex schools achieve
as well in science subjects. Likewise, research done in 1999 by Forum for African Women
Educationists (FAWE), aimed at improving participation and performance of girls in Science
and Mathematics in primary and secondary schools indicated that the achievement of Kenyan
girls in Science is lower than that of boys. The FAWE (1999) report attributed the gender
disparity in performance to teaching methods in which the environment favoured boys as
opposed to girls. From literature review, it is evident that students’ gender is an important
determinant of achievement. Hence the decision to control its effect in this study.
2.4 Teacher Qualification and Achievement
Allen, Gregory, Mikami, Lun, Hamre and Plianta (2013) confirmed links between teacher
qualifications and students learning achievement. Accordingly the more qualified a teacher is
the more he or she will be effective in providing opportunities for students to learn.
Similarly, a survey by Ohlson (2009) on the effect of teacher quality on students learning
found that achievement of students at schools with highly qualified teachers was higher
compared with schools which had lowly qualified teachers. Cohen, Pickeral and McCloskey
(2009) noted that there is positive teacher-student interaction and increased learner
satisfaction. Additionally, there is focus on learning and high expectations for student
learning. Teacher qualifications and in-service training influence the way teachers structure
the class rooms and lessons in recognition of the students needs. This suggested need to
minimise the effect of this variable on the study findings.

33
2.5 Teachers in-service Training and Achievement
According to Thapa, Cohen, Guffey and Higgins’ (2013) survey, teachers who had
undergone in-service training reported increased tracking of their students’ progress towards
measureable academic goals throughout the year, compared to those who had not taken the
course. They also made effort to set high standards for their students and develop competence
in record keeping on student’s progress.The findings from these researches have important
implications for pedagogical approach to achievement. There is need to take a holistic view,
factoring in a mix of these predictors in order to maximise students achievement. This study
considered inservice training in sampling of teachers.
2.6 Summary
This chapter first covered the Biology teaching methods commonly used in Kenyan
secondary schools. It showed that lecture, teacher demonstration and laboratory or class
experiment are predominantly used. Project work and field trips are also encouraged by the
Kenya Institute of Curriculum Development (KICD) but are rarely used.
Although each one of these methods has own strengths and weaknesses, the theories
reviewed supports their importance and role in the teaching in Biology. KICD emphasises use
of a combination of teaching methods for a single unit or topic in the subject (KIE, 2006).
This however is not always possible due to several constraints that schools face in
implementing the Biology syllabus.
The assumption that use of a combination of teaching methods for a single topic may not
necessarily translate to or imply use of Sequential Teaching Methods (STM). Utilisation of
STM calls for consistent pattern in its application in view of pertinent pedagogical
parameters. There is no literature available that highlights use of STM (LDE, ELD, DEL) in

34
Biology in Kenya. This suggested the need to explore and establish which pattern of the most
commonly used methods would yield highest level of academic performance. The primary
goal of the present research was to determine which pattern of the Sequential Teaching
Method leads to highest achievement, knowledge retention and transfer to Concept Map. A
secondary goal was to explore use of Concept Maps as an assessment tool or method for
transfer of knowledge in Biology.
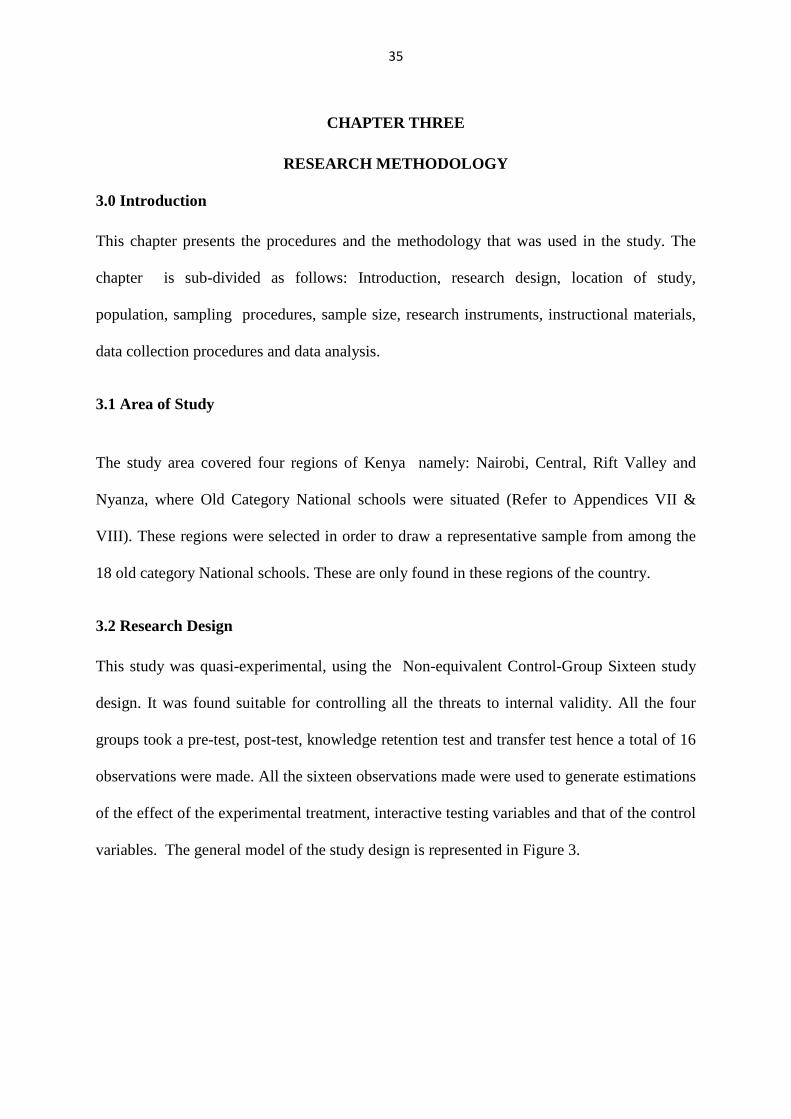
35
CHAPTER THREE
RESEARCH METHODOLOGY
3.0 Introduction
This chapter presents the procedures and the methodology that was used in the study. The
chapter is sub-divided as follows: Introduction, research design, location of study,
population, sampling procedures, sample size, research instruments, instructional materials,
data collection procedures and data analysis.
3.1 Area of Study
The study area covered four regions of Kenya namely: Nairobi, Central, Rift Valley and
Nyanza, where Old Category National schools were situated (Refer to Appendices VII &
VIII). These regions were selected in order to draw a representative sample from among the
18 old category National schools. These are only found in these regions of the country.
3.2 Research Design
This study was quasi-experimental, using the Non-equivalent Control-Group Sixteen study
design. It was found suitable for controlling all the threats to internal validity. All the four
groups took a pre-test, post-test, knowledge retention test and transfer test hence a total of 16
observations were made. All the sixteen observations made were used to generate estimations
of the effect of the experimental treatment, interactive testing variables and that of the control
variables. The general model of the study design is represented in Figure 3.
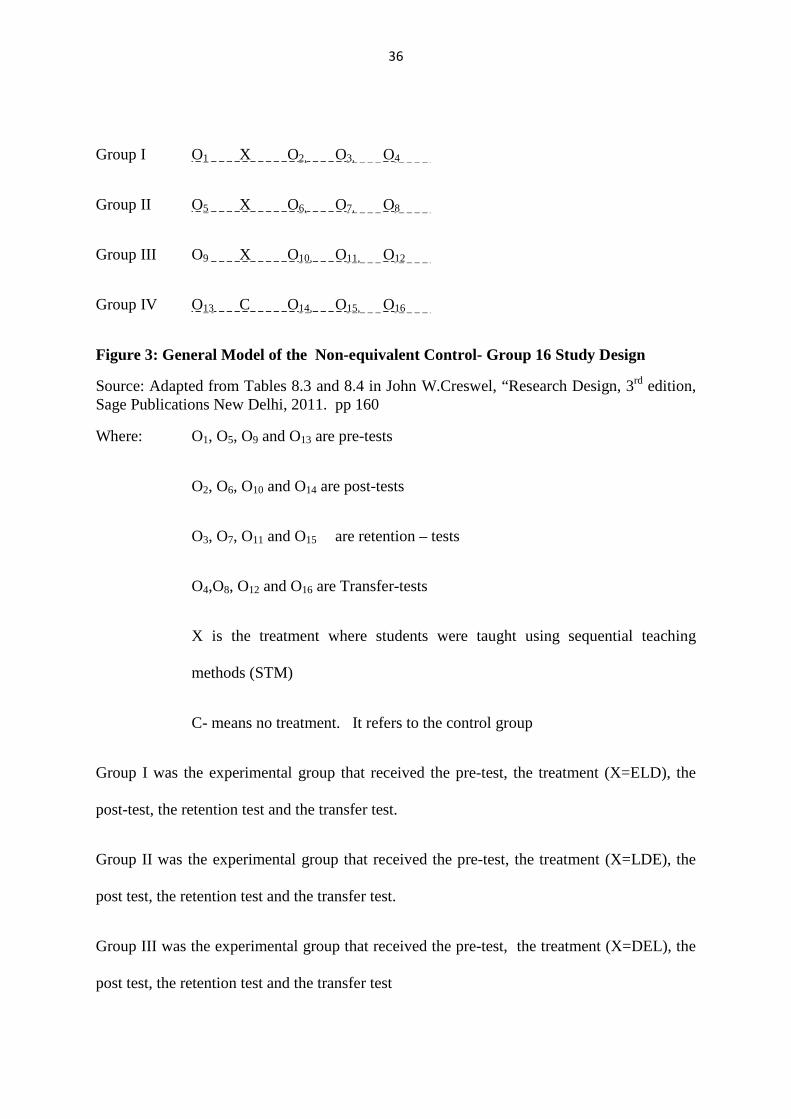
36
Group I O1 X O2, O3, O4
Group II O5 X O6, O7, O8
Group III O9 X O10, O11, O12
Group IV O13 C O14, O15, O16
Figure 3: General Model of the Non-equivalent Control- Group 16 Study Design
Source: Adapted from Tables 8.3 and 8.4 in John W.Creswel, “Research Design, 3rd edition, Sage Publications New Delhi, 2011. pp 160
Where: O1, O5, O9 and O13 are pre-tests
O2, O6, O10 and O14 are post-tests
O3, O7, O11 and O15 are retention – tests
O4,O8, O12 and O16 are Transfer-tests
X is the treatment where students were taught using sequential teaching
methods (STM)
C- means no treatment. It refers to the control group
Group I was the experimental group that received the pre-test, the treatment (X=ELD), the
post-test, the retention test and the transfer test.
Group II was the experimental group that received the pre-test, the treatment (X=LDE), the
post test, the retention test and the transfer test.
Group III was the experimental group that received the pre-test, the treatment (X=DEL), the
post test, the retention test and the transfer test
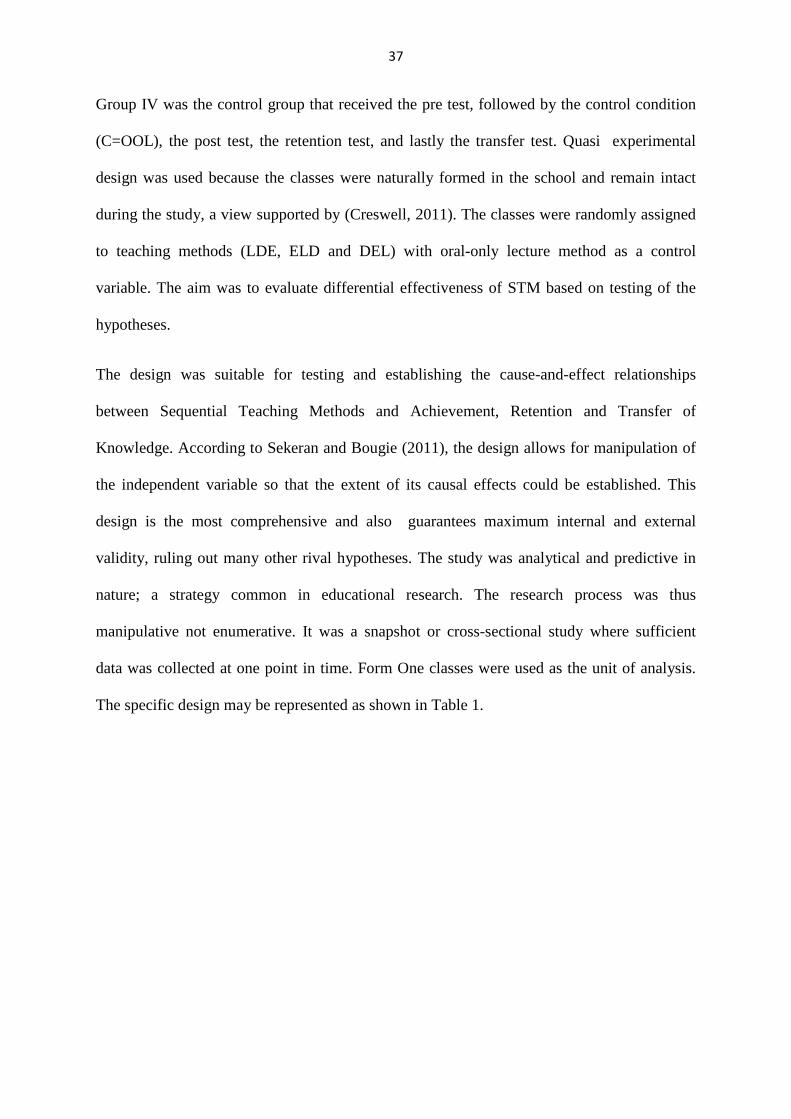
37
Group IV was the control group that received the pre test, followed by the control condition
(C=OOL), the post test, the retention test, and lastly the transfer test. Quasi experimental
design was used because the classes were naturally formed in the school and remain intact
during the study, a view supported by (Creswell, 2011). The classes were randomly assigned
to teaching methods (LDE, ELD and DEL) with oral-only lecture method as a control
variable. The aim was to evaluate differential effectiveness of STM based on testing of the
hypotheses.
The design was suitable for testing and establishing the cause-and-effect relationships
between Sequential Teaching Methods and Achievement, Retention and Transfer of
Knowledge. According to Sekeran and Bougie (2011), the design allows for manipulation of
the independent variable so that the extent of its causal effects could be established. This
design is the most comprehensive and also guarantees maximum internal and external
validity, ruling out many other rival hypotheses. The study was analytical and predictive in
nature; a strategy common in educational research. The research process was thus
manipulative not enumerative. It was a snapshot or cross-sectional study where sufficient
data was collected at one point in time. Form One classes were used as the unit of analysis.
The specific design may be represented as shown in Table 1.
38
Table 1: The Specific Non-equivalent Control-Grp Sixteen Study Design
Exptl- mean experimental
B-mean Boys only School
G-mean Girls only School
Just as in Esra, Ijlal and Ocak (2009) study, the learners in Group I started the topic with an
experiment in the laboratory.This was followed by the relevant theory of enzymes that was
taught through the lecture method. Finally the teachers showed the slides on enzymes
activity to the learners. The sequence of these three methods of teaching was altered in both
group II and III as follows: The lecture method, slide demonstration, experiment for group II
and slide demonstration, experiment and lecture method in group III respectively. In all cases
the lectures and slide demonstration were performed by the teachers. The lecture method
focused on enzyme activity. The students’ experiment was designed for the same reason
(Enzyme activity) and including observation of enzyme catalytic features, co- factors, co-
enzymes and relationship between enzymes and substrates. The experiment was conducted by
the learners under teacher supervision . The slide demonstration method involved use of
Group Treatment Effect
Exptl Group I a.(B)
Exptl Group 1 b.(G)
Experiment; Lecture; Demonstration
Exptl Group II a. (B)
Exptl Group II b. (G)
Lecture; Demonstration;Experiment
Exptl Group III. a. (B)
Exptl Group III b. (G)
Demonstration; Experiment;Lecture
Control group IV.a(B)
Control group IV. b. (G)
Oral-only lecture
Achievement
Retention
Transfer
39
slides on the structure and function of enzymes. The slides too were shown by the
teachers.The study used graduate teachers who had undertaken the Bachelor of Education
Science programme and specificically the Botany/Zoology option. In addition teachers had
undergone the Strengthening of Mathematics and Science in Secondary Education
(SMASSE) training.
3.3 Variables of Study
The independent variables in this study, were the Sequential Teaching Methods: ELD, LDE
and DEL as defined in section 1.10. They were observed and measured using the BAT,
BKRT and Concept Map scores as described in section 3.8.
The dependent variables were learners’ achievement, retention and transfer of knowledge in
Biology as defined in section 1.10. In this study these variables were observed and measured
using scores obtained on BAT, BKRT and Concept Maps as descibed in Section 3.9.
The extraneous variables in this study were the age and gender of the learners, teacher
qualifications and in-service training. These variables were those whose possible effects on
the learning outcomes were controlled. The learners’ age determined the subject topic to be
covered . Teacher’s qualifications and training on the other hand determined the instructional
approach a teacher would prefer to use more often and how effective this would be.
Learners’ age was controlled by using pupils from the same class level; in this case Form
One. This is because the topic selected for the study is offered at Form One level.The topic
was selected because of replicability considerations, and in addition, the KNEC report
(2006), consider enzyme activity to be a difficult topic for learners to conceptualise.
Explicitly, the topic consists of many concepts involving complex relations and interactions.
Representativeness of gender was ensured by having eight sub-groups where half were boys
and the other half were girls. Gender, though an extrenous variable, was investigated since its
40
effect could not be ignored. Single Sex schools were thus used. Teacher qualification as a
variable, was controlled by using teachers who were holders of Bachelor of Education
degree (B Ed. Science Botany-Zoology option) and SMASSE trained.
3.4 Population of the Study
All the learners in secondary schools in the Republic of Kenya constituted the population for
the study. The schools served as sampling units.
3.4.1 Target Population
According to the Ministry of Education, Science and Technology (2014) statistics, there were
approximately 2,514,068 students in 6739 registered secondary schools in Kenya. This was
therefore the target student population.
3.4.2 Accessible Population
The accessible population was approximately 86,400 students. It comprised all the classes in
Form One to Form Four in the 18 Old category National schools. Although the schools are
fairly distributed, some regions of the country had no National schools of the Old Category
(Refer to Table 2). The schools were because they were endowed with teaching–learning
resources that could support the application of STM.

41
Table 2: Regional Distribution of Old Category National Schools
Region
Number of schools Total Boys Girls
Nairobi 4 1 5 Central Kenya 2 4 6 Rift Valley 2 4 6 Nyanza 1 0 1 Western 0 0 0 Eastern 0 0 0 Coast North Eastern
0 0
0 0
0 0
TOTAL 9 9 18
3.5 Sampling Techniques and Sample Size
The researcher used the sampling procedure described in section 3.5.1 to obtain the sample
size for the study.
3.5.1 Sampling Techniques
The types of National Schools in Kenya were grouped into two main categories:
(i.) Old category National schools established between the 1960s and 1980s.These
were 18 in number.
(ii.) New category National schools which were upgraded from provincial status
to national status in 2012.This category comprised of 72 schools.
The schools which were included in the sample were obtained from category (i) above. The
unit of sampling in this study was the secondary school rather than individual students. This
means therefore that each school was considered as one sub-group. The school sample was
drawn through multi-stage sampling, from 18 Old Category National schools situated in
Nairobi, Central Kenya, Rift Valley and Nyanza regions of Kenya. National Schools were
used in the study since they are well endowed with teaching and learning resources and have

42
similar admission criteria. As mentioned in Section 1.10, these schools represent the top
cream of academic power in Kenya.
First, the schools were divided into four clusters according to the regions where they are
located. The 18 National secondary schools were visited to ascertain their suitabilty for the
study. The criteria for suitability included qualifications, training and performance index
(mean score) of subject in Biology for the teachers in the schools. Participating schools from
the four clusters were then selected by purposive sampling after identifying schools
categorised as boys only schools or girls only school. Purposive sampling was used to select
the schools that finally constituted the sample of the study.The schools that were included in
the sample fulfilled the following conditions:
i. Had not taught the topic ‘Enzymes’ within the period scheduled for the study.
ii. Were willing to cooperate with the researcher and support the research work.
iii. Were willing to adhere to the procedure and process related to the use of Sequential
Teaching Methods in their respective schools.
One school from Nairobi region and another from Rift Valley region had covered the topic
halfway and were thus unsuitable for the study. Similarly, one other school from Nairobi
region was excluded from the study because it was uncooperative. The procedure for
selection involved the use of Table of Random Numbers for those that remained on the list
after excluding the ones that were found unsuitable for the study. From the two gender strata,
four boys schools and four girls schools were randomly selected making a total sample of
eight schools.
The regional distribution of selected schools is shown in Table 3
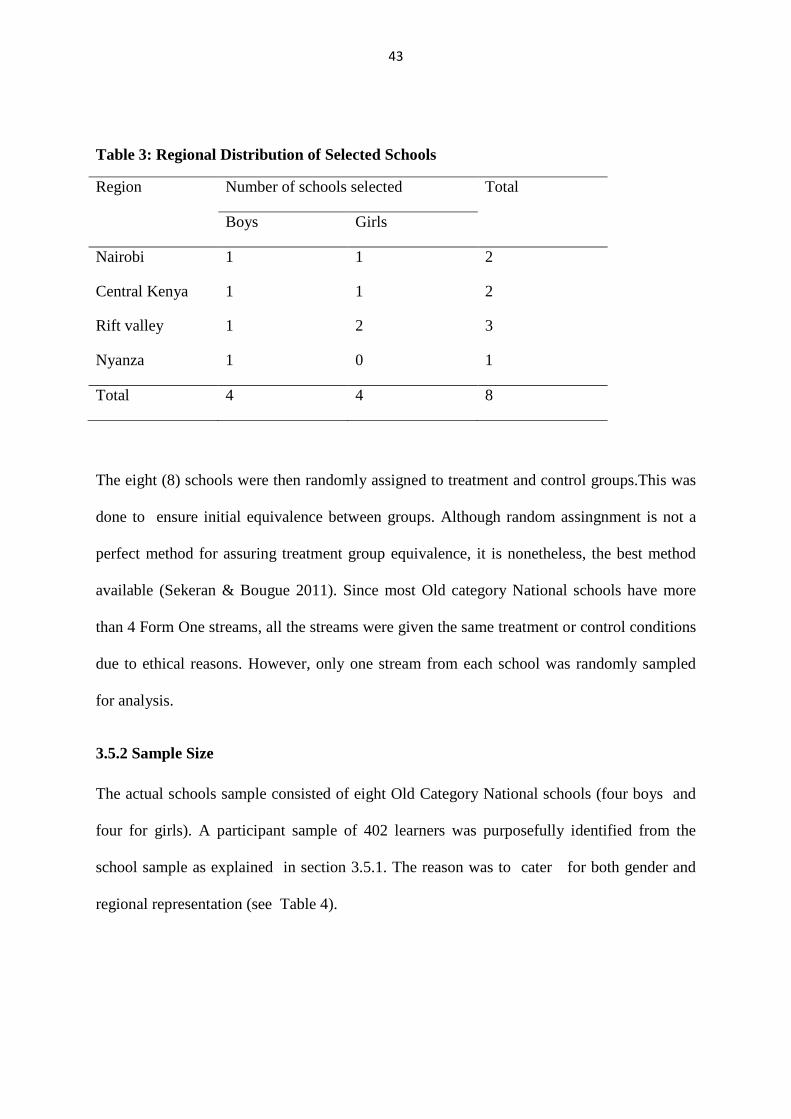
43
Table 3: Regional Distribution of Selected Schools
Region Number of schools selected Total
Boys Girls
Nairobi 1 1 2
Central Kenya 1 1 2
Rift valley 1 2 3
Nyanza 1 0 1
Total 4 4 8
The eight (8) schools were then randomly assigned to treatment and control groups.This was
done to ensure initial equivalence between groups. Although random assingnment is not a
perfect method for assuring treatment group equivalence, it is nonetheless, the best method
available (Sekeran & Bougue 2011). Since most Old category National schools have more
than 4 Form One streams, all the streams were given the same treatment or control conditions
due to ethical reasons. However, only one stream from each school was randomly sampled
for analysis.
3.5.2 Sample Size
The actual schools sample consisted of eight Old Category National schools (four boys and
four for girls). A participant sample of 402 learners was purposefully identified from the
school sample as explained in section 3.5.1. The reason was to cater for both gender and
regional representation (see Table 4).
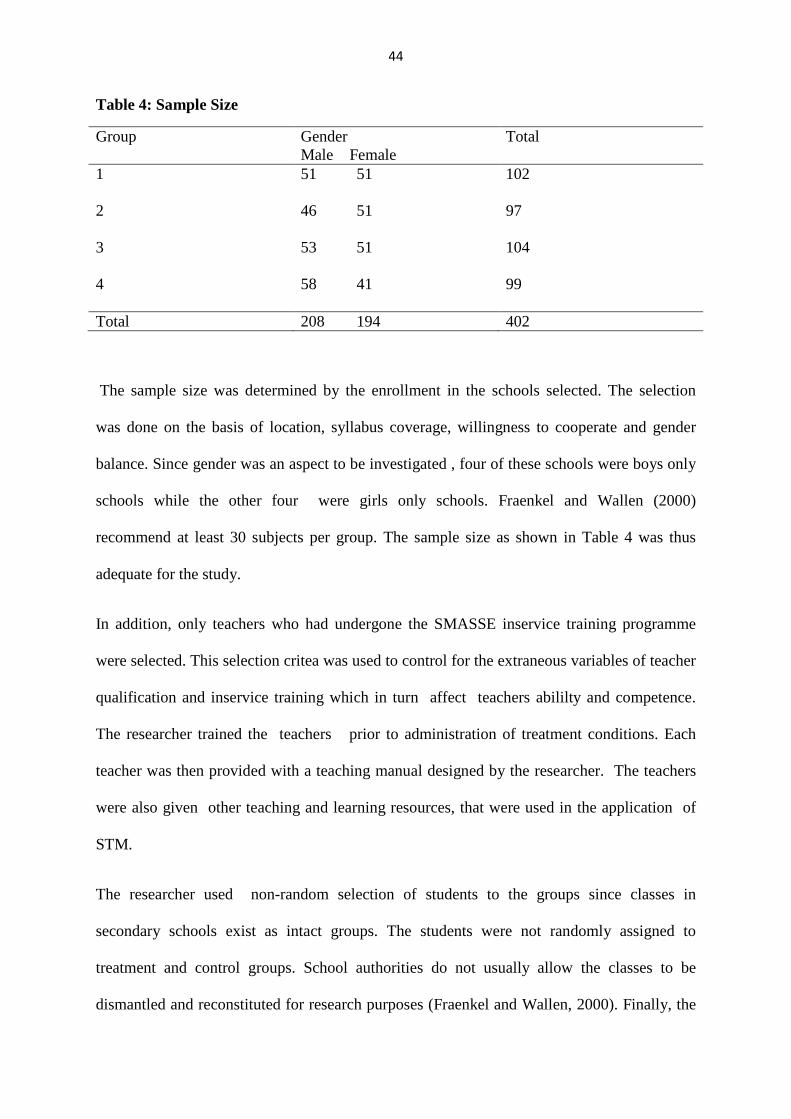
44
Table 4: Sample Size
Group Gender Male Female
Total
1 51 51
102
2 46 51
97
3 53 51
104
4 58 41
99
Total 208 194 402
The sample size was determined by the enrollment in the schools selected. The selection
was done on the basis of location, syllabus coverage, willingness to cooperate and gender
balance. Since gender was an aspect to be investigated , four of these schools were boys only
schools while the other four were girls only schools. Fraenkel and Wallen (2000)
recommend at least 30 subjects per group. The sample size as shown in Table 4 was thus
adequate for the study.
In addition, only teachers who had undergone the SMASSE inservice training programme
were selected. This selection critea was used to control for the extraneous variables of teacher
qualification and inservice training which in turn affect teachers abililty and competence.
The researcher trained the teachers prior to administration of treatment conditions. Each
teacher was then provided with a teaching manual designed by the researcher. The teachers
were also given other teaching and learning resources, that were used in the application of
STM.
The researcher used non-random selection of students to the groups since classes in
secondary schools exist as intact groups. The students were not randomly assigned to
treatment and control groups. School authorities do not usually allow the classes to be
dismantled and reconstituted for research purposes (Fraenkel and Wallen, 2000). Finally, the
45
reseacher randomly assigned the intact groups that were chosen to the various treatment
conditions. This is in line with Borg and Gall’s, (1989) recommendation that random
assignment controls for interaction, maturation and selection.
3.6 Instrumentation
In this study four tools were used for data collection. One pre-test BAT was adopted but two
of these were adapted from previous research by Esra, Ijlal and Ocak (2009). A description
of the ready-made research instruments is made in section 3.6.1 .
3.6.1 Research Instruments
i. Pre-test BAT
This tool was an adoption of the test developed by Esra, Ijlal and Ocak in 2009. The test
items exhaustively covered the topic ‘enzyme activity’. The Pre-test BAT (Appendix I)
whose duration was one hour, and taken individually contained 25 multiple choice items,
each with five distractors. Each test item carries one mark; a maximum score of 25 marks.
The test was scored using a marking scheme (see Appendix XI). Scores were expressed as a
percentage since that is the culture in the Kenyan school system.
ii. Post-test BAT
The Post-test BAT (Appendix II) was similar to the pre-test BAT except for the order of
questions. The test was also taken by individual learner and scored using a marking scheme
(see Appendix IX). Scores were expressed as a percentage.
iii. The Biology Knowledge Retention Test (BKRT)
The BKRT (Appendix III) was designed by changing the order of the test items in the post
Test BAT. It was administered 40 days after the post-test BAT. BKRT was also taken by
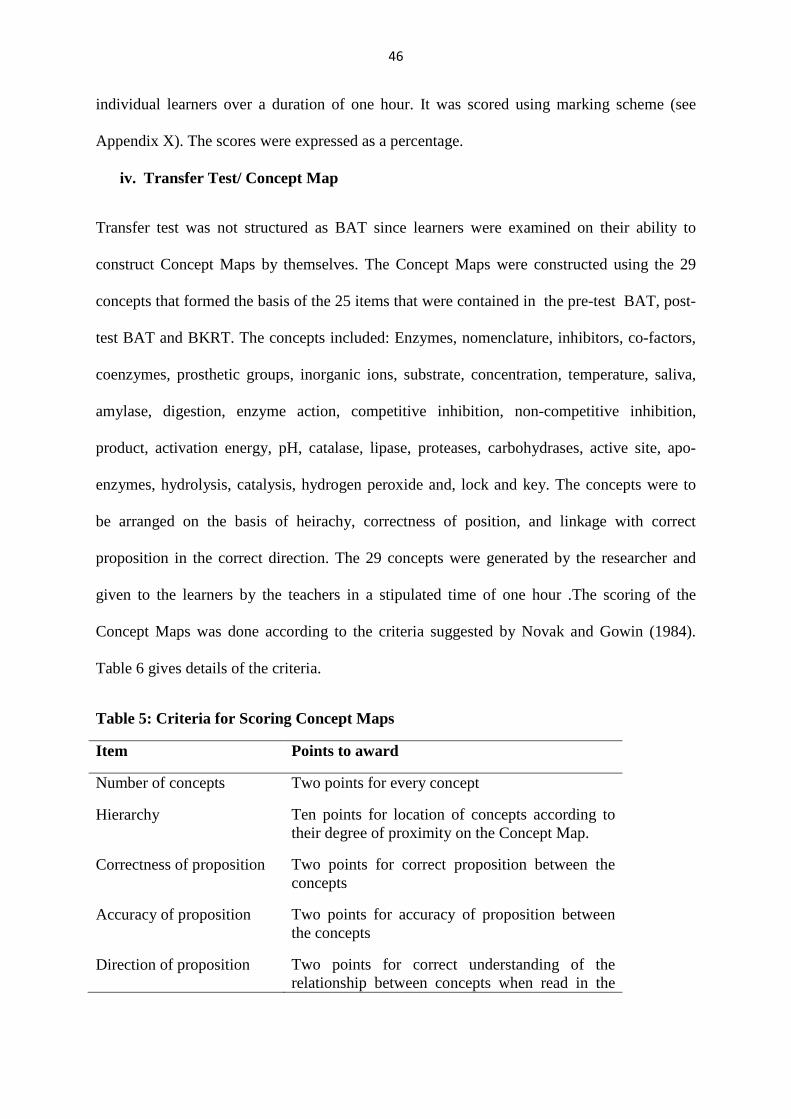
46
individual learners over a duration of one hour. It was scored using marking scheme (see
Appendix X). The scores were expressed as a percentage.
iv. Transfer Test/ Concept Map
Transfer test was not structured as BAT since learners were examined on their ability to
construct Concept Maps by themselves. The Concept Maps were constructed using the 29
concepts that formed the basis of the 25 items that were contained in the pre-test BAT, post-
test BAT and BKRT. The concepts included: Enzymes, nomenclature, inhibitors, co-factors,
coenzymes, prosthetic groups, inorganic ions, substrate, concentration, temperature, saliva,
amylase, digestion, enzyme action, competitive inhibition, non-competitive inhibition,
product, activation energy, pH, catalase, lipase, proteases, carbohydrases, active site, apo-
enzymes, hydrolysis, catalysis, hydrogen peroxide and, lock and key. The concepts were to
be arranged on the basis of heirachy, correctness of position, and linkage with correct
proposition in the correct direction. The 29 concepts were generated by the researcher and
given to the learners by the teachers in a stipulated time of one hour .The scoring of the
Concept Maps was done according to the criteria suggested by Novak and Gowin (1984).
Table 6 gives details of the criteria.
Table 5: Criteria for Scoring Concept Maps
Item Points to award
Number of concepts Two points for every concept
Hierarchy Ten points for location of concepts according to their degree of proximity on the Concept Map.
Correctness of proposition Two points for correct proposition between the concepts
Accuracy of proposition Two points for accuracy of proposition between the concepts
Direction of proposition Two points for correct understanding of the relationship between concepts when read in the
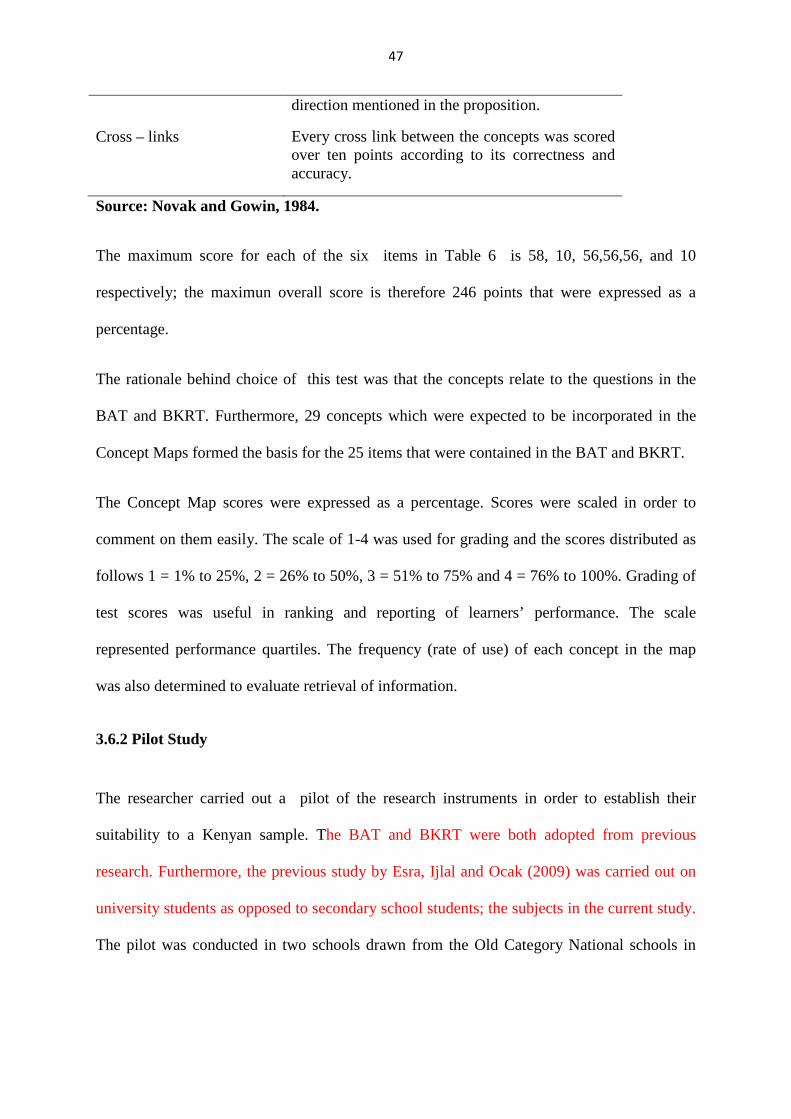
47
direction mentioned in the proposition.
Cross – links Every cross link between the concepts was scored over ten points according to its correctness and accuracy.
Source: Novak and Gowin, 1984.
The maximum score for each of the six items in Table 6 is 58, 10, 56,56,56, and 10
respectively; the maximun overall score is therefore 246 points that were expressed as a
percentage.
The rationale behind choice of this test was that the concepts relate to the questions in the
BAT and BKRT. Furthermore, 29 concepts which were expected to be incorporated in the
Concept Maps formed the basis for the 25 items that were contained in the BAT and BKRT.
The Concept Map scores were expressed as a percentage. Scores were scaled in order to
comment on them easily. The scale of 1-4 was used for grading and the scores distributed as
follows 1 = 1% to 25%, 2 = 26% to 50%, 3 = 51% to 75% and 4 = 76% to 100%. Grading of
test scores was useful in ranking and reporting of learners’ performance. The scale
represented performance quartiles. The frequency (rate of use) of each concept in the map
was also determined to evaluate retrieval of information.
3.6.2 Pilot Study
The researcher carried out a pilot of the research instruments in order to establish their
suitability to a Kenyan sample. The BAT and BKRT were both adopted from previous
research. Furthermore, the previous study by Esra, Ijlal and Ocak (2009) was carried out on
university students as opposed to secondary school students; the subjects in the current study.
The pilot was conducted in two schools drawn from the Old Category National schools in
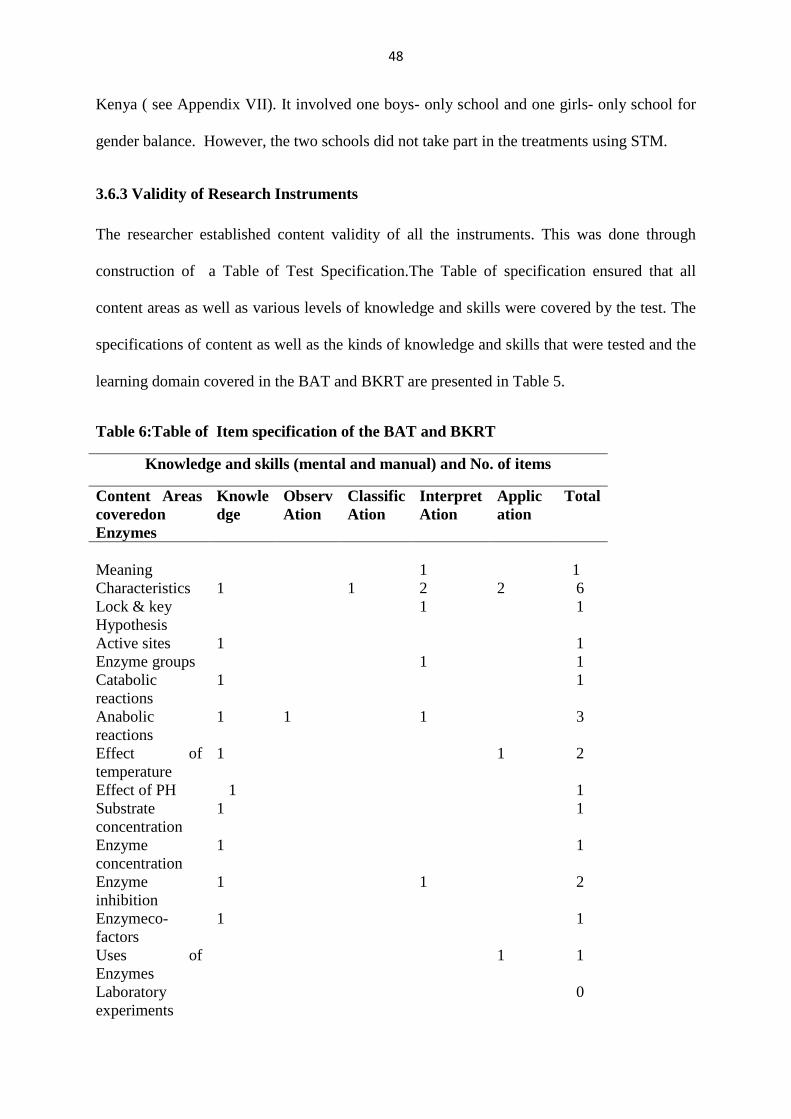
48
Kenya ( see Appendix VII). It involved one boys- only school and one girls- only school for
gender balance. However, the two schools did not take part in the treatments using STM.
3.6.3 Validity of Research Instruments
The researcher established content validity of all the instruments. This was done through
construction of a Table of Test Specification.The Table of specification ensured that all
content areas as well as various levels of knowledge and skills were covered by the test. The
specifications of content as well as the kinds of knowledge and skills that were tested and the
learning domain covered in the BAT and BKRT are presented in Table 5.
Table 6:Table of Item specification of the BAT and BKRT
Knowledge and skills (mental and manual) and No. of items
Content Areas coveredon Enzymes
Knowle dge
Observ Ation
Classific Ation
Interpret Ation
Application
Total
Meaning 1 1 Characteristics 1 1 2 2 6 Lock & key Hypothesis
1 1
Active sites 1 1 Enzyme groups 1 1 Catabolic reactions
1 1
Anabolic reactions
1 1 1 3
Effect of temperature
1 1 2
Effect of PH 1 1 Substrate concentration
1 1
Enzyme concentration
1 1
Enzyme inhibition
1 1 2
Enzymeco-factors
1 1
Uses of Enzymes
1 1
Laboratory experiments
0
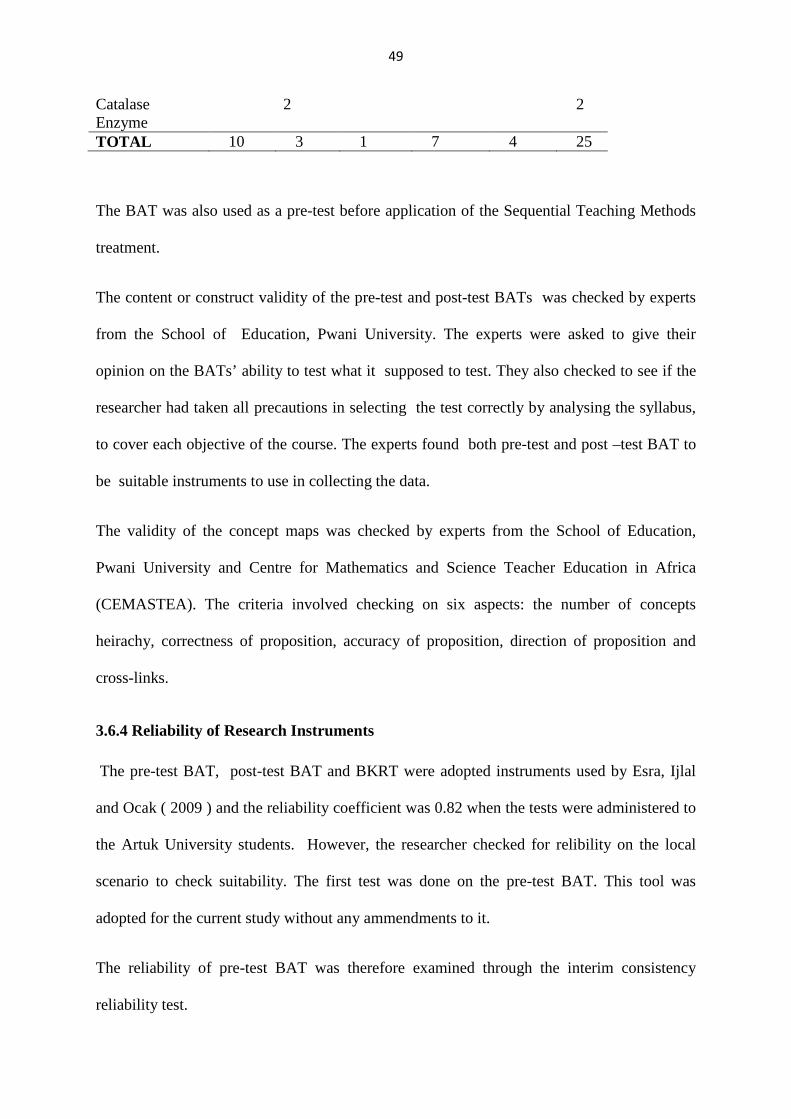
49
Catalase Enzyme
2 2
TOTAL 10 3 1 7 4 25
The BAT was also used as a pre-test before application of the Sequential Teaching Methods
treatment.
The content or construct validity of the pre-test and post-test BATs was checked by experts
from the School of Education, Pwani University. The experts were asked to give their
opinion on the BATs’ ability to test what it supposed to test. They also checked to see if the
researcher had taken all precautions in selecting the test correctly by analysing the syllabus,
to cover each objective of the course. The experts found both pre-test and post –test BAT to
be suitable instruments to use in collecting the data.
The validity of the concept maps was checked by experts from the School of Education,
Pwani University and Centre for Mathematics and Science Teacher Education in Africa
(CEMASTEA). The criteria involved checking on six aspects: the number of concepts
heirachy, correctness of proposition, accuracy of proposition, direction of proposition and
cross-links.
3.6.4 Reliability of Research Instruments
The pre-test BAT, post-test BAT and BKRT were adopted instruments used by Esra, Ijlal
and Ocak ( 2009 ) and the reliability coefficient was 0.82 when the tests were administered to
the Artuk University students. However, the researcher checked for relibility on the local
scenario to check suitability. The first test was done on the pre-test BAT. This tool was
adopted for the current study without any ammendments to it.
The reliability of pre-test BAT was therefore examined through the interim consistency
reliability test.
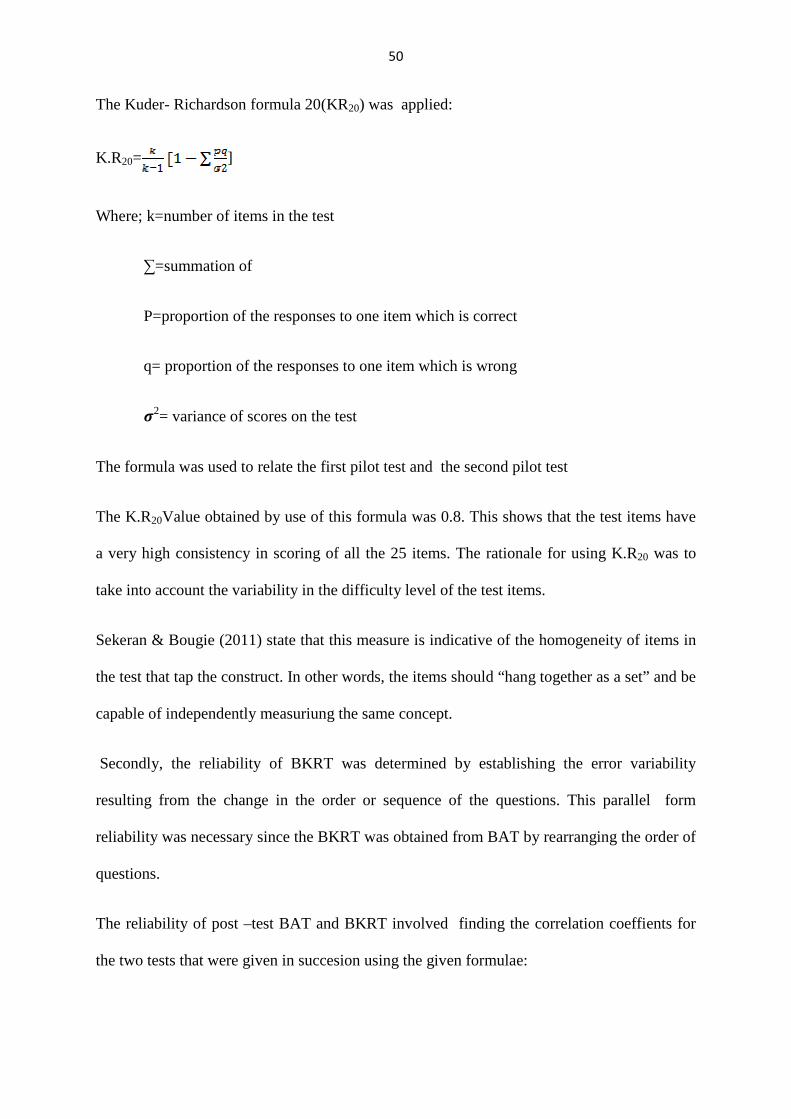
50
The Kuder- Richardson formula 20(KR20) was applied:
K.R20= ]
Where; k=number of items in the test
∑=summation of
P=proportion of the responses to one item which is correct
q= proportion of the responses to one item which is wrong
�2= variance of scores on the test
The formula was used to relate the first pilot test and the second pilot test
The K.R20Value obtained by use of this formula was 0.8. This shows that the test items have
a very high consistency in scoring of all the 25 items. The rationale for using K.R20 was to
take into account the variability in the difficulty level of the test items.
Sekeran & Bougie (2011) state that this measure is indicative of the homogeneity of items in
the test that tap the construct. In other words, the items should “hang together as a set” and be
capable of independently measuriung the same concept.
Secondly, the reliability of BKRT was determined by establishing the error variability
resulting from the change in the order or sequence of the questions. This parallel form
reliability was necessary since the BKRT was obtained from BAT by rearranging the order of
questions.
The reliability of post –test BAT and BKRT involved finding the correlation coeffients for
the two tests that were given in succesion using the given formulae:

51
Where:
x= post-test BAT
y=BKRT
=Correlation between x and y
∑= Sum of
xy=product of the deviation of the two sets of scores from their respective means
Therefore a correlation coefficient between post-test BAT and BKRT was found to be 0.74.
according to Ashworth (1982), a correlation coefficient of 0.70 is reasonably reliable.
Therefore the two tools were suitable for the study.
The reliability of concept maps was established by finding the correlation coefficient of
BKRT scores and the concept map scores using the formulae:
Where;
∑= Sum of
xy=product of the deviation of the two sets of scores from their respective means
N= Number in sample
x=raw scores of first test (BKRT)
y=raw scores of second test (concept maps)
Thus a reliability coefficient of 0.76 was established. Fraenkel and Wallen (2000) point out
that a correlation value of 0.70 and above is considered suitable to make inferences that are

52
accurate. A sample of 10 randomly picked concept maps was used with their corresponding
BKRT scripts.
3.7 The Development and Use of Instructional Materials
The researcher constructed a guiding manual for the teachers use during the treatment period
(Refer to Appendix IV). The content used for class instruction was developed based on the
revised KIE Biology syllabus (2006). The manual also contained the content that all the
learners were taught during treatment. Teachers who were involved in administering
sequential teaching methods used the manual throughout the entire treatment period. The
teachers in Biology for the experimental groups were trained on how to use the manual for a
period of one week. After training, the pre-test was given by the teachers to all the four
groups. The treatment period lasted two weeks as per the time allocated for the topic on
enzymes in the syllabus (KIE, 2006). At the end of the treatment period, a post-test was
administered by the teachers to all the four groups. The procedure for data collection is
described in section 3.8.
3.8 Data Collection Procedure
Research authorisation (see Appendix X) was granted by the National Council for Science
andTechnology (NCST) now, the National Commision of Science Technology and
Innovations (NACOSTI). The researcher also sought permision to collect data from schools
in advance by writing to the Management of each school (See the sample of the letter,
Appendix IX ).
Data for this study was collected between May and July 2013. In the first week, the
researcher introduced all the four (4) groups of students to Concept Maps. The teachers in
Biology attended the sessions only as observers. The purpose was for expert training of
students on how to construct Concept Maps. At this stage learners were shown how to draw

53
Concept Maps using a previously learned topic, “Chemicals of Life”. The goal was to
familiarise the students with Concept Maps. A different but related topic was used so as to
avoid pre-empting what students were to be assessed on.
Concept Mapping was not part of treatment to be given to experimental groups but rather a
skill that students were supposed to learn so as to transfer knowledge of the topic as per the
context of this study. The construction of Concept Maps requires the learner to think on a
deeper cognitive level than a “Fill in the blank” test would urge (Barenholz & Tamir, 1992).
However, Concept Maps could not be required/made if students had not been given
opportunities to learn to make and use them as a tool to represent students’ knowledge (See
Appendix IV). The researcher also trained the teachers in Biology on how to to administer
the treatment. Each trained teacher was provided with a teaching manual with content of
the topic and other teaching and learning resources. In addition, the pre-test BAT was
administered by teachers to the four groups of learners in order to determine homogenity in
their knowledge of the topic “Enzymes,” as well as similarity in learning ability. Treatment
was given over a period of two weeks and was administered by the teachers on the topic
“Enzymes”.
In order to collect data to address objective 1, a post test BAT was administered by teachers
immediately after treatment. Each learner was provided with an answer sheet and asked to
draw a line through or circle around the letter representing the answer they would have
selected. Marking was done by teachers using a Marking Scheme (see Appendix X). The
rationale for the post-test BAT was to collect numerical and quantitative data from the
learners.
Objective 1 sought to compare the effects of different sequences of STM on achievement. All
the 25 multiple choice questions tested knowledge of facts about enzymes as well as ability to
54
solve problems related to enzyme action. BAT post-test was used to obtain raw test scores as
a measure of achievement (Refer to Appendix VI). BAT was a one hour sit –in individual
test.
In order to collect data to address Objective 2, a Biology Knowledge Retention Test (BKRT)
was administered by teachers 40 days after administration of the BAT post – test). BKRT
was also a one hour sit –in individual test. This was to gather numerical and quantitative data
from the learners.
Objective 2 sought to compare knowledge retention of different sequences of STM. BKRT
had the same items and response format as BAT, the only change being order or sequence of
questions. Similarly, BKRT was used to obtain raw test scores as a measure of retention
(Refer to Appendix VI). According to Sisson, Swartz and Wolf (1992), knowledge retention
rate is highest (>85%) immediately after learning but generally falls to 75% of its original
level 3 months after original learning. Therefore 1½ months is assumed optimum period for
assessing short – term retention of knowledge and expecting more than 85% level of
retention.
Objective 3 sought to compare differential effectiveness of STM to transfer of knowledge.
Data for addressing objective 3 was collected using Concept Maps. Transfer in Biology
knowledge on the topic of Enzymes to Concept Maps was thus evaluated immediately after
the Retention Test. Transfer Test involved construction of Concept Map by each student. The
rationale was to obtain numerical and quantitative data from the learners. Learners were
given a list of 29 concepts on the topic enzymes and asked to use these concepts to construct
Concept Maps. Although time consuming, construct-a-map-from-scratch technique was
considered suitable in order to expose the knowledge structure of the students. These Concept
Maps were scored by the researcher using a marking scheme (see Appendix IX).Data on
55
Concept Maps scores was collected from assessment of Concept Maps. The Concept Map test
scores were therefore a measure of transfer of knowledge (Refer to Appendix VI).
3.9 Data Analysis and Presentation Methods
Data analysis is presented according to hypotheses.The scoresheets for the pre-test, BAT,
BKRT and Transfer Test (see Appendix VI) were all checked and edited for accuracy and
consistency. They were categorised according to groups. Data coding was done to conceal
identity of study groups. Finally, tabulation was done by arranging data collected into concise
and logical order.
The analysis involved one-way and two- way Analysis of Variance (ANOVA), using the
univariate general linear model. This type of ANOVA was suitable for estimating the effect
of multiple independent variables such as teaching methods on one dependent variable such
as achievement. The method was used to assess the mean differences between the four
groups. Nassiuma and Mwangi (2004) affirm that ANOVA is a useful technique in research
where multiple sample cases are involved. In this study, the three groups constituted
treatment cases and one was a control group, while the variables under investigation were
achievement, retention and transfer of knowledge. Gender-based test scores were also
compared using an independent sample t-test. This was to establish whether there were any
differences in performance between the male and female students. The Null Hypotheses were
tested at the 0.05 significance level. Data collected in this study was analysed based on the
respective study hypotheses as follows:
Ho1: There is no difference in achievement in Biology when learners are taught using
different sequences of lecture, demonstration and experiment methods. Data consisted of
scores on BAT. Descriptive statistics calculated for observations and measures at the pre-test
and post-test stage of the quasi-experimental design were means and standard error. The
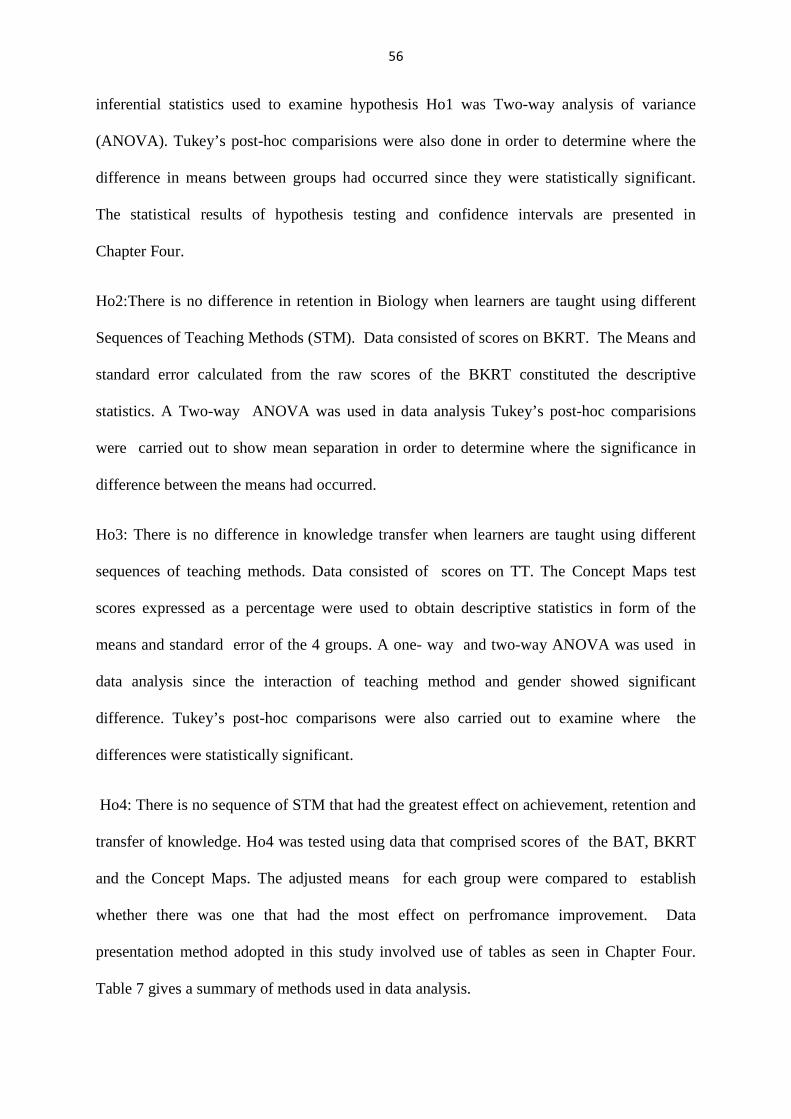
56
inferential statistics used to examine hypothesis Ho1 was Two-way analysis of variance
(ANOVA). Tukey’s post-hoc comparisions were also done in order to determine where the
difference in means between groups had occurred since they were statistically significant.
The statistical results of hypothesis testing and confidence intervals are presented in
Chapter Four.
Ho2:There is no difference in retention in Biology when learners are taught using different
Sequences of Teaching Methods (STM). Data consisted of scores on BKRT. The Means and
standard error calculated from the raw scores of the BKRT constituted the descriptive
statistics. A Two-way ANOVA was used in data analysis Tukey’s post-hoc comparisions
were carried out to show mean separation in order to determine where the significance in
difference between the means had occurred.
Ho3: There is no difference in knowledge transfer when learners are taught using different
sequences of teaching methods. Data consisted of scores on TT. The Concept Maps test
scores expressed as a percentage were used to obtain descriptive statistics in form of the
means and standard error of the 4 groups. A one- way and two-way ANOVA was used in
data analysis since the interaction of teaching method and gender showed significant
difference. Tukey’s post-hoc comparisons were also carried out to examine where the
differences were statistically significant.
Ho4: There is no sequence of STM that had the greatest effect on achievement, retention and
transfer of knowledge. Ho4 was tested using data that comprised scores of the BAT, BKRT
and the Concept Maps. The adjusted means for each group were compared to establish
whether there was one that had the most effect on perfromance improvement. Data
presentation method adopted in this study involved use of tables as seen in Chapter Four.
Table 7 gives a summary of methods used in data analysis.
57
Table 7: Summary of Methods that were used in Data Analysis
Hypothesis
Independent variable
Extraneous variables
Dependent variables
Method of analysis and statistical test
Ho1 There is no statistically significant difference in achievement in Biology when learners are taught using different sequences of lecture, demonstration and experiment methods.
Sequential teaching methods (ELD, LDE,DEL)
Gender Achievement test scores
Two-way ANOVA, Post- hoc comparison and One-way ANOVA
Ho2 There is no statistically significant difference in retention in Biology when learners are taught using different sequences of lecture, demonstration and experiment methods.
Sequential teaching methods (ELD, LDE, DEL)
Gender Retention test scores
Two-way ANOVA and Post-hoc comparison
Ho3 There is no statistically significant difference in knowledge transfer when learners are taught using different sequences of lecture, demonstration and experiment methods.
Sequential teaching methods (ELD, LDE, DEL)
Gender Transfer test scores
Two-way ANOVA, Post-hoc comparison and One-way ANOVA
Ho4 There is no one sequence of STM that has the greatest effect on achievement, retention and transfer of knowledge.
Sequential teaching methods (ELD, LDE, DEL)
Gender Biology Achievement Test scores BKRT scored and Concept Maps scores
One way ANOVA
3.10 Logistical and Ethical considerations
The participants, having exercised the choice to participate in the study, cooperated fully in
the entire task and took part in the experiment. Since most old National schools have six
Form One streams, all the streams in the school were given similar treatment or control
conditions for purposes of uniformity so as to counteract the feeling of discrimination. This
means that all the Form One streams in the sampled schools were involved in the study.
58
However, only one stream was selected for analysis. The procedure involved use of Table of
Random Numbers in which the last digit was selected. During the experimental period, every
effort was made in such a way that students were able to cover their syllabus and achieve the
topic objectives as stated in the school curriculum. Students did not feel disadvantaged for
having taken part in the study. All information collected from them was kept confidential.
The researcher ensured protection of child rights to Information, Education and
Communication (IEC) during the study.
3.11 Summary
The methodology described in this chapter lays foundation for the procedures and tools that
were used in capturing data that was vital for addressing the research problem. The chapter
covered sample, research instruments, data collection and data analysis. The analysis method
used in this study was multivariate analysis using t-test, One-way and Two-way ANOVA.
The results of the analysis are presented, interpreted and discussed in Chapter Four.
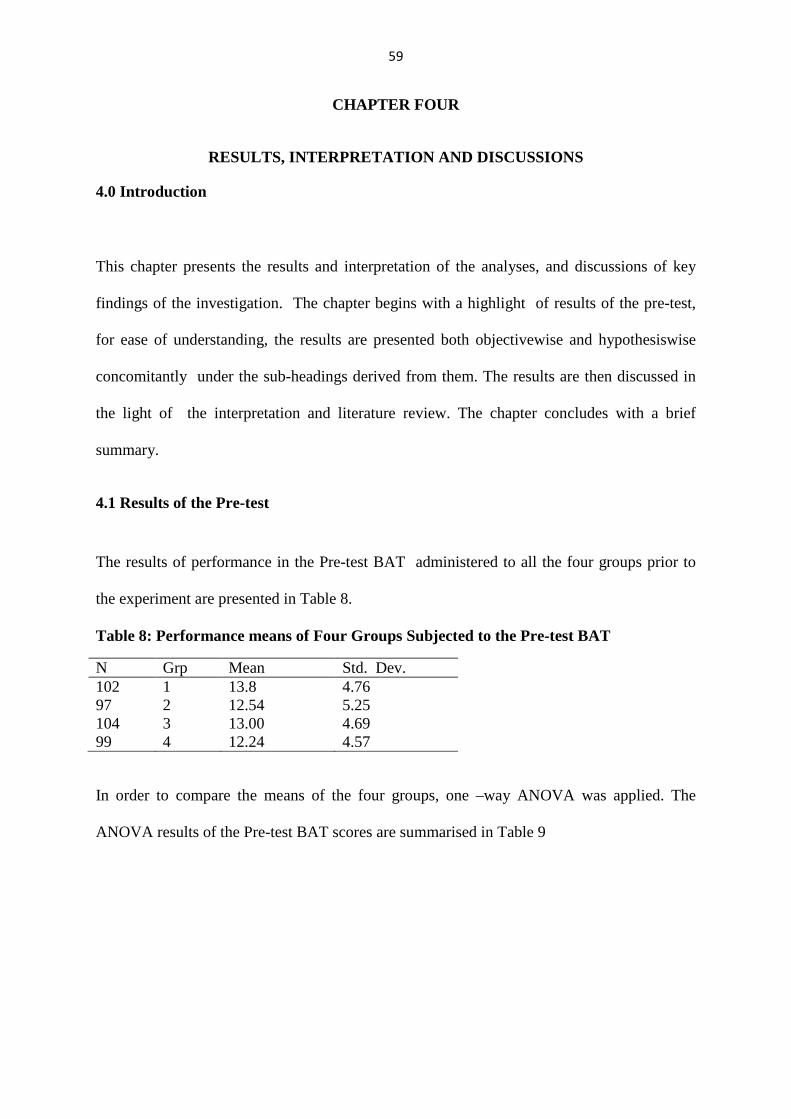
59
CHAPTER FOUR
RESULTS, INTERPRETATION AND DISCUSSIONS
4.0 Introduction
This chapter presents the results and interpretation of the analyses, and discussions of key
findings of the investigation. The chapter begins with a highlight of results of the pre-test,
for ease of understanding, the results are presented both objectivewise and hypothesiswise
concomitantly under the sub-headings derived from them. The results are then discussed in
the light of the interpretation and literature review. The chapter concludes with a brief
summary.
4.1 Results of the Pre-test
The results of performance in the Pre-test BAT administered to all the four groups prior to
the experiment are presented in Table 8.
Table 8: Performance means of Four Groups Subjected to the Pre-test BAT
N Grp Mean Std. Dev. 102 1 13.8 4.76 97 2 12.54 5.25 104 3 13.00 4.69 99 4 12.24 4.57
In order to compare the means of the four groups, one –way ANOVA was applied. The
ANOVA results of the Pre-test BAT scores are summarised in Table 9
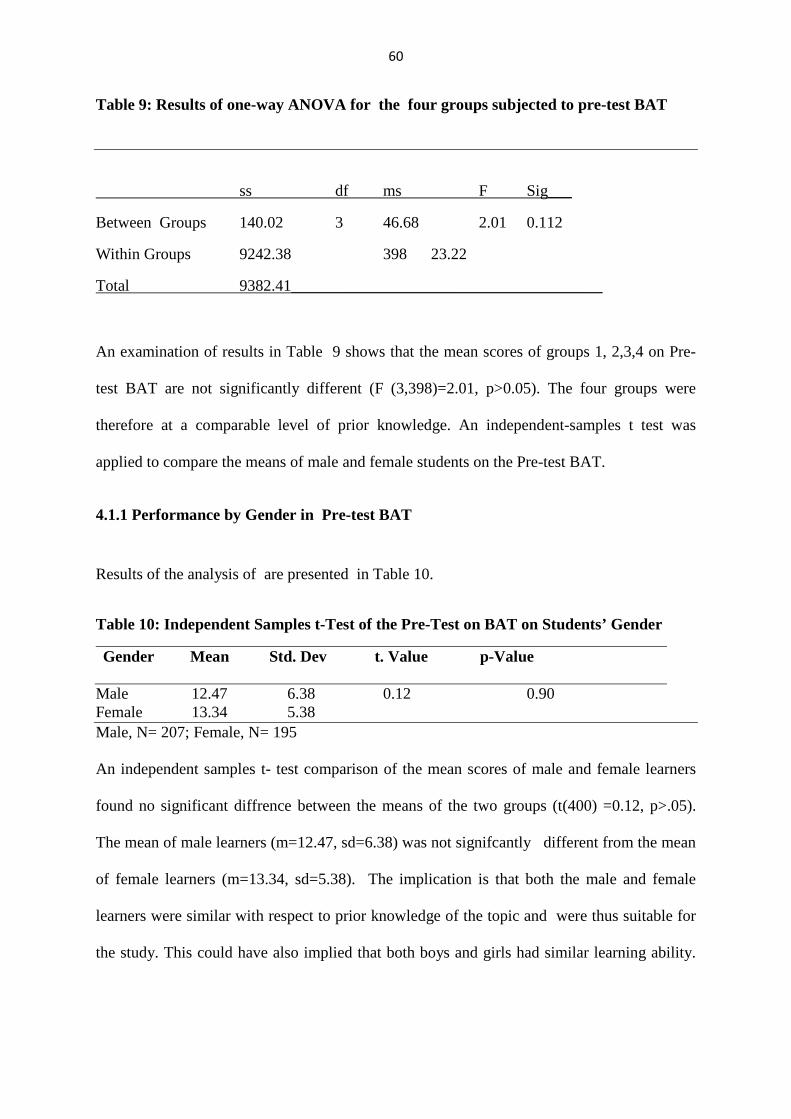
60
Table 9: Results of one-way ANOVA for the four groups subjected to pre-test BAT
ss df ms F Sig___
Between Groups 140.02 3 46.68 2.01 0.112
Within Groups 9242.38 398 23.22
Total 9382.41_______________________________________
An examination of results in Table 9 shows that the mean scores of groups 1, 2,3,4 on Pre-
test BAT are not significantly different (F (3,398)=2.01, p>0.05). The four groups were
therefore at a comparable level of prior knowledge. An independent-samples t test was
applied to compare the means of male and female students on the Pre-test BAT.
4.1.1 Performance by Gender in Pre-test BAT
Results of the analysis of are presented in Table 10.
Table 10: Independent Samples t-Test of the Pre-Test on BAT on Students’ Gender
Gender Mean Std. Dev t. Value p-Value
Male 12.47 6.38 0.12 0.90 Female 13.34 5.38 Male, N= 207; Female, N= 195
An independent samples t- test comparison of the mean scores of male and female learners
found no significant diffrence between the means of the two groups (t(400) =0.12, p>.05).
The mean of male learners (m=12.47, sd=6.38) was not signifcantly different from the mean
of female learners (m=13.34, sd=5.38). The implication is that both the male and female
learners were similar with respect to prior knowledge of the topic and were thus suitable for
the study. This could have also implied that both boys and girls had similar learning ability.
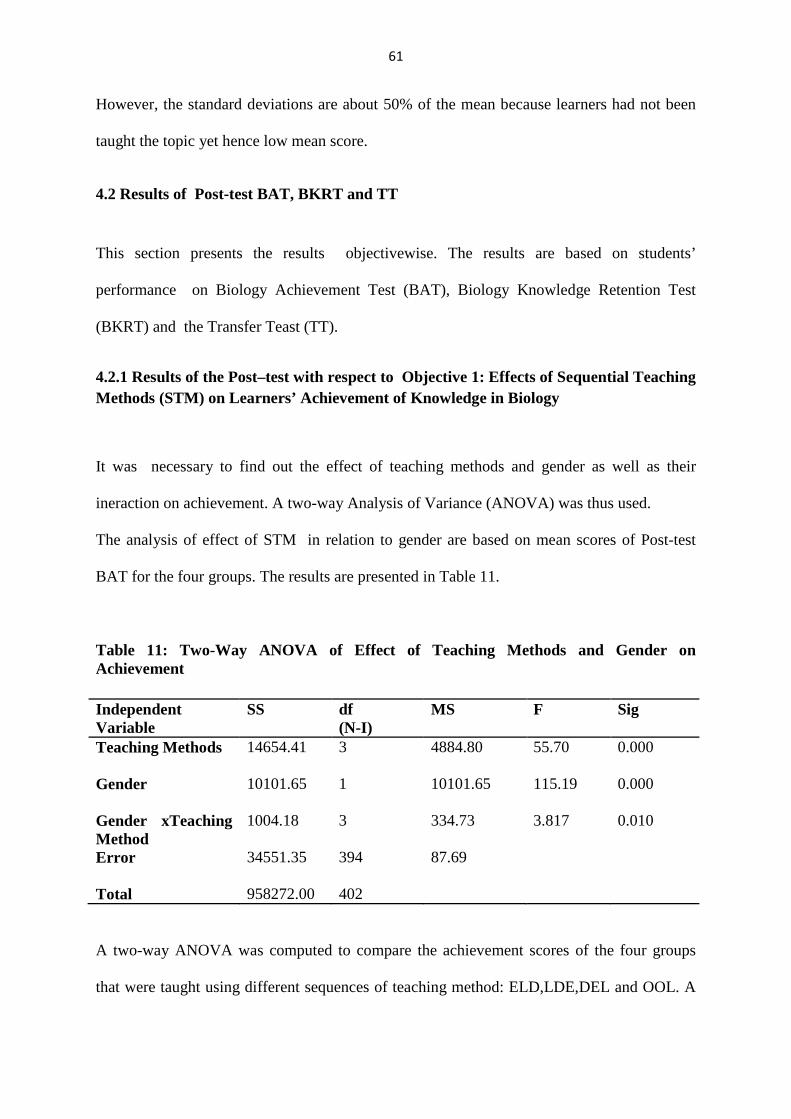
61
However, the standard deviations are about 50% of the mean because learners had not been
taught the topic yet hence low mean score.
4.2 Results of Post-test BAT, BKRT and TT
This section presents the results objectivewise. The results are based on students’
performance on Biology Achievement Test (BAT), Biology Knowledge Retention Test
(BKRT) and the Transfer Teast (TT).
4.2.1 Results of the Post–test with respect to Objective 1: Effects of Sequential Teaching Methods (STM) on Learners’ Achievement of Knowledge in Biology
It was necessary to find out the effect of teaching methods and gender as well as their
ineraction on achievement. A two-way Analysis of Variance (ANOVA) was thus used.
The analysis of effect of STM in relation to gender are based on mean scores of Post-test
BAT for the four groups. The results are presented in Table 11.
Table 11: Two-Way ANOVA of Effect of Teaching Methods and Gender on Achievement
A two-way ANOVA was computed to compare the achievement scores of the four groups
that were taught using different sequences of teaching method: ELD,LDE,DEL and OOL. A
Independent Variable
SS df (N-I)
MS F Sig
Teaching Methods
14654.41
3
4884.80
55.70
0.000
Gender
10101.65
1
10101.65
115.19
0.000
Gender xTeaching Method Error Total
1004.18 34551.35 958272.00
3 394 402
334.73 87.69
3.817 0.010

62
significant difference was found among the sequences of teaching methods
(F(3,394)=55.70, P<.05). A significant difference was also found between male and female
learners (F(1,394)=115.19, P<.05). The teaching method therefore had significant effect on
achievement. This also means that there is a significant effect of gender on achievement.
The interaction of teaching method with gender similarly had a significant effect
F(3,394)=3.82,P<.05).The null hypothesis which stated that, there is no statistically
significant difference in achievement in Biology when learners are taught using different
sequences of lecture, demonstration and experiment methods was thus rejected.
Additionally, the mean scores of the pre-test and post-test were compared using a paired t-
test. The purpose was to establish whether there was a significant mean gain in post-test
scores over pre-test scores as shown in Table 12.
Table 12: Comparison of the Pre-test and Post-test Mean Scores
Mean N Std.Dev Std. Error
Pre-test Score
12.91 402 4.84 .24
Post-test Score
47.20 402 12.49 .62
Table 12 shows that the pre-test average was 12.91, with a standard deviation of 4.84. The
achievement average was 47.20, with a standard deviation of 12.49.
A paired samples t-test was calculated to compare the mean pre-test score to the mean
achievement test score. The results are presented in Table 13.
Table 13: Paired-Samples t-test of Pre-test and Post –test Mean Scores
t Df Sig(2-tailed)
Pre-test Score -60.56 401 .000 Post-test Score
63
The results in Table 13 show a significant increase from pre-test to post-test (t(401)=60.56,
p<.05).
Further analysis of the pre-test and post- test mean scores also revealed that all the
experimental groups (1, 2 and 3) and the control group (4) gained significantly from the
teaching. However, the experimental groups whose learners were taught using the Sequential
Teaching Methods (STM) had by far, a higher mean gain than the control group whose
learners were taught using the oral-only lecture method. This meant that, there was a highly
significant overall effect of treatment. It also suggested that, there was at least some
significant difference among possible comparisons of two means in the four groups. This
result strengthens the position that the STM led to higher achievement than the control
condition.
However, as Sekeran and Bougie (2010) observed , when significant differences among
groups are indicated by the F statistic, there is no way of knowing from only the ANOVA
results where the differences lie. That is, whether the significant difference is between
groups 1 and 2, or between 2 and 3, or 1 and 3. There was therefore need to find out where
this experimental effect had exactly occurred. Tukey’s HSD was used to determine the nature
of differences between the various sequences of teaching methods (STM). This was a better
choice for determination, rather than multiple t tests, taking two groups at a time which,
lowers the confidence level.
The results of mean separation using Tukey’s Post Hoc comparison are presented in
Table 14.
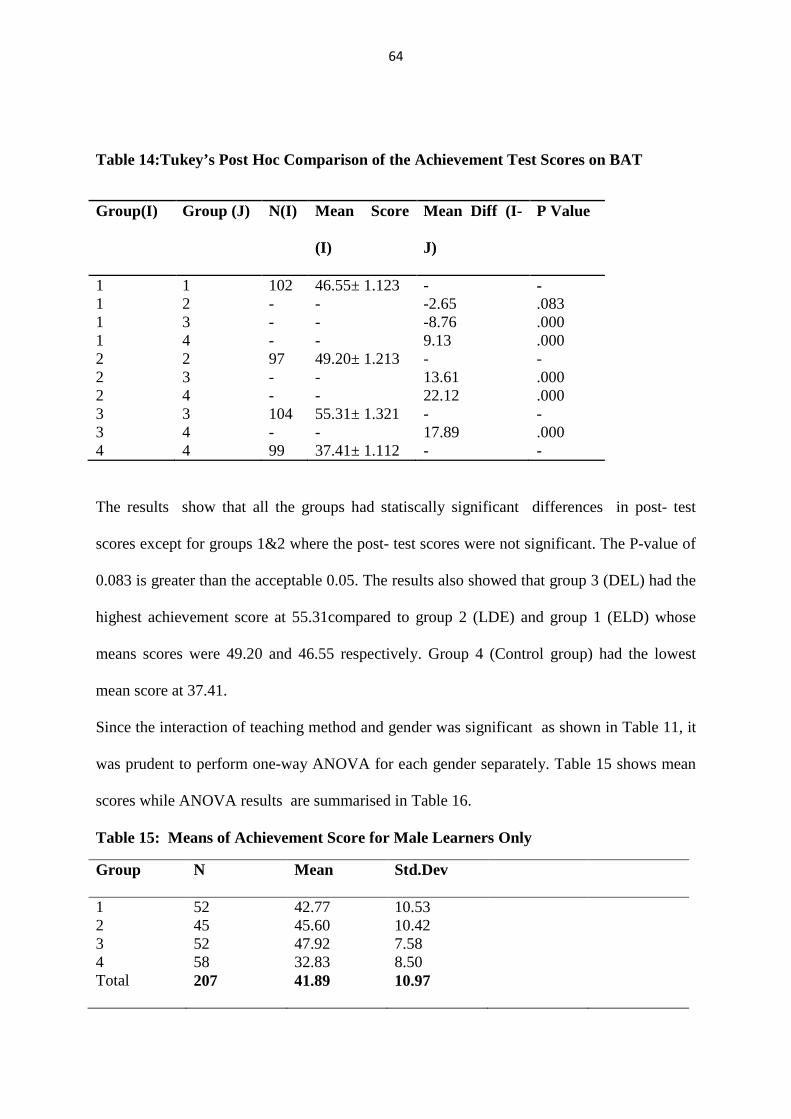
64
Table 14:Tukey’s Post Hoc Comparison of the Achievement Test Scores on BAT
Group(I) Group (J) N(I) Mean Score
(I)
Mean Diff (I-
J)
P Value
1 1 102 46.55± 1.123 - - 1 2 - - -2.65 .083 1 3 - - -8.76 .000 1 4 - - 9.13 .000 2 2 97 49.20± 1.213 - - 2 3 - - 13.61 .000 2 4 - - 22.12 .000 3 3 104 55.31± 1.321 - - 3 4 - - 17.89 .000 4 4 99 37.41± 1.112 - -
The results show that all the groups had statiscally significant differences in post- test
scores except for groups 1&2 where the post- test scores were not significant. The P-value of
0.083 is greater than the acceptable 0.05. The results also showed that group 3 (DEL) had the
highest achievement score at 55.31compared to group 2 (LDE) and group 1 (ELD) whose
means scores were 49.20 and 46.55 respectively. Group 4 (Control group) had the lowest
mean score at 37.41.
Since the interaction of teaching method and gender was significant as shown in Table 11, it
was prudent to perform one-way ANOVA for each gender separately. Table 15 shows mean
scores while ANOVA results are summarised in Table 16.
Table 15: Means of Achievement Score for Male Learners Only
Group N Mean Std.Dev
1 52 42.77 10.53 2 3 4 Total
45 52 58 207
45.60 47.92 32.83 41.89
10.42 7.58 8.50 10.97
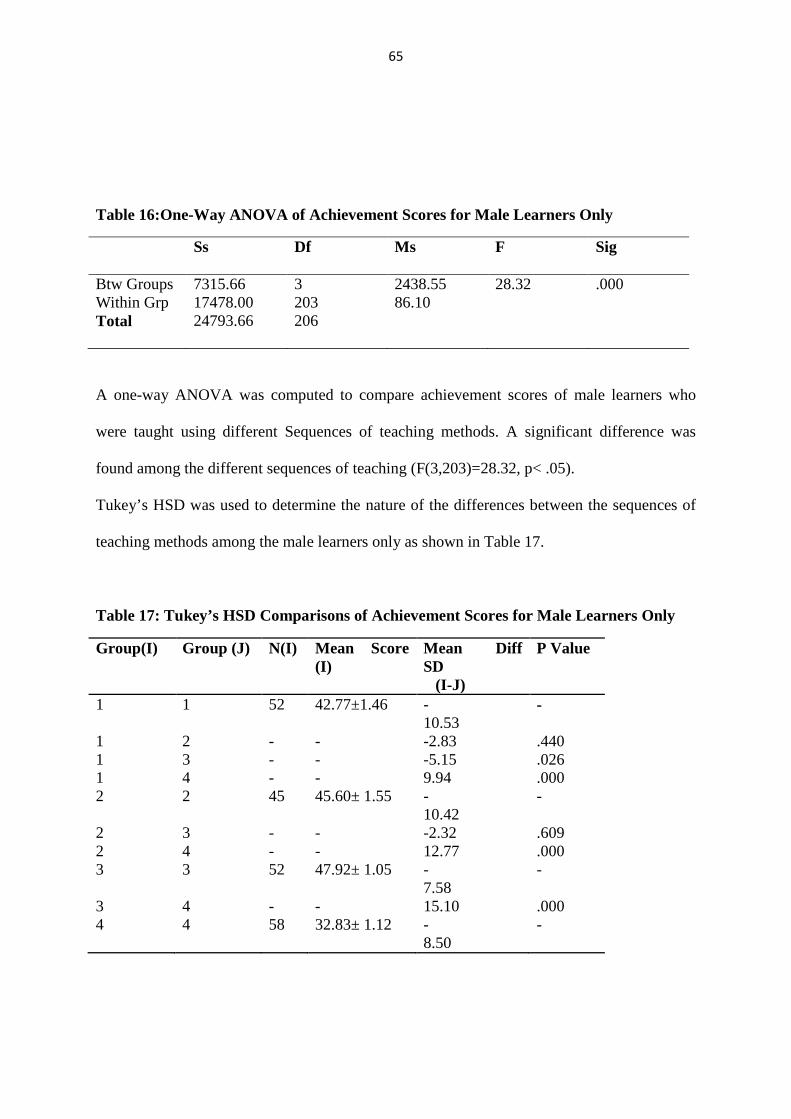
65
Table 16:One-Way ANOVA of Achievement Scores for Male Learners Only
Ss Df Ms F Sig
Btw Groups Within Grp Total
7315.66 17478.00 24793.66
3 203 206
2438.55 86.10
28.32 .000
A one-way ANOVA was computed to compare achievement scores of male learners who
were taught using different Sequences of teaching methods. A significant difference was
found among the different sequences of teaching (F(3,203)=28.32, p< .05).
Tukey’s HSD was used to determine the nature of the differences between the sequences of
teaching methods among the male learners only as shown in Table 17.
Table 17: Tukey’s HSD Comparisons of Achievement Scores for Male Learners Only
Group(I) Group (J) N(I) Mean Score (I)
Mean Diff SD (I-J)
P Value
1 1 52 42.77±1.46 - 10.53
-
1 2 - - -2.83 .440 1 3 - - -5.15 .026 1 4 - - 9.94 .000 2 2 45 45.60± 1.55 -
10.42 -
2 3 - - -2.32 .609 2 4 - - 12.77 .000 3 3 52 47.92± 1.05 -
7.58 -
3 4 - - 15.10 .000 4 4 58 32.83± 1.12 -
8.50 -
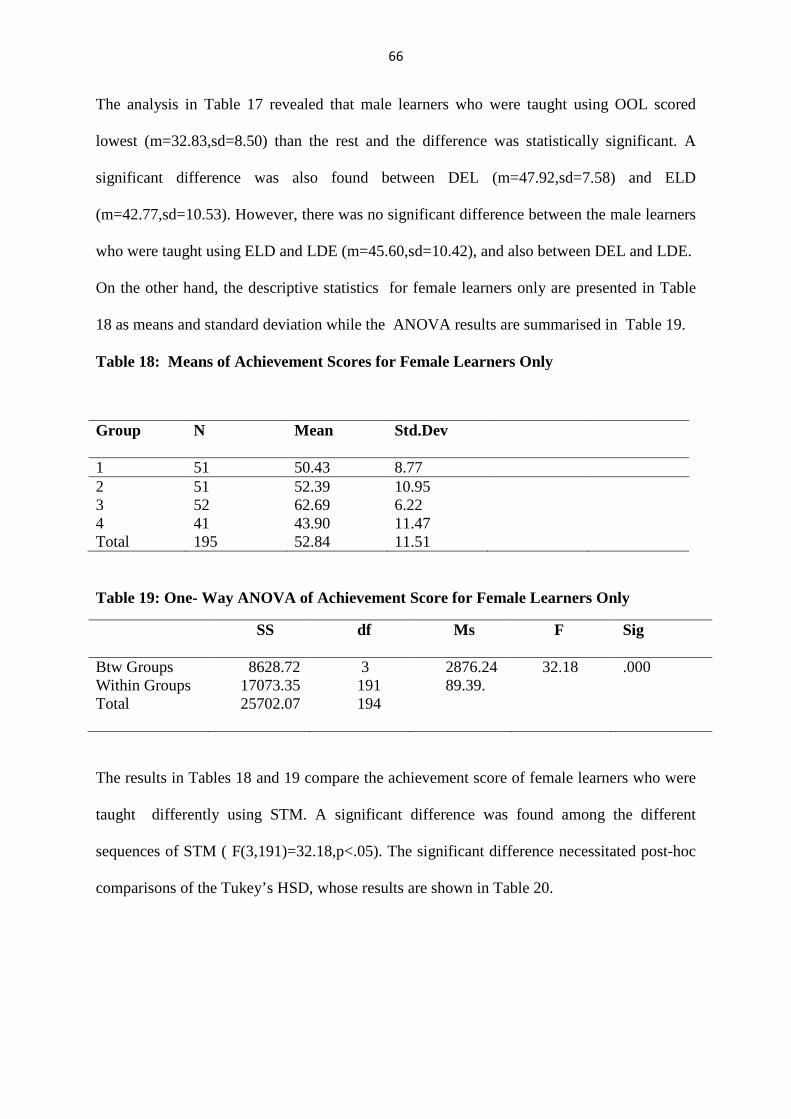
66
The analysis in Table 17 revealed that male learners who were taught using OOL scored
lowest (m=32.83,sd=8.50) than the rest and the difference was statistically significant. A
significant difference was also found between DEL (m=47.92,sd=7.58) and ELD
(m=42.77,sd=10.53). However, there was no significant difference between the male learners
who were taught using ELD and LDE (m=45.60,sd=10.42), and also between DEL and LDE.
On the other hand, the descriptive statistics for female learners only are presented in Table
18 as means and standard deviation while the ANOVA results are summarised in Table 19.
Table 18: Means of Achievement Scores for Female Learners Only
Group N Mean Std.Dev
1 51 50.43 8.77 2 3 4 Total
51 52 41 195
52.39 62.69 43.90 52.84
10.95 6.22 11.47 11.51
Table 19: One- Way ANOVA of Achievement Score for Female Learners Only
SS df Ms F Sig
Btw Groups Within Groups Total
8628.72 17073.35 25702.07
3 191 194
2876.24 89.39.
32.18 .000
The results in Tables 18 and 19 compare the achievement score of female learners who were
taught differently using STM. A significant difference was found among the different
sequences of STM ( F(3,191)=32.18,p<.05). The significant difference necessitated post-hoc
comparisons of the Tukey’s HSD, whose results are shown in Table 20.

67
Table 20: Tukey’s HSD Comparisons of Achievement Scores for Female Learners Only
Group(I) Group (J) N(I) Mean Score (I)
Mean Diff SD (I-J)
P Value
1 1 51 50.43±1.23 - 8.77
-
1 2 - - -1.96 .722 1 3 - - -12.61 .000 1 4 - - 6.53 .006 2 2 51 52.39± 1.53 -
10.95 -
2 3 - - -10.30 .000 2 4 - - 8.50 .000 3 3 52 62.69± 0.86 -
6.22 -
3 4 - - 18.79 .000 4 4 41 43.90± 1.792 -
11.47 -
The results in Table 20 show that there is a significant diffrence in achievement scores of
female learners among all groups except those who were taught using ELD
(m=50.43,sd=8.77) and LDE (m=52.39,sd=10.95).
The results in Tables 11 up to 20 all based on Objective 1 point to the following findings:
i. The use of STM led to improved achievement in knowledge in Biology compared to
use of oral-only lecture method.
ii. DEL sequence led to the highest mean score on achievement test.
iii. Gender had a significant effect on achievement, with female learners achieving higher
scores than male learners.
iv. Interaction of teaching method (STM) and gender also had significant effects on
achievement of knowledge.
These findings are discussed in section 4.3.1
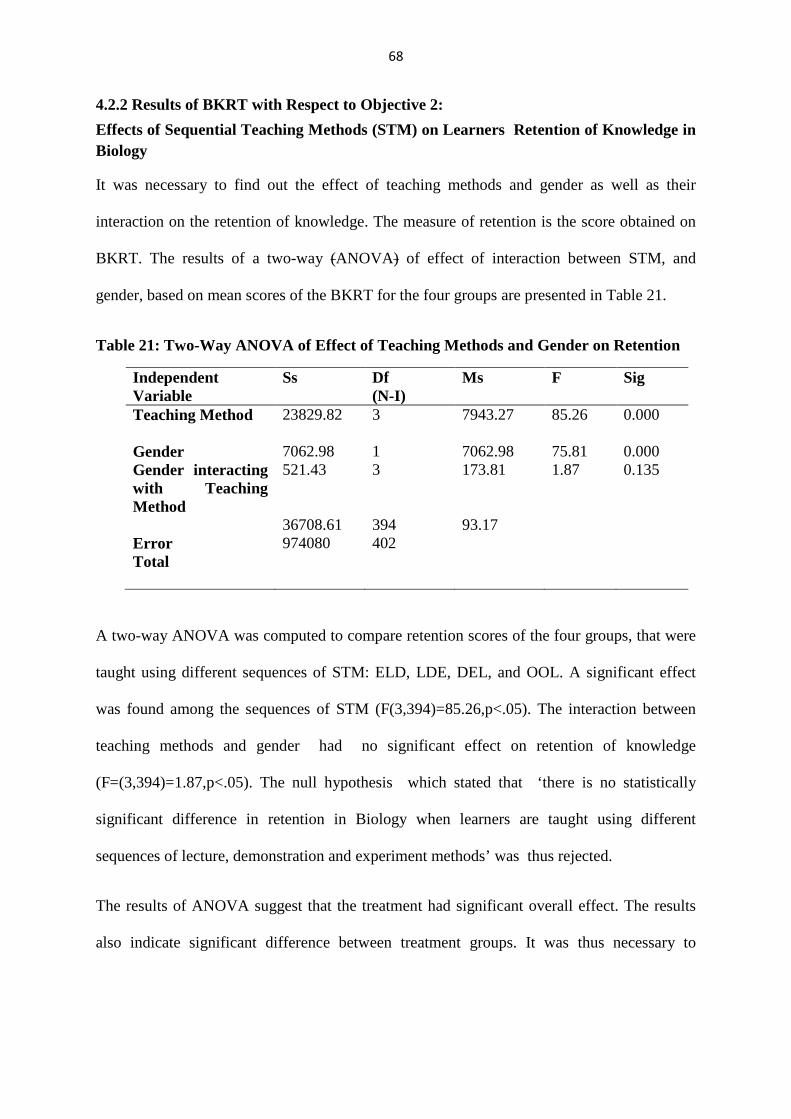
68
4.2.2 Results of BKRT with Respect to Objective 2:
Effects of Sequential Teaching Methods (STM) on Learners Retention of Knowledge in Biology
It was necessary to find out the effect of teaching methods and gender as well as their
interaction on the retention of knowledge. The measure of retention is the score obtained on
BKRT. The results of a two-way (ANOVA) of effect of interaction between STM, and
gender, based on mean scores of the BKRT for the four groups are presented in Table 21.
Table 21: Two-Way ANOVA of Effect of Teaching Methods and Gender on Retention
Independent Variable
Ss Df (N-I)
Ms F Sig
Teaching Method Gender Gender interacting with Teaching Method Error Total
23829.82 7062.98 521.43 36708.61 974080
3 1 3 394 402
7943.27 7062.98 173.81 93.17
85.26 75.81 1.87
0.000 0.000 0.135
A two-way ANOVA was computed to compare retention scores of the four groups, that were
taught using different sequences of STM: ELD, LDE, DEL, and OOL. A significant effect
was found among the sequences of STM (F(3,394)=85.26,p<.05). The interaction between
teaching methods and gender had no significant effect on retention of knowledge
(F=(3,394)=1.87,p<.05). The null hypothesis which stated that ‘there is no statistically
significant difference in retention in Biology when learners are taught using different
sequences of lecture, demonstration and experiment methods’ was thus rejected.
The results of ANOVA suggest that the treatment had significant overall effect. The results
also indicate significant difference between treatment groups. It was thus necessary to

69
perform Tukey’s post hoc comparisions to determine where the differences exactly occurred.
The results of mean separation are presented in Table 22.
Table 22:Tukey’s Post Hoc comparison of the retention test scores on the BKRT.
Group(i) Group (j) n(i) Mean score (i) Mean diff (i-j) P value
1 1 102 45.65± 1.321 - - 1 2 - - -3.92 0.010 1 3 - - -12.43 .000 1 4 - - 9.69 .000 2 2 97 49.57± 1.311 - - 2 3 - - 8.51 .000 2 4 - - 13.61 .000 3 3 104 58.08± 1.145 - - 3 4 - - 22.12 .000 4 4 99 35.96± 1.211 - -
The results show that there was significant diffrence between group means. That is, the
retention mean score of groups 1, 2, 3 and 4 were all different at 0.05 level.Group 3 (DEL)
had the highest retention score at 58.08 compared to group 2 (LDE) and group 1 (ELD)
whose means scores were 49.57 and 45.65 respectively. Group 4 (Control) had the lowest
mean at 35.96. Since the interaction of teaching methods and gender was not significant,
there was no need to perform a one-way ANOVA for each gender separately.
The results in Tables 21, and 22 based on Obective 2 point to the following findings:
i. The use of STM led to improved retention of knowlegde compared to use of oral-only
lecture method.
ii. DEL sequence mean scores were highest on BKRT
iii. Gender had significant effect on retention with female learners scoring higher than
their male counterparts.
iv. Interaction of teaching method (STM) and gender showed no significant effect on
retention of knowledge.
These findings are discussed in section 4.3.2
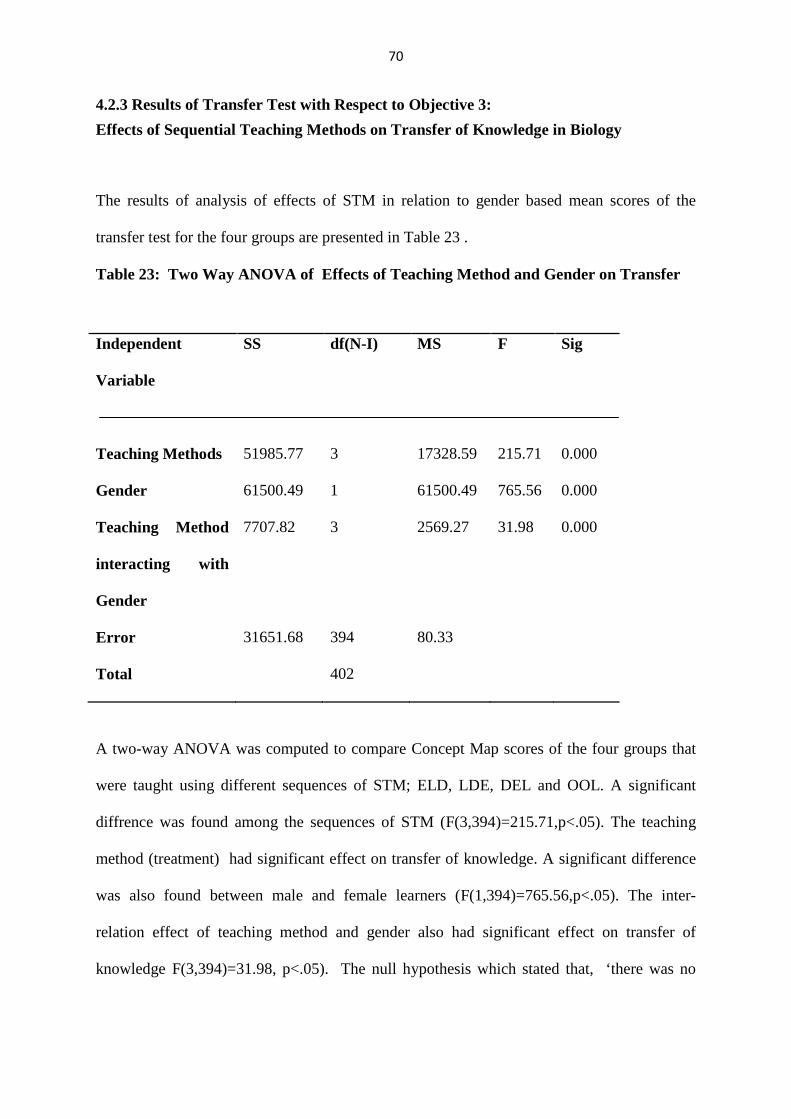
70
4.2.3 Results of Transfer Test with Respect to Objective 3:
Effects of Sequential Teaching Methods on Transfer of Knowledge in Biology
The results of analysis of effects of STM in relation to gender based mean scores of the
transfer test for the four groups are presented in Table 23 .
Table 23: Two Way ANOVA of Effects of Teaching Method and Gender on Transfer
Independent
Variable
SS df(N-I) MS F Sig
Teaching Methods
Gender
Teaching Method
interacting with
Gender
Error
Total
51985.77
61500.49
7707.82
31651.68
3
1
3
394
402
17328.59
61500.49
2569.27
80.33
215.71
765.56
31.98
0.000
0.000
0.000
A two-way ANOVA was computed to compare Concept Map scores of the four groups that
were taught using different sequences of STM; ELD, LDE, DEL and OOL. A significant
diffrence was found among the sequences of STM (F(3,394)=215.71,p<.05). The teaching
method (treatment) had significant effect on transfer of knowledge. A significant difference
was also found between male and female learners (F(1,394)=765.56,p<.05). The inter-
relation effect of teaching method and gender also had significant effect on transfer of
knowledge F(3,394)=31.98, p<.05). The null hypothesis which stated that, ‘there was no
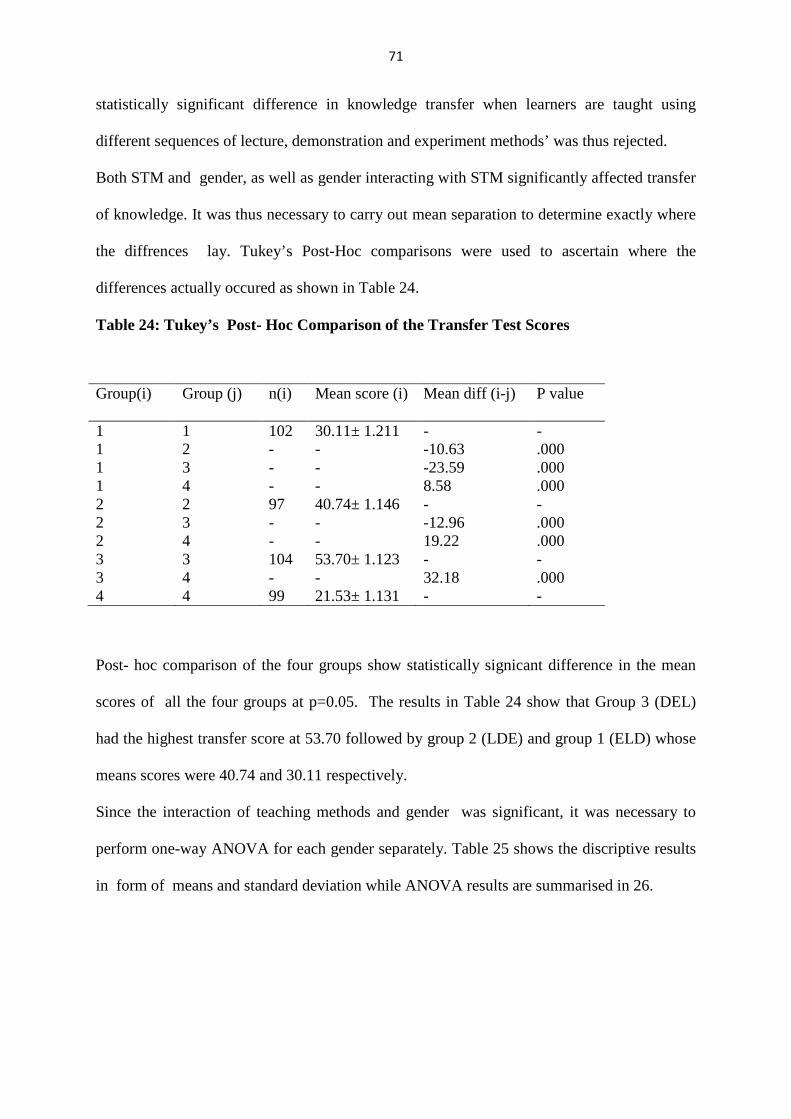
71
statistically significant difference in knowledge transfer when learners are taught using
different sequences of lecture, demonstration and experiment methods’ was thus rejected.
Both STM and gender, as well as gender interacting with STM significantly affected transfer
of knowledge. It was thus necessary to carry out mean separation to determine exactly where
the diffrences lay. Tukey’s Post-Hoc comparisons were used to ascertain where the
differences actually occured as shown in Table 24.
Table 24: Tukey’s Post- Hoc Comparison of the Transfer Test Scores
Group(i) Group (j) n(i) Mean score (i) Mean diff (i-j) P value
1 1 102 30.11± 1.211 - - 1 2 - - -10.63 .000 1 3 - - -23.59 .000 1 4 - - 8.58 .000 2 2 97 40.74± 1.146 - - 2 3 - - -12.96 .000 2 4 - - 19.22 .000 3 3 104 53.70± 1.123 - - 3 4 - - 32.18 .000 4 4 99 21.53± 1.131 - -
Post- hoc comparison of the four groups show statistically signicant difference in the mean
scores of all the four groups at p=0.05. The results in Table 24 show that Group 3 (DEL)
had the highest transfer score at 53.70 followed by group 2 (LDE) and group 1 (ELD) whose
means scores were 40.74 and 30.11 respectively.
Since the interaction of teaching methods and gender was significant, it was necessary to
perform one-way ANOVA for each gender separately. Table 25 shows the discriptive results
in form of means and standard deviation while ANOVA results are summarised in 26.
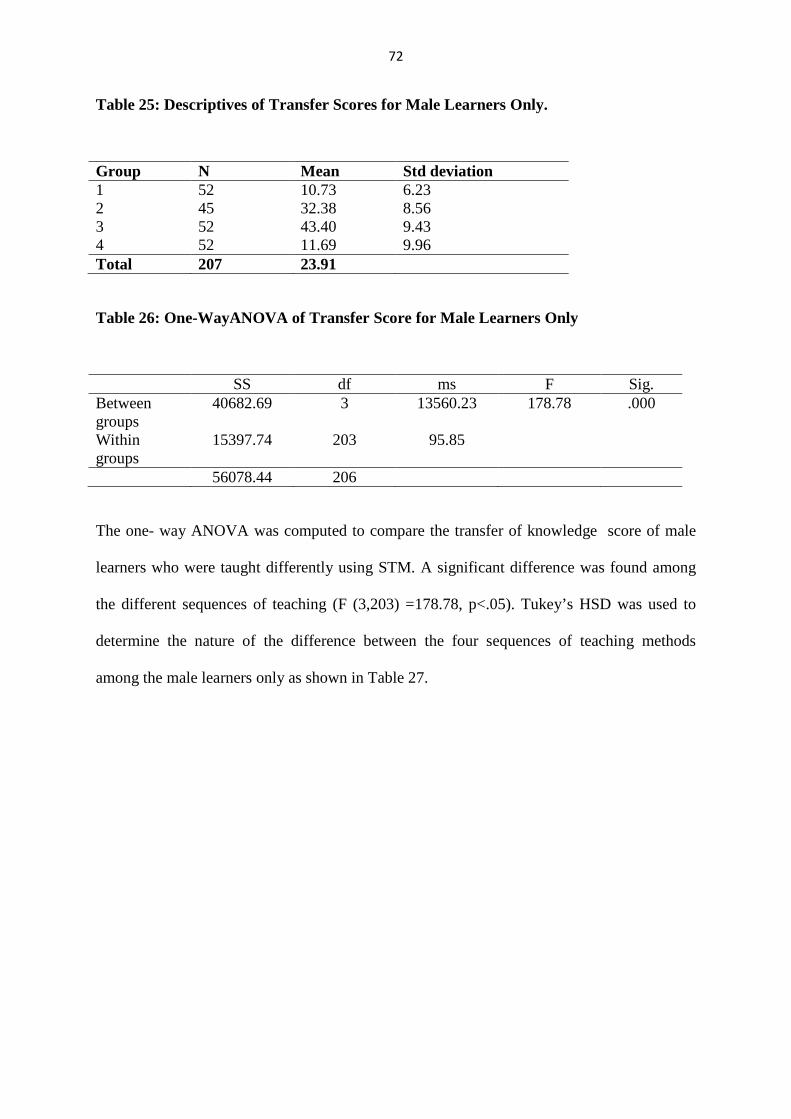
72
Table 25: Descriptives of Transfer Scores for Male Learners Only.
Group N Mean Std deviation 1 52 10.73 6.23 2 45 32.38 8.56 3 52 43.40 9.43 4 52 11.69 9.96 Total 207 23.91
Table 26: One-WayANOVA of Transfer Score for Male Learners Only
SS df ms F Sig. Between groups
40682.69 3 13560.23 178.78 .000
Within groups
15397.74 203 95.85
56078.44 206
The one- way ANOVA was computed to compare the transfer of knowledge score of male
learners who were taught differently using STM. A significant difference was found among
the different sequences of teaching (F (3,203) =178.78, p<.05). Tukey’s HSD was used to
determine the nature of the difference between the four sequences of teaching methods
among the male learners only as shown in Table 27.
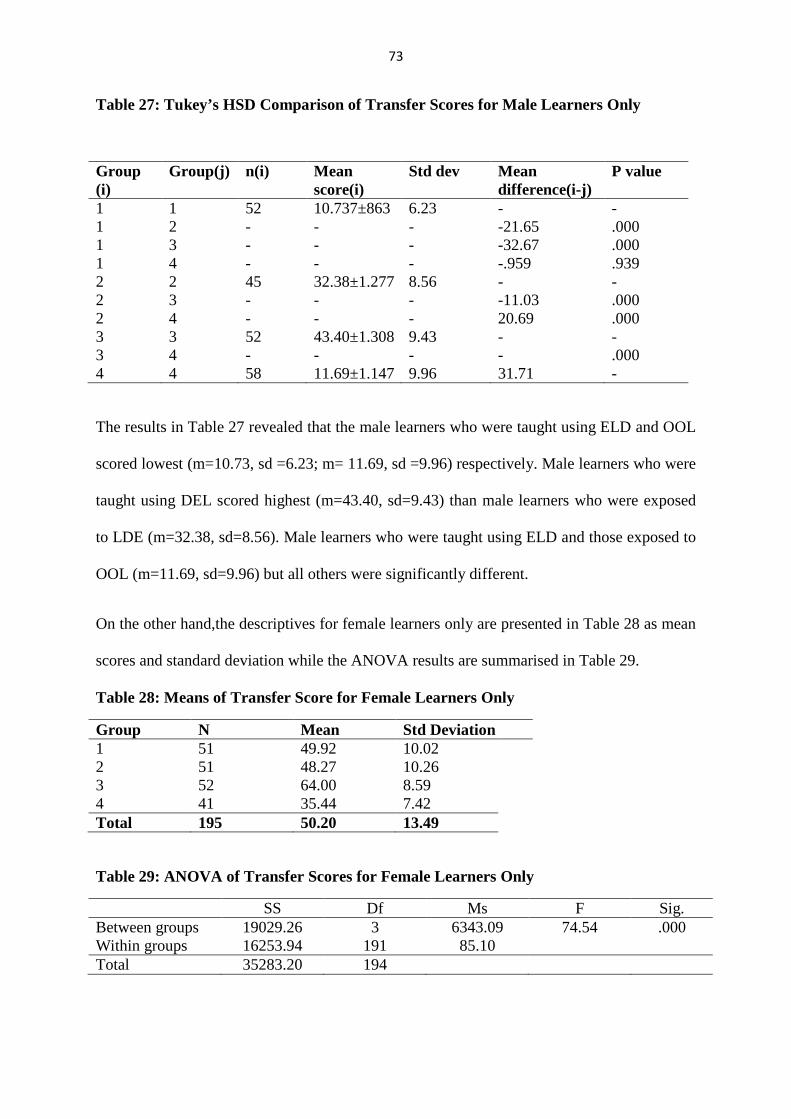
73
Table 27: Tukey’s HSD Comparison of Transfer Scores for Male Learners Only
Group (i)
Group(j) n(i) Mean score(i)
Std dev Mean difference(i-j)
P value
1 1 52 10.737±863 6.23 - - 1 2 - - - -21.65 .000 1 3 - - - -32.67 .000 1 4 - - - -.959 .939 2 2 45 32.38±1.277 8.56 - - 2 3 - - - -11.03 .000 2 4 - - - 20.69 .000 3 3 52 43.40±1.308 9.43 - - 3 4 - - - - .000 4 4 58 11.69±1.147 9.96 31.71 -
The results in Table 27 revealed that the male learners who were taught using ELD and OOL
scored lowest (m=10.73, sd =6.23; m= 11.69, sd =9.96) respectively. Male learners who were
taught using DEL scored highest (m=43.40, sd=9.43) than male learners who were exposed
to LDE (m=32.38, sd=8.56). Male learners who were taught using ELD and those exposed to
OOL (m=11.69, sd=9.96) but all others were significantly different.
On the other hand,the descriptives for female learners only are presented in Table 28 as mean
scores and standard deviation while the ANOVA results are summarised in Table 29.
Table 28: Means of Transfer Score for Female Learners Only
Group N Mean Std Deviation 1 51 49.92 10.02 2 51 48.27 10.26 3 52 64.00 8.59 4 41 35.44 7.42 Total 195 50.20 13.49
Table 29: ANOVA of Transfer Scores for Female Learners Only
SS Df Ms F Sig. Between groups 19029.26 3 6343.09 74.54 .000 Within groups 16253.94 191 85.10 Total 35283.20 194
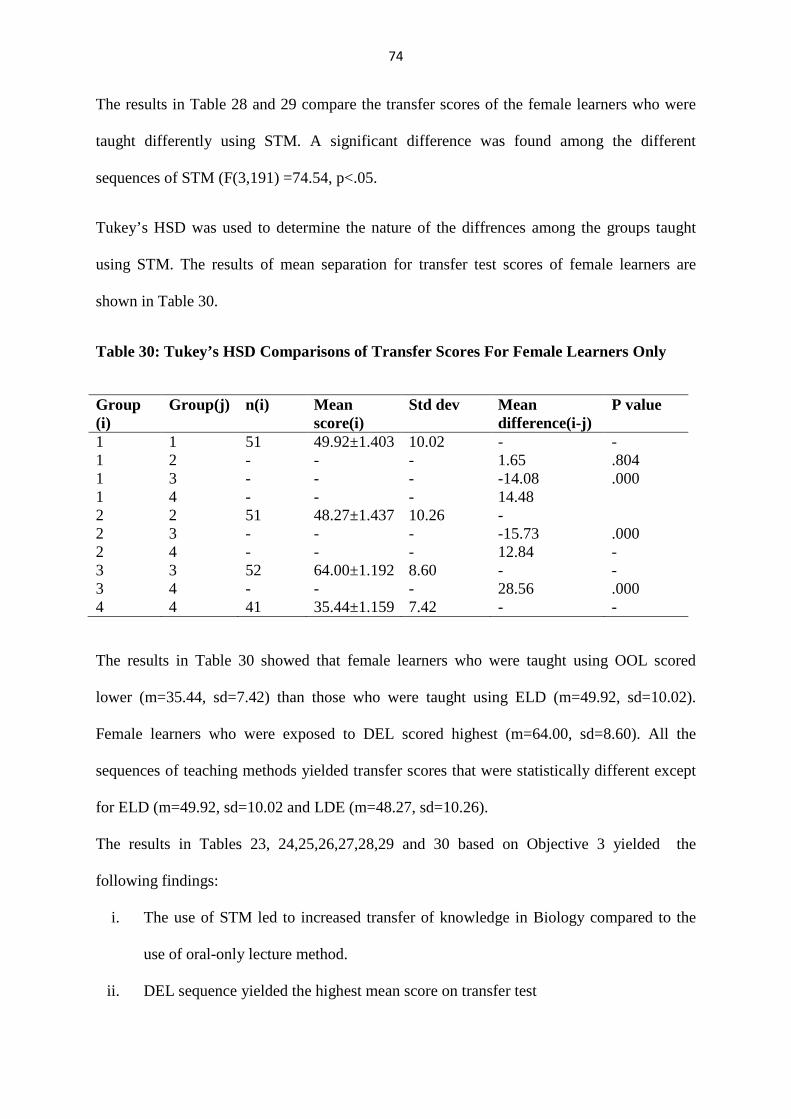
74
The results in Table 28 and 29 compare the transfer scores of the female learners who were
taught differently using STM. A significant difference was found among the different
sequences of STM (F(3,191) =74.54, p<.05.
Tukey’s HSD was used to determine the nature of the diffrences among the groups taught
using STM. The results of mean separation for transfer test scores of female learners are
shown in Table 30.
Table 30: Tukey’s HSD Comparisons of Transfer Scores For Female Learners Only
Group (i)
Group(j) n(i) Mean score(i)
Std dev Mean difference(i-j)
P value
1 1 51 49.92±1.403 10.02 - - 1 2 - - - 1.65 .804 1 3 - - - -14.08 .000 1 4 - - - 14.48 2 2 51 48.27±1.437 10.26 - 2 3 - - - -15.73 .000 2 4 - - - 12.84 - 3 3 52 64.00±1.192 8.60 - - 3 4 - - - 28.56 .000 4 4 41 35.44±1.159 7.42 - -
The results in Table 30 showed that female learners who were taught using OOL scored
lower (m=35.44, sd=7.42) than those who were taught using ELD (m=49.92, sd=10.02).
Female learners who were exposed to DEL scored highest (m=64.00, sd=8.60). All the
sequences of teaching methods yielded transfer scores that were statistically different except
for ELD (m=49.92, sd=10.02 and LDE (m=48.27, sd=10.26).
The results in Tables 23, 24,25,26,27,28,29 and 30 based on Objective 3 yielded the
following findings:
i. The use of STM led to increased transfer of knowledge in Biology compared to the
use of oral-only lecture method.
ii. DEL sequence yielded the highest mean score on transfer test

75
iii. Gender had significant effect where females did better than male learners.
iv. The interaction effect of STM and gender had significant effect.
These findings are discussed in section 4.3.3
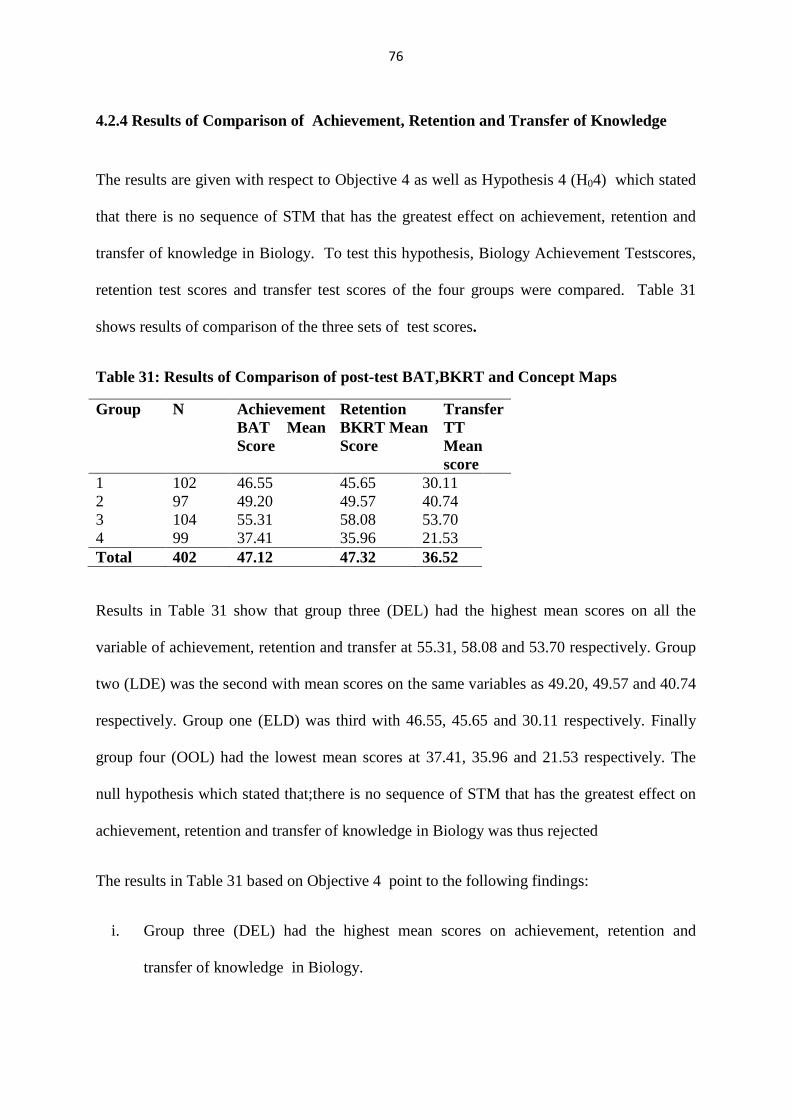
76
4.2.4 Results of Comparison of Achievement, Retention and Transfer of Knowledge
The results are given with respect to Objective 4 as well as Hypothesis 4 (H04) which stated
that there is no sequence of STM that has the greatest effect on achievement, retention and
transfer of knowledge in Biology. To test this hypothesis, Biology Achievement Testscores,
retention test scores and transfer test scores of the four groups were compared. Table 31
shows results of comparison of the three sets of test scores.
Table 31: Results of Comparison of post-test BAT,BKRT and Concept Maps
Group N Achievement BAT Mean Score
Retention BKRT Mean Score
Transfer TT Mean score
1 102 46.55 45.65 30.11 2 97 49.20 49.57 40.74 3 104 55.31 58.08 53.70 4 99 37.41 35.96 21.53 Total 402 47.12 47.32 36.52
Results in Table 31 show that group three (DEL) had the highest mean scores on all the
variable of achievement, retention and transfer at 55.31, 58.08 and 53.70 respectively. Group
two (LDE) was the second with mean scores on the same variables as 49.20, 49.57 and 40.74
respectively. Group one (ELD) was third with 46.55, 45.65 and 30.11 respectively. Finally
group four (OOL) had the lowest mean scores at 37.41, 35.96 and 21.53 respectively. The
null hypothesis which stated that;there is no sequence of STM that has the greatest effect on
achievement, retention and transfer of knowledge in Biology was thus rejected
The results in Table 31 based on Objective 4 point to the following findings:
i. Group three (DEL) had the highest mean scores on achievement, retention and
transfer of knowledge in Biology.
77
ii. Group four (OOL) meanscores were lowest on all the three variables of achievement,
retention and transfer of knowledge
These findings are discussed in section 4.3.4
4.3 Discussion of Results
This section is organised under subheadings generated from the objectives of the study. The
discussion on findings of this study is as follows:
4.3.1 Findings based on Objective 1: Effect of STM on Student’s Achievement in Biology
A comparison of groups 1,2,3 and 4 students’ pre-test BAT mean scores showed non-
significant differences F (401)= 2.01, p> 0.000<0.05 significant level (Table 8). This result
indicates that the four groups were similar in their prior knowledge of the topic: ‘Enzymes’
before the treatment started. The four groups were thus suitable for the study. Administering
pre-test was necessary because knowledge discrepancy among learners has been identified as
influencing effectiveness of instructional design (Mayer & Moreno, 2002). The four groups
were thus homogenous.
However the results of achievement test indicate that students who were taught through the
STM achieved significantly higher scores in post test BAT than those taught using the oral-
only lecture method (Table 12). This then implied that the STM was more effective in
enhancing students’ achievement than the oral-only lecture method.The significant effect of
STM over oral-only lecture method could be attributed to involvement of multimedia. STM is
perhaps most effective due to its ability to satisfy the many types of learning preferences that
a particular type of learners embody.
78
The findings of this study are supported by Reigeluth’s (1979) elaborations theory which,
provides a broad perspective framework for selecting and sequencing the content in
instructional setting. Reigeluth (1979), proposed two fundamental types of sequencing
strategies in teaching that is, topical and spiral sequencing. Both involve mastering a topic or
task in several phases such as STM while using different ways. Wilson and Cole (1992) made
recommendations for restructuring Reigeluth’s elaboration theory giving rise to a new
approach: SCM (Simplifying Conditions Method).
Reigeluth (1999) further proposed a specific method to provide practical guidelines for
organising holistic sequences of instruction. The major contribution of Reigeluth’s theory to
STM is the guidance for scope and sequence decisions for heuristic tasks, using heuristic task
analysis methods. According to Keller’s ARCs model of motivational design (1987),
effective instructional design should provide variability to better reinforce materials and
account for individual differences in learning styles. Use of a variety of methods in
presenting material such as STM is thus encouraged. Sequential teaching methods seen to
represent a learning cycle or spiral where the learner “touches all the bases”. The learner is
provided with opportunities to experience, reflect, think and act or do. The net effect is
enhanced original learning characterized by creation of significant new knowledge.
4.3.1.1 Gender-based Effect of Concept Mapping on Achievement in Biology
All groups were exposed to Concept Mapping whose effect is likely to have had more
positive impact on girls than boys (Table 10). Previous study by Namasaka, Mondoh and
Keraro (2013) showed that girls are more motivated when they are taught using Concept
Mapping strategy. The effect of Concept Mapping done during treatment would thus be
responsible for significant difference in gender scores on achievement. Girls performed
better than boys in all the four groups. Previous research by Moir and Jessel (1997), revealed
79
that girls see more, and remember in detail more of what they see. This could imply that,
gender disparity in performance which is caused by gender differences in organisation and
the mechanism of learning could be resolved using the Concept Mapping technique. The
differences in brain organisation, published works by White (1987), Branford and Cocking
(1999) and John (2003) provide an explanation for female superiority in Concept Mapping
and consequently achievement. According to Canas & Novak (2005) and Prezzler (2004),
Concept Mapping is all about relationships between concepts that indeed form the basis for
Biology Education (Novak, 1998). It is therefore emphasised that establishing the impact of
gender difference on learning through Concept Mapping is important. The idea that females
achieve better when exposed to Concept Maps fits in our knowledge of female brain.
According to Moir & Jessel, (1997), the female mind is organised so as to place primacy on
relationships. Additionally, the female mind model connects a far wide variety of related
pieces of information, against a background where the importance of relationships is
paramount.
The learning differences between two gender is a natural phenomenon. Gender-based
disparities could be addressed if these differences are recognised and understood.
Furthermore, female and male attitude have both biological and social roots (Kimura &
Harshman, 1984). The social roots are easy to alter but not the biological ones. Knowing this
could be the first step to bridging gender gap in learning. Science is doing what it can, by
producing the evidence that the minds of male and females are different (Moir &Jessel,
1997).
Witheston (1985) studied how boys and girls respond to visual messages and found out that
girls have their responses residing in both left and right sides of the brain. The study revealed
that the difference relates to the corpus collosum, bundle of fibres that link the left and right
side of the brain. It allows for exchange of information between the left and right side of the
80
brain. Consequently, in girls, the nerve fibre is thicker and more bulbous than in boys. The
key message – exchange centre is bigger in girls than in boys. This implies that the two sides
of the brain have a larger number of connections in girls. It also means that more information
is exchanged between the left and right sides of the female brain. Later research by Moir &
Jessel (1997) showed that, the more the connections individuals have, the more articulate and
fluent they are in logical and sequential thought processes such as Concept Mapping.
4.3.1.2 Effect of STM Interacting with Gender on Achievement
Gender is a factor of learning whose significant influence cannot be ignored. According to
works by John (2003) and Moir & Jessel (1997) both genders are born with brains wired in
different ways. The male and female learners therefore, think in different ways, have different
strengths, value things in different ways and use different strategies to learning in particular.
However, females are easily visually distracted than males but absence of visual distraction
heighten performance of other senses of touch, taste, smell and hearing.
Findings of this study heightens the awareness of gender disparity in performance as a matter
of differential brain operations in organisation of learning. Showing that females achieve
more than males when using Concept Maps may be unpopular and controversial. However,
most studies on gender and achievement show that on average girls do better in schools than
boys (Bhavnani& Hutt, 1972; National Centre for Education Statistics; 2003).
4.3.2 Findings based on Objective 2:
Effects of STM on Students’ Retention of Knowledge in Biology
Aziz (1990) perceives retention as storage, the process of holding encoded information in
memory. The results presented in Table 21 show that students who were taught through the
81
STM had significantly higher scores in the Biology Knowledge Retention Test (BKRT) than
those taught using the oral-only lecture method. This therefore, implied that the STM was
more effective in enhancing students’ retention of knowledge than the oral-only lecture
method. STM ensures maximum utilisation of most parts of the memory. The study also
sought to determine the best sequence of the STM that would lead to highest retention levels.
To address this, students’ retention of content material relative to the three sequences was
analysed. The analysis of results indicated that the students who were taught through the DEL
sequence obtained significantly higher scores in the BKRT than those who were taught
through the LDE and ELD sequences. perhaps DEL provides the best pattern for elaborative
rehearsal of information. DEL seems to enhance attention to information while in the
working or short term memory. Sisson et al (1992) provide literature on clinical information
with regard to knowledge retention of material taught and examined in Biology. However,
the history of research on retention is fairly recent. It is rather unfortunate that in education a
great deal of time and effort is devoted to the acquisition of knowledge but very little is
known about how long this knowledge is retained. Addressing this issue has practical
relevance to educational policy and practice. It also has implications for theoretical models of
memory and knowledge representation.
The first attempt to address the issues about the retention of formally acquired knowledge
was reported by Bahrick (1984). He found a strong relationship between retention and the
initial depth of learning. Nevertheless, his study laid a strong foundation upon which
subsequent researches were conducted in various specific disciplines, Biology Education
included. Results of a study done by Esra et,al. (2009), focusing on effects of STM on
retention in Biology, showed higher retention level in lessons beginning with experiment or
slide demonstration as opposed to lecture method. Their findings agreed with results of
previous researches that laboratory work offer students hands-on-experience thus enhancing
82
their remembrance to 90%. Similarly the present research findings agree with Esra’s slide
demonstration but differ on the aspect of experiment. Esra et,al. (2009) reported that student
comprehension is enhanced with lesson started with experiment, because laboratory activities
increase students’ interest in the topic. They seem not to have taken into account the impact
of the nature of knowledge as well as its representation. Maslow’s Theory of learning
highlighted the differences between experinental knowledge, procedural knowledge,
theoretical and spectator knowledge. Similarly, the difference in learner’s retention may not
only be in the method but also in the dimension or domain of knowledge. For example,
dimensions or domains of knowledge in Biology include Anatomy, Physiology, Mophology
and Histology. The most effective method is one that can represent the specific domain of
knowledge in a transparent manner for learners to see.
In the present study, animated slide demonstration is a more effective instructional
compliment for teaching processes or mechanisms in Biology. This view is strongly
supported by O’Day (2009), who observed that on retention, animated slide demonstration
rival and at times surpass the pedagogical value of lab work. This is true especially when
dealing with knowledge that involves a physiological process or mechanism.
The aspect that needs to be addressed is: How students could learn about the mechanism of
enzyme action through laboratory work and what the students were supposed to observe. It
was not enzyme activity itself but rather mere effect of enzyme activity. Pedagogically,
learning about enzyme action can only be inferred through experiment. Animated slide
demonstration therefore, provided for direct observation of the mechanism, hence better
understanding and higher retention.
Inquiry-based laboratory approaches are more effective than verification approaches (Opara
2011). In this study, start of lesson with experiment was probably less effective because it
83
focused on verification as opposed to discovery of concepts and observation of actual
mechanism of enzyme activity.
Since the KICD encourage use of a combination of methods, then DEL would be the best
option. The findings of this study show that it is particularly effective if animated slide
demonstrations are introduced to students in the classroom before going to the laboratory to
verify and then finally summarise main points of the topic with a lecture. The students may
meaningfully learn through STM. A skillful coordination of DEL will increase their mutually
supportive synergism thus improving their overall effectiveness. Some learning activities
help students prepare for others, and the ideas-and-skills learned in earlier activities were
reinforced by later experiences (Johnson, 1991). In this way, it is possible not only to increase
the students’ achievement on knowledge, but also increase their levels of retention of
knowledge. According to Cognitive Load Theory of learning by Sweller (1994), the human
working memory has a threshold of four to ten elements making some material difficult to
learn. Element interactivity refers to the degree to which the elements of some to-be-learned
information can, or cannot, be understood in isolation. As a consequence of the high element
inter-activity, the cognitive load induced exceeds the capacity of the working memory.
Chandler and Sweller (1991) provided evidence that the cognitive load of some learning
material can be greatly reduced if the information is presented pictorially as in the case of
slide demonstration.
Cognitive load can either be intrinsic or extraneous. Intrinsic cognitive load is due to solely
the intrinsic nature (difficulty) of some to-be-learned content. Extraneous cognitive load is
due to the instructional method used to present information to learners (Chandler & Sweller,
1996).

84
Applying Cognitive Load Theory to teaching, learning will be maximised by ensuring that as
much of a learner’s working memory as possible is free to attend only to encoding to-be-
learned information. Accordingly, lecture method imposes a relatively high level of cognitive
load (Sweller, 1988). On the other hand, the major weakness of laboratory experiments in
teaching a psychological process such as enzyme action is that learners may successfully
carry out the practical, yet effectively learn nothing. Slide demonstration impose very low
levels of cognitive loads thus facilitate learning (Mousavi, Low & Sweller, 1995). While use
of DEL sequence provided an effective alternative to both LDE and ELD sequences, it can be
argued that perhaps DEL fosters original learning, which in turn is determinant of retention.
This effect could be attributed to reduced cognitive load when visual presentations
(animations) are used in the beginning. In conclusion, DEL sequence has been demonstrated
to be highly effective at improving retention of psychologically based content such as
enzyme activity in Biology. The association between concepts and the motion in the graphic
is clearly indicated in slides. This is necessary for construction of meaning.
The laboratory work and class experiments have a redundancy effect since they only show
the presence of catalase enzyme in cells, effects of pH and temperature on enzyme activity,
but do not show the typical or real mechanism of enzyme action on substrate to yield
products. Use of DEL is thus encouraged since it also has a positive effect on transfer of
knowledge in Biology (see the subsequent section for a detailed explanation of this subject).
4.3.2.1 Gender-based Effect on Retention of Knowledge in Biology
The results of this study indicate that there is a significant difference in retention of
knowledge between male and female learners at .05 level. This could be attributed to the
difference in original learning as reflected in achievement scores. A comparison between
mean scores of male and female learners on both BAT and BKRT reveal that female learners
85
scored significantly higher than their male counterparts. The effect of original learning was
therefore positively carried forward to the retention of knowledge. Based on gender effect of
Concept Mapping as described in section 4.3.1.1, it appears that female learners process
chunks of information more suitably and meaningfully. This ensures that the information is
retained for a longer time and can be used in different situations of life (Mundal 2013). The
researcher observes that Concept Mapping technique could be responsible for helping female
learners to build a frame of concepts that are retained over longer periods. Although a few
studies have been undertaken to investigate gender-based effect on retention of knowledge,
so far scanty literature is available. The present study therefore attempted to bridge the
knowledge gap on gender differences in retention of knowledge of Biology.
4.3.2.2 Effect of STM Interacting with Gender on Retention of Knowledge
The results showed that although both STM and gender separately had significant effect on
retention but the interaction between the two indicated that there was no significant effect
(see Table 13). The findings also revealed that different versions of STM differ with respect
to their effect on retention of knowledge in Biology. Furthermore the female gender
appeared to retain more of the knowledge learned. The insiginificant interaction effect of
STM and gender could be attributed to other factors beyond the scope of the present study. It
could pehaps be due to the nature in Biology subject, which includes many abstract concepts
events, sub-topics and facts that students have to learn. These, according to Cimer (2004)
and Trumper (2006), pose learning difficlties at individual learners level.

86
4.3.3 Findings based on Objective 3:
Effects of STM on Students’ Transfer of Knowledge in Biology
Transfer of knowledge mainly depends on concept formation because these concepts are the
basic building blocks of the structure of the learners knowledge. In addition, Concept
Mapping provides opportunity for transfer of knowledge in a new context of assessment. This
was a major departure from the study done by Esra , Ijlal & Ocak (2009), which only
focused on effect of STM on students’ achievement and retention in Biology thus providing
no information about whether the acquired and retained knowledge could be transferred to
other contexts. Concept Maps made by students in this study were used as transfer test.
The results show that the students who were taught through the DEL sequence obtained
significantly higher scores in the TT than those who were taught through the LDE and ELD
sequences (Table 24). Cognitive Load Theory displays strong constituencies with the findings
of the current study regarding effective teaching sequence (DEL). While information
processing models of learning have historically emphasised the “fixed” limits of working
memory, there is evidence (Pavio, 1990; Baddeley, 1992) to show that under certain
conditions, an expansion of working memory may be achieved. This may only be achieved
by engineering reduced levels of extraneous cognitive load through instructional design. The
bottom line, according to cognitive load theory, will often be the need to decrease total
cognitive load, and the need to maximise cognitive resources available for use in the learning
process (Pavio, 1990). If for some reason cognitive load increases instead of decreasing, then
learning will be inhibited. This explanation attests to the findings of this study. Whereas both
slides demonstration and laboratory experiments methods involve visual aids, but
experiments increase cognitive load.
87
Additionally, laboratory work on enzyme action has a redundancy effect since learners do not
see the actual mechanism in play. They only infer from the results of the experiments since
the actual process is hidden. Experiments also impose a split attention effect as well as
modality effect. However, the researcher still holds the view that experiments are more
effective for explicit information such as anatomy but not for hidden information as is the
case in physiology.
On the other hand, slide demonstration has shown to be highly effective at facilitating
learning of physiologically based content. Cognitive Load Theory explains this result by
focusing on the levels of cognitive load imposed upon the student who needs to process the
varying subject content. Consequently, slides are fully self-contained (O’Day, 2008).
Furthermore, slides eliminate split attention leaving learners to concentrate their
attention / observation wholly on the projection screen. The success of this theory in
developing effective teaching strategies is of paramount importance to educationalist,
teachers and curriculum developers. The findings of this study therefore contribute to the
body of evidence and knowledge to show that students taught using DEL sequence are
actually more able to deal with the issue of transfer of knowledge to new contexts as attested
to by their superior performance on transfer test using Concept Mapping technique.
Results reveal animated slide demonstration is more effective if used prior to experiment and
lecture. This could be attributed to the ability of slides to represent knowledge of mechanism
of enzyme action in a way that learners can understand. Animated slides are effective
knowledge representation tools which enable learners to ‘mentally’ see the knowledge
depicted as a process. Knowledge on enzyme action is factual information which when
acquired in a context of meaningful learning is not only retained longer, but can be
transferred in other contexts to solve new problems (Brawsford et al, 199). Research done by
(Sweller, 1994: O’Day, 2008) support the view that use of slide demonstration helps to make
88
the instruction “conceptually transparent” to students. They are metacognition tools that
easily convey information to learners through a process called mental modeling (Borich;
2004). Mental modeling helps the learners to internalise, recall and then transfer knowledge
to different contexts at a later time. The importance of exploring the issue of transfer of
knowledge arise from the finding that knowledge is retained particularly well when it is
actively employed in practical work (Neisser, 1984).
4.3.3.1 Effect of Gender on Transfer of Knowledge in Biology
The result of the analysis showed that gender has a signficant effect on transfer of knowledge
in Biology. Female learners were found to have significantly higher transfer scores than their
male colleagues. Furthermore Concept Mapping technique appeared to be favourables to
girls as compared to boys. The findings of the present study corroborates those of another
study by Namasaka, Mondoh and Keraro (2013). In Concept Mapping female learners get
an opportunity to exploit there superior inherent functioning abilities of their memory. As
such the female learner is enabled to retain and transfer larger amounts of information.
4.3.3.2 Interaction Effect of STM and Gender on Transfer of Knowledge in Biology
Transfer of knowledge requires retrieval, which involves the process of locating, removing
and using information stored in memory. According to Cimer(2012), students must learn to
transfer what they have learned and it is the teacher’s duty and responsibility to teach
studnents how to transfer learning to other stiutuations.
The results of the present study show significant effect of interaction between STM and
Gender. In accordance with the goals of teaching Biology, students need opportunities to
apply their knowledge in new situations. Studies done by Mondal (2013) and
Aziz(1990)show that there is consistent gender differences in the recall and transfer of
89
episodic memories. Females tend to recal and transfer those with an emotional flavour
(particularly positive) than males do. There exists sex differences in the role of amygdale in
forming and retrieving of episodic memories. This could be applied in the teaching-learning
situation. The effects of STM as revealed by the findings of this study could be attributed to
the role of STM as revealed by the findings of this study could be attributed to the role of
STM which include:enhancing of relearning, meaningfulness and schema formation.
4.3.4 Discussion of Findings based on objective 4 Establishment of the Sequences of STM that had greatest effect on Achievement, Retention and Transfer of knowledge
An overall finding from this study is that sequential teaching methods (STM) increase
achievement, retention and transfer of knowledge in Biology. The DEL sequence of STM is
the most effective relative to LDE and ELD. The use of STM should always consider
adoption of the sequence that yield highest scores on achievement, retention and transfer test.
The DEL sequence was the best alternative since it yielded the highest achievement scores on
BAT, highest retention scores on BKRT and similarly highest transfer score on TT (Concept
Maps). As such, Demonstration- Experiment-Lecture (DEL) sequence is identified as the
most effective in comparison to LDE and ELD.
4.4 Summary
Since the theory of teaching is yet to be developed, the present study indicates some new
focus towards the application of sequential methods of teaching Biology and its impact on
variables like achievement, retention and transfer of knowledge . It has helped to shed new
light on the paradox of teaching Biology. Too much premium is paid on use of laboratory
work as the most effective teaching method without regard to the nature of knowledge being

90
learned. The current study has shown that commencing teaching with demonstration had
greatest impact on perfomance improvement thus playing the role of an advance organiser.
91
CHAPTER FIVE
SUMMARY, CONCLUSIONS AND RECOMMENDATIONS
5.0 Introduction
The purpose of the study was to evaluate differential effectiveness of three versions of
Sequential Teaching Methods namely; ELD, DEL and LDE. The instruments used for Data
Collection were: BAT pre-test, BAT post-test, BKRT and Concept Maps.
This chapter presents a summary of the findings study, and the conclusions drawn from the
study. It also gives implications of the study and recommendations. In addition, areas for
further research are suggested.
5.1 Summary of Main Findings and Contributions to Knowledge
On the basis of the data analysis presented in Chapter 4 the following are the major findings
of the study:
1. The use of STM led to improved achievement in knowledge in Biology compared to
the use of oral-only lecture. Furthermore, there was a significant difference in student
achievement in Biology between learners taught using different sequences of STM. In
addition, Demonstration (animated slides)-Experiment-Lecture (DEL) sequence
yielded the highest mean score on achievement.This is attributed to the “conceptual
transparency” which demonstration provides to learners at the beginning of the topic.
Students’understanding is then deepened and broadened using experiment for
verification and lastly, by making a conclusive summary using a lecture.
2. The use of STM led to improved retention of knowledge compared to the use of oral-
only lecture. There was also a significant difference in students’ retention of
92
knowledge in Biology between students taught using different sequences of STM.
Similarly as in objective one, DEL sequence results were highest (58.08%) on
Biology knowledge retention test.
3. The use of STM led to increased transfer of knowledge in Biology compared to the
use of oral-only lecture. There was a significant difference in students’ transfer of
knowledge when students were taught using different sequences of STM.
4. The DEL sequence yielded the highest mean scores on achievement retention and
transfer of knowledge at 55.31%, 58.80% and 53.70% respectively.
5.3 Conclusion
The teaching philosophy emerging from the findings of this study is that, each teaching
method used yielded some amount of learning. The use of a combination of teaching methods
sequentially enhances mastery and meaningful learning. This is characterised by high
achievement, retention and transfer of knowledge. A combination of teaching methods is
more effective due to complementarity and the supplementary role that each plays. Each
method of teaching has its own strengths and weaknesses. The effects vary depending on the
position of a particular method in the specific sequence of teaching. Thus the first method in
the sequence determines the amount of original learning that occurs.
In conclusion, Sequential Teaching Methods (STM) when used in instruction could enhance
immediate post treatment achievement test scores, retention and transfer of knowledge in
Biology well over oral-only lecture method as predominantly used in Kenyan Secondary
Schools. This will however, be more beneficial when the most effective sequence of STM is
used in teaching.
93
Demonstration Experiment-Lecture (DEL) sequence has been found to be the most effective
with BAT (55.31%), BKRT(58.08%) and TT (57.30%) compared with other alternate
sequences and OOL.
The findings of the study support emphasis made by KIE (now KICD) that teachers in
Biology should use a combination of methods on a single topic. The incorporation of STM in
teaching is therefore beneficial to the pedagogical process. DEL is useful in addressing the
problem of low achievement in Biology at the Kenya Certificate of Secondary Education
Examinations (KCSE) and should be adopted
5.4 Recommendations
This study has provided some insights into the need for teachers to provide students with
more opportunities for meaningful learning to help them improve achievement, retention and
transfer of knowledge in Biology. Thus, the recommendations below are given in the light of
the findings and context of this study.
5.4.1 Recommendations at the pedagogical level
(1) The KICD should formulate new policy guidelines laying emphasis on use of
Sequential Teaching Methods as a means to improve learners conceptual
understanding of knowledge in Biology especially that concerned with physiological
processes or mechanisms such as ‘enzyme action’.
(2) Univesities, colleges and CEMASTEA should improve on the existing policy on
implementation in Biology syllabus by training and retraining teachers on use of
STM. This could be done through workshops, seminars, conferences and training
programs. Animated Slide Demonstration Experiment-Lecture (DEL) sequence is
highly recommended. This is likely to enhance achievement, retention and transfer,
assuming that all other factors are held constant.
94
(3) Schools should provide facilities/equipment which are necessary for effective
implementation of Sequential Teaching Methods. This is important because Biology
is best taught in well equipped laboratories and students learn the subject with much
ease if taught using a sequence of methods.
(4) The ministry of Education and other stakeholders should adopt a policy to provide
secondary schools and universities with financial and material resources needed to
effectively utilise STM. Shortage of fund, equipment and learning resource make
implementation difficult.
(5) Educators should respect and embrace gender differences in achievement and adopt
teaching methods which enhance the potential of female students
(6) Universities and colleges should focus on training for innovative teaching rather than
knowledge.
5.4.2 Recommendations for Further Research
The results of this study have revealed that students who were exposed to STM and
especially DEL sequence performed better on achievement, retention and transfer tests
in the area of Physiology.
The question that remains unanswered by the study is is how the same sequence
(DEL) affects knowledge relating to Anatomy, Histology and Morphology.
The recommendationi in this regard, is that research be carried out to explore the
effects of STM (DEL, LDE and ELD) on achievement, retention and transfer in
relation to different kinds of knowledge in Biology such as Physiology, Anatomy,
Morphology and Histology. This kind of research is likely to make curriculum
developers based at KICD, Quality Assurance Division of the Ministry of Education
Science and Technology (MoEST) and all the stakeholders to become more aware of

95
the importance of using the most effective sequence of STM in the acquisition of
knowledge, development of process skills as well as promotion of positive attitude
towards Biology.
96
REFERENCES
Allen, J., Gregory, A.,Mikami, A., Lun,J., Hamre, B., & Pianta, R (2013). Observations of
Effective Teacher-Student Interactions in Secondary School Classrooms: Predicting
Student Achievement with the Classroom Assessment Scoring System. Secondary
School Psychology Review, 42, 76-97.
Anderson, T.H.,& Huang, S.C.C.(1989). On using Concept Maps to assess the
comprehension effects of reading expository text.(ERIC Document Reproduction
service No. Ed 310368).
Anderson S.J; Yamagishi, N; Karavia, V(2002). “Attentional processes link perception and
action” Proceedings of the Royal Society B : Biological sciences 269 (1497) : 1225
Ashworth, A., E (1982). Testing for Conditions Assessment. A Handbook for Teachers in
Schools and Colleges. Evans Brothers Limited. Ibadan
Aziz, T.(1990). Comparative Effectiveness of Information processing models of Teaching in
Developing certain concepts in Chemistry at Secondary stage, PhD Dessertation,
Jamin Millia Islamia.
Baddeley, A. D. (1992). Working Memory. Science, 255,556-559.
Bahrick, H.P. (1984). Semantic memory content in the permastore: Fifty years of memory for
Spanish learned in school. Journal of experimental psychology: General, 104, 54-75.
Barenholz, H., & Tamir, P.(1992). A Comprehensive use of Concept Mapping in design
instruction and assessment. Research in science and technological Education, 10(1),
37-52.
97
Barwett, S. M. & Ceci, S. J. (2002). When and where do we apply what we learn? A
taxonomy for far transfer. Psychological Bulletin 128. 612 – 637.
Beirute, L., & Mayorga, L. F. (2004). Concept Maps: Theory, methodology, technology.
Proceedings of the 1st international conference on Concept Mapping (Vol. 1).
Pamplong, Spain.
Bharnani, R & Hutt, C.(1972). ‘Divergent Thinking in Boys and Girls’. Child Psycho.
Psychiat 121-27.
Blissett, G., & Atkins, M. (1993). Are they thinking, are they learning? A study of the use of
Interactive Video. Computers in Eduction, 21, 31-39.
Borg, W. R.,& Gall, M.D. (1989). Educational Research: An introduction 5th Ed. Pg 668-737.
White Plains. New York: Longman
Borich, G.D.(2004). Effective Teaching Methods. Fifth Edition. New Jersey:Merrill,
Prenticehall.
Branford, J; Brown, A. L; & Cocking, R. R. (1999). How people learn: Brain, mind,
experience and school. Washington D. C: National Academy Press.
Bennett,& Higgins P.(1996). Researching into Teaching Methods in Colleges
And Universities. London :Kogan Page Limited
Briggs, G., Shamma, D. A., Canas, A. J., Carff, R., Scargle, J., & Navak, J. D. (2004).
Concept Maps applied to mars exploration public outreach. In A. J. Canas, Novak, J.
D & Gouzalez, F (Eds), Concept Maps: Theory, methodology, technology.
98
Proceedingts of the first international conference on Concept Mapping (Vol. pp.
109-116). Pamplona, Spain.
Brown, C.(1995). The Effective Teaching in Biology. New York : Longhorn Group
Limited.Chammy, K (2006) Science and Social Justice: Making the Case for Case
Studies J. Coll Sci. Teach. 36, 54-59.
Canas, A. J., & Novak, J. D. (2005). A Concept Map-centred learning environment. Paper
presented at the symposium at the 11th Biennial conference of the European
Association for Research in Learning and Instruction (EARLI), Cyprus.
Canas, A. J., Carf, R., Hill, G., Garvalho, M., Arguedas, M.,Eskridge, T., et al., (2005).
Concept Maps: Integrating knowledge and information visualization. In S-O. Tergan
& T. Keller (Eds), knowledge and information visualization :Searching for synergies
(pp. 205-219).
Chandler, P. & Sweller, J. (1991). Cognitive Load Theory And The Format Of Instruction.
Cognition and Instruction, 8, 293-332.
Chandler, P. & Sweller, J. (1996). Cognitive Load while learning to use a computer program.
Applied Cognitive psychology, 10,151-170.
Cimer A.(2004). Effective teaching of Science. A review of literature. J.Turkish Science
Education, 4(1): 24-44.
Cimer A.(2012). What makes Biology learning difficult and Effective:students’ views.
Educational Research and Reviews Vol. 7(3), Pp.61-71.
99
Coffey, J. W., Hoffman, R. R., Canas, A. J., & Ford, K. M. (2002). A Concept Map based
knowledge modeling approach to expert knowledge sharing. In M. Bodmedine
(Eds); Proceedings of IKS 2002-the IASTED International Conference on
Information and Knowledge Sharing (pp. 212-217). Calgory, Canada:Actaq press.
Cohan, J., Pickeral, T., and McCloskey, M. (2009). Assesing School Climate. Education
Digest, 74 (8),45-48
Committee on Undergraduate Science Education (1997). Science Teaching Reconsidered: A
Handbook. NationalAcademy Press, hington.
Creswell, J.W.(2011). Research Design: Qualitative, Quantitative and mixed methods
Approaches (3rd Edition). New Delhi: Sage publications India PVT Ltd)
Damico, S.,B. & Roth, J.(1994). Differences Between the Learning Environments of High
and Low Graduation Schools: Listening to General Track Students. A paper
presented at the Annual meeting of the American Educational Research
Association, New Orleans.
Derbentseva, N., Safayeni, F., & Canas, A. J.(2006). Concept Maps: Experiments on dynamic
thinking. Journal of Research in Science Teaching 44 (3)
Edmondson, K. (2000). Assessing science understanding through concept
maps. In J. Mintzes J. Wondersee & J. Novak (Eds), Assessing
science understanding(pp. 19-40). San Diego: Academic Press.
100
Edwards, J., & Fraser, K. (1983). Concept Maps as reflections of conceptual
understanding. Research in Science Education, 13, 19-26
Esra, O., Ijlal, O.,& Ocak, G. (2009). Sequential Teaching methods in Biology and their
effects in Acadeic Achievement. Kuramsal. Atatirk University.
FAWE. (1998). Teachers Training Qualification and working Conditions. Report Number 8
(pp 7-12). Nairobi. Kenya: Self
Fisher, D. Harrison, A. Hernderson, D. & Hofstein, A. (1998). Laboratory
Learning Environments and Practical Tasks in Seniour Secondary
Science Classes. Research in Science Education, 28 (3), 353-363.
Fowler, W.(1995). School Size and Student Outcomes. Advances in Educational
Productivity, 5,3-26
Fraenkel, J.R. & Wallen, H.E. (2000). Educational Research: An Introduction
(6th edition). White plains, NY: Longman.
Genty, S. G. (1994). Introduction to Institutional Development: Process and
Techniques. Wadsworth Publishing Company, Belmont; Carlifornia.
George, A.(1999). Constructivism in Learning. London:Orion Publishing
group ltd
101
Gordon,D; & Jeannette, V (2001). The Learning Revolution Stanford : Network Educational
press ltd
Havice, W. (1999). College Student’s Altitude Toward Oral Lecture and
IntegratedMediaPresentations.http//Scholar.lib.vt.edu/ejournals/JOTS/winterspring19
99PDF/havice.pdf.
Hohn, R., L., (1995). Classroom Learning and Teaching. New York: Longman Publishers Ltd
pp.287-297.
Holstein, A. & Lunetta, V.M. (1982). The Role of the Laboratory in Science
Teaching: Neglected Aspects of Research. Review of Educational
Research 52:201 -207.
John, R. B. (2003). How To Use Your Brain. Mumbai: Jaico Publishing
House.
Johnson, H. (1991). The Relative Effectiveness and Efficiency of Hands- On,
SlideDemonstration and Videotape Laboratories for Non-Science
Major Students. 111p. Master’s Thesis, hington State University.
Katz, D.A. (1991). Science Slide Demonstrations, Student Experiments and
Resource: A Reference List for Dementory through College Teachers
Emphasizing Chemistry with Some Physics and Life Science.
Journal of Chemical Education.68(3)235-244.

102
Keller, J. M. (1987). Development and Use of the ARCS Model of Motivational Design.
Journal of Instructional Development, 10 (3), 2-10.
Kenya Institute of Education (KIE)(1992). Secondary Education Syllabus,
Nairobi: Kenya Literature Bureau.
Kenya Institute of Education (1997). Secondary Education Syllabus,
Nairobi: Kenya Literature Bureau.
Kenya Institute of Education (2002). Secondary Education Syllabus,
Nairobi: Kenya Literature Bureau.
Kenya Institute of Education (2006). Secondary Education Syllabus,
Nairobi: KLB.
Kenya National Examinations Council (KNEC) (2006). Year 2005 Kenya
Certificate of Secondary Education Examination Candidates
Performance Report. Nairobi: Self.
Kenya National Examinations Council (KNEC) (2007). Year 2006 Kenya
Certificate of Secondary Education Examination Candidates
Performance Report. Nairobi: Self.
Kenya National Examinations Council (KNEC) (2008). Year 2007 Kenya
Certificate of Secondary Education Examination Candidates
Performance Report. Nairobi: Self.
Kenya National Examinations Council (KNEC) (2009). Year 2008 Kenya
103
Certificate of Secondary Education Examination Candidates
Performance Report. Nairobi: Self.
Kenya National Examinations Council (KNEC) (2010). Year 2009 Kenya
Certificate of Secondary Education Examination Candidates
Performance Report. Nairobi: Self.
Kenya National Examinations Council (KNEC) (2011). Year 2010 Kenya
Certificate of Secondary Education Examination Candidates
Performance Report. Nairobi: Self.
Kenya National Examinations Council (KNEC) (2012). Year 2011 Kenya
Certificate of Secondary Education Examination Candidates
Performance Report. Nairobi: Self.
Kenya Vision 2030 (2007). http://www.vision2030.go.ke Retrieved September 15, 2013
Kibett, J.K.,& Kathuri, N.J. (2005). Effects of Project-Based Learning on Students
Performance in Secondary Schools Agriculture. Zimbabwe Journal of Educational
Research, 17(1) 30-38.
Killermann, W. (1998). Research into Biology Teaching Methods. Journal of
Biological Education. 33(1): 4-9.
Kimura, D. & Harshman, R. (1984). ‘Sex Differences in Brain Organization for Verbal and
Non-verbal Functions’, Progress in Brain Research, 61, Amsterdam.
104
Kithaka,N (2003), Attitude and motivation in sciences. Findings of the baseline studies
carried out by the SMASE project. Nairobi. CEMASTEA.
Lawson, A.E. (2001) “Using the learning cycle to teach Biology Concepts and Reasoning
Patterns”. Journal of Biological Education, 35 (4), 165-169.
Lave, J., & Wenger, E. (1990). Situated Learning: Legitimate Peripheral Participation.
Cambridge. UK: Cambridge University Press.
Leake, D. B., Maguitman, A., Reinchherzer, T., Canas, A. J., Carvalho, M., Arguedas, M., et
al. (2004). Googling from a Concept Map: Towards automatic concept-map-based
query formation. In AS. J. Canas, Novak, J. D. & Gonzalez, F. M. (Eds), Concept
Maps: Theory, methodology, technology. Proceedings of the first international
conference on Concept Mapping (vol. 1, pp. 409-416). Pamplona Spain.
Maundu. J. N.; Sambili. H. J; and Muthwii S. M (1998). Biology Education: A
methodological approach. AMU Press, Nakuru.
Mayer, R.F and Moreno, R. (2002) Animation as an aid to multimedia
learning.Educ.psychol.Rev.14 87-99
Mc George, J.A (1942). The psychology of human learning : An introduction New York NY:
Longuans green
Mills, H.R. (1991).Teaching and training. A handbook for instructors (3rd
ed).London:Macmillan Publishers.
105
Ministry of Education (2006). The 2006 -2011 Strategic Plan. Nairobi
Mintzes, J.J, Wandwrsee, J.H., and Novak, J.D. (2000). Assessing Science understanding: A
human constructivist view.San Diego: Academic Press.
Moir. A., & Jessel. D (1989). Brainsex. The Real difference Between Men and Women
Berkshire.Cox & Wyman Ltd, Reading.
Mondal, C.B.(2013). A Comparative study for Teaching Chemistry through Inductive
thinking model and advance organiser model, international Journal on New Trends in
Education and their implication, Volume 4;Pp 10-20.
Mondoh, H. O (2005). Methods of Teaching Mathematics: A handbook for
teachers and students. Njoro: Egerton University Press.
Mousavi, S., Low, R., & Sweller, J. (1995). Reducing Cognitive Load by Mixing Auditory
and Visual Presentation Modes. Journal of Educational Psychology, 87, 319-334.
Namasaka, F. W., Mondoh, H. O., & Kerero, F. N. (2013a,). Effects of concept and vee
mapping strategy on students’ motivation in Biology in secondary schools in Uasin-
Gishu District, Kenya. International Journal of Current Research in life sciences, Vol,
No. 7, pp. 023-028.
Namasaka, F. W., Mondoh, H. O., & Kerero, F. N. (2013b,). Effects of concept and vee
mapping strategy on students’ Achievement in Biology in secondary schools in Uasin-

106
Gishu District, Kenya. International Journal of Current Research in life sciences, Vol,
No. 7, pp. 016-022.
Nassiuma, D. K. & Mwangi, J. W. (2004). Statistical methods for Information Analysis: An
Introduction. Egerton University Press.
National Research Council (n.d) (2014) National School Climate Standards: Benchmarks to
Promote Effective Teaching, Learning and Comprehensive School Improvement.
New York. Retrieved from http:www.school-climate.org/climate/documents/school-
climate-standards.pdf
Njogu, Z. C. (2004). Fostering the application of science education research findings in
Nigerian classrooms; Strategies and need for teachers’ professional development.
STAN proceedings of the 45th Annual conference, pp: 217-222.
Njuguna, B., (1998) The Project, the Problem, the Future. Unpublished Paper on the Findings
of Baseline Survey Carried out by the SMASSE Project.
Njuguna, B.M. (1999). The Findings from Baseline Studies by SMASSE Project. SMASSE
project.
Neisser, U. (1984). Interpreting Harry Bahrick‘s discovery: What confers Immunity against
forgetting? Journal of Experimental Psychology: General, 113, 32-35.
107
Nitcher, R. (1984), A Study of UNESCO Science education Improvement Projects in selected
Anglophone Countries of Africa. Project Project Problems, Sciene Education, 68 (4),
381-396
Novak, J.D.& Gowin, D.B.(1984). Learning How to Learn. Cambridge, England;
Cambridge University.
Novak, J.D.(1990). Concept Maps and Vee diagrams: Two metacognitive tools to facilitate
meaningful learning. Instructional science, 19, 29-52.
Novak, J.D (1998). The Pursuit of a Dream: education can be improved. A Human
Constructivist View. San Diego: Academic Press. Pg 3-28.
Novak, J. D. & Canas, A. J. (2006). The Theory Underlying Concept Maps and How to
Construct them. Technical report for Cmap Tools.
O’Day, D.H. (2008). Using animations to teach biology: past and future research on the
attributes that underline pedagogically sound animations. American Biology Teacher
70: 286-290.
O’Day, D.H. (2009). FAMIS animations as teaching tools and laboratory exercises: Their
value and how to make. Pages 338-348, in tested studies for laboratory teaching,
volume 30 (K.L.Clase,Editor). Proceedings of the 30th workshop conference of the
Association for Biology Laboratory Education (ABLE).
108
Odubunmi, O & Balogun, T.A. (1991). The effect of laboratory and oral-only lecture
teaching methods on cognitive achievement in integrated science. Journal of research
in science Teaching 28(3): 213-234.
Ohlson, M., (2009) Examining Instructional Leadership: A Study of School Culture and
Teacher Quality Charactersitics Influencing Student Outcomes. Florida Journal of
Educational Administration and Policy, 2, 102-113
Opara, A. O. (2011). Labwork and student Academic Achievement in Biology. Lessons and
policy implementation. American-Eurasian Journal of scientific research 6(1) : 28-31.
Ormrod,J.(2012). Human learning (6th ed.). Boston : Pearson
Orora, W., Wachanga, S.W & Keraro, F.N. (2005). Effects of Concept
Mapping TeachingApproach on Secondary School Students
Achievement in Biology in Gucha District Kenya. Zimbabwe Journal
of Educational Research, 17(1), 1-18.
Pavio, A. (1990). Mental Representations: A Dual Coding Approach. New York: Oxford
University Press.
Philip, M: Christina, J and Roxanne, R (2004). Molecular and Cellular
Biology Animations: Development and impact on students learning.
Cell Bio Education volume 4 no.2 169-179
109
Preszler, R. W. (2004). Cooperative Concept Mapping improves performance in Biology.
Journal of College Science Teaqching, 33, 30-35.
Reigeluth, C. M. (1979). In Search of a Better Way to Organize Instruction: The Elaboration
Theory. Journal of Instructional Development, 2(3), 8-15.
Reigeluth, C. M. (1999). The Elaboration Theory. Guidance for Scope and Sequences
Decisions. In R. M. Reigeluth, (Ed), Instructional – Design Theories and Models: A
New Paradigm of Instructional Theory, Volume 11, pp 425-454. Mahwah, NJ:
Lawrence Evlbaum Associates.
Rice, D., Ryan, J., &Samson S. (1998). Concept Maps as an instructional and assessment
tool in middle school Science classes. Summary of research presented at poster
session at the annual meeting of the National Association for Research in Science
reaching Cambridge, M.A.
Sekaran, U. & Bougie, R. (2011). Research Methods for Business. A Skill Building
Approach. Dheli: Aggarwal Printing Press.
Semb, G., & Ellis J. (1994). Knowledge taught in school: What is remembered? Rev. Educ
Red.64 (2): 253 – 86.
Semra, S; Caren, T; & Omar, G. (2001). The contribution of conceptual change texts
accompanied by Concept Mapping to students’ understanding of the human
circulatory system. Journal of school science and mathematics, col(2) 91-102
110
Sisson, J., Swortz, R., & Wolf, F. (1992). Learning, retention and recall of clinical
information. Med educ. 26 (6):454-61.
SMASSE Project, (2007). Statistical Analysis on SMASSE Project Impact Assesment
Survey, JICA, Tokyo, Japan.
Sweller, J. (1988). Cognitive Load During Problem Solving: Effects on Learning. Cognitive
Science, 12, 257-285..
Sweller, J., (1991). Some Modern Myths of Cognition and Instruction, in J.B Biggs (Ed.)
Teaching For Learning: The from Cognitive Psychology: ACER, Radford House,
VIC, Australia.
Sweller, J. (1994). Cognitive Load Theory, Learning Difficulty and Instructional Design.
Learning and Instruction; 4, 295-312”
Thapa, A., Cohen, J., Guffey, S., & Higgins, D.A (2013). A Review of School of Climate
Change Reseach. Retrieved from http://rer.aera.net
TNTP, (2012). Greenhouse Schools: How Schools can Build Cultures where teachers and
students Thrive
Trowbridge, L.W and Bybee R.W (1996). Teaching secondary school science: strategies for
developing scientific literacy. New Jersey: Merrill, Prentice Hall.

111
Trumper, R.(2006). Factors affecting Juniour High School students in Biology. Science
Education, Int. 77(1):Pp 31-48.
Vitale, M.R. and Romance, N.R. (2000). Portfolios in Science assessment: Acknowledge-
based model for classroom practice. In J.J Mintees J.H. Wandersee and J.D.
Wachanga,S.W.,& Mwangi, J.G.(2004). Effects of Cooperative class Experiment Teaching
Method on secondary school students’ chemistry Achievement in Kenya’s Nakuru
District. International Educational Journal, 5(1), 26-36.
Wilson, B., & Cole, P. (1992). A Critical Review of Elaboration Theory. Educational
Technology Research Theory. Educational Technology Research and Develeopment,
40(3), 63-79.
Witleson, S. F. (1985). ‘An Exchange on Gender’, New York Review, 53-55.
White, R.T.(1987). Learning how to learn. Journal of curriculum studies, 19,
275-276.
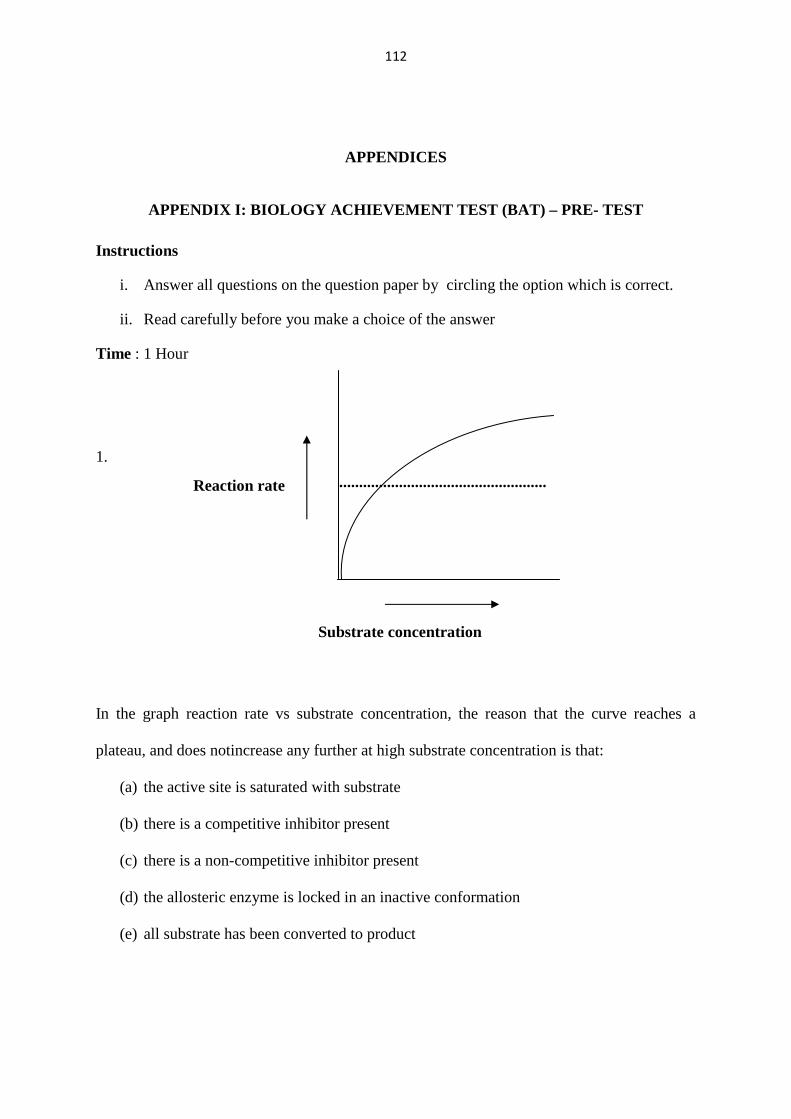
112
APPENDICES
APPENDIX I: BIOLOGY ACHIEVEMENT TEST (BAT) – PRE- T EST
Instructions
i. Answer all questions on the question paper by circling the option which is correct.
ii. Read carefully before you make a choice of the answer
Time : 1 Hour
1.
In the graph reaction rate vs substrate concentration, the reason that the curve reaches a
plateau, and does notincrease any further at high substrate concentration is that:
(a) the active site is saturated with substrate
(b) there is a competitive inhibitor present
(c) there is a non-competitive inhibitor present
(d) the allosteric enzyme is locked in an inactive conformation
(e) all substrate has been converted to product
.................................................... Reaction rate
Substrate concentration
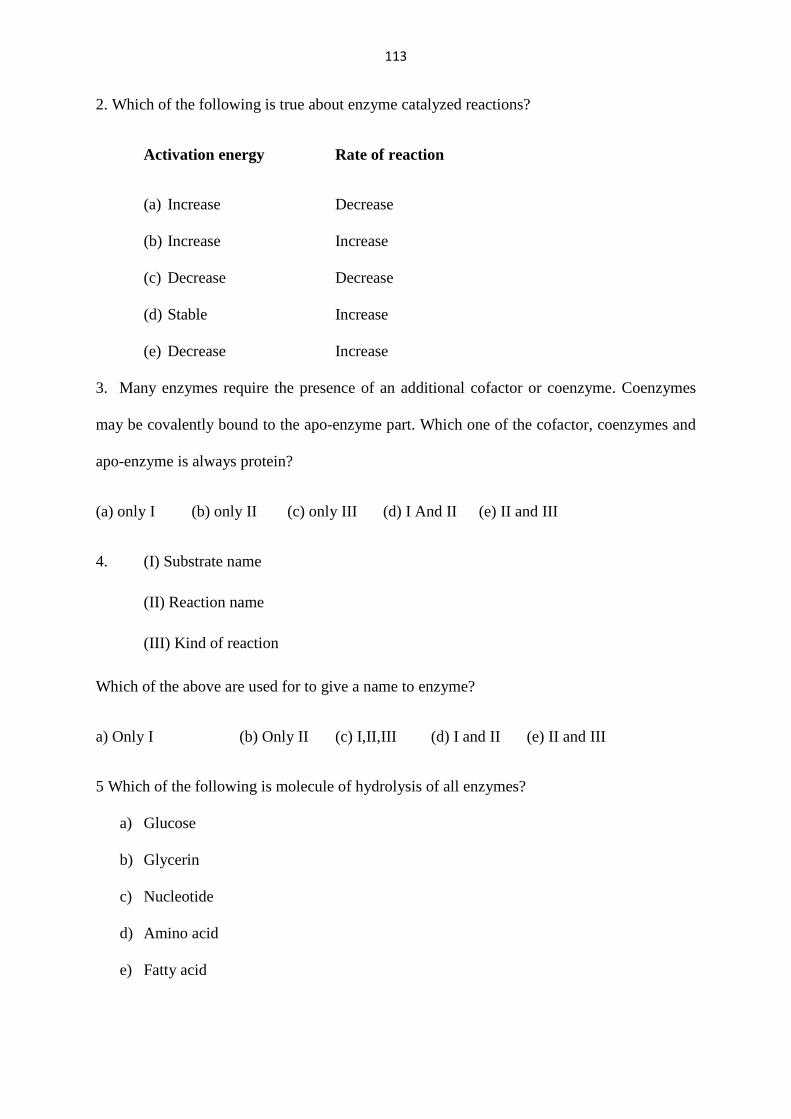
113
2. Which of the following is true about enzyme catalyzed reactions?
Activation energy Rate of reaction
(a) Increase Decrease
(b) Increase Increase
(c) Decrease Decrease
(d) Stable Increase
(e) Decrease Increase
3. Many enzymes require the presence of an additional cofactor or coenzyme. Coenzymes
may be covalently bound to the apo-enzyme part. Which one of the cofactor, coenzymes and
apo-enzyme is always protein?
(a) only I (b) only II (c) only III (d) I And II (e) II and III
4. (I) Substrate name
(II) Reaction name
(III) Kind of reaction
Which of the above are used for to give a name to enzyme?
a) Only I (b) Only II (c) I,II,III (d) I and II (e) II and III
5 Which of the following is molecule of hydrolysis of all enzymes?
a) Glucose
b) Glycerin
c) Nucleotide
d) Amino acid
e) Fatty acid
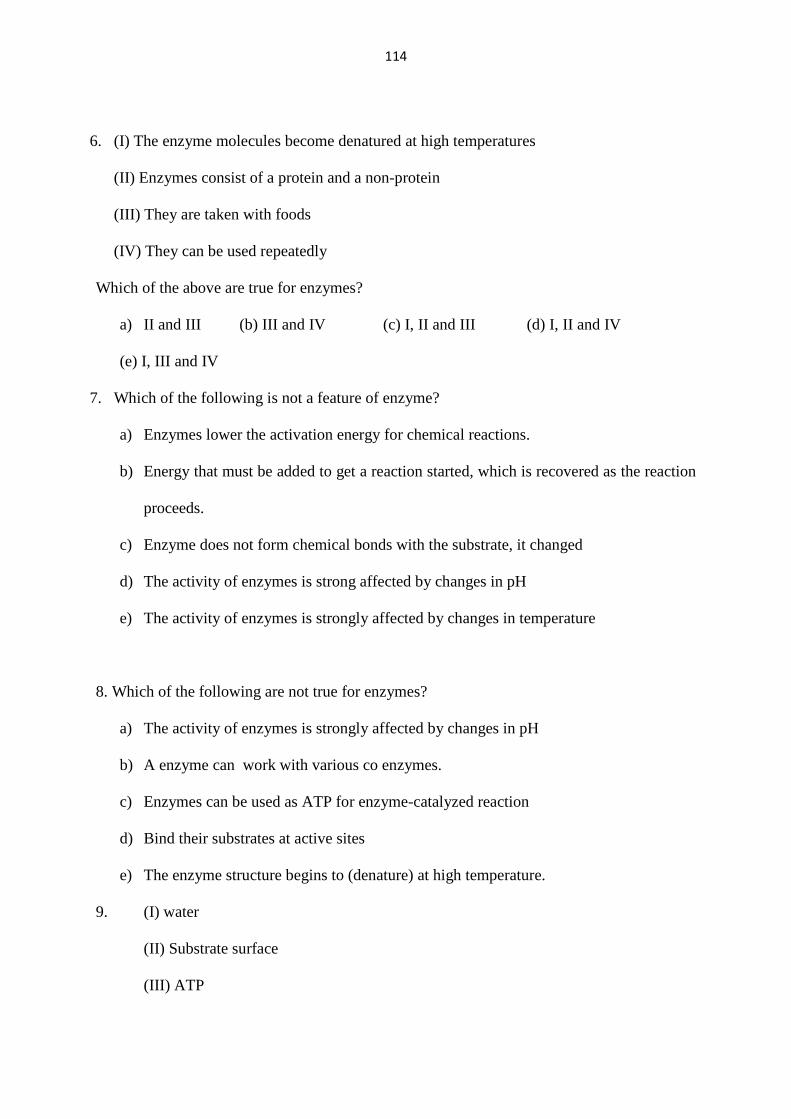
114
6. (I) The enzyme molecules become denatured at high temperatures
(II) Enzymes consist of a protein and a non-protein
(III) They are taken with foods
(IV) They can be used repeatedly
Which of the above are true for enzymes?
a) II and III (b) III and IV (c) I, II and III (d) I, II and IV
(e) I, III and IV
7. Which of the following is not a feature of enzyme?
a) Enzymes lower the activation energy for chemical reactions.
b) Energy that must be added to get a reaction started, which is recovered as the reaction
proceeds.
c) Enzyme does not form chemical bonds with the substrate, it changed
d) The activity of enzymes is strong affected by changes in pH
e) The activity of enzymes is strongly affected by changes in temperature
8. Which of the following are not true for enzymes?
a) The activity of enzymes is strongly affected by changes in pH
b) A enzyme can work with various co enzymes.
c) Enzymes can be used as ATP for enzyme-catalyzed reaction
d) Bind their substrates at active sites
e) The enzyme structure begins to (denature) at high temperature.
9. (I) water
(II) Substrate surface
(III) ATP
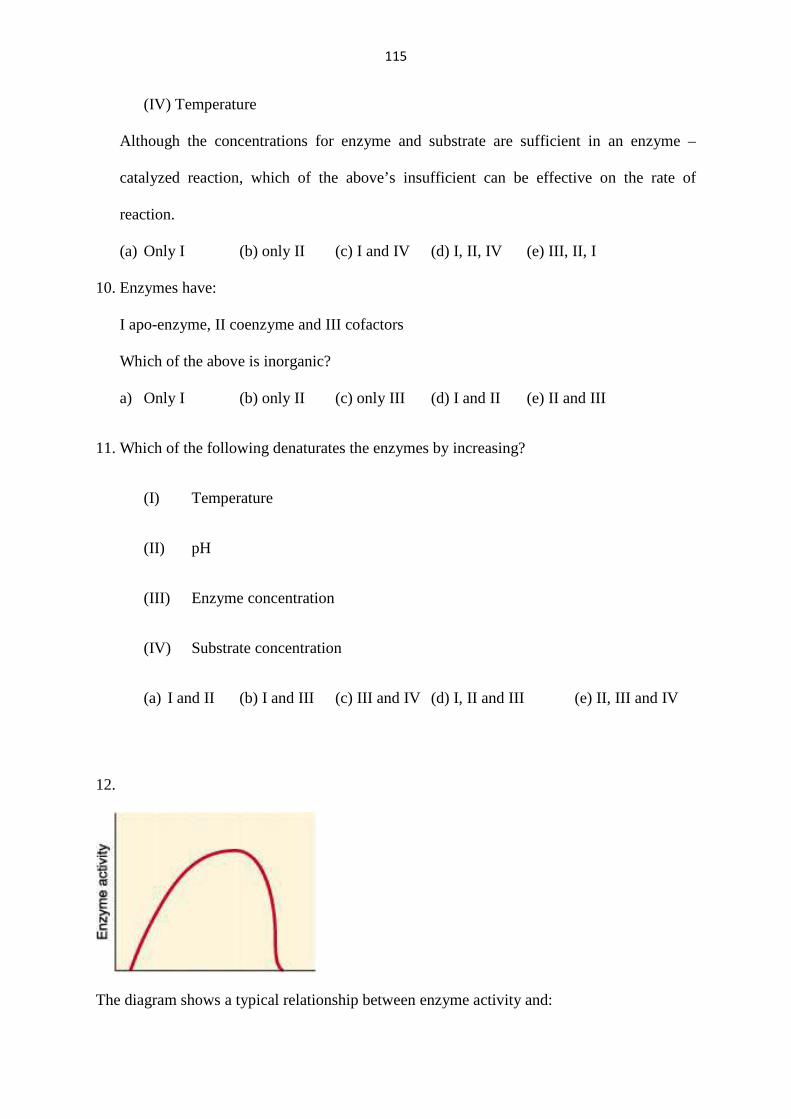
115
(IV) Temperature
Although the concentrations for enzyme and substrate are sufficient in an enzyme –
catalyzed reaction, which of the above’s insufficient can be effective on the rate of
reaction.
(a) Only I (b) only II (c) I and IV (d) I, II, IV (e) III, II, I
10. Enzymes have:
I apo-enzyme, II coenzyme and III cofactors
Which of the above is inorganic?
a) Only I (b) only II (c) only III (d) I and II (e) II and III
11. Which of the following denaturates the enzymes by increasing?
(I) Temperature
(II) pH
(III) Enzyme concentration
(IV) Substrate concentration
(a) I and II (b) I and III (c) III and IV (d) I, II and III (e) II, III and IV
12.
The diagram shows a typical relationship between enzyme activity and:

116
(a) enzyme concentration
(b) substrate concentration
(c) temperature
(d) PH
(e) inhibitors
13. Enzymes
a) Are composed primarily of polypeptides, which are polymers of amino acids.
b) Can bind prosthetic groups such as metal ions that participate in enzyme reactions.
c) Have defined structures
d) Lower the activation energy for chemical reactions.
e) All statements are true.
14. Which of the following can explanation that enzymes are specific for one particular
reaction?
a) Enzyme remains unchanged
b) The enzyme does not form a chemical bond with the substrate.
c) Lowering the activation energy of the reaction
d) Lock and key relation with substrate. This specificity is due to the shapes of the
enzyme molecules.
e). They can be used repeatedly
15. Obtain three test tubes and fill 5ml of hydrogen peroxide to each tube. Crush one of the
pieces of liver with a mortar and pestle and add it to one of the test tubes and add pieces
of frozen liver to a second tube. Add natural pieces of liver to the third tube. It may be
helpful to use a small spatula when transferring the liver to the tube. How do you put in
order the tubes according to rate of reaction?
(a) I, II, III (b) II, I, III (c) II, III, I (d) III, I, II (e) III, II, I

117
(a) Only I (b) only II (c) I and II (d) II and III (e) II, III, IV
16. Which of the following statements about reaction rate is NOT true?
(a) Reaction rate is the speed at which the reaction proceeds toward equilibrium.
(b) Reaction rate is governed by the energy barrier between reactions and products.
(c) Enzymes can accelerate the rate of a reaction.
(d) Reaction rates are not sensitive to temperature.
(e) None of these.
17.Which of the following is true why the activity of enzymes is strongly affected by changes
in
pH and temperature?
(a) Most are proteins
(b) Enzymes are catalysts
(c) Enzymes contains cofactor
(d) Enzymes are catalysts
(e) Enzyme molecules are sensitive to inhibitors.
18. Obtain a test tube and put an amount of starch and then add enzymes for hydrolysis
reaction. Observe the reaction. Which of the following are excepted?
(I) Starch concentration
(II) Enzyme concentration
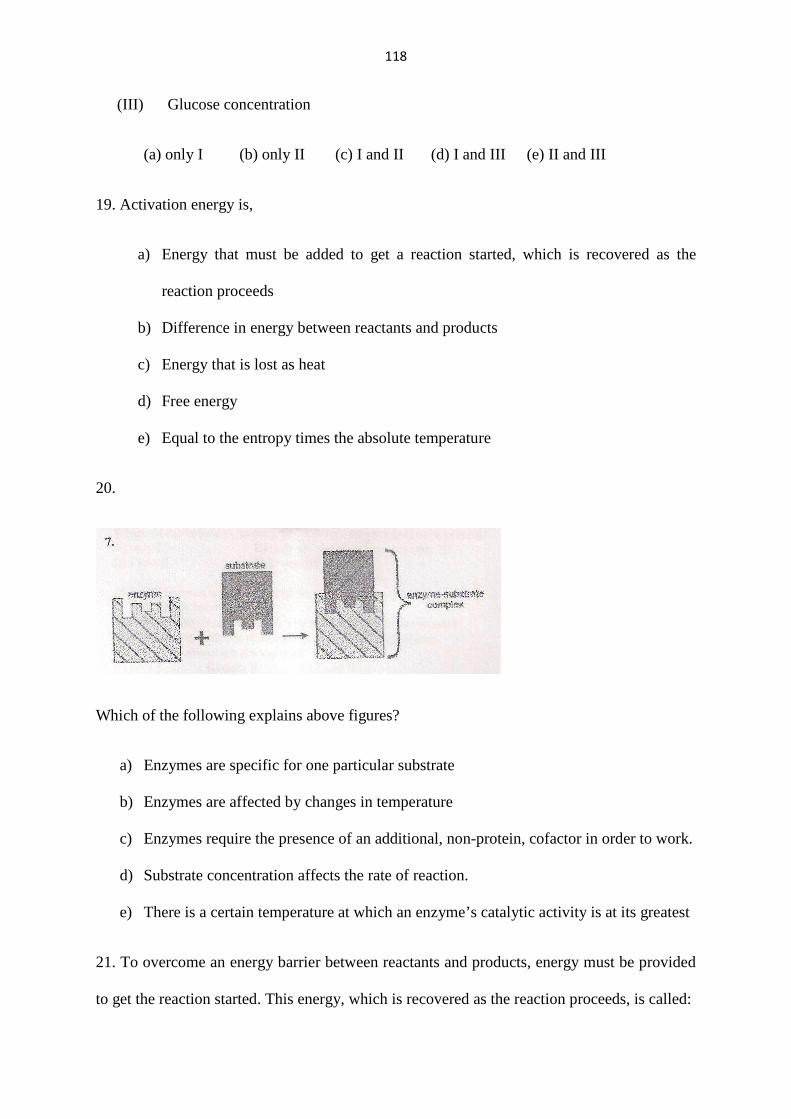
118
(III) Glucose concentration
(a) only I (b) only II (c) I and II (d) I and III (e) II and III
19. Activation energy is,
a) Energy that must be added to get a reaction started, which is recovered as the
reaction proceeds
b) Difference in energy between reactants and products
c) Energy that is lost as heat
d) Free energy
e) Equal to the entropy times the absolute temperature
20.
Which of the following explains above figures?
a) Enzymes are specific for one particular substrate
b) Enzymes are affected by changes in temperature
c) Enzymes require the presence of an additional, non-protein, cofactor in order to work.
d) Substrate concentration affects the rate of reaction.
e) There is a certain temperature at which an enzyme’s catalytic activity is at its greatest
21. To overcome an energy barrier between reactants and products, energy must be provided
to get the reaction started. This energy, which is recovered as the reaction proceeds, is called:
119
(a) activation energy
(b) initiation energy
(c) reaction energy
(d) kinetic energy
(e) potential energy
22. (I) Each enzyme works within quite a small pH range
(II) Enzymes have active site
(III) Enzymes required usually vitamins or made from vitamins
(IV) Enzymes contains prosthetic groups such as metal ions
Which of the following is true about enzyme catalyzed reactions?
a) Only I b) Only II c) I and II d) II and III e) II, III, IV
23.Which of the following is present on enzyme structure?
(a) amino acids (b) glucose (c) nucleic acid (d) nucleotide (e)
fatty acid (e) II and III
24. A+B e C
Which of the following is required for above reaction?
(a) Water (b) coenzyme (c) (cofcator) (d) (high temperature)
(f) ATP
25. Obtain three test tubes and fill 5 ml of hydrogen peroxide to each tube. Crush one of the
pieces of liver with a mortar and pestle and add it to one of the test tubes and add pieces of

120
frozen liver to a second tube. Add natural pieces of liver to the third tube. It may be helpful
to use a small spatula when transferring the liver to the tube. How do you put in order the
tubes according to rate of reaction?
a) I, II, III b) II, I, III c) II, III, I d) III, I, III e) III, II, I
APPENDIX II: BIOLOGY ACHIEVEMENT TEST (BAT) POST- TEST
Instructions
i. Answer all questions on the question paper by circling the option which is correct.
ii. Read carefully before you make a choice of the answer
Time : 1 Hour
1. Which of the following statements about reaction rate is NOT true?
(f) Reaction rate is the speed at which the reaction proceeds toward equilibrium.
(g) Reaction rate is governed by the energy barrier between reactions and products.
(h) Enzymes can accelerate the rate of a reaction.
(i) Reaction rates are not sensitive to temperature.
(j) None of these.
2. Which of the following is true why the activity of enzymes is strongly affected by changes
in
pH and temperature?
(a) Most are proteins
(b) Enzymes are catalysts
121
(c) Enzymes contains cofactor
(d) Enzymes are catalysts
(e) Enzyme molecules are sensitive to inhibitors.
3. Obtain a test tube and put an amount of starch and then add enzymes for hydrolysis
reaction. Observe the reaction. Which of the following are excepted?
(I) Starch concentration
(II) Enzyme concentration
(III) Glucose concentration
(a) only I (b) only II (c) I and II (d) I and III (e) II and III
4. Activation energy is,
(a) Energy that must be added to get a reaction started, which is recovered as the
reaction proceeds
(b) Difference in energy between reactants and products
(c) Energy that is lost as heat
(d) Free energy
(e) Equal to the entropy times the absolute temperature
5 (I) The enzyme molecules become denatured at high temperatures
(II) Enzymes consist of a protein and a non-protein
(III) They are taken with foods
(IV) They can be used repeatedly
Which of the above are true for enzymes?
b) II and III (b) III and IV (c) I, II and III (d) I, II and IV
122
(e) I, III and IV
6 Which of the following is not a feature of enzyme?
(a) Enzymes lower the activation energy for chemical reactions.
(b) Energy that must be added to get a reaction started, which is recovered as the
reaction proceeds.
(c) Enzyme does not form chemical bonds with the substrate, it changed
(d) The activity of enzymes is strong affected by changes in pH
(e) The activity of enzymes is strongly affected by changes in temperature
7. Which of the following are not true for enzymes?
(a) The activity of enzymes is strongly affected by changes in pH
(b) A enzyme can work with various co enzymes.
(c) Enzymes can be used as ATP for enzyme-catalyzed reaction
(d) Bind their substrates at active sites
(e) The enzyme structure begins to (denature) at high temperature.
8. (I) water
(II) Substrate surface
(III) ATP
(IV) Temperature
Although the concentrations for enzyme and substrate are sufficient in an enzyme –catalyzed
reaction, which of the above’s insufficient can be effective on the rate of reaction.
(b) Only I (b) only II (c) I and IV (d) I, II, IV (e) III, II, I
123
9. Many enzymes require the presence of an additional cofactor or coenzyme. Coenzymes
may be covalently bound to the apo-enzyme part. Which one of the cofactor, coenzymes and
apo-enzyme is always protein?
(a) only I (b) only II (c) only III (d) I And II (e) II and III
10. (I) Substrate name
(II) Reaction name
(III) Kind of reaction
Which of the above are used for to give a name to enzyme?
a) Only I (b) Only II (c) I,II,III (d) I and II (e) II and III
11. Which of the following is molecule of hydrolysis of all enzymes?
(a) Glucose
(b) Glycerin
(c) Nucleotide
(d) Amino acid
(e) Fatty acid
12 Enzymes have:
I apo-enzyme, II coenzyme and III cofactors
Which of the above is inorganic?
b) Only I (b) only II (c) only III (d) I and II (e) II and III
13 Which of the following denaturates the enzymes by increasing?
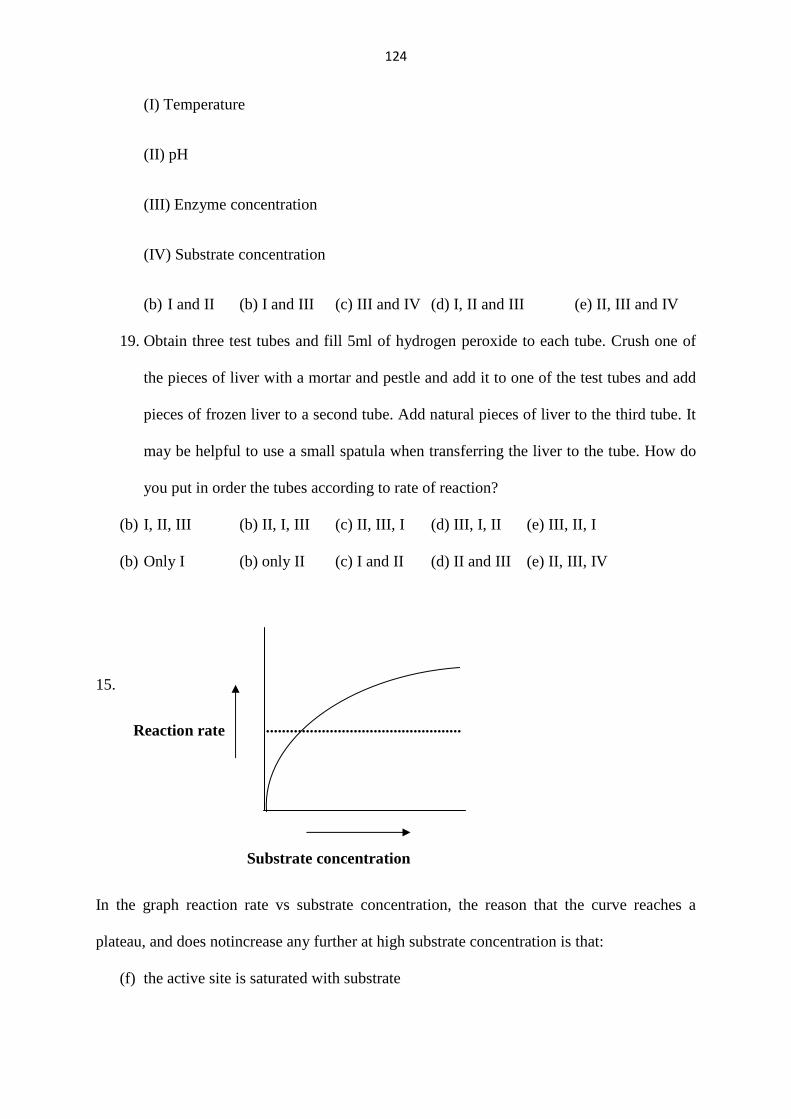
124
(I) Temperature
(II) pH
(III) Enzyme concentration
(IV) Substrate concentration
(b) I and II (b) I and III (c) III and IV (d) I, II and III (e) II, III and IV
19. Obtain three test tubes and fill 5ml of hydrogen peroxide to each tube. Crush one of
the pieces of liver with a mortar and pestle and add it to one of the test tubes and add
pieces of frozen liver to a second tube. Add natural pieces of liver to the third tube. It
may be helpful to use a small spatula when transferring the liver to the tube. How do
you put in order the tubes according to rate of reaction?
(b) I, II, III (b) II, I, III (c) II, III, I (d) III, I, II (e) III, II, I
(b) Only I (b) only II (c) I and II (d) II and III (e) II, III, IV
15.
In the graph reaction rate vs substrate concentration, the reason that the curve reaches a
plateau, and does notincrease any further at high substrate concentration is that:
(f) the active site is saturated with substrate
.................................................Reaction rate
Substrate concentration
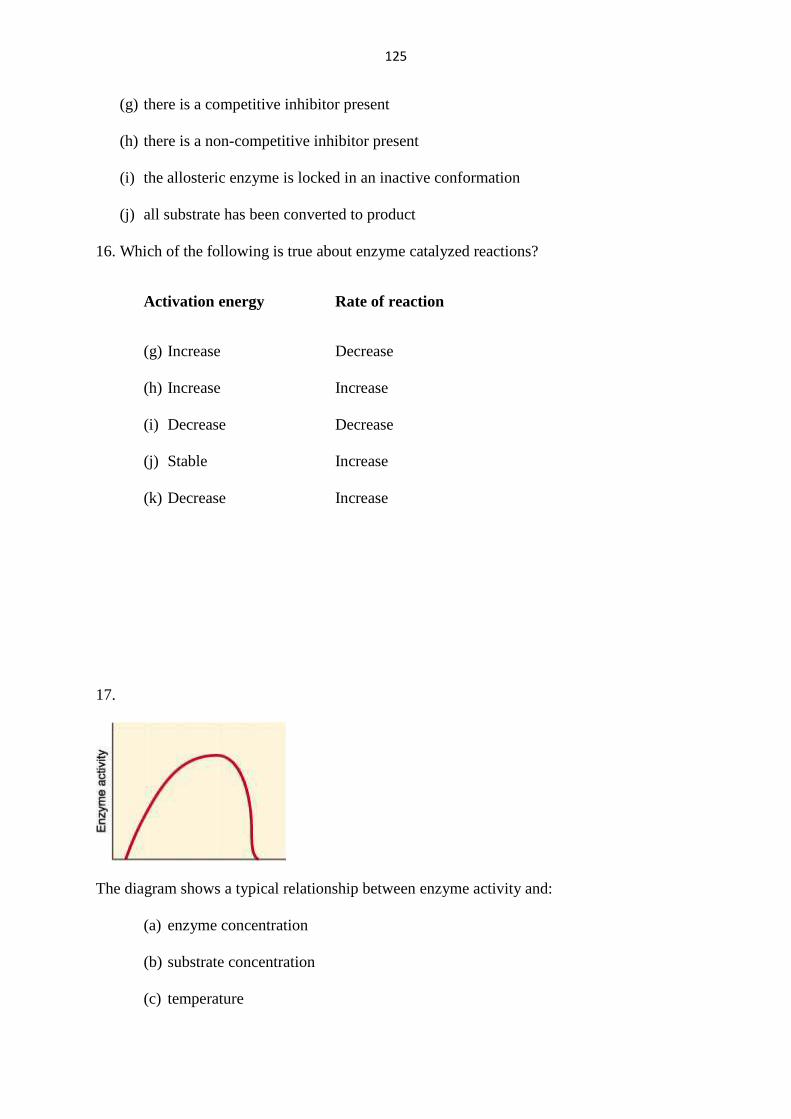
125
(g) there is a competitive inhibitor present
(h) there is a non-competitive inhibitor present
(i) the allosteric enzyme is locked in an inactive conformation
(j) all substrate has been converted to product
16. Which of the following is true about enzyme catalyzed reactions?
Activation energy Rate of reaction
(g) Increase Decrease
(h) Increase Increase
(i) Decrease Decrease
(j) Stable Increase
(k) Decrease Increase
17.
The diagram shows a typical relationship between enzyme activity and:
(a) enzyme concentration
(b) substrate concentration
(c) temperature
126
(d) PH
(e) inhibitors
18. Enzymes
(a) Are composed primarily of polypeptides, which are polymers of amino acids.
(b) Can bind prosthetic groups such as metal ions that participate in enzyme reactions.
(c) Have defined structures
(d) Lower the activation energy for chemical reactions.
(e) All statements are true.
19. Which of the following can explanation that enzymes are specific for one particular
reaction?
(a) Enzyme remains unchanged
(b) The enzyme does not form a chemical bond with the substrate.
(c) Lowering the activation energy of the reaction
(d) Lock and key relation with substrate. This specificity is due to the shapes of the
enzyme molecules.
(e) They can be used repeatedly
20. (I) Each enzyme works within quite a small pH range
(II) Enzymes have active site
(III) Enzymes required usually vitamins or made from vitamins
(IV) Enzymes contains prosthetic groups such as metal ions
Which of the following is true about enzyme catalyzed reactions?
a) Only I b) Only II c) I and II d) II and III e) II, III, IV
21.Which of the following is present on enzyme structure?
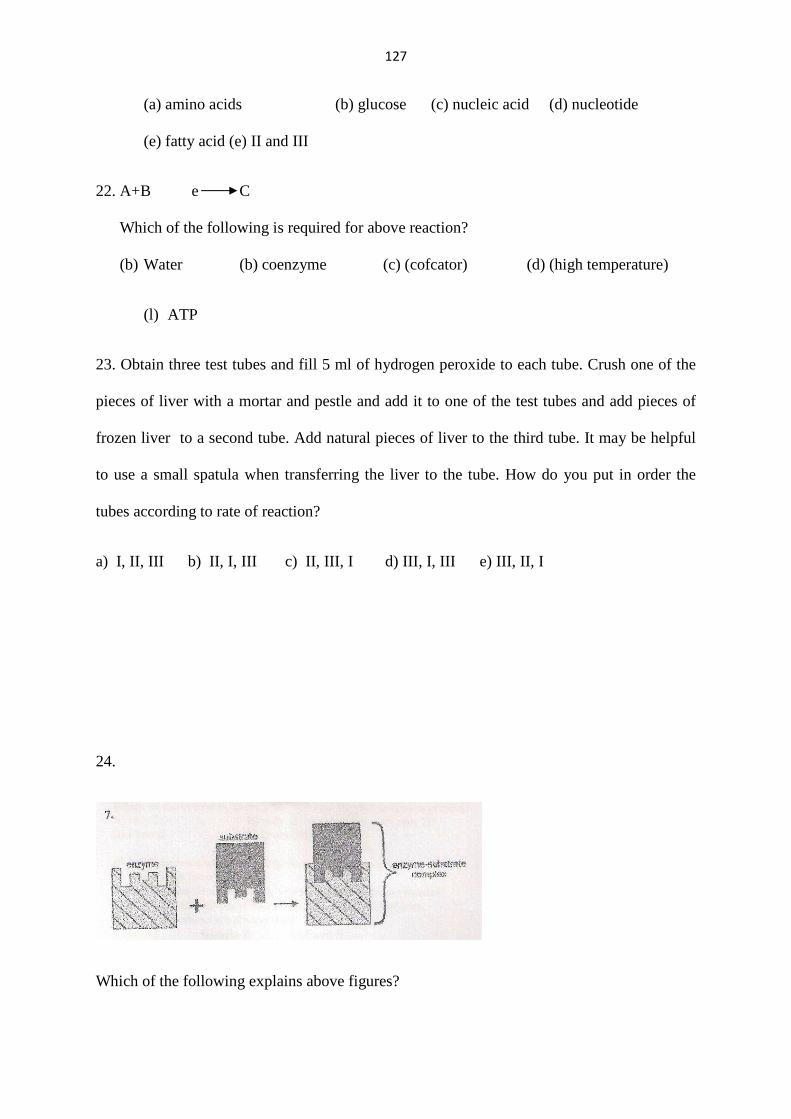
127
(a) amino acids (b) glucose (c) nucleic acid (d) nucleotide
(e) fatty acid (e) II and III
22. A+B e C
Which of the following is required for above reaction?
(b) Water (b) coenzyme (c) (cofcator) (d) (high temperature)
(l) ATP
23. Obtain three test tubes and fill 5 ml of hydrogen peroxide to each tube. Crush one of the
pieces of liver with a mortar and pestle and add it to one of the test tubes and add pieces of
frozen liver to a second tube. Add natural pieces of liver to the third tube. It may be helpful
to use a small spatula when transferring the liver to the tube. How do you put in order the
tubes according to rate of reaction?
a) I, II, III b) II, I, III c) II, III, I d) III, I, III e) III, II, I
24.
Which of the following explains above figures?
128
(a) Enzymes are specific for one particular substrate
(b) Enzymes are affected by changes in temperature
(c) Enzymes require the presence of an additional, non-protein, cofactor in order to
work.
(d) Substrate concentration affects the rate of reaction.
(e) There is a certain temperature at which an enzyme’s catalytic activity is at its
greatest
25. To overcome an energy barrier between reactants and products, energy must be provided
to get the reaction
started. This energy, which is recovered as the reaction proceeds, is called:
(a) activation energy
(b) initiation energy
(c) reaction energy
(d) kinetic energy
(e) potential energy
APPENDIX III: BIOLOGY KNOWLEDGE RETENTION TEST(BKRT ) Instructions
i. Answer all questions on the question paper by circling the option which is correct.
ii. Read carefully before you make a choice of the answer
Time : 1 Hour
1. (I) The enzyme molecules become denatured at high temperatures
(II) Enzymes consist of a protein and a non-protein
129
(III) They are taken with foods
(IV) They can be used repeatedly
Which of the above are true for enzymes?
a) II and III (b) III and IV (c) I, II and III (d) I, II and IV (e) I, III
and IV
2 Which of the following is not a feature of enzyme?
(a) Enzymes lower the activation energy for chemical reactions.
(b) Energy that must be added to get a reaction started, which is recovered as the
reaction proceeds.
(c) Enzyme does not form chemical bonds with the substrate, it changed
(d) The activity of enzymes is strong affected by changes in pH
3. The activity of enzymes is strongly affected by changes in temperature
(I) Substrate name
(II) Reaction name
(III) Kind of reaction
Which of the above are used for to give a name to enzyme?
a) Only I (b) Only II (c) I,II,III (d) I and II (e) II and III
4 Which of the following denaturates the enzymes by increasing?
I. Temperature
II. pH
III. Enzyme concentration
IV. Substrate concentration
20. I and II (b) I and III (c) III and IV (d) I, II and III (e) II, III and IV
130
5 Which of the following can explanation that enzymes are specific for one particular
reaction?
(a) Enzyme remains unchanged
(b) The enzyme does not form a chemical bond with the substrate.
(c) Lowering the activation energy of the reaction
(d) Lock and key relation with substrate. This specificity is due to the shapes of the
enzyme molecules.
(e) They can be used repeatedly
6. Which of the following is present on enzyme structure?
(a) amino acids (b) glucose (c) nucleic acid (d) nucleotide (e)
fatty
acid (e) II and III
7. To overcome an energy barrier between reactants and products, energy must be provided to
get the reaction
started. This energy, which is recovered as the reaction proceeds, is called:
(a) activation energy
(b) initiation energy
(c) reaction energy
(d) kinetic energy
(e) potential energy
8 Which of the following statements about reaction rate is NOT true?
(a) Reaction rate is the speed at which the reaction proceeds toward equilibrium.
(b) Reaction rate is governed by the energy barrier between reactions and products.
131
(c) Enzymes can accelerate the rate of a reaction.
(d) Reaction rates are not sensitive to temperature.
(e) None of these.
9 Obtain a test tube and put an amount of starch and then add enzymes for hydrolysis
reaction. Observe the reaction. Which of the following are excepted?
I. Starch concentration
II. Enzyme concentration
III. Glucose concentration
(a) only I (b) only II (c) I and II (d) I and III (e) II and III
10. Many enzymes require the presence of an additional cofactor or coenzyme. Coenzymes
may be covalently bound to the apo-enzyme part. Which one of the cofactor, coenzymes and
apo-enzyme is always protein?
(a) only I (b) only II (c) only III (d) I And II (e) II and III
11. Which of the following is true why the activity of enzymes is strongly affected by
changes in
pH and temperature?
(a) Most are proteins
(b) Enzymes are catalysts
(c) Enzymes contains cofactor
(d) Enzymes are catalysts
(e) (e) Enzyme molecules are sensitive to inhibitors.
12.
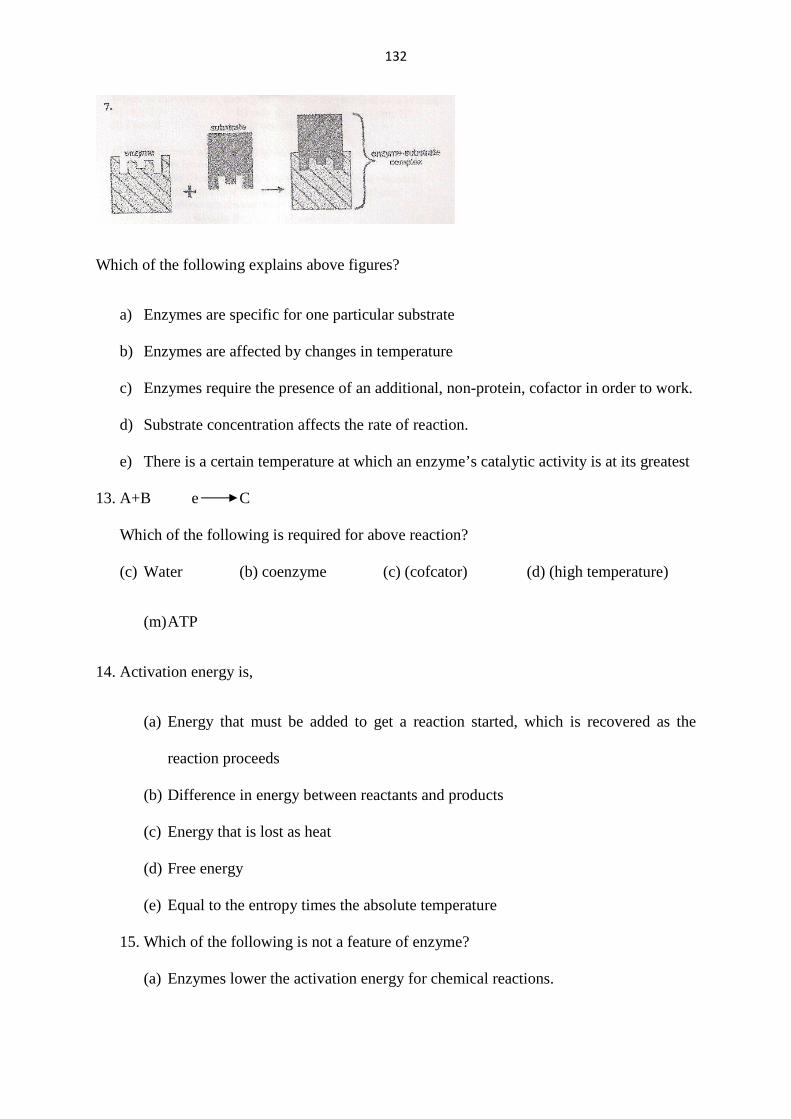
132
Which of the following explains above figures?
a) Enzymes are specific for one particular substrate
b) Enzymes are affected by changes in temperature
c) Enzymes require the presence of an additional, non-protein, cofactor in order to work.
d) Substrate concentration affects the rate of reaction.
e) There is a certain temperature at which an enzyme’s catalytic activity is at its greatest
13. A+B e C
Which of the following is required for above reaction?
(c) Water (b) coenzyme (c) (cofcator) (d) (high temperature)
(m) ATP
14. Activation energy is,
(a) Energy that must be added to get a reaction started, which is recovered as the
reaction proceeds
(b) Difference in energy between reactants and products
(c) Energy that is lost as heat
(d) Free energy
(e) Equal to the entropy times the absolute temperature
15. Which of the following is not a feature of enzyme?
(a) Enzymes lower the activation energy for chemical reactions.

133
(b) Energy that must be added to get a reaction started, which is recovered as the
reaction proceeds.
(c) Enzyme does not form chemical bonds with the substrate, it changed
(d) The activity of enzymes is strong affected by changes in pH
(e) The activity of enzymes is strongly affected by changes in temperature
16. Which of the following are not true for enzymes?
(a) The activity of enzymes is strongly affected by changes in pH
(b) A enzyme can work with various co enzymes.
(c) Enzymes can be used as ATP for enzyme-catalyzed reaction
(d) Bind their substrates at active sites
(e) The enzyme structure begins to (denature) at high temperature.
17. (I) water
I. Substrate surface
II. ATP
III. Temperature
Although the concentrations for enzyme and substrate are sufficient in an enzyme –
catalyzed reaction, which of the above’s insufficient can be effective on the rate of
reaction.
(c) Only I (b) only II (c) I and IV (d) I, II, IV (e) III, II, I
18. Obtain three test tubes and fill 5ml of hydrogen peroxide to each tube. Crush one of
the pieces of liver with a mortar and pestle and add it to one of the test tubes and add
pieces of frozen liver to a second tube. Add natural pieces of liver to the third tube. It
may be helpful to use a small spatula when transferring the liver to the tube. How do
you put in order the tubes according to rate of reaction?
(c) I, II, III (b) II, I, III (c) II, III, I (d) III, I, II (e) III, II, I
134
(c) Only I (b) only II (c) I and II (d) II and III (e) II, III, IV
19. Which of the following is molecule of hydrolysis of all enzymes?
a) Glucose
b) Glycerin
c) Nucleotide
d) Amino acid
e) Fatty acid
20. Enzymes have:
I apo-enzyme, II coenzyme and III cofactors
Which of the above is inorganic?
c) Only I (b) only II (c) only III (d) I and II (e) II and III
21. Enzymes
a) Are composed primarily of polypeptides, which are polymers of amino acids.
b) Can bind prosthetic groups such as metal ions that participate in enzyme reactions.
c) Have defined structures
d) Lower the activation energy for chemical reactions.
e) All statements are true.
22. Obtain three test tubes and fill 5 ml of hydrogen peroxide to each tube. Crush one of the
pieces of liver with a mortar and pestle and add it to one of the test tubes and add pieces of
frozen liver to a second tube. Add natural pieces of liver to the third tube. It may be helpful
to use a small spatula when transferring the liver to the tube. How do you put in order the
tubes according to rate of reaction?
a) I, II, III b) II, I, III c) II, III, I d) III, I, III e) III, II, I
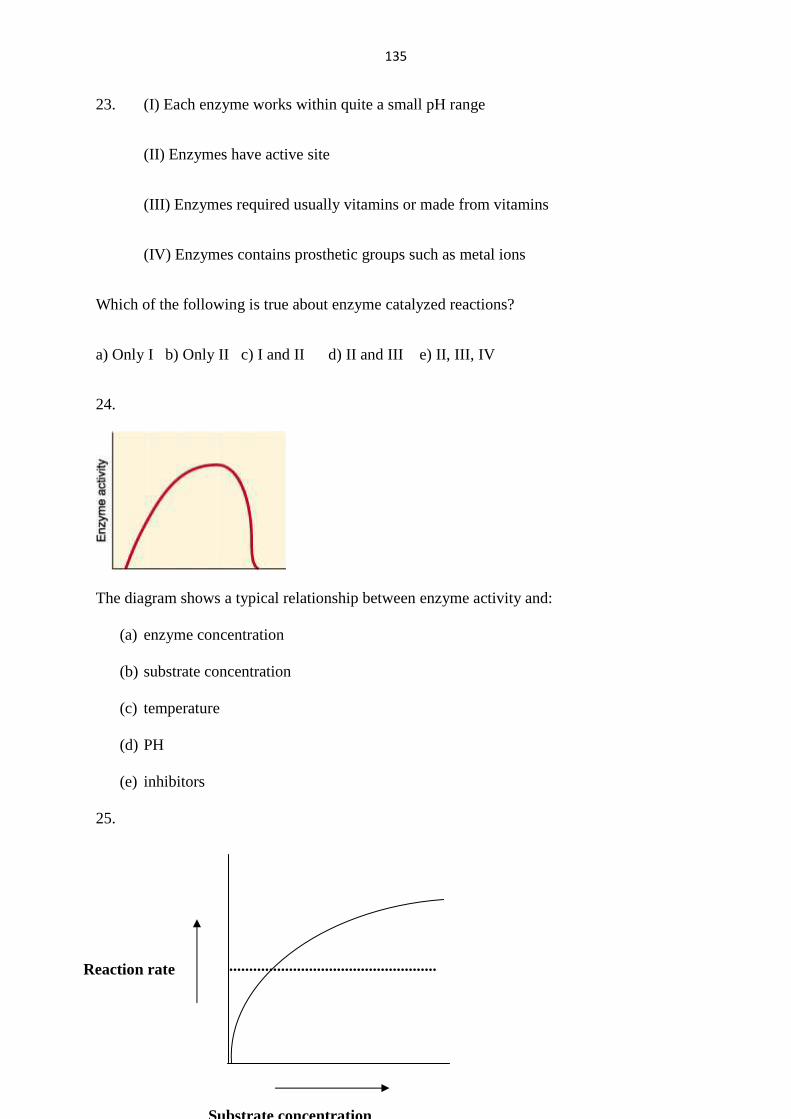
135
23. (I) Each enzyme works within quite a small pH range
(II) Enzymes have active site
(III) Enzymes required usually vitamins or made from vitamins
(IV) Enzymes contains prosthetic groups such as metal ions
Which of the following is true about enzyme catalyzed reactions?
a) Only I b) Only II c) I and II d) II and III e) II, III, IV
24.
The diagram shows a typical relationship between enzyme activity and:
(a) enzyme concentration
(b) substrate concentration
(c) temperature
(d) PH
(e) inhibitors
25.
.................................................... Reaction rate
Substrate concentration
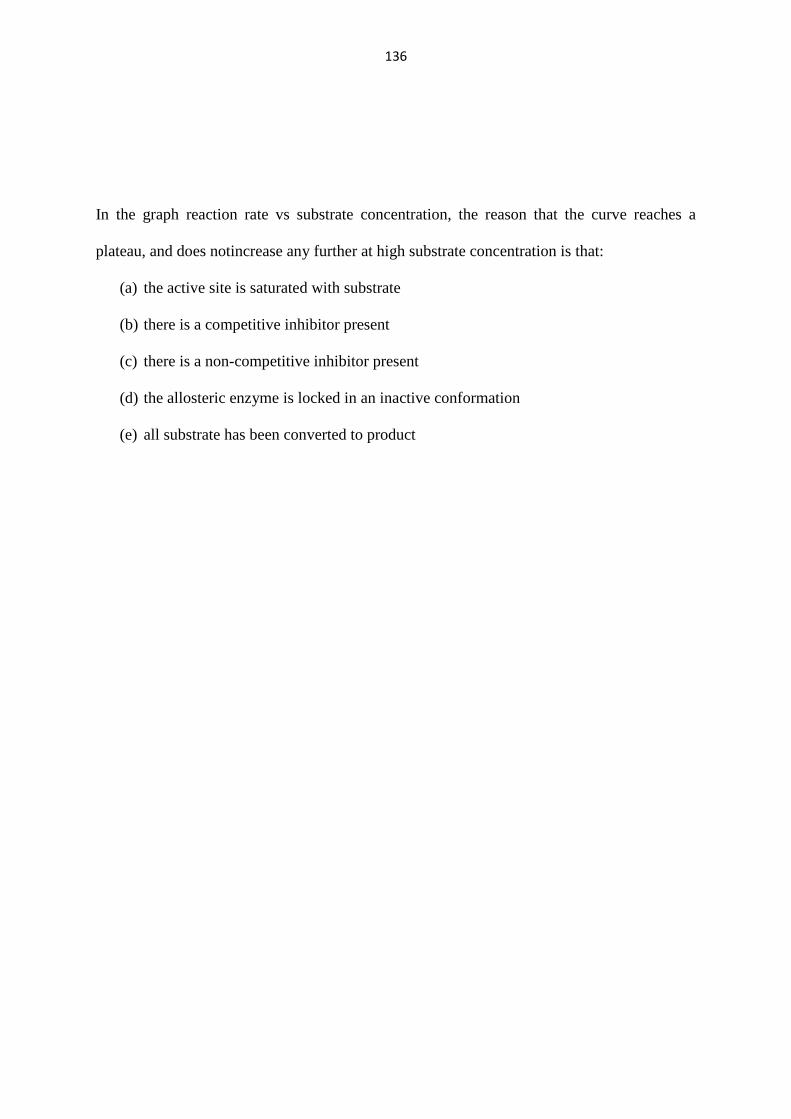
136
In the graph reaction rate vs substrate concentration, the reason that the curve reaches a
plateau, and does notincrease any further at high substrate concentration is that:
(a) the active site is saturated with substrate
(b) there is a competitive inhibitor present
(c) there is a non-competitive inhibitor present
(d) the allosteric enzyme is locked in an inactive conformation
(e) all substrate has been converted to product
137
APPENDIX IV: STM Training Manual
This manual is designed to help teachers in Biology to implement STM on the topic
“ENZYMES”. It contains the methods to be used in teaching specific content which include:
Animated slide demonstration, laboratory student experiment, lecture method and Concept
Mapping. These methods are in line with the requirements of the KICD curriculum and are
arranged to be taught in three different sequences, namely: ELD, LDE and DEL. Several
researches have shown that STM increase achievement of students in Biology hence need to
use it in implementing the Kenyan secondary school curriculum. The implementation will
thus mark a milestone and usher in a new era where teaching in Biology will yield
meaningful learning. Concept Mapping will also be addressed. The strategy has been shown
to be an effective teaching/learning as well as evaluation tool. Concept Maps will therefore
be used at the end of research to assess students’ ability to transfer knowledge. The training
programme using this manual seeks to empower teachers in Biology with adequate content
and skills to be able to teach students according to the design prescribed for the present study.
In that way, the research objectives will thus be achieved.
Theme: Fostering use of Sequential Teaching Methods and Concept Mapping in Biology.
Rationale statement for the training is guided by the following.
1. Need to enhance capacity of the teachers in Biology in order to teach the topic
‘Enzyme activity’ according to the design of the present study.
2. Use of Concept Mapping teaching/ learning and evaluation strategy is relatively new
to our school curriculum hence need to address it adequately.
3. Students need to be equipped further with skills in Concept Mapping so as to apply
them in learning in Biology.
138
4. There are envisaged challenges that teachers in Biology may face in implementing
STM hence need to address them in advance.
5. Need to encourage the practice of STM and Concept Mapping so that the objectives
of the present study could be achieved
6. Teachers and students are both important participants in the study and will be required
to teach and learn respectively hence need to further develop their T/L skills.
Objectives of Training are aimed at empowering participants to acquire knowledge and skills
in the e following areas:
a) To carry out animated slide demonstration on the topic ‘Enzyme action/ activity’.
b) Design and carry out Laboratory student experiment on‘Enzyme action/activity’.
c) To teach using lecture method more competently.
d) To apply the sequence of STM as per the requirements of the study.
e) To enhance Concept Mapping skills through actualization
f) To address challenges experienced in the implementation of STM and Concept
Mapping.
Teachers’ Guide
By the end of the topic, the learner should be able to
a) Define the term enzyme
b) Identify different types of enzymes.
c) Explain how naming of enzymes is done.
d) Identify substrates and types of reactions for various enzymes.
e) Describe properties of enzymes.
139
f) Discuss how various factors affect enzyme controlled reactions. They include:-
temperature, PH, specificity, substrate concentration, Enzyme concentration, co-
factors co-enzymes and inhibitors.
g) Describe the process of enzyme inhibition.
h) Carry out practical activities (lab experiment) to investigate how the various factors
affect enzyme activities
i) Design an experiment to investigate the presence of catalase enzyme in living tissues.
Note: refer to KLB, Sec. New Syllabus. Form one Book).
Teaching Programme
WEEK ONE
Number of lessons: 4
Activities: Pre-test BAT
Concept Mapping- using the topic ‘chemicals of life’
Teaching of content using STM (ELD, LDE, DEL)
Teaching content using oral-only lecture for control group.
WEEK TWO
Number of lessons: 4
Activities: Teaching content using STM for experimental of groups.
Teaching content using oral-only lecture for control groups
Practice on Concept Mapping
140
WEEK THREE
Number of lessons: 4
Activities: Teaching content using STM and oral-only lectures for experimental groups
and control groups respectively
Practice on Concept Mapping
WEEK FOUR
Number of lessons: 2. (for evaluation only)
Activities: Administering of Post-Test BAT.
Marking, scoring and recording of BAT.
AFTER 40 DAYS OF POST-TEST BAT
(About 9th week)
Number of lessons: 4
Activities: Administering in Biology Knowledge Retention test (BKRT)
Administering of transfer test (TT) by Concept Mapping.
Sequential Teaching Methods (STM)
ELD for experimental group 1a and b
LDE for experimental group 2a and b
DEL for experimental group 3a and b
141
Laboratory Student Experiment
This method will be used for aspects concerning enzyme activity such as observation of
enzyme catalytic features, co-factors, co-enzymes and reactions between enzymes and
substrates. This will be learner-centered.
Demonstration Slides
Slide demonstration method will involve use of animated slides about enzyme structure and
functions; lock and key hypothesis and effects of various factors on enzyme structure. This
will be teacher-centered.
Lecture Method
This method will be used to cover relevant theory of enzymes. This will be teacher-learner-
centered activity. Teacher explanation of key concepts and their relationships will dominate
the session.
Oral - only Lecture Method
This will be applied to control group only. All the content covered under the topic ‘enzymes’
will be taught by lecture only.
CONCEPT MAPPING FOR TEACHING IN BIOLOGY
Concept Mapping in Biology
Rationale
Teachers have many strategies at their disposal, many of which have been used to enhance
the quality in Biology during the teaching/learning process. Concept Mapping is a valuable

142
strategy in the biology classroom that can be applied to planning and preparation, teaching,
learning, revision, summarizing and assessment. However, this strategy remains rarely used,
if ever. The purpose of this session is to explore the various applications of Concept Mapping
and adapt them to the various situations related to the teaching/learning in Biology.
Session objectives
By the end of the session the participant should be able to:
1) Explain Concept Mapping as a tool in the teaching/ learning process in biology
2) Construct Concept Maps in given topics.
3) Identify the challenges that teachers may face in using Concept Mapping and suggest
ways to overcome the challenges.
Introduction
Concept Maps have been used successfully to promote meaningful learning and effective
teaching and are helpful in representing qualitative aspects of students’ learning. The whole
idea of Concept Mapping is based on the assertion that human beings are meaning makers
and thus the human brain endeavors to construct order from apparent chaos.
A Concept Map is a visual, structured representation of concepts and their interrelationships
while Concept Mapping is the process that involves identification of concepts in a body of
study materials and the organization of those concepts into hierarchical arrangements from
the most general, most inclusive to the least general, most specific. The key concepts in a
Concept Map are linked with lines bearing propositions (logical connectives).
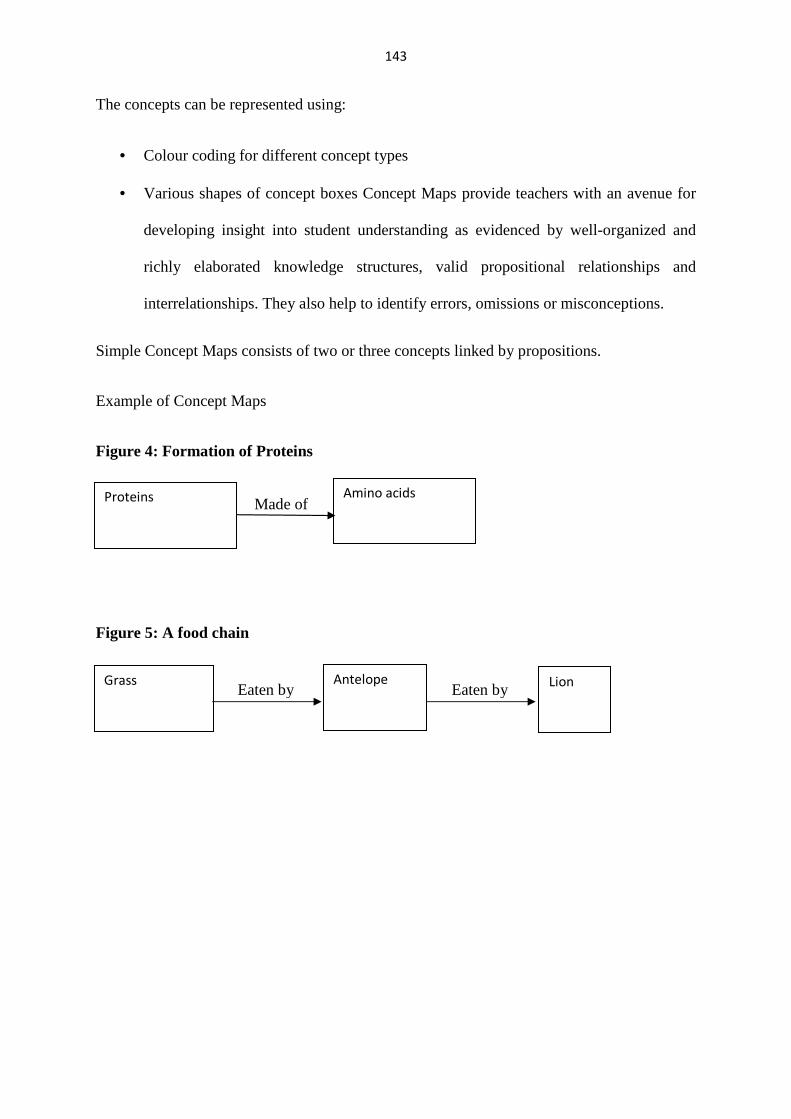
143
The concepts can be represented using:
• Colour coding for different concept types
• Various shapes of concept boxes Concept Maps provide teachers with an avenue for
developing insight into student understanding as evidenced by well-organized and
richly elaborated knowledge structures, valid propositional relationships and
interrelationships. They also help to identify errors, omissions or misconceptions.
Simple Concept Maps consists of two or three concepts linked by propositions.
Example of Concept Maps
Figure 4: Formation of Proteins
Figure 5: A food chain
Made of Proteins
Amino acids
Eaten by Antelope
Grass Lion Eaten by
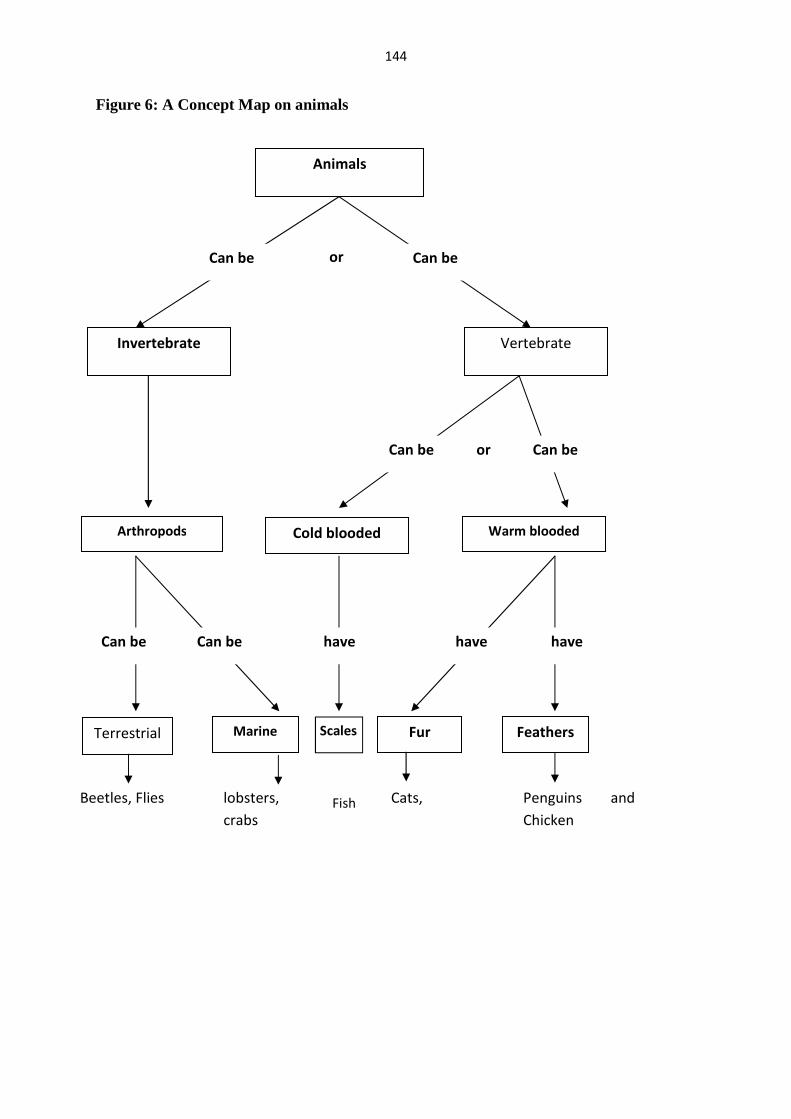
144
Figure 6: A Concept Map on animals
Animals
Cold blooded Arthropods
Feathers
Warm blooded
Terrestrial
Invertebrate
Marine Fur
Vertebrate
Can be Can be or
Can be Can be or
Scales
Can be Can be have have have
Beetles, Flies lobsters,
crabs
Cats, Penguins and
Chicken
Fish
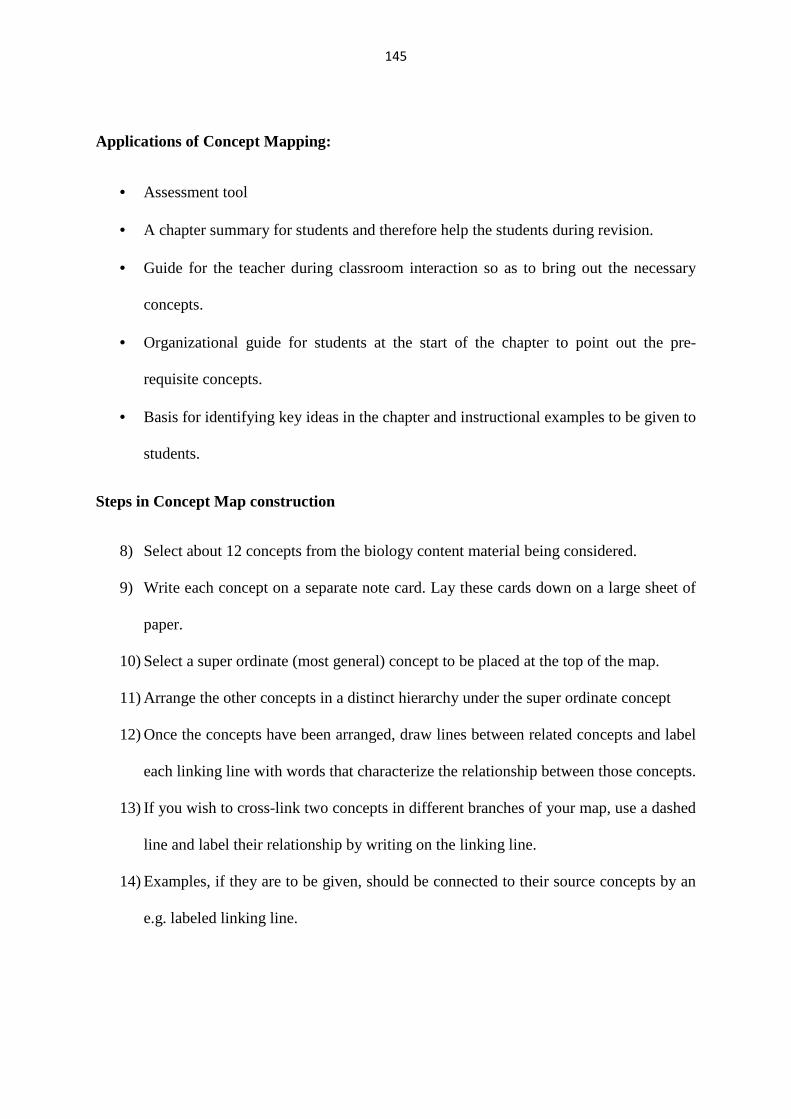
145
Applications of Concept Mapping:
• Assessment tool
• A chapter summary for students and therefore help the students during revision.
• Guide for the teacher during classroom interaction so as to bring out the necessary
concepts.
• Organizational guide for students at the start of the chapter to point out the pre-
requisite concepts.
• Basis for identifying key ideas in the chapter and instructional examples to be given to
students.
Steps in Concept Map construction
8) Select about 12 concepts from the biology content material being considered.
9) Write each concept on a separate note card. Lay these cards down on a large sheet of
paper.
10) Select a super ordinate (most general) concept to be placed at the top of the map.
11) Arrange the other concepts in a distinct hierarchy under the super ordinate concept
12) Once the concepts have been arranged, draw lines between related concepts and label
each linking line with words that characterize the relationship between those concepts.
13) If you wish to cross-link two concepts in different branches of your map, use a dashed
line and label their relationship by writing on the linking line.
14) Examples, if they are to be given, should be connected to their source concepts by an
e.g. labeled linking line.
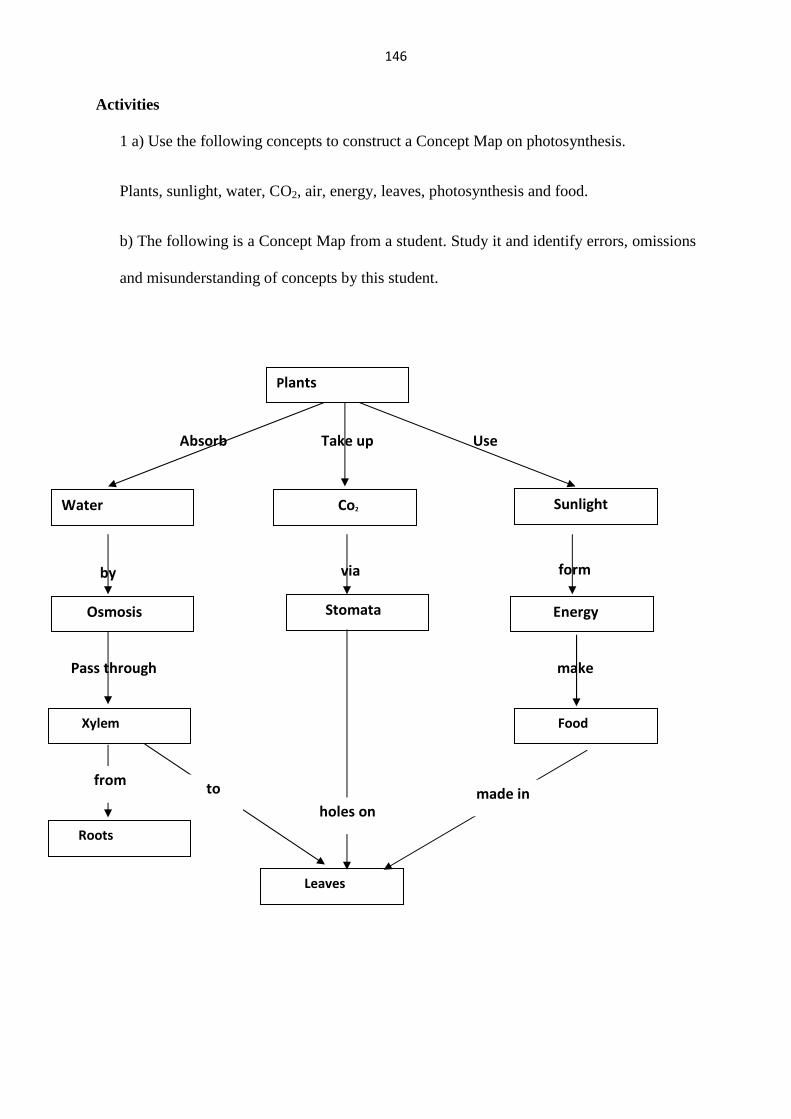
146
Activities
1 a) Use the following concepts to construct a Concept Map on photosynthesis.
Plants, sunlight, water, CO2, air, energy, leaves, photosynthesis and food.
b) The following is a Concept Map from a student. Study it and identify errors, omissions
and misunderstanding of concepts by this student.
Plants
Water Co2 Sunlight
Osmosis Energy Stomata
Xylem Food
Leaves
Roots
Absorb Take up Use
by via form
Pass through
from to
holes on
made in
make

147
You are provided with Manila paper, office glue and cards. Working in your groups make a
poster of a Concept Map using appropriate propositions written in the blank cards and the
concepts provided below. Display the poster in the classroom.
Concepts:
1) Water, salts and urea
2) Water and carbon dioxide
3) Lungs
4) Water, mineral salts and traces of urea
5) Kidneys
6) Stomata leaf and stem
7) Excretion
8) Plants
9) Skin
10) Cortex, medulla and pelvis
11) Oxygen, carbon dioxide, water, nitrogenous waste and mineral salts
12) Humans
3.0 What are the challenges likely to be encountered when using Concept Mapping?
Notes on Concept Mapping in Biology (for Students)
Introduction
The way the course content in Biology subjecttaught in schools as presented gives the
impression that each subject consists of a series of separate chunks of information. This
masks the context of the subject matter and leads to loss of meaning by failing to make the
links between related or associated concepts clear. Among the many concerns teachers of
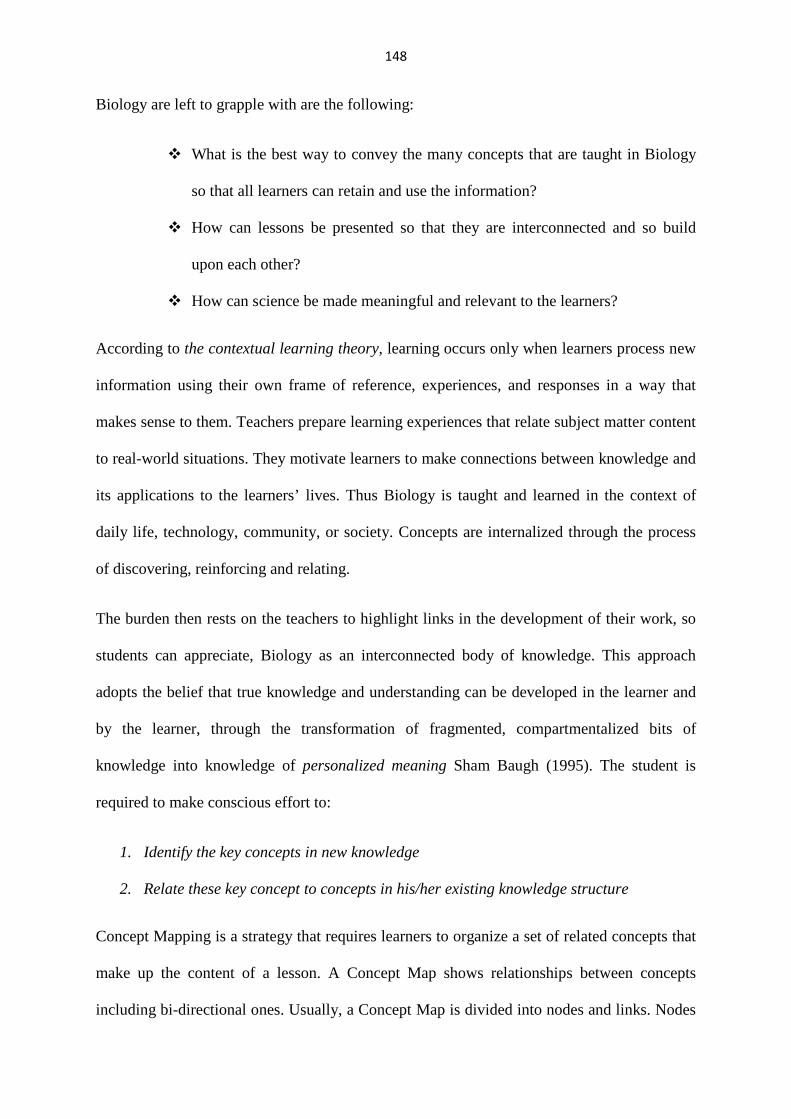
148
Biology are left to grapple with are the following:
� What is the best way to convey the many concepts that are taught in Biology
so that all learners can retain and use the information?
� How can lessons be presented so that they are interconnected and so build
upon each other?
� How can science be made meaningful and relevant to the learners?
According to the contextual learning theory, learning occurs only when learners process new
information using their own frame of reference, experiences, and responses in a way that
makes sense to them. Teachers prepare learning experiences that relate subject matter content
to real-world situations. They motivate learners to make connections between knowledge and
its applications to the learners’ lives. Thus Biology is taught and learned in the context of
daily life, technology, community, or society. Concepts are internalized through the process
of discovering, reinforcing and relating.
The burden then rests on the teachers to highlight links in the development of their work, so
students can appreciate, Biology as an interconnected body of knowledge. This approach
adopts the belief that true knowledge and understanding can be developed in the learner and
by the learner, through the transformation of fragmented, compartmentalized bits of
knowledge into knowledge of personalized meaning Sham Baugh (1995). The student is
required to make conscious effort to:
1. Identify the key concepts in new knowledge
2. Relate these key concept to concepts in his/her existing knowledge structure
Concept Mapping is a strategy that requires learners to organize a set of related concepts that
make up the content of a lesson. A Concept Map shows relationships between concepts
including bi-directional ones. Usually, a Concept Map is divided into nodes and links. Nodes
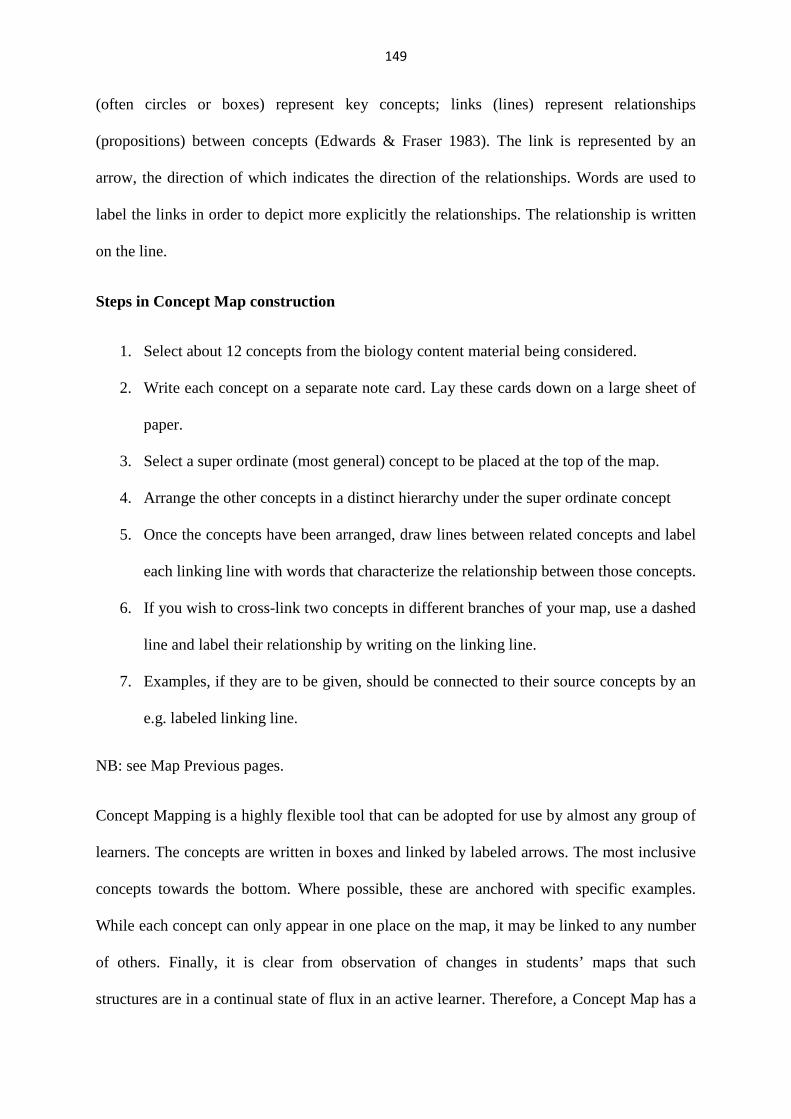
149
(often circles or boxes) represent key concepts; links (lines) represent relationships
(propositions) between concepts (Edwards & Fraser 1983). The link is represented by an
arrow, the direction of which indicates the direction of the relationships. Words are used to
label the links in order to depict more explicitly the relationships. The relationship is written
on the line.
Steps in Concept Map construction
1. Select about 12 concepts from the biology content material being considered.
2. Write each concept on a separate note card. Lay these cards down on a large sheet of
paper.
3. Select a super ordinate (most general) concept to be placed at the top of the map.
4. Arrange the other concepts in a distinct hierarchy under the super ordinate concept
5. Once the concepts have been arranged, draw lines between related concepts and label
each linking line with words that characterize the relationship between those concepts.
6. If you wish to cross-link two concepts in different branches of your map, use a dashed
line and label their relationship by writing on the linking line.
7. Examples, if they are to be given, should be connected to their source concepts by an
e.g. labeled linking line.
NB: see Map Previous pages.
Concept Mapping is a highly flexible tool that can be adopted for use by almost any group of
learners. The concepts are written in boxes and linked by labeled arrows. The most inclusive
concepts towards the bottom. Where possible, these are anchored with specific examples.
While each concept can only appear in one place on the map, it may be linked to any number
of others. Finally, it is clear from observation of changes in students’ maps that such
structures are in a continual state of flux in an active learner. Therefore, a Concept Map has a
150
‘limited shelf life’, after which it is simply an historical record. The active use of Concept
Maps could be applied to any of four stages of the teaching/learning process: Planning and
preparation; Formative learning; Revision/summarizing; Assessment.
Planning and preparation
It has been shown that the planning of lesson session can be helped by the process of Concept
Mapping to provide a coherent structure to learning materials and making essential links
explicit. This is particularly helpful in cases where ‘students’ are learning Biology, as they
may appreciate the explanation offered by the various authors of books and other materials
Formative learning
Concept Mapping helps students to gain more unified understanding of a topic and organize
their knowledge for more effective problem solving. For ‘holists’, who have a global
approach Concept Mapping helps the learners to focus on critical details, whereas, ‘serialists’
can be stimulated to take a wider perspective. However, students who gain most from
Concept Mapping are those identified as ‘visual-spatial learners’, who excel when provided
with visual representations. Such students reject rote memorization and have need to see how
the parts relate to the whole before they can make sense of the isolated ideas typically
presented in Biology lessons. This suggests that for teachers to optimize the benefits of
Concept Mapping for their students, they first need to be familiar with the students’ prior
knowledge and current learning strategies and styles.
Revision / summarizing
Concept Maps are excellent summary/revision tools in which large amounts of information
are condensed. The creation of such a map forces students to revise actively and to
manipulate the information to be learned. Revision by reading through the notes leaves no
151
evidence of the effort that has been made. With students producing a revision Concept Map
to be handed in, the teachers gets much more information about each of his/her students’
performance than would be gained from a test mark alone. Mistakes in the test might be
picked up as misconceptions or gaps in the Concept Map. Discrepancies between test scores
and Concept Map quality might also highlight the relationship between effort, and
achievement.
Assessment
Once completed, the Concept Map is a visual representation of a learner’s cognitive structure.
It shows the hierarchies and the interconnections of concepts in a lesson. A practical way of
generating a Concept Map is to write each term on a piece of paper. The pieces of paper can
be rearranged so that when links are drawn the terms are beautifully laid out. When satisfied
with the arrangement, the pieces of paper can be pasted on a big sheet and the relationship
linking the terms are written on the lines connecting them. This means that the map may vary
from person to person. More revealing is the nature of the relationships or links between the
concepts defined by each person.
As earlier mentioned, there is no wrong or correct map. There is often more than one
appropriate link between a pair of concepts; the layout can vary considerably. However there
are some criteria and scoring procedures in evaluating Concept Maps. An example is shown
A number of schools though have supported the use of Concept Maps for summative
assessment. They also have suggested evaluating student maps by reference to a teacher-
produced or ‘expert map’. Student maps could then be marked according to how many of the
propositions in his/her are incorporated.
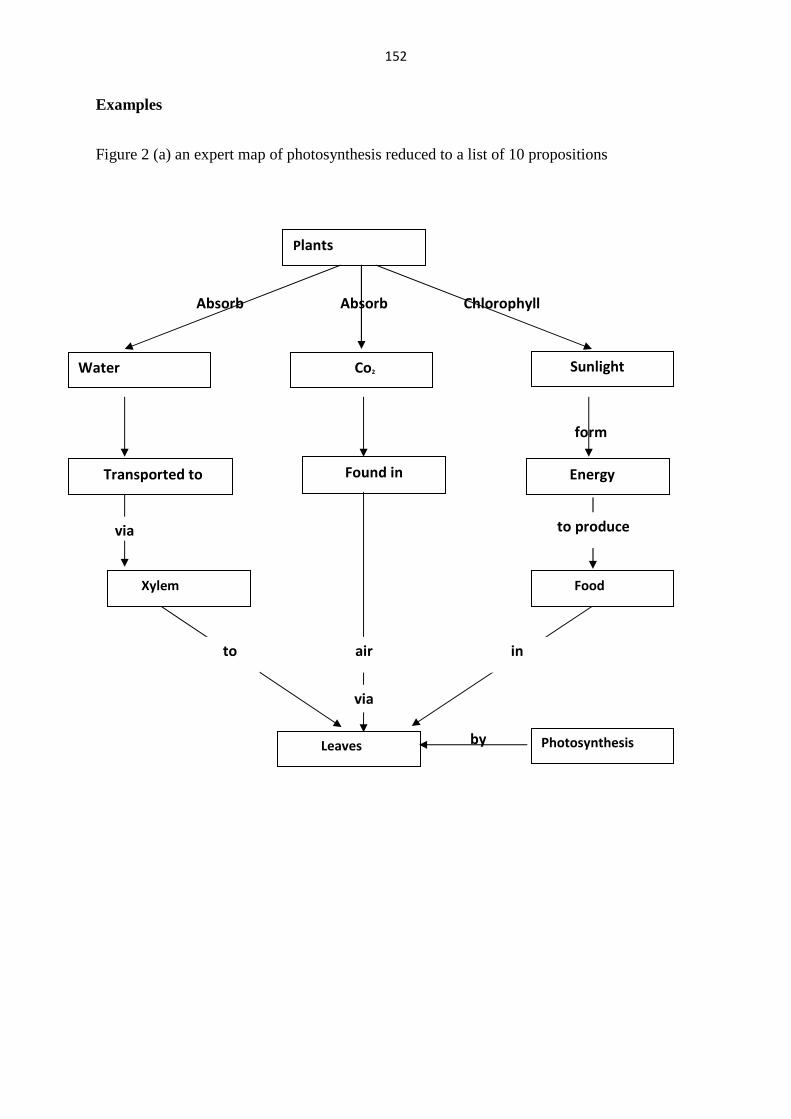
152
Examples
Figure 2 (a) an expert map of photosynthesis reduced to a list of 10 propositions
by
Plants
Water Co2 Sunlight
Transported to Energy Found in
Xylem Food
Leaves
Absorb Absorb Chlorophyll
form
to air
Photosynthesis
via
via
in
to produce
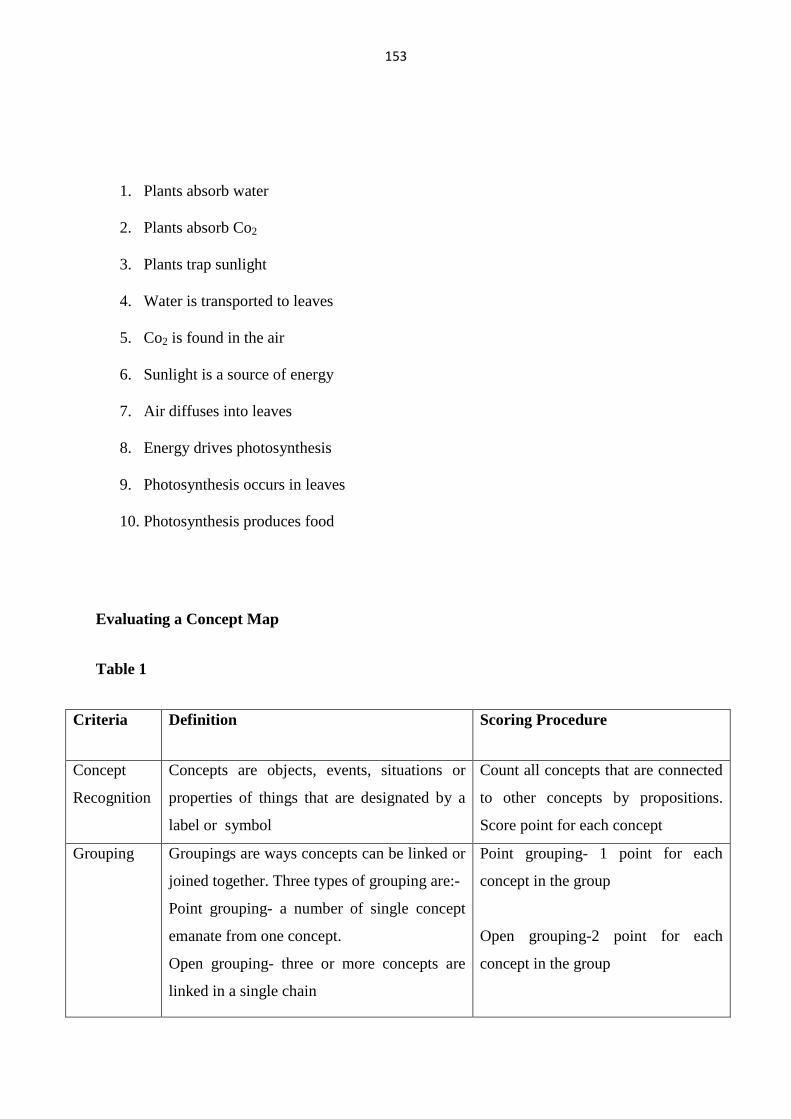
153
1. Plants absorb water
2. Plants absorb Co2
3. Plants trap sunlight
4. Water is transported to leaves
5. Co2 is found in the air
6. Sunlight is a source of energy
7. Air diffuses into leaves
8. Energy drives photosynthesis
9. Photosynthesis occurs in leaves
10. Photosynthesis produces food
Evaluating a Concept Map
Table 1
Criteria Definition Scoring Procedure
Concept
Recognition
Concepts are objects, events, situations or
properties of things that are designated by a
label or symbol
Count all concepts that are connected
to other concepts by propositions.
Score point for each concept
Grouping Groupings are ways concepts can be linked or
joined together. Three types of grouping are:-
Point grouping- a number of single concept
emanate from one concept.
Open grouping- three or more concepts are
linked in a single chain
Point grouping- 1 point for each
concept in the group
Open grouping-2 point for each
concept in the group
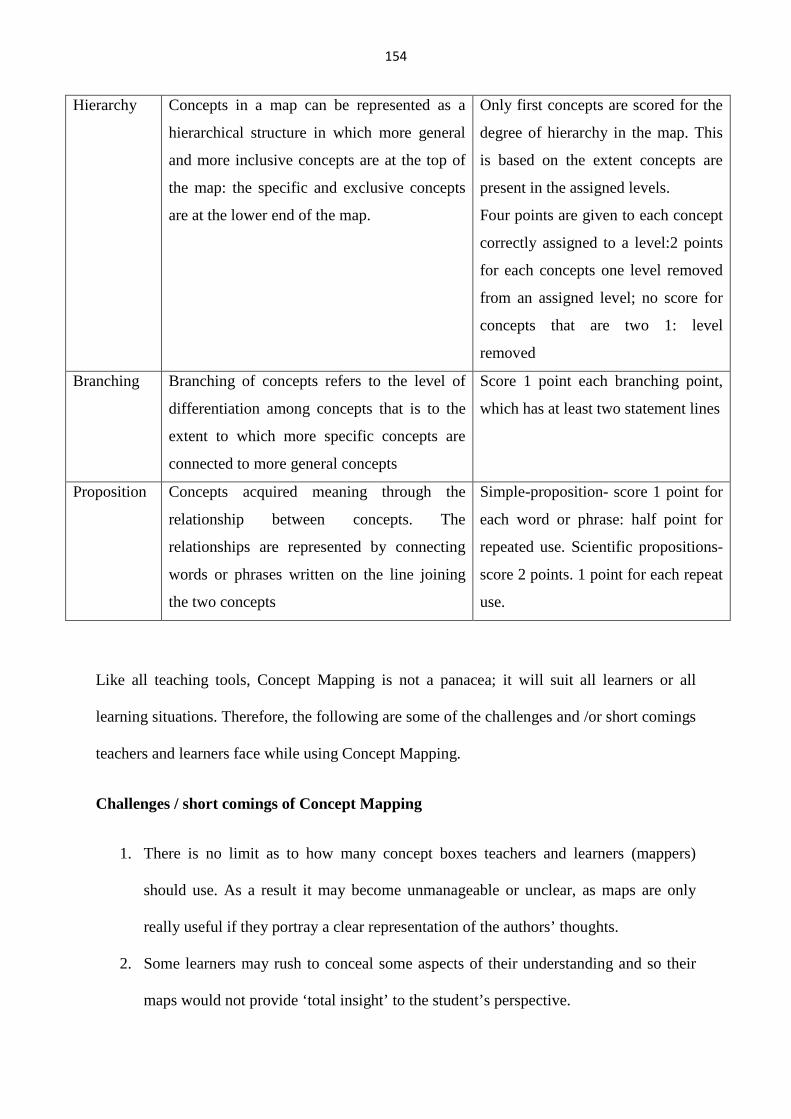
154
Hierarchy Concepts in a map can be represented as a
hierarchical structure in which more general
and more inclusive concepts are at the top of
the map: the specific and exclusive concepts
are at the lower end of the map.
Only first concepts are scored for the
degree of hierarchy in the map. This
is based on the extent concepts are
present in the assigned levels.
Four points are given to each concept
correctly assigned to a level:2 points
for each concepts one level removed
from an assigned level; no score for
concepts that are two 1: level
removed
Branching Branching of concepts refers to the level of
differentiation among concepts that is to the
extent to which more specific concepts are
connected to more general concepts
Score 1 point each branching point,
which has at least two statement lines
Proposition Concepts acquired meaning through the
relationship between concepts. The
relationships are represented by connecting
words or phrases written on the line joining
the two concepts
Simple-proposition- score 1 point for
each word or phrase: half point for
repeated use. Scientific propositions-
score 2 points. 1 point for each repeat
use.
Like all teaching tools, Concept Mapping is not a panacea; it will suit all learners or all
learning situations. Therefore, the following are some of the challenges and /or short comings
teachers and learners face while using Concept Mapping.
Challenges / short comings of Concept Mapping
1. There is no limit as to how many concept boxes teachers and learners (mappers)
should use. As a result it may become unmanageable or unclear, as maps are only
really useful if they portray a clear representation of the authors’ thoughts.
2. Some learners may rush to conceal some aspects of their understanding and so their
maps would not provide ‘total insight’ to the student’s perspective.
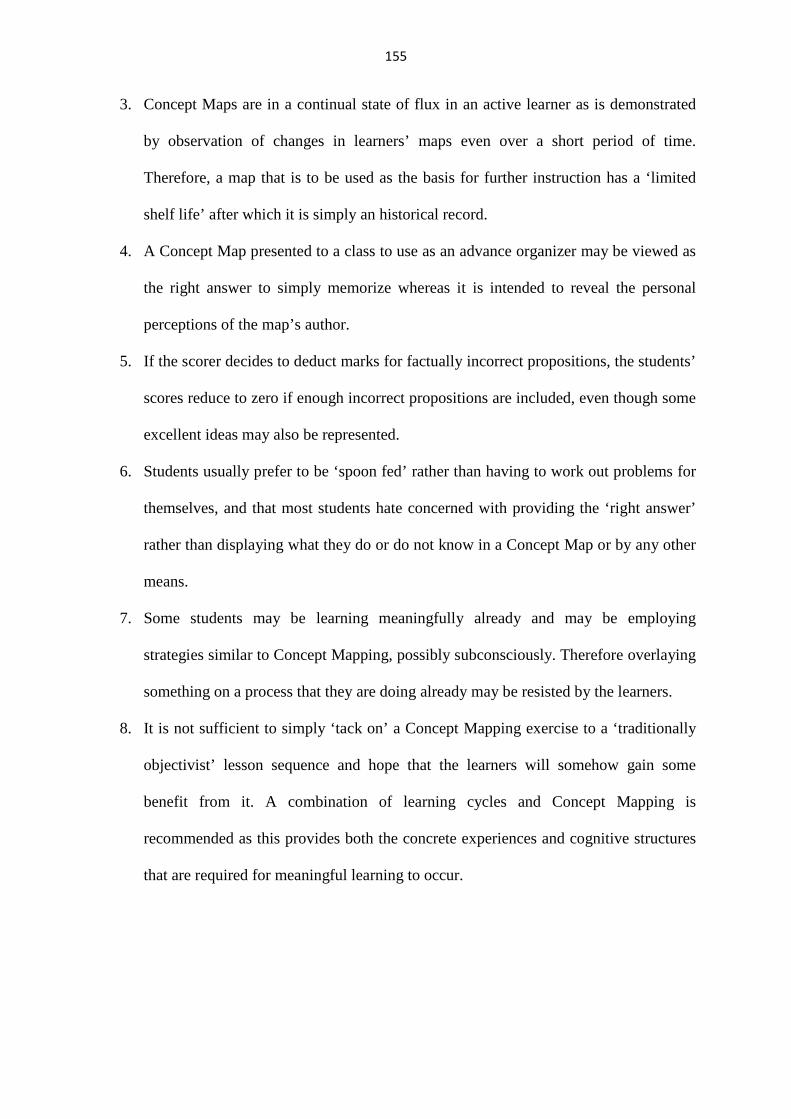
155
3. Concept Maps are in a continual state of flux in an active learner as is demonstrated
by observation of changes in learners’ maps even over a short period of time.
Therefore, a map that is to be used as the basis for further instruction has a ‘limited
shelf life’ after which it is simply an historical record.
4. A Concept Map presented to a class to use as an advance organizer may be viewed as
the right answer to simply memorize whereas it is intended to reveal the personal
perceptions of the map’s author.
5. If the scorer decides to deduct marks for factually incorrect propositions, the students’
scores reduce to zero if enough incorrect propositions are included, even though some
excellent ideas may also be represented.
6. Students usually prefer to be ‘spoon fed’ rather than having to work out problems for
themselves, and that most students hate concerned with providing the ‘right answer’
rather than displaying what they do or do not know in a Concept Map or by any other
means.
7. Some students may be learning meaningfully already and may be employing
strategies similar to Concept Mapping, possibly subconsciously. Therefore overlaying
something on a process that they are doing already may be resisted by the learners.
8. It is not sufficient to simply ‘tack on’ a Concept Mapping exercise to a ‘traditionally
objectivist’ lesson sequence and hope that the learners will somehow gain some
benefit from it. A combination of learning cycles and Concept Mapping is
recommended as this provides both the concrete experiences and cognitive structures
that are required for meaningful learning to occur.
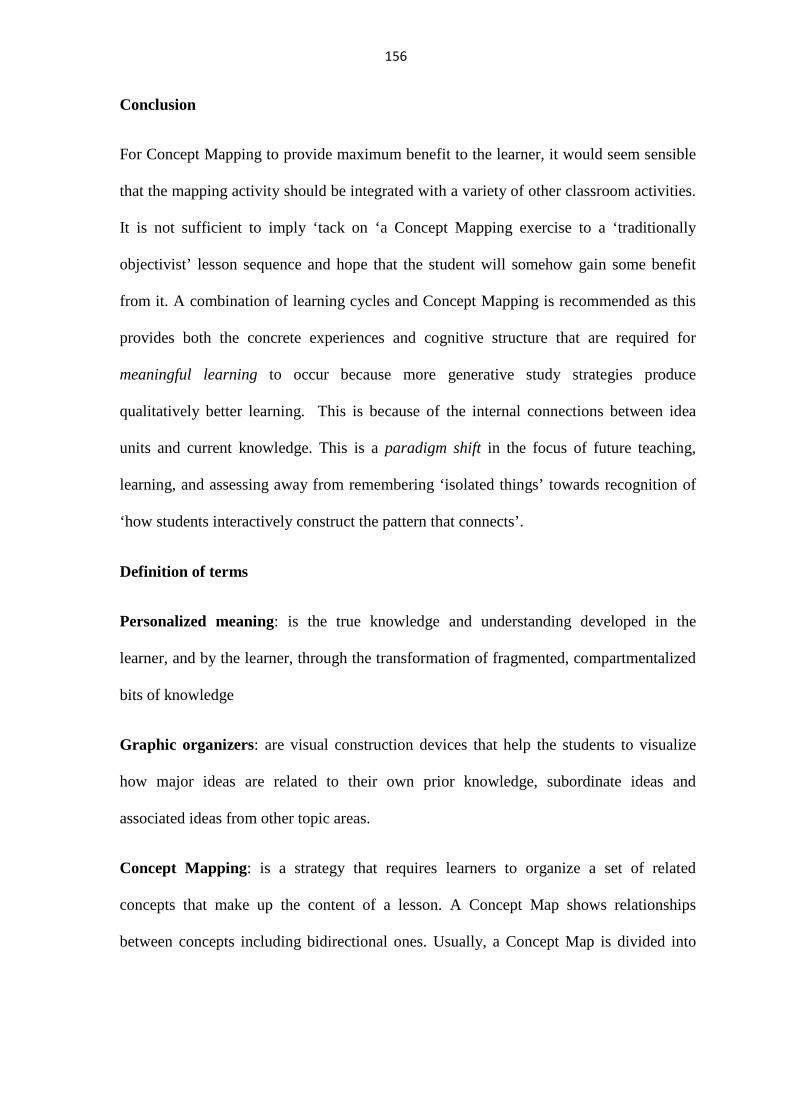
156
Conclusion
For Concept Mapping to provide maximum benefit to the learner, it would seem sensible
that the mapping activity should be integrated with a variety of other classroom activities.
It is not sufficient to imply ‘tack on ‘a Concept Mapping exercise to a ‘traditionally
objectivist’ lesson sequence and hope that the student will somehow gain some benefit
from it. A combination of learning cycles and Concept Mapping is recommended as this
provides both the concrete experiences and cognitive structure that are required for
meaningful learning to occur because more generative study strategies produce
qualitatively better learning. This is because of the internal connections between idea
units and current knowledge. This is a paradigm shift in the focus of future teaching,
learning, and assessing away from remembering ‘isolated things’ towards recognition of
‘how students interactively construct the pattern that connects’.
Definition of terms
Personalized meaning: is the true knowledge and understanding developed in the
learner, and by the learner, through the transformation of fragmented, compartmentalized
bits of knowledge
Graphic organizers: are visual construction devices that help the students to visualize
how major ideas are related to their own prior knowledge, subordinate ideas and
associated ideas from other topic areas.
Concept Mapping: is a strategy that requires learners to organize a set of related
concepts that make up the content of a lesson. A Concept Map shows relationships
between concepts including bidirectional ones. Usually, a Concept Map is divided into
157
nodes and links. Nodes (often circles) represent key concepts; links (lines) represent
relationships (propositions) between concepts (Lazing, 1997).
Visual-spatial learners: are students who excel when provided with visual
representations, reject rote memorizations and take initiative to see how the parts relate to
the whole before they can make sense of the isolated ideas typically presented in Biology
lessons.
Expert map: is a teacher-produced map which show the points a teacher wishes to cover
in a particular lesson sequence, and how they interrelate. It may also be used to show a
basic framework that a teacher might hope for his/her students to have at the end of a
lesson sequence on a topic.
Paradigm shift: a fundamental change in approach from the old way of doing something
Meaningful learning: is the central idea of the Assimilation Theory of learning in which
the student is required to make a conscious effort to identify the key concepts in new
knowledge and relate to them to concepts in his/her existing knowledge structures.
Visual Construction tools: there are various construction tools or ‘graphic organizers’
available for use in a mathematics and science classroom. Such tools help students
visualize how major ideas are related to their own prior knowledge, subordinate ideas and
associated ideas from other topic areas. Each of these graphic organizers has its own
strengths and weaknesses, but it is Concept Mapping, as developed by Novak (1998)
about which the research literature has been consistently positive. In this the student is
required to make a conscious effort to identify the key concepts in new knowledge and
relate them to concepts in his/her existing knowledge structure.
158
2.4.5 Challenges / Shortcomings of Concept Mapping
1. There is no limit as to how many concept boxes teachers and learners (mappers)
should use. As a result it may become unmanageable or unclear, as maps are only
really useful if they portray a clear representation of the authors’ thoughts (Edwards
& Frazer, 1983; Derbentseva et al., 2004).
2. Some learners may rush to conceal some aspects of their understanding and so their
maps would not provide ‘total insight’ to the student’s perspective (Canas et al.,
2005).
3. Concept Maps are in a continual state of flux in an active learner as is demonstrated
by observation of changes in learners’ maps even over a short period of time.
Therefore, a map that is to be used as the basis for further instruction has a ‘limited
shelf life’ after which it is simply an historical record Briggs et al., 2004).
4. A Concept Map presented to a class to use as an advance organizer may be viewed as
the right answer to simply memorize whereas it is intended to reveal the personal
perceptions of the map’s author (Canas et al., 2005).
5. If the scorer decides to deduct marks for factually incorrect propositions, the students’
scores reduce to zero if enough incorrect propositions are included, even though some
excellent ideas may also be represented (Coffey et al., 2002).
6. Students usually prefer to be ‘spoon fed’ rather than having to work out problems for
themselves, and that most students hate concerned with providing the ‘right answer’
rather than displaying what they do or do not know in a Concept Map or by any other
means (Edwards & Frazer, 1983).
7. Some students may be learning meaningfully already and may be employing
strategies similar to Concept Mapping, possibly subconsciously. Therefore overlaying
159
something on a process that they are doing already may be resisted by the learners
(Briggs et al., 2004).
8. It is not sufficient to simply ‘tack on’ a Concept Mapping exercise to a ‘traditionally
objectivist’ lesson sequence and hope that the learners will somehow gain some
benefit from it. A combination of learning cycles and Concept Mapping is
recommended as this provides both the concrete experiences and cognitive structures
that are required for meaningful learning to occur (Beirute & Mayorga, 2004).
The researcher therefore clarifies that for Concept Mapping to provide maximum benefit
to the learner, it would seem sensible that the mapping activity should be integrated with
a variety of other classroom activities. Nevertheless, this is a paradigm shift in the focus
of future teaching, learning, and assessing, away from remembering ‘isolated things’
towards recognition of ‘how students interactively construct the pattern that connects
various bits of information in order to generate knowledge. Furthermore, a study by
Namasaka, Mondoh and Keraro (2013) revealed female students achieve higher scores on
test compared to their male counterparts when both are exposed to Concept Mapping
technique. The results also showed that female students are more motivated to learn
Biology compared to the male students. However, the difference in levels of motivation
were not statistically significant.
160
References
Ch’ng, M.S(1994). PSP: Primary Science 5 Teachers’ Guide Second Edition Singapore:
CDIS
http://inspiration.com/home.cfm
Novak and Johansen (1983). “The use of Concept Mapping and Knowledge Vee Mapping
with Junior High School Science Students” in Science Education. 67(5).
Novak,J.D. (1981a). Applying learning psychology and philosophy of science to biology
teaching. American Biology Teaching. 43.12-20
Novak, J.D (1981b). Effective science instruction: the achievement of shared meaning.
Australian Science Teachers Journal, 27, 5-13
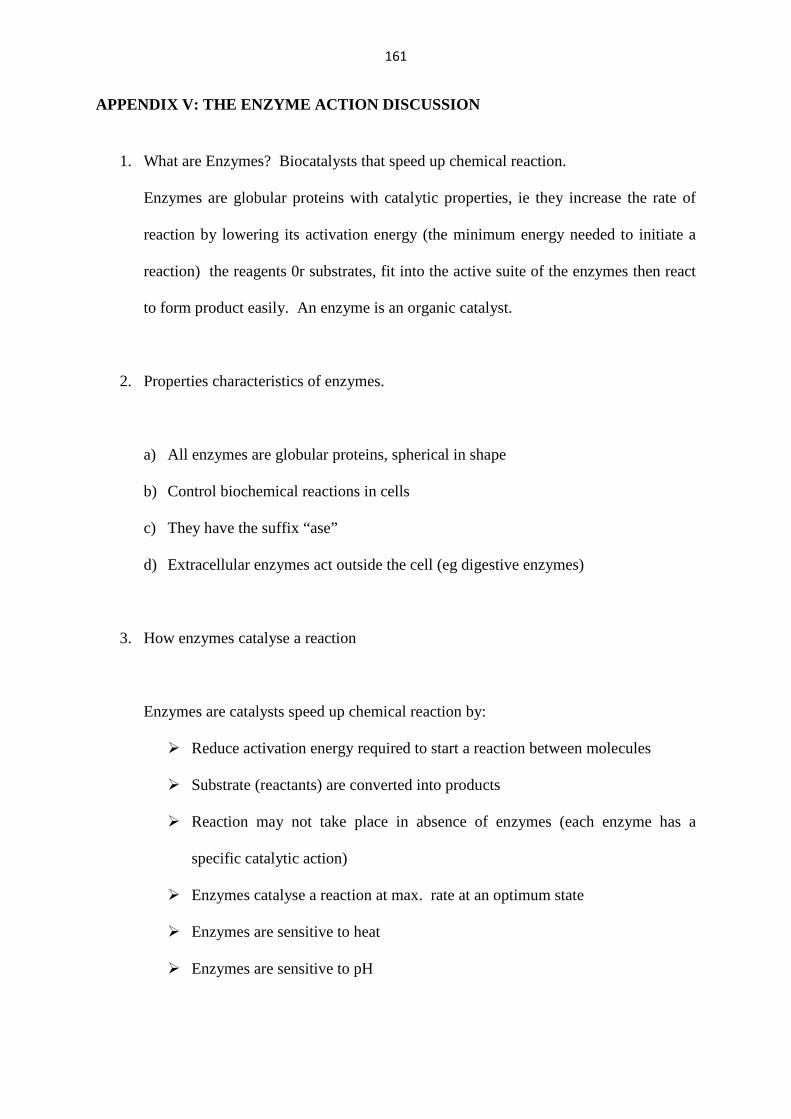
161
APPENDIX V: THE ENZYME ACTION DISCUSSION
1. What are Enzymes? Biocatalysts that speed up chemical reaction.
Enzymes are globular proteins with catalytic properties, ie they increase the rate of
reaction by lowering its activation energy (the minimum energy needed to initiate a
reaction) the reagents 0r substrates, fit into the active suite of the enzymes then react
to form product easily. An enzyme is an organic catalyst.
2. Properties characteristics of enzymes.
a) All enzymes are globular proteins, spherical in shape
b) Control biochemical reactions in cells
c) They have the suffix “ase”
d) Extracellular enzymes act outside the cell (eg digestive enzymes)
3. How enzymes catalyse a reaction
Enzymes are catalysts speed up chemical reaction by:
� Reduce activation energy required to start a reaction between molecules
� Substrate (reactants) are converted into products
� Reaction may not take place in absence of enzymes (each enzyme has a
specific catalytic action)
� Enzymes catalyse a reaction at max. rate at an optimum state
� Enzymes are sensitive to heat
� Enzymes are sensitive to pH
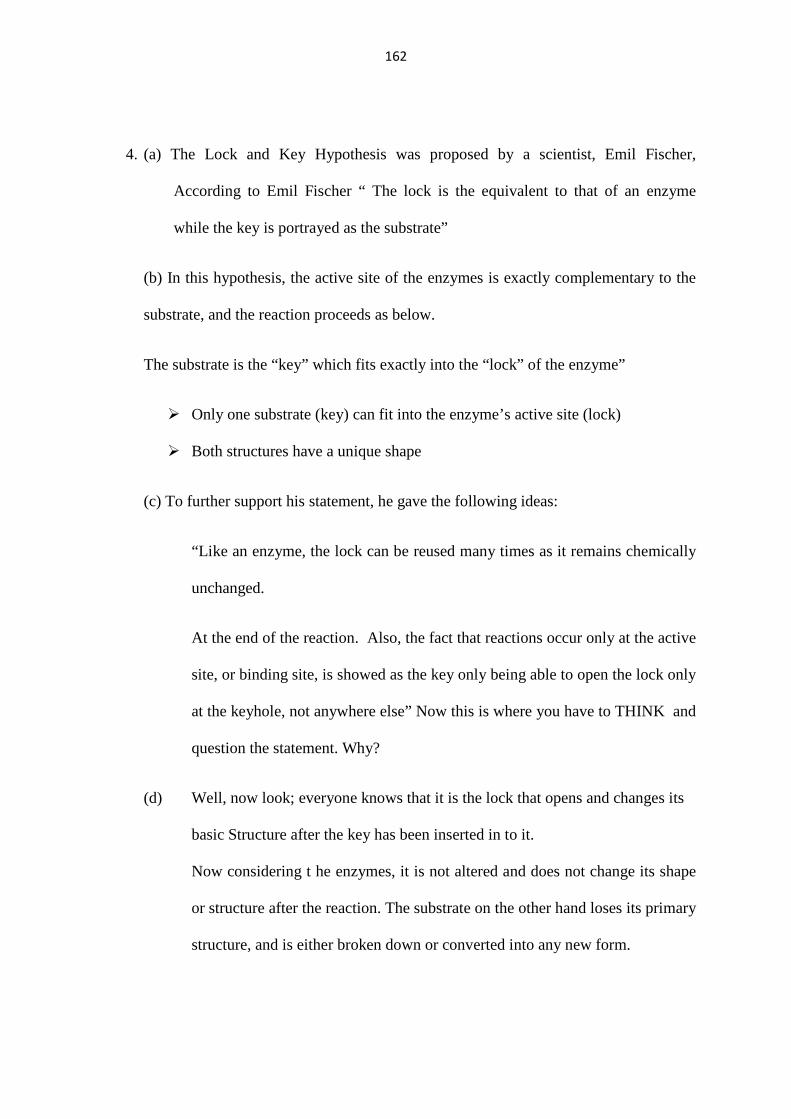
162
4. (a) The Lock and Key Hypothesis was proposed by a scientist, Emil Fischer,
According to Emil Fischer “ The lock is the equivalent to that of an enzyme
while the key is portrayed as the substrate”
(b) In this hypothesis, the active site of the enzymes is exactly complementary to the
substrate, and the reaction proceeds as below.
The substrate is the “key” which fits exactly into the “lock” of the enzyme”
� Only one substrate (key) can fit into the enzyme’s active site (lock)
� Both structures have a unique shape
(c) To further support his statement, he gave the following ideas:
“Like an enzyme, the lock can be reused many times as it remains chemically
unchanged.
At the end of the reaction. Also, the fact that reactions occur only at the active
site, or binding site, is showed as the key only being able to open the lock only
at the keyhole, not anywhere else” Now this is where you have to THINK and
question the statement. Why?
(d) Well, now look; everyone knows that it is the lock that opens and changes its
basic Structure after the key has been inserted in to it.
Now considering t he enzymes, it is not altered and does not change its shape
or structure after the reaction. The substrate on the other hand loses its primary
structure, and is either broken down or converted into any new form.
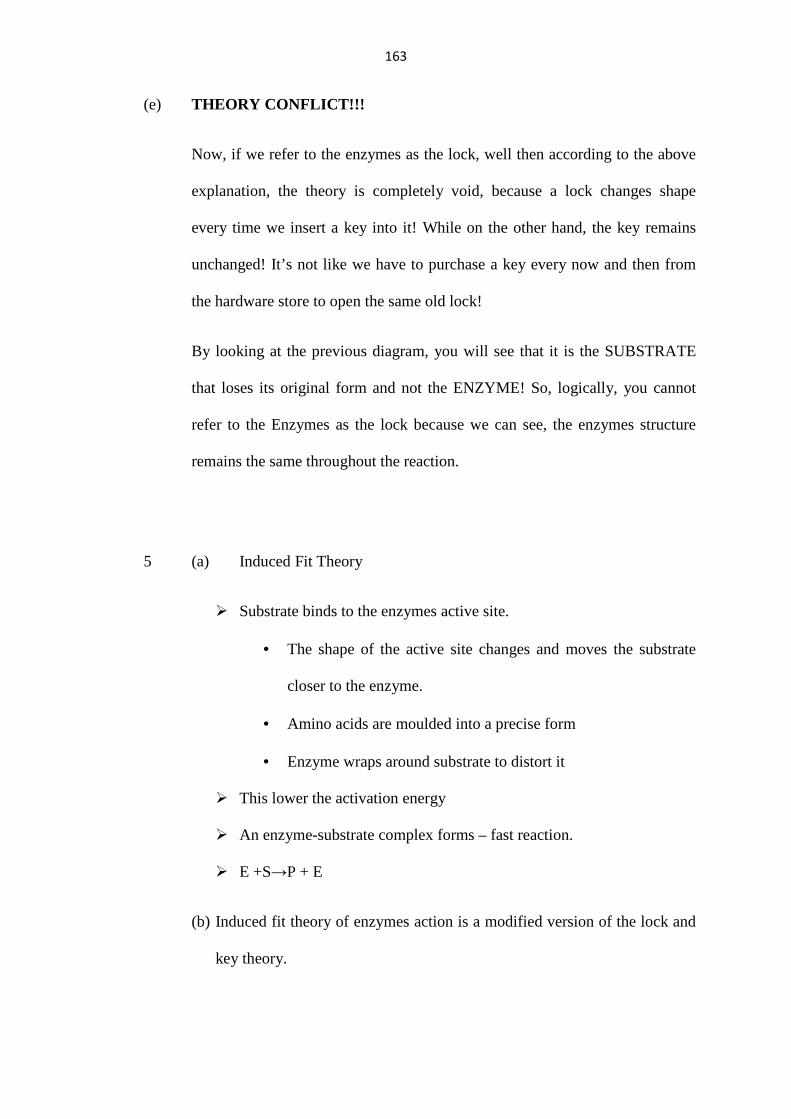
163
(e) THEORY CONFLICT!!!
Now, if we refer to the enzymes as the lock, well then according to the above
explanation, the theory is completely void, because a lock changes shape
every time we insert a key into it! While on the other hand, the key remains
unchanged! It’s not like we have to purchase a key every now and then from
the hardware store to open the same old lock!
By looking at the previous diagram, you will see that it is the SUBSTRATE
that loses its original form and not the ENZYME! So, logically, you cannot
refer to the Enzymes as the lock because we can see, the enzymes structure
remains the same throughout the reaction.
5 (a) Induced Fit Theory
� Substrate binds to the enzymes active site.
• The shape of the active site changes and moves the substrate
closer to the enzyme.
• Amino acids are moulded into a precise form
• Enzyme wraps around substrate to distort it
� This lower the activation energy
� An enzyme-substrate complex forms – fast reaction.
� E +S→P + E
(b) Induced fit theory of enzymes action is a modified version of the lock and
key theory.

164
Here the active site of the enzyme is not quite complementary to the
substrate. However when the substrate enters the active site, its shape is
altered so that the substrate now fits exactly.
6 (a) An active site is the part of an enzyme that directly binds to a substrate and
carries a reaction. It contains catalytic groups which are amino acids that
promote formation and degradation of bonds. By forming and breaking these
bonds, enzymes and substrate interaction promotes the formation of the
transition state structure. Enzymes help a reaction by stabilizing the transition
state intermediate. This is accomplished by lowering the energy barrier or
activation energy – the energy that is required to promote the formation of
transition state intermediate. The three dimensional cleft is formed by the
groups that come from different part of the amino acid sequences. The active
site is only a small part of the total enzyme volume. It enhances the enzyme to
bind to substrate and catalysis by many different weak interactions because of
its no polar microenvironment. The weak interactions include the Van der
Waals, hydrogen bonding and electrostatic interactions. The arrangement of
atoms in the active site is crucial for binding specificity. The overall result is
the acceleration of the reaction process and increasing the rate of reaction.
Furthermore, not only do enzymes contain catalytic abilities, but the active site
also carries the recognition of substrate.
(b) The enzyme active site is binding site for catalytic and inhibition
reactions of enzyme and substrate; structure of active site and its chemical
characteristic are specific for the binding of a particular substance. The
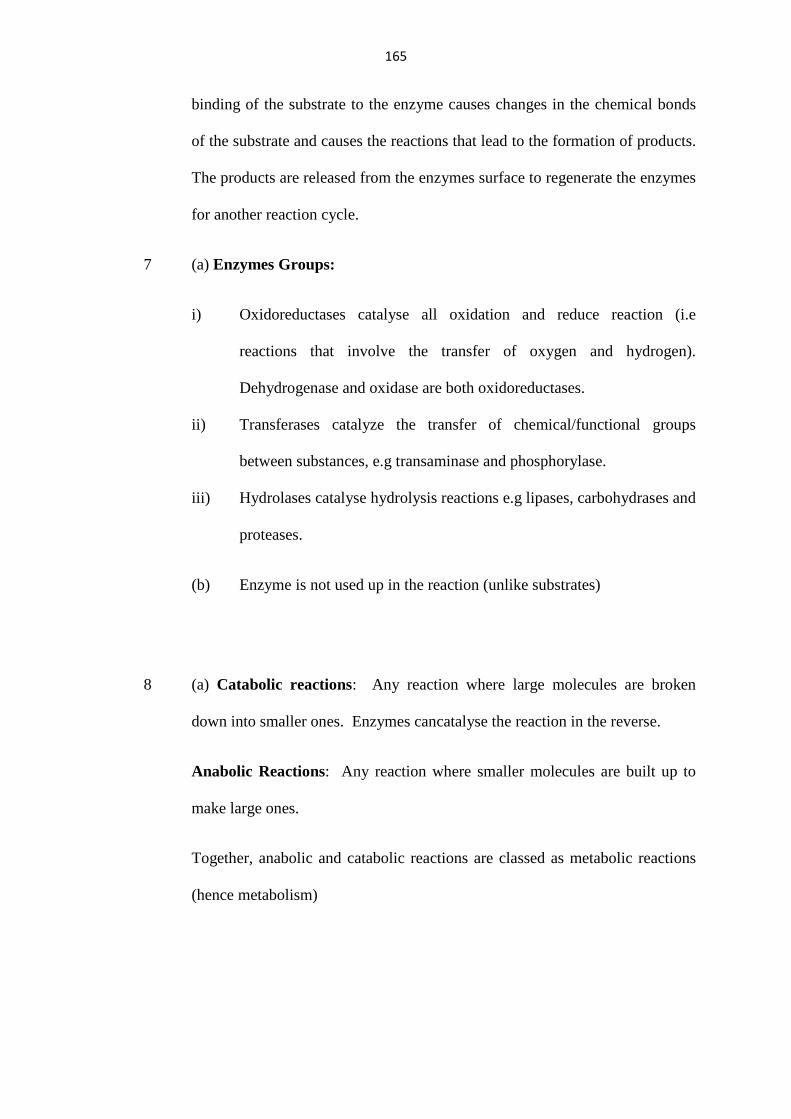
165
binding of the substrate to the enzyme causes changes in the chemical bonds
of the substrate and causes the reactions that lead to the formation of products.
The products are released from the enzymes surface to regenerate the enzymes
for another reaction cycle.
7 (a) Enzymes Groups:
i) Oxidoreductases catalyse all oxidation and reduce reaction (i.e
reactions that involve the transfer of oxygen and hydrogen).
Dehydrogenase and oxidase are both oxidoreductases.
ii) Transferases catalyze the transfer of chemical/functional groups
between substances, e.g transaminase and phosphorylase.
iii) Hydrolases catalyse hydrolysis reactions e.g lipases, carbohydrases and
proteases.
(b) Enzyme is not used up in the reaction (unlike substrates)
8 (a) Catabolic reactions: Any reaction where large molecules are broken
down into smaller ones. Enzymes cancatalyse the reaction in the reverse.
Anabolic Reactions: Any reaction where smaller molecules are built up to
make large ones.
Together, anabolic and catabolic reactions are classed as metabolic reactions
(hence metabolism)
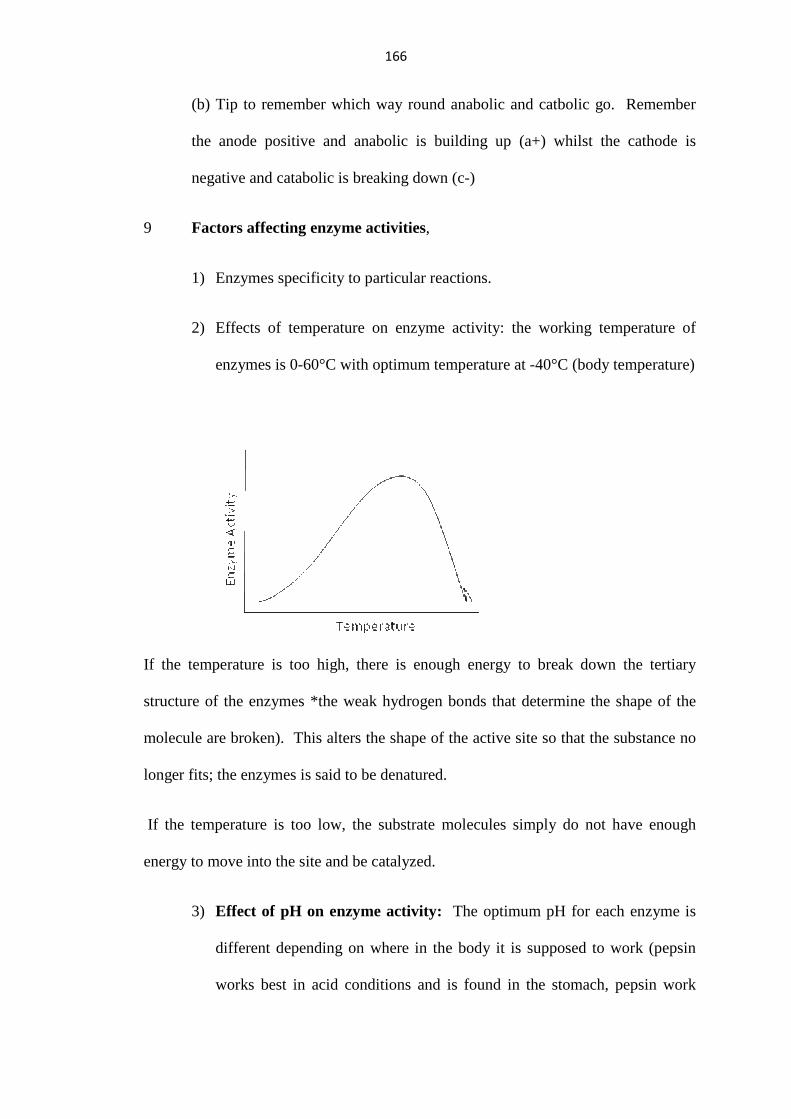
166
(b) Tip to remember which way round anabolic and catbolic go. Remember
the anode positive and anabolic is building up (a+) whilst the cathode is
negative and catabolic is breaking down (c-)
9 Factors affecting enzyme activities,
1) Enzymes specificity to particular reactions.
2) Effects of temperature on enzyme activity: the working temperature of
enzymes is 0-60°C with optimum temperature at -40°C (body temperature)
If the temperature is too high, there is enough energy to break down the tertiary
structure of the enzymes *the weak hydrogen bonds that determine the shape of the
molecule are broken). This alters the shape of the active site so that the substance no
longer fits; the enzymes is said to be denatured.
If the temperature is too low, the substrate molecules simply do not have enough
energy to move into the site and be catalyzed.
3) Effect of pH on enzyme activity: The optimum pH for each enzyme is
different depending on where in the body it is supposed to work (pepsin
works best in acid conditions and is found in the stomach, pepsin work
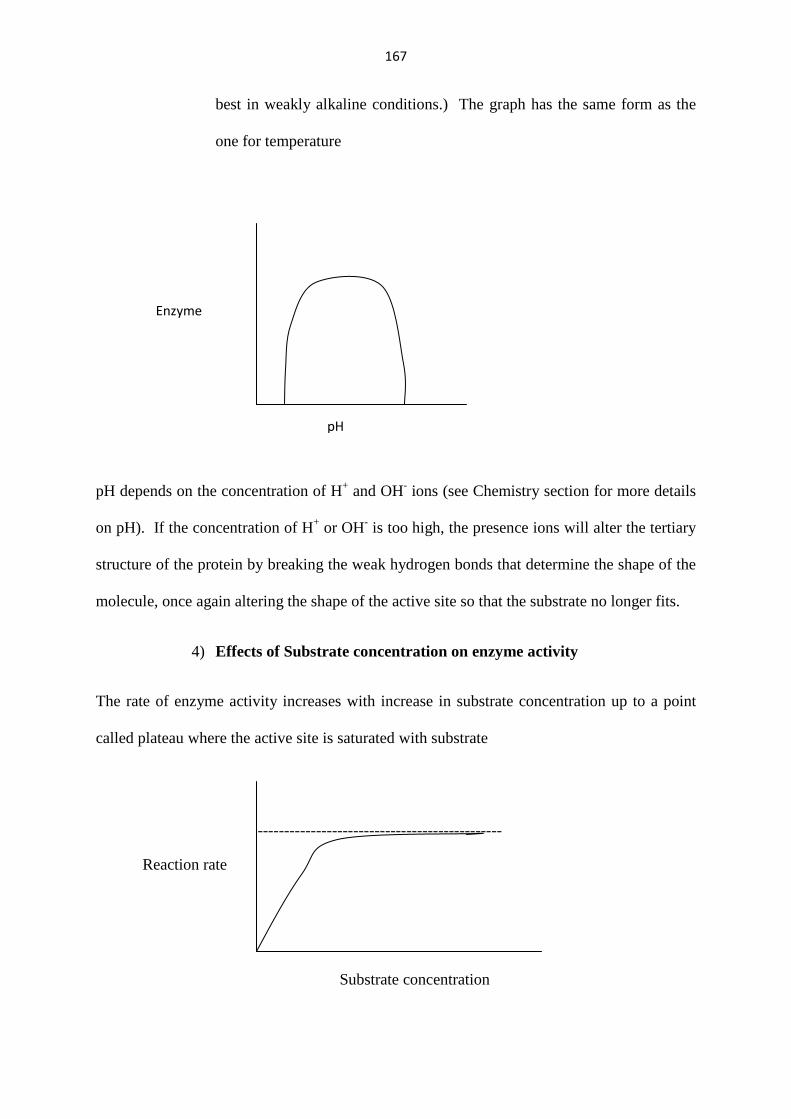
167
best in weakly alkaline conditions.) The graph has the same form as the
one for temperature
pH depends on the concentration of H+ and OH- ions (see Chemistry section for more details
on pH). If the concentration of H+ or OH- is too high, the presence ions will alter the tertiary
structure of the protein by breaking the weak hydrogen bonds that determine the shape of the
molecule, once again altering the shape of the active site so that the substrate no longer fits.
4) Effects of Substrate concentration on enzyme activity
The rate of enzyme activity increases with increase in substrate concentration up to a point
called plateau where the active site is saturated with substrate
pH
Enzyme
Reaction rate
----------------------------------------------
Substrate concentration
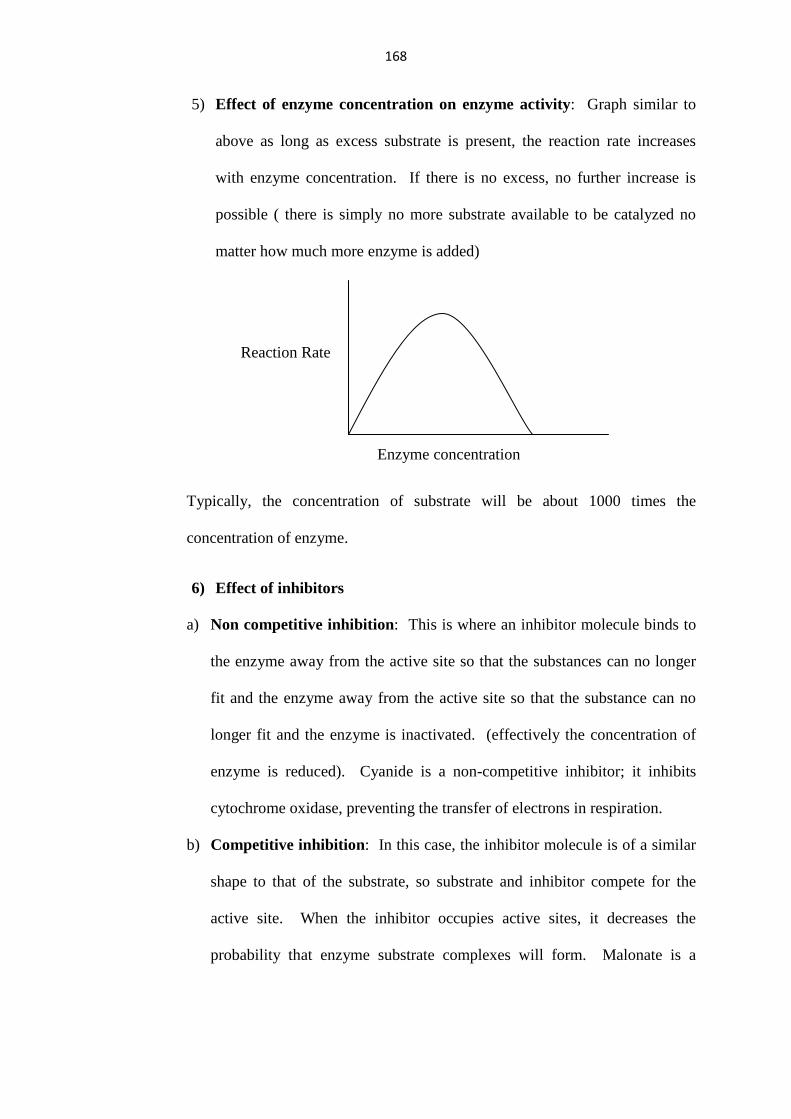
168
5) Effect of enzyme concentration on enzyme activity: Graph similar to
above as long as excess substrate is present, the reaction rate increases
with enzyme concentration. If there is no excess, no further increase is
possible ( there is simply no more substrate available to be catalyzed no
matter how much more enzyme is added)
Typically, the concentration of substrate will be about 1000 times the
concentration of enzyme.
6) Effect of inhibitors
a) Non competitive inhibition: This is where an inhibitor molecule binds to
the enzyme away from the active site so that the substances can no longer
fit and the enzyme away from the active site so that the substance can no
longer fit and the enzyme is inactivated. (effectively the concentration of
enzyme is reduced). Cyanide is a non-competitive inhibitor; it inhibits
cytochrome oxidase, preventing the transfer of electrons in respiration.
b) Competitive inhibition : In this case, the inhibitor molecule is of a similar
shape to that of the substrate, so substrate and inhibitor compete for the
active site. When the inhibitor occupies active sites, it decreases the
probability that enzyme substrate complexes will form. Malonate is a
Reaction Rate
Enzyme concentration
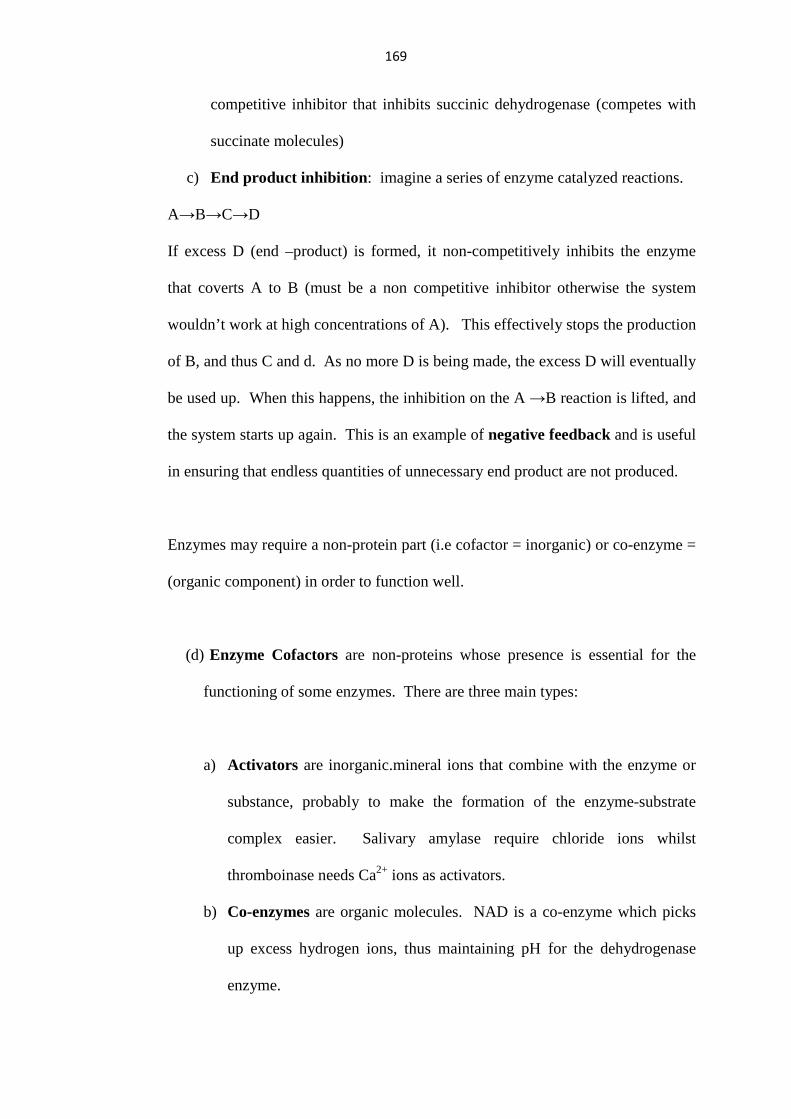
169
competitive inhibitor that inhibits succinic dehydrogenase (competes with
succinate molecules)
c) End product inhibition : imagine a series of enzyme catalyzed reactions.
A→B→C→D
If excess D (end –product) is formed, it non-competitively inhibits the enzyme
that coverts A to B (must be a non competitive inhibitor otherwise the system
wouldn’t work at high concentrations of A). This effectively stops the production
of B, and thus C and d. As no more D is being made, the excess D will eventually
be used up. When this happens, the inhibition on the A →B reaction is lifted, and
the system starts up again. This is an example of negative feedback and is useful
in ensuring that endless quantities of unnecessary end product are not produced.
Enzymes may require a non-protein part (i.e cofactor = inorganic) or co-enzyme =
(organic component) in order to function well.
(d) Enzyme Cofactors are non-proteins whose presence is essential for the
functioning of some enzymes. There are three main types:
a) Activators are inorganic.mineral ions that combine with the enzyme or
substance, probably to make the formation of the enzyme-substrate
complex easier. Salivary amylase require chloride ions whilst
thromboinase needs Ca2+ ions as activators.
b) Co-enzymes are organic molecules. NAD is a co-enzyme which picks
up excess hydrogen ions, thus maintaining pH for the dehydrogenase
enzyme.
170
c) Prosthetic groups are organic molecules that are physically bound to an
enzyme, e.g the haem molecule is bound to catalase.
Uses of enzymes
i) Enzymes in biotechnology: enzymes can be used for the production
and detection of certain compounds because, unlike inorganic catalyst,
they are specific and do not produce harmful by-products. They can
also work at low temperatures and pressures as well as a range of pH
values (more cost effective than an inorganic catalyst which might need
a high temperature in order to work)
ii) Biosensors: enzymes can be used to detect specific compounds. The
example used here is the analysis of glucose:
Β-D-glucose + O2 - > gluconic acid + H2O2
DH2 + H2O2 →2H2O + D (Coloured Compound)
The first reaction is catalysed by glucose oxidase, the second by
peroxidase. Obviously the appearance of the coloured compound D
indicates that glucose is present in the original Sample.
iii) Thermostability: Some enzymes are altered so that they will be stable
at higher temperatures. For example, sustilisin is modified for use in
detergent so that it will work effectively at 60°C instead of being
denatured important if you want to doa 60°C wash)
iv) Immobilization of Enzymes: the enzyme is attached to an inert material
e.g a membrane or ceramic/polymer gel. Reactant can now be passed
171
over the enzyme almost continuously whilst contamination of products
is prevented. Cost-effectiveness is increased as the enzymes can be
quickly and easily recovered.
v) Production of fructose by enzymic hydrolysis of starch: demonstrates
one of the many industrial uses of enzymes.
1) First amylase is used to convert starch into dextrin
2) Saccharifying enzymes are now used to break dextrin down into glucose.
LABORATORY STUDENT EXPERIMENTS
PRACTICAL ACTIVITY I
To investigate the factors affecting enzymes activities.
a) Effect of temperature on enzyme activity.
Requirement
Six clean test-tubes, white tile, test-tube holder, a dropper, distilled water, Benedict’s
solution, iodine solution, water bath maintained at 37°C and 50°C, source of heat,
thermometer, measuring cylinders, labels, 6 cm3 of amylase solution and soluble starch
powder.
PROCEDURE
I) Label three test-tubes A, B AND C
II) Into test-tube A and B, add 3 cm3 of starch solution
III) Into test-tube A,B and C add 2 cm3 of amylase solution
IV) Place test-tube B in the water bath maintained at 50°C for 30 minutes
172
V) Place the remaining test-tubes A and C in the water bath maintained at 30° for 30
minutes
VI) After the 30 minutes, test for starch and reducing sugars on the contents of each
test-tubes. Record your results.
Study Questions
Which of the test tubes showed:
i) Presence of starch:
ii) Presence of reducing sugars?
Explain your results
iii) What was the reason for maintaining the test-tubes at 37°C?
iv) Treating test-tube C to a temperature of 50
b) Effect of pH on enzyme activity:
Requirements
Water bath kept at 37°C, egg albumen suspension, 2M of hydrochloric acid, 2M
sodium hydroxide three test-tubes, 5 cm3 of 1% pepsin solution, means of heating and
measuring cylinder.
Procedure
i) Stir the white of an egg (the albumen) with 500 cm3 tap water. The mixture is
boiled and filtered through glass wool to remove large particles.
ii) Using a measuring cylinder, place 2 cm3 of the cloudy suspension of egg
albumen into each of the two test-tubes labeled A,B and C
iii) Add 1 cm3 of the 1% pepsin solution to each of the three test tubes A, B and C

173
iv) To the contents of test-tube A add three drops of the 2M hydrochloric acid, to
B add three drops of distilled water, to C add three drops of the 2M sodium
hydroxide solution.
v) Incubate the test tubes for 10 minutes in a water bath kept at 37°C
vi) Examine the test tubes every two minutes, noting the cloudiness of the
contents. After 10 minutes remove the test tubes and place them in a test-tube
rack.
vii) Tabulate your results in the following format.
Test-tube
OBSERVATION
OF CLOUDINESS
0 MINS 2
MINS
4
MINS
6
MINS
8 MINS 10MINS
A
B
C
174
Practical Activity 2
To investigate the presence of catalase in living tissues.
Catalase is an enzyme present in living tissues of plant and animals. Its role in living tissues
is to break down hydrogen peroxide (H2O2) produced during cellular metabolism. Hydrogen
peroxide is a highly toxic chemical substance which should not be allowed to accumulate in
the tissues. If it were to accululate in the tissues, it would interfere with cellular metabolism.
Enzyme catalase breaks it down into water and oxygen which are non-toxic substances.
Requirements
Fresh liver, fresh kidney, fresh muscle, potato, hair seeds, leaves, hydrogen peroxide, four
test-tubes, wooden splints means of heating, scapel blade, measuring cylinder (10 cm3) and
labels.
Procedure
i) Label five test tubes A,B,C,D and E
ii) Measure 2 cm3 of hydrogen peroxide and put in test-tube A. repeat the same
procedure for test-tubes B,C,D and E
iii) Cut a small piece of the liver and place it in test-tube A. Record your
observation
iv) Immediately, introduce a glowing splint into the month of the test-tube.
Record your observations.
v) Repeat step 3 using muscle tissue, kidney, potato and finally a small amount of
hair.
vi) Record your observations noting any differences. Explain your observations.
175
vii) Repeat step 3 using boiled liver. Make sure that the liver is thoroughly boiled
for about 5 minutes. Record your observations and account for the differences
with unboiled liver.
Concepts to be used for mapping
The concepts include, Enzymes, nomenclature, inhibitors, co-factors, coenzymes, prosthetic
groups, inorganic ions, substrate, concentration, temperature, saliva, amylase, digestion,
enzyme action, competitive inhibition, non-competitive inhibition, product, activation energy,
Ph, catalase, Lipase, proteases, carbohydrases, Active site, Apo-enzymes, Hydrolysis,
catalysis, Hydrogen peroxide and lock and key.
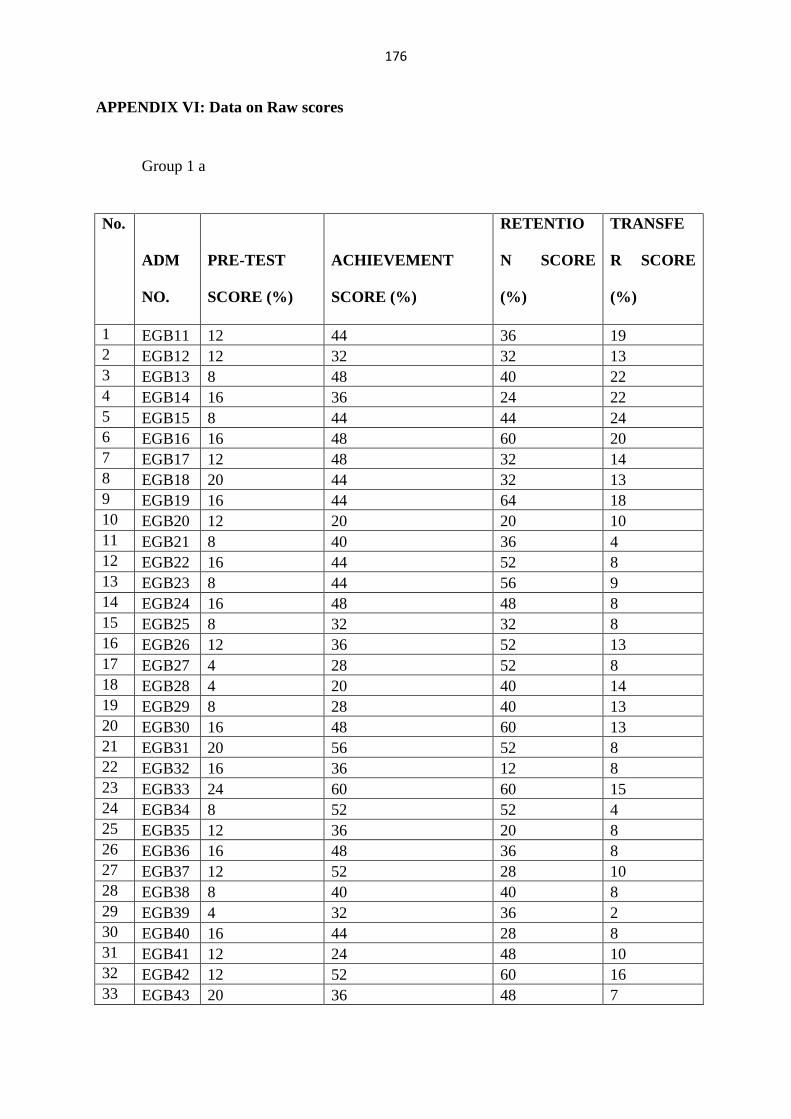
176
APPENDIX VI: Data on Raw scores
Group 1 a
No.
ADM
NO.
PRE-TEST
SCORE (%)
ACHIEVEMENT
SCORE (%)
RETENTIO
N SCORE
(%)
TRANSFE
R SCORE
(%)
1 EGB11 12 44 36 19 2 EGB12 12 32 32 13 3 EGB13 8 48 40 22 4 EGB14 16 36 24 22 5 EGB15 8 44 44 24 6 EGB16 16 48 60 20 7 EGB17 12 48 32 14 8 EGB18 20 44 32 13 9 EGB19 16 44 64 18 10 EGB20 12 20 20 10 11 EGB21 8 40 36 4 12 EGB22 16 44 52 8 13 EGB23 8 44 56 9 14 EGB24 16 48 48 8 15 EGB25 8 32 32 8 16 EGB26 12 36 52 13 17 EGB27 4 28 52 8 18 EGB28 4 20 40 14 19 EGB29 8 28 40 13 20 EGB30 16 48 60 13 21 EGB31 20 56 52 8 22 EGB32 16 36 12 8 23 EGB33 24 60 60 15 24 EGB34 8 52 52 4 25 EGB35 12 36 20 8 26 EGB36 16 48 36 8 27 EGB37 12 52 28 10 28 EGB38 8 40 40 8 29 EGB39 4 32 36 2 30 EGB40 16 44 28 8 31 EGB41 12 24 48 10 32 EGB42 12 52 60 16 33 EGB43 20 36 48 7

177
34 EGB44 16 52 40 8 35 EGB45 8 56 36 8 36 EGB46 16 28 48 6 37 EGB47 12 44 60 2 38 EGB48 16 52 24 8 39 EGB49 20 52 60 13 40 EGB50 16 52 36 2 41 EGB51 12 52 28 8 42 EGB52 8 36 52 6 43 EGB53 12 44 36 8 44 EGB54 24 64 60 22 45 EGB55 12 36 56 4 46 EGB56 8 56 48 8 47 EGB57 16 52 36 8 48 EGB58 12 36 56 4 49 EGB59 8 48 48 8 50 EGB60 16 52 40 8 51 EGB61 4 20 32 9 648 2176 2168 525 12.71 42.67 42.51 10.3
Group 1b
No. ADM
NO.
PRE-TEST
SCORE (%)
ACHIEVEMENT
SCORE (%)
RETENTION
SCORE (%)
TRANSFER
SCORE (%)
1 EGG11 16 60 44 51 2 EGG12 16 56 52 59 3 EGG13 20 52 56 54 4 EGG14 8 56 52 46 5 EGG15 12 52 52 36 6 EGG16 16 48 48 45 7 EGG17 20 52 60 60 8 EGG18 8 52 56 56 9 EGG19 12 48 52 49 10 EGG20 16 56 48 53 11 EGG21 20 64 40 38 12 EGG22 12 44 52 36 13 EGG23 16 56 48 53 14 EGG24 16 40 52 38 15 EGG25 8 48 56 49 16 EGG26 20 60 36 34
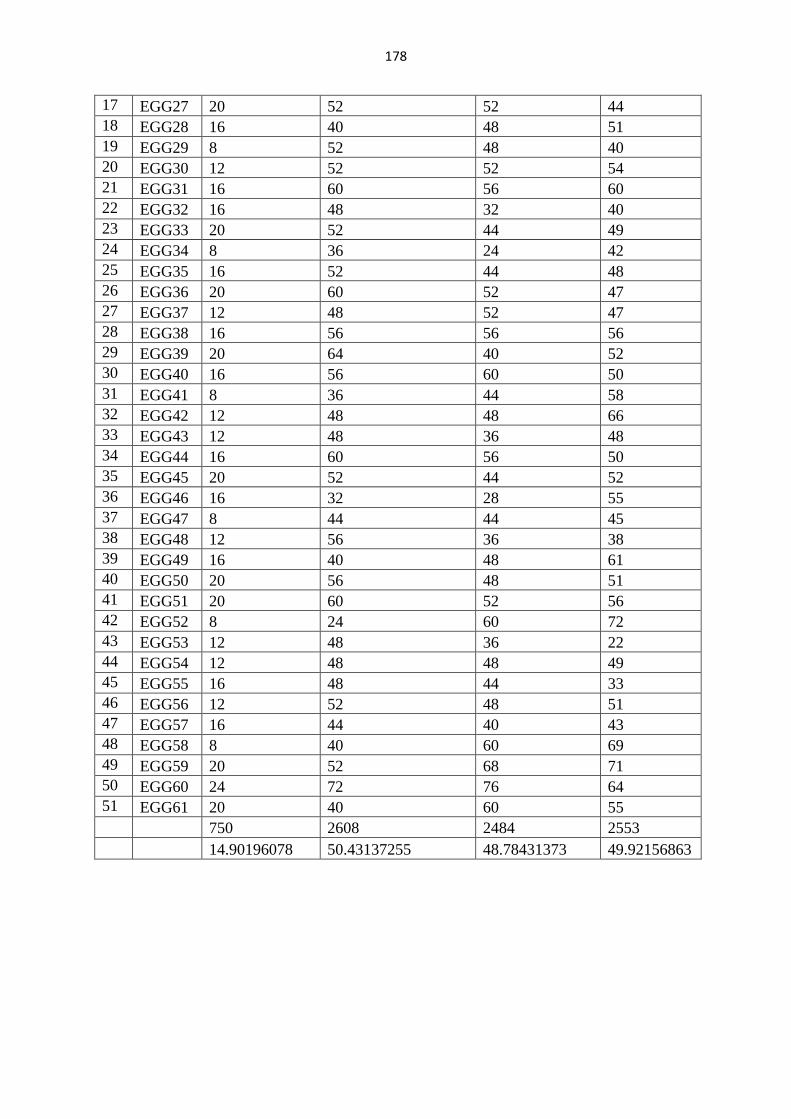
178
17 EGG27 20 52 52 44 18 EGG28 16 40 48 51 19 EGG29 8 52 48 40 20 EGG30 12 52 52 54 21 EGG31 16 60 56 60 22 EGG32 16 48 32 40 23 EGG33 20 52 44 49 24 EGG34 8 36 24 42 25 EGG35 16 52 44 48 26 EGG36 20 60 52 47 27 EGG37 12 48 52 47 28 EGG38 16 56 56 56 29 EGG39 20 64 40 52 30 EGG40 16 56 60 50 31 EGG41 8 36 44 58 32 EGG42 12 48 48 66 33 EGG43 12 48 36 48 34 EGG44 16 60 56 50 35 EGG45 20 52 44 52 36 EGG46 16 32 28 55 37 EGG47 8 44 44 45 38 EGG48 12 56 36 38 39 EGG49 16 40 48 61 40 EGG50 20 56 48 51 41 EGG51 20 60 52 56 42 EGG52 8 24 60 72 43 EGG53 12 48 36 22 44 EGG54 12 48 48 49 45 EGG55 16 48 44 33 46 EGG56 12 52 48 51 47 EGG57 16 44 40 43 48 EGG58 8 40 60 69 49 EGG59 20 52 68 71 50 EGG60 24 72 76 64 51 EGG61 20 40 60 55 750 2608 2484 2553 14.90196078 50.43137255 48.78431373 49.92156863
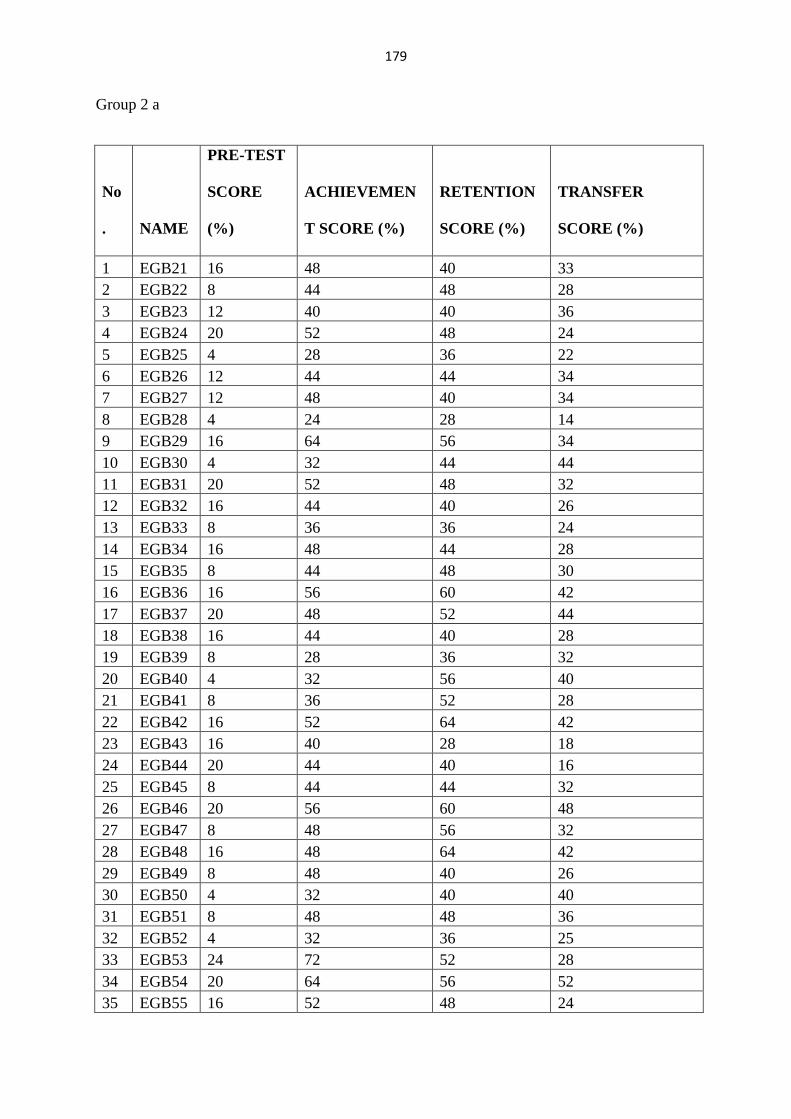
179
Group 2 a
No
. NAME
PRE-TEST
SCORE
(%)
ACHIEVEMEN
T SCORE (%)
RETENTION
SCORE (%)
TRANSFER
SCORE (%)
1 EGB21 16 48 40 33 2 EGB22 8 44 48 28 3 EGB23 12 40 40 36 4 EGB24 20 52 48 24 5 EGB25 4 28 36 22 6 EGB26 12 44 44 34 7 EGB27 12 48 40 34 8 EGB28 4 24 28 14 9 EGB29 16 64 56 34 10 EGB30 4 32 44 44 11 EGB31 20 52 48 32 12 EGB32 16 44 40 26 13 EGB33 8 36 36 24 14 EGB34 16 48 44 28 15 EGB35 8 44 48 30 16 EGB36 16 56 60 42 17 EGB37 20 48 52 44 18 EGB38 16 44 40 28 19 EGB39 8 28 36 32 20 EGB40 4 32 56 40 21 EGB41 8 36 52 28 22 EGB42 16 52 64 42 23 EGB43 16 40 28 18 24 EGB44 20 44 40 16 25 EGB45 8 44 44 32 26 EGB46 20 56 60 48 27 EGB47 8 48 56 32 28 EGB48 16 48 64 42 29 EGB49 8 48 40 26 30 EGB50 4 32 40 40 31 EGB51 8 48 48 36 32 EGB52 4 32 36 25 33 EGB53 24 72 52 28 34 EGB54 20 64 56 52 35 EGB55 16 52 48 24
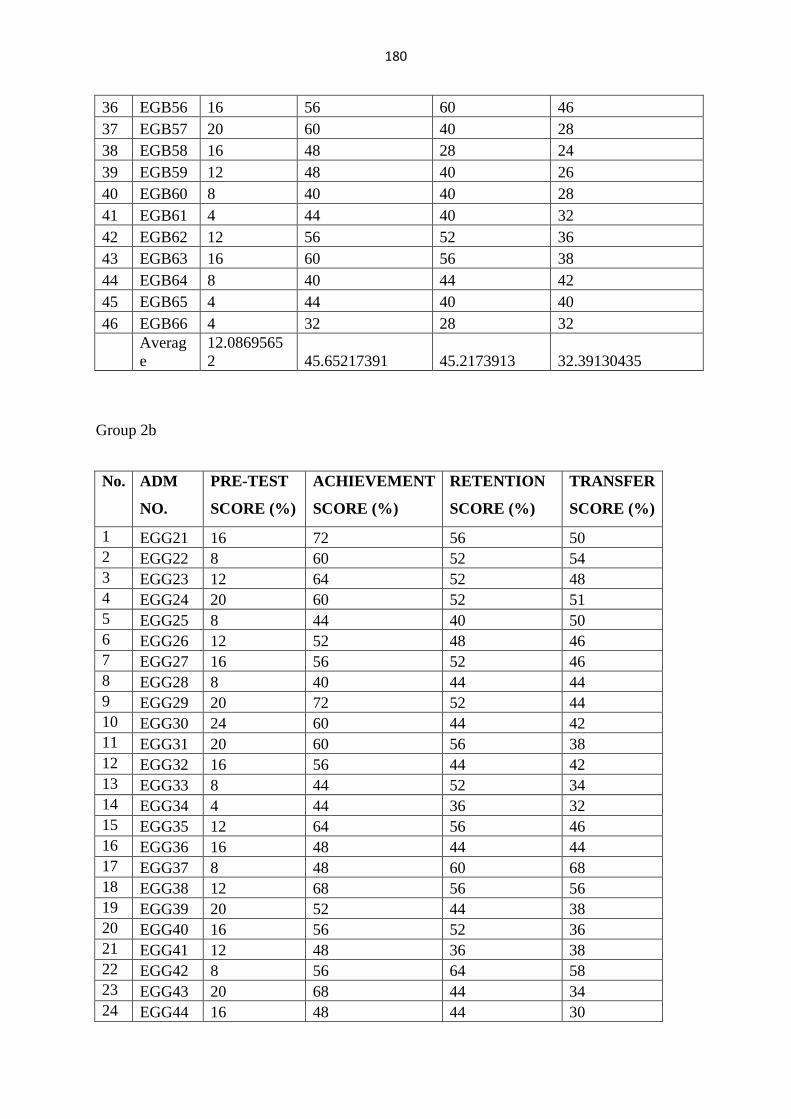
180
36 EGB56 16 56 60 46 37 EGB57 20 60 40 28 38 EGB58 16 48 28 24 39 EGB59 12 48 40 26 40 EGB60 8 40 40 28 41 EGB61 4 44 40 32 42 EGB62 12 56 52 36 43 EGB63 16 60 56 38 44 EGB64 8 40 44 42 45 EGB65 4 44 40 40 46 EGB66 4 32 28 32
Average
12.08695652 45.65217391 45.2173913 32.39130435
Group 2b
No. ADM
NO.
PRE-TEST
SCORE (%)
ACHIEVEMENT
SCORE (%)
RETENTION
SCORE (%)
TRANSFER
SCORE (%)
1 EGG21 16 72 56 50 2 EGG22 8 60 52 54 3 EGG23 12 64 52 48 4 EGG24 20 60 52 51 5 EGG25 8 44 40 50 6 EGG26 12 52 48 46 7 EGG27 16 56 52 46 8 EGG28 8 40 44 44 9 EGG29 20 72 52 44 10 EGG30 24 60 44 42 11 EGG31 20 60 56 38 12 EGG32 16 56 44 42 13 EGG33 8 44 52 34 14 EGG34 4 44 36 32 15 EGG35 12 64 56 46 16 EGG36 16 48 44 44 17 EGG37 8 48 60 68 18 EGG38 12 68 56 56 19 EGG39 20 52 44 38 20 EGG40 16 56 52 36 21 EGG41 12 48 36 38 22 EGG42 8 56 64 58 23 EGG43 20 68 44 34 24 EGG44 16 48 44 30
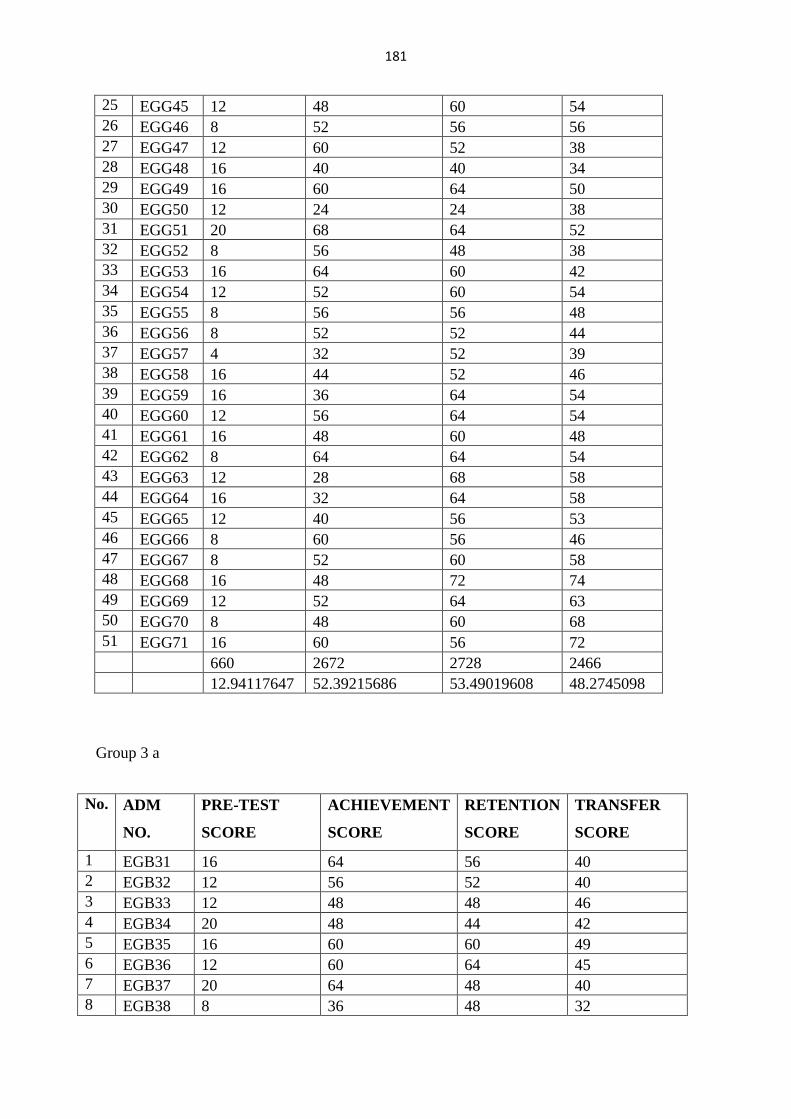
181
25 EGG45 12 48 60 54 26 EGG46 8 52 56 56 27 EGG47 12 60 52 38 28 EGG48 16 40 40 34 29 EGG49 16 60 64 50 30 EGG50 12 24 24 38 31 EGG51 20 68 64 52 32 EGG52 8 56 48 38 33 EGG53 16 64 60 42 34 EGG54 12 52 60 54 35 EGG55 8 56 56 48 36 EGG56 8 52 52 44 37 EGG57 4 32 52 39 38 EGG58 16 44 52 46 39 EGG59 16 36 64 54 40 EGG60 12 56 64 54 41 EGG61 16 48 60 48 42 EGG62 8 64 64 54 43 EGG63 12 28 68 58 44 EGG64 16 32 64 58 45 EGG65 12 40 56 53 46 EGG66 8 60 56 46 47 EGG67 8 52 60 58 48 EGG68 16 48 72 74 49 EGG69 12 52 64 63 50 EGG70 8 48 60 68 51 EGG71 16 60 56 72 660 2672 2728 2466 12.94117647 52.39215686 53.49019608 48.2745098
Group 3 a
No. ADM
NO.
PRE-TEST
SCORE
ACHIEVEMENT
SCORE
RETENTION
SCORE
TRANSFER
SCORE
1 EGB31 16 64 56 40 2 EGB32 12 56 52 40 3 EGB33 12 48 48 46 4 EGB34 20 48 44 42 5 EGB35 16 60 60 49 6 EGB36 12 60 64 45 7 EGB37 20 64 48 40 8 EGB38 8 36 48 32
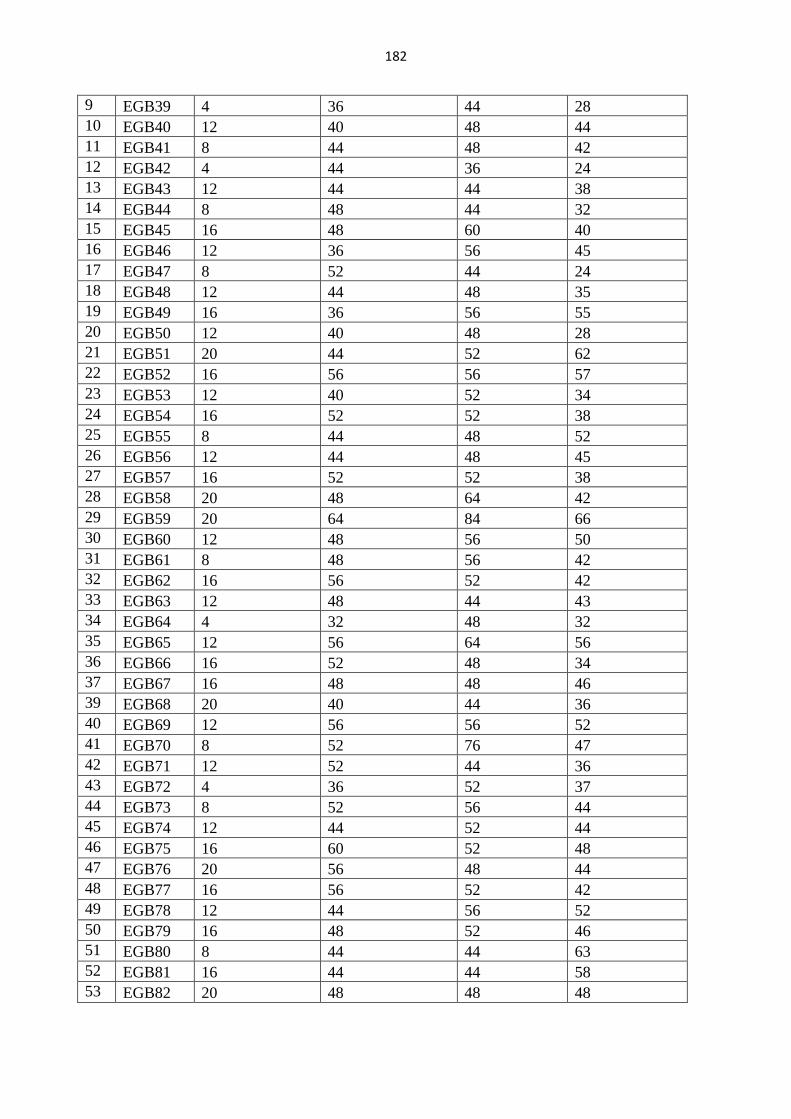
182
9 EGB39 4 36 44 28 10 EGB40 12 40 48 44 11 EGB41 8 44 48 42 12 EGB42 4 44 36 24 13 EGB43 12 44 44 38 14 EGB44 8 48 44 32 15 EGB45 16 48 60 40 16 EGB46 12 36 56 45 17 EGB47 8 52 44 24 18 EGB48 12 44 48 35 19 EGB49 16 36 56 55 20 EGB50 12 40 48 28 21 EGB51 20 44 52 62 22 EGB52 16 56 56 57 23 EGB53 12 40 52 34 24 EGB54 16 52 52 38 25 EGB55 8 44 48 52 26 EGB56 12 44 48 45 27 EGB57 16 52 52 38 28 EGB58 20 48 64 42 29 EGB59 20 64 84 66 30 EGB60 12 48 56 50 31 EGB61 8 48 56 42 32 EGB62 16 56 52 42 33 EGB63 12 48 44 43 34 EGB64 4 32 48 32 35 EGB65 12 56 64 56 36 EGB66 16 52 48 34 37 EGB67 16 48 48 46 39 EGB68 20 40 44 36 40 EGB69 12 56 56 52 41 EGB70 8 52 76 47 42 EGB71 12 52 44 36 43 EGB72 4 36 52 37 44 EGB73 8 52 56 44 45 EGB74 12 44 52 44 46 EGB75 16 60 52 48 47 EGB76 20 56 48 44 48 EGB77 16 56 52 42 49 EGB78 12 44 56 52 50 EGB79 16 48 52 46 51 EGB80 8 44 44 63 52 EGB81 16 44 44 58 53 EGB82 20 48 48 48
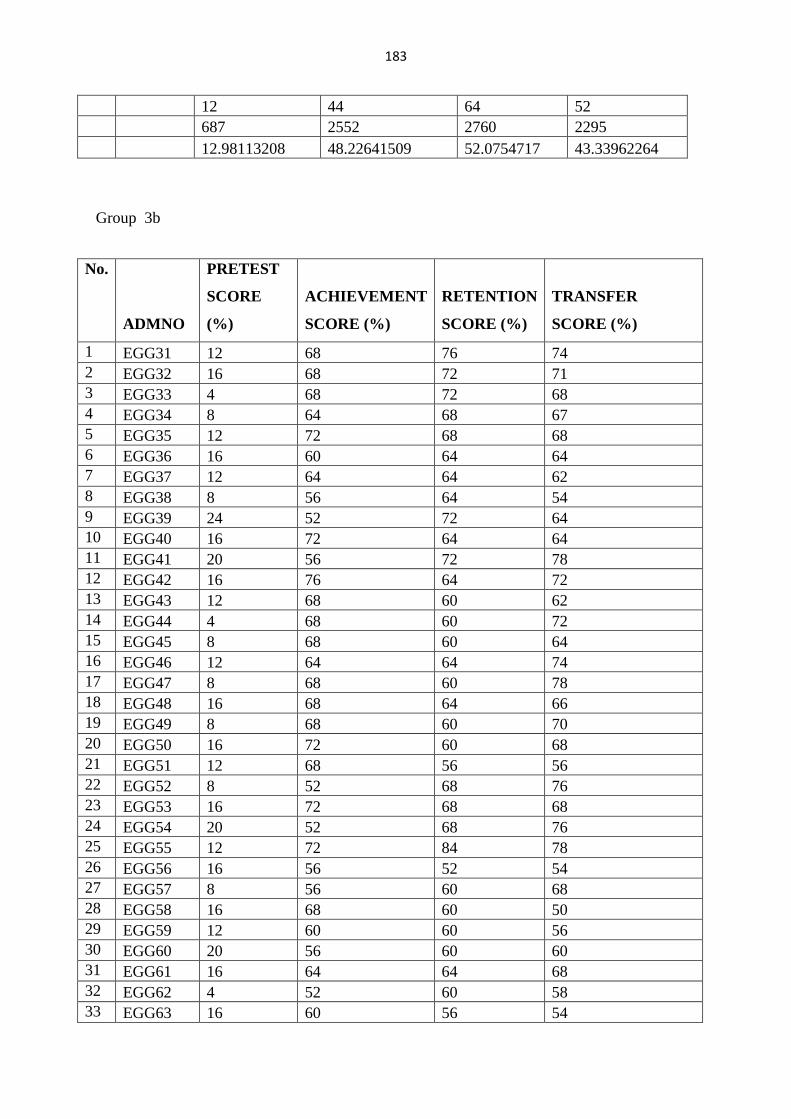
183
12 44 64 52 687 2552 2760 2295 12.98113208 48.22641509 52.0754717 43.33962264
Group 3b
No.
ADMNO
PRETEST
SCORE
(%)
ACHIEVEMENT
SCORE (%)
RETENTION
SCORE (%)
TRANSFER
SCORE (%)
1 EGG31 12 68 76 74 2 EGG32 16 68 72 71 3 EGG33 4 68 72 68 4 EGG34 8 64 68 67 5 EGG35 12 72 68 68 6 EGG36 16 60 64 64 7 EGG37 12 64 64 62 8 EGG38 8 56 64 54 9 EGG39 24 52 72 64 10 EGG40 16 72 64 64 11 EGG41 20 56 72 78 12 EGG42 16 76 64 72 13 EGG43 12 68 60 62 14 EGG44 4 68 60 72 15 EGG45 8 68 60 64 16 EGG46 12 64 64 74 17 EGG47 8 68 60 78 18 EGG48 16 68 64 66 19 EGG49 8 68 60 70 20 EGG50 16 72 60 68 21 EGG51 12 68 56 56 22 EGG52 8 52 68 76 23 EGG53 16 72 68 68 24 EGG54 20 52 68 76 25 EGG55 12 72 84 78 26 EGG56 16 56 52 54 27 EGG57 8 56 60 68 28 EGG58 16 68 60 50 29 EGG59 12 60 60 56 30 EGG60 20 56 60 60 31 EGG61 16 64 64 68 32 EGG62 4 52 60 58 33 EGG63 16 60 56 54
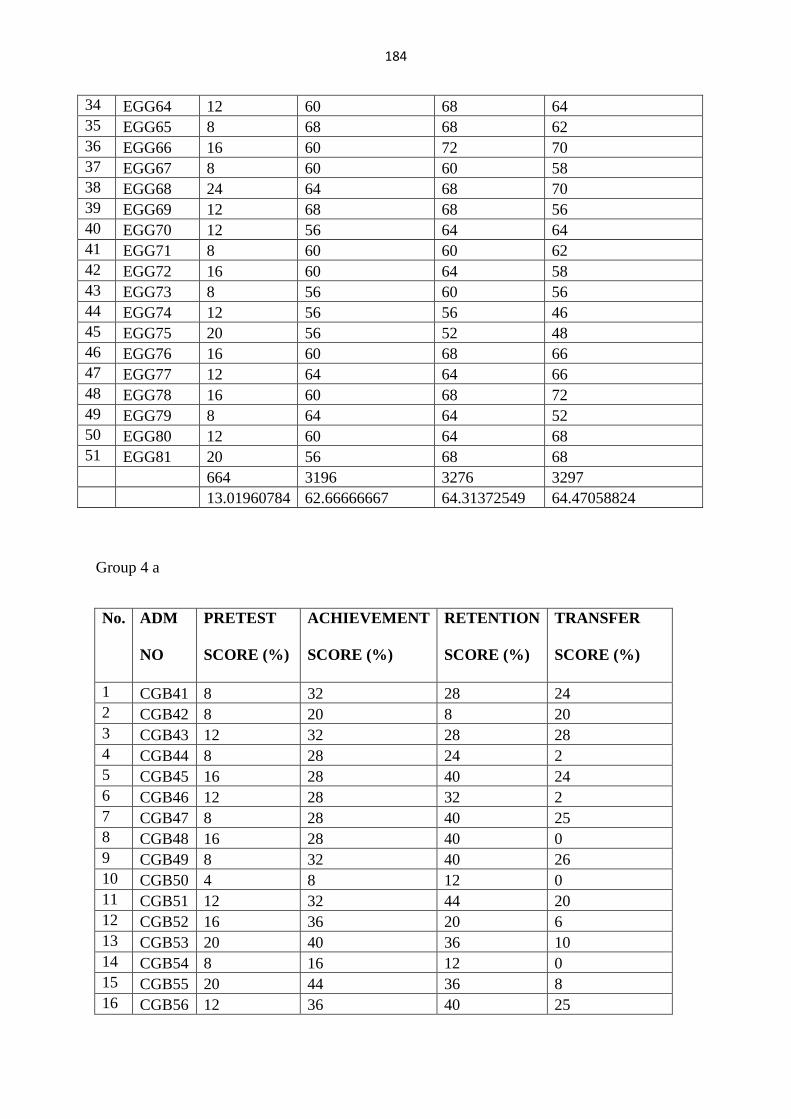
184
34 EGG64 12 60 68 64 35 EGG65 8 68 68 62 36 EGG66 16 60 72 70 37 EGG67 8 60 60 58 38 EGG68 24 64 68 70 39 EGG69 12 68 68 56 40 EGG70 12 56 64 64 41 EGG71 8 60 60 62 42 EGG72 16 60 64 58 43 EGG73 8 56 60 56 44 EGG74 12 56 56 46 45 EGG75 20 56 52 48 46 EGG76 16 60 68 66 47 EGG77 12 64 64 66 48 EGG78 16 60 68 72 49 EGG79 8 64 64 52 50 EGG80 12 60 64 68 51 EGG81 20 56 68 68 664 3196 3276 3297 13.01960784 62.66666667 64.31372549 64.47058824
Group 4 a
No. ADM
NO
PRETEST
SCORE (%)
ACHIEVEMENT
SCORE (%)
RETENTION
SCORE (%)
TRANSFER
SCORE (%)
1 CGB41 8 32 28 24 2 CGB42 8 20 8 20 3 CGB43 12 32 28 28 4 CGB44 8 28 24 2 5 CGB45 16 28 40 24 6 CGB46 12 28 32 2 7 CGB47 8 28 40 25 8 CGB48 16 28 40 0 9 CGB49 8 32 40 26 10 CGB50 4 8 12 0 11 CGB51 12 32 44 20 12 CGB52 16 36 20 6 13 CGB53 20 40 36 10 14 CGB54 8 16 12 0 15 CGB55 20 44 36 8 16 CGB56 12 36 40 25
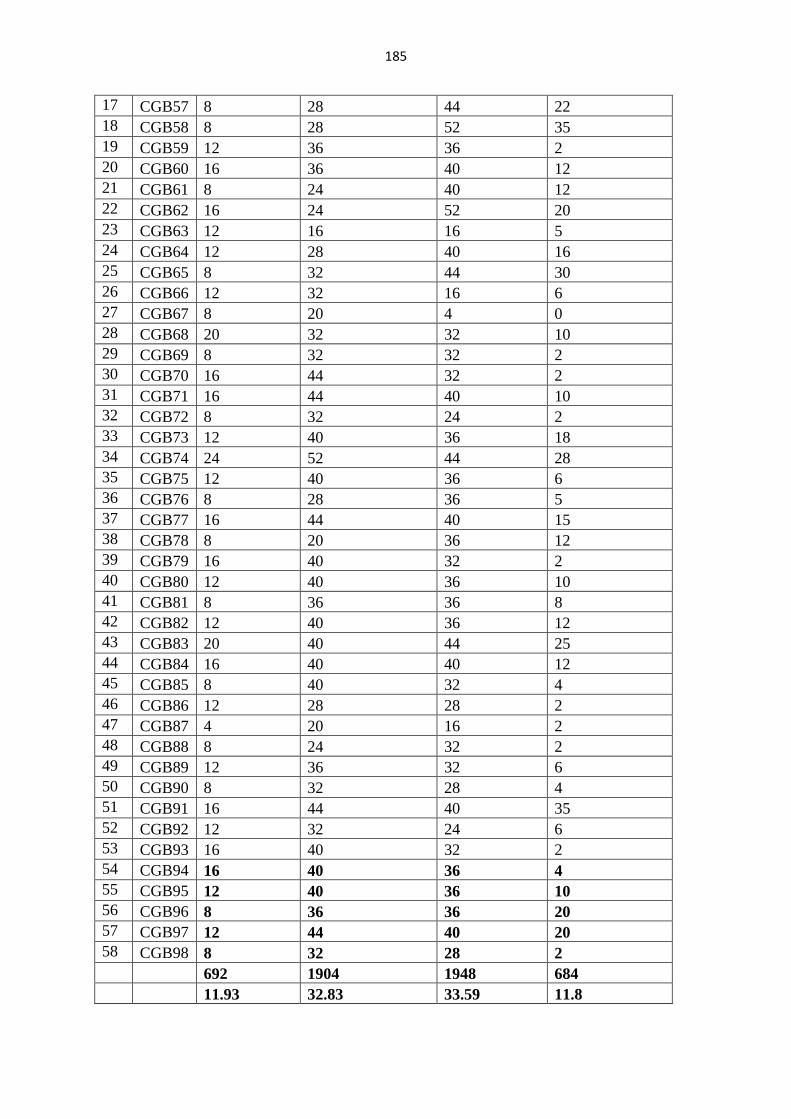
185
17 CGB57 8 28 44 22 18 CGB58 8 28 52 35 19 CGB59 12 36 36 2 20 CGB60 16 36 40 12 21 CGB61 8 24 40 12 22 CGB62 16 24 52 20 23 CGB63 12 16 16 5 24 CGB64 12 28 40 16 25 CGB65 8 32 44 30 26 CGB66 12 32 16 6 27 CGB67 8 20 4 0 28 CGB68 20 32 32 10 29 CGB69 8 32 32 2 30 CGB70 16 44 32 2 31 CGB71 16 44 40 10 32 CGB72 8 32 24 2 33 CGB73 12 40 36 18 34 CGB74 24 52 44 28 35 CGB75 12 40 36 6 36 CGB76 8 28 36 5 37 CGB77 16 44 40 15 38 CGB78 8 20 36 12 39 CGB79 16 40 32 2 40 CGB80 12 40 36 10 41 CGB81 8 36 36 8 42 CGB82 12 40 36 12 43 CGB83 20 40 44 25 44 CGB84 16 40 40 12 45 CGB85 8 40 32 4 46 CGB86 12 28 28 2 47 CGB87 4 20 16 2 48 CGB88 8 24 32 2 49 CGB89 12 36 32 6 50 CGB90 8 32 28 4 51 CGB91 16 44 40 35 52 CGB92 12 32 24 6 53 CGB93 16 40 32 2 54 CGB94 16 40 36 4 55 CGB95 12 40 36 10 56 CGB96 8 36 36 20 57 CGB97 12 44 40 20 58 CGB98 8 32 28 2 692 1904 1948 684 11.93 32.83 33.59 11.8
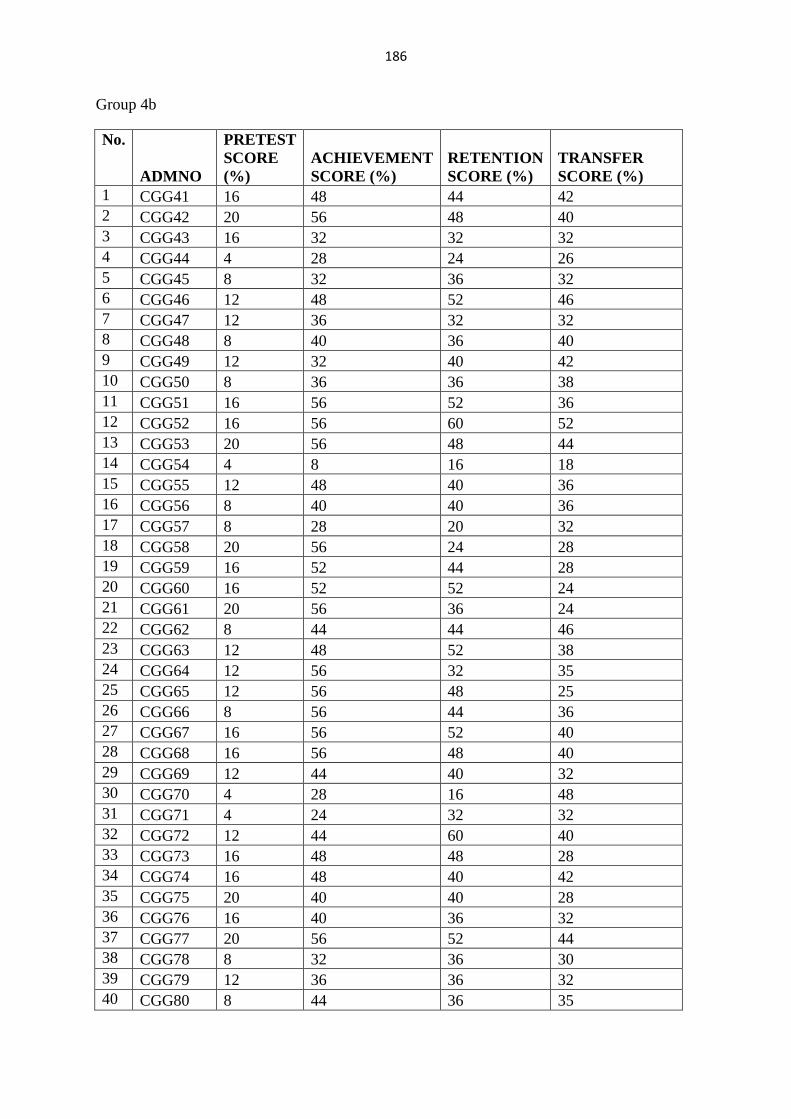
186
Group 4b
No.
ADMNO
PRETEST SCORE (%)
ACHIEVEMENT SCORE (%)
RETENTION SCORE (%)
TRANSFER SCORE (%)
1 CGG41 16 48 44 42 2 CGG42 20 56 48 40 3 CGG43 16 32 32 32 4 CGG44 4 28 24 26 5 CGG45 8 32 36 32 6 CGG46 12 48 52 46 7 CGG47 12 36 32 32 8 CGG48 8 40 36 40 9 CGG49 12 32 40 42 10 CGG50 8 36 36 38 11 CGG51 16 56 52 36 12 CGG52 16 56 60 52 13 CGG53 20 56 48 44 14 CGG54 4 8 16 18 15 CGG55 12 48 40 36 16 CGG56 8 40 40 36 17 CGG57 8 28 20 32 18 CGG58 20 56 24 28 19 CGG59 16 52 44 28 20 CGG60 16 52 52 24 21 CGG61 20 56 36 24 22 CGG62 8 44 44 46 23 CGG63 12 48 52 38 24 CGG64 12 56 32 35 25 CGG65 12 56 48 25 26 CGG66 8 56 44 36 27 CGG67 16 56 52 40 28 CGG68 16 56 48 40 29 CGG69 12 44 40 32 30 CGG70 4 28 16 48 31 CGG71 4 24 32 32 32 CGG72 12 44 60 40 33 CGG73 16 48 48 28 34 CGG74 16 48 40 42 35 CGG75 20 40 40 28 36 CGG76 16 40 36 32 37 CGG77 20 56 52 44 38 CGG78 8 32 36 30 39 CGG79 12 36 36 32 40 CGG80 8 44 36 35

187
41 CGG81 16 48 40 42 508 1800 1644 14.55 12.39 43.9 40.1 35.49

188
APPENDIX VII: OLD CATEGORY OF NATIONAL SCHOOLS
NAME OF SCHOOL REGION GENDER
(BOYS/GIRLS)
ALLIANCE HIGH SCHOOL CENTRAL BOYS
ALLIANCE GIRLS HIGH SCHOOL CENTRAL GIRLS
MOI HIGH SCHOOL-KABARAK RIFT VALLEY MIXED
STAREHE BOYS CENTRE SCHOOL NAIROBI BOYS
MANGU HIGH SCHOOL CENTRAL BOYS
MOI GIRLS HIGH SCHOOL ELDORET RIFT VALLEY GIRLS
THE KENYA HIGH SCHOOL NAIROBI GIRLS
MARYHILL GIRLS HIGH SCHOOL CENTRAL GIRLS
NAIROBI SCHOOL NAIROBI BOYS
LENANA SCHOOL NAIROBI BOYS
LIMURU GIRLS SCHOOL CENTRAL GIRLS
UTUMISH BOYS ACADEMY RIFT VALLEY BOYS
MOI FORCES ACADEMY LANET RIFT VALLEY GIRLS
NAKURU HIGH SCHOOL RIFT VALLEY GIRLS
MASENO SCHOOL NYANZA BOYS
NAKURU GIRLS HIGH SCHOOL RIFT VALLEY GIRLS
LORETO-LIMURU GIRLS H. SCHOOL CENTRAL GIRLS
MOI FORCES ACADEMY NAIROBI NAIROBI BOYS
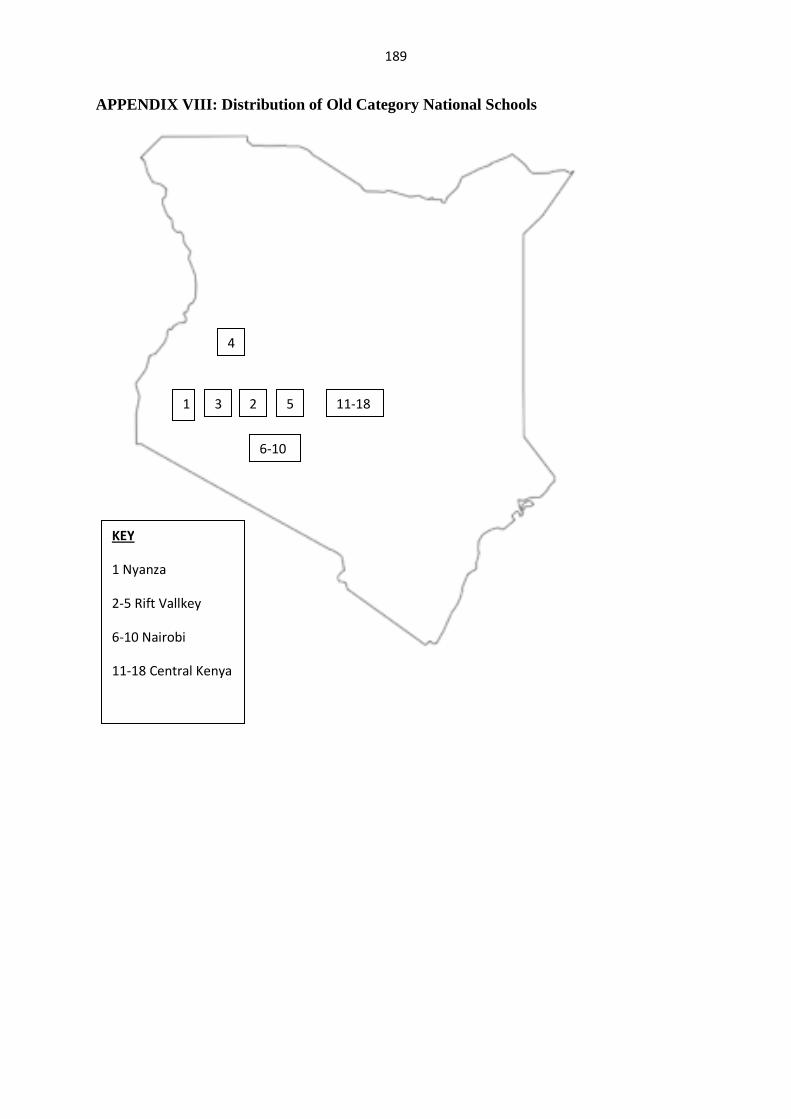
189
APPENDIX VIII: Distribution of Old Category Nationa l Schools
KEY
1 Nyanza
2-5 Rift Vallkey
6-10 Nairobi
11-18 Central Kenya
1 2 3
4
5
6-10
11-18

190
Appendix IX: Marking Scheme for Post-test Biology Achievement Test (BAT) Award four marks for each corret answe up to a maximum of 100 marks
1. c
2. e
3. d
4. d
5. c
6. d
7. a
8. c
9. c
10. d
11 c
12. e
13. a
14. a
15. c
16. e
17. a
18. e
19. a
20. a
21. a
22. d
23. d
24. d
25. b
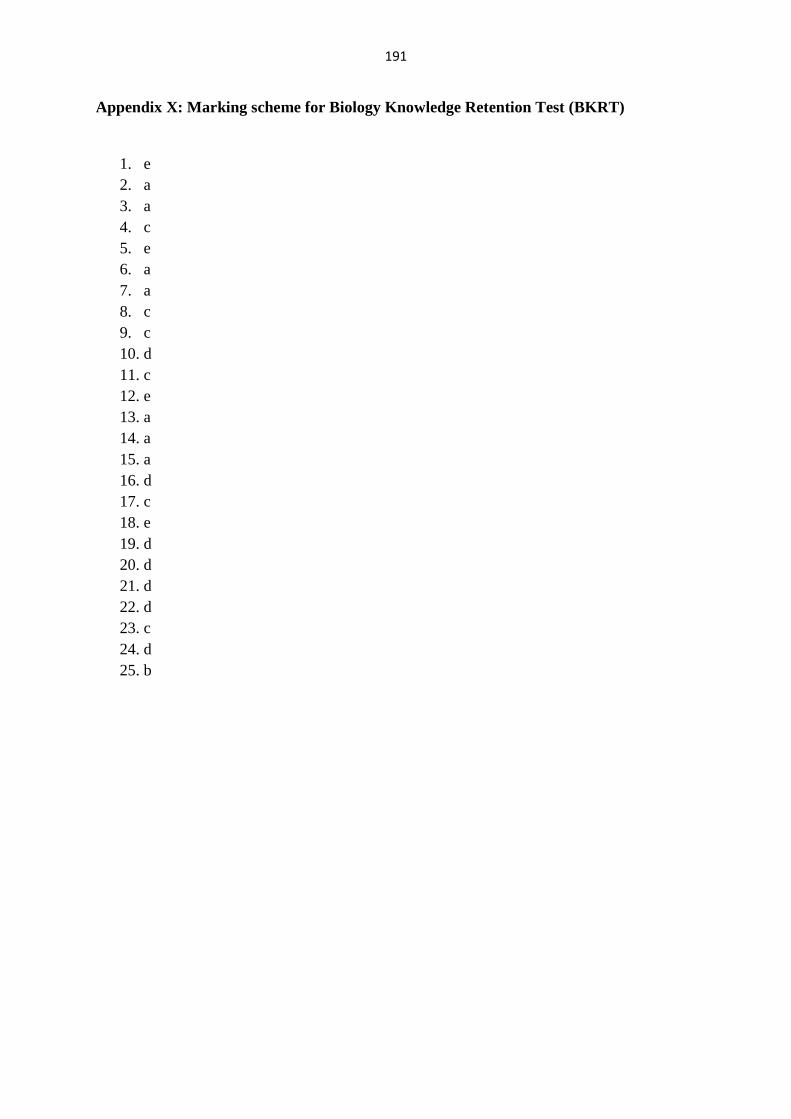
191
Appendix X: Marking scheme for Biology Knowledge Retention Test (BKRT)
1. e 2. a 3. a 4. c 5. e 6. a 7. a 8. c 9. c 10. d 11. c 12. e 13. a 14. a 15. a 16. d 17. c 18. e 19. d 20. d 21. d 22. d 23. c 24. d 25. b

192
Appendix XI: Marking Scheme for Pre-test BAT
1. b 2. e 3. a 4. c 5. d 6. d 7. c 8. c 9. c 10. c 11. a 12. d 13. e 14. d 15. d 16. d 17. a 18. e 19. a 20. a 21. a 22. c 23. a 24. e 25. d
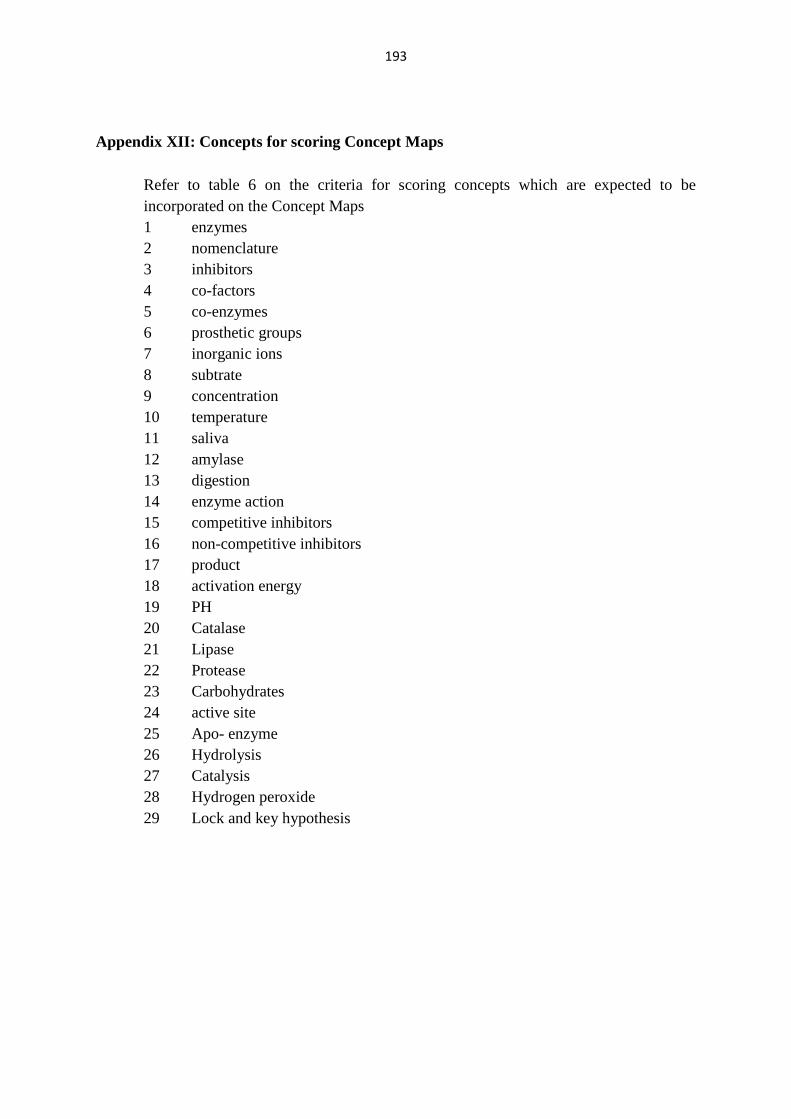
193
Appendix XII: Concepts for scoring Concept Maps Refer to table 6 on the criteria for scoring concepts which are expected to be incorporated on the Concept Maps 1 enzymes 2 nomenclature 3 inhibitors 4 co-factors 5 co-enzymes 6 prosthetic groups 7 inorganic ions 8 subtrate 9 concentration 10 temperature 11 saliva 12 amylase 13 digestion 14 enzyme action 15 competitive inhibitors 16 non-competitive inhibitors 17 product 18 activation energy 19 PH 20 Catalase 21 Lipase 22 Protease 23 Carbohydrates 24 active site 25 Apo- enzyme 26 Hydrolysis 27 Catalysis 28 Hydrogen peroxide 29 Lock and key hypothesis
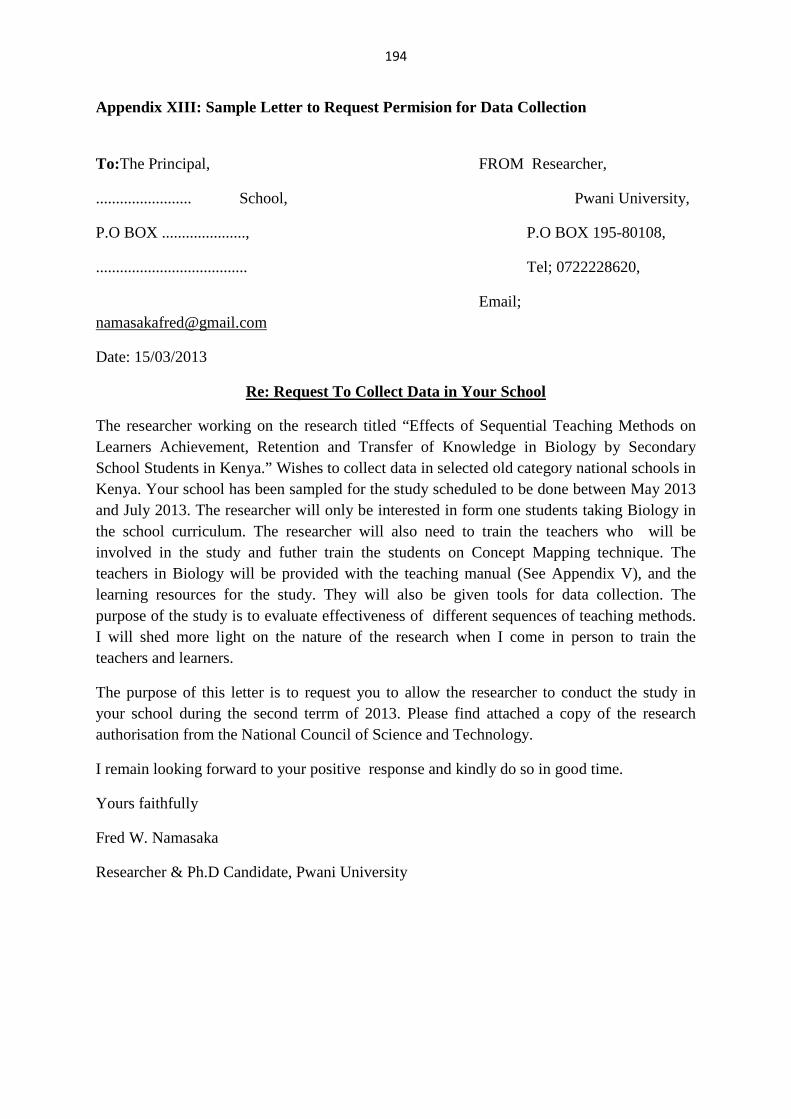
194
Appendix XIII: Sample Letter to Request Permision for Data Collection
To:The Principal, FROM Researcher,
........................ School, Pwani University,
P.O BOX ....................., P.O BOX 195-80108,
...................................... Tel; 0722228620,
Email; [email protected]
Date: 15/03/2013
Re: Request To Collect Data in Your School
The researcher working on the research titled “Effects of Sequential Teaching Methods on Learners Achievement, Retention and Transfer of Knowledge in Biology by Secondary School Students in Kenya.” Wishes to collect data in selected old category national schools in Kenya. Your school has been sampled for the study scheduled to be done between May 2013 and July 2013. The researcher will only be interested in form one students taking Biology in the school curriculum. The researcher will also need to train the teachers who will be involved in the study and futher train the students on Concept Mapping technique. The teachers in Biology will be provided with the teaching manual (See Appendix V), and the learning resources for the study. They will also be given tools for data collection. The purpose of the study is to evaluate effectiveness of different sequences of teaching methods. I will shed more light on the nature of the research when I come in person to train the teachers and learners.
The purpose of this letter is to request you to allow the researcher to conduct the study in your school during the second terrm of 2013. Please find attached a copy of the research authorisation from the National Council of Science and Technology.
I remain looking forward to your positive response and kindly do so in good time.
Yours faithfully
Fred W. Namasaka
Researcher & Ph.D Candidate, Pwani University
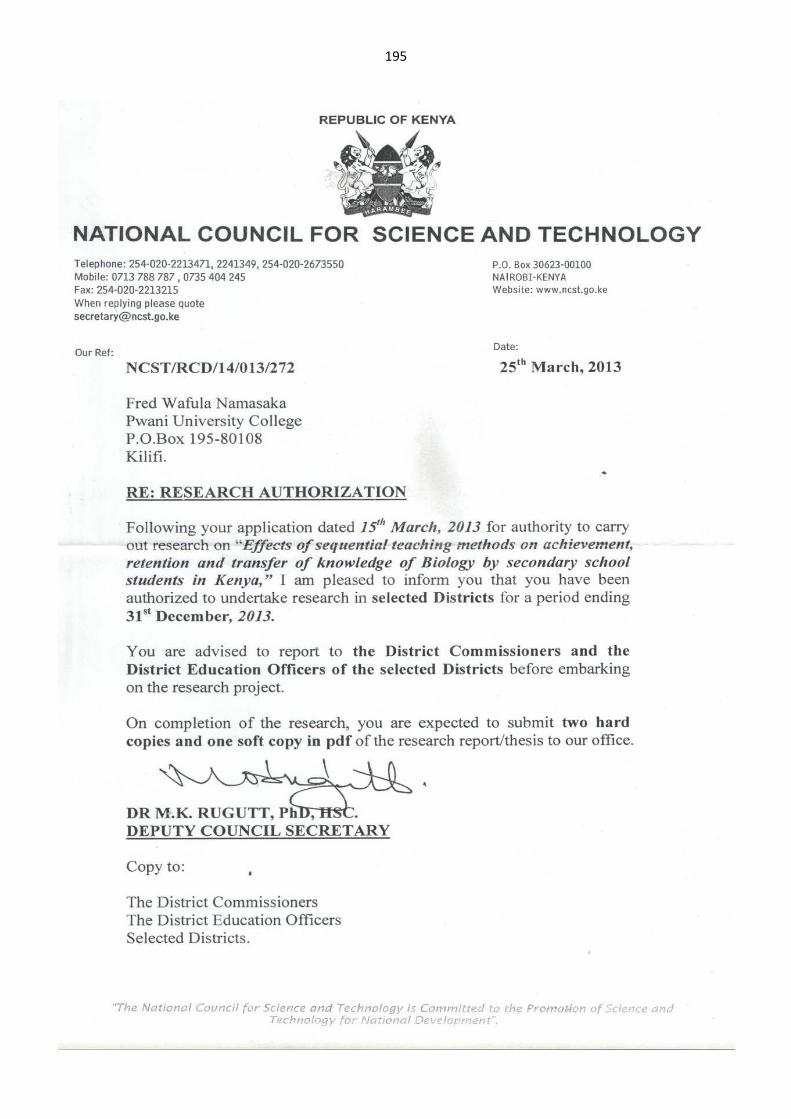
195
196
197