NADPH-diaphorase Histochemical Labeling Patterns in the Hippocampal Neuropil and Visual Cortical...
10
NADPH-diaphorase Histochemical Labeling Patterns in the Hippocampal Neuropil and Visual Cortical Neurons in Weaned Rats Reared during Lactation on Different Litter Sizes ANA PAULA ROCHA-DE-MELO a , CRISTOVAM WANDERLEY PICANC ¸ O-DINIZ b , JULIANA MARIA CARRAZZONE BORBA a , JAILMA SANTOS-MONTEIRO a and RUBEM CARLOS ARAU ´ JO GUEDES a, * a Departamento de Nutric ¸a ˜o, Universidade Federal de Pernambuco, BR-50670-901, Recife, PE, Brazil; b Departamento de Morfologia, Universidade Federal do Para ´, BR-66075-900, Bele ´m, PA, Brazil (Received 7 January 2004; In final form 6 July 2004) Tissue distribution of nitric oxide-synthases was inves- tigated in the rat hippocampus and visual cortex under nutritional changes induced by modification of the litter size. Young (30 – 45-days-old) rats, suckled in litters formed by 3, 6 or 12 pups (called small, medium and large litters, respectively), were studied by using nicotine- adenine-dinucleotide phosphate-diaphorase histochem- istry (shortly, diaphorase), a simple and robust procedure to characterize tissue distribution of nitric oxide- synthases. We assessed morphometric features of the diaphorase-positive cells in visual cortex, and the neuropil histochemical activity in hippocampal CA1 and dentate gyrus using densitometry analysis. In the large-litter group, the labeled-cell density in white matter of area 17 was higher, as compared to the small- litter group. There was a clear trend, in the large-litter group, to lower values of soma area, dendritic field and branches per neuron, but the differences were not significant. Densitometry analysis of hippocampus revealed a significant increase in the relative neuropil histochemical activity of the dentate gyrus molecular layer in the larger litters, which may be associated to increased compensatory blood flow in the hippocampus. The pathophysiological mechanisms of the observed changes remain to be investigated. Keywords: Area 17; Early nutritional changes; Hippocampus; NADPH-diaphorase; Nitric oxide synthases; NOS-positive neurons and neuropil INTRODUCTION It has been widely accepted that adequate food intake during the initial phase of mammals’ life is essential for the normal development and function- ing of the brain (Morgane et al., 1978, 1993; Plagemann et al., 1998, 1999). It is also clear that neural effects due to nutritional disorders are much more severe when such disorders coincide with the so-called “brain growth spurt”. This period is characterized by high rates of brain developmental processes like gliogenesis, neuronal migration and myelination (Dobbing, 1968; Morgane et al., 1978; Rocha-de-Melo and Guedes, 1997; Kehoe et al., 2001). In the rat, this period corresponds to the first three weeks of postnatal life, i.e. the suckling period, when breast milk is the unique source of food for the pups. A variety of different approaches have been used in order to understand to what extent early nutritional disorders affect neuroanatomical and biochemical aspects of the developing brain (Brock and Prasad, 1992; Rabin et al., 1994; Borba et al., 2000; Quinn et al., 2001; Jiang et al., 2002). During the suckling period, the deterioration of the nutritional status of rat pups can be achieved by several procedures (Morgane et al., 1978). Changes in the opposite direction (overnutrition), however, cannot be obtained so easily at that age. A very simple method of producing either overnutrition or malnutrition during the suckling period consists in decreasing or increasing the litter size, respectively i.e. diminis- hing or augmenting the number of pups to be suckled by one dam (Ferna ´ndez et al., 1993; Plagemann et al., 1998, 1999). This technique has ISSN 1028-415X print/ISSN 1476-8305 online q 2004 Taylor & Francis Ltd DOI: 10.1080/10284150400001961 *Corresponding author. Tel.: þ 55-81-21268936. Fax: þ 55-81-21268473. E-mail: [email protected] Nutritional Neuroscience, Volume 7 Number 4 (August 2004), pp. 207–216
Transcript of NADPH-diaphorase Histochemical Labeling Patterns in the Hippocampal Neuropil and Visual Cortical...
NADPH-diaphorase Histochemical Labeling Patternsin the Hippocampal Neuropil and Visual Cortical Neuronsin Weaned Rats Reared during Lactation on DifferentLitter Sizes
ANA PAULA ROCHA-DE-MELOa, CRISTOVAM WANDERLEY PICANCO-DINIZb, JULIANA MARIACARRAZZONE BORBAa, JAILMA SANTOS-MONTEIROa and RUBEM CARLOS ARAUJO GUEDESa,*
aDepartamento de Nutricao, Universidade Federal de Pernambuco, BR-50670-901, Recife, PE, Brazil; bDepartamento de Morfologia, UniversidadeFederal do Para, BR-66075-900, Belem, PA, Brazil
(Received 7 January 2004; In final form 6 July 2004)
Tissue distribution of nitric oxide-synthases was inves-tigated in the rat hippocampus and visual cortex undernutritional changes induced by modification of the littersize. Young (30–45-days-old) rats, suckled in littersformed by 3, 6 or 12 pups (called small, medium and largelitters, respectively), were studied by using nicotine-adenine-dinucleotide phosphate-diaphorase histochem-istry (shortly, diaphorase), a simple and robust procedureto characterize tissue distribution of nitric oxide-synthases. We assessed morphometric features of thediaphorase-positive cells in visual cortex, and theneuropil histochemical activity in hippocampal CA1and dentate gyrus using densitometry analysis. In thelarge-litter group, the labeled-cell density in whitematter of area 17 was higher, as compared to the small-litter group. There was a clear trend, in the large-littergroup, to lower values of soma area, dendritic field andbranches per neuron, but the differences were notsignificant. Densitometry analysis of hippocampusrevealed a significant increase in the relative neuropilhistochemical activity of the dentate gyrus molecularlayer in the larger litters, which may be associated toincreased compensatory blood flow in the hippocampus.The pathophysiological mechanisms of the observedchanges remain to be investigated.
Keywords: Area 17; Early nutritional changes; Hippocampus;NADPH-diaphorase; Nitric oxide synthases; NOS-positiveneurons and neuropil
INTRODUCTION
It has been widely accepted that adequate foodintake during the initial phase of mammals’ life is
essential for the normal development and function-ing of the brain (Morgane et al., 1978, 1993;Plagemann et al., 1998, 1999). It is also clear thatneural effects due to nutritional disorders are muchmore severe when such disorders coincide with theso-called “brain growth spurt”. This period ischaracterized by high rates of brain developmentalprocesses like gliogenesis, neuronal migration andmyelination (Dobbing, 1968; Morgane et al., 1978;Rocha-de-Melo and Guedes, 1997; Kehoe et al., 2001).In the rat, this period corresponds to the first threeweeks of postnatal life, i.e. the suckling period, whenbreast milk is the unique source of food for the pups.A variety of different approaches have been used inorder to understand to what extent early nutritionaldisorders affect neuroanatomical and biochemicalaspects of the developing brain (Brock and Prasad,1992; Rabin et al., 1994; Borba et al., 2000; Quinn et al.,2001; Jiang et al., 2002). During the suckling period,the deterioration of the nutritional status of rat pupscan be achieved by several procedures (Morganeet al., 1978). Changes in the opposite direction(overnutrition), however, cannot be obtained soeasily at that age. A very simple method ofproducing either overnutrition or malnutritionduring the suckling period consists in decreasingor increasing the litter size, respectively i.e. diminis-hing or augmenting the number of pups to besuckled by one dam (Fernandez et al., 1993;Plagemann et al., 1998, 1999). This technique has
ISSN 1028-415X print/ISSN 1476-8305 online q 2004 Taylor & Francis Ltd
DOI: 10.1080/10284150400001961
*Corresponding author. Tel.: þ55-81-21268936. Fax: þ55-81-21268473. E-mail: [email protected]
Nutritional Neuroscience, Volume 7 Number 4 (August 2004), pp. 207–216

been used presently in order to assess possiblechanges on the histochemical labeling patterns ofnitric oxide (NO) producing neurons, consequent toearly malnutrition or overnutrition.
Under physiological conditions, NO is a veryimportant molecule responsible for a variety offunctions related to the intracellular GMP-proteincascades. In the hippocampus, NO has beenimplicated in the induction of long term potentiationand memory formation (Haley et al., 1992; Bohmeet al., 1993) as well as in the control of blood flow(Montecot et al., 1998; Lovick et al., 1999; Jiang et al.,2002). In the visual cortex, the normal functioning ofthe local brain circuits is very important for thevisual function and a number of evidence shows thatthe visual cortex is very sensitive to nutritional andplasticity changes (Leuba and Rabinowicz, 1979;Sirevaag et al., 1988; Dıaz-Cintra et al., 1990;Friedlander et al., 1992; Santos-Monteiro et al.,2000). More recently, data appeared indicating thatnitric oxide-producing neurons are involved in thecontrol of local blood flow in the rat cerebral cortex(Matsura and Kanno, 2002), as well as in theregulation of food intake (Morley and Flood, 1991;Squadrito et al., 1993; Stricker-Krongrad et al., 1996;Kim et al., 2000).
Since NO is short-lived, freely diffusible andextremely membrane permeant, attempts to localizeits production site are best achieved by thelocalization of its synthetic enzyme. The so-calledNADPH-diaphorase (NADPH-d) has been character-ized biochemically and immunochemically as nitricoxide synthase (Bredt and Snyder, 1989; Dawson et al.,1991; Hope et al., 1991). Recent reports haveconfirmed that NADPH-d expression can be changedin the central nervous system following acutelyor chronically induced damage (Xu et al., 2000;Chang et al., 2001; Fabene et al., 2001; Hartlage-Rubsamen and Schliebs, 2001; Quinn et al., 2001).NADPH-d containing neurons are also reported to beresistant to various ischemic, neurodegenerative andneurotoxic insults (Ferrante et al., 1985; Koh et al.,1986; Ferriero et al., 1988; Zhang et al., 1994). Bothdirect and indirect evidence suggest that thesecells co-express anti-oxidative enzymes and anti-apoptotic factors that contributes to their resistance toneuropathological changes (Bidmon et al., 2001). Ithas also been demonstrated that NOS inhibitioncan reduce neuronal death in the hippocampus(Montecot et al., 1998).
To our knowledge, no reports are availablededicated to NADPH-d neuropil changes in thehippocampus associated to malnutrition or over-nutrition, and there are only two reports on theconsequences of malnutrition on the NADPH-dneurons in the visual cortex (Picanco-Diniz et al.,1998; Borba et al., 2000). The possible effects of earlyovernutrition, on such neuronal system, have not
been investigated. Thus, the aim of the present studyis to address two questions in a rat model ofnutritional changes based on the litter size usingNADPH-d histochemistry: (1) Does litter size affectsthe NADPH-d positive neuropil in the hippocampusand if so, to what extent? (2) Does litter size alter thedistribution of the activity of NADPH-d type Ipositive neurons in the visual cortex?
MATERIALS AND METHODS
Animals
Wistar rat pups were randomly distributed, at birth,to form litters of three different sizes: small (group S),medium (group M) or large (group L) groupscomprising 3, 6 and 12 pups, respectively. Theseanimals were born from, and suckled by damsreceiving, during gestation and lactation, a commer-cial laboratory rat chow diet (Purina do Brazil Ltd.)containing 23 g protein/100 g diet. After weaning (atpostnatal day 21) pups were housed 4–6 per cage(metallic wire-grid) in a room maintained at 23 ^ 28Cwith a 12 h light–dark cycle (lights on at 7:00 am),and fed the same lab chow diet until the day ofthe experiment (30–45 days of life). A total of 21 rats(8 S-, 6 M- and 7 L-rats), taken randomly fromdifferent litters, were used. The three groupscontained the same proportion of males and females.Since no sex-related differences were detected, forthis particular subset of neurons, data from malesand females of the same group were pooled andanalyzed together. The animals have been handled inaccordance with the “Principles of LaboratoryAnimal Care” (NIH) and with the norms of theEthics Committee for Animal Research, of theUniversidade Federal de Pernambuco.
Histochemical Procedures
All chemicals used in this investigation weresupplied by Sigma (Poole, UK). The rats were deeplyanesthetized with a mixture of urethane pluschloralose (1000:40 mg/kg, ip) and perfusedtranscardially with phosphate-buffered saline(pH 7.2–7.4), followed by 10% formaldehyde. Thealdehyde-fixed brains were cut in a vibratome into200-mm thick sections in coronal planes. The reactionrequires aldehyde fixation in order to inhibit othertypes of NADPH-dependent oxide-reductases thatcan also convert tetrazolium salts to colored andinsoluble formazan deposition upon reduction(Scherer-Singler et al., 1983). All sections were free-floating processed for NADPH-d histochemistryfollowing the malic indirect method (Scherer-Singleret al., 1983). In brief, sections were collected in 0.1 MTRIS buffer pH 8.0, washed twice in the same TRIS
A.P. ROCHA-DE-MELO et al.208

buffer and then incubated at room temperatureunder continuous agitation in the histochemicalreaction mixture. This contained 0.6% malic aciddiluted in 0.1 M TRIS buffer pH 8.0, bNADP(0.1% w/v), manganese chloride (0.04% w/v) andnitroblue tetrazolium (0.03% w/v), previouslysolubilized in DMSO (0.3% w/v). Triton X-100 at0.1% w/v was added to the final mixture. Micro-scope inspection was used to assay when thereaction product was visible in the distal dendrites(3rd and 4th order), and the reaction was terminated.This usually occurred after an average time of 4 ^
ð1=2Þh: The reaction was finished by washing thesections during 3 £ 15 min in 0.1 M TRIS buffer, pH8.0. Thick sections (200mm) were chosen to preservehigher order dendritic branches in the same section.Incomplete dendritic arborizations were not con-sidered for morphometric analysis. Other technicaldetails followed the same conditions as describedpreviously (Picanco-Diniz et al., 1998).
Morphometric Analysis
In brain coronal sections that reacted for NADPH-d,the lateral margin of area 17 was easily identified bythe change of the laminar pattern of neuropilhistochemical activity, including reduction of stain-ing in layers V and VI, which in area 17 becamethicker and paler, as compared to layers II/III(Picanco-Diniz et al., 1998). Low power drawings ofthe outline of the section including area 17 weremade using a camera lucida attached to themicroscope, enabling to identify the location ofNADPH-d-positive cell bodies in relation to thecortical layers. A digital tablet connected to amicrocomputer was used to estimate the cell area.For each group, a total of 30 sections containing area17 were used for quantitative analysis. Relative celldensity was calculated both in gray- and in thesubjacent white matter by dividing the number ofcells by area of the scanned area 17 of the chosensection. Since type I cells are very distinct from theneuropile background, even in low power magnifi-cation, cell counting procedure included all type Ineurons found throughout the thickness of thesection in the scanned area. Cell density wasestimated (as described above) assuming that thethickness of vibratome sections remains constant.Due to the low density of type I cells, uncertaintiesimplicit in the process of selection of NADPH-dpositive cells from different layers of differentexperimental groups are difficult to control. How-ever, the absence of incongruous results, both withinand between the data sets, can be taken as evidencethat our assumption was valid. Two-dimensionalquantitative analysis of soma area, dendritic fieldarea, number of dendritic branches per cell andnumber of branching points per dendritic tree were
performed in gray matter using procedures similarto those described by Borba et al. (2000). NADPH-dpositive type I neurons from the visual cortex havedifferent morphologies and sizes. In order tominimize sample bias, we pooled neurons usingsimilar criteria in all groups. The comparisonbetween different data sets was made by poolingvarious regions from the same subject and calcula-ting the average value from at least 30 cells from eachexperimental group.
The differences between metric features of thethree nutritionally distinct groups were analyzed byusing a contrast index, as described previously(Borba et al., 2000). This index allows the compari-sons of the three possible pairs of groups (M vs. S, Lvs. S and L vs. M groups), and is defined by thefollowing relation: C ¼ ðg1 2 g2Þ=ðg1 þ g2Þ; where Crepresents the contrast index and g1 and g2
correspond to the values of metric features for thepair of groups under consideration (g1 alwayscorresponds to the larger-litter group of the pair).Positive or negative values of the contrast index for acertain metric feature indicate, respectively, higher orlower values of this feature in the larger-litter group(g1) of the pair. This approach includes the advantageto normalize the relative scales, reducing the effect ofthe staining variability associated to differenthistological parameters (e.g. degree of tissue fix-ation), between different sections, within andbetween groups.
Densitometry Analysis of CA1 and Dentate Gyrus
Four to ten hippocampal NADPH-d reacted sectionswere selected from each brain of each experimentalgroup. Digital images were captured using a videocamera attached to the microscope. In these images,the density of the reaction product was measured.The transmitted light in different dorsal hippo-campal layers was assayed using LEICA-QWinsystem for densitometry to assess changes in theneuropil. Rectangular windows containing themaximum area possible without passing into otherhippocampal strata were densitometrically ana-lyzed. Analyses of 4–10 sections were performed toobtain an average for each experimental group inorder to calculate a mean for n ¼ 4: NADPH-dstaining is subject to inter-run variability anddecreasing activity with time. Thus, for the sake ofthe comparative analysis of tissues which have beenreacted at the same time and thus have experiencedslightly different experimental conditions, we haveadopted a normalized relative scale, based on thechoice of an internal control measurement in eachsection, which is not affected significantly by thenutritional conditions. This allows us to makecomparisons between sections stained at differenttimes. For neuropil densitometry measurements,
NUTRITION AND NADPH-DIAPHORASE NEURONS 209
the light transmitted throughout the granular layerof the dentate gyrus was chosen as an internalcontrol, because this layer has the highest transmit-tance (i.e. lowest NADPH-d staining) and thistransmittance stayed relatively unchanged in allgroups (see “Results” section). The highest transmit-tance of dentate gyrus was assigned Tmax and thetransmittance of the layer under study was desig-nated Tmin. A contrast index was calculatedaccording to the previously published equation(Borba et al. 2000):
C ¼ ðTmax 2 TminÞ=ðTmax þ TminÞ:
Contrast indices were estimated for each layer ineach section. The calculation of the contrast indiceshas the advantage that it normalizes the relativescales for each morphological parameter and wehave found that this procedure reduces the effect ofthe staining variability associated with differenthistological parameters (e.g. degree of tissue fixation,thickness, inter-run variability, etc.), between differ-ent sections, both within and between groups. Noshrinkage corrections were done in our comparativeanalysis due to the fact that the non-linearity of theeffects of fixation procedures made it non-predict-able. Thus, it is very difficult to know if the errors inour sample compound or cancel each other, but, asstated above, the absence of incongruous results,both in the intergroup and intragroup comparisonsreinforced our confidence in the results.
Statistics
Parametric statistical analysis using ANOVA fol-lowed by Newman–Keuls post-hoc test was per-formed and the differences between groups wereaccepted as significant at the 95% confidence levelðp , 0:05Þ:
RESULTS
At postnatal day 30, L-, M-, and S-pups presentedsignificantly different mean body weights(52:2 ^ 12:7; 67:2 ^ 17:0 and 90:4 ^ 11:3 g, respect-ively; p , 0:05; ANOVA plus Newman–Keuls post-hoc test).
NADPH-d-Positive Neurons in Area 17
Qualitative Analysis of the Histochemical StainingPattern
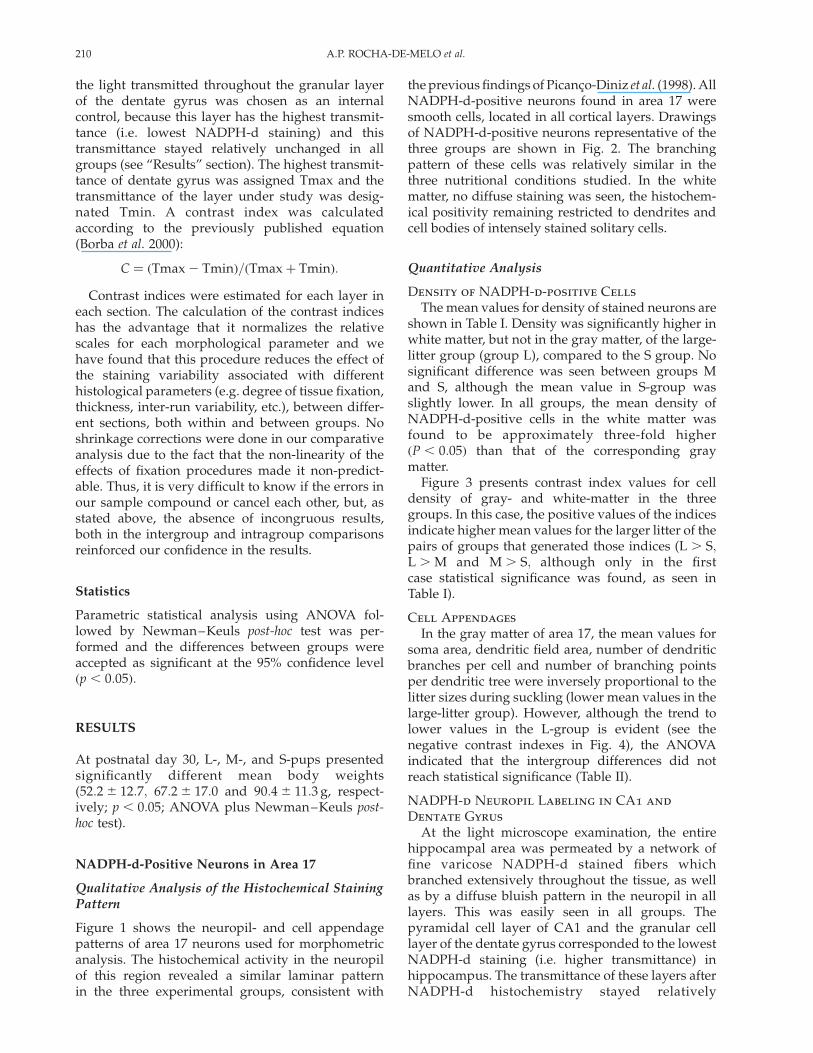
Figure 1 shows the neuropil- and cell appendagepatterns of area 17 neurons used for morphometricanalysis. The histochemical activity in the neuropilof this region revealed a similar laminar patternin the three experimental groups, consistent with
the previous findings of Picanco-Diniz et al. (1998). AllNADPH-d-positive neurons found in area 17 weresmooth cells, located in all cortical layers. Drawingsof NADPH-d-positive neurons representative of thethree groups are shown in Fig. 2. The branchingpattern of these cells was relatively similar in thethree nutritional conditions studied. In the whitematter, no diffuse staining was seen, the histochem-ical positivity remaining restricted to dendrites andcell bodies of intensely stained solitary cells.
Quantitative Analysis
Density of NADPH-d-positive Cells
The mean values for density of stained neurons areshown in Table I. Density was significantly higher inwhite matter, but not in the gray matter, of the large-litter group (group L), compared to the S group. Nosignificant difference was seen between groups Mand S, although the mean value in S-group wasslightly lower. In all groups, the mean density ofNADPH-d-positive cells in the white matter wasfound to be approximately three-fold higherðP , 0:05Þ than that of the corresponding graymatter.
Figure 3 presents contrast index values for celldensity of gray- and white-matter in the threegroups. In this case, the positive values of the indicesindicate higher mean values for the larger litter of thepairs of groups that generated those indices (L . S;L . M and M . S; although only in the firstcase statistical significance was found, as seen inTable I).
Cell Appendages
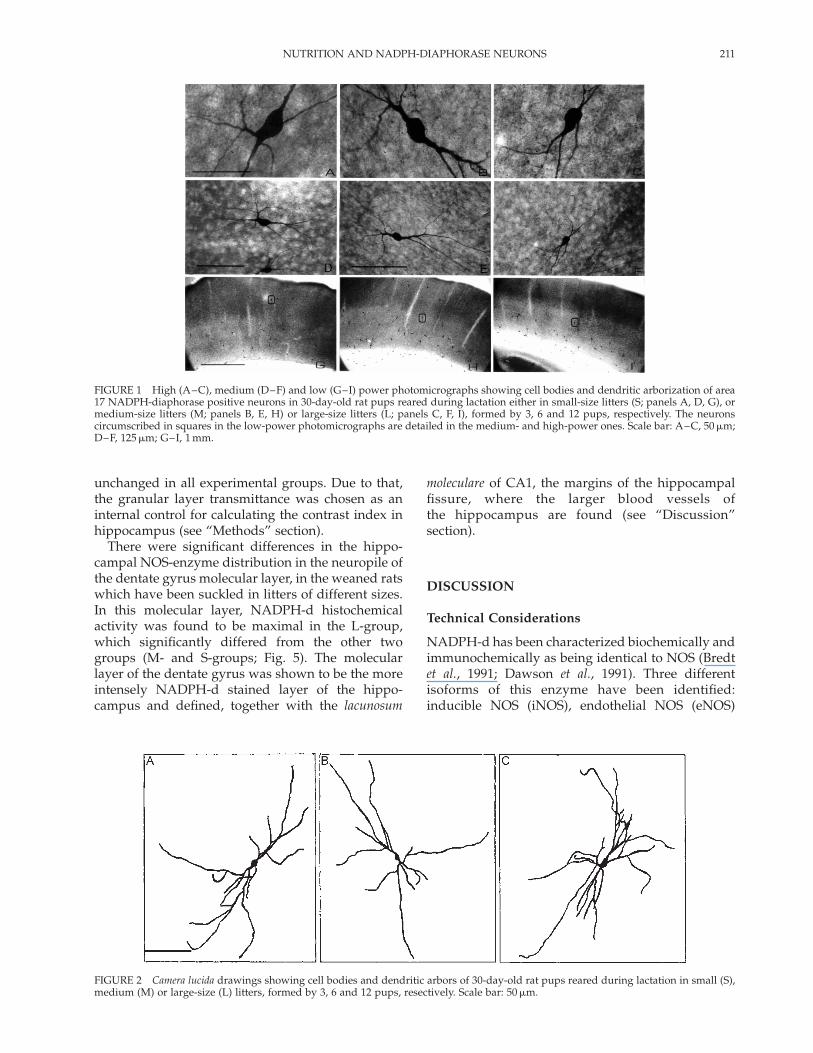
In the gray matter of area 17, the mean values forsoma area, dendritic field area, number of dendriticbranches per cell and number of branching pointsper dendritic tree were inversely proportional to thelitter sizes during suckling (lower mean values in thelarge-litter group). However, although the trend tolower values in the L-group is evident (see thenegative contrast indexes in Fig. 4), the ANOVAindicated that the intergroup differences did notreach statistical significance (Table II).
NADPH-d Neuropil Labeling in CA1 and
Dentate Gyrus
At the light microscope examination, the entirehippocampal area was permeated by a network offine varicose NADPH-d stained fibers whichbranched extensively throughout the tissue, as wellas by a diffuse bluish pattern in the neuropil in alllayers. This was easily seen in all groups. Thepyramidal cell layer of CA1 and the granular celllayer of the dentate gyrus corresponded to the lowestNADPH-d staining (i.e. higher transmittance) inhippocampus. The transmittance of these layers afterNADPH-d histochemistry stayed relatively
A.P. ROCHA-DE-MELO et al.210
unchanged in all experimental groups. Due to that,the granular layer transmittance was chosen as aninternal control for calculating the contrast index inhippocampus (see “Methods” section).
There were significant differences in the hippo-campal NOS-enzyme distribution in the neuropile ofthe dentate gyrus molecular layer, in the weaned ratswhich have been suckled in litters of different sizes.In this molecular layer, NADPH-d histochemicalactivity was found to be maximal in the L-group,which significantly differed from the other twogroups (M- and S-groups; Fig. 5). The molecularlayer of the dentate gyrus was shown to be the moreintensely NADPH-d stained layer of the hippo-campus and defined, together with the lacunosum
moleculare of CA1, the margins of the hippocampalfissure, where the larger blood vessels ofthe hippocampus are found (see “Discussion”section).
DISCUSSION
Technical Considerations
NADPH-d has been characterized biochemically andimmunochemically as being identical to NOS (Bredtet al., 1991; Dawson et al., 1991). Three differentisoforms of this enzyme have been identified:inducible NOS (iNOS), endothelial NOS (eNOS)
FIGURE 1 High (A–C), medium (D–F) and low (G–I) power photomicrographs showing cell bodies and dendritic arborization of area17 NADPH-diaphorase positive neurons in 30-day-old rat pups reared during lactation either in small-size litters (S; panels A, D, G), ormedium-size litters (M; panels B, E, H) or large-size litters (L; panels C, F, I), formed by 3, 6 and 12 pups, respectively. The neuronscircumscribed in squares in the low-power photomicrographs are detailed in the medium- and high-power ones. Scale bar: A–C, 50mm;D–F, 125mm; G–I, 1 mm.
FIGURE 2 Camera lucida drawings showing cell bodies and dendritic arbors of 30-day-old rat pups reared during lactation in small (S),medium (M) or large-size (L) litters, formed by 3, 6 and 12 pups, resectively. Scale bar: 50mm.
NUTRITION AND NADPH-DIAPHORASE NEURONS 211

and neuronal NOS (nNOS). There are other enzymeswith diaphorase activity in the brain but it has beenshown that aldehyde fixation of the tissue inhibitsother NADPH-d activities while enhancing histo-chemical staining in the nNOS-containing cells(Buwalda et al., 1995). Thus it is reasonable toconclude that the NADPH-d histochemical changesobserved here reflect changes in NOS activity.However, this does not inform on which NOSisoform is altered. In 4% paraformaldehyde-fixatedbrain, the distribution of n-NOS throughout thehippocampus was previously reported using bothimmunocytochemistry and histochemistry forNADPH-d (Vincent and Kimura, 1992; Valtschanoffet al., 1993; Dun et al., 1994). At low magnification,diffuse staining extended throughout the hippo-campus, most prominently in the inner third ofthe molecular layer of the dentate gyrus, andsparing only the stratum lacunosum moleculare(Burette et al., 2002). Thus it is unlikely thatthe diaphorase activity quantified in this study isthe result of diaphorase activities other than theNOS-associated enzymes.
NADPH-diaphorase Neuronal Changesin the Visual Cortex
It was mainly shown in the present work thatmanipulating the litter size during the suckling
period can effectively alter the nutritional status of thepups, as judged by the differences in body weight inthe three groups. It was also demonstrated that thesedifferent nutritional conditions were associated witha clear trend to present distinct histochemical patternsof NADPH-d positive neurons in the visual cortex. Toour knowledge, for the first time under conditions ofexcessive food availability (rats suckled in smalllitters; S-group), data are presented documentingmorphometric features of visual cortex neuronscontaining the enzyme NADPH-d. On the otherhand, in the large-litter rats (L-group), a decrease inbody weight associated with an increase in whitematter NADPH-d cell densities (“cell packing effect”)has been found. These results are similar to thosefound previously in protein-deficient rats (Picanco-Diniz et al., 1998; Borba et al., 2000) and demonstratethe effectiveness of increasing the litter size duringlactation in impairing the nutritional status of thepups. Concerning malnutrition-related alterations incell density, it is known that processes like gliogenesisand myelination largely occur during early postnatallife. These processes could be affected by changingthe suckling condition of the pups, and so, couldcontribute to change cell density and histology(Morgane et al., 1978, 1993).
The morphometric parameters of NADPH-d-positive neurons in visual cortex were found to beinfluenced by the litter size in an inverse manner,
FIGURE 3 NADPH-diaphorase contrast index (C) for white- (W) and gray-matter (G) cell density of area 17 (30–45-day-old rats). Threegroups of rats, S, M and L-groups, respectively reared during lactation in small, medium and large litters (formed by 3, 6 and 12 pups),were compared. Contrast index is defined by the relation: C ¼ ðg1 2 g2Þ=ðg1 þ g2Þ; where g1 and g2 are the density values for a pair ofgroups (g1 always corresponding to the larger-litter group of the pair). Density values can be seen in Table I. * Indicate significant differencebetween the two groups of the corresponding pair (p , 0:05; ANOVA plus Newman–Keuls test).
TABLE I NADPH-diaphorase-positive cell densities in rat area 17
Experimental groups
S M L
Gray matter (cells/mm2) 12 ^ 3.5 12.3 ^ 3.1 14.7 ^ 4White matter (cells/mm2) 34.1 ^ 8.8 38.9 ^ 13.1 52.7 ^ 13.8*Scanned areas (n) 30 30 30Subjects (n) 4 4 4
Data are expressed as mean ^ standard deviation. S, small-litter group; M, medium-litter; L, large-litter. *p , 0:05 (ANOVA plus Newman–Keuls test),compared to the S-group.
A.P. ROCHA-DE-MELO et al.212
suggesting that the number of pups in each litter canbe a contributing factor to alter the development ofthis particular group of neurons. When comparedwith the previous reports on NADPH-d positive cellsof the same neocortical neuronal population(Picanco-Diniz et al., 1998; Borba et al., 2000), thepresent results indicate a less strong effect in themodel of food deprivation based on increasing litter-size, suggesting that the effects would depend on theintensity of the nutritional alteration.
The NADPH-d labeled neurons in visual cortexseems to be less influenced by the pups’ nutritionalstatus than other neuronal populations (Dıaz-Cintraet al., 1990, 1994). We found that the NADPH-dhistochemical activity in the neuropil of the visualcortex remained unaffected by the manipulations ofthe litter size. A similar sparing of the NADPH-d-labeled neuropil has been previously described inthe visual cortex of rats malnourished early in life,both at adulthood (Picanco-Diniz et al., 1998) and atthe presently studied age (Borba et al., 2000).However, no quantitative analysis was applied inthose neuropil studies of the visual cortexand therefore, the question remains open to beinvestigated in more detail. When analyzed in
conjunction with the present observations, the datasuggest a certain degree of resistance of these corticalcells either to malnutrition (Picanco-Diniz et al., 1998;Borba et al., 2000, present results) or to overnutritionproduced by reducing the litter size (present data).Interestingly, resistance of NADPH-d cells has alsobeen reported for other injurious conditions, distinctfrom malnutrition or overnutrition, like hypoxia(Ferriero et al., 1988; Zhang et al., 1994), brainchemical lesions (Beahl et al., 1990) and Alzheimer’sdisease (Woolf et al., 1989).
Hippocampal Neuropil Changes: FunctionalConsequences of altered NO Production
It has been reported that 24–48 h food deprivationincreases brain nitric oxide synthases in the ratdiencephalon (Squadrito et al., 1994; Jang et al., 2002).However, information is not yet available concerningthe effects of early nutritional changes on theNADPH-diaphorase stained neuropil in the hippo-campal formation. Thus the present report hasextended those observations, focusing in the neuro-pil of CA1 and dentate gyrus of rats suckled in littersof different sizes. The data demonstrated that the
FIGURE 4 NADPH-diaphorase contrast index for gray-matter soma area (A), dendritic field area (B), number of dendritic branches percell (C) and number of branching points per cell (D) of area 17 (30–45-day-old rats). Definitions of the experimental groups and of thecontrast index are the same as in Fig. 3. The numerical values for all parameters of this figure can be seen in Table II. Although thedifferences are not significant, the trend to lower values in L-group is evident.
TABLE II Metric features of NADPH-diaphorase-positive cells (gray matter) of area 17
Experimental groups
Metric feature S ðn ¼ 8Þ M ðn ¼ 6Þ L ðn ¼ 7Þ
Soma area (mm2) 276 ^ 57 277 ^ 54 230 ^ 51Dendritic field area (mm2 £ 103) 125.7 ^ 41.5 102.2 ^ 30.5 86.4 ^ 19.4Number of dendritic branches per cell 34 ^ 9 29 ^ 6 25 ^ 5Branching points per dendritic tree 14.46 ^ 4.65 11.96 ^ 2.82 10.52 ^ 2.87
Data are expressed as mean ^ standard deviation. S, small-litter group; M, medium-litter; L, large-litter. Although the trend to lower values in L-group isevident, ANOVA showed that the intergroup differences are not significant.
NUTRITION AND NADPH-DIAPHORASE NEURONS 213

molecular layer of dentate gyrus is sensitive to thedistinct nutritional status generated in early life bymanipulating the litter size. The sensitivity of thathippocampal layer was expressed by the increase orreduction of its NADPH-d histochemical activity, asa consequence of malnutrition or overnutrition,respectively.
The strong diaphorase staining near the arteries inthe hippocampal fissure suggests a role forNADPH-d in the molecular layer of the dentategyrus in local blood flow regulation, and indeed,there is some evidence that NO is involved inhippocampal blood flow (Montecot et al., 1998; Jianget al., 2002). NADPH-d staining on vascularendothelial cells of cerebral blood vessels andinnervation of smooth muscle cells of the arterialwall has been demonstrated (Gabbott and Bacon,1993; Tsuchida et al., 2001). In the hippocampus, thehighest densities of microvessels, arterioles and ofthe NADPH-d positive nerve fiber network are in thelacunosum moleculare that, together with the mole-cular layer, defines the margin of the hippocampalfissure (Lovick et al., 1999). Because NO contributesto local blood flow in the hippocampus and wedescribe statistically significant changes for NOS inthe molecular layer of the dentate gyrus in thelarge-litters experimental group, we predict thathippocampal blood flow may be increased inthis group.
On the other hand, abnormal NO levels may play arole in cognitive impairment that might be associatedto malnutrition and oxidative stress (Magri et al.,2003). Because increased NOS activity may lead toelevated NO, it is possible that increased NOSactivity in the neuropil could contribute to peroxy-nitrite generation. Anatomical evidence has beendescribed, of CA3 synaptic damage after perinatalmalnutrition, which may contribute as well for
permanent cognitive dysfunction at adulthood(Diaz-Cintra et al., 1994; Debassio et al., 1996;Granados-Rojas et al., 2002). Thus, food deprivationcould trigger an up-regulation of the NADPH-dneuropil activity in the molecular layer of the dentategyrus in order to achieve an increasing local bloodflow, offering high proportion of neuronal meta-bolites to the hippocampus in the deprived group.By the same logic, one can expect the oppositereaction of the NADPH-d hippocampal neuropil inthe overnourished animals (S-group). If this hypoth-esis has merit, then neuronal NOS up-regulationwould have to be expected under other conditionsthat, directly or indirectly could lead to deficiency ofnutrients. In fact, up-regulation of neuronal NOS hasrecently been reported in astrocytes, in vitro, inconditions of serum deficiency in the culturemedium, as well as in vivo after electrically-inducedstatus epilepticus (Catania et al., 2003). NOS up-regulation has also been recently described in thehypothalamus of rats submitted to 48 h fooddeprivation (Jang et al., 2002).
At this point, some clinical evidence must becommented in order to emphasize the relevance ofthe present data to human nutrition, memoryformation and visual function. As mentioned in the“Introduction” section, experimental data haveshown that the visual cortex is very sensitive tonutritional and plasticity changes (Rabinowicz,1979; Sirevaag et al., 1988; Borba et al., 2000;Leuba and Santos-Monteiro et al., 2000). Data invery low birthweight infants and children havepointed to strong links between impaired neuro-developmental outcome and reduced visual func-tion, as assessed by stereo-acuity, color vision andcontrast sensitivity (Dowdeswell et al., 1995; Powlset al., 1997). Behaviorally, malnourished childrenpresent disturbances in response to novel andcompetitive situations (Barret and Radke-Yarrow,1985), less capability to develop physical- andverbal activity, as well as deficits in executingcognitive tasks (Meeks-Gardner and Grantham-McGregor, 1994; Pollitt et al., 1995; Teodosio et al.,2000). Also, the deficiency of specific compounds ofthe breast milk, like polyunsaturated fatty acids,has been associated with disturbances in cognitivedevelopment (Lucas, 1997). However, it remainsan open question, how changes in nitric oxidesynthases would be contributing to these develop-mental disturbances.
Acknowledgements
This work was supported by FACEPE (No. 0737-4.01/98), Conselho Nacional de DesenvolvimentoCientıfico e Tecnologico (CNPq), PROPESP/UFPA,MCT-PRONEX and PROPESQ/UFPE. RCAG isResearch Fellow from CNPq (No. 52.0722/96).
FIGURE 5 Hippocampal NADPH-diaphorase neuropil changesin the molecular layer of the Dentate Gyrus (Mol). The values inthe Y-axis correspond to the relative histochemical activity definedby the contrast index, as indicated in “Methods”, taking thegranular layer of the dentate gyrus (Gr) as internal standardreference ðC ¼ ½Gr 2 Mol�=½Gr þ Mol�Þ: Observe that the large-litter group (L) presents a significant increase (* p , 0:05; ANOVAplus Newman–Keuls test) in the NADPH-d histochemical activity,in comparison with the other two groups (M and S).
A.P. ROCHA-DE-MELO et al.214
References
Barret, D.E. and Radke-Yarrow, M. (1985) “Effects of nutritionalsupplementation on children’s responses to novel, frustratingand competitive situations”, American Journal of ClinicalNutrition 42, 102–120.
Beahl, M.F., Kowall, N.W., Swartz, K.J. and Ferrante, T.J. (1990)“Homocysteic acid lesion in rat stritatum spare somatostain-neuropeptide Y (NADPH-diaphorase) neurons”, NeuroscienceLetters 108, 36–42.
Bidmon, H.J., Emde, B., Kowalski, T., Schmitt, M., Mayer, B., Kato,K., Assayama, K., Witte, O.W. and Ziles, K. (2001) “Nitricoxide synthase-I containing cortical interneurons co-expressantioxidative enzymes and anti-apoptotic Bcl-2 followingfocal ischemia: evidence for direct and indirect mechanismstowards their resistance to neuropathology”, Journal ofChemical Neuroanatomy 22, 167–184.
Bohme, G.A., Bon, C. and Lemaire, M. (1993) “Altered synapticplasticity and memory formation in nitric oxide synthaseinhibitor-treated rats”, Proceedings of the National Academy ofSciences USA 90, 9191–9194.
Borba, J.M.C., Araujo, M.S., Picanco-Diniz, C.W., Manhaes-de-Castro, R. and Guedes, R.C.A. (2000) “Permanent andtransitory morphometric changes of NADPH-diaphorase-containing neurons in the rat visual cortex after earlymalnutrition”, Brain Research Bulletin 53, 193–201.
Bredt, D.S. and Snyder, S.H. (1989) “Nitric oxide mediatesglutamate-linked enhancement of cGMP levels in thecerebellum”, Proceedings of the National Academy of SciencesUSA 86, 9030–9033.
Bredt, D.S., Glatt, C.H., Hwang, P.M., Fotuhi, M., Dawson, T.M.and Snyder, S.H. (1991) “Nitric oxide synthase protein andmRNA are discretely localized in neuronal populations of themammalian CNS together with NADPH diaphorase”, Neuron7, 615–624.
Brock, J.W. and Prasad, C. (1992) “Alterations in dendritic spinedensity in the rat brain associated with protein malnutrition”,Developmental Brain Research 66, 266–269.
Burette, A., Zabel, U., Weinberg, R.J., Schmidt, H.H. andValtschanoff, J.G. (2002) “Synaptic localization of nitricoxide synthase and soluble guanylyl cyclase in the hippo-campus”, Journal of Neuroscience 22, 8961–8970.
Buwalda, B., Nyakas, C., Gast, J., Luiten, P.G. and Schmidt, H.H.(1995) “Aldehyde fixation differentially affects distribution ofdiaphorase activity but not of nitric oxide synthaseimmunoreactivity in rat brain”, Brain Research Bulletin 38,467–473.
Catania, M.V., Giuffrida, R., Seminara, G., Barbagallo, G., Aronica,E., Gorter, J.A., Dell’Albani, P., Ravagna, A., Calabrese, V. andGiuffrida-Stella, A.M. (2003) “Upregulation of neuronal nitricoxide synthase in in vitro stelate astrocytes and in vivo reactiveastrocytes after electrically induced status epilepticus”,Neurochemical Research 28, 607–615.
Chang, H.M., Lue, J.H., Wen, C.Y. and Shieh, J.Y. (2001) “Axotomyalong with hypoxia enhances the neuronal NADPH-d/NOSexpression in lower brain stem motor neurons of adult rats”,Experimental Neurology 171, 116–126.
Dawson, T.M., Bredt, D.S., Fotuhi, M., Hwang, P.M. and Snyder,S.H. (1991) “Nitric oxide synthase and neuronal NADPHdiaphorase are identical in brain and peripheral tissues”,Proceedings of the National Academy of Sciences USA 88,7797–7801.
Debassio, W.A., Kemper, T.L., Tonkiss, J. and Galler, J.R. (1996)“Effect of prenatal protein deprivation on postnatal granulecell generation in the hippocampal dentate gyrus”, BrainResearch Bulletin 41, 379–383.
Dıaz-Cintra, S., Cintra, L., Ortega, A., Kemper, T. and Morgane, P.J.(1990) “Effects of protein deprivation on pyramidal cells of thevisual cortex in rats of three age groups”, Journal ofComparative Neurology 292, 117–126.
Dıaz-Cintra, S., Garcia-Ruiz, M., Corkidi, G. and Cintra, L. (1994)“Effects of pre-natal malnutrition and post-natal nutritionalrehabilitation on CA3 hippocampal pyramidal cells in rats offour ages”, Brain Research 662, 117–126.
Dobbing, J. (1968) “Vulnerable periods in developing brain”, In:Davison, N.A. and Dobbing, J., eds, Applied Neurochemistry(Blackwell, Oxford), pp 287–316.
Dowdeswell, H.J., Slater, A.M., Broomhall, J. and Tripp, J. (1995)“Visual deficits in children born at less than 32 weeksgestation with and without major ocular pathologyand cerebral damage”, British Journal of Ophthalmology 79,1–6.
Dun, N.J., Dun, S.L., Wong, R.K. and Forstermann, U. (1994)“Colocalization of nitric oxide synthase and somatostatinimmunoreactivity in rat dentate hilar neurons”, Proceedings ofthe National Academy of Sciences USA 91, 2955–2959.
Fabene, P.F., Correia, L., Carvalho, R.A., Cavalheiro, E.A.and Bentivoglio, M. (2001) “The spiny rat Proechimysguyannensis as model of resistance to epilepsy: chemicalcharacterization of hippocampal cell populationsand pilocarpine-induced changes”, Neuroscience 104,979–1002.
Fernandez, V., Pascual, R. and Ruız, S. (1993) “Early lifeenvironmental deterioration, nutrition and ontogenesis ofthe motor cortex in the rat: a Golgi study”, Biology of theNeonate 64, 245–253.
Ferrante, R.J., Kowall, N.W., Beal, M.F., Richardson, E.P., Jr, Bird,E.D. and Martin, J.B. (1985) “Selective sparing of a class ofstriatal neurons in Huntington’s disease”, Science 230,561–563.
Ferriero, D.M., Arcavi, L.J., Sagar, S.M., McIntosh, T.K. and Simon,R.P. (1988) “Selective sparing of NADPH-diaphorase neuronsin neonatal hypoxia-ischemia”, Annals of Neurology 24,670–676.
Friedlander, M.J., Montague, P.R., Hester, F. and Marchase, R.B.(1992) “Role of nitric oxide in NMDA-receptor mediatedrelease of neurotransmitter in visual cortex”, Society forNeuroscience 18, 210, (Abstract).
Gabbot, P.L. and Bacon, S.J. (1993) “Histochemical localization ofNADPH-dependent diaphorase (nitric oxide synthase)activity in vascular endothelial cells in the rat brain”,Neuroscience 57, 79–95.
Granados-Rojas, L., Larriva-Sahd, J., Gutierrez-Ospina, G.,Rondan, A. and Diaz-Cintra, S. (2002) “Prenatal proteinmalnutrition decreases mossy fibers-CA3 thorny excrescencesasymmetrical synapses in adult rats”, Brain Research 933,164–171.
Haley, J.E., Wilcox, G.L. and Chapman, P.F. (1992) “The role ofnitric oxide in hippocampal long-term potentiation”, Neuron8, 211–216.
Hartlage-Rubsamen, M. and Schliebs, R. (2001) “Rat basalforebrain cholinergic lesion affects neuronal nitric oxidesynthase activity in hippocampal and neocortical targetregions”, Brain Research 889, 155–164.
Hope, B.T., Michael, G.J., Knigge, K.M. and Vicent, S.R. (1991)“Neuronal NADPH-diaphorase is a nitric oxide synthase”,Proceedings of the National Academy of Sciences USA 88,2811–2814.
Jang, M.H., Shin, M.C., Lim, B.V., Chung, J.K., Kang, H.S., Kang,S.A., Choue, R.W., Kim, E.H. and Kim, C.J. (2002) “Nicotineadministration decreases nitric oxide synthase expression inthe hypothalamus of food deprived rats”, Neuroscience Letters322, 29–32.
Jiang, M.H., Kaku, T., Hada, J. and Hayashi, Y. (2002) “Differenteffects of eNOS and nNOS inhibition on transient forebrainischemia”, Brain Research 946, 139–147.
Kehoe, P., Mallinson, K., Bronzino, J. and McCormick, C.M. (2001)“Effects of protein malnutrition and neonatal stress on CNSresponsiveness”, Developental Brain Research 132, 23–31.
Kim, M.J., Kim, Y., Choe, B.K., Kim, S.A., Lee, H.J., Kim, J.W., Huh,Y., Kin, C. and Chung, J.H. (2000) “Differential expression ofnicotinamide adenine dinucleotide phosphate-diaphorase inhypothalamic areas of obese Zucker rats”, Neuroscience Letters292, 60–62.
Koh, J.Y., Peters, S. and Choi, D.W. (1986) “Neurons containingNADPH-diaphorase are selectively resistant to quinolinatetoxicity”, Science 234, 73–76.
Leuba, G. and Rabinowicz, T. (1979) “Long-term effects ofpostnatal undernutrition and maternal malnutrition onmouse cerebral cortex. I. Cellular densities, cortical volumeand total number of cells”, Experimental Brain Research 37,283–298.
Lovick, T.A., Brown, L.A. and Key, B.J. (1999) “Neurovascularrelationships in hippocampal slices: physiological and
NUTRITION AND NADPH-DIAPHORASE NEURONS 215
anatomical studies of mechanisms underlying flow-meta-bolism coupling in intraparenchymal microvessels”, Neuro-science 92, 47–60.
Lucas, A. (1997) “Long-chain polyunsaturated fatty acids, infantfeeding and cognitive development”, In: Dobbing, J., ed.,Developing Brain and Behaviour. The Role of Lipids in InfantFormula (Academic Press, London), pp 3–39.
Magri, F., Borza, A., Del Vecchio, S., Chytiris, S., Cuzzoni, G.,Busconi, L., Rebesco, A. and Ferrari, E. (2003) “Nutritionalassessment of demented patients: a descriptive study”, AgingClinical and Experimental Research 15, 148–153.
Matsura, T. and Kanno, I. (2002) “Effect of nitric oxide synthaseinhibitor on the local cerebral blood flow evoked by ratsomatosensory stimulation under hyperoxia”, ComparativeBiochemistry and Physiology A Molecular and IntegrativePhysiology 131, 267–274.
Meeks-Gardner, J.M. and Grantham-McGregor, S.M. (1994)“Physical activity, undernutrition and child development”,Proceedings of the Nutrition Society 53, 241–248.
Montecot, C.L., Rondi-Reig, L., Springhetti, V., Seylaz, J. andPinard, E. (1998) “Inhibition of neuronal (type 1) nitric oxidesynthase prevents hyperaemia and hippocampal lesionsresulting from kainate-induced seizures”, Neuroscience 84,791–800.
Morgane, P.J., Miller, M., Kemper, T., Stern, W., Forbes, W., Hall, R.,Bronzino, J.D., Kissane, J., Hawrylewicz, E. and Resnick, O.(1978) “The effects of protein malnutrition on the developingcentral nervous system in the rat”, Neuroscience andBiobehavioral Reviews 2, 137–230.
Morgane, P.J., Austin-Lafrance, R.J., Bronzino, J.D., Tonkiss, J.,Dıaz-Cintra, S., Cintra, L., Kemper, T. and Galler, J.R. (1993)“Prenatal malnutrition and development of the brain”,Neuroscience and Biobehavioral Reviews 17, 91–128.
Morley, J.E. and Flood, J.F. (1991) “Evidence that nitric oxidemodulates food intake in mice”, Life Science 49, 707–711.
Picanco-Diniz, C.W., Araujo, M.S., Borba, J.M.C. and Guedes,R.C.A. (1998) “NADPH-diaphorase containing neurons andbiocytin-labelled axon terminal in the visual cortex of adultrats malnourished during development”, Nutritional Neuro-science 1, 35–48.
Plagemann, A., Rake, A., Melchior, K., Rohde, W. and Dorner, G.(1998) “Reduction of cholecystokinin-8S-neurons in theparaventricular hypothalamic nucleus of neonatally overfedweanling rats”, Neuroscience Letters 258, 13–16.
Plagemann, A., Harder, T., Rake, A., Voits, M., Fink, H., Rohde, W.and Dorner, G. (1999) “Perinatal elevation of hypothalamicinsulin, acquired malformation of hypothalamic galaninergicneurons, and syndrome x-like alterations in adulthood ofneonatally overfed rats”, Brain Research 836, 146–155.
Pollitt, E., Gorman, K.S., Engel, P.L., Rivera, J.A. and Martorell, R.(1995) “Nutrition in early life and the fulfillment ofintellectual potential. Supplement: The INCAP follow-upstudy”, Journal of Nutrition 125, 1111S–1118S.
Powls, A., Botting, N., Cooke, R.W.I., Stephenson, G. and Marlow,N. (1997) “Visual impairment in very low birth-weightchildren”, Archives of Diseases in Childhood 76, 82–87.
Quinn, J., Davis, F., Woodward, W.R. and Eckenstein, F. (2001)“Beta-amyloid plaques induce neuritic dystrophy ofnitric oxide-producing neurons in a transgenic mousemodel of Alzheimer’s disease”, Experimental Neurology 168,203–212.
Rabin, O., Lefauconnier, J.M., Chanez, C., Bernad, G. and Bourre,J.M. (1994) “Developmental effects of intrauterine growth
retardation on cerebral amino acid transport”, PediatricResearch 35, 640–648.
Rocha-de-Melo, A.P. and Guedes, R.C.A. (1997) “Spreadingdepression is facilitated in adult rats previously submittedto short episodes of malnutrition during the lactationperiod”, Brazilian Journal of Medical and Biological Research 30,663–669.
Santos-Monteiro, J., Teodosio, N.R. and Guedes, R.C.A. (2000)“Long-lasting effects of early environmental stimulation oncortical spreading depression in normal and early-malnou-rished adult rats”, Nutritional Neuroscience 3, 29–40.
Scherer-Singler, U., Vicent, S.R., Kimura, H. and Mcgeer, E.G.(1983) “Demonstration of unique population of neurons withNADPH diaphorase histochemistry”, Journal of NeuroscienceMethods 9, 229–234.
Sirevaag, A.M., Black, J.E., Shafron, D. and Greenough, W.T. (1988)“Direct evidence that complex experience increases capillarybranching and surface area in visual cortex of young rats”,Brain Research 471, 299–304.
Squadrito, F., Calapai, G., Cucinotta, D., Altavilla, D., Zingarelli, B.,Ioculano, M., Urna, G., Sardella, A., Campo, G.M. and Caputi,A.P. (1993) “Anorectic activity of NG-nitro-L-arginine, aninhibitor of brain nitric oxide synthase, in obese Zucker rats”,European Journal of Pharmacology 230, 125–128.
Squadrito, F., Calapai, G., Altavilla, D., Cucinotta, D., Zingarelli, B.,Campo, G.M., Arcoraci, V., Sautebin, L., Mazzaglia, G. andCaputi, A.P. (1994) “Food deprivation increases brain nitricoxide synthase and depresses brain serotonin levels in rats”,Neuropharmacology 33, 83–86.
Stricker-Krongrad, A., Beck, B. and Burlet, C. (1996) “Nitric oxidemediates hyperphagia of obese Zucker rats: relation tospecific changes in the microstructure of feeding behavior”,Life Science 58, 9–15.
Teodosio, N.R., Peres, E.P., Alves, A.J., Dimenstein, W. and Guedes,R.C.A. (2000) “A new dietary supplement based on bovineblood: recovering Brazilian children from malnutrition”,Nutritional Neuroscience 3, 73–86.
Tsuchida, A., Handa, Y., Nojyo, Y. and Kubota, T. (2001)“Ultrastructure of NADPH diaphorase-positive nerve fibersand their terminals in the rat cerebral arterial system”, Journalof Chemical Neuroanatomy 21, 267–275.
Valtschanoff, J.G., Weinberg, R.J., Kharazia, V.N., Schmidt,H.H.H.W., Nakane, M. and Rustinoni, A. (1993) “Neurons inrat cerebral cortex that synthesize nitric oxide: NADPHdiaphorase histochemistry, NOS immunocytochemistry,and colocalization with GABA”, Neuroscience Letters 157,157–161.
Vincent, S.R. and Kimura, H. (1992) “Histochemical mapping ofnitric oxide synthase in the rat brain”, Neuroscience 46,755–784.
Woolf, N.J., Jacobs, R.W. and Butcher, L.L. (1989) “Thepontomesencephalotegmental cholinergic system does notdegenerate in Alzheimer’s disease”, Neuroscience Letters 96,277–282.
Xu, M., Ng, Y.K. and Leong, S.K. (2000) “Neuroprotective andneurodestructive functions of nitric oxide after spinal cordhemisection”, Experimental Neurology 161, 472–480.
Zhang, Z.G., Choop, M., Gautam, S., Zaloga, C., Zhang, R.L.,Schmidt, H.H.H.W., Pollock, J.S. and Forstermann, U. (1994)“Upregulation of neuronal nitric oxide synthase and mRNA,and selective sparing of nitric oxide synthase-containingneurons after focal cerebral ischemia in rat”, Brain Research654, 85–95.
A.P. ROCHA-DE-MELO et al.216