Effect of barley and oat cultivars with different carbohydrate compositions on the intestinal...
11
RESEARCH ARTICLE E¡ect of barley and oat cultivars with di¡erent carbohydrate compositions on the intestinal bacterial communities in weaned piglets Robert Pieper 1,2 , Rajesh Jha 2,3 , Brian Rossnagel 4 , Andrew G. Van Kessel 2 , Wolfgang B. Souffrant 1 & Pascal Leterme 3 1 Research Unit for Nutritional Physiology ‘Oskar Kellner’, Research Institute for the Biology of Farm Animals, Dummerstorf, Germany; 2 Department of Animal and Poultry Sciences, College of Agriculture and Bioresources, University of Saskatchewan, Saskatoon, SK, Canada; 3 Prairie Swine Centre Inc., Saskatoon, SK, Canada; and 4 Crop Development Centre, College of Agriculture and Bioresources, University of Saskatchewan, Saskatoon, SK, Canada Correspondence: Pascal Leterme, Prairie Swine Centre Inc., PO Box 21057, 2105 8th Street East, Saskatoon, SK, Canada S7H 5N9. Tel.: 101 306 667 7445; fax: 101 306 955 2510; e-mail: [email protected] Received 27 June 2008; revised 27 August 2008; accepted 1 September 2008. First published online November 2008. DOI:10.1111/j.1574-6941.2008.00605.x Editor: Julian Marchesi Keywords barley; oat; mixed-linked b-glucan; intestinal microbiota; weaning piglets. Abstract This experiment was aimed at comparing the intestinal microbial community composition in pigs fed hulled common barley supplemented with isolated barley mixed-linked b-glucan, four hulless barley varieties and breeding lines with mixed- linked b-glucan contents ranging from 41 to 84 g kg 1 and different amylose/ amylopectin ratios as well as two oat varieties. Seventy-two weaned piglets were allocated to one of nine diets composed of 81.5% cereal, 6% whey, 9% soy protein isolate and 3.5% minerals. After 15 days, pigs were sacrificed and ileum and colon contents were collected for quantitative real-time PCR (qPCR) and denaturing gradient gel electrophoresis to evaluate microbial communities. Shifts in intestinal microbial communities were observed with the hulless barley cultivars with a normal to high b-glucan content and from normal starch toward either high- amylopectin or high-amylose starch. These hulless barleys had the lowest (P o 0.05) microbial diversity, whereas oats had intermediate diversity compared with low-b-glucan hulless cultivars and hulled varieties. Furthermore, hulless varieties favoured xylan- and b-glucan-degrading bacteria whereas mixed-linked b-glucan-supplemented hulled barley favoured lactobacilli. Numbers of lactoba- cilli decreased in the ileum of pigs fed hulless/high mixed-linked b-glucan barley- based diets. Thus, cultivar differences in both the form and the quantity of carbohydrates affect gut microbiota in pigs, which provides information for future feeding strategies. Introduction The gastrointestinal tract (GIT) of pigs is colonized with a highly diverse microbiota, comprising 4 400 different phylotypes (Hill et al., 2002; Leser et al., 2002), having a considerable impact on GIT development, physiology and immunology (Chowdhury et al., 2007; Danielsen et al., 2007; Willing & Van Kessel, 2007). Furthermore, they provide the host organism with nutrients from fermentation processes, stimulate the gut mucosal immune system and protect the intestine from pathogen overgrowth, adhesion to gut mucosa and lumen colonization (Berg, 1996; Isolauri et al., 2001). There has been growing interest in the inclusion of dietary fibre in the diet of weaning pigs due to its potential prebiotic effects and promotion of beneficial bacteria such as lactobacilli (Verstegen & Williams, 2002). Carbohydrates are the predominant fraction of cereals such as barley and oat. Because cereals are the major component in pig diets and given the fact that enzymatically indigestible carbohydrates are the main substrate for bacterial fermenta- tion (Bach Knudsen & Hansen, 1991), there might be opportunities for manipulating the composition of the GIT microbiota by selecting cereal grains based on the type and amount of dietary fibre. However, the b-glucan content and starch amylose/amylopectin ratio of barley and oat can differ markedly between single varieties. For example, the FEMS Microbiol Ecol 66 (2008) 556–566 Journal compilation c 2008 Federation of European Microbiological Societies Published by Blackwell Publishing Ltd. No claim to original Canadian government works
-
Upload
independent -
Category
Documents
-
view
1 -
download
0
Transcript of Effect of barley and oat cultivars with different carbohydrate compositions on the intestinal...
R E S E A R C H A R T I C L E
E¡ectof barleyand oat cultivarswith di¡erent carbohydratecompositionson the intestinal bacterial communities inweanedpigletsRobert Pieper1,2, Rajesh Jha2,3, Brian Rossnagel4, Andrew G. Van Kessel2, Wolfgang B. Souffrant1 &Pascal Leterme3
1Research Unit for Nutritional Physiology ‘Oskar Kellner’, Research Institute for the Biology of Farm Animals, Dummerstorf, Germany; 2Department
of Animal and Poultry Sciences, College of Agriculture and Bioresources, University of Saskatchewan, Saskatoon, SK, Canada; 3Prairie Swine Centre
Inc., Saskatoon, SK, Canada; and 4Crop Development Centre, College of Agriculture and Bioresources, University of Saskatchewan, Saskatoon,
SK, Canada
Correspondence: Pascal Leterme, Prairie
Swine Centre Inc., PO Box 21057, 2105 8th
Street East, Saskatoon, SK, Canada S7H 5N9.
Tel.: 101 306 667 7445; fax: 101 306 955
2510; e-mail: [email protected]
Received 27 June 2008; revised 27 August
2008; accepted 1 September 2008.
First published online November 2008.
DOI:10.1111/j.1574-6941.2008.00605.x
Editor: Julian Marchesi
Keywords
barley; oat; mixed-linked b-glucan; intestinal
microbiota; weaning piglets.
Abstract
This experiment was aimed at comparing the intestinal microbial community
composition in pigs fed hulled common barley supplemented with isolated barley
mixed-linked b-glucan, four hulless barley varieties and breeding lines with mixed-
linked b-glucan contents ranging from 41 to 84 g kg�1 and different amylose/
amylopectin ratios as well as two oat varieties. Seventy-two weaned piglets were
allocated to one of nine diets composed of 81.5% cereal, 6% whey, 9% soy protein
isolate and 3.5% minerals. After 15 days, pigs were sacrificed and ileum and colon
contents were collected for quantitative real-time PCR (qPCR) and denaturing
gradient gel electrophoresis to evaluate microbial communities. Shifts in intestinal
microbial communities were observed with the hulless barley cultivars with a
normal to high b-glucan content and from normal starch toward either high-
amylopectin or high-amylose starch. These hulless barleys had the lowest
(Po 0.05) microbial diversity, whereas oats had intermediate diversity compared
with low-b-glucan hulless cultivars and hulled varieties. Furthermore, hulless
varieties favoured xylan- and b-glucan-degrading bacteria whereas mixed-linked
b-glucan-supplemented hulled barley favoured lactobacilli. Numbers of lactoba-
cilli decreased in the ileum of pigs fed hulless/high mixed-linked b-glucan barley-
based diets. Thus, cultivar differences in both the form and the quantity of
carbohydrates affect gut microbiota in pigs, which provides information for future
feeding strategies.
Introduction
The gastrointestinal tract (GIT) of pigs is colonized with
a highly diverse microbiota, comprising 4 400 different
phylotypes (Hill et al., 2002; Leser et al., 2002), having a
considerable impact on GIT development, physiology and
immunology (Chowdhury et al., 2007; Danielsen et al.,
2007; Willing & Van Kessel, 2007). Furthermore, they
provide the host organism with nutrients from fermentation
processes, stimulate the gut mucosal immune system and
protect the intestine from pathogen overgrowth, adhesion to
gut mucosa and lumen colonization (Berg, 1996; Isolauri
et al., 2001). There has been growing interest in the inclusion
of dietary fibre in the diet of weaning pigs due to its
potential prebiotic effects and promotion of beneficial
bacteria such as lactobacilli (Verstegen & Williams, 2002).
Carbohydrates are the predominant fraction of cereals such
as barley and oat. Because cereals are the major component
in pig diets and given the fact that enzymatically indigestible
carbohydrates are the main substrate for bacterial fermenta-
tion (Bach Knudsen & Hansen, 1991), there might be
opportunities for manipulating the composition of the GIT
microbiota by selecting cereal grains based on the type and
amount of dietary fibre. However, the b-glucan content and
starch amylose/amylopectin ratio of barley and oat can
differ markedly between single varieties. For example, the
FEMS Microbiol Ecol 66 (2008) 556–566Journal compilation c� 2008 Federation of European Microbiological SocietiesPublished by Blackwell Publishing Ltd. No claim to original Canadian government works
b-glucan content ranges from c. 1% in wheat to 3–7% in oat
and 5–11% in barley (Brennan & Cleary, 2005). Environmen-
tal and, especially, genetic factors have an impact on the b-
glucan content (Fox et al., 2007; Gamlath et al., 2008).
Although dietary b-glucans attenuate the postprandial glycae-
mic and insulinaemic response in humans (Wood, 2007), little
is known about their effects on the intestinal fermentation
processes and microbiota in general. In farm animals, there
have traditionally been concerns about the b-glucan content of
cereals and its negative effect on digestibility and weight gain.
Enzymes (i.e. b-glucanases and xylanases) have been used in
pig diets to decrease viscosity and enhance the digestibility of
nutrients. However, it has been shown that barley b-glucans in
the diet of weaning piglets can promote lactobacilli that are
capable of degrading b-glucans, thus suggesting prebiotic
properties (Jonsson & Hemmingsson, 1991).
The aim of the present experiment was to investigate the
effect of a hulled barley, either alone or supplemented with an
isolated barley mixed-linked b-glucan concentrate, and four
hulless barley cultivars with increasing mixed-linked b-glucan
content (41–84 g kg�1) and different starch compositions on
the composition of the small and large intestinal microbial
community of weaned piglets by means of PCR-denaturing
gradient gel electrophoresis (DGGE) and quantitative real-
time PCR (qPCR) of the 16S rRNA gene. Two oat varieties
with 29 and 40 g kg�1 mixed-linked b-glucan content, respec-
tively, were also included in the study for comparison.
Materials and methods
Animals and diets
Seventy-two (Commercial breed-PIC CamboroughsPlus;
PIC Canada Ltd) piglets, weaned at 21 days of age, were
used in this study. After weaning, they were kept for 2 weeks
in group pens to allow adaptation of the gastrointestinal
microbiota to the newly introduced weaning diet in order to
prevent weaning bias in the feeding trial (Janczyk et al.,
2007; Pieper et al., 2008). No antibiotics, either for prophy-
lactic or for therapeutic purposes, were administered to the
animals. Standard commercial rearing conditions (photo-
period, humidity and temperature) were used at Prairie
Swine Centre Inc. (Saskatoon, SK, Canada) facilities. Piglets
with a mean body weight of 12.8� 1.9 kg were then allo-
cated randomly into nine feeding groups with eight piglets
each. They were housed in individual cages (1.2� 0.6 m).
Common hulled barley, four hulless barley varieties and
breeding lines and two oat varieties CDC Baler and CDC
Sol-Fi (high b-glucan) were used. Two diets were also
formulated with 8.2% or 16.3% (w/w) of a commercial
barley mixed-linked b-glucan (BBG) concentrate (Parrheim
Foods, Saskatoon, SK, Canada), containing 23.5% barley
mixed-linked b-glucan, added at the expense of common
barley. The experimental diets (Tables 1 and 2) were fed for
15 days according to the metabolic body weight
(110 g feed kg�0.75 BW). The nutritional composition of the
diets was analysed as follows: dry matter (AOAC 930.15),
nitrogen (AOAC 968.06 using an elemental analyser LECO
FP528, St Joseph, MI), ether extract (AOAC 920.39 using
Soxhlet apparatus and petroleum ether), ash (AOAC
942.05), starch and mixed-linked b-glucans (Megazyme
International, Ireland) and gross energy (PARR 1281 calori-
meter, Moline, IL). The feed was offered in mashed form
twice daily (8:00 and 16:00 hours), and animals had ad
libitum access to water. On the last experimental day, all
animals received the last meal 4 h before killing in order to
provide approximately equal amounts of bacterial fermen-
tative nutrients in the small intestine.
All procedures involving animal handling and treatment
were approved by the Committee of Animal Care and
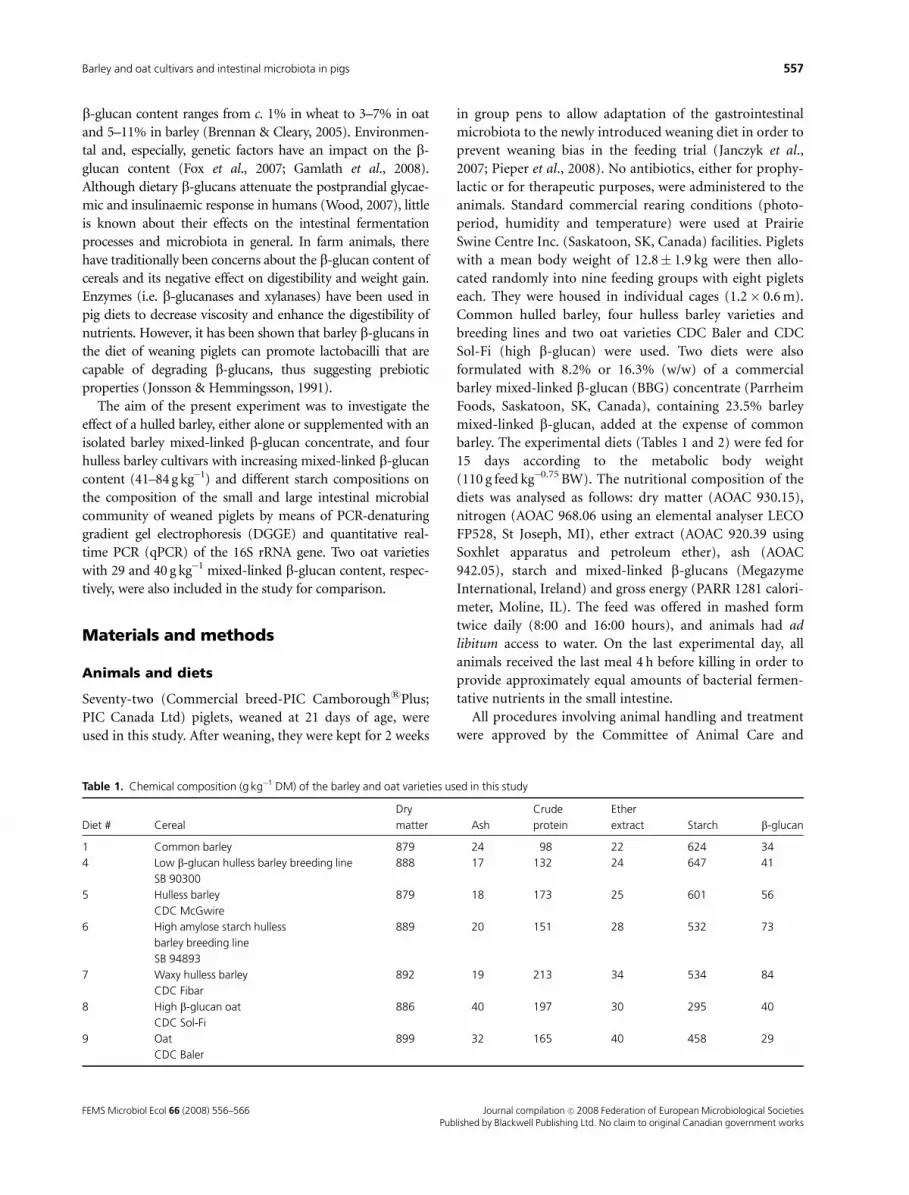
Table 1. Chemical composition (g kg�1 DM) of the barley and oat varieties used in this study
Diet # Cereal
Dry
matter Ash
Crude
protein
Ether
extract Starch b-glucan
1 Common barley 879 24 98 22 624 34
4 Low b-glucan hulless barley breeding line
SB 90300
888 17 132 24 647 41
5 Hulless barley
CDC McGwire
879 18 173 25 601 56
6 High amylose starch hulless
barley breeding line
SB 94893
889 20 151 28 532 73
7 Waxy hulless barley
CDC Fibar
892 19 213 34 534 84
8 High b-glucan oat
CDC Sol-Fi
886 40 197 30 295 40
9 Oat
CDC Baler
899 32 165 40 458 29
FEMS Microbiol Ecol 66 (2008) 556–566 Journal compilation c� 2008 Federation of European Microbiological SocietiesPublished by Blackwell Publishing Ltd. No claim to original Canadian government works
557Barley and oat cultivars and intestinal microbiota in pigs
Supply of the University of Saskatchewan and were per-
formed in accordance with the recommendations of the
Canadian Council on Animal Care (1993).
Slaughtering and sampling
Animals were sacrificed by stunning using a captive bolt,
followed by immediate exsanguination. The abdomen was
opened and the entire GIT was removed. The small and large
intestines were separated and digesta samples were taken
from the last quarter of the small intestine (defined as the
ileum) and from 20 cm of the medial colon. Approximately
2 g of mixed digesta was subsampled and immediately stored
at � 20 1C until extraction of genomic DNA (within 12 h).
DNA isolation
DNA was isolated from digesta using a series of chemical,
physical and enzymatic treatments, as described previously
(Hill et al., 2005), with slight modifications. Briefly, 0.3 g of
digesta was placed in a bead-beating tube (Mo-Bio Labora-
tories, Solano Beach, Canada). Cells were lysed by incuba-
tion at 37 1C for 30 min in the presence of RNAse A (75mg),
lysozyme (750mg) and proteinase K (400 mg) in 365 mL of
lysing buffer A (containing per litre: 50 mM Tris-HCl,
50 mM EDTA with 0.5% Tween 20% and 0.5% Triton X-
100, 18.61 g Na2EDTA and 6.06 g Tris base). After addition
of 135mL of lysing buffer B (containing per litre: 3 M
guanidine-HCl and 20% Tween 20), the mixture was
incubated for another 30 min at 50 1C and subsequently
frozen at � 70 1C for 20 min. After thawing, 700 mL of
phenol/chloroform/isoamyl (25 : 24 : 1) was added to each
tube, and samples were then processed three times in a
FastPrep Instrument (Bio101 ThermoSavant FP120) at
5 m s�1 for 20 s to release and purify the genomic DNA.
After centrifugation at 14 000 g for 15 min, the supernatant
was transferred to a new tube and 70mL of 3 M sodium
acetate and 700mL isopropanol were added and the pre-
cipitated DNA was pelleted for 15 min at 14 000 g. The pellet
was washed with 70% ethanol, air dried and finally redis-
solved in 100 mL MilliQ water. The DNA concentration was
measured using a picoGreen assay (Molecular Probes,
Eugene, OR).
PCR and DGGE
The V6–V8 variable regions of the bacterial 16S rRNA gene
from ileal and colon contents were amplified by a nested
PCR approach using forward primer S-D-Bact-0011-a-A-17
and reverse primer S-D-Bact-1492-a-A-19 (Table 3), fol-
lowed by a second amplification using forward primer S-D-
Bact-0968-a-S-GC and reverse primer S-D-Bact-1401-a-
A-17 (Table 3). PCR reactions contained 5 mL of 10�incubation buffer, 3 mL of 50 mM MgCl2, 1 mL of each of
the four primers (10mM), 1 mL of each dNTP (10 mM) and
0.25 mL of Taq-Polymerase (5 UmL�1; ‘Taq-CORE Kit 10’,
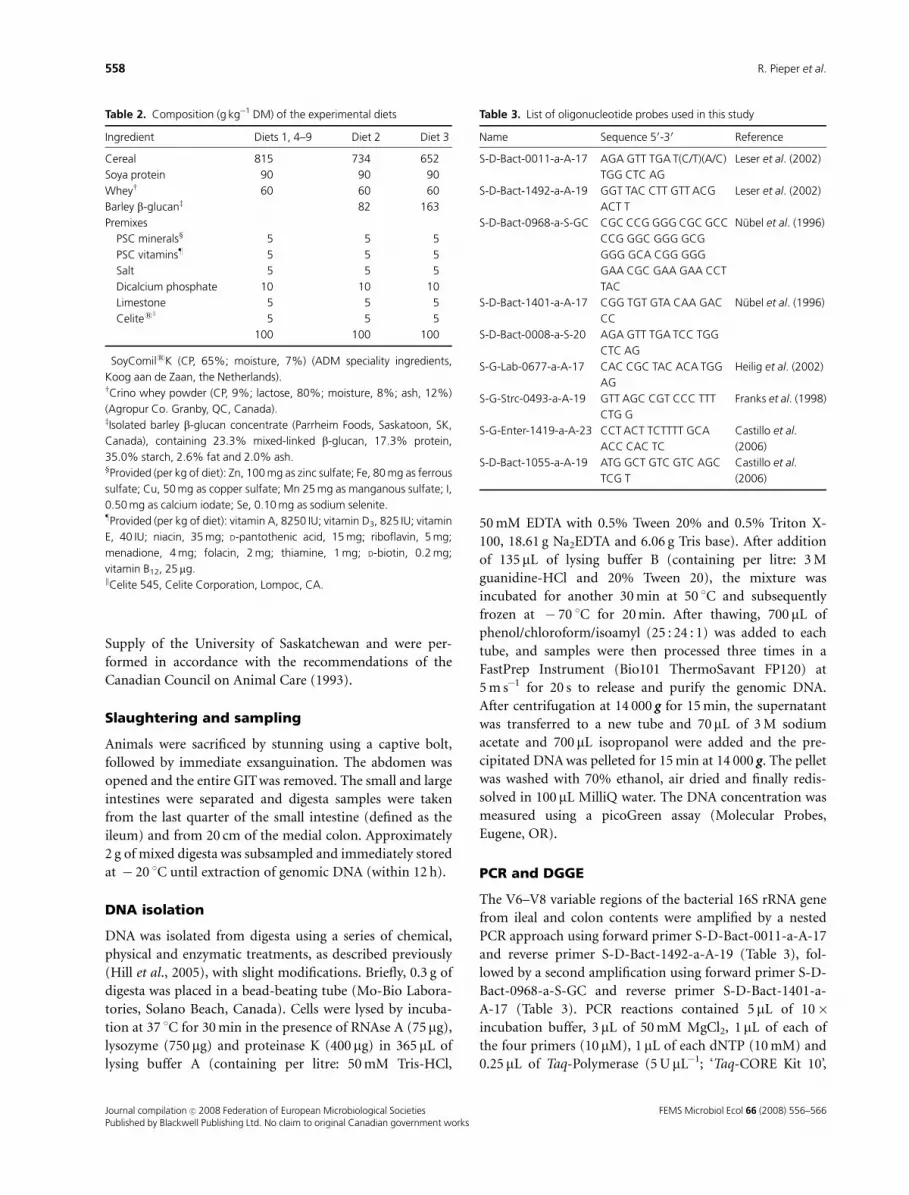
Table 2. Composition (g kg�1 DM) of the experimental diets
Ingredient Diets 1, 4–9 Diet 2 Diet 3
Cereal 815 734 652
Soya protein� 90 90 90
Wheyw 60 60 60
Barley b-glucanz 82 163
Premixes
PSC minerals‰ 5 5 5
PSC vitaminsz 5 5 5
Salt 5 5 5
Dicalcium phosphate 10 10 10
Limestone 5 5 5
Celitesk
5 5 5
100 100 100
�SoyComilsK (CP, 65%; moisture, 7%) (ADM speciality ingredients,
Koog aan de Zaan, the Netherlands).wCrino whey powder (CP, 9%; lactose, 80%; moisture, 8%; ash, 12%)
(Agropur Co. Granby, QC, Canada).zIsolated barley b-glucan concentrate (Parrheim Foods, Saskatoon, SK,
Canada), containing 23.3% mixed-linked b-glucan, 17.3% protein,
35.0% starch, 2.6% fat and 2.0% ash.‰Provided (per kg of diet): Zn, 100 mg as zinc sulfate; Fe, 80 mg as ferrous
sulfate; Cu, 50 mg as copper sulfate; Mn 25 mg as manganous sulfate; I,
0.50 mg as calcium iodate; Se, 0.10 mg as sodium selenite.zProvided (per kg of diet): vitamin A, 8250 IU; vitamin D3, 825 IU; vitamin
E, 40 IU; niacin, 35 mg; D-pantothenic acid, 15 mg; riboflavin, 5 mg;
menadione, 4 mg; folacin, 2 mg; thiamine, 1 mg; D-biotin, 0.2 mg;
vitamin B12, 25mg.kCelite 545, Celite Corporation, Lompoc, CA.
Table 3. List of oligonucleotide probes used in this study
Name Sequence 50-30 Reference
S-D-Bact-0011-a-A-17 AGA GTT TGA T(C/T)(A/C)
TGG CTC AG
Leser et al. (2002)
S-D-Bact-1492-a-A-19 GGT TAC CTT GTT ACG
ACT T
Leser et al. (2002)
S-D-Bact-0968-a-S-GC CGC CCG GGG CGC GCC
CCG GGC GGG GCG
GGG GCA CGG GGG
GAA CGC GAA GAA CCT
TAC
Nubel et al. (1996)
S-D-Bact-1401-a-A-17 CGG TGT GTA CAA GAC
CC
Nubel et al. (1996)
S-D-Bact-0008-a-S-20 AGA GTT TGA TCC TGG
CTC AG
S-G-Lab-0677-a-A-17 CAC CGC TAC ACA TGG
AG
Heilig et al. (2002)
S-G-Strc-0493-a-A-19 GTT AGC CGT CCC TTT
CTG G
Franks et al. (1998)
S-G-Enter-1419-a-A-23 CCT ACT TCTTTT GCA
ACC CAC TC
Castillo et al.
(2006)
S-D-Bact-1055-a-A-19 ATG GCT GTC GTC AGC
TCG T
Castillo et al.
(2006)
FEMS Microbiol Ecol 66 (2008) 556–566Journal compilation c� 2008 Federation of European Microbiological SocietiesPublished by Blackwell Publishing Ltd. No claim to original Canadian government works
558 R. Pieper et al.
MPBiomedicals, Eschwege, Germany), and UV-sterilized
millipore water was added till 49 mL according to Konstanti-
nov et al. (2004). One microlitre of template (adjusted to
1 ngmL�1 DNA) was added to each reaction mix. Both PCR
amplifications were accomplished as follows: 5 min at 94 1C,
35 cycles of 94 1C for 30 s, 56 1C for 20 s and 68 1C for 40 s
and a final extension at 68 1C for 7 min. The size and yield of
PCR products were checked by electrophoresis in 1.5%
agarose gel after staining with ethidium bromide (0.4mg
EtBr mL�1 agarose).
DGGE was performed for separation of PCR products.
Eighteen microlitres of each PCR product was loaded on a
polyacrylamide gel with a vertical gradient of denaturants of
35–55% (42.16% urea and 40% formamide in 100% dena-
turant). The electrophoresis was conducted at 85 V for 16 h
in 0.5�TAE buffer (containing per litre: 242 g Tris, 57.1 mL
glacial acetic acid and 100 mL 0.5 M EDTA) and a constant
temperature of 60 1C in a DCode Universal Mutation
Detection System (BioRad, Munich, Germany). DGGE gels
were stained with SYBRs Gold Nucleic Acid Gel Stain
(Molecular Probes) in 0.5�TAE buffer (pH 7.5) for 10 min
at room temperature, subsequently exposed to UV light
(AlphaDigiDocs RT, Alpha Innotech Corporation, San
Leandro, CA) for 2 s and photographed with a digital camera
SP-500 UZ (Olympus, Hamburg, Germany) using the
ALPHAEASEFCTM 4.0 software (Alpha Innotech Corporation).
Identification of dominant bands
Dominant bands or bands that were characteristic for the
majority of the animals in one group were picked from
DGGE gels with a sterile needle and reamplified by PCR
using the primers S-D-Bact-0968-a-S-18 (without GC
clamp) and S-D-Bact-1401-a-A-17 as described above. The
PCR products were purified with the Qiagens PCR Pur-
ification Kit (Qiagen, Hilden, Germany) according to the
manufacturers’ protocol and sequenced using the DYEna-
micTM ET Terminator Cycle Sequencing Kit (Amersham
Biosciences, Piscataway), followed by automatic sequencing
on a MegaBACETM Sequencing System (Amersham Bios-
ciences). The sequences obtained were compared with
public entries at the NCBI website (Altschul et al., 1997)
and deposited under GenBank accession numbers
EU381235–EU381274.
qPCR
For quantification of 16S rRNA gene copy numbers of some
bacterial groups in the DNA isolates of SI and colon
contents, previously published group-specific primers
(Table 3) were used. The reverse primers S-G-Lab-0677-a-
A-17 (lactobacilli) and S-G-Strc-0493-a-A-19 (streptococci)
were used in conjunction with forward primer S-D-Bact-
0008-a-S-20 yielding PCR products of c. 670 and 485 bp.
Primers S-D-Bact-1055-a-A-19 and S-G-Enter-1419-a-A-23
were used for amplification of a 370-bp fragment of the
enterobacterial 16S rRNA gene. Amplification was accom-
plished using Platinum SYBR green qPCR SuperMix-UDG
(Invitrogen) in the presence of 3 mM MgCl2 and 500 nM of
each primer as described by Dumonceaux et al. (2006). One
microlitre of diluted genomic DNA was used as a template.
Amplification conditions for lactobacilli were 50 1C for
2 min (uracil DNA glycosylase activation) and then 95 1C
for 5 min (well factor collection), followed by 40 cycles for
95 1C for 30 s, 56 1C for 40 s and 72 1C for 40 s. Identical
conditions were used for streptococci and enterobacteria,
except that the annealing temperature was 60 1C. The
amplifications were performed on an iCycler iQ Real-Time
PCR detection system (BioRad), with the data collection set at
the annealing/extension step. Standard curves were generated
using serial dilutions of the purified and quantified (Pico-
Green, Molecular Probes) PCR product generated by standard
PCR using appropriate primers and genomic DNA template
extracted from pig intestinal contents (Dumonceaux et al.,
2006). The detection limit was 102 copy numbers g�1 digesta.
Melting curves were checked after amplification in order to
assure correct amplification results. Results are reported as
16S rRNA gene copy number g�1 digesta.
Statistical analysis
The DGGE images were analysed using BIONUMERICS 5.0
(Applied Maths, St-Martens-Latem, Belgium). Based on the
densitometric curves of each lane, the patterns were normal-
ized, adjusting the distance between bands where marker
lanes were used as reference lanes, and using automatic band
detection with manual correction. Bands with an area of
Z1% of the total area were retained for subsequent analysis.
Similarity between lanes (samples) was detected using the
Dice correlation coefficient based on the presence/absence of
bands. The diversity of bands in individual lanes (single
animal/lane) was calculated applying the Shannon index
(H0) (Janczyk et al., 2007).
The dietary effects on the number of bands, Shannon
index and Dice similarity values calculated from DGGE
fingerprints were determined by one-way ANOVA, followed
by the least significant difference test using SPSS (SPSS Inc.,
Chicago). Analysis of the mean differences between bacterial
16S rRNA gene copy numbers was similar, except that the
Spjotvoll–Stoline test (Spjotvoll & Stoline, 1973) was used as
a nonparametric post hoc test because some microbial
groups could not be detected in all ileum samples. Generally,
differences at Po 0.05 were considered significant.
Results
Throughout the study, all animals were in good condition
and no incidence of diarrhoea or other disease symptoms
FEMS Microbiol Ecol 66 (2008) 556–566 Journal compilation c� 2008 Federation of European Microbiological SocietiesPublished by Blackwell Publishing Ltd. No claim to original Canadian government works
559Barley and oat cultivars and intestinal microbiota in pigs
were observed. There were no significant differences in daily
weight gain and body weight at the end of the study.
The mixed-linked b-glucan content of the barley varieties
used in the present study ranged from 34 to 84 g kg�1 and
from 29 to 40 g kg�1 in the oat. The hulled barley, hulless
barley breeding line SB 90300 and hulless variety CDC
McGwire and the two oat varieties used in this study had a
normal starch composition with a 75% amylopectin/25%
amylose (approximate values) ratio, whereas CDC Fibar was
a hulless ‘waxy’ starch barley with 100% amylopectin and
the hulless breeding line SB94893 had a 60% amylopectin/
40% amylose ratio. The addition of the BBG concentrate
increased the mixed-linked b-glucan content in diets 2 and 3
from 24 to 40 and 53 g kg�1, respectively.
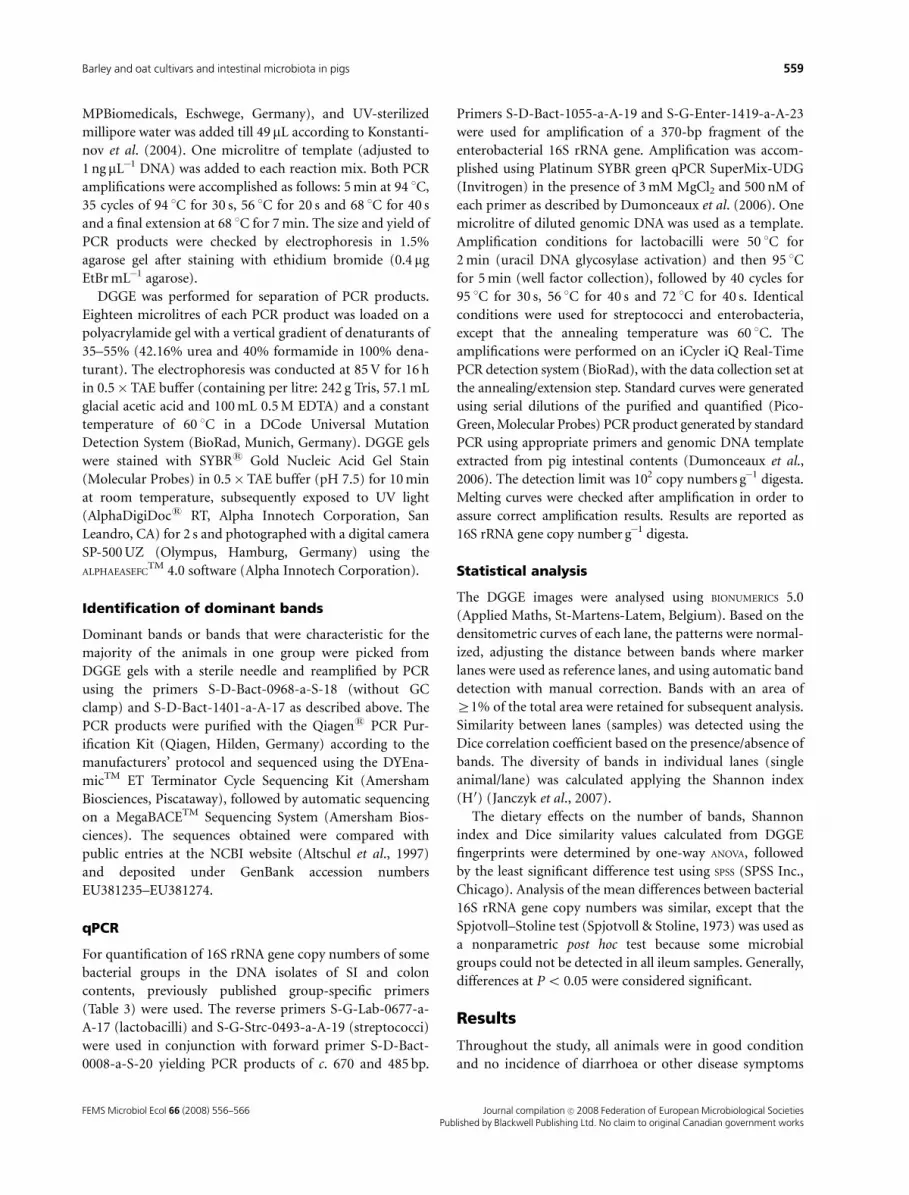
To study the effect of varietal differences in the carbohy-
drate composition of hulled and hulless barleys and oat on
the gastrointestinal microbiota in piglets, PCR-DGGE fin-
gerprinting of the V6-V8 regions of the 16S rRNA genes was
used. The DGGE profiles of ileum (not shown) and colon
(Fig. 1) samples revealed obvious shifts in the community
composition and apparent abundance of species as indicated
by band position and intensity. Further analysis of the
fingerprints revealed a lower number of bands and Shannon
diversity in the ileal contents of animals fed common barley
supplemented with the lowest level (8.2%) of BBG concen-
trate, hulless barley SB 94893 and CDC Baler oat, whereas
higher values were found with CDC McGwire hulless barley
as compared with the other cereals (Table 4). In the colon,
there was a decrease in the number of bands and Shannon
diversity with addition of BBG to common barley. Further,
significant (Po 0.05) decreases were observed in hulless
barleys with increasing mixed-linked b-glucan content as
compared with nonsupplemented common barley diets.
The lowest values for the band number and the Shannon
diversity index occurred for hulless barley with the highest
b-glucan content and waxy starch (CDC Fibar). The oat
varieties had intermediate values. No difference was ob-
served for the intragroup Dice similarity index for ileum
samples, except for the high-b-glucan CDC Sol-Fi oat
variety, which had a significantly higher value, and the diet
containing 16.3% BBG concentrate, which had the lowest
value. In contrast, in the colon, a decrease of intragroup
similarity was observed from common barley to hulless
varieties and breeding lines, and depending on the level of
b-glucans and starch composition. Diets with common
barley had the highest values, and diets containing either
8.2% or 16.3% of the BBG concentrate had similar values as
the nonsupplemented common barley, irrespective of the b-
glucan content. The oats again showed intermediate values.
To illustrate the differences between treatment groups, the
clustering of all colon samples, based on the inter- and
intragroup Dice coefficient of similarity, is shown in Fig. 2.
Profiles of piglets fed the common barley and the diet with
8.2% BBG concentrate formed one cluster, whereas the
profiles of the 16.3% BBG diet formed two clusters with SB
90300 hulless barley (low b-glucan content and normal
starch) and four oat profiles. The profiles from the other
oat-fed animals formed three smaller clusters. Interestingly,
all the samples from animals fed the CDC McGwire hulless
barley formed one separate cluster, although the b-glucan
content and starch composition were similar to the hulless
breeding line SB 90300. Most profiles from colon samples of
animals fed the hulless breeding line SB 94893 and the
hulless CDC Fibar barley (high b-glucan content) were
more similar to each other than to the other treatment
groups but generally showed the lowest similarity and
formed only small clusters.
The reamplification and identification of bands from
colon samples, which were characteristic for the majority of
the profiles within each diet, revealed a predominance of
Clostridium glycolicum, Mogibacterium diversum, Butyrivi-
brio fibrisolvens, Syntrophococcus sucromutans, Weissella
Fig. 1. DGGE evaluation of colon microbiota of piglets after feeding
common barley; two diets with common barley, supplemented with 82
or 163 g kg�1 isolated barley mixed-linked b-glucan; two oat varieties
(CDC Sol-Fi, CDC Baler) and hulless barley varieties (SB 90300, CDC
McWire, SB 94893, CDC Fibar) with increasing mixed-linked b-glucan
content. DGGE of PCR products of V6 to V8 regions of 16SrRNA gene
was performed on a 35–55% denaturant gradient. Each lane represents
the microbial profile of each piglet per group (eight animals, respec-
tively). M, marker lane. The arrows and numbers indicate excised and
reamplified bands for species identification (Table 5).
FEMS Microbiol Ecol 66 (2008) 556–566Journal compilation c� 2008 Federation of European Microbiological SocietiesPublished by Blackwell Publishing Ltd. No claim to original Canadian government works
560 R. Pieper et al.

confusae and Lactobacillus sobrius-like phylotypes in animals
fed the common barley, common barley supplemented with
BBG concentrate and the hulless barley SB 90300 (Fig. 1,
Table 5). Some of these phylotypes such as L. sobrius, B.
fibrisolvens were also detected with the other diets, whereas
others such as Escherichia coli, C. glycolicum and M. diver-
sum-like phylotypes were reduced in abundance as indicated
by the relative band intensity. On the other hand, in the
other hulless barley diets (CDC McGwire, SB 94893 and
CDC Fibar), Eubacterium uniforme-, Eubacterium cellulosol-
vens- and Clostridium xylanovorans-like phylotypes ap-
peared and represented the predominant bands, together
with sequences that could not be assigned to any typed
bacterium. In the DGGE fingerprints of animals fed the two
oat diets, Eubacterium ramulus, Ruminococcus bromii-, C.
glycolicum-, Mitsoukella jalaludinii- and Lactobacillus john-
sonii-like phylotypes represented the most dominant bands
(Table 5).
In the ileum fingerprints (figure not shown), C. glycoli-
cum, W. confusae and L. sobrius-like phylotypes were pre-
dominant independent of the diet. Interestingly, only in the
two hulless barley varieties with high mixed-linked b-glucan
content and altered starch composition (SB 94893 and CDC
Fibar) were some other dominant bacteria such as E.
cellulosolvens and Clostridium butyricum found. Moreover,
a Bifidobacterium pseudolongum-like phylotype was detected
in three animals fed CDC McGwire and in four animals fed
SB94893.
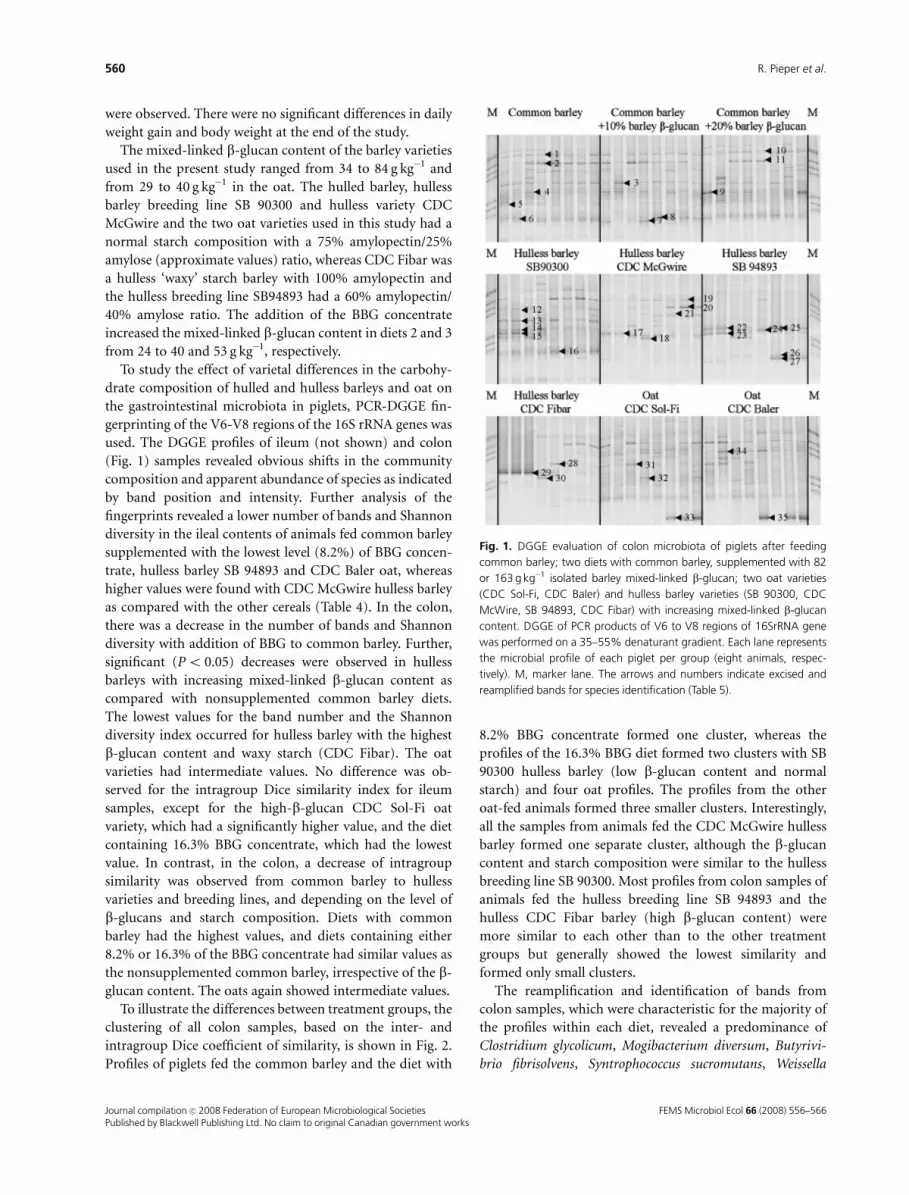
Furthermore, qPCR was used to obtain information
about 16S rRNA gene copy numbers in the genomic DNA
from ileum and colon samples. Results show lower numbers
of lactobacilli (Po 0.05) in the ileum of animals fed the SB
94893 and CDC Fibar varieties, as compared with the oat
diet (Table 6). The addition of either 8.2% or 16.3% BBG
concentrate increased the number of ileal lactobacilli
slightly, but not significantly. The abundance of these
microbial groups was not different in the colon samples.
Interestingly, no enterobacteria or streptococci could be
detected in the ileum of animals fed the high mixed-linked
b-glucan diets compared with occasional detection with
very low abundance in the other diets.
Discussion
Cereal grains such as barley and oat are interesting sources
of potential prebiotic carbohydrates, especially mixed-linked
b-glucan and resistant starch (Topping, 2007). Besides the
fact that these carbohydrate fractions are coming more to
the attention of human nutritionists due to their functional
properties, they have been neglected up to now in prebiotic
research for farm animals. In the present study, we therefore
used a PCR-DGGE approach to examine the potential
prebiotic effect of barley and oat b-glucans in weaned piglets
either as a ‘purified’ supplement or as it occurs naturally in
the grain in combination with other compounds. Here, we
showed that barley and oat varieties, differing in their
carbohydrate composition, namely mixed-linked b-glucan
content and starch structure, affect the gastrointestinal
microbial community composition significantly, as evi-
denced from analysis of DGGE banding patterns of both
ileal and colonic microbial communities. DGGE banding
pattern responses were most pronounced in the colon of
pigs fed the hulless varieties with a high b-glucan content
compared with common barley as a control diet. At this site
of the GIT and within the hulless barley varieties, microbial
diversity appeared to decline with increasing b-glucan
content, a trend also observed, to a lesser extent, when
common barley diets were supplemented with a mixed-
Table 4. Mean� SD number of bands, Shannon diversity and intragroup Dice similarity values calculated from DGGE fingerprints of ileum and colon
microbial communities
Diet #
1 2 3 4 5 6 7 8 9
HB HB1BBG HB1BBG hB hB hB hB oat oat
b-glucan
(g kg�1 DM) 24 40 53 30 42 65 84 32 23
Bands
Ileum 8.9� 2.5a 6.8� 2.6b 7.8� 1.8abc 8.6�2.6a 9.9� 2.5a 5.9� 1.8c 7.6� 2.1abc 8.3� 2.0ab 6.5�2.5bc
Colon 17.4� 1.9a 17.8� 2.4a 14.1� 2.6b 11.9�4.0b 11.3� 2.8b 8.3� 2.7c 5.8� 2.1c 13.4� 2.1b 12.1�3.0b
Shannon diversity
Ileum 0.73� 0.07ab 0.69� 0.15b 0.72� 0.10ab 0.73�0.11ab 0.80� 0.08a 0.54� 0.10c 0.68� 0.11b 0.66� 0.11b 0.64�0.10bc
Colon 1.15� 0.08a 1.12� 0.09a 1.02� 0.13b 0.91�0.15b 0.86� 0.11b 0.80� 0.13b 0.52� 0.27c 0.96� 0.11b 0.86�0.19b
Dice similarity
Ileum 43.4� 24.6bc 42.8� 14.2bc 34.9� 17.3c 43.0�23.8bc 53.4� 20.6b 38.8� 22.1bc 47.8� 12.0bc 69.6� 13.3a 52.8�20.0b
Colon 73.9� 5.4a 67.4� 5.8ab 67.2� 8.0ab 62.5�6.0b 61.6� 7.6b 49.5� 17.4c 49.0� 16.8c 61.9� 9.7b 58.0�8.4b
a,b,cSignificant (Po 0.05) differences within rows.
HB, common (hulled) barley; hB, hulless barley; BBG, barley mixed-linked b-glucan concentrate.
FEMS Microbiol Ecol 66 (2008) 556–566 Journal compilation c� 2008 Federation of European Microbiological SocietiesPublished by Blackwell Publishing Ltd. No claim to original Canadian government works
561Barley and oat cultivars and intestinal microbiota in pigs

linked b-glucan concentrate. Only a few significant differ-
ences were observed in ileal microbial profiles. Because the
high b-glucan-containing hulless barley varieties had either
a high amylose (diet 6) or amylopectin (diet 7) content,
these carbohydrates could also have contributed to the
diversity response. On the other hand, as shown by Dice
coefficient-based cluster analysis, the microbial profiles for
these varieties formed a common separate cluster sup-
porting a b-glucan-mediated, rather than starch-mediated,
response.
b-glucans and arabinoxylans are the predominant com-
ponents of cell walls of barleys and oats, respectively (Bach
Knudsen, 2001). Soluble nonstarch polysaccharides such as
mixed-linked b-glucans can increase the digesta reten-
tion time in the GIT and endogenous nitrogen excretion
(Leterme et al., 2000; Charalampopoulos et al., 2002),
thereby affecting the digestibility of other nutrients such as
protein and starch and increasing their flow to the large
intestine. Increased viscosity in turn could positively affect
the growth of bacteria in the upper GIT. However, we
observed significantly lower numbers of lactobacilli and no
streptococci and enterobacteria in the small intestine of
piglets fed the high mixed-linked b-glucan diets. The reasons
Table 5. Affiliation of partial 16S rRNA (V6–V8 region) gene sequences
obtained from excised bands of DGGE fingerprints with their closest
relatives in GenBank
Band # Closest cultured relative (GenBank accession #) ID %
1, 2, 10, 11,
19, 20
Clostridium glycolicum 99
3, 13, 28 Mogibacterium diversum 96
4, 9 Escherichia coli 99
5 Weissella confusae 99
6, 8, 16, 26 Lactobacillus sobrius 99
7, 27 Clostridium xylanovorans 91
12, 21 Uncultured butyrate-producing bacterium� 99
14, 17 Butyrivibrio fibrisolvens 97
15 Syntrophocoocus sucromutans 92
18 Uncultured butyrate-producing bacterium� 99
22, 23, 24, 30 Eubacterium cellulosolvens 93
23 Eubacterium uniforme 87
25, 29 Uncultured butyrate-producing bacterium� 99
31 Eubacterium ramulus 93
32 Mitsoukella jalaludinii 98
33, 35 Lactobacillus johnsonii 99
34 Ruminococcus bromii 87
�No sequence from cultivated bacterial species available in GenBank.
Fig. 2. Cluster analysis of DGGE banding patterns of universal microbial
profiles in the colon of piglets fed diets containing common barley &,
two diets with common barley, supplemented with 82 or 163 g kg�1
isolated barley mixed-linked b-glucan ( , ); two oat varieties (CDC
Sol-Fi, CDC Baler, ’) and hulless barley varieties with low/normal (SB
90300, CDC McWire, ) and high (SB 94893, CDC Fibar, ) mixed-
linked b-glucan content. The cluster was generated using the un-
weighted pair group method with an averaging algorithm based on the
Dice coefficient of similarity. The scale bar indicates the percentage of
similarity. Error flags are shown on each node.
FEMS Microbiol Ecol 66 (2008) 556–566Journal compilation c� 2008 Federation of European Microbiological SocietiesPublished by Blackwell Publishing Ltd. No claim to original Canadian government works
562 R. Pieper et al.
for this effect are not clear. We did not observe inhibitory
effects of b-glucans on DNA extraction efficiency. Although
the genomic DNA was diluted to 1 ng mL�1, we cannot
exclude the inhibitory effects of b-glucans on the PCR
efficiency. Although speculative at this point, it might be
possible that other bacteria such as enterococci were fa-
voured in the high mixed-linked b-glucan diets because
some strains display b-glucanase activity (Beckmann et al.,
2006). In the colon, we observed a decrease in diversity
(Po 0.05) with cereals high in mixed-linked b-glucan. This
suggests favouring of only a few bacterial phylotypes that are
able to use b-glucans as a substrate, thereby outcompeting
other bacteria.
On the other hand, the inclusion of a mixed-linked
b-glucan as a purified supplement did not decrease the
microbial diversity in the same way and, in turn, slightly
increased the number of ileal lactobacilli, which confirms
previous findings in the rat (Snart et al., 2006). Therefore,
not only the content of mixed-linked b-glucan in the diet
but also the physical form and possible interactions with
other nutrients in the matrix of the grain (i.e. starch and
proteins) seem to be an important factor influencing the
intestinal microbiota. However, animal-related factors such
as the gastric emptying rate or altered production of bile
acids can also play an important role.
Despite some well-known limitations of 16S rRNA gene-
based DGGE in microbial ecology (Muyzer & Smalla, 1998),
the method has been introduced and used successfully to
study the general or taxonomic group-specific alterations of
microbial communities in the porcine GIT during the
weaning period or after dietary interventions (Konstantinov
et al., 2006a; Janczyk et al., 2007). One limitation to consider
is the heterogeneity of rrn operon copy number and
sequence among bacterial species (Klappenbach et al., 2000;
Makarova & Koonin, 2007) that could lead to the misinter-
pretation of DGGE fingerprints because one bacterial spe-
cies could produce more than one single band in the
banding pattern (Crosby & Criddle, 2003). In our study,
this was particularly true for C. glycolicum, which yielded
two dominant bands. On the other hand, species with near-
identical sequences can migrate to the same position, which
would lead to an underestimation of species diversity
(Simpson et al., 1999). Recognizing these limitations, we
excised and sequenced DNA from bands of each group to
determine the identity of bacterial species associated with
common and unique bands among cereals.
Up to now, only little information exists about the effect
of cereal b-glucans on specific microorganisms that inhabit
the GIT. Of specific interest in the concept of prebiotics is
their potential to promote the growth of beneficial bacteria
such as bifidobacteria and lactobacilli or to enhance the
large intestinal production of microbial metabolites such as
n-butyrate (Louis et al., 2007). It has been shown that
bifidobacteria and lactobacilli can utilize isolated cereal b-
glucans depending on the degree of polymerization (Jonsson
& Hemmingsson, 1991). Recently, it has been shown that
b-glucans and resistant starch can enhance faecal numbers
of lactobacilli and decrease coliforms (Bird et al., 2007).
Furthermore, the supplementation of high-viscosity barley
b-glucans to a casein-based diet favoured the growth of
lactobacilli in the caecum of rats (Snart et al., 2006). In the
present study, we detected an L. sobrius-like phylotype,
which was described recently as an abundant resident of the
porcine GIT (Konstantinov et al., 2006b). DGGE bands
associated with L. sobrius were found in nearly all ileum
samples but only in the colon of piglets fed the common
barley diet, one diet containing hulless barley with normal
mixed-linked b-glucan content and the two oat diets. We
Table 6. Mean� SD copy numbers (log copies g�1 digesta) of 16S rRNA gene of microbial groups in ileum and colon genomic DNA
Diet #
1 2 3 4 5 6 7 8 9
HB HB1BBG HB1BBG hB hB hB hB Oat Oat
b-Glucan
(g kg�1 DM)
24 40 53 30 42 65 84 32 23
Lactobacilli
Ileum 5.3� 1.2ab 6.1� 0.7ab 6.0�0.7ab 5.9�0.7ab 5.3�1.2ab 4.9� 1.1a 4.6� 1.2a 6.5� 0.3b 6.5� 0.8b
Colon 7.2� 0.2a 7.3� 0.5a 7.1�0.5a 7.1�0.5a 6.9�0.4a 7.0� 0.4a 6.9� 0.5a 7.4� 0.4a 7.1� 0.5
Streptococci
Ileum 2.9� 1.2 (4)a 2.2� 1.1 (3)a 2.4�0.5 (4)a 2.4 (1)a 2.5�0.8 (4)a ND ND 2.2� 0.7a 2.5� 0.8 (6)a
Colon 8.0� 0.6a 7.8� 0.6a 7.8�0.4a 7.7�0.5a 7.7�0.2a 7.6� 0.3a 7.6� 0.5a 7.9� 0.2a 7.8� 0.3a
Enterobacteria
Ileum 3.6� 1.3 (4)a 2.4� 0.5 (3)a 2.8�1.1 (4)a 2.6 (1)a 3.0�1.1 (4)a ND ND 4.3� 0.5a 3.8� 1.4 (6)a
Colon 2.7� 1.1a 2.7� 0.6a 2.7�0.9a 2.5�0.4a 2.6�0.8a 3.3� 1.0a 2.7� 0.8a 3.6� 1.1a 2.9� 1.4a
Numbers in parentheses indicate the number of colonized piglets.a,b,cSignificant (Po 0.05) differences.
HB, common (hulled) barley; hB, hulless barley; BBG, barley mixed-linked b-glucan concentrate; ND, not detected.
FEMS Microbiol Ecol 66 (2008) 556–566 Journal compilation c� 2008 Federation of European Microbiological SocietiesPublished by Blackwell Publishing Ltd. No claim to original Canadian government works
563Barley and oat cultivars and intestinal microbiota in pigs
also detected a B. pseudolongum-like phylotype in the ileum
of piglets fed the hulless breeding line SB 94893 and the
waxy starch hulless variety CDC Fibar. Although bifidobac-
teria play only a minor role in the GIT of pigs (Leser et al.,
2002), this species has been found in the caecum of adult
pigs (Simpson et al., 2003). Bifidobacteria and lactobacilli
are assumed to exert antimicrobial activities that participate
in the host’s gastrointestinal defence system (Servin, 2004).
Although a lower 16S rRNA gene copy number for lactoba-
cilli was detected in the ileum of piglets fed the hulless high-
b-glucan barleys, enterobacteria or streptococci were con-
sistently below detection limits in the ileum of these
animals. This might be of specific importance, especially in
young and susceptible animals such as weaning piglets, and
is of specific interest in the postantibiotic era.
Nucleotide sequences associated with DGGE bands sug-
gested that diets containing SB 94893 and CDC Fibar barleys
also promoted the growth of E. uniforme-, E. cellulosolvens-,
B. fibrisolvens- and C. xylanovorans-like phylotypes, which
were previously identified as dominant xylan- and arabi-
noxylan-degrading species inhabiting the rumen of herbi-
vores (Hespell & Cotta, 1995; Yoda et al., 2005). It should be
noted here that the sequence similarity of DGGE bands
varied between 87% and 99% identities with cultured
relatives, indicating that they might also represent novel
phylotypes with yet unknown metabolic properties. How-
ever, it is well known that fibrous diets can promote the
growth of cellulolytic bacteria in the GIT of pigs (Varel &
Yen, 1997). The xylan-degrading species identified here
could reflect a higher xylan and/or arabinoxylan content in
these varieties (not measured). Alternatively, these species
may also be capable of degrading b-glucans and thus
supported by the higher mixed-linked b-glucan content.
The species, identified here on the basis of their partial 16S
rRNA gene sequence, seem to belong to the Clostridium
coccoides–Eubacterium rectale cluster XIVa, which includes
many species that produce n-butyrate (Barcenilla et al.,
2000; Pryde et al., 2002). This might be of specific interest
because n-butyrate is used as the primary energy source by
the colonocytes and reduces the risk of human colon cancer
(Wong & Jenkins, 2007).
Little is known about other species such as C. glycolicum,
M. diversum and S. sucromutans that were identified in
profiles of animals fed common barley and the Sb 90300
and CDC McGwire hulless barleys. Clostridium glycolicum-
like sequences formed a dominant band in almost all ileum
profiles and most colon samples. Because species were
identified only based on partial 16S rRNA gene similarities,
they might also represent novel phylotypes. For example,
C. glycolicum has not yet been described to inhabit the
porcine intestinal tract. Attempts to obtain more insight
into the role of C. glycolicum in the porcine intestinal tract
are currently underway in our institute.
Conclusion
In the present study, we used a DGGE approach to evaluate
the effect of barley and oat varieties and breeding lines,
mainly differing in the mixed-linked b-glucan content and
starch composition, on the gastrointestinal microbial com-
munities. By analysis of banding patterns and species
identification, we could clearly show a varietal-dependent
response of microbiota, especially in the colon. Increased
levels of b-glucans and altered amylopectin/amylose ratios
in the diet seemed to selectively favour butyrate-producing
bacteria, possibly capable of degrading complex carbohy-
drates, which would have beneficial effects on the host.
Furthermore, other beneficial microorganisms such as bifi-
dobacteria and lactobacilli were influenced by the choice of
cereal variety. However, the exact effect of each carbohydrate
fraction still remains to be assessed and will be addressed in
future studies. Taken together, our results provide a first
comprehensive view of the interaction between varietal
differences in barleys and oats and the porcine gastrointest-
inal microbiota, thus providing further information for
future feeding strategies.
Acknowledgements
We thank the National Pork Board, Des Moines, IA, USA
(project # 06-117) and the Alberta Barley Commission,
Edmonton, AB, Canada (project # 60-192) for funding of
the study. The continuing core support of the Prairie Swine
Centre received from Sask Pork, Manitoba Pork Council,
Alberta Pork and the Saskatchewan Agriculture Develop-
ment Fund is gratefully acknowledged. We also thank
‘Parrheim Foods’, SK, Canada, for the supply of the barley
b-glucan concentrate and for financial support. R.P. was
funded by a Kurzzeitstipendium fuer Doktoranden’ from
Deutscher Akademischer Austauschdienst (DAAD), Ger-
many. We are grateful to the technical staff of the Prairie
Swine Centre Inc. and the Department of Animal and
Poultry Science at the University of Saskatchewan for their
assistance. We also thank Niels Burzan for his excellent
technical support at the Research Institute of Farm Animal
Sciences (FBN), Germany.
References
Altschul SF, Madden TL, Schaffer AA, Zhang J, Zhang Z, Miller W
& Lipman DJ (1997) Gapped BLAST and PSI-BLAST: a new
generation of protein database search programs. Nucleic Acids
Res 25: 3389–3402.
Bach Knudsen KE (2001) The nutritional significance of ‘‘dietary
fibre’’ analysis. Anim Feed Sci Tech 90: 3–20.
Bach Knudsen KE & Hansen I (1991) Gastrointestinal
implications in pigs of wheat and oat fractions. 1. Digestibility
FEMS Microbiol Ecol 66 (2008) 556–566Journal compilation c� 2008 Federation of European Microbiological SocietiesPublished by Blackwell Publishing Ltd. No claim to original Canadian government works
564 R. Pieper et al.
and bulking properties of polysaccharides and other major
constituents. Brit J Nutr 65: 217–232.
Barcenilla A, Pryde SE, Martin JC, Duncan SH, Stewart CS,
Henderson C & Flint HJ (2000) Phylogenetic relationships of
butyrate-producing bacteria from the human gut. Appl
Environ Microb 66: 1654–1661.
Beckmann L, Simon O & Vahjen W (2006) Isolation and
identification of mixed-linked beta-glucan degrading bacteria
in the intestine of broiler chickens and partial characterization
of respective 1,3-1,4-beta -glucanase activities. J Basic Microb
46: 175–185.
Berg RD (1996) The indigenous gastrointestinal microflora.
Trends Microbiol 4: 430–435.
Bird AR, Vuaran M, Brown I & Topping IL (2007) Two high-
amylose maize starches with different amounts of resistant
starch vary in their effects on fermentation, tissue and digesta
mass accretion, and bacterial populations in the large bowel of
pigs. Brit J Nutr 97: 134–144.
Brennan CS & Cleary LJ (2005) The potential use of cereal
(1–4 3,1–4 4)-[beta]-D-glucans as functional food
ingredients. J Cereal Sci 42: 1–13.
Canadian Council on Animal Care (1993) Guide to the Care and
Use of Experimental Animals, Vol. 1, 2nd edn. CCAC, Ottawa,
ON.
Castillo M, Martin-Orue SM, Manzanilla EG, Badiola I, Martin
M & Gasa J (2006) Quantification of total bacteria,
enterobacteria and lactobacilli populations in pig digesta by
real-time PCR. Vet Microbiol 114: 165–170.
Charalampopoulos D, Wang R, Pandiella SS & Webb C (2002)
Application of cereals and cereal components in functional
foods: a review. Int J Food Microbiol 79: 131–141.
Chowdhury SR, King DE, Willing BP et al. (2007) Transcriptome
profiling of the small intestinal epithelium in germfree versus
conventional piglets. BMC Genomics 8: 215.
Crosby LD & Criddle CS (2003) Understanding bias in microbial
community analysis techniques due to rrn operon copy
number heterogeneity. Biotechniques 34: 790–802.
Danielsen M, Hornshoj H, Siggers RH, Jensen BB, Van Kessel AG
& Bendixen E (2007) Effects of bacterial colonization on the
porcine intestinal proteome. J Proteome Res 6: 2596–2604.
Dumonceaux TJ, Hill JE, Briggs SA, Amoako KK, Hemmingsen
SM & Van Kessel AG (2006) Enumeration of specific bacterial
populations in complex intestinal communities using
quantitative PCR based on the chaperonin-60 target. J
Microbiol Meth 64: 46–62.
Fox GP, Osborne B, Bowman B, Kelly A, Cakir M, Poulsen D,
Inkerman A & Henry R (2007) Measurement of genetic and
environmental variation in barley (Hordeum vulgare) grain
hardness. J Cereal Sci 46: 82–92.
Franks AH, Harmsen HJ, Raangs GC, Jansen GJ, Schut F &
Welling GW (1998) Variations of bacterial populations in
human feces measured by fluorescent in situ hybridization
with group-specific 16S rRNA-targeted oligonucleotide
probes. Appl Environ Microb 64: 3336–3345.
Gamlath J, Aldred GP & Panozzo JF (2008) Barley (1–4 3;
1–4 4)-[beta]-glucan and arabinoxylan content are related to
kernel hardness and water uptake. J Cereal Sci 47: 365–371.
Heilig HGHJ, Zoetendal EG, Vaughan EE, Marteau P, Akkermans
ADL & de Vos WM (2002) Molecular Diversity of Lactobacillus
spp. and other lactic acid bacteria in the human intestine as
determined by specific amplification of 16S ribosomal DNA.
Appl Environ Microb 68: 114–123.
Hespell RB & Cotta MA (1995) Degradation and utilization by
Butyrivibrio fibrisolvens H17c of xylans with different chemical
and physical properties. Appl Environ Microb 61: 3042–3050.
Hill JE, Seipp RP, Betts M, Hawkins L, Van Kessel AG, Crosby WL
& Hemmingsen SM (2002) Extensive profiling of a complex
microbial community by high-throughput sequencing. Appl
Environ Microb 68: 3055–3066.
Hill JE, Hemmingsen SM, Goldade BG, Dumonceaux TJ, Klassen
J, Zijlstra RT, Goh SH & Van Kessel AG (2005) Comparison of
ileum microflora of pigs fed corn-, wheat-, or barley-based
diets by chaperonin-60 sequencing and quantitative PCR. Appl
Environ Microb 71: 867–875.
Isolauri E, Sutas Y, Kankaanpaa P, Arvilommi H & Salminen S
(2001) Probiotics: effects on immunity. Am J Clin Nutr 73:
444s–450s.
Janczyk P, Pieper R, Smidt H & Souffrant WB (2007) Changes in
the diversity of pig ileal lactobacilli around weaning
determined by means of 16S rRNA gene amplification and
denaturing gradient gel electrophoresis. FEMS Microbiol Ecol
61: 132–140.
Jonsson E & Hemmingsson S (1991) Establishment in the piglet
gut of lactobacilli capable of degrading mixed-linked b-
glucans. J Appl Bacteriol 70: 512–516.
Klappenbach JA, Dunbar JM & Schmidt TM (2000) rRNA
operon copy number reflects ecological strategies of bacteria.
Appl Environ Microb 66: 1328–1333.
Konstantinov SR, Awati A, Smidt H, Williams BA, Akkermans
ADL & de Vos WM (2004) Specific response of a novel and
abundant Lactobacillus amylovorus-like phylotype to dietary
prebiotics in the guts of weaning piglets. Appl Environ Microb
70: 3821–3830.
Konstantinov SR, Awati AA, Williams BA, Miller BG, Jones P,
Stokes CR, Akkermans ADL, Smidt H & de Vos WM (2006a)
Post-natal development of the porcine microbiota
composition and activities. Environ Microbiol 8: 1191–1199.
Konstantinov SR, Poznanski E, Fuentes S, Akkermans ADL,
Smidt H & de Vos WM (2006b) Lactobacillus sobrius sp. nov.,
abundant in the intestine of weaning piglets. Int J Syst Evol
Micr 56: 29–32.
Leser TD, Amenuvor JZ, Jensen TK, Lindecrona RH, Boye M &
Moller K (2002) Culture-independent analysis of gut bacteria:
the pig gastrointestinal tract microbiota revisited. Appl Environ
Microb 68: 673–690.
Leterme P, Souffrant WB & Thewis A (2000) Effect of barley fibres
and barley intake on the ileal endogenous nitrogen losses in
piglets. J Cereal Sci 31: 229–239.
FEMS Microbiol Ecol 66 (2008) 556–566 Journal compilation c� 2008 Federation of European Microbiological SocietiesPublished by Blackwell Publishing Ltd. No claim to original Canadian government works
565Barley and oat cultivars and intestinal microbiota in pigs

Louis P, Scott KP, Duncan SH & Flint HJ (2007) Understanding
the effects of diet on bacterial metabolism in the large
intestine. J Appl Microbiol 102: 1197–1208.
Makarova KS & Koonin EV (2007) Evolutionary genomics of
lactic acid bacteria. J Bacteriol 189: 1199–1208.
Muyzer G & Smalla K (1998) Application of denaturing gradient
gel electrophoresis (DGGE) and temperature gradient gel
electrophoresis (TGGE) in microbial ecology. Antonie Van
Leeuwenhoek 73: 127–141.
Nubel U, Engelen B, Felske A, Snaidr J, Wieshuber A, Amann RI,
Ludwig W & Backhaus HH (1996) Sequence heterogeneities of
genes encoding 16S rRNAs in Paenibacillus polymyxa detected
by temperature gradient gel electrophoresis. J Bacteriol 178:
5636–5643.
Pieper R, Janczyk P, Zeyner A, Smidt H, Guiard V & Souffrant
WB (2008) Ecophysiology of the total and Lactobacillus
communities in the terminal small intestine of weaning
piglets. Microbial Ecology 56: 474–483.
Pryde SE, Duncan SH, Hold GL, Stewart CS & Flint HJ (2002)
The microbiology of butyrate formation in the human colon.
FEMS Microbiol Lett 217: 133–139.
Servin AL (2004) Antagonistic activities of lactobacilli and
bifidobacteria against microbial pathogens. FEMS Microbiol
Rev 28: 405–440.
Simpson JM, McCracken VJ, White BA, Gaskins HR & Mackie RI
(1999) Application of denaturant gradient gel electrophoresis
for the analysis of the porcine gastrointestinal microbiota.
J Microbiol Meth 36: 167–179.
Simpson PJ, Stanton C, Fitzgerald GF & Ross RP (2003) Genomic
diversity and relatedness of bifidobacteria isolated from a
porcine cecum. J Bacteriol 185: 2571–2581.
Snart J, Bibiloni R, Grayson T et al. (2006) Supplementation of
the diet with high-viscosity beta-glucan results in enrichment
for lactobacilli in the rat cecum. Appl Environ Microb 72:
1925–1931.
Spjotvoll E & Stoline MR (1973) An extension of the T-method of
multiple comparison to include the cases with unequal sample
sizes. J Am Stat Assoc 68: 975–978.
Topping D (2007) Cereal complex carbohydrates and their
contribution to human health. J Cereal Sci 46: 220–229.
Varel VH & Yen JT (1997) Microbial perspective on fiber
utilization by swine. J Anim Sci 75: 2715–2722.
Verstegen MW & Williams BA (2002) Alternatives to the use of
antibiotics as growth promoters for monogastric animals.
Anim Biotechnol 13: 113–127.
Willing BP & Van Kessel AG (2007) Enterocyte proliferation and
apoptosis in the caudal small intestine is influenced by the
composition of colonizing commensal bacteria in the neonatal
gnotobiotic pig. J Anim Sci 85: 3256–3266.
Wong JM & Jenkins DJ (2007) Carbohydrate digestibility and
metabolic effects. J Nutr 137: 2539S–2546S.
Wood PJ (2007) Cereal [beta]-glucans in diet and health. J Cereal
Sci 46: 230–238.
Yoda K, Toyoda A, Mukoyama Y, Nakamura Y & Minato H
(2005) Cloning, sequencing, and expression of a Eubacterium
cellulosolvens 5 gene encoding an endoglucanase (Cel5A) with
novel carbohydrate-binding modules, and properties of Cel5A.
Appl Environ Microb 71: 5787–5793.
FEMS Microbiol Ecol 66 (2008) 556–566Journal compilation c� 2008 Federation of European Microbiological SocietiesPublished by Blackwell Publishing Ltd. No claim to original Canadian government works
566 R. Pieper et al.