
Myocardial perfusion distribution and coronary arterial pressure and flow signals: clinical...
18
1 23 Medical & Biological Engineering & Computing ISSN 0140-0118 Med Biol Eng Comput DOI 10.1007/s11517-013-1088-8 Myocardial perfusion distribution and coronary arterial pressure and flow signals: clinical relevance in relation to multiscale modeling, a review Froukje Nolte, Eoin R. Hyde, Cristina Rolandi, Jack Lee, Pepijn van Horssen, Kal Asrress, Jeroen P. H. M. van den Wijngaard, et al.
-
Upload
academicmedicalcentreuniversiteitvanamsterdam -
Category
Documents
-
view
0 -
download
0
Transcript of Myocardial perfusion distribution and coronary arterial pressure and flow signals: clinical...
1 23
Medical & Biological Engineering &Computing ISSN 0140-0118 Med Biol Eng ComputDOI 10.1007/s11517-013-1088-8
Myocardial perfusion distribution andcoronary arterial pressure and flow signals:clinical relevance in relation to multiscalemodeling, a review
Froukje Nolte, Eoin R. Hyde, CristinaRolandi, Jack Lee, Pepijn van Horssen,Kal Asrress, Jeroen P. H. M. van denWijngaard, et al.

1 23
Your article is protected by copyright and all
rights are held exclusively by International
Federation for Medical and Biological
Engineering. This e-offprint is for personal
use only and shall not be self-archived in
electronic repositories. If you wish to self-
archive your article, please use the accepted
manuscript version for posting on your own
website. You may further deposit the accepted
manuscript version in any repository,
provided it is only made publicly available 12
months after official publication or later and
provided acknowledgement is given to the
original source of publication and a link is
inserted to the published article on Springer's
website. The link must be accompanied by
the following text: "The final publication is
available at link.springer.com”.

SPECIAL ISSUE - REVIEW
Myocardial perfusion distribution and coronary arterial pressureand flow signals: clinical relevance in relation to multiscalemodeling, a review
Froukje Nolte • Eoin R. Hyde • Cristina Rolandi • Jack Lee • Pepijn van Horssen •
Kal Asrress • Jeroen P. H. M. van den Wijngaard • Andrew N. Cookson •
Tim van de Hoef • Radomir Chabiniok • Reza Razavi • Christian Michler •
Gilion L. T. F. Hautvast • Jan J. Piek • Marcel Breeuwer • Maria Siebes •
Eike Nagel • Nic P. Smith • Jos A. E. Spaan
Received: 13 February 2013 / Accepted: 11 May 2013
� International Federation for Medical and Biological Engineering 2013
Abstract Coronary artery disease, CAD, is associated
with both narrowing of the epicardial coronary arteries and
microvascular disease, thereby limiting coronary flow and
myocardial perfusion. CAD accounts for almost 2 million
deaths within the European Union on an annual basis. In
this paper, we review the physiological and pathophysio-
logical processes underlying clinical decision making in
coronary disease as well as the models for interpretation of
the underlying physiological mechanisms. Presently, clin-
ical decision making is based on non-invasive magnetic
resonance imaging, MRI, of myocardial perfusion and
invasive coronary hemodynamic measurements of coro-
nary pressure and Doppler flow velocity signals obtained
during catheterization. Within the euHeart project, several
innovations have been developed and applied to
improve diagnosis-based understanding of the underlying
biophysical processes. Specifically, MRI perfusion data
interpretation has been advanced by the gradientogram, a
novel graphical representation of the spatiotemporal myo-
cardial perfusion gradient. For hemodynamic data, func-
tional indices of coronary stenosis severity that do not
depend on maximal vasodilation are proposed and the
Valsalva maneuver for indicating the extravascular resis-
tance component of the coronary circulation has been
introduced. Complementary to these advances, model
innovation has been directed to the porous elastic model
coupled to a one-dimensional model of the epicardial
arteries. The importance of model development is related
to the integration of information from different modalities,
which in isolation often result in conflicting treatment
recommendations.
Keywords Multi scale modeling � Coronary disease �Coronary stenosis evaluation � Magnetic resonance
imaging � Perfusion distribution
F. Nolte � C. Rolandi � P. van Horssen �J. P. H. M. van den Wijngaard � T. van de Hoef � M. Siebes �J. A. E. Spaan (&)
Department of Biomedical Engineering and Physics, Academic
Medical Center, University of Amsterdam, Meibergdreef 9,
1105 AZ Amsterdam, The Netherlands
e-mail: [email protected]; [email protected]
E. R. Hyde � J. Lee � A. N. Cookson � R. Chabiniok �C. Michler � N. P. Smith
Imaging Sciences and Biomedical Engineering Division,
St Thomas’ Hospital, King’s College London,
London SE17EH, UK
K. Asrress � R. Razavi � E. Nagel
Division of Imaging Sciences, BHF Centre of Research
Excellence, The Rayne Institute, St. Thomas’ Hospital,
London, UK
T. van de Hoef � J. J. Piek
Department of Cardiology, Academic Medical Center,
University of Amsterdam, Amsterdam, The Netherlands
G. L. T. F. Hautvast � M. Breeuwer
Philips Research, Eindhoven, The Netherlands
G. L. T. F. Hautvast
Philips Healthcare, Imaging Systems, MR Clinical Science,
Best, The Netherlands
M. Breeuwer
Eindhoven University of Technology, Biomedical Engineering,
Biomedical Image Analysis, Eindhoven, The Netherlands
123
Med Biol Eng Comput
DOI 10.1007/s11517-013-1088-8
Author's personal copy
1 Introduction
Coronary artery disease, CAD, accounts for almost 2 mil-
lion deaths within the EU on an annual basis. It is associ-
ated with an annual mortality rate of 25 % once congestive
heart failure develops [65]. Cardiovascular disease often
leads to focal narrowing of epicardial arteries, limiting
coronary flow and myocardial perfusion. The resulting
myocardial ischemia is not only secondary to epicardial
disease, but also caused by alterations at the microvascular
level. In general, myocardial ischemia is not global, but
shows heterogeneity. Subendocardial layers are more vul-
nerable to ischemia than the subepicardial layers as a
consequence of the compression of the embedded vascu-
lature [12, 33, 34]. The structure of the coronary vascular
network seems to be designed to compensate for this
subendocardial impediment by a large volume of suben-
docardial resistance vessels [106]. This results in a layer-
specific distribution of resistance in the diastolic state [15,
26]. The impeding effect of contraction on microvascular
flow is the result of several mechanisms including local
tissue pressure and muscle stiffness [48, 94, 103], and this
effect is altered in the presence of an epicardial stenosis
[60]. Hence, myocardial perfusion in the presence of CAD
is complicated, and its analysis requires insight into
mechanisms determining perfusion at a local level, and its
translation into the morphology of coronary pressure and
flow signals.
The increase in computational power facilitates analyses
of large and diverse sets of biological data by means of
multiscale biophysical modeling of organ function [36, 66],
which generally encompasses the interaction of different
physics such as fluid dynamics and large-deformation
mechanics. Within the context of CAD, computer simula-
tions may help to understand the flow and perfusion
alterations secondary to atherosclerosis [52]. Moreover,
such models may find direct clinical application in diag-
nosis and treatment of patients with CAD by offering a
biophysical interpretation of perfusion distribution patterns
in relation to hemodynamic parameters derived from cor-
onary arterial pressure and flow signals. Within euHeart,
the CAD work package aimed at developing a compre-
hensive model of the coronary circulation starting from
detailed knowledge of the coronary arterial tree morphol-
ogy embedded in a mechanical model of the contracting
myocardium. Moreover, clinical data were obtained on
perfusion distribution by perfusion MRI, as well as on
coronary hemodynamics derived from epicardial pressure
and flow velocity signals.
This paper reviews the literature on the application of
perfusion models of the heart as well as physiological
knowledge in order to provide a comprehensive assessment
of the state of the art, especially in relation to clinical
applicability. However, it will start out with a description
of the pathophysiology of CAD and its treatment.
Throughout, specific results obtained within the euHeart
project are illustrated in order to underline the relevance of
specific models to clinical applicability.
2 Clinical and physiological background
Revascularization therapy of CAD started some 50 years
ago and its development has recently been described [30].
Initial treatment involved bypass surgery requiring the
opening of the thorax and use of a heart–lung machine. In
such a procedure, either an internal mammary artery or a
vein harvested from the leg was used to connect the cor-
onary artery distal of the stenosis to the aorta. Presently, the
treatment of choice is percutaneous coronary intervention
(PCI). In this scenario, a peripheral artery is made acces-
sible using an introduction sheath through which a guiding
catheter is introduced (lumen diameter varying between 5
and 7 Fr (1 Fr = 0.3 mm)) that is advanced to the ostium
of either the left or right coronary artery. A guide wire
(diameter *0.014 inch) with a flexible tip is advanced
through the guiding catheter and maneuvered distal to the
stenosis. The epicardial narrowing is, in general, treated by
pre-dilation using an expandable balloon followed by stent
placement. Special guide wires have been developed
equipped with a pressure and/or flow velocity sensor at its
tip to obtain intracoronary hemodynamic signals [82].
These signals allow an evaluation of the functional sig-
nificance of a stenosis in terms of pressure and flow
velocity alterations.
2.1 Coronary pressure and flow velocity signals
Flow velocity as measured by a Doppler crystal is the
maximal velocity detected by the Doppler signal in a cross
section of the vessel a few millimeters away the sensor
from which average velocity and eventually flow can be
calculated when vessel diameter is known [24]. However,
maximal flow velocity is used in clinical studies and in this
paper throughout. Because of the small diameter, the guide
wire has only an influence at narrow stenosis [98].
The intracoronary hemodynamic signals obtained from a
coronary artery before and after stent placement for the
same patient are demonstrated in Fig. 1.1 The signals after
stent placement, indicated as ‘‘POST’’ in the figure,
approximate a normal physiological condition and will be
discussed as such. The figure depicts the coronary flow
1 Data from patients presented in this paper were obtained from study
protocols approved by the Medical Ethics Committees of the AMC
and KCL, and all patients gave written informed consent.
Med Biol Eng Comput
123
Author's personal copy
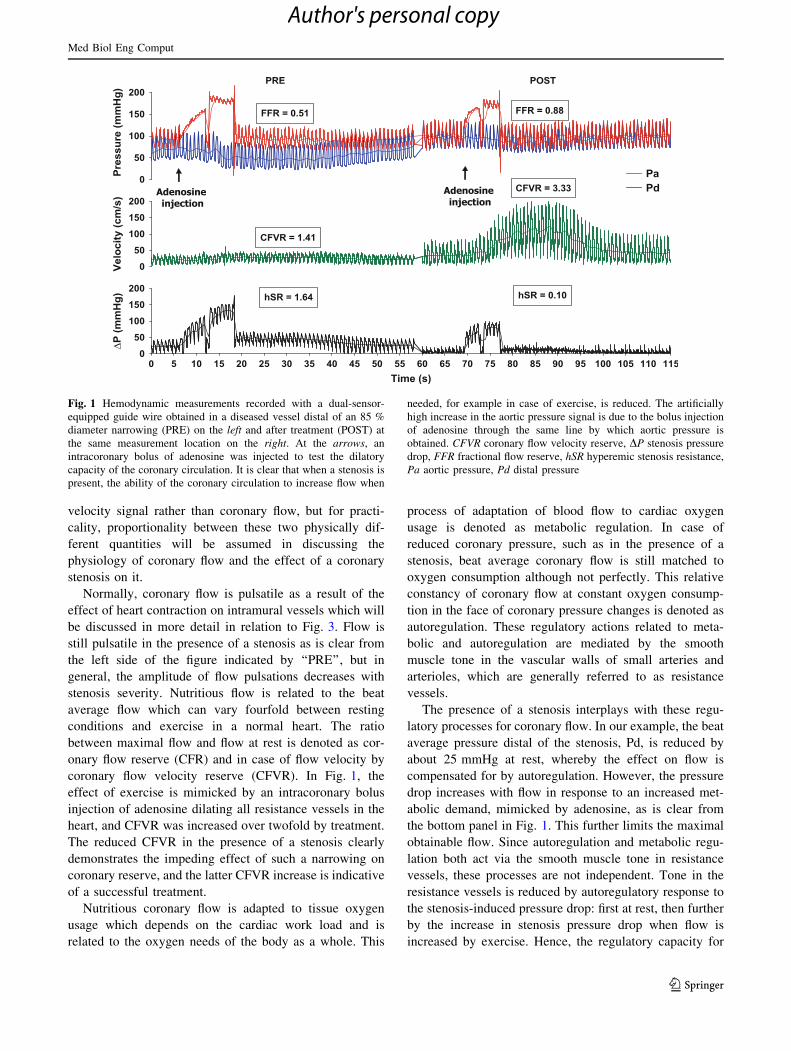
velocity signal rather than coronary flow, but for practi-
cality, proportionality between these two physically dif-
ferent quantities will be assumed in discussing the
physiology of coronary flow and the effect of a coronary
stenosis on it.
Normally, coronary flow is pulsatile as a result of the
effect of heart contraction on intramural vessels which will
be discussed in more detail in relation to Fig. 3. Flow is
still pulsatile in the presence of a stenosis as is clear from
the left side of the figure indicated by ‘‘PRE’’, but in
general, the amplitude of flow pulsations decreases with
stenosis severity. Nutritious flow is related to the beat
average flow which can vary fourfold between resting
conditions and exercise in a normal heart. The ratio
between maximal flow and flow at rest is denoted as cor-
onary flow reserve (CFR) and in case of flow velocity by
coronary flow velocity reserve (CFVR). In Fig. 1, the
effect of exercise is mimicked by an intracoronary bolus
injection of adenosine dilating all resistance vessels in the
heart, and CFVR was increased over twofold by treatment.
The reduced CFVR in the presence of a stenosis clearly
demonstrates the impeding effect of such a narrowing on
coronary reserve, and the latter CFVR increase is indicative
of a successful treatment.
Nutritious coronary flow is adapted to tissue oxygen
usage which depends on the cardiac work load and is
related to the oxygen needs of the body as a whole. This
process of adaptation of blood flow to cardiac oxygen
usage is denoted as metabolic regulation. In case of
reduced coronary pressure, such as in the presence of a
stenosis, beat average coronary flow is still matched to
oxygen consumption although not perfectly. This relative
constancy of coronary flow at constant oxygen consump-
tion in the face of coronary pressure changes is denoted as
autoregulation. These regulatory actions related to meta-
bolic and autoregulation are mediated by the smooth
muscle tone in the vascular walls of small arteries and
arterioles, which are generally referred to as resistance
vessels.
The presence of a stenosis interplays with these regu-
latory processes for coronary flow. In our example, the beat
average pressure distal of the stenosis, Pd, is reduced by
about 25 mmHg at rest, whereby the effect on flow is
compensated for by autoregulation. However, the pressure
drop increases with flow in response to an increased met-
abolic demand, mimicked by adenosine, as is clear from
the bottom panel in Fig. 1. This further limits the maximal
obtainable flow. Since autoregulation and metabolic regu-
lation both act via the smooth muscle tone in resistance
vessels, these processes are not independent. Tone in the
resistance vessels is reduced by autoregulatory response to
the stenosis-induced pressure drop: first at rest, then further
by the increase in stenosis pressure drop when flow is
increased by exercise. Hence, the regulatory capacity for
Fig. 1 Hemodynamic measurements recorded with a dual-sensor-
equipped guide wire obtained in a diseased vessel distal of an 85 %
diameter narrowing (PRE) on the left and after treatment (POST) at
the same measurement location on the right. At the arrows, an
intracoronary bolus of adenosine was injected to test the dilatory
capacity of the coronary circulation. It is clear that when a stenosis is
present, the ability of the coronary circulation to increase flow when
needed, for example in case of exercise, is reduced. The artificially
high increase in the aortic pressure signal is due to the bolus injection
of adenosine through the same line by which aortic pressure is
obtained. CFVR coronary flow velocity reserve, DP stenosis pressure
drop, FFR fractional flow reserve, hSR hyperemic stenosis resistance,
Pa aortic pressure, Pd distal pressure
Med Biol Eng Comput
123
Author's personal copy
metabolic regulation is reduced by the stenosis pressure
drop. When flow cannot meet the metabolic demand,
ischemia is induced.
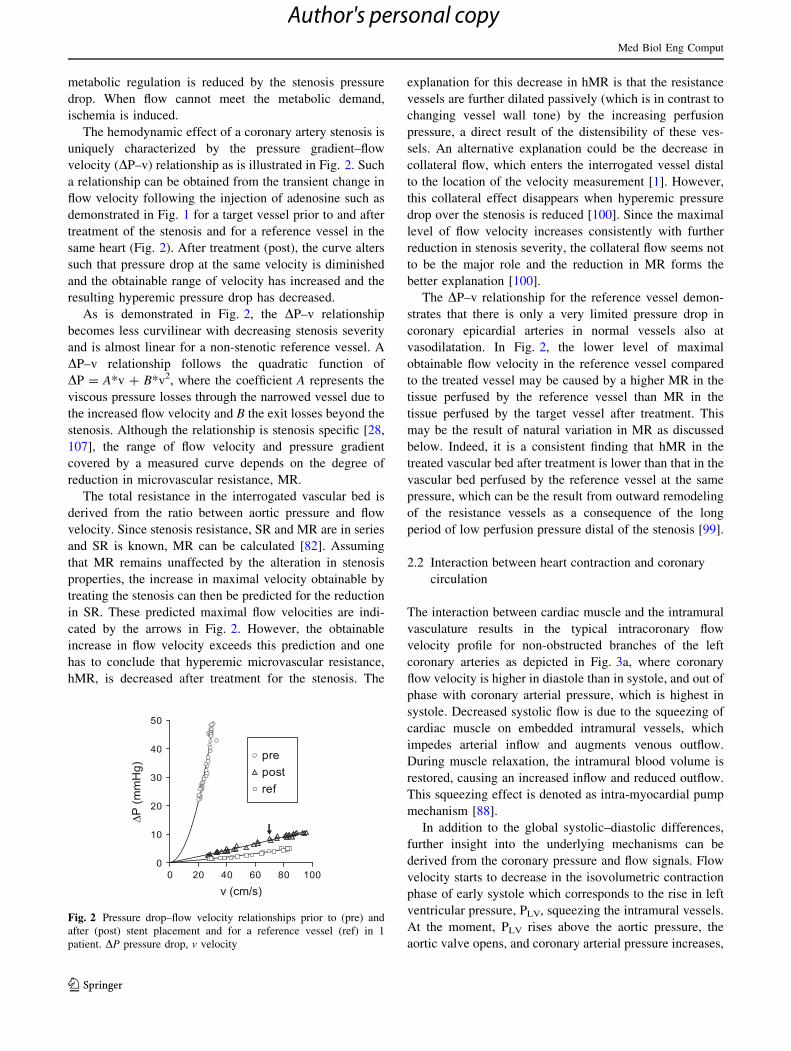
The hemodynamic effect of a coronary artery stenosis is
uniquely characterized by the pressure gradient–flow
velocity (DP–v) relationship as is illustrated in Fig. 2. Such
a relationship can be obtained from the transient change in
flow velocity following the injection of adenosine such as
demonstrated in Fig. 1 for a target vessel prior to and after
treatment of the stenosis and for a reference vessel in the
same heart (Fig. 2). After treatment (post), the curve alters
such that pressure drop at the same velocity is diminished
and the obtainable range of velocity has increased and the
resulting hyperemic pressure drop has decreased.
As is demonstrated in Fig. 2, the DP–v relationship
becomes less curvilinear with decreasing stenosis severity
and is almost linear for a non-stenotic reference vessel. A
DP–v relationship follows the quadratic function of
DP = A*v ? B*v2, where the coefficient A represents the
viscous pressure losses through the narrowed vessel due to
the increased flow velocity and B the exit losses beyond the
stenosis. Although the relationship is stenosis specific [28,
107], the range of flow velocity and pressure gradient
covered by a measured curve depends on the degree of
reduction in microvascular resistance, MR.
The total resistance in the interrogated vascular bed is
derived from the ratio between aortic pressure and flow
velocity. Since stenosis resistance, SR and MR are in series
and SR is known, MR can be calculated [82]. Assuming
that MR remains unaffected by the alteration in stenosis
properties, the increase in maximal velocity obtainable by
treating the stenosis can then be predicted for the reduction
in SR. These predicted maximal flow velocities are indi-
cated by the arrows in Fig. 2. However, the obtainable
increase in flow velocity exceeds this prediction and one
has to conclude that hyperemic microvascular resistance,
hMR, is decreased after treatment for the stenosis. The
explanation for this decrease in hMR is that the resistance
vessels are further dilated passively (which is in contrast to
changing vessel wall tone) by the increasing perfusion
pressure, a direct result of the distensibility of these ves-
sels. An alternative explanation could be the decrease in
collateral flow, which enters the interrogated vessel distal
to the location of the velocity measurement [1]. However,
this collateral effect disappears when hyperemic pressure
drop over the stenosis is reduced [100]. Since the maximal
level of flow velocity increases consistently with further
reduction in stenosis severity, the collateral flow seems not
to be the major role and the reduction in MR forms the
better explanation [100].
The DP–v relationship for the reference vessel demon-
strates that there is only a very limited pressure drop in
coronary epicardial arteries in normal vessels also at
vasodilatation. In Fig. 2, the lower level of maximal
obtainable flow velocity in the reference vessel compared
to the treated vessel may be caused by a higher MR in the
tissue perfused by the reference vessel than MR in the
tissue perfused by the target vessel after treatment. This
may be the result of natural variation in MR as discussed
below. Indeed, it is a consistent finding that hMR in the
treated vascular bed after treatment is lower than that in the
vascular bed perfused by the reference vessel at the same
pressure, which can be the result from outward remodeling
of the resistance vessels as a consequence of the long
period of low perfusion pressure distal of the stenosis [99].
2.2 Interaction between heart contraction and coronary
circulation
The interaction between cardiac muscle and the intramural
vasculature results in the typical intracoronary flow
velocity profile for non-obstructed branches of the left
coronary arteries as depicted in Fig. 3a, where coronary
flow velocity is higher in diastole than in systole, and out of
phase with coronary arterial pressure, which is highest in
systole. Decreased systolic flow is due to the squeezing of
cardiac muscle on embedded intramural vessels, which
impedes arterial inflow and augments venous outflow.
During muscle relaxation, the intramural blood volume is
restored, causing an increased inflow and reduced outflow.
This squeezing effect is denoted as intra-myocardial pump
mechanism [88].
In addition to the global systolic–diastolic differences,
further insight into the underlying mechanisms can be
derived from the coronary pressure and flow signals. Flow
velocity starts to decrease in the isovolumetric contraction
phase of early systole which corresponds to the rise in left
ventricular pressure, PLV, squeezing the intramural vessels.
At the moment, PLV rises above the aortic pressure, the
aortic valve opens, and coronary arterial pressure increases,
Fig. 2 Pressure drop–flow velocity relationships prior to (pre) and
after (post) stent placement and for a reference vessel (ref) in 1
patient. DP pressure drop, v velocity
Med Biol Eng Comput
123
Author's personal copy
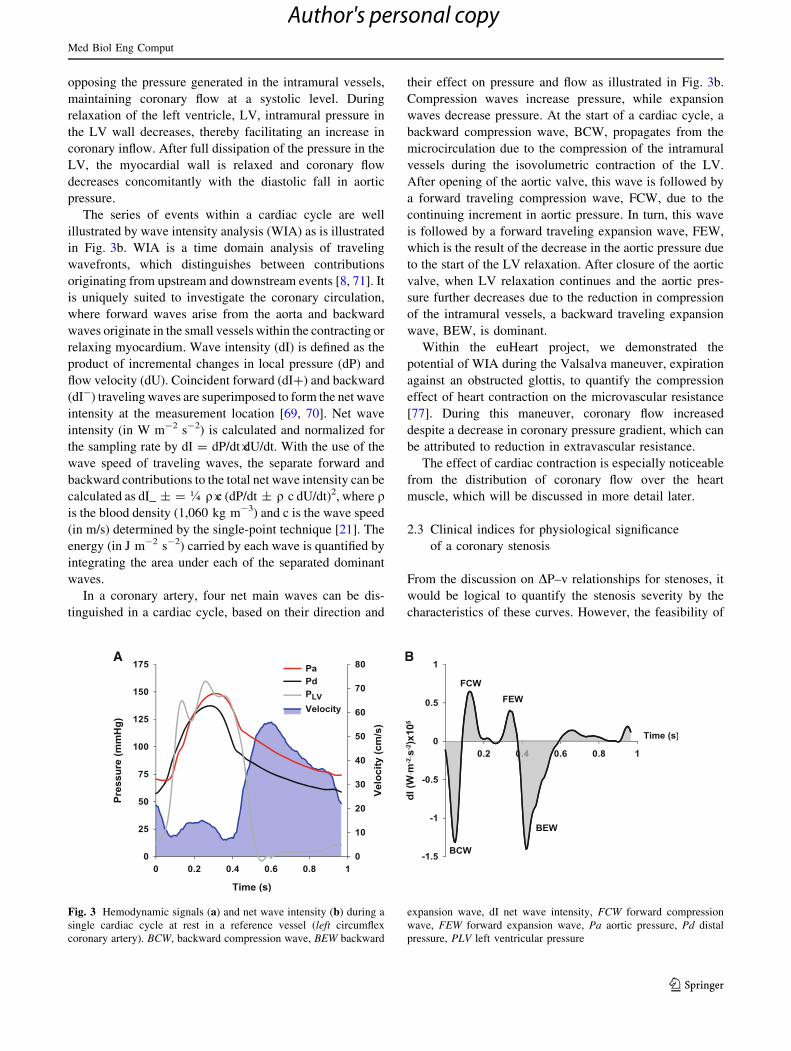
opposing the pressure generated in the intramural vessels,
maintaining coronary flow at a systolic level. During
relaxation of the left ventricle, LV, intramural pressure in
the LV wall decreases, thereby facilitating an increase in
coronary inflow. After full dissipation of the pressure in the
LV, the myocardial wall is relaxed and coronary flow
decreases concomitantly with the diastolic fall in aortic
pressure.
The series of events within a cardiac cycle are well
illustrated by wave intensity analysis (WIA) as is illustrated
in Fig. 3b. WIA is a time domain analysis of traveling
wavefronts, which distinguishes between contributions
originating from upstream and downstream events [8, 71]. It
is uniquely suited to investigate the coronary circulation,
where forward waves arise from the aorta and backward
waves originate in the small vessels within the contracting or
relaxing myocardium. Wave intensity (dI) is defined as the
product of incremental changes in local pressure (dP) and
flow velocity (dU). Coincident forward (dI?) and backward
(dI-) traveling waves are superimposed to form the net wave
intensity at the measurement location [69, 70]. Net wave
intensity (in W m-2 s-2) is calculated and normalized for
the sampling rate by dI = dP/dt�dU/dt. With the use of the
wave speed of traveling waves, the separate forward and
backward contributions to the total net wave intensity can be
calculated as dI_ ± = � q�c (dP/dt ± q c dU/dt)2, where qis the blood density (1,060 kg m-3) and c is the wave speed
(in m/s) determined by the single-point technique [21]. The
energy (in J m-2 s-2) carried by each wave is quantified by
integrating the area under each of the separated dominant
waves.
In a coronary artery, four net main waves can be dis-
tinguished in a cardiac cycle, based on their direction and
their effect on pressure and flow as illustrated in Fig. 3b.
Compression waves increase pressure, while expansion
waves decrease pressure. At the start of a cardiac cycle, a
backward compression wave, BCW, propagates from the
microcirculation due to the compression of the intramural
vessels during the isovolumetric contraction of the LV.
After opening of the aortic valve, this wave is followed by
a forward traveling compression wave, FCW, due to the
continuing increment in aortic pressure. In turn, this wave
is followed by a forward traveling expansion wave, FEW,
which is the result of the decrease in the aortic pressure due
to the start of the LV relaxation. After closure of the aortic
valve, when LV relaxation continues and the aortic pres-
sure further decreases due to the reduction in compression
of the intramural vessels, a backward traveling expansion
wave, BEW, is dominant.
Within the euHeart project, we demonstrated the
potential of WIA during the Valsalva maneuver, expiration
against an obstructed glottis, to quantify the compression
effect of heart contraction on the microvascular resistance
[77]. During this maneuver, coronary flow increased
despite a decrease in coronary pressure gradient, which can
be attributed to reduction in extravascular resistance.
The effect of cardiac contraction is especially noticeable
from the distribution of coronary flow over the heart
muscle, which will be discussed in more detail later.
2.3 Clinical indices for physiological significance
of a coronary stenosis
From the discussion on DP–v relationships for stenoses, it
would be logical to quantify the stenosis severity by the
characteristics of these curves. However, the feasibility of
A B
Fig. 3 Hemodynamic signals (a) and net wave intensity (b) during a
single cardiac cycle at rest in a reference vessel (left circumflex
coronary artery). BCW, backward compression wave, BEW backward
expansion wave, dI net wave intensity, FCW forward compression
wave, FEW forward expansion wave, Pa aortic pressure, Pd distal
pressure, PLV left ventricular pressure
Med Biol Eng Comput
123
Author's personal copy
this measurement is rather recent [82], and alternative
clinical methods have been introduced based on pressure or
flow velocity alone. In this section, some clinical indices of
the physiological significance of coronary stenoses will be
discussed. These indices are mostly based on the beat
average values of aortic pressure and pressure distal of the
stenosis or coronary flow velocity.
2.3.1 Coronary flow velocity reserve, CFVR
The physiological meaning of CFVR has been discussed
above in relation to Fig. 1. CFVR is obtained clinically by
measuring flow velocity before and during adenosine-
induced vasodilatation. In healthy hearts, CFVR values as
high as 4.5 have been reported [49]. Epidemiological
studies have indicated that a stenosis should be treated
when CFVR is lower than 2 [50].
2.3.2 Fractional flow reserve, FFR
Stenosis resistance is in series with MR, and hence, the
ratio between distal and aortic pressure, Pd/Pa, equals MR/
(MR ? SR) [81]. Obviously, this is only true when venous
pressure is zero. In general, this value is around 5 mmHg
and neglected for practical purposes. Hence, the limitation
that a stenosis poses on coronary flow at maximal vaso-
dilatation, when MR is minimal, can be expressed by Pd/Pa
at hyperemia and is generally referred to as fractional flow
reserve (FFR). Assuming that SR and MR at maximal
hyperemia are pressure and flow independent and hMR is
equal in the absence and presence of the stenosis, FFR
indicates the stenosis-induced reduction in hyperemic flow
[75]. In unstenosed vessels, FFR equals 1. A threshold of
0.75 was found as indicative of inducible ischemia by
independent methods such as single photon emission
computed tomography (SPECT). More recently, a cutoff
value of 0.8 is used in clinical practice [104].
2.3.3 Hyperemic stenosis resistance, hSR
The ratio of stenosis pressure gradient to distally measured
flow velocity can be interpreted as a velocity-based resis-
tance index. Please note that the units of a velocity-based
resistance index are different from those of a flow-based
resistance. At maximal hyperemia, this resistance is denoted
as the hyperemic stenosis resistance (hSR). hSR has been
shown to be more stenosis specific than CFVR and FFR [62]
since it is almost independent on hMR, which depends on a
variety of clinical and hemodynamic factors. It has been
demonstrated that approximately 30 % of patients with an
angiographically determined intermediate stenosis severity
show discordant outcomes between CFVR and FFR [61].
hSR has been validated as a predictive index for inducible
ischemia by SPECT as well and was shown to be superior to
FFR and CFVR, especially for those patients with discordant
outcomes between the latter two indices. A threshold for
inducible ischemia of 0.8 mmHg cm-1s was found [62].
2.3.4 Clinical indices of functional stenosis severity
not requiring maximal hyperemia
The aforementioned indices all require maximal hyper-
emia, although hSR to a smaller extent since the pressure
drop is divided by the flow velocity and both parameters
alter in the same direction with vasodilation [62, 74, 92].
Most frequently, adenosine is used to induce hyperemia
[59]. However, adenosine is not always available in the
catheterization room in an applicable form due to local
regulatory issues. This may in part explain that functional
assessment of stenosis severity is performed in the USA in
only about 6 % of the patients undergoing diagnostic car-
diac catheterization. Therefore, several alternative indices
of functional stenosis severity have been proposed that do
not require the achievement of maximal vasodilatation.
The diastolic stenosis pressure drop at a fixed flow
velocity of 50 cm/s (dPv50) can be derived from the dia-
stolic DP–v relationship and does not need maximal
hyperemia [56, 57]. More recently, two drug-free indices
have been introduced, namely the instantaneous wave-free
ratio, iFR [79], which is based on the distal-to-proximal
pressure ratio during a specific mid-diastolic period, and
baseline stenosis resistance index, BSR, calculated as the
ratio between the stenosis pressure drop and distally
assessed flow velocity under basal conditions [93]. Both
iFR and BSR can be obtained during resting conditions.
BSR is one of the outcomes of the euHeart project.
3 Clinical assessment of perfusion distribution
3.1 Rationale for non-invasive measurement
of perfusion
Perfusion of the myocardium is heterogeneous, which is
not only induced by flow hindrance in one of the sub-
branches, but also due to non-symmetrical branching of the
coronary arterial tree [7, 52] and regional differences in
function [4]. Especially during hyperemia, regional dif-
ferences across the layers of the myocardium result from
spatial variation in the intramural compressive forces [6].
The hemodynamic conductance at the subendocardium
diminishes with diastolic time fraction with perfusion
pressure as a parameter [26]. Thus, because of perfusion
heterogeneity, the hemodynamic parameters measured at
the epicardial arteries may appear to be normal in the
presence of local ischemia.
Med Biol Eng Comput
123
Author's personal copy

Since myocardial ischemia is more pronounced in the
subendocardial layers of the LV [2, 26, 90], non-invasive
assessment of myocardial perfusion is becoming essential
in treatment decision making for an increasing number of
patients with stable CAD. Event-free survival can be
improved when decisions regarding revascularization are
based on the presence of ischemia [22, 73, 91]. Cardiac
magnetic resonance (CMR) perfusion imaging is
increasingly used to diagnose non-invasively the presence
of CAD and to document the presence of myocardial
ischemia for clinical decision making. [10]. The main
advantages of CMR perfusion imaging is the lack of
radiation exposure as with CT [5], the excellent safety
profile of the contrast agents and the capability of CMR
perfusion imaging to provide dynamic images of myo-
cardial perfusion with a better spatial resolution compared
with other imaging modalities [42]. After extensive vali-
dation against microspheres [18, 35, 105] and invasive
reference standards like FFR [20, 55, 102], CMR perfu-
sion is becoming the non-invasive test of choice in
patients with stable CAD, at least equivalent to results of
SPECT [31].
Moreover, the excellent spatial and temporal resolutions
are interesting features of CMR perfusion imaging. As
such, this technique allows to obtain separate information
from the endo- and the epicardium [55, 68, 76], and
therefore, CMR perfusion imaging is highly attractive for
clinical and research purposes.
Cardiac magnetic resonance imaging also has draw-
backs compared with other modalities. Image acquisition
still takes considerable longer modalities (typically
30–45 min), and the production of high-quality images
requires experienced, specially trained MRI operators.
Furthermore, CMR cannot be used for patients with pace-
makers or claustrophobia. The use of contrast-enhanced
CMR perfusion imaging needs to be weighed against other
risks for patient with renal insufficiency due to a small risk
of nephrogenic systemic fibrosis.
3.2 Analysis of high-resolution cardiac magnetic
resonance perfusion imaging
Clinically, CMR perfusion images are usually interpreted
based on visual assessment. Expert observers integrate the
spatial and temporal information of the contrast agent
arrival in the myocardium into a coherent account, using
typical patterns as diagnostic markers. Besides the
requirement of significant training of the highly special-
ized observers, a limitation of visual assessment is its
inability to identify the presence of balanced ischemia in
patients with three-vessel disease. In balanced ischemia,
there is no normal reference segment, and as such,
relative abnormalities can be missed [72]. Quantitative
analyses may be able to overcome these shortcomings and
also provide additional information based on the abun-
dance of data contained in the CMR perfusion images
[42, 44, 45].
Using standardized methods (e.g., specific contrast agent
injection schemes [43], model-independent deconvolution
[44]) myocardial perfusion reserve (MPR) can be assessed
objectively [72] in a reproducible manner [64]. This has
been validated against microspheres [18] and FFR [55]. We
have recently shown comparable quantitative results of
CMR-MPR with positron emission computed tomography
(PET) [76].
We have now expanded these techniques within euHeart
to differentiate blood flow on a voxelwise level, thus dis-
criminating the endo- and epicardial layers to better
understand the (patho-)physiology and to improve sensi-
tivity of disease detection. To achieve this, we have
developed a novel hardware CMR perfusion phantom [16]
to validate our techniques for voxelwise quantification
[108] in comparison with microspheres and animal data, as
well as translated novel high-resolution imaging techniques
[35] into patient studies. Voxelwise quantitative analysis
allows the quantification of MPR while preserving the
information about extent, localization and transmurality of
ischemia (ischemic burden). Combining the advantages of
visual (high spatial resolution) and quantitative (more
objective and reproducible) assessment, voxelwise quanti-
fication has the potential to allow an improvement in the
accuracy of detection of CAD as well as to provide novel
and valuable information on the severity and extent of
ischemia.
An alternative pathway is transmural perfusion gradient
(TPG), which assesses the perfusion gradient between the
endo- and epicardium as depicted in Fig. 4. This method is
highly attractive due to several advantages. As the differ-
ence between epi- and endocardial perfusion is measured,
the method autocorrects for differences in contrast agent
injection schemes, CMR data acquisition methods and coil
sensitivities. It does not require a specific pre-bolus as no
input function is used. In addition, it can be evaluated from
stress scans only. As such, it can be applied in many standard
clinical scenarios. TPG analysis is based on a two-dimen-
sional ‘‘gradientogram’’, which displays the evolution of the
transmural gradient in LV myocardial perfusion (contrast
uptake) over time. Using the temporal persistence and radial
extent of a perfusion gradient, normal perfusion and areas of
inducible ischemia can be differentiated with excellent
accuracy [32]. We have recently optimized and validated the
diagnostic criteria for TPG in patients with suspected CAD
versus FFR [17]. With TPG analysis, we achieved a com-
parable diagnostic accuracy as visual assessment in a fully
automated fashion.
Med Biol Eng Comput
123
Author's personal copy

3.3 Complementary nature of clinical indices
Hemodynamic indices are not always consistent in their
recommendation to treat a vessel. For example, as men-
tioned previously, FFR and CFVR are not consistent in
approximately 30 % of coronary lesions [61]. Also MRI and
FFR do not perfectly match. To demonstrate the difficulties
in diagnosing coronary disease, we examine a patient case,
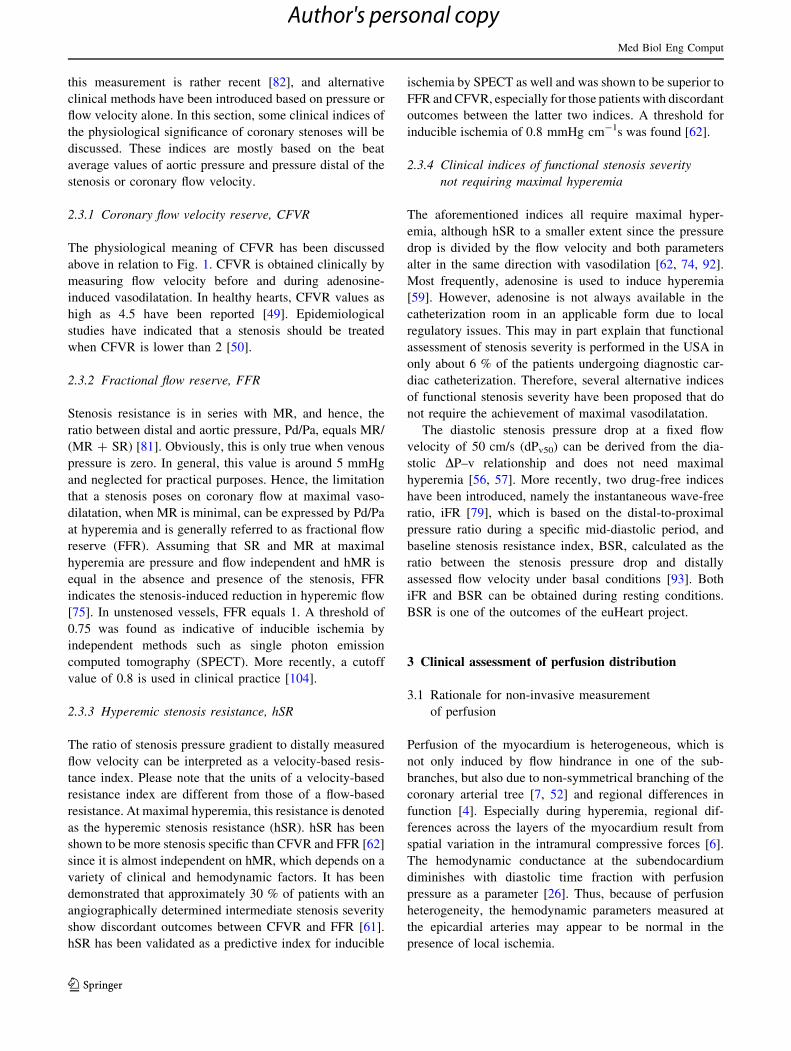
for which the MRI perfusion is depicted in Fig. 5. The top
panel demonstrates hypoperfusion of the inferior and lateral
wall supplied by the right coronary artery compared to the
septum, which is most pronounced in the endocardium.
Perfusion is normalized after treatment for the stenosis. This
case is interesting since the patient was originally diagnosed
by angiography as having three-vessel disease and as such
was a candidate for bypass surgery. After functional mea-
surements with MR and FFR of the different lesions, the
patient was regarded with single-vessel disease and
treated by a stent via PCI. However, the lesion treated
resulted pre-PCI in the following indices: FFR 0.78, HSR
1.4 mmHg�cm-1s, CFVR 1.9. Based on the threshold of
0.75, the stenosis would not induce ischemia, but based on
HSR (threshold 0.8) and CFVR (threshold 2.0), it should.
Although the most important conclusion is that surgery was
avoided, the physiological results for this patient point to the
differences of different parameters as each parameter relies
on numerous assumptions. Such findings underline the
importance for a realistic biophysical model unifying all
aspects of coronary physiology.
4 Model development of the coronary circulation
For a proper interpretation of clinical measurements in
terms of hemodynamics and perfusion distribution, models
of the coronary circulation are required that capture the
structure of the coronary tree, the physiological mecha-
nisms of distensibility of vessels in hyperemic conditions
and the intramural compressive forces that impede perfu-
sion at a regional level. Attempts have been made in the
past applying lumped models where vessel compartments
have been approximated by either linear or nonlinear
resistances and compliances [3, 6, 11]. With the avail-
ability of increasingly high-resolution information reveal-
ing the structure of the intramural coronary arterial tree
[46, 47, 96], more detailed models have been presented
[37, 38, 86]. However, since the morphological data were
obtained from corrosion casts, the 3D information about
location and orientation of the coronary vessel segments
was lost. With the recent possibilities to measure vascular
structure by computed tomography (CT) for smaller hearts
and by the imaging cryomicrotome [95] for larger hearts,
the 3D structure of the coronary arterial tree can now be
retained. These anatomically accurate tree representations,
in combination with increasing computational power,
provide the means to develop more realistic coronary
models.
4.1 Coupled Navier–Stokes blood flow models
Coronary blood flow is divided across many scales. The
diameter of the epicardial coronary arteries is in the order of
3 9 10-3 m, whereas the diameter of a capillary is in the
order of 7 9 10-6 m. Blood flow in the larger vessels can
generate complex secondary flow patterns at vessel curves
and bifurcations. Flow analysis is further complicated by the
compliance of the vessel wall. 3D Navier–Stokes models on
deforming domains can be employed to resolve the flow in
such individual vessels [25]. In the smaller vessels with
lower Reynolds numbers, flow patterns are less complex, but
their branching structure leads to far more segments with
decreased diameters. Thus, the computational cost of
Fig. 4 Transmural perfusion
gradient (TPG) analysis
(modified with permission from
the publisher). a Single image
from a CMR perfusion image
series, b bull’s eye plot of the
peak perfusion gradient,
c example of mid-myocardial
perfusogram (gradient as
function of angle and time),
d thresholded perfusogram
indicating potentially ischemic
areas in green
Med Biol Eng Comput
123
Author's personal copy
applying 3D models to all vessel segments in the coronary
arterial system would make such an approach intractable. In
this context, 1D models seem better suited for investigation
of unsteady blood flow. 1D network models have been
developed for many years for the systemic circulation [4] and
have been developed more recently for the coronary circu-
lation as well. These models approximate the blood vessel as
a one-dimensional elastic tube and describe the conservation
of mass and momentum in the space–time domain. Various
recent numerical studies have demonstrated the computa-
tional tractability of the 1D approach [54, 80, 85], which
comes at the cost of only providing information averaged
over the vessel cross section. These studies have a common
root in a basic underlying mathematical model that dates
back to the eighteenth century, proposed by Euler. The focus
of more recent work has been to achieve an efficient com-
putational solution of the governing equations, using both
finite difference [84] and finite element techniques [27],
including high-order spectral element method implementa-
tions [80]. These modeling frameworks have in turn enabled
investigations into coronary blood flow dynamics ranging in
scale from hematocrit distribution [53] through to the whole
organ effects of heart rate on systolic flow impediment [26].
1D blood flow models also provide a reasonable description
of the propagation of pressure waves in arteries, and they
have also been used to investigate the effects on pulse waves
of geometrical and mechanical arterial modifications, for
example flow alteration due to a stenosis, or treatment by PCI
[80]. A central challenge with translating these models into
clinical applications is their dependence on detailed ana-
tomical information which is typically not available via
in vivo imaging of human subjects. This motivates devel-
opment of the alternative approaches discussed below.
Solutions to both 1D and 3D systems of blood flow are
highly dependent on the boundary conditions imposed to
represent the vessels distal to the simulated domain.
However, it is frequently the case that the flow distribution
and/or pressure field at the simulated domain boundaries is
unknown and is difficult, if not impossible, to determine
experimentally. Thus, it is noteworthy that some 1D blood
flow studies [27, 80, 84] attempt to overcome this boundary
condition issue by extending their model to couple the
terminal points of the discrete vessel network to lumped-
parameter models [2]. These extended models allow for
flow in a network to be calculated while taking into account
distal resistances not explicitly represented by discrete
vessels. The development of these terminal resistance-type
phenomenological models was based in part on the intra-
myocardial pump theory of Spaan et al. [88].
In some cases, only lumped-parameter models have been
used to completely reproduce the observed flow responses to
arteriolar and venular pressures of an anatomically based
model combining nonlinear resistive and capacitive ele-
ments [11]. This is a reasonable, computationally efficient
way of reproducing experimentally observed behavior while
maintaining some of the fundamental physics of the prob-
lem. However, the treatment of vascular subgroups as single
entities whose behavior is assumed to be characterized by a
small number of parameters may be deemed to be somewhat
crude for certain modeling applications. For example, a
lumped-parameter component is of limited use for modeling
(as discussed above) many of the inherently heterogeneous
phenomena, for example local metabolite delivery and
interpretation or prediction of contrast MRI results where
fine spatial detail is required.
4.2 3D tissue perfusion models
For the reasons outlined above, a comprehensive model of
perfusion necessitates the spatial treatment for the micro-
circulation, that is, not simply using lumped parameters.
Moreover, the main clinical interest is often focused on
regional perfusion states (e.g., the American Heart Associ-
ation standardized myocardial segmentation), typically
expressed in terms of capillary pressure and flow. Therefore,
a continuum approach to blood perfusion, describing blood
flow throughout the perfused domain by averaged quantities,
would be appropriate. This point is further reinforced by the
Fig. 5 Perfusion MRI. a Pre-treatment, b post-treatment. The arrows
indicate ischemia
Med Biol Eng Comput
123
Author's personal copy

fact that clinical perfusion data, provided by PET, SPECT or
MRI, are inherently spatially averaged, thereby enabling
continuum perfusion models, with a spatial scale directly
matched to the relevant imaging resolution, to be directly
compared with imaging data in comparison with alternative
discrete perfusion models.
Exploiting this approach, some continuum models,
developed via homogenization theory, have been success-
fully utilized for studying the mechanics of perfused
myocardium [58]. In these models, homogenization theory
is used to extract effective or macroscale parameters for
heterogeneous media from more elaborate microscopic
models. Homogenization of periodic media has previously
been employed in a 3D model of fluid flow and transport
within both healthy tissue and tumor regions [14]. Despite
providing an elegant method of separating flow at the
various vessel scales under consideration, this theory does
require the existence of a repeating unit or periodic
‘‘canonical cell.’’ As biological arterial networks are gen-
erally aperiodic in nature, a method of parameter derivation
that does not require periodic vascular features is desirable.
The multicompartment porous model of Huyghe et al.
[40] allows for scale separation of the flow and does not
require any periodicity of the material properties. In this
model, fluid flows through compartments of decreasing
arterial radius, into a capillary compartment, and is then
drained via compartments of increasing venous radius. The
sequential flow among compartments is an assumption that
greatly simplifies the model and is representative of an
underlying idealized network, although no actual discrete
network is referenced. Due to the lack of a vascular model,
their approach to parameterize the permeability tensor field
was to assume isotropic tensors, proportional to the square
of the intramyocardial blood volume under a constant
vessel length assumption.
The 3D perfusion models mentioned thus far lack the
ability to capture fluid–solid interactions [67, 83]. In
Huyghe et al. [39], the authors applied a mixture theory
model to the mechanics of the left ventricular myocardium.
Their two-phase mixture model featured a solid component
and a fluid component. It allowed for finite deformation of
the tissue and was fundamentally based upon the work of
Biot [7] and Bowen [9]. As their model consists of a single
porous domain, the authors admit to not being able to
model physiological coronary blood flow, in the sense of a
flow from arteries to veins. More recently, Chapelle et al.
[13] presented a derivation of a general single-compart-
ment poroelastic model valid for a nearly incompressible
medium which experiences finite deformations and fea-
tures active contraction, fiber orientation and spatially
distributed volumetric fluid influx. It was sufficient to
reproduce some known mechanical effects resulting from
the mechanisms of cross talk between the myocardium and
coronary flow, such as a decrease in myocardial volume,
flow impediment during contraction and a nonlinear
transmural pressure field. While this paper represents a
significant contribution to the model development of car-
diac perfusion, it too applied an unphysiological isotropic
permeability tensor field. Interestingly, the lack of an
explicit representation of the arterial and venous vessels is
flagged by the authors as a major limitation of their model,
a factor which is blamed upon a lack of sufficiently detailed
measurements to both parameterize and validate the model.
4.3 Parameterization of 3D perfusion models
from discrete vascular models
A more physiologically realistic model of perfusion in
biological tissues with an embedded vasculature was
undertaken by Vankan et al. [97]. This was also a multi-
compartment perfusion model, accompanied by an explicit
synthetic network created using a constrained constructive
optimization algorithm [78]. A spatial averaging technique,
utilizing a moving averaging window, was used to derive
the permeability fields for each Darcy compartment, and
the intercompartment coupling terms. This technique was
derived in Huyghe and van Campen [41] and makes use of
the Slattery–Whitaker spatial averaging theorem. Although
derived for a 4D Darcy model, whereby the fourth
dimension allowed for volume coupling between neigh-
boring 3D porous compartments, perhaps because of
computational limitations at that time, Vankan et al. only
simulated 2D porous domains. This model, while pio-
neering, neglected the connections across non-neighboring
compartments identified by histological studies showing
cross-Strahler ordering connectivity [46]. Despite the
decrease in the number of connections with compartment
separation order, the fact that the pressure difference
simultaneously increases means that these long-range in-
tercompartmental effects could be quite significant. This
cross-Strahler ordering, or non-neighboring porous com-
partment connectivity, is a feature of anatomical vascular
models that is not captured by the synthetic networks used
by Huyghe and Vankan.
Most recently, Cookson et al. [19] produced a 3D
multicompartment perfusion model of a porcine LV free
wall segment. The Darcy compartments of this perfused
tissue region were parameterized using an arterial vascular
model derived from cryomicrotome data [89, 95] which
was also used to define the region boundary itself. These
authors demonstrated that there is a significant improve-
ment in the Darcy pressure (with respect to a comparison to
the associated spatially averaged Poiseuille pressure) when
the non-neighboring connections are accounted for. In the
same work, their perfusion model was then extended into a
poroelastic framework. The combination of having the
Med Biol Eng Comput
123
Author's personal copy

Darcy model parameters determined from anatomically
realistic vascular models, and the poroelastic simulations
being carried out on a cardiac geometry constructed from
the same cryomicrotome data set, arguably constitutes an
ideal in silico framework for studying the effects of fluid–
solid coupling on the coronary perfusion state. Such
mechanical coupling is widely thought to be of critical
importance to cardiac function and, in particular, to have a
large impact on the coronary circulation [48, 103].
The modeling framework just described, and shown in
Fig. 6, provides the capacity to run clinically relevant
simulations where ischemia results from vessel occlusion.
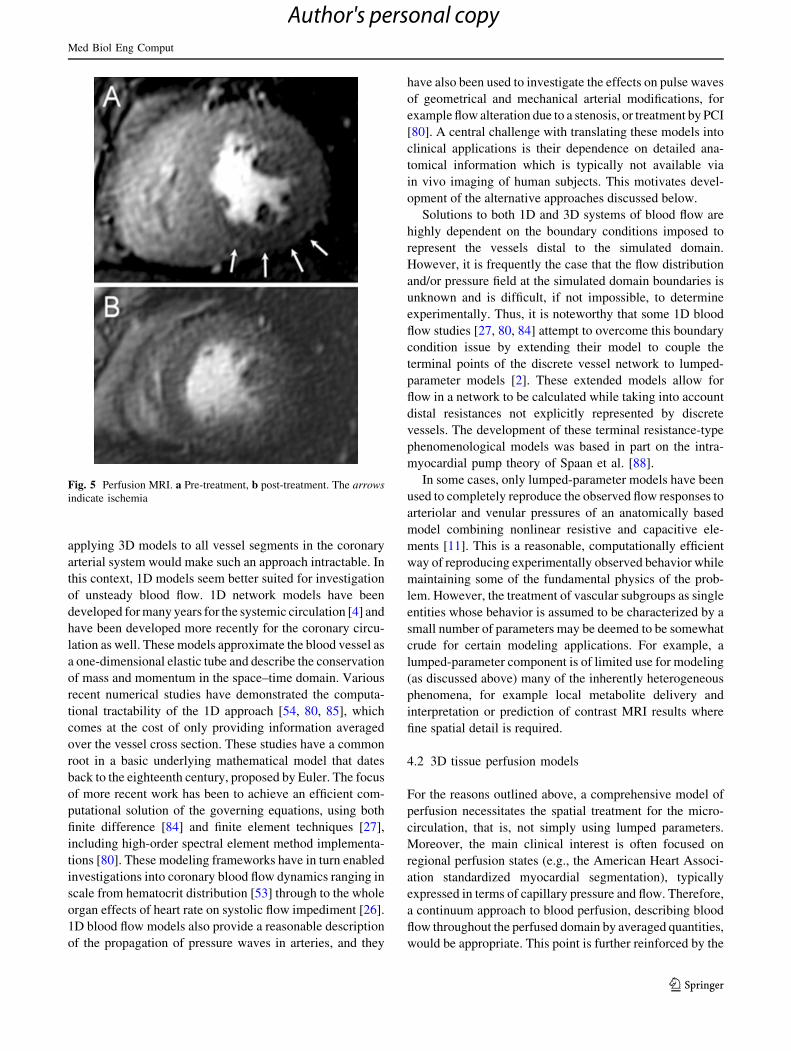
This is shown in Fig. 7, where a simulation of perfusion in
the myocardial tissue of a porcine LV was performed using
the 3D-compartment Darcy model coupled to a 1D flow
model based on the incompressible Navier–Stokes equation
in an elastic vessel. The geometry is derived from cryomi-
crotome data of the coronary vasculature [29]. While
arteries with a diameter larger than 0.22 mm are represented
as a discrete tree, all arteries of smaller size, arterioles and
capillaries are modeled as a homogenized Darcy model of
three distinct yet spatially coexisting compartments that
exchange fluid mass. The venous system is represented via a
pressure-dependent sink term in compartment three.
To simulate the stenosis of a coronary artery branch, we
decreased the cross-sectional area of the branch feeding the
hypoperfused region displayed in Fig. 7a by a factor of 0.7.
To enable the direct comparison of simulation results with
clinically acquired images, transport of the contrast agent, as
used in MR perfusion imaging, was modeled using a multi-
compartment system of reaction-advection–diffusion equa-
tions. This model accounts for both the transport in the blood,
for each of the porous compartments, and the diffusion of
contrast agent through the capillary wall into the extracel-
lular space. The observed concentration which is a proxy for
the MR signal is therefore the porosity-weighted sum of each
of these component concentrations. Figure 7b and c shows a
contour plot of the total concentration for both a healthy and
diseased case, 20 s after the injection of the contrast agent
bolus. Although both sets of results display spatial inhomo-
geneity, in the pathological case there is a large region of
near-zero concentration, indicating that the contrast agent
has not been transported to this part of the myocardium, and
hence identifying the regional perfusion defect.
5 Perspective of model developments for clinical
application
The discrepancy between angiographic and physiology
derived significance of a stenosis has been demonstrated in
earlier studies [91]. The major reason for this discrepancy
relates to the complexity of describing all the details
involved in calculating the flow and pressure field within
and distal of a stenosis not captured by the Poiseuille and
Bernoulli equations using simplified parameters of stenosis
severity. More recently, there have been new attempts to
apply computational fluid dynamics using meshes derived
from images of stenotic vessels and from these to predict
the significance of the stenosis by predicting FFR [51],
although the future of this approach remains uncertain.
The field of evaluation of stenosis significance is rapidly
evolving. The main developments can roughly be divided
in those based on epicardial hemodynamic measurements
and those on detection of regional ischemia. The perfusion
measurement will find its place in preselection of patients
prior to revascularization. However, within the cardiac
catheterization laboratory, intracoronary hemodynamic
measurements form the only resource for a physiological
diagnosis of lesion severity on the spot.
Fig. 6 a Vascular model derived from a porcine cryomicrotome data
set. This model has been reduced to the available vessels that perfuse
the LV tissue model only. Red vessels represent the 1D model
component; silver vessels represent the remaining vessels that are
utilized in the parameterization process. b The derived permeability
tensor field with glyphs directed along the principal eigenvector and
colored according to the normalized principal eigenvalue. c The
Darcy pressure solution
Med Biol Eng Comput
123
Author's personal copy
Notwithstanding the significant improvement obtained
with clinical outcome with the application of FFR com-
pared to visual assessment using coronary angiography for
clinical decision making [91], there is still much room for
improvement. From a basic biophysical and physiological
point of view, the model underlying FFR is oversimplified
for a variety of reasons. FFR describes the hyperemic
condition of the coronary circulation by linear resistances,
thereby ignoring the fact that all vessels are distensible and
hence vessel diameters change with pressure. Since resis-
tance varies with diameter to the fourth power, this
assumption of the FFR model is most likely incorrect. The
FFR model also ignores the effect of cardiac contraction on
MR as has been discussed in recent reviews [90, 94].
Moreover, it considers the resistance per unit mass for a
healthy part of the myocardium the same as for that distal
of a coronary stenosis, thereby ignoring remodeling of the
microcirculation under the influence of the altered hemo-
dynamic conditions [99]. CFVR has the major disadvan-
tage that it depends not only on hyperemic flow but also on
baseline flow, which, in turn, depends on oxygen needs of
the heart. However, conceptually, it is a good index since it
expresses the real clinical and physiological issue of how
much more flow can be realized distal of a stenosis by
increased exercise. In a large percentage of patients, CFVR
and FFR result in contradictory advice to treat, which was
shown to be the result of variability in hMR [61, 63].
Combined measurement of distal pressure and flow
velocity allows the measurement of hSR, which is more
specific for the lesion development since it is almost
independent of distal events. It has been shown that this
index performs better than FFR and CFVR [62].
The indices discussed above require in one way or
another the full vasodilatation of the vascular bed distal of
a stenosis. The problem is the uncertainty about what
maximal is. Increasing the dose of intracoronary adenosine
injection tenfold results in a further decrease in FFR [23].
The uncertainty about a well-defined maximal hyperemic
state and the practical problems related to the application
of adenosine has resulted in so-called adenosine-free
methods for establishing physiological stenosis severity
such as iFR [79], BSR [93] or the pressure drop at given
flow velocity at submaximal vasodilation [57].
Because of the complexity of the physiological processes
and the many interactions between them, model develop-
ments as described in this paper are needed. This is also
required to integrate measurements by different modalities
such as MRI and epicardial hemodynamics [87, 101].
6 Conclusions
In this paper, we have reviewed major physiological and
pathophysiological processes and their bearing on tech-
niques for the diagnosis of coronary artery disease. The
hemodynamic measurements distal of a stenosis provide the
ability to quantify the overall results of a stenosis on coronary
perfusion and the state of the coronary microcirculation.
Moreover, it allows the study of the interaction between
cardiac function and coronary flow dynamics. The devel-
opments in regional perfusion measurements are a major step
forward in bringing physiology to the clinical arena since
regional differences are induced by a stenosis. These regio-
nal differences are not only present between perfusion ter-
ritories distal of obstructed and normal epicardial arteries but
also within these territories, especially between subepicar-
dial and subendocardial regions. Model developments allow
the integration of all of these measurements at the epicardial
level, from pressure and flow data, and regional information,
provided by whole organ myocardial perfusion imaging. In
addition to integrating data, the computational frameworks
presented above enable the simulation of individual entities
such as coronary occlusion or microvascular disease as well
as analysis of physiological mechanisms such as the role that
contraction or ventricular pressure plays on regional distri-
bution of coronary flow. Our goal is that such models will
provide a more complete picture of coronary physiology in
normal and diseased cardiac conditions to enhance differ-
entiation and personalization for diagnostic purposes as was
the aim for the euHeart project.
Fig. 7 a The cross-sectional
area of the feeding artery of the
red subtree was decreased by a
factor of 0.7 to model stenosis
of a branch of the coronary
artery. Total concentration of
contrast agent in the tissue 20 s
after administering a bolus
injection for a physiological
case (b) and the simulated
occlusion of a coronary artery
branch (c)
Med Biol Eng Comput
123
Author's personal copy

Acknowledgments The authors acknowledge funding from the
European Community’s Seventh Framework Program (FP7-ICT-
2007-224495: euHeart), the Netherlands Heart Foundation (grants
2000.090 and 2006B186) and Engineering and Physical Sciences
Research Council (EP/G007527/2).
References
1. Aarnoudse W, Fearon WF, Manoharan G, Geven M, van de
Vosse F, Rutten M, De Bruyne B, Pijls NH (2004) Epicardial
stenosis severity does not affect minimal microcirculatory
resistance. Circulation 110:2137–2142
2. Algranati D, Kassab GS, Lanir Y (2010) Mechanisms of myo-
cardium-coronary vessel interaction. Am J physiol. Heart circ
physiol 298:H861–H873
3. Arts MGJ (1978) A mathematical model of the dynamics of the
left ventricle and the coronary circulation, Maastricht, the
Netherlands
4. Avolio AP (1980) Multi-branched model of the human arterial
system. Med Biol Eng Comput 18:709–718
5. Becker A, Becker C (2013) Ct imaging of myocardial perfusion:
possibilities and perspectives. J nucl cardiol: off publ Am Soc
Nucl Cardiol 20:289–296
6. Beyar R, Sideman S (1987) Time-dependent coronary blood flow
distribution in left ventricular wall. Am J Physiol 252:H417–H433
7. Biot MA (1972) Theory of finite deformations of porous solids.
Indiana Univ Math J 21:597–620
8. Bleasdale RA, Parker KH, Jones CJH (2003) Chasing the wave.
Unfashionable but important new concepts in arterial wave
travel. Am J Physiol Heart Circ Physiol 284:H1879–H1885
9. Bowen RM (1980) Incompressible porous-media models by use
of the theory of mixtures. Int J Eng Sci 18:1129–1148
10. Bruder O, Schneider S, Nothnagel D, Dill T, Hombach V,
Schulz-Menger J, Nagel E, Lombardi M, van Rossum AC,
Wagner A, Schwitter J, Senges J, Sabin GV, Sechtem U,
Mahrholdt H (2009) EuroCMR (European Cardiovascular
Magnetic Resonance) registry: results of the german pilot phase.
J Am Coll Cardiol 54:1457–1466
11. Bruinsma P, Arts T, Dankelman J, Spaan JA (1988) Model of
the coronary circulation based on pressure dependence of cor-
onary resistance and compliance. Basic Res Cardiol 83:510–524
12. Camici PG, Crea F (2007) Coronary microvascular dysfunction.
N Engl J med 356:830–840
13. Chapelle D, Gerbeau JF, Sainte-Marie J, Vignon-Clementel IE
(2010) A poroelastic model valid in large strains with applica-
tions to perfusion in cardiac modeling. Comput Mech 46:91–101
14. Chapman SJ, Shipley RJ, Jawad R (2008) Multiscale modeling
of fluid transport in tumors. B Math Biol 70:2334–2357
15. Chilian WM (1991) Microvascular pressures and resistances in
the left ventricular subepicardium and subendocardium. Circ
Res 69:561–570
16. Chiribiri A, Schuster A, Ishida M, Hautvast G, Zarinabad N,
Morton G, Otton J, Plein S, Breeuwer M, Batchelor P,
Schaeffter T, Nagel E (2012) Perfusion phantom: An efficient
and reproducible method to simulate myocardial first-pass per-
fusion measurements with cardiovascular magnetic resonance.
Magnetic resonance in medicine: official journal of the Society
of Magnetic Resonance in Medicine/Society of Magnetic Res-
onance in Medicine
17. Chiribiri A, Hautvast GLTF, Lockie T, Schuster A, Bigalke B,
Olivotti L, Redwood SR, Breeuwer M, Plein S, Nagel E. In
press: Quantitative analysis of transmural perfusion gradients by
high-resolution magnetic resonance versus fractional flow
reserve for the assessment of coronary artery stenosis severity
and location: JACC Cardiovasc Imaging; Feb 01 2013
18. Christian TF, Aletras AH, Arai AE (2008) Estimation of abso-
lute myocardial blood flow during first-pass mr perfusion
imaging using a dual-bolus injection technique: comparison to
single-bolus injection method. J magn reson imaging: JMRI
27:1271–1277
19. Cookson AN, Lee J, Michler C, Chabiniok R, Hyde E, Nords-
letten DA, Sinclair M, Siebes M, Smith NP (2012) A novel
porous mechanical framework for modelling the interaction
between coronary perfusion and myocardial mechanics. J Bio-
mech 45:850–855
20. Costa MA, Shoemaker S, Futamatsu H, Klassen C, Angiolillo
DJ, Nguyen M, Siuciak A, Gilmore P, Zenni MM, Guzman L,
Bass TA, Wilke N (2007) Quantitative magnetic resonance
perfusion imaging detects anatomic and physiologic coronary
artery disease as measured by coronary angiography and frac-
tional flow reserve. J Am Coll Cardiol 50:514–522
21. Davies JE, Whinnett ZI, Francis DP, Willson K, Foale RA,
Malik IS, Hughes AD, Parker KH, Mayet J (2006) Use of
simultaneous pressure and velocity measurements to estimate
arterial wave speed at a single site in humans. Am J physiol.
Heart circ physiol 290:H878–H885
22. De Bruyne B, Pijls NHJ, Kalesan B, Barbato E, Tonino PAL,
Piroth Z, Jagic N, Mobius-Winckler S, Rioufol G, Witt N, Kala P,
MacCarthy P, Engstrøm T, Oldroyd KG, Mavromatis K, Manoh-
aran G, Verlee P, Frobert O, Curzen N, Johnson JB, Juni P, Fearon
WF (2012) Fractional flow reserve–guided pci versus medical
therapy in stable coronary disease. N Engl J med 367:991–1001
23. De Luca G, Venegoni L, Iorio S, Giuliani L, Marino P (2011)
Effects of increasing doses of intracoronary adenosine on the
assessment of fractional flow reserve. JACC. Cardiovasc interv
4:1079–1084
24. Doucette JW, Corl PD, Payne HM, Flynn AE, Goto M, Nassi M,
Segal J (1992) Validation of a doppler guide wire for intravas-
cular measurement of coronary artery flow velocity. Circulation
85:1899–1911
25. Figueroa CA, Vignon-Clementel IE, Jansen KE, Hughes TJR,
Taylor CA (2006) A coupled momentum method for modeling
blood flow in three-dimensional deformable arteries. Comput
Method Appl M 195:5685–5706
26. Fokkema DS, VanTeeffelen JW, Dekker S, Vergroesen I, Reit-
sma JB, Spaan JA (2005) Diastolic time fraction as a determinant
of subendocardial perfusion. Am J physiol. Heart circ physiol
288:H2450–H2456
27. Formaggia L, Lamponi D, Quarteroni A (2003) One-dimen-
sional models for blood flow in arteries. J Eng Math 47:251–276
28. Gould KL (1978) Pressure-flow characteristics of coronary ste-
noses in unsedated dogs at rest and during coronary vasodila-
tion. Circ Res 43:242–253
29. Goyal A, Lee J, Lamata P, van den Wijngaard J, van Horssen P,
Spaan J, Siebes M, Grau V, Smith NP (2013) Model-based
vasculature extraction from optical fluorescence cryomicrotome
images. IEEE Trans Med Imaging 32:56–72
30. Greason KL, Schaff HV (2011) Myocardial revascularization by
coronary arterial bypass graft: past, present, and future. Curr
Probl Cardiol 36:325–368
31. Greenwood JP, Maredia N, Younger JF, Brown JM, Nixon J,
Everett CC, Bijsterveld P, Ridgway JP, Radjenovic A, Dickin-
son CJ, Ball SG, Plein S (2012) Cardiovascular magnetic reso-
nance and single-photon emission computed tomography for
diagnosis of coronary heart disease (ce-marc): a prospective
trial. Lancet 379:453–460
32. Hautvast GLTF, Chiribiri A, Lockie T, Breeuwer M, Nagel E,
Plein S (2011) Quantitative analysis of transmural gradients in
myocardial perfusion magnetic resonance images. Magn reson
med: off J Soc Magn Reson Med/Soc Magn Reson Med
66:1477–1487
Med Biol Eng Comput
123
Author's personal copy
33. Hoffman JI, Buckberg GD (1975) Pathophysiology of suben-
docardial ischaemia. Br Med J 1:76–79
34. Hoffman JI, Spaan JA (1990) Pressure-flow relations in coro-
nary circulation. Physiol Rev 70:331–390
35. Hsu LY, Groves DW, Aletras AH, Kellman P, Arai AE (2012) A
quantitative pixel-wise measurement of myocardial blood flow
by contrast-enhanced first-pass CMR perfusion imaging. JCMG
5:154–166
36. Hunter PJ, Borg TK (2003) Integration from proteins to organs:
the physiome project. Nat Rev Mol Cell Biol 4:237–243
37. Huo Y, Kaimovitz B, Lanir Y, Wischgoll T, Hoffman JI, Kassab
GS (2009) Biophysical model of the spatial heterogeneity of
myocardial flow. Biophys J 96:4035–4043
38. Huo Y, Kassab GS (2012) Compensatory remodeling of coro-
nary microvasculature maintains shear stress in porcine left-
ventricular hypertrophy. J Hypertens 30:608–616
39. Huyghe JM, Vancampen DH, Arts T, Heethaar RM (1991) A
2-phase finite-element model of the diastolic left-ventricle.
J Biomech 24:527–538
40. Huyghe JM, Arts T, Vancampen DH, Reneman RS (1992)
Porous-medium finite-element model of the beating left-ventri-
cle. Am J Physiol 262:H1256–H1267
41. Huyghe JM, Vancampen DH (1995) Finite deformation-theory
of hierarchically arranged porous solids. 2. Constitutive behav-
ior. Int J Eng Sci 33:1873–1886
42. Ishida M, Morton G, Schuster A, Nagel E, Chiribiri A (2010)
Quantitative assessment of myocardial perfusion MRI. Curr
Cardiovasc Imaging Rep 3:65–73
43. Ishida M, Schuster A, Morton G, Chiribiri A, Hussain S, Paul M,
Merkle N, Steen H, Lossnitzer D, Schnackenburg B, Alfakih K,
Plein S, Nagel E (2011) Development of a universal dual-bolus
injection scheme for the quantitative assessment of myocardial
perfusion cardiovascular magnetic resonance. J cardiovasc magn
reson: off J Soc Cardiovasc Magn Reson 13:28
44. Jerosch-Herold M, Wilke N, Stillman AE (1998) Magnetic
resonance quantification of the myocardial perfusion reserve
with a Fermi function model for constrained deconvolution.
Med Phys 25:73–84
45. Jerosch-Herold M (2010) Quantification of myocardial perfu-
sion by cardiovascular magnetic resonance. J Cardiovasc Magn
Reson 12:57. doi:10.1186/1532-429X-12-57
46. Kassab GS, Rider CA, Tang NJ, Fung YC (1993) Morphometry
of pig coronary arterial trees. Am J physiol 265:H350–H365
47. Kassab GS, Molloi S (2001) Cross-sectional area and volume
compliance of porcine left coronary arteries. Am J physiol.
Heart circ physiol 281:H623–H628
48. Kassab GS, Dotan Algranati D, Lanir Y (2013) Myocardial-
vessel interaction: role of lv pressure and myocardial contrac-
tility. Medical & biological engineering & computing in press
49. Kern MJ, Bach RG, Mechem CJ, Caracciolo EA, Aguirre FV, Miller
LW, Donohue TJ (1996) Variations in normal coronary vasodilatory
reserve stratified by artery, gender, heart transplantation and coro-
nary artery disease. J Am Coll Cardiol 28:1154–1160
50. Kern MJ, Lerman A, Bech JW, De Bruyne B, Eeckhout E, Fearon
WF, Higano ST, Lim MJ, Meuwissen M, Piek JJ, Pijls NH, Siebes
M, Spaan JA (2006) Physiological assessment of coronary artery
disease in the cardiac catheterization laboratory: a scientific
statement from the american heart association committee on
diagnostic and interventional cardiac catheterization, council on
clinical cardiology. Circulation 114:1321–1341
51. Kim HJ, Vignon-Clementel IE, Coogan JS, Figueroa CA, Jansen
KE, Taylor CA (2010) Patient-specific modeling of blood flow
and pressure in human coronary arteries. Ann Biomed Eng
38:3195–3209
52. Krams R, Wentzel JJ, Oomen JA, Vinke R, Schuurbiers JC,
de Feyter PJ, Serruys PW, Slager CJ (1997) Evaluation of
endothelial shear stress and 3d geometry as factors determining
the development of atherosclerosis and remodeling in human
coronary arteries in vivo. Combining 3d reconstruction from
angiography and IVUS (ANGUS) with computational fluid
dynamics. Arterioscler Thromb Vasc Biol 17:2061–2065
53. Lee J, Smith NP (2008) Theoretical modeling in hemodynamics
of microcirculation. Microcirculation 15:699–714
54. Lee J, Smith NP (2012) The multi-scale modelling of coronary
blood flow. Ann Biomed Eng 40(11):2399–2413
55. Lockie T, Ishida M, Perera D, Chiribiri A, De Silva K, Kozerke
S, Marber M, Nagel E, Rezavi R, Redwood S, Plein S (2011)
High-resolution magnetic resonance myocardial perfusion
imaging at 3.0-tesla to detect hemodynamically significant
coronary stenoses as determined by fractional flow reserve.
J Am Coll Cardiol 57:70–75
56. Marques KM, Spruijt HJ, Boer C, Westerhof N, Visser CA,
Visser FC (2002) The diastolic flow-pressure gradient relation in
coronary stenoses in humans. J Am Coll Cardiol 39:1630–1636
57. Marques KM, van Eenige MJ, Spruijt HJ, Westerhof N, Twisk J,
Visser CA, Visser FC (2006) The diastolic flow velocity-pres-
sure gradient relation and dpv50 to assess the hemodynamic
significance of coronary stenoses. Am J physiol. Heart circ
physiol 291:H2630–H2635
58. May-Newman K, McCulloch AD (1998) Homogenization
modeling for the mechanics of perfused myocardium. Prog
Biophys Mol Biol 69:463–481
59. McGeoch RJ, Oldroyd KG (2008) Pharmacological options for
inducing maximal hyperaemia during studies of coronary
physiology. Catheter Cardiovasc Interv 71:198–204
60. Merkus D, Vergroesen I, Hiramatsu O, Tachibana H, Nakamoto H,
Toyota E, Goto M, Ogasawara Y, Spaan JA, Kajiya F (2001) Ste-
nosis differentially affects subendocardial and subepicardial arteri-
oles in vivo. Am J physiol. Heart circ physiol 280:H1674–H1682
61. Meuwissen M, Chamuleau SA, Siebes M, Schotborgh CE, Koch
KT, de Winter RJ, Bax M, de Jong A, Spaan JA, Piek JJ (2001)
Role of variability in microvascular resistance on fractional flow
reserve and coronary blood flow velocity reserve in intermediate
coronary lesions. Circulation 103:184–187
62. Meuwissen M, Siebes M, Chamuleau SAJ, van Eck-Smit BLF,
Koch KT, de Winter RJ, Tijssen JGP, Spaan JAE, Piek JJ (2002)
Hyperemic stenosis resistance index for evaluation of functional
coronary lesion severity. Circulation 106:441–446
63. Meuwissen M, Siebes M, Spaan JA, Piek JJ (2002) Rationale of
combined intracoronary pressure and flow velocity measure-
ments. Z Kardiol 91(Suppl 3):108–112
64. Morton G, Jogiya R, Plein S, Schuster A, Chiribiri A, Nagel E
(2012) Quantitative cardiovascular magnetic resonance perfu-
sion imaging: inter-study reproducibility. Eur Heart J Cardio-
vasc Imaging 13:954–960
65. Neubauer S (2007) The failing heart–an engine out of fuel.
N Engl J med 356:1140–1151
66. Noble D (2002) Modeling the heart–from genes to cells to the
whole organ. Science 295:1678–1682
67. Nordsletten D, McCormick M, Kilner PJ, Hunter P, Kay D,
Smith NP (2011) Fluid-solid coupling for the investigation of
diastolic and systolic human left ventricular function. Int J
Numer Meth Bio 27:1017–1039
68. Panting JR, Gatehouse PD, Yang G-Z, Grothues F, Firmin DN,
Collins P, Pennell DJ (2002) Abnormal subendocardial perfu-
sion in cardiac syndrome x detected by cardiovascular magnetic
resonance imaging. N Engl J med 346:1948–1953
69. Parker KH, Jones CJ (1990) Forward and backward running
waves in the arteries: analysis using the method of characteris-
tics. J Biomech Eng 112:322–326
70. Parker KH (2009) An introduction to wave intensity analysis.
Med Biol Eng Comput 47:175–188
Med Biol Eng Comput
123
Author's personal copy
71. Parker KH (2009) A brief history of arterial wave mechanics.
Med Biol Eng Comput 47:111–118
72. Patel AR, Antkowiak PF, Nandalur KR, West AM, Salerno M,
Arora V, Christopher J, Epstein FH, Kramer CM (2010) Assess-
ment of advanced coronary artery disease. JAC 56:561–569
73. Pijls N, Vanschaardenburgh P, Manoharan G, Boersma E, Bech
J, Vantveer M, Bar F, Hoorntje J, Koolen J, Wijns W (2007)
Percutaneous coronary intervention of functionally nonsignifi-
cant stenosis 5-year follow-up of the defer study. J Am Coll
Cardiol 49:2105–2111
74. Pijls NH, Tonino PA (2011) The crux of maximum hyperemia:
the last remaining barrier for routine use of fractional flow
reserve. J Am Coll Cardiol Intv 4:1093–1095
75. Pijls NHJ, van Son JA, Kirkeeide RL, De Bruyne B, Gould KL
(1993) Experimental basis of determining maximum coronary,
myocardial, and collateral blood flow by pressure measurements for
assessing functional stenosis severity before and after percutaneous
transluminal coronary angioplasty. Circulation 87:1354–1367
76. Plein S, Schwitter J, Suerder D, Greenwood JP, Boesiger P,
Kozerke S (2008) K-space and time sensitivity encoding-
accelerated myocardial perfusion mr imaging at 3.0 t: compar-
ison with 1.5 t. Radiology 249:493–500
77. Rolandi MC, Nolte F, van de Hoef TP, Remmelink M, Baan J, Piek
JJ, Spaan JA, Siebes M (2012) Coronary wave intensity during the
valsalva manoeuvre in humans reflects altered intramural vessel
compression responsible for extravascular resistance. J Physiol
590:4623–4635. doi:10.1113/jphysiol.2012.229914
78. Schreiner W, Karch R, Neumann F, Neumann M (2000) Con-
strained constructive optimization of arterial tree models. In:
Press OU, ed. Scaling in biology, Oxford, pp. 145–165
79. Sen S, Escaned J, Malik IS, Mikhail GW, Foale RA, Mila R,
Tarkin J, Petraco R, Broyd C, Jabbour R, Sethi A, Baker CS,
Bellamy M, Al-Bustami M, Hackett D, Khan M, Lefroy D,
Parker KH, Hughes AD, Francis DP, Di Mario C, Mayet J,
Davies JE (2012) Development and validation of a new aden-
osine-independent index of stenosis severity from coronary
wave-intensity analysis: results of the advise (adenosine vaso-
dilator independent stenosis evaluation) study. J Am Coll Car-
diol 59:1392–1402
80. Sherwin SJ, Franke V, Peiro J, Parker K (2003) One-dimen-
sional modelling of a vascular network in space-time variables.
J Eng Math 47:217–250
81. Siebes M, Chamuleau SA, Meuwissen M, Piek JJ, Spaan JA
(2002) Influence of hemodynamic conditions on fractional flow
reserve: parametric analysis of underlying model. Am J physiol.
Heart circ physiol 283:H1462–H1470
82. Siebes M, Verhoeff BJ, Meuwissen M, de Winter RJ, Spaan JA,
Piek JJ (2004) Single-wire pressure and flow velocity mea-
surement to quantify coronary stenosis hemodynamics and
effects of percutaneous interventions. Circulation 109:756–762
83. Smith NP, Kassab GS (2001) Analysis of coronary blood flow
interaction with myocardial mechanics based on anatomical
models. Philos T Roy Soc A 359:1251–1262
84. Smith NP, Mulquiney PJ, Nash MP, Bradley CP, Nickerson DP,
Hunter PJ (2002) Mathematical modelling of the heart: cell to
organ. Chaos Soliton Fract 13:1613–1621
85. Smith NP, Pullen AJ, Hunter PJ (2002) An anatomically based
model of transient coronary blood flow in the heart. SIAM J
Appl Math 62:28
86. Smith NP (2004) A computational study of the interaction
between coronary blood flow and myocardial mechanics.
Physiol Meas 25:863–877
87. Spaan J, Kolyva C, van den Wijngaard J, ter Wee R, van
Horssen P, Piek J, Siebes M (2008) Coronary structure and
perfusion in health and disease. Philos trans. Ser A, Math, phys,
eng sci 366:3137–3153
88. Spaan JA, Breuls NP, Laird JD (1981) Diastolic-systolic coro-
nary flow differences are caused by intramyocardial pump
action in the anesthetized dog. Circ Res 49:584–593
89. Spaan JA, ter Wee R, van Teeffelen JW, Streekstra G, Siebes M,
Kolyva C, Vink H, Fokkema DS, VanBavel E (2005) Visual-
isation of intramural coronary vasculature by an imaging cryo-
microtome suggests compartmentalisation of myocardial
perfusion areas. Med Biol Eng Compu 43:431–435
90. Spaan JA, Piek JJ, Hoffman JI, Siebes M (2006) Physiological
basis of clinically used coronary hemodynamic indices. Circu-
lation 113:446–455
91. Tonino PAL, De Bruyne B, Pijls NHJ, Siebert U, Ikeno F, vant
Veer M, Klauss V, Manoharan G, Engstrøm T, Oldroyd KG, Ver
Lee PN, MacCarthy PA, Fearon WF, Investigators FS (2009)
Fractional flow reserve versus angiography for guiding percu-
taneous coronary intervention. N Engl J med 360:213–224
92. van de Hoef TP, Nolte F, Rolandi MC, Piek JJ, van den Wi-
jngaard JP, Spaan JA, Siebes M (2011) Coronary pressure-flow
relations as basis for the understanding of coronary physiology.
J Mol Cell Cardiol 52:786–793
93. van de Hoef TP, Nolte F, Damman P, Delewi R, Bax M, Chamu-
leau SA, Voskuil M, Siebes M, Tijssen JG, Spaan JA, Piek JJ,
Meuwissen M (2012) Diagnostic accuracy of combined intracor-
onary pressure and flow velocity information during baseline
conditions: adenosine-free assessment of functional coronary
lesion severity. Circulation. Cardiovasc interv 5:508–514
94. van de Hoef TP, Nolte F, Rolandi MC, Piek JJ, van den Wi-
jngaard JP, Spaan JA, Siebes M (2012) Coronary pressure-flow
relations as basis for the understanding of coronary physiology.
J Mol Cell Cardiol 52:786–793
95. van den Wijngaard JP, Schwarz JC, van Horssen P, van Lier
MG, Dobbe JG, Spaan JA, Siebes M (2013) 3d imaging of
vascular networks for biophysical modeling of perfusion distri-
bution within the heart. J Biomech 46:229–239. doi:10.1016/j.
jbiomech.2012.11.027
96. VanBavel E, Spaan JA (1992) Branching patterns in the porcine
coronary arterial tree. Estimation of flow heterogeneity. Circ res
71:1200–1212
97. Vankan WJ, Huyghe JM, Janssen JD, Huson A, Hacking WJG,
Schreiner W (1997) Finite element analysis of blood flow
through biological tissue. Int J Eng Sci 35:375–385
98. Verberne HJ, Meuwissen M, Chamuleau SA, Verhoeff BJ, van
Eck-Smit BL, Spaan JA, Piek JJ, Siebes M (2007) Effect of
simultaneous intracoronary guidewires on the predictive accu-
racy of functional parameters of coronary lesion severity. Am J
physiol. Heart circ physiol 292:H2349–H2355
99. Verhoeff BJ, Siebes M, Meuwissen M, Atasever B, Voskuil M,
de Winter RJ, Koch KT, Tijssen JG, Spaan JA, Piek JJ (2005)
Influence of percutaneous coronary intervention on coronary
microvascular resistance index. Circulation 111:76–82
100. Verhoeff BJ, van de Hoef TP, Spaan JA, Piek JJ, Siebes M
(2012) Minimal effect of collateral flow on coronary micro-
vascular resistance in the presence of intermediate and non-
critical coronary stenoses. Am J physiol. Heart circ physiol
303:H422–H428
101. Waters SL, Alastruey J, Beard DA, Bovendeerd PH, Davies PF,
Jayaraman G, Jensen OE, Lee J, Parker KH, Popel AS, Secomb
TW, Siebes M, Sherwin SJ, Shipley RJ, Smith NP, van de Vosse
FN (2011) Theoretical models for coronary vascular biomechan-
ics: progress and challenges. Prog Biophys Mol Biol 104:49–76
102. Watkins S, McGeoch R, Lyne J, Steedman T, Good R,
McLaughlin M-J, Cunningham T, Bezlyak V, Ford I, Dargie HJ,
Oldroyd KG (2009) Validation of magnetic resonance myocar-
dial perfusion imaging with fractional flow reserve for the
detection of significant coronary heart disease. Circulation
120:2207–2213
Med Biol Eng Comput
123
Author's personal copy

103. Westerhof N, Boer C, Lamberts RR, Sipkema P (2006) Cross-
talk between cardiac muscle and coronary vasculature. Physiol
Rev 86:1263–1308
104. Wijns W, Kolh P, Danchin N, Di Mario C, Falk V, Folliguet T,
Garg S, Huber K, James S, Knuuti J, Lopez-Sendon J, Marco J,
Menicanti L, Ostojic M, Piepoli MF, Pirlet C, Pomar JL, Reifart
N, Ribichini FL, Schalij MJ, Sergeant P, Serruys PW, Silber S,
Sousa Uva M, Taggart D (2010) Guidelines on myocardial
revascularization. Task force on myocardial revascularization of
the European Society of Cardiology (ESC) and the European
Association for Cardio-Thoracic Surgery (EACTS); European
Association for Percutaneous Cardiovascular Interventions
(EAPCI). Eur Heart J 31:2501–2555
105. Wilke N, Simm C, Zhang J, Ellermann J, Ya X, Merkle H, Path
G, Ludemann H, Bache RJ, Ugurbil K (1993) Contrast-enhanced
first pass myocardial perfusion imaging: correlation between
myocardial blood flow in dogs at rest and during hyperemia.
Magn reson med: off J Soc Magn Reson Med/Soc Magn Reson
Med 29:485–497
106. Wusten B, Buss DD, Deist H, Schaper W (1977) Dilatory
capacity of the coronary circulation and its correlation to the
arterial vasculature in the canine left ventricle. Basic Res Car-
diol 72:636–650
107. Young DF, Cholvin NR, Kirkeeide RL, Roth AC (1977)
Hemodynamics of arterial stenoses at elevated flow rates. Circ
Res 41:99–107
108. Zarinabad N, Chiribiri A, Hautvast GLTF, Ishida M, Schuster A,
Cvetkovic Z, Batchelor PG, Nagel E (2012) Voxel-wise quanti-
fication of myocardial perfusion by cardiac magnetic resonance.
Feasibility and methods comparison. Magn reson med: off J Soc
Magn Reson Med/Soc Magn Reson Med 68:1994–2004
Med Biol Eng Comput
123
Author's personal copy