
Multivariate Probabilistic Seismic Demand Analysis of Steel Concrete Composite Bridges under...
10
KEYWORDS: near-fault ground motions, intensity measures (IMs), engineering demand pa- rameter (EDP), multivariate probabilistic seismic demand model, steel-concrete composite bridge. 1 INTRODUCTION Nowadays, the short-to-medium span steel-concrete composite bridges have been used more and more worldwide, owing to their several advantages in terms of: 1) small height of cross sec- tion and low dead weight; 2) short construction time owing to limited foundations and steelwork on site; 3) good integrity and limited weight for seismic areas. With regard to static loading, the- se bridges can be easily designed according to codes; however, the seismic performance of this kind of bridges, especially under near-fault pulse-like ground motions, has not been well inves- tigated to the knowledge of the authors, and thus, they may exhibit big damages even in low seismicity zones. (Paolacci et al., 2014) Multivariate Probabilistic Seismic Demand Analysis of Steel- concrete Composite Bridges under Near-fault Pulse-like Ground Motions Y. Liu & D. G. Lu* School of Civil Engineering, Harbin Institute of Technology, Harbin, P.R. China * Corresponding author: [email protected] F. Paolacci Department of Engineering, Roma Tre University, Rome, Italy ABSTRACT: In recent years, the short-to-medium span steel-concrete composite bridges have been used more and more worldwide. However, the seismic performance of this kind of bridges, especially under near-fault pulse-like ground motions, has not been well investigated to the knowledge of the authors. In this paper, a two-span steel-concrete composite bridge is taken as a case study, whose finite element model is established by OpenSEES. To comprehensively in- vestigate the effects of near-fault pulse-like ground motions on the seismic demands of this kind of bridges, also to fully consider the uncertainties in the input seismic ground motions, 80 dou- ble-side pulse-like ground motion records are selected from the PEER NGA strong ground mo- tion database based on the perk point method (PPM). For comparison, 80 far-field records are also selected following the opposite rules. The spectral acceleration (Sa) and the peak ground velocity (PGV) are chosen as the two intensity measures (IMs) for the near-fault pulse-like ground motions, while the displacement of the middle pier of the case-study bridge is selected as a global engineering demand parameter (EDP). Based on a series of nonlinear dynamic time- history analysis of the case-study bridge structure, a multiple regression relationship between the global EDP and two IMs are firstly established. According to the test of significance of re- gression coefficients,the coefficients of determination R 2 are calculated and the multivariate probabilistic seismic demand model is proved to be feasible. The corresponding seismic demand fragility surfaces are then developed with the two input IMs, Sa and PGV. The numerical results of the short-to-medium span steel-concrete composite bridges show that the seismic demand of near-fault pulse-like ground motions are much larger than those of far-field ground motions. It is suggested that, to take into account more characteristics of near-fault pulse-like ground mo- tions, the multivariate probabilistic seismic demand models should be developed for assessment of seismic vulnerability of this kind of bridges.
Transcript of Multivariate Probabilistic Seismic Demand Analysis of Steel Concrete Composite Bridges under...

KEYWORDS: near-fault ground motions, intensity measures (IMs), engineering demand pa-rameter (EDP), multivariate probabilistic seismic demand model, steel-concrete composite bridge.
1 INTRODUCTION
Nowadays, the short-to-medium span steel-concrete composite bridges have been used more and more worldwide, owing to their several advantages in terms of: 1) small height of cross sec-tion and low dead weight; 2) short construction time owing to limited foundations and steelwork on site; 3) good integrity and limited weight for seismic areas. With regard to static loading, the-se bridges can be easily designed according to codes; however, the seismic performance of this kind of bridges, especially under near-fault pulse-like ground motions, has not been well inves-tigated to the knowledge of the authors, and thus, they may exhibit big damages even in low seismicity zones. (Paolacci et al., 2014)
Multivariate Probabilistic Seismic Demand Analysis of Steel-concrete Composite Bridges under Near-fault Pulse-like Ground Motions
Y. Liu & D. G. Lu* School of Civil Engineering, Harbin Institute of Technology, Harbin, P.R. China * Corresponding author: [email protected]
F. Paolacci Department of Engineering, Roma Tre University, Rome, Italy
ABSTRACT: In recent years, the short-to-medium span steel-concrete composite bridges have been used more and more worldwide. However, the seismic performance of this kind of bridges, especially under near-fault pulse-like ground motions, has not been well investigated to the knowledge of the authors. In this paper, a two-span steel-concrete composite bridge is taken as a case study, whose finite element model is established by OpenSEES. To comprehensively in-vestigate the effects of near-fault pulse-like ground motions on the seismic demands of this kind of bridges, also to fully consider the uncertainties in the input seismic ground motions, 80 dou-ble-side pulse-like ground motion records are selected from the PEER NGA strong ground mo-tion database based on the perk point method (PPM). For comparison, 80 far-field records are also selected following the opposite rules. The spectral acceleration (Sa) and the peak ground velocity (PGV) are chosen as the two intensity measures (IMs) for the near-fault pulse-like ground motions, while the displacement of the middle pier of the case-study bridge is selected as a global engineering demand parameter (EDP). Based on a series of nonlinear dynamic time-history analysis of the case-study bridge structure, a multiple regression relationship between the global EDP and two IMs are firstly established. According to the test of significance of re-gression coefficients,the coefficients of determination R2 are calculated and the multivariate probabilistic seismic demand model is proved to be feasible. The corresponding seismic demand fragility surfaces are then developed with the two input IMs, Sa and PGV. The numerical results of the short-to-medium span steel-concrete composite bridges show that the seismic demand of near-fault pulse-like ground motions are much larger than those of far-field ground motions. It is suggested that, to take into account more characteristics of near-fault pulse-like ground mo-tions, the multivariate probabilistic seismic demand models should be developed for assessment of seismic vulnerability of this kind of bridges.
A large number of earthquake damage show that near-fault pulse-like ground motions are dif-ferent from far field ground motions. The former leads to higher requirements for structure. The near-fault pulse-like ground motions contain large velocity pulse, thus it can produce great de-structive power to structures. The research on seismic response of the short-medium span steel-concrete composite bridges subjected to near-fault pulse-like ground motions and their fragility degree is of great importance to seismic design of the same bridges of near field region.
Probabilistic seismic demand analysis (PSDA) in modern multi-level design and rehabilita-tion procedures is the common method to quantify the performance of structures (Bazzurro, 1998). The results of PSDA exhibit the probability relationship between the properties of ground motions and structures. The traditional method based on single intensity measure is not enough to describe the uncertainty of inputted ground motions, multi intensity measures includ-ing more information of ground motions should be considered in PSDA.
In this paper, a two-span steel-concrete composite bridge is taken as a case study, whose 3D finite element model is established by OpenSEES. To fully consider the uncertainties in the in-put seismic ground motions, 80 double-side pulse-like ground motion records are selected from the PEER NGA strong ground motion database based on the perk point method (PPM). For comparison, 80 far-field records are also selected following the opposite rules. The spectral ac-celeration (Sa) and the peak ground velocity (PGV) are chosen as the two intensity measures (IMs) for the near-fault pulse-like ground motions, while the top displacement of the middle pier of the case-study bridge is selected as the global engineering demand parameter (EDP). Based on a series of nonlinear dynamic time-history analysis of the case-study bridge structure, a multiple regression relationship between the global EDP and two IMs are firstly established. According to the test of significance of regression coefficients,the coefficients of determina-tion R2 are calculated and the multivariate probabilistic seismic demand model is proved to be feasible. Finally, the corresponding seismic demand fragility surfaces are then developed with the two input IMs, Sa and PGV.
2 DESCRIPTION OF BRIDGE AND NUMERICAL MODEL
The case study is illustrated by a typical 2-span overpasses, currently under investigation within the European Project SEQBRI (www.seqbri.it). The straight bridge is 40.0 m long and consists of two spans of 20.0 m (Figure1).The total width of the road cross-section is 10.6 m, with car-riageway 6.5 m wide and 2 sidewalks 2.05m wide. This is a typical overpass cross-section with 2 traffic lanes. Four main girders HE600B made of S460 steel girders are designed, with center distance of 2.65 m. The thickness of the concrete slab is equal to 25cm.The steel girders are fixed to reinforced concrete crossbeams at abutments. By this diaphragm, the deck is simply supported on normal (low-damping) damping rubber bearings. At the intermediate pier, the steel girders are fixed to a reinforced concrete crossbeam 0.9 m wide monolithically connected to the pier. The wall type pier is 7.0 m height, 0.6 m thick and 7.0 m wide. It is assumed that the foun-dation soil is categorized as type B according to EN1998 and the SSI effect is neglected.
Figure1. Longitudinal section and cross section at span Figure 2.3D FE model
20.00 20.00
40.00
2.05 3.25 3.25 2.05
10.60
2.5%2.5%
Unit:m

For seismic demand analysis, the 3D finite element (FE) model is developed by OpenSEES software (Figure2). In the refined model, the nonlinearities of material are considered. The shear force connections models between steel girders and concrete slab, also between crossbeam and composite beam, are built. The plane models for each girder 2.65m wide at transverse direction are firstly built and then the 3D model is achieved by adding transverse connections to the plane models of girders. In this 3D model, steel girder and concrete slab were modeled using nonline-ar beam elements with fiber sections. The reinforced concrete pier was also modeled by beam elements. Vertical shear studs connecting the steel girders to slab as well as the shear studs within the CCB are modeled using nonlinear links with elastic-plastic behavior. For materials, the concrete01 type was selected as the mechanical model of concrete in slab according to Kent and Park model where the tensile strength of concrete is neglected. Meanwhile, the steel01 type, an elastic-perfectly plastic model, has been selected as the mechanical model of steel in girders.
The joint of composite girder, concrete crossbeam and pier is difficult to reproduce. The re-fined crossbeam model is built to simulate the complicated mechanical behavior. The single concrete crossbeam FE model is shown in detail in Figure 4. The vertical head plates welded on the steel girders and directly in contact with the transverse concrete beam are modeled by rigid links. Links standing for shear headed studs within the joint are connected to these rigid links according to concrete crossbeam configuration. In order to reproduce the constraint in compres-sion due to the presence of the concrete crossbeam, four compression gap elements have been modeled both at left and right sides of the CCB joints, as shown in Figure 4. The compression gaps of the numerical model link the vertical end-plate to the axis of CCB beam at mid-support, both in the left and in the right side of the joint. The two levels of pretension bars in the bottom area of the CCB have been modeled by two elastic truss elements.
0.0 0.2 0.4 0.6 0.8 1.0
5.8
6.0
6.2
6.4
6.6
6.8
7.0
7.2
7.4
7.6
7.8 Near-fault Far-field
Mw
PGA (g) Figure4. Details of crossbeam model Figure5. Moment magnitude and PGA
of NF and FF ground motions
3 SELECTION OF INPUT GROUND MOTIONS
3.1 Selection of near-fault and far-field ground motions
A subset ground motion records based on PEER strong ground motion database of 80 near-fault (NF) pulse-like and 80 far-field (FF) have been selected. The group of NF records are formed with closest site-to-source distances (R) less than 20 km and moment magnitudes (MW) greater than 6.0. The ratio of PGV and PGA is greater than 0.2 for making sure the ground motions in-cluding obvious velocity pulse. Through directly observing, the ground motions records in NF group should have double sides velocity pulse. On the opposite rules, the FF ground motion records are selected with matching the PGA and MW of the NF records. The MW-PGA of NF records and FF records are shown in Figure 5.
80 NF ground motions records come from 5 strong earthquakes. These strong shock earth-quakes are N. Palm Springs Earthquake (America, 1986), Imperial Valley Earthquake (America, 1979), ChiChi Earthquake (Taiwan, 1999), Kocaeli Earthquake (Turkey, 1999) and Northridge Earthquake (America, 1994); 80 FF ground motions records from 7 strong shock earthquakes are selected, which are the same 5 strong earthquakes as NF and Kobe Earthquake (Japan, 1995), Whittier Narrows Earthquake (America, 1987). Due to limited space, only the list of se-lected NF ground motions is shown in Table 1.
Steel girder
Concrete slab
Pier
Crossbeam
Gap element
End plate
Concrete slab
Steel girderEnd plate
Transvers link elementTruss elementZero-length elementand vertical element

Table 1. The selection of NF ground motion records and FF ground motion records. NGA No. station PGV(cm/s) PGV/PGA Sa(T1,5%)(g) MW Tp(s) Ep 1531 TCU104_N 47.2 0.57 0.18 7.6 6.7 0.49 1497 TCU057_N 42.6 0.47 0.16 7.6 7.6 0.50 1531 TCU104_W 36.6 0.35 0.30 7.6 7.6 0.49 1499 TCU060-N 45.3 0.44 0.23 7.6 6.8 0.52 1502 TCU064_W 39.2 0.37 0.18 7.6 7.6 0.51 1532 TCU105_W 34.6 0.32 0.16 7.6 5.9 0.52 1486 TCU046_N 30.9 0.27 0.16 7.6 4.6 0.62 1527 TCU100_N 46.5 0.41 0.17 7.6 7.9 0.40 1527 TCU100_W 34.6 0.30 0.23 7.6 11.1 0.53 1502 TCU064_N 54 0.47 0.18 7.6 7.6 0.49 1497 TCU057_W 35.2 0.30 0.20 7.6 10.3 0.52 1519 TCU087-N 37.1 0.31 0.25 7.6 4.5 0.56 1488 TCU048_W 32.6 0.27 0.24 7.6 11.2 0.44 1519 TCU087-W 40.8 0.33 0.18 7.6 8.5 0.56 1480 TCU036_N 50.2 0.39 0.24 7.6 5.8 0.60 1486 TCU046_W 39.8 0.31 0.14 7.6 8.2 0.62 1530 TCU103_W 61.9 0.47 0.36 7.6 6.7 0.59 1496 TCU056_N 42.9 0.33 0.21 7.6 7.8 0.35 1496 TCU056_W 42.5 0.32 0.20 7.6 6.9 0.35 1501 TCU063_N 73.1 0.56 0.28 7.6 4.2 0.48
GBZ270 29.7 0.22 0.16 7.4 6.4 0.75 1548 TCU128_W 73 0.54 0.28 7.6 8.1 0.64 1480 TCU036_W 59.6 0.44 0.23 7.6 5.9 0.60 1500 TCU061_W 40.3 0.29 0.24 7.6 5.6 0.41 1482 TCU039_N 54 0.38 0.21 7.6 5.4 0.65 1490 TCU050-W 36.9 0.26 0.23 7.6 9.8 0.53 1541 TCU116_N 45.3 0.31 0.28 7.6 4.3 0.32 1494 TCU054_W 59.4 0.41 0.29 7.6 8.2 0.63
1148 KOCAE-LI/ARC090 39.5 0.27 0.10 7.4 6.5 0.79
1148 ARC090 39.5 0.27 0.10 7.4 3.6 0.64 1535 TCU109-W 50.8 0.33 0.33 7.6 6.5 0.39 161 H-BRA225 35.9 0.23 0.21 6.5 3.2 0.47 1498 TCU059_W 59.4 0.37 0.41 7.6 6.6 0.49 1529 TCU102_N 77.1 0.47 0.57 7.6 2.9 0.40 1506 TCU070_N 62.3 0.38 0.33 7.6 5.3 0.36 1548 TCU128_N 68.8 0.41 0.25 7.6 4.3 0.64 173 H-E10050 47.5 0.28 0.20 6.5 3.2 0.54 1550 TCU136_N 47.5 0.27 0.44 7.6 5.1 0.56 1462 TCU-E 40.5 0.23 0.31 7.6 5.8 0.48 1541 TCU116_W 48.7 0.27 0.56 7.6 5.8 0.39 1488 TCU048_N 48.3 0.27 0.18 7.6 7.8 0.45 1496 TCU051_W 49.3 0.27 0.29 7.6 7.7 0.35 1515 TCU082_N 40.5 0.22 0.29 7.6 7.7 0.40 1550 TCU136_E 55.8 0.29 0.43 7.6 8.4 0.56 1528 TCU101_W 67.9 0.34 0.28 7.6 6.0 0.59 527 MVH135 40.9 0.20 0.34 6.6 2.1 0.57 1482 TCU039_W 50 0.25 0.16 7.6 8.3 0.45

Table 1. Continued NGA No. station PGV(cm/s) PGV/PGA Sa(T1,5%)(g) Mw Tp(s) Ep 185 H-HVP315 49.8 0.23 0.29 6.5 3.5 0.75 1515 TCU082_W 58.4 0.27 0.33 7.6 8.2 0.42 178 H-E03140 46.8 0.21 0.28 6.5 2.6 0.66 170 H-ECC092 68.8 0.30 0.32 6.5 3.5 0.55 1161 GBZ000 50.3 0.21 0.15 7.4 4.9 0.67 1528 TCU101_N 49.4 0.20 0.33 7.6 5.6 0.44 1489 TCU049-N 61.2 0.25 0.37 7.6 5.1 0.66 1176 YPT060 65.7 0.25 0.36 6.5 5.0 0.48 171 H-EMO270 90.5 0.31 0.40 6.5 2.8 0.71 1529 TCU102_W 112.4 0.38 0.66 7.6 3.7 0.47 1511 TCU076-W 62.6 0.21 0.33 7.6 3.3 0.35 171 H-EMO000 71.7 0.23 0.36 6.5 2.5 0.71 1045 WPI316 67.4 0.21 0.53 6.7 1.8 0.62 1510 TCU075_W 88.3 0.27 0.29 7.6 4.0 0.70 1492 TCU052_W 159 0.47 0.96 7.6 6.8 0.64 184 H-EDA270 71.2 0.21 0.25 6.5 3.2 0.58 1244 CHY101_W 70.6 0.20 0.40 7.6 3.4 0.47 179 H-E04230 76.6 0.22 0.54 6.5 3.4 0.60 1171 SKR090 79.5 0.22 0.40 7.4 6.4 0.89 1999 H-SHP270 30.95 0.33 0.29 6.5 1.4 0.43 180 H-E05140 90.5 0.24 0.62 6.5 3.9 0.41 180 H-E05230 90.5 0.24 0.62 6.5 3.9 0.67 1492 TCU052_N 118.4 0.29 1.15 7.6 10.1 0.70 982 JEN022 106.2 0.26 1.04 6.7 2.7 0.56 181 H-E06230 109.8 0.26 0.44 6.5 3.5 0.67 1244 CHY101_N 115 0.27 0.70 7.6 5.0 0.47 318 B-PTS225 112 0.25 0.89 6.7 1.9 0.76 1045 WPI046 92.8 0.21 0.84 6.7 2.1 0.69 1505 TCU068_N 263.1 0.58 0.65 7.6 9.2 0.45
182 IMPVALL/H-E07230 109.3 0.24 0.62 7.6 3.4 0.69
1505 TCU068_W 176.6 0.32 0.97 7.6 7.9 0.45 1120 TAK000 127.1 0.21 1.55 6.9 1.6 0.41 1063 RRS228 166.1 0.20 1.71 6.7 1.1 0.61
3.2 Quantitative identification of near-fault pulse-like ground motions
In this paper the approach of Zhai et al. that suggested to use a method based on energy to quan-titative identify the NF pulse-like ground motions is used (Zhai et al., 2012).
First, the real ground motion time-histories are matched to the simplified mathematical model by the Least square method. Then, the simplified time-histories with characteristics of main pulse are got. Second, the perk-point method (PPM) is used to identify the parameters (e.g.: pe-riod of pulse, perk velocity) of the main pulse of real ground motions. Finally, the energy index Ep is defined to identify the pulse-like ground motion (Baker, 2007). When the Ep is greater than 0.3, the NF ground motion records include obvious velocity pulses (Zhai et al., 2012).
The pulse model (Dickinson & Gavin, 2011) is defined as
(1) 2
2
( ;, , , , , ) exp cos 24
pk pkp p p c pk p
c p p
t T t Tv t V T N T V
N T Tπ
ϕ π ϕ⎡ ⎤⎛ ⎞ ⎛ ⎞− −⎢ ⎥= − × −⎜ ⎟ ⎜ ⎟⎜ ⎟ ⎜ ⎟⎢ ⎥⎝ ⎠ ⎝ ⎠⎣ ⎦

In which, is the extracted velocity pulse, is pulse amplitude, is period of pulse, is the number of cycles in the pulse, is the location of the pulse. Through the Least
square method, the velocity pulse in real ground motion time-histories are matched the simpli-fied mathematical model. Based on the velocity pulse model from the real ground motion, the PPM (Osaki, 2008) is used to define the time interval of valley and peak in time-history curves as the pulse period. The pulse period results of the 80 near-fault ground motions records are identified and shown in Figure 7 and Table 1.
To identify the velocity pulse ground motion, the energy index Ep is defined as
E(t) =v2 (τ )dτ
0
t
∫v2 (τ )dτ
0
∞
∫Ep = dE(t)
ts
te∫ = E(te )− E(ts )
⎧
⎨
⎪⎪⎪
⎩
⎪⎪⎪
(2)
In which E(t) is cumulative energy of a ground motion at time t; v(τ ) is the velocity time se-ries; ts and te represent the starting and ending time points of a velocity pulse. The results of Ep are listed in Table 1. According to the energy index results, all the selection NF ground motion records include obvious velocity pulse.
4 PROBABILISTIC SEISMIC DEMAND ANALYSIS UNDER PULSE-LIKE GROUND MOTIONS
The probabilistic seismic demand analysis (PSDA) provides the probability relationship be-tween the properties of ground motions and structural response parameters (Engineering De-mand Parameters). In this paper the demand analysis has been performed by a series of time-history analysis on the case study of Fig. 1, using the previously selected accelerograms for a to-tal of 160 ground motions.
4.1 Selection of intensity measures and engineering demand parameters
Many different Intensity Measures (IMs) can be selected for a PSDA, while selection of the op-timal IM for the probability demand model, which contain the uncertainty of ground motions, need a lot of work (Padgett, 2008). The elastic spectral acceleration Sa (T1, 5%) at the first lon-gitudinal fundamental period for 5% damping is selected as IM. Concerning pulse-like ground motions, the peak ground velocity (PGV) is here considered.
The different engineering demand parameters (EDPs) can represent different performances of bridges, which can be sorted to global, mediate and local level groups. In this study, the pier drift ratio (D) is selected as the EDP, defined as the ratio of the maximum horizontal relative displacement between the pier top and bottom and the column height. It describes the overall bridge behavior under seismic loading. (Tondini & Stojadinovic , 2012)
4.2 Univariate probabilistic seismic demand model
The total of 160 nonlinear analyses data provides the parameters of the conditional probability distribution of the EDP given IM. Assuming that the EDP has a lognormal distribution, the con-ditional mean of EDP given IM can be assumed linear in log-log space whereas the conditional dispersion is constant. Thus, the probabilistic demand model (PSDM) can be expressed as
ln(EDP) = β0 + β1 ln(IM ) (3)
in which, the β0 and β1 are regression parameters. Hence, the logarithmic standard deviation could be obtained as following,
pv pV pTcN pkT

βEDP|IM =
ln(EDPi )− ln(EDP)( )2
i=1
N
∑N − 2
(4)
where, N is the number of fitting data. Through significance testing of regression coefficients, the equation (3) can be confirmed.
The logarithmic standard deviation 𝛽!"#|!" and coefficients of determination R2 can be used to test the goodness of fit.
The analysis results under 80 NF pulse-like ground motions and 80 FF ground motions de-scribe the inelastic response of composite bridge on longitudinal direction. The demand results of this bridge are shown in Table 5. Table 5. The demand results on longitudinal direction GMs type Mean Standard Maximum value NF 0.014 0.013 0.072 FF 0.006 0.004 0.023
The results of regression are shown in Table6 and Figure 8. According to the regression re-sults, the goodness of fit for FF ground motions is better than NF ground motions with the IM being Sa. This may be due to the more uncertainty of NF ground motions. However, the good-ness of fit for PGV is a reverse situation, which is to prove that the PGV leads to a closer rela-tionship with NF ground motions. In general, the Sa exhibits more relationship than PGV with the Drift ratio for both NF ground motions and FF ground motions. Table 6. The regression parameters and determination coefficients β0 β1
βEDP|IM R2
Sa-NF 1.07 1.13 0.247 0.880 PGV-NF -5.58 0.004 0.023 0.695 Sa-FF 0.61 0.88 0.226 0.901 PGV-FF -0.49 1.09 0.453 0.604
4.3 Multivariate probabilistic seismic demand model
The two IMs are now considered together and it is assumed that the double parameters demand model as
ln(EDP) = β0 + β1 ln(IM1)+ β2 ln(IM 2 ) (5)
where, the β0 , β1 and are regression parameters, is the median of EDP, which is defined as the ratio of the maximum horizontal relative displacement between the pier top and bottom and the column height. Through multivariate regression analysis, the multivariate demand model is proved feasible (Table 7). The regression parameters and determination coefficients of bi-parameters demand model represent more goodness of fit than the single parameter demand model. The regression surface models are shown in Figure 9. The results of multivariate demand model more obvious-ly represent the correlation between IM and EDP of this bridge. Table 7. The regression parameters and determination coefficients
β0 β1 β2 βEDP|IM R2
NF -4.95 0.34 0.92 0.228 0.897 FF -4.33 0.15 0.81 0.221 0.906
β2 EDP
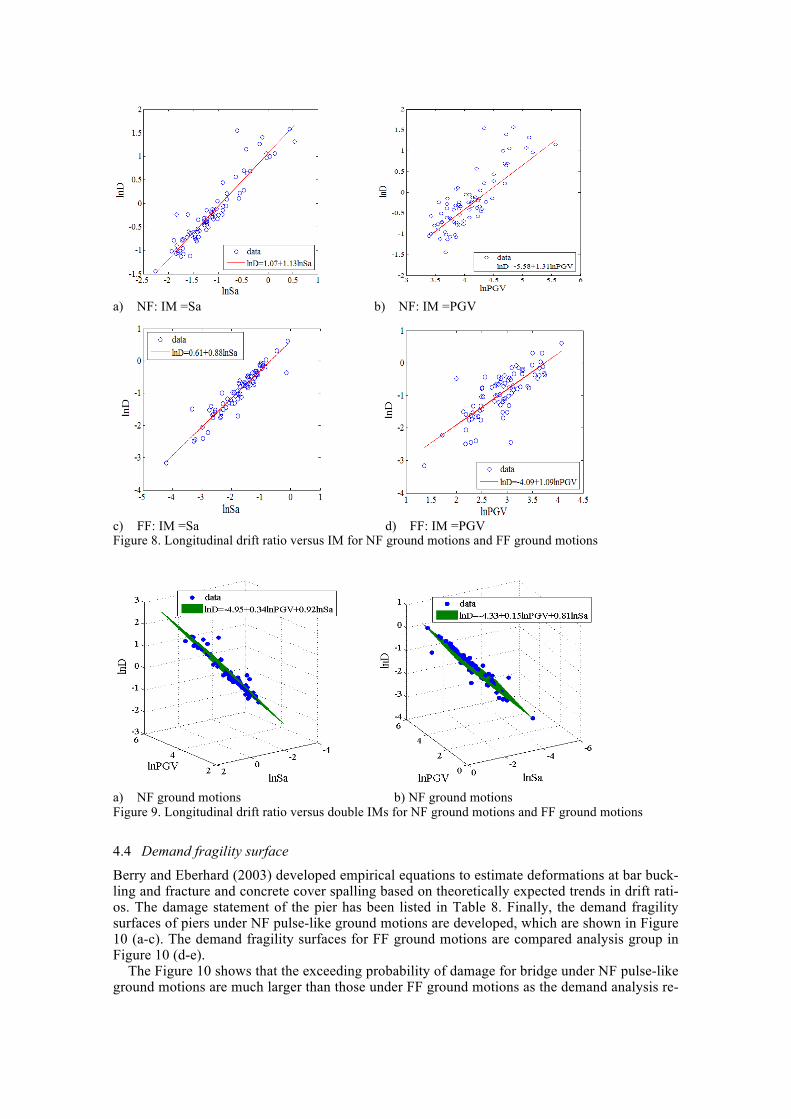
a) NF: IM =Sa b) NF: IM =PGV
c) FF: IM =Sa d) FF: IM =PGV Figure 8. Longitudinal drift ratio versus IM for NF ground motions and FF ground motions
a) NF ground motions b) NF ground motions Figure 9. Longitudinal drift ratio versus double IMs for NF ground motions and FF ground motions
4.4 Demand fragility surface
Berry and Eberhard (2003) developed empirical equations to estimate deformations at bar buck-ling and fracture and concrete cover spalling based on theoretically expected trends in drift rati-os. The damage statement of the pier has been listed in Table 8. Finally, the demand fragility surfaces of piers under NF pulse-like ground motions are developed, which are shown in Figure 10 (a-c). The demand fragility surfaces for FF ground motions are compared analysis group in Figure 10 (d-e).
The Figure 10 shows that the exceeding probability of damage for bridge under NF pulse-like ground motions are much larger than those under FF ground motions as the demand analysis re-

sults. The probabilities of different damage statements, while the inputted ground motions are with obvious velocity pulse, are about 30% bigger. In the considered range of IMs, the max probability of bars yielding of bridge constructed in NF region is about 90% while the probabil-ity is about 60% with the bridge in FF region. At the extreme statement, the probability of bars fracture of bridge is about 30% under the NF pulse-like ground motions. However, the probabil-ity of bars fracture with the bridge shocking by FF ground motions is only about 5% at the same extreme statement. Table 8. Damage index for pier drift ratio
No damage Cover Spalling
Bars Yielding
Bars Fracture
Damage index (Drift ratio) 0 1.37% 4.25% 8.96%
a) NF - Cover spalling b) NF - Bars yielding c) NF - Bars fracture
a) FF - Cover spalling b) FF - Bars yielding c) FF - Bars fracture Figure10. The demand fragility surface
5 CONCLUSION
The pulse-like ground motions have been identified by perk-point method based on energy and 80 near-fault strong ground motions with velocity pulse have been selected. The 3D refined FE model has been built and the complicated mechanical behavior of concrete crossbeam is consid-ered. Through the series of nonlinear time-history analysis (total of 160), the data of EDP are got to procedure the probability demand analysis for steel-concrete composite bridge. Thus, the multivariate probability demand model has been proposed by this paper and has been tested fea-sible. Finally, the demand fragility surfaces for pier drift ratio have been developed. The numer-ical results for the short-medium span steel-concrete composite bridges show that the seismic

demands of near-fault pulse-like ground motions are much larger than those of far-field ground motions. The multivariate demand model including more characteristics of the inputted ground motions represents more accurate relationship between the IMs and the EDP. Based on the mul-tivariate probability demand analysis, the seismic performance of steel-concrete composite could be better understood.
ACKNOWLEDGEMENT
The financial supports received from the National Science Foundation of China (Grant Nos. 91315301, 51378162, 51178150), the Research Fund from Ministry of Science and Technology of China (2013BAJ08B01), and the Open Research Fund of State Key Laboratory for Disaster Reduction in Civil Engineering (SLDRCE12-MB-04) are gratefully appreciated. The Present work is also supported by the funds of the European Project SEQBRI: “Performance-Based Earthquake Engineering Analysis Of Short-Medium Span Steel-Concrete Composite Bridges”, Grant N° RFSR-CT-2012-00032. Any opinions, findings and conclusions or recommendations expressed in this paper are those of the authors and do not necessarily reflect those of SEQBRI sponsors.
REFERENCES
Baker, J.W. 2007. Quantitative classification of near-fault ground motions with wavelet analysis. Bulletin of the Seismological Society of America, 97(5): 1486-1501.
Bazzurro, P. 1998. Probabilistic Seismic Demand Analysis. PhD Dissertation. Stanford University: UMI Berry, M.P. & Eberhard, M. 2003. Performance Models for Flexural Damage in Reinforced Concrete
Columns. PEER Report, 2003/18. Dickinson, B.W. & Gavin, H.P. 2011. Parametric statistical generalization of uniform hazard earthquake
ground motions, Journal of Structural Engineering, ASCE, 137(3): 410-422. Padgett, J.E. 2008. Selection of optimal intensity measures in probabilistic seismic demand models of
highway bridge portfolios, Earthquake Engineering and Structural Dynamics, 37:711-725. Paolacci, F. & Giannini. R. 2014. Toward a performance-based earthquake engineering analysis of short-
medium span steel-concrete composite bridges. Second European Conference on Earthquake Engi-neering and Seismology. Istanbul.
Tondini, N. & Stojadinovic, B. 2012. Probabilistic seismic demand model for curved reinforced concrete bridges, Bulletin of Earthquake Engineering, 10: 1455-1479.
Osaki, Y. 2008. Spectral Analysis in Earthquake Engineering, Beijing: Seismological Press. Zhai, C., Chang, Z., Li, S., Chen, Z.Q., Xie, L. 2013. Quantitative Identification of Near-Fault Pulse-Like
Ground Motions Based on Energy. Bulletin of the Seismological Society of America, 103(5): 2591-2603.