Multisensory processing and oscillatory activity: analyzing non-linear electrophysiological measures...
12
Abstract Stimulus-related oscillations are known to be closely linked to integrative processing in the brain. One research domain within which there has been tremen- dous interest in oscillatory mechanisms is in the inte- gration of inputs across the widely separated sensory systems. Under the standard approach of assessing multisensory interactions in electrophysiological data- sets, the event-related response to a multisensory stim- ulus is directly compared with the sum of the responses to its unisensory constituents when presented alone. When using methods like wavelet transformation or fast Fourier transformation to derive induced oscillatory signals, however, such linear operations are not appro- priate. Here we introduce a simple bootstrapping pro- cedure wherein the linear summation of single unisensory trials forms a distribution against which multisensory trials may be statistically compared, an approach that circumvents the issue of non-linearity when combining unisensory oscillatory responses. To test this approach we applied it to datasets from intracranial recordings in non-human primates and human scalp-re- corded EEG, both derived from a simple audio-visual integration paradigm. Significant multisensory interac- tions were revealed in oscillatory activity centered at 15 and 20 Hz (the so-called beta band). Simulations of dif- ferent levels of background noise further validated the results obtained by this method. By demonstrating super- and sub-additive effects, our analyses showed that this approach is a valuable metric for studying multisensory interactions reflected in induced oscillatory responses. Keywords Cross-modal Bimodal EEG ERP Binding Oscillation Beta Gamma In 1989, Gray, Singer, and colleagues published groundbreaking work on the association between gamma oscillations and stimulus feature integration processes in the cat visual cortex (Gray et al. 1989). Further animal studies have shown that oscillatory re- sponses in the gamma band (30–80 Hz) are associated with short and long-range synchronizations in visual cortical areas (Castelo-Branco et al. 1998; Engel et al. 1991; Konig et al. 1995). Subsequent human studies using electroencephalography (EEG) and magnetoen- cephalography (MEG) have demonstrated similar oscillatory phenomena (e.g., Kaiser et al. 2004; Tallon- Baudry and Bertrand 1999; Muller et al. 1996). Feature integration processing has also been linked to oscilla- tory activity in other frequencies such as alpha (8– 12 Hz) or beta band activity (12–30 Hz) (e.g., Alegre et al. 2004; Brovelli et al. 2004; Busch et al. 2003; Classen et al. 1998; Herrmann et al. 2004; Klimesch 1999; Liang et al. 2002). D. Senkowski M. Gomez-Ramirez P. Lakatos G. R. Wylie S. Molholm C. E. Schroeder J. J. Foxe (&) The Cognitive Neurophysiology Laboratory, Program in Cognitive Neuroscience and Schizophrenia, Nathan S. Kline Institute for Psychiatric Research, 140 Old Orangeburg Road, Orangeburg, NY 10962, USA e-mail: [email protected] M. Gomez-Ramirez J. J. Foxe Program in Cognitive Neuroscience, Department of Psychology, The City College of the City University of New York, 138th Street and Convent Avenue, New York, NY 10031, USA P. Lakatos Institute for Psychology, Hungarian Academy of Sciences, Budapest, Hungaria Exp Brain Res (2007) 177:184–195 DOI 10.1007/s00221-006-0664-7 123 RESEARCH ARTICLE Multisensory processing and oscillatory activity: analyzing non-linear electrophysiological measures in humans and simians Daniel Senkowski Manuel Gomez-Ramirez Peter Lakatos Glenn R. Wylie Sophie Molholm Charles E. Schroeder John J. Foxe Received: 10 January 2006 / Accepted: 31 July 2006 / Published online: 19 October 2006 Ó Springer-Verlag 2006
-
Upload
kesslerfoundation -
Category
Documents
-
view
3 -
download
0
Transcript of Multisensory processing and oscillatory activity: analyzing non-linear electrophysiological measures...
Abstract Stimulus-related oscillations are known to be
closely linked to integrative processing in the brain. One
research domain within which there has been tremen-
dous interest in oscillatory mechanisms is in the inte-
gration of inputs across the widely separated sensory
systems. Under the standard approach of assessing
multisensory interactions in electrophysiological data-
sets, the event-related response to a multisensory stim-
ulus is directly compared with the sum of the responses
to its unisensory constituents when presented alone.
When using methods like wavelet transformation or fast
Fourier transformation to derive induced oscillatory
signals, however, such linear operations are not appro-
priate. Here we introduce a simple bootstrapping pro-
cedure wherein the linear summation of single
unisensory trials forms a distribution against which
multisensory trials may be statistically compared, an
approach that circumvents the issue of non-linearity
when combining unisensory oscillatory responses. To test
this approach we applied it to datasets from intracranial
recordings in non-human primates and human scalp-re-
corded EEG, both derived from a simple audio-visual
integration paradigm. Significant multisensory interac-
tions were revealed in oscillatory activity centered at 15
and 20 Hz (the so-called beta band). Simulations of dif-
ferent levels of background noise further validated the
results obtained by this method. By demonstrating super-
and sub-additive effects, our analyses showed that this
approach is a valuable metric for studying multisensory
interactions reflected in induced oscillatory responses.
Keywords Cross-modal � Bimodal � EEG � ERP �Binding � Oscillation � Beta Gamma
In 1989, Gray, Singer, and colleagues published
groundbreaking work on the association between
gamma oscillations and stimulus feature integration
processes in the cat visual cortex (Gray et al. 1989).
Further animal studies have shown that oscillatory re-
sponses in the gamma band (30–80 Hz) are associated
with short and long-range synchronizations in visual
cortical areas (Castelo-Branco et al. 1998; Engel et al.
1991; Konig et al. 1995). Subsequent human studies
using electroencephalography (EEG) and magnetoen-
cephalography (MEG) have demonstrated similar
oscillatory phenomena (e.g., Kaiser et al. 2004; Tallon-
Baudry and Bertrand 1999; Muller et al. 1996). Feature
integration processing has also been linked to oscilla-
tory activity in other frequencies such as alpha (8–
12 Hz) or beta band activity (12–30 Hz) (e.g., Alegre
et al. 2004; Brovelli et al. 2004; Busch et al. 2003;
Classen et al. 1998; Herrmann et al. 2004; Klimesch
1999; Liang et al. 2002).
D. Senkowski � M. Gomez-Ramirez � P. Lakatos �G. R. Wylie � S. Molholm � C. E. Schroeder �J. J. Foxe (&)The Cognitive Neurophysiology Laboratory,Program in Cognitive Neuroscience and Schizophrenia,Nathan S. Kline Institute for Psychiatric Research,140 Old Orangeburg Road, Orangeburg, NY 10962, USAe-mail: [email protected]
M. Gomez-Ramirez � J. J. FoxeProgram in Cognitive Neuroscience,Department of Psychology,The City College of the City University of New York,138th Street and Convent Avenue, New York,NY 10031, USA
P. LakatosInstitute for Psychology,Hungarian Academy of Sciences, Budapest, Hungaria
Exp Brain Res (2007) 177:184–195
DOI 10.1007/s00221-006-0664-7
123
RESEARCH ARTICLE
Multisensory processing and oscillatory activity: analyzingnon-linear electrophysiological measures in humans and simians
Daniel Senkowski Æ Manuel Gomez-Ramirez ÆPeter Lakatos Æ Glenn R. Wylie Æ Sophie Molholm ÆCharles E. Schroeder Æ John J. Foxe
Received: 10 January 2006 / Accepted: 31 July 2006 / Published online: 19 October 2006� Springer-Verlag 2006

This association between oscillatory activity and
feature integration raises the strong likelihood that
similar oscillatory mechanisms are involved in multi-
sensory processing, for example, when auditory speech
is integrated with visual lip movements. Recent work
has also shown that the different sensory features of a
multisensory object are integrated not only in the
classical ‘‘multisensory areas’’ but also in low level
cortical structures that were traditionally believed to
be purely unisensory in function (e.g., Foxe et al. 2000;
Foxe and Schroeder 2005; Fort et al. 2002a; Giard and
Perronet 1999; Gonzalez Andino et al. 2005; Molholm
et al. 2004; Murray et al. 2005a, b Schroeder et al. 2001;
Schroeder and Foxe 2002, 2004, 2005). It is likely that
oscillatory synchronization in these structures plays an
important role in the integration of the multiple sen-
sory inputs of a multisensory event (Kaiser et al. 2005;
Sakowitz et al. 2005; Senkowski et al. 2005). Moreover,
recent observations indicate that oscillatory responses
may even be more sensitive to some experimental
manipulations than the broad-band event-related po-
tential (ERP) (Bertrand and Tallon-Baudry 2000;
Herrmann and Mecklinger 2001; Senkowski and
Herrmann 2002; Tallon-Baudry et al. 1996, 1998),
emphasizing the importance of examining multisensory
interactions in oscillatory responses.
The standard approach for assessing multisensory
interactions in the ERP and functional magnetic res-
onance imaging (fMRI) literature is to compare the
responses evoked by multisensory stimuli (e.g., multi-
sensory audio-visual) with the linear summation of the
responses to the respective unisensory constituents
(e.g., unisensory-auditory plus unisensory-visual)
(Calvert 2001a, b; Fort et al. 2002b; Foxe et al. 2002;
Giard and Peronnet 1999; Molholm et al. 2002; Talsma
and Woldorff 2005).1 This approach is warranted and
appropriate when assessing ERPs since voltage mea-
sures sum linearly. However, the property of linearity
does not hold for induced oscillatory responses when
they are computed using the standard methods such as
the wavelet transformation (WT) or fast Fourier
transformations (FFTs). For this reason, it is not valid
to use the standard approach to study multisensory
interactions in induced oscillatory responses (Fig. 1),
although it has been certainly applied already in the
literature (e.g., Bhattacharya et al. 2002).
Here we present an approach for studying multi-
sensory interactions in induced oscillatory brain re-
sponses. The approach is based on the linear
summation of the raw data of all single trials from two
separately presented unisensory modalities (e.g., all
single unisensory-auditory trials are combined with all
single unisensory-visual trials). The unisensory trial
combinations are bootstrapped to provide a distribu-
tion against which the responses to multisensory stim-
uli are compared.
The method was tested in monkey intracranial local
field potential data and in human EEG recordings
exploring multisensory audiovisual interactions in the
induced beta band (13–30 Hz). Although both datasets
were collected for audiovisual interactions, there were
substantial differences in the location of recording sites
and the paradigms used between species. As such, it
should be stated that our purpose here was not to di-
rectly compare and contrast these datasets but rather,
to test the approach on different types of recordings
(i.e., different species and different recording tech-
niques). The beta frequency band was chosen because
we have recently found multisensory interactions in the
evoked responses in this frequency range (Senkowski
et al. 2006a). Evoked and induced oscillatory activity
differ in that the former is strictly phase and time
locked to the onset of a stimulus, whereas the latter
does not have to be strictly phase and time locked to
the onset of each trial. In Senkowski et al. (2006a), we
have explicitly described how multisensory interactions
can be examined for evoked oscillations. The issue of
non-linearity mentioned above, however, prevents the
application of the previously described approach for
the analysis of induced oscillations. For this reason, we
present a more appropriate non-linear approach to
study multisensory interactions in induced oscillations
here.
Since the approach is based on the linear summation
of single trials from two different sensory modalities, it
is possible that background noise in the data affects the
output of the method. That is, background noise is only
represented once in the multisensory audiovisual trials
whereas during linear summation of unisensory-audi-
tory and unisensory-visual trials two sources of back-
ground noise activities are summated. To rule out the
possibility that some of the multisensory oscillatory
effects we observe with this method are a result of this
background noise issue, we performed a noise simula-
tion where we added artificial noise to the continuous
raw data. This simulation shows that background noise
is not the source of our multisensory effects.
1 By convention, multisensory responses that are smaller than thesum of the unisensory responses are referred to as sub-additivewhile multisensory responses that are larger than the sum arereferred to as super-additive (e.g., Calvert 2001a, b). However, itshould be noted that a multisensory AV stimulus could evokelarger responses than either of the respective unisensory re-sponses while still being classified as sub-additive relative to thesummed unisensory responses.
Exp Brain Res (2007) 177:184–195 185
123
Methods and results
Multisensory audiovisual interactions in induced
oscillatory beta responses were investigated in monkey
intracranial local field potential data and in human
EEG data from a simple audio-visual integration par-
adigm (The materials and paradigms of the data ana-
lyzed here are described in the Appendix.). First, a
target frequency and a time interval were defined for
the analysis. Then a five-step analysis was performed
for the selected target frequency and time interval.
Definition of a frequency and time interval
for the analysis of multisensory interactions
The five-step analysis of multisensory interactions is
described here in detail for the intracranial monkey
data shown in Fig. 2.
Before analysis begins, a time window and a specific
frequency-band must be first defined. We recommend
computing time–frequency (TF) planes to define these
parameters (e.g., Herrmann et al. 1999; Senkowski and
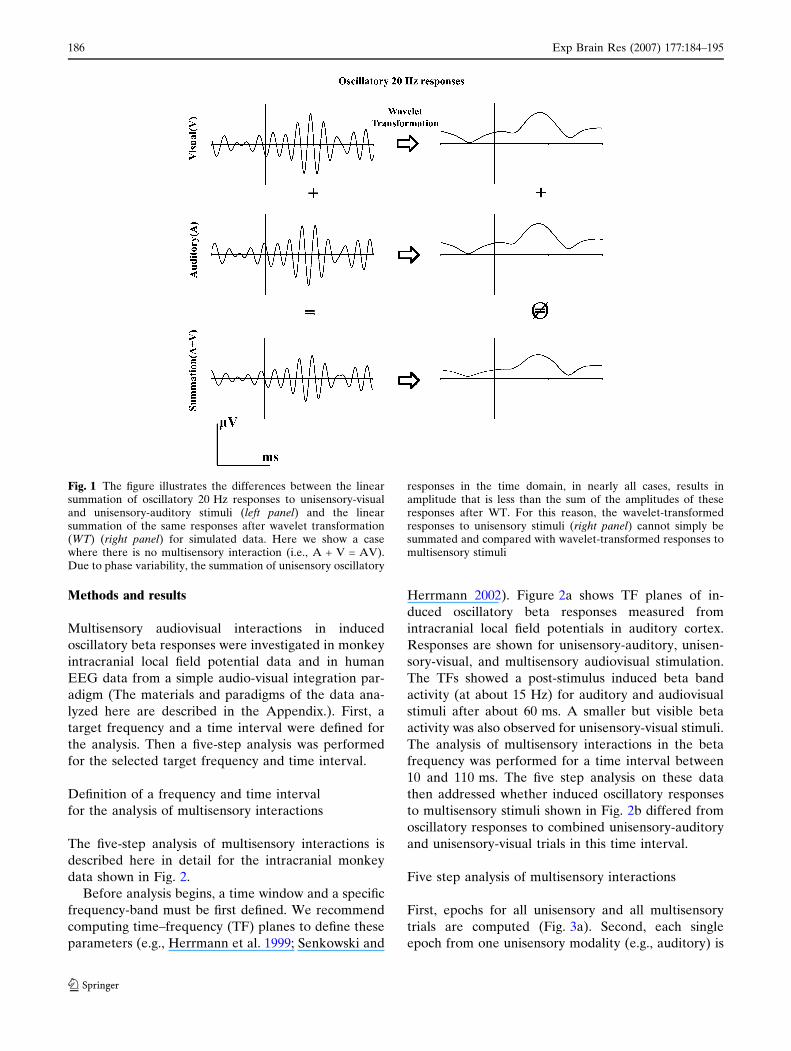
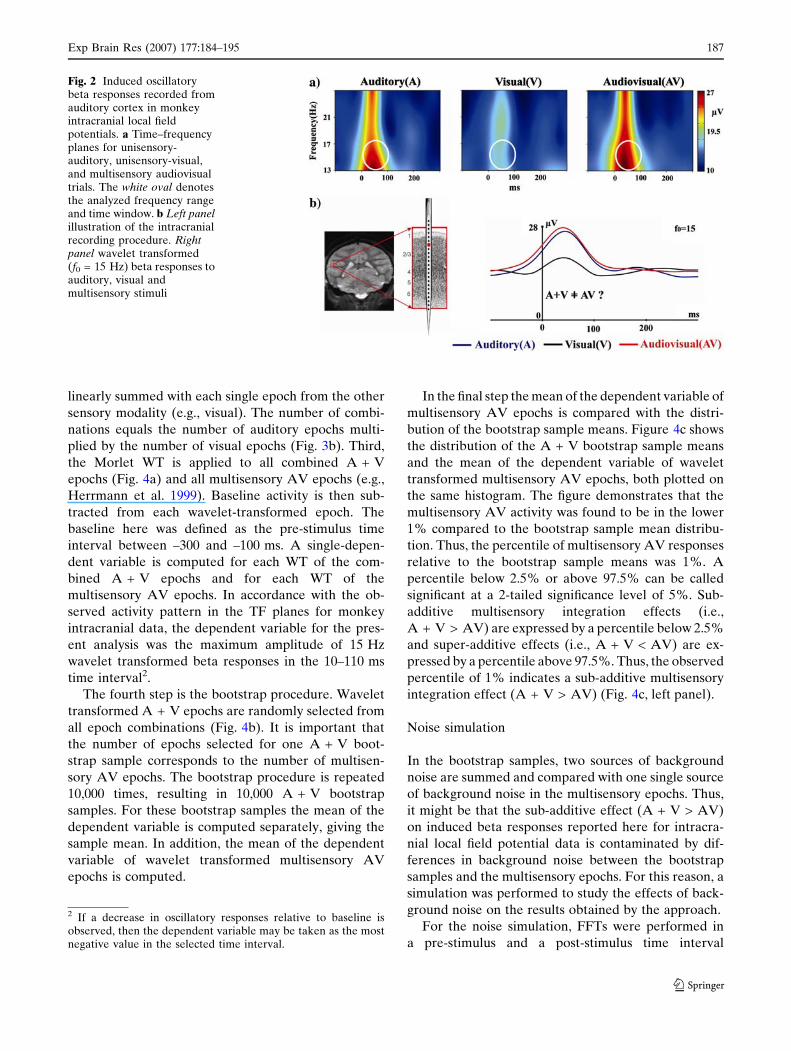
Herrmann 2002). Figure 2a shows TF planes of in-
duced oscillatory beta responses measured from
intracranial local field potentials in auditory cortex.
Responses are shown for unisensory-auditory, unisen-
sory-visual, and multisensory audiovisual stimulation.
The TFs showed a post-stimulus induced beta band
activity (at about 15 Hz) for auditory and audiovisual
stimuli after about 60 ms. A smaller but visible beta
activity was also observed for unisensory-visual stimuli.
The analysis of multisensory interactions in the beta
frequency was performed for a time interval between
10 and 110 ms. The five step analysis on these data
then addressed whether induced oscillatory responses
to multisensory stimuli shown in Fig. 2b differed from
oscillatory responses to combined unisensory-auditory
and unisensory-visual trials in this time interval.
Five step analysis of multisensory interactions
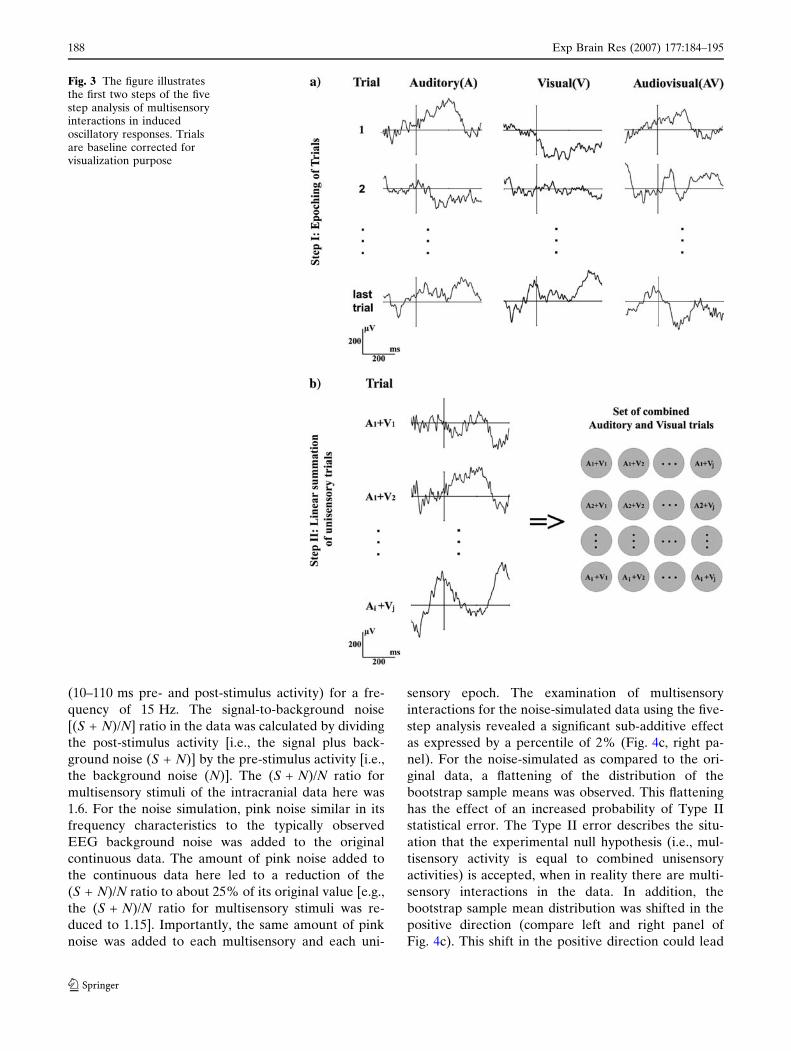
First, epochs for all unisensory and all multisensory
trials are computed (Fig. 3a). Second, each single
epoch from one unisensory modality (e.g., auditory) is
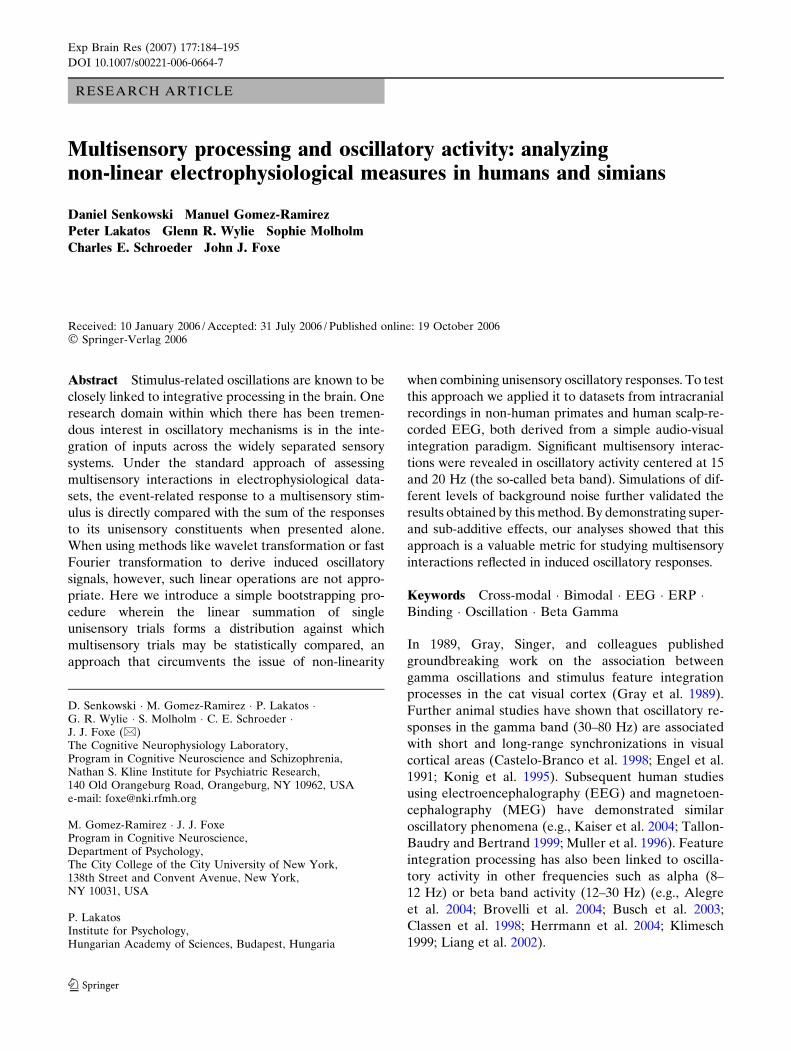
Fig. 1 The figure illustrates the differences between the linearsummation of oscillatory 20 Hz responses to unisensory-visualand unisensory-auditory stimuli (left panel) and the linearsummation of the same responses after wavelet transformation(WT) (right panel) for simulated data. Here we show a casewhere there is no multisensory interaction (i.e., A + V = AV).Due to phase variability, the summation of unisensory oscillatory
responses in the time domain, in nearly all cases, results inamplitude that is less than the sum of the amplitudes of theseresponses after WT. For this reason, the wavelet-transformedresponses to unisensory stimuli (right panel) cannot simply besummated and compared with wavelet-transformed responses tomultisensory stimuli
186 Exp Brain Res (2007) 177:184–195
123
linearly summed with each single epoch from the other
sensory modality (e.g., visual). The number of combi-
nations equals the number of auditory epochs multi-
plied by the number of visual epochs (Fig. 3b). Third,
the Morlet WT is applied to all combined A + V
epochs (Fig. 4a) and all multisensory AV epochs (e.g.,
Herrmann et al. 1999). Baseline activity is then sub-
tracted from each wavelet-transformed epoch. The
baseline here was defined as the pre-stimulus time
interval between –300 and –100 ms. A single-depen-
dent variable is computed for each WT of the com-
bined A + V epochs and for each WT of the
multisensory AV epochs. In accordance with the ob-
served activity pattern in the TF planes for monkey
intracranial data, the dependent variable for the pres-
ent analysis was the maximum amplitude of 15 Hz
wavelet transformed beta responses in the 10–110 ms
time interval2.
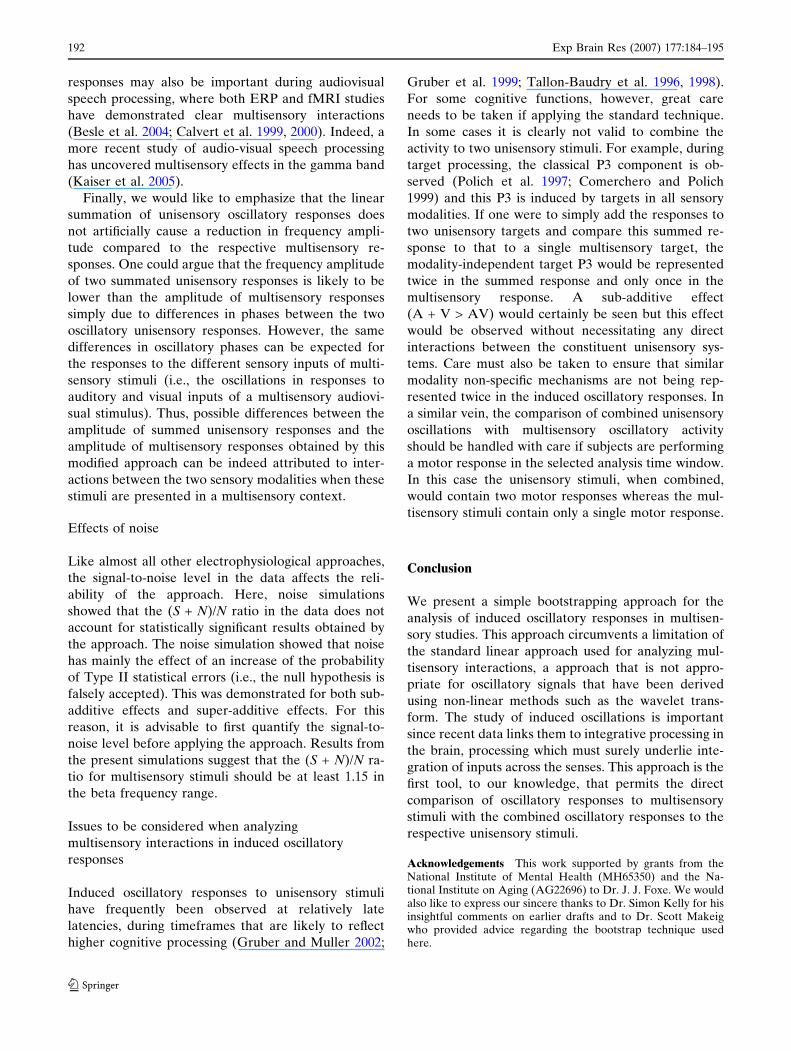
The fourth step is the bootstrap procedure. Wavelet
transformed A + V epochs are randomly selected from
all epoch combinations (Fig. 4b). It is important that
the number of epochs selected for one A + V boot-
strap sample corresponds to the number of multisen-
sory AV epochs. The bootstrap procedure is repeated
10,000 times, resulting in 10,000 A + V bootstrap
samples. For these bootstrap samples the mean of the
dependent variable is computed separately, giving the
sample mean. In addition, the mean of the dependent
variable of wavelet transformed multisensory AV
epochs is computed.
In the final step the mean of the dependent variable of
multisensory AV epochs is compared with the distri-
bution of the bootstrap sample means. Figure 4c shows
the distribution of the A + V bootstrap sample means
and the mean of the dependent variable of wavelet
transformed multisensory AV epochs, both plotted on
the same histogram. The figure demonstrates that the
multisensory AV activity was found to be in the lower
1% compared to the bootstrap sample mean distribu-
tion. Thus, the percentile of multisensory AV responses
relative to the bootstrap sample means was 1%. A
percentile below 2.5% or above 97.5% can be called
significant at a 2-tailed significance level of 5%. Sub-
additive multisensory integration effects (i.e.,
A + V > AV) are expressed by a percentile below 2.5%
and super-additive effects (i.e., A + V < AV) are ex-
pressed by a percentile above 97.5%. Thus, the observed
percentile of 1% indicates a sub-additive multisensory
integration effect (A + V > AV) (Fig. 4c, left panel).
Noise simulation
In the bootstrap samples, two sources of background
noise are summed and compared with one single source
of background noise in the multisensory epochs. Thus,
it might be that the sub-additive effect (A + V > AV)
on induced beta responses reported here for intracra-
nial local field potential data is contaminated by dif-
ferences in background noise between the bootstrap
samples and the multisensory epochs. For this reason, a
simulation was performed to study the effects of back-
ground noise on the results obtained by the approach.
For the noise simulation, FFTs were performed in
a pre-stimulus and a post-stimulus time interval
Fig. 2 Induced oscillatorybeta responses recorded fromauditory cortex in monkeyintracranial local fieldpotentials. a Time–frequencyplanes for unisensory-auditory, unisensory-visual,and multisensory audiovisualtrials. The white oval denotesthe analyzed frequency rangeand time window. b Left panelillustration of the intracranialrecording procedure. Rightpanel wavelet transformed(f0 = 15 Hz) beta responses toauditory, visual andmultisensory stimuli
2 If a decrease in oscillatory responses relative to baseline isobserved, then the dependent variable may be taken as the mostnegative value in the selected time interval.
Exp Brain Res (2007) 177:184–195 187
123
(10–110 ms pre- and post-stimulus activity) for a fre-
quency of 15 Hz. The signal-to-background noise
[(S + N)/N] ratio in the data was calculated by dividing
the post-stimulus activity [i.e., the signal plus back-
ground noise (S + N)] by the pre-stimulus activity [i.e.,
the background noise (N)]. The (S + N)/N ratio for
multisensory stimuli of the intracranial data here was
1.6. For the noise simulation, pink noise similar in its
frequency characteristics to the typically observed
EEG background noise was added to the original
continuous data. The amount of pink noise added to
the continuous data here led to a reduction of the
(S + N)/N ratio to about 25% of its original value [e.g.,
the (S + N)/N ratio for multisensory stimuli was re-
duced to 1.15]. Importantly, the same amount of pink
noise was added to each multisensory and each uni-
sensory epoch. The examination of multisensory
interactions for the noise-simulated data using the five-
step analysis revealed a significant sub-additive effect
as expressed by a percentile of 2% (Fig. 4c, right pa-
nel). For the noise-simulated as compared to the ori-
ginal data, a flattening of the distribution of the
bootstrap sample means was observed. This flattening
has the effect of an increased probability of Type II
statistical error. The Type II error describes the situ-
ation that the experimental null hypothesis (i.e., mul-
tisensory activity is equal to combined unisensory
activities) is accepted, when in reality there are multi-
sensory interactions in the data. In addition, the
bootstrap sample mean distribution was shifted in the
positive direction (compare left and right panel of
Fig. 4c). This shift in the positive direction could lead
Fig. 3 The figure illustratesthe first two steps of the fivestep analysis of multisensoryinteractions in inducedoscillatory responses. Trialsare baseline corrected forvisualization purpose
188 Exp Brain Res (2007) 177:184–195
123

to an increase in the probability of Type I statistical
error (i.e., the null hypothesis is falsy rejected). The
reduction of statistical significance of the noise-simu-
lated data compared to the original data (2 vs. 1%,
respectively), however, demonstrates that noise mainly
increases the probability of Type II statistical errors
(i.e., the null hypothesis is falsely accepted). Thus, it is
very unlikely that background noise accounts for the
multisensory sub-additive effect observed in the intra-
cranial data.
Multisensory interactions in scalp recorded human
EEG recordings
Figure 5a shows time–frequency (TF) representations
for wavelet transformed induced beta responses to
unisensory-auditory, unisensory-visual, and multisen-
sory audiovisual stimuli for one right-frontal channel.
The figure illustrates a strong increase in beta activity
after about 150 ms, primarily for multisensory stimuli.
Thus, based on our observations from the TF, the
maximum amplitude of the 20 Hz wavelet transform in
the time interval 80–170 ms was defined as the
dependent variable to analyze for multisensory inter-
actions (Fig. 5b). Figure 5c (left panel) shows the dis-
tribution of the bootstrap sample means and the mean
of the dependent variable of multisensory epochs. A
percentile of 99.9 % was observed for the mean of the
dependent variable of multisensory epochs compared
to the distribution of the bootstrap sample means,
suggesting a multisensory super-additive effect
[(A + V) < AV)]. As detailed above, the effects of
background noise this super-additive effect were then
explored. The (S + N)/N ratio was computed by cal-
Fig. 4 The figure illustratessteps three to five of the fivestep analysis. In addition, theresults of the noise simulationare shown (Step c, right panel)
Exp Brain Res (2007) 177:184–195 189
123
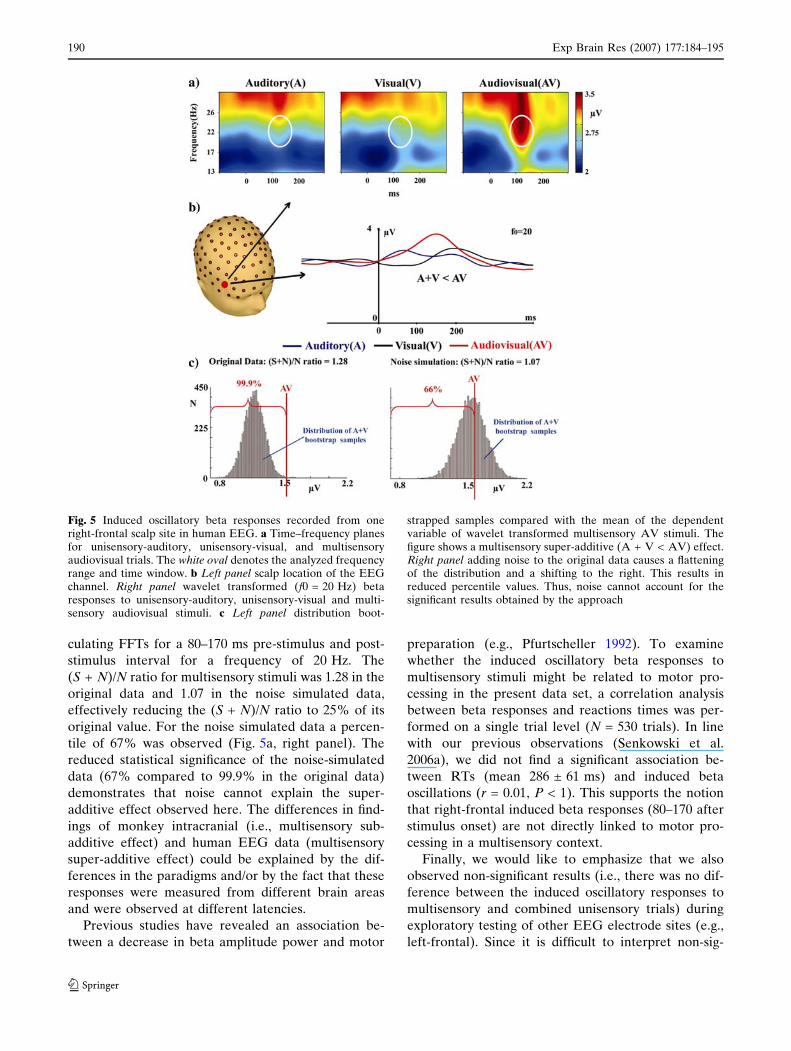
culating FFTs for a 80–170 ms pre-stimulus and post-
stimulus interval for a frequency of 20 Hz. The
(S + N)/N ratio for multisensory stimuli was 1.28 in the
original data and 1.07 in the noise simulated data,
effectively reducing the (S + N)/N ratio to 25% of its
original value. For the noise simulated data a percen-
tile of 67% was observed (Fig. 5a, right panel). The
reduced statistical significance of the noise-simulated
data (67% compared to 99.9% in the original data)
demonstrates that noise cannot explain the super-
additive effect observed here. The differences in find-
ings of monkey intracranial (i.e., multisensory sub-
additive effect) and human EEG data (multisensory
super-additive effect) could be explained by the dif-
ferences in the paradigms and/or by the fact that these
responses were measured from different brain areas
and were observed at different latencies.
Previous studies have revealed an association be-
tween a decrease in beta amplitude power and motor
preparation (e.g., Pfurtscheller 1992). To examine
whether the induced oscillatory beta responses to
multisensory stimuli might be related to motor pro-
cessing in the present data set, a correlation analysis
between beta responses and reactions times was per-
formed on a single trial level (N = 530 trials). In line
with our previous observations (Senkowski et al.
2006a), we did not find a significant association be-
tween RTs (mean 286 ± 61 ms) and induced beta
oscillations (r = 0.01, P < 1). This supports the notion
that right-frontal induced beta responses (80–170 after
stimulus onset) are not directly linked to motor pro-
cessing in a multisensory context.
Finally, we would like to emphasize that we also
observed non-significant results (i.e., there was no dif-
ference between the induced oscillatory responses to
multisensory and combined unisensory trials) during
exploratory testing of other EEG electrode sites (e.g.,
left-frontal). Since it is difficult to interpret non-sig-
Fig. 5 Induced oscillatory beta responses recorded from oneright-frontal scalp site in human EEG. a Time–frequency planesfor unisensory-auditory, unisensory-visual, and multisensoryaudiovisual trials. The white oval denotes the analyzed frequencyrange and time window. b Left panel scalp location of the EEGchannel. Right panel wavelet transformed (f0 = 20 Hz) betaresponses to unisensory-auditory, unisensory-visual and multi-sensory audiovisual stimuli. c Left panel distribution boot-
strapped samples compared with the mean of the dependentvariable of wavelet transformed multisensory AV stimuli. Thefigure shows a multisensory super-additive (A + V < AV) effect.Right panel adding noise to the original data causes a flatteningof the distribution and a shifting to the right. This results inreduced percentile values. Thus, noise cannot account for thesignificant results obtained by the approach
190 Exp Brain Res (2007) 177:184–195
123

nificant statistical results, however, these findings are
not presented in further detail here.
Protocol for the five-step analysis
The five-step analysis can be reiterated briefly as fol-
lows:
1. Segmentation of each unisensory-auditory (XA),
unisensory visual (Xv), and multisensory (XAV)
epochs.
2. Linear summation of unisensory epochs:
XA+Vi,j = XV
j , for i = 1, ..., NA and j = 1, ..., NV,
where N denotes the number of epochs.
3. Wavelet transformation of each combined unisen-
sory epoch
WTi;jAþVða; bÞ ¼
1ffiffiffi
ap W
t � b
a
� �
Xi;jAþVðtÞdt
�
�
�
�
�
�
�
�
;
for i ¼ 1; :::;NA and j ¼ 1; :::;Nv;
and each multisensory epoch
WTkAVða; bÞ ¼
1ffiffiffi
ap W
t � b
a
� �
XkAVðtÞdt
�
�
�
�
�
�
�
�
;
for k ¼ 1; :::; NAV:
The complex morlet WT is represented by
WðtÞ ¼ ejxt � e�t2=2; where ejxt represents a sinusoi-
dal function which is multiplied with the envelope
function e�t2=2: �w is the conjugate of the complex
wavelet. The term a represents scale and b the time
shift. The maxima or minima within a chosen
interval at a chosen scale are defined as the
dependent variable for the analysis.
4. Bootstrapping the dependent variables from the
set of combined WTA+V epochs and calculating the
mean of the dependent variable over epochs for
each bootstrap sample. The number of combined
WTA+V epochs in each bootstrap sample should
correspond to the number of multisensory WTAV
epochs (i.e., NAV). We recommend repeating the
bootstrap procedure 10,000 times, resulting in
10,000 bootstrap samples.
5. Comparison of the mean of the dependent variable
for WTAV with the distribution of bootstrap sam-
ple means.
From single subject data to group level statistics
To explore whether statistical findings on a single
subject level are significant on a group level, it seems to
be useful to test whether the percentile values over
subjects differ from that expected by chance. One
possible approach is the application of chi-square-tests.
To perform chi-square-tests, the percentiles obtained
from different subjects would have to be categorized
first. For instance, percentiles might be categorized in
three groups (Group A: percentile < 0.025, Group B:
0.025 £ percentile ‡ 0.975, and Group C: percen-
tile > 0.025). For a given sample of N = 40, one would
on average expect to find one subject in group A, 38
subjects in group B, and one subject in group C. The
Chi-Square-test computes the goodness-of-fit between
the distribution expected simply by chance and the
actual distribution, providing a statistic that indicates
whether they differ significantly.
Discussion
Here we present a simple approach for the analysis of
induced oscillatory responses in multisensory studies.
Induced oscillatory responses are believed to be a
sensitive marker of feature integration processes in the
visual and the auditory domains (Gray 1999; Kaiser
and Lutzenberger 2003; Konig et al. 1995; von Stein
et al. 2000), and there is reason to believe that they also
play a role in integration of multisensory inputs. For
example, electrophysiological studies have revealed
multisensory oscillatory interactions during the early
phases of the evoked response (Sakowitz et al. 2001,
2005; Senkowski et al. 2005, 2006b). The role of in-
duced oscillatory activity in cortical binding and find-
ings of multisensory processing in evoked oscillatory
activity, suggests that the analysis of induced oscilla-
tory responses will reveal important information about
the mechanisms underlying multisensory interactions
in the brain.
Possible applications
This approach provides a reliable metric for detecting
multisensory interactions (both sub- and super-addi-
tive) in human and non-human primate electrophysi-
ological data. A particular advantage of the approach
is the statistical testing of multisensory interactions at
the single subject level. This offers the opportunity of
reliable application in research fields that often rely on
the analysis of small sample sizes (e.g., non-human
primate research or human intracranial studies).
In principle, the approach can be applied to diverse
multisensory datasets. For example, it has been shown
that induced alpha and theta activity play an important
role in memory processing (Herrmann et al. 2004;
Klimesch 1999; Sauseng et al. 2004) and oscillatory
Exp Brain Res (2007) 177:184–195 191
123
responses may also be important during audiovisual
speech processing, where both ERP and fMRI studies
have demonstrated clear multisensory interactions
(Besle et al. 2004; Calvert et al. 1999, 2000). Indeed, a
more recent study of audio-visual speech processing
has uncovered multisensory effects in the gamma band
(Kaiser et al. 2005).
Finally, we would like to emphasize that the linear
summation of unisensory oscillatory responses does
not artificially cause a reduction in frequency ampli-
tude compared to the respective multisensory re-
sponses. One could argue that the frequency amplitude
of two summated unisensory responses is likely to be
lower than the amplitude of multisensory responses
simply due to differences in phases between the two
oscillatory unisensory responses. However, the same
differences in oscillatory phases can be expected for
the responses to the different sensory inputs of multi-
sensory stimuli (i.e., the oscillations in responses to
auditory and visual inputs of a multisensory audiovi-
sual stimulus). Thus, possible differences between the
amplitude of summed unisensory responses and the
amplitude of multisensory responses obtained by this
modified approach can be indeed attributed to inter-
actions between the two sensory modalities when these
stimuli are presented in a multisensory context.
Effects of noise
Like almost all other electrophysiological approaches,
the signal-to-noise level in the data affects the reli-
ability of the approach. Here, noise simulations
showed that the (S + N)/N ratio in the data does not
account for statistically significant results obtained by
the approach. The noise simulation showed that noise
has mainly the effect of an increase of the probability
of Type II statistical errors (i.e., the null hypothesis is
falsely accepted). This was demonstrated for both sub-
additive effects and super-additive effects. For this
reason, it is advisable to first quantify the signal-to-
noise level before applying the approach. Results from
the present simulations suggest that the (S + N)/N ra-
tio for multisensory stimuli should be at least 1.15 in
the beta frequency range.
Issues to be considered when analyzing
multisensory interactions in induced oscillatory
responses
Induced oscillatory responses to unisensory stimuli
have frequently been observed at relatively late
latencies, during timeframes that are likely to reflect
higher cognitive processing (Gruber and Muller 2002;
Gruber et al. 1999; Tallon-Baudry et al. 1996, 1998).
For some cognitive functions, however, great care
needs to be taken if applying the standard technique.
In some cases it is clearly not valid to combine the
activity to two unisensory stimuli. For example, during
target processing, the classical P3 component is ob-
served (Polich et al. 1997; Comerchero and Polich
1999) and this P3 is induced by targets in all sensory
modalities. If one were to simply add the responses to
two unisensory targets and compare this summed re-
sponse to that to a single multisensory target, the
modality-independent target P3 would be represented
twice in the summed response and only once in the
multisensory response. A sub-additive effect
(A + V > AV) would certainly be seen but this effect
would be observed without necessitating any direct
interactions between the constituent unisensory sys-
tems. Care must also be taken to ensure that similar
modality non-specific mechanisms are not being rep-
resented twice in the induced oscillatory responses. In
a similar vein, the comparison of combined unisensory
oscillations with multisensory oscillatory activity
should be handled with care if subjects are performing
a motor response in the selected analysis time window.
In this case the unisensory stimuli, when combined,
would contain two motor responses whereas the mul-
tisensory stimuli contain only a single motor response.
Conclusion
We present a simple bootstrapping approach for the
analysis of induced oscillatory responses in multisen-
sory studies. This approach circumvents a limitation of
the standard linear approach used for analyzing mul-
tisensory interactions, a approach that is not appro-
priate for oscillatory signals that have been derived
using non-linear methods such as the wavelet trans-
form. The study of induced oscillations is important
since recent data links them to integrative processing in
the brain, processing which must surely underlie inte-
gration of inputs across the senses. This approach is the
first tool, to our knowledge, that permits the direct
comparison of oscillatory responses to multisensory
stimuli with the combined oscillatory responses to the
respective unisensory stimuli.
Acknowledgements This work supported by grants from theNational Institute of Mental Health (MH65350) and the Na-tional Institute on Aging (AG22696) to Dr. J. J. Foxe. We wouldalso like to express our sincere thanks to Dr. Simon Kelly for hisinsightful comments on earlier drafts and to Dr. Scott Makeigwho provided advice regarding the bootstrap technique usedhere.
192 Exp Brain Res (2007) 177:184–195
123
Appendix: Materials and paradigm
Intracranial field potentials in macaques
To evaluate the application of this technique to intra-
cranial field potential data, we used data recorded
during the course of a multisensory investigation in
auditory cortex of an awake behaving macaque mon-
key (see Lakatos et al. 2005a). All procedures were
approved in advance by the Animal Care and Use
Committee of the Nathan Kline Institute. The subject,
a Rhesus monkey (Maccaca mulatta) was adapted to a
custom fitted primate chair and to the recording
chamber and then surgically prepared for chronic
awake electrophysiological recording. Surgery was
performed under anesthesia (1–2% isoflourane), using
standard aseptic surgical methods (see Schroeder et al.
2001). To allow electrode access to the brain, and to
promote an orderly pattern of sampling across the
surface of the auditory cortices, matrices of 18 gauge
stainless steel guide tubes were placed over auditory
cortex. These matrices were angled so that the elec-
trode track would be perpendicular to the plane of
auditory cortex, as determined by pre-implant MRI
(Schroeder et al. 1998). They were placed within small,
appropriately shaped craniotomies, to rest against the
intact dura. The matrices, along with a titanium head
post (permitting painless head restraint), were
embedded in dental acrylic and secured to the skull
with titanium orthopaedic screws.
Recordings were made in an electrically shielded,
sound-attenuated chamber with SONEX ProSPEC
CompositeTM sound absorbing foam. Laminar profiles
of field potentials (EEG) were recorded using a linear
array multi-contact electrode (24 contacts, 100 lm in-
tercontact spacing) positioned to sample from all the
layers simultaneously (Lakatos et al. 2005b). Signals
were impedance matched with a pre-amplifier (10·gain, bandpass dc-10 kHz) situated on the electrode,
and after further amplification (500·) the signal was
band pass filtered by analogue filtering (0.1–500 Hz) to
extract the field potential sampled at 2 kHz/16 bit
precision.
Eye position was monitored using an ISCAN ETL-
200 eye tracking system, and stimuli were presented
only when the monkey’s gaze was held within a 10�degree window surrounding the fixation point in the
middle of the monitor. Auditory stimuli consisted of
broadband Gaussian noise bursts (16 ms duration;
70 dB SPL, 1 ms rise/fall times). The visual stimuli
consisted of a bright white monitor flash (16 ms dura-
tion). Unisensory-auditory, unisensory-visual, and
multisensory audiovisual stimuli were presented in
separate blocks (SOA = 767 ms), each consisting of
100 stimuli. Trial blocks were separated by brief breaks
in which the monkey was checked and fed dried fruits
and other preferred treats.
In accordance with the time–frequency representa-
tions (Fig. 2), for the analysis of multisensory interac-
tions a 15 Hz WT was performed. The wavelet had a
duration (2rt) of 67 ms and a spectral bandwidth (2rf)
of 4.8 Hz. As a measure of 15 Hz activity, the maxi-
mum value of the modulus of the complex transform
coefficient was computed in a time interval between 10
and 110 ms for each epoch.
Human EEG recordings
Induced oscillatory beta responses for one subject
(female, 27 years, right handed) from one right-frontal
channel were analyzed (Fig. 5). This channel was se-
lected because a right-frontal maximum was found at
this electrode site. The nearest neighboring site within
the 10–20 system of this electrode is the F4 electrode.
The EEG was recorded in an electrically shielded
chamber from 2 EOG and 128 scalp electrodes
(impedances < 5 kW), referenced to the nose at a
sample rate of 500 Hz. Epochs for EEG beta activity
lasted from 500 ms before to 1000 ms after stimulus
onset. Baselines were computed from –300 to –100 ms
pre-stimulus. For artifact suppression, trials were
automatically excluded from averaging if the standard
deviation within a moving 200 ms time interval ex-
ceeded 30 lV in any one of the EEG channels and
40 lV at the EOG channels in a time interval between
–300 and 500 ms.
Auditory stimuli in the experiment consisted of a
1,000 Hz tone (60 ms duration; 75 dB SPL) presented
from a single speaker located atop the monitor on
which the visual stimuli were presented. The visual
stimulus consisted of a red circular disk subtending 1.2�in diameter presented on a black background. Visual
stimuli were presented 1.56� lateral left above a central
fixation cross for 60 ms. Unisensory-auditory (A),
unisensory-visual (V), and multisensory audiovisual
(AV) were presented at inter-stimulus-intervals rang-
ing between 750 and 3,000 ms. The subject was in-
structed to maintain central fixation at all times and to
make a speeded button response with their right index
finger when a stimulus in either modality was detected.
A total number of 533 auditory, 547 auditory and 530
audiovisual trials were submitted to the analysis.
For the analysis of beta responses, the maximum
value of the modulus of the complex 20 Hz trans-
formed coefficient was computed in a time interval
between 80 and 170 ms for each epoch. The duration
Exp Brain Res (2007) 177:184–195 193
123

(2rt) of the wavelet was 100 ms with a spectral band-
width (2rf) of 6.4 Hz. The subject gave written in-
formed consent to participate in the study.
References
Alegre M, Gurtubay IG, Labarga A, Iriarte J, Valencia M,Artieda J (2004) Frontal and central oscillatory changesrelated to different aspects of the motor process: a study ingo/no-go paradigms. Exp Brain Res 159:14–22
Beauchamp MS, Argall BD, Bodurka J, Duyn JH, Martin A(2004) Unraveling multisensory integration: patchy organi-zation within human STS multisensory cortex. Nat Neurosci7:1190–1192
Bertrand O, Tallon-Baudry C (2000) Oscillatory gamma activityin humans: a possible role for object representation. Int JPsychophysiol 38:211–223
Besle J, Fort A, Delpuech C, Giard MH (2004) Bimodal speech:early suppressive visual effects in human auditory cortex.Eur J Neurosci 20:2225–2234
Bhattacharya J, Shams L, Shimojo S (2002) Sound-inducedillusory flash perception: role of gamma band responses.Neuroreport 13: 1727–1730
Brovelli A, Ding M, Ledberg A, Chen Y, Nakamura R, BresslerSL (2004) Beta oscillations in a large-scale sensorimotorcortical network: directional influences revealed by Grangercausality. Proc Natl Acad Sci USA 101:9849–9854
Busch NA, Herrmann CS (2003) Object-load and feature-loadmodulate EEG in a short-term memory task. Neuroreport14: 1721–1724
Bushara KO, Hanakawa T, Immisch I, Toma K, Kansaku K,Hallett M (2003) Neural correlates of cross-modal binding.Nat Neurosci 6:190–195
Calvert GA (2001a) Crossmodal processing in the human brain:insights from functional neuroimaging studies. Cereb Cortex11:1110–1123
Calvert GA, Brammer MJ, Bullmore ET, Campbell R, IversenSD, David AS (1999) Response amplification in sensory-specific cortices during crossmodal binding. Neuroreport10:2619–2623
Calvert GA, Campbell R, Brammer MJ (2000) Evidence fromfunctional magnetic resonance imaging of crossmodal bind-ing in the human heteromodal cortex. Curr Biol 10:649–657
Calvert GA (2001b) Crossmodal processing in the human brain:Insights from functional neuroimaging studies. Cereb Cor-tex 11: 1110–1123
Castelo-Branco M, Neuenschwander S, Singer W (1998) Syn-chronization of visual responses between the cortex, lateralgeniculate nucleus, and retina in the anesthetized cat.J Neurosci 18:6395–6410
Classen J, Gerloff C, Honda M, Hallett M (1998) Integrativevisuomotor behavior is associated with interregionallycoherent oscillations in the human brain. J Neurophysiol79:1567–1573
Comerchero MD, Polich J (1999) P3a and P3b from typicalauditory and visual stimuli. Clin Neurophysiol 110:24–30
Engel AK, Konig P, Singer W (1991) Direct physiologicalevidence for scene segmentation by temporal coding. ProcNatl Acad Sci USA 88:9136–9140
Fort A, Delpuech C, Pernier J, Giard MH (2002a) Earlyauditory–visual interactions in human cortex during nonre-dundant target identification. Brain Res Cogn Brain Res.14:20–30
Fort A, Depuech C, Pernier J, Giard MH (2002b). Dynamics ofcortico-subcortical cross-modal operations involved in audio-visual object detection in humans. Cereb Cortex 12: 1031–1039
Foxe JJ, Schroeder CE (2005) The case for feedforwardmultisensory convergence during early cortical processing.Neuroreport 16:419–423
Foxe JJ, Wylie GR, Martinez A, Schroeder CE, Javitt DC,Guilfoyle D, Ritter W, Murray MM (2002) Auditory-somatosensory multisensory processing in auditory associa-tion cortex: an fMRI study. J Neurophysiol 88:540–543
Foxe JJ, Morocz IA, Higgins BA, Murray MM, Javitt DC,Schroeder CE (2000) Multisensory auditory-somatosensoryinteractions in early cortical processing. Brain Res CognBrain Res. 10:77–83
Giard MH, Peronnet F (1999) Auditory-visual integration duringmultimodal object recognition in humans: a behavioral andelectrophysiological study. J Cogn Neurosci 11:473–490
Gonzalez Andino SL, Murray MM, Foxe JJ, Grave de PeraltaMenendez R (2005) How single-trial electrical neuroimag-ing contributes to multisensory research? Exp Brain Res166:298–304
Gray CM (1999) The temporal correlation hypothesis of visualfeature integration: still alive and well. Neuron 24:31–25
Gray CM, Konig P, Engel AK, Singer W (1989) Oscillatoryresponses in cat visual cortex exhibit inter-columnar syn-chronization which reflects global stimulus properties.Nature 338:334–337
Gruber T, Muller MM (2002) Effects of picture repetition oninduced gamma band responses, evoked potentials, andphase synchrony in the human EEG. Brain Res Cogn BrainRes. 13:377–392
Gruber T, Muller MM, Keil A, Elbert T (1999) Selective visual-spatial attention alters induced gamma band responses inthe human EEG. Clin Neurophysiol 110:2074–2085
Herrmann CS, Mecklinger A (2001) Gamma activity in humanEEG is related to high-speed memory comparisons duringobject selective attention. Vis Cogn 8:593–608
Herrmann CS, Mecklinger A, Pfeifer E (1999) Gamma responsesand ERPs in a visual classification task. Clin Neurophysiol110:636–642
Herrmann CS, Senkowski D, Rottger S (2004) Phase-locking andamplitude modulations of EEG alpha: two measures reflectdifferent cognitive processes in a working memory task. ExpPsychol 51:311–318
Kaiser J, Buhler M, Lutzenberger W (2004) Magnetoencepha-lographic gamma-band responses to illusory triangles inhumans. Neuroimage 23:551–560
Kaiser J, Hertrich I, Ackermann H, Mathiak K, Lutzenberger W(2005) Hearing Lips: Gamma-band Activity During Audio-visual Speech Perception. Cereb Cortex 15:646–653
Kaiser J, Lutzenberger W (2003) Induced gamma-band activityand human brain function. Neuroscientist 9:475–484
Kaiser J, Lutzenberger W, Ackermann H, Birbaumer N (2002)Dynamics of gamma-band activity induced by auditorypattern changes in humans. Cereb Cortex 12:212–221
Klimesch W (1999) EEG alpha and theta oscillations reflectcognitive and memory performance: a review and analysis.Brain Res Brain Res Rev 29:169–195
Konig P, Engel AK, Singer W (1995) Relation betweenoscillatory activity and long-range synchronization in catvisual cortex. Proc Natl Acad Sci USA 92:290–294
Lakatos P, Chen CM, Rajkai C, Karmos G, Schroeder CE(2005a) The role of oscillations in multisensory enhance-ment of auditory stimulus processing. Abstract at theSociety for Neuroscience
194 Exp Brain Res (2007) 177:184–195
123
Lakatos P, Shah AS, Knuth KH, Ulbert I, Karmos G, SchroederCE (2005b) An oscillatory hierarchy controlling neuronalexcitability and stimulus processing in the auditory cortex.J Neurophysiol 94:1904–1911
Liang H, Bressler SL, Ding M, Truccolo WA, Nakamura R(2002) Synchronized activity in prefrontal cortex duringanticipation of visuomotor processing. Neuroreport13:2011–2015
Logothetis NK (2002) The neural basis of the blood-oxygen-level-dependent functional magnetic resonance imagingsignal. Philos Trans R Soc Lond B Biol Sci 357:1003–1037
Molholm S, Ritter W, Javitt DC, Foxe JJ (2004) Multisensoryvisual–auditory object recognition in humans: a high-densityelectrical mapping study. Cereb Cortex 14:452–465
Molholm S, Ritter W, Murray MM, Javitt DC, Schroeder CE,Foxe JJ (2002) Multisensory auditory–visual interactionsduring early sensory processing in humans: a high-densityelectrical mapping study. Brain Res Cogn Brain Res 14:115–128
Muller MM, Bosch J, Elbert T, Kreiter A, Sosa MV, Sosa PV,Rockstroh B (1996) Visually induced gamma-band re-sponses in human electroencephalographic activity—a linkto animal studies. Exp Brain Res 112:96–102
Murray MM, Molholm S, Michel CM, Ritter W, Heslenfeld DJ,Schroeder CE, Javitt DC, Foxe JJ (2005a) Grabbing yourear: Rapid auditory-somatosensory multisensory interac-tions in low-level sensory cortices are not constrained bystimulus alignment. Cereb Cortex 15: 963–974
Murray MM, Foxe JJ, Wylie GR (2005b) The brain uses single-trial multisensory memories to discriminate without aware-ness. Neuroimage 27:473–478
Niessing J, Ebisch B, Schmidt KE, Niessing M, Singer W,Galuske RA (2005) Hemodynamic signals correlate tightlywith synchronized gamma oscillations. Science 309:948–951
Pfurtscheller G (1992) Event-related synchronization (ERS): anelectrophysiological correlate of cortical areas at rest.Electroencephalogr Clin Neurophysiol 83:62–69
Polich J, Alexander JE, Bauer LO, Kuperman S, Morzorati S,O’Connor SJ, Porjesz B, Rohrbaugh J, Begleiter H (1997)P300 topography of amplitude/latency correlations. BrainTopogr. 9:275–282
Sakowitz O, Quian Quiroga R., Schurmann M, Basar E (2005)Spatio-temporal frequency characteristics of intersensorycomponents in audiovisual evoked potentials. Brain ResCogn Brain Res 23:316–326
Sakowitz OW, Quian Quiroga R, Schurmann M, Basar E (2001)Bisensory stimulation increases gamma-responses overmultiple cortical regions. Brain Res Cogn Brain Res11:267–279
Sauseng P, Klimesch W, Doppelmayr M, Hanslmayr S, SchabusM, Gruber WR (2004) Theta coupling in the humanelectroencephalogram during a working memory task.Neurosci Lett 354:123–126
Schroeder CE, Foxe JJ (2002) The timing and laminar profile ofconverging inputs to multisensory areas of the macaqueneocortex. Brain Res Cogn Brain Res 14: 187–198
Schroeder CE, Foxe JJ (2004) Multisensory convergence in earlycortical processing. In: Calvert GA, Spence C, Stein BE(eds) The handbook of multisensory processes. MIT Press,Cambridge, pp 295–309
Schroeder CE, Molholm S, Lakatos P, Ritter W, Foxe JJ (2004)Human–Simian correspondence in the early cortical pro-cessing of multisensory cues. Cogn Process 5:140–151
Schroeder CE, Foxe JJ (2005) Multisensory contributions to low-level, ‘unisensory’ processing. Curr Opin Neurobiol 15:454–458
Schroeder CE, Lindsley RW, Specht C, Marcovici A, Smiley JF,Javitt DC (2001) Somatosensory input to auditory associa-tion cortex in the macaque monkey. J Neurophysiol85:1322–1327
Schroeder CE, Mehta AD, Givre SJ (1998) A spatiotemporalprofile of visual system activation revealed by current sourcedensity analysis in the awake macaque. Cereb Cortex 8:575–592
Senkowski D, Herrmann CS (2002) Effects of task difficulty onevoked gamma activity and ERPs in a visual discriminationtask. Clin Neurophysiol 113:1742–1753
Senkowski D, Talsma D, Herrmann CS, Woldorff MG (2005)Multisensory processing and oscillatory gamma responses:Effects of spatial selective attention. Exp Brain Res166:411–426
Senkowski D, Molholm, S, Gomez-Ramirez M, Foxe JJ (2006a)Oscillatory beta activity predicts response speed during amultisensory audiovisual reaction time task: a high-densityelectrical mapping study. Cereb Cortex 16:1556–1565
Senkowski D, Talsma D, Grigutsch M, Herrmann CS, andWoldorff MG (2006b) Good times for multisensory inte-gration: effects of the precision of temporal synchrony asrevealed by gamma-band oscillations. Neuropsychologia (inpress)
Singer W, Gray CM (1995) Visual feature integration and thetemporal correlation hypothesis. Annu Rev Neurosci18:555–586
Tallon-Baudry C, Bertrand O (1999) Oscillatory gamma activityin humans and its role in object representation. Trends CognSci 3:151–162
Tallon-Baudry C, Bertrand O, Delpuech C, Permier J (1997)Oscillatory gamma-band (30–70 Hz) activity induced by avisual search task in humans. J Neurosci 17:722–734
Tallon-Baudry C, Bertrand O, Delpuech C, Pernier J (1996)Stimulus specificity of phase-locked and non-phase-locked40 Hz visual responses in human. J Neurosci 16:4240–4249
Tallon-Baudry C, Bertrand O, Peronnet F, Pernier J (1998)Induced gamma-band activity during the delay of a visualshort-term memory task in humans. J Neurosci 18:4244–4254
Talsma D, Woldorff MG (2005) Selective attention and multi-sensory integration: Multiple phases of effects on theevoked brain activity. J.Cogn Neurosci 17:1098–1114
von Stein A, Chiang C, Konig P (2000) Top-down processingmediated by interareal synchronization. Proc Natl Acad SciUSA 97:14748–14753
Exp Brain Res (2007) 177:184–195 195
123