Multimode energy management for multi-tier server clusters
10
Multi-mode Energy Management for Multi-tier Server Clusters Tibor Horvath [email protected] Kevin Skadron [email protected] Department of Computer Science University of Virginia Charlottesville, VA 22904 ABSTRACT This paper presents an energy management policy for recon- figurable clusters running a multi-tier application, exploit- ing DVS together with multiple sleep states. We develop a theoretical analysis of the corresponding power optimiza- tion problem and design an algorithm around the solution. Moreover, we rigorously investigate selection of the optimal number of spare servers for each power state, a problem that has only been approached in an ad-hoc manner in current policies. To validate our results and policies, we implement them on an actual multi-tier server cluster where nodes support all power management techniques considered. Experimental results using realistic dynamic workloads based on the TPC- W benchmark show that exploiting multiple sleep states re- sults in significant additional cluster-wide energy savings up to 23% with little or no performance degradation. Categories and Subject Descriptors C.4 [Performance of Systems]: Performance attributes; D.4 [Operating Systems]: General General Terms Algorithms, Design, Experimentation, Management, Perfor- mance Keywords energy management, internet servers, multi-tier applications, reconfigurable clusters, end-to-end latency, dynamic power management, dynamic voltage scaling, sleep states 1. INTRODUCTION Large data center operating costs arising from the steadily increasing energy consumption of recent server hardware have prompted the consideration of cluster-level energy man- agement policies by researchers. Current solutions increase Permission to make digital or hard copies of all or part of this work for personal or classroom use is granted without fee provided that copies are not made or distributed for profit or commercial advantage and that copies bear this notice and the full citation on the first page. To copy otherwise, to republish, to post on servers or to redistribute to lists, requires prior specific permission and/or a fee. PACT’08, October 25–29, 2008, Toronto, Ontario, Canada. Copyright 2008 ACM 978-1-60558-282-5/08/10 ...$5.00. overall cluster energy efficiency through dynamic power man- agement techniques such as DVS and dynamic cluster re- configuration. DVS may increase the efficiency of individual machines by reducing their power and performance when they are not fully utilized. On the other hand, reconfigu- ration strategies reduce total cluster power by consolidating load on a subset of machines and turn off the remaining ones. A key observation is that these existing policies are fo- cused on energy management of the active portion of the cluster: based on the current load, they determine what the active capacity should be. The inactive (idle) portion is simply turned off (except for a few spare servers). How- ever, newer systems already contain support for multiple sleep states with various latencies and standby power levels. Exploiting the benefits of these extra states requires energy management of the inactive portion, which allows minimiz- ing the total energy consumption of sleeping machines sub- ject to responsiveness constraints. The resulting multi-mode energy management solution can achieve the same level of responsiveness as existing policies using a single sleep state (Off) only, but with significantly less energy. Despite this potential, we are not aware of any research that has explored the benefits of multiple sleep modes. Yet our promising re- sults indicate that multi-mode energy management might become an important necessity in future energy-aware clus- ters. The main contribution of this paper is the presentation of a comprehensive theoretical analysis, design, and evalua- tion of multi-mode energy management for multi-tier server clusters. This includes developing the active energy opti- mization and the sleep energy optimization policies, as well as experimental studies on an actual cluster, in which we compare the energy efficiency and performance of several policies. 2. RELATED WORK Pinheiro et al. [12] design a power management scheme for reconfigurable clusters based on distributing demand for resources to a subset of the cluster. Transient demand varia- tions are compensated for with PID feedback control. They report energy savings of 45%, however their static web work- load was network interface-bound with peak CPU utiliza- tions of only about 25%. To provide some spare capacity to compensate for wakeup latency, they assume that machines have a lower than actual capacity. To control the amount of spare capacity, a heuristic parameter was used. Elnozahy et al. [4] propose cluster reconfiguration combined with DVS,
-
Upload
independent -
Category
Documents
-
view
1 -
download
0
Transcript of Multimode energy management for multi-tier server clusters

Multi-mode Energy Management for Multi-tier ServerClusters
Tibor [email protected]
Kevin [email protected]
Department of Computer ScienceUniversity of Virginia
Charlottesville, VA 22904
ABSTRACTThis paper presents an energy management policy for recon-figurable clusters running a multi-tier application, exploit-ing DVS together with multiple sleep states. We developa theoretical analysis of the corresponding power optimiza-tion problem and design an algorithm around the solution.Moreover, we rigorously investigate selection of the optimalnumber of spare servers for each power state, a problem thathas only been approached in an ad-hoc manner in currentpolicies.
To validate our results and policies, we implement themon an actual multi-tier server cluster where nodes supportall power management techniques considered. Experimentalresults using realistic dynamic workloads based on the TPC-W benchmark show that exploiting multiple sleep states re-sults in significant additional cluster-wide energy savings upto 23% with little or no performance degradation.
Categories and Subject DescriptorsC.4 [Performance of Systems]: Performance attributes;D.4 [Operating Systems]: General
General TermsAlgorithms, Design, Experimentation, Management, Perfor-mance
Keywordsenergy management, internet servers, multi-tier applications,reconfigurable clusters, end-to-end latency, dynamic powermanagement, dynamic voltage scaling, sleep states
1. INTRODUCTIONLarge data center operating costs arising from the steadily
increasing energy consumption of recent server hardwarehave prompted the consideration of cluster-level energy man-agement policies by researchers. Current solutions increase
Permission to make digital or hard copies of all or part of this work forpersonal or classroom use is granted without fee provided that copies arenot made or distributed for profit or commercial advantage and that copiesbear this notice and the full citation on the first page. To copy otherwise, torepublish, to post on servers or to redistribute to lists, requires prior specificpermission and/or a fee.PACT’08, October 25–29, 2008, Toronto, Ontario, Canada.Copyright 2008 ACM 978-1-60558-282-5/08/10 ...$5.00.
overall cluster energy efficiency through dynamic power man-agement techniques such as DVS and dynamic cluster re-configuration. DVS may increase the efficiency of individualmachines by reducing their power and performance whenthey are not fully utilized. On the other hand, reconfigu-ration strategies reduce total cluster power by consolidatingload on a subset of machines and turn off the remainingones.
A key observation is that these existing policies are fo-cused on energy management of the active portion of thecluster: based on the current load, they determine whatthe active capacity should be. The inactive (idle) portionis simply turned off (except for a few spare servers). How-ever, newer systems already contain support for multiplesleep states with various latencies and standby power levels.Exploiting the benefits of these extra states requires energymanagement of the inactive portion, which allows minimiz-ing the total energy consumption of sleeping machines sub-ject to responsiveness constraints. The resulting multi-modeenergy management solution can achieve the same level ofresponsiveness as existing policies using a single sleep state(Off) only, but with significantly less energy. Despite thispotential, we are not aware of any research that has exploredthe benefits of multiple sleep modes. Yet our promising re-sults indicate that multi-mode energy management mightbecome an important necessity in future energy-aware clus-ters.
The main contribution of this paper is the presentationof a comprehensive theoretical analysis, design, and evalua-tion of multi-mode energy management for multi-tier serverclusters. This includes developing the active energy opti-mization and the sleep energy optimization policies, as wellas experimental studies on an actual cluster, in which wecompare the energy efficiency and performance of severalpolicies.
2. RELATED WORKPinheiro et al. [12] design a power management scheme
for reconfigurable clusters based on distributing demand forresources to a subset of the cluster. Transient demand varia-tions are compensated for with PID feedback control. Theyreport energy savings of 45%, however their static web work-load was network interface-bound with peak CPU utiliza-tions of only about 25%. To provide some spare capacity tocompensate for wakeup latency, they assume that machineshave a lower than actual capacity. To control the amountof spare capacity, a heuristic parameter was used. Elnozahyet al. [4] propose cluster reconfiguration combined with DVS,

assuming a cubic relation between CPU frequency and power,evaluated by simulation. They conclude that the clusteruses least energy when all machines operate in an optimalfrequency range, not necessarily using the least number ofactive machines, which is in contrast with our observations(due to our different power model). The work by Raja-mani and Lefurgy [14] is highly relevant to ours. They pointout critical workload factors (e.g., peak load) that must beproperly selected for valid evaluations of energy manage-ment schemes. Hence, we use a similar methodology in ourevaluations. They also study how the availability of spareservers affect energy savings in different workloads, but donot attempt to derive the optimal number of spare servers.
Heterogeneous clusters were also addressed in the liter-ature. Heath et al. [7] developed a solution based on acomplex system model built from extensive characterization.Implementing an adaptive Web server that takes advantageof the model, they achieve 42% energy savings on a smallcluster with two types of machines, serving mostly staticrequests. One shortcoming is that their model does not in-corporate DVS. Rusu et al. [16] report 45% energy savingsin a small heterogeneous cluster combining reconfigurationand local (independent) DVS. The rely on power, executiontime, and server capacity characterization to provide energymanagement with soft real-time performance. They definethe max_load_increase variable as the maximum slope ofthe cluster’s load, based on which they precompute a tableof load values at which additional machines must be turnedon.
Complementary to our research are efforts by Ranganathanet al. [15] directed at dealing with cluster-level power pro-visioning. While our work addresses the power optimiza-tion problem under performance constraints, their work ad-dresses the opposite: the performance optimization prob-lem under power constraints. Fan et al. [5] employed powermodeling to attack data center-level power provisioning in-efficiencies. These approaches are useful for saving on powerdelivery and cooling infrastructure costs, while our work isuseful for saving additional operational energy costs. Suchsolutions can be combined; Raghavendra et al. [13] investi-gate a coordinated design, which ensures that the variouspower and performance optimizing controllers at differentlevels of the data center hierarchy can correctly interoper-ate. However, their work does not discuss spare capacity ormulti-mode energy management.
Our work is different from the above in that (i) we addressmulti-tier clusters with highly dynamic workloads, (ii) weperform active energy optimization using coordinated recon-figuration and DVS based on theoretical analysis, (iii) we usefeedback control to correct for estimation errors, and (iv) ourpolicy is evaluated with a realistic trace-driven benchmarkwith the peak load correctly sized to our cluster’s capac-ity. Another key difference is that we address multiple sleepstates. In general, it is not straightforward to extend thetechniques presented in previous work to multiple states, be-cause the new trade-off between wakeup latency and sleeppower must be examined.
3. SYSTEM MODELWe consider multi-tier server clusters, consisting of a con-
stant number of tiers, each of which are composed of a vari-able number of machines. All machines in one tier run thesame application, and requests go through all tiers. The
end-to-end server performance must meet a predefined ser-vice level agreement (SLA). We assume a simple SLA spec-ifying a target average end-to-end server delay D. Finally,each machine optionally supports multiple P-states (DVS).
In order to simplify the problem, we make a few impor-tant assumptions. First, we assume that machines withina single tier have identical power and performance charac-teristics; in other words tiers are homogeneous in terms ofhardware. This is a reasonable assumption because, eventhough whole data centers are typically heterogeneous, it isnormally preferred that groups of servers running the sameapplication and being load balanced (i.e. the equivalent ofa tier) are identical—this simplifies load balancing, amongothers. The second, related assumption is that there is per-fect load balancing within a tier such that the CPU uti-lization of the constituent machines is equal. While this isidealistic, it is only required for analytical tractability, andbased on our empirical observations the impact of moderateimbalances on actual performance is insignificant.
As an implication of the assumptions above, we do notneed to model individual machine CPU frequencies—it issufficient to use a single value per tier. This is because,since power is a convex function of frequency [8], setting thesame frequency on all nodes within a tier is equally or morepower-efficient than setting different values. Further, theperformance effects of frequency scaling are not greater thanits effects on power [9], therefore there is no performanceor energy-efficiency benefit from different settings within a(homogeneous) tier either. Therefore, we limit our studyto the model where each tier is operated at a single CPUfrequency.
3.1 Power ModelIn our system model, two variables have a significant effect
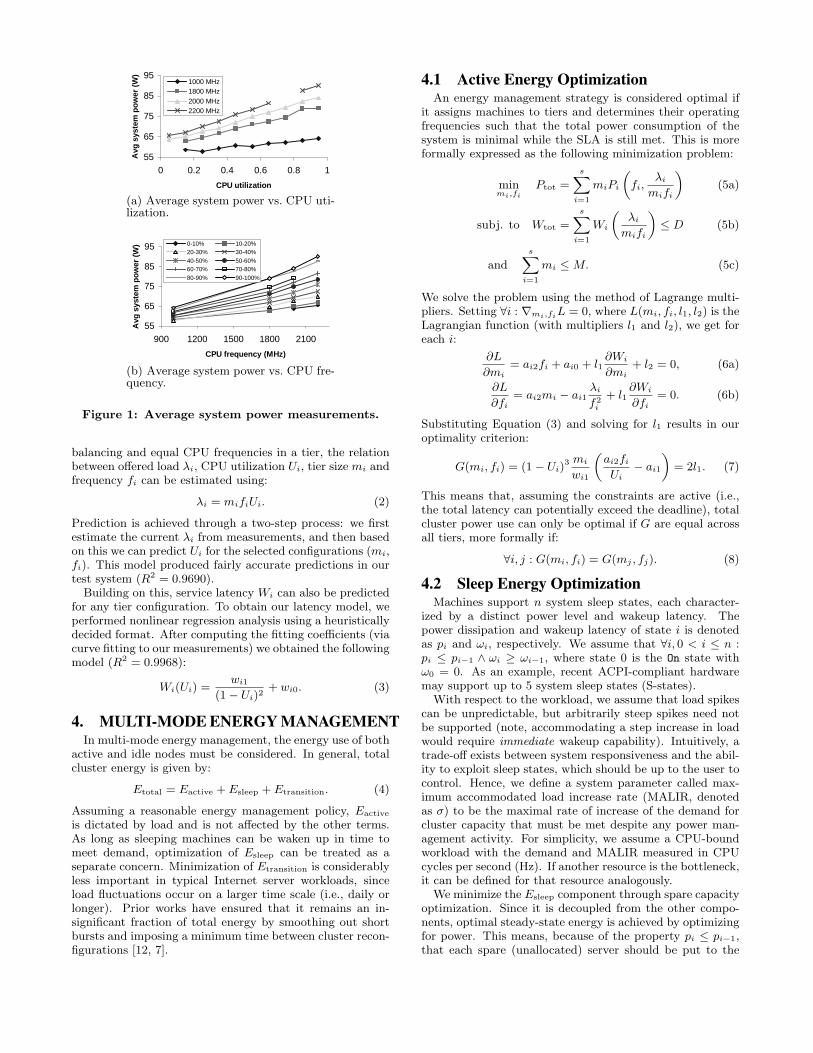
on the power draw of an individual active machine: its CPUutilization and frequency (which also affects core voltage).Other variables may have an indirect effect by influencingthese. To obtain a predictive model for machine power, Pi,we analyzed the actual power measurements from a largepool of characterization experiments, in which a machineoperates at a varying CPU utilization (Ui) and frequency(fi). Figure 1 shows the resulting curves. We found that Pi
is approximately linear in both Ui and fi for any fixed fi
and Ui, respectively. The relationship between power andCPU frequency is in reality slightly super-linear (as expectedfrom the CMOS power model [11] assumed throughout theliterature, e.g., [2, 4, 10]), however a linear approximationwas sufficiently accurate for our purposes and preferable forits simplicity.
From analysis of the curves, we obtain our power model:
Pi(fi, Ui) = ai3fiUi + ai2fi + ai1Ui + ai0. (1)
Parameters aij are determined by curve fitting. Power es-timation for our test system using this model was fairly ac-curate (confirmed by the coefficient of determination R2 =0.9879), with average error of 1% (worst case < 4%).
3.2 Service Latency ModelThe service latency of short requests in concurrent servers
is mostly a function of CPU utilization. Hence, in order topredict latency for various cluster configurations and per-formance states, we first need to model CPU utilization inthose configurations. Given our assumptions on perfect load
55
65
75
85
95
0 0.2 0.4 0.6 0.8 1
CPU utilization
Avg
sys
tem
po
wer
(W
)
1000 MHz1800 MHz2000 MHz2200 MHz
(a) Average system power vs. CPU uti-lization.
55
65
75
85
95
900 1200 1500 1800 2100
CPU frequency (MHz)
Avg
sys
tem
po
wer
(W
) 0-10% 10-20%20-30% 30-40%40-50% 50-60%60-70% 70-80%80-90% 90-100%
(b) Average system power vs. CPU fre-quency.
Figure 1: Average system power measurements.
balancing and equal CPU frequencies in a tier, the relationbetween offered load λi, CPU utilization Ui, tier size mi andfrequency fi can be estimated using:
λi = mifiUi. (2)
Prediction is achieved through a two-step process: we firstestimate the current λi from measurements, and then basedon this we can predict Ui for the selected configurations (mi,fi). This model produced fairly accurate predictions in ourtest system (R2 = 0.9690).
Building on this, service latency Wi can also be predictedfor any tier configuration. To obtain our latency model, weperformed nonlinear regression analysis using a heuristicallydecided format. After computing the fitting coefficients (viacurve fitting to our measurements) we obtained the followingmodel (R2 = 0.9968):
Wi(Ui) =wi1
(1− Ui)2+ wi0. (3)
4. MULTI-MODE ENERGY MANAGEMENTIn multi-mode energy management, the energy use of both
active and idle nodes must be considered. In general, totalcluster energy is given by:
Etotal = Eactive + Esleep + Etransition. (4)
Assuming a reasonable energy management policy, Eactive
is dictated by load and is not affected by the other terms.As long as sleeping machines can be waken up in time tomeet demand, optimization of Esleep can be treated as aseparate concern. Minimization of Etransition is considerablyless important in typical Internet server workloads, sinceload fluctuations occur on a larger time scale (i.e., daily orlonger). Prior works have ensured that it remains an in-significant fraction of total energy by smoothing out shortbursts and imposing a minimum time between cluster recon-figurations [12, 7].
4.1 Active Energy OptimizationAn energy management strategy is considered optimal if
it assigns machines to tiers and determines their operatingfrequencies such that the total power consumption of thesystem is minimal while the SLA is still met. This is moreformally expressed as the following minimization problem:
minmi,fi
Ptot =
sXi=1
miPi
„fi,
λi
mifi
«(5a)
subj. to Wtot =
sXi=1
Wi
„λi
mifi
«≤ D (5b)
and
sXi=1
mi ≤ M. (5c)
We solve the problem using the method of Lagrange multi-pliers. Setting ∀i : ∇mi,fiL = 0, where L(mi, fi, l1, l2) is theLagrangian function (with multipliers l1 and l2), we get foreach i:
∂L
∂mi= ai2fi + ai0 + l1
∂Wi
∂mi+ l2 = 0, (6a)
∂L
∂fi= ai2mi − ai1
λi
f2i
+ l1∂Wi
∂fi= 0. (6b)
Substituting Equation (3) and solving for l1 results in ouroptimality criterion:
G(mi, fi) = (1− Ui)3 mi
wi1
„ai2fi
Ui− ai1
«= 2l1. (7)
This means that, assuming the constraints are active (i.e.,the total latency can potentially exceed the deadline), totalcluster power use can only be optimal if G are equal acrossall tiers, more formally if:
∀i, j : G(mi, fi) = G(mj , fj). (8)
4.2 Sleep Energy OptimizationMachines support n system sleep states, each character-
ized by a distinct power level and wakeup latency. Thepower dissipation and wakeup latency of state i is denotedas pi and ωi, respectively. We assume that ∀i, 0 < i ≤ n :pi ≤ pi−1 ∧ ωi ≥ ωi−1, where state 0 is the On state withω0 = 0. As an example, recent ACPI-compliant hardwaremay support up to 5 system sleep states (S-states).
With respect to the workload, we assume that load spikescan be unpredictable, but arbitrarily steep spikes need notbe supported (note, accommodating a step increase in loadwould require immediate wakeup capability). Intuitively, atrade-off exists between system responsiveness and the abil-ity to exploit sleep states, which should be up to the user tocontrol. Hence, we define a system parameter called max-imum accommodated load increase rate (MALIR, denotedas σ) to be the maximal rate of increase of the demand forcluster capacity that must be met despite any power man-agement activity. For simplicity, we assume a CPU-boundworkload with the demand and MALIR measured in CPUcycles per second (Hz). If another resource is the bottleneck,it can be defined for that resource analogously.
We minimize the Esleep component through spare capacityoptimization. Since it is decoupled from the other compo-nents, optimal steady-state energy is achieved by optimizingfor power. This means, because of the property pi ≤ pi−1,that each spare (unallocated) server should be put to the

deepest possible state (greatest i), subject to the MALIRconstraint.
4.2.1 Feasible Wakeup ScheduleOur problem becomes that of determining the minimum
number of spare servers for each sleep state such that if theoffered load increases with rate σ, a feasible wakeup schedulestill exists. Let c(t) and d(t) denote cluster capacity anddemand, respectively, at time t. Further let t0 be the timeat which load begins to increase. Assume that both c(t0) andd(t0) are known (e.g., from measurements and estimation).Then, from the definition of σ:
d(t) = d(t0) + σ(t− t0). (9)
In order to determine whether a feasible wakeup scheduleexists, it is sufficient to consider the case when all spareservers are waken up at time t0—if this does not result in afeasible schedule, then one does not exist. Let Si stand forthe number of spare servers in sleep state i, and fmax themaximum CPU frequency. For the case described, capacitycan be obtained from the recursive formula:
c(t0 + ωi) = c(t0 + ωi−1) + Sifmax. (10)
In other words, cluster capacity at the expiration of thewakeup latency of some state increases by the maximumcapacity of all machines in that particular state. From this,and observing that d(t) continuously increases while c(t) isstepwise, a feasible wakeup schedule exists iff:
c(t0 + ωi) ≥ d(t0 + ωi+1), 0 ≤ i < n. (11)
4.2.2 Spare ServersSince we want to put spare servers in the deepest possible
sleep states, we examine the limit (equality) case of Equa-tion (11) so that no slack time is allowed before waking upspare servers. Because this requires the set of greatest stillfeasible wakeup latencies, it also results in the smallest fea-sible overall power due to the monotonicity of ωi and pi ini. Substituting into Equation (10), we get:
d(t0 + ωi+1) = d(t0 + ωi) + Sifmax, (12)
which, after simplification by applying Equation (9) and re-arrangement, yields the optimal number of spare servers foreach sleep state as follows:
Si = σωi+1 − ωi
fmax. (13)
The above formula is in the continuous domain, whereasa) cluster reconfiguration is typically performed periodically;and b) only whole machines can be transitioned to sleepstates. Hence, the formula is discretized to obtain the finalsolution:
S∗i =
‰σT (ωi+1)− T (ωi)
fmax
ı, 0 ≤ i < n, (14)
where T (ω) = dω/T e·T and T is the control period. This ac-counts for both that wakeups will only be initiated, and thatthe cluster will only be reconfigured to include the awakenedmachines, at controller activation.
5. POLICY DESIGNWe designed energy management policies that take advan-
tage of our predictive models and theoretical results. The
policies are periodically invoked, when they obtain basicmeasurements from the system, apply the models, computethe optimal power states, and initiate the necessary powerstate transitions.
5.1 Active Capacity PolicyA simple approach to computing the optimal power states
would be to perform an exhaustive search over the possiblecluster configurations, selecting the one that best matchesthe optimality criterion derived in section 4.1. However,there are two issues with this. Firstly, the criterion is onlya necessary condition of optimality, and may not be a suf-ficient condition. Secondly, an exhaustive search does notscale up to large cluster sizes, or to large numbers of pos-sible frequencies. Therefore, to address these issues, we de-signed a greedy heuristic search algorithm to perform theoptimization.
5.1.1 Heuristic OptimizationThe algorithm relies on an additional assumption regard-
ing the power characteristics of the hardware: it assumesthat the static system power dissipation is large enough thatturning on an additional machine and lowering the commonCPU frequency such that CPU utilization is kept constant,never saves power. More formally:
(mi + 1)Pi(λi
(mi + 1)Ui, Ui) ≥ miPi(
λi
miUi, Ui), (15)
which reduces to ai1Ui + ai0 ≥ 0. This is a very realisticassumption with current server hardware. For instance, themachines in our testbed clearly satisfy it, and prior work hasrelied on similar findings [12].
The optimization can be performed in two rounds. Thefirst round finds the minimum number of machines in eachtier so that the end-to-end performance constraint Wtot ≤ Dis satisfied using the highest frequency for the machines. Westart from computing a minimum allocation that only en-sures that any one tier will not exceed the end-to-end dead-line in itself. Then, we continue the search by incrementallyassigning machines to tiers one by one, until the predictedtotal latency meets the constraint. At each step, we needto decide which tier to add a machine to. We base this de-cision on our optimality criterion: we choose the tier that,with the added machine, would result in the “most equal”values G(mi, fi). More precisely, we choose the assignmentfor which StdDev(Gi) is minimal. In the second round, tierfrequencies are decreased one at a time in a similar fash-ion, as long as Wtot ≤ D is still met. The decision whichtier to affect at each step, is guided by the same objective:select the change that minimizes StdDev(Gi). (The two-round structure of our heuristic is similar to the queuingtheory based heuristic proposed by Chen et al. [3].)
5.2 Spare Server PoliciesWe developed two policies for comparison: Optimal, based
on our sleep energy optimization result (section 4.2), and De-motion, which gradually demotes (transitions into a deeperstate) spare servers after some fixed timeouts. The fixedtimeout-based predictive technique is the most common DPMpolicy [1], and it also addresses multiple sleep states, whichare the reasons for our choice. To ensure a fair comparison,a wakeup scheduling algorithm is used together with bothpolicies that always wakes up machines when needed to meet

the expected future load based on the MALIR parameter.The difference is that while the Optimal policy attempts toensure that machines can be awakened by the time they areneeded, the Demotion policy does not.
5.2.1 Optimal PolicyThe design of the Optimal policy is relatively simple. An
algorithm precomputes S∗i for each system power state (0 ≤i < n) allowed by the user at initialization. Then, it isinvoked in each control period with the list of nodes deter-mined by the active capacity policy to be idle. The Optimalpolicy is responsible for assigning these to sleep states as nec-essary. We start by checking if there are more idle machinesin the On state than the optimum S∗0 . If so, each surplus ma-chine must be assigned to one of the sleep states. Going fromshallow to deep states, we assign as many surplus machinesto each as necessary for it to reach its optimum. Finally,any remaining surplus machines are assigned to state n.
5.2.2 Demotion PolicyThe main idea of the Demotion policy is that whenever a
machine becomes idle, a timer is started, and as it reacheseach timeout the machine is demoted into the correspondingsleep state. There are two problems with directly applyingthis approach in a cluster. First, it is not scalable to main-tain individual timers for each machine in a large cluster;and second, unless the activation of idle nodes is always donein a predetermined order (e.g., by rank), it is suboptimal.To see this, consider an example where demand fluctuatesbetween 1 and 2 machines, but whenever it increases to 2,a different node is activated in a round robin fashion (e.g.,for thermal load distribution). If this happens frequentlyenough, timers may never reach any timeouts, even thoughmost of the cluster is always idle.
Therefore, instead of per-node timers, our solution is tojust maintain the count of idle machines together with thetime each smaller count was first seen. More precisely, wedefine a list of timestamps named idle_since, which is ini-tialized empty and then maintained as follows. If the numberof idle machines at the current time t is greater than the sizeof idle_since, then t is appended to its end as many timesas the difference. If it is smaller, then as many elementsas the difference are removed from the list’s end. Then, foreach list element e, its timeout for state i has been reached ift > e+ωi. Summing up the number of elements by the deep-est state they reached, we obtain the timeout count for eachstate. Taking the difference between the number of nodescurrently in each state and that state’s timeout count, weget the number of surplus nodes (or deficit) in each state.Then, working our way from the On state to deeper states,surplus nodes are demoted to states with a deficit, filling updeepest states first.
5.3 Load EstimationEstimation of the offered load is crucial for predicting la-
tency in a target cluster configuration. However, calculat-ing it from the current CPU utilization has a limitation:demand that is higher than total CPU capacity cannot bedetected from utilization measurement because it saturatesat 100% (and in practice even lower). Therefore, relyingon this method only would result in unacceptable underes-timation of offered load as the system got into saturation.Hence, other inputs are needed to detect this condition. We
chose to add two types of performance monitoring: one todetect when response times exceed D, and another to detectservice errors resulting from overload (e.g., timeouts), bothmeaning our estimate of λi is low. Once detected, we relyon feedback control to increase our load estimates, in orderto quickly and reliably drive performance within the SLAspecification. The addition of our feedback controller is alsobeneficial since it allows the performance target to be metdespite errors in modeling, characterization inaccuracies, pa-rameter variations, and practical issues such as server errorsdue to overload.
Error rate > 0Error
PI ControllerYes
Delay
PI ControllerNo
Tier Load
Estimator
Tier utilizations
Service error rate
Service delay
Target delay-
+
Control
output
Power Optimization
Algorithm
Tier
loads
Spare Capacity
Optimization
Algorithm
Required tier capacities
Multi-tier
Server Cluster Target
power states
Figure 2: Design of the energy management policywith closed-loop control.
Our feedback control loop, sketched in Figure 2, is de-signed as follows. The controlled system (or “plant”) is amulti-tier server cluster. Each period, three kinds of mea-surements are taken from it: tier CPU utilization, end-to-end service delay, and service error rate. These are all easyto obtain in practical systems: end-to-end response timesamples are collected at the front-end tier and averagedacross servers (weighted by the number of samples fromeach server), while error rates are summed. We employtwo Proportional-Integral (PI) feedback controllers: one re-sponds to latency violations, and one to service errors. (Thereason to separate them is that they require different gains.)If service errors were observed, their rate is fed to the errorcontroller, otherwise delay error is calculated by subtractingthe target delay D from the measured average delay, whichis fed to the delay controller. The final control output isproduced by adding the selected controller’s output and theother controller’s integral component. Since the service er-ror rate can never go below its target (i.e. zero), the integralcomponent of the error controller is exponentially decayed(halved) when the rate is zero.
Next, the tier load estimator takes the utilization mea-surements and calculates an estimated offered load for eachtier (section 3.2), adding the control output (if positive).The increment is distributed between reconfigurable tiersproportionally to their measured utilization, which ensuresconvergence to the true load plus any compensation addedby the controller to correct steady state error. Then, theestimated tier loads are input to the active capacity policy(section 5.1), which determines the new energy-optimal al-location, reflecting minimal tier capacities required to main-tain the required performance. Any extra machines are as-signed to the appropriate power state by the spare serverpolicy (section 5.2). Finally, the determined target powerstates are applied to the cluster, affecting the service andthereby closing the loop.

6. EXPERIMENTAL EVALUATION
6.1 Experimental Setup
6.1.1 HardwareOur testbed uses a 12-node cluster composed of Linux-
based PCs. Each PC has a DVS-capable AMD Athlon 64processor, which supports the frequencies 1.0, 1.8, 2.0, and2.2GHz, as well as an Ethernet interface that supports theWake-On-LAN protocol for remote wakeup capability. Inaddition, our PCs support four ACPI system power states:On (S0), Hibernate-to-RAM (S3), Hibernate-to-Disk (S4),and Soft-Off (S5). The machines also have 512MB RAM,a hard disk, and a simple display adapter, but no monitorin order to keep the setup more realistic. A Watts Up Propower meter is connected to the main power strip, measuringthe AC power draw of the entire cluster.
6.1.2 SoftwareThe cluster is set up as a 4-tier Web server consisting of
the following tiers:1. A front load balancer tier with 1 machine statically
allocated. It runs the Linux Virtual Server (LVS) high-performance load balancer. The power draw of this tierwas not measured because in a real-life cluster it wouldrepresent a much smaller fraction of total power thanin our setup, thus our results would be skewed if weincluded it.
2. A Web (HTTP) server tier with dynamic machine al-location. This runs Apache with the mod_jk connectormodule, which forwards dynamic requests to the loadbalanced backend servers. We also developed a load-able module, which reports end-to-end latency samplesto our controller.
3. An application server tier, also with dynamic machineallocation, which runs the JBoss enterprise Java appli-cation server. It uses the MySQL Java connector toforward queries to the backend database cluster.
4. A database cluster tier with 3 machines statically allo-cated. The MySQL Cluster scalable database packageis used with 3 data nodes, over which the data set ispartitioned. An SQL node (through which the clustercan be accessed) is co-located with each applicationserver.
For each tier, standard versions of server software are usedwith no modifications necessary.
6.1.3 PoliciesAs our baseline, we consider a traditional cluster stat-
ically provisioned for peak load (i.e., not overprovisionedoverall), which serves as our reference in energy efficiencyand performance. This is first improved by applying our ac-tive capacity policy with only DVS enabled, modeling a non-reconfigurable cluster for comparison. Then, the two spareserver policies are tested, each with both multiple states andwith only the Off state allowed. This has two goals: to findout what additional gains can be realized by using multiplestates over previous approaches that only exploit the Off
state; and to compare the spare server policies themselves.The policies are listed in Table 1.
Table 1: List of policies compared.
Policy Description
Baseline Statically provisioned for peak load.DVS Baseline with DVS added.Demotion (Off) Demotion policy using the Off
state only.Demotion (Multiple) Demotion policy using Multiple
states.Optimal (Off) Optimal policy using the Off state
only.Optimal (Multiple) Optimal policy using Multiple
states.
6.2 Parameter Selection
6.2.1 Control ParametersOur goal is to design a highly responsive controller, there-
fore we opt for an 8-second control period that can be con-sidered very short in server applications. Hence, care mustbe taken when choosing the controller gains to avoid un-stable behavior (i.e., oscillations between extremes). Sincethe controlled process is complex and dynamic, it is prefer-able not to rely on a detailed model when determining thegains. We use the classic Ziegler-Nichols tuning method,which although imperfect [6], has the advantage that it re-quires very little information about the system. In the finalcontroller, the total integral component is clipped to be-tween 0 and 8.8GHz. Such clipping is typically performed toprevent excessive response in Integral controllers that mayexhibit steady state error due to system constraints (e.g.,not enough machines are available to reach the target). Af-ter experimenting with our system, we chose 250ms for theaverage latency target, which is reasonable both in terms ofuser expectations of an interactive website, and comparedto the 120–140ms baseline with no energy management.
6.2.2 Optimal Timeout ValuesWe follow the methodology proposed by Benini et al. [1],
who define the break-even time TBE,i for each sleep statei, which is the minimum inactivity time required to com-pensate for the transition energy. They suggest the optimalchoice for timeout (yielding 2-competitive energy savings) isequal to TBE,i. To calculate this for each state, characteriza-tion of the following parameters is necessary: time to enterand exit the state, average power while entering and exit-ing, and average power while in the state. From these, forthe Demotion (Multiple) policy we obtain TBE,S3 = 20 s andTBE,S4 = 5980 s. Here, the S5 state was found not beneficialbecause its power level is identical to that of S4 and thus itis excluded. Separate characterization is performed for thecase when only the S5 state is used, yielding TBE,S5 = 114 sfor the Demotion (Off) policy.
6.3 Trace-driven Dynamic WorkloadA 3-tier implementation of the TPC-W benchmark was
used as the test workload. It models a realistic bookstorewebsite where all types of pages are dynamically generatedusing fresh data from the database, and also contain typi-cal web images (buttons, logos, item thumbnails, etc.). Theserver establishes sessions with shopping carts, and ensures

Table 2: Description of Web traces used in our ex-periments.
Name Length Service
epa 1 day The EPA WWW server at ResearchTriangle Park, NC; Aug. 30, 1995(Wed).
sdsc 1 day The SDSC WWW server at the SanDiego Supercomputer Center, CA;Aug. 22, 1995 (Tue).
wcd37 1 day 1998 World Cup Web site; Jun. 1(Mon).
wcw8 1 week 1998 World Cup Web site; May 3–9(Sun-Sat).
all transactions within the same session are routed to thesame application server (session stickyness). A separateclient machine is used to generate load for the servers. It canemulate hundreds of independent emulated browsers (EBs),each navigating through pages as guided by a stochastictransition matrix. Retrieving a page and all images refer-enced by it is defined as one web interaction. Server through-put is measured in web interactions per second (WIPS), andlatency in web interaction response time (WIRT).
Instead of a static load as in performance-oriented studies,we are interested in performance and energy efficiency dur-ing realistic operation, which includes significant periods ofoff-peak load conditions. Hence, we simulate load variationsfound in real-life Web server traces, but using our dynamicbenchmark—to create a trace-driven dynamic workload. Wecalculate the hourly average loads (in requests/s) for thetrace in question, scale them by a constant factor to obtainthe corresponding number of EBs such that the maximumequals the desired peak load, and then run experiments inwhich the number of EBs is varied over time to match the re-sulting sequence. Between data points, we linearly interpo-late to achieve smooth fluctuations. A similar trace-drivenapproach was used by Rajamani and Lefurgy [14].
6.4 ResultsWe perform comparison studies along three dimensions,
to understand how certain aspects affect the performance ofeach policy. We consider different load profiles, then vary-ing the peak load intensity, and the rate of load fluctua-tions. We experiment with several different traces listed inTable 2. The performance of each policy, including energysavings, energy-delay product (i.e. energy efficiency), andaverage end-to-end latency, is compared.
6.4.1 Performance and Energy EfficiencyWe begin by validating the effectiveness of the active ca-
pacity management policy compared to the baseline setupand the DVS-only policy. The Optimal (Off) spare serverpolicy is used so that results are comparable with previ-ous ad-hoc spare server approaches. We ran the epa tracewith peak load of 400 EBs (full capacity) and speedup fac-tor of 5×, by which the day-long trace is simulated in 4.8hours. Performance results are shown in Figure 3. As ex-pected, our algorithm leaves sufficient margin over the es-timated load when determining demand (Figure 3(a)), so
that tier utilizations stay low enough to meet the target la-tency. Importantly, capacity follows demand without lag,which indicates the success of the spare server policy. Aver-age latency for both the DVS and the Optimal (Off) policywas 227ms, within the 250ms target. (Baseline was 139ms.)The power traces are compared in Figure 3(b). Looking atpure cost reduction, Optimal (Off) achieved 34% total clus-ter energy savings by dynamically turning off some machineswhen fewer could handle the load, compared to 11% withDVS only. To compare energy efficiency, we must factor inperformance degradation as well. We use the energy-delayproduct, a widely used metric, defined as energy per requestmultiplied by the inverse of throughput (calculated from av-erage power divided by the square of throughput). Fromthis, we obtained 0.996 Js for Optimal (Off), a substantialimprovement over the energy efficiency of both Baseline with1.475 Js and DVS with 1.342 Js.
0
2
4
6
8
10
12
14
16
18
0 0.5 1 1.5 2 2.5 3 3.5 4 4.5C
apac
ity (
GH
z)Time (h)
CapacityDemandLoad
(a) Evolution of total cluster capacity (avail-able machines), demand (optimal capacityas computed by the policy), and estimatedload.
300400
500600
700800
9001000
0 1 2 3 4 5
Time (h)
Po
wer
(W
)
BaselineDVSOptimal (Off)
(b) Comparison of cluster power traces.
Figure 3: Power and performance results with theactive capacity policy.
6.4.2 Shape of Load FluctuationsEach trace has a unique shape of daily load fluctuations,
giving rise to different energy saving opportunities. Thepeak load for each trace is identical (400 EBs), sized to totalcluster capacity. All traces are accelerated 20× to shortenexperiments. Results are shown in Figure 4. (Note, the datapoint of Demotion (Multiple) with wcw8 is not available dueto testbed instability.)
A number of key observations can be made. First, ex-ploiting multiple states yields significant extra energy sav-ings in the range 6–14%. Average gain is 10% for Demotionand 7% for Optimal. Second, the workload sensitivity of
0%
5%
10%
15%
20%
25%
30%
35%
40%
epa sdsc wcd37 wcw8
Trace
To
tal E
ner
gy
Sav
ing
s (%
) Demotion (Multiple) Demotion (Off)
Optimal (Multiple) Optimal (Off)
Figure 4: Cluster-wide energy savings of the exper-imental policies run against several traces, relativeto the baseline.
Optimal (i.e., range of extra savings across workloads) issubstantially smaller than that of Demotion (7–9% vs. 6–14%), which means a more predictable performance can beexpected from it. Third, Optimal overall outperforms De-motion, by up to 7% in energy savings. The explanation ofthe one data point exception is that an extended period ofepa has such a light load that no spare capacity is needed atall, giving an advantage to Demotion. The other traces havea slightly smaller dynamic range (in load level), where thatadvantage is lost, and Optimal wins by putting most nodesinto deep sleep immediately instead of waiting for a longtimeout. Finally, due to the common wakeup scheduling al-gorithm, all policies managed to maintain the expected per-formance with the fluctuations present in these workloads.
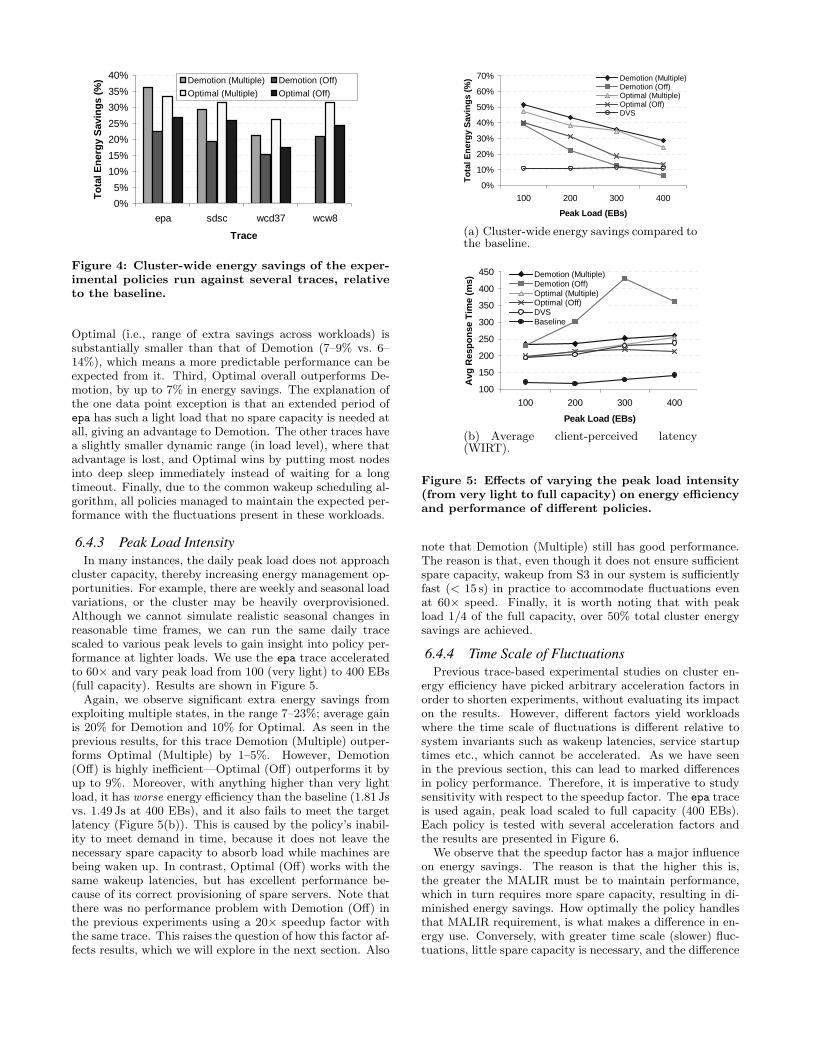
6.4.3 Peak Load IntensityIn many instances, the daily peak load does not approach
cluster capacity, thereby increasing energy management op-portunities. For example, there are weekly and seasonal loadvariations, or the cluster may be heavily overprovisioned.Although we cannot simulate realistic seasonal changes inreasonable time frames, we can run the same daily tracescaled to various peak levels to gain insight into policy per-formance at lighter loads. We use the epa trace acceleratedto 60× and vary peak load from 100 (very light) to 400 EBs(full capacity). Results are shown in Figure 5.
Again, we observe significant extra energy savings fromexploiting multiple states, in the range 7–23%; average gainis 20% for Demotion and 10% for Optimal. As seen in theprevious results, for this trace Demotion (Multiple) outper-forms Optimal (Multiple) by 1–5%. However, Demotion(Off) is highly inefficient—Optimal (Off) outperforms it byup to 9%. Moreover, with anything higher than very lightload, it has worse energy efficiency than the baseline (1.81 Jsvs. 1.49 Js at 400 EBs), and it also fails to meet the targetlatency (Figure 5(b)). This is caused by the policy’s inabil-ity to meet demand in time, because it does not leave thenecessary spare capacity to absorb load while machines arebeing waken up. In contrast, Optimal (Off) works with thesame wakeup latencies, but has excellent performance be-cause of its correct provisioning of spare servers. Note thatthere was no performance problem with Demotion (Off) inthe previous experiments using a 20× speedup factor withthe same trace. This raises the question of how this factor af-fects results, which we will explore in the next section. Also
0%
10%
20%
30%
40%
50%
60%
70%
100 200 300 400
Peak Load (EBs)
To
tal E
ner
gy
Sav
ing
s (%
) Demotion (Multiple)Demotion (Off)Optimal (Multiple)Optimal (Off)DVS
(a) Cluster-wide energy savings compared tothe baseline.
100
150
200
250
300
350
400
450
100 200 300 400
Peak Load (EBs)
Avg
Res
po
nse
Tim
e (m
s)
Demotion (Multiple)Demotion (Off)Optimal (Multiple)Optimal (Off)DVSBaseline
(b) Average client-perceived latency(WIRT).
Figure 5: Effects of varying the peak load intensity(from very light to full capacity) on energy efficiencyand performance of different policies.
note that Demotion (Multiple) still has good performance.The reason is that, even though it does not ensure sufficientspare capacity, wakeup from S3 in our system is sufficientlyfast (< 15 s) in practice to accommodate fluctuations evenat 60× speed. Finally, it is worth noting that with peakload 1/4 of the full capacity, over 50% total cluster energysavings are achieved.
6.4.4 Time Scale of FluctuationsPrevious trace-based experimental studies on cluster en-
ergy efficiency have picked arbitrary acceleration factors inorder to shorten experiments, without evaluating its impacton the results. However, different factors yield workloadswhere the time scale of fluctuations is different relative tosystem invariants such as wakeup latencies, service startuptimes etc., which cannot be accelerated. As we have seenin the previous section, this can lead to marked differencesin policy performance. Therefore, it is imperative to studysensitivity with respect to the speedup factor. The epa traceis used again, peak load scaled to full capacity (400 EBs).Each policy is tested with several acceleration factors andthe results are presented in Figure 6.
We observe that the speedup factor has a major influenceon energy savings. The reason is that the higher this is,the greater the MALIR must be to maintain performance,which in turn requires more spare capacity, resulting in di-minished energy savings. How optimally the policy handlesthat MALIR requirement, is what makes a difference in en-ergy use. Conversely, with greater time scale (slower) fluc-tuations, little spare capacity is necessary, and the difference

0%
5%
10%
15%
20%
25%
30%
35%
40%
0 10 20 30 40 50 60
Trace Speedup Factor
To
tal E
ner
gy
Sav
ing
s (%
)
Demotion (Multiple)Demotion (Off)Optimal (Multiple)Optimal (Off)
Figure 6: Effects of different trace acceleration fac-tors on cluster-wide energy savings of different poli-cies.
between policies becomes minor (assuming a MALIR-basedwakeup scheduling algorithm is used).
7. CONCLUSIONSEnergy management for reconfigurable clusters can be
separated into two independent concerns: the managementof active and spare capacity. Spare capacity optimizationminimizes energy of idle nodes subject to responsiveness con-straints. In contrast with existing ad-hoc approaches onlyaddressing a single Off state, we theoretically analyzed theproblem in the context of multiple sleep states, and designedan optimization policy based on the results. Our resultsshow that spare capacity optimization is especially impor-tant in Off-only systems with high rates of load fluctuation,where a Demotion-like naive policy should clearly be avoidedbecause of significant performance degradation.
Our policies were validated by measurements on a realistictestbed with appropriate workloads and using actual hard-ware sleep states. The key result is that exploiting multiplesleep states affords substantial energy benefits. Extra en-ergy savings of up to 23% over the Off-only version of thesame policy were observed in highly dynamic workloads withnegligible performance impact. Further, total energy sav-ings over 50% were measured with lighter load. In addition,we found that the Optimal policy is superior to Demotionbecause it: (i) outperforms Demotion in energy efficiencywith the majority of traces; (ii) avoids unavailable periodsinevitable with Demotion due to late wakeups; (iii) guar-antees responsiveness to the user-specified level (MALIR)with the least amount of energy; and (iv) does not relyon workload prediction, and therefore handles unexpectedbursts and typical expected load fluctuations equally well.
An important implication of our results is that energysavings reported from policy studies using different traceacceleration factors may not be directly comparable (unlessequal spare capacity was provisioned). A sensitivity analy-sis with respect to this factor is desirable to help interpretsuch results. Further, it is not clear how results from accel-erated traces in small testbeds apply to real-time workloadsin large-scale clusters because, even if spare capacity is thesame, it represents a very different fraction of total clusterenergy.
8. ACKNOWLEDGMENTSThis research was supported in part by NSF grant nos.
CNS-0306404 and CNS-0615277, Army Research Office grant
no. W911NF-04-1-0288, and a grant from Intel MRL. Wewould like to thank Tarek Abdelzaher for helpful discussionsin the development of our approach and the anonymous re-viewers for their constructive feedback.
9. REFERENCES[1] L. Benini, A. Bogliolo, and G. D. Micheli. A survey of
design techniques for system-level dynamic powermanagement. IEEE Trans. VLSI Syst., 8(3):299–316,2000.
[2] P. Bohrer, E. N. Elnozahy, T. Keller, M. Kistler,C. Lefurgy, and R. Rajamony. The case for powermanagement in web servers. In R. Graybill andR. Melhem, editors, Power-Aware Computing,Kluwer/Plenum series in Computer Science. KluwerAcademic Publishers, Jan. 2002.
[3] Y. Chen, A. Das, W. Qin, A. Sivasubramaniam,Q. Wang, and N. Gautam. Managing server energyand operational costs in hosting centers.SIGMETRICS Perform. Eval. Rev., 33(1):303–314,2005.
[4] E. Elnozahy, M. Kistler, and R. Rajamony.Energy-efficient server clusters. In Proc. Workshop onPower-Aware Computing Systems, Feb. 2002.
[5] X. Fan, W.-D. Weber, and L. A. Barroso. Powerprovisioning for a warehouse-sized computer. In Proc.34th Annual ACM/IEEE International Symposium onComputer Architecture, pages 13–23, 2007.
[6] C. Hang, K. Astrom, and W. Ho. Refinements of theZiegler-Nichols tuning formula. IEE Proceedings D,Control Theory and Applications, 138(2):111–118,Mar. 1991.
[7] T. Heath, B. Diniz, E. V. Carrera, W. M. Jr., andR. Bianchini. Energy conservation in heterogeneousserver clusters. In Proc. 10th ACM SIGPLANSymposium on Principles and Practice of ParallelProgramming, pages 186–195, 2005.
[8] C. hsing Hsu and W. chun Feng. When discretenessmeets continuity: Energy-optimal dvs schedulingrevisited. Technical Report LA-UR 05-3104, LosAlamos National Laboratory, Feb. 2005.
[9] C. Lefurgy, K. Rajamani, F. Rawson, W. Felter,M. Kistler, and T. W. Keller. Energy management forcommercial servers. IEEE Computer, 36(12):39–48,2003.
[10] A. Miyoshi, C. Lefurgy, E. V. Hensbergen,R. Rajamony, and R. Rajkumar. Critical power slope:understanding the runtime effects of frequency scaling.In Proc. 16th International Conference onSupercomputing, pages 35–44, 2002.
[11] T. Mudge. Power: A first-class architectural designconstraint. IEEE Computer, 34(4):52–58, 2001.
[12] E. Pinheiro, R. Bianchini, E. Carrera, and T. Heath.Dynamic cluster reconfiguration for power andperformance. In L. Benini, M. Kandemir, andJ. Ramanujam, editors, Compilers and OperatingSystems for Low Power. Kluwer Academic Publishers,2002.
[13] R. Raghavendra, P. Ranganathan, V. Talwar,Z. Wang, and X. Zhu. No ”power” struggles:coordinated multi-level power management for the

data center. SIGARCH Comput. Archit. News,36(1):48–59, 2008.
[14] K. Rajamani and C. Lefurgy. On evaluatingrequest-distribution schemes for saving energy inserver clusters. In Proc. IEEE InternationalSymposium on Performance Analysis of Systems andSoftware, pages 111–122, 2003.
[15] P. Ranganathan, P. Leech, D. Irwin, and J. Chase.Ensemble-level power management for dense bladeservers. Proc. 33rd Annual ACM/IEEE InternationalSymposium on Computer Architecture, pages 66–77,2006.
[16] C. Rusu, A. Ferreira, C. Scordino, and A. Watson.Energy-efficient real-time heterogeneous serverclusters. In Proc. 12th IEEE Real-Time and EmbeddedTechnology and Applications Symposium, pages418–428, 2006.