
The Effect of Axial Flow Misalignment on Tidal Turbine Performance

Dublin Institute of TechnologyARROW@DIT
Articles School of Electronic and CommunicationsEngineering
2009-01-01
Misalignment Limits for a Singlemode-multimode-singlemode Fiber-based Edge FilterAgus HattaDublin Institute of Technology, [email protected]
Gerald FarrellDublin Institute of Technology, [email protected]
Pengfei WangDublin Institute of Technology, [email protected]
Ginu RajanDublin Institute of Technology
Yuliya SemenovaDublin Institute of Technology, [email protected]
This Article is brought to you for free and open access by the School ofElectronic and Communications Engineering at ARROW@DIT. It hasbeen accepted for inclusion in Articles by an authorized administrator ofARROW@DIT. For more information, please [email protected], [email protected].
This work is licensed under a Creative Commons Attribution-Noncommercial-Share Alike 3.0 License
Recommended CitationHatta, A., Farrell, G., Wang, P., Rajan, G., Semenova, Y.: Misalignment limits for a singlemode-multimode-singlemode fiber-based edgefilter. Journal of Lightwave Technology, Vol.27, 13, 2009, pp.2482-2488.
2482 JOURNAL OF LIGHTWAVE TECHNOLOGY, VOL. 27, NO. 13, JULY 1, 2009
Misalignment Limits for a Singlemode–Multi-mode–Singlemode Fiber-Based Edge Filter
Agus Muhamad Hatta, Gerald Farrell, Pengfei Wang, Ginu Rajan, and Yuliya Semenova
Abstract—Misalignment effects on the spectral characteristicsof edge filters based on singlemode–multimode–singlemode (SMS)fibre structures are investigated numerically and experimentally. Amodal propagation analysis is used with a set of guided modes cal-culated using the finite-difference method to determine the trans-mission loss of the SMS-based edge filters. A limit for the toler-able misalignment of the SMS fiber-based edge filter is proposed,beyond which the spectral performance of the SMS structure de-grades unacceptably. The numerical results are verified experi-mentally with good agreement.
Index Terms—Edge filter, multimode interference, optical fibers.
I. INTRODUCTION
S INGLEMODE–MULTIMODE–SINGLEMODE (SMS)fiber structures have been investigated for use in several
applications, e.g., as a refractometer, a bandpass filter, and anedge filter [1]–[4]. An optical device based on the SMS fiberstructure offers an all-fiber solution for optical communica-tions and optical sensing applications with the advantages ofsimplicity of packaging and ease of interconnection to otheroptical fibers.
The SMS structure is fabricated by splicing a precisely di-mensioned multimode fiber (MMF) section between two single-mode fibers (SMFs). Ideally, the center axes of all the fibre coresare precisely aligned. However, in practice the splicing processitself, along with the manufacturing variations in core-claddingconcentricity can introduce lateral misalignment between thecenters of the SMF–MMF–SMF cores.
In [2], [4], and [5], the SMS fiber structure is analyzed usinga modal propagation analysis (MPA) for the linearly polarized(LP) (or scalar) modes. The input light can be assumed to havethe field distribution of the fundamental mode of the SMF [5].When the light launches into the MMF, the input field can bedecomposed into the eigenmodes of the MMF. Dueto the circular symmetric nature of the input field and an idealalignment assumption, the number of guided modes of the MMF
Manuscript received September 12, 2008; revised December 04, 2008. Firstpublished April 17, 2009; current version published July 01, 2009.
A.M. Hatta is with the Applied Optoelectronics Centre, School of Elec-tronic and Communications Engineering, Dublin Institute of Technology,Kevin Street, D8, Ireland, on leave from Engineering Physics Department,Institut Teknologi Sepuluh Nopember (ITS), Surabaya, Indonesia (e-mail:[email protected]).
G. Farrell, P. Wang, G. Rajan, and Y. Semenova are with the Applied Op-toelectronics Centre, School of Electronic and Communications Engineering,Dublin Institute of Technology, Dublin D8, Ireland (e-mail: [email protected]; [email protected]; [email protected]; [email protected]).
Color versions of one or more of the figures in this paper are available onlineat http://ieeexplore.ieee.org.
Digital Object Identifier 10.1109/JLT.2008.2011499
used in the modal propagation analysis is greatly reduced fromto or the circular symmetry modes. This reduced
number of modes means the calculation can be performed effi-ciently. In [1] and [3], the SMS structure is investigated usingthe beam propagation method, where it is assumed that only thecircular symmetry modes exist. With this assumption the opticalfield is simplified so that it is independent of the angular coor-dinate in a cylindrical coordinate system. However, if the center(or meridional) axes of the SMS cores are misaligned relativeto one another then we cannot assume circularly symmetricalmodes. Thus, both approaches published so far cannot be usedto study the effect of misalignment in an SMS structure.
An MPA using a complete set of hybrid modes or vectorialform guided modes in the MMF has been proposed to analyzethe misalignment effect [6]. In this approach, a complete set ofguided modes in the MMF is calculated and an adaptive algo-rithm is developed to perform mode expansion of the opticalfield in the MMF. However, the complete set of guided modesin the MMF can also be solved with an alternative numericalmethod, the finite difference method (FDM) [7]. The numericalapproach using FDM offers simplicity of its implementation.In this paper, the FDM is used to calculate the complete set ofguided modes in the MMF and then the MPA is performed toanalyze the misalignment effect. Building on previous researchon an SMS-based edge filter [3], [4], in this paper, the effect offiber misalignment within an SMS-based edge filter is investi-gated both numerically and experimentally, so as to establish anupper limit on tolerable misalignment above which the perfor-mance of SMS structure is degraded significantly.
To put the misalignment induced performance degradation incontext, the application chosen here for the SMS is that of anedge filter used within a ratiometric wavelength measurementsystem. A ratiometric wavelength measurement usually consistsof a 3-dB coupler which the two outputs connect to an edge filterarm with a well-defined spectral response and a reference arm,or alternatively two edge filter arms with opposite slope spectralresponses can be used. The use of two opposite slope edge filterscan increase the usable resolution of the ratiometric system [8].A ratiometric wavelength measurement based system on twoopposite slope SMS-based edge filters is built and demonstratedin this paper.
II. SMS-BASED EDGE FILTERS
A schematic structure for a ratiometric wavelength measure-ment consisting of two SMS-based edge filters is shown inFig. 1(a). The target spectral responses in dB of the SMS-basededge filters are shown in Fig. 1(b), and can have either anegative (P1) or a positive (P2) slope. Two key parameters foran edge filter are baseline loss and discrimination range. The
0733-8724/$25.00 © 2009 IEEE
Authorized licensed use limited to: DUBLIN INSTITUTE OF TECHNOLOGY. Downloaded on August 7, 2009 at 05:13 from IEEE Xplore. Restrictions apply.

HATTA et al.: MISALIGNMENT LIMITS FOR A SINGLEMODE–MULTIMODE–SINGLEMODE FIBER-BASED EDGE FILTER 2483
Fig. 1. (a) Schematic configuration of a ratiometric wavelength measurement,(b) desired spectral responses of the SMS-based edge filter, negative (solid line)and positive (dash line) slope versions, and (c) the output ratio between twooutput SMS-based edge filters.
SMS-based edge filter operates over a wavelength range fromto with a progressively larger or smaller transmission
loss as the wavelength increases from to , for the negativeor positive slope, respectively. The baseline loss is defined asthe transmission loss of the filter at or , for the negativeand the positive slopes, respectively, while the discriminationrange is the difference between the transmission loss at and
. The corresponding ratio (P2–P1) of the two outputs overthe wavelength range is presented in Fig. 1(c). The wavelengthof an input signal can be determined through measuring thepower ratio of the output ports at the outputs of the two arms,assuming that a suitable calibration has taken place.
The fiber structure under consideration consists of an inputSMF, a sandwiched MMF section, and an output SMF, asshown in Fig. 2(a). The concentric alignment and misalignmentconditions in the Cartesian coordinate system, between theinput SMF, MMF section, and output SMF cores, are shownin Fig. 2(b) and (c), respectively. The radii of SMF and MMFare denoted as and , respectively. The input SMF and
Fig. 2. (a) Schematic configuration of the SMS fiber structure, (b) concentricalignment, and (c) misalignment condition.
output SMF positions are denoted by the coordinatesand , respectively, where and are in m.
III. MODAL PROPAGATION ANALYSIS
The MMF section can support many guided modes and theinput field is reproduced as single image at periodic intervalsalong the propagation direction due to the interference betweenthese guided modes. This is the so-called self-imaging prin-ciple and the distance at which self-imaging occurs is calledthe re-imaging distance. The approach used here to analyze thefield distribution in the MMF section is a modal propagationanalysis [9]. In the MMF, an MPA using a cylindrical coordi-nate system has been employed in [2], [4], and [5] based ona scalar approximation of the modes. The modescould not be used to investigate misalignment effects because itonly consists of circularly symmetrical modes. To analyze mis-alignment it is necessary to calculate a complete set of guidedmodes in the MMF [6]. In the approach used here, the MPAis performed in the Cartesian coordinate system with a set ofcalculated guided modes using FDM to allow investigation ofmisalignment effects.
The MPA procedure is as follows: the input light is assumedto have the field distribution of the fundamental modeof the SMF. The input field can be decomposed into the eigen-modes of the MMF, , when the light enters the MMFsection. The input field at the MMF can be written as
(1)
Authorized licensed use limited to: DUBLIN INSTITUTE OF TECHNOLOGY. Downloaded on August 7, 2009 at 05:13 from IEEE Xplore. Restrictions apply.

2484 JOURNAL OF LIGHTWAVE TECHNOLOGY, VOL. 27, NO. 13, JULY 1, 2009
where is the excitation coefficient of each mode. The co-efficient can be calculated by an overlap integral between
and
(2)
As the light propagates in the MMF section, the field at a prop-agation distance can be calculated by
(3)
where is the propagation constant of each eigenmode of theMMF. The transmission loss in dB can be determined by usingthe overlap integral method between and the eigen-mode of the output SMF
(4)Here and can be obtained by using a semivectorialFDM. It should be noted that FDM calculates a set of all possibleguided modes in the MMF section, not just concentric circularmodes, allowing the transmission loss due to misalignment tobe calculated. Using the above equations, the light propagationin the whole structure can be analyzed.
IV. DESIGN EXAMPLE AND SPECTRAL RESPONSE
To investigate the effect of misalignment, in the first instanceit is necessary to present a typical SMS structure designed tomeet a target spectral response and calculate its ideal, perfectlyaligned, spectral response.
To design the SMS-based edge filter, the MMF length needsto be determined. It has been shown that the re-imaging distanceis wavelength dependent [2], [5]. If re-coupling into the outputSMF takes place at the re-imaging distance, then the MMF sec-tion of the SMS structure has by definition a length equal to there-coupling distance and operates as a bandpass filter as in [2]and [5]. However, for the purpose of designing an edge filter, thebandpass response can be considered as two spectral responses,on either side of a center wavelength. Consequently, the devicecan behave as an edge filter for a selected wavelength range. TwoSMS-based edge filters with opposite slope spectral responseswithin a given wavelength range can be obtained by choosingtwo bandpass filters with appropriate center wavelengths [4].
As an example to illustrate the design process, a target wave-length range for wavelength measurement from nmto nm is chosen. This range is chosen as it corre-sponds to the typical center wavelengths for many fiber Bragggrating (FBG) sensors. Based on the target spectral responsesas in Fig. 1(b), the SMS-based edge filters are designed withthe baseline loss 8 dB and the desired discrimination range
8 dB. A standard SMF28 fiber is chosen as the SMF, for
Fig. 3. Transmission loss responses of the two SMS-based edge filters.
which the parameters are: the refractive indices for the core andcladding are 1.4504 and 1.4447, respectively (at a wavelengthof 1550 nm), and the radius of the core m. AnMMF-type AFS105/125Y is chosen as the MMF section forwhich the parameters are: refractive indices for the core andcladding are 1.4446 and 1.4271, respectively, with a core ra-dius m. The small difference between the refrac-tive indices of the SMF and MMF means that the Fresnel re-flection occurring at their interface is negligible (the level of re-flection is 54 dB or lower relative to the injected light level)and a one-way modal propagation analysis can be used [5]. Asmentioned above, for the specified wavelength range, two op-posite response slope edge filters (negative and positive slopes)can be obtained by designing two bandpass filters with peakwavelengths: 1520 nm and 1545 nm, respectively. From(10) in [5], the peak wavelengths from 1500 to 1520 nm cor-respond to the MMF lengths – mm, and from1545 to 1560 nm correspond to – mm. Suit-able peak wavelengths for the targeted wavelength range are1510 and 1547 nm and the corresponding MMF lengths are
mm and mm, for the negative and pos-itive slope edge filters, respectively. The peak wavelengths at1510 and 1547 nm are chosen for the SMS-based edge filtersbecause their transmission loss responses have a suitable spec-tral response over the targeted wavelength range from 1520 to1545 nm. The calculated transmission loss responses by using(4) for the designed SMS-based edge filter are shown in Fig. 3.These responses represent the performance of the design ex-ample for the case of perfect alignment. It can be seen thatthe two opposite edge filter responses within the targeted wave-length range can be achieved using two bandpass filters. The cal-culated negative and positive slope responses of the SMS-basededge filters from 1520 to 1545 nm have a transmission loss from
7.20 to 15.53 dB and 11.84 to 0.77 dB, respectively,and the corresponding discrimination ranges are 8.33 dB and11.06 dB, respectively, suitable for use as edge filters.
Authorized licensed use limited to: DUBLIN INSTITUTE OF TECHNOLOGY. Downloaded on August 7, 2009 at 05:13 from IEEE Xplore. Restrictions apply.
HATTA et al.: MISALIGNMENT LIMITS FOR A SINGLEMODE–MULTIMODE–SINGLEMODE FIBER-BASED EDGE FILTER 2485
V. INVESTIGATION OF MISALIGNMENT EFFECTS
FOR THE DESIGN EXAMPLE
To investigate the misalignment effect, the transmission lossof several positions of the input SMF and output SMF are calcu-lated using (4). We calculated the transmission loss within thewavelength range 1520–1545 nm of the offset positions, ,
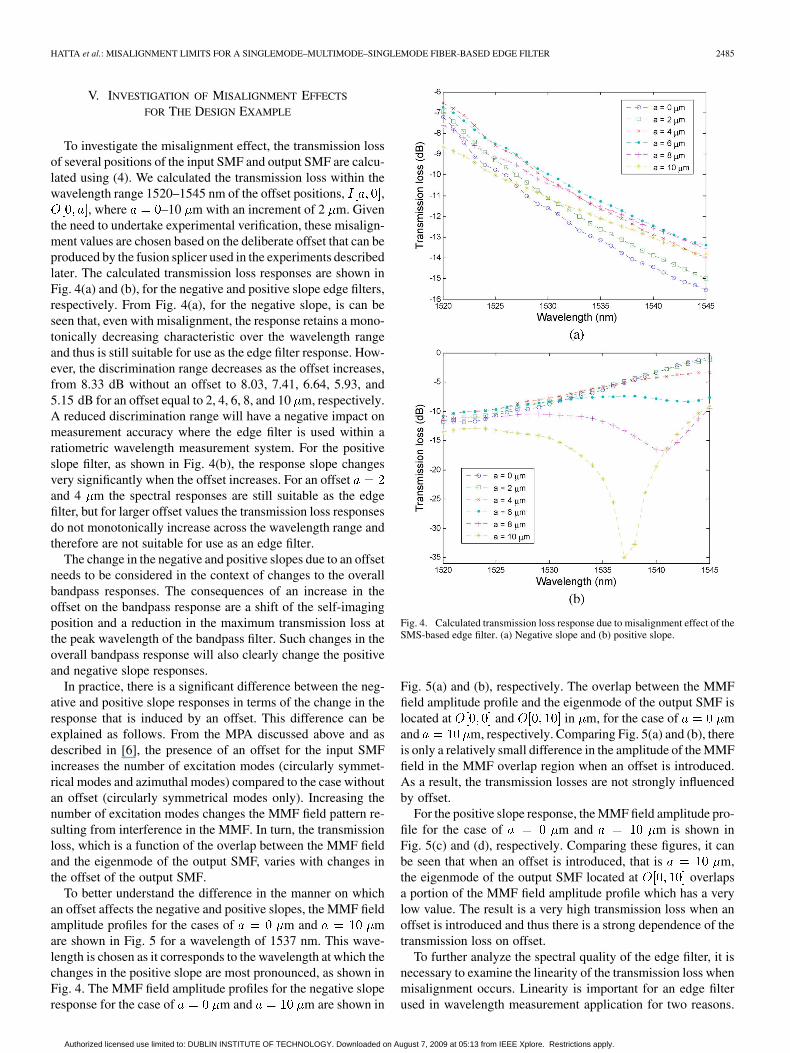
, where –10 m with an increment of 2 m. Giventhe need to undertake experimental verification, these misalign-ment values are chosen based on the deliberate offset that can beproduced by the fusion splicer used in the experiments describedlater. The calculated transmission loss responses are shown inFig. 4(a) and (b), for the negative and positive slope edge filters,respectively. From Fig. 4(a), for the negative slope, is can beseen that, even with misalignment, the response retains a mono-tonically decreasing characteristic over the wavelength rangeand thus is still suitable for use as the edge filter response. How-ever, the discrimination range decreases as the offset increases,from 8.33 dB without an offset to 8.03, 7.41, 6.64, 5.93, and5.15 dB for an offset equal to 2, 4, 6, 8, and 10 m, respectively.A reduced discrimination range will have a negative impact onmeasurement accuracy where the edge filter is used within aratiometric wavelength measurement system. For the positiveslope filter, as shown in Fig. 4(b), the response slope changesvery significantly when the offset increases. For an offsetand 4 m the spectral responses are still suitable as the edgefilter, but for larger offset values the transmission loss responsesdo not monotonically increase across the wavelength range andtherefore are not suitable for use as an edge filter.
The change in the negative and positive slopes due to an offsetneeds to be considered in the context of changes to the overallbandpass responses. The consequences of an increase in theoffset on the bandpass response are a shift of the self-imagingposition and a reduction in the maximum transmission loss atthe peak wavelength of the bandpass filter. Such changes in theoverall bandpass response will also clearly change the positiveand negative slope responses.
In practice, there is a significant difference between the neg-ative and positive slope responses in terms of the change in theresponse that is induced by an offset. This difference can beexplained as follows. From the MPA discussed above and asdescribed in [6], the presence of an offset for the input SMFincreases the number of excitation modes (circularly symmet-rical modes and azimuthal modes) compared to the case withoutan offset (circularly symmetrical modes only). Increasing thenumber of excitation modes changes the MMF field pattern re-sulting from interference in the MMF. In turn, the transmissionloss, which is a function of the overlap between the MMF fieldand the eigenmode of the output SMF, varies with changes inthe offset of the output SMF.
To better understand the difference in the manner on whichan offset affects the negative and positive slopes, the MMF fieldamplitude profiles for the cases of m and mare shown in Fig. 5 for a wavelength of 1537 nm. This wave-length is chosen as it corresponds to the wavelength at which thechanges in the positive slope are most pronounced, as shown inFig. 4. The MMF field amplitude profiles for the negative sloperesponse for the case of m and m are shown in
Fig. 4. Calculated transmission loss response due to misalignment effect of theSMS-based edge filter. (a) Negative slope and (b) positive slope.
Fig. 5(a) and (b), respectively. The overlap between the MMFfield amplitude profile and the eigenmode of the output SMF islocated at and in m, for the case of mand m, respectively. Comparing Fig. 5(a) and (b), thereis only a relatively small difference in the amplitude of the MMFfield in the MMF overlap region when an offset is introduced.As a result, the transmission losses are not strongly influencedby offset.
For the positive slope response, the MMF field amplitude pro-file for the case of m and m is shown inFig. 5(c) and (d), respectively. Comparing these figures, it canbe seen that when an offset is introduced, that is m,the eigenmode of the output SMF located at overlapsa portion of the MMF field amplitude profile which has a verylow value. The result is a very high transmission loss when anoffset is introduced and thus there is a strong dependence of thetransmission loss on offset.
To further analyze the spectral quality of the edge filter, it isnecessary to examine the linearity of the transmission loss whenmisalignment occurs. Linearity is important for an edge filterused in wavelength measurement application for two reasons.
Authorized licensed use limited to: DUBLIN INSTITUTE OF TECHNOLOGY. Downloaded on August 7, 2009 at 05:13 from IEEE Xplore. Restrictions apply.

2486 JOURNAL OF LIGHTWAVE TECHNOLOGY, VOL. 27, NO. 13, JULY 1, 2009
Fig. 5. The MMF field amplitude profile at � � ���� nm for the negative slope (a) � � � �m, (b) � � �� �m; for the positive slope (c) � � � �m, (d) � �
�� �m.
First, a linear response by definition monotonically increasesor decreases, so there can be no ambiguity in wavelength mea-surements. Second, a linear response will ensure that the resolu-tion for wavelength measurement is the same for all measuredwavelengths. The linearity can be examined by using the cor-relation coefficient of the linear regression analysis. Anideal spectral response has , and a lower indi-cates a lower quality for the spectral response linearity. Fig. 6shows the correlation coefficient for the different offsets from0 to 10 m with an increment of 1 m. It is shown that for thenegative slope, the maintains a high value and is almost con-stant with , 0.98, 0.99, 0.99, 0.99, 0.99, and 0.99 forthe offset , 2, 4, 6, 8, and 10 m, respectively. This meansthat the offset has little effect on the slope quality for the nega-tive slope spectral response, but does reduce the discriminationrange as mentioned above. For the positive slope, it is clear thatthe offset effects the slope quality. The are 0.98, 0.99, 0.99,0.67, 0.28, and 0.07 for the offset of 0, 2, 4, 6, 8, and 10 m,respectively. The value degrades beyond an offset value of
m, with , and such spectral responses arenot suitable for use in an edge filter. Based on the calculation ofthe value, it is suggested as a conservative guiding principlethat the misalignment should be less than the core radius of the
SMF (4.15 m in this case) to maintain the slope quality for thetwo SMS-based edge filters with opposite spectral responses.
For the purpose of experimental verification, the twoSMS-based edge filters were fabricated using a precisionFujikura CT-07 cleaver and a Sumitomo type-36 three-axisfusion splicer. For each SMS structure the process is the same.First, the input SMF and the input end of the MMF are cleavedand spliced together. To deliberately introduce an offset (andthus misalignment) in this splice, an attenuation splicing mode,available as an option on the fusion splicer, is used. Thissplicing mode allows for the creation of a fiber splice witha preset optical power loss. Given a preset power loss, thefusion splicer will automatically perform the splice with anappropriate axial offset.
The cleaver is again used to precisely cleave the un-termi-nated end of the MMF fiber so that its length is set to the de-sired value. Finally, the output end of MMF section is splicedto the cleaved end of the output SMF, again with the attenuationsplicing option. The desired power loss is set so that it corre-sponds to an offset of 3.3 m.
The transmission loss response of each fabricated filter ismeasured using a tunable laser and an optical spectrum ana-lyzer (OSA). The measured results are shown in Fig. 7 for the
Authorized licensed use limited to: DUBLIN INSTITUTE OF TECHNOLOGY. Downloaded on August 7, 2009 at 05:13 from IEEE Xplore. Restrictions apply.

HATTA et al.: MISALIGNMENT LIMITS FOR A SINGLEMODE–MULTIMODE–SINGLEMODE FIBER-BASED EDGE FILTER 2487
Fig. 6. Correlation coefficient of the spectral response for different offsets.
Fig. 7. Measured and calculated transmission loss with misalignment of theSMS-based edge filters.
negative and the positive slope SMS-based edge filters. The cal-culation of transmission loss using (4) is also shown in Fig. 7.The calculated and measured results show a good agreement.The discrepancy between the calculated and measured results ismost likely a result of: 1) residual splicing insertion losses and2) errors in the exact length of the MMF section. MMF sectionlength errors, which arise during fabrication of the SMS struc-ture, shift the peak wavelength of the bandpass filter response,which in turn alters the measured transmission loss values overa fixed wavelength range.
Experimentally the two edge filters with their deliberate mis-alignment, while they do possess a higher insertion loss, demon-strate response slopes with an acceptable discrimination rangesof 9.47 and 8.89 dB for the negative and positive slopes, respec-tively. The edge filters are therefore still suitable for use as edgefilters. This result verifies our assertion that as long as the mis-alignment between SMF and MMF cores is less than an offsetmisalignment limit which is equal to the SMF core radius thenthere is no significant effect on the slope quality.
Fig. 8. Measured ratio.
To provide confirmation a misaligned SMS-based edge filterwill work as long as the lateral misalignment in an SMS struc-ture is less than the limit proposed, the edge filter describedabove with a 3.3 m lateral misalignment was employed ina functioning wavelength measurement system, based on thescheme described in Fig. 1(a). The input signal is split intotwo equal intensity signals using a 3 dB fiber splitter. One ofthe signals passes through the negative slope SMS-based edgefilter and the other passes through the positive slope SMS-basededge filter. A dual channel power meter is placed at the endsof both arms. Fig. 8 shows the measured ratio of the opticalpower. The measured ratio between 1520 and 1545 nm has alinear slope with a discrimination range of 18.14 dB from 7.17to 10.97 dB, which is suitable for wavelength measurement.
It should be noted that for the fabrication of an SMS, it ispreferable to use a fusion splicing machine with the capabilityof three-axis adjustment rather than a single-axis (also calleda fixed V-groove) fusion splicer. Lateral misalignment arisesin an SMS structure for two reasons. First, there is the lat-eral misalignment introduced by the fusion splicer itself, andsecond, there is the misalignment that results from the limitedmanufacturing tolerance of core-cladding concentricity of thefibers used. Using a fusion splicer with three-axis adjustmentcan negate the effect of the limited core-cladding concentricityof the fibers. This means that the only significant source ofmisalignment is the inherent alignment accuracy of the fu-sion splicer itself. Typical three-axis adjustment splicers canmaintain inherent misalignment to less than 0.5 m in thecase of identical SMF or MMF splicing and thus can allowthe fabrication of SMS structures with repeatably low lateralmisalignment. The use of a single-axis fusion splicer is lessadvisable for SMS fabrication as it is not possible to overcomemisalignment due to limited core concentricity and furthermorea single-axis splicer typically has an inherent misalignment thatis higher than a three-axis adjustment splice machine.
VI. CONCLUSION
The effect of misalignment on the spectral response of anSMS-based edge filter has been investigated. An MPA with a
Authorized licensed use limited to: DUBLIN INSTITUTE OF TECHNOLOGY. Downloaded on August 7, 2009 at 05:13 from IEEE Xplore. Restrictions apply.

2488 JOURNAL OF LIGHTWAVE TECHNOLOGY, VOL. 27, NO. 13, JULY 1, 2009
calculated set of guided modes using FDM is employed to ana-lyze the misalignment effect. It is shown that the performance ofthe SMS based edge filter degrades when the lateral misalign-ment is larger than a misalignment limit which is equal to thecore radius of the SMF used.The measured transmission loss re-sponses show a good agreement with the numerical results. TheSMS-based edge filter used in the experiment is found to be suit-able for use in a wavelength measurement system. Overall, it isshown that an SMS structure fabricated using a fusion splicerwith three-axis adjustment has the advantage of a useful fabri-cation tolerance, within which the lateral misalignment has nosignificant effect on the slope of edge filter.
REFERENCES
[1] Q. Wang and G. Farrell, “All-fiber multimode-interference-based re-fractometer sensor: Proposal and design,” Opt. Lett., vol. 31, no. 3, pp.317–319, 2006.
[2] W. S. Mohammed, P. W. E. Smith, and X. Gu, “All-fiber multimodeinterference bandpass filter,” Opt. Lett., vol. 31, no. 17, pp. 2547–2549,2006.
[3] Q. Wang and G. Farrell, “Multimode-fiber-based edge filter for opticalwavelength measurement application and its design,” Microw. Opt.Technol. Lett., vol. 48, no. 5, pp. 900–902, 2006.
[4] A. M. Hatta, G. Farrell, Q. Wang, G. Rajan, P. Wang, and Y. Se-menova, “Ratiometric wavelength monitor based on singlemode–mul-timode–singlemode fiber structure,” Microw. Opt. Technol. Lett., to bepublished.
[5] Q. Wang, G. Farrell, and W. Yan, “Investigation on singlemode–mul-timode–singlemode fiber structure,” J. Lightw. Technol., vol. 26, no. 5,pp. 512–519, May 2008.
[6] H. Li, M. Brio, L. Li, A. Schülzgen, N. Peyghambarian, and J. V.Moloney, “Multimode interference in circular step-index fibers studiedwith the mode expansion approach,” J. Opt. Soc. Amer. B, Opt. Phys.,vol. 24, no. 10, pp. 2707–2720, 2007.
[7] K. Kawano and T. Kitoh, Introduction to Optical Waveguide Anal-ysis: Solving the Maxwell Equations and the Schrodinger Equation.Hoboken, NJ: Wiley, 2001, pp. 117–160.
[8] S. M. Melle, K. Liu, and R. M. Measures, “Practical fiber-opticBragg grating strain gauge system,” Appl. Opt., vol. 32, no. 19, pp.3601–3609, 1993.
[9] L. B. Soldano and E. C. M. Pennings, “Optical multi-mode interferencedevices based on self-imaging: Principles and applications,” J. Ligthw.Technol., vol. 13, no. 4, pp. 615–627, Apr. 1995.
Agus Muhamad Hatta (S’09) received his B.Eng. degree in engineeringphysics and M.Sc. degree in optoelectronics-physics from Institut TeknologiSepuluh Nopember (ITS) Surabaya, Indonesia, in 2002 and 2005 respectively.
He is currently on leave from the Engineering Physics Department, InstitutTeknologi Sepuluh Nopember (ITS) Surabaya, Indonesia as a junior lecturer.Since 2006 he has been working toward his Ph.D. degree at Applied Optoelec-tronics Centre, Dublin Institute of Technology, Ireland. His research interest
includes modeling and application of fiber optics and integrated optics for fastwavelength measurement and optical sensing.
Gerald Farrell graduated with an honours degree in electronic engineeringfrom University College Dublin in 1979. He has a Ph.D. (1994) from TrinityCollege Dublin for research in all-optical synchronization using self-pulsatinglaser diodes that resulted in the development and patenting of a new method ofall-optical frequency changing.
He spent a number of years as a communications systems design engineerbefore joining the DIT. He is the Head of the School of Electronic and Com-munications Engineering at the Dublin Institute of Technology (DIT). For thelast 12 years Dr. Farrell has been the Director of the Applied OptoelectronicsCentre at the DIT and also is the group leader for the Photonics Research groupat the DIT. His research interests are in fast wavelength measurement for opticalsensing; the modeling and analysis of FBG interrogation schemes and the mod-eling and application of fiber bend loss. He has authored or coauthored over 95articles in journals and conferences and is a referee for a number of Optical andPhotonic journals.
He is a principle investigator on several funded projects, some with interna-tional partners.
Pengfei Wang has been working toward his Ph.D. degree at the Applied Opto-electronics Centre Dublin Institute of Technology, Dublin, Ireland, since 2005.
His research interests include optoelectronics devices and the modeling andexperimental investigations of bend loss in waveguides and fibers.
Ginu Rajan received his B.Sc. degree in physics from University of Keralaand M.Sc. degree in applied physics from Mahatma Gandhi University, Kerala,India, in 2000 and 2002, respectively. Since 2005 he has been working towardhis Doctoral degree at Applied Optoelectronics Centre, Dublin Institute of Tech-nology, Ireland.
He worked as a Research Trainee at Indian Institute of Astrophysics duringthe period 2003–2005. His research interest includes optical fiber sensors and itsapplications, fiber edge filters, FBG interrogation systems, and fast wavelengthmeasurement techniques.
Yuliya Semenova graduated with a B.Sc. degree in electronic engineering fromLviv Polytechnic National University, Ukraine in 1992. She subsequently un-dertook research leading to a Ph.D. degree in physics of molecular and liquidcrystals in 1999.
Between 1997 and 2001 she worked as a researcher at the faculty of Elec-trophysics, Lviv Polytechnic National University, Ukraine. Since 2001 she is aresearcher and lecturer at the School of Electronic and Communications Engi-neering, Dublin Institute of Technology. Her research interests include physicsof liquid crystals, their applications in photonics and fiber optic sensing. She hasauthored or coauthored over 40 articles in journals and conferences.
Authorized licensed use limited to: DUBLIN INSTITUTE OF TECHNOLOGY. Downloaded on August 7, 2009 at 05:13 from IEEE Xplore. Restrictions apply.
Copyright © 2022 FDOKUMEN


![Active low pass filter design[1]](https://static.fdokumen.com/doc/165x107/631aaeddd43f4e1763048eee/active-low-pass-filter-design1.jpg)