Multilayer Stock Forecasting Model Using Fuzzy Time Series
11
Research Article Multilayer Stock Forecasting Model Using Fuzzy Time Series Hossein Javedani Sadaei and Muhammad Hisyam Lee Department of Mathematical Sciences, Faculty of Science, Universiti Teknologi Malaysia, 81310 Skudai, Johor, Malaysia Correspondence should be addressed to Muhammad Hisyam Lee; [email protected] Received 31 August 2013; Accepted 17 November 2013; Published 29 January 2014 Academic Editors: L. Koczy and Z. Wang Copyright © 2014 H. Javedani Sadaei and M. H. Lee. is is an open access article distributed under the Creative Commons Attribution License, which permits unrestricted use, distribution, and reproduction in any medium, provided the original work is properly cited. Aſter reviewing the vast body of literature on using FTS in stock market forecasting, certain deficiencies are distinguished in the hybridization of findings. In addition, the lack of constructive systematic framework, which can be helpful to indicate direction of growth in entire FTS forecasting systems, is outstanding. In this study, we propose a multilayer model for stock market forecasting including five logical significant layers. Every single layer has its detailed concern to assist forecast development by reconciling certain problems exclusively. To verify the model, a set of huge data containing Taiwan Stock Index (TAIEX), National Association of Securities Dealers Automated Quotations (NASDAQ), Dow Jones Industrial Average (DJI), and S&P 500 have been chosen as experimental datasets. e results indicate that the proposed methodology has the potential to be accepted as a framework for model development in stock market forecasts using FTS. 1. Introduction e statistical complex system model investigation of finan- cial market index and return is an issue to understand and model the distribution of financial price fluctuation, which has long been an effort of economic study. As the stock markets are becoming deregulated globally, the stock market system modeling and forecast are becoming more complex in the risk management and derivatives rating. e development of novel statistical analyzing methods of stock returns delivers numerous observed indications of old random-walk hypothesis, demanding the invention of new financial models to describe price movements in the market [1]. However, one of the key aspects of complex statistical model in stock market is accurate forecasting that could yield significant profits and it could also decrease investment risks [2–4]. Considering the stock prediction, the most frequently used forecasting methods are nonlinear models, for example, neural network [5–7], genetic algorithm [8, 9], hybrid models [10–12], fuzzy logic [13], and support vector machine [14]. However, fuzzy time-series method has been developed as one of novel forecasting methods in this area. So far, various FTS have been applied successfully to handle stock index forecasting [15–23]. Since this study is focused on applying FTS on stock data prediction, the following paragraphs provide a brief review of FTS models. Song and Chissom [24, 25] first applied a FTS model by using fuzzy relation equations and approximate reasoning. ere are two classes of FTS: time-variant and time-invariant. Chen [26] presented a method to forecast student enrolment at the University of Alabama that takes less time computing max-min composition operations than Song and Chissom’s model [24, 25]. e length of intervals influences forecast accuracy in FTS. Consequently, determining optimal length of interval in FTS is the central issue in studies. Along these lines, Huarng [27] proposed distribution- and average-based length to determine the effective length of intervals in FTS. In addi- tion, Sheng and Yeh [28], at their work, presented a novel approach to handle the issue of finding the effective length by applying the natural partitioning technique, which can recursively partition the universe of discourse level by level in a natural way. ey indicated that the model could be used to handle high-order FTS as well. Experimental results on the enrolment data of the University of Alabama proved that the results of forecasting model could forecast the data effectively and efficiently. Yu [29] proposed a refined fuzzy time-series model to further refine the lengths of intervals. Hindawi Publishing Corporation e Scientific World Journal Volume 2014, Article ID 610594, 10 pages http://dx.doi.org/10.1155/2014/610594
-
Upload
independent -
Category
Documents
-
view
2 -
download
0
Transcript of Multilayer Stock Forecasting Model Using Fuzzy Time Series
Research ArticleMultilayer Stock Forecasting Model Using Fuzzy Time Series
Hossein Javedani Sadaei and Muhammad Hisyam Lee
Department of Mathematical Sciences Faculty of Science Universiti Teknologi Malaysia 81310 Skudai Johor Malaysia
Correspondence should be addressed to Muhammad Hisyam Lee mhlutmmy
Received 31 August 2013 Accepted 17 November 2013 Published 29 January 2014
Academic Editors L Koczy and Z Wang
Copyright copy 2014 H Javedani Sadaei and M H Lee This is an open access article distributed under the Creative CommonsAttribution License which permits unrestricted use distribution and reproduction in any medium provided the original work isproperly cited
After reviewing the vast body of literature on using FTS in stock market forecasting certain deficiencies are distinguished in thehybridization of findings In addition the lack of constructive systematic framework which can be helpful to indicate direction ofgrowth in entire FTS forecasting systems is outstanding In this study we propose a multilayer model for stock market forecastingincluding five logical significant layers Every single layer has its detailed concern to assist forecast development by reconcilingcertain problems exclusively To verify the model a set of huge data containing Taiwan Stock Index (TAIEX) National Associationof Securities Dealers Automated Quotations (NASDAQ) Dow Jones Industrial Average (DJI) and SampP 500 have been chosen asexperimental datasets The results indicate that the proposed methodology has the potential to be accepted as a framework formodel development in stock market forecasts using FTS
1 Introduction
The statistical complex system model investigation of finan-cial market index and return is an issue to understandand model the distribution of financial price fluctuationwhich has long been an effort of economic study As thestock markets are becoming deregulated globally the stockmarket system modeling and forecast are becoming morecomplex in the risk management and derivatives ratingThe development of novel statistical analyzing methods ofstock returns delivers numerous observed indications of oldrandom-walk hypothesis demanding the invention of newfinancial models to describe price movements in the market[1] However one of the key aspects of complex statisticalmodel in stock market is accurate forecasting that could yieldsignificant profits and it could also decrease investment risks[2ndash4] Considering the stock prediction the most frequentlyused forecasting methods are nonlinear models for exampleneural network [5ndash7] genetic algorithm [8 9] hybridmodels[10ndash12] fuzzy logic [13] and support vector machine [14]However fuzzy time-series method has been developed asone of novel forecasting methods in this area So far variousFTS have been applied successfully to handle stock indexforecasting [15ndash23] Since this study is focused on applying
FTS on stock data prediction the following paragraphsprovide a brief review of FTS models
Song and Chissom [24 25] first applied a FTS model byusing fuzzy relation equations and approximate reasoningThere are two classes of FTS time-variant and time-invariantChen [26] presented a method to forecast student enrolmentat the University of Alabama that takes less time computingmax-min composition operations than Song and Chissomrsquosmodel [24 25]
The length of intervals influences forecast accuracy inFTS Consequently determining optimal length of interval inFTS is the central issue in studies Along these lines Huarng[27] proposed distribution- and average-based length todetermine the effective length of intervals in FTS In addi-tion Sheng and Yeh [28] at their work presented a novelapproach to handle the issue of finding the effective lengthby applying the natural partitioning technique which canrecursively partition the universe of discourse level by levelin a natural way They indicated that the model could beused to handle high-order FTS as well Experimental resultson the enrolment data of the University of Alabama provedthat the results of forecasting model could forecast the dataeffectively and efficiently Yu [29] proposed a refined fuzzytime-series model to further refine the lengths of intervals
Hindawi Publishing Corporatione Scientific World JournalVolume 2014 Article ID 610594 10 pageshttpdxdoiorg1011552014610594
2 The Scientific World Journal
Their model could improve the lengths of intervals duringthe formulation of fuzzy relationships and hence establishedthe fuzzy relationships more appropriately Using geneticalgorithms Chen and Chung [30] presented a method thatmodified the length of each interval in the universe ofdiscourse to deal with the forecasting complications basedon high-order fuzzy time Moreover they used historicalenrolments of the University of Alabama to illustrate theforecasting process of their proposed method Cheng et al[16 31] proposed two approaches for overcoming the prob-lems of determining the universe of discourse the lengthof intervals and membership functions of FTS Huarng andYu [32] proposed ratio-based lengths of intervals to improveFTS forecasting In their research algebraic growth datasuch as enrolments and the stock index and exponentialgrowth data such as inventory demand were selected as theforecasting targetsThe empirical examination recommendedthat the ratio-based lengths of intervals could also be usedto improve FTS forecasting Li and Cheng [33] proposeda deterministic forecasting model to accomplish the issuesof controlling uncertainty in forecasting partitioning theintervals effectively and consistently achieving forecastingaccuracy with different interval lengths In addition intheir work an important parameter the maximum lengthof subsequence in a FTS resulting in a certain state wasdeterministically quantified Moreover their model followedthe consistency principle that a shorter interval length leadsto more accurate results Later Li et al [34] proposed anovel forecasting model to enhance forecasting functionalityand to allow processing of two-factor forecasting problemsMoreover that model applied fuzzy c-means (FCM) clus-tering to deal with interval partitioning which consideredthe nature of data and formed unequal-sized intervals In arecent study Wang and Chen [35] presented a method toforecast the temperature and the Taiwan Futures Exchange(TAIFEX) based on automatic clustering techniques anda two-factor high-order FTS Aladag et al [36] proposedanother approach which used a single-variable constrainedoptimization to determine the ratio for the length of intervalsTheirmethodwas successfully applied to the two case studieswhich are the enrolment data at the University of Alabamaand the inventory demand data Su et al proposed a modelfor the forecasting process which combined two granulatingmethods (the minimize entropy principle approach and thecumulative probability distribution approach) and a roughset algorithm [37] Their model surpassed the conventionalfuzzy time-series models and a multiple regression model(MLR) in forecast accuracy In a different study Egriogluet al [38] proposed a new method which used MATLABfunction that employs an algorithm based on golden sectionsearch to optimize a function with single-variable constraintfor finding the effective length of intervals in high-orderFTS Forecasting number of enrolments in Alabama Uni-versity showed a great improvement in accuracy by thismethod
A remarkable development in forecasting stock markethas been materialized by using adaption models Few studiesdealt with this issue Cheng et al [39] for instance intro-duced a fuzzy time-seriesmodelwhich combines the adaptive
expectation model into forecasting processes to adjust fore-casting errors Liu et al [20] presented a multiple attributeFTS method which integrates a clustering method andadaptive expectationmodel Teoh et al [21] proposed a hybridmodel based on multiorder FTS which employs rough setstheory to mine fuzzy logical relationship from time-seriesand adaptive expectation model to modify forecasting resultsin order to increase forecasting accuracy Chen et al [15]proposed a model that could adjust the forecasting resultswith the possibility of minimal error in the training dataset
Based on the above information most of forecastingliteratures to date have focused on the development ofspecific algorithms In addition in some of these studiesthe effect of data preprocessing has been disregarded thatis researchers directly utilized unprocessed stock data forforecasting purposes This gives the impression that they arenot willing to spend time doing data preprocessing Howeveras it will be noted in the following sections forecast accuracywill be improved by appropriate data preprocessing
The second issue is the shortage of forecasts modificationbased on recent observations As stated above adaption offorecast has major impacts on forecast accuracy nonethelessit has received consideration in few studies
Still another vague issue in previous studies is deter-mining universe of discourse and establishing linguisticvariables In order to forecast stock market using FTS weneed to determine the length of each interval to estab-lish linguistic variables Even though researchers proposedmany approaches to reconcile this problem almost all ofthem ignored to show how universe of discourse must beexactly defined Besides distinguishing the length of intervalsanother issue that must be taken into account is determiningthe starting point of universe of discourse If the role ofstarting points is neglected in FTS algorithms it will bedifficult to judge whether a particular FTS model exactlyproduces robust forecast or not To address the importanceof the starting point as an important gap in previous studieswe perform certain experiments The results demonstratethat while the lengths of intervals are identical the degreeof accuracy is considerably different with different startingpoints (notice Table 1) For instance notice the difference inyears 1991 1992 and 1998 In this table the starting pointcorresponding to each year is start = min(data) minus 1198631
Last but not least there is lack of studies on the combi-nation of different algorithms having positive role in stockmarket prediction In other words the hybridization ofconstructive findings of earlier studies appears to receive lessattention Based on their interest researchers focus on certainsubjects such as developing FTS algorithms or developingalgorithms for finding the effective length of intervals how-ever there is not any systematic model to motivate them tocombine or ensemble several positive features to progressforecasts in this field of study
In this study our approach differs from those reviewedin the literature Earlier studies were tied to a particularalgorithm However in this study the aim is not to proposenew algorithm instead we propose a systematic descriptiveand well-structured framework model which is constructedof some meaningful layers that play an independent role
The Scientific World Journal 3
Table 1 Forecasting performance for TAIEX with length = 100
Model 1198631
Year1990 1991 1992 1993 1994 1995 1996 1997 1998 1999
Chen [40] 50 2154 1096 588 1209 1075 786 639 1453 1393 122370 2179 969 677 1256 1067 929 577 1484 1257 1232
Yu [17 32] 50 2197 773 523 1136 1029 742 651 1406 1457 115870 2237 921 715 1241 995 874 592 1388 1245 1124
throughout the forecast process Each layer has a responsi-bility to resolve specific problems such as those mentionedabove The proposed methodology is model-based ratherthan algorithm-based
The rest of the paper proceeds as followsThe next sectionpresents related works to FTS models In Section 3 theframework of proposed multilayer stock forecasting modelis documented Section 4 provides information about stockdatabases that used in this study In Section 5 empirical exper-iments are presented Section 6 provides our discussions andfindings The final section displays conclusions and futureworks
2 Related Studies
This section provides definitions of fuzzy time series Further-more weighted fuzzy time-series algorithm is explained
21 Fuzzy Time-Series Definitions and Algorithms Song andChissom first presented the concepts of fuzzy time series [2425 41] where the values in a fuzzy time series are presentedby fuzzy sets [42] Let 119880 be the universe of discourse where119880 = 119906
1 1199062 119906
119898 A fuzzy set 119860
119894(119894 = 1 2 119898) of 119880 is
defined as follows
119860119894=
119891119860119894(1199061)
1199061
+
119891119860119894(1199062)
1199062
+ sdot sdot sdot +
119891119860119894(119906119898)
119906119898
(1)
where 119891119860119894
is the membership function of the fuzzy set119860119894 119891119860119894
119880 rarr [0 1] 119906119899is a generic element of
fuzzy set 119860119894 119891119860119894(119906119899) is the degree of belongingness of 119906
119899to
119860119894 119891119860119894(119906119899) isin [0 1] and 1 le 119899 le 119898
Definition 1 (see [25]) Let 119884(119905) 119905 = 0 1 2 a subset ofreal numbers 119877 be the universe of discourse by which fuzzysets119891119895(119905) are defined If 119865(119905) is a collection of 119891
1(119905) 1198912(119905)
then 119865(119905) is called a fuzzy time series defined on 119884(119905)
Definition 2 (see [25]) If there exists a fuzzy relationship119877(119905minus1 119905) such that 119865(119905) = 119865(119905minus1)∘119877(119905minus1 119905) where ldquo∘rdquo is anarithmetic operator then 119865(119905) is said to be caused by 119865(119905 minus 1)The relationship between 119865(119905) and 119865(119905 minus 1) can be denoted by119865(119905 minus 1) rarr 119865(119905)
Definition 3 (see [25]) Suppose that119865(119905) is calculated only by119865(119905 minus 1) and 119865(119905) = 119865(119905 minus 1) ∘119877(119905 minus 1 119905) For any 119905 if 119877(119905 minus 1 119905)is independent of 119905 then 119865(119905) is considered a time-invariantfuzzy time series Otherwise 119865(119905) is time-variant Assuming119865(119905 minus 1) = 119860
119894and 119865(119905) = 119860
119895 a fuzzy logical relationship
can be defined as 119860119894rarr 119860119895 where 119860
119894and 119860
119895are called the
left-hand side (LHS) and right-hand side (RHS) of the fuzzylogical relationship respectively
22 The Algorithm of Yursquos Model Since in this study weemploy weighted FTS proposed by Yu [22] in this section westated it with details as follows
Step 1 Defining the universe of discourse and intervalsfor observations according to the problem domain theuniverse of discourse for observations is defined as 119880 =
[starting ending] The length of the intervals 119897 is thendetermined where 119880 can be partitioned into equal-lengthintervals 119906
1 1199062 119906
119887 Each interval 119906
119889can be considered to
be [starting + (119889 minus 1) times 119897 starting + 119889 times 119897] and each matchingmidpoint119872
119889as 12 times (starting+ (119889 minus 1) times 119897 + starting+ 119889times 119897)
where 119889 = 1 2 3 119898
Step 2 Defining fuzzy sets for observations each linguisticobservation 119860
119894can be defined by the intervals 119906
1 1199062 119906
119898
119860119894= 119891119860119894(1199061)1199061+119891119860119894(1199062)1199062+ sdot sdot sdot +119891
119860119894(119906119898)119906119898 Each119860
119894can
be denoted as 119860119894= sdot sdot sdot + 0119906
119894minus2+ 05119906
119894minus1+ 1119906119894+ 05119906
119894+1+
0119906119894+2
+ sdot sdot sdot 119894 = 1 2 119898
Step 3 Fuzzifying each observations in training dataset
Step 4 Establishing FLRs two successive fuzzy sets 119860119894(at
119905minus1) and1198601198951(at 119905) can be used to create the FLR119860
119894rarr 1198601198951
Step 5 Establishing fuzzy relationships the FLRswith similarLHS establish FLRGs
Step 6 Forecasting supposing the FLRG 119860119894
rarr 1198601198951
1198601198952 119860
119895119896 (1 le 119896 le 119898) if 119865(119905 minus 1) = 119860
119894 then the forecast
of 119865(119905) is 1198601198951 1198601198952 119860
119895119896
Step 7 Defuzzifying assume that the forecast of 119865(119905) is1198601198951 1198601198952 119860
119895119896 The defuzzified matrix is equivalent to a
matrix with midpoints 119872(119905) = [11987211989511198721198952 119872
119895119896] where
119872(119905) denotes the defuzzified forecast of 119865(119905)
Step 8 Assigning weights assume the forecast of 119865(119905)
is 1198601198951 1198601198952 119860
119895119896 The corresponding weights for
1198601198951 1198601198952 119860
119895119896 for example 119908
1 1199082 119908
119896 are stated
Before making the weight matrix with these 1199081 1199082 119908
119896
the weight matrix 119882(119905) = [119908
1015840
1 119908
1015840
2 119908
1015840
119896] must satisfy
the condition sum
119896
ℎ=1119908
1015840
ℎ= 1 Henceforth these weights
4 The Scientific World Journal
1199081 1199082 119908
119896should be standardizedThen achieve the next
weight matrix
119882(119905) = [119908
1015840
1 119908
1015840
2 119908
1015840
119896]
= [
1199081
sum
119896
ℎ=1119908ℎ
1199082
sum
119896
ℎ=1119908ℎ
119908119896
sum
119896
ℎ=1119908ℎ
]
(2)
where 119908ℎis the corresponding weight for 119860
119895ℎ Furthermore
the weight matrix is monotonic therefore it also satisfies thefollowing condition
1199081le 1199082le sdot sdot sdot le 119908
119896 (3)
One intuitive weight scheme based on Yursquos study is here
1199081= 1 119908
119894= 119908119894minus1
+ 1 for 119894 ge 2 (4)
Hence the 119894th item in (2) can be denoted as
119882(119905) = [119908
1015840
1 119908
1015840
2 119908
1015840
119896]
= [
1
sum
119896
ℎ=1ℎ
2
sum
119896
ℎ=1ℎ
ℎ
sum
119896
ℎ=1ℎ
]
(5)
Step 9 Calculating results in the weighted model the finalforecast is equal to the product of the defuzzified matrix andthe transpose of the weight matrix final(119905) = 119872(119905) times 119882(119905)
119879where ldquotimesrdquo is the matrix product operator 119872(119905) is a 1 times 119896
matrix and119882(119905)
119879 is a 119896 times 1matrix
3 The Framework of the Proposed MultilayerStock Forecasting Model
Having discussed the key points in the introduction sectionwe proposed a multilayer model that could be beneficialfor stock market forecasting by using FTS methods Theproposed model contains five logical meaningful layers asdisplayed in Figure 1
Each layer has its specific task to assist forecast process byreconciling certain problems The details about these layersare as follows
Layer 1 Data preprocessing layer in this layer the aim is totransform original data to new domain with less fluctuationor volatility For instance detrendization of data assists inthe forecastability increase [43 44] This layer is supposed tostabilize variance and mean of data that have major impacton forecasting Likewise detecting and handling outliersfiltering inconsistent data and reducing noises are performedin this layer
Layer 2 Universe of discourse and portioning in this layerthe universe of discourse should be recognized In additionthe number of linguistic variables and the number of intervalsor the length of each interval used in FTS must be exactlydetermined There are some advanced research works in thisarea of study for example [27 32 37 38 45 46] and so forth
Start
Data preprocessing
FTS
Initial forecasting
Adaptation forecast
End
Figure 1 Proposed multilayer model
Previous studies imply the fact that development in this layerfunctionally has positive influence on forecast
Layer 3 FTS this layer is about deciding on the properFTS method for stock data prediction So far different FTSalgorithms have been adopted to forecast stock data forexample [15ndash23 37] and so forth The more appropriate theFTS method is selected or developed the more enhanced thewhole model will be
Layer 4 Initial forecasting in this layer initial forecast iscalculated The possibility to improve initial forecasts in thislayer occurs by either using novel defuzzification methods[45] or employing additional information inside trainingdatasets [23] or applying expertise knowledge [47] or givingappropriate weights in forecast process [22] and so forth
Layer 5 Adaptation in stock markets investors usually maketheir investment decisions based on recent stock evidence forexample latemarket news stock technical indicators or pricefluctuationsThus it is logical that investors will modify theirforecasts with the latest prediction errors [39]The aim of thislayer is using recent periods of forecasting errors to modifythe forecast for the future stock index by employing adaptiveexpectation models
In theory the developments in all forecast procedure inthe whole model will be promised by concentrating on andthen advancing each layer The ideal circumstance happenswhen every single layer could be categorically standingby itself In other words development in each layer caninfluence the improvement in forecast accuracy In practiceinterdependencies cannot be removed from among layerscompletely since layers interact with each other Nonethelessthe proposed multilayer model attempts to implement a per-fect model as much as possible Considering this hypothesis
The Scientific World Journal 5
and based on researchersrsquo interest they are able to focus onimprovement performance of layers exclusively For instanceimagine that layers 119860 119861 119862119863 and 119864 were already proposedcorresponding to five layers of perfect model respectivelySuppose that new FTS algorithm is developed as 1198621015840 corre-sponding to FTS layer thus in theory applying new sequenceof layers that is119860 119861 1198621015840 119863 and119864 together can lead to furtherimprovement in forecasting compared with the previousone By this hypothesis we perform huge experiments tocheck reliability and predictability strength of the proposedmodel
4 Data
To illustrate the proposed method 10 years of closingprices data of TAIEX (Taiwan Stock Exchange CapitalizationWeighted Stock Index) NASDAQ (National Association ofSecurities Dealers Automated Quotations) from 1990 to 1999DJI (Dow Jones Industrial Average) and SampP 500 from 2000to 2009 were chosen as experimental datasets The first tenmonths (JanuaryndashOctober) of each year were considered astraining datasets and the remaining last months (Novemberand December) as testing datasets
5 Empirical Works
As noted above one of the key assumptions for modeldevelopment is improving a particular layer separately Inthis section we use our experience knowledge and previousfindings to propose suggestions to positively improve thelayers gradually The experiment process involves certainstages as follows
(1) Data Preprocessing As stated in Section 4 there areseveral motives to perform data preprocessingThis part usedReturn on Investment ROI concept for data preprocessingIt is the efficiency of an investment and use to compare theefficiency of a number of different investments
ROI = Gains minus Investments CostsInvestments Costs
(6)
Consider a time series such as 119883119905which denotes a stock
price of particular item 119868 then we define daily ROI for thisitem as follows
ROI119905=
119909119905(119868) minus 119909
119905minus1(119868)
119909119905minus1
(119868)
(7)
Equation (7) provides strong criteria for investors todecide whether investment on item 119868 is gainful or not In allstock markets the condition is similar for example TAIEXNASDAQ DJI and SampP 500 indexes can be considered asreflection of overall market movement because these indexespresent themovement average ofmany individual stocks suchas item 119868 By this brief introduction we start our proposeddata preprocessing Assume 119885
119905 is time series of our interest
in stock databases namely TAIEX NASDAQ DJI or SampP500 then we define
ROI (119905) = 119911 (119905) minus 119911 (119905 minus 1)
119911 (119905 minus 1)
(8)
Febr
uary
1 2
002
May
1 2
002
Augu
st 1
200
2
Nov
embe
r 1 2
002
Day
1050010000
95009000850080007500
Inde
x
Figure 2 Unprocessed data for year 2002 of DJI
Febr
uary
1 2
002
May
1 2
002
Augu
st 1
200
2
Nov
embe
r 1 2
002
Day
006004002
0minus002
minus004
Inde
x
Figure 3 Processed data for year 2002 of DJI
Hence our proposed data preprocessing gives us newtime series that is ROI(119905) in new domainwith less volatilityand noisy effects Notice and compare Figures 2 and 3
Thus for one-step-ahead forecasting for example at time119905 + 1 we employ and compare both 119885
119905 and ROI(119905) to
emphasis positive influence of proposed data preprocessingon forecasting
(2)Universe ofDiscourse andPartitioningTodemonstrateimprovement in forecast process stepwise we initially employthe effective length of intervals based on Huarngrsquos [27]findings This study utilizes average-based length (noticeTables 2 and 3) These lengths are denoted by 120579 in all tablesand then to refine the accuracy further by minimizing errorin fitting values we try to find optimum length in the range[120579minus02120579 120579+02120579] for each year Next we use optimum lengthfor forecastsThe optimum lengths are displayed by 120579lowasts Afterperforming data preprocessing based on (8) we use Sturgesrsquos[48] formula for calculating the effective lengths (see Tables 2and 3) which is simply defined by
119897 =
max (ROI (119905)) minusmin (ROI (119905))log1198992+ 1
(9)
where 119899 is the number of ROI(119905)members
6 The Scientific World Journal
Table 2 Different length of intervals for TAIEX and NASDAQ problems
Year TAIEX NASDAQ120579 120579
lowast119897 119897
lowast120579 120579
lowast119897 119897
lowast
1990 100 82 0015111473 0016389178 2 173 0012644574 00115156591991 70 59 0023985040 0019988032 2 166 0009269332 00074154661992 30 24 0011033589 0009826871 2 184 0006353103 00054824821993 30 25 0014197516 0011658013 2 168 0006699332 00066594661994 40 32 0013543730 0011834984 2 164 0007258739 00083069911995 30 25 0011603234 0009282587 3 260 0007482858 00061862861996 30 27 0012010076 0009608061 4 328 0008841882 00078735061997 60 54 0012898377 0011818702 6 544 0014677997 00123423981998 60 49 0010228951 0009183161 10 800 0018233427 00154867421999 50 42 0013423875 0013039100 20 1744 0012306245 0011744996
Table 3 Different length of intervals for DJI and SampP 500 problems
Year DJI SampP 500120579 120579
lowast119897 119897
lowast120579 120579
lowast119897 119897
lowast
2000 50 43 0013228300 001108264 8 67 0013240505 00115924042001 50 46 0014497805 0013398244 6 53 0012414271 00128314172002 50 47 0013735529 0011088423 6 49 0012357930 00134863442003 30 24 0008995559 0008396447 4 32 0008832271 00094658172004 30 28 0004236985 0003389588 3 29 0004085710 00033685682005 30 26 0004900489 0004720391 3 24 0004557089 00036456712006 30 26 0004925252 0004640202 6 53 0004986411 00043891292007 40 37 0007309639 0007847711 8 74 0007991680 00065933442008 80 67 0023692012 0026353610 10 82 0025768770 00206150162009 40 32 0014316920 0015253536 6 49 0015446702 0018357362
Finally like the above process we find optimum length inthe [119897 minus 02119897 119897 + 02119897] which are denoted by 119897lowasts and use themto improve forecasts
(3) FTS For model illustration due to space limitationswe just choose Yursquos (2005) FTS first-order algorithm which isfrequently used in stockmarket forecasting area of researches[15 21 22 49]
(4) Initial forecasting In our experiments if data pre-processing is performed then initial forecast retrieved byconverting operation will be as follows
(119905 + 1) = 119911 (119905) (ROI (119905 + 1) + 1) (10)
Otherwise initial forecast is calculated as usualIn the above equation (119905 + 1) is initial forecast at time
119905 + 1 and ROI(119905 + 1) is forecasted value of ROI at time 119905 + 1
(5) Adaption In the following experiments two typesof forecast modification are utilized These equations areemployed to adapt the initial forecast to promote betterforecasts Type I adaption is adopted from Chengrsquos [39] studywhich is defined asAdaptive forecast (119905 + 1) = 119901 (119905) + 120572 ( (119905 + 1) minus 119901 (119905)) (11)
and type II is retrieved from Chen et alrsquos [15] study which isderived by
Adaptive forecast (119905 + 1) = 119901 (119905) + 120572 ( (119905 + 1) minus 119901 (119905))
+ 120573 ( (119905) minus 119901 (119905 minus 1))
(12)
whereminus1 le 120572 120573 le 1 (119905) is forecasted value and119901(119905) is actualvalue at time119905
51 Illustrative Experiments To examine how the proposedmodel causes improvement in forecast procedure stepwiseand to show to what extent the existence of each layer ismeaningful we design certain experiments in chronologicalorder However the main idea in these experiments is torestrict attention to the role of three layers namely data pre-processing universe of discourse and adaption in forecastsimprovement functionally in the proposed multilayer modelIn these experiments the influence of the rest of layers ondeveloping model is being of secondary concern
In empirical works first we used unprocessed data with-out using adaption and then we employed both processeddata and adaption layers To simplify demonstration allexperiments are categorized in groups a and b as follows
The Scientific World Journal 7
Table 4 Different results on TAIEX NASDAQ DJI and SampP 500 for original data (Yu [22])
Length Adaptation Year Average1990 1991 1992 1993 1994 1995 1996 1997 1998 1999
TAIEX
120579 Ne 2739 671 550 1051 1344 829 545 1488 1526 1229 1197120579 I 2412 574 499 1041 1090 766 538 1414 1337 1180 1085120579 II 2420 591 501 1044 1104 758 536 1417 1323 1189 1088120579
lowast Ne 2346 783 515 1011 1309 816 536 1433 1644 1462 1185120579
lowast I 2210 665 495 1008 1126 767 532 1379 1425 1258 1086120579
lowast II 2212 683 493 1010 1140 770 532 1373 1427 1262 1090
NASDAQ
120579 Ne 71 64 47 69 75 120 110 264 330 503 165120579 I 62 63 45 64 68 113 107 227 319 501 157120579 II 62 63 44 64 66 114 107 229 321 501 157120579
lowast Ne 66 70 51 67 73 112 107 281 320 499 165120579
lowast I 60 67 48 64 68 110 106 252 312 499 159120579
lowast II 60 66 48 67 69 109 104 252 319 499 159
Length Adaptation Year Average2000 2001 2002 2003 2004 2005 2006 2007 2008 2009
DJI
120579 Ne 1382 1980 1480 674 779 650 486 1881 5853 859 1602120579 I 1350 1461 1333 656 731 552 494 1768 4128 848 1332120579 II 1296 1507 1338 657 743 564 486 1774 4183 851 1340120579
lowast Ne 1386 2030 1561 660 734 613 546 1821 5641 834 1583120579
lowast I 1368 1683 1399 647 701 546 540 1742 4173 830 1363120579
lowast II 1359 1717 1390 649 700 546 537 1749 4197 831 1368
SampP 500
120579 Ne 291 154 142 70 73 70 78 195 422 122 162120579 I 233 142 129 70 72 66 71 198 375 112 147120579 II 244 141 131 70 72 66 71 199 376 111 148120579
lowast Ne 284 149 180 78 76 64 72 212 431 116 166120579
lowast I 246 143 169 76 76 63 69 210 371 111 153120579
lowast II 253 142 166 78 76 63 69 210 378 111 154
(a) databases TAIEX NASDAQ DJI and SampP 500
data preprocessing Neuniverse of discourse starting = min(data)minus1198631(for TAIEX and DJI D1 = 10 and for NASDAQand SampP 500 D1 = 2)length of interval both 120579s and 120579lowasts are employedto compareadaption Ne type I and type IIresults are collected in Table 4
(b) databases TAIEX NASDAQ DJI and SampP 500
data preprocessing according to (8)universe of discourse starting = min(data) minus 0length of interval both 119897s and 119897lowasts are employedto compareadaption Ne type I and type IIresults are collected in Table 5
6 Remarks Findings and Discussions ofthe Proposed Model
The root mean square error (RMSE) is a frequently usedcriterion in comparison results which we also utilized in ourproposed model This criterion is defined as follows
RMSE = radicsum
119899
119894=1[forecasted value (119894) minus real value (119894)]2
119899
(13)
In this section six key results of this empirical study arepresented as follows
(1) The proposed model provides changes in stockmarket forecasting using FTS from the algorithm-oriented to the model-oriented which is a furtheradvanced view
(2) The results presented here show that the proposeddata preprocessing together with the proposed effec-tive length of intervals that is 119897s has major positiveeffects on forecast accuracy in comparison with using
8 The Scientific World Journal
Table 5 Different results on TAIEX NASDAQ DJI and SampP 500 for preprocessed data (Yu [22])
Length Adaptation Year Average1990 1991 1992 1993 1994 1995 1996 1997 1998 1999
TAIEX
119897 Ne 1757 453 419 1068 934 641 505 1374 1158 1033 934119897 I 1718 436 414 1044 939 648 516 1369 1149 1058 929119897 II 1701 433 416 1046 952 651 516 1374 1164 1057 931119897
lowast Ne 1769 439 447 1022 930 622 486 1468 1168 989 934119897
lowast I 1707 429 431 1016 929 625 492 1442 1137 1008 922119897
lowast II 1711 431 431 1016 953 623 488 1449 1144 1008 925
NASDAQ
119897 Ne 42 68 41 52 57 121 99 198 341 469 149119897 I 48 67 40 52 56 117 102 202 324 490 150119897 II 48 64 41 53 56 120 102 202 344 472 150119897
lowast Ne 53 67 40 52 54 115 98 198 306 484 147119897
lowast I 52 68 40 52 54 114 100 205 304 501 149119897
lowast II 52 65 40 52 54 115 100 206 302 484 147
Length Adaptation Year Average2000 2001 2002 2003 2004 2005 2006 2007 2008 2009
DJI
119897 Ne 1445 1002 1086 607 660 491 562 1608 3061 793 1132119897 I 1428 980 1084 607 653 474 552 1624 2905 853 1116119897 II 1423 969 1099 621 655 475 553 1629 2990 861 1127119897
lowast Ne 1368 953 1107 585 640 520 558 1616 2963 818 1113119897
lowast I 1361 945 1099 584 633 498 551 1623 2960 848 1110119897
lowast II 1363 948 1117 590 641 498 553 1631 3017 848 1120
SampP 500
119897 Ne 193 115 118 69 74 64 70 205 363 89 136119897 I 197 113 118 69 73 63 68 206 351 99 136119897 II 196 113 118 69 73 63 71 207 350 99 136119897
lowast Ne 197 116 117 66 77 61 69 203 318 90 131119897
lowast I 203 114 116 66 75 60 67 204 319 95 132119897
lowast II 201 114 119 67 77 61 67 206 316 95 132
unprocessed (original) data together with average-based length that is 120579s Consequently as expectedpresence of this layer in the proposed model waslogical For instance while the average of RMSEsfor 10 years TAIEX was 1197 (Table 4 first row)by using unprocessed data the average of RMSEswas interestingly dropped by 263 from 1197 to 934(Table 5 first row) by applying processed data and theeffective length The rest of the dropping amounts forall cases were 156 157 251 164 165 16 07 07 18 112 47 216 213 47 253 248 26 11 12 35 21 and22 In whole in 80 of all experiments the proposeddata preprocessing together with the proposed lengthshowed better forecasts
(3) Between two adaption types used in this research(typs I and II) type I provided superior RMSE per-formance In 50 of all experiments type I promotebetter forecast than type II In 28 of all experimentstwo methods produced similar results and only in22 of all experiments type II presented superiorperformance
(4) While applying preprocessed data the results fromthese experiments which are presented in Tables4 and 5 reveal that employing Sturgisrsquos formulafor calculating effective length of intervals improvesforecast accuracy
(5) Reviewing RMSEs in Tables 4 and 5 emphasizethat using adaption layer in the proposed multilayermodel has positive influence on forecast accuracytherefore the presence of this layer in the proposedmodel was reasonable
(6) Employing optimal length (in our study 120579
lowasts and119897
lowasts) slightly reduce RMSEs Just in 56 of relatedexperiments using optimal lengths contributed toimprove forecasts Since finding these values is time-consuming it is up to users whether they approveto pay extra costs to obtain them or to use 120579s or 119897sdirectly
7 Conclusions and Future Works
In this study a five-layer model was proposed for stockmarket forecasting The model was established based on this
The Scientific World Journal 9
assumption that thinking of improving and advancing eachlayer separately will guarantee the development in the wholemodel To check whether the proposed model is reliableand can promote enhancement in stock market forecastingwe designed experiments and performed enhancing in eachlayer gradually however the goal was to highlight the role ofdata preprocessing the proposed effective length of intervalsand adaption layer After comparing 480 different results itwas proved that the multilayer model is proper for modeldevelopment and can therefore be used for stock marketforecasting purposes In short although presenting a newmodel is not a definite proposition because not everyone willagree on the principles followed the results show that theproposed model can be considered as a standard systematicmodel whereby it is possible to develop stock predictions byusing FTS
For future research considering the behavior of each layerdiscretely as much as possible will lead to the development oflayers more rapidly because these roles might be captured bysome specifications of the externally observable subsystemsIn this way many questions remain to be answered andmany other problems remain to be researched to developan improved version of the proposed model Some criticalquestions for further studies for instance are in which orderthe development of layers should be carried out which layershave more contribution to enhance the whole model how itis possible to add more significant component to this modeland where should research efforts be directed to developthis model In short based on proficiencies and interestsresearcher can develop performance of specific layer
Conflict of Interests
The authors declare that there is no conflict of interestsregarding the publication of this paper
References
[1] D Xiao and J Wang ldquoModeling stock price dynamics bycontinuum percolation system and relevant complex systemsanalysisrdquo Physica A vol 391 pp 4827ndash4838 2012
[2] M T Leung H Daouk and A-S Chen ldquoForecasting stockindices a comparison of classification and level estimationmodelsrdquo International Journal of Forecasting vol 16 no 2 pp173ndash190 2000
[3] D G McMillan ldquoNon-linear forecasting of stock returns doesvolume helprdquo International Journal of Forecasting vol 23 no 1pp 115ndash126 2007
[4] D Onkal and GMuradoglu ldquoEffects of feedback on probabilis-tic forecasts of stock pricesrdquo International Journal of Forecastingvol 11 no 2 pp 307ndash319 1995
[5] A-S Chen M T Leung and H Daouk ldquoApplication of neuralnetworks to an emerging financial market forecasting andtrading the Taiwan Stock Indexrdquo Computers amp OperationsResearch vol 30 no 6 pp 901ndash923 2003
[6] E Guresen G Kayakutlu and T U Daim ldquoUsing artificialneural network models in stock market index predictionrdquoExpert Systems with Applications vol 38 no 8 pp 10389ndash103972011
[7] J-ZWang J-JWang Z-G Zhang and S-P Guo ldquoForecastingstock indices with back propagation neural networkrdquo ExpertSystems with Applications vol 38 no 11 pp 14346ndash14355 2011
[8] C-F Huang ldquoA hybrid stock selection model using geneticalgorithms and support vector regressionrdquo Applied Soft Com-puting Journal vol 12 no 2 pp 807ndash818 2012
[9] M Versace R Bhatt O Hinds and M Shiffer ldquoPredicting theexchange traded fund DIA with a combination of genetic algo-rithms and neural networksrdquo Expert Systems with Applicationsvol 27 no 3 pp 417ndash425 2004
[10] T Chavarnakul and D Enke ldquoA hybrid stock trading systemfor intelligent technical analysis-based equivolume chartingrdquoNeurocomputing vol 72 no 16ndash18 pp 3517ndash3528 2009
[11] W Leigh M Paz and R Purvis ldquoAn analysis of a hybrid neuralnetwork and pattern recognition technique for predictingshort-term increases in theNYSE composite indexrdquoOmega vol30 no 2 pp 69ndash76 2002
[12] R Tsaih YHsu andCC Lai ldquoForecasting SampP 500 stock indexfutures with a hybrid AI systemrdquo Decision Support Systems vol23 no 2 pp 161ndash174 1998
[13] H Dourra and P Siy ldquoInvestment using technical analysis andfuzzy logicrdquo Fuzzy Sets and Systems vol 127 no 2 pp 221ndash2402002
[14] W Huang Y Nakamori and S-Y Wang ldquoForecasting stockmarket movement direction with support vector machinerdquoComputers ampOperations Research vol 32 no 10 pp 2513ndash25222005
[15] T-L Chen C-H Cheng and H Jong Teoh ldquoFuzzy time-series based on Fibonacci sequence for stock price forecastingrdquoPhysica A vol 380 no 1-2 pp 377ndash390 2007
[16] C H Cheng T L Chen and C H Chiang ldquoTrend-weightedfuzzy time-series model for TAIEX forecastingrdquo in NeuralInformation Processing I King J Wang L W Chan and DWang Eds vol 4234 pp 469ndash477 Springer Berlin Germany2006
[17] K Huarng and H-K Yu ldquoA type 2 fuzzy time series model forstock index forecastingrdquo Physica A vol 353 no 1ndash4 pp 445ndash462 2005
[18] T A Jilani and S M A Burney ldquoA refined fuzzy time seriesmodel for stock market forecastingrdquo Physica A vol 387 no 12pp 2857ndash2862 2008
[19] L-W Lee L-H Wang and S-M Chen ldquoTemperature predic-tion and TAIFEX forecasting based on high-order fuzzy logicalrelationships and genetic simulated annealing techniquesrdquoExpert Systems with Applications vol 34 no 1 pp 328ndash3362008
[20] J-W Liu T-L Chen C-H Cheng and Y-H Chen ldquoAdaptive-expectation based multi-attribute FTS model for forecastingTAIEXrdquo Computers amp Mathematics with Applications vol 59no 2 pp 795ndash802 2010
[21] H J Teoh T-L Chen C-H Cheng and H-H Chu ldquoA hybridmulti-order fuzzy time series for forecasting stock marketsrdquoExpert Systems with Applications vol 36 no 4 pp 7888ndash78972009
[22] H-K Yu ldquoWeighted fuzzy time series models for TAIEXforecastingrdquo Physica A vol 349 no 3-4 pp 609ndash624 2005
[23] T H-K Yu and K-H Huarng ldquoA bivariate fuzzy time seriesmodel to forecast the TAIEXrdquo Expert Systems with Applicationsvol 34 no 4 pp 2945ndash2952 2008
[24] Q Song and B S Chissom ldquoForecasting enrollments with fuzzytime seriesmdashpart Irdquo Fuzzy Sets and Systems vol 54 no 1 pp 1ndash9 1993
10 The Scientific World Journal
[25] Q Song and B S Chissom ldquoFuzzy time series and its modelsrdquoFuzzy Sets and Systems vol 54 no 3 pp 269ndash277 1993
[26] S-M Chen ldquoForecasting enrollments based on fuzzy timeseriesrdquo Fuzzy Sets and Systems vol 81 no 3 pp 311ndash319 1996
[27] KHuarng ldquoEffective lengths of intervals to improve forecastingin fuzzy time seriesrdquo Fuzzy Sets and Systems vol 123 no 3 pp387ndash394 2001
[28] S-T Li and Y-P Chen ldquoNatural partitioning-based forecastingmodel for fuzzy time-seriesrdquo in Proceedings of the IEEE Inter-national Conference on Fuzzy Systems vol 3 pp 1355ndash1359 July2004
[29] H-K Yu ldquoA refined fuzzy time-series model for forecastingrdquoPhysica A vol 346 no 3-4 pp 657ndash681 2005
[30] S-M Chen and N-Y Chung ldquoForecasting enrollments usinghigh-order fuzzy time series and genetic algorithmsrdquo Interna-tional Journal of Intelligent Systems vol 21 no 5 pp 485ndash5012006
[31] C-H Cheng J-R Chang and C-A Yeh ldquoEntropy-based andtrapezoid fuzzification-based fuzzy time series approaches forforecasting IT project costrdquo Technological Forecasting and SocialChange vol 73 no 5 pp 524ndash542 2006
[32] K Huarng and T H-K Yu ldquoRatio-based lengths of intervalsto improve fuzzy time series forecastingrdquo IEEE Transactions onSystems Man and Cybernetics B vol 36 no 2 pp 328ndash3402006
[33] S-T Li andY-C Cheng ldquoDeterministic fuzzy time seriesmodelfor forecasting enrollmentsrdquo Computers amp Mathematics withApplications vol 53 no 12 pp 1904ndash1920 2007
[34] S-T Li Y-C Cheng and S-Y Lin ldquoA FCM-based deterministicforecasting model for fuzzy time seriesrdquo Computers amp Mathe-matics with Applications vol 56 no 12 pp 3052ndash3063 2008
[35] N-Y Wang and S-M Chen ldquoTemperature prediction andTAIFEX forecasting based on automatic clustering techniquesand two-factors high-order fuzzy time seriesrdquo Expert Systemswith Applications vol 36 no 2 pp 2143ndash2154 2009
[36] C H Aladag M A Basaran E Egrioglu U Yolcu and V RUslu ldquoForecasting in high order fuzzy times series by usingneural networks to define fuzzy relationsrdquo Expert Systems withApplications vol 36 no 3 pp 4228ndash4231 2009
[37] C-H Su T-L Chen C-H Cheng and Y-C Chen ldquoFore-casting the stock market with linguistic rules generated fromthe minimize entropy principle and the cumulative probabilitydistribution approachesrdquo Entropy vol 12 no 12 pp 2397ndash24172010
[38] E Egrioglu C H Aladag U Yolcu V R Uslu and M ABasaran ldquoFinding an optimal interval length in high order fuzzytime seriesrdquo Expert Systems with Applications vol 37 no 7 pp5052ndash5055 2010
[39] C-H Cheng T-L Chen H J Teoh and C-H Chiang ldquoFuzzytime-series based on adaptive expectation model for TAIEXforecastingrdquo Expert Systems with Applications vol 34 no 2 pp1126ndash1132 2008
[40] S-M Chen andC-D Chen ldquoTAIEX forecasting based on fuzzytime series and fuzzy variation groupsrdquo IEEE Transactions onFuzzy Systems vol 19 no 1 pp 1ndash12 2011
[41] Q Song and B S Chissom ldquoForecasting enrollments with fuzzytime seriesmdashpart IIrdquo Fuzzy Sets and Systems vol 62 no 1 pp1ndash8 1994
[42] L A Zadeh ldquoFuzzy setsrdquo Information and Control vol 8 no 3pp 338ndash353 1965
[43] N J Gonedes andH V Roberts ldquoDifferencing of randomwalksand near random walksrdquo Journal of Econometrics vol 6 no 3pp 289ndash308 1977
[44] S G Koreisha and T M Pukkila ldquoNew approaches fordetermining the degree of differencing necessary to inducestationarity in ARIMA modelsrdquo Journal of Statistical Planningand Inference vol 36 no 2-3 pp 399ndash412 1993
[45] T-L Chen C-H Cheng and H-J Teoh ldquoHigh-order fuzzytime-series based on multi-period adaptation model for fore-casting stock marketsrdquo Physica A vol 387 no 4 pp 876ndash8882008
[46] U Yolcu E Egrioglu V R Uslu M A Basaran and C HAladag ldquoAnew approach for determining the length of intervalsfor fuzzy time seriesrdquoApplied Soft Computing Journal vol 9 no2 pp 647ndash651 2009
[47] S R Singh ldquoA computational method of forecasting based onfuzzy time seriesrdquo Mathematics and Computers in Simulationvol 79 no 3 pp 539ndash554 2008
[48] H A Sturges ldquoThe choice of a class intervalrdquo Journal of theAmerican Statistical Association vol 21 pp 65ndash66 1926
[49] Y Leu and T-I Chiu ldquoAn effective stock portfolio tradingstrategy using genetic algorithms and weighted fuzzy timeseriesrdquo in Proceedings of the 16th North-East Asia Symposium onNano Information Technology and Reliability (NASNIT rsquo11) pp70ndash75 Macao China October 2011
Submit your manuscripts athttpwwwhindawicom
Computer Games Technology
International Journal of
Hindawi Publishing Corporationhttpwwwhindawicom Volume 2014
Hindawi Publishing Corporationhttpwwwhindawicom Volume 2014
Distributed Sensor Networks
International Journal of
Advances in
FuzzySystems
Hindawi Publishing Corporationhttpwwwhindawicom
Volume 2014
International Journal of
ReconfigurableComputing
Hindawi Publishing Corporation httpwwwhindawicom Volume 2014
Hindawi Publishing Corporationhttpwwwhindawicom Volume 2014
Applied Computational Intelligence and Soft Computing
thinspAdvancesthinspinthinsp
Artificial Intelligence
HindawithinspPublishingthinspCorporationhttpwwwhindawicom Volumethinsp2014
Advances inSoftware EngineeringHindawi Publishing Corporationhttpwwwhindawicom Volume 2014
Hindawi Publishing Corporationhttpwwwhindawicom Volume 2014
Electrical and Computer Engineering
Journal of
Journal of
Computer Networks and Communications
Hindawi Publishing Corporationhttpwwwhindawicom Volume 2014
Hindawi Publishing Corporation
httpwwwhindawicom Volume 2014
Advances in
Multimedia
International Journal of
Biomedical Imaging
Hindawi Publishing Corporationhttpwwwhindawicom Volume 2014
ArtificialNeural Systems
Advances in
Hindawi Publishing Corporationhttpwwwhindawicom Volume 2014
RoboticsJournal of
Hindawi Publishing Corporationhttpwwwhindawicom Volume 2014
Hindawi Publishing Corporationhttpwwwhindawicom Volume 2014
Computational Intelligence and Neuroscience
Industrial EngineeringJournal of
Hindawi Publishing Corporationhttpwwwhindawicom Volume 2014
Modelling amp Simulation in EngineeringHindawi Publishing Corporation httpwwwhindawicom Volume 2014
The Scientific World JournalHindawi Publishing Corporation httpwwwhindawicom Volume 2014
Hindawi Publishing Corporationhttpwwwhindawicom Volume 2014
Human-ComputerInteraction
Advances in
Computer EngineeringAdvances in
Hindawi Publishing Corporationhttpwwwhindawicom Volume 2014
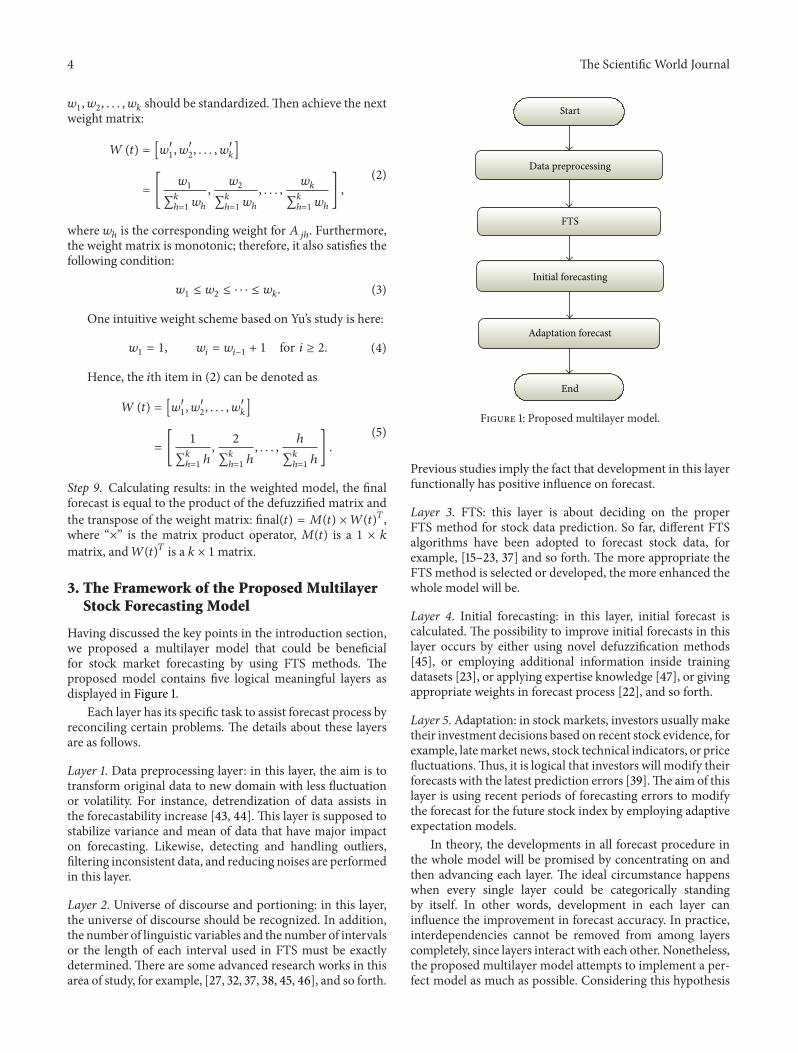
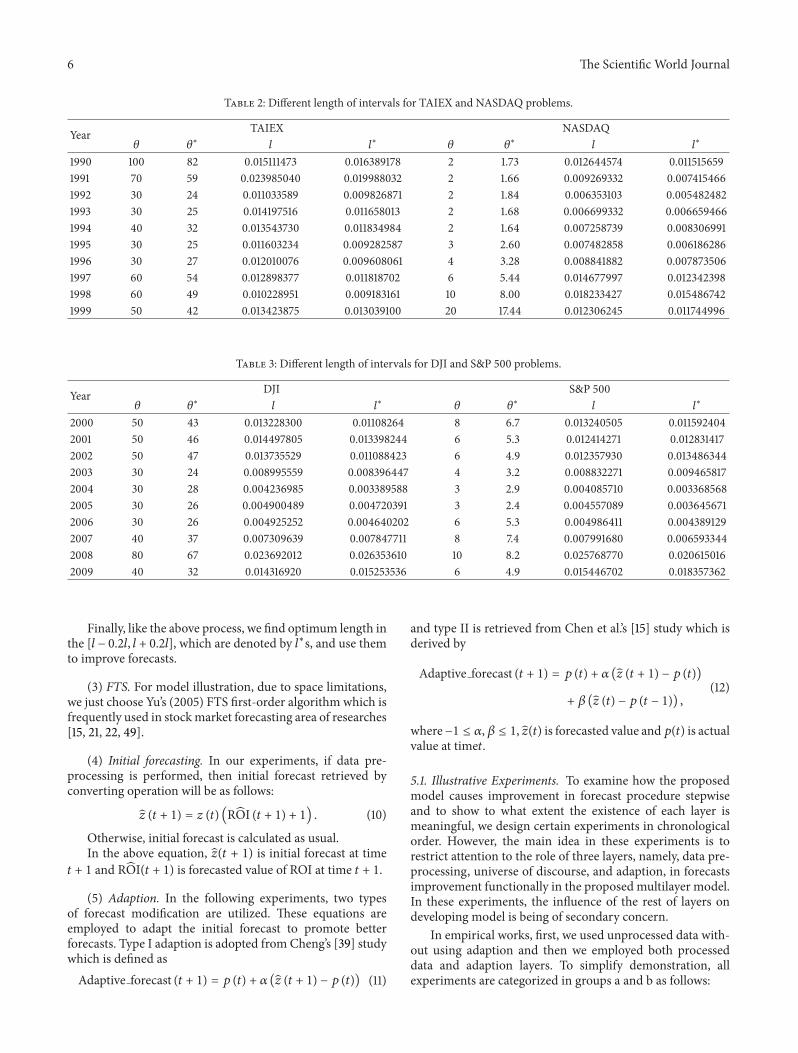
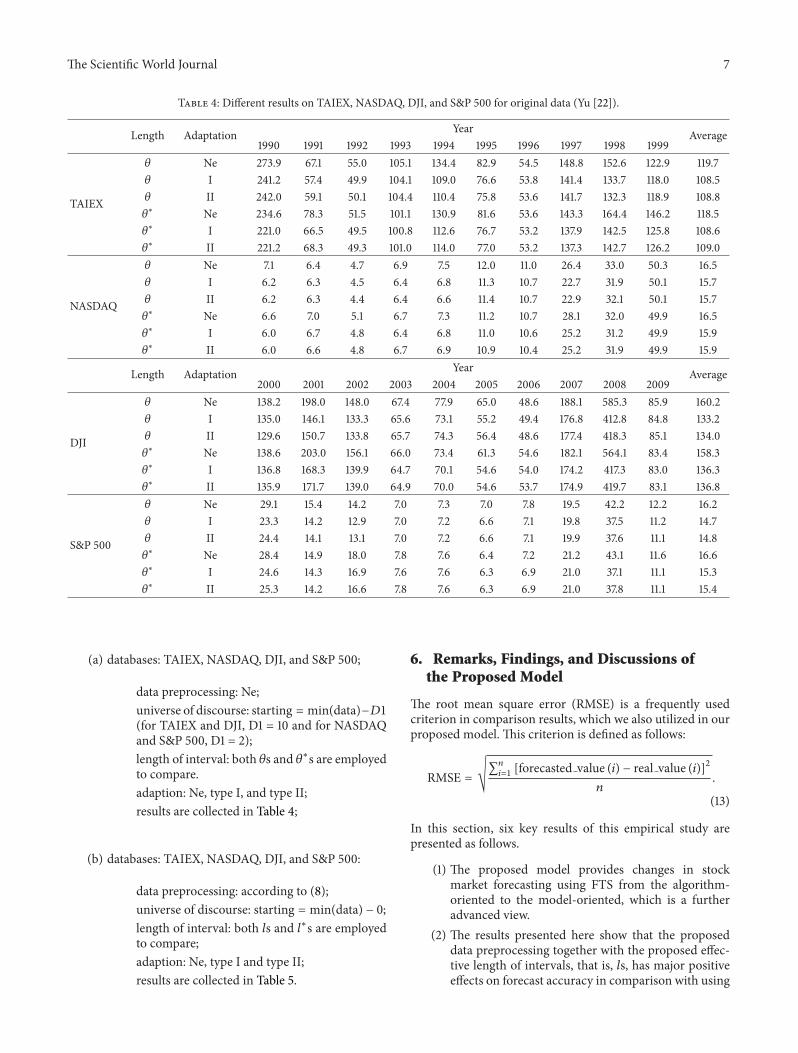
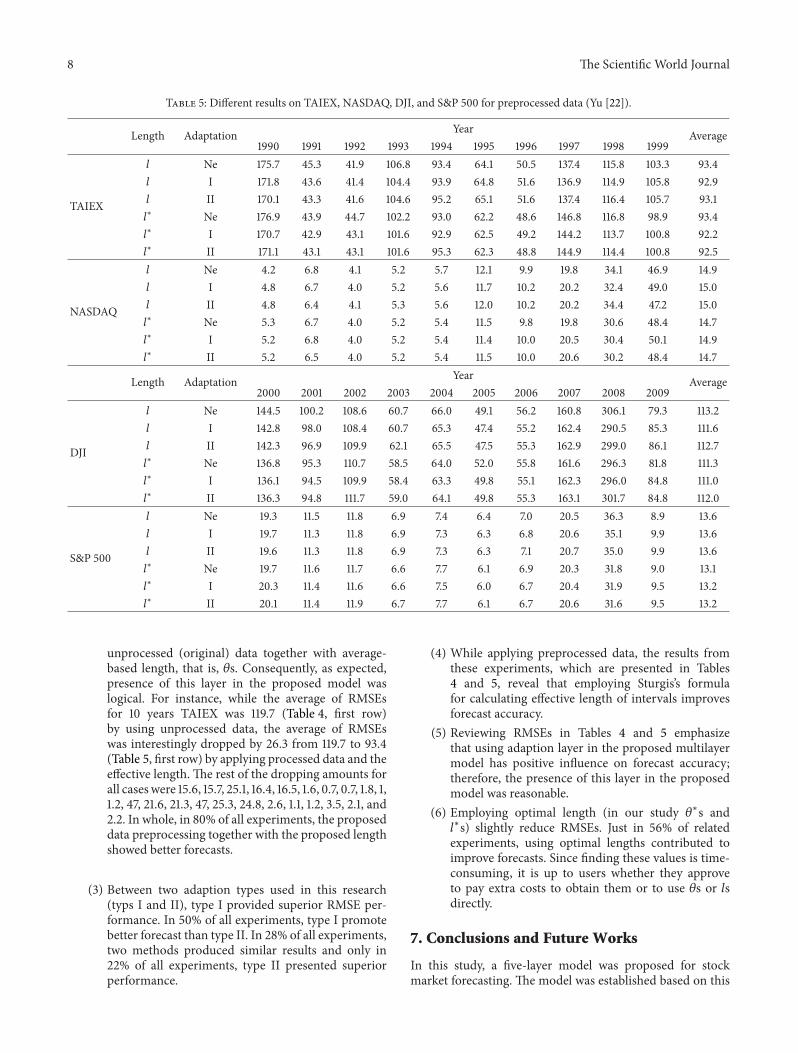