Triplet State Phosphorescence in Tris(8-hydroxyquinoline) Aluminum Light Emitting Diode Materials
M
Ya
b
a
ARRAA
KMOOGLE
1
oa[[pbibpanoc
0d
Sensors and Actuators B 134 (2008) 727–735
Contents lists available at ScienceDirect
Sensors and Actuators B: Chemical
journa l homepage: www.e lsev ier .com/ locate /snb
ultianalyte sensor array based on an organic light emitting diode platform
uankun Caia, Ruth Shinarb,∗, Zhaoqun Zhoua,1, Joseph Shinara,∗
Ames Laboratory-USDOE and Department of Physics and Astronomy, Iowa State University, Ames, IA 50011, USAMicroelectronics Research Center, Iowa State University, Ames, IA 50011, USA
r t i c l e i n f o
rticle history:eceived 12 December 2007eceived in revised form 10 May 2008ccepted 13 June 2008vailable online 25 June 2008
eywords:ultianalyte sensor arraysrganic light emitting devicesLEDslucoseactatethanol sensor array
a b s t r a c t
A compact photoluminescence (PL)-based sensor array, utilizing pulsed organic light emitting diode(OLED) pixels as the excitation sources, for sequential or simultaneous detection of multiple analytesin a single sample, is described. The utility and potential advantages of the structurally integrated OLED-based platform for multianalyte detection are demonstrated for oxygen, glucose, lactate, and ethanol.The detection of glucose, lactate, and ethanol is based on monitoring the concentration of dissolved oxy-gen (DO) at the completion of the enzymatic oxidation reactions of these analytes in sealed cells. Themonitoring in sealed cells and the ready access of the enzyme, when in solution, to the analyte enable alimit of detection of ∼0.02 mM, which is better than that obtained with enzymes embedded in sol–gelfilms. The DO concentration is determined via its effect on the PL decay time of the oxygen-sensitive dyePt octaethylporphyrin embedded in a polystyrene film. A modified Stern–Volmer equation is derived togenerate a linear calibration. The 2 mm × 2 mm OLED pixels and the sensor films are fabricated on glass
substrates that are attached back-to-back, generating a compact module devoid of any optical couplers.Two individually addressable OLED pixels are associated with the detection of each analyte. This configu-ration enables consecutive detection of all analytes within a few minutes utilizing a single photodetector(PD). Simultaneous detection is achieved by using an array of small-size Si photodiode PDs compatiblewith the OLED pixel array. The OLED-based sensing array is unique in its ease of fabrication and integra-tion with the sensing component, while its performance attributes are comparable to those obtained forte us
bltilrt
aiap
detection of a single analy
. Introduction
Multianalyte detection in a single sample using sensor arraysf various designs and sizes has been studied extensively withrange of transduction mechanisms, including electrochemical
1–3], piezoelectric [4], electrical resistance [5,6], and optical7–19]. Such studies are driven by the need for high through-ut, inexpensive, and efficient analyses of complex samples in aroad range of applications, such as medical, biological (includ-
ng biodefense), environmental, and industrial (e.g., the food andeverage industry). Sensor arrays are often fabricated by usinghotolithography and soft lithography [2,3,6,20], inkjet-, screen-,nd pin-printing [13,14], and photodeposition [7,8,20]. These tech-
iques frequently involve labor-intensive multistep fabrication,r require sophisticated image analysis and pattern-recognitionodes.∗ Corresponding authors.E-mail addresses: [email protected] (R. Shinar), [email protected] (J. Shinar).
1 Current address: QD Vision Inc., 313 Pleasant Street, Watertown, MA 02142, USA.
iOiatci
r
925-4005/$ – see front matter © 2008 Elsevier B.V. All rights reserved.oi:10.1016/j.snb.2008.06.019
ing any excitation source.© 2008 Elsevier B.V. All rights reserved.
In addition to monitoring multiple analytes, sensor arrays cane used to improve reliability in the monitoring of a single ana-
yte through redundancy. That is, instead of using a single sensoro monitor the concentration of an analyte, an array of sensorss utilized, providing redundant information regarding the ana-yte concentration. Such electrochemical sensor arrays, employingedundant microelectrodes, were used for monitoring glucose, lac-ate, and pyruvate [2].
In this work we describe photoluminescence (PL)-based sensorrrays for simultaneous or sequential monitoring of multianalytesn a single sample. The excitation source is an array of individuallyddressable organic light emitting diode (OLED) pixels. It is com-act and unique in its ease of fabrication and in the simplicity of the
ntegration of the excitation source with the sensing component.ther light sources in PL-based sensors include lasers, lamps, and
norganic LEDs. However, such excitation sources are either bulkynd/or costly, cannot be integrated with the other components due
o size, geometrical, or operational constraints, or require intri-ate integration procedures for their incorporation in a structurallyntegrated, compact device [21].OLED arrays can be based on single- or multi-color pixels fab-icated in a combinatorial approach that results in adjacent OLED

7 ctuato
ppso
tflclMmeO
OoDtccotAcittw(balt(
uttnftbOi(msmoacsluic
cimpeAsa
ctvdccidg(dttrdedtl
i[dtwetsdttast
actfimdPbiotup
[
wSicac
28 Y. Cai et al. / Sensors and A
ixels that emit at wavelengths ranging from blue to red [22]. OLEDixels of nanometer size have been reported recently [23–25]; asuch, they could be suitable for sensor microarrays for a wide rangef applications.
In addition to the small size of the OLED pixel excitation source,he advantage of the OLED-based sensing platform is also in itsexible design (OLEDs can be fabricated on plastic substrates), itsompatibility with microfluidic architectures, and in its potentialow cost, which will enable development of disposable sensors.
oreover, the thickness of the OLED excitation source is deter-ined by that of the substrate, which will lead to field-deployable,
ventually badge-size sensors. Additional beneficial attributes ofLEDs in sensing applications are detailed below.
The OLEDs fabricated in this study were small-molecularLEDs (SMOLEDs). They are easily fabricated using thermal evap-ration in a low vacuum (∼2 × 10⁻⁶ Torr) evaporation chamber.etails on their fabrication and encapsulation, for enhanced long-
erm stability, are provided elsewhere [26,27]. A typical SMOLEDonsists of a transparent conducting indium tin oxide (ITO)-oated glass or plastic substrate (the ITO is the anode), therganic layers that include hole transport layer(s) (HTLs), emit-ing layer(s), electron transport layer(s) (ETLs), and a metal, e.g.,l, cathode. The total thickness of the ITO, organic layers, and Alathode is typically <0.4 �m. Under forward bias, electrons arenjected from the low-workfunction cathode into the ETL(s), e.g.,ris(quinolinolate) Al (Alq3), which, for green OLEDs, is often alsohe emitting layer. Similarly, holes are injected from the high-orkfunction ITO into the HTL(s), often copper phthalocyanine
CuPc) followed by N,N′-diphenyl-N,N′-bis(1-naphthylphenyl)-1,1′-iphenyl-4,4′-diamine (NPD). Due to the applied bias, the electronsnd holes drift towards each other, and recombine in the emittingayer. A certain fraction of the recombination events results in radia-ive excited states. These states provide the electroluminescenceEL) of the device.
The structurally integrated OLED/sensing component module isnique in its simplicity. The OLED and the sensing component areypically fabricated on separate transparent substrates (e.g., glass)hat are attached back-to-back to form a module with a total thick-ess of ∼2 mm [27–29]. The photodetector (PD) can be located in
ront of the analyte cell (“front detection” geometry) or behindhe OLED array, collecting the PL that passes through the gapsetween the OLED pixels (“back detection” geometry) [29,30]. TheLED excitation source can be operated by applying a DC bias (typ-
cally ∼5–20 V) for measurements of analyte-induced PL intensityI) changes. Alternatively, the OLEDs can be operated in a pulsed
ode (typically at ∼10–20 V); in Alq3 OLEDs, ∼99.99% of the ELignal decays within <100 ns, enabling the use of the OLEDs foronitoring the effect of analytes on the excited-state decay time �
f suitable luminophores. Operation in the � mode is advantageous,s it eliminates the need for frequent sensor calibration. Frequentalibration and a reference sensor are needed when operating theensors in the I mode. This need is due to, e.g., changes in scatteredight, and moderate changes in the sensor film or light source. These of the OLED excitation source in conjunction with detection
n the � mode results in a compact module devoid of any opticalouplers or filters.
OLEDs have dramatically improved over the past decade, andommercial products incorporating them are rapidly proliferat-ng [31]. They are inherently advantageous as low-voltage [32],
iniaturizable [33], and flexible light sources [34,35]. Electrophos-
horescent green and blue OLEDs with an external quantumfficiency of ∼20% and ∼12%, respectively, have been reported [35].s mentioned, fabrication of nm-size OLED arrays has been demon-trated [23–25]; such arrays hold promise for OLED-based chemicalnd biological (micro)sensor arrays.e
suo
rs B 134 (2008) 727–735
In this work, glucose, lactate, ethanol, and oxygen, which are oflinical, health, industrial (including the food and beverage indus-ry), and environmental importance, are used to demonstrate theiability of the OLED-based multianalyte sensing platform. Theetection is based on monitoring dissolved oxygen (DO) in sealedells, utilizing an oxygen-sensitive dye, whose I and � decrease uponollisions with gas-phase O2 or DO [27,29,30,36–40]. For monitor-ng glucose, ethanol, and lactate, in addition to the oxygen-sensitiveye, well known specific enzymes that oxidize these analytes, i.e.,lucose oxidase (GOx), alcohol oxidase (AOx), and lactate oxidaseLOx), respectively, are used. Oxygen is consumed during the oxi-ation reactions, and in performing the reactions in a sealed cell,here is no replenishing of the DO. Consequently, the concentra-ion of the DO at the completion of the oxidation reaction [DO]final,eflected by changes in I and � of the oxygen-sensitive dye PL, isetermined by the analyte concentration. This approach, with thenzymes dissolved in solution, yields a lower (improved) limit ofetection (LOD) than that using immobilized enzymes [41], due tohe accessibility of the enzymes and the ability to monitor the ppmevels of DO accurately.
Some of the above-mentioned analytes were previously mon-tored using sensor arrays. For example, a microelectrode array1] was used to develop a multianalyte sensor for simultaneousetection of glucose, L-lactate, and uric acid. The fabrication ofhe array was based on CMOS technology and, as is often the caseith electrochemical-based sensors, approaches to eliminate the
ffects of interferants were needed. An optical sensor for simul-aneous detection of glucose and O2 was also reported [14]. Theensor was fabricated by pin-printing a Ru-based oxygen-sensitiveye and enzyme-doped xerogels, and using a laser or an LED ashe excitation source. The LOD for glucose was 0.1–0.2 mM withhe poorer LOD obtained when using the LED. Intensity variabilitycross the sensor array was observed when using the latter lightource. Intensity variability issues are eliminated when operatinghe sensors in the � mode, as done in the present work.
As in the case, mentioned above, of electrochemical sensorrrays employing redundant microelectrodes, an OLED-based arrayan also be used for redundancy or complementary analyte moni-oring. For example, in monitoring O2 [27], arrays of similar sensorlms, films prepared under different conditions containing a com-on analyte-sensitive dye, or films with different oxygen-sensitive
yes (e.g., Ru-based, Pt octaethylporphyrin (PtOEP), or the Pd analogdOEP) can be used for simultaneous or sequential O2 monitoringy the different sensor films. This approach provides redundancyn the measurement, improving the accuracy, and enabling the usef different sensor films for monitoring O2 in different concentra-ion regions using a single compact device. Simultaneous detectionsing several films can be achieved by using a small-size array ofhotodiodes, as described below.
In O2-sensors, the relation between the oxygen concentrationO2], I, and � is ideally given by the Stern–Volmer (SV) equation
I0I
= �0
�= 1 + KSV[O2], (1)
here I0 and �0 are the unquenched values, KSV = kq�0 is thetern–Volmer constant, and kq is the rate constant of the PL quench-ng reaction. However, deviations from that linear relation are quiteommon [27,28,36–39]. As shown below, the relation between 1/�nd glucose, lactate, or ethanol concentrations at a given initial DOoncentration [DO]initial can be expressed as a linear modified SV
quation.The OLED-based sensor array of this work demonstrates con-ecutive or simultaneous detection of glucose, lactate, and ethanolsing a single PD (photomultiplier tube (PMT) or Si photodi-de) or an assembled, small-size PD array of commercial Si

ctuato
prbPiptwrigfitdisc
2
2
2
AoS
2
4GcSEa
2
ogwb
R15tspit
gaofl
2
2
ow
laaao8ft
wsebS
wo
2
1crwa
bceaaasboGttbtutisde
prfw�
2
ftppl
Y. Cai et al. / Sensors and A
hotodiodes that are compatible with the OLED array design,espectively. As expected, comparable results were obtained usingoth approaches. As mentioned, the sensing film was based ontOEP embedded in a polystyrene (PS) film that was structurallyntegrated with the OLED pixel array [27–29] to generate a com-act device. The film served as the base of a cell that containedhe analytes and the corresponding enzymes. The measurementsere typically performed in sealed cells; in some cases, complex
esponses were obtained when the measurements were performedn cells open to air. The PDs were positioned in the back-detectioneometry and monitored �, which eliminates the need for opticallters and frequent sensor calibration. The results are discussed inerms of the OLED-based sensor array attributes, including the arrayesign, LOD, dynamic range, response time, and the reproducibil-
ty of the measurements. The potential for wide use of OLED-basedensors and their advantage for complex samples are also dis-ussed.
. Experimental
.1. Materials
.1.1. Materials for OLED fabrication20 �/� indium tin oxide (ITO)-coated glass was obtained from
pplied Films Corp., �-NPD, coumarin (C545T), and Alq3 werebtained from H. W. Sands. CuPc and CsF were obtained fromigma–Aldrich.
.1.2. Materials for sensing filmsPtOEP was obtained from H. W. Sands, PS, molecular weight
5,000, from Sigma–Aldrich, and toluene from Fisher Scientific.Ox from Aspergillus niger, AOx from Pichia pastoris, LOx from pedio-occus species, and L-lactate were purchased from Sigma–Aldrich.tabilized LOx from Aerococcus viridans was obtained from Appliednzyme Technology Inc. (Pontypool, UK). All chemicals were useds received.
.2. Instrumentation
OLED arrays were fabricated by thermal vacuum evaporationf the organic layers in a home-built evaporation chamber (back-round pressure ∼2 × 10⁻⁶ Torr) installed in an Ar-filled glove boxith typically ∼1 ppm water and O2 levels. The OLEDs were driven
y an AVTECH AV-1011B pulse-generator.The PD used for monitoring the sensor PL was a Hamamatsu
6060 PMT operated at 900 V, or a ∼2 mm thick Hamamatsu S51070 mm × 10 mm Si photodiode; an array of four Hamamatsu S5106mm × 5 mm Si photodiodes, mounted on a circuit board con-
aining an array of four preamplifier circuits, was used for theimultaneous detection of the four analytes. The PD was typicallyositioned in the “back-detection” geometry, collecting the PL pass-
ng through the gap between two OLED pixels that were used forhe excitation [29,30].
Gas-phase O2 and DO were monitored using flowing oxy-en/argon mixtures, as previously described [27]. Mixing waschieved by means of mass flow controllers, where the flow ratesf the oxygen and argon varied, while maintaining a constant totalow rate, thus generating varying oxygen partial pressures.
.3. Procedures
.3.1. OLED fabricationOLED arrays were fabricated by thermal vacuum evaporation
f organic layers on ∼100 nm-thick ITO (the anode)-coated glass,hich was treated as described previously [42–44]. The organic
t�spt
rs B 134 (2008) 727–735 729
ayers consisted of a 5 nm-thick CuPc hole injecting layer that islso believed to reduce the surface roughness of the ITO [45] and50 nm-thick NPD HTL. For the green OLEDs, with peak emission
t ∼530 nm, the ∼40 nm thick emitting and ETL was either Alq3r (20 nm 1 wt.% coumarin (C545T)-doped Alq3)/(25 nm Alq3). An–10 Å CsF buffer layer was deposited on the organic layers [46,47],ollowed by the ∼150 nm thick Al cathode. The total thickness ofhe OLEDs, excluding the glass substrate, was thus <0.4 �m.
For measurements in the “back-detection” geometry, the OLEDsere prepared as an encapsulated matrix array of ∼2 mm × 2 mm
quare pixels resulting from mutually perpendicular stripes oftched ITO and evaporated Al [29,30]. Encapsulation was achievedy lining the edges of the glass substrate with high-vacuum Torr-eal epoxy, and binding a top glass cover to the substrate.
For � measurements, the OLEDs were operated in a pulsed modeith a bias of 10–20 V, a pulse width of 100 �s, and a repetition rate
f 50–200 Hz.
.3.2. Sensing elements fabricationPtOEP-based sensing elements were prepared by dissolving
–2 mg/mL of the dye and 40–100 mg/mL PS in toluene, and dropasting 20 �L of the solution evenly onto cleaned glass slides. Theesulting films, ∼7–9 mm in diameter and typically ∼8 �m thick,ere allowed to dry for ∼24 h in air in the dark at ambient temper-
ture.The oxidase enzymes were immobilized in thin sol–gel films
ased on known procedures [48]. The sol–gel films were drop-ast or spin-coated over the PS:dye films [30]. Alternatively, thenzymes were dissolved in a pH 7.4 buffer solution, in which theirctivity in repeated measurements in sealed cells was reproduciblend their stability improved. Stability of enzymes is crucial for oper-tion of biosensors, and their immobilization has been extensivelytudied [7,48,49]. However, prolonged use and storage of immo-ilized enzymes often remain a challenge [7,47,48]. Indeed, thexidase-embedded films in this study, except for the films withOx, were usable for a few measurements only, possibly due also
o enzyme leaching. To evaluate the OLED-based platform for mul-iple analyte monitoring, we therefore typically used enzymes inuffered solution of 100–200 �L total volume, which were con-ained in glass wells. We note that the use of immobilized enzymessing improved approaches [49] is expected to similarly work withhe OLED-based platform. The difference between an array withmmobilized enzymes and that utilizing enzymes in solution inealed cells is expected to be in the dynamic range and LOD, due toifferences in the O2 level, its in-diffusion from the ambient, andnzyme accessibility.
The measurements in this work were performed at room tem-erature (∼23 ◦C) or 37 ◦C. The PS:dye sensor films were stable,evealing no significant changes in response to gas-phase O2 or DOor a period exceeding 3 months. No dye leaching from the filmsas observed during this period, and in any case, operation in themode is insensitive to small changes in the sensor film.
.3.3. Monitoring �The � values were obtained by monitoring the PL decay curves
ollowing the OLED pulses. The decay curves were recorded at 20 sime intervals, starting 12 s after the addition of the analyte. It wasossible to successfully fit the data to an exponential decay curvelus a constant, which reflects the background signal and/or offset
evel. The response time of the PMT is ∼5 ns, and, as mentioned,
he EL decays in <100 ns; both are much faster than the measuredvalues. We note that the PL decay curves of a gas-phase O2 sen-or often deviate from a simple exponential decay [27,50–52], inarticular at short � values, corresponding to high oxygen concen-rations (>∼20%). In the current study, however, � ranged from ∼28
7 ctuato
tret
2
Oofl
Tlcsrrmla
cm
2
irpPsac
3
ifAucoGIbpbr
(aic(mutr
rtr
c
g
top[sr
[
stgmt
twPtt
st[b
raaswsta(etd
3
apsemomott
30 Y. Cai et al. / Sensors and A
o 95 �s with the shortest � corresponding to a DO level in equilib-ium with air (i.e., in the absence of an analyte). Based on repeatedxperiments, the experimental error in � was found to be smallerhan 5%.
.3.4. O2 level measurementsMeasurements of gas-phase oxygen using the integrated Alq3
LEDs/PtOEP-based film were performed in a flow cell with flowingxygen/argon mixtures. Mixing was achieved by means of massow controllers, as described above.
Measurements of DO in water were performed in a sealed cell.he gas-phase O2 was allowed to equilibrate with the solution fol-owing initial bubbling of O2/Ar mixtures through the solution andontinued flow at the gas-phase/liquid interface during the mea-urement [27]. This approach resulted in reproducible and reliableesults, as the value of � measured when the solution was in equilib-ium with ambient air was within experimental error of the valueeasured when the solution was exposed to 21% O2 in Ar. The DO
evel in water at 23 ◦C, in equilibrium with ambient air at 1 atm, isbout 8.5 ppm.
We note that monitoring [DO] indicated that at the ethanol con-entrations used in this study there was no observable increasediscibility of O2.
.3.5. Glucose, lactate, and ethanol monitoringSingle and multiple analytes in buffered solutions were mon-
tored via their effect on � following their enzymatic oxidationeactions. In the sequential measurements, groups of two OLEDixels were lit consecutively, using the PMT for monitoring theL. In the simultaneous monitoring mode, all OLED pixels were litimultaneously, and the PL of each analyte was monitored by itsssociated 5 mm × 5 mm Si photodiode. A Labview program wasreated to enable simultaneous monitoring via separate channels.
. Results and discussion
Structurally integrated OLED/sensing film modules for monitor-ng oxygen and glucose were reported earlier [27,29,30]. In brief,or O2 detection, PtOEP or PdOEP were embedded in a PS film, andlq3:C545T/Alq3 or rubrene-doped Alq3 OLEDs, respectively, weresed as the excitation source to monitor the effect of the analyteoncentration on �. SV calibration curves for gas-phase and DO werebtained [27]. For glucose detection, a sol–gel film with embeddedOx was drop-cast or spin-coated on top of the PtOEP:PS film [30].and � were measured as a function of glucose concentrations. Foroth OLED-based sensors, the dynamic range and LOD were com-arable or improved in comparison to previously reported sensorsased on a variety of other excitation sources [27,30]. The dynamicange of the glucose sensor covered the physiological range.
For ethanol and lactate detection, embedding the enzymesincluding the stabilized ones) in a similar sol–gel or polymeric filmppeared to adversely affect the long-term enzyme activity, render-ng the sensors usable for a few measurements only. Such sensorsan therefore be re-used with disposable enzyme-containing filmsin contrast, the OLEDs and the PS:PtOEP films are stable for many
onths). To demonstrate the multianalyte sensor, we thereforesed a PS:PtOEP film, but kept the enzyme in a solution to whichhe analytes (single analyte or mixtures) were added. This approach
esulted in reproducible results.The analytes were monitored by determining [DO]final (in sealedeaction cells) at the completion of the analytes’ oxidation reac-ions. That is, the DO that was not consumed in the oxidationeactions was monitored.
tawWe
rs B 134 (2008) 727–735
In the presence of GOx and O2, glucose is oxidized to yield glu-onic acid as oxygen is reduced to H2O2:
lucose + O2GOx−→H2O2 + gluconic acid (2)
LOx and AOx similarly oxidize lactate and ethanol, respec-ively. Therefore, in sealed containers, where there is no supplyf DO beyond the initial concentration, the change in [DO] is pro-ortional to the change in the analyte concentration [analyte]. Ifanalyte]initial ≤ [DO]initial, and assuming that the analyte conver-ion into products is complete, which was confirmed by the presentesults, [DO]final is given by
DO]final = [DO]initial − [analyte]initial (3)
Within the assumption stated above, this equation is valid forealed wells, as mentioned, and for containers open to air, wherehe oxidation reaction is much faster than the in-diffusion rate ofas-phase oxygen. In the latter case (see below), [DO] should beonitored shortly (depending on the enzyme concentration) after
he addition of the analyte. The SV equation becomes, accordingly:
I0I
= �0
�= 1 + KSV × {[DO]initial − [analyte]initial} (4)
Thus, a plot of 1/� vs. the initial analyte concentration in theest solution will ideally be linear up to [DO]initial = [analyte]initial,ith the slope yielding the value of the rate constant of the PtOEP
L quenching reaction by DO, kq. This rate constant depends onhe oxygen solubility in the film and its diffusion coefficient, and isherefore film- and temperature-dependent.
If the above-mentioned assumptions are valid for reactionsuch as shown by Eq. (2), under comparable experimental condi-ions, and given sensor film and analyte concentration (i.e., givenDO]final), � values for glucose, lactate, or ethanol are expected toe identical, since they depend only on [DO]final, kq, and �0.
The foregoing closed-cell sensor limits the apparent dynamicange at ∼23 ◦C to [analyte]initial ∼0.25 mM, i.e., 8 ppm DO, whichpproaches the [DO]initial level of 8.5 wt. ppm in equilibrium withir at that temperature. However, this limited dynamic range corre-ponds only to the analyte concentration in the final test solution,here it is diluted, i.e., added to the enzyme-containing buffer
olution. Thus, the actual dynamic range is wide, and can coverhe concentration range of medical/industrial interest. Moreover,s an example, it has been shown that there is a linear relationalbeit patient-dependent) between blood and saliva glucose lev-ls, with typical levels of ∼0.02 to ∼0.2 mM in the latter. As such,he approach described here, with its LOD of ∼0.02 mM, can beeveloped as a possible alternative for blood testing [53].
.1. Sensor array design and approaches to multianalyte testing
In the sequential operation mode, a single sample containingmixture of the analytes was placed above the different OLED
ixels/sensing films; the OLED pixels were energized in succes-ion to monitor each analyte (in the presence of the correspondingnzyme) separately. This operation mode required ∼5 min to deter-ine the level of all four analytes. We note that the response time
f the oxygen sensor is ∼1–2 s [27], however, in all the measure-ents of this study, the slower enzymatic reactions, which depend
n the enzyme concentration, determined the overall monitoringime, which was ∼0.5–5 min. In the simultaneous detection mode,he four 5 mm × 5 mm Si photodiodes were assembled in an array
hat was designed to be compatible with the OLED pixel array. Thenalyte mixtures were analyzed simultaneously on the OLED array,ith the output of each PD corresponding to a different analyte.e note that various Si-based PD arrays with rectangular 1–4 mm2lements are available commercially (from, e.g., Hamamatsu) and
Y. Cai et al. / Sensors and Actuators B 134 (2008) 727–735 731
F varioum for 0.1
cotSsfti
t
3
c�lcwcgtpsb
edaiwc
tEwaoi
1Atbb
ctca�rrirrayc
it(vaccing ethanol resulted in comparable results.
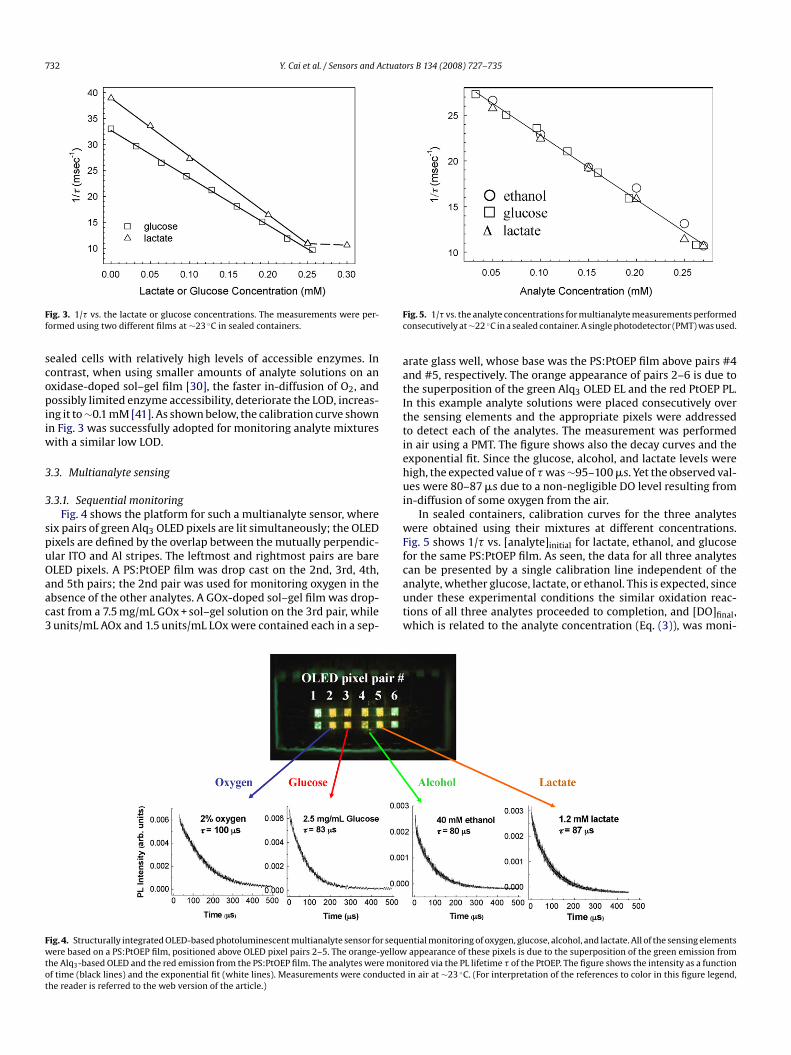
Fig. 3 demonstrates that the LOD is ∼0.02 mM for lactate andglucose. This improved LOD was attained, since [DO], which can beeasily measured at low ppm levels, was monitored in 100–200 �L
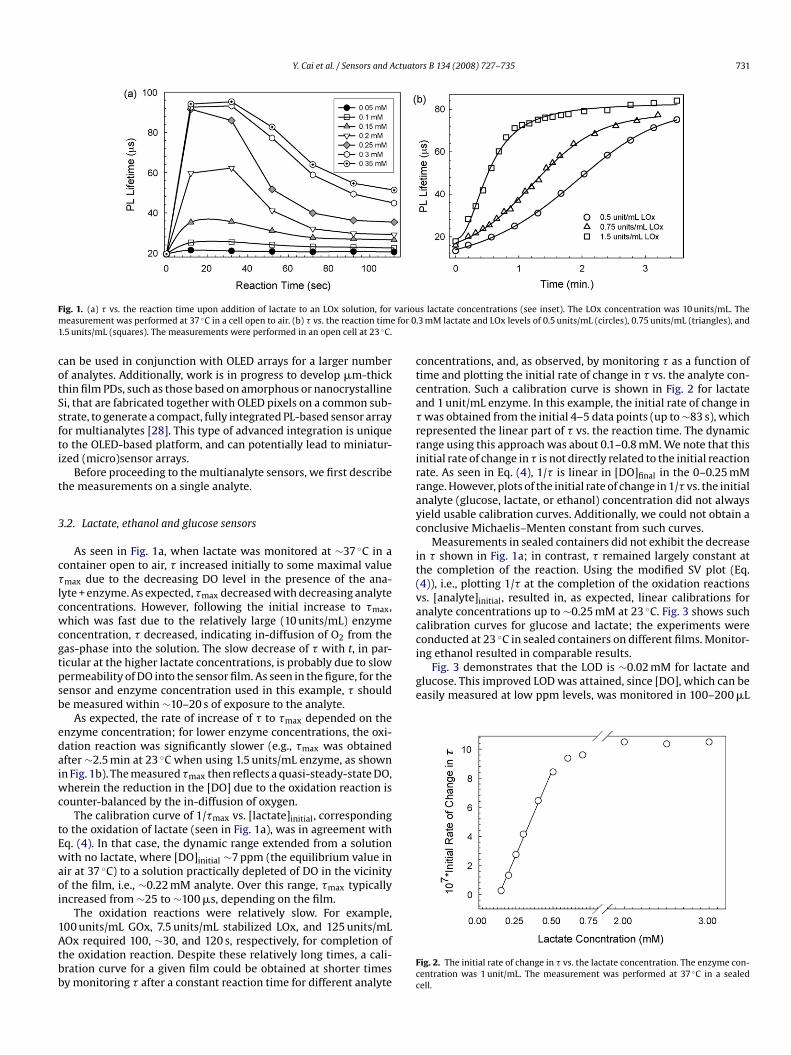
ig. 1. (a) � vs. the reaction time upon addition of lactate to an LOx solution, foreasurement was performed at 37 ◦C in a cell open to air. (b) � vs. the reaction time
.5 units/mL (squares). The measurements were performed in an open cell at 23 ◦C.
an be used in conjunction with OLED arrays for a larger numberf analytes. Additionally, work is in progress to develop �m-thickhin film PDs, such as those based on amorphous or nanocrystallinei, that are fabricated together with OLED pixels on a common sub-trate, to generate a compact, fully integrated PL-based sensor arrayor multianalytes [28]. This type of advanced integration is uniqueo the OLED-based platform, and can potentially lead to miniatur-zed (micro)sensor arrays.
Before proceeding to the multianalyte sensors, we first describehe measurements on a single analyte.
.2. Lactate, ethanol and glucose sensors
As seen in Fig. 1a, when lactate was monitored at ∼37 ◦C in aontainer open to air, � increased initially to some maximal valuemax due to the decreasing DO level in the presence of the ana-
yte + enzyme. As expected, �max decreased with decreasing analyteoncentrations. However, following the initial increase to �max,hich was fast due to the relatively large (10 units/mL) enzyme
oncentration, � decreased, indicating in-diffusion of O2 from theas-phase into the solution. The slow decrease of � with t, in par-icular at the higher lactate concentrations, is probably due to slowermeability of DO into the sensor film. As seen in the figure, for theensor and enzyme concentration used in this example, � shoulde measured within ∼10–20 s of exposure to the analyte.
As expected, the rate of increase of � to �max depended on thenzyme concentration; for lower enzyme concentrations, the oxi-ation reaction was significantly slower (e.g., �max was obtainedfter ∼2.5 min at 23 ◦C when using 1.5 units/mL enzyme, as shownn Fig. 1b). The measured �max then reflects a quasi-steady-state DO,
herein the reduction in the [DO] due to the oxidation reaction isounter-balanced by the in-diffusion of oxygen.
The calibration curve of 1/�max vs. [lactate]initial, correspondingo the oxidation of lactate (seen in Fig. 1a), was in agreement withq. (4). In that case, the dynamic range extended from a solutionith no lactate, where [DO]initial ∼7 ppm (the equilibrium value in
ir at 37 ◦C) to a solution practically depleted of DO in the vicinityf the film, i.e., ∼0.22 mM analyte. Over this range, �max typicallyncreased from ∼25 to ∼100 �s, depending on the film.
The oxidation reactions were relatively slow. For example,
00 units/mL GOx, 7.5 units/mL stabilized LOx, and 125 units/mLOx required 100, ∼30, and 120 s, respectively, for completion ofhe oxidation reaction. Despite these relatively long times, a cali-ration curve for a given film could be obtained at shorter timesy monitoring � after a constant reaction time for different analyteFcc
s lactate concentrations (see inset). The LOx concentration was 10 units/mL. The3 mM lactate and LOx levels of 0.5 units/mL (circles), 0.75 units/mL (triangles), and
oncentrations, and, as observed, by monitoring � as a function ofime and plotting the initial rate of change in � vs. the analyte con-entration. Such a calibration curve is shown in Fig. 2 for lactatend 1 unit/mL enzyme. In this example, the initial rate of change inwas obtained from the initial 4–5 data points (up to ∼83 s), which
epresented the linear part of � vs. the reaction time. The dynamicange using this approach was about 0.1–0.8 mM. We note that thisnitial rate of change in � is not directly related to the initial reactionate. As seen in Eq. (4), 1/� is linear in [DO]final in the 0–0.25 mMange. However, plots of the initial rate of change in 1/� vs. the initialnalyte (glucose, lactate, or ethanol) concentration did not alwaysield usable calibration curves. Additionally, we could not obtain aonclusive Michaelis–Menten constant from such curves.
Measurements in sealed containers did not exhibit the decreasen � shown in Fig. 1a; in contrast, � remained largely constant athe completion of the reaction. Using the modified SV plot (Eq.4)), i.e., plotting 1/� at the completion of the oxidation reactionss. [analyte]initial, resulted in, as expected, linear calibrations fornalyte concentrations up to ∼0.25 mM at 23 ◦C. Fig. 3 shows suchalibration curves for glucose and lactate; the experiments wereonducted at 23 ◦C in sealed containers on different films. Monitor-
ig. 2. The initial rate of change in � vs. the lactate concentration. The enzyme con-entration was 1 unit/mL. The measurement was performed at 37 ◦C in a sealedell.
732 Y. Cai et al. / Sensors and Actuators B 134 (2008) 727–735
Ff
scopiiw
3
3
spuOaac3
Fc
aatIttiehui
wFf
Fwtot
ig. 3. 1/� vs. the lactate or glucose concentrations. The measurements were per-ormed using two different films at ∼23 ◦C in sealed containers.
ealed cells with relatively high levels of accessible enzymes. Inontrast, when using smaller amounts of analyte solutions on anxidase-doped sol–gel film [30], the faster in-diffusion of O2, andossibly limited enzyme accessibility, deteriorate the LOD, increas-
ng it to ∼0.1 mM [41]. As shown below, the calibration curve shownn Fig. 3 was successfully adopted for monitoring analyte mixtures
ith a similar low LOD.
.3. Multianalyte sensing
.3.1. Sequential monitoringFig. 4 shows the platform for such a multianalyte sensor, where
ix pairs of green Alq3 OLED pixels are lit simultaneously; the OLEDixels are defined by the overlap between the mutually perpendic-lar ITO and Al stripes. The leftmost and rightmost pairs are bare
LED pixels. A PS:PtOEP film was drop cast on the 2nd, 3rd, 4th,nd 5th pairs; the 2nd pair was used for monitoring oxygen in thebsence of the other analytes. A GOx-doped sol–gel film was drop-ast from a 7.5 mg/mL GOx + sol–gel solution on the 3rd pair, whileunits/mL AOx and 1.5 units/mL LOx were contained each in a sep-cautw
ig. 4. Structurally integrated OLED-based photoluminescent multianalyte sensor for sequere based on a PS:PtOEP film, positioned above OLED pixel pairs 2–5. The orange-yellow
he Alq3-based OLED and the red emission from the PS:PtOEP film. The analytes were monf time (black lines) and the exponential fit (white lines). Measurements were conductedhe reader is referred to the web version of the article.)
ig. 5. 1/� vs. the analyte concentrations for multianalyte measurements performedonsecutively at ∼22 ◦C in a sealed container. A single photodetector (PMT) was used.
rate glass well, whose base was the PS:PtOEP film above pairs #4nd #5, respectively. The orange appearance of pairs 2–6 is due tohe superposition of the green Alq3 OLED EL and the red PtOEP PL.n this example analyte solutions were placed consecutively overhe sensing elements and the appropriate pixels were addressedo detect each of the analytes. The measurement was performedn air using a PMT. The figure shows also the decay curves and thexponential fit. Since the glucose, alcohol, and lactate levels wereigh, the expected value of � was ∼95–100 �s. Yet the observed val-es were 80–87 �s due to a non-negligible DO level resulting from
n-diffusion of some oxygen from the air.In sealed containers, calibration curves for the three analytes
ere obtained using their mixtures at different concentrations.ig. 5 shows 1/� vs. [analyte]initial for lactate, ethanol, and glucoseor the same PS:PtOEP film. As seen, the data for all three analytes
an be presented by a single calibration line independent of thenalyte, whether glucose, lactate, or ethanol. This is expected, sincender these experimental conditions the similar oxidation reac-ions of all three analytes proceeded to completion, and [DO]final,hich is related to the analyte concentration (Eq. (3)), was moni-ential monitoring of oxygen, glucose, alcohol, and lactate. All of the sensing elementsappearance of these pixels is due to the superposition of the green emission from
itored via the PL lifetime � of the PtOEP. The figure shows the intensity as a functionin air at ∼23 ◦C. (For interpretation of the references to color in this figure legend,

Y. Cai et al. / Sensors and Actuators B 134 (2008) 727–735 733
Fig. 6. (a) Schematic of the OLED array designed for simultaneous monitoring of four analytes. The vertical lines are the ITO anode stripes, the horizontal lines are the Alc ITO anm actatel ach Oc adde
trsdtitagr0
3
sstifapu
w3
tltaictsstraoiim
aet
4
bDtsfppdicaacTdisaor in a simultaneous mode, where all OLED pixels were energizedsimultaneously and the analytes were monitored using an arrayof photodiodes compatible with the OLED pixel array, with eachphotodiode used for a specific sensor in the array. The sensors’ per-
athode stripes. The (square) OLED pixels are defined by the overlap between theultianalyte sensor for simultaneous monitoring of oxygen, glucose, alcohol, and l
ocated under each PS:PtOEP film, a 5 mm × 5 mm Si photodiode is located under eontains a buffer solution with no oxidase, GOx, LOx, or AOx to which the sample is
ored. No interference between the analytes was observed and theeaction for a given analyte occurred only in the presence of thepecific corresponding enzyme. In the presence of that specific oxi-ase, � was determined (to within less than 1.5%) only by the level ofhe analyte that corresponds to that specific oxidase. For example,n the presence of LOx, � for 0.1 and 0.2 mM lactate varied from 45.3o 46.1 �s and from 68.0 to 69.1 �s, respectively, in the presence ofny combination of 0.15 or 0.35 mM ethanol and 0.15 or 0.35 mMlucose. In the presence of GOx, � for 0.35 mM glucose varied in theange 79.6–81.7 in the presence of 0.1 or 0.2 mM lactate and 0.15 or.35 mM ethanol.
.3.2. Simultaneous monitoringFig. 6(a) shows one basic design of the OLED pixel array for the
imultaneous multianalyte monitoring platform; as in the designhown in Fig. 4, the OLED pixels are defined by the overlap betweenhe mutually perpendicular ITO and Al stripes. The pixel size is typ-cally 2 mm × 2 mm; 0.3 mm × 0.3 mm pixels were also tested andound similarly adequate for use as the excitation source for sensingpplications. We note that there is no cross talk between the OLEDixels. As in the sequential operation mode (Fig. 4), two pixels weresed for each of the four analytes.
Fig. 6(b) shows an array of four wells mounted on the OLED array,ith the four 5 mm × 5 mm Si photodiodes, mentioned in Section
.1 above, positioned underneath the OLED array.Fig. 7 shows the calibration curves obtained for single analytes
ogether with data points obtained for analyte mixtures measuredater to check the validity of the approach for (unknown) mix-ures. In all cases the OLED array pixels were lit simultaneouslynd [DO]final or each analyte concentration was measured withts specific photodiode; the Labview software handled all the dataoncurrently. The measurement time, determined by the rate ofhe oxidation reactions, was ∼1–2 min. As seen, similar to theequential monitoring, the compact OLED-platform is suitable forimultaneous monitoring of multiple analytes in a mixture. As washe case for the consecutive measurements, a single line fits theesults for all analytes up to concentrations approaching [DO]initial,nd the analysis results of mixtures fit the linear calibration curvesf the single analytes very well; the LOD was ∼0.02 mM, as in mon-toring of the single analytes. Hence, the compact OLED platforms suitable for simultaneous monitoring of multiple analytes in a
ixture.For all the sensor films used in this study kq for DO in the water
nd PS film at ∼23 ◦C was in the range of (9 ± 2) × 107 M−1 s−1. Asxpected, this value is similar to the value we found in evaluatinghe OLED-based platform for monitoring DO [27].
Fspou
d the Al stripes. (b) 2′′ × 2′′ structurally integrated OLED-based photoluminescent. The PS:PtOEP film is located at the bottom of each of the wells, an OLED array isLED array, and a preamplifier circuit is located under each photodiode. Each well
d.
. Summary and concluding remarks
A compact, structurally integrated, photoluminescent OLED-ased multianalyte sensor for monitoring gas-phase oxygen andO, glucose, alcohol, and lactate was demonstrated. The advan-
age of this OLED-based platform is in its flexible design and smallize, individually addressable pixel configuration, unique ease ofabrication and integration of the OLED with the sensing com-onent, compatibility with microfluidic structures, as well as theossibility to fabricate OLEDs on plastic substrates, and eventually,evelop disposable badge-size sensor modules. All of the sens-
ng elements included a PS:PtOEP film; the PL of the PtOEP isollisionally quenched by O2. The addition of glucose-, alcohol-,nd lactate-oxidase catalyzes the oxidation of the correspondingnalytes, resulting in depletion of the oxygen in the solution andonsequently, an increase in the PL intensity I and decay time �.he sensors in this work monitored the analytes’ concentrations byetermining the latter. In contrast to the I mode, the � mode elim-
nates the need for frequent sensor calibration. The multianalyteensor was operated in either a sequential mode by individuallyddressing the OLED pixels that excite a given sensing element,
ig. 7. 1/� vs. the analyte concentrations for multianalyte measurements performedimultaneously at ∼22 ◦C in a sealed container. The open symbols indicate dataoints used to generate the calibration curves; the filled points are different mixturesf all analytes used for testing the analysis of mixtures. Detection was performed byse of an array of 5 mm × 5 mm Si photodiodes.
7 ctuato
fttctmnuitimeiutdas
ppacsi
A
oS0fIAF
R
[
[
[
[
[
[
[
[
[
[
[
[
[
[
[
[
[
[
[
[
[
[
[
[[
[[
[
[
[
[
[
34 Y. Cai et al. / Sensors and A
ormance was evaluated in terms of the dynamic range, the LOD,he analytes’ interference with each other, the response time, andhe reproducibility of the measurements. A modified Stern–Volmeralibration curve, linear with [analyte]initial for concentrations upo [DO]initial, was used successfully for monitoring reproducibly
ixtures of glucose, lactate, and ethanol in sealed containers witho interference between the analytes. Since [DO]initial ∼8.5 ppmnder ambient conditions, the apparent dynamic range was lim-
ted to [analyte]initial ∼0.25 mM in the test solution. However, sincehe analyte sample is diluted prior to the measurement this limits eliminated straightforwardly. Moreover, conducting the experi-
ents with solutions in seals cells with easily accessible enzymesnabled attaining a low LOD value of ∼0.02 mM, which is signif-cantly better than the ∼0.1 mM obtained by PL-based methodssing immobilized enzymes. The measurement time, which reflectshe oxidation reactions time under the specific experimental con-itions, was typically ∼1–2 min in the simultaneous measurementnd a total of ∼5 min for all of the analytes in the sequential mea-urement. The response time of the oxygen sensor is ∼1–2 s.
Eight pixels of a single-color OLED array were utilized in theresent demonstration of the viability of the structurally integratedlatform for multianalyte detection in mixtures. However, OLEDrrays typically contain many more pixels, so that several sensorsan be employed for each analyte. The use of such redundant sen-ors should enable monitoring the analytes’ concentration withncreased accuracy.
cknowledgments
We thank Chengliang Qian for technical assistance. Ames Lab-ratory is operated by Iowa State University (ISU) for the Unitedtates Department of Energy (USDOE) under Contract DE-AC 02-7CH11358. This work was partially supported by the Directoror Energy Research, Office of Basic Energy Sciences, USDOE, theSU Institute for Physical Research and Technology, the Nationaleronautics and Space Administration, and the National Scienceoundation.
eferences
[1] H. Frebel, G.-C. Chemnitius, K. Cammann, R. Kakerow, M. Rospert, W. Mokwa,Multianalyte sensor for the simultaneous determination of glucose, L-lactateand uric acid based on a microelectrode array, Sens. Actuators B Chem. 43 (1997)87–93.
[2] A.F. Revzin, K. Sirkar, A. Simonian, M.V. Pishko, Glucose, lactate, and pyruvatesensors based on redox polymer/oxidoreductase nanocomposite thin-filmsdeposited on photolithographically patterned gold microelectrodes, Sens.Actuators B Chem. 81 (2002) 359–368.
[3] M.S. Wilson, W. Nie, Electrochemical multianalyte immunoassays using anarray-based sensor, Anal. Chem. 78 (2006) 2507–2513.
[4] E.T. Zellers, M. Han, Effects of temperature and humidity on the performanceof polymer-coated surface acoustic wave vapor sensor arrays, Anal. Chem. 68(1996) 2409–2418.
[5] M.S. Freund, N.S. Lewis, A chemically diverse conducting polymer-based “elec-tronic nose, Proc. Natl. Acad. Sci. U.S.A. 92 (1995) 2652–2656.
[6] A. Carbonaro, L. Sohn, A resistive-pulse sensor chip for multianalyte immunoas-says, Lab Chip 5 (2005) 1155–1160.
[7] L. Li, D.R. Walt, Dual-analyte fiber-optic sensor for the simultaneous and contin-uous measurement of glucose and oxygen, Anal. Chem. 67 (1995) 3746–3752.
[8] T.A. Dickinson, J. White, J.S. Kauer, D.R. Walt, A chemical-detecting system basedon a cross-reactive optical sensor array, Nature 382 (1996) 697–700.
[9] D.R. Walt, T. Dickinson, J. White, J. Kauer, S. Johnson, H. Engelhardt, J. Sutter, P.Jurs, Optical sensor arrays for odor recognition, Biosens. Bioelectron. 13 (1998)697–699.
10] K.L. Michael, L.C. Taylor, S.L. Schultz, D.R. Walt, Randomly ordered addressable
high-density optical sensor arrays, Anal. Chem. 70 (1998) 1242–1248.11] C.A. Rowe, L.M. Tender, M.J. Feldstein, J.P. Golden, S.B. Scruggs, B.D. MacCraith,J.J. Cras, F.S. Liegler, Array biosensor for simultaneous identification of bacterial,viral, and protein analytes, Anal. Chem. 71 (1999) 3846–3852.
12] M.D. Marazuela, M.C. Moreno-Bondi, Fiber-optic biosensors—an overview,Anal. Bioanal. Chem. 372 (2002) 664–682.
[
rs B 134 (2008) 727–735
13] E.J. Cho, F.V. Bright, Pin-printed chemical sensor arrays for simultaneous mul-tianalyte quantification, Anal. Chem. 74 (2002) 1462–1466.
14] E.J. Cho, Z. Tao, E.C. Tehan, F.V. Bright, Multianalyte pin-printed biosensor arraysbased on protein-doped xerogels, Anal. Chem. 74 (2002) 6177–6184.
15] V.K. Yadavalli, W.-G. Koh, G.J. Lazur, M.V. Pishko, Microfabricated protein-containing poly(ethylene glycol) hydrogel arrays for biosensing, Sens. ActuatorsB Chem. 97 (2004) 290–297.
16] E.R. Goldman, A.R. Clapp, G.P. Anderson, H.T. Uyeda, J.M. Mauro, I.L. Mend-intz, H. Mattoussi, Multiplexed toxin analysis using four colors of quantum dotfluororeagents, Anal. Chem. 76 (2004) 684–688.
17] N.M. Grubor, R. Shinar, R. Jankowiak, M.D. Porter, G.J. Small, Novel biosensorchip for simultaneous detection of DNA-carcinogen adducts with low-temperature fluorescence, Biosens. Bioelectron. 19 (2004) 547–556.
18] M. Vollprecht, F. Dieterle, S. Busche, G. Gauglitz, K.-J. Eichhorn, B. Voit, Quan-tification of quaternary mixtures of low alcohols in water: temporal-resolvedmeasurements with microporous and hyperbranched polymer sensors forreduction of sensor number, Anal. Chem. 77 (2005) 5542–5550.
19] J. Liu, J.H. Lee, Y. Lu, Quantum dot encoding of aptamer-linked nanostructuresfor one-pot simultaneous detection of multiple analytes, Anal. Chem. 79 (2007)4120–4125.
20] G. McGall, J. Labadie, P. Brock, G. Wallraff, T. Nguyen, W. Hinsberg, Light-directedsynthesis of high-density oligonucleotide arrays using semiconductor photore-sists, Proc. Natl. Acad. Sci. U.S.A. 93 (1996) 13555–13560.
21] E.J. Cho, F.V. Bright, Optical sensor array and integrated light source, Anal. Chem.73 (2001) 3289.
22] K.O. Cheon, J. Shinar, Combinatorial fabrication and study of doped-layer-thickness-dependent color evolution in bright small molecular organiclight-emitting devices, Appl. Phys. Lett. 83 (2003) 2073–2075.
23] J.G.C. Veinot, H. Yan, S.M. Smith, J. Cui, Q. Huang, T.J. Marks, Fabrication andproperties of organic light-emitting “nanodiode” arrays, Nano Lett. 2 (2002)333–335.
24] F.A. Boroumand, P.W. Fry, D.G. Lidzey, Nanoscale conjugated-polymer light-emitting diodes, Nano Lett. 5 (2005) 67–71.
25] C.H. Yamamoto, J. Wilkinson, J.P. Long, K. Bussman, J.A. Christodoulides, Z.H.Kafafi, Nanoscale organic light-emitting diodes, Nano Lett. 5 (2005) 2485–2488.
26] J. Shinar, V. Savvate’ev, in: J. Shinar (Ed.), Organic Light Emitting Devices: ASurvey, Springer Verlag, NY, 2003, pp. 1–41 (Chapter 1).
27] R. Shinar, Z. Zhou, B. Choudhury, J. Shinar, Structurally integrated organic lightemitting device-based sensors for gas phase and dissolved oxygen, Anal. Chim.Acta 568 (2006) 190–199.
28] R. Shinar, D. Ghosh, B. Choudhury, M. Noack, V.L. Dalal, J. Shinar, Luminescence-based oxygen sensor structurally integrated with an organic light-emittingdevice excitation source and an amorphous Si-based photodetector, J. NonCryst. Solids 352 (2006) 1995–1998.
29] R. Shinar, C. Qian, Y. Cai, Z. Zhou, B. Choudhury, J. Shinar, Structurally integratedorganic light-emitting device (OLED)-based multianalyte sensing throughanalyte-oxidase interaction, in: B.M. Cullum, J.C. Chance (Eds.), Smart Medicaland Biomedical Sensor Technology III, Proc. SPIE 6007 (2005) 600710-1.
30] B. Choudhury, R. Shinar, J. Shinar, Glucose biosensors based on organic lightemitting devices integrated with a luminescent sensing element, J. Appl. Phys.96 (2004) 2949–2954.
31] http://optics.org/articles/news/11/9/16?alert=1;http://optics.org/articles/news/12/6/6/1.
32] R.H. Friend, R.W. Gymer, A.B. Holmes, J.H. Burroughes, R.N. Marks, C. Taliani,D.D.C. Bradley, D.A. Dos Santos, J.L. Brédas, M. Lögdlund, W.R. Salaneck, Elec-troluminescence in conjugated polymers, Nature 397 (1999) 121–128.
33] http://www.emagin.com.34] G. Gustafsson, Y. Cao, G.M. Treacy, F. Klavetter, N. Colaneri, A.J. Heeger, Flexi-
ble light-emitting diodes made from soluble conducting polymers, Nature 357(1992) 477–479.
35] www.universaldisplay.com.36] C. McDonagh, B.D. MacCraith, A.K. McEvoy, Tailoring of sol–
gel films for optical sensing of oxygen in gas and aqueous phase, Anal.Chem. 70 (1998) 45–50.
37] D. Garcia-Fresnadillo, M.D. Marazuela, M.C. Moreno-Bondi, G. Orellana, Lumi-nescent nafion membranes dyed with ruthenium(II) complexes as sensingmaterials for dissolved oxygen, Langmuir 15 (1999) 6451–6459.
38] R.N. Gillanders, M.C. Tedford, P.J. Crilly, R.T. Bailey, Thin film dissolved oxy-gen sensor based on platinum octaethylporphyrin encapsulated in an elasticfluorinated polymer, Anal. Chim. Acta 502 (2004) 1–6.
39] C.S. Burke, O. McGaughey, J.-M. Sabattie, H. Barry, A.K. Mcevoy, C. McDon-agh, B.D. MacCraith, Development of an integrated optic oxygen sensor usinga novel, generic platform, Analyst 130 (2005) 41–45.
40] A.J. Palma, J. Loı̌pez-Gonzaı̌lez, L.J. Asensio, M.D. Fernaı̌ndez-Ramos, L. Fermıı̌nCapitaı̌n-Vallvey, Open air calibration with temperature compensation of aluminescence quenching-based oxygen sensor for portable instrumentation,Anal. Chem. 79 (2007) 3173–3179.
41] O.S. Wolfbeis, M. Schaeferling, A. Duerkop, Reversible optical sensor mem-brane for hydrogen peroxide using an immobilized fluorescent probe, and its
application to a glucose biosensor, Microchim. Acta 143 (2003) 221–227.42] V. Savvate’ev, J.H. Friedl, L. Zou, J. Shinar, K. Christensen, W. Oldham,L.J. Rothberg, Z. Chen-Esterlit, R. Kopelman, Nanosecond transients in theelectroluminescence from multilayer blue organic light-emitting devicesbased on 4,4′-bis(2,2′-diphenylvinyl)-1,1′-biphenyl, Appl. Phys. Lett. 76 (2000)1501–1503.

ctuato
[
[
[
[
[
[
[
[
[
[
[
B
YiofO
RSUcc
Z2sOL
Y. Cai et al. / Sensors and A
43] K.O. Cheon, J. Shinar, Bright white small molecular organic light-emittingdevices based on a red-emitting guest–host layer and blue-emitting 4,4′-bis(2,2′-diphenylvinyl)-1,1′-biphenyl, Appl. Phys. Lett. 81 (2002) 1738–1740.
44] G. Li, J. Shinar, Combinatorial fabrication and studies of bright white organiclight-emitting devices based on emission from rubrene-doped 4,4′-bis(2,2′-diphenylvinyl)-1,1′-biphenyl, Appl. Phys. Lett. 83 (2003) 5359–5361.
45] L. Zou, V. Savvate’ev, J. Booher, C.-H. Kim, J. Shinar, Combinatorial fabricationand studies of intense efficient ultraviolet–violet organic light-emitting devicearrays, Appl. Phys. Lett. 7 (2001) 2282–2284.
46] L.S. Hung, C.W. Tang, M.G. Mason, Enhanced electron injection in organic elec-troluminescence devices using an Al/LiF electrode, Appl. Phys. Lett. 70 (1997)152–154.
47] S.E. Shaheen, G.E. Jabbour, M.M. Morell, Y. Kawabe, B. Kippelen, N. Peygham-barian, M.-F. Nabor, R. Schlaf, E.A. Mash, N.R. Armstrong, Bright blue organiclight-emitting diode with improved color purity using a LiF/Al cathode, J. Appl.Phys. 84 (1998) 2324–2327.
48] O.S. Wolfbeis, I. Oehme, N. Papkovskaya, I. Klimant, Sol–gel based glucosebiosensors employing optical oxygen transducers, and a method for compen-sation for variable oxygen background, Biosens. Bioelectron. 15 (2000) 69–76.
49] P. Pandey, S.P. Singh, S.K. Arya, V. Gupta, M. Datta, S. Singh, B.D. Malhotra, Appli-cation of thiolated gold nanoparticles for the enhancement of glucose oxidaseactivity, Langmuir 23 (2007) 333–3337 (and references therein).
50] A. Mills, Optical sensors for oxygen: a log-Gaussian multisite-quenching model,Sens. Actuators, B Chem. 51 (1998) 69–76.
51] P. Roche, R. Al-Jowder, R. Naravanaswamy, J. Young, P. Scully, A novel lumines-
cent lifetime-based optrode for the detection of gaseous and dissolved oxygenutilising a mixed ormosil matrix containing ruthenium (4,7-diphenyl-1,10-phenanthroline)3Cl2 (Ru.dpp), Anal. Bioanal. Chem. 386 (2006) 1245–1257.52] Z. Zhou, R. Shinar, A.J. Allison, J. Shinar, Enhanced photoluminescence of oxygensensing films through doping with high dielectric constant particles, Adv. Funct.Mater. 17 (2007) 3530–3537.
JJLtis
rs B 134 (2008) 727–735 735
53] M. Yamaguchi, M. Mitsumori, Y. Kano, Noninvasively measuring blood glucoseusing saliva, IEEE Eng. Med. Biol. 17 (May/June (3)) (1998) 59–63.
iographies
uankun Cai received his BSc in Physics from Nankai University, China in 2003. Hes currently a graduate student in the Ames Laboratory-USDOE and the Departmentf Physics and Astronomy of Iowa State University. His research interests includeabrication and characterization of organic light-emitting devices (OLEDs) and theLED-based sensor platform.
uth Shinar is a Senior Scientist at the Microelectronics Research Center of Iowatate University. She received her PhD in Physical Chemistry in 1977 from the Hebrewniversity, Jerusalem, Israel. Her research interests include chemical and biologi-al sensors, including organic light emitting diode (OLED)-based sensors, surfacehemistry, and chip-scale instrumentation.
haoqun Zhou received his PhD in Physics from Iowa State University in006. He is currently a staff scientist at QD Vision, Inc., in Watertown, Mas-achusetts. His research interests include fabrication and characterization ofLEDs, the OLED-based sensor platform, and hybrid organic quantum dotEDs.
oseph Shinar received his PhD in Physics from the Hebrew University,erusalem, Israel in 1980. He is currently a Senior Physicist at the Amesaboratory-USDOE, Professor of Physics and Astronomy, and Professor of Elec-rical and Computer Engineering of Iowa State University. His research interestsnclude organic semiconductors, OLEDs, and OLED-based chemical and biologicalensors.
Copyright © 2022 FDOKUMEN