
MPPT Wind and Photovoltaic using multiple input DC/DC ...
107
MPPT Wind and Photovoltaic using multiple input DC/DC converter Group:? Aalborg University Department of Energy Technology June 1, 2014
-
Upload
khangminh22 -
Category
Documents
-
view
0 -
download
0
Transcript of MPPT Wind and Photovoltaic using multiple input DC/DC ...

MPPT Wind and Photovoltaic using multipleinput DC/DC converter
Group:?Aalborg University
Department of Energy TechnologyJune 1, 2014

ii

Title: Current Control of a multiple input DC/DC converterSemester: 4rd semester M.Sc., PED4Semester theme: Optimization, Diagnosis and Control of Power Electronic Drives or ConvertersPeriod: 01/02-2014 - 1/06-2014ECTS: 30Supervisor: Erik SchaltzProject group:
Andres Lopez-Aranguren Oliver
Number of reports:2Number of pages: 107Appendix pages:10CD’s: 2
ABSTRACT:
The purpose of this project is to design and
build a double input DC/DC converter for con-
trolling a hybrid system formed by a photo-
voltaic system and a vertical axis wind turbine,
with the goal of tracking the maximum power
point. Both power generation systems must be
deeply studied in order to understand their prin-
ciple of working and find the most optimum
MPPT algorithm for this purpose. Once the
MPPT algorithm has been selected, it will be
simulated with both power generation models.
Several multiple input power converter topolo-
gies will be analysed and the most suitable for
this application will be studied.A simulation will
be carry on using the models developed for this
purpose in order to study its behaviour. The se-
lected double input converter will be simulated
and the control system will be tested in the sim-
ulation. Finally it will be built and tested in the
laboratory first and afterwards with both power
generation systems.
By signing this document, each member of the group confirms that all participated inthe project work and thereby that all members are collectively liable for the content ofthe report.
iii


Resume
Renewable energies sources are becoming really important since the last decade. However due to thefact that they extremely depend on weather conditions, the usage of power electronics systems toextract the maximum power and controlling the energy flow becomes an essential issue.
This project is based on a hybrid system formed by a vertical axis wind turbine and a photovoltaicsystem. The project is developed in Nicaragua, in collaboration with the national engineeringuniversity of Managua, with the purpose of improve the quality of life of people in the communitiesby bringing them electricity through renewable energies.
This project start with an overview of the system, based on a vertical axis wind turbine developed bystudents from the UNI and a photovoltaic system.
A deep research about both power generation system is done in order to understand the behavior ofthese renewable energy under weather changes.
Afterwards, different maximum power point tracking algorithms are studied and the one most suitablefor this application is selected and analysed.
Double input converters are studied and the one considered more appropriate for this aplication isanalysed and simulated.
Finally the double input DC/DC converter selected is designed and built. Some laboratory test aredone in order to verify its behaviour under different scenarios.
v


PrefaceThis report is produced by a 10th semester student from Institute of Energy Technology at AalborgUniversity. This project is done in
I would like to address many thanks to Erik Schaltz my supervisor from Aalborg University and tomy supervisors of the UNI of Managua, Jernimo Zeas, head of the Wind Energy Department and JoseManuel Arcia from the Electronic department, for helping me throughout this project and for givingme constructive criticism. Furthermore I would like to direct a big thanks to my family and friendsfor encouraging me and for being proud of what I do.
Reading instructionsThe report will have a short introduction and an ending at each section. There will throughout theproject be source references.They are written using Harvard method which means the sources arewritten as follows, [Surname, Year]. If only a single source is used in a chapter or a section it is foundat the end. If multiple sources are used in a chapter they the will be found immediately after eachtext section. All sources are assembled in a bibliography at the back of the report. An explanatorytext is found under every figure, and table. In the start a nomenclature list is found where all units,abbreviations, and parameters are listed. On the enclosed CD, all relevant data from simulations andlaboratory test and computer models are saved. In addition there is a PDF-version of the projectattached to the CD.
vii

Table of Contents
Resume v
1 Introduction 11.1 Background . . . . . . . . . . . . . . . . . . . . . . . . . . . . . . . . . . . . . . . . . . 11.2 Problem Statement . . . . . . . . . . . . . . . . . . . . . . . . . . . . . . . . . . . . . . 31.3 Objective . . . . . . . . . . . . . . . . . . . . . . . . . . . . . . . . . . . . . . . . . . . 41.4 Methodology . . . . . . . . . . . . . . . . . . . . . . . . . . . . . . . . . . . . . . . . . 4
2 System description 5
3 Wind Energy systems 93.1 Wind energy power generation systems . . . . . . . . . . . . . . . . . . . . . . . . . . . 93.2 Permanent Magnet Synchronous Generator and three phase rectifier . . . . . . . . . . 123.3 Maximum Power Point Tracking . . . . . . . . . . . . . . . . . . . . . . . . . . . . . . 163.4 Verification of the Wind turbine power generation system . . . . . . . . . . . . . . . . 22
4 Photovoltaic systems and energy storage 274.1 Photovoltaic principles . . . . . . . . . . . . . . . . . . . . . . . . . . . . . . . . . . . . 274.2 Maximum Power Point Tracking . . . . . . . . . . . . . . . . . . . . . . . . . . . . . . 324.3 Energy storage . . . . . . . . . . . . . . . . . . . . . . . . . . . . . . . . . . . . . . . . 334.4 Verification of the photovoltaic power generation system . . . . . . . . . . . . . . . . . 37
5 Multiple Input DC converters 395.1 MIC Converter topologies . . . . . . . . . . . . . . . . . . . . . . . . . . . . . . . . . . 405.2 Double input buck-boost converter analysis . . . . . . . . . . . . . . . . . . . . . . . . 415.3 System design and small signal model . . . . . . . . . . . . . . . . . . . . . . . . . . . 45
6 MIC power converter control and simulations results 516.1 Power Management and control design . . . . . . . . . . . . . . . . . . . . . . . . . . . 516.2 Steady state simulations of the proposed converter . . . . . . . . . . . . . . . . . . . . 60
7 System design and experimental results 677.1 System design . . . . . . . . . . . . . . . . . . . . . . . . . . . . . . . . . . . . . . . . . 677.2 Experimental results . . . . . . . . . . . . . . . . . . . . . . . . . . . . . . . . . . . . . 68
8 Conclusion 77
9 CD Content 79
Bibliography 81
Appendix A Energy Storage. Lead-acid Batteries I
Appendix B Single DC DC converter IIIB.1 Boost converter analysis . . . . . . . . . . . . . . . . . . . . . . . . . . . . . . . . . . . IIIB.2 Boost converter design and data logger . . . . . . . . . . . . . . . . . . . . . . . . . . . VII
Appendix C Small signal analyse for multiple input DC/DC converter XI
ix

List of Symbols
Symbol Description Units
A Swept area of the blades m2
Cp Coefficient of performance -
D Duty ratio of a PWM signal -
d Distance of the movement mEa Distance of the movement mH Height of the Wind turbine blades mIa Phase-a stator current AIDC Output current of the rectifier AIPV Photovoltaic module current AISC Photovoltaic module Short Circuit Current AId Photovoltaic module Diode current AIo Photovoltaic module dark condition current Aq Electron charge CJ Inertia kg/m2
k Boltzmann constant J/Km Unity of mass kgU Kinetic energy JVan Phase-a stator voltage Vvw Wind speed msVDC Ouput voltage of the rectifier VVPV Photovoltaic module voltage VVOC Photovoltaic module Diode current VVd Single cell output voltage VVbatt. Battery voltage level Vpp Number of pole pairs -
q Actual battery capacity Cqmax Nominal battery capacity CRe Incident radiance kHz/
(µW/cm2
)Rm Measuring resistor ΩRs Measuring resistor ΩTemm Electro-mechanical Torque NmTm Mechanical Torque Nmwe Electrical speed rad/swm Mechanical speed rad/swmo Cut-in Mechanical speed rad/sx Space of the movement mXs Stator reactance Ωρ Density kg/m3
λ Tip spit ratio -
xi


Abbreviations
Description Acronym
Alternating Current ACAnalogue to Digital Conversion ADCAmpere-Hour AhDepth of Discharge DODDirect Current DCHorizontal Axis Wind Turbine HAWTInternational Energy Agency IEALED Light Emitter DiodeMaximum Power Point Tracking MPPTNickel Cadmium Ni-CadPulse Width Modulation PWMPermanent Magnet Synchronous Generator PMSGPersonal Computer PCPhotovoltaic PVRenewable Energy Sources RESReal Time Clock RTCState of discharge SOCVertical Axis Wind Turbine VAWT
xiii


Chapter 1
Introduction
1.1 Background
In the last decade, the concept of climate change has become a central issue for governments in allover the world. This fact forced governments to make a big investment in renewable energies, withthe challenge of pursuing the research and development of alternative energies, which are now moreefficient and reliable. In addition, renewable energies are becoming increasingly cost-competitive withother non renewable energy sources.
The access to the electricity is essential for the development of people in poor countries. However, theInternational Energy Agency(IEA) estimated in 2011 that there was approximately 1.2 billion peopleliving without access to electricity. Extending the national grid to remote and inaccessible areas canbe extremely costly and it is usually not feasible for non developed countries. However, it is possibleto be achieve universal access to electricity though renewable energies
Nicaragua is the second poorest country in Latin America and 28% of its population does not haveaccess to electricity [1]. However, this country possess a big potential in the context of renewableenergy sources. Nicaragua is third-highest country in terms of renewable energy potential of LatinAmerica, with an amount of approximately 4.500 MW of renewable energy generation potential,between geothermal, hydroelectric, biomass and wind sources [18]. In fact, thanks to its naturalresources, the country could generate nine times more energy from renewable than it consumes andcould sell excess energy across its borders thanks to this outstanding potential.
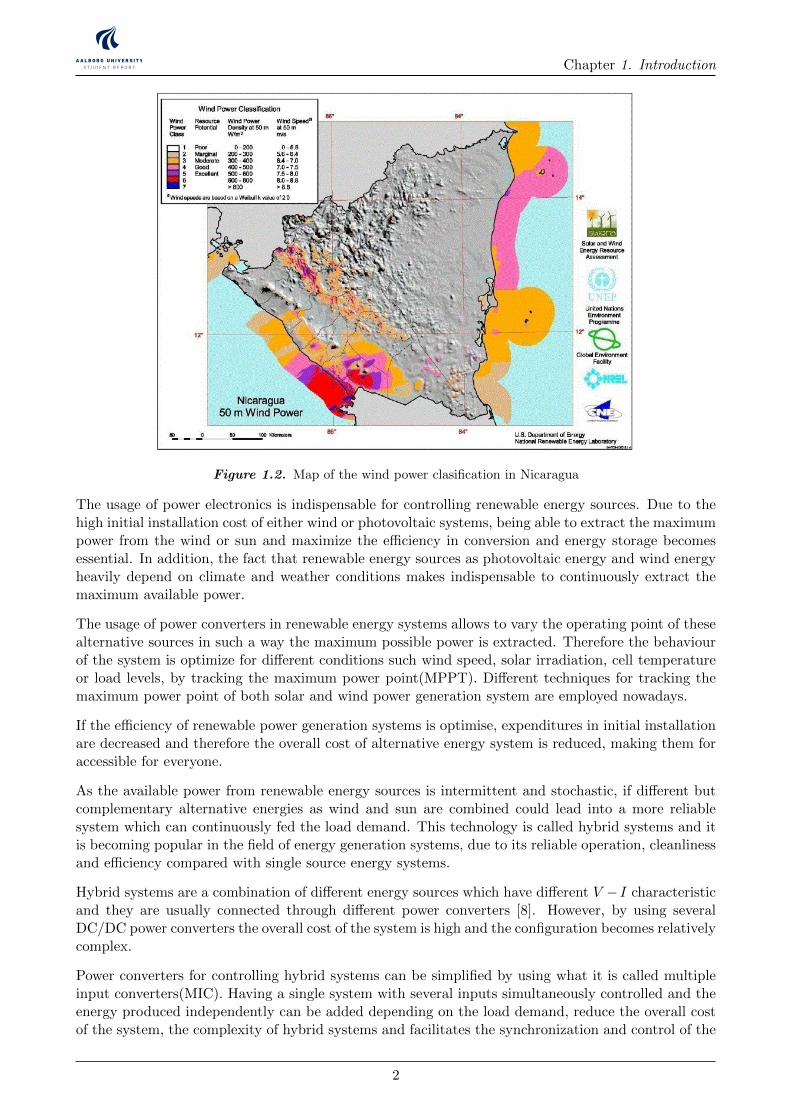
Figure 1.1 shows the irradiation map of Nicaragua in which the high irradiation potential can beobserved. The wind power potential of the country is shown in Figure 1.2.
Figure 1.1. Solar irradiation map of Nicaragua.
1
Chapter 1. Introduction
Figure 1.2. Map of the wind power clasification in Nicaragua
The usage of power electronics is indispensable for controlling renewable energy sources. Due to thehigh initial installation cost of either wind or photovoltaic systems, being able to extract the maximumpower from the wind or sun and maximize the efficiency in conversion and energy storage becomesessential. In addition, the fact that renewable energy sources as photovoltaic energy and wind energyheavily depend on climate and weather conditions makes indispensable to continuously extract themaximum available power.
The usage of power converters in renewable energy systems allows to vary the operating point of thesealternative sources in such a way the maximum possible power is extracted. Therefore the behaviourof the system is optimize for different conditions such wind speed, solar irradiation, cell temperatureor load levels, by tracking the maximum power point(MPPT). Different techniques for tracking themaximum power point of both solar and wind power generation system are employed nowadays.
If the efficiency of renewable power generation systems is optimise, expenditures in initial installationare decreased and therefore the overall cost of alternative energy system is reduced, making them foraccessible for everyone.
As the available power from renewable energy sources is intermittent and stochastic, if different butcomplementary alternative energies as wind and sun are combined could lead into a more reliablesystem which can continuously fed the load demand. This technology is called hybrid systems and itis becoming popular in the field of energy generation systems, due to its reliable operation, cleanlinessand efficiency compared with single source energy systems.
Hybrid systems are a combination of different energy sources which have different V − I characteristicand they are usually connected through different power converters [8]. However, by using severalDC/DC power converters the overall cost of the system is high and the configuration becomes relativelycomplex.
Power converters for controlling hybrid systems can be simplified by using what it is called multipleinput converters(MIC). Having a single system with several inputs simultaneously controlled and theenergy produced independently can be added depending on the load demand, reduce the overall costof the system, the complexity of hybrid systems and facilitates the synchronization and control of the
2
Chapter 1. Introduction
renewable energy sources [8].
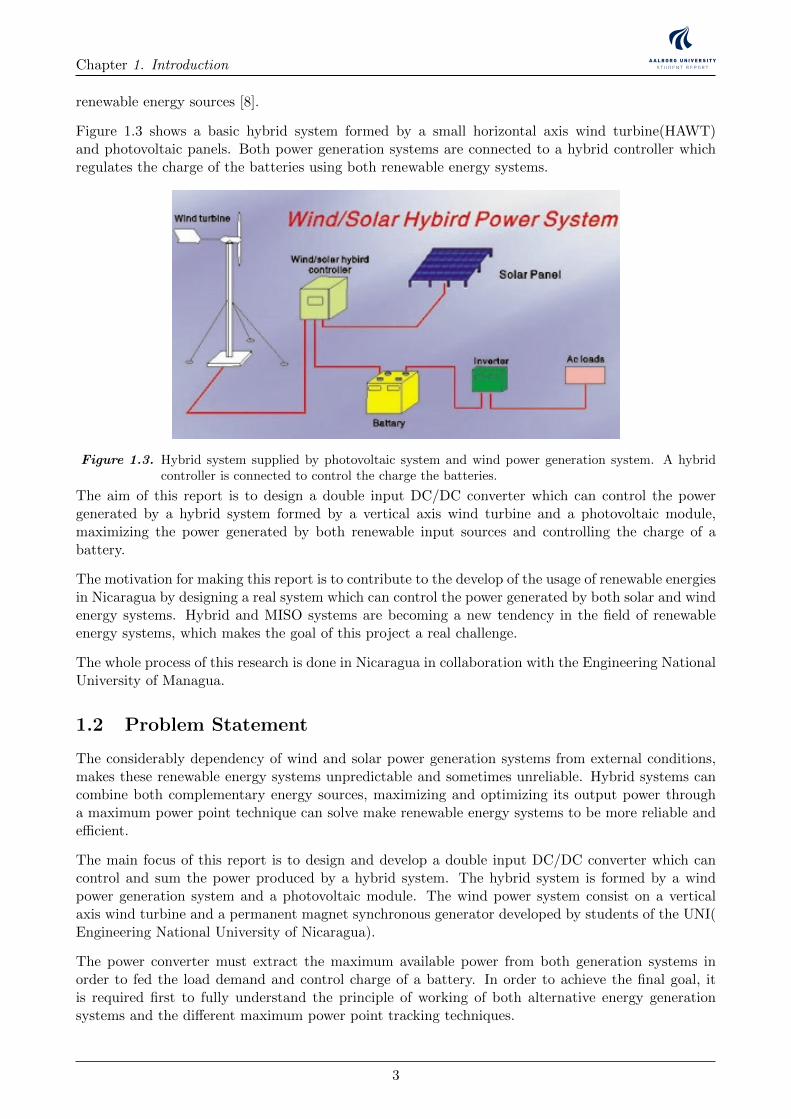
Figure 1.3 shows a basic hybrid system formed by a small horizontal axis wind turbine(HAWT)and photovoltaic panels. Both power generation systems are connected to a hybrid controller whichregulates the charge of the batteries using both renewable energy systems.
Figure 1.3. Hybrid system supplied by photovoltaic system and wind power generation system. A hybridcontroller is connected to control the charge the batteries.
The aim of this report is to design a double input DC/DC converter which can control the powergenerated by a hybrid system formed by a vertical axis wind turbine and a photovoltaic module,maximizing the power generated by both renewable input sources and controlling the charge of abattery.
The motivation for making this report is to contribute to the develop of the usage of renewable energiesin Nicaragua by designing a real system which can control the power generated by both solar and windenergy systems. Hybrid and MISO systems are becoming a new tendency in the field of renewableenergy systems, which makes the goal of this project a real challenge.
The whole process of this research is done in Nicaragua in collaboration with the Engineering NationalUniversity of Managua.
1.2 Problem Statement
The considerably dependency of wind and solar power generation systems from external conditions,makes these renewable energy systems unpredictable and sometimes unreliable. Hybrid systems cancombine both complementary energy sources, maximizing and optimizing its output power througha maximum power point technique can solve make renewable energy systems to be more reliable andefficient.
The main focus of this report is to design and develop a double input DC/DC converter which cancontrol and sum the power produced by a hybrid system. The hybrid system is formed by a windpower generation system and a photovoltaic module. The wind power system consist on a verticalaxis wind turbine and a permanent magnet synchronous generator developed by students of the UNI(Engineering National University of Nicaragua).
The power converter must extract the maximum available power from both generation systems inorder to fed the load demand and control charge of a battery. In order to achieve the final goal, itis required first to fully understand the principle of working of both alternative energy generationsystems and the different maximum power point tracking techniques.
3

Chapter 1. Introduction
1.3 Objective
The objective of this project is to design and build a double input DC/DC converter for a hybridsystem formed by a VAWT and a photovoltaic module, both in simulations and in a real systemprovided by the UNI. This includes an study of both power generations systems, different maximumpower point techniques will be studied and simulated in order to find the most suitable for thisapplication. It is required to do an study of different multiple input power converters and analysingthe final system selected for this purpose. A further objective is to improve the system so it can beused in communities in Nicaragua and people can be benified by this technology.
1.4 Methodology
First the system overview is explained in Chapter I. Wind energy systems are analysed and studiedin Chapter II as well as the MPPT tracking algorithm is simulated with the wind turbine modeldeveloped for this purpose. In Chapter III photovoltaic energy is studied. In Chapter IV multipleinput DC converter are showed and analysed. Chapter V shows the MIC converted selected and thesmall signal analyses. Finally in Chapter IV the system design is explained and laboratory results areshowed
4
Chapter 2
System description
In this chapter a general description of the hybrid system is presented. The essential system modelparts are presented for a better understanding of the goal of this report.
+ - + -
+ - + -
PMSG
500 W
Vertical axis wind turbine Gear box
+
-
600 W Vpv
DC/DC
Ibat
+
-
Vo
Io
3-ph Rectifier
+
-VWG
IPV
IWG
Control Unit
ON/OFF Control
IWG
VWG
Vpv
IPV
IbatVo
Dummy Load
12 V 450 AH Battery Bench
900 W
Control signals
PMSG
500 W
Vertical axis wind turbine Gear box
+
-
Vw
w
+
-
600 W Solar Pump controller PM DC motor
Vpv
Back- Up system Diesel Generator
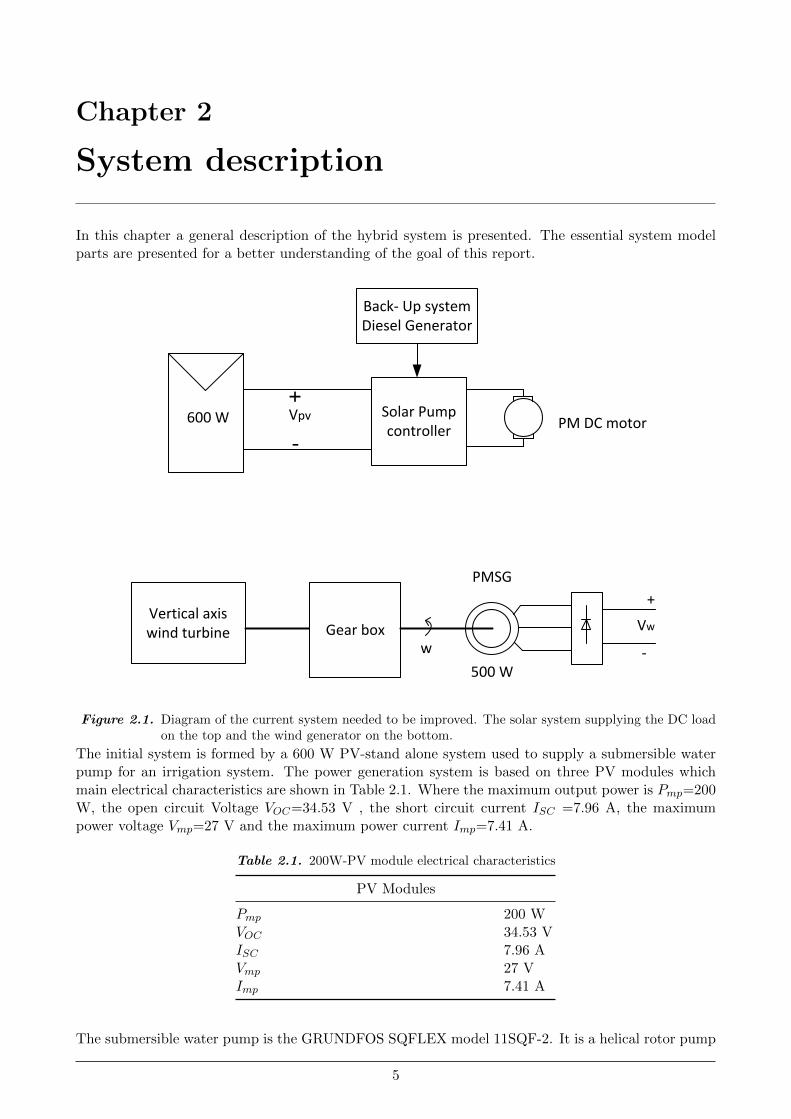
Figure 2.1. Diagram of the current system needed to be improved. The solar system supplying the DC loadon the top and the wind generator on the bottom.
The initial system is formed by a 600 W PV-stand alone system used to supply a submersible waterpump for an irrigation system. The power generation system is based on three PV modules whichmain electrical characteristics are shown in Table 2.1. Where the maximum output power is Pmp=200W, the open circuit Voltage VOC=34.53 V , the short circuit current ISC =7.96 A, the maximumpower voltage Vmp=27 V and the maximum power current Imp=7.41 A.
Table 2.1. 200W-PV module electrical characteristics
PV Modules
Pmp 200 WVOC 34.53 VISC 7.96 AVmp 27 VImp 7.41 A
The submersible water pump is the GRUNDFOS SQFLEX model 11SQF-2. It is a helical rotor pump
5
Chapter 2. System description
formed by a brushless, electronically commutated AC-motor with a permanent-magnet rotor. Thesemotors are called electronically commutated motors(ECM), which can be either powered with ACcurrent or with DC though an integrated inverter. This motor has a nominal power of Pn=0.9 kW,the DC supply voltage is in the range of VDC=[30;300] V, the AC supply voltage VAC= [90;240] V,the input nominal current is In=7 A, the power factor PF =1 and the speed is nn=[500 ;3000] rpm.Table 2.2 shows the electrical characteristics previously mentioned.
Table 2.2. SQFLEX GRUNDFOS submersible power pump electrical characteristics
AC PM motor
VDC [30;300] VVAC [90;240] VPn 0.9 kWIn 7 APF 1nn [500 ;3000] rpm
The submersible pump has its own controller which protects the pump against dry-running protectionand it has a water level switch for a water tank or reservoir. In addition in case the PV modules hasnot enough power to run the pump, it rectifies the signal from an AC generator.
In Figure (2.1) the initial system is shown. The vertical axis wind turbine system is not used yetfor the need of a controller. It is connected to a 500 W three phase Permanent Magnet SynchronousGenerator. For rectifying the output voltage, a 3-Phase rectifier is used.
Table (2.3) shows the electrical characteristic of the PMSG.
Table 2.3. System PV configuration rated values
Permanent magnet Synchronous Generator electrical characteristics
Rated Mechanical Power 500 WRated Rotor Speed 419 RPMNumber of Pole Pairs 6VLL 18.5 VILL 34 AStator Winding Resistance 0.8 ΩStator Synchronous Reactance 1.22 ΩPermanent magnet flux linkage 0.165 WbConnexion Star connexion
In the previous system, both the Photovoltaic and the wind turbine system require a MPPT controllerfor better performance. It is also required a controller for braking the wind turbine in case of reallyhigh wind speeds.
The aim of this project is to design a controller which can add the energy produced by both systemsto fed the load or in case only one is producing energy, they system still works.
A battery pack will be added to the output of the controller so the energy can be stored and it canbe used during the night. Thereby it is required that the controller also includes a charge algorithmfor the batteries.
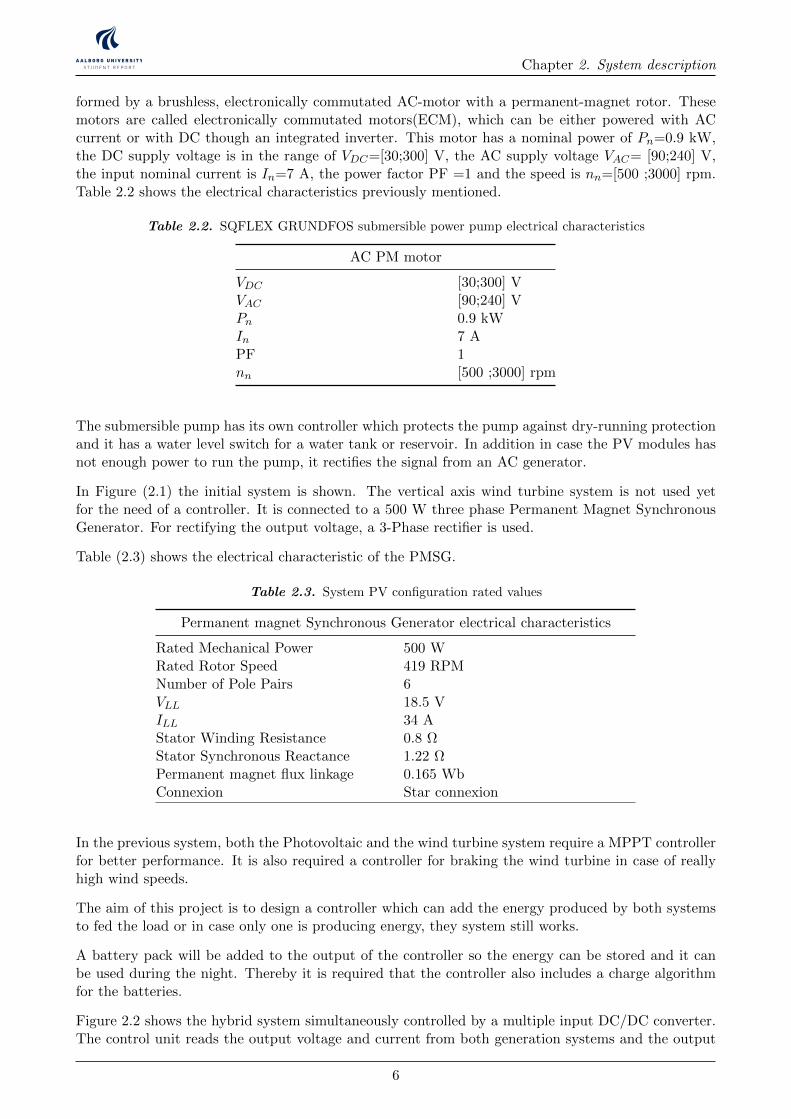
Figure 2.2 shows the hybrid system simultaneously controlled by a multiple input DC/DC converter.The control unit reads the output voltage and current from both generation systems and the output
6
Chapter 2. System description
voltage and current of the controller.
By comparing the read signals and the reference voltage or current, the control unit generates thecontrol signal for the DC/DC converter to operate as desired. The control unit also reads the currentfrom the batteries. Most of the charge controllers evaluate the SOC(State of Charge) of the batteryby reading the voltage battery level. However, it is more accurate to read the current coming into thebattery and the current used by the load to estimate the battery charge level.
+ - + -
+ - + -
PMSG
500 W
Vertical axis wind turbine Gear box
+
-
600 W Vpv
DC/DC
Ibat
+
-
Vo
Io
3-ph Rectifier
+
-VWG
IPV
IWG
Control Unit
ON/OFF Control
IWG
VWG
Vpv
IPV
IbatVo
Dummy Load
12 V 450 AH Battery Bench
900 W
Control signals
PMSG
500 W
Vertical axis wind turbine Gear box
+
-
Vw
w
+
-
600 W Solar Pump controller PM DC motor
Vpv
Back- Up system Diesel Generator
Figure 2.2. Prosed system with a double input DC/DC converter connected to the load and the batteries.The inputs are the rectifier of the wind turbine and the solar array. The control unit reads theDC/DC converter input current and voltage, battery voltage and current and it generates thecontrol signals for the converter.
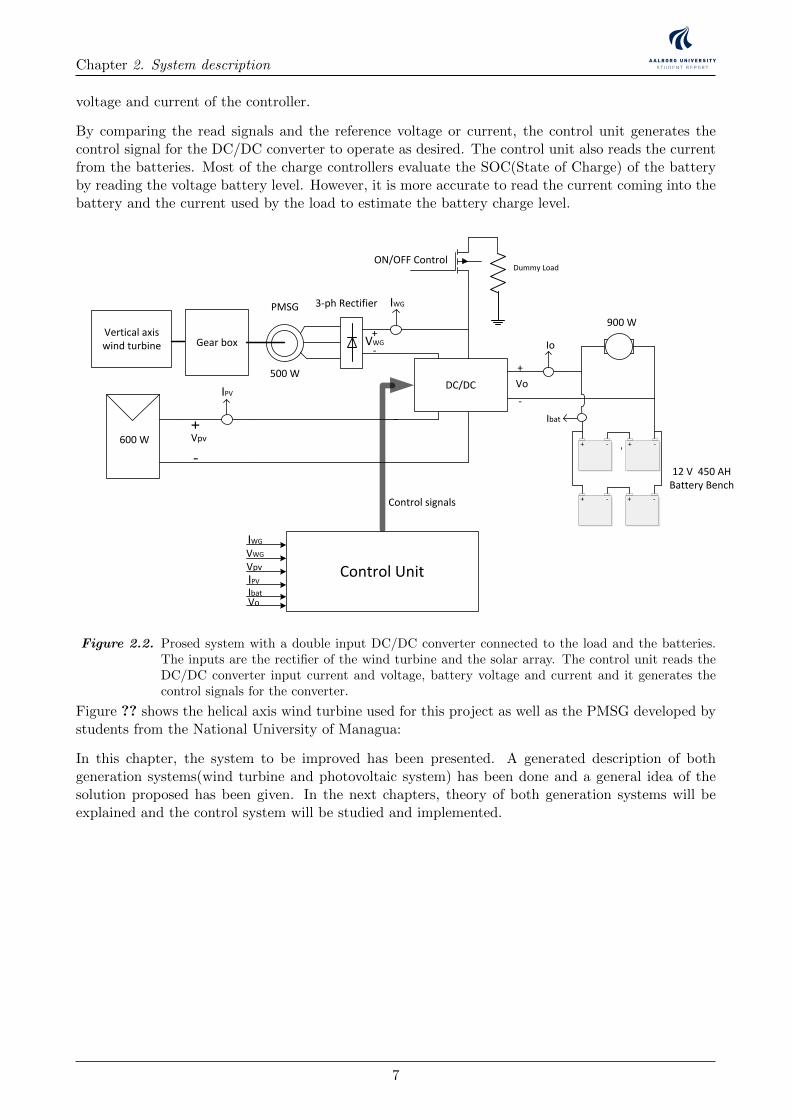
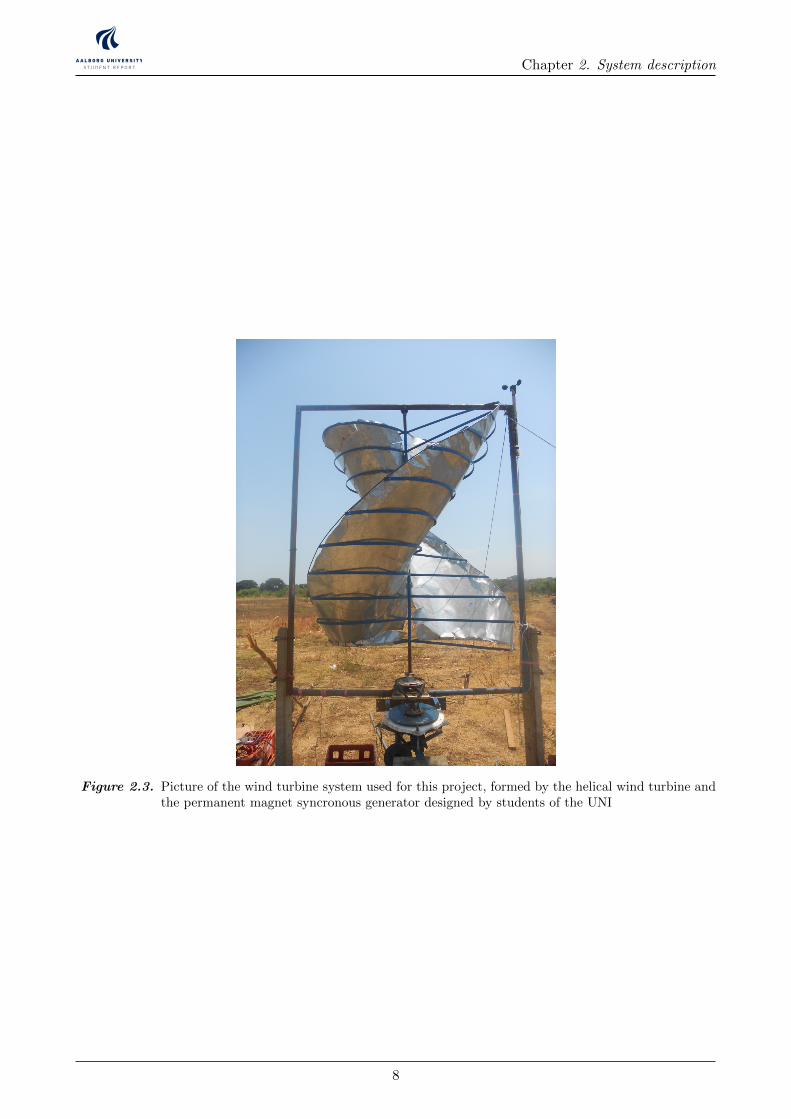
Figure ?? shows the helical axis wind turbine used for this project as well as the PMSG developed bystudents from the National University of Managua:
In this chapter, the system to be improved has been presented. A generated description of bothgeneration systems(wind turbine and photovoltaic system) has been done and a general idea of thesolution proposed has been given. In the next chapters, theory of both generation systems will beexplained and the control system will be studied and implemented.
7
Chapter 2. System description
Figure 2.3. Picture of the wind turbine system used for this project, formed by the helical wind turbine andthe permanent magnet syncronous generator designed by students of the UNI
8
Chapter 3
Wind Energy systems
Domestic wind turbines are used for several purposes, they are usually used to supply energy to smallmicro-grid systems or urban applications. There are different wind turbine designs available on themarket and they can be studied into two groups, Vertical Axis Wind Turbines(VAWT) and HorizontalAxis Wind Turbines(HAWT).
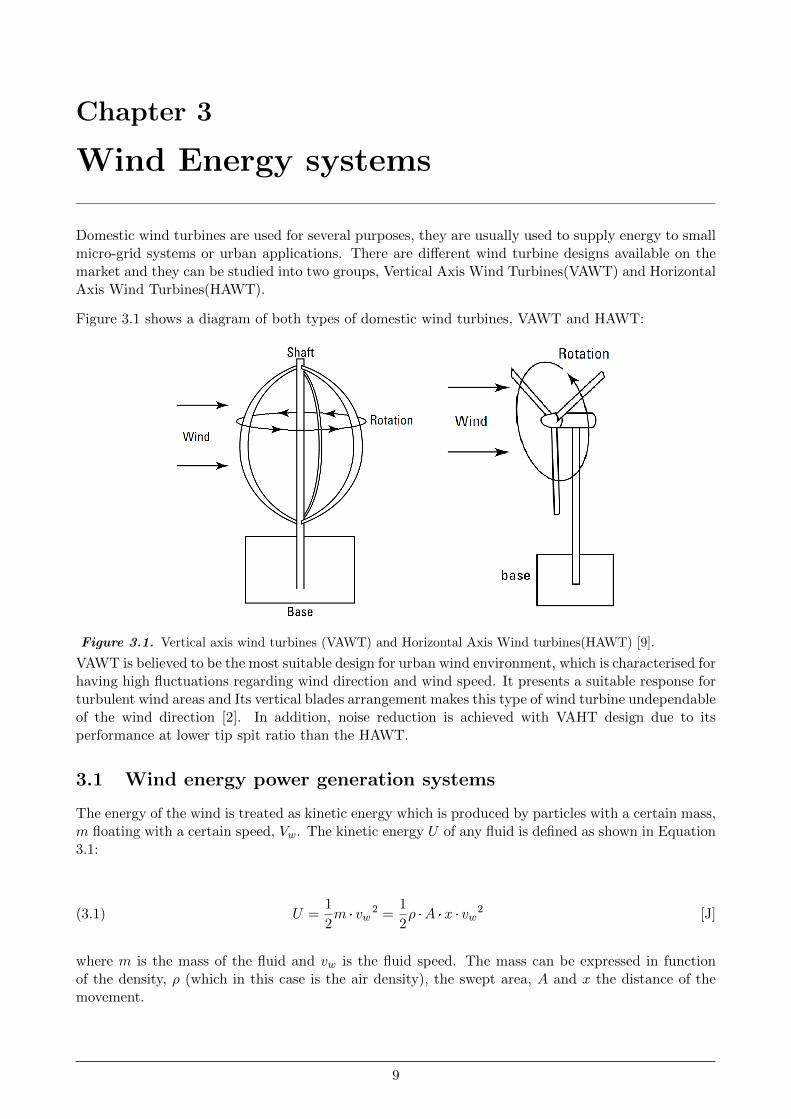
Figure 3.1 shows a diagram of both types of domestic wind turbines, VAWT and HAWT:
Figure 3.1. Vertical axis wind turbines (VAWT) and Horizontal Axis Wind turbines(HAWT) [9].
VAWT is believed to be the most suitable design for urban wind environment, which is characterised forhaving high fluctuations regarding wind direction and wind speed. It presents a suitable response forturbulent wind areas and Its vertical blades arrangement makes this type of wind turbine undependableof the wind direction [2]. In addition, noise reduction is achieved with VAHT design due to itsperformance at lower tip spit ratio than the HAWT.
3.1 Wind energy power generation systems
The energy of the wind is treated as kinetic energy which is produced by particles with a certain mass,m floating with a certain speed, Vw. The kinetic energy U of any fluid is defined as shown in Equation3.1:
U =1
2m · vw
2 =1
2ρ ·A ·x · vw
2 [J](3.1)
where m is the mass of the fluid and vw is the fluid speed. The mass can be expressed in functionof the density, ρ (which in this case is the air density), the swept area, A and x the distance of themovement.
9
Chapter 3. Wind Energy systems
The power is defined as the variation of the energy during a timespan, P = ∆Uδt . If there is any
movement, the distance changes with the time and the variation of distance with respect to time isequal to the speed. Thereby, Equation 3.1 can be expressed as follows (3.2):
Pm,ideal =1
2ρ ·A · vw
3 [W](3.2)
However, it is not possible to extract the total amount of energy in the wind. The phenomenon of theenergy absorbed by a wind turbine is shown in Figure 3.2 :
PMSGWind
turbine
Rectifier
wm
DC
DCLOAD
Rotating speed -Power characteristic Pactual
Cotrol Unit
Poptimal
error
Control Signal
Power Converter
PMSG
Wind turbine
Rectifier
DC
DCLOAD
Cotrol Unit
Control Signal
Power Converter
Wind speed
Vw
R
Wm
Wm-optimal
error
+-
+ -
Ea
Eb
Ec
Xs Rs
ILL VLL
D1 D3 D5
D2 D4D6
+
-
p
N
Id
Ea
Eb
Ec
Xs RsIa
Xs
Xs
Rs
Rs
+
-
VDC
IDC+
+
+
Va
Vb
Vc
Ib
Ic
H
D
VG
S1
V1
V2
L
+
-
Vo
M1
M2
D1
D2
+
-
+
-
Vi1
Vi2
+ -VL
+
-Vo
Ii1
C
L
D1
D2
IL IC Io
+
-
+
-
Vi1
Vi2
+ -VL
+
-
+
-Vo
ID1
C
L
D1
D2
IL IC Io
+VD2
-
+ -VM1
M1
M2
M1
M2
C
VG
S2
+
-
+
-
V1
V2
+ -VL
+
-VD1
+
-Vo
+ -VM2
ID2
I1
C
L
D1
D2
IL IC Io
M1
M2
+
-
+
-
Vi1
Vi2
+ -VL
+
-Vo
+ -VM2
ID2
C
L
D1
D2
IL IC Io
Vc+
-
VM1+ -
M2
M1
VPVDC
DC
VWindDC
DC
LOADVo+
-
VPV
DC
DC
VWind
LOADVo
+
-
VD2+
-
-
+
VD1
+
+
VD1
+-
+
-
+ -VM1
+ -VM2
Ii2
ID1
+
+ - + -
+ - + -
PMSG
500 W
Vertical axis wind turbine Gear box
+
-
600 W Vpv
DC/DC
Ibat
+
-
Vo
Io
3-ph Rectifier
+
-VWG
IPV
IWG
Control Unit
ON/OFF Control
IWG
VWG
Vpv
IPV
IbatVo
Dummy Load
12 V 450 AH Battery Bench
900 W
Control signals
PMSG
500 W
Vertical axis wind turbine Gear box
+
-
Vw
w
+
-
Solar Pump controller PM DC motor
Vpv
Back- Up system Diesel Generator
-
200 W
-
200 W
-+ +
200 W
+
Ea
Eb
Ec
Xs Rs
ILL VLL
D1 D3 D5
D2 D4D6
+
-
p
N
Id
Ea
Eb
Ec
Xs RsIa
Xs
Xs
Rs
Rs
+
-
VDC
IDC+
+
+
Va
Vb
Vc
Ib
Ic
+-
LvLi
iv +
-
CR
C
LLR
PWM S
+
ovloadR
Si
Di Ri
Ci
Cv
+
LvLi
iv CR
C
LLR
S ovloadR
Si
Di Ri
Ci
Cv
+iv CR
C
LLR
S ovloadR
Si Ci
Cv
1I
sDT (1 ) sD T
iv
i ov v
Lv
Li
PWM
D3
PMSGWind
turbine
Rectifier
DC
DC
Cotrol UnitControl Signal
Power Converter
DCI
LOAD
+
-
DCV
MPPT algorithm
+
-
Vcc
D9
Vin
+
-
An3 An5An4
Relay
LM7805 +5V
D2
2
31
7
27K
5.6K22uF
5.1V
1N4001
10K
8
3305.6 3305.615K
680
5.6K
330uF
680
15V
22uF
6.8K
15K
5.6K22uF
Relay
5.1V
VLoadSwitch
20K
5.6K22uF
5.1V
680 Vb
att.
D2
MOSPEC S20C40C(x2)
D3
1mH FQP12P20(x2)
0.39 c/v
1.2 K
+ +
+
Current Transducer
5VAn2
GND
Arduino Uno
An2
An3
An4An5
+5V
An
alo
g 0
..5
GND
An0
An1
D0D1D2D3D4D5D6D7D8D9D10D11D12
Swep
t A
rea
Ewind EturbineD
Swep
t A
rea
H
VAWTHAWT
Eunabsorved
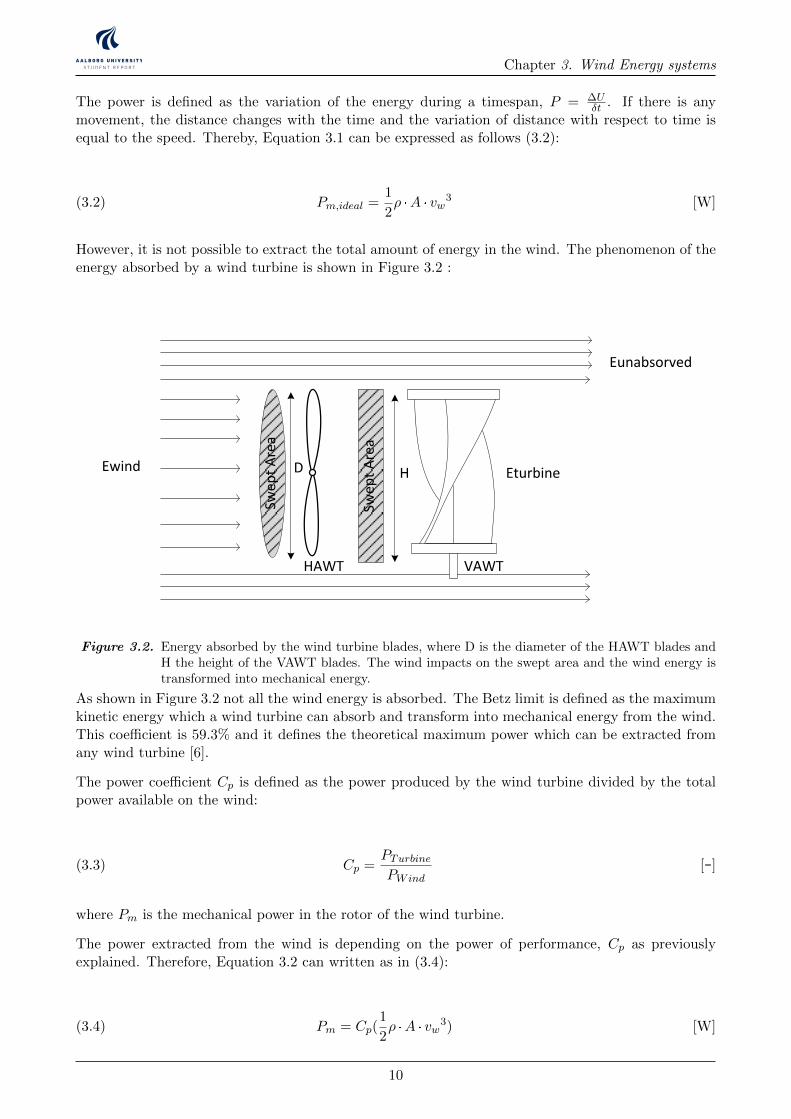
Figure 3.2. Energy absorbed by the wind turbine blades, where D is the diameter of the HAWT blades andH the height of the VAWT blades. The wind impacts on the swept area and the wind energy istransformed into mechanical energy.
As shown in Figure 3.2 not all the wind energy is absorbed. The Betz limit is defined as the maximumkinetic energy which a wind turbine can absorb and transform into mechanical energy from the wind.This coefficient is 59.3% and it defines the theoretical maximum power which can be extracted fromany wind turbine [6].
The power coefficient Cp is defined as the power produced by the wind turbine divided by the totalpower available on the wind:
Cp =PTurbinePWind
[-](3.3)
where Pm is the mechanical power in the rotor of the wind turbine.
The power extracted from the wind is depending on the power of performance, Cp as previouslyexplained. Therefore, Equation 3.2 can written as in (3.4):
Pm = Cp(1
2ρ ·A · vw
3) [W](3.4)
10
Chapter 3. Wind Energy systems
The coefficient of performance, (Cp) of Equation 3.4, is limited to a maximum of 0.59 (Betz’s limit),which is essentially depending on the tip speed ratio λ.
The tip speed ratio (λ) is the ratio between the rotational speed of the blades and the velocity of thewind, vw. It is defined in Equation 3.5:
λ =wm ·R
uw[-](3.5)
where R is the radio of the wind turbine, wm the rotor angular speed and uw the wind speed.
The tip speed ratio plays an important role when designing wind turbines, they are designed to extractas much power out of the wind as possible. The rotor can not rotate neither too slow nor too quicklyso the blades must let pass the proper amount of wind. For low speed wind turbines higher numberof blades is needed to cover more area of the wind, and for high speed wind turbines less blades areneeded.
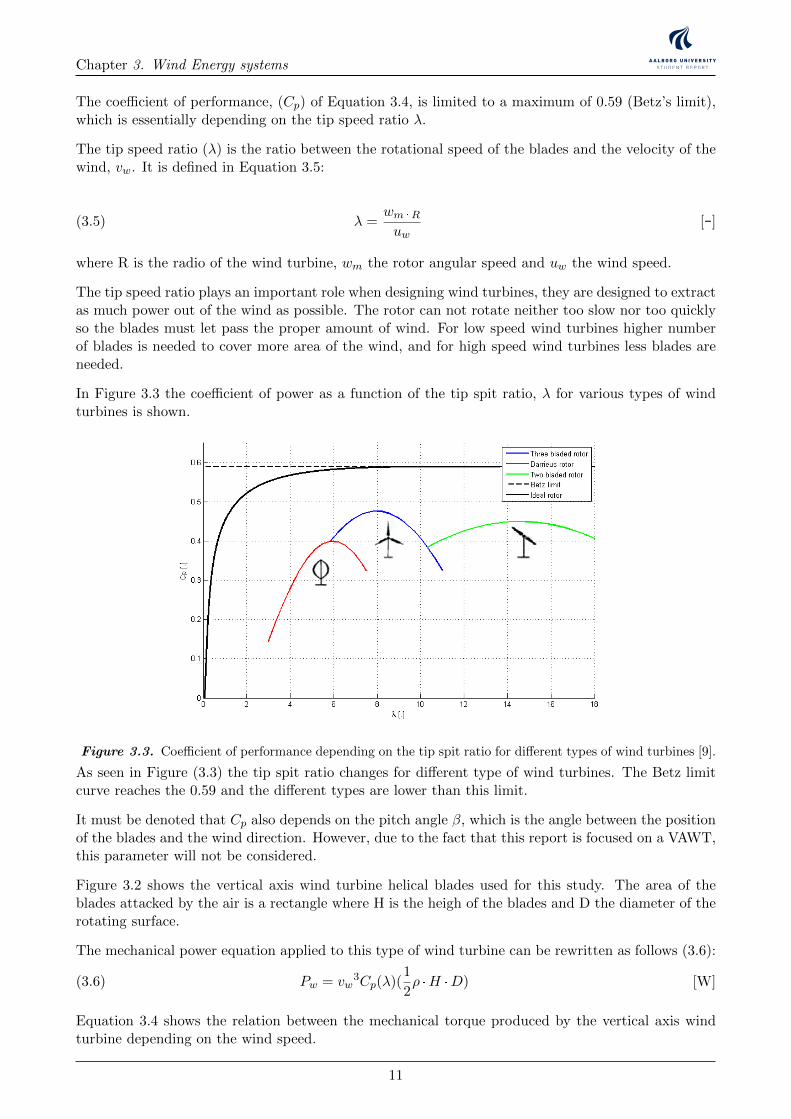
In Figure 3.3 the coefficient of power as a function of the tip spit ratio, λ for various types of windturbines is shown.
Figure 3.3. Coefficient of performance depending on the tip spit ratio for different types of wind turbines [9].
As seen in Figure (3.3) the tip spit ratio changes for different type of wind turbines. The Betz limitcurve reaches the 0.59 and the different types are lower than this limit.
It must be denoted that Cp also depends on the pitch angle β, which is the angle between the positionof the blades and the wind direction. However, due to the fact that this report is focused on a VAWT,this parameter will not be considered.
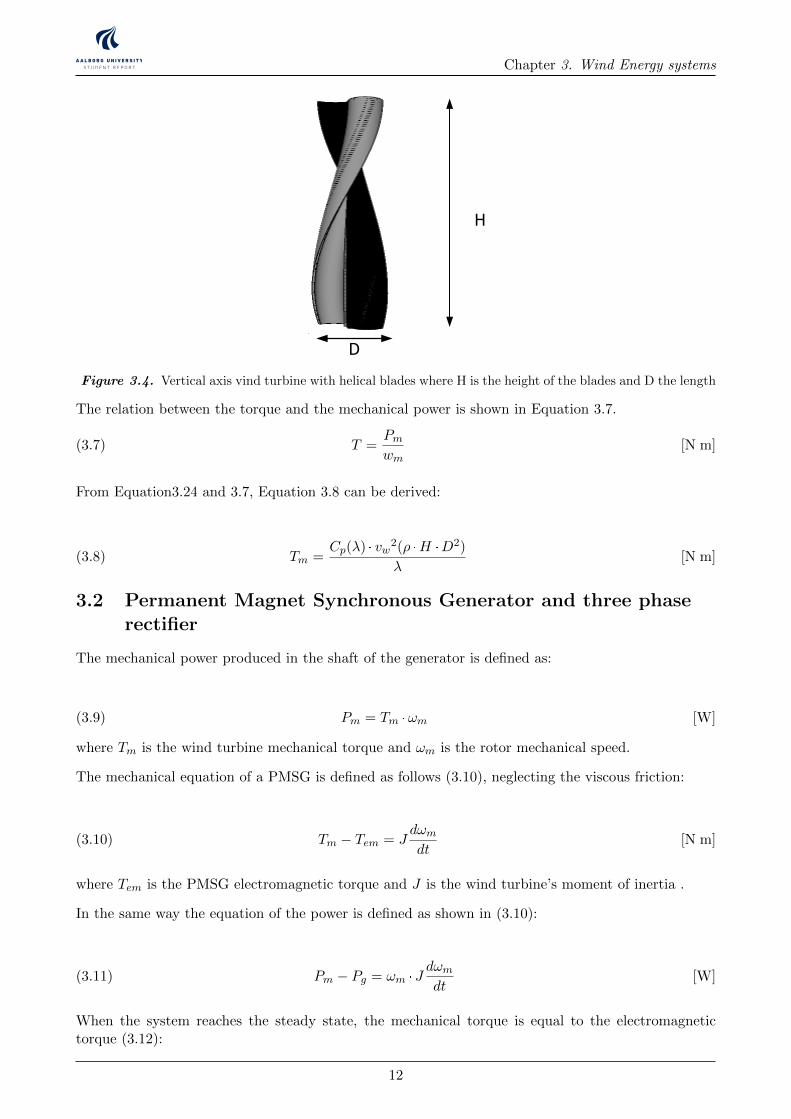
Figure 3.2 shows the vertical axis wind turbine helical blades used for this study. The area of theblades attacked by the air is a rectangle where H is the heigh of the blades and D the diameter of therotating surface.
The mechanical power equation applied to this type of wind turbine can be rewritten as follows (3.6):
Pw = vw3Cp(λ)(
1
2ρ ·H ·D) [W](3.6)
Equation 3.4 shows the relation between the mechanical torque produced by the vertical axis windturbine depending on the wind speed.
11
Chapter 3. Wind Energy systems
PMSGWind
turbine
Rectifier
wm
DC
DCLOAD
Rotating speed -Power characteristic Pactual
Cotrol Unit
Poptimal
error
Control Signal
Power Converter
PMSG
Wind turbine
Rectifier
DC
DCLOAD
Cotrol Unit
Control Signal
Power Converter
Wind speed
Vw
R
Wm
Wm-optimal
error
+-
+ -
Ea
Eb
Ec
Xs Rs
ILL VLL
D1 D3 D5
D2 D4D6
+
-
p
N
Id
Ea
Eb
Ec
Xs RsIa
Xs
Xs
Rs
Rs
+
-
VDC
IDC+
+
+
Va
Vb
Vc
Ib
Ic
H
D
VG
S1
V1
V2
L
+
-
Vo
M1
M2
D1
D2
+
-
+
-
Vi1
Vi2
+ -VL
+
-Vo
Ii1
C
L
D1
D2
IL IC Io
+
-
+
-
Vi1
Vi2
+ -VL
+
-
+
-Vo
ID1
C
L
D1
D2
IL IC Io
+VD2
-
+ -VM1
M1
M2
M1
M2
C
VG
S2
+
-
+
-
V1
V2
+ -VL
+
-VD1
+
-Vo
+ -VM2
ID2
I1
C
L
D1
D2
IL IC Io
M1
M2
+
-
+
-
Vi1
Vi2
+ -VL
+
-Vo
+ -VM2
ID2
C
L
D1
D2
IL IC Io
Vc+
-
VM1+ -
M2
M1
VPVDC
DC
VWindDC
DC
LOADVo+
-
VPV
DC
DC
VWind
LOADVo
+
-
VD2+
-
-
+
VD1
+
+
VD1
+-
+
-
+ -VM1
+ -VM2
Ii2
ID1
+
+ - + -
+ - + -
PMSG
500 W
Vertical axis wind turbine Gear box
+
-
600 W Vpv
DC/DC
Ibat
+
-
Vo
Io
3-ph Rectifier
+
-VWG
IPV
IWG
Control Unit
ON/OFF Control
IWG
VWG
Vpv
IPV
IbatVo
Dummy Load
12 V 450 AH Battery Bench
900 W
Control signals
PMSG
500 W
Vertical axis wind turbine Gear box
+
-
Vw
w
+
-
Solar Pump controller PM DC motor
Vpv
Back- Up system Diesel Generator
-
200 W
-
200 W
-+ +
200 W
+
Ea
Eb
Ec
Xs Rs
ILL VLL
D1 D3 D5
D2 D4D6
+
-
p
N
Id
Ea
Eb
Ec
Xs RsIa
Xs
Xs
Rs
Rs
+
-
VDC
IDC+
+
+
Va
Vb
Vc
Ib
Ic
+-
LvLi
iv +
-
CR
C
LLR
PWM S
+
ovloadR
Si
Di Ri
Ci
Cv
+
LvLi
iv CR
C
LLR
S ovloadR
Si
Di Ri
Ci
Cv
+iv CR
C
LLR
S ovloadR
Si Ci
Cv
1I
sDT (1 ) sD T
iv
i ov v
Lv
Li
PWM
D3
PMSGWind
turbine
Rectifier
DC
DC
Cotrol UnitControl Signal
Power Converter
DCI
LOAD
+
-
DCV
MPPT algorithm
+
-
Vcc
D9
Vin
+
-
An3 An5An4
Relay
LM7805 +5V
D2
2
31
7
27K
5.6K22uF
5.1V
1N4001
10K
8
3305.6 3305.615K
680
5.6K
330uF
680
15V
22uF
6.8K
15K
5.6K22uF
Relay
5.1V
VLoadSwitch
20K
5.6K22uF
5.1V
680 Vb
att.
D2
MOSPEC S20C40C(x2)
D3
1mH FQP12P20(x2)
0.39 c/v
1.2 K
+ +
+
Current Transducer
5VAn2
GND
Arduino Uno
An2
An3
An4An5
+5V
An
alo
g 0
..5
GND
An0
An1
D0D1D2D3D4D5D6D7D8D9D10D11D12
Swep
t A
rea
Ewind EturbineD
Swep
t A
rea
H
VAWTHAWT
Eunabsorved
Figure 3.4. Vertical axis vind turbine with helical blades where H is the height of the blades and D the length
The relation between the torque and the mechanical power is shown in Equation 3.7.
T =Pmwm
[N m](3.7)
From Equation3.24 and 3.7, Equation 3.8 can be derived:
Tm =Cp(λ) · vw
2(ρ ·H ·D2)
λ[N m](3.8)
3.2 Permanent Magnet Synchronous Generator and three phaserectifier
The mechanical power produced in the shaft of the generator is defined as:
Pm = Tm ·ωm [W](3.9)
where Tm is the wind turbine mechanical torque and ωm is the rotor mechanical speed.
The mechanical equation of a PMSG is defined as follows (3.10), neglecting the viscous friction:
Tm − Tem = Jdωmdt
[N m](3.10)
where Tem is the PMSG electromagnetic torque and J is the wind turbine’s moment of inertia .
In the same way the equation of the power is defined as shown in (3.10):
Pm − Pg = ωm · Jdωmdt
[W](3.11)
When the system reaches the steady state, the mechanical torque is equal to the electromagnetictorque (3.12):
12
Chapter 3. Wind Energy systems
Tm = Te [N m](3.12)
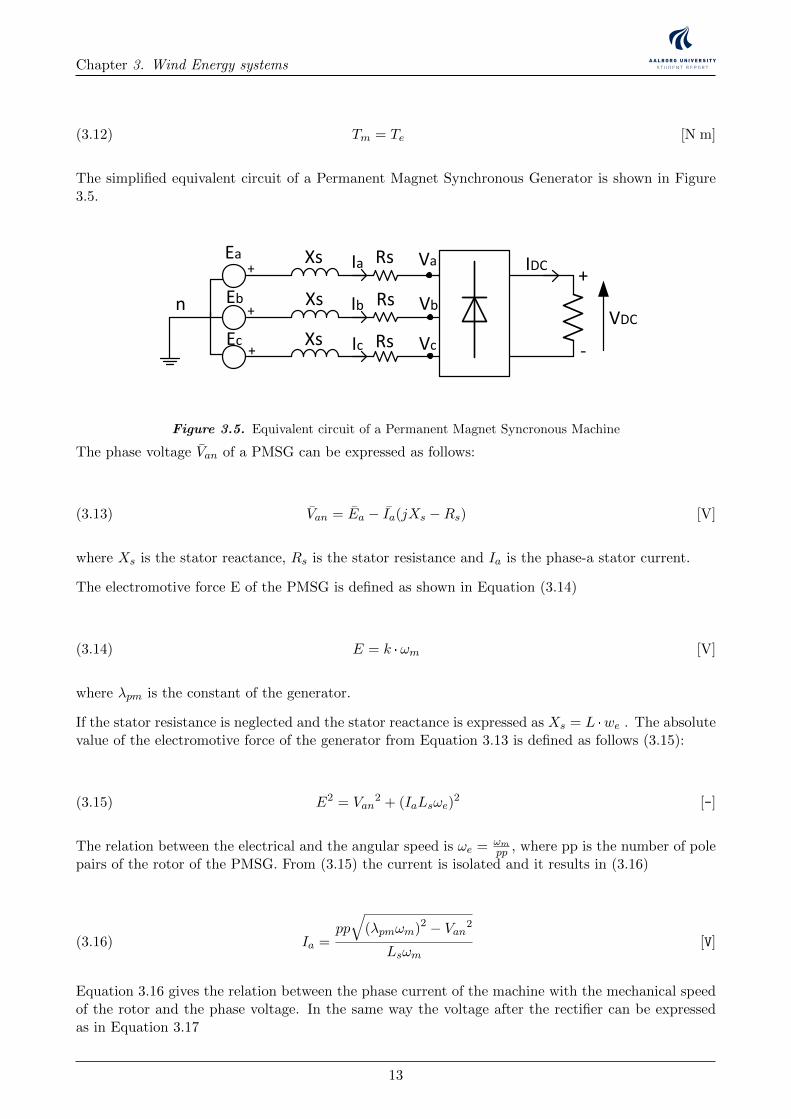
The simplified equivalent circuit of a Permanent Magnet Synchronous Generator is shown in Figure3.5.
Ea
Eb
Ec
Xs Rs
ILL VLL
D1 D3 D5
D2 D4D6
+
-
p
N
Id
Ea
Eb
Ec
Xs RsIa
Xs
Xs
Rs
Rs
+
-
VDC
IDC+
+
+
Va
Vb
Vc
n Ib
Ic
Figure 3.5. Equivalent circuit of a Permanent Magnet Syncronous Machine
The phase voltage Van of a PMSG can be expressed as follows:
Van = Ea − Ia(jXs −Rs) [V](3.13)
where Xs is the stator reactance, Rs is the stator resistance and Ia is the phase-a stator current.
The electromotive force E of the PMSG is defined as shown in Equation (3.14)
E = k ·ωm [V](3.14)
where λpm is the constant of the generator.
If the stator resistance is neglected and the stator reactance is expressed as Xs = L ·we . The absolutevalue of the electromotive force of the generator from Equation 3.13 is defined as follows (3.15):
E2 = Van2 + (IaLsωe)
2 [-](3.15)
The relation between the electrical and the angular speed is ωe = ωmpp , where pp is the number of pole
pairs of the rotor of the PMSG. From (3.15) the current is isolated and it results in (3.16)
Ia =pp√
(λpmωm)2 − Van2
Lsωm[V](3.16)
Equation 3.16 gives the relation between the phase current of the machine with the mechanical speedof the rotor and the phase voltage. In the same way the voltage after the rectifier can be expressedas in Equation 3.17
13
Chapter 3. Wind Energy systems
VDC =3√
6
πwm
√λ2pm − ( IDC
√6Ls
π )2 [A](3.17)
The power at the output of the stator is given in Equation 3.18 which is the same after the threephase rectifier if it is considered ideal.
P = 3 ·Van · Ia = VDCIDC [W](3.18)
where VDC and IDC are the rectifier output peak voltage and current values.
The relation between the phase voltage, Van and the output voltage of the rectifier, VDC is defined inEquation 3.19 [10].
VDC =3
π
√6Van [V](3.19)
Equation 3.20 defines the value of the DC current output of the 3-phase rectifier depending on thephase current of the stator of the PMSG [10].
IDC =π√6Ia [A](3.20)
From Equation 3.16, 3.18, 3.19 and 3.20, Equation 3.21 is derived. This equation represents the powerproduced after the rectifier depending on the DC-Voltage and the rotor speed.
P =πppVDC√
6Lsωm
√(λpmωm)2 − (
π
3√
6VDC)
2[W](3.21)
As the term inside the square root must be positive, it yields:
ωm ≥π
3√
6λpmVDC [rad/s](3.22)
Equation 3.23 gives the minimum speed for the PMSG for starting to generate energy. As shown inEquation 3.23 the DC bus voltage defines the cut-in speed of the PSMG.
ωmo =π
3√
6λpmVDC [rads](3.23)
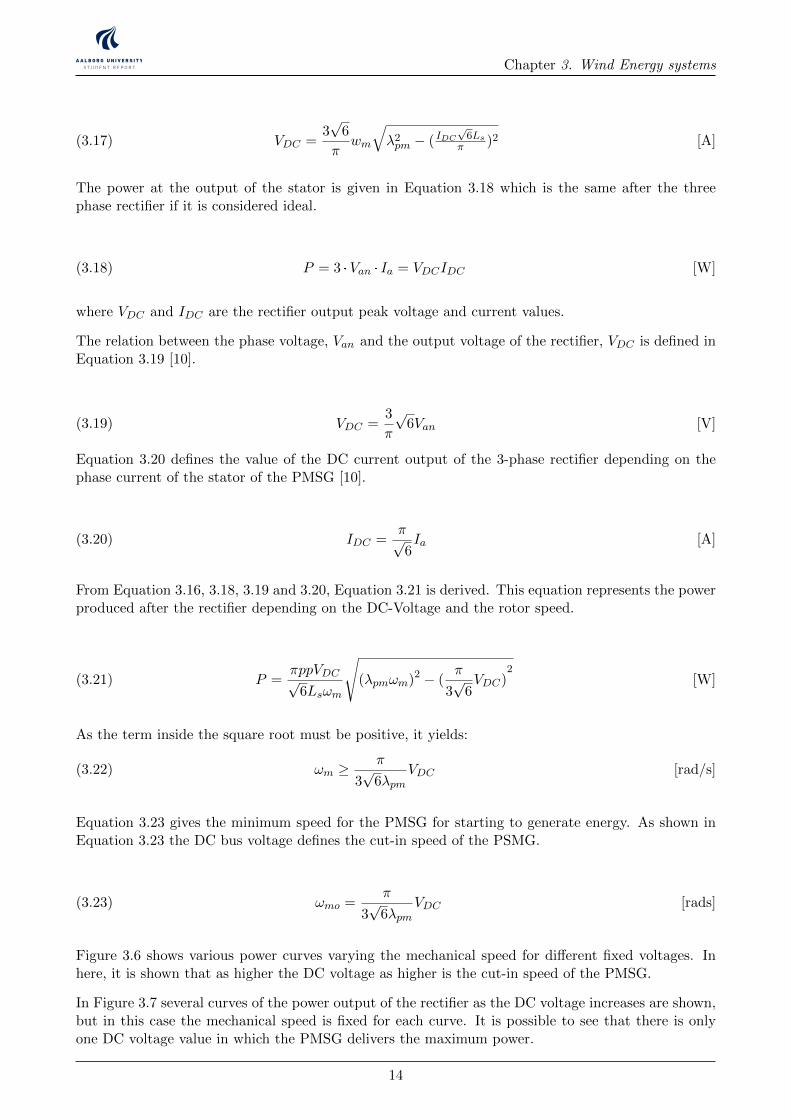
Figure 3.6 shows various power curves varying the mechanical speed for different fixed voltages. Inhere, it is shown that as higher the DC voltage as higher is the cut-in speed of the PMSG.
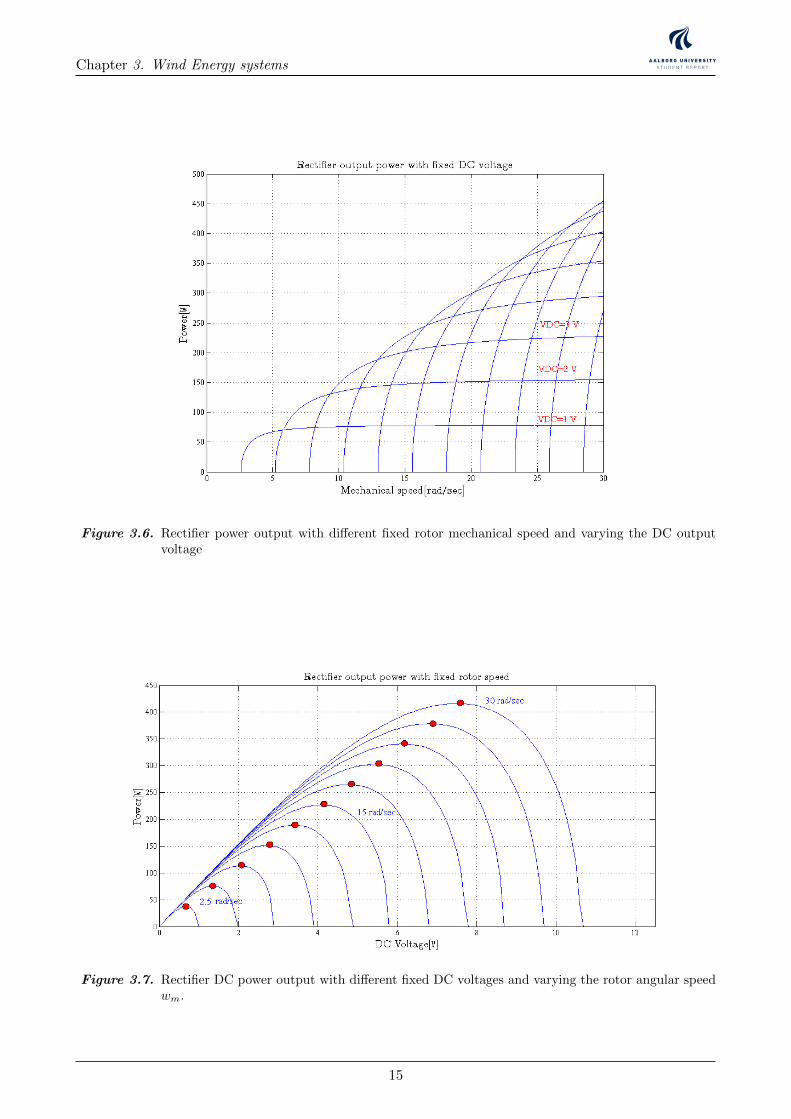
In Figure 3.7 several curves of the power output of the rectifier as the DC voltage increases are shown,but in this case the mechanical speed is fixed for each curve. It is possible to see that there is onlyone DC voltage value in which the PMSG delivers the maximum power.
14
Chapter 3. Wind Energy systems
Figure 3.6. Rectifier power output with different fixed rotor mechanical speed and varying the DC outputvoltage
Figure 3.7. Rectifier DC power output with different fixed DC voltages and varying the rotor angular speedwm.
15
Chapter 3. Wind Energy systems
If it is desired to convert energy at low wind speeds, as shown in Figure (3.6) the DC bus voltageshould be low. If on the other hand, maximum power is required for high wind speeds, the DC voltageshould be high.
Thereby, a DC/DC converter it is required to control the output voltage of the rectifier and to fix theoutput voltage of the system. By doing this, maximum power at any wind speed can be achieved.
3.3 Maximum Power Point Tracking
There are several methods to track the maximum power point of WG systems.
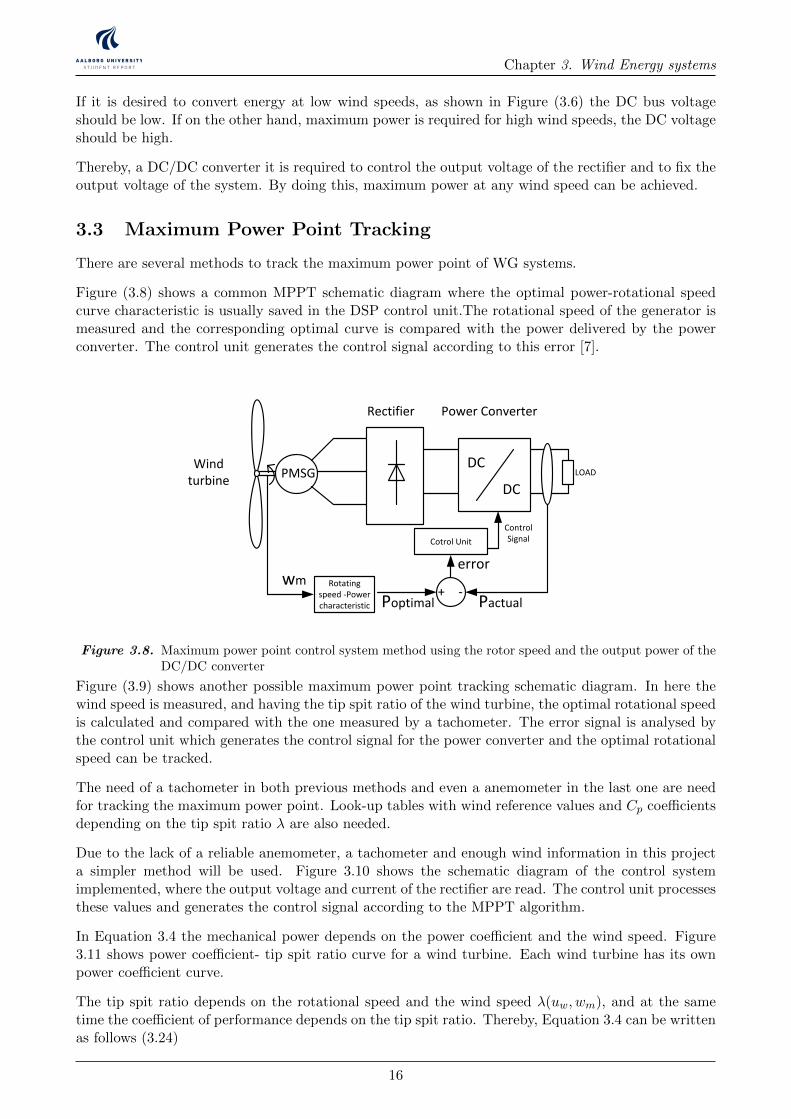
Figure (3.8) shows a common MPPT schematic diagram where the optimal power-rotational speedcurve characteristic is usually saved in the DSP control unit.The rotational speed of the generator ismeasured and the corresponding optimal curve is compared with the power delivered by the powerconverter. The control unit generates the control signal according to this error [7].
PMSGWind
turbine
Rectifier
wm
DC
DCLOAD
Rotating speed -Power characteristic Pactual
Cotrol Unit
Poptimal
error
Control Signal
Power Converter
PMSG
Wind turbine
Rectifier
DC
DCLOAD
Cotrol Unit
Control Signal
Power Converter
Wind speed
Vwind
R
Wm
Wm-optimal
error
+-
+ -
Figure 3.8. Maximum power point control system method using the rotor speed and the output power of theDC/DC converter
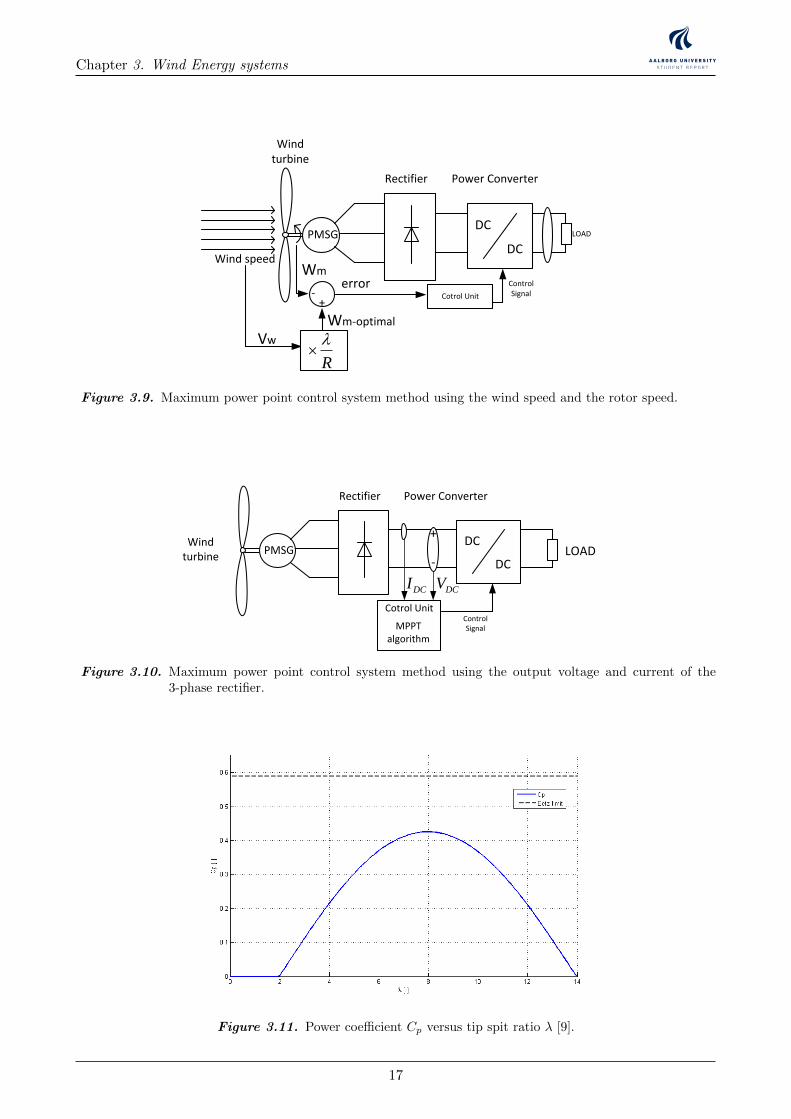
Figure (3.9) shows another possible maximum power point tracking schematic diagram. In here thewind speed is measured, and having the tip spit ratio of the wind turbine, the optimal rotational speedis calculated and compared with the one measured by a tachometer. The error signal is analysed bythe control unit which generates the control signal for the power converter and the optimal rotationalspeed can be tracked.
The need of a tachometer in both previous methods and even a anemometer in the last one are needfor tracking the maximum power point. Look-up tables with wind reference values and Cp coefficientsdepending on the tip spit ratio λ are also needed.
Due to the lack of a reliable anemometer, a tachometer and enough wind information in this projecta simpler method will be used. Figure 3.10 shows the schematic diagram of the control systemimplemented, where the output voltage and current of the rectifier are read. The control unit processesthese values and generates the control signal according to the MPPT algorithm.
In Equation 3.4 the mechanical power depends on the power coefficient and the wind speed. Figure3.11 shows power coefficient- tip spit ratio curve for a wind turbine. Each wind turbine has its ownpower coefficient curve.
The tip spit ratio depends on the rotational speed and the wind speed λ(uw, wm), and at the sametime the coefficient of performance depends on the tip spit ratio. Thereby, Equation 3.4 can be writtenas follows (3.24)
16
Chapter 3. Wind Energy systems
Wind PMSG
turbine
Rectifier
wm
DC
DCLOAD
Rotating speed -Power characteristic Pactual
Cotrol Unit
Poptimal
error
Control Signal
Power Converter
PMSG
Wind turbine
Rectifier
DC
DCLOAD
Cotrol Unit
Control Signal
Power Converter
Wind speed
Vw
R
Wm
Wm-optimal
error
+-
+ -
Ea
Eb
Ec
Xs Rs
ILL VLL
D1 D3 D5
D2 D4D6
+
-
p
N
Id
Ea
Eb
Ec
Xs RsIa
Xs
Xs
Rs
Rs
+
-
VDC
IDC+
+
+
Va
Vb
Vc
Ib
Ic
H
D
VG
S1
V1
V2
L
+
-
Vo
M1
M2
D1
D2
+
-
+
-
Vi1
Vi2
+ -VL
+
-Vo
Ii1
C
L
D1
D2
IL IC Io
+
-
+
-
Vi1
Vi2
+ -VL
+
-
+
-Vo
ID1
C
L
D1
D2
IL IC Io
+VD2
-
+ -VM1
M1
M2
M1
M2
C
VG
S2
+
-
+
-
V1
V2
+ -VL
+
-VD1
+
-Vo
+ -VM2
ID2
I1
C
L
D1
D2
IL IC Io
M1
M2
+
-
+
-
Vi1
Vi2
+ -VL
+
-Vo
+ -VM2
ID2
C
L
D1
D2
IL IC Io
+Vc
-
+VM1
-
M2
M1
VPVDC
DC
VWindDC
DC
LOADVo+
-
VPV
DC
DC
VWind
LOADVo
+
-
VD2+
-
-
+
VD1
+
+
VD1
+-
+
-
+ -VM1
+ -VM2
Ii2
ID1
+
+ - + -
+ - + -
PMSG
500 W
Vertical axis wind turbine Gear box
+-
600 W Vpv
DC/DC
Ibat
+
-
Vo
Io
3-ph Rectifier
+
-VWG
IPV
IWG
Control Unit
ON/OFF Control
IWG
VWG
Vpv
IPV
IbatVo
Dummy Load
12 V 450 AH Battery Bench
900 W
Control signals
PMSG
500 W
Vertical axis wind turbine Gear box
+
-
Vw
w
+
-
Solar Pump controller PM DC motor
Vpv
Back- Up system Diesel Generator
-
200 W
-
200 W
-+ +
200 W
+
Ea
Eb
Ec
Xs Rs
ILL VLL
D1 D3 D5
D2 D4D6
+
-
p
N
Id
Ea
Eb
Ec
Xs RsIa
Xs
Xs
Rs
Rs
+
-
VDC
IDC+
+
+
Va
Vb
Vc
Ib
Ic
+-
LvLi
iv +
-
CR
C
LLR
PWM S
+
ovloadR
Si
Di Ri
Ci
Cv
+
LvLi
iv CR
C
LLR
S ovloadR
Si
Di Ri
Ci
Cv
+iv CR
C
LLR
S ovloadR
Si Ci
Cv
1I
sDT (1 ) sD T
iv
i ov v
Lv
Li
PWM
D3
Figure 3.9. Maximum power point control system method using the wind speed and the rotor speed.
PMSGWind
turbine
Rectifier
wm
DC
DCLOAD
Rotating speed -Power characteristic Pactual
Cotrol Unit
Poptimal
error
Control Signal
Power Converter
PMSG
Wind turbine
Rectifier
DC
DCLOAD
Cotrol Unit
Control Signal
Power Converter
Wind speed
Vw
R
Wm
Wm-optimal
error
+-
+ -
Ea
Eb
Ec
Xs Rs
ILL VLL
D1 D3 D5
D2 D4D6
+
-
p
N
Id
Ea
Eb
Ec
Xs RsIa
Xs
Xs
Rs
Rs
+
-
VDC
IDC+
+
+
Va
Vb
Vc
Ib
Ic
H
D
VG
S1
V1
V2
L
+
-
Vo
M1
M2
D1
D2
+
-
+
-
Vi1
Vi2
+ -VL
+
-Vo
Ii1
C
L
D1
D2
IL IC Io
+
-
+
-
Vi1
Vi2
+ -VL
+
-
+
-Vo
ID1
C
L
D1
D2
IL IC Io
+VD2
-
+ -VM1
M1
M2
M1
M2
C
VG
S2
+
-
+
-
V1
V2
+ -VL
+
-VD1
+
-Vo
+ -VM2
ID2
I1
C
L
D1
D2
IL IC Io
M1
M2
+
-
+
-
Vi1
Vi2
+ -VL
+
-Vo
+ -VM2
ID2
C
L
D1
D2
IL IC Io
Vc+
-
VM1+ -
M2
M1
VPVDC
DC
VWindDC
DC
LOADVo+
-
VPV
DC
DC
VWind
LOADVo
+
-
VD2+
-
-
+
VD1
+
+
VD1
+-
+
-
+ -VM1
+ -VM2
Ii2
ID1
+
+ - + -
+ - + -
PMSG
500 W
Vertical axis wind turbine Gear box
+
-
600 W Vpv
DC/DC
Ibat
+
-
Vo
Io
3-ph Rectifier
+
-VWG
IPV
IWG
Control Unit
ON/OFF Control
IWG
VWG
Vpv
IPV
IbatVo
Dummy Load
12 V 450 AH Battery Bench
900 W
Control signals
PMSG
500 W
Vertical axis wind turbine Gear box
+
-
Vw
w
+
-
Solar Pump controller PM DC motor
Vpv
Back- Up system Diesel Generator
-
200 W
-
200 W
-+ +
200 W
+
Ea
Eb
Ec
Xs Rs
ILL VLL
D1 D3 D5
D2 D4D6
+
-
p
N
Id
Ea
Eb
Ec
Xs RsIa
Xs
Xs
Rs
Rs
+
-
VDC
IDC+
+
+
Va
Vb
Vc
Ib
Ic
+-
LvLi
iv +
-
CR
C
LLR
PWM S
+
ovloadR
Si
Di Ri
Ci
Cv
+
LvLi
iv CR
C
LLR
S ovloadR
Si
Di Ri
Ci
Cv
+iv CR
C
LLR
S ovloadR
Si Ci
Cv
1I
sDT (1 ) sD T
iv
i ov v
Lv
Li
PWM
D3
PMSGWind
turbine
Rectifier
DC
DC
Cotrol UnitControl Signal
Power Converter
DCI
LOAD
+
-
DCV
MPPT algorithm
Figure 3.10. Maximum power point control system method using the output voltage and current of the3-phase rectifier.
Figure 3.11. Power coefficient Cp versus tip spit ratio λ [9].
17

Chapter 3. Wind Energy systems
Pm = Cp(wm, uw)vw3(
1
2ρ ·A · d) [W](3.24)
From Equation 3.24various power- mechanical speed for different fixed wind speeds can be plotted asshown in Figure 3.12. On each wind speed value, there is only one mechanical speed where the poweris maximum.
Figure 3.12. Power-mechanical speed curve for different wind speeds [9].
Equation (3.25) shows the torque equation where it only depends on the wind speed and the mechanicalspeed:
Tm =Cp(wm, uw)vw
3(12ρ ·A · d)
wm[Nm](3.25)
In the same way, various torque-mechanical speed curves can be plotted as shown in Figure 3.13. Itis obvious that for maximum power higher speed is needed whereas for maximum torque the speedmust be lower. In the plot, the maximum torque curve rises for different wind speeds with almostconstant speed, but for maximum power the speed increases together with the wind speed.
As shown in Figure 3.10 a DC/DC converter is needed to track the maximum power point of thegenerator at any speed. The control unit processes the power output of the rectifier and generates aduty signal for the DC/DC converter so the PMSG works under the desired condition.
The algorithm used to track the maximum power point is explained below:
From Figure 3.12 it can be observed that at the point of maximum power, the variation of power withrespect to the rotor mechanical speed is zero (3.26):
dP
dt= 0 [-](3.26)
By applying the chain rule ( dydx = dydu
dudx) the follow equation can be stated (3.27) :
dP
dwm=dP
dD
dD
dVDC
dVDCdwe
dwedwm
= 0 [-](3.27)
18

Chapter 3. Wind Energy systems
Figure 3.13. Torque-mechanical speed curve characteristic for different wind speeds [9].
Each derivative is calculated independently below.
The VDC is the voltage after the rectifier. If the DC/DC converter connected at the output is aStep-up converter, the relation between the input voltage VDC , the output voltage(in this case is thebattery level) and the duty cycle D is shown in Equation 3.28. The derivative of the duty cycle Dwith respect the DC voltage VDC is shown in (3.29)
Vo =VDC
(1−D)→ D = 1− VDC
Vo[-](3.28)
dD
dVDC= − 1
V o6= 0 [-](3.29)
The design of the MPPT algorithm proposed is being explained for the case of a Step-Up DC/DCconverter. However, the same tracking method can be applied to other DC/DC converter topologyby using the same procedure but using the proper converter relation and its derivative, as shown inEquation 3.30 for the Buck-Boost converter example:
VDC = Vo(1−D)
D→ dVin
dD= − 1
D2[-](3.30)
In Equation 3.17 it can be observed that the derivative of VDC with respect the angular speed wm isnot zero (3.31):
dVDCdwe
> 0 [-](3.31)
The relation between the mechanical speed wm and the electrical speed weis we = pp ·wm where ppis the machine pole pairs. Then the derivative can not be zero (3.32).
dwedwm
= pp > 0 [-](3.32)
19

Chapter 3. Wind Energy systems
It has been proved that from Equation 3.33, the only parameter which makes to fulfil the equation isdPdD .
dP
dwm=dP
dD= 0 [-](3.33)
This proves that there is a value of the duty cycle D which makes the function P (D) to converges tothe maximum power point at a certain wind speed vw.
The voltage after the rectifier if a Step-up converter is connected and considered the output voltageas the battery voltage level Vbatt is defined as (3.34) :
VDC = (1−D)Vbatt [V](3.34)
Equation 3.35 results from combining (3.21) and (3.34)
P =πpp(1−D)Vbatt√
6Lsωm
√(kωm)2 − (
π
3√
6(1−D)Vbatt)
2[W](3.35)
Plotting Equation 3.29 varying the duty cycle D from 0 to 1 for and a battery voltage level ofVbatt = 14.5 Figure 3.14 is obtained. In here, two power curves are plotted, for wm = 20 rad/s andwm = 30rad/s.
Figure 3.14. Power rectified generated by the PMSG varying the duty cycle from 0 to 1 for wm = 20rad/sand wm = 30rad/s. The X-axis represents the DC voltage after the rectifier which isVDC = (1−D)Vbatt
As pointed in the graph, when the wm = 20rad/s the maximum power point occurs when the dutycycle is D = 0.38 whereas when the wm = 30rad/s, D = 0.44 for maximum power. Thereby, Figure3.14 proves what stated before, for tracking the maximum power point it is required to find the specificduty cycle at a each mechanical speed.
The maximum power point tracking process is showed in Figure 3.15. When the starting point ison the low speed side of the curve, the system must increase the duty cycle until the desired pointis reached. On the other hand, when the starting point is on the high speed side, the duty cycle isincreased so the speed is reduced and the MPP is tracked.
20
Chapter 3. Wind Energy systems
PMSGWind
turbine
Rectifier
wm
DC
DCLOAD
Rotating speed -Power characteristic Pactual
Cotrol Unit
Poptimal
error
Control Signal
Power Converter
PMSG
Wind turbine
Rectifier
DC
DCLOAD
Cotrol Unit
Control Signal
Power Converter
Wind speed
Vw
R
Wm
Wm-optimal
error
+-
+ -
Ea
Eb
Ec
Xs Rs
ILL VLL
D1 D3 D5
D2 D4D6
+
-
p
N
Id
Ea
Eb
Ec
Xs RsIa
Xs
Xs
Rs
Rs
+
-
VDC
IDC+
+
+
Va
Vb
Vc
Ib
Ic
H
D
VG
S1
V1
V2
L
+
-
Vo
M1
M2
D1
D2
+
-
+
-
Vi1
Vi2
+ -VL
+
-Vo
Ii1
C
L
D1
D2
IL IC Io
+
-
+
-
Vi1
Vi2
+ -VL
+
-
+
-Vo
ID1
C
L
D1
D2
IL IC Io
+VD2
-
+ -VM1
M1
M2
M1
M2
C
VG
S2
+
-
+
-
V1
V2
+ -VL
+
-VD1
+
-Vo
+ -VM2
ID2
I1
C
L
D1
D2
IL IC Io
M1
M2
+
-
+
-
Vi1
Vi2
+ -VL
+
-Vo
+ -VM2
ID2
C
L
D1
D2
IL IC Io
Vc+
-
VM1+ -
M2
M1
VPVDC
DC
VWindDC
DC
LOADVo+
-
VPV
DC
DC
VWind
LOADVo
+
-
VD2+
-
-
+
VD1
+
+
VD1
+-
+
-
+ -VM1
+ -VM2
Ii2
ID1
+
+ - + -
+ - + -
PMSG
500 W
Vertical axis wind turbine Gear box
+
-
600 W Vpv
DC/DC
Ibat
+
-
Vo
Io
3-ph Rectifier
+
-VWG
IPV
IWG
Control Unit
ON/OFF Control
IWG
VWG
Vpv
IPV
IbatVo
Dummy Load
12 V 450 AH Battery Bench
900 W
Control signals
PMSG
500 W
Vertical axis wind turbine Gear box
+
-
Vw
w
+
-
Solar Pump controller PM DC motor
Vpv
Back- Up system Diesel Generator
-
200 W
-
200 W
-+ +
200 W
+
Ea
Eb
Ec
Xs Rs
ILL VLL
D1 D3 D5
D2 D4D6
+
-
p
N
Id
Ea
Eb
Ec
Xs RsIa
Xs
Xs
Rs
Rs
+
-
VDC
IDC+
+
+
Va
Vb
Vc
Ib
Ic
+-
LvLi
iv +
-
CR
C
LLR
PWM S
+
ovloadR
Si
Di Ri
Ci
Cv
+
LvLi
iv CR
C
LLR
S ovloadR
Si
Di Ri
Ci
Cv
+iv CR
C
LLR
S ovloadR
Si Ci
Cv
1I
sDT (1 ) sD T
iv
i ov v
Lv
Li
PWM
D3
PMSGWind
turbine
Rectifier
DC
DC
Cotrol UnitControl Signal
Power Converter
DCI
LOAD
+
-
DCV
MPPT algorithm
+
-
Vcc
D9
Vin
+
-
An3 An5An4
Relay
LM7805 +5V
D2
2
31
7
27K
5.6K22uF
5.1V
1N4001
10K
8
3305.6 3305.615K
680
5.6K
330uF
680
15V
22uF
6.8K
15K
5.6K22uF
Relay
5.1V
VLoadSwitch
20K
5.6K22uF
5.1V
680 Vb
att.
D2
MOSPEC S20C40C(x2)
D3
1mH FQP12P20(x2)
0.39 c/v
1.2 K
+ +
+
Current Transducer
5VAn2
GND
Arduino Uno
An2
An3
An4An5
+5V
An
alo
g 0
..5
GND
An0
An1
D0D1D2D3D4D5D6D7D8D9D10D11D12
Swep
t A
rea
Ewind EturbineD
Swep
t A
rea
H
VAWTHAWT
Eunabsorved
DCP
mw
maxP
0, 0m
dP dP
dw dD
0, 0, 0 0DC
m DC m
dVdP dD dP
dw dV dw dD
0, 0, 0 0DC
m DC m
dVdP dD dP
dw dV dw dD
High Speed Low Speed
Track Starting Point Track Starting Point
D D
Maximum Power Point Tracking process
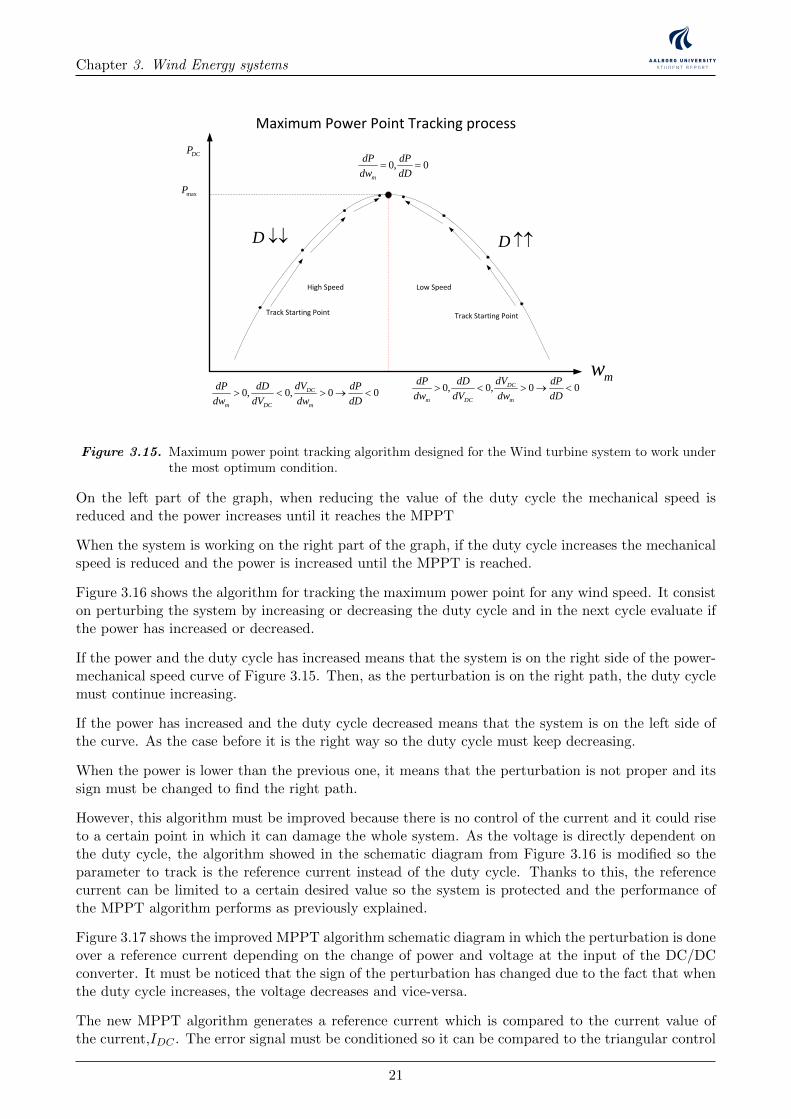
Figure 3.15. Maximum power point tracking algorithm designed for the Wind turbine system to work underthe most optimum condition.
On the left part of the graph, when reducing the value of the duty cycle the mechanical speed isreduced and the power increases until it reaches the MPPT
When the system is working on the right part of the graph, if the duty cycle increases the mechanicalspeed is reduced and the power is increased until the MPPT is reached.
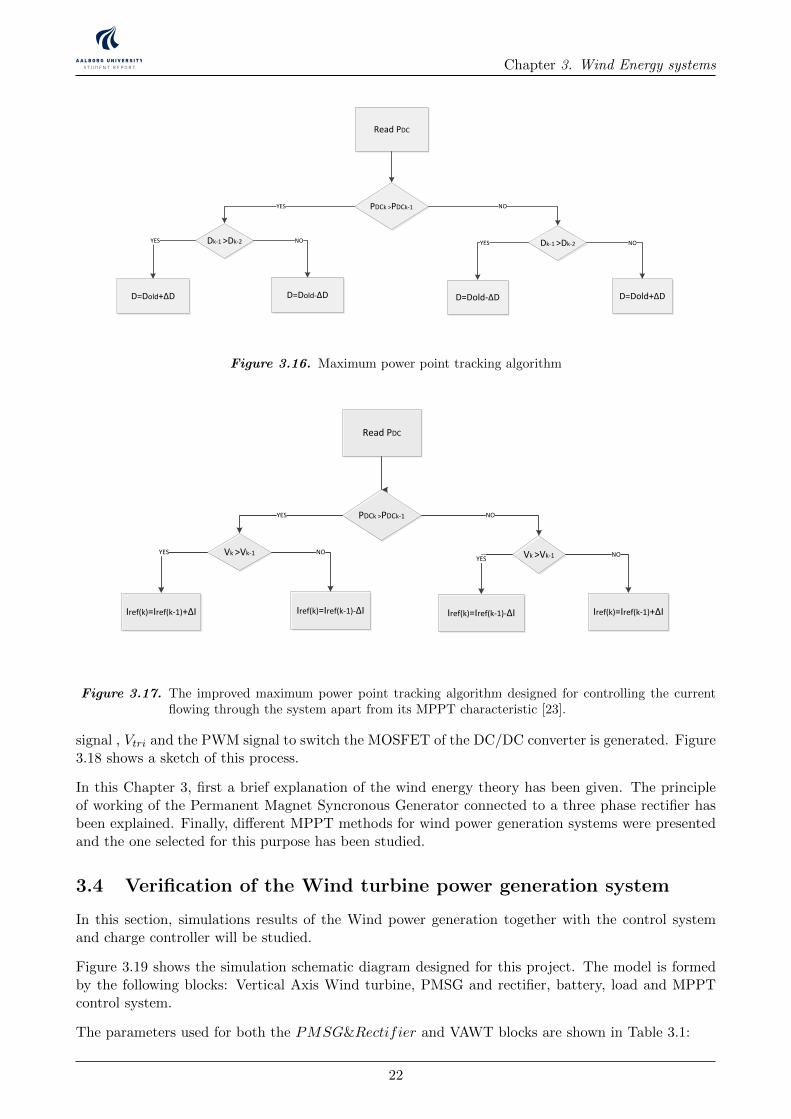
Figure 3.16 shows the algorithm for tracking the maximum power point for any wind speed. It consiston perturbing the system by increasing or decreasing the duty cycle and in the next cycle evaluate ifthe power has increased or decreased.
If the power and the duty cycle has increased means that the system is on the right side of the power-mechanical speed curve of Figure 3.15. Then, as the perturbation is on the right path, the duty cyclemust continue increasing.
If the power has increased and the duty cycle decreased means that the system is on the left side ofthe curve. As the case before it is the right way so the duty cycle must keep decreasing.
When the power is lower than the previous one, it means that the perturbation is not proper and itssign must be changed to find the right path.
However, this algorithm must be improved because there is no control of the current and it could riseto a certain point in which it can damage the whole system. As the voltage is directly dependent onthe duty cycle, the algorithm showed in the schematic diagram from Figure 3.16 is modified so theparameter to track is the reference current instead of the duty cycle. Thanks to this, the referencecurrent can be limited to a certain desired value so the system is protected and the performance ofthe MPPT algorithm performs as previously explained.
Figure 3.17 shows the improved MPPT algorithm schematic diagram in which the perturbation is doneover a reference current depending on the change of power and voltage at the input of the DC/DCconverter. It must be noticed that the sign of the perturbation has changed due to the fact that whenthe duty cycle increases, the voltage decreases and vice-versa.
The new MPPT algorithm generates a reference current which is compared to the current value ofthe current,IDC . The error signal must be conditioned so it can be compared to the triangular control
21
Chapter 3. Wind Energy systems
PDCk >PDCk-1
Read PDC
D=Dold-∆D
Dk-1 >Dk-2
NO
D=Dold-∆D
YES
D=Dold+∆D
NODk-1 >Dk-2
YES
D=Dold+∆D
YES NO
Figure 3.16. Maximum power point tracking algorithm
Wind PMSG
turbine
Rectifier
wm
DC
DCLOAD
Rotating speed -Power characteristic Pactual
Cotrol Unit
Poptimal
error
Control Signal
Power Converter
PMSG
Wind turbine
Rectifier
DC
DCLOAD
Cotrol Unit
Control Signal
Power Converter
Wind speed
Vw
R
Wm
Wm-optimal
error
+-
+ -
Ea
Eb
Ec
Xs Rs
ILL VLL
D1 D3 D5
D2 D4D6
+
-
p
N
Id
Ea
Eb
Ec
Xs RsIa
Xs
Xs
Rs
Rs
+
-
VDC
IDC+
+
+
Va
Vb
Vc
Ib
Ic
H
D
VG
S1
V1
V2
L
+
-
Vo
M1
M2
D1
D2
+
-
+
-
Vi1
Vi2
+ -VL
+
-Vo
Ii1
C
L
D1
D2
IL IC Io
+
-
+
-
Vi1
Vi2
+ -VL
+
-
+
-Vo
ID1
C
L
D1
D2
IL IC Io
+VD2
-
+ -VM1
M1
M2
M1
M2
C
VG
S2
+
-
+
-
V1
V2
+ -VL
+
-VD1
+
-Vo
+ -VM2
ID2
I1
C
L
D1
D2
IL IC Io
M1
M2
+
-
+
-
Vi1
Vi2
+ -VL
+
-Vo
+ -VM2
ID2
C
L
D1
D2
IL IC Io
+Vc
-
+VM1
-
M2
M1
VPVDC
DC
VWindDC
DC
LOADVo+
-
VPV
DC
DC
VWind
LOADVo
+
-
VD2+
-
-
+
VD1
+
+
VD1
+-
+
-
+ -VM1
+ -VM2
Ii2
ID1
+
+ - + -
+ - + -
PMSG
500 W
Vertical axis wind turbine Gear box
+
-
600 W Vpv
DC/DC
Ibat
+
-
Vo
Io
3-ph Rectifier
+
-VWG
IPV
IWG
Control Unit
ON/OFF Control
IWG
VWG
Vpv
IPV
IbatVo
Dummy Load
12 V 450 AH Battery Bench
900 W
Control signals
PMSG
500 W
Vertical axis wind turbine Gear box
+
-
Vw
w
+
-
Solar Pump controller PM DC motor
Vpv
Back- Up system Diesel Generator
-
200 W
-
200 W
-+ +
200 W
+
Ea
Eb
Ec
Xs Rs
ILL VLL
D1 D3 D5
D2 D4D6
+
-
p
N
Id
Ea
Eb
Ec
Xs RsIa
Xs
Xs
Rs
Rs
+
-
VDC
IDC+
+
+
Va
Vb
Vc
Ib
Ic
+-
LvLi
iv +
-
CR
C
LLR
PWM S
+
ovloadR
Si
Di Ri
Ci
Cv
+
LvLi
iv CR
C
LLR
S ovloadR
Si
Di Ri
Ci
Cv
+iv CR
C
LLR
S ovloadR
Si Ci
Cv
sDT (1 ) sD T
iv
i oV V
( )Lv t
( )Ci t
PWM
D3
Wind PMSG
turbine
Rectifier
DC
DC
Cotrol UnitControl Signal
Power Converter
DCI
LOAD
+
-
DCV
MPPT algorithm
+
-
Vcc
D9
Vin
+
-
An3 An5An4
Relay
LM7805 +5V
D2
2
31
7
27K
5.6K22uF
5.1V
1N4001
10K
8
3305.6 3305.615K
680
5.6K
330uF
680
15V
22uF
6.8K
15K
5.6K22uF
Relay
5.1V
VLoadSwitch
20K
5.6K22uF
5.1V
680 Vb
att.
D2
MOSPEC S20C40C(x2)
D3
1mH FQP12P20(x2)
0.39 c/v
1.2 K
+ +
+
Current Transducer
5VAn2
GND
Arduino Uno
An2
An3
An4An5
+5V
An
alo
g0
..5
GND
An0
An1
D0D1D2D3D4D5D6D7D8D9D10D11D12
Swep
tA
rea
Ewind EturbineD
Swep
tA
rea
H
VAWTHAWT
Eunabsorved
DCP
mw
maxP
0, 0m
dP dP
dw dD
0, 0, 0 0DC
m DC m
dVdP dD dP
dw dV dw dD
0, 0, 0 0DC
m DC m
dVdP dD dP
dw dV dw dD
High Speed Low Speed
Track Starting Point Track Starting Point
D D
Maximum Power Point Tracking process
PDCk >PDCk-1
Read PDC
Iref(k)=Iref(k-1)-∆I
Vk >Vk-1
NO
Iref(k)=Iref(k-1)-∆I
YES
Iref(k)=Iref(k-1)+∆I
NOVk >Vk-1
YES
Iref(k)=Iref(k-1)+∆I
YES NO
sDT
I
Li
i oV V
L
sT
iV
L
LI
t
oV
R
oL
load
VI
R
t
t
t
sDT
CV
( )v t
LI V
C RC
sT
V
RC
CV
t
0.5
0.0
1
1.5
2
2.5
3
5 10 15 20
Voltage
Cu
rren
t
Vmp
Imp
Isc Short circuit current
VocOpen circuit voltage
MPP
V.Battery
I-V PV panel characteristics
DC/DC converterDC loadVbatt
+
-
Vp
v
Ipv +
-
Vo
Io
A/D A/D
MPPT and Charging algorithm
PWM
PV array
MPP
SCI
1dI
I
Load
2dI
1D
SR
PR2D
rI
DC/DCPV -Wind
system
Battery charge control.
Load regulation.
.battV.battI
Battery
.battD loadD
DCLOAD
.battI
t
sDT sT
-
Vin
+
-
Relay
CVbatt.
L Rb
Microcontroller
Iin
Vcontrol1
D1
M1
Sensor Signals Control Signals
VinVoutVbatt.
Ibatt
IinIbatt.
Vcontrol1Vcontrol2Vcontrol3
Vcontrol2
Vcontrol3
Vout Vout
file:///C:/Users/Andres/Documents/17c276_250_205.jpg
file:///C:/Users/Andres/Documents/17c276_250_205.jpg
windv
+
-12
12
1R
2R
fR
+
-
12
12
3R
4R
5R 6RoutV
Datalogger
M2
+
-
G
Iref=10A
+
-Vtrian.
Battery Charge ControllerVcontrol Ibatt.
MPPT AlgorithmDCV
DCI
refI+
-
e+
-.triV
P
PWM
Figure 3.17. The improved maximum power point tracking algorithm designed for controlling the currentflowing through the system apart from its MPPT characteristic [23].
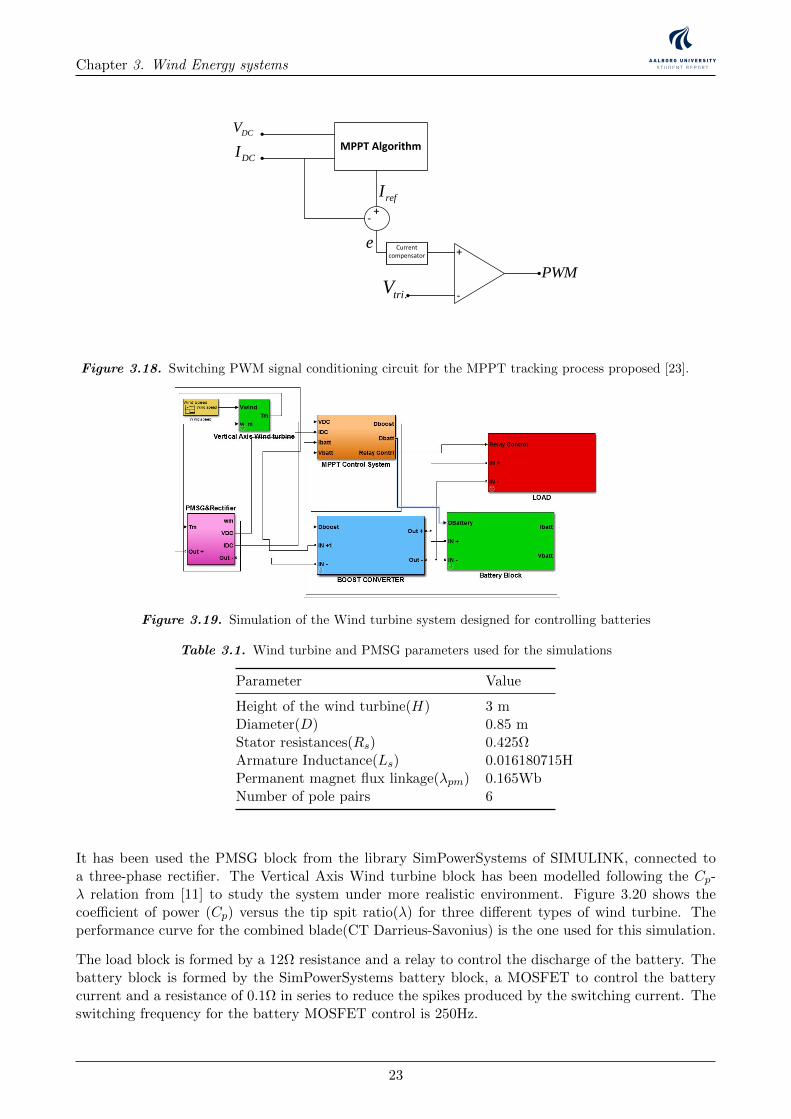
signal , Vtri and the PWM signal to switch the MOSFET of the DC/DC converter is generated. Figure3.18 shows a sketch of this process.
In this Chapter 3, first a brief explanation of the wind energy theory has been given. The principleof working of the Permanent Magnet Syncronous Generator connected to a three phase rectifier hasbeen explained. Finally, different MPPT methods for wind power generation systems were presentedand the one selected for this purpose has been studied.
3.4 Verification of the Wind turbine power generation system
In this section, simulations results of the Wind power generation together with the control systemand charge controller will be studied.
Figure 3.19 shows the simulation schematic diagram designed for this project. The model is formedby the following blocks: Vertical Axis Wind turbine, PMSG and rectifier, battery, load and MPPTcontrol system.
The parameters used for both the PMSG&Rectifier and VAWT blocks are shown in Table 3.1:
22
Chapter 3. Wind Energy systems
2CT
PMSGWind
turbine
Rectifier
wm
DC
DCLOAD
Rotating speed -Power characteristic Pactual
Cotrol Unit
Poptimal
error
Control Signal
Power Converter
PMSG
Wind turbine
Rectifier
DC
DCLOAD
Cotrol Unit
Control Signal
Power Converter
Wind speed
Vw
R
Wm
Wm-optimal
error
+-
+ -
Ea
Eb
Ec
Xs Rs
ILL VLL
D1 D3 D5
D2 D4D6
+
-
p
N
Id
Ea
Eb
Ec
Xs RsIa
Xs
Xs
Rs
Rs
+
-
VDC
IDC+
+
+
Va
Vb
Vc
Ib
Ic
H
D
VPVDC
DC
VWindDC
DC
LOADVo+
-
VPV
DC
DC
VWind
LOADVo
+
-
+
+ - + -
+ - + -
PMSG
500 W
Vertical axis wind turbine Gear box
+
-
600 W Vpv
DC/DC
Ibat
+
-
Vo
Io
3-ph Rectifier
+
-VWG
IPV
IWG
Control Unit
ON/OFF Control
IWG
VWG
Vpv
IPV
IbatVo
Dummy Load
12 V 450 AH Battery Bench
900 W
Control signals
PMSG
500 W
Vertical axis wind turbine Gear box
+
-
Vw
w
+
-
Solar Pump controller PM DC motor
Vpv
Back- Up system Diesel Generator
-
200 W
-
200 W
-+ +
200 W
+
Ea
Eb
Ec
Xs Rs
ILL VLL
D1 D3 D5
D2 D4D6
+
-
p
N
Id
Ea
Eb
Ec
Xs RsIa
Xs
Xs
Rs
Rs
+
-
VDC
IDC+
+
+
Va
Vb
Vc
Ib
Ic
+-
LvLi
iv +
-
CR
C
LLR
PWM S
+
ovloadR
Si
Di Ri
Ci
Cv
+
LvLi
iv CR
C
LLR
S ovloadR
Si
Di Ri
Ci
Cv
+iv CR
C
LLR
S ovloadR
Si Ci
Cv
sDT (1 ) sD T
iv
i oV V
( )Lv t
( )Ci t
PWM
D3
PMSGWind
turbine
Rectifier
DC
DC
Cotrol UnitControl Signal
Power Converter
DCI
LOAD
+
-
DCV
MPPT algorithm
+
-
Vcc
D9
Vin
+
-
An3 An5An4
Relay
LM7805 +5V
D2
2
31
7
27K
5.6K22uF
5.1V
1N4001
10K
8
3305.6 3305.615K
680
5.6K
330uF
680
15V
22uF
6.8K
15K
5.6K22uF
Relay
5.1V
VLoadSwitch
20K
5.6K22uF
5.1V
680 Vb
att.
D2
MOSPEC S20C40C(x2)
D3
1mH FQP12P20(x2)
0.39 c/v
1.2 K
+ +
+
Current Transducer
5VAn2
GND
Arduino Uno
An2
An3
An4An5
+5V
An
alo
g 0
..5
GND
An0
An1
D0D1D2D3D4D5D6D7D8D9D10D11D12
Swep
t A
rea
Ewind EturbineD
Swep
t A
rea
H
VAWTHAWT
Eunabsorved
DCP
mw
maxP
0, 0m
dP dP
dw dD
0, 0, 0 0DC
m DC m
dVdP dD dP
dw dV dw dD
0, 0, 0 0DC
m DC m
dVdP dD dP
dw dV dw dD
High Speed Low Speed
Track Starting Point Track Starting Point
D D
Maximum Power Point Tracking process
PDCk >PDCk-1
Read PDC
Iref(k)=Iref(k-1)-∆I
Vk >Vk-1
NO
Iref(k)=Iref(k-1)-∆I
YES
Iref(k)=Iref(k-1)+∆I
NOVk >Vk-1
YES
Iref(k)=Iref(k-1)+∆I
YES NO
sDT
I
Li
i oV V
L
sT
iV
L
LI
t
oV
R
oL
load
VI
R
t
t
t
sDT
CV
( )v t
LI V
C RC
sT
V
RC
CV
t
0.5
0.0
1
1.5
2
2.5
3
5 10 15 20
Voltage
Cu
rren
t
Vmp
Imp
Isc Short circuit current
VocOpen circuit voltage
MPP
V.Battery
I-V PV panel characteristics
DC/DC converterDC loadVbatt
+
-
Vp
v
Ipv +
-
Vo
Io
A/D A/D
MPPT and Charging algorithm
PWM
PV array
MPP
SCI
1dI
I
Load
2dI
1D
SR
PR2D
rI
DC/DCPV -Wind
system
Battery charge control.
Load regulation.
.battV.battI
Battery
.battD loadD
DCLOAD
.battI
t
sDT sT
-
Vin
+
-
Relay
CVbatt.
L Rb
Microcontroller
Iin
Vcontrol1
D1
M1
Sensor Signals Control Signals
VoutVin
Vbatt.
Ibatt
IinIbatt.
Vcontrol1Vcontrol2Vcontrol3
Vcontrol2
Vcontrol3
Vout Vout
file:///C:/Users/Andres/Documents/17c276_250_205.jpg
file:///C:/Users/Andres/Documents/17c276_250_205.jpg
windv
+
-12
12
1R
2R
fR
+
-
12
12
3R
4R
5R 6RoutV
Datalogger
M2
+
-
G
Iref=10A
+
-Vtrian.
Battery Charge ControllerVcontrol Ibatt.
MPPT AlgorithmDCV
DCI
refI+
-
e+
-.triVPWM
G
Io
-
+
-
+
-
+
Vo
V1
V2
C
+ -VL
+
-VD1
+ -VM2
ID2
I1 L
D1
D2
IL IC
M1
M2
VD2
+ -VM1
C Vo
Io+
-
+
-
-
+
+ -VL
+
-ID1
L
D1
D2
IL IC
+VD2
-
+ -VM1
M1
M2+ -VM2
V1
V2
C
+
-Vo
Io
Ii1
Ii2
+
-
+
-
V1
V2
+ -VL
L
D1
D2
IL ICM1
M2
VD2+
-
-
+VD1
+
-
+
-
+
-Vo
Io
Vc
V1
V2
+ -VL
+ -VM2
ID2
C
L
D1
D2
IL IC
+
-
VM1+ -
M2
M1
ID1
VD1
VD1
( )a ( )b
( )c ( )d
+
-
V1
V2
Vo
+
-
VG
S1
LM1
M2
D1
D2
C
-
+
VG
S2
VG
S1
+
-
-
+
V1
V2
+
-
Vo
LM1
M2
D1
D2
C
VG
S2
( )b
( )a
PMSGWind
turbine
Rectifier
wm
DC
DCLOAD
Rotating speed -Power characteristic Pactual
Cotrol Unit
Poptimal
error
Control Signal
Power Converter
PMSG
Wind turbine
Rectifier
DC
DCLOAD
Cotrol Unit
Control Signal
Power Converter
Wind speed
Vw
R
Wm
Wm-optimal
error
+-
+ -
Ea
Eb
Ec
Xs Rs
ILL VLL
D1 D3 D5
D2 D4D6
+
-
p
N
Id
Ea
Eb
Ec
Xs RsIa
Xs
Xs
Rs
Rs
+
-
VDC
IDC+
+
+
Va
Vb
Vc
Ib
Ic
H
D
VPVDC
DC
VWindDC
DC
LOADVo+
-
VPV
DC
DC
VWind
LOADVo
+
-
+
+ - + -
+ - + -
PMSG
500 W
Vertical axis wind turbine Gear box
+
-
600 W Vpv
DC/DC
Ibat
+
-
Vo
Io
3-ph Rectifier
+
-VWG
IPV
IWG
Control Unit
ON/OFF Control
IWG
VWG
Vpv
IPV
IbatVo
Dummy Load
12 V 450 AH Battery Bench
900 W
Control signals
PMSG
500 W
Vertical axis wind turbine Gear box
+
-
Vw
w
+
-
Solar Pump controller PM DC motor
Vpv
Back- Up system Diesel Generator
-
200 W
-
200 W
-+ +
200 W
+
Ea
Eb
Ec
Xs Rs
ILL VLL
D1 D3 D5
D2 D4D6
+
-
p
N
Id
Ea
Eb
Ec
Xs RsIa
Xs
Xs
Rs
Rs
+
-
VDC
IDC+
+
+
Va
Vb
Vc
Ib
Ic
+-
LvLi
iv +
-
CR
C
LLR
PWM S
+
ovloadR
Si
Di Ri
Ci
Cv
+
LvLi
iv CR
C
LLR
S ovloadR
Si
Di Ri
Ci
Cv
+iv CR
C
LLR
S ovloadR
Si Ci
Cv
sDT (1 ) sD T
iv
i oV V
( )Lv t
( )Ci t
PWM
D3
PMSGWind
turbine
Rectifier
DC
DC
Cotrol UnitControl Signal
Power Converter
DCI
LOAD
+
-
DCV
MPPT algorithm
+
-
Vcc
D9
Vin
+
-
An3 An5An4
Relay
LM7805 +5V
D2
2
31
7
27K
5.6K22uF
5.1V
1N4001
10K
8
3305.6 3305.615K
680
5.6K
330uF
680
15V
22uF
6.8K
15K
5.6K22uF
Relay
5.1V
VLoadSwitch
20K
5.6K22uF
5.1V
680 Vb
att.
D2
MOSPEC S20C40C(x2)
D3
1mH FQP12P20(x2)
0.39 c/v
1.2 K
+ +
+
Current Transducer
5VAn2
GND
Arduino Uno
An2
An3
An4An5
+5V
An
alo
g 0
..5
GND
An0
An1
D0D1D2D3D4D5D6D7D8D9D10D11D12
Swep
t A
rea
Ewind EturbineD
Swep
t A
rea
H
VAWTHAWT
Eunabsorved
DCP
mw
maxP
0, 0m
dP dP
dw dD
0, 0, 0 0DC
m DC m
dVdP dD dP
dw dV dw dD
0, 0, 0 0DC
m DC m
dVdP dD dP
dw dV dw dD
High Speed Low Speed
Track Starting Point Track Starting Point
D D
Maximum Power Point Tracking process
PDCk >PDCk-1
Read PDC
Iref(k)=Iref(k-1)-∆I
Vk >Vk-1
NO
Iref(k)=Iref(k-1)-∆I
YES
Iref(k)=Iref(k-1)+∆I
NOVk >Vk-1
YES
Iref(k)=Iref(k-1)+∆I
YES NO
sDT
I
Li
i oV V
L
sT
iV
L
LI
t
oV
R
oL
load
VI
R
t
t
t
sDT
CV
( )v t
LI V
C RC
sT
V
RC
CV
t
0.5
0.0
1
1.5
2
2.5
3
5 10 15 20
Voltage
Cu
rren
t
Vmp
Imp
Isc Short circuit current
VocOpen circuit voltage
MPP
V.Battery
I-V PV panel characteristics
DC/DC converterDC loadVbatt
+
-
Vp
v
Ipv +
-
Vo
Io
A/D A/D
MPPT and Charging algorithm
PWM
PV array
MPP
SCI
1dI
I
Load
2dI
1D
SR
PR2D
rI
DC/DCPV -Wind
system
Battery charge control.
Load regulation.
.battV.battI
Battery
.battD loadD
DCLOAD
.battI
t
sDT sT
-
Vin
+
-
Relay
CVbatt.
L Rb
Microcontroller
Iin
Vcontrol1
D1
M1
Sensor Signals Control Signals
VoutVin
Vbatt.
Ibatt
IinIbatt.
Vcontrol1Vcontrol2Vcontrol3
Vcontrol2
Vcontrol3
Vout Vout
file:///C:/Users/Andres/Documents/17c276_250_205.jpg
file:///C:/Users/Andres/Documents/17c276_250_205.jpg
windv
+
-12
12
1R
2R
fR
+
-
12
12
3R
4R
5R 6RoutV
Datalogger
M2
+
-
G
Iref=10A
+
-Vtrian.
Battery Charge ControllerVcontrol Ibatt.
MPPT AlgorithmDCV
DCI
refI+
-
e+
-.triV
Current compensator
PWM
Io
-
+
-
+
-
+
Vo
V1
V2
C
+ -VL
+
-VD1
+ -VM2
ID2
I1 L
D1
D2
IL IC
M1
M2
VD2
+ -VM1
C Vo
Io+
-
+
-
-
+
+ -VL
+
-ID1
L
D1
D2
IL IC
+VD2
-
+ -VM1
M1
M2+ -VM2
V1
V2
C
+
-Vo
Io
Ii1
Ii2
+
-
+
-
V1
V2
+ -VL
L
D1
D2
IL ICM1
M2
VD2+
-
-
+VD1
+
-
+
-
+
-Vo
Io
Vc
V1
V2
+ -VL
+ -VM2
ID2
C
L
D1
D2
IL IC
+
-
VM1+ -
M2
M1
ID1
VD1
VD1
( )a
( )b
( )c ( )d
+
-
V1
V2
Vo
+
-
VG
S1
LM1
M2
D1
D2
C
-
+ VG
S2
VG
S1
+
-
-
+
V1
V2
+
-
Vo
LM1
M2
D1
D2
C
VG
S2
( )b( )a
( )a
( )b
sT
1d
1d
2t1t 4t3t
t
t
1GSV
2GSV
-+
V1
+
-V2
Vo
-
VG
S1
LM1
M2
D1
D2
C
+ VG
S2
( )c
VGS3
-+
V1
+
-V2
Vo
-
VG
S1
LM1
M2
D1
D2
C
+
VG
S2
VGS3
3M
-+
V1
+
-V2
Vo
-
VG
S1
LM1
M2
D1
D2
C
+ VG
S2
( )c
VGS3
+
-
Relay
CVbatt.
L Rb
VGS3
D3
M1
Ibatt.
Vrelay
Vout Vout
M2
Vwind
Iwind
-
+-
VPV
D1
D2
VGS1
VGS2
VGS4
-
Microcontroller
Ipv
Sensor Signals Control Signals
VoutVin
Vbatt
Vcontrol1Vcontrol2Vcontrol3
IwindIbatt Vrelay
Vcontrol4
+
-
+
-
Ipv
IoILIL
IL
( )a
IL
-+
V1
+
-V2
Vo
-
VG
S1
LM1
M2
D1
D2
C
+
VG
S2
VGS3
Io IoIL
( )c
-+
V1
+
-V2
Vo
-
VG
S1
LM1
M2
D1
D2
C
+
VG
S2
VGS3
IL
IL
( )b
IL
-+
V1
+
-V2
Vo
-
VG
S1
LM1
M2
D1
D2
C
+
VG
S2
VGS3
IL
( )c
Ic Io
Io
Ic
D3 D3
D3D3
+- 2G
1CT1G
2CT+-
1H
refVoV
*
refI
LI
duty
Plant 1 Plant 2Controller 2Controller 1
measuredLI
Microprocessor
(MPPT Programming)
-+ +
-
PVI
PVVWindV
WindI
1d 2d
1
*
refI2
*
refI
+
-
+
-
PVV
windV
*
refV
Microprocessor(Current Control programming)
Boost mode
3d
oVoI
*
refV
Microprocessor(Current Control programming)
Buck mode
1d
oVoI
2d
L D3
D1
D2
Double input DC/DC converter
PVI
WindILoad
oI+
-
oVABV
AV
BV
MicroprocessorPower managament
control unit
PVV
PVI
windV
WindI
ABV
oV
oI
1d 2d 3d
1S
2S
3S
1d
2d
3d
+-
*
refI1( )d s
Plant 1 LI
12G
11G
2 ( )d s
+
+
1H
+refV
1CT-
2GPlant 2
oV
*
refILI
+refV
1CT- 2G
Plant 2
oVInner current loop
Figure 3.18. Switching PWM signal conditioning circuit for the MPPT tracking process proposed [23].
Figure 3.19. Simulation of the Wind turbine system designed for controlling batteries
Table 3.1. Wind turbine and PMSG parameters used for the simulations
Parameter Value
Height of the wind turbine(H) 3 mDiameter(D) 0.85 mStator resistances(Rs) 0.425ΩArmature Inductance(Ls) 0.016180715HPermanent magnet flux linkage(λpm) 0.165WbNumber of pole pairs 6
It has been used the PMSG block from the library SimPowerSystems of SIMULINK, connected toa three-phase rectifier. The Vertical Axis Wind turbine block has been modelled following the Cp-λ relation from [11] to study the system under more realistic environment. Figure 3.20 shows thecoefficient of power (Cp) versus the tip spit ratio(λ) for three different types of wind turbine. Theperformance curve for the combined blade(CT Darrieus-Savonius) is the one used for this simulation.
The load block is formed by a 12Ω resistance and a relay to control the discharge of the battery. Thebattery block is formed by the SimPowerSystems battery block, a MOSFET to control the batterycurrent and a resistance of 0.1Ω in series to reduce the spikes produced by the switching current. Theswitching frequency for the battery MOSFET control is 250Hz.
23
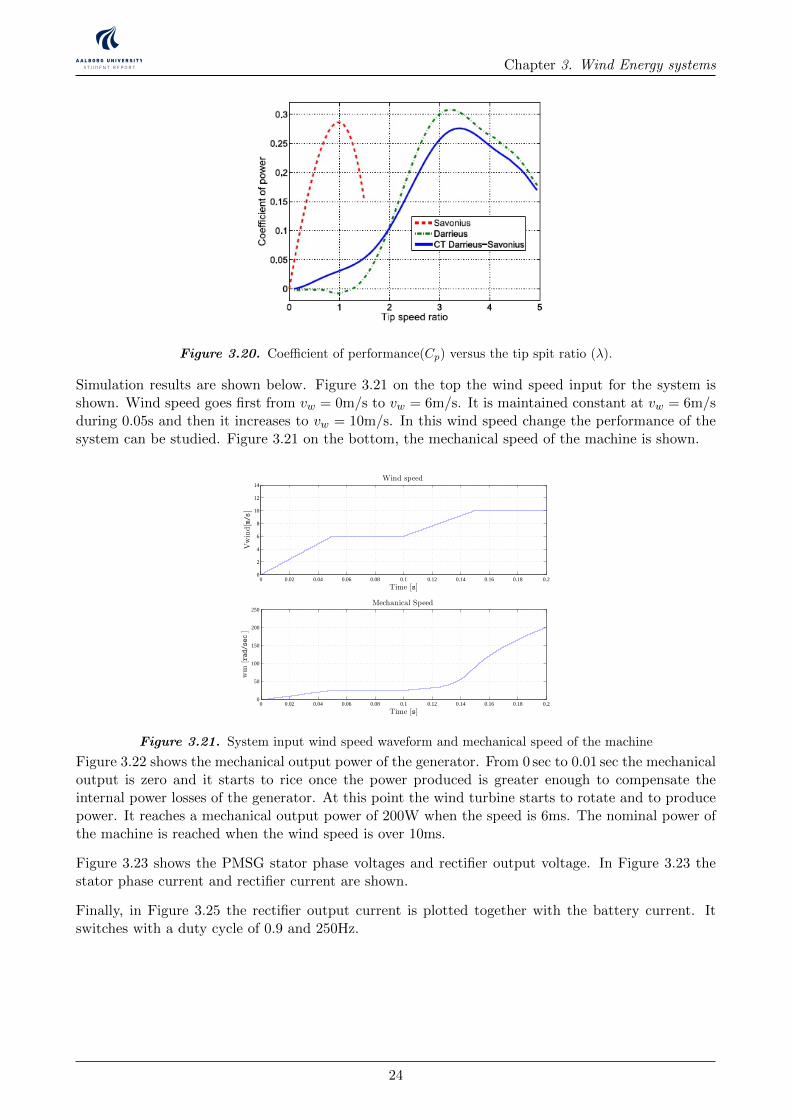
Chapter 3. Wind Energy systems
Figure 3.20. Coefficient of performance(Cp) versus the tip spit ratio (λ).
Simulation results are shown below. Figure 3.21 on the top the wind speed input for the system isshown. Wind speed goes first from vw = 0m/s to vw = 6m/s. It is maintained constant at vw = 6m/sduring 0.05s and then it increases to vw = 10m/s. In this wind speed change the performance of thesystem can be studied. Figure 3.21 on the bottom, the mechanical speed of the machine is shown.
0 0.02 0.04 0.06 0.08 0.1 0.12 0.14 0.16 0.18 0.20
2
4
6
8
10
12
14
Time [s]
Vwind[m/s]
Wind speed
0 0.02 0.04 0.06 0.08 0.1 0.12 0.14 0.16 0.18 0.20
50
100
150
200
250
Time [s]
wm
[rad/sec]
Mechanical Speed
Figure 3.21. System input wind speed waveform and mechanical speed of the machine
Figure 3.22 shows the mechanical output power of the generator. From 0 sec to 0.01 sec the mechanicaloutput is zero and it starts to rice once the power produced is greater enough to compensate theinternal power losses of the generator. At this point the wind turbine starts to rotate and to producepower. It reaches a mechanical output power of 200W when the speed is 6ms. The nominal power ofthe machine is reached when the wind speed is over 10ms.
Figure 3.23 shows the PMSG stator phase voltages and rectifier output voltage. In Figure 3.23 thestator phase current and rectifier current are shown.
Finally, in Figure 3.25 the rectifier output current is plotted together with the battery current. Itswitches with a duty cycle of 0.9 and 250Hz.
24
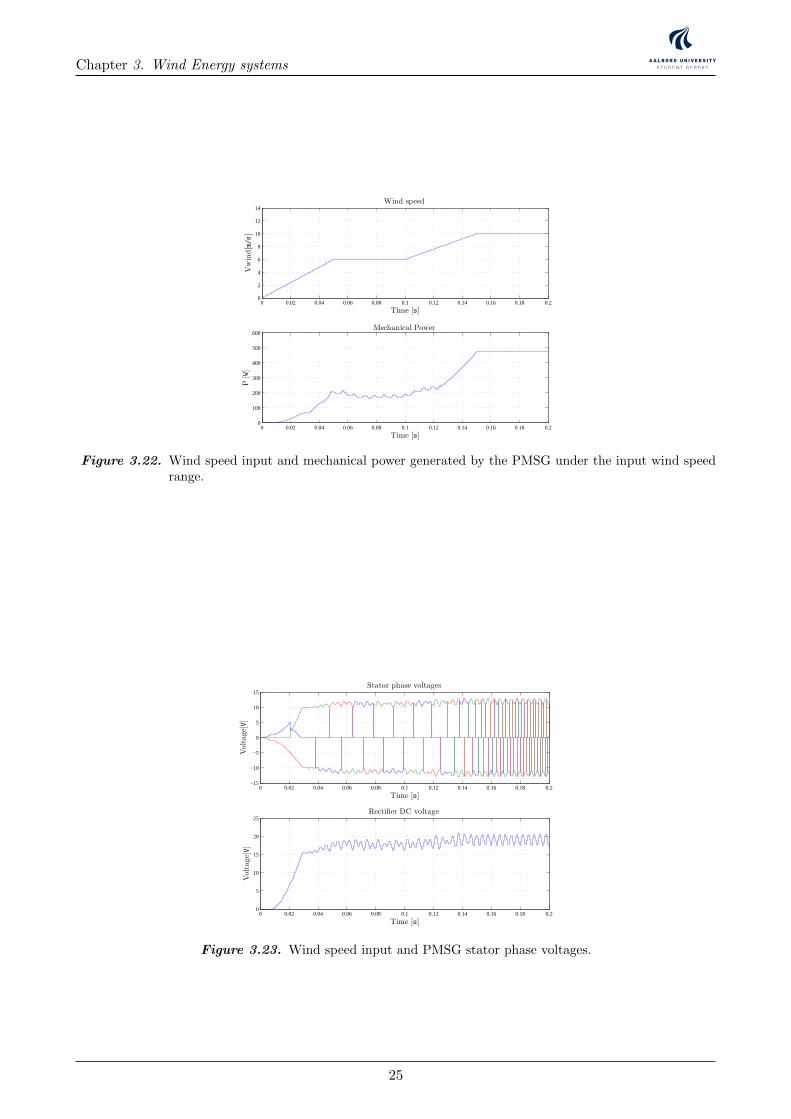
Chapter 3. Wind Energy systems
0 0.02 0.04 0.06 0.08 0.1 0.12 0.14 0.16 0.18 0.20
2
4
6
8
10
12
14
Time [s]
Vwind[m/s]
Wind speed
0 0.02 0.04 0.06 0.08 0.1 0.12 0.14 0.16 0.18 0.20
100
200
300
400
500
600
Time [s]
P[W]
Mechanical Power
Figure 3.22. Wind speed input and mechanical power generated by the PMSG under the input wind speedrange.
0 0.02 0.04 0.06 0.08 0.1 0.12 0.14 0.16 0.18 0.2−15
−10
−5
0
5
10
15
Time [s]
Voltage[V]
Stator phase voltages
0 0.02 0.04 0.06 0.08 0.1 0.12 0.14 0.16 0.18 0.20
5
10
15
20
25
Time [s]
Voltage[V]
Rectifier DC voltage
Figure 3.23. Wind speed input and PMSG stator phase voltages.
25
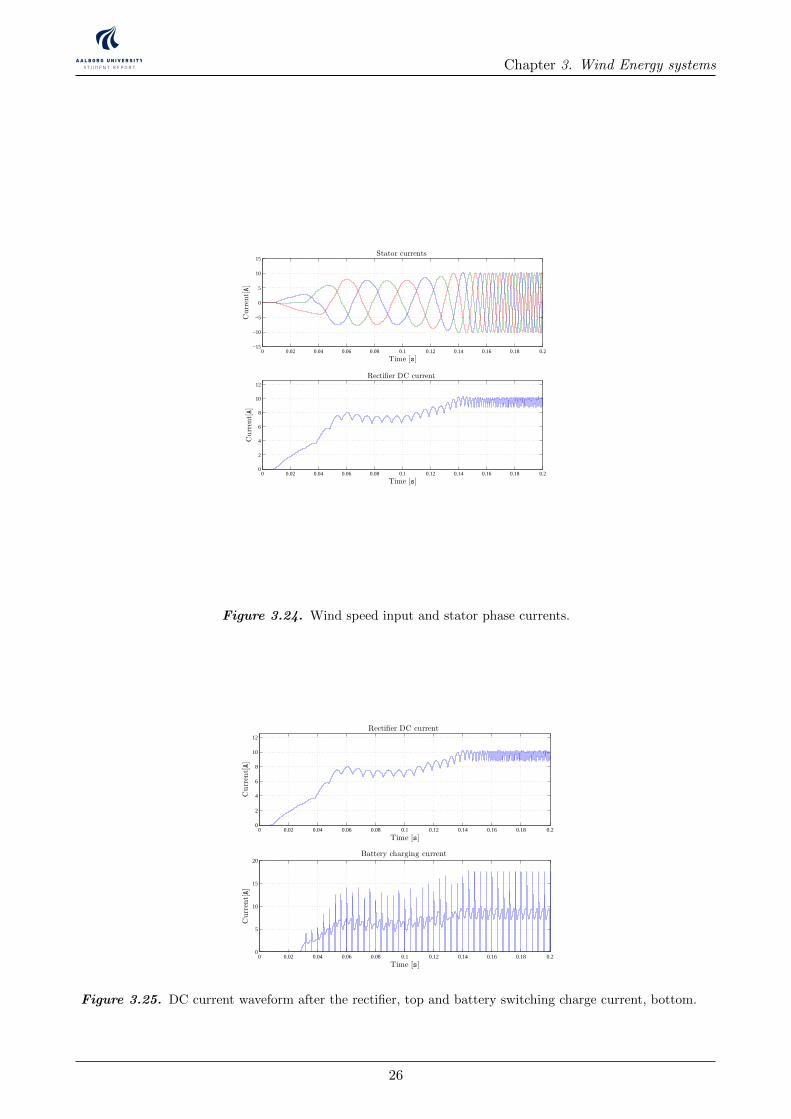
Chapter 3. Wind Energy systems
0 0.02 0.04 0.06 0.08 0.1 0.12 0.14 0.16 0.18 0.2−15
−10
−5
0
5
10
15
Time [s]
Current[A]
Stator currents
0 0.02 0.04 0.06 0.08 0.1 0.12 0.14 0.16 0.18 0.20
2
4
6
8
10
12
Time [s]
Current[A]
Rectifier DC current
Figure 3.24. Wind speed input and stator phase currents.
0 0.02 0.04 0.06 0.08 0.1 0.12 0.14 0.16 0.18 0.20
2
4
6
8
10
12
Time [s]
Current[A]
Rectifier DC current
0 0.02 0.04 0.06 0.08 0.1 0.12 0.14 0.16 0.18 0.20
5
10
15
20
Time [s]
Current[A]
Battery charging current
Figure 3.25. DC current waveform after the rectifier, top and battery switching charge current, bottom.
26
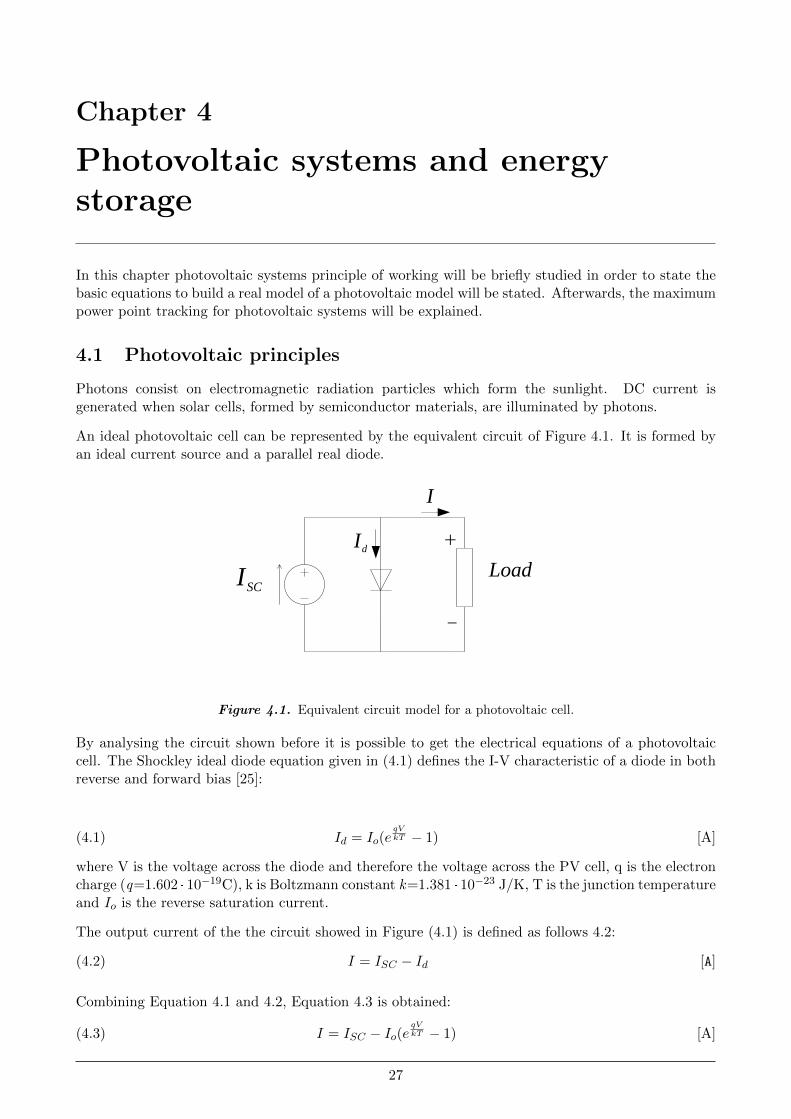
Chapter 4
Photovoltaic systems and energystorage
In this chapter photovoltaic systems principle of working will be briefly studied in order to state thebasic equations to build a real model of a photovoltaic model will be stated. Afterwards, the maximumpower point tracking for photovoltaic systems will be explained.
4.1 Photovoltaic principles
Photons consist on electromagnetic radiation particles which form the sunlight. DC current isgenerated when solar cells, formed by semiconductor materials, are illuminated by photons.
An ideal photovoltaic cell can be represented by the equivalent circuit of Figure 4.1. It is formed byan ideal current source and a parallel real diode.
ModuleCell Array
SCI
dI
I
Load
Figure 4.1. Equivalent circuit model for a photovoltaic cell.
By analysing the circuit shown before it is possible to get the electrical equations of a photovoltaiccell. The Shockley ideal diode equation given in (4.1) defines the I-V characteristic of a diode in bothreverse and forward bias [25]:
Id = Io(eqVkT − 1) [A](4.1)
where V is the voltage across the diode and therefore the voltage across the PV cell, q is the electroncharge (q=1.602 · 10−19C), k is Boltzmann constant k=1.381 · 10−23 J/K, T is the junction temperatureand Io is the reverse saturation current.
The output current of the the circuit showed in Figure (4.1) is defined as follows 4.2:
I = ISC − Id [A](4.2)
Combining Equation 4.1 and 4.2, Equation 4.3 is obtained:
I = ISC − Io(eqVkT − 1) [A](4.3)
27
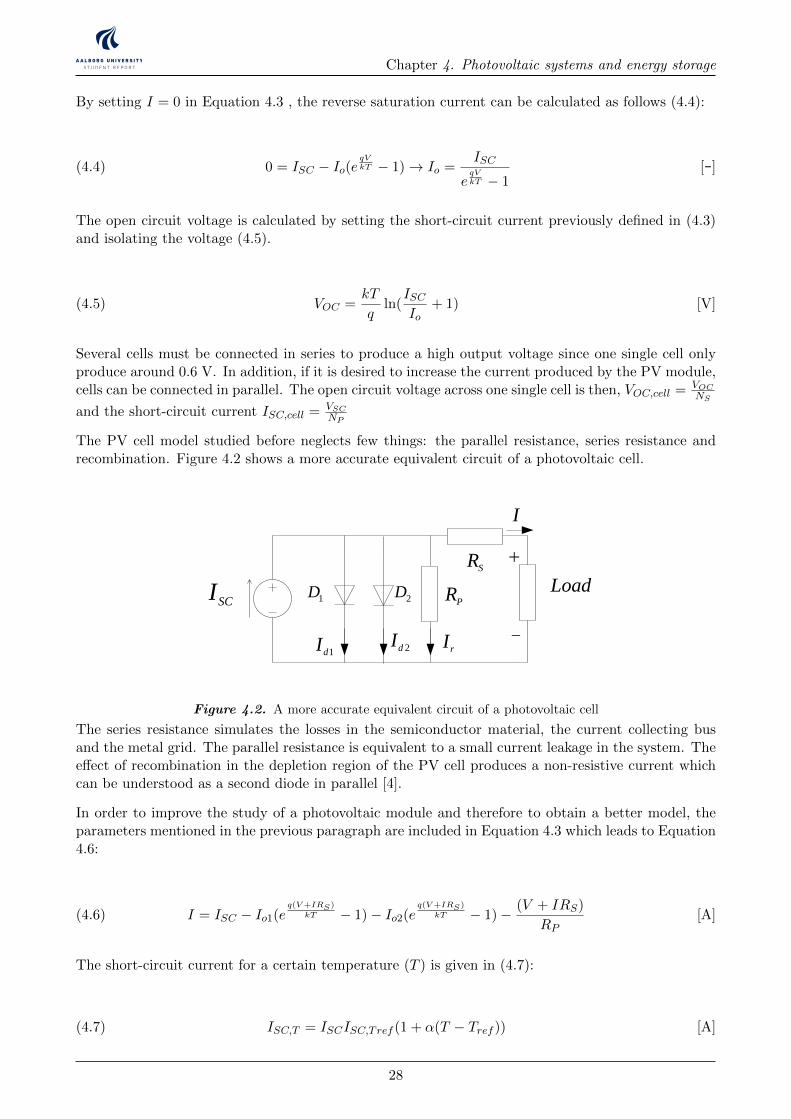
Chapter 4. Photovoltaic systems and energy storage
By setting I = 0 in Equation 4.3 , the reverse saturation current can be calculated as follows (4.4):
0 = ISC − Io(eqVkT − 1)→ Io =
ISC
eqVkT − 1
[-](4.4)
The open circuit voltage is calculated by setting the short-circuit current previously defined in (4.3)and isolating the voltage (4.5).
VOC =kT
qln(
ISCIo
+ 1) [V](4.5)
Several cells must be connected in series to produce a high output voltage since one single cell onlyproduce around 0.6 V. In addition, if it is desired to increase the current produced by the PV module,cells can be connected in parallel. The open circuit voltage across one single cell is then, VOC,cell = VOC
NS
and the short-circuit current ISC,cell = VSCNP
The PV cell model studied before neglects few things: the parallel resistance, series resistance andrecombination. Figure 4.2 shows a more accurate equivalent circuit of a photovoltaic cell.
Wind PMSG
turbine
Rectifier
wm
DC
DCLOAD
Rotating speed -Power characteristic Pactual
Cotrol Unit
Poptimal
error
Control Signal
Power Converter
PMSG
Wind turbine
Rectifier
DC
DCLOAD
Cotrol Unit
Control Signal
Power Converter
Wind speed
Vw
R
Wm
Wm-optimal
error
+-
+ -
Ea
Eb
Ec
Xs Rs
ILL VLL
D1 D3 D5
D2 D4D6
+
-
p
N
Id
Ea
Eb
Ec
Xs RsIa
Xs
Xs
Rs
Rs
+
-
VDC
IDC+
+
+
Va
Vb
Vc
Ib
Ic
H
D
VG
S1
V1
V2
L
+
-
Vo
M1
M2
D1
D2
+
-
+
-
Vi1
Vi2
+ -VL
+
-Vo
Ii1
C
L
D1
D2
IL IC Io
+
-
+
-
Vi1
Vi2
+ -VL
+
-
+
-Vo
ID1
C
L
D1
D2
IL IC Io
+VD2
-
+ -VM1
M1
M2
M1
M2
C
VG
S2
+
-
+
-
V1
V2
+ -VL
+
-VD1
+
-Vo
+ -VM2
ID2
I1
C
L
D1
D2
IL IC Io
M1
M2
+
-
+
-
Vi1
Vi2
+ -VL
+
-Vo
+ -VM2
ID2
C
L
D1
D2
IL IC Io
+Vc
-
+VM1
-
M2
M1
VPVDC
DC
VWindDC
DC
LOADVo+
-
VPV
DC
DC
VWind
LOADVo
+
-
VD2+
-
-
+
VD1
+
+
VD1
+-
+
-
+ -VM1
+ -VM2
Ii2
ID1
+
+ - + -
+ - + -
PMSG
500 W
Vertical axis wind turbine Gear box
+
-
600 W Vpv
DC/DC
Ibat
+
-
Vo
Io
3-ph Rectifier
+
-VWG
IPV
IWG
Control Unit
ON/OFF Control
IWG
VWG
Vpv
IPV
IbatVo
Dummy Load
12 V 450 AH Battery Bench
900 W
Control signals
PMSG
500 W
Vertical axis wind turbine Gear box
+
-
Vw
w
+
-
Solar Pump controller PM DC motor
Vpv
Back- Up system Diesel Generator
-
200 W
-
200 W
-+ +
200 W
+
Ea
Eb
Ec
Xs Rs
ILL VLL
D1 D3 D5
D2 D4D6
+
-
p
N
Id
Ea
Eb
Ec
Xs RsIa
Xs
Xs
Rs
Rs
+
-
VDC
IDC+
+
+
Va
Vb
Vc
Ib
Ic
+-
LvLi
iv +
-
CR
C
LLR
PWM S
+
ovloadR
Si
Di Ri
Ci
Cv
+
LvLi
iv CR
C
LLR
S ovloadR
Si
Di Ri
Ci
Cv
+iv CR
C
LLR
S ovloadR
Si Ci
Cv
sDT (1 ) sD T
iv
i oV V
( )Lv t
( )Ci t
PWM
D3
Wind PMSG
turbine
Rectifier
DC
DC
Cotrol UnitControl Signal
Power Converter
DCI
LOAD
+
-
DCV
MPPT algorithm
+
-
Vcc
D9
Vin
+
-
An3 An5An4
Relay
LM7805 +5V
D2
2
31
7
27K
5.6K22uF
5.1V
1N4001
10K
8
3305.6 3305.615K
680
5.6K
330uF
680
15V
22uF
6.8K
15K
5.6K22uF
Relay
5.1V
VLoadSwitch
20K
5.6K22uF
5.1V
680 Vb
att.
D2
MOSPEC S20C40C(x2)
D3
1mH FQP12P20(x2)
0.39 c/v
1.2 K
+ +
+
Current Transducer
5VAn2
GND
Arduino Uno
An2
An3
An4An5
+5V
An
alo
g0
..5
GND
An0
An1
D0D1D2D3D4D5D6D7D8D9D10D11D12
Swep
tA
rea
Ewind EturbineD
Swep
tA
rea
H
VAWTHAWT
Eunabsorved
DCP
mw
maxP
0, 0m
dP dP
dw dD
0, 0, 0 0DC
m DC m
dVdP dD dP
dw dV dw dD
0, 0, 0 0DC
m DC m
dVdP dD dP
dw dV dw dD
High Speed Low Speed
Track Starting Point Track Starting Point
D D
Maximum Power Point Tracking process
PDCk >PDCk-1
Read PDC
D=Dold-∆D
Dk-1 >Dk-2
NO
D=Dold-∆D
YES
D=Dold+∆D
NODk-1 >Dk-2
YES
D=Dold+∆D
YES NO
sDT
I
Li
i oV V
L
sT
iV
L
LI
t
oV
R
oL
load
VI
R
t
t
t
sDT
CV
( )v t
LI V
C RC
sT
V
RC
CV
t
0.5
0.0
1
1.5
2
2.5
3
5 10 15 20
Voltage
Cu
rren
t
Vmp
Imp
Isc Short circuit current
VocOpen circuit voltage
MPP
V.Battery
I-V PV panel characteristics
DC/DC converterDC loadVbatt
+
-
Vp
v
Ipv +
-
Vo
Io
A/D A/D
MPPT and Charging algorithm
PWM
PV array
MPP
SCI
1dI
I
Load
2dI
1D
SR
PR2D
rI
Figure 4.2. A more accurate equivalent circuit of a photovoltaic cell
The series resistance simulates the losses in the semiconductor material, the current collecting busand the metal grid. The parallel resistance is equivalent to a small current leakage in the system. Theeffect of recombination in the depletion region of the PV cell produces a non-resistive current whichcan be understood as a second diode in parallel [4].
In order to improve the study of a photovoltaic module and therefore to obtain a better model, theparameters mentioned in the previous paragraph are included in Equation 4.3 which leads to Equation4.6:
I = ISC − Io1(eq(V +IRS)
kT − 1)− Io2(eq(V +IRS)
kT − 1)− (V + IRS)
RP[A](4.6)
The short-circuit current for a certain temperature (T ) is given in (4.7):
ISC,T = ISCISC,Tref (1 + α(T − Tref )) [A](4.7)
28

Chapter 4. Photovoltaic systems and energy storage
where the ISC,Tref is the short circuit current at reference temperature Tref ( Tref = 298K) and α isthe temperature coefficient of the ISC .
Equation 4.8 shows the short-circuit current, ISC,G for a certain insolation value, G:
ISC,G = GISC,T [A](4.8)
The reverse saturation current, can now be calculated for the reference temperature Tref as shown inEquation 4.9:
Io,Tref =ISC,Tref
eqVOC,cellnkTref − 1
[A](4.9)
Having the reverse saturation current at Tref from Equation 4.9, it can be calculated at thetemperature of the module T as done in Equation 4.10:
Io,T = (Io,Tref )[T
Tref]3n (e−[
qVOC,cellnK
][TrefT−1
]) [A](4.10)
Equation 4.6 can be simplified by combining both diodes including the ideality factor, n. In additionRP is neglected due to the small effect it produces[4]. By doing these simplifications Equation 4.11 isderived:
IPV = ISC,G − Io,T (eq(VOC,cell+IRS)
nkT − 1) [A](4.11)
For obtaining the value of the series resistance, XV is calculated first.
XV = Io,Trefq
nkTrefe
qVOCcellnKTref [A](4.12)
Rs = −dvdi− 1
XV[A](4.13)
The current output of a PV module can be then calculated by applying Newton’s equation showed inEquation 4.14:
IPVk+1= IPV −
f(IPV )
f ′(IPV )[A](4.14)
Equation 4.15 summarizes the three equations needed for using Newton’s equation:
IPV = IG − Io,T (e(VPV,cell+IPV RS)q
nKT−1)
f(IPV ) = IG − IPV − Io,T (e(VPV,cell+IPV RS)q
nKT−1)
f ′(IPV ) = −1− qnKT Io,T (e
(VPV,cell+IPV RS)q
nKT )
[A](4.15)
29
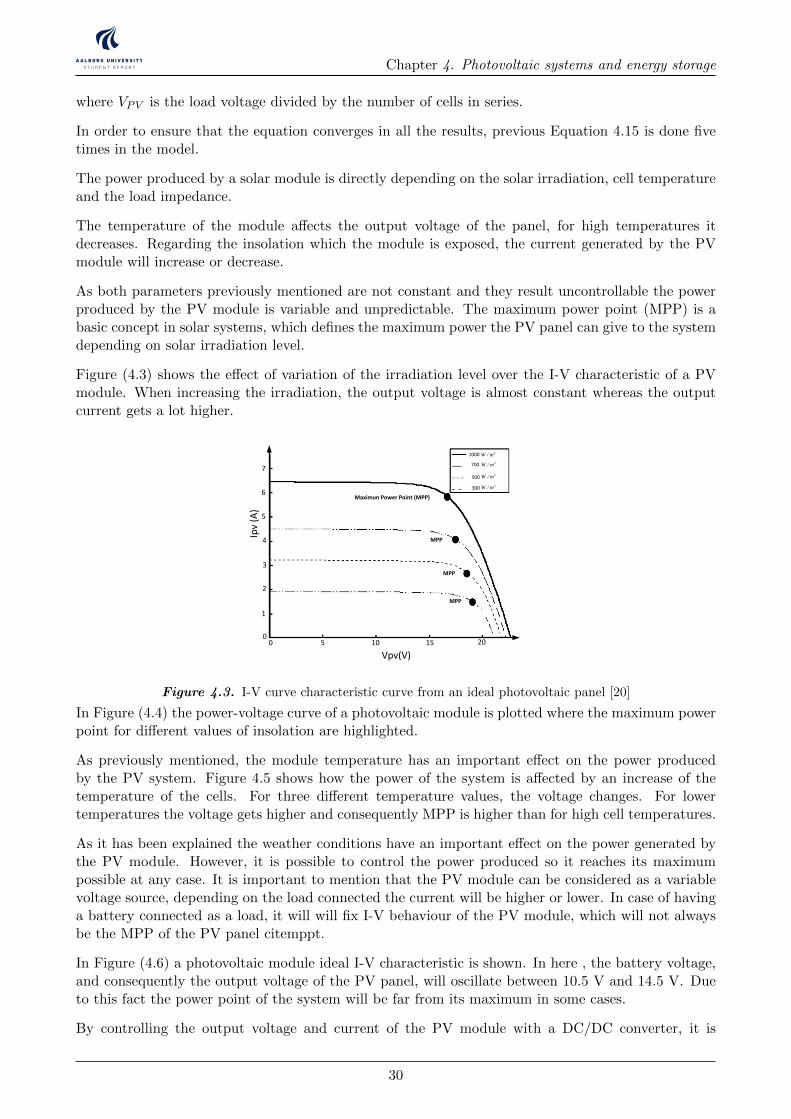
Chapter 4. Photovoltaic systems and energy storage
where VPV is the load voltage divided by the number of cells in series.
In order to ensure that the equation converges in all the results, previous Equation 4.15 is done fivetimes in the model.
The power produced by a solar module is directly depending on the solar irradiation, cell temperatureand the load impedance.
The temperature of the module affects the output voltage of the panel, for high temperatures itdecreases. Regarding the insolation which the module is exposed, the current generated by the PVmodule will increase or decrease.
As both parameters previously mentioned are not constant and they result uncontrollable the powerproduced by the PV module is variable and unpredictable. The maximum power point (MPP) is abasic concept in solar systems, which defines the maximum power the PV panel can give to the systemdepending on solar irradiation level.
Figure (4.3) shows the effect of variation of the irradiation level over the I-V characteristic of a PVmodule. When increasing the irradiation, the output voltage is almost constant whereas the outputcurrent gets a lot higher.
1000 2/W m
700 2/W m
5002/W m
3002/W m
Ipv
(A)
Vpv(V)
0
2
3
4
5
7
6
1
0 5 10 15 20
Maximun Power Point (MPP)
MPP
MPP
MPP
Figure 4.3. I-V curve characteristic curve from an ideal photovoltaic panel [20]
In Figure (4.4) the power-voltage curve of a photovoltaic module is plotted where the maximum powerpoint for different values of insolation are highlighted.
As previously mentioned, the module temperature has an important effect on the power producedby the PV system. Figure 4.5 shows how the power of the system is affected by an increase of thetemperature of the cells. For three different temperature values, the voltage changes. For lowertemperatures the voltage gets higher and consequently MPP is higher than for high cell temperatures.
As it has been explained the weather conditions have an important effect on the power generated bythe PV module. However, it is possible to control the power produced so it reaches its maximumpossible at any case. It is important to mention that the PV module can be considered as a variablevoltage source, depending on the load connected the current will be higher or lower. In case of havinga battery connected as a load, it will will fix I-V behaviour of the PV module, which will not alwaysbe the MPP of the PV panel citemppt.
In Figure (4.6) a photovoltaic module ideal I-V characteristic is shown. In here , the battery voltage,and consequently the output voltage of the PV panel, will oscillate between 10.5 V and 14.5 V. Dueto this fact the power point of the system will be far from its maximum in some cases.
By controlling the output voltage and current of the PV module with a DC/DC converter, it is
30
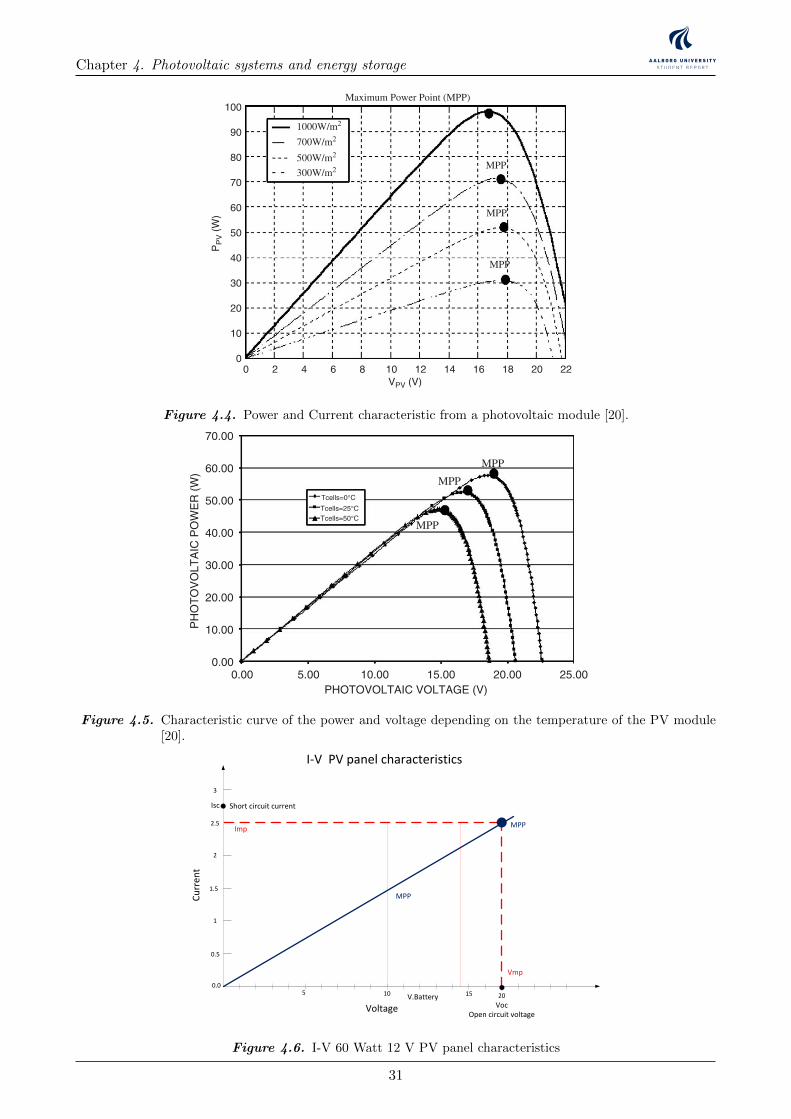
Chapter 4. Photovoltaic systems and energy storage
ARTICLE IN PRESS
100
90
80
70
60
50
40
30
20
10
00 2 4 6 8 10 12 14 16 18 20 22
VPV (V)
PP
V (
W)
MPP
MPP
MPP
Maximum Power Point (MPP)
1000W/m2
700W/m2
500W/m2
300W/m2
Fig. 2. P– V photovoltaic characteristic for four different irradiation levels.
8
7
6
5
4
3
2
1
00 5 10 15 20
VPV (V)
I PV (
A)
MPP
MPP
MPP
MAXIMUM POWER POINT (MPP)
1000W/m2
700W/m2
500W/m2
300W/m2
Fig. 1. I– V photovoltaic characteristic for four different irradiation levels.
V. Salas et al. / Solar Energy Materials & Solar Cells 90 (2006) 1555–1578 1557
Figure 4.4. Power and Current characteristic from a photovoltaic module [20].
consists of a DC load and batteries. However, it should be noted, that such impedance isnot constant. When a PV generator is directly connected to the load, the system willoperate at the intersection of the I– V curve and load line, which can be far from themaximum power point (MPP).The maximum power production is based on the load-line adjustment under varying
atmospheric conditions.Another important element of a stand-alone PV system is the battery because of the
fluctuating nature of the output delivered by the PV array [1]. Moreover, the load, in manycases, requires a power level that is maintained constant. Commonly, lead-acid batteries
ARTICLE IN PRESS
4.00
3.50
3.00
2.50
2.00
1.50
1.00
0.50
0.000.00 5.00 10.00 15.00 20.00 25.00
PHOTOVOLTAIC VOLTAGE (V)
PH
OT
OV
OLT
AIC
CU
RR
EN
T (
A)
Tcells=0°C
Tcells=25°CTcells=50°C
MPP MPP MPP
Fig. 3. I– V characteristics for three temperatures level.
70.00
60.00
50.00
40.00
30.00
20.00
10.00
0.000.00 5.00 10.00 15.00 20.00 25.00
PHOTOVOLTAIC VOLTAGE (V)
PH
OT
OV
OLT
AIC
PO
WE
R (
W)
MPP
MPP
MPPTcells=0°CTcells=25°CTcells=50°C
Fig. 4. P– V characteristic for three temperatures level.
V. Salas et al. / Solar Energy Materials & Solar Cells 90 (2006) 1555–15781558
Figure 4.5. Characteristic curve of the power and voltage depending on the temperature of the PV module[20].
Wind PMSG
turbine
Rectifier
wm
DC
DCLOAD
Rotating speed -Power characteristic Pactual
Cotrol Unit
Poptimal
error
Control Signal
Power Converter
PMSG
Wind turbine
Rectifier
DC
DCLOAD
Cotrol Unit
Control Signal
Power Converter
Wind speed
Vw
R
Wm
Wm-optimal
error
+-
+ -
Ea
Eb
Ec
Xs Rs
ILL VLL
D1 D3 D5
D2 D4D6
+
-
p
N
Id
Ea
Eb
Ec
Xs RsIa
Xs
Xs
Rs
Rs
+
-
VDC
IDC+
+
+
Va
Vb
Vc
Ib
Ic
H
D
VG
S1
V1
V2
L
+
-
Vo
M1
M2
D1
D2
+
-
+
-
Vi1
Vi2
+ -VL
+
-Vo
Ii1
C
L
D1
D2
IL IC Io
+
-
+
-
Vi1
Vi2
+ -VL
+
-
+
-Vo
ID1
C
L
D1
D2
IL IC Io
+VD2
-
+ -VM1
M1
M2
M1
M2
C
VG
S2
+
-
+
-
V1
V2
+ -VL
+
-VD1
+
-Vo
+ -VM2
ID2
I1
C
L
D1
D2
IL IC Io
M1
M2
+
-
+
-
Vi1
Vi2
+ -VL
+
-Vo
+ -VM2
ID2
C
L
D1
D2
IL IC Io
+Vc
-
+VM1
-
M2
M1
VPVDC
DC
VWindDC
DC
LOADVo+
-
VPV
DC
DC
VWind
LOADVo
+
-
VD2+
-
-
+
VD1
+
+
VD1
+-
+
-
+ -VM1
+ -VM2
Ii2
ID1
+
+ - + -
+ - + -
PMSG
500 W
Vertical axis wind turbine Gear box
+
-
600 W Vpv
DC/DC
Ibat
+
-
Vo
Io
3-ph Rectifier
+
-VWG
IPV
IWG
Control Unit
ON/OFF Control
IWG
VWG
Vpv
IPV
IbatVo
Dummy Load
12 V 450 AH Battery Bench
900 W
Control signals
PMSG
500 W
Vertical axis wind turbine Gear box
+
-
Vw
w
+
-
Solar Pump controller PM DC motor
Vpv
Back- Up system Diesel Generator
-
200 W
-
200 W
-+ +
200 W
+
Ea
Eb
Ec
Xs Rs
ILL VLL
D1 D3 D5
D2 D4D6
+
-
p
N
Id
Ea
Eb
Ec
Xs RsIa
Xs
Xs
Rs
Rs
+
-
VDC
IDC+
+
+
Va
Vb
Vc
Ib
Ic
+-
LvLi
iv +
-
CR
C
LLR
PWM S
+
ovloadR
Si
Di Ri
Ci
Cv
+
LvLi
iv CR
C
LLR
S ovloadR
Si
Di Ri
Ci
Cv
+iv CR
C
LLR
S ovloadR
Si Ci
Cv
sDT (1 ) sD T
iv
i oV V
( )Lv t
( )Ci t
PWM
D3
Wind PMSG
turbine
Rectifier
DC
DC
Cotrol UnitControl Signal
Power Converter
DCI
LOAD
+
-
DCV
MPPT algorithm
+
-
Vcc
D9
Vin
+
-
An3 An5An4
Relay
LM7805 +5V
D2
2
31
7
27K
5.6K22uF
5.1V
1N4001
10K
8
3305.6 3305.615K
680
5.6K
330uF
680
15V
22uF
6.8K
15K
5.6K22uF
Relay
5.1V
VLoadSwitch
20K
5.6K22uF
5.1V
680 Vb
att.
D2
MOSPEC S20C40C(x2)
D3
1mH FQP12P20(x2)
0.39 c/v
1.2 K
+ +
+
Current Transducer
5VAn2
GND
Arduino Uno
An2
An3
An4An5
+5V
An
alo
g0
..5
GND
An0
An1
D0D1D2D3D4D5D6D7D8D9D10D11D12
Swep
tA
rea
Ewind EturbineD
Swep
tA
rea
H
VAWTHAWT
Eunabsorved
DCP
mw
maxP
0, 0m
dP dP
dw dD
0, 0, 0 0DC
m DC m
dVdP dD dP
dw dV dw dD
0, 0, 0 0DC
m DC m
dVdP dD dP
dw dV dw dD
High Speed Low Speed
Track Starting Point Track Starting Point
D D
Maximum Power Point Tracking process
PDCk >PDCk-1
Read PDC
D=Dold-∆D
Dk-1 >Dk-2
NO
D=Dold-∆D
YES
D=Dold+∆D
NODk-1 >Dk-2
YES
D=Dold+∆D
YES NO
sDT
I
Li
i oV V
L
sT
iV
L
LI
t
oV
R
oL
load
VI
R
t
t
t
sDT
CV
( )v t
LI V
C RC
sT
V
RC
CV
t
0.5
0.0
1
1.5
2
2.5
3
5 10 15 20
Voltage
Cu
rren
t
Vmp
Imp
Isc Short circuit current
VocOpen circuit voltage
MPP
V.Battery
I-V PV panel characteristics
DC/DC converterDC loadVbatt
+
-
Vp
v
Ipv +
-
Vo
Io
A/D A/D
MPPT and Charging algorithm
PWM
PV array
MPP
Figure 4.6. I-V 60 Watt 12 V PV panel characteristics
31
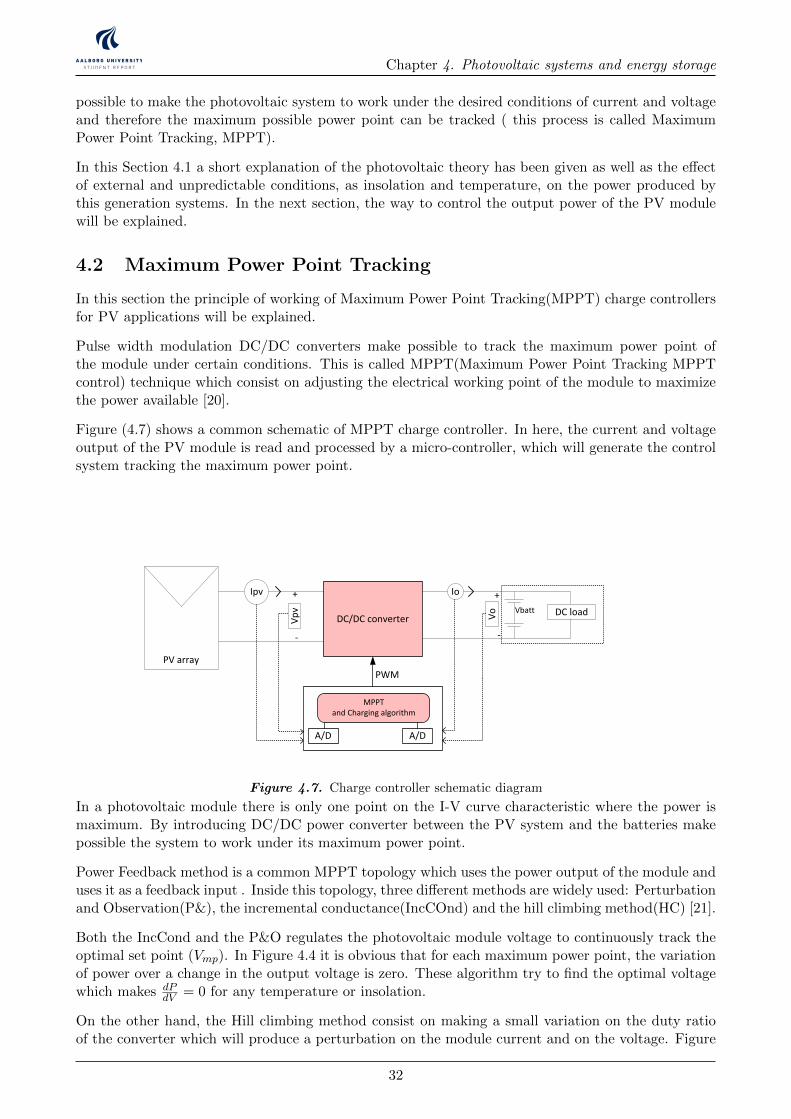
Chapter 4. Photovoltaic systems and energy storage
possible to make the photovoltaic system to work under the desired conditions of current and voltageand therefore the maximum possible power point can be tracked ( this process is called MaximumPower Point Tracking, MPPT).
In this Section 4.1 a short explanation of the photovoltaic theory has been given as well as the effectof external and unpredictable conditions, as insolation and temperature, on the power produced bythis generation systems. In the next section, the way to control the output power of the PV modulewill be explained.
4.2 Maximum Power Point Tracking
In this section the principle of working of Maximum Power Point Tracking(MPPT) charge controllersfor PV applications will be explained.
Pulse width modulation DC/DC converters make possible to track the maximum power point ofthe module under certain conditions. This is called MPPT(Maximum Power Point Tracking MPPTcontrol) technique which consist on adjusting the electrical working point of the module to maximizethe power available [20].
Figure (4.7) shows a common schematic of MPPT charge controller. In here, the current and voltageoutput of the PV module is read and processed by a micro-controller, which will generate the controlsystem tracking the maximum power point.
Power Loss
0.5
0.0
1
1.5
2
2.5
3
5 10 15 20
Voltage
Cu
rren
t
Vmp
ImpMaximun power point
Isc Short circuit current
VscShort circuit voltage
MPP
V.Battery
I-V PV panel characteristics
DC/DC converterDC loadVbatt
+
-
Vp
v
Ipv +
-
Vo
Io
A/D A/D
MPPT and Charging algorithm
PWM
PV array
Figure 4.7. Charge controller schematic diagram
In a photovoltaic module there is only one point on the I-V curve characteristic where the power ismaximum. By introducing DC/DC power converter between the PV system and the batteries makepossible the system to work under its maximum power point.
Power Feedback method is a common MPPT topology which uses the power output of the module anduses it as a feedback input . Inside this topology, three different methods are widely used: Perturbationand Observation(P&), the incremental conductance(IncCOnd) and the hill climbing method(HC) [21].
Both the IncCond and the P&O regulates the photovoltaic module voltage to continuously track theoptimal set point (Vmp). In Figure 4.4 it is obvious that for each maximum power point, the variationof power over a change in the output voltage is zero. These algorithm try to find the optimal voltagewhich makes dP
dV = 0 for any temperature or insolation.
On the other hand, the Hill climbing method consist on making a small variation on the duty ratioof the converter which will produce a perturbation on the module current and on the voltage. Figure
32
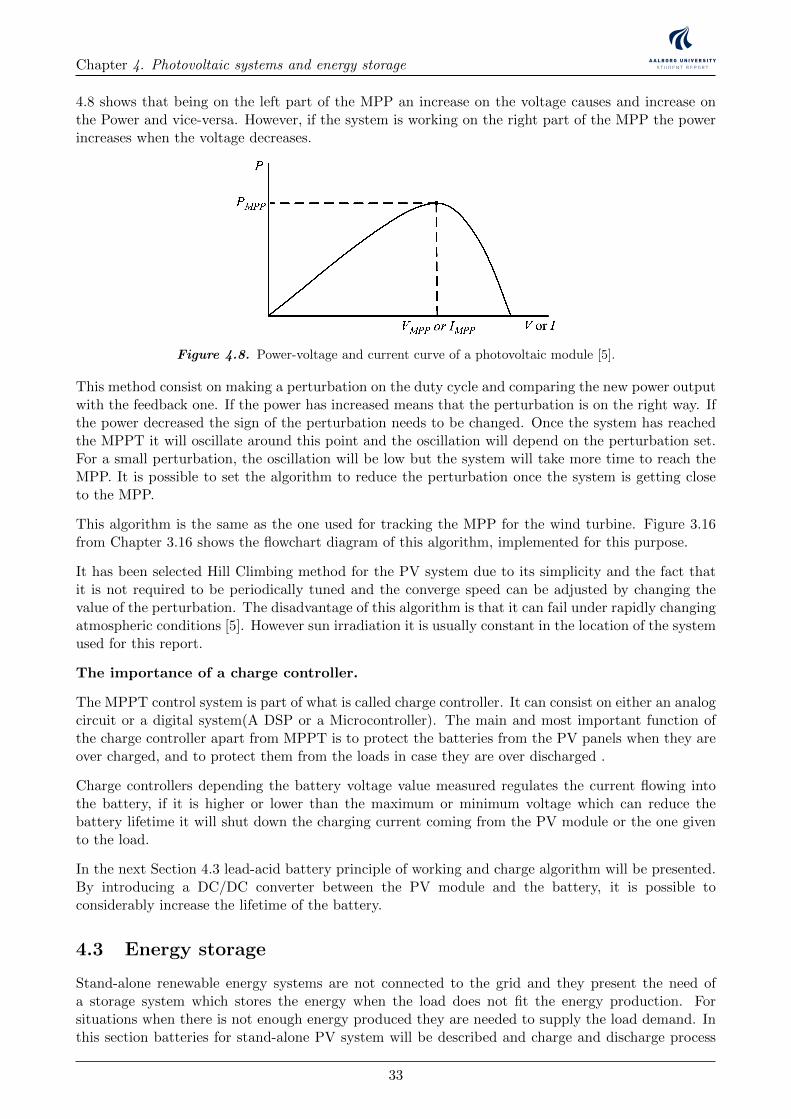
Chapter 4. Photovoltaic systems and energy storage
4.8 shows that being on the left part of the MPP an increase on the voltage causes and increase onthe Power and vice-versa. However, if the system is working on the right part of the MPP the powerincreases when the voltage decreases.
Figure 4.8. Power-voltage and current curve of a photovoltaic module [5].
This method consist on making a perturbation on the duty cycle and comparing the new power outputwith the feedback one. If the power has increased means that the perturbation is on the right way. Ifthe power decreased the sign of the perturbation needs to be changed. Once the system has reachedthe MPPT it will oscillate around this point and the oscillation will depend on the perturbation set.For a small perturbation, the oscillation will be low but the system will take more time to reach theMPP. It is possible to set the algorithm to reduce the perturbation once the system is getting closeto the MPP.
This algorithm is the same as the one used for tracking the MPP for the wind turbine. Figure 3.16from Chapter 3.16 shows the flowchart diagram of this algorithm, implemented for this purpose.
It has been selected Hill Climbing method for the PV system due to its simplicity and the fact thatit is not required to be periodically tuned and the converge speed can be adjusted by changing thevalue of the perturbation. The disadvantage of this algorithm is that it can fail under rapidly changingatmospheric conditions [5]. However sun irradiation it is usually constant in the location of the systemused for this report.
The importance of a charge controller.
The MPPT control system is part of what is called charge controller. It can consist on either an analogcircuit or a digital system(A DSP or a Microcontroller). The main and most important function ofthe charge controller apart from MPPT is to protect the batteries from the PV panels when they areover charged, and to protect them from the loads in case they are over discharged .
Charge controllers depending the battery voltage value measured regulates the current flowing intothe battery, if it is higher or lower than the maximum or minimum voltage which can reduce thebattery lifetime it will shut down the charging current coming from the PV module or the one givento the load.
In the next Section 4.3 lead-acid battery principle of working and charge algorithm will be presented.By introducing a DC/DC converter between the PV module and the battery, it is possible toconsiderably increase the lifetime of the battery.
4.3 Energy storage
Stand-alone renewable energy systems are not connected to the grid and they present the need ofa storage system which stores the energy when the load does not fit the energy production. Forsituations when there is not enough energy produced they are needed to supply the load demand. Inthis section batteries for stand-alone PV system will be described and charge and discharge process
33
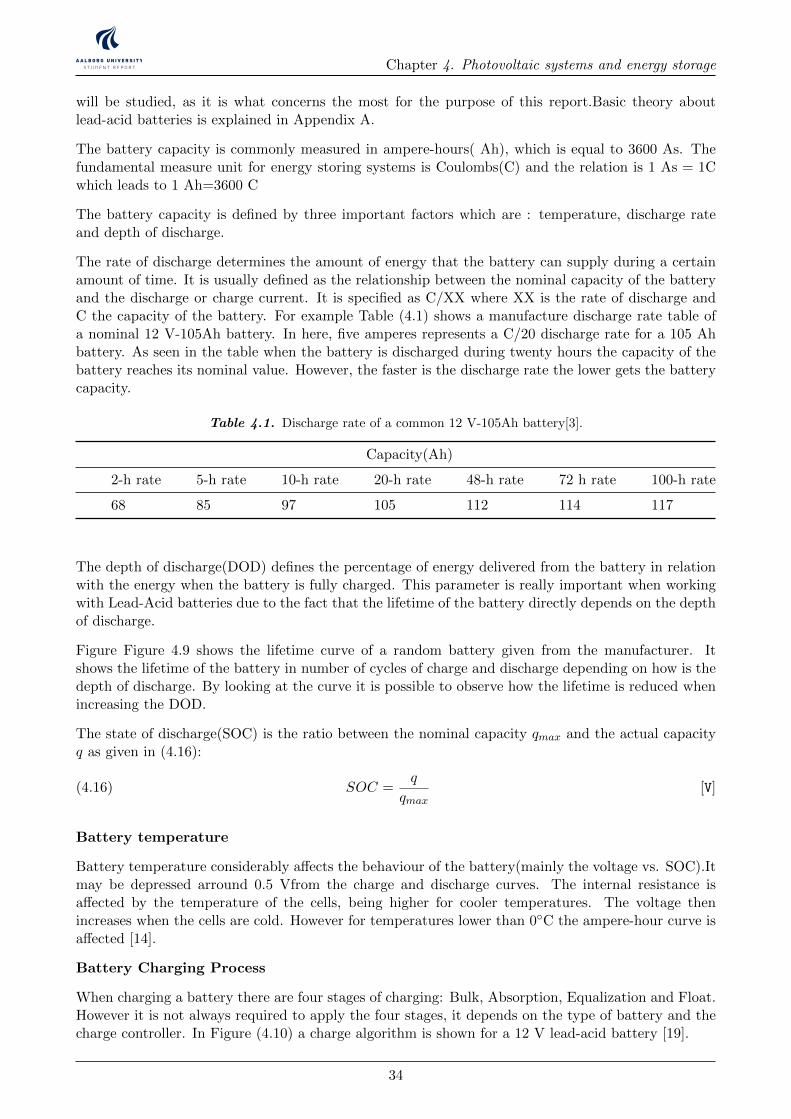
Chapter 4. Photovoltaic systems and energy storage
will be studied, as it is what concerns the most for the purpose of this report.Basic theory aboutlead-acid batteries is explained in Appendix A.
The battery capacity is commonly measured in ampere-hours( Ah), which is equal to 3600 As. Thefundamental measure unit for energy storing systems is Coulombs(C) and the relation is 1 As = 1Cwhich leads to 1 Ah=3600 C
The battery capacity is defined by three important factors which are : temperature, discharge rateand depth of discharge.
The rate of discharge determines the amount of energy that the battery can supply during a certainamount of time. It is usually defined as the relationship between the nominal capacity of the batteryand the discharge or charge current. It is specified as C/XX where XX is the rate of discharge andC the capacity of the battery. For example Table (4.1) shows a manufacture discharge rate table ofa nominal 12 V-105Ah battery. In here, five amperes represents a C/20 discharge rate for a 105 Ahbattery. As seen in the table when the battery is discharged during twenty hours the capacity of thebattery reaches its nominal value. However, the faster is the discharge rate the lower gets the batterycapacity.
Table 4.1. Discharge rate of a common 12 V-105Ah battery[3].
Capacity(Ah)
2-h rate 5-h rate 10-h rate 20-h rate 48-h rate 72 h rate 100-h rate
68 85 97 105 112 114 117
The depth of discharge(DOD) defines the percentage of energy delivered from the battery in relationwith the energy when the battery is fully charged. This parameter is really important when workingwith Lead-Acid batteries due to the fact that the lifetime of the battery directly depends on the depthof discharge.
Figure Figure 4.9 shows the lifetime curve of a random battery given from the manufacturer. Itshows the lifetime of the battery in number of cycles of charge and discharge depending on how is thedepth of discharge. By looking at the curve it is possible to observe how the lifetime is reduced whenincreasing the DOD.
The state of discharge(SOC) is the ratio between the nominal capacity qmax and the actual capacityq as given in (4.16):
SOC =q
qmax[V](4.16)
Battery temperature
Battery temperature considerably affects the behaviour of the battery(mainly the voltage vs. SOC).Itmay be depressed arround 0.5 Vfrom the charge and discharge curves. The internal resistance isaffected by the temperature of the cells, being higher for cooler temperatures. The voltage thenincreases when the cells are cold. However for temperatures lower than 0C the ampere-hour curve isaffected [14].
Battery Charging Process
When charging a battery there are four stages of charging: Bulk, Absorption, Equalization and Float.However it is not always required to apply the four stages, it depends on the type of battery and thecharge controller. In Figure (4.10) a charge algorithm is shown for a 12 V lead-acid battery [19].
34
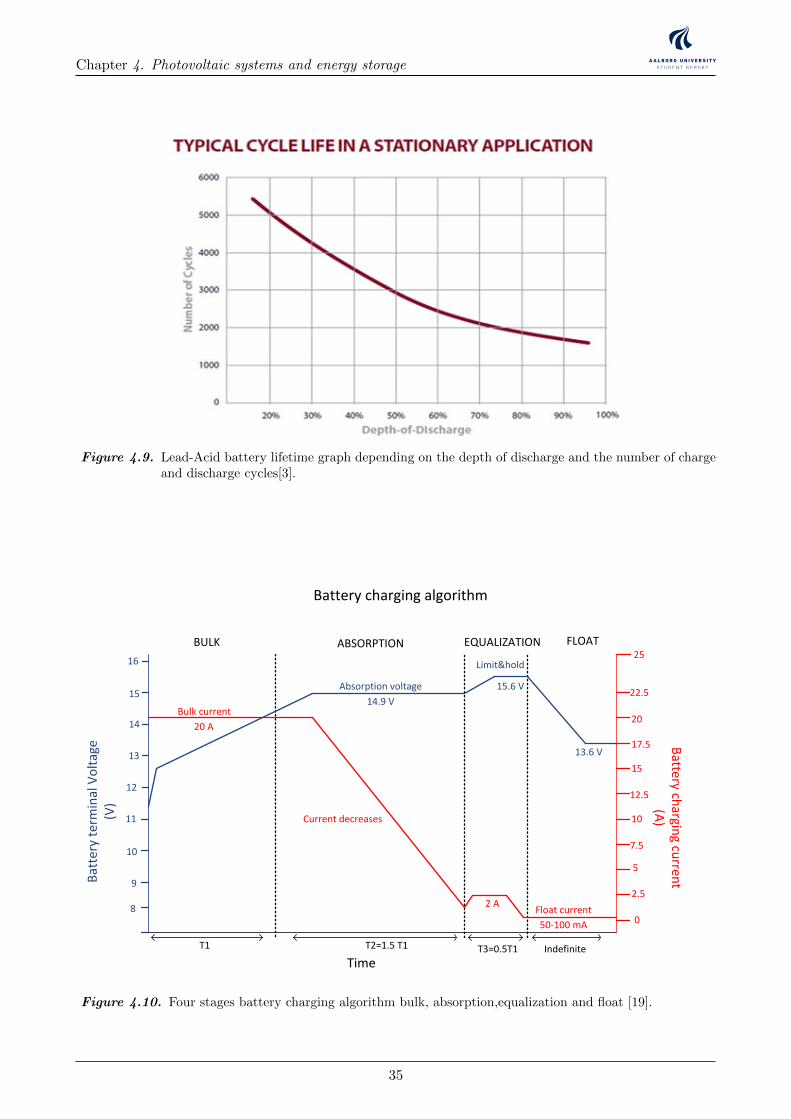
Chapter 4. Photovoltaic systems and energy storage
Figure 4.9. Lead-Acid battery lifetime graph depending on the depth of discharge and the number of chargeand discharge cycles[3].
9
10
11
12
13
14
15
80
2.5
5
7.5
10
12.5
15
17.5
20
22.5
25BULK ABSORPTION EQUALIZATION FLOAT
Bulk current
20 A
Absorption voltage
14.9 V
13.6 V
15.6 V
Float current
50-100 mA
2 A
Current decreases
Limit&hold16
IndefiniteT1 T3=0.5T1T2=1.5 T1
Bat
tery
ter
min
al V
olt
age
(V)
Battery ch
arging cu
rrent
(A)
Time
Battery charging algorithm
Figure 4.10. Four stages battery charging algorithm bulk, absorption,equalization and float [19].
35
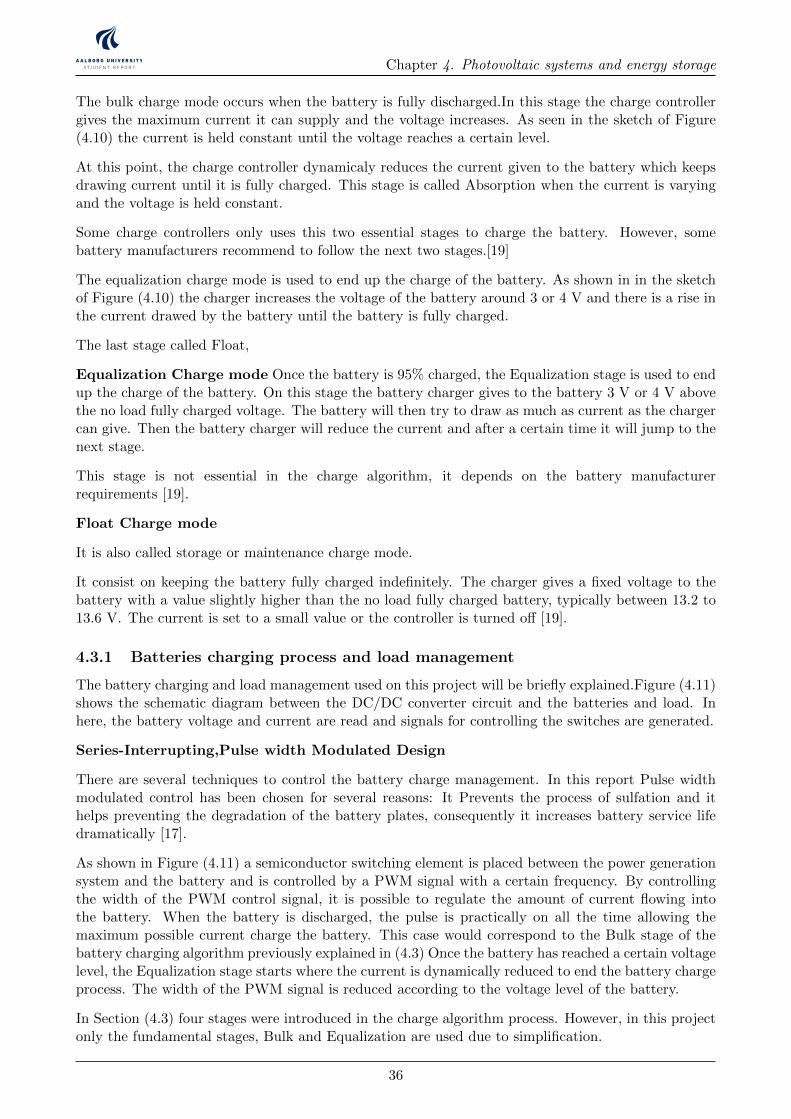
Chapter 4. Photovoltaic systems and energy storage
The bulk charge mode occurs when the battery is fully discharged.In this stage the charge controllergives the maximum current it can supply and the voltage increases. As seen in the sketch of Figure(4.10) the current is held constant until the voltage reaches a certain level.
At this point, the charge controller dynamicaly reduces the current given to the battery which keepsdrawing current until it is fully charged. This stage is called Absorption when the current is varyingand the voltage is held constant.
Some charge controllers only uses this two essential stages to charge the battery. However, somebattery manufacturers recommend to follow the next two stages.[19]
The equalization charge mode is used to end up the charge of the battery. As shown in in the sketchof Figure (4.10) the charger increases the voltage of the battery around 3 or 4 V and there is a rise inthe current drawed by the battery until the battery is fully charged.
The last stage called Float,
Equalization Charge mode Once the battery is 95% charged, the Equalization stage is used to endup the charge of the battery. On this stage the battery charger gives to the battery 3 V or 4 V abovethe no load fully charged voltage. The battery will then try to draw as much as current as the chargercan give. Then the battery charger will reduce the current and after a certain time it will jump to thenext stage.
This stage is not essential in the charge algorithm, it depends on the battery manufacturerrequirements [19].
Float Charge mode
It is also called storage or maintenance charge mode.
It consist on keeping the battery fully charged indefinitely. The charger gives a fixed voltage to thebattery with a value slightly higher than the no load fully charged battery, typically between 13.2 to13.6 V. The current is set to a small value or the controller is turned off [19].
4.3.1 Batteries charging process and load management
The battery charging and load management used on this project will be briefly explained.Figure (4.11)shows the schematic diagram between the DC/DC converter circuit and the batteries and load. Inhere, the battery voltage and current are read and signals for controlling the switches are generated.
Series-Interrupting,Pulse width Modulated Design
There are several techniques to control the battery charge management. In this report Pulse widthmodulated control has been chosen for several reasons: It Prevents the process of sulfation and ithelps preventing the degradation of the battery plates, consequently it increases battery service lifedramatically [17].
As shown in Figure (4.11) a semiconductor switching element is placed between the power generationsystem and the battery and is controlled by a PWM signal with a certain frequency. By controllingthe width of the PWM control signal, it is possible to regulate the amount of current flowing intothe battery. When the battery is discharged, the pulse is practically on all the time allowing themaximum possible current charge the battery. This case would correspond to the Bulk stage of thebattery charging algorithm previously explained in (4.3) Once the battery has reached a certain voltagelevel, the Equalization stage starts where the current is dynamically reduced to end the battery chargeprocess. The width of the PWM signal is reduced according to the voltage level of the battery.
In Section (4.3) four stages were introduced in the charge algorithm process. However, in this projectonly the fundamental stages, Bulk and Equalization are used due to simplification.
36
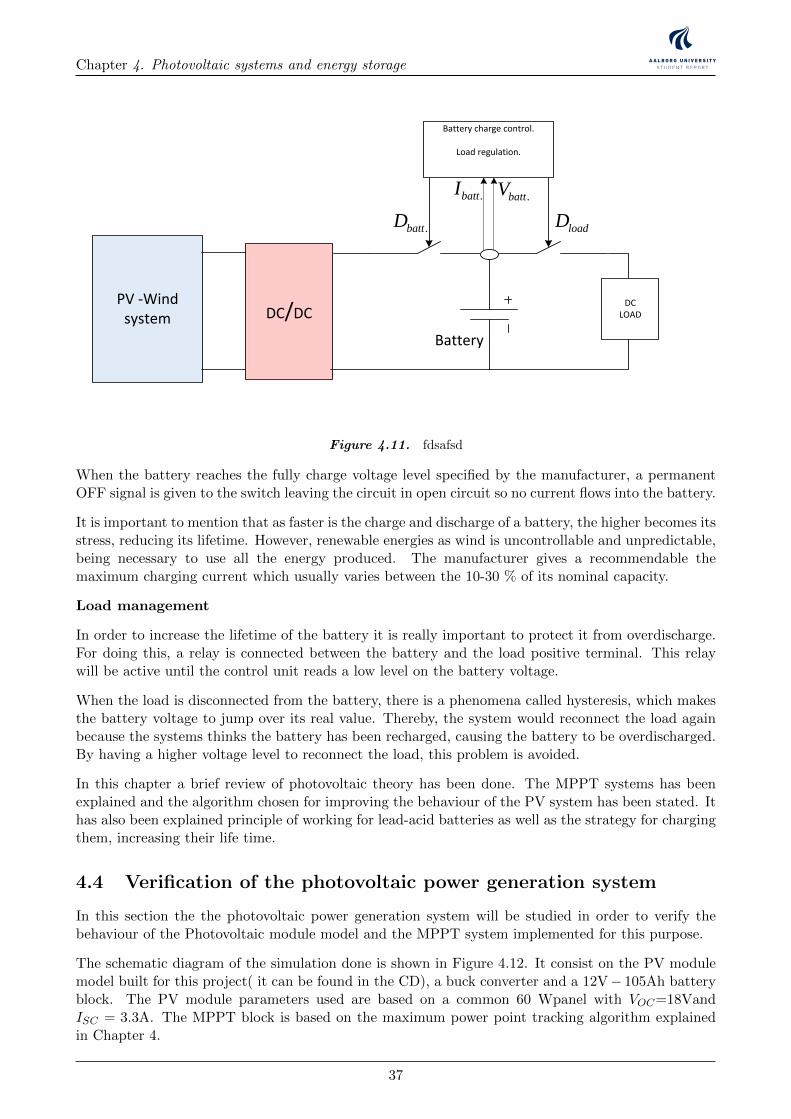
Chapter 4. Photovoltaic systems and energy storage
PMSGWind
turbine
Rectifier
wm
DC
DCLOAD
Rotating speed -Power characteristic Pactual
Cotrol Unit
Poptimal
error
Control Signal
Power Converter
PMSG
Wind turbine
Rectifier
DC
DCLOAD
Cotrol Unit
Control Signal
Power Converter
Wind speed
Vw
R
Wm
Wm-optimal
error
+-
+ -
Ea
Eb
Ec
Xs Rs
ILL VLL
D1 D3 D5
D2 D4D6
+
-
p
N
Id
Ea
Eb
Ec
Xs RsIa
Xs
Xs
Rs
Rs
+
-
VDC
IDC+
+
+
Va
Vb
Vc
Ib
Ic
H
D
VG
S1
V1
V2
L
+
-
Vo
M1
M2
D1
D2
+
-
+
-
Vi1
Vi2
+ -VL
+
-Vo
Ii1
C
L
D1
D2
IL IC Io
+
-
+
-
Vi1
Vi2
+ -VL
+
-
+
-Vo
ID1
C
L
D1
D2
IL IC Io
+VD2
-
+ -VM1
M1
M2
M1
M2
C
VG
S2
+
-
+
-
V1
V2
+ -VL
+
-VD1
+
-Vo
+ -VM2
ID2
I1
C
L
D1
D2
IL IC Io
M1
M2
+
-
+
-
Vi1
Vi2
+ -VL
+
-Vo
+ -VM2
ID2
C
L
D1
D2
IL IC Io
Vc+
-
VM1+ -
M2
M1
VPVDC
DC
VWindDC
DC
LOADVo+
-
VPV
DC
DC
VWind
LOADVo
+
-
VD2+
-
-
+
VD1
+
+
VD1
+-
+
-
+ -VM1
+ -VM2
Ii2
ID1
+
+ - + -
+ - + -
PMSG
500 W
Vertical axis wind turbine Gear box
+
-
600 W Vpv
DC/DC
Ibat
+
-
Vo
Io
3-ph Rectifier
+
-VWG
IPV
IWG
Control Unit
ON/OFF Control
IWG
VWG
Vpv
IPV
IbatVo
Dummy Load
12 V 450 AH Battery Bench
900 W
Control signals
PMSG
500 W
Vertical axis wind turbine Gear box
+
-
Vw
w
+
-
Solar Pump controller PM DC motor
Vpv
Back- Up system Diesel Generator
-
200 W
-
200 W
-+ +
200 W
+
Ea
Eb
Ec
Xs Rs
ILL VLL
D1 D3 D5
D2 D4D6
+
-
p
N
Id
Ea
Eb
Ec
Xs RsIa
Xs
Xs
Rs
Rs
+
-
VDC
IDC+
+
+
Va
Vb
Vc
Ib
Ic
+-
LvLi
iv +
-
CR
C
LLR
PWM S
+
ovloadR
Si
Di Ri
Ci
Cv
+
LvLi
iv CR
C
LLR
S ovloadR
Si
Di Ri
Ci
Cv
+iv CR
C
LLR
S ovloadR
Si Ci
Cv
sDT (1 ) sD T
iv
i oV V
( )Lv t
( )Ci t
PWM
D3
PMSGWind
turbine
Rectifier
DC
DC
Cotrol UnitControl Signal
Power Converter
DCI
LOAD
+
-
DCV
MPPT algorithm
+
-
Vcc
D9
Vin
+
-
An3 An5An4
Relay
LM7805 +5V
D2
2
31
7
27K
5.6K22uF
5.1V
1N4001
10K
8
3305.6 3305.615K
680
5.6K
330uF
680
15V
22uF
6.8K
15K
5.6K22uF
Relay
5.1V
VLoadSwitch
20K
5.6K22uF
5.1V
680 Vb
att.
D2
MOSPEC S20C40C(x2)
D3
1mH FQP12P20(x2)
0.39 c/v
1.2 K
+ +
+
Current Transducer
5VAn2
GND
Arduino Uno
An2
An3
An4An5
+5V
An
alo
g 0
..5
GND
An0
An1
D0D1D2D3D4D5D6D7D8D9D10D11D12
Swep
t A
rea
Ewind EturbineD
Swep
t A
rea
H
VAWTHAWT
Eunabsorved
DCP
mw
maxP
0, 0m
dP dP
dw dD
0, 0, 0 0DC
m DC m
dVdP dD dP
dw dV dw dD
0, 0, 0 0DC
m DC m
dVdP dD dP
dw dV dw dD
High Speed Low Speed
Track Starting Point Track Starting Point
D D
Maximum Power Point Tracking process
PDCk >PDCk-1
Read PDC
D=Dold-∆D
Dk-1 >Dk-2
NO
D=Dold-∆D
YES
D=Dold+∆D
NODk-1 >Dk-2
YES
D=Dold+∆D
YES NO
sDT
I
Li
i oV V
L
sT
iV
L
LI
t
oV
R
oL
load
VI
R
t
t
t
sDT
CV
( )v t
LI V
C RC
sT
V
RC
CV
t
0.5
0.0
1
1.5
2
2.5
3
5 10 15 20
Voltage
Cu
rren
t
Vmp
Imp
Isc Short circuit current
VocOpen circuit voltage
MPP
V.Battery
I-V PV panel characteristics
DC/DC converterDC loadVbatt
+
-
Vp
v
Ipv +
-
Vo
Io
A/D A/D
MPPT and Charging algorithm
PWM
PV array
MPP
SCI
1dI
I
Load
2dI
1D
SR
PR2D
rI
DC/DCPV -Wind
systemDC
LOAD
Battery charge control.
Load regulation.
.battV.battI
Battery
.battD loadD
Figure 4.11. fdsafsd
When the battery reaches the fully charge voltage level specified by the manufacturer, a permanentOFF signal is given to the switch leaving the circuit in open circuit so no current flows into the battery.
It is important to mention that as faster is the charge and discharge of a battery, the higher becomes itsstress, reducing its lifetime. However, renewable energies as wind is uncontrollable and unpredictable,being necessary to use all the energy produced. The manufacturer gives a recommendable themaximum charging current which usually varies between the 10-30 % of its nominal capacity.
Load management
In order to increase the lifetime of the battery it is really important to protect it from overdischarge.For doing this, a relay is connected between the battery and the load positive terminal. This relaywill be active until the control unit reads a low level on the battery voltage.
When the load is disconnected from the battery, there is a phenomena called hysteresis, which makesthe battery voltage to jump over its real value. Thereby, the system would reconnect the load againbecause the systems thinks the battery has been recharged, causing the battery to be overdischarged.By having a higher voltage level to reconnect the load, this problem is avoided.
In this chapter a brief review of photovoltaic theory has been done. The MPPT systems has beenexplained and the algorithm chosen for improving the behaviour of the PV system has been stated. Ithas also been explained principle of working for lead-acid batteries as well as the strategy for chargingthem, increasing their life time.
4.4 Verification of the photovoltaic power generation system
In this section the the photovoltaic power generation system will be studied in order to verify thebehaviour of the Photovoltaic module model and the MPPT system implemented for this purpose.
The schematic diagram of the simulation done is shown in Figure 4.12. It consist on the PV modulemodel built for this project( it can be found in the CD), a buck converter and a 12V− 105Ah batteryblock. The PV module parameters used are based on a common 60 Wpanel with VOC=18VandISC = 3.3A. The MPPT block is based on the maximum power point tracking algorithm explainedin Chapter 4.
37
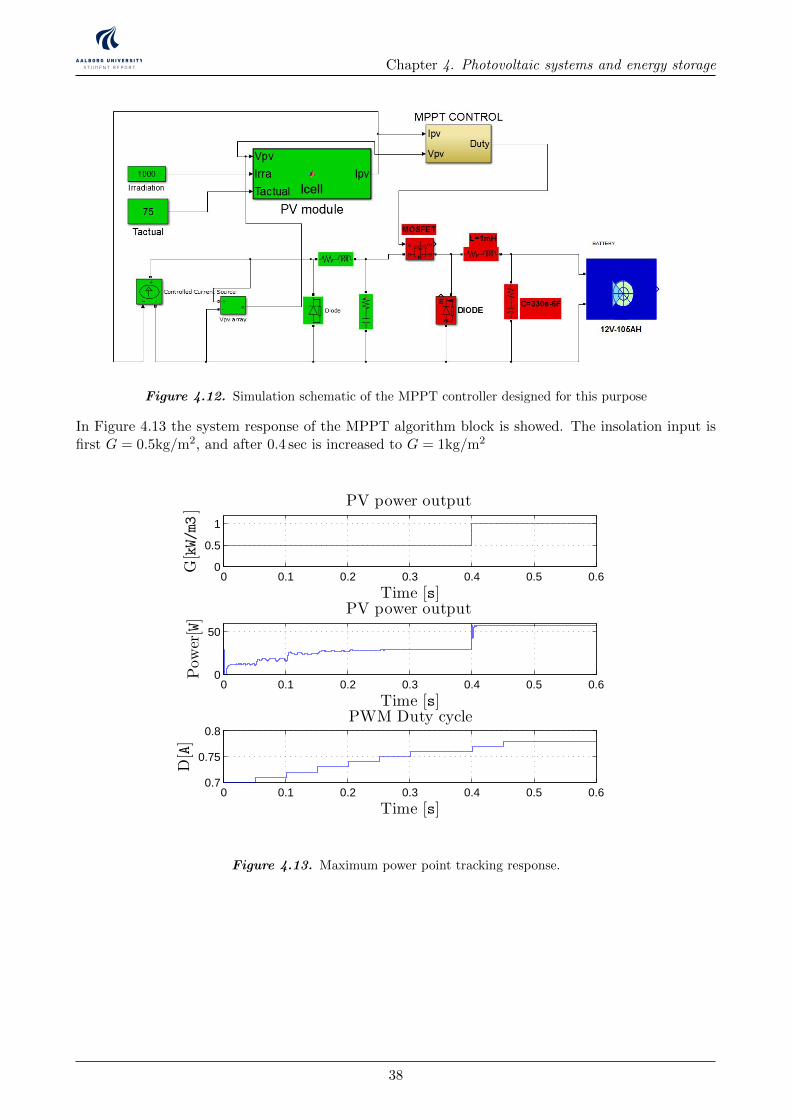
Chapter 4. Photovoltaic systems and energy storage
Figure 4.12. Simulation schematic of the MPPT controller designed for this purpose
In Figure 4.13 the system response of the MPPT algorithm block is showed. The insolation input isfirst G = 0.5kg/m2, and after 0.4 sec is increased to G = 1kg/m2
0 0.1 0.2 0.3 0.4 0.5 0.60
0.5
1
Time [s]
G[kW/m3]
PV power output
0 0.1 0.2 0.3 0.4 0.5 0.60
50
Time [s]
Power[W]
PV power output
0 0.1 0.2 0.3 0.4 0.5 0.60.7
0.75
0.8
Time [s]
D[A]
PWM Duty cycle
Figure 4.13. Maximum power point tracking response.
38
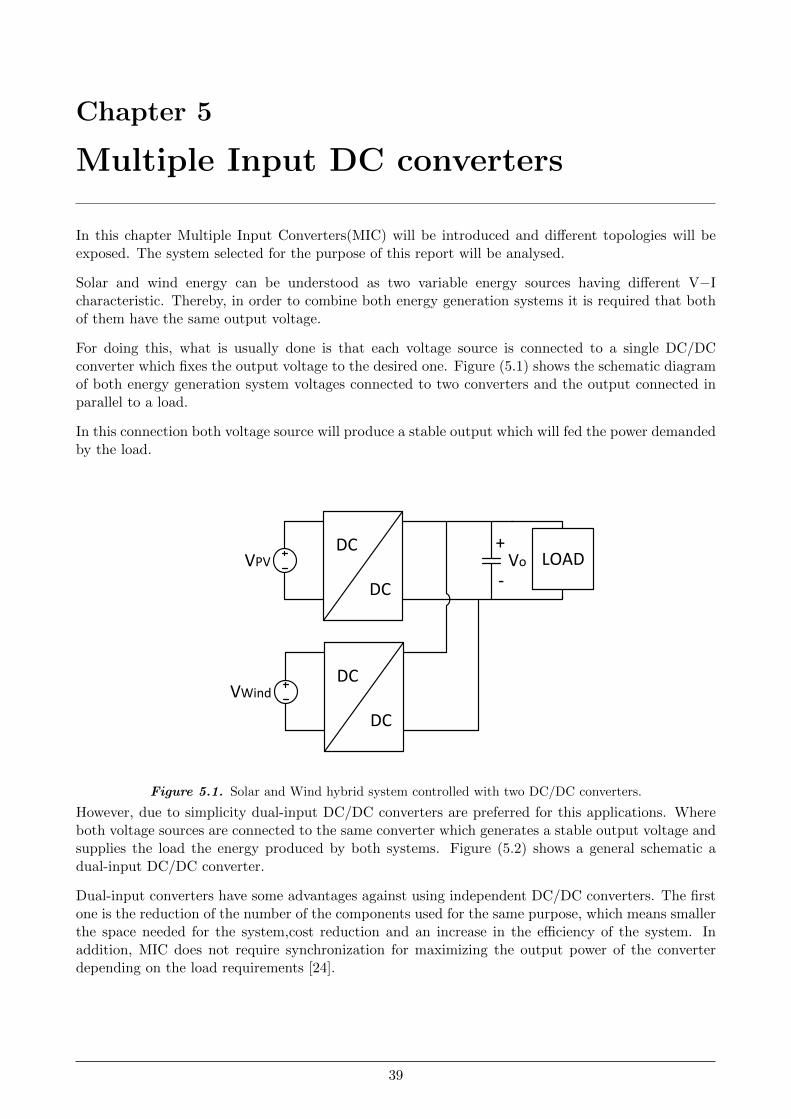
Chapter 5
Multiple Input DC converters
In this chapter Multiple Input Converters(MIC) will be introduced and different topologies will beexposed. The system selected for the purpose of this report will be analysed.
Solar and wind energy can be understood as two variable energy sources having different V−Icharacteristic. Thereby, in order to combine both energy generation systems it is required that bothof them have the same output voltage.
For doing this, what is usually done is that each voltage source is connected to a single DC/DCconverter which fixes the output voltage to the desired one. Figure (5.1) shows the schematic diagramof both energy generation system voltages connected to two converters and the output connected inparallel to a load.
In this connection both voltage source will produce a stable output which will fed the power demandedby the load.
VGS1
V1
V2
L
+
-V1
V2+
-
+
-
Vo
M1
M2
D1
D2
+
-
+
-
V1
V2
+ -VL
+
-Vo
I1,2C
L
D1
D2
IL IC Io
+
-
+
-
V1
V2
+ -VL
+
-
+
-Vo
ID2C
L
D1
D2
IL IC Io
+VD1-
+ -VM2
M1
M2
M1
M2
C Ro
VGS2
+
-
+
-
V1
V2
+ -VL
+
-VD1
+
-Vo
+ -VM2
ID2
I1
C
L
D1
D2
IL IC Io
+
M1
M2
+
-
+
-
V1
V2
+ -VL
+
-Vo
+ -VM2
ID2C
L
D1
D2
IL IC Io
Vc+
-
VM1+ -
M2
M1
VPVDC
DC
VWindDC
DC
LOADVo+
-
VPV
DC
DC
VWind
LOADVo+
-
Figure 5.1. Solar and Wind hybrid system controlled with two DC/DC converters.
However, due to simplicity dual-input DC/DC converters are preferred for this applications. Whereboth voltage sources are connected to the same converter which generates a stable output voltage andsupplies the load the energy produced by both systems. Figure (5.2) shows a general schematic adual-input DC/DC converter.
Dual-input converters have some advantages against using independent DC/DC converters. The firstone is the reduction of the number of the components used for the same purpose, which means smallerthe space needed for the system,cost reduction and an increase in the efficiency of the system. Inaddition, MIC does not require synchronization for maximizing the output power of the converterdepending on the load requirements [24].
39
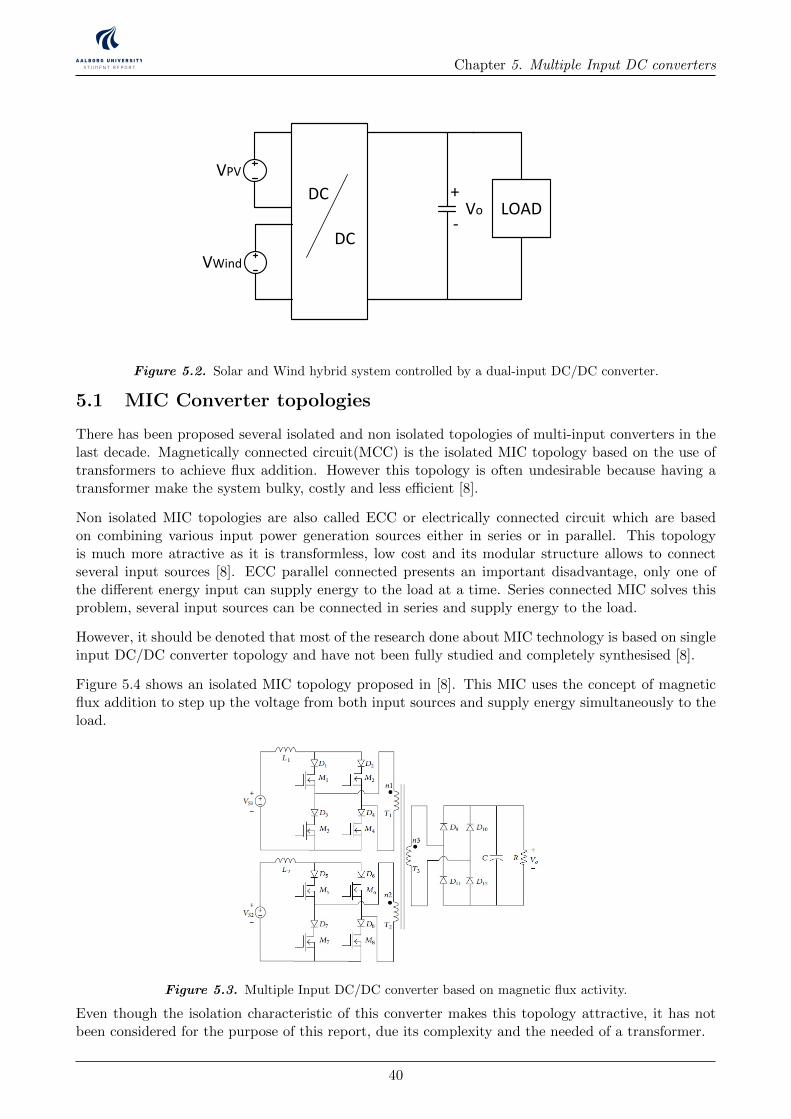
Chapter 5. Multiple Input DC converters
VGS1
V1
V2
L
+
-V1
V2+
-
+
-
Vo
M1
M2
D1
D2
+
-
+
-
V1
V2
+ -VL
+
-Vo
I1,2C
L
D1
D2
IL IC Io
+
-
+
-
V1
V2
+ -VL
+
-
+
-Vo
ID2C
L
D1
D2
IL IC Io
+VD1-
+ -VM2
M1
M2
M1
M2
C Ro
VGS2
+
-
+
-
V1
V2
+ -VL
+
-VD1
+
-Vo
+ -VM2
ID2
I1
C
L
D1
D2
IL IC Io
+
M1
M2
+
-
+
-
V1
V2
+ -VL
+
-Vo
+ -VM2
ID2C
L
D1
D2
IL IC Io
Vc+
-
VM1+ -
M2
M1
VPVDC
DC
VWindDC
DC
LOADVo+
-
VPV
DC
DC
VWind
LOADVo+
-
Figure 5.2. Solar and Wind hybrid system controlled by a dual-input DC/DC converter.
5.1 MIC Converter topologies
There has been proposed several isolated and non isolated topologies of multi-input converters in thelast decade. Magnetically connected circuit(MCC) is the isolated MIC topology based on the use oftransformers to achieve flux addition. However this topology is often undesirable because having atransformer make the system bulky, costly and less efficient [8].
Non isolated MIC topologies are also called ECC or electrically connected circuit which are basedon combining various input power generation sources either in series or in parallel. This topologyis much more atractive as it is transformless, low cost and its modular structure allows to connectseveral input sources [8]. ECC parallel connected presents an important disadvantage, only one ofthe different energy input can supply energy to the load at a time. Series connected MIC solves thisproblem, several input sources can be connected in series and supply energy to the load.
However, it should be denoted that most of the research done about MIC technology is based on singleinput DC/DC converter topology and have not been fully studied and completely synthesised [8].
Figure 5.4 shows an isolated MIC topology proposed in [8]. This MIC uses the concept of magneticflux addition to step up the voltage from both input sources and supply energy simultaneously to theload.
Figure 5.3. Multiple Input DC/DC converter based on magnetic flux activity.
Even though the isolation characteristic of this converter makes this topology attractive, it has notbeen considered for the purpose of this report, due its complexity and the needed of a transformer.
40
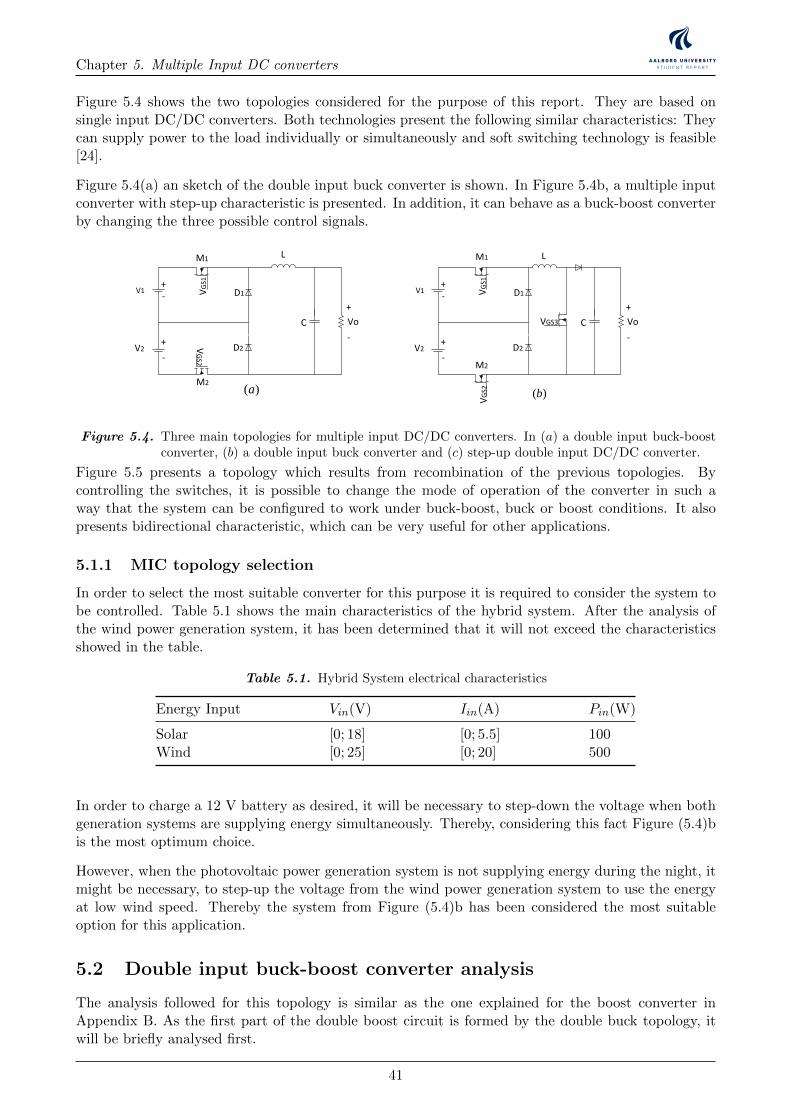
Chapter 5. Multiple Input DC converters
Figure 5.4 shows the two topologies considered for the purpose of this report. They are based onsingle input DC/DC converters. Both technologies present the following similar characteristics: Theycan supply power to the load individually or simultaneously and soft switching technology is feasible[24].
Figure 5.4(a) an sketch of the double input buck converter is shown. In Figure 5.4b, a multiple inputconverter with step-up characteristic is presented. In addition, it can behave as a buck-boost converterby changing the three possible control signals.
PMSGWind
turbine
Rectifier
wm
DC
DCLOAD
Rotating speed -Power characteristic Pactual
Cotrol Unit
Poptimal
error
Control Signal
Power Converter
PMSG
Wind turbine
Rectifier
DC
DCLOAD
Cotrol Unit
Control Signal
Power Converter
Wind speed
Vw
R
Wm
Wm-optimal
error
+-
+ -
Ea
Eb
Ec
Xs Rs
ILL VLL
D1 D3 D5
D2 D4D6
+
-
p
N
Id
Ea
Eb
Ec
Xs RsIa
Xs
Xs
Rs
Rs
+
-
VDC
IDC+
+
+
Va
Vb
Vc
Ib
Ic
H
D
VPVDC
DC
VWindDC
DC
LOADVo+
-
VPV
DC
DC
VWind
LOADVo
+
-
+
+ - + -
+ - + -
PMSG
500 W
Vertical axis wind turbine Gear box
+
-
600 W Vpv
DC/DC
Ibat
+
-
Vo
Io
3-ph Rectifier
+
-VWG
IPV
IWG
Control Unit
ON/OFF Control
IWG
VWG
Vpv
IPV
IbatVo
Dummy Load
12 V 450 AH Battery Bench
900 W
Control signals
PMSG
500 W
Vertical axis wind turbine Gear box
+
-
Vw
w
+
-
Solar Pump controller PM DC motor
Vpv
Back- Up system Diesel Generator
-
200 W
-
200 W
-+ +
200 W
+
Ea
Eb
Ec
Xs Rs
ILL VLL
D1 D3 D5
D2 D4D6
+
-
p
N
Id
Ea
Eb
Ec
Xs RsIa
Xs
Xs
Rs
Rs
+
-
VDC
IDC+
+
+
Va
Vb
Vc
Ib
Ic
+-
LvLi
iv +
-
CR
C
LLR
PWM S
+
ovloadR
Si
Di Ri
Ci
Cv
+
LvLi
iv CR
C
LLR
S ovloadR
Si
Di Ri
Ci
Cv
+iv CR
C
LLR
S ovloadR
Si Ci
Cv
sDT (1 ) sD T
iv
i oV V
( )Lv t
( )Ci t
PWM
D3
PMSGWind
turbine
Rectifier
DC
DC
Cotrol UnitControl Signal
Power Converter
DCI
LOAD
+
-
DCV
MPPT algorithm
+
-
Vcc
D9
Vin
+
-
An3 An5An4
Relay
LM7805 +5V
D2
2
31
7
27K
5.6K22uF
5.1V
1N4001
10K
8
3305.6 3305.615K
680
5.6K
330uF
680
15V
22uF
6.8K
15K
5.6K22uF
Relay
5.1V
VLoadSwitch
20K
5.6K22uF
5.1V
680 Vb
att.
D2
MOSPEC S20C40C(x2)
D3
1mH FQP12P20(x2)
0.39 c/v
1.2 K
+ +
+
Current Transducer
5VAn2
GND
Arduino Uno
An2
An3
An4An5
+5V
An
alo
g 0
..5
GND
An0
An1
D0D1D2D3D4D5D6D7D8D9D10D11D12
Swep
t A
rea
Ewind EturbineD
Swep
t A
rea
H
VAWTHAWT
Eunabsorved
DCP
mw
maxP
0, 0m
dP dP
dw dD
0, 0, 0 0DC
m DC m
dVdP dD dP
dw dV dw dD
0, 0, 0 0DC
m DC m
dVdP dD dP
dw dV dw dD
High Speed Low Speed
Track Starting Point Track Starting Point
D D
Maximum Power Point Tracking process
PDCk >PDCk-1
Read PDC
Iref(k)=Iref(k-1)-∆I
Vk >Vk-1
NO
Iref(k)=Iref(k-1)-∆I
YES
Iref(k)=Iref(k-1)+∆I
NOVk >Vk-1
YES
Iref(k)=Iref(k-1)+∆I
YES NO
sDT
I
Li
i oV V
L
sT
iV
L
LI
t
oV
R
oL
load
VI
R
t
t
t
sDT
CV
( )v t
LI V
C RC
sT
V
RC
CV
t
0.5
0.0
1
1.5
2
2.5
3
5 10 15 20
Voltage
Cu
rren
t
Vmp
Imp
Isc Short circuit current
VocOpen circuit voltage
MPP
V.Battery
I-V PV panel characteristics
DC/DC converterDC loadVbatt
+
-
Vp
v
Ipv +
-
Vo
Io
A/D A/D
MPPT and Charging algorithm
PWM
PV array
MPP
SCI
1dI
I
Load
2dI
1D
SR
PR2D
rI
DC/DCPV -Wind
system
Battery charge control.
Load regulation.
.battV.battI
Battery
.battD loadD
DCLOAD
.battI
t
sDT sT
-
Vin
+
-
Relay
CVbatt.
L Rb
Microcontroller
Iin
Vcontrol1
D1
M1
Sensor Signals Control Signals
VoutVin
Vbatt.
Ibatt
IinIbatt.
Vcontrol1Vcontrol2Vcontrol3
Vcontrol2
Vcontrol3
Vout Vout
file:///C:/Users/Andres/Documents/17c276_250_205.jpg
file:///C:/Users/Andres/Documents/17c276_250_205.jpg
windv
+
-12
12
1R
2R
fR
+
-
12
12
3R
4R
5R 6RoutV
Datalogger
M2
+
-
G
Iref=10A
+
-Vtrian.
Battery Charge ControllerVcontrol Ibatt.
MPPT AlgorithmDCV
DCI
refI+
-
e+
-.triVPWM
G
Io
-
+
-
+
-
+
Vo
V1
V2
C
+ -VL
+
-VD1
+ -VM2
ID2
I1 L
D1
D2
IL IC
M1
M2
VD2
+ -VM1
C Vo
Io+
-
+
-
-
+
+ -VL
+
-ID1
L
D1
D2
IL IC
+VD2
-
+ -VM1
M1
M2+ -VM2
V1
V2
C
+
-Vo
Io
Ii1
Ii2
+
-
+
-
V1
V2
+ -VL
L
D1
D2
IL ICM1
M2
VD2+
-
-
+VD1
+
-
+
-
+
-Vo
Io
Vc
V1
V2
+ -VL
+ -VM2
ID2
C
L
D1
D2
IL IC
+
-
VM1+ -
M2
M1
ID1
VD1
VD1
( )a ( )b
( )c ( )d
+
-
V1
V2
Vo
+
-
VG
S1
LM1
M2
D1
D2
C
-
+
VG
S2
VG
S1
+
-
-
+
V1
V2
+
-
Vo
LM1
M2
D1
D2
C
VG
S2
( )b
( )a
PMSGWind
turbine
Rectifier
wm
DC
DCLOAD
Rotating speed -Power characteristic Pactual
Cotrol Unit
Poptimal
error
Control Signal
Power Converter
PMSG
Wind turbine
Rectifier
DC
DCLOAD
Cotrol Unit
Control Signal
Power Converter
Wind speed
Vw
R
Wm
Wm-optimal
error
+-
+ -
Ea
Eb
Ec
Xs Rs
ILL VLL
D1 D3 D5
D2 D4D6
+
-
p
N
Id
Ea
Eb
Ec
Xs RsIa
Xs
Xs
Rs
Rs
+
-
VDC
IDC+
+
+
Va
Vb
Vc
Ib
Ic
H
D
VPVDC
DC
VWindDC
DC
LOADVo+
-
VPV
DC
DC
VWind
LOADVo
+
-
+
+ - + -
+ - + -
PMSG
500 W
Vertical axis wind turbine Gear box
+
-
600 W Vpv
DC/DC
Ibat
+
-
Vo
Io
3-ph Rectifier
+
-VWG
IPV
IWG
Control Unit
ON/OFF Control
IWG
VWG
Vpv
IPV
IbatVo
Dummy Load
12 V 450 AH Battery Bench
900 W
Control signals
PMSG
500 W
Vertical axis wind turbine Gear box
+
-
Vw
w
+
-Solar Pump controller PM DC motor
Vpv
Back- Up system Diesel Generator
-
200 W
-
200 W
-+ +
200 W
+
Ea
Eb
Ec
Xs Rs
ILL VLL
D1 D3 D5
D2 D4D6
+
-
p
N
Id
Ea
Eb
Ec
Xs RsIa
Xs
Xs
Rs
Rs
+
-
VDC
IDC+
+
+
Va
Vb
Vc
Ib
Ic
+-
LvLi
iv +
-
CR
C
LLR
PWM S
+
ovloadR
Si
Di Ri
Ci
Cv
+
LvLi
iv CR
C
LLR
S ovloadR
Si
Di Ri
Ci
Cv
+iv CR
C
LLR
S ovloadR
Si Ci
Cv
sDT (1 ) sD T
iv
i oV V
( )Lv t
( )Ci t
PWM
D3
PMSGWind
turbine
Rectifier
DC
DC
Cotrol UnitControl Signal
Power Converter
DCI
LOAD
+
-
DCV
MPPT algorithm
+
-
Vcc
D9
Vin
+
-
An3 An5An4
Relay
LM7805 +5V
D2
2
31
7
27K
5.6K22uF
5.1V
1N4001
10K
8
3305.6 3305.615K
680
5.6K
330uF
680
15V
22uF
6.8K
15K
5.6K22uF
Relay
5.1V
VLoadSwitch
20K
5.6K22uF
5.1V
680 Vb
att.
D2
MOSPEC S20C40C(x2)
D3
1mH FQP12P20(x2)
0.39 c/v
1.2 K
+ +
+
Current Transducer
5VAn2
GND
Arduino Uno
An2
An3
An4An5
+5V
An
alo
g 0
..5
GND
An0
An1
D0D1D2D3D4D5D6D7D8D9D10D11D12
Swep
t A
rea
Ewind EturbineD
Swep
t A
rea
H
VAWTHAWT
Eunabsorved
DCP
mw
maxP
0, 0m
dP dP
dw dD
0, 0, 0 0DC
m DC m
dVdP dD dP
dw dV dw dD
0, 0, 0 0DC
m DC m
dVdP dD dP
dw dV dw dD
High Speed Low Speed
Track Starting Point Track Starting Point
D D
Maximum Power Point Tracking process
PDCk >PDCk-1
Read PDC
Iref(k)=Iref(k-1)-∆I
Vk >Vk-1
NO
Iref(k)=Iref(k-1)-∆I
YES
Iref(k)=Iref(k-1)+∆I
NOVk >Vk-1
YES
Iref(k)=Iref(k-1)+∆I
YES NO
sDT
I
Li
i oV V
L
sT
iV
L
LI
t
oV
R
oL
load
VI
R
t
t
t
sDT
CV
( )v t
LI V
C RC
sT
V
RC
CV
t
0.5
0.0
1
1.5
2
2.5
3
5 10 15 20
Voltage
Cu
rren
t
Vmp
Imp
Isc Short circuit current
VocOpen circuit voltage
MPP
V.Battery
I-V PV panel characteristics
DC/DC converterDC loadVbatt
+
-
Vp
v
Ipv +
-
Vo
Io
A/D A/D
MPPT and Charging algorithm
PWM
PV array
MPP
SCI
1dI
I
Load
2dI
1D
SR
PR2D
rI
DC/DCPV -Wind
system
Battery charge control.
Load regulation.
.battV.battI
Battery
.battD loadD
DCLOAD
.battI
t
sDT sT
-
Vin
+
-
Relay
CVbatt.
L Rb
Microcontroller
Iin
Vcontrol1
D1
M1
Sensor Signals Control Signals
VoutVin
Vbatt.
Ibatt
IinIbatt.
Vcontrol1Vcontrol2Vcontrol3
Vcontrol2
Vcontrol3
Vout Vout
file:///C:/Users/Andres/Documents/17c276_250_205.jpg
file:///C:/Users/Andres/Documents/17c276_250_205.jpg
windv
+
-12
12
1R
2R
fR
+
-
12
12
3R
4R
5R 6RoutV
Datalogger
M2
+
-
G
Iref=10A
+
-Vtrian.
Battery Charge ControllerVcontrol Ibatt.
MPPT AlgorithmDCV
DCI
refI+
-
e+
-.triVPWM
G
Io
-
+
-
+
-
+
Vo
V1
V2
C
+ -VL
+
-VD1
+ -VM2
ID2
I1 L
D1
D2
IL IC
M1
M2
VD2
+ -VM1
C Vo
Io+
-
+
-
-
+
+ -VL
+
-ID1
L
D1
D2
IL IC
+VD2
-
+ -VM1
M1
M2+ -VM2
V1
V2
C
+
-Vo
Io
Ii1
Ii2
+
-
+
-
V1
V2
+ -VL
L
D1
D2
IL ICM1
M2
VD2+
-
-
+VD1
+
-
+
-
+
-Vo
Io
Vc
V1
V2
+ -VL
+ -VM2
ID2
C
L
D1
D2
IL IC
+
-
VM1+ -
M2
M1
ID1
VD1
VD1
( )a
( )b
( )c ( )d
+
-
V1
V2
Vo
+
-
VG
S1
LM1
M2
D1
D2
C
-
+ VG
S2
VG
S1
( )b( )a
sT
1d
1d
2t1t 4t3t
t
t
1GSV
2GSV
-+
V1
+
-V2
Vo
-
VG
S1
LM1
M2
D1
D2
C
+
VG
S2
VGS3
-+
V1
+
-V2
Vo
-
VG
S1
LM1
M2
D1
D2
C
+ VG
S2
( )c
VGS3
+
-
Relay
CVbatt.
L Rb
VGS3
D3
M1
Ibatt.
Vrelay
Vout Vout
M2
Vwind
Iwind
-
+-
VPV
D1
D2
VGS1
VGS2
VGS4
-
Microcontroller
Ipv
Sensor Signals Control Signals
VoutVin
Vbatt
Vcontrol1Vcontrol2Vcontrol3
IwindIbatt Vrelay
Vcontrol4
+
-
+
-
Ipv
IoILIL
IL
( )a
IL
-+
V1
+
-V2
Vo
-
VG
S1
LM1
M2
D1
D2
C
+
VG
S2
VGS3
Io IoIL
( )c
-+
V1
+
-V2
Vo
-
VG
S1
LM1
M2
D1
D2
C
+
VG
S2
VGS3
IL
IL
( )b
IL
-+
V1
+
-V2
Vo
-
VG
S1
LM1
M2
D1
D2
C
+
VG
S2
VGS3
IL
( )c
Ic Io
Io
Ic
D3 D3
D3D3
-+
V1
+
-V2
Vo
-
VG
S1
LM1
M2
D1
D2
C
+
VG
S2
VGS3
Figure 5.4. Three main topologies for multiple input DC/DC converters. In (a) a double input buck-boostconverter, (b) a double input buck converter and (c) step-up double input DC/DC converter.
Figure 5.5 presents a topology which results from recombination of the previous topologies. Bycontrolling the switches, it is possible to change the mode of operation of the converter in such away that the system can be configured to work under buck-boost, buck or boost conditions. It alsopresents bidirectional characteristic, which can be very useful for other applications.
5.1.1 MIC topology selection
In order to select the most suitable converter for this purpose it is required to consider the system tobe controlled. Table 5.1 shows the main characteristics of the hybrid system. After the analysis ofthe wind power generation system, it has been determined that it will not exceed the characteristicsshowed in the table.
Table 5.1. Hybrid System electrical characteristics
Energy Input Vin(V) Iin(A) Pin(W)
Solar [0; 18] [0; 5.5] 100Wind [0; 25] [0; 20] 500
In order to charge a 12 V battery as desired, it will be necessary to step-down the voltage when bothgeneration systems are supplying energy simultaneously. Thereby, considering this fact Figure (5.4)bis the most optimum choice.
However, when the photovoltaic power generation system is not supplying energy during the night, itmight be necessary, to step-up the voltage from the wind power generation system to use the energyat low wind speed. Thereby the system from Figure (5.4)b has been considered the most suitableoption for this application.
5.2 Double input buck-boost converter analysis
The analysis followed for this topology is similar as the one explained for the boost converter inAppendix B. As the first part of the double boost circuit is formed by the double buck topology, itwill be briefly analysed first.
41
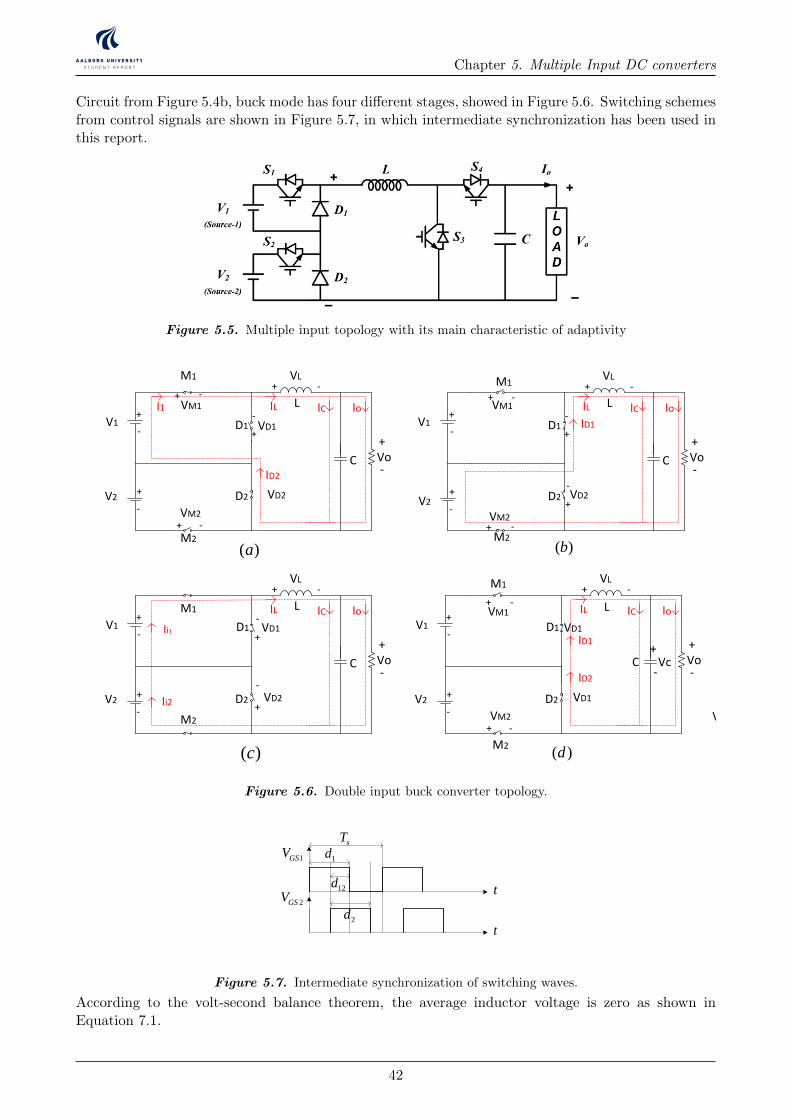
Chapter 5. Multiple Input DC converters
Circuit from Figure 5.4b, buck mode has four different stages, showed in Figure 5.6. Switching schemesfrom control signals are shown in Figure 5.7, in which intermediate synchronization has been used inthis report.
Figure 5.5. Multiple input topology with its main characteristic of adaptivity
PMSGWind
turbine
Rectifier
wm
DC
DCLOAD
Rotating speed -Power characteristic Pactual
Cotrol Unit
Poptimal
error
Control Signal
Power Converter
PMSG
Wind turbine
Rectifier
DC
DCLOAD
Cotrol Unit
Control Signal
Power Converter
Wind speed
Vw
R
Wm
Wm-optimal
error
+-
+ -
Ea
Eb
Ec
Xs Rs
ILL VLL
D1 D3 D5
D2 D4D6
+
-
p
N
Id
Ea
Eb
Ec
Xs RsIa
Xs
Xs
Rs
Rs
+
-
VDC
IDC+
+
+
Va
Vb
Vc
Ib
Ic
H
D
VPVDC
DC
VWindDC
DC
LOADVo+
-
VPV
DC
DC
VWind
LOADVo
+
-
+
+ - + -
+ - + -
PMSG
500 W
Vertical axis wind turbine Gear box
+
-
600 W Vpv
DC/DC
Ibat
+
-
Vo
Io
3-ph Rectifier
+
-VWG
IPV
IWG
Control Unit
ON/OFF Control
IWG
VWG
Vpv
IPV
IbatVo
Dummy Load
12 V 450 AH Battery Bench
900 W
Control signals
PMSG
500 W
Vertical axis wind turbine Gear box
+
-
Vw
w
+
-
Solar Pump controller PM DC motor
Vpv
Back- Up system Diesel Generator
-
200 W
-
200 W
-+ +
200 W
+
Ea
Eb
Ec
Xs Rs
ILL VLL
D1 D3 D5
D2 D4D6
+
-
p
N
Id
Ea
Eb
Ec
Xs RsIa
Xs
Xs
Rs
Rs
+
-
VDC
IDC+
+
+
Va
Vb
Vc
Ib
Ic
+-
LvLi
iv +
-
CR
C
LLR
PWM S
+
ovloadR
Si
Di Ri
Ci
Cv
+
LvLi
iv CR
C
LLR
S ovloadR
Si
Di Ri
Ci
Cv
+iv CR
C
LLR
S ovloadR
Si Ci
Cv
sDT (1 ) sD T
iv
i oV V
( )Lv t
( )Ci t
PWM
D3
PMSGWind
turbine
Rectifier
DC
DC
Cotrol UnitControl Signal
Power Converter
DCI
LOAD
+
-
DCV
MPPT algorithm
+
-
Vcc
D9
Vin
+
-
An3 An5An4
Relay
LM7805 +5V
D2
2
31
7
27K
5.6K22uF
5.1V
1N4001
10K
8
3305.6 3305.615K
680
5.6K
330uF
680
15V
22uF
6.8K
15K
5.6K22uF
Relay
5.1V
VLoadSwitch
20K
5.6K22uF
5.1V
680 Vb
att.
D2
MOSPEC S20C40C(x2)
D3
1mH FQP12P20(x2)
0.39 c/v
1.2 K
+ +
+
Current Transducer
5VAn2
GND
Arduino Uno
An2
An3
An4An5
+5V
An
alo
g 0
..5
GND
An0
An1
D0D1D2D3D4D5D6D7D8D9D10D11D12
Swep
t A
rea
Ewind EturbineD
Swep
t A
rea
H
VAWTHAWT
Eunabsorved
DCP
mw
maxP
0, 0m
dP dP
dw dD
0, 0, 0 0DC
m DC m
dVdP dD dP
dw dV dw dD
0, 0, 0 0DC
m DC m
dVdP dD dP
dw dV dw dD
High Speed Low Speed
Track Starting Point Track Starting Point
D D
Maximum Power Point Tracking process
PDCk >PDCk-1
Read PDC
Iref(k)=Iref(k-1)-∆I
Vk >Vk-1
NO
Iref(k)=Iref(k-1)-∆I
YES
Iref(k)=Iref(k-1)+∆I
NOVk >Vk-1
YES
Iref(k)=Iref(k-1)+∆I
YES NO
sDT
I
Li
i oV V
L
sT
iV
L
LI
t
oV
R
oL
load
VI
R
t
t
t
sDT
CV
( )v t
LI V
C RC
sT
V
RC
CV
t
0.5
0.0
1
1.5
2
2.5
3
5 10 15 20
Voltage
Cu
rren
t
Vmp
Imp
Isc Short circuit current
VocOpen circuit voltage
MPP
V.Battery
I-V PV panel characteristics
DC/DC converterDC loadVbatt
+
-
Vp
v
Ipv +
-
Vo
Io
A/D A/D
MPPT and Charging algorithm
PWM
PV array
MPP
SCI
1dI
I
Load
2dI
1D
SR
PR2D
rI
DC/DCPV -Wind
system
Battery charge control.
Load regulation.
.battV.battI
Battery
.battD loadD
DCLOAD
.battI
t
sDT sT
-
Vin
+
-
Relay
CVbatt.
L Rb
Microcontroller
Iin
Vcontrol1
D1
M1
Sensor Signals Control Signals
VoutVin
Vbatt.
Ibatt
IinIbatt.
Vcontrol1Vcontrol2Vcontrol3
Vcontrol2
Vcontrol3
Vout Vout
file:///C:/Users/Andres/Documents/17c276_250_205.jpg
file:///C:/Users/Andres/Documents/17c276_250_205.jpg
windv
+
-12
12
1R
2R
fR
+
-
12
12
3R
4R
5R 6RoutV
Datalogger
M2
+
-
G
Iref=10A
+
-Vtrian.
Battery Charge ControllerVcontrol Ibatt.
MPPT AlgorithmDCV
DCI
refI+
-
e+
-.triVPWM
G
Io
-
+
-
+
-
+
Vo
V1
V2
C
+ -VL
+
-VD1
+ -VM2
ID2
I1 L
D1
D2
IL IC
M1
M2
VD2
+ -VM1
C Vo
Io+
-
+
-
-
+
+ -VL
+
-ID1
L
D1
D2
IL IC
+VD2
-
+ -VM1
M1
M2+ -VM2
V1
V2
C
+
-Vo
Io
Ii1
Ii2
+
-
+
-
V1
V2
+ -VL
L
D1
D2
IL ICM1
M2
VD2+
-
-
+VD1
+
-
+
-
+
-Vo
Io
Vc
V1
V2
+ -VL
+ -VM2
ID2
C
L
D1
D2
IL IC
+
-
VM1+ -
M2
M1
ID1
VD1
VD1
( )a ( )b
( )c ( )d
+
-
V1
V2
Vo
+
-
VG
S1
LM1
M2
D1
D2
C
-
+
VG
S2
VG
S1
+
-
-
+
V1
V2
+
-
Vo
LM1
M2
D1
D2
C
VG
S2
( )b
( )a
PMSGWind
turbine
Rectifier
wm
DC
DCLOAD
Rotating speed -Power characteristic Pactual
Cotrol Unit
Poptimal
error
Control Signal
Power Converter
PMSG
Wind turbine
Rectifier
DC
DCLOAD
Cotrol Unit
Control Signal
Power Converter
Wind speed
Vw
R
Wm
Wm-optimal
error
+-
+ -
Ea
Eb
Ec
Xs Rs
ILL VLL
D1 D3 D5
D2 D4D6
+
-
p
N
Id
Ea
Eb
Ec
Xs RsIa
Xs
Xs
Rs
Rs
+
-
VDC
IDC+
+
+
Va
Vb
Vc
Ib
Ic
H
D
VPVDC
DC
VWindDC
DC
LOADVo+
-
VPV
DC
DC
VWind
LOADVo
+
-
+
+ - + -
+ - + -
PMSG
500 W
Vertical axis wind turbine Gear box
+
-
600 W Vpv
DC/DC
Ibat
+
-
Vo
Io
3-ph Rectifier
+
-VWG
IPV
IWG
Control Unit
ON/OFF Control
IWG
VWG
Vpv
IPV
IbatVo
Dummy Load
12 V 450 AH Battery Bench
900 W
Control signals
PMSG
500 W
Vertical axis wind turbine Gear box
+
-
Vw
w
+
-
Solar Pump controller PM DC motor
Vpv
Back- Up system Diesel Generator
-
200 W
-
200 W
-+ +
200 W
+
Ea
Eb
Ec
Xs Rs
ILL VLL
D1 D3 D5
D2 D4D6
+
-
p
N
Id
Ea
Eb
Ec
Xs RsIa
Xs
Xs
Rs
Rs
+
-
VDC
IDC+
+
+
Va
Vb
Vc
Ib
Ic
+-
LvLi
iv +
-
CR
C
LLR
PWM S
+
ovloadR
Si
Di Ri
Ci
Cv
+
LvLi
iv CR
C
LLR
S ovloadR
Si
Di Ri
Ci
Cv
+iv CR
C
LLR
S ovloadR
Si Ci
Cv
sDT (1 ) sD T
iv
i oV V
( )Lv t
( )Ci t
PWM
D3
PMSGWind
turbine
Rectifier
DC
DC
Cotrol UnitControl Signal
Power Converter
DCI
LOAD
+
-
DCV
MPPT algorithm
+
-
Vcc
D9
Vin
+
-
An3 An5An4
Relay
LM7805 +5V
D2
2
31
7
27K
5.6K22uF
5.1V
1N4001
10K
8
3305.6 3305.615K
680
5.6K
330uF
680
15V
22uF
6.8K
15K
5.6K22uF
Relay
5.1V
VLoadSwitch
20K
5.6K22uF
5.1V
680 Vb
att.
D2
MOSPEC S20C40C(x2)
D3
1mH FQP12P20(x2)
0.39 c/v
1.2 K
+ +
+
Current Transducer
5VAn2
GND
Arduino Uno
An2
An3
An4An5
+5V
An
alo
g 0
..5
GND
An0
An1
D0D1D2D3D4D5D6D7D8D9D10D11D12
Swep
t A
rea
Ewind EturbineD
Swep
t A
rea
H
VAWTHAWT
Eunabsorved
DCP
mw
maxP
0, 0m
dP dP
dw dD
0, 0, 0 0DC
m DC m
dVdP dD dP
dw dV dw dD
0, 0, 0 0DC
m DC m
dVdP dD dP
dw dV dw dD
High Speed Low Speed
Track Starting Point Track Starting Point
D D
Maximum Power Point Tracking process
PDCk >PDCk-1
Read PDC
Iref(k)=Iref(k-1)-∆I
Vk >Vk-1
NO
Iref(k)=Iref(k-1)-∆I
YES
Iref(k)=Iref(k-1)+∆I
NOVk >Vk-1
YES
Iref(k)=Iref(k-1)+∆I
YES NO
sDT
I
Li
i oV V
L
sT
iV
L
LI
t
oV
R
oL
load
VI
R
t
t
t
sDT
CV
( )v t
LI V
C RC
sT
V
RC
CV
t
0.5
0.0
1
1.5
2
2.5
3
5 10 15 20
Voltage
Cu
rren
t
Vmp
Imp
Isc Short circuit current
VocOpen circuit voltage
MPP
V.Battery
I-V PV panel characteristics
DC/DC converterDC loadVbatt
+
-
Vp
v
Ipv +
-
Vo
Io
A/D A/D
MPPT and Charging algorithm
PWM
PV array
MPP
SCI
1dI
I
Load
2dI
1D
SR
PR2D
rI
DC/DCPV -Wind
system
Battery charge control.
Load regulation.
.battV.battI
Battery
.battD loadD
DCLOAD
.battI
t
sDT sT
-
Vin
+
-
Relay
CVbatt.
L Rb
Microcontroller
Iin
Vcontrol1
D1
M1
Sensor Signals Control Signals
VoutVin
Vbatt.
Ibatt
IinIbatt.
Vcontrol1Vcontrol2Vcontrol3
Vcontrol2
Vcontrol3
Vout Vout
file:///C:/Users/Andres/Documents/17c276_250_205.jpg
file:///C:/Users/Andres/Documents/17c276_250_205.jpg
windv
+
-12
12
1R
2R
fR
+
-
12
12
3R
4R
5R 6RoutV
Datalogger
M2
+
-
G
Iref=10A
+
-Vtrian.
Battery Charge ControllerVcontrol Ibatt.
MPPT AlgorithmDCV
DCI
refI+
-
e+
-.triVPWM
G
Io
-
+
-
+
-
+
Vo
V1
V2
C
+ -VL
+
-VD1
+ -VM2
ID2
I1 L
D1
D2
IL IC
M1
M2
VD2
+ -VM1
C Vo
Io+
-
+
-
-
+
+ -VL
+
-ID1
L
D1
D2
IL IC
+VD2
-
+ -VM1
M1
M2+ -VM2
V1
V2
C
+
-Vo
Io
Ii1
Ii2
+
-
+
-
V1
V2
+ -VL
L
D1
D2
IL ICM1
M2
VD2+
-
-
+VD1
+
-
+
-
+
-Vo
Io
Vc
V1
V2
+ -VL
+ -VM2
ID2
C
L
D1
D2
IL IC
+
-
VM1+ -
M2
M1
ID1
VD1
VD1
( )a
( )b
( )c ( )d
+
-
V1
V2
Vo
+
-
VG
S1
LM1
M2
D1
D2
C
-
+
VG
S2
VG
S1
+
-
-
+
V1
V2
+
-
Vo
LM1
M2
D1
D2
C
VG
S2
( )b
( )a
( )a
( )b
+
-
V1
V2
Vo
+
-
VG
S1
LM1
M2
D1
D2
C
-
+
VG
S2 ( )c
VGS3
sT
1d
1d
2t1t 4t3t
t
t
1GSV
2GSV
Figure 5.6. Double input buck converter topology.
Wind PMSG
turbine
Rectifier
wm
DC
DCLOAD
Rotating speed -Power characteristic Pactual
Cotrol Unit
Poptimal
error
Control Signal
Power Converter
PMSG
Wind turbine
Rectifier
DC
DCLOAD
Cotrol Unit
Control Signal
Power Converter
Wind speed
Vw
R
Wm
Wm-optimal
error
+-
+ -
Ea
Eb
Ec
Xs Rs
ILL VLL
D1 D3 D5
D2 D4D6
+
-
p
N
Id
Ea
Eb
Ec
Xs RsIa
Xs
Xs
Rs
Rs
+
-
VDC
IDC+
+
+
Va
Vb
Vc
Ib
Ic
H
D
VPVDC
DC
VWindDC
DC
LOADVo+
-
VPV
DC
DC
VWind
LOADVo
+
-
+
+ - + -
+ - + -
PMSG
500 W
Vertical axis wind turbine Gear box
+
-
600 W Vpv
DC/DC
Ibat
+
-
Vo
Io
3-ph Rectifier
+
-VWG
IPV
IWG
Control Unit
ON/OFF Control
IWG
VWG
Vpv
IPV
IbatVo
Dummy Load
12 V 450 AH Battery Bench
900 W
Control signals
PMSG
500 W
Vertical axis wind turbine Gear box
+
-
Vw
w
+
-
Solar Pump controller PM DC motor
Vpv
Back- Up system Diesel Generator
-
200 W
-
200 W
-+ +
200 W
+
Ea
Eb
Ec
Xs Rs
ILL VLL
D1 D3 D5
D2 D4D6
+
-
p
N
Id
Ea
Eb
Ec
Xs RsIa
Xs
Xs
Rs
Rs
+
-
VDC
IDC+
+
+
Va
Vb
Vc
Ib
Ic
+-
LvLi
iv +
-
CR
C
LLR
PWM S
+
ovloadR
Si
Di Ri
Ci
Cv
+
LvLi
iv CR
C
LLR
S ovloadR
Si
Di Ri
Ci
Cv
+iv CR
C
LLR
S ovloadR
Si Ci
Cv
sDT (1 ) sD T
iv
i oV V
( )Lv t
( )Ci t
PWM
D3
Wind PMSG
turbine
Rectifier
DC
DC
Cotrol UnitControl Signal
Power Converter
DCI
LOAD
+
-
DCV
MPPT algorithm
+
-
Vcc
D9
Vin
+
-
An3 An5An4
Relay
LM7805 +5V
D2
2
31
7
27K
5.6K22uF
5.1V
1N4001
10K
8
3305.6 3305.615K
680
5.6K
330uF
680
15V
22uF
6.8K
15K
5.6K22uF
Relay
5.1V
VLoadSwitch
20K
5.6K22uF
5.1V
680 Vb
att.
D2
MOSPEC S20C40C(x2)
D3
1mH FQP12P20(x2)
0.39 c/v
1.2 K
+ +
+
Current Transducer
5VAn2
GND
Arduino Uno
An2
An3
An4An5
+5V
An
alo
g0
..5
GND
An0
An1
D0D1D2D3D4D5D6D7D8D9D10D11D12
Swep
tA
rea
Ewind EturbineD
Swep
tA
rea
H
VAWTHAWT
Eunabsorved
DCP
mw
maxP
0, 0m
dP dP
dw dD
0, 0, 0 0DC
m DC m
dVdP dD dP
dw dV dw dD
0, 0, 0 0DC
m DC m
dVdP dD dP
dw dV dw dD
High Speed Low Speed
Track Starting Point Track Starting Point
D D
Maximum Power Point Tracking process
PDCk >PDCk-1
Read PDC
Iref(k)=Iref(k-1)-∆I
Vk >Vk-1
NO
Iref(k)=Iref(k-1)-∆I
YES
Iref(k)=Iref(k-1)+∆I
NOVk >Vk-1
YES
Iref(k)=Iref(k-1)+∆I
YES NO
sDT
I
Li
i oV V
L
sT
iV
L
LI
t
oV
R
oL
load
VI
R
t
t
t
sDT
CV
( )v t
LI V
C RC
sT
V
RC
CV
t
0.5
0.0
1
1.5
2
2.5
3
5 10 15 20
Voltage
Cu
rren
t
Vmp
Imp
Isc Short circuit current
VocOpen circuit voltage
MPP
V.Battery
I-V PV panel characteristics
DC/DC converterDC loadVbatt
+
-
Vp
v
Ipv +
-
Vo
Io
A/D A/D
MPPT and Charging algorithm
PWM
PV array
MPP
SCI
1dI
I
Load
2dI
1D
SR
PR2D
rI
DC/DCPV -Wind
system
Battery charge control.
Load regulation.
.battV.battI
Battery
.battD loadD
DCLOAD
.battI
t
sDT sT
-
Vin
+
-
Relay
CVbatt.
L Rb
Microcontroller
Iin
Vcontrol1
D1
M1
Sensor Signals Control Signals
VinVoutVbatt.
Ibatt
IinIbatt.
Vcontrol1Vcontrol2Vcontrol3
Vcontrol2
Vcontrol3
Vout Vout
file:///C:/Users/Andres/Documents/17c276_250_205.jpg
file:///C:/Users/Andres/Documents/17c276_250_205.jpg
windv
+
-12
12
1R
2R
fR
+
-
12
12
3R
4R
5R 6RoutV
Datalogger
M2
+
-
G
Iref=10A
+
-Vtrian.
Battery Charge ControllerVcontrol Ibatt.
MPPT AlgorithmDCV
DCI
refI+
-
e+
-.triVPWM
G
Io
-
+
-
+
-
+
Vo
V1
V2
C
+ -VL
+
-VD1
+ -VM2
ID2
I1 L
D1
D2
IL IC
M1
M2
VD2
+ -VM1
C Vo
Io+
-
+
-
-
+
+ -VL
+
-ID1
L
D1
D2
IL IC
+VD2
-
+ -VM1
M1
M2+ -VM2
V1
V2
C
+
-Vo
Io
Ii1
Ii2
+
-
+
-
V1
V2
+ -VL
L
D1
D2
IL ICM1
M2
VD2+
-
-
+VD1
+
-
+
-
+
-Vo
Io
Vc
V1
V2
+ -VL
+ -VM2
ID2
C
L
D1
D2
IL IC
+
-
+VM1
-
M2
M1
ID1
VD1
VD1
( )a ( )b
( )c ( )d
+
-
V1
V2
Vo
+
-
VG
S1
LM1
M2
D1
D2
C
-
+
VG
S2
VG
S1
+
-
-
+
V1
V2
+
-
Vo
LM1
M2
D1
D2
C
VG
S2
( )b
( )a
Wind PMSG
turbine
Rectifier
wm
DC
DCLOAD
Rotating speed -Power characteristic Pactual
Cotrol Unit
Poptimal
error
Control Signal
Power Converter
PMSG
Wind turbine
Rectifier
DC
DCLOAD
Cotrol Unit
Control Signal
Power Converter
Wind speed
Vw
R
Wm
Wm-optimal
error
+-
+ -
Ea
Eb
Ec
Xs Rs
ILL VLL
D1 D3 D5
D2 D4D6
+
-
p
N
Id
Ea
Eb
Ec
Xs RsIa
Xs
Xs
Rs
Rs
+
-
VDC
IDC+
+
+
Va
Vb
Vc
Ib
Ic
H
D
VPVDC
DC
VWindDC
DC
LOADVo+
-
VPV
DC
DC
VWind
LOADVo
+
-
+
+ - + -
+ - + -
PMSG
500 W
Vertical axis wind turbine Gear box
+
-
600 W Vpv
DC/DC
Ibat
+
-
Vo
Io
3-ph Rectifier
+
-VWG
IPV
IWG
Control Unit
ON/OFF Control
IWG
VWG
Vpv
IPV
IbatVo
Dummy Load
12 V 450 AH Battery Bench
900 W
Control signals
PMSG
500 W
Vertical axis wind turbine Gear box
+
-
Vw
w
+
-
Solar Pump controller PM DC motor
Vpv
Back- Up system Diesel Generator
-
200 W
-
200 W
-+ +
200 W
+
Ea
Eb
Ec
Xs Rs
ILL VLL
D1 D3 D5
D2 D4D6
+
-
p
N
Id
Ea
Eb
Ec
Xs RsIa
Xs
Xs
Rs
Rs
+
-
VDC
IDC+
+
+
Va
Vb
Vc
Ib
Ic
+-
LvLi
iv +
-
CR
C
LLR
PWM S
+
ovloadR
Si
Di Ri
Ci
Cv
+
LvLi
iv CR
C
LLR
S ovloadR
Si
Di Ri
Ci
Cv
+iv CR
C
LLR
S ovloadR
Si Ci
Cv
sDT (1 ) sD T
iv
i oV V
( )Lv t
( )Ci t
PWM
D3
Wind PMSG
turbine
Rectifier
DC
DC
Cotrol UnitControl Signal
Power Converter
DCI
LOAD
+
-
DCV
MPPT algorithm
+
-
Vcc
D9
Vin
+
-
An3 An5An4
Relay
LM7805 +5V
D2
2
31
7
27K
5.6K22uF
5.1V
1N4001
10K
8
3305.6 3305.615K
680
5.6K
330uF
680
15V
22uF
6.8K
15K
5.6K22uF
Relay
5.1V
VLoadSwitch
20K
5.6K22uF
5.1V
680 Vb
att.
D2
MOSPEC S20C40C(x2)
D3
1mH FQP12P20(x2)
0.39 c/v
1.2 K
+ +
+
Current Transducer
5VAn2
GND
Arduino Uno
An2
An3
An4An5
+5V
An
alo
g0
..5
GND
An0
An1
D0D1D2D3D4D5D6D7D8D9D10D11D12
Swep
tA
rea
Ewind EturbineD
Swep
tA
rea
H
VAWTHAWT
Eunabsorved
DCP
mw
maxP
0, 0m
dP dP
dw dD
0, 0, 0 0DC
m DC m
dVdP dD dP
dw dV dw dD
0, 0, 0 0DC
m DC m
dVdP dD dP
dw dV dw dD
High Speed Low Speed
Track Starting Point Track Starting Point
D D
Maximum Power Point Tracking process
PDCk >PDCk-1
Read PDC
Iref(k)=Iref(k-1)-∆I
Vk >Vk-1
NO
Iref(k)=Iref(k-1)-∆I
YES
Iref(k)=Iref(k-1)+∆I
NOVk >Vk-1
YES
Iref(k)=Iref(k-1)+∆I
YES NO
sDT
I
Li
i oV V
L
sT
iV
L
LI
t
oV
R
oL
load
VI
R
t
t
t
sDT
CV
( )v t
LI V
C RC
sT
V
RC
CV
t
0.5
0.0
1
1.5
2
2.5
3
5 10 15 20
Voltage
Cu
rren
t
Vmp
Imp
Isc Short circuit current
VocOpen circuit voltage
MPP
V.Battery
I-V PV panel characteristics
DC/DC converterDC loadVbatt
+
-
Vp
v
Ipv +
-
Vo
Io
A/D A/D
MPPT and Charging algorithm
PWM
PV array
MPP
SCI
1dI
I
Load
2dI
1D
SR
PR2D
rI
DC/DCPV -Wind
system
Battery charge control.
Load regulation.
.battV.battI
Battery
.battD loadD
DCLOAD
.battI
t
sDT sT
-
Vin
+
-
Relay
CVbatt.
L Rb
Microcontroller
Iin
Vcontrol1
D1
M1
Sensor Signals Control Signals
VinVoutVbatt.
Ibatt
IinIbatt.
Vcontrol1Vcontrol2Vcontrol3
Vcontrol2
Vcontrol3
Vout Vout
file:///C:/Users/Andres/Documents/17c276_250_205.jpg
file:///C:/Users/Andres/Documents/17c276_250_205.jpg
windv
+
-12
12
1R
2R
fR
+
-
12
12
3R
4R
5R 6RoutV
Datalogger
M2
+
-
G
Iref=10A
+
-Vtrian.
Battery Charge ControllerVcontrol Ibatt.
MPPT AlgorithmDCV
DCI
refI+
-
e+
-.triVPWM
G
Io
-
+
-
+
-
+
Vo
V1
V2
C
+ -VL
+
-VD1
+ -VM2
ID2
I1 L
D1
D2
IL IC
M1
M2
VD2
+ -VM1
C Vo
Io+
-
+
-
-
+
+ -VL
+
-ID1
L
D1
D2
IL IC
+VD2
-
+ -VM1
M1
M2+ -VM2
V1
V2
C
+
-Vo
Io
Ii1
Ii2
+
-
+
-
V1
V2
+ -VL
L
D1
D2
IL ICM1
M2
VD2+
-
-
+VD1
+
-
+
-
+
-Vo
Io
Vc
V1
V2
+ -VL
+ -VM2
ID2
C
L
D1
D2
IL IC
+
-
+VM1
-
M2
M1
ID1
VD1
VD1
( )a
( )b
( )c ( )d
+
-
V1
V2
Vo
+
-
VG
S1
LM1
M2
D1
D2
C
-
+
VG
S2
VG
S1
+
-
-
+
V1
V2
+
-
Vo
LM1
M2
D1
D2
C
VG
S2
( )b( )a
( )a
( )b
sT
1d
t
t
1GSV
2GSV
-+
V1
+
-V2
Vo
-
VG
S1
LM1
M2
D1
D2
C
+
VG
S2 ( )c
VGS3
3d
t
3GSV
2d
12d
t
t
1V1 2V V
2V
0V
LI
LV
sT
1d
t
t
1GSV
2GSV
2d
12d
Figure 5.7. Intermediate synchronization of switching waves.
According to the volt-second balance theorem, the average inductor voltage is zero as shown inEquation 7.1.
42

Chapter 5. Multiple Input DC converters
iL =1
L
Ts∫0
vL(t)dt+ iL(0)→Ts∫
0
vL(t)dt = 0 [-](5.1)
By analysing the circuit at the four different stages shown in Figure 5.6, Equation 5.2 is derived. Inhere, d1 and d2 are the duty cycles of the control signals VGS1 and VGS2, whereas d12 correspondswith the duty cycle of the signals when they are both in ON state.
Ts [(V1 − Vo)(d1 − d12) + (V1 + V2 − Vo)(d12) + (V2 − Vo)(d2 − d12) + (−Vo)(1− d1 − d2 + d12)] = 0 [-](5.2)
Simplifying Equation 7.1, the input-output relation depending on the duty cycle of both switches isderived in (5.3)
Vo = V1d1 + V2d2 [V](5.3)
In the same way, circuit from Figure 5.4b is analysed by including the duty cycle of the signal VGS3,d3. The behaviour of the system is now similar to the boost converter explained in Chapter B.
Figure 5.8 shows the three switching signal waveforms VGS1,VGS2 and VGS3 and the current and thevoltage in the inductor, VL and IL.
PMSGWind
turbine
Rectifier
wm
DC
DCLOAD
Rotating speed -Power characteristic Pactual
Cotrol Unit
Poptimal
error
Control Signal
Power Converter
PMSG
Wind turbine
Rectifier
DC
DCLOAD
Cotrol Unit
Control Signal
Power Converter
Wind speed
Vw
R
Wm
Wm-optimal
error
+-
+ -
Ea
Eb
Ec
Xs Rs
ILL VLL
D1 D3 D5
D2 D4D6
+
-
p
N
Id
Ea
Eb
Ec
Xs RsIa
Xs
Xs
Rs
Rs
+
-
VDC
IDC+
+
+
Va
Vb
Vc
Ib
Ic
H
D
VPVDC
DC
VWindDC
DC
LOADVo+
-
VPV
DC
DC
VWind
LOADVo
+
-
+
+ - + -
+ - + -
PMSG
500 W
Vertical axis wind turbine Gear box
+
-
600 W Vpv
DC/DC
Ibat
+
-
Vo
Io
3-ph Rectifier
+
-VWG
IPV
IWG
Control Unit
ON/OFF Control
IWG
VWG
Vpv
IPV
IbatVo
Dummy Load
12 V 450 AH Battery Bench
900 W
Control signals
PMSG
500 W
Vertical axis wind turbine Gear box
+
-
Vw
w
+
-
Solar Pump controller PM DC motor
Vpv
Back- Up system Diesel Generator
-
200 W
-
200 W
-+ +
200 W
+
Ea
Eb
Ec
Xs Rs
ILL VLL
D1 D3 D5
D2 D4D6
+
-
p
N
Id
Ea
Eb
Ec
Xs RsIa
Xs
Xs
Rs
Rs
+
-
VDC
IDC+
+
+
Va
Vb
Vc
Ib
Ic
+-
LvLi
iv +
-
CR
C
LLR
PWM S
+
ovloadR
Si
Di Ri
Ci
Cv
+
LvLi
iv CR
C
LLR
S ovloadR
Si
Di Ri
Ci
Cv
+iv CR
C
LLR
S ovloadR
Si Ci
Cv
sDT (1 ) sD T
iv
i oV V
( )Lv t
( )Ci t
PWM
D3
PMSGWind
turbine
Rectifier
DC
DC
Cotrol UnitControl Signal
Power Converter
DCI
LOAD
+
-
DCV
MPPT algorithm
+
-
Vcc
D9
Vin
+
-
An3 An5An4
Relay
LM7805 +5V
D2
2
31
7
27K
5.6K22uF
5.1V
1N4001
10K
8
3305.6 3305.615K
680
5.6K
330uF
680
15V
22uF
6.8K
15K
5.6K22uF
Relay
5.1V
VLoadSwitch
20K
5.6K22uF
5.1V
680 Vb
att.
D2
MOSPEC S20C40C(x2)
D3
1mH FQP12P20(x2)
0.39 c/v
1.2 K
+ +
+
Current Transducer
5VAn2
GND
Arduino Uno
An2
An3
An4An5
+5V
An
alo
g 0
..5
GND
An0
An1
D0D1D2D3D4D5D6D7D8D9D10D11D12
Swep
t A
rea
Ewind EturbineD
Swep
t A
rea
H
VAWTHAWT
Eunabsorved
DCP
mw
maxP
0, 0m
dP dP
dw dD
0, 0, 0 0DC
m DC m
dVdP dD dP
dw dV dw dD
0, 0, 0 0DC
m DC m
dVdP dD dP
dw dV dw dD
High Speed Low Speed
Track Starting Point Track Starting Point
D D
Maximum Power Point Tracking process
PDCk >PDCk-1
Read PDC
Iref(k)=Iref(k-1)-∆I
Vk >Vk-1
NO
Iref(k)=Iref(k-1)-∆I
YES
Iref(k)=Iref(k-1)+∆I
NOVk >Vk-1
YES
Iref(k)=Iref(k-1)+∆I
YES NO
sDT
I
Li
i oV V
L
sT
iV
L
LI
t
oV
R
oL
load
VI
R
t
t
t
sDT
CV
( )v t
LI V
C RC
sT
V
RC
CV
t
0.5
0.0
1
1.5
2
2.5
3
5 10 15 20
Voltage
Cu
rren
t
Vmp
Imp
Isc Short circuit current
VocOpen circuit voltage
MPP
V.Battery
I-V PV panel characteristics
DC/DC converterDC loadVbatt
+
-
Vp
v
Ipv +
-
Vo
Io
A/D A/D
MPPT and Charging algorithm
PWM
PV array
MPP
SCI
1dI
I
Load
2dI
1D
SR
PR2D
rI
DC/DCPV -Wind
system
Battery charge control.
Load regulation.
.battV.battI
Battery
.battD loadD
DCLOAD
.battI
t
sDT sT
-
Vin
+
-
Relay
CVbatt.
L Rb
Microcontroller
Iin
Vcontrol1
D1
M1
Sensor Signals Control Signals
VoutVin
Vbatt.
Ibatt
IinIbatt.
Vcontrol1Vcontrol2Vcontrol3
Vcontrol2
Vcontrol3
Vout Vout
file:///C:/Users/Andres/Documents/17c276_250_205.jpg
file:///C:/Users/Andres/Documents/17c276_250_205.jpg
windv
+
-12
12
1R
2R
fR
+
-
12
12
3R
4R
5R 6RoutV
Datalogger
M2
+
-
G
Iref=10A
+
-Vtrian.
Battery Charge ControllerVcontrol Ibatt.
MPPT AlgorithmDCV
DCI
refI+
-
e+
-.triVPWM
G
Io
-
+
-
+
-
+
Vo
V1
V2
C
+ -VL
+
-VD1
+ -VM2
ID2
I1 L
D1
D2
IL IC
M1
M2
VD2
+ -VM1
C Vo
Io+
-
+
-
-
+
+ -VL
+
-ID1
L
D1
D2
IL IC
+VD2
-
+ -VM1
M1
M2+ -VM2
V1
V2
C
+
-Vo
Io
Ii1
Ii2
+
-
+
-
V1
V2
+ -VL
L
D1
D2
IL ICM1
M2
VD2+
-
-
+VD1
+
-
+
-
+
-Vo
Io
Vc
V1
V2
+ -VL
+ -VM2
ID2
C
L
D1
D2
IL IC
+
-
VM1+ -
M2
M1
ID1
VD1
VD1
( )a ( )b
( )c ( )d
+
-
V1
V2
Vo
+
-
VG
S1
LM1
M2
D1
D2
C
-
+
VG
S2
VG
S1
+
-
-
+
V1
V2
+
-
Vo
LM1
M2
D1
D2
C
VG
S2
( )b
( )a
PMSGWind
turbine
Rectifier
wm
DC
DCLOAD
Rotating speed -Power characteristic Pactual
Cotrol Unit
Poptimal
error
Control Signal
Power Converter
PMSG
Wind turbine
Rectifier
DC
DCLOAD
Cotrol Unit
Control Signal
Power Converter
Wind speed
Vw
R
Wm
Wm-optimal
error
+-
+ -
Ea
Eb
Ec
Xs Rs
ILL VLL
D1 D3 D5
D2 D4D6
+
-
p
N
Id
Ea
Eb
Ec
Xs RsIa
Xs
Xs
Rs
Rs
+
-
VDC
IDC+
+
+
Va
Vb
Vc
Ib
Ic
H
D
VPVDC
DC
VWindDC
DC
LOADVo+
-
VPV
DC
DC
VWind
LOADVo
+
-
+
+ - + -
+ - + -
PMSG
500 W
Vertical axis wind turbine Gear box
+
-
600 W Vpv
DC/DC
Ibat
+
-
Vo
Io
3-ph Rectifier
+
-VWG
IPV
IWG
Control Unit
ON/OFF Control
IWG
VWG
Vpv
IPV
IbatVo
Dummy Load
12 V 450 AH Battery Bench
900 W
Control signals
PMSG
500 W
Vertical axis wind turbine Gear box
+
-
Vw
w
+
-
Solar Pump controller PM DC motor
Vpv
Back- Up system Diesel Generator
-
200 W
-
200 W
-+ +
200 W
+
Ea
Eb
Ec
Xs Rs
ILL VLL
D1 D3 D5
D2 D4D6
+
-
p
N
Id
Ea
Eb
Ec
Xs RsIa
Xs
Xs
Rs
Rs
+
-
VDC
IDC+
+
+
Va
Vb
Vc
Ib
Ic
+-
LvLi
iv +
-
CR
C
LLR
PWM S
+
ovloadR
Si
Di Ri
Ci
Cv
+
LvLi
iv CR
C
LLR
S ovloadR
Si
Di Ri
Ci
Cv
+iv CR
C
LLR
S ovloadR
Si Ci
Cv
sDT (1 ) sD T
iv
i oV V
( )Lv t
( )Ci t
PWM
D3
PMSGWind
turbine
Rectifier
DC
DC
Cotrol UnitControl Signal
Power Converter
DCI
LOAD
+
-
DCV
MPPT algorithm
+
-
Vcc
D9
Vin
+
-
An3 An5An4
Relay
LM7805 +5V
D2
2
31
7
27K
5.6K22uF
5.1V
1N4001
10K
8
3305.6 3305.615K
680
5.6K
330uF
680
15V
22uF
6.8K
15K
5.6K22uF
Relay
5.1V
VLoadSwitch
20K
5.6K22uF
5.1V
680 Vb
att.
D2
MOSPEC S20C40C(x2)
D3
1mH FQP12P20(x2)
0.39 c/v
1.2 K
+ +
+
Current Transducer
5VAn2
GND
Arduino Uno
An2
An3
An4An5
+5V
An
alo
g 0
..5
GND
An0
An1
D0D1D2D3D4D5D6D7D8D9D10D11D12
Swep
t A
rea
Ewind EturbineD
Swep
t A
rea
H
VAWTHAWT
Eunabsorved
DCP
mw
maxP
0, 0m
dP dP
dw dD
0, 0, 0 0DC
m DC m
dVdP dD dP
dw dV dw dD
0, 0, 0 0DC
m DC m
dVdP dD dP
dw dV dw dD
High Speed Low Speed
Track Starting Point Track Starting Point
D D
Maximum Power Point Tracking process
PDCk >PDCk-1
Read PDC
Iref(k)=Iref(k-1)-∆I
Vk >Vk-1
NO
Iref(k)=Iref(k-1)-∆I
YES
Iref(k)=Iref(k-1)+∆I
NOVk >Vk-1
YES
Iref(k)=Iref(k-1)+∆I
YES NO
sDT
I
Li
i oV V
L
sT
iV
L
LI
t
oV
R
oL
load
VI
R
t
t
t
sDT
CV
( )v t
LI V
C RC
sT
V
RC
CV
t
0.5
0.0
1
1.5
2
2.5
3
5 10 15 20
Voltage
Cu
rren
t
Vmp
Imp
Isc Short circuit current
VocOpen circuit voltage
MPP
V.Battery
I-V PV panel characteristics
DC/DC converterDC loadVbatt
+
-
Vp
v
Ipv +
-
Vo
Io
A/D A/D
MPPT and Charging algorithm
PWM
PV array
MPP
SCI
1dI
I
Load
2dI
1D
SR
PR2D
rI
DC/DCPV -Wind
system
Battery charge control.
Load regulation.
.battV.battI
Battery
.battD loadD
DCLOAD
.battI
t
sDT sT
-
Vin
+
-
Relay
CVbatt.
L Rb
Microcontroller
Iin
Vcontrol1
D1
M1
Sensor Signals Control Signals
VoutVin
Vbatt.
Ibatt
IinIbatt.
Vcontrol1Vcontrol2Vcontrol3
Vcontrol2
Vcontrol3
Vout Vout
file:///C:/Users/Andres/Documents/17c276_250_205.jpg
file:///C:/Users/Andres/Documents/17c276_250_205.jpg
windv
+
-12
12
1R
2R
fR
+
-
12
12
3R
4R
5R 6RoutV
Datalogger
M2
+
-
G
Iref=10A
+
-Vtrian.
Battery Charge ControllerVcontrol Ibatt.
MPPT AlgorithmDCV
DCI
refI+
-
e+
-.triVPWM
G
Io
-
+
-
+
-
+
Vo
V1
V2
C
+ -VL
+
-VD1
+ -VM2
ID2
I1 L
D1
D2
IL IC
M1
M2
VD2
+ -VM1
C Vo
Io+
-
+
-
-
+
+ -VL
+
-ID1
L
D1
D2
IL IC
+VD2
-
+ -VM1
M1
M2+ -VM2
V1
V2
C
+
-Vo
Io
Ii1
Ii2
+
-
+
-
V1
V2
+ -VL
L
D1
D2
IL ICM1
M2
VD2+
-
-
+VD1
+
-
+
-
+
-Vo
Io
Vc
V1
V2
+ -VL
+ -VM2
ID2
C
L
D1
D2
IL IC
+
-
VM1+ -
M2
M1
ID1
VD1
VD1
( )a
( )b
( )c ( )d
+
-
V1
V2
Vo
+
-
VG
S1
LM1
M2
D1
D2
C
-
+
VG
S2
VG
S1
+
-
-
+
V1
V2
+
-
Vo
LM1
M2
D1
D2
C
VG
S2
( )b( )a
( )a
( )b
sT
1d
t
t
1GSV
2GSV
-+
V1
+
-V2
Vo
-
VG
S1
LM1
M2
D1
D2
C
+
VG
S2 ( )c
VGS3
3d
t
3GSV
2d
12d
t
t
1V1 2V V
2V
0V
LI
LV
sT
1d
t
t
1GSV
2GSV
2d
12d
Figure 5.8. Switching signals VGS1,VGS2 and VGS3, and current and voltage through the inductor VL and ILfor the double buck-boost circuit topology
Figure 5.9 shows four sketches of the different possible states of the circuit from Figure 5.4b. InFigure 5.9a, only the switch M1 is on and as the switch M3 is also ON, ON the inductance is being
43
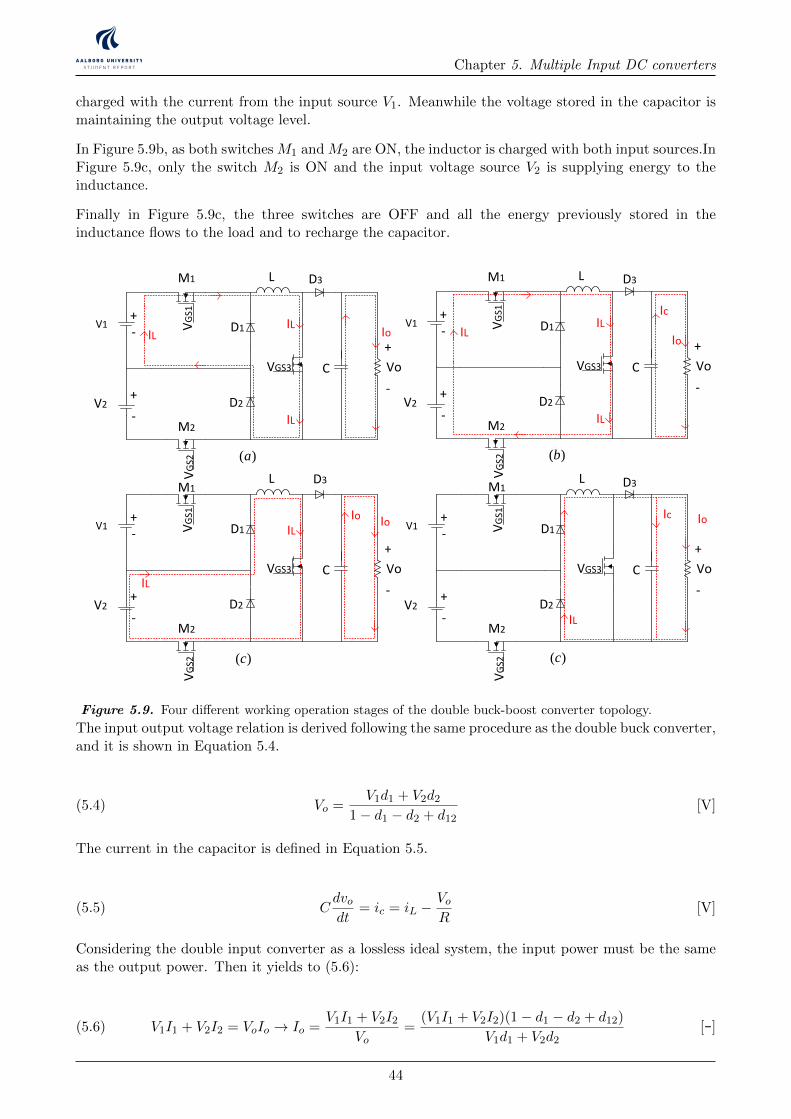
Chapter 5. Multiple Input DC converters
charged with the current from the input source V1. Meanwhile the voltage stored in the capacitor ismaintaining the output voltage level.
In Figure 5.9b, as both switches M1 and M2 are ON, the inductor is charged with both input sources.InFigure 5.9c, only the switch M2 is ON and the input voltage source V2 is supplying energy to theinductance.
Finally in Figure 5.9c, the three switches are OFF and all the energy previously stored in theinductance flows to the load and to recharge the capacitor.
PMSGWind
turbine
Rectifier
wm
DC
DCLOAD
Rotating speed -Power characteristic Pactual
Cotrol Unit
Poptimal
error
Control Signal
Power Converter
PMSG
Wind turbine
Rectifier
DC
DCLOAD
Cotrol Unit
Control Signal
Power Converter
Wind speed
Vw
R
Wm
Wm-optimal
error
+-
+ -
Ea
Eb
Ec
Xs Rs
ILL VLL
D1 D3 D5
D2 D4D6
+
-
p
N
Id
Ea
Eb
Ec
Xs RsIa
Xs
Xs
Rs
Rs
+
-
VDC
IDC+
+
+
Va
Vb
Vc
Ib
Ic
H
D
VPVDC
DC
VWindDC
DC
LOADVo+
-
VPV
DC
DC
VWind
LOADVo
+
-
+
+ - + -
+ - + -
PMSG
500 W
Vertical axis wind turbine Gear box
+
-
600 W Vpv
DC/DC
Ibat
+
-
Vo
Io
3-ph Rectifier
+
-VWG
IPV
IWG
Control Unit
ON/OFF Control
IWG
VWG
Vpv
IPV
IbatVo
Dummy Load
12 V 450 AH Battery Bench
900 W
Control signals
PMSG
500 W
Vertical axis wind turbine Gear box
+
-
Vw
w
+
-
Solar Pump controller PM DC motor
Vpv
Back- Up system Diesel Generator
-
200 W
-
200 W
-+ +
200 W
+
Ea
Eb
Ec
Xs Rs
ILL VLL
D1 D3 D5
D2 D4D6
+
-
p
N
Id
Ea
Eb
Ec
Xs RsIa
Xs
Xs
Rs
Rs
+
-
VDC
IDC+
+
+
Va
Vb
Vc
Ib
Ic
+-
LvLi
iv +
-
CR
C
LLR
PWM S
+
ovloadR
Si
Di Ri
Ci
Cv
+
LvLi
iv CR
C
LLR
S ovloadR
Si
Di Ri
Ci
Cv
+iv CR
C
LLR
S ovloadR
Si Ci
Cv
sDT (1 ) sD T
iv
i oV V
( )Lv t
( )Ci t
PWM
D3
PMSGWind
turbine
Rectifier
DC
DC
Cotrol UnitControl Signal
Power Converter
DCI
LOAD
+
-
DCV
MPPT algorithm
+
-
Vcc
D9
Vin
+
-
An3 An5An4
Relay
LM7805 +5V
D2
2
31
7
27K
5.6K22uF
5.1V
1N4001
10K
8
3305.6 3305.615K
680
5.6K
330uF
680
15V
22uF
6.8K
15K
5.6K22uF
Relay
5.1V
VLoadSwitch
20K
5.6K22uF
5.1V
680 Vb
att.
D2
MOSPEC S20C40C(x2)
D3
1mH FQP12P20(x2)
0.39 c/v
1.2 K
+ +
+
Current Transducer
5VAn2
GND
Arduino Uno
An2
An3
An4An5
+5V
An
alo
g 0
..5
GND
An0
An1
D0D1D2D3D4D5D6D7D8D9D10D11D12
Swep
t A
rea
Ewind EturbineD
Swep
t A
rea
H
VAWTHAWT
Eunabsorved
DCP
mw
maxP
0, 0m
dP dP
dw dD
0, 0, 0 0DC
m DC m
dVdP dD dP
dw dV dw dD
0, 0, 0 0DC
m DC m
dVdP dD dP
dw dV dw dD
High Speed Low Speed
Track Starting Point Track Starting Point
D D
Maximum Power Point Tracking process
PDCk >PDCk-1
Read PDC
Iref(k)=Iref(k-1)-∆I
Vk >Vk-1
NO
Iref(k)=Iref(k-1)-∆I
YES
Iref(k)=Iref(k-1)+∆I
NOVk >Vk-1
YES
Iref(k)=Iref(k-1)+∆I
YES NO
sDT
I
Li
i oV V
L
sT
iV
L
LI
t
oV
R
oL
load
VI
R
t
t
t
sDT
CV
( )v t
LI V
C RC
sT
V
RC
CV
t
0.5
0.0
1
1.5
2
2.5
3
5 10 15 20
Voltage
Cu
rren
t
Vmp
Imp
Isc Short circuit current
VocOpen circuit voltage
MPP
V.Battery
I-V PV panel characteristics
DC/DC converterDC loadVbatt
+
-
Vp
v
Ipv +
-
Vo
Io
A/D A/D
MPPT and Charging algorithm
PWM
PV array
MPP
SCI
1dI
I
Load
2dI
1D
SR
PR2D
rI
DC/DCPV -Wind
system
Battery charge control.
Load regulation.
.battV.battI
Battery
.battD loadD
DCLOAD
.battI
t
sDT sT
-
Vin
+
-
Relay
CVbatt.
L Rb
Microcontroller
Iin
Vcontrol1
D1
M1
Sensor Signals Control Signals
VoutVin
Vbatt.
Ibatt
IinIbatt.
Vcontrol1Vcontrol2Vcontrol3
Vcontrol2
Vcontrol3
Vout Vout
file:///C:/Users/Andres/Documents/17c276_250_205.jpg
file:///C:/Users/Andres/Documents/17c276_250_205.jpg
windv
+
-12
12
1R
2R
fR
+
-
12
12
3R
4R
5R 6RoutV
Datalogger
M2
+
-
G
Iref=10A
+
-Vtrian.
Battery Charge ControllerVcontrol Ibatt.
MPPT AlgorithmDCV
DCI
refI+
-
e+
-.triVPWM
G
Io
-
+
-
+
-
+
Vo
V1
V2
C
+ -VL
+
-VD1
+ -VM2
ID2
I1 L
D1
D2
IL IC
M1
M2
VD2
+ -VM1
C Vo
Io+
-
+
-
-
+
+ -VL
+
-ID1
L
D1
D2
IL IC
+VD2
-
+ -VM1
M1
M2+ -VM2
V1
V2
C
+
-Vo
Io
Ii1
Ii2
+
-
+
-
V1
V2
+ -VL
L
D1
D2
IL ICM1
M2
VD2+
-
-
+VD1
+
-
+
-
+
-Vo
Io
Vc
V1
V2
+ -VL
+ -VM2
ID2
C
L
D1
D2
IL IC
+
-
VM1+ -
M2
M1
ID1
VD1
VD1
( )a ( )b
( )c ( )d
+
-
V1
V2
Vo
+
-
VG
S1
LM1
M2
D1
D2
C
-
+
VG
S2
VG
S1
+
-
-
+
V1
V2
+
-
Vo
LM1
M2
D1
D2
C
VG
S2
( )b
( )a
PMSGWind
turbine
Rectifier
wm
DC
DCLOAD
Rotating speed -Power characteristic Pactual
Cotrol Unit
Poptimal
error
Control Signal
Power Converter
PMSG
Wind turbine
Rectifier
DC
DCLOAD
Cotrol Unit
Control Signal
Power Converter
Wind speed
Vw
R
Wm
Wm-optimal
error
+-
+ -
Ea
Eb
Ec
Xs Rs
ILL VLL
D1 D3 D5
D2 D4D6
+
-
p
N
Id
Ea
Eb
Ec
Xs RsIa
Xs
Xs
Rs
Rs
+
-
VDC
IDC+
+
+
Va
Vb
Vc
Ib
Ic
H
D
VPVDC
DC
VWindDC
DC
LOADVo+
-
VPV
DC
DC
VWind
LOADVo
+
-
+
+ - + -
+ - + -
PMSG
500 W
Vertical axis wind turbine Gear box
+
-
600 W Vpv
DC/DC
Ibat
+
-
Vo
Io
3-ph Rectifier
+
-VWG
IPV
IWG
Control Unit
ON/OFF Control
IWG
VWG
Vpv
IPV
IbatVo
Dummy Load
12 V 450 AH Battery Bench
900 W
Control signals
PMSG
500 W
Vertical axis wind turbine Gear box
+
-
Vw
w
+
-
Solar Pump controller PM DC motor
Vpv
Back- Up system Diesel Generator
-
200 W
-
200 W
-+ +
200 W
+
Ea
Eb
Ec
Xs Rs
ILL VLL
D1 D3 D5
D2 D4D6
+
-
p
N
Id
Ea
Eb
Ec
Xs RsIa
Xs
Xs
Rs
Rs
+
-
VDC
IDC+
+
+
Va
Vb
Vc
Ib
Ic
+-
LvLi
iv +
-
CR
C
LLR
PWM S
+
ovloadR
Si
Di Ri
Ci
Cv
+
LvLi
iv CR
C
LLR
S ovloadR
Si
Di Ri
Ci
Cv
+iv CR
C
LLR
S ovloadR
Si Ci
Cv
sDT (1 ) sD T
iv
i oV V
( )Lv t
( )Ci t
PWM
D3
PMSGWind
turbine
Rectifier
DC
DC
Cotrol UnitControl Signal
Power Converter
DCI
LOAD
+
-
DCV
MPPT algorithm
+
-
Vcc
D9
Vin
+
-
An3 An5An4
Relay
LM7805 +5V
D2
2
31
7
27K
5.6K22uF
5.1V
1N4001
10K
8
3305.6 3305.615K
680
5.6K
330uF
680
15V
22uF
6.8K
15K
5.6K22uF
Relay
5.1V
VLoadSwitch
20K
5.6K22uF
5.1V
680 Vb
att.
D2
MOSPEC S20C40C(x2)
D3
1mH FQP12P20(x2)
0.39 c/v
1.2 K
+ +
+
Current Transducer
5VAn2
GND
Arduino Uno
An2
An3
An4An5
+5V
An
alo
g 0
..5
GND
An0
An1
D0D1D2D3D4D5D6D7D8D9D10D11D12
Swep
t A
rea
Ewind EturbineD
Swep
t A
rea
H
VAWTHAWT
Eunabsorved
DCP
mw
maxP
0, 0m
dP dP
dw dD
0, 0, 0 0DC
m DC m
dVdP dD dP
dw dV dw dD
0, 0, 0 0DC
m DC m
dVdP dD dP
dw dV dw dD
High Speed Low Speed
Track Starting Point Track Starting Point
D D
Maximum Power Point Tracking process
PDCk >PDCk-1
Read PDC
Iref(k)=Iref(k-1)-∆I
Vk >Vk-1
NO
Iref(k)=Iref(k-1)-∆I
YES
Iref(k)=Iref(k-1)+∆I
NOVk >Vk-1
YES
Iref(k)=Iref(k-1)+∆I
YES NO
sDT
I
Li
i oV V
L
sT
iV
L
LI
t
oV
R
oL
load
VI
R
t
t
t
sDT
CV
( )v t
LI V
C RC
sT
V
RC
CV
t
0.5
0.0
1
1.5
2
2.5
3
5 10 15 20
Voltage
Cu
rren
t
Vmp
Imp
Isc Short circuit current
VocOpen circuit voltage
MPP
V.Battery
I-V PV panel characteristics
DC/DC converterDC loadVbatt
+
-
Vp
v
Ipv +
-
Vo
Io
A/D A/D
MPPT and Charging algorithm
PWM
PV array
MPP
SCI
1dI
I
Load
2dI
1D
SR
PR2D
rI
DC/DCPV -Wind
system
Battery charge control.
Load regulation.
.battV.battI
Battery
.battD loadD
DCLOAD
.battI
t
sDT sT
-
Vin
+
-
Relay
CVbatt.
L Rb
Microcontroller
Iin
Vcontrol1
D1
M1
Sensor Signals Control Signals
VoutVin
Vbatt.
Ibatt
IinIbatt.
Vcontrol1Vcontrol2Vcontrol3
Vcontrol2
Vcontrol3
Vout Vout
file:///C:/Users/Andres/Documents/17c276_250_205.jpg
file:///C:/Users/Andres/Documents/17c276_250_205.jpg
windv
+
-12
12
1R
2R
fR
+
-
12
12
3R
4R
5R 6RoutV
Datalogger
M2
+
-
G
Iref=10A
+
-Vtrian.
Battery Charge ControllerVcontrol Ibatt.
MPPT AlgorithmDCV
DCI
refI+
-
e+
-.triVPWM
G
Io
-
+
-
+
-
+
Vo
V1
V2
C
+ -VL
+
-VD1
+ -VM2
ID2
I1 L
D1
D2
IL IC
M1
M2
VD2
+ -VM1
C Vo
Io+
-
+
-
-
+
+ -VL
+
-ID1
L
D1
D2
IL IC
+VD2
-
+ -VM1
M1
M2+ -VM2
V1
V2
C
+
-Vo
Io
Ii1
Ii2
+
-
+
-
V1
V2
+ -VL
L
D1
D2
IL ICM1
M2
VD2+
-
-
+VD1
+
-
+
-
+
-Vo
Io
Vc
V1
V2
+ -VL
+ -VM2
ID2
C
L
D1
D2
IL IC
+
-
VM1+ -
M2
M1
ID1
VD1
VD1
( )a
( )b
( )c ( )d
+
-
V1
V2
Vo
+
-
VG
S1
LM1
M2
D1
D2
C
-
+ VG
S2
VG
S1
+
-
-
+
V1
V2
+
-
Vo
LM1
M2
D1
D2
C
VG
S2
( )b( )a
( )a
( )b
sT
1d
1d
2t1t 4t3t
t
t
1GSV
2GSV
-+
V1
+
-V2
Vo
-
VG
S1
LM1
M2
D1
D2
C
+ VG
S2
( )c
VGS3
-+
V1
+
-V2
Vo
-
VG
S1
LM1
M2
D1
D2
C
+
VG
S2
VGS3
3M
-+
V1
+
-V2
Vo
-
VG
S1
LM1
M2
D1
D2
C
+ VG
S2
( )c
VGS3
+
-
Relay
CVbatt.
L Rb
VGS3
D3
M1
Ibatt.
Vrelay
Vout Vout
M2
Vwind
Iwind
-
+-
VPV
D1
D2
VGS1
VGS2
VGS4
-
Microcontroller
Ipv
Sensor Signals Control Signals
VoutVin
Vbatt
Vcontrol1Vcontrol2Vcontrol3
IwindIbatt Vrelay
Vcontrol4
+
-
+
-
Ipv
IoILIL
IL
( )a
IL
-+
V1
+
-V2
Vo
-
VG
S1
LM1
M2
D1
D2
C
+
VG
S2
VGS3
Io IoIL
( )c
-+
V1
+
-V2
Vo
-
VG
S1
LM1
M2
D1
D2
C
+
VG
S2
VGS3
IL
IL
( )b
IL
-+
V1
+
-V2
Vo
-
VG
S1
LM1
M2
D1
D2
C
+
VG
S2
VGS3
IL
( )c
Ic Io
Io
Ic
D3 D3
D3D3
Figure 5.9. Four different working operation stages of the double buck-boost converter topology.
The input output voltage relation is derived following the same procedure as the double buck converter,and it is shown in Equation 5.4.
Vo =V1d1 + V2d2
1− d1 − d2 + d12[V](5.4)
The current in the capacitor is defined in Equation 5.5.
Cdvodt
= ic = iL −VoR
[V](5.5)
Considering the double input converter as a lossless ideal system, the input power must be the sameas the output power. Then it yields to (5.6):
V1I1 + V2I2 = VoIo → Io =V1I1 + V2I2
Vo=
(V1I1 + V2I2)(1− d1 − d2 + d12)
V1d1 + V2d2[-](5.6)
44

Chapter 5. Multiple Input DC converters
Both input current I1 and I2 can be expressed in function of the inductor current IL, as I1 = d1ILand I2 = d2IL and previous Equation 5.6 can be simplified in (5.7)
Io = IL(1− d1 − d2 + d12) [V](5.7)
Equation 5.7 can be transformed into the input current equation for both power generation sources,they are defined as follows5.8:
I1 = Iod1
(1−d1−d2+d12)
I2 = Iod2
(1−d1−d2+d12)
[A](5.8)
From previous Equation 5.8, Equation 5.9 is derived. In here, it proves it is possible to control theinput current by changing the duty ratio.
I1
I2=d1
d2[A](5.9)
The inductor current and the capacitor voltage ripple ∆IL and ∆VL defines the inductor and capacitorvalues L and C respectively, as shown in Equation 5.10 and 5.11:
∆IL =Vo(1− d3)
2Lfs[A](5.10)
∆VC =Vo
2RloadCfs[A](5.11)
5.3 System design and small signal model
In this section state-space averaging will be calculated for the topology selected, with the purpose ofanalysing the average values of state variables lie voltage and current in steady state. In state-spaceaveraging the elements which store energy are considered the state space variables, and as the energylevel stored does not remain constant over a switching cycle those elements need to be averaged. Theprocedure to follow in state-space averaging is to calculate the different equations for each state andthen they are averaged with the corresponding duty ratio.
The state-space equation is defined in (5.12)
[K]X(t) = Ax(t) +Bu(t)y(t) = Fx(t) +Gu(t)
[-](5.12)
where the state-vector is x(t) =
[iLvc
], the input vector is u(t) =
[v1
v2
]and y(t) =
[i1i2
]is
the output vector. K contains the value of the inductor and capacitor and matrix A, B, F and Gcorresponds to constants for different states of the converter.
The proposed converter, the buck-boost has four states on each cycle, shown in the graph from Figure5.9.By multiplying Equation 5.12 to each time interval Equation 5.13 is derived, in which all theaveraged state equations over a switching cycle are included.
45
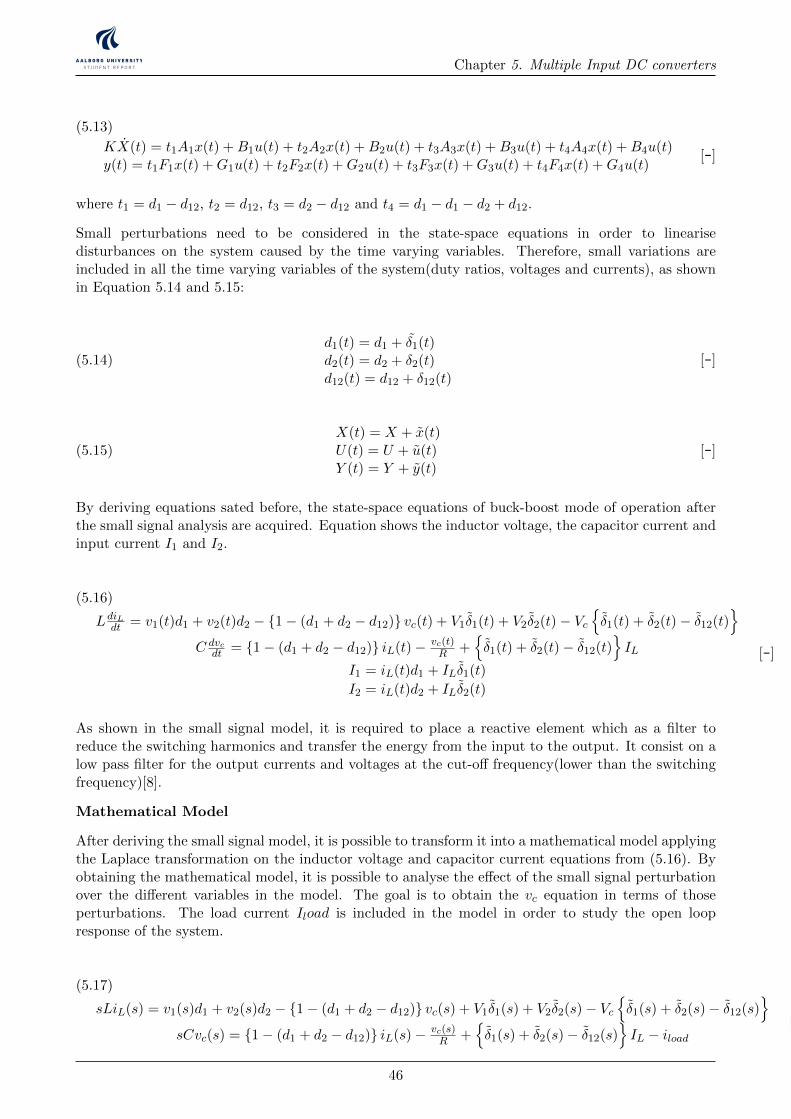
Chapter 5. Multiple Input DC converters
KX(t) = t1A1x(t) +B1u(t) + t2A2x(t) +B2u(t) + t3A3x(t) +B3u(t) + t4A4x(t) +B4u(t)y(t) = t1F1x(t) +G1u(t) + t2F2x(t) +G2u(t) + t3F3x(t) +G3u(t) + t4F4x(t) +G4u(t)
[-]
(5.13)
where t1 = d1 − d12, t2 = d12, t3 = d2 − d12 and t4 = d1 − d1 − d2 + d12.
Small perturbations need to be considered in the state-space equations in order to linearisedisturbances on the system caused by the time varying variables. Therefore, small variations areincluded in all the time varying variables of the system(duty ratios, voltages and currents), as shownin Equation 5.14 and 5.15:
d1(t) = d1 + δ1(t)d2(t) = d2 + δ2(t)d12(t) = d12 + δ12(t)
[-](5.14)
X(t) = X + x(t)U(t) = U + u(t)Y (t) = Y + y(t)
[-](5.15)
By deriving equations sated before, the state-space equations of buck-boost mode of operation afterthe small signal analysis are acquired. Equation shows the inductor voltage, the capacitor current andinput current I1 and I2.
LdiLdt = v1(t)d1 + v2(t)d2 − 1− (d1 + d2 − d12) vc(t) + V1δ1(t) + V2δ2(t)− Vcδ1(t) + δ2(t)− δ12(t)
C dvc
dt = 1− (d1 + d2 − d12) iL(t)− vc(t)R +
δ1(t) + δ2(t)− δ12(t)
IL
I1 = iL(t)d1 + ILδ1(t)
I2 = iL(t)d2 + ILδ2(t)
[-]
(5.16)
As shown in the small signal model, it is required to place a reactive element which as a filter toreduce the switching harmonics and transfer the energy from the input to the output. It consist on alow pass filter for the output currents and voltages at the cut-off frequency(lower than the switchingfrequency)[8].
Mathematical Model
After deriving the small signal model, it is possible to transform it into a mathematical model applyingthe Laplace transformation on the inductor voltage and capacitor current equations from (5.16). Byobtaining the mathematical model, it is possible to analyse the effect of the small signal perturbationover the different variables in the model. The goal is to obtain the vc equation in terms of thoseperturbations. The load current Iload is included in the model in order to study the open loopresponse of the system.
sLiL(s) = v1(s)d1 + v2(s)d2 − 1− (d1 + d2 − d12) vc(s) + V1δ1(s) + V2δ2(s)− Vcδ1(s) + δ2(s)− δ12(s)
sCvc(s) = 1− (d1 + d2 − d12) iL(s)− vc(s)
R +δ1(s) + δ2(s)− δ12(s)
IL − iload
[-]
(5.17)
46
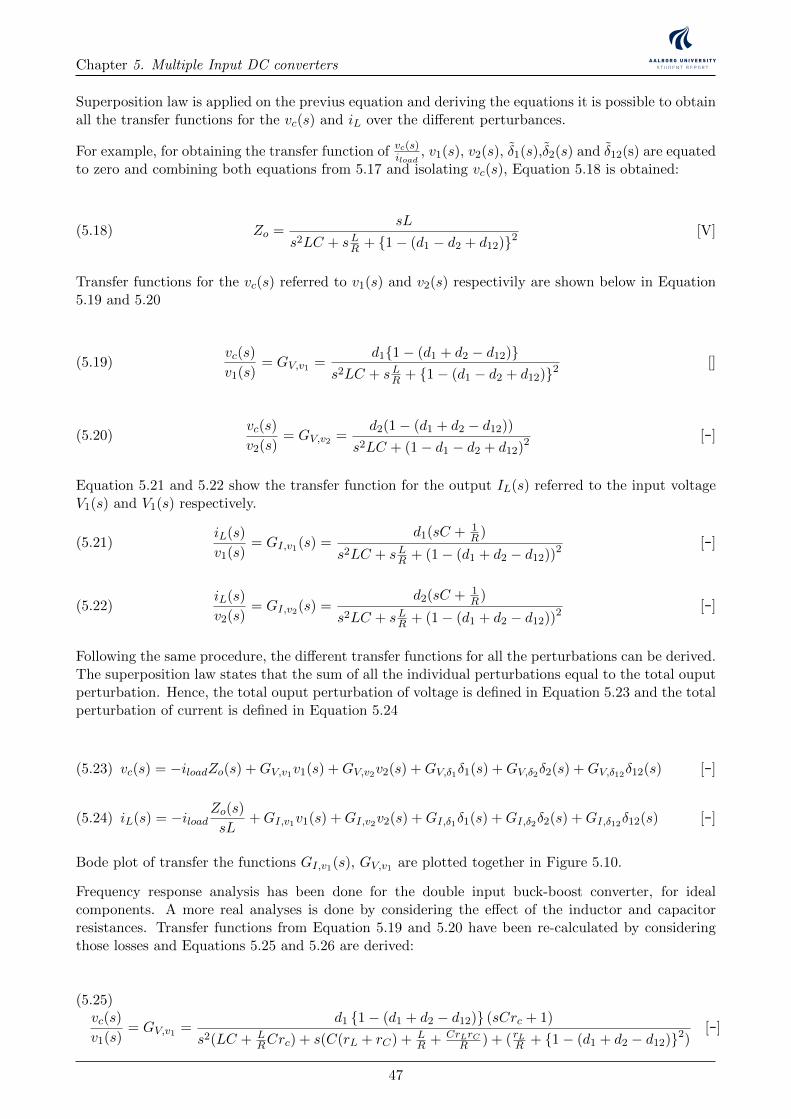
Chapter 5. Multiple Input DC converters
Superposition law is applied on the previus equation and deriving the equations it is possible to obtainall the transfer functions for the vc(s) and iL over the different perturbances.
For example, for obtaining the transfer function of vc(s)iload
, v1(s), v2(s), δ1(s),δ2(s) and δ12(s) are equatedto zero and combining both equations from 5.17 and isolating vc(s), Equation 5.18 is obtained:
Zo =sL
s2LC + sLR + 1− (d1 − d2 + d12)2[V](5.18)
Transfer functions for the vc(s) referred to v1(s) and v2(s) respectivily are shown below in Equation5.19 and 5.20
vc(s)
v1(s)= GV,v1 =
d11− (d1 + d2 − d12)s2LC + sLR + 1− (d1 − d2 + d12)2
[](5.19)
vc(s)
v2(s)= GV,v2 =
d2(1− (d1 + d2 − d12))
s2LC + (1− d1 − d2 + d12)2 [-](5.20)
Equation 5.21 and 5.22 show the transfer function for the output IL(s) referred to the input voltageV1(s) and V1(s) respectively.
iL(s)
v1(s)= GI,v1(s) =
d1(sC + 1R)
s2LC + sLR + (1− (d1 + d2 − d12))2 [-](5.21)
iL(s)
v2(s)= GI,v2(s) =
d2(sC + 1R)
s2LC + sLR + (1− (d1 + d2 − d12))2 [-](5.22)
Following the same procedure, the different transfer functions for all the perturbations can be derived.The superposition law states that the sum of all the individual perturbations equal to the total ouputperturbation. Hence, the total ouput perturbation of voltage is defined in Equation 5.23 and the totalperturbation of current is defined in Equation 5.24
vc(s) = −iloadZo(s) +GV,v1v1(s) +GV,v2v2(s) +GV,δ1δ1(s) +GV,δ2δ2(s) +GV,δ12δ12(s) [-](5.23)
iL(s) = −iloadZo(s)
sL+GI,v1v1(s) +GI,v2v2(s) +GI,δ1δ1(s) +GI,δ2δ2(s) +GI,δ12δ12(s) [-](5.24)
Bode plot of transfer the functions GI,v1(s), GV,v1 are plotted together in Figure 5.10.
Frequency response analysis has been done for the double input buck-boost converter, for idealcomponents. A more real analyses is done by considering the effect of the inductor and capacitorresistances. Transfer functions from Equation 5.19 and 5.20 have been re-calculated by consideringthose losses and Equations 5.25 and 5.26 are derived:
vc(s)
v1(s)= GV,v1 =
d1 1− (d1 + d2 − d12) (sCrc + 1)
s2(LC + LRCrc) + s(C(rL + rC) + L
R + CrLrCR ) + ( rLR + 1− (d1 + d2 − d12)2)
[-]
(5.25)
47
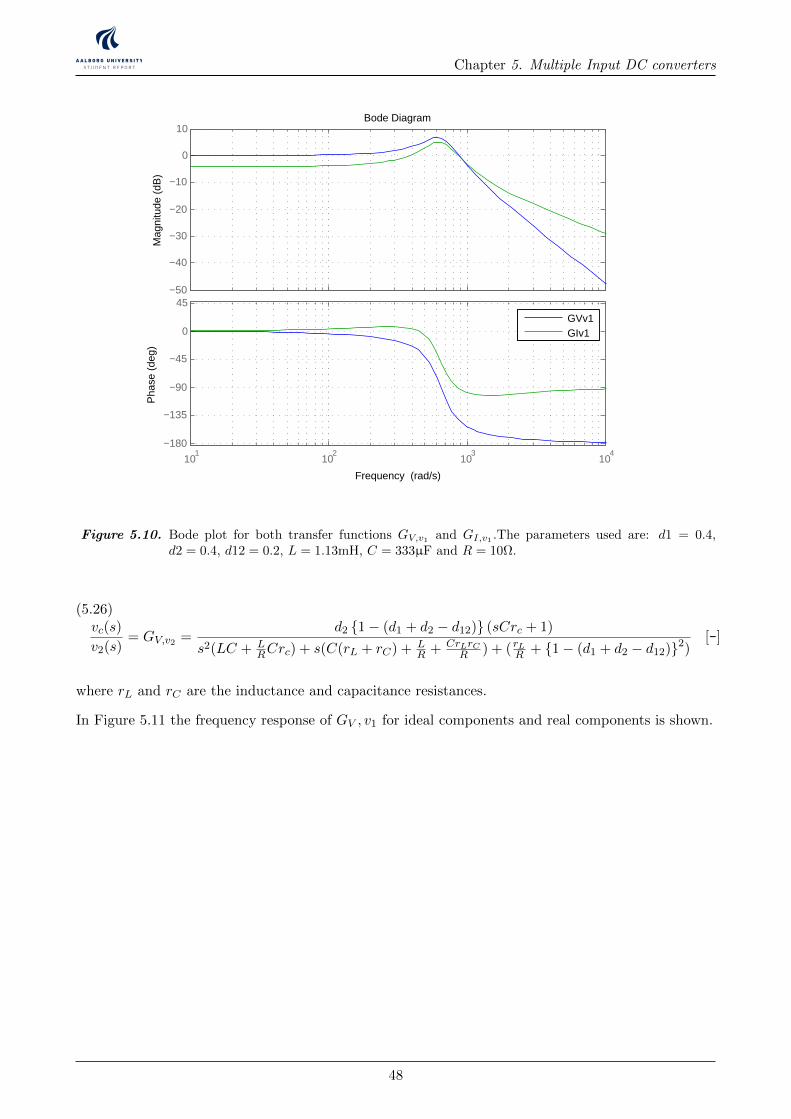
Chapter 5. Multiple Input DC converters
−50
−40
−30
−20
−10
0
10
Mag
nitu
de (
dB)
101
102
103
104
−180
−135
−90
−45
0
45
Pha
se (
deg)
Bode Diagram
Frequency (rad/s)
GVv1GIv1
Figure 5.10. Bode plot for both transfer functions GV,v1 and GI,v1 .The parameters used are: d1 = 0.4,d2 = 0.4, d12 = 0.2, L = 1.13mH, C = 333µF and R = 10Ω.
vc(s)
v2(s)= GV,v2 =
d2 1− (d1 + d2 − d12) (sCrc + 1)
s2(LC + LRCrc) + s(C(rL + rC) + L
R + CrLrCR ) + ( rLR + 1− (d1 + d2 − d12)2)
[-]
(5.26)
where rL and rC are the inductance and capacitance resistances.
In Figure 5.11 the frequency response of GV , v1 for ideal components and real components is shown.
48
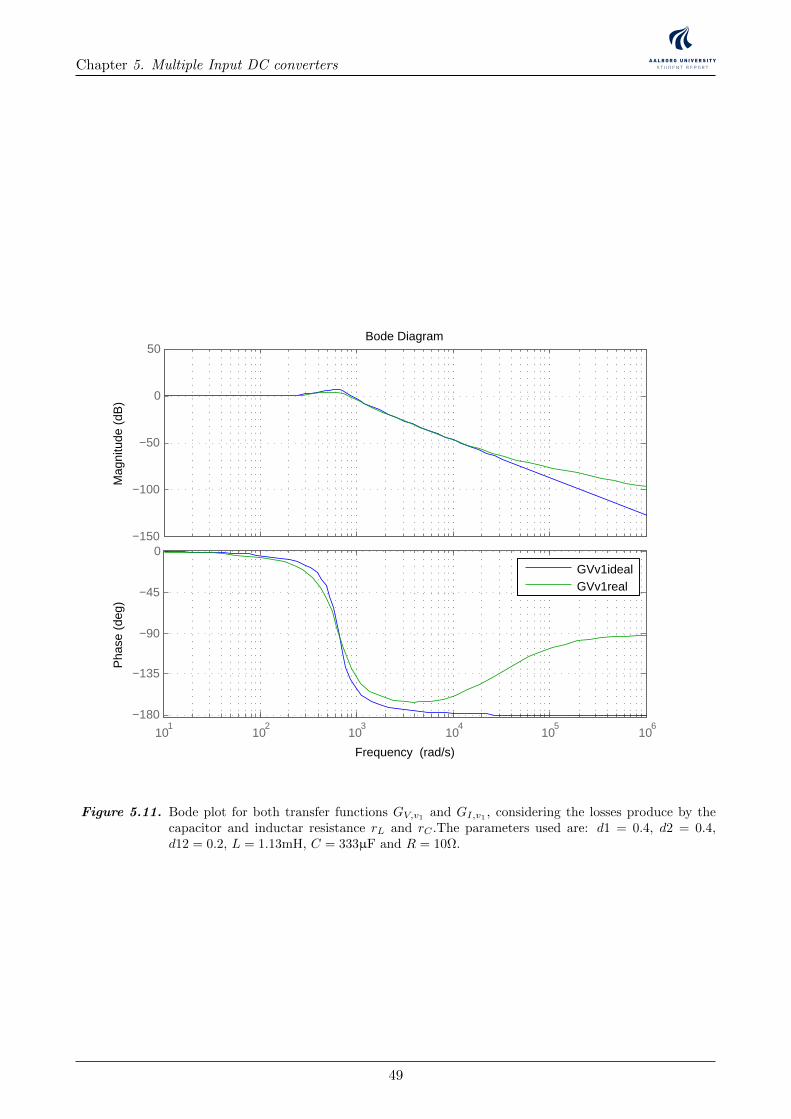
Chapter 5. Multiple Input DC converters
−150
−100
−50
0
50
Mag
nitu
de (
dB)
101
102
103
104
105
106
−180
−135
−90
−45
0
Pha
se (
deg)
Bode Diagram
Frequency (rad/s)
GVv1idealGVv1real
Figure 5.11. Bode plot for both transfer functions GV,v1 and GI,v1 , considering the losses produce by thecapacitor and inductar resistance rL and rC .The parameters used are: d1 = 0.4, d2 = 0.4,d12 = 0.2, L = 1.13mH, C = 333µF and R = 10Ω.
49

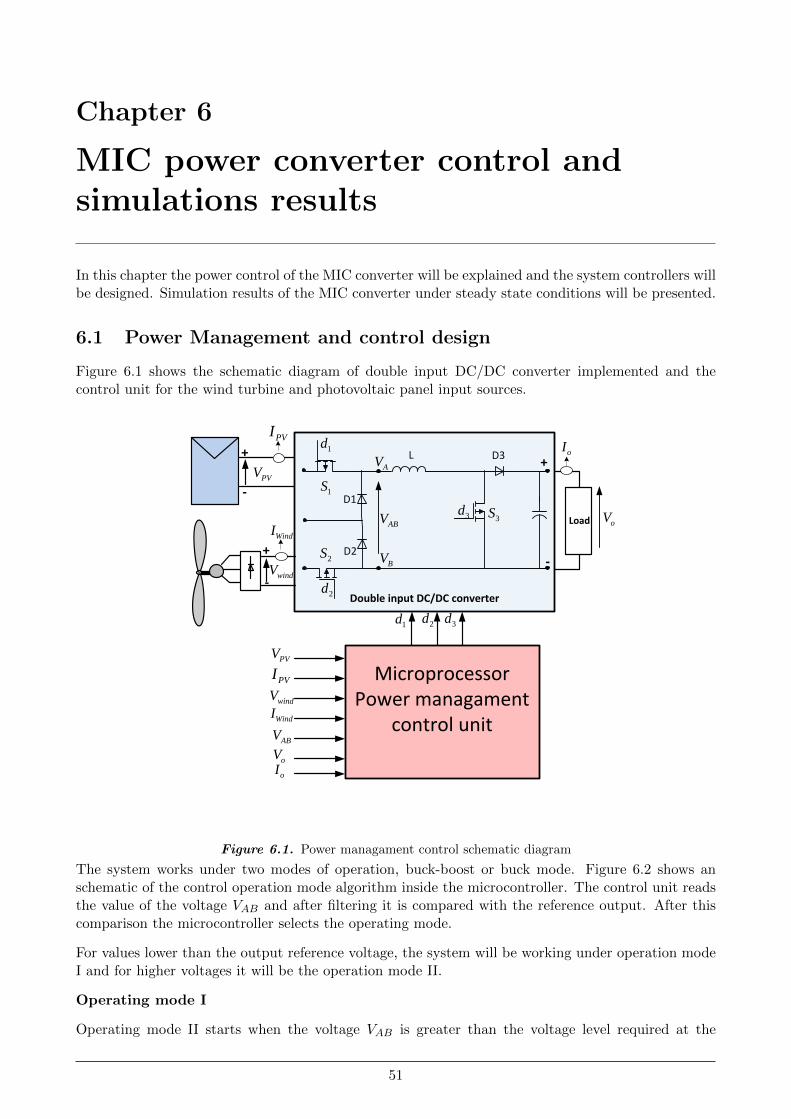
Chapter 6
MIC power converter control andsimulations results
In this chapter the power control of the MIC converter will be explained and the system controllers willbe designed. Simulation results of the MIC converter under steady state conditions will be presented.
6.1 Power Management and control design
Figure 6.1 shows the schematic diagram of double input DC/DC converter implemented and thecontrol unit for the wind turbine and photovoltaic panel input sources.
PMSGWind
turbine
Rectifier
wm
DC
DCLOAD
Rotating speed -Power characteristic Pactual
Cotrol Unit
Poptimal
error
Control Signal
Power Converter
PMSG
Wind turbine
Rectifier
DC
DCLOAD
Cotrol Unit
Control Signal
Power Converter
Wind speed
Vw
R
Wm
Wm-optimal
error
+-
+ -
Ea
Eb
Ec
Xs Rs
ILL VLL
D1 D3 D5
D2 D4D6
+
-
p
N
Id
Ea
Eb
Ec
Xs RsIa
Xs
Xs
Rs
Rs
+
-
VDC
IDC+
+
+
Va
Vb
Vc
Ib
Ic
H
D
VPVDC
DC
VWindDC
DC
LOADVo+
-
VPV
DC
DC
VWind
LOADVo
+
-
+
+ - + -
+ - + -
PMSG
500 W
Vertical axis wind turbine Gear box
+
-
600 W Vpv
DC/DC
Ibat
+
-
Vo
Io
3-ph Rectifier
+
-VWG
IPV
IWG
Control Unit
ON/OFF Control
IWG
VWG
Vpv
IPV
IbatVo
Dummy Load
12 V 450 AH Battery Bench
900 W
Control signals
PMSG
500 W
Vertical axis wind turbine Gear box
+
-
Vw
w
+
-
Solar Pump controller PM DC motor
Vpv
Back- Up system Diesel Generator
-
200 W
-
200 W
-+ +
200 W
+
Ea
Eb
Ec
Xs Rs
ILL VLL
D1 D3 D5
D2 D4D6
+
-
p
N
Id
Ea
Eb
Ec
Xs RsIa
Xs
Xs
Rs
Rs
+
-
VDC
IDC+
+
+
Va
Vb
Vc
Ib
Ic
+-
LvLi
iv +
-
CR
C
LLR
PWM S
+
ovloadR
Si
Di Ri
Ci
Cv
+
LvLi
iv CR
C
LLR
S ovloadR
Si
Di Ri
Ci
Cv
+iv CR
C
LLR
S ovloadR
Si Ci
Cv
sDT (1 ) sD T
iv
i oV V
( )Lv t
( )Ci t
PWM
D3
PMSGWind
turbine
Rectifier
DC
DC
Cotrol UnitControl Signal
Power Converter
DCI
LOAD
+
-
DCV
MPPT algorithm
+
-
Vcc
D9
Vin
+
-
An3 An5An4
Relay
LM7805 +5V
D2
2
31
7
27K
5.6K22uF
5.1V
1N4001
10K
8
3305.6 3305.615K
680
5.6K
330uF
680
15V
22uF
6.8K
15K
5.6K22uF
Relay
5.1V
VLoadSwitch
20K
5.6K22uF
5.1V
680 Vb
att.
D2
MOSPEC S20C40C(x2)
D3
1mH FQP12P20(x2)
0.39 c/v
1.2 K
+ +
+
Current Transducer
5VAn2
GND
Arduino Uno
An2
An3
An4An5
+5V
An
alo
g 0
..5
GND
An0
An1
D0D1D2D3D4D5D6D7D8D9D10D11D12
Swep
t A
rea
Ewind EturbineD
Swep
t A
rea
H
VAWTHAWT
Eunabsorved
DCP
mw
maxP
0, 0m
dP dP
dw dD
0, 0, 0 0DC
m DC m
dVdP dD dP
dw dV dw dD
0, 0, 0 0DC
m DC m
dVdP dD dP
dw dV dw dD
High Speed Low Speed
Track Starting Point Track Starting Point
D D
Maximum Power Point Tracking process
PDCk >PDCk-1
Read PDC
Iref(k)=Iref(k-1)-∆I
Vk >Vk-1
NO
Iref(k)=Iref(k-1)-∆I
YES
Iref(k)=Iref(k-1)+∆I
NOVk >Vk-1
YES
Iref(k)=Iref(k-1)+∆I
YES NO
sDT
I
Li
i oV V
L
sT
iV
L
LI
t
oV
R
oL
load
VI
R
t
t
t
sDT
CV
( )v t
LI V
C RC
sT
V
RC
CV
t
0.5
0.0
1
1.5
2
2.5
3
5 10 15 20
Voltage
Cu
rren
t
Vmp
Imp
Isc Short circuit current
VocOpen circuit voltage
MPP
V.Battery
I-V PV panel characteristics
DC/DC converterDC loadVbatt
+
-
Vp
v
Ipv +
-
Vo
Io
A/D A/D
MPPT and Charging algorithm
PWM
PV array
MPP
SCI
1dI
I
Load
2dI
1D
SR
PR2D
rI
DC/DCPV -Wind
system
Battery charge control.
Load regulation.
.battV.battI
Battery
.battD loadD
DCLOAD
.battI
t
sDT sT
-
Vin
+
-
Relay
CVbatt.
L Rb
Microcontroller
Iin
Vcontrol1
D1
M1
Sensor Signals Control Signals
VoutVin
Vbatt.
Ibatt
IinIbatt.
Vcontrol1Vcontrol2Vcontrol3
Vcontrol2
Vcontrol3
Vout Vout
file:///C:/Users/Andres/Documents/17c276_250_205.jpg
file:///C:/Users/Andres/Documents/17c276_250_205.jpg
windv
+
-12
12
1R
2R
fR
+
-
12
12
3R
4R
5R 6RoutV
Datalogger
M2
+
-
G
Iref=10A
+
-Vtrian.
Battery Charge ControllerVcontrol Ibatt.
MPPT AlgorithmDCV
DCI
refI+
-
e+
-.triVPWM
G
Io
-
+
-
+
-
+
Vo
V1
V2
C
+ -VL
+
-VD1
+ -VM2
ID2
I1 L
D1
D2
IL IC
M1
M2
VD2
+ -VM1
C Vo
Io+
-
+
-
-
+
+ -VL
+
-ID1
L
D1
D2
IL IC
+VD2
-
+ -VM1
M1
M2+ -VM2
V1
V2
C
+
-Vo
Io
Ii1
Ii2
+
-
+
-
V1
V2
+ -VL
L
D1
D2
IL ICM1
M2
VD2+
-
-
+VD1
+
-
+
-
+
-Vo
Io
Vc
V1
V2
+ -VL
+ -VM2
ID2
C
L
D1
D2
IL IC
+
-
VM1+ -
M2
M1
ID1
VD1
VD1
( )a ( )b
( )c ( )d
+
-
V1
V2
Vo
+
-
VG
S1
LM1
M2
D1
D2
C
-
+
VG
S2
VG
S1
+
-
-
+
V1
V2
+
-
Vo
LM1
M2
D1
D2
C
VG
S2
( )b
( )a
PMSGWind
turbine
Rectifier
wm
DC
DCLOAD
Rotating speed -Power characteristic Pactual
Cotrol Unit
Poptimal
error
Control Signal
Power Converter
PMSG
Wind turbine
Rectifier
DC
DCLOAD
Cotrol Unit
Control Signal
Power Converter
Wind speed
Vw
R
Wm
Wm-optimal
error
+-
+ -
Ea
Eb
Ec
Xs Rs
ILL VLL
D1 D3 D5
D2 D4D6
+
-
p
N
Id
Ea
Eb
Ec
Xs RsIa
Xs
Xs
Rs
Rs
+
-
VDC
IDC+
+
+
Va
Vb
Vc
Ib
Ic
H
D
VPVDC
DC
VWindDC
DC
LOADVo+
-
VPV
DC
DC
VWind
LOADVo
+
-
+
+ - + -
+ - + -
PMSG
500 W
Vertical axis wind turbine Gear box
+
-
600 W Vpv
DC/DC
Ibat
+
-
Vo
Io
3-ph Rectifier
+
-VWG
IPV
IWG
Control Unit
ON/OFF Control
IWG
VWG
Vpv
IPV
IbatVo
Dummy Load
12 V 450 AH Battery Bench
900 W
Control signals
PMSG
500 W
Vertical axis wind turbine Gear box
+
-
Vw
w
+
-
Solar Pump controller PM DC motor
Vpv
Back- Up system Diesel Generator
-
200 W
-
200 W
-+ +
200 W
+
Ea
Eb
Ec
Xs Rs
ILL VLL
D1 D3 D5
D2 D4D6
+
-
p
N
Id
Ea
Eb
Ec
Xs RsIa
Xs
Xs
Rs
Rs
+
-
VDC
IDC+
+
+
Va
Vb
Vc
Ib
Ic
+-
LvLi
iv +
-
CR
C
LLR
PWM S
+
ovloadR
Si
Di Ri
Ci
Cv
+
LvLi
iv CR
C
LLR
S ovloadR
Si
Di Ri
Ci
Cv
+iv CR
C
LLR
S ovloadR
Si Ci
Cv
sDT (1 ) sD T
iv
i oV V
( )Lv t
( )Ci t
PWM
D3
PMSGWind
turbine
Rectifier
DC
DC
Cotrol UnitControl Signal
Power Converter
DCI
LOAD
+
-
DCV
MPPT algorithm
+
-
Vcc
D9
Vin
+
-
An3 An5An4
Relay
LM7805 +5V
D2
2
31
7
27K
5.6K22uF
5.1V
1N4001
10K
8
3305.6 3305.615K
680
5.6K
330uF
680
15V
22uF
6.8K
15K
5.6K22uF
Relay
5.1V
VLoadSwitch
20K
5.6K22uF
5.1V
680 Vb
att.
D2
MOSPEC S20C40C(x2)
D3
1mH FQP12P20(x2)
0.39 c/v
1.2 K
+ +
+
Current Transducer
5VAn2
GND
Arduino Uno
An2
An3
An4An5
+5V
An
alo
g 0
..5
GND
An0
An1
D0D1D2D3D4D5D6D7D8D9D10D11D12
Swep
t A
rea
Ewind EturbineD
Swep
t A
rea
H
VAWTHAWT
Eunabsorved
DCP
mw
maxP
0, 0m
dP dP
dw dD
0, 0, 0 0DC
m DC m
dVdP dD dP
dw dV dw dD
0, 0, 0 0DC
m DC m
dVdP dD dP
dw dV dw dD
High Speed Low Speed
Track Starting Point Track Starting Point
D D
Maximum Power Point Tracking process
PDCk >PDCk-1
Read PDC
Iref(k)=Iref(k-1)-∆I
Vk >Vk-1
NO
Iref(k)=Iref(k-1)-∆I
YES
Iref(k)=Iref(k-1)+∆I
NOVk >Vk-1
YES
Iref(k)=Iref(k-1)+∆I
YES NO
sDT
I
Li
i oV V
L
sT
iV
L
LI
t
oV
R
oL
load
VI
R
t
t
t
sDT
CV
( )v t
LI V
C RC
sT
V
RC
CV
t
0.5
0.0
1
1.5
2
2.5
3
5 10 15 20
Voltage
Cu
rren
t
Vmp
Imp
Isc Short circuit current
VocOpen circuit voltage
MPP
V.Battery
I-V PV panel characteristics
DC/DC converterDC loadVbatt
+
-
Vp
v
Ipv +
-
Vo
Io
A/D A/D
MPPT and Charging algorithm
PWM
PV array
MPP
SCI
1dI
I
Load
2dI
1D
SR
PR2D
rI
DC/DCPV -Wind
system
Battery charge control.
Load regulation.
.battV.battI
Battery
.battD loadD
DCLOAD
.battI
t
sDT sT
-
Vin
+
-
Relay
CVbatt.
L Rb
Microcontroller
Iin
Vcontrol1
D1
M1
Sensor Signals Control Signals
VoutVin
Vbatt.
Ibatt
IinIbatt.
Vcontrol1Vcontrol2Vcontrol3
Vcontrol2
Vcontrol3
Vout Vout
file:///C:/Users/Andres/Documents/17c276_250_205.jpg
file:///C:/Users/Andres/Documents/17c276_250_205.jpg
windv
+
-12
12
1R
2R
fR
+
-
12
12
3R
4R
5R 6RoutV
Datalogger
M2
+
-
G
Iref=10A
+
-Vtrian.
Battery Charge ControllerVcontrol Ibatt.
MPPT AlgorithmDCV
DCI
refI+
-
e+
-.triVPWM
G
Io
-
+
-
+
-
+
Vo
V1
V2
C
+ -VL
+
-VD1
+ -VM2
ID2
I1 L
D1
D2
IL IC
M1
M2
VD2
+ -VM1
C Vo
Io+
-
+
-
-
+
+ -VL
+
-ID1
L
D1
D2
IL IC
+VD2
-
+ -VM1
M1
M2+ -VM2
V1
V2
C
+
-Vo
Io
Ii1
Ii2
+
-
+
-
V1
V2
+ -VL
L
D1
D2
IL ICM1
M2
VD2+
-
-
+VD1
+
-
+
-
+
-Vo
Io
Vc
V1
V2
+ -VL
+ -VM2
ID2
C
L
D1
D2
IL IC
+
-
VM1+ -
M2
M1
ID1
VD1
VD1
( )a
( )b
( )c ( )d
+
-
V1
V2
Vo
+
-
VG
S1
LM1
M2
D1
D2
C
-
+ VG
S2
VG
S1
+
-
-
+
V1
V2
+
-
Vo
LM1
M2
D1
D2
C
VG
S2
( )b( )a
( )a
( )b
sT
1d
1d
2t1t 4t3t
t
t
1GSV
2GSV
-+
V1
+
-V2
Vo
-
VG
S1
LM1
M2
D1
D2
C
+ VG
S2
( )c
VGS3
-+
V1
+
-V2
Vo
-
VG
S1
LM1
M2
D1
D2
C
+
VG
S2
VGS3
3M
-+
V1
+
-V2
Vo
-
VG
S1
LM1
M2
D1
D2
C
+ VG
S2
( )c
VGS3
+
-
Relay
CVbatt.
L Rb
VGS3
D3
M1
Ibatt.
Vrelay
Vout Vout
M2
Vwind
Iwind
-
+-
VPV
D1
D2
VGS1
VGS2
VGS4
-
Microcontroller
Ipv
Sensor Signals Control Signals
VoutVin
Vbatt
Vcontrol1Vcontrol2Vcontrol3
IwindIbatt Vrelay
Vcontrol4
+
-
+
-
Ipv
IoILIL
IL
( )a
IL
-+
V1
+
-V2
Vo
-
VG
S1
LM1
M2
D1
D2
C
+
VG
S2
VGS3
Io IoIL
( )c
-+
V1
+
-V2
Vo
-
VG
S1
LM1
M2
D1
D2
C
+
VG
S2
VGS3
IL
IL
( )b
IL
-+
V1
+
-V2
Vo
-
VG
S1
LM1
M2
D1
D2
C
+
VG
S2
VGS3
IL
( )c
Ic Io
Io
Ic
D3 D3
D3D3
+- 2G
1CT1G
2CT+-
1H
refVoV
*
refI
LI
duty
Plant 1 Plant 2Controller 2Controller 1
measuredLI
Microprocessor
(MPPT Programming)
-+ +
-
PVI
PVVWindV
WindI
1d 2d
1
*
refI2
*
refI
+
-
+
-
PVV
windV
*
refV
Microprocessor(Current Control programming)
Boost mode
3d
oVoI
*
refV
Microprocessor(Current Control programming)
Buck mode
1d
oVoI
2d
L D3
D1
D2
Double input DC/DC converter
PVI
WindILoad
oI+
-
oVABV
AV
BV
MicroprocessorPower managament
control unit
PVV
PVI
windV
WindI
ABV
oV
oI
1d 2d 3d
1S
2S
3S
1d
2d
3d
Figure 6.1. Power managament control schematic diagram
The system works under two modes of operation, buck-boost or buck mode. Figure 6.2 shows anschematic of the control operation mode algorithm inside the microcontroller. The control unit readsthe value of the voltage VAB and after filtering it is compared with the reference output. After thiscomparison the microcontroller selects the operating mode.
For values lower than the output reference voltage, the system will be working under operation modeI and for higher voltages it will be the operation mode II.
Operating mode I
Operating mode II starts when the voltage VAB is greater than the voltage level required at the
51
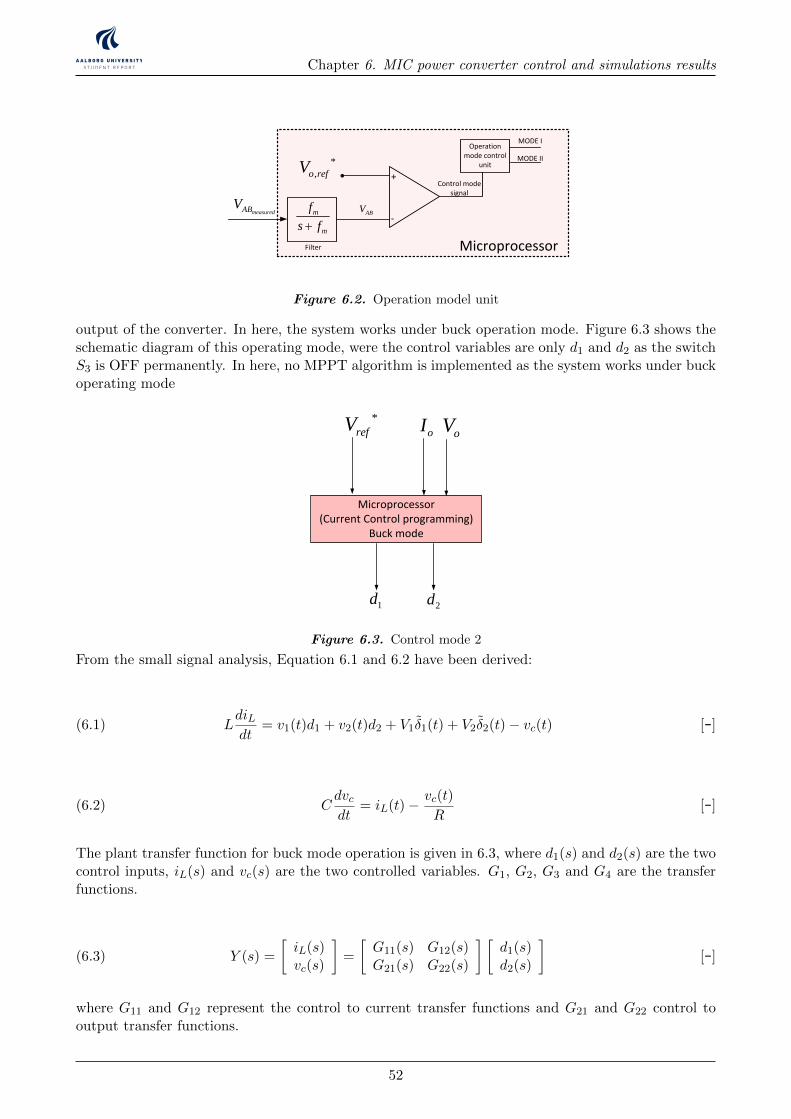
Chapter 6. MIC power converter control and simulations results
PMSGWind
turbine
Rectifier
wm
DC
DCLOAD
Rotating speed -Power characteristic Pactual
Cotrol Unit
Poptimal
error
Control Signal
Power Converter
PMSG
Wind turbine
Rectifier
DC
DCLOAD
Cotrol Unit
Control Signal
Power Converter
Wind speed
Vw
R
Wm
Wm-optimal
error
+-
+ -
Ea
Eb
Ec
Xs Rs
ILL VLL
D1 D3 D5
D2 D4D6
+
-
p
N
Id
Ea
Eb
Ec
Xs RsIa
Xs
Xs
Rs
Rs
+
-
VDC
IDC+
+
+
Va
Vb
Vc
Ib
Ic
H
D
VPVDC
DC
VWindDC
DC
LOADVo+
-
VPV
DC
DC
VWind
LOADVo
+
-
+
+ - + -
+ - + -
PMSG
500 W
Vertical axis wind turbine Gear box
+
-
600 W Vpv
DC/DC
Ibat
+
-
Vo
Io
3-ph Rectifier
+
-VWG
IPV
IWG
Control Unit
ON/OFF Control
IWG
VWG
Vpv
IPV
IbatVo
Dummy Load
12 V 450 AH Battery Bench
900 W
Control signals
PMSG
500 W
Vertical axis wind turbine Gear box
+
-
Vw
w
+
-
Solar Pump controller PM DC motor
Vpv
Back- Up system Diesel Generator
-
200 W
-
200 W
-+ +
200 W
+
Ea
Eb
Ec
Xs Rs
ILL VLL
D1 D3 D5
D2 D4D6
+
-
p
N
Id
Ea
Eb
Ec
Xs RsIa
Xs
Xs
Rs
Rs
+
-
VDC
IDC+
+
+
Va
Vb
Vc
Ib
Ic
+-
LvLi
iv +
-
CR
C
LLR
PWM S
+
ovloadR
Si
Di Ri
Ci
Cv
+
LvLi
iv CR
C
LLR
S ovloadR
Si
Di Ri
Ci
Cv
+iv CR
C
LLR
S ovloadR
Si Ci
Cv
sDT (1 ) sD T
iv
i oV V
( )Lv t
( )Ci t
PWM
D3
PMSGWind
turbine
Rectifier
DC
DC
Cotrol UnitControl Signal
Power Converter
DCI
LOAD
+
-
DCV
MPPT algorithm
+
-
Vcc
D9
Vin
+
-
An3 An5An4
Relay
LM7805 +5V
D2
2
31
7
27K
5.6K22uF
5.1V
1N4001
10K
8
3305.6 3305.615K
680
5.6K
330uF
680
15V
22uF
6.8K
15K
5.6K22uF
Relay
5.1V
VLoadSwitch
20K
5.6K22uF
5.1V
680 Vb
att.
D2
MOSPEC S20C40C(x2)
D3
1mH FQP12P20(x2)
0.39 c/v
1.2 K
+ +
+
Current Transducer
5VAn2
GND
Arduino Uno
An2
An3
An4An5
+5V
An
alo
g 0
..5
GND
An0
An1
D0D1D2D3D4D5D6D7D8D9D10D11D12
Swep
t A
rea
Ewind EturbineD
Swep
t A
rea
H
VAWTHAWT
Eunabsorved
DCP
mw
maxP
0, 0m
dP dP
dw dD
0, 0, 0 0DC
m DC m
dVdP dD dP
dw dV dw dD
0, 0, 0 0DC
m DC m
dVdP dD dP
dw dV dw dD
High Speed Low Speed
Track Starting Point Track Starting Point
D D
Maximum Power Point Tracking process
PDCk >PDCk-1
Read PDC
Iref(k)=Iref(k-1)-∆I
Vk >Vk-1
NO
Iref(k)=Iref(k-1)-∆I
YES
Iref(k)=Iref(k-1)+∆I
NOVk >Vk-1
YES
Iref(k)=Iref(k-1)+∆I
YES NO
sDT
I
Li
i oV V
L
sT
iV
L
LI
t
oV
R
oL
load
VI
R
t
t
t
sDT
CV
( )v t
LI V
C RC
sT
V
RC
CV
t
0.5
0.0
1
1.5
2
2.5
3
5 10 15 20
Voltage
Cu
rren
t
Vmp
Imp
Isc Short circuit current
VocOpen circuit voltage
MPP
V.Battery
I-V PV panel characteristics
DC/DC converterDC loadVbatt
+
-
Vp
v
Ipv +
-
Vo
Io
A/D A/D
MPPT and Charging algorithm
PWM
PV array
MPP
SCI
1dI
I
Load
2dI
1D
SR
PR2D
rI
DC/DCPV -Wind
system
Battery charge control.
Load regulation.
.battV.battI
Battery
.battD loadD
DCLOAD
.battI
t
sDT sT
-
Vin
+
-
Relay
CVbatt.
L Rb
Microcontroller
Iin
Vcontrol1
D1
M1
Sensor Signals Control Signals
VoutVin
Vbatt.
Ibatt
IinIbatt.
Vcontrol1Vcontrol2Vcontrol3
Vcontrol2
Vcontrol3
Vout Vout
file:///C:/Users/Andres/Documents/17c276_250_205.jpg
file:///C:/Users/Andres/Documents/17c276_250_205.jpg
windv
+
-12
12
1R
2R
fR
+
-
12
12
3R
4R
5R 6RoutV
Datalogger
M2
+
-
G
Iref=10A
+
-Vtrian.
Battery Charge ControllerVcontrol Ibatt.
MPPT AlgorithmDCV
DCI
refI+
-
e+
-.triVPWM
G
Io
-
+
-
+
-
+
Vo
V1
V2
C
+ -VL
+
-VD1
+ -VM2
ID2
I1 L
D1
D2
IL IC
M1
M2
VD2
+ -VM1
C Vo
Io+
-
+
-
-
+
+ -VL
+
-ID1
L
D1
D2
IL IC
+VD2
-
+ -VM1
M1
M2+ -VM2
V1
V2
C
+
-Vo
Io
Ii1
Ii2
+
-
+
-
V1
V2
+ -VL
L
D1
D2
IL ICM1
M2
VD2+
-
-
+VD1
+
-
+
-
+
-Vo
Io
Vc
V1
V2
+ -VL
+ -VM2
ID2
C
L
D1
D2
IL IC
+
-
VM1+ -
M2
M1
ID1
VD1
VD1
( )a ( )b
( )c ( )d
+
-
V1
V2
Vo
+
-
VG
S1
LM1
M2
D1
D2
C
-
+
VG
S2
VG
S1
+
-
-
+
V1
V2
+
-
Vo
LM1
M2
D1
D2
C
VG
S2
( )b
( )a
PMSGWind
turbine
Rectifier
wm
DC
DCLOAD
Rotating speed -Power characteristic Pactual
Cotrol Unit
Poptimal
error
Control Signal
Power Converter
PMSG
Wind turbine
Rectifier
DC
DCLOAD
Cotrol Unit
Control Signal
Power Converter
Wind speed
Vw
R
Wm
Wm-optimal
error
+-
+ -
Ea
Eb
Ec
Xs Rs
ILL VLL
D1 D3 D5
D2 D4D6
+
-
p
N
Id
Ea
Eb
Ec
Xs RsIa
Xs
Xs
Rs
Rs
+
-
VDC
IDC+
+
+
Va
Vb
Vc
Ib
Ic
H
D
VPVDC
DC
VWindDC
DC
LOADVo+
-
VPV
DC
DC
VWind
LOADVo
+
-
+
+ - + -
+ - + -
PMSG
500 W
Vertical axis wind turbine Gear box
+
-
600 W Vpv
DC/DC
Ibat
+
-
Vo
Io
3-ph Rectifier
+
-VWG
IPV
IWG
Control Unit
ON/OFF Control
IWG
VWG
Vpv
IPV
IbatVo
Dummy Load
12 V 450 AH Battery Bench
900 W
Control signals
PMSG
500 W
Vertical axis wind turbine Gear box
+
-
Vw
w
+
-
Solar Pump controller PM DC motor
Vpv
Back- Up system Diesel Generator
-
200 W
-
200 W
-+ +
200 W
+
Ea
Eb
Ec
Xs Rs
ILL VLL
D1 D3 D5
D2 D4D6
+
-
p
N
Id
Ea
Eb
Ec
Xs RsIa
Xs
Xs
Rs
Rs
+
-
VDC
IDC+
+
+
Va
Vb
Vc
Ib
Ic
+-
LvLi
iv +
-
CR
C
LLR
PWM S
+
ovloadR
Si
Di Ri
Ci
Cv
+
LvLi
iv CR
C
LLR
S ovloadR
Si
Di Ri
Ci
Cv
+iv CR
C
LLR
S ovloadR
Si Ci
Cv
sDT (1 ) sD T
iv
i oV V
( )Lv t
( )Ci t
PWM
D3
PMSGWind
turbine
Rectifier
DC
DC
Cotrol UnitControl Signal
Power Converter
DCI
LOAD
+
-
DCV
MPPT algorithm
+
-
Vcc
D9
Vin
+
-
An3 An5An4
Relay
LM7805 +5V
D2
2
31
7
27K
5.6K22uF
5.1V
1N4001
10K
8
3305.6 3305.615K
680
5.6K
330uF
680
15V
22uF
6.8K
15K
5.6K22uF
Relay
5.1V
VLoadSwitch
20K
5.6K22uF
5.1V
680 Vb
att.
D2
MOSPEC S20C40C(x2)
D3
1mH FQP12P20(x2)
0.39 c/v
1.2 K
+ +
+
Current Transducer
5VAn2
GND
Arduino Uno
An2
An3
An4An5
+5V
An
alo
g 0
..5
GND
An0
An1
D0D1D2D3D4D5D6D7D8D9D10D11D12
Swep
t A
rea
Ewind EturbineD
Swep
t A
rea
H
VAWTHAWT
Eunabsorved
DCP
mw
maxP
0, 0m
dP dP
dw dD
0, 0, 0 0DC
m DC m
dVdP dD dP
dw dV dw dD
0, 0, 0 0DC
m DC m
dVdP dD dP
dw dV dw dD
High Speed Low Speed
Track Starting Point Track Starting Point
D D
Maximum Power Point Tracking process
PDCk >PDCk-1
Read PDC
Iref(k)=Iref(k-1)-∆I
Vk >Vk-1
NO
Iref(k)=Iref(k-1)-∆I
YES
Iref(k)=Iref(k-1)+∆I
NOVk >Vk-1
YES
Iref(k)=Iref(k-1)+∆I
YES NO
sDT
I
Li
i oV V
L
sT
iV
L
LI
t
oV
R
oL
load
VI
R
t
t
t
sDT
CV
( )v t
LI V
C RC
sT
V
RC
CV
t
0.5
0.0
1
1.5
2
2.5
3
5 10 15 20
Voltage
Cu
rren
t
Vmp
Imp
Isc Short circuit current
VocOpen circuit voltage
MPP
V.Battery
I-V PV panel characteristics
DC/DC converterDC loadVbatt
+
-
Vp
v
Ipv +
-
Vo
Io
A/D A/D
MPPT and Charging algorithm
PWM
PV array
MPP
SCI
1dI
I
Load
2dI
1D
SR
PR2D
rI
DC/DCPV -Wind
system
Battery charge control.
Load regulation.
.battV.battI
Battery
.battD loadD
DCLOAD
.battI
t
sDT sT
-
Vin
+
-
Relay
CVbatt.
L Rb
Microcontroller
Iin
Vcontrol1
D1
M1
Sensor Signals Control Signals
VoutVin
Vbatt.
Ibatt
IinIbatt.
Vcontrol1Vcontrol2Vcontrol3
Vcontrol2
Vcontrol3
Vout Vout
file:///C:/Users/Andres/Documents/17c276_250_205.jpg
file:///C:/Users/Andres/Documents/17c276_250_205.jpg
windv
+
-12
12
1R
2R
fR
+
-
12
12
3R
4R
5R 6RoutV
Datalogger
M2
+
-
G
Iref=10A
+
-Vtrian.
Battery Charge ControllerVcontrol Ibatt.
MPPT AlgorithmDCV
DCI
refI+
-
e+
-.triVPWM
G
Io
-
+
-
+
-
+
Vo
V1
V2
C
+ -VL
+
-VD1
+ -VM2
ID2
I1 L
D1
D2
IL IC
M1
M2
VD2
+ -VM1
C Vo
Io+
-
+
-
-
+
+ -VL
+
-ID1
L
D1
D2
IL IC
+VD2
-
+ -VM1
M1
M2+ -VM2
V1
V2
C
+
-Vo
Io
Ii1
Ii2
+
-
+
-
V1
V2
+ -VL
L
D1
D2
IL ICM1
M2
VD2+
-
-
+VD1
+
-
+
-
+
-Vo
Io
Vc
V1
V2
+ -VL
+ -VM2
ID2
C
L
D1
D2
IL IC
+
-
VM1+ -
M2
M1
ID1
VD1
VD1
( )a
( )b
( )c ( )d
+
-
V1
V2
Vo
+
-
VG
S1
LM1
M2
D1
D2
C
-
+ VG
S2
VG
S1
+
-
-
+
V1
V2
+
-
Vo
LM1
M2
D1
D2
C
VG
S2
( )b( )a
( )a
( )b
sT
1d
1d
2t1t 4t3t
t
t
1GSV
2GSV
-+
V1
+
-V2
Vo
-
VG
S1
LM1
M2
D1
D2
C
+ VG
S2
( )c
VGS3
-+
V1
+
-V2
Vo
-
VG
S1
LM1
M2
D1
D2
C
+
VG
S2
VGS3
3M
-+
V1
+
-V2
Vo
-
VG
S1
LM1
M2
D1
D2
C
+ VG
S2
( )c
VGS3
+
-
Relay
CVbatt.
L Rb
VGS3
D3
M1
Ibatt.
Vrelay
Vout Vout
M2
Vwind
Iwind
-
+-
VPV
D1
D2
VGS1
VGS2
VGS4
-
Microcontroller
Ipv
Sensor Signals Control Signals
VoutVin
Vbatt
Vcontrol1Vcontrol2Vcontrol3
IwindIbatt Vrelay
Vcontrol4
+
-
+
-
Ipv
IoILIL
IL
( )a
IL
-+
V1
+
-V2
Vo
-
VG
S1
LM1
M2
D1
D2
C
+
VG
S2
VGS3
Io IoIL
( )c
-+
V1
+
-V2
Vo
-
VG
S1
LM1
M2
D1
D2
C
+
VG
S2
VGS3
IL
IL
( )b
IL
-+
V1
+
-V2
Vo
-
VG
S1
LM1
M2
D1
D2
C
+
VG
S2
VGS3
IL
( )c
Ic Io
Io
Ic
D3 D3
D3D3
+- 2G
1CT1G
2CT+-
1H
refVoV
*
refI
LI
duty
Plant 1 Plant 2Controller 2Controller 1
measuredLI
Microprocessor
(MPPT Programming)
-+ +
-
PVI
PVVWindV
WindI
1d 2d
1
*
refI2
*
refI
+
-
+
-
PVV
windV
*
refV
Microprocessor(Current Control programming)
Boost mode
3d
oVoI
*
refV
Microprocessor(Current Control programming)
Buck mode
1d
oVoI
2d
L D3
D1
D2
Double input DC/DC converter
PVI
WindILoad
oI+
-
oVABV
AV
BV
MicroprocessorPower managament
control unit
PVV
PVI
windV
WindI
ABV
oV
oI
1d 2d 3d
1S
2S
3S
1d
2d
3d
Current compensator
Current compensator
Operation mode control
unit*
,o refV+
-
Control mode signal
m
m
f
s f
measuredABV
Filter
MODE I
MODE II
Microprocessor
ABV
Figure 6.2. Operation model unit
output of the converter. In here, the system works under buck operation mode. Figure 6.3 shows theschematic diagram of this operating mode, were the control variables are only d1 and d2 as the switchS3 is OFF permanently. In here, no MPPT algorithm is implemented as the system works under buckoperating mode
PMSGWind
turbine
Rectifier
wm
DC
DCLOAD
Rotating speed -Power characteristic Pactual
Cotrol Unit
Poptimal
error
Control Signal
Power Converter
PMSG
Wind turbine
Rectifier
DC
DCLOAD
Cotrol Unit
Control Signal
Power Converter
Wind speed
Vw
R
Wm
Wm-optimal
error
+-
+ -
Ea
Eb
Ec
Xs Rs
ILL VLL
D1 D3 D5
D2 D4D6
+
-
p
N
Id
Ea
Eb
Ec
Xs RsIa
Xs
Xs
Rs
Rs
+
-
VDC
IDC+
+
+
Va
Vb
Vc
Ib
Ic
H
D
VPVDC
DC
VWindDC
DC
LOADVo+
-
VPV
DC
DC
VWind
LOADVo
+
-
+
+ - + -
+ - + -
PMSG
500 W
Vertical axis wind turbine Gear box
+
-
600 W Vpv
DC/DC
Ibat
+
-
Vo
Io
3-ph Rectifier
+
-VWG
IPV
IWG
Control Unit
ON/OFF Control
IWG
VWG
Vpv
IPV
IbatVo
Dummy Load
12 V 450 AH Battery Bench
900 W
Control signals
PMSG
500 W
Vertical axis wind turbine Gear box
+
-
Vw
w
+
-
Solar Pump controller PM DC motor
Vpv
Back- Up system Diesel Generator
-
200 W
-
200 W
-+ +
200 W
+
Ea
Eb
Ec
Xs Rs
ILL VLL
D1 D3 D5
D2 D4D6
+
-
p
N
Id
Ea
Eb
Ec
Xs RsIa
Xs
Xs
Rs
Rs
+
-
VDC
IDC+
+
+
Va
Vb
Vc
Ib
Ic
+-
LvLi
iv +
-
CR
C
LLR
PWM S
+
ovloadR
Si
Di Ri
Ci
Cv
+
LvLi
iv CR
C
LLR
S ovloadR
Si
Di Ri
Ci
Cv
+iv CR
C
LLR
S ovloadR
Si Ci
Cv
sDT (1 ) sD T
iv
i oV V
( )Lv t
( )Ci t
PWM
D3
PMSGWind
turbine
Rectifier
DC
DC
Cotrol UnitControl Signal
Power Converter
DCI
LOAD
+
-
DCV
MPPT algorithm
+
-
Vcc
D9
Vin
+
-
An3 An5An4
Relay
LM7805 +5V
D2
2
31
7
27K
5.6K22uF
5.1V
1N4001
10K
8
3305.6 3305.615K
680
5.6K
330uF
680
15V
22uF
6.8K
15K
5.6K22uF
Relay
5.1V
VLoadSwitch
20K
5.6K22uF
5.1V
680 Vb
att.
D2
MOSPEC S20C40C(x2)
D3
1mH FQP12P20(x2)
0.39 c/v
1.2 K
+ +
+
Current Transducer
5VAn2
GND
Arduino Uno
An2
An3
An4An5
+5V
An
alo
g 0
..5
GND
An0
An1
D0D1D2D3D4D5D6D7D8D9D10D11D12
Swep
t A
rea
Ewind EturbineD
Swep
t A
rea
H
VAWTHAWT
Eunabsorved
DCP
mw
maxP
0, 0m
dP dP
dw dD
0, 0, 0 0DC
m DC m
dVdP dD dP
dw dV dw dD
0, 0, 0 0DC
m DC m
dVdP dD dP
dw dV dw dD
High Speed Low Speed
Track Starting Point Track Starting Point
D D
Maximum Power Point Tracking process
PDCk >PDCk-1
Read PDC
Iref(k)=Iref(k-1)-∆I
Vk >Vk-1
NO
Iref(k)=Iref(k-1)-∆I
YES
Iref(k)=Iref(k-1)+∆I
NOVk >Vk-1
YES
Iref(k)=Iref(k-1)+∆I
YES NO
sDT
I
Li
i oV V
L
sT
iV
L
LI
t
oV
R
oL
load
VI
R
t
t
t
sDT
CV
( )v t
LI V
C RC
sT
V
RC
CV
t
0.5
0.0
1
1.5
2
2.5
3
5 10 15 20
Voltage
Cu
rren
t
Vmp
Imp
Isc Short circuit current
VocOpen circuit voltage
MPP
V.Battery
I-V PV panel characteristics
DC/DC converterDC loadVbatt
+
-
Vp
v
Ipv +
-
Vo
Io
A/D A/D
MPPT and Charging algorithm
PWM
PV array
MPP
SCI
1dI
I
Load
2dI
1D
SR
PR2D
rI
DC/DCPV -Wind
system
Battery charge control.
Load regulation.
.battV.battI
Battery
.battD loadD
DCLOAD
.battI
t
sDT sT
-
Vin
+
-
Relay
CVbatt.
L Rb
Microcontroller
Iin
Vcontrol1
D1
M1
Sensor Signals Control Signals
VoutVin
Vbatt.
Ibatt
IinIbatt.
Vcontrol1Vcontrol2Vcontrol3
Vcontrol2
Vcontrol3
Vout Vout
file:///C:/Users/Andres/Documents/17c276_250_205.jpg
file:///C:/Users/Andres/Documents/17c276_250_205.jpg
windv
+
-12
12
1R
2R
fR
+
-
12
12
3R
4R
5R 6RoutV
Datalogger
M2
+
-
G
Iref=10A
+
-Vtrian.
Battery Charge ControllerVcontrol Ibatt.
MPPT AlgorithmDCV
DCI
refI+
-
e+
-.triVPWM
G
Io
-
+
-
+
-
+
Vo
V1
V2
C
+ -VL
+
-VD1
+ -VM2
ID2
I1 L
D1
D2
IL IC
M1
M2
VD2
+ -VM1
C Vo
Io+
-
+
-
-
+
+ -VL
+
-ID1
L
D1
D2
IL IC
+VD2
-
+ -VM1
M1
M2+ -VM2
V1
V2
C
+
-Vo
Io
Ii1
Ii2
+
-
+
-
V1
V2
+ -VL
L
D1
D2
IL ICM1
M2
VD2+
-
-
+VD1
+
-
+
-
+
-Vo
Io
Vc
V1
V2
+ -VL
+ -VM2
ID2
C
L
D1
D2
IL IC
+
-
VM1+ -
M2
M1
ID1
VD1
VD1
( )a ( )b
( )c ( )d
+
-
V1
V2
Vo
+
-V
GS1
LM1
M2
D1
D2
C
-
+
VG
S2
VG
S1
+
-
-
+
V1
V2
+
-
Vo
LM1
M2
D1
D2
C
VG
S2
( )b
( )a
PMSGWind
turbine
Rectifier
wm
DC
DCLOAD
Rotating speed -Power characteristic Pactual
Cotrol Unit
Poptimal
error
Control Signal
Power Converter
PMSG
Wind turbine
Rectifier
DC
DCLOAD
Cotrol Unit
Control Signal
Power Converter
Wind speed
Vw
R
Wm
Wm-optimal
error
+-
+ -
Ea
Eb
Ec
Xs Rs
ILL VLL
D1 D3 D5
D2 D4D6
+
-
p
N
Id
Ea
Eb
Ec
Xs RsIa
Xs
Xs
Rs
Rs
+
-
VDC
IDC+
+
+
Va
Vb
Vc
Ib
Ic
H
D
VPVDC
DC
VWindDC
DC
LOADVo+
-
VPV
DC
DC
VWind
LOADVo
+
-
+
+ - + -
+ - + -
PMSG
500 W
Vertical axis wind turbine Gear box
+
-
600 W Vpv
DC/DC
Ibat
+
-
Vo
Io
3-ph Rectifier
+
-VWG
IPV
IWG
Control Unit
ON/OFF Control
IWG
VWG
Vpv
IPV
IbatVo
Dummy Load
12 V 450 AH Battery Bench
900 W
Control signals
PMSG
500 W
Vertical axis wind turbine Gear box
+
-
Vw
w
+
-
Solar Pump controller PM DC motor
Vpv
Back- Up system Diesel Generator
-
200 W
-
200 W
-+ +
200 W
+
Ea
Eb
Ec
Xs Rs
ILL VLL
D1 D3 D5
D2 D4D6
+
-
p
N
Id
Ea
Eb
Ec
Xs RsIa
Xs
Xs
Rs
Rs
+
-
VDC
IDC+
+
+
Va
Vb
Vc
Ib
Ic
+-
LvLi
iv +
-
CR
C
LLR
PWM S
+
ovloadR
Si
Di Ri
Ci
Cv
+
LvLi
iv CR
C
LLR
S ovloadR
Si
Di Ri
Ci
Cv
+iv CR
C
LLR
S ovloadR
Si Ci
Cv
sDT (1 ) sD T
iv
i oV V
( )Lv t
( )Ci t
PWM
D3
PMSGWind
turbine
Rectifier
DC
DC
Cotrol UnitControl Signal
Power Converter
DCI
LOAD
+
-
DCV
MPPT algorithm
+
-
Vcc
D9
Vin
+
-
An3 An5An4
Relay
LM7805 +5V
D2
2
31
7
27K
5.6K22uF
5.1V
1N4001
10K
8
3305.6 3305.615K
680
5.6K
330uF
680
15V
22uF
6.8K
15K
5.6K22uF
Relay
5.1V
VLoadSwitch
20K
5.6K22uF
5.1V
680 Vb
att.
D2
MOSPEC S20C40C(x2)
D3
1mH FQP12P20(x2)
0.39 c/v
1.2 K
+ +
+
Current Transducer
5VAn2
GND
Arduino Uno
An2
An3
An4An5
+5V
An
alo
g 0
..5
GND
An0
An1
D0D1D2D3D4D5D6D7D8D9D10D11D12
Swep
t A
rea
Ewind EturbineD
Swep
t A
rea
H
VAWTHAWT
Eunabsorved
DCP
mw
maxP
0, 0m
dP dP
dw dD
0, 0, 0 0DC
m DC m
dVdP dD dP
dw dV dw dD
0, 0, 0 0DC
m DC m
dVdP dD dP
dw dV dw dD
High Speed Low Speed
Track Starting Point Track Starting Point
D D
Maximum Power Point Tracking process
PDCk >PDCk-1
Read PDC
Iref(k)=Iref(k-1)-∆I
Vk >Vk-1
NO
Iref(k)=Iref(k-1)-∆I
YES
Iref(k)=Iref(k-1)+∆I
NOVk >Vk-1
YES
Iref(k)=Iref(k-1)+∆I
YES NO
sDT
I
Li
i oV V
L
sT
iV
L
LI
t
oV
R
oL
load
VI
R
t
t
t
sDT
CV
( )v t
LI V
C RC
sT
V
RC
CV
t
0.5
0.0
1
1.5
2
2.5
3
5 10 15 20
Voltage
Cu
rren
t
Vmp
Imp
Isc Short circuit current
VocOpen circuit voltage
MPP
V.Battery
I-V PV panel characteristics
DC/DC converterDC loadVbatt
+
-
Vp
v
Ipv +
-
Vo
Io
A/D A/D
MPPT and Charging algorithm
PWM
PV array
MPP
SCI
1dI
I
Load
2dI
1D
SR
PR2D
rI
DC/DCPV -Wind
system
Battery charge control.
Load regulation.
.battV.battI
Battery
.battD loadD
DCLOAD
.battI
t
sDT sT
-
Vin
+
-
Relay
CVbatt.
L Rb
Microcontroller
Iin
Vcontrol1
D1
M1
Sensor Signals Control Signals
VoutVin
Vbatt.
Ibatt
IinIbatt.
Vcontrol1Vcontrol2Vcontrol3
Vcontrol2
Vcontrol3
Vout Vout
file:///C:/Users/Andres/Documents/17c276_250_205.jpg
file:///C:/Users/Andres/Documents/17c276_250_205.jpg
windv
+
-12
12
1R
2R
fR
+
-
12
12
3R
4R
5R 6RoutV
Datalogger
M2
+
-
G
Iref=10A
+
-Vtrian.
Battery Charge ControllerVcontrol Ibatt.
MPPT AlgorithmDCV
DCI
refI+
-
e+
-.triVPWM
G
Io
-
+
-
+
-
+
Vo
V1
V2
C
+ -VL
+
-VD1
+ -VM2
ID2
I1 L
D1
D2
IL IC
M1
M2
VD2
+ -VM1
C Vo
Io+
-
+
-
-
+
+ -VL
+
-ID1
L
D1
D2
IL IC
+VD2
-
+ -VM1
M1
M2+ -VM2
V1
V2
C
+
-Vo
Io
Ii1
Ii2
+
-
+
-
V1
V2
+ -VL
L
D1
D2
IL ICM1
M2
VD2+
-
-
+VD1
+
-
+
-
+
-Vo
Io
Vc
V1
V2
+ -VL
+ -VM2
ID2
C
L
D1
D2
IL IC
+
-
VM1+ -
M2
M1
ID1
VD1
VD1
( )a
( )b
( )c ( )d
+
-
V1
V2
Vo
+
-
VG
S1
LM1
M2
D1
D2
C
-
+ VG
S2
VG
S1
+
-
-
+
V1
V2
+
-
Vo
LM1
M2
D1
D2
C
VG
S2
( )b( )a
( )a
( )b
sT
1d
1d
2t1t 4t3t
t
t
1GSV
2GSV
-+
V1
+
-V2
Vo
-
VG
S1
LM1
M2
D1
D2
C
+ VG
S2
( )c
VGS3
-+
V1
+
-V2
Vo
-
VG
S1
LM1
M2
D1
D2
C
+
VG
S2
VGS3
3M
-+
V1
+
-V2
Vo
-
VG
S1
LM1
M2
D1
D2
C
+ VG
S2
( )c
VGS3
+
-
Relay
CVbatt.
L Rb
VGS3
D3
M1
Ibatt.
Vrelay
Vout Vout
M2
Vwind
Iwind
-
+-
VPV
D1
D2
VGS1
VGS2
VGS4
-
Microcontroller
Ipv
Sensor Signals Control Signals
VoutVin
Vbatt
Vcontrol1Vcontrol2Vcontrol3
IwindIbatt Vrelay
Vcontrol4
+
-
+
-
Ipv
IoILIL
IL
( )a
IL
-+
V1
+
-V2
Vo
-
VG
S1
LM1
M2
D1
D2
C
+
VG
S2
VGS3
Io IoIL
( )c
-+
V1
+
-V2
Vo
-
VG
S1
LM1
M2
D1
D2
C
+
VG
S2
VGS3
IL
IL
( )b
IL
-+
V1
+
-V2
Vo
-
VG
S1
LM1
M2
D1
D2
C
+
VG
S2
VGS3
IL
( )c
Ic Io
Io
Ic
D3 D3
D3D3
+- 2G
1CT1G
2CT+-
1H
refVoV
*
refI
LI
duty
Plant 1 Plant 2Controller 2Controller 1
measuredLI
Microprocessor
(MPPT Programming)
-+ +
-
PVI
PVVWindV
WindI
1d 2d
1
*
refI2
*
refI
+
-
+
-
PVV
windV
*
refV
Microprocessor(Current Control programming)
Boost mode
3d
oVoI
*
refV
Microprocessor(Current Control programming)
Buck mode
1d
oVoI
2d
L D3
D1
D2
Double input DC/DC converter
PVI
WindILoad
oI+
-
oVABV
AV
BV
MicroprocessorPower managament
control unit
PVV
PVI
windV
WindI
ABV
oV
oI
1d 2d 3d
1S
2S
3S
1d
2d
3d
Current compensator
Current compensator
Figure 6.3. Control mode 2
From the small signal analysis, Equation 6.1 and 6.2 have been derived:
LdiLdt
= v1(t)d1 + v2(t)d2 + V1δ1(t) + V2δ2(t)− vc(t) [-](6.1)
Cdvcdt
= iL(t)− vc(t)
R[-](6.2)
The plant transfer function for buck mode operation is given in 6.3, where d1(s) and d2(s) are the twocontrol inputs, iL(s) and vc(s) are the two controlled variables. G1, G2, G3 and G4 are the transferfunctions.
Y (s) =
[iL(s)vc(s)
]=
[G11(s) G12(s)G21(s) G22(s)
] [d1(s)d2(s)
][-](6.3)
where G11 and G12 represent the control to current transfer functions and G21 and G22 control tooutput transfer functions.
52
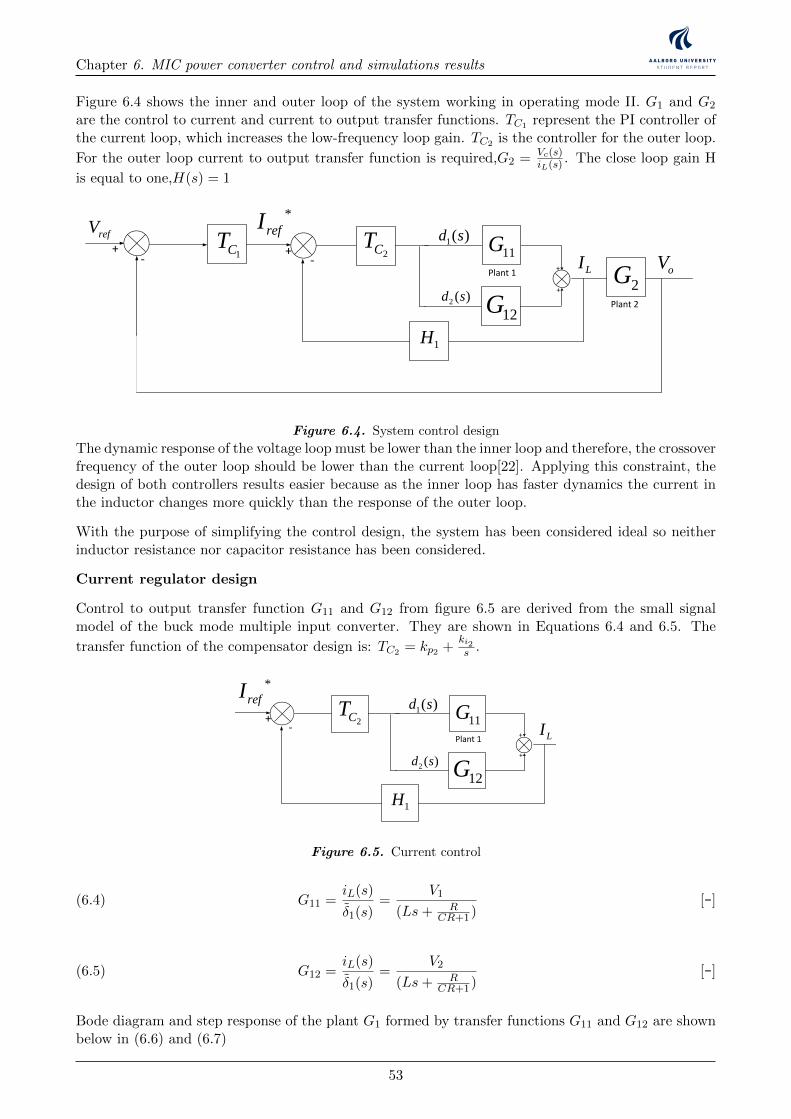
Chapter 6. MIC power converter control and simulations results
Figure 6.4 shows the inner and outer loop of the system working in operating mode II. G1 and G2
are the control to current and current to output transfer functions. TC1 represent the PI controller ofthe current loop, which increases the low-frequency loop gain. TC2 is the controller for the outer loop.
For the outer loop current to output transfer function is required,G2 = Vc(s)iL(s) . The close loop gain H
is equal to one,H(s) = 1
2CT
PMSGWind
turbine
Rectifier
wm
DC
DCLOAD
Rotating speed -Power characteristic Pactual
Cotrol Unit
Poptimal
error
Control Signal
Power Converter
PMSG
Wind turbine
Rectifier
DC
DCLOAD
Cotrol Unit
Control Signal
Power Converter
Wind speed
Vw
R
Wm
Wm-optimal
error
+-
+ -
Ea
Eb
Ec
Xs Rs
ILL VLL
D1 D3 D5
D2 D4D6
+
-
p
N
Id
Ea
Eb
Ec
Xs RsIa
Xs
Xs
Rs
Rs
+
-
VDC
IDC+
+
+
Va
Vb
Vc
Ib
Ic
H
D
VPVDC
DC
VWindDC
DC
LOADVo+
-
VPV
DC
DC
VWind
LOADVo
+
-
+
+ - + -
+ - + -
PMSG
500 W
Vertical axis wind turbine Gear box
+
-
600 W Vpv
DC/DC
Ibat
+
-
Vo
Io
3-ph Rectifier
+
-VWG
IPV
IWG
Control Unit
ON/OFF Control
IWG
VWG
Vpv
IPV
IbatVo
Dummy Load
12 V 450 AH Battery Bench
900 W
Control signals
PMSG
500 W
Vertical axis wind turbine Gear box
+
-
Vw
w
+
-
Solar Pump controller PM DC motor
Vpv
Back- Up system Diesel Generator
-
200 W
-
200 W
-+ +
200 W
+
Ea
Eb
Ec
Xs Rs
ILL VLL
D1 D3 D5
D2 D4D6
+
-
p
N
Id
Ea
Eb
Ec
Xs RsIa
Xs
Xs
Rs
Rs
+
-
VDC
IDC+
+
+
Va
Vb
Vc
Ib
Ic
+-
LvLi
iv +
-
CR
C
LLR
PWM S
+
ovloadR
Si
Di Ri
Ci
Cv
+
LvLi
iv CR
C
LLR
S ovloadR
Si
Di Ri
Ci
Cv
+iv CR
C
LLR
S ovloadR
Si Ci
Cv
sDT (1 ) sD T
iv
i oV V
( )Lv t
( )Ci t
PWM
D3
PMSGWind
turbine
Rectifier
DC
DC
Cotrol UnitControl Signal
Power Converter
DCI
LOAD
+
-
DCV
MPPT algorithm
+
-
Vcc
D9
Vin
+
-
An3 An5An4
Relay
LM7805 +5V
D2
2
31
7
27K
5.6K22uF
5.1V
1N4001
10K
8
3305.6 3305.615K
680
5.6K
330uF
680
15V
22uF
6.8K
15K
5.6K22uF
Relay
5.1V
VLoadSwitch
20K
5.6K22uF
5.1V
680 Vb
att.
D2
MOSPEC S20C40C(x2)
D3
1mH FQP12P20(x2)
0.39 c/v
1.2 K
+ +
+
Current Transducer
5VAn2
GND
Arduino Uno
An2
An3
An4An5
+5V
An
alo
g 0
..5
GND
An0
An1
D0D1D2D3D4D5D6D7D8D9D10D11D12
Swep
t A
rea
Ewind EturbineD
Swep
t A
rea
H
VAWTHAWT
Eunabsorved
DCP
mw
maxP
0, 0m
dP dP
dw dD
0, 0, 0 0DC
m DC m
dVdP dD dP
dw dV dw dD
0, 0, 0 0DC
m DC m
dVdP dD dP
dw dV dw dD
High Speed Low Speed
Track Starting Point Track Starting Point
D D
Maximum Power Point Tracking process
PDCk >PDCk-1
Read PDC
Iref(k)=Iref(k-1)-∆I
Vk >Vk-1
NO
Iref(k)=Iref(k-1)-∆I
YES
Iref(k)=Iref(k-1)+∆I
NOVk >Vk-1
YES
Iref(k)=Iref(k-1)+∆I
YES NO
sDT
I
Li
i oV V
L
sT
iV
L
LI
t
oV
R
oL
load
VI
R
t
t
t
sDT
CV
( )v t
LI V
C RC
sT
V
RC
CV
t
0.5
0.0
1
1.5
2
2.5
3
5 10 15 20
Voltage
Cu
rren
t
Vmp
Imp
Isc Short circuit current
VocOpen circuit voltage
MPP
V.Battery
I-V PV panel characteristics
DC/DC converterDC loadVbatt
+
-
Vp
v
Ipv +
-
Vo
Io
A/D A/D
MPPT and Charging algorithm
PWM
PV array
MPP
SCI
1dI
I
Load
2dI
1D
SR
PR2D
rI
DC/DCPV -Wind
system
Battery charge control.
Load regulation.
.battV.battI
Battery
.battD loadD
DCLOAD
.battI
t
sDT sT
-
Vin
+
-
Relay
CVbatt.
L Rb
Microcontroller
Iin
Vcontrol1
D1
M1
Sensor Signals Control Signals
VoutVin
Vbatt.
Ibatt
IinIbatt.
Vcontrol1Vcontrol2Vcontrol3
Vcontrol2
Vcontrol3
Vout Vout
file:///C:/Users/Andres/Documents/17c276_250_205.jpg
file:///C:/Users/Andres/Documents/17c276_250_205.jpg
windv
+
-12
12
1R
2R
fR
+
-
12
12
3R
4R
5R 6RoutV
Datalogger
M2
+
-
G
Iref=10A
+
-Vtrian.
Battery Charge ControllerVcontrol Ibatt.
MPPT AlgorithmDCV
DCI
refI+
-
e+
-.triVPWM
G
Io
-
+
-
+
-
+
Vo
V1
V2
C
+ -VL
+
-VD1
+ -VM2
ID2
I1 L
D1
D2
IL IC
M1
M2
VD2
+ -VM1
C Vo
Io+
-
+
-
-
+
+ -VL
+
-ID1
L
D1
D2
IL IC
+VD2
-
+ -VM1
M1
M2+ -VM2
V1
V2
C
+
-Vo
Io
Ii1
Ii2
+
-
+
-
V1
V2
+ -VL
L
D1
D2
IL ICM1
M2
VD2+
-
-
+VD1
+
-
+
-
+
-Vo
Io
Vc
V1
V2
+ -VL
+ -VM2
ID2
C
L
D1
D2
IL IC
+
-
VM1+ -
M2
M1
ID1
VD1
VD1
( )a ( )b
( )c ( )d
+
-
V1
V2
Vo
+
-
VG
S1
LM1
M2
D1
D2
C
-
+
VG
S2
VG
S1
+
-
-
+
V1
V2
+
-
Vo
LM1
M2
D1
D2
C
VG
S2
( )b
( )a
PMSGWind
turbine
Rectifier
wm
DC
DCLOAD
Rotating speed -Power characteristic Pactual
Cotrol Unit
Poptimal
error
Control Signal
Power Converter
PMSG
Wind turbine
Rectifier
DC
DCLOAD
Cotrol Unit
Control Signal
Power Converter
Wind speed
Vw
R
Wm
Wm-optimal
error
+-
+ -
Ea
Eb
Ec
Xs Rs
ILL VLL
D1 D3 D5
D2 D4D6
+
-
p
N
Id
Ea
Eb
Ec
Xs RsIa
Xs
Xs
Rs
Rs
+
-
VDC
IDC+
+
+
Va
Vb
Vc
Ib
Ic
H
D
VPVDC
DC
VWindDC
DC
LOADVo+
-
VPV
DC
DC
VWind
LOADVo
+
-
+
+ - + -
+ - + -
PMSG
500 W
Vertical axis wind turbine Gear box
+
-
600 W Vpv
DC/DC
Ibat
+
-
Vo
Io
3-ph Rectifier
+
-VWG
IPV
IWG
Control Unit
ON/OFF Control
IWG
VWG
Vpv
IPV
IbatVo
Dummy Load
12 V 450 AH Battery Bench
900 W
Control signals
PMSG
500 W
Vertical axis wind turbine Gear box
+
-
Vw
w
+
-
Solar Pump controller PM DC motor
Vpv
Back- Up system Diesel Generator
-
200 W
-
200 W
-+ +
200 W
+
Ea
Eb
Ec
Xs Rs
ILL VLL
D1 D3 D5
D2 D4D6
+
-
p
N
Id
Ea
Eb
Ec
Xs RsIa
Xs
Xs
Rs
Rs
+
-
VDC
IDC+
+
+
Va
Vb
Vc
Ib
Ic
+-
LvLi
iv +
-
CR
C
LLR
PWM S
+
ovloadR
Si
Di Ri
Ci
Cv
+
LvLi
iv CR
C
LLR
S ovloadR
Si
Di Ri
Ci
Cv
+iv CR
C
LLR
S ovloadR
Si Ci
Cv
sDT (1 ) sD T
iv
i oV V
( )Lv t
( )Ci t
PWM
D3
PMSGWind
turbine
Rectifier
DC
DC
Cotrol UnitControl Signal
Power Converter
DCI
LOAD
+
-
DCV
MPPT algorithm
+
-
Vcc
D9
Vin
+
-
An3 An5An4
Relay
LM7805 +5V
D2
2
31
7
27K
5.6K22uF
5.1V
1N4001
10K
8
3305.6 3305.615K
680
5.6K
330uF
680
15V
22uF
6.8K
15K
5.6K22uF
Relay
5.1V
VLoadSwitch
20K
5.6K22uF
5.1V
680 Vb
att.
D2
MOSPEC S20C40C(x2)
D3
1mH FQP12P20(x2)
0.39 c/v
1.2 K
+ +
+
Current Transducer
5VAn2
GND
Arduino Uno
An2
An3
An4An5
+5V
An
alo
g 0
..5
GND
An0
An1
D0D1D2D3D4D5D6D7D8D9D10D11D12
Swep
t A
rea
Ewind EturbineD
Swep
t A
rea
H
VAWTHAWT
Eunabsorved
DCP
mw
maxP
0, 0m
dP dP
dw dD
0, 0, 0 0DC
m DC m
dVdP dD dP
dw dV dw dD
0, 0, 0 0DC
m DC m
dVdP dD dP
dw dV dw dD
High Speed Low Speed
Track Starting Point Track Starting Point
D D
Maximum Power Point Tracking process
PDCk >PDCk-1
Read PDC
Iref(k)=Iref(k-1)-∆I
Vk >Vk-1
NO
Iref(k)=Iref(k-1)-∆I
YES
Iref(k)=Iref(k-1)+∆I
NOVk >Vk-1
YES
Iref(k)=Iref(k-1)+∆I
YES NO
sDT
I
Li
i oV V
L
sT
iV
L
LI
t
oV
R
oL
load
VI
R
t
t
t
sDT
CV
( )v t
LI V
C RC
sT
V
RC
CV
t
0.5
0.0
1
1.5
2
2.5
3
5 10 15 20
Voltage
Cu
rren
t
Vmp
Imp
Isc Short circuit current
VocOpen circuit voltage
MPP
V.Battery
I-V PV panel characteristics
DC/DC converterDC loadVbatt
+
-
Vp
v
Ipv +
-
Vo
Io
A/D A/D
MPPT and Charging algorithm
PWM
PV array
MPP
SCI
1dI
I
Load
2dI
1D
SR
PR2D
rI
DC/DCPV -Wind
system
Battery charge control.
Load regulation.
.battV.battI
Battery
.battD loadD
DCLOAD
.battI
t
sDT sT
-
Vin
+
-
Relay
CVbatt.
L Rb
Microcontroller
Iin
Vcontrol1
D1
M1
Sensor Signals Control Signals
VoutVin
Vbatt.
Ibatt
IinIbatt.
Vcontrol1Vcontrol2Vcontrol3
Vcontrol2
Vcontrol3
Vout Vout
file:///C:/Users/Andres/Documents/17c276_250_205.jpg
file:///C:/Users/Andres/Documents/17c276_250_205.jpg
windv
+
-12
12
1R
2R
fR
+
-
12
12
3R
4R
5R 6RoutV
Datalogger
M2
+
-
G
Iref=10A
+
-Vtrian.
Battery Charge ControllerVcontrol Ibatt.
MPPT AlgorithmDCV
DCI
refI+
-
e+
-.triVPWM
G
Io
-
+
-
+
-
+
Vo
V1
V2
C
+ -VL
+
-VD1
+ -VM2
ID2
I1 L
D1
D2
IL IC
M1
M2
VD2
+ -VM1
C Vo
Io+
-
+
-
-
+
+ -VL
+
-ID1
L
D1
D2
IL IC
+VD2
-
+ -VM1
M1
M2+ -VM2
V1
V2
C
+
-Vo
Io
Ii1
Ii2
+
-
+
-
V1
V2
+ -VL
L
D1
D2
IL ICM1
M2
VD2+
-
-
+VD1
+
-
+
-
+
-Vo
Io
Vc
V1
V2
+ -VL
+ -VM2
ID2
C
L
D1
D2
IL IC
+
-
VM1+ -
M2
M1
ID1
VD1
VD1
( )a
( )b
( )c ( )d
+
-
V1
V2
Vo
+
-
VG
S1
LM1
M2
D1
D2
C
-
+ VG
S2
VG
S1
+
-
-
+
V1
V2
+
-
Vo
LM1
M2
D1
D2
C
VG
S2
( )b( )a
( )a
( )b
sT
1d
1d
2t1t 4t3t
t
t
1GSV
2GSV
-+
V1
+
-V2
Vo
-
VG
S1
LM1
M2
D1
D2
C
+ VG
S2
( )c
VGS3
-+
V1
+
-V2
Vo
-
VG
S1
LM1
M2
D1
D2
C
+
VG
S2
VGS3
3M
-+
V1
+
-V2
Vo
-
VG
S1
LM1
M2
D1
D2
C
+ VG
S2
( )c
VGS3
+
-
Relay
CVbatt.
L Rb
VGS3
D3
M1
Ibatt.
Vrelay
Vout Vout
M2
Vwind
Iwind
-
+-
VPV
D1
D2
VGS1
VGS2
VGS4
-
Microcontroller
Ipv
Sensor Signals Control Signals
VoutVin
Vbatt
Vcontrol1Vcontrol2Vcontrol3
IwindIbatt Vrelay
Vcontrol4
+
-
+
-
Ipv
IoILIL
IL
( )a
IL
-+
V1
+
-V2
Vo
-
VG
S1
LM1
M2
D1
D2
C
+
VG
S2
VGS3
Io IoIL
( )c
-+
V1
+
-V2
Vo
-
VG
S1
LM1
M2
D1
D2
C
+
VG
S2
VGS3
IL
IL
( )b
IL
-+
V1
+
-V2
Vo
-
VG
S1
LM1
M2
D1
D2
C
+
VG
S2
VGS3
IL
( )c
Ic Io
Io
Ic
D3 D3
D3D3
+- 2G
1CT1G
2CT+-
1H
refVoV
*
refI
LI
duty
Plant 1 Plant 2Controller 2Controller 1
measuredLI
Microprocessor
(MPPT Programming)
-+ +
-
PVI
PVVWindV
WindI
1d 2d
1
*
refI2
*
refI
+
-
+
-
PVV
windV
*
refV
Microprocessor(Current Control programming)
Boost mode
3d
oVoI
*
refV
Microprocessor(Current Control programming)
Buck mode
1d
oVoI
2d
L D3
D1
D2
Double input DC/DC converter
PVI
WindILoad
oI+
-
oVABV
AV
BV
MicroprocessorPower managament
control unit
PVV
PVI
windV
WindI
ABV
oV
oI
1d 2d 3d
1S
2S
3S
1d
2d
3d
+-
*
refI1( )d s
Plant 1 LI
12G
11G
2 ( )d s
+
+
1H
+refV
1CT-
2GPlant 2
oV
Figure 6.4. System control design
The dynamic response of the voltage loop must be lower than the inner loop and therefore, the crossoverfrequency of the outer loop should be lower than the current loop[22]. Applying this constraint, thedesign of both controllers results easier because as the inner loop has faster dynamics the current inthe inductor changes more quickly than the response of the outer loop.
With the purpose of simplifying the control design, the system has been considered ideal so neitherinductor resistance nor capacitor resistance has been considered.
Current regulator design
Control to output transfer function G11 and G12 from figure 6.5 are derived from the small signalmodel of the buck mode multiple input converter. They are shown in Equations 6.4 and 6.5. The
transfer function of the compensator design is: TC2 = kp2 +ki2s .
2CT
PMSGWind
turbine
Rectifier
wm
DC
DCLOAD
Rotating speed -Power characteristic Pactual
Cotrol Unit
Poptimal
error
Control Signal
Power Converter
PMSG
Wind turbine
Rectifier
DC
DCLOAD
Cotrol Unit
Control Signal
Power Converter
Wind speed
Vw
R
Wm
Wm-optimal
error
+-
+ -
Ea
Eb
Ec
Xs Rs
ILL VLL
D1 D3 D5
D2 D4D6
+
-
p
N
Id
Ea
Eb
Ec
Xs RsIa
Xs
Xs
Rs
Rs
+
-
VDC
IDC+
+
+
Va
Vb
Vc
Ib
Ic
H
D
VPVDC
DC
VWindDC
DC
LOADVo+
-
VPV
DC
DC
VWind
LOADVo
+
-
+
+ - + -
+ - + -
PMSG
500 W
Vertical axis wind turbine Gear box
+
-
600 W Vpv
DC/DC
Ibat
+
-
Vo
Io
3-ph Rectifier
+
-VWG
IPV
IWG
Control Unit
ON/OFF Control
IWG
VWG
Vpv
IPV
IbatVo
Dummy Load
12 V 450 AH Battery Bench
900 W
Control signals
PMSG
500 W
Vertical axis wind turbine Gear box
+
-
Vw
w
+
-
Solar Pump controller PM DC motor
Vpv
Back- Up system Diesel Generator
-
200 W
-
200 W
-+ +
200 W
+
Ea
Eb
Ec
Xs Rs
ILL VLL
D1 D3 D5
D2 D4D6
+
-
p
N
Id
Ea
Eb
Ec
Xs RsIa
Xs
Xs
Rs
Rs
+
-
VDC
IDC+
+
+
Va
Vb
Vc
Ib
Ic
+-
LvLi
iv +
-
CR
C
LLR
PWM S
+
ovloadR
Si
Di Ri
Ci
Cv
+
LvLi
iv CR
C
LLR
S ovloadR
Si
Di Ri
Ci
Cv
+iv CR
C
LLR
S ovloadR
Si Ci
Cv
sDT (1 ) sD T
iv
i oV V
( )Lv t
( )Ci t
PWM
D3
PMSGWind
turbine
Rectifier
DC
DC
Cotrol UnitControl Signal
Power Converter
DCI
LOAD
+
-
DCV
MPPT algorithm
+
-
Vcc
D9
Vin
+
-
An3 An5An4
Relay
LM7805 +5V
D2
2
31
7
27K
5.6K22uF
5.1V
1N4001
10K
8
3305.6 3305.615K
680
5.6K
330uF
680
15V
22uF
6.8K
15K
5.6K22uF
Relay
5.1V
VLoadSwitch
20K
5.6K22uF
5.1V
680 Vb
att.
D2
MOSPEC S20C40C(x2)
D3
1mH FQP12P20(x2)
0.39 c/v
1.2 K
+ +
+
Current Transducer
5VAn2
GND
Arduino Uno
An2
An3
An4An5
+5V
An
alo
g 0
..5
GND
An0
An1
D0D1D2D3D4D5D6D7D8D9D10D11D12
Swep
t A
rea
Ewind EturbineD
Swep
t A
rea
H
VAWTHAWT
Eunabsorved
DCP
mw
maxP
0, 0m
dP dP
dw dD
0, 0, 0 0DC
m DC m
dVdP dD dP
dw dV dw dD
0, 0, 0 0DC
m DC m
dVdP dD dP
dw dV dw dD
High Speed Low Speed
Track Starting Point Track Starting Point
D D
Maximum Power Point Tracking process
PDCk >PDCk-1
Read PDC
Iref(k)=Iref(k-1)-∆I
Vk >Vk-1
NO
Iref(k)=Iref(k-1)-∆I
YES
Iref(k)=Iref(k-1)+∆I
NOVk >Vk-1
YES
Iref(k)=Iref(k-1)+∆I
YES NO
sDT
I
Li
i oV V
L
sT
iV
L
LI
t
oV
R
oL
load
VI
R
t
t
t
sDT
CV
( )v t
LI V
C RC
sT
V
RC
CV
t
0.5
0.0
1
1.5
2
2.5
3
5 10 15 20
Voltage
Cu
rren
t
Vmp
Imp
Isc Short circuit current
VocOpen circuit voltage
MPP
V.Battery
I-V PV panel characteristics
DC/DC converterDC loadVbatt
+
-
Vp
v
Ipv +
-
Vo
Io
A/D A/D
MPPT and Charging algorithm
PWM
PV array
MPP
SCI
1dI
I
Load
2dI
1D
SR
PR2D
rI
DC/DCPV -Wind
system
Battery charge control.
Load regulation.
.battV.battI
Battery
.battD loadD
DCLOAD
.battI
t
sDT sT
-
Vin
+
-
Relay
CVbatt.
L Rb
Microcontroller
Iin
Vcontrol1
D1
M1
Sensor Signals Control Signals
VoutVin
Vbatt.
Ibatt
IinIbatt.
Vcontrol1Vcontrol2Vcontrol3
Vcontrol2
Vcontrol3
Vout Vout
file:///C:/Users/Andres/Documents/17c276_250_205.jpg
file:///C:/Users/Andres/Documents/17c276_250_205.jpg
windv
+
-12
12
1R
2R
fR
+
-
12
12
3R
4R
5R 6RoutV
Datalogger
M2
+
-
G
Iref=10A
+
-Vtrian.
Battery Charge ControllerVcontrol Ibatt.
MPPT AlgorithmDCV
DCI
refI+
-
e+
-.triVPWM
G
Io
-
+
-
+
-
+
Vo
V1
V2
C
+ -VL
+
-VD1
+ -VM2
ID2
I1 L
D1
D2
IL IC
M1
M2
VD2
+ -VM1
C Vo
Io+
-
+
-
-
+
+ -VL
+
-ID1
L
D1
D2
IL IC
+VD2
-
+ -VM1
M1
M2+ -VM2
V1
V2
C
+
-Vo
Io
Ii1
Ii2
+
-
+
-
V1
V2
+ -VL
L
D1
D2
IL ICM1
M2
VD2+
-
-
+VD1
+
-
+
-
+
-Vo
Io
Vc
V1
V2
+ -VL
+ -VM2
ID2
C
L
D1
D2
IL IC
+
-
VM1+ -
M2
M1
ID1
VD1
VD1
( )a ( )b
( )c ( )d
+
-
V1
V2
Vo
+
-
VG
S1
LM1
M2
D1
D2
C
-
+
VG
S2
VG
S1+
-
-
+
V1
V2
+
-
Vo
LM1
M2
D1
D2
CV
GS2
( )b
( )a
PMSGWind
turbine
Rectifier
wm
DC
DCLOAD
Rotating speed -Power characteristic Pactual
Cotrol Unit
Poptimal
error
Control Signal
Power Converter
PMSG
Wind turbine
Rectifier
DC
DCLOAD
Cotrol Unit
Control Signal
Power Converter
Wind speed
Vw
R
Wm
Wm-optimal
error
+-
+ -
Ea
Eb
Ec
Xs Rs
ILL VLL
D1 D3 D5
D2 D4D6
+
-
p
N
Id
Ea
Eb
Ec
Xs RsIa
Xs
Xs
Rs
Rs
+
-
VDC
IDC+
+
+
Va
Vb
Vc
Ib
Ic
H
D
VPVDC
DC
VWindDC
DC
LOADVo+
-
VPV
DC
DC
VWind
LOADVo
+
-
+
+ - + -
+ - + -
PMSG
500 W
Vertical axis wind turbine Gear box
+
-
600 W Vpv
DC/DC
Ibat
+
-
Vo
Io
3-ph Rectifier
+
-VWG
IPV
IWG
Control Unit
ON/OFF Control
IWG
VWG
Vpv
IPV
IbatVo
Dummy Load
12 V 450 AH Battery Bench
900 W
Control signals
PMSG
500 W
Vertical axis wind turbine Gear box
+
-
Vw
w
+
-
Solar Pump controller PM DC motor
Vpv
Back- Up system Diesel Generator
-
200 W
-
200 W
-+ +
200 W
+
Ea
Eb
Ec
Xs Rs
ILL VLL
D1 D3 D5
D2 D4D6
+
-
p
N
Id
Ea
Eb
Ec
Xs RsIa
Xs
Xs
Rs
Rs
+
-
VDC
IDC+
+
+
Va
Vb
Vc
Ib
Ic
+-
LvLi
iv +
-
CR
C
LLR
PWM S
+
ovloadR
Si
Di Ri
Ci
Cv
+
LvLi
iv CR
C
LLR
S ovloadR
Si
Di Ri
Ci
Cv
+iv CR
C
LLR
S ovloadR
Si Ci
Cv
sDT (1 ) sD T
iv
i oV V
( )Lv t
( )Ci t
PWM
D3
PMSGWind
turbine
Rectifier
DC
DC
Cotrol UnitControl Signal
Power Converter
DCI
LOAD
+
-
DCV
MPPT algorithm
+
-
Vcc
D9
Vin
+
-
An3 An5An4
Relay
LM7805 +5V
D2
2
31
7
27K
5.6K22uF
5.1V
1N4001
10K
8
3305.6 3305.615K
680
5.6K
330uF
680
15V
22uF
6.8K
15K
5.6K22uF
Relay
5.1V
VLoadSwitch
20K
5.6K22uF
5.1V
680 Vb
att.
D2
MOSPEC S20C40C(x2)
D3
1mH FQP12P20(x2)
0.39 c/v
1.2 K
+ +
+
Current Transducer
5VAn2
GND
Arduino Uno
An2
An3
An4An5
+5V
An
alo
g 0
..5
GND
An0
An1
D0D1D2D3D4D5D6D7D8D9D10D11D12
Swep
t A
rea
Ewind EturbineD
Swep
t A
rea
H
VAWTHAWT
Eunabsorved
DCP
mw
maxP
0, 0m
dP dP
dw dD
0, 0, 0 0DC
m DC m
dVdP dD dP
dw dV dw dD
0, 0, 0 0DC
m DC m
dVdP dD dP
dw dV dw dD
High Speed Low Speed
Track Starting Point Track Starting Point
D D
Maximum Power Point Tracking process
PDCk >PDCk-1
Read PDC
Iref(k)=Iref(k-1)-∆I
Vk >Vk-1
NO
Iref(k)=Iref(k-1)-∆I
YES
Iref(k)=Iref(k-1)+∆I
NOVk >Vk-1
YES
Iref(k)=Iref(k-1)+∆I
YES NO
sDT
I
Li
i oV V
L
sT
iV
L
LI
t
oV
R
oL
load
VI
R
t
t
t
sDT
CV
( )v t
LI V
C RC
sT
V
RC
CV
t
0.5
0.0
1
1.5
2
2.5
3
5 10 15 20
Voltage
Cu
rren
t
Vmp
Imp
Isc Short circuit current
VocOpen circuit voltage
MPP
V.Battery
I-V PV panel characteristics
DC/DC converterDC loadVbatt
+
-
Vp
v
Ipv +
-
Vo
Io
A/D A/D
MPPT and Charging algorithm
PWM
PV array
MPP
SCI
1dI
I
Load
2dI
1D
SR
PR2D
rI
DC/DCPV -Wind
system
Battery charge control.
Load regulation.
.battV.battI
Battery
.battD loadD
DCLOAD
.battI
t
sDT sT
-
Vin
+
-
Relay
CVbatt.
L Rb
Microcontroller
Iin
Vcontrol1
D1
M1
Sensor Signals Control Signals
VoutVin
Vbatt.
Ibatt
IinIbatt.
Vcontrol1Vcontrol2Vcontrol3
Vcontrol2
Vcontrol3
Vout Vout
file:///C:/Users/Andres/Documents/17c276_250_205.jpg
file:///C:/Users/Andres/Documents/17c276_250_205.jpg
windv
+
-12
12
1R
2R
fR
+
-
12
12
3R
4R
5R 6RoutV
Datalogger
M2
+
-
G
Iref=10A
+
-Vtrian.
Battery Charge ControllerVcontrol Ibatt.
MPPT AlgorithmDCV
DCI
refI+
-
e+
-.triVPWM
G
Io
-
+
-
+
-
+
Vo
V1
V2
C
+ -VL
+
-VD1
+ -VM2
ID2
I1 L
D1
D2
IL IC
M1
M2
VD2
+ -VM1
C Vo
Io+
-
+
-
-
+
+ -VL
+
-ID1
L
D1
D2
IL IC
+VD2
-
+ -VM1
M1
M2+ -VM2
V1
V2
C
+
-Vo
Io
Ii1
Ii2
+
-
+
-
V1
V2
+ -VL
L
D1
D2
IL ICM1
M2
VD2+
-
-
+VD1
+
-
+
-
+
-Vo
Io
Vc
V1
V2
+ -VL
+ -VM2
ID2
C
L
D1
D2
IL IC
+
-
VM1+ -
M2
M1
ID1
VD1
VD1
( )a
( )b
( )c ( )d
+
-
V1
V2
Vo
+
-
VG
S1
LM1
M2
D1
D2
C
-
+ VG
S2
VG
S1+
-
-
+
V1
V2
+
-
Vo
LM1
M2
D1
D2
CV
GS2
( )b( )a
( )a
( )b
sT
1d
1d
2t1t 4t3t
t
t
1GSV
2GSV
-+
V1
+
-V2
Vo
-
VG
S1
LM1
M2
D1
D2
C
+ VG
S2
( )c
VGS3
-+
V1
+
-V2
Vo
-
VG
S1
LM1
M2
D1
D2
C
+
VG
S2
VGS3
3M
-+
V1
+
-V2
Vo
-
VG
S1
LM1
M2
D1
D2
C
+ VG
S2
( )c
VGS3
+
-
Relay
CVbatt.
L Rb
VGS3
D3
M1
Ibatt.
Vrelay
Vout Vout
M2
Vwind
Iwind
-
+-
VPV
D1
D2
VGS1
VGS2
VGS4
-
Microcontroller
Ipv
Sensor Signals Control Signals
VoutVin
Vbatt
Vcontrol1Vcontrol2Vcontrol3
IwindIbatt Vrelay
Vcontrol4
+
-
+
-
Ipv
IoILIL
IL
( )a
IL
-+
V1
+
-V2
Vo
-
VG
S1
LM1
M2
D1
D2
C
+
VG
S2
VGS3
Io IoIL
( )c
-+
V1
+
-V2
Vo
-
VG
S1
LM1
M2
D1
D2
C
+
VG
S2
VGS3
IL
IL
( )b
IL
-+
V1
+
-V2
Vo
-
VG
S1
LM1
M2
D1
D2
C
+
VG
S2
VGS3
IL
( )c
Ic Io
Io
Ic
D3 D3
D3D3
+- 2G
1CT1G
2CT+-
1H
refVoV
*
refI
LI
duty
Plant 1 Plant 2Controller 2Controller 1
measuredLI
Microprocessor
(MPPT Programming)
-+ +
-
PVI
PVVWindV
WindI
1d 2d
1
*
refI2
*
refI
+
-
+
-
PVV
windV
*
refV
Microprocessor(Current Control programming)
Boost mode
3d
oVoI
*
refV
Microprocessor(Current Control programming)
Buck mode
1d
oVoI
2d
L D3
D1
D2
Double input DC/DC converter
PVI
WindILoad
oI+
-
oVABV
AV
BV
MicroprocessorPower managament
control unit
PVV
PVI
windV
WindI
ABV
oV
oI
1d 2d 3d
1S
2S
3S
1d
2d
3d
+-
*
refI1( )d s
Plant 1 LI
12G
11G
2 ( )d s
+
+
1H
+refV
1CT-
2GPlant 2
oV
Figure 6.5. Current control
G11 =iL(s)
δ1(s)=
V1
(Ls+ RCR+1)
[-](6.4)
G12 =iL(s)
δ1(s)=
V2
(Ls+ RCR+1)
[-](6.5)
Bode diagram and step response of the plant G1 formed by transfer functions G11 and G12 are shownbelow in (6.6) and (6.7)
53
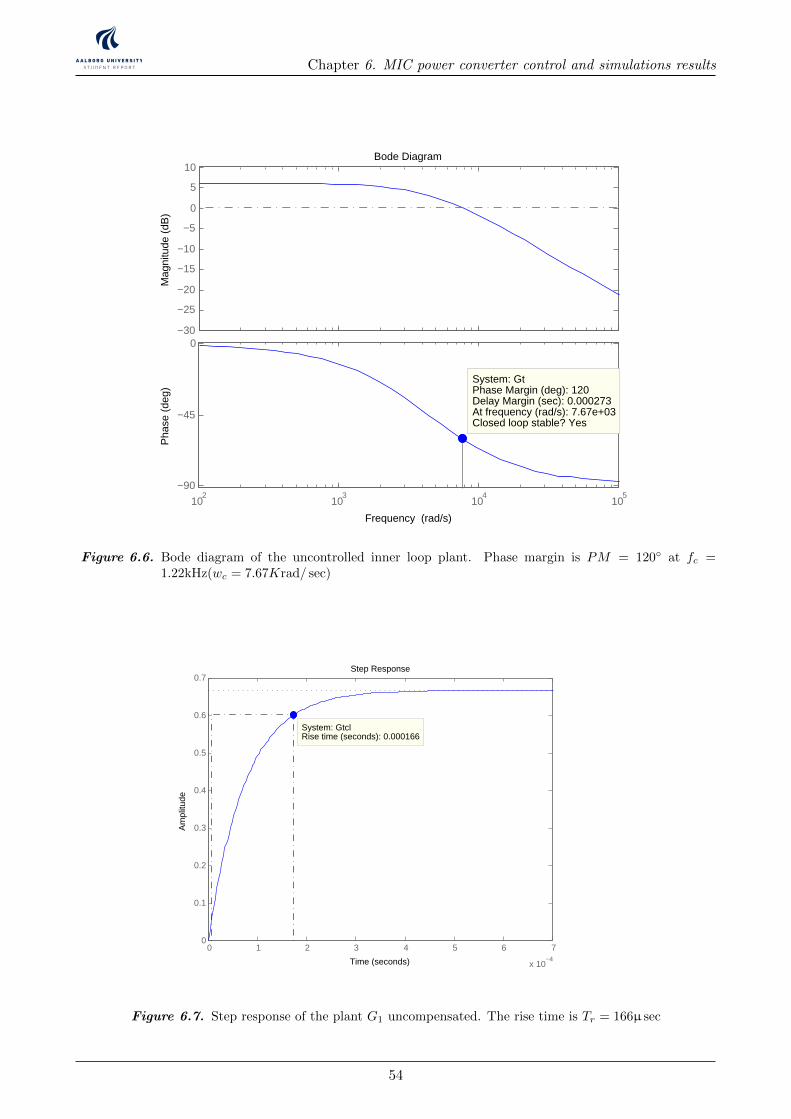
Chapter 6. MIC power converter control and simulations results
−30
−25
−20
−15
−10
−5
0
5
10M
agni
tude
(dB
)Bode Diagram
Frequency (rad/s)
102
103
104
105
−90
−45
0
System: GtPhase Margin (deg): 120Delay Margin (sec): 0.000273At frequency (rad/s): 7.67e+03Closed loop stable? Yes
Pha
se (
deg)
Figure 6.6. Bode diagram of the uncontrolled inner loop plant. Phase margin is PM = 120 at fc =1.22kHz(wc = 7.67Krad/ sec)
Step Response
Time (seconds)
Am
plitu
de
0 1 2 3 4 5 6 7
x 10−4
0
0.1
0.2
0.3
0.4
0.5
0.6
0.7
System: GtclRise time (seconds): 0.000166
Figure 6.7. Step response of the plant G1 uncompensated. The rise time is Tr = 166µ sec
54

Chapter 6. MIC power converter control and simulations results
The uncompensated system is stable and its phase margin is PM = 120 at fc = 1.22kHz(wc =7.67Krad/ sec). The system responds with a rise time of Tr = 166µ sec. The system responds fast butthe step response shows an steady state error which must be compensated. Therefore, a PI controlleris designed to reduce this steady state error and increase the low frequency gain. The phase marginmust be maintained positive and the frequency will be reduced.
The values of the PI controller have been obtained through SISOtool, keeping the constrains previouslymentioned. The values of the controller are: ki = 516330 and kp = 9.29. The bode plot and the stepresponse of the compensated system is shown below in 6.8 and 6.9.
The system is faster now, the rise time is Tr = 13.7µ sec and the phase margin is PM = 62.4
at fc = 15kHz. The low frequency gain has been increased and the steady state error has beencompensated.
−50
0
50
100
Mag
nitu
de (
dB)
Bode Diagram
Frequency (rad/s)
102
103
104
105
106
−150
−120
−90System: GtPhase Margin (deg): 62.4Delay Margin (sec): 1.14e−05At frequency (rad/s): 9.51e+04Closed loop stable? Yes
Pha
se (
deg)
Figure 6.8. Compensated system bode diagram. Phase margin is PM = 60 at fc = 15kHz(wc =95.1Krad/ sec)
Outer loop control design
Once the inner loop has been designed, it is possible to proceed with the design of the voltage loopcontroller. Figure shows the 6.10 outer loop, formed by the controller TC1 , the inner loop and thetransfer function for plant 2 G2.
The controller for the outer loop should be slower than the inner loop as previously explained. It hasbeen decide that the outer loop crossover frequency must ten times slower than the inner loop one.
The transfer function of the compensator design is: TC1 = kp1 +ki1s .
55
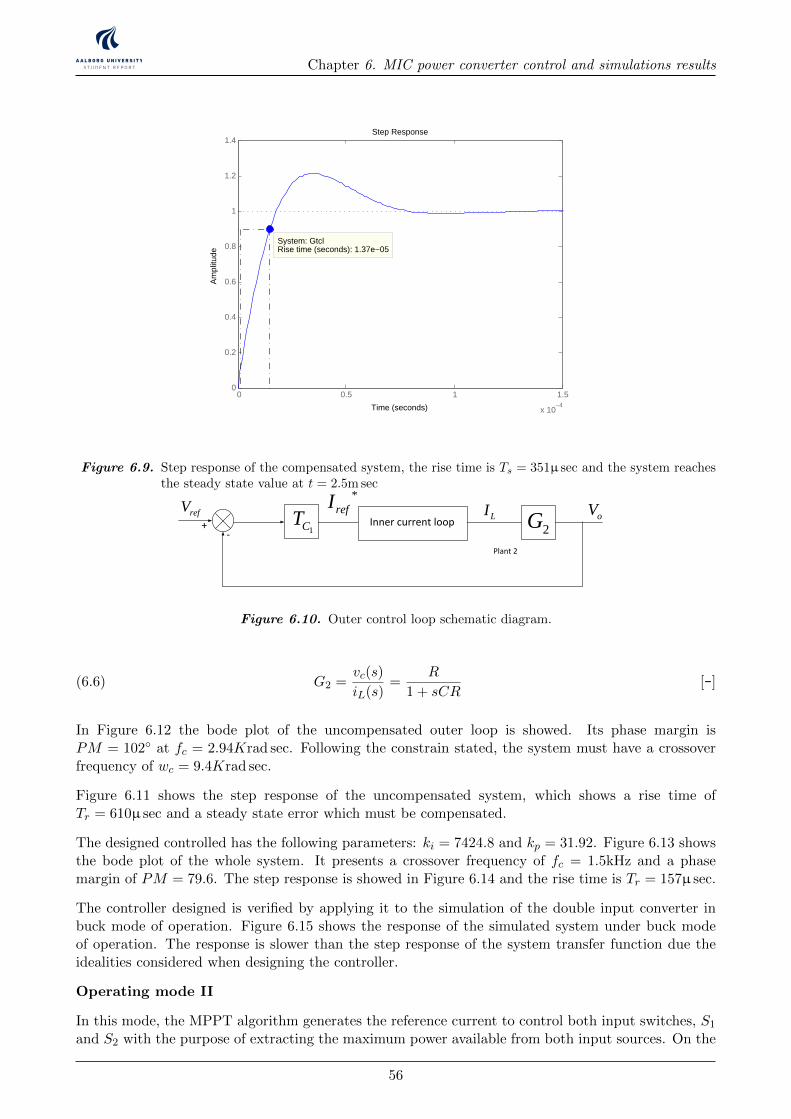
Chapter 6. MIC power converter control and simulations results
Step Response
Time (seconds)
Am
plitu
de
0 0.5 1 1.5
x 10−4
0
0.2
0.4
0.6
0.8
1
1.2
1.4
System: GtclRise time (seconds): 1.37e−05
Figure 6.9. Step response of the compensated system, the rise time is Ts = 351µ sec and the system reachesthe steady state value at t = 2.5m sec
2CT
PMSGWind
turbine
Rectifier
wm
DC
DCLOAD
Rotating speed -Power characteristic Pactual
Cotrol Unit
Poptimal
error
Control Signal
Power Converter
PMSG
Wind turbine
Rectifier
DC
DCLOAD
Cotrol Unit
Control Signal
Power Converter
Wind speed
Vw
R
Wm
Wm-optimal
error
+-
+ -
Ea
Eb
Ec
Xs Rs
ILL VLL
D1 D3 D5
D2 D4D6
+
-
p
N
Id
Ea
Eb
Ec
Xs RsIa
Xs
Xs
Rs
Rs
+
-
VDC
IDC+
+
+
Va
Vb
Vc
Ib
Ic
H
D
VPVDC
DC
VWindDC
DC
LOADVo+
-
VPV
DC
DC
VWind
LOADVo
+
-
+
+ - + -
+ - + -
PMSG
500 W
Vertical axis wind turbine Gear box
+
-
600 W Vpv
DC/DC
Ibat
+
-
Vo
Io
3-ph Rectifier
+
-VWG
IPV
IWG
Control Unit
ON/OFF Control
IWG
VWG
Vpv
IPV
IbatVo
Dummy Load
12 V 450 AH Battery Bench
900 W
Control signals
PMSG
500 W
Vertical axis wind turbine Gear box
+
-
Vw
w
+
-
Solar Pump controller PM DC motor
Vpv
Back- Up system Diesel Generator
-
200 W
-
200 W
-+ +
200 W
+
Ea
Eb
Ec
Xs Rs
ILL VLL
D1 D3 D5
D2 D4D6
+
-
p
N
Id
Ea
Eb
Ec
Xs RsIa
Xs
Xs
Rs
Rs
+
-
VDC
IDC+
+
+
Va
Vb
Vc
Ib
Ic
+-
LvLi
iv +
-
CR
C
LLR
PWM S
+
ovloadR
Si
Di Ri
Ci
Cv
+
LvLi
iv CR
C
LLR
S ovloadR
Si
Di Ri
Ci
Cv
+iv CR
C
LLR
S ovloadR
Si Ci
Cv
sDT (1 ) sD T
iv
i oV V
( )Lv t
( )Ci t
PWM
D3
PMSGWind
turbine
Rectifier
DC
DC
Cotrol UnitControl Signal
Power Converter
DCI
LOAD
+
-
DCV
MPPT algorithm
+
-
Vcc
D9
Vin
+
-
An3 An5An4
Relay
LM7805 +5V
D2
2
31
7
27K
5.6K22uF
5.1V
1N4001
10K
8
3305.6 3305.615K
680
5.6K
330uF
680
15V
22uF
6.8K
15K
5.6K22uF
Relay
5.1V
VLoadSwitch
20K
5.6K22uF
5.1V
680 Vb
att.
D2
MOSPEC S20C40C(x2)
D3
1mH FQP12P20(x2)
0.39 c/v
1.2 K
+ +
+
Current Transducer
5VAn2
GND
Arduino Uno
An2
An3
An4An5
+5V
An
alo
g 0
..5
GND
An0
An1
D0D1D2D3D4D5D6D7D8D9D10D11D12
Swep
t A
rea
Ewind EturbineD
Swep
t A
rea
H
VAWTHAWT
Eunabsorved
DCP
mw
maxP
0, 0m
dP dP
dw dD
0, 0, 0 0DC
m DC m
dVdP dD dP
dw dV dw dD
0, 0, 0 0DC
m DC m
dVdP dD dP
dw dV dw dD
High Speed Low Speed
Track Starting Point Track Starting Point
D D
Maximum Power Point Tracking process
PDCk >PDCk-1
Read PDC
Iref(k)=Iref(k-1)-∆I
Vk >Vk-1
NO
Iref(k)=Iref(k-1)-∆I
YES
Iref(k)=Iref(k-1)+∆I
NOVk >Vk-1
YES
Iref(k)=Iref(k-1)+∆I
YES NO
sDT
I
Li
i oV V
L
sT
iV
L
LI
t
oV
R
oL
load
VI
R
t
t
t
sDT
CV
( )v t
LI V
C RC
sT
V
RC
CV
t
0.5
0.0
1
1.5
2
2.5
3
5 10 15 20
Voltage
Cu
rren
t
Vmp
Imp
Isc Short circuit current
VocOpen circuit voltage
MPP
V.Battery
I-V PV panel characteristics
DC/DC converterDC loadVbatt
+
-
Vp
v
Ipv +
-
Vo
Io
A/D A/D
MPPT and Charging algorithm
PWM
PV array
MPP
SCI
1dI
I
Load
2dI
1D
SR
PR2D
rI
DC/DCPV -Wind
system
Battery charge control.
Load regulation.
.battV.battI
Battery
.battD loadD
DCLOAD
.battI
t
sDT sT
-
Vin
+
-
Relay
CVbatt.
L Rb
Microcontroller
Iin
Vcontrol1
D1
M1
Sensor Signals Control Signals
VoutVin
Vbatt.
Ibatt
IinIbatt.
Vcontrol1Vcontrol2Vcontrol3
Vcontrol2
Vcontrol3
Vout Vout
file:///C:/Users/Andres/Documents/17c276_250_205.jpg
file:///C:/Users/Andres/Documents/17c276_250_205.jpg
windv
+
-12
12
1R
2R
fR
+
-
12
12
3R
4R
5R 6RoutV
Datalogger
M2
+
-
G
Iref=10A
+
-Vtrian.
Battery Charge ControllerVcontrol Ibatt.
MPPT AlgorithmDCV
DCI
refI+
-
e+
-.triVPWM
G
Io
-
+
-
+
-
+
Vo
V1
V2
C
+ -VL
+
-VD1
+ -VM2
ID2
I1 L
D1
D2
IL IC
M1
M2
VD2
+ -VM1
C Vo
Io+
-
+
-
-
+
+ -VL
+
-ID1
L
D1
D2
IL IC
+VD2
-
+ -VM1
M1
M2+ -VM2
V1
V2
C
+
-Vo
Io
Ii1
Ii2
+
-
+
-
V1
V2
+ -VL
L
D1
D2
IL ICM1
M2
VD2+
-
-
+VD1
+
-
+
-
+
-Vo
Io
Vc
V1
V2
+ -VL
+ -VM2
ID2
C
L
D1
D2
IL IC
+
-
VM1+ -
M2
M1
ID1
VD1
VD1
( )a ( )b
( )c ( )d
+
-
V1
V2
Vo
+
-
VG
S1
LM1
M2
D1
D2
C
-
+
VG
S2
VG
S1
+
-
-
+
V1
V2
+
-
Vo
LM1
M2
D1
D2
C
VG
S2
( )b
( )a
PMSGWind
turbine
Rectifier
wm
DC
DCLOAD
Rotating speed -Power characteristic Pactual
Cotrol Unit
Poptimal
error
Control Signal
Power Converter
PMSG
Wind turbine
Rectifier
DC
DCLOAD
Cotrol Unit
Control Signal
Power Converter
Wind speed
Vw
R
Wm
Wm-optimal
error
+-
+ -
Ea
Eb
Ec
Xs Rs
ILL VLL
D1 D3 D5
D2 D4D6
+
-
p
N
Id
Ea
Eb
Ec
Xs RsIa
Xs
Xs
Rs
Rs
+
-
VDC
IDC+
+
+
Va
Vb
Vc
Ib
Ic
H
D
VPVDC
DC
VWindDC
DC
LOADVo+
-
VPV
DC
DC
VWind
LOADVo
+
-
+
+ - + -
+ - + -
PMSG
500 W
Vertical axis wind turbine Gear box
+
-
600 W Vpv
DC/DC
Ibat
+
-
Vo
Io
3-ph Rectifier
+
-VWG
IPV
IWG
Control Unit
ON/OFF Control
IWG
VWG
Vpv
IPV
IbatVo
Dummy Load
12 V 450 AH Battery Bench
900 W
Control signals
PMSG
500 W
Vertical axis wind turbine Gear box
+
-
Vw
w
+
-
Solar Pump controller PM DC motor
Vpv
Back- Up system Diesel Generator
-
200 W
-
200 W
-+ +
200 W
+
Ea
Eb
Ec
Xs Rs
ILL VLL
D1 D3 D5
D2 D4D6
+
-
p
N
Id
Ea
Eb
Ec
Xs RsIa
Xs
Xs
Rs
Rs
+
-
VDC
IDC+
+
+
Va
Vb
Vc
Ib
Ic
+-
LvLi
iv +
-
CR
C
LLR
PWM S
+
ovloadR
Si
Di Ri
Ci
Cv
+
LvLi
iv CR
C
LLR
S ovloadR
Si
Di Ri
Ci
Cv
+iv CR
C
LLR
S ovloadR
Si Ci
Cv
sDT (1 ) sD T
iv
i oV V
( )Lv t
( )Ci t
PWM
D3
PMSGWind
turbine
Rectifier
DC
DC
Cotrol UnitControl Signal
Power Converter
DCI
LOAD
+
-
DCV
MPPT algorithm
+
-
Vcc
D9
Vin
+
-
An3 An5An4
Relay
LM7805 +5V
D2
2
31
7
27K
5.6K22uF
5.1V
1N4001
10K
8
3305.6 3305.615K
680
5.6K
330uF
680
15V
22uF
6.8K
15K
5.6K22uF
Relay
5.1V
VLoadSwitch
20K
5.6K22uF
5.1V
680 Vb
att.
D2
MOSPEC S20C40C(x2)
D3
1mH FQP12P20(x2)
0.39 c/v
1.2 K
+ +
+
Current Transducer
5VAn2
GND
Arduino Uno
An2
An3
An4An5
+5V
An
alo
g 0
..5
GND
An0
An1
D0D1D2D3D4D5D6D7D8D9D10D11D12
Swep
t A
rea
Ewind EturbineD
Swep
t A
rea
H
VAWTHAWT
Eunabsorved
DCP
mw
maxP
0, 0m
dP dP
dw dD
0, 0, 0 0DC
m DC m
dVdP dD dP
dw dV dw dD
0, 0, 0 0DC
m DC m
dVdP dD dP
dw dV dw dD
High Speed Low Speed
Track Starting Point Track Starting Point
D D
Maximum Power Point Tracking process
PDCk >PDCk-1
Read PDC
Iref(k)=Iref(k-1)-∆I
Vk >Vk-1
NO
Iref(k)=Iref(k-1)-∆I
YES
Iref(k)=Iref(k-1)+∆I
NOVk >Vk-1
YES
Iref(k)=Iref(k-1)+∆I
YES NO
sDT
I
Li
i oV V
L
sT
iV
L
LI
t
oV
R
oL
load
VI
R
t
t
t
sDT
CV
( )v t
LI V
C RC
sT
V
RC
CV
t
0.5
0.0
1
1.5
2
2.5
3
5 10 15 20
Voltage
Cu
rren
t
Vmp
Imp
Isc Short circuit current
VocOpen circuit voltage
MPP
V.Battery
I-V PV panel characteristics
DC/DC converterDC loadVbatt
+
-
Vp
v
Ipv +
-
Vo
Io
A/D A/D
MPPT and Charging algorithm
PWM
PV array
MPP
SCI
1dI
I
Load
2dI
1D
SR
PR2D
rI
DC/DCPV -Wind
system
Battery charge control.
Load regulation.
.battV.battI
Battery
.battD loadD
DCLOAD
.battI
t
sDT sT
-
Vin
+
-
Relay
CVbatt.
L Rb
Microcontroller
Iin
Vcontrol1
D1
M1
Sensor Signals Control Signals
VoutVin
Vbatt.
Ibatt
IinIbatt.
Vcontrol1Vcontrol2Vcontrol3
Vcontrol2
Vcontrol3
Vout Vout
file:///C:/Users/Andres/Documents/17c276_250_205.jpg
file:///C:/Users/Andres/Documents/17c276_250_205.jpg
windv
+
-12
12
1R
2R
fR
+
-
12
12
3R
4R
5R 6RoutV
Datalogger
M2
+
-
G
Iref=10A
+
-Vtrian.
Battery Charge ControllerVcontrol Ibatt.
MPPT AlgorithmDCV
DCI
refI+
-
e+
-.triVPWM
G
Io
-
+
-
+
-
+
Vo
V1
V2
C
+ -VL
+
-VD1
+ -VM2
ID2
I1 L
D1
D2
IL IC
M1
M2
VD2
+ -VM1
C Vo
Io+
-
+
-
-
+
+ -VL
+
-ID1
L
D1
D2
IL IC
+VD2
-
+ -VM1
M1
M2+ -VM2
V1
V2
C
+
-Vo
Io
Ii1
Ii2
+
-
+
-
V1
V2
+ -VL
L
D1
D2
IL ICM1
M2
VD2+
-
-
+VD1
+
-
+
-
+
-Vo
Io
Vc
V1
V2
+ -VL
+ -VM2
ID2
C
L
D1
D2
IL IC
+
-
VM1+ -
M2
M1
ID1
VD1
VD1
( )a
( )b
( )c ( )d
+
-
V1
V2
Vo
+
-
VG
S1
LM1
M2
D1
D2
C
-
+ VG
S2
VG
S1
+
-
-
+
V1
V2
+
-
Vo
LM1
M2
D1
D2
C
VG
S2
( )b( )a
( )a
( )b
sT
1d
1d
2t1t 4t3t
t
t
1GSV
2GSV
-+
V1
+
-V2
Vo
-
VG
S1
LM1
M2
D1
D2
C
+ VG
S2
( )c
VGS3
-+
V1
+
-V2
Vo
-
VG
S1
LM1
M2
D1
D2
C
+
VG
S2
VGS3
3M
-+
V1
+
-V2
Vo
-
VG
S1
LM1
M2
D1
D2
C
+ VG
S2
( )c
VGS3
+
-
Relay
CVbatt.
L Rb
VGS3
D3
M1
Ibatt.
Vrelay
Vout Vout
M2
Vwind
Iwind
-
+-
VPV
D1
D2
VGS1
VGS2
VGS4
-
Microcontroller
Ipv
Sensor Signals Control Signals
VoutVin
Vbatt
Vcontrol1Vcontrol2Vcontrol3
IwindIbatt Vrelay
Vcontrol4
+
-
+
-
Ipv
IoILIL
IL
( )a
IL
-+
V1
+
-V2
Vo
-
VG
S1
LM1
M2
D1
D2
C
+
VG
S2
VGS3
Io IoIL
( )c
-+
V1
+
-V2
Vo
-
VG
S1
LM1
M2
D1
D2
C
+
VG
S2
VGS3
IL
IL
( )b
IL
-+
V1
+
-V2
Vo
-
VG
S1
LM1
M2
D1
D2
C
+
VG
S2
VGS3
IL
( )c
Ic Io
Io
Ic
D3 D3
D3D3
+- 2G
1CT1G
2CT+-
1H
refVoV
*
refI
LI
duty
Plant 1 Plant 2Controller 2Controller 1
measuredLI
Microprocessor
(MPPT Programming)
-+ +
-
PVI
PVVWindV
WindI
1d 2d
1
*
refI2
*
refI
+
-
+
-
PVV
windV
*
refV
Microprocessor(Current Control programming)
Boost mode
3d
oVoI
*
refV
Microprocessor(Current Control programming)
Buck mode
1d
oVoI
2d
L D3
D1
D2
Double input DC/DC converter
PVI
WindILoad
oI+
-
oVABV
AV
BV
MicroprocessorPower managament
control unit
PVV
PVI
windV
WindI
ABV
oV
oI
1d 2d 3d
1S
2S
3S
1d
2d
3d
+-
*
refI1( )d s
Plant 1 LI
12G
11G
2 ( )d s
+
+
1H
+refV
1CT-
2GPlant 2
oV
*
refILI
+refV
1CT- 2G
Plant 2
oVInner current loop
Figure 6.10. Outer control loop schematic diagram.
G2 =vc(s)
iL(s)=
R
1 + sCR[-](6.6)
In Figure 6.12 the bode plot of the uncompensated outer loop is showed. Its phase margin isPM = 102 at fc = 2.94Krad sec. Following the constrain stated, the system must have a crossoverfrequency of wc = 9.4Krad sec.
Figure 6.11 shows the step response of the uncompensated system, which shows a rise time ofTr = 610µ sec and a steady state error which must be compensated.
The designed controlled has the following parameters: ki = 7424.8 and kp = 31.92. Figure 6.13 showsthe bode plot of the whole system. It presents a crossover frequency of fc = 1.5kHz and a phasemargin of PM = 79.6. The step response is showed in Figure 6.14 and the rise time is Tr = 157µ sec.
The controller designed is verified by applying it to the simulation of the double input converter inbuck mode of operation. Figure 6.15 shows the response of the simulated system under buck modeof operation. The response is slower than the step response of the system transfer function due theidealities considered when designing the controller.
Operating mode II
In this mode, the MPPT algorithm generates the reference current to control both input switches, S1
and S2 with the purpose of extracting the maximum power available from both input sources. On the
56
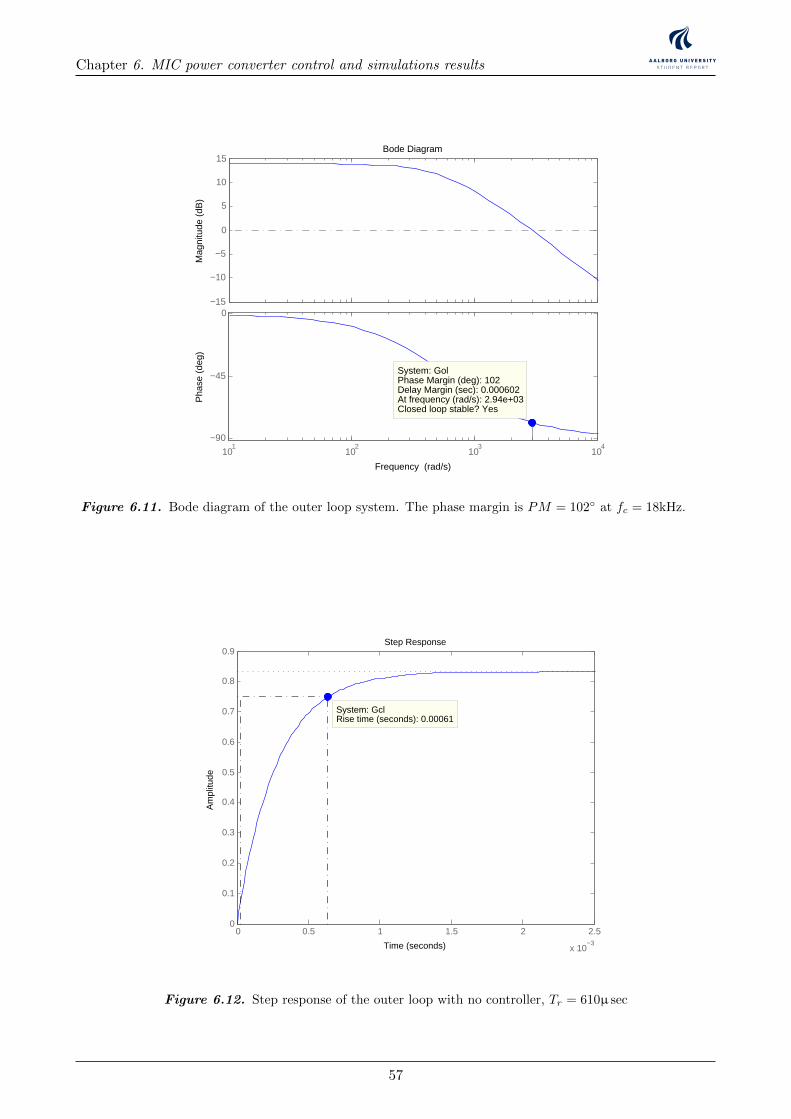
Chapter 6. MIC power converter control and simulations results
−15
−10
−5
0
5
10
15
Mag
nitu
de (
dB)
Bode Diagram
Frequency (rad/s)
101
102
103
104
−90
−45
0
System: GolPhase Margin (deg): 102Delay Margin (sec): 0.000602At frequency (rad/s): 2.94e+03Closed loop stable? Yes
Pha
se (
deg)
Figure 6.11. Bode diagram of the outer loop system. The phase margin is PM = 102 at fc = 18kHz.
Step Response
Time (seconds)
Am
plitu
de
0 0.5 1 1.5 2 2.5
x 10−3
0
0.1
0.2
0.3
0.4
0.5
0.6
0.7
0.8
0.9
System: GclRise time (seconds): 0.00061
Figure 6.12. Step response of the outer loop with no controller, Tr = 610µ sec
57

Chapter 6. MIC power converter control and simulations results
−100
−50
0
50
100
Mag
nitu
de (
dB)
Bode Diagram
Frequency (rad/s)
101
102
103
104
105
106
−180
−135
−90
System: GolPhase Margin (deg): 79.6Delay Margin (sec): 0.000139At frequency (rad/s): 1e+04Closed loop stable? Yes
Pha
se (
deg)
Figure 6.13. Bode
Step Response
Time (seconds)
Am
plitu
de
0 0.5 1 1.5 2 2.5
x 10−3
0
0.2
0.4
0.6
0.8
1
1.2
1.4
System: GclRise time (seconds): 0.000157
Figure 6.14. Step
58
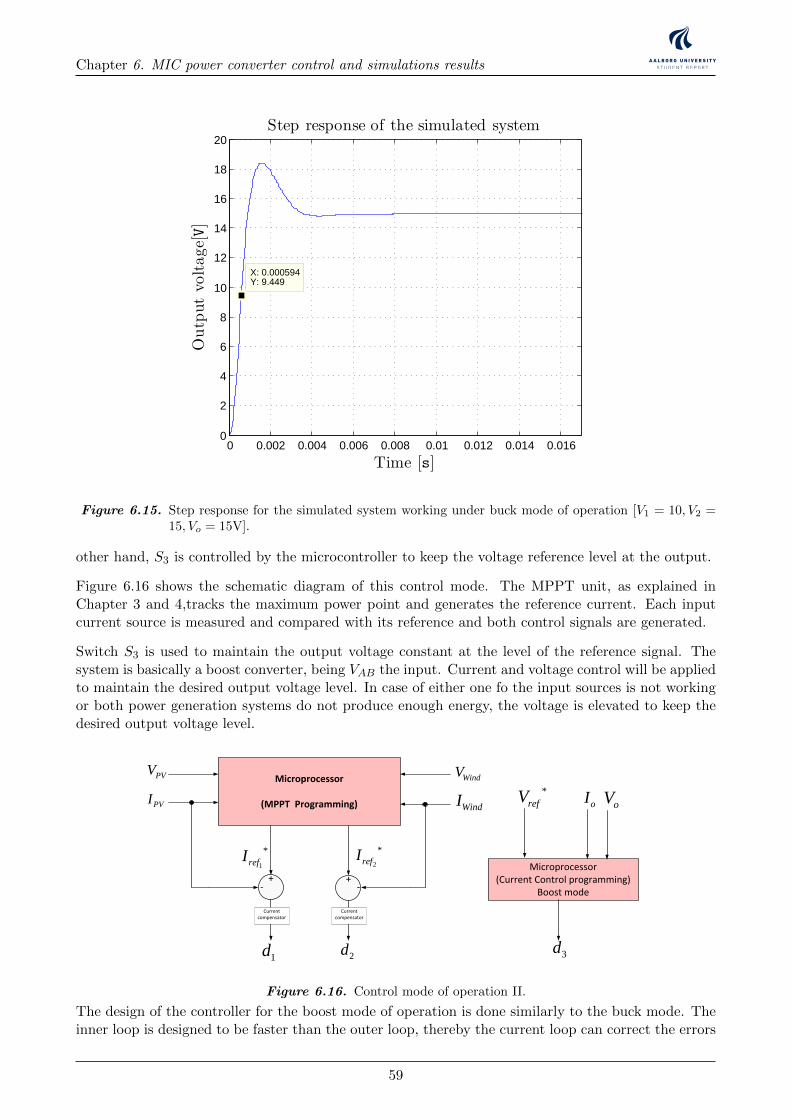
Chapter 6. MIC power converter control and simulations results
0 0.002 0.004 0.006 0.008 0.01 0.012 0.014 0.0160
2
4
6
8
10
12
14
16
18
20
X: 0.000594Y: 9.449
Time [s]
Outputvo
ltage[V]
Step response of the simulated system
Figure 6.15. Step response for the simulated system working under buck mode of operation [V1 = 10, V2 =15, Vo = 15V].
other hand, S3 is controlled by the microcontroller to keep the voltage reference level at the output.
Figure 6.16 shows the schematic diagram of this control mode. The MPPT unit, as explained inChapter 3 and 4,tracks the maximum power point and generates the reference current. Each inputcurrent source is measured and compared with its reference and both control signals are generated.
Switch S3 is used to maintain the output voltage constant at the level of the reference signal. Thesystem is basically a boost converter, being VAB the input. Current and voltage control will be appliedto maintain the desired output voltage level. In case of either one fo the input sources is not workingor both power generation systems do not produce enough energy, the voltage is elevated to keep thedesired output voltage level.
PMSGWind
turbine
Rectifier
wm
DC
DCLOAD
Rotating speed -Power characteristic Pactual
Cotrol Unit
Poptimal
error
Control Signal
Power Converter
PMSG
Wind turbine
Rectifier
DC
DCLOAD
Cotrol Unit
Control Signal
Power Converter
Wind speed
Vw
R
Wm
Wm-optimal
error
+-
+ -
Ea
Eb
Ec
Xs Rs
ILL VLL
D1 D3 D5
D2 D4D6
+
-
p
N
Id
Ea
Eb
Ec
Xs RsIa
Xs
Xs
Rs
Rs
+
-
VDC
IDC+
+
+
Va
Vb
Vc
Ib
Ic
H
D
VPVDC
DC
VWindDC
DC
LOADVo+
-
VPV
DC
DC
VWind
LOADVo
+
-
+
+ - + -
+ - + -
PMSG
500 W
Vertical axis wind turbine Gear box
+
-
600 W Vpv
DC/DC
Ibat
+
-
Vo
Io
3-ph Rectifier
+
-VWG
IPV
IWG
Control Unit
ON/OFF Control
IWG
VWG
Vpv
IPV
IbatVo
Dummy Load
12 V 450 AH Battery Bench
900 W
Control signals
PMSG
500 W
Vertical axis wind turbine Gear box
+
-
Vw
w
+
-
Solar Pump controller PM DC motor
Vpv
Back- Up system Diesel Generator
-
200 W
-
200 W
-+ +
200 W
+
Ea
Eb
Ec
Xs Rs
ILL VLL
D1 D3 D5
D2 D4D6
+
-
p
N
Id
Ea
Eb
Ec
Xs RsIa
Xs
Xs
Rs
Rs
+
-
VDC
IDC+
+
+
Va
Vb
Vc
Ib
Ic
+-
LvLi
iv +
-
CR
C
LLR
PWM S
+
ovloadR
Si
Di Ri
Ci
Cv
+
LvLi
iv CR
C
LLR
S ovloadR
Si
Di Ri
Ci
Cv
+iv CR
C
LLR
S ovloadR
Si Ci
Cv
sDT (1 ) sD T
iv
i oV V
( )Lv t
( )Ci t
PWM
D3
PMSGWind
turbine
Rectifier
DC
DC
Cotrol UnitControl Signal
Power Converter
DCI
LOAD
+
-
DCV
MPPT algorithm
+
-
Vcc
D9
Vin
+
-
An3 An5An4
Relay
LM7805 +5V
D2
2
31
7
27K
5.6K22uF
5.1V
1N4001
10K
8
3305.6 3305.615K
680
5.6K
330uF
680
15V
22uF
6.8K
15K
5.6K22uF
Relay
5.1V
VLoadSwitch
20K
5.6K22uF
5.1V
680 Vb
att.
D2
MOSPEC S20C40C(x2)
D3
1mH FQP12P20(x2)
0.39 c/v
1.2 K
+ +
+
Current Transducer
5VAn2
GND
Arduino Uno
An2
An3
An4An5
+5V
An
alo
g 0
..5
GND
An0
An1
D0D1D2D3D4D5D6D7D8D9D10D11D12
Swep
t A
rea
Ewind EturbineD
Swep
t A
rea
H
VAWTHAWT
Eunabsorved
DCP
mw
maxP
0, 0m
dP dP
dw dD
0, 0, 0 0DC
m DC m
dVdP dD dP
dw dV dw dD
0, 0, 0 0DC
m DC m
dVdP dD dP
dw dV dw dD
High Speed Low Speed
Track Starting Point Track Starting Point
D D
Maximum Power Point Tracking process
PDCk >PDCk-1
Read PDC
Iref(k)=Iref(k-1)-∆I
Vk >Vk-1
NO
Iref(k)=Iref(k-1)-∆I
YES
Iref(k)=Iref(k-1)+∆I
NOVk >Vk-1
YES
Iref(k)=Iref(k-1)+∆I
YES NO
sDT
I
Li
i oV V
L
sT
iV
L
LI
t
oV
R
oL
load
VI
R
t
t
t
sDT
CV
( )v t
LI V
C RC
sT
V
RC
CV
t
0.5
0.0
1
1.5
2
2.5
3
5 10 15 20
Voltage
Cu
rren
t
Vmp
Imp
Isc Short circuit current
VocOpen circuit voltage
MPP
V.Battery
I-V PV panel characteristics
DC/DC converterDC loadVbatt
+
-
Vp
v
Ipv +
-
Vo
Io
A/D A/D
MPPT and Charging algorithm
PWM
PV array
MPP
SCI
1dI
I
Load
2dI
1D
SR
PR2D
rI
DC/DCPV -Wind
system
Battery charge control.
Load regulation.
.battV.battI
Battery
.battD loadD
DCLOAD
.battI
t
sDT sT
-
Vin
+
-
Relay
CVbatt.
L Rb
Microcontroller
Iin
Vcontrol1
D1
M1
Sensor Signals Control Signals
VoutVin
Vbatt.
Ibatt
IinIbatt.
Vcontrol1Vcontrol2Vcontrol3
Vcontrol2
Vcontrol3
Vout Vout
file:///C:/Users/Andres/Documents/17c276_250_205.jpg
file:///C:/Users/Andres/Documents/17c276_250_205.jpg
windv
+
-12
12
1R
2R
fR
+
-
12
12
3R
4R
5R 6RoutV
Datalogger
M2
+
-
G
Iref=10A
+
-Vtrian.
Battery Charge ControllerVcontrol Ibatt.
MPPT AlgorithmDCV
DCI
refI+
-
e+
-.triVPWM
G
Io
-
+
-
+
-
+
Vo
V1
V2
C
+ -VL
+
-VD1
+ -VM2
ID2
I1 L
D1
D2
IL IC
M1
M2
VD2
+ -VM1
C Vo
Io+
-
+
-
-
+
+ -VL
+
-ID1
L
D1
D2
IL IC
+VD2
-
+ -VM1
M1
M2+ -VM2
V1
V2
C
+
-Vo
Io
Ii1
Ii2
+
-
+
-
V1
V2
+ -VL
L
D1
D2
IL ICM1
M2
VD2+
-
-
+VD1
+
-
+
-
+
-Vo
Io
Vc
V1
V2
+ -VL
+ -VM2
ID2
C
L
D1
D2
IL IC
+
-
VM1+ -
M2
M1
ID1
VD1
VD1
( )a ( )b
( )c ( )d
+
-
V1
V2
Vo
+
-
VG
S1
LM1
M2
D1
D2
C
-
+
VG
S2
VG
S1
+
-
-
+
V1
V2
+
-
Vo
LM1
M2
D1
D2
C
VG
S2
( )b
( )a
PMSGWind
turbine
Rectifier
wm
DC
DCLOAD
Rotating speed -Power characteristic Pactual
Cotrol Unit
Poptimal
error
Control Signal
Power Converter
PMSG
Wind turbine
Rectifier
DC
DCLOAD
Cotrol Unit
Control Signal
Power Converter
Wind speed
Vw
R
Wm
Wm-optimal
error
+-
+ -
Ea
Eb
Ec
Xs Rs
ILL VLL
D1 D3 D5
D2 D4D6
+
-
p
N
Id
Ea
Eb
Ec
Xs RsIa
Xs
Xs
Rs
Rs
+
-
VDC
IDC+
+
+
Va
Vb
Vc
Ib
Ic
H
D
VPVDC
DC
VWindDC
DC
LOADVo+
-
VPV
DC
DC
VWind
LOADVo
+
-
+
+ - + -
+ - + -
PMSG
500 W
Vertical axis wind turbine Gear box
+
-
600 W Vpv
DC/DC
Ibat
+
-
Vo
Io
3-ph Rectifier
+
-VWG
IPV
IWG
Control Unit
ON/OFF Control
IWG
VWG
Vpv
IPV
IbatVo
Dummy Load
12 V 450 AH Battery Bench
900 W
Control signals
PMSG
500 W
Vertical axis wind turbine Gear box
+
-
Vw
w
+
-
Solar Pump controller PM DC motor
Vpv
Back- Up system Diesel Generator
-
200 W
-
200 W
-+ +
200 W
+
Ea
Eb
Ec
Xs Rs
ILL VLL
D1 D3 D5
D2 D4D6
+
-
p
N
Id
Ea
Eb
Ec
Xs RsIa
Xs
Xs
Rs
Rs
+
-
VDC
IDC+
+
+
Va
Vb
Vc
Ib
Ic
+-
LvLi
iv +
-
CR
C
LLR
PWM S
+
ovloadR
Si
Di Ri
Ci
Cv
+
LvLi
iv CR
C
LLR
S ovloadR
Si
Di Ri
Ci
Cv
+iv CR
C
LLR
S ovloadR
Si Ci
Cv
sDT (1 ) sD T
iv
i oV V
( )Lv t
( )Ci t
PWM
D3
PMSGWind
turbine
Rectifier
DC
DC
Cotrol UnitControl Signal
Power Converter
DCI
LOAD
+
-
DCV
MPPT algorithm
+
-
Vcc
D9
Vin
+
-
An3 An5An4
Relay
LM7805 +5V
D2
2
31
7
27K
5.6K22uF
5.1V
1N4001
10K
8
3305.6 3305.615K
680
5.6K
330uF
680
15V
22uF
6.8K
15K
5.6K22uF
Relay
5.1V
VLoadSwitch
20K
5.6K22uF
5.1V
680 Vb
att.
D2
MOSPEC S20C40C(x2)
D3
1mH FQP12P20(x2)
0.39 c/v
1.2 K
+ +
+
Current Transducer
5VAn2
GND
Arduino Uno
An2
An3
An4An5
+5V
An
alo
g 0
..5
GND
An0
An1
D0D1D2D3D4D5D6D7D8D9D10D11D12
Swep
t A
rea
Ewind EturbineD
Swep
t A
rea
H
VAWTHAWT
Eunabsorved
DCP
mw
maxP
0, 0m
dP dP
dw dD
0, 0, 0 0DC
m DC m
dVdP dD dP
dw dV dw dD
0, 0, 0 0DC
m DC m
dVdP dD dP
dw dV dw dD
High Speed Low Speed
Track Starting Point Track Starting Point
D D
Maximum Power Point Tracking process
PDCk >PDCk-1
Read PDC
Iref(k)=Iref(k-1)-∆I
Vk >Vk-1
NO
Iref(k)=Iref(k-1)-∆I
YES
Iref(k)=Iref(k-1)+∆I
NOVk >Vk-1
YES
Iref(k)=Iref(k-1)+∆I
YES NO
sDT
I
Li
i oV V
L
sT
iV
L
LI
t
oV
R
oL
load
VI
R
t
t
t
sDT
CV
( )v t
LI V
C RC
sT
V
RC
CV
t
0.5
0.0
1
1.5
2
2.5
3
5 10 15 20
Voltage
Cu
rren
t
Vmp
Imp
Isc Short circuit current
VocOpen circuit voltage
MPP
V.Battery
I-V PV panel characteristics
DC/DC converterDC loadVbatt
+
-
Vp
v
Ipv +
-
Vo
Io
A/D A/D
MPPT and Charging algorithm
PWM
PV array
MPP
SCI
1dI
I
Load
2dI
1D
SR
PR2D
rI
DC/DCPV -Wind
system
Battery charge control.
Load regulation.
.battV.battI
Battery
.battD loadD
DCLOAD
.battI
t
sDT sT
-
Vin
+
-
Relay
CVbatt.
L Rb
Microcontroller
Iin
Vcontrol1
D1
M1
Sensor Signals Control Signals
VoutVin
Vbatt.
Ibatt
IinIbatt.
Vcontrol1Vcontrol2Vcontrol3
Vcontrol2
Vcontrol3
Vout Vout
file:///C:/Users/Andres/Documents/17c276_250_205.jpg
file:///C:/Users/Andres/Documents/17c276_250_205.jpg
windv
+
-12
12
1R
2R
fR
+
-
12
12
3R
4R
5R 6RoutV
Datalogger
M2
+
-
G
Iref=10A
+
-Vtrian.
Battery Charge ControllerVcontrol Ibatt.
MPPT AlgorithmDCV
DCI
refI+
-
e+
-.triVPWM
G
Io
-
+
-
+
-
+
Vo
V1
V2
C
+ -VL
+
-VD1
+ -VM2
ID2
I1 L
D1
D2
IL IC
M1
M2
VD2
+ -VM1
C Vo
Io+
-
+
-
-
+
+ -VL
+
-ID1
L
D1
D2
IL IC
+VD2
-
+ -VM1
M1
M2+ -VM2
V1
V2
C
+
-Vo
Io
Ii1
Ii2
+
-
+
-
V1
V2
+ -VL
L
D1
D2
IL ICM1
M2
VD2+
-
-
+VD1
+
-
+
-
+
-Vo
Io
Vc
V1
V2
+ -VL
+ -VM2
ID2
C
L
D1
D2
IL IC
+
-
VM1+ -
M2
M1
ID1
VD1
VD1
( )a
( )b
( )c ( )d
+
-
V1
V2
Vo
+
-
VG
S1
LM1
M2
D1
D2
C
-
+ VG
S2
VG
S1
+
-
-
+
V1
V2
+
-
Vo
LM1
M2
D1
D2
C
VG
S2
( )b( )a
( )a
( )b
sT
1d
1d
2t1t 4t3t
t
t
1GSV
2GSV
-+
V1
+
-V2
Vo
-
VG
S1
LM1
M2
D1
D2
C
+ VG
S2
( )c
VGS3
-+
V1
+
-V2
Vo
-
VG
S1
LM1
M2
D1
D2
C
+
VG
S2
VGS3
3M
-+
V1
+
-V2
Vo
-
VG
S1
LM1
M2
D1
D2
C
+ VG
S2
( )c
VGS3
+
-
Relay
CVbatt.
L Rb
VGS3
D3
M1
Ibatt.
Vrelay
Vout Vout
M2
Vwind
Iwind
-
+-
VPV
D1
D2
VGS1
VGS2
VGS4
-
Microcontroller
Ipv
Sensor Signals Control Signals
VoutVin
Vbatt
Vcontrol1Vcontrol2Vcontrol3
IwindIbatt Vrelay
Vcontrol4
+
-
+
-
Ipv
IoILIL
IL
( )a
IL
-+
V1
+
-V2
Vo
-
VG
S1
LM1
M2
D1
D2
C
+
VG
S2
VGS3
Io IoIL
( )c
-+
V1
+
-V2
Vo
-
VG
S1
LM1
M2
D1
D2
C
+
VG
S2
VGS3
IL
IL
( )b
IL
-+
V1
+
-V2
Vo
-
VG
S1
LM1
M2
D1
D2
C
+
VG
S2
VGS3
IL
( )c
Ic Io
Io
Ic
D3 D3
D3D3
+- 2G
1CT1G
2CT+-
1H
refVoV
*
refI
LI
duty
Plant 1 Plant 2Controller 2Controller 1
measuredLI
Microprocessor
(MPPT Programming)
-+ +
-
PVI
PVVWindV
WindI
1d 2d
1
*
refI2
*
refI
+
-
+
-
PVV
windV
*
refV
Microprocessor(Current Control programming)
Boost mode
3d
oVoI
*
refV
Microprocessor(Current Control programming)
Buck mode
1d
oVoI
2d
L D3
D1
D2
Double input DC/DC converter
PVI
WindILoad
oI+
-
oVABV
AV
BV
MicroprocessorPower managament
control unit
PVV
PVI
windV
WindI
ABV
oV
oI
1d 2d 3d
1S
2S
3S
1d
2d
3d
Current compensator
Current compensator
Figure 6.16. Control mode of operation II.
The design of the controller for the boost mode of operation is done similarly to the buck mode. Theinner loop is designed to be faster than the outer loop, thereby the current loop can correct the errors
59
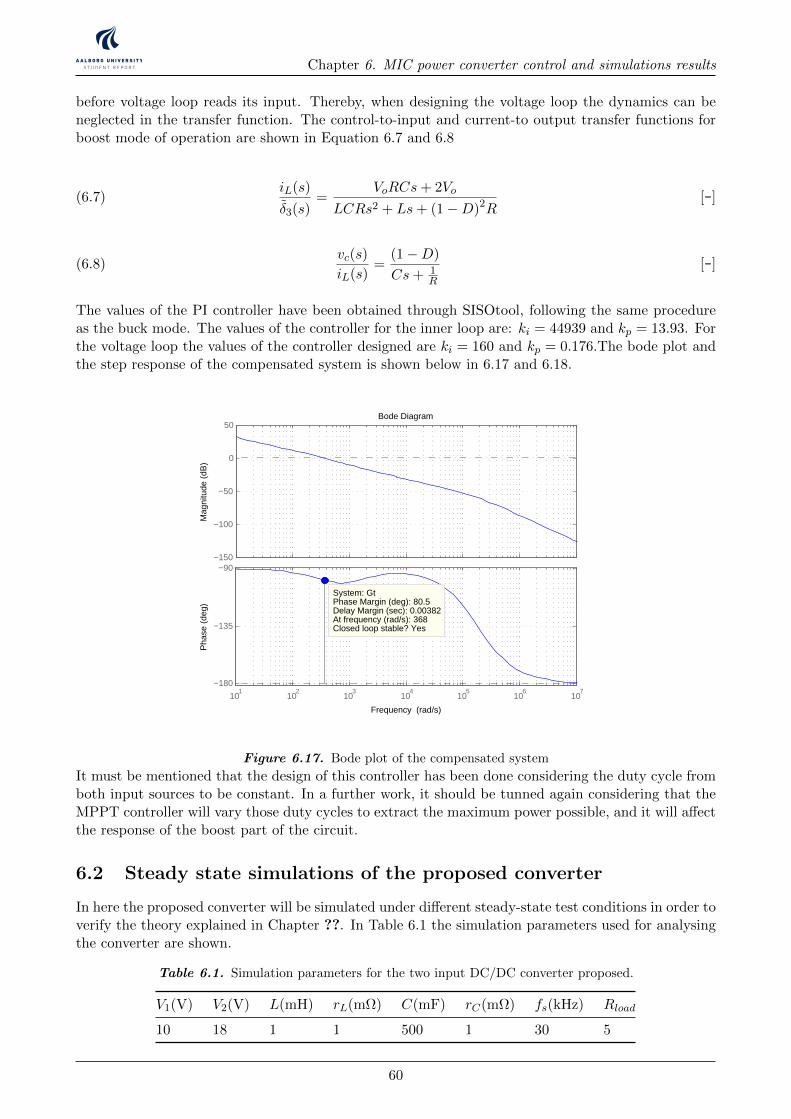
Chapter 6. MIC power converter control and simulations results
before voltage loop reads its input. Thereby, when designing the voltage loop the dynamics can beneglected in the transfer function. The control-to-input and current-to output transfer functions forboost mode of operation are shown in Equation 6.7 and 6.8
iL(s)
δ3(s)=
VoRCs+ 2Vo
LCRs2 + Ls+ (1−D)2R[-](6.7)
vc(s)
iL(s)=
(1−D)
Cs+ 1R
[-](6.8)
The values of the PI controller have been obtained through SISOtool, following the same procedureas the buck mode. The values of the controller for the inner loop are: ki = 44939 and kp = 13.93. Forthe voltage loop the values of the controller designed are ki = 160 and kp = 0.176.The bode plot andthe step response of the compensated system is shown below in 6.17 and 6.18.
−150
−100
−50
0
50
Mag
nitu
de (
dB)
Bode Diagram
Frequency (rad/s)
101
102
103
104
105
106
107
−180
−135
−90
System: GtPhase Margin (deg): 80.5Delay Margin (sec): 0.00382At frequency (rad/s): 368Closed loop stable? Yes
Pha
se (
deg)
Figure 6.17. Bode plot of the compensated system
It must be mentioned that the design of this controller has been done considering the duty cycle fromboth input sources to be constant. In a further work, it should be tunned again considering that theMPPT controller will vary those duty cycles to extract the maximum power possible, and it will affectthe response of the boost part of the circuit.
6.2 Steady state simulations of the proposed converter
In here the proposed converter will be simulated under different steady-state test conditions in order toverify the theory explained in Chapter ??. In Table 6.1 the simulation parameters used for analysingthe converter are shown.
Table 6.1. Simulation parameters for the two input DC/DC converter proposed.
V1(V) V2(V) L(mH) rL(mΩ) C(mF) rC(mΩ) fs(kHz) Rload
10 18 1 1 500 1 30 5
60
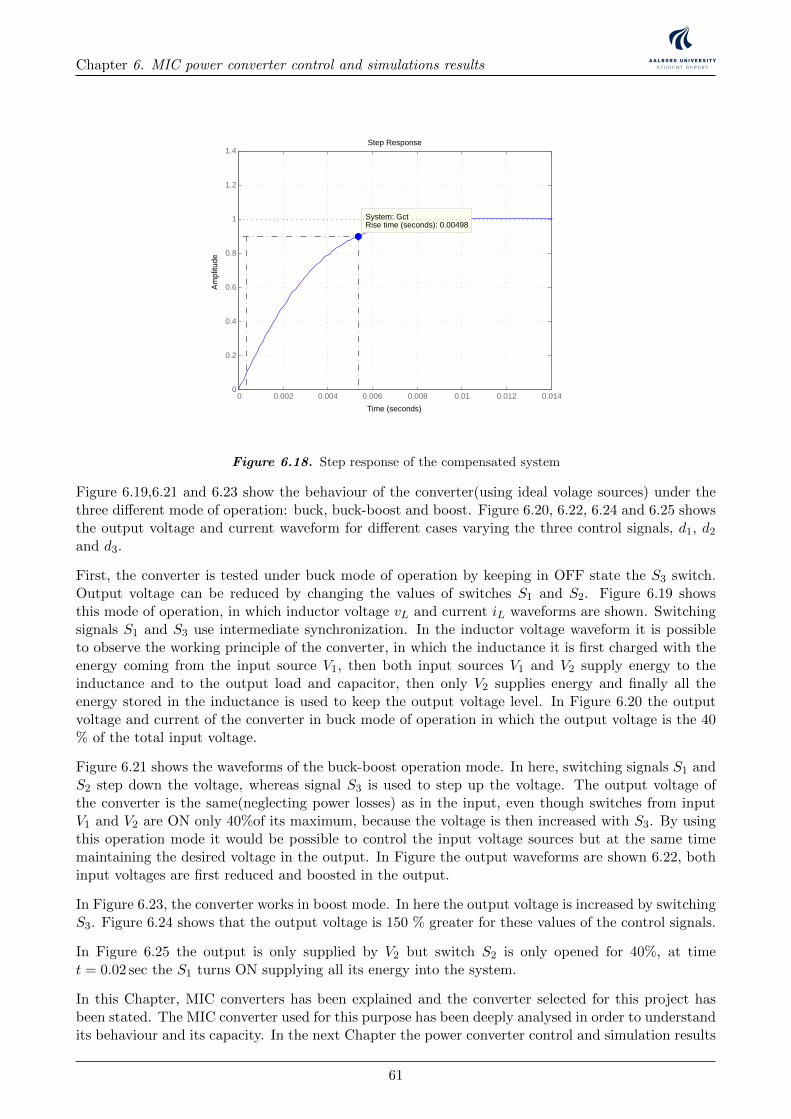
Chapter 6. MIC power converter control and simulations results
Step Response
Time (seconds)
Am
plitu
de
0 0.002 0.004 0.006 0.008 0.01 0.012 0.0140
0.2
0.4
0.6
0.8
1
1.2
1.4
System: GctRise time (seconds): 0.00498
Figure 6.18. Step response of the compensated system
Figure 6.19,6.21 and 6.23 show the behaviour of the converter(using ideal volage sources) under thethree different mode of operation: buck, buck-boost and boost. Figure 6.20, 6.22, 6.24 and 6.25 showsthe output voltage and current waveform for different cases varying the three control signals, d1, d2
and d3.
First, the converter is tested under buck mode of operation by keeping in OFF state the S3 switch.Output voltage can be reduced by changing the values of switches S1 and S2. Figure 6.19 showsthis mode of operation, in which inductor voltage vL and current iL waveforms are shown. Switchingsignals S1 and S3 use intermediate synchronization. In the inductor voltage waveform it is possibleto observe the working principle of the converter, in which the inductance it is first charged with theenergy coming from the input source V1, then both input sources V1 and V2 supply energy to theinductance and to the output load and capacitor, then only V2 supplies energy and finally all theenergy stored in the inductance is used to keep the output voltage level. In Figure 6.20 the outputvoltage and current of the converter in buck mode of operation in which the output voltage is the 40% of the total input voltage.
Figure 6.21 shows the waveforms of the buck-boost operation mode. In here, switching signals S1 andS2 step down the voltage, whereas signal S3 is used to step up the voltage. The output voltage ofthe converter is the same(neglecting power losses) as in the input, even though switches from inputV1 and V2 are ON only 40%of its maximum, because the voltage is then increased with S3. By usingthis operation mode it would be possible to control the input voltage sources but at the same timemaintaining the desired voltage in the output. In Figure the output waveforms are shown 6.22, bothinput voltages are first reduced and boosted in the output.
In Figure 6.23, the converter works in boost mode. In here the output voltage is increased by switchingS3. Figure 6.24 shows that the output voltage is 150 % greater for these values of the control signals.
In Figure 6.25 the output is only supplied by V2 but switch S2 is only opened for 40%, at timet = 0.02 sec the S1 turns ON supplying all its energy into the system.
In this Chapter, MIC converters has been explained and the converter selected for this project hasbeen stated. The MIC converter used for this purpose has been deeply analysed in order to understandits behaviour and its capacity. In the next Chapter the power converter control and simulation results
61
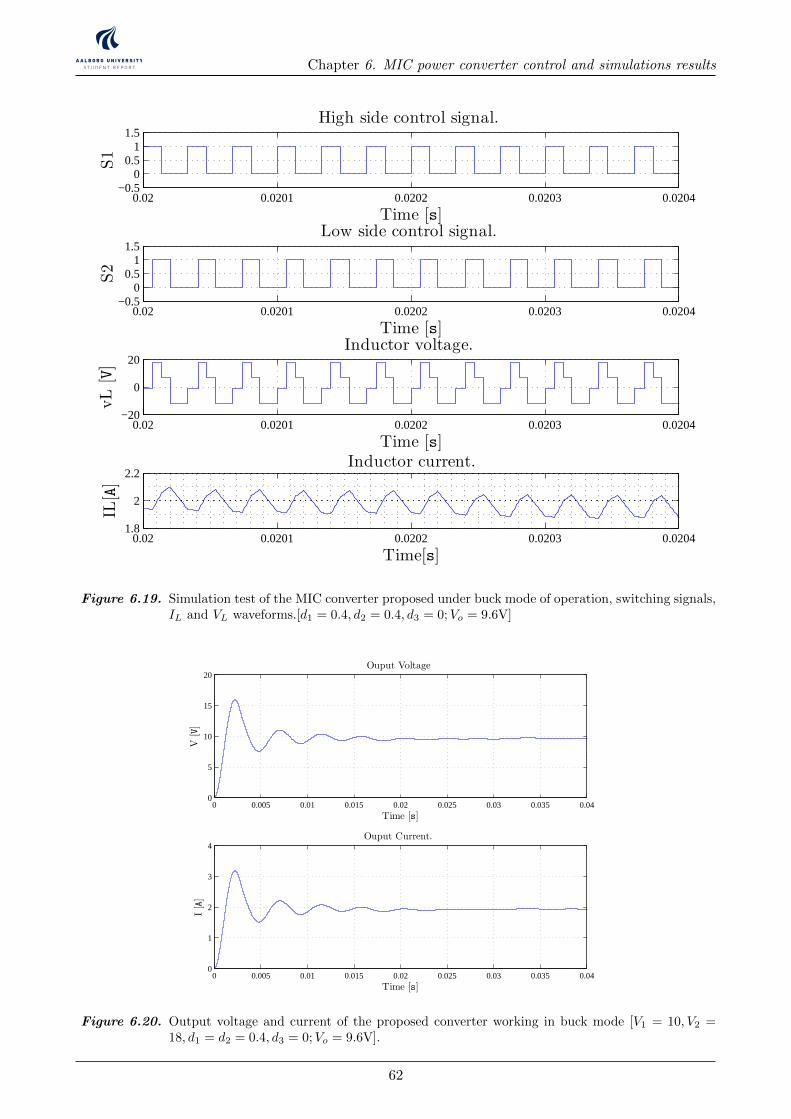
Chapter 6. MIC power converter control and simulations results
0.02 0.0201 0.0202 0.0203 0.0204−0.5
00.5
11.5
Time [s]
S1
High side control signal.
0.02 0.0201 0.0202 0.0203 0.0204−0.5
00.5
11.5
Time [s]
S2
Low side control signal.
0.02 0.0201 0.0202 0.0203 0.0204−20
0
20
Time [s]
vL[V]
Inductor voltage.
0.02 0.0201 0.0202 0.0203 0.02041.8
2
2.2
Time[s]
IL[A]
Inductor current.
Figure 6.19. Simulation test of the MIC converter proposed under buck mode of operation, switching signals,IL and VL waveforms.[d1 = 0.4, d2 = 0.4, d3 = 0;Vo = 9.6V]
0 0.005 0.01 0.015 0.02 0.025 0.03 0.035 0.040
5
10
15
20
Time [s]
V[V]
Ouput Voltage
0 0.005 0.01 0.015 0.02 0.025 0.03 0.035 0.040
1
2
3
4
Time [s]
I[A]
Ouput Current.
Figure 6.20. Output voltage and current of the proposed converter working in buck mode [V1 = 10, V2 =18, d1 = d2 = 0.4, d3 = 0;Vo = 9.6V].
62
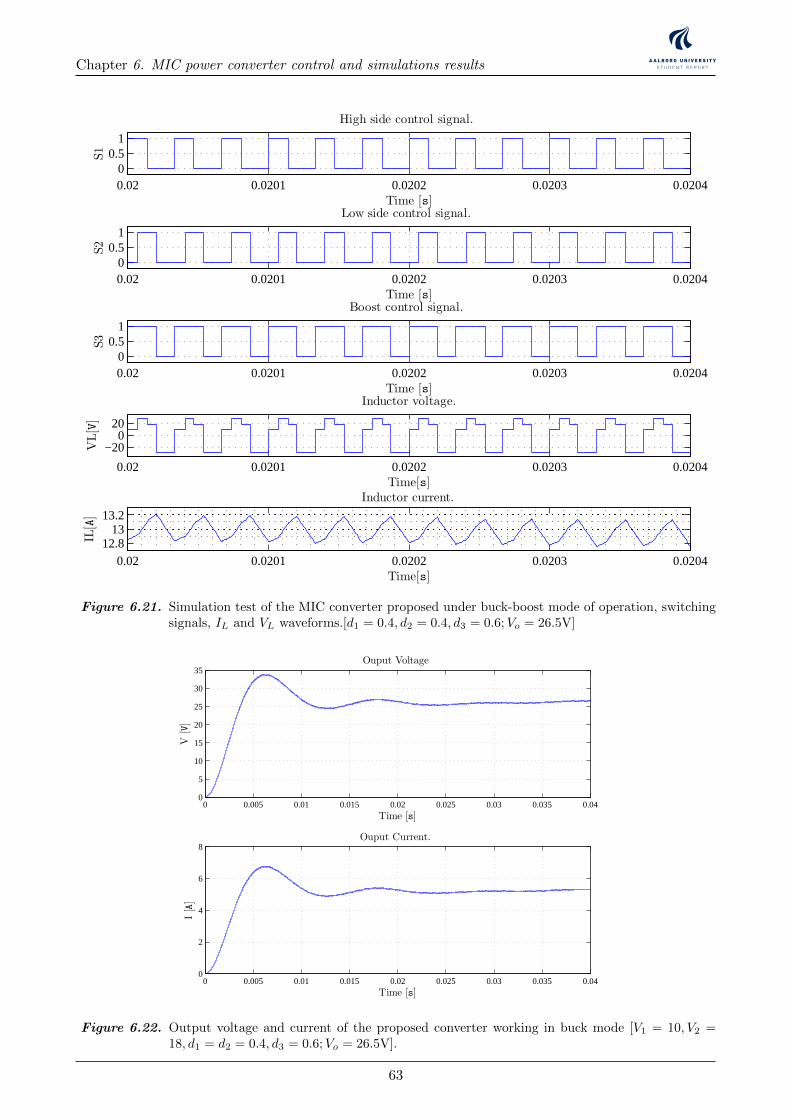
Chapter 6. MIC power converter control and simulations results
0.02 0.0201 0.0202 0.0203 0.02040
0.51
Time [s]
S1
High side control signal.
0.02 0.0201 0.0202 0.0203 0.02040
0.51
Time [s]
S2
Low side control signal.
0.02 0.0201 0.0202 0.0203 0.02040
0.51
Time [s]
S3
Boost control signal.
0.02 0.0201 0.0202 0.0203 0.0204
−200
20
Time[s]
VL[V]
Inductor voltage.
0.02 0.0201 0.0202 0.0203 0.020412.8
1313.2
Time[s]
IL[A]
Inductor current.
Figure 6.21. Simulation test of the MIC converter proposed under buck-boost mode of operation, switchingsignals, IL and VL waveforms.[d1 = 0.4, d2 = 0.4, d3 = 0.6;Vo = 26.5V]
0 0.005 0.01 0.015 0.02 0.025 0.03 0.035 0.040
5
10
15
20
25
30
35
Time [s]
V[V]
Ouput Voltage
0 0.005 0.01 0.015 0.02 0.025 0.03 0.035 0.040
2
4
6
8
Time [s]
I[A]
Ouput Current.
Figure 6.22. Output voltage and current of the proposed converter working in buck mode [V1 = 10, V2 =18, d1 = d2 = 0.4, d3 = 0.6;Vo = 26.5V].
63
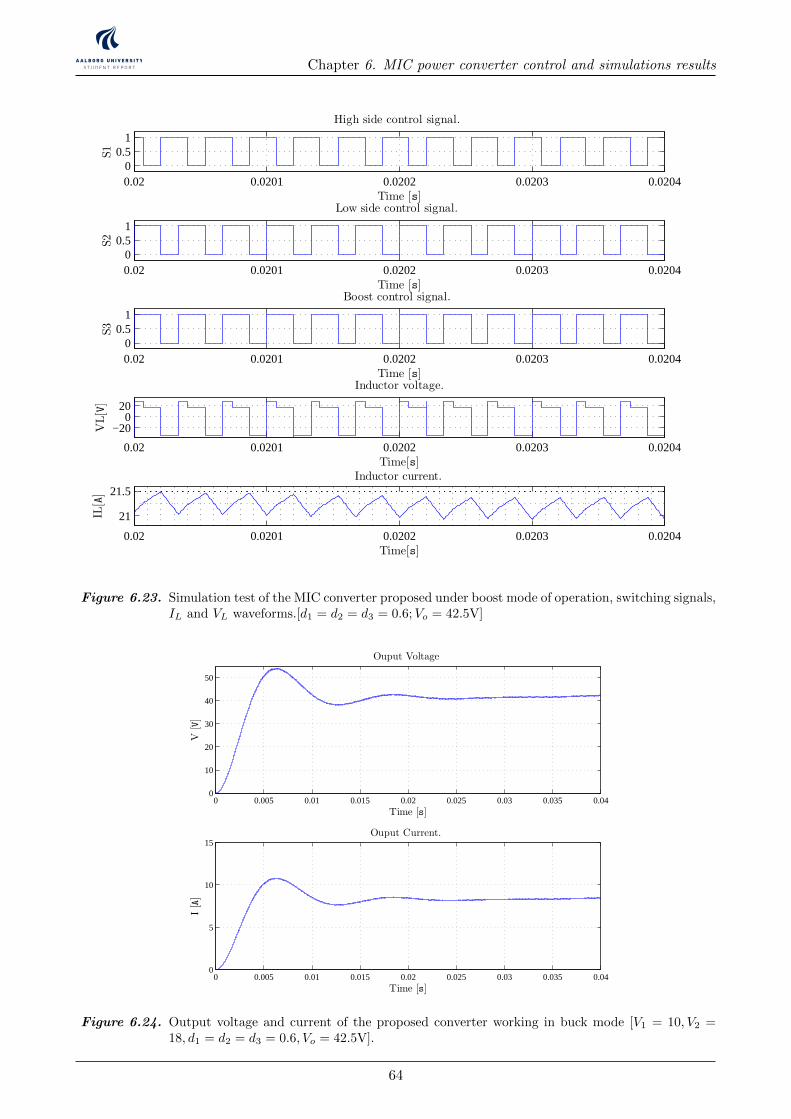
Chapter 6. MIC power converter control and simulations results
0.02 0.0201 0.0202 0.0203 0.02040
0.51
Time [s]
S1
High side control signal.
0.02 0.0201 0.0202 0.0203 0.02040
0.51
Time [s]
S2
Low side control signal.
0.02 0.0201 0.0202 0.0203 0.02040
0.51
Time [s]
S3
Boost control signal.
0.02 0.0201 0.0202 0.0203 0.0204
−200
20
Time[s]
VL[V]
Inductor voltage.
0.02 0.0201 0.0202 0.0203 0.0204
21
21.5
Time[s]
IL[A]
Inductor current.
Figure 6.23. Simulation test of the MIC converter proposed under boost mode of operation, switching signals,IL and VL waveforms.[d1 = d2 = d3 = 0.6;Vo = 42.5V]
0 0.005 0.01 0.015 0.02 0.025 0.03 0.035 0.040
10
20
30
40
50
Time [s]
V[V]
Ouput Voltage
0 0.005 0.01 0.015 0.02 0.025 0.03 0.035 0.040
5
10
15
Time [s]
I[A]
Ouput Current.
Figure 6.24. Output voltage and current of the proposed converter working in buck mode [V1 = 10, V2 =18, d1 = d2 = d3 = 0.6, Vo = 42.5V].
64
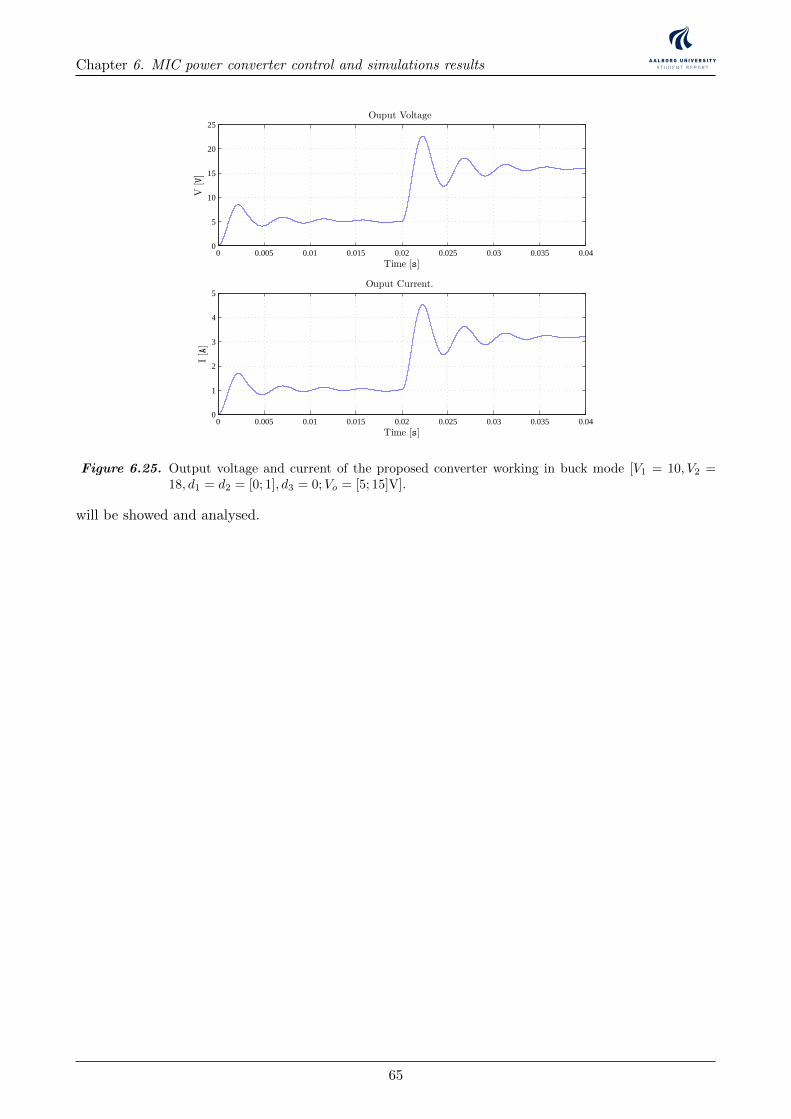
Chapter 6. MIC power converter control and simulations results
0 0.005 0.01 0.015 0.02 0.025 0.03 0.035 0.040
5
10
15
20
25
Time [s]
V[V]
Ouput Voltage
0 0.005 0.01 0.015 0.02 0.025 0.03 0.035 0.040
1
2
3
4
5
Time [s]
I[A]
Ouput Current.
Figure 6.25. Output voltage and current of the proposed converter working in buck mode [V1 = 10, V2 =18, d1 = d2 = [0; 1], d3 = 0;Vo = [5; 15]V].
will be showed and analysed.
65

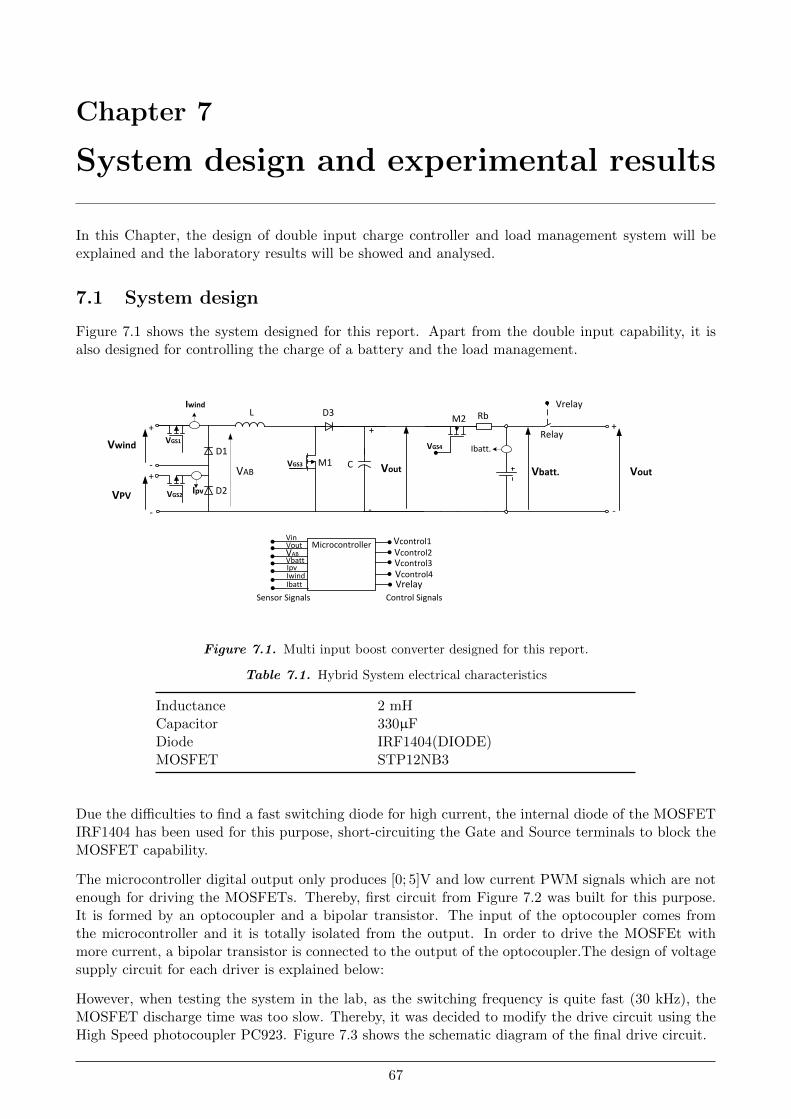
Chapter 7
System design and experimental results
In this Chapter, the design of double input charge controller and load management system will beexplained and the laboratory results will be showed and analysed.
7.1 System design
Figure 7.1 shows the system designed for this report. Apart from the double input capability, it isalso designed for controlling the charge of a battery and the load management.
2CT
Wind PMSG
turbine
Rectifier
wm
DC
DCLOAD
Rotating speed -Power characteristic Pactual
Cotrol Unit
Poptimal
error
Control Signal
Power Converter
PMSG
Wind turbine
Rectifier
DC
DCLOAD
Cotrol Unit
Control Signal
Power Converter
Wind speed
Vw
R
Wm
Wm-optimal
error
+-
+ -
Ea
Eb
Ec
Xs Rs
ILL VLL
D1 D3 D5
D2 D4D6
+
-
p
N
Id
Ea
Eb
Ec
Xs RsIa
Xs
Xs
Rs
Rs
+
-
VDC
IDC+
+
+
Va
Vb
Vc
Ib
Ic
H
D
VPVDC
DC
VWindDC
DC
LOADVo+
-
VPV
DC
DC
VWind
LOADVo
+
-
+
+ - + -
+ - + -
PMSG
500 W
Vertical axis wind turbine Gear box
+
-
600 W Vpv
DC/DC
Ibat
+
-
Vo
Io
3-ph Rectifier
+
-VWG
IPV
IWG
Control Unit
ON/OFF Control
IWG
VWG
Vpv
IPV
IbatVo
Dummy Load
12 V 450 AH Battery Bench
900 W
Control signals
PMSG
500 W
Vertical axis wind turbine Gear box
+
-
Vw
w
+
-
Solar Pump controller PM DC motor
Vpv
Back- Up system Diesel Generator
-
200 W
-
200 W
-+ +
200 W
+
Ea
Eb
Ec
Xs Rs
ILL VLL
D1 D3 D5
D2 D4D6
+
-
p
N
Id
Ea
Eb
Ec
Xs RsIa
Xs
Xs
Rs
Rs
+
-
VDC
IDC+
+
+
Va
Vb
Vc
Ib
Ic
+-
LvLi
iv +
-
CR
C
LLR
PWM S
+
ovloadR
Si
Di Ri
Ci
Cv
+
LvLi
iv CR
C
LLR
S ovloadR
Si
Di Ri
Ci
Cv
+iv CR
C
LLR
S ovloadR
Si Ci
Cv
sDT (1 ) sD T
iv
i oV V
( )Lv t
( )Ci t
PWM
D3
Wind PMSG
turbine
Rectifier
DC
DC
Cotrol UnitControl Signal
Power Converter
DCI
LOAD
+
-
DCV
MPPT algorithm
+
-
Vcc
D9
Vin
+
-
An3 An5An4
Relay
LM7805 +5V
D2
2
31
7
27K
5.6K22uF
5.1V
1N4001
10K
8
3305.6 3305.615K
680
5.6K
330uF
680
15V
22uF
6.8K
15K
5.6K22uF
Relay
5.1V
VLoadSwitch
20K
5.6K22uF
5.1V
680 Vb
att.
D2
MOSPEC S20C40C(x2)
D3
1mH FQP12P20(x2)
0.39 c/v
1.2 K
+ +
+
Current Transducer
5VAn2
GND
Arduino Uno
An2
An3
An4An5
+5V
An
alo
g0
..5
GND
An0
An1
D0D1D2D3D4D5D6D7D8D9D10D11D12
Swep
tA
rea
Ewind EturbineD
Swep
tA
rea
H
VAWTHAWT
Eunabsorved
DCP
mw
maxP
0, 0m
dP dP
dw dD
0, 0, 0 0DC
m DC m
dVdP dD dP
dw dV dw dD
0, 0, 0 0DC
m DC m
dVdP dD dP
dw dV dw dD
High Speed Low Speed
Track Starting Point Track Starting Point
D D
Maximum Power Point Tracking process
PDCk >PDCk-1
Read PDC
Iref(k)=Iref(k-1)-∆I
Vk >Vk-1
NO
Iref(k)=Iref(k-1)-∆I
YES
Iref(k)=Iref(k-1)+∆I
NOVk >Vk-1
YES
Iref(k)=Iref(k-1)+∆I
YES NO
sDT
I
Li
i oV V
L
sT
iV
L
LI
t
oV
R
oL
load
VI
R
t
t
t
sDT
CV
( )v t
LI V
C RC
sT
V
RC
CV
t
0.5
0.0
1
1.5
2
2.5
3
5 10 15 20
Voltage
Cu
rren
t
Vmp
Imp
Isc Short circuit current
VocOpen circuit voltage
MPP
V.Battery
I-V PV panel characteristics
DC/DC converterDC loadVbatt
+
-
Vp
v
Ipv +
-
Vo
Io
A/D A/D
MPPT and Charging algorithm
PWM
PV array
MPP
SCI
1dI
I
Load
2dI
1D
SR
PR2D
rI
DC/DCPV -Wind
system
Battery charge control.
Load regulation.
.battV.battI
Battery
.battD loadD
DCLOAD
.battI
t
sDT sT
-
Vin
+
-
Relay
CVbatt.
L Rb
Microcontroller
Iin
Vcontrol1
D1
M1
Sensor Signals Control Signals
VinVoutVbatt.
Ibatt
IinIbatt.
Vcontrol1Vcontrol2Vcontrol3
Vcontrol2
Vcontrol3
Vout Vout
file:///C:/Users/Andres/Documents/17c276_250_205.jpg
file:///C:/Users/Andres/Documents/17c276_250_205.jpg
windv
+
-12
12
1R
2R
fR
+
-
12
12
3R
4R
5R 6RoutV
Datalogger
M2
+
-
G
Iref=10A
+
-Vtrian.
Battery Charge ControllerVcontrol Ibatt.
MPPT AlgorithmDCV
DCI
refI+
-
e+
-.triVPWM
G
Io
-
+
-
+
-
+
Vo
V1
V2
C
+ -VL
+
-VD1
+ -VM2
ID2
I1 L
D1
D2
IL IC
M1
M2
VD2
+ -VM1
C Vo
Io+
-
+
-
-
+
+ -VL
+
-ID1
L
D1
D2
IL IC
+VD2
-
+ -VM1
M1
M2+ -VM2
V1
V2
C
+
-Vo
Io
Ii1
Ii2
+
-
+
-
V1
V2
+ -VL
L
D1
D2
IL ICM1
M2
VD2+
-
-
+VD1
+
-
+
-
+
-Vo
Io
Vc
V1
V2
+ -VL
+ -VM2
ID2
C
L
D1
D2
IL IC
+
-
+VM1
-
M2
M1
ID1
VD1
VD1
( )a ( )b
( )c ( )d
+
-
V1
V2
Vo
+
-
VG
S1
LM1
M2
D1
D2
C
-
+
VG
S2
VG
S1
+
-
-
+
V1
V2
+
-
Vo
LM1
M2
D1
D2
C
VG
S2
( )b
( )a
Wind PMSG
turbine
Rectifier
wm
DC
DCLOAD
Rotating speed -Power characteristic Pactual
Cotrol Unit
Poptimal
error
Control Signal
Power Converter
PMSG
Wind turbine
Rectifier
DC
DCLOAD
Cotrol Unit
Control Signal
Power Converter
Wind speed
Vw
R
Wm
Wm-optimal
error
+-
+ -
Ea
Eb
Ec
Xs Rs
ILL VLL
D1 D3 D5
D2 D4D6
+
-
p
N
Id
Ea
Eb
Ec
Xs RsIa
Xs
Xs
Rs
Rs
+
-
VDC
IDC+
+
+
Va
Vb
Vc
Ib
Ic
H
D
VPVDC
DC
VWindDC
DC
LOADVo+
-
VPV
DC
DC
VWind
LOADVo
+
-
+
+ - + -
+ - + -
PMSG
500 W
Vertical axis wind turbine Gear box
+
-
600 W Vpv
DC/DC
Ibat
+
-
Vo
Io
3-ph Rectifier
+
-VWG
IPV
IWG
Control Unit
ON/OFF Control
IWG
VWG
Vpv
IPV
IbatVo
Dummy Load
12 V 450 AH Battery Bench
900 W
Control signals
PMSG
500 W
Vertical axis wind turbine Gear box
+
-
Vw
w
+
-
Solar Pump controller PM DC motor
Vpv
Back- Up system Diesel Generator
-
200 W
-
200 W
-+ +
200 W
+
Ea
Eb
Ec
Xs Rs
ILL VLL
D1 D3 D5
D2 D4D6
+
-
p
N
Id
Ea
Eb
Ec
Xs RsIa
Xs
Xs
Rs
Rs
+
-
VDC
IDC+
+
+
Va
Vb
Vc
Ib
Ic
+-
LvLi
iv +
-
CR
C
LLR
PWM S
+
ovloadR
Si
Di Ri
Ci
Cv
+
LvLi
iv CR
C
LLR
S ovloadR
Si
Di Ri
Ci
Cv
+iv CR
C
LLR
S ovloadR
Si Ci
Cv
sDT (1 ) sD T
iv
i oV V
( )Lv t
( )Ci t
PWM
D3
Wind PMSG
turbine
Rectifier
DC
DC
Cotrol UnitControl Signal
Power Converter
DCI
LOAD
+
-
DCV
MPPT algorithm
+
-
Vcc
D9
Vin
+
-
An3 An5An4
Relay
LM7805 +5V
D2
2
31
7
27K
5.6K22uF
5.1V
1N4001
10K
8
3305.6 3305.615K
680
5.6K
330uF
680
15V
22uF
6.8K
15K
5.6K22uF
Relay
5.1V
VLoadSwitch
20K
5.6K22uF
5.1V
680 Vb
att.
D2
MOSPEC S20C40C(x2)
D3
1mH FQP12P20(x2)
0.39 c/v
1.2 K
+ +
+
Current Transducer
5VAn2
GND
Arduino Uno
An2
An3
An4An5
+5V
An
alo
g0
..5
GND
An0
An1
D0D1D2D3D4D5D6D7D8D9D10D11D12
Swep
tA
rea
Ewind EturbineD
Swep
tA
rea
H
VAWTHAWT
Eunabsorved
DCP
mw
maxP
0, 0m
dP dP
dw dD
0, 0, 0 0DC
m DC m
dVdP dD dP
dw dV dw dD
0, 0, 0 0DC
m DC m
dVdP dD dP
dw dV dw dD
High Speed Low Speed
Track Starting Point Track Starting Point
D D
Maximum Power Point Tracking process
PDCk >PDCk-1
Read PDC
Iref(k)=Iref(k-1)-∆I
Vk >Vk-1
NO
Iref(k)=Iref(k-1)-∆I
YES
Iref(k)=Iref(k-1)+∆I
NOVk >Vk-1
YES
Iref(k)=Iref(k-1)+∆I
YES NO
sDT
I
Li
i oV V
L
sT
iV
L
LI
t
oV
R
oL
load
VI
R
t
t
t
sDT
CV
( )v t
LI V
C RC
sT
V
RC
CV
t
0.5
0.0
1
1.5
2
2.5
3
5 10 15 20
Voltage
Cu
rren
t
Vmp
Imp
Isc Short circuit current
VocOpen circuit voltage
MPP
V.Battery
I-V PV panel characteristics
DC/DC converterDC loadVbatt
+
-
Vp
v
Ipv +
-
Vo
Io
A/D A/D
MPPT and Charging algorithm
PWM
PV array
MPP
SCI
1dI
I
Load
2dI
1D
SR
PR2D
rI
DC/DCPV -Wind
system
Battery charge control.
Load regulation.
.battV.battI
Battery
.battD loadD
DCLOAD
.battI
t
sDT sT
-
Vin
+
-
Relay
CVbatt.
L Rb
Microcontroller
Iin
Vcontrol1
D1
M1
Sensor Signals Control Signals
VinVoutVbatt.
Ibatt
IinIbatt.
Vcontrol1Vcontrol2Vcontrol3
Vcontrol2
Vcontrol3
Vout Vout
file:///C:/Users/Andres/Documents/17c276_250_205.jpg
windv
+
-12
12
1R
2R
fR
+
-
12
12
3R
4R
5R 6RoutV
Datalogger
M2
+
-
G
Iref=10A
+
-Vtrian.
Battery Charge ControllerVcontrol Ibatt.
MPPT AlgorithmDCV
DCI
refI+
-
e+
-.triV
Current compensator
PWM
Io
-
+
-
+
-
+
Vo
V1
V2
C
+ -VL
+
-VD1
+ -VM2
ID2
I1 L
D1
D2
IL IC
M1
M2
VD2
+ -VM1
C Vo
Io+
-
+
-
-
+
+ -VL
+
-ID1
L
D1
D2
IL IC
+VD2
-
+ -VM1
M1
M2+ -VM2
V1
V2
C
+
-Vo
Io
Ii1
Ii2
+
-
+
-
V1
V2
+ -VL
L
D1
D2
IL ICM1
M2
VD2+
-
-
+VD1
+
-
+
-
+
-Vo
Io
Vc
V1
V2
+ -VL
+ -VM2
ID2
C
L
D1
D2
IL IC
+
-
+VM1
-
M2
M1
ID1
VD1
VD1
( )a
( )b
( )c ( )d
+
-
V1
V2
Vo
+
-
VG
S1
LM1
M2
D1
D2
C
-
+ VG
S2
VG
S1
+
-
-
+
V1
V2
+
-
Vo
LM1
M2
D1
D2
C
VG
S2
( )b( )a
( )a
( )b
sT
1d
1d
2t1t 4t3t
t
t
1GSV
2GSV
-+
V1
+
-V2
Vo
-
VG
S1
LM1
M2
D1
D2
C
+ VG
S2
( )c
VGS3
-+
V1
+
-V2
Vo
-
VG
S1
LM1
M2
D1
D2
C
+
VG
S2
VGS3
3M
-+
V1
+
-V2
Vo
-
VG
S1
LM1
M2
D1
D2
C
+ VG
S2
( )c
VGS3
+
-
Relay
CVbatt.
L Rb
VGS3
D3
M1
Ibatt.
Vrelay
Vout Vout
M2
Vwind
Iwind
-
+-
VPV
D1
D2
VGS1VGS4
-
Microcontroller
Ipv
Sensor Signals Control Signals
VinVout
Vbatt
Vcontrol1Vcontrol2Vcontrol3
IwindIbatt Vrelay
Vcontrol4
+
-
+
-
Ipv
IoILIL
IL
( )a
IL
-+
V1
+
-V2
Vo
-
VG
S1
LM1
M2
D1
D2
C
+
VG
S2
VGS3
Io IoIL
( )c
-+
V1
+
-V2
Vo
-
VG
S1
LM1
M2
D1
D2
C
+
VG
S2
VGS3
IL
IL
( )b
IL
-+
V1
+
-V2
Vo
-
VG
S1
LM1
M2
D1
D2
C
+
VG
S2
VGS3
IL
( )c
Ic Io
Io
Ic
D3 D3
D3D3
+- 2G
1CT1G
2CT+-
1H
refVoV
*
refI
LI
duty
Plant 1 Plant 2Controller 2Controller 1
measuredLI
Microprocessor
(MPPT Programming)
-+ +
-
PVI
PVVWindV
WindI
1d 2d
1
*
refI2
*
refI
+
-
+
-
PVV
windV
*
refV
Microprocessor(Current Control programming)
Boost mode
3d
oVoI
*
refV
Microprocessor(Current Control programming)
Buck mode
1d
oVoI
2d
L D3
D1
D2
Double input DC/DC converter
PVI
WindILoad
oI+
-
oVABV
AV
BV
MicroprocessorPower managament
control unit
PVV
PVI
windV
WindI
ABV
oV
oI
1d 2d 3d
1S
2S
3S
1d
2d
3d
+-
*
refI1( )d s
Plant 1 LI
12G
11G
2 ( )d s
+
+
1H
+refV
1CT-
2GPlant 2
oV
*
refILI
+refV
1CT- 2G
Plant 2
oVInner current loop
110 V
12 V
12 V
Microcontroller PWM signal
18 V
V1
V2
VGS
1 K
10 K 220Ω 15V
G
SDrive Circuit
Optocoupler
4N28
LP-575
Transformer
Grid voltage
Rectifier circuit
Independent voltage sources
DCP
maxP
0, 0, 0 0DC
m DC m
dVdP dD dP
dw dV dw dD
High Speed
Track Starting Point
D
windv
+
-12
12
1R
2R
fR
+
-
12
12
3R
4R
5R 6RoutV
Datalogger
fR
VGS2
VAB
VAB
Figure 7.1. Multi input boost converter designed for this report.
Table 7.1. Hybrid System electrical characteristics
Inductance 2 mHCapacitor 330µFDiode IRF1404(DIODE)MOSFET STP12NB3
Due the difficulties to find a fast switching diode for high current, the internal diode of the MOSFETIRF1404 has been used for this purpose, short-circuiting the Gate and Source terminals to block theMOSFET capability.
The microcontroller digital output only produces [0; 5]V and low current PWM signals which are notenough for driving the MOSFETs. Thereby, first circuit from Figure 7.2 was built for this purpose.It is formed by an optocoupler and a bipolar transistor. The input of the optocoupler comes fromthe microcontroller and it is totally isolated from the output. In order to drive the MOSFEt withmore current, a bipolar transistor is connected to the output of the optocoupler.The design of voltagesupply circuit for each driver is explained below:
However, when testing the system in the lab, as the switching frequency is quite fast (30 kHz), theMOSFET discharge time was too slow. Thereby, it was decided to modify the drive circuit using theHigh Speed photocoupler PC923. Figure 7.3 shows the schematic diagram of the final drive circuit.
67
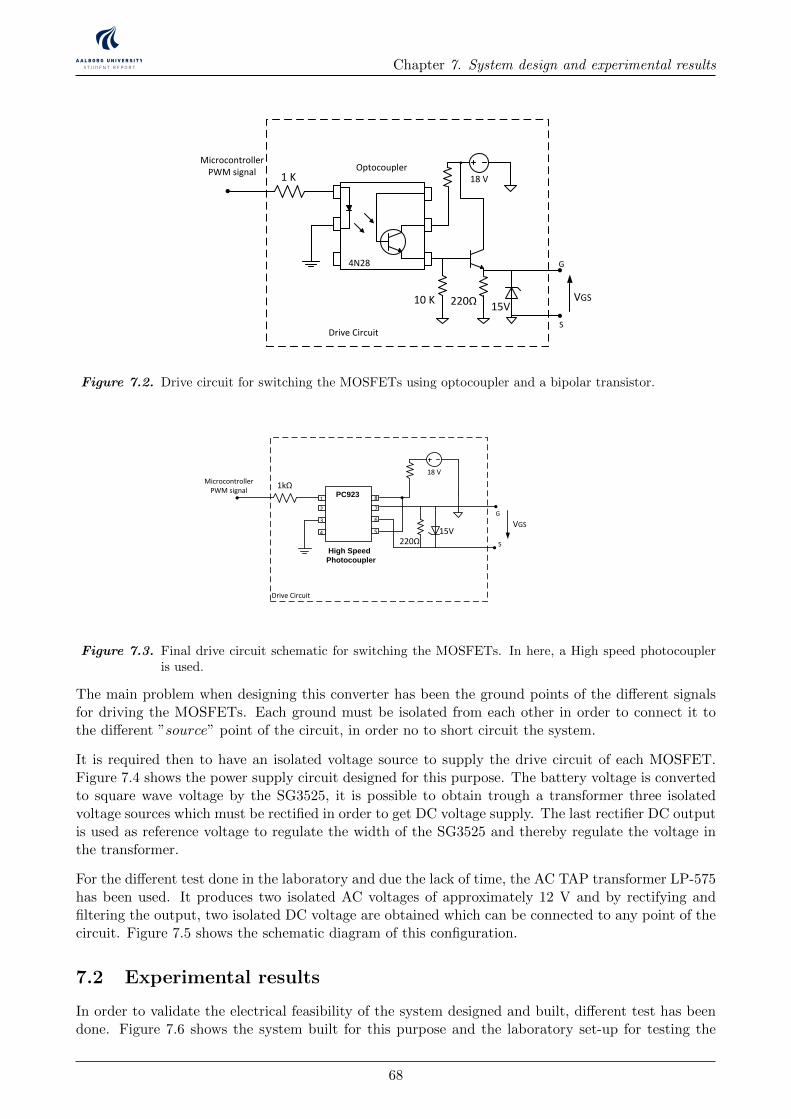
Chapter 7. System design and experimental results
2CT
Wind PMSG
turbine
Rectifier
wm
DC
DCLOAD
Rotating speed -Power characteristic Pactual
Cotrol Unit
Poptimal
error
Control Signal
Power Converter
PMSG
Wind turbine
Rectifier
DC
DCLOAD
Cotrol Unit
Control Signal
Power Converter
Wind speed
Vw
R
Wm
Wm-optimal
error
+-
+ -
Ea
Eb
Ec
Xs Rs
ILL VLL
D1 D3 D5
D2 D4D6
+
-
p
N
Id
Ea
Eb
Ec
Xs RsIa
Xs
Xs
Rs
Rs
+
-
VDC
IDC+
+
+
Va
Vb
Vc
Ib
Ic
H
D
VPVDC
DC
VWindDC
DC
LOADVo+
-
VPV
DC
DC
VWind
LOADVo
+
-
+
+ - + -
+ - + -
PMSG
500 W
Vertical axis wind turbine Gear box
+
-
600 W Vpv
DC/DC
Ibat
+
-
Vo
Io
3-ph Rectifier
+
-VWG
IPV
IWG
Control Unit
ON/OFF Control
IWG
VWG
Vpv
IPV
IbatVo
Dummy Load
12 V 450 AH Battery Bench
900 W
Control signals
PMSG
500 W
Vertical axis wind turbine Gear box
+
-
Vw
w
+
-
Solar Pump controller PM DC motor
Vpv
Back- Up system Diesel Generator
-
200 W
-
200 W
-+ +
200 W
+
Ea
Eb
Ec
Xs Rs
ILL VLL
D1 D3 D5
D2 D4D6
+
-
p
N
Id
Ea
Eb
Ec
Xs RsIa
Xs
Xs
Rs
Rs
+
-
VDC
IDC+
+
+
Va
Vb
Vc
Ib
Ic
+-
LvLi
iv +
-
CR
C
LLR
PWM S
+
ovloadR
Si
Di Ri
Ci
Cv
+
LvLi
iv CR
C
LLR
S ovloadR
Si
Di Ri
Ci
Cv
+iv CR
C
LLR
S ovloadR
Si Ci
Cv
sDT (1 ) sD T
iv
i oV V
( )Lv t
( )Ci t
PWM
D3
Wind PMSG
turbine
Rectifier
DC
DC
Cotrol UnitControl Signal
Power Converter
DCI
LOAD
+
-
DCV
MPPT algorithm
+
-
Vcc
D9
Vin
+
-
An3 An5An4
Relay
LM7805 +5V
D2
2
31
7
27K
5.6K22uF
5.1V
1N4001
10K
8
3305.6 3305.615K
680
5.6K
330uF
680
15V
22uF
6.8K
15K
5.6K22uF
Relay
5.1V
VLoadSwitch
20K
5.6K22uF
5.1V
680 Vb
att.
D2
MOSPEC S20C40C(x2)
D3
1mH FQP12P20(x2)
0.39 c/v
1.2 K
+ +
+
Current Transducer
5VAn2
GND
Arduino Uno
An2
An3
An4An5
+5V
An
alo
g0
..5
GND
An0
An1
D0D1D2D3D4D5D6D7D8D9D10D11D12
Swep
tA
rea
Ewind EturbineD
Swep
tA
rea
H
VAWTHAWT
Eunabsorved
DCP
mw
maxP
0, 0m
dP dP
dw dD
0, 0, 0 0DC
m DC m
dVdP dD dP
dw dV dw dD
0, 0, 0 0DC
m DC m
dVdP dD dP
dw dV dw dD
High Speed Low Speed
Track Starting Point Track Starting Point
D D
Maximum Power Point Tracking process
PDCk >PDCk-1
Read PDC
Iref(k)=Iref(k-1)-∆I
Vk >Vk-1
NO
Iref(k)=Iref(k-1)-∆I
YES
Iref(k)=Iref(k-1)+∆I
NOVk >Vk-1
YES
Iref(k)=Iref(k-1)+∆I
YES NO
sDT
I
Li
i oV V
L
sT
iV
L
LI
t
oV
R
oL
load
VI
R
t
t
t
sDT
CV
( )v t
LI V
C RC
sT
V
RC
CV
t
0.5
0.0
1
1.5
2
2.5
3
5 10 15 20
Voltage
Cu
rren
t
Vmp
Imp
Isc Short circuit current
VocOpen circuit voltage
MPP
V.Battery
I-V PV panel characteristics
DC/DC converterDC loadVbatt
+
-
Vp
v
Ipv +
-
Vo
Io
A/D A/D
MPPT and Charging algorithm
PWM
PV array
MPP
SCI
1dI
I
Load
2dI
1D
SR
PR2D
rI
DC/DCPV -Wind
system
Battery charge control.
Load regulation.
.battV.battI
Battery
.battD loadD
DCLOAD
.battI
t
sDT sT
-
Vin
+
-
Relay
CVbatt.
L Rb
Microcontroller
Iin
Vcontrol1
D1
M1
Sensor Signals Control Signals
VoutVin
Vbatt.
Ibatt
IinIbatt.
Vcontrol1Vcontrol2Vcontrol3
Vcontrol2
Vcontrol3
Vout Vout
file:///C:/Users/Andres/Documents/17c276_250_205.jpg
file:///C:/Users/Andres/Documents/17c276_250_205.jpg
windv
+
-12
12
1R
2R
fR
+
-
12
12
3R
4R
5R 6RoutV
Datalogger
M2
+
-
G
Iref=10A
+
-Vtrian.
Battery Charge ControllerVcontrol Ibatt.
MPPT AlgorithmDCV
DCI
refI+
-
e+
-.triVPWM
G
Io
-
+
-
+
-
+
Vo
V1
V2
C
+ -VL
+
-VD1
+ -VM2
ID2
I1 L
D1
D2
IL IC
M1
M2
VD2
+ -VM1
C Vo
Io+
-
+
-
-
+
+ -VL
+
-ID1
L
D1
D2
IL IC
+VD2
-
+ -VM1
M1
M2+ -VM2
V1
V2
C
+
-Vo
Io
Ii1
Ii2
+
-
+
-
V1
V2
+ -VL
L
D1
D2
IL ICM1
M2
VD2+
-
-
+VD1
+
-
+
-
+
-Vo
Io
Vc
V1
V2
+ -VL
+ -VM2
ID2
C
L
D1
D2
IL IC
+
-
+VM1
-
M2
M1
ID1
VD1
VD1
( )a ( )b
( )c ( )d
+
-
V1
V2
Vo
+
-
VG
S1
LM1
M2
D1
D2
C
-
+
VG
S2
VG
S1
+
-
-
+
V1
V2
+
-
Vo
LM1
M2
D1
D2
C
VG
S2
( )b
( )a
Wind PMSG
turbine
Rectifier
wm
DC
DCLOAD
Rotating speed -Power characteristic Pactual
Cotrol Unit
Poptimal
error
Control Signal
Power Converter
PMSG
Wind turbine
Rectifier
DC
DCLOAD
Cotrol Unit
Control Signal
Power Converter
Wind speed
Vw
R
Wm
Wm-optimal
error
+-
+ -
Ea
Eb
Ec
Xs Rs
ILL VLL
D1 D3 D5
D2 D4D6
+
-
p
N
Id
Ea
Eb
Ec
Xs RsIa
Xs
Xs
Rs
Rs
+
-
VDC
IDC+
+
+
Va
Vb
Vc
Ib
Ic
H
D
VPVDC
DC
VWindDC
DC
LOADVo+
-
VPV
DC
DC
VWind
LOADVo
+
-
+
+ - + -
+ - + -
PMSG
500 W
Vertical axis wind turbine Gear box
+
-
600 W Vpv
DC/DC
Ibat
+
-
Vo
Io
3-ph Rectifier
+
-VWG
IPV
IWG
Control Unit
ON/OFF Control
IWG
VWG
Vpv
IPV
IbatVo
Dummy Load
12 V 450 AH Battery Bench
900 W
Control signals
PMSG
500 W
Vertical axis wind turbine Gear box
+
-
Vw
w
+
-
Solar Pump controller PM DC motor
Vpv
Back- Up system Diesel Generator
-
200 W
-
200 W
-+ +
200 W
+
Ea
Eb
Ec
Xs Rs
ILL VLL
D1 D3 D5
D2 D4D6
+
-
p
N
Id
Ea
Eb
Ec
Xs RsIa
Xs
Xs
Rs
Rs
+
-
VDC
IDC+
+
+
Va
Vb
Vc
Ib
Ic
+-
LvLi
iv +
-
CR
C
LLR
PWM S
+
ovloadR
Si
Di Ri
Ci
Cv
+
LvLi
iv CR
C
LLR
S ovloadR
Si
Di Ri
Ci
Cv
+iv CR
C
LLR
S ovloadR
Si Ci
Cv
sDT (1 ) sD T
iv
i oV V
( )Lv t
( )Ci t
PWM
D3
Wind PMSG
turbine
Rectifier
DC
DC
Cotrol UnitControl Signal
Power Converter
DCI
LOAD
+
-
DCV
MPPT algorithm
+
-
Vcc
D9
Vin
+
-
An3 An5An4
Relay
LM7805 +5V
D2
2
31
7
27K
5.6K22uF
5.1V
1N4001
10K
8
3305.6 3305.615K
680
5.6K
330uF
680
15V
22uF
6.8K
15K
5.6K22uF
Relay
5.1V
VLoadSwitch
20K
5.6K22uF
5.1V
680 Vb
att.
D2
MOSPEC S20C40C(x2)
D3
1mH FQP12P20(x2)
0.39 c/v
1.2 K
+ +
+
Current Transducer
5VAn2
GND
Arduino Uno
An2
An3
An4An5
+5V
An
alo
g0
..5
GND
An0
An1
D0D1D2D3D4D5D6D7D8D9D10D11D12
Swep
tA
rea
Ewind EturbineD
Swep
tA
rea
H
VAWTHAWT
Eunabsorved
DCP
mw
maxP
0, 0m
dP dP
dw dD
0, 0, 0 0DC
m DC m
dVdP dD dP
dw dV dw dD
0, 0, 0 0DC
m DC m
dVdP dD dP
dw dV dw dD
High Speed Low Speed
Track Starting Point Track Starting Point
D D
Maximum Power Point Tracking process
PDCk >PDCk-1
Read PDC
Iref(k)=Iref(k-1)-∆I
Vk >Vk-1
NO
Iref(k)=Iref(k-1)-∆I
YES
Iref(k)=Iref(k-1)+∆I
NOVk >Vk-1
YES
Iref(k)=Iref(k-1)+∆I
YES NO
sDT
I
Li
i oV V
L
sT
iV
L
LI
t
oV
R
oL
load
VI
R
t
t
t
sDT
CV
( )v t
LI V
C RC
sT
V
RC
CV
t
0.5
0.0
1
1.5
2
2.5
3
5 10 15 20
Voltage
Cu
rren
t
Vmp
Imp
Isc Short circuit current
VocOpen circuit voltage
MPP
V.Battery
I-V PV panel characteristics
DC/DC converterDC loadVbatt
+
-
Vp
v
Ipv +
-
Vo
Io
A/D A/D
MPPT and Charging algorithm
PWM
PV array
MPP
SCI
1dI
I
Load
2dI
1D
SR
PR2D
rI
DC/DCPV -Wind
system
Battery charge control.
Load regulation.
.battV.battI
Battery
.battD loadD
DCLOAD
.battI
t
sDT sT
-
Vin
+
-
Relay
CVbatt.
L Rb
Microcontroller
Iin
Vcontrol1
D1
M1
Sensor Signals Control Signals
VinVoutVbatt.
Ibatt
IinIbatt.
Vcontrol1Vcontrol2Vcontrol3
Vcontrol2
Vcontrol3
Vout Vout
file:///C:/Users/Andres/Documents/17c276_250_205.jpg
windv
+
-12
12
1R
2R
fR
+
-
12
12
3R
4R
5R 6RoutV
Datalogger
M2
+
-
G
Iref=10A
+
-Vtrian.
Battery Charge ControllerVcontrol Ibatt.
MPPT AlgorithmDCV
DCI
refI+
-
e+
-.triV
Current compensator
PWM
Io
-
+
-
+
-
+
Vo
V1
V2
C
+ -VL
+
-VD1
+ -VM2
ID2
I1 L
D1
D2
IL IC
M1
M2
VD2
+ -VM1
C Vo
Io+
-
+
-
-
+
+ -VL
+
-ID1
L
D1
D2
IL IC
+VD2
-
+ -VM1
M1
M2+ -VM2
V1
V2
C
+
-Vo
Io
Ii1
Ii2
+
-
+
-
V1
V2
+ -VL
L
D1
D2
IL ICM1
M2
VD2+
-
-
+VD1
+
-
+
-
+
-Vo
Io
Vc
V1
V2
+ -VL
+ -VM2
ID2
C
L
D1
D2
IL IC
+
-
+VM1
-
M2
M1
ID1
VD1
VD1
( )a
( )b
( )c ( )d
+
-
V1
V2
Vo
+
-
VG
S1
LM1
M2
D1
D2
C
-
+ VG
S2
VG
S1
+
-
-
+
V1
V2
+
-
Vo
LM1
M2
D1
D2
C
VG
S2
( )b( )a
( )a
( )b
sT
1d
1d
2t1t 4t3t
t
t
1GSV
2GSV
-+
V1
+
-V2
Vo
-
VG
S1
LM1
M2
D1
D2
C
+ VG
S2
( )c
VGS3
-+
V1
+
-V2
Vo
-
VG
S1
LM1
M2
D1
D2
C
+
VG
S2
VGS3
3M
-+
V1
+
-V2
Vo
-
VG
S1
LM1
M2
D1
D2
C
+ VG
S2
( )c
VGS3
+
-
Relay
CVbatt.
L Rb
VGS3
D3
M1
Ibatt.
Vrelay
Vout Vout
M2
Vwind
Iwind
-
+-
VPV
D1
D2
VGS1
VGS2
VGS4
-
Microcontroller
Ipv
Sensor Signals Control Signals
VinVoutVbatt
Vcontrol1Vcontrol2Vcontrol3
IwindIbatt Vrelay
Vcontrol4
+
-
+
-
Ipv
IoILIL
IL
( )a
IL
-+
V1
+
-V2
Vo
-
VG
S1
LM1
M2
D1
D2
C
+
VG
S2
VGS3
Io IoIL
( )c
-+
V1
+
-V2
Vo
-
VG
S1
LM1
M2
D1
D2
C
+
VG
S2
VGS3
IL
IL
( )b
IL
-+
V1
+
-V2
Vo
-
VG
S1
LM1
M2
D1
D2
C
+
VG
S2
VGS3
IL
( )c
Ic Io
Io
Ic
D3 D3
D3D3
+- 2G
1CT1G
2CT+-
1H
refVoV
*
refI
LI
duty
Plant 1 Plant 2Controller 2Controller 1
measuredLI
Microprocessor
(MPPT Programming)
-+ +
-
PVI
PVVWindV
WindI
1d 2d
1
*
refI2
*
refI
+
-
+
-
PVV
windV
*
refV
Microprocessor(Current Control programming)
Boost mode
3d
oVoI
*
refV
Microprocessor(Current Control programming)
Buck mode
1d
oVoI
2d
L D3
D1
D2
Double input DC/DC converter
PVI
WindILoad
oI+
-
oVABV
AV
BV
MicroprocessorPower managament
control unit
PVV
PVI
windV
WindI
ABV
oV
oI
1d 2d 3d
1S
2S
3S
1d
2d
3d
+-
*
refI1( )d s
Plant 1 LI
12G
11G
2 ( )d s
+
+
1H
+refV
1CT-
2GPlant 2
oV
*
refILI
+refV
1CT- 2G
Plant 2
oVInner current loop
110 V
12 V
12 V
Microcontroller PWM signal
18 V
V1
V2
VGS
1 K
10 K 220Ω 15V
G
SDrive Circuit
Optocoupler
4N28
Figure 7.2. Drive circuit for switching the MOSFETs using optocoupler and a bipolar transistor.
2CT
Wind PMSG
turbine
Rectifier
wm
DC
DCLOAD
Rotating speed -Power characteristic Pactual
Cotrol Unit
Poptimal
error
Control Signal
Power Converter
PMSG
Wind turbine
Rectifier
DC
DCLOAD
Cotrol Unit
Control Signal
Power Converter
Wind speed
Vw
R
Wm
Wm-optimal
error
+-
+ -
Ea
Eb
Ec
Xs Rs
ILL VLL
D1 D3 D5
D2 D4D6
+
-
p
N
Id
Ea
Eb
Ec
Xs RsIa
Xs
Xs
Rs
Rs
+
-
VDC
IDC+
+
+
Va
Vb
Vc
Ib
Ic
H
D
VPVDC
DC
VWindDC
DC
LOADVo+
-
VPV
DC
DC
VWind
LOADVo
+
-
+
+ - + -
+ - + -
PMSG
500 W
Vertical axis wind turbine Gear box
+
-
600 W Vpv
DC/DC
Ibat
+
-
Vo
Io
3-ph Rectifier
+
-VWG
IPV
IWG
Control Unit
ON/OFF Control
IWG
VWG
Vpv
IPV
IbatVo
Dummy Load
12 V 450 AH Battery Bench
900 W
Control signals
PMSG
500 W
Vertical axis wind turbine Gear box
+
-
Vw
w
+
-
Solar Pump controller PM DC motor
Vpv
Back- Up system Diesel Generator
-
200 W
-
200 W
-+ +
200 W
+
Ea
Eb
Ec
Xs Rs
ILL VLL
D1 D3 D5
D2 D4D6
+
-
p
N
Id
Ea
Eb
Ec
Xs RsIa
Xs
Xs
Rs
Rs
+
-
VDC
IDC+
+
+
Va
Vb
Vc
Ib
Ic
+-
LvLi
iv +
-
CR
C
LLR
PWM S
+
ovloadR
Si
Di Ri
Ci
Cv
+
LvLi
iv CR
C
LLR
S ovloadR
Si
Di Ri
Ci
Cv
+iv CR
C
LLR
S ovloadR
Si Ci
Cv
sDT (1 ) sD T
iv
i oV V
( )Lv t
( )Ci t
PWM
D3
Wind PMSG
turbine
Rectifier
DC
DC
Cotrol UnitControl Signal
Power Converter
DCI
LOAD
+
-
DCV
MPPT algorithm
+
-
Vcc
D9
Vin
+
-
An3 An5An4
Relay
LM7805 +5V
D2
2
31
7
27K
5.6K22uF
5.1V
1N4001
10K
8
3305.6 3305.615K
680
5.6K
330uF
680
15V
22uF
6.8K
15K
5.6K22uF
Relay
5.1V
VLoadSwitch
20K
5.6K22uF
5.1V
680 Vb
att.
D2
MOSPEC S20C40C(x2)
D3
1mH FQP12P20(x2)
0.39 c/v
1.2 K
+ +
+
Current Transducer
5VAn2
GND
Arduino Uno
An2
An3
An4An5
+5V
An
alo
g0
..5
GND
An0
An1
D0D1D2D3D4D5D6D7D8D9D10D11D12
Swep
tA
rea
Ewind EturbineD
Swep
tA
rea
H
VAWTHAWT
Eunabsorved
DCP
mw
maxP
0, 0m
dP dP
dw dD
0, 0, 0 0DC
m DC m
dVdP dD dP
dw dV dw dD
0, 0, 0 0DC
m DC m
dVdP dD dP
dw dV dw dD
High Speed Low Speed
Track Starting Point Track Starting Point
D D
Maximum Power Point Tracking process
PDCk >PDCk-1
Read PDC
Iref(k)=Iref(k-1)-∆I
Vk >Vk-1
NO
Iref(k)=Iref(k-1)-∆I
YES
Iref(k)=Iref(k-1)+∆I
NOVk >Vk-1
YES
Iref(k)=Iref(k-1)+∆I
YES NO
sDT
I
Li
i oV V
L
sT
iV
L
LI
t
oV
R
oL
load
VI
R
t
t
t
sDT
CV
( )v t
LI V
C RC
sT
V
RC
CV
t
0.5
0.0
1
1.5
2
2.5
3
5 10 15 20
Voltage
Cu
rren
t
Vmp
Imp
Isc Short circuit current
VocOpen circuit voltage
MPP
V.Battery
I-V PV panel characteristics
DC/DC converterDC loadVbatt
+
-
Vp
v
Ipv +
-
Vo
Io
A/D A/D
MPPT and Charging algorithm
PWM
PV array
MPP
SCI
1dI
I
Load
2dI
1D
SR
PR2D
rI
DC/DCPV -Wind
system
Battery charge control.
Load regulation.
.battV.battI
Battery
.battD loadD
DCLOAD
.battI
t
sDT sT
-
Vin
+
-
Relay
CVbatt.
L Rb
Microcontroller
Iin
Vcontrol1
D1
M1
Sensor Signals Control Signals
VinVoutVbatt.
Ibatt
IinIbatt.
Vcontrol1Vcontrol2Vcontrol3
Vcontrol2
Vcontrol3
Vout Vout
file:///C:/Users/Andres/Documents/17c276_250_205.jpg
file:///C:/Users/Andres/Documents/17c276_250_205.jpg
windv
+
-12
12
1R
2R
fR
+
-
12
12
3R
4R
5R 6RoutV
Datalogger
M2
+
-
G
Iref=10A
+
-Vtrian.
Battery Charge ControllerVcontrol Ibatt.
MPPT AlgorithmDCV
DCI
refI+
-
e+
-.triVPWM
G
Io
-
+
-
+
-
+
Vo
V1
V2
C
+ -VL
+
-VD1
+ -VM2
ID2
I1 L
D1
D2
IL IC
M1
M2
VD2
+ -VM1
C Vo
Io+
-
+
-
-
+
+ -VL
+
-ID1
L
D1
D2
IL IC
+VD2
-
+ -VM1
M1
M2+ -VM2
V1
V2
C
+
-Vo
Io
Ii1
Ii2
+
-
+
-
V1
V2
+ -VL
L
D1
D2
IL ICM1
M2
VD2+
-
-
+VD1
+
-
+
-
+
-Vo
Io
Vc
V1
V2
+ -VL
+ -VM2
ID2
C
L
D1
D2
IL IC
+
-
+VM1
-
M2
M1
ID1
VD1
VD1
( )a ( )b
( )c ( )d
+
-
V1
V2
Vo
+
-
VG
S1
LM1
M2
D1
D2
C
-
+
VG
S2
VG
S1
+
-
-
+
V1
V2
+
-
Vo
LM1
M2
D1
D2
C
VG
S2
( )b
( )a
Wind PMSG
turbine
Rectifier
wm
DC
DCLOAD
Rotating speed -Power characteristic Pactual
Cotrol Unit
Poptimal
error
Control Signal
Power Converter
PMSG
Wind turbine
Rectifier
DC
DCLOAD
Cotrol Unit
Control Signal
Power Converter
Wind speed
Vw
R
Wm
Wm-optimal
error
+-
+ -
Ea
Eb
Ec
Xs Rs
ILL VLL
D1 D3 D5
D2 D4D6
+
-
p
N
Id
Ea
Eb
Ec
Xs RsIa
Xs
Xs
Rs
Rs
+
-
VDC
IDC+
+
+
Va
Vb
Vc
Ib
Ic
H
D
VPVDC
DC
VWindDC
DC
LOADVo+
-
VPV
DC
DC
VWind
LOADVo
+
-
+
+ - + -
+ - + -
PMSG
500 W
Vertical axis wind turbine Gear box
+
-
600 W Vpv
DC/DC
Ibat
+
-
Vo
Io
3-ph Rectifier
+
-VWG
IPV
IWG
Control Unit
ON/OFF Control
IWG
VWG
Vpv
IPV
IbatVo
Dummy Load
12 V 450 AH Battery Bench
900 W
Control signals
PMSG
500 W
Vertical axis wind turbine Gear box
+
-
Vw
w
+
-
Solar Pump controller PM DC motor
Vpv
Back- Up system Diesel Generator
-
200 W
-
200 W
-+ +
200 W
+
Ea
Eb
Ec
Xs Rs
ILL VLL
D1 D3 D5
D2 D4D6
+
-
p
N
Id
Ea
Eb
Ec
Xs RsIa
Xs
Xs
Rs
Rs
+
-
VDC
IDC+
+
+
Va
Vb
Vc
Ib
Ic
+-
LvLi
iv +
-
CR
C
LLR
PWM S
+
ovloadR
Si
Di Ri
Ci
Cv
+
LvLi
iv CR
C
LLR
S ovloadR
Si
Di Ri
Ci
Cv
+iv CR
C
LLR
S ovloadR
Si Ci
Cv
sDT (1 ) sD T
iv
i oV V
( )Lv t
( )Ci t
PWM
D3
Wind PMSG
turbine
Rectifier
DC
DC
Cotrol UnitControl Signal
Power Converter
DCI
LOAD
+
-
DCV
MPPT algorithm
+
-
Vcc
D9
Vin
+
-
An3 An5An4
Relay
LM7805 +5V
D2
2
31
7
27K
5.6K22uF
5.1V
1N4001
10K
8
3305.6 3305.615K
680
5.6K
330uF
680
15V
22uF
6.8K
15K
5.6K22uF
Relay
5.1V
VLoadSwitch
20K
5.6K22uF
5.1V
680 Vb
att.
D2
MOSPEC S20C40C(x2)
D3
1mH FQP12P20(x2)
0.39 c/v
1.2 K
+ +
+
Current Transducer
5VAn2
GND
Arduino Uno
An2
An3
An4An5
+5V
An
alo
g0
..5
GND
An0
An1
D0D1D2D3D4D5D6D7D8D9D10D11D12
Swep
tA
rea
Ewind EturbineD
Swep
tA
rea
H
VAWTHAWT
Eunabsorved
DCP
mw
maxP
0, 0m
dP dP
dw dD
0, 0, 0 0DC
m DC m
dVdP dD dP
dw dV dw dD
0, 0, 0 0DC
m DC m
dVdP dD dP
dw dV dw dD
High Speed Low Speed
Track Starting Point Track Starting Point
D D
Maximum Power Point Tracking process
PDCk >PDCk-1
Read PDC
Iref(k)=Iref(k-1)-∆I
Vk >Vk-1
NO
Iref(k)=Iref(k-1)-∆I
YES
Iref(k)=Iref(k-1)+∆I
NOVk >Vk-1
YES
Iref(k)=Iref(k-1)+∆I
YES NO
sDT
I
Li
i oV V
L
sT
iV
L
LI
t
oV
R
oL
load
VI
R
t
t
t
sDT
CV
( )v t
LI V
C RC
sT
V
RC
CV
t
0.5
0.0
1
1.5
2
2.5
3
5 10 15 20
Voltage
Cu
rren
t
Vmp
Imp
Isc Short circuit current
VocOpen circuit voltage
MPP
V.Battery
I-V PV panel characteristics
DC/DC converterDC loadVbatt
+
-
Vp
v
Ipv +
-
Vo
Io
A/D A/D
MPPT and Charging algorithm
PWM
PV array
MPP
SCI
1dI
I
Load
2dI
1D
SR
PR2D
rI
DC/DCPV -Wind
system
Battery charge control.
Load regulation.
.battV.battI
Battery
.battD loadD
DCLOAD
.battI
t
sDT sT
-
Vin
+
-
Relay
CVbatt.
L Rb
Microcontroller
Iin
Vcontrol1
D1
M1
Sensor Signals Control Signals
VoutVin
Vbatt.
Ibatt
IinIbatt.
Vcontrol1Vcontrol2Vcontrol3
Vcontrol2
Vcontrol3
Vout Vout
file:///C:/Users/Andres/Documents/17c276_250_205.jpg
windv
+
-12
12
1R
2R
fR
+
-
12
12
3R
4R
5R 6RoutV
Datalogger
M2
+
-
G
Iref=10A
+
-Vtrian.
Battery Charge ControllerVcontrol Ibatt.
MPPT AlgorithmDCV
DCI
refI+
-
e+
-.triV
Current compensator
PWM
Io
-
+
-
+
-
+
Vo
V1
V2
C
+ -VL
+
-VD1
+ -VM2
ID2
I1 L
D1
D2
IL IC
M1
M2
VD2
+ -VM1
C Vo
Io+
-
+
-
-
+
+ -VL
+
-ID1
L
D1
D2
IL IC
+VD2
-
+ -VM1
M1
M2+ -VM2
V1
V2
C
+
-Vo
Io
Ii1
Ii2
+
-
+
-
V1
V2
+ -VL
L
D1
D2
IL ICM1
M2
VD2+
-
-
+VD1
+
-
+
-
+
-Vo
Io
Vc
V1
V2
+ -VL
+ -VM2
ID2
C
L
D1
D2
IL IC
+
-
+VM1
-
M2
M1
ID1
VD1
VD1
( )a
( )b
( )c ( )d
+
-
V1
V2
Vo
+
-
VG
S1
LM1
M2
D1
D2
C
-
+ VG
S2
VG
S1
+
-
-
+
V1
V2
+
-
Vo
LM1
M2
D1
D2
C
VG
S2
( )b( )a
( )a
( )b
sT
1d
1d
2t1t 4t3t
t
t
1GSV
2GSV
-+
V1
+
-V2
Vo
-
VG
S1
LM1
M2
D1
D2
C
+ VG
S2
( )c
VGS3
-+
V1
+
-V2
Vo
-
VG
S1
LM1
M2
D1
D2
C
+
VG
S2
VGS3
3M
-+
V1
+
-V2
Vo
-
VG
S1
LM1
M2
D1
D2
C
+ VG
S2
( )c
VGS3
+
-
Relay
CVbatt.
L Rb
VGS3
D3
M1
Ibatt.
Vrelay
Vout Vout
M2
Vwind
Iwind
-
+-
VPV
D1
D2
VGS1VGS4
-
Microcontroller
Ipv
Sensor Signals Control Signals
VinVout
Vbatt
Vcontrol1Vcontrol2Vcontrol3
IwindIbatt Vrelay
Vcontrol4
+
-
+
-
Ipv
IoILIL
IL
( )a
IL
-+
V1
+
-V2
Vo
-
VG
S1
LM1
M2
D1
D2
C
+
VG
S2
VGS3
Io IoIL
( )c
-+
V1
+
-V2
Vo
-
VG
S1
LM1
M2
D1
D2
C
+
VG
S2
VGS3
IL
IL
( )b
IL
-+
V1
+
-V2
Vo
-
VG
S1
LM1
M2
D1
D2
C
+
VG
S2
VGS3
IL
( )c
Ic Io
Io
Ic
D3 D3
D3D3
+- 2G
1CT1G
2CT+-
1H
refVoV
*
refI
LI
duty
Plant 1 Plant 2Controller 2Controller 1
measuredLI
Microprocessor
(MPPT Programming)
-+ +
-
PVI
PVVWindV
WindI
1d 2d
1
*
refI2
*
refI
+
-
+
-
PVV
windV
*
refV
Microprocessor(Current Control programming)
Boost mode
3d
oVoI
*
refV
Microprocessor(Current Control programming)
Buck mode
1d
oVoI
2d
L D3
D1
D2
Double input DC/DC converter
PVI
WindILoad
oI+
-
oVABV
AV
BV
MicroprocessorPower managament
control unit
PVV
PVI
windV
WindI
ABV
oV
oI
1d 2d 3d
1S
2S
3S
1d
2d
3d
+-
*
refI1( )d s
Plant 1 LI
12G
11G
2 ( )d s
+
+
1H
+refV
1CT-
2GPlant 2
oV
*
refILI
+refV
1CT- 2G
Plant 2
oVInner current loop
110 V
12 V
12 V
Microcontroller PWM signal
18 V
V1
V2
VGS
1 K
10 K 220Ω 15V
G
SDrive Circuit
Optocoupler
4N28
LP-575
Transformer
Grid voltage
Rectifier circuit
Independent voltage sources
DCP
maxP
0, 0, 0 0DC
m DC m
dVdP dD dP
dw dV dw dD
High Speed
Track Starting Point
D
windv
+
-12
12
1R
2R
fR
+
-
12
12
3R
4R
5R 6RoutV
Datalogger
fR
VGS2
VAB
VAB
Microcontroller PWM signal
18 V
VGS
1 K
10 K 220Ω 15V
G
SDrive Circuit
Optocoupler
4N28
Microcontroller PWM signal
18 V
VGS
220Ω 15V
S
Drive Circuit
PC293
High Speed
Photocoupler
1kΩ
1
2
3
4
8
7
6
5
PC923
G
Figure 7.3. Final drive circuit schematic for switching the MOSFETs. In here, a High speed photocoupleris used.
The main problem when designing this converter has been the ground points of the different signalsfor driving the MOSFETs. Each ground must be isolated from each other in order to connect it tothe different ”source” point of the circuit, in order no to short circuit the system.
It is required then to have an isolated voltage source to supply the drive circuit of each MOSFET.Figure 7.4 shows the power supply circuit designed for this purpose. The battery voltage is convertedto square wave voltage by the SG3525, it is possible to obtain trough a transformer three isolatedvoltage sources which must be rectified in order to get DC voltage supply. The last rectifier DC outputis used as reference voltage to regulate the width of the SG3525 and thereby regulate the voltage inthe transformer.
For the different test done in the laboratory and due the lack of time, the AC TAP transformer LP-575has been used. It produces two isolated AC voltages of approximately 12 V and by rectifying andfiltering the output, two isolated DC voltage are obtained which can be connected to any point of thecircuit. Figure 7.5 shows the schematic diagram of this configuration.
7.2 Experimental results
In order to validate the electrical feasibility of the system designed and built, different test has beendone. Figure 7.6 shows the system built for this purpose and the laboratory set-up for testing the
68
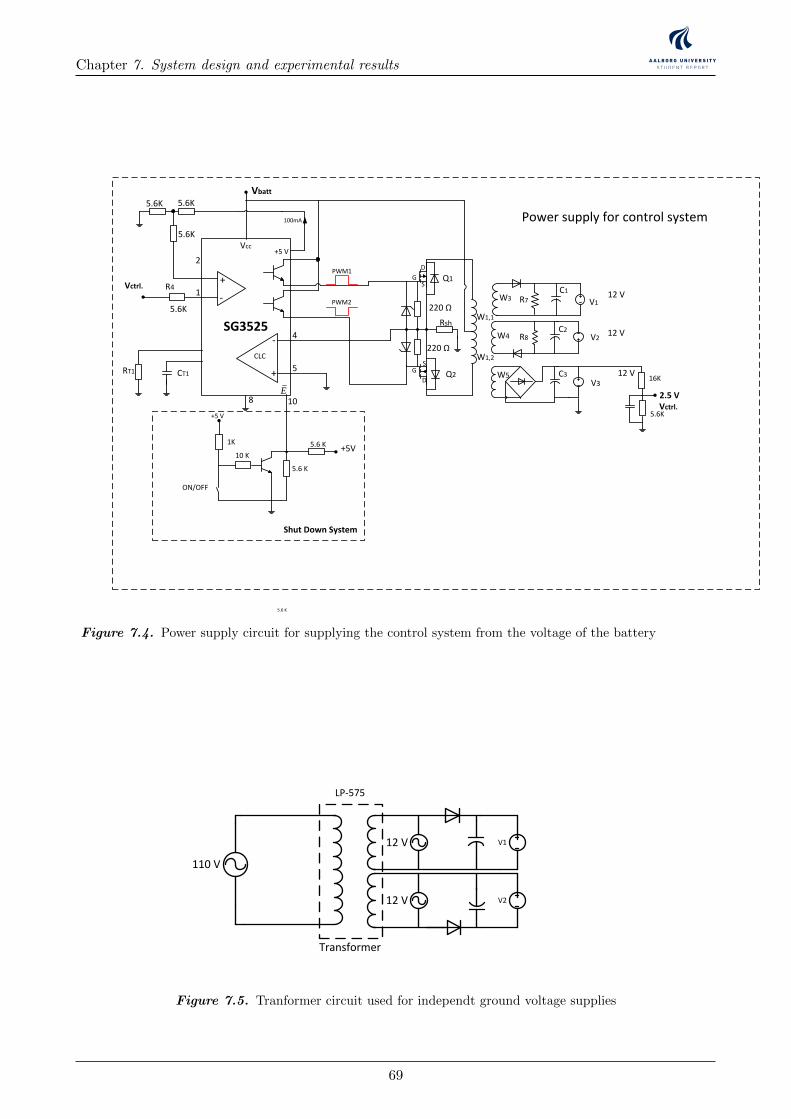
Chapter 7. System design and experimental results
2CT
PMSGWind
turbine
Rectifier
wm
DC
DCLOAD
Rotating speed -Power characteristic Pactual
Cotrol Unit
Poptimal
error
Control Signal
Power Converter
PMSG
Wind turbine
Rectifier
DC
DCLOAD
Cotrol Unit
Control Signal
Power Converter
Wind speed
Vw
R
Wm
Wm-optimal
error
+-
+ -
Ea
Eb
Ec
Xs Rs
ILL VLL
D1 D3 D5
D2 D4D6
+
-
p
N
Id
Ea
Eb
Ec
Xs RsIa
Xs
Xs
Rs
Rs
+
-
VDC
IDC+
+
+
Va
Vb
Vc
Ib
Ic
H
D
VPVDC
DC
VWindDC
DC
LOADVo+
-
VPV
DC
DC
VWind
LOADVo
+
-
+
+ - + -
+ - + -
PMSG
500 W
Vertical axis wind turbine Gear box
+
-600 W Vpv
DC/DC
Ibat
+
-
Vo
Io
3-ph Rectifier
+
-VWG
IPV
IWG
Control Unit
ON/OFF Control
IWG
VWG
Vpv
IPV
IbatVo
Dummy Load
12 V 450 AH Battery Bench
900 W
Control signals
PMSG
500 W
Vertical axis wind turbine Gear box
+
-
Vw
w
+
-
Solar Pump controller PM DC motor
Vpv
Back- Up system Diesel Generator
-
200 W
-
200 W
-+ +
200 W
+
Ea
Eb
Ec
Xs Rs
ILL VLL
D1 D3 D5
D2 D4D6
+
-
p
N
Id
Ea
Eb
Ec
Xs RsIa
Xs
Xs
Rs
Rs
+
-
VDC
IDC+
+
+
Va
Vb
Vc
Ib
Ic
+-
LvLi
iv +
-
CR
C
LLR
PWM S
+
ovloadR
Si
Di Ri
Ci
Cv
+
LvLi
iv CR
C
LLR
S ovloadR
Si
Di Ri
Ci
Cv
+iv CR
C
LLR
S ovloadR
Si Ci
Cv
sDT (1 ) sD T
iv
i oV V
( )Lv t
( )Ci t
PWM
D3
PMSGWind
turbine
Rectifier
DC
DC
Cotrol UnitControl Signal
Power Converter
DCI
LOAD
+
-
DCV
MPPT algorithm
+
-
Vcc
D9
Vin
+
-
An3 An5An4
Relay
LM7805 +5V
D2
2
31
7
27K
5.6K22uF
5.1V
1N4001
10K
8
3305.6 3305.615K
680
5.6K
330uF
680
15V
22uF
6.8K
15K
5.6K22uF
Relay
5.1V
VLoadSwitch
20K
5.6K22uF
5.1V
680 Vb
att.
D2
MOSPEC S20C40C(x2)
D3
1mH FQP12P20(x2)
0.39 c/v
1.2 K
+ +
+
Current Transducer
5VAn2
GND
Arduino Uno
An2
An3
An4An5
+5V
An
alo
g 0
..5
GND
An0
An1
D0D1D2D3D4D5D6D7D8D9D10D11D12
Swep
t A
rea
Ewind EturbineD
Swep
t A
rea
H
VAWTHAWT
Eunabsorved
DCP
mw
maxP
0, 0m
dP dP
dw dD
0, 0, 0 0DC
m DC m
dVdP dD dP
dw dV dw dD
0, 0, 0 0DC
m DC m
dVdP dD dP
dw dV dw dD
High Speed Low Speed
Track Starting Point Track Starting Point
D D
Maximum Power Point Tracking process
PDCk >PDCk-1
Read PDC
Iref(k)=Iref(k-1)-∆I
Vk >Vk-1
NO
Iref(k)=Iref(k-1)-∆I
YES
Iref(k)=Iref(k-1)+∆I
NOVk >Vk-1
YES
Iref(k)=Iref(k-1)+∆I
YES NO
sDT
I
Li
i oV V
L
sT
iV
L
LI
t
oV
R
oL
load
VI
R
t
t
t
sDT
CV
( )v t
LI V
C RC
sT
V
RC
CV
t
0.5
0.0
1
1.5
2
2.5
3
5 10 15 20
Voltage
Cu
rren
t
Vmp
Imp
Isc Short circuit current
VocOpen circuit voltage
MPP
V.Battery
I-V PV panel characteristics
DC/DC converterDC loadVbatt
+
-
Vp
v
Ipv +
-
Vo
Io
A/D A/D
MPPT and Charging algorithm
PWM
PV array
MPP
SCI
1dI
I
Load
2dI
1D
SR
PR2D
rI
DC/DCPV -Wind
system
Battery charge control.
Load regulation.
.battV.battI
Battery
.battD loadD
DCLOAD
.battI
t
sDT sT
-
Vin
+
-
Relay
CVbatt.
L Rb
Microcontroller
Iin
Vcontrol1
D1
M1
Sensor Signals Control Signals
VoutVin
Vbatt.
Ibatt
IinIbatt.
Vcontrol1Vcontrol2Vcontrol3
Vcontrol2
Vcontrol3
Vout Vout
file:///C:/Users/Andres/Documents/17c276_250_205.jpg
windv
+
-12
12
1R
2R
fR
+
-
12
12
3R
4R
5R 6RoutV
Datalogger
M2
+
-
G
Iref=10A
+
-Vtrian.
Battery Charge ControllerVcontrol Ibatt.
MPPT AlgorithmDCV
DCI
refI+
-
e+
-.triVPWM
G
Io
-
+
-
+
-
+
Vo
V1
V2
C
+ -VL
+
-VD1
+ -VM2
ID2
I1 L
D1
D2
IL IC
M1
M2
VD2
+ -VM1
C Vo
Io+
-
+
-
-
+
+ -VL
+
-ID1
L
D1
D2
IL IC
+VD2
-
+ -VM1
M1
M2+ -VM2
V1
V2
C
+
-Vo
Io
Ii1
Ii2
+
-
+
-
V1
V2
+ -VL
L
D1
D2
IL ICM1
M2
VD2+
-
-
+VD1
+
-
+
-
+
-Vo
Io
Vc
V1
V2
+ -VL
+ -VM2
ID2
C
L
D1
D2
IL IC
+
-
VM1+ -
M2
M1
ID1
VD1
VD1
( )a ( )b
( )c ( )d
+
-
V1
V2
Vo
+
-
VG
S1
LM1
M2
D1
D2
C
-
+
VG
S2
VG
S1
+
-
-
+
V1
V2
+
-
Vo
LM1
M2
D1
D2
C
VG
S2
( )b
( )a
PMSGWind
turbine
Rectifier
wm
DC
DCLOAD
Rotating speed -Power characteristic Pactual
Cotrol Unit
Poptimal
error
Control Signal
Power Converter
PMSG
Wind turbine
Rectifier
DC
DCLOAD
Cotrol Unit
Control Signal
Power Converter
Wind speed
Vw
R
Wm
Wm-optimal
error
+-
+ -
Ea
Eb
Ec
Xs Rs
ILL VLL
D1 D3 D5
D2 D4D6
+
-
p
N
Id
Ea
Eb
Ec
Xs RsIa
Xs
Xs
Rs
Rs
+
-
VDC
IDC+
+
+
Va
Vb
Vc
Ib
Ic
H
D
VPVDC
DC
VWindDC
DC
LOADVo+
-
VPV
DC
DC
VWind
LOADVo
+
-
+
+ - + -
+ - + -
PMSG
500 W
Vertical axis wind turbine Gear box
+
-
600 W Vpv
DC/DC
Ibat
+
-
Vo
Io
3-ph Rectifier
+
-VWG
IPV
IWG
Control Unit
ON/OFF Control
IWG
VWG
Vpv
IPV
IbatVo
Dummy Load
12 V 450 AH Battery Bench
900 W
Control signals
PMSG
500 W
Vertical axis wind turbine Gear box
+
-
Vw
w
+
-
Solar Pump controller PM DC motor
Vpv
Back- Up system Diesel Generator
-
200 W
-
200 W
-+ +
200 W
+
Ea
Eb
Ec
Xs Rs
ILL VLL
D1 D3 D5
D2 D4D6
+
-
p
N
Id
Ea
Eb
Ec
Xs RsIa
Xs
Xs
Rs
Rs
+
-
VDC
IDC+
+
+
Va
Vb
Vc
Ib
Ic
+-
LvLi
iv +
-
CR
C
LLR
PWM S
+
ovloadR
Si
Di Ri
Ci
Cv
+
LvLi
iv CR
C
LLR
S ovloadR
Si
Di Ri
Ci
Cv
+iv CR
C
LLR
S ovloadR
Si Ci
Cv
sDT (1 ) sD T
iv
i oV V
( )Lv t
( )Ci t
PWM
D3
PMSGWind
turbine
Rectifier
DC
DC
Cotrol UnitControl Signal
Power Converter
DCI
LOAD
+
-
DCV
MPPT algorithm
+
-
Vcc
D9
Vin
+
-
An3 An5An4
Relay
LM7805 +5V
D2
2
31
7
27K
5.6K22uF
5.1V
1N4001
10K
8
3305.6 3305.615K
680
5.6K
330uF
680
15V
22uF
6.8K
15K
5.6K22uF
Relay
5.1V
VLoadSwitch
20K
5.6K22uF
5.1V
680 Vb
att.
D2
MOSPEC S20C40C(x2)
D3
1mH FQP12P20(x2)
0.39 c/v
1.2 K
+ +
+
Current Transducer
5VAn2
GND
Arduino Uno
An2
An3
An4An5
+5V
An
alo
g 0
..5
GND
An0
An1
D0D1D2D3D4D5D6D7D8D9D10D11D12
Swep
t A
rea
Ewind EturbineD
Swep
t A
rea
H
VAWTHAWT
Eunabsorved
DCP
mw
maxP
0, 0m
dP dP
dw dD
0, 0, 0 0DC
m DC m
dVdP dD dP
dw dV dw dD
0, 0, 0 0DC
m DC m
dVdP dD dP
dw dV dw dD
High Speed Low Speed
Track Starting Point Track Starting Point
D D
Maximum Power Point Tracking process
PDCk >PDCk-1
Read PDC
Iref(k)=Iref(k-1)-∆I
Vk >Vk-1
NO
Iref(k)=Iref(k-1)-∆I
YES
Iref(k)=Iref(k-1)+∆I
NOVk >Vk-1
YES
Iref(k)=Iref(k-1)+∆I
YES NO
sDT
I
Li
i oV V
L
sT
iV
L
LI
t
oV
R
oL
load
VI
R
t
t
t
sDT
CV
( )v t
LI V
C RC
sT
V
RC
CV
t
0.5
0.0
1
1.5
2
2.5
3
5 10 15 20
Voltage
Cu
rren
t
Vmp
Imp
Isc Short circuit current
VocOpen circuit voltage
MPP
V.Battery
I-V PV panel characteristics
DC/DC converterDC loadVbatt
+
-
Vp
v
Ipv +
-
Vo
Io
A/D A/D
MPPT and Charging algorithm
PWM
PV array
MPP
SCI
1dI
I
Load
2dI
1D
SR
PR2D
rI
DC/DCPV -Wind
system
Battery charge control.
Load regulation.
.battV.battI
Battery
.battD loadD
DCLOAD
.battI
t
sDT sT
-
Vin
+
-
Relay
CVbatt.
L Rb
Microcontroller
Iin
Vcontrol1
D1
M1
Sensor Signals Control Signals
VoutVin
Vbatt.
Ibatt
IinIbatt.
Vcontrol1Vcontrol2Vcontrol3
Vcontrol2
Vcontrol3
Vout Vout
file:///C:/Users/Andres/Documents/17c276_250_205.jpg
windv
+
-12
12
1R
2R
fR
+
-
12
12
3R
4R
5R 6RoutV
Datalogger
M2
+
-
G
Iref=10A
+
-Vtrian.
Battery Charge ControllerVcontrol Ibatt.
MPPT AlgorithmDCV
DCI
refI+
-
e+
-.triV
Current compensator
PWM
Io
-
+
-
+
-
+
Vo
V1
V2
C
+ -VL
+
-VD1
+ -VM2
ID2
I1 L
D1
D2
IL IC
M1
M2
VD2
+ -VM1
C Vo
Io+
-
+
-
-
+
+ -VL
+
-ID1
L
D1
D2
IL IC
+VD2
-
+ -VM1
M1
M2+ -VM2
V1
V2
C
+
-Vo
Io
Ii1
Ii2
+
-
+
-
V1
V2
+ -VL
L
D1
D2
IL ICM1
M2
VD2+
-
-
+VD1
+
-
+
-
+
-Vo
Io
Vc
V1
V2
+ -VL
+ -VM2
ID2
C
L
D1
D2
IL IC
+
-
VM1+ -
M2
M1
ID1
VD1
VD1
( )a
( )b
( )c ( )d
+
-
V1
V2
Vo
+
-
VG
S1
LM1
M2
D1
D2
C
-
+ VG
S2
VG
S1
+
-
-
+
V1
V2
+
-
Vo
LM1
M2
D1
D2
C
VG
S2
( )b( )a
( )a
( )b
sT
1d
1d
2t1t 4t3t
t
t
1GSV
2GSV
-+
V1
+
-V2
Vo
-
VG
S1
LM1
M2
D1
D2
C
+ VG
S2
( )c
VGS3
-+
V1
+
-V2
Vo
-
VG
S1
LM1
M2
D1
D2
C
+
VG
S2
VGS3
3M
-+
V1
+
-V2
Vo
-
VG
S1
LM1
M2
D1
D2
C
+ VG
S2
( )c
VGS3
+
-
Relay
CVbatt.
L Rb
VGS3
D3
M1
Ibatt.
Vrelay
Vout Vout
M2
Vwind
Iwind
-
+-
VPV
D1
D2
VGS1VGS4
-
Microcontroller
Ipv
Sensor Signals Control Signals
VoutVin
Vbatt
Vcontrol1Vcontrol2Vcontrol3
IwindIbatt Vrelay
Vcontrol4
+
-
+
-
Ipv
IoILIL
IL
( )a
IL
-+
V1
+
-V2
Vo
-
VG
S1
LM1
M2
D1
D2
C
+
VG
S2
VGS3
Io IoIL
( )c
-+
V1
+
-V2
Vo
-
VG
S1
LM1
M2
D1
D2
C
+
VG
S2
VGS3
IL
IL
( )b
IL
-+
V1
+
-V2
Vo
-
VG
S1
LM1
M2
D1
D2
C
+
VG
S2
VGS3
IL
( )c
Ic Io
Io
Ic
D3 D3
D3D3
+- 2G
1CT1G
2CT+-
1H
refVoV
*
refI
LI
duty
Plant 1 Plant 2Controller 2Controller 1
measuredLI
Microprocessor
(MPPT Programming)
-+ +
-
PVI
PVVWindV
WindI
1d 2d
1
*
refI2
*
refI
+
-
+
-
PVV
windV
*
refV
Microprocessor(Current Control programming)
Boost mode
3d
oVoI
*
refV
Microprocessor(Current Control programming)
Buck mode
1d
oVoI
2d
L D3
D1
D2
Double input DC/DC converter
PVI
WindILoad
oI+
-
oVABV
AV
BV
MicroprocessorPower managament
control unit
PVV
PVI
windV
WindI
ABV
oV
oI
1d 2d 3d
1S
2S
3S
1d
2d
3d
+-
*
refI1( )d s
Plant 1 LI
12G
11G
2 ( )d s
+
+
1H
+refV
1CT-
2GPlant 2
oV
*
refILI
+refV
1CT- 2G
Plant 2
oVInner current loop
110 V
12 V
12 V
Microcontroller PWM signal
18 V
V1
V2
VGS
1 K
10 K 220Ω 15V
G
SDrive Circuit
Optocoupler
4N28
LP-575
Transformer
Grid voltage
Rectifier circuit
Independent voltage sources
DCP
maxP
0, 0, 0 0DC
m DC m
dVdP dD dP
dw dV dw dD
High Speed
Track Starting Point
D
windv
+
-12
12
1R
2R
fR
+
-
12
12
3R
4R
5R 6RoutV
Datalogger
fR
VGS2
VAB
VAB
Microcontroller PWM signal
18 V
VGS
1 K
10 K 220Ω 15V
G
SDrive Circuit
Optocoupler
4N28
Microcontroller PWM signal
18 V
VGS
220Ω 15V
S
Drive Circuit
PC293
High Speed
Photocoupler
1kΩ
1
2
3
4
8
7
6
5
PC923
G
V2
C1
C2
C3
R7
R8
V1
V3
+
-
Vbatt
+5 V
1
2
RT1 CT1
+
-
SG3525
Vcc
5.6K
CLC
Rsh
D
SG
GS
D
4
5
8
100mA
PWM1
PWM212 V
12 V
12 V
2.5 VVctrl.
Q1
Q2
Power supply for control system
W1,1
W1,1
W3
W4
W5
W1,2
R4
220 Ω
220 Ω
E
+5 V
10
5.6 K
5.6 K
5.6 K +5V
ON/OFF
10 K
1K
Shut Down System
5.6K
5.6K
5.6K
Vctrl.
5.6K
16K
Figure 7.4. Power supply circuit for supplying the control system from the voltage of the battery
2CT
PMSGWind
turbine
Rectifier
wm
DC
DCLOAD
Rotating speed -Power characteristic Pactual
Cotrol Unit
Poptimal
error
Control Signal
Power Converter
PMSG
Wind turbine
Rectifier
DC
DCLOAD
Cotrol Unit
Control Signal
Power Converter
Wind speed
Vw
R
Wm
Wm-optimal
error
+-
+ -
Ea
Eb
Ec
Xs Rs
ILL VLL
D1 D3 D5
D2 D4D6
+
-
p
N
Id
Ea
Eb
Ec
Xs RsIa
Xs
Xs
Rs
Rs
+
-
VDC
IDC+
+
+
Va
Vb
Vc
Ib
Ic
H
D
VPVDC
DC
VWindDC
DC
LOADVo+
-
VPV
DC
DC
VWind
LOADVo
+
-
+
+ - + -
+ - + -
PMSG
500 W
Vertical axis wind turbine Gear box
+
-
600 W Vpv
DC/DC
Ibat
+
-
Vo
Io
3-ph Rectifier
+
-VWG
IPV
IWG
Control Unit
ON/OFF Control
IWG
VWG
Vpv
IPV
IbatVo
Dummy Load
12 V 450 AH Battery Bench
900 W
Control signals
PMSG
500 W
Vertical axis wind turbine Gear box
+
-
Vw
w
+
-
Solar Pump controller PM DC motor
Vpv
Back- Up system Diesel Generator
-
200 W
-
200 W
-+ +
200 W
+
Ea
Eb
Ec
Xs Rs
ILL VLL
D1 D3 D5
D2 D4D6
+
-
p
N
Id
Ea
Eb
Ec
Xs RsIa
Xs
Xs
Rs
Rs
+
-
VDC
IDC+
+
+
Va
Vb
Vc
Ib
Ic
+-
LvLi
iv +
-
CR
C
LLR
PWM S
+
ovloadR
Si
Di Ri
Ci
Cv
+
LvLi
iv CR
C
LLR
S ovloadR
Si
Di Ri
Ci
Cv
+iv CR
C
LLR
S ovloadR
Si Ci
Cv
sDT (1 ) sD T
iv
i oV V
( )Lv t
( )Ci t
PWM
D3
PMSGWind
turbine
Rectifier
DC
DC
Cotrol UnitControl Signal
Power Converter
DCI
LOAD
+
-
DCV
MPPT algorithm
+
-
Vcc
D9
Vin
+
-
An3 An5An4
Relay
LM7805 +5V
D2
2
31
7
27K
5.6K22uF
5.1V
1N4001
10K
8
3305.6 3305.615K
680
5.6K
330uF
680
15V
22uF
6.8K
15K
5.6K22uF
Relay
5.1V
VLoadSwitch
20K
5.6K22uF
5.1V
680 Vb
att.
D2
MOSPEC S20C40C(x2)
D3
1mH FQP12P20(x2)
0.39 c/v
1.2 K
+ +
+
Current Transducer
5VAn2
GND
Arduino Uno
An2
An3
An4An5
+5V
An
alo
g 0
..5
GND
An0
An1
D0D1D2D3D4D5D6D7D8D9D10D11D12
Swep
t A
rea
Ewind EturbineD
Swep
t A
rea
H
VAWTHAWT
Eunabsorved
DCP
mw
maxP
0, 0m
dP dP
dw dD
0, 0, 0 0DC
m DC m
dVdP dD dP
dw dV dw dD
0, 0, 0 0DC
m DC m
dVdP dD dP
dw dV dw dD
High Speed Low Speed
Track Starting Point Track Starting Point
D D
Maximum Power Point Tracking process
PDCk >PDCk-1
Read PDC
Iref(k)=Iref(k-1)-∆I
Vk >Vk-1
NO
Iref(k)=Iref(k-1)-∆I
YES
Iref(k)=Iref(k-1)+∆I
NOVk >Vk-1
YES
Iref(k)=Iref(k-1)+∆I
YES NO
sDT
I
Li
i oV V
L
sT
iV
L
LI
t
oV
R
oL
load
VI
R
t
t
t
sDT
CV
( )v t
LI V
C RC
sT
V
RC
CV
t
0.5
0.0
1
1.5
2
2.5
3
5 10 15 20
Voltage
Cu
rren
t
Vmp
Imp
Isc Short circuit current
VocOpen circuit voltage
MPP
V.Battery
I-V PV panel characteristics
DC/DC converterDC loadVbatt
+
-
Vp
v
Ipv +
-
Vo
Io
A/D A/D
MPPT and Charging algorithm
PWM
PV array
MPP
SCI
1dI
I
Load
2dI
1D
SR
PR2D
rI
DC/DCPV -Wind
system
Battery charge control.
Load regulation.
.battV.battI
Battery
.battD loadD
DCLOAD
.battI
t
sDT sT
-
Vin
+
-
Relay
CVbatt.
L Rb
Microcontroller
Iin
Vcontrol1
D1
M1
Sensor Signals Control Signals
VoutVin
Vbatt.
Ibatt
IinIbatt.
Vcontrol1Vcontrol2Vcontrol3
Vcontrol2
Vcontrol3
Vout Vout
file:///C:/Users/Andres/Documents/17c276_250_205.jpg
file:///C:/Users/Andres/Documents/17c276_250_205.jpg
windv
+
-12
12
1R
2R
fR
+
-
12
12
3R
4R
5R 6RoutV
Datalogger
M2
+
-
G
Iref=10A
+
-Vtrian.
Battery Charge ControllerVcontrol Ibatt.
MPPT AlgorithmDCV
DCI
refI+
-
e+
-.triVPWM
G
Io
-
+
-
+
-
+
Vo
V1
V2
C
+ -VL
+
-VD1
+ -VM2
ID2
I1 L
D1
D2
IL IC
M1
M2
VD2
+ -VM1
C Vo
Io+
-
+
-
-
+
+ -VL
+
-ID1
L
D1
D2
IL IC
+VD2
-
+ -VM1
M1
M2+ -VM2
V1
V2
C
+
-Vo
Io
Ii1
Ii2
+
-
+
-
V1
V2
+ -VL
L
D1
D2
IL ICM1
M2
VD2+
-
-
+VD1
+
-
+
-
+
-Vo
Io
Vc
V1
V2
+ -VL
+ -VM2
ID2
C
L
D1
D2
IL IC
+
-
VM1+ -
M2
M1
ID1
VD1
VD1
( )a ( )b
( )c ( )d
+
-
V1
V2
Vo
+
-
VG
S1
LM1
M2
D1
D2
C
-
+
VG
S2
VG
S1
+
-
-
+
V1
V2
+
-
Vo
LM1
M2
D1
D2
C
VG
S2
( )b
( )a
PMSGWind
turbine
Rectifier
wm
DC
DCLOAD
Rotating speed -Power characteristic Pactual
Cotrol Unit
Poptimal
error
Control Signal
Power Converter
PMSG
Wind turbine
Rectifier
DC
DCLOAD
Cotrol Unit
Control Signal
Power Converter
Wind speed
Vw
R
Wm
Wm-optimal
error
+-
+ -
Ea
Eb
Ec
Xs Rs
ILL VLL
D1 D3 D5
D2 D4D6
+
-
p
N
Id
Ea
Eb
Ec
Xs RsIa
Xs
Xs
Rs
Rs
+
-
VDC
IDC+
+
+
Va
Vb
Vc
Ib
Ic
H
D
VPVDC
DC
VWindDC
DC
LOADVo+
-
VPV
DC
DC
VWind
LOADVo
+
-
+
+ - + -
+ - + -
PMSG
500 W
Vertical axis wind turbine Gear box
+
-
600 W Vpv
DC/DC
Ibat
+
-
Vo
Io
3-ph Rectifier
+
-VWG
IPV
IWG
Control Unit
ON/OFF Control
IWG
VWG
Vpv
IPV
IbatVo
Dummy Load
12 V 450 AH Battery Bench
900 W
Control signals
PMSG
500 W
Vertical axis wind turbine Gear box
+
-
Vw
w
+
-
Solar Pump controller PM DC motor
Vpv
Back- Up system Diesel Generator
-
200 W
-
200 W
-+ +
200 W
+
Ea
Eb
Ec
Xs Rs
ILL VLL
D1 D3 D5
D2 D4D6
+
-
p
N
Id
Ea
Eb
Ec
Xs RsIa
Xs
Xs
Rs
Rs
+
-
VDC
IDC+
+
+
Va
Vb
Vc
Ib
Ic
+-
LvLi
iv +
-
CR
C
LLR
PWM S
+
ovloadR
Si
Di Ri
Ci
Cv
+
LvLi
iv CR
C
LLR
S ovloadR
Si
Di Ri
Ci
Cv
+iv CR
C
LLR
S ovloadR
Si Ci
Cv
sDT (1 ) sD T
iv
i oV V
( )Lv t
( )Ci t
PWM
D3
PMSGWind
turbine
Rectifier
DC
DC
Cotrol UnitControl Signal
Power Converter
DCI
LOAD
+
-
DCV
MPPT algorithm
+
-
Vcc
D9
Vin
+
-
An3 An5An4
Relay
LM7805 +5V
D2
2
31
7
27K
5.6K22uF
5.1V
1N4001
10K
8
3305.6 3305.615K
680
5.6K
330uF
680
15V
22uF
6.8K
15K
5.6K22uF
Relay
5.1V
VLoadSwitch
20K
5.6K22uF
5.1V
680 Vb
att.
D2
MOSPEC S20C40C(x2)
D3
1mH FQP12P20(x2)
0.39 c/v
1.2 K
+ +
+
Current Transducer
5VAn2
GND
Arduino Uno
An2
An3
An4An5
+5V
An
alo
g 0
..5
GND
An0
An1
D0D1D2D3D4D5D6D7D8D9D10D11D12
Swep
t A
rea
Ewind EturbineD
Swep
t A
rea
H
VAWTHAWT
Eunabsorved
DCP
mw
maxP
0, 0m
dP dP
dw dD
0, 0, 0 0DC
m DC m
dVdP dD dP
dw dV dw dD
0, 0, 0 0DC
m DC m
dVdP dD dP
dw dV dw dD
High Speed Low Speed
Track Starting Point Track Starting Point
D D
Maximum Power Point Tracking process
PDCk >PDCk-1
Read PDC
Iref(k)=Iref(k-1)-∆I
Vk >Vk-1
NO
Iref(k)=Iref(k-1)-∆I
YES
Iref(k)=Iref(k-1)+∆I
NOVk >Vk-1
YES
Iref(k)=Iref(k-1)+∆I
YES NO
sDT
I
Li
i oV V
L
sT
iV
L
LI
t
oV
R
oL
load
VI
R
t
t
t
sDT
CV
( )v t
LI V
C RC
sT
V
RC
CV
t
0.5
0.0
1
1.5
2
2.5
3
5 10 15 20
Voltage
Cu
rren
t
Vmp
Imp
Isc Short circuit current
VocOpen circuit voltage
MPP
V.Battery
I-V PV panel characteristics
DC/DC converterDC loadVbatt
+
-
Vp
v
Ipv +
-
Vo
Io
A/D A/D
MPPT and Charging algorithm
PWM
PV array
MPP
SCI
1dI
I
Load
2dI
1D
SR
PR2D
rI
DC/DCPV -Wind
system
Battery charge control.
Load regulation.
.battV.battI
Battery
.battD loadD
DCLOAD
.battI
t
sDT sT
-
Vin
+
-
Relay
CVbatt.
L Rb
Microcontroller
Iin
Vcontrol1
D1
M1
Sensor Signals Control Signals
VoutVin
Vbatt.
Ibatt
IinIbatt.
Vcontrol1Vcontrol2Vcontrol3
Vcontrol2
Vcontrol3
Vout Vout
file:///C:/Users/Andres/Documents/17c276_250_205.jpg
windv
+
-12
12
1R
2R
fR
+
-
12
12
3R
4R
5R 6RoutV
Datalogger
M2
+
-
G
Iref=10A
+
-Vtrian.
Battery Charge ControllerVcontrol Ibatt.
MPPT AlgorithmDCV
DCI
refI+
-
e+
-.triV
Current compensator
PWM
Io
-
+
-
+
-
+
Vo
V1
V2
C
+ -VL
+
-VD1
+ -VM2
ID2
I1 L
D1
D2
IL IC
M1
M2
VD2
+ -VM1
C Vo
Io+
-
+
-
-
+
+ -VL
+
-ID1
L
D1
D2
IL IC
+VD2
-
+ -VM1
M1
M2+ -VM2
V1
V2
C
+
-Vo
Io
Ii1
Ii2
+
-
+
-
V1
V2
+ -VL
L
D1
D2
IL ICM1
M2
VD2+
-
-
+VD1
+
-
+
-
+
-Vo
Io
Vc
V1
V2
+ -VL
+ -VM2
ID2
C
L
D1
D2
IL IC
+
-
VM1+ -
M2
M1
ID1
VD1
VD1
( )a
( )b
( )c ( )d
+
-
V1
V2
Vo
+
-
VG
S1
LM1
M2
D1
D2
C
-
+ VG
S2
VG
S1
+
-
-
+
V1
V2
+
-
Vo
LM1
M2
D1
D2
C
VG
S2
( )b( )a
( )a
( )b
sT
1d
1d
2t1t 4t3t
t
t
1GSV
2GSV
-+
V1
+
-V2
Vo
-
VG
S1
LM1
M2
D1
D2
C
+ VG
S2
( )c
VGS3
-+
V1
+
-V2
Vo
-
VG
S1
LM1
M2
D1
D2
C
+
VG
S2
VGS3
3M
-+
V1
+
-V2
Vo
-
VG
S1
LM1
M2
D1
D2
C
+ VG
S2
( )c
VGS3
+
-
Relay
CVbatt.
L Rb
VGS3
D3
M1
Ibatt.
Vrelay
Vout Vout
M2
Vwind
Iwind
-
+-
VPV
D1
D2
VGS1
VGS2
VGS4
-
Microcontroller
Ipv
Sensor Signals Control Signals
VoutVin
Vbatt
Vcontrol1Vcontrol2Vcontrol3
IwindIbatt Vrelay
Vcontrol4
+
-
+
-
Ipv
IoILIL
IL
( )a
IL
-+
V1
+
-V2
Vo
-
VG
S1
LM1
M2
D1
D2
C
+
VG
S2
VGS3
Io IoIL
( )c
-+
V1
+
-V2
Vo
-
VG
S1
LM1
M2
D1
D2
C
+
VG
S2
VGS3
IL
IL
( )b
IL
-+
V1
+
-V2
Vo
-
VG
S1
LM1
M2
D1
D2
C
+
VG
S2
VGS3
IL
( )c
Ic Io
Io
Ic
D3 D3
D3D3
+- 2G
1CT1G
2CT+-
1H
refVoV
*
refI
LI
duty
Plant 1 Plant 2Controller 2Controller 1
measuredLI
Microprocessor
(MPPT Programming)
-+ +
-
PVI
PVVWindV
WindI
1d 2d
1
*
refI2
*
refI
+
-
+
-
PVV
windV
*
refV
Microprocessor(Current Control programming)
Boost mode
3d
oVoI
*
refV
Microprocessor(Current Control programming)
Buck mode
1d
oVoI
2d
L D3
D1
D2
Double input DC/DC converter
PVI
WindILoad
oI+
-
oVABV
AV
BV
MicroprocessorPower managament
control unit
PVV
PVI
windV
WindI
ABV
oV
oI
1d 2d 3d
1S
2S
3S
1d
2d
3d
+-
*
refI1( )d s
Plant 1 LI
12G
11G
2 ( )d s
+
+
1H
+refV
1CT-
2GPlant 2
oV
*
refILI
+refV
1CT- 2G
Plant 2
oVInner current loop
110 V
12 V
12 V
Microcontroller PWM signal
18 V
V1
V2
VGS
1 K
10 K 220Ω 15V
G
SDrive Circuit
Optocoupler
4N28
LP-575
Transformer
Figure 7.5. Tranformer circuit used for independt ground voltage supplies
69
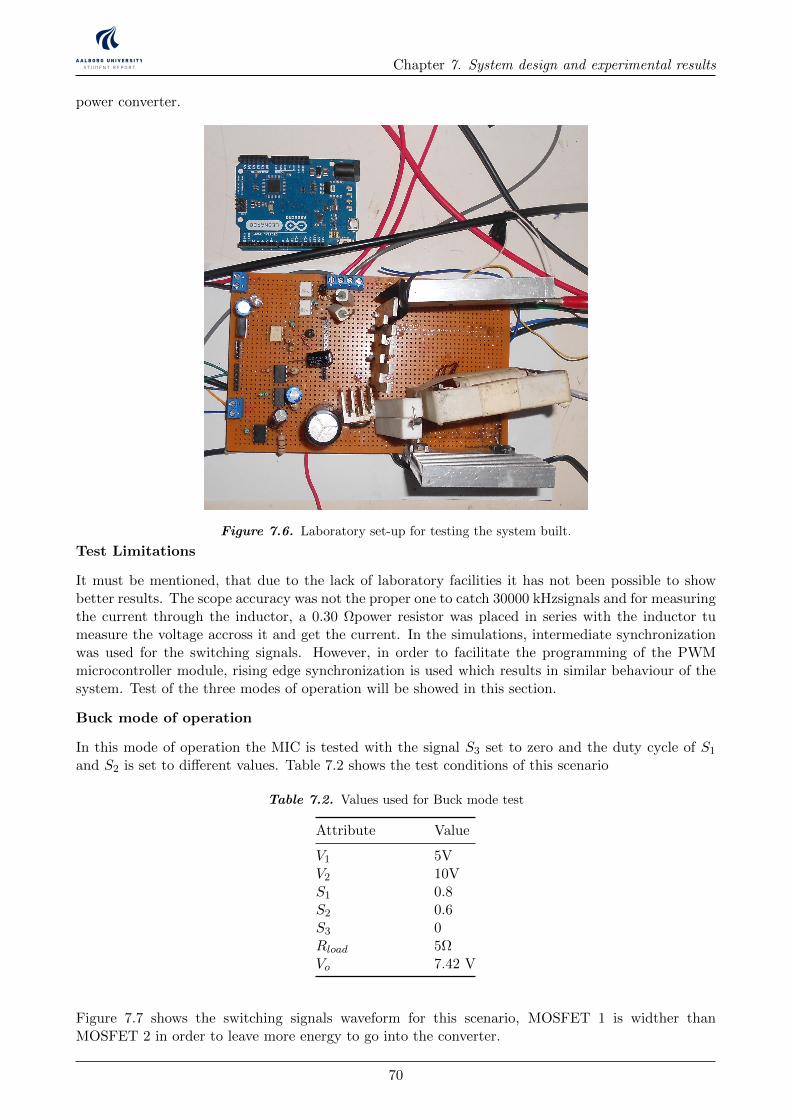
Chapter 7. System design and experimental results
power converter.
Figure 7.6. Laboratory set-up for testing the system built.
Test Limitations
It must be mentioned, that due to the lack of laboratory facilities it has not been possible to showbetter results. The scope accuracy was not the proper one to catch 30000 kHzsignals and for measuringthe current through the inductor, a 0.30 Ωpower resistor was placed in series with the inductor tumeasure the voltage accross it and get the current. In the simulations, intermediate synchronizationwas used for the switching signals. However, in order to facilitate the programming of the PWMmicrocontroller module, rising edge synchronization is used which results in similar behaviour of thesystem. Test of the three modes of operation will be showed in this section.
Buck mode of operation
In this mode of operation the MIC is tested with the signal S3 set to zero and the duty cycle of S1
and S2 is set to different values. Table 7.2 shows the test conditions of this scenario
Table 7.2. Values used for Buck mode test
Attribute Value
V1 5VV2 10VS1 0.8S2 0.6S3 0Rload 5ΩVo 7.42 V
Figure 7.7 shows the switching signals waveform for this scenario, MOSFET 1 is widther thanMOSFET 2 in order to leave more energy to go into the converter.
70
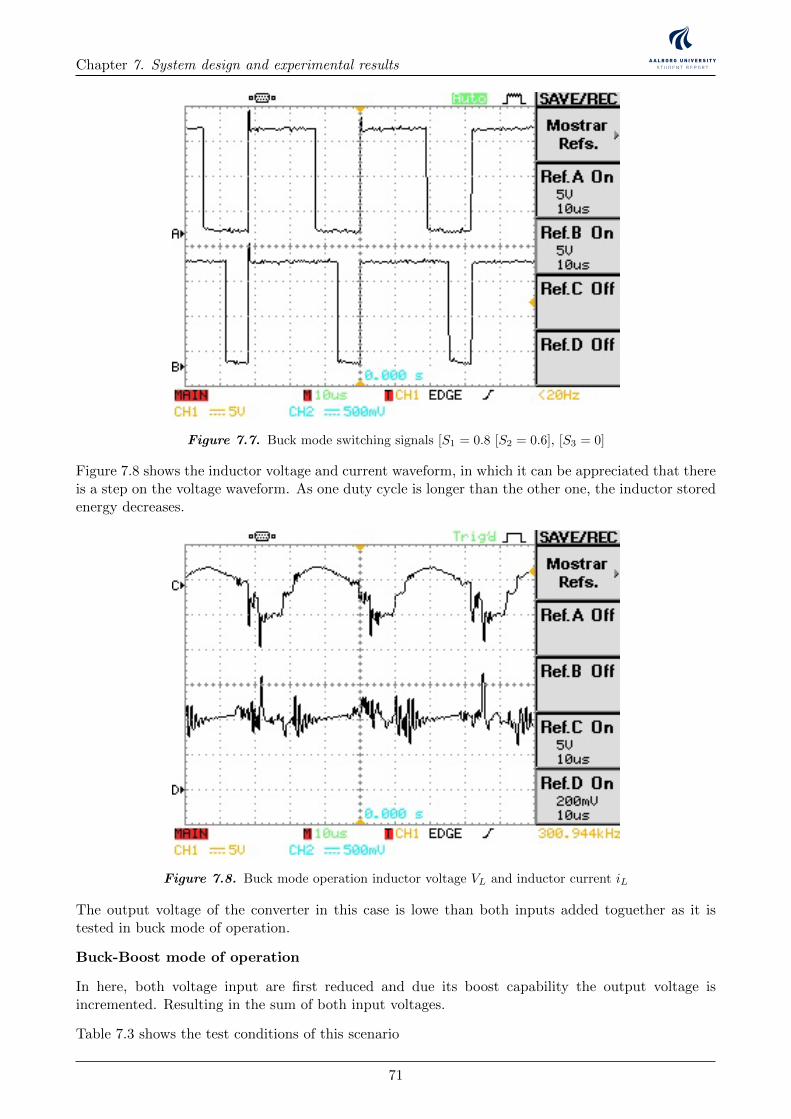
Chapter 7. System design and experimental results
Figure 7.7. Buck mode switching signals [S1 = 0.8 [S2 = 0.6], [S3 = 0]
Figure 7.8 shows the inductor voltage and current waveform, in which it can be appreciated that thereis a step on the voltage waveform. As one duty cycle is longer than the other one, the inductor storedenergy decreases.
Figure 7.8. Buck mode operation inductor voltage VL and inductor current iL
The output voltage of the converter in this case is lowe than both inputs added toguether as it istested in buck mode of operation.
Buck-Boost mode of operation
In here, both voltage input are first reduced and due its boost capability the output voltage isincremented. Resulting in the sum of both input voltages.
Table 7.3 shows the test conditions of this scenario
71
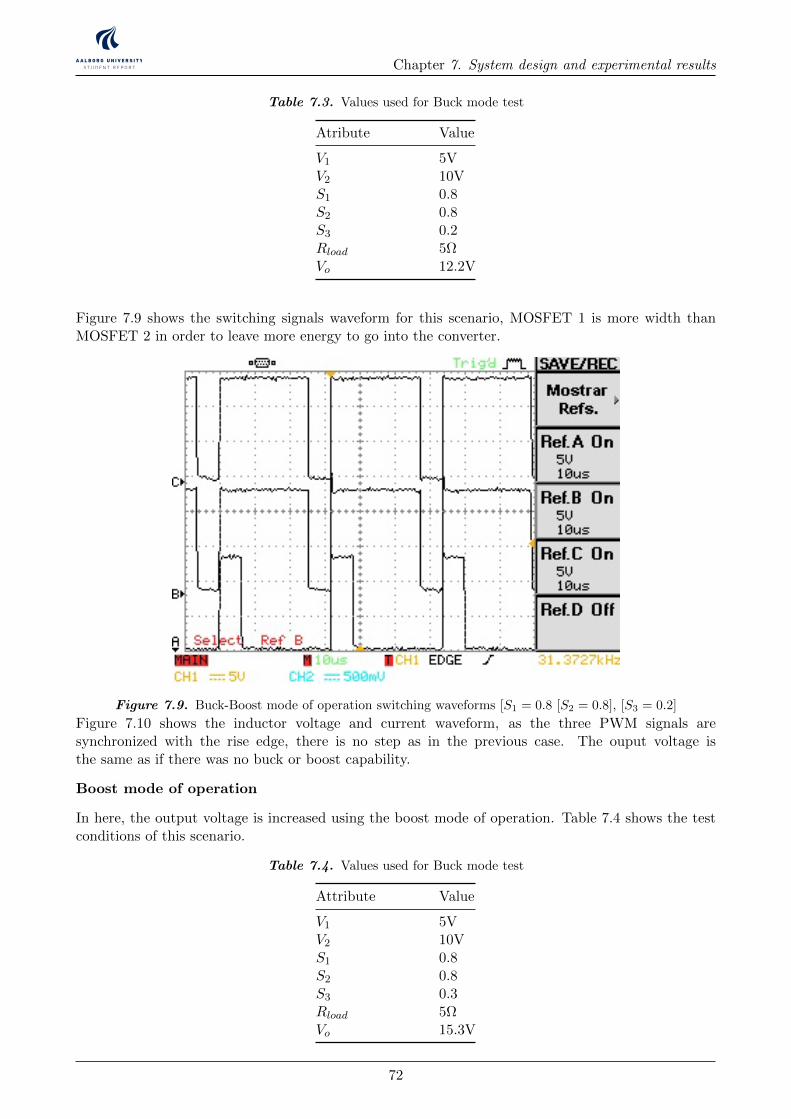
Chapter 7. System design and experimental results
Table 7.3. Values used for Buck mode test
Atribute Value
V1 5VV2 10VS1 0.8S2 0.8S3 0.2Rload 5ΩVo 12.2V
Figure 7.9 shows the switching signals waveform for this scenario, MOSFET 1 is more width thanMOSFET 2 in order to leave more energy to go into the converter.
Figure 7.9. Buck-Boost mode of operation switching waveforms [S1 = 0.8 [S2 = 0.8], [S3 = 0.2]
Figure 7.10 shows the inductor voltage and current waveform, as the three PWM signals aresynchronized with the rise edge, there is no step as in the previous case. The ouput voltage isthe same as if there was no buck or boost capability.
Boost mode of operation
In here, the output voltage is increased using the boost mode of operation. Table 7.4 shows the testconditions of this scenario.
Table 7.4. Values used for Buck mode test
Attribute Value
V1 5VV2 10VS1 0.8S2 0.8S3 0.3Rload 5ΩVo 15.3V
72
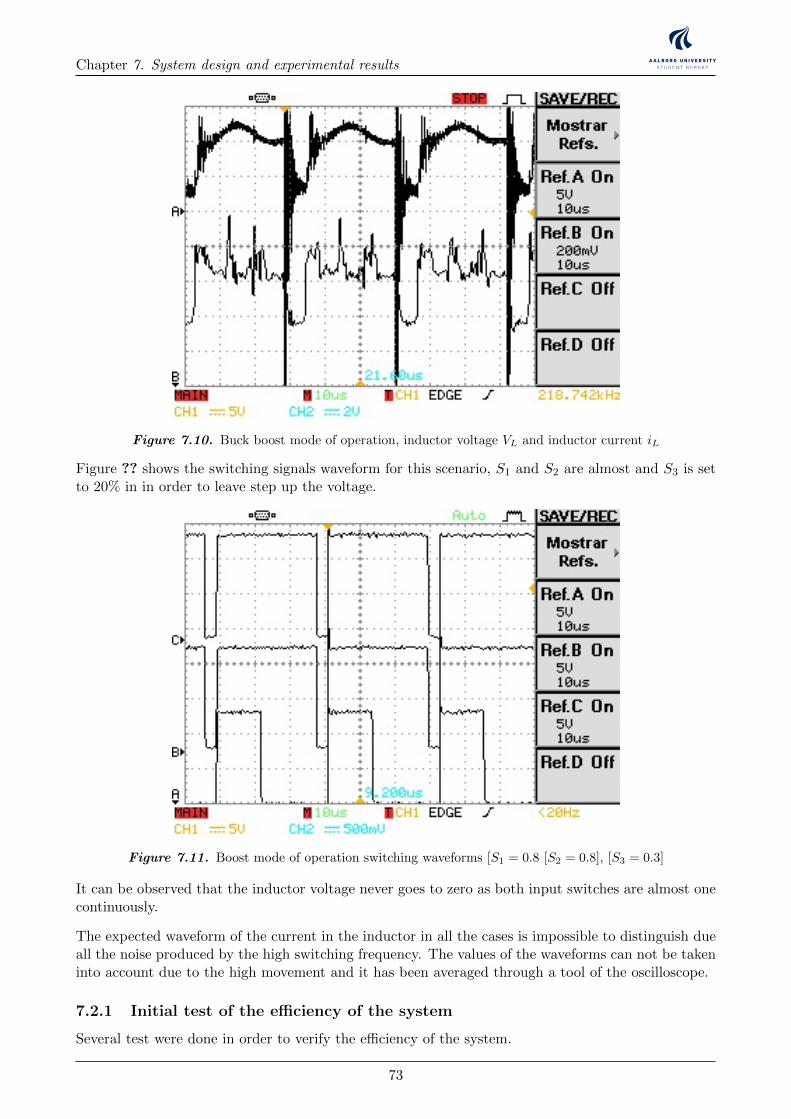
Chapter 7. System design and experimental results
Figure 7.10. Buck boost mode of operation, inductor voltage VL and inductor current iL
Figure ?? shows the switching signals waveform for this scenario, S1 and S2 are almost and S3 is setto 20% in in order to leave step up the voltage.
Figure 7.11. Boost mode of operation switching waveforms [S1 = 0.8 [S2 = 0.8], [S3 = 0.3]
It can be observed that the inductor voltage never goes to zero as both input switches are almost onecontinuously.
The expected waveform of the current in the inductor in all the cases is impossible to distinguish dueall the noise produced by the high switching frequency. The values of the waveforms can not be takeninto account due to the high movement and it has been averaged through a tool of the oscilloscope.
7.2.1 Initial test of the efficiency of the system
Several test were done in order to verify the efficiency of the system.
73
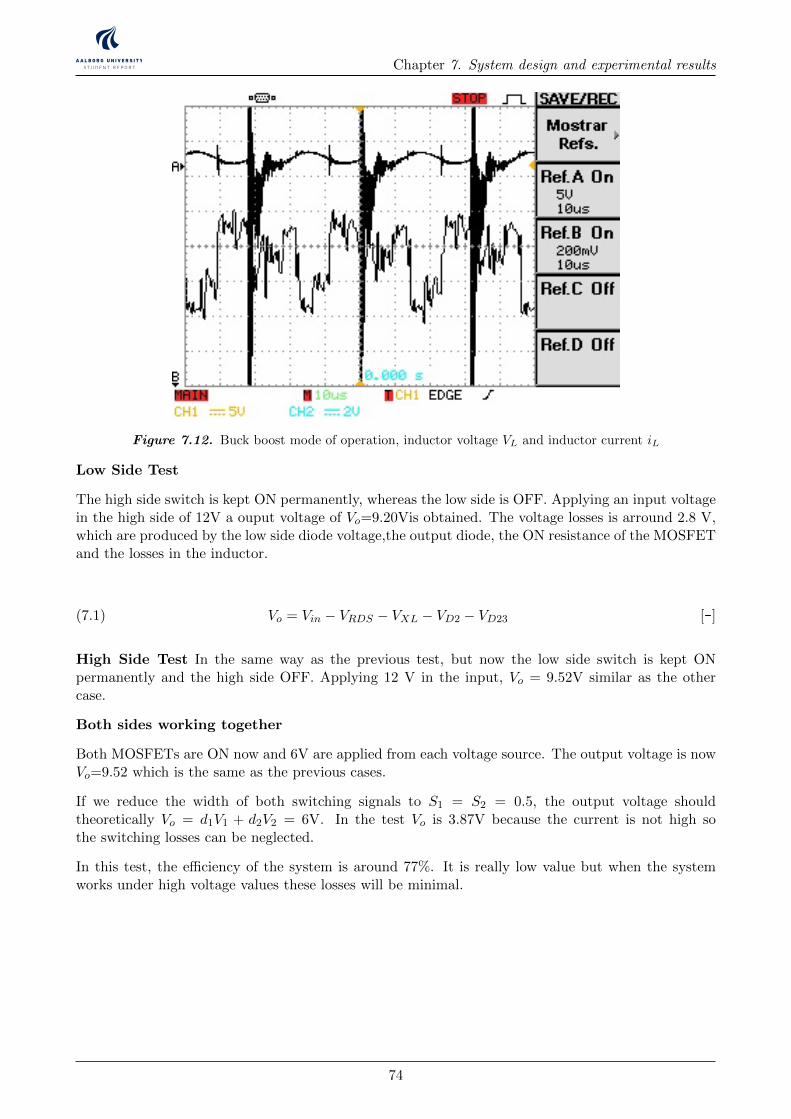
Chapter 7. System design and experimental results
Figure 7.12. Buck boost mode of operation, inductor voltage VL and inductor current iL
Low Side Test
The high side switch is kept ON permanently, whereas the low side is OFF. Applying an input voltagein the high side of 12V a ouput voltage of Vo=9.20Vis obtained. The voltage losses is arround 2.8 V,which are produced by the low side diode voltage,the output diode, the ON resistance of the MOSFETand the losses in the inductor.
Vo = Vin − VRDS − VXL − VD2 − VD23 [-](7.1)
High Side Test In the same way as the previous test, but now the low side switch is kept ONpermanently and the high side OFF. Applying 12 V in the input, Vo = 9.52V similar as the othercase.
Both sides working together
Both MOSFETs are ON now and 6V are applied from each voltage source. The output voltage is nowVo=9.52 which is the same as the previous cases.
If we reduce the width of both switching signals to S1 = S2 = 0.5, the output voltage shouldtheoretically Vo = d1V1 + d2V2 = 6V. In the test Vo is 3.87V because the current is not high sothe switching losses can be neglected.
In this test, the efficiency of the system is around 77%. It is really low value but when the systemworks under high voltage values these losses will be minimal.
74
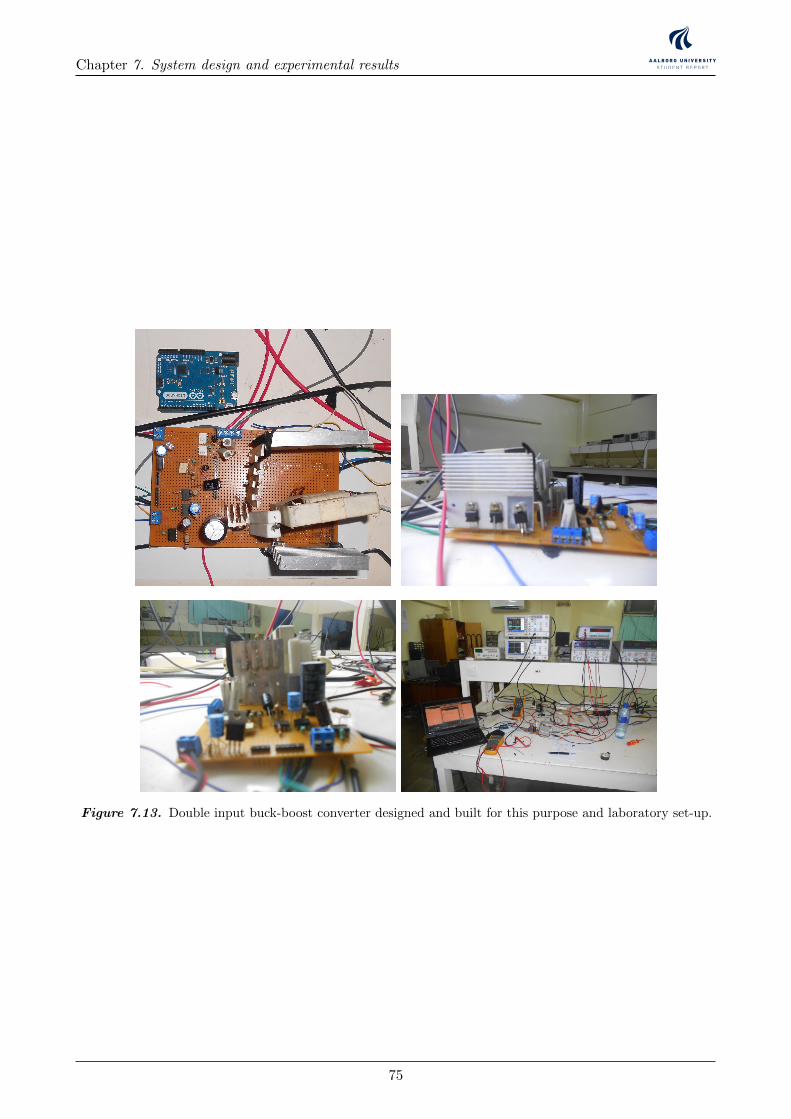
Chapter 7. System design and experimental results
Figure 7.13. Double input buck-boost converter designed and built for this purpose and laboratory set-up.
75

Chapter 8
Conclusion
The purpose of this project was to study the MPPT systems for both wind and photovoltaic energy,and to design, implement and test a multiple input converter for controlling a hybrid system. Thisgoal has been kept in mind during the whole development of the project.
A deep research about maximum power point tracking algorithm for both wind and photovoltaic energysystems has been done. In addition, a boost converter has been designed and built for controllingindependently the wind turbine, but it has not been possible any result from this system.
After researching different MIC converter topologies, the selected one as been analysed and simulatedobtained satisfactory results. Small signal analysis and a control system has been proposed.
The system selected has been designed and build, and the laboratory results corresponds with thesimulation results and the system behave as expected. Due the lack of facilities at the laboratory, ithas not been possible to show better results.
Due to the fact some time was spent building a single input DC/DC converter for analysing thenominal rates of the wind turbine system, there has been to time to test the system built underdynamical conditions.
The system has only been tested under steady state conditions and no control has been tested. Duethe lack of time it has not been possible to achieve this goal. However, for further work is expectedto test the system with the wind turbine and the solar panel with the control system proposed.
It is also required to fit the system designed with the requirements of both power generation systems.In Chapter 2, it was stated that the PV modules produces an opern circuit voltage of 27V. Howeverthe wind turbine is not believe it can produce more than 20 V. Thereby, if both systems are connectedto the double input converter designed to a 12V battery, the PV modules will be working under lowerpower than their capability.
The best solution would be to use 60W PV modules for this wind turbine. Or it is also fesible for theconverter to use a higher voltage and charge 24V batteries.
It can be conclude that the goal of the project which was to study the MPPT tracking technology forboth PV and wind energy and to build a double input power converter has been achieved. However, itis missing the control part of the system which could not be tested due the lack of time. In addition,the presentation of the laboratory results is not satisfactory more simulation content is missing.
Future prospects
Simulate the whole system control with MPPT with both power generation models and test thewhole control with the system implemented under real circustances. Improve the control system forextracting the maximum energy possible. Test the maximum capability of the system built and selectin which cases behaves more optimum.
77


Chapter 9
CD Content
References. Matlab files of simulations. P10Report.
79

Bibliography
[1] A Marandin, C. and Casillas (2013). Small-scale wind power in nicaragua, market analysis 2012 -2013. Green Empowerment.
[2] Bertenyi, T. and Youngy, T. (2009). Power electronics solutions for vertical axis urban windturbines. IEE.
[3] company, T. B. (2005). 27tmx data sheet.
[4] DenHerder, T. (2006). Design and simulation of photovoltaic super system using simulink.Electrical Engineering department California Polytechnic State University.
[5] Esram, T. and Chapman, P. L. (2007). Comparison of photovoltaic array maximum power pointtracking techniques. IEEE TRANSACTIONS ON ENERGY CONVERSION.
[6] Johnson, D. G. (2001). Wind energy systems. Rainbow Power Company.
[7] Koutroulis, E. and Kalaitzakis, K. (2006). Design of a maximum power tracking system forwind-energy-conversion applications. Rainbow Power Company.
[8] Lalit Kumar, S. J. (2013). Multiple-input dc/dc converter topology for hybrid energy system.Department of Electrical Engineering, MANIT, Bhopal, India.
[9] Mathias Pedersen, Erik Nielsen, C. H. (2011). A domestic wind turbine system for sub-saharanafrica. 5th semester Aalborg Univesity group project.
[10] Ned Mohan, Tore M.Undeland, W. P. (1989). POWER ELECTRONICS. Converters,Applications and Design.
[11] Nicola Bianchi, S. B. (2012). Optimal drive and machine sizing for a self starting vertical axis,low power wind generator.
[12] NRG (2007). Renewable nrg systems 40c anemometer, calibrated. Product Specifications.
[13] P.Dunlop, J. (1997). Batteries and charge control in stand-alone photovoltaic systems.fundamentals and application. Florida Solar Energy Center.
[14] Perez, R. (1993). Lead-acid battery state of charge vs. voltage.
[15] Prez, B. H. (2007). Fhotovoltaics: Design and Installation Manual. Solar Energy Internationaland New Society Publishers.
[16] Robert W.Erickson, D. M. (2001). Fundamentals of Power Electronics.
[17] Schilling, S. (1998). Ensuring lead-acid battery performance with renew-it pulse technology.PulseTech.
[18] Technology, W. (2013). Nicaragua: self-reliance and sustainability. Global Trade Media.
[19] Tender, B. (2002). Battery charging basics and charging algorithm fundamentals. DeltranCoorporatio.
[20] V. Salas, E. Olas, A. (2005). Review of the maximum power point tracking algorithms forstand-alone photovoltaic systems. ELSEVIER.
81

Chapter BIBLIOGRAPHY
[21] Xiao, W. and Dunford, W. G. (2004). A modified adaptive hill climbing mppt method forphotovoltaic power systems. 35th Annual IEEE Power Electronics Specialist Conference.
[22] Yan Li, Xinbo Ruan, D. Y. and Liu, F. (2009). Modeling, analysis and design for hybrid powersystems with dual-input dc/dc converter. IEEE.
[23] Yaow-Ming Chen, Tuan-Chuan Liu, S.-C. H. and Cheng, C.-S. (2007). Multi-input inverter forgrid-connected hybrid pv/wind power system. IEEE.
[24] Yaow-Ming Chen, Y.-C. L. and Lin, S.-H. (2013). Double-input pwm dc/dc converter forhig/low voltage sources. Power Electronics Applied Research Laboratory Department of ElectricalEngineering National Chung Cheng University.
[25] Y.Baghzouz (2012). Photovoltaic devices.
82

Appendix A
Energy Storage. Lead-acid Batteries
Batteries are formed by electrical cells with a certain DC voltage interconnected in series to supplythe nominal voltage of the battery. For renewable energy systems Lead-Acid batteries and Nickel-Cadmium(Ni-Cad) batteries are the most common.
Ni-Cad batteries present better characteristics than Lead-Acid batteries as a longer life-time(morecharge and discharge cycles), more resistance to over-discharge and better behaviour under extremetemperature conditions. However, Lead-acid batteries present a lower cost which make them moresuitable for small residential applications [13] [15].
However, Ni-Cad batteries present a higher cost and their availability is limited compared with Lead-acid batteries Thereby, lead-acid batteries are commonly used for residential photovoltaic installationsand Ni-Cad batteries are used for industrial applications, extreme temperatures locations and smallportable devices [13] [15].
Lead-Acid batteries are formed by lead dioxide(PbO2) in the positive plate ,lead(Pb) in the negativeplate and sulfuric acid(H2SO4) in the electrolyte. The electrical energy is produced by the chemicalreaction between the different materials on each plate and the electrolyte [17].
During the discharge process, the lead dioxide(PbO2) is combined with the sulphate(SO4) of theelectrolyte forming lead sulphate(PbSO4) in the positive plate. Similarly, in the negative plate thesame process occurs, the lead reacts with the sulphate forming lead sulphate on the plate. Themolecules of oxygen are lost at each reaction [17].
If electrical current is passing through the battery, the cycle is reverse than during the discharge.The lead sulphate formed in both plates splits in lead(Pb) and acid(SO4), and reacting with thehydrogen(H) of the water in order to restore the electrolyte. The lead and the oxygen combines againforming lead dioxide(PbO2) in the positive plate. In the negative plate only lead is formed [17].
When the discharged process occurs fast more sulphate is generated. It is important that the sulphatesdo not crystallize on the plates by leaving the battery discharged during a long period or by improperrecharge, because they will not recombine again into active materials. In addition high level of crystalsulphate on the plates can damage the battery [13] [19].
Thereby, it is required to control the discharge and charge battery process which is usually chargealgorithm and consists on different electrical stages software controlled.
I

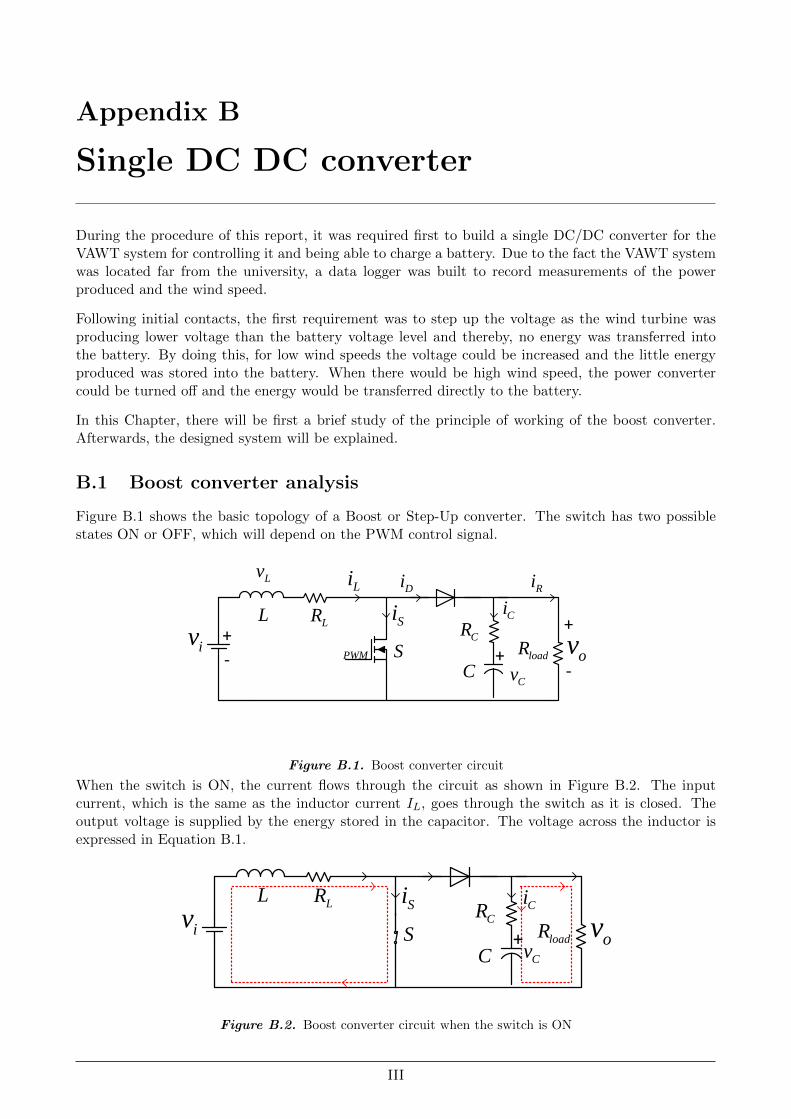
Appendix B
Single DC DC converter
During the procedure of this report, it was required first to build a single DC/DC converter for theVAWT system for controlling it and being able to charge a battery. Due to the fact the VAWT systemwas located far from the university, a data logger was built to record measurements of the powerproduced and the wind speed.
Following initial contacts, the first requirement was to step up the voltage as the wind turbine wasproducing lower voltage than the battery voltage level and thereby, no energy was transferred intothe battery. By doing this, for low wind speeds the voltage could be increased and the little energyproduced was stored into the battery. When there would be high wind speed, the power convertercould be turned off and the energy would be transferred directly to the battery.
In this Chapter, there will be first a brief study of the principle of working of the boost converter.Afterwards, the designed system will be explained.
B.1 Boost converter analysis
Figure B.1 shows the basic topology of a Boost or Step-Up converter. The switch has two possiblestates ON or OFF, which will depend on the PWM control signal.
PMSGWind
turbine
Rectifier
wm
DC
DCLOAD
Rotating speed -Power characteristic Pactual
Cotrol Unit
Poptimal
error
Control Signal
Power Converter
PMSG
Wind turbine
Rectifier
DC
DCLOAD
Cotrol Unit
Control Signal
Power Converter
Wind speed
Vwind
R
Wm
Wm-optimal
error
+-
+ -
Ea
Eb
Ec
Xs Rs
ILL VLL
D1 D3 D5
D2 D4D6
+
-
p
N
Id
Ea
Eb
Ec
Xs RsIa
Xs
Xs
Rs
Rs
+
-
VDC
IDC+
+
+
Va
Vb
Vc
Ib
Ic
H
D
VG
S1
V1
V2
L
+
-
Vo
M1
M2
D1
D2
+
-
+
-
Vi1
Vi2
+ -VL
+
-Vo
Ii1
C
L
D1
D2
IL IC Io
+
-
+
-
Vi1
Vi2
+ -VL
+
-
+
-Vo
ID1
C
L
D1
D2
IL IC Io
+VD2
-
+ -VM1
M1
M2
M1
M2
C
VG
S2
+
-
+
-
V1
V2
+ -VL
+
-VD1
+
-Vo
+ -VM2
ID2
I1
C
L
D1
D2
IL IC Io
M1
M2
+
-
+
-
Vi1
Vi2
+ -VL
+
-Vo
+ -VM2
ID2
C
L
D1
D2
IL IC Io
Vc+
-
VM1+ -
M2
M1
VPVDC
DC
VWindDC
DC
LOADVo+
-
VPV
DC
DC
VWind
LOADVo
+
-
VD2+
-
-
+
VD1
+
+
VD1
+-
+
-
+ -VM1
+ -VM2
Ii2
ID1
+
+ - + -
+ - + -
PMSG
500 W
Vertical axis wind turbine Gear box
+
-
600 W Vpv
DC/DC
Ibat
+
-
Vo
Io
3-ph Rectifier
+
-VWG
IPV
IWG
Control Unit
ON/OFF Control
IWG
VWG
Vpv
IPV
IbatVo
Dummy Load
12 V 450 AH Battery Bench
900 W
Control signals
PMSG
500 W
Vertical axis wind turbine Gear box
+
-
Vw
w
+
-
Solar Pump controller PM DC motor
Vpv
Back- Up system Diesel Generator
-
200 W
-
200 W
-+ +
200 W
+
Ea
Eb
Ec
Xs Rs
ILL VLL
D1 D3 D5
D2 D4D6
+
-
p
N
Id
Ea
Eb
Ec
Xs RsIa
Xs
Xs
Rs
Rs
+
-
VDC
IDC+
+
+
Va
Vb
Vc
Ib
Ic
+-
LvLi
iv +
-
+CR
C
LLR
PWM S
+
ovloadR
Si
Di Ri
Ci
Cv
Figure B.1. Boost converter circuit
When the switch is ON, the current flows through the circuit as shown in Figure B.2. The inputcurrent, which is the same as the inductor current IL, goes through the switch as it is closed. Theoutput voltage is supplied by the energy stored in the capacitor. The voltage across the inductor isexpressed in Equation B.1.
PMSGWind
turbine
Rectifier
wm
DC
DCLOAD
Rotating speed -Power characteristic Pactual
Cotrol Unit
Poptimal
error
Control Signal
Power Converter
PMSG
Wind turbine
Rectifier
DC
DCLOAD
Cotrol Unit
Control Signal
Power Converter
Wind speed
Vwind
R
Wm
Wm-optimal
error
+-
+ -
Ea
Eb
Ec
Xs Rs
ILL VLL
D1 D3 D5
D2 D4D6
+
-
p
N
Id
Ea
Eb
Ec
Xs RsIa
Xs
Xs
Rs
Rs
+
-
VDC
IDC+
+
+
Va
Vb
Vc
Ib
Ic
H
D
VG
S1
V1
V2
L
+
-
Vo
M1
M2
D1
D2
+
-
+
-
Vi1
Vi2
+ -VL
+
-Vo
Ii1
C
L
D1
D2
IL IC Io
+
-
+
-
Vi1
Vi2
+ -VL
+
-
+
-Vo
ID1
C
L
D1
D2
IL IC Io
+VD2
-
+ -VM1
M1
M2
M1
M2
C
VG
S2
+
-
+
-
V1
V2
+ -VL
+
-VD1
+
-Vo
+ -VM2
ID2
I1
C
L
D1
D2
IL IC Io
M1
M2
+
-
+
-
Vi1
Vi2
+ -VL
+
-Vo
+ -VM2
ID2
C
L
D1
D2
IL IC Io
Vc+
-
VM1+ -
M2
M1
VPVDC
DC
VWindDC
DC
LOADVo+
-
VPV
DC
DC
VWind
LOADVo
+
-
VD2+
-
-
+
VD1
+
+
VD1
+-
+
-
+ -VM1
+ -VM2
Ii2
ID1
+
+ - + -
+ - + -
PMSG
500 W
Vertical axis wind turbine Gear box
+
-
600 W Vpv
DC/DC
Ibat
+
-
Vo
Io
3-ph Rectifier
+
-VWG
IPV
IWG
Control Unit
ON/OFF Control
IWG
VWG
Vpv
IPV
IbatVo
Dummy Load
12 V 450 AH Battery Bench
900 W
Control signals
PMSG
500 W
Vertical axis wind turbine Gear box
+
-
Vw
w
+
-
Solar Pump controller PM DC motor
Vpv
Back- Up system Diesel Generator
-
200 W
-
200 W
-+ +
200 W
+
Ea
Eb
Ec
Xs Rs
ILL VLL
D1 D3 D5
D2 D4D6
+
-
p
N
Id
Ea
Eb
Ec
Xs RsIa
Xs
Xs
Rs
Rs
+
-
VDC
IDC+
+
+
Va
Vb
Vc
Ib
Ic
+-
LvLi
iv +
-
CR
C
LLR
PWM S
+
ovloadR
Si
Di Ri
Ci
Cv
+
LvLi
iv CR
C
LLR
S ovloadR
Si
Di Ri
Ci
Cv
+iv CR
C
LLR
S ovloadR
Si Ci
Cv
Figure B.2. Boost converter circuit when the switch is ON
III
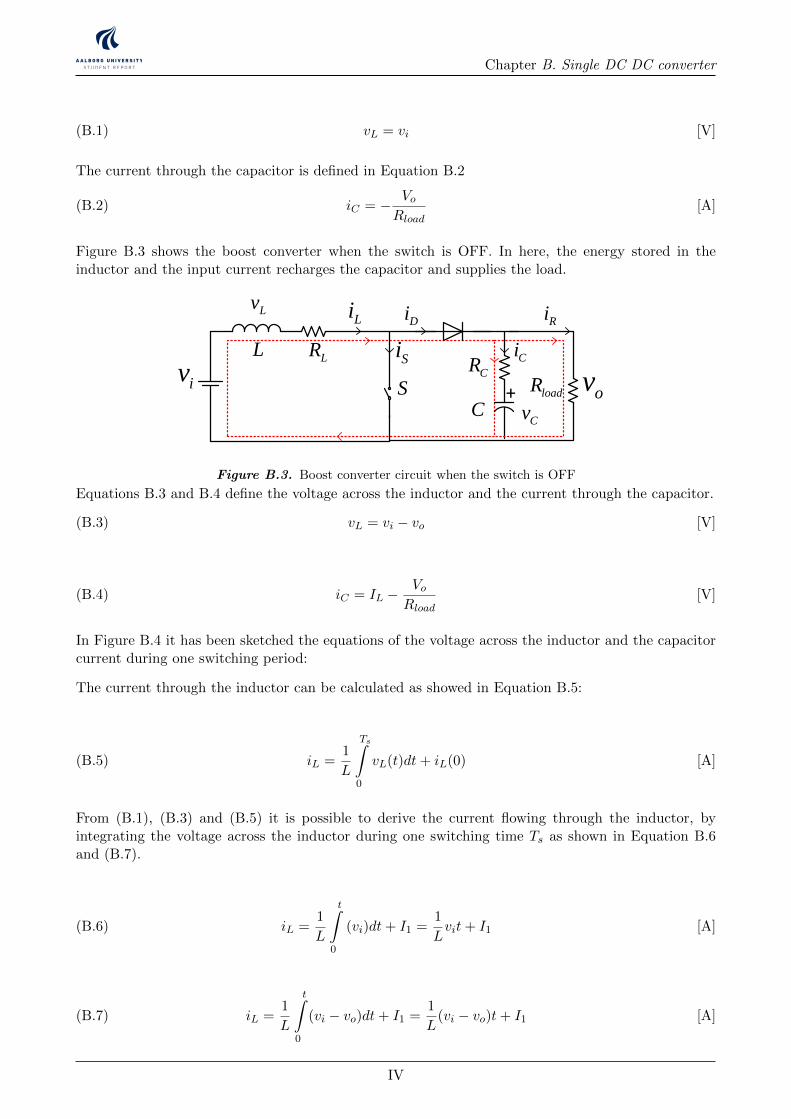
Chapter B. Single DC DC converter
vL = vi [V](B.1)
The current through the capacitor is defined in Equation B.2
iC = − VoRload
[A](B.2)
Figure B.3 shows the boost converter when the switch is OFF. In here, the energy stored in theinductor and the input current recharges the capacitor and supplies the load.
PMSGWind
turbine
Rectifier
wm
DC
DCLOAD
Rotating speed -Power characteristic Pactual
Cotrol Unit
Poptimal
error
Control Signal
Power Converter
PMSG
Wind turbine
Rectifier
DC
DCLOAD
Cotrol Unit
Control Signal
Power Converter
Wind speed
Vwind
R
Wm
Wm-optimal
error
+-
+ -
Ea
Eb
Ec
Xs Rs
ILL VLL
D1 D3 D5
D2 D4D6
+
-
p
N
Id
Ea
Eb
Ec
Xs RsIa
Xs
Xs
Rs
Rs
+
-
VDC
IDC+
+
+
Va
Vb
Vc
Ib
Ic
H
D
VG
S1
V1
V2
L
+
-
Vo
M1
M2
D1
D2
+
-
+
-
Vi1
Vi2
+ -VL
+
-Vo
Ii1
C
L
D1
D2
IL IC Io
+
-
+
-
Vi1
Vi2
+ -VL
+
-
+
-Vo
ID1
C
L
D1
D2
IL IC Io
+VD2
-
+ -VM1
M1
M2
M1
M2
C
VG
S2
+
-
+
-
V1
V2
+ -VL
+
-VD1
+
-Vo
+ -VM2
ID2
I1
C
L
D1
D2
IL IC Io
M1
M2
+
-
+
-
Vi1
Vi2
+ -VL
+
-Vo
+ -VM2
ID2
C
L
D1
D2
IL IC Io
Vc+
-
VM1+ -
M2
M1
VPVDC
DC
VWindDC
DC
LOADVo+
-
VPV
DC
DC
VWind
LOADVo
+
-
VD2+
-
-
+
VD1
+
+
VD1
+-
+
-
+ -VM1
+ -VM2
Ii2
ID1
+
+ - + -
+ - + -
PMSG
500 W
Vertical axis wind turbine Gear box
+
-
600 W Vpv
DC/DC
Ibat
+
-
Vo
Io
3-ph Rectifier
+
-VWG
IPV
IWG
Control Unit
ON/OFF Control
IWG
VWG
Vpv
IPV
IbatVo
Dummy Load
12 V 450 AH Battery Bench
900 W
Control signals
PMSG
500 W
Vertical axis wind turbine Gear box
+
-
Vw
w
+
-
Solar Pump controller PM DC motor
Vpv
Back- Up system Diesel Generator
-
200 W
-
200 W
-+ +
200 W
+
Ea
Eb
Ec
Xs Rs
ILL VLL
D1 D3 D5
D2 D4D6
+
-
p
N
Id
Ea
Eb
Ec
Xs RsIa
Xs
Xs
Rs
Rs
+
-
VDC
IDC+
+
+
Va
Vb
Vc
Ib
Ic
+-
LvLi
iv +
-
CR
C
LLR
PWM S
+
ovloadR
Si
Di Ri
Ci
Cv
+
LvLi
iv CR
C
LLR
S ovloadR
Si
Di Ri
Ci
Cv
+iv CR
C
LLR
S ovloadR
Si Ci
Cv
Figure B.3. Boost converter circuit when the switch is OFF
Equations B.3 and B.4 define the voltage across the inductor and the current through the capacitor.
vL = vi − vo [V](B.3)
iC = IL −VoRload
[V](B.4)
In Figure B.4 it has been sketched the equations of the voltage across the inductor and the capacitorcurrent during one switching period:
The current through the inductor can be calculated as showed in Equation B.5:
iL =1
L
Ts∫0
vL(t)dt+ iL(0) [A](B.5)
From (B.1), (B.3) and (B.5) it is possible to derive the current flowing through the inductor, byintegrating the voltage across the inductor during one switching time Ts as shown in Equation B.6and (B.7).
iL =1
L
t∫0
(vi)dt+ I1 =1
Lvit+ I1 [A](B.6)
iL =1
L
t∫0
(vi − vo)dt+ I1 =1
L(vi − vo)t+ I1 [A](B.7)
IV
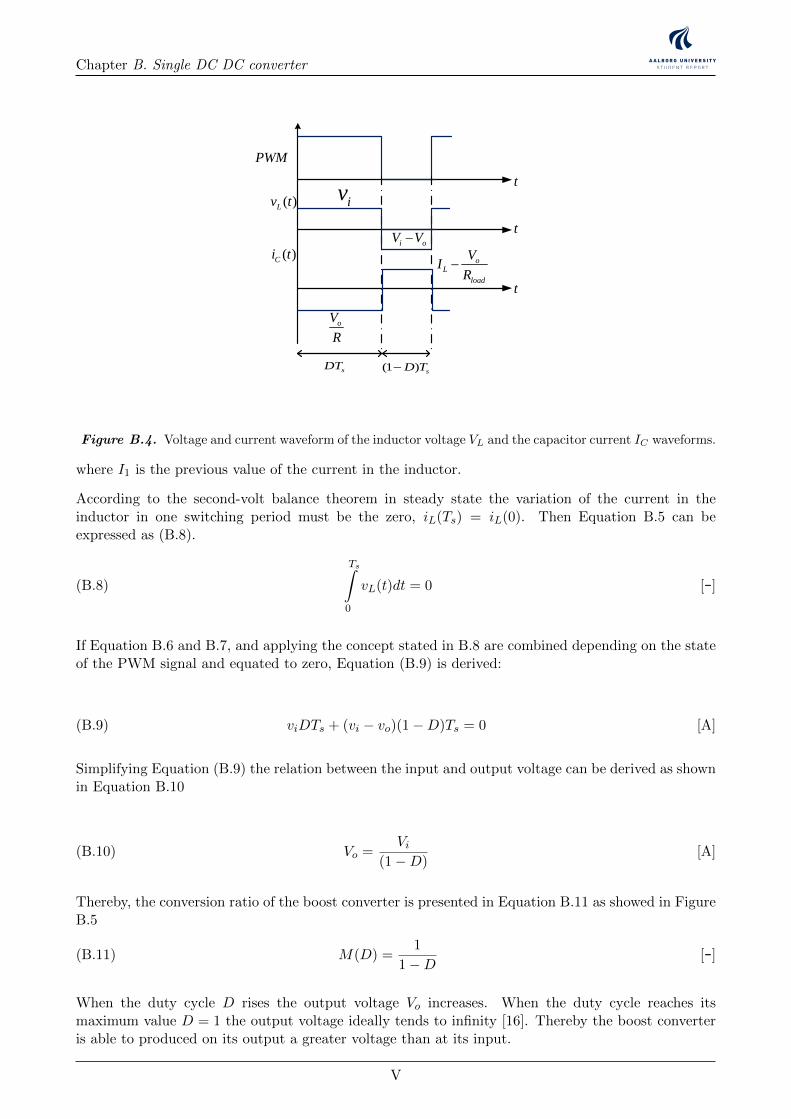
Chapter B. Single DC DC converter
PMSGWind
turbine
Rectifier
wm
DC
DCLOAD
Rotating speed -Power characteristic Pactual
Cotrol Unit
Poptimal
error
Control Signal
Power Converter
PMSG
Wind turbine
Rectifier
DC
DCLOAD
Cotrol Unit
Control Signal
Power Converter
Wind speed
Vw
R
Wm
Wm-optimal
error
+-
+ -
Ea
Eb
Ec
Xs Rs
ILL VLL
D1 D3 D5
D2 D4D6
+
-
p
N
Id
Ea
Eb
Ec
Xs RsIa
Xs
Xs
Rs
Rs
+
-
VDC
IDC+
+
+
Va
Vb
Vc
Ib
Ic
H
D
VG
S1
V1
V2
L
+
-
Vo
M1
M2
D1
D2
+
-
+
-
Vi1
Vi2
+ -VL
+
-Vo
Ii1
C
L
D1
D2
IL IC Io
+
-
+
-
Vi1
Vi2
+ -VL
+
-
+
-Vo
ID1
C
L
D1
D2
IL IC Io
+VD2
-
+ -VM1
M1
M2
M1
M2
C
VG
S2
+
-
+
-
V1
V2
+ -VL
+
-VD1
+
-Vo
+ -VM2
ID2
I1
C
L
D1
D2
IL IC Io
M1
M2
+
-
+
-
Vi1
Vi2
+ -VL
+
-Vo
+ -VM2
ID2
C
L
D1
D2
IL IC Io
Vc+
-
VM1+ -
M2
M1
VPVDC
DC
VWindDC
DC
LOADVo+
-
VPV
DC
DC
VWind
LOADVo
+
-
VD2+
-
-
+
VD1
+
+
VD1
+-
+
-
+ -VM1
+ -VM2
Ii2
ID1
+
+ - + -
+ - + -
PMSG
500 W
Vertical axis wind turbine Gear box
+
-
600 W Vpv
DC/DC
Ibat
+
-
Vo
Io
3-ph Rectifier
+
-VWG
IPV
IWG
Control Unit
ON/OFF Control
IWG
VWG
Vpv
IPV
IbatVo
Dummy Load
12 V 450 AH Battery Bench
900 W
Control signals
PMSG
500 W
Vertical axis wind turbine Gear box
+
-
Vw
w
+
-
Solar Pump controller PM DC motor
Vpv
Back- Up system Diesel Generator
-
200 W
-
200 W
-+ +
200 W
+
Ea
Eb
Ec
Xs Rs
ILL VLL
D1 D3 D5
D2 D4D6
+
-
p
N
Id
Ea
Eb
Ec
Xs RsIa
Xs
Xs
Rs
Rs
+
-
VDC
IDC+
+
+
Va
Vb
Vc
Ib
Ic
+-
LvLi
iv +
-
CR
C
LLR
PWM S
+
ovloadR
Si
Di Ri
Ci
Cv
+
LvLi
iv CR
C
LLR
S ovloadR
Si
Di Ri
Ci
Cv
+iv CR
C
LLR
S ovloadR
Si Ci
Cv
sDT (1 ) sD T
iv
i oV V
( )Lv t
( )Ci t
PWM
D3
PMSGWind
turbine
Rectifier
DC
DC
Cotrol UnitControl Signal
Power Converter
DCI
LOAD
+
-
DCV
MPPT algorithm
+
-
Vcc
D9
Vin
+
-
An3 An5An4
Relay
LM7805 +5V
D2
2
31
7
27K
5.6K22uF
5.1V
1N4001
10K
8
3305.6 3305.615K
680
5.6K
330uF
680
15V
22uF
6.8K
15K
5.6K22uF
Relay
5.1V
VLoadSwitch
20K
5.6K22uF
5.1V
680 Vb
att.
D2
MOSPEC S20C40C(x2)
D3
1mH FQP12P20(x2)
0.39 c/v
1.2 K
+ +
+
Current Transducer
5VAn2
GND
Arduino Uno
An2
An3
An4An5
+5V
An
alo
g 0
..5
GND
An0
An1
D0D1D2D3D4D5D6D7D8D9D10D11D12
Swep
t A
rea
Ewind EturbineD
Swep
t A
rea
H
VAWTHAWT
Eunabsorved
DCP
mw
maxP
0, 0m
dP dP
dw dD
0, 0, 0 0DC
m DC m
dVdP dD dP
dw dV dw dD
0, 0, 0 0DC
m DC m
dVdP dD dP
dw dV dw dD
High Speed Low Speed
Track Starting Point Track Starting Point
D D
Maximum Power Point Tracking process
PDCk >PDCk-1
Read PDC
D=Dold-∆D
Dk-1 >Dk-2
NO
D=Dold-∆D
YES
D=Dold+∆D
NODk-1 >Dk-2
YES
D=Dold+∆D
YES NO
sDT
I
Li
i oV V
L
sT
iV
L
LI
t
oV
R
oL
load
VI
R
t
t
t
Figure B.4. Voltage and current waveform of the inductor voltage VL and the capacitor current IC waveforms.
where I1 is the previous value of the current in the inductor.
According to the second-volt balance theorem in steady state the variation of the current in theinductor in one switching period must be the zero, iL(Ts) = iL(0). Then Equation B.5 can beexpressed as (B.8).
Ts∫0
vL(t)dt = 0 [-](B.8)
If Equation B.6 and B.7, and applying the concept stated in B.8 are combined depending on the stateof the PWM signal and equated to zero, Equation (B.9) is derived:
viDTs + (vi − vo)(1−D)Ts = 0 [A](B.9)
Simplifying Equation (B.9) the relation between the input and output voltage can be derived as shownin Equation B.10
Vo =Vi
(1−D)[A](B.10)
Thereby, the conversion ratio of the boost converter is presented in Equation B.11 as showed in FigureB.5
M(D) =1
1−D[-](B.11)
When the duty cycle D rises the output voltage Vo increases. When the duty cycle reaches itsmaximum value D = 1 the output voltage ideally tends to infinity [16]. Thereby the boost converteris able to produced on its output a greater voltage than at its input.
V
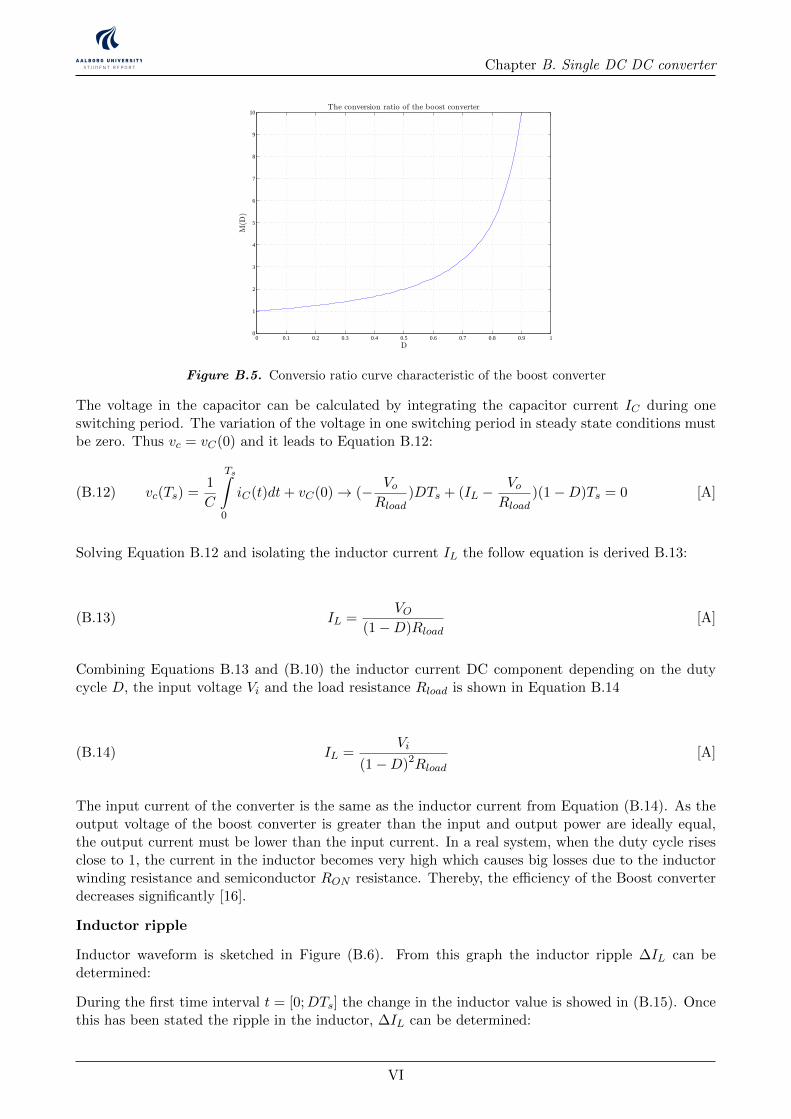
Chapter B. Single DC DC converter
0 0.1 0.2 0.3 0.4 0.5 0.6 0.7 0.8 0.9 10
1
2
3
4
5
6
7
8
9
10The conversion ratio of the boost converter
M(D
)
D
Figure B.5. Conversio ratio curve characteristic of the boost converter
The voltage in the capacitor can be calculated by integrating the capacitor current IC during oneswitching period. The variation of the voltage in one switching period in steady state conditions mustbe zero. Thus vc = vC(0) and it leads to Equation B.12:
vc(Ts) =1
C
Ts∫0
iC(t)dt+ vC(0)→ (− VoRload
)DTs + (IL −VoRload
)(1−D)Ts = 0 [A](B.12)
Solving Equation B.12 and isolating the inductor current IL the follow equation is derived B.13:
IL =VO
(1−D)Rload[A](B.13)
Combining Equations B.13 and (B.10) the inductor current DC component depending on the dutycycle D, the input voltage Vi and the load resistance Rload is shown in Equation B.14
IL =Vi
(1−D)2Rload[A](B.14)
The input current of the converter is the same as the inductor current from Equation (B.14). As theoutput voltage of the boost converter is greater than the input and output power are ideally equal,the output current must be lower than the input current. In a real system, when the duty cycle risesclose to 1, the current in the inductor becomes very high which causes big losses due to the inductorwinding resistance and semiconductor RON resistance. Thereby, the efficiency of the Boost converterdecreases significantly [16].
Inductor ripple
Inductor waveform is sketched in Figure (B.6). From this graph the inductor ripple ∆IL can bedetermined:
During the first time interval t = [0;DTs] the change in the inductor value is showed in (B.15). Oncethis has been stated the ripple in the inductor, ∆IL can be determined:
VI
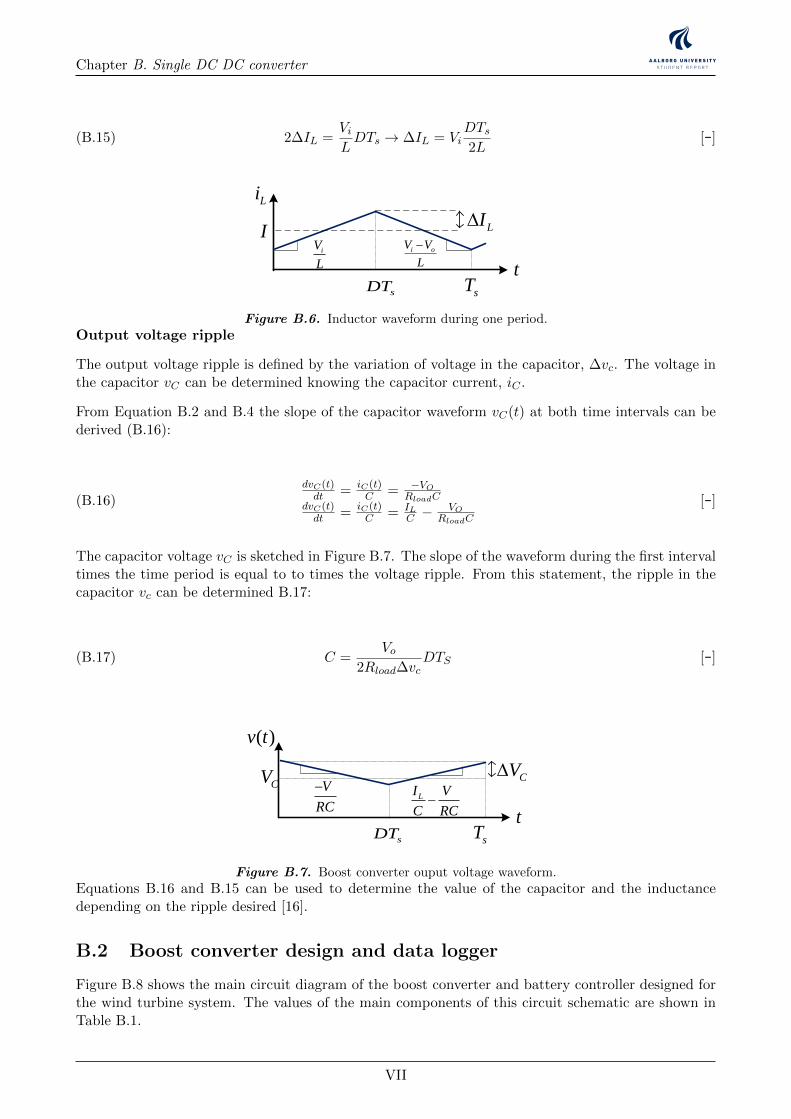
Chapter B. Single DC DC converter
2∆IL =ViLDTs → ∆IL = Vi
DTs2L
[-](B.15)
Wind PMSG
turbine
Rectifier
wm
DC
DCLOAD
Rotating speed -Power characteristic Pactual
Cotrol Unit
Poptimal
error
Control Signal
Power Converter
PMSG
Wind turbine
Rectifier
DC
DCLOAD
Cotrol Unit
Control Signal
Power Converter
Wind speed
Vw
R
Wm
Wm-optimal
error
+-
+ -
Ea
Eb
Ec
Xs Rs
ILL VLL
D1 D3 D5
D2 D4D6
+
-
p
N
Id
Ea
Eb
Ec
Xs RsIa
Xs
Xs
Rs
Rs
+
-
VDC
IDC+
+
+
Va
Vb
Vc
Ib
Ic
H
D
VG
S1
V1
V2
L
+
-
Vo
M1
M2
D1
D2
+
-
+
-
Vi1
Vi2
+ -VL
+
-Vo
Ii1
C
L
D1
D2
IL IC Io
+
-
+
-
Vi1
Vi2
+ -VL
+
-
+
-Vo
ID1
C
L
D1
D2
IL IC Io
+VD2
-
+ -VM1
M1
M2
M1
M2
C
VG
S2
+
-
+
-
V1
V2
+ -VL
+
-VD1
+
-Vo
+ -VM2
ID2
I1
C
L
D1
D2
IL IC Io
M1
M2
+
-
+
-
Vi1
Vi2
+ -VL
+
-Vo
+ -VM2
ID2
C
L
D1
D2
IL IC Io
+Vc
-
+VM1
-
M2
M1
VPVDC
DC
VWindDC
DC
LOADVo+
-
VPV
DC
DC
VWind
LOADVo
+
-
VD2+
-
-
+
VD1
+
+
VD1
+-
+
-
+ -VM1
+ -VM2
Ii2
ID1
+
+ - + -
+ - + -
PMSG
500 W
Vertical axis wind turbine Gear box
+
-
600 W Vpv
DC/DC
Ibat
+
-
Vo
Io
3-ph Rectifier
+
-VWG
IPV
IWG
Control Unit
ON/OFF Control
IWG
VWG
Vpv
IPV
IbatVo
Dummy Load
12 V 450 AH Battery Bench
900 W
Control signals
PMSG
500 W
Vertical axis wind turbine Gear box
+
-
Vw
w
+
-
Solar Pump controller PM DC motor
Vpv
Back- Up system Diesel Generator
-
200 W
-
200 W
-+ +
200 W
+
Ea
Eb
Ec
Xs Rs
ILL VLL
D1 D3 D5
D2 D4D6
+
-
p
N
Id
Ea
Eb
Ec
Xs RsIa
Xs
Xs
Rs
Rs
+
-
VDC
IDC+
+
+
Va
Vb
Vc
Ib
Ic
+-
LvLi
iv +
-
CR
C
LLR
PWM S
+
ovloadR
Si
Di Ri
Ci
Cv
+
LvLi
iv CR
C
LLR
S ovloadR
Si
Di Ri
Ci
Cv
+iv CR
C
LLR
S ovloadR
Si Ci
Cv
1I
sDT (1 ) sD T
iv
i ov v
Lv
Li
PWM
D3
Wind PMSG
turbine
Rectifier
DC
DC
Cotrol UnitControl Signal
Power Converter
DCI
LOAD
+
-
DCV
MPPT algorithm
+
-
Vcc
D9
Vin
+
-
An3 An5An4
Relay
LM7805 +5V
D2
2
31
7
27K
5.6K22uF
5.1V
1N4001
10K
8
3305.6 3305.615K
680
5.6K
330uF
680
15V
22uF
6.8K
15K
5.6K22uF
Relay
5.1V
VLoadSwitch
20K
5.6K22uF
5.1V
680 Vb
att.
D2
MOSPEC S20C40C(x2)
D3
1mH FQP12P20(x2)
0.39 c/v
1.2 K
+ +
+
Current Transducer
5VAn2
GND
Arduino Uno
An2
An3
An4An5
+5V
An
alo
g0
..5
GND
An0
An1
D0D1D2D3D4D5D6D7D8D9D10D11D12
Swep
tA
rea
Ewind EturbineD
Swep
tA
rea
H
VAWTHAWT
Eunabsorved
DCP
mw
maxP
0, 0m
dP dP
dw dD
0, 0, 0 0DC
m DC m
dVdP dD dP
dw dV dw dD
0, 0, 0 0DC
m DC m
dVdP dD dP
dw dV dw dD
High Speed Low Speed
Track Starting Point Track Starting Point
D D
Maximum Power Point Tracking process
PDCk >PDCk-1
Read PDC
D=Dold-∆D
Dk-1 >Dk-2
NO
D=Dold-∆D
YES
D=Dold+∆D
NODk-1 >Dk-2
YES
D=Dold+∆D
YES NO
sDT
I
Li
i oV V
L
sT
iV
L
LI
t
Figure B.6. Inductor waveform during one period.
Output voltage ripple
The output voltage ripple is defined by the variation of voltage in the capacitor, ∆vc. The voltage inthe capacitor vC can be determined knowing the capacitor current, iC .
From Equation B.2 and B.4 the slope of the capacitor waveform vC(t) at both time intervals can bederived (B.16):
dvC(t)dt = iC(t)
C = −VORloadC
dvC(t)dt = iC(t)
C = ILC −
VORloadC
[-](B.16)
The capacitor voltage vC is sketched in Figure B.7. The slope of the waveform during the first intervaltimes the time period is equal to to times the voltage ripple. From this statement, the ripple in thecapacitor vc can be determined B.17:
C =Vo
2Rload∆vcDTS [-](B.17)
Wind PMSG
turbine
Rectifier
wm
DC
DCLOAD
Rotating speed -Power characteristic Pactual
Cotrol Unit
Poptimal
error
Control Signal
Power Converter
PMSG
Wind turbine
Rectifier
DC
DCLOAD
Cotrol Unit
Control Signal
Power Converter
Wind speed
Vw
R
Wm
Wm-optimal
error
+-
+ -
Ea
Eb
Ec
Xs Rs
ILL VLL
D1 D3 D5
D2 D4D6
+
-
p
N
Id
Ea
Eb
Ec
Xs RsIa
Xs
Xs
Rs
Rs
+
-
VDC
IDC+
+
+
Va
Vb
Vc
Ib
Ic
H
D
VG
S1
V1
V2
L
+
-
Vo
M1
M2
D1
D2
+
-
+
-
Vi1
Vi2
+ -VL
+
-Vo
Ii1
C
L
D1
D2
IL IC Io
+
-
+
-
Vi1
Vi2
+ -VL
+
-
+
-Vo
ID1
C
L
D1
D2
IL IC Io
+VD2
-
+ -VM1
M1
M2
M1
M2
C
VG
S2
+
-
+
-
V1
V2
+ -VL
+
-VD1
+
-Vo
+ -VM2
ID2
I1
C
L
D1
D2
IL IC Io
M1
M2
+
-
+
-
Vi1
Vi2
+ -VL
+
-Vo
+ -VM2
ID2
C
L
D1
D2
IL IC Io
+Vc
-
+VM1
-
M2
M1
VPVDC
DC
VWindDC
DC
LOADVo+
-
VPV
DC
DC
VWind
LOADVo
+
-
VD2+
-
-
+
VD1
+
+
VD1
+-
+
-
+ -VM1
+ -VM2
Ii2
ID1
+
+ - + -
+ - + -
PMSG
500 W
Vertical axis wind turbine Gear box
+
-
600 W Vpv
DC/DC
Ibat
+
-
Vo
Io
3-ph Rectifier
+
-VWG
IPV
IWG
Control Unit
ON/OFF Control
IWG
VWG
Vpv
IPV
IbatVo
Dummy Load
12 V 450 AH Battery Bench
900 W
Control signals
PMSG
500 W
Vertical axis wind turbine Gear box
+
-
Vw
w
+
-
Solar Pump controller PM DC motor
Vpv
Back- Up system Diesel Generator
-
200 W
-
200 W
-+ +
200 W
+
Ea
Eb
Ec
Xs Rs
ILL VLL
D1 D3 D5
D2 D4D6
+
-
p
N
Id
Ea
Eb
Ec
Xs RsIa
Xs
Xs
Rs
Rs
+
-
VDC
IDC+
+
+
Va
Vb
Vc
Ib
Ic
+-
LvLi
iv +
-
CR
C
LLR
PWM S
+
ovloadR
Si
Di Ri
Ci
Cv
+
LvLi
iv CR
C
LLR
S ovloadR
Si
Di Ri
Ci
Cv
+iv CR
C
LLR
S ovloadR
Si Ci
Cv
sDT (1 ) sD T
iv
i oV V
( )Lv t
( )Ci t
PWM
D3
Wind PMSG
turbine
Rectifier
DC
DC
Cotrol UnitControl Signal
Power Converter
DCI
LOAD
+
-
DCV
MPPT algorithm
+
-
Vcc
D9
Vin
+
-
An3 An5An4
Relay
LM7805 +5V
D2
2
31
7
27K
5.6K22uF
5.1V
1N4001
10K
8
3305.6 3305.615K
680
5.6K
330uF
680
15V
22uF
6.8K
15K
5.6K22uF
Relay
5.1V
VLoadSwitch
20K
5.6K22uF
5.1V
680 Vb
att.
D2
MOSPEC S20C40C(x2)
D3
1mH FQP12P20(x2)
0.39 c/v
1.2 K
+ +
+
Current Transducer
5VAn2
GND
Arduino Uno
An2
An3
An4An5
+5V
An
alo
g0
..5
GND
An0
An1
D0D1D2D3D4D5D6D7D8D9D10D11D12
Swep
tA
rea
Ewind EturbineD
Swep
tA
rea
H
VAWTHAWT
Eunabsorved
DCP
mw
maxP
0, 0m
dP dP
dw dD
0, 0, 0 0DC
m DC m
dVdP dD dP
dw dV dw dD
0, 0, 0 0DC
m DC m
dVdP dD dP
dw dV dw dD
High Speed Low Speed
Track Starting Point Track Starting Point
D D
Maximum Power Point Tracking process
PDCk >PDCk-1
Read PDC
D=Dold-∆D
Dk-1 >Dk-2
NO
D=Dold-∆D
YES
D=Dold+∆D
NODk-1 >Dk-2
YES
D=Dold+∆D
YES NO
sDT
I
Li
i oV V
L
sT
iV
L
LI
t
oV
R
oL
load
VI
R
t
t
t
sDT
CV
( )v t
LI V
C RC
sT
V
RC
CV
t
Figure B.7. Boost converter ouput voltage waveform.
Equations B.16 and B.15 can be used to determine the value of the capacitor and the inductancedepending on the ripple desired [16].
B.2 Boost converter design and data logger
Figure B.8 shows the main circuit diagram of the boost converter and battery controller designed forthe wind turbine system. The values of the main components of this circuit schematic are shown inTable B.1.
VII

Chapter B. Single DC DC converter
The first part of the circuit is formed by the Boost circuit explained in Chapter B which is connected tothe output of the rectifier. In here, the input voltage and current are measured by the microcontrollerin order to generate the control signal to switch the MOSFET, using the MPPT algorithm describedin Chapter3.
The second part of the circuit is the battery charge controller and load management explained inChapter ??. It consist on a P-Channel MOSFET, a resistor Rb(it is used to reduce the spikes producedby the switching current flowing into the battery) and the relay used to shut down the load in caseof over-discharge. In here, the voltage and the current are sensed to regulate the current flowing intothe battery and the battery voltage level.
PMSGWind
turbine
Rectifier
wm
DC
DCLOAD
Rotating speed -Power characteristic Pactual
Cotrol Unit
Poptimal
error
Control Signal
Power Converter
PMSG
Wind turbine
Rectifier
DC
DCLOAD
Cotrol Unit
Control Signal
Power Converter
Wind speed
Vw
R
Wm
Wm-optimal
error
+-
+ -
Ea
Eb
Ec
Xs Rs
ILL VLL
D1 D3 D5
D2 D4D6
+
-
p
N
Id
Ea
Eb
Ec
Xs RsIa
Xs
Xs
Rs
Rs
+
-
VDC
IDC+
+
+
Va
Vb
Vc
Ib
Ic
H
D
VG
S1
V1
V2
L
+
-
Vo
M1
M2
D1
D2
+
-
+
-
Vi1
Vi2
+ -VL
+
-Vo
Ii1
C
L
D1
D2
IL IC Io
+
-
+
-
Vi1
Vi2
+ -VL
+
-
+
-Vo
ID1
C
L
D1
D2
IL IC Io
+VD2
-
+ -VM1
M1
M2
M1
M2
C
VG
S2
+
-
+
-
V1
V2
+ -VL
+
-VD1
+
-Vo
+ -VM2
ID2
I1
C
L
D1
D2
IL IC Io
M1
M2
+
-
+
-
Vi1
Vi2
+ -VL
+
-Vo
+ -VM2
ID2
C
L
D1
D2
IL IC Io
Vc+
-
VM1+ -
M2
M1
VPVDC
DC
VWindDC
DC
LOADVo+
-
VPV
DC
DC
VWind
LOADVo
+
-
VD2+
-
-
+
VD1
+
+
VD1
+-
+
-
+ -VM1
+ -VM2
Ii2
ID1
+
+ - + -
+ - + -
PMSG
500 W
Vertical axis wind turbine Gear box
+
-
600 W Vpv
DC/DC
Ibat
+
-
Vo
Io
3-ph Rectifier
+
-VWG
IPV
IWG
Control Unit
ON/OFF Control
IWG
VWG
Vpv
IPV
IbatVo
Dummy Load
12 V 450 AH Battery Bench
900 W
Control signals
PMSG
500 W
Vertical axis wind turbine Gear box
+
-
Vw
w
+
-
Solar Pump controller PM DC motor
Vpv
Back- Up system Diesel Generator
-
200 W
-
200 W
-+ +
200 W
+
Ea
Eb
Ec
Xs Rs
ILL VLL
D1 D3 D5
D2 D4D6
+
-
p
N
Id
Ea
Eb
Ec
Xs RsIa
Xs
Xs
Rs
Rs
+
-
VDC
IDC+
+
+
Va
Vb
Vc
Ib
Ic
+-
LvLi
iv +
-
CR
C
LLR
PWM S
+
ovloadR
Si
Di Ri
Ci
Cv
+
LvLi
iv CR
C
LLR
S ovloadR
Si
Di Ri
Ci
Cv
+iv CR
C
LLR
S ovloadR
Si Ci
Cv
sDT (1 ) sD T
iv
i oV V
( )Lv t
( )Ci t
PWM
D3
PMSGWind
turbine
Rectifier
DC
DC
Cotrol UnitControl Signal
Power Converter
DCI
LOAD
+
-
DCV
MPPT algorithm
+
-
Vcc
D9
Vin
+
-
An3 An5An4
Relay
LM7805 +5V
D2
2
31
7
27K
5.6K22uF
5.1V
1N4001
10K
8
3305.6 3305.615K
680
5.6K
330uF
680
15V
22uF
6.8K
15K
5.6K22uF
Relay
5.1V
VLoadSwitch
20K
5.6K22uF
5.1V
680 Vb
att.
D2
MOSPEC S20C40C(x2)
D3
1mH FQP12P20(x2)
0.39 c/v
1.2 K
+ +
+
Current Transducer
5VAn2
GND
Arduino Uno
An2
An3
An4An5
+5V
An
alo
g 0
..5
GND
An0
An1
D0D1D2D3D4D5D6D7D8D9D10D11D12
Swep
t A
rea
Ewind EturbineD
Swep
t A
rea
H
VAWTHAWT
Eunabsorved
DCP
mw
maxP
0, 0m
dP dP
dw dD
0, 0, 0 0DC
m DC m
dVdP dD dP
dw dV dw dD
0, 0, 0 0DC
m DC m
dVdP dD dP
dw dV dw dD
High Speed Low Speed
Track Starting Point Track Starting Point
D D
Maximum Power Point Tracking process
PDCk >PDCk-1
Read PDC
D=Dold-∆D
Dk-1 >Dk-2
NO
D=Dold-∆D
YES
D=Dold+∆D
NODk-1 >Dk-2
YES
D=Dold+∆D
YES NO
sDT
I
Li
i oV V
L
sT
iV
L
LI
t
oV
R
oL
load
VI
R
t
t
t
sDT
CV
( )v t
LI V
C RC
sT
V
RC
CV
t
0.5
0.0
1
1.5
2
2.5
3
5 10 15 20
Voltage
Cu
rren
t
Vmp
Imp
Isc Short circuit current
VocOpen circuit voltage
MPP
V.Battery
I-V PV panel characteristics
DC/DC converterDC loadVbatt
+
-
Vp
v
Ipv +
-
Vo
Io
A/D A/D
MPPT and Charging algorithm
PWM
PV array
MPP
SCI
1dI
I
Load
2dI
1D
SR
PR2D
rI
DC/DCPV -Wind
system
Battery charge control.
Load regulation.
.battV.battI
Battery
.battD loadD
DCLOAD
.battI
t
sDT sT
-
Vin
+
-
Relay
CVbatt.
L Rb
Microcontroller
Iin
Vcontrol1
D1
M1
Sensor Signals Control Signals
VoutVin
Vbatt.
Ibatt
IinIbatt.
Vcontrol1Vcontrol2Vcontrol3
Vcontrol2
Vcontrol3
Vout Vout
file:///C:/Users/Andres/Documents/17c276_250_205.jpg
file:///C:/Users/Andres/Documents/17c276_250_205.jpg
windv
+
-
12
12
1R
2R
fR
+
-
12
12
3R
4R
5R 6RoutV
Datalogger
M2
Figure B.8. Boost converter and control circuit designed for this purpose.
Table B.1. Boost converter and charge controller components used.
Name Symbol Value
Inductor L 1 mHCapacitor C 330µFResistor RbDiode D1 MOSPEC S20C40CMOSFET M1 FQP12N20MOSFET M2 FQP12P20Relay - RP310012Microcontroller - Arduino Uno
In order to characterize the power produced by the wind turbine designed, an anemometer is usedto measure the wind speed. The anemometer used is called NRG#40 which generates an outputAC voltage signal and its frequency depends on the wind speed [12]. Thus, it is required to read thefrequency of the signal in order to know the wind speed.For reading the signal with the microcontroller,this signal needs to be conditioned as it has a minimum amplitude of 0.3V and the microcontrollercan not read negative signals. Therefore, an amplification and zero-crossing detector system has beenimplemented. Figure B.9 shows the analog circuit designed for this purpose.
Table B.2 shows the values of the resistors used on the analogue circuit used for conditioning theoutput signal of the converter so it can be read and processed by the microcontroller. The value of Rfis designed according to the gain desired for the ouput of the first amplifier, which in this case G = 4.
VIII
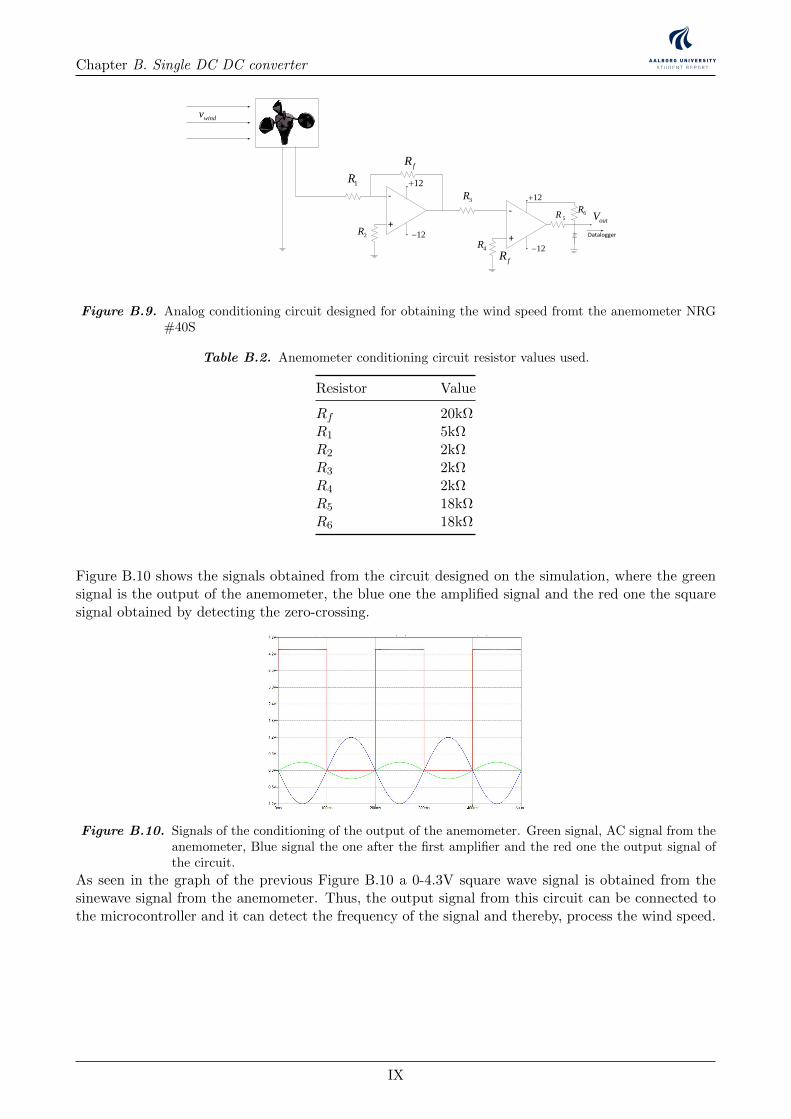
Chapter B. Single DC DC converter
2CT
PMSGWind
turbine
Rectifier
wm
DC
DCLOAD
Rotating speed -Power characteristic Pactual
Cotrol Unit
Poptimal
error
Control Signal
Power Converter
PMSG
Wind turbine
Rectifier
DC
DCLOAD
Cotrol Unit
Control Signal
Power Converter
Wind speed
Vw
R
Wm
Wm-optimal
error
+-
+ -
Ea
Eb
Ec
Xs Rs
ILL VLL
D1 D3 D5
D2 D4D6
+
-
p
N
Id
Ea
Eb
Ec
Xs RsIa
Xs
Xs
Rs
Rs
+
-
VDC
IDC+
+
+
Va
Vb
Vc
Ib
Ic
H
D
VPVDC
DC
VWindDC
DC
LOADVo+
-
VPV
DC
DC
VWind
LOADVo
+
-
+
+ - + -
+ - + -
PMSG
500 W
Vertical axis wind turbine Gear box
+
-
600 W Vpv
DC/DC
Ibat
+
-
Vo
Io
3-ph Rectifier
+
-VWG
IPV
IWG
Control Unit
ON/OFF Control
IWG
VWG
Vpv
IPV
IbatVo
Dummy Load
12 V 450 AH Battery Bench
900 W
Control signals
PMSG
500 W
Vertical axis wind turbine Gear box
+
-
Vw
w
+
-
Solar Pump controller PM DC motor
Vpv
Back- Up system Diesel Generator
-
200 W
-
200 W
-+ +
200 W
+
Ea
Eb
Ec
Xs Rs
ILL VLL
D1 D3 D5
D2 D4D6
+
-
p
N
Id
Ea
Eb
Ec
Xs RsIa
Xs
Xs
Rs
Rs
+
-
VDC
IDC+
+
+
Va
Vb
Vc
Ib
Ic
+-
LvLi
iv +
-
CR
C
LLR
PWM S
+
ovloadR
Si
Di Ri
Ci
Cv
+
LvLi
iv CR
C
LLR
S ovloadR
Si
Di Ri
Ci
Cv
+iv CR
C
LLR
S ovloadR
Si Ci
Cv
sDT (1 ) sD T
iv
i oV V
( )Lv t
( )Ci t
PWM
D3
PMSGWind
turbine
Rectifier
DC
DC
Cotrol UnitControl Signal
Power Converter
DCI
LOAD
+
-
DCV
MPPT algorithm
+
-
Vcc
D9
Vin
+
-
An3 An5An4
Relay
LM7805 +5V
D2
2
31
7
27K
5.6K22uF
5.1V
1N4001
10K
8
3305.6 3305.615K
680
5.6K
330uF
680
15V
22uF
6.8K
15K
5.6K22uF
Relay
5.1V
VLoadSwitch
20K
5.6K22uF
5.1V
680 Vb
att.
D2
MOSPEC S20C40C(x2)
D3
1mH FQP12P20(x2)
0.39 c/v
1.2 K
+ +
+
Current Transducer
5VAn2
GND
Arduino Uno
An2
An3
An4An5
+5V
An
alo
g 0
..5
GND
An0
An1
D0D1D2D3D4D5D6D7D8D9D10D11D12
Swep
t A
rea
Ewind EturbineD
Swep
t A
rea
H
VAWTHAWT
Eunabsorved
DCP
mw
maxP
0, 0m
dP dP
dw dD
0, 0, 0 0DC
m DC m
dVdP dD dP
dw dV dw dD
0, 0, 0 0DC
m DC m
dVdP dD dP
dw dV dw dD
High Speed Low Speed
Track Starting Point Track Starting Point
D D
Maximum Power Point Tracking process
PDCk >PDCk-1
Read PDC
Iref(k)=Iref(k-1)-∆I
Vk >Vk-1
NO
Iref(k)=Iref(k-1)-∆I
YES
Iref(k)=Iref(k-1)+∆I
NOVk >Vk-1
YES
Iref(k)=Iref(k-1)+∆I
YES NO
sDT
I
Li
i oV V
L
sT
iV
L
LI
t
oV
R
oL
load
VI
R
t
t
t
sDT
CV
( )v t
LI V
C RC
sT
V
RC
CV
t
0.5
0.0
1
1.5
2
2.5
3
5 10 15 20
Voltage
Cu
rren
t
Vmp
Imp
Isc Short circuit current
VocOpen circuit voltage
MPP
V.Battery
I-V PV panel characteristics
DC/DC converterDC loadVbatt
+
-
Vp
v
Ipv +
-
Vo
Io
A/D A/D
MPPT and Charging algorithm
PWM
PV array
MPP
SCI
1dI
I
Load
2dI
1D
SR
PR2D
rI
DC/DCPV -Wind
system
Battery charge control.
Load regulation.
.battV.battI
Battery
.battD loadD
DCLOAD
.battI
t
sDT sT
-
Vin
+
-
Relay
CVbatt.
L Rb
Microcontroller
Iin
Vcontrol1
D1
M1
Sensor Signals Control Signals
VoutVin
Vbatt.
Ibatt
IinIbatt.
Vcontrol1Vcontrol2Vcontrol3
Vcontrol2
Vcontrol3
Vout Vout
file:///C:/Users/Andres/Documents/17c276_250_205.jpg
file:///C:/Users/Andres/Documents/17c276_250_205.jpg
windv
+
-12
12
1R
2R
fR
+
-
12
12
3R
4R
5R 6RoutV
Datalogger
M2
+
-
G
Iref=10A
+
-Vtrian.
Battery Charge ControllerVcontrol Ibatt.
MPPT AlgorithmDCV
DCI
refI+
-
e+
-.triVPWM
G
Io
-
+
-
+
-
+
Vo
V1
V2
C
+ -VL
+
-VD1
+ -VM2
ID2
I1 L
D1
D2
IL IC
M1
M2
VD2
+ -VM1
C Vo
Io+
-
+
-
-
+
+ -VL
+
-ID1
L
D1
D2
IL IC
+VD2
-
+ -VM1
M1
M2+ -VM2
V1
V2
C
+
-Vo
Io
Ii1
Ii2
+
-
+
-
V1
V2
+ -VL
L
D1
D2
IL ICM1
M2
VD2+
-
-
+VD1
+
-
+
-
+
-Vo
Io
Vc
V1
V2
+ -VL
+ -VM2
ID2
C
L
D1
D2
IL IC
+
-
VM1+ -
M2
M1
ID1
VD1
VD1
( )a ( )b
( )c ( )d
+
-
V1
V2
Vo
+
-
VG
S1
LM1
M2
D1
D2
C
-
+
VG
S2
VG
S1
+
-
-
+
V1
V2
+
-
Vo
LM1
M2
D1
D2
C
VG
S2
( )b
( )a
PMSGWind
turbine
Rectifier
wm
DC
DCLOAD
Rotating speed -Power characteristic Pactual
Cotrol Unit
Poptimal
error
Control Signal
Power Converter
PMSG
Wind turbine
Rectifier
DC
DCLOAD
Cotrol Unit
Control Signal
Power Converter
Wind speed
Vw
R
Wm
Wm-optimal
error
+-
+ -
Ea
Eb
Ec
Xs Rs
ILL VLL
D1 D3 D5
D2 D4D6
+
-
p
N
Id
Ea
Eb
Ec
Xs RsIa
Xs
Xs
Rs
Rs
+
-
VDC
IDC+
+
+
Va
Vb
Vc
Ib
Ic
H
D
VPVDC
DC
VWindDC
DC
LOADVo+
-
VPV
DC
DC
VWind
LOADVo
+
-
+
+ - + -
+ - + -
PMSG
500 W
Vertical axis wind turbine Gear box
+
-
600 W Vpv
DC/DC
Ibat
+
-
Vo
Io
3-ph Rectifier
+
-VWG
IPV
IWG
Control Unit
ON/OFF Control
IWG
VWG
Vpv
IPV
IbatVo
Dummy Load
12 V 450 AH Battery Bench
900 W
Control signals
PMSG
500 W
Vertical axis wind turbine Gear box
+
-
Vw
w
+
-
Solar Pump controller PM DC motor
Vpv
Back- Up system Diesel Generator
-
200 W
-
200 W
-+ +
200 W
+
Ea
Eb
Ec
Xs Rs
ILL VLL
D1 D3 D5
D2 D4D6
+
-
p
N
Id
Ea
Eb
Ec
Xs RsIa
Xs
Xs
Rs
Rs
+
-
VDC
IDC+
+
+
Va
Vb
Vc
Ib
Ic
+-
LvLi
iv +
-
CR
C
LLR
PWM S
+
ovloadR
Si
Di Ri
Ci
Cv
+
LvLi
iv CR
C
LLR
S ovloadR
Si
Di Ri
Ci
Cv
+iv CR
C
LLR
S ovloadR
Si Ci
Cv
sDT (1 ) sD T
iv
i oV V
( )Lv t
( )Ci t
PWM
D3
PMSGWind
turbine
Rectifier
DC
DC
Cotrol UnitControl Signal
Power Converter
DCI
LOAD
+
-
DCV
MPPT algorithm
+
-
Vcc
D9
Vin
+
-
An3 An5An4
Relay
LM7805 +5V
D2
2
31
7
27K
5.6K22uF
5.1V
1N4001
10K
8
3305.6 3305.615K
680
5.6K
330uF
680
15V
22uF
6.8K
15K
5.6K22uF
Relay
5.1V
VLoadSwitch
20K
5.6K22uF
5.1V
680 Vb
att.
D2
MOSPEC S20C40C(x2)
D3
1mH FQP12P20(x2)
0.39 c/v
1.2 K
+ +
+
Current Transducer
5VAn2
GND
Arduino Uno
An2
An3
An4An5
+5V
An
alo
g 0
..5
GND
An0
An1
D0D1D2D3D4D5D6D7D8D9D10D11D12
Swep
t A
rea
Ewind EturbineD
Swep
t A
rea
H
VAWTHAWT
Eunabsorved
DCP
mw
maxP
0, 0m
dP dP
dw dD
0, 0, 0 0DC
m DC m
dVdP dD dP
dw dV dw dD
0, 0, 0 0DC
m DC m
dVdP dD dP
dw dV dw dD
High Speed Low Speed
Track Starting Point Track Starting Point
D D
Maximum Power Point Tracking process
PDCk >PDCk-1
Read PDC
Iref(k)=Iref(k-1)-∆I
Vk >Vk-1
NO
Iref(k)=Iref(k-1)-∆I
YES
Iref(k)=Iref(k-1)+∆I
NOVk >Vk-1
YES
Iref(k)=Iref(k-1)+∆I
YES NO
sDT
I
Li
i oV V
L
sT
iV
L
LI
t
oV
R
oL
load
VI
R
t
t
t
sDT
CV
( )v t
LI V
C RC
sT
V
RC
CV
t
0.5
0.0
1
1.5
2
2.5
3
5 10 15 20
Voltage
Cu
rren
t
Vmp
Imp
Isc Short circuit current
VocOpen circuit voltage
MPP
V.Battery
I-V PV panel characteristics
DC/DC converterDC loadVbatt
+
-
Vp
v
Ipv +
-
Vo
Io
A/D A/D
MPPT and Charging algorithm
PWM
PV array
MPP
SCI
1dI
I
Load
2dI
1D
SR
PR2D
rI
DC/DCPV -Wind
system
Battery charge control.
Load regulation.
.battV.battI
Battery
.battD loadD
DCLOAD
.battI
t
sDT sT
-
Vin
+
-
Relay
CVbatt.
L Rb
Microcontroller
Iin
Vcontrol1
D1
M1
Sensor Signals Control Signals
VoutVin
Vbatt.
Ibatt
IinIbatt.
Vcontrol1Vcontrol2Vcontrol3
Vcontrol2
Vcontrol3
Vout Vout
file:///C:/Users/Andres/Documents/17c276_250_205.jpg
windv
+
-12
12
1R
2R
fR
+
-
12
12
3R
4R
5R 6RoutV
Datalogger
M2
+
-
G
Iref=10A
+
-Vtrian.
Battery Charge ControllerVcontrol Ibatt.
MPPT AlgorithmDCV
DCI
refI+
-
e+
-.triV
Current compensator
PWM
Io
-
+
-
+
-
+
Vo
V1
V2
C
+ -VL
+
-VD1
+ -VM2
ID2
I1 L
D1
D2
IL IC
M1
M2
VD2
+ -VM1
C Vo
Io+
-
+
-
-
+
+ -VL
+
-ID1
L
D1
D2
IL IC
+VD2
-
+ -VM1
M1
M2+ -VM2
V1
V2
C
+
-Vo
Io
Ii1
Ii2
+
-
+
-
V1
V2
+ -VL
L
D1
D2
IL ICM1
M2
VD2+
-
-
+VD1
+
-
+
-
+
-Vo
Io
Vc
V1
V2
+ -VL
+ -VM2
ID2
C
L
D1
D2
IL IC
+
-
VM1+ -
M2
M1
ID1
VD1
VD1
( )a
( )b
( )c ( )d
+
-
V1
V2
Vo
+
-
VG
S1
LM1
M2
D1
D2
C
-
+ VG
S2
VG
S1
+
-
-
+
V1
V2
+
-
Vo
LM1
M2
D1
D2
C
VG
S2
( )b( )a
( )a
( )b
sT
1d
1d
2t1t 4t3t
t
t
1GSV
2GSV
-+
V1
+
-V2
Vo
-
VG
S1
LM1
M2
D1
D2
C
+ VG
S2
( )c
VGS3
-+
V1
+
-V2
Vo
-
VG
S1
LM1
M2
D1
D2
C
+
VG
S2
VGS3
3M
-+
V1
+
-V2
Vo
-
VG
S1
LM1
M2
D1
D2
C
+ VG
S2
( )c
VGS3
+
-
Relay
CVbatt.
L Rb
VGS3
D3
M1
Ibatt.
Vrelay
Vout Vout
M2
Vwind
Iwind
-
+-
VPV
D1
D2
VGS1
VGS2
VGS4
-
Microcontroller
Ipv
Sensor Signals Control Signals
VoutVin
Vbatt
Vcontrol1Vcontrol2Vcontrol3
IwindIbatt Vrelay
Vcontrol4
+
-
+
-
Ipv
IoILIL
IL
( )a
IL
-+
V1
+
-V2
Vo
-
VG
S1
LM1
M2
D1
D2
C
+
VG
S2
VGS3
Io IoIL
( )c
-+
V1
+
-V2
Vo
-
VG
S1
LM1
M2
D1
D2
C
+
VG
S2
VGS3
IL
IL
( )b
IL
-+
V1
+
-V2
Vo
-
VG
S1
LM1
M2
D1
D2
C
+
VG
S2
VGS3
IL
( )c
Ic Io
Io
Ic
D3 D3
D3D3
+- 2G
1CT1G
2CT+-
1H
refVoV
*
refI
LI
duty
Plant 1 Plant 2Controller 2Controller 1
measuredLI
Microprocessor
(MPPT Programming)
-+ +
-
PVI
PVVWindV
WindI
1d 2d
1
*
refI2
*
refI
+
-
+
-
PVV
windV
*
refV
Microprocessor(Current Control programming)
Boost mode
3d
oVoI
*
refV
Microprocessor(Current Control programming)
Buck mode
1d
oVoI
2d
L D3
D1
D2
Double input DC/DC converter
PVI
WindILoad
oI+
-
oVABV
AV
BV
MicroprocessorPower managament
control unit
PVV
PVI
windV
WindI
ABV
oV
oI
1d 2d 3d
1S
2S
3S
1d
2d
3d
+-
*
refI1( )d s
Plant 1 LI
12G
11G
2 ( )d s
+
+
1H
+refV
1CT-
2GPlant 2
oV
*
refILI
+refV
1CT- 2G
Plant 2
oVInner current loop
110 V
12 V
12 V
Microcontroller PWM signal
18 V
V1
V2
VGS
1 K
10 K 220Ω 15V
G
SDrive Circuit
Optocoupler
4N28
LP-575
Transformer
Grid voltage
Rectifier circuit
Independent voltage sources
DCP
maxP
0, 0, 0 0DC
m DC m
dVdP dD dP
dw dV dw dD
High Speed
Track Starting Point
D
NO
windv
+
-12
12
1R
2R
fR
+
-
12
12
3R
4R
5R 6RoutV
Datalogger
fR
Figure B.9. Analog conditioning circuit designed for obtaining the wind speed fromt the anemometer NRG#40S
Table B.2. Anemometer conditioning circuit resistor values used.
Resistor Value
Rf 20kΩR1 5kΩR2 2kΩR3 2kΩR4 2kΩR5 18kΩR6 18kΩ
Figure B.10 shows the signals obtained from the circuit designed on the simulation, where the greensignal is the output of the anemometer, the blue one the amplified signal and the red one the squaresignal obtained by detecting the zero-crossing.
Figure B.10. Signals of the conditioning of the output of the anemometer. Green signal, AC signal from theanemometer, Blue signal the one after the first amplifier and the red one the output signal ofthe circuit.
As seen in the graph of the previous Figure B.10 a 0-4.3V square wave signal is obtained from thesinewave signal from the anemometer. Thus, the output signal from this circuit can be connected tothe microcontroller and it can detect the frequency of the signal and thereby, process the wind speed.
IX
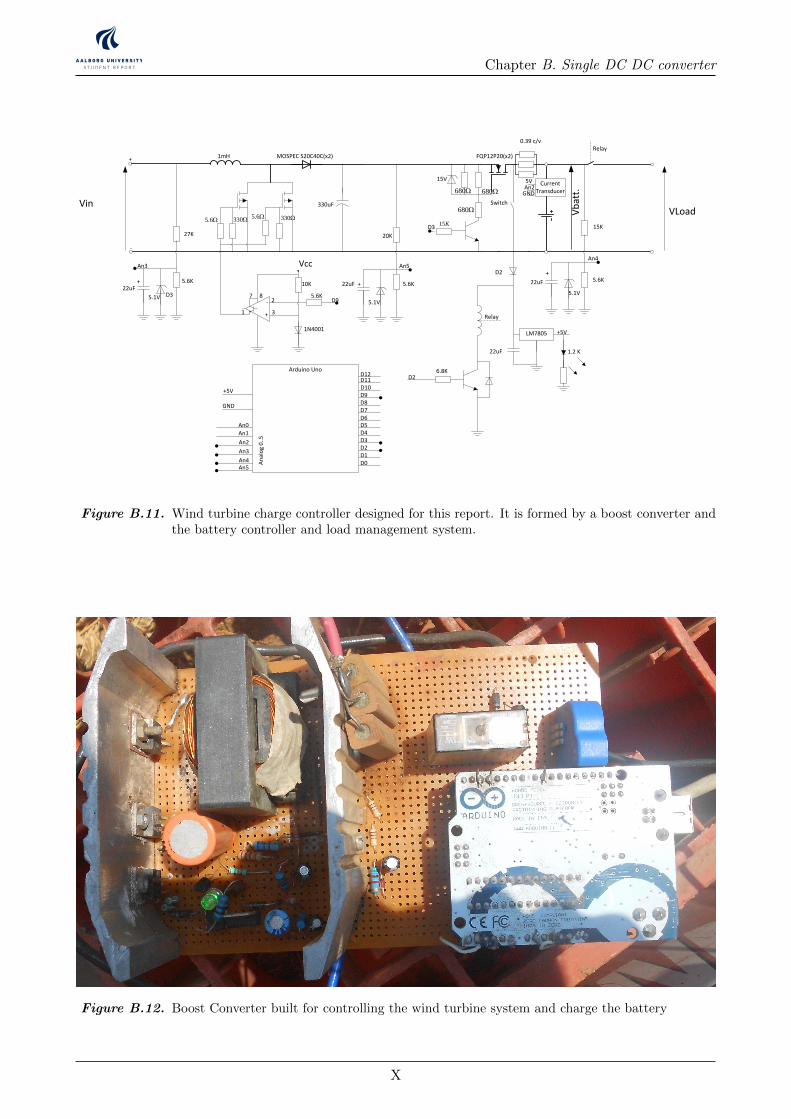
Chapter B. Single DC DC converter
Wind PMSG
turbine
Rectifier
wm
DC
DCLOAD
Rotating speed -Power characteristic Pactual
Cotrol Unit
Poptimal
error
Control Signal
Power Converter
PMSG
Wind turbine
Rectifier
DC
DCLOAD
Cotrol Unit
Control Signal
Power Converter
Wind speed
Vw
R
Wm
Wm-optimal
error
+-
+ -
Ea
Eb
Ec
Xs Rs
ILL VLL
D1 D3 D5
D2 D4D6
+
-
p
N
Id
Ea
Eb
Ec
Xs RsIa
Xs
Xs
Rs
Rs
+
-
VDC
IDC+
+
+
Va
Vb
Vc
Ib
Ic
H
D
VG
S1
V1
V2
L
+
-
Vo
M1
M2
D1
D2
+
-
+
-
Vi1
Vi2
+ -VL
+
-Vo
Ii1
C
L
D1
D2
IL IC Io
+
-
+
-
Vi1
Vi2
+ -VL
+
-
+
-Vo
ID1
C
L
D1
D2
IL IC Io
+VD2
-
+ -VM1
M1
M2
M1
M2
C
VG
S2
+
-
+
-
V1
V2
+ -VL
+
-VD1
+
-Vo
+ -VM2
ID2
I1
C
L
D1
D2
IL IC Io
M1
M2
+
-
+
-
Vi1
Vi2
+ -VL
+
-Vo
+ -VM2
ID2
C
L
D1
D2
IL IC Io
+Vc
-
+VM1
-
M2
M1
VPVDC
DC
VWindDC
DC
LOADVo+
-
VPV
DC
DC
VWind
LOADVo
+
-
VD2+
-
-
+
VD1
+
+
VD1
+-
+
-
+ -VM1
+ -VM2
Ii2
ID1
+
+ - + -
+ - + -
PMSG
500 W
Vertical axis wind turbine Gear box
+
-
600 W Vpv
DC/DC
Ibat
+
-
Vo
Io
3-ph Rectifier
+
-VWG
IPV
IWG
Control Unit
ON/OFF Control
IWG
VWG
Vpv
IPV
IbatVo
Dummy Load
12 V 450 AH Battery Bench
900 W
Control signals
PMSG
500 W
Vertical axis wind turbine Gear box
+
-
Vw
w
+
-
Solar Pump controller PM DC motor
Vpv
Back- Up system Diesel Generator
-
200 W
-
200 W
-+ +
200 W
+
Ea
Eb
Ec
Xs Rs
ILL VLL
D1 D3 D5
D2 D4D6
+
-
p
N
Id
Ea
Eb
Ec
Xs RsIa
Xs
Xs
Rs
Rs
+
-
VDC
IDC+
+
+
Va
Vb
Vc
Ib
Ic
+-
LvLi
iv +
-
CR
C
LLR
PWM S
+
ovloadR
Si
Di Ri
Ci
Cv
+
LvLi
iv CR
C
LLR
S ovloadR
Si
Di Ri
Ci
Cv
+iv CR
C
LLR
S ovloadR
Si Ci
Cv
sDT (1 ) sD T
iv
i oV V
( )Lv t
( )Ci t
PWM
D3
Wind PMSG
turbine
Rectifier
DC
DC
Cotrol UnitControl Signal
Power Converter
DCI
LOAD
+
-
DCV
MPPT algorithm
+
-
Vcc
D9
Vin
+
-
An3 An5An4
Relay
LM7805 +5V
D2
2
31
7
27K
5.6K22uF
5.1V
1N4001
10K
8
3305.6 3305.615K
680
5.6K
330uF
680
15V
22uF
6.8K
15K
5.6K22uF
Relay
5.1V
VLoadSwitch
20K
5.6K22uF
5.1V
680 Vb
att.
D2
MOSPEC S20C40C(x2)
D3
1mH FQP12P20(x2)
0.39 c/v
1.2 K
+ +
+
Current Transducer
5VAn2
GND
Arduino Uno
An2
An3
An4An5
+5V
An
alo
g0
..5
GND
An0
An1
D0D1D2D3D4D5D6D7D8D9D10D11D12
Swep
tA
rea
Ewind EturbineD
Swep
tA
rea
H
VAWTHAWT
Eunabsorved
DCP
mw
maxP
0, 0m
dP dP
dw dD
0, 0, 0 0DC
m DC m
dVdP dD dP
dw dV dw dD
0, 0, 0 0DC
m DC m
dVdP dD dP
dw dV dw dD
High Speed Low Speed
Track Starting Point Track Starting Point
D D
Maximum Power Point Tracking process
PDCk >PDCk-1
Read PDC
D=Dold-∆D
Dk-1 >Dk-2
NO
D=Dold-∆D
YES
D=Dold+∆D
NODk-1 >Dk-2
YES
D=Dold+∆D
YES NO
sDT
I
Li
i oV V
L
sT
iV
L
LI
t
oV
R
oL
load
VI
R
t
t
t
sDT
CV
( )v t
LI V
C RC
sT
V
RC
CV
t
0.5
0.0
1
1.5
2
2.5
3
5 10 15 20
Voltage
Cu
rren
t
Vmp
Imp
Isc Short circuit current
VocOpen circuit voltage
MPP
V.Battery
I-V PV panel characteristics
DC/DC converterDC loadVbatt
+
-
Vp
v
Ipv +
-
Vo
Io
A/D A/D
MPPT and Charging algorithm
PWM
PV array
MPP
SCI
1dI
I
Load
2dI
1D
SR
PR2D
rI
DC/DCPV -Wind
system
Battery charge control.
Load regulation.
.battV.battI
Battery
.battD loadD
DCLOAD
.battI
t
sDT sT
-
Vin
+
-
Relay
CVbatt.
L Rb
Microcontroller
Iin
Vcontrol1
D1
M1
Sensor Signals Control Signals
VinVoutVbatt.
Ibatt
IinIbatt.
Vcontrol1Vcontrol2Vcontrol3
Vcontrol2
Vcontrol3
Vout Vout
file:///C:/Users/Andres/Documents/17c276_250_205.jpg
file:///C:/Users/Andres/Documents/17c276_250_205.jpg
windv
+
-12
12
1R
2R
fR
+
-
12
12
3R
4R
5R 6RoutV
Datalogger
M2
Figure B.11. Wind turbine charge controller designed for this report. It is formed by a boost converter andthe battery controller and load management system.
Figure B.12. Boost Converter built for controlling the wind turbine system and charge the battery
X
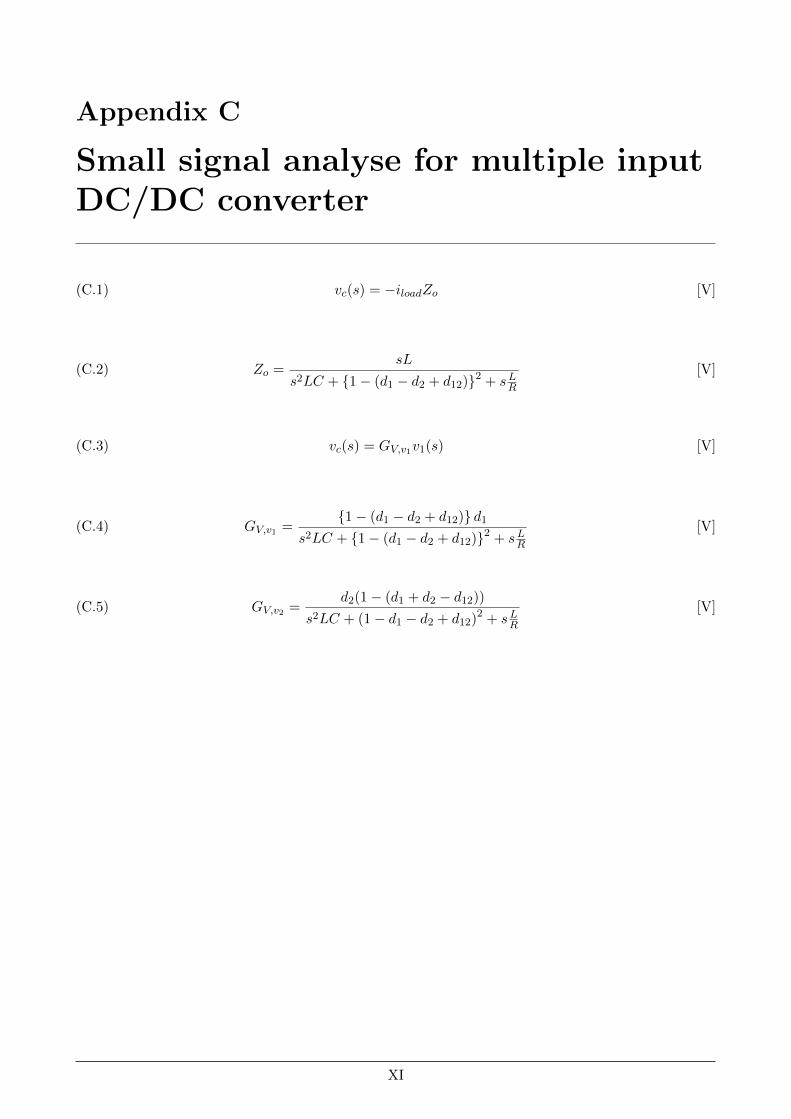
Appendix C
Small signal analyse for multiple inputDC/DC converter
vc(s) = −iloadZo [V](C.1)
Zo =sL
s2LC + 1− (d1 − d2 + d12)2 + sLR[V](C.2)
vc(s) = GV,v1v1(s) [V](C.3)
GV,v1 =1− (d1 − d2 + d12) d1
s2LC + 1− (d1 − d2 + d12)2 + sLR[V](C.4)
GV,v2 =d2(1− (d1 + d2 − d12))
s2LC + (1− d1 − d2 + d12)2 + sLR[V](C.5)
XI