Genital lesions in cows naturally infected with trypanosomes ...
a r c h i v e s o f o r a l b i o l o g y 5 4 ( 2 0 0 9 ) 1 0 0 8 – 1 0 1 5
Morphological characterization of rat incisor fluorotic lesions
Regina Aparecida Saiani a, Isabel Maria Porto b, Elcio Marcantonio Junior c,Jaime Aparecido Cury d, Frederico Barbosa de Sousa e, Raquel Fernanda Gerlach f,*aDepartment of Pediatric Clinics, Preventive and Social Dentistry, Dental School of Ribeirao Preto, University of Sao Paulo,
FORP/USP, Ribeirao Preto, SP, BrazilbDepartment of Morphology, Dental School of Piracicaba, University of Campinas, FOP/UNICAMP, Piracicaba, SP, BrazilcDepartment of Diagnostic and Surgery, Division of Periodontics, Dental School of Araraquara,
Sao Paulo State University – UNESP, Araraquara, SP, BrazildDepartment of Biochemistry, Dental School of Piracicaba, University of Campinas, FOP/UNICAMP, Piracicaba, SP, BrazileDepartment of Morphology, Health Science Center, Federal University of Paraıba, UFPB, Joao Pessoa, PB, BrazilfDepartment of Morphology, Stomatology and Physiology, Dental School of Ribeirao Preto, University of Sao Paulo,
FORP/USP, Avenida do Cafe, S/N, CEP 14040-904 Ribeirao Preto, SP, Brazil
a r t i c l e i n f o
Article history:
Accepted 30 August 2009
Keywords:
Fluorosis
Polarized light microscopy
SEM
BSE-SEM
Birefringence
a b s t r a c t
The morphological characterization of fluorotic rat incisor enamel was carried out. Experi-
mental adult animals received drinking water with 45 mg F/L of fluoride, and the control
group received distilled water. Fluoride concentrations found in the control and fluorosis
groups were 0.04 and 0.09 mg/mL (plasma), 0.26 and 0.66 mg/mg (whole tibia), and 0.24 and
2.3 mg/mg (tibia surface), with P � 0.001 for all comparisons between the groups. A succes-
sion of white and pigmented bands was observed in the fluorotic rat incisors. Under
polarizing light microscopy, cross-sections of superficial areas corresponding to the white
bands (from the surface to �20 mm) showed high positive birefringence. These fluorotic
lesions also exhibited the lowest resistance to superficial acid etching. No morphological
differences in inner enamel were seen under scanning electron microscopy. In fluorotic
enamel, only the surface layer related to the white areas presented lower birefringence
compared with the enamel of control teeth and the surface layer of the pigmented areas
(normal ones) of fluorotic teeth. In conclusion, the white bands of fluorotic rat enamel
represent hypomineralized superficial areas and are not subsurface lesions. The detailed
description of these lesions is important to understand dental fluorosis.
# 2009 Elsevier Ltd. All rights reserved.
avai lable at www.sc iencedi rec t .com
journal homepage: www.intl.elsevierhealth.com/journals/arob
1. Introduction
Enamel fluorosis is a consequence of impaired maturation of
the dental enamel by systemic fluoride, causing a poorly
mineralized tissue with normal thickness.1 Although several
studies have described retention of proteins in fluorotic
enamel,2–5 the majority of these reports have employed rat
enamel in the early maturation stage.
* Corresponding author at: Departamento de Morfologia, EstomatologiaAvenida do Cafe, S/N, CEP 14040-904 Ribeirao Preto, SP, Brazil. Fax: +
E-mail address: [email protected] (R.F. Gerlach).
0003–9969/$ – see front matter # 2009 Elsevier Ltd. All rights reservedoi:10.1016/j.archoralbio.2009.08.009
A recent review on dental fluorosis6 includes the following
hypotheses for dental fluorosis: (i) alteration in the conforma-
tion or aggregation of enamel matrix proteins, (ii) binding of
fluoride ion to enamel matrix proteins and proteases, (iii)
alteration in protein–crystal interaction, (iv) different proces-
sing or lifetime of proteases in situ and (v) alteration of
proteolytic activities sensitive to calcium levels. In addition,
fluoride-induced early mineralization of the enamel surface
e Fisiologia, Faculdade de Odontologia de Ribeirao Preto, FORP/USP,55 16 3602 4102.
d.
a r c h i v e s o f o r a l b i o l o g y 5 4 ( 2 0 0 9 ) 1 0 0 8 – 1 0 1 5 1009
layer, which might impede complete removal of organic
matter from the inner layers, has been suggested as a
contributing factor7 to fluorosis.
Both human and rat fluorotic enamel lesions have been
histologically described as a subsurface hypomineralized area
underneath a relatively well-mineralized surface layer; i.e.,
subsurface lesions.8,9 Such surface layer appears radiopaque
in a microradiography, and negatively birefringent in water
under examination by polarizing microscopy. The description
of these lesions as being radiolucent inside and covered by
normal enamel9 is consistent with the hypothesis that
fluorotic enamel lesions are caused by impaired removal of
organic matter from inner enamel layers resulting from the
early mineralization of the surface layer of the maturing
enamel.
The rat incisor is widely employed for studies on
amelogenesis, but few literature reports describe the histo-
pathology of fluorotic enamel lesions in the rat incisor.
Regarding the subsurface nature of the fluorotic lesion in
the rat incisor enamel, published microradiographs9,10 do not
give unequivocal evidence of the presence of a relatively well-
mineralized surface layer. While the presence of this layer
would suggest that a physical barrier exists in the outer
enamel that might impede the removal of organic matter from
the inner enamel, the lack of such mineralized layer would
indicate that this physical barrier does not exist. Therefore,
the in-depth characterization of the mature fluorotic enamel
may aid understanding of the mechanism underlying the
development of fluorotic enamel defects, particularly in the
rat incisor amelogenesis model.
Therefore, we have carried out the detailed morphological
characterization of fluorotic rat incisor enamel by bright field,
polarized light microscopy and scanning electron microscopy
(secondary and backscattered electron modes).
2. Materials and methods
This study was approved by the University’s Ethical Commit-
tee for Animal Research (CEEUA – USP, protocol number
01.1364.53.4). Forty one-month-old male Wistar rats were used
and divided into two groups: the experimental group, which
received 45 mg fluoride (100 mg sodium fluoride)/L distilled
water for 60 days; and the control group, which received
distilled water. Water and food were administered ad libitum.
After 60 days, the rats were killed, and their upper incisors
were removed for morphological analysis. The labial surface
of both control and fluorotic enamel of incisors was photo-
graphed under low magnification prior to other analyses.
2.1. Determination of fluoride ion
2.1.1. PlasmaThe blood of five control and five fluorotic rats was extracted
from the jugular vein and transferred to a tube containing
ethylenediamine tetraacetic acid (EDTA: Sigma Chemical Co.,
USA), to avoid blood coagulation. The blood was centrifuged
for 10 min at 2000 � g, and 1 mL plasma was placed on Petri
dishes (Falcon 1007), to which 2 mL deionized water was
added. A 0.075N sodium hydroxide (NaOH, A.R.: Sigma
Chemical Co., USA) trap solution (50 mL in five drops) was
placed on the Petri dish lid, and after addition of 1 mL 3N
sulphuric acid (H2SO4: Sigma Chemical Co., USA) saturated
with hexamethyldisiloxane (HMDS), each dish was immedi-
ately sealed. During overnight diffusion, fluoride ion released
by acid hydrolysis was collected in the NaOH trap. The trap
was then recovered and buffered to pH 5.2 with 25 mL acetic
acid 0.20N (CHCOOH: Sigma Chemical Co., USA), and the
recovered solution was adjusted to a final volume of 100 mL
with deionized water. The fluoride concentration was deter-
mined by means of a specific electrode (Orion Research Inc.,
Model 96-09, Boston, USA) coupled with an ion analyzer (Orion
Research Inc., Model EA 940, Boston, USA). Standard solutions
(Orion #940907) in triplicates, at concentrations ranging from
0.031 to 0.5 mg F/mL, were also acid-diffused. Blanks were
subjected to the same procedure.
2.1.2. BoneThe femurs of five control and five fluorotic rats were dried for
24 h at 90 8C. Then, the femurs were transversally sectioned,
leading to two slices measuring approximately 5 mm from the
mid-diaphysial region of each bone.11 One slice was dissolved
in acid, to obtain the whole bone fluoride concentration; the
other one was used to evaluate fluoride concentration on the
bone surface. For whole bone determinations, the femur slices
were left at 90 8C for 24 h.11 The slices were weighed and
transferred to plastic test tubes, to which 15.55N nitric acid
(HNO3: Sigma Chemical Co., USA) was added in a 0.1 mL acid/
mg bone ratio. After 24 h at room temperature, the acid was
neutralized with 15.55N NaOH, and the mixture was buffered
with TISAB II. The extracted fluoride was determined as
described above, on the basis of a fluoride standard curve built
with fluoride standard solutions (0.05–0.5 mg F/mL) prepared in
the same way as the samples. The results are expressed in mg
F/mg bone.
To determine fluoride concentration on the bone surface, a
circular hole (2.0 mm diameter) was punched in an adhesive
tape, which was applied to the surface of the bone slice.11 A
window of 3.14 mm2 area was exposed, and 5 mL 1.6N
hydrochloric acid (HCl: Sigma Chemical Co., USA) in 70%
glycerol was applied for 1 min, under agitation. The extract
was transferred to a tube containing 190 mL deionized water.
This etching step was repeated, and the second 5 mL etching
solution was directly added to the tube. In the end, 5 mL of a
70% glycerol solution was applied to the window for 30 s and
added to the same tube. The extracts were neutralized with
0.105 mL 0.228N NaOH, and buffered with TISAB II. The
extracted fluoride was determined as described above. The
amount of dissolved bone was inferred from the amount of P
present in the acid extracts, assuming that its concentration in
the bone is 13.5%. The P contents of the samples were
determined colorimetrically.12 Fluoride concentrations in the
bone are expressed as mg F/mg bone.
2.2. Preparation of hard tissue sections of incisors
Analyses of enamel in hand-ground longitudinal sections
(100 mm thick) of five rat incisors in a pilot study showed that
the thickness of the enamel varied from 100 mm to more than
250 mm in animals of the same age group. The variability in the

a r c h i v e s o f o r a l b i o l o g y 5 4 ( 2 0 0 9 ) 1 0 0 8 – 1 0 1 51010
thickness suggested that the method employed for prepara-
tion of the sections was not satisfactory. To determine the best
method to prepare adequate midsagittal sections of enamel
we prepared transversal sections at three different points of
the incisor length and measured the enamel width, which was
smallest at the most central aspect of the enamel.
To ensure that midsagittal sections of incisors would be
obtained, the more apical 1/3 of the tooth was removed. Then,
the remaining incisal 2/3 were hand-ground, so that a
longitudinal section reaching the central aspect of the tooth
was achieved, on the basis of the anatomical aspect of the pulp
cavity. At this point, the other side of the tooth was exposed to
sand paper, so that this side would be ground until a
midsagittal 100 mm section was obtained. Thereafter, the
section was polished and cleaned for quantitative polarized
light microscopy and scanning electron microscopy analyses.
2.3. Polarized light microscopy (PLM)
For qualitative PLM, five control and five fluorotic incisors were
previously fixed in 4% paraformaldehyde for 48 h, dehydrated
in increasing degrees of alcohol, embedded in glycolmetha-
crylate resin (Technovit1 7200, Heraeus Kulzer GmbH,
Wehrheim, Germany),13 and cut by means of a high precision
diamond disk (100 mm) in a sectioning machine (EXAKT,
Germany). These sections were ground until a thickness of
80 mm was achieved. The thickness was measured with a
digital paquimeter (accuracy of �10 mm). Embedded sections
were qualitatively analysed for birefringence sign using a Red I
Plate. Qualitative analyses were performed after immersion of
the sections in distilled water for 24 h, followed by immersion
in Thoulet’s solution with a refractive index of 1.62 for 48 h.
Enamel birefringence is the result of the intrinsic (due to the
mineral content, with refractive index of 1.62) and the form
(due to the non-mineral content—water and organic matter,
with refractive indexes of 1.33 and 1.56, respectively)
birefringences.14 When the tissue presents increased amounts
of larger pores than normal human enamel, it is believed that
an aqueous solution with the same refractive index of the
mineral content can replace water. The Thoulet’s solution,
which is a solution of potassium iodide and mercurial iodide in
water, and has a refractive index of 1.62. Using this solution
the form birefringence is almost completely eliminated, so
that the observed birefringence is directly proportional to the
Fig. 1 – Stereomicroscope images of control (A) and fluorotic (B)
incisor enamel displays an even orange colouration, fluorotic ra
and orange bands, which appear heterogeneous in colour and
mineral content, as experimentally shown with Thoulet’s 1.62
in carious enamel.15
For the quantitative analysis of enamel birefringence,
longitudinal ground sections of ten control and ten fluorotic
incisors were employed. To this end, the teeth were firstly
fixed in 4% paraformaldehyde, and ground sections were then
manually prepared without previous embedding in resin. The
thickness was measured edge-on to the nearest 2 mm in a light
microscope equipped with a reticule. The thickness of the
sections ranged from 80 to 110 mm. Only sections immersed in
Thoulet’s 1.62 were analysed. The refractive index of the
immersion medium was determined by an Abbe refract-
ometer. Quantitative birefringence analyses were performed
in a polarizing microscope equipped with a Senarmont
compensator and interference green filter (546 nm). The
following histological layers were analysed in the area
covering a distance of �100 mm from the enamel surface to
the enamel–dentine junction (EDJ): the outer enamel, the
superficial 30 mm enamel layer; the middle enamel, the 20 mm
layer just beneath the outer layer; and the inner layer, which
comprised the innermost 20 mm enamel layer, close to the EDJ.
2.4. Statistical analysis
Analyses of fluoride concentration in the plasma and bone were
accomplished by unpaired t-test. Comparisons between the
fluoride concentration in the surface and whole bone weredone
by paired t-test. Analyses of differences in enamel birefringence
were carried out using one-way analysis of variance (ANOVA). A
probability value of P < 0.05 was considered to be the minimum
acceptable level of statistical significance.
2.5. Scanning electron microscopy—secondary electrons(SEM) and backscattered electrons (BSE-SEM)
Twenty control and twenty fluorotic incisors (from ten
animals of each group) were removed and stored at �20 8C
until preparation for SEM, when the teeth were randomly
divided into four groups. Group I: teeth were individually
ultrasonicated for 10 min and then fixed in 4% buffered
paraformaldehyde, being then used for surface analysis;
Group II: the enamel was treated with 37% phosphoric acid
for 30 s and teeth were ultrasonicated for 10 min, being then
fixed as above for surface analysis; Group III: teeth were
rat incisors, the incisal edge on the left (4T). While normal
t incisor enamel is characterized by a succession of white
do not show precise limits. Bars = 300 mm.

Table 1 – Fluoride concentration in the plasma, wholetibia and tibia surface (average W S.E.).
Control(n = 5)
Fluorosis(n = 5)
P value
Plasma (mg/mL) 0.04 � 0.01 0.09 � 0.01 <0.0001
Whole tibia (mg/mg) 0.26 � 0.03 0.66 � 0.07* 0.001
Tibia surface (mg/mg) 0.24 � 0.26 2.30 � 0 71* <0.0001
* P < 0.001 fluoride concentration of whole tibia versus tibia surface
in the fluorosis group.
Fig. 2 – Cross-section of an upper rat incisor under
polarized light microscope (10T). Rectangles ‘a’–‘d’
represent possible sagittal sections obtained while the
incisor was being ground or sectioned. Arrows inside the
rectangles represent the different widths the enamel
would show on longitudinal sections (a–d) observed under
a microscope. Bar = 100 mm. E: enamel; De: dentine; black
a r c h i v e s o f o r a l b i o l o g y 5 4 ( 2 0 0 9 ) 1 0 0 8 – 1 0 1 5 1011
ground until the midsagittal plane was reached, followed by
individual ultrasonication for 10 min and fixation as above,
being then used for internal enamel analysis; Group IV: teeth
were ground until the midsagittal plane was reached, being
the internal surface of the enamel then treated with 37%
phosphoric acid for 30 s, and teeth ultrasonicated for 10 min,
being then fixed as above for internal enamel analysis. The
teeth were dehydrated with increasing concentrations of
acetone, mounted in stubs, covered with carbon, and analysed
in a scanning electron microscope (Jeol JSM – 5600LV, Tokyo,
Japan) using both secondary electrons and backscattered
electrons detectors with an energy of 20 keV.
arrow: dentine–enamel junction.3. Results
The upper incisor photographs of control and experimental
animals exposed to 45 mg F/L in the drinking water (Fig. 1)
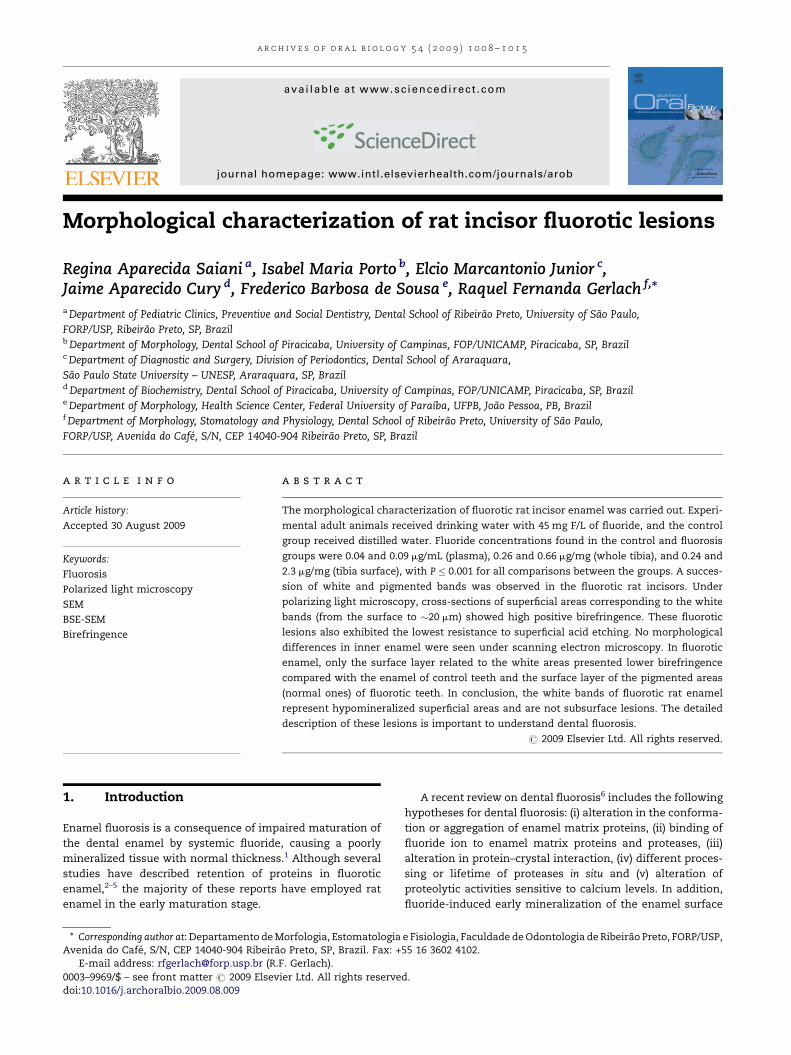
Fig. 3 – Longitudinal sections of control (A and B) and fluorotic (C and D) upper rat incisors (10T). Pictures A–C were taken
under bright light; pictures B–D under polarized light in Thoulet’s 1.62 medium. Fluorotic enamel displays bands in the case
of the outer enamel, which are dark under white light and less birefringent under polarized light, consistent with less
mineralized areas. E: enamel; De: dentine; arrows: dentine–enamel junction.

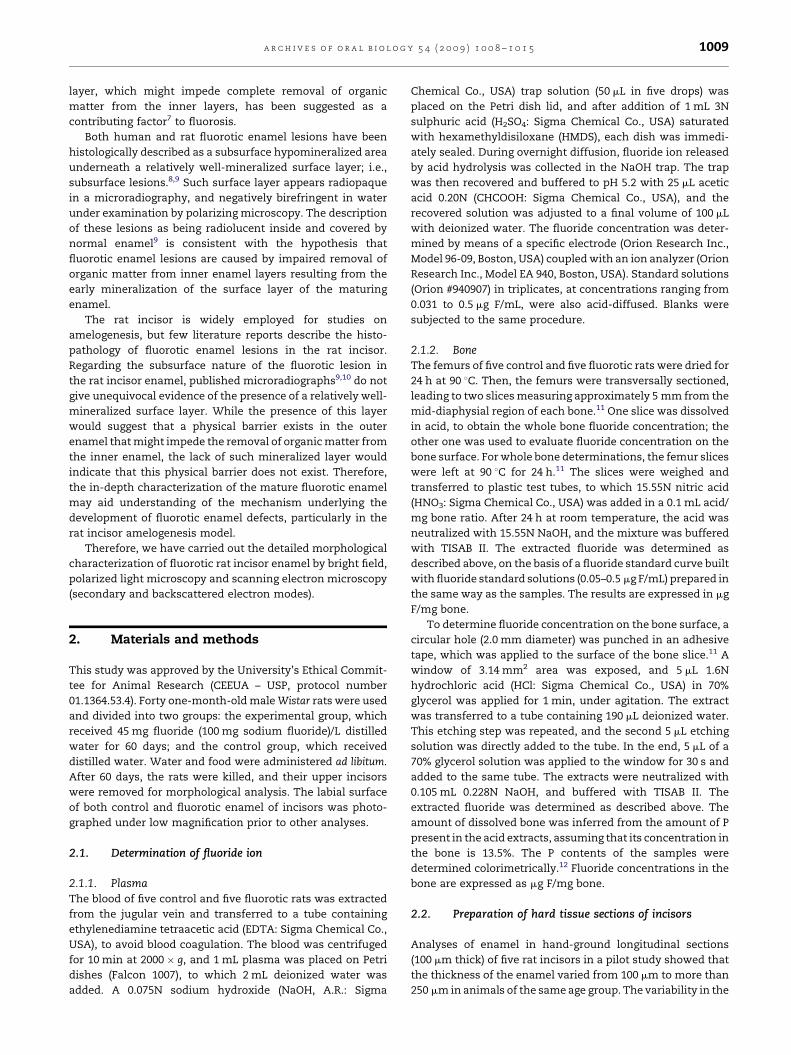
Fig. 4 – Birefringence values of sites in rat enamel related to
the pigmented and white bands of fluorotic teeth and from
control teeth, located in the outer, middle and inner
enamel histological layers. Only in the outer layer were
differences found, represented by a lower negative
birefringence in the white bands relative to the pigmented
bands/control areas. *P < 0.05 dark band versus light band;?P < 0.001 light band versus control.
a r c h i v e s o f o r a l b i o l o g y 5 4 ( 2 0 0 9 ) 1 0 0 8 – 1 0 1 51012
showed the classical fluorosis pattern of rat incisor enamel in
the animals exposed to fluoride, with lack of iron pigmenta-
tion in some areas, forming a succession of white and
pigmented bands (Fig. 1B).
The determination of fluoride ion in the plasma and in the
bone of control and fluoride-exposed animals revealed a
fluoride concentration of 0.04 versus 0.09 mg/mL in the plasma
of control and fluorosis animals, respectively (P < 0.0001); 0.26
versus 0.66 mg/mg in the whole tibia (P � 0.001); and 0.24 versus
2.30 mg/mg in the tibia surface (P < 0.0001). In the fluorosis
group, there was also �3.5 times more fluoride on the bone
surface compared with the whole bone (0.66 versus 2.30,
respectively) (P < 0.001) (Table 1).
Variation in the enamel thickness in the mesiodistal
direction is shown in Fig. 2. White double headed arrows
inside rectangles represent the enamel thickness that would
be shown in sections located in positions ‘a’–‘d’ (black
rectangles mimic 100 mm thick longitudinal sections). Once
this was established, only sections in position ‘b’ were
prepared (yielding a 100 mm thick enamel layer ongoing from
the surface to the EDJ). This was also important for preparation
of the midsagittal plane samples for SEM.
Embedded midsagittal sections of control and fluorotic
enamel under bright field and PLM are shown in Fig. 3.
Histological features observed via polarizing microscopy of
water-immersed sections revealed that the three histological
layers of both control and fluorotic teeth had positive
birefringence. In fluorotic teeth, the white areas presented a
more positive birefringent surface layer if compared with the
surface layers of the pigmented areas of the same sections and
those of normal enamel. The more birefringent areas were
located in the very superficial aspect of enamel to a depth of
�30 mm. When immersed in Thoulet’s solution, the three
layers (outer, middle, and inner enamel) of control and
fluorotic teeth displayed negative birefringence. However, the
surface layer of fluorotic teeth related to the white areas
presented a less negative birefringent value than the other
layers of the same sections and the control teeth (Fig. 3). Apart
from such differences, no other qualitative differences
between fluorotic and control sections were observed.
Quantitative birefringence data in Thoulet’s 1.62 for the
control teeth showed that the outer layer presented the lowest
values, followed by the inner layer, while the middle layer
presented the highest values (Fig. 4). Surface layer related to the
white areas of fluorotic teeth presented lower birefringence
values compared with the other layers of fluorotic and control
teeth. Birefringence of the surface layer of the white areas of
fluorotic teeth was different from that of the surface layer of
control teeth (P < 0.001)and alsofromthat of the surface layer of
the pigmented areas of the fluorotic teeth (P < 0.05). There were
no statistically significant differences between teeth from the
two groups with respect to the other layers.
SEM analysis showed that the labial surface of control and
fluorotic enamel is homogeneous when specimens are
prepared without acid etching (Fig. 5). Acid etching revealed
bands with the same pattern observed in Fig. 1. Careful
analysis evidenced that white bands seen with the naked eye,
observed as darker areas in bright field microscopy and less
birefringent areas by PLM, were less resistant to acid and
appeared as depressions under SEM (Fig. 5B and C). These
areas appear more porous than those of the control teeth,
since they displayed a rougher surface after acid etching. BSE-
SEM analysis indicated that white bands of the labial surface,
seen in Fig. 1B, are darker than the pigmented bands, thus
reflecting a higher mean atomic number in the latter. In
groups treated with 37% phosphoric acid, these differences
disappeared in the midsagittal sections (Fig. 6).

Fig. 5 – Panel of SEM (A–C) and BSE-SEM (D) photographs showing the surface of control (A) and fluorotic incisor enamel (B–
D). (A–C) Phosphoric acid (37%) etching. (D) Without treatment. White bands are more susceptible to acid etching and show
a rougher appearance when observed by SEM (C), while the pigmented bands are more resistant to acid and exhibit a
brighter appearance by BSE-SEM, indicating that these pigmented bands have a more mineralized structure in comparison
to the less bright bands, with increased organic content.
a r c h i v e s o f o r a l b i o l o g y 5 4 ( 2 0 0 9 ) 1 0 0 8 – 1 0 1 5 1013
4. Discussion
Excess fluoride results in a pattern of repeated pigmented and
white bands in the labial surface of rat incisors (Fig. 1B).
In an attempt to characterize the degree of fluorosis in the
animals, fluoride was determined in the plasma, as well as in
whole and surface bone. While plasma fluoride levels only
doubled in the fluorosis group compared with the control (due
to exposure to fluoride from other sources), fluoride concen-
tration was 2.5 times higher in the whole bone and almost 10
times higher on the surface of the tibia. Therefore, surface
bone may be a good marker of the amount of fluoride
accumulated by the animals in studies in which this
parameter is critical. In our case, the values obtained in this
study will enable future reliable comparisons.
Acid etching followed by SEM analysis showed that
pigmented bands are more resistant to acid attack, as already
described.16 This agrees with the interpretation that pigmen-
ted bands resemble the control enamel, which has the same
colour and is also more resistant to acid. Our BSE-SEM findings
showed that the white bands present a lower quantity of
backscattered electrons; i.e., they are darker, which reflects a
lower mean atomic number. This is probably due to a decrease
in iron content and decreased mineralization. In a previous
study, we demonstrated that enamel mineralized without
post-secretory ameloblasts shows a whitish colour, due to
absence of iron on the enamel surface, and a decrease in the
enamel mineralization.17
For light microscopy and SEM analysis of inner enamel, the
thinnest enamel (position ‘‘b’’ in Fig. 2) was chosen to obtain
good reproducibility of ground sections perpendicular to the
enamel surface. Our findings show that the rat incisor fluorotic
lesions are superficial. This description is important for
understanding of possible mechanism responsible for dental
fluorosis, but it is in contrast with what has been previously
described for the rat incisor fluorotic enamel.9 Our long-
itudinal sections of fluorotic enamel under bright field and
PLM (Fig. 3C and D) resemble published micrographs of
fluorotic rat incisor enamel9,10 which, in spite of authors’
descriptions, do not give clear evidence of subsurface lesions.
The careful grinding of midsagittal enamel sections was
essential to avoid artifacts that could lead to an erroneous
description of subsurface rat enamel fluorotic lesions resem-
bling those that are well known in human fluorotic teeth, and
do have a well-mineralized surface layer. Evidence of
abnormal mineralization in the white bands of the rat incisor
fluorotic enamel is important, because some hypotheses
concerning fluorosis suggest that inner enamel proteins might
be entrapped within the enamel by a more mineralized outer
enamel layer in fluorotic teeth,7 which is not the case with the
rat incisor.
Our sections also revealed the fluorotic lesions as darker
areas under light microscopy in bright field. These sections
also displayed a higher positive birefringence in water and a
lower negative birefringence under PLM in Thoulet’s solution
1.62. The behaviour of the rat enamel birefringence mimics the

Fig. 6 – Panel of SEM (A and C) and BSE-SEM (B and D) photographs showing the internal aspect of a midsagittal section of the
control (A and B) and the fluorotic enamel (C and D) after 37% phosphoric acid etching for 30 s (700T). No differences in the
internal enamel could be observed between the groups.
a r c h i v e s o f o r a l b i o l o g y 5 4 ( 2 0 0 9 ) 1 0 0 8 – 1 0 1 51014
behaviour of the birefringence of the body of the lesion of
carious human enamel, which also presents positive sign in
water and negative sign in Thoulet’s 1.62.15 It is also the same
birefringence pattern that we found in a previous study, in
which the absence of post-secretory ameloblasts caused a
defect in enamel mineralization.17
Therefore, we decided to perform quantitative analysis of
the birefringence of rat enamel in Thoulet’s 1.62, which
reasonably relates to the mineral content obtained by
microradiography.15 The outer layer of the white areas in
fluorotic enamel showed a lower birefringence in Thoulet’s
1.62, consistent with a lower mineral content.
The positive birefringence in water of both control and
fluorotic rat enamel differs from that of mature sound human
enamel, which presents negative birefringence in water.18
This difference may be due to a lower mineral content in rat
enamel compared with human enamel, leading to a higher
contribution from the positive form of birefringence to the
observed birefringence. This in turn results in a higher positive
birefringence in water and a lower negative birefringence in
Thoulet’s 1.62, which is consistent with the interpretation that
the outer layer of the white areas in fluorotic teeth can be
regarded as hypomineralized.
These defects are visible in all specimens of satisfactorily
prepared fluorotic rat incisors, and they clearly show that the
defect is located in the outside enamel only. Observing
fluorotic defects by PLM may be a very useful tool for
researchers trying to better characterize these defects.
Another interesting finding of the present work is that data
from control teeth suggest that the different histological layers
present different mineral contents, with the middle enamel
layer having the highest mineral content, followed by the
inner layer and the outer enamel layer. This is in agreement
with previous experimental data indicating that the outer-
most and the innermost 20 mm of rat enamel present the
lowest mineral content, as shown by electron microprobe
analysis.19 The outer and inner layers analysed in our study
were within the abovementioned locations. It is noteworthy
that PLM is more sensitive to mineral loss than microradio-
graphy.20
As described in a previous study,19 administration of
different substances to rats induces a decrease in the mineral
content of the outer enamel, suggesting that they may disturb
normal enamel maturation and mineralization of the outer
enamel, which is the last layer to mineralize.
In conclusion, the fluorotic lesions in the enamel of rat
incisors displayed a pattern of repeated white and pigmented
bands in the labial surface. We found evidences that under the
fluorosis inducing conditions used here, the white bands of
fluorotic enamel represent hypomineralized superficial areas

a r c h i v e s o f o r a l b i o l o g y 5 4 ( 2 0 0 9 ) 1 0 0 8 – 1 0 1 5 1015
of the enamel. No subsurface lesions were identified when the
midsagittal section of each tooth was analysed.
Acknowledgements
The authors thank the excellent technical assistance of Mrs.
Ana Claudia Gregolin Costa Miranda, Department of Diagnosis
and Surgery, Dental School of Araraquara, UNESP; and
Waldomiro Vieira Filho, Department of Biochemistry, Dental
School of Piracicaba, FOP/UNICAMP, during preparation of the
specimens and fluoride determinations, respectively. The
authors state that there is no possible conflict of interest such
as patent, ownership, stock ownership, consultancies or
speaker’s fee.
Funding: This study was supported by The State of Sao Paulo
Research Foundation (FAPESP) and the (Brazilian) National
Research Council (CNPq).
Competing interests: We state that none of the authors have
any conflict of interests.
Ethical approval: University’s Ethical Committee for Animal
Research (CEEUA – USP, protocol number 01.1364.53.4).
r e f e r e n c e s
1. Fejerskov O, Larsen MJ, Richards A, Baelum V. Dental tissueeffects of fluoride. Adv Dent Res 1994;8(1):15–31.
2. Denbesten PK. Effects of fluoride on protein secretion andremoval during enamel development in the rat. J Dent Res1986;65(10):1272–7.
3. Denbesten PK, Heffernan LM. Enamel proteases in secretoryand maturation enamel of rats ingesting 0 and 100 ppmfluoride in drinking water. Adv Dent Res 1989;3(2):199–202.
4. Smith CE, Nanci A, Denbesten PK. Effects of chronic fluorideexposure on morphometric parameters defining the stagesof amelogenesis and ameloblast modulation in rat incisors.Anat Rec 1993;237(2):243–58.
5. Zhang Y, Yan Q, Li W, Denbesten PK. Fluoride down-regulates the expression of matrix metalloproteinase-20 in
human fetal tooth ameloblast-lineage cells in vitro. Eur JOral Sci 2006;114:105–10.
6. Aoba T, Fejerskov O. Dental fluorosis: chemistry andbiology. Crit Rev Oral Biol Med 2002;13(2):155–70.
7. Sato K, Hattori M, Aoba T. Disturbed enamel mineralizationin a rat incisor model. Adv Dent Res 1996;10(2):216–24.
8. Fejerskov O, Thylstrup A, Larsen MJ. Clinical and structuralfeatures and possible pathogenic mechanisms of dentalfluorosis. Scand J Dent Res 1977;85(7):510–34.
9. Fejerskov O, Yaeger JA, Thylstrup A. Microradiography ofthe effect of acute and chronic administration of fluoride onhuman and rat dentine and enamel. Arch Oral Biol1979;24(2):123–30.
10. Angmar-Mansson B, Whiford GM. Plasma fluoride levelsand enamel fluorosis in the rat. Caries Res 1982;16(4):334–9.
11. Cury JA. Fluoride metabolism in rats during successivepregnancies, Thesis, Faculty of Dentistry of Piracicaba, StateUniversity of Campinass; 1984. p. 136 [in Portuguese].
12. Fiske CH, Subbarow Y. The colorimetric determination ofphosphorous. J Biol Chem 1925;66:375–400.
13. Donath K, Breuner G. A method for study of undecalcifiedbones and teeth with attached soft tissue. The Sage–Scliff(sawing and grinding) technique. J Oral Pathol 1982;11:318–26.
14. Sousa FB, Vianna SS, Santos-Magalhaes NS. A new approachfor improving the birefringence analysis of dental enamelmineral content using polarizing microscopy. J Microsc2006;221:79–83.
15. Theuns HM, Shellis RP, Groeneveld A, Van Dijk JM, Poole DF.Relationships between birefringence and mineral content inartificial caries lesions of enamel. Caries Res 1993;27(1):9–14.
16. Kruger BJ. Scanning electron microscopy of sections offluorosed rat enamel. J Dent Res 1971;50(6):1685.
17. Porto IM, Merzel J, de Sousa FB, Bachmann L, Cury JA, Line SR,et al. Enamel mineralization in the absence of maturationstage ameloblasts. Arch Oral Biol 2009;54(4):313–21.
18. Angmar B, Carlstrom D, Glas JE. Studies on theultrastructure of dental enamel. IV. The mineralization ofnormal human enamel. J Ultrastruct Res 1963;8:12–23.
19. Suga S, Aoki H, Yamashita Y, Tsuno M, Ogawa M. Acomparative study of disturbed mineralization of rat incisorenamel induced by strontium and fluoride administration.Adv Dent Res 1987;1(2):339–55.
20. Darling AI. Studies of the early lesion of enamel caries. BrDent J 1958;105:119–35.
Copyright © 2022 FDOKUMEN