Segmenting Reddish Lesions in Capsule Endoscopy Images ...
6
Segmenting Reddish lesions in Capsule Endoscopy Images Using a GastroIntestinal Color Space Hai Vu ∗ , Tomio Echigo † , Yuma Imura ‡ , Yukiko Yanagawa ¶‡ , Yasushi Yagi ‡ , ∗ International Research Institute MICA, Hanoi University of Science and Technology † Dept. of Engineering Informatics, Osaka Electro-Communication University ‡ The Institute of Scientific and Industrial Research, Osaka University ¶ Technology Development Center, OMRON Corporation Abstract—Segmenting reddish lesions in capsule endoscopy (CE) images is an initial step for further computer-assisted applications such as image enhancement, abnormal measure- ment/tracking, and so on. In this paper, we propose an automatic segmentation method that is successful even with CE image including unclear reddish lesions. To obtain this, the proposed method seeks good features to discriminate the reddish lesions from normal tissues. For implementations, we first extract only meaningful regions in a CE image through a pre-segmentation step. The proposed features then are extracted for the meaningful regions in stead of the whole image. We approaches segmentation task through considering a statistical operator for the extracted features, that is local mean image. Candidates of the abnormal regions are located in the local mean image with assistants of a diffusion process. Evaluations in the experiments confirm effectiveness of the proposed method with both qualitative and quantitative measurement. I. I NTRODUCTION The capsule endoscopy (CE) technology [1] has been widely used in examining diseases in the GastroIntestinal (GI) tract. It is especially successful for finding obscure bleeding regions in the small bowel, that is difficult for the conventional endoscopy techniques [2], [3]. An obscure bleeding abnormal- ity usually presents a color tone with more red (or reddish) than normal regions. In general term, we name these appearances as reddish lesions. The reddish lesions in CE images infer symptoms of different abnormality: bleeding, angioectasia, and erythema diseases [2], [4]. Examining characteristics of these blood-based abnormalities 1 therefore usually takes account extremely concentrations of the examining doctors. Fig. 1 shows several examples of reddish lesions in CE images. While appearance of reddish lesions in Fig. 1(a)-(b) are dominant from normal tissues, reddish lesions in Fig. 1(c)-(d) are more ambiguous and unclear. Intuitively, examining doctors need assistant tools for enhancing the image display. Segmenting the reddish lesions is an initial step for such tools. It also has important roles in evaluating abnormal types, abnormal measurements and classifications. Regarding computer-aided tools for CE images, various state-of-the-art techniques are listed in recent surveys of Karar- gyris et al. [5] and Chen et al. [6]. For segmenting bleeding regions task, color and its derivations usually are favor features. Lau et al. [7] proposed a technique utilizing two-level threshold for image luminance and color saturation features. The work 1 In this paper, description about blood-based abnormalities is concerned to reddish lesions. by Karargyris in [4] utilized features in Ohta color space [8]. Penna et al. in [9] discriminated bleeding lesions from normal regions by using Reed-Xiaoli (RX) detector [10]. For detecting bleeding regions, Giritharan et al. [11] extracts dominant color descriptor [12], which is one of MPEG-7 visual descriptors, and co-occurrence of the dominant colors. Pan et al. [13] deploys a probabilistic neural network using six color components (R,G,B,H,S,V). However, specific characteristics of the GI wall’s appearance, which often distinct from other type of images, are not carefully considered. The previous works utilize color features in a full range of a color space (e.g, original RGB space or transformed space as HSV, Lab). The fact that the color tones of GI wall regions distribute quite strictly in a subspace: e.g., the stomach contains pinkish colors, while the small intestine contains pinkish-yellowish colors. To adapt with this observation, a specific color space, named GI color space, was proposed in our previous work [14]. Advantages of the GI color space is that it suggests available color ranges that definitely define to the CE images. These characteristics are useful for presenting image data of CE images, but also for discriminating abnormalities from normal tissues. In this work, we tackle this observation suggests valuable features by evaluating discriminations between abnormal and normal regions through a training dataset in the learning procedure. The results show that discriminant characteristic is a 1-D feature that is extracted in the GI color space. It is as good discriminant as original color features (RGB triple). Based on this feature, a segmentation algorithm is proposed. A pre-segmentation step is implemented to eliminate non-wall GI regions. The image data of the meaningful regions is projected into the GI color space. After extracting the image features, a statistical version of the transformed image is calculated, that is local mean image. This operator formulates an local mean image from neighborhood regions through a sampling function at a certain scale. Candidates of the abnormal regions are located in the local mean image through a diffusion process. The experiments evaluate the bleeding segmentations with a large testing data set in term of both qualitative and quantitative measurements. II. LEARNING FEATURES FOR DISCRIMINATING ( AB) NORMALITIES A. The feature extractions Because GastroIntestinal (GI) color space [14] associates us in regarding works, we shortly introduce its establishment 2014 22nd International Conference on Pattern Recognition 1051-4651/14 $31.00 © 2014 IEEE DOI 10.1109/ICPR.2014.562 3263
-
Upload
khangminh22 -
Category
Documents
-
view
5 -
download
0
Transcript of Segmenting Reddish Lesions in Capsule Endoscopy Images ...

Segmenting Reddish lesions in Capsule EndoscopyImages Using a GastroIntestinal Color Space
Hai Vu∗, Tomio Echigo†, Yuma Imura‡, Yukiko Yanagawa¶‡, Yasushi Yagi‡,∗International Research Institute MICA, Hanoi University of Science and Technology
†Dept. of Engineering Informatics, Osaka Electro-Communication University‡The Institute of Scientific and Industrial Research, Osaka University
¶Technology Development Center, OMRON Corporation
Abstract—Segmenting reddish lesions in capsule endoscopy(CE) images is an initial step for further computer-assistedapplications such as image enhancement, abnormal measure-ment/tracking, and so on. In this paper, we propose an automaticsegmentation method that is successful even with CE imageincluding unclear reddish lesions. To obtain this, the proposedmethod seeks good features to discriminate the reddish lesionsfrom normal tissues. For implementations, we first extract onlymeaningful regions in a CE image through a pre-segmentationstep. The proposed features then are extracted for the meaningfulregions in stead of the whole image. We approaches segmentationtask through considering a statistical operator for the extractedfeatures, that is local mean image. Candidates of the abnormalregions are located in the local mean image with assistantsof a diffusion process. Evaluations in the experiments confirmeffectiveness of the proposed method with both qualitative andquantitative measurement.
I. INTRODUCTION
The capsule endoscopy (CE) technology [1] has beenwidely used in examining diseases in the GastroIntestinal (GI)tract. It is especially successful for finding obscure bleedingregions in the small bowel, that is difficult for the conventionalendoscopy techniques [2], [3]. An obscure bleeding abnormal-ity usually presents a color tone with more red (or reddish) thannormal regions. In general term, we name these appearancesas reddish lesions. The reddish lesions in CE images infersymptoms of different abnormality: bleeding, angioectasia, anderythema diseases [2], [4]. Examining characteristics of theseblood-based abnormalities1 therefore usually takes accountextremely concentrations of the examining doctors. Fig. 1shows several examples of reddish lesions in CE images. Whileappearance of reddish lesions in Fig. 1(a)-(b) are dominantfrom normal tissues, reddish lesions in Fig. 1(c)-(d) are moreambiguous and unclear. Intuitively, examining doctors needassistant tools for enhancing the image display. Segmentingthe reddish lesions is an initial step for such tools. It alsohas important roles in evaluating abnormal types, abnormalmeasurements and classifications.
Regarding computer-aided tools for CE images, variousstate-of-the-art techniques are listed in recent surveys of Karar-gyris et al. [5] and Chen et al. [6]. For segmenting bleedingregions task, color and its derivations usually are favor features.Lau et al. [7] proposed a technique utilizing two-level thresholdfor image luminance and color saturation features. The work
1In this paper, description about blood-based abnormalities is concerned toreddish lesions.
by Karargyris in [4] utilized features in Ohta color space[8]. Penna et al. in [9] discriminated bleeding lesions fromnormal regions by using Reed-Xiaoli (RX) detector [10].For detecting bleeding regions, Giritharan et al. [11] extractsdominant color descriptor [12], which is one of MPEG-7 visualdescriptors, and co-occurrence of the dominant colors. Pan etal. [13] deploys a probabilistic neural network using six colorcomponents (R,G,B,H,S,V). However, specific characteristicsof the GI wall’s appearance, which often distinct from othertype of images, are not carefully considered. The previousworks utilize color features in a full range of a color space(e.g, original RGB space or transformed space as HSV, Lab).The fact that the color tones of GI wall regions distributequite strictly in a subspace: e.g., the stomach contains pinkishcolors, while the small intestine contains pinkish-yellowishcolors. To adapt with this observation, a specific color space,named GI color space, was proposed in our previous work [14].Advantages of the GI color space is that it suggests availablecolor ranges that definitely define to the CE images. Thesecharacteristics are useful for presenting image data of CEimages, but also for discriminating abnormalities from normaltissues.
In this work, we tackle this observation suggests valuablefeatures by evaluating discriminations between abnormal andnormal regions through a training dataset in the learningprocedure. The results show that discriminant characteristicis a 1-D feature that is extracted in the GI color space. It isas good discriminant as original color features (RGB triple).Based on this feature, a segmentation algorithm is proposed. Apre-segmentation step is implemented to eliminate non-wall GIregions. The image data of the meaningful regions is projectedinto the GI color space. After extracting the image features, astatistical version of the transformed image is calculated, thatis local mean image. This operator formulates an local meanimage from neighborhood regions through a sampling functionat a certain scale. Candidates of the abnormal regions arelocated in the local mean image through a diffusion process.The experiments evaluate the bleeding segmentations with alarge testing data set in term of both qualitative and quantitativemeasurements.
II. LEARNING FEATURES FOR DISCRIMINATING
(AB)NORMALITIES
A. The feature extractions
Because GastroIntestinal (GI) color space [14] associatesus in regarding works, we shortly introduce its establishment
2014 22nd International Conference on Pattern Recognition
1051-4651/14 $31.00 © 2014 IEEE
DOI 10.1109/ICPR.2014.562
3263

(a) (b) (c) (d)(a) (b) (c) (d)
Fig. 1. Some examples of reddish lesions. (a)-(b) are clear images, whereas (c)-(d) are unclear images. Blue circles are marked around reddish lesions byexamining doctors.
(a) (b) (c)(a) (b) (c)
Fig. 2. The proposed GI Color space. (a) Distribution of RGB data from a large CE images. (b) Clustering color components into wall/non-wall groups. (c).Distribution of wall color components presented by two principal components (using PCA)
and features in the following section. A GI color space isconstructed from a large dataset of the CE images. The mostpopular color components are extracted from such dataset. Fig.2(a) plots them in the original RGB color space. As shownin Fig. 2(b), the color components of GI wall regions arelocated within white boundary regions of a map created bySelf-Organized Map (SOM). A set of these color componentsis denoted as a set of Θ. The statistical characteristics of Θalso are measured through two features: eigenvectors νΘ andmean values μΘ. Hence, given a crgb color, it can be projectedinto the proposed GI color space following a form of PCAtransformation ζ as follow:
crgb → cpc1,pc2,pc3 : νTΘ(crgb − μΘ) (1)
It notes that we transform only color components of the wallregions in CE images. Therefore, a pre-segmentation step isproposed to eliminate non-wall regions from an original image.It is a quite straightforward process. First, an image is dividedinto blocks or windows. Size of each window region is W×H .In each window, we look for pixels, whose image data belongsto a color component of Θ. Such window is considered as awall region if total number of the pixels found larger than athreshold value. In our implementation, the threshold value isequal 70% of the window size. Then a 2-D dilation operatoris applied to smoothly connect the wall regions together. Fig.3(a)-(d) shows some examples with boundary of the wallregions. While darkness of lumen regions are eliminated in Fig.3(a) and (d), current approach also success in cases includingnoises such as fluid, food, as shown in Fig. 3(b) and (c).
To learn characteristics of the reddish lesions and discrim-inating features, we prepare a training dataset including threecommon types of blooded-based pathology:
- Erythema: 134 images;
- Angiodysplacia: 64 images;
- Bleeding: 143 images;
The data set is collected from 300 patient sequenceswithin two years in Graduate School of Medicine, Osaka CityUniversity. Reddish lesions are carefully marked by experts.Some of them with marked regions are shown in Fig. 4(a). Fordiscriminant analysis, color features are extracted from thesetraining dataset. Besides r, g, b channel and rgb triplet, theimage features extracted in the GI color space are examined.
A triplet color components in the GI color space(pc1, pc2, pc3) presents uncorrelated variables as good aspossible. Furthermore, while the main components pc1, pc2
present commons or general appearance of wall regions, thelast component pc3 is more sensitive, especially, with smallchanges in neighborhood regions. This feature (pc3) thereforeis expected to well discriminate abnormal and normal regions,especially, in case of unclear reddish lesions. Finally, fivefeatures (r, g, b, rgb and pc3 components) are extracted. Weassess performance of these features using Linear DiscriminantAnalysis (LDA). In the empirical study below, we confirmthat pc3 component is an optimal feature. The fact that pc3
is also more sensitive with noise data than other components.
3264
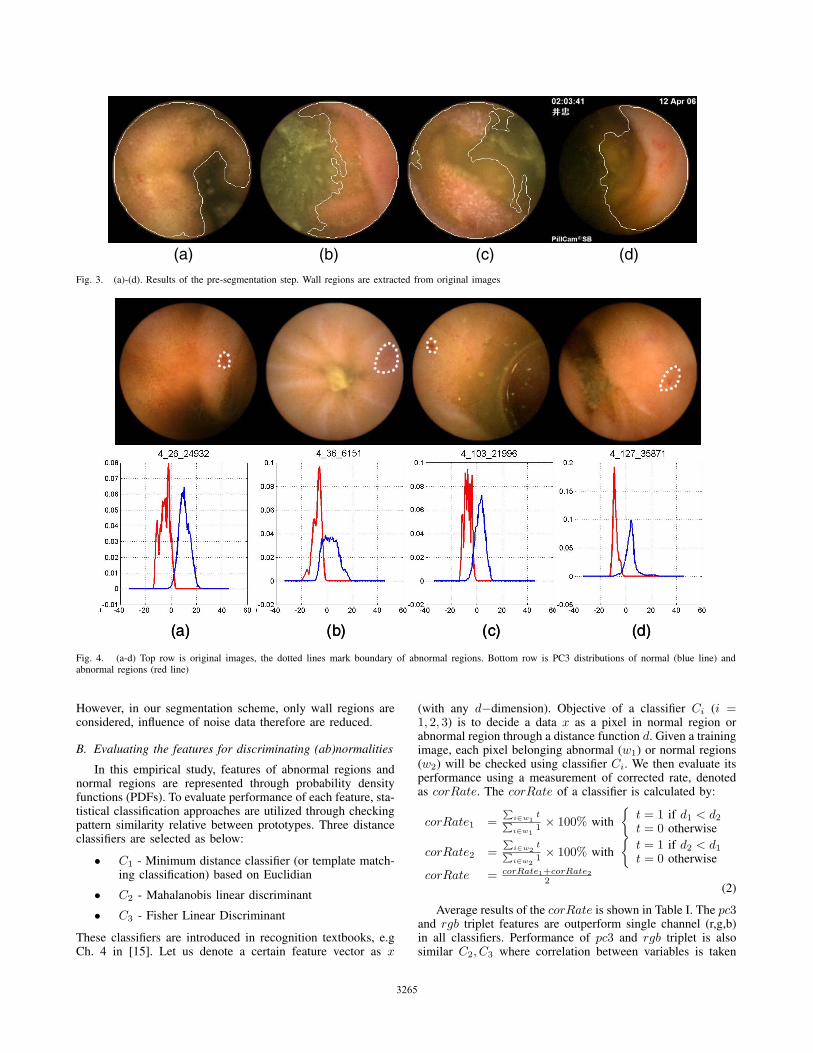
(a) (b) (c) (d) Fig. 3. (a)-(d). Results of the pre-segmentation step. Wall regions are extracted from original images
(a) (b) (c) (d)(a) (b) (c) (d)
Fig. 4. (a-d) Top row is original images, the dotted lines mark boundary of abnormal regions. Bottom row is PC3 distributions of normal (blue line) andabnormal regions (red line)
However, in our segmentation scheme, only wall regions areconsidered, influence of noise data therefore are reduced.
B. Evaluating the features for discriminating (ab)normalities
In this empirical study, features of abnormal regions andnormal regions are represented through probability densityfunctions (PDFs). To evaluate performance of each feature, sta-tistical classification approaches are utilized through checkingpattern similarity relative between prototypes. Three distanceclassifiers are selected as below:
• C1 - Minimum distance classifier (or template match-ing classification) based on Euclidian
• C2 - Mahalanobis linear discriminant
• C3 - Fisher Linear Discriminant
These classifiers are introduced in recognition textbooks, e.gCh. 4 in [15]. Let us denote a certain feature vector as x
(with any d−dimension). Objective of a classifier Ci (i =1, 2, 3) is to decide a data x as a pixel in normal region orabnormal region through a distance function d. Given a trainingimage, each pixel belonging abnormal (w1) or normal regions(w2) will be checked using classifier Ci. We then evaluate itsperformance using a measurement of corrected rate, denotedas corRate. The corRate of a classifier is calculated by:
corRate1 =P
i∈w1t
Pi∈w1
1 × 100% with
{t = 1 if d1 < d2
t = 0 otherwise
corRate2 =P
i∈w2t
Pi∈w2
1 × 100% with
{t = 1 if d2 < d1
t = 0 otherwise
corRate = corRate1+corRate22
(2)
Average results of the corRate is shown in Table I. The pc3and rgb triplet features are outperform single channel (r,g,b)in all classifiers. Performance of pc3 and rgb triplet is alsosimilar C2, C3 where correlation between variables is taken
3265

(a) (b) (c) (d)(a) (b) (c) (d)
Fig. 5. Local Mean Image calculation. (a) Original Image. (b) PC3 image data. (c) Responsibility of a Gaussian (G(50,2.5)), (d) Local Mean Image Result
account. The results confirm that pc3 feature presents verywell discriminations between normal and abnormal regions.Fig. 4(b) shows intuitively performance of pc3, whose theabnormal distributions (in red lines) is obviously separatedfrom the normal ones (in blue lines).
TABLE I. AVERAGE OF THE corRate WITH DIFFERENT CLASSIFIERS
Classifier R G B RGB PC3
C1 74 62 65.5 80.3 90.5C2 74 62 65.5 91.5 90.5C3 74 62 65.5 92.5 90.5
III. SEGMENTATION ALGORITHMS
In our proposed method, the segmentation task is ap-proached in view of analysis of multiscale image statistics.Originally, there is an adaption between statistical analysis andimage scale space. For example, multiscale image statistics inworks of Yoo et al [16] seeks crucial scale through the statis-tical operators, image can be segmented at ”natural” boundaryof normal and abnormal regions without requirements of aprior knowledge (e.g, boundary, or shape of objects). In otherwords, the segmentation algorithms are based on estimatingcentral moments of the probability distribution of intensitiesat arbitrary locations within an image across a continuouslyvarying range of the scale.
In light of these considerations, we utilize a basic statisticaloperator, that is local mean image. Let consider an area of anobserved image I(x). Its values may be sampled over a localneighborhood about a particular location x using a weightingfunction, h(x), and a convolution operator: I(x)⊗h(x). Withrespect to invariant spatial translation and rotation, the h(x)function can be a normalized Gaussian function. At eachscale s of the Gaussian, the statistical operator comprises of asum of the original image intensities weighted by a Gaussiansampling kernel. With the desired s, abnormal regions in I(x)is extractable.
A. Local mean image calculation
Utilizing the optimal feature within the meaningful regionw0, definition of I(x) is:
I(x) ={
pc3(x) if x ∈ w0
0 otherwise(3)
A normalized gaussian kernel h(x) is defined at scale s by:
h(x) = G(x, s) =1√
2πs2e
−x2
2s2 (4)
Where parameter s is standard derivation or spread parameter.A statistical operator such as the local mean image, denotedby μ(I(x), s), is defined by:
μ(I(x), s) = E〈I(x), s〉 =∑x∈ω
(G(I(x))I(x) (5)
Parameter ω presents a window region with size of w × hpixels (e.g, 3×3 pixels in our implementations). Fig. 5 showsa local mean image calculated using (5). In this example, thereddish lesions in the original image (Fig. 5(a)) is unclearand ambiguous. The extracted meaningful regions obviouslyremove contaminations. Using pc3 data as shown in Fig. 5(b),it is more clear to discriminate abnormal and normal regions.By using a reasonable scale s, Fig. 5(c) shows probabilityvalues of the I(x) values. Finally, Fig. 5(d) measured theabnormal regions at the desired scale s. As shown in Fig. 5(d),the abnormal regions can be intuitively located through a localpeak detections. A diffusion technique is applied to the localmean image for this task.
B. Detecting local peaks by diffusion techniques
A diffusion processing is adopted to apply to the local meanimage mu(Ix, si) for detecting local peaks. A desirable char-acteristic of a nonlinear diffusion filter is that it will encourageintra-region smoothing, while inhibit inter-region smoothing.The nonlinear diffusion technique is first introduced by Peronaand Malik in [17]. Fig. 6(a) shows diffused results from thelocal mean image in Fig. 5(d). The desirable characteristic ofthe diffused image is that abnormal region is smoothed whereasit even enhances the edge with normal one.
Identifying the boundaries between abnormal and normalregions from the diffused image is a straightforward proce-dures. We deploy a scheme including two threshold-level. Thefirst threshold T1 defines a level that is a saddle level. The sec-ond threshold T2 defines a minimum/maximum level in orderto confirm actual peaks are existing within an abnormal region.The diffused image normalizes the original data into l levels(l=64, in our implementation). Visually, seeking threshold T1
is similar to find pixels coded in yellow color in Fig. 6(a). T1
value is average data as such pixels. T2 level is a relative valuebetween T1 and minimum value of the diffused image. In ourimplementation, T2 is equal 75% of T1, as shown in Fig. 6(b).By comparing the diffused image with with T1 and T2, theabnormal regions is extracted, as shown in Fig. 6(c). Fig. 6(d)shows the corresponding boundary between the abnormal andnormal regions in the original image.
3266

T2 level
T1 level
(a) (b) (c) (d)
T2 level
T1 level
T2 level
T1 level
(a) (b) (c) (d)
Fig. 6. Two level threshold value approach. (a) The diffused image of Fig. 5(d). (b). Two level threshold identifies local peaks. (c). A region satisfy both T1
and T2 thresholds (c). Boundary of abnormal region is plotted in the original image. (Fig. 5(a))
IV. EXPERIMENTAL RESULTS
For visualizing comparisons, we evaluate boundary of theproposed method with segmentation results using watershedtransformation with user iterations. With a good initial scheme,segmenting abnormalities can obtain well results by the wa-tershed algorithms (Ch. 5 in [18]). We uses an initial schemewith two markers: external and internal markers. An externalmarker coarsely marks boundary in order to quickly separatethe abnormal regions from normal regions. Internal markerspoint out seed (a center area) of abnormal regions. Fig. 7 showsan example with a zoom-in version around the segmentedregions. As shown, there is not so large differences betweentwo results, even the boundary of the proposed method is moreprecisely. Additional segmented results are shown in Fig.8.For CE images including the scatted reddish lesions (the lastrow in Fig. 8), the watershed results make misunderstand withseveral initial markers. By using our method, the problem ofsegmenting scatted reddish regions is solved.
We examine quantitative measurement of the segmentationresults by using two testing data. Testset1 includes 100images with only reddish lesions. Because they may appear indifferent type of abnormal regions, Testset2 is same numberof images with any type of abnormal regions (such as tumor,ulcer, polyps, so on). The ground-truth data is manuallymarked by circles or arrows yielded directly in diagnosticprocedures of the medical experts. Segmentation results of twotesting data are measured following criteria below:
• υd the probability of detection. For a good segmenta-tion, υd should be close to 100%.
• υfar the probability of false alarm or over segmen-tation rate, For a good segmentation, υfar should beclose to 0%.
• υun the probability of under segmentation, i.e., thepercentage of ground truth data that are not includingin automatic segmentation results.
TABLE II. EVALUATION RESULTS
TestingData υd υfar υun
Testset1 95 8 14Testset2 90 12 29
Avg. 92 10 16
The υd value in Table II confirms effectiveness of theproposed method. We obtain very good results for the CE im-
(a) (b) (c)
(d) (e) (f)
(a) (b) (c)
(d) (e) (f)
Fig. 7. Qualitative evaluation of the segmentation results. Upper row: (a)Original image. (b) The segmented abnormal regions by the proposed method.(c) A zoom-in to region around abnormal region in (b). Boundary is markedin white-line Lower row: (d) Internal and external marker are marked forapplying the watershed algorithms. (e) The segmented result. (f). A zoom-into region around abnormal region in (e)
age including reddish lesions. By using the proposed method,the segmentation results based on Testset1 is outperformTestset2 testing dataset, particularly for υun values. Themain reasons is that Testset2 data includes different type ofabnormal regions. However, the over-segmentation rate υfar isstill quite high because the scheme to select two-level thresholdvalue in Sec.III-B is not strong enough to eliminate noise datain local mean images.
V. CONCLUSION
This paper proposed an automatic method for segmentingthe reddish lesions from CE images. The segmentation tasksolved problems of unclear reddish regions. We first utilizeda good feature in the dedicated color space of CE imagesfor discriminating reddish lesions from normal regions. Thesegmenting algorithms had impacts from the statistical im-age techniques. The segmentation results suffered from theexperimental evaluations in both qualitative and quantitativemeasurements. The current segmentation results fit to ap-plications such as image enhancement, in which the over-segmentation rate is not strictly required. In the future, a robustclassification scheme can be applied to the current results toeliminate non-abnormal regions. It is expected to reduce theover-segmentation rate.
3267

(a) (b) (c) (d) (e)
Fig. 8. Some examples of the segmentation results. In each row : (a) Original Image. (b) Segmentation results by the proposed method. (c) Ground-truth datamarked by the examining doctors in blue circles. (d). Internal/External markers (manually) for watershed algorithm. (e). Watershed algorithm results
VI. ACKNOWLEDGEMENTS
The first author thanks to Vietnam National Foundation forScience and Technology Development (NAFOSTED) for theirsupports to fulfill the study.
REFERENCES
[1] G. Iddan, G. Meron, A. Glukovsky, and P. Swain, “Wireless capsuleendoscope,” Nature, vol. 405, p. 417, 2000.
[2] B. Lewis, R. Franchis, and G.Gay, “Consensus report,” in Proceedingof the 5th International Conference on Capsule Endoscopy, 2006.
[3] P. Swain, “Wireless capsule endoscopy,” GUT, vol. 52, pp. 48–50, 2003.
[4] A. KARARGYRIS, “A novel synergistic diagnosis methodology foridentifying abnormalities in wireless capsule endoscopy videos,” Ph.D.Thesis - Wright State University, 2010.
[5] A. Karargyris and N. Bourbakis, “Wireless capsule endoscopy andendoscopic imaging: A survey on various methodologies presented,”IEEE Engineering in medicine and biology magazine, vol. 29, pp. 72–83, Feb. 2010.
[6] Y. Chen and J. Lee, “A review of machine-vision-based analysisof wireless capsule endoscopy video,” Diagnostic and TherapeuticEndoscopy, vol. 2012, pp. 1–9, 2012.
[7] P. Lau and P. L. Correia, “Detection of bleeding patterns in wce videousing multiple features,” in Proceedings of the 29th IEEE InternationalConference on EMBS, Aug 2007, pp. 5601–5604.
[8] T. K. Y. Ohta and T. Sakai, “Color information for region segmentation,”Computer Graphics and Image Processing, vol. 13, pp. 222–241.
[9] B. Penna, T. Tilloy, and M. Grangettoz, “A technique for blood detectionin wireless capsule endoscopy images,” in Proceedings of the 17thEuropean Signal Processing Conference, Aug 2009, pp. 1864 – 1868.
[10] I. Reed and X.Yu, “Adaptive multiband far detection of an opticalpattern with unknown spectral distribution,” IEEE Trans. on Acoustics,Speech and Signal Processing, vol. 38, no. 10, pp. 1760–1770, Oct1990.
[11] B. Giritharan, X. Yuan, and J. Liu, “Bleeding detection from capsuleendoscopy videos,” in Proceedings of the 30th IEEE InternationalConference on EMBS, 2008, pp. 4780 – 4783.
[12] V. V. B.S. Manjunath, J.-R. Ohm and A. Yamada, “Color and texturedescriptors,” IEEE Transactions on Circuits and Systems for VideoTechnology, vol. 11, no. 6, pp. 703–715, Jun. 2001.
[13] G. Pan, G. Yan, X. Qiu, and J. Cui, “Bleeding detection in wirelesscapsule endoscopy based on probabilistic neural network,” Journal ofMedical System, pp. 1–8, 2010, 10.1007/s10916-009-9424-0.
[14] H. Vu, T. Echigo, K. Yagi, M. Shiba, K. Higuchi, T. Arakawa, andY. Yagi, “Color analysis for segmenting digestive organs in vce,” inProceeding of 20th International Conference on Pattern Recognition,Aug., pp. 2468 – 2471.
[15] J. de Sa’, Pattern Recognition - Concepts, Methods and Applications.Springer-Verlag, 2001.
[16] T. Yoo, “Scale and statistics in variable conductance diffusion,” inProceedings of the AAAI Symposium on Applications of ComputerVision in Medical Image, Mar. 1994.
[17] P. Perona and J. Malik, “Scale-space and edge detection usinganisotropic diffusion,” IEEE Trans. on PAMI, vol. 12, pp. 629–639,Jul. 1990.
[18] A. Bovik, Handbook of Image and Video Processing. ACADEMICPRESS, 2000.
3268