Ten-year measurements of gaseous pollutants in urban air by an open-path analyzer
Upload
independentCategory
view
0download
0
This content has been downloaded from IOPscience. Please scroll down to see the full text.
Download details:
IP Address: 180.180.121.26
This content was downloaded on 17/10/2013 at 20:32
Please note that terms and conditions apply.
Monitoring of the operating parameters of the KATRIN Windowless Gaseous Tritium Source
View the table of contents for this issue, or go to the journal homepage for more
2012 New J. Phys. 14 103046
(http://iopscience.iop.org/1367-2630/14/10/103046)
Home Search Collections Journals About Contact us My IOPscience

T h e o p e n – a c c e s s j o u r n a l f o r p h y s i c s
New Journal of Physics
Monitoring of the operating parameters of theKATRIN Windowless Gaseous Tritium Source
M Babutzka1, M Bahr2, J Bonn3, B Bornschein1, A Dieter4,G Drexlin3,4, K Eitel3, S Fischer1, F Gluck4,5, S Grohmann6,M Hotzel4, T M James7, W Kafer3,10, M Leber2, B Monreal2,F Priester1, M Rollig1, M Schlosser1, U Schmitt3, F Sharipov8,M Steidl3,10, M Sturm1, H H Telle7 and N Titov9
1 Tritium Laboratory Karlsruhe, Karlsruhe Institute of Technology,PO Box 3640, D-76021 Karlsruhe, Germany2 Department of Physics, University of California, Santa Barbara, CA, USA3 IKP, Karlsruhe Institute of Technology, PO Box 3640, D-76021 Karlsruhe,Germany4 EKP, Karlsruhe Institute of Technology, PO Box 3640, D-76021 Karlsruhe,Germany5 ITTK, Karlsruhe Institute of Technology, PO Box 3640, D-76021 Karlsruhe,Germany6 Institute for Particle and Nuclear Physics, Wigner RCP, PO Box 49,H-1525 Budapest, Hungary7 Department of Physics, College of Science, Swansea University,Singleton Park, Swansea SA2 8PP, UK8 Departmento de Fisica, Universidade Federal do Parana, Curitiba, Brazil9 Academy of Sciences of Russia, Institute for Nuclear Research,60th October Anniversary Prospect 7a, 117312 Moscow, RussiaE-mail: [email protected] and [email protected]
New Journal of Physics 14 (2012) 103046 (29pp)Received 24 May 2012Published 29 October 2012Online at http://www.njp.org/doi:10.1088/1367-2630/14/10/103046
Abstract. The KArlsruhe TRItium Neutrino (KATRIN) experiment willmeasure the absolute mass scale of neutrinos with a sensitivity of mν =
200 meV/c2 by high-precision spectroscopy close to the tritium β-decay
10 Authors to whom any correspondence should be addressed.
Content from this work may be used under the terms of the Creative Commons Attribution-NonCommercial-ShareAlike 3.0 licence. Any further distribution of this work must maintain attribution to the author(s) and the title
of the work, journal citation and DOI.
New Journal of Physics 14 (2012) 1030461367-2630/12/103046+29$33.00 © IOP Publishing Ltd and Deutsche Physikalische Gesellschaft
2
endpoint at 18.6 keV. Its Windowless Gaseous Tritium Source (WGTS) is aβ-decay source of high intensity (1011 s−1) and stability, where high-puritymolecular tritium at 30 K is circulated in a closed loop with a yearly throughputof 10 kg. To limit systematic effects the column density of the source has to bestabilized at the 10−3 level. This requires extensive sensor instrumentation anddedicated control and monitoring systems for parameters such as the beam tubetemperature, injection pressure, gas composition and so on. In this paper, wegive an overview of these systems including a dedicated laser-Raman systemas well as several β-decay activity monitors. We also report on the results ofthe WGTS demonstrator and other large-scale test experiments giving proof-of-principle that all parameters relevant to the systematics can be controlled andmonitored on the 10−3 level or better. As a result of these works, the WGTSsystematics can be controlled within stringent margins, enabling the KATRINexperiment to explore the neutrino mass scale with the design sensitivity.
Contents
1. Introduction 22. The Windowless Gaseous Tritium Source (WGTS) 4
2.1. Key parameters of the WGTS . . . . . . . . . . . . . . . . . . . . . . . . . . . 52.2. The WGTS cryostat . . . . . . . . . . . . . . . . . . . . . . . . . . . . . . . . 7
3. Modelling of the WGTS gas dynamics 93.1. The gas dynamical model . . . . . . . . . . . . . . . . . . . . . . . . . . . . . 93.2. The results of the gas dynamics simulation . . . . . . . . . . . . . . . . . . . . 11
4. Control and monitoring 134.1. The inner tritium loop . . . . . . . . . . . . . . . . . . . . . . . . . . . . . . . 144.2. Beam tube temperature . . . . . . . . . . . . . . . . . . . . . . . . . . . . . . 164.3. Gas composition monitoring using Raman spectroscopy . . . . . . . . . . . . . 174.4. Activity measurements . . . . . . . . . . . . . . . . . . . . . . . . . . . . . . 204.5. Other measurement methods for the column density . . . . . . . . . . . . . . . 26
5. Conclusions 26Acknowledgments 28References 28
1. Introduction
With the discovery of massive neutrinos from ν-oscillation experiments about a decade ago(see, e.g., [1] and references therein), one of the most fundamental tasks for the next yearswill be the determination of the absolute mass scale of neutrinos. Neutrino masses can also beobtained from cosmological observations and neutrinoless double beta decay (e.g. [1]), but thesemethods strongly depend on the employed model. Model-independent results are provided onlyby kinematic β-decay experiments [2].
The next-generation KArlsruhe TRItium Neutrino (KATRIN) experiment aims atimproving the sensitivity in the neutrino mass measurement down to 200 meV/c2 (90%C.L.) [3], one order of magnitude lower than upper limits obtained by the Mainz [4] and
New Journal of Physics 14 (2012) 103046 (http://www.njp.org/)

3
Figure 1. Overview of the KATRIN experiment. A more detailed description ofthe system components is given in the main text.
Troitsk [5] experiments, the most sensitive direct neutrino mass experiments so far. In this kindof experiment, information about the neutrino mass (i.e. an upper limit or its value) was and willbe derived with a precise measurement of the shape of the tritium β-spectrum near its endpointat E0 = (18 571.8 ± 1.2) eV [2]. The KATRIN experiment will be performed at the KarlsruheInstitute of Technology (KIT). Locating KATRIN at KIT allows the use of the unique expertiseof the on-site Tritium Laboratory Karlsruhe (TLK), the only scientific laboratory equipped witha closed tritium loop [6] and licensed to handle the necessary amount of tritium required for theKATRIN experiment.
The schematic layout of the KATRIN experiment is shown in figure 1. KATRIN intends touse a Windowless Gaseous Tritium Source (WGTS) with an activity of 1011 Bq. Such a sourcewas used by the LANL experiment [7] and developed further by the Troitsk experiment [8].Superconducting solenoids will generate a homogeneous magnetic field of 3.6 T, whichadiabatically guides the β-decay electrons towards the tube ends.
The energy measurement of the electrons is made by the spectrometer and detector sectionthat is attached to the forward side of the WGTS via the transport section. The spectrometers areof MAC-E type [9, 10]. A detailed energy analysis is performed by the main spectrometer withan energy resolution of 0.93 eV. It uses an electrostatic retarding potential to transmit electronswith energies above the chosen retarding energy qU to the detector, while electrons with lowerenergies are rejected. By changing the retarding potential, KATRIN will measure an integratedtritium β-spectrum, reaching its design sensitivity of 200 meV/c2 (90% C.L.) within three fullyears of neutrino mass data taking, corresponding to about 5–6 years of operation.
The continuous precise knowledge or, even better, high stability of the isotopic compositionand the column density of the WGTS is very important for the determination of the neutrinomass. These parameters are associated with the main systematic uncertainties of KATRIN,namely activity fluctuations of the WGTS, energy loss corrections taking into account scatteringof β-electrons in the WGTS and the final state spectrum [3]. For example, underestimating theenergy loss will lead to a negative neutrino mass squared in the analysis, a problem that wasencountered in analyses during the nineties of the last century [2, 11]. Furthermore, knowledgeof these parameters is vital to combine data taken over the extended measurement period of afew years.
Here we present the significant progress made in modelling the gas dynamics insidethe WGTS as well as in the construction and commissioning of the actual componentsfor controlling and monitoring the WGTS parameters. We focus on the methodologies andinstrumentation needed to control and monitor the column density N and tritium purity εT as
New Journal of Physics 14 (2012) 103046 (http://www.njp.org/)

4
close to real time as possible, i.e. the time to obtain the information is shorter than or equal tothe time interval (of the order of minutes) during which the retarding potential is constant beforebeing shifted to the next value in the sequence. It should be noted that the different componentsare well past their design stage and in some cases are already fully operational.
The paper is structured as follows. In section 2, we give an introduction to the WGTS andits important parameters. Our gas dynamics simulation is presented in section 3 as well as theresulting requirements for the different control and monitoring methods for the WGTS. Theirstatus is described in section 4. The paper ends with a presentation of the impact for KATRINin section 5.
2. The Windowless Gaseous Tritium Source (WGTS)
Key parameters of the WGTS to achieve high statistical sensitivity in the neutrino mass searchare the column densityN , defined as the number of molecules within a flux tube volume of unitcross section (further discussed in section 2.1.1), and the isotopic composition (T2, DT, HT, D2,HD, H2), as the count rate S of the source scales as
S = CεTN . (1)
Here εT refers to the tritium purity further discussed in section 2.1.2; the proportionality constantC encompasses various experimental properties (detector efficiency, acceptance, etc).
It should be noted that equation (1) is not necessarily valid over the full N -range sincethe observed activity of a source saturates for large column densities. The reason for this isthat electrons escape the source only with a reduced energy, due to the increasing scatteringprobabilities, which is enhanced with increasing cross section towards lower energies; thus theseelectrons cannot overcome the retarding potential anymore. This can lead to nonlinearities in therelation between the measured source activity and column density. However, simulations withfull particle tracking of the scattered electrons in the magnetic field down to a threshold of100 eV show that the nonlinearity of equation (1) is negligible in an interval ±1% around acentral value N = 5.0 × 10¹⁷ molecules cm−2.
Both the parameters, N and εT, also have a significant effect on the systematic uncertaintyin deriving mν from the measurement as N strongly affects the energy losses of the electronsinside the source by inelastic scattering. Non-T2 impurities lead to mandatory corrections of theβ-electron spectrum, because of their different recoil energies and different molecular final statedistributions.
In the discussion of the requirements for N and εT monitoring, we will distinguishbetween trueness, precision and accuracy (e.g. [12]). The trueness 1true is defined as thedifference between the mean value of a measured observable and the true value, for example,1true(N ) = 〈Nmeas〉 −Ntrue. The precision 1prec corresponds to the square root of the statisticalvariance of several measured values around their mean value, for instance 1prec(N ) =√⟨
(Nmeas − 〈Nmeas〉)2⟩. The accuracy 1acc is defined as the difference between a single measured
value and the true physical value, e.g. 1acc(N ) =Nmeas −Ntrue.In section 2.1, the entities N and εT are defined in detail together with their targets
in trueness and precision. Those are derived from the KATRIN goal, namely that no singlesystematic effect gives rise to an uncertainty of 1m2
ν < 7.5 × 10⁻³ eV2/c4 to the neutrino massanalysis [3]. In section 2.2, the technical realization of the WGTS is presented with a focus onthe required control and monitoring systems (CMSs) to access N and εT experimentally.
New Journal of Physics 14 (2012) 103046 (http://www.njp.org/)

5
Figure 2. Principle of the WGTS. The density profile inside the beam tube iskept constant by continuously injecting tritium gas in the middle and pumping itout at both ends.
2.1. Key parameters of the WGTS
From a physicist’s point of view, the WGTS is a column of tritium gas inside an open cylinderwith a diameter of D = 90 mm and a length of L = 10 m inside a homogeneous magnetic fieldof B = 3.6 T generated by superconducting solenoid magnets (see figure 2). The gas consistsof different species with mole fractions ci . It is injected near the middle with an adjustablepressure pin of about 10−3 mbar, and pumped out at both ends with constant pumping speedwith an outlet pressure pout ≈ 0.05pin. Apart from the geometry and this pressure gradient, theflow for a gas with viscosity η is determined by the beam tube temperature, which has a certainprofile TBT(φ, z) with a mean value in the 30 K regime. Here, z denotes the cylinder axis withz = 0 being the middle in the source and φ the azimuthal angle.
These parameters define the distribution function fi(Er , Ev) describing the number ofmolecules of species i , which can be found in the phase space volume [Er , Er + d3
Er ], [Ev, Ev + d3Ev].
From calculations of fi(Er , Ev), the influence of the above parameters on the column density Ncan be investigated. Details of this are given in section 3.1.
The full computation of the distribution function fi(Er , Ev) is also required for investigationsof plasma and ion physics effects (e.g. calculations of space charge effects [14]) or forinvestigating the interactions of low-energy secondary or shake-off electrons due to the shortpath length of such electrons. Also, the velocity distribution of the mother molecules isdetermined by the aforementioned fi(Er , Ev). Thus, one may apply thermal Doppler-broadeningcorrections to the β-electrons associated with the thermal diffusion and position-dependent gasflow speeds of the decaying tritium molecules (see section 3.1). Such corrections are essentialfor the exact description of the β-electron spectrum.
2.1.1. Column density. The column density N is defined as
N (pin, pout, TBT(φ, z)) =
∑i
∫ +L/2
−L/2ni(ρ, φ, z, pin, pout, TBT(φ, z))dz (2)
with ni(ρ, φ, z, pin, pout, TBT(φ, z)) being the integral of fi(Er , Ev) over the velocity phase spacein cylindrical polar coordinates (ρ, φ, z) for a given set of experimental boundary conditions.
New Journal of Physics 14 (2012) 103046 (http://www.njp.org/)

6
In fact, N is, of course, a function of (ρ, φ), but due to the homogeneity in (ρ, φ) (seesection 3.2) this dependence is omitted in the notation.
At first glance, knowledge of the true value Ntrue seems to be of no particular interestas the signal strength and therefore N (see equation (1)) is an unrestricted parameter in thefitting algorithms of the neutrino mass analysis as long as activity fluctuations during onescan of the β-spectrum are monitored and taken into account. However, the neutrino massanalysis depends on the accurate description of inelastic scattering of the signal electronsby the gas molecules inside the source (σinel(18.6 keV) = 3.40(7) × 10−18 cm2) [13]. Undernominal conditions, 41.3% of all electrons escape the source without inelastic interaction,29.3% are scattered once and 16.7% are scattered twice. Hereby, the reference column densityof the WGTS of N = 5.0 × 10¹⁷ molecules cm−2 and the nominal EB-field configuration ofKATRIN, which accepts β-electrons with starting angles with respect to the EB-field of up to51◦ for transmission through the KATRIN beam line, is assumed. In principle, these scatteringprobabilities and associated energy losses will be measured directly in a dedicated calibrationmeasurement [3]. However, such a measurement is time consuming and thus cannot be appliedin parallel to the neutrino mass search. Hence, monitoring the amount of energy losses dueto scattering is required. This is achieved by continuously measuring N with an experimentalprecision 1prec(N ).
According to neutrino mass sensitivity simulations, the necessary precision 1prec(N )/N tokeep the corresponding systematic error below 1m2
ν < 7.5 × 10⁻³ eV2/c4 [3] depends on detailsof the neutrino mass analysis, in particular the width of the analysed energy window belowthe endpoint. For reference, we use the most demanding value from [3], namely 1prec(N )/N< 0.1%.
As can be seen from equation (2), changes in N are due to shifts or fluctuations ofthe experimental conditions of inlet and outlet pressures 1pin, 1pout and temperature changes1T (r, φ). The latter can either be localized or affect the whole beam tube.
2.1.2. Isotopologue composition. The tritium purity εT is defined as the ratio of the numberof tritium atoms to the total sum of atoms in the WGTS. A high tritium purity is primarilynecessary to maximize the signal rate S according to equation (1). It is planned to maintainεT > 0.95 over the complete measurement period. This will be achieved using molecular tritium(T2) as the main gas constituent with a high mole fraction c(T2)> 0.9, a small admixture of DT(c(DT) < 0.1) and only trace amounts of HT, D2 and H2. The tritiated hydrogen isotopologuesT2, DT and HT differ not only in their mass and therefore in their respective recoil energies,but also in the rotational and vibrational final state distribution of their daughter moleculesfollowing tritium decay. Both effects are taken into account in the modelling of the WGTS. Thecorresponding final state distribution for T2 for the first four initial rotational states and DT/HTfor the initial states J = 0 and 1 have been calculated in [15].
The systematic uncertainty for m2ν that is introduced by the theoretical description
of the different final states is estimated to be 6 × 10⁻³ eV2/c4 [3]. In the neutrino massanalysis, the final state distributions of the individual isotopologues will be weighted with themeasured mole fraction of the individual isotopologue. The accuracy of the gas compositionmeasurement therefore has to be converted into a systematic uncertainty 1acc(gas) for m2
ν ,which has to be combined with the uncertainty of the final state description, i.e. (1acc(m2
ν))2=
(6 × 10⁻³ eV2/c4)2 + (1acc(gas))2. The uncertainty 1acc(gas) should be below a certain limit(1 × 10⁻³ eV2/c4) in order to avoid a significant inflation of the combined uncertainty even
New Journal of Physics 14 (2012) 103046 (http://www.njp.org/)

7
in the case of an improvement of the theoretical description of the final state distributions.Simulations [16] show that an accuracy of 1acc(εT) ≈ 1% is required, which can also be derivedfrom general considerations [2]. This is a rather moderate requirement due to the envisaged highT2 mole fraction (εT > 0.95).
Regardless of this, there is a compelling reason to measure εT with at least a magnitudebetter precision. Namely, it opens up a complementary approach for monitoring 1(N ) which isindependent of hydrodynamical calculations of fi . According to equation (1), monitoring N isequivalent to monitoring both εT and the activity of the WGTS. For this reason the WGTSinstrumentation is extended by different activity detectors and a laser Raman spectroscopysystem (LARA) to measure εT with a relative precision of 1prec(εT)/εT < 0.1%.
2.2. The WGTS cryostat
Achieving the proposed tritium purity and activity in the WGTS constitutes a rather challengingtask. Specifically, the column density inside the source beam tube has to be kept constant to alevel of at least 0.1%. Accordingly, a variety of parameters have to be stabilized; these are:
• the injection rate,
• the pumping speed in forward and rear directions,
• the gas composition,
• the beam tube temperature.
Fulfilling these requirements results in a complex cryostat system, the so-called WGTScryostat [17]. Its cryogenic system consists of 13 fluid circuits operated with six cryogenicfluids. The cryostat requires a measurement and control system with more than 500 sensors.Besides the actual WGTS, the cryostat incorporates the DPS1-F and DPS1-R (the first stages ofthe differential pumping sections in the front and rear directions, respectively). Also includedare the first seven superconducting magnets guiding the electrons adiabatically from the sourcebeam tube through the transport section to the spectrometers.
The DPS1-R will be connected to the Calibration and Monitoring System (CMS) via theso-called rear wall. The rear wall separates the WGTS beam tube from the CMS and definesthe electrical potential of the tritium plasma inside the WGTS. Furthermore, it may be used tomeasure the β-electron current directly (see section 4.4.1), provided the current measurementcan be shielded from low energetic secondary electrons and ions. In addition, it acts as an x-rayconverter which allows activity measurements of the source via beta-induced x-ray spectroscopy(BIXS; see section 4.4.2). Furthermore, the CMS houses an e-gun for calibration measurements(see section 4.5). In the forward direction, the DPS1-F is connected to the DPS2-F, a furtherdifferential pumping section. Its role is to reduce the tritium flow by at least another four ordersof magnitude [18] and to host a Fourier transform ion cyclotron resonance mass spectrometerfor ion physics [19].
The basic concept of keeping the injection rate into the WGTS constant is based oninjecting tritium gas from a pressure-controlled buffer vessel over a 5 m long capillary withconstant conductance and pumping the gas at both ends of the beam tube. The details of thecomplex tritium gas handling system, the so-called inner loop, are discussed in section 4.1.
The inner loop is supplied with high-purity tritium by the outer loop system, which iscovered by the existing infrastructure of TLK [6]. The isotopic purity in the inner loop system
New Journal of Physics 14 (2012) 103046 (http://www.njp.org/)

8
Figure 3. The cooling concept of the WGTS beam tube is based on a thermo-siphon with two 16 mm evaporator tubes brazed onto the beam tube, which arepartially filled with neon at its boiling point (30 K). Convection in the thermo-siphon will be controlled by heater wires inside the evaporator tubes. The vapourflows to the evaporator ends, and back through a common return line to thecondenser. The thermo-siphon is cooled with liquid helium.
is monitored in line with a laser Raman spectroscopy setup (LARA) discussed in detail insection 4.3.
The set point for the WGTS temperature is about 30 K. This constitutes a near optimum: athigher temperatures, the gas flow rate and the throughput increase. Thus a larger T2 inventorywould be required to reach the same column density; also the Doppler broadening effectincreases. At lower temperatures, clustering and condensation of the hydrogen isotopologueswould be induced, which would be equally undesirable.
The concept of providing the cooling for the 10 m long source tube is summarized infigure 3. As shown there, it is based on a two-phase neon thermo-siphon. Two copper tubesare brazed over the whole length on the outside of the source beam tube and thus determinethe temperature on both sides. The neon gas flows to a condenser in a closed cycle; there itis liquefied again, being cooled with gaseous helium at ∼25 K. The measured fluctuations ofthe helium cryogenic circuit used to cool the condenser are of the order of 300 mK h−1 [20].These fluctuations exceed the temperature stability requirements derived in the next section.Therefore, these fluctuations need to be damped by the coupling between the helium circuitand the two-phase neon system; therefore the condenser has a large heat capacity. Since sucha cooling concept has never been applied to a large component such as the WGTS, a full-scale test experiment (the WGTS demonstrator) was performed in 2011. This demonstratorconsists of original components of the final WGTS assembly, in particular the beam tubeand its instrumentation. The main difference compared to the final WGTS cryostat is that allsuperconducting magnet components are replaced by a cold mass to simulate their thermalproperties during the demonstrator tests. Furthermore, the WGTS demonstrator was operatedwithout external potential while the WGTS in its final configuration can be operated on avariable voltage of up to 1000 V to define the potential difference between WGTS and the
New Journal of Physics 14 (2012) 103046 (http://www.njp.org/)

9
main spectrometer. Selected results of the demonstrator experiment are briefly summarized insection 4.2 and will be discussed in more detail in a future publication.
The aim of the demonstrator tests is to understand the thermal behaviour of the systemand to verify that the only non-negligible influx of heat into the beam tube originates from thepump ports at both ends of the WGTS tube, as predicted and shown in [20]. This heat influxleads to an azimuthal temperature profile of the beam tube that can be measured by temperaturesensors distributed along the tube and at several azimuthal positions. The measured temperaturedistribution can then be used in the gas dynamics modelling for the WGTS.
3. Modelling of the WGTS gas dynamics
Section 3.1 focuses on the current state of the gas dynamics simulation developed specificallyfor the WGTS to compute the density profile and column density, as well as the velocityprofile of molecules in the source. From these, one can determine the influence of experimentalparameters on the column density and thus ultimately on the neutrino mass sensitivity. Inaddition, one can deduce the specification for the monitoring of the crucial WGTS parameterspresented in section 3.2.
3.1. The gas dynamical model
In order to determine the influence of the thermodynamical properties of the WGTS on thecolumn densityN as defined by equation (2), a detailed gas dynamical simulation of the WGTShas been developed, which allows one to compute the density distribution n(Er) and consequentlyN . The velocity distribution f (ρ, φ, z, Ev) is also of interest, since the resulting electron energyis Doppler-shifted due to the motion of the tritium molecules.
One can characterize the flow regime in the WGTS beam tube with the so-called rarefactionparameter [21]
δ =Rp
η vm, with vm =
√2kBT
m. (3)
Here R is the tube radius, p is the pressure, η is the viscosity and vm is the most probablespeed for molecules with mass m and temperature T . Depending on the flow regime, one candistinguish three cases:
• the hydrodynamic regime with δ � 1, where the equations of continuum mechanics arevalid;
• the free molecular flow regime (δ � 1), where intermolecular collisions can be neglectedand the molecules move independently of each other;
• the transition regime, where the full Boltzmann equation needs to be solved, using adetailed model of intermolecular collisions. Since for this, the intrinsic nature of theintermolecular interactions is important, this is the most difficult scenario.
The rarefaction parameter varies from δ ≈ 20 at the injection in the WGTS beam tubeto δ . 10−1 at the beginning of the differential pumping chambers, with a significantpart of the beam tube exhibiting values within the intermediate regime. One can use thephenomenological intermediate conductance formula of Knudsen [22] to compute the gasdistribution approximately inside the WGTS, delivering an easily computable formula for the
New Journal of Physics 14 (2012) 103046 (http://www.njp.org/)

10
Figure 4. (a) Calculated relative density profile n(z)/n(0) along the WGTSbeam based on an expected source temperature distribution, an injection pressureof pin = 3.368 × 10⁻³ mbar at z = 0 and exit pressures of pout = 0.05pin atz = 5 m. (b) The expected relative deviations from the average column density(N (x, y) −Nave) /Nave for a quarter of the WGTS cross section and an assumedazimuthal temperature variation.
pressure distribution in [23]. To be more precise and to be able to include detailed boundaryconditions, in principle the full Boltzmann equation needs to be solved.
The length of the beam tube L is much larger than its radius R. Thus, to a goodapproximation, the radial dimensions can be neglected (n(Er) = n(z)) as will be shown insection 3.2. The problem is reduced to only a single (the longitudinal) spatial dimension, whichsimplifies the analytical description and tremendously reduces the necessary CPU time requiredfor the calculation.
For this one-dimensional case, the method outlined in [24] can be applied: it relies on thefact that the mass flow rate
M =π R3
vm
[−GP(δ)
dp
dz+ GT(δ)
p(z)
T (z)
dT
dz
], (4)
driven by small gradients of pressure p and temperature T , has to remain constant alongthe tube. The Poiseuille coefficient GP and the thermal creep coefficient GT, which dependonly on the rarefaction parameter δ, are available in [21]. The coefficients were obtainedby linearizing the Boltzmann equation around a Maxwell–Boltzmann distribution, employingthe S-model [25] for intermolecular collisions and using the small pressure and temperaturegradients as perturbation parameters.
With these coefficients, and incorporating the boundary conditions T (z) and pin (cfsections 4.1 and 4.2), provided by the continuous monitoring systems, equation (4) can besolved numerically. As a result one can determine the pressure p = p(z), and density n(z) =
p(z)/kBT (z) profiles along the tube. The resulting density profile obtained for typical values ofthese boundary conditions is shown in the left part of figure 4.
However, the one-dimensional model cannot fully describe the gas flow in the morecomplex geometries of the injection and pump port region. Furthermore, the injection andexit pressures cannot be measured directly, but have to be inferred from pressure sensors inthe Inner Loop. Therefore, the development of more detailed three-dimensional simulations ofthese regions is currently in progress. As a first step, a radial density distribution caused byan azimuthal temperature variation was computed for different positions along the beam tube.
New Journal of Physics 14 (2012) 103046 (http://www.njp.org/)

11
Table 1. Proportionality constants between different experimental parametersand the column density [3].
Parameter αX
Temperature αT = −1.2Injection pressure αpin = 1.1Exit pressure αpout = 0.03
Weighting these cross sections with their tritium content allows computation of the expectedradial column density fluctuations shown in the right part of figure 4.
It should be stressed that the gas dynamics simulation will not be used to quantitativelydetermine the absolute value of N . Although it is, in principle, possible to compute the columndensity for a given set of boundary conditions T (z), pin and pout, the simulation has only atrueness of about 5%. The trueness is limited by two facts: firstly, important fluid dynamicalproperties such as the viscosity of tritium and the accommodation coefficient between tritiumand the beam tube walls are not known accurately enough. Secondly, intrinsic uncertaintiesof the simulation, in particular the modelling of the intermolecular collisions and using thelinearized Boltzmann equation to compute the coefficients GP and GT in equation (4), alsocause systematic uncertainties within the simulation. Solving the exact Boltzmann equationnumerically has only been achieved in a very few and simple cases; the complex WGTScase would require excessive computational effort and is thus not pursued. Instead, the gasdynamics simulation is used to determine the influence of a certain (experimental) parameteron N . Once this influence is known, the task of monitoring N is translated into continuouslymeasuring this parameter with the required precision. In particular, the existing one-dimensionalsimulation is sufficiently fast to be suitable as a nearly real-time analysis tool for the columndensity based on the actual real-time monitoring of the beam tube temperature and injectionpressure.
3.2. The results of the gas dynamics simulation
Of particular interest for the monitoring requirements of the WGTS is the influence of anexperimental parameter X = T0, pin, pout on the column density defined in equation (2), whichgoverns the energy loss of β-electrons in the source:
1NN
= αX1X
X. (5)
This influence has been determined with the gas dynamics simulation in [3] and is summarizedhere. The coefficients αX given in table 1 allow for determining the stability requirements forthe corresponding physical quantity.
With the current version of the gas dynamics simulation, it has become possible to includethe influence of a temperature profile on n(Er) and N too, as determined by the instrumentationon the WGTS beam tube (see section 4.2). Now, it is also possible to compute the fulldistribution function f (z, Ev) instead of only the density distribution. It turns out that thevelocity distribution of the tritium molecules is well described analytically using a so-called
New Journal of Physics 14 (2012) 103046 (http://www.njp.org/)

12
local Maxwell–Boltzmann distribution
f (ρ, φ, z, Ev) =n(z)
(√
πvm)3exp
(−
v2ρ + v2
φ + (vz − Uz(ρ, φ, z))2
v2m
). (6)
The bulk velocity Uz(ρ, φ, z) reflects the fact that the gas flows from the injection in the middleof the beam tube to both ends. Uz(ρ, φ, z) is of the order of 10 m s−1 for most of the beam tubelength, but increases to about 50 m s−1 at the beam tube exits. This is much smaller than the mostprobable thermal speed vm =
√2kBT/m X ≈ 288 m s−1, where m X is the molecular mass of the
respective isotopologue. According to the Doppler effect, the motion of the decaying moleculechanges the β-electron energy as
1E = ELAB − ECMS =12me[(EvT2 + Eve)
2− Ev2
e ]. (7)
For example, the additional energy change 1E for an 18.6 keV β-electron emitted by a tritiummolecule with velocity vm corresponds to 1E = cos θT e × 130 meV, where θT e is the anglebetween momenta of the mother molecule and the β-electron. Since this is of the order ofthe KATRIN neutrino mass sensitivity, it needs to be taken into account in the β-spectrumcalculation.
Several additional investigations have been carried out to study specific effects thatpotentially influence the column density:
• A detailed simulation of the injection region based on [26] has been performed to optimizethe design of the injection chamber; a design with many small holes was shown to beadvantageous to avoid turbulence. The final design of the injection chamber features415 holes with a diameter of 2 mm.
• The thermal velocity of the different hydrogen isotopologues differs slightly due to theirmass difference
(vDT
m =√
mT2/mDTvT2m ≈ 1.1vT2
m
). This results in separation phenomena
and consequently a dependence of the gas composition on the position. This was studied indedicated simulations based on [27]. In the standard operational mode of the WGTS, theseeffects are negligible (the relative change is below 10−4). However, in a special operationalmode of the WGTS, the so-called krypton mode, this effect becomes significant. In thekrypton mode, a small fraction of 83Kr is added to the gas mixture for calibration purposes.This implies that the WGTS has to be operated at 120 K since krypton freezes at lowertemperatures. In this case, the larger temperature in combination with the larger massof krypton increases de-mixture effects significantly, but this is not relevant for the workdescribed here.
• The influence of an azimuthal temperature variation was investigated and can be calculatedfor inhomogeneities up to a few K by solving the linearized Boltzmann equation using thediscrete velocity method outlined, e.g., in [21, 28, 29]. However, as shown in figure 4, thiseffect is negligible for the expected radial temperature gradients since the correspondingcolumn density fluctuations are below 10−4.
Overall, according to these simulations, the influence of the corresponding effects onn(Er) and therefore N is of the order of 1N /N . 10−4; this is safely below the critical valuefor an unaccounted shift of 1N crit/N = 0.1% [3]. Consequently, monitoring T (z), pin, pout issufficient.
The effect on the shape of the tritium β-spectrum by tritium decays occurring in the pumpports or in the differential pumping section (DPS1-F, DPS1-R) has not yet been investigated in
New Journal of Physics 14 (2012) 103046 (http://www.njp.org/)

13
Table 2. Reference values and requirements for the stability of WGTSparameters, partially from [3].
Parameter Reference value Req. relative stability Req. trueness
Temperature T0 = 27–30K 10−3 0.5 KInjection pressure pin = 3.368 × 10⁻³ mbar 10−3
Exit pressure pout ≈ (0.03–0.05)pin 0.03Purity εT > 0.95 10−3 0.1Activity A = 1011 Bq 10−3
detail. In [3], it has been noted that effects from decays outside the central beam tube should, inprinciple, not be significant due to their small fraction (pout < 0.05pin). To properly account fordecays from these regions, which are partially operated at 80 K and which have inhomogeneousmagnetic fields, a simulation with full three-dimensional geometry has to be done in the future.
The resulting stability requirements for the monitoring systems are summarized in table 2.In addition to the precision requirements obtained with the values from table 1, the absolutevalue of the beam tube temperature is also of interest; it influences the integrated β-spectrumthrough the Doppler effect. However, the impact of the Doppler effect is relatively small due tothe low source temperature. In recent investigations, we have shown that the resulting accuracyrequirement is only about 500 mK.
For completeness, we briefly address the requirements for gas composition and activitymonitoring. As outlined in section 2.1.1, monitoring these two quantities constitutes acomplementary approach to the monitoring of pin, pout and T (z), since column densityfluctuations can also be obtained by measuring both the gas composition and the source activityusing equation (1). Furthermore, as a consequence of the different final state distributions ofT2, DT and HT, now also the trueness (and not only the precision) of the gas compositionmeasurement is of relevance. Fortunately, the resulting accuracy requirement is much lessstringent than for the precision; in recent studies, we have shown that in the case of the envisagedhigh tritium purity εT > 0.95, a 1% accuracy for εT can be reached with a trueness of the LARAsystem of only about 20% [16].
4. Control and monitoring
In table 2, the actual requirements for the control and monitoring of the crucial sourceparameters are listed. These requirements can only be met if the gas inlet and outlet rates, thebeam tube temperature and the gas composition are stable. In the Technical Design Report ofKATRIN [3] only rough concepts were sketched. Now that research and development has beenperformed on all relevant control and monitoring devices, it has been demonstrated that theserequirements can be fully met.
The different CMSs summarized in figure 5 are as follows.
• The inner loop system provides stable gas injection and the stable gas composition togetherwith the infrastructure of the TLK (see section 4.1).
• A sensor system of PT500 temperature sensors provides the monitoring of the spatial andtemporal temperature distribution TBT(φ, z) on the WGTS beam tube (see section 4.2).
New Journal of Physics 14 (2012) 103046 (http://www.njp.org/)

14
Figure 5. Overview of the analytic systems for the control and monitoring of thegaseous tritium source. A detailed description of the systems is given in the maintext. Note that both spectrometers are scaled to 50% of their size.
• LARA is connected to the inner loop and enables the in-line monitoring of gas compositionεT (see section 4.3).
• Three activity detectors are foreseen to measure the activity of the WGTS. The overallWGTS activity is proportional to the product of column density (N ) and isotopic purity(εT) (see section 4.4).
• An electron gun embedded into the CMS of the KATRIN experiment is used to measurethe scattering losses of the electrons in the WGTS (see section 4.5).
It should be noted that most of the systems have now been set up, and we have proven theirsuitability for the various control and monitoring tasks. The few remaining systems are alreadybeyond the prototype phase and the results so far suggest that they could be implemented intoKATRIN in the near future. Below we introduce the various CMSs, and discuss their currentstatus.
4.1. The inner tritium loop
From the point of view of tritium circulation, achieving a stable column density requires (i) thestable injection of tritium in the middle of the WGTS beam tube and (ii) stable pumping on bothends.
While conceptually this sounds very simple, in reality it requires a rather complexassembly. Overall, the actual working principle very much resembles Ohm’s law (for gases):Q = 1pc. A constant pressure gradient 1p and a constant conductance c (which will beachieved by a constant temperature and length of the connection pipe) will result in a constantgas flow Q into the WGTS.
To fulfil the first requirement, a highly precise ‘flow controller’ had to be built at the TLK;this is the so-called Inner Loop (figure 6(b)). It consists of 45 sensors for pressure, temperatureand ionization, 70 automatic and manual valves, 2 flow controllers, 1 flow meter, 9 vacuumpumps, 6 buffer vessels, 2 palladium membrane filters, ≈70 custom made pipes, ≈20 metalbellows and a total of >400 metallic seals.
New Journal of Physics 14 (2012) 103046 (http://www.njp.org/)

15
Figure 6. (a) Simplified flow scheme and (b) picture of the complete setup of thetritium circulation loop.
The second requirement, i.e. a stable pumping rate, will be achieved using turbo molecularpumps (Oerlikon Leybold MAG W 2800) on both ends of the WGTS. Due to a constant rotationfrequency (on a 10−4 level), a constant pumping speed and consequently a constant exit pressurewill be maintained.
After setting up the flow controller, leak tests of every single component and an integralleak test were performed. The measured integral leakage rate of 7 × 10⁻⁹ mbar l s−1 conformsto the regulations for primary systems of the Tritium Laboratory.
Since the WGTS is not yet available for test measurements, the connection had tobe bypassed by a tube with a similar conductance as the later combination of WGTS andconnection line.
An example of the measured pressure trend during pressure-stabilized circulation ofdeuterium is shown in figure 7. Here, the KATRIN limits are indicated by the dotted lines;clearly, the pressure stabilization falls well within these limits. Note that the particular runshown here may be seen as the worst case. The apparent dip during the early times of therun did not occur in any other of the runs; it could well have been the result of a variation inthe room temperature. From the trace in figure 7(a), one extracts an average pressure 〈p1〉 =
15.024 ± 0.002 mbar inside the pressure-controlled buffer vessel, for a set-point of 15 mbar.The corresponding gas flow is stable within 120.4±0.5 sccm, with a temperature fluctuation
of the buffer vessel of ±0.125 K at 318 K. Fourier analysis of the pressure trends shows noindication of periodic short-term (seconds/hours) or long-term (days/weeks) fluctuations.
For calibration (see, e.g., section 4.5) and verification reasons, the pressure stabilization isdesigned to operate between p1 ≈ 1 mbar and p1 ≈ 20 mbar. A series of pressure stability testsat different pressures has been performed with N2 filling. The results are shown in figure 7(b).The observed fluctuations are well within the KATRIN requirement for all pressure set-points.
New Journal of Physics 14 (2012) 103046 (http://www.njp.org/)

16
Figure 7. (a) Results of an individual pressure-control run. The pressure in theWGTS buffer vessel is shown for several hours of deuterium circulation and apressure set-point of 15 mbar. The dashed lines represent the 1σ requirement forKATRIN operation. (b) Measured pressure fluctuation as a function of the meanpressure during nitrogen circulation, as measured for different set-points.
In particular, for the standard KATRIN conditions with a pressure set-point of p1 ≈ 15 mbar andonly negligible temperature fluctuations on the connection line to the WGTS, the Inner Loopperforms nearly an order of magnitude better than the 0.1% limit required by KATRIN, for bothdeuterium and N2.
To examine the effect of a temperature variation of the WGTS connection line, the WGTSbypass is equipped with an electrical heater to simulate temperature changes resulting in adifferent conductance. The temperature Tbypass was varied in four steps over an interval of ≈20 Kwithin a few hours. This exceeds the expected fluctuations under KATRIN conditions by threeorders of magnitude. Such extreme variations of up to 20 K do not affect the pressure to suchan extent that the KATRIN 0.1% limit would be surpassed. For a variation 1Tbypass of ≈2 K(still ≈100 times the KATRIN specification), no visible influence on the pressure stabilizationhas been observed. Therefore, it can be concluded from these test measurements that the InnerLoop fulfils and even exceeds the requirements for KATRIN.
4.2. Beam tube temperature
In both the WGTS demonstrator setup and the final WGTS assembly described in section 2.2,the monitoring of the beam tube temperature is performed by 24 metallic resistance temperaturesensors (Pt500) and 24 vapour pressure sensors. The Pt500 sensors are used to monitor thetemperature continuously. Their resistance is measured by digital multimeters with a resolutionof 1R = 3 × 10⁻⁵ �. A common calibration curve, measured for the original sensors of theWGTS, is used to convert the resistance to actual temperatures with a theoretical temperatureresolution of 1T = 3 × 10⁻⁵ K. Several contributions to the uncertainty have been evaluatedin [30]; the results suggest a combined calibration uncertainty of 125 mK at T = 30 K; themain contribution seems to be due to the magnetic field dependence of the Pt500 temperaturemeasurements. This uncertainty is insufficient to reliably monitor the beam tube temperaturewith requirements of 30 mK on stability and homogeneity. Therefore, each Pt500 sensor iscalibrated in situ by an adjacent vapour pressure sensor. A vapour pressure sensor is a small
New Journal of Physics 14 (2012) 103046 (http://www.njp.org/)
17
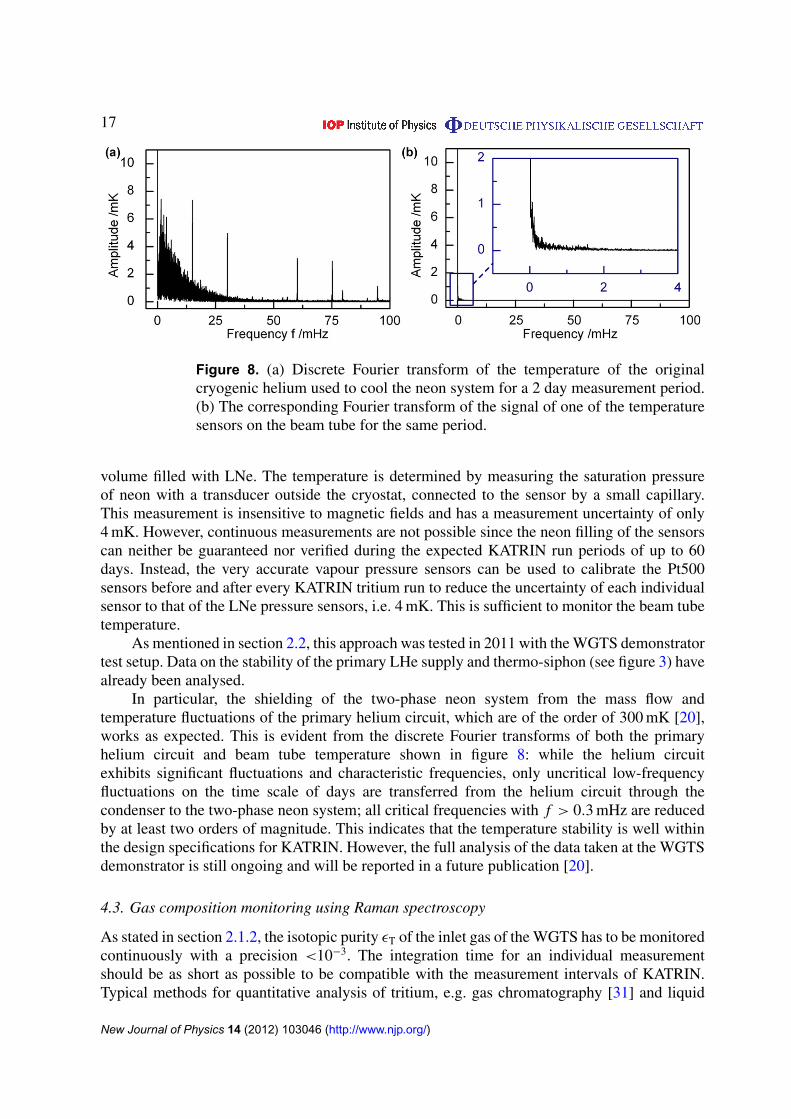
Figure 8. (a) Discrete Fourier transform of the temperature of the originalcryogenic helium used to cool the neon system for a 2 day measurement period.(b) The corresponding Fourier transform of the signal of one of the temperaturesensors on the beam tube for the same period.
volume filled with LNe. The temperature is determined by measuring the saturation pressureof neon with a transducer outside the cryostat, connected to the sensor by a small capillary.This measurement is insensitive to magnetic fields and has a measurement uncertainty of only4 mK. However, continuous measurements are not possible since the neon filling of the sensorscan neither be guaranteed nor verified during the expected KATRIN run periods of up to 60days. Instead, the very accurate vapour pressure sensors can be used to calibrate the Pt500sensors before and after every KATRIN tritium run to reduce the uncertainty of each individualsensor to that of the LNe pressure sensors, i.e. 4 mK. This is sufficient to monitor the beam tubetemperature.
As mentioned in section 2.2, this approach was tested in 2011 with the WGTS demonstratortest setup. Data on the stability of the primary LHe supply and thermo-siphon (see figure 3) havealready been analysed.
In particular, the shielding of the two-phase neon system from the mass flow andtemperature fluctuations of the primary helium circuit, which are of the order of 300 mK [20],works as expected. This is evident from the discrete Fourier transforms of both the primaryhelium circuit and beam tube temperature shown in figure 8: while the helium circuitexhibits significant fluctuations and characteristic frequencies, only uncritical low-frequencyfluctuations on the time scale of days are transferred from the helium circuit through thecondenser to the two-phase neon system; all critical frequencies with f > 0.3 mHz are reducedby at least two orders of magnitude. This indicates that the temperature stability is well withinthe design specifications for KATRIN. However, the full analysis of the data taken at the WGTSdemonstrator is still ongoing and will be reported in a future publication [20].
4.3. Gas composition monitoring using Raman spectroscopy
As stated in section 2.1.2, the isotopic purity εT of the inlet gas of the WGTS has to be monitoredcontinuously with a precision <10−3. The integration time for an individual measurementshould be as short as possible to be compatible with the measurement intervals of KATRIN.Typical methods for quantitative analysis of tritium, e.g. gas chromatography [31] and liquid
New Journal of Physics 14 (2012) 103046 (http://www.njp.org/)

18
0 1000 2000 3000 4000
0
5
10
15
20
25
30
35
40
Scaled byfactor x10
T2 (S
1, J’’=2)
T2, DT, HT
S0 branches of
Inte
nsity
(a.u
.)
Raman shift (cm-1)
T2 (Q
1)
HT (Q1)
DT (Q1)
(b)
Figure 9. (a) Simplified schematic drawing of the LARA setup (for details seethe main text). The polarization angle of the laser beam is controlled by a half-wave plate (λ/2). The photo diode and power meter are used for monitoringthe laser stability. The LARA cell is located inside the glove box of the InnerLoop, while the optical setup is on the outside to prevent contamination. (b)Representative Raman spectrum of a gas mixture with ptot = 217 mbar andεT > 90%. The Raman branches are labelled according to [33]. T2 dominatesthe mixture but traces of DT and HT are visible.
scintillation counting [32], are not suitable for non-stop operation at the KATRIN experimentbecause of the duration of the measurement procedure (typically � 250 s), the need for sampleextraction and the continuous waste production. In contrast, laser Raman spectroscopy is anon-contact and in-line method which is based on the inelastic Raman scattering [33] of lightfrom gas molecules and continuous monitoring in measurement intervals of <250 s is feasible.Raman spectroscopy systems are commercially available and widely used for gas analysis. Butwhen combining the requirements of operation with tritium and <10−3 statistical uncertainty,off-the-shelf commercial products are not suitable [34].
Although, in principle, no other gas species than hydrogen isotopologues are expected tobe injected into the source tube, Raman spectroscopy is also sensitive to any other molecularspecies such as nitrogen and tritiated methane species (CT4, CDT3, etc) [35]; the former isthought to originate from incomplete evacuation of the loop prior to the filling with tritium,whereas the latter can be attributed to exchange reactions with carbon liberated from the steelvessel and tubes.
Over the last 5 years, a specialized laser Raman spectroscopy unit (LARA) has evolvedand was thoroughly tested [36, 37]. It consists of a measurement cell (LARA cell), which islocated between the buffer vessels of the Inner Loop (see figure 6) and a laser setup for gasanalysis (see figure 9(a)). The gas pressure inside the LARA cell is typically in the rangeof 150–200 mbar during operation of the Inner Loop. A DPSS laser, operating at 532 nm, isused as the excitation source. The Raman scattered light is collected under an angle of 90◦ byoptical lenses and guided by an optical fibre to a spectrometer (Princeton Instruments, HTS) andCCD detector (Princeton Instruments, PIXIS:2KB) for spectral analyses. The Raman shifts and
New Journal of Physics 14 (2012) 103046 (http://www.njp.org/)

19
intensities of the vibrational Q1 branches of the hydrogen isotopologues are used for qualitativeand quantitative analyses, respectively (see figure 9(b)). A custom-written analysis package hasbeen developed, which incorporates the automated correction of high-intensity CCD pixels dueto cosmic rays, background subtraction and peak fitting [38].
Although the present system is still based on the originally proposed concept [3], recentlythree major improvements have been implemented which have aided in maximizing the signal-to-noise ratio.
• A temperature controlled high-stability laser (Laser Quantum, Finesse 5 W, 532 nm), andthermally stable mounts for the optical components are used to reduce fluctuations of laserpower and beam alignment that would impose intensity fluctuations in the Raman spectra.
• The laser beam is passed through the LARA cell twice to nearly double the effective laserpower in the cell with respect to the standard, single-pass setup.
• Groups of CCD pixels are simultaneously read out (‘on-chip binning’) to minimize noisefrom the analogue-to-digital conversion in the CCD [38].
By 2011, the LARA system was tested in the tritium test circulation loop, LOOPINO.Here it had already reached 1prec(εT2)/εT2 = 0.1% for T2 monitoring within 250 s acquisitiontime under conditions similar to KATRIN operation (∼200 mbar absolute pressure; tritiumpurity εT ∼ 0.95) before the aforementioned improvements were implemented [35]. At thistime, a level of detection of 0.012 mbar partial-pressure equivalent was reached [34]. Afterthe implementation of the improvements, a first test with a tritium mixture (p(T2) ≈ 7.4 mbar,p(HT) ≈ 1.6 mbar, p(DT) ≈ 0.7 mbar) was performed. For this, a statistical uncertaintyof 1prec(εT2)/εT2 = 0.3% was achieved for T2 monitoring within 250 s acquisition time.Extrapolating this performance to the KATRIN operating conditions, the LARA system canreach 1prec(εT2)/εT2 = 0.1% within 60 s acquisition time.
In contrast to the other monitoring tools of the WGTS, not only the precision but also thetrueness of LARA measurements is of interest, due to the influence of the different final statedistributions of the individual isotopologues on the β-spectrum (see section 2.1.2).
To address the problem of trueness in the observed Raman signal amplitudes, a calibrationmethod with non-tritiated reference gas mixtures has been developed to determine the responsefunctions for H2, HD and D2, which relate the Raman line intensities to the molar fraction of theisotopologues in the gas mixture. The response functions, which are different for the individualisotopologues, include quantum mechanical transition matrix elements, the ν4 wave numberdependence of Raman scattering and the spectral sensitivity of the light collection system ofLARA. In this study, an apparent variation between the individual response functions by up to10% has been observed.
In an alternative approach, ‘synthetic’ calibration spectra are generated against whichthe measured spectra are compared. For this, the transition matrix elements of the hydrogenisotopologues are calculated using ab initio formalisms [39]. Unfortunately, the relevant matrixelements were not yet experimentally verified for all hydrogen isotopologues; hence, any slighterrors therein would potentially propagate into the LARA measurement of the gas composition.Therefore, a precise experimental check of the transition matrix elements of all hydrogenisotopologues has been performed and the results will be reported shortly [40].
Another calibration issue in determining the trueness in the Raman peak amplitudes is thespectral efficiency of the light collection system; for this a complete characterization of theLARA setup is required, which will rely on a well-defined calibration light source (currently
New Journal of Physics 14 (2012) 103046 (http://www.njp.org/)

20
under development). The aim is to further improve the accuracy of the LARA calibration(currently ∼10%). However, should the understanding of the final states improve, and thusthe uncertainty estimate reduce, then this would immediately impact on the LARA accuracyrequirements. Most likely, they would become more stringent; however, the current improvedimplementation of the LARA setup would certainly be capable of meeting such a demand.
As a final note, we would like to mention that during operation with concentrated tritiumgas mixtures, damage of the tritium facing anti-reflection coatings of the LARA cell windowswas observed [35]. A test experiment is currently ongoing to search for tritium-resistant coatingsand to investigate the potential loss of optical transparency of the windows under β radiation.For final testing, a long-term measurement campaign of the LARA setup with a circulatingtritium gas mixture (εT > 0.95) is planned for 2012.
4.4. Activity measurements
The activity monitoring systems presented in this section have two important goals: (i) theyprovide information about fluctuations of the WGTS activity itself with a time scale of minutes;these would cause systematic effects in the neutrino mass analysis if not taken into account.(ii) Together with the measured tritium purity εT, equation (1) can be used (in the form ofN = Si/(CiεT)) to monitor fluctuations of the column density N with 0.1% precision. Here,the index i reflects the fact that the proportionality constant Ci and thus the signal rate Si aredifferent for each activity monitoring system. The combined monitoring of both activity andgas composition thus allows one to disentangle whether observed activity fluctuations are dueto changes of the gas composition or changes in the column density N (which have a differenteffect on the KATRIN count rate).
Various concepts to measure the source activity have been studied. In all methods, a lowerthreshold for the β-electron detection is necessary to separate the signal from the overwhelmingamount of low-energy secondary and shake-off electrons. Furthermore, the detection methodmust not disturb the electron transport from the source to the main spectrometer.
In the following, we present three experimental concepts and devices which can beintegrated into the KATRIN beam line. Two of these are located in the CMS, either directlymeasuring the current in the rear wall incurred by the β-electrons (see section 4.4.1) or withBIXS (see section 4.4.2). The third device, the Forward Beam Monitor Detector (FBMD; seesection 4.4.3), is located in the Cryogenic Pumping Section (CPS). Prototype tests demonstratedthat with all three concepts the detection of electrons with a suitably low-energy threshold isfeasible.
The column density will also be measured periodically (every few hours) by an electrongun; as discussed in section 4.5, this is an important calibration measurement by itself. It alsoallows one to probe whether the constants Ci of the activity monitoring systems are truly timeindependent (within the required precision of 0.1%).
4.4.1. The rear wall as a Faraday cup. To use the rear wall as a Faraday cup to monitorthe WGTS source activity, the WGTS β-electron emission is treated as a dc current, whichis of the order −10 nA. This is accompanied by low-energy plasma currents, which must bescreened. For this a multi-layer thin-film coating is applied to the rear wall. The top layeris a gold film of about 50 nm thickness; while relatively thin, this gold layer is sufficient tointercept all low-energy plasma species. It is electrically isolated from the metallic substrate by
New Journal of Physics 14 (2012) 103046 (http://www.njp.org/)
21
(a)Au Ti SiO2 AlAl2O3
(b)
0 2 4 6 8 10 12-5
-4
-3
-2
-1
0
AlAu
Cur
rent
/nA
Electron energy /keV
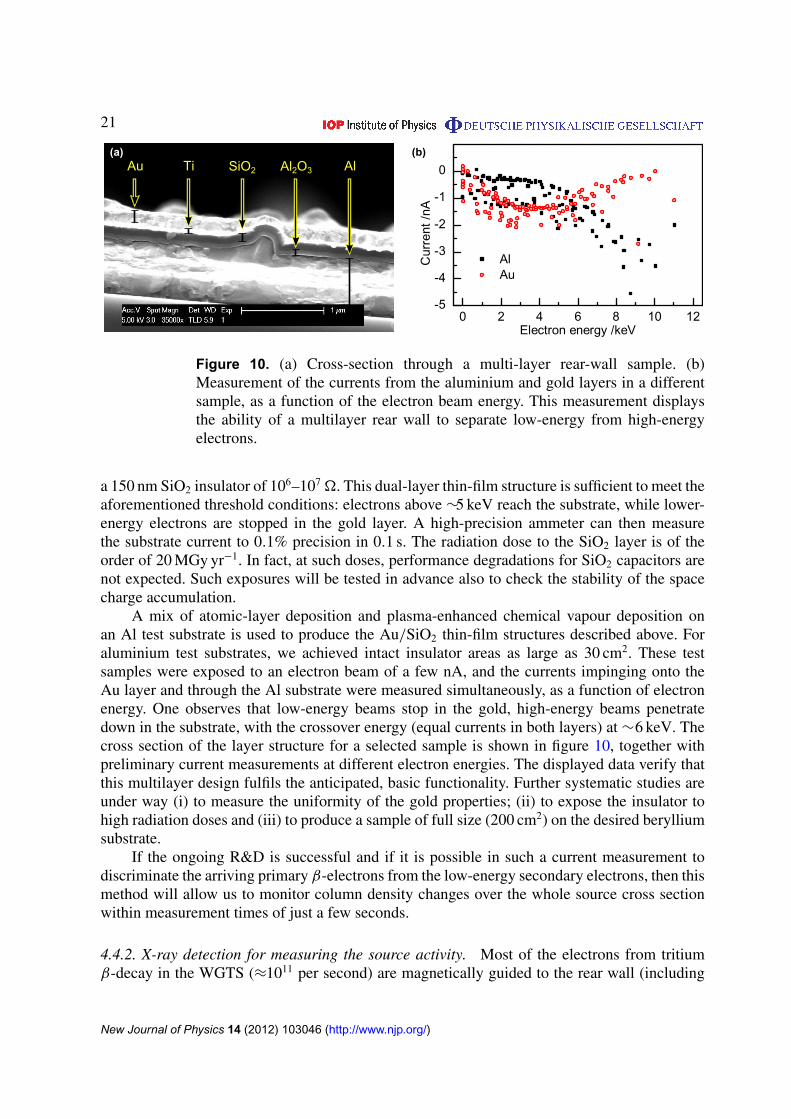
Figure 10. (a) Cross-section through a multi-layer rear-wall sample. (b)Measurement of the currents from the aluminium and gold layers in a differentsample, as a function of the electron beam energy. This measurement displaysthe ability of a multilayer rear wall to separate low-energy from high-energyelectrons.
a 150 nm SiO2 insulator of 106–107 �. This dual-layer thin-film structure is sufficient to meet theaforementioned threshold conditions: electrons above ∼5 keV reach the substrate, while lower-energy electrons are stopped in the gold layer. A high-precision ammeter can then measurethe substrate current to 0.1% precision in 0.1 s. The radiation dose to the SiO2 layer is of theorder of 20 MGy yr−1. In fact, at such doses, performance degradations for SiO2 capacitors arenot expected. Such exposures will be tested in advance also to check the stability of the spacecharge accumulation.
A mix of atomic-layer deposition and plasma-enhanced chemical vapour deposition onan Al test substrate is used to produce the Au/SiO2 thin-film structures described above. Foraluminium test substrates, we achieved intact insulator areas as large as 30 cm2. These testsamples were exposed to an electron beam of a few nA, and the currents impinging onto theAu layer and through the Al substrate were measured simultaneously, as a function of electronenergy. One observes that low-energy beams stop in the gold, high-energy beams penetratedown in the substrate, with the crossover energy (equal currents in both layers) at ∼6 keV. Thecross section of the layer structure for a selected sample is shown in figure 10, together withpreliminary current measurements at different electron energies. The displayed data verify thatthis multilayer design fulfils the anticipated, basic functionality. Further systematic studies areunder way (i) to measure the uniformity of the gold properties; (ii) to expose the insulator tohigh radiation doses and (iii) to produce a sample of full size (200 cm2) on the desired berylliumsubstrate.
If the ongoing R&D is successful and if it is possible in such a current measurement todiscriminate the arriving primary β-electrons from the low-energy secondary electrons, then thismethod will allow us to monitor column density changes over the whole source cross sectionwithin measurement times of just a few seconds.
4.4.2. X-ray detection for measuring the source activity. Most of the electrons from tritiumβ-decay in the WGTS (≈1011 per second) are magnetically guided to the rear wall (including
New Journal of Physics 14 (2012) 103046 (http://www.njp.org/)

22
Figure 11. Schematic representation of the TriReX setup.
the electrons originally flying towards the spectrometer section, as most of them are reflectedby the retarding potential and eventually hit the rear wall). The absorption of β-decay electronsin the gold coating of the rear wall then generates x-rays (see section 2.2), which can be detectedusing BIXS.
Provided that the rear-wall substrate is sufficiently transparent for x-rays produced bybremsstrahlung or fluorescence, a detection system for activity monitoring of the WGTS canbe placed behind the rear wall.
A proof of principle experiment (Tritium Rear wall eXperiment (TriReX)) was built at TLKto demonstrate the feasibility of monitoring the activity of gaseous tritium under conditionssimilar to the WGTS.
A simplified setup of TriReX is shown in figure 11. Conceptually, it is divided into threeseparate volumes. The first (right) recipient volume contains the (H, D, T)-gas mixture. An axialmagnetic field up to 120 mT provided by a water-cooled air coil guides the β-decay electronsto the gold-coated beryllium windows at both ends. The right beryllium window (of 50 mmdiameter and 180 µm thickness) serves as a reference surface for later adsorption measurements,while the left beryllium window (of 39 mm diameter and 200 µm thickness) constitutes theequivalent of the KATRIN rear wall. In addition, the window prevents contamination of thesilicon drift detector (SDD, KETEK AXAS-M), located in the second (central) volume, withtritium. The SDD (active area: 80 mm2) is oriented towards the beryllium window. The energyresolution of the system is less than 160 eV at 5.9 keV. The third (left) volume contains thedetector electronics, including pre-amplification and temperature control.
A spectrum taken with the TriReX setup is shown in figure 12(a). The continuousbremsstrahlung spectrum is superimposed by x-ray fluorescence lines. The x-ray line spectrumis dominated by a peak around 2 keV. This peak originates from the Zr collimator which isfactory mounted to the SDD. Additional peaks can be associated with Cr, Fe, Mn and Mo, whichare present as trace constituents in the stainless steel vacuum vessel. Two further peaks at higherenergies are caused by the gold coatings of the beryllium windows. The characteristic x-raysprovide the unique possibility of an in situ energy calibration of the system. The cut-off below2 keV is caused by absorption of the x-rays within the beryllium windows; the energy thresholdof the detector had been set to 6 150 eV. The shape of the measured bremsstrahlung spectrum
New Journal of Physics 14 (2012) 103046 (http://www.njp.org/)
23
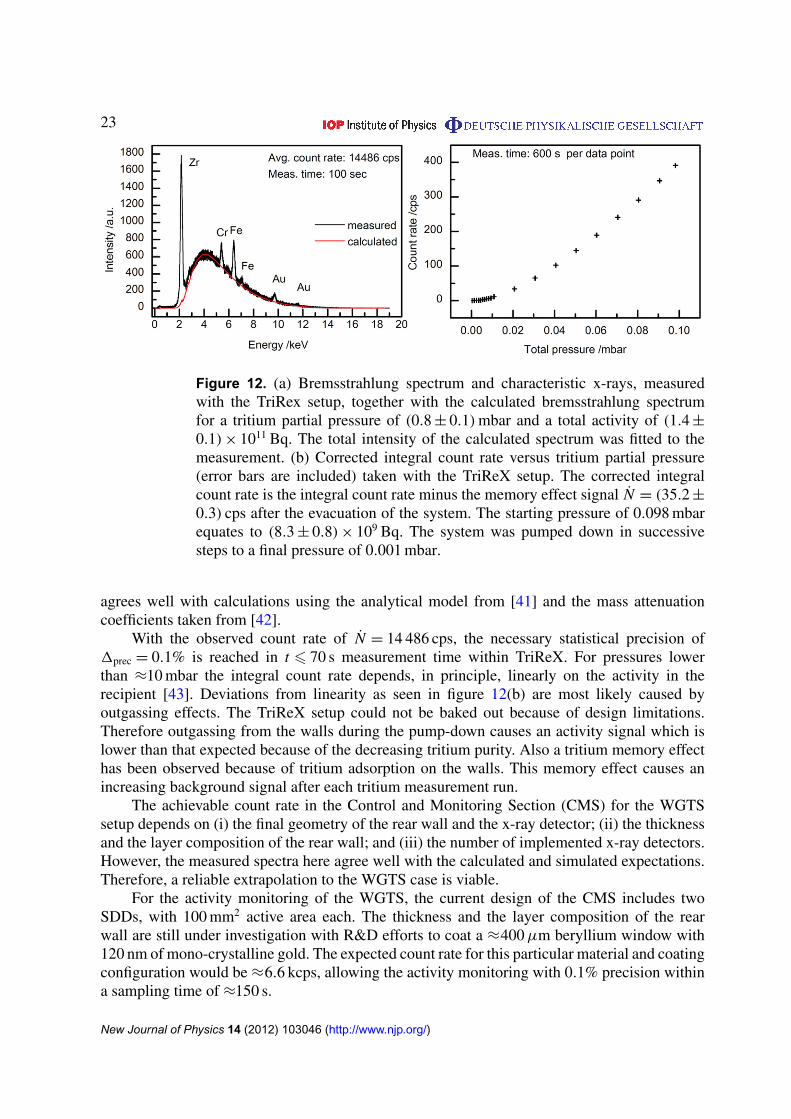
Figure 12. (a) Bremsstrahlung spectrum and characteristic x-rays, measuredwith the TriRex setup, together with the calculated bremsstrahlung spectrumfor a tritium partial pressure of (0.8 ± 0.1) mbar and a total activity of (1.4 ±
0.1) × 1011 Bq. The total intensity of the calculated spectrum was fitted to themeasurement. (b) Corrected integral count rate versus tritium partial pressure(error bars are included) taken with the TriReX setup. The corrected integralcount rate is the integral count rate minus the memory effect signal N = (35.2 ±
0.3) cps after the evacuation of the system. The starting pressure of 0.098 mbarequates to (8.3 ± 0.8) × 109 Bq. The system was pumped down in successivesteps to a final pressure of 0.001 mbar.
agrees well with calculations using the analytical model from [41] and the mass attenuationcoefficients taken from [42].
With the observed count rate of N = 14 486 cps, the necessary statistical precision of1prec = 0.1% is reached in t 6 70 s measurement time within TriReX. For pressures lowerthan ≈10 mbar the integral count rate depends, in principle, linearly on the activity in therecipient [43]. Deviations from linearity as seen in figure 12(b) are most likely caused byoutgassing effects. The TriReX setup could not be baked out because of design limitations.Therefore outgassing from the walls during the pump-down causes an activity signal which islower than that expected because of the decreasing tritium purity. Also a tritium memory effecthas been observed because of tritium adsorption on the walls. This memory effect causes anincreasing background signal after each tritium measurement run.
The achievable count rate in the Control and Monitoring Section (CMS) for the WGTSsetup depends on (i) the final geometry of the rear wall and the x-ray detector; (ii) the thicknessand the layer composition of the rear wall; and (iii) the number of implemented x-ray detectors.However, the measured spectra here agree well with the calculated and simulated expectations.Therefore, a reliable extrapolation to the WGTS case is viable.
For the activity monitoring of the WGTS, the current design of the CMS includes twoSDDs, with 100 mm2 active area each. The thickness and the layer composition of the rearwall are still under investigation with R&D efforts to coat a ≈400 µm beryllium window with120 nm of mono-crystalline gold. The expected count rate for this particular material and coatingconfiguration would be ≈6.6 kcps, allowing the activity monitoring with 0.1% precision withina sampling time of ≈150 s.
New Journal of Physics 14 (2012) 103046 (http://www.njp.org/)

24
Figure 13. Setup of the FBMD. (a) Manipulator with detector module in theindicated flux tube (the same scale). (b) PIN diode with an active area of 1.3 mm2.
Further investigations regarding the long-term stability of such a system, backgrounds bytritium adsorption on gold and stainless steel and an absolute calibration of the system at the≈1% level will take place in the near future.
4.4.3. Forward beam monitor detector. Silicon radiation detectors, which directly detect theβ-electrons in the flux tube, can also be used to monitor the source activity. Such a detectorshould not shadow any parts of the electron flux tube, which is used for the neutrino massanalysis, neither in the rear nor in the forward direction. Therefore, care has to be taken whereto position the detector. Because of these constraints, this component will be implemented inthe so-called FBMD configuration, which probes only the outermost rim of the flux tube. Apicture of the setup is shown in figure 13. It is assumed that this localized activity measurementis nevertheless representative for the whole beam cross section. That this assumption holds maybe verified during periodic calibration runs, since the detector concept also includes the option tomove the detector element across the whole flux tube cross section. The FBMD will be mountedbetween the last two superconducting solenoids of the CPS, i.e. at the end of the transportsection, where the tritium partial pressure is reduced by 14 orders of magnitudes compared tothe WGTS. This minimizes any background effects and contamination of the sensitive detectorsurface by tritium, and vice versa minimizes any impact from the detector on the tritium gas.
The magnetic field EB at this position is axially symmetric with | EB| ∼ 1.6 T and cantherefore be used to study the spatial homogeneity of the source profile with a position resolutionof the manipulator of 50 µm. For its standard monitoring role, the detector will be 61–67 mmaway from the beam axis.
The concept was tested by a proof-of-principle experiment using an off-the-shelf PIN diode(manufactured by Micron semiconductor). It comprises a circular active area of 1.3 mm2, athickness of 300 µm and a dead layer of approximately 100 nm. The diode chip is mountedwith epoxy on a ceramic substrate which also carries the charge-sensitive pre-amplifier as ahybrid module. The signal path is split into a spectroscopic ac mode and a dc mode which canbe used in parallel. Both methods can be utilized to measure the actual activity of the WGTS.
In the ac mode, the energy of each impinging electron is measured individually bydigitalization of the pre-amplifier signal and subsequent pulse height analysis.
New Journal of Physics 14 (2012) 103046 (http://www.njp.org/)

25
In the dc mode, the continuous flow of decay electrons results in an increased dc offsetof the integrating pre-amplifier, which scales with the activity. Of course, information on theenergy of the β-electrons is lost in the dc mode, but sampling times are significantly reducedwith respect to the ac mode; thus the activity can be measured with 0.1% precision within justa few seconds.
The reason for this is that in dc mode no ‘pile-up’ effects are encountered, which areprevalent at higher count rates in ac mode. As a consequence, a larger detector area could bechosen for the dc mode detection, capturing a larger electron flux. The opposite would holdfor the ac mode: count rates can be limited by making the detector area smaller. Currently, thesensitive detector area is a compromise between the optimal 0.1 mm2 for ac readout mode and5 mm2 which would be the optimum for the dc readout mode. For the final design, it is proposedto use a custom designed detector chip with two active pixels, their respective sizes optimizedfor ac and dc readout modes.
For both modes, temperature stabilization of the detector is important. In the spectroscopic(ac) mode, the energy resolution and thus the stability of detection threshold depend on thedetector temperature. In the dc mode, the diode leakage current which is superimposed on thesignal produced by the impinging electrons rises exponentially with the detector temperature.Therefore, precise temperature control and stabilization of the detector element at temperaturesof about −30 ◦C is necessary. The cooling concept is based on a highly flexible copper braid witha cross section of 10 mm2 which thermally connects the movable detector holder to a copperheat sink. The heat sink is cooled by a cold gas supply which is based on liquid nitrogen in adewar vessel evaporated with an electrical heater. With this approach, temperature stabilizationto better than ± 0.1 K has been achieved.
The detector as well as its electronics and temperature control was mounted on a two-dimensional UHV manipulator; the complete assembly was tested with an electron gun. Thebeam scanning capability of the manipulator was successfully shown. In the (spectroscopic) acmode the monitoring of the electron flux proved to be reliable up to rates of about 50 kHzwhen pile-up becomes the limiting factor. Within the linear response regime, the electronenergy resolution was measured to be σ(FWHM) = 1120 ± 50 eV at 17.5 keV; this agrees withcalculated noise sources such as Fano and electronic noise.
In the (integral) dc mode, count rates of up to 212 kHz have been measured with asystematic uncertainty of 1.9%. It should be noted that during long-term measurements drifts ofthe dc signal were observed; it was suspected that electrons hitting the corners of the detectorsurface create this effect. A detector optimized for this measurement mode, incorporatingadditional shielding, should reduce or avoid these adverse effects.
It was possible to show that the FBMD system is capable of providing activity monitoringto a reasonable precision; however for the final KATRIN implementation, some modificationsare required. The dimensions at the KATRIN experiment dictate that a larger UHV manipulator,but of the same type and the same cooling concept, has to be used. The detector, especially itssensitive area, needs to be designed to accommodate the high β-intensity of 1.6 × 10⁶ s−1 mm−2.Due to the low energy of the electrons, which is insufficient to create lattice defects, radiationdamage is not an issue [44]. But the detector sensitive area needs to be limited to reach animpinging rate of, e.g., 50 kHz in the ac mode, meaning that within an integration time of 30 san activity uncertainty of 0.1% can be achieved. On the other hand, the dc detector can measurewith a high rate like 5 MHz to reach a precision of 0.1% within 1 s integration time, assumingthat the systematic error remains constant.
New Journal of Physics 14 (2012) 103046 (http://www.njp.org/)

26
4.5. Other measurement methods for the column density
In this paper, the focus has been on tools for in-line monitoring and characterization ofthe WGTS, on time scales as close as possible to real time. For completeness, we brieflyaddress a complementary, but off-line, method to infer N , namely via the analysis of scatteredelectrons. The method is based on an approach which involves both the high-resolution mainspectrometer and the focal plane detector. Consequently, the precision of the method is linkedto the performance and precision of those two main KATRIN components. It has the potentialto directly measure the energy losses caused by scattering, with a nominal accuracy of theprobability for n-fold scattering Pn of 1acc(Pn)/Pn < 0.1%, and it may be seen as one of themost crucial calibration measurements for the KATRIN experiment.
Unfortunately, this monitoring method cannot be performed simultaneously with theneutrino mass measurements. Therefore, it will be used only in periodic tests rather than forcontinuous monitoring. Despite not being a near real-time method it is a vital cross-calibrationcheck for N and therefore it is worthwhile to briefly describe it here.
An electron emitter (electron gun, e-gun) in the CMS based on the photo-electric effectproduces quasi-mono-energetic electrons with stable intensity and with a well-defined angle θ
(the angle between electron momentum and EB-field) and adjustable kinetic energy E0 [45]. Theparameter pair (E0, θ) can be varied over the full range of tritium-β-electron values encounteredin the WGTS, with a maximum angular spread of σθ < 4◦. The maximum kinetic energy istechnically limited to 25 keV with a proposed maximum energy spread of σE0 < 0.2eV in thelow rate mode (R < 104 cps).
The measurement principle relies on the correlation between the electron scatteringprobability and the column density N : changes in the WGTS column density can be invokedby the changes of probabilities for no, single or multiple scattering events. The scatteringprobabilities are solely dependent on the total cross section, the path length through the sourceand the column density. From the Poisson distribution, one finds that the probabilities for no-lossand single scattering of an electron entering the WGTS from the CMS amount to
P0(θ) = e−σNcos θ and P1(θ) = e−
σNcos θ
σNcos θ
. (8)
Due to the high energy resolution of the main spectrometer, the energy loss spectrumdN/dEloss can be measured for a given condition of the electron gun (E0, θ). Then,deconvolving the differential cross section dσ/dEloss from the measured spectrum yields Pn [3].The required differential energy loss function is either taken from models or derived from aspecial calibration measurement. According to formulae (8), the column density N can bemonitored with the measured precision of 1(P1/P0). However, the method is not suitablefor near-time monitoring since this would lead to a significant loss of measuring time forthe neutrino mass campaign. Therefore, it is useful only for periodic examinations instead ofcontinuous monitoring. Nevertheless, it can be regarded as a complementary method to theother 1N measurements described above.
5. Conclusions
In order to achieve the design sensitivity in the measurement of the neutrino mass, all main-taskcomponents in the KATRIN experiment need to operate with extreme stability over extended
New Journal of Physics 14 (2012) 103046 (http://www.njp.org/)

27
periods of time, and their behaviour needs to be well characterized. In particular, this is truefor the WGTS, which provides the essential tritium β-electrons from whose energy spectrumanalysis the neutrino mass will be extracted. Here, we have presented the status of the CMSthat is designed to ensure that the stability of the key WGTS parameters, namely the columndensityN and tritium purity εT, can be monitored and analysed as close to real time as possible.For this task, theoretical modelling and experimental methodologies were developed; both weresuccessfully combined confirming that the challenging requirements for the WGTS operationcan be met.
Gas dynamics simulations were used to link the requirements for the precision andaccuracy of N and εT to experimentally observable quantities such as pressures andtemperatures. Progress in this modelling includes (i) the incorporation of temperatureinhomogeneities in the gas dynamics simulation, and (ii) a detailed investigation of the position-dependent velocity distribution in the WGTS.
The first strategy to monitor N relies on monitoring the experimental parametersinfluencing N , namely injection and outlet pressure as well as the beam tube temperature, witha precision determined by these simulations. The pressure stability is realized by the Inner Loopsystem. The Inner Loop is operational and has reached and even exceeded the necessary relativestability of the injection pressure of 1prec(p)/p < 10−3. The performance of the beam tubecooling system and the corresponding temperature monitoring have been tested with an almostfull-scale demonstration setup of the WGTS using original components. Fourier analysis of themeasured temperature fluctuations on the beam tube confirm the functionality of the coolingcircuit design and in particular prove that temperature or mass flow fluctuations in the primaryLHe circuit are not transferred to the cooling circuit of the beam tube.
Complementary to the control and monitoring of the experimental parameters defining N ,another method has been developed to monitor fluctuations in N close to real time; it is basedon measuring tritium purity and source activity simultaneously.
The tritium purity, which is also of interest in its own right, is hereby determined with alaser Raman setup (LARA); LARA has also exceeded its specification and has reached 0.3%statistical uncertainty in T2 monitoring of a low-mole-fraction tritium sample. Based on thisresult, it is expected that the system reaches 0.1% statistical uncertainty in <60 s for KATRINrelevant gas compositions. The system was calibrated with non-tritiated gas mixtures. Foreach isotopologue, specific response functions were determined which vary by up to ∼10%.Further improvements of the accuracy are expected once quantum mechanical transition matrixelements are included whose accurate experimental verification has just been completed.
For the activity monitoring, three different approaches are pursued. Two methods ofmeasuring the source activity can be implemented in the CMS at the rear end of the KATRINsetup: the β-electron current through the rear wall of the KATRIN experiment can be measuredwith a Faraday cup, and BIXS makes use of the x-rays produced by these β-electrons to monitorthe source activity. The third option, the FBMD, monitors the edge of the flux tube in the forwarddirection towards the main spectrometer. All three options are on the R&D way to demonstratetheir suitability to measure with the required precision of 10−3 under KATRIN conditions.
Since most of the systems are now operational and perform beyond expectation, we areconfident that the challenging control and monitoring requirements for the operation of theKATRIN WGTS will be met and even exceeded. As a consequence of this better-than-expectedperformance, it might even be possible to further reduce systematic uncertainties.
New Journal of Physics 14 (2012) 103046 (http://www.njp.org/)

28
Acknowledgments
The authors thank S Mirz for the contributions to the assembly, commissioning and testing of theLARA setup and T Bode and T Wahl for the commissioning, testing and operation of the WGTSDemonstrator, as well as the workshops and technicians of KIT for their support. This workhas been supported by the Bundesministerium fur Bildung und Forschung (BMBF) with projectnumber 05A08VK2, the Deutsche Forschungsgemeinschaft (DFG) via Transregio 27 ‘Neutrinosand Beyond’, the Helmholtz Association (HGF) and the Helmholtz Alliance for AstroparticlePhysics (HAP), and the Department of Energy through grant number DE-SC0004036. Wealso thank the Karlsruhe House of Young Scientists (KHYS) of KIT for their support. Weacknowledge support by Deutsche Forschungsgemeinschaft and Open Access Publishing Fundof Karlsruhe Institute of Technology.
Dedication We dedicate this paper to the memory of our Russian colleague, AcademicianVladimir M Lobashev (1934–2011), the long-term head of the Troitsk neutrino massexperiment, who pioneered many scientific and technical issues discussed in this paper.
References
[1] Behringer J et al (Particle Data Group) 2012 Phys. Rev. D 86 010001[2] Otten E W and Weinheimer C 2008 Rep. Prog. Phys. 71 086201[3] Angrik J et al (KATRIN collaboration) 2004 FZKA Scientific Report 7090[4] Kraus Ch et al 2005 Eur. Phys. J. C 40 447[5] Lobashev V M et al 1999 Phys. Lett. B 460 227–35[6] Dorr L et al 2005 Fusion Sci. Technol. 48 262–7[7] Robertson R G H et al 1991 Phys. Rev. Lett. 67 957–60[8] Belesev A I et al 1995 Phys. Lett. B 350 263–72[9] Kruit P and Read F H 1983 J. Phys. E: Sci. Instrum. 16 313
[10] Beamson J et al 1980 J. Phys. E: Sci. Instrum. 13 64[11] Bornschein B 2008 Fusion Sci. Technol. 54 59–66[12] International Organization for Standardization 1994 ISO 5725.1[13] Assev V N et al 2000 Eur. Phys. J. D 10 39–52[14] Anatoly F and Nastoyashchii et al 2005 Fusion Sci. Technol. 48 743–6[15] Doss N et al 2006 Phys. Rev. C 73 025502[16] Schlosser M et al 2011 Proc. Int. School of Physics ‘E Fermi’, Neutrino Physics and Astrophysics (Varenna
2011) arXiv:1203.4099 [physics.ins-det][17] Grohmann S et al 2008 Adv. Cryog. Eng. 53B 1277–84[18] Lukic S et al 2012 Vacuum 86 8 1126–33[19] Ubieto-Daz M et al 2009 Int. J. Mass Spectrom. 288 1–5[20] Grohmann S 2009 Cryogenics 49 413–20[21] Sharipov F and Seleznev V 1998 J. Phys. Chem. Data 27 657[22] Dushman S 1962 Scientific Foundations of Vacuum Technique (New York: Wiley)[23] Gluck F 2012 Tritium gas flow in the KATRIN source tube (submitted)[24] Sharipov F 1997 J. Vac. Sci. Technol. A 15 4 2434–6[25] Shakov E M 1968 Fluid Dyn. 3 1 142[26] Sharipov F 2004 J. Fluid Mech. 518 35–60[27] Kalempa D and Sharipov F 2011 Eur. J. Mech. B 30 466–73[28] Graur I and Sharipov F 2008 Eur. J. Mech. B 27 335–45
New Journal of Physics 14 (2012) 103046 (http://www.njp.org/)

29
[29] Sharipov F 2009 Proc. 7th Int. Conf. on Nanochannels, Microchannels, Minichannels paper 82028[30] Grohmann S et al 2011 Cryogenics 51 438–45[31] Kollo Z et al 2009 Fusion Eng. Des. 84 1073–2058[32] Broda R, Cassette P and Kossert K 2007 Metrologia 44 36–52[33] Long D A 2002 The Raman Effect: A Unified Treatment of the Theory of Raman Scattering by Molecules
(Chichester: Wiley)[34] Schlosser M et al 2011 Fusion Sci. Technol. 60 976–81[35] Fischer S et al 2011 Fusion Sci. Technol. 60 925–30[36] Lewis R J et al 2008 Laser Phys. Lett. 5 522–31[37] Sturm M et al 2010 Laser Phys. 20 493–507[38] James T M et al 2012 Automated quantitative spectroscopic analysis combining cosmic-ray removal, back-
ground subtraction and peak fitting Appl. Spectrosc. submitted (source code available at http://sourceforge.net/projects/spectools/)
[39] Schwartz C and Le Roy R J 1987 J. Mol. Spectrosc. 121 420–39[40] James T M et al 2012 Accurate and precise Raman-depolarization measurements of all hydrogen
isotopologues J. Raman Spectrosc. at press[41] Castellano G, Osan J and Trincavelli J 2004 Spectrochim. Acta B 59 313–9[42] Chantler C T et al NIST Standard Reference Database 66: X-Ray Form Factor, Attenuation and Scattering
tables (version 2.1) http://physics.nist.gov/ffast; originally published as Chantler C T 2000 J. Phys. Chem.Data 29 597–1048
Chantler C T 1995 J. Phys. Chem. Data 24 71–643[43] Shu W M et al 2006 Fusion Eng. Des. 81 803–8[44] Wunstorf R et al 1997 IEEE Trans. Nucl. Sci. 44 806–14[45] Valerius K et al 2011 J. Instrum. 6 P01002
New Journal of Physics 14 (2012) 103046 (http://www.njp.org/)
Copyright © 2022 FDOKUMEN