Urine Microscopy Findings Predict Outcomes In Hospitalized ...
Upload
independentCategory
view
2download
0
Gaseous Nitrogen Emission from Soil Aggregatesas Affected by Clay Mineralogy and RepeatedUrine Applications
Olga Singurindy & Marina Molodovskaya &
Brian K. Richards & Tammo S. Steenhuis
Received: 8 February 2008 /Accepted: 11 May 2008 /Published online: 28 June 2008# Springer Science + Business Media B.V. 2008
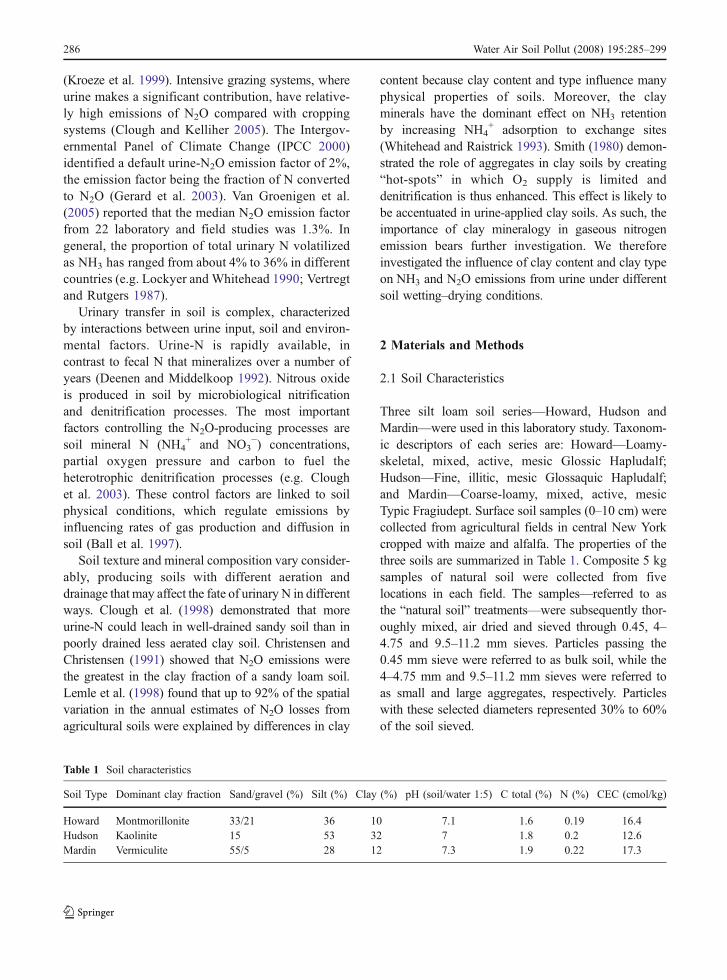
Abstract Urine-treated soils make a significant con-tribution to gaseous N losses to the atmosphere. Ourgoal was to investigate the influence of clay type andcontent on ammonia (NH3) and nitrous oxide (N2O)emissions from urine under different wetting–dryingsoil conditions and to relate these results to urine-Ntransformation processes in soil. Three types of silt loamsoils and synthetic sand–clay aggregates with threedifferent clay-dominated materials (kaolinite, montmo-rillonite and vermiculite) were used in this laboratorystudy. Bulk soil, 4–4.75 mm and 9.5–11.2 mm aggre-gates were incubated with synthetic urine at 50% and75% saturation under aerobic conditions. Repeatedurine application affected the properties of the aggre-gates depending on the type of clay present. Greater claycontent increased aggregate stability and reduced NH3
volatilization. The variation in clay ammonium (NH4+)
fixation capacities was reflected in NH3 volatilizationas well as in the onset of N2O emissions, occurring
first from kaolinite-dominated and last from vermiculite-dominated soils. Nitrous oxide productionwas greater inaggregates than in bulk soil, a difference that consis-tently increased with repeated urine applications forkaolinitic and vermiculitic treatments. A dual-peak N2Oemission pattern was found, with the second maximumincreasing with the number of urine applications.Emission of 15N-labeled N2 was found at 75%saturation in kaolinite and vermiculite-dominated sam-ples. Anaerobic conditions were less pronounced withmontmorillonite-dominated samples because shrink–swell action caused aggregate breakage.
Keywords Greenhouse gases . Emission .
Nitrogen cycle . Soil aggregates . Clay minerals
1 Introduction
Agricultural soils are a major source of NH3 and N2O.Volatilized NH3 combines with nitric and sulfuricacids in cloud droplets which prolongs their residencein the atmosphere and therefore influences thegeographic distribution of acidic depositions. Nitrousoxide is a greenhouse gas which is oxidized in thestratosphere to form nitrogen oxides (NOx) that partici-pate in photochemical processes that destroy ozone(Duxbury 1994). One of the main sources of gaseousN losses is spreading of animal waste on agriculturalfields, amounting to 35% of the global annual emission
Water Air Soil Pollut (2008) 195:285–299DOI 10.1007/s11270-008-9746-4
O. SingurindyDepartment of Earth and Ocean Sciences,University of British Columbia,Vancouver, British Columbia, Canada
M. Molodovskaya :B. K. Richards (*) : T. S. SteenhuisDepartment of Biological and Environmental Engineering,Cornell University,Ithaca, NY, USAe-mail: [email protected]
(Kroeze et al. 1999). Intensive grazing systems, whereurine makes a significant contribution, have relative-ly high emissions of N2O compared with croppingsystems (Clough and Kelliher 2005). The Intergov-ernmental Panel of Climate Change (IPCC 2000)identified a default urine-N2O emission factor of 2%,the emission factor being the fraction of N convertedto N2O (Gerard et al. 2003). Van Groenigen et al.(2005) reported that the median N2O emission factorfrom 22 laboratory and field studies was 1.3%. Ingeneral, the proportion of total urinary N volatilizedas NH3 has ranged from about 4% to 36% in differentcountries (e.g. Lockyer and Whitehead 1990; Vertregtand Rutgers 1987).
Urinary transfer in soil is complex, characterizedby interactions between urine input, soil and environ-mental factors. Urine-N is rapidly available, incontrast to fecal N that mineralizes over a number ofyears (Deenen and Middelkoop 1992). Nitrous oxideis produced in soil by microbiological nitrificationand denitrification processes. The most importantfactors controlling the N2O-producing processes aresoil mineral N (NH4
+ and NO3−) concentrations,
partial oxygen pressure and carbon to fuel theheterotrophic denitrification processes (e.g. Cloughet al. 2003). These control factors are linked to soilphysical conditions, which regulate emissions byinfluencing rates of gas production and diffusion insoil (Ball et al. 1997).
Soil texture and mineral composition vary consider-ably, producing soils with different aeration anddrainage that may affect the fate of urinary N in differentways. Clough et al. (1998) demonstrated that moreurine-N could leach in well-drained sandy soil than inpoorly drained less aerated clay soil. Christensen andChristensen (1991) showed that N2O emissions werethe greatest in the clay fraction of a sandy loam soil.Lemle et al. (1998) found that up to 92% of the spatialvariation in the annual estimates of N2O losses fromagricultural soils were explained by differences in clay
content because clay content and type influence manyphysical properties of soils. Moreover, the clayminerals have the dominant effect on NH3 retentionby increasing NH4
+ adsorption to exchange sites(Whitehead and Raistrick 1993). Smith (1980) demon-strated the role of aggregates in clay soils by creating“hot-spots” in which O2 supply is limited anddenitrification is thus enhanced. This effect is likely tobe accentuated in urine-applied clay soils. As such, theimportance of clay mineralogy in gaseous nitrogenemission bears further investigation. We thereforeinvestigated the influence of clay content and clay typeon NH3 and N2O emissions from urine under differentsoil wetting–drying conditions.
2 Materials and Methods
2.1 Soil Characteristics
Three silt loam soil series—Howard, Hudson andMardin—were used in this laboratory study. Taxonom-ic descriptors of each series are: Howard—Loamy-skeletal, mixed, active, mesic Glossic Hapludalf;Hudson—Fine, illitic, mesic Glossaquic Hapludalf;and Mardin—Coarse-loamy, mixed, active, mesicTypic Fragiudept. Surface soil samples (0–10 cm) werecollected from agricultural fields in central New Yorkcropped with maize and alfalfa. The properties of thethree soils are summarized in Table 1. Composite 5 kgsamples of natural soil were collected from fivelocations in each field. The samples—referred to asthe “natural soil” treatments—were subsequently thor-oughly mixed, air dried and sieved through 0.45, 4–4.75 and 9.5–11.2 mm sieves. Particles passing the0.45 mm sieve were referred to as bulk soil, while the4–4.75 mm and 9.5–11.2 mm sieves were referred toas small and large aggregates, respectively. Particleswith these selected diameters represented 30% to 60%of the soil sieved.
Table 1 Soil characteristics
Soil Type Dominant clay fraction Sand/gravel (%) Silt (%) Clay (%) pH (soil/water 1:5) C total (%) N (%) CEC (cmol/kg)
Howard Montmorillonite 33/21 36 10 7.1 1.6 0.19 16.4Hudson Kaolinite 15 53 32 7 1.8 0.2 12.6Mardin Vermiculite 55/5 28 12 7.3 1.9 0.22 17.3
286 Water Air Soil Pollut (2008) 195:285–299

2.2 Urine Mixtures
Synthetic urine was used following de Klein et al.(2003), containing urea (11.5 g/l), glycine (2.9 g/l),KHCO3 (13.8 g/l), KCl (2.5 g/l), KBr (4.2 g/l), andK2SO4 (1.4 g/l). Concentration of 11.5 g/l of urea isrepresentative for cow urine patches of 592 kg N/ha(∼10 l/m2). In order to initiate microbial activity in thesynthetic system, 1% of cow urine collected fromlactating cows at a local dairy farm (nonsterile as itcontained some fecal matter and bedding) was filteredand added to the mixture of synthetic urine. 15N-labeled urea and glycine were used in experimentswhere N2 measurements were made.
2.3 Synthetic Aggregate Properties
The series with prepared sand–clay–urine systemswere carried out to provide a contrast to the naturalsoils which had variable pre-existing microbial activi-ty and organic matter composition. These experimentsallowed us to examine processes while avoiding con-founding effects of N loss from pre-existing organicmatter that would have occurred in field soil. Threeclay types, montmorillonite (cloisite Na+, SouthernClay Products, Inc) kaolinite (purum natural, Fluka),and vermiculite (grade #3, Sigma-Aldrich) wereselected for the study.
Commercial quartz sand (0.5 mm grains) waswashed in hot 1 M HCl, rinsed with distilled waterand dried. In order to maintain CEC levels close tothe natural soil samples, synthetic aggregates (SA)were prepared from sand/clay slurries consisting of31%, 5.5% and 6.5% of kaolinite, montmirillonite andvermiculite, respectively (balance sand) by suspend-ing the clay in deionized water (20%), then addingsand and stirring for 2 h. Greater clay contentaggregates—referred to as “high clay synthetic aggre-gates” (HCSA)—were prepared from slurries consist-ing of 46%, 9% and 10% of kaolinite, montmorilloniteand vermiculite, respectively (balance sand) in order tostudy the influence of increased clay content. Allmixtures were dried at 45°C, crushed and sieved.Material finer than 0.2 mm was discarded. Particlesremaining on the 0.2–0.45 mm sieve were referred toas the bulk sand–clay medium. Particles on the 4–4.75 mm and 9.5–11.2 mm sieves were referred to assmall and large aggregates, respectively.
2.4 Incubation Procedure
For incubations with the bulk soil/sand–clay medium(particle size <0.45 mm), urine was added to eachsample to bring the degree of saturation to 50%(considered optimal for N2O formation) or 75% (whereboth N2O and N2 formation would be expected). Thewetted samples were packed to 1.5 cm depth in sampleunits that were then sealed for incubation. Theapproximate sample weight in sample units was 170 g.
Small and large aggregates were placed on filterpaper disks in small aluminum dishes for the wettingand incubation. Each cycle started with wetting theaggregates indirectly by wetting the edge of the filterpaper disk with synthetic urine mixtures. The disheswith the wetted aggregates were placed inside thesample units for incubation.
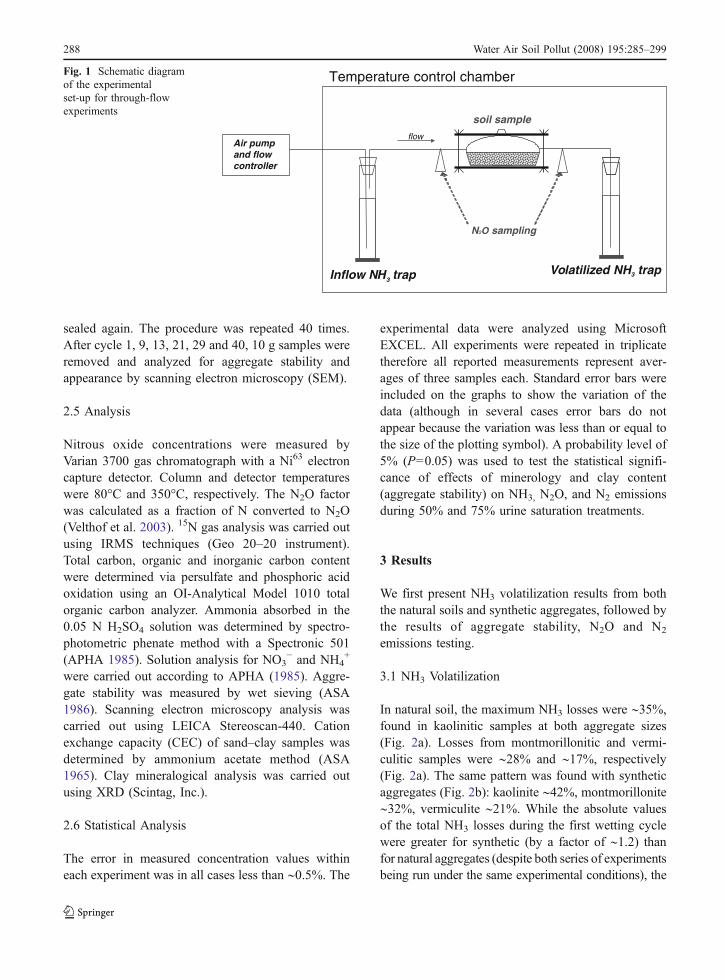
All incubations were carried out in triplicate for16 days at 25°C in 14 cm diameter plastic desiccators(Bel-Art No.F42010). The schematic diagram of theexperimental apparatus for flow-through chamberexperiments is presented in Fig. 1. In order to studyeffects of repetitive urine application with subsequentdrying, the sample unit input and output ports wereplaced close to the sample surface on opposite sites ofthe unit lid, thus directing airflow across the soilsamples. In order to prevent gas leaks, silicon gluewas used to seal the sample unit lids which were thenclamped with wooden plates.
The experiments were carried out with constant airflow rates using an air pump (Top Fin 50) thatinjected air at the constant flow rates of 200 ml/minfor the first 25 h and 20 ml/min thereafter. Air inflowand outflow were routed through plastic cylinderscontaining 250 ml 0.05 N H2SO4, where NH3 wasabsorbed for subsequent concentration analysis. Airsamples (6 and 12 ml) were taken from the air tubingnear the inlet and outlet with syringes every 4 hduring the first 2 days and then every 6 h during thesubsequent 14 days. The air samples were analyzedfor N2O and N2 concentrations. During the experi-ment, samples were weighed to monitor the evapora-tive moisture loss, and were rewetted after that. Whenthe moisture loss reached 70% of loss they wererewetted. Before each second rewetting, small por-tions of the soil were removed for NH4
+ and nitrateanalysis. After each soil sampling, the sample unitswere opened shortly to room atmosphere and then
Water Air Soil Pollut (2008) 195:285–299 287
sealed again. The procedure was repeated 40 times.After cycle 1, 9, 13, 21, 29 and 40, 10 g samples wereremoved and analyzed for aggregate stability andappearance by scanning electron microscopy (SEM).
2.5 Analysis
Nitrous oxide concentrations were measured byVarian 3700 gas chromatograph with a Ni63 electroncapture detector. Column and detector temperatureswere 80°C and 350°C, respectively. The N2O factorwas calculated as a fraction of N converted to N2O(Velthof et al. 2003). 15N gas analysis was carried outusing IRMS techniques (Geo 20–20 instrument).Total carbon, organic and inorganic carbon contentwere determined via persulfate and phosphoric acidoxidation using an OI-Analytical Model 1010 totalorganic carbon analyzer. Ammonia absorbed in the0.05 N H2SO4 solution was determined by spectro-photometric phenate method with a Spectronic 501(APHA 1985). Solution analysis for NO3
− and NH4+
were carried out according to APHA (1985). Aggre-gate stability was measured by wet sieving (ASA1986). Scanning electron microscopy analysis wascarried out using LEICA Stereoscan-440. Cationexchange capacity (CEC) of sand–clay samples wasdetermined by ammonium acetate method (ASA1965). Clay mineralogical analysis was carried outusing XRD (Scintag, Inc.).
2.6 Statistical Analysis
The error in measured concentration values withineach experiment was in all cases less than ∼0.5%. The
experimental data were analyzed using MicrosoftEXCEL. All experiments were repeated in triplicatetherefore all reported measurements represent aver-ages of three samples each. Standard error bars wereincluded on the graphs to show the variation of thedata (although in several cases error bars do notappear because the variation was less than or equal tothe size of the plotting symbol). A probability level of5% (P=0.05) was used to test the statistical signifi-cance of effects of minerology and clay content(aggregate stability) on NH3, N2O, and N2 emissionsduring 50% and 75% urine saturation treatments.
3 Results
We first present NH3 volatilization results from boththe natural soils and synthetic aggregates, followed bythe results of aggregate stability, N2O and N2
emissions testing.
3.1 NH3 Volatilization
In natural soil, the maximum NH3 losses were ∼35%,found in kaolinitic samples at both aggregate sizes(Fig. 2a). Losses from montmorillonitic and vermi-culitic samples were ∼28% and ∼17%, respectively(Fig. 2a). The same pattern was found with syntheticaggregates (Fig. 2b): kaolinite ∼42%, montmorillonite∼32%, vermiculite ∼21%. While the absolute valuesof the total NH3 losses during the first wetting cyclewere greater for synthetic (by a factor of ∼1.2) thanfor natural aggregates (despite both series of experimentsbeing run under the same experimental conditions), the
N2O sampling
soil sample
flowAir pumpand flowcontroller
Temperature control chamber
Inflow NH trap3Volatilized NH trap3
Fig. 1 Schematic diagramof the experimentalset-up for through-flowexperiments
288 Water Air Soil Pollut (2008) 195:285–299
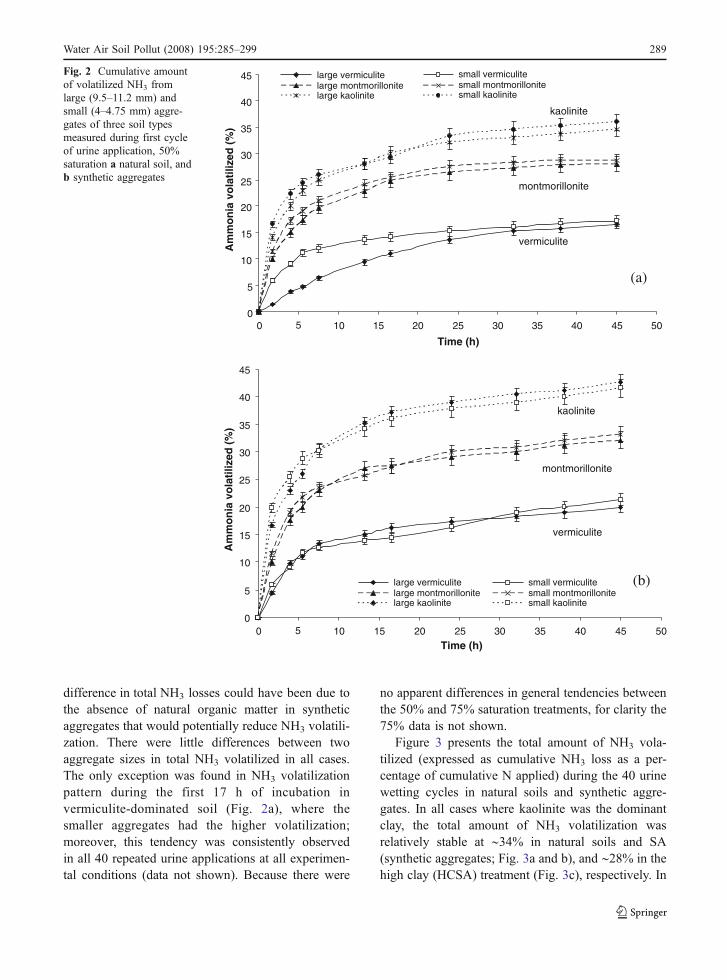
difference in total NH3 losses could have been due tothe absence of natural organic matter in syntheticaggregates that would potentially reduce NH3 volatili-zation. There were little differences between twoaggregate sizes in total NH3 volatilized in all cases.The only exception was found in NH3 volatilizationpattern during the first 17 h of incubation invermiculite-dominated soil (Fig. 2a), where thesmaller aggregates had the higher volatilization;moreover, this tendency was consistently observedin all 40 repeated urine applications at all experimen-tal conditions (data not shown). Because there were
no apparent differences in general tendencies betweenthe 50% and 75% saturation treatments, for clarity the75% data is not shown.
Figure 3 presents the total amount of NH3 vola-tilized (expressed as cumulative NH3 loss as a per-centage of cumulative N applied) during the 40 urinewetting cycles in natural soils and synthetic aggre-gates. In all cases where kaolinite was the dominantclay, the total amount of NH3 volatilization wasrelatively stable at ∼34% in natural soils and SA(synthetic aggregates; Fig. 3a and b), and ∼28% in thehigh clay (HCSA) treatment (Fig. 3c), respectively. In
0
5
10
15
20
25
30
35
40
45
0 5
5
10 15 20 25 30 35 40 45 50
Time (h)
Am
mo
nia
vo
lati
lized
(%
)vermiculite
montmorillonite
kaolinite
0
5
10
15
20
25
30
35
40
45
0 10 15 20 25 30 35 40 45 50
Time (h)
Am
mo
nia
vo
lati
lized
(%
)
large vermiculite small vermiculitelarge montmorillonite small montmorillonitelarge kaolinite small kaolinite
large vermiculite small vermiculitelarge montmorillonite small montmorillonitelarge kaolinite small kaolinite
vermiculite
montmorillonite
kaolinite
(a)
(b)
Fig. 2 Cumulative amountof volatilized NH3 fromlarge (9.5–11.2 mm) andsmall (4–4.75 mm) aggre-gates of three soil typesmeasured during first cycleof urine application, 50%saturation a natural soil, andb synthetic aggregates
Water Air Soil Pollut (2008) 195:285–299 289
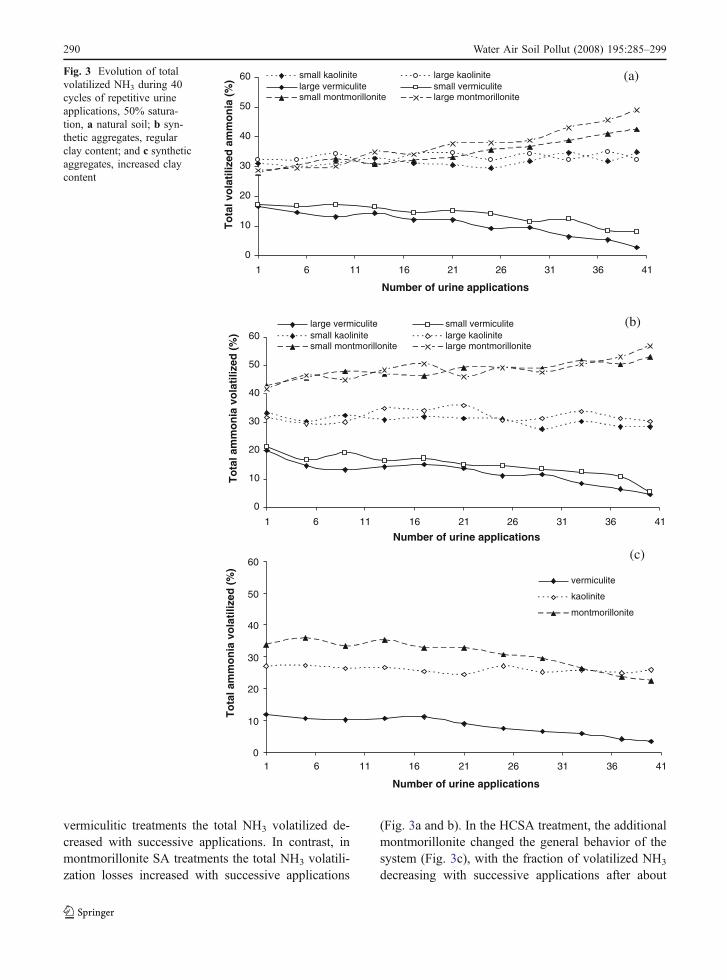
vermiculitic treatments the total NH3 volatilized de-creased with successive applications. In contrast, inmontmorillonite SA treatments the total NH3 volatili-zation losses increased with successive applications
(Fig. 3a and b). In the HCSA treatment, the additionalmontmorillonite changed the general behavior of thesystem (Fig. 3c), with the fraction of volatilized NH3
decreasing with successive applications after about
0
10
20
30
40
50
60
1 11 16 21 26 31 36 41
Number of urine applications
To
tal a
mm
on
ia v
ola
tiliz
ed (
%)
vermiculite
kaolinite
montmorillonite
0
10
20
30
40
50
60
1 11 16 21 26 31 36 41
Number of urine applications
To
tal a
mm
on
ia v
ola
tiliz
ed (
%)
large vermiculite small vermiculitesmall kaolinite large kaolinitesmall montmorillonite large montmorillonite
0
10
20
30
40
50
60
1 11 16 21 26 31 36 41
Number of urine applications
To
tal v
ola
tiliz
ed a
mm
on
ia (
%) small kaolinite large kaolinite
large vermiculite small vermiculitesmall montmorillonite large montmorillonite
(a)
(b)
(c)
6
6
6
Fig. 3 Evolution of totalvolatilized NH3 during 40cycles of repetitive urineapplications, 50% satura-tion, a natural soil; b syn-thetic aggregates, regularclay content; and c syntheticaggregates, increased claycontent
290 Water Air Soil Pollut (2008) 195:285–299

the 20th urine application. In montmorillonitic naturalsoil samples, large aggregates had greater volatiliza-tion losses than small aggregates, with the differencegrowing in magnitude over successive applications. Incontrast, the large aggregates in vermiculitic soils hadlower losses, and the difference between the two sizeclasses had less of an increasing trend (Fig. 3a).
3.2 Aggregate Stability (Percentage of WaterStable Aggregates)
Table 2 presents stability of small (4–4.75 mm) andlarge (9.5–11.2 mm) aggregates of all soil treatmentsbefore and after incubation at 50% and 75% satura-tion. The initial stability of kaolinitic natural and SAsamples was 24–26%, increased to 28–32% after ninecycles, but had no substantial changes thereafter. Thekaolinite HCSA had a greater initial stability of 31–32% that also increased slightly during initial cycles.No significant differences were found among kaolin-ite aggregate sizes and degrees of saturation throughall 40 cycles.
The initial stability of montmorillonite-dominatedsamples was greater than kaolinite-dominated, rang-ing from 56–60% for natural soil and to 62–65% forSA treatments. The stability of aggregates decreasedthrough 40 cycles in natural soil and SA, mostnotably in the 75% saturation treatment. In contrast,the HCSA montmorillonite treatment demonstratedquite different behavior, increasing the initial ∼67%stability up to ∼76% at both aggregate sizes at 50%saturation. The 75% saturation HCSA stabilitydropped from 67–68% to 59–60% after the first ninecycles, followed by a steady increase to 70–74%.Vermiculate-dominated soil and SA samples increasedfrom initial levels of 34–38% to final levels of 41–50%. HCSA vermiculite aggregates had greater initialstabilities (54–59%) and increased by an additional 7–12% during repeated applications.
3.3 N2O and N2 Emissions
Figure 4 demonstrates N2O emitted as a percentage ofthe urine-N applied during the 1st and 21st application
Table 2 Percentage of water stable aggregates, small (4–4.75 mm) and large (9.5–11.2 mm) aggregates, incubations at 50% and 75%saturation
Number of applications Natural soils Synthetic aggregates (SA) High clay SA (HCSA)
Small Large Small Large Small Large
50% 75% 50% 75% 50% 75% 50% 75% 50% 75% 50% 75%
Kaolinite-dominated0 26 26 25 25 24 24 26 26 32 32 31 319 32 29 31 28 29 28 28 28 35 32 32 3513 31 31 30 31 31 30 28 30 37 35 36 3421 33 32 29 30 31 28 31 32 33 34 34 3529 32 31 32 32 30 31 30 32 36 36 35 3640 34 33 31 31 32 29 31 29 35 33 36 33Montmorillonite-dominated0 60 60 56 56 65 65 62 62 67 67 68 689 58 51 48 48 63 56 59 59 68 60 69 5913 50 49 40 45 59 51 55 55 66 64 73 7221 53 43 38 36 55 53 57 48 69 68 72 7129 49 35 33 30 51 48 55 48 71 66 75 7340 43 30 32 27 48 45 50 46 75 70 77 74Vermiculite-dominated0 36 36 34 34 38 38 36 36 54 54 59 599 44 43 40 42 42 41 44 41 65 58 58 6013 43 45 41 43 46 44 42 43 67 63 62 6121 46 47 38 45 45 42 45 46 56 65 61 6329 46 49 42 46 47 46 44 45 65 65 60 6340 49 50 41 45 45 43 46 43 66 64 65 66
Water Air Soil Pollut (2008) 195:285–299 291

0
0.2
0.4
0.6
0.8
1
1.2
1.4
1.6
1.8
2
0 4 8 10 12 14 16Time (d)
Nit
rou
s o
xid
e em
issi
on
fac
tor
(%)
kaolinite
vermiculite
montmorillonite
(a) urine application # 1
0
0.2
0.4
0.6
0.8
1
1.2
1.4
1.6
1.8
2
0
0.2
0.4
0.6
0.8
1
1.2
1.4
1.6
1.8
2
Time (d)
Nit
rou
s o
xid
e em
issi
on
fac
tor
(%)
kaolinite
vermiculite
montmorillonite
(b)urine application # 1
Time (d)
Nit
rou
s o
xid
e em
issi
on
fac
tor
(%)
kaolinite
vermiculite
montmorillonite
(c) urine application # 21
2 6
0 4 8 10 12 14 162 6
0 4 8 10 12 14 162 6
Fig. 4 Time evolution ofN2O emission factor, 50%saturation, 9.5–11.2 mmsize aggregates, a naturalsoils, first urine application;b synthetic aggregates, firsturine application; c synthet-ic aggregates, 21st urineapplication. Interpolationhas been made for once aday measurements
292 Water Air Soil Pollut (2008) 195:285–299

cycles of urine for natural soil and large SA aggregates.(Because there were no apparent differences in resultsamong aggregate sizes, for clarity the small aggregatedata is not shown.) There were significant differencesin N2O emission patterns from three clay types duringthe initial urine application (Fig. 4a). In naturalkaolinite-dominated aggregates, the peak of N2Oemission occurred 2 days after application. Thegeneral shape of montmorillonite-dominated soilemission was similar, but with the maximum of1.95% occurring after 3 days. Both soils had a muchsmaller secondary peak between days 5–8. In con-trast, N2O emission from vermiculate-dominated soilbegan later than in the other soil types and had abroad peak that lasted for eight more days. Theoverall pattern was similar for SA treatments(Fig. 4b), although cumulative emissions were slightlylower (especially for vermiculite), while the intensityof N2O emission was lower in synthetic aggregatesthan in natural soils. With repeated applications, themagnitude of the secondary peak increased. After the21st application the emission peaks occurred at 5, 6 and8th day in kaolinite, montmorillonite and vermiculite-dominated soils, respectively (Fig. 4c).
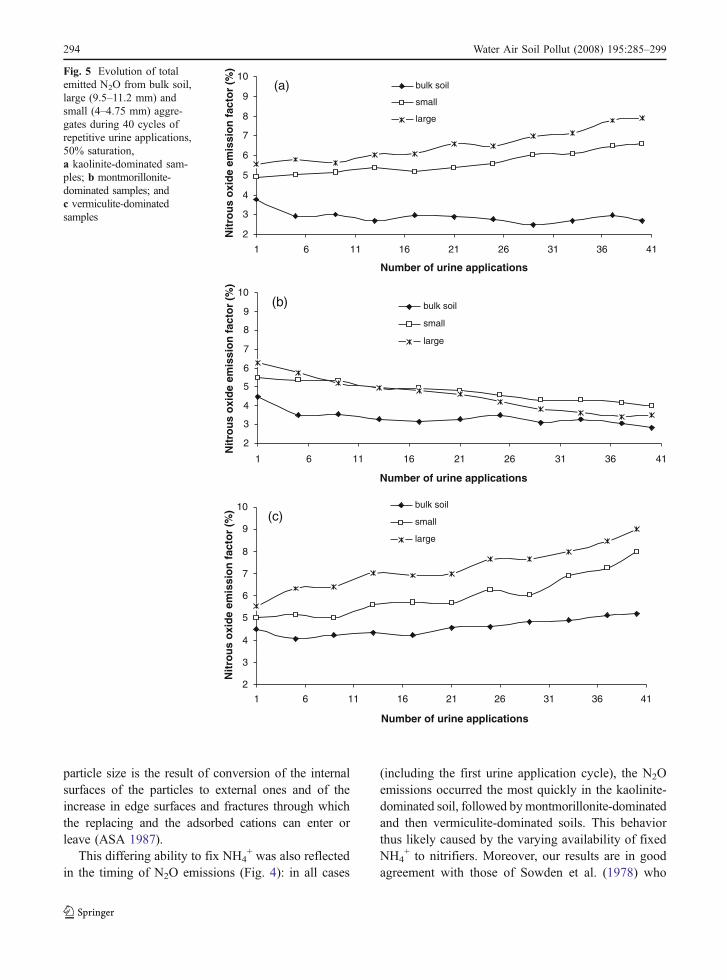
The N2O emission factors from the 40 repeated-application cycles in natural soils incubated at 50%saturation are shown in Fig. 5. The total amount emit-ted was lower in bulk soil samples than in aggregatesin all three soil types. Emission from bulk soils de-creased during the first five application cycles. There-after there was no significant change in the emissionfactor for the kaolinite and montmorillonite-dominatedsoils, remaining around 3% and 3.5%, respectively(Fig. 5a and b). A slight increase from 4% to 5.2%was observed in vermiculite bulk soil (Fig. 5c). Inboth kaolinitic and vermiculitic soil aggregates, N2Oemission factors increased steadily for both sizeclasses (Fig. 5a and c). In contrast, emissions de-creased in both aggregate sizes of the montmorillonite-dominated soil over the 40 urine application cycles(Fig. 5b), the decrease being slightly more pro-nounced for the larger aggregates.
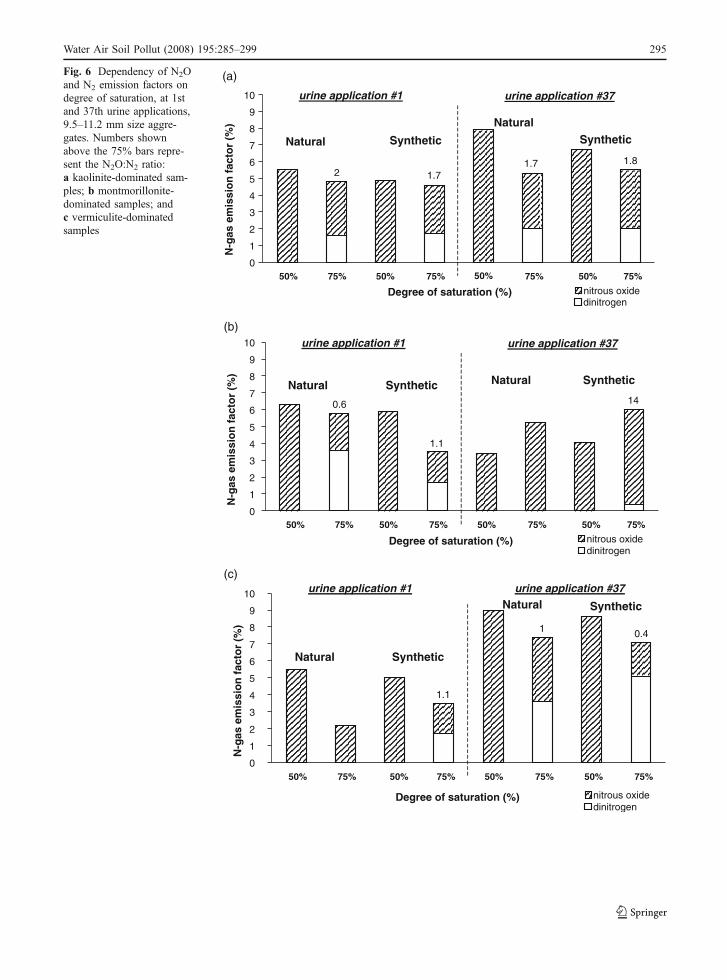
Figure 6 shows the N2O and N2 emission factorsfrom 9.5–11.2 mm aggregates of natural soil and SAtreatments following the 1st and 37th urine applica-tion cycles. Emissions of 15N-labeled N2 weredetectable by isotope ratio mass spectroscopy onlyfrom 75% saturation treatments; numbers shownabove the 75% bars represent the N2O:N2 ratio. In
kaolinite-dominated aggregates the N2O:N2 ratio wassimilar for natural soil and SA treatments and variedlittle between 1st and 37th urine application cycles(between 1.7 and 2 in all cases). During the firstapplication cycle at 75% saturation, the N2 emissionfactor in montmorillonite-dominated natural soilaggregates (Fig. 6b) was 3.4%, greater than the1.7% in synthetic aggregates. No significant N2 wasemitted from either treatment at 75% saturation afterthe 37th application. The opposite tendency wasfound in vermiculite-dominated soil aggregates(Fig. 6c), where the N2 emission factor increasedfrom non-detectable for natural soils and 1.7% for theSA treatment after the first application to 3.6% and5.1% in natural and synthetic aggregates, respectivelyduring the 37th application cycle.
4 Discussion
The quality and quantity of added organic matter (inthe synthetic urine) as well as CEC of the three soilstested were similar; therefore we may posit that thedifferences in clay materials present in the soils arethe main factors controlling the observed differencesin gaseous nitrogen emissions. Of these clay minerals,vermiculites have the greatest capacity to fix NH4
+.Kaolinites are generally considered as nonfixing, andmontmorillonites do not fix NH4
+ under moistconditions (Sowden et al. 1978). These tendenciescorrespond to the results presented in Fig. 2 thatdemonstrate a kaolinite-dominated > montmorillonite-dominated > vermiculite-dominated ranking of NH3
volatilization. However, repetitive urine applicationhad divergent effects on the three soil types (Fig. 3).Our results are in agreement with Jansson (1982) whofound that drying and wetting were effective inincreasing NH4
+ fixation in illitic sandy loam soilsfrom 50% of added NH4
+ fixed up to 77% fixed afterthree wetting/drying cycles.
The results presented in Fig. 2 suggest that therewas no influence of aggregate size on the cumulativeamount of NH3 volatilized during the first urine appli-cation cycle. The smaller aggregates from vermiculite-dominated Mardin soils increased NH3 emission at theinitial 10 h of incubation at all wetting cycles (Fig. 2a).The decrease in the particle size of vermiculite led to adecrease in NH4
+ fixation, suggesting that the in-creased accessibility accompanying the decrease in
Water Air Soil Pollut (2008) 195:285–299 293
particle size is the result of conversion of the internalsurfaces of the particles to external ones and of theincrease in edge surfaces and fractures through whichthe replacing and the adsorbed cations can enter orleave (ASA 1987).
This differing ability to fix NH4+ was also reflected
in the timing of N2O emissions (Fig. 4): in all cases
(including the first urine application cycle), the N2Oemissions occurred the most quickly in the kaolinite-dominated soil, followed bymontmorillonite-dominatedand then vermiculite-dominated soils. This behaviorthus likely caused by the varying availability of fixedNH4
+ to nitrifiers. Moreover, our results are in goodagreement with those of Sowden et al. (1978) who
2
3
4
5
6
7
8
9
10
1 11 16 21 26 31 36 41
Number of urine applications
Nit
rou
s o
xid
e em
issi
on
fac
tor
(%)
bulk soil
small
large
(a)
2
3
4
5
6
7
8
9
10
1 11 16 21 26 31 36 41
Number of urine applications
Nit
rou
s o
xid
e em
issi
on
fac
tor
(%)
bulk soil
small
large
(b)
2
3
4
5
6
7
8
9
10
1 11 16 21 26 31 36 41
Number of urine applications
Nit
rou
s o
xid
e em
issi
on
fac
tor
(%) bulk soil
small
large
(c)
6
6
6
Fig. 5 Evolution of totalemitted N2O from bulk soil,large (9.5–11.2 mm) andsmall (4–4.75 mm) aggre-gates during 40 cycles ofrepetitive urine applications,50% saturation,a kaolinite-dominated sam-ples; b montmorillonite-dominated samples; andc vermiculite-dominatedsamples
294 Water Air Soil Pollut (2008) 195:285–299
0
1
2
3
4
5
6
7
8
9
10
Degree of saturation (%)
N-g
as e
mis
sio
n f
acto
r (%
)
dinitrogen
urine application #1 urine application #37
Natural
Natural
Synthetic Synthetic
50% 50% 50%75% 75% 75% 75%
2 1.71.7 1.8
0
1
2
3
4
5
6
7
8
9
10
Degree of saturation (%)
N-g
as e
mis
sio
n f
acto
r (%
)
dinitrogen
urine application #1 urine application #37
Natural NaturalSynthetic Synthetic
50% 50% 50% 50%75% 75% 75% 75%
0.6
1.1
14
0
1
2
3
4
5
6
7
8
9
10
Degree of saturation (%)
N-g
as e
mis
sio
n f
acto
r (%
)
nitrous oxidedinitrogen
urine application #1 urine application #37
Natural
Natural
Synthetic
Synthetic
50% 50% 50% 50%75% 75% 75% 75%
1
1.1
0.4
(a)
(b)
(c)
nitrous oxide
nitrous oxide
50%
Fig. 6 Dependency of N2Oand N2 emission factors ondegree of saturation, at 1stand 37th urine applications,9.5–11.2 mm size aggre-gates. Numbers shownabove the 75% bars repre-sent the N2O:N2 ratio:a kaolinite-dominated sam-ples; b montmorillonite-dominated samples; andc vermiculite-dominatedsamples
Water Air Soil Pollut (2008) 195:285–299 295

found that availability of fixed NH4+ was lower in
vermiculite-containing soils than in montmorilloniticsoil. The timing of N2O emission as a byproduct ofnitrification may also be affected by varying K+ con-centrations in the systems, because K+ may interferewith defixation of NH4
+ (Sowden et al. 1978).Significantly greater amounts of N2O were emitted
from aggregates than from the bulk soil for kaolinite-and vermiculite-dominated treatments, and emissionsincreased with aggregate size (Fig. 5). This tendencycorrelated with increased aggregate stability in thesame treatments. The decreasing of both aggregatestability (Table 2) and N2O emissions (Fig. 5b)through repetitive urine applications in montmorillonite-dominated samples corresponds to the findings ofQuirk (1978) who reported that, in the dry state, clayparticles are in a random pattern (face-to-face, face-to-edge and edge-to-edge). The capability of montmo-rillonite to shrink and swell increases as successiveadditions of moisture causes face-to-face orientation topredominate, leading to decreased aggregate stabilityand fewer anaerobic microenvironments (Singer et al.1992). In contrast, kaolinite particles are stabilized byhydrogen bonds between adjacent tetrahedral andoctahedral layers which prevent swelling and disper-sion (Singer et al. 1992). In addition, the slightincrease in N2O emission factor in vermiculite-dominated bulk soil through cycles 5 to 40 wascaused by a process of aggregation that was observedduring the repetitive urine applications (Fig. 5c).
This difference between N2O production in aggre-gates and bulk soil increased through repetitive urineapplications in kaolinitic and vermiculitic soils (caseswhen aggregate stability increased). These results areconsistent with the expectation indicating that bacterialactivity is reduced by dry–wet cycles in the absence ofaggregates which physically protect bacterial popula-tions against drying–wetting forces (Denef et al. 2001).Bacterial populations were more stable inside aggre-gates than on the external surfaces, where they weremore exposed to fluctuations in the soil environment(e.g. drying and wetting).
Soil denitrification potential is directly related tothe aggregate anaerobic volume (Smith 1980), whichis assumed to be greater in the larger aggregates thanin the small aggregates or in the bulk soil. Stevenson(1982) found the formation of anaerobic zones only inwater-saturated aggregates with radii greater than9 mm. Accordingly, the largest aggregate size in our
experiment was large enough to stimulate an increaseof the anaerobic zones. As a result, the presence of thesecond peak of N2O production became moresignificant with increasing number of urine applica-tions. He et al. (2001) reported a similar dual-peakN2O emission pattern for the aerobic composting oforganic wastes, but at a different time scale likely dueto the varying microbial decomposition rates andtemperatures arising from differences in experimentalconditions (organic wastes vs. soil–urine). In oururine–soil systems, the dual-peak emission patterncould occur because nitrification was the predominantprocess regulating N2O production at the beginning ofthe experiment (Singurindy et al. 2006) with denitri-fication as the likely process leading to N2O forma-tion in the latter stage.
For HCSA treatments, both drying and wettingprocesses had positive effects on aggregate stability inall samples (Table 2). These observations supportedthe findings of Denef et al. (2001) who reported thatrepeated wetting–drying cycles increased the potentialstabilization of soil aggregates. Other studies havenoted reductions in aggregate stability after repeatedwetting–drying cycles, attributed to the slaking of theair-dry aggregates by fast rewetting (Jager and Bruins1975). In contrast, rewetting was always slow in ourwork and therefore drying process could cause anincrease the solid phase cohesion of aggregatedparticles and in addition resulted in precipitation ofbonding agents at particles contact points, as perKemper et al. (1987). SEM analysis (data not shown)demonstrated that increasing clay content led to moreclay adhering to the sand grains and thicker claylayers were formed. Moreover, it changed the tenden-cy in montmorillonite-dominated samples so thataggregate stability increased through 40 repetitiveurine applications as in the other treatments. Asexpected, the increased clay content reduced NH3
volatilization losses (Fig. 3c).Increasing levels of urine (moisture content)
decreased oxygen diffusion potential. It would alsobe expected that under the resulting anaerobic con-ditions, the N2O:N2 ratio would decrease (Davidsonet al. 1986), but our research provides only limitedinformation regarding this tendency. Figure 6 showsthat emission of N2 was found only at 75% saturation,in contrast to 50% saturation where N2O was thedominant gaseous N product (e.g. Davidson et al.2000). In montmorillonite-dominated soil (Fig. 6b),
296 Water Air Soil Pollut (2008) 195:285–299

the repetitive shrinkage–swelling caused progressiveaggregate disruption, making anaerobic conditionsless pronounced and thus resulting in reduced N2
formation. (Note that under field conditions, disrup-tion of aggregates might lead to pore destruction andthus enhanced anaerobic environments.) In kaolinite-dominated soils, little increase was found in N2
emission from 1st to 37th urine application cycle(Fig. 6a). In vermiculite-dominated soil, where theaggregate stability increased through the number ofrepetitive urine applications, the dominance of anaero-bic conditions inside the aggregates facilitated theproduction of N2 (Fig. 6c). The results presented inFig. 6a and c confirm that slow rewetting allows theentrapped air to escape (Kemper and Rosenau 1984)causing the development of anaerobic conditionswithin soil aggregates (Kremen et al. 2005).
Our findings clearly demonstrate that there weretwo main factors − aggregate stability and degree ofsaturation − controlling N2O formation processes underour experimental conditions. Figure 7 presents the
generalized changes of the N2O emission factor withthese two main factors, based on small (4–4.75 mm)synthetic aggregates of the three clay types (kaolinite-,montmorillonite-, and vermiculite-dominated). The
Degree of saturation (%)
40 50 60 70 80
Agg
rega
te s
tabi
lity
(%)
40
50
60
70
80
24681012
Nitrousoxideemissionfactor (%)
Fig. 7 The generalizedchanges of N2O emissionfactor with degree of satu-ration and percentage ofwater stable aggregates,small (4–4.75 mm) aggre-gates of three clay types,HCSA treatment, cycles#16–26
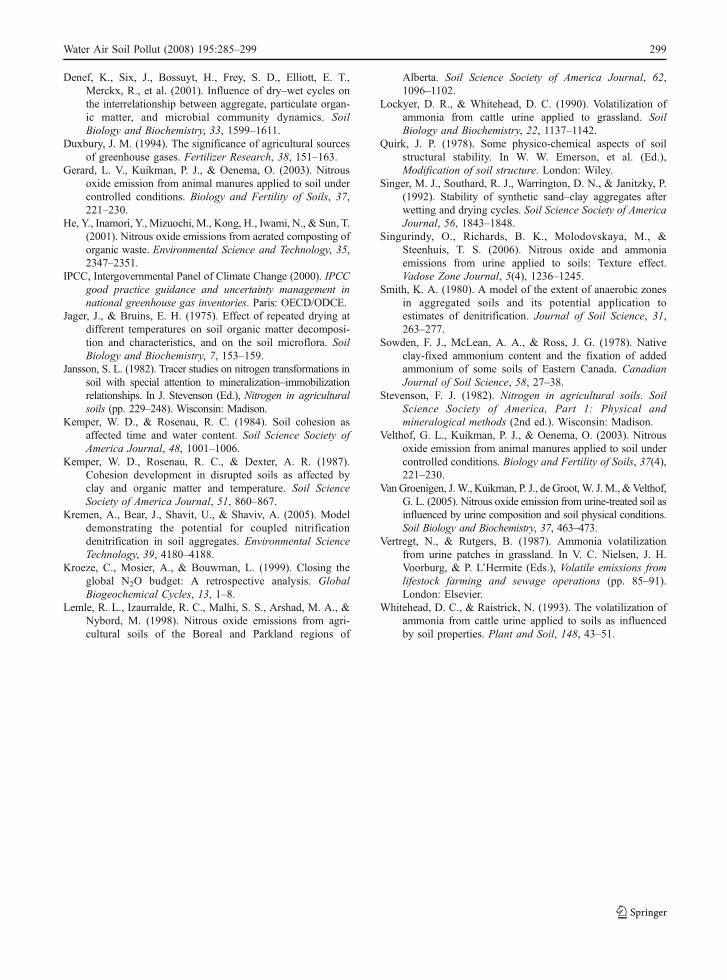
100 µm
Fig. 8 Scanning electron microscopy of montmorillonite-dominated small (4–4.75 mm) synthetic aggregate (HCSAtreatment), magnification ×1,000
Water Air Soil Pollut (2008) 195:285–299 297
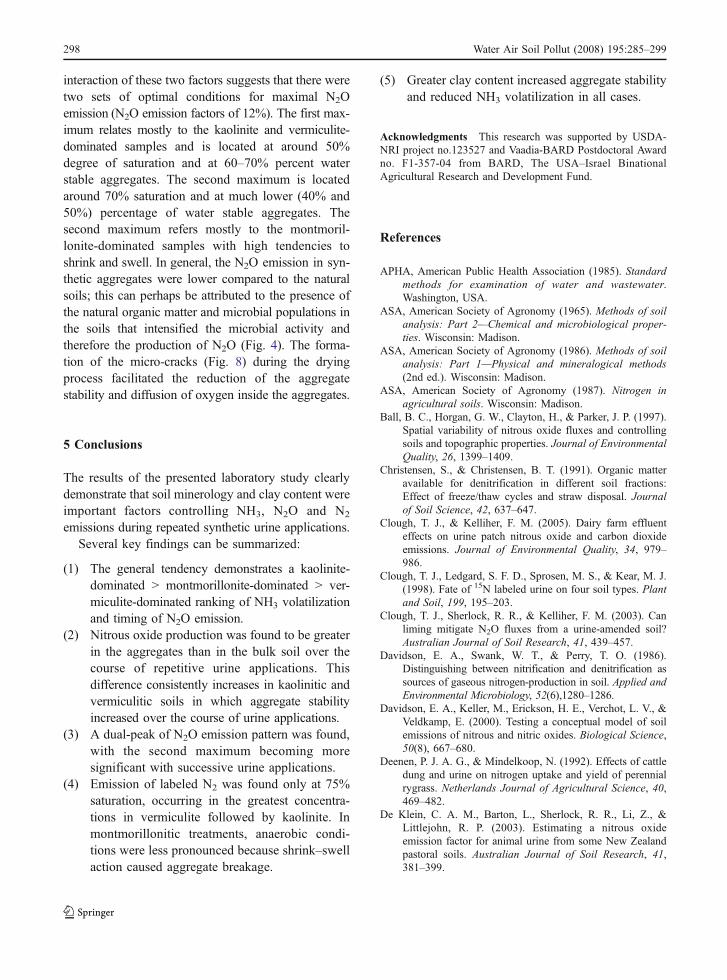
interaction of these two factors suggests that there weretwo sets of optimal conditions for maximal N2Oemission (N2O emission factors of 12%). The first max-imum relates mostly to the kaolinite and vermiculite-dominated samples and is located at around 50%degree of saturation and at 60–70% percent waterstable aggregates. The second maximum is locatedaround 70% saturation and at much lower (40% and50%) percentage of water stable aggregates. Thesecond maximum refers mostly to the montmoril-lonite-dominated samples with high tendencies toshrink and swell. In general, the N2O emission in syn-thetic aggregates were lower compared to the naturalsoils; this can perhaps be attributed to the presence ofthe natural organic matter and microbial populations inthe soils that intensified the microbial activity andtherefore the production of N2O (Fig. 4). The forma-tion of the micro-cracks (Fig. 8) during the dryingprocess facilitated the reduction of the aggregatestability and diffusion of oxygen inside the aggregates.
5 Conclusions
The results of the presented laboratory study clearlydemonstrate that soil minerology and clay content wereimportant factors controlling NH3, N2O and N2
emissions during repeated synthetic urine applications.Several key findings can be summarized:
(1) The general tendency demonstrates a kaolinite-dominated > montmorillonite-dominated > ver-miculite-dominated ranking of NH3 volatilizationand timing of N2O emission.
(2) Nitrous oxide production was found to be greaterin the aggregates than in the bulk soil over thecourse of repetitive urine applications. Thisdifference consistently increases in kaolinitic andvermiculitic soils in which aggregate stabilityincreased over the course of urine applications.
(3) A dual-peak of N2O emission pattern was found,with the second maximum becoming moresignificant with successive urine applications.
(4) Emission of labeled N2 was found only at 75%saturation, occurring in the greatest concentra-tions in vermiculite followed by kaolinite. Inmontmorillonitic treatments, anaerobic condi-tions were less pronounced because shrink–swellaction caused aggregate breakage.
(5) Greater clay content increased aggregate stabilityand reduced NH3 volatilization in all cases.
Acknowledgments This research was supported by USDA-NRI project no.123527 and Vaadia-BARD Postdoctoral Awardno. F1-357-04 from BARD, The USA–Israel BinationalAgricultural Research and Development Fund.
References
APHA, American Public Health Association (1985). Standardmethods for examination of water and wastewater.Washington, USA.
ASA, American Society of Agronomy (1965). Methods of soilanalysis: Part 2—Chemical and microbiological proper-ties. Wisconsin: Madison.
ASA, American Society of Agronomy (1986). Methods of soilanalysis: Part 1—Physical and mineralogical methods(2nd ed.). Wisconsin: Madison.
ASA, American Society of Agronomy (1987). Nitrogen inagricultural soils. Wisconsin: Madison.
Ball, B. C., Horgan, G. W., Clayton, H., & Parker, J. P. (1997).Spatial variability of nitrous oxide fluxes and controllingsoils and topographic properties. Journal of EnvironmentalQuality, 26, 1399–1409.
Christensen, S., & Christensen, B. T. (1991). Organic matteravailable for denitrification in different soil fractions:Effect of freeze/thaw cycles and straw disposal. Journalof Soil Science, 42, 637–647.
Clough, T. J., & Kelliher, F. M. (2005). Dairy farm effluenteffects on urine patch nitrous oxide and carbon dioxideemissions. Journal of Environmental Quality, 34, 979–986.
Clough, T. J., Ledgard, S. F. D., Sprosen, M. S., & Kear, M. J.(1998). Fate of 15N labeled urine on four soil types. Plantand Soil, 199, 195–203.
Clough, T. J., Sherlock, R. R., & Kelliher, F. M. (2003). Canliming mitigate N2O fluxes from a urine-amended soil?Australian Journal of Soil Research, 41, 439–457.
Davidson, E. A., Swank, W. T., & Perry, T. O. (1986).Distinguishing between nitrification and denitrification assources of gaseous nitrogen-production in soil. Applied andEnvironmental Microbiology, 52(6),1280–1286.
Davidson, E. A., Keller, M., Erickson, H. E., Verchot, L. V., &Veldkamp, E. (2000). Testing a conceptual model of soilemissions of nitrous and nitric oxides. Biological Science,50(8), 667–680.
Deenen, P. J. A. G., & Mindelkoop, N. (1992). Effects of cattledung and urine on nitrogen uptake and yield of perennialrygrass. Netherlands Journal of Agricultural Science, 40,469–482.
De Klein, C. A. M., Barton, L., Sherlock, R. R., Li, Z., &Littlejohn, R. P. (2003). Estimating a nitrous oxideemission factor for animal urine from some New Zealandpastoral soils. Australian Journal of Soil Research, 41,381–399.
298 Water Air Soil Pollut (2008) 195:285–299
Denef, K., Six, J., Bossuyt, H., Frey, S. D., Elliott, E. T.,Merckx, R., et al. (2001). Influence of dry–wet cycles onthe interrelationship between aggregate, particulate organ-ic matter, and microbial community dynamics. SoilBiology and Biochemistry, 33, 1599–1611.
Duxbury, J. M. (1994). The significance of agricultural sourcesof greenhouse gases. Fertilizer Research, 38, 151–163.
Gerard, L. V., Kuikman, P. J., & Oenema, O. (2003). Nitrousoxide emission from animal manures applied to soil undercontrolled conditions. Biology and Fertility of Soils, 37,221–230.
He, Y., Inamori, Y., Mizuochi, M., Kong, H., Iwami, N., & Sun, T.(2001). Nitrous oxide emissions from aerated composting oforganic waste. Environmental Science and Technology, 35,2347–2351.
IPCC, Intergovernmental Panel of Climate Change (2000). IPCCgood practice guidance and uncertainty management innational greenhouse gas inventories. Paris: OECD/ODCE.
Jager, J., & Bruins, E. H. (1975). Effect of repeated drying atdifferent temperatures on soil organic matter decomposi-tion and characteristics, and on the soil microflora. SoilBiology and Biochemistry, 7, 153–159.
Jansson, S. L. (1982). Tracer studies on nitrogen transformations insoil with special attention to mineralization–immobilizationrelationships. In J. Stevenson (Ed.), Nitrogen in agriculturalsoils (pp. 229–248). Wisconsin: Madison.
Kemper, W. D., & Rosenau, R. C. (1984). Soil cohesion asaffected time and water content. Soil Science Society ofAmerica Journal, 48, 1001–1006.
Kemper, W. D., Rosenau, R. C., & Dexter, A. R. (1987).Cohesion development in disrupted soils as affected byclay and organic matter and temperature. Soil ScienceSociety of America Journal, 51, 860–867.
Kremen, A., Bear, J., Shavit, U., & Shaviv, A. (2005). Modeldemonstrating the potential for coupled nitrificationdenitrification in soil aggregates. Environmental ScienceTechnology, 39, 4180–4188.
Kroeze, C., Mosier, A., & Bouwman, L. (1999). Closing theglobal N2O budget: A retrospective analysis. GlobalBiogeochemical Cycles, 13, 1–8.
Lemle, R. L., Izaurralde, R. C., Malhi, S. S., Arshad, M. A., &Nybord, M. (1998). Nitrous oxide emissions from agri-cultural soils of the Boreal and Parkland regions of
Alberta. Soil Science Society of America Journal, 62,1096–1102.
Lockyer, D. R., & Whitehead, D. C. (1990). Volatilization ofammonia from cattle urine applied to grassland. SoilBiology and Biochemistry, 22, 1137–1142.
Quirk, J. P. (1978). Some physico-chemical aspects of soilstructural stability. In W. W. Emerson, et al. (Ed.),Modification of soil structure. London: Wiley.
Singer, M. J., Southard, R. J., Warrington, D. N., & Janitzky, P.(1992). Stability of synthetic sand–clay aggregates afterwetting and drying cycles. Soil Science Society of AmericaJournal, 56, 1843–1848.
Singurindy, O., Richards, B. K., Molodovskaya, M., &Steenhuis, T. S. (2006). Nitrous oxide and ammoniaemissions from urine applied to soils: Texture effect.Vadose Zone Journal, 5(4), 1236–1245.
Smith, K. A. (1980). A model of the extent of anaerobic zonesin aggregated soils and its potential application toestimates of denitrification. Journal of Soil Science, 31,263–277.
Sowden, F. J., McLean, A. A., & Ross, J. G. (1978). Nativeclay-fixed ammonium content and the fixation of addedammonium of some soils of Eastern Canada. CanadianJournal of Soil Science, 58, 27–38.
Stevenson, F. J. (1982). Nitrogen in agricultural soils. SoilScience Society of America, Part 1: Physical andmineralogical methods (2nd ed.). Wisconsin: Madison.
Velthof, G. L., Kuikman, P. J., & Oenema, O. (2003). Nitrousoxide emission from animal manures applied to soil undercontrolled conditions. Biology and Fertility of Soils, 37(4),221–230.
VanGroenigen, J.W., Kuikman, P. J., de Groot,W. J.M., &Velthof,G. L. (2005). Nitrous oxide emission from urine-treated soil asinfluenced by urine composition and soil physical conditions.Soil Biology and Biochemistry, 37, 463–473.
Vertregt, N., & Rutgers, B. (1987). Ammonia volatilizationfrom urine patches in grassland. In V. C. Nielsen, J. H.Voorburg, & P. L’Hermite (Eds.), Volatile emissions fromlifestock farming and sewage operations (pp. 85–91).London: Elsevier.
Whitehead, D. C., & Raistrick, N. (1993). The volatilization ofammonia from cattle urine applied to soils as influencedby soil properties. Plant and Soil, 148, 43–51.
Water Air Soil Pollut (2008) 195:285–299 299
Copyright © 2022 FDOKUMEN