Measurements of the viscosity of compressed gaseous and liquid ethane1
10
Physica 104A (1980) 417-426 0 North-Holland Publishing Co. MEASUREMENTS OF THE VISCOSITY OF COMPRESSED GASEOUS AND LIQUID METHANE* Dwain E. DILLER Thermophysical Properties Division, National Engineering Laboratory, National Bureau of Standards, Boulder, Colorado 80303, USA Received 4 July 1980 The shear viscosity coefficient of compressed gaseous and liquid methane has been measured at temperatures between 100 and 300K and at pressures up to 30MPa (4350psia) with a torsionally oscillating quartz crystal viscometer. The estimated precision and accuracy of the measurements are about 0.5% and 2%, respectively. The measurements have been compared with an equation previously proposed for calculating the viscosity of gaseous and liquid methane. Most of the differences between the equation and the measurements reported here are within our experimental error. Larger differences (up to 6%) are reported at the lowest temperature (100 K) and high pressures, and along a supercritical isotherm at 200 K (T = 1.05 TJ. 1. Introduction This research is part of a long-range program on the thermophysical properties of mixtures of compressed and liquefied hydrocarbon gases. The purpose of this report is to provide additional wide range measurements for testing and improving accurate mathematical models for calculating the dependence of the shear viscosity coefficient of compressed gaseous and liquid methane on temperature, pressure and density. More specifically, the immediate objective is to test and improve an equatio@) previously proposed for representing the viscosity behavior of methane over a wide range of experimental conditions. This report provides new absolute isothermal viscosity measurements for methane at eight temperatures between 100 K and 300 K, at pressures up to 30 MPa (4350 psia), and at densities from the low pressure gas up to the liquid density of 28.6 mol/& Most of the differences between the equation previously proposed and the measurements reported here are within our experimental error. Several differences which exceed our experimental error are discussed. * Contribution of the National Bureau of Standards (USA), not subject to copyright. This work was partially supported by the U.S. Department of Energy, Division of Geothermal Energy. 417
Transcript of Measurements of the viscosity of compressed gaseous and liquid ethane1
Physica 104A (1980) 417-426 0 North-Holland Publishing Co.
MEASUREMENTS OF THE VISCOSITY OF COMPRESSED GASEOUS AND LIQUID METHANE*
Dwain E. DILLER
Thermophysical Properties Division, National Engineering Laboratory, National Bureau of Standards, Boulder, Colorado 80303, USA
Received 4 July 1980
The shear viscosity coefficient of compressed gaseous and liquid methane has been measured at temperatures between 100 and 300K and at pressures up to 30MPa (4350psia) with a torsionally oscillating quartz crystal viscometer. The estimated precision and accuracy of the measurements are about 0.5% and 2%, respectively. The measurements have been compared with an equation previously proposed for calculating the viscosity of gaseous and liquid methane. Most of the differences between the equation and the measurements reported here are within our experimental error. Larger differences (up to 6%) are reported at the lowest temperature (100 K) and high pressures, and along a supercritical isotherm at 200 K (T = 1.05 TJ.
1. Introduction
This research is part of a long-range program on the thermophysical properties of mixtures of compressed and liquefied hydrocarbon gases. The purpose of this report is to provide additional wide range measurements for testing and improving accurate mathematical models for calculating the dependence of the shear viscosity coefficient of compressed gaseous and liquid methane on temperature, pressure and density. More specifically, the immediate objective is to test and improve an equatio@) previously proposed for representing the viscosity behavior of methane over a wide range of experimental conditions.
This report provides new absolute isothermal viscosity measurements for methane at eight temperatures between 100 K and 300 K, at pressures up to 30 MPa (4350 psia), and at densities from the low pressure gas up to the liquid density of 28.6 mol/& Most of the differences between the equation previously proposed and the measurements reported here are within our experimental error. Several differences which exceed our experimental error are discussed.
* Contribution of the National Bureau of Standards (USA), not subject to copyright. This work was partially supported by the U.S. Department of Energy, Division of Geothermal Energy.
417
418 D.E. DILLER
2. Apparatus and procedures
The method of measurement, the apparatus and the experimental procedure are essentially the same as reported in earlier papers on hydrogen3), argon4), fluorine’), oxygen’), and saturated liquid methane’). Only details specific to this work are reported here.
The identical torsionally oscillating quartz crystal of approximately 5 cm length and 0.5 cm diameter, discussed in refs. 4, 7, was used for these measurements. The measurements were performed on commercial, research- grade methane, further purified by passing it through a molecular sieve trap, cooled with liquid ethyl alcohol in equilibrium with its solid phase, to remove residual water vapor. The specified minimum purity was claimed to be 99.99%, with the most likely impurities being nitrogen, carbon dioxide and ethane.
Densities were obtained from measured temperatures and pressures and an equation reported by McCarty’) to represent the wide range PVT properties of methane. The estimated inaccuracy in the calculated densities is believed to be less than 0.2%, except very near the critical temperature and density.
Viscosities were derived from the measured crystal resonance-curve bandwidths using the equation
where p is the fluid density; M and S are the mass and surface area of the crystal; f and Af are the resonant frequency and bandwidth of the crystal resonance-curve respectively. This equation is based on an analysis of the instrument given by Webeler[9] and has been used to derive all of the viscosities reported from this laboratory.
The bandwidth of the resonance curve in vacuum, Af,,,, was measured directly and ranged from 0.020 Hz at 100 K to 0.072 Hz at 300 K. The value of Af,,, was measured with an imprecision of about 5%.
Viscosities and pressures were measured nearly simultaneously, after wai- ting for about one hour between each data point to permit obtaining thermal equilibrium. The viscosity was measured first with the pressure piston gauge in steady-state operation. The pressure typically increased slightly (less than 0.2%) during the course of a viscosity measurement, which requires about ten minutes.
The initial runs at all temperatures were made beginning at a pressure of about 10 MPa (1450 psia). Subsequent runs were made beginning at a pressure of about 30 MPa, obtained either by filling the cell with liquid and warming it to the desired temperature, or by isothermally increasing the pressure in the
VISCOSITY OF GASEOUS AND LIQUID METHANE 419
cell with an external thermal booster, cooled initially with liquid nitrogen. This procedure permitted examination of the sample-to-sample measurement repeatability, which typically was within the estimated precision.
3. Results
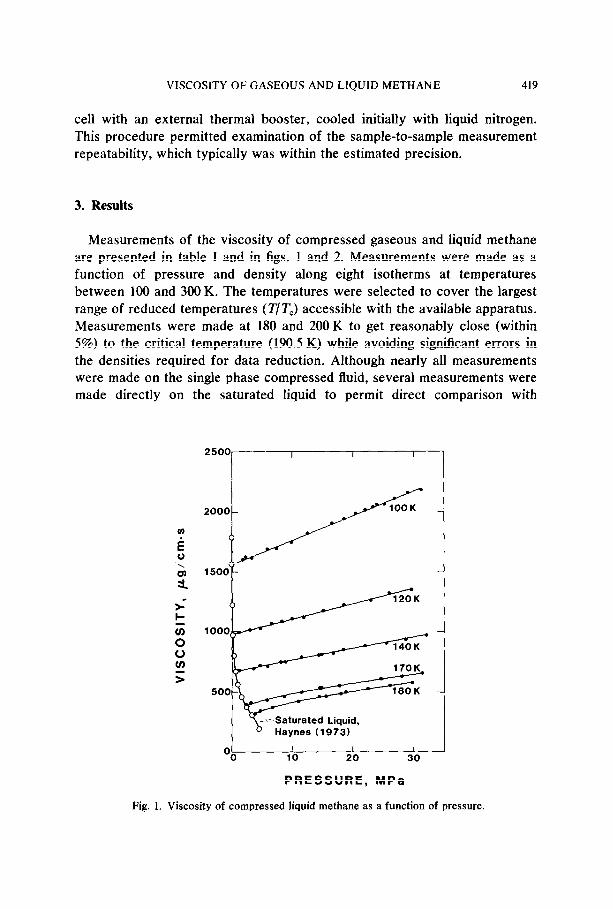
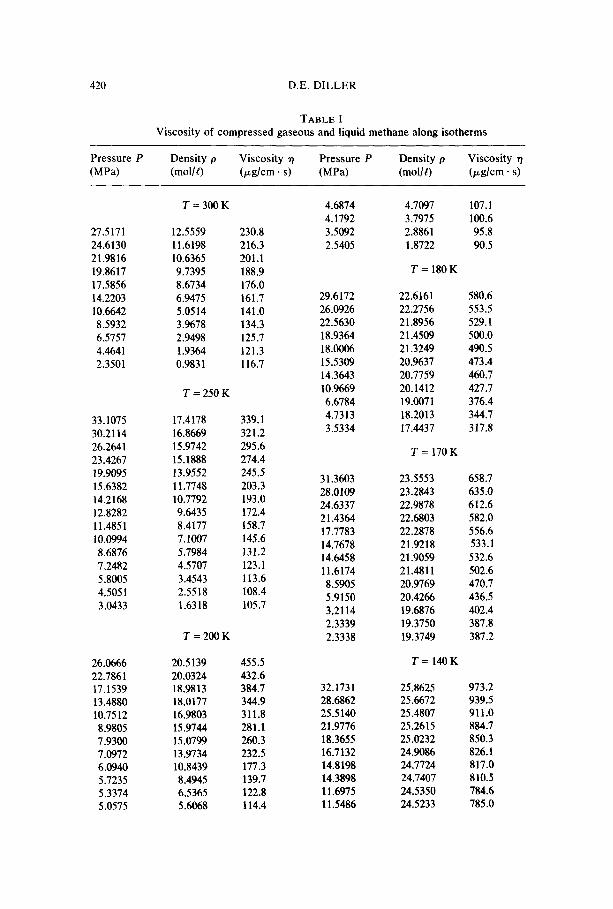
Measurements of the viscosity of compressed gaseous and liquid methane are presented in table I and in figs. 1 and 2. Measurements were made as a function of pressure and density along eight isotherms at temperatures between 100 and 300 K. The temperatures were selected to cover the largest range of reduced temperatures (T/T,) accessible with the available apparatus. Measurements were made at 180 and 200 K to get reasonably close (within 5%) to the critical temperature (190.5 K) while avoiding significant errors in the densities required for data reduction. Although nearly all measurements were made on the single phase compressed fluid, several measurements were made directly on the saturated liquid to permit direct comparison with
2500-
Haynes (1973)
I OO
I I I I IO 20 30
PRESSURE, MPa
Fig. 1. Viscosity of compressed liquid methane as a function of pressure.
420 D.E. DILLER
TABLE I Viscosity of compressed gaseous and liquid methane along isotherms
Pressure P Density p Viscosity 7) Pressure P Density p Viscosity n
(MPa) (moU0 (pglcm. s) (MPa) (mol/0 kg/cm. 4
27.5171 12.5559 230.8 24.6130 11.6198 216.3 21.9816 10.6365 201.1 19.8617 9.7395 188.9 17.5856 8.6734 176.0 14.2203 6.9475 161.7 10.6642 5.0514 141.0 8.5932 3.%78 134.3 6.5757 2.9498 125.7 4.4641 1.9364 121.3 2.3501 0.983 1 116.7
T=250K
33.1075 17.4178 339.1 30.2114 16.8669 321.2 26.2641 15.9742 295.6 23.4267 15.1888 274.4 19.9095 13.9552 245.5 15.6382 11.7748 203.3 14.2168 10.7792 193.0 12.8282 9.6435 172.4 11.4851 8.4177 158.7 10.0994 7.1007 145.6 8.6876 5.7984 131.2 7.2482 4.5707 123.1
5.8005 3.4543 113.6 4.5051 2.5518 108.4
3.0433 1.6318 105.7
T=2OOK
26.0666 20.5139 455.5 22.7861 20.0324 432.6 17.1539 18.9813 384.7 13.4880 18.0177 344.9 10.7512 16.9803 311.8 8.9805 15.9744 281.1 7.9300 15.0799 260.3 7.0972 13.9734 232.5 6.0940 10.8439 177.3 5.7235 8.4945 139.7 5.3374 6.5365 122.8 5.0575 5.6068 114.4
T=3OOK 4.6874 4.1792 3.5092 2.5405
4.7097 107.1 3.7975 100.6 2.8861 95.8 1.8722 90.5
T=lSOK
29.6172 26.0926 22.5630 18.9364 18.0006 15.5309 14.3643 lo.%69 6.6784 4.7313 3.5334
22.6161 580.6 22.2756 553.5 21.8956 529.1 21.4509 500.0 21.3249 490.5 20.9637 473.4 20.7759 460.7 20.1412 427.7 19.007 1 376.4 18.2013 344.7 17.4437 317.8
T=l70K
31.3603 28.0109 24.6337 21.4364 17.7783 14.7678 14.6458 11.6174 8.5905 5.9150 3.2114 2.3339 2.3338
23.5553 658.7 23.2843 635.0 22.9878 612.6 22.6803 582.0 22.2878 556.6 21.9218 533.1 21.9059 532.6 21.4811 502.6 20.9769 470.7 20.4266 436.5 19.6876 402.4 19.3750 387.8 19.3749 387.2
T=l4OK
32.1731 25.8625 973.2 28.6862 25.6672 939.5 25.5140 25.4807 911.0 21.9776 25.2615 884.7 18.3655 25.0232 850.3 16.7132 24.9086 826.1 14.8198 24.7724 817.0 14.3898 24.7407 810.5 11.6975 24.5350 784.6 11.5486 24.5233 785.0
VISCOSITY OF GASEOUS AND LrQUID METHANE 421
TABLE I (continued)
Pressure P (MW
Density p (mol/Q
Viscosity f Wcm .s)
Pressure P NW
density p (mol/O
Viscosity 9 kidcm . s)
8.7964 8.1090 5.9313 4.6192 3.6012 3.5782 1.0162 0.6435
29.6804 26.0938 22.8894 18.5450 14.9691 11.8634 10.0661 8.2936 6.4887 4.7333 3.0145 1.1885
24.2976 753.3 24.2386 752.2 24.0436 719.3 31.3341
23.9196 713.9 29.1106
23.81% 695.4 27.6657
23.8173 695.9 26.8786
23.5481 677.4 25.2648
23.5066 661.8 24.0528 23.3380
T= 120K 22.0477 20.4257
27.1751 1356.6 18.5381
27.0098 1320.2 16.5683
26.8568 1269.3 12.5966
26.6403 1218.7 9.8678
26.4535 1173.6 9.4111
26.2839 1125.6 7.3829
26.1824 1109.8 5.8976
26.0795 1090.4 4.5249
25.9718 1054.8 3.3040
25.8639 1030.4 2.3281 25.755 1 1016.9 1.7964
25.6357 994.9
T=lOOK
28.6048 2184.9 28.5259 2154.8 28.4740 2121.3 28.4456 2107.5 28.3867 2068.0 28.3422 2055.8 28.3157 2036.8 28.2677 2015.6 28.2067 1984.0 28.1348 1939.4 28.0589 1900.5 27.9024 1819.4 27.7923 1743.7 27.7736 1759.5 27.6900 1695.0 27.6279 1693.2 27.5698 1647.4 27.5177 1616.3 27.4756 1626.2 27.4525 1599.9
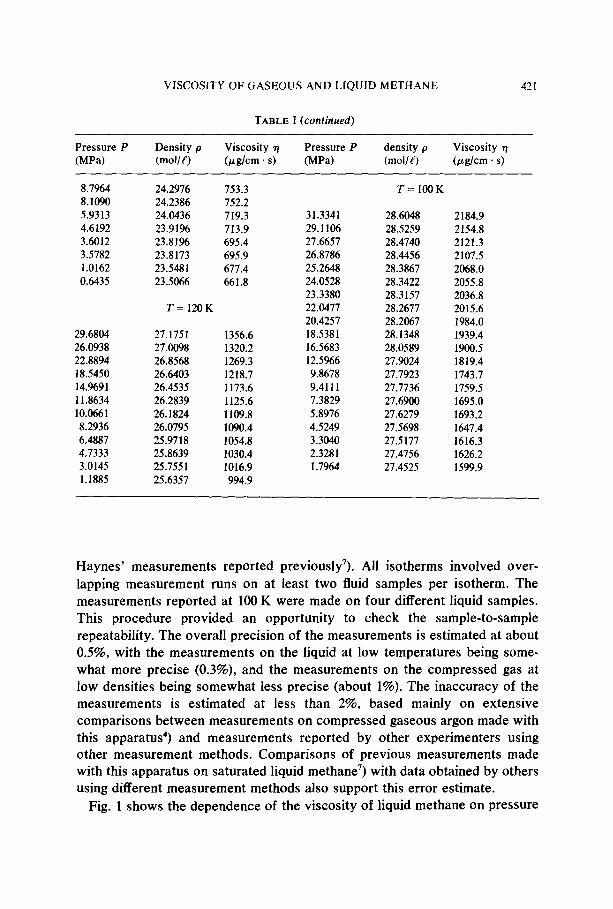
Haynes’ measurements reported previously7). All isotherms involved over- lapping measurement runs on at least two fluid samples per isotherm. The measurements reported at 100 K were made on four different liquid samples. This procedure provided an opportunity to check the sample-to-sample repeatability. The overall precision of the measurements is estimated at about 0.5%, with the measurements on the liquid at low temperatures being some- what more precise (0.3%), and the measurements on the compressed gas at low densities being somewhat less precise (about 1%). The inaccuracy of the measurements is estimated at less than 2%, based mainly on extensive comparisons between measurements on compressed gaseous argon made with this apparatus4) and measurements reported by other experimenters using other measurement methods. Comparisons of previous measurements made with this apparatus on saturated liquid methane7) with data obtained by others using different measurement methods also support this error estimate.
Fig. 1 shows the dependence of the viscosity of liquid methane on pressure

422 D.E. DILLER
2200, I I I I I I
1800
1600
1OOK _j
Methane Viscosity Measurements
i ‘
Saturated Liquid GJ
120K
? .
: 1000
zi
z 800
v)
2 600
400
DENSITY, mol/L
Fig. 2. Viscosity of compressed gaseous and liquid methane as a function of density along isotherms.
at five temperatures (lO&lSO K). The saturated liquid data are from Haynes’). At high pressures the viscosity of liquid methane increases nearly linearly with pressure at fixed temperature. However, there is noticeable curvature in the isotherms at the highest temperature and lowest pressures.
Fig. 2 shows the dependence of the viscosity of gaseous and liquid methane on the density at seven temperatures (lOCL300 K). The highest density (28.6 mollt) exceeds the density of the liquid at the triple point. The saturated liquid viscosity data are from Haynes’). The wide-range behavior of the dependence of the viscosity on density and temperature is similar to that for other compressed and liquefied gases we have examined. However, the location of the 180 K isotherm (T = 0.94 T,) is a little unusual in that it lies above the saturated liquid curve in the density range examined here.
VISCOSITY OF GASEOUS AND LIQUID METHANE 423
4. Discussion
The purpose of this research is to provide new absolute isothermal vis- cosity measurements for methane, especially for the liquid state at low temperatures and high densities, to test and improve an equation previously proposed’.‘) for calculating the viscosity of methane. Since the proposed equation is based on a corresponding states approach and on wide-range viscosity data for other fluids, and has also been optimized to carefully selected data previously available for gaseous and liquid methane, the differences between the equation and the data of this report provide com- parisons between our data and this substantial body of previous data.
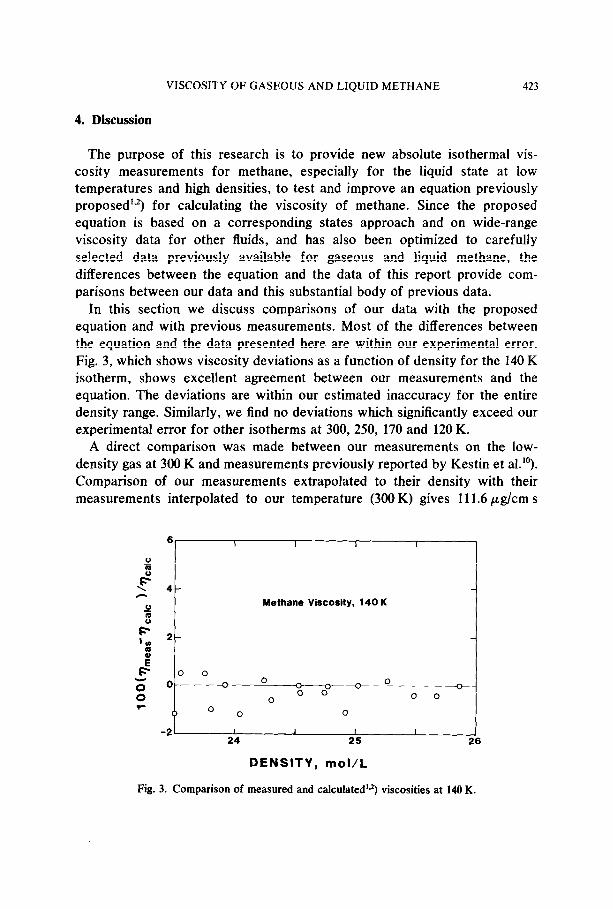
In this section we discuss comparisons of our data with the proposed equation and with previous measurements. Most of the differences between the equation and the data presented here are within our experimental error. Fig. 3, which shows viscosity deviations as a function of density for the 140 K isotherm, shows excellent agreement between our measurements and the equation. The deviations are within our estimated inaccuracy for the entire density range. Similarly, we find no deviations which significantly exceed our experimental error for other isotherms at 300,250, 170 and 120 K.
A direct comparison was made between our measurements on the low- density gas at 300 K and measurements previously reported by Kestin et al.“). Comparison of our measurements extrapolated to their density with their measurements interpolated to our temperature (300 K) gives 111.6 ,ug/cm s
6r I I I I 1
Y
$ L 4- -
Y Methane Viscosity, 140 K
z
p ‘, 2-
$
g 00
5 O- 0 _ 0 ”
0 0 0 0 0 r
0 O 0 0
-2- , I I I 24 25 26
DENSITY, mol/L
Fig. 3. Comparison of measured and calculated’2) viscosities at 140 K.
424 D.E. DILLER
6, I I I w I
i
Methane Viscosity, 100 K F” I
4
t
0 i.
/ AJO
01 I_ calculated
27 26 29
DENSITY, mot/L
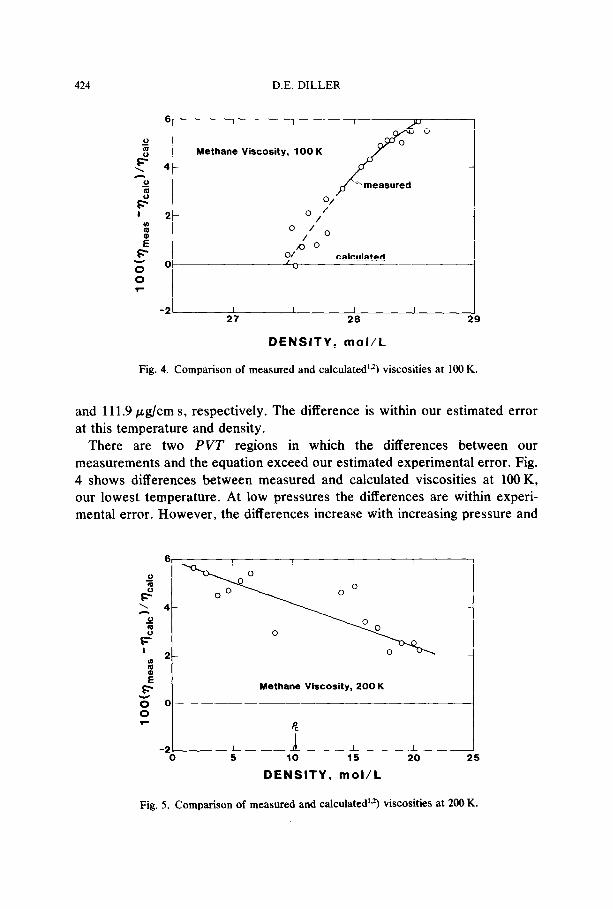
Fig. 4. Comparison of measured and calculated’-2) viscosities at 100 K.
and 111.9 pg/cm s, respectively. The difference is within our estimated error at this temperature and density.
There are two PVT regions in which the differences between our measurements and the equation exceed our estimated experimental error. Fig. 4 shows differences between measured and calculated viscosities at 100 K, our lowest temperature. At low pressures the differences are within experi- mental error. However, the differences increase with increasing pressure and
t “E
F Methane Viscosity, 200 K
z 0 0 r
P,
-2 I 1 I L 0 5 10 15 20 25
DENSITY, mol/L
Fig. 5. Comparison of measured and calculated’3 viscosities at 200 K.
VISCOSITY OF GASEOUS AND LIQUID METHANE 425
density to about 6% at the highest density, where the density range of the correlation is exceeded. It is worth mentioning that the measurements of Hellemans et al.“) show the same trend. Fig. 5 shows differences between measured and calculated viscosities at 200 K, which is about 5% above the critical temperature. The differences are about 5% at low densities and decrease with increasing density to about 2% at high densities. A similar trend was found for the 180K isotherm; the differences decrease with increasing density from about 3% at low densities to about 1% at high densities. These deviations indicate that, at low densities and at temperatures approaching the critical temperature, the true viscosity is probably 3-5% larger than that calculated from the equation.
5. Conclusions
Absolute wide-range viscosity measurements have been reported for com- pressed gaseous and liquid methane which substantially extend the pressure and density ranges of previous measurements. Our measurements are con- sistent with those of others within our combined experimental errors. The differences between our measurements and an equation, which has been previously proposed for calculating the dependence of the viscosity coefficient on temperature and density, are generally within our experimental error, except at the lowest temperatures and highest densities, and at tem- peratures within a few percent of the critical temperature.
Acknowledgments
Howard J. M. Hanley participated in the planning of this work and provided encouragement. James F. Ely provided the computer programs for processing the measurements and for comparing the measurements with the methane viscosity correlation. Scott Starsky assisted with data processing and analysis.
References
1) H.J.M. Hanley, R.D. McCarty and W.M. Haynes, Cmogenics 15 (1975) 413. 2) H.J.M. Hanley, W.M. Haynes and R.D. McCarty, J. Phys. Chem. Ref. Data 6 (1977) 597. 3) D.E. Diller, J. Chem. Phys. 42 (1965) 2089. 4) W.M. Haynes, Physica 67 (1973) 440. 5) W.M. Haynes, Physica 76 (1974) 1.

426 D.E. DILLER
6) W.M. Haynes, Physica 89A (1977) 569. 7) W.M. Haynes, Physica 70 (1973) 410. 8) R.D. McCarty, Cryogenics 14 (1974) 276. 9) R.H.W. Webeler, Ph.D. Thesis, University of Cincinnati, Ohio, (l%l) (University Microfilms
No. 61-5234, Ann Arbor, Michigan). 10) J. Kestin, H.E. Khalifa and W.A. Wakeham, J. Chem. Phys. 66 (1977) 1132. 11) J. Hellemans, H. Zink and 0. Van Paemel, Physica 46 (1970) 395.