
Between Purity and Hybridity: Technoscientific and Ethnic Myths of Brazil

Monitoring of tritium purity during long-term circulation in the KATRIN test experiment LOOPINO using laser Raman spectroscopy
S. Fischera, M. Sturma,*, M. Schlössera, B. Bornscheina, G. Drexlinb, F. Priesterb, R.J. Lewisc, H.H. Tellec
a Institute for Technical Physics, Tritium Laboratory Karlsruhe, Karlsruhe Institute of Technology, 76021 Karlsruhe, Germany
b Institute for Experimental Nuclear Physics, Karlsruhe Institute of Technology, 76021 Karlsruhe, Germany
c Department of Physics, Swansea University, Singleton Park, Swansea, SA2 8PP, United Kingdom
The gas circulation loop LOOPINO has been set up
and commissioned at Tritium Laboratory Karlsruhe (TLK) to perform Raman measurements of circulating tritium mixtures under conditions similar to the inner loop system of the neutrino-mass experiment KATRIN, which is currently under construction. A custom-made interface is used to connect the tritium containing measurement cell, located inside a glove box, with the Raman setup standing on the outside. A tritium sample (purity > 95 %, 20 kPa total pressure) was circulated in LOOPINO for more than three weeks with a total throughput of 770 g of tritium. Compositional changes in the sample and the formation of tritiated and deuterated methanes CT4-nXn (X=H,D; n=0,1) were observed. Both effects are caused by hydro-gen isotope exchange reactions and gas – wall inter-actions, due to tritium β decay. A precision of 0.1 % was achieved for the monitoring of the T2 Q1-branch, which fulfils the requirements for the KATRIN experiment and demonstrates the feasibility of high-precision Raman measurements with tritium inside a glove box.
I. INTRODUCTION
Possible solutions for precise compositional analysis, in-line and in (near) real-time, of flowing gases containing tritium have now been discussed for more than a decade. Key applications are at present encountered in the funda-mental research KATRIN (the Karlsruhe Tritium Neu-trino mass experiment) collaboration, and in the various analytical systems for the Tritium Plant of the ITER (International Thermonuclear Experimental Reactor) pro-ject. In-line analysis of flowing gases is problematic at the best of times but it constitutes a major challenge if radio-active (or toxic) compounds are involved, for which the integrity of a circulation loop cannot be compromised.
Of the laser spectroscopic techniques now in routine use for compositional analysis of gases Laser Raman spectroscopy (LARA) has been identified as the method of choice for this task; it is the most suitable to cover a wide variety of expected molecular compounds and re-quiring only a single, fixed wavelength laser excitations source. A number of implementations were proposed, and promising results have been reported, albeit mostly for non-tritiated mixtures. 1-4
The requirements for the KATRIN experiment are that the composition of the tritium gas (of purity >95%), which will be injected into its windowless gaseous tritium source (WGTS), needs to be known to a precision of 0.1% (1σ). Monitoring data have to be provided at least every 250 seconds. 5 In an experiment in which the conditions of the full KATRIN inner loop were mimicked (Test of Inner-loop setup, TILO), 6 we showed that we could meet these requirements for mixtures of hydrogen and deuter-ium, measured at the position of the buffer vessel in the KATRIN loop (for gas mixtures of total pressure 10-20 kPa). 4 More recently, we demonstrated that with our LARA system we can indeed also achieve this for gas mixtures containing all six hydrogen isotopologues, 7 al-though this proof-of-principle was done in a static-gas cell.
We are now at the stage of carrying out tests to determine, whether our Raman measurement system is suitable for the KATRIN inner loop with circulating tritium gas. Since not all components of the full KATRIN tritium loop are yet in place (the WGTS will become available only toward the end of 2011), this was done in a simpler loop, LOOPINO, which runs under KATRIN-conditions regarding throughput, pressure and composi-tion. The purpose of these measurements was to ascertain the stability and reliability of the setup, both of the loop itself and of the Laser Raman system during runs over extended periods of time. Such measurements have proven to be crucial during the TILO test phase, 6 affect-ing some of the design issues of the KATRIN inner loop
* Corresponding author. E-Mail address: michael.sturm @ kit.edu

design. Also, LOOPINO will allow us to verify that reliable LARA measurements are possible inside the secondary containment of the glove box.
In this paper, we describe and discuss results from our first long-time LARA measurements of tritium flows in LOOPINO, under KATRIN-like conditions.
II. EXPERIMENT DESCRIPTION II.A. Technical requirements
Laser Raman measurements on tritium impose technical requirements on the experimental setup concerning leak tightness of the setup, safety. All components of the primary systemwhich are in direct contact to tritium, have to be certified material, metal sealed (typically tubes, VCR- or CF-connections) and leak-tested to mbar l/s for each individual connection and <mbar l/s integral leak rate. 8 When working with activities > 1010 Bq, the primary system has to be enclosed by a secondary containment with tested integral leak rate of < 0.1 Vol.% h-1. As much of the optical equipment as possible should be located outside the secondment to minimize the risk of contaminationfor easy handling. Therefore, the connection between tglove box and the optical setup plays a majdesign of the experimental setup. II.B. Experimental setup Figure 1 shows the conceptual flow-diagram of the InnerLoop system of KATRIN, which will be used to continuously feed the KATRIN WGTS with a constant rate of
Fig. 1: Conceptual flow-diagram of the InnerKATRIN. Note that LOOPINO is a simplified setup test version, excluding the buffer vessel, the permeator and the KATRIN tritium source.
us to verify that ments are possible inside the
describe and discuss results from time LARA measurements of tritium flows
conditions.
Laser Raman measurements on tritium impose stringent requirements on the experimental setup
and radiation components of the primary system, i.e. those
have to be made of stainless steel tested to < 10-9
nnection and < 10-8 When working with activities
to be enclosed by a tegral leak rate of
As much of the optical equipment as possible should be located outside the secondary contain-ment to minimize the risk of contamination, and to allow
the connection between the nd the optical setup plays a major role in the
diagram of the Inner-which will be used to contin-
with a constant rate of
high-purity tritium gas (tritium purity >dium membrane filter (permeator)hydrogen compounds from the gas streamproduct 3He and CT4-nXn (X=H,D) gues. 5 The pressure within the pressurevessel is stabilised via a PID-controller and a regulating valve. The Laser Raman sample located between the two buffer vessels and used to monitor the gas composition in-line.
Since the Inner Loop system will not be operated with tritium until the commissioning simplified circulation test-loop, LOOPINOup and commissioned. It consists of (volume 1000 cm3), the LARA cell (Metal Bellows 601DC). The pressure in the buffer vessel, and hence also the pressure controlled by a regulating valve and a PIDwhile a coarse setting of the flow rate can be done by a needle valve. Since a permeator is nminimised loop, an enrichment of impurities during long term circulation is expected.
Figure 2 shows the glove box in which Inner Loop system as well as System (ISS) 9 of TLK and LOOPINO arecomplete optical setup is located outside the glove box on a mobile optical table in a lightLARA setup. An appendix has been attached to the glove box at the interface between loop system and the LARA setup (see Fig. 3). Laser windows in the walls
of the Inner-Loop of KATRIN. Note that LOOPINO is a simplified setup test version, excluding the buffer vessel, the permeator and
Fig. 2: LARA setup attached to the glove box.appendix connects the optical setup outside the glove box with the LARA cell located inside.
gas (tritium purity > 95 %). A palla-ium membrane filter (permeator) is used to separate non-
from the gas stream, e.g. the decay H,D) methane isotopolo-pressure-controlled buffer
controller and a regulating cell (LARA cell) will be
located between the two buffer vessels and used to line.
the Inner Loop system will not be operated commissioning of the WGTS a
LOOPINO, has been set consists of a buffer vessel
cell and a pumping unit The pressure in the buffer
the pressure in the LARA cell, is valve and a PID-controller,
while a coarse setting of the flow rate can be done by a Since a permeator is not installed in this
enrichment of impurities during long
2 shows the glove box in which parts of the as the Isotope Separation
of TLK and LOOPINO are located. The optical setup is located outside the glove box on
in a light-tight housing, called An appendix has been attached to the glove
box at the interface between loop system and the LARA windows in the walls of the
LARA setup attached to the glove box. The appendix connects the optical setup outside the glove box with the LARA cell located inside.

appendix allow the laser beam to pass through the LARA cell, which is connected to the circulation loop via bellows. The scattered light leaves the cell at 90° to the direction of excitation, through a third window in the appendix wall. The LARA cell is mounted on a suspended base plate for the decoupling of vibrations produced by pumps in the glove box. The optical path inside the appendix is enclosed by light-tight tubes to prevent ambient light to enter along with the Raman scattered light, and to ensure laser safety. Once moved to the right place, the LARA setup is screwed down, ensuring a fixed position of the LARA cell relative to the optical setup.
The LARA setup uses a 532 nm laser (Coherent Verdi V5) as the excitation source. After leaving the appendix, the scattered light is focused by a set of lenses onto an optical fibre bundle that transport the light to the spectrograph. A low-noise CCD (PI PIXIS:2K) is used to acquire the spectra. The LARA setup and the design of the LARA cell have been discussed in detail in previous publications 2,7, while a general discussion of the design of LARA systems for tritium monitoring can be found in Schlösser et al. 11 Automated software post-processing routines transform the raw 2D-image of the CCD into a spectrum. These routines include an astigmatism correc-tion as well as a cosmic ray removal, which is necessary due to the long exposure times. 4
Measurements at LOOPINO are typically performed in three steps: (1) LOOPINO is evacuated to less than 10 Pa and
afterwards filled with gas from the ISS and/or the CAPER facility 10 of the Tritium Laboratory Karls-ruhe (TLK).
(2) The pumping unit of LOOPINO circulates the gas for several weeks through the LARA-cell and the buffer vessel, while Raman measurements (250 s acquisition time, 5 W laser power) are continuously performed.
(3) After a measurement run the gas is being transferred back to the CAPER facility for tritium-recovery.
The CAPER facility can be also used to perform gas
chromatographic (GC) analyses of tritiated gas mixtures with about 5 % relative uncertainty.
III. RESULTS AND DISCUSSION III.A. Gas mixture with low levels of tritium The first test-measurements at LOOPINO were performed with non-tritiated gas mixtures, e.g. with deuterium (not discussed here), and a gas mixtures with a low concentra-tion of tritium that contained all six hydrogen isotopolo-gues T2 : DT : D2 : HT : HD : H2 (approximate concentra-tion 0.9 : 8.3 : 16.3 : 9.0 : 4.6 : 31.8, in %, according to GC analysis). Figure 4 shows an example spectrum of this mixture, which was circulated in LOOPINO for about 160 hours. The Q1-branches of the hydrogen isotopo-logues, which correspond to purely vibrational excitations (∆ν = 1, ∆J = 0), are in the spectral range 2450–4250 cm-1 and are well separated. The S0-branches, related to pure rotational excitations (∆ν = 0, ∆J = 2), are found in the first 1500 cm-1 of the spectrum and cannot be fully resolved with our combination of spectrograph and CCD.
The underlying background spectrum consists of the Lorentz wing of the laser line (strongly suppressed by an edge filter) as well of Raman scattering and fluorescence from the SiO2 cell windows (peaking at ~450 cm-1). 7 Due to these two reasons, all quantitative analysis is based on the Q1-branches of the hydrogen isotopologues. Besides the Q1-branches, several weaker spectral lines of the main gas constituents D2, HD and H2 can be observed, namely S1 (∆ν = 1, ∆J = 2) and O1 (∆ν = 1, ∆J = −2) lines.
Besides the new gas composition no significant dif-ferences between the spectra of the circulated mixture and of a static sample 7 were found, i.e. the additional win-dows in the appendix and the vibrations from the pumping units inside the glove box did not influence the measure-ments.
Fig. 3: Sketch of the connection of the LARA system (left) and the LARA cell inside the glove box, using the appendix (right).
Fig. 4: Spectrum of lowly-tritiated gas sample with all six hydrogen isotopologues measured inside the appendix.
The absolute peak intensities of the Q1-branches of the hydrogen isotopologues varied during the monitoring by up to 5 %, due to laser power fluctuations. In order to be insensitive to such laser power fluctuations, relative peak intensities were used for the analysis, i.e. the inten-sity of each Q1-branch in the spectrum is normalized on the sum of all Q1-branch intensities. The relative peak intensities varied only within 0.5 % since all absolute peak intensities are equally affected by laser power varia-tions. Therefore, relative peak intensities seem to be suitable when monitoring gas mixtures with known con-stituents.7 In a first approximation, the relative intensities are interpreted as concentration ratios. Earlier measure-ments showed that this approximation is valid within the stated tolerances of commercial non-active gas mixtures, and within the GC measurement uncertainties for tritiated mixtures. This approximation is used in the following.
A more detailed analysis is possible when one incur-porates the individual transition probabilities of spectral lines, the fourth-power wave number dependence of the scattering intensity 12 and the quantum efficiency of the collection optics. All these corrections will be implemen-ted in the analyses in the near future. Calculated transition probabilities are available for all hydrogen isotopolo-gues. 13,14 Experimental data, in contrast, are only found for the non-tritiated species. 15,16 Hence, measurements for the tritiated isotopologues are under way at TLK.
III.B. Gas mixture with high levels of tritium
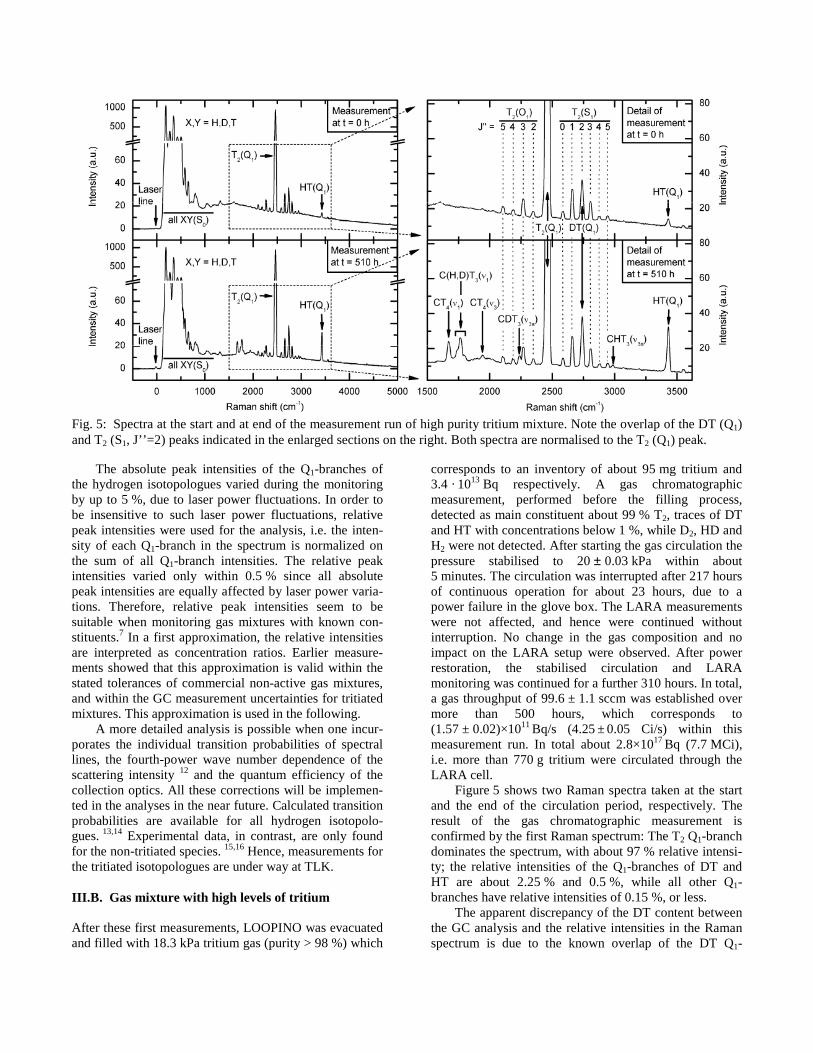
After these first measurements, LOOPINO was evacuated and filled with 18.3 kPa tritium gas (purity > 98 %) which
corresponds to an inventory of about 95 mg tritium and 3.4 · 1013 Bq respectively. A gas chromatographic measurement, performed before the filling process, detected as main constituent about 99 % T2, traces of DT and HT with concentrations below 1 %, while D2, HD and H2 were not detected. After starting the gas circulation the pressure stabilised to 20 ± 0.03 kPa within about 5 minutes. The circulation was interrupted after 217 hours of continuous operation for about 23 hours, due to a power failure in the glove box. The LARA measurements were not affected, and hence were continued without interruption. No change in the gas composition and no impact on the LARA setup were observed. After power restoration, the stabilised circulation and LARA monitoring was continued for a further 310 hours. In total, a gas throughput of 99.6 ± 1.1 sccm was established over more than 500 hours, which corresponds to (1.57 ± 0.02)×1011 Bq/s (4.25 ± 0.05 Ci/s) within this measurement run. In total about 2.8×10¹⁷ Bq (7.7 MCi), i.e. more than 770 g tritium were circulated through the LARA cell.
Figure 5 shows two Raman spectra taken at the start and the end of the circulation period, respectively. The result of the gas chromatographic measurement is confirmed by the first Raman spectrum: The T2 Q1-branch dominates the spectrum, with about 97 % relative intensi-ty; the relative intensities of the Q1-branches of DT and HT are about 2.25 % and 0.5 %, while all other Q1-branches have relative intensities of 0.15 %, or less.
The apparent discrepancy of the DT content between the GC analysis and the relative intensities in the Raman spectrum is due to the known overlap of the DT Q1-
Fig. 5: Spectra at the start and at end of the measurement run of high purity tritium mixture. Note the overlap of the DT (Q1) and T2 (S1, J’’=2) peaks indicated in the enlarged sections on the right. Both spectra are normalised to the T2 (Q1) peak.

branch and the T2 (S1, J’’=2) peak. 7 The overlap was not considered in the analysis of the spectra, which thus results in an overestimate of the peak intensity for the DT Q1-branch.
During the circulation period the laser power decreased by about 20 %, and in unison so did all absolute peak intensities. The variations can mainly be attributed to thermal influences on the laser. For clarity, and to allow for easier comparison, all spectra in Fig. 5 were normal-ized to the peak intensity of the T2 Q1-branch, in order to eliminate the effect of decreasing laser power.
As in the case of the mixtures with low levels of tritium only minor changes of the relative concentration of the non-tritiated isotopologues could be observed (see Fig. 6). In contrast, the concentrations of the tritiated species varied strongly. The relative intensity of the T2 Q1-branch decreased to about 94 %, while the relative intensities of the DT and HT peaks continuously in-creased to about 3 %. The expected reduction of T2 concentration in the sample, due to β-decay, is below 0.5 % and thus not sufficient to explain the observed change in composition. In addition, further features in the spectral range 1600−1800 cm-1, and around 2250 cm-1 and 3000 cm-1 slowly appeared during the long-term monitor-ing. These features can be correlated to vibrational excita-
tions of tritiated methane species, such as CT4, CDT3 and CHT3.
17 The ν1-mode peaks associated with CHT3 and CDT3 at around 1750 cm-1 could not be resolved individually with our spectrograph and CCD combination, and hence are jointly treated in the following. The methane ν1-mode peaks were included in the calculation of relative intensities, since not merely hydrogen isotopologues were present in the gas mixture.
The observed compositional changes are caused by hydrogen isotope exchange reactions and gas−wall interactions with the stainless steel tube walls, which both are triggered by the released energy from tritium β-decay. 18-21 Both effects will be discussed in more detail in the following paragraphs.
The time evolution of the T2, DT and HT concentra-tions is described reasonably well by a double-exponential
( ) 2//0
1 ττ tt eBeAytf −− ⋅+⋅+= trend, with a common short
time constant τ1 ≈ 11-22 h and different, longer time constants τ2 ≈ 100 h (for DT), τ2 ≈ 1000 h (for HT) and τ2 ≈ 2000 (for T2). The short time constant τ1 is compa-tible with measurements of Uda et al, 18 who studied hydrogen isotope exchange reactions in glass cells. The longer time constants τ2 are more likely related to gas −
wall interactions than to gas − gas interactions. Since H2 had been the main constituent of most gas samples in LOOPINO before this measurement, a non-negligible amount of hydrogen atoms was dissolved in the tube walls. After filling LOOOPINO with the high purity tritium mixture the hydrogen atoms started to diffuse back into the gas volume, while tritium atoms were dissolved in the walls. This process did not stop within the measurement period due to the evidently rather large amount of hydrogen atoms in the tube walls and the high tritium concentration in the gas. Since LOOPINO was also operated with deuterium in prior test measurements, the formation of DT is very likely based on the same mechanism, but with a smaller initial deuterium concen-tration in the tube walls. The formation of DT therefore slowed down after 2-3 days due to the decreasing concentration of deuterium atoms in the tube walls, which yields to a significant smaller time constant τ2 for DT than for HT.
The concentrations of the tritiated methane species increase nearly linearly within the measurement period. The formation of tritiated methane species in presence of tritium gas and stainless steel was demonstrated by Morris, 21 who tested the influence of surface cleanliness of test vessels (volume 293 cm3, 353 cm2 inner surface) on the methane formation rate. For about 70 % of all investigated samples Morris found that, saturation of the methane concentrations occurred after 20-80 hours. The absence of saturation effects in our measurement is not surprising when taking into account the ×50 factor larger surface-to-volume ratio of LOOPINO (volume about 2000 cm3, 1.2×105 cm2 inner surface).
Fig. 6: Time evolution of relative intensities of hydrogen isotopologues and tritiated methane species in the sample.

The achieved measurement precision σI / I, where σI is the standard deviation of the residuals of the double-exponential fit and I is the intensity of the peak of interest, can be calculated for each branch. A precision of 0.1 % is achieved over the whole measurement period for the T2 Q1-branch. This fulfils the requirement for LARA for the KATRIN experiment. 5 The precision of the second-most intense DT Q1-branch (relative intensity < 3 %) is in the range 1.47–1.87 %; here the reduction in precision due to the decrease of laser power is quite visible.
The gas mixture was kept in LOOPINO after the circulation period for additional measurements. After three months of exposure to the highly-concentrated tritium mixture damage of the anti-reflection coatings on the inner side of all windows of the LARA cell was observed. Further investigations of this tritium-induced coating damage are ongoing. IV. SUMMARY & CONCLUSIONS LOOPINO has been successfully commissioned and was operated the first time with a high purity tritium sample (95 mg tritium, 3.4 · 1013 Bq) over a period of about three weeks. The feasibility of monitoring the gas composition based on Raman spectroscopy, using the appendix as connection between the optical setup and the tritium containing LARA cell, has been proven. In comparison to the measurements performed with static gas samples outside the glove box 7 no further serious disturbances have been observed. The experimentally achieved measurement precision of 0.1 % for the T2 Q1-branch fulfils the requirements for KATRIN experiment.
Hydrogen isotope exchange effects and the formation of tritiated methane species, due to gas − wall interactions, have been monitored in the highly-concentrated tritium mixture; tritium β-decay has been identified as trigger mechanism. In the lowly-tritiated sample the effect of exchange reactions is nearly unnoticeable. These findings are broadly in agreement with the study by Morris. 21 Although the permeator in the inner loop system of KATRIN will separate impurities from the gas flow towards the WGTS, further investigations on methane formation with LOOPINO are planned.
While having reached the KATRIN requirements, further improvements of the LARA setup towards im-proved sensitivity and precision are scheduled. In particu-lar, the installation of a new temperature-stabilised 5 W, 532 nm laser will further improve the signal-to-noise ratio in the spectra, and accordingly the measurement preci-sion. Also, the incorporation of a double-pass geometry has been successfully demonstrated in first test experi-ments at TLK. This nearly doubled the laser irradiance in the LARA cell by back-reflecting the laser beam for a second pass through the LARA cell.
ACKNOWLEDGMENTS This work has been partially supported by funds of the DFG (SFB/Transregio 27 "Neutrinos and Beyond"). The authors also would like to thank the TLK infrastructure team for their invaluable help.
REFERENCES 1. S. O'HIRA et al., Nucl. Fusion, 40, 519 (2000). 2. D.J. TAYLOR, M. GLUGLA and R.D. PENZHORN,
Rev. Sci. Instrum. 72, 1970 (2001). 3. R. LASCOLA et al., Proc. SPIE, 5586, 83 (2004). 4. R.J. LEWIS et al., Laser Phys. Lett., 5, 522 (2008). 5. THE KATRIN COLLABORATION, “The KATRIN
Design Report 2004”, FZKA Scientific Report, 7090 (2005).
6. O. KAZACHENKO et al., Fusion Sci. Technol. 54, 67 (2008).
7. M. STURM et al., Laser Phys. 20, 493 (2010). 8. U. BESSERER, L. DÖRR and M. GLUGLA, Fusion
Sci. Technol., 54, 1, 160 (2008). 9. L. DÖRR, et al., Fusion Sci. Technol. 41, 1155
(2002). 10. B. BORNSCHEIN et al., Fusion Sci. Technol. 48, 15
(2005). 11. M. SCHLÖSSER et al., “Design implications for
Laser Raman measurement systems for tritium sample analysis, accountancy and process-control applications”, Tritium 2010 (Nara, Japan, 2010).
12. D. A. LONG, The Raman effect: a unified treatment of the theory of Raman scattering by molecules, Wiley, Chichester, UK (2002).
13. J. L. HUNT, J. D. POLL and L. WOLNIEWICZ; Can.J. Phys., 62, 1719 (1984).
14. C. SCHWARTZ and R.J. LE ROY, J. Mol. Spec-trosc., 1212, 420 (1987).
15. D. M. GOLDEN and B. CRAWFORD; J. Chem. Phys., 36, 1654 (1962).
16. R. W. CARLSON and W. R. FENNER, Astrophys. J. 178, 551 (1972).
17. U. ENGELMANN, US DOE HNF-MR-0532 (1997), doi:10.2172/334155.
18. T. UDA, K. OKUNO, Y. NARUSE, Radiochim. Acta, 56, 209 (1992).
19. T. UDA et al., J. Nucl. Sci. Technol., 28, 7, 618 (1991).
20. T. UDA, K. OKUNO, Y. NARUSE, J. Radioanal. Nucl. Chem., 159, 1, 145 (1992).
21. G. A. MORRIS, “Methane formation in tritium gas exposed to stainless steel”, Lawrence Livermore Laboratory Report, UCRL-52262 (1977).
Copyright © 2022 FDOKUMEN