Monitoring of the heat-shock response in Escherichia coli using an optical biosensor
8
Monitoring of the heat-shock response in Escherichia coli using an optical biosensor Igor Vostiar, 1 Jan Tkac, 2 and Carl-Fredrik Mandenius * Division of Biotechnology, Department of Physics and Measurement Technology, Link€ oping University, 581 83 Link€ oping, Sweden Received 29 April 2003 Abstract A surface plasmon resonance (SPR) method for monitoring the concentration of the chaperone DnaK and its relation to physiological stress response in a recombinant Escherichia coli strain subjected to heat shock is described. The DnaK protein, an abundantly occurring representative of the heat-shock proteins, was used as a marker of physiological stress. The SPR biosensor instrument was used for label-free immunoaffinity detection directly in cell culture lysates using an anti-DnaK monoclonal IgG antibody immobilized on the sensor surface. The SPR method provides a fast response (<8 min) and a reproducible (RSD < 2%), accurate (comparison to the direct enzyme-linked immunosorbent assay), and sensitive (LOD < 1 nM) assay for determination of the DnaK level in cell culture lysates. The operational stability of the method was high compared to that of other SPR assays; the sensitivity decreased at only 2.7%/h. This allowed measurement of more than 220 samples per sensor surface. Storage stability was determined at 25 °C (100% after 17 h) and 10 °C (101% after 1 month). The method was validated by standard additions of DnaK (30, 60, and 120 nM) with recovery indices in the range 95.7–103.7%. Ó 2003 Elsevier Inc. All rights reserved. Keywords: Surface plasmon resonance; Heat shock response analysis; Stress response sensor; DnaK analysis; Escherichia coli Bacterial cells have developed efficient protection sys- tems to cope with a variety of physiologically unfavorable conditions. One of the best studied is the heat-shock re- sponse, used by the cell to adapt to different physiological stresses [1,2]. The effect of the response is a fast transient increase of the cellÕs biosynthesis of ATP-dependent proteases and molecular chaperones [3], which facilitate appropriate folding or cleavage of misfolded proteins. Of these, the DnaK–DnaJ–GrpE and GroEL–GroES chap- erone systems in the cytoplasm of Escherichia coli and other bacteria are considered the most important [4,5]. Although the heat-shock response in bacterial cells is intensively studied, mainly semiquantitative immuno- electroblotting methods have been used for determination of the intracellular concentration of the key heat-shock protein DnaK. Recently, methods based on two-dimen- sional electrophoresis with matrix-assisted laser desorp- tion ionization time-of-flight mass spectrometry detection [6], N-terminal protein sequencing [8], or detection of [L- 35 S]methionine-labeled proteins have been described in the literature [7–9]. Also use of the green fluorescent protein gene [10] and the lux gene [11,12] fused to heat- shock promoters are reported to allow monitoring of gene expression under the control of this promoter. In addi- tion, DNA-microarray technology has successfully been used for expression profiling of heat-shock genes in bac- terial cell cultures subjected to physiological stress [13,14]. Here we describe a label-free method for quantitative detection of DnaK directly in the bacterial cell lysate. The method is based on the use of a surface plasmon resonance (SPR) 3 biosensor system (Biacore). The SPR technology has previously successfully been used to study the Analytical Biochemistry 322 (2003) 156–163 ANALYTICAL BIOCHEMISTRY www.elsevier.com/locate/yabio * Corresponding author. Fax: +46-13-122587. E-mail address: [email protected] (C.-F. Mandenius). 1 Present address: Department of Biochemical Technology, Faculty of Chemical and Food Technology, Slovak University of Technology, Radlinskeho 9, 812 37 Bratislava, Slovak Republic. 2 Present address: Institute of Chemistry, Slovak Academy of Sciences, Dubravska cesta 9, 842 38 Bratislava, Slovak Republic. 3 Abbreviations used: SPR, surface plasmon resonance; ELSIA, enzyme-linked immunosorbent assay; EA, ethanolamine; NHS, N-hydroxysuccinimide; EDC, 1-ethyl-3-(3-dimethylaminopropyl)-car- bodiimide; HBS, Hepes buffer-solution; TMB, tetramethylbenzidine; TES, trace element solution; HRP, horseradish peroxidase; BSA, bovine serum albumin; PBS, phosphate-buffered saline. 0003-2697/$ - see front matter Ó 2003 Elsevier Inc. All rights reserved. doi:10.1016/j.ab.2003.07.019
Transcript of Monitoring of the heat-shock response in Escherichia coli using an optical biosensor

ANALYTICAL
Analytical Biochemistry 322 (2003) 156–163
BIOCHEMISTRY
www.elsevier.com/locate/yabio
Monitoring of the heat-shock response in Escherichia coli usingan optical biosensor
Igor Vostiar,1 Jan Tkac,2 and Carl-Fredrik Mandenius*
Division of Biotechnology, Department of Physics and Measurement Technology, Link€ooping University, 581 83 Link€ooping, Sweden
Received 29 April 2003
Abstract
A surface plasmon resonance (SPR) method for monitoring the concentration of the chaperone DnaK and its relation to
physiological stress response in a recombinant Escherichia coli strain subjected to heat shock is described. The DnaK protein, an
abundantly occurring representative of the heat-shock proteins, was used as a marker of physiological stress. The SPR biosensor
instrument was used for label-free immunoaffinity detection directly in cell culture lysates using an anti-DnaK monoclonal IgG
antibody immobilized on the sensor surface. The SPR method provides a fast response (<8min) and a reproducible (RSD < 2%),
accurate (comparison to the direct enzyme-linked immunosorbent assay), and sensitive (LOD < 1 nM) assay for determination of
the DnaK level in cell culture lysates. The operational stability of the method was high compared to that of other SPR assays; the
sensitivity decreased at only 2.7%/h. This allowed measurement of more than 220 samples per sensor surface. Storage stability was
determined at 25 �C (100% after 17 h) and 10 �C (101% after 1month). The method was validated by standard additions of DnaK
(30, 60, and 120 nM) with recovery indices in the range 95.7–103.7%.
� 2003 Elsevier Inc. All rights reserved.
Keywords: Surface plasmon resonance; Heat shock response analysis; Stress response sensor; DnaK analysis; Escherichia coli
Bacterial cells have developed efficient protection sys-tems to copewith a variety of physiologically unfavorable
conditions. One of the best studied is the heat-shock re-
sponse, used by the cell to adapt to different physiological
stresses [1,2]. The effect of the response is a fast transient
increase of the cell�s biosynthesis of ATP-dependent
proteases and molecular chaperones [3], which facilitate
appropriate folding or cleavage of misfolded proteins. Of
these, the DnaK–DnaJ–GrpE and GroEL–GroES chap-erone systems in the cytoplasm of Escherichia coli and
other bacteria are considered the most important [4,5].
Although the heat-shock response in bacterial cells is
intensively studied, mainly semiquantitative immuno-
electroblottingmethods have beenused for determination
of the intracellular concentration of the key heat-shock
protein DnaK. Recently, methods based on two-dimen-
* Corresponding author. Fax: +46-13-122587.
E-mail address: [email protected] (C.-F. Mandenius).1 Present address: Department of Biochemical Technology, Faculty
of Chemical and Food Technology, Slovak University of Technology,
Radlinskeho 9, 812 37 Bratislava, Slovak Republic.2 Present address: Institute of Chemistry, Slovak Academy of
Sciences, Dubravska cesta 9, 842 38 Bratislava, Slovak Republic.
0003-2697/$ - see front matter � 2003 Elsevier Inc. All rights reserved.
doi:10.1016/j.ab.2003.07.019
sional electrophoresis with matrix-assisted laser desorp-tion ionization time-of-flightmass spectrometry detection
[6], N-terminal protein sequencing [8], or detection of
[L-35S]methionine-labeled proteins have been described
in the literature [7–9]. Also use of the green fluorescent
protein gene [10] and the lux gene [11,12] fused to heat-
shock promoters are reported to allowmonitoring of gene
expression under the control of this promoter. In addi-
tion, DNA-microarray technology has successfully beenused for expression profiling of heat-shock genes in bac-
terial cell cultures subjected to physiological stress [13,14].
Here we describe a label-free method for quantitative
detection ofDnaK directly in the bacterial cell lysate. The
method is based on the use of a surface plasmon resonance
(SPR)3 biosensor system (Biacore). The SPR technology
has previously successfully been used to study the
3 Abbreviations used: SPR, surface plasmon resonance; ELSIA,
enzyme-linked immunosorbent assay; EA, ethanolamine; NHS,
N-hydroxysuccinimide; EDC, 1-ethyl-3-(3-dimethylaminopropyl)-car-
bodiimide; HBS, Hepes buffer-solution; TMB, tetramethylbenzidine;
TES, trace element solution; HRP, horseradish peroxidase; BSA,
bovine serum albumin; PBS, phosphate-buffered saline.
I. Vostiar et al. / Analytical Biochemistry 322 (2003) 156–163 157
interaction of the DnaK chaperone with its cochaperoneDnaJ [15,16] and to elucide the molecular mechanism of
the chaperone GroEL [17]. However, a selective method
for detection of DnaK directly in the cell lysate with SPR
is here described for the first time. The method was tested
on an Escherichia coli culture under heat stress. The SPR
data were compared with data acquired using conven-
tional bioanalytical methods (Western blotting, ELISA).
The SPRmethod proved to be sensitive and fast, allowingreproducible off-line monitoring of the intracellular
DnaK level.
Experimental
Materials
DnaK solution (0.9 gL�1) was obtained from Stress-
Gen Biotechnologies (Victoria, Canada) and anti-
DnaK monoclonal antibody solution (1.4 gL�1) from
Calbiochem (CA, USA). Ethanolamine (EA), N-hy-
droxysuccinimide (NHS), 1-ethyl-3-(3-dimethylamino-
propyl)-carbodiimide (EDC), sensor chip CM5 (research
grade), Hepes buffer solution (HBS; 10mMHepes (N-[2-
hydroxyethyl]piperazine-N 0-[2-ethane sulfonic acid]),150mM NaCl, 3.4mM EDTA, 0.005% Tween 20, pH
7.4), coupling buffers (10mMacetate buffers, pH4.5–5.5),
and regeneration buffers (10mMglycine–HCl buffers, pH
1.5–3.0) were purchased from Biacore International AB
(Uppsala, Sweden). Protease inhibitor cocktail tablets
(Complete Mini EDTA–free) were obtained from Roche
(Mannheim, Germany) and bacterial extraction reagent
CelLytic was provided by Sigma (MO, USA).Tris(hydroxymethyl)aminoethane (Tris), Hepes, hy-
drochloric acid, sodium hydroxide, sulfuric acid, and
acetic acid were purchased from Merck (Germany).
Immunoblot (Western blot) and ELISA assays were
performed using goat anti-mouse IgG labeled with
horseradish peroxidase (HRP). 4-Chloro-1-naphthol and
hydrogen peroxide (Bio-Rad, CA, USA) were used as
substrates for immunoblot assay while tetramethylbenz-idine (TMB) in combination with hydrogen peroxide
(RD, MN, USA) was used for ELISA. Prestained mo-
lecular standards (broad range; 6.4–198 kDa) and all
other reagents used for Western blot were obtained from
Bio-Rad. Polystyrene microtiter plates were purchased
from Nunc (Denmark).
E. coli cultivation
Recombinant E. coli strain HMS174(DE3) (pET11a/
rhSOD) [18] was used as a model culture to establish a
method for determination of DnaK protein in the cell
lysate. The medium consisted of (g L�1): glucose 16.0,
KH2PO4 3.0, K2HPO4 � 3H2O 6.0, yeast extract 0.05,
trypticase 1.0, MgSO4 � 7H2O 0.5, CaCl2 � 2H2O 0.05,
sodium citrate � 2H2O 1.25, (NH4)2SO4 2.25, NH4Cl 1.85,TES 250 ll, CuCl2 � 2H2O 0.02, ZnSO4 � 7H2O 0.017. The
TES consisted of (g L�1) FeSO4 � 7H2O 40.0, MnSO4 �H2O 10.0, AlCl3 � 6H2O 10.0, CoCl2 4.0, ZnSO4 � 7H2O
2.0, Na2MoO2 � 2H2O 2.0, CuCl2 � 2H2O, 1.0, andH3BO3
0.5 in 5M HCl.
The cells were grown overnight at 30 �C in 500-ml
flasks containing 100mlmedium to reach adesired optical
density (OD600 ¼ 1:0). Subsequently, the cultivationtemperature was shifted to 42 �C. Samples were taken out
through a sampling device that allowed aseptic sampling
during the cultivation. Samples were immediately pre-
treated as follows: 1ml of sample was centrifuged for
3min at 10,000g and 4 �C. Cell sediment was resuspended
in 150 ll of lysing buffer containing 100 ll of TEN buffer
(50mMTris buffer, pH7.4, 3mMEDTA, 0.9%w/vNaCl,
and 1 tablet of protease inhibitor per 10ml of the buffer)and 50 ll of detergent. The suspension was allowed to
react for 15min at 22 �C with intermittent mixing. Sub-
sequently, the mixture was centrifuged for 10min at
10,000g and 4 �C and the supernatant was collected and
stored at 4 �C until measured.
SPR measurements
All experiments were performed using a Biacore 2000
instrument. For optimization of the immobilization
procedure, a preconcentration test using 10mM acetate
coupling buffers with pH in the range from 4.5 to 5.5
was performed. Running buffer (HBS) was used at a
flow rate of 10 ll min�1, when not stated otherwise.
Other buffers were used after filtration through a 0.2-llfilter and degassing; 10mM glycine buffers (pH 1.5–3.0)were tested for regeneration.
The Biacore evaluation software (Version 3.0) was
applied for estimation of the concentration of DnaK.
The response from the reference channel with inacti-
vated anti-DnaK or rabbit anti-myoglobin was sub-
tracted from the sensor response.
Surface immobilization
Anti-DnaK was immobilized on the CM5 (carbo-
xymethylated dextran-modified gold-surface) chip using
a standard amino coupling kit. A 35-ll aliquot of a mix-
ture of EDC (200mM) and NHS (50mM) (1:1) was in-
jected at a flow rate of 5 ll min�1. After the surface
activation, 70 ll of anti-DnaK (45 lgml�1) solution was
injected and followed by a deactivation of the sensorsurface using an ethanolamine solution (1M; pH 8.5;
35 ll). After immobilization, several 5-ll injections (usu-ally 10) of the regeneration buffer (pH 2.0) were used to
wash out noncovalently bound antibody until a stable
baseline was obtained. A reference surface immobilized
with an irrelevant antibody to compensate for nonspecific
binding effects was used as detailed below.
158 I. Vostiar et al. / Analytical Biochemistry 322 (2003) 156–163
Western blot assays
Electrophoresis of samples was run according to
Laemmli [19]. Proteins were transferred to nitrocellulose
membrane for 45min (0.8mA cm�2) using a semidry
electroblotter (GelmanSciences, Denmark), blocked
with gelatin (3% w/v gelatin in TBS (20mM Tris,
500mM NaCl, pH 7.5)), and washed with TTBS
washing buffer (20mM Tris, 500mM NaCl, 0.05%Tween 20, pH 7.5). In the next step the nitrocellulose
membrane was incubated with primary antibody (dilu-
tion 1/1000 in 1% w/v gelatin solution in TTBS) for 1 h,
washed with TTBS washing buffer, and incubated with
secondary antibody–HRP conjugate (diluted 1/3000 in
1% w/v gelatin solution in TTBS) for 1 h. Membrane
was washed with distilled water and developed in the
substrate solution, and densitometric data were evalu-ated using the Image processing toolbox in MATLAB
6.1 software (The MathWorks, USA).
ELISA
A direct ELISA protocol for DnaK was developed
for use as a reference method. The microtiter plates were
precoated with appropriately diluted samples and stan-dards (up to 1.5 nM) (50 ll per well) in sodium bicar-
bonate buffer (50mM, pH 9.6), incubated at laboratory
temperature for 2 h, and blocked with BSA (1% w/v in
PBS (100mM phosphate buffer, 500mM NaCl, pH 7.4))
(50 ll per well) for 30min. In the next step wells were
filled with anti-DnaK monoclonal antibody solution
(dilution 1/1000 in PBS–Tween antibody buffer (100mM
phosphate buffer, 500mM NaCl, 0.1% w/v BSA, 0.05%v/v Tween 20, pH 7.4)) (30 ll per well) and incubated at
22 �C for 2 h. Antibody–HRP conjugate solution (dilu-
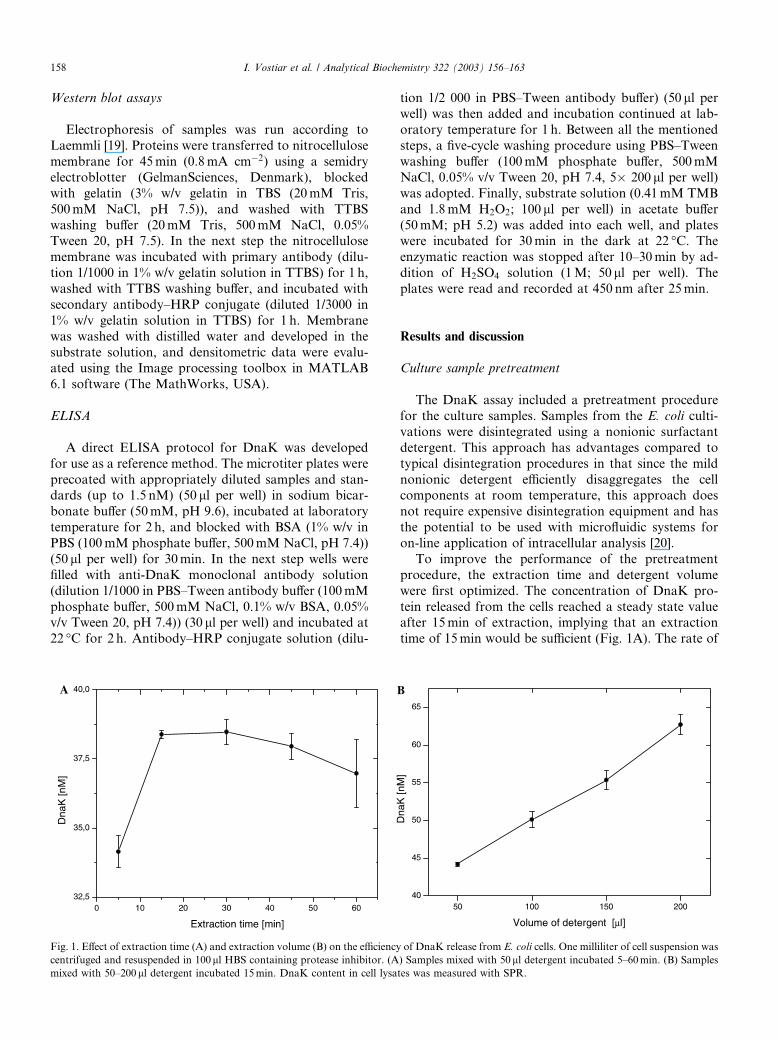
Fig. 1. Effect of extraction time (A) and extraction volume (B) on the efficiency
centrifuged and resuspended in 100ll HBS containing protease inhibitor. (A
mixed with 50–200ll detergent incubated 15min. DnaK content in cell lysa
tion 1/2 000 in PBS–Tween antibody buffer) (50 ll perwell) was then added and incubation continued at lab-
oratory temperature for 1 h. Between all the mentioned
steps, a five-cycle washing procedure using PBS–Tween
washing buffer (100mM phosphate buffer, 500mM
NaCl, 0.05% v/v Tween 20, pH 7.4, 5� 200 ll per well)was adopted. Finally, substrate solution (0.41mM TMB
and 1.8mM H2O2; 100 ll per well) in acetate buffer
(50mM; pH 5.2) was added into each well, and plateswere incubated for 30min in the dark at 22 �C. The
enzymatic reaction was stopped after 10–30min by ad-
dition of H2SO4 solution (1M; 50 ll per well). The
plates were read and recorded at 450 nm after 25min.
Results and discussion
Culture sample pretreatment
The DnaK assay included a pretreatment procedure
for the culture samples. Samples from the E. coli culti-
vations were disintegrated using a nonionic surfactant
detergent. This approach has advantages compared to
typical disintegration procedures in that since the mild
nonionic detergent efficiently disaggregates the cellcomponents at room temperature, this approach does
not require expensive disintegration equipment and has
the potential to be used with microfluidic systems for
on-line application of intracellular analysis [20].
To improve the performance of the pretreatment
procedure, the extraction time and detergent volume
were first optimized. The concentration of DnaK pro-
tein released from the cells reached a steady state valueafter 15min of extraction, implying that an extraction
time of 15min would be sufficient (Fig. 1A). The rate of
of DnaK release from E. coli cells. One milliliter of cell suspension was
) Samples mixed with 50ll detergent incubated 5–60min. (B) Samples
tes was measured with SPR.
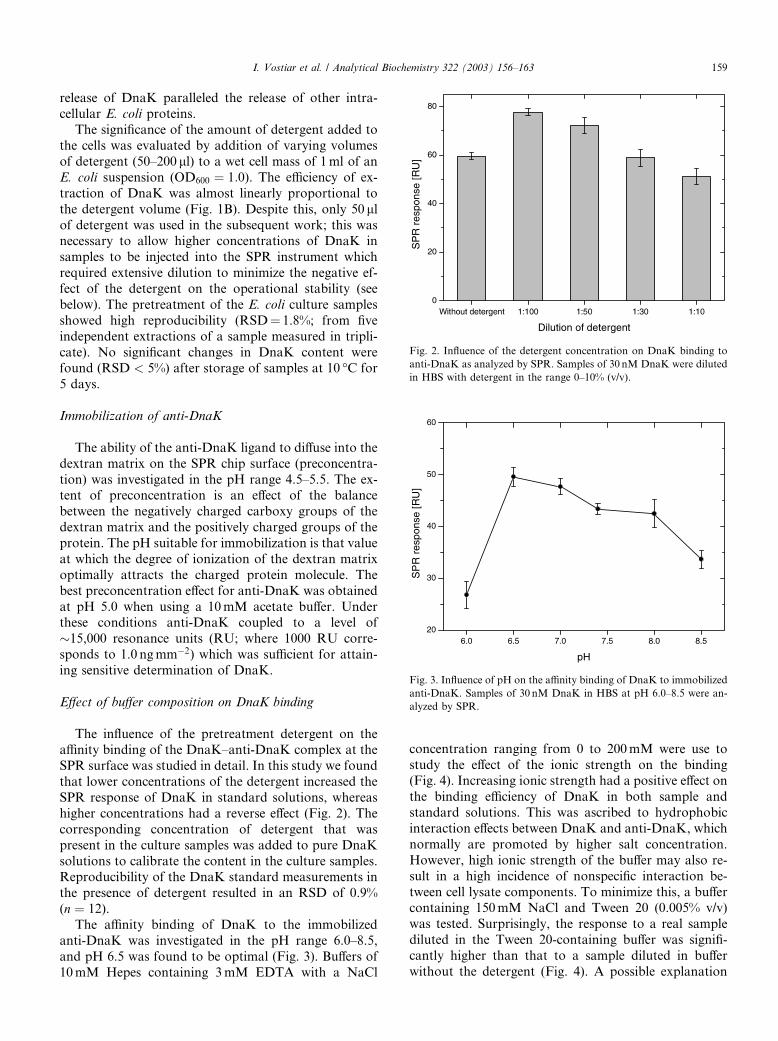
Fig. 2. Influence of the detergent concentration on DnaK binding to
anti-DnaK as analyzed by SPR. Samples of 30 nM DnaK were diluted
in HBS with detergent in the range 0–10% (v/v).
Fig. 3. Influence of pH on the affinity binding of DnaK to immobilized
anti-DnaK. Samples of 30 nM DnaK in HBS at pH 6.0–8.5 were an-
alyzed by SPR.
I. Vostiar et al. / Analytical Biochemistry 322 (2003) 156–163 159
release of DnaK paralleled the release of other intra-cellular E. coli proteins.
The significance of the amount of detergent added to
the cells was evaluated by addition of varying volumes
of detergent (50–200 ll) to a wet cell mass of 1ml of an
E. coli suspension (OD600 ¼ 1:0). The efficiency of ex-
traction of DnaK was almost linearly proportional to
the detergent volume (Fig. 1B). Despite this, only 50 llof detergent was used in the subsequent work; this wasnecessary to allow higher concentrations of DnaK in
samples to be injected into the SPR instrument which
required extensive dilution to minimize the negative ef-
fect of the detergent on the operational stability (see
below). The pretreatment of the E. coli culture samples
showed high reproducibility (RSD¼ 1.8%; from five
independent extractions of a sample measured in tripli-
cate). No significant changes in DnaK content werefound (RSD < 5%) after storage of samples at 10 �C for
5 days.
Immobilization of anti-DnaK
The ability of the anti-DnaK ligand to diffuse into the
dextran matrix on the SPR chip surface (preconcentra-
tion) was investigated in the pH range 4.5–5.5. The ex-tent of preconcentration is an effect of the balance
between the negatively charged carboxy groups of the
dextran matrix and the positively charged groups of the
protein. The pH suitable for immobilization is that value
at which the degree of ionization of the dextran matrix
optimally attracts the charged protein molecule. The
best preconcentration effect for anti-DnaK was obtained
at pH 5.0 when using a 10mM acetate buffer. Underthese conditions anti-DnaK coupled to a level of
�15,000 resonance units (RU; where 1000 RU corre-
sponds to 1.0 ngmm�2) which was sufficient for attain-
ing sensitive determination of DnaK.
Effect of buffer composition on DnaK binding
The influence of the pretreatment detergent on theaffinity binding of the DnaK–anti-DnaK complex at the
SPR surface was studied in detail. In this study we found
that lower concentrations of the detergent increased the
SPR response of DnaK in standard solutions, whereas
higher concentrations had a reverse effect (Fig. 2). The
corresponding concentration of detergent that was
present in the culture samples was added to pure DnaK
solutions to calibrate the content in the culture samples.Reproducibility of the DnaK standard measurements in
the presence of detergent resulted in an RSD of 0.9%
(n ¼ 12).
The affinity binding of DnaK to the immobilized
anti-DnaK was investigated in the pH range 6.0–8.5,
and pH 6.5 was found to be optimal (Fig. 3). Buffers of
10mM Hepes containing 3mM EDTA with a NaCl
concentration ranging from 0 to 200mM were use to
study the effect of the ionic strength on the binding(Fig. 4). Increasing ionic strength had a positive effect on
the binding efficiency of DnaK in both sample and
standard solutions. This was ascribed to hydrophobic
interaction effects between DnaK and anti-DnaK, which
normally are promoted by higher salt concentration.
However, high ionic strength of the buffer may also re-
sult in a high incidence of nonspecific interaction be-
tween cell lysate components. To minimize this, a buffercontaining 150mM NaCl and Tween 20 (0.005% v/v)
was tested. Surprisingly, the response to a real sample
diluted in the Tween 20-containing buffer was signifi-
cantly higher than that to a sample diluted in buffer
without the detergent (Fig. 4). A possible explanation
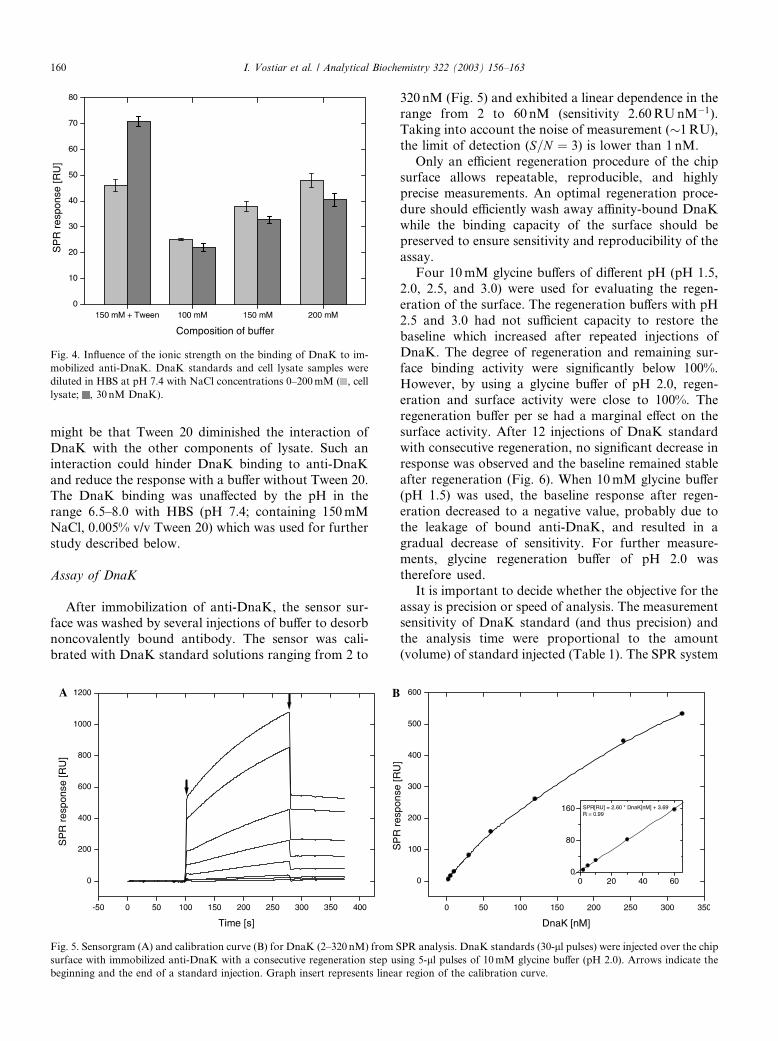
Fig. 4. Influence of the ionic strength on the binding of DnaK to im-
mobilized anti-DnaK. DnaK standards and cell lysate samples were
diluted in HBS at pH 7.4 with NaCl concentrations 0–200mM ( , cell
lysate; , 30 nM DnaK).
160 I. Vostiar et al. / Analytical Biochemistry 322 (2003) 156–163
might be that Tween 20 diminished the interaction of
DnaK with the other components of lysate. Such an
interaction could hinder DnaK binding to anti-DnaK
and reduce the response with a buffer without Tween 20.The DnaK binding was unaffected by the pH in the
range 6.5–8.0 with HBS (pH 7.4; containing 150mM
NaCl, 0.005% v/v Tween 20) which was used for further
study described below.
Assay of DnaK
After immobilization of anti-DnaK, the sensor sur-face was washed by several injections of buffer to desorb
noncovalently bound antibody. The sensor was cali-
brated with DnaK standard solutions ranging from 2 to
Fig. 5. Sensorgram (A) and calibration curve (B) for DnaK (2–320 nM) from S
surface with immobilized anti-DnaK with a consecutive regeneration step u
beginning and the end of a standard injection. Graph insert represents linea
320 nM (Fig. 5) and exhibited a linear dependence in therange from 2 to 60 nM (sensitivity 2.60RUnM�1).
Taking into account the noise of measurement (�1RU),
the limit of detection (S=N ¼ 3) is lower than 1 nM.
Only an efficient regeneration procedure of the chip
surface allows repeatable, reproducible, and highly
precise measurements. An optimal regeneration proce-
dure should efficiently wash away affinity-bound DnaK
while the binding capacity of the surface should bepreserved to ensure sensitivity and reproducibility of the
assay.
Four 10mM glycine buffers of different pH (pH 1.5,
2.0, 2.5, and 3.0) were used for evaluating the regen-
eration of the surface. The regeneration buffers with pH
2.5 and 3.0 had not sufficient capacity to restore the
baseline which increased after repeated injections of
DnaK. The degree of regeneration and remaining sur-face binding activity were significantly below 100%.
However, by using a glycine buffer of pH 2.0, regen-
eration and surface activity were close to 100%. The
regeneration buffer per se had a marginal effect on the
surface activity. After 12 injections of DnaK standard
with consecutive regeneration, no significant decrease in
response was observed and the baseline remained stable
after regeneration (Fig. 6). When 10mM glycine buffer(pH 1.5) was used, the baseline response after regen-
eration decreased to a negative value, probably due to
the leakage of bound anti-DnaK, and resulted in a
gradual decrease of sensitivity. For further measure-
ments, glycine regeneration buffer of pH 2.0 was
therefore used.
It is important to decide whether the objective for the
assay is precision or speed of analysis. The measurementsensitivity of DnaK standard (and thus precision) and
the analysis time were proportional to the amount
(volume) of standard injected (Table 1). The SPR system
PR analysis. DnaK standards (30-ll pulses) were injected over the chip
sing 5-ll pulses of 10mM glycine buffer (pH 2.0). Arrows indicate the
r region of the calibration curve.
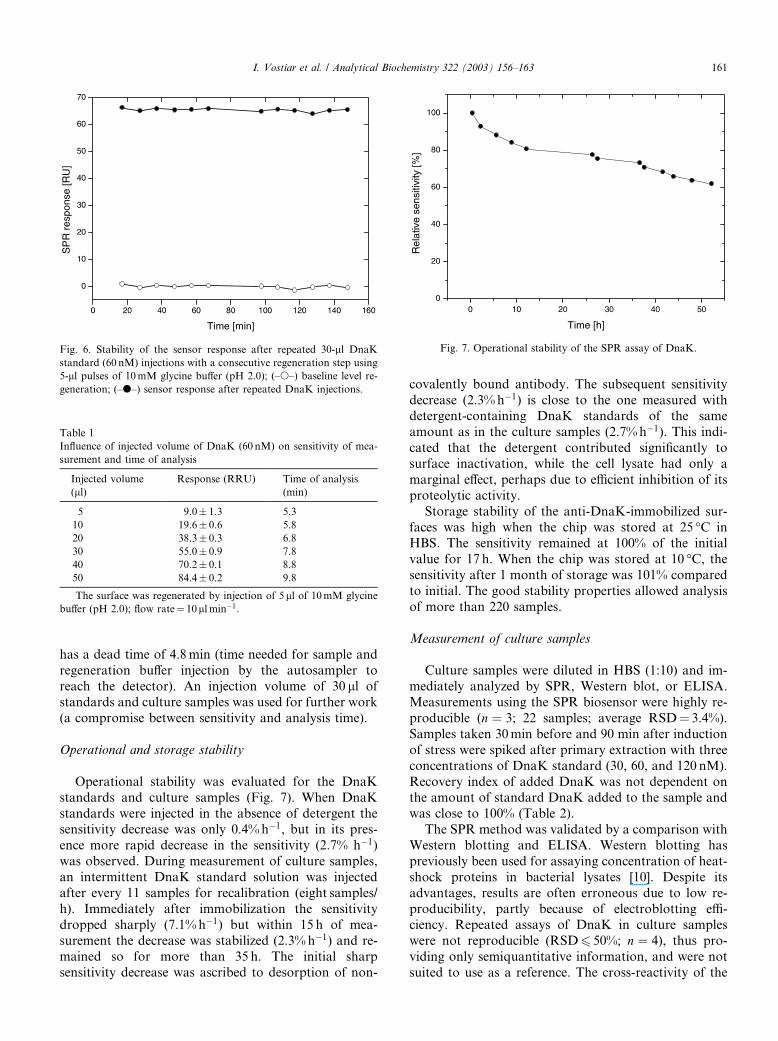
Fig. 6. Stability of the sensor response after repeated 30-ll DnaK
standard (60 nM) injections with a consecutive regeneration step using
5-ll pulses of 10mM glycine buffer (pH 2.0); (–s–) baseline level re-
generation; (–d–) sensor response after repeated DnaK injections.
Table 1
Influence of injected volume of DnaK (60 nM) on sensitivity of mea-
surement and time of analysis
Injected volume
(ll)Response (RRU) Time of analysis
(min)
5 9.0� 1.3 5.3
10 19.6� 0.6 5.8
20 38.3� 0.3 6.8
30 55.0� 0.9 7.8
40 70.2� 0.1 8.8
50 84.4� 0.2 9.8
The surface was regenerated by injection of 5ll of 10mM glycine
buffer (pH 2.0); flow rate¼ 10ll min�1.
Fig. 7. Operational stability of the SPR assay of DnaK.
I. Vostiar et al. / Analytical Biochemistry 322 (2003) 156–163 161
has a dead time of 4.8min (time needed for sample and
regeneration buffer injection by the autosampler to
reach the detector). An injection volume of 30 ll ofstandards and culture samples was used for further work
(a compromise between sensitivity and analysis time).
Operational and storage stability
Operational stability was evaluated for the DnaK
standards and culture samples (Fig. 7). When DnaK
standards were injected in the absence of detergent thesensitivity decrease was only 0.4%h�1, but in its pres-
ence more rapid decrease in the sensitivity (2.7% h�1)
was observed. During measurement of culture samples,
an intermittent DnaK standard solution was injected
after every 11 samples for recalibration (eight samples/
h). Immediately after immobilization the sensitivity
dropped sharply (7.1%h�1) but within 15 h of mea-
surement the decrease was stabilized (2.3%h�1) and re-mained so for more than 35 h. The initial sharp
sensitivity decrease was ascribed to desorption of non-
covalently bound antibody. The subsequent sensitivity
decrease (2.3%h�1) is close to the one measured withdetergent-containing DnaK standards of the same
amount as in the culture samples (2.7%h�1). This indi-
cated that the detergent contributed significantly to
surface inactivation, while the cell lysate had only a
marginal effect, perhaps due to efficient inhibition of its
proteolytic activity.
Storage stability of the anti-DnaK-immobilized sur-
faces was high when the chip was stored at 25 �C inHBS. The sensitivity remained at 100% of the initial
value for 17 h. When the chip was stored at 10 �C, thesensitivity after 1 month of storage was 101% compared
to initial. The good stability properties allowed analysis
of more than 220 samples.
Measurement of culture samples
Culture samples were diluted in HBS (1:10) and im-
mediately analyzed by SPR, Western blot, or ELISA.
Measurements using the SPR biosensor were highly re-
producible (n ¼ 3; 22 samples; average RSD¼ 3.4%).
Samples taken 30min before and 90 min after induction
of stress were spiked after primary extraction with three
concentrations of DnaK standard (30, 60, and 120 nM).
Recovery index of added DnaK was not dependent onthe amount of standard DnaK added to the sample and
was close to 100% (Table 2).
The SPR method was validated by a comparison with
Western blotting and ELISA. Western blotting has
previously been used for assaying concentration of heat-
shock proteins in bacterial lysates [10]. Despite its
advantages, results are often erroneous due to low re-
producibility, partly because of electroblotting effi-ciency. Repeated assays of DnaK in culture samples
were not reproducible (RSD6 50%; n ¼ 4), thus pro-
viding only semiquantitative information, and were not
suited to use as a reference. The cross-reactivity of the

Table 2
Recovery index of samples taken from fermentation stressed by tem-
perature up-shift
Concentration of internal
standard
Recovery index (%)a
)30minb 90minb
30 nM DnaK 103.7� 2.7 99.8� 3.0
60 nM DnaK 97.6� 1.4 97.9� 2.2
120 nM DnaK 97.8� 1.9 95.7� 0.9
aRecovery index ð%Þ ¼ ½ðR1� R2Þ=R3� � 100; R1, response for
cell lysate sample spiked with DnaK standard solution; R2, responsefor cell lysate sample; R3, response for DnaK standard containing
detergent amount equivalent to the content in the cell lysate samples.b Time relative to the stress induction.
Fig. 9. Comparison of the SPR signal during typical injection cycles of
E. coli cell lysate. Arrows indicate start (1) and end (2) of the injections
of sample and regeneration buffer (3) (- - - response channel with im-
mobilized anti-DnaK; – � – � – response reference channel with an ir-
relevant immobilized antibody; ––––– differential response).
Table 3
Comparison of ELISA and SPR method for DnaK assay
ELISAa SPR
Limit of detection (nM) 0.05 1.0
Dynamic range of method (nM) 1.5 5000
Average RSD of method (%) 8.5 3.4
a ELISA method was not fully optimized.
162 I. Vostiar et al. / Analytical Biochemistry 322 (2003) 156–163
monoclonal antibody was tested with Western blot as-
says for DnaK in total cell lysates. Cell lysate samples
resulted in one sharp band, with the same retention on
the gel as that of the DnaK standard (Fig. 8A). The
molecular weight was estimated at 69 kDa based onrelative mobility. This value is in a good agreement with
the published data [4]. No significant cross-reactivity
with other components in the cell lysate, which would
negate ELISA and SPR detection, was noted, although
cross-reactivity with the components in native confor-
mation could not be completely excluded. Furthermore,
bacterial proteins can also interact with conserved IgG
regions, resulting in erroneous positive results. The IgGcross-reactivity with a monoclonal rabbit anti-myoglo-
bin antibody was also tested by SPR as a reference. No
binding of cell lysate to anti-myoglobin immobilized in
Fig. 8. DnaK determination in the cell lysate of E. coli exposed to heat shock. (A) Comparison of densitometric curves of electrophoreograms of the
lysate stained with Coomassie blue (2), Western blot assay of DnaK in cell lysate samples taken at )30, 0, 30, and 60min relative to heat shock (3–6)
and molecular weight standards (1). (B) Correlation of DnaK content in the lysate measured with SPR and the ELISA reference method (stressed
culture: –s– SPR, –�– ELISA; reference culture: –d– SPR, –j– ELISA).

I. Vostiar et al. / Analytical Biochemistry 322 (2003) 156–163 163
the reference channel of the chip was observed, whereasthe anti-DnaK antibody immobilized on the measure-
ment channel bound significantly (Fig. 9). As an alter-
native approach to eliminate nonspecific responses, anti-
DnaK immobilized in the reference channel was dena-
tured with 7M guanidine chloride. However repeated
injections of cell lysates gradually increased the SPR
response, as did also injections of DnaK standards. This
may be explained by refolding of denatured antibodyrestoring the DnaK binding activity.
The cross-reactivity test verified the specificity of the
interaction of anti-DnaK with DnaK in complex ma-
trices and showed that nonspecific effects will not sig-
nificantly influence the detection of DnaK in complex
culture samples.
The ELISA method quantitated DnaK in cell lysate
samples with a relative standard deviation of 8.5%,which was significantly better than that with Western
blotting (Table 3). The method�s limit of detection was
0.05 nM and the dynamic range reached up to 1.5 nM.
The DnaK concentration roughly correlated with Wes-
tern blot assays in E. coli culture exposed to heat stress
(Fig. 8A). The ELISA results were compared with SPR
in culture samples and showed good agreement (Fig. 8B).
The average relative error of SPR compared to ELISAwas 7.1% (22 culture samples analyzed in triplicate).
The amount of DnaK after heat-shock treatment of
the culture by a temperature increase (30–42 �C) was
detected in the cell lysate. The DnaK raised by 80%
compared to the levels at 30 �C and rapid increase of the
DnaK concentration reached a new steady state value
approximately 30min after the temperature shift to
42 �C. A nonstressed control culture, grown at 30 �C,showed no detectable concentration increase.
The observed good correlation of the SPR assay for
analysis of DnaK in the cell culture lysates with ELISA
and Western blotting suggests that SPR monitoring is a
preferable alternative for analyzing intracellular con-
centrations due to its practical convenience. In addition,
the SPR assay is easily automated, more precise, and less
laborious than Western blotting or ELISA.
Acknowledgments
This work was partly supported by an EU Marie
Curie Fellowship (HPMT-CT-2000-00130) (I.V.).
References
[1] C. Schlieker, B. Bukau, A. Mogk, Prevention and reversion of
protein aggregation by molecular chaperones in the E. coli cytosol:
implications for their applicability in biotechnology, J. Biotechnol.
96 (2002) 13–21.
[2] T. Yura, K. Nakahigashi, Regulation of the heat-shock response,
Curr. Opin. Microbiol. 2 (1999) 153–158.
[3] S. Wickner, M.R. Maurizi, S. Gottesman, Posttranslational
quality control: folding, refolding, and degrading protein, Science
286 (1999) 1888–1893.
[4] B. Bukau, A.L. Horwich, The Hsp70 and Hsp60 chaperone
machines, Cell 92 (1998) 351–366.
[5] J.G. Thomas, A. Ayling, F. Baneyx, Molecular chaperones,
folding catalysis and the recovery of active recombinant proteins
from E. coli, Appl. Biochem. Biotechnol. 66 (1997) 197–238.
[6] B. Jurgen, H.Y. Link, S. Riemschneider, C. Scharf, P. Neubauer,
R. Schmid, M. Hecker, T. Schweder, Monitoring of genes that
respond to overproduction of an insoluble recombinant protein in
Escherichia coli glucose-limited fed-batch fermentations, Biotech-
nol. Bioeng. 70 (2000) 217–224.
[7] H. Dong, J, L. Nilsson, C.G. Kurland, Gratuitous overxpression
of genes in Escherichia coli leads to growth inhibition and
ribosome destruction, J. Bacteriol. 177 (1995) 1497–1504.
[8] F. Hoffmann, U. Rinas, On-line estimation of the metabolic
burden resulting from the synthesis of plasmid-encoded and heat-
shock proteins by monitoring respiratory energy generation,
Biotechnol. Bioeng. 76 (2001) 333–340.
[9] U. Rinas, Synthesis rates of cellular proteins involved in trans-
lation and protein folding are strongly altered in response to
overproduction of basic fibroblast growth factor by recombinant
Escherichia coli, Biotechnol. Progr. 12 (1996) 196–200.
[10] H.J. Cha, R. Srivastava, V.M. Vakharia, G. Rao, W.E. Bentley,
Green fluorescent protein as a noninvasive stress probe in
resting Escherichia coli cells, Appl. Environ. Microb. 65 (1999)
409–414.
[11] S.P. Rupani, M.R. Gu, K.B. Konstantinov, P.S. Dhurjati, T.K.
VanDyk, R.A. LaRossa, Characterization of the stress response
of a bioluminescent biological sensor in batch and continuous
cultures, Biotechnol. Progr. 12 (1996) 387–392.
[12] T.K. Van Dyk, T.R. Reed, A.C. Vollmer, R. LaRossa, Van
Synergistic induction of the heat shock response in Escherichia coli
by simultaneous treatment with chemical inducers, J. Bacteriol.
177 (1995) 6001–6004.
[13] M.-K. Oh, J.C. Liao, DNA microarray detection of metabolic
responses to protein overproduction in Escherichia coli, Metab.
Eng. 2 (2000) 201–209.
[14] M. Zheng, X. Wang, L.J. Templeton, D.R. Smulski, R.A.
LaRossa, G. Storz, DNA microarray-mediated transcriptional
profiling of the Escherichia coli response to hydrogen peroxide, J.
Bacteriol. 183 (2001) 4562–4570.
[15] M.P. Mayer, T. Laufen, K. Paal, J.S. McCarty, B. Bukau,
Investigation of the interaction between DnaK and DnaJ by
surface plasmon resonance spectroscopy, J. Mol. Biol. 289 (1999)
1131–1144.
[16] W.C. Suh, C.Z. Lu, C.A. Gross, Structural features required for
the interaction of the Hsp70 molecular chaperone DnaK with its
cochaperone DnaJ, J. Biol. Chem. 274 (1999) 30534–30539.
[17] M.K. Hayer-Hartl, J. Martin, F.U. Hartl, The assymetrical
interaction of GroEL and GroES in the chaperonin ATPase cycle
of assisted protein folding, Science 269 (1995) 836–841.
[18] M. Cserjan-Puschmann, W. Kramer, E. Duerrschmid, G, K.
Bayer, Metabolic approaches for the optimisation of recombinant
fermentation processes, Appl. Microbiol. Biotechnol. 53 (1999)
43–50.
[19] U.K. Laemmli, Cleavage of structural proteins during the
assembly of the head of bacteriophage T4, Nature 227 (1970)
680–685.
[20] E.A. Schilling, A.E. Kamholz, P. Yager, Cell lysis and protein
extraction in a microfluidic device with detection by a fluorogenic
enzyme assay, Anal. Chem. 74 (2002) 1798–1804.