Molecular structure of the ParM polymer and the mechanism leading to its nucleotide-driven dynamic...
10
Molecular structure of the ParM polymer and the mechanism leading to its nucleotide-driven dynamic instability David Popp 1, *, Akihiro Narita 1 , Toshiro Oda 1,2 , Tetsuro Fujisawa 3 , Hiroshi Matsuo 2 , Yasushi Nitanai 1,2 , Mitsusada Iwasa 1 , Kayo Maeda 1 , Hirofumi Onishi 1 and Yuichiro Mae ´da 1,4 1 ERATO ‘Actin Filament Dynamics’ Project, RIKEN Harima Institute, Japan Science and Technology Corporation, Sayo, Hyogo, Japan, 2 RIKEN Harima Institute, Sayo, Hyogo, Japan, 3 Department of Biomolecular Science, Graduate School of Engineering, Gifu University, Gifu, Japan and 4 Division of Biological Science, Graduate School of Science, Nagoya University, Nagoya, Japan ParM is a prokaryotic actin homologue, which ensures even plasmid segregation before bacterial cell division. In vivo, ParM forms a labile filament bundle that is reminiscent of the more complex spindle formed by micro- tubules partitioning chromosomes in eukaryotic cells. However, little is known about the underlying structural mechanism of DNA segregation by ParM filaments and the accompanying dynamic instability. Our biochemical, TIRF microscopy and high-pressure SAX observations indicate that polymerization and disintegration of ParM filaments is driven by GTP rather than ATP and that ParM acts as a GTP-driven molecular switch similar to a G protein. Image analysis of electron micrographs reveals that the ParM filament is a left-handed helix, opposed to the right- handed actin polymer. Nevertheless, the intersubunit con- tacts are similar to those of actin. Our atomic model of the ParM-GMPPNP filament, which also fits well to X-ray fibre diffraction patterns from oriented gels, can explain why after nucleotide release, large conformational changes of the protomer lead to a breakage of intra- and interstrand interactions, and thus to the observed disintegration of the ParM filament after DNA segregation. The EMBO Journal (2008) 27, 570–579. doi:10.1038/ sj.emboj.7601978; Published online 10 January 2008 Subject Categories: microbiology & pathogens; structural biology Keywords: GTPase; left-handed helix; molecular switch; ParM Introduction In Escherichia coli plasmid R1 (M^ller-Jensen et al, 2000), single-copy stability is accomplished by only three components: a filament-forming protein ParM, a DNA-binding protein ParR and a centromere-like site in the DNA (parC) (Gerdes et al, 2000). ParR–parC binding to ParM is thought to induce ParM polymerization, the filaments formed pushing the plas- mids to opposing bacterial poles (M^ller-Jensen et al, 2002). Despite some significant differences in loop, helix and sheet arrangement within the four subdomains (Ia, Ib, IIa and IIb) (van den Ent et al, 2002), the crystal structure of ParM proved to be similar to g-actin, confirming the original sequence-based assignment of an ‘actin fold’ (van den Ent et al, 2002). Two different crystal forms revealed that on loss of ADP, a large conformational change (E251) occurs between subdomains I and II that results in the opening of the interdomain cleft (van den Ent et al, 2002). In vivo, ParM filaments are only visible in about 40% of a bacterial population at any given time point, indicating that they are transient and dynamically instable (M^ller-Jensen et al, 2002). As a response to molecular crowd- ing (about 30% of a bacterium is filled with various proteins), ParM filaments are usually observed as randomly oriented bundles both in vivo (M^ller-Jensen et al, 2002) and in vitro (Popp et al, 2007c). The structural basis leading to the observed dynamic instability of ParM filaments remains unknown. In this paper, on the basis of our results, we show that ParM, despite being a member of the actin family containing the typical structural motif ‘actin fold’, which characterizes it as an ATPase, acts as a GTP-driven molecular switch, resem- bling some behaviour of G proteins. We have characterized the nucleotide-dependent dynamics of ParM filaments by a wide variety of methods, including TIRF microscopy and high-pressure SAX. Together with our structural analysis of ParM, combining X-ray crystallography of the monomer, EM reconstructions of the filament and high- resolution X-ray diffraction patterns from oriented ParM gels, a picture has been emerged to reveal how the biochemical and structural instability of ParM are related. Results Probing nucleotide-dependent instability Using in vitro TIRF microscopy, we found that the addition of not only ATP (Garner et al, 2004; Popp et al, 2007c) but also GTP and its analogues leads to ParM filament formation (Figure 1A and B; Supplementary movie 1). Yet the dynamic properties of ParM filaments were highly dependent on the bound nucleotides. The polymerization rate was substantially faster with GTP than with ATP, whereas a (1:1) mixture of ATP and GTP (ParM-Mix filaments) resulted in a polymeriza- tion rate halfway in between (Figure 1D). At steady state, a more dramatic difference is seen. ParM filaments poly- merized with nonhydrolysable nucleotides like ATPgS or GMPPNP were stable and retained a constant length. ParM- ATP filaments underwent phases of repeated catastrophe and rescue, similar to microtubules (Supplementary movie 2), Received: 2 September 2007; accepted: 4 December 2007; published online: 10 January 2008 *Corresponding author. ERATO ‘Actin Filament Dynamics’ Project, RIKEN Harima Institute, Japan Science and Technology Corporation, 1-1-1 Kouto, Sayo, Hyogo 679-5148, Japan. Tel.: þ 81 791 58 2822; Fax: 81 791 58 2836; E-mail: [email protected] The EMBO Journal (2008) 27, 570–579 | & 2008 European Molecular Biology Organization | All Rights Reserved 0261-4189/08 www.embojournal.org The EMBO Journal VOL 27 | NO 3 | 2008 & 2008 European Molecular Biology Organization EMBO THE EMBO JOURNAL THE EMBO JOURNAL 570
Transcript of Molecular structure of the ParM polymer and the mechanism leading to its nucleotide-driven dynamic...
Molecular structure of the ParM polymer and themechanism leading to its nucleotide-drivendynamic instability
David Popp1,*, Akihiro Narita1,Toshiro Oda1,2, Tetsuro Fujisawa3,Hiroshi Matsuo2, Yasushi Nitanai1,2,Mitsusada Iwasa1, Kayo Maeda1,Hirofumi Onishi1 and Yuichiro Maeda1,4
1ERATO ‘Actin Filament Dynamics’ Project, RIKEN Harima Institute,Japan Science and Technology Corporation, Sayo, Hyogo, Japan,2RIKEN Harima Institute, Sayo, Hyogo, Japan, 3Department ofBiomolecular Science, Graduate School of Engineering, Gifu University,Gifu, Japan and 4Division of Biological Science, Graduate School ofScience, Nagoya University, Nagoya, Japan
ParM is a prokaryotic actin homologue, which ensures
even plasmid segregation before bacterial cell division.
In vivo, ParM forms a labile filament bundle that is
reminiscent of the more complex spindle formed by micro-
tubules partitioning chromosomes in eukaryotic cells.
However, little is known about the underlying structural
mechanism of DNA segregation by ParM filaments and the
accompanying dynamic instability. Our biochemical, TIRF
microscopy and high-pressure SAX observations indicate
that polymerization and disintegration of ParM filaments
is driven by GTP rather than ATP and that ParM acts as a
GTP-driven molecular switch similar to a G protein. Image
analysis of electron micrographs reveals that the ParM
filament is a left-handed helix, opposed to the right-
handed actin polymer. Nevertheless, the intersubunit con-
tacts are similar to those of actin. Our atomic model of the
ParM-GMPPNP filament, which also fits well to X-ray fibre
diffraction patterns from oriented gels, can explain why
after nucleotide release, large conformational changes of
the protomer lead to a breakage of intra- and interstrand
interactions, and thus to the observed disintegration of the
ParM filament after DNA segregation.
The EMBO Journal (2008) 27, 570–579. doi:10.1038/
sj.emboj.7601978; Published online 10 January 2008
Subject Categories: microbiology & pathogens; structural
biology
Keywords: GTPase; left-handed helix; molecular switch;
ParM
Introduction
In Escherichia coli plasmid R1 (M^ller-Jensen et al, 2000),
single-copy stability is accomplished by only three components:
a filament-forming protein ParM, a DNA-binding protein
ParR and a centromere-like site in the DNA (parC) (Gerdes
et al, 2000). ParR–parC binding to ParM is thought to induce
ParM polymerization, the filaments formed pushing the plas-
mids to opposing bacterial poles (M^ller-Jensen et al, 2002).
Despite some significant differences in loop, helix and sheet
arrangement within the four subdomains (Ia, Ib, IIa and IIb)
(van den Ent et al, 2002), the crystal structure of ParM proved
to be similar to g-actin, confirming the original sequence-based
assignment of an ‘actin fold’ (van den Ent et al, 2002). Two
different crystal forms revealed that on loss of ADP, a large
conformational change (E251) occurs between subdomains I
and II that results in the opening of the interdomain cleft (van
den Ent et al, 2002). In vivo, ParM filaments are only visible in
about 40% of a bacterial population at any given time point,
indicating that they are transient and dynamically instable
(M^ller-Jensen et al, 2002). As a response to molecular crowd-
ing (about 30% of a bacterium is filled with various proteins),
ParM filaments are usually observed as randomly oriented
bundles both in vivo (M^ller-Jensen et al, 2002) and in vitro
(Popp et al, 2007c). The structural basis leading to the observed
dynamic instability of ParM filaments remains unknown.
In this paper, on the basis of our results, we show that
ParM, despite being a member of the actin family containing
the typical structural motif ‘actin fold’, which characterizes it
as an ATPase, acts as a GTP-driven molecular switch, resem-
bling some behaviour of G proteins.
We have characterized the nucleotide-dependent dynamics
of ParM filaments by a wide variety of methods, including
TIRF microscopy and high-pressure SAX. Together with our
structural analysis of ParM, combining X-ray crystallography
of the monomer, EM reconstructions of the filament and high-
resolution X-ray diffraction patterns from oriented ParM gels,
a picture has been emerged to reveal how the biochemical
and structural instability of ParM are related.
Results
Probing nucleotide-dependent instability
Using in vitro TIRF microscopy, we found that the addition of
not only ATP (Garner et al, 2004; Popp et al, 2007c) but also
GTP and its analogues leads to ParM filament formation
(Figure 1A and B; Supplementary movie 1). Yet the dynamic
properties of ParM filaments were highly dependent on the
bound nucleotides. The polymerization rate was substantially
faster with GTP than with ATP, whereas a (1:1) mixture of
ATP and GTP (ParM-Mix filaments) resulted in a polymeriza-
tion rate halfway in between (Figure 1D). At steady state, a
more dramatic difference is seen. ParM filaments poly-
merized with nonhydrolysable nucleotides like ATPgS or
GMPPNP were stable and retained a constant length. ParM-
ATP filaments underwent phases of repeated catastrophe and
rescue, similar to microtubules (Supplementary movie 2),Received: 2 September 2007; accepted: 4 December 2007; publishedonline: 10 January 2008
*Corresponding author. ERATO ‘Actin Filament Dynamics’ Project,RIKEN Harima Institute, Japan Science and Technology Corporation,1-1-1 Kouto, Sayo, Hyogo 679-5148, Japan. Tel.: þ 81 791 58 2822;Fax: 81 791 58 2836; E-mail: [email protected]
The EMBO Journal (2008) 27, 570–579 | & 2008 European Molecular Biology Organization | All Rights Reserved 0261-4189/08
www.embojournal.org
The EMBO Journal VOL 27 | NO 3 | 2008 &2008 European Molecular Biology Organization
EMBO
THE
EMBOJOURNAL
THE
EMBOJOURNAL
570

whereas ParM-GTP and ParM-Mix filaments quite steadily
disintegrated into monomers to completion (Figure 1E;
Supplementary movies 3 and 4). Disintegration of subunits
appeared to be approximately symmetric at either end of the
bidirectional ParM bundles observed in our in vitro TIRF
microscopy assays in the presence of crowding agents (Figure
1C, F–J; Supplementary movie 3).
We confirmed the findings on the nucleotide-dependent
polymerization and steady-state behaviour by stopped
flow performed on crowding-agent-free buffers where ParM
forms predominantly single filaments (Figure 2A and B;
Supplementary Figure S9). The critical concentrations of
ParM-ATP and ParM-GTP filaments were similar and both
were in the range of 1.5–2 mM, as determined by both light
scattering (Figure 2C) and TIRF microscopy (Supplementary
Figure S11).
To further quantify the stability of ParM filaments with
different nucleotides bound, we performed high-pressure
SAX studies. Exerting pressure on a filamentous structure
can lead to the destruction of noncovalent bonds, loss of
nucleotide and subsequently to filament depolymerization,
as shown in actin filaments (Ikeuchi et al, 2002). ParM-GTP
filaments were most unstable and disintegrated earlier than
ParM-ATP filaments, with the ParM-Mix filaments again
titrating in between (Figure 3A and B; Supplementary
movies 5 and 6). ParM polymerized with nonhydrolysable
A B C
D E
F G H I J
Figure 1 Typical ParM filaments observed in the TIRF microscope at steady state. (A) Polymerization of ParM (5.4mM) was initiated by adding10 mM ATP, in the presence of 8% PVA. (B) Same as (A) but 10 mM GTP was added to initiate polymerization (see Supplementary movie 1)Scale bar 5mm. (C) In the electron microscope, the filaments observed under the TIRF microscope (A, B) usually appear as bundles in thepresence of crowding agents. Conditions were 5.4 mM ParM, 10 mM GTP and 8% PVA. Scale bar, 100 nm. Note that ParM bundles look spindle-shaped for both ParM-GTP and ParM-ATP filaments, whereas filaments polymerized with nonhydrolysable nucleotides are straight with bluntends (data not shown) (D) Typical time courses of polymerizing ParM filaments measured from TIRF microscopy images. Conditions were5.4mM ParM in the presence of 8% PVA. After adding 10 mM GTP (red), 10 mM ATP (blue) and a 1:1 mixture of GTP and ATP (10 mM Mix) ingreen symbols. (E) Typical behaviour of some filaments at steady state. ParM (4mM) with 8% PVA. ParM-GTP filaments (red) and ParM-Mixfilaments (pink) decreased steadily, ParM-ATP filaments (blue) displayed microtubule-like instability, ParM-ATPgS (black) and ParM-GMPPNPfilaments (green) were stable filaments. (F–J) An example of a ParM-GTP bundle (5.4mM, 8% PVA) disintegrating approximately symmetricallyat both ends. Scale bar, 10mm. At 240 s (F), 510 s (G), 810 s (H), 1110 s (I) and 1410 s (J) after initiating polymerization by adding 10 mM GTP.
Molecular structure of the ParM polymerD Popp et al
&2008 European Molecular Biology Organization The EMBO Journal VOL 27 | NO 3 | 2008 571
nucleotides were very stable and disintegrated at substan-
tially higher pressures (Figure 3A). The instability or disin-
tegration of ParM-ATP or ParM-GTP filaments is caused by
nucleotide release, as we will show later. In either case,
disintegration of ParM filaments was complete at relatively
low pressures of about 400 bar and directly reflected how
tightly the two nucleotides (ADP and GDP) were bound in the
filamentous state.
Static SAX measurements also confirmed that the content
of polymer was highest for nonhydrolysable nucleotides, and
less for ParM-ATP and ParM-GTP filaments at steady state,
whereas ParM could not form a polymer with GDP or ADP
(Garner et al, 2004) even at high ParM concentrations
(Figure 3C).
We also monitored the ATPase and GTPase activity of ParM
upon polymerization by measuring phosphate release. After
adding GTP, we observed extremely rapid hydrolysis of GTP
(GTP burst), which lagged behind filament polymerization,
whereas ATP hydrolysis was comparably a much slower
process. Even when added a 3:1 mixture of ATP to GTP,
polymerization was dominated by a GTP burst (Figure 2D).
This behaviour is entirely different from actin and resembles
that of G-proteins, which act as molecular switches, being
active only when bound to GTP and inactive upon hydrolysis
of GTP to GDP (Bourne et al, 1991). The continued slow ATP
hydrolysis, opposed to the complete halt of GTPase activity at
steady state, already indicates why ParM-ATP filaments may
be rescued after a catastrophe, whereas ParM-GTP filaments
disintegrate to completion. In our present in vitro study, we
have used nucleotide concentrations of either 5 or 10 mM,
which is higher than that found in the cell to avoid poisoning
effects from released GDP or ADP molecules. Yet we did
some controls in our stopped-flow experiments with only
1 mM GTP present. The results indicated that there was no
substantial difference between 5 and 1 mM of nucleotide, and
the depolymerization rate was similar in both cases
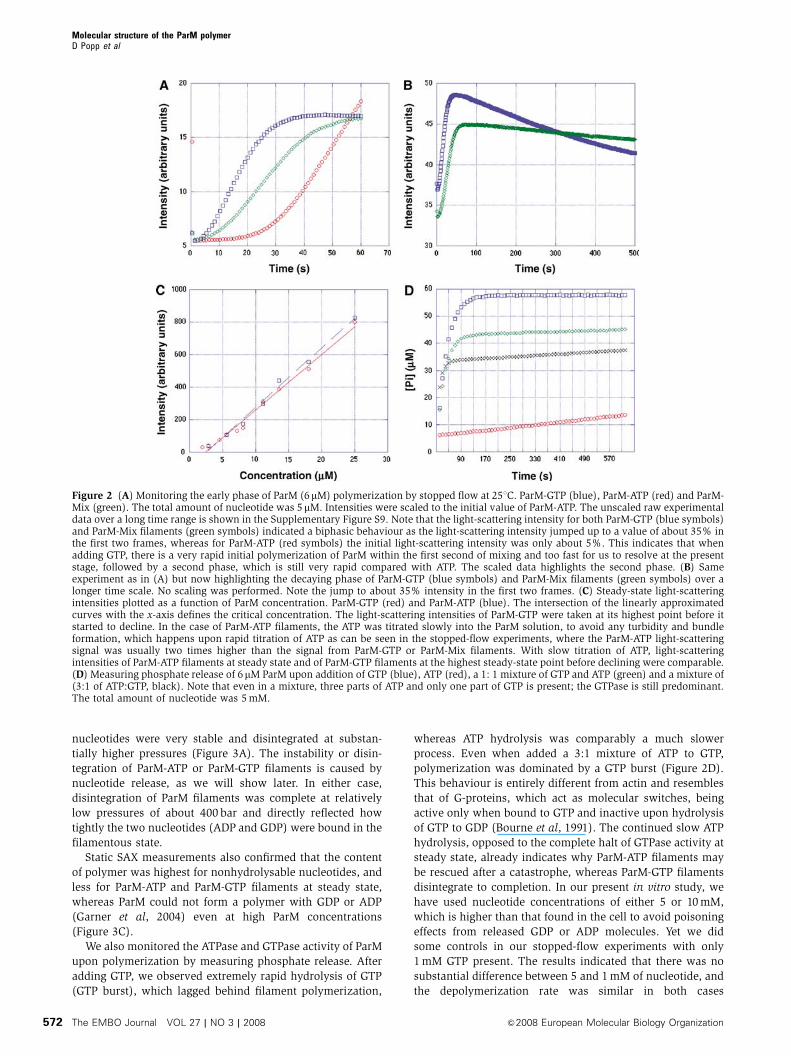
Figure 2 (A) Monitoring the early phase of ParM (6mM) polymerization by stopped flow at 251C. ParM-GTP (blue), ParM-ATP (red) and ParM-Mix (green). The total amount of nucleotide was 5 mM. Intensities were scaled to the initial value of ParM-ATP. The unscaled raw experimentaldata over a long time range is shown in the Supplementary Figure S9. Note that the light-scattering intensity for both ParM-GTP (blue symbols)and ParM-Mix filaments (green symbols) indicated a biphasic behaviour as the light-scattering intensity jumped up to a value of about 35% inthe first two frames, whereas for ParM-ATP (red symbols) the initial light-scattering intensity was only about 5%. This indicates that whenadding GTP, there is a very rapid initial polymerization of ParM within the first second of mixing and too fast for us to resolve at the presentstage, followed by a second phase, which is still very rapid compared with ATP. The scaled data highlights the second phase. (B) Sameexperiment as in (A) but now highlighting the decaying phase of ParM-GTP (blue symbols) and ParM-Mix filaments (green symbols) over alonger time scale. No scaling was performed. Note the jump to about 35% intensity in the first two frames. (C) Steady-state light-scatteringintensities plotted as a function of ParM concentration. ParM-GTP (red) and ParM-ATP (blue). The intersection of the linearly approximatedcurves with the x-axis defines the critical concentration. The light-scattering intensities of ParM-GTP were taken at its highest point before itstarted to decline. In the case of ParM-ATP filaments, the ATP was titrated slowly into the ParM solution, to avoid any turbidity and bundleformation, which happens upon rapid titration of ATP as can be seen in the stopped-flow experiments, where the ParM-ATP light-scatteringsignal was usually two times higher than the signal from ParM-GTP or ParM-Mix filaments. With slow titration of ATP, light-scatteringintensities of ParM-ATP filaments at steady state and of ParM-GTP filaments at the highest steady-state point before declining were comparable.(D) Measuring phosphate release of 6mM ParM upon addition of GTP (blue), ATP (red), a 1: 1 mixture of GTP and ATP (green) and a mixture of(3:1 of ATP:GTP, black). Note that even in a mixture, three parts of ATP and only one part of GTP is present; the GTPase is still predominant.The total amount of nucleotide was 5 mM.
Molecular structure of the ParM polymerD Popp et al
The EMBO Journal VOL 27 | NO 3 | 2008 &2008 European Molecular Biology Organization572
(see Supplementary Figure S9). These controls implied that
the conclusions drawn from nucleotide concentrations of
5–10 mM may not be very different from those obtained at
lower concentrations of 1–3 mM, as found in the cell.
The structure of ParM
To see whether various nucleotides bind differently or cause
conformational changes of ParM, we crystallized the mono-
mer in the presence of GDP and GMPPNP and compared
these structures with the known atomic structure of ParM-
ADP (van den Ent et al, 2002). GDP- and GMPPNP-bound
ParM crystals grew to form the same space group as ParM-
ADP crystals (tetragonal, P41) (van den Ent et al, 2002) and
their structures were solved by molecular replacement. A
comparison of both GDP-ParM and GMPPNP-ParM structures
(2.25 A resolution) with the ParM-ADP structure (van den Ent
et al, 2002) revealed that all nucleotides bind at the same site,
at the interdomain cleft between subunits I and II, in a highly
conserved region of residues, known as actin fold (Bork et al,
1992; Figure 4). Overlaying all three structures showed that
there are only minor differences between them (Figure 4).
We used a combination of helical reconstruction (EOS,
Yasunaga and Wakabayashi, 1996) and single-particle ana-
lysis to obtain the 3D structure of negatively stained ParM-
GMPPNP filaments (Figure 5A). The general outline of the
procedures that we used to calculate the ParM structure from
the electron micrographs is described in detail in the
Supplementary data. However, the information on the hand-
edness of the ParM helix is lost in any EM image, and hence
in any subsequent 3D reconstruction (Belnap et al, 1997). Tilt
experiments have been used to determine the handedness of
biological macromolecules imaged by EM (Klug and Finch,
1968; Finch, 1972). By comparing two sets of the same ParM
filaments, untilted and tilted by 301 along their axis, similar to
the one described by Belnap et al (1997), we found ParM to
form left-handed double helical filaments, opposed to the
well-characterized right-handed actin filaments (Holmes
et al, 1990; Figure 5B–D). The exact procedure how we
determined the handedness is described in detail in the
Supplementary Figures 4S, 5S and Table S1. We determined
the helical parameters to be 37 ParM molecules per 13 turns
with a repeat of about 300 A (see the power spectrum in
Supplementary Figure S1). Then we fitted the atomic crystal
structure of ParM-ADP into the (23 A) electron-density map
(see the Fourier Shell Correlation in Supplementary Figure
S3) using a search that placed the ParM monomer into the
ParM helix in all possible orientations using six parameters,
three rotational and three translational. One orientation
matched the observed electron density significantly better
than all other solutions and this best fit was further refined
by energy minimization (Figure 5B and C; Supplementary
Figure S6). Docking and energy minimization procedures are
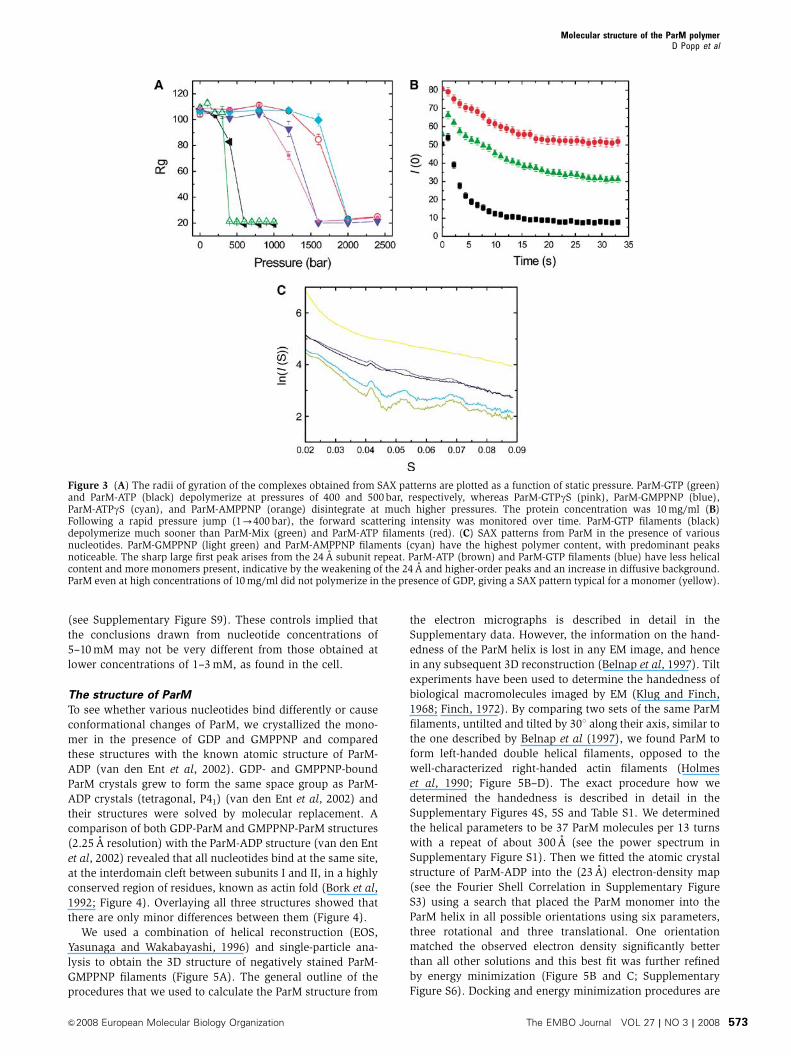
Figure 3 (A) The radii of gyration of the complexes obtained from SAX patterns are plotted as a function of static pressure. ParM-GTP (green)and ParM-ATP (black) depolymerize at pressures of 400 and 500 bar, respectively, whereas ParM-GTPgS (pink), ParM-GMPPNP (blue),ParM-ATPgS (cyan), and ParM-AMPPNP (orange) disintegrate at much higher pressures. The protein concentration was 10 mg/ml (B)Following a rapid pressure jump (1-400 bar), the forward scattering intensity was monitored over time. ParM-GTP filaments (black)depolymerize much sooner than ParM-Mix (green) and ParM-ATP filaments (red). (C) SAX patterns from ParM in the presence of variousnucleotides. ParM-GMPPNP (light green) and ParM-AMPPNP filaments (cyan) have the highest polymer content, with predominant peaksnoticeable. The sharp large first peak arises from the 24 A subunit repeat. ParM-ATP (brown) and ParM-GTP filaments (blue) have less helicalcontent and more monomers present, indicative by the weakening of the 24 A and higher-order peaks and an increase in diffusive background.ParM even at high concentrations of 10 mg/ml did not polymerize in the presence of GDP, giving a SAX pattern typical for a monomer (yellow).
Molecular structure of the ParM polymerD Popp et al
&2008 European Molecular Biology Organization The EMBO Journal VOL 27 | NO 3 | 2008 573
described in detail in the Supplementary data. In our model,
the large domain (comprising subdomain Ia and Ib; van den
Ent et al, 2002) is at small radius, and the small domain
(subdomains IIa, IIb; van den Ent et al, 2002) is at large
radius (Figure 5D). The maximum diameter is between 80
and 85 A. The long a-helices H10 and H12 of subdomain
I (van den Ent et al, 2002) are arranged almost parallel to the
filament axis. The large domain is about 48 A in its long
dimension and fits rather naturally along the long left-handed
two-start ParM helix. The C-terminus is at largest radius
(E40 A). Our atomic model of the ParM-GMPPNP filament
allows us to identify the residues involved in intra- and
interstrand interactions between protomers. Intrastrand inter-
actions are extensive, involving many polar and electrostatic
interactions: 13 pairs of hydrogen bonds (107–42, 108–42,
113–38, 116–40, 237–161, 238–161, 238–164, 297–240, 297–241,
33–111, 39–114, 43–112 and 43–113) and 4 salt bridges
(D164–R238, D161–R238, E35–R110 and D241–R297). The
interstrand interactions are also polar: six pairs of hydrogen
bonds (110–254, 258–35, 258–54, 262–63, 34–261 and
34–265) and three salt bridges (E35–K258, D63–R262 and
E254–R110).
We further elucidated the correctness of our model, using
oriented gels. ParM-GMPPNP filaments like f-actin can be
oriented in capillary tubes (Popp et al, 1987; Yamashita et al,
1998), and the resulting oriented gels (see Supplementary
Figure S7) gives detailed X-ray diffraction patterns that
diffract to high resolution. A comparison between the X-ray
diffraction pattern of f-actin and ParM filaments at 8-A
resolution revealed many differences in the layer line spacing
and profiles (Figure 6A). We calculated the fibre diffraction
pattern from the atomic coordinates of our EM model, taking
into account the contrast variation (Holmes et al, 1990). The
overall fit to the X-ray fibre diffraction was very good: the
intensities of the strong low-order layer lines (1, 2, 5 and 6)
were well accounted. At high resolution, peak intensities
were not all accurately predicted, but practically in each
case, an observed peak matched a calculated peak
(Figure 6B). This indicates that our EM model for the ParM-
GMPPNP filament is correct within the limits of our rigid
body refinement. Oriented gels of ParM diffract to very high
resolution (1.5 A resolution, data not shown), which may
provide a more detailed atomic model of the ParM filament in
the future by allowing individual domain movement.
Discussion
How is physiological function of ParM related to its atomic
structure? As we have shown, ParM will preferably bind to
GTP rather than ATP, both nucleotides being present in
millimolar concentrations inside a bacterium (Schneider
and Gourse, 2004).
It was shown that both in vivo (M^ller-Jensen et al, 2002)
and by reconstituting the ParM–ParR–parC complex in vitro
(Garner et al, 2007), a bidirectional bundle of several ParM
filaments formed upon the initial binding of the ParR–parC
complex to ParM and that ParM polymerization pushed the
plasmids to opposing poles of the bacterium (Garner et al,
2007). Here, we demonstrate that in contrast to the previous
notion that ParM is a purely ATP-driven ‘polymerization
motor’ (Garner et al, 2004), ParM is a predominantly GTP-
driven molecular switch. Biphasic polymerization observed
with GTP is much more rapid than with ATP and is accom-
panied by a GTP burst. The ATPase activity was a comparably
slow process.
Phosphate release lagged the polymerization rate for both
ParM-GTP and ParM-ATP filaments. This behaviour is similar
as reported in actin filaments, in which after adding actin
monomers to the growing filament end as ATP-actin, ATP is
rapidly hydrolysed to ADP and inorganic phosphate (Pi), both
remaining attached to the filament host and only after a delay
Pi is released into solution, generating ADP-actin (Carlier
and Pantaloni, 1986; Carlier, 1987). At steady state, ParM
filaments show nucleotide-dependant dynamic instability.
Although ParM-ATP filaments have the tendency to switch
spontaneously between phases of steady elongation and
rapid shortening, similar to microtubules, ParM-GTP fila-
ments cannot be rescued after reaching steady state and
desintegrate steadily to completion. This intrinsic mechanism
of the ParM-GTP filament is important to ensure even redis-
tribution of ParM molecules after successful plasmid segrega-
tion in mother and daughter cell before cell division.
Based on our results, we propose a simple picture of the
events involved in bacterial plasmid segregation in vivo. First,
other unknown factors like clock proteins may trigger the
initial binding of ParR–parC complex to ParM. This would be
followed by rapid GTP-driven bidirectional polymerization of
a ParM bundle formed spontaneously due to molecular
crowding pushing the plasmids apart. For E. coli, with a
size of about 3 mm and a ParM concentration around 10 mM
(M^ller-Jensen et al, 2002), it would take only about 15 s for
the plasmids to be segregated and hit opposing cell walls, the
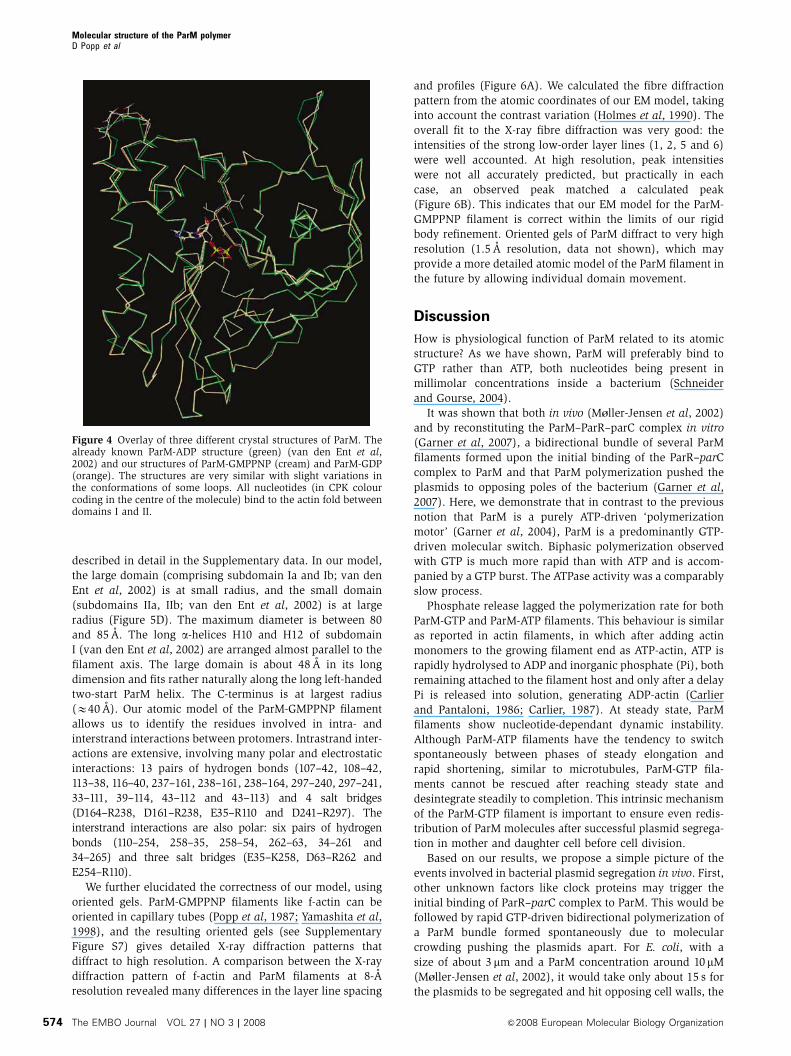
Figure 4 Overlay of three different crystal structures of ParM. Thealready known ParM-ADP structure (green) (van den Ent et al,2002) and our structures of ParM-GMPPNP (cream) and ParM-GDP(orange). The structures are very similar with slight variations inthe conformations of some loops. All nucleotides (in CPK colourcoding in the centre of the molecule) bind to the actin fold betweendomains I and II.
Molecular structure of the ParM polymerD Popp et al
The EMBO Journal VOL 27 | NO 3 | 2008 &2008 European Molecular Biology Organization574

impact and force from the membrane leading to unbinding of
the ParR–parC complex. Now all ParM monomers in the
filament bundle would be in the inactive GDP state. GDP
would be released only from the monomers at filament ends,
as these are freely exposed to the solvent. Upon loss of
nucleotide, these monomers undergo a large conformational
change (from closed to open), as described in the literature
(van den Ent et al, 2002), leading to the dissociation of these
subunits, as we describe in more detail below.
This view is supported by our in vitro experiments and our
EM model. First, we would like to point out a major differ-
ence between actin and ParM. Whereas monomeric ParM is a
completely stable protein without any bound nucleotide,
actin unfolds and irreversibly denatures upon loss of its
nucleotide. Therefore, in the f-actin filament under physiolo-
gical conditions, its major nucleotide ADP stays bound,
whereas in the ParM filament, the loss of nucleotide can
happen more readily and will not have any drastic effects
such as protein unfolding. This interpretation is directly
reflected by our high-pressure SAX studies (Figure 3A and
B). Whereas f-actin depolymerizes at very high pressures
above 2000 bar (Ikeuchi et al, 2002 and our own results, data
not shown), ParM-GTP and ParM-ATP filaments are depoly-
merized at much lower pressures of 400 and 500 bar, respec-
tively. These results directly indicate how tightly the
nucleotides are bound. In f-actin, it is extremely tightly
bound, as actin would denature otherwise. In the ParM
filament, the nucleotide is much less tightly bound than in
f-actin and GDP is lost more readily than ADP, as can be seen
from the kinetics of our pressure jump measurements
(Figure 3B).
We have tested how the release of GDP would effect in-
and interstrand interactions by placing the nucleotide-free
ParM crystal structure into the EM electron-density map and
again performing energy minimization (Figure 5E). We find
that several vital interactions are lost, compared with the
A B
D E
C
D
F
H
G
E
Figure 5 (A) A typical electron micrograph of negatively stained ParM-GMPPNP filaments. Scale bar, 200 nm. (B, C) Two different views of the3D electron-density map of ParM-GMPPNP filaments, obtained from micrographs as shown in (A), with a cutoff at the contour enveloping130% volume, is superimposed by the ribbon model of the ParM-ADP monomer crystal structure (closed conformation) orientated to give theoptimal fit. (D). The best atomic model of the ParM-GMPPNP filament. In all models shown, the pointed end of the filament is at the top(subdomains Ib and IIb) and the barbed end at the bottom (subdomains Ia and IIa) (Holmes et al, 1990). We show the main interactionsbetween subunit F and its neighbouring monomers E and D in the ParM helix. Red and blue represent salt bridges, cyan are hydrogen bondsand yellow hydrophobic residues. (E) Testing how nucleotide release effects intra- and interstrand interactions. The nucleotide-free crystalstructure in the open conformation (van den Ent et al, 2002) was fitted into the electron-density map and energy minimization was performed.Our model is shown in (D). All molecules are in the closed conformation except monomer F (brown colour coding), which is in the nucleotide-free open conformation. Note that various interactions to neighbouring monomers D and E are broken when upon loss of nucleotide the cleftbetween subdomain I and II of monomer F opens. Interactions between the other neighbouring monomers G and H are not shown in detail.
Molecular structure of the ParM polymerD Popp et al
&2008 European Molecular Biology Organization The EMBO Journal VOL 27 | NO 3 | 2008 575

nucleotide-bound conformation. In the nucleotide-free fila-
ment model in-strand interactions are reduced from four to
two salt bridges between domains F–D and F–H, respectively.
The number of hydrogen bonds formed drops from 13 with
nucleotide to only 6 for in-strand contacts between mono-
mers F–D. They involve the following residues: 110–35, 115–
40, 116–42, 43–113, 43–114 and 61–188. Between monomers
F and H, 10 pairs of hydrogen bonds remain in the nucleotide-
free state, which is lower by 3 from the nucleotide-bound
state. Interstrand interactions are also reduced upon loss of
nucleotide. The three salt bridges formed between monomers
F–E and F–G in the nucleotide-bound state are reduced to two
for F–E interaction (residues 208–110 and 35–258) and only
one salt bridge (35–258) remains for the F–G interaction. The
number of hydrogen bonds also drops from six pairs in the
nucleotide-bound conformation to three in the nucleotide-
free conformation.
The reduction of interactions upon loss of nucleotide thus
leads to depolymerization and the dynamic instability
observed. Following the actin terminology, ParM monomers
have a higher probability to disintegrate from the barbed end
(Holmes et al, 1990; Figure 5E), as more interactions are lost
at this side of the filament compared with the pointed end.
Like microtubules, both ParM-ATP and ParM-GTP fila-
ments face a catastrophe when their ATP or GTP cap is lost.
We propose a simple explanation for the observation that
ParM-ATP filaments can be rescued after a catastrophe
occurs, whereas ParM-GTP filaments cannot. As outlined
above, ParM polymers will start to depolymerize when the
nucleotide (GDP or ADP) is released from the monomers at
the ends of the filament. These monomers at the filament
ends will undergo a conformational change from the closed
configuration (nucleotide bound) within the ParM helix into
the open conformation (nucleotide-free) and then disinte-
grate from the filament. Under these circumstances, a rescue
of the filament is impossible as ParM-GTP or ParM-ATP
monomers, which are in the closed conformation, cannot
bind to monomers in the open conformation due to steric
hindrance. Whether the rescue can take place depends on
how fast the nucleotides GDP and ADP are released from the
monomers at filament ends, causing these monomers to
switch their conformation from closed to open. Our high-
pressure SAX experiments showed that GDP is released faster
than ADP. Our TIRF microscopy results on nucleotide-depen-
dent steady-state behaviour indicate that in the case of ParM-
GTP filaments at steady state, GDP is released continuously
and fast enough to ensure that monomers at filament ends
are always in the open conformation, making the rescue
impossible. In the case of ParM-ADP filaments, ADP release
is slower, giving the new ParM-ATP monomers from solution
a chance to bind occasionally, when the monomer at the
filament end is still in the closed conformation. In this case,
A B
C
Figure 6 (A) X-ray diffraction patterns of oriented gels of ParM-GMPPNP filaments (right half) and f-actin (left half). Note the difference in thepositions and intensity profiles of the layer lines. (B) The experimental X-ray diffraction pattern from ParM-GMPPNP fibres (left half) iscompared with the simulated diffraction pattern from our EM model (right half). The resolution at the edge was about 8 A. The R-factor was0.47. The R-factor was defined as R¼
P|Iobs�k*Icalc|/
PIobs, with the scaling factor k*¼ Icalc
2 /Iobs Icalc. (C) The experimental X-ray diffractionpattern from ParM-GMPPNP fibres (left half) is compared with the simulated diffraction pattern from the Egelman model (Orlova et al, 2007,protein data bank code 2QU4.pdb, right half). The R-factor of the Egelman model was 0.68 and thus much worse than our EM model of ParM.Note that the characteristic near equatorial double horseshoe pattern (arrow 1) from oriented gels of ParM-GMPPNP filaments (left half) cannotbe reproduced by the Egelman model. Other strong reflections produced by the Egelman model are not accounted for in the experimental fibrediffraction data (three examples are shown by the arrows on the right half) and other reflections experimentally observed (examples are shownby arrows on the left side) are missing in the diffraction of the Egelman model. Also note the difference in the layer line spacing between the leftand right hand side.
Molecular structure of the ParM polymerD Popp et al
The EMBO Journal VOL 27 | NO 3 | 2008 &2008 European Molecular Biology Organization576
the polymer will start to elongate again. This type of rescue is
a stochastic process, as observed in our in vitro TIRF experi-
ments. The fact that ParM-ATP filaments can be rescued after
a catastrophe, whereas ParM-GTP filaments cannot, is also
reflected by the behaviour of the ATPase and GTPase activity.
After the first initial burst, the GTPase activity stops, whereas
the ATPase is a continued slow process (Figure 2D).
Disintegration is observed only at the ends of the unidirec-
tional ParM bundles typically observed in vivo due to mole-
cular crowding (M^ller-Jensen et al, 2002) and in vitro (Popp
et al, 2007c), as short-range filament interactions within the
bundle hinder both nucleotide release and filament breakage
and thus disintegration. This notion is supported by our
electron micrographs, which show that both ParM-ATP and
ParM-GTP bundles are spindle-shaped at steady state
(Figure 1C) in contrast to ParM bundles with nonhydrolysa-
ble nucleotides, which are uniform in length with blunted
ends (Popp et al, 2007a).
ParM-Mix filaments behave in manner similar to ParM-
GTP filaments, the depolymerization rate being slower.
Nevertheless, both ParM-GTP and ParM-Mix filaments, unlike
ParM-ATP filaments, will depolymerize to completion within
about 10 min over the dimensions of the bacterium (Figure
1F–J; Supplementary movies 3 and 4). This is well below the
division time for E. coli, of about 20 min, thus ensuring equal
ParM distribution between mother and daughter cell. As our
results show that ParM binds to GTP preferentially even at
ATP:GTP ratios of 3:1, it is safe to conclude that in vivo ParM
filaments contain mainly bound GDP with some ADP-bound
monomers sprinkled in, which will not affect the ability of the
filament to disassemble to completion after segregating the
ParR–parC complex.
In summary, ParM is distinct from the atomic structure of
f-actin not only by forming a left-handed helix but also with
respect to its filament assembly dynamics. Despite being an
actin homologue, ParM is distinguished from actin by several
important properties: (i) the use of GTP rather than ATP; (ii)
an extremely rapid instead of slow spontaneous nucleation;
(iii) symmetrical bidirectional elongation due to spontaneous
bundle formation in a crowded environment (Popp et al,
2007a, b, c) and (iv) dynamic instability as a GTP-driven
molecular switch resulting in a phase of steady elongation
followed by a phase of shortening to complete disintegration
of the polymer instead of steady-state treadmilling.
Recently, a model for the ParM filament based on both
negatively stained and cryo-EM ParM-AMPPNP filaments has
been proposed by the Egelman group (Orlova et al, 2007). As
in our model of the ParM-GMPPNP filament, the Egelman
model shows ParM to be a left-handed helix opposed to the
right-handed actin helix. Yet otherwise, the two models are in
disagreement. For example, in our model, the ParM mono-
mers within the ParM filament are in the closed conforma-
tion, whereas in the Egelman model they are in the open
configuration. We have tested the correctness of the Egelman
ParM structure by calculating the diffraction pattern from
their model (protein data bank code 2QU4.pdb), taking into
account the contrast variation (Holmes et al, 1990). Then we
compared this to the experimentally observed X-ray fibre
diffraction pattern from oriented gels of ParM-GMPPNP.
Note that the X-ray fibre diffraction patterns from oriented
gels of ParM-GMPPNP and ParM-AMPPNP are virtually
identical (Supplementary Figure S8), indicating that there is
no major structural difference between ParM-AMPPNP and
ParM-GMPPNP filaments. We find that the Egelman model
does not fit to our experimentally observed X-ray fibre
diffraction pattern well (Figure 6C). The Egelman model
produces layer lines that are not observed experimentally,
whereas other strong layer lines visible in the X-ray diffrac-
tion pattern of the oriented ParM gels are missing. The
characteristic double horseshoe-like pattern near the equator
observed from oriented ParM fibres also cannot be accounted
for by the Egelman model. Furthermore, the helical para-
meters of the Egelman model differ from the parameters we
observe both from X-ray diffraction patterns of oriented gels
and from negatively stained ParM-GMPPNP filaments. In
the Egelman model, helical parameters are assigned as
l¼ 14nþ 31m, whereas we find the helical parameters to be
l¼ 17nþ 37m. The R-factor of the Egelman model against
the experimentally observed fibre diffraction data is 0.68,
whereas our EM model even with the limitation of rigid body
refinement is much better at 0.47. These findings strongly
argue in favour of our model of the ParM filament.
Still remains one intriguing puzzle in bacteria: so far, no
motor-, filament-severing- or formin-like proteins that are
prominent components of the eukaryotic cytoskeleton and
that control the dynamic behaviour of actin filaments have
been discovered. Our hypothesis is that they simply do not
exist and bacterial cells manage with ‘fibrous protein poly-
merization motors’, which work by a well-defined balance
between nucleotide-driven nonequilibrium polymerization
and dynamic instability. Whether a filament shows dynamic
microtubule-like instability, disintegrates to completion
or treadmills or neither (if both ends have similar rate
constants) seems to depend rather critically on a balance of
all various binding constants and is not specific to particular
classes of proteins.
Materials and methods
TIRF microscopy and biochemical experimentsSingle-molecule visualization of polymerization and steady-statebehaviour of ParM filaments upon addition of various nucleotideswere undertaken similarly as described previously (Popp et al,2007c). Buffer conditions, crowding agents, labelling of ParM withfluorophores and the optical setup using an inverted Nikon 2000microscope equipped with perfect focus and subsequent dataanalysis fitting the filament length with a polygon by hand usingImage J, Aqua Cosmos and Kaleidograph were similar as describedin detail previously (Popp et al, 2007c). Initially, as in our previousexperiments (Popp et al, 2007c), we added 10 mM of nucleotide toParM to initiate polymerization. Yet we found that the polymeriza-tion rates and steady-state behaviour did not change when loweringthe nucleotide concentration to 5 mM, so subsequently, we mostlyused this concentration, as it is closer to the physiologicalnucleotide concentration within the cell (about 1–3 mM).
Clean glass slides were very important to obtain reproducibleresults. We tried various procedures of cleaning as described byother groups to make the surface of the glass hydrophilic (Kuhn andPollard, 2005), and we also tested additional procedures likeblocking the surface with BSA, which increases the hydrophobicityand, in some cases, decreases the high mobility of the filaments.The results obtained from all these glass surfaces were rathersimilar, yet the washing procedure we mostly used (Popp et al,2007b, c) was fast and produced reliable hydrophilic surfaces. Wewant to point out in this context that according to the principalpredictions of adsorption theory, proteins do not adsorb tohydrophilic surfaces and are separated from the surface by anaqueous layer (Vogler, 1998). We have recently proven thishypothesis to be correct for actin-containing filaments (Popp et al,
Molecular structure of the ParM polymerD Popp et al
&2008 European Molecular Biology Organization The EMBO Journal VOL 27 | NO 3 | 2008 577

2007a, b). ParM filaments behaved similarly. Therefore, for mostfilaments, only the total length of the filament could be studied overtime, owing to the large motions the filaments underwent near theglass surface. Only for a small amount of filaments (less than 3% ofall filaments) the behaviour of both filament ends could be followedat steady state. This was possible, when either a filament appearedfirmly adsorbed to the surface or fluorescent speckles in thefilament could be used as a ficidual mark.
Stopped-flow experiments were performed with an SF61-DX2stopped-flow spectrophotometer (Hi-Tech Scientific, Salisbury, UK).Filament formation at 251C was monitored using light-scattering asdescribed previously (Bagshaw and Trentham, 1973). Softwareprovided by Hi-Tech Scientific was used for curve fitting of the data.
Conventional light-scattering experiments on ParM polymeriza-tion was carried out at 251C using a Hitachi Fluorescence Spectro-meter F-4550 at the wavelength of 660 nm.
The release of inorganic phosphate upon nucleotide hydrolysisduring ParM polymerization was measured at 251C using PhosphateAssay Kit (E-6646) from Molecular Probes, based on a methoddescribed previously (Webb, 1992).
SAX and high-pressure SAXParM in P-buffer (25 mM Hepes, pH 7.5, 30 mM KCl, 2 mM MgCl2and 5 mM DTT) at concentrations between 5 mg/ml and 15 mg/mlwere polymerized by the addition of 5 or 10 mM nucleotide andplaced into specially designed chambers (Fujisawa, 2000; Nishika-wa et al, 2001). Temperature was controlled at 251C. Hydrostaticpressure was applied either in multiple steps or by a single stepwithin about 1 s (Nishikawa et al, 2001). Using beam line BL45-XU(l¼ 0.9 A) and camera lengths of 1–2.2 m, the small-angle-scattering pattern of ParM was recorded on a cooled CCD cameraand data were analysed as described previously (Fujisawa, 2000).
X-ray crystallographyParM-GDP crystals were grown under conditions similarly aspreviously described for ParM-ADP (van den Ent et al, 2002).ParM-GMPPNP crystals were prepared by soaking GMPPNP intoParM-GDP crystals. X-ray data to a resolution of 2.25 A werecollected at BL45 and the ParM-GDP and ParM-GMPPNP structureswere solved by molecular replacement.
Oriented gelsParM-GMPPNP and ParM-AMPPNP filaments were oriented in glasscapillaries as previously described for f-actin and other biologicalpolymers (Popp et al, 1987; Yamashita et al, 1998). The cross-section of the X-ray beam at BL45-XU (l¼ 0.9 A) was optimized to150�150mm. The camera length was 85 cm and fibre diffractionpatterns were recorded on Rigaku imaging plates. The exposuretime was 40 s per image. X-ray fibre diffraction data were analysedusing the software package developed by K Hasegawa and K Namba(unpublished data), which allowed, among other features, strippingof the background, averaging of data sets or quadrants andcorrecting for angular disorientation.
Electron microscopyA drop of ParM-GMPPNP filaments was applied to carbon-coatedcopper grids, blotted stained with 1% uranyl acetate and visualizedunder a Jeol JEM-2010 HC microscope operated at 100 keV and anominal magnification of 40 000. Films were digitized withPhotoScan2000 (Z/I Imaging) at 7mm steps. The handedness ofParM was determined by tilting a filament by 301 along its axis andcomparing the two views as described previously (Belnap et al,1997). Reconstructions of ParM were performed as described indetail recently (Narita and Maeda, 2007). Exact procedures of howthe reconstruction was performed and how the handedness wasdetermined are given in the Supplementary data.
Supplementary dataSupplementary data are available at The EMBO Journal Online(http://www.embojournal.org).
Acknowledgements
We thank Shiho Minakata for taking the X-ray data of ParM crystals,Kazuki Ito for beam line support at Spring8 BL45-XU and AkihiroYamamoto for technical supervision of our light microscopy facil-ities. ParM plasmid was a kind gift from Jakob M^ller-Jensen. Weare indebted to Harold P Erickson for initially pointing out to usthe possible importance of GTP in ParM polymerization.
References
Bagshaw C, Trentham D (1973) The characterization of myosin–product complexes and of product-release steps during themagnesium ion-dependent adenosine triphosphate reaction.Biochem J 141: 331–349
Belnap DM, Olson NH, Baker TS (1997) A method for establishingthe handedness of biological macromolecules. J Struct Biol 120:44–51
Bork P, Sander C, Valencia A (1992) An ATPase domain common toprokaryotic cell cycle proteins, sugar kinases, actin, and hsp70heat shock proteins. Proc Natl Acad Sci USA 89: 7290–7294
Bourne HR, Sanders DA, McCormick F (1991) The GTPase super-family: conserved structure and molecular mechanism. Nature349: 117–127
Carlier M-F (1987) Measurement of Pi dissociation from actinfilaments following ATPase hydrolysis using a linked enzymesystem. Biochem Biophys Res Commun 143: 1069–1075
Carlier M-F, Pantaloni D (1986) Direct evidence for ADP-Pi-F-actinas the major intermediate in ATP-actin polymerization. Rateof dissociation of Pi from actin filaments. Biochemistry 35:7789–7792
Finch JT (1972) The hand of the helix of tobacco virus. J Mol Biol66: 291–294
Fujisawa T (2000) Structural studies on protein solutions by usingsolution X-ray scattering technique at RIKEN structural biologybeamline I (BL45XU). J Cryst Soc Jpn 42: 97–105
Garner EC, Cambell CS, Mullins RD (2004) Dynamic instability ina DNA-segregating prokaryotic actin homolog. Science 306: 1021–1025
Garner EC, Cambell CS, Weibel DB, Mullins RD (2007)Reconstitution of DNA segregation driven by assembly of aprokaryotic actin homolog. Science 315: 1270–1274
Gerdes K, M^ller-Jensen J, Bugge-Jensen R (2000) Plasmidand chromosome partitioning: surprises from phylogeny.Mol Microbiol 37: 455–466
Holmes KC, Popp D, Gebhard W, Kabsch W (1990) Atomic model ofthe actin filament. Nature 347: 44–49
Ikeuchi Y, Suzuki A, Oota T, Hagiwara K, Tatsumi R, Ito T, Balny C(2002) Fluorescence study of the high pressure-induced denatura-tion of skeletal muscle actin. Eur J Biochem 269: 364–371
Klug A, Finch JT (1968) Structure of viruses of the papilloma-polyoma type: IV. Analysis of tilting experiments in the electronmicroscope. J Mol Biol 31: 1–12
Kuhn JR, Pollard TD (2005) Real-time measurements of actinfilament polymerization by total internal reflection fluorescencemicroscopy. Biophys J 88: 1387–1402
M^ller-Jensen J, Jensen RB, Gerdes K (2000) Plasmid and chromo-some segregation in prokaryotes. Trends Microbiol 8: 313–320
M^ller-Jensen J, Jensen RB, Lowe J, Gerdes K (2002) ProkaryoticDNA segregation by an actin-like filament. EMBO J 21:3119–3127
Narita A, Maeda Y (2007) Molecular determination by electronmicroscopy of the actin filament end structure. J Mol Biol 365:480–501
Nishikawa Y, Fujisawa T, Inoko Y, Moritoki M (2001) Improvementof a high pressure cell with diamond windows for solution X-rayscattering of proteins. Nucl Instrum Methods Phys Res A 467:1384–1387
Orlova A, Garner EC, Galkin VE, Heuser J, Mullins RD, Egelman EH(2007) The structure of bacterial ParM filaments. Nat Struct MolBiol 14: 921–925
Popp D, Lednev VV, Jahn W (1987) Methods of preparingwell-orientated sols of f-actin containing filaments suitable forX-ray diffraction. J Mol Biol 197: 679–684
Popp D, Yamamoto A, Iwasa M, Nitanai Y, Maeda Y (2007a) Singlemolecule polymerization, annealing and bundling dynamicsof SipA induced actin filaments. Cell Motil Cytoskeleton; e-pubahead of print December 12
Molecular structure of the ParM polymerD Popp et al
The EMBO Journal VOL 27 | NO 3 | 2008 &2008 European Molecular Biology Organization578
Popp D, Yamamoto A, Maeda Y (2007b) Crowded surfaces changeannealing dynamics of actin filaments. J Mol Biol 368: 365–374
Popp D, Yamamoto A, Narita A, Iwasa M, Maeda K, Maeda Y(2007c) Concerning the dynamic instability of actin homologParM. Biochem Biophys Res Commun 353: 109–114
Schneider DA, Gourse RL (2004) Relationship between growth rateand ATP concentration in Escherichia coli: a bioassay for availablecellular ATP. J Biol Chem 279: 8262–8268
van den Ent F, M^ller-Jensen J, Amos LA, Gerdes K, Lowe J (2002)F-actin-like filaments formed by plasmid segregation proteinParM. EMBO J 21: 6935–6943
Vogler EA (1998) Structure and reactivity of water at biomaterialsurfaces. Adv Colloid Interface Sci 74: 69–117
Webb MR (1992) A continous spectrophotometric assay for in-organic phosphate and for measuring phosphate release kineticsin biological systems. Proc Natl Acad Sci USA 89: 4884–4887
Yamashita I, Suzuki H, Namba K (1998) Multiple-step method formaking exceptionally well oriented liquid-crystalline sols ofmacromolecular assemblies. J Mol Biol 278: 609–615
Yasunaga T, Wakabayashi T (1996) Extensible and object-orientedsystem Eos supplies a new environment for image analysis ofelectron micrographs of macromolecules. J Struc Biol 116: 155–160
Molecular structure of the ParM polymerD Popp et al
&2008 European Molecular Biology Organization The EMBO Journal VOL 27 | NO 3 | 2008 579